Electronic Delocalization in Discotic Liquid Crystals: A Joint Experimental and Theoretical Study
11
Electronic Delocalization in Discotic Liquid Crystals: A Joint Experimental and Theoretical Study Xavier Crispin,* ,², | Je ´ ro ˆ me Cornil, ‡,§ Rainer Friedlein, ² Koji Kamiya Okudaira, ∇ Vincent Lemaur, ‡ Annica Crispin, ² Gae ¨ l Kestemont, ⊥ Matthias Lehmann, ⊥ Mats Fahlman, | Roberto Lazzaroni, ‡,§ Yves Geerts, ⊥ Go ¨ ran Wendin, # Nobuo Ueno, ∇ Jean-Luc Bre ´ das, ‡,§ and William R. Salaneck ² Contribution from the Department of Physics and Measurement Technology, IFM, Linko ¨ping UniVersity, S-58183 Linko ¨ping, Sweden, SerVice de Chimie des Mate ´ riaux NouVeaux, Centre de Recherche en Electronique et Photonique Mole ´ culaires, UniVersite ´ de Mons-Hainaut, Place du Parc 20, B-7000 Mons, Belgium, School of Chemistry and Biochemistry, Georgia Institute of Technology, Atlanta, Georgia 30332-0400, Laboratoire de Chimie des Polyme ` res, CP 206/1, UniVersite ´ Libre de Bruxelles, BouleVard du Triomphe, B-1050 Bruxelles, Belgium, Department of Science and Technology, Campus Norrko ¨ping, Linko ¨ping UniVersity, S-60174 Norrko ¨ping, Sweden, Department of Microtechnology and Nanoscience, MC2, Chalmers UniVersity of Technology, S-412 96 Go ¨teborg, Sweden, and Department of Materials Science, Faculty of Engineering, Chiba UniVersity, Yayoi-cho, Inage-ku, Chiba 263-8522, Japan Received March 8, 2004; E-mail: [email protected] Abstract: Discotic liquid crystals emerge as very attractive materials for organic-based (opto)electronics as they allow efficient charge and energy transport along self-organized molecular columns. Here, angle- resolved photoelectron spectroscopy (ARUPS) is used to investigate the electronic structure and supramolecular organization of the discotic molecule, hexakis(hexylthio)diquinoxalino[2,3- a:2′,3′-c]phenazine, deposited on graphite. The ARUPS data reveal significant changes in the electronic properties when going from disordered to columnar phases, the main feature being a decrease in ionization potential by 1.8 eV following the appearance of new electronic states at low binding energy. This evolution is rationalized by quantum-chemical calculations performed on model stacks containing from two to six molecules, which illustrate the formation of a quasi-band structure with Bloch-like orbitals delocalized over several molecules in the column. The ARUPS data also point to an energy dispersion of the upper π-bands in the columns by some 1.1 eV, therefore highlighting the strongly delocalized nature of the π-electrons along the discotic stacks. 1. Introduction Discotic liquid crystals are currently widely considered for applications in organic-based (opto)electronic devices, such as light-emitting devices, 1-3 field-effect transistors, 4 solar cells, 5,6 and sensors. 7 This originates from their unique combination of properties: (i) the molecules, typically made of a central conjugated core substituted by saturated chains, are highly soluble and easily processed into organic thin films by spin- coating or ink-jet printing; 8 (ii) structural defects can be repaired by the self-healing properties of liquid crystal phases; (iii) the materials can be highly purified to eliminate impurities and/or chemical defects that are detrimental for charge transport; (iv) a high (supra)molecular order can be spontaneously achieved in films, 4,9 leading to charge mobilities in the discotic phase comparable to those in amorphous silicon (around 0.1 cm 2 /V‚ s), 10,11 i.e., up to 3 orders of magnitude larger than typical values in conjugated polymers; and (v) the exciton diffusion length, a highly relevant parameter for sensors and photovoltaic applica- tions, is 1 order of magnitude larger than in conjugated polymers. 12,13 ² Department of Physics and Measurement Technology, Linko ¨ping University. ‡ Universite ´ de Mons-Hainaut. § Georgia Institute of Technology. ⊥ Universite ´ Libre de Bruxelles. | Department of Science and Technology, Linko ¨ping University. # Chalmers University of Technology. ∇ Chiba University. (1) Lu ¨ssem, G.; Wendorff, J. H. Polym. AdV. Technol. 1998, 9, 443-460. (2) Seguy, I.; Destruel, P.; Boch, H. Synth. Met. 2000, 111-112, 15-18. (3) Seguy, I.; Jolinat, P.; Destruel, P.; Farenc, J.; Mamy, R.; Bock, H.; Ip, J.; Nguyen, T. P. J. Appl. Phys. 2001, 89, 5442-5448. (4) Stutzmann, N.; Friend, R. H.; Sirringhaus, H. Science 2003, 299, 1881- 1884. (5) Schmidt-Mende, L.; Fechtenko ¨tter, A.; Mu ¨llen, K.; Moons, E.; Friend, R. H.; MacKenzie, J. D. Science 2001, 293, 1119-1122. (6) Schmidt-Mende, L.; Fechtenkotter, A.; Mullen, K.; Friend, R. H.; Mac- Kenzie, J. D. Physica E 2002, 14, 263-267. (7) Boden, N.; Bushby, R. J.; Clements, J.; Movaghar, B. J. Mater. Chem. 1999, 9, 2081-2086. (8) Simpson, C. D.; Wu, J.; Watson, M. D.; Mu ¨llen, K. J. Mater. Chem. 2004, 14, 494-504. (9) Zimmermann, S.; Wendorff, J. H.; Weder, C. Chem. Mater. 2002, 14, 2218-2223. (10) Craats, A. M. v. d.; Warman, J. M.; Fechtenko ¨tter, A.; Brand, J. D.; Harbison, M. A.; Mu ¨llen, K. AdV. Mater. 1999, 11, 1469-1472. (11) Craats, A. M. v. d.; Warman, J. M. AdV. Mater. 2001, 13, 130-133. (12) Markovitsi, D.; Marguet, S.; Gallos, L. K.; Sigal, H.; Millie ´, P.; Argyrakis, P.; Ringsdorf, H.; Kumar, S. Chem. Phys. Lett. 1999, 306, 163-167. Published on Web 09/04/2004 10.1021/ja048669j CCC: $27.50 © 2004 American Chemical Society J. AM. CHEM. SOC. 2004, 126, 11889-11899 9 11889
-
Upload
independent -
Category
Documents
-
view
4 -
download
0
Transcript of Electronic Delocalization in Discotic Liquid Crystals: A Joint Experimental and Theoretical Study

Electronic Delocalization in Discotic Liquid Crystals:A Joint Experimental and Theoretical Study
Xavier Crispin,*,†,| Jerome Cornil,‡,§ Rainer Friedlein,† Koji Kamiya Okudaira,∇
Vincent Lemaur,‡ Annica Crispin,† Gael Kestemont,⊥ Matthias Lehmann,⊥
Mats Fahlman,| Roberto Lazzaroni,‡,§ Yves Geerts,⊥ Goran Wendin,# Nobuo Ueno,∇
Jean-Luc Bredas,‡,§ and William R. Salaneck†
Contribution from the Department of Physics and Measurement Technology, IFM,Linkoping UniVersity, S-58183 Linko¨ping, Sweden, SerVice de Chimie des Mate´riaux NouVeaux,Centre de Recherche en Electronique et Photonique Mole´culaires, UniVersitede Mons-Hainaut,
Place du Parc 20, B-7000 Mons, Belgium, School of Chemistry and Biochemistry, GeorgiaInstitute of Technology, Atlanta, Georgia 30332-0400, Laboratoire de Chimie des Polyme`res, CP
206/1, UniVersiteLibre de Bruxelles, BouleVard du Triomphe, B-1050 Bruxelles, Belgium,Department of Science and Technology, Campus Norrko¨ping, Linkoping UniVersity,
S-60174 Norrko¨ping, Sweden, Department of Microtechnology and Nanoscience, MC2, ChalmersUniVersity of Technology, S-412 96 Go¨teborg, Sweden, and Department of Materials Science,
Faculty of Engineering, Chiba UniVersity, Yayoi-cho, Inage-ku, Chiba 263-8522, Japan
Received March 8, 2004; E-mail: [email protected]
Abstract: Discotic liquid crystals emerge as very attractive materials for organic-based (opto)electronicsas they allow efficient charge and energy transport along self-organized molecular columns. Here, angle-resolved photoelectron spectroscopy (ARUPS) is used to investigate the electronic structure andsupramolecular organization of the discotic molecule, hexakis(hexylthio)diquinoxalino[2,3-a:2′,3′-c]phenazine,deposited on graphite. The ARUPS data reveal significant changes in the electronic properties when goingfrom disordered to columnar phases, the main feature being a decrease in ionization potential by 1.8 eVfollowing the appearance of new electronic states at low binding energy. This evolution is rationalized byquantum-chemical calculations performed on model stacks containing from two to six molecules, whichillustrate the formation of a quasi-band structure with Bloch-like orbitals delocalized over several moleculesin the column. The ARUPS data also point to an energy dispersion of the upper π-bands in the columnsby some 1.1 eV, therefore highlighting the strongly delocalized nature of the π-electrons along the discoticstacks.
1. Introduction
Discotic liquid crystals are currently widely considered forapplications in organic-based (opto)electronic devices, such aslight-emitting devices,1-3 field-effect transistors,4 solar cells,5,6
and sensors.7 This originates from their unique combination ofproperties: (i) the molecules, typically made of a central
conjugated core substituted by saturated chains, are highlysoluble and easily processed into organic thin films by spin-coating or ink-jet printing;8 (ii) structural defects can be repairedby the self-healing properties of liquid crystal phases; (iii) thematerials can be highly purified to eliminate impurities and/orchemical defects that are detrimental for charge transport; (iv)a high (supra)molecular order can be spontaneously achievedin films,4,9 leading to charge mobilities in the discotic phasecomparable to those in amorphous silicon (around 0.1 cm2/V‚s),10,11i.e., up to 3 orders of magnitude larger than typical valuesin conjugated polymers; and (v) the exciton diffusion length, ahighly relevant parameter for sensors and photovoltaic applica-tions, is 1 order of magnitude larger than in conjugatedpolymers.12,13
† Department of Physics and Measurement Technology, Linko¨pingUniversity.
‡ Universitede Mons-Hainaut.§ Georgia Institute of Technology.⊥ UniversiteLibre de Bruxelles.| Department of Science and Technology, Linko¨ping University.# Chalmers University of Technology.∇ Chiba University.
(1) Lussem, G.; Wendorff, J. H.Polym. AdV. Technol.1998, 9, 443-460.(2) Seguy, I.; Destruel, P.; Boch, H.Synth. Met.2000, 111-112, 15-18.(3) Seguy, I.; Jolinat, P.; Destruel, P.; Farenc, J.; Mamy, R.; Bock, H.; Ip, J.;
Nguyen, T. P.J. Appl. Phys.2001, 89, 5442-5448.(4) Stutzmann, N.; Friend, R. H.; Sirringhaus, H.Science2003, 299, 1881-
1884.(5) Schmidt-Mende, L.; Fechtenko¨tter, A.; Mullen, K.; Moons, E.; Friend, R.
H.; MacKenzie, J. D.Science2001, 293, 1119-1122.(6) Schmidt-Mende, L.; Fechtenkotter, A.; Mullen, K.; Friend, R. H.; Mac-
Kenzie, J. D.Physica E2002, 14, 263-267.(7) Boden, N.; Bushby, R. J.; Clements, J.; Movaghar, B.J. Mater. Chem.
1999, 9, 2081-2086.
(8) Simpson, C. D.; Wu, J.; Watson, M. D.; Mu¨llen, K. J. Mater. Chem.2004,14, 494-504.
(9) Zimmermann, S.; Wendorff, J. H.; Weder, C.Chem. Mater.2002, 14,2218-2223.
(10) Craats, A. M. v. d.; Warman, J. M.; Fechtenko¨tter, A.; Brand, J. D.;Harbison, M. A.; Mullen, K. AdV. Mater. 1999, 11, 1469-1472.
(11) Craats, A. M. v. d.; Warman, J. M.AdV. Mater. 2001, 13, 130-133.(12) Markovitsi, D.; Marguet, S.; Gallos, L. K.; Sigal, H.; Millie´, P.; Argyrakis,
P.; Ringsdorf, H.; Kumar, S.Chem. Phys. Lett.1999, 306, 163-167.
Published on Web 09/04/2004
10.1021/ja048669j CCC: $27.50 © 2004 American Chemical Society J. AM. CHEM. SOC. 2004 , 126, 11889-11899 9 11889

Discotic molecules are known to pack into one-dimensionalcolumns in both the crystalline and liquid crystalline phases.The molecular organization in thin films is influenced by thesubstrate14,15 and can therefore be different than in the bulk.The formation of such columns is governed by the strongintermolecular interactions among the cores and among lateralchains of adjacent units and induces an efficient one-dimensionalcharge transport along the stacks. Recent theoretical studies havepointed out the main parameters controlling the charge mobilityin organic semiconductors at the molecular scale16 and, inparticular, inπ-conjugated discotic liquid crystals.17-20 Due tothe large degree of geometric fluctuations within the columns,leading to modulations in the inter-disk distance and/or rotationsof the disks around the stacking axis,21 charge transport indiscotic liquid crystals is usually expected to correspond to aphonon-assisted hopping regime, as is the case in amorphousorganic thin films22 or molecular crystals at high temperature.23
In such a regime, the charges are localized over a singlemolecule and jump from site to site to yield a current. A majorparameter governing the charge mobility, be it in a (localized)hopping or (delocalized) band regime, is the transfer integralt.The transfer integral describes the strength of the interactionsbetween adjacent molecules and can be estimated to a very goodapproximation for hole [electron] transport as half the splittingof the highest occupied molecular orbital, HOMO [lowestunoccupied molecular orbital, LUMO], level in a dimer madeof two neutral molecules.16,24-26 In the context of a tight-bindingmodel, the widths of the valence and conduction bands of aneutral infinite stack equal 4 times the corresponding transferintegrals.16,25,27The width of the valence band can be probedby ultraviolet photoelectron spectroscopy (UPS). Similar con-siderations apply to the conduction band; however, the latter isless accessible at the experimental level.
Here, we study by means of angle-resolved ultravioletphotoelectron spectroscopy (ARUPS) the electronic structureof hexakis(hexylthio)diquinoxalino[2,3-a:2′,3′-c]phenazine (HAT-NA-SC6) molecules and its evolution when the molecules orderinto columns upon heating in ultrahigh vacuum. The choice ofHATNA derivatives is motivated by their very good transport
properties; the sum of the hole and electron mobilities variesfrom 0.01 to 0.6 cm2/Vs at room temperature, depending onthe alkyl chain length.28 This discotic molecule is larger thanthe well-known triphenylene molecule and incorporates sixnitrogen atoms within the conjugated core (Figure 1a). Notethat UPS allows us to probe the electronic structure of thecolumns in the geometric structure characteristic of the neutralstate, since the photoemission process is much faster (∼10-16
s) than the nuclear geometry relaxation induced by the creationof the photohole (∼10-14-10-13 s). The spectroscopic data areinterpreted with the help of the independent atomic centerapproximation29 in order to shed light onto the preferentialmolecular orientation in the films, and with quantum-chemicalcalculations performed on the isolated molecule and modelstacks containing from two to six molecules in order tocharacterize theπ-electron delocalization.
2. Experimental Section
The synthesis of the HATNA-SC6 molecules has been reportedearlier.30 Six alkyl side chains, composed of six carbon atoms each,are attached via a sulfur atom to the HATNA conjugated core. Thepurity of the material used in this work is better than 99%. Theimpurities observed by nuclear magnetic resonance (1H NMR) arenonconjugated solvent residues remaining from the purification by
(13) Markovitsi, D.; Gallos, L. K.; Lemaistre, J. P.; Argyrakis, P.Chem. Phys.2001, 269, 147-158.
(14) Ruffieux, P.; Gro¨ning, O.; Bielmann, M.; Simpson, C.; Mu¨llen, K.;Schlapbach, L.; Gro¨ning, P.Phys. ReV. B 2002, 66, 0734091-0734094.
(15) Friedlein, R.; Crispin, X.; Simpson, C.; Ja¨ckel, F.; Osikowicz, W.;Marciniak, S.; Jong, M. P. d.; Jo¨nsson, S. K. M.; Samori, P.; Fahlman, M.;Watson, M.; Mullen, K.; Rabe, J. P.; Salaneck, W. R.Phys. ReV. B 2003,68, 195414-195417.
(16) Bredas, J. L.; Calbert, J. P.; Filho, D. A. d. S.; Cornil, J.Proc. Natl. Acad.Sci., U.S.A.2002, 99, 5804-5809.
(17) Cornil, J.; Lemaur, V.; Calbert, J. P.; Bre´das, J. L.AdV. Mater. 2002, 14,726-729.
(18) Lemaur, V.; Filho, D. A. d. S.; Coropceanu, V.; Lehmann, M.; Geerts, Y.;Piris, J.; Debije, M. G.; Craats, A. M. v. d.; Senthilkumar, K.; Siebbeles,L. D. A.; Warman, J. M.; Bre´das, J.-L.; Cornil, J.J. Am. Chem. Soc.2004,126, 3271-3279.
(19) Senthilkumar, K.; Grozema, F. C.; Bickelhaup, F. M.; Siebbeles, L. D. A.J. Chem. Phys.2003, 119, 9809-9817.
(20) Palenberg, M. A.; Silbey, R. J.; Malagoli, M.; Bre´das, J. L.J. Chem. Phys.2000, 112, 1541-1546.
(21) Fischbach, I.; Pakula, T.; Minkin, P.; Fechtenko¨tter, A.; Mullen, K.; Spiess,H. W.; Saalwa¨chter, K.J. Phys. Chem. B2002, 106, 6408-6418.
(22) Bassler, H.Phys. Stat. Solidi B1993, 175, 15-18.(23) Duke, C.; Schein, L.Phys. Today1980, 33, 42-48.(24) Li, X. Y.; Tang, X. S.; He, F. C.Chem. Phys.1999, 248, 137-146.(25) Cornil, J.; Beljonne, D.; Calbert, J. P.; Bre´das, J. L.AdV. Mater.2001, 13,
1053-1067.(26) Cornil, J.; Calbert, J. P.; Beljonne, D.; Silbey, R.; Bre´das, J. L.Synth. Met.
2001, 119, 1-6.(27) Salem, L.The molecular theory of conjugated systems; W. A. Benjamin,
Inc.: New York, 1966.
(28) Warman, J.; Piris, J.; Debije, M., personal communication.(29) Grobman, W. D.Phys. ReV. B 1978, 17, 4573-4585.(30) Kestemont, G.; Halleux, V. d.; Lehmann, M.; Ivanov, D. A.; Watson, M.;
Geerts, Y. H.Chem. Commun.2001, 2074-2075.
Figure 1. (a) Chemical structure of the HATNA-SC6 molecule. (b)Geometry of the ARUPS experiments.φe andφp are the azimuthal anglesfor electrons and photons, respectively.θe andθp are the polar angles forelectrons and photons, respectively, defined with respect to the surfacenormal. The position of the molecule is defined by two angles: the moleculartilt angle â with respect to the surface and the molecular azimuthal angleφm.
A R T I C L E S Crispin et al.
11890 J. AM. CHEM. SOC. 9 VOL. 126, NO. 38, 2004

column chromatography. No large aromatic side products are detectedby thin-layer chromatography. The films are formed by evaporating,at room temperature, a drop of a HATNA-SC6/CHCl3 (0.1 mg/mL)solution deposited onto a freshly cleaved highly oriented pyrolyticgraphite (0001) surface (ZYB Bquality) or on a naturally oxidizedsilicon (100) surface (previously cleaned in an ultrasonic bath of acetoneand 2-propanol). The thickness of the thin films is estimated from thesuppression of the substrate core-level line by additional X-rayphotoelectron spectroscopy measurements and is typically around 100-200 Å.
The angle-integrated UPS measurements have been carried out inLinkoping with a spectrometer of our own design and construction,with a base pressure less than 1× 10⁻⁹ mbar. The UPS spectra arerecorded using monochromatized He I (21.2 eV) and He II (40.8 eV)radiations from a helium discharge lamp. The energy resolution isestimated to(0.1 eV, as determined by the width of the gold Fermiedge. The work function is determined by the position of the secondaryelectron cutoff.
The angle-resolved photoelectron spectra have been recorded atbeamline 41 of MAX-I at the MAX-Laboratory for SynchrotronRadiation Research in Lund, Sweden. The overall energy resolution isabout 100 meV for an angular resolution of about 2°. The geometry ofthe ARUPS experiment is sketched in Figure 1b. The electric fieldvector of the incident photon beam, the surface normal, and the sample-detector axis are kept in the same plane. In other words, the azimuthalangles for ejected electrons,φe, and incident photons,φp, relative to areference axisa on the surface are the same and kept constant. In allof the measurements, the photon beam hits the surface at grazingincidence with a polar angleθp ) 80°, while the photoelectrons arecollected at a chosen polar angleθe. The binding energies refer to thevacuum level, as obtained by adding the work function of the samplesto the energy scale of the UPS spectra initially measured with respectto the Fermi level.
3. Theoretical Approach
The model molecule HATNA-SH chosen for the electronicstructure calculations has the same conjugated core as the actualHATNA-SC6 discotic liquid crystal molecules. The geometricstructure of the HATNA-SH molecule has been optimized atthe density functional theory (DFT) level using the B3LYPfunctionals and a 6-31g(d,p) basis set.31,32Model stacks are builtby superimposing HATNA-SH molecules, separated by 3.4 Å,without any further structure optimization. The theoretical UPSspectra of the isolated molecule and of stacks containingfrom two to six molecules have been simulated with the helpof the intermediate neglect of differential overlap (INDO) semi-empirical Hartree-Fock method developed by Zerner and co-workers.33 The general procedure used to calculate the UPSspectra has been described in detail elsewhere.34 Briefly, wesimulate the spectra within Koopmans’ approximation (i.e.,using eigenvalues as binding energies), without estimating crosssections, and by matching the HOMO of the single moleculeto the experimental spectrum obtained for the disordered phasein order to account for solid-state polarization effects. For thesingle HATNA-SH molecule, the energy scale has beencontracted by a factor of 1.3 to compensate for the neglect of
intramolecular electronic relaxation and correlation effects, asused and justified in previous studies.34 The broadening of theUPS features is introduced with the help of Gaussian functions(with a full-width at half-maximum set at 0.3 eV if not otherwisestated) centered on each eigenvalue.
The angle dependence of the photoelectron emission of theHATNA-SH molecule is simulated within the independentatomic center (IAC) approximation developed by Grobman.29
This type of analysis has been shown to be reliable indetermining the orientation of large conjugated molecules suchas phthalocyanines35 and bis(1,2,5-thiadiazolo)-p-quinobis(1,3-dithiole) (BTQBT) deposited on graphite,36 or In-[perylene-3,4,9,10-tetracarboxylic dianhydride] on MoS2.37 In this model,photoelectrons are considered to be coherently emitted from allthe atoms involved in a given molecular orbital of the HATNA-SH core. Note that our simulation does not take into accounthere the alkane side chains. Since the analysis spot of theexperiments probes a surface area of about 1 mm× 1 mm onthe samples, the photoemission signal is expected to originatefrom a multitude of orientations of the molecules along theazimuthal angle. Therefore, the calculated ARUPS spectra havebeen integrated over the molecular azimuthal angleφm in therange 0°-360° in 3° steps. The molecular azimuthal angleφm
defines the rotation of the molecular axis (x,y,z) with respect tothe fixed axisa on the surface of the substrate. As for theexperiments, we set the photon polar angle atθp ) 80° andφp
) φe. The total amplitudeAtot of the photoemission from thenth molecular orbital is given by
The first term is the damping factor of spherical waves at thedetector positionR ()RR). The sum over the contributions fromeach individual atoma yieldsAtot. Can is the linear combinationof atomic orbitals (LCAO) coefficient of thenth molecularorbital on atom a, as provided by the INDO calculationsperformed on a single HATNA-SH molecule. The term e-ikRa
is the phase factor taking into account the difference in the pathlength to the detector from each atomic positionRa, with k()kR) being the wavevector of the photoelectron. The factorNa(k) ) ∑l,m Ml,a
m ylm is the so-called atomic factor, withMl,a
m ylm
∝ ⟨φEkin,k|ε‚r |φnlm⟩. The right-hand term is the transition dipolemoment for the optical excitation from the initial stateφnlm tothe final continuum stateφEkin,k of kinetic energyEkin and wavevectork. ε [)(εx,εy,εz)] represents the direction of the photonpolarization. The full expression of the atomic factor has beendescribed elsewhere and depends on the angles specifying thephotoemission direction and the polarization direction of theincident photons.29,36
4. Results and Discussion
4.1. Molecular Order in “As-Prepared” Films. Figure 2displays the experimental ARUPS data for “as-prepared” films(just after the solvent has evaporated) deposited on highly(31) Lee, C.; Yang, W.; Parr, R. G.Phys. ReV. B 1988, 37, 785-789.
(32) Becke, A. D.J. Chem. Phys.1993, 98, 1372-1377.(33) Zerner, M. C.; Loew, G. H.; Kichner, R. F.; Mueller-Westerhoff, U. T.J.
Am. Chem. Soc.1980, 102, 589-599.(34) Cornil, J.; Vanderdonckt, S.; Lazzaroni, R.; Santos, D. A. d.; Thys, G.;
Geise, H. J.; Yu, L. M.; Szablewski, M.; Bloor, D.; Lo¨gdlund, M.; Salaneck,W. R.; Gruhn, N. E.; Lichtenberger, D. L.; Lee, P. A.; Armstrong, N. R.;Bredas, J. L.Chem. Mater.1999, 11, 2436-2443.
(35) Kawaguchi, T.; Tada, H.; Koma, A.J. Appl. Phys.1994, 75, 1484-1492.(36) Hasegawa, S.; Tanaka, S.; Yamashita, Y.; Inokuchi, H.; Fujimoto, H.;
Kamiya, K.; Seki, K.; Uneo, N.Phys. ReV. B 1993, 48, 2596-2600.(37) Azuma, Y.; Akatsuka, S.; Okudaira, K. K.; Harada, Y.; Ueno, N.J. Appl.
Phys.2000, 87, 766-769.
Atot(R) )eikR
R∑
a
Cna e-ikRaNa(k) (1)
Electronic Delocalization in Discotic Liquid Crystals A R T I C L E S
J. AM. CHEM. SOC. 9 VOL. 126, NO. 38, 2004 11891

oriented pyrolytic graphite (HOPG), as well as the calculatedelectronic structure of the core portion of a single HATNAmolecule. The onset of the lowest UPS feature occurs at 5.9eV, while the calculated HOMO is at 6.5 eV after the rigidshift. Although the theoretical value is subject to caution dueto the use of Koopmans’ theorem and the simple account ofpolarization effects, we estimate the line width of this featureto be 0.6( 0.2 eV from the comparison of the theoretical andexperimental spectra. The HOMO is doubly degenerate anddelocalized over the conjugated core. The ARUPS shows onefeature at 7.2 eV attributed to a sum of contributions from theHOMO-1, doubly degenerate HOMO-2, and HOMO-3levels, all of which areπ-levels delocalized over the conjugatedcore. This signal increases for lower emission anglesθe andreaches its maximum around 10°. In contrast, the peak seen at8 eV corresponds toσ-type orbitals, the doubly degenerateHOMO-4 and HOMO-5 levels, arising mainly from thenitrogen lone pairs. The UPS features associated to theseσ-orbitals display a maximum at 50°. The peak at 8.5 eV in theINDO spectrum originates from the HOMO-6 π-level, whichis delocalized on the conjugated core (with a significantcontribution on the sulfur atoms); it shows a maximum inphotoemission intensity at 20°. The strong feature observed inthe UPS spectra between 9 and 11 eV originates from bothσ-andπ-orbitals delocalized on the conjugated core with signifi-cant electronic density on the sulfur atoms. When going tohigher binding energies, the orbitals acquire a predominantσ-character; it is worth noting that the intensity in the regionbetween 12 and 13 eV is enhanced at low emission angles(0°-10°). The good agreement between the experimental photo-electron spectra and the peak positions in the theoreticalsimulation obtained for a single conjugated HATNA core
indicates that the shape of the photoelectron spectra in as-prepared films is dominated by contributions from weaklyinteracting molecules.
The ARUPS spectra show some spatial anisotropy for thephotoelectron emissions originating from the different orbitals,which implies that a slight preferential molecular order is presentin the as-prepared thin films. We have interpreted the ARUPSdata within the IAC approximation in order to shed light ontothis preferential orientation of the molecules in the film. Thebest semiquantitative agreement with the experiments is foundfor a single HATNA-SH molecule tilted byâ ) 12° with respectto the HOPG surface.
We present in Figure 3 the calculated spectra associated witha specific electron polar angle,θe, as obtained by integratingthe photoemission signal over all the possible azimuthalorientations of the molecule tilted by 12° with respect to thesurface. Between 6.5 and 7.5 eV, the frontierπ-orbitals (HOMO,HOMO-1, HOMO-2, and HOMO-3) reach their maximumintensity at 10°, and their emission is suppressed at 30°. Theσ-orbitals at 8 eV (HOMO-4 and HOMO-5 levels) display amaximum around 40°-50°. The π-orbital HOMO-6, locatedat 8.5 eV, is visible at low polar angles. However, its maximumat 20°, found in the experiments, is not properly reproduced bythe calculations. The region between 12 and 13 eV is enhancedat low emission angles (0°-20°). Note that discrepanciesbetween theory and experiment in terms of peak intensities andangles defining the maximum intensity of peaks might arisedue to (i) the low degree of molecular order in the film sincemolecules oriented randomly remove the sharpness of theexperimental photoemission angle dependence,38 and (ii) thetheoretical approximation that is to neglect the scatteringphenomena in the ARUPS simulation.39,40
(38) Morikawa, E.; Saile, V.; Okudaira, K. K.; Azuma, Y.; Meguro, K.; Harada,Y.; Seki, K.; Hasegawa, S.; Ueno, N.J. Chem. Phys.2000, 112, 10476-10481.
(39) Hasegawa, S.; Inokuchi, H.; Seki, K.; Ueno, N.J. Electron Spectrosc. Relat.Phenom.1996, 78, 391-394.
Figure 2. INDO-simulated UPS spectrum (bottom curve) of a singleHATNA-SH core and ARUPS valence level spectra of a HATNA-SC6 filmdeposited on HOPG just after evaporation of the solvent. The photon beam(hν ) 80 eV) hits the surface at grazing incidence (θp ) 80°); thedistribution of the photoelectrons from the valence levels is characterizedby tuning the polar angleθe. The binding energies are relative to the vacuumlevel (Evac). The theoretical spectrum is obtained by matching the positionof the HOMO level to the first ionization potential in the experimentalspectrum and by contracting the energy scale by a factor 1.3 to account forcorrelation and relaxation effects. A Gaussian function is centered on thecalculated INDO eigenvalues to simulate solid-state broadening.
Figure 3. Calculated ARUPS spectra of a single HATNA-SH molecule inthe independent atomic center (IAC) approximation. The molecular tilt angleâ is set to 12°. The photoemission signal is integrated over the molecularazimuthal angleφm. The theoretical spectrum is obtained by matching theposition of the HOMO level to the first ionization potential in theexperimental spectra. A Gaussian function is centered on the calculatedINDO eigenvalues to simulate solid-state broadening.
A R T I C L E S Crispin et al.
11892 J. AM. CHEM. SOC. 9 VOL. 126, NO. 38, 2004

The close similarity between these simulations and theexperimental observations indicates that, although a high degreeof disorder is present in the as-prepared films, some moleculeshave a preferential orientation in which the conjugated coresare slightly tilted (â ≈ 12°) with respect to the HOPG surface.
4.2. Change in the Electronic Structure upon Annealing.HATNA-SC6 is known to undergo a bulk phase transition froma crystalline phase (K) to a liquid crystal columnar mesophase(LC) at 206°C under atmospheric pressure.30 Annealing of thepartially ordered organic thin film up to the LC transitiontemperature is thus expected to help the film self-organize inits liquid crystal columnar mesophase. A subsequent coolingto room temperature should provide a crystalline columnar phasewhere the free enthalpy of the system is minimized. Figure 4shows the evolution upon heating of the angle-integrated UPS(He I) spectrum of the organic thin film deposited on SiO2 inthe low-binding-energy region. We stress that dewetting and/or formation of pinholes take place in thin organic films spin-coated on HOPG substrates at a temperature slightly above thetransition temperature, thus allowing for a possible contributionof the substrate in the spectra; the SiO2 substrate is chosen hereon the basis of the fact that its electronic density of states (DOS)does not appear in the energy region of theπ-orbitals of thediscotic molecule. The electronic structure of the discotic
molecules in the as-prepared sample (dotted line) represents thestarting point of the experiment and is similar to that describedin Figure 2 on the HOPG substrate. As discussed above, thespectrum shows the electronic signature of weakly coupleddiscotic molecules, with the HOMO level located at 6.5 eV inthe shoulder of the lowest binding energy peak. Raising thetemperature from 20 to 120°C leads to an increase in theintensity of the feature around 7.2 eV (see dotted lines) withoutchanging the global shape of the spectrum. This evolution mightbe related to a change in the orientation of the alkyl chains closeto the surface. Indeed, at room temperature, the alkyl chains ofdiscotic molecules are known to be oriented toward the surface,41
thus screening the conjugated cores from being seen in UPS.Due to the lower number of neighboring molecules at the surfacecompared to the bulk, alkyl chains could start melting at thesurface at a lower temperature than in the bulk. In this way,they could unprotect the conjugated cores at high temperaturesand make them more visible in the UPS spectrum.
Between 140 and 200°C, the electronic structure (full lines)changes in the energy range between 7.2 and 8.7 eV, asevidenced by the fact that the valley previously observed at 7.7eV is now filled. Beyond 210°C, the intensity in the 7.2-8.7eV region is further enhanced; moreover, a new peak appearsin the gap of the disordered film around 5.5 eV (dashed lines).We attribute this new electronic feature to the formation ofcolumns in the LC phase and the simultaneous formation oforbitals delocalized over several molecules rather than localizedon a single molecule (vide infra). Cooling the sample to roomtemperature in its crystal columnar phase increases significantlythis low-binding-energy contribution and leads to the appearanceof a valley around 8.2 eV (crossed line). We stress that severalannealing-cooling cycles performed around the transition-phasetemperature shows the reversibility of the process, as confirmedby the systematic appearance of the valley at 8.2 eV charac-teristic of the KT LC transition. The main feature of the orderedK phase at 20°C is thus a new photoemission signal lyingbetween 4 and 6 eV, i.e., in the electronic gap of the cast(disordered) film. The onset of this new peak (Figure 4b) yieldsan ionization potential of 4.1 eV, i.e., 1.8 eV lower than in thedisordered phase before annealing. To our knowledge, this isthe first time that such a large variation in ionization potentialhas been reported upon ordering of an organic material. Duringthe cooling step, the increase in intensity of the new UPS featureis attributed to an increase in the number of molecules involvedin stacks with a good spatial overlap between theπ-orbitals ofadjacent conjugated cores. This is expected when going fromthe LC to the K phase as a result of the attenuation of thegeometric fluctuations within the columns.42 Note that the workfunction of the organic layer decreases from 4.1 to 3.8 eV afterannealing (which is why two differentEF values have beenreported in Figure 4b). Hence, the ionization potential of theannealed organic layer becomes very close to its work function.Since all experiments were performed in ultrahigh vacuum, amaterial with such a low ionization potential does not have anopportunity to react with dioxygen.
The changes in the electronic structure upon heating andcooling cannot be explained by quantum-chemical calculations
(40) Ueno, N.; Kitamura, A.; Okudaira, K. K.; Miyamae, T.; Harada, Y.;Hasegawa, S.; Ishii, H.; Inokuchi, H.; Fujikawa, T.; Miyazaki, T.; Seki, K.J. Chem. Phys.1997, 107, 2079-2088.
(41) Hiesgen, R.; Scho¨nherr, H.; Kumar, S.; Ringsdorf, H.; Meissner, D.ThinSolid Films2000, 358, 241-249.
(42) Herwig, P.; Kayser, C. W.; Mu¨llen, K.; Spiess, H. W.AdV. Mater. 1996,8, 510-513.
Figure 4. Angle-integrated UPS spectra showing the modification in theupper part of the valence band of a HATNA-SC6 film deposited on SiO2
upon the annealing-cooling treatment. The binding energies are relativeto the vacuum level (Evac). Note that all the spectra collected in this figureare normalized with respect to the intensity of the peak at 11 eV. (b)Enlargement of the low-binding-energy region of (a), where the positionof the Fermi level is indicated before and after annealing.
Electronic Delocalization in Discotic Liquid Crystals A R T I C L E S
J. AM. CHEM. SOC. 9 VOL. 126, NO. 38, 2004 11893

performed on a single conjugated molecular core. However,since the SiO2 substrate has no DOS in the region of interest,this new feature can safely be attributed to the organic layer.We note that similar modifications in the electronic structureare observed when the HATNA-SC6 layer is deposited on othersubstrates, such as HOPG, Au, Cu2O, and Ag2O. A new featurein the forbidden electronic energy gap of the molecule couldarise from a degradation mechanism involving UV light orsecondary electrons, creating, for example, a radical by bondcleavage. A degradation process can be ruled out by thefollowing experimental observations: (i) the changes observedin the electronic properties when heating the sample to 220°Care not sensitive to the time of UV light exposure; (ii) the newfeature at 5.5 eV is never detected at room temperature, beforeany annealing, even after a long UV light exposure; (iii) theelectronic modifications can be observed at room temperatureafter a heating-cooling cycle undergone in UHV withoutexposure to UV light; and (iv) X-ray photoelectron spectroscopy,which is also a surface-sensitive technique, does not show theappearance of new C(1s), N(1s), or S(2p) signals expected ifbond cleavage were to occur.
4.3. Molecular Orientation after Annealing. Figure 5displays the angular distribution of the photoelectron emissionfrom the organic film deposited on HOPG following annealing.The low-binding-energy feature (at 5.5 eV) observed for theannealed film when deposited on SiO2 is well reproduced. TheARUPS pattern is sharp for theσ-orbitals lying between 9 and14 eV, as well as for theπ-orbitals (in the 5-9 eV range). Theintensity ratio between theσ- andπ-orbital contributions changesdramatically with the electron emission angle (e.g., 20° vs 0°),which underlines the high molecular order obtained afterannealing. From the orbital analysis of a five-molecule stack,we assign the spectral features between 5 and 8 eV toπ-orbitalsdelocalized over several molecules in the columns. The lowestbinding energy peak (at 5.5 eV) has a maximum intensity at
about 20°-30°. The feature appearing as a shoulder at 6.9 eVreaches a maximum in intensity at 20°. The peak visible at 7.9eV between 70° and 40° and reaching a maximum at 50° isattributed to the emission fromσ-orbitals localized on thenitrogen lone pairs, as found in the as-prepared film. Theinteractions between adjacent conjugated cores in the columndo not modify their local character. As is the case for theπ-region between 5 and 8 eV, the peak at 8.4 eV shows amaximum at 20°. Above 10 eV, theσ-character becomespredominant and the photoemission originates mainly fromorbitals localized over a single molecule. Within the angularportion (70°-20°), the maximum intensity of theσ-orbitals at11 eV is detected at 40°. Below 20°, the emission is suddenlyamplified at 10° and then diminishes toward 0°, where theintensity is shifted to higher binding energies.
The pattern of photoemission fromσ-orbitals in organicmolecules is sharp when using a photon energy of 80 eV.29 Thephotoemission distribution from localizedσ-orbitals in the highlyordered annealed film can be compared to the emission patterncalculated on a single molecule. The neglect of the alkane chainsin our simulations could cause some slight deviations withrespect to the experimental ARUPS spectra since the C-Cbonds in the side chains likely have a slight preferentialorientation. In contrast, the C-H bonds are expected to berandomly oriented, thus contributing a constant weight to thespectrum for various electron polar angles. The ARUPS spectraof a single HATNA-SH molecule have been calculated forseveral molecular tilt angles with respect to the surface. Thetheoretical photoemission pattern (Figure 6) displays the bestsemiquantitative agreement with the experimental ARUPSspectra when the HATNA conjugated core is parallel to theHOPG surface (â ) 0°). Although the π-orbitals have anintermolecular character in the film, the polar angle of maximumphotoemission in theπ-region (5-8 eV) of the annealed filmmeasured at 20° is similar to that calculated for theπ-orbitals
Figure 5. (a) Angle-resolved UPS spectra of the HATNA-SC6 film deposited on HOPG after the annealing-cooling treatment, i.e., after the transitionsfrom the disordered K phase to the ordered K phase passing by the LC phase. The photon beam (hν ) 80 eV) hits the surface at grazing incidence (θp )80°); the distribution of the photoelectrons from the valence levels is characterized by tuning the polar angleθe. The binding energies are relative to thevacuum level (Evac). (b) Enlargement of the low-binding-energy region of (a).
A R T I C L E S Crispin et al.
11894 J. AM. CHEM. SOC. 9 VOL. 126, NO. 38, 2004

(6-8 eV) of a single molecule. Theσ-feature originating fromthe localized nitrogen lone pairs (8 eV) grows from 70° to 40°-50°, and then decreases at lower angles, in agreement with theexperimental data. In the range between 70° and 0°, the spectralweight related to theσ-states in the 10-11 eV region reachesa first maximum at 40°, and then is reduced before reachinganother maximum at 10°. The very good agreement betweenthe calculated and measured photoemission patterns proves thata high molecular order is achieved after annealing. Moreover,the results indicate that the HATNA-SC6 molecules likely packin columns with the conjugated cores parallel to the HOPGsurface. Such a preferential orientation in thin films (100-200Å thick) may be induced by the substrate, as found recently forhexabenzocoronene derivatives deposited on MoS2.15
4.4. Electronic Structure of a Column.The analysis in thesection above provides only the tilt angle of the HATNA coreswith respect to the HOPG surface. Since the one-dimensionalcolumns could be tilted by any angleτc with respect to theHOPG surface, the tilt angleτm of the HATNA molecules withrespect to the columnar axis is still unknown (Figure 7). Below,we compare the results expected for three different columnarorientations. (i) Structure A: the columns are tilted byτc )60° (versus the surface normal) on the HOPG surface, theHATNA molecules being then tilted byτm ) 30° with respectto the columnar axis. In that case, we calculate a very smallHOMO splitting of 0.15 eV (corresponding to a transfer integralof 0.075 eV) in a dimer made of two HATNA molecules witha separation of 3.4 Å between their planes. Structure A modifiesthe least the electronic structure of individual molecules due tothe poor overlap between the electronic wave functions ofadjacent units; it is therefore not the most likely. (ii) StructureB: the columns are tilted byτc ) 30°, the HATNA cores beingtilted by τm ) 60°; here, the electronic coupling betweenadjacent cores becomes significant and characterized by aHOMO splitting of 0.62 eV. (iii) Structure C: the columns stand
perpendicular to the substrate (τc ) 0°), the conjugated coresbeing packed in a cofacial manner (τm ) 90°); this structureyields the most efficient orbital overlap and leads to a HOMOsplitting 2t ) 0.99 eV.
On the basis of these three examples, it is clearly seen thatthe electronic coupling decreases when the columnar tilt angleτc is reduced. This leads to the conclusion that the columns’axes are (nearly) perpendicular to the HOPG surface in orderto promote significant electronic coupling between adjacentconjugated cores that generatesπ-orbitals delocalized overseveral molecules responsible for the appearance of the low-binding-energy feature in the experimental spectra (Figure 4).This columnar axis orientation is experimentally confirmed bythe absence of any energy dispersion of the low-binding-energyfeature when the polar emission angle is tuned (see section 4.5).Since the calculated HOMO splitting is quite similar for acolumn with a slight τc tilt, we have considered for thesubsequent analysis an ideal stack standing perpendicular to theHOPG substrate (in addition, we have not considered anyrotation between adjacent disks18). This model maximizes theelectronic coupling between adjacent disks and allows for asimple analysis of the electronic structure of the stacks withoutremoving the underlying physics in the actual HATNA-SC6
columns formed on the HOPG substrate. Note that a rotationalangle of 25° between two adjacent HATNA-SC6 cores providesthe energetically most stable columnar organization;18 this resultsfrom a balance between the repulsion of the negatively chargednitrogen atoms of the two adjacent cores and the van der Waalsattraction of the alkyl chains. The INDO calculations performedon HATNA dimers show that the HOMO splitting is stillsignificant for such a rotational angle of 25° (2t ) 0.4 eV at25° vs 0.9 eV for the cofacial packing).18 We will come backto this point below.
The INDO-simulated UPS spectra of one-dimensional stackscontaining up to six unsubstituted HATNA-SH molecules arepresented in Figure 8. The cofacial distance between twoadjacent cores is set at 3.4 Å, a value corresponding to thetypical intermolecular distance reported for triphenylene-baseddiscotic columns;43-45 the neglect of the lateral chains in these
(43) Reitzel, N.; Hassenkam, T.; Balashev, K.; Jensen, T. R.; Howes, P. B.;Kjaer, K.; Fechtenko¨tter, A.; Tchebotareva, N.; Ito, S.; Mu¨llen, K.;Bjornholm, T.Chem. Eur. J.2001, 7, 4894-4901.
Figure 6. Calculated ARUPS spectra of a single HATNA-SH molecule inthe independent atomic center (IAC) approximation. The molecular tilt angleâ is set to 0°, i.e., the conjugated core is parallel to the HOPG surface. Thephotoemission signal is integrated over the molecular azimuthal angleφm.The theoretical spectrum is obtained by matching the position of the HOMOlevel to the first ionization potential in the experimental spectra. A Gaussianfunction is centered on the calculated INDO eigenvalues to simulate solid-state broadening.
Figure 7. Sketch of the various orientations of the columns with respectto the HOPG surface for a molecular tilt angleâ ) 0° of the HATNAcores. The orientation of the one-dimensional columns is characterized bythe tilt angleτc relative to the HOPG surface, while the tilt angleτm, definedwith respect to the columnar axis, specifies the orientation of the HATNAmolecules within the columns.
Electronic Delocalization in Discotic Liquid Crystals A R T I C L E S
J. AM. CHEM. SOC. 9 VOL. 126, NO. 38, 2004 11895
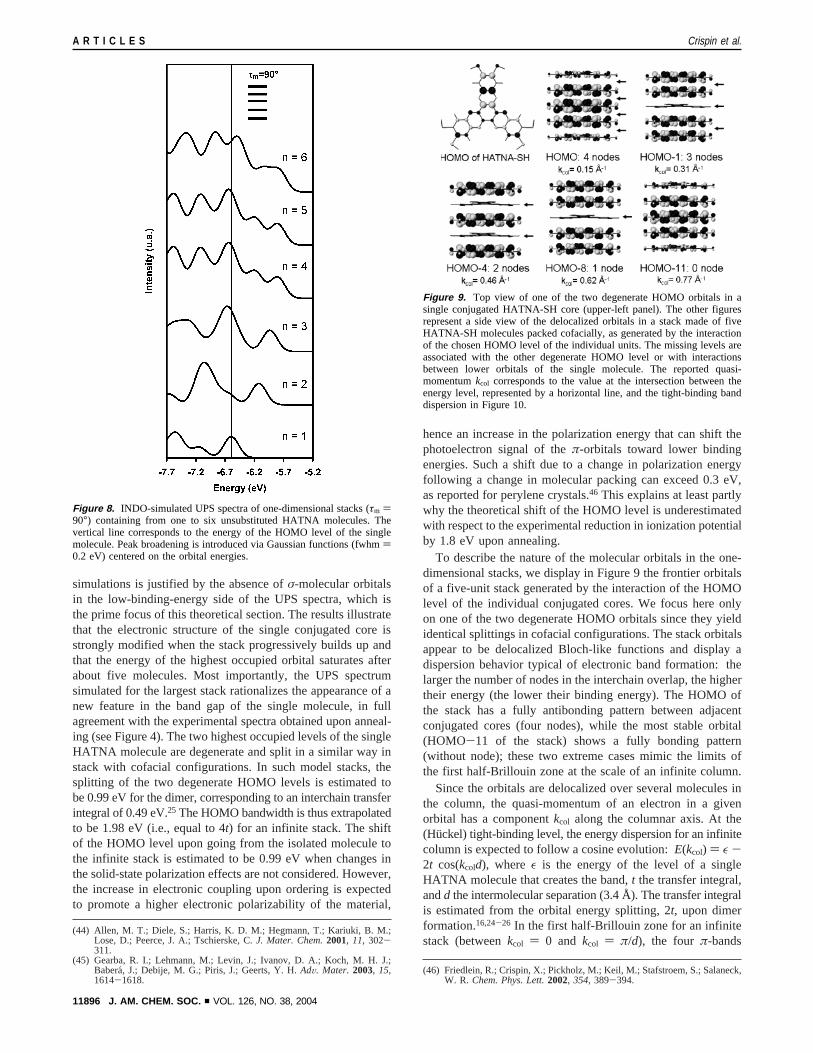
simulations is justified by the absence ofσ-molecular orbitalsin the low-binding-energy side of the UPS spectra, which isthe prime focus of this theoretical section. The results illustratethat the electronic structure of the single conjugated core isstrongly modified when the stack progressively builds up andthat the energy of the highest occupied orbital saturates afterabout five molecules. Most importantly, the UPS spectrumsimulated for the largest stack rationalizes the appearance of anew feature in the band gap of the single molecule, in fullagreement with the experimental spectra obtained upon anneal-ing (see Figure 4). The two highest occupied levels of the singleHATNA molecule are degenerate and split in a similar way instack with cofacial configurations. In such model stacks, thesplitting of the two degenerate HOMO levels is estimated tobe 0.99 eV for the dimer, corresponding to an interchain transferintegral of 0.49 eV.25 The HOMO bandwidth is thus extrapolatedto be 1.98 eV (i.e., equal to 4t) for an infinite stack. The shiftof the HOMO level upon going from the isolated molecule tothe infinite stack is estimated to be 0.99 eV when changes inthe solid-state polarization effects are not considered. However,the increase in electronic coupling upon ordering is expectedto promote a higher electronic polarizability of the material,
hence an increase in the polarization energy that can shift thephotoelectron signal of theπ-orbitals toward lower bindingenergies. Such a shift due to a change in polarization energyfollowing a change in molecular packing can exceed 0.3 eV,as reported for perylene crystals.46 This explains at least partlywhy the theoretical shift of the HOMO level is underestimatedwith respect to the experimental reduction in ionization potentialby 1.8 eV upon annealing.
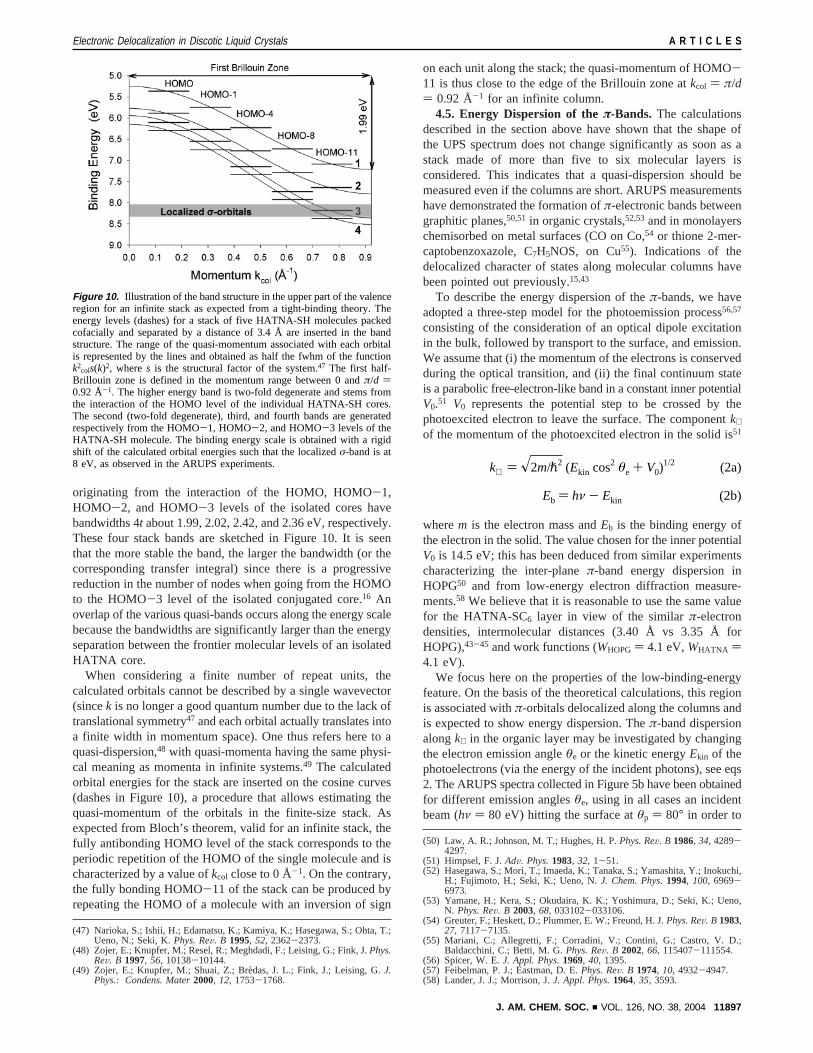
To describe the nature of the molecular orbitals in the one-dimensional stacks, we display in Figure 9 the frontier orbitalsof a five-unit stack generated by the interaction of the HOMOlevel of the individual conjugated cores. We focus here onlyon one of the two degenerate HOMO orbitals since they yieldidentical splittings in cofacial configurations. The stack orbitalsappear to be delocalized Bloch-like functions and display adispersion behavior typical of electronic band formation: thelarger the number of nodes in the interchain overlap, the highertheir energy (the lower their binding energy). The HOMO ofthe stack has a fully antibonding pattern between adjacentconjugated cores (four nodes), while the most stable orbital(HOMO-11 of the stack) shows a fully bonding pattern(without node); these two extreme cases mimic the limits ofthe first half-Brillouin zone at the scale of an infinite column.
Since the orbitals are delocalized over several molecules inthe column, the quasi-momentum of an electron in a givenorbital has a componentkcol along the columnar axis. At the(Huckel) tight-binding level, the energy dispersion for an infinitecolumn is expected to follow a cosine evolution:E(kcol) ) ε -2t cos(kcold), where ε is the energy of the level of a singleHATNA molecule that creates the band,t the transfer integral,andd the intermolecular separation (3.4 Å). The transfer integralis estimated from the orbital energy splitting, 2t, upon dimerformation.16,24-26 In the first half-Brillouin zone for an infinitestack (betweenkcol ) 0 and kcol ) π/d), the four π-bands
(44) Allen, M. T.; Diele, S.; Harris, K. D. M.; Hegmann, T.; Kariuki, B. M.;Lose, D.; Peerce, J. A.; Tschierske, C.J. Mater. Chem.2001, 11, 302-311.
(45) Gearba, R. I.; Lehmann, M.; Levin, J.; Ivanov, D. A.; Koch, M. H. J.;Babera, J.; Debije, M. G.; Piris, J.; Geerts, Y. H.AdV. Mater. 2003, 15,1614-1618.
(46) Friedlein, R.; Crispin, X.; Pickholz, M.; Keil, M.; Stafstroem, S.; Salaneck,W. R. Chem. Phys. Lett.2002, 354, 389-394.
Figure 8. INDO-simulated UPS spectra of one-dimensional stacks (τm )90°) containing from one to six unsubstituted HATNA molecules. Thevertical line corresponds to the energy of the HOMO level of the singlemolecule. Peak broadening is introduced via Gaussian functions (fwhm)0.2 eV) centered on the orbital energies.
Figure 9. Top view of one of the two degenerate HOMO orbitals in asingle conjugated HATNA-SH core (upper-left panel). The other figuresrepresent a side view of the delocalized orbitals in a stack made of fiveHATNA-SH molecules packed cofacially, as generated by the interactionof the chosen HOMO level of the individual units. The missing levels areassociated with the other degenerate HOMO level or with interactionsbetween lower orbitals of the single molecule. The reported quasi-momentumkcol corresponds to the value at the intersection between theenergy level, represented by a horizontal line, and the tight-binding banddispersion in Figure 10.
A R T I C L E S Crispin et al.
11896 J. AM. CHEM. SOC. 9 VOL. 126, NO. 38, 2004
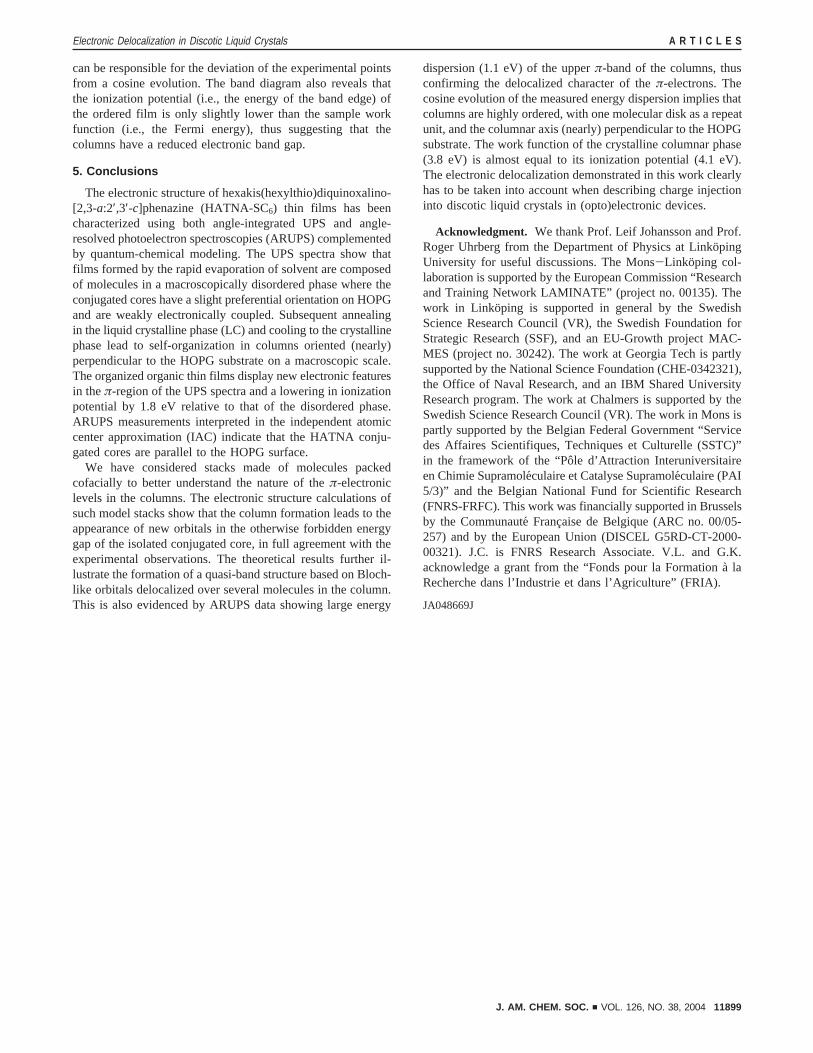
originating from the interaction of the HOMO, HOMO-1,HOMO-2, and HOMO-3 levels of the isolated cores havebandwidths 4t about 1.99, 2.02, 2.42, and 2.36 eV, respectively.These four stack bands are sketched in Figure 10. It is seenthat the more stable the band, the larger the bandwidth (or thecorresponding transfer integral) since there is a progressivereduction in the number of nodes when going from the HOMOto the HOMO-3 level of the isolated conjugated core.16 Anoverlap of the various quasi-bands occurs along the energy scalebecause the bandwidths are significantly larger than the energyseparation between the frontier molecular levels of an isolatedHATNA core.
When considering a finite number of repeat units, thecalculated orbitals cannot be described by a single wavevector(sincek is no longer a good quantum number due to the lack oftranslational symmetry47 and each orbital actually translates intoa finite width in momentum space). One thus refers here to aquasi-dispersion,48 with quasi-momenta having the same physi-cal meaning as momenta in infinite systems.49 The calculatedorbital energies for the stack are inserted on the cosine curves(dashes in Figure 10), a procedure that allows estimating thequasi-momentum of the orbitals in the finite-size stack. Asexpected from Bloch’s theorem, valid for an infinite stack, thefully antibonding HOMO level of the stack corresponds to theperiodic repetition of the HOMO of the single molecule and ischaracterized by a value ofkcol close to 0 Å-1. On the contrary,the fully bonding HOMO-11 of the stack can be produced byrepeating the HOMO of a molecule with an inversion of sign
on each unit along the stack; the quasi-momentum of HOMO-11 is thus close to the edge of the Brillouin zone atkcol ) π/d) 0.92 Å-1 for an infinite column.
4.5. Energy Dispersion of theπ-Bands. The calculationsdescribed in the section above have shown that the shape ofthe UPS spectrum does not change significantly as soon as astack made of more than five to six molecular layers isconsidered. This indicates that a quasi-dispersion should bemeasured even if the columns are short. ARUPS measurementshave demonstrated the formation ofπ-electronic bands betweengraphitic planes,50,51 in organic crystals,52,53and in monolayerschemisorbed on metal surfaces (CO on Co,54 or thione 2-mer-captobenzoxazole, C7H5NOS, on Cu55). Indications of thedelocalized character of states along molecular columns havebeen pointed out previously.15,43
To describe the energy dispersion of theπ-bands, we haveadopted a three-step model for the photoemission process56,57
consisting of the consideration of an optical dipole excitationin the bulk, followed by transport to the surface, and emission.We assume that (i) the momentum of the electrons is conservedduring the optical transition, and (ii) the final continuum stateis a parabolic free-electron-like band in a constant inner potentialV0.51 V0 represents the potential step to be crossed by thephotoexcited electron to leave the surface. The componentk⊥of the momentum of the photoexcited electron in the solid is51
wherem is the electron mass andEb is the binding energy ofthe electron in the solid. The value chosen for the inner potentialV0 is 14.5 eV; this has been deduced from similar experimentscharacterizing the inter-planeπ-band energy dispersion inHOPG50 and from low-energy electron diffraction measure-ments.58 We believe that it is reasonable to use the same valuefor the HATNA-SC6 layer in view of the similarπ-electrondensities, intermolecular distances (3.40 Å vs 3.35 Å forHOPG),43-45 and work functions (WHOPG) 4.1 eV,WHATNA )4.1 eV).
We focus here on the properties of the low-binding-energyfeature. On the basis of the theoretical calculations, this regionis associated withπ-orbitals delocalized along the columns andis expected to show energy dispersion. Theπ-band dispersionalongk⊥ in the organic layer may be investigated by changingthe electron emission angleθe or the kinetic energyEkin of thephotoelectrons (via the energy of the incident photons), see eqs2. The ARUPS spectra collected in Figure 5b have been obtainedfor different emission anglesθe, using in all cases an incidentbeam (hν ) 80 eV) hitting the surface atθp ) 80° in order to
(47) Narioka, S.; Ishii, H.; Edamatsu, K.; Kamiya, K.; Hasegawa, S.; Ohta, T.;Ueno, N.; Seki, K.Phys. ReV. B 1995, 52, 2362-2373.
(48) Zojer, E.; Knupfer, M.; Resel, R.; Meghdadi, F.; Leising, G.; Fink, J.Phys.ReV. B 1997, 56, 10138-10144.
(49) Zojer, E.; Knupfer, M.; Shuai, Z.; Bre´das, J. L.; Fink, J.; Leising, G.J.Phys.: Condens. Mater2000, 12, 1753-1768.
(50) Law, A. R.; Johnson, M. T.; Hughes, H. P.Phys. ReV. B 1986, 34, 4289-4297.
(51) Himpsel, F. J.AdV. Phys.1983, 32, 1-51.(52) Hasegawa, S.; Mori, T.; Imaeda, K.; Tanaka, S.; Yamashita, Y.; Inokuchi,
H.; Fujimoto, H.; Seki, K.; Ueno, N.J. Chem. Phys.1994, 100, 6969-6973.
(53) Yamane, H.; Kera, S.; Okudaira, K. K.; Yoshimura, D.; Seki, K.; Ueno,N. Phys. ReV. B 2003, 68, 033102-033106.
(54) Greuter, F.; Heskett, D.; Plummer, E. W.; Freund, H. J.Phys. ReV. B 1983,27, 7117-7135.
(55) Mariani, C.; Allegretti, F.; Corradini, V.; Contini, G.; Castro, V. D.;Baldacchini, C.; Betti, M. G.Phys. ReV. B 2002, 66, 115407-111554.
(56) Spicer, W. E.J. Appl. Phys.1969, 40, 1395.(57) Feibelman, P. J.; Eastman, D. E.Phys. ReV. B 1974, 10, 4932-4947.(58) Lander, J. J.; Morrison, J.J. Appl. Phys.1964, 35, 3593.
Figure 10. Illustration of the band structure in the upper part of the valenceregion for an infinite stack as expected from a tight-binding theory. Theenergy levels (dashes) for a stack of five HATNA-SH molecules packedcofacially and separated by a distance of 3.4 Å are inserted in the bandstructure. The range of the quasi-momentum associated with each orbitalis represented by the lines and obtained as half the fwhm of the functionk2
cols(k)2, wheres is the structural factor of the system.47 The first half-Brillouin zone is defined in the momentum range between 0 andπ/d )0.92 Å-1. The higher energy band is two-fold degenerate and stems fromthe interaction of the HOMO level of the individual HATNA-SH cores.The second (two-fold degenerate), third, and fourth bands are generatedrespectively from the HOMO-1, HOMO-2, and HOMO-3 levels of theHATNA-SH molecule. The binding energy scale is obtained with a rigidshift of the calculated orbital energies such that the localizedσ-band is at8 eV, as observed in the ARUPS experiments. k⊥ ) x2m/p2 (Ekin cos2 θe + V0)
1/2 (2a)
Eb ) hν - Ekin (2b)
Electronic Delocalization in Discotic Liquid Crystals A R T I C L E S
J. AM. CHEM. SOC. 9 VOL. 126, NO. 38, 2004 11897

promote the maximal photoemission from theπ-orbitals in theordered film. Under those conditions, bothk| andk⊥ can change.The value ofk⊥ estimated from eq 2a changes marginally (2.0-2.3 Å-1) when the detector positionθe is varied (0°-70°). Forcolumns standing perpendicular to the surface,k⊥ is equal tokcol, and the theoretical band structure (Figure 10) predicts thatthe spectral feature can disperse by up to 0.4 eV for this narrowrange ofkcol. Theπ-features observed between 5.0 and 6.2 eVshow only a weak energy dispersion (0.2 eV), thus confirmingthat the columns are almost perpendicular to the HOPG surface.Similar observations have been made for other discotic liquidcrystal thin films with columns standing on the substrate.15
To tune k⊥ and probe the electronic band formed withincolumns oriented perpendicular to the HOPG substrate, ourexperimental setup is chosen such that the electrons are collectednormal to the surface (θe ) 0°), while varying the energies ofthe incident photons. The resulting spectra display two dispers-ing features, A and B, located around 5.5 and 7.0 eV,respectively (Figure 11a). According to the theoretical models,four dispersingπ-bands are expected to lie on the low-binding-energy side of the localizedσ-orbital’s flat band at 7.9 eV. Forall the photon energies, feature A always has a lower intensitycompared to feature B. Since the top of the upper band (band1) has a lower energy than the three lower bands in Figure 10,feature A has a dominant contribution arising from the bandgenerated by the interaction of the degenerate HOMO levels ofadjacent HATNA cores. The difference between the onset offeature A (at 4.8 eV) and the energy at the top of band 1 inFigure 10 (5.3 eV) has to be associated with the absence of aproper treatment of the polarization effects in the simulations,as mentioned previously. Feature B would then be formed bythe dispersion of the three lower bands (2, 3, and 4 in Figure10). Note that both features A and B disperse in a similar way,
which is consistent with the parallel dispersion of the four bandspredicted from theory. Since the evolution of feature A is nottrivial to follow, we concentrate on its low-binding-energy edgein Figure 11b to probe the dispersion of the upper band. Theedge of the dispersed band is expected to shift by a constantvalue (0.8 eV) with respect to the center of feature A. From thefour visible peaks observed at 115, 95, 85, and 70 eV, thisdifference is 0.8 eV, which is only slightly larger than the 0.6eV peak width determined previously (as the difference betweenthe center of the HOMO peak, 6.5 eV, and the edge, 5.9 eV,for the nonannealed film, see Figure 2). The energy dispersionof the edge yields an estimate of the bandwidth of 1.1( 0.2eV for the upper band. The measured bandwidth is lower thanthe calculated value (1.99 eV), suggesting that the moleculesdo not interact as strongly as in the model columns, as expectedfrom possible molecular rotations along the stacks (see discus-sion in section 4.4), lateral displacements, and/or fluctuationsin intermolecular distances. This experimental value has thesame order of magnitude as the inter-planar bandwidth ingraphite (1-1.4 eV50,59) and is much larger than those estimatedin molecular crystals (∼0.5 eV for BTQBT42 and oligoacenes60).Given the∼1.1 eV bandwidth, it would be of great interest toinvestigate whether a band regime of transport can actually beachieved in thin films of HATNA-SC6.
The dispersion of the onset of the upper band is plotted inFigure 12 using eq 2a and the energies of the low-binding-energy edge obtained for various photon energies. As expectedfrom the tight-binding model, a cosine functionE(k⊥) ) ε - 2tcos(k⊥d) fits the experimental data reasonably well if the repeatunit in the column is made of a single HATNA-SC6 moleculeseparated from the adjacent disks by 3.4 Å (this validates theintermolecular distance selected in the calculations). All together,the results suggest that the HATNA-SC6 columns are highlyordered and maintain a periodicity in the columns, leading to aband following a cosine function. Slight rotational disorder andfluctuations in intermolecular distances and lateral displacements
(59) Marchand, D.; Fretigny, C.; Lagues, M.; Batallan, F.; Simon, C.; Rosenman,I.; Pinchaux, R.Phys. ReV. B 1984, 30, 4788.
(60) Cheng, Y. C.; Silbey, R. J.; Filho, D. A. d. S.; Calbert, J. P.; Cornil, J.;Bredas, J. L.J. Chem. Phys.2003, 118, 3764-3774.
Figure 11. (a) Angle-resolved UPS spectra of the HATNA-SC6 film inthe ordered K phase on HOPG. The incident photon beam hits the surfaceat grazing incidence (θp ) 80°), and the photoelectrons emitted normal tothe surface are analyzed (θe ) 0°). The value of the momentumk⊥ is tunedby using different energies for the incident photons. Energy dispersion oftwo spectral features, A and B, is observed. The binding energies are relativeto the vacuum level (Evac). (b) Energy dispersion of the low-binding-energyedge.
Figure 12. Experimental values of the energy of the band edge as a functionof the photon energy are used to plot a band diagram for the upper bandusing eq 2a. A tight-binding cosine functionE(k⊥) ) εedge - 2t cos(k⊥d)fits well the data for an intermolecular distanced set to 3.4 Å. The estimatedtransfer integralt is 0.26 eV. The energyεedgedefines the position of thelow-binding-energy edge. According to the calculated values of themomentumk⊥, the experiment probes part of the fifth and sixth Brillouinzones.
A R T I C L E S Crispin et al.
11898 J. AM. CHEM. SOC. 9 VOL. 126, NO. 38, 2004
can be responsible for the deviation of the experimental pointsfrom a cosine evolution. The band diagram also reveals thatthe ionization potential (i.e., the energy of the band edge) ofthe ordered film is only slightly lower than the sample workfunction (i.e., the Fermi energy), thus suggesting that thecolumns have a reduced electronic band gap.
5. Conclusions
The electronic structure of hexakis(hexylthio)diquinoxalino-[2,3-a:2′,3′-c]phenazine (HATNA-SC6) thin films has beencharacterized using both angle-integrated UPS and angle-resolved photoelectron spectroscopies (ARUPS) complementedby quantum-chemical modeling. The UPS spectra show thatfilms formed by the rapid evaporation of solvent are composedof molecules in a macroscopically disordered phase where theconjugated cores have a slight preferential orientation on HOPGand are weakly electronically coupled. Subsequent annealingin the liquid crystalline phase (LC) and cooling to the crystallinephase lead to self-organization in columns oriented (nearly)perpendicular to the HOPG substrate on a macroscopic scale.The organized organic thin films display new electronic featuresin theπ-region of the UPS spectra and a lowering in ionizationpotential by 1.8 eV relative to that of the disordered phase.ARUPS measurements interpreted in the independent atomiccenter approximation (IAC) indicate that the HATNA conju-gated cores are parallel to the HOPG surface.
We have considered stacks made of molecules packedcofacially to better understand the nature of theπ-electroniclevels in the columns. The electronic structure calculations ofsuch model stacks show that the column formation leads to theappearance of new orbitals in the otherwise forbidden energygap of the isolated conjugated core, in full agreement with theexperimental observations. The theoretical results further il-lustrate the formation of a quasi-band structure based on Bloch-like orbitals delocalized over several molecules in the column.This is also evidenced by ARUPS data showing large energy
dispersion (1.1 eV) of the upperπ-band of the columns, thusconfirming the delocalized character of theπ-electrons. Thecosine evolution of the measured energy dispersion implies thatcolumns are highly ordered, with one molecular disk as a repeatunit, and the columnar axis (nearly) perpendicular to the HOPGsubstrate. The work function of the crystalline columnar phase(3.8 eV) is almost equal to its ionization potential (4.1 eV).The electronic delocalization demonstrated in this work clearlyhas to be taken into account when describing charge injectioninto discotic liquid crystals in (opto)electronic devices.
Acknowledgment. We thank Prof. Leif Johansson and Prof.Roger Uhrberg from the Department of Physics at Linko¨pingUniversity for useful discussions. The Mons-Linkoping col-laboration is supported by the European Commission “Researchand Training Network LAMINATE” (project no. 00135). Thework in Linkoping is supported in general by the SwedishScience Research Council (VR), the Swedish Foundation forStrategic Research (SSF), and an EU-Growth project MAC-MES (project no. 30242). The work at Georgia Tech is partlysupported by the National Science Foundation (CHE-0342321),the Office of Naval Research, and an IBM Shared UniversityResearch program. The work at Chalmers is supported by theSwedish Science Research Council (VR). The work in Mons ispartly supported by the Belgian Federal Government “Servicedes Affaires Scientifiques, Techniques et Culturelle (SSTC)”in the framework of the “Poˆle d’Attraction Interuniversitaireen Chimie Supramole´culaire et Catalyse Supramole´culaire (PAI5/3)” and the Belgian National Fund for Scientific Research(FNRS-FRFC). This work was financially supported in Brusselsby the Communaute´ Francaise de Belgique (ARC no. 00/05-257) and by the European Union (DISCEL G5RD-CT-2000-00321). J.C. is FNRS Research Associate. V.L. and G.K.acknowledge a grant from the “Fonds pour la Formation a` laRecherche dans l’Industrie et dans l’Agriculture” (FRIA).
JA048669J
Electronic Delocalization in Discotic Liquid Crystals A R T I C L E S
J. AM. CHEM. SOC. 9 VOL. 126, NO. 38, 2004 11899