Density Functional Theory Study Of Molecules And Crystals ...
149
University of Central Florida University of Central Florida STARS STARS Electronic Theses and Dissertations, 2004-2019 2011 Density Functional Theory Study Of Molecules And Crystals Density Functional Theory Study Of Molecules And Crystals Containing D And F Metals Containing D And F Metals Shruba Gangopadhyay University of Central Florida Part of the Chemistry Commons Find similar works at: https://stars.library.ucf.edu/etd University of Central Florida Libraries http://library.ucf.edu This Doctoral Dissertation (Open Access) is brought to you for free and open access by STARS. It has been accepted for inclusion in Electronic Theses and Dissertations, 2004-2019 by an authorized administrator of STARS. For more information, please contact [email protected]. STARS Citation STARS Citation Gangopadhyay, Shruba, "Density Functional Theory Study Of Molecules And Crystals Containing D And F Metals" (2011). Electronic Theses and Dissertations, 2004-2019. 2037. https://stars.library.ucf.edu/etd/2037
-
Upload
khangminh22 -
Category
Documents
-
view
0 -
download
0
Transcript of Density Functional Theory Study Of Molecules And Crystals ...
University of Central Florida University of Central Florida
STARS STARS
Electronic Theses and Dissertations, 2004-2019
2011
Density Functional Theory Study Of Molecules And Crystals Density Functional Theory Study Of Molecules And Crystals
Containing D And F Metals Containing D And F Metals
Shruba Gangopadhyay University of Central Florida
Part of the Chemistry Commons
Find similar works at: https://stars.library.ucf.edu/etd
University of Central Florida Libraries http://library.ucf.edu
This Doctoral Dissertation (Open Access) is brought to you for free and open access by STARS. It has been accepted
for inclusion in Electronic Theses and Dissertations, 2004-2019 by an authorized administrator of STARS. For more
information, please contact [email protected].
STARS Citation STARS Citation Gangopadhyay, Shruba, "Density Functional Theory Study Of Molecules And Crystals Containing D And F Metals" (2011). Electronic Theses and Dissertations, 2004-2019. 2037. https://stars.library.ucf.edu/etd/2037
DENSITY FUNCTIONAL THEORY STUDY OF MOLECULES AND CRYSTALS CONTAINING d AND f METALS
by
SHRUBA GANGOPADHYAY
M.S. Case Western Reserve University, U.S.A. 2005
A dissertation submitted in partial fulfillment of the requirements for the degree of Doctor of Philosophy
in the Department of Chemistry in the College of Sciences
at the University of Central Florida Orlando, Florida
Spring Term
2011
Major Professor: Artëm E. Masunov

ii
© 2010 Shruba Gangopadhyay
iii
ABSTRACT
Density Functional Theory (DFT) method is applied to study the crystal structure of
transition metal and lanthanide oxides, as well as molecular magnetic complexes. DFT is a
widely popular computational approach because it recasts a many-body problem of interacting
electrons into an equivalent problem of non-interacting electrons, greatly reducing computational
cost. We show that for certain structural properties like phase stability, lattice parameter and
oxygen migration energetics pure DFT can give good agreement with experiments. But moving
to more sensitive properties like spin state energetic certain modifications of standard DFT are
needed.
First we investigated mixed ionic-electronic conducting perovskite type oxides with a
general formula ABO3 (where A =Ba, Sr, Ca and B = Co, Fe, Mn). These oxides often have high
mobility of the oxygen vacancies and exhibit strong ionic conductivity. They are key materials
that find use in several energy related applications, including solid oxide fuel cell (SOFC),
sensors, oxygen separation membranes, and catalysts. Different cations and oxygen vacancies
ordering are examined using plane wave pseudopotential density functional theory. We find that
cations are completely disordered, whereas oxygen vacancies exhibit a strong trend for
aggregation in L-shaped trimer and square tetramer structure. On the basis of our results, we
suggest a new explanation for BSCF phase stability. Instead of linear vacancy ordering, which
must take place before the phase transition into brownmillerite structure, the oxygen vacancies in
BSCF prefer to form the finite clusters and preserve the disordered cubic structure. This
structural feature could be found only in the first-principles simulations and cannot be explained
by the effect of the ionic radii alone. In order to understand vacancy clustering and phase
iv
stability in oxygen-deficient barium strontium cobalt iron oxide (BSCF), we predict stability and
activation energies for oxygen vacancy migration. Using symmetry constrained search and
Nudged Elastic Band method, we characterize the transition states for an oxygen anion moving
into a nearby oxygen vacancy site that is surrounded by different cations and find the activation
energies to vary in the range 30-50 kJ/mol in good agreement with experimental data.
Next we study spin alignments of single molecule magnets (SMM). SMMs are a class of
polynuclear transition metal complexes, which characterized by a large spin ground state and
considerable negative anisotropy. These properties lead to a barrier for the reversal of
magnetization. For these reasons SMM are expected to be promising materials for molecular
spintronics and quantum computing applications. To design SMM for quantum computation, we
need to accurately predict their magnetic properties. The most important property is, Heisenberg
exchange coupling constant (J). This constant appears in model Heisenberg Hamiltonian that can
be written in general form as
here Jij represents the coupling between the two magnetic centers i and j with the spin states Si
and Sj. The positive J values indicate the ferromagnetic ground state and the negative ones
indicate the antiferromagnetic ground state. We found pure DFT is not accurate enough to
predict J values. We employ density functionals with a Hubbard U term that helps to counteract
the unphysical delocalization of electrons due to errors in pure exchange-correlation functionals.
Unlike most previous DFT+U studies, we calibrate U parameters for both metal and ligand
atoms using five binuclear manganese complexes as the benchmarks. We note delocalization of
the spin density onto acetate ligands due to π-back bonding, inverting spin-polarization of the
Jiij S.S.JH ∑−=
v
acetate oxygen atoms relative to that predicted from superexchange mechanism. This inversion
may affect performance of the models assuming strict localization of the spins on magnetic
centers for the complexes with bridging acetate ligands. Next, we apply DFT+U methodology
for Mn12(mda) and Mn12(ada) complexes to calculate all six nearest neighbor Jij value. Our result
shows both qualitative and quantitative agreement with experiments unlike other DFT studies.
Using the optimized geometry of the ground spin state instead of less accurate experimental
geometry was found to be crucial for this good agreement. The protocol tested in this study can
be applied for the rational design of single-molecule magnets for molecular spintronics and
quantum computing applications.
Finally we apply hybrid DFT methodology to calculate geometrical parameters for
cerium oxides. We review the experimental and computational studies on the cerium oxide
nanoparticles, as well as stoichiometric phases of bulk ceria. Electroneutral and nonpolar
pentalayers are identified as building blocks of type A sesqioxide structure. The idealized
structure of the nanoparticles is described as dioxide covered by a single pentalayer of
sesquioxide, which explains the exceptional stability of subsurface vacancies in nanoceria. The
density functional theory (DFT) predictions of the lattice parameters and bulk moduli for the
Ce(IV) and Ce(III) oxides at the hybrid DFT level are also presented. The calculated values for
both compounds agree with experiment and allow to predict changes in the lattice parameter with
decreasing size of the nanoparticles. The results validate hybrid DFT as a promising method for
future study the structure of oxygen vacancies and catalytic properties of ceria nanoparticles.

vi
To Almighty

vii
ACKNOWLEDGMENTS
First, my greatest regards to the Almighty for bestowing upon me the courage to face the
complexities of life and complete my dissertation successfully. I am dedicating my dissertation
to the super power who teaches us to do duties without getting attached to the results.
I owe my gratitude to all those people who have made this dissertation possible and
because of whom my graduate experience has been one that I will cherish forever.
My sincere and the deepest gratitude goes to my loving parents for their love and
sacrifice. I especially thank my father for being my role model, he teaches me never to give up
until reaching the destination. His constant encouragement for instilling the importance of hard
work make this day possible.
I would like to express my cordial thanks to my dissertation advisor Professor Artem E.
Masunov for his encouragement, thoughtful guidance, and critical comments. I am thankful to
him for giving me the opportunity to work with diverse research projects, which helped me
enormously gain confidence in my research work.
My next thank goes to Department of Chemistry for accepting my application for
doctoral study and NanoScience Technology Center for proving me collaborative and wonderful
research environment.
I am grateful to my dissertation committee members Professor Ratan Guha, Professor
Andre Gesquiere, Professor Steven Kuebler, Professor Robert Igarashi for their constructive
reviews, a special thanks to Professor Enrique del Barco for his encouragement to move my
future research direction towards magnetism. I am sincerely thanking all my past and present
group members for providing me friendly and convivial work environments.
viii
I express my sincere thanks to my collaborators, Professor Nina Orlovskaya, Professor
Ratan Guha, Professor Jayanta Kapat, Professor Ahmet Sleiti for solid oxide fuel cell project, for
my molecular magnet project Professor Michael Leuenberger, Professor George Christou,
Professor Enrique del Barco, Professor Eduardo Mucciolo. for cerium oxide project Professor
Sudipta Seal, Dr. Konstantin Kudin. Not to forget the student members in the collaboration team,
Arpita, Deanna, Ajay, Jaruwan, Simranjeet, Eliza, Richard, Oleg.
All the computational work won’t be possible without NERSC and I2lab support team.
My deepest thanks to Zhengji Zhao, Steve Dick, and Sampyo Hong for compilation help in
Quantum ESPRESSO. I would like to thank Professor Sergey Stolbov for first introducing me
with Quantum ESPRESSO. Comments from unknown referees, helps us to make our papers
more meaningful, all the Quantum ESPRESSO forum members for their insightful discussions
and the research awards for appreciating our efforts. It is too short place to name but I don’t
want to skip mentioning the researchers for their constructive criticism during my conference
presentations.
Not to forget all office stuff members in NanoScience Technology Center and
Department of Chemistry. I would like to mention my teaching lab instructor Dr. Donavon
Dixon for his special support, especially during conference travel time.
To my teachers, Dr Rathin Mitra, Suman Bhattacharya, Basana Bagchi, Professor
Rajkumar Roychoudhury, Professor Swapan Mukherjee, Professor Asoke Prasun
Chattopadhyay, Ms Lily De. Dr Arunava Sen and Professor Fred L. Urbach for making me
interested in inorganic chemistry.

ix
I want to dedicate separate place to some of my very dear friends. I can refer them as
AAA, they are Anindarupa, Arunima, Angel. I convey my sincere thanks to them for supporting
me in the worst days of life.
Another earnest thanks to my wonderful roommates, Jyoti and Simranjeet for providing
wonderful ambience and support me in every possible ways. Without them I don’t think I will be
able to complete my degree.
Thanks to my brother Samidh Gangopadhyay, my cousin Ranita, and sweet little cousin
Anannya (Jaya), my aunt Krishna Gangopadhyay for their love and support.
I would like to thank Tapasda and Dr. Jes Seller for his constant support and motivation
for doing good work. I should not forget another person, Souvik for making me smile in my
gloomiest days.
Some of my closest people not in this earth I am missing them today, Ms. Rama
Majumdar, Maternal Grandmother Bijaya Devi, Paternal Grandaunt Shantilata Chattopadhyay,
Granduncle Shailashekhar Chattopadhyay. A special gratitude to my Granduncle Dr.
Rabindranarayan Gangopadhyay, without mentioning him this acknowledgment will be
incomplete. He was legendary example in our family for academic excellence, and my
inspiration for my higher education.
Now it’s time to write about my friends in Orlando, who made my doctoral days
enjoyable, Anindarupa, Debasis, Tanusri, Surajit, Satarupa, Soumitra, Ranita, Sourangsu,
Sriparna, Indra, Jaya, Subhash, Tandra, Subhajit, Atreye, Sudip, Chaitali, Pansy, Annu,
Satyender, Mona, Saptarshi, Tanmay and many others. I acknowledge all of them for wonderful
get-togethers. Thanks to my school and college friends Jayeeta, Saswati, Tuhin, Ayesha, Mithun,

x
Siddhartha, my net friends Malini, Anuradha, Soiti. Last but not the least members of
feluscinations for supplying fuels for magajastra (intellectual acumen) want to especially
mention Soumitda, Soumendu, Jedida, and many others.
I certainly overlooked the help and encouragement of many others, please forgive me for
unconditional oversight. On finale many many thanks to Google, Wikipedia and YouTube.
xi
TABLE OF CONTENTS
LIST OF FIGURES ........................................................................................................................... xiv
LIST OF TABLES ........................................................................................................................... xviii
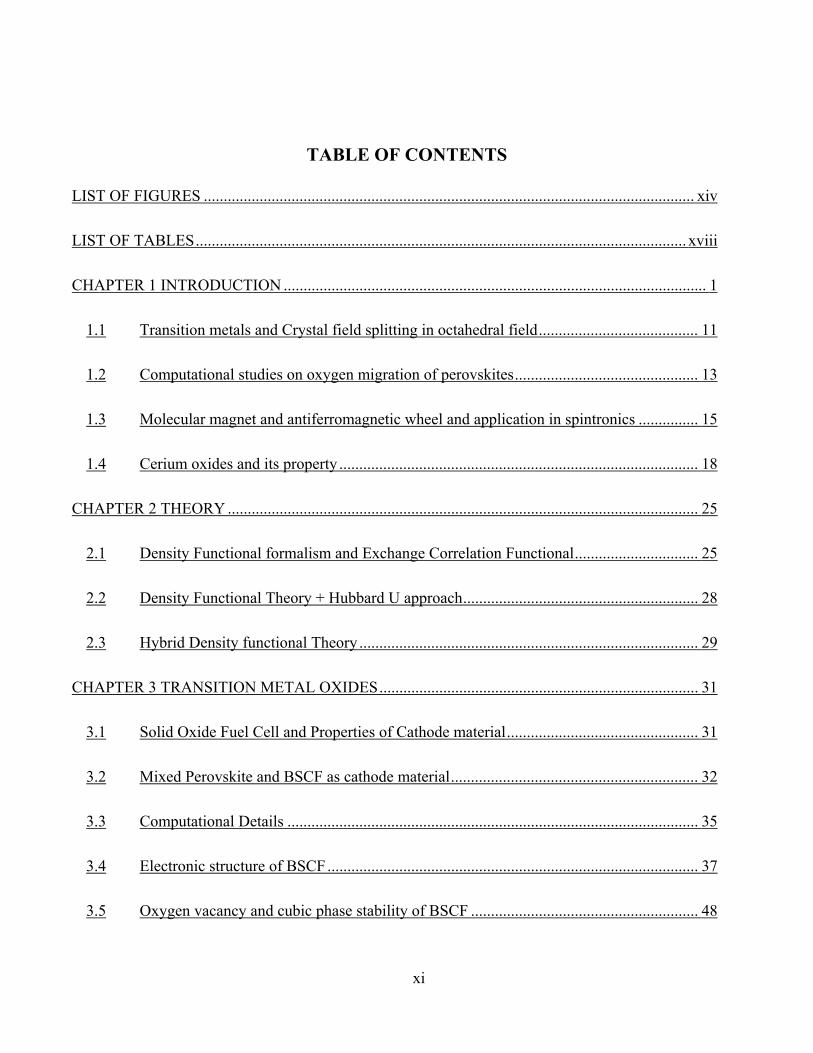
CHAPTER 1 INTRODUCTION .......................................................................................................... 1
1.1 Transition metals and Crystal field splitting in octahedral field ........................................ 11
1.2 Computational studies on oxygen migration of perovskites .............................................. 13
1.3 Molecular magnet and antiferromagnetic wheel and application in spintronics ............... 15
1.4 Cerium oxides and its property .......................................................................................... 18
CHAPTER 2 THEORY ...................................................................................................................... 25
2.1 Density Functional formalism and Exchange Correlation Functional ............................... 25
2.2 Density Functional Theory + Hubbard U approach ........................................................... 28
2.3 Hybrid Density functional Theory ..................................................................................... 29
CHAPTER 3 TRANSITION METAL OXIDES ................................................................................ 31
3.1 Solid Oxide Fuel Cell and Properties of Cathode material ................................................ 31
3.2 Mixed Perovskite and BSCF as cathode material .............................................................. 32
3.3 Computational Details ....................................................................................................... 35
3.4 Electronic structure of BSCF ............................................................................................. 37
3.5 Oxygen vacancy and cubic phase stability of BSCF ......................................................... 48
xii
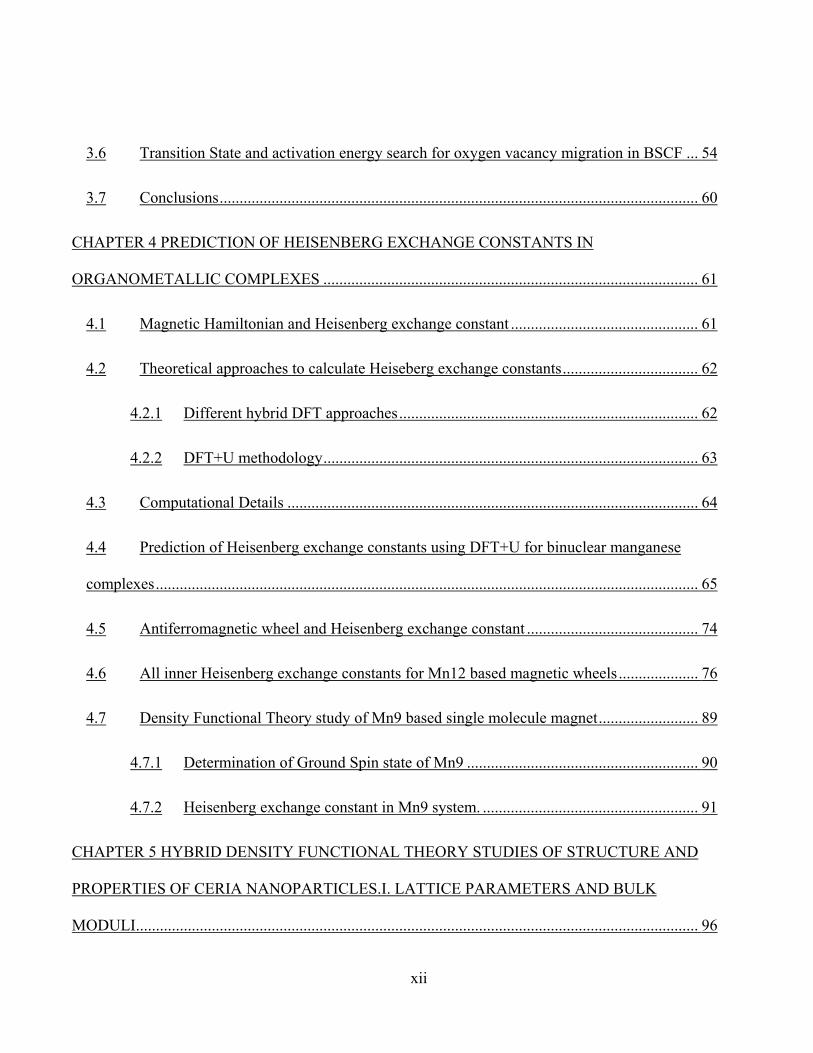
3.6 Transition State and activation energy search for oxygen vacancy migration in BSCF ... 54
3.7 Conclusions ........................................................................................................................ 60
CHAPTER 4 PREDICTION OF HEISENBERG EXCHANGE CONSTANTS IN
ORGANOMETALLIC COMPLEXES .............................................................................................. 61
4.1 Magnetic Hamiltonian and Heisenberg exchange constant ............................................... 61
4.2 Theoretical approaches to calculate Heiseberg exchange constants .................................. 62
4.2.1 Different hybrid DFT approaches ........................................................................... 62
4.2.2 DFT+U methodology .............................................................................................. 63
4.3 Computational Details ....................................................................................................... 64
4.4 Prediction of Heisenberg exchange constants using DFT+U for binuclear manganese
complexes ........................................................................................................................................ 65
4.5 Antiferromagnetic wheel and Heisenberg exchange constant ........................................... 74
4.6 All inner Heisenberg exchange constants for Mn12 based magnetic wheels .................... 76
4.7 Density Functional Theory study of Mn9 based single molecule magnet ......................... 89
4.7.1 Determination of Ground Spin state of Mn9 .......................................................... 90
4.7.2 Heisenberg exchange constant in Mn9 system. ...................................................... 91
CHAPTER 5 HYBRID DENSITY FUNCTIONAL THEORY STUDIES OF STRUCTURE AND
PROPERTIES OF CERIA NANOPARTICLES.I. LATTICE PARAMETERS AND BULK
MODULI............................................................................................................................................. 96

xiii
5.1 Cerium oxides and its property .......................................................................................... 96
5.2 Structural relations between cerium oxides. ...................................................................... 99
5.3 First Principles studies of Ceria published to date ........................................................... 102
5.4 Computational Details ..................................................................................................... 105
5.5 Results and Discussions ................................................................................................... 107
5.6 Conclusions ...................................................................................................................... 115
BIBLIOGRAPHY ............................................................................................................................. 116
REFERENCES ................................................................................................................................. 117
xiv
LIST OF FIGURES
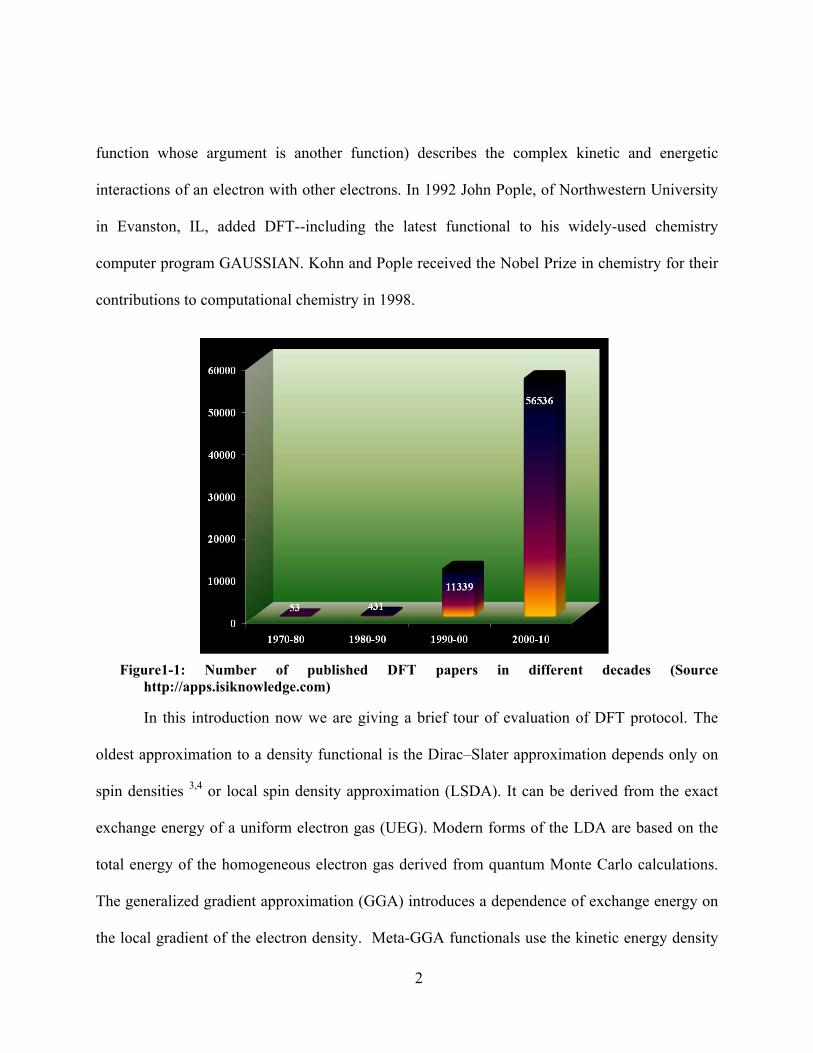
Figure1-1: Number of published DFT papers in different decades (Source
http://apps.isiknowledge.com) ........................................................................................................ 2
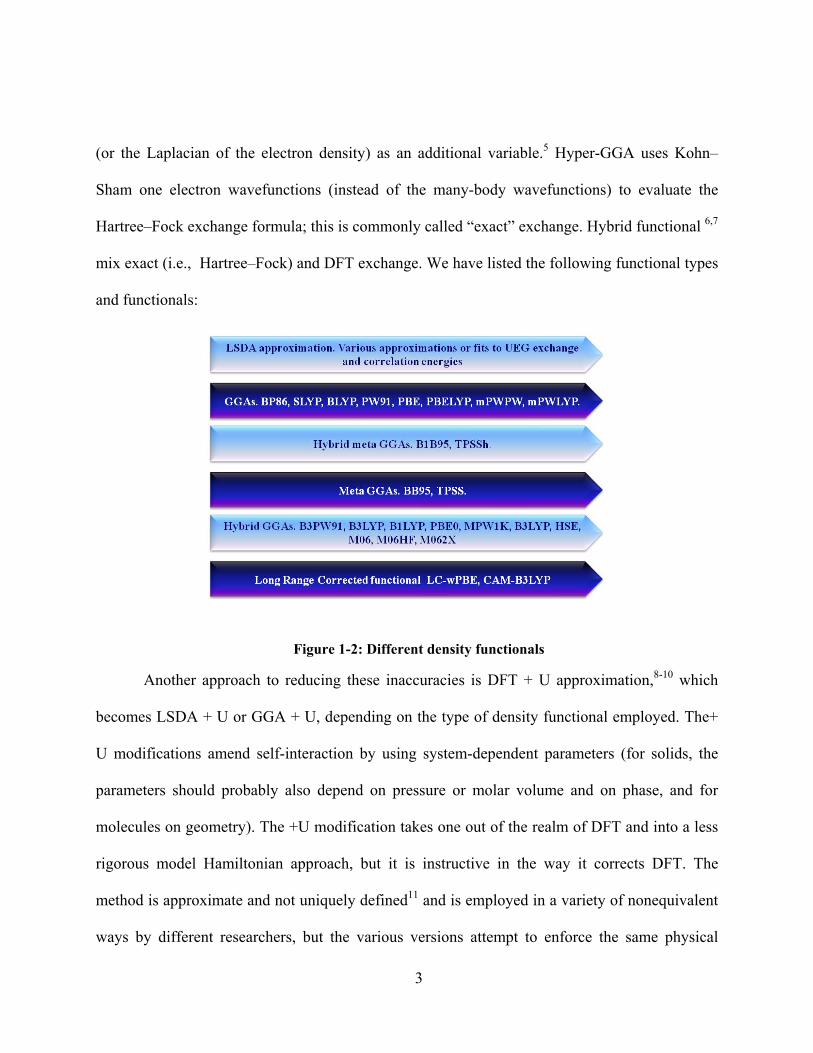
Figure 1-2: Different density functionals .............................................................................................. 3
Figure 1-3: Electronic configuration of first row transition metal compounds .................................... 5
Figure 1-4: Applications of d and f based materials ............................................................................. 7
Figure 1-5: Landmark for computational DFT ..................................................................................... 8
Figure 1-6: Available DFT based codes22 ........................................................................................... 10
Figure 1-7: Crystal field splitting of five degenerate d orbitals in tetrahedral and octahedral field ... 11
Figure 1-8 http://science.nasa.gov/headlines/y2003/18mar_fuelcell.htm Anode - Ceria/Nickel cermet
, Electrolyte - Gadolinia doped Ceria (CGO), Cathode - LSCF (a four component oxide based on
La, Sr, Co, and Fe oxides)............................................................................................................. 14
Figure 1-9 Oxygen migration pathway in cubic perovskite ................................................................ 15
Figure 1-10 Magnetic wheel complex [Mn12(O2CMe)14(mda)8]: pink balls denote Mn(III), and green
ones denote Mn(II). ....................................................................................................................... 17
Figure 3-1: Different possible spin states of Fe+4 and Co+4 in octahedral crystal field. ..................... 44
Figure 3-2: ABO3 perovskite supercell used for calculation. Here A is barium or strontium (marked
by indexes 9-16), B is iron or cobalt (marked by indexs 1-8), and the rest are oxygen atoms
(marked by indexes 17-40). .......................................................................................................... 45
xv
Figure 3-3: Jahn-Teller distortion of the coordination octahedron around the Co4+ cation is the
consequence of the intermediate spin state in the BSCF supercell. Calculated equilibrium
distances between Co4+ and nearest oxygen ions are shown. ....................................................... 46
Figure 3-4: Raman spectra of BSCF indicates intensity decrease and broadening of 675 cm−1 peak
with elevated temperature ............................................................................................................. 47
Figure 3-5: TEM micrograph showing a particle size and morphology of BSCF perovskite powder 47
Figure 3-6: ABO3 perovskite supercell used for calculation. Sites B (Iron or Cobalt cations)
represented using indexes 1-8, sites A (Barium or Strontium cations) represented using indexes
9-16, while indexes 17-40 represent Oxygen ions. ....................................................................... 50
Figure 3-7: Ba0.5Sr0.5Co0.8Fe0.2O2.5 supercell ground state structure. Four oxygen vacancies are
denoted as Vo. The positions of oxygen atoms in the initial vacancy free lattice are labeled as Ox
to demonstrate oxygen atoms displacement accompanying the oxygen vacancies formation ..... 51
Figure 3-8: Elementary step of oxygen vacancy diffusion in a cubic perovskites ............................. 54
Figure 3-9: Oxygen migration energetics for (a) symmetric ionic arrangements (corresponds to line 8
in Table 3-5), and (b) non-symmetric environment (line 9 in Table 3-5), (c) special case of tetra-
vacancy square formation (line 13 in Table 3-5); the MMO angle in marked next to each image
point. ............................................................................................................................................. 55
Figure 3-10: The NEB images along the oxygen vacancy migration pathway in square tetra-vacancy
case. ............................................................................................................................................... 56
Figure 4-1 Molecular structures of the binuclear complexes of the benchmark set and Löwdin spin
densities in their low-spin (LS) and high-spin (HS) states. .......................................................... 73
xvi
Figure 4-2: Schematic diagram of magnetic coupling in Mn12 wheels, number in italics (1-6 and 1΄-
6΄) and other numbers are for individual spin. Mn+3(S=2) green and Mn+2(S=5/2) orange-yellow
....................................................................................................................................................... 83
Figure 4-3: Schematic for antiferromagnetic Mn12 wheels ............................................................... 83
Figure 4-4: Density of states plotted for Mn12(Mdea) in S=7 ground state. Positive values present
spin up, and negative values present spin down densities. ........................................................... 85
Figure 4-5: Density of states plotted for Mn12(Adea) in S=7 ground state. ........................................ 86
Figure 4-6: PDOS diagram for d orbitals localized Mn(1) and Mn(3) for Mn12 wheels, the upper
row is showing PDOS result for Mn12(Mdea) and down row showing Mn12(Adea) wheel results
....................................................................................................................................................... 87
Figure 4-7: PDOS diagram for d orbitals localized on Mn(2,6) and Mn(4) for Mn12 wheels, the up
row is showing PDOS result for Mn12(Mdea) and down row is showing Mn12(Adea) wheel
results. ........................................................................................................................................... 88
Figure 4-8: [MnIII8MnIIO3(OMe) (O2CCMe3)7(edte)(edteH)2(N3)2] .................................................. 90
Figure 4-9: Schematic diagram of magnetic coupling in Mn9 in ground state, the green ball is Mn+3
and pink is for Mn+2. Atom 4, 5, 6 is forming an isosceles triangle. ........................................... 95
Figure 5-1: a) crystal structure of CeO2 fluorite-type cubic structure; b) crystal structure of
hexagonal Ce2O3 (A type). Ce and O atoms are shown here in black and grey circles respectively
245................................................................................................................................................. 111
Figure 5-2: Side view of MX2 sandwich bilayer .............................................................................. 111

xvii
Figure 5-3: Schematic representation of a) Fluorite type CeO2 ; b) C type body centered cubic; (c)
A type hexagonal sesqioxide. Here solid dots represent metal ions and circles are oxygen ions
216................................................................................................................................................. 112
Figure 5-4: Formation of CaF2-type structure as ABC stacking of MX2 sandwich bilayers. ........... 112
Figure 5-5: Formation of PbCl2 type structure as stacking and distortion of MX2 sandwich bilayers.
..................................................................................................................................................... 113
Figure 5-6: Layer structure for Type A ............................................................................................. 114
Figure 5-7: Surface oxygen vacancy by Esch et. al56 ....................................................................... 114
xviii
LIST OF TABLES
Table 3-1: Lattice parameters a (Ǻ) and bulk moduli B (GPa) calculated for some pure and mixed
perovskites. Two different spin states of Co+4, and oxygen vacancy in BSCF are also reported.
BSCF calculations are preformed for 2x2x2 supercell, then devided by 2. The experimental unit
cell parameters and bulk moduli are shown for comparison. ....................................................... 42
Table 3-2: Spin densities on transition metal cations, set up as initial guess and obtained with
Lowdin population analysis at SCF convergence for BSCF 2x2x2 supercell, their relative
energies and Boltzmann factors. ................................................................................................... 43
Table 3-3: Relative ground state energies of BSCF supercell with respect to different cation
positions. The index for cations indicates the positions according to Figure 3-6, and spin states
are s=2 (Fe), s=3/2 (Co). ΔE is the relative ground state energy measured in kcal/mol, C
indicates the Boltzmann factors at 1150C. ................................................................................... 52
Table 3-4. Relative ground state energies ΔE (kcal/mol) of 1, 2, 3, and 4-oxygen deficient
Ba0.5Sr0.5Co0.8Fe0.2O3-δ supercells with respect to different vacancy positions (denoted according
to Figure 3-6). The positions of cations are: Fe=1,5; Co=2,3,4,6,7,8; Ba=10,12,14,16;
Sr=9,11,13,15 (see Figure 3-6). .................................................................................................... 53
Table 3-5: Transition states and activation energies of the oxygen vacancy hopping between
crystallographic sites, calculated for different local cation arrangements in the BSCF supercell.59
Table 4-1: Heisenberg exchange constant J for the binuclear complexes, calculated using DFT+U on
Mn and ligands (U(Mn)=2.1 eV, U(O)=1.0 eV, U(N)=0.2 eV), DFT+U on Mn only, and pure
DFT, compared to BS-DFT predictions and to the experimental data. ........................................ 67
xix
Table 4-2: Dependence of Heisenberg Exchange Constant (J) on atomic Hubbard U parameters for
complex II. .................................................................................................................................... 68
Table 4-3 Calculated Heisenberg Exchange constants of Mn12(Mdea) using DFT+U and previous
first principle calculations. The first column is labeled according to Figure 4-2. Second and third
columns are showing the Mn-Mn bond distance from X-ray data and optimized structure
respectively. Fourth and fifth column is showing the DFT result reported by Cano et al.207 The
sixth column is the BSDFT value obtained by fragmenting Mn12(mdea) wheel205. The seventh
and eighth columns are J values calculated by DFT+Up+d for X ray and optimized geometry. The
last column is representing the Heisenberg Exchange constants for Mn12(Adea) ........................ 82
Table 4-4: Löwdin Population analysis for Mn12(Mdea) and Mn12(Adea) ........................................ 84
Table 4-5: Energy differences between different spin orientations in Mn9, first nine columns are
presenting the spin of Mn atoms in different spin orientations labeled according to Figure 4-9,
10th column is multiplicity; the 11th column is energy difference in kcal/mol, from stable most
spin state. The HS is designated where we have maximum possible multiplicity and all
orientations are ferromagnetic, the multiplicity 28,22,20,12 are designated as IS, LS is describing
the multiplicity 6, and suffix(s) are indicating the index of Mn according to Figure 4-9 ........... 94
Table 4-6: Heisenberg exchange constant for two adjacent metal centers, first column is the
Heisenberg exchange constant labeled according to Figure 4-9, next column is distance between
Mni and Mnj, the third one is Heisenberg exchange constant, and fourth and fifth column is
calculated and ideal spin coupling according to eq (4-7) ............................................................. 95
Table 5-1: Lattice parameter and bulk modulus of CeO2 using different methods .......................... 109

xx
Table 5-2: Lattice parameter and bulk modulus of Ce2O3 obtained with different methods. Val and
Core indicate 4f-electron treated explicitly or with the Effective Core Potential respectively.
Antiferromagnetic (AF) ,Ferromagnetic (FM) ........................................................................... 110
1
CHAPTER 1 INTRODUCTION
Investigations of electronic structures of different functional materials using quantum
mechanical simulation become an almost obligatory tool in present day science. This
understanding is a key feature behind the tailoring new materials for specific applications like
spins based electronics, energy applications, drug design, catalysis are to name few. In addition
to physical and life science contributions in this field its worthwhile to mention present
advancement of computer hardware and softwares also a reason to the tremendous growth in this
field. To deal with a larger molecular system one needs to make a compromise between the
computational cost and the accuracy of results. In that purpose Density functional theory (DFT)
has now become the preferred method for electronic structure theory, its cost scales favorably
with system size than does the cost of other expensive quantum mechanical method based on
wave function theory. In addition to reasonable computational cost it can yet competes well in
terms of accuracy. Figure 1-1, shows a graph according to web of science is presenting the
number of paper published by using DFT calculations in last four decades. In 1970-1980 the
number was 53, increased by thousand times. This tremendous growth in terms of publication is
a proof of popularity of this method in scientific community.
A breakthrough in these computational efforts was realized in 1964 when Walter Kohn
and coworkers developed the density functional theory (DFT), a theory based on electron
density, which is a function of only three spatial coordinates.1,2 The Kohn–Sham equations of
DFT cast the intractable complexity of the electron–electron interactions into an effective single-
particle potential determined by the exchange-correlation functional. This functional (i.e., a
2
function whose argument is another function) describes the complex kinetic and energetic
interactions of an electron with other electrons. In 1992 John Pople, of Northwestern University
in Evanston, IL, added DFT--including the latest functional to his widely-used chemistry
computer program GAUSSIAN. Kohn and Pople received the Nobel Prize in chemistry for their
contributions to computational chemistry in 1998.
Figure1-1: Number of published DFT papers in different decades (Source
http://apps.isiknowledge.com)
In this introduction now we are giving a brief tour of evaluation of DFT protocol. The
oldest approximation to a density functional is the Dirac–Slater approximation depends only on
spin densities 3,4 or local spin density approximation (LSDA). It can be derived from the exact
exchange energy of a uniform electron gas (UEG). Modern forms of the LDA are based on the
total energy of the homogeneous electron gas derived from quantum Monte Carlo calculations.
The generalized gradient approximation (GGA) introduces a dependence of exchange energy on
the local gradient of the electron density. Meta-GGA functionals use the kinetic energy density
3
(or the Laplacian of the electron density) as an additional variable.5 Hyper-GGA uses Kohn–
Sham one electron wavefunctions (instead of the many-body wavefunctions) to evaluate the
Hartree–Fock exchange formula; this is commonly called “exact” exchange. Hybrid functional 6,7
mix exact (i.e., Hartree–Fock) and DFT exchange. We have listed the following functional types
and functionals:
Figure 1-2: Different density functionals
Another approach to reducing these inaccuracies is DFT + U approximation,8-10 which
becomes LSDA + U or GGA + U, depending on the type of density functional employed. The+
U modifications amend self-interaction by using system-dependent parameters (for solids, the
parameters should probably also depend on pressure or molar volume and on phase, and for
molecules on geometry). The +U modification takes one out of the realm of DFT and into a less
rigorous model Hamiltonian approach, but it is instructive in the way it corrects DFT. The
method is approximate and not uniquely defined11 and is employed in a variety of nonequivalent
ways by different researchers, but the various versions attempt to enforce the same physical
4
corrections by adding a Hubbard-like12 term to the DFT energy. A key issue in essentially all
implementations is the inclusion of the Hubbard-like term only in a basis of localized d electrons
(or f electrons). The Hubbard-like term adds a penalty for non-idempotent density matrices in
this subspace and therefore it favors filling d orbitals that are localized on one particular atom 13
(a ‘‘correlation’’ effect), which sometimes also favors high-spin states on each atom and
therefore less covalent, bonding in molecules or antiferromagnetic coupling in solids. The +U
correction would be expected to be smaller for a GGA than for LSDA, and smaller yet or not
needed for a well balanced hybrid functional; for accurate results, the +U correction should
depend on the structure.14 In some cases, for example solid MnO,15-17 FeO,15,16,18 and Co,15,16,18
the +U approach and the inclusion of partial Hartree–Fock exchange lead to similar results,
which are much better than GGA, and one anticipates that the methods would be even more
similar if the Hubbard like term were included for the entire electronic space rather than just the
metal d space.17
In broad aspect materials can be divided into two basic classes a) Carbon based materials
or organic materials and b) inorganic materials. Inorganic materials can have metal or not. For
metal based systems we mostly see open shell d and f based compounds. This open shell nature
in d shell is capable of multiple valence states (e.g. Mn can have +2, +3, and +4). For f based
systems though it is not very common still we can see Ce (+3 and +4) states. This multiple
valence property of d and f metal leads to different applications including insulators,
semiconductors, conductors, or superconductors, and they may have interesting magnetic,
ferroelectric, antiferroelectric, and piezoelectric properties. These important modern
technological applications lead scientific community to investigate in deep of these materials.19
5
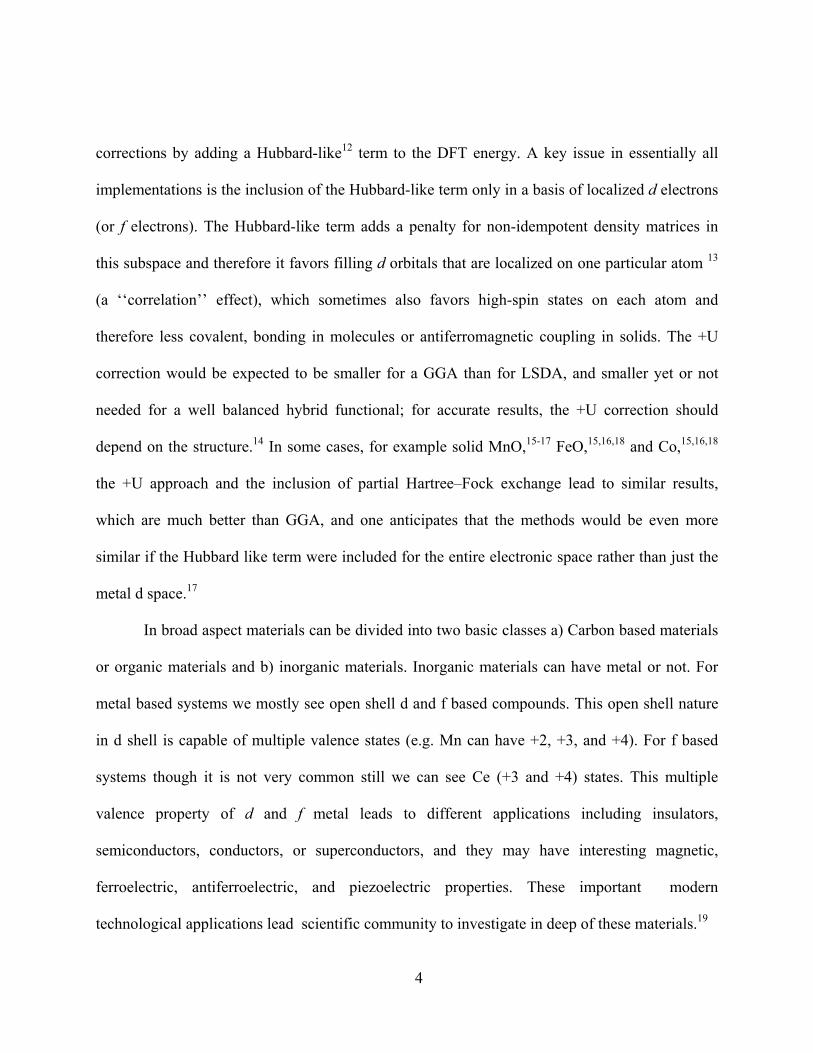
Figure 1-3: Electronic configuration of first row transition metal compounds
We listed in Figure 1-3 here first row transition metals showing general tendency of
having dn configuration (n=1-10). We normally exclude Zn because Zn+2 has closed 3d shell.
The Mn, Fe, Ni are highlighted because, we used this three transition metal based complexes and
solids for our study. It is obvious that with increasing number of electrons computational costs
also increases by significant amount. To reduce this cost most of the time the only valence
electrons in the elements are treated explicitly. The rest of the core electron is replaced by a
potential called effective core potential or pseudopotential. In next part we are elaborating four
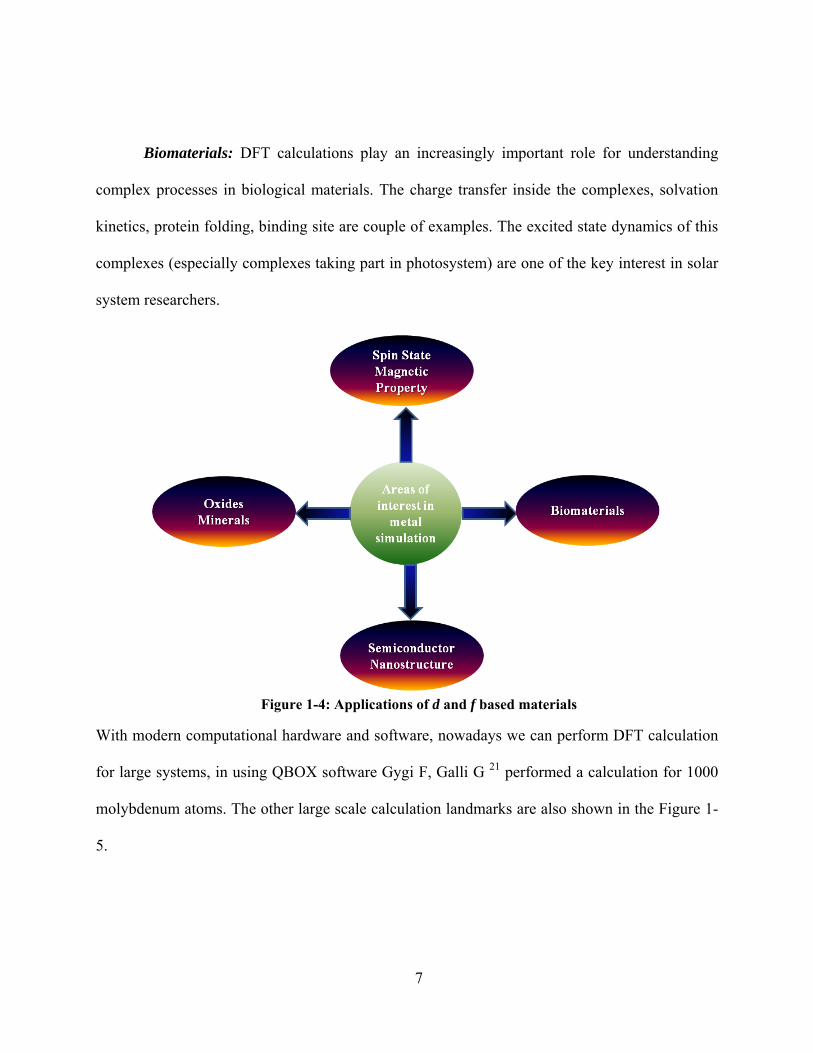
different key applications (Figure 1-4) which are studied in details in later parts of this thesis.
Magnetism and Magnetic Materials: The amplification in the recording density of hard
disk drives by a magnitude of eight orders during the past 50 years (see the May 2006 issue of
MRS Bulletin on “Materials for Magnetic Data Storage”) has been obtained by slimming down
6
the bits size in the magnetic storage layer. Recently, based on DFT calculations, tetragonal iron
cobalt alloys were proposed as promising materials with the desired high uniaxial magnetic
anisotropy and high saturation magnetization.20 Molecular magnets (a special class of
organometallics) are also suggested a special class of compound having potential application to
be a part for quantum computer. To design a tailored molecular magnet needs prior knowledge of
its magnetic properties. DFT calculation is enormously using to investigate magnetic properties
in these materials.
Oxides and Minerals: Applications of DFT have predicted such fundamental properties
as the properties of iron and (Mg,Fe)SiO3 under the extreme pressures and temperatures of the
Earth’s interior. The metal oxides shows its wide range of application starting form catalysis,
electrolyte, cathode, anode, semiconductor, superconductor to name a few. The application of
DFT in transition-metal oxides is a difficult task, as the spurious self-interaction error in DFT
overly delocalizes electrons, leading to excess metallic behavior and the wiping out of mixed-
valence states in doped oxides, affecting local spin magnetism, conductivity, and even phase
stability.
Semiconductors and Nanotechnology: All the device industry now days are based on
semiconductor. The key property in these materials is the energy gap between valence and
conduction bands. To design new materials one needs to suggest an appropriate band gap. This is
one of the most important challenges for DFT community. Pure DFT is well known for not to
calculate band gap due to self-interaction error. This error leads to artificial stabilization of
delocalized states. The effect is the most evident in systems with an odd number of electrons.
Hybrid DFT and DFT+U extensively used to calculate band gap.
7
Biomaterials: DFT calculations play an increasingly important role for understanding
complex processes in biological materials. The charge transfer inside the complexes, solvation
kinetics, protein folding, binding site are couple of examples. The excited state dynamics of this
complexes (especially complexes taking part in photosystem) are one of the key interest in solar
system researchers.
Figure 1-4: Applications of d and f based materials
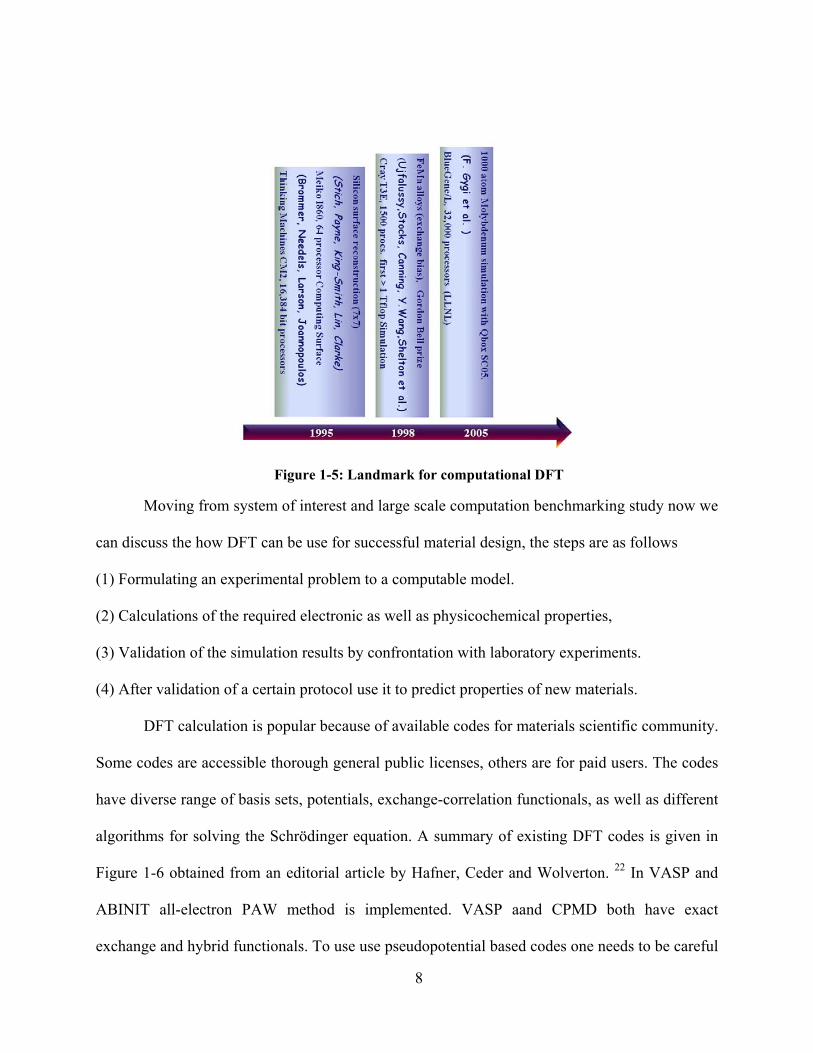
With modern computational hardware and software, nowadays we can perform DFT calculation
for large systems, in using QBOX software Gygi F, Galli G 21 performed a calculation for 1000
molybdenum atoms. The other large scale calculation landmarks are also shown in the Figure 1-
5.
8
Figure 1-5: Landmark for computational DFT
Moving from system of interest and large scale computation benchmarking study now we
can discuss the how DFT can be use for successful material design, the steps are as follows
(1) Formulating an experimental problem to a computable model.
(2) Calculations of the required electronic as well as physicochemical properties,
(3) Validation of the simulation results by confrontation with laboratory experiments.
(4) After validation of a certain protocol use it to predict properties of new materials.
DFT calculation is popular because of available codes for materials scientific community.
Some codes are accessible thorough general public licenses, others are for paid users. The codes
have diverse range of basis sets, potentials, exchange-correlation functionals, as well as different
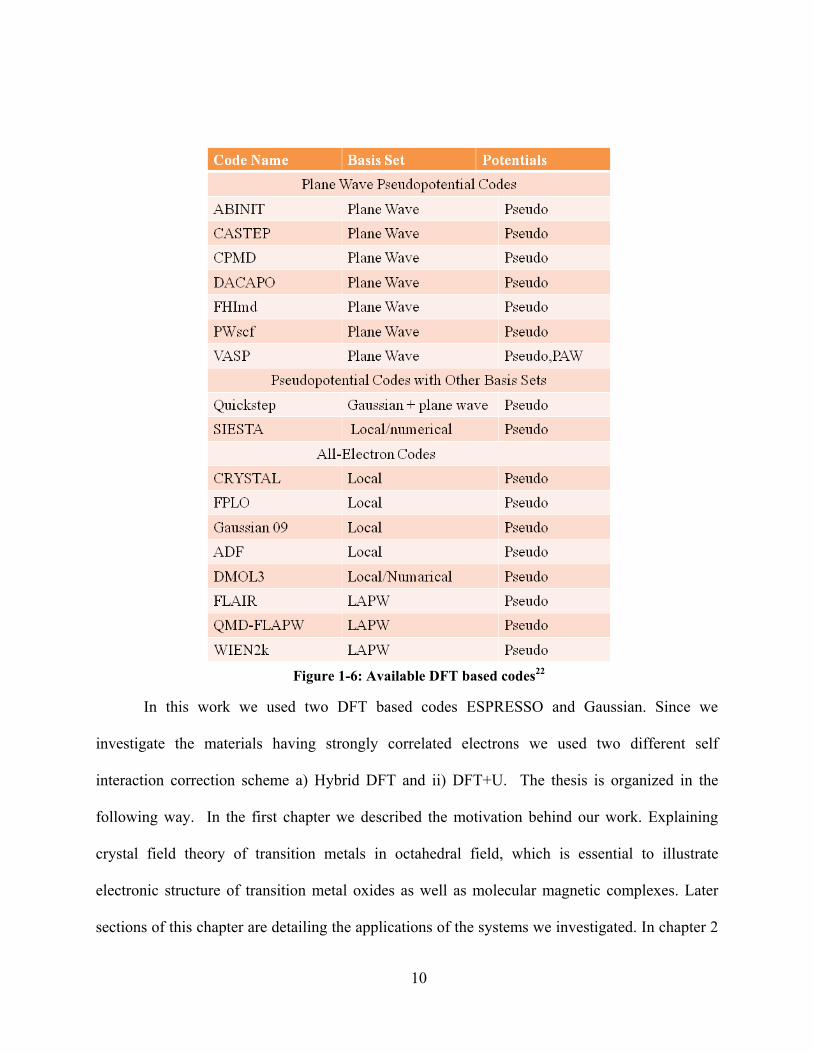
algorithms for solving the Schrödinger equation. A summary of existing DFT codes is given in
Figure 1-6 obtained from an editorial article by Hafner, Ceder and Wolverton. 22 In VASP and
ABINIT all-electron PAW method is implemented. VASP aand CPMD both have exact
exchange and hybrid functionals. To use use pseudopotential based codes one needs to be careful
9
about choosing well validated pseudopotentials . In some codes we can see external library of
pseudopotentials developed by the code developer. All-electron codes use either local or
augmented plane-wave basis sets. DFT, exact exchange, and hybrid calculations all together is
implemented in both Gaussian 03 and CRYSTAL codes. FPLO is useful especially for second
row and third row transition metals along with lanthanides because it solves Dirac equation.
DMol3 is a numerical basis set based code, this code can be employed either in an all-electron
mode or through semilocal pseudopotentials. For full-potential LAPW methods one can use
WIEN2K, FLAIR, and QMD-FLAPW( all of them are all electron codes). For benchmarking
pseudopotential codes we can use all electron codes. Unit cells with a few hundred atoms with
pseudopotential and PAW codes, are not even that difficult due to highly parallel implementation
of codes.
10
Figure 1-6: Available DFT based codes22
In this work we used two DFT based codes ESPRESSO and Gaussian. Since we
investigate the materials having strongly correlated electrons we used two different self
interaction correction scheme a) Hybrid DFT and ii) DFT+U. The thesis is organized in the
following way. In the first chapter we described the motivation behind our work. Explaining
crystal field theory of transition metals in octahedral field, which is essential to illustrate
electronic structure of transition metal oxides as well as molecular magnetic complexes. Later
sections of this chapter are detailing the applications of the systems we investigated. In chapter 2
11
we described the DFT formalism and then the modification we used over DFT. Chapter 3 is the
prediction of electronic structures and activation energy of oxygen migration of mixed transition
metal oxides. Next chapter is showing the prediction of spin state orientation of molecular
magnetic complexes. For this sensitive property pure DFT was not sufficient, we used certain
modifications over pure DFT by adding onsite coulomb repulsion on both metals and ligand in
the molecules. We validate our protocol by using a benchmark set for five bimetallic complexes
and applied it on two molecular magnetic complexes. The correct qualitative and quantitative
prediction shows our theoretical protocol can be use to suggest a rational design of molecular
magnetic complexes. The final chapter is about prediction of lattice parameter of cerium (III and
IV) oxides by considering explicit f electron on the metals. In this chapter first we described
previous theoretical approaches applied to study these oxides and why the lattice parameter
validation is challenging. In the next section in that chapter we wrote the detail methodology of
our calculation. The key part of this calculation is generation of initial guess. Our result shows
good agreement with experimental findings.
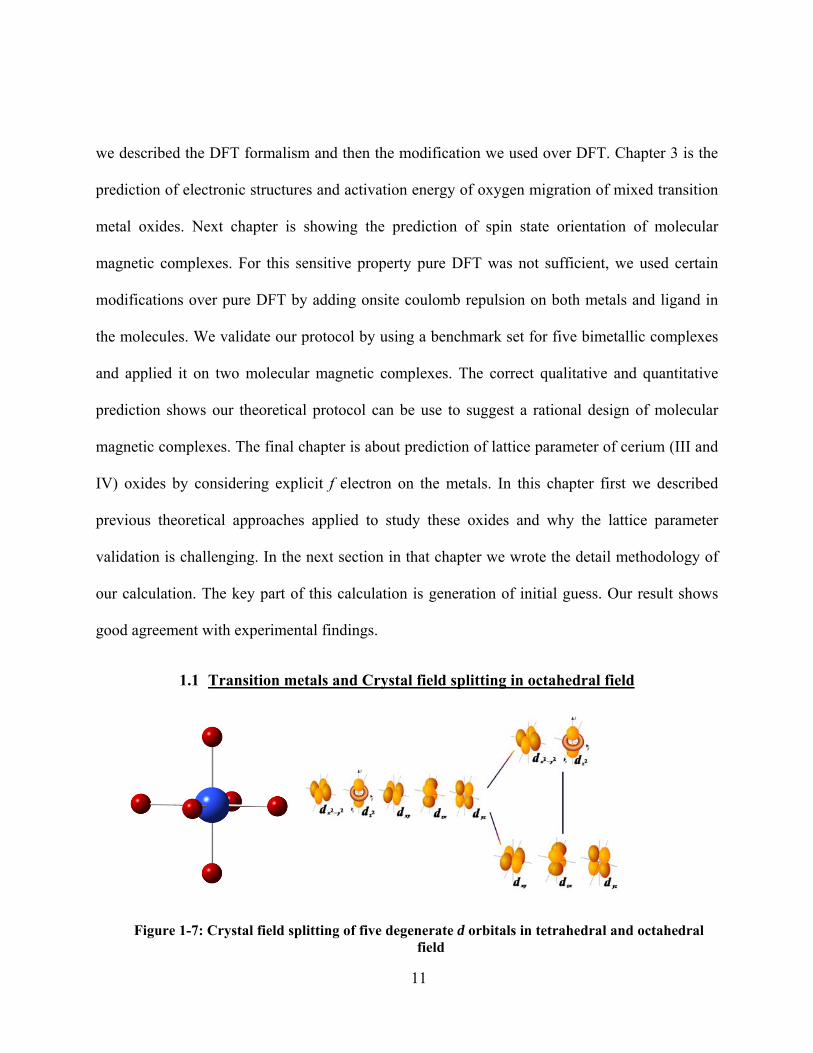
1.1 Transition metals and Crystal field splitting in octahedral field
Figure 1-7: Crystal field splitting of five degenerate d orbitals in tetrahedral and octahedral field
12
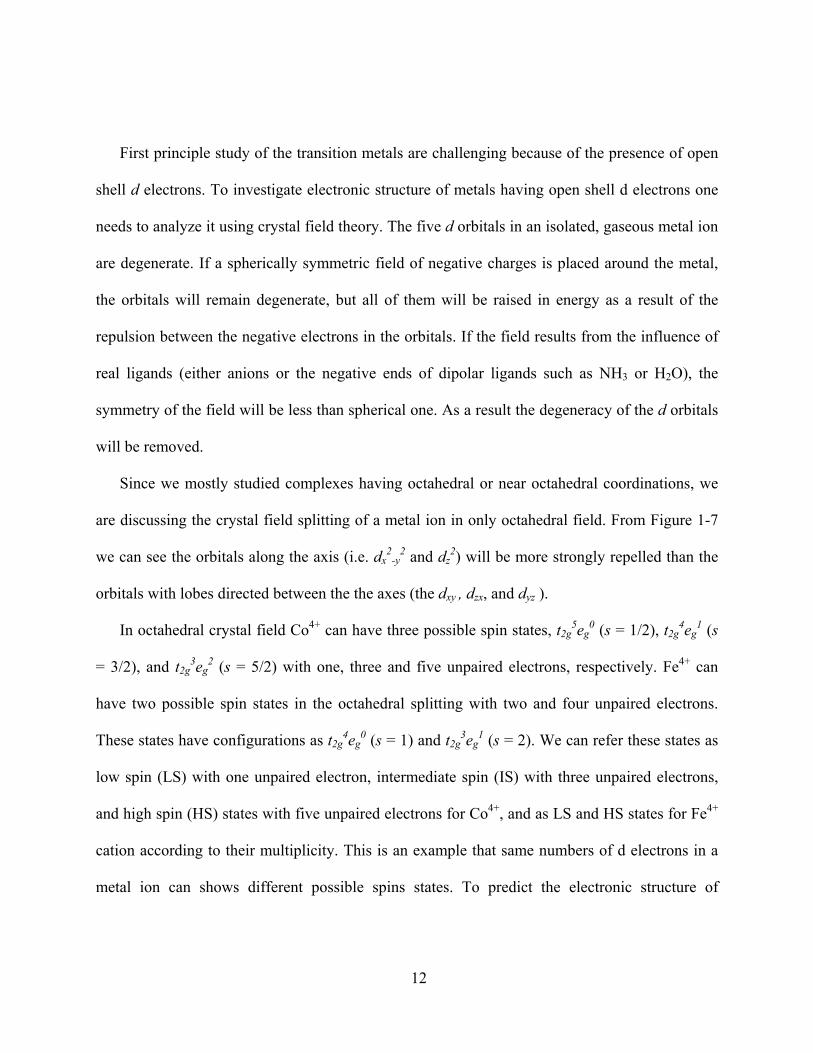
First principle study of the transition metals are challenging because of the presence of open
shell d electrons. To investigate electronic structure of metals having open shell d electrons one
needs to analyze it using crystal field theory. The five d orbitals in an isolated, gaseous metal ion
are degenerate. If a spherically symmetric field of negative charges is placed around the metal,
the orbitals will remain degenerate, but all of them will be raised in energy as a result of the
repulsion between the negative electrons in the orbitals. If the field results from the influence of
real ligands (either anions or the negative ends of dipolar ligands such as NH3 or H2O), the
symmetry of the field will be less than spherical one. As a result the degeneracy of the d orbitals
will be removed.
Since we mostly studied complexes having octahedral or near octahedral coordinations, we
are discussing the crystal field splitting of a metal ion in only octahedral field. From Figure 1-7
we can see the orbitals along the axis (i.e. dx2
-y2 and dz
2) will be more strongly repelled than the
orbitals with lobes directed between the the axes (the dxy , dzx, and dyz ).
In octahedral crystal field Co4+ can have three possible spin states, t2g5eg
0 (s = 1/2), t2g4eg
1 (s
= 3/2), and t2g3eg
2 (s = 5/2) with one, three and five unpaired electrons, respectively. Fe4+ can
have two possible spin states in the octahedral splitting with two and four unpaired electrons.
These states have configurations as t2g4eg
0 (s = 1) and t2g3eg
1 (s = 2). We can refer these states as
low spin (LS) with one unpaired electron, intermediate spin (IS) with three unpaired electrons,
and high spin (HS) states with five unpaired electrons for Co4+, and as LS and HS states for Fe4+
cation according to their multiplicity. This is an example that same numbers of d electrons in a
metal ion can shows different possible spins states. To predict the electronic structure of
13
molecules and crystals having “d” and “f” metals we need to investigate correct crystal field
configurations. In section 3-4 we discussed more details about it.
1.2 Computational studies on oxygen migration of perovskites
To suggest better cathode material in solid oxide fuel cell, one needs to estimate the ease of
oxygen diffusion. To calculate this property we need to predict the activation energy of oxygen
migration in atomic environment. Computational studies of ionic transport were reviewed by
Islam.23 He emphasized the importance of three factors: dopant/defect association, ion migration
mechanism, and surface structures. Several theoretical studies have focused on vacancy
mobilities.24-26 Based on their Monte Carlo (MC) simulations, Meyer et al. 25 concluded that the
mobility of vacancies is reduced in the neighborhood of dopant ions. This is in agreement with
other experimental results and with molecular dynamics (MD) simulations by Shimojo and
Okazaki. 24 More detailed investigation requires evaluation of the activation energies of the
elementary steps for vacancy diffusion and the atomic mechanism for each elementary step.
Eichler 27 studied diffusion barriers for oxygen ions at several locations in a supercell of
tetragonal yttrium-stabilized zirconia with a distorted fluorite structure. The energy for oxygen
diffusion was assumed to be the difference between the highest and lowest energies along a
linear path connecting occupation sites. Recent research by Ramanarayanan et al. 26 suggested
that such an approach can serve as an approximation only because the path is assumed to be
linear instead of being optimized. The mechanism of oxygen ion migration in perovskite oxides
was studied with atomistic simulations by several authors. 28,29 They reported that ion migration
involves a curved pathway. Indeed, a recent neutron scattering study of pure and doped LaGaO3
30 provides evidence in favor of this prediction. Several ab initio studies of oxygen vacancy
14
diffusion in perovskites appeared in the literature only recently. Karki et al. 31 studied the
orthorimbic perovskites and post-perovskite phases of MgSiO3. In order to calculate the
migration enthalpy, they have chosen the saddle point at which a migrating ion is placed exactly
halfway between the initial and destination sites from where the ions are removed to create
vacancy sites. A more advanced approach was taken by Ammann et al. 32 for the same system.
They searched for the minimum energy position of the ion constrained to the saddle plane. While
this search resulted in fairly complex Si migration pathway, the midway position was found to be
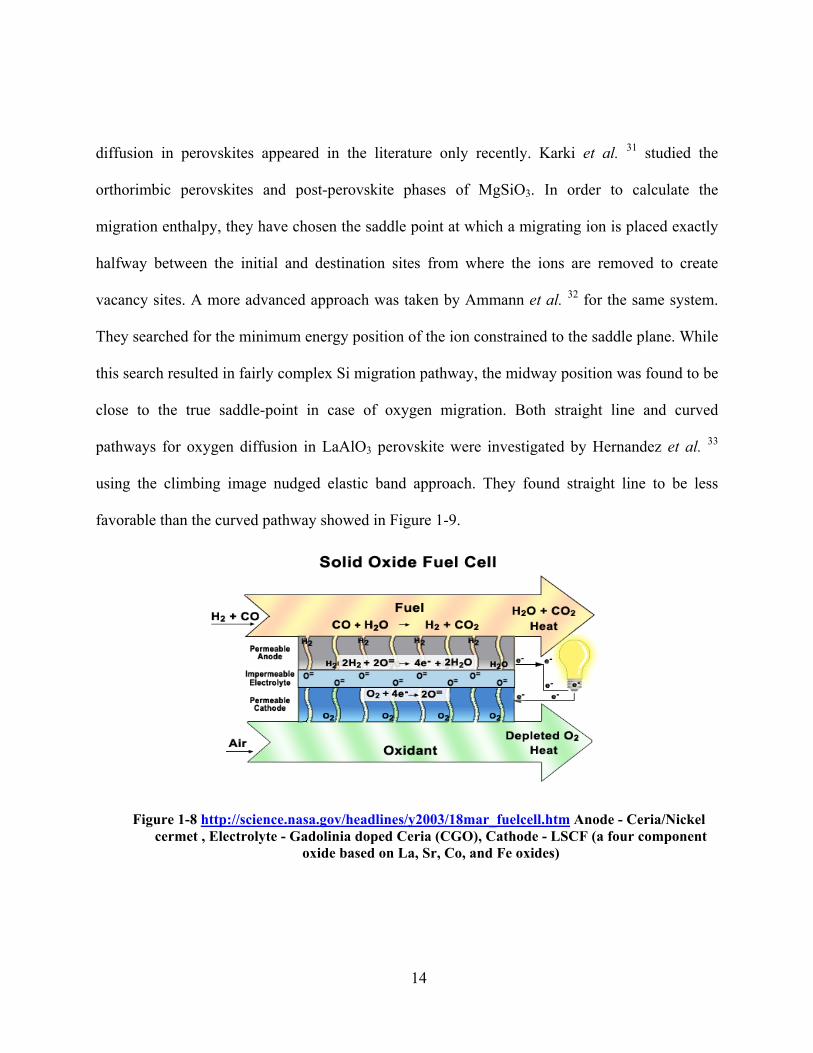
close to the true saddle-point in case of oxygen migration. Both straight line and curved
pathways for oxygen diffusion in LaAlO3 perovskite were investigated by Hernandez et al. 33
using the climbing image nudged elastic band approach. They found straight line to be less
favorable than the curved pathway showed in Figure 1-9.
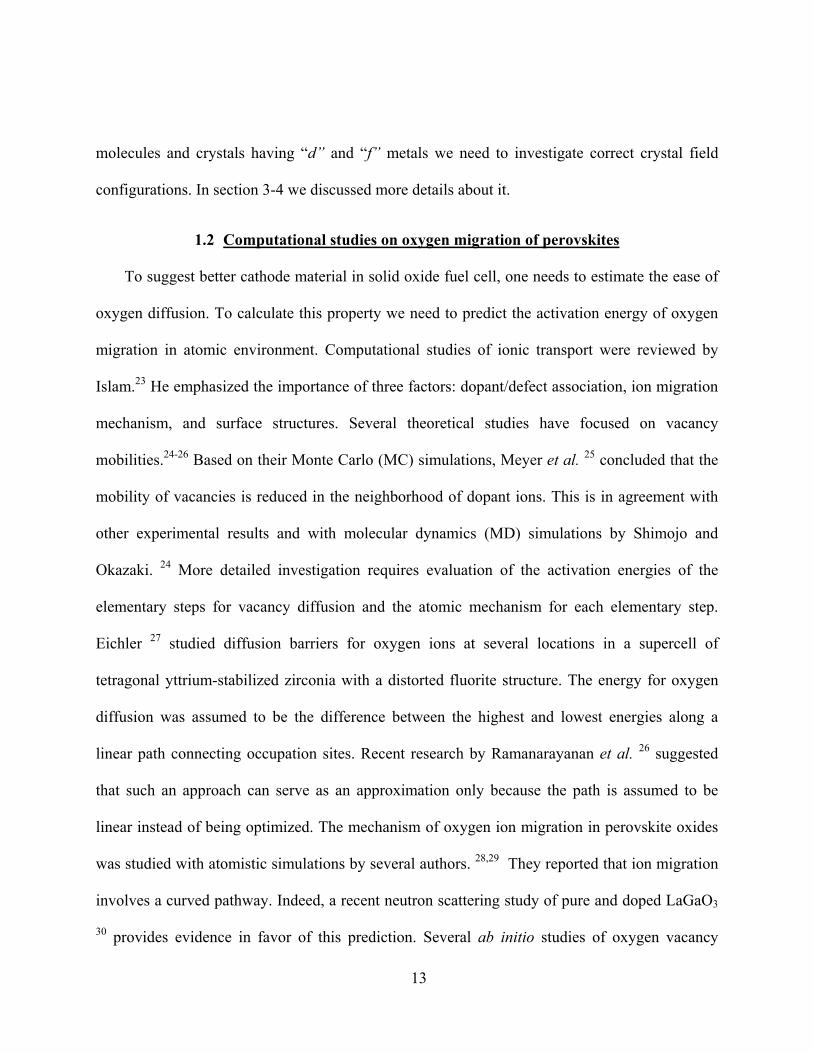
Figure 1-8 http://science.nasa.gov/headlines/y2003/18mar_fuelcell.htm Anode - Ceria/Nickel cermet , Electrolyte - Gadolinia doped Ceria (CGO), Cathode - LSCF (a four component
oxide based on La, Sr, Co, and Fe oxides)
15
Figure 1-9 Oxygen migration pathway in cubic perovskite
1.3 Molecular magnet and antiferromagnetic wheel and application in spintronics
In chapter 4 we moved from crystal to molecule. This chapter is focused on the spin state
alignment energetic of single molecule magnets (SMM). SMMs attracted interest physicists and
chemists since their initial discovery in 1993.34,35 Typical SMMs belong to the class of
polynuclear transition metal complexes. They are characterized by a large spin ground state and
considerable negative anisotropy leading to a barrier for the reversal of magnetization. SMMs are
also characterized by slow magnetization relaxation and can be magnetized below their blocking
temperature.34,35 For these reasons, SMMs hold a great promise as potential elements of
molecular spintronics and quantum computers.36-38 Spintronics is a rapidly developing area of
nanotechnology, where device operation requires active manipulation of the spin degrees of
freedom (in addition to the electric charge, used in traditional semiconductor electronics
devices). Use of molecular elements in spintronics can take advantage of the chemical, structural
and electronic versatility provided by the molecular structures. In molecular systems electron
spins can be preserved for longer time periods and distances than in conventional inorganic
16
materials. The low density, flexibility, transparency, processability and novel added
functionalities (magnetic switching at the molecular level, emission of light, etc.) can also be
advantageous for the design of spintronic devices.
Single molecules, similar to the ones considered in this study have the size c.a. 20Å and can
be used as the smallest “bits” for magnetic storage and processing of information.39 Presently
accessible magnetic domains have 20 nm in size, and their further miniaturization is complicated
by approaching the superparamagnetic limit.40 However, this limit does not apply to magnetic
molecules, because the magnetic order is determined by the electronic structure of a molecule
and not by a certain critical size. In order to become practical, the intramolecular magnetic
interaction have to be strong enough to prevent decoupling of the spins within the molecule by
thermal fluctuations, so that the single molecule effectively behaves as an atom with a large spin
S.39 Moreover, a high magnetic anisotropy is required to prevent spontaneous reorientation of the
magnetization of the molecular unit, i.e. to increase its blocking temperature.39 The interaction
between molecular magnetic properties and charge transport is another important issue to be
considered. The combination of different properties to accomplish desirable functionality makes
the rational design of the molecular magnets with optimized properties increasingly important for
the spintronic applications.
The idea of using SMMs to implement the idea of quantum computer was proposed by
Leuenberger and Loss.37 Instead of the classical bits, which can take only one value (1 or 0),
quantum computers operate with quantum bits (qubits, prepared in quantum superposition state
of 1 and 0) and carry out multiple operations at the same time. The electron spin is a natural
candidate for a qubit, as its interaction with environment is weaker than for the charge state. The
17
spin can be controlled by electron spin resonance impulse in order to write, transform, and read
out the information on a quantum state of the multilevel system.
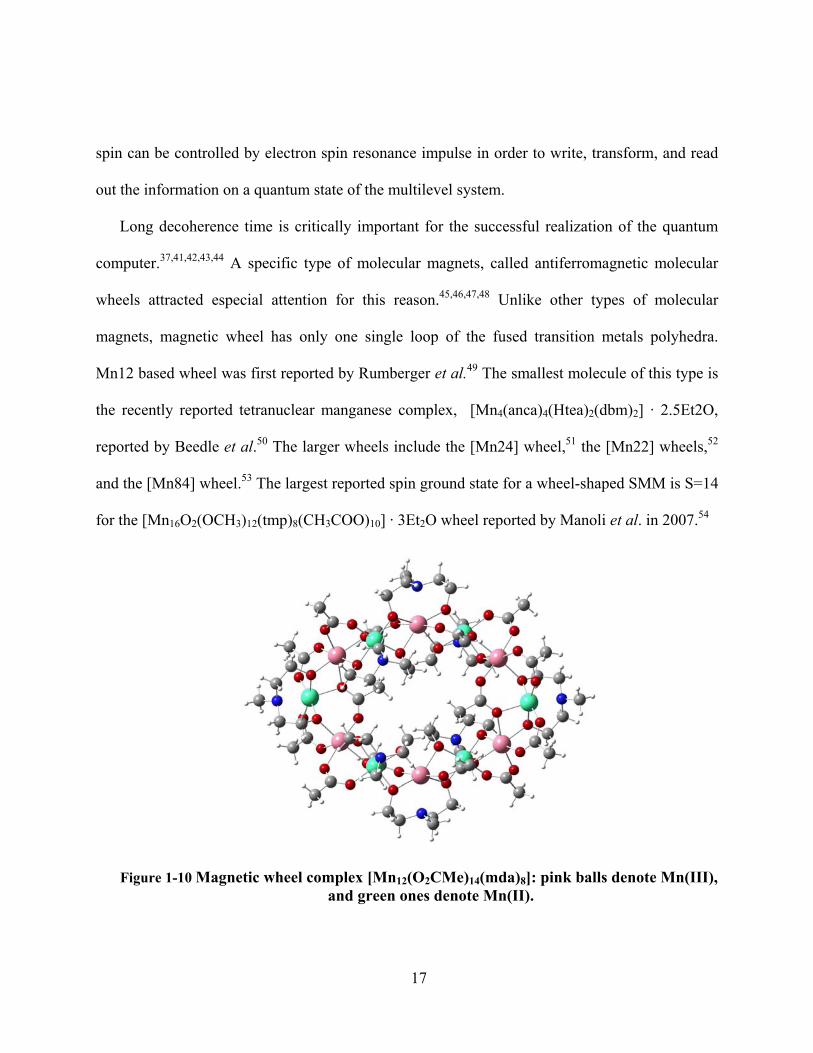
Long decoherence time is critically important for the successful realization of the quantum
computer.37,41,42,43,44 A specific type of molecular magnets, called antiferromagnetic molecular
wheels attracted especial attention for this reason.45,46,47,48 Unlike other types of molecular
magnets, magnetic wheel has only one single loop of the fused transition metals polyhedra.
Mn12 based wheel was first reported by Rumberger et al.49 The smallest molecule of this type is
the recently reported tetranuclear manganese complex, [Mn4(anca)4(Htea)2(dbm)2] · 2.5Et2O,
reported by Beedle et al.50 The larger wheels include the [Mn24] wheel,51 the [Mn22] wheels,52
and the [Mn84] wheel.53 The largest reported spin ground state for a wheel-shaped SMM is S=14
for the [Mn16O2(OCH3)12(tmp)8(CH3COO)10] · 3Et2O wheel reported by Manoli et al. in 2007.54
Figure 1-10 Magnetic wheel complex [Mn12(O2CMe)14(mda)8]: pink balls denote Mn(III), and green ones denote Mn(II).
18
1.4 Cerium oxides and its property
Surface structure of metal oxides holds the key to understanding their catalytic properties. 55
The surface oxygen vacancies are suspected to participate in various chemical reactions
catalyzed by metal oxides. Vacancies are also bind adsorbents more strongly than normal oxide
sites and assist in their dissociation. 56 Oxygen vacancies are also involved in photo catalysis on
oxides, and their changed nature may control band bending thus electron-hole pair separation.
Since the most of ceria properties are determined by its surface, films and nanoparticles
(NP) make the most efficient use of this material. Resulting surface structure depends both on
nanoparticle size, and on fabrication method. Films can be produced by several growth
technique, electron beam evaporation (EBE) 57-59 pulsed laser deposition 60-62, metaloorganic
chemical vapor deposition 63, ion beam assisted deposition (IBAD) 64, reactive magnetic
sputtering.65 Ceria thin films are used to fabricate anode material for intermediate temperature
solid oxide fuel cell (IT-SOFC). Replacement of yttrium-stabilized zirconia with doped ceria as
anode material in IT-SOFC allows to the lower the operating temperature 5000C. 66 Thin film of
CeO2 exhibits a high refractive index, and high dielectric constant, so it is a very promising
material to use for optoelectrical, microelectronic, electro-optical devices.57 The doped ceria
films are transparent for the wave lengths of or above 500nm and show no optical loss around
6000C. Ceria thin films made by pulse laser ablation and having thickness about 1000 Å are used
in optoelectronic devices.
Ceria NPs (nanoceria) had been extensively studied since early 1970s, but for inadequate
characterization facility those cannot be properly characterized, in recent years with the
development of experimental techniques as well as the help of theoretical studies this area is
19
much widely explored. In a review article it is told that from June 1993 to end of 1998, there was
560 papers had been published.67 Basically in theoretical field from mid 1990 simulated
annealing and interionic potentials are used to investigate the structure and reductability of
intermediate valance ceria nanoparticle.68 The most applications of nanocrystalline ceria are
based on its oxygen storage capacity and electronic properties. Although CeO2 has a wide band
gap of 6 eV 69 and acts as an insulator, in the higher temperature region (3000C-4000C) and in
reduced oxidation state it demonstrates an enhancement of the electric conductivity, 60 which is a
disadvantage for some applications. Adachi in his review referred that composite contained nano
particle 4.1nm having band gap 3.42 eV and with 5.37nm nanoparticle it is 3.37eV. 70
Like bulk ceria nano cerium dioxide also exhibit phase transition from fluorite phase to
orthorhombic phase , the lattice papmeter of the orthorhombic phase is a=5.641 b=6.647 c=3.481
, but the difference is nano cerium dioxide shows bulk modulus 328 ±12 GPa 71 in contrast with
bulk cerium dioxide 230 GPa. The phase transition pressure ( 22.3 GPa) is also very low
compared with bulk one (31 GPa),72 this observation is quite anomolas with other nano oxide
and sulfides , the author suggested that larger volume collapse and exsistance of unstable high
pressure phase is responsible for the decrese of transition pressure of nano cerium dioxide
compared with bulk. 71
Nanoceria used in design a three way catalyst for automobile exhaust,73 since ceria
catalytically oxidizes hydrocarbons to water, carbon monoxide to dioxide and nitrogen oxides to
nitrogen. Ceria NPs are also used for promotion of water gas shift, steam reforming reaction, and
carbon monoxide removal,73 The oxygen vacancies play an important role for the catalytic
20
activity of ceria. Zirconia doped ceria (CeO2/ZrO2 solid solution) can operate at lower
temperature around 6000C than pure ceria catalyst. 74
I ) There are different methods of preparing cerium oxide nanaoparticle
a) In colloidal medium cerium (III) forms crystalline oxydicarbonate solid particle, this oxydi
carbonates were readily converted to the corresponding oxides of ellipsoidal shape by calcination
at 6000C , while the other rare earth elements yields sols of amorphous spherical particle. 75
b) Fine particle by gas condensation -, in this method cerium oxide form by using inert gas
condensation of a metallic cerium precursor, followed by oxidation using a magnetic
sputtering.76
c)Fine particle by solgel method - In this method submicron size of cerium dioxide nano
particles are prepared, the sol is made by using cerium nitrate, and the precipitation of cerium
(+3) hydroxide uses basic medium.77
d) Combustion method it is based on the solid state combustion process based on the principle of
explosive decomposition of nitrate urea mixture in a low temperature s in a low temperature such
as 5000C, using this method cerium oxide particle size obtained is 1 μm.78
There are some other methods such as aging cerium(III) nitrate solution with hexamethyl
tetraamine . Oxidation from +3 to +4 state occurs in precipitate and then the wet precipitate is
crystallizes to dioxide. 79
There is another method which used calcination , For this synthesis,in cerium chloride
CeCl3 , 7H2O solution is used, ammonia was added dropwise and that changes the pH of the
solution from 2.5 to a final value 11.4. This addition causes the precipitation of yellow
21
gelateneous Ce(OH)3, after filter and wash the mixture with water and acetone, then the
resultant mixture is calcinated.
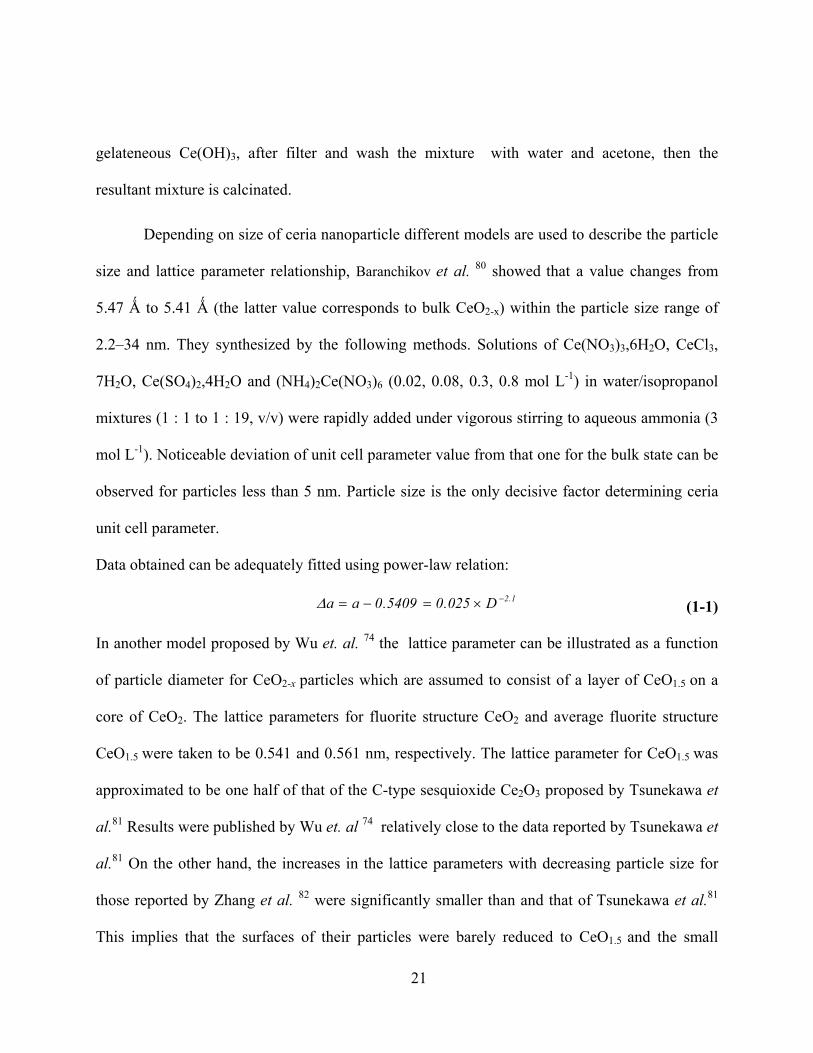
Depending on size of ceria nanoparticle different models are used to describe the particle
size and lattice parameter relationship, Baranchikov et al. 80 showed that a value changes from
5.47 Ǻ to 5.41 Ǻ (the latter value corresponds to bulk CeO2-x) within the particle size range of
2.2–34 nm. They synthesized by the following methods. Solutions of Ce(NO3)3,6H2O, CeCl3,
7H2O, Ce(SO4)2,4H2O and (NH4)2Ce(NO3)6 (0.02, 0.08, 0.3, 0.8 mol L-1) in water/isopropanol
mixtures (1 : 1 to 1 : 19, v/v) were rapidly added under vigorous stirring to aqueous ammonia (3
mol L-1). Noticeable deviation of unit cell parameter value from that one for the bulk state can be
observed for particles less than 5 nm. Particle size is the only decisive factor determining ceria
unit cell parameter.
Data obtained can be adequately fitted using power-law relation:
1.2D025.05409.0aa −×=−=Δ (1-1)
In another model proposed by Wu et. al. 74 the lattice parameter can be illustrated as a function
of particle diameter for CeO2-x particles which are assumed to consist of a layer of CeO1.5 on a
core of CeO2. The lattice parameters for fluorite structure CeO2 and average fluorite structure
CeO1.5 were taken to be 0.541 and 0.561 nm, respectively. The lattice parameter for CeO1.5 was
approximated to be one half of that of the C-type sesquioxide Ce2O3 proposed by Tsunekawa et
al.81 Results were published by Wu et. al 74 relatively close to the data reported by Tsunekawa et
al.81 On the other hand, the increases in the lattice parameters with decreasing particle size for
those reported by Zhang et al. 82 were significantly smaller than and that of Tsunekawa et al.81
This implies that the surfaces of their particles were barely reduced to CeO1.5 and the small
22
increase in their lattice parameters with decreasing particle size could be due primarily to
vacancies in bulk of the particles according to Raman spectra.
According to Baranchikov et. al 80 they estimated size of ceria nanoparticles which
corresponds to complete transition of cerium atoms into +3 oxidation state. Within the
framework of Tsunekawa et al.’s 81 model, this critical size appeared to be approximately 1.1
nm. In turn, according to model proposed by Wu et al.74 reduction of Ce(IV) with the decrease of
particle size results in formation of Ce2O3 with fluorite structure having disordered oxygen
vacancy sublattice. Unit cell parameter of fluorite Ce2O3 was estimated to be 5.56Ǻ.74 Critical
particle size of ceria calculated using this model and relation appeared to be approximately 1.2
nm. It should be noted that thus estimated critical size values are nearly equal to double unit cell
parameter of cerium dioxide. In other words complete reduction of Ce(IV) takes place when all
CeO2-x unit cells are on the surface of a particle.
Different synthetic methods have significant impact in ceria nanoparticle size and the
corresponding lattice parameter.
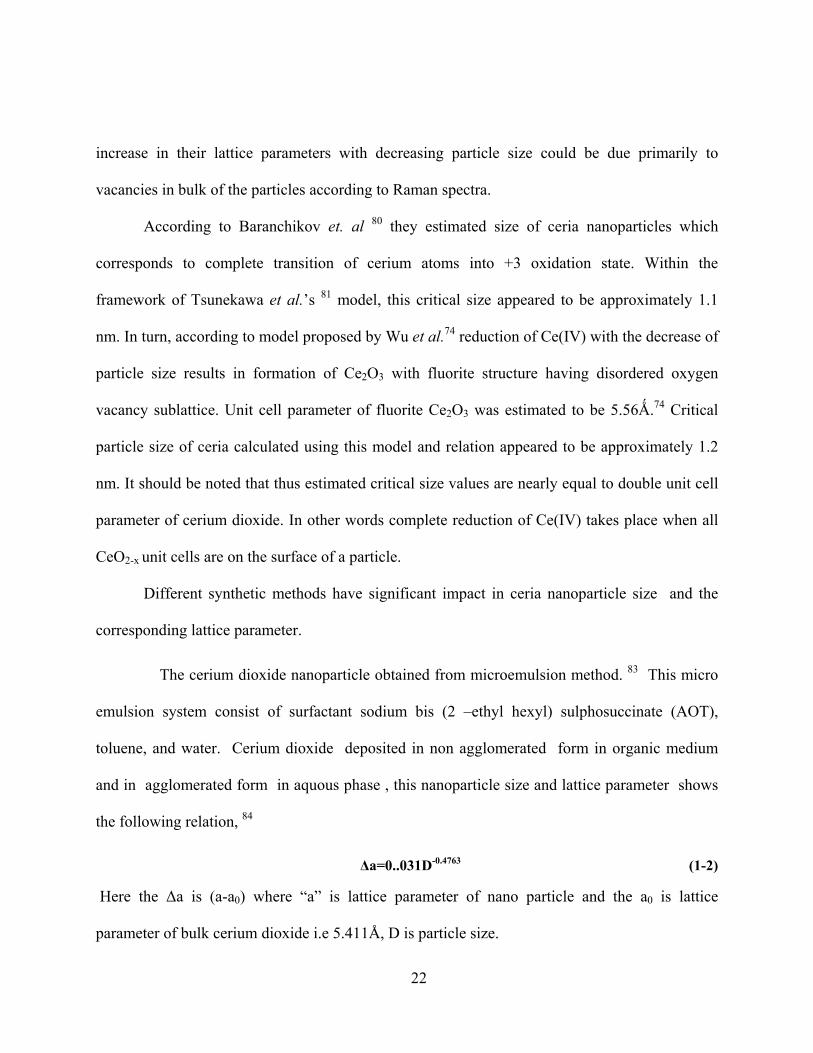
The cerium dioxide nanoparticle obtained from microemulsion method. 83 This micro
emulsion system consist of surfactant sodium bis (2 –ethyl hexyl) sulphosuccinate (AOT),
toluene, and water. Cerium dioxide deposited in non agglomerated form in organic medium
and in agglomerated form in aquous phase , this nanoparticle size and lattice parameter shows
the following relation, 84
Δa=0..031D-0.4763 (1-2)
Here the Δa is (a-a0) where “a” is lattice parameter of nano particle and the a0 is lattice
parameter of bulk cerium dioxide i.e 5.411Å, D is particle size.
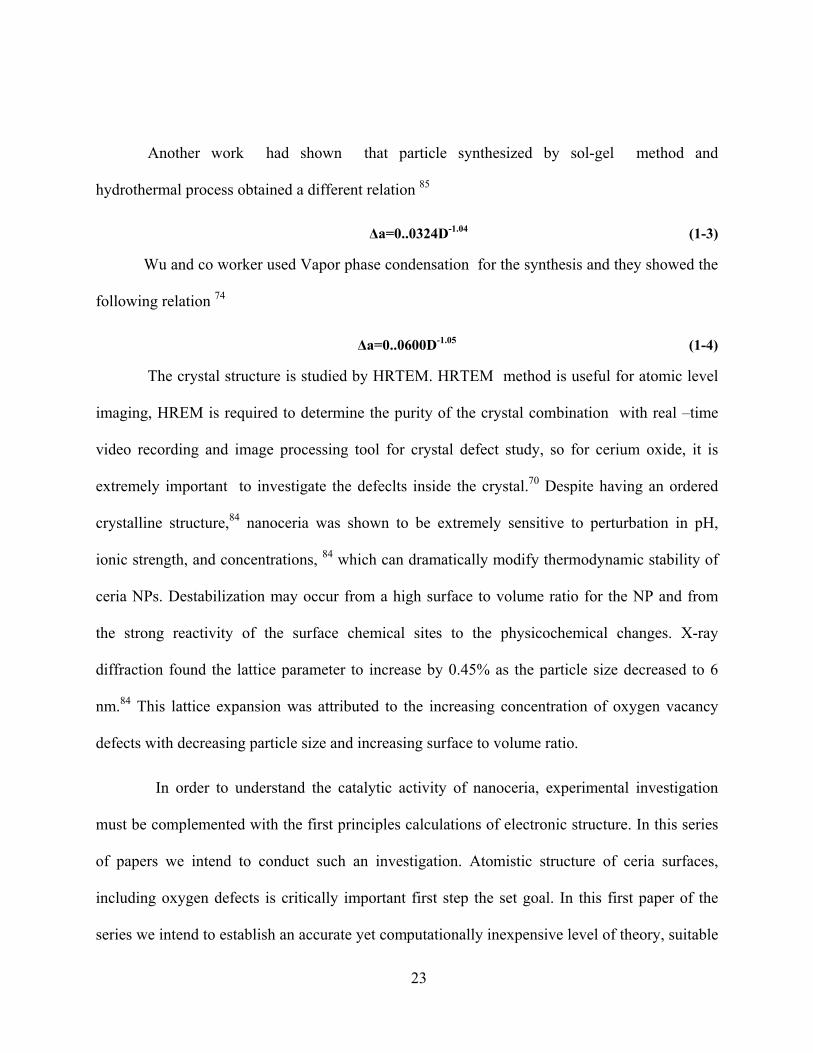
23
Another work had shown that particle synthesized by sol-gel method and
hydrothermal process obtained a different relation 85
Δa=0..0324D-1.04 (1-3)
Wu and co worker used Vapor phase condensation for the synthesis and they showed the
following relation 74
Δa=0..0600D-1.05 (1-4)
The crystal structure is studied by HRTEM. HRTEM method is useful for atomic level
imaging, HREM is required to determine the purity of the crystal combination with real –time
video recording and image processing tool for crystal defect study, so for cerium oxide, it is
extremely important to investigate the defeclts inside the crystal.70 Despite having an ordered
crystalline structure,84 nanoceria was shown to be extremely sensitive to perturbation in pH,
ionic strength, and concentrations, 84 which can dramatically modify thermodynamic stability of
ceria NPs. Destabilization may occur from a high surface to volume ratio for the NP and from
the strong reactivity of the surface chemical sites to the physicochemical changes. X-ray
diffraction found the lattice parameter to increase by 0.45% as the particle size decreased to 6
nm.84 This lattice expansion was attributed to the increasing concentration of oxygen vacancy
defects with decreasing particle size and increasing surface to volume ratio.
In order to understand the catalytic activity of nanoceria, experimental investigation
must be complemented with the first principles calculations of electronic structure. In this series
of papers we intend to conduct such an investigation. Atomistic structure of ceria surfaces,
including oxygen defects is critically important first step the set goal. In this first paper of the
series we intend to establish an accurate yet computationally inexpensive level of theory, suitable

24
to describe ceria, and its mixed-valence nature. Our short-tem goal is to find optimal lattice
parameters and bulk moduli for the ideal bulk crystal structure in CeO2 and Ce2O3, then use them
to find dependence of lattice parameter for the partially reduced phases CeO2-x on the
composition x and compare it with the experiment. In Section 5.2 we establish structural
relations between ceria oxides, in Section 5.3 we review the first principles studies of ceria
published to date, Section 5.4 describes the details of our approach. We present the results of our
calculations and build an ideal model of nanoceria in Section 5.5. Major results are summarized
in the 5.6.
25
CHAPTER 2 THEORY
2.1 Density Functional formalism and Exchange Correlation Functional
Density Functional Theory (DFT) is one of the most widely used quantum chemical method
for electronic structure calculations in solid-state physics. It is a well known approach to study
ground state properties of many-body systems such as atoms, molecules, crystals and surfaces.
Its applicability extends to the fields like biology and mineralogy. It is a versatile methodology to
calculate energetics of complex systems due to the generality and flexibility of implemented
fundamental concepts. DFT’s framework is primarily build on Hohenberg-Kohn theorem1 and
Kohn-Sham equations.2,86 Although DFT is a first principle approach to solve Schrödinger wave
equation. To describe DFT approach in general, we start with Born-Oppenheimer approximation
where atomic nuclei are treated classically as fixed and the electrons are moving in their electric
potential ν. Thus a many electron Schrödinger equation can be written as:
[ ] ( ) ( ) Ψ=Ψ⎥⎦
⎤⎢⎣
⎡++∇−=Ψ++=Ψ ∑∑∑
<
ErrUrVm
UVTHN
jiji
N
iii
N
i
rrrh ,2
ˆˆˆˆ 22
(2-1)
Where Ĥ is the Hamiltonian, Û is the electron-electron interaction energy, N is the number of
electrons, T̂ is the kinetic energy, V̂ is the potential energy from the nucleian field, E is the total
energy and Ψ represents the wave function of the system.
Density Functional Theory is mapping many body problem with Û onto a single body
problem without Û, where key variable remaining is the particle density n(r). According to
Hohnberg-Kohn (HK) theorem, electronic density n(r) determines all ground state properties of
multi-electron system, where energy of the ground state is a functional of electronic density. The
26
HK equation describing ground state properties of many electron systems in terms of electron
density is:
∫ +=++= − ][)()(][][][)]([ nFdrrvrnnVnVnTrnE HKexteeext (2-2)
where Hohnberg-Kohn functional FHK[n] = ][][ nVnT ee−+ . Although HK approach is in principle
exact, the form of ][nFHK is unknown. The approximate form of kinetic energy functioinal T[n]
is usually given by Kohn-Sham (KS) equations. KS equations mapped the real system into an
auxiliary non-interacting reference system with the same density, where each electron moves in
an effective 1-particle potential due to surrounding electrons. Kohn and Sham introduced the
way to solve Schrödinger wave equation by giving relation between particle density and
corresponding potential to finally calculate the kinetic energy of non-interacting N particle
system. The Kohn-Sham equation:
iiieff rV φεφ =⎥⎦⎤
⎢⎣⎡ +∇− )(
21 2
(2-3)
where iφ are KS orbitals, is the system of N effective one-particle equations, making up the total
density ∑=i
i rrn 2)()( φ .
There are several approximations for exchange-correlation functionals87 in equation (2-2). In
this form, Density functional theory (DFT)2,86 has become a method of choice for the calculation
of numerous properties of molecules and solids. Unlike modern semiempirical methods such as
MSINDO88 and DFTB,89 it does not require tedious empirical parameter fitting to produce
acceptable results. Unlike WFT methods,90 DFT accounts for electron-correlation not through
increasing complexity of the wavefunction, but via approximate exchange-correlation functional.
27
The need to improve exchange–correlation functionals arises from known deficiencies of DFT
describing so called strongly correlated systems where vacant and occupied electronic levels are
approaching degeneracy (this effect is also known as static or non-dynamic electron correlation).
This situation is observed in d and f electron systems or when chemical bonds are being
stretched. Despite these limitations different exchange-correlation functionals are widely used
for modeling of various systems. Early exchange–correlation functionals were dependent only on
electron spin density (Local Spin Density Approximation, LSDA). Next generation of exchange–
correlation functionals also included energy dependence on the gradient of the density
(Generalized Gradient Approximation, GGA). Among the later developments are kinetic energy
density dependent functionals which are also known as meta-GGA, including TPSS and
BB95.91,92 GGA and meta-GGA functionals are called semilocal functionals to distinguish them
from LDA on one hand, and non-local functionals including orbital dependence on the other
hand. One of the meta-GGA functional we used in our study, TPSS93 was designed to correct the
too-large atomization energies and increase the too-small jellium surface energies obtained with
LSD (Jellium is the term for model system of interacting electrons and a uniform background of
positive charge). It had been shown to accurately predict bond energies and bond lengths in
molecules, hydrogen-bonded complexes, and ionic solids.94 Performance of TPSS approaches
that of the hybrid PBE0 functional with a practical advantage of not including Hartree-Fock
exchange.93
28
2.2 Density Functional Theory + Hubbard U approach
The description and understanding of electronic properties of strongly correlated materials is
a very important and long standing problem for ab initio calculations. Pure LDA and GGA is not
always accurate enough for calculating sensitive property like spin state energetic and band gap
of d and f metals. Anisimov and co-workers 8,9,95 correct the standard functional adding an onsite
Hubbard-like interaction to treat metal oxides. The method represents one of the simplest orbital
dependent functionals in which a generalized Hubbard model is used to enforce localization of
the electrons. Number of the first-principle approaches to estimate the U parameter had been
proposed.96,97 However, in many cases quantitatively better results can be obtained with the value
of U determined empirically as a fitting parameter to experimental results98,99,100. Anisimov
described Hubbard-like interaction EHub.
[ ] [ ] { }[ ] { }[ ]σσ l
DClmHubLDAULDA nEnErnErnE −+=+ )()(
(2-4)
Where n(r) is the electron density and σlmn are the atomic orbital occupations for the atom I
experiencing the Hubbard term. The last term in the above equation is then subtracted in order to
avoid double counting of the interactions contained both in EHub and, in some average way, in
ELDA. In this term the total, spin projected, occupation of the localized manifold is used
σσ l
mml nn ∑= . In
29
2.3 Hybrid Density functional Theory
All LSDA, GGA and meta-GGA are known to underestimate band gaps in solids. On the
other hand, Hartree Fock (HF) method yields an overestimated band gap. The electron
correlation in DFT is introduced in terms of exchange-correlation functional XCE , replacing exact
exchange HFXE in HF theory without increase in computational expense. Some empirical
parameter fitting is typically involved in the design of the exchange-correlation functional in this
formalism; it is largely system-independent. Although exact exchange is non-local and orbital-
dependent, in DFT the functional XCE is expressed in terms of the total electron density and its
gradients (respectively local and semi-local approximation). Unlike exact exchange, XCE
includes repulsion of electron from its own density and does not vanish for one-electron systems.
This property is known as self-interaction error, and it has both negative and positive effects. As
negative result, in DFT bonds are too weak, while electrons are over-delocalized and do not
interact with Coulomb asymptotic r/1~ at large separations. On a positive side, self interaction
is mimicking non-local part of electron correlation and should be retained to some degree.
Practically useful step in balancing self-interaction error was made by Becke,101 who suggested
to include a fraction of HF exchange energy in XCE functional:
CDFXHFXXC EEaaEE +−+= )1( (2-5)
where a=0.2 is an empirical parameter, DFXE and CE are exchange and correlation functionals
including local and semi-local terms. The original (B3LYP)101 as well as more recent hybrid
functionals often achieve chemical accuracy in properties predictions.102,103,104 We used BMK

30
(Boese-Martin for kinetics) a hybrid meta-GGA functional with 42% of HF exchange, and
PBE1PBE functional with 25% exchange functional for calculation of cerium oxides.

31
CHAPTER 3 TRANSITION METAL OXIDES
3.1 Solid Oxide Fuel Cell and Properties of Cathode material
Recent worldwide interest in cleaner energy technology has refocused attention to the solid
oxide fuel cells (SOFC) as a potential source of efficient, environmentally friendly, and fuel
versatile electric power. Because of high operating temperatures, the SOFCs offer several
potential advantages over proton exchange membranes fuel cells including low internal
resistance, high tolerance to catalyst poisons, production of high-quality waste heat for
reformation of hydrocarbon fuels, as well as the possibility of oxidation of hydrocarbon fuels
directly. SOFC’s efficiency ranges from 50 to 65% and they can be used as environmentally
acceptable source of electric energy.105,106
Continuous effort in the design of SOFC multicell stacks and systems requires deeper
understanding of the structure/property-performance relationships. Numerous attempts had been
made to explore new electrode materials and microstructures, and establish how and why
electrode performance changes with time, temperature, thermal cycling, operating conditions,
impurities, and other factors.105,106 Despite the advances in electrochemical measurement and
modeling, understanding of SOFC cathode oxygen reduction and transport mechanisms remains
largely circumstantial today. The elucidation of the cathode mechanisms often relies on having
limited understanding for an observed phenomenon (e.g. chemical capacitance as evidence for
bulk transport) rather than direct independent measurements.106 Therefore, direct experimental
observations (such as spectroscopic evidence of oxidation/reduction of the electrode material)
are critically important to achieve further progress in SOFC design. Experimental

32
characterization techniques may not, however, always be available to determine certain
properties and atomistic structure of the materials. In those cases, the computational investigation
of the representative supercells from the first principles can greatly assist in completing the
picture and achieve deeper understanding of the relevant processes. Such combined experimental
and theoretical investigation has an added value and contributes to the design of more efficient
and cost-effective devices.
The SOFC is built using porous solid ceramic cathode, anode, and dense electrolyte. The
cathode is required to be stable in an oxidizing atmosphere, be electronically conductive, and
maintain a porous structure at high operating temperatures. It is also beneficial for the cathode
material to exhibit oxygen ion conductivity. To be a good oxygen ion conductor, a ceramic
cathode should satisfy two fundamental requirements: (i) it has to contain a significant amount of
vacancies in the oxygen sublattice, and (ii) the energy barriers for site to site oxygen migration
need to be fairly small (3). Mixed ionic-electronic conducting transition metal perovskite type
oxides are considered materials of choice for SOFC cathodes because of their porosity and good
electrical conductivity.
3.2 Mixed Perovskite and BSCF as cathode material
Mixed oxides with the general formula ABO3 crystallize in perovskite structure, where A
cations are either lanthanides or alkaline earth metals, and B cations are transition metals such as
Mn, Fe, or Co. These perovskites often have large mobility of the oxygen vacancies, exhibit
strong ionic conductivity, and are often used as cathode materials in SOFC. 105 The first studies
of the mixed perovskite compounds were focused on lanthanum strontium cobaltite (LSC) with
the formula La1−xSrxCoO3−δ.107 The high oxygen permeation flux in LSC was attributed to the
33
high concentration of vacancy in the anion sublattice due to the substitution of La3+ by Sr2+ at the
A-site of the perovskite.108 Unfortunately, at oxygen partial pressures <10 kPa and temperatures
below 790 °C, LSC is unstable and phase transition to vacancy-ordered brownmillerite structure
takes place. Burggraaf et al. examined oxygen permeability of perovskite-type oxides
SrCo0.8B0.2O3−δ (B = Cr, Fe, Co, and Cu) and La0.6Sr0.4CoO3−δ.109 They found a 5 orders of
magnitude increase in oxygen permeability (up to 0.3−3 × 10⁻⁷ mol cm−2s−1) at the onset of the
transition from a low-temperature vacancy-ordered state to defective perovskite for all
compounds except SrCo0.8Fe0.2O3−δ. In the latter case, only a slight anomaly was found for the
oxygen permeability. The comparatively high oxygen flux through SrCo0.8Fe0.2O3−δ observed at
intermediate temperatures was interpreted in terms of a two-phase mixture of a vacancy-ordered
state and disordered perovskite, whereas above 790 °C, the sample is single-phase of defective
perovskite structure .109 Kharton et al. measured oxygen permeation fluxes in SrCo0.8M0.2O3 (M
= Cr, Mn, Ni, Cu, Ti) materials using the electrochemical method.110,111 The highest permeation
flux was found for the strontium cobaltite-ferrite (SCF) perovskite with composition of
SrCo0.8Fe0.2O3. The substitution of Sr2+ ions in SCF by ions with higher charge such as La3+
usually increases phase stability, whereas the oxygen permeability is simultaneously
decreasing.112,113 Recently, a new solution to this permeability decrease was suggested. It
consists of partial substitution of Sr2+ with Ba2+ in SCF. The resulting material, called
barium−strontium cobaltite−ferrate (BSCF) has improved phase stability, whereas the oxygen
permeation flux remains unchanged. Initially, BSCF was developed as a high-temperature
oxygen permeation membrane material.108,114 Recently Shao et al. proposed BSCF as an
intermediate temperature cathode material.115 The reason of phase stability of BSCF is suggested
34
by McIntosh et al. 116 According to their explanation, the Ba2+ ion is too large to sustain the
transition-metal brownmillerite structure.
The size and charge of the B-site cations are found to be even more important parameters for
the conductivity in perovskites. The B−O octahedra constitute the framework of the perovskite
structure, and the oxide anion interacts with the B cation by a much stronger partially covalent
bond, unlike the purely ionc bond to the large A cation. Lybye 67 compared four perovskites,
La0.9Sr0.1B0.9Mg0.1O2.9 (B = Al3+, Ga3+, Sc3+, or In3+) where only the B ion is changed, and found
the maximum ionic conductivity for B = Ga3+. This trend which could not be rationalized using
the lattice free volume and the critical ionic radius point (proposed by Sammells et al.117) or by
Goldschmidt factor points. Mogensen 118 rationalized the observed trend using the concept of the
lattice stresses: a stress-free lattice will give the maximum oxide ion conductivity. The
importance of the nature of the B-site ion is further evidenced by the results published on the rare
earth gallates. Ishihara et al.119reported that substituting half of the Mg2+ in
La0.8Sr0.2Ga0.8Mg0.2O2.8 with Co or Ni ions improves the oxide ionic conductivity significantly.
Another reason for improving ionic conductivity by different B-site cations is the change in
concentration of the oxygen defects, tuned by substituting B-site cations with more or less
reducible ones, or by substituting A-site cations with cations of a different charge.120 In this
paper, we report results of X-ray diffraction analysis, transmission electron microscopy, micro-
Raman spectroscopy study, and density functional theory (DFT) calculations of structural and
electronic properties of BSCF, including the spin states of B cations. Special attention is paid to
the oxygen vacancies and cation ordering to clarify the stability of this material. Theoretical
results are compared with experimental data.
35
3.3 Computational Details
Our calculations are based on Density Functional Theory (DFT) with the Perdew-Burke-
Ernzerhof (PBE) exchange-correlation functional, Vanderbilt ultrasoft pseudopotentials 121 and
the plane wave basis set implemented in the Quantum-ESPRESSO program package.122 The
Brillouin-zone integrations are performed using Monkhorst-Pack grids with a 2×2×2 mesh for
supercell calculations. Spin polarized DFT with Marzari-Vanderbilt smearing 123 is used
throughout. Geometry optimizations used the Broyden-Fletcher-Goldfarb-Shanno algorithm. The
wave function and electron density representation are limited by kinetic energies of 40 and 360
Rydberg respectively. We treated the Ba(5s,5p,6s), Sr(4s,4p,5s), Co(4s,3d), Fe(3d,4s) and
O(2s,2p) electrons as valence states, while the remaining electrons were represented by
pseudopotentials. These pseudopotentials were validated by computing the equilibrium lattice
parameters (a) and bulk moduli (B) and comparing their values with the experimental ones (see
Reasults and Discussion section). For Co4+ we found an intermediate spin state to be the most
stable among three possible spin states: low spin (LS), intermediate spin (IS), and high spin (HS)
states (spin of S=1/2, S=3/2, and S=5/2 respectively) .124 For Fe4+ cations HS is the more stable
of LS and HS states (S=1 and S=2).124
For the mixed perovskite material Ba0.5Sr0.5Fe0.2Co0.8O3 we used a 2×2×2 supercell,
containing 4 Ba atoms, 4 Sr atoms, 2 Fe atoms and 6 Co atoms, along with 24 oxygen atoms
(Figure 3-6). This amounts to a Ba0.5Sr0.5Fe0.25Co0.75O3 formula unit, which is fairly close to the
experimentally observed stoichiometry. Figure 3-2 shows the ion numbering scheme used in the
following discussion.
36
Activation energies for oxygen migration were obtained starting from different ion
distributions in the supercell. For each ion distribution we performed three structural relaxation
calculations: two for the stable supercell with one vacancy before and after migration, and one
transition state with an oxygen ion in the middle of the XYX plane with OYZ angle of 450. In the
transition states found, the oxygen ion was located away from the straight line connecting the
oxygen positions before and after the migration. That means the migration pathway is curved
shows in Figure 1-3, in agreement with previously published results obtained using the empirical
force fields.28,29 While geometry relaxation of the symmetric transition barriers can be
accomplished be simply constraining the angle at 45o, the asymmetric transition barrier search
requires use of special algorithms. The Nudged Elastic Band (NEB) 125 method is one of them. It
enables one to find the optimal transition state and minimal energy reaction pathway when both
the initial and final states are known. Seven replicas are chosen including the initial and final
ones to construct the elastic band in this method. Here we used NEB method 125 with 7 images.
This type of calculations increased CPU time by the factor of 20 compared to the regular
relaxation, but allows one to obtain complete trajectory of the oxygen migration.
For all investigated stable ionic configurations Boltzmann factors were calculated to
estimate the probability to observe this local structure at a sample preparation temperature of
11500C. Boltzmann factors correspond to the probability for each local structure occurring in the
sample, assuming it was cooled down fast after the preparation. Annealing at lower temperatures
is expected to increase the frequency for the more stable configurations and decrease the
frequency for the less stable ones, whereas the relative energy order of the configurations will
37
remain the same. In order to identify the spin state of each cation in the supercell containing
different types of ions, we used Löwdin population analysis of the spin density.
3.4 Electronic structure of BSCF
In octahedral crystal field Co4+ can have three possible spin states, t2g5eg
0 (S = 1/2), t2g4eg
1
(S= 3/2), and t2g3eg
2 (S= 5/2) with one, three and five unpaired electrons, respectively. Fe4+ can
have two possible spin states in the octahedral splitting with two and four unpaired electrons.
These states have configurations as t2g4eg
0 (S = 1) and t2g3eg
1 (S = 2). We denote these states as
low spin (LS) with one unpaired electron, intermediate spin (IS) with three unpaired electrons,
and high spin (HS) states with five unpaired electrons for Co4+, and as LS and HS states for Fe4+
cation according to their multiplicity. The spin-state configurations of Co4+ and Fe4+ in
octahedral crystal field are schematically shown in Figure 3-1.
The accuracy of used pseudopotentials was validated by computing the equilibrium lattice
parameter (a) for pure perovskites SrCoO3, SrFeO3, BaTiO3, and SrTiO3. For last two
perovskites bulk moduli (B) were also calculated and compared with experimental values in
Table 3-1. The bulk moduli were obtained by fitting the energy-volume curves using the
Birch−Murnaghan equation of states.126 All calculations for the pure perovskites were performed
using a unit cell containing a single formula unit. For modeling the mixed perovskite
Ba0.5Sr0.5Fe0.2Co0.8O3, we used a 2 × 2 × 2 supercell. One supercell has 4 Ba atoms, 4 Sr atoms, 2
Fe atoms, and 6 Co atoms, which results in a Ba0.5Sr0.5Fe0.25Co0.75O3 formula unit, fairly close to
the experimentally observed stoichiometry. For all investigated configurations, we calculated the
Boltzmann factors at the temperature of sample preparation (1150 °C). These factors correspond
to the frequency for each local structure occurring in the sample, assuming it was cooled down
38
fast after the preparation. Annealing at lower temperatures is expected to increase the frequency
for the more stable configurations and decrease the frequency for the less stable ones, whereas
the relative order will remain the same.
The single phase BSCF perovskite was refined in cubic Pm3m space group symmetry with a
lattice constant a = 4.00013(8) Å. No secondary phases have been detected. The morphology and
particle size of the BSCF are presented in Figure 3-5. As one can see, the powder particles have
an irregular shape with a particle size of d50 = 0.35 μm. The chemical analysis using energy-
dispersive spectrometer has shown the presence of Ba, Sr, Co, and Fe as well as oxygen atoms in
the appropriate stoichiometry. Our observations are in agreement with the literature data. In a
recent study on BSCF, the cubic phase was found to reversibly transform to a hexagonal
polymorph upon long-term annealing at 900 °C. 127 The phase stability of the cubic BSCF at
higher temperature is confirmed by Yang et al.128 According to their study, at 1000 °C, most of
the compositions maintain the cubic phase.
In the ideal cubic perovskite structure, all lattice sites have inversion symmetry.
Therefore, first-order Raman scattering is forbidden and no Raman active band is expected to be
found in cubic BSCF perovskite.129 However, the broad band is detected at 675 cm−1, as is
shown in Figure 3-4 This broad peak consists of the two overlapping bands which parameters,
such as peak positions and intensities could be detected using the full width at half-maximum
(FWHM) approach. The appearance of these vibration bands, forbidden in cubic structure, could
be explained by the Jahn−Teller distortion in BSCF perovskite at room temperature. We
associate this dynamic, local site distortion around the Co4+ cation with its intermediate spin state
t2g5eg
1. The presence of a single electron on the degenerate energy level results in distortion of
39
the octahedral coordination of this cation by the first-order Jahn−Teller mechanism. The rising
temperature will result in dynamic disorder, and average out the Jahn−Teller distortion. Thus, the
intensities of the bands are expected to decrease, and the peaks become indistinguishable from
the background. Therefore, the experimentally observed decrease in the intensities of two broad
peaks at 600 °C reflects the transition to a dynamically less distorted local structure of BSCF.
In the case of the ordering of two different B-site cations in cubic perovskites a face-
centered cubic superstructure with Fm3m symmetry is created (called elpasolite-type structure).
This leads to several normal modes active in Raman spectra. Their wavenumbers were shown to
change with temperature, whereas their intensities do not depend on the temperature
significantly. 130 Unlike the B-cation ordering, the Jahn−Teller distortion results in a strong
temperature dependence of the Raman intensities, which was reported, for instance, in our
previous study of LaCoO3,131 as well as other studies of this perovskite.132
The comparisons of calculated and experimental values of lattice parameters and bulk
modulus of pure perovskites are presented in Table 3-1. In agreement with experimental
data,133our calculations result in IS state of the cobalt ion for the ground state of SrCoO3. For this
compound, our calculations also demonstrate a close agreement with the experimental value of
the lattice parameter 134 (the deviation is +0.2% for LS state, and −0.6% for IS state, whereas the
deviation is as large as 3.3% for HS state). The IS state of Co3+ was experimentally observed
with photoemission spectra 135 and the ferromagnetic resonance measurements.136 The
experimental value for magnetic moment of strontium cobaltite SrCoO3 is 2.1 μB. This value of
magnetic moment is bracketed by idealized magnetic moments of HS and LS states.137 Our
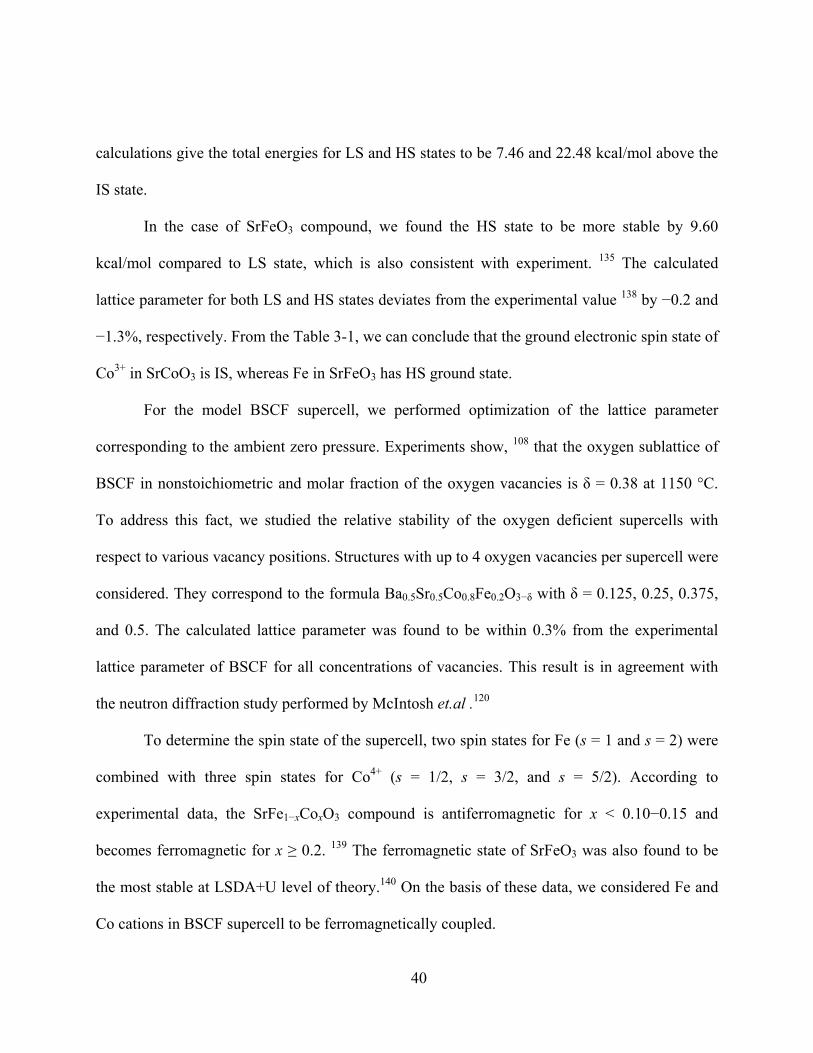
40
calculations give the total energies for LS and HS states to be 7.46 and 22.48 kcal/mol above the
IS state.
In the case of SrFeO3 compound, we found the HS state to be more stable by 9.60
kcal/mol compared to LS state, which is also consistent with experiment. 135 The calculated
lattice parameter for both LS and HS states deviates from the experimental value 138 by −0.2 and
−1.3%, respectively. From the Table 3-1, we can conclude that the ground electronic spin state of
Co3+ in SrCoO3 is IS, whereas Fe in SrFeO3 has HS ground state.
For the model BSCF supercell, we performed optimization of the lattice parameter
corresponding to the ambient zero pressure. Experiments show, 108 that the oxygen sublattice of
BSCF in nonstoichiometric and molar fraction of the oxygen vacancies is δ = 0.38 at 1150 °C.
To address this fact, we studied the relative stability of the oxygen deficient supercells with
respect to various vacancy positions. Structures with up to 4 oxygen vacancies per supercell were
considered. They correspond to the formula Ba0.5Sr0.5Co0.8Fe0.2O3−δ with δ = 0.125, 0.25, 0.375,
and 0.5. The calculated lattice parameter was found to be within 0.3% from the experimental
lattice parameter of BSCF for all concentrations of vacancies. This result is in agreement with
the neutron diffraction study performed by McIntosh et.al .120
To determine the spin state of the supercell, two spin states for Fe (s = 1 and s = 2) were
combined with three spin states for Co4+ (s = 1/2, s = 3/2, and s = 5/2). According to
experimental data, the SrFe1−xCoxO3 compound is antiferromagnetic for x < 0.10−0.15 and
becomes ferromagnetic for x ≥ 0.2. 139 The ferromagnetic state of SrFeO3 was also found to be
the most stable at LSDA+U level of theory.140 On the basis of these data, we considered Fe and
Co cations in BSCF supercell to be ferromagnetically coupled.
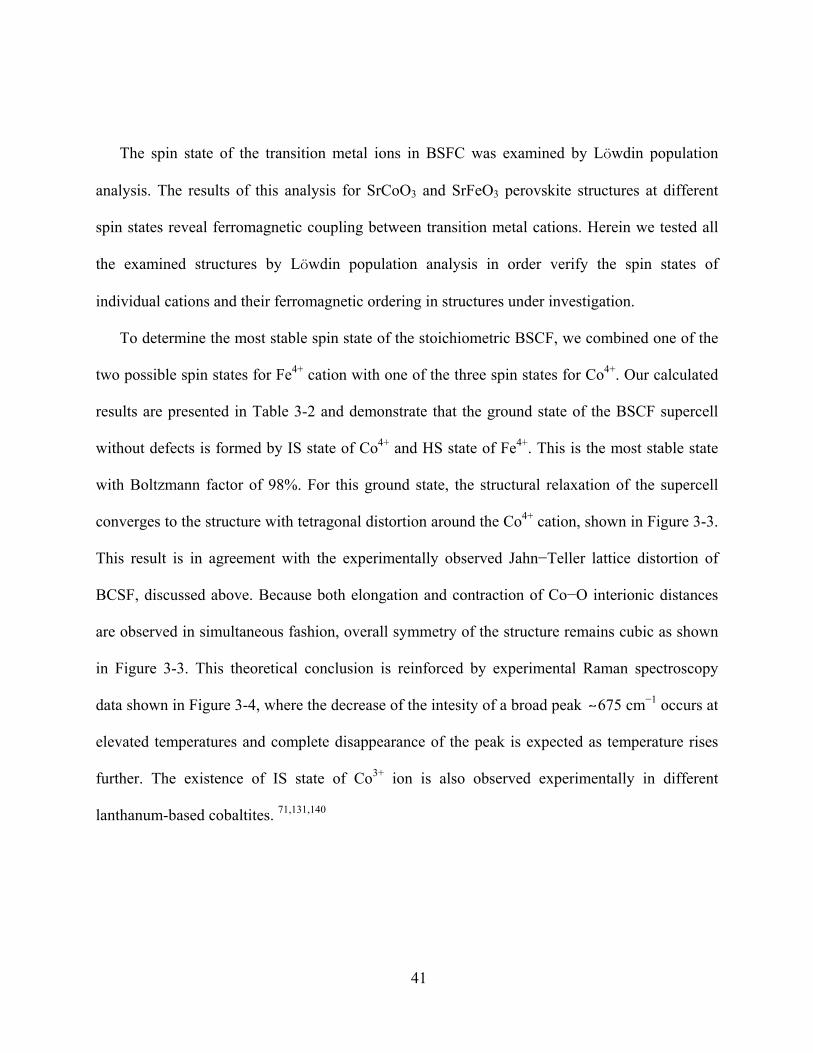
41
The spin state of the transition metal ions in BSFC was examined by Löwdin population
analysis. The results of this analysis for SrCoO3 and SrFeO3 perovskite structures at different
spin states reveal ferromagnetic coupling between transition metal cations. Herein we tested all
the examined structures by Löwdin population analysis in order verify the spin states of
individual cations and their ferromagnetic ordering in structures under investigation.
To determine the most stable spin state of the stoichiometric BSCF, we combined one of the
two possible spin states for Fe4+ cation with one of the three spin states for Co4+. Our calculated
results are presented in Table 3-2 and demonstrate that the ground state of the BSCF supercell
without defects is formed by IS state of Co4+ and HS state of Fe4+. This is the most stable state
with Boltzmann factor of 98%. For this ground state, the structural relaxation of the supercell
converges to the structure with tetragonal distortion around the Co4+ cation, shown in Figure 3-3.
This result is in agreement with the experimentally observed Jahn−Teller lattice distortion of
BCSF, discussed above. Because both elongation and contraction of Co−O interionic distances
are observed in simultaneous fashion, overall symmetry of the structure remains cubic as shown
in Figure 3-3. This theoretical conclusion is reinforced by experimental Raman spectroscopy
data shown in Figure 3-4, where the decrease of the intesity of a broad peak 675 cm−1 occurs at
elevated temperatures and complete disappearance of the peak is expected as temperature rises
further. The existence of IS state of Co3+ ion is also observed experimentally in different
lanthanum-based cobaltites. 71,131,140
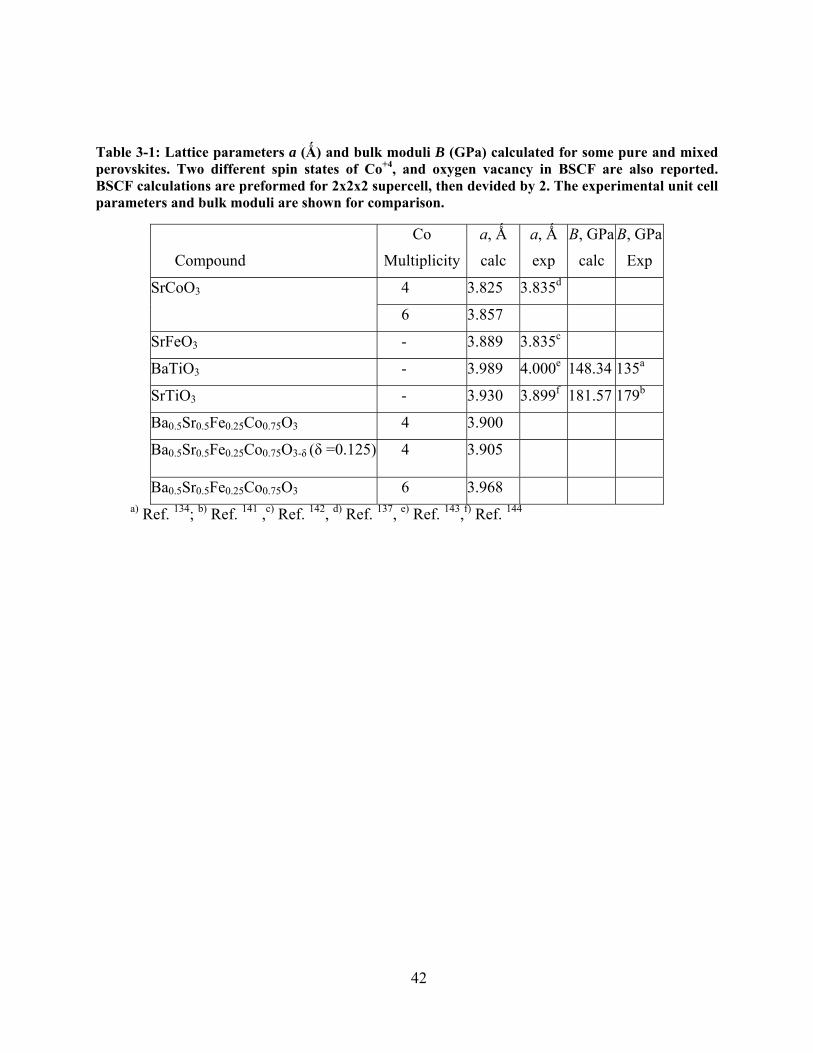
42
Table 3-1: Lattice parameters a (Ǻ) and bulk moduli B (GPa) calculated for some pure and mixed perovskites. Two different spin states of Co+4, and oxygen vacancy in BSCF are also reported. BSCF calculations are preformed for 2x2x2 supercell, then devided by 2. The experimental unit cell parameters and bulk moduli are shown for comparison.
Compound
Co
Multiplicity
a, Ǻ
calc
a, Ǻ
exp
B, GPa
calc
B, GPa
Exp
SrCoO3 4 3.825 3.835d
6 3.857
SrFeO3 - 3.889 3.835c
BaTiO3 - 3.989 4.000e 148.34 135a
SrTiO3 - 3.930 3.899f 181.57 179b
Ba0.5Sr0.5Fe0.25Co0.75O3 4 3.900
Ba0.5Sr0.5Fe0.25Co0.75O3-δ (δ =0.125) 4 3.905
Ba0.5Sr0.5Fe0.25Co0.75O3 6 3.968 a) Ref. 134; b) Ref. 141 ,c) Ref. 142, d) Ref. 137, e) Ref. 143,f) Ref. 144
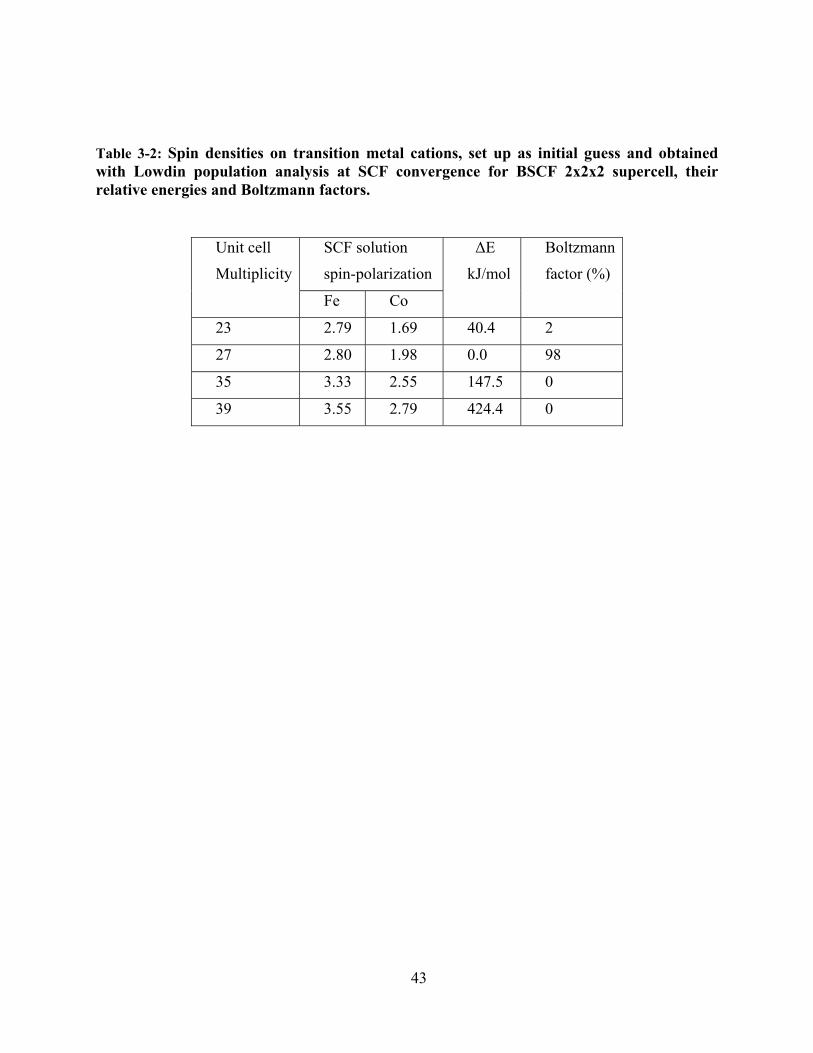
43
Table 3-2: Spin densities on transition metal cations, set up as initial guess and obtained with Lowdin population analysis at SCF convergence for BSCF 2x2x2 supercell, their relative energies and Boltzmann factors.
Unit cell
Multiplicity
SCF solution
spin-polarization
ΔE
kJ/mol
Boltzmann
factor (%)
Fe Co
23 2.79 1.69 40.4 2
27 2.80 1.98 0.0 98
35 3.33 2.55 147.5 0
39 3.55 2.79 424.4 0
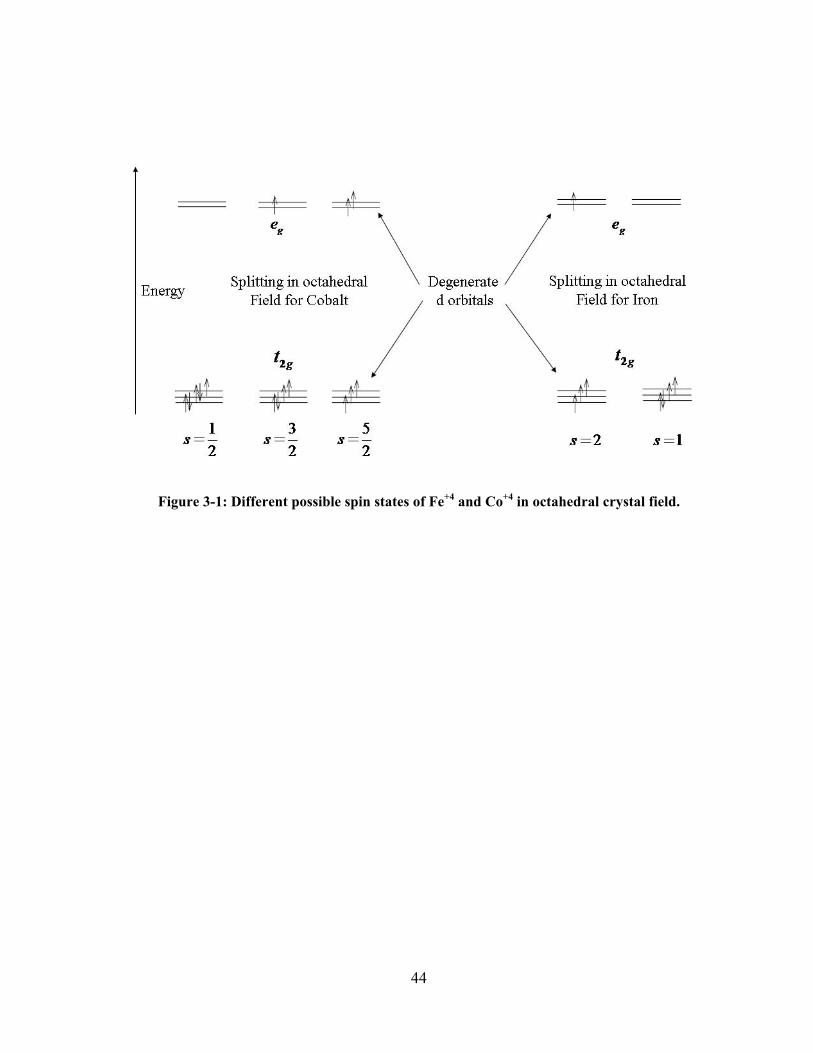
44
Figure 3-1: Different possible spin states of Fe+4 and Co+4 in octahedral crystal field.
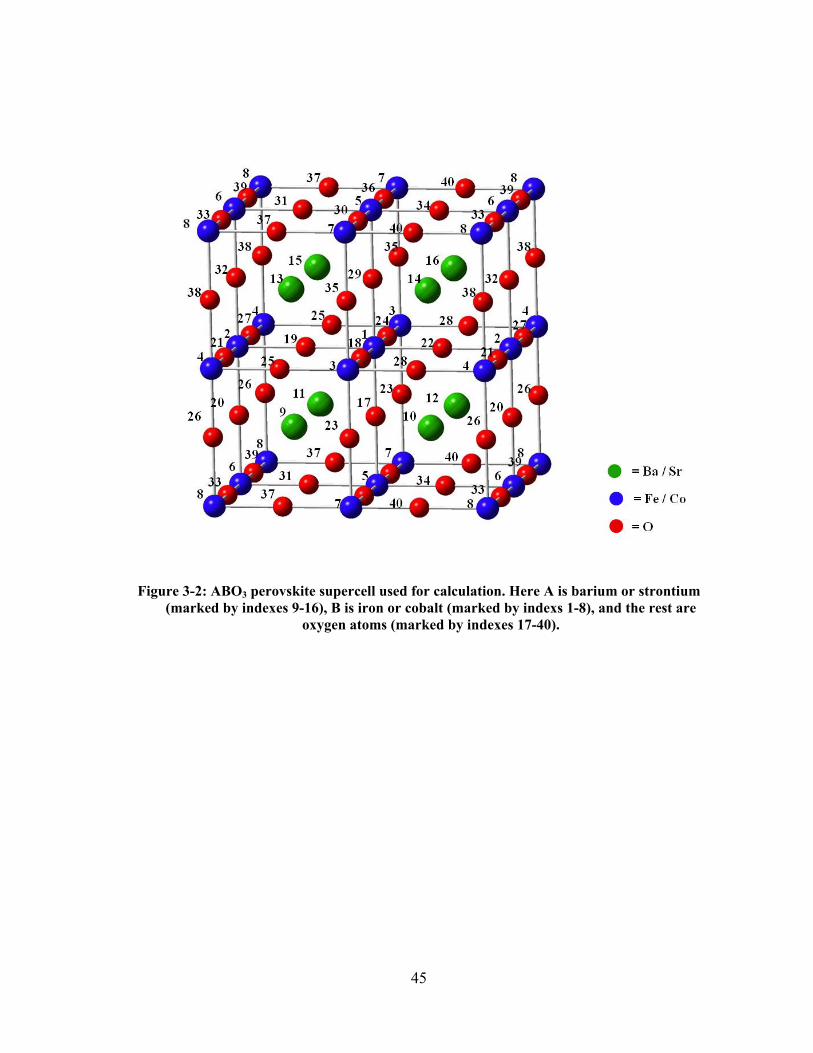
45
Figure 3-2: ABO3 perovskite supercell used for calculation. Here A is barium or strontium (marked by indexes 9-16), B is iron or cobalt (marked by indexs 1-8), and the rest are
oxygen atoms (marked by indexes 17-40).
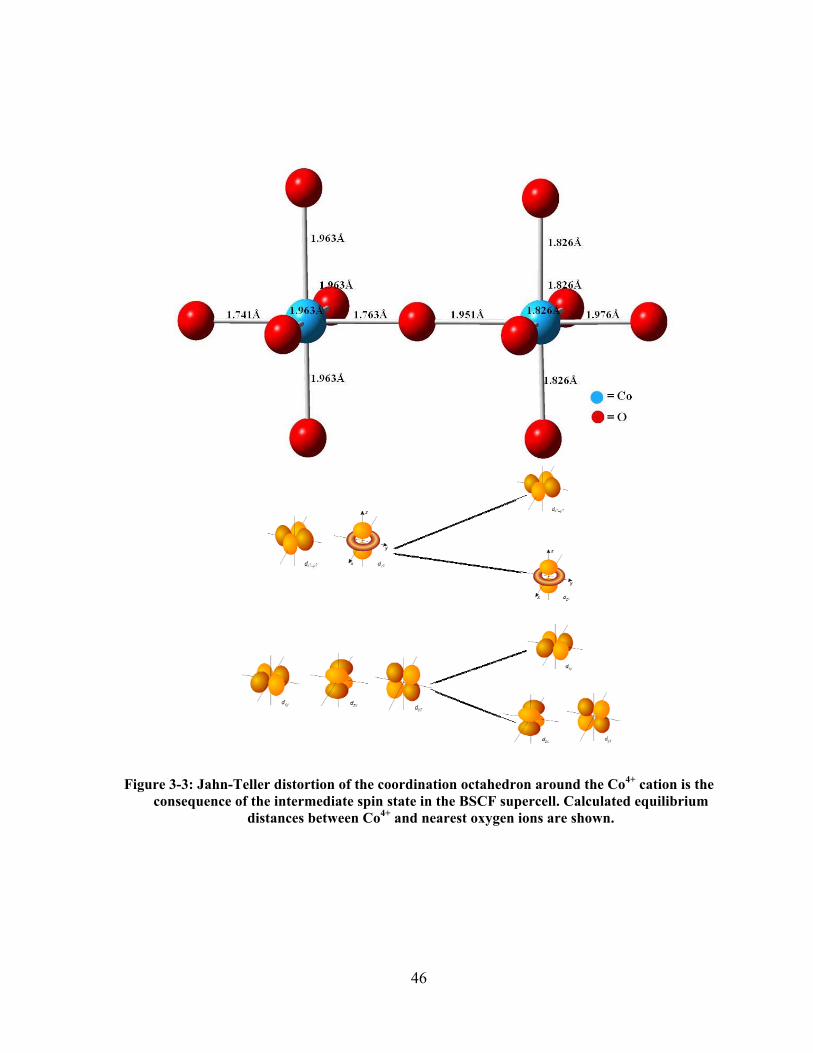
46
Figure 3-3: Jahn-Teller distortion of the coordination octahedron around the Co4+ cation is the consequence of the intermediate spin state in the BSCF supercell. Calculated equilibrium
distances between Co4+ and nearest oxygen ions are shown.
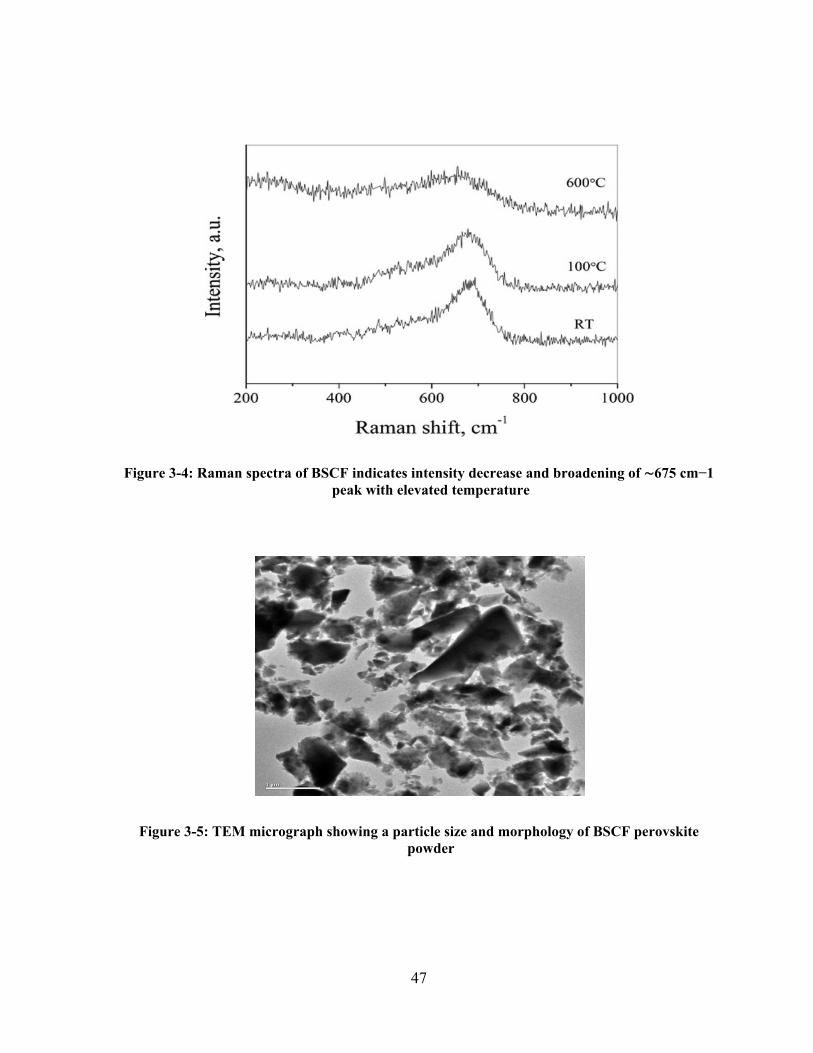
47
Figure 3-4: Raman spectra of BSCF indicates intensity decrease and broadening of 675 cm−1 peak with elevated temperature
Figure 3-5: TEM micrograph showing a particle size and morphology of BSCF perovskite powder
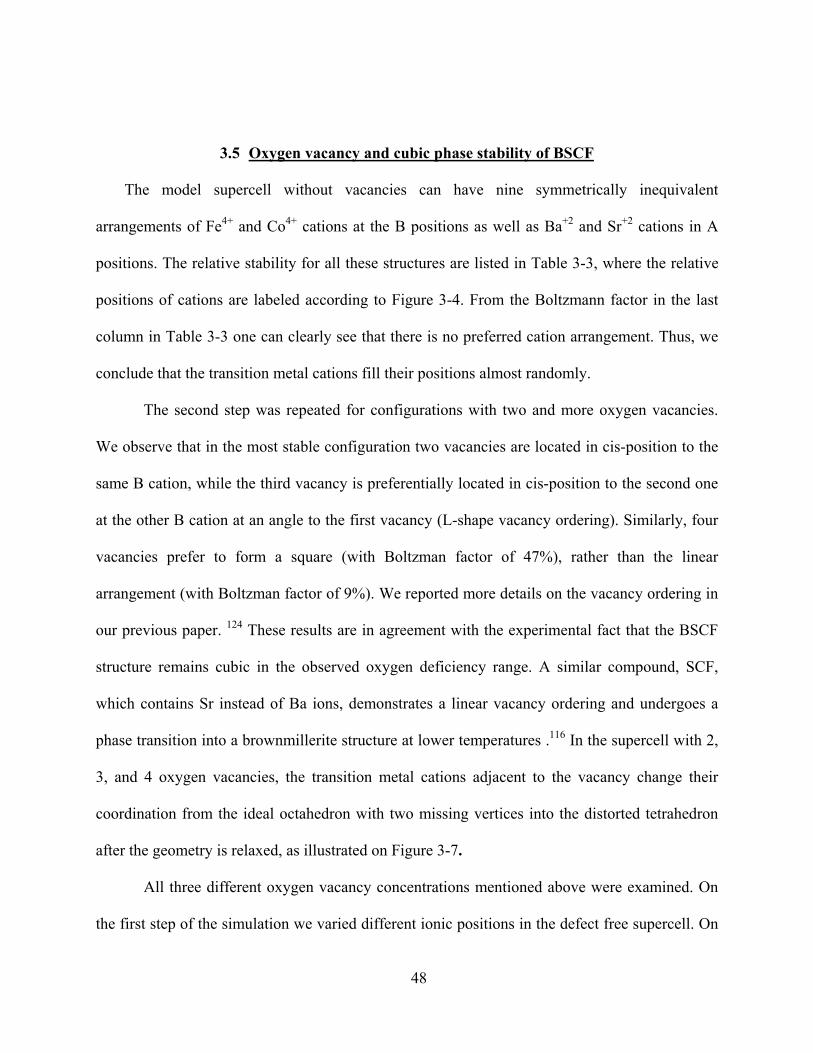
48
3.5 Oxygen vacancy and cubic phase stability of BSCF
The model supercell without vacancies can have nine symmetrically inequivalent
arrangements of Fe4+ and Co4+ cations at the B positions as well as Ba+2 and Sr+2 cations in A
positions. The relative stability for all these structures are listed in Table 3-3, where the relative
positions of cations are labeled according to Figure 3-4. From the Boltzmann factor in the last
column in Table 3-3 one can clearly see that there is no preferred cation arrangement. Thus, we
conclude that the transition metal cations fill their positions almost randomly.
The second step was repeated for configurations with two and more oxygen vacancies.
We observe that in the most stable configuration two vacancies are located in cis-position to the
same B cation, while the third vacancy is preferentially located in cis-position to the second one
at the other B cation at an angle to the first vacancy (L-shape vacancy ordering). Similarly, four
vacancies prefer to form a square (with Boltzman factor of 47%), rather than the linear
arrangement (with Boltzman factor of 9%). We reported more details on the vacancy ordering in
our previous paper. 124 These results are in agreement with the experimental fact that the BSCF
structure remains cubic in the observed oxygen deficiency range. A similar compound, SCF,
which contains Sr instead of Ba ions, demonstrates a linear vacancy ordering and undergoes a
phase transition into a brownmillerite structure at lower temperatures .116 In the supercell with 2,
3, and 4 oxygen vacancies, the transition metal cations adjacent to the vacancy change their
coordination from the ideal octahedron with two missing vertices into the distorted tetrahedron
after the geometry is relaxed, as illustrated on Figure 3-7.
All three different oxygen vacancy concentrations mentioned above were examined. On
the first step of the simulation we varied different ionic positions in the defect free supercell. On
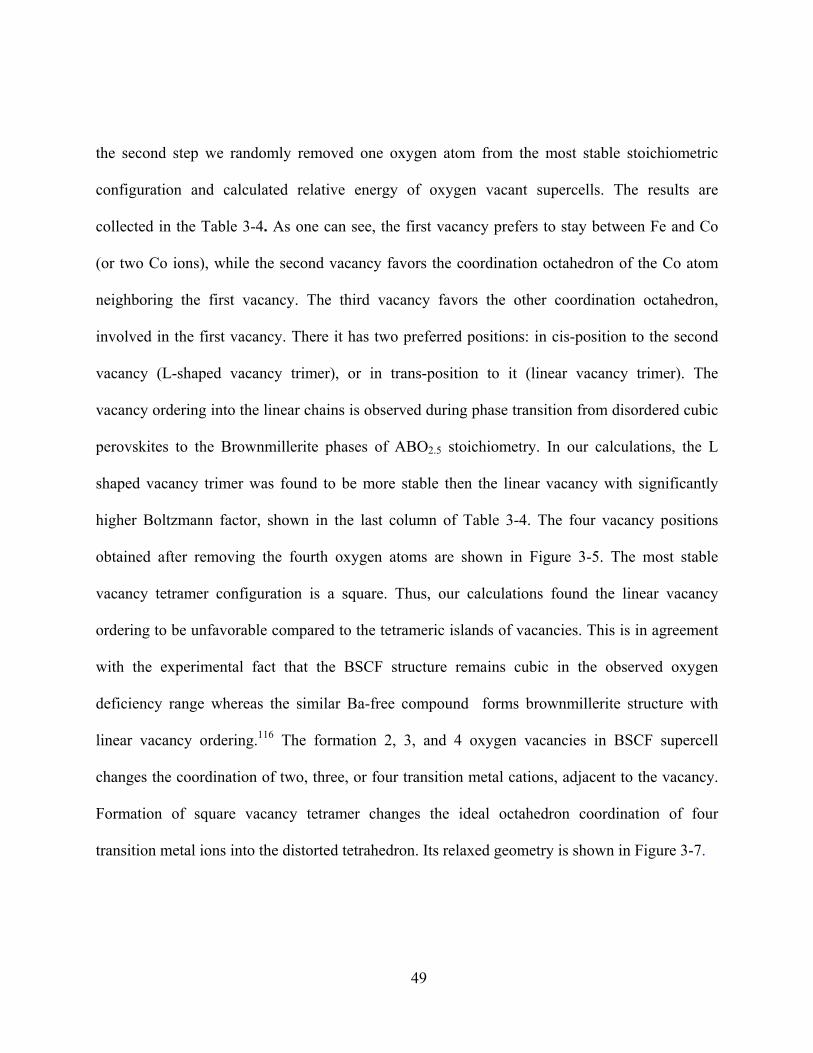
49
the second step we randomly removed one oxygen atom from the most stable stoichiometric
configuration and calculated relative energy of oxygen vacant supercells. The results are
collected in the Table 3-4. As one can see, the first vacancy prefers to stay between Fe and Co
(or two Co ions), while the second vacancy favors the coordination octahedron of the Co atom
neighboring the first vacancy. The third vacancy favors the other coordination octahedron,
involved in the first vacancy. There it has two preferred positions: in cis-position to the second
vacancy (L-shaped vacancy trimer), or in trans-position to it (linear vacancy trimer). The
vacancy ordering into the linear chains is observed during phase transition from disordered cubic
perovskites to the Brownmillerite phases of ABO2.5 stoichiometry. In our calculations, the L
shaped vacancy trimer was found to be more stable then the linear vacancy with significantly
higher Boltzmann factor, shown in the last column of Table 3-4. The four vacancy positions
obtained after removing the fourth oxygen atoms are shown in Figure 3-5. The most stable
vacancy tetramer configuration is a square. Thus, our calculations found the linear vacancy
ordering to be unfavorable compared to the tetrameric islands of vacancies. This is in agreement
with the experimental fact that the BSCF structure remains cubic in the observed oxygen
deficiency range whereas the similar Ba-free compound forms brownmillerite structure with
linear vacancy ordering.116 The formation 2, 3, and 4 oxygen vacancies in BSCF supercell
changes the coordination of two, three, or four transition metal cations, adjacent to the vacancy.
Formation of square vacancy tetramer changes the ideal octahedron coordination of four
transition metal ions into the distorted tetrahedron. Its relaxed geometry is shown in Figure 3-7.
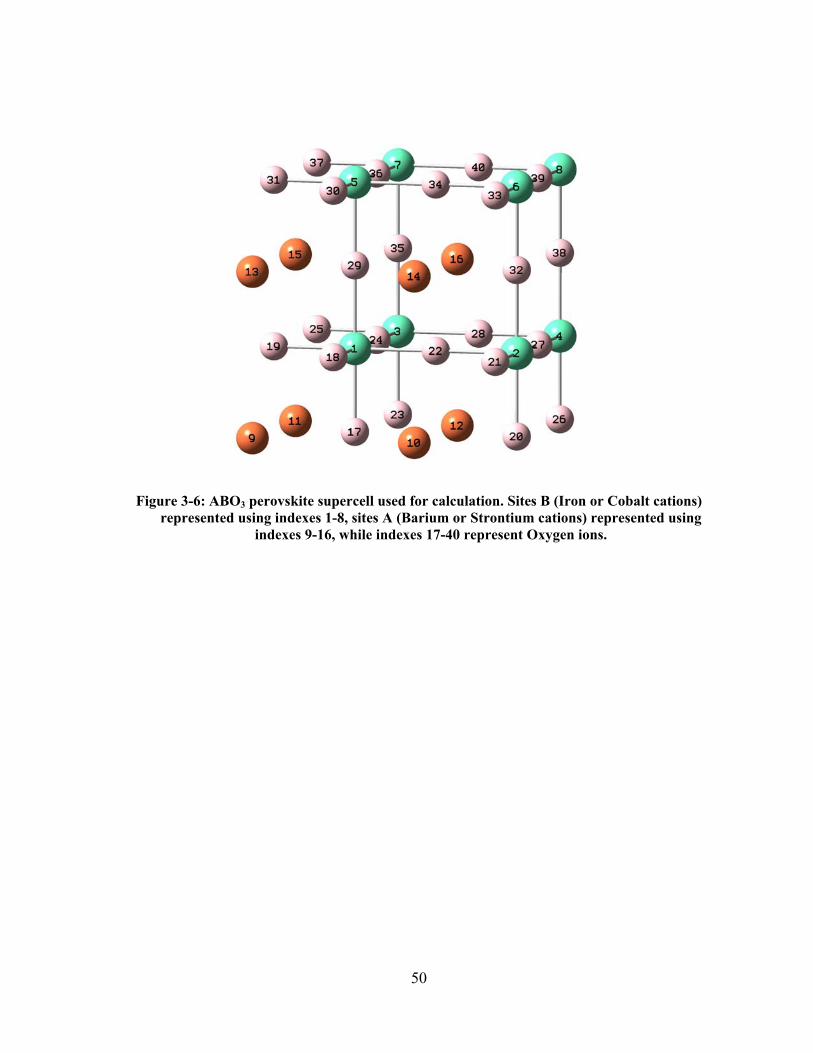
50
Figure 3-6: ABO3 perovskite supercell used for calculation. Sites B (Iron or Cobalt cations) represented using indexes 1-8, sites A (Barium or Strontium cations) represented using
indexes 9-16, while indexes 17-40 represent Oxygen ions.
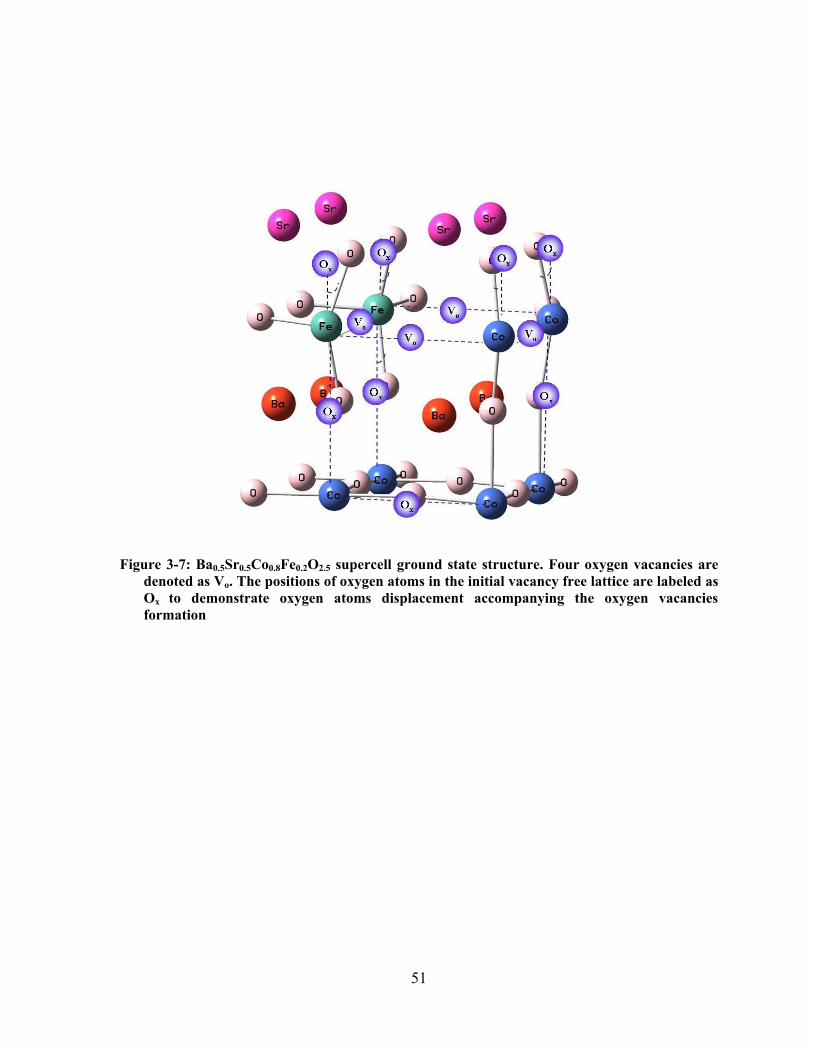
51
Figure 3-7: Ba0.5Sr0.5Co0.8Fe0.2O2.5 supercell ground state structure. Four oxygen vacancies are denoted as Vo. The positions of oxygen atoms in the initial vacancy free lattice are labeled as Ox
to demonstrate oxygen atoms displacement accompanying the oxygen vacancies formation
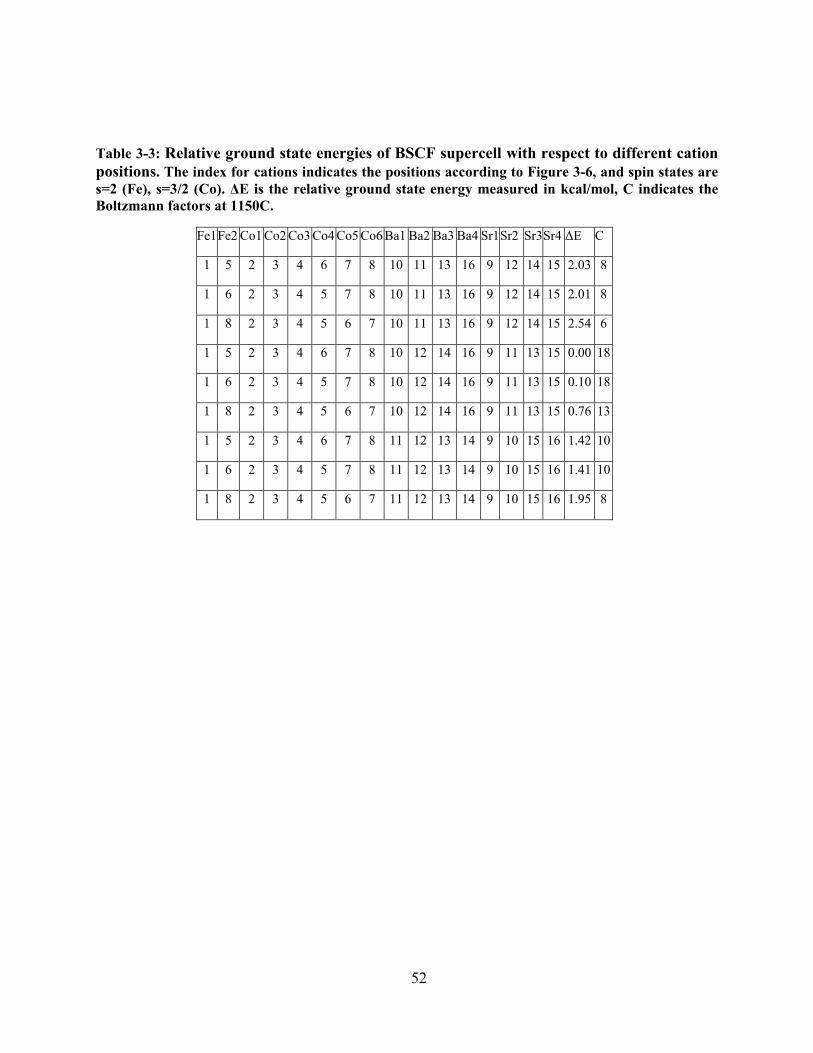
52
Table 3-3: Relative ground state energies of BSCF supercell with respect to different cation positions. The index for cations indicates the positions according to Figure 3-6, and spin states are s=2 (Fe), s=3/2 (Co). ΔE is the relative ground state energy measured in kcal/mol, C indicates the Boltzmann factors at 1150C.
Fe1 Fe2 Co1 Co2 Co3 Co4 Co5 Co6 Ba1 Ba2 Ba3 Ba4 Sr1Sr2 Sr3Sr4 ΔE C
1 5 2 3 4 6 7 8 10 11 13 16 9 12 14 15 2.03 8
1 6 2 3 4 5 7 8 10 11 13 16 9 12 14 15 2.01 8
1 8 2 3 4 5 6 7 10 11 13 16 9 12 14 15 2.54 6
1 5 2 3 4 6 7 8 10 12 14 16 9 11 13 15 0.00 18
1 6 2 3 4 5 7 8 10 12 14 16 9 11 13 15 0.10 18
1 8 2 3 4 5 6 7 10 12 14 16 9 11 13 15 0.76 13
1 5 2 3 4 6 7 8 11 12 13 14 9 10 15 16 1.42 10
1 6 2 3 4 5 7 8 11 12 13 14 9 10 15 16 1.41 10
1 8 2 3 4 5 6 7 11 12 13 14 9 10 15 16 1.95 8
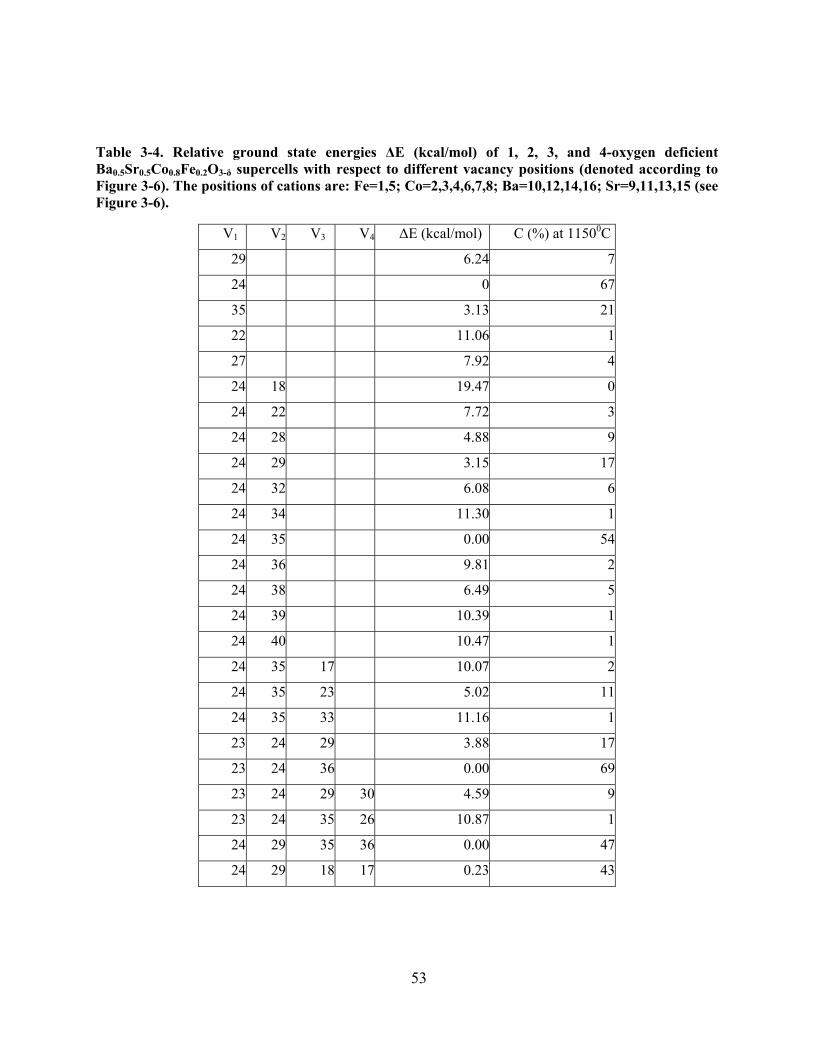
53
Table 3-4. Relative ground state energies ΔE (kcal/mol) of 1, 2, 3, and 4-oxygen deficient Ba0.5Sr0.5Co0.8Fe0.2O3-δ supercells with respect to different vacancy positions (denoted according to Figure 3-6). The positions of cations are: Fe=1,5; Co=2,3,4,6,7,8; Ba=10,12,14,16; Sr=9,11,13,15 (see Figure 3-6).
V1 V2 V3 V4 ΔE (kcal/mol) C (%) at 11500C
29 6.24 7
24 0 67
35 3.13 21
22 11.06 1
27 7.92 4
24 18 19.47 0
24 22 7.72 3
24 28 4.88 9
24 29 3.15 17
24 32 6.08 6
24 34 11.30 1
24 35 0.00 54
24 36 9.81 2
24 38 6.49 5
24 39 10.39 1
24 40 10.47 1
24 35 17 10.07 2
24 35 23 5.02 11
24 35 33 11.16 1
23 24 29 3.88 17
23 24 36 0.00 69
23 24 29 30 4.59 9
23 24 35 26 10.87 1
24 29 35 36 0.00 47
24 29 18 17 0.23 43
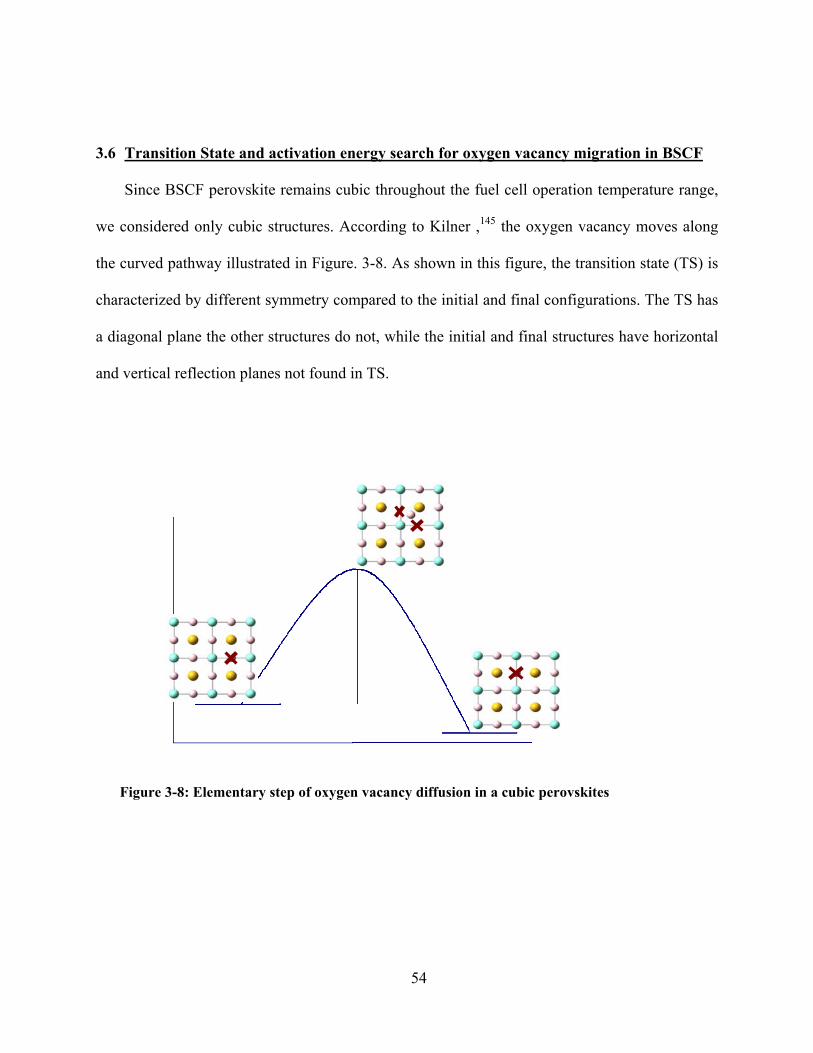
54
3.6 Transition State and activation energy search for oxygen vacancy migration in BSCF
Since BSCF perovskite remains cubic throughout the fuel cell operation temperature range,
we considered only cubic structures. According to Kilner ,145 the oxygen vacancy moves along
the curved pathway illustrated in Figure. 3-8. As shown in this figure, the transition state (TS) is
characterized by different symmetry compared to the initial and final configurations. The TS has
a diagonal plane the other structures do not, while the initial and final structures have horizontal
and vertical reflection planes not found in TS.
Figure 3-8: Elementary step of oxygen vacancy diffusion in a cubic perovskites
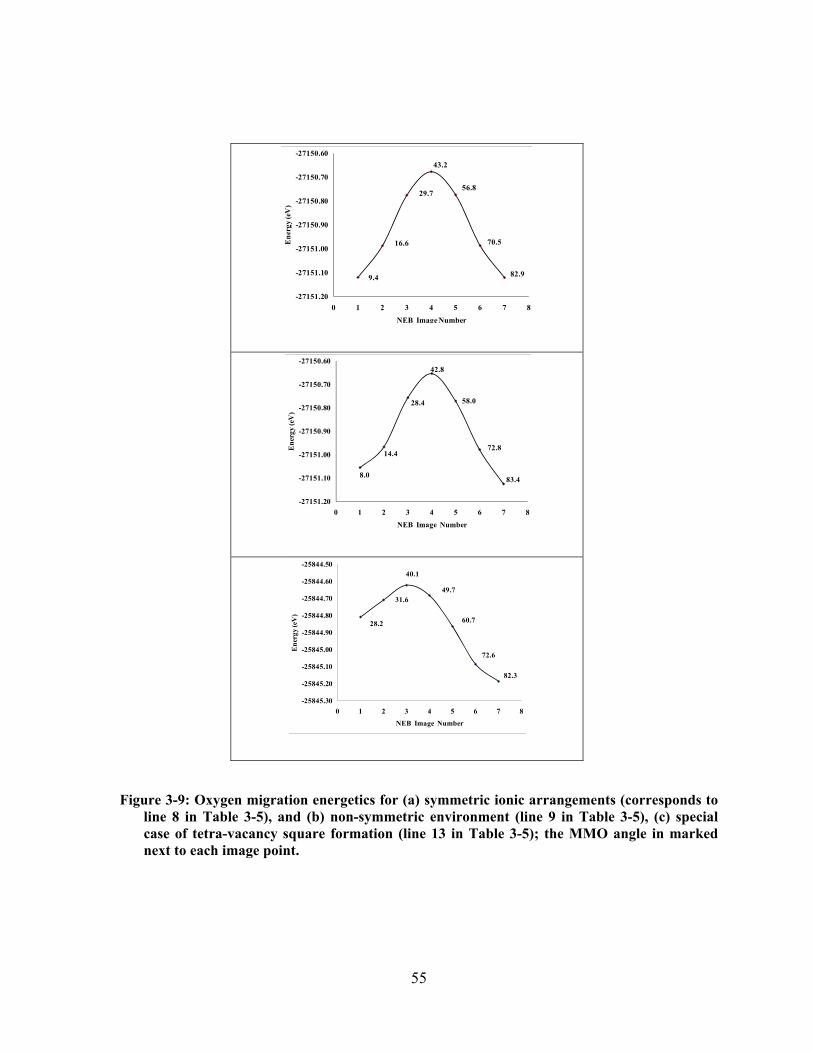
55
Figure 3-9: Oxygen migration energetics for (a) symmetric ionic arrangements (corresponds to line 8 in Table 3-5), and (b) non-symmetric environment (line 9 in Table 3-5), (c) special case of tetra-vacancy square formation (line 13 in Table 3-5); the MMO angle in marked next to each image point.
-27151.20
-27151.10
-27151.00
-27150.90
-27150.80
-27150.70
-27150.60
0 1 2 3 4 5 6 7 8
Ene
rgy
(eV
)
NEB Image Number
9.4
16.6
29.7
43.2
56.8
70.5
82.9
-27151.20
-27151.10
-27151.00
-27150.90
-27150.80
-27150.70
-27150.60
0 1 2 3 4 5 6 7 8
Ene
rgy
(eV
)
NEB Image Number
83.4
72.8
58.0
42.8
28.4
14.4
8.0
-25845.30
-25845.20
-25845.10
-25845.00
-25844.90
-25844.80
-25844.70
-25844.60
-25844.50
0 1 2 3 4 5 6 7 8
Ene
rgy
(eV
)
NEB Image Number
28.2
31.6
40.1
49.7
60.7
72.6
82.3
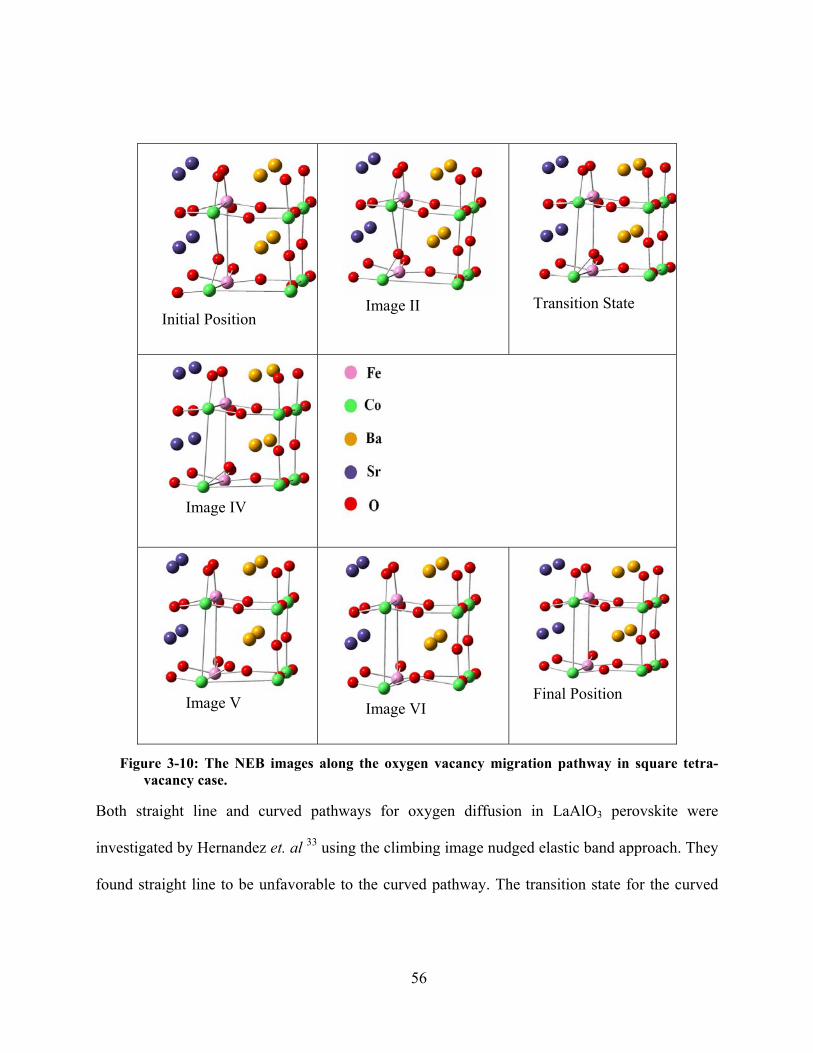
56
Figure 3-10: The NEB images along the oxygen vacancy migration pathway in square tetra-vacancy case.
Both straight line and curved pathways for oxygen diffusion in LaAlO3 perovskite were
investigated by Hernandez et. al 33 using the climbing image nudged elastic band approach. They
found straight line to be unfavorable to the curved pathway. The transition state for the curved
Initial Position Image II Transition State
Image IV
Image V Image VI Final Position
57
pathway was also obtained in their study from DFT molecular dynamics simulations. the
pathway described in Figure 3-8.
In the Section 3.3 of this paper we concluded that cation positions in BSCF are
essentially random. Thus, we considered various cation distributions in the supercell to calculate
the activation energy (also known as the barriers to oxygen hopping, and defined as the
difference between the initial state and the transition state energies). They are expected to be
dependent on the specific distribution of cations. For comparison, we use the same protocol for
two undoped cubic perovskites: SrFeO3-δ and SrCoO3-δ. The calculated activation energies for
SrFeO3-δ, and SrCoO3-δ were 85.6 kJ/mol and 80.1 kJ/mol respectively. In both cases the ground
spin state was considered: multiplicity 5 for iron, and multiplicity 4 for cobalt, according to our
calculations. 124 For SrCoO3-δ in less stable high spin state the activation energy was predicted to
be 156.1 kJ/mol, nearly twice that for the intermediate spin state. This sharp increase is not due
to the increased lattice parameter predicted for high-spin SrCoO3-δ. The activation energy
predicted for high-spin state at the intermediate spin state lattice parameter was found to be
somewhat higher. This indicates that it is the presence of Co4+ in the intermediate spin state that
lowers the activation energy in BSCF considerably.
The calculated activation energies for symmetric ion distributions in BSCF are presented in
Table 3-5, lines 1-7. These values may be compared with the experimental vacancy diffusion
activation energy of 46±2 kJ/mol reported by Shao et al., 108 based on the oxygen permeation
measurements conducted for the oxygen partial pressures of 0.025 and 0.21 atm on the opposite
sides of the membrane. On average, our results are somewhat lower than this value. The
calculated values, however, are more than twice smaller than the activation energies we
58
calculated for SrFeO3-δ, and SrCoO3-δ. This confirms that mobility of oxygen vacancies is
significantly higher for BSCF compared to SCF (purely Sr based) perovskite. This reduction in
activation energy is the result of the lattice parameter expansion upon increase in the
concentration of the large Ba2+ ions, weakens cobalt-oxygen interactions in the ground state. The
lowest activation energy was found for hopping between two sites located far away from the Fe4+
cations. Based on this finding, we suggest that an increased concentration of Co and Ba in BSCF
will improve the vacancy mobility in this material. A more accurate atomistic description of the
vacancy diffusion in BSCF would require to account for uneven (clustered) vacancy distributions
and its effect on the activation barriers of diffusion. The research along these lines is ongoing.
The activation energies for asymmetric ion distributions in BSCF were calculated with NEB
method and presented in Table 3-5, lines 8-13. From the comparison of the lines 7 and 8 in this
table one can see that symmetry constrained search (line 7) agrees with the results of NEB
method (line 8) to within 1.6 kJ/mol. Next two lines (9 and 10) illustrate that for two randomly
picked asymmetric cases the predicted activation energy for oxygen migration falls in the same
range as the symmetric barriers. Due to computational expense of NEB calculations we did not
investigate all the possibilities. The NEB energy profiles for the reaction pathways reported in
lines 9 and 10, are presented in Figure. 3-8. The last three lines in the Table 3-5 report the
activation energies in the presence of two and three additional vacancies. In lines 11 and 12 we
described the most stable cation arrangement (with Boltzmann factors of 9% and 47%) as found
in our calculations, 124 while the edge jump is considered in the last line 13. The activation
energies reported in lines 11 and 12 fall within the range of symmetric cases reported in Table 3-
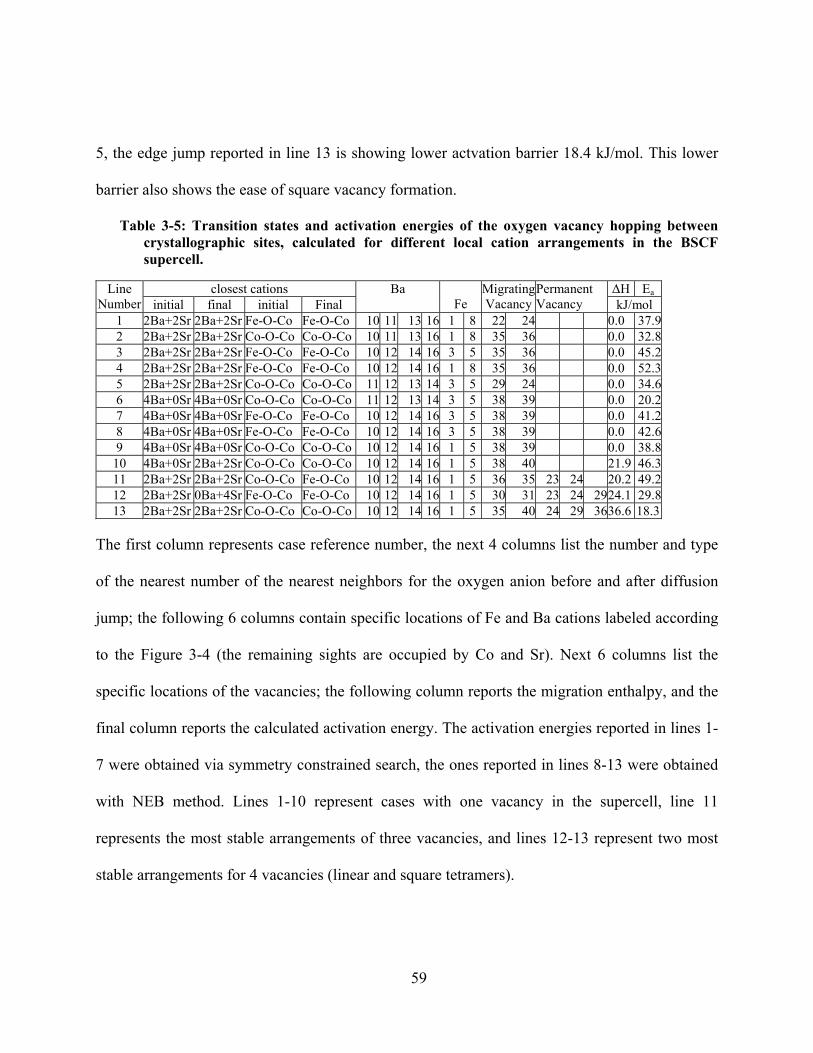
59
5, the edge jump reported in line 13 is showing lower actvation barrier 18.4 kJ/mol. This lower
barrier also shows the ease of square vacancy formation.
Table 3-5: Transition states and activation energies of the oxygen vacancy hopping between crystallographic sites, calculated for different local cation arrangements in the BSCF supercell.
Line Number
closest cations Ba
Fe
MigratingVacancy
Permanent Vacancy
ΔH Ea initial final initial Final kJ/mol
1 2Ba+2Sr 2Ba+2Sr Fe-O-Co Fe-O-Co 10 11 13 16 1 8 22 24 0.0 37.92 2Ba+2Sr 2Ba+2Sr Co-O-Co Co-O-Co 10 11 13 16 1 8 35 36 0.0 32.83 2Ba+2Sr 2Ba+2Sr Fe-O-Co Fe-O-Co 10 12 14 16 3 5 35 36 0.0 45.24 2Ba+2Sr 2Ba+2Sr Fe-O-Co Fe-O-Co 10 12 14 16 1 8 35 36 0.0 52.35 2Ba+2Sr 2Ba+2Sr Co-O-Co Co-O-Co 11 12 13 14 3 5 29 24 0.0 34.66 4Ba+0Sr 4Ba+0Sr Co-O-Co Co-O-Co 11 12 13 14 3 5 38 39 0.0 20.27 4Ba+0Sr 4Ba+0Sr Fe-O-Co Fe-O-Co 10 12 14 16 3 5 38 39 0.0 41.28 4Ba+0Sr 4Ba+0Sr Fe-O-Co Fe-O-Co 10 12 14 16 3 5 38 39 0.0 42.69 4Ba+0Sr 4Ba+0Sr Co-O-Co Co-O-Co 10 12 14 16 1 5 38 39 0.0 38.8
10 4Ba+0Sr 2Ba+2Sr Co-O-Co Co-O-Co 10 12 14 16 1 5 38 40 21.9 46.311 2Ba+2Sr 2Ba+2Sr Co-O-Co Fe-O-Co 10 12 14 16 1 5 36 35 23 24 20.2 49.212 2Ba+2Sr 0Ba+4Sr Fe-O-Co Fe-O-Co 10 12 14 16 1 5 30 31 23 24 2924.1 29.813 2Ba+2Sr 2Ba+2Sr Co-O-Co Co-O-Co 10 12 14 16 1 5 35 40 24 29 3636.6 18.3
The first column represents case reference number, the next 4 columns list the number and type
of the nearest number of the nearest neighbors for the oxygen anion before and after diffusion
jump; the following 6 columns contain specific locations of Fe and Ba cations labeled according
to the Figure 3-4 (the remaining sights are occupied by Co and Sr). Next 6 columns list the
specific locations of the vacancies; the following column reports the migration enthalpy, and the
final column reports the calculated activation energy. The activation energies reported in lines 1-
7 were obtained via symmetry constrained search, the ones reported in lines 8-13 were obtained
with NEB method. Lines 1-10 represent cases with one vacancy in the supercell, line 11
represents the most stable arrangements of three vacancies, and lines 12-13 represent two most
stable arrangements for 4 vacancies (linear and square tetramers).
60
3.7 Conclusions
We applied plane wave DFT calculation to describe the atomic and electronic structure and
oxygen transport properties of mixed perovskite BSCF. Our calculations predict an intermediate
spin state and a Jahn–Teller distorted coordination for cobalt ions; both are in agreement with
experiment. We also show that the cations are completely disordered, while oxygen vacancies
exhibit a strong trend to form cluster arrangements. We demonstrated that the most preferable
position for oxygen vacancy in the structure with δ=0.125 is between Fe and Co cations. The
second vacancy occurs at the most energetically favorable position next to a Co cation which
already has a vacancy in its coordination sphere. The preferential vacancy arrangements are
predicted to be L-shaped for three, and square for four vacancies. This is in contrast with linear
vacancy arrangement and phase transition to brownmillerite type of structure for similar material
containing no Ba ions. We predicted the activation energies for oxygenmigration using two
different methods: symmetry constrained search and Nudged Elastic Band (NEB) method. We
also performed similar calculations for supercell, containing more than one vacancy. Lower
activation barrier of square cluster of vacancies also suggest that squares of the vacancies form
fast. The site-specific activation energies for oxygen migration for all other configurations found
to be close to the experimental value. Our calculations found that Co and Ba cations decrease the
activation energies for the oxygen vacancy migration. Therefore, we suggest increasing the
concentration of these cations in order to improve the ionic conductivity of the cathode materials.
It is expected that this will allow a reduction in the operating temperature for Solid Oxide Fuel
Cells.
61
CHAPTER 4 PREDICTION OF HEISENBERG EXCHANGE CONSTANTS IN ORGANOMETALLIC COMPLEXES
Molecular nanomagnets have been proposed as a good candidate for qubits for quantum
computation.37 The flexibility in their synthesis represents a distinct advantage over other spin
systems, enabling the systematic production of samples with desirable properties. The synthesis
and study of magnetic properties of large polynuclear transition metal clusters is a field to which
many research groups have devoted considerable effort during the past years. Some of those
polynuclear complexes show a slow relaxation of the magnetization that could eventually lead to
applications for information storage at the molecular level.146 Electron spin in the solid state
systems are currently considered as one of the promising candidate for storing and processing of
quantum information processing. In this perspective both ferro and antiferromagnetic magnets
catched interest for spintronic applications in quantum computer.
4.1 Magnetic Hamiltonian and Heisenberg exchange constant
Heisenberg exchange constant J. This constant appears in Heisenberg Hamiltonian that can be
written in general form as
Jiij S.S.JH ∑−= (4-1)
here Jij represents the coupling constant between the two magnetic centers i and j with spin states
Si and Sj. The positive J values indicate the ferromagnetic ground state and the negative ones
indicate the antiferromagnetic ground state. For the system of two equivalent magnetic centers,
the J value can be calculated from the first principles using total energies of the high spin state
(where Si=Sj) and the low spin state (where Si=-Sj).
62
4.2 Theoretical approaches to calculate Heiseberg exchange constants
4.2.1 Different hybrid DFT approaches
The most common theoretical method for prediction of J is Broken Symmetry Density
Functional Theory (BS-DFT). In this method the energy correction is made to account for the
fact that the low spin state is described by the open shell single Slater determinant, which is not
an eigenfunction of the spin operator (spin symmetry is “broken”). The first analytical form for
the energy correction was proposed by Noodleman:147,148,149,150,151
2maxS
EEJ HSLS
ij−
=
(4-2)
here ELS and EHS are the computed energies of the low and high spin states, and Smax=|Si|+|Sj|.
This correction scheme is applicable for weakly bonded molecular fragments with small overlap
between the magnetic orbitals.147,152, 153 An alternative correction scheme has been used by Ruiz
and co-workers.154 In this scheme, J value is computed as
)1( maxmax +−
=SS
EEJ HSLS
ij
(4-3)
This scheme assumes strong bonding between molecular fragments with localized spins, and
may be more appropriate for binuclear complexes than (4-2). The third way to compute J is
independent of the bonding situation in the molecule. It had been proposed by Nishino et al.155
LSHS
HSLSij SS
EEJ
22 −
−= (4-4)
here <S2>HS and <S2>BS are the total spin angular momentum expectation values for high and
low spin states. This correction scheme approximately accounts for the overlap between
63
magnetic orbitals. Less approximate schemes may also take into account differences in the
overlap between different magnetic orbitals of the same system.156,157 Since pure DFT usually
overestimates J values, BS-DFT is making use of the hybrid exchange-correlation functionals,
where fraction of the orbital-dependent Hartee-Fock exchange is replacing local and semi-local
exchange. Unfortunately, BS-DFT was not sufficiently accurate in predictions of J for binuclear
complexes with acetate bridges,151,158 presumably due to strong delocalization of the spin density
form the metal centers to the ligands.
4.2.2 DFT+U methodology
The attractive alternative for BS-DFT method is DFT+U, introduced by Anisimov et al.9 and
simplified by Cococcioni et al.159 In this work we adopt the empirical approach and show that
both metal centers and ligand atoms need to be assigned a specific U values in order to
accurately describe the properties of molecular magnets.
Considering importance of superexchange interactions, Cao et. al.160 performed DFT+U
calculations for Ni(hmp)(MeOH)Cl4 complex, where they both metal and ligand oxygen atoms
were assigned their U parameters. Because of the strong correlation effects in this system, the
pure DFT approach artificially results in the hybridization of orbitals, leading to AFM coupling.
The inclusion of a Hubbard-U term for both the Ni 3d and O 2p electrons greatly enhances the
localization, and is essential in order to obtain the correct ferromagnetic ground state and
positive value for the exchange-coupling constant. The rationale for using the parameter U for
both the p and d orbital is the following. Coulomb interactions between oxygen 2p electrons are
comparable to those between d electrons,161,162 and should hence be taken into consideration.
However, since oxygen usually bares a fully occupied p-shell, this correlation effect contributes
64
equally to the low- and high-spin states. Therefore, DFT+Ud already yield a satisfactory
description of the ground state. However, when 2p-electrons of the ligand are involved in π-
conjugated system, DFT+Up+d has to be used for both the 3d and oxygen 2p electrons in order to
obtain the correct ground state for the molecule.
4.3 Computational Details
All the reported calculations were done using the Quantum-ESPRESSO-4.0.1 package,122
using PBE exchange-correlation functional, Vanderbilt ultrasoft pseudopotentials121 and a plane-
wave basis set. We employ the same protocol used in our previous studies.124 Namely, the energy
cutoffs for the wave functions and charge densities were set at 25 and 250 Ry to ensure total
energy convergence, spin polarized approach, the Marzari-Vanderbilt123 cold smearing
(smearing factor 0.0008), and local Thomas-Fermi mixing mode to improve SCF convergence.
To better describe the magnetic states for manganese, both valence and semicore shells
(3s3p3d4s) were treated explicitly, while rest of the electrons was replaced by Vanderbilt
Ultrasoft pseudopotential. For homovalent antiferromagnetic state we used equal and opposite
“starting magnetization” on manganese to ensure correct antiferromagnetic state. For
heterovalent compound we used different “starting magnetization” on manganese atoms with
opposite signs. All molecular structures were optimized in their most stable (low spin, except for
complex III) state starting from atomic coordinates, taken from X-Ray diffraction data with
geometrically added hydrogen atoms. The optimization was found to be critically important for
the accuracy of the final results, presumably due to inaccuracies introduced in some of X-Ray
structures by partial disorder.
65
In application of DFT+U method, we followed the protocol described by Cao et. al.160 We
used simplified rotational-invariant formulation, which was originally developed by
Liechtenstein et al.10 as basis set independent generalization of DFT+U. The values of the U
parameter for both the metal atom and the ligand atoms (O and N) were empirically adjusted to
fit the experimental spin splitting energies for the benchmark set of five small binuclear
manganese complexes with various oxidation states (+2, +3 and +4), as described in Section 4.4.
4.4 Prediction of Heisenberg exchange constants using DFT+U for binuclear manganese
complexes
In order to calibrate DFT+U approach and validate it for predictions of the coupling constant
values, we selected five binuclear manganese complexes presented in Figure 4-1. The manganese
complexes of this type have been extensively studied. They have rich redox chemistry and play a
functional role in a variety of biologically important metalloproteins.163 In particular, oxo-
manganese clusters are either known or have been implicated in the catalytic function of
manganese catalase,163,164 manganese ribonucleotide reductase,165-167 and the oxygen-evolving
complex of photosystem II.168,169,170
For this work the we select a representative set of five different classes, based on the
oxidation number and type of bridging groups: (I) Mn(IV) di-μ-oxo; (II) Mn(IV) di-μ-oxo-μ-
carboxylato; (III) Mn(III) μ-oxo-di-μ-carboxylato, and (IV) Mn(II) tri-μ-carboxylato, (V)
Mn(III)Mn(IV) μ-oxo-di-μ-carboxylato bridged systems. Our molecule of interest
[Mn6IIIMn6II(O2CMe)14(mda)8] (mda=N-methyl diethanolamine) is a mixed valence Mn
complex, containing both acetate and oxo bridges. We choose our benchmark molecules so that
they have the similar structural features withThe complexes III and IV were selected for this
66
study to represent oxidation states, Mn (III) and Mn(II) bridged by two and three acetate ligands,
respectively, and complex V represents the mixed valence Mn(III)-Mn(IV) complex, with the
structure similar to the Mn(III)-Mn(III) complex.
The exchange coupling in most of these complexes were previously studied with BS-DFT,
combined with spin contamination correction schemes (Eq. 2-4).171,151 While BS-DFT gives
reasonable agreement with experiment for the complex I, its prediction was 63% in error for
complex II. Similar failures of hybrid DFT were reported for other molecules with acetate
bridge,151,158 and were traced to the delocalization of magnetic orbitals from the manganese
centers to the ligand atoms151 for complex III the BS-DFT not only fails to predict the
quantitative value of exchange constant but also predicts the incorrect ground state. BS-DFT
calculation158 for complex V produced overestimated J values.
The Table 4-1 reports the J values for the benchmark complexes, obtained in this work, and
compares them to the experimental J values. Predictions obtained in BS-DFT formalism using
B3LYP exchange-correlation functional and spin-contamination correction scheme (Eq. 4-2) are
also shown for comparison. Out of these five complexes the complex IV including Mn(II)
magnetic center demonstrates the weakest magnetic coupling J, similar to that in the Mn12
wheel.171 The second weakest coupling is found in complex III with Mn(III) center; this complex
has ferromagnetic ground state. The complex (V) is included to validate the method for Mn(III)-
Mn(IV) center mixed-valence compound.
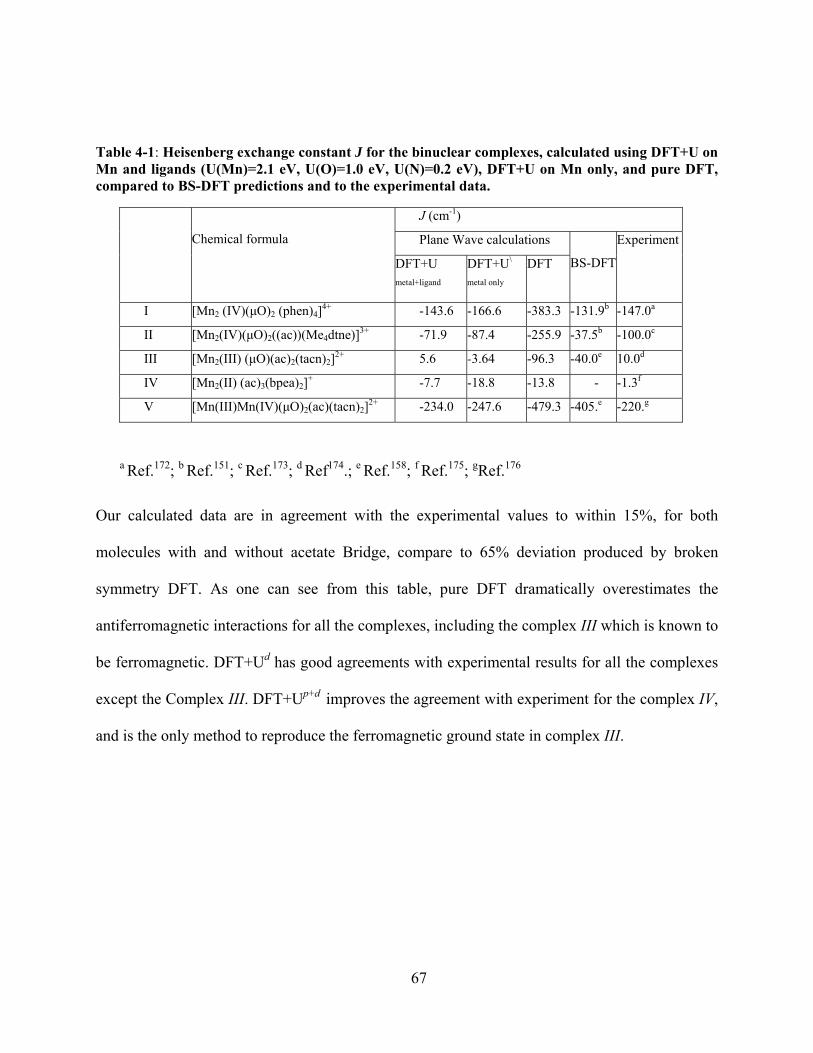
67
Table 4-1: Heisenberg exchange constant J for the binuclear complexes, calculated using DFT+U on Mn and ligands (U(Mn)=2.1 eV, U(O)=1.0 eV, U(N)=0.2 eV), DFT+U on Mn only, and pure DFT, compared to BS-DFT predictions and to the experimental data.
Chemical formula
J (cm-1)
Plane Wave calculations
BS-DFT
Experiment
DFT+Umetal+ligand
DFT+U\
metal only
DFT
I [Mn2 (IV)(μO)2 (phen)4]4+ -143.6 -166.6 -383.3 -131.9b -147.0a
II [Mn2(IV)(μO)2((ac))(Me4dtne)]3+ -71.9 -87.4 -255.9 -37.5b -100.0c
III [Mn2(III) (μO)(ac)2(tacn)2]2+ 5.6 -3.64 -96.3 -40.0e 10.0d
IV [Mn2(II) (ac)3(bpea)2]+ -7.7 -18.8 -13.8 - -1.3f
V [Mn(III)Mn(IV)(μO)2(ac)(tacn)2]2+ -234.0 -247.6 -479.3 -405.e -220.g
a Ref.172; b Ref.151; c Ref.173; d Ref174.; e Ref.158; f Ref.175; gRef.176
Our calculated data are in agreement with the experimental values to within 15%, for both
molecules with and without acetate Bridge, compare to 65% deviation produced by broken
symmetry DFT. As one can see from this table, pure DFT dramatically overestimates the
antiferromagnetic interactions for all the complexes, including the complex III which is known to
be ferromagnetic. DFT+Ud has good agreements with experimental results for all the complexes
except the Complex III. DFT+Up+d improves the agreement with experiment for the complex IV,
and is the only method to reproduce the ferromagnetic ground state in complex III.
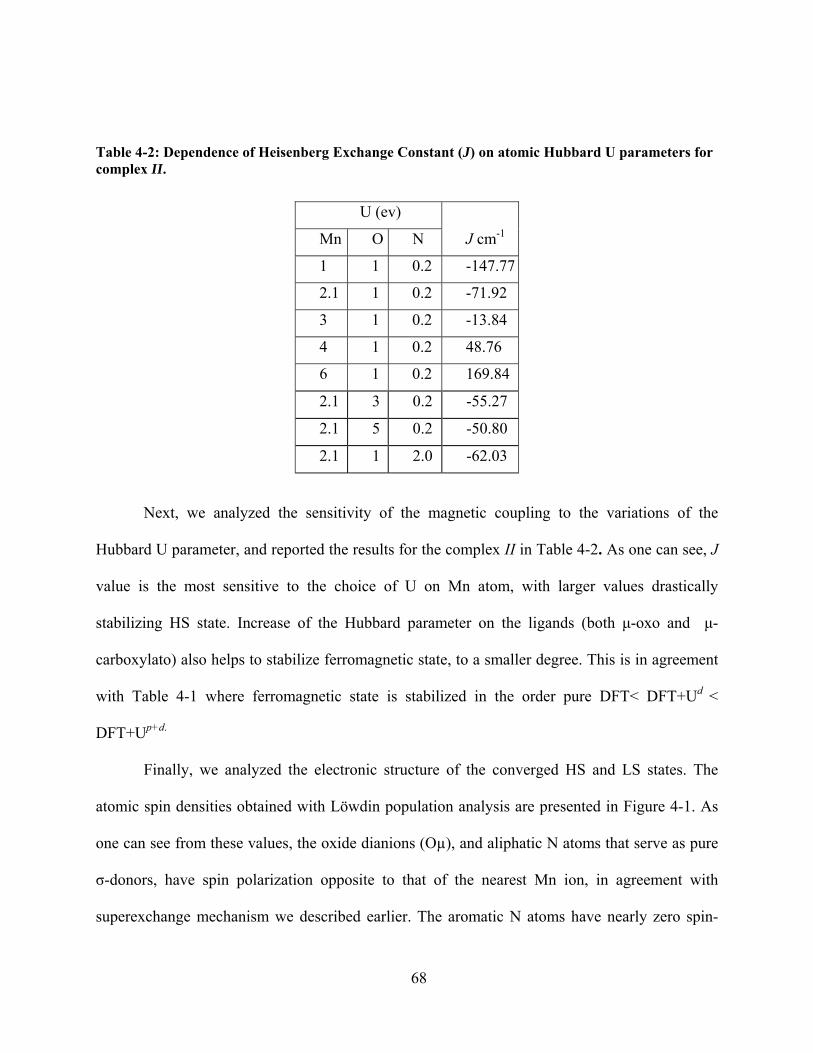
68
Table 4-2: Dependence of Heisenberg Exchange Constant (J) on atomic Hubbard U parameters for complex II.
Next, we analyzed the sensitivity of the magnetic coupling to the variations of the
Hubbard U parameter, and reported the results for the complex II in Table 4-2. As one can see, J
value is the most sensitive to the choice of U on Mn atom, with larger values drastically
stabilizing HS state. Increase of the Hubbard parameter on the ligands (both μ-oxo and μ-
carboxylato) also helps to stabilize ferromagnetic state, to a smaller degree. This is in agreement
with Table 4-1 where ferromagnetic state is stabilized in the order pure DFT< DFT+Ud <
DFT+Up+d.
Finally, we analyzed the electronic structure of the converged HS and LS states. The
atomic spin densities obtained with Löwdin population analysis are presented in Figure 4-1. As
one can see from these values, the oxide dianions (Oµ), and aliphatic N atoms that serve as pure
σ-donors, have spin polarization opposite to that of the nearest Mn ion, in agreement with
superexchange mechanism we described earlier. The aromatic N atoms have nearly zero spin-
U (ev)
J cm-1 Mn O N
1 1 0.2 -147.77
2.1 1 0.2 -71.92
3 1 0.2 -13.84
4 1 0.2 48.76
6 1 0.2 169.84
2.1 3 0.2 -55.27
2.1 5 0.2 -50.80
2.1 1 2.0 -62.03
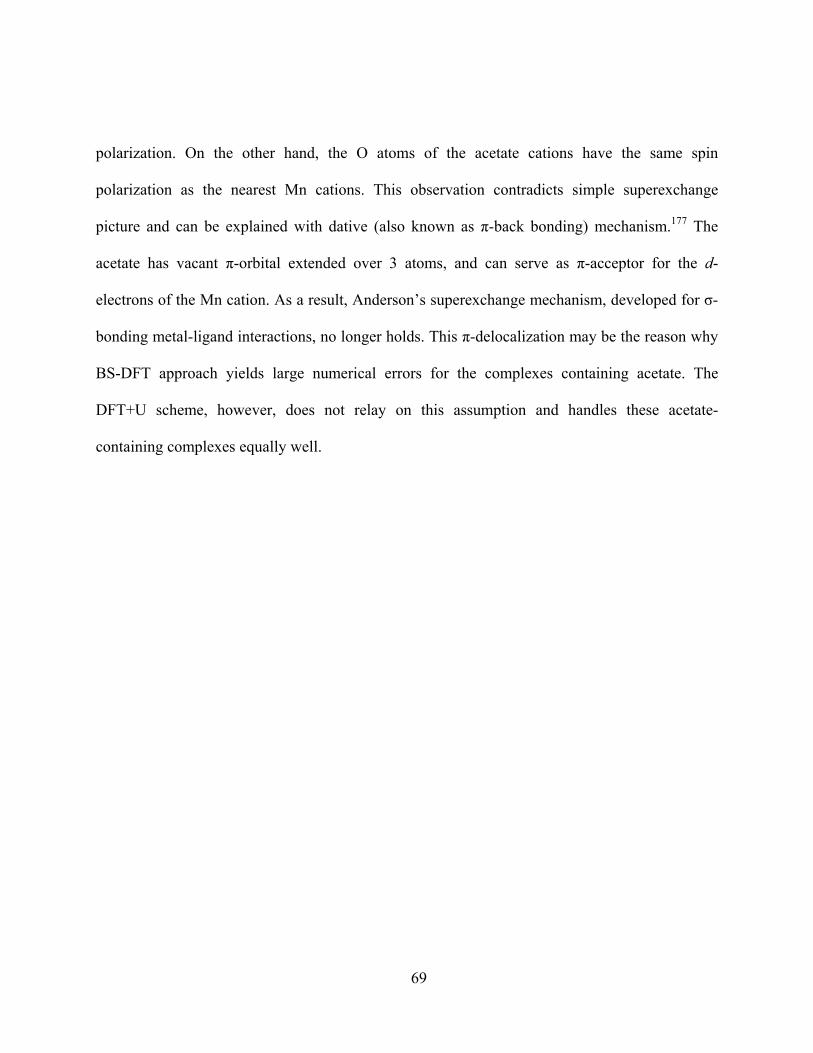
69
polarization. On the other hand, the O atoms of the acetate cations have the same spin
polarization as the nearest Mn cations. This observation contradicts simple superexchange
picture and can be explained with dative (also known as π-back bonding) mechanism.177 The
acetate has vacant π-orbital extended over 3 atoms, and can serve as π-acceptor for the d-
electrons of the Mn cation. As a result, Anderson’s superexchange mechanism, developed for σ-
bonding metal-ligand interactions, no longer holds. This π-delocalization may be the reason why
BS-DFT approach yields large numerical errors for the complexes containing acetate. The
DFT+U scheme, however, does not relay on this assumption and handles these acetate-
containing complexes equally well.
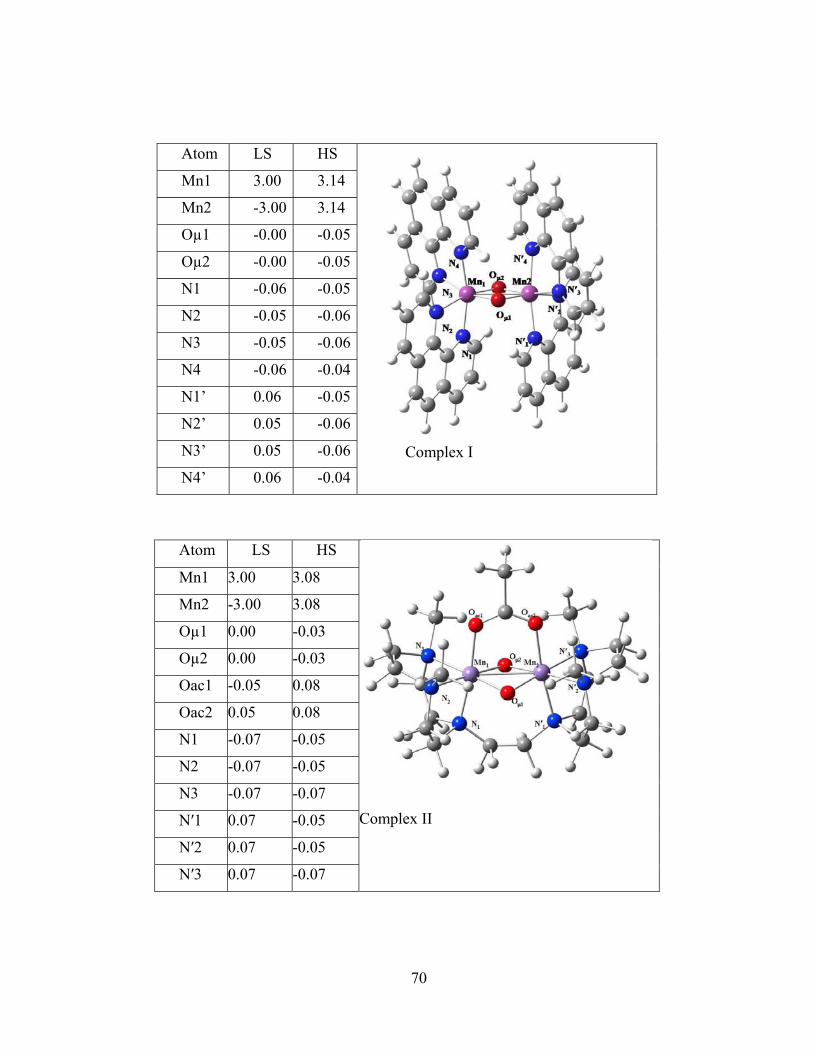
70
Atom LS HS
Complex I
Mn1 3.00 3.14
Mn2 -3.00 3.14
Oµ1 -0.00 -0.05
Oµ2 -0.00 -0.05
N1 -0.06 -0.05
N2 -0.05 -0.06
N3 -0.05 -0.06
N4 -0.06 -0.04
N1’ 0.06 -0.05
N2’ 0.05 -0.06
N3’ 0.05 -0.06
N4’ 0.06 -0.04
Atom LS HS
Complex II
Mn1 3.00 3.08
Mn2 -3.00 3.08
Oµ1 0.00 -0.03
Oµ2 0.00 -0.03
Oac1 -0.05 0.08
Oac2 0.05 0.08
N1 -0.07 -0.05
N2 -0.07 -0.05
N3 -0.07 -0.07
N′1 0.07 -0.05
N′2 0.07 -0.05
N′3 0.07 -0.07
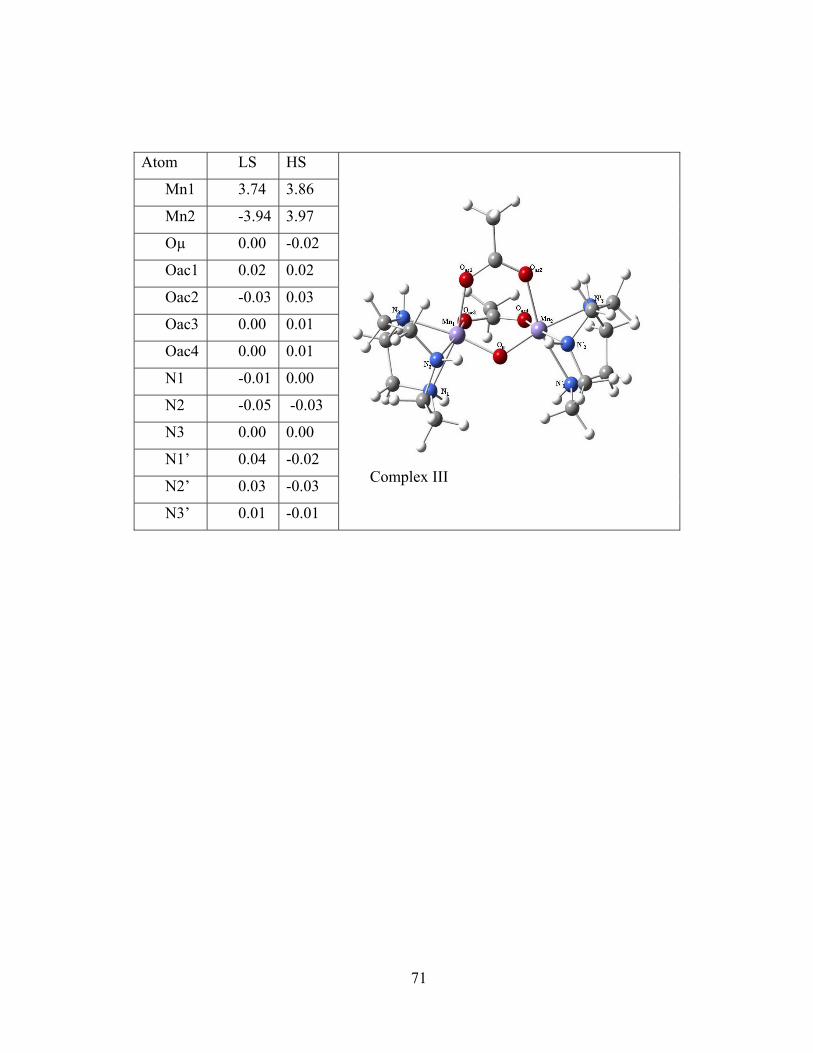
71
Atom LS HS
Complex III
Mn1 3.74 3.86
Mn2 -3.94 3.97
Oµ 0.00 -0.02
Oac1 0.02 0.02
Oac2 -0.03 0.03
Oac3 0.00 0.01
Oac4 0.00 0.01
N1 -0.01 0.00
N2 -0.05 -0.03
N3 0.00 0.00
N1’ 0.04 -0.02
N2’ 0.03 -0.03
N3’ 0.01 -0.01
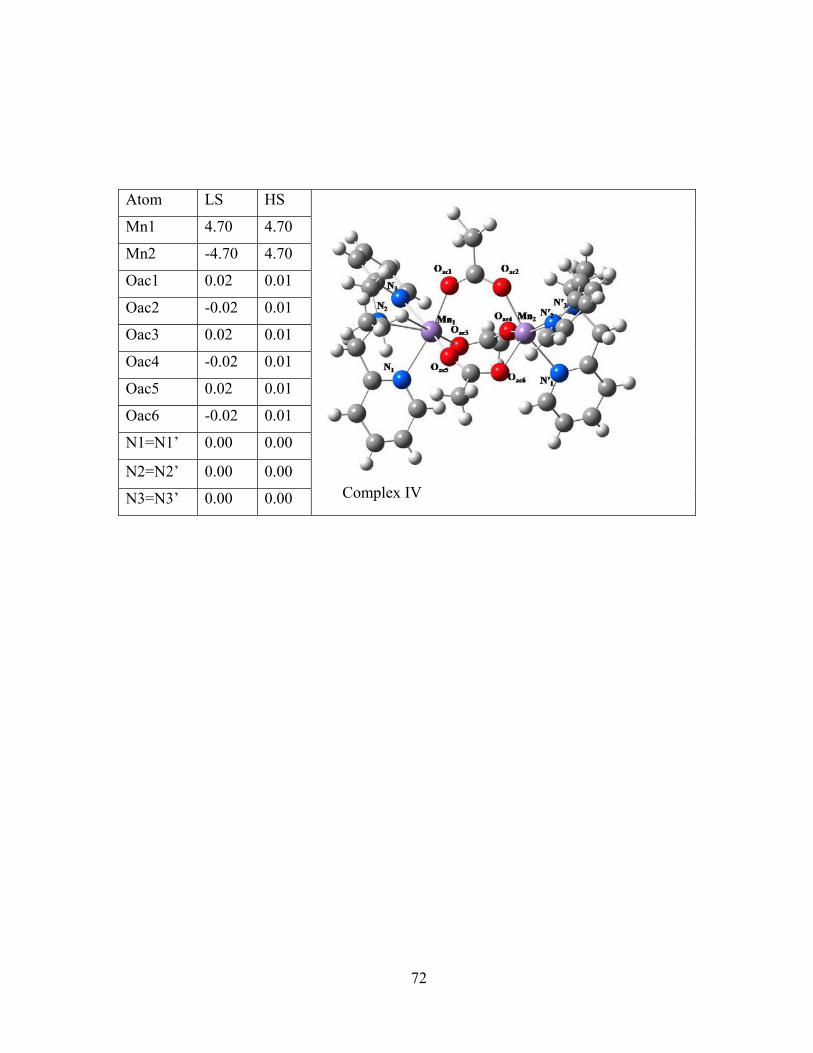
72
Atom LS HS
Complex IV
Mn1 4.70 4.70
Mn2 -4.70 4.70
Oac1 0.02 0.01
Oac2 -0.02 0.01
Oac3 0.02 0.01
Oac4 -0.02 0.01
Oac5 0.02 0.01
Oac6 -0.02 0.01
N1=N1’ 0.00 0.00
N2=N2’ 0.00 0.00
N3=N3’ 0.00 0.00
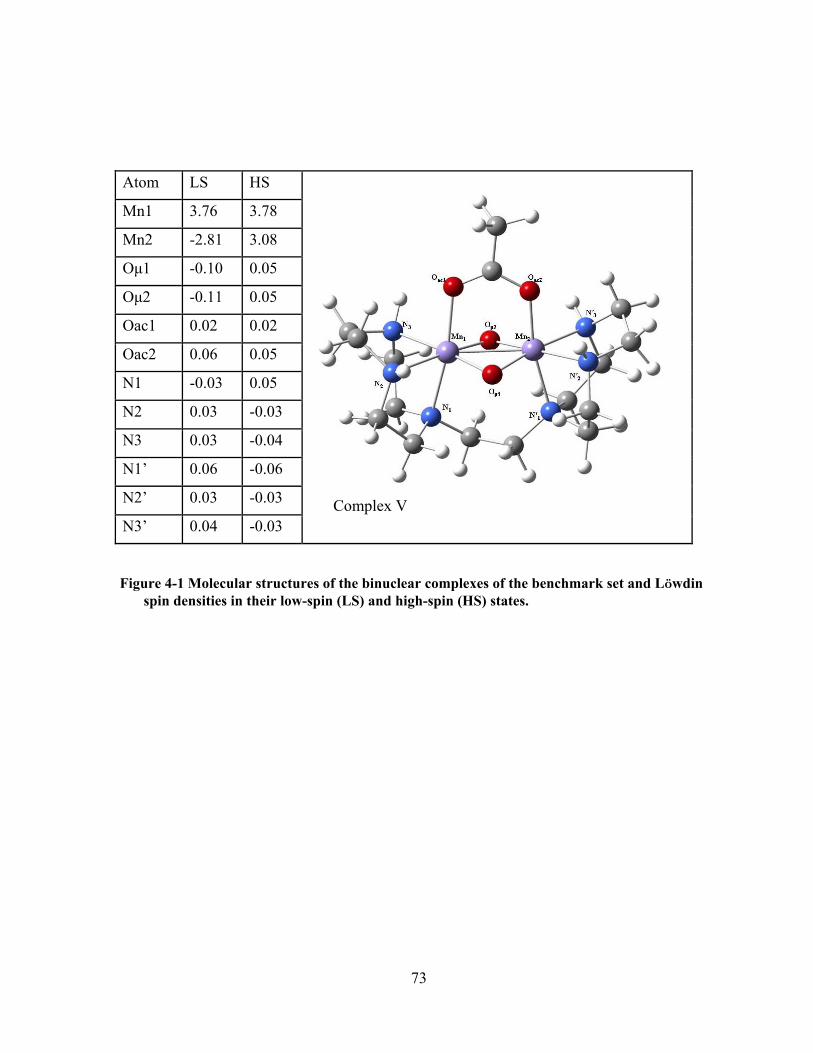
73
Figure 4-1 Molecular structures of the binuclear complexes of the benchmark set and Löwdin spin densities in their low-spin (LS) and high-spin (HS) states.
Atom LS HS
Complex V
Mn1 3.76 3.78
Mn2 -2.81 3.08
Oμ1 -0.10 0.05
Oμ2 -0.11 0.05
Oac1 0.02 0.02
Oac2 0.06 0.05
N1 -0.03 0.05
N2 0.03 -0.03
N3 0.03 -0.04
N1’ 0.06 -0.06
N2’ 0.03 -0.03
N3’ 0.04 -0.03
74
4.5 Antiferromagnetic wheel and Heisenberg exchange constant
Predictions of magnetic properties of molecular systems present a long standing problem, as
they require a balanced description of static and dynamic electron correlation. Density Functional
Theory (DFT) approaches is the only ab initio method capable to describe large molecules, such
as Mn12Ac, Fe8, and V15 classical molecular magnets 178-184. Two variations of DFT are
commonly used for prediction of J values. One is broken symmetry DFT proposed by
Noodleman 147,149,150,185,186 and Yamaguchi .187-193 The other versions of BSDFT formalism are
proposed by Ruiz 154 and Nishino.155 Less approximate schemes may also take into account
differences in the overlap between different magnetic orbitals of the same systems.156,157 BSDFT
is known to have its limitations in at least three different cases i) acetate bridged manganese
complexes.151 ii) mix valence 158 and iii) ferromagnetic coupling 158. The alternative variation of
DFT is known as DFT+U approach (U stands for onsite coulomb repulsion). It was used for J
value calculations are applied on molecular magnets 194-197 and organometallics. 198-202 The
general approach in DFT+U is to add Hubbard U on d orbitals in metal atoms, but Cao et al.203
showed adding Hubard U not only on metal but also on ligand atoms p orbital is needed to
predict correct ferromagnetic order. We are referring this methodology as DFT+Up+d.
In our previous paper we successfully applied DFT+Up+d approach for different valence
Mn (+2, +3, +4, including mix valence) complexes having various ligands. 204 We applied
DFT+Up+d approach using same U values to predict antiferromagnetic exchange Mn1-Mn6΄
center in Mn12(mdea) wheel in the same paper. 204 In this paper we applied similar approach to
predict six Heisenberg exchange constants in two different Mn12 wheels. The general chemical
formula for the wheels is [Mn12Rdea8(CH3COO)14].n(CH3CN), in which the Rdea2− are dianions
75
of N-R diethanolamine, with R = a(allyl) and m(methyl). Both the wheels reported to have S=7
spin ground state 205,206 and weak antiferromagnetic coupling between two identical halves
having six manganese atoms.
Predictions of magnetic properties of molecular systems present a long standing problem, as
they require a balanced description of static and dynamic electron correlation. Density Functional
Theory (DFT) approach is the only ab initio method capable to describe large molecules, such as
Mn12Ac, Fe8, and V15 classical molecular magnets 178-184. Two variations of DFT are commonly
used for prediction of J values. One is broken symmetry DFT proposed by Noodleman
147,149,150,185,186 and Yamaguchi. 187-193 The other versions of BSDFT formalism are proposed by
Ruiz 154 and Nishino.155 Less approximate schemes may also take into account differences in the
overlap between different magnetic orbitals of the same systems.156,157 BSDFT is known to have
its limitations in at least three different cases i) acetate bridged manganese complexes,151 ii) mix
valence 158 and iii) ferromagnetic coupling, 158 The alternative variation of DFT is known as
DFT+U approach (U stands for onsite coulomb repulsion). It was used for J value calculations
are applied on molecular magnets 194-197 and organometallics. 198-202 The general approach in
DFT+U is to add Hubbard U on d orbitals in metal atoms, but Cao et al.203 showed adding
Hubard U not only on metal but also on ligand atoms p orbital is needed to predict correct
ferromagnetic order. We are referring this methodology as DFT+Up+d.
In our previous paper we successfully applied DFT+Up+d approach for different valence
Mn (+2, +3, +4, including mix valence) complexes having various ligands.204 We applied
DFT+Up+d approach using same U values to predict antiferromagnetic exchange Mn1-Mn6΄
center in Mn12(mdea) wheel in the same paper. 204 In this paper we applied similar approach to
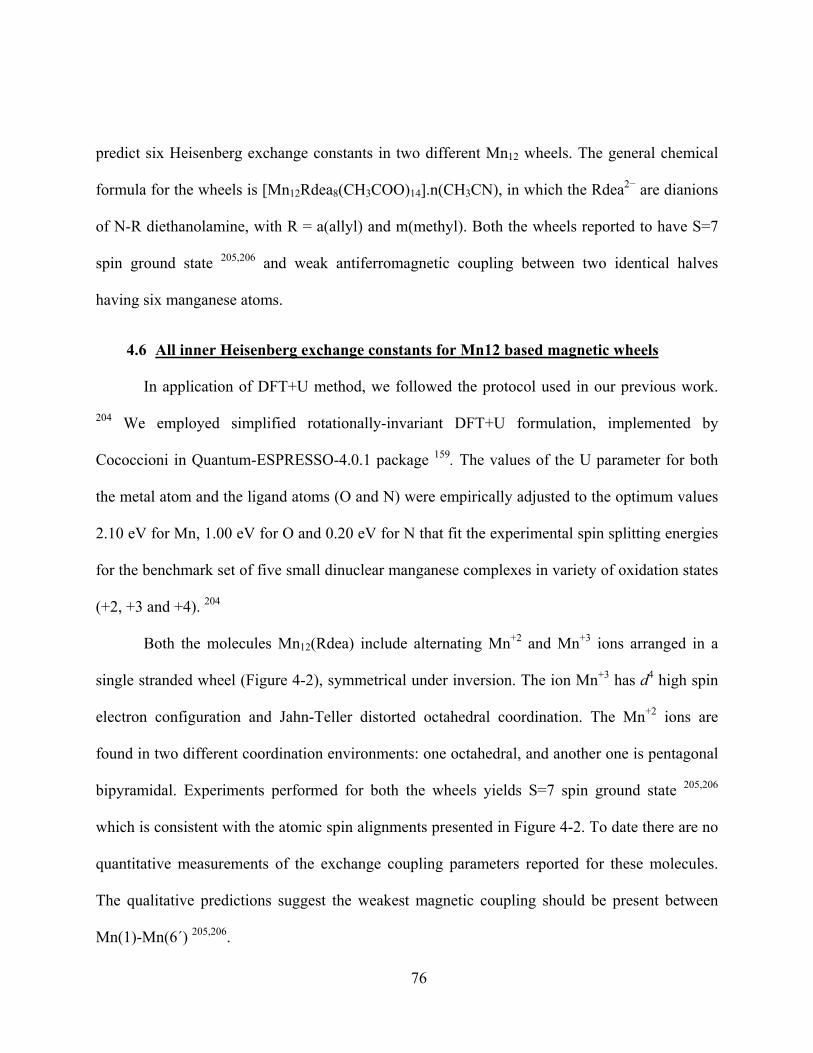
76
predict six Heisenberg exchange constants in two different Mn12 wheels. The general chemical
formula for the wheels is [Mn12Rdea8(CH3COO)14].n(CH3CN), in which the Rdea2− are dianions
of N-R diethanolamine, with R = a(allyl) and m(methyl). Both the wheels reported to have S=7
spin ground state 205,206 and weak antiferromagnetic coupling between two identical halves
having six manganese atoms.
4.6 All inner Heisenberg exchange constants for Mn12 based magnetic wheels
In application of DFT+U method, we followed the protocol used in our previous work.
204 We employed simplified rotationally-invariant DFT+U formulation, implemented by
Cococcioni in Quantum-ESPRESSO-4.0.1 package 159. The values of the U parameter for both
the metal atom and the ligand atoms (O and N) were empirically adjusted to the optimum values
2.10 eV for Mn, 1.00 eV for O and 0.20 eV for N that fit the experimental spin splitting energies
for the benchmark set of five small dinuclear manganese complexes in variety of oxidation states
(+2, +3 and +4). 204
Both the molecules Mn12(Rdea) include alternating Mn+2 and Mn+3 ions arranged in a
single stranded wheel (Figure 4-2), symmetrical under inversion. The ion Mn+3 has d4 high spin
electron configuration and Jahn-Teller distorted octahedral coordination. The Mn+2 ions are
found in two different coordination environments: one octahedral, and another one is pentagonal
bipyramidal. Experiments performed for both the wheels yields S=7 spin ground state 205,206
which is consistent with the atomic spin alignments presented in Figure 4-2. To date there are no
quantitative measurements of the exchange coupling parameters reported for these molecules.
The qualitative predictions suggest the weakest magnetic coupling should be present between
Mn(1)-Mn(6΄) 205,206.
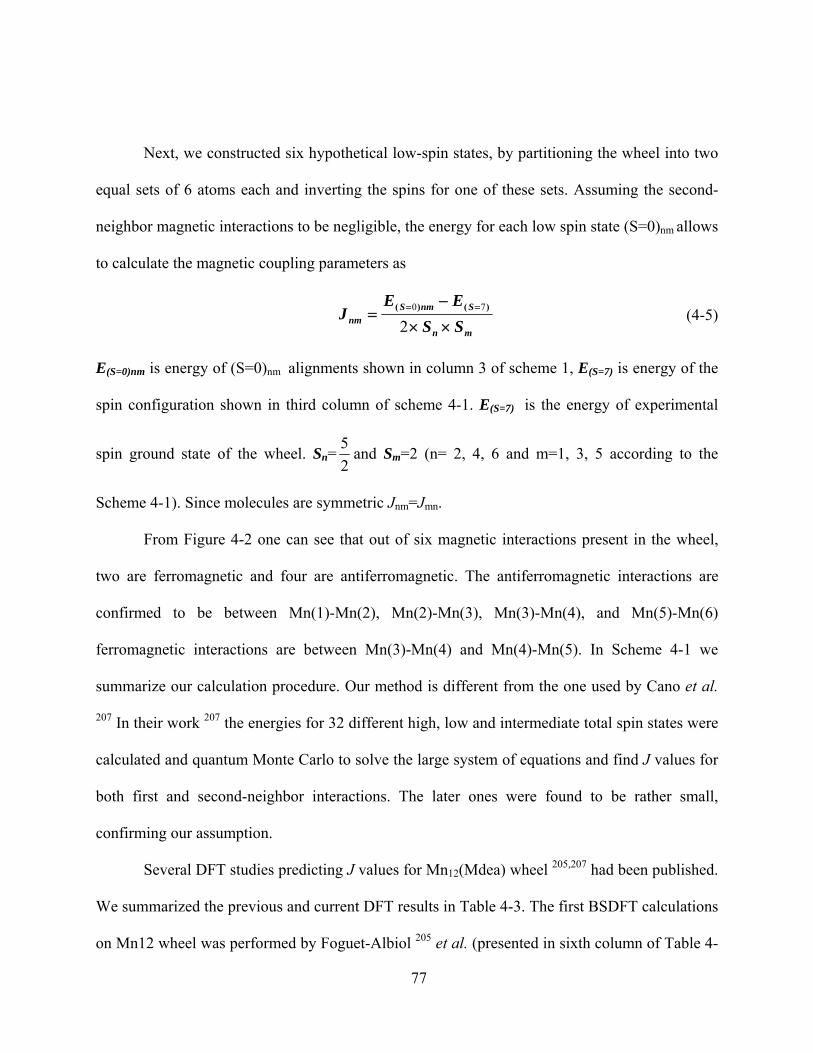
77
Next, we constructed six hypothetical low-spin states, by partitioning the wheel into two
equal sets of 6 atoms each and inverting the spins for one of these sets. Assuming the second-
neighbor magnetic interactions to be negligible, the energy for each low spin state (S=0)nm allows
to calculate the magnetic coupling parameters as
mn
SnmSnm SS
EEJ
××
−= ==
270 )()( (4-5)
E(S=0)nm is energy of (S=0)nm alignments shown in column 3 of scheme 1, E(S=7) is energy of the
spin configuration shown in third column of scheme 4-1. E(S=7) is the energy of experimental
spin ground state of the wheel. Sn=25 and Sm=2 (n= 2, 4, 6 and m=1, 3, 5 according to the
Scheme 4-1). Since molecules are symmetric Jnm=Jmn.
From Figure 4-2 one can see that out of six magnetic interactions present in the wheel,
two are ferromagnetic and four are antiferromagnetic. The antiferromagnetic interactions are
confirmed to be between Mn(1)-Mn(2), Mn(2)-Mn(3), Mn(3)-Mn(4), and Mn(5)-Mn(6)
ferromagnetic interactions are between Mn(3)-Mn(4) and Mn(4)-Mn(5). In Scheme 4-1 we
summarize our calculation procedure. Our method is different from the one used by Cano et al.
207 In their work 207 the energies for 32 different high, low and intermediate total spin states were
calculated and quantum Monte Carlo to solve the large system of equations and find J values for
both first and second-neighbor interactions. The later ones were found to be rather small,
confirming our assumption.
Several DFT studies predicting J values for Mn12(Mdea) wheel 205,207 had been published.
We summarized the previous and current DFT results in Table 4-3. The first BSDFT calculations
on Mn12 wheel was performed by Foguet-Albiol 205 et al. (presented in sixth column of Table 4-
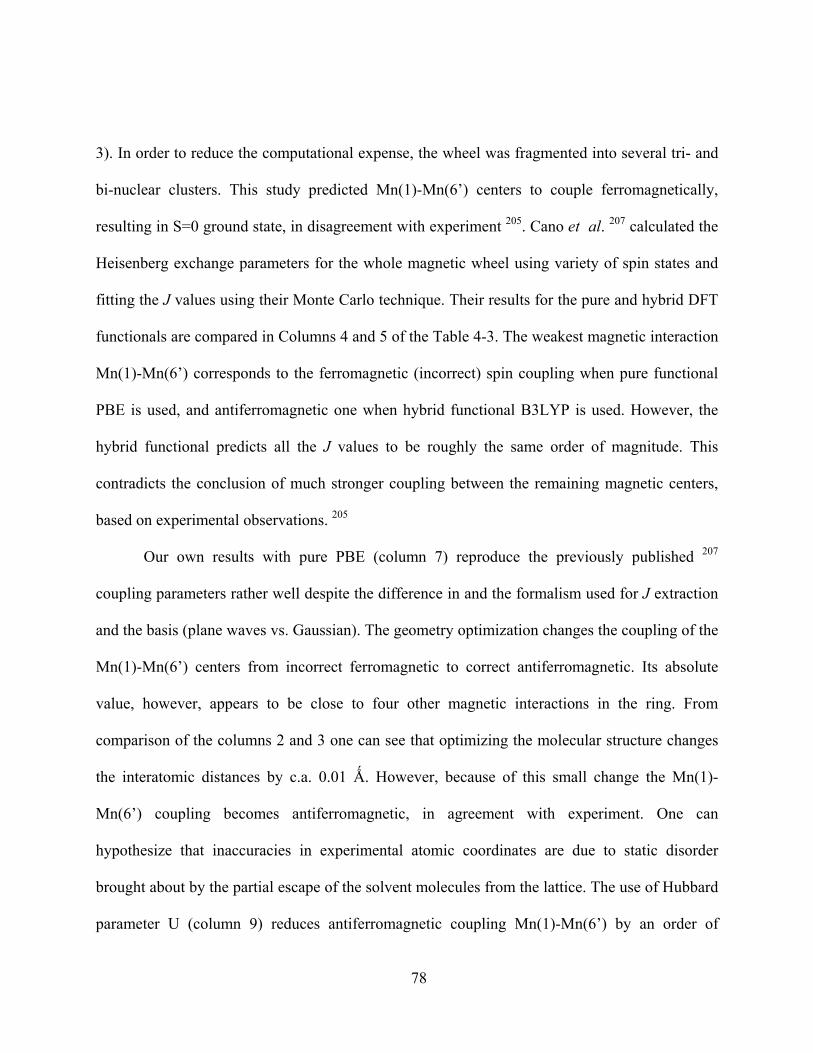
78
3). In order to reduce the computational expense, the wheel was fragmented into several tri- and
bi-nuclear clusters. This study predicted Mn(1)-Mn(6’) centers to couple ferromagnetically,
resulting in S=0 ground state, in disagreement with experiment 205. Cano et al. 207 calculated the
Heisenberg exchange parameters for the whole magnetic wheel using variety of spin states and
fitting the J values using their Monte Carlo technique. Their results for the pure and hybrid DFT
functionals are compared in Columns 4 and 5 of the Table 4-3. The weakest magnetic interaction
Mn(1)-Mn(6’) corresponds to the ferromagnetic (incorrect) spin coupling when pure functional
PBE is used, and antiferromagnetic one when hybrid functional B3LYP is used. However, the
hybrid functional predicts all the J values to be roughly the same order of magnitude. This
contradicts the conclusion of much stronger coupling between the remaining magnetic centers,
based on experimental observations. 205
Our own results with pure PBE (column 7) reproduce the previously published 207
coupling parameters rather well despite the difference in and the formalism used for J extraction
and the basis (plane waves vs. Gaussian). The geometry optimization changes the coupling of the
Mn(1)-Mn(6’) centers from incorrect ferromagnetic to correct antiferromagnetic. Its absolute
value, however, appears to be close to four other magnetic interactions in the ring. From
comparison of the columns 2 and 3 one can see that optimizing the molecular structure changes
the interatomic distances by c.a. 0.01 Ǻ. However, because of this small change the Mn(1)-
Mn(6’) coupling becomes antiferromagnetic, in agreement with experiment. One can
hypothesize that inaccuracies in experimental atomic coordinates are due to static disorder
brought about by the partial escape of the solvent molecules from the lattice. The use of Hubbard
parameter U (column 9) reduces antiferromagnetic coupling Mn(1)-Mn(6’) by an order of
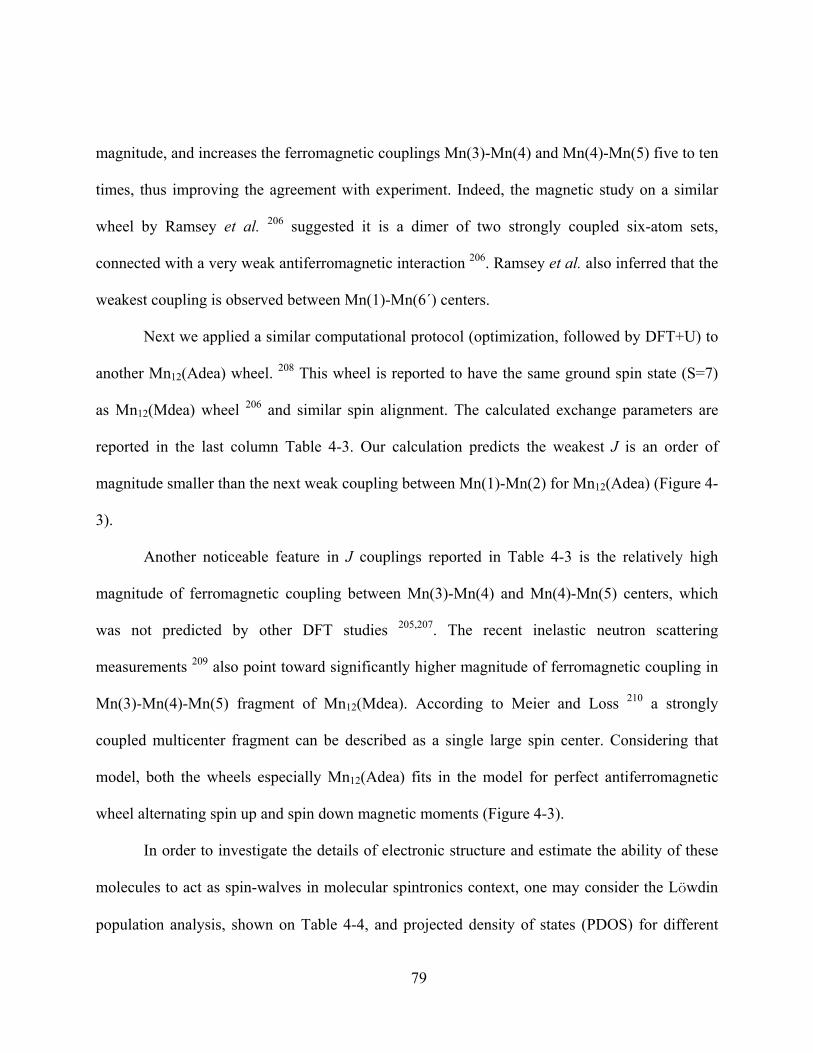
79
magnitude, and increases the ferromagnetic couplings Mn(3)-Mn(4) and Mn(4)-Mn(5) five to ten
times, thus improving the agreement with experiment. Indeed, the magnetic study on a similar
wheel by Ramsey et al. 206 suggested it is a dimer of two strongly coupled six-atom sets,
connected with a very weak antiferromagnetic interaction 206. Ramsey et al. also inferred that the
weakest coupling is observed between Mn(1)-Mn(6΄) centers.
Next we applied a similar computational protocol (optimization, followed by DFT+U) to
another Mn12(Adea) wheel. 208 This wheel is reported to have the same ground spin state (S=7)
as Mn12(Mdea) wheel 206 and similar spin alignment. The calculated exchange parameters are
reported in the last column Table 4-3. Our calculation predicts the weakest J is an order of
magnitude smaller than the next weak coupling between Mn(1)-Mn(2) for Mn12(Adea) (Figure 4-
3).
Another noticeable feature in J couplings reported in Table 4-3 is the relatively high
magnitude of ferromagnetic coupling between Mn(3)-Mn(4) and Mn(4)-Mn(5) centers, which
was not predicted by other DFT studies 205,207. The recent inelastic neutron scattering
measurements 209 also point toward significantly higher magnitude of ferromagnetic coupling in
Mn(3)-Mn(4)-Mn(5) fragment of Mn12(Mdea). According to Meier and Loss 210 a strongly
coupled multicenter fragment can be described as a single large spin center. Considering that
model, both the wheels especially Mn12(Adea) fits in the model for perfect antiferromagnetic
wheel alternating spin up and spin down magnetic moments (Figure 4-3).
In order to investigate the details of electronic structure and estimate the ability of these
molecules to act as spin-walves in molecular spintronics context, one may consider the Löwdin
population analysis, shown on Table 4-4, and projected density of states (PDOS) for different
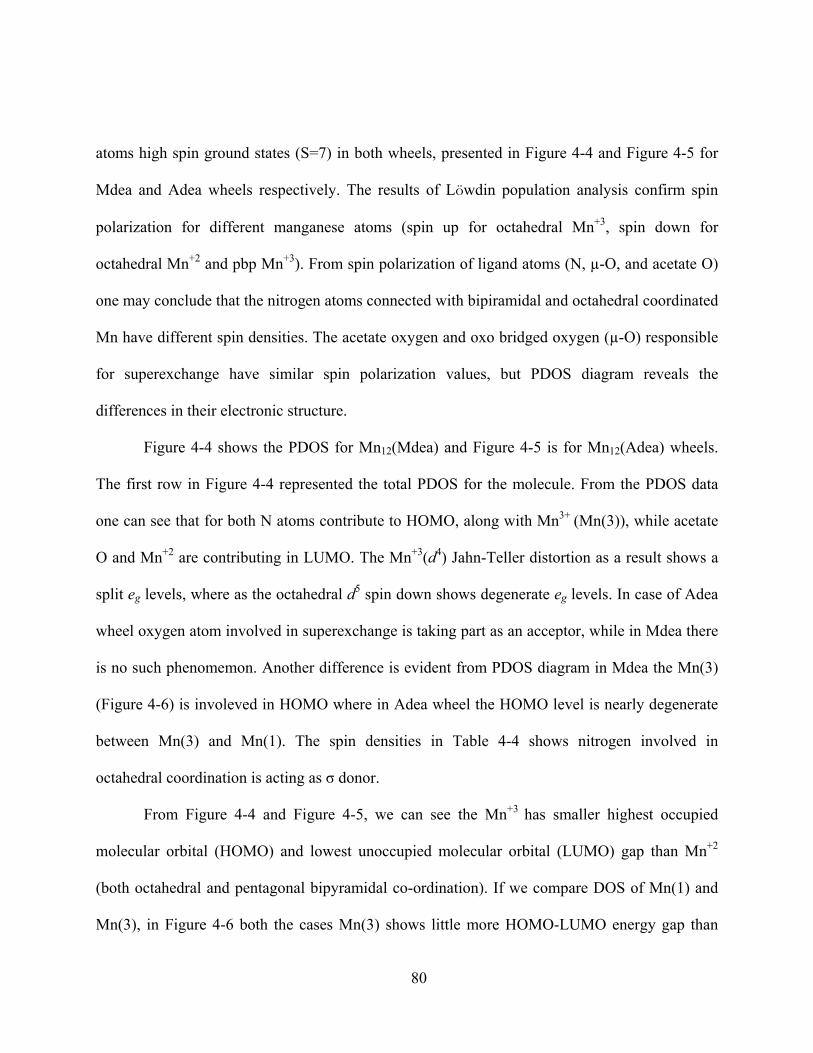
80
atoms high spin ground states (S=7) in both wheels, presented in Figure 4-4 and Figure 4-5 for
Mdea and Adea wheels respectively. The results of Löwdin population analysis confirm spin
polarization for different manganese atoms (spin up for octahedral Mn+3, spin down for
octahedral Mn+2 and pbp Mn+3). From spin polarization of ligand atoms (N, µ-O, and acetate O)
one may conclude that the nitrogen atoms connected with bipiramidal and octahedral coordinated
Mn have different spin densities. The acetate oxygen and oxo bridged oxygen (µ-O) responsible
for superexchange have similar spin polarization values, but PDOS diagram reveals the
differences in their electronic structure.
Figure 4-4 shows the PDOS for Mn12(Mdea) and Figure 4-5 is for Mn12(Adea) wheels.
The first row in Figure 4-4 represented the total PDOS for the molecule. From the PDOS data
one can see that for both N atoms contribute to HOMO, along with Mn3+ (Mn(3)), while acetate
O and Mn+2 are contributing in LUMO. The Mn+3(d4) Jahn-Teller distortion as a result shows a
split eg levels, where as the octahedral d5 spin down shows degenerate eg levels. In case of Adea
wheel oxygen atom involved in superexchange is taking part as an acceptor, while in Mdea there
is no such phenomemon. Another difference is evident from PDOS diagram in Mdea the Mn(3)
(Figure 4-6) is involeved in HOMO where in Adea wheel the HOMO level is nearly degenerate
between Mn(3) and Mn(1). The spin densities in Table 4-4 shows nitrogen involved in
octahedral coordination is acting as σ donor.
From Figure 4-4 and Figure 4-5, we can see the Mn+3 has smaller highest occupied
molecular orbital (HOMO) and lowest unoccupied molecular orbital (LUMO) gap than Mn+2
(both octahedral and pentagonal bipyramidal co-ordination). If we compare DOS of Mn(1) and
Mn(3), in Figure 4-6 both the cases Mn(3) shows little more HOMO-LUMO energy gap than
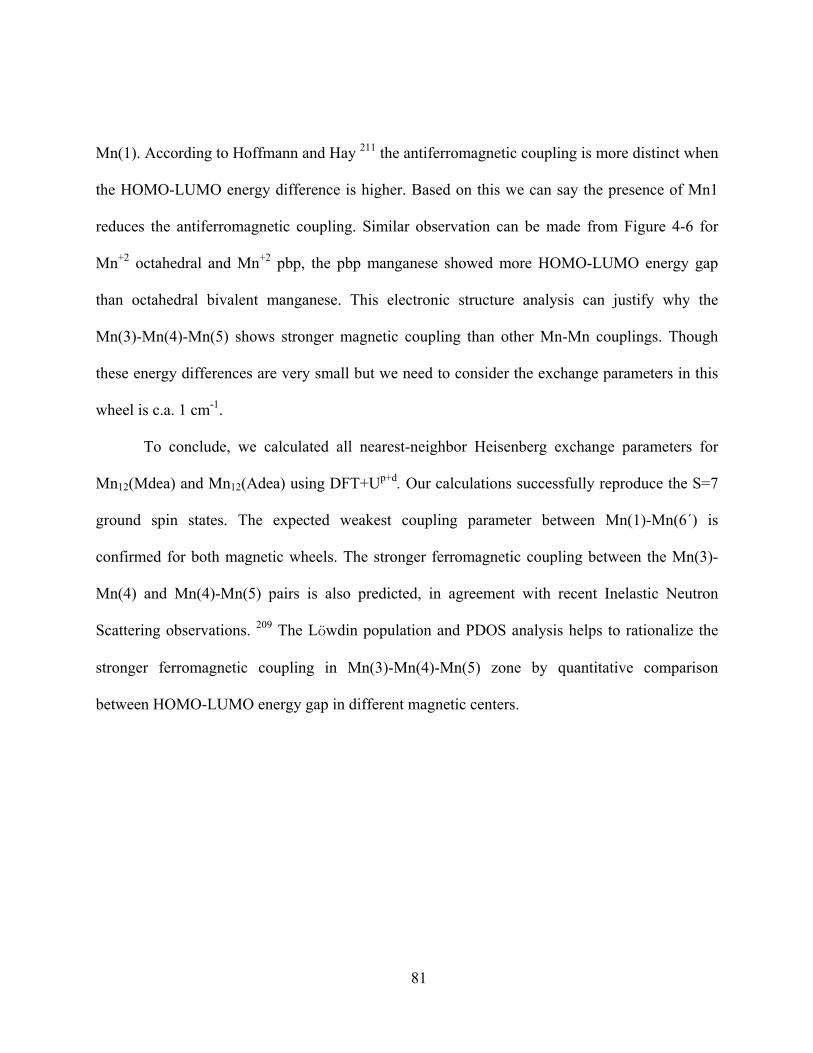
81
Mn(1). According to Hoffmann and Hay 211 the antiferromagnetic coupling is more distinct when
the HOMO-LUMO energy difference is higher. Based on this we can say the presence of Mn1
reduces the antiferromagnetic coupling. Similar observation can be made from Figure 4-6 for
Mn+2 octahedral and Mn+2 pbp, the pbp manganese showed more HOMO-LUMO energy gap
than octahedral bivalent manganese. This electronic structure analysis can justify why the
Mn(3)-Mn(4)-Mn(5) shows stronger magnetic coupling than other Mn-Mn couplings. Though
these energy differences are very small but we need to consider the exchange parameters in this
wheel is c.a. 1 cm-1.
To conclude, we calculated all nearest-neighbor Heisenberg exchange parameters for
Mn12(Mdea) and Mn12(Adea) using DFT+Up+d. Our calculations successfully reproduce the S=7
ground spin states. The expected weakest coupling parameter between Mn(1)-Mn(6΄) is
confirmed for both magnetic wheels. The stronger ferromagnetic coupling between the Mn(3)-
Mn(4) and Mn(4)-Mn(5) pairs is also predicted, in agreement with recent Inelastic Neutron
Scattering observations. 209 The Löwdin population and PDOS analysis helps to rationalize the
stronger ferromagnetic coupling in Mn(3)-Mn(4)-Mn(5) zone by quantitative comparison
between HOMO-LUMO energy gap in different magnetic centers.
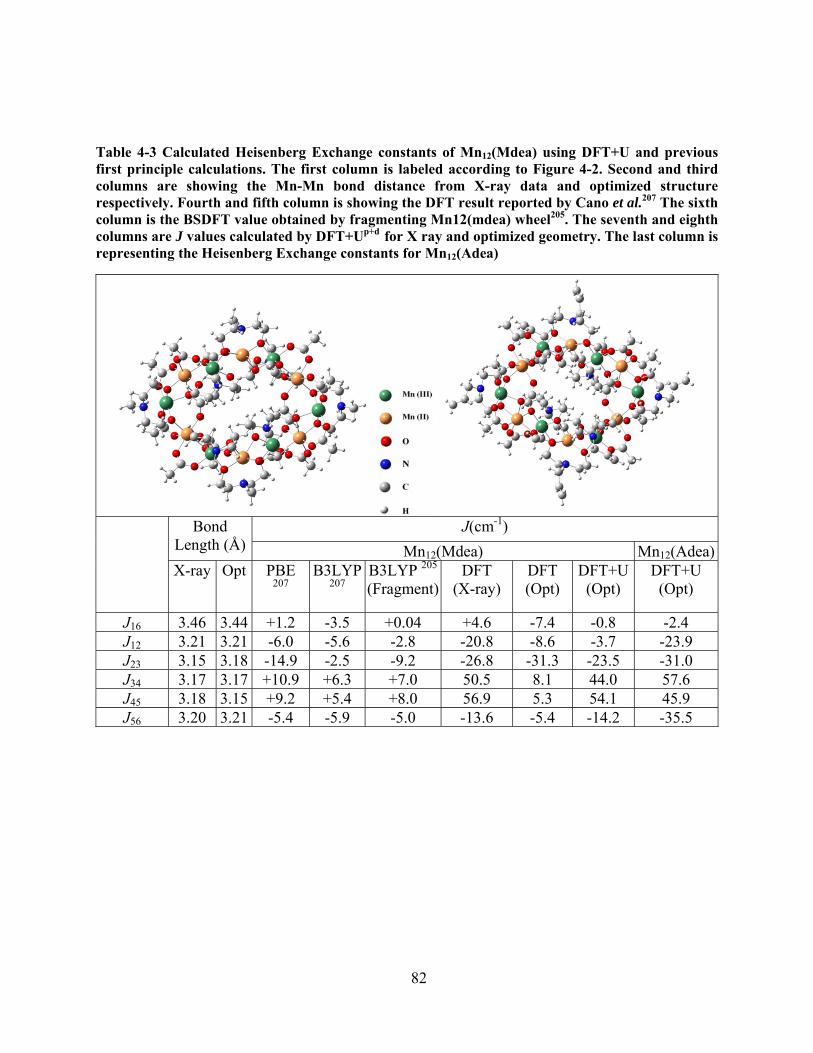
82
Table 4-3 Calculated Heisenberg Exchange constants of Mn12(Mdea) using DFT+U and previous first principle calculations. The first column is labeled according to Figure 4-2. Second and third columns are showing the Mn-Mn bond distance from X-ray data and optimized structure respectively. Fourth and fifth column is showing the DFT result reported by Cano et al.207 The sixth column is the BSDFT value obtained by fragmenting Mn12(mdea) wheel205. The seventh and eighth columns are J values calculated by DFT+Up+d for X ray and optimized geometry. The last column is representing the Heisenberg Exchange constants for Mn12(Adea)
Bond Length (Å)
J(cm-1) Mn12(Mdea) Mn12(Adea)
X-ray Opt PBE 207
B3LYP207
B3LYP 205
(Fragment)DFT
(X-ray) DFT (Opt)
DFT+U (Opt)
DFT+U (Opt)
J16 3.46 3.44 +1.2 -3.5 +0.04 +4.6 -7.4 -0.8 -2.4 J12 3.21 3.21 -6.0 -5.6 -2.8 -20.8 -8.6 -3.7 -23.9 J23 3.15 3.18 -14.9 -2.5 -9.2 -26.8 -31.3 -23.5 -31.0 J34 3.17 3.17 +10.9 +6.3 +7.0 50.5 8.1 44.0 57.6 J45 3.18 3.15 +9.2 +5.4 +8.0 56.9 5.3 54.1 45.9 J56 3.20 3.21 -5.4 -5.9 -5.0 -13.6 -5.4 -14.2 -35.5
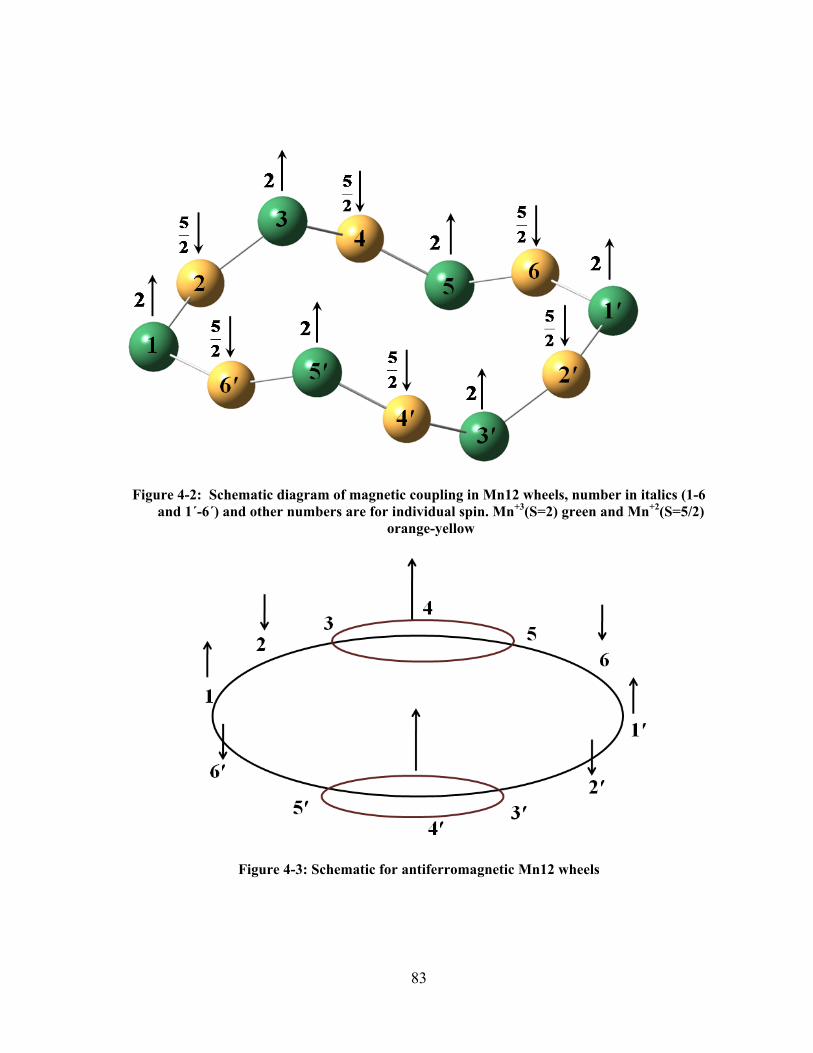
83
Figure 4-2: Schematic diagram of magnetic coupling in Mn12 wheels, number in italics (1-6 and 1΄-6΄) and other numbers are for individual spin. Mn+3(S=2) green and Mn+2(S=5/2)
orange-yellow
Figure 4-3: Schematic for antiferromagnetic Mn12 wheels
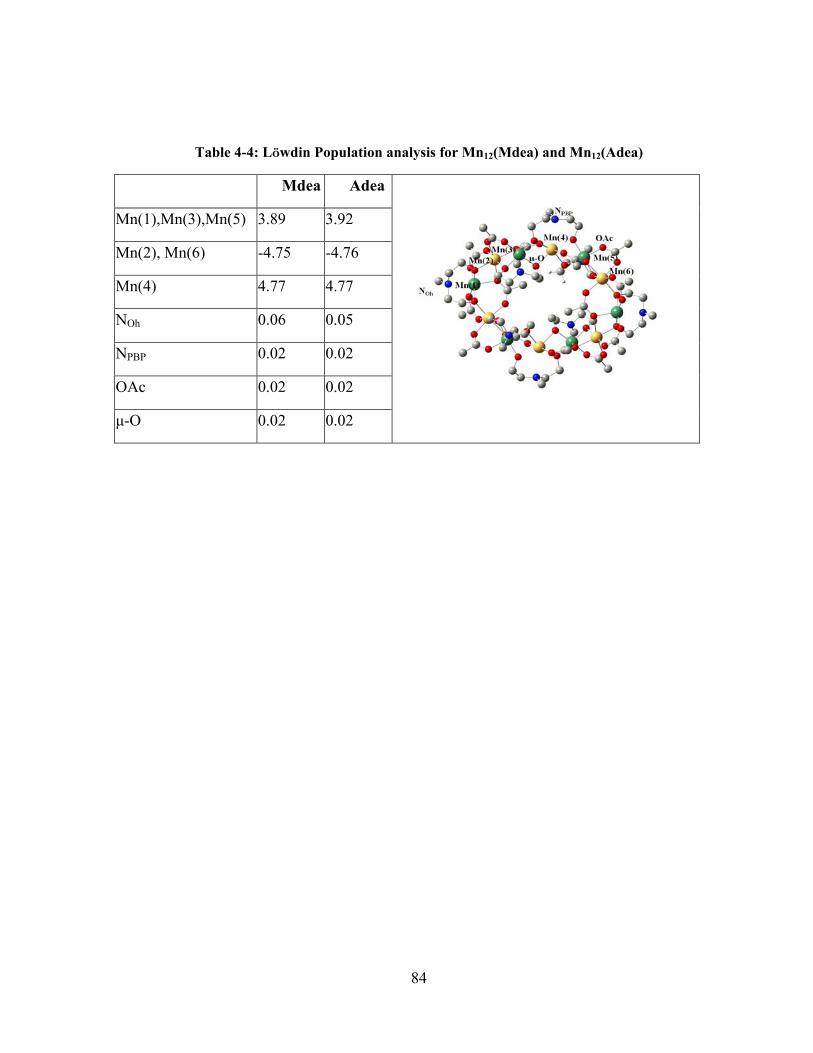
84
Table 4-4: Löwdin Population analysis for Mn12(Mdea) and Mn12(Adea)
Mdea Adea
Mn(1),Mn(3),Mn(5) 3.89 3.92
Mn(2), Mn(6) -4.75 -4.76
Mn(4) 4.77 4.77
NOh 0.06 0.05
NPBP 0.02 0.02
OAc 0.02 0.02
μ-O 0.02 0.02
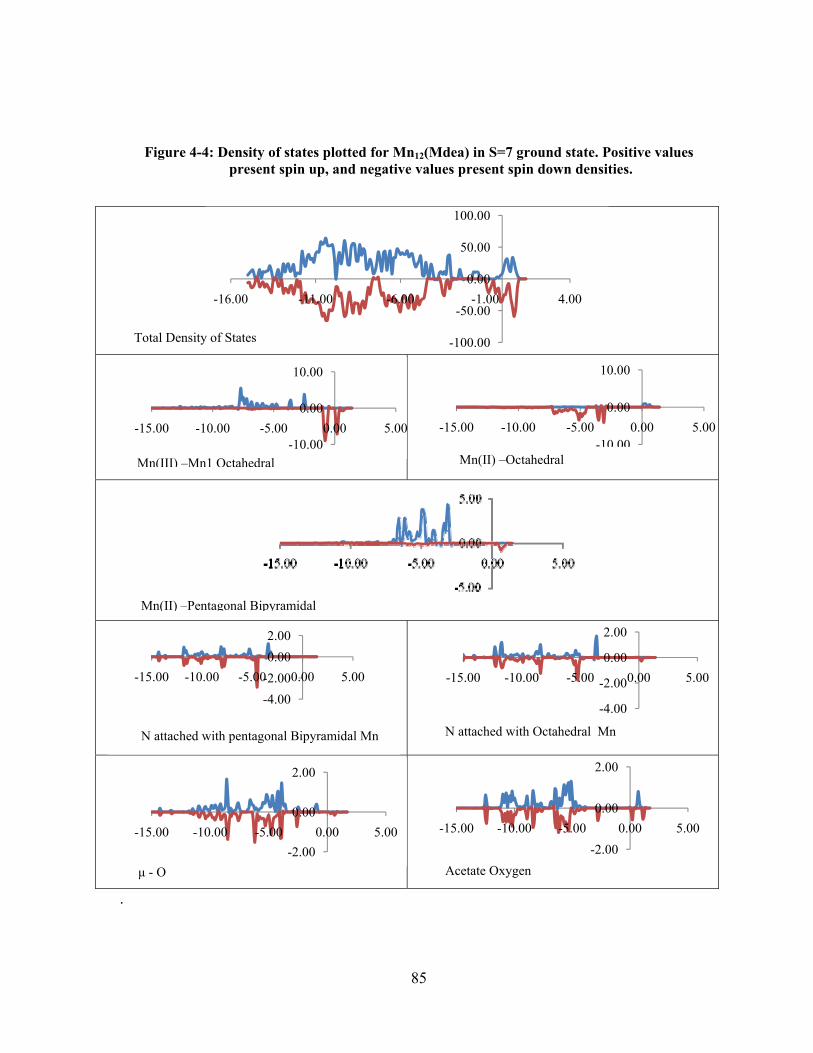
85
Figure 4-4: Density of states plotted for Mn12(Mdea) in S=7 ground state. Positive values present spin up, and negative values present spin down densities.
.
-100.00
-50.00
0.00
50.00
100.00
-16.00 -11.00 -6.00 -1.00 4.00
-10.00
0.00
10.00
-15.00 -10.00 -5.00 0.00 5.00-10.00
0.00
10.00
-15.00 -10.00 -5.00 0.00 5.00
-4.00-2.000.002.00
-15.00 -10.00 -5.00 0.00 5.00
-4.00
-2.00
0.00
2.00
-15.00 -10.00 -5.00 0.00 5.00
-2.00
0.00
2.00
-15.00 -10.00 -5.00 0.00 5.00-2.00
0.00
2.00
-15.00 -10.00 -5.00 0.00 5.00
Total Density of States
Mn(III) –Mn1 Octahedral Mn(II) –Octahedral
N attached with pentagonal Bipyramidal Mn
μ - O Acetate Oxygen
N attached with Octahedral Mn
Mn(II) –Pentagonal Bipyramidal
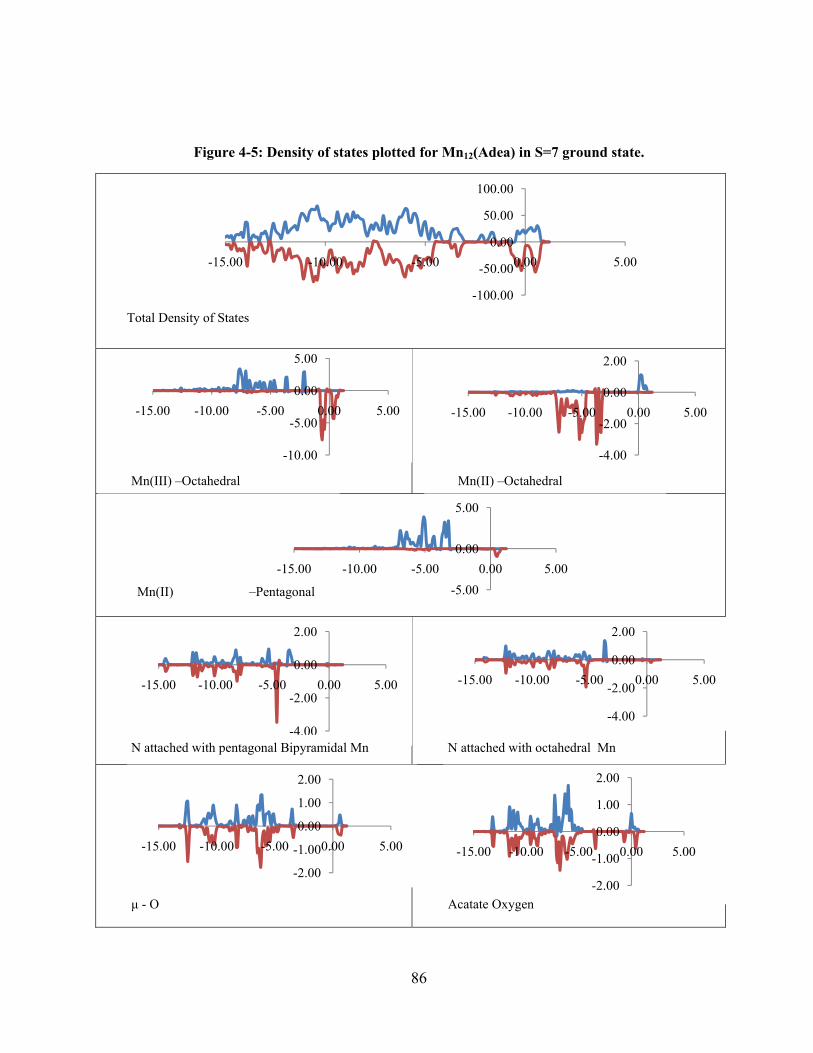
86
Figure 4-5: Density of states plotted for Mn12(Adea) in S=7 ground state.
Total Density of States
-100.00
-50.00
0.00
50.00
100.00
-15.00 -10.00 -5.00 0.00 5.00
-10.00
-5.00
0.00
5.00
-15.00 -10.00 -5.00 0.00 5.00
-4.00
-2.00
0.00
2.00
-15.00 -10.00 -5.00 0.00 5.00
-5.00
0.00
5.00
-15.00 -10.00 -5.00 0.00 5.00
-4.00
-2.00
0.00
2.00
-15.00 -10.00 -5.00 0.00 5.00
-4.00
-2.00
0.00
2.00
-15.00 -10.00 -5.00 0.00 5.00
-2.00
-1.00
0.00
1.00
2.00
-15.00 -10.00 -5.00 0.00 5.00
-2.00
-1.00
0.00
1.00
2.00
-15.00 -10.00 -5.00 0.00 5.00
Mn(II) –Octahedral Mn(III) –Octahedral
N attached with pentagonal Bipyramidal Mn N attached with octahedral Mn
μ - O Acatate Oxygen
Mn(II) –Pentagonal
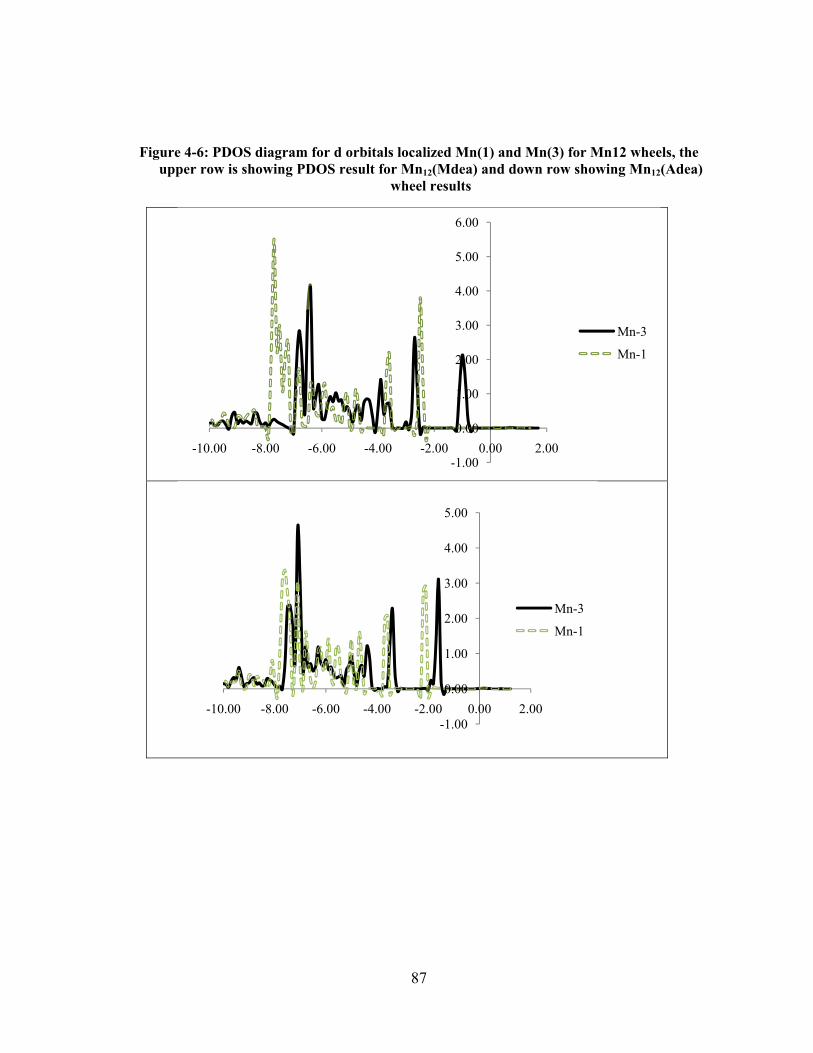
87
Figure 4-6: PDOS diagram for d orbitals localized Mn(1) and Mn(3) for Mn12 wheels, the upper row is showing PDOS result for Mn12(Mdea) and down row showing Mn12(Adea)
wheel results
-1.00
0.00
1.00
2.00
3.00
4.00
5.00
6.00
-10.00 -8.00 -6.00 -4.00 -2.00 0.00 2.00
Mn-3
Mn-1
-1.00
0.00
1.00
2.00
3.00
4.00
5.00
-10.00 -8.00 -6.00 -4.00 -2.00 0.00 2.00
Mn-3
Mn-1
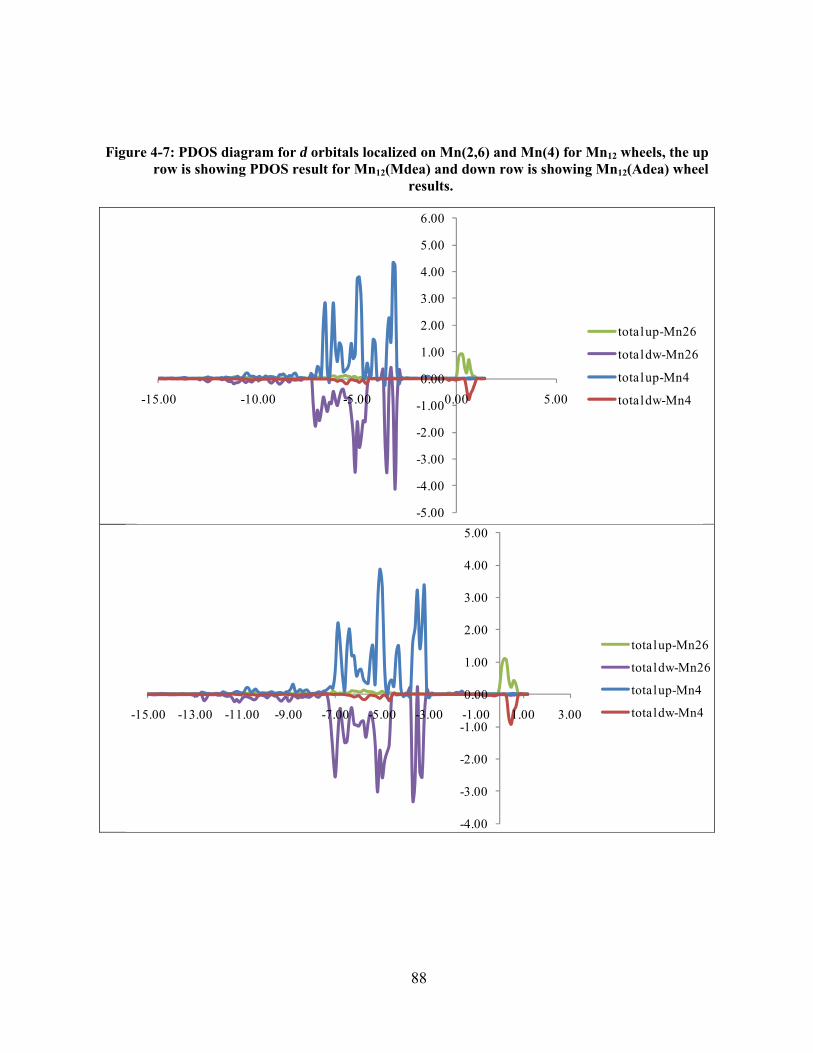
88
Figure 4-7: PDOS diagram for d orbitals localized on Mn(2,6) and Mn(4) for Mn12 wheels, the up row is showing PDOS result for Mn12(Mdea) and down row is showing Mn12(Adea) wheel
results.
-5.00
-4.00
-3.00
-2.00
-1.00
0.00
1.00
2.00
3.00
4.00
5.00
6.00
-15.00 -10.00 -5.00 0.00 5.00
total up-Mn26
total dw-Mn26
total up-Mn4
total dw-Mn4
-4.00
-3.00
-2.00
-1.00
0.00
1.00
2.00
3.00
4.00
5.00
-15.00 -13.00 -11.00 -9.00 -7.00 -5.00 -3.00 -1.00 1.00 3.00
total up-Mn26
total dw-Mn26
total up-Mn4
total dw-Mn4
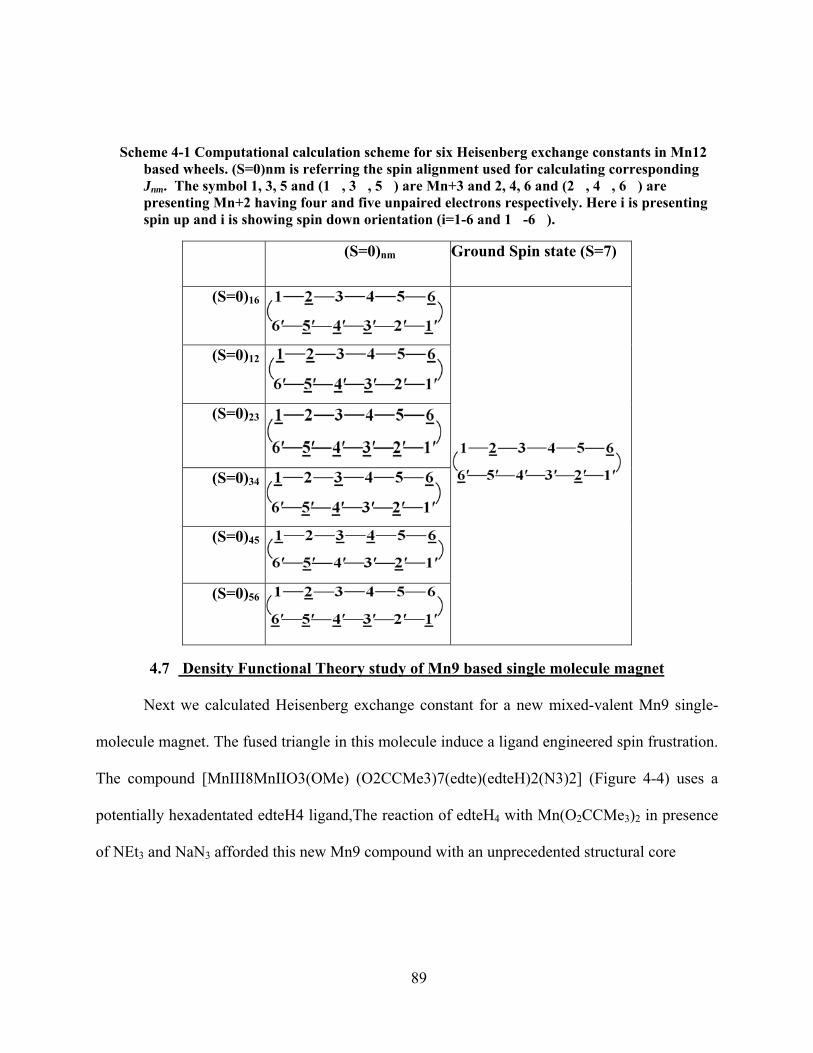
89
Scheme 4-1 Computational calculation scheme for six Heisenberg exchange constants in Mn12 based wheels. (S=0)nm is referring the spin alignment used for calculating corresponding Jnm. The symbol 1, 3, 5 and (1�, 3�, 5�) are Mn+3 and 2, 4, 6 and (2�, 4�, 6�) are presenting Mn+2 having four and five unpaired electrons respectively. Here i is presenting spin up and i is showing spin down orientation (i=1-6 and 1�-6�).
(S=0)nm Ground Spin state (S=7)
(S=0)16
(S=0)12
(S=0)23
(S=0)34
(S=0)45
(S=0)56
4.7 Density Functional Theory study of Mn9 based single molecule magnet
Next we calculated Heisenberg exchange constant for a new mixed-valent Mn9 single-
molecule magnet. The fused triangle in this molecule induce a ligand engineered spin frustration.
The compound [MnIII8MnIIO3(OMe) (O2CCMe3)7(edte)(edteH)2(N3)2] (Figure 4-4) uses a
potentially hexadentated edteH4 ligand,The reaction of edteH4 with Mn(O2CCMe3)2 in presence
of NEt3 and NaN3 afforded this new Mn9 compound with an unprecedented structural core
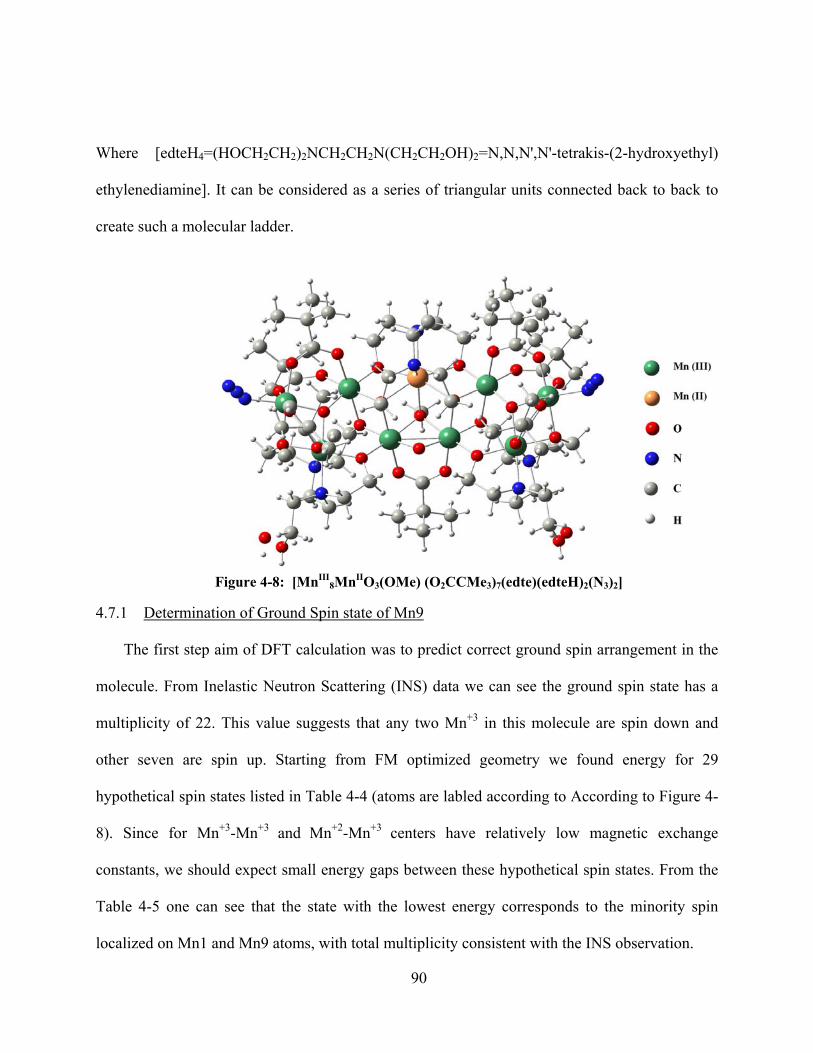
90
Where [edteH4=(HOCH2CH2)2NCH2CH2N(CH2CH2OH)2=N,N,N',N'-tetrakis-(2-hydroxyethyl)
ethylenediamine]. It can be considered as a series of triangular units connected back to back to
create such a molecular ladder.
Figure 4-8: [MnIII
8MnIIO3(OMe) (O2CCMe3)7(edte)(edteH)2(N3)2]
4.7.1 Determination of Ground Spin state of Mn9
The first step aim of DFT calculation was to predict correct ground spin arrangement in the
molecule. From Inelastic Neutron Scattering (INS) data we can see the ground spin state has a
multiplicity of 22. This value suggests that any two Mn+3 in this molecule are spin down and
other seven are spin up. Starting from FM optimized geometry we found energy for 29
hypothetical spin states listed in Table 4-4 (atoms are labled according to According to Figure 4-
8). Since for Mn+3-Mn+3 and Mn+2-Mn+3 centers have relatively low magnetic exchange
constants, we should expect small energy gaps between these hypothetical spin states. From the
Table 4-5 one can see that the state with the lowest energy corresponds to the minority spin
localized on Mn1 and Mn9 atoms, with total multiplicity consistent with the INS observation.
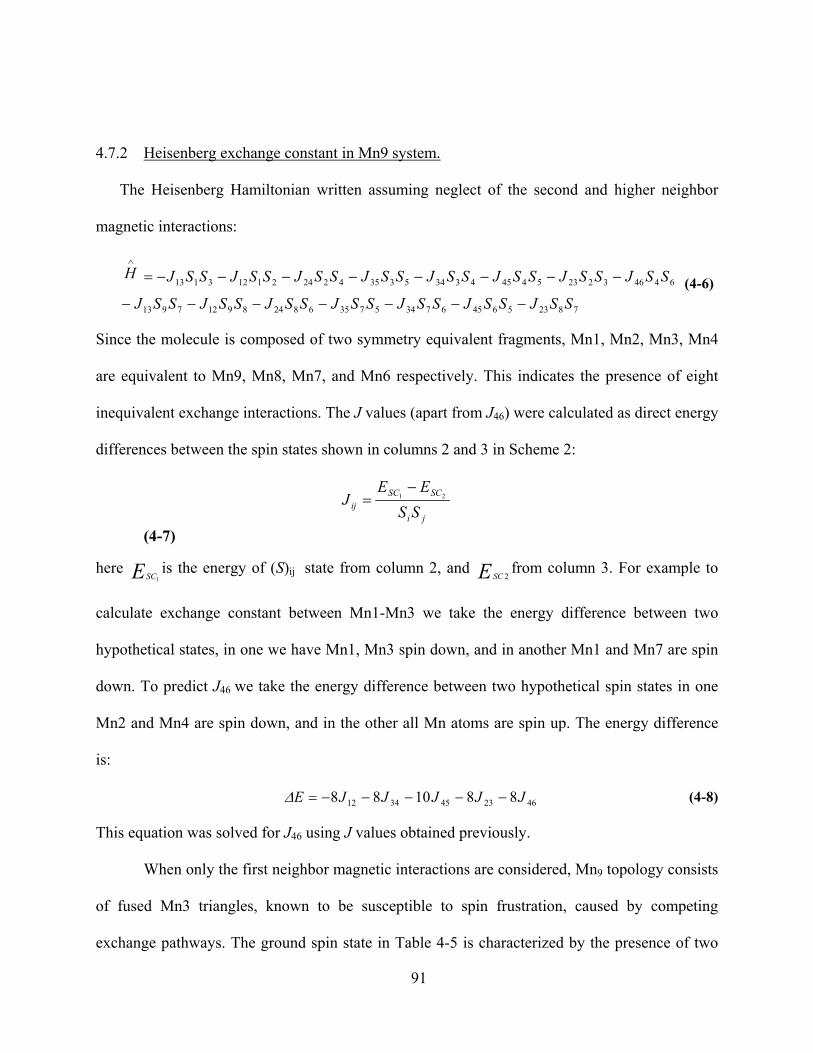
91
4.7.2 Heisenberg exchange constant in Mn9 system.
The Heisenberg Hamiltonian written assuming neglect of the second and higher neighbor
magnetic interactions:
7823564567345735682489127913
64463223544543345335422421123113
SSJSSJSSJSSJSSJSSJSSJ
SSJSSJSSJSSJSSJSSJSSJSSJH
−−−−−−−
−−−−−−−−=∧
(4-6)
Since the molecule is composed of two symmetry equivalent fragments, Mn1, Mn2, Mn3, Mn4
are equivalent to Mn9, Mn8, Mn7, and Mn6 respectively. This indicates the presence of eight
inequivalent exchange interactions. The J values (apart from J46) were calculated as direct energy
differences between the spin states shown in columns 2 and 3 in Scheme 2:
ji
SCSCij SS
EEJ 21
−=
(4-7)
here ESC1is the energy of (S)ij state from column 2, and ESC 2
from column 3. For example to
calculate exchange constant between Mn1-Mn3 we take the energy difference between two
hypothetical states, in one we have Mn1, Mn3 spin down, and in another Mn1 and Mn7 are spin
down. To predict J46 we take the energy difference between two hypothetical spin states in one
Mn2 and Mn4 are spin down, and in the other all Mn atoms are spin up. The energy difference
is:
4623453412 881088 JJJJJE −−−−−=Δ (4-8)
This equation was solved for J46 using J values obtained previously.
When only the first neighbor magnetic interactions are considered, Mn9 topology consists
of fused Mn3 triangles, known to be susceptible to spin frustration, caused by competing
exchange pathways. The ground spin state in Table 4-5 is characterized by the presence of two
92
AF couplings between Mn1/Mn3 and Mn1/Mn2, while the rest are FM. The calculated J12
(Mn1/Mn2) interactions in Table 4-6 are negative (AF) with spin couplings of c.a. -16.87 cm-1, as
expected for antiparallel alignments). The rest of the couplings (ranging from 1.14 cm-1 to 27.32
cm-1) are FM.
Coupling for two multielectron spin centers was expressed by Clark and Davidson as:212
[ ])1()1()1(21
+−+−+= jjiiTTij SSSSSSJ (4-9)
where Si and Sj coupled together to give a total spin ST (ST =Si+Sj). One can compare J predicted
by Eq.4-9 for two adjacent spins. For a Mn+2/Mn+3, and Mn+3/Mn+3 pairs aligned parallel, the
spin couplings from Eq 4-9 are 5 and 4., respectively. The calculated J13 Mn1/Mn3 interactions
in Table 4-6 are positive (ferromagnetic) with spin couplings of 7.48 cm-1. However, the J13
(Mn1/Mn3) interactions of the Mn1Mn3, pair in Table 4-6 are ferromagnetic, and yet their J are
very negative (-3.84 cm-1). This means that these ferromagnetic interactions are completely
frustrated, and the spins are aligned antiparallel. Here we can see the azide ligand induced spin
frustration present in Mn1, Mn2, Mn3 containing triangle, showed in Figure 4-9.
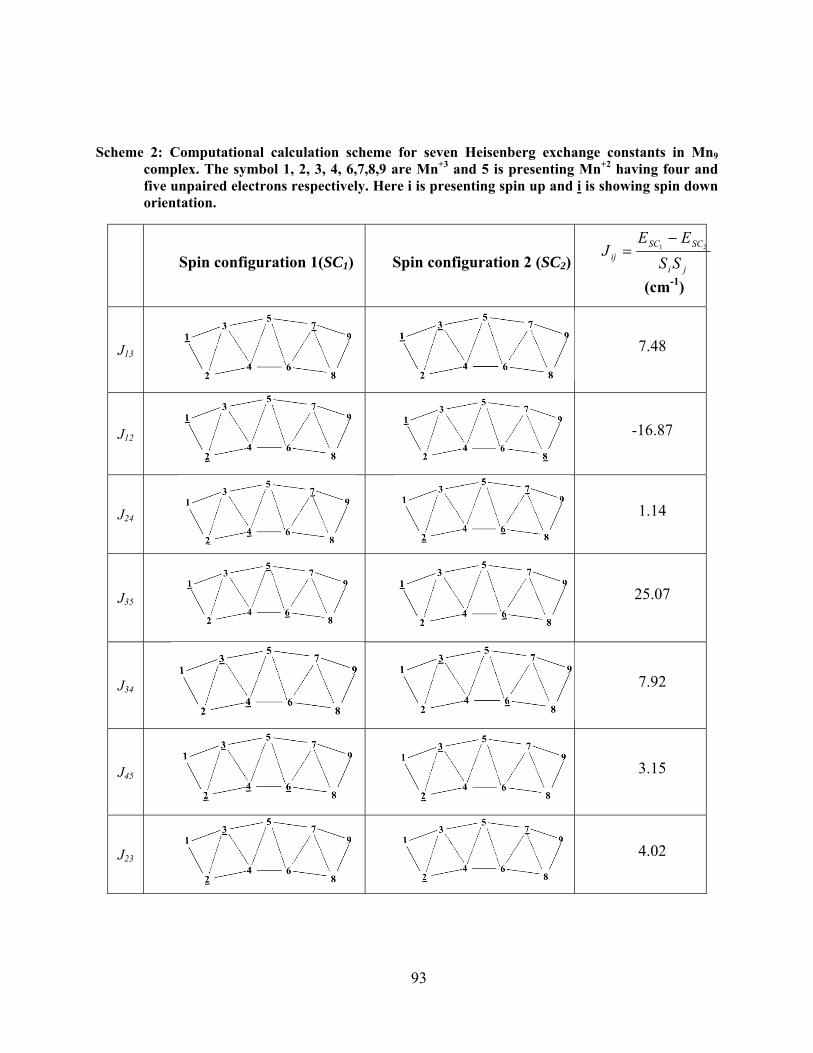
93
Scheme 2: Computational calculation scheme for seven Heisenberg exchange constants in Mn9 complex. The symbol 1, 2, 3, 4, 6,7,8,9 are Mn+3 and 5 is presenting Mn+2 having four and five unpaired electrons respectively. Here i is presenting spin up and i is showing spin down orientation.
Spin configuration 1(SC1) Spin configuration 2 (SC2) ji
SCSCij SS
EEJ 21
−=
(cm-1)
J13 7.48
J12 -16.87
J24
1.14
J35
25.07
J34 7.92
J45
3.15
J23
4.02
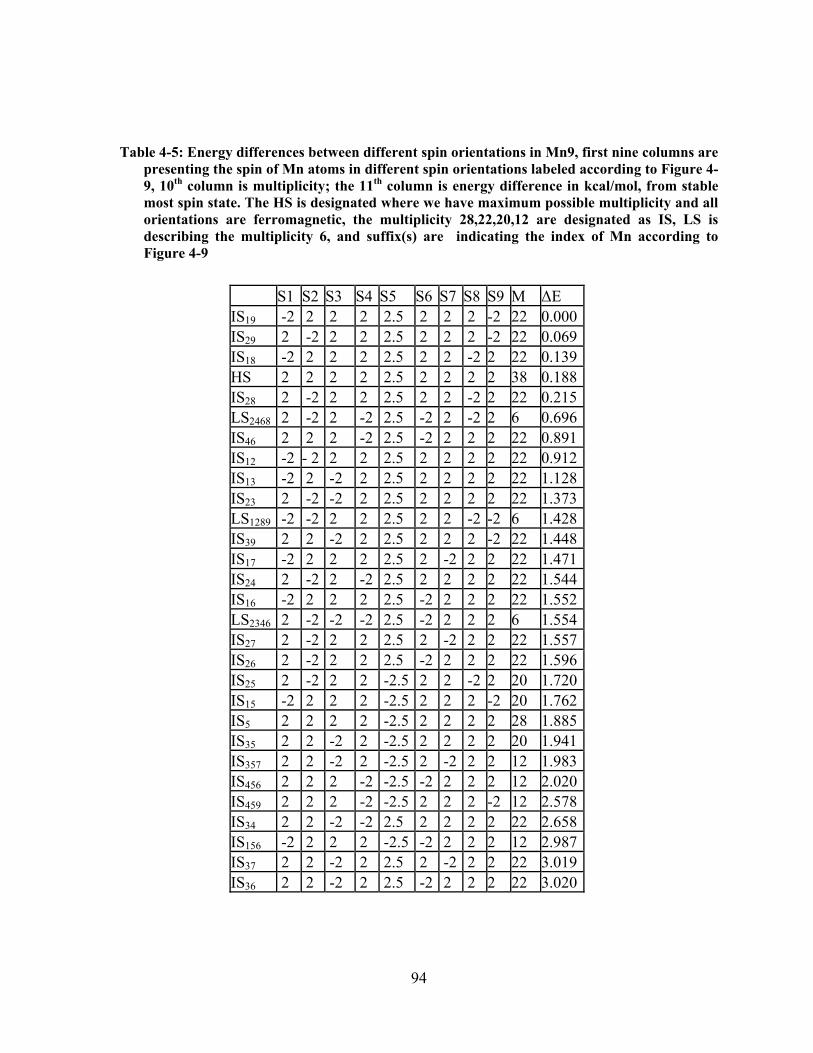
94
Table 4-5: Energy differences between different spin orientations in Mn9, first nine columns are presenting the spin of Mn atoms in different spin orientations labeled according to Figure 4-9, 10th column is multiplicity; the 11th column is energy difference in kcal/mol, from stable most spin state. The HS is designated where we have maximum possible multiplicity and all orientations are ferromagnetic, the multiplicity 28,22,20,12 are designated as IS, LS is describing the multiplicity 6, and suffix(s) are indicating the index of Mn according to Figure 4-9
S1 S2 S3 S4 S5 S6 S7 S8 S9 M ΔE IS19 -2 2 2 2 2.5 2 2 2 -2 22 0.000 IS29 2 -2 2 2 2.5 2 2 2 -2 22 0.069 IS18 -2 2 2 2 2.5 2 2 -2 2 22 0.139 HS 2 2 2 2 2.5 2 2 2 2 38 0.188 IS28 2 -2 2 2 2.5 2 2 -2 2 22 0.215 LS2468 2 -2 2 -2 2.5 -2 2 -2 2 6 0.696 IS46 2 2 2 -2 2.5 -2 2 2 2 22 0.891 IS12 -2 - 2 2 2 2.5 2 2 2 2 22 0.912 IS13 -2 2 -2 2 2.5 2 2 2 2 22 1.128 IS23 2 -2 -2 2 2.5 2 2 2 2 22 1.373 LS1289 -2 -2 2 2 2.5 2 2 -2 -2 6 1.428 IS39 2 2 -2 2 2.5 2 2 2 -2 22 1.448 IS17 -2 2 2 2 2.5 2 -2 2 2 22 1.471 IS24 2 -2 2 -2 2.5 2 2 2 2 22 1.544 IS16 -2 2 2 2 2.5 -2 2 2 2 22 1.552 LS2346 2 -2 -2 -2 2.5 -2 2 2 2 6 1.554 IS27 2 -2 2 2 2.5 2 -2 2 2 22 1.557 IS26 2 -2 2 2 2.5 -2 2 2 2 22 1.596 IS25 2 -2 2 2 -2.5 2 2 -2 2 20 1.720 IS15 -2 2 2 2 -2.5 2 2 2 -2 20 1.762 IS5 2 2 2 2 -2.5 2 2 2 2 28 1.885 IS35 2 2 -2 2 -2.5 2 2 2 2 20 1.941 IS357 2 2 -2 2 -2.5 2 -2 2 2 12 1.983 IS456 2 2 2 -2 -2.5 -2 2 2 2 12 2.020 IS459 2 2 2 -2 -2.5 2 2 2 -2 12 2.578 IS34 2 2 -2 -2 2.5 2 2 2 2 22 2.658 IS156 -2 2 2 2 -2.5 -2 2 2 2 12 2.987 IS37 2 2 -2 2 2.5 2 -2 2 2 22 3.019 IS36 2 2 -2 2 2.5 -2 2 2 2 22 3.020
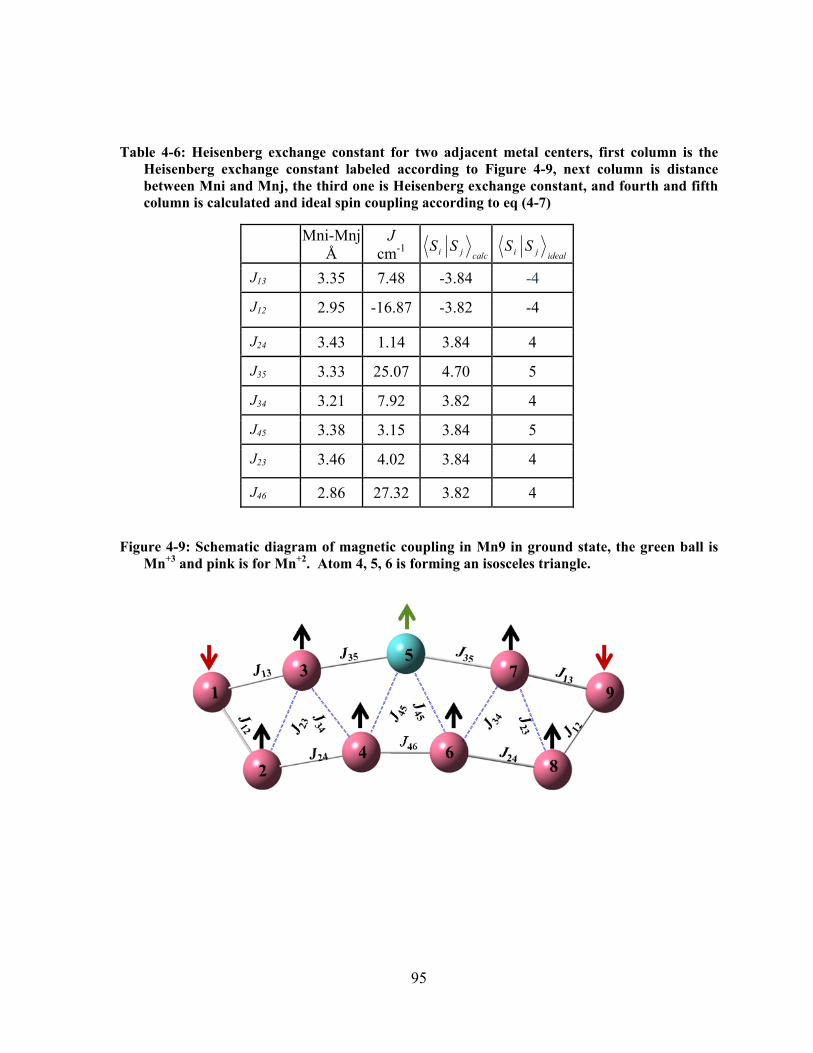
95
Table 4-6: Heisenberg exchange constant for two adjacent metal centers, first column is the Heisenberg exchange constant labeled according to Figure 4-9, next column is distance between Mni and Mnj, the third one is Heisenberg exchange constant, and fourth and fifth column is calculated and ideal spin coupling according to eq (4-7)
Mni-MnjÅ
J cm-1 calcji SS
idealji SS
J13 3.35 7.48 -3.84 -4
J12 2.95 -16.87 -3.82 -4
J24 3.43 1.14 3.84 4
J35 3.33 25.07 4.70 5
J34 3.21 7.92 3.82 4
J45 3.38 3.15 3.84 5
J23 3.46 4.02 3.84 4
J46 2.86 27.32 3.82 4
Figure 4-9: Schematic diagram of magnetic coupling in Mn9 in ground state, the green ball is Mn+3 and pink is for Mn+2. Atom 4, 5, 6 is forming an isosceles triangle.
96
CHAPTER 5 HYBRID DENSITY FUNCTIONAL THEORY STUDIES OF STRUCTURE AND PROPERTIES OF CERIA NANOPARTICLES.I.
LATTICE PARAMETERS AND BULK MODULI
5.1 Cerium oxides and its property
Unique chemical and electronic properties of the mixed cerium oxide, generally known as
ceria, make it an important material for number of applications. Ceria is used as a catalyst for
various chemical processes, including production and purification of hydrogen, 213 and carbon
monoxide removal from the automobile exhaust.214 Mobility of oxygen vacancies and
consequently high ionic conductivity makes ceria a promising electrolyte for solid oxide fuel
cells.215 Electronic structure of ceria leads to its use as UV absorber in cosmetic industry and
manufacturing of glass windows. 81 It is also used in light harvesting devices and optical
displays. 81 In most of the process the oxygen vacancies play essential role.
Bulk cerium oxide has at least two stable stoichiometries, the dioxide (CeO2) and
dicerium trioxide which is commonly referred as sesquioxide (Ce2O3). At ambient conditions
dioxide forms CaF2 (fluorite) type structure in face centered cubic space group Fm-3m with the
lattice parameter of 5.411Å. 216 In that structure cerium ions occupy the vertices and faces of
cubic unit cell. Each Ce(IV) is coordinated with eight oxygen ions arranged in a perfect cube,
while each oxygen ion is surrounded by four cerium ions in tetrahedral arrangement. This
structure is often described as cubic closed packing (ccp) of Cerium ions with oxygen ions
occupying all tetrahedral holes. At the elevated pressure (31 GPa and room temperature) cerium
dioxide undergoes phase transition from fluorite to α-PbCl2 structure type with orthorhombic
space group Pnam .72 Another structural type (δ-Ni2Si) had also been suggested. Both α-PbCl2
97
and δ-Ni2Si types have similar positions of Ce ions and only differ in the position of oxygen
ions. Neither Raman spectroscopy, nor X-ray diffraction are sensitive enough to the the position
of of light oxygen ions in the presence heavy ones, so the direct evidence is missing. However,
based on axial ratios, high pressure polymorph of cerium dioxide was found more unlikely to
belong to α-PbCl2 structural type. 217 In α-PbCl2 type structure seven anions at roughly the same
separation and two at a slightly larger separation from the cation, which is denoted as [7+2]
coordination. There are two anion coordinations, one of which is four coordinate and the other is
five coordinate. 217
At 3000C cerium dioxide is stable in bulk at partial oxygen pressure down to 10-40 atm.
Cerium sesquioxide Ce2O3 had been reported to form at same temperature and in between 10-98
atm to 10-40 atm. 70 Similar to other trivalent lanthanide oxides, Ce(III) oxide was found to have
two different crystal structures: one is A type with nearly hexagonal close packing to Ce ions
(hcp), and the other is C type with body centered cubic (bcc) packing of Ce ions. Barnighausen
and Schiller reported 218 structure determination for A type cerium sesquioxide from single-
crystal X-ray diffraction study. Amber colored well-shaped plate-like crystals were obtained by
heating a mixture of LiCeO2, CeO2, and anhydrous LiCl in a closed steel crucible temperatures
between 700-8000C for several weeks. It has P-32/m1 space group with the lattice parameters
a=3.891Å and c=6.059Å. 218 In the type A structure every metal ion is coordinated with seven
oxygen ions; four oxygen ions are closer than other three. The former are five-coordinated and
the latter are four-coordinated.
C type Ce2O3 structure is formed at room temperature in a few hours on the surfaces of
the Ce metal left in the air. 219 The C type has space group Ia3 with the lattice parameter of 11.16
98
Å. Its unit cell contains 32 metal ions and 48 oxygen ions. The existence of type C cerium
sesquioxide in bulk is controversial. However, X-ray diffraction study of nanopowder with
particles below certain size indicates C type structure. An X-ray photo-electron spectroscopic
study reports the lattice parameter of nanoscale sesqioxide to be 5.61 Å, just half of C type unit
cell 81. From this evidence one may conclude that type C cerium sesquioxide may only exist in
the nanoparticle form. It is recognized that from A type sesquioxide to dioxide conversion is so
exothermic spontaneous ignition was often observed, CeO2 hardly dissolved in acids and alkali
but reacts with water. 220
Ceria NPs (nanoceria) had been extensively studied since early 1970s, but for inadequate
characterization facility those cannot be properly characterized, in recent years with the
development of experimental techniques as well as the help of theoretical studies this area is
much widly explored. In a review article it is told that from June 1993 to end of 1998, there was
560 paper had been published.67 Basically in theoretical field from mid 1990 simulated annealing
and interionic potentials are used to investigate the structure and reductability of intermediate
valance ceria nanoparticle.68 The most applications of nanocrystalline ceria are based on its
oxygen storage capacity and electronic properties. Although CeO2 has a wide band gap of 6 eV 69
and acts as an insulator, in the higher temperature region (3000C-4000C) and in reduced
oxidation state it demonstrates an enhancement of the electric conductivity,60which is a
disadvantage for some applications. Adachi in his review referred that composite contained
nano particle 4.1nm having band gap 3.42 eV and with 5.37nm nanoparticle it is 3.37eV.70
Like bulk ceria nano cerium dioxide also exhibit phase transition from fluorite phase to
orthorhombic phase , the lattice papmeter of the orthorhombic phase is a=5.641Å, b=6.647Å,
99
c=3.481Å , but the difference is nano cerium dioxide shows bulk modulus 328 ±12 GPa 71 in
contrast with bulk cerium dioxide 230 GPa. The phase transition pressure ( 22.3 GPa) is also
very low compared with bulk one (31 GPa), 72 this observation is quite anomolas with other
nano oxide and sulfides , the author suggested that larger volume collapse and exsistance of
unstable high pressure phase is responsible for the decrese of transition pressure of nano
cerium dioxide compared with bulk. 71
Nanoceria used in design a three way catalyst for automobile exhaust, 73 since ceria
catalytically oxidizes hydrocarbons to water, carbon monoxide to dioxide and nitrogen oxides to
nitrogen. Ceria NPs are also used for water gas shift, steam reforming reaction, and carbon
monoxide removal. 73 The oxygen vacancies play an important role for the catalytic activity of
ceria. Zirconia doped ceria (CeO2/ZrO2 solid solution) can operate at relatively lower
temperature around 6000C than pure ceria catalyst. 74
5.2 Structural relations between cerium oxides.
To illustrate the relationship between fluorite and other structural types of ceria it is
advantageous to consider it in hexagonal aspect. 221 One can start with hexagonal close-packed
layers of Cerium ions, then sandwich them between two hexagonal layers of O ions (one on each
side) in ABC motiff. In this construct (called thereafter "sandwich trilayer") Ce ions have
octahedral coordination, compressed along 3-fold symmetry axis in the real structure (Figure 5-
2). Three dimensional fluorite structure is then formed by stacking of these sandwich trilayers
(Figure 5-3). If only Ce layers are considered, they form ABC packing (the cubic structure). If
both Ce and O layers are considered, the stacking can be described as CABABCBCA (Ce layers
are marked in bold). Upon this stacking distorted octahedral coordination of each Ce ion is
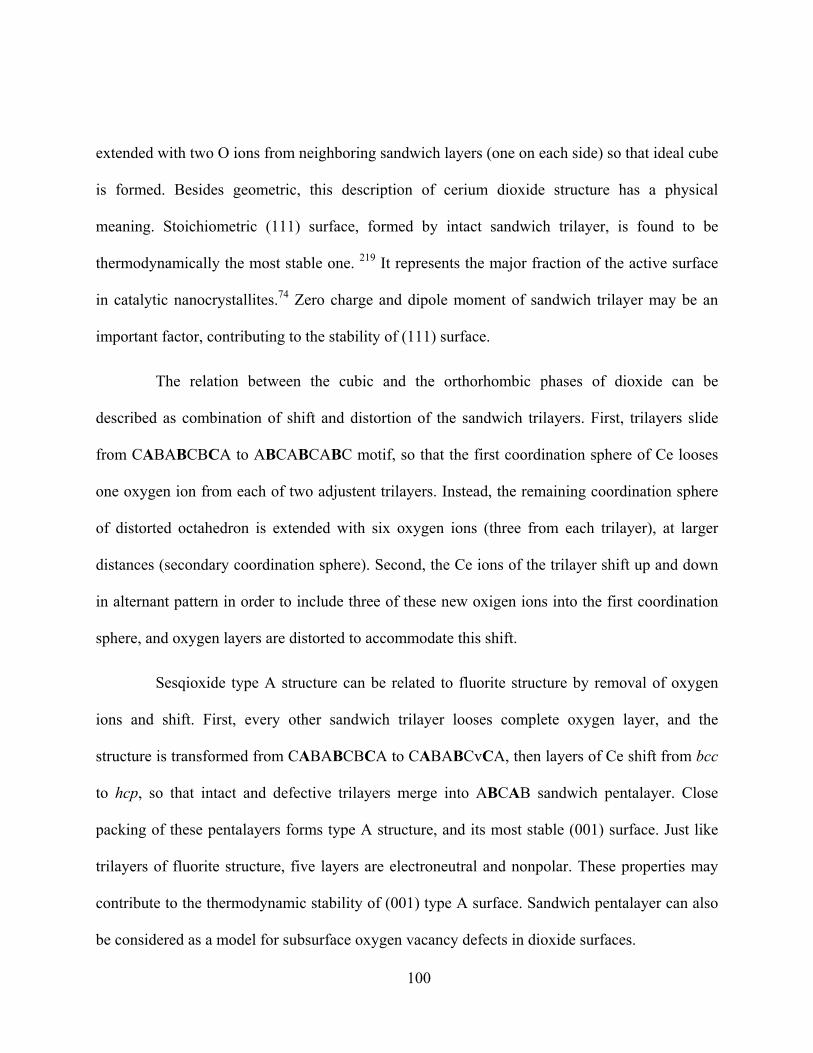
100
extended with two O ions from neighboring sandwich layers (one on each side) so that ideal cube
is formed. Besides geometric, this description of cerium dioxide structure has a physical
meaning. Stoichiometric (111) surface, formed by intact sandwich trilayer, is found to be
thermodynamically the most stable one. 219 It represents the major fraction of the active surface
in catalytic nanocrystallites.74 Zero charge and dipole moment of sandwich trilayer may be an
important factor, contributing to the stability of (111) surface.
The relation between the cubic and the orthorhombic phases of dioxide can be
described as combination of shift and distortion of the sandwich trilayers. First, trilayers slide
from CABABCBCA to ABCABCABC motif, so that the first coordination sphere of Ce looses
one oxygen ion from each of two adjustent trilayers. Instead, the remaining coordination sphere
of distorted octahedron is extended with six oxygen ions (three from each trilayer), at larger
distances (secondary coordination sphere). Second, the Ce ions of the trilayer shift up and down
in alternant pattern in order to include three of these new oxigen ions into the first coordination
sphere, and oxygen layers are distorted to accommodate this shift.
Sesqioxide type A structure can be related to fluorite structure by removal of oxygen
ions and shift. First, every other sandwich trilayer looses complete oxygen layer, and the
structure is transformed from CABABCBCA to CABABCvCA, then layers of Ce shift from bcc
to hcp, so that intact and defective trilayers merge into ABCAB sandwich pentalayer. Close
packing of these pentalayers forms type A structure, and its most stable (001) surface. Just like
trilayers of fluorite structure, five layers are electroneutral and nonpolar. These properties may
contribute to the thermodynamic stability of (001) type A surface. Sandwich pentalayer can also
be considered as a model for subsurface oxygen vacancy defects in dioxide surfaces.
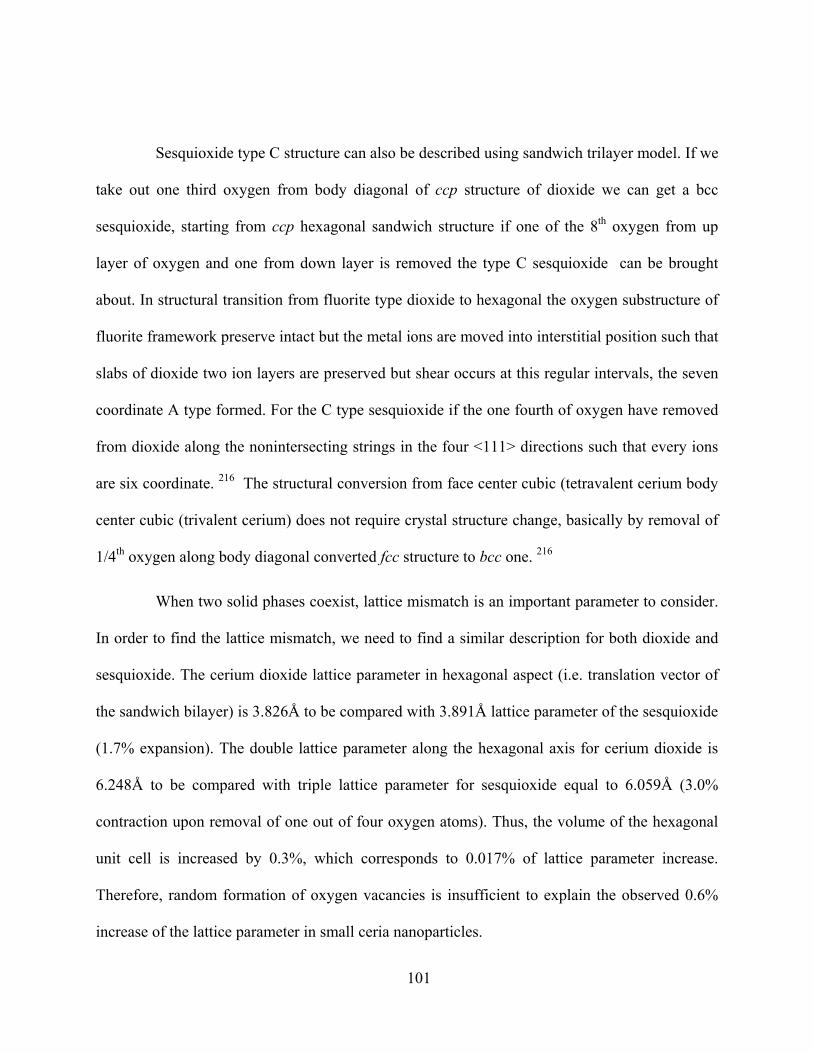
101
Sesquioxide type C structure can also be described using sandwich trilayer model. If we
take out one third oxygen from body diagonal of ccp structure of dioxide we can get a bcc
sesquioxide, starting from ccp hexagonal sandwich structure if one of the 8th oxygen from up
layer of oxygen and one from down layer is removed the type C sesquioxide can be brought
about. In structural transition from fluorite type dioxide to hexagonal the oxygen substructure of
fluorite framework preserve intact but the metal ions are moved into interstitial position such that
slabs of dioxide two ion layers are preserved but shear occurs at this regular intervals, the seven
coordinate A type formed. For the C type sesquioxide if the one fourth of oxygen have removed
from dioxide along the nonintersecting strings in the four <111> directions such that every ions
are six coordinate. 216 The structural conversion from face center cubic (tetravalent cerium body
center cubic (trivalent cerium) does not require crystal structure change, basically by removal of
1/4th oxygen along body diagonal converted fcc structure to bcc one. 216
When two solid phases coexist, lattice mismatch is an important parameter to consider.
In order to find the lattice mismatch, we need to find a similar description for both dioxide and
sesquioxide. The cerium dioxide lattice parameter in hexagonal aspect (i.e. translation vector of
the sandwich bilayer) is 3.826Å to be compared with 3.891Å lattice parameter of the sesquioxide
(1.7% expansion). The double lattice parameter along the hexagonal axis for cerium dioxide is
6.248Å to be compared with triple lattice parameter for sesquioxide equal to 6.059Å (3.0%
contraction upon removal of one out of four oxygen atoms). Thus, the volume of the hexagonal
unit cell is increased by 0.3%, which corresponds to 0.017% of lattice parameter increase.
Therefore, random formation of oxygen vacancies is insufficient to explain the observed 0.6%
increase of the lattice parameter in small ceria nanoparticles.
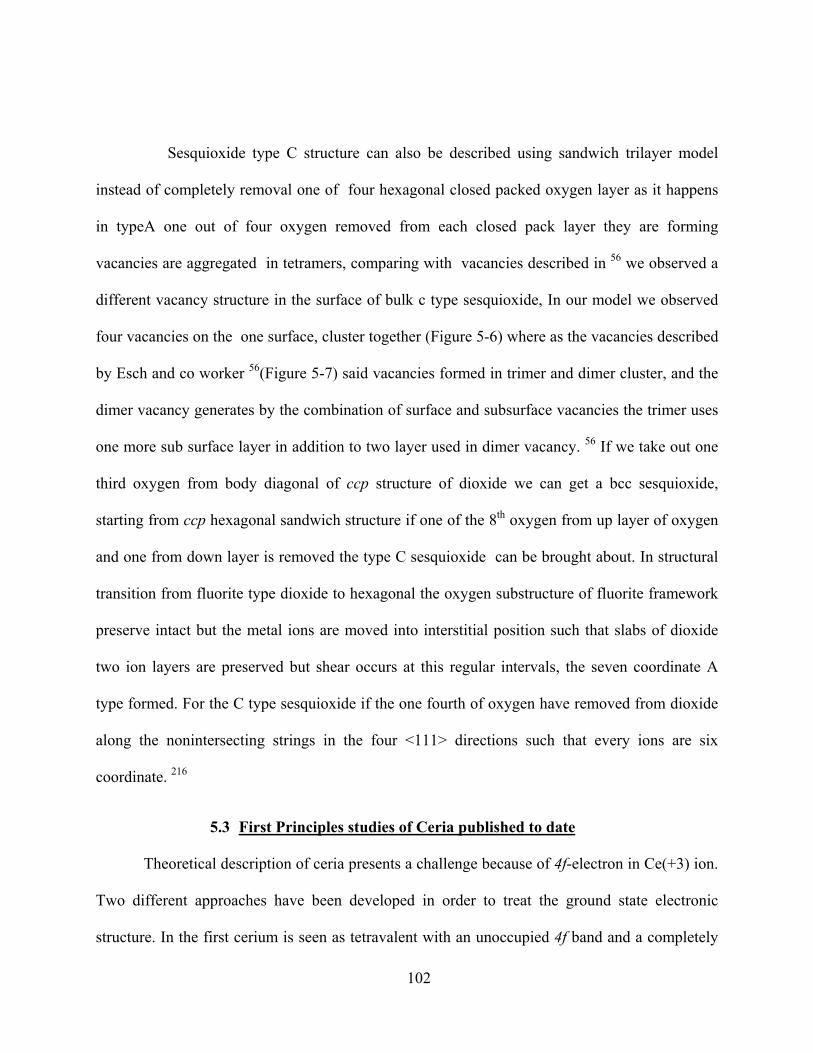
102
Sesquioxide type C structure can also be described using sandwich trilayer model
instead of completely removal one of four hexagonal closed packed oxygen layer as it happens
in typeA one out of four oxygen removed from each closed pack layer they are forming
vacancies are aggregated in tetramers, comparing with vacancies described in 56 we observed a
different vacancy structure in the surface of bulk c type sesquioxide, In our model we observed
four vacancies on the one surface, cluster together (Figure 5-6) where as the vacancies described
by Esch and co worker 56(Figure 5-7) said vacancies formed in trimer and dimer cluster, and the
dimer vacancy generates by the combination of surface and subsurface vacancies the trimer uses
one more sub surface layer in addition to two layer used in dimer vacancy. 56 If we take out one
third oxygen from body diagonal of ccp structure of dioxide we can get a bcc sesquioxide,
starting from ccp hexagonal sandwich structure if one of the 8th oxygen from up layer of oxygen
and one from down layer is removed the type C sesquioxide can be brought about. In structural
transition from fluorite type dioxide to hexagonal the oxygen substructure of fluorite framework
preserve intact but the metal ions are moved into interstitial position such that slabs of dioxide
two ion layers are preserved but shear occurs at this regular intervals, the seven coordinate A
type formed. For the C type sesquioxide if the one fourth of oxygen have removed from dioxide
along the nonintersecting strings in the four <111> directions such that every ions are six
coordinate. 216
5.3 First Principles studies of Ceria published to date
Theoretical description of ceria presents a challenge because of 4f-electron in Ce(+3) ion.
Two different approaches have been developed in order to treat the ground state electronic
structure. In the first cerium is seen as tetravalent with an unoccupied 4f band and a completely
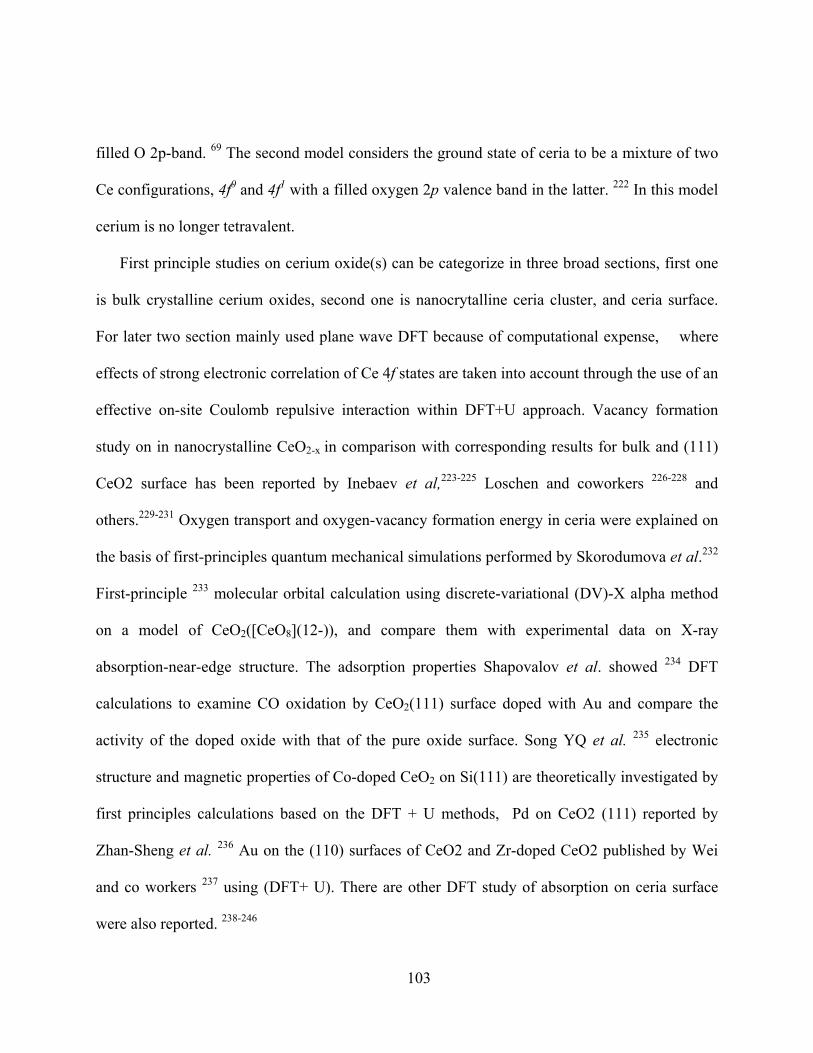
103
filled O 2p-band. 69 The second model considers the ground state of ceria to be a mixture of two
Ce configurations, 4f0 and 4f1 with a filled oxygen 2p valence band in the latter. 222 In this model
cerium is no longer tetravalent.
First principle studies on cerium oxide(s) can be categorize in three broad sections, first one
is bulk crystalline cerium oxides, second one is nanocrytalline ceria cluster, and ceria surface.
For later two section mainly used plane wave DFT because of computational expense, where
effects of strong electronic correlation of Ce 4f states are taken into account through the use of an
effective on-site Coulomb repulsive interaction within DFT+U approach. Vacancy formation
study on in nanocrystalline CeO2-x in comparison with corresponding results for bulk and (111)
CeO2 surface has been reported by Inebaev et al,223-225 Loschen and coworkers 226-228 and
others.229-231 Oxygen transport and oxygen-vacancy formation energy in ceria were explained on
the basis of first-principles quantum mechanical simulations performed by Skorodumova et al.232
First-principle 233 molecular orbital calculation using discrete-variational (DV)-X alpha method
on a model of CeO2([CeO8](12-)), and compare them with experimental data on X-ray
absorption-near-edge structure. The adsorption properties Shapovalov et al. showed 234 DFT
calculations to examine CO oxidation by CeO2(111) surface doped with Au and compare the
activity of the doped oxide with that of the pure oxide surface. Song YQ et al. 235 electronic
structure and magnetic properties of Co-doped CeO2 on Si(111) are theoretically investigated by
first principles calculations based on the DFT + U methods, Pd on CeO2 (111) reported by
Zhan-Sheng et al. 236 Au on the (110) surfaces of CeO2 and Zr-doped CeO2 published by Wei
and co workers 237 using (DFT+ U). There are other DFT study of absorption on ceria surface
were also reported. 238-246
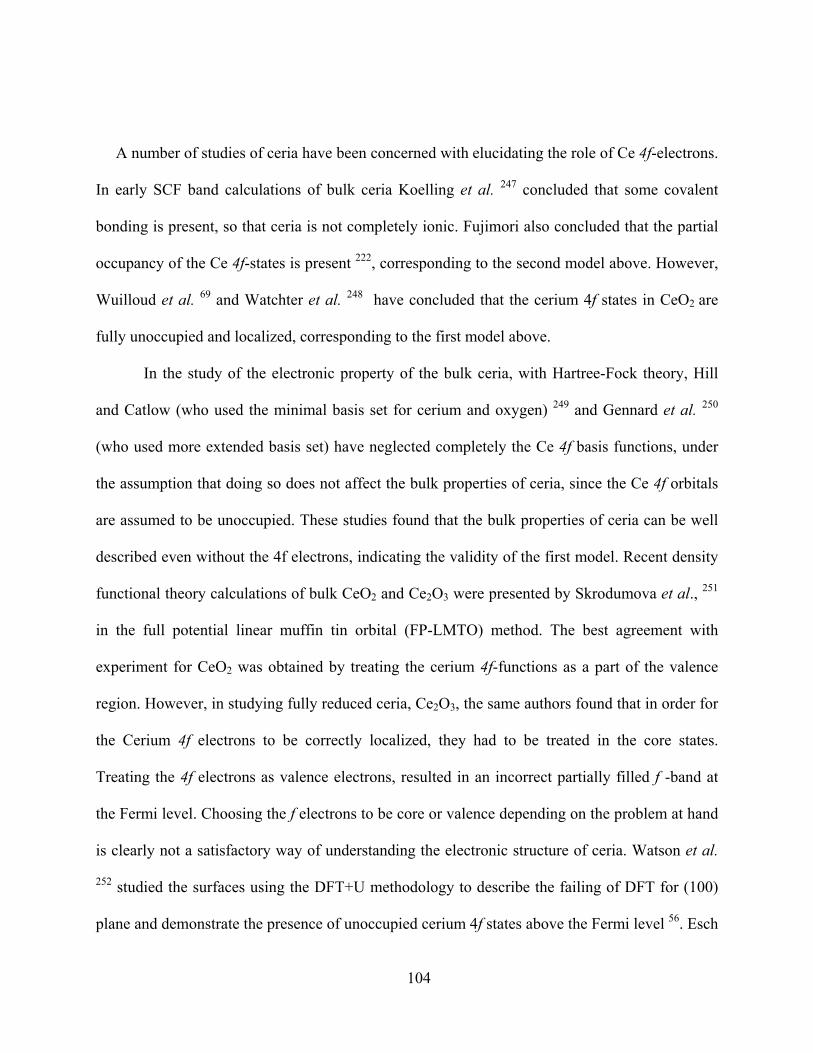
104
A number of studies of ceria have been concerned with elucidating the role of Ce 4f-electrons.
In early SCF band calculations of bulk ceria Koelling et al. 247 concluded that some covalent
bonding is present, so that ceria is not completely ionic. Fujimori also concluded that the partial
occupancy of the Ce 4f-states is present 222, corresponding to the second model above. However,
Wuilloud et al. 69 and Watchter et al. 248 have concluded that the cerium 4f states in CeO2 are
fully unoccupied and localized, corresponding to the first model above.
In the study of the electronic property of the bulk ceria, with Hartree-Fock theory, Hill
and Catlow (who used the minimal basis set for cerium and oxygen) 249 and Gennard et al. 250
(who used more extended basis set) have neglected completely the Ce 4f basis functions, under
the assumption that doing so does not affect the bulk properties of ceria, since the Ce 4f orbitals
are assumed to be unoccupied. These studies found that the bulk properties of ceria can be well
described even without the 4f electrons, indicating the validity of the first model. Recent density
functional theory calculations of bulk CeO2 and Ce2O3 were presented by Skrodumova et al., 251
in the full potential linear muffin tin orbital (FP-LMTO) method. The best agreement with
experiment for CeO2 was obtained by treating the cerium 4f-functions as a part of the valence
region. However, in studying fully reduced ceria, Ce2O3, the same authors found that in order for
the Cerium 4f electrons to be correctly localized, they had to be treated in the core states.
Treating the 4f electrons as valence electrons, resulted in an incorrect partially filled f -band at
the Fermi level. Choosing the f electrons to be core or valence depending on the problem at hand
is clearly not a satisfactory way of understanding the electronic structure of ceria. Watson et al.
252 studied the surfaces using the DFT+U methodology to describe the failing of DFT for (100)
plane and demonstrate the presence of unoccupied cerium 4f states above the Fermi level 56. Esch
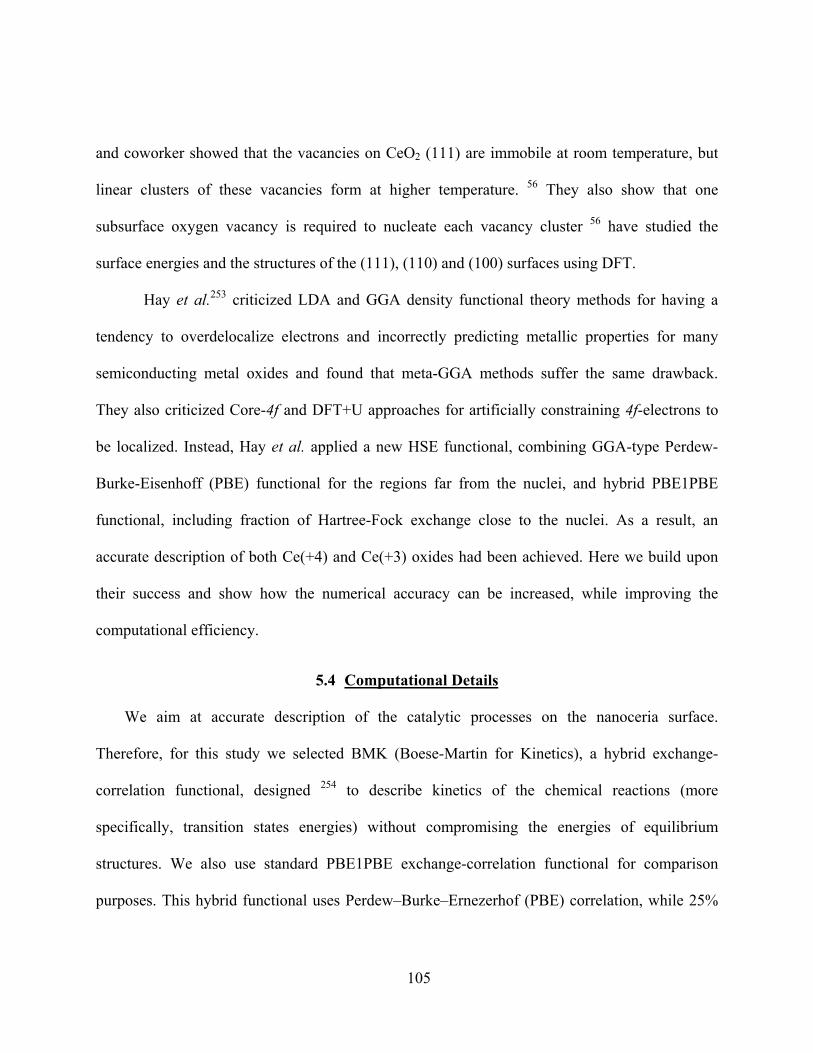
105
and coworker showed that the vacancies on CeO2 (111) are immobile at room temperature, but
linear clusters of these vacancies form at higher temperature. 56 They also show that one
subsurface oxygen vacancy is required to nucleate each vacancy cluster 56 have studied the
surface energies and the structures of the (111), (110) and (100) surfaces using DFT.
Hay et al.253 criticized LDA and GGA density functional theory methods for having a
tendency to overdelocalize electrons and incorrectly predicting metallic properties for many
semiconducting metal oxides and found that meta-GGA methods suffer the same drawback.
They also criticized Core-4f and DFT+U approaches for artificially constraining 4f-electrons to
be localized. Instead, Hay et al. applied a new HSE functional, combining GGA-type Perdew-
Burke-Eisenhoff (PBE) functional for the regions far from the nuclei, and hybrid PBE1PBE
functional, including fraction of Hartree-Fock exchange close to the nuclei. As a result, an
accurate description of both Ce(+4) and Ce(+3) oxides had been achieved. Here we build upon
their success and show how the numerical accuracy can be increased, while improving the
computational efficiency.
5.4 Computational Details
We aim at accurate description of the catalytic processes on the nanoceria surface.
Therefore, for this study we selected BMK (Boese-Martin for Kinetics), a hybrid exchange-
correlation functional, designed 254 to describe kinetics of the chemical reactions (more
specifically, transition states energies) without compromising the energies of equilibrium
structures. We also use standard PBE1PBE exchange-correlation functional for comparison
purposes. This hybrid functional uses Perdew–Burke–Ernezerhof (PBE) correlation, while 25%
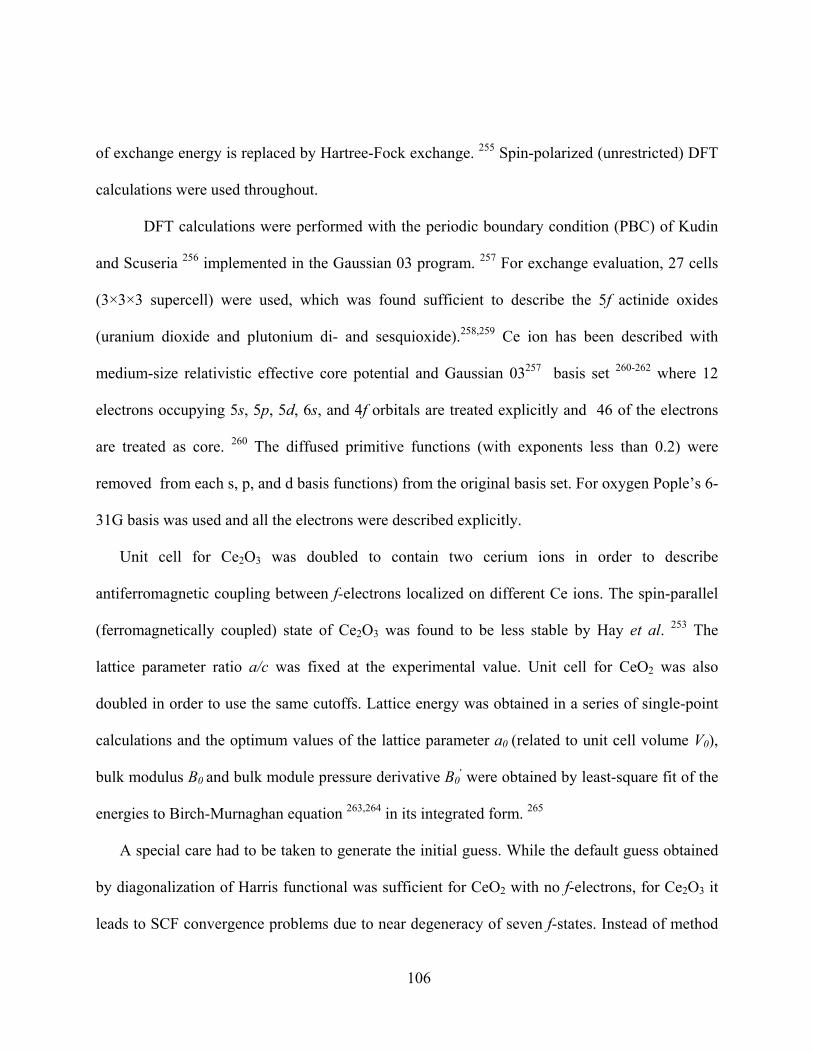
106
of exchange energy is replaced by Hartree-Fock exchange. 255 Spin-polarized (unrestricted) DFT
calculations were used throughout.
DFT calculations were performed with the periodic boundary condition (PBC) of Kudin
and Scuseria 256 implemented in the Gaussian 03 program. 257 For exchange evaluation, 27 cells
(3×3×3 supercell) were used, which was found sufficient to describe the 5f actinide oxides
(uranium dioxide and plutonium di- and sesquioxide).258,259 Ce ion has been described with
medium-size relativistic effective core potential and Gaussian 03257 basis set 260-262 where 12
electrons occupying 5s, 5p, 5d, 6s, and 4f orbitals are treated explicitly and 46 of the electrons
are treated as core. 260 The diffused primitive functions (with exponents less than 0.2) were
removed from each s, p, and d basis functions) from the original basis set. For oxygen Pople’s 6-
31G basis was used and all the electrons were described explicitly.
Unit cell for Ce2O3 was doubled to contain two cerium ions in order to describe
antiferromagnetic coupling between f-electrons localized on different Ce ions. The spin-parallel
(ferromagnetically coupled) state of Ce2O3 was found to be less stable by Hay et al. 253 The
lattice parameter ratio a/c was fixed at the experimental value. Unit cell for CeO2 was also
doubled in order to use the same cutoffs. Lattice energy was obtained in a series of single-point
calculations and the optimum values of the lattice parameter a0 (related to unit cell volume V0),
bulk modulus B0 and bulk module pressure derivative B0 were obtained by least-square fit of the ׳
energies to Birch-Murnaghan equation 263,264 in its integrated form. 265
A special care had to be taken to generate the initial guess. While the default guess obtained
by diagonalization of Harris functional was sufficient for CeO2 with no f-electrons, for Ce2O3 it
leads to SCF convergence problems due to near degeneracy of seven f-states. Instead of method
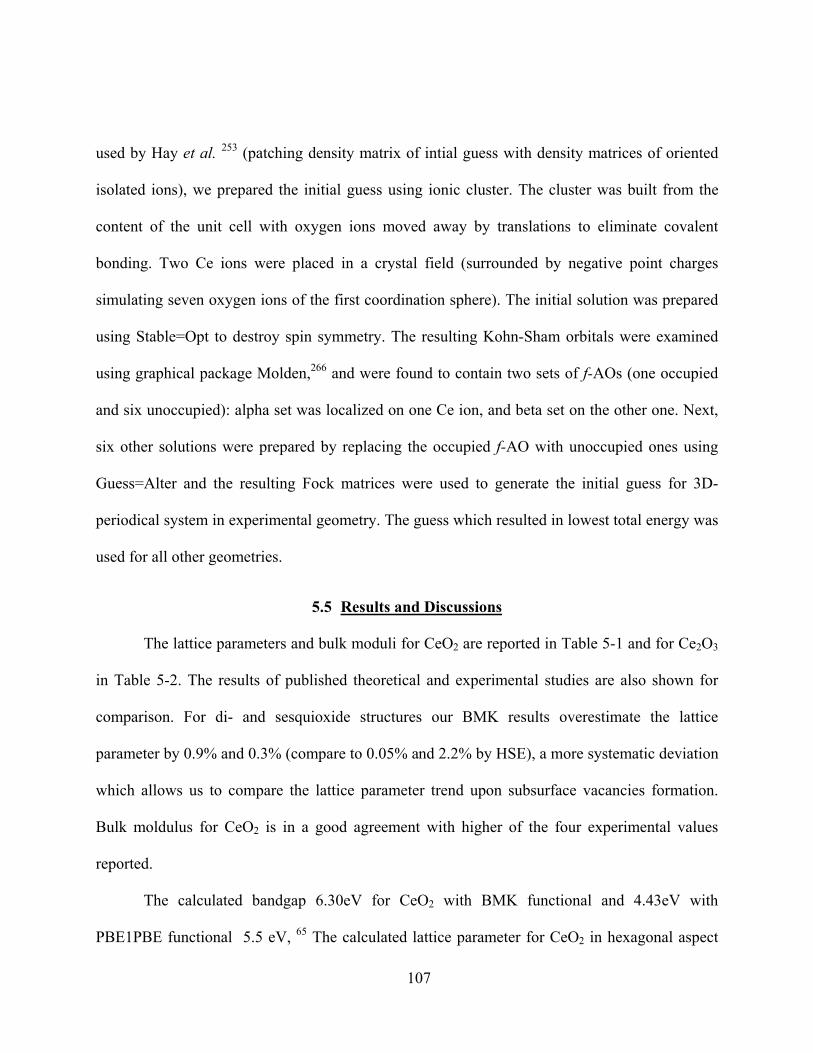
107
used by Hay et al. 253 (patching density matrix of intial guess with density matrices of oriented
isolated ions), we prepared the initial guess using ionic cluster. The cluster was built from the
content of the unit cell with oxygen ions moved away by translations to eliminate covalent
bonding. Two Ce ions were placed in a crystal field (surrounded by negative point charges
simulating seven oxygen ions of the first coordination sphere). The initial solution was prepared
using Stable=Opt to destroy spin symmetry. The resulting Kohn-Sham orbitals were examined
using graphical package Molden,266 and were found to contain two sets of f-AOs (one occupied
and six unoccupied): alpha set was localized on one Ce ion, and beta set on the other one. Next,
six other solutions were prepared by replacing the occupied f-AO with unoccupied ones using
Guess=Alter and the resulting Fock matrices were used to generate the initial guess for 3D-
periodical system in experimental geometry. The guess which resulted in lowest total energy was
used for all other geometries.
5.5 Results and Discussions
The lattice parameters and bulk moduli for CeO2 are reported in Table 5-1 and for Ce2O3
in Table 5-2. The results of published theoretical and experimental studies are also shown for
comparison. For di- and sesquioxide structures our BMK results overestimate the lattice
parameter by 0.9% and 0.3% (compare to 0.05% and 2.2% by HSE), a more systematic deviation
which allows us to compare the lattice parameter trend upon subsurface vacancies formation.
Bulk moldulus for CeO2 is in a good agreement with higher of the four experimental values
reported.
The calculated bandgap 6.30eV for CeO2 with BMK functional and 4.43eV with
PBE1PBE functional 5.5 eV, 65 The calculated lattice parameter for CeO2 in hexagonal aspect
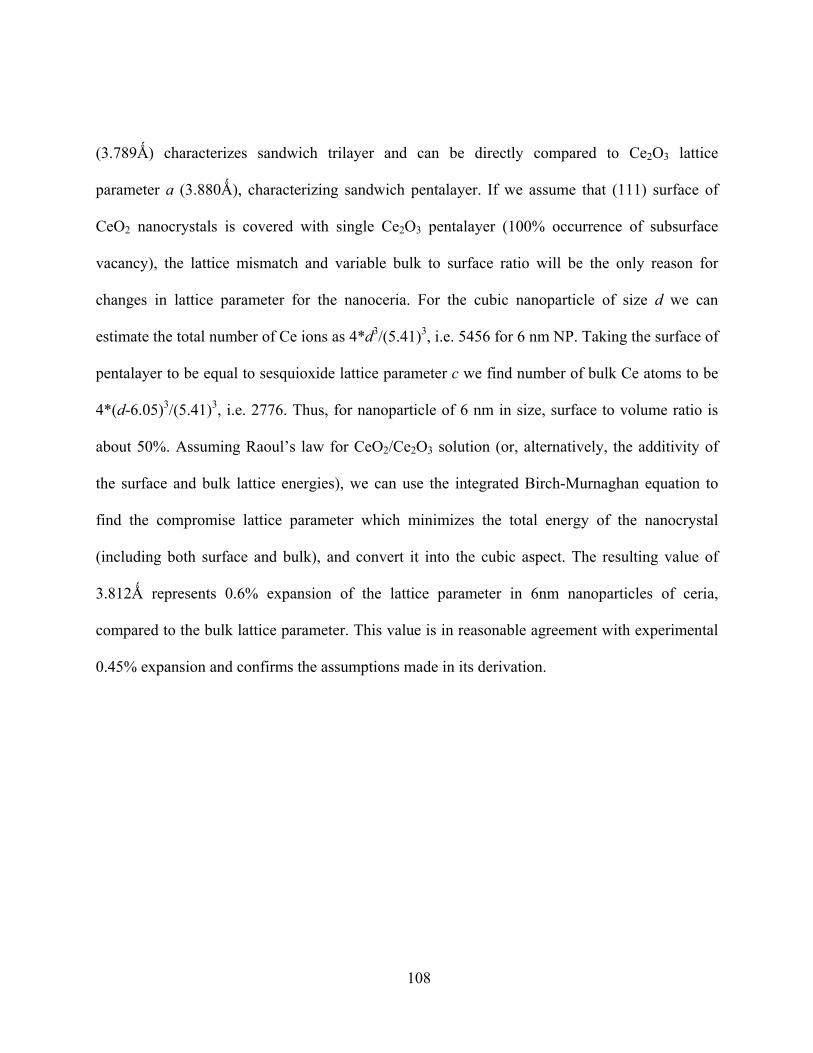
108
(3.789Ǻ) characterizes sandwich trilayer and can be directly compared to Ce2O3 lattice
parameter a (3.880Ǻ), characterizing sandwich pentalayer. If we assume that (111) surface of
CeO2 nanocrystals is covered with single Ce2O3 pentalayer (100% occurrence of subsurface
vacancy), the lattice mismatch and variable bulk to surface ratio will be the only reason for
changes in lattice parameter for the nanoceria. For the cubic nanoparticle of size d we can
estimate the total number of Ce ions as 4*d3/(5.41)3, i.e. 5456 for 6 nm NP. Taking the surface of
pentalayer to be equal to sesquioxide lattice parameter c we find number of bulk Ce atoms to be
4*(d-6.05)3/(5.41)3, i.e. 2776. Thus, for nanoparticle of 6 nm in size, surface to volume ratio is
about 50%. Assuming Raoul’s law for CeO2/Ce2O3 solution (or, alternatively, the additivity of
the surface and bulk lattice energies), we can use the integrated Birch-Murnaghan equation to
find the compromise lattice parameter which minimizes the total energy of the nanocrystal
(including both surface and bulk), and convert it into the cubic aspect. The resulting value of
3.812Ǻ represents 0.6% expansion of the lattice parameter in 6nm nanoparticles of ceria,
compared to the bulk lattice parameter. This value is in reasonable agreement with experimental
0.45% expansion and confirms the assumptions made in its derivation.
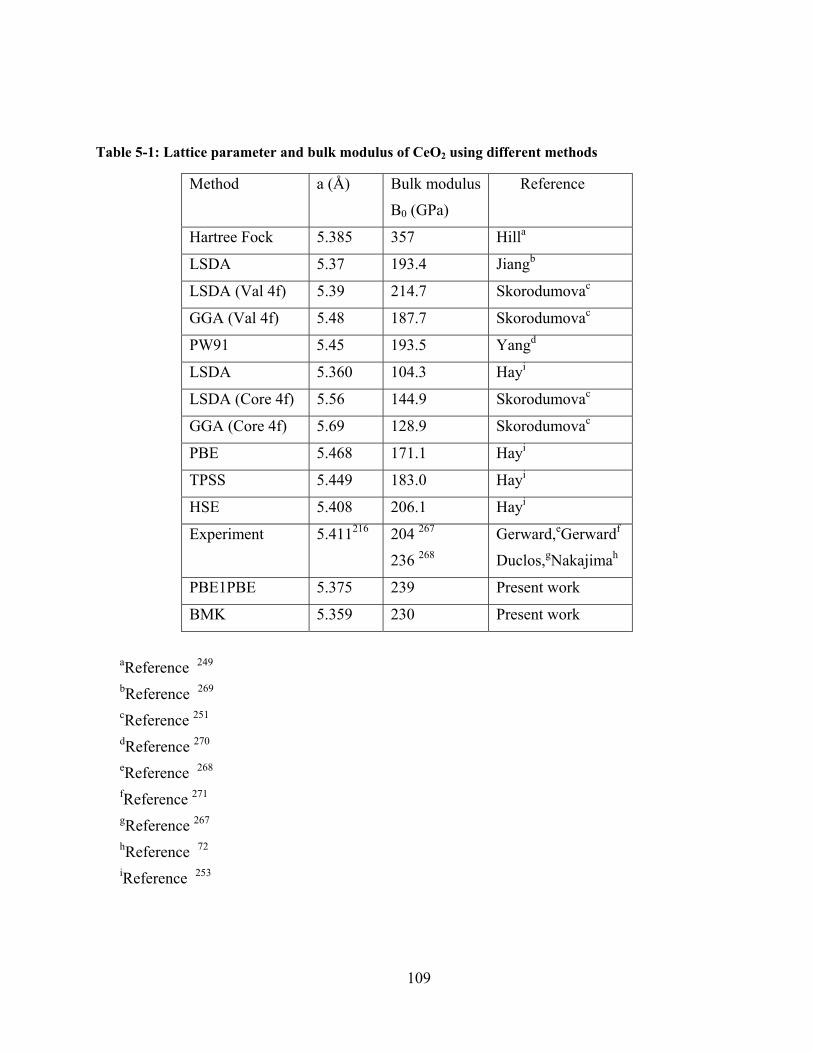
109
Table 5-1: Lattice parameter and bulk modulus of CeO2 using different methods
Method a (Å) Bulk modulus
B0 (GPa)
Reference
Hartree Fock 5.385 357 Hilla
LSDA 5.37 193.4 Jiangb
LSDA (Val 4f) 5.39 214.7 Skorodumovac
GGA (Val 4f) 5.48 187.7 Skorodumovac
PW91 5.45 193.5 Yangd
LSDA 5.360 104.3 Hayi
LSDA (Core 4f) 5.56 144.9 Skorodumovac
GGA (Core 4f) 5.69 128.9 Skorodumovac
PBE 5.468 171.1 Hayi
TPSS 5.449 183.0 Hayi
HSE 5.408 206.1 Hayi
Experiment 5.411216 204 267
236 268
Gerward,eGerwardf
Duclos,gNakajimah
PBE1PBE 5.375 239 Present work
BMK 5.359 230 Present work
aReference 249 bReference 269 cReference 251 dReference 270 eReference 268 fReference 271 gReference 267 hReference 72 iReference 253
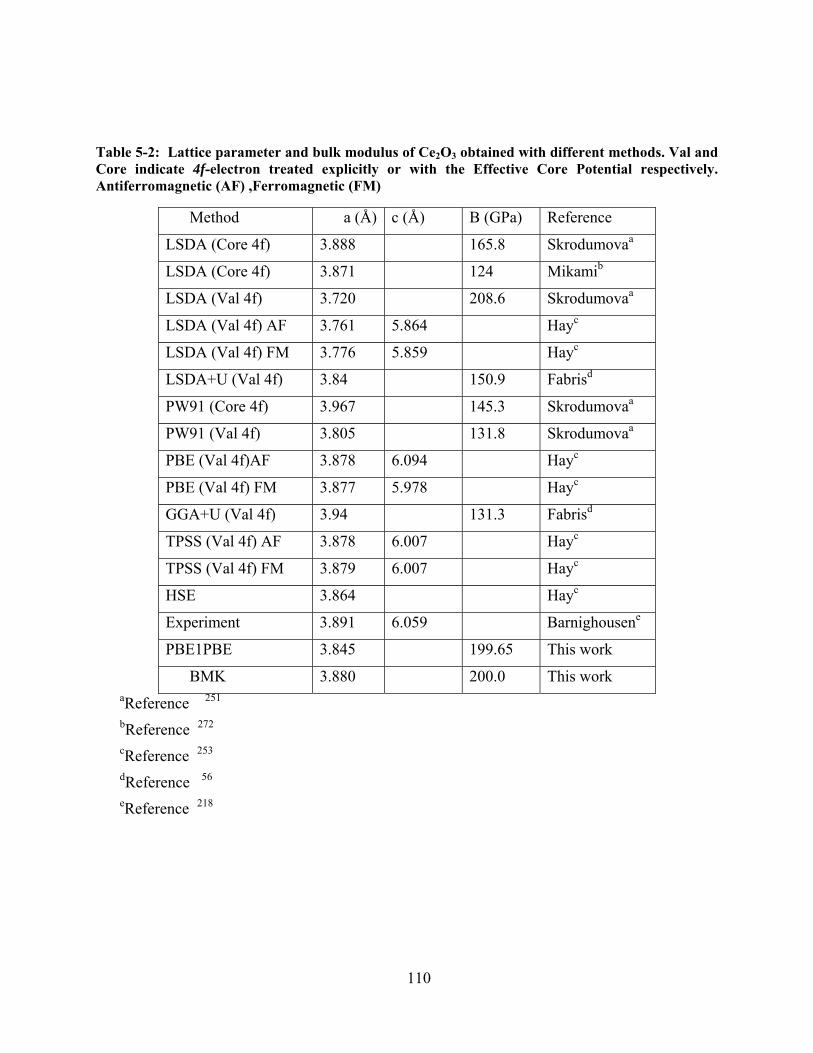
110
Table 5-2: Lattice parameter and bulk modulus of Ce2O3 obtained with different methods. Val and Core indicate 4f-electron treated explicitly or with the Effective Core Potential respectively. Antiferromagnetic (AF) ,Ferromagnetic (FM)
Method a (Å) c (Å) B (GPa) Reference
LSDA (Core 4f) 3.888 165.8 Skrodumovaa
LSDA (Core 4f) 3.871 124 Mikamib
LSDA (Val 4f) 3.720 208.6 Skrodumovaa
LSDA (Val 4f) AF 3.761 5.864 Hayc
LSDA (Val 4f) FM 3.776 5.859 Hayc
LSDA+U (Val 4f) 3.84 150.9 Fabrisd
PW91 (Core 4f) 3.967 145.3 Skrodumovaa
PW91 (Val 4f) 3.805 131.8 Skrodumovaa
PBE (Val 4f)AF 3.878 6.094 Hayc
PBE (Val 4f) FM 3.877 5.978 Hayc
GGA+U (Val 4f) 3.94 131.3 Fabrisd
TPSS (Val 4f) AF 3.878 6.007 Hayc
TPSS (Val 4f) FM 3.879 6.007 Hayc
HSE 3.864 Hayc
Experiment 3.891 6.059 Barnighousene
PBE1PBE 3.845 199.65 This work
BMK 3.880 200.0 This work aReference 251 bReference 272 cReference 253 dReference 56 eReference 218
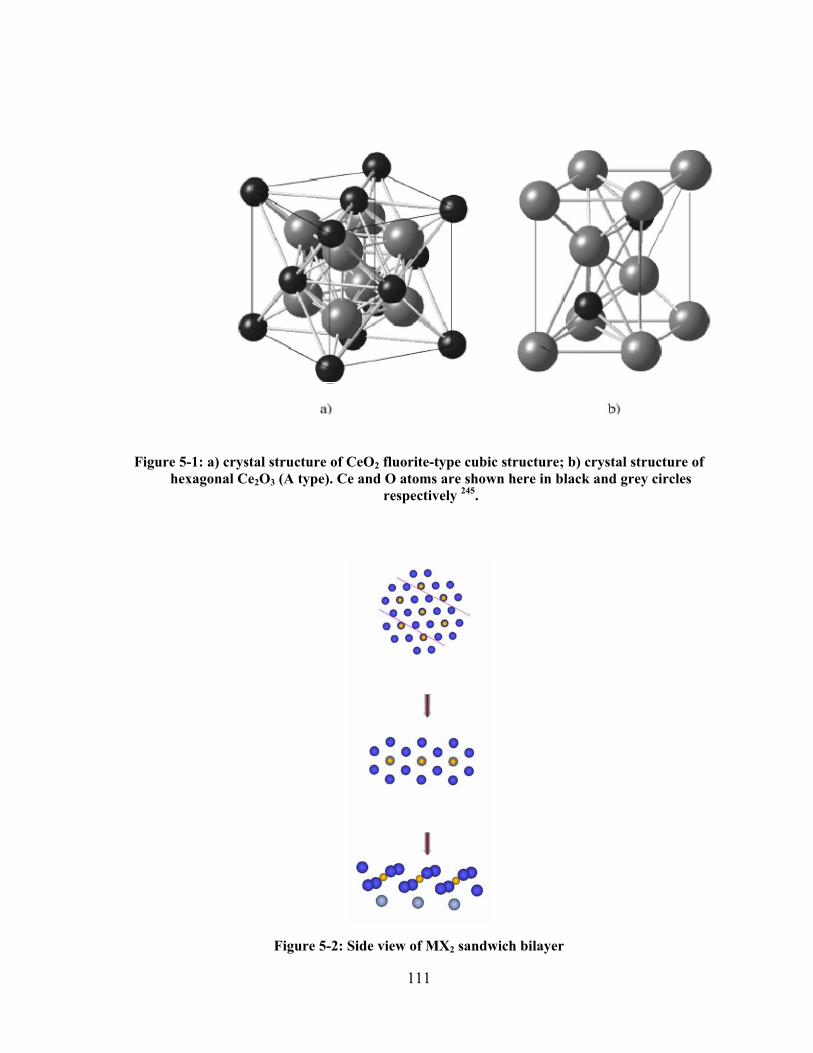
111
Figure 5-1: a) crystal structure of CeO2 fluorite-type cubic structure; b) crystal structure of hexagonal Ce2O3 (A type). Ce and O atoms are shown here in black and grey circles
respectively 245.
Figure 5-2: Side view of MX2 sandwich bilayer
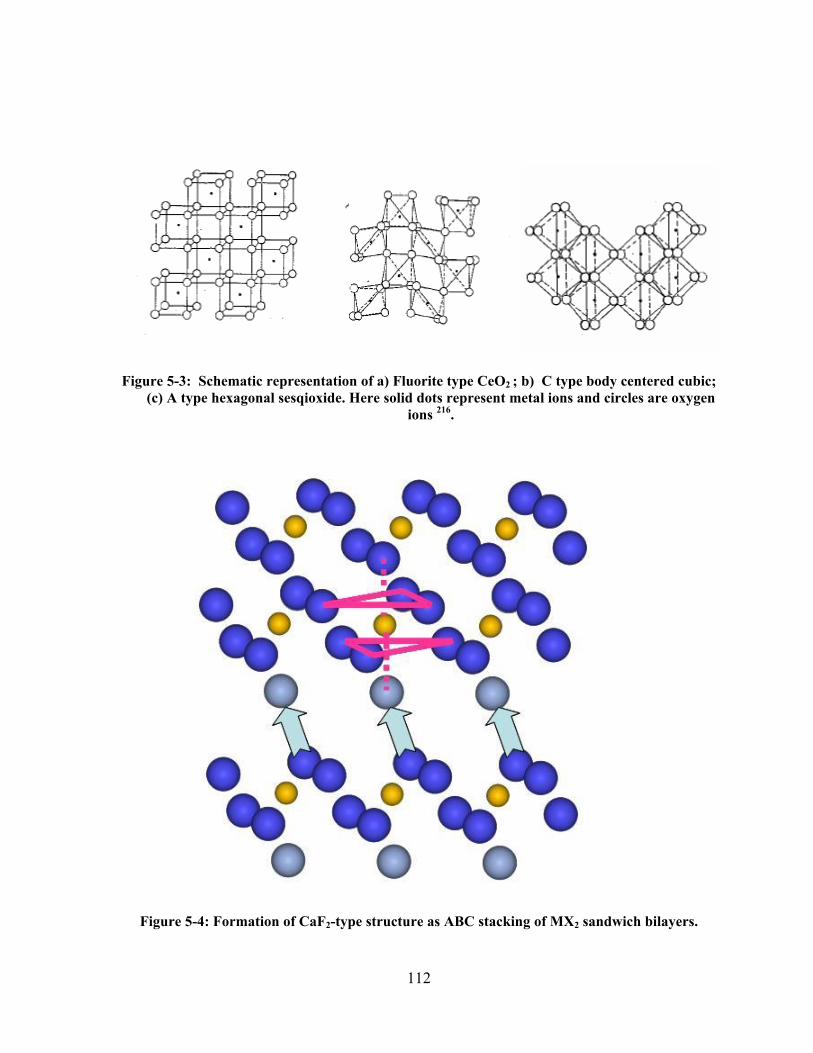
112
Figure 5-3: Schematic representation of a) Fluorite type CeO2 ; b) C type body centered cubic; (c) A type hexagonal sesqioxide. Here solid dots represent metal ions and circles are oxygen
ions 216.
Figure 5-4: Formation of CaF2-type structure as ABC stacking of MX2 sandwich bilayers.
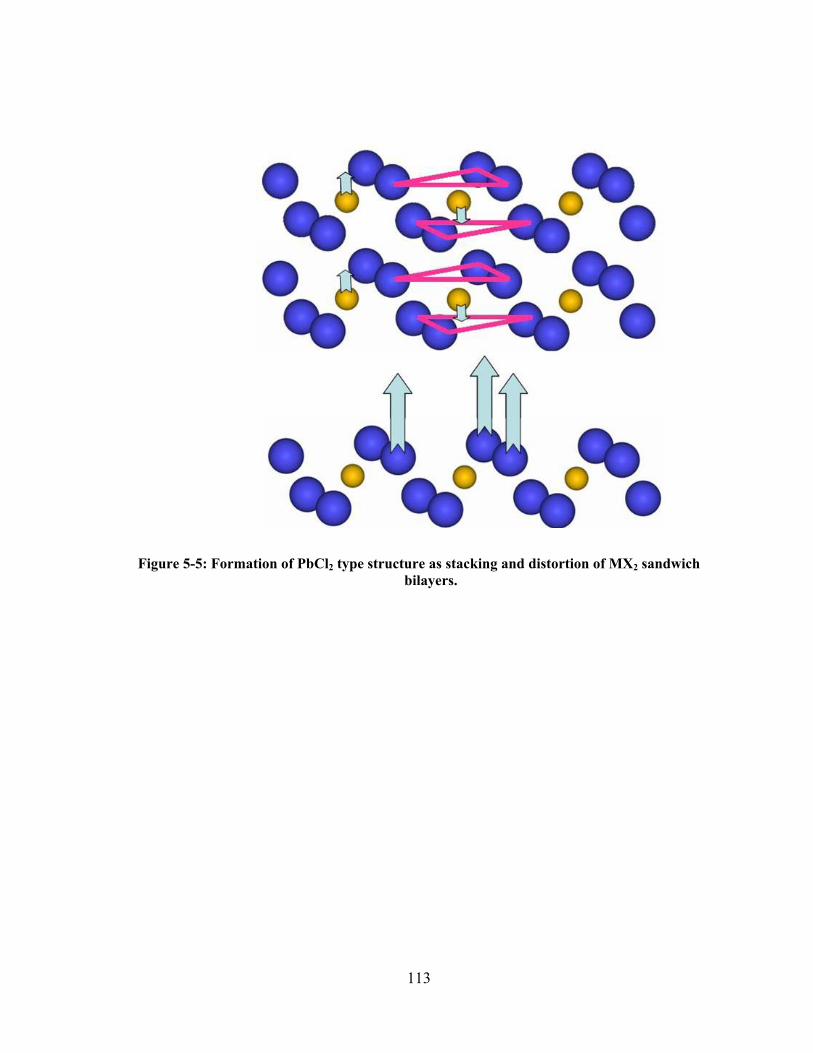
113
Figure 5-5: Formation of PbCl2 type structure as stacking and distortion of MX2 sandwich bilayers.
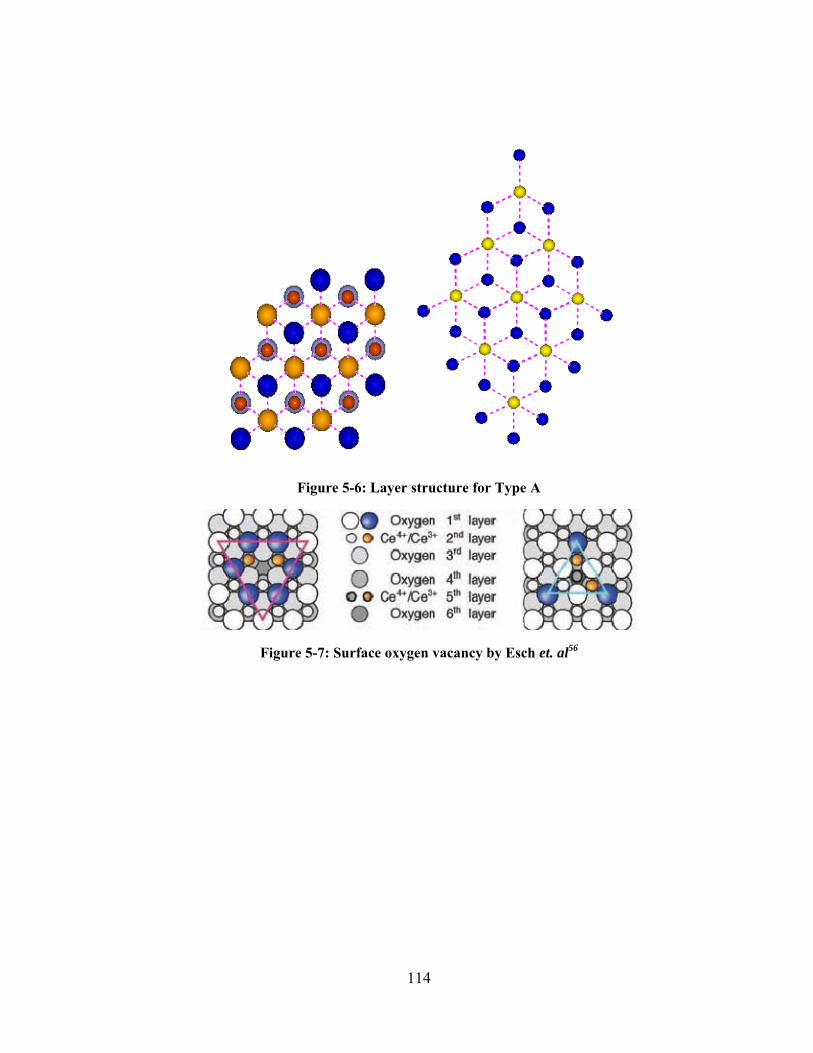
114
Figure 5-6: Layer structure for Type A
Figure 5-7: Surface oxygen vacancy by Esch et. al56
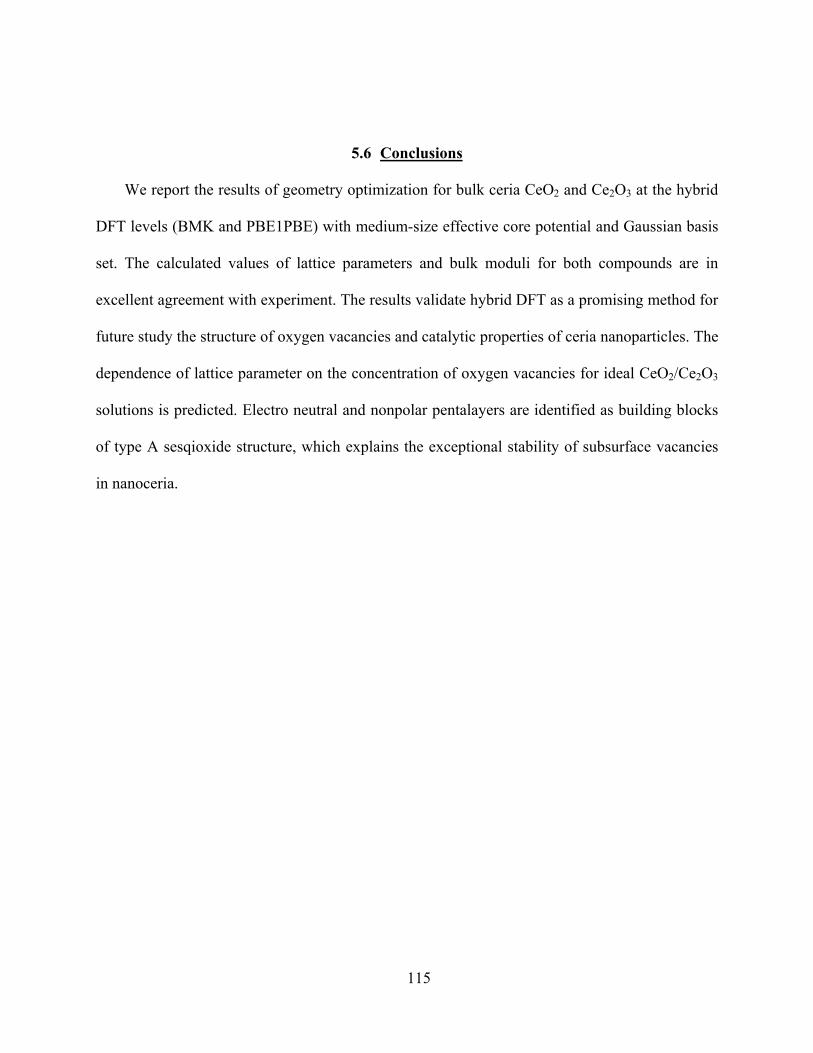
115
5.6 Conclusions
We report the results of geometry optimization for bulk ceria CeO2 and Ce2O3 at the hybrid
DFT levels (BMK and PBE1PBE) with medium-size effective core potential and Gaussian basis
set. The calculated values of lattice parameters and bulk moduli for both compounds are in
excellent agreement with experiment. The results validate hybrid DFT as a promising method for
future study the structure of oxygen vacancies and catalytic properties of ceria nanoparticles. The
dependence of lattice parameter on the concentration of oxygen vacancies for ideal CeO2/Ce2O3
solutions is predicted. Electro neutral and nonpolar pentalayers are identified as building blocks
of type A sesqioxide structure, which explains the exceptional stability of subsurface vacancies
in nanoceria.
116
BIBLIOGRAPHY
1. Gangopadhyay, S., Masunov, A. E. Kilina, S. "Hubbard U on the Ligand Atoms is Necessary for Quantitative Prediction of Heisenberg Exchange Constants " (to be submitted to Physical Review Letters)
2. Saha, A., Gangopadhyay, S., Nehrkorn, J., Milazzo, R. Waldmann, O., Hannu, M., Abboud, K. A.,Wernsdorfer, W., Masunov, A., Christou, G.* "Synthesis and Characterization of a New High Spin, Half Integer Spin Mn9 SMM by Electrochemistry, Magneto-chemistry, INS and DFT Studies" (to be submitted to Journal of the American Chemical Society)
3. Gangopadhayay, S., Kudin, K., Seal, S., Masunov, A., "Structure, Stability, and Composition of Ceria in Bulk and Nanoparticles from Density Functional Theory Simulations" (to be submitted to Structural Chemistry)
4. Gangopadhyay, S., Inerbaev, T., Masunov,* A. E., Mesit, J., Guha, R., Sleiti, A., Kapat, J. "Toward Rational Design of Ceramic Materials for Intermediate Temperature Solid Oxide Fuel Cell Cathodes: Understanding of Oxygen Vacancy Migration and Clustering in Barium/Strontium Ferrate/Cobaltate " Solid State Ionics 181 1067-1073 2010
5. Gangopadhyay, S., Masunov,* A. E., Poalelungi, E., Leuenberger,* M. Weak magnetic coupling in Mn12 molecular magnet is predicted correctly at DFT+U theory level. J. Chem. Phys 132, 244104 2010
6. Gangopadhyay, S., Masunov, A.E., Poalelungi, E.;,Leuenberger, M.N. "Prediction of exchange coupling constant for Mn12 molecular magnet using DFT+U, Proceedings of the 9th International Conference on Computational Science (ICCS), LNCS 5545, pp. 151, Springer: 2009.
7. Gangopadhayay, S., Inerbaev, T., Masunov,* A.E., Orlovskaya, N.S. Structural characterization combined with the first principles simulations of barium/strontium ferrate/cobaltate as a promising material for SOFC. ACS Applied Materials & Interfaces.1 (7), 1512-1519, 2009.
8. Gangopadhyay, S., Inerbaev, T., Masunov, *A. E., Mesit, J., Guha, R., Sleiti, A., Kapat, J. "Density Functional Theory and Multiscale Simulations Combined With Spectroscopic Study of Barium/Strontium Ferrate/Cobaltate (BSCF) as a Promising Material For Solid Oxide Fuel Cell (SOFC) " pp 150-154, 2008, 17th Conference on Current Trends in Computational Chemistry (CCTCC).
9. Gangopadhyay, S., Inerbaev, T., Masunov, *A. E., Mesit, J., Guha, R., Sleiti, A., Kapat, J. "Multiscale Simulations Combined With Experimental Study of Barium/Strontium Ferrate/Cobaltate (BSCF) as a Promising Material For Solid Oxide Fuel Cell (SOFC) " MMM, pp.120-124, 2008, International Conference on MutiScale Material Modeling
117
REFERENCES
(1) Hohenberg, P.; Kohn, W. Physical Review 1964, 136, B864 - B871. (2) Kohn, W.; Sham, L. J. Physical Review 1965, 140, 1133-&. (3) Dirac, P. A. M. Mathematical Proceedings of the Cambridge Philosophical Society 1930, 26. (4) Slater, J. C. Physical Review 1951, 81, 385. (5) Hartree, D. R.; Hartree, W.; Swirles, B. Phil. Trans. R. Soc. Lond. A 1939, 238, 229-247. (6) Oktay, S.; Debbie Fu-tai, T. The Journal of Chemical Physics 1963, 38, 1740-1748. (7) Truhlar, D. G. J. Comput. Chem. 2007, 28, 73-86. (8) Anisimov, V. I.; Solovyev, I. V.; Korotin, M. A.; Czyzyk, M. T.; Sawatzky, G. A. Physical Review B 1993, 48, 16929-16934. (9) Anisimov, V. I.; Zaanen, J.; Andersen, O. K. Phys. Rev. B: Condens. Matter 1991, 44, 943-54. (10) Liechtenstein, A. I.; Anisimov, V. I.; Zaanen, J. Physical Review B 1995, 52, R5467. (11) Pickett, W. E.; Erwin, S. C.; Ethridge, E. C. Physical Review B 1998, 58, 1201-1209. (12) Hubbard, J. Proceedings of the Royal Society of London. Series A. Mathematical and Physical Sciences 1963, 276, 238-257. (13) Dudarev, S. L.; Botton, G. A.; Savrasov, S. Y.; Humphreys, C. J.; Sutton, A. P. Physical Review B 1998, 57, 1505-1509. (14) Hsu, H.; Umemoto, K.; Cococcioni, M.; Wentzcovitch, R. Physical Review B 2009, 79. (15) Svane, A.; Gunnarsson, O. Physical Review Letters 1990, 65, 1148-1151. (16) Szotek, Z.; Temmerman, W. M.; Winter, H. Physical Review B 1993, 47, 4029-4032. (17) Rohrbach, A.; Hafner, J.; Kresse, G. Physical Review B 2004, 70, 17. (18) Tran, F.; Blaha, P.; Schwarz, K.; Novak, P. Physical Review B 2006, 74. (19) Rignanese, G. M.; Pasquarello, A. Journal of Physics-Condensed Matter 2005, 17, S2089-S2098. (20) Burkert, T.; Nordstr; ouml; m, L.; Eriksson, O.; Heinonen, O. Physical Review Letters 2004, 93, 027203. (21) Raty, J. Y.; Gygi, F.; Galli, G. Physical Review Letters 2005, 95. (22) Hafner, J.; Wolverton, C.; Ceder, G. MRS Bulletin 2006, 31, 659-668. (23) Islam, M. S. 2002, p 75-85. (24) Shimojo, F.; Okazaki, H. J. Phys. Soc. Jpn. 1992, 61, 4106-18. (25) Meyer, M.; Nicoloso, N.; Jaenisch, V. Phys. Rev. B: Condens. Matter 1997, 56, 5961-5966.
118
(26) Ramanarayanan, P.; Srinivasan, B.; Cho, K.; Clemens, B. M. J. Appl. Phys. 2004, 96, 7095-7107. (27) Eichler, A. Physical Review B 2001, 64. (28) Cherry, M.; Islam, M. S.; Catlow, C. R. A. J. Solid State Chem. 1995, 118, 125-32. (29) Khan, M. S.; Islam, M. S.; Bates, D. R. J. Phys. Chem. B 1998, 102, 3099-3104. (30) Lerch, M.; Boysen, H.; Hansen, T. J. Phys. Chem. Solids 2001, 62, 445-455. (31) Karki, B. B.; Khanduja, G. Earth and Planetary Science Letters 2007, 260, 201-211. (32) Ammann, M. W.; Brodholt, J. P.; Dobson, D. P. Phys. Chem. Miner. 2009, 36, 151-158. (33) Norge Cruz, H.; Javier Fernandez, S.; Luis Javier, A. Journal of Physics: Condensed Matter 2009, 305502. (34) Sessoli, R.; Gatteschi, D.; Caneschi, A.; Novak, M. A. Nature (London) 1993, 365, 141-3. (35) Sessoli, R.; Tsai, H. L.; Schake, A. R.; Wang, S.; Vincent, J. B.; Folting, K.; Gatteschi, D.; Christou, G.; Hendrickson, D. N. J. Am. Chem. Soc. 1993, 115, 1804-16. (36) Lehmann, J.; Gaita-Arino, A.; Coronado, E.; Loss, D. Nat Nano 2007, 2, 312-317. (37) Leuenberger, M. N.; Loss, D. Nature (London, U. K.) 2001, 410, 789-793. (38) Ardavan, A.; Rival, O.; Morton, J. J. L.; Blundell, S. J.; Tyryshkin, A. M.; Timco, G. A.; Winpenny, R. E. P. Phys Rev Lett 2007, 98, 057201-4. (39) Postnikov, A. V.; Kortus, J.; Pederson, M. R. Physica Status Solidi B-Basic Solid State Physics 2006, 243, 2533-2572. (40) Dobisz, E. A.; Bandic, Z. Z.; Wu, T. W.; Albrecht, T. Proceedings of the Ieee 2008, 96, 1836-1846. (41) Meier, F.; Loss, D. Phys. Rev. Lett. 2001, 86, 5373-5376. (42) Affronte, M.; Troiani, F.; Ghirri, A.; Candini, A.; Evangelisti, M.; Corradini, V.; Carretta, S.; Santini, P.; Amoretti, G.; Tuna, F.; Timco, G.; Winpenny, R. E. P. J. Phys. D: Appl. Phys. 2007, 40, 2999-3004. (43) Friedman, J. r.; Sarachik, M. P.; Tejada, J.; Ziolo, R. Phys. Rev. Lett. 1996, 76, 3830-3833. (44) Gatteschi, D.; Caneschi, A.; Pardi, L.; Sessoli, R. Science (Washington, D. C.) 1994, 265, 1054-1058. (45) Canada-Vilalta, C.; O'Brien, T. A.; Pink, M.; Davidson, E. R.; Christou, G. Inorg. Chem. 2003, 42, 7819-7829. (46) Canada-Vilalta, C.; Pink, M.; Christou, G. Chem. Commun. (Cambridge, U. K.) 2003, 1240-1241. (47) Waldmann, O.; Guidi, T.; Carretta, S.; Mondelli, C.; Dearden, A. L. Phys Rev Lett 2003, 91, 237202. (48) Van Slageren, J.; Sessoli, R.; Gatteschi, D.; Smith, A. A.; Helliwell, M.; Winpenny, R. E. P.; Cornia, A.; Barra, A.-L.; Jansen, A. G. M.; Rentschler, E.; Timco, G. A. Chem.--Eur. J. 2002, 8, 277-285. (49) Rumberger, E. M.; Zakharov, L. N.; Rheingold, A. L.; Hendrickson, D. N. Inorg. Chem. 2004, 43, 6531-6533.
119
(50) Beedle, C. C.; Heroux, K. J.; Nakano, M.; DiPasquale, A. G.; Rheingold, A. L.; Hendrickson, D. N. Polyhedron 2007, 26, 2200-2206. (51) Scott, R. T. W.; Milios, C. J.; Vinslava, A.; Lifford, D.; Parsons, S.; Wernsdorfer, W.; Christou, G.; Brechin, E. K. Dalton Trans. 2006, 3161-3163. (52) Murugesu, M.; Raftery, J.; Wernsdorfer, W.; Christou, G.; Brechin, E. K. Inorg. Chem. 2004, 43, 4203-4209. (53) Anastasios, J. T.; Alina, V.; Wolfgang, W.; Khalil, A. A.; George, C. Angewandte Chemie International Edition 2004, 43, 2117-2121. (54) Manoli, M.; Prescimone, A.; Mishra, A.; Parsons, S.; Christou, G.; Brechin, E. K. Dalton Trans. 2007, 532-534. (55) Campbell, C. T.; Peden, C. H. F. Science 2005, 309, 713-714. (56) Esch, F.; Fabris, S.; Zhou, L.; Montini, T.; Africh, C.; Fornasiero, P.; Comelli, G.; Rosei, R. Science 2005, 309, 752-755. (57) Ozer, N. Solar Energy Materials and Solar Cells 2001, 68, 391-400. (58) Atanassov, G.; Thielsch, R.; Popov, D. Thin Solid Films 1993, 223, 288-292. (59) Krishna, M. G.; Hartridge, A.; Bhattacharya, A. K. Materials Science and Engineering B-Solid State Materials for Advanced Technology 1998, 55, 14-20. (60) Tye, L.; Elmasry, N. A.; Chikyow, T.; Mclarty, P.; Bedair, S. M. Applied Physics Letters 1994, 65, 3081-3083. (61) Steele, B. C. R. Acad. Sci., Ser. IIc: Chim. 1998, 1, 533-543. (62) Patsalas, P.; Logothetidis, S.; Metaxa, C. Applied Physics Letters 2002, 81, 466-468. (63) Norton, D. P.; Budai, J. D.; Chisholm, M. F. Applied Physics Letters 2000, 76, 1677-1679. (64) Huang, D. D.; Qin, F. G.; Yao, Z. Y.; Ren, Z. Z.; Lin, L. Y.; Gao, W. B.; Ren, Q. Y. Applied Physics Letters 1995, 67, 3724-3725. (65) Morshed, A. H.; Moussa, M. E.; Bedair, S. M.; Leonard, R.; Liu, S. X.; ElMasry, N. Applied Physics Letters 1997, 70, 1647-1649. (66) Frayret, C.; Villesuzanne, A.; Pouchard, M.; Matar, S. International Journal of Quantum Chemistry 2005, 101, 826-839. (67) Lybye, D.; Poulsen, F. W.; Mogensen, M. Solid State Ionics 2000, 128, 91-103. (68) Fernandez-Garcia, M.; Martinez-Arias, A.; Hanson, J. C.; Rodriguez, J. A. Chemical Reviews 2004, 104, 4063-4104. (69) Wuilloud, E.; Delley, B.; Schneider, W. D.; Baer, Y. Physical Review Letters 1984, 53, 202-205. (70) Adachi, G.; Imanaka, N. Chemical Reviews 1998, 98, 1479-1514. (71) Wang, Z. W.; Saxena, S. K.; Pischedda, V.; Liermann, H. P.; Zha, C. S. Physical Review B 2001, 6401. (72) Duclos, S. J.; Vohra, Y. K.; Ruoff, A. L.; Jayaraman, A.; Espinosa, G. P. Physical Review B 1988, 38, 7755-7758. (73) Kaspar, J.; Fornasiero, P.; Graziani, M. Catalysis Today 1999, 50, 285-298. (74) Wu, L.; Wiesmann, H. J.; Moodenbaugh, A. R.; Klie, R. F.; Zhu, Y.; Welch, D. O.; Suenaga, M. Physical Review B (Condensed Matter and Materials Physics) 2004, 69, 125415-9.
120
(75) Matijevic, E.; Hsu, W. P. Journal of Colloid and Interface Science 1987, 118, 506-523. (76) Mani, T. V.; Varma, H. K.; Damodaran, A. D.; Warrier, K. G. K. Ceramics International 1993, 19, 125-128. (77) Chu, X.; Chung, W. I.; Schmidt, L. D. Journal of the American Ceramic Society 1993, 76, 2115-2118. (78) Varma, H. K.; Mukundan, P.; Warrier, K. G. K.; Damodaran, A. D. Journal of Materials Science Letters 1990, 9, 377-379. (79) Nabavi, M.; Spalla, O.; Cabane, B. Journal of Colloid and Interface Science 1993, 160, 459-471. (80) Baranchikov, A. E.; Polezhaeva, O. S.; Ivanov, V. K.; Tretyakov, Y. D. Crystengcomm 2010, 12, 3531-3533. (81) Tsunekawa, S.; Sivamohan, R.; Ohsuna, T.; Kasuya, A.; Takahashi, H.; Tohji, K. In Rare Earths '98 1999; Vol. 315-3, p 439-445. (82) Zhang, J.; Ju, X.; Wu, Z. Y.; Liu, T.; Hu, T. D.; Xie, Y. N.; Zhang, Z. L. Chemistry of Materials 2001, 13, 4192-4197. (83) Patil, S.; Kuiry, S. C.; Seal, S.; Vanfleet, R. Journal of Nanoparticle Research 2002, 4, 433-438. (84) Deshpande, S.; Patil, S.; Kuchibhatla, S.; Seal, S. Applied Physics Letters 2005, 87. (85) Tsunekawa, S.; Ito, S.; Kawazoe, Y. Applied Physics Letters 2004, 85, 3845-3847. (86) Kohn, W.; Becke, A. D.; Parr, R. G. Journal of Physical Chemistry 1996, 100, 12974-12980. (87) Geerlings, P.; De Proft, F.; Langenaeker, W. Chemical Reviews 2003, 103, 1793-1873. (88) Bredow, T.; Geudtner, G.; Jug, K. Journal of Computational Chemistry 2001, 22, 861-887. (89) Porezag, D.; Frauenheim, T.; Kohler, T.; Seifert, G.; Kaschner, R. Physical Review B 1995, 51, 12947-12957. (90) Pettersson, L. G. M.; Bauschlicher, C. W.; Langhoff, S. R.; Partridge, H. Journal of Chemical Physics 1987, 87, 481-492. (91) Becke, A. D. Physical Review A 1988, 38, 3098-3100. (92) Becke, A. D. Journal of Chemical Physics 1996, 104, 1040-1046. (93) Tao, J. M.; Perdew, J. P.; Staroverov, V. N.; Scuseria, G. E. Physical Review Letters 2003, 91, 4. (94) Furche, F.; Perdew, J. P. Journal of Chemical Physics 2006, 124, 27. (95) Solovyev, I. V.; Dederichs, P. H.; Anisimov, V. I. Physical Review B 1994, 50, 16861-16871. (96) Tablero, C. Journal of Physics-Condensed Matter 2008, 20. (97) Kulik, H. J.; Cococcioni, M.; Scherlis, D. A.; Marzari, N. Physical Review Letters 2006, 97, 4. (98) Inerbaev, T. M.; Seal, S.; Masunov, A. E. Journal of Molecular Modeling 2010, N/A, 1-7.
121
(99) Vincent, A.; Babu, S.; Heckert, E.; Dowding, J.; Hirst, S. M.; Inerbaev, T. M.; Self, W. T.; Reilly, C. M.; Masunov, A. E.; Rahman, T. S.; Seal, S. ACS Nano 2009, 3, 1203-1211. (100) Babu, S.; Thanneeru, R.; Inerbaev, T.; Day, R.; Masunov, A. E.; Schulte, A.; Seal, S. Nanotechnology 2009, 20. (101) Becke, A. D. Journal of Chemical Physics 1993, 98, 5648-5652. (102) Sousa, S. F.; Fernandes, P. A.; Ramos, M. J. Journal of Physical Chemistry A 2007, 111, 10439-10452. (103) Zhao, Y.; Truhlar, D. G. Journal of Chemical Theory and Computation 2008, 4, 1849-1868. (104) Jacquemin, D.; Wathelet, V.; Perpete, E. A.; Adamo, C. Journal of Chemical Theory and Computation 2009, 5, 2420-2435. (105) Adler, S. B. Chemical Reviews 2004, 104, 4791-4843. (106) Pena, M. A.; Fierro, J. L. G. Chem. Rev. 2001, 101, 1981-2018. (107) Möbius, H.-H. Journal of Solid State Electrochemistry 1997, 1, 2-16. (108) Shao, Z. P.; Haile, S. M. Nature 2004, 431, 170-173. (109) Kruidhof, H.; Bouwmeester, H. J. M.; Vondoorn, R. H. E.; Burggraaf, A. J. Solid State Ionics 1993, 63-5, 816-822. (110) Kharton, V. V.; Li, S. B.; Kovalevsky, A. V.; Naumovich, E. N. Solid State Ionics 1997, 96, 141-151. (111) Kharton, V. V.; Naumovich, E. N.; Nikolaev, A. V. Journal of Membrane Science 1996, 111, 149-157. (112) Teraoka, Y.; Nobunaga, T.; Okamoto, K.; Miura, N.; Yamazoe, N. Solid State Ionics 1991, 48, 207-212. (113) Teraoka, Y.; Zhang, H. M.; Furukawa, S.; Yamazoe, N. Chemistry Letters 1985, 1743-1746. (114) Shao, Z. P.; Dong, H.; Xiong, G. X.; Gong, Y.; Yang, W. S. Journal of Membrane Science 2001, 183, 181-192. (115) Shao, Z.; Yang, W.; Cong, Y.; Dong, H.; Tong, J.; Xiong, G. Journal of Membrane Science 2000, 172, 177-188. (116) McIntosh, S.; Vente, J. F.; Haije, W. G.; Blank, D. H. A.; Bouwmeester, H. J. M. Solid State Ionics 2006, 177, 1737-1742. (117) Sammells, A. F.; Cook, R. L.; White, J. H.; Osborne, J. J.; Macduff, R. C.; Elsevier Science Bv: 1992, p 111-123. (118) Mogensen, M.; Lybye, D.; Bonanos, N.; Hendriksen, R.; Poulsen, F. W. Solid State Ionics 2004, 174, 279-286. (119) Ishihara, T.; Matsuda, H.; Takita, Y. J. Am. Chem. Soc. 1994, 116, 3801-3. (120) McIntosh, S.; Vente, J. F.; Haije, W. G.; Blank, D. H. A.; Bouwmeester, H. J. M. Chemistry of Materials 2006, 18, 2187-2193. (121) Vanderbilt, D. Physical Review B 1990, 41, 7892-7895. (122) Baroni, S.; Dal Corso, A.; de Gironcoli, S.; Giannozzi, P.; Cavazzoni, C.; Ballabio, G.; Scandolo, S.; Chiarotti, G.; Focher, P.; Pasquarello, A. Code available from http://www. quantum-espresso. org.
122
(123) Marzari, N.; Vanderbilt, D.; De Vita, A.; Payne, M. C. Physical Review Letters 1999, 82, 3296-3299. (124) Gangopadhayay, S.; Inerbaev, T.; Masunov, A. E.; Altilio, D.; Orlovskaya, N. Acs Applied Materials & Interfaces 2009, 1, 1512-1519. (125) Graeme, H.; Hannes, J. The Journal of Chemical Physics 2000, 113, 9978-9985. (126) Birch, F. Journal of Geophysical Research 1978, 83, 1257-1268. (127) Svarcova, S.; Wiik, K.; Tolchard, J.; Bouwmeester, H. J. M.; Grande, T. Solid State Ionics 2008, 178, 1787-1791. (128) Yang, Z.; Harvey, A. S.; Infortuna, A.; Gauckler, L. J. Journal of Applied Crystallography 2009, 42, 153-160. (129) Glazer, A. M. Acta Crystallographica Section B-Structural Science 1972, B 28, 3384-&. (130) Runka, T.; Berkowski, M.; Lapinski, A.; Drozdowski, M. Journal of Physics and Chemistry of Solids 2008, 69, 1646-1651. (131) Orlovskaya, N.; Steinmetz, D.; Yarmolenko, S.; Pai, D.; Sankar, J.; Goodenough, J. Physical Review B 2005, 72, 014122. (132) Kozlenko, D. P.; Golosova, N. O.; Jirak, Z.; Dubrovinsky, L. S.; Savenko, B. N.; Tucker, M. G.; Le Godec, Y.; Glazkov, V. P. Physical Review B 2007, 75, 10. (133) Potze, R. H.; Sawatzky, G. A.; Abbate, M. Physical Review B 1995, 51, 11501-11506. (134) Pruzan, P.; Gourdain, D.; Chervin, J. C.; Canny, B.; Couzinet, B.; Hanfland, M. Solid State Communications 2002, 123, 21-26. (135) Abbate, M.; Zampieri, G.; Okamoto, J.; Fujimori, A.; Kawasaki, S.; Takano, M. Physical Review B 2002, 65. (136) Bahadur, D.; Kollali, S.; Rao, C. N. R.; Patni, M. J.; Srivastava, C. M. Journal of Physics and Chemistry of Solids 1979, 40, 981-985. (137) Bezdicka, P.; Wattiaux, A.; Grenier, J. C.; Pouchard, M.; Hagenmuller, P. Zeitschrift Fur Anorganische Und Allgemeine Chemie 1993, 619, 7-12. (138) Watanabe Journal of the Physical Society of Japan 1957, 12, 515. (139) Lee, K. W.; Pickett, W. E. Physical Review B (Condensed Matter and Materials Physics) 2006, 73, 174428-8. (140) Shein, I. R.; Shein, K. I.; Kozhevnikov, V. L.; Ivanovskii, A. L. Physics of the Solid State 2005, 47, 2082-2088. (141) Lheureux, D.; Fischer, M.; Polian, A.; Itie, J. P.; Gauthier, M.; Syfosse, G. Proceedings - IEEE Ultrasonics Symposium 1999, 533-536. (142) Takeda, T. Journal of The Physical Society of Japan 1972, 33, 967. (143) Collaboration: Authors and editors of the volumes, I. H. I. E. In Ternary Compounds, Organic Semiconductors 2000, p 1-6. (144) Abramov, Y. A.; Tsirelson, V. G.; Zavodnik, V. E.; Ivanov, S. A.; Brown, I. D. Acta Crystallographica Section B-Structural Science 1995, 51, 942-951. (145) Kilner, J. A. Solid State Ionics 1983, 8, 201-207. (146) Arom, G.; Brechin, E. Struct. Bonding 2006, 122, 1. (147) Noodleman, L. Journal of Chemical Physics 1981, 74, 5737-5743. (148) Noodleman, L.; Case, D. A. Advances in Inorganic Chemistry 1992, 38, 423-+.
123
(149) Noodleman, L.; Davidson, E. R. Chemical Physics 1986, 109, 131-143. (150) Noodleman, L.; Han, W. G. Journal of Biological Inorganic Chemistry 2006, 11, 674-694. (151) Rudberg, E.; Salek, P.; Rinkevicius, Z.; Aagren, H. J. Chem. Theory Comput. 2006, 2, 981-989. (152) Neese, F. J. Phys. Chem. Solids 2004, 65, 781-785. (153) Soda, T.; Kitagawa, Y.; Onishi, T.; Takano, Y.; Shigeta, Y.; Nagao, H.; Yoshioka, Y.; Yamaguchi, K. Chem. Phys. Lett. 2000, 319, 223-230. (154) Ruiz, E.; Cano, J.; Alvarez, S.; Alemany, P. J. Comput. Chem. 1999, 20, 1391-1400. (155) Nishino, M.; Yamanaka, S.; Yoshioka, Y.; Yamaguchi, K. J. Phys. Chem. A 1997, 101, 705-712. (156) Goel, S.; Masunov, A. E. In Lecture Notes in Computer Science 2009; Vol. 5545 LNCS, p 141-150. (157) Goel, S.; Masunov, A. E. Journal of Chemical Physics 2008, 129. (158) Zhao, X. G.; Richardson, W. H.; Chen, J. L.; Li, J.; Noodleman, L.; Tsai, H. L.; Hendrickson, D. N. Inorg Chem 1997, 36, 1198-1217. (159) Cococcioni, M.; de Gironcoli, S. Physical Review B 2005, 71, 035105. (160) Cao, C.; Hill, S.; Cheng, H.-P. Phys. Rev. Lett. 2008, 100, 167206/1-167206/4. (161) McMahan, A. K.; Martin, R. M.; Satpathy, S. Phys. Rev. B: Condens. Matter 1988, 38, 6650-66. (162) Yoo, J.; Brechin, E. K.; Yamaguchi, A.; Nakano, M.; Huffman, J. C.; Maniero, A. L.; Brunel, L. C.; Awaga, K.; Ishimoto, H.; Christou, G.; Hendrickson, D. N. Inorg Chem 2000, 39, 3615-23. (163) Dismukes, G. C. Chem. Rev. (Washington, D. C.) 1996, 96, 2909-2926. (164) Whittaker, M. M.; Barynin, V. V.; Antonyuk, S. V.; Whittaker, J. W. Biochemistry 1999, 38, 9126-9136. (165) Willing, A.; Follmann, H.; Auling, G. Eur. J. Biochem. 1988, 175, 167-73. (166) Willing, A.; Follmann, H.; Auling, G. Eur. J. Biochem. 1988, 170, 603-11. (167) Willing, A.; Follmann, H.; Auling, G. Eur J Biochem 1988, 175, 167-73. (168) Yachandra, V. K.; Sauer, K.; Klein, M. P. Chem. Rev. (Washington, D. C.) 1996, 96, 2927-2950. (169) Manchanda, R.; Brudvig, G. W.; Crabtree, R. H. Coord. Chem. Rev. 1995, 144, 1-38. (170) Pecoraro, V. L.; Baldwin, M. J.; Gelasco, A. Chem. Rev. (Washington, D. C.) 1994, 94, 807-26. (171) Foguet-Albiol, D.; O'Brien, T. A.; Wernsdorfer, W.; Moulton, B.; Zaworotko, M. J.; Abboud, K. A.; Christou, G. Angew. Chem., Int. Ed. 2005, 44, 897-901. (172) Pal, S.; Olmstead, M. M.; Armstrong, W. H. Inorg. Chem. 1995, 34, 4708-15. (173) Schafer, K. O.; Bittl, R.; Zweygart, W.; Lendzian, F.; Haselhorst, G.; Weyhermuller, T.; Wieghardt, K.; Lubitz, W. Journal of the American Chemical Society 1998, 120, 13104-13120. (174) Bossek, U.; Wieghardt, K.; Nuber, B.; Weiss, J. Inorg. Chim. Acta 1989, 165, 123-9.
124
(175) Romero, I.; Dubois, L.; Collomb, M. N.; Deronzier, A.; Latour, J. M.; Pecaut, J. Inorg Chem 2002, 41, 1795-1806. (176) Wieghardt, K.; Bossek, U.; Zsolnai, L.; Huttner, G.; Blondin, G.; Girerd, J. J.; Babonneau, F. J. Chem. Soc., Chem. Commun. 1987, 651-3. (177) Gultneh, Y.; Tesema, Y. T.; Yisgedu, T. B.; Butcher, R. J.; Wang, G. B.; Yee, G. T. Inorganic Chemistry 2006, 45, 3023-3033. (178) Andrei, V. P.; Jens, K.; Mark, R. P. Physica Status Solidi (b) 2006, 243, 2533-2572. (179) Kortus, J.; Pederson, M. R.; Hellberg, C. S.; Khanna, S. N. European Physical Journal D 2001, 16, 177-180. (180) Michalak, L.; Canali, C. M.; Pederson, M. R.; Paulsson, M.; Benza, V. G. Physical Review Letters 2010, 104. (181) Park, K.; Baruah, T.; Pederson, M. R. Abstracts of Papers of the American Chemical Society 2004, 228, 436-PHYS. (182) Ribas-Arino, J.; Baruah, T.; Pederson, M. R. Journal of the American Chemical Society 2006, 128, 9497-9505. (183) Zhang, J. R.; He, L. H.; Cao, H. B.; Wang, F. W.; Zhang, P. L. Journal of Chemical Physics 2008, 128. (184) Postnikov, A. V.; Bihimayer, G.; Blugel, S. Computational Materials Science 2006, 36, 91-95. (185) Noodleman, L.; Case, D. A. Adv. Inorg. Chem. 1992, 38, 423-70. (186) Noodleman, L.; Lovell, T.; Han, W. G.; Li, J.; Himo, F. Chem. Rev. 2004, 104, 459-508. (187) Shoji, M.; Hamamoto, T.; Koizumi, K.; Isobe, H.; Kitagawa, Y.; Takano, Y.; Yamanaka, S.; Okumura, M.; Yamaguchi, K. Polyhedron 2005, 24, 2701-2707. (188) Shoji, M.; Isobe, H.; Saito, T.; Yabushita, H.; Koizumi, K.; Kitagawa, Y.; Yamanaka, S.; Kawakami, T.; Okumura, M.; Hagiwara, M.; Yamaguchi, K. International Journal of Quantum Chemistry 2008, 108, 631-650. (189) Shoji, M.; Koizumi, K.; Kitagawa, Y.; Yamanaka, S.; Kawakami, T.; Okumura, M.; Yamaguchi, K. International Journal of Quantum Chemistry 2005, 105, 628. (190) Shoji, M.; Koizumi, K.; Kitagawa, Y.; Yamanaka, S.; Okumura, M.; Yamaguchi, K. International Journal of Quantum Chemistry 2007, 107, 609-627. (191) Shoji, M.; Koizumi, K.; Kitagawa, Y.; Yamanaka, S.; Okumura, M.; Yamaguchi, K. International Journal of Quantum Chemistry 2007, 107, 609-627. (192) Shoji, M.; Koizumi, K.; Taniguchi, T.; Kitagawa, Y.; Yamanaka, S.; Okumura, M.; Yamaguchi, K. International Journal of Quantum Chemistry 2007, 107, 116-133. (193) Shoji, M.; Nishiyama, Y.; Maruno, Y.; Koizumi, K.; Kitagawa, Y.; Yamanaka, S.; Kawakami, T.; Okumura, M.; Yamaguchi, K. International Journal of Quantum Chemistry 2004, 100, 887-906. (194) Boukhvalov, D. W.; Al-Saqer, M.; Kurmaev, E. Z.; Moewes, A.; Galakhov, V. R.; Finkelstein, L. D.; Chiuzbaian, S.; Neumann, M.; Dobrovitski, V. V.; Katsnelson, M. I.; Lichtenstein, A. I.; Harmon, B. N.; Endo, K.; North, J. M.; Dalal, N. S. Physical Review B 2007, 75.
125
(195) Boukhvalov, D. W.; Dobrovitski, V. V.; Katsnelson, M. I.; Lichtenstein, A. I.; Harmon, B. N.; Kogerler, P. Journal of Applied Physics 2003, 93, 7080-7082. (196) Boukhvalov, D. W.; Dobrovitski, V. V.; Katsnelson, M. I.; Lichtenstein, A. I.; Harmon, B. N.; Kogerler, P. Physical Review B 2004, 70. (197) Boukhvalov, D. W.; Kurmaev, E. Z.; Moewes, A.; Zatsepin, D. A.; Cherkashenko, V. M.; Nemnonov, S. N.; Finkelstein, L. D.; Yarmoshenko, Y. M.; Neumann, M.; Dobrovitski, V. V.; Katsnelson, M. I.; Lichtenstein, A. I.; Harmon, B. N.; Kogerler, P. Physical Review B 2003, 67. (198) Pablo, R.; Christoph, L.; Ibério De, P. R. M.; Francesc, I. Journal of Computational Chemistry 2009, 30, 2316-2326. (199) Nair, N. N.; Ribas-Arino, J.; Staemmler, V.; Marx, D. Journal of Chemical Theory and Computation 2010, 6, 569-575. (200) Nair, N. N.; Schreiner, E.; Pollet, R.; Staemmler, V.; Marx, D. Journal of Chemical Theory and Computation 2008, 4, 1174-1188. (201) Schreiner, E.; Nair, N. N.; Pollet, R.; Staemmler, V.; Marx, D. Proceedings of the National Academy of Sciences of the United States of America 2007, 104, 20725-20730. (202) Kulik, H. J.; Cococcioni, M.; Scherlis, D. A.; Marzari, N. Physical Review Letters 2006, 97, 103001. (203) Cao, C.; Hill, S.; Cheng, H.-P. Phys Rev Lett 2008, 100, 167206. (204) Gangopadhyay, S.; Masunov, A. E.; Poalelungi, E.; Leuenberger, M. N. The Journal of Chemical Physics 2010, 132, 244104-7. (205) Foguet-Albiol, D.; O'Brien, T. A.; Wernsdorfer, W.; Moulton, B.; Zaworotko, M. J.; Abboud, K. A.; Christou, G. Angewandte Chemie-International Edition 2005, 44, 897-901. (206) Ramsey, C. M.; Del Barco, E.; Hill, S.; Shah, S. J.; Beedle, C. C.; Hendrickson, D. N. Nature Physics 2008, 4, 277-281. (207) Cano, J.; Costa, R.; Alvarez, S.; Ruiz, E. Journal of Chemical Theory and Computation 2007, 3, 782-788. (208) Rumberger, E. M.; Shah, S. J.; Beedle, C. C.; Zakharov, L. N.; Rheingold, A. L.; Hendrickson, D. N. Inorg. Chem. 2005, 44, 2742-2752. (209) Waldmann, O. Private Communication. (210) Meier, F.; Loss, D. Physical Review B 2001, 64. (211) Hay, P. J.; Thibeault, J. C.; Hoffmann, R. Journal of the American Chemical Society 1975, 97, 4884-4899. (212) Clark, A. E.; Davidson, E. R. The Journal of Chemical Physics 2001, 115, 7382-7392. (213) Deluga, G. A.; Salge, J. R.; Schmidt, L. D.; Verykios, X. E. Science 2004, 303, 993-997. (214) Otsuka, K.; Ushiyama, T.; Yamanaka, I. Chemistry Letters 1993, 1517-1520. (215) Park, S. D.; Vohs, J. M.; Gorte, R. J. Nature 2000, 404, 265-267. (216) Gschneidner, K. A.; Eyring, L. Handbook on the physics and chemistry of rare earths; North-Holland Pub. Co. ; sole distributors for the U.S.A. and Canada Elsevier North Holland: Amsterdam ; New York New York, 1979.
126
(217) Kourouklis, G. A.; Jayaraman, A.; Espinosa, G. P. Physical Review B 1988, 37, 4250-4253. (218) Barnighausen, H.; Schiller, G. Journal of the Less-Common Metals 1985, 110, 385-390. (219) Trovarelli, A. Catalysis by ceria and related materials; Imperial College Press: London, 2002. (220) Yoshimura, S. a. Journal of Ceramic association of Japan 1968, 76. (221) Masunov, A. E. Koordinatsionnaya Khimiya 1993, 19, 261-268. (222) Fujimori, A. Physical Review Letters 1984, 53, 2518-2518. (223) Inerbaev, T. M.; Seal, S.; Masunov, A. E. Journal of Molecular Modeling, 16, 1617-1623. (224) Vincent, A.; Inerbaev, T. M.; Babu, S.; Karakoti, A. S.; Self, W. T.; Masunov, A. E.; Seal, S. Langmuir, 26, 7188-7198. (225) Vincent, A.; Babu, S.; Heckert, E.; Dowding, J.; Hirst, S. M.; Inerbaev, T. M.; Self, W. T.; Reilly, C. M.; Masunov, A. E.; Rahman, T. S.; Seal, S. Acs Nano 2009, 3, 1203-1211. (226) Loschen, C.; Bromley, S. T.; Neyman, K. M.; Illas, F. Journal of Physical Chemistry C 2007, 111, 10142-10145. (227) Loschen, C.; Carrasco, J.; Neyman, K. M.; Illas, F. Physical Review B 2007, 75. (228) Loschen, C.; Migani, A.; Bromley, S. T.; Illas, F.; Neyman, K. M. Physical Chemistry Chemical Physics 2008, 10, 5730-5738. (229) Yang, Z. X.; Wang, Q. G.; Wei, S. Y.; Ma, D. W.; Sun, Q. A. Journal of Physical Chemistry C 2010, 114, 14891-14899. (230) Chen, C.; Chen, H. L.; Weng, M. H.; Ju, S. P.; Chang, J. G.; Chang, C. S. Chinese Journal of Catalysis 2008, 29, 1117-1121. (231) Choi, Y. M.; Abernathy, H.; Chen, H. T.; Lin, M. C.; Liu, M. L. Chemphyschem 2006, 7, 1957-1963. (232) Skorodumova, N. V.; Simak, S. I.; Lundqvist, B. I.; Abrikosov, I. A.; Johansson, B. Physical Review Letters 2002, 89, 4. (233) Suzuki, C.; Tochio, T. Chemical Physics 2007, 340, 203-210. (234) Shapovalov, V.; Metiu, H. Journal of Catalysis 2007, 245, 205-214. (235) Song, Y. Q.; Zhang, H. W.; Yang, Q. H.; Liu, Y. L.; Li, Y. X.; Shah, L. R.; Zhu, H.; Xiao, J. Q. Journal of Physics-Condensed Matter 2009, 21, 5. (236) Zhan-Sheng, L.; Gai-Xia, L.; Zong-Xian, Y. Acta Physica Sinica 2007, 56, 5382-5388. (237) Wei, Y. W.; Yang, Z. X. Acta Physica Sinica 2008, 57, 7139-7144. (238) Baudin, M.; Wojcik, M.; Hermansson, K. Surface Science 2000, 468, 51-61. (239) Castleton, C. W. M.; Kullgren, J.; Hermansson, K. Journal of Chemical Physics 2007, 127. (240) Herschend, B.; Baudin, M.; Hermansson, K. Surface Science 2005, 599, 173-186. (241) Herschend, B.; Baudin, M.; Hermansson, K. Chemical Physics 2006, 328, 345-353. (242) Muller, C.; Freysoldt, C.; Baudin, M.; Hermansson, K. Chemical Physics 2005, 318, 180-190.
127
(243) Muller, C.; Herschend, B.; Hermansson, K.; Paulus, B. Journal of Chemical Physics 2008, 128. (244) Muller, C.; Paulus, B.; Hermansson, K. Surface Science 2009, 603, 2619-2623. (245) Skorodumova, N. V.; Baudin, M.; Hermansson, K. Physical Review B 2004, 69. (246) Yang, Z. X.; Woo, T. K.; Hermansson, K. Surface Science 2006, 600, 4953-4960. (247) Koelling, D. D.; Boring, A. M.; Wood, J. H. Solid State Communications 1983, 47, 227-232. (248) Marabelli, F.; Wachter, P. Physical Review B 1987, 36, 1238-1243. (249) Hill, S. E.; Catlow, C. R. A. Journal of Physics and Chemistry of Solids 1993, 54, 411-419. (250) Gennard, S.; Cora, F.; Catlow, C. R. A. Journal of Physical Chemistry B 1999, 103, 10158-10170. (251) Skorodumova, N. V.; Ahuja, R.; Simak, S. I.; Abrikosov, I. A.; Johansson, B.; Lundqvist, B. I. Physical Review B 2001, 6411. (252) Nolan, M.; Grigoleit, S.; Sayle, D. C.; Parker, S. C.; Watson, G. W. Surface Science 2005, 576, 217-229. (253) Hay, P. J.; Martin, R. L.; Uddin, J.; Scuseria, G. E. Journal of Chemical Physics 2006, 125, -. (254) Boese, A. D.; Martin, J. M. L. Journal of Chemical Physics 2004, 121, 3405-3416. (255) Becke, A. D. Journal of Chemical Physics 1993, 98, 1372-1377. (256) Kudin, K. N.; Scuseria, G. E. Physical Review B 2000, 61, 16440-16453. (257) Frisch, M. J.; C.02 ed.; Gaussian Inc Wallingford CT, 2004. (258) Kudin, K. N.; Scuseria, G. E.; Martin, R. L. Physical Review Letters 2002, 89, -. (259) Prodan, I. D.; Scuseria, G. E.; Sordo, J. A.; Kudin, K. N.; Martin, R. L. Journal of Chemical Physics 2005, 123. (260) Cundari, T. R.; Stevens, W. J.; Sommerer, S. O. Chemical Physics 1993, 178, 235-243. (261) Stevens, W. J.; Basch, H.; Krauss, M. Journal of Chemical Physics 1984, 81, 6026-6033. (262) Stevens, W. J.; Krauss, M.; Basch, H.; Jasien, P. G. Canadian Journal of Chemistry-Revue Canadienne De Chimie 1992, 70, 612-630. (263) Birch, F. Physical Review 1947, 71, 809. (264) Birch, F. Journal of Applied Physics 1938, 9, 279-288. (265) Ziambaras, E.; Schroder, E. Physical Review B (Condensed Matter and Materials Physics) 2003, 68, 064112-7. (266) Schaftenaar, G.; Noordik, J. H. J. Comput.-Aided Mol. Design 2000, 14, 123-134. (267) Nakajima, A.; Yoshihara, A.; Ishigame, M. Physical Review B 1994, 50, 13297-13307. (268) Gerward, L.; Olsen, J. S. Powder Diffraction 1993, 8, 127-129. (269) Jiang, Y.; Adams, J. B.; van Schilfgaarde, M. Journal of Chemical Physics 2005, 123, -. (270) Yang, Z. X.; Woo, T. K.; Baudin, M.; Hermansson, K. Journal of Chemical Physics 2004, 120, 7741-7749.

128
(271) Gerward, L.; Staun Olsen, J.; Petit, L.; Vaitheeswaran, G.; Kanchana, V.; Svane, A. Journal of Alloys and Compounds 2005, 400, 56-61. (272) Mikami, M.; Nakamura, S. Journal of Alloys and Compounds 2006, 408, 687-692.