Experimental and Theoretical Electron Density Studies in Large Molecules: NAD + , β-Nicotinamide...
13
Experimental and Theoretical Electron Density Studies in Large Molecules: NAD + , -Nicotinamide Adenine Dinucleotide Benoı ˆt Guillot, ² Nicolas Muzet, ² Emilio Artacho, ‡ Claude Lecomte, ² and Christian Jelsch* ,² Laboratoire de Cristallographie et Mode ´ lisation des Mate ´ riaux Mine ´ raux et Biologiques (LCM3B), CNRS UMR 7036, UniVersite ´ H. Poincare ´ , VandoeuVre-les-Nancy, France, and Department of Earth Sciences, UniVersity of Cambridge, Downing Street, Cambridge CB2 3EQ, U.K. ReceiVed: February 25, 2003; In Final Form: May 27, 2003 NAD + is the oxidized form of the coenzyme redox pair NAD + /NADH and plays a main role in catalysis of biological processes. Accurate X-ray diffraction data have been collected at 100 K from a crystal of the free acid form of the coenzyme NAD + with a CCD area detector up to 0.55 Å resolution. A multipole refinement was carried out, and the electron density of the molecule has been analyzed in order to further model its interaction with enzymes. The electron density of NAD + has also been computed by a DFT (density functional theory) approach. The charge density and electrostatic potential obtained from experiment and theory compare well. There is a very good agreement between the theoretical and experimental charge densities for all the C-C and C-N type connections of the NAD + molecule; this is less the case for the pyrophosphate region. The experimental electron density lone pairs of the pyrophosphate lateral oxygen atoms are distorted by hydrogen bonds effects. The electrostatic potential has large spatial extensions with highly positive and negative regions, suggesting that NAD + is likely to interact with proteins mostly by electrostatic interactions. Introduction Nicotinamide adenine dinucleotide cofactor (NAD + ) plays a major role in enzyme-catalyzed biological oxido-reduction processes. NAD + is the oxidized form of the redox pair NAD + / NADH and binds to enzymes involved in metabolic oxidation reactions, mostly dehydrogenase reactions. NAD + is composed of a pyrophosphate moiety linking together an adenylic acid and a nicotinamide-5′-ribonucleotide group. In the dehydrogen- ation process, NAD + is reduced to NADH by accepting an hydride anion (H - ) from the substrate to its redox active site located on the C18 atom (in the present paper nomenclature) of the nicotinamide ring. When the cofactor has formed a reactive complex with an enzyme, the carboxamide group loses freedom of rotation, owing to intermolecular binding forces such as hydrogen bonds. The ubiquitous redox cofactors nicotinamide adenine dinucle- otides [NAD + /NADP + ] are very similar molecules, despite their participation in substantially different biochemical processes. NADP + differs from NAD + only by the presence of an additional phosphate group esterified to a hydroxyl group of the adenine side ribose. NADP + is confined with few exceptions to the reactions of reductive biosynthesis, whereas NAD + is used almost exclusively in oxidative degradations. There are many known tertiary structures of NADP + and NAD + protein complexes. The conserved and variable interac- tions between the two cofactors and their respective binding pockets in several proteins are reported in detail in the reviews of Carugo et al. 1,2 A clear fingerprint in NAD + complexes is a carboxylate side chain that chelates the diol group at the ribose near the adenine, whereas in NADP + complexes an arginine side chain faces the adenine plane and interacts with the phosphomonoester moiety. The NADP + coenzymes are more flexible in conformation than those of NAD + . The protein cofactor interactions are largely conserved in the NAD + complexes, while they are quite variable in those of NADP + . In both cases the pocket around the nicotinamide moiety is substrate dependent and rules the stereospecificity of the chemical process involving the cofactor. Experimental and theoretical studies on model compounds for such a reaction have suggested that the favored mecanism involves hydride transfer to the face of the NADH pyridine ring near the carbonyl oxygen. 3 On the basis of the quantum chemical energy calculations of the transition state by Donkersloot and Buck, 4 it has been suggested that the stereospecific property of the reaction is induced by an interaction between the negatively charged carboxamide oxygen atom and the positive charge of the hydride donating moiety. A distortion of the nicotinamide ring of NADH was observed in the 1 Å resolution crystal structure of horse liver alcohol dehydrogenase in complex with NADH. 5 Quantum chemical calculations showed that the puckering of the pyridine ring activates NADH for enzymatic hydride transfer. Information on the relationship between the electronic proper- ties and molecular conformations of NAD + will enable under- standing the electron and hydride transfer in biological processes and the reaction mechanism of dehydrogenase and hydrogenase processes at the electronic level. Therefore, the aim of this study is a description of the charge density and electrostatic properties of the NAD + molecule. The accurate crystal structure of the nicotinamide molecule was determined from X-ray and neutron diffraction experiments by Miwa et al. 6 An estimation of the electron distribution by the maximum entropy method indicates that the electrostatic properties depend on the rotation of the carboxamide group out of the pyridine plane. But, to the best of our knowledge, no * To whom correspondence should be addressed. E-mail: jelsch@ lcm3b.uhp-nancy.fr. ² Universite ´ H. Poincare ´. ‡ University of Cambridge. 9109 J. Phys. Chem. B 2003, 107, 9109-9121 10.1021/jp034478b CCC: $25.00 © 2003 American Chemical Society Published on Web 08/05/2003
-
Upload
independent -
Category
Documents
-
view
2 -
download
0
Transcript of Experimental and Theoretical Electron Density Studies in Large Molecules: NAD + , β-Nicotinamide...

Experimental and Theoretical Electron Density Studies in Large Molecules: NAD+,â-Nicotinamide Adenine Dinucleotide
Benoıt Guillot, † Nicolas Muzet,† Emilio Artacho, ‡ Claude Lecomte,† and Christian Jelsch*,†
Laboratoire de Cristallographie et Mode´lisation des Mate´riaux Mineraux et Biologiques (LCM3B), CNRS UMR7036, UniVersiteH. Poincare, VandoeuVre-les-Nancy, France, and Department of Earth Sciences, UniVersity ofCambridge, Downing Street, Cambridge CB2 3EQ, U.K.
ReceiVed: February 25, 2003; In Final Form: May 27, 2003
NAD+ is the oxidized form of the coenzyme redox pair NAD+/NADH and plays a main role in catalysis ofbiological processes. Accurate X-ray diffraction data have been collected at 100 K from a crystal of the freeacid form of the coenzyme NAD+ with a CCD area detector up to 0.55 Å resolution. A multipole refinementwas carried out, and the electron density of the molecule has been analyzed in order to further model itsinteraction with enzymes. The electron density of NAD+ has also been computed by a DFT (density functionaltheory) approach. The charge density and electrostatic potential obtained from experiment and theory comparewell. There is a very good agreement between the theoretical and experimental charge densities for all theC-C and C-N type connections of the NAD+ molecule; this is less the case for the pyrophosphate region.The experimental electron density lone pairs of the pyrophosphate lateral oxygen atoms are distorted byhydrogen bonds effects. The electrostatic potential has large spatial extensions with highly positive and negativeregions, suggesting that NAD+ is likely to interact with proteins mostly by electrostatic interactions.
Introduction
Nicotinamide adenine dinucleotide cofactor (NAD+) plays amajor role in enzyme-catalyzed biological oxido-reductionprocesses. NAD+ is the oxidized form of the redox pair NAD+/NADH and binds to enzymes involved in metabolic oxidationreactions, mostly dehydrogenase reactions. NAD+ is composedof a pyrophosphate moiety linking together an adenylic acidand a nicotinamide-5′-ribonucleotide group. In the dehydrogen-ation process, NAD+ is reduced to NADH by accepting anhydride anion (H-) from the substrate to its redox active sitelocated on the C18 atom (in the present paper nomenclature)of the nicotinamide ring. When the cofactor has formed areactive complex with an enzyme, the carboxamide group losesfreedom of rotation, owing to intermolecular binding forces suchas hydrogen bonds.
The ubiquitous redox cofactors nicotinamide adenine dinucle-otides [NAD+/NADP+] are very similar molecules, despite theirparticipation in substantially different biochemical processes.NADP+ differs from NAD+ only by the presence of anadditional phosphate group esterified to a hydroxyl group ofthe adenine side ribose. NADP+ is confined with few exceptionsto the reactions of reductive biosynthesis, whereas NAD+ isused almost exclusively in oxidative degradations.
There are many known tertiary structures of NADP+ andNAD+ protein complexes. The conserved and variable interac-tions between the two cofactors and their respective bindingpockets in several proteins are reported in detail in the reviewsof Carugo et al.1,2 A clear fingerprint in NAD+ complexes is acarboxylate side chain that chelates the diol group at the ribosenear the adenine, whereas in NADP+ complexes an arginine
side chain faces the adenine plane and interacts with thephosphomonoester moiety. The NADP+ coenzymes are moreflexible in conformation than those of NAD+. The proteincofactor interactions are largely conserved in the NAD+
complexes, while they are quite variable in those of NADP+.In both cases the pocket around the nicotinamide moiety issubstrate dependent and rules the stereospecificity of thechemical process involving the cofactor.
Experimental and theoretical studies on model compoundsfor such a reaction have suggested that the favored mecanisminvolves hydride transfer to the face of the NADH pyridine ringnear the carbonyl oxygen.3 On the basis of the quantum chemicalenergy calculations of the transition state by Donkersloot andBuck,4 it has been suggested that the stereospecific property ofthe reaction is induced by an interaction between the negativelycharged carboxamide oxygen atom and the positive charge ofthe hydride donating moiety.
A distortion of the nicotinamide ring of NADH was observedin the 1 Å resolution crystal structure of horse liver alcoholdehydrogenase in complex with NADH.5 Quantum chemicalcalculations showed that the puckering of the pyridine ringactivates NADH for enzymatic hydride transfer.
Information on the relationship between the electronic proper-ties and molecular conformations of NAD+ will enable under-standing the electron and hydride transfer in biological processesand the reaction mechanism of dehydrogenase and hydrogenaseprocesses at the electronic level. Therefore, the aim of this studyis a description of the charge density and electrostatic propertiesof the NAD+ molecule.
The accurate crystal structure of the nicotinamide moleculewas determined from X-ray and neutron diffraction experimentsby Miwa et al.6 An estimation of the electron distribution bythe maximum entropy method indicates that the electrostaticproperties depend on the rotation of the carboxamide group outof the pyridine plane. But, to the best of our knowledge, no
* To whom correspondence should be addressed. E-mail: [email protected].
† UniversiteH. Poincare´.‡ University of Cambridge.
9109J. Phys. Chem. B2003,107,9109-9121
10.1021/jp034478b CCC: $25.00 © 2003 American Chemical SocietyPublished on Web 08/05/2003

detailed ab initio calculation or experimental determination ofthe charge density of NAD+ has been undertaken. Sometheoretical calculations were performed for calculating atomicpoint charges to be used in force field parametrization,7 basedon geometrical optimization comparison. Therefore, to ac-curately determine the electrostatic properties of NAD+, DFTcalculations and experimental high-resolution X-ray diffractionanalyses (X - (X + N))8 have been performed. Such a theoreticalcalculation on a large molecule like NAD+ and the resultingproperties have to be calibrated against the experimental chargedensity study. This comparison will also determine the minimalbasis sets required to accurately analyze the interaction ofNAD+/NADH with proteins in further calculations.9
The experimental charge density determination of thismolecule of 48 non-hydrogen atoms, crystallizing in theP1space group, requires neutron diffraction data to determineaccurate hydrogen atoms positional and anisotropic thermalmotion displacement parameters (ADPs). The high-resolutionneutron crystal structure of NAD+ has therefore been recentlydetermined.10
Finally, another aim of the present crystallographic analysisis to expand our database of multipolar parameters11 describingthe electron density of biological molecules, including proteinsand nucleic acids. This database is the starting point forelectrostatic experimental force field parameters. Furthermore,the resulting charge density parameters are presently being usedin the multipolar refinement of the ultrahigh resolution aldosereductase-inhibitor-NAD+ complex.9
Experimental Section
X-ray Data Collection. NAD+ was purchased from SIGMA(St Louis, MO). In the present study, NAD+ differs from thatunder physiological conditions, as its adenine base is protonated.The conditions yielding triclinic crystals of the acidic form ofNAD+ in an aqueous solution of 50% methanol were alreadydescribed.12 The Mo KR X-ray diffraction intensities weremeasured with a Nonius Kappa CCD diffractometer at 100 Kusing a nitrogen vapor open flow stream device (OxfordCryosystems cooler 600 series). The data collection strategywas performed with the programs COLLECT and STRAT-EGY.13 The maximum 2θ swing angle was 35° (sin θmax/λ )0.91 Å-1, dmin ) 0.55 Å), and the crystal-to-detector distancewas fixed to 50 mm. A total of 4565 frames was collected overa 6 day period.
The intensity integration was performed using DENZO.14 Thefinal unit cell parameters were refined with the SCALEPACK14
program using all the frames. More experimental details andintensity statistics are summarized in Table 1. The diffractionframes scaling was performed using the SCALEPACK program.The Friedel pairs were merged during the scaling procedure.As NAD+ crystallizes in theP1 space group, much attentionwas payed to ensure high redundancy: the final redundancydepends on the resolution, varying continuously from 17 to about2, respectively, for the lowest and highest resolution shells. Thesignal to noise ratio is very high, with an averageI/σ(I) valueof 32, and less than 2% of the averaged data present aI/σ(I)ratio less than 3.
Electron Density Models and Refinement Strategy.Theinitial non-hydrogen atoms’ coordinates were taken from theneutron structure of NAD+.10 The atomic numbering is shownin Figure 1. All hydrogen atoms were clearly located in theX-ray difference Fourier maps, demonstrating the diffractiondata quality. The least-squares refinement program MoPro15 wasused to refine the structure and charge density of NAD+. The
least squares refinement was performed against the 9504structure factor moduli with|FH| > 3σ(|FH|). As the origin isundetermined in the space groupP1, the position of the O1atom was kept fixed during all the refinements.
Spherical Atom Refinement.First, positional and anisotropicdisplacement parameters (ADPs) of the non-hydrogen atomswere refined against the high order reflections (sinθ/λ > 0.8Å-1). This was followed by a refinement of the same parametersfor the H atoms using low-order data (sinθ/λ < 0.5 Å-1). Thisprocedure was iterated until convergence. The scale factor wasrefined at the beginning of each refinement step. The crystal-lographic residual at the end of the spherical atom refinementis given in Table 2.
To transfer positional and thermal parameters of the H atomsfrom the neutron structure,10 the isotropic thermal displacementparameters of the non-hydrogen atoms derived from X-ray and
Figure 1. ORTEP view45 of the NAD+ molecule. Displacementellipsoids are shown at the 50% probability level. The NAD+ moleculestudied here is a formally neutral bis-zwitterion, with N6 and N3-Hformally positive, and O3-P1-O2 and O1-P2-O8 formally negative.
TABLE 1: Summary of Experimental Conditions and X-rayCrystallographic Diffraction Data
formula C21H27N7O14P2 + 4H2Ospace group triclinicP1temperature (K) 100(5)a b c(Å) 8.592(10) 8.845(10) 11.192(10)R â γ (deg) 109.64(5) 90.56(5) 103.92(5)V (Å3) 773.71Z F(0 0 0) 1 384edensity calc (g/cm3) 1.578crystal size 0.35× 0.35× 0.30 mm3
radiation type Mo KRwavelengthλ (Å) 0.7107monochromator graphitescan width∆ω (deg) 0.5-1time per step min/max. (s) 150-300max. sinθ/λ (Å-1) 0.91 (0.55 Å)redundancy 16.0completeness (%) 88.4wR(I) merge (%) 2.3N measured 154 769N unique 9643 9504 (Ι > 3σ)
TABLE 2: Summary of Conventional and MultipolarRefinementsa
spherical atom model multipolar refinement
|F|/σ(F) > 0 |F| > 3σ(F) |F|/σ(F) > 0 |F| > 3σ(F)
nb. of observations 9617 9504 9617 9504R(F) (%) 2.33 2.24 1.26 1.22wR(F)(%) 3.28 3.12 1.25 1.24goodness of fit 2.83 2.75 1.08 1.08
a wR(F) ) [∑Hw(Fo - kFc)2/∑HwFo2 ]1/2. R(F)) ∑H(Fo - kFc)/∑HFo.
gof ) [∑Hw(Fo - kFc)2/(Nobs - Nvar)]1/2. Weighting scheme:w )1/σ2(F).
9110 J. Phys. Chem. B, Vol. 107, No. 34, 2003 Guillot et al.
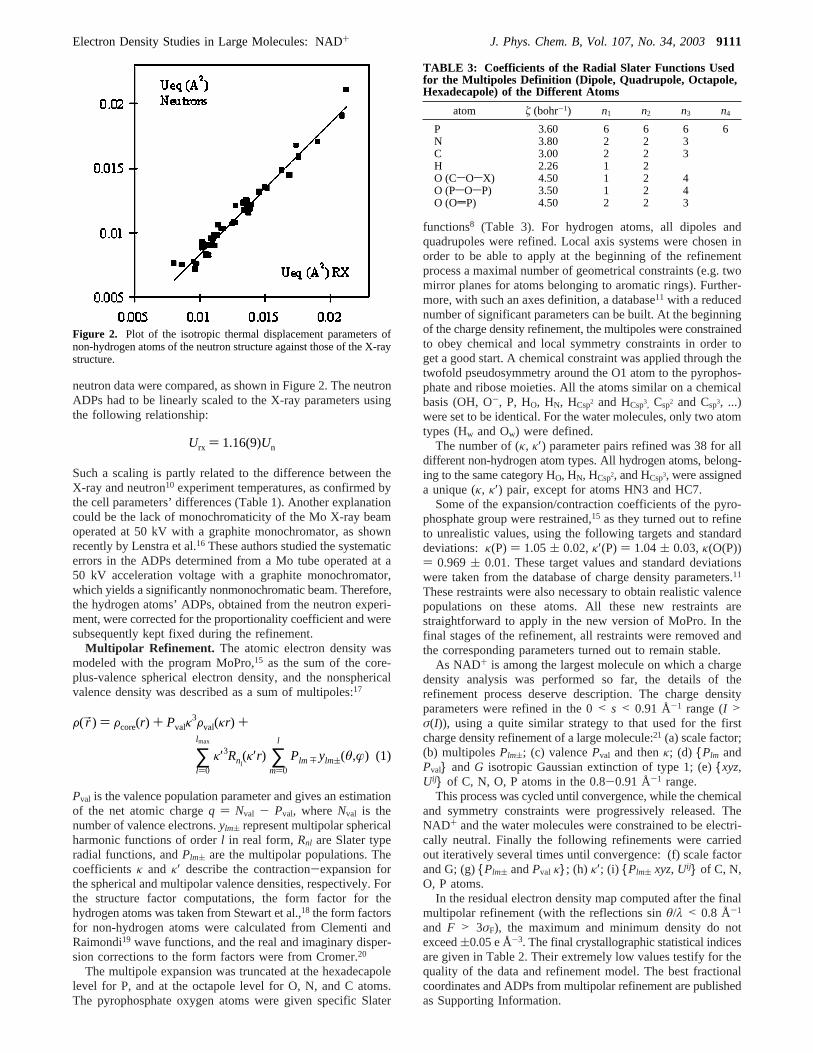
neutron data were compared, as shown in Figure 2. The neutronADPs had to be linearly scaled to the X-ray parameters usingthe following relationship:
Such a scaling is partly related to the difference between theX-ray and neutron10 experiment temperatures, as confirmed bythe cell parameters’ differences (Table 1). Another explanationcould be the lack of monochromaticity of the Mo X-ray beamoperated at 50 kV with a graphite monochromator, as shownrecently by Lenstra et al.16 These authors studied the systematicerrors in the ADPs determined from a Mo tube operated at a50 kV acceleration voltage with a graphite monochromator,which yields a significantly nonmonochromatic beam. Therefore,the hydrogen atoms’ ADPs, obtained from the neutron experi-ment, were corrected for the proportionality coefficient and weresubsequently kept fixed during the refinement.
Multipolar Refinement. The atomic electron density wasmodeled with the program MoPro,15 as the sum of the core-plus-valence spherical electron density, and the nonsphericalvalence density was described as a sum of multipoles:17
Pval is the valence population parameter and gives an estimationof the net atomic chargeq ) Nval - Pval, whereNval is thenumber of valence electrons.ylm( represent multipolar sphericalharmonic functions of orderl in real form,Rnl are Slater typeradial functions, andPlm( are the multipolar populations. Thecoefficientsκ and κ′ describe the contraction-expansion forthe spherical and multipolar valence densities, respectively. Forthe structure factor computations, the form factor for thehydrogen atoms was taken from Stewart et al.,18 the form factorsfor non-hydrogen atoms were calculated from Clementi andRaimondi19 wave functions, and the real and imaginary disper-sion corrections to the form factors were from Cromer.20
The multipole expansion was truncated at the hexadecapolelevel for P, and at the octapole level for O, N, and C atoms.The pyrophosphate oxygen atoms were given specific Slater
functions8 (Table 3). For hydrogen atoms, all dipoles andquadrupoles were refined. Local axis systems were chosen inorder to be able to apply at the beginning of the refinementprocess a maximal number of geometrical constraints (e.g. twomirror planes for atoms belonging to aromatic rings). Further-more, with such an axes definition, a database11 with a reducednumber of significant parameters can be built. At the beginningof the charge density refinement, the multipoles were constrainedto obey chemical and local symmetry constraints in order toget a good start. A chemical constraint was applied through thetwofold pseudosymmetry around the O1 atom to the pyrophos-phate and ribose moieties. All the atoms similar on a chemicalbasis (OH, O-, P, HO, HN, HCsp2 and HCsp3, Csp2 and Csp3, ...)were set to be identical. For the water molecules, only two atomtypes (Hw and Ow) were defined.
The number of (κ, κ′) parameter pairs refined was 38 for alldifferent non-hydrogen atom types. All hydrogen atoms, belong-ing to the same category HO, HN, HCsp2, and HCsp3, were assigneda unique (κ, κ′) pair, except for atoms HN3 and HC7.
Some of the expansion/contraction coefficients of the pyro-phosphate group were restrained,15 as they turned out to refineto unrealistic values, using the following targets and standarddeviations: κ(P) ) 1.05( 0.02,κ′(P) ) 1.04( 0.03,κ(O(P))) 0.969( 0.01. These target values and standard deviationswere taken from the database of charge density parameters.11
These restraints were also necessary to obtain realistic valencepopulations on these atoms. All these new restraints arestraightforward to apply in the new version of MoPro. In thefinal stages of the refinement, all restraints were removed andthe corresponding parameters turned out to remain stable.
As NAD+ is among the largest molecule on which a chargedensity analysis was performed so far, the details of therefinement process deserve description. The charge densityparameters were refined in the 0< s < 0.91 Å-1 range (I >σ(I)), using a quite similar strategy to that used for the firstcharge density refinement of a large molecule:21 (a) scale factor;(b) multipolesPlm(; (c) valencePval and thenκ; (d) {Plm andPval} andG isotropic Gaussian extinction of type 1; (e){xyz,Uij} of C, N, O, P atoms in the 0.8-0.91 Å-1 range.
This process was cycled until convergence, while the chemicaland symmetry constraints were progressively released. TheNAD+ and the water molecules were constrained to be electri-cally neutral. Finally the following refinements were carriedout iteratively several times until convergence: (f) scale factorand G; (g){Plm( andPval κ}; (h) κ′; (i) {Plm( xyz, Uij} of C, N,O, P atoms.
In the residual electron density map computed after the finalmultipolar refinement (with the reflections sinθ/λ < 0.8 Å-1
and F > 3σF), the maximum and minimum density do notexceed(0.05 e Å-3. The final crystallographic statistical indicesare given in Table 2. Their extremely low values testify for thequality of the data and refinement model. The best fractionalcoordinates and ADPs from multipolar refinement are publishedas Supporting Information.
Figure 2. Plot of the isotropic thermal displacement parameters ofnon-hydrogen atoms of the neutron structure against those of the X-raystructure.
Urx ) 1.16(9)Un
F( rb) ) Fcore(r) + Pvalκ3Fval(κr) +
∑l)0
lmax
κ′3Rnl(κ′r) ∑
m)0
l
Plm - ylm((θ,æ) (1)
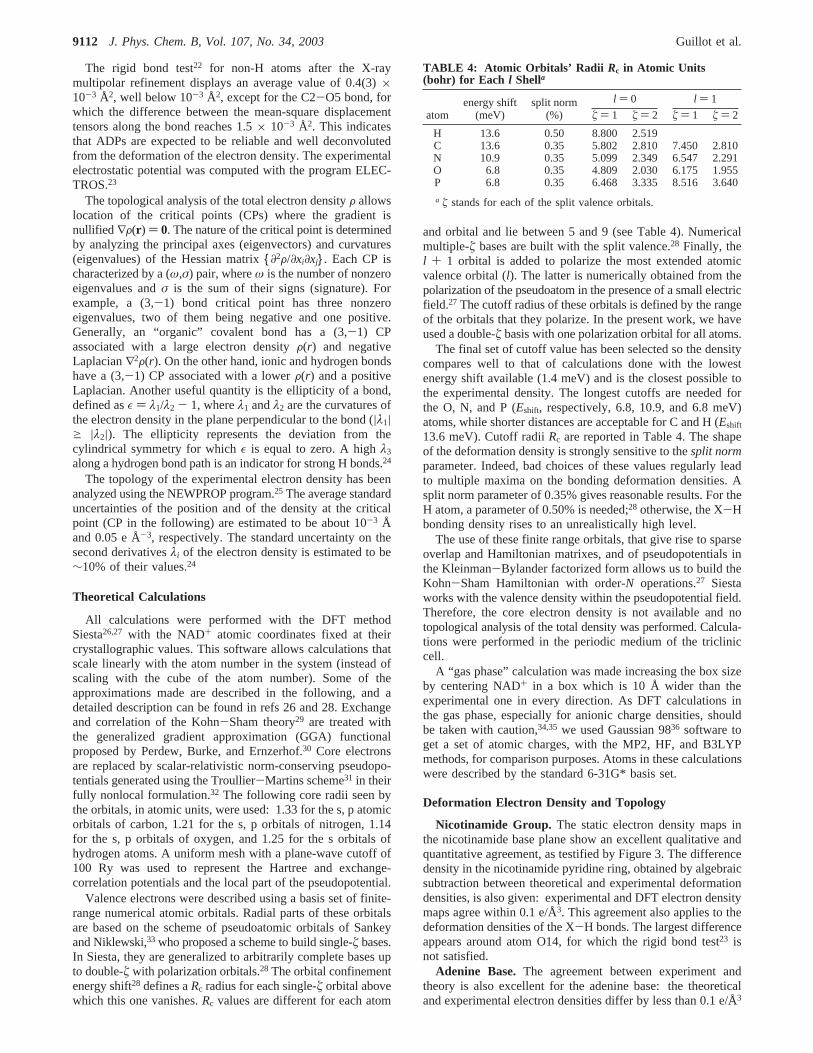
TABLE 3: Coefficients of the Radial Slater Functions Usedfor the Multipoles Definition (Dipole, Quadrupole, Octapole,Hexadecapole) of the Different Atoms
atom ú (bohr-1) n1 n2 n3 n4
P 3.60 6 6 6 6N 3.80 2 2 3C 3.00 2 2 3H 2.26 1 2O (CsOsX) 4.50 1 2 4O (PsOsP) 3.50 1 2 4O (OdP) 4.50 2 2 3
Electron Density Studies in Large Molecules: NAD+ J. Phys. Chem. B, Vol. 107, No. 34, 20039111
The rigid bond test22 for non-H atoms after the X-raymultipolar refinement displays an average value of 0.4(3)×10-3 Å2, well below 10-3 Å2, except for the C2-O5 bond, forwhich the difference between the mean-square displacementtensors along the bond reaches 1.5× 10⁻³ Å2. This indicatesthat ADPs are expected to be reliable and well deconvolutedfrom the deformation of the electron density. The experimentalelectrostatic potential was computed with the program ELEC-TROS.23
The topological analysis of the total electron densityF allowslocation of the critical points (CPs) where the gradient isnullified ∇F(r) ) 0. The nature of the critical point is determinedby analyzing the principal axes (eigenvectors) and curvatures(eigenvalues) of the Hessian matrix{∂2F/∂xi∂xj}. Each CP ischaracterized by a (ω,σ) pair, whereω is the number of nonzeroeigenvalues andσ is the sum of their signs (signature). Forexample, a (3,-1) bond critical point has three nonzeroeigenvalues, two of them being negative and one positive.Generally, an “organic” covalent bond has a (3,-1) CPassociated with a large electron densityF(r) and negativeLaplacian∇2F(r). On the other hand, ionic and hydrogen bondshave a (3,-1) CP associated with a lowerF(r) and a positiveLaplacian. Another useful quantity is the ellipticity of a bond,defined asε ) λ1/λ2 - 1, whereλ1 andλ2 are the curvatures ofthe electron density in the plane perpendicular to the bond (|λ1|g |λ2|). The ellipticity represents the deviation from thecylindrical symmetry for whichε is equal to zero. A highλ3
along a hydrogen bond path is an indicator for strong H bonds.24
The topology of the experimental electron density has beenanalyzed using the NEWPROP program.25 The average standarduncertainties of the position and of the density at the criticalpoint (CP in the following) are estimated to be about 10-3 Åand 0.05 e Å-3, respectively. The standard uncertainty on thesecond derivativesλi of the electron density is estimated to be∼10% of their values.24
Theoretical Calculations
All calculations were performed with the DFT methodSiesta26,27 with the NAD+ atomic coordinates fixed at theircrystallographic values. This software allows calculations thatscale linearly with the atom number in the system (instead ofscaling with the cube of the atom number). Some of theapproximations made are described in the following, and adetailed description can be found in refs 26 and 28. Exchangeand correlation of the Kohn-Sham theory29 are treated withthe generalized gradient approximation (GGA) functionalproposed by Perdew, Burke, and Ernzerhof.30 Core electronsare replaced by scalar-relativistic norm-conserving pseudopo-tentials generated using the Troullier-Martins scheme31 in theirfully nonlocal formulation.32 The following core radii seen bythe orbitals, in atomic units, were used: 1.33 for the s, p atomicorbitals of carbon, 1.21 for the s, p orbitals of nitrogen, 1.14for the s, p orbitals of oxygen, and 1.25 for the s orbitals ofhydrogen atoms. A uniform mesh with a plane-wave cutoff of100 Ry was used to represent the Hartree and exchange-correlation potentials and the local part of the pseudopotential.
Valence electrons were described using a basis set of finite-range numerical atomic orbitals. Radial parts of these orbitalsare based on the scheme of pseudoatomic orbitals of Sankeyand Niklewski,33 who proposed a scheme to build single-ú bases.In Siesta, they are generalized to arbitrarily complete bases upto double-ú with polarization orbitals.28 The orbital confinementenergy shift28 defines aRc radius for each single-ú orbital abovewhich this one vanishes.Rc values are different for each atom
and orbital and lie between 5 and 9 (see Table 4). Numericalmultiple-ú bases are built with the split valence.28 Finally, thel + 1 orbital is added to polarize the most extended atomicvalence orbital (l). The latter is numerically obtained from thepolarization of the pseudoatom in the presence of a small electricfield.27 The cutoff radius of these orbitals is defined by the rangeof the orbitals that they polarize. In the present work, we haveused a double-ú basis with one polarization orbital for all atoms.
The final set of cutoff value has been selected so the densitycompares well to that of calculations done with the lowestenergy shift available (1.4 meV) and is the closest possible tothe experimental density. The longest cutoffs are needed forthe O, N, and P (Eshift, respectively, 6.8, 10.9, and 6.8 meV)atoms, while shorter distances are acceptable for C and H (Eshift
13.6 meV). Cutoff radiiRc are reported in Table 4. The shapeof the deformation density is strongly sensitive to thesplit normparameter. Indeed, bad choices of these values regularly leadto multiple maxima on the bonding deformation densities. Asplit norm parameter of 0.35% gives reasonable results. For theH atom, a parameter of 0.50% is needed;28 otherwise, the X-Hbonding density rises to an unrealistically high level.
The use of these finite range orbitals, that give rise to sparseoverlap and Hamiltonian matrixes, and of pseudopotentials inthe Kleinman-Bylander factorized form allows us to build theKohn-Sham Hamiltonian with order-N operations.27 Siestaworks with the valence density within the pseudopotential field.Therefore, the core electron density is not available and notopological analysis of the total density was performed. Calcula-tions were performed in the periodic medium of the tricliniccell.
A “gas phase” calculation was made increasing the box sizeby centering NAD+ in a box which is 10 Å wider than theexperimental one in every direction. As DFT calculations inthe gas phase, especially for anionic charge densities, shouldbe taken with caution,34,35 we used Gaussian 9836 software toget a set of atomic charges, with the MP2, HF, and B3LYPmethods, for comparison purposes. Atoms in these calculationswere described by the standard 6-31G* basis set.
Deformation Electron Density and Topology
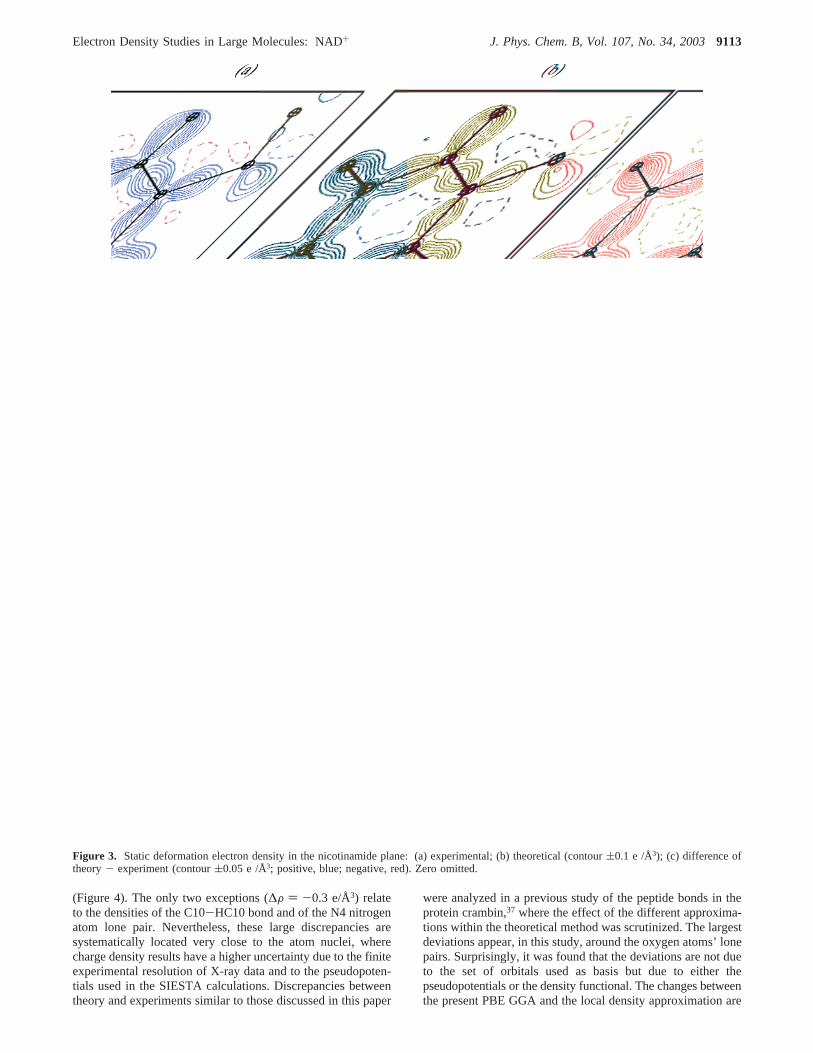
Nicotinamide Group. The static electron density maps inthe nicotinamide base plane show an excellent qualitative andquantitative agreement, as testified by Figure 3. The differencedensity in the nicotinamide pyridine ring, obtained by algebraicsubtraction between theoretical and experimental deformationdensities, is also given: experimental and DFT electron densitymaps agree within 0.1 e/Å3. This agreement also applies to thedeformation densities of the X-H bonds. The largest differenceappears around atom O14, for which the rigid bond test23 isnot satisfied.
Adenine Base. The agreement between experiment andtheory is also excellent for the adenine base: the theoreticaland experimental electron densities differ by less than 0.1 e/Å3
TABLE 4: Atomic Orbitals’ Radii Rc in Atomic Units(bohr) for Each l Shella
l ) 0 l ) 1
atomenergy shift
(meV)split norm
(%) ú ) 1 ú ) 2 ú ) 1 ú ) 2
H 13.6 0.50 8.800 2.519C 13.6 0.35 5.802 2.810 7.450 2.810N 10.9 0.35 5.099 2.349 6.547 2.291O 6.8 0.35 4.809 2.030 6.175 1.955P 6.8 0.35 6.468 3.335 8.516 3.640
a ú stands for each of the split valence orbitals.
9112 J. Phys. Chem. B, Vol. 107, No. 34, 2003 Guillot et al.
(Figure 4). The only two exceptions (∆F ) -0.3 e/Å3) relateto the densities of the C10-HC10 bond and of the N4 nitrogenatom lone pair. Nevertheless, these large discrepancies aresystematically located very close to the atom nuclei, wherecharge density results have a higher uncertainty due to the finiteexperimental resolution of X-ray data and to the pseudopoten-tials used in the SIESTA calculations. Discrepancies betweentheory and experiments similar to those discussed in this paper
were analyzed in a previous study of the peptide bonds in theprotein crambin,37 where the effect of the different approxima-tions within the theoretical method was scrutinized. The largestdeviations appear, in this study, around the oxygen atoms’ lonepairs. Surprisingly, it was found that the deviations are not dueto the set of orbitals used as basis but due to either thepseudopotentials or the density functional. The changes betweenthe present PBE GGA and the local density approximation are
Figure 3. Static deformation electron density in the nicotinamide plane: (a) experimental; (b) theoretical (contour(0.1 e /Å3); (c) difference oftheory- experiment (contour(0.05 e /Å3; positive, blue; negative, red). Zero omitted.
Electron Density Studies in Large Molecules: NAD+ J. Phys. Chem. B, Vol. 107, No. 34, 20039113

however considerably smaller than the discrepancies betweentheory and experiment. Performing calculations beyond thepseudopotential approximation and density functional theoryrepresents a demanding effort largely unjustified, given thesatisfactory accuracy of the present methodology.
The experimental charge density topology of the adenine ringis of great interest, since the protonation of the pyrimidine N3atom implies several resonating canonical forms (Figure 5). Itwas shown on the basis of bond lengths in a sample of 13structures containing a protonated adenine38 that canonical forms2 and 4 contribute more significantly to the resonance scheme.In the case of an interaction of a trichlorozinc group with theN4 atom of the N3-protonated base, it was observed that form2 is favored.39 Examination of the C-N interatomic distancesallows us to gather them into two categories (Table 5b): C7-N2, C8-N5, and C10-N4 bonds have similar lengths of about
1.32 Å, whereas the remaining C-N bonds are all larger than1.35 Å. This suggests that the bonds of the first category havea more pronounced double bond character and that canonicalform 2 of the N3-protonated adenine base is the most compatiblewith this observation (Figure 5). The C9-C8 (1.412 Å) andC9-C6 (1.392 Å) bonds have lengths close to that of the C-Cbond of benzene (1.397 Å). The comparison of the bond lengthsas well as the electron densities and ellipticity values at theCPs (Table 5b) suggests that C6-C9 has a slightly strongerdouble bond character than C9-C8, indicating a partial prefer-ence for structures 1 and 2 over structures 3 and 4 in Figure 5.Therefore, the resonant form 2 is likely to be dominant withthe occurrence of other forms. The topological properties fullyconfirm this hypothesis, since the electron densities at the C7-N2, C8-N5, and C10-N4 bonds’ CPs are higher than 2.4 e/Å3,whereas all other C-N bonds of the adenine base have values
Figure 4. Static deformation electron density in the adenine plane: (a) experimental; (b) theoretical; (c) difference of theory- experiment. Contouras in Figure 3.
9114 J. Phys. Chem. B, Vol. 107, No. 34, 2003 Guillot et al.

ranging between 2.1 and 2.2 e/Å3. Furthermore, the experimentaland theoretical results agree with previous charge density studiesof other molecules containing a protonated adenine:39,40 thehighest deformation density peaks in the adenine plane are onthe C6-C9 and C9-C8 bonds.
Ribose Rings.The experimental and theoretical deformationdensities of the two ribose rings agree very well except for thehydroxyl oxygen lone pairs. As mentioned in the NAD+ neutronstructure study,10 the C-O bond lengths of the ribose ethergroups are split in two groups: C4-O5 (d ) 1.408 Å), C15-O11 (d ) 1.392 Å), near the bases, and C12-O11 (d ) 1.451Å), C2-O5 (d ) 1.454 Å), near the pyrophosphate. Thiscorrelates well with the large electron density and Laplacianvalues at the CP (Fcp ≈ 1.9 e/Å3 and ∇2F ≈ -12.5 e/Å5)observed for the C5-O5 and C15-O11 bonds. The C2-O5and C12-O11 bonds display smaller values:Fcp ≈ 1.5 e/Å3
and ∇2F ≈ -6. e/Å.5 The shorter ether bond lengths on thebases’ side could be related to the electron withdrawing effectof the N6 and N1 nitrogen atoms of the bases, while the electronwithdrawing pyrophosphate oxygen atoms are separated fromthe ether group by a supplementary carbon atom.
Pyrophosphate Group.The agreement between experimentand DFT calculation is generally poorer in the region of thephosphorus atoms. The peaks of the static deformation densityare located at the same position in the experimental andtheoretical maps (Figure 6), but the P-O peak heights andoxygen lone pairs’ densities are different. There is a pseudodyadaxis passing through the middle of the pyrophosphate moietyrelating the two nucleotides (Figure 1) if the differences betweenthe two base rings are neglected. However, significant differ-ences are found between the two sides of the molecule,especially for the O1-P bonds. The experimental deformationdensity (Figure 6) is stronger on the O-P1 bond (F ) 0.60e/Å3) than on the O-P2 bond (F ) 0.40 e/Å3). This reflectswell the strong asymmetry of the O1-P bond lengths withd(O1-P1) ) 1.581(1) Å andd(O1-P2) ) 1.629(1) Å (Table6). The corresponding deformation density peaks are lessdissimilar in the DFT maps. The experimental and theoreticalmaps in the P1-O1-P2 plane (Figure 6) are also significantlydifferent: peaks corresponding to the oxygen atom lone pairsare stronger in the DFT map whereas they are barely observablein the experimental maps. Another discrepancy is that theexperimental map shows only charge accumulation along theinternuclear axis, while theory displays both depletion andaccumulation regions along this axis.
A dissimilarity in the bond lengths in the P1sO1sP2 moietywas also found in the structure of the NAD+, Li+ salt obtained
Figure 5. Four possible resonant forms of the N3-protonated adenine.
TABLE 5: Topological Characteristics of the ElectronDensity at the Covalent Bond Critical Points (CPs) of theNicotinamide (a), the Adenine (b), and the Pyrophosphate(c) Moietiesa
(a) Nicotinamide
bondd1-2(Å)
d2-cp(Å)
d1-cp(Å)
Fcp(e/Å3)
∇2F(e/Å5) ε
λ1(e/Å5)
λ2(e/Å5)
λ3(e/Å5)
C21-O14 1.239(2) 0.486 0.486 0.754-30.5 0.18-27.8 -23.6 20.9C21-N7 1.336(2) 0.570 0.570 0.766-21.4 0.23-20.5 -16.7 15.8C20-N6 1.345(2) 0.533 0.533 0.815-18.1 0.20-18.1 -15.2 15.2C16-N6 1.349(1) 0.549 0.549 0.801-20.2 0.17-18.7 -16.0 14.6C17-C16 1.384(2) 0.645 0.645 0.74-19.7 0.24-16.7 -13.5 10.4C19-C20 1.386(2) 0.672 0.672 0.714-20.9 0.24-17.8 -14.3 11.2C17-C18 1.394(2) 0.654 0.654 0.742-17.6 0.16-15.5 -13.3 11.2C18-C19 1.397(2) 0.629 0.629 0.769-18.3 0.15-16.1 -14.0 11.8C15-N6 1.501(2) 0.611 0.611 0.891-8.1 0.09-11.5 -10.5 13.9HC18-
C181.096 0.444 0.444 0.653-20.9 0.11-18.3 -16.5 13.9
HC16-C16
1.092 0.376 0.376 0.718-22.6 0.03-19.5 -18.9 15.8
HC17-C17
1.086 0.445 0.445 0.641-21.2 0.13-18.2 -16.0 12.9
HC20-C20
1.082 0.387 0.387 0.695-26.2 0.07-20.7 -19.3 13.9
HN7B-N7
1.036 0.266 0.266 0.770-40.9 0.09-33.7 -30.8 23.6
HN7A-N7
1.037 0.268 0.268 0.770-26.5 0.12-28.7 -25.7 28.0
ring 3.8 0.12 -0.2 1.9 2.1
(b) Adenine
bondd1-2(Å)
d2-cp(Å)
d1-cp(Å)
Fcp(e/Å3)
∇2F(e/Å5) ε
λ1(e/Å5)
λ2(e/Å5)
λ3(e/Å5)
C10-N4 1.323(2) 0.572 0.751 2.40-18.3 0.14-19.5 -17.1 18.3C10-N1 1.372(2) 0.594 0.785 2.12-15.0 0.26-17.9 -14.2 17.0C5-N1 1.465(2) 0.570 0.896 1.52 -8.8 0.14-11.1 -9.8 12.1C9-N4 1.376(2) 0.615 0.763 2.10-16.2 0.09-16.8 -15.5 16.2C6-N1 1.366(2) 0.562 0.806 2.11-17.5 0.26-17.8 -14.1 14.4C9-C6 1.392(2) 0.669 0.726 2.12-19.3 0.31-17.2 -13.2 11.2C6-N2 1.353(2) 0.633 0.722 2.21-14.2 0.19-18.3 -15.4 19.5C9-C8 1.412(2) 0.683 0.73 2.02-17.3 0.25-16.0 -12.8 11.6C8-N5 1.319(2) 0.577 0.743 2.45-23.2 0.23-22.0 -17.9 16.7C8-N3 1.366(2) 0.567 0.802 2.08-14.7 0.15-16.6 -14.4 16.4C7-N2 1.314(2) 0.586 0.729 2.43-22.9 0.12-20.2 -18.0 15.3C7-N3 1.359(2) 0.575 0.786 2.22-20.4 0.15-18.1 -15.7 13.3HN3-N3 1.097 0.268 0.828 1.91-34.5 0.01-27.2 -27.0 19.7HN5A-
N51.037 0.294 0.743 2.35-45.3 0.05-33.1 -31.6 19.4
HN5B-N5
1.028 0.302 0.728 2.27-37.1 0.08-30.7 -28.4 22.0
HC10-C10
1.089 0.439 0.655 1.85-19.4 0.01-16.9 -16.8 14.2
HC7-C7
1.104 0.351 0.754 1.92-23.4 0.03-19.1 -18.5 14.2
indolering
0.33 8.5 0.1 -1.2 4.6 5.1
imidazolering
0.16 4.2 0.4 -0.4 1.8 2.8
(c) Pyrophosphate
bondd1-2(Å)
d1-cp(Å)
d2-cp(Å)
Fcp(e/Å3)
∇2F(e/Å5) ε
λ1(e/Å5)
l2(e/Å5)
λ3(e/Å5)
O1-P2 1.629(1) 0.661 0.968 1.27 3.7 0.20-9.3 -7.8 20.9O1-P1(1) 1.581(1) 0.640 0.941 1.41 7.3 0.22-11.3 -9.3 28.0P1-O2 1.498(1) 0.617 0.882 1.61 17.4 0.07-11.6 -10.9 40.0P1-O3(1) 1.497(1) 0.614 0.884 1.63 20.7 0.29-12.7 -9.8 43.2P2-O8 1.485(1) 0.617 0.871 1.58 22.6 0.05-10.1 -9.7 42.4P2-O9 1.484(1) 0.607 0.877 1.77 20.0 0.07-13.3 -12.4 45.7P1-O4 1.597(1) 0.648 0.949 1.30 5.7 0.14-10.6 -9.3 25.7P2-O10 1.597(1) 0.653 0.945 1.27 8.1 0.17-8.9 -7.6 24.6C1-O4 1.445(1) 0.576 0.872 1.49-6.1 0.06-11.2 -10.6 15.7C11-O10 1.442(2) 0.571 0.872 1.52-5.3 0.15-11.4 -9.9 16.0
a d1-2 is the bond length; d1-cp andd2-cp are the distances from theCP to the first and the second atoms defining the bond, respectively. Fand∇2F denote the total electron density and its Laplacian at the criticalpoint (CP).λ1, λ2, andλ3 are the eigenvalues of the Hessian matrix ofsecond derivatives{∂2F/∂xi∂xj}. ε is the ellipticity λ1/λ2 - 1.
Electron Density Studies in Large Molecules: NAD+ J. Phys. Chem. B, Vol. 107, No. 34, 20039115
from orthorhombic crystals:d(O1sP1)) 1.56(1) Å and d(O1sP2) ) 1.66(1) Å.41 In the complex of the aldose reductaseprotein with NADP+ and an inhibitor,9 we find a smaller andreversed (but possibly not statistically significant) discrepan-
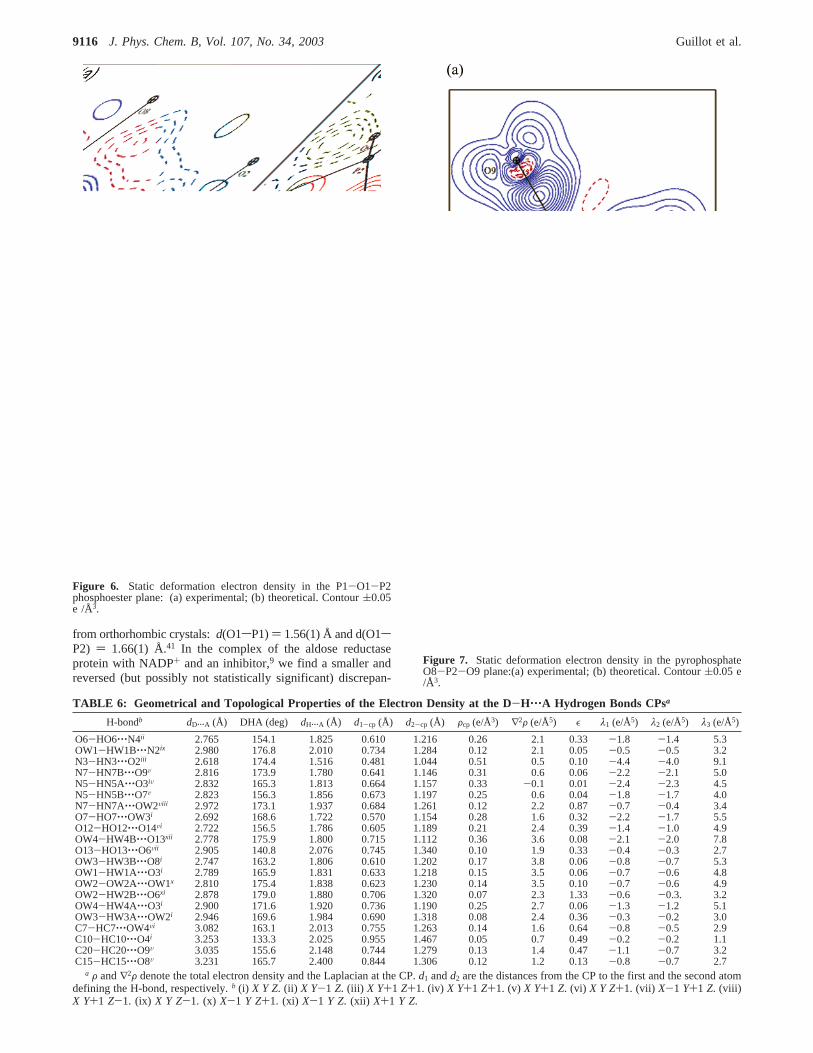
Figure 6. Static deformation electron density in the P1-O1-P2phosphoester plane: (a) experimental; (b) theoretical. Contour(0.05e /Å3.
TABLE 6: Geometrical and Topological Properties of the Electron Density at the D-H‚‚‚A Hydrogen Bonds CPsa
H-bondb dD‚‚‚A (Å) DHA (deg) dH‚‚‚A (Å) d1-cp (Å) d2-cp (Å) Fcp (e/Å3) ∇2F (e/Å5) ε λ1 (e/Å5) λ2 (e/Å5) λ3 (e/Å5)
O6-HO6‚‚‚N4ii 2.765 154.1 1.825 0.610 1.216 0.26 2.1 0.33 -1.8 -1.4 5.3OW1-HW1B‚‚‚N2ix 2.980 176.8 2.010 0.734 1.284 0.12 2.1 0.05 -0.5 -0.5 3.2N3-HN3‚‚‚O2iii 2.618 174.4 1.516 0.481 1.044 0.51 0.5 0.10 -4.4 -4.0 9.1N7-HN7B‚‚‚O9V 2.816 173.9 1.780 0.641 1.146 0.31 0.6 0.06 -2.2 -2.1 5.0N5-HN5A‚‚‚O3iV 2.832 165.3 1.813 0.664 1.157 0.33 -0.1 0.01 -2.4 -2.3 4.5N5-HN5B‚‚‚O7V 2.823 156.3 1.856 0.673 1.197 0.25 0.6 0.04 -1.8 -1.7 4.0N7-HN7A‚‚‚OW2Viii 2.972 173.1 1.937 0.684 1.261 0.12 2.2 0.87 -0.7 -0.4 3.4O7-HO7‚‚‚OW3i 2.692 168.6 1.722 0.570 1.154 0.28 1.6 0.32 -2.2 -1.7 5.5O12-HO12‚‚‚O14Vi 2.722 156.5 1.786 0.605 1.189 0.21 2.4 0.39 -1.4 -1.0 4.9OW4-HW4B‚‚‚O13xii 2.778 175.9 1.800 0.715 1.112 0.36 3.6 0.08 -2.1 -2.0 7.8O13-HO13‚‚‚O6Vii 2.905 140.8 2.076 0.745 1.340 0.10 1.9 0.33 -0.4 -0.3 2.7OW3-HW3B‚‚‚O8i 2.747 163.2 1.806 0.610 1.202 0.17 3.8 0.06 -0.8 -0.7 5.3OW1-HW1A‚‚‚O3i 2.789 165.9 1.831 0.633 1.218 0.15 3.5 0.06 -0.7 -0.6 4.8OW2-OW2A‚‚‚OW1x 2.810 175.4 1.838 0.623 1.230 0.14 3.5 0.10 -0.7 -0.6 4.9OW2-HW2B‚‚‚O6xi 2.878 179.0 1.880 0.706 1.320 0.07 2.3 1.33 -0.6 -0.3. 3.2OW4-HW4A‚‚‚O3i 2.900 171.6 1.920 0.736 1.190 0.25 2.7 0.06 -1.3 -1.2 5.1OW3-HW3A‚‚‚OW2i 2.946 169.6 1.984 0.690 1.318 0.08 2.4 0.36 -0.3 -0.2 3.0C7-HC7‚‚‚OW4Vi 3.082 163.1 2.013 0.755 1.263 0.14 1.6 0.64 -0.8 -0.5 2.9C10-HC10‚‚‚O4i 3.253 133.3 2.025 0.955 1.467 0.05 0.7 0.49 -0.2 -0.2 1.1C20-HC20‚‚‚O9V 3.035 155.6 2.148 0.744 1.279 0.13 1.4 0.47 -1.1 -0.7 3.2C15-HC15‚‚‚O8V 3.231 165.7 2.400 0.844 1.306 0.12 1.2 0.13 -0.8 -0.7 2.7
a F and∇2F denote the total electron density and the Laplacian at the CP.d1 andd2 are the distances from the CP to the first and the second atomdefining the H-bond, respectively.b (i) X Y Z. (ii) X Y-1 Z. (iii) X Y+1 Z+1. (iv) X Y+1 Z+1. (v) X Y+1 Z. (vi) X Y Z+1. (vii) X-1 Y+1 Z. (viii)X Y+1 Z-1. (ix) X Y Z-1. (x) X-1 Y Z+1. (xi) X-1 Y Z. (xii) X+1 Y Z.
Figure 7. Static deformation electron density in the pyrophosphateO8-P2-O9 plane:(a) experimental; (b) theoretical. Contour(0.05 e/Å3.
9116 J. Phys. Chem. B, Vol. 107, No. 34, 2003 Guillot et al.
cy: d(O1sP1) ) 1.62(1) Å andd(O1sP2) ) 1.60(1) Å. Thevariability of the OsP bond lengths may be attributed to strongcrystal packing or intramolecular effects and to the differentchemical environments on the neighboring lateral PdO andPsO- groups. P1sO3 and P1sO4 are hydrogen bond acceptorsthree times and one time, respectively. On the other hand, P2sO8 and P2sO9 receive both one hydrogen bond and one weakCsH‚‚‚O interaction. Such apparent dissimilarity of OsPsOgroups in NAD+ and NADP+ pyrophosphate structures was alsoobserved for pentacovalent phosphorus in a trigonal bipyramidalRsOsPO3sOsR′ intermediate trapped in a phosphoryl trans-fer enzyme.42
The four lateral P-O bonds have similar lengths and representPOO- groups where the negative charge is equally distributedon the two oxygen atoms. While all the lateral P-O groupsdisplay similar deformation density in the DFT maps, theirexperimental bonding density shows some variability (Figure7). For instance, the P2-O8 and P2-O9 lateral bonds haveequivalent lengths but the experimental deformation map showsnevertheless a discrepancy of 0.2 e/Å3 (Figure 7a).
The unshared electron pairs of the pyrophosphate lateraloxygen atoms are expected to be located in the POO- planeaccording to the sp2 hybridization of the lateral PO2 moiety.However, as shown on Figure 7a, the lone pairs peaks in theexperimental deformation density do not lie in that plane, since,due to the hydrogen bond interactions, they are reoriented outof the POO- plane along the hydrogen bond path (Figure 8).Such behavior occurs for all lateral P-O bonds in theexperimental maps.
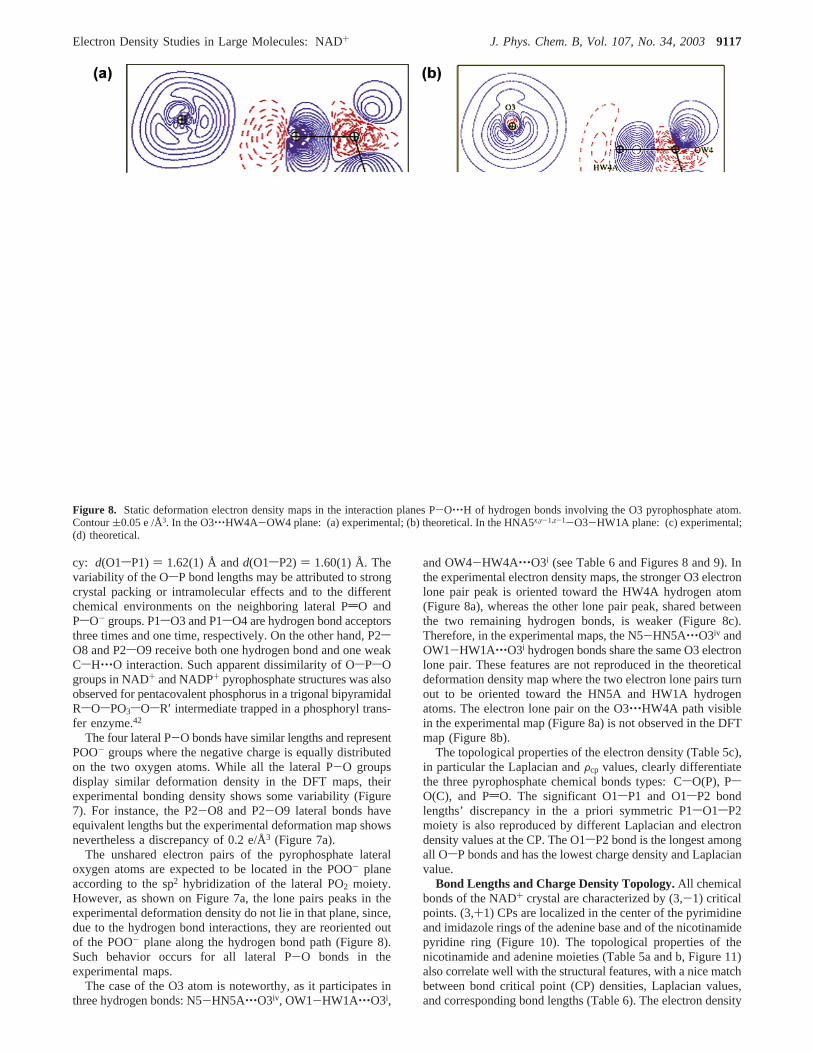
The case of the O3 atom is noteworthy, as it participates inthree hydrogen bonds: N5-HN5A‚‚‚O3iv, OW1-HW1A‚‚‚O3i,
and OW4-HW4A‚‚‚O3i (see Table 6 and Figures 8 and 9). Inthe experimental electron density maps, the stronger O3 electronlone pair peak is oriented toward the HW4A hydrogen atom(Figure 8a), whereas the other lone pair peak, shared betweenthe two remaining hydrogen bonds, is weaker (Figure 8c).Therefore, in the experimental maps, the N5-HN5A‚‚‚O3iv andOW1-HW1A‚‚‚O3i hydrogen bonds share the same O3 electronlone pair. These features are not reproduced in the theoreticaldeformation density map where the two electron lone pairs turnout to be oriented toward the HN5A and HW1A hydrogenatoms. The electron lone pair on the O3‚‚‚HW4A path visiblein the experimental map (Figure 8a) is not observed in the DFTmap (Figure 8b).
The topological properties of the electron density (Table 5c),in particular the Laplacian andFcp values, clearly differentiatethe three pyrophosphate chemical bonds types: CsO(P), PsO(C), and PdO. The significant O1sP1 and O1sP2 bondlengths’ discrepancy in the a priori symmetric P1sO1sP2moiety is also reproduced by different Laplacian and electrondensity values at the CP. The O1sP2 bond is the longest amongall OsP bonds and has the lowest charge density and Laplacianvalue.
Bond Lengths and Charge Density Topology.All chemicalbonds of the NAD+ crystal are characterized by (3,-1) criticalpoints. (3,+1) CPs are localized in the center of the pyrimidineand imidazole rings of the adenine base and of the nicotinamidepyridine ring (Figure 10). The topological properties of thenicotinamide and adenine moieties (Table 5a and b, Figure 11)also correlate well with the structural features, with a nice matchbetween bond critical point (CP) densities, Laplacian values,and corresponding bond lengths (Table 6). The electron density
Figure 8. Static deformation electron density maps in the interaction planes P-O‚‚‚H of hydrogen bonds involving the O3 pyrophosphate atom.Contour(0.05 e /Å3. In the O3‚‚‚HW4A-OW4 plane: (a) experimental; (b) theoretical. In the HNA5x,y-1,z-1-O3-HW1A plane: (c) experimental;(d) theoretical.
Electron Density Studies in Large Molecules: NAD+ J. Phys. Chem. B, Vol. 107, No. 34, 20039117
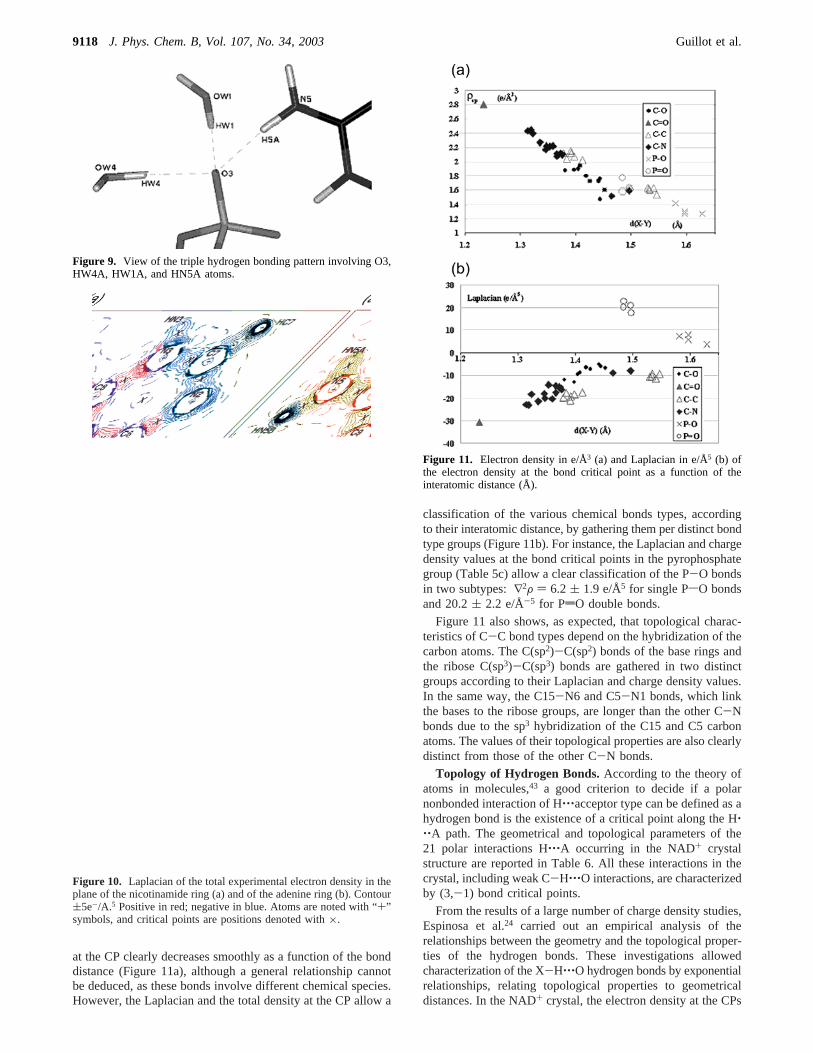
at the CP clearly decreases smoothly as a function of the bonddistance (Figure 11a), although a general relationship cannotbe deduced, as these bonds involve different chemical species.However, the Laplacian and the total density at the CP allow a
classification of the various chemical bonds types, accordingto their interatomic distance, by gathering them per distinct bondtype groups (Figure 11b). For instance, the Laplacian and chargedensity values at the bond critical points in the pyrophosphategroup (Table 5c) allow a clear classification of the P-O bondsin two subtypes:∇2F ) 6.2 ( 1.9 e/Å5 for single PsO bondsand 20.2( 2.2 e/Å-5 for PdO double bonds.
Figure 11 also shows, as expected, that topological charac-teristics of C-C bond types depend on the hybridization of thecarbon atoms. The C(sp2)-C(sp2) bonds of the base rings andthe ribose C(sp3)-C(sp3) bonds are gathered in two distinctgroups according to their Laplacian and charge density values.In the same way, the C15-N6 and C5-N1 bonds, which linkthe bases to the ribose groups, are longer than the other C-Nbonds due to the sp3 hybridization of the C15 and C5 carbonatoms. The values of their topological properties are also clearlydistinct from those of the other C-N bonds.
Topology of Hydrogen Bonds.According to the theory ofatoms in molecules,43 a good criterion to decide if a polarnonbonded interaction of H‚‚‚acceptor type can be defined as ahydrogen bond is the existence of a critical point along the H‚‚‚A path. The geometrical and topological parameters of the21 polar interactions H‚‚‚A occurring in the NAD+ crystalstructure are reported in Table 6. All these interactions in thecrystal, including weak C-H‚‚‚O interactions, are characterizedby (3,-1) bond critical points.
From the results of a large number of charge density studies,Espinosa et al.24 carried out an empirical analysis of therelationships between the geometry and the topological proper-ties of the hydrogen bonds. These investigations allowedcharacterization of the X-H‚‚‚O hydrogen bonds by exponentialrelationships, relating topological properties to geometricaldistances. In the NAD+ crystal, the electron density at the CPs
Figure 9. View of the triple hydrogen bonding pattern involving O3,HW4A, HW1A, and HN5A atoms.
Figure 10. Laplacian of the total experimental electron density in theplane of the nicotinamide ring (a) and of the adenine ring (b). Contour(5e-/A.5 Positive in red; negative in blue. Atoms are noted with “+”symbols, and critical points are positions denoted with×.
Figure 11. Electron density in e/Å3 (a) and Laplacian in e/Å5 (b) ofthe electron density at the bond critical point as a function of theinteratomic distance (Å).
9118 J. Phys. Chem. B, Vol. 107, No. 34, 2003 Guillot et al.
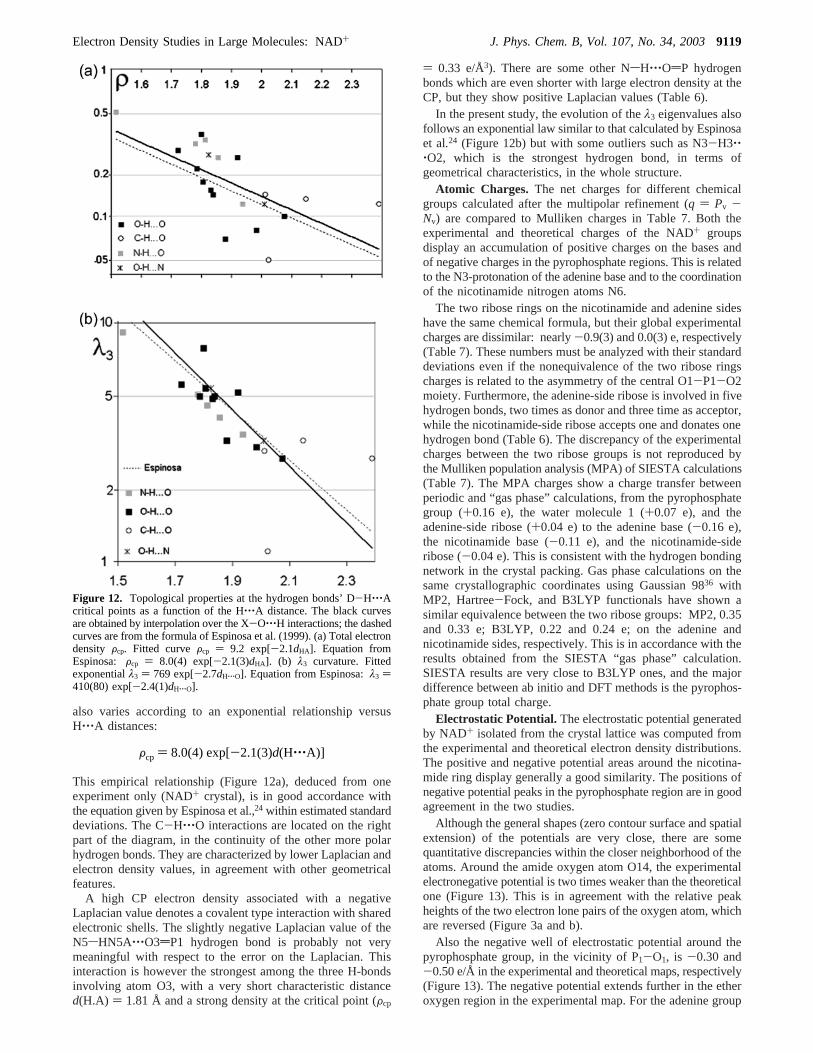
also varies according to an exponential relationship versusH‚‚‚A distances:
This empirical relationship (Figure 12a), deduced from oneexperiment only (NAD+ crystal), is in good accordance withthe equation given by Espinosa et al.,24 within estimated standarddeviations. The C-H‚‚‚O interactions are located on the rightpart of the diagram, in the continuity of the other more polarhydrogen bonds. They are characterized by lower Laplacian andelectron density values, in agreement with other geometricalfeatures.
A high CP electron density associated with a negativeLaplacian value denotes a covalent type interaction with sharedelectronic shells. The slightly negative Laplacian value of theN5sHN5A‚‚‚O3dP1 hydrogen bond is probably not verymeaningful with respect to the error on the Laplacian. Thisinteraction is however the strongest among the three H-bondsinvolving atom O3, with a very short characteristic distanced(H.A) ) 1.81 Å and a strong density at the critical point (Fcp
) 0.33 e/Å3). There are some other NsH‚‚‚OdP hydrogenbonds which are even shorter with large electron density at theCP, but they show positive Laplacian values (Table 6).
In the present study, the evolution of theλ3 eigenvalues alsofollows an exponential law similar to that calculated by Espinosaet al.24 (Figure 12b) but with some outliers such as N3-H3‚‚‚O2, which is the strongest hydrogen bond, in terms ofgeometrical characteristics, in the whole structure.
Atomic Charges. The net charges for different chemicalgroups calculated after the multipolar refinement (q ) Pv -Nv) are compared to Mulliken charges in Table 7. Both theexperimental and theoretical charges of the NAD+ groupsdisplay an accumulation of positive charges on the bases andof negative charges in the pyrophosphate regions. This is relatedto the N3-protonation of the adenine base and to the coordinationof the nicotinamide nitrogen atoms N6.
The two ribose rings on the nicotinamide and adenine sideshave the same chemical formula, but their global experimentalcharges are dissimilar: nearly-0.9(3) and 0.0(3) e, respectively(Table 7). These numbers must be analyzed with their standarddeviations even if the nonequivalence of the two ribose ringscharges is related to the asymmetry of the central O1-P1-O2moiety. Furthermore, the adenine-side ribose is involved in fivehydrogen bonds, two times as donor and three time as acceptor,while the nicotinamide-side ribose accepts one and donates onehydrogen bond (Table 6). The discrepancy of the experimentalcharges between the two ribose groups is not reproduced bythe Mulliken population analysis (MPA) of SIESTA calculations(Table 7). The MPA charges show a charge transfer betweenperiodic and “gas phase” calculations, from the pyrophosphategroup (+0.16 e), the water molecule 1 (+0.07 e), and theadenine-side ribose (+0.04 e) to the adenine base (-0.16 e),the nicotinamide base (-0.11 e), and the nicotinamide-sideribose (-0.04 e). This is consistent with the hydrogen bondingnetwork in the crystal packing. Gas phase calculations on thesame crystallographic coordinates using Gaussian 9836 withMP2, Hartree-Fock, and B3LYP functionals have shown asimilar equivalence between the two ribose groups: MP2, 0.35and 0.33 e; B3LYP, 0.22 and 0.24 e; on the adenine andnicotinamide sides, respectively. This is in accordance with theresults obtained from the SIESTA “gas phase” calculation.SIESTA results are very close to B3LYP ones, and the majordifference between ab initio and DFT methods is the pyrophos-phate group total charge.
Electrostatic Potential.The electrostatic potential generatedby NAD+ isolated from the crystal lattice was computed fromthe experimental and theoretical electron density distributions.The positive and negative potential areas around the nicotina-mide ring display generally a good similarity. The positions ofnegative potential peaks in the pyrophosphate region are in goodagreement in the two studies.
Although the general shapes (zero contour surface and spatialextension) of the potentials are very close, there are somequantitative discrepancies within the closer neighborhood of theatoms. Around the amide oxygen atom O14, the experimentalelectronegative potential is two times weaker than the theoreticalone (Figure 13). This is in agreement with the relative peakheights of the two electron lone pairs of the oxygen atom, whichare reversed (Figure 3a and b).
Also the negative well of electrostatic potential around thepyrophosphate group, in the vicinity of P1-O1, is -0.30 and-0.50 e/Å in the experimental and theoretical maps, respectively(Figure 13). The negative potential extends further in the etheroxygen region in the experimental map. For the adenine group
Figure 12. Topological properties at the hydrogen bonds’ D-H‚‚‚Acritical points as a function of the H‚‚‚A distance. The black curvesare obtained by interpolation over the X-O‚‚‚H interactions; the dashedcurves are from the formula of Espinosa et al. (1999). (a) Total electrondensity Fcp. Fitted curveFcp ) 9.2 exp[-2.1dHA]. Equation fromEspinosa: Fcp ) 8.0(4) exp[-2.1(3)dHA]. (b) λ3 curvature. Fittedexponentialλ3 ) 769 exp[-2.7dH‚‚‚O]. Equation from Espinosa:λ3 )410(80) exp[-2.4(1)dH‚‚‚O].
Fcp ) 8.0(4) exp[-2.1(3)d(H‚‚‚A)]
Electron Density Studies in Large Molecules: NAD+ J. Phys. Chem. B, Vol. 107, No. 34, 20039119
(figure not shown), the spatial extensions are similar; the onlysignificant discrepancy is located in the vicinity of the N4 atom,due to a stronger nitrogen electron lone pair in the theoreticaldeformation map compared to the experiment (Figure 4).
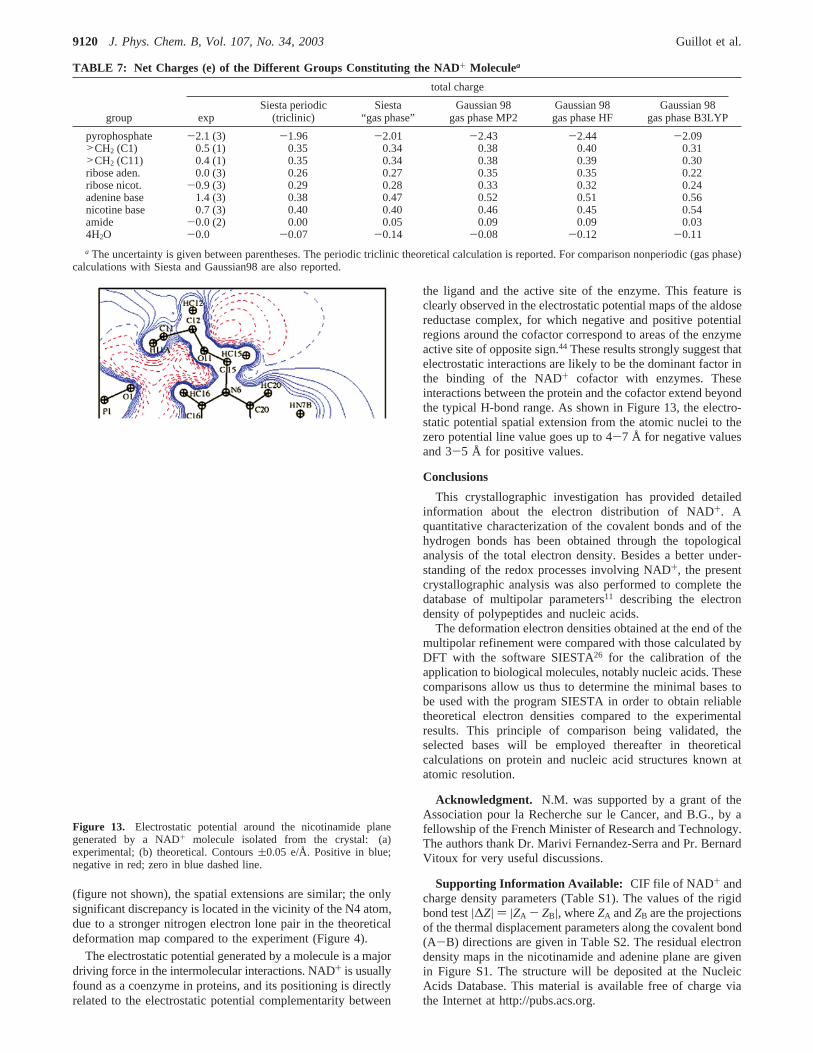
The electrostatic potential generated by a molecule is a majordriving force in the intermolecular interactions. NAD+ is usuallyfound as a coenzyme in proteins, and its positioning is directlyrelated to the electrostatic potential complementarity between
the ligand and the active site of the enzyme. This feature isclearly observed in the electrostatic potential maps of the aldosereductase complex, for which negative and positive potentialregions around the cofactor correspond to areas of the enzymeactive site of opposite sign.44 These results strongly suggest thatelectrostatic interactions are likely to be the dominant factor inthe binding of the NAD+ cofactor with enzymes. Theseinteractions between the protein and the cofactor extend beyondthe typical H-bond range. As shown in Figure 13, the electro-static potential spatial extension from the atomic nuclei to thezero potential line value goes up to 4-7 Å for negative valuesand 3-5 Å for positive values.
Conclusions
This crystallographic investigation has provided detailedinformation about the electron distribution of NAD+. Aquantitative characterization of the covalent bonds and of thehydrogen bonds has been obtained through the topologicalanalysis of the total electron density. Besides a better under-standing of the redox processes involving NAD+, the presentcrystallographic analysis was also performed to complete thedatabase of multipolar parameters11 describing the electrondensity of polypeptides and nucleic acids.
The deformation electron densities obtained at the end of themultipolar refinement were compared with those calculated byDFT with the software SIESTA26 for the calibration of theapplication to biological molecules, notably nucleic acids. Thesecomparisons allow us thus to determine the minimal bases tobe used with the program SIESTA in order to obtain reliabletheoretical electron densities compared to the experimentalresults. This principle of comparison being validated, theselected bases will be employed thereafter in theoreticalcalculations on protein and nucleic acid structures known atatomic resolution.
Acknowledgment. N.M. was supported by a grant of theAssociation pour la Recherche sur le Cancer, and B.G., by afellowship of the French Minister of Research and Technology.The authors thank Dr. Marivi Fernandez-Serra and Pr. BernardVitoux for very useful discussions.
Supporting Information Available: CIF file of NAD+ andcharge density parameters (Table S1). The values of the rigidbond test|∆Z| ) |ZA - ZB|, whereZA andZB are the projectionsof the thermal displacement parameters along the covalent bond(A-B) directions are given in Table S2. The residual electrondensity maps in the nicotinamide and adenine plane are givenin Figure S1. The structure will be deposited at the NucleicAcids Database. This material is available free of charge viathe Internet at http://pubs.acs.org.
TABLE 7: Net Charges (e) of the Different Groups Constituting the NAD+ Moleculea
total charge
group expSiesta periodic
(triclinic)Siesta
“gas phase”Gaussian 98
gas phase MP2Gaussian 98gas phase HF
Gaussian 98gas phase B3LYP
pyrophosphate -2.1 (3) -1.96 -2.01 -2.43 -2.44 -2.09>CH2 (C1) 0.5 (1) 0.35 0.34 0.38 0.40 0.31>CH2 (C11) 0.4 (1) 0.35 0.34 0.38 0.39 0.30ribose aden. 0.0 (3) 0.26 0.27 0.35 0.35 0.22ribose nicot. -0.9 (3) 0.29 0.28 0.33 0.32 0.24adenine base 1.4 (3) 0.38 0.47 0.52 0.51 0.56nicotine base 0.7 (3) 0.40 0.40 0.46 0.45 0.54amide -0.0 (2) 0.00 0.05 0.09 0.09 0.034H2O -0.0 -0.07 -0.14 -0.08 -0.12 -0.11
a The uncertainty is given between parentheses. The periodic triclinic theoretical calculation is reported. For comparison nonperiodic (gas phase)calculations with Siesta and Gaussian98 are also reported.
Figure 13. Electrostatic potential around the nicotinamide planegenerated by a NAD+ molecule isolated from the crystal: (a)experimental; (b) theoretical. Contours(0.05 e/Å. Positive in blue;negative in red; zero in blue dashed line.
9120 J. Phys. Chem. B, Vol. 107, No. 34, 2003 Guillot et al.
References and Notes
(1) Carugo, O.; Argos, P.Proteins: Struct., Funct., Genet.1997, 28,10.
(2) Carugo, O.; Argos, P.Proteins: Struct., Funct., Genet.1997, 28,29.
(3) Wu, Y. D.; Houk, K. N.J. Am. Chem. Soc.1991, 113, 2353.(4) Donkersloot, M. C. A.; Buck, H. M.J. Am. Chem. Soc.1981, 103,
6554.(5) Meijers, R.; Morris, R. J.; Adolph, H. W.; Merlii, A.; Lamzin, V.
S.; Cedergren-Zeppezauer, E. S.J. Biol. Chem. 2001, 276, 9316.(6) Miwa, Y.; Mizuno, T.; Tsuchida, K.; Taga, T.; Iwata, Y.Acta
Crystallogr.1999, B55, 78.(7) Pavelites, J. J.; Gao, J.; Bash, P. A.; Mackerell, A. D.J. Comput.
Chem.1997, 18, 221.(8) Espinosa, E.; Lecomte, C.; Molins, E.; Veintemillas, S.; Cousson,
A.; Paulus, W.Acta Crystallogr.1996, B52, 519.(9) Guillot, B.; Muzet, N.; Jelsch, C.; Lecomte, C.; Mitschler, A.;
Chevrier, B.; Howard, E.; Podjarny, A. 20th European CrystallographyMeeting, Krakow, 2001, Aug 25-31.
(10) Guillot, B.; Lecomte, C.; Cousson, A.; Scherf, C.; Jelsch, C.ActaCrystallogr.2001, D57, 981-989.
(11) Pichon-Pesme, V.; Lecomte, C.; Lachekar, H.J. Phys. Chem.1995,99, 6242.
(12) Guillot, B.; Jelsch, C.; Lecomte, C.Acta Crystallogr.2000, C56,726.
(13) COLLECT: Data Collection Software; Nonius BV: Delf, TheNetherlands, 1998.
(14) Otwinowski, Z.; Minor, W.Methods Enzymol.1997, 276, 307.(15) Guillot, B.; Viry, L.; Guillot, R.; Lecomte, C.; Jelsch, C.J. Appl.
Crystallogr.2001, 34, 214.(16) Lenstra, A. T. H.; Van Loock, J. F. J.; Rousseau, B.; Maes, S. T.
Acta Crystallogr.2000, A56, 300.(17) Hansen, N. K.; Coppens, P.Acta Crystallogr.1978, A34, 909.(18) Stewart, R. F.; Davidson, E. R.; Simpson, W. T.J. Chem. Phys.
1965, 43, 175.(19) Clementi, E.; Raimondi, D. L. J.Chem. Phys.1963, 41, 2686.(20) Cromer, D. T.International Tables for X-ray Crystallography;
Kynoch Press: Birmingham, 1974.(21) Pichon-Pesme, V.; Lecomte, C.; Wiest, R.; Benard, M.J. Am. Chem.
Soc.1992, 114, 2713.(22) Hirshfeld, F. L.Acta Crystallogr.1976, A32, 239.(23) Bouhmaida, N.; Ghermani, N. E.; Lecomte, C.; Thalal, A.Acta
Crystallogr. 1999, A55, 729.(24) Espinosa, E.; Souhassou, M.; Lachekar, H.; Lecomte, C.Acta
Crystallogr.1999, B55, 563.(25) Souhassou, M.; Blessing, R. H.J. Appl. Crystallogr.1999, 32, 210.
(26) Sanchez-Portal, D.; Ordejon, P.; Artacho, E.; Soler, J. M.Int. J.Quantum Chem.1997, 65, 453.
(27) Soler, J. M.; Artacho, E.; Gale, J. D.; Garcia, A.; Junquera, J.;Ordejon, P.; Sanchez-Portal, D.J. Phys.: Condens. Matter2002, 14, 2745.
(28) Artacho, E.; Sanchez-Portal, D.; Ordejon, P.; Garcia, E.; Soler, J.M. Phys. Status Solidi B1999, 215, 809.
(29) Kohn, W.; Sham, L. J.Phys. ReV. 1965, 140, 1133.(30) Perdew, J. P.; Burke, K.; Ernzerhof, M.Phys. ReV. Lett.1996, 77,
3865.(31) Troullier, N.; Martins, J.-L.Phys. ReV. B 1991, 43, 1993.(32) Kleinman, L.; Bylander, D. M.Phys. ReV. Lett. 1982, 48, 1425.(33) Sankey, O. F.; Niklewski, D. J.Phys. ReV. B 1989, 40, 3979.(34) Domene, C.; Fowler, P. W.; Jemmer, P.; Madden, P.Chem. Phys.
Lett. 1999, 299, 51.(35) Greatbanks, S. P.; Gready, J. E.; Limaye, A. C.; Rendell, A. P.J.
Comput. Chem.2000, 21 (9), 788.(36) Frisch, M. J.; Trucks, G. W.; Schlegel, H. B.; Scuseria, G. E.; Robb,
M. A.; Cheeseman, J. R.; Zakrzewski, V. G.; Montgomery, J. A., Jr.;Stratmann, R. E.; Burant, J. C.; Dapprich, S.; Millam, J. M.; Daniels, A.D.; Kudin, K. N.; Strain, M. C.; Farkas, O.; Tomasi, J.; Barone, V.; Cossi,M.; Cammi, R.; Mennucci, B.; Pomelli, C.; Adamo, C.; Clifford, S.;Ochterski, J.; Petersson, G. A.; Ayala, P. Y.; Cui, Q.; Morokuma, K.;Salvador, P.; Dannenberg, J. J.; Malick, D. K.; Rabuck, A. D.; Raghavachari,K.; Foresman, J. B.; Cioslowski, J.; Ortiz, J. V.; Baboul, A. G.; Stefanov,B. B.; Liu, G.; Liashenko, A.; Piskorz, P.; Komaromi, I.; Gomperts, R.;Martin, R. L.; Fox, D. J.; Keith, T.; Al-Laham, M. A.; Peng, C. Y.;Nanayakkara, A.; Challacombe, M.; Gill, P. M. W.; Johnson, B.; Chen,W.; Wong, M. W.; Andres, J. L.; Gonzalez, C.; Head-Gordon, M.; Replogle,E. S.; Pople, J. A.Gaussian, Inc.: Pittsburgh, PA, 2001.
(37) Fernandez-Serra, M. V.; Junquera, J.; Jelsch, C.; Lecomte, C.;Artacho, E.Solid State Commun.2000, 116, 395.
(38) Taylor, R.; Kennard, O.J. Mol. Struct.1982, 78, 1.(39) Cunane, L. M.; Taylor, M. R.Acta Crystallogr.1997, D53, 765.(40) Cunane, L. M.; Taylor, M. R.Acta Crystallogr.1993, B49, 524.(41) Reddy, B. S.; Saenger, W.; Mu¨hllegger, K.; Weimann, G.J. Am.
Chem. Soc.1981, 103, 907.(42) Lahiri, S. D.; Zhang, G.; Dunaway-Mariano, D.; Allen, K. N.
Science2003, 299, 2067.(43) Bader, R. W. F.Atoms in Molecules. A Quantum Theory; Oxford
Science Publications: Oxford, 1990.(44) Muzet, N.; Guillot, B.; Jelsch, C.; Lecomte, C.Proc. Natl. Acad.
Sci. U.S.A., in press.(45) Burnett, M. N.; Johnson, C. K.ORTEP-III: Oak Ridge Thermal.
Ellipsoid Plot Program for Crystal Structure Illustrations; Oak RidgeNational Laboratory Report ORNL-6895; 1996.
Electron Density Studies in Large Molecules: NAD+ J. Phys. Chem. B, Vol. 107, No. 34, 20039121