
Discrete models of dislocations and their motion in cubic crystals

J. Phys. II trance 5 (1995) 789-801 JUNE 1995, PAGE 789
Classification
Physics Abstracts
61.12 61.30 82.70
Shear Melting and Orientation of a Lyotropic Cubic Phase
Uli Olsson(I) and Kell Mortensen (~)
ii) Physical Chemistry I, Chemical Center, Lund University, P-O-B- 124, S-221 00 LUND,Sweden
(~) Physics Department,
Riso National Laboratory DK-4000 Roskilde, Denmark
(Received 13 December 1994, revised 28 February 1995, accepted 13 March 1995)
Abstract. A bicontinuous lyotropic cubic phase, composed of the nonionic surfactant pen-taethylene glycol dodecyl ether (C12E5), heavy water (D20) and tetradecane (C14H30),
was
investigated by small angle neutron scattering (SANS). The cubic phase is stable only in a nar-
row temperature and composition range Upon increasing the oil content the phase melts to
anL3 phase and at higher temperature it is in equilibrium with a
lamellar (L~) phase. The
scattering function of the powder cubic sample is dominated bya strong correlation peak at
q =0.057 l~~ in addition to a
small hump at q m 0. II l~~. From the knownarea per C12E5
molecule at the polar lapolar interface the lattice parameter is calculated for different minimal
surface model structures. The position of the dominating reflection from the cubic phase is
found to be consistent with the spacing between the 211 planes of the Gyroid minimal surface
structure. The effect of shearon the scattering pattern was
investigated usinga
Couette shear
cell. Under shear aweakly anisotropic scattering pattern was obtained. From a separate rhe-
ology experiments it was concluded that shearing the sample has the effect of melting the long
range cubic order, presumably into afluid disordered L3 phase. When turning off the shear, the
cubic phase recrystallises witha
preferred orientation. The diffraction pattern is consistent with
the diffraction from 211 planes with one major and one minor population in the orientation of
the < 111 > axis. A major population having the < 111 > axis parallel to the shear velocityii-e- the tangent direction), and
a minor component having the < 111 > axis parallel to the
velocity gradient.
1. Introduction
Suriactants and lipids in solution can form phases of fluid surfaces, with monolayer or bilayerfilms extending over macroscopic distances. One phase which has attracted particular attention
in recent years is the L3 l'sponge') phase [1-3]. Here a bilayer film forms a disordered multiplyconnected dividing-surface between two interwoven subvolumes containing the same solvent.
At higher concentrations, the bilayer film may crystallise into a cubic lattice. Here the order-
disorder transition occurs while retaining the topology of the bilayer film, as seen by the
self-diffusion ofsurfactant and solvent [4,5].
© Les Editions de Physique 1995

790 JOURNAL DE PHYSIQUE II N°6
Recently the phase behaviour and phase structures of a ternary surfactant system: pen-taethyleneoxide dodecylether (C12E5)-water-tetradecane, at a constant C12E5/water weightratio of 3/2,
was reported [6]. In this section of the composition- temperature phase prism
a bicontinuous cubic phase, Vi, is formed close to room temperature for oil volume fractions
in the range lbo "0A 0.5. The cubic phase is stable only in a narrow temperature range
(cz 6 °C) and transforms upon heating to a lamellar phase, La. At lower temperatures, it is
in equilibrium with a normal hexagonal phase. Upon dilution with oil, the cubic phase 'melts'
and transforms to a liquid, oil-rich L3 Phase. We note also that the cubic phase here contains
simultaneously relatively large amounts of water and oil, which is a less common feature.
Lyotropic cubic phases often form relatively large microcrystallite domains, which makes
small angle X-ray (SAXS) studies, using thin capillaries, of these materials difficult. Samplesoften posses a finite and unknown distribution of microcrystallite orientations rather than a
uniform powder. This is a problem also in the present system, where all attempts to prepare
a powder sample of the cubic phase in the X-ray capillary failed [6].In small angle neutron scattering (SANS) experiments, it is less of a problem, since one
here often work with larger sample sizes (path lengths up to several mm can be used). In the
present paper we report on a SANS study of a sample containing C12E5/D20/C14H30 with
the relative weight fractions 0.362/0.268 /0.370 in the cubic and lamellar phases. In a first set
of experiments, powder samples were prepared in normal quartz cells, and the scattering from
the lamellar and cubic phases were recorded. In a second set of experiments, we investigatedthe influence of shear on the lamellar and cubic phases, using a Couette shear cell. Finally, we
also report on a stress-sweep experiment on the cubic phase using a cone and plate rheometer.
As mentioned above, a phase diagram has been published in [6].
2. Experimental
2.I. SAMPLE COMPOSITION. The sample composition in weight fraction and volume frac-
tion, respectively, is presented in Table I. In this table are also given the densities of the various
compounds as used in the calculation of volume fractions from weight fractions.
Table I. Sample Composition.
lveieht frac(ion Volume fraction rim-3
C12E5 0.362 0341 0.96
D20 0.268 0.220 105
Ci4Hm 0.370 0.439 0.763
2.2. SANS STUDIES. SANS experiments were performed using the Ris@-SANS facility.The shear cell, of the Couette type has been described in details elsewhere [7]. The gap size
was b=
0.5 mm and the inner radius of the outer cylinder (rotator)was R
=30 mm. Although
we anticipate the possibility of non-laminar flow in the liquid crystalline samples, we still, for
simplicityj represent the applied shear in terms of a single effective shear rate few=
Rw/b,where
w is the angular velocity.
N°6 SHEAR MELTING OF A LYOTROPIC CUBIC PHASE 791
3. Powder Scattering Experiment
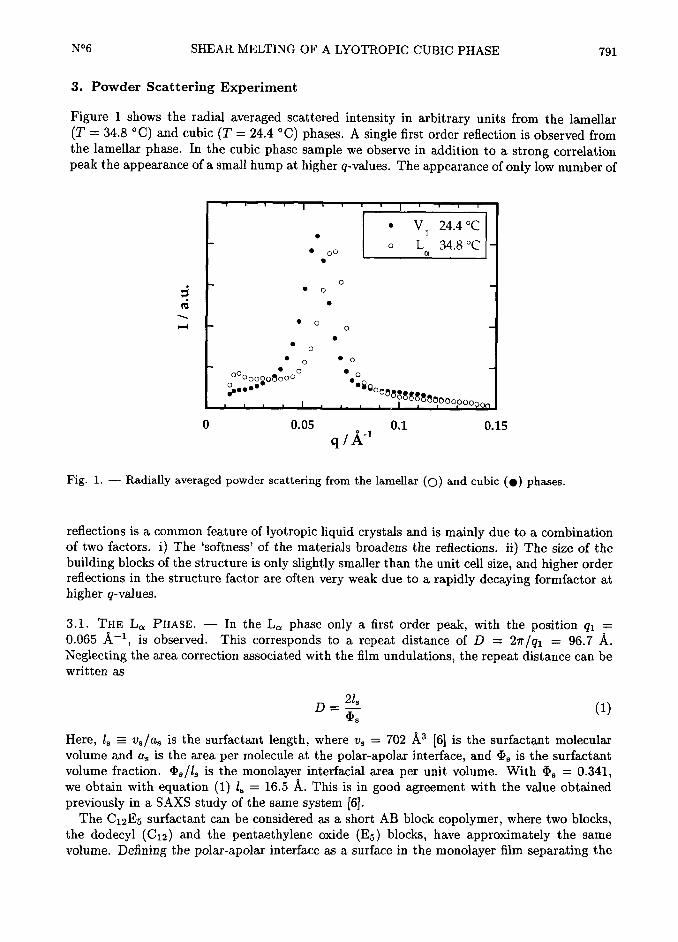
Figure I shows the radial averaged scattered intensity in arbitrary units from the lamellar(T
=34.8 °C) and cubic (T
=24.4 °C) phases. A single first order reflection is observed from
the lamellar phase. In the cubic phase sample we observe in addition to a strong correlationpeak the appearance of a small hump at higher q-values. The appearance of only low number of
. V 24.4 °C,
. ~o
L 34.8°Co
o
fl~ '
__ .
o
'o
~~
o
0
~ 0.1
q /

792 JOURNAL DE PHYSIQUE II N°6
C12 from the Es block, we can define the bilayer volume fraction, 4lb"
4lw + 4ls/2, where the
bilayer half thickness, L, is given by
L=
la()
+j) (2)
s
Using the value ls=
16.5 I,we obtain L
=18.9 I.
3.2. THE CUBIC PHASE. The scattering function of the powder cubic sample is dominated
by a strong correlation peak at qm =0.057 i~l. This corresponds to a lattice parameter
a =27r@/qm
m110@ I, where m =
h~ + k~ + l~. In addition we can also identify a weak
reflection around q cz o-I I A~~.
Self-diffusion measurements [6] have shown that the cubic phase is bicontinuous. From its
relative position in the phase diagram, between the lamellar and normal hexagonal phases, we
expect the monolayer to have a mean curvature on the average towards oil, I.e. intermediate
between that in the lamellar phase and that in the normal hexagonal phase.There are two commonly accepted and complementary descriptions of bicontinuous cubic
phases. In the interconnected-rod model [8] the structure is described as two infinite networks
of interconnected cylinders. In the bilayer model [9,10], the structure is described as a multiplyconnected bilayer decorating a minimal surface (corresponding to the mid-plane of the bilayer)
of cubic symmetry. The two descriptions are complementary in the sense that the two cylindernetworks in the first description are associated with the skeletal graphs of the two interwoven
sub-volumes separated by the minimal dividing surface in the bilayer description. Here we will
consider the bilayer description which appears to be the most appropriate. In particular if
we also consider the disordered L3 Phase structure at higher oil-content. Note that a bilayer
structure here implies a reverse, water-swollen bilayer separating two interwoven oil labyrinths.The area per surfactant molecule, aa, evaluated at the polar lapolar interface defined above,
was found to be almost identical in the lamellar and hexagonal phases of the present system [6].Assuming as to be the same also in the cubic phase, we can calculate the cubic lattice parameter,for minimal surface cubic phase model structures, using the parallel surface formalism ii,11].Here, the bilayer midplane is modelled
as a minimal surface, and the polar lapolar interface a
parallel surface at a distance L. The area, A, of the parallel surface is related to that of the
base minimal surface, Ao, according to:
dA=
Ii + KL~)dAo (3)
Here, K is the Gaussian curvature of the base surface and L is the distance from the base
surface. Integrating equation (3) over one unit cell, we obtain
A~=
At + 27rx~L~ (4)
where A~ and At are the parallel surface and base surface areas per unit cell, respectively, and
x~ is the surface Euler characteristic per unit cell, which is given by
J J dAoK7rx~ (5)unit cell
2A~la3=
4ls /la, where 03 is the unit cell volume, is the polar lapolar interracial area per unit
volume. Noting further that At=
ga~we obtain
Ala =
~~~~ Ii +~~~~ (~) (6)
° °
~

N°6 SHEAR MELTING OF A LYOTROPIC CUBIC PHASE 793
Table II. Properties of the G, D and P minimal surfaces.
surface space group xU g [14j
G la3d -8 3.09
D Pn3m -2 1.919
P Im3m ~ 2,345
Table III. Calculated and ezpertmental values for the lattice parameter of the cubic phase.
surface ~cajc~/I ~exp~/~ '~~ ~~~
G 279 269 6 21
D 172 156 2 1lo
191 3 iii
P 209 156 2 1(J
??0 4 ~00
la) Calculated according to equations (6) and (9).lb) Calculated from the observed reflection at qm =
0.057 i~~ in the cubic phase, according to
~y =no@ A.
(c) Assumed value of m =
h~ + k~ + l~, where h, k and I are the Miller indices.
The effective bilayer half-thickness, L, can be obtained in a similar way by considering the
volume fraction constraint:
~=
4lb=
4lw + 4l~ /2 (7)
where Vi is the bilayer film volume per unit cell, and can be written as
Vi=
2 J J dAo/
dL~~
(8)unit cell
~~~°
Using equations (3) and (7) in (8) we obtain

794 JOURNAL DE PHYSIQUE II N°6
4~b "
~'~Ii +
~~~~ (~) (9)° 3G °
~
The most commonly found bicontinuous cubic phase structure corresponds to the Gyroid min-
imal surface with the space group Ia3d [12,13]. In some occasions structures corresponding
to the D (Pm3n) and the P (Im3m) minimal surfaces, have also been reported. In Table II
are given the space group, values for the Euler characteristic and the dimensionless constant
g [14], for the three minimal surfaces.
Using equations (6) and (9),we have calculated the lattice parameter, o~~ic for the various
minimal surface structures, assuming la =16.5 I
as determined from the lamellar phase.These values are presented in Table III where we also compare with a lattice parameter, a~xp,calculated from the observed reflection at qm =
0.057 l~~, by assuming a value for m. As
is seen, the best agreement is found with the G-surface, assuming that the strong reflection
corresponds to the [211] planes. Possibly, the weak reflection at q cz o-ii i~~ corresponds to
[hkl]=
[332]. As will be shown below, the indexation of the strong reflection to [hkl]=
[21ii is
consistent with the results obtained in the shear cell experiments. We note also that the 211-
reflection normally is much stronger than other reflections from the Ia3d cubic phase [is,16],which supports our indexation.
4. Shear Cell Experiments
Scattering experiments in the shear cell were performed at various temperatures and effective
shear rates. The geometry of the experimental set up is illustrated in Figure 2, defining the
directions of the z, y, and z axis. The primary beam we define in the y-direction which also
defines the direction of the velocity gradient in the Couette flow. The velocity vector is parallelwith z-axis while the z-axis defines the cylindrical symmetry axis of the Couette.
4.I. THE LAMELLAR PHASE. The larnellar phase showed no indication of apreferred
orientation in the shear field except very close to the lower phase boundary. The situation is
illustrated in Figure 3 where we show the twc-dimensional scattering pattern from the lamellar
phase at three different temperatures approaching the lower phase boundary towards the cubic
phase (cz 30.5 °C) fora shear rate of §~w =
150 s~l. At 33.3 °C no orientation effects
are observed. However near the phase boundary the scattering function becomes stronglyanisotropic. At higher temperatures in the lamellar phase, the scattering similar patterns as
at 33.3 °C was observed, with no preferred orientation. The Bragg-spots in the qz direction
at 30.9 °C originates from lamellae oriented with the normal direction parallel with the z-axis.
However, the scattered intensity along qz at 30.9 °C is very similar to that observed in the
powder lamellar phase at higher temperatures, showing that this is not the main orientation
in the shear flow. This can be seen more clearly in Figure 4 where we compare the radiallyaveraged intensity and angular dependence of the scattered intensity for the sample at 30.9 °C
and 33.3 °C, respectively. In (a)we have plotted the radially averaged scattering intensity, I,
vs. q =(q] + q))~/~ and in (b)
we show the azimuthal angular dependence (tan(q)= qz /q~)
of the scattered intensity, integrated from q =0.04 i~~ to 0.09 i~~. In Figure 4a we see
that the total scattering intensity in the (q~, qz )-plane is strongly reduced at 30.9 °C comparedto powder situation at 33.3 °C, and in Figure 4b, we see that the intensity in the two Braggspots at 30.9 °C has the same magnitude as in the powder ring at 33.3 °C. From these results,
we can conclude that the main orientation at 30.9 °C is with the normal direction, n, of the
lamellae parallel with the y-axis (gradient direction) which does not give any scattering in the

N°6 SHEAR MELTING OF A LYOTROPIC CUBIC PHASE 795
Area-detector
Couette-cell
/
/i i /
Ii
/ Z
/
/
~
/
~~~
X
primarybeam
Fig. 2. Schematic illustration of the scattering and shear cell geometry. The primary neutron beam
is defined in the y direction parallel with the velocity gradient of the Couette shear geometry. The
cylindrical symmetry axis of the shear cell is defined in the z direction. In the scattering volume, the
velocity vectors are parallel with the ~-axis.
Cl 2E5 Shear=150/sec
T=33.3C T=31.5C T=30.9C
0.1 /~$
f~(TO-O j~' ~
°~
~ABQVE2OO~~/ ~ 1W200om 12D160
~ Q%& 080120~/U~ 04&080
~,it BELQv©40
-0.I
IA)
Fig. 3. Two dimensional scattering patterns recorded at three jifferent temperatures within the
lamellar phase foran
effective shear rate i~A=
150 s~~. The various temperatures are indicated in
the figures. ~

796 JOURNAL DE PHYSIQUE II N°6
~~
Q ~~ ~ O~O
~~O
d
~ o o
~+l3* O~' ° Q~
~O~~
O
@~
@
0 0.05 0.1 0.15 0.2a)
o ~q / A"
'~
33.3 °C
Id
$ 30.9 °C
Af
0 0.2 0.4 0.6 0.8 1
~~ azimuthal angle (1/360)
Fig. 4. a) The radially averaged scattering intensity plotted as a function of q(= (q] + qj)~/~),and b) the angular dependence of the scattered intensity in the q-band 0.04 < q < 0.09 i~~, for
two temperatures, 30.9 °C and 33.3 °C, respectively, and §~A=
150 s~~ in the lamellar phase. The
corresponding two-dimensional scattering patterns are shown in Figure 3.
(q~, qz )-plane. While other orientations in the powder have flipped to nlly, the residual nllzorientation remains since the resulting torque on this orientation is zero. The same behaviour
of alamellar piase in a Couette cell was recently observed by Diat et al. [17]. The reason why
the lamellar phase here orients only very close to the phase boundary with the cubic phase,and not at,higher temperatures, is not yet understood. One possibility is the formation of
Iiposomes~(onions) ii?] at higher temperatures which become unstable at lower temperatures
close to the phase boundary. Further experiments are needed however to clarify this issue.

N°6 SHEAR MELTING OF A LYOTROPIC CUBIC PHASE 797
C12E5 T=25.4C
SHEAR~300/sec Relaxed
0.1
~_
~ ~
~ '~~
~0.0 ~.@~~($
N/~~
~ ogo,m
~ff~ ~©~~
t-sELovow
-0.1
Fig. 5. Two dimensional scattering pattern from the cubic phase at 25.4 °C. a) §~A =300 s~~ b)
Shortly after the shear had been turned off.
4.2. THE CUBIC PHASE. Under shear, the sample scatters almost uniformly on a ring,although with a weak azimuthal dependence. However, turning oil the shear results in a
preferred orientation. The situation is illustrated in Figure 5 for a temperature of 25.4 °C.
In Figure 5a we show the scattering pattern obtained with a shear rate of i~w=
300 s~~.
Figure 5b shows the scattering pattern obtained shortly aiter the shear has been turned off.
In Figure 6 la and b, respectively)we have plotted the radially averaged intensity la) and the
azimuthal angular dependence oi the scattered intensity 16), the latter as obtained in the q-band 0.04 0.07 i~~, ior the two situations with i~w
=300 s~~ and i~w
=0, respectively. Six
sharp peaks at q =0.057 i~~
are observed in the oriented sample. Two peaks correspond to
scattering vectors qxz =(q~, qz =
(0, qm), and (0, -qm) respectively, and hence to a scatteringplane with its normal direction parallel with the z-axis. The angles between this scatteringplane and the two additional planes are close to + the tetrahedral angle, 109.5°. This angle is
indeed present between certain planes in the (211) family oi reticular planes, namely between
the [211] and [§11] planes, and permutations of this combination. The observation of peaks at
qxz =(0, qm) and (0, -qm) suggests that the < iii > direction is parallel to the z-axis.
In addition tq the six strong peaks, iour peaks of lower intensity can be resolved. They are
located on either side oi the two peaks on the qy-axis, Presumably, these peaks stem from an
additional orientation of the unit cell, where the < iii > direction is parallel to the y-axis. In
this case we expect two additional peaks to lie on the q~-axis, which are not resolved between
the stronger peaks. Close to the qx axis additional intensity appear at q cs 0. ii i~~, probablyrevealing scattering from (332)-type of reflections (These reflections are not visible in Fig. 5,which has been experimentally optimised to resolve the (211) reflections).
We now turn to the question if the observed orientation corresponds to only a minor part
of the sample, as was the case for the lamellar phase, or if it corresponds to a major part and
hence a preferred orientation of the sample. These plots in Figure 6 can be compared with
the analogous plots for the lamellar phase in Figure 4, and if we do, we see that the situation
for the cubic phase (Fig. 6) is different. In Figure 6a we see that when the sample orients,
after the shear is turned off, we are not loosing intensity in the (q~, qz )-plane,as we did in the
case of the lamellar phase. The integrated scattering intensity is similar for i~w=
300 s~~ and

798 JOURNAL DE PHYSIQUE II N°6
oy=300s'~ oo~
o .oy=0 o o
8qd
o 8
~+°~o
~
a)
0 0.02 0.04 0.06 0.08 0.I
q / I"~
--y=300s~~
~ y= 0
b)
0 0.2 0.4 0.6 0.8 1
azimuthal angle (1/360)
Fig. 6. a) The radially averaged scattering intensity and b) the angular dependence of the scattered
intensity in the q-band 0.04 < q < 0.07 i~~, for i~A=
300 s~~ and §~A=
0, respectively at 25.4 °C.
The corresponding two-dimensional scattering patterns are shown in Figure 5.
i~w=
0, respectively. Also, if we compare the angular dependence of the scattered intensity(Fig. 6b) we see that the intensity of the Bragg spots in the oriented sample (§~w =
o) now has
an intensity which is higher than the average intensity under shear. This indicates that the
observed orientation of the cubic phase after the shear has been turned off indeed correspondsto a major part of the sample, and hence to a preferred orientation. However we do not
expect to have a monocrystal situation. Rather, we probably orient only one axis of the cubic
structure, namely that the < iii > direction orients parallel to the velocity (z-axis). Hence,
we expect a 2D powder of the < 211 > directions in the yz-plane. (Unfortunately it was not
possible to shift the Couette cell sideways in order to detect the (qy, qz )-plane).

N°6 SHEAR MELTING OF A LYOTROPIC CUBIC PHASE 799
Single crystals of the Gyroid cubic phase have been obtained previously in both surfactant
and block copolymer systems [16,18,19]. In those studies, however, the cubic phase crystals
were grown from oriented lamellar or hexagonal phases with epitaxial relationships. Here, the
mechanism is different. Under shear we observe a weak orientational order in the zz-plane as
can be seen in the angular dependence of the scattered intensity in Figure 6b. The angulardependence at i~w
=300 s~l is qualitatively similar to that at §~w =
0, indicatinga similar
structure in the two cases. One possibility is then that the cubic phase melts in the shear
field into a disordered liquid L3 Phase, and that the cubic phase recrystalfises after the shear
has been turned off. The disordered structure shows only a weak orientation in the shear
field, however sufficient enough to produce a strong orientation effect when the cubic phaserecrystallises. This possibility is supported by the fact that the present cubic phase is very close
in composition to the first order melting transition to the L3 Phase when diluting with oil [6],and as we will see below, a stress-sweep experiment performed on the cubic phase indicate that
it indeed may undergo a melting transition under shear.
As mentioned above, the observed orientation of the recrystallised cubic phase corresponds to
the (I ii axis parallel with the velocity direction (y-axis). This three-fold < ill > symmetryaxis of the Gyroid structure contains straight 'cylindrical'pores (see, e.g., Ref. [20]). While
the properties of bicontinuous structures in a shear field is at present unknown, we note here
that the observed orientation seems understandable, considering the cylindrical pores in the
iii-direction-
If indeed the high shear phase corresponds to an L3 Phase, it is interesting to note that the
position of the major correlation peak (the 211-peak in the cubic phase) remains unchangedunder shear, since a particularly interesting question in L3 Phases concerns the average bilayer
topology or coordination number. Self-diffusion measurements have demonstrated previously,for this system [6], as well as for the ACT-brine system [4, 5], that the bilayer topology in the
L3 and cubic phases (Gyroid in both systems) are essentially identical. In other words the
corresponding minimal surface of which the L3 Phase is the disordered or melted analogue,is indeed the Gyroid minimal surface, which also appears to be the most commonly observed
cubic phase structure in surfactant systems. Since the conclusions irom the self-diffusion mea-
surements are partly based on an observed continuity oi the diffusion constant across the
order-disorder transition the question oi the average topology in the disordered L3 Phase has
only been addressed in systems which do show such a transition, and it is not yet clear if a
low average coordination number (= 3 in the Gyroid case) is a general property of L3 Phases.This property could possibly be addressed also by small angle scattering experiments. What
the present results indicate is that the correlation peak in the L3 Phase which only reports
on nearest neighbour correlations, is related to the 211-reflection from the crystalline Gyroid
structure. It would certainly be interesting with a more systematic study in this area, on sys-
tems with well controlled area to volume ratios. Also the ongoing debate on how ordered the
disordered L3 phase in fact is, may benefit from such a study. For this however, the present
system is less suitable, due to the strong temperature sensitivity of the nonionic surfactants,
but we hope to return to this question in a future publication.
5. Stress-Sweep Experiment
The rheological properties of the cubic phase were further investigated with a controlled stress
cone-and-plate rheometer (Carri-Med CSL 100). In Figure 6 we present the results of a stress-
sweep experiment on the cubic phase sample at 24 °C. In this experiment, a variable stress
is applied to the sample and the resulting shear-rate is recorded. As seen in Figure 7, the
sample has essentially the characteristics of ayield-stress. At low stress, the sample behaves

800 JOURNAL DE PHYSIQUE II N°6
300
~ 200Cw
~(
i~~ 100
o
0 200 400 600 800 1000 1200
j / s"~
Fig. 7. Applied stress versus shear rate recorded in the cubic phase at 24.0 °C ina stress-sweep
experiment (increasing stress)on a cone and plate rheometer.
essentially as a solid. When the stress is increased above a particular (yield-stress) value the
sample turns fluid and the shear-rate increases dramatically, indicative of a melting of the
cubic phase. The results of Figure 7 should be considered only qualitatively since we do not
control the cubic phase orientation and size distribution of the microcrystallites la repeatedexperiment resulted in a similar curve however with a (cz 20$l smaller yield stress). The results
nevertheless indicate a melting transition when the cubic phase is exposed to a sufficiently highshear stress. Completely parallel scattering and rheology experiments could not be carried out,
since in the Couette shear cell used in the scattering experiments only the shear rate, and not
the shear stress, could be controlled.
The cubic phase here is stable only in a narrow range of oil concentrations. Upon dilution
with oil, the cubic crystalline order 'melts', at a weak first order (order-disorder type) phasetransition, to a liquid L3 l'sponge') phase, retaining the bilayer topology [6]. This type of phasetransition has been addressed by Bruinsma [21] who showed that the bicontinuous cubic phase
cannot be diluted infinitely. The shear modulus decrease upon dilution and vanishes at a finite
concentration, where the cubic structure is expected to 'melt' [21]. The results presented here
indicate that a melting transition also can occur under shear.
Acknowledgments
We are grateful to Krister Thuresson for his assistence with the stress-sweep experiment. A
grant from Nils and Dorthi Tro@dsson Research Foundation, financing the rheometer, is kindlyacknowledged. This work was financially supported by the Swedish (NFR) and Danish Natural
Science Research Council.

N°6 SHEAR MELTING OF A LYOTROPIC CUBIC PHASE 801
References
iii Anderson D., Wennerstr6m H., Olsson U., J. Phys. Chem 93 (1989) 4243.
[2] Gazeau D., Bellocq A. M., Roux D., Zemb T., Europhys. Lett. 9 (1989) 447.
[3] Porte G., Marignan J., Bassereau P., May R., J. Phys. France 49 (1988) sll.
[4] Balinov B., Olsson U., S6derman O., J. Phys. Chem 95 (1991) 5931.
[5] Olsson U., Balinov B., S6derman O., In The Structure and Conformation of Amphiphilic Mem-
branes; R. Lipowski, D. Richter and K. Kremer Eds. (Springer-Verlag: Berlin Heidelberg, 1992)
p. 287.
[6] Olsson U., Wilrz U., Strey R., J. Phys. Chem. 97 (1993) 4535.
[7] Mortensen K,
Almdal K., Bates F., Koppi K., Tirell M., Nord6n B., Physica B (1994) in press.
[8] Luzzati V., Tardieu A., Gulik-Krzywicki T., Rivas E., Reiss-Husson F., Nature 220 (1968) 485.
[9] Scriven L. E., Nature 263 (1976) 123.
[10] Hyde S. T., Andersson S., Ericsson B., Larsson K., Z. Krtstallogr. 168 (1984) 213.
ill] Hyde S. T., J. Phys. Chem. 93 (1989) 1458.
[12] Fontell K.,Colloid Polym. Sm. 268 (1990) 264.
[13] Fontell K., Adv. Colloid Interface Sm. 41 (1992) 127.
[14] Anderson D. M, Davis H. T., Scriven L. E., Nitsche J. C. C., Adv. Chem. Phys. 77 (1990) 337.
[15] Clerc M., Dubois-Violette E., J. Phys II l+ance 4 (1994) 275.
[16] Ran~on Y., Charvolin J., J Phys France 48 (1987) 1067.
[17] Diat O., Roux D., Nallet F., J. Phys. II France 3 (1993) 1427.
[18] Ran~on Y., Charvolin J., J. Phys. Chem. 92 (1988) 2646.
[19] Schulz M. F., Bates F. S., Almdal K., Mortensen K., Phys. Rev. Lett. 73 (1994) 86.
[20] Fogden A., Haeberlein M., Lidin S., J. Phys. I France 3 (1993) 2371.
[21] Bruinsma J., J. Phys. II France 2 (1992) 425.
Copyright © 2022 FDOKUMEN