Nonlinear spectroscopy of cold, trapped atoms
15
Nonlinear spectroscopy of cold, trapped atoms Jerzy Zachorowski, * Tomasz Brzozowski, Tadeusz Palasz, Michal Zawada, and Wojciech Gawlik Instytut Fizyki M. Smoluchowskiego, Uniwersytet Jagielloński, ulica Reymonta 4, 30–059 Kraków, Poland. (Dated: appeared in Acta Physica Polonica A 101, 61 2002) We report on our studies of atoms contained in a magneto-optical trap using the nonlinear spectroscopy methods. Absorption and four- wave mixing signals are recorded for the probe frequency near the cooling transition frequency and the two methods are compared. The differences in the signal structure and their sensitivity on external conditions are discussed. It is revealed that central feature of these spectra consists of several contributions of different origin. PACS numbers: 32.80.Pj,42.65.An,42.65.Hw I. INTRODUCTION Cold samples of trapped atoms form very attractive objects for spectroscopic re- search. Their main characteristic is the absence of an inhomogeneous broadening. The popular way to study the properties of cold, well-isolated atoms is such that the atoms are gathered in a magneto-optical trap [1] (MOT) and cooled there, but during the actual measurement when they are subject to pump and probe laser beams, the trapping light, and often also the quadrupole magnetic field, are switched off. While such experiments play a very important role for better understanding the quantum processes of light interaction with multilevel atoms, they provide little information on the atom dynamics in a working trap. At the same time, spectroscopy provides also a means of studying properties and dynamics of cold, trapped atoms in situ. In this aspect the spectroscopic measurement can be used to study the behavior of atoms in the trap and effective parameters of the trap itself. Therefore, such experiments should be performed while the trap is active and all the fields present. First experiments on nonlinear absorption of trapped atoms have been performed by Tabosa et al. [2] with rubidium and by Grison et al. [3] with cesium atoms. Studies of absorption spectra of atoms gathered in the trap, but after switching the trap beams off, were performed by Mitsunaga et al. [4], Lipsich et al. [5], and Chen et al. [6]. Four-wave mixing (FWM) spectroscopy of atoms in a MOT has started with the works of Lounis et al. [7, 8], and Hemmerich et al. [9] and continued by Tabosa et al. [10–12] and Lezama et al. [13]. * Electronic address: [email protected]
-
Upload
jagiellonian -
Category
Documents
-
view
1 -
download
0
Transcript of Nonlinear spectroscopy of cold, trapped atoms

Nonlinear spectroscopy of cold, trapped atoms
Jerzy Zachorowski,∗ Tomasz Brzozowski, Tadeusz
Pałasz, Michał Zawada, and Wojciech Gawlik
Instytut Fizyki M. Smoluchowskiego, Uniwersytet Jagielloński,
ulica Reymonta 4, 30–059 Kraków, Poland.
(Dated: appeared in Acta Physica Polonica A 101, 61 2002)We report on our studies of atoms contained in a magneto-optical
trap using the nonlinear spectroscopy methods. Absorption and four-wave mixing signals are recorded for the probe frequency near thecooling transition frequency and the two methods are compared. Thedifferences in the signal structure and their sensitivity on externalconditions are discussed. It is revealed that central feature of thesespectra consists of several contributions of different origin.
PACS numbers: 32.80.Pj,42.65.An,42.65.Hw
I. INTRODUCTION
Cold samples of trapped atoms form very attractive objects for spectroscopic re-search. Their main characteristic is the absence of an inhomogeneous broadening.The popular way to study the properties of cold, well-isolated atoms is such that theatoms are gathered in a magneto-optical trap [1] (MOT) and cooled there, but duringthe actual measurement when they are subject to pump and probe laser beams, thetrapping light, and often also the quadrupole magnetic field, are switched off. Whilesuch experiments play a very important role for better understanding the quantumprocesses of light interaction with multilevel atoms, they provide little information onthe atom dynamics in a working trap. At the same time, spectroscopy provides alsoa means of studying properties and dynamics of cold, trapped atoms in situ. In thisaspect the spectroscopic measurement can be used to study the behavior of atomsin the trap and effective parameters of the trap itself. Therefore, such experimentsshould be performed while the trap is active and all the fields present.
First experiments on nonlinear absorption of trapped atoms have been performed byTabosa et al. [2] with rubidium and by Grison et al. [3] with cesium atoms. Studiesof absorption spectra of atoms gathered in the trap, but after switching the trapbeams off, were performed by Mitsunaga et al. [4], Lipsich et al. [5], and Chen et
al. [6]. Four-wave mixing (FWM) spectroscopy of atoms in a MOT has started withthe works of Lounis et al. [7, 8], and Hemmerich et al. [9] and continued by Tabosaet al. [10–12] and Lezama et al. [13].
∗Electronic address: [email protected]

2
Our aim is to establish methods of a real-time diagnostics of atoms in a work-ing MOT. We have thus undertaken studies of the nonlinear spectra with the useof both absorption and FWM spectroscopy. The measurements were performed inthe configuration where the trapping beams are present and play the role of pump.The quadrupole magnetic field were neither switched off, i.e., the recorded spectracharacterize a working MOT rather than an unperturbed cloud of cold atoms.
II. MAGNETO-OPTICAL TRAP
Let us recall briefly the working principles of the magneto-optical trap (Fig. 1).Atoms in a light field are subject to two kinds of optical forces: the spontaneousor light pressure force due to the gradient of the light field phase
−→F S ∝ ∇Φ(−→r )
and the dipole force due to the gradient of the field amplitude−→F D ∝ ∇E(−→r ). The
two kinds of forces differ in that one is dissipative and the other reactive, they havedifferent dependence on the light frequency around the atomic resonance line. Acombination of six light beams of frequency νL, counter propagating along the threeorthogonal spatial directions, and detuned by about 1-3 natural widths Γ below theatomic transition (red detuning) give a resulting force which has a viscous character,−→F (−→v ) ∝ −−→v . This force cools atoms and forms the so-called optical molasses.When quadrupole magnetic field is produced where the beams are crossing and propercircular polarization of the beams is used, the force becomes position dependent,−→F (−→r ) ∝ −−→r , and optical force provides the restoring force needed to form a trap .
The cloud of cold atoms stored in the MOT contains 106–108 atoms and has the sizeof a fraction of a mm. The maximum density is limited to 1010–1012 atoms/cm−3.The kinetic temperature of the atomic sample is of the order of the Doppler limittemperature which is 0.1–1 mK. This temperature corresponds to the atomic velocitiesof the order of 10 cm/s. Even lower temperatures can be obtained by sub-Dopplercooling after switching the magnetic field off.
The most important feature of the atoms in the trap from the spectroscopy’s pointof view is that atomic Doppler width is smaller than natural width of the transitionused for cooling the atoms, ∆D ¿ Γ. This constitutes a sample of unusual absorptionproperties where many interesting effects, normally blurred by Doppler effect, show upeasily. This sample possesses also some very interesting characteristics as a mediumfor the wave-mixing experiments. Since the Doppler width is smaller than the naturalwidth, all atoms contribute to the signal, moreover, for the almost immobile atoms the“grating washing” effect [14] is strongly reduced, which allows for relatively big anglesbetween the pump and the probe beams. On the other hand, the number of atomsand the size of the sample is small, so the achieved four-wave mixing efficiency reaches1%. The slow decrease of the signal due to the movement of the atoms has been usedby Mitsunaga [15] to measure the temperature of the atoms via the time-resolvedfour-wave mixing.
Our experiment was performed with 85Rb atoms trapped in a vapour-loaded MOT.For the details of the trap see [16]. The axial gradient of the quadrupole magneticfield was 6 Gs/cm. The laser beams used for trapping had waist of 4 mm and carriedthe typical power IL = 14 mW/cm2 each. This intensity was varied in the experiment,

3
which resulted in the changes of the number of stored atoms, the cloud density andtemperature. The trapping laser was locked to the atomic resonance and tuned belowthe frequency ν3−4 of the cooling transition Fg = 3−Fe = 4 of the 85Rb D2 line withthe use of an acousto-optical modulator (AOM). The actual detuning δ = νL − ν3−4
was varied between −6 and −30 MHz (–1 to –5Γ) in the experiment. To avoidthe escape of atoms into the other hyperfine ground level a weak repumping beam,resonant with the Fg = 2 − Fe = 3 transition, was superimposed on the trap. Themeasured temperature of atoms in the trap was 0.75 mK for laser detuning of δ = −2Γand for low trapping intensity of 2.9 mW/cm2 in each beam. This corresponds wellto the theoretical predictions of the temperature for these parameters.
III. WIDE SCAN
Our studies were performed in a setup schematized in Fig. 2. The six trap beamsacted as the pump field. A weak beam of linear polarization and of frequency νp
was used as a probe of the trapped atom absorption or for inducing the four-wavemixing (FWM) signal. The probe beam made an angle of about 20 to one of thetrapping beams and was focused to a waist of 100 µm. Detector 1 (see Fig. 2)recorded the absorption spectrum and a beamsplitter inserted in the probe beamdirected the generated phase-conjugated beam (FWM beam) to detector 2. The lock-in detection scheme was used to improve the signal-to-noise ratio in the wave-mixingmeasurements.
FIG. 1: Scheme of the magneto-optical trap. Six light beams of circular polarization σ+/σ−
exert light-pressure force on atoms in the magnetic quadrupole field B produced by two coilsof opposite current flow (thick loops).

4
FIG. 2: Experimental set-up illustrating the probe beam and two detectors. DET1 recordsthe absorption signal and DET2 measures the intensity of the FWM beam reflected fromthe beamsplitter. The dotted line indicates optional pump beams used in degenerate FWMmeasurements.
In the recordings of the wide scans of absorption and FWM, covering all the lines oftransition from the Fg = 3 ground state, we derived the probe beam from a separatediode laser, tuned independently. As the relative frequency difference between thepump laser and the probe laser was not controlled there is an additional broadeningof about 5 MHz in the spectra.
A. Absorption
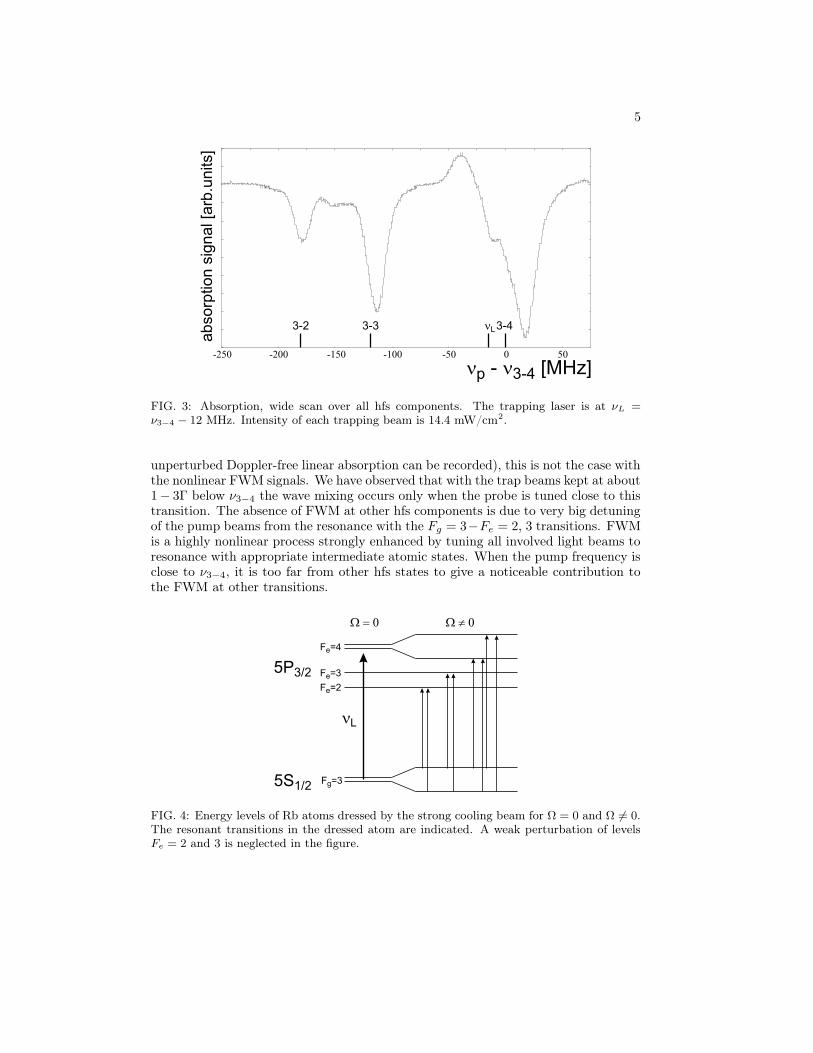
A typical plot of an absorption spectrum is presented in Fig. 3. It shows absorptionchanges around all allowed hfs components: Fg = 3 − Fe = 2, 3, and 4. Thoseassociated with the 3 − 2 and 3 − 3 transitions have a form of asymmetric doubletswith one strong component slightly above the unperturbed resonance frequency (blue-shifted) and one much weaker, red-shifted component. In Fig. 3, the red-shiftedcomponent of the Fg = 3 − Fe = 2 doublet is too weak to be resolved and can beseen only as a broadening of the low-frequency wing of the absorption line. Aroundthe 3−4 hfs transition, the absorption signal has a distinct triple structure consistingof two sidebands: one showing the probe gain at the low-frequency side of νL andanother, absorptive one on the blue side of ν3−4 plus a central feature at the pumplaser frequency νL. All these resonances can be easily explained in terms of dressedatom states (Fig. 4).
B. FWM spectra
FWM spectra differ strongly from the absorption signals. While absorption exhibitsvisible resonances corresponding to all allowed hfs transitions irrespectively of thepump beam frequency and power (in particular, even without any pump beam an
5
FIG. 3: Absorption, wide scan over all hfs components. The trapping laser is at νL =
ν3−4 − 12 MHz. Intensity of each trapping beam is 14.4 mW/cm2.
unperturbed Doppler-free linear absorption can be recorded), this is not the case withthe nonlinear FWM signals. We have observed that with the trap beams kept at about1− 3Γ below ν3−4 the wave mixing occurs only when the probe is tuned close to thistransition. The absence of FWM at other hfs components is due to very big detuningof the pump beams from the resonance with the Fg = 3−Fe = 2, 3 transitions. FWMis a highly nonlinear process strongly enhanced by tuning all involved light beams toresonance with appropriate intermediate atomic states. When the pump frequency isclose to ν3−4, it is too far from other hfs states to give a noticeable contribution tothe FWM at other transitions.
FIG. 4: Energy levels of Rb atoms dressed by the strong cooling beam for Ω = 0 and Ω 6= 0.The resonant transitions in the dressed atom are indicated. A weak perturbation of levelsFe = 2 and 3 is neglected in the figure.

6
In order to see the FWM signal at each allowed hfs component, we used the tech-nique of degenerate FWM (DFWM). The second laser provided not only a weak probebeam but also two stronger, counterpropagating beams acting as additional pumps.They were directed onto the trapped cloud under 1.6 angle to the probe beam andabout 20 to one of the trapping beams. In this way, the phase-conjugated signalsdue to DFWM could be recorded for atoms simultaneously illuminated by trappingbeams. Fig. 5 shows a typical spectrum obtained while scanning the second laser (theprobe and two additional pump beams) over the Fg = 3−Fe = 2, 3, and 4 transitions.DFWM signal occurs around each of the hfs components, similarly to the absorptionspectra of Fig. 3. The intensity of the additional counterpropagating beams was up to0.70 mW/cm2 per each beam, i.e., much less than the 14.4 mW/cm2 typical intensityof each of the trap beams. For this reason, the presence of the additional beams doesnot add much perturbation to this already imposed by the trap beams on the atomicstructure and dynamics. We have verified this by recording the absorption spectrawith these additional beams (not shown here). Almost no distortion of the spectrawas seen except for about 50% reduction of the absorption depth. Most likely thisreduction was due to additional saturation caused by more efficient optical pumpingby the two extra beams. This extra saturation reduces also resolution of the DFWMspectra. In particular, weak components of the doublets in the 3− 2 and 3− 3 com-ponents are now seen only as the line asymmetry. Apart from that, the resolution ofthe wide scans is limited mainly by the relative noise between two independent lasers.
IV. NARROW SCAN
To get better resolution around the trapping transition we repeated the scans butwith the probe laser locked to the trapping laser (injection locking). We used twoAOMs to control the frequency of the probe laser: one tunable in a double passageto shift the frequency of the injected laser beam and thus to set the probe frequencyand one with fixed frequency. This resulted in perfect phase correlation between thepump (trap) and probe beams and allowed recording of spectral structures well belowthe 6 MHz natural width of the Rb lines and even below the laser linewidth. Theparameters of the AOMs limited the possible scan range of about ±60 MHz aroundthe pump frequency ν3−4. The scheme of the laser system is shown in Fig. 6.
A. Absorption
The high-resolution absorption spectrum of strongly driven cold atoms is presentedin Fig. 7. If we analyze the spectrum in terms of a dressed two-level atom in thevicinity of the strong pump frequency we should expect a triplet structure consisting ofan absorptive feature close to ν3−4, of a three-photon gain feature close to 2νL−ν3−4,and of an asymmetric component at νL. These AC-Stark effect sidebands shouldoccur close to νL±Ω′, where Ω′ =
√Ω2 + δ2 is the generalized Rabi frequency for the
laser detuning δ [17]. Our spectrum resembles roughly such a spectrum of a two-leveldressed atom. There are, however, important differences. First, the central featurehas much bigger amplitude, smaller width and even a different sign of asymmetry

7
than in the absorption spectrum of two-level atoms. It has a complex sub-naturalstructure. The second difference concerns the absorptive and gain sidebands, which
FIG. 5: Degenerate four-wave mixing signal, wide scan over all hfs components. The trappinglaser is at νL = ν3−4 − 15.7 MHz. Intensity of each trapping beam is 14.4 mW/cm2 and ofeach additional pump beam is 0.7 mW/cm2.
FIG. 6: Scheme of the laser system. OI - optical isolator, AOM - acousto-optical modulator,PD - photodiode, λ/4 - quarter-waveplate.

8
FIG. 7: Absorption, narrow scan around the trapping laser frequency. The trapping laser isat νL = ν3−4 − 13 MHz. Intensity of each trapping beam is 6.4 mW/cm2.
appear much broader and are not symmetrically positioned around νL.Please note that the difference in shape of the central feature at νL frequency
between the recordings of Fig. 3 and Fig. 7 is due to the poor resolution of theformer, obtained with independent (unlocked) probe laser. We have verified that thisis indeed the cause: we have numerically averaged the spectrum of Fig. 7 over the 5MHz relative jitter of the two lasers and obtained a spectrum very closely resemblingthe one in Fig. 3, with shallow and inverted central feature.
The positions of side resonances show asymmetry. We note that the low-frequency,gain sideband is more displaced from νL than the high-frequency, absorption side-band. There are two reasons for this: one is that our atom is by no means a two-levelsystem. It has instead several Zeeman levels and a related spread of dipole momentsof individual transitions. The second reason is that there exists spatial inhomogeneityof the net trapping light field due to interference of beams intersecting in the trap,which involves periodic intensity and polarization variations. Therefore, even in thesimplest case when the local light polarizations of the pump and probe fields allowdecomposition of the driven transition into several two-level substructures (equal cir-cular or parallel linear polarizations), the absorption spectrum is a superposition ofseveral spectra of two-level subsystems characterized by different dipole moments [5].The crucial point is that the absorption and gain sidebands show different amplitudedependence on the Rabi frequency. As the dipole moment of the transition increasesthe gain sideband also increases but the absorption one saturates. Thus, even if the

9
sideband positions within individual triplet substructures are perfectly symmetric, theresulting superposition spectrum shows a clear asymmetry: the absorption sidebandis shifted towards νL, while the gain sideband is shifted towards higher detuning. Toshow this effect we have modelled the absorption signal as a sum of contributionsfrom different π-polarization transitions on the Fg = 3 − Fe = 4 transition in 85Rb.The plot in Fig. 8 shows the same behavior as the experimental recordings.
B. Four-wave mixing
Fig. 9 shows the spectrum of the near-degenerate four-wave mixing in the setupshown in Fig. 2 without the extra pump beams. The spectrum has a narrow cen-tral resonance and two sidebands. These sidebands have the same origin as thoseseen in absorption spectra, i.e., AC-Stark effect and should appear close to νL ± Ω′.The asymmetry of sidebands positions is opposite to the absorption case: the low-frequency sideband is closer to the pump-laser frequency than the high-frequency one.This asymmetry cannot be caused by the different intensity dependence of the twosidebands, as for the two-level atom the amplitudes of both FWM sidebands scalein the same way [18] and thus the signal, which is a sum of two-level substructures,remains symmetrical. This holds also for more complicated polarization cases. Weattribute the observed asymmetry to the influence of the AC-Stark perturbed absorp-tion. In consequence, the resonant absorption shifts the position of the blue sidebandmaximum towards higher frequencies, as seen in Fig. 9.
V. CENTRAL RESONANCE
The central resonance appears for the probe frequency being very close (of theorder of a few MHz) to the frequency of the trap (pump) laser. It differs significantlyfrom the case of a dressed two-level model, which predicts a dispersive shape ofwidth Γ, while the actual experiment gives a more complicated shape. The spectraof Fig. 7 show already that the resonance width is below the natural width Γ, andits asymmetry is reversed. An even narrower scan presented in Fig. 10 shows asubstructure with resonances a few hundred kilohertz apart. Please note that torecord such a narrow structure it was necessary to use the probe laser injection lockedto the pump laser and tuned with acousto-optical modulators.
Let us consider the situation of the π-polarized pump beam and the σ-polarizedprobe. Distances between the resonances correspond to the spacing between the light-shifted magnetic sublevels of the ground state. The resonances result from the Ramantransitions involving pump and probe photons as suggested in [3] (Fig. 11). Due tothe differences in population of the sublevels, the probe beam is amplified (for positivedetuning) or absorbed (for negative detuning). The positions of the Raman resonancesdepend on the pump light intensity and on the relevant Clebsch-Gordan coefficients.The resonances of Fig. 10 have been associated with the transitions between states|3, 0〉 ↔ |3, 1〉 and |3, 0〉 ↔ |3,−1〉— resonances a and b, respectively, and transitions|3, 1〉 ↔ |3, 2〉 and |3,−1〉 ↔ |3,−2〉 — resonance c and its barely visible counterpartd. With the increase of the pump intensity the light shift increases as Ω2/δ for

10
-60 -40 -20 0
0
20
abso
rpti
on
[ar
b.
u.]
- [MHz]n np 3-4
FIG. 8: Absorption spectrum due to four, Zeeman degenerate, two-level substructures withdifferent dipole moments. The actual values of these moments correspond to the ∆m = 0
transitions in the rubidium Fg = 3− Fe = 4 line.
low perturbation, when Ω2 ¿ Γ2/4 + δ2, or linearly with Ω for strong fields, whenΩ2 À Γ2/4+δ2. The plot of frequency of the resonance c vs the frequency of a shouldbe a straight line of slope given by the ratio of the C-G coefficients (low perturbation)or by the square of the coefficients (strong perturbation). For rubidium atoms andthe studied transition the two limiting cases of low and strong perturbation give 3and 3.22, respectively. The plot of Fig. 12 shows our experimental points which fitthe straight line with slope 3.16, corresponding well to the value calculated for therange of intensities used in the experiment. This proves that the observed resonancesare indeed the transitions between light-shifted magnetic sublevels.
We have recorded also the four-wave mixing spectra around the trap laser frequencysimultaneously with the absorption (Fig. 13). The FWM signal exhibits very narrowresonances at a distance of a few hundred kilohertz from the pump laser frequencythat are barely visible in the absorption spectrum. One of the possible explanationsof these resonances is the effect of optical lattices (see the review paper [19]). Sixtrapping beams create a periodic spatial modulation of intensity and/or polarizationof the light field. Thus created dipole forces act on atoms and at low enough tem-perature of the atoms may lead to their localization in the minima of the potentialand to the quantization of atomic motion. Assuming a harmonic potential, the vi-brational atomic energy levels are equally spaced by a few hundred kilohertz. Asthe probability of tunnelling of the localized atom to the neighboring site is low, onecan observe Raman transitions between the vibrational energy levels producing verynarrow resonances.
Another effect that might show up in the signals is the recoil resonance [20]. Itresults from the momentum transfer between atoms and photons of the pump and

11
FIG. 9: Near-degenerate four-wave mixing, narrow scan around the trapping laser frequency.The trapping laser is at νL = ν3−4 − 16 MHz. Intensity of each trapping beam is 14.4mW/cm2.
probe beams. It has a quasi-dispersive shape of the Gauss curve derivative. Its widthappears to be comparable to the width of the above discussed Raman resonances dueto transitions between vibrational energy levels of atoms localized in optical latticesand of the same order as the experimentally observed resonances. This makes thediscrimination of particular components difficult.
As noted above, the well-resolved resonances visible in the four-wave mixing spectraof Fig. 13 can only be noticed as subtle kinks in the shape of absorption signal. Thisproves the superior sensitivity of the wave mixing as compared to absorption in thestudies of optical lattices. Nevertheless, only the simultaneous recording of absorptionand FWM spectra gives a complete information on the behaviour of atoms in theMOT. Some of the features of the experimentally observed spectra can be explainedby the invoked theory, the others are still unexplained. In particular, it is noticeablethat there is no full analogy in the positions of resonances in absorption and FWMspectra: although the two processes have different characters, the resonance conditionshould be the same in both cases. The full dependence of the signal shape on theprobe polarization deserve further studies as well as the role of the magnetic field ofthe trap.

12
FIG. 10: Absorption signal showing only the central resonance of Fig. 7. The trapping laseris at νL = ν3−4 − 14 MHz. Intensity of each trapping beam is 14 mW/cm2.
FIG. 11: Scheme of the Raman transitions for the Zeeman sublevels of the Fg = 3 groundlevel. Degeneracy of the sublevels is lifted by the light-shift effect due to the strong pump(trapping) field. Thick arrows represent ∆m = 0 transitions caused by the pump field, thinarrows represent ∆m = +1 transitions induced by the probe field.
CONCLUSIONS
In this work we have studied cold atoms in the working magneto-optical trap by thenonlinear spectroscopy methods. The absorption and four-wave mixing spectra have

13
FIG. 12: Relative position of the components of the central resonance: position of the c
resonance vs the one of a and b. The two broken lines show two limiting cases: of weakfield limit, when light shifts scale as Ω2/δ, and of strong field limit, when light shifts becomeproportional to Ω. The solid line is a linear fit to the experimental points with slope 3.16±0.08. The pump beam detuning is −14 MHz.
been recorded. The origins of the asymmetry of the AC-Stark effect sidebands havebeen discussed and attributed to the multilevel structure and spatial inhomogeneityof the field in the case of absorption and to the influence of absorption in the FWMcase. The physical effects responsible for the central resonance have been presented.We have noted the differences in the sensitivity of absorption and four-wave mixing.
Nonlinear spectra of trapped atoms form a very useful diagnostics method of thetrap conditions. The FWM spectroscopy appears here most suitable. It is less affectedby the multilevel atomic structure and allows a more accurate determination of thestrength of the light field interaction. Moreover, FWM spectra reveal very subtleeffects related to optical lattices and atomic recoil.
ACKNOWLEDGMENTS
The authors wish to thank G. Grynberg ans S.G. Odoulov for valuable discussionson the FWM spectra. This work is supported by KBN grant No. 5 P03B 015 16.

14
FIG. 13: Central resonance in absorption (top) and FWM spectra (bottom) recorded simul-taneously.
REFERENCES
[1] E.L. Raab, M. Prentiss, A. Cable, S. Chu, and D.E. Pritchard, Phys. Rev. Lett.59, 2631 (1987).
[2] J.R.W. Tabosa, G. Chen, Z. Hu, R.B. Lee, and H.J. Kimble, Phys. Rev. Lett.66, 3245 (1991).
[3] D. Grison, B. Lounis, C. Salomon, J-Y. Courtois, and G. Grynberg, Europhys.Lett. 15, 149 (1991).
[4] M. Mitsunaga, J. Mukai, K. Watanabe, and T. Mukai, J. Opt. Soc. Am. B 13,2696 (1996).
[5] A. Lipsich, S. Barreiro, A.M. Akulshin, and A. Lezama, Phys. Rev. A 61, 053803(2000).
[6] Y-C. Chen, Y-W. Chen, J-J. Su, J-H. Huang, and I.A. You, Phys. Rev. A 63,043808 (2001).
[7] B. Lounis, P. Verkerk, J-Y. Courtois, C. Salomon, and G. Grynberg, Europhys.Lett. 21, p. 13 (1993);
[8] B. Lounis, P. Verkerk, J-Y. Courtois, C. Salomon, and G. Grynberg, Nonlin.Opt. 5, 459 (1993).
[9] A. Hemmerich, M. Weidenmuller, and T. Hansch, Europhys. Lett. 27, 427 (1994).[10] J.W.R. Tabosa, S.S. Vianna, and F.A.M. de Oliveira, Phys. Rev. A 55, p. 2968
(1997).

15
[11] G.C. Cardoso, V.R. de Carvalho, S.S. Vianna, and J.W.R. Tabosa, Phys. Rev.A 59, 1408 (1999).
[12] G.C. Cardoso and J.W .R. Tabosa, Opt. Commun. 185, 353 (2000).[13] A. Lezama, G.C. Cardoso, and J.W.R. Tabosa, Phys. Rev. A 63, 013805 (2000).[14] S.M. Wandzura, Opt. Lett. 4, 208 (1979); L.M. Humphrey, J.P. Gordon, and
P.F. Liao, Opt. Lett. 5, 56 (1980); M. Ducloy and D. Bloch, J. Phys. (Paris) 42,711 (1981).
[15] M. Mitsunaga, M. Yamashita, M. Koashi, and N. Imoto, Opt. Lett. 23, 840(1998)
[16] J. Zachorowski, T. Pałasz, and W. Gawlik, Opt. Appl. 28, 239 (1998).[17] F.Y. Wu, S. Ezekiel, M. Ducloy, and B.R. Mollow, Phys. Rev. Lett. 38, 1077
(1977).[18] D.J. Harter and R.W. Boyd, IEEE J. Quant. Electron. QE-16, 1126 (1980).[19] L. Guidoni and P. Verkerk, J. Opt. B: Quantum Semiclass. Opt. 1, R23 (1999).[20] P. Verkerk, Phys. Rev. Lett. 72, 3017 (1994).