Atoms to Bits
64
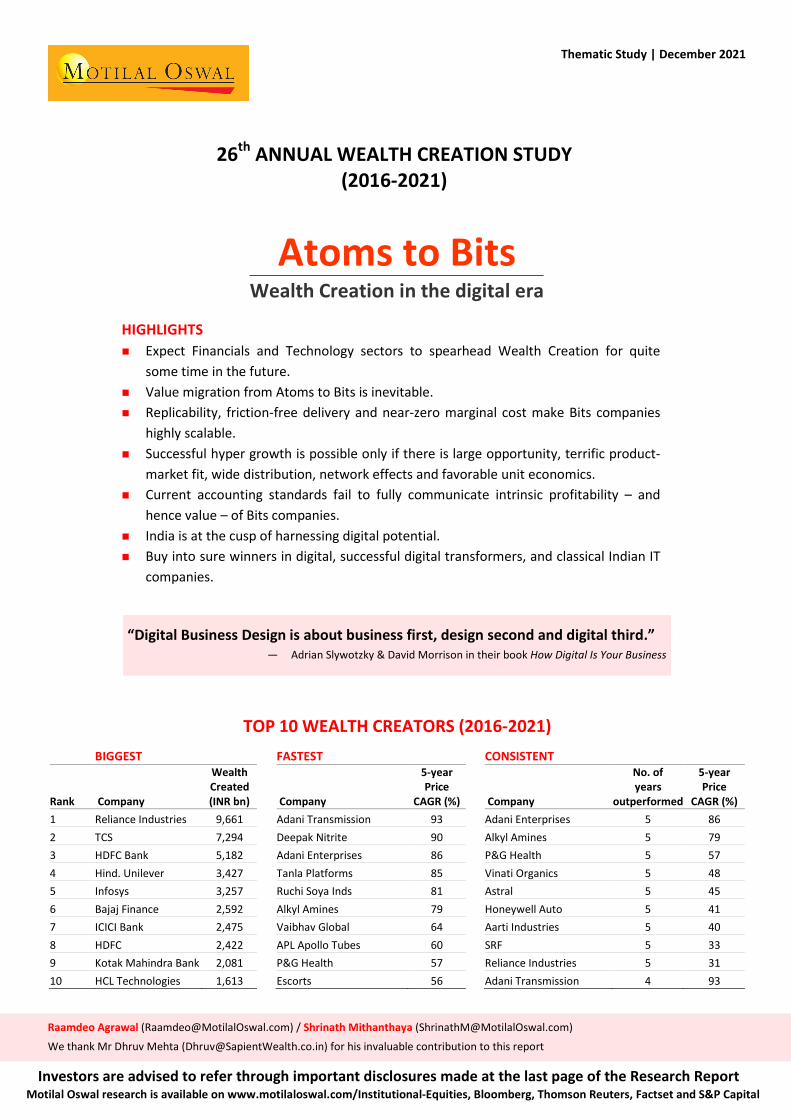
26 th ANNUAL WEALTH CREATION STUDY (2016-2021) Atoms to Bits Wealth Creation in the digital era HIGHLIGHTS Expect Financials and Technology sectors to spearhead Wealth Creation for quite some time in the future. Value migration from Atoms to Bits is inevitable. Replicability, friction-free delivery and near-zero marginal cost make Bits companies highly scalable. Successful hyper growth is possible only if there is large opportunity, terrific product- market fit, wide distribution, network effects and favorable unit economics. Current accounting standards fail to fully communicate intrinsic profitability – and hence value – of Bits companies. India is at the cusp of harnessing digital potential. Buy into sure winners in digital, successful digital transformers, and classical Indian IT companies. “Digital Business Design is about business first, design second and digital third.” — Adrian Slywotzky & David Morrison in their book How Digital Is Your Business TOP 10 WEALTH CREATORS (2016-2021) BIGGEST FASTEST CONSISTENT Rank Company Wealth Created (INR bn) Company 5-year Price CAGR (%) Company No. of years outperformed 5-year Price CAGR (%) 1 Reliance Industries 9,661 Adani Transmission 93 Adani Enterprises 5 86 2 TCS 7,294 Deepak Nitrite 90 Alkyl Amines 5 79 3 HDFC Bank 5,182 Adani Enterprises 86 P&G Health 5 57 4 Hind. Unilever 3,427 Tanla Platforms 85 Vinati Organics 5 48 5 Infosys 3,257 Ruchi Soya Inds 81 Astral 5 45 6 Bajaj Finance 2,592 Alkyl Amines 79 Honeywell Auto 5 41 7 ICICI Bank 2,475 Vaibhav Global 64 Aarti Industries 5 40 8 HDFC 2,422 APL Apollo Tubes 60 SRF 5 33 9 Kotak Mahindra Bank 2,081 P&G Health 57 Reliance Industries 5 31 10 HCL Technologies 1,613 Escorts 56 Adani Transmission 4 93 Thematic Study | December 2021 Raamdeo Agrawal ([email protected]) / Shrinath Mithanthaya ([email protected]) We thank Mr Dhruv Mehta ([email protected]) for his invaluable contribution to this report Investors are advised to refer through important disclosures made at the last page of the Research Report Motilal Oswal research is available on www.motilaloswal.com/Institutional-Equities, Bloomberg, Thomson Reuters, Factset and S&P Capital
-
Upload
khangminh22 -
Category
Documents
-
view
0 -
download
0
Transcript of Atoms to Bits
26th ANNUAL WEALTH CREATION STUDY (2016-2021)
Atoms to Bits Wealth Creation in the digital era
HIGHLIGHTS Expect Financials and Technology sectors to spearhead Wealth Creation for quite
some time in the future. Value migration from Atoms to Bits is inevitable. Replicability, friction-free delivery and near-zero marginal cost make Bits companies
highly scalable. Successful hyper growth is possible only if there is large opportunity, terrific product-
market fit, wide distribution, network effects and favorable unit economics. Current accounting standards fail to fully communicate intrinsic profitability – and
hence value – of Bits companies. India is at the cusp of harnessing digital potential. Buy into sure winners in digital, successful digital transformers, and classical Indian IT
companies.
“Digital Business Design is about business first, design second and digital third.”
— Adrian Slywotzky & David Morrison in their book How Digital Is Your Business
TOP 10 WEALTH CREATORS (2016-2021)
BIGGEST
FASTEST
CONSISTENT
Rank Company
Wealth Created (INR bn)
Company
5-year Price
CAGR (%)
Company
No. of years
outperformed
5-year Price
CAGR (%) 1 Reliance Industries 9,661
Adani Transmission 93
Adani Enterprises 5 86 2 TCS 7,294
Deepak Nitrite 90
Alkyl Amines 5 79
3 HDFC Bank 5,182
Adani Enterprises 86
P&G Health 5 57 4 Hind. Unilever 3,427
Tanla Platforms 85
Vinati Organics 5 48
5 Infosys 3,257
Ruchi Soya Inds 81
Astral 5 45 6 Bajaj Finance 2,592
Alkyl Amines 79
Honeywell Auto 5 41
7 ICICI Bank 2,475
Vaibhav Global 64
Aarti Industries 5 40 8 HDFC 2,422
APL Apollo Tubes 60
SRF 5 33
9 Kotak Mahindra Bank 2,081
P&G Health 57
Reliance Industries 5 31 10 HCL Technologies 1,613
Escorts 56
Adani Transmission 4 93
Thematic Study | December 2021
Raamdeo Agrawal ([email protected]) / Shrinath Mithanthaya ([email protected])
We thank Mr Dhruv Mehta ([email protected]) for his invaluable contribution to this report
Investors are advised to refer through important disclosures made at the last page of the Research Report Motilal Oswal research is available on www.motilaloswal.com/Institutional-Equities, Bloomberg, Thomson Reuters, Factset and S&P Capital
26th Annual Wealth Creation Study (2016-2021)
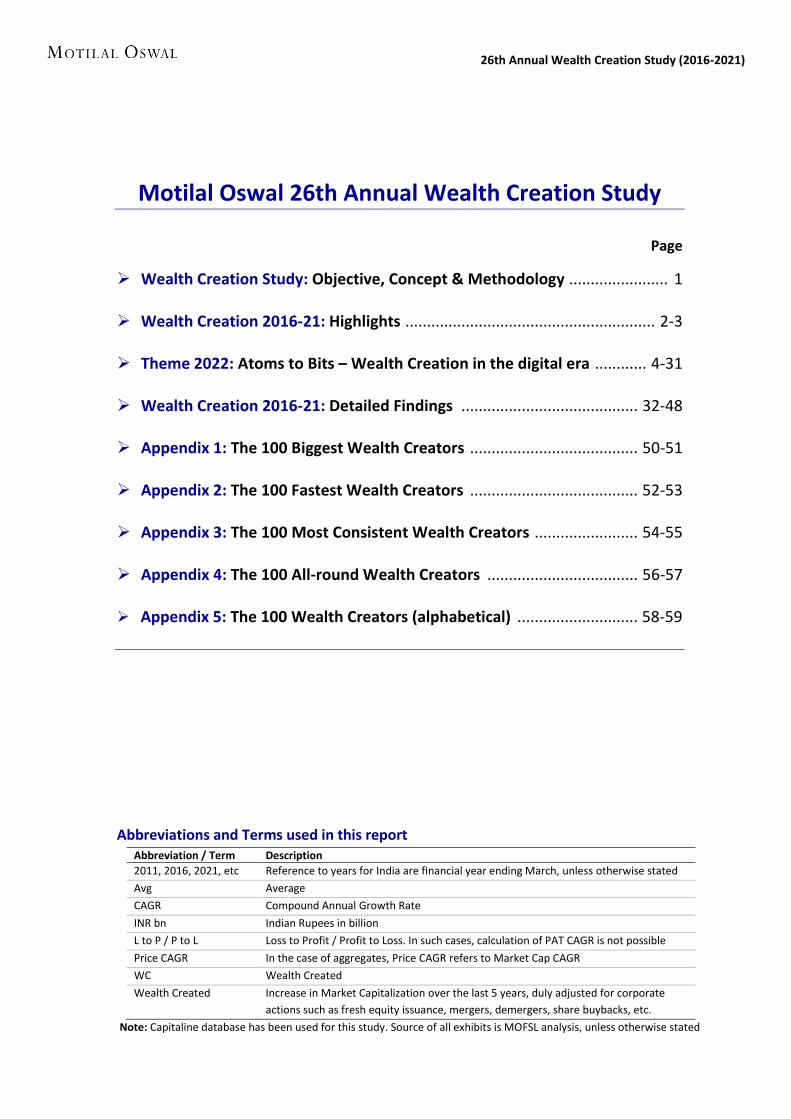
Motilal Oswal 26th Annual Wealth Creation Study
Page
Wealth Creation Study: Objective, Concept & Methodology ....................... 1
Wealth Creation 2016-21: Highlights .......................................................... 2-3
Theme 2022: Atoms to Bits – Wealth Creation in the digital era ............ 4-31
Wealth Creation 2016-21: Detailed Findings ......................................... 32-48
Appendix 1: The 100 Biggest Wealth Creators ....................................... 50-51
Appendix 2: The 100 Fastest Wealth Creators ....................................... 52-53
Appendix 3: The 100 Most Consistent Wealth Creators ........................ 54-55
Appendix 4: The 100 All-round Wealth Creators ................................... 56-57
Appendix 5: The 100 Wealth Creators (alphabetical) ............................ 58-59
Abbreviations and Terms used in this report Abbreviation / Term Description
2011, 2016, 2021, etc Reference to years for India are financial year ending March, unless otherwise stated
Avg Average
CAGR Compound Annual Growth Rate
INR bn Indian Rupees in billion
L to P / P to L Loss to Profit / Profit to Loss. In such cases, calculation of PAT CAGR is not possible
Price CAGR In the case of aggregates, Price CAGR refers to Market Cap CAGR
WC Wealth Created
Wealth Created Increase in Market Capitalization over the last 5 years, duly adjusted for corporate
actions such as fresh equity issuance, mergers, demergers, share buybacks, etc.
Note: Capitaline database has been used for this study. Source of all exhibits is MOFSL analysis, unless otherwise stated

December 2021 1
26th Annual Wealth Creation Study (2016-2021)
Wealth Creation Study Objective, Concept & Methodology
Objective The foundation of Wealth Creation is to buy businesses at a price substantially lower than their
“intrinsic value” or “expected value”. The lower the market value compared to the intrinsic value,
the higher is the margin of safety. Every year, as in the past 25 years, we endeavor to cull out the
characteristics of businesses that create value for their shareholders.
As Phil Fisher says, “It seems logical that even before thinking of buying any common stock, the
first step is to see how money has been most successfully made in the past.” Our Wealth Creation
Studies are attempts to study the past as a guide to the future, and gain insights into the various
dynamics of stock market investing.
Concept & Methodology Wealth Creation is the process by which a company enhances the market value of the capital
entrusted to it by its shareholders. It is a basic measure of success for any commercial venture.
For listed companies, we define Wealth Created as the difference in market capitalization over a
period of last five years, duly adjusted for corporate events such as fresh equity issuance,
mergers, demergers, share buybacks, etc.
We rank the top 100 companies in descending order of absolute Wealth Created, subject to the
company’s stock price at least outperforming the benchmark index (BSE Sensex in our case).
These top 100 Wealth Creators are also ranked according to speed (i.e. price CAGR during the
period under study).
We define Consistent Wealth Creators based on the number of years the stock has outperformed
in each of the last 5 years. Where the number of years is the same, the stock price CAGR decides
the rank.
We define All-round Wealth Creators based on the summation of ranks, under each of the 3
categories – Biggest, Fastest and Consistent. Where the scores are tied, the stock price CAGR
decides the All-round rank.
Report structure We present the 2016-2021 Wealth Creation Study highlights in pages 2-3. The detailed findings
are presented in pages 32-48. Appendix 1 (pages 50-51) ranks the top 100 Wealth Creators by
size, Appendix 2 (pages 52-53) ranks the same 100 Wealth Creators by speed, Appendix 3 (pages
54-55) lists the Consistent Wealth Creators in descending order, Appendix 4 (pages 56-57)
presents the All-round Wealth Creators, and Appendix 5 (pages 58-59) provides an alphabetical
listing of the Wealth Creators.
This year’s theme study titled “Atoms to Bits – Wealth Creation in the digital era” is featured in
pages 4-31.

December 2021 2
26th Annual Wealth Creation Study (2016-2021)
Wealth Creation 2016-2021 Highlights
INR 71 trillion Wealth Created during 2016-21
This is by far the highest ever Wealth Created in the last 26 five-year periods.
Exhibit 1 2016-21 Wealth Created at INR 71 trillion is the highest ever by far
Reliance smashes all records to emerge as largest Wealth Creator
Over 2016-21, Reliance industries emerged the largest Wealth Creator for the third time in
succession, with total Wealth Created of a whopping INR 9.7 trillion.
This is by far the highest ever, beating its own previous record of INR 5.6 trillion in 2014-19.
Exhibit 2 Top 10 Biggest Wealth Creators (2016-21)
Rank Company Wealth Created CAGR (%) P/E (x) RoE (%) INR bn % share Price PAT 2021 2016 2021 2016
1 Reliance Inds 9,661 13.6 31 8 30 11 6 13
2 TCS 7,294 10.3 20 7 35 21 39 34
3 HDFC Bank 5,182 7.3 23 20 26 21 15 17
4 Hind. Unilever 3,427 4.8 23 14 70 45 17 64
5 Infosys 3,257 4.6 18 7 30 21 28 22
6 Bajaj Finance 2,592 3.7 49 28 70 29 12 17
7 ICICI Bank 2,475 3.5 22 13 22 14 12 11
8 HDFC 2,422 3.4 18 13 24 17 12 20
9 Kotak Mahindra 2,081 2.9 21 24 35 36 12 10
10 HCL Tech 1,613 2.3 19 15 24 21 18 20
Total of Top 10 40,003 56 24 12 31 19 12 18
Total of Top 100 70,815 100 25 18 32 24 13 12
Adani Transmission emerges the Fastest Wealth Creator
Over 2016-21, Adani Transmission has emerged the Fastest Wealth Creator with price CAGR
of 93%.
INR 1 million invested equally in 2016 among the top 10 fastest Wealth Creators would have
grown to INR 17 million in 2021; return CAGR of 77% v/s just 14% for the Sensex.
14.3 16.3
25.4
9.7
26.522.1
16.2 18.4
29.434.2
28.4
38.944.9
49.0
26.1
70.8
20
01
-06
20
02
-07
20
03
-08
20
04
-09
20
05
-10
20
06
-11
20
07
-12
20
08
-13
20
09
-14
20
10
-15
20
11
-16
20
12
-17
20
13
-18
20
14
-19
20
15
-20
20
16
-21
Wealth Creation trend (INR trillion)

December 2021 3
26th Annual Wealth Creation Study (2016-2021)
Exhibit 3 Top 10 Fastest Wealth Creators (2016-21)
Rank Company Price Appn. Price PAT Mkt Cap (INR bn) P/E (x) (x) CAGR % CAGR % 2021 2016 2021 2016
1 Adani Transmission 26 93 27 999 38 82 10
2 Deepak Nitrite 24 90 65 226 8 29 12
3 Adani Enterprises 22 86 1 1,134 81 103 8
4 Tanla Platforms 21 85 108 111 4 31 42
5 Ruchi Soya Inds 20 81 L to P 190 11 28 –
6 Alkyl Amines 18 79 43 116 6 39 13
7 Vaibhav Global 12 64 48 125 10 46 27
8 APL Apollo Tubes 11 60 25 175 16 49 13
9 P&G Health 10 57 27 103 11 58 20
10 Escorts 9 56 57 174 17 20 19
Adani Enterprises is the Most Consistent Wealth Creator
We define Consistent Wealth Creators based on the number of years the stock has out-
performed in each of the last 5 years. Where the number of years is the same, the stock price
CAGR decides the rank.
Based on this, over 2016-21, Adani Enterprises has emerged as the Most Consistent Wealth
Creator. It has outperformed in all the last 5 years, and has the highest price CAGR of 86%.
Exhibit 4 Top 10 Most Consistent Wealth Creators (2016-21)
No. of years 2016-21 2016-21 RoE (%) P/E (x)
Rank Company Name outperformed Price CAGR (%) PAT CAGR (%) 2021 2016 2021 2016
1 Adani Enterprises 5 86 1 6 8 103 8
2 Alkyl Amines 5 79 43 37 24 39 13
3 P & G Health 5 57 27 25 9 58 20
4 Vinati Organics 5 48 15 17 24 53 15
5 Astral 5 45 32 21 14 81 50
6 Honeywell Auto 5 41 27 18 14 91 54
7 Aarti Industries 5 40 15 15 23 44 17
8 SRF 5 33 23 17 15 27 18
9 Reliance Inds. 5 31 8 6 13 30 11
10 Adani Trans. 4 93 27 14 14 82 10
Adani Enterprises is the Best All-round Wealth Creator
We define All-round Wealth Creators based on the summation of ranks, under each of the 3
categories – Biggest, Fastest and Consistent. Where the scores are tied, the stock price CAGR
decides the All-round rank.
Exhibit 5 Top 10 All-round Wealth Creators (2016-21)
All-round Rank Total of 2016-21
Rank Company Biggest Fastest Consistent Ranks Price CAGR (%)
1 Adani Enterprises 16 3 1 20 86
2 Adani Transmission 17 1 10 28 93
3 Bajaj Finance 6 13 17 36 49
4 Bajaj Finserv 12 20 20 52 42
5 Reliance Industries 1 45 9 55 31
6 Muthoot Finance 33 15 18 66 47
7 Astral 44 17 5 66 45
8 Honeywell Auto 38 22 6 66 41
9 Deepak Nitrite 56 2 11 69 90
10 Info Edge (India) 31 21 21 73 41
Detailed findings page 32 onwards

December 2021 4
26th Annual Wealth Creation Study (2016-2021)
Theme 2022

December 2021 5
26th Annual Wealth Creation Study (2016-2021)
Atoms to Bits Wealth Creation in the digital era
Whatever can be digital, will become digital.” – Nicholas Negroponte, author of Being Digital
1. Summary Focus on Digital Business Designs and their enablers
What is Atoms to Bits
Globally, value is migrating from Atoms (businesses dealing in physical matter) to Bits (businesses
which are digital in nature). This has already played out in a big way in the US. The digital
ecosystem in India is right for Atoms-to-Bits to play out here.
Atoms v/s Bits
Unlike Atoms, Bits deal in intangible assets, enjoy very low cost of replicating their offering, and
benefit from network effects. As a result, Bits can scale up very rapidly compared to their Atoms
counterparts.
Key success factors for Bits
Given high initial losses, the success of Bits companies centers around rapid growth in order to
achieve critical mass. Their key success factors are –
1. Large opportunity size
2. Product-market fit
3. Wide distribution
4. Network effects
5. Favorable unit economics
6. Operational scalability.
Losses of Bits companies tend to be optical
Atoms use financial capital to acquire physical assets which reflect in their balance sheet. In
contrast, Bits mainly use human capital to self-generate intangible assets (e.g. technology
platform), which gets fully charged to the income statement, resulting in optical loss. Cash flow
is the leveler between Atoms and Bits financials.
Valuation of Bits
We suggest 3 valuation methodologies for Bits companies, which can then be averaged to arrive
at the final value –
1. DCF (Discounted Cash Flow)
2. Comparables, with special emphasis on PSG (Price/Sales to Growth)
3. Last private equity valuation.

December 2021 6
26th Annual Wealth Creation Study (2016-2021)
How to play Atoms to Bits
Investors should focus on Digital Business Designs
Whether a business is physical, digital or phygital, the key to success is a Digital Business Design.
In their book, How digital is your business?, the authors write, “… you must remember that Digital
Business Design is about business first, design second and digital third.” They identify two
determinants of Digital Business Design –
1. Quality of Business Design and
2. Degree of Digitization.
The matrix below offers a framework for how to play the Atoms to Bits theme. The challenge for
investors is to identify –
1. Digital Business Designs i.e. Strong business design with high Degree of Digitization;
2. Digital Aspirants who are likely to attain Digital Business Design; and
3. Dotcoms who are likely to improve their Business Design.
Bet on digital enablers with great managements
A second way to play the Atoms to Bits theme is by investing in digital enablers (i.e. IT service
providers), run by great managements. These companies will be catering to players in all the
above four quadrants, and may well prove to be the biggest beneficiaries of Atoms to Bits.
Framework to play Atoms to Bits – Look for Digital Business Designs and Digital Enablers
High Dotcoms Digital Business Design
Degree of
Digitization
Low Weak Business Designs Digital Aspirants
Weak Strong
Quality of Business Design
DigitalEnablers

December 2021 7
26th Annual Wealth Creation Study (2016-2021)
2. What is Atoms to Bits? Value Migration from the physical to the digital
2.1 What is Atoms An atom is the smallest element of physical matter. So, for the purposes of this report, Atoms
represent anything which is physical. In the context of businesses, Atoms refers mainly to product
businesses – Autos, Cement, Steel, Pharma, etc. However, broadening the concept, Atoms also
include businesses which do not allow for non-linear scale-up. For instance, IT services companies
are not in the product business. Yet, their scale-up involves matching hiring of people. Thus, even
IT services will be classified as Atoms.
2.2 What is Bits
A bit is the smallest unit of information that can be stored in the digital format. So, for the
purposes of this report, Bits represent anything which is digital. In the context of businesses, Bits
refers to those businesses which are predominantly digital – email, web search, social networks,
e-commerce, streaming video, etc.
Major types of Bits business models
Bits model Brief description Examples
Portals These offer primary access to the
internet – search, email, news
Google, Yahoo, AOL, Rediff
Platforms The software or hardware which allows
for interaction of its users
iOS and Android (for app
developers), Facebook (for
networking), Instagram (for photos
& videos), Naukri (for employment),
Nazara (for gaming), Matrimony (for
matrimonial ads)
Marketplaces These are special type of platforms
which allow for buyers and sellers to
interact
eBay, Alibaba, Airbnb, Indiamart,
Zomato, Oyo
Subscriptions These are software/data delivered
digitally, for which users need to pay a
subscription fee
Bloomberg, Salesforce, Netflix
Feeds Social media news feeds, used as a
medium for advertising
Facebook, Twitter
2.3 What is Atoms to Bits
In the US, companies like Amazon, Apple, Google, Facebook and Netflix (the “Bits”) have
handsomely outperformed veteran companies such as Walmart, Exxon Mobil, Coca Cola and
General Electric (the “Atoms”).

December 2021 8
26th Annual Wealth Creation Study (2016-2021)
Exhibit 1 The Bits are beating the Atoms
Also consider Exhibit 2. In the US, of the current top 10 market cap companies, 7 are Bits. Of the
top 10 market cap companies in 1995, Microsoft is the only company to remain in the current list
as well. The current market cap of Apple alone is significantly higher than the sum of the 1995
top 10 (excluding Microsoft).
Exhibit 2 Top 10 US companies by Market Cap – Current and 1995 (USD bn)
Company Current Company 1995 Current
Apple 2,712 General Electric 120 104
Microsoft 2,482 AT&T 103 163
Alphabet 1,888 Exxon Mobil 100 253
Amazon.com 1,779 Coca-Cola 94 227
Tesla 1,150 Merck & Co 81 189
Meta Platforms 903 Altria Group 75 78
Nvidia Corp 817 Procter & Gamble 57 350
Berkshire Hathaway 619 Johnson & Johnson 55 411
J P Morgan Chase 469 Microsoft 52 2,482
Visa 422 Walmart 51 392
The outperformance of Bits is not just stock market frenzy. Even on the fundamental metric of
profit, the corporate landscape is shifting (Exhibit 3). 5 of the top 10 profit companies in the US
are Bits. The profit of Apple alone is multiple times higher than the sum of the 1995 top 10.
Exhibit 3 Top 10 US companies by Profit – Current and 1995 (USD bn)
Company Current Company 1995 Current
Apple 95 Exxon Mobil 6.7 -5.9
Berkshire Hathaway 86 Motors Liquidation 6.6 –
Alphabet 71 General Electric 5.5 0
Microsoft 68 Altria Group 5.3 2.8
J P Morgan Chase 50 Ford Motor 5.0 2.9
Meta Platforms 40 AT&T 4.3 1.2
Bank Of America 30 Georgia-Pacific 4.2 –
Amazon.com 26 IBM 3.7 4.8
Citigroup 23 Citigroup 3.6 23
Goldman Sachs 22 DuPont 3.3 6.7
20
12
20
13
20
14
20
15
20
16
20
17
20
18
20
19
20
20
20
21
Netflix 53%
Amazon 34%Facebook 32%Google 27%Apple 25%
The Bits2012-21 Share price CAGR(indexed to 100)
20
12
20
13
20
14
20
15
20
16
20
17
20
18
20
19
20
20
20
21
Coca Cola 5%Walmart 10%
ExxonMobil -3%GE -6%
The Atoms2012-21 Share price CAGR(indexed to 100)

December 2021 9
26th Annual Wealth Creation Study (2016-2021)
The above is irrefutable evidence that value – defined as profit and market cap – is silently
migrating from Atoms to Bits. This is a global phenomenon. Hence, such long-period value
migration is inevitable in India, where the digital ecosystem has turned conducive over the last
5-6 years (see box “India – all set for the Bits era”).
The early signs of Atoms to Bits in India are already here. In the last 6 months alone, India has
seen 3 fresh listings – Zomato, Nykaa and Paytm – with market cap of over INR 1 trillion (Exhibit
5). Contrast this with the fact that India has 44 listed companies of over 100 years old. Of these,
only two – ITC and Tata Steel – enjoy market cap of over INR 1 tn.
India – all set for the Bits era
India is on the cusp of a digital revolution. For a population of 1.3 billion, India’s wireless
subscriber base is at 1.2 billion and broadband subscriber base at 0.8 billion. Almost 0.75
billion users access the internet through their mobile phones.
Exhibit 4 India’s penetration of telecom and internet is high
Even as the customer base is rising, the corporate and investment climate is also getting
conducive by the day. Entrepreneurs are conjuring up digital business ideas across domains –
from fintech to foodtech to edutech. They are backed by a whole host of venture capital and
private equity funds, leading to the emergence of several unicorns (companies with valuation
of USD 1 bn or higher), numbering over 70 at last count.
The Indian government too is doing its bit. Almost 99% of India’s adult population now have
Aadhaar (unique identification number). In 2016, government launched a Unified Payment
Interface (UPI), enabling peer-to-peer interbank transfers at zero cost. Under a scheme called
Jan Dhan, over the past 7 years, 430 million low-income strata people now have bank
accounts, a trigger for widespread financial and commercial inclusion.
On the stock market front, regulator SEBI (Securities & Exchange Board of India) has relaxed
its regulations to permit listing of loss-making companies as well.
Thus, India is all set for an exciting Bits era.
0
200
400
600
800
1,000
1,200
1,400
De
c-0
7
De
c-0
9
De
c-1
1
De
c-1
3
De
c-1
5
De
c-1
7
De
c-1
9
Cu
rre
nt
Wireless subscribers (mn)
0
200
400
600
800
1,000
De
c-0
7
De
c-0
9
De
c-1
1
De
c-1
3
De
c-1
5
De
c-1
7
De
c-1
9
Cu
rre
nt
Broadband subscribers (mn)

December 2021 10
26th Annual Wealth Creation Study (2016-2021)
Exhibit 5 India’s recent experience of digital companies
Company Age Listed TTM PAT Market Cap P/E
(years) in (INR mn) (INR bn) (x)
Zomato 11 Jul-21 -10,259 1,201 N.M.
FSN E-Commerce (Nykaa) 9 Nov-21 * 100 1,154 11,542
One 97 (Paytm) 21 Nov-21 -15,661 1,102 N.M.
PB Fintech 13 Nov-21 ** -1,500 544 N.M.
Indiamart Intermesh 22 Jul-19 3,060 228 75
Nazara Technologies 22 Mar-21 288 73 254
Fino Payments 14 Nov-21 174 37 214
TOTAL / AVERAGE 16 -23,799 4,339 N.M.
* Estimated; ** - FY21 PAT; N.M. - Not meaningful
We see two questions facing investors in India’s Bits era –
1. Which Bits will survive in order to thrive?, and equally important
2. How do we value these Bits, especially when they are currently loss-making?
In answering these questions, it is essential to understand the following about Bits businesses –
How they are different from Atoms businesses
What are their key success factors and growth drivers
What are their financial nuances, and finally
How to go about valuing Bits businesses.
This study discusses each of these points in subsequent sections.
3. Atoms v/s Bits The tangible v/s the intangible
There are fundamental differences between Atoms and Bits businesses on various aspects –
3.1 Assets
First and foremost, Atoms businesses are founded on fixed/tangible assets – appearing in the
balance sheet as Property, Plant & Equipment. These assets are used to produce goods and
services, which in turn, generate revenue and profit. In sharp contrast, Bits businesses hardly
need any tangible assets. On the contrary, they self-generate intangible assets – a software, or a
technology platform, which generate revenue and profit (more on this under Capex v/s Opex,
page 21).
In their book, Capitalism Without Capital, authors Jonathan Haskel and Stian Westlake refer to
two important characteristics of intangible assets – Scalability and Sunkenness. On Scalability,
they write, “Physical assets can only be in one place at one time. Intangible assets, by contrast,
can usually be used over and over, in multiple places at the same time.”
Sunkenness refers to the fact if an intangible asset fails to deliver, very little value can be
recovered from it. This is unlike tangible assets, where even if the business fails, there is some
value which can be salvaged.
December 2021 11
26th Annual Wealth Creation Study (2016-2021)
Given the interplay of Scalability and Sunkenness, “when things go wrong, intangibles tend to be
worth less, and when they go well, they tend to be worth much more.”
3.2 Replication of product/service offering Replication of products/services offerings by Atoms businesses involves time, physical and
financial resources, which can together be called “friction”. In contrast, replication of Bits
offerings is near friction-free. Hence, the marginal cost of producing an additional “Bit” is very
low. This implies that once a Bits business achieves scale, it can be hugely profitable. For the
academically oriented, this can be proved using microeconomics.
3.2.1 The microeconomics of Bits businesses
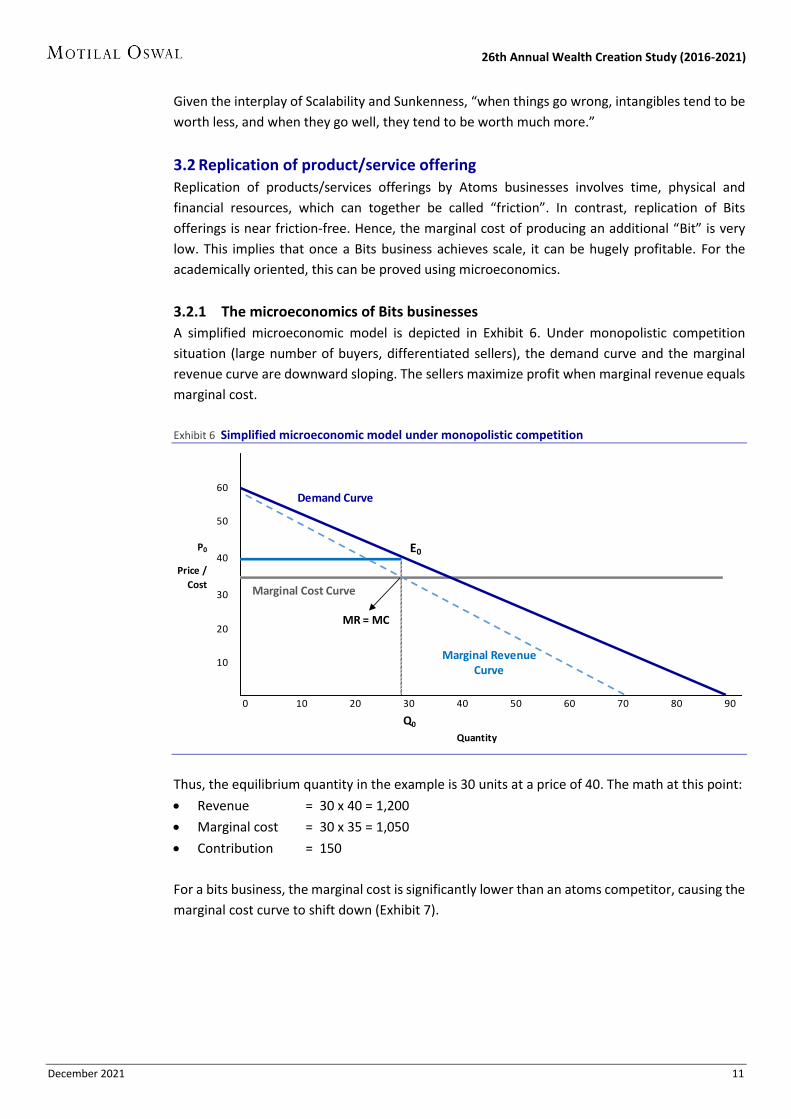
A simplified microeconomic model is depicted in Exhibit 6. Under monopolistic competition
situation (large number of buyers, differentiated sellers), the demand curve and the marginal
revenue curve are downward sloping. The sellers maximize profit when marginal revenue equals
marginal cost.
Exhibit 6 Simplified microeconomic model under monopolistic competition
Thus, the equilibrium quantity in the example is 30 units at a price of 40. The math at this point:
Revenue = 30 x 40 = 1,200
Marginal cost = 30 x 35 = 1,050
Contribution = 150
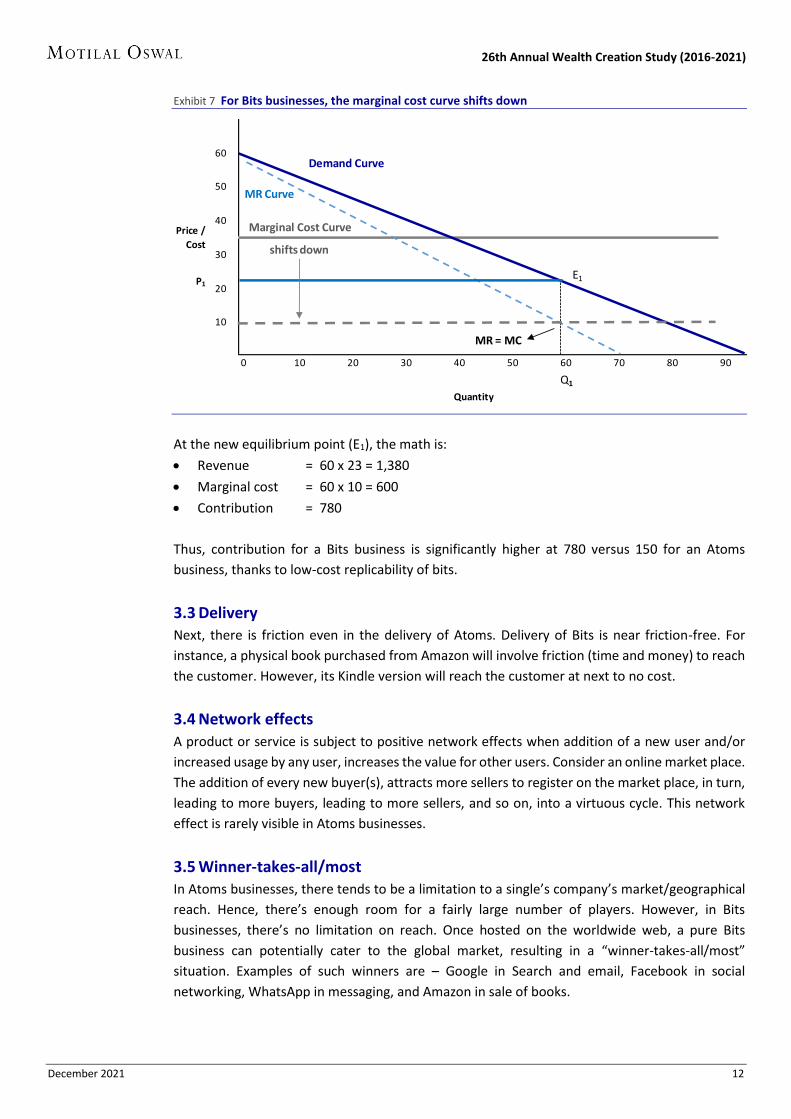
For a bits business, the marginal cost is significantly lower than an atoms competitor, causing the
marginal cost curve to shift down (Exhibit 7).
P0 E0
0 10 20 30 40 50 60 70 80 90
Q0
Quantity
10
60
50
40Price /
Cost30
20
Demand Curve
Marginal RevenueCurve
MR = MC
Marginal Cost Curve
December 2021 12
26th Annual Wealth Creation Study (2016-2021)
Exhibit 7 For Bits businesses, the marginal cost curve shifts down
At the new equilibrium point (E1), the math is:
Revenue = 60 x 23 = 1,380
Marginal cost = 60 x 10 = 600
Contribution = 780
Thus, contribution for a Bits business is significantly higher at 780 versus 150 for an Atoms
business, thanks to low-cost replicability of bits.
3.3 Delivery
Next, there is friction even in the delivery of Atoms. Delivery of Bits is near friction-free. For
instance, a physical book purchased from Amazon will involve friction (time and money) to reach
the customer. However, its Kindle version will reach the customer at next to no cost.
3.4 Network effects
A product or service is subject to positive network effects when addition of a new user and/or
increased usage by any user, increases the value for other users. Consider an online market place.
The addition of every new buyer(s), attracts more sellers to register on the market place, in turn,
leading to more buyers, leading to more sellers, and so on, into a virtuous cycle. This network
effect is rarely visible in Atoms businesses.
3.5 Winner-takes-all/most
In Atoms businesses, there tends to be a limitation to a single’s company’s market/geographical
reach. Hence, there’s enough room for a fairly large number of players. However, in Bits
businesses, there’s no limitation on reach. Once hosted on the worldwide web, a pure Bits
business can potentially cater to the global market, resulting in a “winner-takes-all/most”
situation. Examples of such winners are – Google in Search and email, Facebook in social
networking, WhatsApp in messaging, and Amazon in sale of books.
0 10 20 30 40 50 60 70 80 90
Q1
Quantity
60
50
40Price /
Cost30
P120
10
Demand Curve
MR Curve
Marginal Cost Curve
shifts down
MR = MC
E1

December 2021 13
26th Annual Wealth Creation Study (2016-2021)
Network “Laws”
Over the years, various network pioneers have attempted to model how the growth of a
network increases its value. In other words, they tried to describe the power of network
effects. As time went on, each new law discovered that the value of networks and network
growth had been significantly underestimated in the past. These laws are not true laws in the
same way that the law of gravity is a scientifically proven law. They’re simply math concepts
that describe the relationships between different types of networks and the value of those
networks.
Sarnoff’s Law
David Sarnoff was a titan of broadcast era radio and TV, who led the Radio Corporation of
America (which created NBC) from 1919 until 1970. It was one of the largest networks in the
world during those years. Sarnoff observed that the value of his network seemed to increase
in direct proportion to the size of the network — proportional to N, where N is the total
number of users on the network.
Metcalfe’s Law
Metcalfe’s Law states the value of a communications network grows in proportion to the
square of the number of users on the network (N2 where N is the total number of users on
the network). The formulation of this concept, which dates to about 1980, is attributed to
Robert Metcalfe, who was one of the inventors of the Ethernet standard. Metcalfe’s Law
seems to hold because the number of links between nodes on a network increase
mathematically at a rate of N2, where N is the number of nodes. Although originally
formulated to describe communication networks like Ethernet, fax, or phone networks, with
the arrival of the internet it has evolved to describe social networks and marketplaces as well.
Reed’s Law
Reed’s Law was published by David P Reed of MIT in 1999. While Reed acknowledged that
“many kinds of value grow proportionally to network size” and that some grow as a
proportion to the square of network size, he suggested that “group-forming networks” that
allow for the formation of clusters scale value even faster than other networks. Group-
forming networks, according to Reed, increase in value a rate of 2N, where N is the total
number of nodes on the network.
Extract from an essay on NFX.com, “The Network Effects Bible”

December 2021 14
26th Annual Wealth Creation Study (2016-2021)
3.6 Scale-up
Given all of the above, Bits-based business models yield to hyper-growth much more than their
Atoms-based counterparts. Such scale-up can be – (1) Vertical i.e. in existing business, and/or
(2) Horizontal i.e. in adjacent businesses and/or completely new businesses.
Thus, Bits companies tend to experience multiple S-curves (Exhibit 8). One example is that of
Amazon. Starting with retailing books, it scaled up to retailing a wide range of products
(adjacencies), and also diversified into new businesses like Amazon Web Services (AWS). Yet
another is that of Apple, which started with Apple II (home computer), followed by Macintosh
(laptop), iMac (desktop), iPod, iTunes, iPhone series, AirPods, and so on.
Exhibit 8 Bits companies tend to experience multiple S-curves
Having understood how Bits business are different from their Atoms counterparts, we proceed
to assess their key success factors.
4. Bits companies – Key success factors Driving hyper growth
The success of Bits companies is founded in hyper growth in revenue. Most Bits start-ups face
heavy initial losses. The same can be erased only when revenues hit a critical mass, driving
operating and financial leverage.
Exhibit 9 Hyper growth in revenue is the key to success for Bits companies
Figures in brackets are years since listing
46% 45%42% 41%
29% 28% 28%
Tencent(16)
Alibaba(6)
Facebook(8)
Amazon(23)
Google(16)
Twitter(7)
Netflix(16)
Revenue CAGR since listing to date
Time
Scal
e-u
p

December 2021 15
26th Annual Wealth Creation Study (2016-2021)
We discuss six key success factors for Bits companies, which set the stage for hyper growth –
1. Large opportunity size
2. Product-market fit
3. Wide distribution
4. Network effects
5. Favorable unit economics
6. Operational scalability.
4.1 Large opportunity size
A large opportunity size or total addressable market (TAM) is favorable for all businesses but
especially so for digital companies, as their marginal cost is near zero. Larger the opportunity,
greater the chances of achieving hyper growth. Since internet transcends sovereignty, the
opportunities can be truly global. Experience of American digital companies which have crossed
USD 1 trillion in valuation are all global. – Microsoft, Apple and Google.
4.2 Product-market fit Product-market fit means being in a good market with a product/service offering that can satisfy
that market. Without product-market fit, it’s not possible to grow a startup into a successful
business. Consider Uber. Its call-a-cab service is a perfect fit in at least two ways –
(1) It is a superior offering than the “hail-a-cab” option, and
(2) It is also a great option for those who do not fancy driving their own cars to work, especially
in cities where peak-hour traffic jams are an issue.
4.3 Wide distribution In an over-communicated world, reaching a company’s product/service to customers is critical.
The fastest and cheapest mode of distribution is virality i.e. widespread referrals by users to
others. In many cases, companies trigger such virality by offering incentives for referrals. For
instance, Paytm ran such an offer for quite some time:
“Earn up to ₹10,000 by referring your friends to join Paytm. You will receive ₹100 for every
successful referral. Your friend will also receive a surprise but guaranteed cashback reward on
making his/her first money transfer on Paytm.”
4.4 Network effects
As stated earlier, product or service is subject to positive network effects when addition of a new
user and/or increased usage by any user, increases the value for other users. There are two main
kinds of network effects –
4.4.1 Direct network effects
Direct network effects occur when the value of a product, service, or platform increases simply
because the number of users increases, causing the network itself to grow. Social media
platforms – Facebook, Twitter, WhatsApp, etc – primarily benefit from direct network effects.
Thus, the 100th user in a network can create 99 fresh connections, whereas the 1,000th user can
potentially create 999 fresh connections.
December 2021 16
26th Annual Wealth Creation Study (2016-2021)
4.4.2 Indirect network effects
Indirect network effects occur when a platform or service has two or more user groups, such as
producers and consumers, buyers and sellers, or users and developers. More people from one
group joining the platform, enhances the value to the other group(s), triggering more of the latter
to join the group, leading to a virtuous cycle. Consider Uber again. The more drivers join the
platform, the more beneficial it is for riders. Hence, more riders join the platform, in turn, causing
more drivers to join, and so on. It is such network effects that creates the phenomenon of
“Winner-takes-it-all/most”.
4.5 Favorable unit economics
Growth for the sake of growth at any cost is unsustainable. A company can invest into growth
only if it has favorable unit economics. Unit economics refers to an analysis of a specific business
model's revenues and costs in relation to an individual unit of its product/service offering. For a
product company like Domino’s, the unit is a pizza, while for a service company like Zomato, the
unit is a “delivery”. Once it is established that every single delivery is profitable, only then does it
make sense to heavily invest into “acquiring” more and more deliveries.
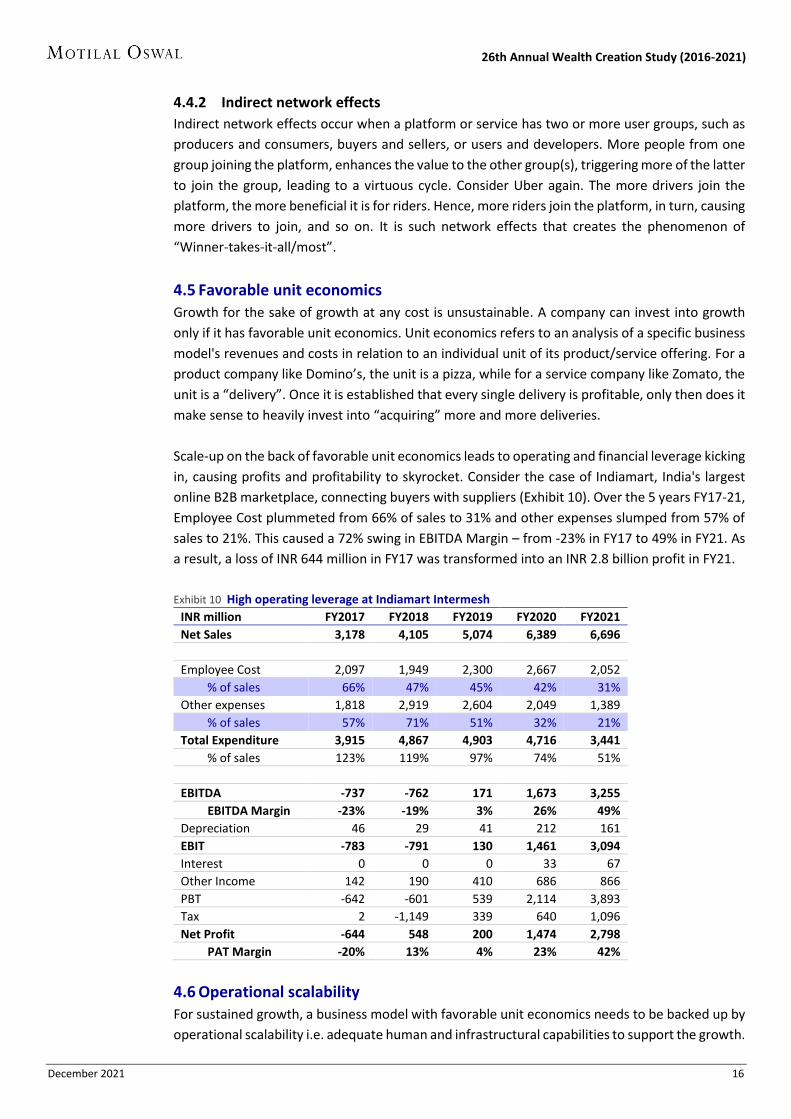
Scale-up on the back of favorable unit economics leads to operating and financial leverage kicking
in, causing profits and profitability to skyrocket. Consider the case of Indiamart, India's largest
online B2B marketplace, connecting buyers with suppliers (Exhibit 10). Over the 5 years FY17-21,
Employee Cost plummeted from 66% of sales to 31% and other expenses slumped from 57% of
sales to 21%. This caused a 72% swing in EBITDA Margin – from -23% in FY17 to 49% in FY21. As
a result, a loss of INR 644 million in FY17 was transformed into an INR 2.8 billion profit in FY21.
Exhibit 10 High operating leverage at Indiamart Intermesh
INR million FY2017 FY2018 FY2019 FY2020 FY2021
Net Sales 3,178 4,105 5,074 6,389 6,696
Employee Cost 2,097 1,949 2,300 2,667 2,052
% of sales 66% 47% 45% 42% 31%
Other expenses 1,818 2,919 2,604 2,049 1,389
% of sales 57% 71% 51% 32% 21%
Total Expenditure 3,915 4,867 4,903 4,716 3,441
% of sales 123% 119% 97% 74% 51%
EBITDA -737 -762 171 1,673 3,255
EBITDA Margin -23% -19% 3% 26% 49%
Depreciation 46 29 41 212 161
EBIT -783 -791 130 1,461 3,094
Interest 0 0 0 33 67
Other Income 142 190 410 686 866
PBT -642 -601 539 2,114 3,893
Tax 2 -1,149 339 640 1,096
Net Profit -644 548 200 1,474 2,798
PAT Margin -20% 13% 4% 23% 42%
4.6 Operational scalability
For sustained growth, a business model with favorable unit economics needs to be backed up by
operational scalability i.e. adequate human and infrastructural capabilities to support the growth.

December 2021 17
26th Annual Wealth Creation Study (2016-2021)
4.7 Case studies
We assess 3 Indian digital companies on the key success factors – Zomato, Nykaa and Angel One.
4.7.1 Case Study #1 – Zomato
Large opportunity size
Zomato is primarily a food delivery company. Total addressable Indian food services market stood
at USD 65 billion in FY2019 and is expected to grow at 9% CAGR to USD 110 bn in FY2025 (as per
research agency, RedSeer). Currently, restaurant food contributes only ~10% of the food market
in India vis-à-vis 54% in the US and 58% in China. Additionally, Zomato’s business model has
optionalities to enter into adjacencies like groceries, where the Total Addressable Market can be
~10x the base business opportunity.
Exhibit 11 Zomato has a large opportunity ahead
India US China
Population (mn) 1.36 0.33 1.43
Internet penetration (%) 43 88 63
Restaurant food 10 54 58
(% of food consumption)
Online food delivery market (USD bn) 4 21 90
Online food delivery users (mn) 45-55 90-120 430-470
% of internet users 9 36 50
Product-market fit
India has a large middle and high income earning population for whom instant food delivery
(around 30 minutes) is a big draw. Better internet connectivity and mobile ecosystem have
accelerated the product-market fit for Zomato.
Wide distribution
Over the years, Zomato has built strong distribution reach with ~148k restaurant partners and
~300k delivery partners across more than 500 cities in India. Zomato has over 100m app
downloads across App Store and Play Store.
Network effects
Zomato started off as a restaurant listings business, where more content drove more value for
customers which drove more restaurant content and number of customers. Today, it has evolved
into a delivery business network effect. More restaurants on the platform has led to higher
deliveries, resulting into lower cost per delivery, in turn, driving more customers to the platform,
in turn, leading to more restaurants, and so on.
December 2021 18
26th Annual Wealth Creation Study (2016-2021)
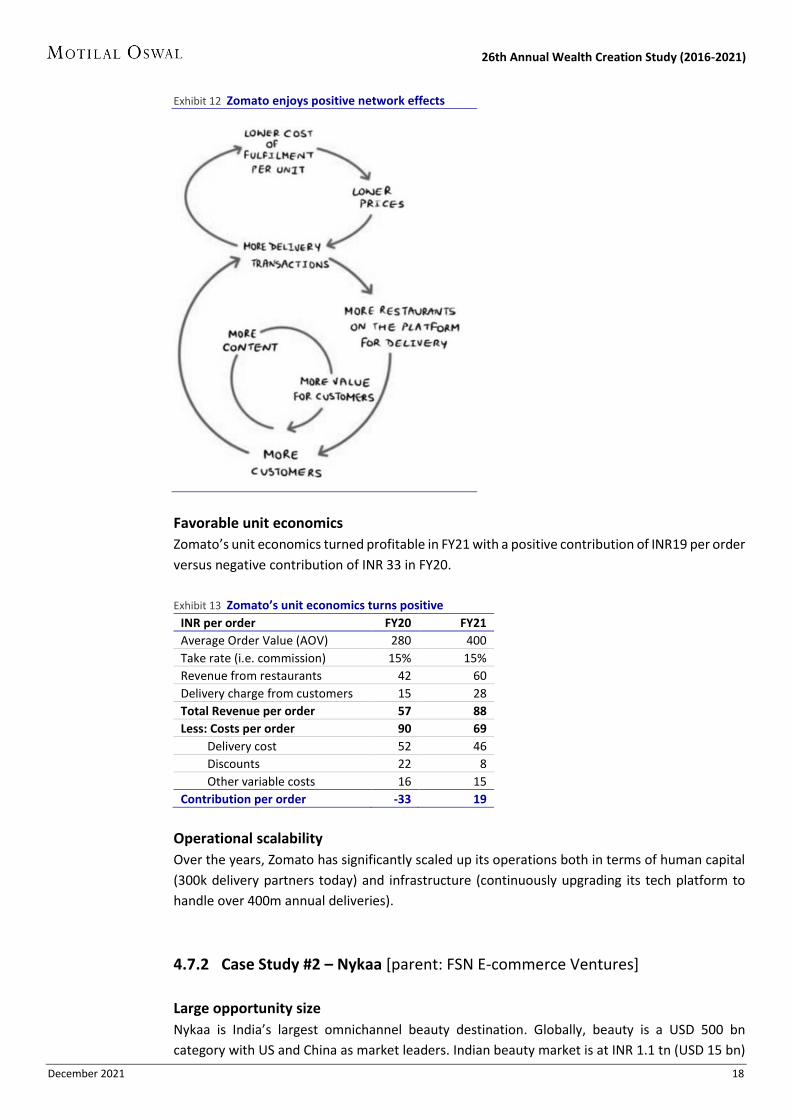
Exhibit 12 Zomato enjoys positive network effects
Favorable unit economics
Zomato’s unit economics turned profitable in FY21 with a positive contribution of INR19 per order
versus negative contribution of INR 33 in FY20.
Exhibit 13 Zomato’s unit economics turns positive
INR per order FY20 FY21
Average Order Value (AOV) 280 400
Take rate (i.e. commission) 15% 15%
Revenue from restaurants 42 60
Delivery charge from customers 15 28
Total Revenue per order 57 88
Less: Costs per order 90 69
Delivery cost 52 46
Discounts 22 8
Other variable costs 16 15
Contribution per order -33 19
Operational scalability
Over the years, Zomato has significantly scaled up its operations both in terms of human capital
(300k delivery partners today) and infrastructure (continuously upgrading its tech platform to
handle over 400m annual deliveries).
4.7.2 Case Study #2 – Nykaa [parent: FSN E-commerce Ventures]
Large opportunity size
Nykaa is India’s largest omnichannel beauty destination. Globally, beauty is a USD 500 bn
category with US and China as market leaders. Indian beauty market is at INR 1.1 tn (USD 15 bn)

December 2021 19
26th Annual Wealth Creation Study (2016-2021)
growing at 8% per annum. Per capita spending on cosmetics remains low in India (USD 13)
compared to global markets – US (USD 114) and China (USD 31). Online beauty market is likely to
grow at 30% + till 2025 to INR91 bn as per research agency, Redseer.
Product-market fit
Nykaa sells a wide range of products on its platforms catering to all needs of customers – from
skincare, cosmetics to haircare, and from low-end mass brands to very premium global brands.
Exhibit 14 Nykaa has a strong product-market fit for Indian women customers
Brands on Nykaa platform
Category Pricing (INR) Major brands
Luxury 2,000-5,000 MAC, Bobby Brown, Estee Lauder, Armani, Ralph Lauren, Clinique, Kama
Prestige 1,200-1,500 Body Shop, L'Oreal, Toni & Guy, ColorBar, Kaya
Mass 500-600 Lakme, Pond's Dove, Olay, VLCC, Neutrogena, Biotique
Wide distribution
Nykaa through its platform serves 24,817 pin codes, covering 86% of the serviceable pin codes
across the country. It has 18 warehouses with a storage space of 580,000 sq ft. It has an allocation
engine which helps fulfil orders by utilizing inventory efficiently across warehouses. It operates
over 70 physical stores in 38 cities of India — 35 Nykaa Luxe stores, 30 Nykaa on-trend stores and
7 kiosks. It has 270+ beauty and personal care advisors at the physical stores, who help to
personalize the offline shopping experience.
Exhibit 15 Nykaa’s e-commerce is gaining online traction
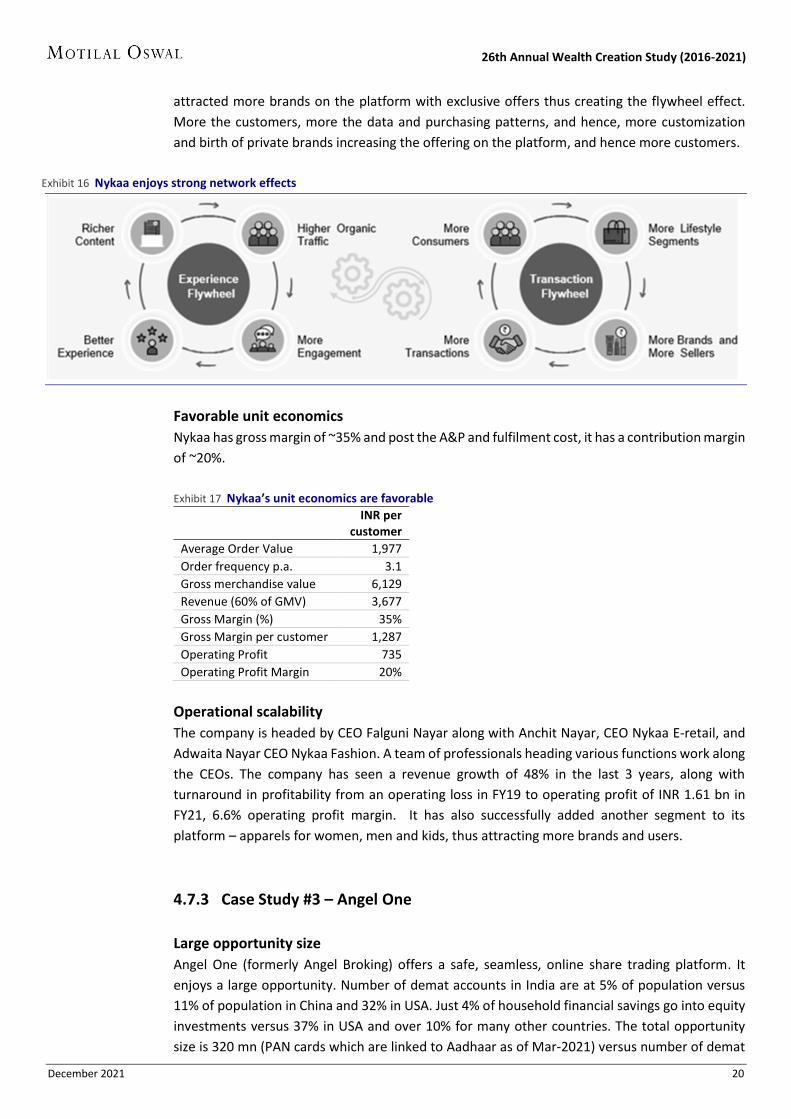
Network effects
Nykaa has created a strong moat and customer-pull around its platform by delivering authentic
goods, exclusive brands and high engaging content. More customers on the platform, in turn, has
Premium, 20%
Prestige, 30%
Mass, 50%
Sales by brand category
Cosmetics, 40%
Skincare, 40%
Haircare, 10%
Others, 10%
Sales by product category
378
575659
FY19 FY20 FY21
Website visits (mn)
9
1214
FY19 FY20 FY21
Monthly Avg Unique Visitors (mn)
December 2021 20
26th Annual Wealth Creation Study (2016-2021)
attracted more brands on the platform with exclusive offers thus creating the flywheel effect.
More the customers, more the data and purchasing patterns, and hence, more customization
and birth of private brands increasing the offering on the platform, and hence more customers.
Exhibit 16 Nykaa enjoys strong network effects
Favorable unit economics
Nykaa has gross margin of ~35% and post the A&P and fulfilment cost, it has a contribution margin
of ~20%.
Exhibit 17 Nykaa’s unit economics are favorable
INR per
customer
Average Order Value 1,977
Order frequency p.a. 3.1
Gross merchandise value 6,129
Revenue (60% of GMV) 3,677
Gross Margin (%) 35%
Gross Margin per customer 1,287
Operating Profit 735
Operating Profit Margin 20%
Operational scalability
The company is headed by CEO Falguni Nayar along with Anchit Nayar, CEO Nykaa E-retail, and
Adwaita Nayar CEO Nykaa Fashion. A team of professionals heading various functions work along
the CEOs. The company has seen a revenue growth of 48% in the last 3 years, along with
turnaround in profitability from an operating loss in FY19 to operating profit of INR 1.61 bn in
FY21, 6.6% operating profit margin. It has also successfully added another segment to its
platform – apparels for women, men and kids, thus attracting more brands and users.
4.7.3 Case Study #3 – Angel One
Large opportunity size
Angel One (formerly Angel Broking) offers a safe, seamless, online share trading platform. It
enjoys a large opportunity. Number of demat accounts in India are at 5% of population versus
11% of population in China and 32% in USA. Just 4% of household financial savings go into equity
investments versus 37% in USA and over 10% for many other countries. The total opportunity
size is 320 mn (PAN cards which are linked to Aadhaar as of Mar-2021) versus number of demat
December 2021 21
26th Annual Wealth Creation Study (2016-2021)
accounts at ~65 mn. In addition to pure equity broking, there are other revenue opportunities
e.g. asset management, which is also underpenetrated in India with AUM at 14% of GDP (112%
of GDP in the US).
Exhibit 18 Angel has a large opportunity size
India US China
Population (bn) 1.36 0.33 1.43
Internet penetration 43% 88% 63%
Demat accounts penetration 5% 32% 11%
Equity share in HH’s Financial Savings (%) 4% 37% N.A.
Product-market fit
India has a large middle and high income earning population who are looking at alternative to
fixed deposits, provident funds and insurance for investments. Better internet connectivity and
mobile ecosystem have accelerated the product-market fit for discount brokers like Angel.
Wide distribution
Angel covers 98% of pin codes in India which are serviced through its digital customer sourcing
model. In addition to this, it also has the largest Authorized Persons network of 15,000+.
Network effects
Broking traditionally is a one-way platform with negligible network effects as only users were
individually transacting on the platform. We are witnessing brokers becoming two-way platforms
with network effects as users can interact with each other – exchange ideas, copy trades of
successful traders/investors, etc. Angel is in the nascent stage of building these capabilities. Angel
Smart Store is one such initiative where various fintech players or users can sell their algorithms
to Angel’s customer base.
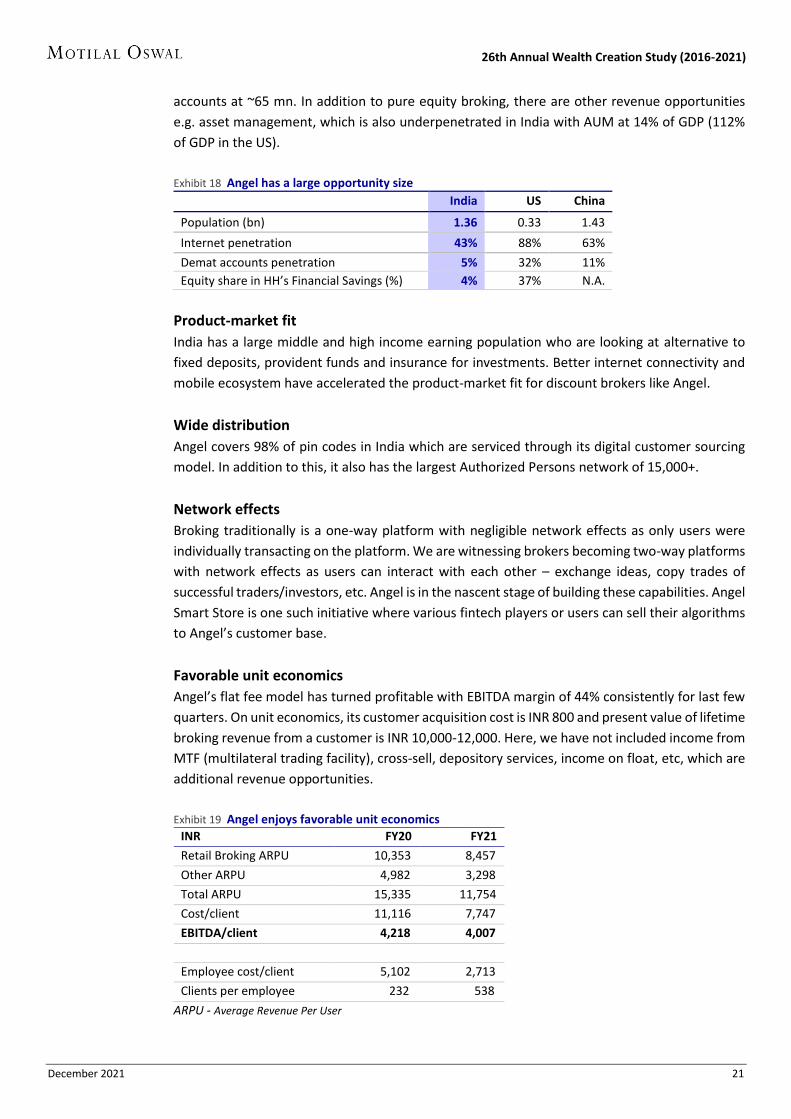
Favorable unit economics
Angel’s flat fee model has turned profitable with EBITDA margin of 44% consistently for last few
quarters. On unit economics, its customer acquisition cost is INR 800 and present value of lifetime
broking revenue from a customer is INR 10,000-12,000. Here, we have not included income from
MTF (multilateral trading facility), cross-sell, depository services, income on float, etc, which are
additional revenue opportunities.
Exhibit 19 Angel enjoys favorable unit economics
INR FY20 FY21
Retail Broking ARPU 10,353 8,457
Other ARPU 4,982 3,298
Total ARPU 15,335 11,754
Cost/client 11,116 7,747
EBITDA/client 4,218 4,007
Employee cost/client 5,102 2,713
Clients per employee 232 538
ARPU - Average Revenue Per User

December 2021 22
26th Annual Wealth Creation Study (2016-2021)
Operational scalability
Angel does not need physical infrastructure to scale its customer base as it has transformed into
a completely tech model. Angel One has scaled its tech capabilities significantly to be able to
manage more than 1.5x its current volumes. In the retail segment, it has a market share of 21%
in F&O, 14% in cash equity, and 37% in commodities.
Even where Bits companies score well on the key success factors, in most cases, there is a major
issue around their financials, which we discuss next.
5. Major issue around financials of Bits companies Capex v/s Opex and optical losses
Unlike for Atoms companies, the current accounting standards and statements (balance sheet
and income statement) do not capture the true financial position of Bits companies. At the core
of Atoms companies are physical assets and goods. In a given accounting period, there is a clear
distinction between capital expenditure (capex) which gets added to the asset base, and
operating expenditure (opex) which gets charged to the income statement. So, their balance
sheet presents a fair picture of productive assets, and their income statement presents a near-
accurate picture of the revenues and expenses for the period under consideration. This is not
true in the case of Bits companies.
As stated earlier, Bits companies have virtually no physical assets or inventories. They mainly use
human capital to self-generate intangible assets, such as a software or a technology platform,
which generate revenue and profit. Such intangible assets do not find a place in the balance
sheet. Instead, the human capital gets fully expensed in the income statement as employee cost.
Thus, there is no distinction between capex and opex. Logically, the costs of creating a software
are high in the initial years. Hence, Bits companies tend to show high optical accounting losses in
their formative years.
In a paper, “Why Financial Statements Don’t Work for Digital Companies”, Vijay Govindrajan,
Shivaram Rajgopal, and Anup Srivastava write, “Our current financial accounting model cannot
capture the principle value creator for digital companies: increasing return to scale on intangible
investments.” What this means is that the value of Bits companies’ intangible assets appreciate
with higher use, whereas the value of physical assets of Atoms depreciate with use.
Hypothetical example:
Consider the following hypothetical example for a startup Atoms company and Bits company –
Exhibit 20 Hypothetical data for a startup Atoms company & Bits company
Basic data Atoms company Bits company
Sales 1,000 1,000
Raw material cost 400 -
Employee cost 200 600
Software development cost - 450
Other expenses 100 100
Capital expenditure 500 50
(useful life of 10 years)
Opening Equity / Cash 500 500

December 2021 23
26th Annual Wealth Creation Study (2016-2021)
The Income statement, Balance sheet and Cash flow statement will be as under –
Exhibit 21 Income statement for a startup Atoms company & Bits company
Atoms Bits
company company
Sales 1,000 1,000
Less: Raw material cost 400 -
Employee cost 200 600
Software development cost - 450
Other expenses 100 100
Depreciation (10% of capex) 50 5
Profit 250 -155
Exhibit 22 Balance Sheet for a startup Atoms company & Bits company
Atoms Bits
company company
Assets Property, Plant & Equipment 500 50
Less: Depreciation 50 5
Net Property, Plant & Equipment 450 45
Cash 300 300
TOTAL ASSETS 750 345
Liabilities
Opening Equity 500 500
Profit / (Loss) 250 -155
Closing Equity 750 345
TOTAL LIABILITIES 750 345
Exhibit 23 Cash Flow statement for a startup Atoms company & Bits company
Atoms Bits
company company
Opening Cash 500 500
Add: Profit 250 -155
Add: Depreciation 50 5
Less: Capex (500) (50)
Closing Cash 300 300
Observations:
The Bits company reports a loss of 155 v/s a profit of 250 for the Atoms company.
This is because the Bits company’s entire Software development cost (opex) of 450 is charged
to the Income Statement, whereas the Atom company’s capex of 500 is taken to the Balance
Sheet with only a 10% charge to the Income Statement.
The two Income Statements and Balance Sheet look entirely different. However, everything
gets even at the Cash Flow level, where in both cases, closing cash is 300.
Most investors tend to get misled by the optical losses in the Bits company v/s a healthy profit
in the Atoms company.
Having understood the financial nuance of Bits companies, we proceed to discuss a few
approaches to valuing them.

December 2021 24
26th Annual Wealth Creation Study (2016-2021)
6. Valuing Bits companies DCF, Comparables, Private equity valuation
We suggest 3 valuation methodologies for Bits companies, which can then be averaged to arrive
at the final value –
4. DCF (Discounted Cash Flow)
5. Comparables, with special emphasis on PSG (Price/Sales to Growth)
6. Last private equity valuation.
6.1 DCF
Due to optical losses of Bits companies (at least in the initial years), conventional fundamental
and valuation metrics – RoE, RoCE, Profit growth, P/E, PEG, etc – cannot be applied. However, as
seen above, cash flow is a great leveler of Atoms and Bits companies. Thus, the DCF (Discounted
Cash Flow) method is equally valid for Bits companies. The only caveat – in startups, due to high
initial cash burn, cash flows stay negative for quite some time. This necessitates building DCF
models for several years into the future, increasing the uncertainty of cash flows, and the risk of
inaccurate valuation.
6.2 Comparables, with emphasis on PSG (Price/Sales to Growth)
Profitable Bits companies can be valued using conventional ratios like P/E, PEG EV/EBITDA, etc.
The challenge is when the company is optically loss-making. The common metric here is Price-to-
Sales, calculated as Market Cap ÷ Sales. However, this ratio does not consider varying rates of
growth. Thus, if two companies are valued at Price/Sales of 4x, and one company is expected to
grow sales at 20% and the other at 40%, clearly the latter is preferable. This is captured by the
metric PSG (Price/Sales to Growth), calculated at Price/Sales ÷ Future sales growth rate. Thus, in
the above example, the first company has a PSG of 0.2 (4÷20), while the second company has a
more attractive PSG of 0.1 (4÷40). A company’s PSG can be compared with suitable peers, both
locally and globally.
Exhibits 24 and 25 present PSG and other key numbers for select Indian and US Bits companies.
Exhibit 24 Indian Bits companies – Key numbers
CMP Mkt Cap FY21 (INR mn) FY19-21 CAGR FY21-24E CAGR* P/E Price/Sales
Company (INR) (INR bn) Sales PAT Sales PAT Sales PAT FY21 PEG FY21 PSG
5Paisa Capital 424 12 1,929 147 75% L to P 40% 57% 85 1.5 6 0.2
Nazara Tech. 2,322 71 4,542 92 64% -27% 39% 126% 765 6.1 16 0.4
Matrimony.com 950 22 3,779 408 4% -2% 13% 27% 53 2.0 6 0.4
Angel One 1,123 93 12,637 2,969 29% 89% 16% 35% 31 0.9 7 0.5
One 97 1,564 1,014 28,024 -16,961 -7% L to L 43% L to L - - 36 0.9
Just Dial 729 61 6,752 2,142 -13% 2% 11% 15% 28 1.9 9 0.9
Zomato 146 1,148 19,938 -8,128 23% L to L 63% L to L - - 58 0.9
FSN E-Commerce 2,170 1,026 24,409 618 58% L to P 46% 88% 1,659 18.9 42 0.9
C D S L 1,535 160 4,006 2,003 28% 33% 22% 26% 80 3.0 40 1.8
Indiamart Inter. 7,334 224 6,696 2,798 15% 274% 18% 18% 80 4.5 33 1.9
Info Edge 5,742 739 11,201 1,156 -1% 19% 24% 86% 640 7.4 66 2.8
Fino Payments 395 33 7,910 205 46% L to P N.A. N.A. 161 - 4 -
* – Estimates based on Bloomberg consensus

December 2021 25
26th Annual Wealth Creation Study (2016-2021)
Exhibit 25 US Bits companies – Key numbers
CMP Mkt Cap CY21 (USD mn) CY19-21 CAGR CY21-23E CAGR* P/E Price/Sales
Company (USD) (USD bn) Sales PAT Sales PAT Sales PAT CY21 PEG CY21 PSG
Uber 38 74 17,062 -1,304 15% L to L 37% L to P - - 4.3 0.1
Amazon 3,523 1,787 4,70,561 30,071 30% 61% 17% 35% 59 1.7 3.8 0.2
Bookings Holdings 2,245 92 10,864 1,730 -15% -40% 30% 71% 53 0.8 8.5 0.3
Twitter 44 36 5,092 361 21% -50% 21% 79% 98 1.2 7.0 0.3
Facebook 323 898 1,17,583 42,116 29% 51% 19% 8% 21 2.8 7.6 0.4
PayPal 191 224 25,357 5,474 19% 49% 20% 20% 41 2.1 8.9 0.4
Google 2,945 1,960 2,09,495 76,928 14% 50% 16% 10% 25 2.5 9.4 0.6
Netflix 626 277 29,713 5,221 21% 67% 15% 25% 53 2.1 9.3 0.6
Zoom 189 56 4,081 1,484 251% 1299% 18% 3% 38 12.0 13.8 0.8
EBay 67 42 10,415 2,647 10% 22% 5% 6% 16 2.5 4.0 0.8
Airbnb 183 116 5,929 -370 11% L to L 23% L to P - - 19.6 0.9
Apple 171 2,808 3,81,823 93,344 21% 30% 5% 4% 30 7.4 7.4 1.3
* – Estimates based on Bloomberg consensus
6.3 Private equity valuation
Almost every startup raises funds through multiple rounds of venture capital and/or private
equity funding. Private equity funds have a vast experience of valuing Bits companies, given their
widespread global investments. Thus, valuation for the latest round of funding is a good base
value, which can be suitably raised or discounted depending on subsequent developments.
6.4 Average of all the above The valuation under each of the above methodologies is likely to be diverse. Hence, the average
of these methodologies may be deemed to be the final value of the company.
6.5 Valuation Case study – Unlisted food tech company
We apply the methodologies discussed to arrive at a fair value for an unlisted food tech company
named, say, Foodie.
6.5.1 Foodie’s business model
Any valuation exercise entails a detailed understanding of the company’s business model. The
key elements of Foodie’s business model are as listed below.
Food delivery business
Foodie is a technology platform which allows customers to order food via its app.
It passes on the orders to its restaurant partners, and gets the food collected and delivered
by its delivery partners i.e. riders.
It charges 15% of the order value as commission from restaurants (i.e. “take rate”).
It further chargers customers a delivery charge.
It pays a delivery fee to its riders.
Non-food delivery business
Foodie has recently forayed into delivery of select grocery items (“convenience grocery”).
The dynamics here similar to that of food delivery with the key exception that Foodie will
hold inventory of the grocery items that it intends to deliver.
December 2021 26
26th Annual Wealth Creation Study (2016-2021)
Others
Foodie earns ad revenue on its app.
6.5.2 Key assumptions
Having understood the business model, the next step is to build in assumptions on key variables
like – growth in orders, growth in average order value, contribution margin, and growth in fixed
/ discretionary costs such as employee, marketing and admin costs.
6.5.3 For DCF, choice of discount rate and continuing growth rate
Finally, for the DCF model, we need to choose an appropriate discount rate and continuing
growth rate beyond explicit forecast period.
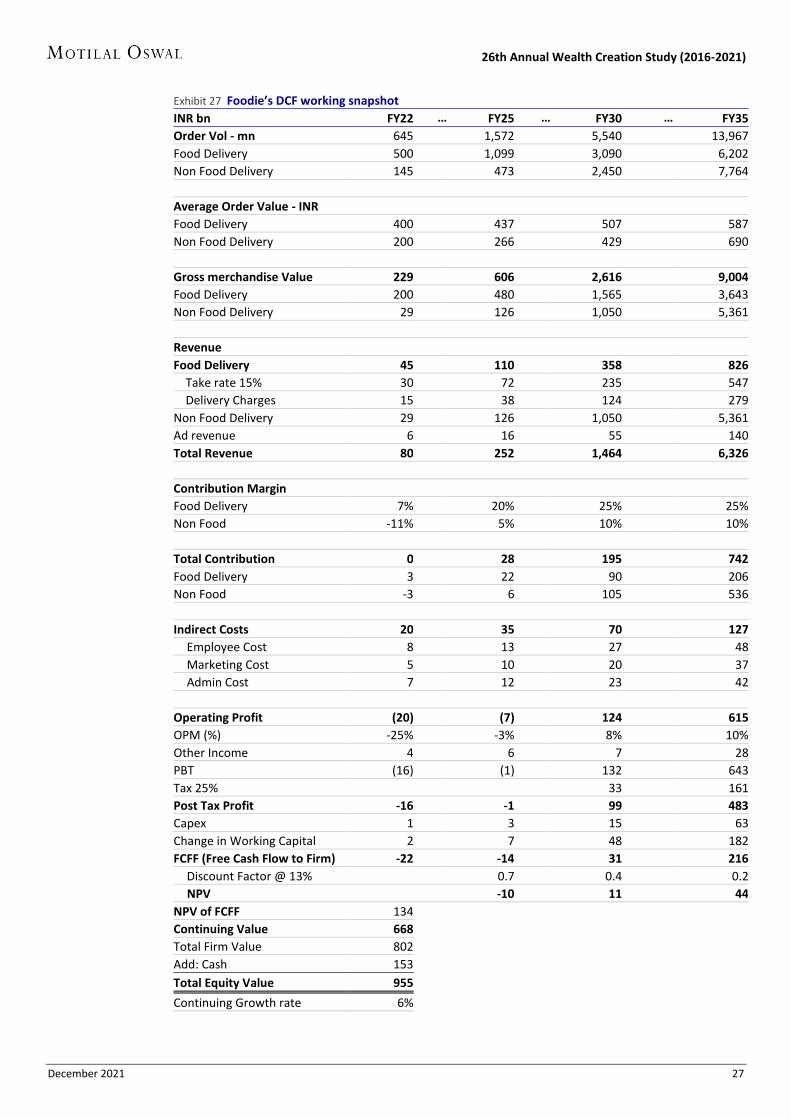
Based on all of the above, Foodie’s DCF model will be as tabled in Exhibit 27, on page 27.
6.5.4 Comparable valuation based on PSG
The most appropriate domestic peer for Foodie is Zomato, which trades at PSG of 0.9x. Applying
a 50% haircut for margin of safety, Foodie can be valued at PSG of 0.45x. Its FY22-25 Sales CAGR
is 46%. Thus, Price/Sales works out to 21x (0.45 x 46). Applying this multiple to its FY22 Sales of
INR 80 billion gives us a value of around INR 1.7 trillion (80 x 21).
6.5.5 Private equity valuation
Foodie recently concluded a private equity round of funding at INR 800 billion.
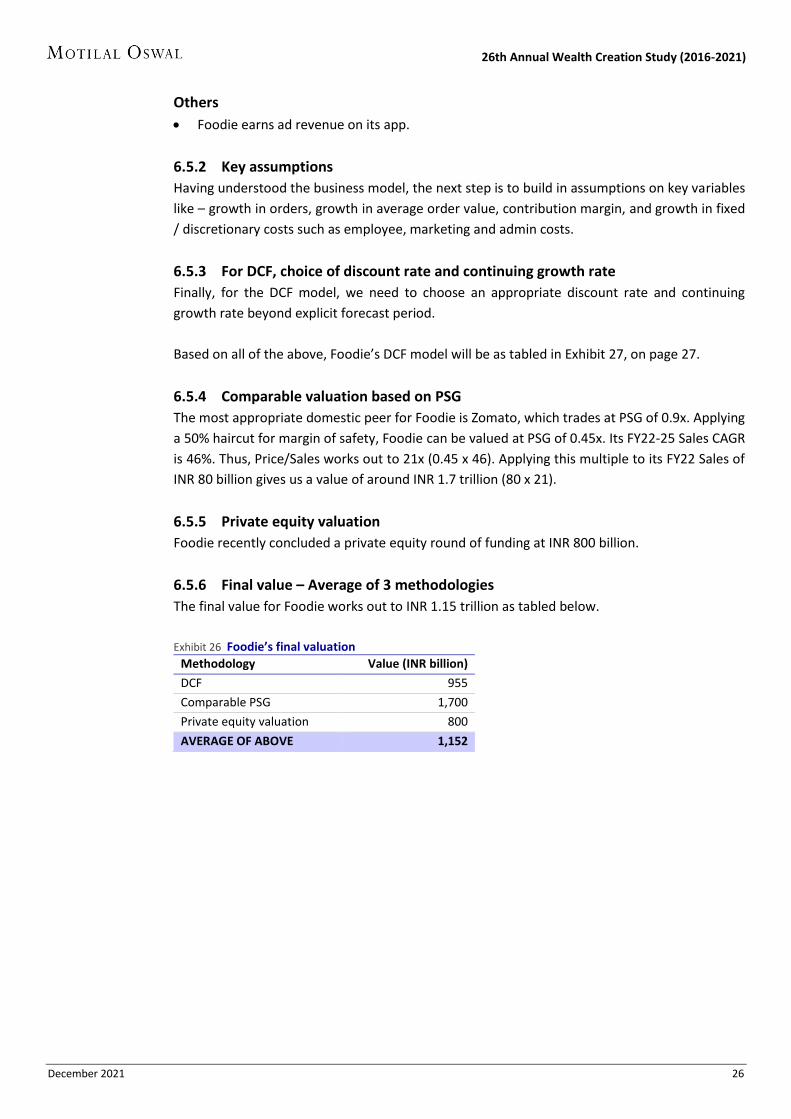
6.5.6 Final value – Average of 3 methodologies
The final value for Foodie works out to INR 1.15 trillion as tabled below.
Exhibit 26 Foodie’s final valuation
Methodology Value (INR billion)
DCF 955
Comparable PSG 1,700
Private equity valuation 800
AVERAGE OF ABOVE 1,152
December 2021 27
26th Annual Wealth Creation Study (2016-2021)
Exhibit 27 Foodie’s DCF working snapshot
INR bn FY22 … FY25 … FY30 … FY35
Order Vol - mn 645 1,572 5,540 13,967
Food Delivery 500 1,099 3,090 6,202
Non Food Delivery 145 473 2,450 7,764
Average Order Value - INR
Food Delivery 400 437 507 587
Non Food Delivery 200 266 429 690
Gross merchandise Value 229 606 2,616 9,004
Food Delivery 200 480 1,565 3,643
Non Food Delivery 29 126 1,050 5,361
Revenue
Food Delivery 45 110 358 826
Take rate 15% 30 72 235 547
Delivery Charges 15 38 124 279
Non Food Delivery 29 126 1,050 5,361
Ad revenue 6 16 55 140
Total Revenue 80 252 1,464 6,326
Contribution Margin
Food Delivery 7% 20% 25% 25%
Non Food -11% 5% 10% 10%
Total Contribution 0 28 195 742
Food Delivery 3 22 90 206
Non Food -3 6 105 536
Indirect Costs 20 35 70 127
Employee Cost 8 13 27 48
Marketing Cost 5 10 20 37
Admin Cost 7 12 23 42
Operating Profit (20) (7) 124 615
OPM (%) -25% -3% 8% 10%
Other Income 4 6 7 28
PBT (16) (1) 132 643
Tax 25% 33 161
Post Tax Profit -16 -1 99 483
Capex 1 3 15 63
Change in Working Capital 2 7 48 182
FCFF (Free Cash Flow to Firm) -22 -14 31 216
Discount Factor @ 13% 0.7 0.4 0.2
NPV -10 11 44
NPV of FCFF 134 Continuing Value 668 Total Firm Value 802 Add: Cash 153 Total Equity Value 955
Continuing Growth rate 6%

December 2021 28
26th Annual Wealth Creation Study (2016-2021)
7. How to play Atoms to Bits Focus on Digital Business Designs and their enablers
Using the Atoms and Bits framework, there are 3 types of businesses –
1. Purely physical (“Atoms”)
2. Purely digital (“Bits”) and
3. “Phygital” i.e. physical + digital (say, “At-Bits”).
Phygital is the concept of using technology to bridge the digital world and the physical world,
with the purpose of providing a unique interactive experience for the user i.e. customer, in the
business context. Thus, buying a book from a bookstore is a purely physical experience. However,
buying a book on Amazon is a phygital experience – besides getting a healthy discount over the
retail price and home delivery, buyers can read book reviews and book extracts, and also see
what other books people bought.
Likewise, having food at a restaurant is a purely physical experience. However, ordering food
from Zomato or Swiggy is a phygital experience – from the comfort of your home, you can choose
food from a variety of eateries, get user ratings, discounts, etc.
7.1 Investors should focus on Digital Business Designs Whether a business is physical, digital or phygital, the key to success is a Digital Business Design.
Michael Dell, founder of Dell Computer, has said, “If you take a business that is a bad business
and put it online, it’s still a bad business. It’s just become an online bad business.”
In their book, How digital is your business?, the authors write, “… you must remember that Digital
Business Design is about business first, design second and digital third.” They identify two
determinants of Digital Business Design –
3. Quality of Business Design and
4. Degree of Digitization.
The matrix in Exhibit 28 offers a framework for how to play the Atoms to Bits theme. The
challenge for investors is to identify –
4. Digital Business Designs i.e. Strong business design with high Degree of Digitization;
5. Digital Aspirants who are likely to attain Digital Business Design; and
6. Dotcoms who are likely to improve their Business Design.
7.2 Bet on digital enablers with great managements
A second way to play the Atoms to Bits theme is by investing in digital enablers (i.e. IT service
providers), run by great managements. These companies will be catering to players in all the
above four quadrants, and may well prove to be the biggest beneficiaries of Atoms to Bits.

December 2021 29
26th Annual Wealth Creation Study (2016-2021)
Exhibit 28 Framework to play Atoms to Bits – Look for Digital Business Designs and Digital Enablers
8. Bits companies – Risks & challenges Survival bias, Hype factor, Criticality of contribution
The growth opportunity that Bits companies present is exciting. However, it is also important to
bear in mind the risks and challenges involved. The main ones are – (1) Survival bias, (2) Hype
factor, and (3) Criticality of contribution.
8.1 Survival bias
Survival bias is a framework from behavioral finance. It is the logical error of concentrating on
people or things that made it past some selection process and overlooking those that did not,
typically because of their lack of visibility.
In the context of Bits companies, survival bias is the tendency for failed companies to be excluded
from performance studies because they no longer exist. Thus, all studies of Bits companies tend
to be centered on the Amazons, the Googles, and the Facebooks of the world. In reality, there
may be scores of companies which started off along the same lines, only to go out of business
now. Some of these names include Lycos, AltaVista, Orkut and Webvan.
The key takeaway from Survival bias – it’s extremely important that the Bits company one invests
in survives over the long-term, in which case, it’s likely to benefit from “winner-takes-all/most”
phenomenon. As is said, “To finish first, you need to first finish.”
High Dotcoms Digital Business Design
Degree of
Digitization
Low Weak Business Designs Digital Aspirants
Weak Strong
Quality of Business Design
DigitalEnablers

December 2021 30
26th Annual Wealth Creation Study (2016-2021)
8.2 Hype factor
If the number of times recent digital companies’ IPOs have got oversubscribed (Exhibit 29) is any
indication, there are early signs of hype.
Exhibit 29 Oversubscriptions to recent Bits IPOs suggest some level of hype
Issue size No. of times Issue price Listing day Gain over
Company (INR bn) oversubscribed Listing date (INR) close (INR) issue price
Nykaa 54 82 Nov 10, 2021 1,125 2,207 96%
Zomato 94 38 Jul 23, 2021 76 126 66%
Car Trade 30 20 Aug 20, 2021 1,618 1,500 -7%
Policybazaar 56 17 Nov 15, 2021 980 1,203 23%
Fino Payments Bank 12 2 Nov 12, 2021 577 545 -6%
Paytm 183 2 Nov 18, 2021 2,150 1,564 -27%
Here, Gartner’s Hype Curve framework is worth understanding (Exhibit 30). Although created for
technology, it can be adapted for investing as well.
Exhibit 30 Gartner’s Hype Curve
Time
Exp
ect
atio
n

December 2021 31
26th Annual Wealth Creation Study (2016-2021)
The digital hype is at two levels – (1) at the business capability of the companies, and even more
so (2) in their valuations. There is a risk of hitting the Trough of Disillusionment, at least in some
companies where the business model is not very solid, and the path to profit is unclear.
8.3 Criticality of contribution
Hyper growth of Bits companies is defendable only so long as unit economics is favorable. The
bottomline of unit economics is Contribution i.e. revenue minus all variable costs. When
Contribution is positive, every unit sold contributes to cover the high fixed costs. As things stand,
the company management is the main source for unit contribution data. Any misstatement of
expenses could have serious repercussion for the company’s profitability, and hence, stock
prices.
9. Conclusions
Value migration from Atoms to Bits is inevitable.
Replicability, friction-free delivery and near-zero marginal cost make Bits companies highly
scalable.
Successful hyper growth is possible only if there is large opportunity, terrific product-market
fit, wide distribution, network effects and favorable unit economics.
Current accounting standards fail to fully communicate intrinsic profitability – and hence
value – of Bits companies.
India is at the cusp of harnessing digital potential.
Buy into sure winners in digital, successful digital transformers and classical Indian IT
companies.

December 2021 32
26th Annual Wealth Creation Study (2016-2021)
2016-21 Wealth Creation Study:
Detailed findings

December 2021 33
26th Annual Wealth Creation Study (2016-2021)
Trend in Wealth Creation
INR 71 trillion Wealth Created during 2016-21
Over the 5-year period 2016-21 (ended March), the top 100 Wealth Creating companies
created wealth of INR 71 trillion.
This is by far the highest ever Wealth Created in the last 26 5-year periods.
The pace of Wealth Creation is also robust at 24% CAGR vis-à-vis 14% for the BSE Sensex.
Exhibit 1 2016-21 Wealth Created at INR 71 trillion is the highest ever by far
Exhibit 2 2016-21 pace of Wealth Creation is a robust 24% CAGR vis-à-vis benchmark’s 14% CAGR
14.3 16.3
25.4
9.7
26.522.1
16.2 18.4
29.434.2
28.4
38.944.9
49.0
26.1
70.8
20
01
-06
20
02
-07
20
03
-08
20
04
-09
20
05
-10
20
06
-11
20
07
-12
20
08
-13
20
09
-14
20
10
-15
20
11
-16
20
12
-17
20
13
-18
20
14
-19
20
15
-20
20
16
-21
Wealth Creation trend (INR trillion)
36%40%
49%
19%
26%
17%19%
17%
33%
25%
18%22% 23% 22%
12%
24%
20
01
-06
20
02
-07
20
03
-08
20
04
-09
20
05
-10
20
06
-11
20
07
-12
20
08
-13
20
09
-14
20
10
-15
20
11
-16
20
12
-17
20
13
-18
20
14
-19
20
15
-20
20
16
-21
Wealth Created CAGR (%)(Figures in brackets are Sensex CAGR)
(26%)(30%)
(39%)
(12%)
(22%)
(12%)(6%)
(4%)
(18%)
(10%)
(5%)(11%) (12%)
(12%)
(1%)
(14%)
#1
Key Takeaway
Forget markets, think stocks
For the past 7 successive study periods, market benchmark indices have delivered muted
returns ranging from 5% to 14%. Still, the top Wealth Creators have maintained their track
record of 10-15% outperformance over the benchmark. This reinforces our pet take on market
timing, “Forget markets, think stocks.”

December 2021 34
26th Annual Wealth Creation Study (2016-2021)
The Biggest Wealth Creators
Reliance smashes all records to emerge as largest Wealth Creator
Over 2016-21, Reliance industries emerged the largest Wealth Creator for the third time in
succession, with total Wealth Created of a whopping INR 9.7 trillion.
This is by far the highest ever, beating its own previous record of INR 5.6 trillion in 2014-19.
For the third year in a row, TCS, HDFC Bank and Hindustan Unilever remain in the race for
the second-to-fourth spot.
Five of the top 10 Wealth Creators are from the Financials sector
Exhibit 3 Top 10 Biggest Wealth Creators (2016-21)
Rank Company Wealth Created CAGR (%) P/E (x) RoE (%) INR bn % share Price PAT 2021 2016 2021 2016
1 Reliance Inds 9,661 13.6 31 8 30 11 6 13
2 TCS 7,294 10.3 20 7 35 21 39 34
3 HDFC Bank 5,182 7.3 23 20 26 21 15 17
4 Hind. Unilever 3,427 4.8 23 14 70 45 17 64
5 Infosys 3,257 4.6 18 7 30 21 28 22
6 Bajaj Finance 2,592 3.7 49 28 70 29 12 17
7 ICICI Bank 2,475 3.5 22 13 22 14 12 11
8 HDFC 2,422 3.4 18 13 24 17 12 20
9 Kotak Mahindra 2,081 2.9 21 24 35 36 12 10
10 HCL Tech 1,613 2.3 19 15 24 21 18 20
Total of Top 10 40,003 56 24 12 31 19 12 18
Total of Top 100 70,815 100 25 18 32 24 13 12
Exhibit 4 Reliance Industries has emerged the Biggest Wealth Creator for the eighth time overall
1,2
47
37
7
38
3
24
5 1,0
30
1,0
65
1,6
78
1,8
56
3,0
77
1,5
14
2,5
56
1,7
42
1,1
87 2,2
84 3,6
38
3,4
58
2,6
37
2,4
99
3,2
47
5,6
36
4,4
01
9,6
61
20
00
20
01
20
02
20
03
20
04
20
05
20
06
20
07
20
08
20
09
20
10
20
11
20
12
20
13
20
14
20
15
20
16
20
17
20
18
20
19
20
20
20
21
Wipro
HUL Wipro (2)
ONGC (3)
Reliance Industries (5)
ITC
TCS (5) HDFC Bank
Reliance Inds (3)
Key Takeaway
The power of the phygital
Reliance’s re-emergence as the Biggest Wealth Creator reflects the power of phygital – physical
plus digital. Its oil-to-chemicals and retail businesses are strongly rooted in the physical whereas
the telecom business is the digital dimension. Going forward, expect more and more phygital
and digital companies to spearhead Wealth Creation.
#2

December 2021 35
26th Annual Wealth Creation Study (2016-2021)
The Fastest Wealth Creators
Adani Transmission emerges the Fastest Wealth Creator
Over 2016-21, Adani Transmission has emerged the Fastest Wealth Creator with price CAGR
of 93%.
Another Adani group company – Adani Enterprises – ranks the third Fastest Wealth Creator.
INR 1 million invested equally in 2016 among the top 10 fastest Wealth Creators would have
grown to INR 17 million in 2021; return CAGR of 77% v/s just 14% for the Sensex.
In almost all cases, there is significant P/E re-rating over and above robust earnings growth.
Exhibit 5 Top 10 Fastest Wealth Creators (2016-21)
Rank Company Price Appn. Price PAT Mkt Cap (INR bn) P/E (x) (x) CAGR % CAGR % 2021 2016 2021 2016
1 Adani Transmission 26 93 27 999 38 82 10
2 Deepak Nitrite 24 90 65 226 8 29 12
3 Adani Enterprises 22 86 1 1,134 81 103 8
4 Tanla Platforms 21 85 108 111 4 31 42
5 Ruchi Soya Inds 20 81 L to P 190 11 28 –
6 Alkyl Amines 18 79 43 116 6 39 13
7 Vaibhav Global 12 64 48 125 10 46 27
8 APL Apollo Tubes 11 60 25 175 16 49 13
9 P&G Health 10 57 27 103 11 58 20
10 Escorts 9 56 57 174 17 20 19
Exhibit 6 History of Fastest Wealth Creators
Year Company 5-yr Price
Multiple (x) 5-yr Price CAGR %
Year Company
5-yr Price Multiple (x)
5-yr Price CAGR %
1996 Dr Reddy's Labs 30 97 2009 Unitech 54 122
1997 Cipla 7 48 2010 Unitech 28 95
1998 Satyam Computers 23 87 2011 Sanwaria Agro 50 119
1999 Satyam Computers 75 137 2012 TTK Prestige 24 89
2000 SSI 223 195 2013 TTK Prestige 28 95
2001 Infosys 66 131 2014 Eicher Motors 27 94
2002 Wipro 69 133 2015 Ajanta Pharma 50 119
2003 e-Serve 50 119 2016 Ajanta Pharma 53 121
2004 Matrix Labs 75 137 2017 Ajanta Pharma 29 96
2005 Matrix Labs 136 167 2018 Indiabulls Ventures 30 97
2006 Matrix Labs 182 183 2019 Indiabulls Ventures 18 78
2007 B F Utilities 665 267 2020 Tasty Bite Eatables 15 72
2008 Unitech 837 284 2021 Adani Transmission 26 93
#3
Key Takeaway
Small for speed
Eight out of top 10 Fastest Wealth Creators had a market cap below INR 20 billion in 2016.
Further, most of them were reasonably valued then, especially relative to their growth
prospects. Thus, the data confirms the obvious – for high Wealth Creation, pick small-to-mid
companies with robust earnings growth prospects trading at reasonable valuations. As all our
26 studies show, such stocks are available in all market conditions.

December 2021 36
26th Annual Wealth Creation Study (2016-2021)
The Most Consistent Wealth Creators
Adani Enterprises is the Most Consistent Wealth Creator
We define Consistent Wealth Creators based on the number of years the stock has out-
performed in each of the last 5 years. Where the number of years is the same, the stock price
CAGR decides the rank.
Based on this, over 2016-21, Adani Enterprises has emerged as the Most Consistent Wealth
Creator. It has outperformed in all the last 5 years, and has the highest price CAGR of 86%.
Like in the case of Fastest Wealth Creators, the list here too is dominated by mid and small
caps. Given this, a surprise entry is Reliance Industries.
Consistent Wealth Creation is a challenge – only 9 out of 100 have outperformed in each of
the last 5 years.
Exhibit 7 Top 10 Most Consistent Wealth Creators (2016-21)
No. of years of 2016-21 2016-21 RoE (%) P/E (x)
Rank Company Name outperformance Price CAGR (%) PAT CAGR (%) 2021 2016 2021 2016
1 Adani Enterprises 5 86 1 6 8 103 8
2 Alkyl Amines 5 79 43 37 24 39 13
3 P & G Health 5 57 27 25 9 58 20
4 Vinati Organics 5 48 15 17 24 53 15
5 Astral 5 45 32 21 14 81 50
6 Honeywell Auto 5 41 27 18 14 91 54
7 Aarti Industries 5 40 15 15 23 44 17
8 SRF 5 33 23 17 15 27 18
9 Reliance Industries 5 31 8 6 13 30 11
10 Adani Transmission 4 93 27 14 14 82 10
Exhibit 8 Consistent Wealth Creation is a challenge – only 9 out of 100 have outperformed in each of the 5 years
9
30
46
15
5 4 3 2
Years of outperformance
Distribution of outperformance
#4
Key Takeaway
Investors’ nirvana – Speed with Consistency
One key characteristic of mid- and small cap stocks is high volatility of returns. Such stocks may
outperform over 5 years, but in the interim, they may cause investors quite a few anxious
moments. This is where consistency comes in. Investors’ nirvana is in identifying stocks which
not only outperform point-to-point but in the interim as well.

December 2021 37
26th Annual Wealth Creation Study (2016-2021)
All-round Wealth Creators
Adani Enterprises is the Best All-round Wealth Creator
We define All-round Wealth Creators based on the summation of ranks, under each of the 3
categories – Biggest, Fastest and Consistent. Where the scores are tied, the stock price CAGR
decides the All-round rank.
Based on the above criteria, Adani Enterprises has emerged as the Best All-round Wealth
Creator, followed by group company Adani Transmission.
As tabled below, 7 out of 10 top All-round Wealth Creators are within the top 10 of at least
one criteria – Biggest, Fastest or Most Consistent. Given this, it’s a credible performance by
Bajaj Finserv, Muthoot Finance and Info Edge to appear in the list without being within the
top 10 in any of the 3 categories.
Exhibit 9 Top 10 All-round Wealth Creators (2016-21)
All-round Rank Total of 2016-21
Rank Company Biggest Fastest Consistent Ranks Price CAGR (%)
1 Adani Enterprises 16 3 1 20 86
2 Adani Transmission 17 1 10 28 93
3 Bajaj Finance 6 13 17 36 49
4 Bajaj Finserv 12 20 20 52 42
5 Reliance Industries 1 45 9 55 31
6 Muthoot Finance 33 15 18 66 47
7 Astral 44 17 5 66 45
8 Honeywell Auto 38 22 6 66 41
9 Deepak Nitrite 56 2 11 69 90
10 Info Edge (India) 31 21 21 73 41
Exhibit 10 Consistency is the clincher for All-round Wealth Creation
2
3
5
Biggest Fastest Consistent
No. of companies in Top 10 All-round Wealth Creators from other categories
Key Takeaway
Consistency is the clincher for All-round Wealth Creation
Five out of top 10 All-round Wealth Creators are also among the top 10 Consistent Wealth
Creators. Thus, Consistency is the clincher for All-round Wealth Creation. This is so as
consistency influences the speed of Wealth Creation (“Fastest”), which in turn, influences the
absolute Wealth Creation (“Biggest”).
#5

December 2021 38
26th Annual Wealth Creation Study (2016-2021)
Wealth Creators Index (Wealthex) v/s BSE Sensex
We compare Wealthex (top 100 Wealth Creators Market Cap index) with the BSE Sensex on 3
parameters - (1) market performance, (2) earnings growth and (3) valuation.
Market performance: Over 2016-21, Wealth Creating companies have delivered return CAGR
of 25% v/s 14% for the BSE Sensex. March 2021 over March 2016, Wealthex is up 203%
whereas the Sensex is up 96% i.e. 107% outperformance over 5 years.
Earnings growth: Wealthex clocked FY16-21 earnings CAGR of 18% v/s 5% for BSE Sensex.
Further, YoY earnings growth for Wealthex is higher in each of the 5 years 2016 through 2021.
Valuation: Valuation re-rating has contributed 9% to Sensex CAGR of 14%. In contrast, much
of Wealthex’s 25% CAGR is led by 18% earnings CAGR.
Exhibit 11 Wealthex v/s Sensex: Outperformance led by earnings growth
Mar-16 Mar-17 Mar-18 Mar-19 Mar-20 Mar-21 5 Year CAGR (%)
BSE Sensex 25,342 29,621 32,969 38,673 29,468 49,509 14
YoY (%) 17 11 17 -24 68
Wealthex - based to Sensex 25,342 30,968 38,413 48,115 42,266 76,711 25
YoY (%) 22 24 25 -12 81
Sensex EPS (INR) 1,342 1,359 1,354 1,488 1,513 1,701 5
YoY (%) 1 0 10 2 12
Wealthex EPS (INR) 1,053 1,308 1,537 1,845 1,982 2,391 18
YoY (%) 24 18 20 7 21
Sensex PE (x) 19 22 24 26 19 29 9
Wealthex PE (x) 24 24 25 26 21 32 6
Exhibit 12 Wealthex invariably outperforms benchmark indices handsomely
50
100
150
200
250
300
350
Mar
-16
Sep
-16
Mar
-17
Sep
-17
Mar
-18
Sep
-18
Mar
-19
Sep
-19
Mar
-20
Sep
-20
Mar
-21
Wealthex - Rebased Sensex - Rebased
107% Outperformance
#6
Key Takeaway
Sensex a weak earnings machine
In the last 4 studies including this one, Sensex earnings growth has been in single digits. In the
markets, broadly G = R i.e. growth in earnings = return on the stock. Given this, a portfolio of
stocks with even a slightly superior earnings profile vis-à-vis the Sensex should consistently
outperform it.

December 2021 39
26th Annual Wealth Creation Study (2016-2021)
Wealth Creation: Sector analysis
Financials sector regains its top spot in Wealth Creation
The Financials sector has regained its top spot in Wealth Creation, after briefly losing it in the
previous study period to Consumer & Retail.
The sector has also gained significant share of Wealth Creation – almost 25% of total Wealth
Created v/s 18% five years ago.
The highest share gain is by the Oil & Gas sector led by Reliance Industries.
Two big losers in terms of share of Wealth Creation are Autos and Pharma.
Exhibit 13 Financials is the top Wealth Creating sector
Sector WC Share of WC % CAGR 16-21 (%) P/E (x) RoE (%)
(No of companies) (INR bn) 2021 2016 Price PAT 2021 2016 2021 2016
Financials (12) 17,365 24.5 17.6 26 18 27 19 13 15
Technology (11) 15,192 21.5 17.4 18 8 31 20 26 24
Consumer & Retail (22) 12,541 17.7 22.4 26 16 75 50 19 22
Oil & Gas (3) 10,242 14.5 2.4 31 9 30 12 6 13
Metals / Mining (6) 2,711 3.8 1.0 30 -219 12 -7 13 -9
Pharma & related (10) 2,379 3.4 13.0 26 16 47 32 17 15
Cement (5) 2,226 3.1 4.5 19 17 32 29 10 10
Chem. & Fert. (12) 2,028 2.9 – 33 21 30 18 14 15
Utilities (2) 1,157 1.6 0.7 54 22 53 17 11 9
Auto (5) 856 1.2 14.4 32 3 30 9 13 26
Realty (3) 732 1.0 – 30 13 78 38 3 3
Others (9) 3,387 4.8 6.6 32 59 64 162 16 2
Total 70,815 100.0 100.0 25 18 32 24 13 12
Exhibit 14 Highest ever Wealth Created by any sector
5,1943,672
4,456
7,103 7,5866,364
9,346
11,905
15,899
8,172
17,365
Finan-cials
Finan-cials
Consumer & Retail
Techno-logy
Consumer & Retail
Consumer & Retail
Finan-cials
Finan-cials
Finan-cials
Consumer & Retail
Finan-cials
2011 2012 2013 2014 2015 2016 2017 2018 2019 2020 2021
Top Wealth Creating Sector trend(wealth created in INR billion)
#7
Key Takeaway
Technology sector the only potential contender for the top spot next year
Led by rapid digitization, the Technology sector is bagging huge orders from overseas clients,
leading to high growth visibility. Stock prices have responded handsomely. Thus, it is the only
sector which may potentially challenge the dominance of the Financials sector in the next
Wealth Creation Study period, 2017-2022.

December 2021 40
26th Annual Wealth Creation Study (2016-2021)
Wealth Creation: Ownership – Private v/s PSU
Worst ever performance by PSUs
PSUs’ (public sector undertakings) Wealth Creation performance during 2016-21 was the
worst ever:
– The number of PSUs in the top 100 Wealth Creators is only 2.
– Wealth Created by these 2 PSUs is less than 1% of total.
The only 2 Wealth Creating PSUs are Gujarat Gas and Indraprastha Gas.
Exhibit 15 PSUs remain insignificant in Wealth Creation
Exhibit 16 Exhibit 17
Handsome performance by the Wealth Creators Gujarat Gas & Indraprastha Gas Oil & Gas the only Wealth Creating sector
2016-2021
PSU Private
No. of Wealth Creators in Top 100 2 98
Share of Wealth Created (%) 0.8 99.2
5-year Sales CAGR (%) 9 10
5-year PAT CAGR (%) 29 18
5-year Price CAGR (%) 37 25
P/E - 2016 (x) 23 24
P/E - 2021 (x) 30 32
RoE - 2016 (%) 17 12
RoE - 2021 (%) 23 13
28 3026
18
25
16
22 2420
11 5 5 7 9 11 9 7 2
49 51
36
25
35
2730
27
20
92 2 4
10 96 3 1
19
99
-20
04
20
00
-20
05
20
01
-20
06
20
02
-20
07
20
03
-20
08
20
04
-20
09
20
05
-20
10
20
06
-20
11
20
07
-20
12
20
08
-20
13
20
09
-20
14
20
10
-20
15
20
11
-20
16
20
12
-20
17
20
13
-20
18
20
14
-20
19
20
15
-20
20
20
16
-20
21
PSUs' Wealth Creation trend
No of PSUs
% of Wealth Created
Key Takeaway
Privatization – the pressing need of the hour
The above data make it amply clear why the oft-quoted words hold true – “The government
has no business to be in business.” Following the Air India model, the government is better off
privatizing as many PSUs as it can. This has a dual positive – (1) The divested companies are
likely to become more efficient, and equally important, (2) The resources raised from such
privatization can be used for socio-economic development.
#8
Oil & Gas
100%

December 2021 41
26th Annual Wealth Creation Study (2016-2021)
Wealth Creation: Market Cap Rank Analysis
We call large, mid and small cap stocks as Mega, Mid and Mini, respectively, defined as under:
Mega – Top 100 stocks by market cap rank for any given year
Mid – Next 150 stocks by market cap rank
Mini – All stocks below the top 250 ranks.
Market cap ranks of companies change constantly. Over time, companies also cross over from
one category to another. For the period 2016-21, the market cap ranks crossover matrix stands
as under –
Exhibit 18 2016-21: Market cap rank crossovers: Number of companies and average returns
How to read the table
In 2016, there were 2,680 Mini companies (i.e. ranked beyond 250). Of these, 1 moved to the
Mega category by 2021, clocking 5-year return CAGR of 93%. 20 Minis moved to Mid category
by 2021, delivering a return CAGR of 46% in the process. Next, 2,659 Mini companies stayed
as Mini and delivered return CAGR of 2%.
Of the 150 Mid companies in 2016, 12 moved to Mega by 2021, delivering an average 34%
return CAGR in the process. 77 Mid companies stayed as Mid (16% return CAGR) and 61
slipped to the Mini category (-10% return CAGR).
Finally, of the 100 Mega companies in 2016, 74 stayed as Mega (12% return CAGR), 25 slipped
to Mid (0% return CAGR), and 1 slipped to the Mini category (-21% return CAGR).
Note: During the 2016-21 period, benchmark return was 14%.
1 34% 12%
(1) (12) (74)
46% 16% 0%
(20) (77) (25)
2% -10% -21%
(2,659) (61) (1)
Mini Mid Mega
FROM
Total stocks 2,680 150 100
Mega
TO Mid
Mini
#9

December 2021 42
26th Annual Wealth Creation Study (2016-2021)
We specifically analyze the 3 positive crossovers –
1. Mini-to-Mega
2. Mini-to-Mid and
3. Mid-to-Mega.
8.1 Mini-to-Mega: 1 company, 93% CAGR
During 2016-21, 1 company – Adani Transmission – moved from Mini to Mega.
Needless to add, it is the Fastest Wealth Creator in this Study with a price CAGR of 93%.
Exhibit 19 Mini-to-Mega (2016-21): 1 company (Adani Transmission), this Study’s Fastest Wealth Creator
Mkt Cap Rank WC Rank * Price PAT P/E
Company Mar-21 Mar-16 Biggest Fastest CAGR CAGR 2021 2016
Adani Transmission 38 280 17 1 93% 27% 82 10
* 2016-21 Wealth Creation Rank
8.2 Mini-to-Mid: 20 companies, 46% average Price CAGR
During 2016-21, 20 companies crossed over from Mini to Mid category, generating an
average return CAGR of 46%.
Of these 20 Mini-to-Mid stocks, as high as 16 feature in our list of top 100 Wealth Creators,
delivering average return CAGR of 53% v/s 14% for the Sensex
Exhibit 20 Mini-to-Mid (2016-21): 16 of 20 Mini-to-Mid stocks feature among top 100 Wealth Creators
Mkt Cap Rank WC Rank * Price PAT P/E (x)
Company 2021 2016 Biggest Fastest CAGR CAGR 2021 2016
Deepak Nitrite 168 633 56 2 90% 65% 29 12
Ruchi Soya Inds. 192 551 66 5 81% L to P 28 –
Alkyl Amines 245 691 92 6 79% 43% 39 13
Vaibhav Global 240 563 89 7 64% 48% 46 27
APL Apollo Tubes 200 457 76 8 60% 25% 49 13
Escorts 202 439 79 10 56% 57% 20 19
Minda Industries 216 453 85 11 52% 14% 72 15
Navin Fluorine 228 447 88 12 52% 25% 55 20
Vinati Organics 223 410 87 14 48% 15% 53 15
Linde India 212 373 84 16 46% 53% 102 128
Coforge 199 325 77 18 43% 12% 38 11
Aarti Industries 166 261 65 24 40% 15% 44 17
Relaxo Footwear 174 259 70 28 37% 19% 76 37
Sundram Fasten. 205 289 83 31 36% 12% 47 18
Atul 178 254 74 34 36% 18% 33 17
Manappuram Fin. 236 334 99 40 34% 37% 7 8
AVERAGE 53%
* 2016-21 Wealth Creation Rank
8.3 Mid-to-Mega: 12 companies, 34% average Price CAGR
During 2016-21, 12 companies crossed over from Mid to Mega.
Of these, 10 made it to this year’s list of 100 Biggest Wealth Creators.
The Mid-to-Mega Wealth Creators delivered average return CAGR of 43% over 2016-21 v/s
14% for Sensex.

December 2021 43
26th Annual Wealth Creation Study (2016-2021)
Exhibit 21 Mid-to-Mega (2016-21): 10 companies feature among top 100 Wealth Creators
Mkt Cap Rank WC Rank * Price PAT P/E (x)
Company 2021 2016 Biggest Fastest CAGR CAGR 2021 2016
Adani Enterprises 30 176 16 3 86% 1% 103 8
Muthoot Finance 80 193 33 15 47% 36% 13 9
Info Edge 74 158 31 21 41% -5% 477 61
Honeywell Auto 86 183 38 22 41% 27% 91 54
Tata Consumer 72 184 32 25 39% L to P 68 -275
Biocon 79 154 35 26 38% 16% 67 28
Godrej Properties 95 206 46 29 37% P to L -177 40
Jubilant Food 97 170 41 35 36% 19% 162 85
Berger Paints 55 102 24 38 34% 15% 104 47
Cholaman.Inv.&Fn 82 139 39 44 31% 21% 30 19
AVERAGE 53%
* 2016-21 Wealth Creation Rank
Key Takeaway
Mid-to-Mega is a potent investment strategy
Every year, our analysis of market cap crossovers lead to the same findings –
Companies leap-frogging from Mini to Mega is very rare.
A fair number of companies move from Mini to Mid and deliver supernormal returns.
However, they need to be identified from a large base of about 500 companies.
The most potent and focused hunting ground for high-performing stocks is the Mid
category i.e. 150 stocks with market cap rank 101 to 250.
Over the next five years, 12-15 of these stocks (8-10% strike rate) will cross over to the
Mega category and deliver handsome returns in the process.

December 2021 44
26th Annual Wealth Creation Study (2016-2021)
Wealth Creation: Valuation parameters analysis
Payback ratio < 1 offers distinctly superior returns
Every Wealth Creation Study invariably suggests that Payback Ratio < 1x is the most reliable
valuation metric for supernormal returns.
(Payback is a proprietary ratio of Motilal Oswal, defined as current market cap divided by
estimated profits over the next five years. For 2016, we calculate this ratio based on market
cap as on 31-Mar-2016 divided by the actual profits reported over the next five years).
Exhibit 22 Payback ratio less than 1x remains a sure shot formula for multi-baggers Range No. of WC % Share CAGR (%) RoE (%)
in 2016 Cos. (INR b) of WC Price PAT 2021 2016
P/E
<10 12 4,376 6 35 L to P 12 -7
10-15 10 15,359 22 32 10 8 12
15-20 21 9,002 13 21 13 14 16
20-25 12 19,255 27 20 12 21 23
25-30 5 3,469 5 45 23 12 14
>30 40 19,353 27 25 17 15 15
Total 100 70,815 100 25 18 13 12
Price / Book
<1 9 3,531 5 36 L to P 10 -11
1-2 19 18,060 26 31 L to P 8 12
2-3 13 3,690 5 20 8 17 19
3-4 20 14,503 20 23 17 14 16
4-5 7 8,329 12 22 12 21 21
5-6 4 948 1 24 -8 4 12
>6 27 21,561 30 23 10 27 31
Others 1 194 0 23 125 N.M. -6
Total 100 70,815 100 25 18 13 12
Price / Sales
<1 20 5,757 8 33 L to P 13 -7
1-2 23 16,451 23 32 13 8 13
2-3 19 8,648 12 23 11 13 12
3-4 14 8,043 11 22 15 14 18
4-5 5 15,962 23 20 11 23 24
> 5 19 15,955 23 26 15 15 20
Total 100 70,815 100 25 18 13 12
Payback ratio
< 1 13 3,420 5 40 L to P 10 -2
1-2 27 22,449 32 31 24 9 8
2-3 22 25,586 36 20 12 18 18
> 3 38 19,360 27 25 17 16 17
Total 100 70,815 100 25 18 13 12
#10

December 2021 45
26th Annual Wealth Creation Study (2016-2021)
PEG < 1x is also a solid formula for superior returns
For the purposes of this section, PEG (P/E to Growth ratio) is obtained by dividing trailing
12-month P/E by future 5-year earnings CAGR.
We have used perfect foresight of 5 years’ earnings to calculate PEG. Thus, if a stock’s P/E in
2016 was 20x, and its 2016-21 PAT CAGR is 25%, its 2016 PEG works out to 0.8x (20 ÷ 25).
Clearly, lower the PEG, higher the likely return.
Stocks with PEG less than 1x tend to significantly outperform the market.
As tabled below, the story was no different for the 2016-21 Wealth Creators. PEG < 0.5x
outperformed across all valuation metrics. Even stocks with PEG 0.5-1x delivered higher than
average return.
Exhibit 23 PEG less than 1x is a solid formula for high returns PEG Range No. of WC % Share CAGR (%) RoE (%)
in 2016 (x) Cos. (INR b) of WC Price PAT 2021 2016
<0.5 7 2,043 3 67 39 22 13
0.5-1 15 4,767 7 33 24 15 13
1-2 33 33,551 47 26 14 10 14
2-3 11 13,267 19 19 8 26 23
3 19 13,015 18 23 9 19 22
Others 15 4,171 6 30 L to P 10 -10
Total 100 70,815 100 25 18 13 12
Note: PEG here is calculated as P/E of March 2016 divided by 2016-21 PAT CAGR
“Others” are cases where PAT CAGR cannot be calculated e.g. turnarounds

December 2021 46
26th Annual Wealth Creation Study (2016-2021)
Those who missed the Wealth Creators’ list
The big who didn’t beat the market
During 2016-21, the Sensex return CAGR was 14.3%.
21 companies created enough wealth to qualify among the 100 biggest Wealth Creators, but
failed to make it to the final list as their stock return CAGR was lower than that of the Sensex.
(Exhibit 24)
They made way for 21 others to join the list (Exhibit 25).
Exhibit 24 Those who missed the list … Exhibit 25 … and those who made it
2016-21 WC * Price Potential 2016-21 WC * Price Size
(INR b) CAGR (%) Size Rank ** (INR b) CAGR (%) Rank
Torrent Pharm 203 13.7 76 The Ramco Cement 143 20 80
Colgate-Palm. 199 13.5 79 Sundaram Finance 142 17 81
St Bk of India 1,409 13.4 12 Syngene Intl. 140 23 82
Interglobe Avn. 288 13.4 50 Sundram Fasteners 132 36 83
Maruti Suzuki 949 13.0 20 Linde India 131 46 84
SAIL 148 12.9 99 Minda Industries 126 52 85
L&T 854 11.8 23 Pfizer 125 20 86
Motherson 260 11.2 58 Vinati Organics 124 48 87
Marico 218 11.2 71 Navin Fluorine 119 52 88
Siemens 265 10.9 56 Vaibhav Global 117 64 89
Bharti Airtel 1,008 9.9 18 Bata India 115 23 90
Cipla 244 9.7 61 Oberoi Realty 112 19 91
Godrej Cons. 276 9.6 52 Alkyl Amines 110 79 92
Axis Bank 731 9.4 25 Tata Elxsi 109 23 93
Power Grid 400 9.2 39 Tanla Platforms 106 85 94
Bajaj Auto 366 8.8 43 Hatsun Agro 106 20 95
Dr Reddy's Labs 263 8.3 57 AIA Engineering 105 17 96
Hindustan Zinc 377 8.3 42 Alok Industries 101 35 97
B P C L 218 7.3 72 Tata Chemicals 96 36 98
Eicher Motors 190 6.3 83 Manappuram Fin. 95 34 99
M & M 235 5.6 66 P&G Health 92 57 100
* - Wealth Created; ** Size rank had the stock outperformed the benchmark
#11

December 2021 47
26th Annual Wealth Creation Study (2016-2021)
The fast who didn’t make it big
The 100th biggest Wealth Creator (P&G Health) created Wealth of INR 92 billion.
Nearly 130 more companies beat the 2016-21 benchmark return CAGR of 14% but did not
make it to the list as they created absolute wealth less than INR 92 billion.
Exhibit 26 lists the top 20 fastest among them.
Exhibit 26 The fast who didn’t make it big
2016-21 Price Price WC 2016-21 Price Price WC
CAGR (%) Mult. (x) (INR b) CAGR (%) Mult. (x) (INR b)
Borosil Renewables 71 14.5 20 Poly Medicure 42 5.8 62
HEG 60 10.5 58 Sudarshan Chem. 41 5.5 29
Balaji Amines 58 9.9 51 KEI Industries 40 5.3 34
Garware Tech Fibres 50 7.6 46 Bajaj Electricals 39 5.3 89
Suven Life Sciences 49 7.2 -14 FACT 39 5.2 57
Graphite India 48 7.2 86 Meghmani Organics 39 5.1 24
Gujarat Ambuja Exports 44 6.3 24 J B Chem & Pharma 38 5.0 79
Aarti Drugs 44 6.1 53 ITI 37 4.8 92
V-Mart Retail 43 5.9 42 Rain Industries 37 4.8 38
Radico Khaitan 42 5.9 62 Jindal Stainless Hisar 37 4.7 23
Note: In choosing companies, the condition is that base year 2016 market cap is at least INR 5 billion

December 2021 48
26th Annual Wealth Creation Study (2016-2021)
Wealth Destruction: Companies & Sectors
Financials – both, the top Wealth Creating and the top Wealth Destroying sector
The total Wealth Destroyed during 2016-21 is INR 11 trillion, 15% of the total Wealth Created
by top 100 companies. This is sharply below the previous Covid-hit study period 2015-20.
Five of the top 10 Wealth Destroying companies are PSUs.
Financials sector is both the top Wealth Creating and top Wealth Destroying sector. The
former is thanks to the private sector banks and NBFCs, and the latter mainly to public sector
banks.
Exhibit 27 Wealth destroyed is sharply below the previous Covid-hit study period 2015-20
Exhibit 28 Exhibit 29
5 of top 10 Wealth Destroyers are PSUs Financials top both Wealth Creation and Wealth Destruction Company Wealth Destroyed Price
INR bn % Share CAGR (%)
Vodafone Idea 1,362 12 -33
Coal India 994 9 -15
Sun Pharma 532 5 -6
ONGC 512 5 -7
Yes Bank 292 3 -38
Bank of Baroda 278 3 -13
Central Bank 212 2 10
Lupin 207 2 -26
IDBI Bank 202 2 -7
Indus Towers 201 2 -11
Total of Above 4,790 44
Total Wealth Destroyed 10,952 100
2,5
86
12
4
14
2
59 1,7
04
65
0
3,2
54
5,4
25
17
,14
0
4,1
85
14
,65
4
15
,83
3
6,0
06
4,8
82
8,6
26
33
,80
8
10
,95
2
43
1 1 0
182
15
33
93
14
4356
15 11 18
130
15
20
00
-05
20
01
-06
20
02
-07
20
03
-08
20
04
-09
20
05
-10
20
06
-11
20
07
-12
20
08
-13
20
09
-14
20
10
-15
20
11
-16
20
12
-17
20
13
-18
20
14
-19
20
15
-20
20
16
-21
Wealth destroyed (INR bn)
% of Wealth Created by top 100 Wealth Creators
#12
Sector Wealth
Destroyed (INR bn)
% Share
Financials 2,239 20
Telecom 1,822 17
Metals / Mining 1,049 10
Pharma / Healthcare 1,033 9
Capital Goods 727 7
Oil & Gas 672 6
Media 599 5
Auto 447 4
Constn. / Real Estate 382 3
Others 1,982 18
Total 10,952 100

December 2021 49
26th Annual Wealth Creation Study (2016-2021)
Appendices

December 2021 50
26th Annual Wealth Creation Study (2016-2021)
Appendix 1: The 100 Biggest Wealth Creators (2016-2021)
Wealth Created CAGR (2016-21, %) Mkt Cap (INR bn) ROE (%) P/E (x)
Rank Company INR b Share (%) Price PAT 2021 2016 2021 2016 2021 2016
1 Reliance Industries 9,661 13.6 31 8 13,160 3,387 6 13 30 11
2 TCS 7,294 10.3 20 7 11,754 4,958 39 34 35 21
3 HDFC Bank 5,182 7.3 23 20 8,234 2,708 15 17 26 21
4 Hind. Unilever 3,427 4.8 23 14 5,711 1,882 17 64 70 45
5 Infosys 3,257 4.6 18 7 5,828 2,798 28 22 30 21
6 Bajaj Finance 2,592 3.7 49 28 3,103 373 12 17 70 29
7 ICICI Bank 2,475 3.5 22 13 4,020 1,375 12 11 22 14
8 HDFC 2,422 3.4 18 13 4,508 1,747 12 20 24 17
9 Kotak Mahindra 2,081 2.9 21 24 3,476 1,249 12 10 35 36
10 HCL Technologies 1,613 2.3 19 15 2,669 1,148 18 20 24 21
11 Asian Paints 1,600 2.3 24 13 2,433 833 24 27 78 48
12 Bajaj Finserv 1,267 1.8 42 19 1,539 271 12 14 34 15
13 Wipro 1,226 1.7 14 4 2,269 1,392 20 19 21 16
14 Nestle India 1,099 1.6 24 19 1,655 556 103 31 79 63
15 Titan Company 1,082 1.5 36 7 1,383 301 13 19 144 44
16 Adani Enterprises 1,053 1.5 86 1 1,134 81 6 8 103 8
17 Adani Transmission 961 1.4 93 27 999 38 14 14 82 10
18 Ultratech Cement 945 1.3 16 18 1,945 886 13 11 35 36
19 Adani Ports 934 1.3 23 12 1,428 513 16 21 29 18
20 JSW Steel 821 1.2 30 36 1,131 310 17 9 14 18
21 Divi's Labs 702 1.0 30 12 964 261 21 26 49 23
22 Pidilite Inds. 622 0.9 25 7 920 303 20 30 81 38
23 Shree Cement 607 0.9 19 15 1,063 433 15 17 47 38
24 Berger Paints 573 0.8 34 15 743 170 21 23 104 47
25 Britannia Inds. 551 0.8 22 18 874 321 53 40 47 39
26 Tata Steel 538 0.8 22 L to P 972 310 11 -5 12 -15
27 Hindalco Inds. 519 0.7 30 L to P 734 182 5 -1 22 -54
28 Dabur India 514 0.7 17 7 956 438 22 29 56 36
29 Tech Mahindra 510 0.7 16 8 960 460 18 20 22 15
30 Havells India 455 0.6 27 12 657 201 19 19 65 35
31 Info Edge 439 0.6 41 -5 551 93 2 10 477 61
32 Tata Consumer 417 0.6 39 L to P 588 76 6 0 68 N.M.
33 Muthoot Finance 410 0.6 47 36 484 71 24 14 13 9
34 Vedanta 400 0.6 21 L to P 850 267 19 -28 7 N.M.
35 Biocon 395 0.6 38 16 491 96 10 9 67 28
36 Grasim Inds. 360 0.5 18 16 956 359 7 8 22 17
37 DLF 360 0.5 20 28 711 204 3 1 61 61
38 Honeywell Auto 343 0.5 41 27 419 76 18 14 91 54
39 Cholaman.Inv.&Fn 335 0.5 31 21 458 111 16 16 30 19
40 Gujarat Gas 303 0.4 38 43 378 76 28 14 30 35
41 Jubilant Foodworks 301 0.4 36 19 384 84 17 13 162 85
42 Indraprastha Gas 278 0.4 35 20 358 80 18 18 31 17
43 Jindal Steel 275 0.4 42 L to P 351 55 15 -9 7 N.M.
44 Astral 273 0.4 45 32 325 50 21 14 81 50
45 Balkrishna Inds. 266 0.4 40 21 327 61 19 16 28 14
46 Godrej Properties 260 0.4 37 P to L 391 64 -3 9 N.M. 40
47 Mphasis 251 0.4 29 14 334 103 19 11 27 16
48 P I Industries 244 0.3 32 19 342 78 14 27 46 25
49 Voltas 240 0.3 29 10 331 92 11 12 63 28
50 SRF 238 0.3 33 23 320 75 17 15 27 18
Wealth Created CAGR (2016-21, %) Mkt Cap (INR bn) ROE (%) P/E (x)
Rank Company INR b Share (%) Price PAT 2021 2016 2021 2016 2021 2016

December 2021 51
26th Annual Wealth Creation Study (2016-2021)
Appendix 1: The 100 Biggest Wealth Creators (2016-2021) … continued
Wealth Created CAGR (2016-21, %) Mkt Cap (INR bn) ROE (%) P/E (x)
Rank Company INR b Share (%) Price PAT 2021 2016 2021 2016 2021 2016
51 Mindtree 236 0.3 26 15 343 109 26 23 31 20
52 UPL 235 0.3 15 25 491 205 15 17 16 21
53 Apollo Hospitals 222 0.3 17 -13 417 184 2 7 372 81
54 3M India 219 0.3 23 -4 341 122 8 20 211 62
55 Abbott India 218 0.3 26 22 319 100 27 21 46 39
56 Deepak Nitrite 215 0.3 90 65 226 8 33 14 29 12
57 Trent 205 0.3 36 P to L 267 53 -6 3 N.M. 107
58 Bajaj Holdings 204 0.3 18 10 366 163 10 15 10 7
59 Page Industries 202 0.3 20 8 338 136 39 44 99 59
60 P & G Hygiene 201 0.3 15 9 404 204 91 26 62 48
61 Adani Power 195 0.3 20 18 328 116 10 7 26 21
62 Tata Comm 194 0.3 23 125 303 109 1101 -6 24 489
63 Whirlpool India 194 0.3 26 8 283 89 12 21 80 37
64 MRF 186 0.3 16 -12 349 163 10 34 27 7
65 Aarti Industries 180 0.3 40 15 229 43 15 23 44 17
66 Ruchi Soya Inds. 178 0.3 81 L to P 190 11 17 -52 28 N.M.
67 Kansai Nerolac 172 0.2 16 2 324 152 13 19 62 32
68 J K Cements 172 0.2 34 67 224 47 20 4 30 82
69 Coromandel Inter. 171 0.2 32 31 227 55 26 13 17 16
70 Relaxo Footwear 170 0.2 37 19 217 44 18 25 76 37
71 Alkem Labs 168 0.2 15 16 331 163 21 20 21 22
72 Ipca Labs 168 0.2 27 66 241 73 24 4 21 82
73 Supreme Inds. 165 0.2 23 34 259 94 31 17 27 42
74 Atul 164 0.2 36 18 209 46 17 17 33 17
75 Max Financial 161 0.2 20 11 297 92 13 13 70 36
76 APL Apollo Tubes 157 0.2 60 25 175 16 21 21 49 13
77 Coforge 150 0.2 43 12 177 30 19 17 38 11
78 Dr Lal Pathlabs 149 0.2 24 17 226 76 23 26 77 58
79 Escorts 146 0.2 56 57 174 17 17 6 20 19
80 The Ramco Cement 143 0.2 20 8 237 95 14 17 30 17
81 Sundaram Finance 142 0.2 17 15 287 145 15 14 25 25
82 Syngene Intl. 140 0.2 23 10 217 77 13 23 57 32
83 Sundram Fasteners 132 0.2 36 12 168 36 15 21 47 18
84 Linde India 131 0.2 46 53 154 23 7 1 102 128
85 Minda Industries 126 0.2 52 14 147 16 9 22 72 15
86 Pfizer 125 0.2 20 11 207 82 21 14 42 27
87 Vinati Organics 124 0.2 48 15 144 20 17 24 53 15
88 Navin Fluorine 119 0.2 52 25 136 17 15 13 55 20
89 Vaibhav Global 117 0.2 64 48 125 10 28 11 46 27
90 Bata India 115 0.2 23 P to L 181 65 -5 14 N.M. 39
91 Oberoi Realty 112 0.2 19 12 209 82 8 8 28 19
92 Alkyl Amines 110 0.2 79 43 116 6 37 24 39 13
93 Tata Elxsi 109 0.2 23 19 168 59 27 40 46 38
94 Tanla Platforms 106 0.2 85 108 111 4 40 1 31 42
95 Hatsun Agro 106 0.2 20 33 156 45 24 26 63 75
96 AIA Engineering 105 0.1 17 5 193 88 13 18 36 21
97 Alok Industries 101 0.1 35 L to L 100 6 16 -96 N.M. N.M.
98 Tata Chemicals 96 0.1 36 -21 191 95 2 10 87 13
99 Manappuram Finance 95 0.1 34 37 126 29 24 13 7 8
100 P & G Health 92 0.1 57 27 103 11 25 9 58 20
TOTAL / AVERAGE 70,815 100 25 18 1,08,320 35,784 13 12 32 24
Wealth Created CAGR (2016-21, %) Mkt Cap (INR bn) ROE (%) P/E (x)
Rank Company INR b Share (%) Price PAT 2021 2016 2021 2016 2021 2016
Note: L to P stands for Loss to Profit; P to L stands for Profit to Loss; L to L stands for Loss to Loss; N.M. stands for Not Meaningful

December 2021 52
26th Annual Wealth Creation Study (2016-2021)
Appendix 2: The 100 Fastest Wealth Creators (2016-2021)
Rank Company 2016-21 Price CAGR 16-21 (%) Wealth Created RoE (%) P/E (x)
CAGR (%) Times (x) PAT Sales INR b Share (%) 2021 2016 2021 2016
1 Adani Transmission 93 26.5 27 35 961 1.4 14 14 82 10
2 Deepak Nitrite 90 24.5 65 26 215 0.3 33 14 29 12
3 Adani Enterprises 86 22.4 1 3 1,053 1.5 6 8 103 8
4 Tanla Platforms 85 21.5 108 40 106 0.2 40 1 31 42
5 Ruchi Soya Inds. 81 19.6 L to P -12 178 0.3 17 -52 28 N.M.
6 Alkyl Amines 79 18.1 43 21 110 0.2 37 24 39 13
7 Vaibhav Global 64 12.0 48 15 117 0.2 28 11 46 27
8 APL Apollo Tubes 60 10.5 25 15 157 0.2 21 21 49 13
9 P & G Health 57 9.6 27 1 92 0.1 25 9 58 20
10 Escorts 56 9.3 57 15 146 0.2 17 6 20 19
11 Minda Industries 52 8.2 14 20 126 0.2 9 22 72 15
12 Navin Fluorine 52 8.1 25 12 119 0.2 15 13 55 20
13 Bajaj Finance 49 7.4 28 30 2,592 3.7 12 17 70 29
14 Vinati Organics 48 7.2 15 9 124 0.2 17 24 53 15
15 Muthoot Finance 47 6.8 36 18 410 0.6 24 14 13 9
16 Linde India 46 6.7 53 -1 131 0.2 7 1 102 128
17 Astral 45 6.4 32 14 273 0.4 21 14 81 50
18 Coforge 43 5.9 12 12 150 0.2 19 17 38 11
19 Jindal Steel 42 5.7 L to P 20 275 0.4 15 -9 7 N.M.
20 Bajaj Finserv 42 5.7 19 24 1,267 1.8 12 14 34 15
21 Info Edge 41 5.6 -5 8 439 0.6 2 10 477 61
22 Honeywell Auto 41 5.5 27 7 343 0.5 18 14 91 54
23 Balkrishna Inds. 40 5.4 21 12 266 0.4 19 16 28 14
24 Aarti Industries 40 5.3 15 8 180 0.3 15 23 44 17
25 Tata Consumer 39 5.3 L to P 12 417 0.6 6 0 68 N.M.
26 Biocon 38 5.1 16 16 395 0.6 10 9 67 28
27 Gujarat Gas 38 5.0 43 10 303 0.4 28 14 30 35
28 Relaxo Footwear 37 4.8 19 7 170 0.2 18 25 76 37
29 Godrej Properties 37 4.8 P to L -18 260 0.4 -3 9 N.M. 40
30 Trent 36 4.7 P to L 9 205 0.3 -6 3 N.M. 107
31 Sundram Fasteners 36 4.7 12 2 132 0.2 15 21 47 18
32 Tata Chemicals 36 4.6 -21 -7 96 0.1 2 10 87 13
33 Titan Company 36 4.6 7 14 1,082 1.5 13 19 144 44
34 Atul 36 4.6 18 8 164 0.2 17 17 33 17
35 Jubilant Foodworks 36 4.6 19 6 301 0.4 17 13 162 85
36 Indraprastha Gas 35 4.5 20 6 278 0.4 18 18 31 17
37 Alok Industries 35 4.5 L to L -22 101 0.1 16 -96 N.M. N.M.
38 Berger Paints 34 4.4 15 10 573 0.8 21 23 104 47
39 J K Cements 34 4.3 67 9 172 0.2 20 4 30 82
40 Manappuram Fin. 34 4.3 37 22 95 0.1 24 13 7 8
41 SRF 33 4.1 23 13 238 0.3 17 15 27 18
42 Coromandel Inter. 32 4.1 31 4 171 0.2 26 13 17 16
43 P I Industries 32 4.0 19 17 244 0.3 14 27 46 25
44 Cholaman.Inv.&Fn 31 3.9 21 18 335 0.5 16 16 30 19
45 Reliance Industries 31 3.9 8 11 9,661 13.6 6 13 30 11
46 Hindalco Inds. 30 3.7 L to P 6 519 0.7 5 -1 22 N.M.
47 Divi's Labs 30 3.7 12 13 702 1.0 21 26 49 23
48 JSW Steel 30 3.7 36 14 821 1.2 17 9 14 18
49 Mphasis 29 3.6 14 10 251 0.4 19 11 27 16
50 Voltas 29 3.6 10 6 240 0.3 11 12 63 28
Rank Company 2016-21 Price CAGR 16-21 (%) Wealth Created RoE (%) P/E (x)
CAGR (%) Times (x) PAT Sales INR bn Share (%) 2021 2016 2021 2016
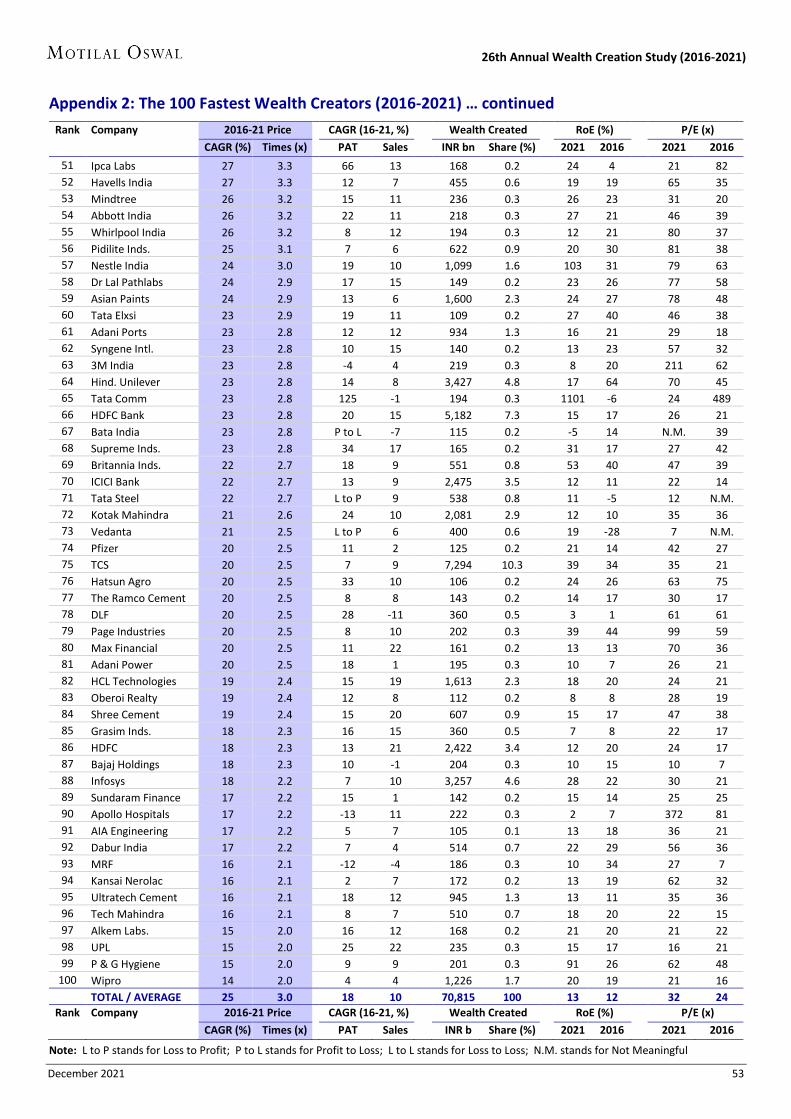
December 2021 53
26th Annual Wealth Creation Study (2016-2021)
Appendix 2: The 100 Fastest Wealth Creators (2016-2021) … continued
Rank Company 2016-21 Price CAGR (16-21, %) Wealth Created RoE (%) P/E (x) CAGR (%) Times (x) PAT Sales INR bn Share (%) 2021 2016 2021 2016
51 Ipca Labs 27 3.3 66 13 168 0.2 24 4 21 82
52 Havells India 27 3.3 12 7 455 0.6 19 19 65 35
53 Mindtree 26 3.2 15 11 236 0.3 26 23 31 20
54 Abbott India 26 3.2 22 11 218 0.3 27 21 46 39
55 Whirlpool India 26 3.2 8 12 194 0.3 12 21 80 37
56 Pidilite Inds. 25 3.1 7 6 622 0.9 20 30 81 38
57 Nestle India 24 3.0 19 10 1,099 1.6 103 31 79 63
58 Dr Lal Pathlabs 24 2.9 17 15 149 0.2 23 26 77 58
59 Asian Paints 24 2.9 13 6 1,600 2.3 24 27 78 48
60 Tata Elxsi 23 2.9 19 11 109 0.2 27 40 46 38
61 Adani Ports 23 2.8 12 12 934 1.3 16 21 29 18
62 Syngene Intl. 23 2.8 10 15 140 0.2 13 23 57 32
63 3M India 23 2.8 -4 4 219 0.3 8 20 211 62
64 Hind. Unilever 23 2.8 14 8 3,427 4.8 17 64 70 45
65 Tata Comm 23 2.8 125 -1 194 0.3 1101 -6 24 489
66 HDFC Bank 23 2.8 20 15 5,182 7.3 15 17 26 21
67 Bata India 23 2.8 P to L -7 115 0.2 -5 14 N.M. 39
68 Supreme Inds. 23 2.8 34 17 165 0.2 31 17 27 42
69 Britannia Inds. 22 2.7 18 9 551 0.8 53 40 47 39
70 ICICI Bank 22 2.7 13 9 2,475 3.5 12 11 22 14
71 Tata Steel 22 2.7 L to P 9 538 0.8 11 -5 12 N.M.
72 Kotak Mahindra 21 2.6 24 10 2,081 2.9 12 10 35 36
73 Vedanta 21 2.5 L to P 6 400 0.6 19 -28 7 N.M.
74 Pfizer 20 2.5 11 2 125 0.2 21 14 42 27
75 TCS 20 2.5 7 9 7,294 10.3 39 34 35 21
76 Hatsun Agro 20 2.5 33 10 106 0.2 24 26 63 75
77 The Ramco Cement 20 2.5 8 8 143 0.2 14 17 30 17
78 DLF 20 2.5 28 -11 360 0.5 3 1 61 61
79 Page Industries 20 2.5 8 10 202 0.3 39 44 99 59
80 Max Financial 20 2.5 11 22 161 0.2 13 13 70 36
81 Adani Power 20 2.5 18 1 195 0.3 10 7 26 21
82 HCL Technologies 19 2.4 15 19 1,613 2.3 18 20 24 21
83 Oberoi Realty 19 2.4 12 8 112 0.2 8 8 28 19
84 Shree Cement 19 2.4 15 20 607 0.9 15 17 47 38
85 Grasim Inds. 18 2.3 16 15 360 0.5 7 8 22 17
86 HDFC 18 2.3 13 21 2,422 3.4 12 20 24 17
87 Bajaj Holdings 18 2.3 10 -1 204 0.3 10 15 10 7
88 Infosys 18 2.2 7 10 3,257 4.6 28 22 30 21
89 Sundaram Finance 17 2.2 15 1 142 0.2 15 14 25 25
90 Apollo Hospitals 17 2.2 -13 11 222 0.3 2 7 372 81
91 AIA Engineering 17 2.2 5 7 105 0.1 13 18 36 21
92 Dabur India 17 2.2 7 4 514 0.7 22 29 56 36
93 MRF 16 2.1 -12 -4 186 0.3 10 34 27 7
94 Kansai Nerolac 16 2.1 2 7 172 0.2 13 19 62 32
95 Ultratech Cement 16 2.1 18 12 945 1.3 13 11 35 36
96 Tech Mahindra 16 2.1 8 7 510 0.7 18 20 22 15
97 Alkem Labs. 15 2.0 16 12 168 0.2 21 20 21 22
98 UPL 15 2.0 25 22 235 0.3 15 17 16 21
99 P & G Hygiene 15 2.0 9 9 201 0.3 91 26 62 48
100 Wipro 14 2.0 4 4 1,226 1.7 20 19 21 16
TOTAL / AVERAGE 25 3.0 18 10 70,815 100 13 12 32 24
Rank Company 2016-21 Price CAGR (16-21, %) Wealth Created RoE (%) P/E (x) CAGR (%) Times (x) PAT Sales INR b Share (%) 2021 2016 2021 2016
Note: L to P stands for Loss to Profit; P to L stands for Profit to Loss; L to L stands for Loss to Loss; N.M. stands for Not Meaningful

December 2021 54
26th Annual Wealth Creation Study (2016-2021)
Appendix 3: The 100 Consistent Wealth Creators (2016-2021)
No. of years of 2016-21 2016-21 Market Cap (INR bn) RoE (%) P/E (x)
Rank Company Name outperformance Price CAGR (%) PAT CAGR (%) 2021 2016 2021 2016 2021 2016
1 Adani Enterprises 5 86 1 1,134 81 6 8 103 8
2 Alkyl Amines 5 79 43 116 6 37 24 39 13
3 P & G Health 5 57 27 103 11 25 9 58 20
4 Vinati Organics 5 48 15 144 20 17 24 53 15
5 Astral 5 45 32 325 50 21 14 81 50
6 Honeywell Auto 5 41 27 419 76 18 14 91 54
7 Aarti Industries 5 40 15 229 43 15 23 44 17
8 SRF 5 33 23 320 75 17 15 27 18
9 Reliance Industries 5 31 8 13,160 3,387 6 13 30 11
10 Adani Transmission 4 93 27 999 38 14 14 82 10
11 Deepak Nitrite 4 90 65 226 8 33 14 29 12
12 Tanla Platforms 4 85 108 111 4 40 1 31 42
13 Vaibhav Global 4 64 48 125 10 28 11 46 27
14 APL Apollo Tubes 4 60 25 175 16 21 21 49 13
15 Escorts 4 56 57 174 17 17 6 20 19
16 Navin Fluorine 4 52 25 136 17 15 13 55 20
17 Bajaj Finance 4 49 28 3,103 373 12 17 70 29
18 Muthoot Finance 4 47 36 484 71 24 14 13 9
19 Coforge 4 43 12 177 30 19 17 38 11
20 Bajaj Finserv 4 42 19 1,539 271 12 14 34 15
21 Info Edge 4 41 -5 551 93 2 10 477 61
22 Balkrishna Inds. 4 40 21 327 61 19 16 28 14
23 Tata Consumer 4 39 L to P 588 76 6 0 68 N.M.
24 Relaxo Footwear 4 37 19 217 44 18 25 76 37
25 Tata Chemicals 4 36 -21 191 95 2 10 87 13
26 Titan Company 4 36 7 1,383 301 13 19 144 44
27 Atul 4 36 18 209 46 17 17 33 17
28 Jubilant Foodworks 4 36 19 384 84 17 13 162 85
29 Divi’s Labs 4 30 12 964 261 21 26 49 23
30 Mindtree 4 26 15 343 109 26 23 31 20
31 Pidilite Inds. 4 25 7 920 303 20 30 81 38
32 Syngene Intl. 4 23 10 217 77 13 23 57 32
33 HDFC Bank 4 23 20 8,234 2,708 15 17 26 21
34 Britannia Inds. 4 22 18 874 321 53 40 47 39
35 ICICI Bank 4 22 13 4,020 1,375 12 11 22 14
36 Kotak Mahindra 4 21 24 3,476 1,249 12 10 35 36
37 TCS 4 20 7 11,754 4,958 39 34 35 21
38 Bajaj Holdings 4 18 10 366 163 10 15 10 7
39 Sundaram Finance 4 17 15 287 145 15 14 25 25
40 Minda Industries 3 52 14 147 16 9 22 72 15
41 Linde India 3 46 53 154 23 7 1 102 128
42 Jindal Steel 3 42 L to P 351 55 15 -9 7 N.M.
43 Biocon 3 38 16 491 96 10 9 67 28
44 Gujarat Gas 3 38 43 378 76 28 14 30 35
45 Godrej Properties 3 37 P to L 391 64 -3 9 N.M. 40
46 Trent 3 36 P to L 267 53 -6 3 N.M. 107
47 Sundram Fasteners 3 36 12 168 36 15 21 47 18
48 Indraprastha Gas 3 35 20 358 80 18 18 31 17
49 Alok Industries 3 35 L to L 100 6 16 -96 N.M. N.M.
50 Berger Paints 3 34 15 743 170 21 23 104 47
No. of years of 2016-21 2016-21 Market Cap (INR bn) RoE (%) P/E (x)
Rank Company Name outperformance Price CAGR (%) PAT CAGR (%) 2021 2016 2021 2016 2021 2016

December 2021 55
26th Annual Wealth Creation Study (2016-2021)
Appendix 3: The 100 Consistent Wealth Creators (2016-2021) … continued
No. of years of 2016-21 2016-21 Market Cap (INR bn) RoE (%) P/E (x)
Rank Company Name outperformance Price CAGR (%) PAT CAGR (%) 2021 2016 2021 2016 2021 2016
51 J K Cements 3 34 67 224 47 20 4 30 82
52 Coromandel Inter. 3 32 31 227 55 26 13 17 16
53 P I Industries 3 32 19 342 78 14 27 46 25
54 Cholaman.Inv.&Fn 3 31 21 458 111 16 16 30 19
55 JSW Steel 3 30 36 1,131 310 17 9 14 18
56 Mphasis 3 29 14 334 103 19 11 27 16
57 Voltas 3 29 10 331 92 11 12 63 28
58 Havells India 3 27 12 657 201 19 19 65 35
59 Abbott India 3 26 22 319 100 27 21 46 39
60 Whirlpool India 3 26 8 283 89 12 21 80 37
61 Nestle India 3 24 19 1,655 556 103 31 79 63
62 Dr Lal Pathlabs 3 24 17 226 76 23 26 77 58
63 Asian Paints 3 24 13 2,433 833 24 27 78 48
64 3M India 3 23 -4 341 122 8 20 211 62
65 Hind. Unilever 3 23 14 5,711 1,882 17 64 70 45
66 Bata India 3 23 P to L 181 65 -5 14 N.M. 39
67 Supreme Inds. 3 23 34 259 94 31 17 27 42
68 Tata Steel 3 22 L to P 972 310 11 -5 12 N.M.
69 Pfizer 3 20 11 207 82 21 14 42 27
70 DLF 3 20 28 711 204 3 1 61 61
71 Page Industries 3 20 8 338 136 39 44 99 59
72 Max Financial 3 20 11 297 92 13 13 70 36
73 Oberoi Realty 3 19 12 209 82 8 8 28 19
74 Grasim Inds. 3 18 16 956 359 7 8 22 17
75 HDFC 3 18 13 4,508 1,747 12 20 24 17
76 Infosys 3 18 7 5,828 2,798 28 22 30 21
77 AIA Engineering 3 17 5 193 88 13 18 36 21
78 Dabur India 3 17 7 956 438 22 29 56 36
79 MRF 3 16 -12 349 163 10 34 27 7
80 Kansai Nerolac 3 16 2 324 152 13 19 62 32
81 Ultratech Cement 3 16 18 1,945 886 13 11 35 36
82 Tech Mahindra 3 16 8 960 460 18 20 22 15
83 UPL 3 15 25 491 205 15 17 16 21
84 P & G Hygiene 3 15 9 404 204 91 26 62 48
85 Wipro 3 14 4 2,269 1,392 20 19 21 16
86 Ruchi Soya Inds. 2 81 L to P 190 11 17 -52 28 N.M.
87 Manappuram Fin. 2 34 37 126 29 24 13 7 8
88 Hindalco Inds. 2 30 L to P 734 182 5 -1 22 N.M.
89 Ipca Labs 2 27 66 241 73 24 4 21 82
90 Tata Elxsi 2 23 19 168 59 27 40 46 38
91 Adani Ports 2 23 12 1,428 513 16 21 29 18
92 Tata Comm 2 23 125 303 109 1,101 -6 24 489
93 Vedanta 2 21 L to P 850 267 19 -28 7 N.M.
94 Hatsun Agro 2 20 33 156 45 24 26 63 75
95 The Ramco Cement 2 20 8 237 95 14 17 30 17
96 Adani Power 2 20 18 328 116 10 7 26 21
97 HCL Technologies 2 19 15 2,669 1,148 18 20 24 21
98 Shree Cement 2 19 15 1,063 433 15 17 47 38
99 Apollo Hospitals 2 17 -13 417 184 2 7 372 81
100 Alkem Labs 2 15 16 331 163 21 20 21 22
No. of years of 2016-21 2016-21 Market Cap (INR bn) RoE (%) P/E (x)
Rank Company Name outperformance Price CAGR (%) PAT CAGR (%) 2021 2016 2021 2016 2021 2016
Note: L to P stands for Loss to Profit; P to L stands for Profit to Loss; L to L stands for Loss to Loss; N.M. stands for Not Meaningful

December 2021 56
26th Annual Wealth Creation Study (2016-2021)
Appendix 4: The 100 All-round Wealth Creators (2016-2021)
All-round Rank Total of 2016-21
Rank Company Biggest Fastest Consistent Ranks Price CAGR (%)
1 Adani Enterprises 16 3 1 20 86
2 Adani Transmission 17 1 10 28 93
3 Bajaj Finance 6 13 17 36 49
4 Bajaj Finserv 12 20 20 52 42
5 Reliance Industries 1 45 9 55 31
6 Muthoot Finance 33 15 18 66 47
7 Astral 44 17 5 66 45
8 Honeywell Auto 38 22 6 66 41
9 Deepak Nitrite 56 2 11 69 90
10 Info Edge 31 21 21 73 41
11 Titan Company 15 33 26 74 36
12 Tata Consumer 32 25 23 80 39
13 Balkrishna Inds. 45 23 22 90 40
14 Aarti Industries 65 24 7 96 40
15 Divi’s Labs 21 47 29 97 30
16 APL Apollo Tubes 76 8 14 98 60
17 SRF 50 41 8 99 33
18 Alkyl Amines 92 6 2 100 79
19 HDFC Bank 3 66 33 102 23
20 Escorts 79 10 15 104 56
21 Jindal Steel 43 19 42 104 42
22 Biocon 35 26 43 104 38
23 Jubilant Foodworks 41 35 28 104 36
24 Vinati Organics 87 14 4 105 48
25 Vaibhav Global 89 7 13 109 64
26 Pidilite Inds. 22 56 31 109 25
27 Tanla Platforms 94 4 12 110 85
28 Gujarat Gas 40 27 44 111 38
29 P & G Health 100 9 3 112 57
30 Berger Paints 24 38 50 112 34
31 ICICI Bank 7 70 35 112 22
32 Coforge 77 18 19 114 43
33 TCS 2 75 37 114 20
34 Navin Fluorine 88 12 16 116 52
35 Kotak Mahindra 9 72 36 117 21
36 Godrej Properties 46 29 45 120 37
37 Relaxo Footwear 70 28 24 122 37
38 JSW Steel 20 48 55 123 30
39 Indraprastha Gas 42 36 48 126 35
40 Britannia Inds. 25 69 34 128 22
41 Nestle India 14 57 61 132 24
42 Trent 57 30 46 133 36
43 Asian Paints 11 59 63 133 24
44 Hind. Unilever 4 64 65 133 23
45 Mindtree 51 53 30 134 26
46 Atul 74 34 27 135 36
47 Minda Industries 85 11 40 136 52
48 Cholaman.Inv.&Fn 39 44 54 137 31
49 Havells India 30 52 58 140 27
50 Linde India 84 16 41 141 46
All-round Rank Total of 2016-21
Rank Company Biggest Fastest Consistent Ranks Price CAGR (%)

December 2021 57
26th Annual Wealth Creation Study (2016-2021)
Appendix 4: The 100 All-round Wealth Creators (2016-2021) … continued
All-round Rank Total of 2016-21
Rank Company Biggest Fastest Consistent Ranks Price CAGR (%)
51 P I Industries 48 43 53 144 32
52 Mphasis 47 49 56 152 29
53 Tata Chemicals 98 32 25 155 36
54 Voltas 49 50 57 156 29
55 Ruchi Soya Inds. 66 5 86 157 81
56 J K Cements 68 39 51 158 34
57 Sundram Fasteners 83 31 47 161 36
58 Hindalco Inds. 27 46 88 161 30
59 Coromandel Inter 69 42 52 163 32
60 Tata Steel 26 71 68 165 22
61 Abbott India 55 54 59 168 26
62 HDFC 8 86 75 169 18
63 Infosys 5 88 76 169 18
64 Adani Ports 19 61 91 171 23
65 Syngene Intl. 82 62 32 176 23
66 Whirlpool India 63 55 60 178 26
67 3M India 54 63 64 181 23
68 Alok Industries 97 37 49 183 35
69 Bajaj Holdings 58 87 38 183 18
70 DLF 37 78 70 185 20
71 HCL Technologies 10 82 97 189 19
72 Ultratech Cement 18 95 81 194 16
73 Grasim Inds 36 85 74 195 18
74 Dr Lal Pathlabs 78 58 62 198 24
75 Dabur India 28 92 78 198 17
76 Wipro 13 100 85 198 14
77 Vedanta 34 73 93 200 21
78 Shree Cement 23 84 98 205 19
79 Tech Mahindra 29 96 82 207 16
80 Supreme Inds. 73 68 67 208 23
81 Page Industries 59 79 71 209 20
82 Sundaram Finance 81 89 39 209 17
83 Ipca Labs 72 51 89 212 27
84 Tata Comm 62 65 92 219 23
85 Bata India 90 67 66 223 23
86 Manappuram Fin. 99 40 87 226 34
87 Max Financial 75 80 72 227 20
88 Pfizer 86 74 69 229 20
89 UPL 52 98 83 233 15
90 MRF 64 93 79 236 16
91 Adani Power 61 81 96 238 20
92 Kansai Nerolac 67 94 80 241 16
93 Apollo Hospitals 53 90 99 242 17
94 Tata Elxsi 93 60 90 243 23
95 P & G Hygiene 60 99 84 243 15
96 Oberoi Realty 91 83 73 247 19
97 The Ramco Cement 80 77 95 252 20
98 AIA Engineering 96 91 77 264 17
99 Hatsun Agro 95 76 94 265 20
100 Alkem Labs 71 97 100 268 15
All-round Rank Total of 2016-21
Rank Company Biggest Fastest Consistent Ranks Price CAGR (%)
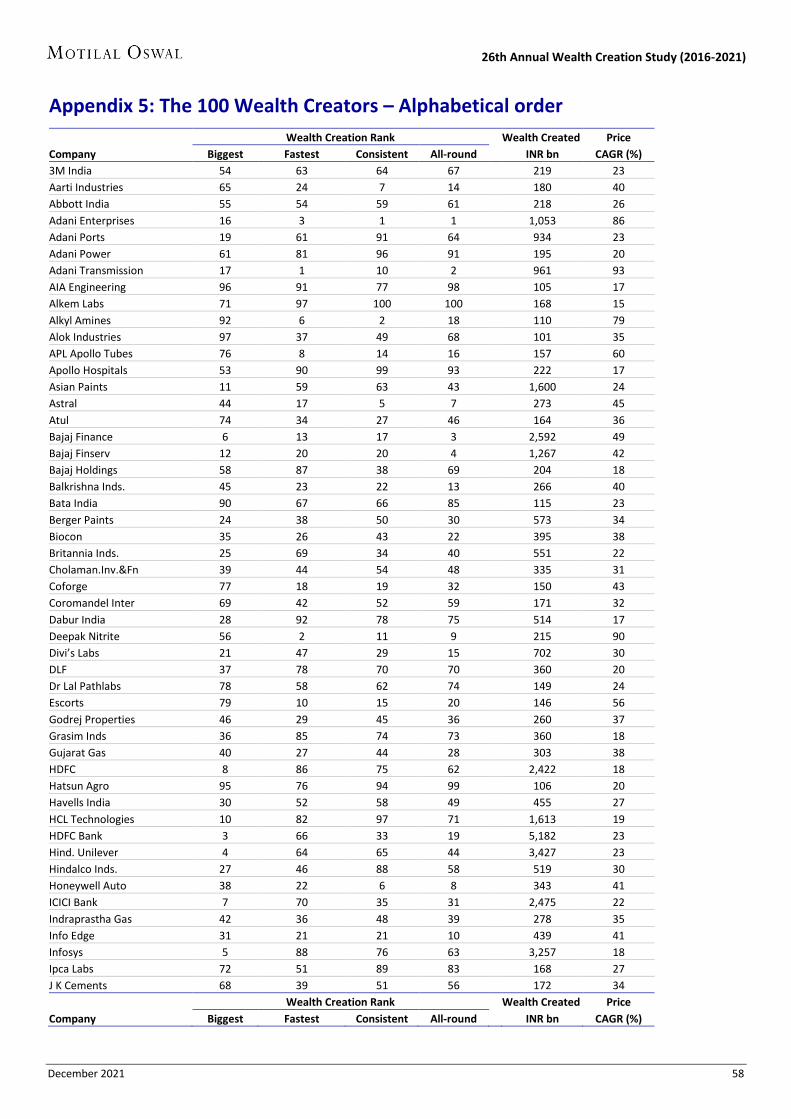
December 2021 58
26th Annual Wealth Creation Study (2016-2021)
Appendix 5: The 100 Wealth Creators – Alphabetical order
Wealth Creation Rank Wealth Created Price
Company Biggest Fastest Consistent All-round INR bn CAGR (%)
3M India 54 63 64 67 219 23
Aarti Industries 65 24 7 14 180 40
Abbott India 55 54 59 61 218 26
Adani Enterprises 16 3 1 1 1,053 86
Adani Ports 19 61 91 64 934 23
Adani Power 61 81 96 91 195 20
Adani Transmission 17 1 10 2 961 93
AIA Engineering 96 91 77 98 105 17
Alkem Labs 71 97 100 100 168 15
Alkyl Amines 92 6 2 18 110 79
Alok Industries 97 37 49 68 101 35
APL Apollo Tubes 76 8 14 16 157 60
Apollo Hospitals 53 90 99 93 222 17
Asian Paints 11 59 63 43 1,600 24
Astral 44 17 5 7 273 45
Atul 74 34 27 46 164 36
Bajaj Finance 6 13 17 3 2,592 49
Bajaj Finserv 12 20 20 4 1,267 42
Bajaj Holdings 58 87 38 69 204 18
Balkrishna Inds. 45 23 22 13 266 40
Bata India 90 67 66 85 115 23
Berger Paints 24 38 50 30 573 34
Biocon 35 26 43 22 395 38
Britannia Inds. 25 69 34 40 551 22
Cholaman.Inv.&Fn 39 44 54 48 335 31
Coforge 77 18 19 32 150 43
Coromandel Inter 69 42 52 59 171 32
Dabur India 28 92 78 75 514 17
Deepak Nitrite 56 2 11 9 215 90
Divi’s Labs 21 47 29 15 702 30
DLF 37 78 70 70 360 20
Dr Lal Pathlabs 78 58 62 74 149 24
Escorts 79 10 15 20 146 56
Godrej Properties 46 29 45 36 260 37
Grasim Inds 36 85 74 73 360 18
Gujarat Gas 40 27 44 28 303 38
HDFC 8 86 75 62 2,422 18
Hatsun Agro 95 76 94 99 106 20
Havells India 30 52 58 49 455 27
HCL Technologies 10 82 97 71 1,613 19
HDFC Bank 3 66 33 19 5,182 23
Hind. Unilever 4 64 65 44 3,427 23
Hindalco Inds. 27 46 88 58 519 30
Honeywell Auto 38 22 6 8 343 41
ICICI Bank 7 70 35 31 2,475 22
Indraprastha Gas 42 36 48 39 278 35
Info Edge 31 21 21 10 439 41
Infosys 5 88 76 63 3,257 18
Ipca Labs 72 51 89 83 168 27
J K Cements 68 39 51 56 172 34
Wealth Creation Rank Wealth Created Price
Company Biggest Fastest Consistent All-round INR bn CAGR (%)

December 2021 59
26th Annual Wealth Creation Study (2016-2021)
Appendix 5: The 100 Wealth Creators – Alphabetical order … continued
Wealth Creation Rank Wealth Created Price
Company Biggest Fastest Consistent All-round INR bn CAGR (%)
Jindal Steel 43 19 42 21 275 42
JSW Steel 20 48 55 38 821 30
Jubilant Foodworks 41 35 28 23 301 36
Kansai Nerolac 67 94 80 92 172 16
Kotak Mahindra 9 72 36 35 2,081 21
Linde India 84 16 41 50 131 46
Manappuram Finance 99 40 87 86 95 34
Max Financial 75 80 72 87 161 20
Minda Industries 85 11 40 47 126 52
Mindtree 51 53 30 45 236 26
Mphasis 47 49 56 52 251 29
MRF 64 93 79 90 186 16
Muthoot Finance 33 15 18 6 410 47
Navin Fluorine 88 12 16 34 119 52
Nestle India 14 57 61 41 1,099 24
Oberoi Realty 91 83 73 96 112 19
P & G Health 100 9 3 29 92 57
P & G Hygiene 60 99 84 95 201 15
P I Industries 48 43 53 51 244 32
Page Industries 59 79 71 81 202 20
Pfizer 86 74 69 88 125 20
Pidilite Inds. 22 56 31 26 622 25
Relaxo Footwear 70 28 24 37 170 37
Reliance Industries 1 45 9 5 9,661 31
Ruchi Soya Inds. 66 5 86 55 178 81
Shree Cement 23 84 98 78 607 19
SRF 50 41 8 17 238 33
Sundaram Finance 81 89 39 82 142 17
Sundram Fasteners 83 31 47 57 132 36
Supreme Inds. 73 68 67 80 165 23
Syngene Intl. 82 62 32 65 140 23
Tanla Platforms 94 4 12 27 106 85
Tata Chemicals 98 32 25 53 96 36
Tata Comm 62 65 92 84 194 23
Tata Consumer 32 25 23 12 417 39
Tata Elxsi 93 60 90 94 109 23
Tata Steel 26 71 68 60 538 22
TCS 2 75 37 33 7,294 20
Tech Mahindra 29 96 82 79 510 16
The Ramco Cement 80 77 95 97 143 20
Titan Company 15 33 26 11 1,082 36
Trent 57 30 46 42 205 36
Ultratech Cement 18 95 81 72 945 16
UPL 52 98 83 89 235 15
Vaibhav Global 89 7 13 25 117 64
Vedanta 34 73 93 77 400 21
Vinati Organics 87 14 4 24 124 48
Voltas 49 50 57 54 240 29
Whirlpool India 63 55 60 66 194 26
Wipro 13 100 85 76 1,226 14
Wealth Creation Rank Wealth Created Price
Company Biggest Fastest Consistent All-round INR bn CAGR (%)

N O T E S

Disclosures: The following Disclosures are being made in compliance with the SEBI Research Analyst Regulations 2014 (herein after referred to as the Regulations).
Motilal Oswal Financial Services Ltd. (MOFSL) is a SEBI Registered Research Analyst having registration no. INH000000412. MOFSL, the Research Entity (RE) as defined in the Regulations, is engaged in the business of providing Stock broking services, Investment Advisory Services, Depository participant services & distribution of various financial products. MOFSL is a subsidiary company of Passionate Investment Management Pvt. Ltd.. (PIMPL). MOFSL is a listed public company, the details in respect of which are available on www.motilaloswal.com. MOFSL (erstwhile Motilal Oswal Securities Limited - MOSL) is registered with the Securities & Exchange Board of India (SEBI) and is a registered Trading Member with National Stock Exchange of India Ltd. (NSE) and Bombay Stock Exchange Limited (BSE), Multi Commodity Exchange of India Limited (MCX) and National Commodity & Derivatives Exchange Limited (NCDEX) for its stock broking activities & is Depository participant with Central Depository Services Limited (CDSL) National Securities Depository Limited (NSDL),NERL, COMRIS and CCRL and is member of Association of Mutual Funds of India (AMFI) for distribution of financial products and Insurance Regulatory & Development Authority of India (IRDA) as Corporate Agent for insurance products. Details of associate entities of Motilal Oswal Financial Services Limited are available on the website at http://onlinereports.motilaloswal.com/Dormant/documents/Associate%20Details.pdf
Details of pending Enquiry Proceedings of Motilal Oswal Financial Services Limited are available on the website at https://galaxy.motilaloswal.com/ResearchAnalyst/PublishViewLitigation.aspx
MOFSL, it’s associates, Research Analyst or their relative may have any financial interest in the subject company. MOFSL and/or its associates and/or Research Analyst may have actual/beneficial ownership of 1% or more securities in the subject company in the past 12 months. MOFSL and its associate company(ies), their directors and Research Analyst and their relatives may; (a) from time to time, have a long or short position in, act as principal in, and buy or sell the securities or derivatives thereof of companies mentioned herein. (b) be engaged in any other transaction involving such securities and earn brokerage or other compensation or act as a market maker in the financial instruments of the company(ies) discussed herein or act as an advisor or lender/borrower to such company(ies) or may have any other potential conflict of interests with respect to any recommendation and other related information and opinions.; however the same shall have no bearing whatsoever on the specific recommendations made by the analyst(s), as the recommendations made by the analyst(s) are completely independent of the views of the associates of MOFSL even though there might exist an inherent conflict of interest in some of the stocks mentioned in the research report. Research Analyst may have served as director/officer, etc. in the subject company in the past 12 months. MOFSL and/or its associates may have received any compensation from the subject company in the past 12 months.
In the past 12 months , MOFSL or any of its associates may have: a) managed or co-managed public offering of securities from subject company of this research report, b) received compensation for investment banking or merchant banking or brokerage services from subject company of this research report, c) received compensation for products or services other than investment banking or merchant banking or brokerage services from the subject company of this research report. d) Subject Company may have been a client of MOFSL or its associates in the past 12 months.
MOFSL and it’s associates have not received any compensation or other benefits from the subject company or third party in connection with the research report. To enhance transparency, MOFSL has incorporated a Disclosure of Interest Statement in this document. This should, however, not be treated as endorsement of the views expressed in the report. MOFSL and / or its affiliates do and seek to do business including investment banking with companies covered in its research reports. As a result, the recipients of this report should be aware that MOFSL may have a potential conflict of interest that may affect the objectivity of this report. Compensation of Research Analysts is not based on any specific merchant banking, investment banking or brokerage service transactions. Above disclosures include beneficial holdings lying in demat account of MOFSL which are opened for proprietary investments only. While calculating beneficial holdings, It does not consider demat accounts which are opened in name of MOFSL for other purposes (i.e holding client securities, collaterals, error trades etc.). MOFSL also earns DP income from clients which are not considered in above disclosures. Above disclosures include beneficial holdings lying in demat account of MOFSL which are opened for proprietary investments only. While calculating beneficial holdings, It does not consider demat accounts which are opened in name of MOFSL for other purposes (i.e holding client securities, collaterals, error trades etc.). MOFSL also earns DP income from clients which are not considered in above disclosures.
Terms & Conditions: This report has been prepared by MOFSL and is meant for sole use by the recipient and not for circulation. The report and information contained herein is strictly confidential and may not be altered in any way, transmitted to, copied or distributed, in part or in whole, to any other person or to the media or reproduced in any form, without prior written consent of MOFSL. The report is based on the facts, figures and information that are considered true, correct, reliable and accurate. The intent of this report is not recommendatory in nature. The information is obtained from publicly available media or other sources believed to be reliable. Such information has not been independently verified and no guaranty, representation of warranty, express or implied, is made as to its accuracy, completeness or correctness. All such information and opinions are subject to change without notice. The report is prepared solely for informational purpose and does not constitute an offer document or solicitation of offer to buy or sell or subscribe for securities or other financial instruments for the clients. Though disseminated to all the customers simultaneously, not all customers may receive this report at the same time. MOFSL will not treat recipients as customers by virtue of their receiving this report. Analyst Certification The views expressed in this research report accurately reflect the personal views of the analyst(s) about the subject securities or issues, and no part of the compensation of the research analyst(s) was, is, or will be directly or indirectly related to the specific recommendations and views expressed by research analyst(s) in this report.
Disclosure of Interest Statement Companies where there is interest Analyst ownership of the stock No A graph of daily closing prices of securities is available at www.nseindia.com, www.bseindia.com. Research Analyst views on Subject Company may vary based on Fundamental research and Technical Research. Proprietary trading desk of MOFSL or its associates maintains arm’s length distance with Research Team as all the activities are segregated from MOFSL research activity and therefore it can have an independent view with regards to subject company for which Research Team have expressed their views.
Regional Disclosures (outside India) This report is not directed or intended for distribution to or use by any person or entity resident in a state, country or any jurisdiction, where such distribution, publication, availability or use would be contrary to law, regulation or which would subject MOFSL & its group companies to registration or licensing requirements within such jurisdictions.
For Hong Kong: This report is distributed in Hong Kong by Motilal Oswal capital Markets (Hong Kong) Private Limited, a licensed corporation (CE AYY-301) licensed and regulated by the Hong Kong Securities and Futures Commission (SFC) pursuant to the Securities and Futures Ordinance (Chapter 571 of the Laws of Hong Kong) “SFO”. As per SEBI (Research Analyst Regulations) 2014 Motilal Oswal Financial Services Limited(SEBI Reg No. INH000000412) has an agreement with Motilal Oswal capital Markets (Hong Kong) Private Limited for distribution of research report in Hong Kong. This report is intended for distribution only to “Professional Investors” as defined in Part I of Schedule 1 to SFO. Any investment or investment activity to which this document relates is only available to professional investor and will be engaged only with professional investors.” Nothing here is an offer or solicitation of these securities, products and services in any jurisdiction where their offer or sale is not qualified or exempt from registration. The Indian Analyst(s) who compile this report is/are not located in Hong Kong & are not conducting Research Analysis in Hong Kong.
For U.S: Motilal Oswal Financial Services Limited (MOFSL) is not a registered broker - dealer under the U.S. Securities Exchange Act of 1934, as amended (the"1934 act") and under applicable state laws in the United States. In addition MOFSL is not a registered investment adviser under the U.S. Investment Advisers Act of 1940, as amended (the "Advisers Act" and together with the 1934 Act, the "Acts), and under applicable state laws in the United States. Accordingly, in the absence of specific exemption under the Acts, any brokerage and investment services provided by MOFSL, including the products and services described herein are not available to or intended for U.S. persons. This report is intended for distribution only to "Major Institutional Investors" as defined by Rule 15a-6(b)(4) of the Exchange Act and interpretations thereof by SEC (henceforth referred to as "major institutional investors"). This document must not be acted on or relied on by persons who are not major institutional investors. Any investment or investment activity to which this document relates is only available to major institutional investors and will be engaged in only with major institutional investors. In reliance on the exemption from registration provided by Rule 15a-6 of the U.S. Securities Exchange Act of 1934, as amended (the "Exchange Act") and interpretations thereof by the U.S. Securities and Exchange Commission ("SEC") in order to conduct business with Institutional Investors based in the U.S., MOFSL has entered into a chaperoning agreement with a U.S. registered broker-dealer, Motilal Oswal Securities International Private Limited. ("MOSIPL"). Any business interaction pursuant to this report will have to be executed within the provisions of this chaperoning agreement.
The Research Analysts contributing to the report may not be registered /qualified as research analyst with FINRA. Such research analyst may not be associated persons of the U.S. registered broker-dealer, MOSIPL, and therefore, may not be subject to NASD rule 2711 and NYSE Rule 472 restrictions on communication with a subject company, public appearances and trading securities held by a research analyst account.
For Singapore: In Singapore, this report is being distributed by Motilal Oswal Capital Markets Singapore Pte Ltd (“MOCMSPL”) (Co.Reg. NO. 201129401Z) which is a holder of a capital markets services license and an exempt financial adviser in Singapore, as per the approved agreement under Paragraph 9 of Third Schedule of Securities and Futures Act (CAP 289) and Paragraph 11 of First Schedule of Financial Advisors Act (CAP 110) provided to MOCMSPL by Monetary Authority of Singapore. Persons in Singapore should contact MOCMSPL in respect of any matter arising from, or in connection with this report/publication/communication. This report is distributed solely to persons who qualify as “Institutional Investors”, of which some of whom may consist of "accredited" institutional investors as defined in section 4A(1) of the Securities and Futures Act, Chapter 289 of Singapore (“the SFA”). Accordingly, if a Singapore person is not or ceases to be such an institutional investor, such Singapore Person must immediately discontinue any use of this Report and inform MOCMSPL.
Disclaimer: The report and information contained herein is strictly confidential and meant solely for the selected recipient and may not be altered in any way, transmitted to, copied or distributed, in part or in whole, to any other person or to the media or reproduced in any form, without prior written consent. This report and information herein is solely for informational purpose and may not be used or considered as an offer document or solicitation of offer to buy or sell or subscribe for securities or other financial instruments. Nothing in this report constitutes investment, legal, accounting and tax advice or a representation that any investment or strategy is suitable or appropriate to your specific circumstances. The securities discussed and opinions expressed in this report may not be suitable for all investors, who must make their own investment decisions, based on their own investment objectives, financial positions and needs of specific recipient. This may not be taken in substitution for the exercise of independent judgment by any recipient. Each recipient of this document should make such investigations as it deems necessary to arrive at an independent evaluation of an investment in the securities of companies referred to in this document (including the merits and risks involved), and should consult its own advisors to determine the merits and risks of such an investment. The investment discussed or views expressed may not be suitable for all investors. Certain transactions -including those involving futures, options, another derivative products as well as non-investment grade securities - involve substantial risk and are not suitable for all investors. No representation or warranty, express or implied, is made as to the accuracy, completeness or fairness of the information and opinions contained in this document. The Disclosures of Interest Statement incorporated in this document is provided solely to enhance the transparency and should not be treated as endorsement of the views expressed in the report. This information is subject to change without any prior notice. The Company reserves the right to make modifications and alternations to this statement as may be required from time to time without any prior approval. MOFSL, its associates, their directors and the employees may from time to time, effect or have effected an own account transaction in, or deal as principal or agent in or for the securities mentioned in this document. They may perform or seek to perform investment banking or other services for, or solicit investment banking or other business from, any company referred to in this report. Each of these entities functions as a separate, distinct and independent of each other. The recipient should take this into account before interpreting the document. This report has been prepared on the basis of information that is already available in publicly accessible media or developed through analysis of MOFSL. The views expressed are those of the analyst, and the Company may or may not subscribe to all the views expressed therein. This document is being supplied to you solely for your information and may not be reproduced, redistributed or passed on, directly or indirectly, to any other person or published, copied, in whole or in part, for any purpose. This report is not directed or intended for distribution to, or use by, any person or entity who is a citizen or resident of or located in any locality, state, country or other jurisdiction, where such distribution, publication, availability or use would be contrary to law, regulation or which would subject MOFSL to any registration or licensing requirement within such jurisdiction. The securities described herein may or may not be eligible for sale in all jurisdictions or to certain category of investors. Persons in whose possession this document may come are required to inform themselves of and to observe such restriction. Neither the Firm, not its directors, employees, agents or representatives shall be liable for any damages whether direct or indirect, incidental, special or consequential including lost revenue or lost profits that may arise from or in connection with the use of the information. The person accessing this information specifically agrees to exempt MOFSL or any of its affiliates or employees from, any and all responsibility/liability arising from such misuse and agrees not to hold MOFSL or any of its affiliates or employees responsible for any such misuse and further agrees to hold MOFSL or any of its affiliates or employees free and harmless from all losses, costs, damages, expenses that may be suffered by the person accessing this information due to any errors and delays.
Registered Office Address: Motilal Oswal Tower, Rahimtullah Sayani Road, Opposite Parel ST Depot, Prabhadevi, Mumbai-400025; Tel No.: 022 71934200/ 022-71934263; Website www.motilaloswal.com. CIN No.: L67190MH2005PLC153397.Correspondence Office Address: Palm Spring Centre, 2nd Floor, Palm Court Complex, New Link Road, Malad(West), Mumbai- 400 064. Tel No: 022 7188 1000. Registration Nos.: Motilal Oswal Financial Services Limited (MOFSL)*: INZ000158836(BSE/NSE/MCX/NCDEX); CDSL and NSDL: IN-DP-16-2015; Research Analyst: INH000000412. AMFI: ARN - 146822; Investment Adviser: INA000007100; Insurance Corporate Agent: CA0579 ;PMS:INP000006712. Motilal Oswal Asset Management Company Ltd. (MOAMC): PMS (Registration No.: INP000000670); PMS and Mutual Funds are offered through MOAMC which is group company of MOFSL. Motilal Oswal Wealth Management Ltd. (MOWML): PMS (Registration No.: INP000004409) is offered through MOWML, which is a group company of MOFSL. Motilal Oswal Financial Services Limited is a distributor of Mutual Funds, PMS, Fixed Deposit, Bond, NCDs,Insurance Products and IPOs.Real Estate is offered through Motilal Oswal Real Estate Investment Advisors II Pvt. Ltd. which is a group company of MOFSL. Private Equity is offered through Motilal Oswal Private Equity Investment Advisors Pvt. Ltd which is a group company of MOFSL. Research & Advisory services is backed by proper research. Please read the Risk Disclosure Document prescribed by the Stock Exchanges carefully before investing. There is no assurance or guarantee of the returns. Investment in securities market is subject to market risk, read all the related documents carefully before investing. Details of Compliance Officer: Name: Neeraj Agarwal, Email ID: [email protected], Contact No.:022-71881085.
* MOSL has been amalgamated with Motilal Oswal Financial Services Limited (MOFSL) w.e.f August 21, 2018 pursuant to order dated July 30, 2018 issued by Hon'ble National Company Law Tribunal, Mumbai Bench.
Motilal Oswal Wealth Creation Study Gallery