Transverse reinforcement effects on anchored deformed bars
39
TRANSVERSE REINFORCEMENT EFFECTS ON ANCHORED DEFORMED BARS Giovanni A. Plizzari Professor Massimo A. Deldossi Structural Engineer Stefano Massimo Structural Engineer Dept. of Civil Engineering University of Brescia - Via Branze, 38 - Brescia 25123 - Italy email:[email protected] Published on: Magazine of Concrete, Vol.50(2), pp. 161-177 April 4, 2002
-
Upload
brescia-it -
Category
Documents
-
view
4 -
download
0
Transcript of Transverse reinforcement effects on anchored deformed bars

TRANSVERSE REINFORCEMENT EFFECTS
ON ANCHORED DEFORMED BARS
Giovanni A. Plizzari
Professor
Massimo A. Deldossi
Structural Engineer
Stefano Massimo
Structural Engineer
Dept. of Civil EngineeringUniversity of Brescia - Via Branze, 38 - Brescia 25123 - Italy
email:[email protected]
Published on:Magazine of Concrete, Vol.50(2), pp. 161-177
April 4, 2002

1 Introduction
In anchorages and lap splices of large diameter ribbed bars, because of the wedge action of
the ribs, splitting cracks are often present in the concrete surrounding the bar [1]. These
cracks start from flexural cracks, where the bar-to-concrete slip reaches its maximum, and
propagate in longitudinal planes along the reinforcing bar (Fig. 1). Splitting cracks may
also be present along the transfer zones of prestressing strands owing to the transverse
deformation of the tendon.
Splitting cracks impair bond mechanical behaviour (stiffness and strength) and make
bond sensitive to confinement [2]. They also have particular relevance for structural dura-
bility owing to their longitudinal propagation that exposes a large area of the bar to the
environment; this should make the corrosion resistance of members with splitting cracks
lower than the resistance of members with flexural cracks [3].
After splitting, the confining action along anchored bars or splices is partly produced
by transverse reinforcement [1, 4, 5], by concrete tensile strength in the uncracked cover
and by concrete cohesive stresses between the crack faces in the split cover [1, 6, 7, 8].
Moreover, where it is present, an external transverse pressure provides a further confining
action [2, 9, 10] (Fig. 2a).
In beams with small concrete cover and clear spacing between the rebars, transverse
reinforcement provides the most relevant confining action, especially in zones far from
direct supports where external pressure is not present. If transverse reinforcement is
not sufficient, splitting cracks open and develop abruptly along the anchored bars and a
sudden anchorage collapse occurs [1, 4, 11] (“splitting failure”, Fig. 2b); on the contrary,
an adequate number of stirrups limits splitting crack opening and allows the bond stress to
increase until the compressive failure of the concrete layer around the ribs occurs (“pull-out
failure”; Fig. 2c).
Anchorage behaviour can be correctly studied only if splitting and confinement are
taken into account [12]. The research-work on concrete splitting available in the literature
mainly regards the bond behaviour in short anchorages. A theoretical model, valid in
1

the influence zone of one stirrup, was proposed in [11]; it provides relationships between
bond stress, bar-to-concrete slip, splitting crack opening and stirrup stress. As far as
long anchorages are concerned, the numerous experimental results available mostly give
information on the overall anchorage capacity but little on splitting crack opening and
development [13, 14], so that several aspects related to splitting in anchorage behaviour
still need to be investigated.
Because of the complexity of the mechanical aspects involved, the study of anchorage
behaviour requires further basic tests to shed new light on the development of splitting
cracks along the bars. To this end, in the present research-work long anchorages with
transverse reinforcement were tested with the aim of studying the confining effects of
stirrups. Particular attention was devoted to gathering more detailed results on splitting
crack propagation along the anchored bar and on stirrup stresses, in order to provide
needed information for further theoretical modelling. Moreover, a relationship between
the anchorage capacity and the amount of transverse reinforcement is determined and a
comparison is made with the values proposed in the building codes [15, 16].
The experiments concern pull-out tests, which are certainly one of the simplest ways
to test anchorages but are often influenced by the confining action provoked by the friction
between the specimen and the contrast plate. This friction becomes particularly important
when long anchorages are tested, because of the higher pull-out loads involved. In order
to eliminate this confining action, which is not found in any actual structure, a special
set-up was adopted.
2 Test planning and materials
2.1 Specimen geometry
The specimens concerned two anchored bars with three two-legged stirrups. They simulate
a concrete block close to a flexural crack at an indirect support (where transverse pressure
is not present) and plane BB ideally represents one crack face (Fig. 1). The concrete
block embedding the bars is somewhat simplified and is cast as a thick plate with two
2

bars laying in mean plane AA. The anchored bars had a diameter, φp, of 20 mm and an
embedment length, lb, of 450 mm; consequently, the stirrup spacing distance (∆z) was
150 mm (Fig. 3b). The stirrups had different diameters (φst) with the purpose of studying
the anchorage response for different amounts of transverse reinforcement; in order to
measure the confining contribution of the concrete cover and the clear spacing between
the bars, two specimens had no stirrups (Table 1).
With closely-spaced anchored bars, concrete tends to split in the plane containing the
bars (Fig. 1). In order to reproduce this case and to provoke the maximum force in the
transverse reinforcement, a small specimen width was chosen (b= 120 mm); furthermore,
the principal bars were placed with the ribs acting at right angles to the plane passing
through the bar axes so that plane AA became the preferential plane for the formation of
the splitting crack (Figs. 3b,c). The stirrup ribs were oriented in to avoid wedge actions
towards the concrete surface. The anchored bars were machined to remove the ribs in the
first 25 mm of the bar at each end of the concrete block so that these bar ends were made
unbonded. Two steel angles placed in the concrete preformed a splitting crack in plane
AA (Figs. 3a,b).
As far as anchorages in split concrete are concerned, the following two significant
parameters should be considered [11]:
• “stirrup index of confinement” Ω, defined as the ratio between the total area of
stirrups nstAst and the total area of the longitudinal section of the anchored bars
npA∗
p in the influence zone ∆z of one stirrup:
Ω =nstAst
npA∗
p
=nstπφ2
st
4npφp∆z(1)
where np is the number of anchored bars and nst is the number of stirrup legs;
• “concrete index of confinement” B, defined as the ratio between the net area of
concrete in ∆z and npA∗
p:
B =(b − npφp)∆z
npφp∆z(2)
3

where b is the specimen (or beam) width.
The values of Ω for the specimens tested are shown in Table 1; the small specimen
width corresponds to a value B=2 for all the specimens.
2.2 Instrumentation
The instrumentation consisted of a set of strain gauges and LVDTs (Linear Variable Dif-
ferential Transformers). The former allowed the determination of the stirrup and the
principal bar stresses; the latter were adopted to measure splitting crack opening close to
the stirrups as well as the bar slip at both loaded and unloaded ends (Fig. 3).
Slip δL at the loaded end of the bars was measured by means of two transducers
(at each bar) to take possible bar rotations into account (Fig. 3b). Since the aluminum
support on the anchored bar was placed at a distance of about 95 mm from the beginning
of the embedded zone, slip δL was determined by subtracting the elastic elongation of the
bar from the measured displacement δ=(δ1 + δ2)/2. Slip δF at the free end of the bars
was measured by means of one LVDT placed on the concrete surface close to the bar.
The splitting crack opening close to the stirrups was measured by six LVDTs attached
to small aluminum supports glued to the specimen at a distance of about 60 mm (Fig. 3).
Since the elastic deformation along the short base length after cracking is negligible, the
measurements provide the splitting crack opening.
Strain gauges were placed outside the embedment length of the principal bars and
in the middle section of some stirrups (Figs. 3a,c); the effective area of the weakened
section of the stirrups was determined by measuring the load-strain relationship (in the
middle section) before casting, and assuming a Young’s modulus for steel of 206.000 MPa
(Table 1).
Splitting crack propagation was illustrated by means of a thin layer of gypsum placed
on the specimen surface along the splitting plane AA (Fig. 5); the crack tip position was
determined by observation by means of a magnifying glass (6x).
4

2.3 Experimental set-up and loading modalities
As mentioned above, in split concrete, bond is strongly dependent on the confining action
present along the bar. While the confining action developed by both concrete cover and
transverse reinforcement are often found in actual structures, the friction-induced confining
action at the loaded end of pull-out specimens is only related to the test set-up, it varies
during the experiment and also is different in different tests. In order to avoid this confining
action, a special (and simple) fixture, based on a concept previously proposed by Giuriani
and Plizzari [5], was adopted here. In this fixture, the pull-out force acting on the specimen
was counteracted by two bottom plates, separated along the main splitting plane (AA)
(Figs. 3 and 4). The contrast plates were connected to the upper part of the fixture by
means of four bars with bolts which do not have any flexural stiffness so that concrete
blocks C1 and C2 are allowed to move freely (Fig. 4).
The fixture was assembled in an Instron 2714/8500 hydraulic servo-controlled test ma-
chine. The signal from the LVDT of the actuator was used as the control parameter. The
load was applied by imposing a continuous displacement of the actuator up to a maxi-
mum loaded-end slip of 4-5 mm (about half the distance between the ribs). The average
displacement rate was 20 µm/min; because of the elastic deformation of the fixture, the
bar-to-concrete slip rate was even smaller, so that the specimens could be considered as
subjected to a quasi-static loading process. The load applied from the machine was mea-
sured by a reversible load cell with a capacity of 250 kN and a sensitivity of 0.025 kN/mV;
this measurement allowed for a double check of the load determined by means of the strain
gauges applied to the anchored bars. During the test, some unloading and reloading cycles
were performed.
The measurements from the strain gauges and LVDTs were converted from analog to
digital by an HBM UPM 100 multipoint measuring unit, and then stored in a PC at a
frequency of 1 Hz.
Further details about the experimental set-up can be found in [17].
5

3 Material properties
The concrete mix proportions are the following:
• Portland cement Type II 32.5 A/L-R: Portland: 325 kg/m3;
• water: 175 l/m3 (water-cement ratio = 0.54);
• aggregates (sand and river gravel): 1853 kg/m3 (see also Table 2);
• superplasticizer: 3.3 l/m3.
The application of strain gauges required machining the anchored bars in order to
have a smoother surface; in doing so, the bar section was somewhat reduced where the
strain gauges were placed. The weakening of the section is more significant for Tempcore c©
bars, which are characterized by a stronger outer shell. Albeit there are no detrimental
effects on short anchorages, a certain reduction in load capacity has to be expected in long
anchorages because of the earlier yielding of the bar in the weaker sections, as occurred in
the first tests performed. In order to avoid the reduction of the maximum pull-out load,
a special heat treatment was applied to the bars to increase the yield strength of the bar
to about 1200 MPa, without changing the other mechanical properties (Table 3).
The stirrups having a 5 mm diameter were cold-drawn steel bars, while all the other
stirrups, as well as the principal bars, were hot-rolled bars; their geometrical and mechan-
ical properties are shown in Table 3.
The concrete was poured into wood forms with the principal bars in a vertical position
(Fig. 3b); since the casting direction was the opposite of the pull-out force, better bond
characteristics were obtained [18]. Two days after casting, the specimens were demoulded
and then cured in water until two weeks before the test; then they were stored in the
laboratory at 15-25oC and ≈70% R.H. The workability of the fresh concrete, measured on
the different batches with a typical slump test, varied between 100 and 140 mm. During
the pour, six sample cylinders (φ x h = 100 x 300 mm) and two cubes (a=150 mm) for
each specimen, were cast and cured in the same manner as the specimens. After 28 days
6

of curing, compressive strength fc,28, (direct) tensile strength fct,28 and Young’s modulus
Ec,28 were measured on the cylinders; the values obtained are summarized in Table 4.
Before each test, concrete compressive strength fc,cube was determined by testing of the
cubes (Table 5).
4 Results and Discussion
In all specimens, owing to the presence of the preformed crack between the steel angles
at the loaded end of the specimen and to the orientation of the bar ribs, a main splitting
crack formed along plane AA (Figs. 3b and 5a). In some specimens secondary splitting
cracks appeared in other longitudinal planes (generally after the peak load) [17]. The main
splitting crack allowed the transverse reinforcement to work properly, since it was at right
angles to the split-concrete faces.
Figure 6 exhibits the typical results obtained from specimen 45S5P4, having stirrups
of 5 mm. In particular, the figure shows plots of pull-out force F , splitting crack widths
ws1, ws2, ws3 (measured at the stirrup levels), stress σs1, σs2 and σs3 in the first, second
and third stirrup (from the loaded end of the bar), and free-end slip δF , as functions of
loaded-end slip δL (the results are plotted both up to the maximum slip and up to the peak
load and concern the left and the right sides of the specimen). Notice the two unloading
and reloading cycles performed during the test, when the tensile stress in the anchored
bar was about 150 and 240 MPa respectively.
The values of maximum load Fmax, slip at the maximum load δL,P , maximum anchored
bar stress σP (evaluated on the basis of the nominal bar diameter), maximum bond stress
τu (assumed evenly distributed along the bar), concrete compressive strength fc,cube and
the age of the specimens at the time of the test are summarized in Table 5. Unfortunately,
because of unexpected rotations of the specimen that occurred during the tests, only one
test of specimens with 10 mm diameter stirrups was successful. As mentioned above, a
special heat-treated steel was adopted to avoid early yielding of the weaker sections of the
anchored bar instrumented with strain gauges; however, it should be noted that observed
7

maximum bar stress σP generally was lower than 550-600 MPa, which is a typical yield
strength of steel often used in Europe.
The complete set of experimental results can be found in [17].
4.1 Bond-slip relationship
A comparison between the curves of the average bond stress versus loaded-end slip δL
(normalised to φp), is shown up to the peak load in Fig. 7. Although bond capacity was
found to depend on the square root of the concrete compressive strength [19], here τu is
normalised to fc,cube in order to obtain dimensionless diagrams; this was possible since
concrete compressive strength (determined at the time of the tests) showed a low scatter.
It should be noted that in specimens 45NSP1 and 45NSP2, without transverse rein-
forcement, a brittle splitting collapse of the anchorage occurred when the splitting crack
reached the unloaded end of the anchored bars (Fig. 7a). In these specimens, after an-
chorage failure, the concrete corbels between the ribs were undamaged. In each diagram
of Fig. 7, the mean curve is plotted with the experimental results; all the mean curves are
then reported in Fig. 7f showing that, for increasing values of the stirrup diameter (and
thus of the stirrup index of confinement), both bond stiffness and capacity increased.
4.2 Splitting-crack opening and propagation
Figure 8 exhibits splitting crack opening ws1 at the first stirrup level versus the principal
bar stress as measured up to the peak load for all the specimens. To ease the comparison,
for each stirrup diameter the mean curves were determined and plotted together in Fig. 8f.
It is worth noting that the smaller the stirrup diameter is, the larger the splitting crack
opening. Furthermore, splitting crack width reaches remarkable values under service loads;
for example, in specimens with 5 mm stirrups, splitting crack width is nearly 0.2 mm when
the principal bar stress is 250 MPa.
The splitting crack penetration Y , measured from the loaded end of the anchorage
and divided by embedment length of the bar lb, is plotted versus the normalised bond
stress τ/fc,cube in Fig. 9; therefore, the normalised splitting crack penetration varies from
8

zero (splitting crack not present) to one (splitting crack completely propagated). From
these results, the splitting crack length seems to increase linearly with the applied load.
It should be noted that the splitting-propagation rate is lower for larger stirrup diameters
and that in specimens with transverse reinforcement, the anchorage capacity was reached
after the complete propagation of the splitting crack along the bar, owing to the favourable
effects of the confinement action.
4.3 Stresses in transverse reinforcement
In Fig. 10 the stress in the stirrup closest to the loaded end of the bar is plotted versus
the loaded-end bar slip. Unfortunately, strain gauges glued to the stirrups did not always
work properly and few experimental curves are available. The stresses are determined
by using the effective area of the stirrups, shown in Table 1. The large scatter of the
experimental results is probably due to the irregular surfaces of the splitting cracks that
often did not lay in the stirrup middle section where strain gauges were placed (Fig. 5);
this resulted in experimental measurements smaller than the actual maximum stirrup
stresses. All the experimental curves are plotted up to the yield stress, as determined
for the different stirrups (Table 3); it can be noted that the smaller the stirrup diameter
is, the higher the stirrup stress and the sooner yielding occurs. However, all the small
diameter stirrups (5 and 6 mm) closest to the loaded end of the principal bars yielded
before the specimens reached the maximum bond stress. In the same figure, empty squares
illustrate the stirrup stress when the characteristic bond strength prescribed by Eurocode 2
(fbk,EC2) [15] is reached; this is evaluated on the basis of the concrete compressive strength
determined at the time of the tests. The filled squares indicate that the stirrup yielded
before reaching fbk,EC2. Although the transverse reinforcement amount was always higher
than the minimum prescribed by Eurocode 2 (Ωmin,EC2 ≈0.0044 for a beam with two
anchored bars having φp = 20 mm and lb = 450 mm), this occurred in all the stirrups
monitored, with the exception of two specimens with φst=8 mm, where the stirrup stresses
were higher than 400 MPa. This behaviour is more significant if one considers that, as
mentioned above, the measurements did not always provide the actual maximum stress
9

in the stirrups and that in actual structures, besides bond effects, stirrups are stressed
by other actions. Therefore, stirrup stresses related to bond can reduce the ultimate
structure load capacity since they can provoke an earlier stirrup failure. Moreover, in
specimens with φst=5 mm, the stirrups yielded when the loaded-end slip was about 0.4
mm, and the principal-bar stress was about 260 MPa, which is typical of bar stresses under
service loads.
4.4 Anchorage capacity
Figure 11a exhibits the ultimate bond stress τu versus the stirrup index of confinement
Ω (Eq. 1), as obtained from all the specimens tested; in this diagram, the bond strength
is normalised to the concrete compressive strength fc,cube determined at the time of the
test (Table 5). In the same figure, the results obtained by the authors in previous tests
are also plotted (Series 1 [14]). It can be observed that bond capacity increases with the
stirrup index of confinement and tends to an upper bound that is reached for a value
Ω ≈ 0.03 − 0.04; beyond this value, no significant increase of bond strength occurs. It
is worth mentioning that the specimens of the previous tests [14] were characterized by
different values of the “concrete index of confinement” B; however, small values of this
index do not significantly influence the anchorage capacity of rebars in normal concrete
[14, 20], so that the results should be comparable. An increase of anchorage capacity of
transversely-reinforced rebars was also observed by Morita and Fujii [21], by Kaku and
co-workers [22, 23] and by Maeda and co-workers [20], by testing beam specimens with
19 mm diameter flexural reinforcement. Figure 11b shows some of these results referring
to the average response of corner bars (“supported” by 90o stirrup corner bends) and inner
bars (“unsupported”); the latter are characterized by a lower anchorage capacity owing
to the larger splitting crack opening that locally occurs [21]. These different restraints
would explain the lower values of bond strength of Fig. 11b with respect to the ones of
Fig. 11a, since the two anchored bars of the present series of tests were better confined
being both “supported” by stirrup legs (Fig. 3). The lower effectiveness of stirrups in
restraining interior (“unsupported”) bars was already observed by Warren [24] who tested
10
specimens containing from two to seven bars within a single two-legges stirrup [25]. This
again underlines the importance that a correct transverse-reinforcement placement has
on anchorage capacity owing to the different splitting crack development along the sec-
tion width [14]. Experimental results of Fig. 11 do not show any upper bound but the
experiments regarded specimens with Ω ≤ 0.035.
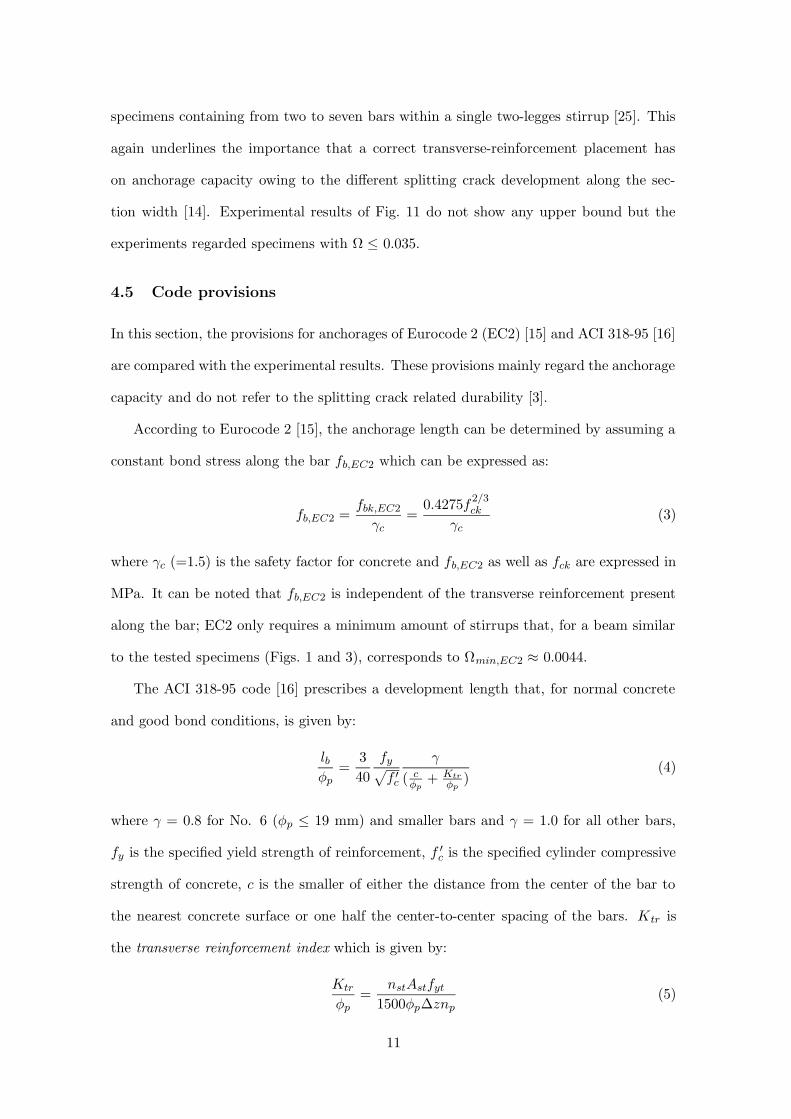
4.5 Code provisions
In this section, the provisions for anchorages of Eurocode 2 (EC2) [15] and ACI 318-95 [16]
are compared with the experimental results. These provisions mainly regard the anchorage
capacity and do not refer to the splitting crack related durability [3].
According to Eurocode 2 [15], the anchorage length can be determined by assuming a
constant bond stress along the bar fb,EC2 which can be expressed as:
fb,EC2 =fbk,EC2
γc=
0.4275f2/3
ck
γc(3)
where γc (=1.5) is the safety factor for concrete and fb,EC2 as well as fck are expressed in
MPa. It can be noted that fb,EC2 is independent of the transverse reinforcement present
along the bar; EC2 only requires a minimum amount of stirrups that, for a beam similar
to the tested specimens (Figs. 1 and 3), corresponds to Ωmin,EC2 ≈ 0.0044.
The ACI 318-95 code [16] prescribes a development length that, for normal concrete
and good bond conditions, is given by:
lbφp
=3
40
fy√
f ′
c
γ
( cφp
+ Ktr
φp)
(4)
where γ = 0.8 for No. 6 (φp ≤ 19 mm) and smaller bars and γ = 1.0 for all other bars,
fy is the specified yield strength of reinforcement, f ′
c is the specified cylinder compressive
strength of concrete, c is the smaller of either the distance from the center of the bar to
the nearest concrete surface or one half the center-to-center spacing of the bars. Ktr is
the transverse reinforcement index which is given by:
Ktr
φp=
nstAstfyt
1500φp∆znp(5)
11

where fyt is the specified yield strength of transverse reinforcement. The term in the
denominator of Eq. 4 that takes into account the confining action provided by concrete
cover and transverse reinforcement, has the limitation:
(c
φp+
Ktr
φp) ≤ 2.5 (6)
Note that Eqs. 4 and 5 are valid for stresses expressed in psi. Ktr is a coefficient similar
to the stirrup index of confinement Ω (Eq. 1); in fact, it can be written as:
Ktr
φp= Ω
fyt
1500(7)
By assuming a uniform bond stress distribution along the bar and expressing the stresses
in MPa, the bond strength according to ACI 318-95 becomes:
fb,ACI =fyφp
4lb=
0.277√
f ′
c
γ(
c
φp+ 0.0967Ωfyt) (8)
and the limitation of Eq. 6 can be written as:
Ω ≤ Ωmax,ACI = (2.5 −c
φp)10.34
fyt(9)
It is worth noting that the bond strength according to ACI is linearly dependent on the
concrete cover (or on the clear spacing between the bars) [25, 26], and on the stirrup index
of confinement, up to a value Ωmax,ACI beyond which a constant bond strength should be
adopted.
A linear dependency of bond capacity on the transverse reinforcement area has been
observed by Morita and Fujii [21], by Darwin and coworkers [27] and by Orangun et al.
[25] who proposed a bilinear approximation to take the upper bound of the bond strength
into account. The linear increase of bond capacity versus the confining action was also
observed by Gambarova and Rosati [28] and Modena and co-workers [29] who did pull-out
tests on reinforcement in concrete blocks with external transverse pressure.
The bond strength as prescribed by Eurocode 2 and ACI 318-95 is plotted as a func-
tion of Ω in Fig. 11 along with the experimental results. Bond strengths fb,EC2 and fb,ACI
12

were determined by assuming the following values of the mechanical properties and of
the geometrical characteristics, which are similar to those of the experiments shown in
Fig. 11: fyt = 500 MPa, fck = f ′
c = 25 MPa (that, according to code [15], corresponds
to fck,cube = 30 MPa), γ = 1.0 for the results plotted in Fig. 11a (φp = 20 mm) and
γ = 0.8 for the results shown in Fig. 11b (φp = 19 mm), and c/φp = 1.5. The latter is
evaluated from the geometry of the specimens tested in the present research-work but also
averages the values of the specimens tested in [14, 20, 22, 23] that vary between 1.25 and
2.5. Based on the adopted mechanical properties of materials and parameter c/φp, a value
Ωmax,ACI = 0.0208 was obtained. It is worth noting that fb,EC2 approaches the experi-
mental results for small values of Ω (close to the small amount required) and remarkably
underestimates the experimental results when a larger amount of transverse reinforcement
is adopted (Fig. 11a). The bond strength prescribed by ACI is closer to the experimen-
tal trend owing to the linear increase with Ω, but it also remarkably underestimates the
bond capacity for large amounts of transverse reinforcement (Ω > 0.03). However, when
bars are “unsupported” by stirrups so that a larger splitting crack opening occurs, fb,EC2
as well as fb,ACI overestimate some of the experimental results obtained in [20, 22, 23]
(Fig. 11b).
5 Conclusions
Pull-out specimens with long anchorages of ribbed bars confined with stirrups were tested
with the aim of studying the confining effects of transverse reinforcement on splitting
crack development and anchorage behaviour. A special test set-up allowed to eliminate
the confining action due to friction at the counteracting plate to better simulate an actual
structure.
The experimental results can be summarized as follows:
• The maximum splitting crack opening increased for decreasing transverse-reinforcement
diameter size and reached remarkable values (> 0.2 mm) under service loads (Fig. 8).
In specimens with transverse reinforcement, the anchorage capacity was reached af-
13

ter the complete propagation of the splitting crack along the bar, owing to the
favourable effects of the stirrup confining-action. In specimens without transverse
reinforcement, an earlier splitting collapse of the anchorage occurred.
• Anchorage capacity increases with the stirrup index of confinement Ω up to an
upper bound; in fact, no significant increase of bond strength occurred for Ω >
0.03-0.04 (Fig. 11a). Anchorage capacity also depends on transverse reinforcement
distribution along the section width since stirrup legs placed close to the anchored
bars limit splitting crack opening and increase bond capacity.
• Although the transverse reinforcement area was always larger than the minimum
value required by EC2, stirrups yielded before reaching the characteristic bond
strength fbk,EC2 prescribed by the code; in a real beam, this would provoke a re-
duction of the ultimate load because of an earlier stirrup failure. Moreover, stirrup
in specimens with a small amount of transverse reinforcement yielded under service
loads (Fig. 10).
A comparison with the values prescribed by building codes evidenced that the bond
strength according to Eurocode 2 and ACI 318-95 remarkably underestimated the exper-
imental anchorage capacity for large values of stirrup index of confinement when all the
anchored bars are supported by stirrups (Fig. 11a). However, when anchored bars are not
placed close to stirrup legs so that a larger splitting crack opening occurs locally, the bond
strength prescribed by ACI 318-95 and by EC2 overestimated some experimental results
available in the literature (Fig. 11b).
The anchorage capacity of prestressing strands also increases when transverse rein-
forcement is present along the tendon [30]. Although bond mechanisms in strands differ
from ribbed bars, the results here presented provide qualitative information on transverse
reinforcement effects on anchorages of prestressing strands. However, because the lack of
experimental results, more research should be undertaken in this field.
Finally, with a view to the future, a better understanding of all the aspects related
to concrete splitting and transverse reinforcement effects also is required by the latest ad-
14
vances in the field of structural materials. In fact, lightweight and high-strength concretes
are particularly sensitive to splitting because of their brittle behaviour as are systems with
epoxy coated bars, which induce a larger wedging action on the surrounding concrete.
6 Acknowledgments
This research project was financed by both the Italian National Council for Scientific Re-
search - CNR (national project “Special materials for better structures”) and by Valsabbia
steelworks “Ferriera Valsabbia” (Odolo, Brescia, Italy). The understanding and coopera-
tion of Mr. Ruggero Brunori (Project Manager) and Mr. Fabrizio Oliva (Project Monitor)
of Ferriera Valsabbia, are kindly acknowledged. The authors are also indebted to Prof.
Ezio Giuriani and Prof. Alberto Franchi for their useful suggestions, as well as to Mr.
Alessandro Coffetti and the technical staff of the laboratory P. Pisa (Brescia University)
for their patience and skillfulness in preparing the tests.
References
[1] R. Tepfers. A Theory of Bond applied to Overlapped Tensile Reinforcement Splices
for Deformed Bars. PhD thesis, Chalmers University of Technology, Goteborg, 1973.
[2] P.G. Gambarova and G.P. Rosati. Bond and Splitting in bar Pull-out: Behavioral
Laws and Concrete Cover Role. Magazine of Concrete Research, 49(179):99–110,
1997.
[3] E. Giuriani and G.A. Plizzari. Interrelation of Splitting and Flexural Cracks in Re-
inforced Concrete Beams. ASCE, Journal of Structural Engineering, 124(9), 1998.
[4] R. Eligehausen, V.V. Bertero, and E. P. Popov. Local Bond Stress-Slip Relationships
of Deformed Bars Under Generalized Excitations: Tests and Analytical Model. Tech-
nical Report UCB/EERC-83, Earthquake Engineering Research Center, University
of California, Berkeley, California, 1983.
15

[5] E. Giuriani and G.A. Plizzari. Local Bond-Slip Law after Splitting of Concrete. Studi
e Ricerche, School for the Design of R.C. Structures, Milan University of Technology,
7:57–118, 1985. in Italian.
[6] G.A. Plizzari, C. Schumm, and E. Giuriani. The Effect of Residual Tensile Strength
of Cracked Concrete on the Local Bond-Slip Law after Splitting. Studi e Ricerche,
School for the Design of R.C. Structures, Milan University of Technology, 9:129–155,
1987.
[7] H.W. Reinhardt and C. Van der Veen. Splitting Failure of a Strain-Softening ma-
terial due to Bond Stresses. In Alberto Carpinteri, editor, Applications of Fracture
Mechanics to Reinforced Concrete, pages 333–346, Turin, October 6 1990. Elsevier
Applied Science.
[8] P. Balaguru, P.G. Gambarova, G.P. Rosati, and Schumm C.E. Bond of Reinforcing
Bars and Prestressing Tendons in HPFRCC Matrices. In A.E. Naaman and H.W.
Reinhardt, editors, Second International Workshop: High-Performance Fiber Rein-
forced Composities - Volume 2, pages 325–363, AnnArbor, Michigan, June 11-14 1995.
University of Michigan - Dept. of Civil and Environmental Engineering.
[9] R.E. Untrauer and R.L. Henry. Influence of Normal Pressure on Bond Strength. ACI
Journal, Proceedings, 62(5):577–586, 1965.
[10] R.J. Malvar. Bond of Reinforcement under Controlled Confinement. Technical Report
N-1833, Naval Civil Engineering Laboratory, Port Hueneme, California, June 1991.
[11] E. Giuriani, G.A. Plizzari, and C. Schumm. Role of Stirrups and Residual Tensile
Strength of Cracked Concrete on Bond. ASCE, Journal of Structural Engineering,
117:1–18, 1991.
[12] G.P. Gambarova and E. Giuriani. Discussion of ‘Study of the transfer of Tensile Forces
by Bond.’ by D. H. Jiang, S. P. Shah, and A. T. Andonian. Proceedings, American
Concrete Institute Journal, 82(3):381–383, 1985.
16

[13] G.A. Plizzari, E. Marchina, and E. Giuriani. Experimental Study of Splitting and
Flexural Cracks in a RC Beam with Overlapped Splices. RILEM Materials and
Structures, 29:19–27, 1996.
[14] G.A. Plizzari, A.M. Deldossi, and S. Massimo. Experimental Study on Anchored Bars
in R.C. Elements with Transverse Reinforcement. RILEM Materials and Structures,
29:534–542, 1996.
[15] European Committee for Standardization. EUROCODE No.2: Design of Concrete
Structures - Part 1-1: General Rules and Rules for Buildings-ENV 1992-1-1. Brussel,
1991.
[16] ACI Committee 318. Building Code Requirements for Reinforced Concrete, (ACI
318-95). American Concrete Institute, Farmington Hills, MI (USA), 1995.
[17] G.A. Plizzari, A.M. Deldossi, and S. Massimo. Experimental investigation on long an-
chorages confined by transverse reinforcement. Technical Report 5.5/96, Department
of Civil Engineering, University of Brescia, Brescia, Italy, 1996. in Italian.
[18] G. Rehm. Ueber die Grundlagen des Verbundes zwischen Stahl und Beton. Deutcher
Ausschuß fur Stahlbeton (D.A.f.St), 138, 1961. in German.
[19] Comite Eurointernational du Beton. CEB-FIP Model Code 1990. C.E.B Bullettins
d’Information 213-214, May 1993.
[20] M. Maeda, S. Otani, and H. Aoyama. Effect of Confinement on Bond Splitting Be-
havior in Reinforced Concrete Beams. IABSE, Structural Engineering International,
5(3):166–171, 1995.
[21] S. Morita and S. Fujii. Bond Capacity of Deformed Bars due to Splitting of Sur-
rounding Concrete. In P. Bartos, editor, Bond in Concrete, pages 331–352. Applied
Science Publishers, London, England, 1982.
17

[22] T. Kaku, M. Yamada, M. Shibata, and H. Takahashi. Bond Splitting Strength of
Simply Supported Reinforced Concrete Beams. Transactions of the Japan Concrete
Institute, 10:171–176, 1988.
[23] T. Kaku, M. Yamada, and M. Gouraku. Effect of Transverse Reinforcement on Bond
Splitting Strength of Reinforced Concrete Beams. Transactions of the Japan Concrete
Institute, 11:371–378, 1989.
[24] G.E. Warren. Anchorage Strength of Tensile Steel in Reinforced Concrete Beams.
PhD thesis, Iowa State University, Ames, 1969.
[25] C.O. Orangun, J.O. Jirsa, and J.E. Breen. A reevaluation of Test Data on Develop-
ment Length and Splices. ACI Journal, 74(11):114–122, 1977.
[26] D. Darwin, S.L. McCabe, E.K. Idun, and S.P. Schoenekase. Development Length
Criteria: Bars Not Confined by Transverse Reinforcement. ACI Structural Journal,
89(6):709–720, 1992.
[27] D. Darwin, Z. Zuo, M.L. Tholen, and E.K. Idun. Development Length Criteria for
Conventional and High Relative Rib Area Reinforcing Bars. ACI Structural Journal,
93(3):347–359, 1996.
[28] P.G. Gambarova and G.P. Rosati. Bond and Splitting in Reinforced Concrete: Test
Results on Bar Pull-out. RILEM Materials and Structures, 29:267–276, 1996.
[29] C. Modena, T. Coltro, and G.P. Rossaro. A study of Steel-to-Concrete Bond after
Concrete Splitting: Experimental Results at Constant Confinement. Studi e Ricerche,
School for the Design of R.C. Structures, Milan University of Technology, 10:179–218,
1988. in Italian.
[30] A.J. Bigaj, J.A. Den Uijl, and J.C. Walraven. A Bond Model for Ribbed Bars in HSC
and NSC - An Experimental Study. In 4th International Symposium on Utilization
of High-strength/ High-performance concrete, pages 1125–1134, Paris, 1996.
18

[31] G.A. Plizzari and C. Schumm. On Bond Collapse due to Bar Pull-out and Concrete
Splitting. Studi e Ricerche, School for the Design of R.C. Structures, Milan University
of Technology, 12:81–116, 1990. in Italian.
19

A Notation
The following symbols are used in this paper:
A∗
p = longitudinal-section area of one anchored bar in influence length ∆z;
Ast = cross-section area of the transverse bar leg;B = concrete index of confinement: B = (b − npφp)/(npφp);Ec,28 = Young’s modulus of concrete after 28 days;Fmax = maximum pull-out load;Ktr = transverse reinforcement index according to ACI 318-95;b = cross-section width;c = coefficient for the concrete confining action according to ACI 318-95;fb,ACI = bond strength prescribed ACI 318-95 for design;fb,EC2 = bond strength prescribed by EC2 for design: fb,EC2 = fbk,EC2/γc;fbk,EC2 = characteristic value of the bond strength according to EC2;f ′
c = specified cylindrical compressive strength according to ACI 318-95;fc,cube = concrete cube strength in compression;fck = concrete characteristic cylindrical strength in compression according to EC2;fck,cube = concrete characteristic cube strength in compression according to EC2;fc,28 = concrete cylindrical strength in compression after 28 days;fct,28 = concrete cylindrical strength in tension after 28 days;fst = steel tensile strength;fsy = steel yield strength;fy = specified yield strength for anchored reinforcement according to ACI 318-95;fyt = specified yield strength for stirrups according to ACI 318-95;lb = anchorage length;np = number of anchored bars;nst = leg number of stirrups in the section width;wsi = splitting crack opening close to the stirrups (i = 1,2,3);∆z = transverse reinforcement spacing;Ω = stirrup index of confinement: Ω = (nstAst)/(npφp∆z);γ = coefficient related to the bar diameter according to ACI 318-95;γc = concrete safety factor according to EC2;δF = free-end slip of the anchored reinforcement;δL = loaded-end slip of the anchored reinforcement;δL,P = loaded-end slip at the maximum load;σP = maximum stress in the anchored reinforcement;σsti = stirrup stresses (i = 1,2,3);τ = average anchored-reinforcement bond stress;τu = maximum bond stress;φp = anchored-bar diameter;φst = transverse-bar diameter.
20

Contents
1 Introduction 1
2 Test planning and materials 2
2.1 Specimen geometry . . . . . . . . . . . . . . . . . . . . . . . . . . . . . . . . 2
2.2 Instrumentation . . . . . . . . . . . . . . . . . . . . . . . . . . . . . . . . . . 4
2.3 Experimental set-up and loading modalities . . . . . . . . . . . . . . . . . . 5
3 Material properties 6
4 Results and Discussion 7
4.1 Bond-slip relationship . . . . . . . . . . . . . . . . . . . . . . . . . . . . . . 8
4.2 Splitting-crack opening and propagation . . . . . . . . . . . . . . . . . . . . 8
4.3 Stresses in transverse reinforcement . . . . . . . . . . . . . . . . . . . . . . . 9
4.4 Anchorage capacity . . . . . . . . . . . . . . . . . . . . . . . . . . . . . . . . 10
4.5 Code provisions . . . . . . . . . . . . . . . . . . . . . . . . . . . . . . . . . . 11
5 Conclusions 13
6 Acknowledgments 15
A Notation 20
List of Figures
1 Splitting-crack propagation in anchorages and scheme of the specimen tested. 29
2 Splitting crack and confining actions around a ribbed bar [11] (a); scheme
of local bond failure: “pull-out failure” (b) and “splitting failure” (c) [31]. . 30
3 Specimen geometry and instrument placement. . . . . . . . . . . . . . . . . 31
4 Test set-up. . . . . . . . . . . . . . . . . . . . . . . . . . . . . . . . . . . . . 32
5 Typical splitting cracks, as observed in specimens 45S6P4. . . . . . . . . . . 32
21

6 Experimental results obtained from specimen 45S5P4 with 5 mm diameter
stirrups. . . . . . . . . . . . . . . . . . . . . . . . . . . . . . . . . . . . . . . 33
7 Average bond stress versus loaded-end slip. . . . . . . . . . . . . . . . . . . 34
8 Maximum splitting crack opening at the first-stirrup level versus principal-
bar stress. . . . . . . . . . . . . . . . . . . . . . . . . . . . . . . . . . . . . . 35
9 Splitting crack length versus average bond stress. . . . . . . . . . . . . . . . 36
10 Stress in the stirrup closest to the loaded end of the bar versus loaded-end
slip. . . . . . . . . . . . . . . . . . . . . . . . . . . . . . . . . . . . . . . . . 37
11 Bond capacity τu/fc,cube versus stirrup index of confinement Ω. . . . . . . . 38
List of Tables
1 Geometrical characteristics of the specimens tested. . . . . . . . . . . . . . . 23
2 Aggregate composition of concrete. . . . . . . . . . . . . . . . . . . . . . . . 24
3 Geometrical and mechanical properties of the reinforcing bars. . . . . . . . 25
4 Mechanical properties of concrete after 28 days of curing. . . . . . . . . . . 26
5 Values of peak load Fmax, loaded-end slip δL,P , maximum stress σP in the
anchored bar, bond capacity τu and concrete compressive strength fc,cube. . 27
22

Table 1: Geometrical characteristics of the specimens tested.
Specimen φst Ω φp Ast1L Ast1R Ast2L Ast2R Ast3L Ast3R
[mm] [mm] [mm2] [mm2] [mm2] [mm2] [mm2] [mm2]
45NSP1 - 0 20 - - - - - -45NSP2 - 0 20 - - - - - -
45S5P1 5∗ 0.00654 20 17.60 19.29 19.29 19.29 19.29 19.2945S5P3 5∗ 0.00654 20∗∗ 18.50 19.29 19.29 19.29 19.29 19.2945S5P4 5∗ 0.00654 20∗∗ 18.40 18.60 18.00 19.29 18.20 19.29
45S6P1 6 0.00942 20 28.39 28.39 28.39 28.39 28.39 28.3945S6P2 6 0.00942 20 26.90 28.39 28.39 28.39 28.39 28.3945S6P3 6 0.00942 20∗∗ 28.39 26.50 28.39 28.39 28.39 28.3945S6P4 6 0.00942 20∗∗ 26.20 26.00 28.39 26.10 28.39 26.50
45S8P1 8 0.01675 20 42.50 48.77 48.77 48.77 48.77 48.7745S8P2 8 0.01675 20 40.50 42.50 43.10 48.77 42.90 48.7745S8P3 8 0.01675 20∗∗ 49.60 48.77 48.77 48.77 48.77 48.7745S8P4 8 0.01675 20∗∗ 48.50 48.77 48.77 47.90 48.77 48.70
45S10P4 10 0.02618 20∗∗ 73.70 75.71 75.71 72.30 75.71 74.70
* = cold-drawn bars; ** = heat-treated bars.
23

Table 2: Aggregate composition of concrete.
Diameter Weight Percentage[mm] [kg/m3] [%]
0.00÷0.35 229 12.40.35÷0.45 39 2.10.40÷0.60 51 2.80.60÷1.50 223 121.50÷2.50 176 9.52.50÷3.50 207 11.24.00÷6.00 223 127.00÷12.0 353 19.110.0÷15.0 352 18.9
24
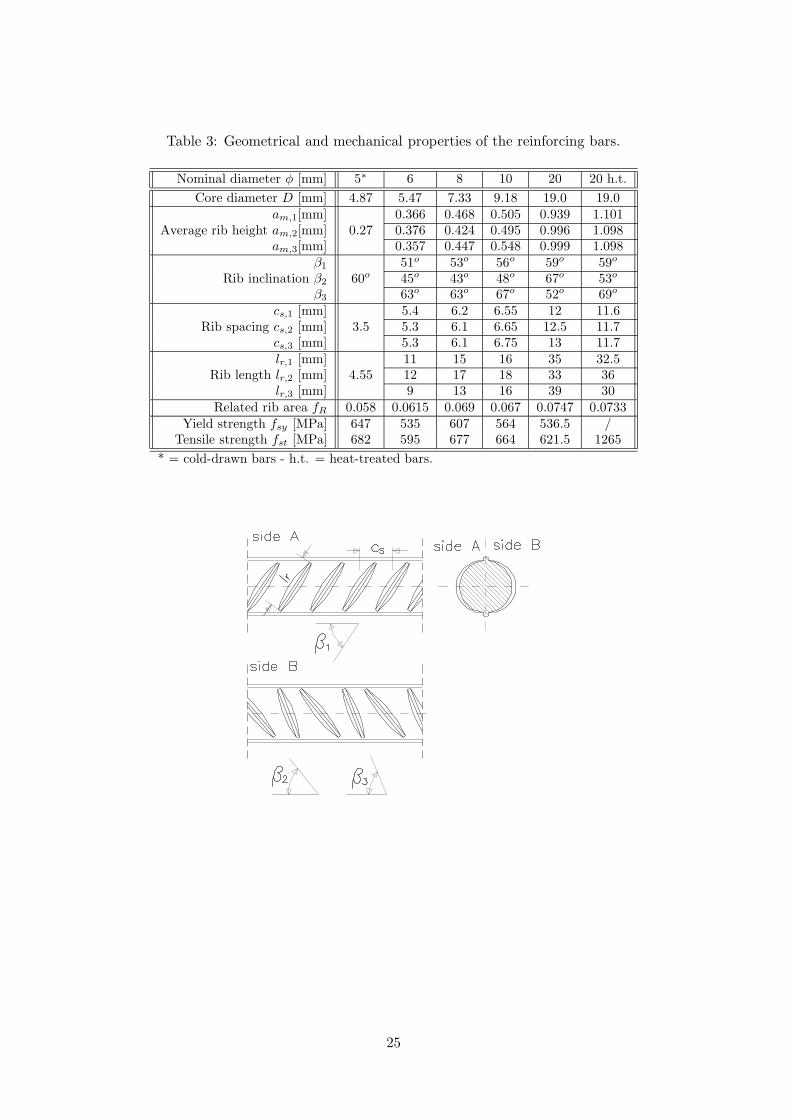
Table 3: Geometrical and mechanical properties of the reinforcing bars.
Nominal diameter φ [mm] 5∗ 6 8 10 20 20 h.t.
Core diameter D [mm] 4.87 5.47 7.33 9.18 19.0 19.0am,1[mm] 0.366 0.468 0.505 0.939 1.101
Average rib height am,2[mm] 0.27 0.376 0.424 0.495 0.996 1.098am,3[mm] 0.357 0.447 0.548 0.999 1.098
β1 51o 53o 56o 59o 59o
Rib inclination β2 60o 45o 43o 48o 67o 53o
β3 63o 63o 67o 52o 69o
cs,1 [mm] 5.4 6.2 6.55 12 11.6Rib spacing cs,2 [mm] 3.5 5.3 6.1 6.65 12.5 11.7
cs,3 [mm] 5.3 6.1 6.75 13 11.7lr,1 [mm] 11 15 16 35 32.5
Rib length lr,2 [mm] 4.55 12 17 18 33 36lr,3 [mm] 9 13 16 39 30
Related rib area fR 0.058 0.0615 0.069 0.067 0.0747 0.0733Yield strength fsy [MPa] 647 535 607 564 536.5 /
Tensile strength fst [MPa] 682 595 677 664 621.5 1265
* = cold-drawn bars - h.t. = heat-treated bars.
25

Table 4: Mechanical properties of concrete after 28 days of curing.
Specimen fc,28 fct,28 Ec,28
[MPa] [MPa] [MPa]
45S6P1 41.50 2.60 3110045S6P245S5P145S8P1 24.25 2.80 2726345S8P245S6P345S6P445S8P3 33.95 2.50 2993845S8P445S10P445NSP1 24.90 2.84 2945545NSP245S5P3 31.49 2.45 2884545S5P4
26

Table 5: Values of peak load Fmax, loaded-end slip δL,P , maximum stress σP in theanchored bar, bond capacity τu and concrete compressive strength fc,cube.
Specimen Age Fmax δL,P σP τu fc,cube
[days] [kN] [mm] [MPa] [MPa] [MPa]
45NSP1 right side 29 53.84 0.121 171.4 1.90 28.2left side 43.21 0.179 137.5 1.52
45NSP2 right side 38 46.15 0.243 146.9 1.63 30.6left side 53.75 0.146 171.0 1.90
45S5P1 right side 32 118.92 1.089 378.5 4.20 31.8left side 141.83 2.130 451.4 5.01
45S5P3 right side 48 132.95∗ 1.128∗ 423.2 4.70 31.4left side 118.50∗ 0.722∗ 377.1 4.19
45S5P4 right side 62 137.51 0.790 437.7 4.86 33.0left side 128.38 0.898 408.6 4.54
45S6P1 right side 22 139.70 1.125 444.6 4.94 29.7left side 139.70 0.963 444.6 4.94
45S6P2 right side 82 118.53∗ 0.427∗ 377.3 4.19 36.6left side 122.20∗ 0.430∗ 389.0 4.32
45S6P3 right side 27 138.62 1.062 441.2 4.90 29.5left side 119.29 0.812 379.7 4.21
45S6P4 right side 47 125.44 0.848 399.3 4.43 30.3left side 139.38 0.882 443.6 4.92
45S8P1 right side 65 154.95∗ 1.026∗ 493.2 5.48 32.8left side 136.37∗ 0.712∗ 434.0 4.82
45S8P2 right side 60 144.79∗ 0.669∗ 460.9 5.12 32.2left side 121.67∗ 0.684∗ 387.3 4.30
45S8P3 right side 40 205.77 1.238 655.0 7.27 28.2left side 184.82 1.095 588.3 6.53
45S8P4 right side 50 ∼199.35 ∼1.101 ∼634.55 ∼7.05 33.1left side ∼193.66 ∼1.180 ∼616.43 ∼6.84
45S10P4 right side 93 261.54 1.500 832.5 9.25 29.1left side 183.33 1.187 583.6 6.48
* = yielding in the sections with strain gauges.
27

Abstract
In the present research project, long anchorages provided with transverse rein-
forcement were tested with the aim of studying the confining effects of the stirrups.
Particular attention was devoted to gathering detailed data on bar-to-concrete slip,
splitting crack propagation and stirrup stresses. To carry out the pull-out tests, a
special test set-up was build and the friction between the specimen and the reaction
plate was eliminated by resorting to a sophisticated design.
The results show that: 1) the maximum splitting crack opening increased for de-
creasing transverse-reinforcement diameter size and, under service loads, reached re-
markable values; 2) anchorage capacity increases with the stirrup index of confinement
Ω up to an upper bound; 3) stirrup in specimens with a small amount of transverse
reinforcement yielded under service loads.
A comparison with the values prescribed by building codes evidenced that the
bond strength prescribed by both Eurocode 2 and ACI 318-95 code remarkably un-
derestimated the experimental anchorage capacity for large values of stirrup index of
confinement.
Keywords
Reinforced Concrete, Bond in R.C., Anchorages, Concrete Splitting, Transverse Reinforcement in
R.C..
28

Figure 1: Splitting-crack propagation in anchorages and scheme of the specimen tested.
29

Figure 2: Splitting crack and confining actions around a ribbed bar [11] (a); scheme oflocal bond failure: “pull-out failure” (b) and “splitting failure” (c) [31].
30

Figure 3: Specimen geometry and instrument placement.
31

Figure 4: Test set-up.
Figure 5: Typical splitting cracks, as observed in specimens 45S6P4.
32

0 1 2 3 4 5δL [mm]
0
1
2
3
4
5
δ F [m
m]
Left SideRight Side
0 1 2 3 4 5δL [mm]
0.0
0.5
1.0
1.5
2.0
ws [m
m]
ws1 l.s.ws2 l.s.ws2 l.s.ws1 r.s.ws2 r.s.ws3 r.s.
0 1 2 3 4 5δL [mm]
0
50
100
150
F [k
N]
Left SideRight Side
0.0 0.5 1.0 1.5δL [mm]
0
200
400
600
800
σ st [
MP
a] σst1 Left Sideσst2 Left Sideσst3 Left Sideσst1 Right Side
0.0 0.5 1.0 1.5δL [mm]
0.0
0.2
0.4
0.6
0.8
1.0w
s [m
m]
ws1 l.s.ws2 l.s.ws2 l.s.ws1 r.s.ws2 r.s.ws3 r.s.
0.0 0.5 1.0 1.5δL [mm]
0
50
100
150
F [k
N]
Left SideRight Side
a) b)
c) d)
e) f)
45S5P4
Figure 6: Experimental results obtained from specimen 45S5P4 with 5 mm diameterstirrups. 33

0.00 0.02 0.04 0.06 0.08δL / φp
0.00
0.10
0.20
0.30
τ/f c,
cube
Stirrups φst=10 mm
45S10P4Mean
0.00 0.02 0.04 0.06δL / φp
0.00
0.05
0.10
0.15
0.20
τ/f c,
cube
Stirrups φst=6 mm
45S6P145S6P245S6P345S6P4Mean
0.000 0.005 0.010 0.015 0.020δL / φp
0.00
0.02
0.04
0.06
0.08
τ/f c,
cube
No Stirrups
45NSP145NSP2Mean
0.00 0.02 0.04 0.06 0.08δL / φp
0.00
0.05
0.10
0.15
0.20
0.25
τ/f c,
cube
Comparison
No Stirrupsφst= 5 mmφst= 6 mmφst= 8 mmφst=10 mm
0.00 0.02 0.04 0.06δL / φp
0.00
0.05
0.10
0.15
0.20
0.25
τ/f c,
cube
Stirrups φst=8 mm
45S8P145S8P245S8P345S8P4Mean
0.00 0.02 0.04 0.06δL / φp
0.00
0.05
0.10
τ/f c,
cube
Stirrups φst=5 mm
45S5P145S5P345S5P4Mean
a) b)
c) d)
e) f)
Figure 7: Average bond stress versus loaded-end slip.34

0 100 200 300 400 500σp [MPa]
0.0
0.2
0.4
0.6
0.8
ws1
[mm
]
Stirrups φst=10 mm
45S10P4Mean
0 100 200 300 400 500σp [MPa]
0.0
0.2
0.4
0.6
0.8
ws1
[mm
]
Stirrups φst=6 mm
45S6P145S6P245S6P345S6P4Mean
0 100 200σp [MPa]
0.0
0.1
0.2
ws1
[mm
]
No Stirrups
45NSP145NSP2Mean
0 100 200 300 400 500σp [MPa]
0.0
0.2
0.4
0.6
0.8
ws1
[mm
]
Comparison
No Stirrupsφst= 5 mmφst= 6 mmφst= 8 mmφst=10 mm
0 100 200 300 400 500σp [MPa]
0.0
0.2
0.4
0.6
0.8
ws1
[mm
]
Stirrups φst=8 mm
45S8P145S8P245S8P345S8P4Mean
0 100 200 300 400 500σp [MPa]
0.0
0.2
0.4
0.6
0.8
ws1
[mm
]
Stirrups φst=5 mm
45S5P145S5P345S5P4Mean
a) b)
c) d)
e) f)
Figure 8: Maximum splitting crack opening at the first-stirrup level versus principal-barstress.
35

0.00 0.05 0.10 0.15 0.20τ/fc,cube
0.0
0.2
0.4
0.6
0.8
1.0
Y/l b
Stirrups φst = 6 mm
45S6P145S6P245S6P345S6P4
0.00 0.05 0.10 0.15 0.20τ/fc,cube
0.0
0.2
0.4
0.6
0.8
1.0
Y/l b
No stirrups
45NSP1
0.00 0.05 0.10 0.15 0.20τ/fc,cube
0.0
0.2
0.4
0.6
0.8
1.0
Y/l b
Stirrups φst = 8 mm
45S8P145S8P245S8P345S8P4
0.00 0.05 0.10 0.15 0.20τ/fc,cube
0.0
0.2
0.4
0.6
0.8
1.0
Y/l b
Stirrups φst = 5 mm
45S5P145S5P345S5P4
a) b)
c) d)
Figure 9: Splitting crack length versus average bond stress.
36

0.0 0.3 0.6δL [mm]
0
200
400
600
σ st1
[MP
a]
Stirrups φst=6 mm
45S6P2 l.s.45S6P3 r.s.45S6P4 l.s.
0.0 0.3 0.6 0.9δL [mm]
0
200
400
600
σ st1
[MP
a]
Stirrups φst=8 mm
45S8P1 l.s.45S8P2 l.s.45S8P3 r.s.45S8P4 l.s.45S8P4 r.s.
0.0 0.3 0.6 0.9δL [mm]
0
200
400
600
σ st1
[MP
a]
Stirrups φst=5 mm
45S5P1 l.s.45S5P3 l.s.45S5P3 r.s.45S5P4 l.s.45S5P4 r.s. a) b)
c)
Figure 10: Stress in the stirrup closest to the loaded end of the bar versus loaded-end slip.
37

0.00 0.01 0.02 0.03 0.04Stirrup Index of Confinement Ω
0.0
0.1
0.2
τ u/f c,
cube
Kaku, Yamada, Shibata and Takahashi (1988)Kaku, Yamada and Goraku (1989)Maeda, Otani and Aoyama (1995)fb,EC2 (fck=25 MPa)fb,ACI (fck=25 MPa)
0.00 0.03 0.06 0.09Stirrup Index of Confinement Ω
0.0
0.1
0.2
0.3
0.4
τ u/f c,
cube
Series 1 - No stirrupsSeries 1 - B=4Series 1 - B=1.5Series 1 - Preform. crackPresent tests - No stirrupsPresent tests - B=2fb,EC2 (fck=25 MPa)fb,ACI (fck=25 MPa)
a)
b)
Ωmax,ACI
Ωmax,ACI
Ωmin,EC2
Figure 11: Bond capacity τu/fc,cube versus stirrup index of confinement Ω.
38