Dynamic mechanical properties of deformed rubber-modified acrylics
17
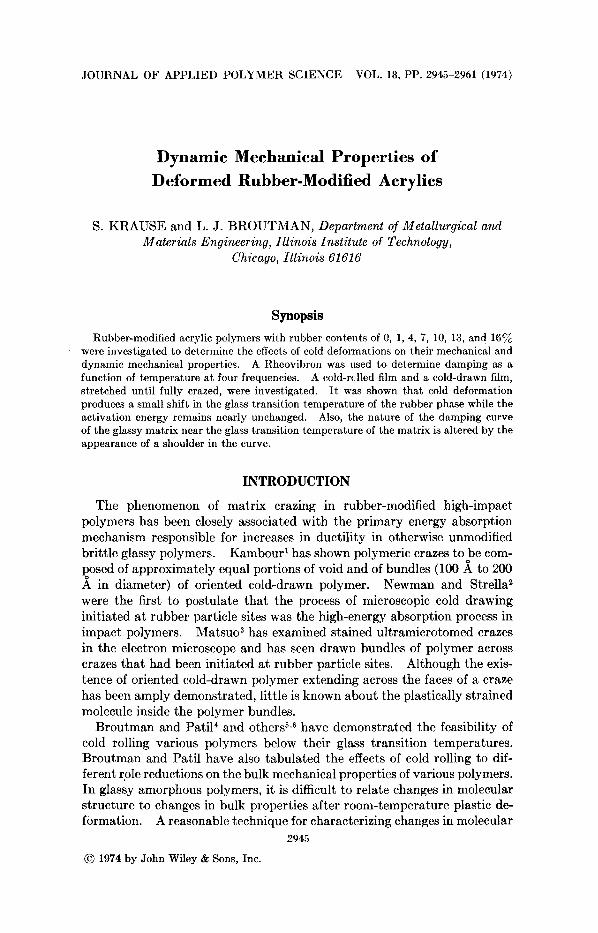
JOURNAL OF APPLIED POLYMER SCIENCE VOL. 18, PI'. 2945-2961 (1974) Dynamic Mechanical Properties of Deformed Rubber-Modified Acrylics S. KRAUSE and L. J. BROUTRIAN, Department of Metallurgical and Materials Engineering, Illinois Institute of Technology, Chicago, Illinois 61616 Synopsis Rubber-modified acrylic polymers with rubber contents of 0, 1, 4, 7, 10, 13, and 16% were investigated to determine the effects of cold deformations on their mechanical and dynamic mechanical properties. A Rheovibron was used to determine damping as a function of temperature at four frequencies. A cold-rclled film and a cold-drawn film, stretched until fully crazed, were investigated. It was shown that cold deformation produces a small shift in the glass transition temperature of the rubber phase while the activation energy remains nearly unchanged. Also, the nature of the damping curve of the glassy matrix near the glass transition temperature of the matrix is altered by the appearance of a shoulder in the curve. INTRODUCTION The phenomenon of matrix crazing in rubber-modified high-impact polymers has been closely associated with the primary energy absorption mechanism responsible for increases in ductility in otherwise unmodified brittle glassy polymers. Kambourl has shown polymeric crazes toke com- posed of approximately equal portions of void and of bundles (100 A to 200 Newman and Strella2 were the first to postulate that the process of microscopic cold drawing initiated at rubber particle sites was the high-energy absorption process in impact polymers. Matsuo3 has examined stained ultramicrotomed crazes in the electron microscope and has seen drawn bundles of polymer across crazes that had been initiated at rubber particle sites. Although the exis- tence of oriented cold-drawn polymer extending across the faces of a craze has been amply demonstrated, little is known about the plastically strained molecule inside the polymer bundles. Broutman and Pati14 and others5z6 have demonstrated the feasibility of cold rolling various polymers below their glass transition temperatures. Broutman and Patil have also tabulated the effects of cold rolling to dif- ferent role reductions on the bulk mechanical properties of various polymers. In glassy amorphous polymers, it is difficult to relate changes in molecular structure to changes in bulk properties after room-temperature plastic de- formation. A reasonable technique for characterizing changes in molecular 2945 in diameter) of oriented cold-drawn polymer. @ 1974 by John Wiley & Sons, Inc.
-
Upload
independent -
Category
Documents
-
view
0 -
download
0
Transcript of Dynamic mechanical properties of deformed rubber-modified acrylics
JOURNAL OF APPLIED POLYMER SCIENCE VOL. 18, PI'. 2945-2961 (1974)
Dynamic Mechanical Properties of Deformed Rub ber-Modified Acrylics
S. KRAUSE and L. J. BROUTRIAN, Department of Metallurgical and Materials Engineering, Illinois Institute of Technology,
Chicago, Illinois 61616
Synopsis Rubber-modified acrylic polymers with rubber contents of 0, 1, 4, 7, 10, 13, and 16%
were investigated to determine the effects of cold deformations on their mechanical and dynamic mechanical properties. A Rheovibron was used to determine damping as a function of temperature a t four frequencies. A cold-rclled film and a cold-drawn film, stretched until fully crazed, were investigated. It was shown that cold deformation produces a small shift in the glass transition temperature of the rubber phase while the activation energy remains nearly unchanged. Also, the nature of the damping curve of the glassy matrix near the glass transition temperature of the matrix is altered by the appearance of a shoulder in the curve.
INTRODUCTION
The phenomenon of matrix crazing in rubber-modified high-impact polymers has been closely associated with the primary energy absorption mechanism responsible for increases in ductility in otherwise unmodified brittle glassy polymers. Kambourl has shown polymeric crazes toke com- posed of approximately equal portions of void and of bundles (100 A to 200
Newman and Strella2 were the first to postulate that the process of microscopic cold drawing initiated at rubber particle sites was the high-energy absorption process in impact polymers. Matsuo3 has examined stained ultramicrotomed crazes in the electron microscope and has seen drawn bundles of polymer across crazes that had been initiated at rubber particle sites. Although the exis- tence of oriented cold-drawn polymer extending across the faces of a craze has been amply demonstrated, little is known about the plastically strained molecule inside the polymer bundles.
Broutman and Pati14 and others5z6 have demonstrated the feasibility of cold rolling various polymers below their glass transition temperatures. Broutman and Patil have also tabulated the effects of cold rolling to dif- ferent role reductions on the bulk mechanical properties of various polymers. In glassy amorphous polymers, it is difficult to relate changes in molecular structure to changes in bulk properties after room-temperature plastic de- formation. A reasonable technique for characterizing changes in molecular
2945
in diameter) of oriented cold-drawn polymer.
@ 1974 by John Wiley & Sons, Inc.

2946 KRAUSE AND BROUTMAN
structure after deformation by crazing or cold rolling is the viscoelastic response measured by dynamic mechanical damping. Because dynamic mechanical damping is influenced by the internal molecular response, it is possible with this method to investigate changes in molecular structure due to plastic deformation.
There have been some studies in the past regarding the effects of orienta- tion on the dynamic damping response of polymers, but none concerning the effects on damping of an amorphous glassy polymer plastically deformed below To. Matsuoka’ measured the effect of hot stretching an ABS poly- mer on damping and found a dilational shift of the rubber-component damp- ing peak. Van Krevelens discusses changes in T , peak width and tempera- ture in PET fibers after elongations of 4ooyO to 800%.
EXPERIMENTAL
Materials
Rubber-modified acrylic polymers were supplied by the Army Materials and Mechanics Research Center, Watertown, Massachusetts. They con- sisted of a grafted styrene-butadiene rubber component dispersed in a styrene-acrylonitrilemethylmethacrylate matrix. Varying rubber con- tents were created by “dilution” of a polymer containing an original 16% rubber to those of reduced rubber contents. The polymers tested contained 0, 1,4,7, 10, 13, and 16% rubber. These polymers are referred to as acrylic multipolymers (AMP), and their rubber content will be designated by ab- breviations, e.g., AMP 16 and AMP 0 for 16% and 0% rubber, respectively.
Compression Molding of Sheet and Sheet Film
Sheets and sheet films were molded on a Dake Model 44-251 compression- molding machine. A sample of the bulk AMP material was placed be- tween a 0.003-in. steel sheet shim stock located between two steel blocks of dimensions 4 in. by 4 in. Molding was done at 180°C under a load of 30,000 pounds using steel shim stock spacers a t the four corners for thickness con- trol. A lubricant, Dow Corning Silicone Mold Release Agent, was em- ployed on the sheet shim stock to facilitate polymer flow and prevent stick- ing. The AMP sheet and sheet film were allowed to anneal for relief of stresses and to achieve an equilibrium structure. The anneal was ac- complished by slow cooling from molding temperature to room temperature (cooling rate approximately 15’F/hr). Films 0.004 in. thick were die cut for tensile testing and razor cut for dynamic mechanical damping. Sheets 0.050 in. thick were die cut for tensile impact testing.
Compression Molding of High-Temperature Sandwich Specimens
A dynamic damping specimen in the Rheovibron I1 is always a t a slight tension throughout the course of the test. The effect of this tension on the specimen is negligible at temperatures much below the polymer T,, but in

RUBBER-MODIFIED ACRYLICS 2947
the vicinity of the polymer T,, the specimen will sag and stretch, causing the test to be discontinued. To circumvent this problem and allow mea- surements in the T, range, other researchers have either lightly crosslinked the amorphous polymer or embedded a small portion of it in a material of much higher T,. For AMP materials, i t is possible to determine T , using a sandwich specimen.
Regarding the construction of the sandwich specimen, the outer layers must consist of an acoustically inert material in the T, temperature region of AMP materials. The sandwich specimen was therefore structured of sheet films of polycarbonate (T, = 145°C) + AMP (T, = 95°C) + poly- carbonate. Intimate contact between the materials 'was promoted by heating the specimen to 180°C in the compression-molding machine at 10 psi and then cooling to 25°C. A damping specimen was then cut, and the AMP T, was determined a t various frequencies in the Rheovibron 11.
Deformation of Films The materials AMP 0 through AMP 16 were crazed to study the effects
upon dynamic mechanical damping. Specimens were crazed by stretching the films in tension to approximately 750/, of the ultimate elongation of the film. A specimen to be used for dynamic damping measurements was then razor cut from the crazed area of the tensile specimens.
Rolling of plastic films was done on a two-roll mill having 4.5-in.-diameter rolls that were 6.3 in. long. Sheet films and sheets of rectangular dimen- sions 0.5 in. by 3.0 in. were unidirectionally rolled between 0.003-in. sheets of steel shim stock to reductions in thickness of 20% to 25%. Specimens were then die cut or razor cut for tensile testing or dynamic mechanical testing, respectively .
Tensile Testing The determination of stress-strain properties of annealed and cold-rolled
specimens of materials AMP 0 through AMP 16 was conducted on speci- mens whose dimensions are specified by ASTM 1822-68 Type L.9 The use of these specimens was necessitated because sheet films were molded discs of only 3 in. in diameter. The annealed specimens and the cold-rolled speci- mens were all tested a t room temperature a t a cross-head rate of 0.1 in./ min. For modulus of elasticity measurements, a gauge length of 0.5 in. was employed between the pneumatic clamps in the Instron testing ma- chine.
Measurement of Dynamic Damping and Dynamic Modulus The determination of the dynamic mechanical damping and dynamic
modulus was conducted on a Rheovibron I1 for annealed, cold-rolled, and crazed AMP 0 through AMP 16. Measurements were taken every 4" from -120°C to +84'C. For the T, matrix determination, measure- ments were taken on sandwich specimens from 80°C to 100°C at 1" inter- vals. For calculation of molecular motion relaxation energies of activation,

2948
I
KRAUSE AND BROUTMAN
0 1 L 1 I I I I
2 . 5 3 . 0 3 . 5 4 . 0 4 . 5 5 . 0 5 . 5 6 . 0 1/T X l o 2
Fig. 1. Experimental data for AMP 7 used to obtain activation energies of molecular relaxations.
measurements were made a t frequencies of 3.5, 11, 35, and 110 Hi. Mea- surements were taken at 1°C intervals for the T, rubber and the T, matrix peaks. For the broader p-matrix peak, measurements were taken a t 4" intervals. A typical plot from which activation energies were determined is shown in Figure 1 for AMP 7.
RESULTS
Tensile Properties
The appearance of annealed tensile specimens after fracture is shown in Figure 2. All specimens are seen to exhibit shear banding across and craz- ing throughout the gauge length. With increasing rubber content, the shear banding and crazing progresses from slight to incomplete to complete. In AMP 16, it is observed that crazing has taken place so thoroughly that any indication of shear banding has been completely masked.
Shown in Figure 3 is the appearance of cold-rolled specimens after frac- ture in tension. In comparison with the annealed specimens in Figure 2, the chief effect of the cold rolling was to reduce the shear banding and craz- ing in the respective specimens. As with the annealed specimens, there is an increase in crazing with increasing rubber content.
The load elongation curves for the specimens exhibited in Figures 2 and 3 are shown in Figures 4 and 5. These curves assist greatly in the explanation of the appearance of the crazed polymers broken in tension. A number of effects due to increasing rubber content may be noted. As shown in Figure 6, the modulus of elasticity decreases linearly with increasing per cent rubber. In Figure 7, the effect of rubber content on the yield point has

RUBBER-MODIFIED ACRYLICS 2949
Fig. 2. Appearance of annealed -4MP 0 through AMP 16 after fracture in tension a t a st.rain rate of 0.2 in./min.
Fig. 3. Appearance of cold-rolled AMP 0 through AMP 16 after fracture in tension at a strain rate of 0.2 in./min.
been plotted. A linear relationship between increasing rubber content and decreasing yield stress is displayed for the annealed polymers.
AMP 0 and AMP 1 exhibit a yield point but are so brittle that they have no ability to draw. From AMP 4 through AMP 16, a trend toward in- creasing elongation to failure with increasing rubber content is observed. It is noted, though, that throughout the entire elongation the drawing stress (the stress after yield while the polymer is elongating) remains rela-

2950 KRAUSE AND BROUTMAN
0 1 0 0.05 0.10 0.15 0.20 0.25 0.30 0.35 0.
Elongation in .
Fig. 4. Load elongation curves for annealed AMP 0 through AMP 16 specimens.
10,000
3 8,000 0 n - 0
a3
5 6.000
M .i
a3
a 4,000
s w
2,000
0
Fig. 5.
0 0.05 0.10 0.15 0.20 0.25 0.30 0.35 0.
Load elongation curves for cold-rolled AMP 0 through AMP 16 specimens.
Elongation i n .
I
D
tively constant and does not increase with increasing elongation. Shown in Figure 5 are the load elongation curves for the cold-rolled AMP polymers. A number of effects are noted in comparing the curves in Figure 5 with those of the annealed specimens in Figure 4. The yield point in the cold- rolled specimens is broader and not as sharply defined as in the annealed specimens. In the cold-rolled polymers, AMP 0 and AMP 1 exhibit some degree of ductility because they draw slightly beyond the yield point. All

4.0
3.5
ul 0 I 4
x -4 D a
3.0
3 .4 u 4
I m PI w
0
& 2 .5
%I
B 2 . 0
2 PI 1 a
1 . 5
1.0
RUBBER-MODIFIED ACRYLICS 2951
Annealed 0- Cold R o l l e d 0--
I I I I I I I
0 2 4 R u b b e r Content ( 0 )
Fig. 6. Effect of rubber content of the modulus of elasticity for annealed and cold-rolled AMP polymers.
cold-rolled AMP polymers exhibit considerable increases in elongation to failure over the annealed AMP polymers. In the cold-rolled polymers AMP 13 and AMP 16, the yield point has disappeared, whereas in the annealed polymers AMP 13 and AMP 16, a distinct yield point was ex- hibited. In Figure 7, the effect of rubber content on the yield stress of annealed and cold-rolled polymers is shown. In all cold-rolled polymers, the yield stress is higher than in the annealed polymers. Figure 6 shows the effect of rubber content on the modulus of elasticity for annealed and cold-rolled AMP polymers. In all polymers, the modulus has increased over that of the annealed specimens.
Dynamic Mechanical Properties Before considering the effect of the rubber component on the dynamic
mechanical properties, it will be useful to examine the dynamic mechanical properties of the unmodified matrix polymer, otherwise referred to as AMP 0.

2952 KRAUSE AND BROUTMAN
11
10
9
m 0 +-I
x 8
a a a a
4
al &
= : 7 m r( 01 .r( *
6
5
4
Annealed 0 Cold RolledO- -
Y \
'\
\ "\
0 2 4 6 8 10 12 14 16 Rubber C o n t e n t ( 0 )
Fig. 7. Effect of rubber content on the yield stress of annealed and cold-rolled AMP polymers.
Figure 8 represents the dynamic mechanical damping versus tempera- ture a t frequencies of 3.5, 11, 35, and 110 Hz for AMP 0. Starting from the lowest temperature, an increasing tan 6 is observed climaxed by a peak a t 0°C a t a frequency of 3.5 Hz. This peak, which is referred to as the @-matrix peak, is associated with the strong @-transition of the poly(methy1 meth- acrylate) component of the matrix. lo This peak is very much temperature- rate dependent as demonstrated by a large shift toward T, over the fre- quency range of 3.5 Hz to 110 Hz. From this shift, the activation energy of the peak may be determined. The average activation energy for the @- matrix peak for all AMP polymers is shown in Table I to be 16.7 kcal/mole.

RUBBER-MODIFIED ACRYLICS 2953
0.080
,0.060
1
I1 0.120
FREQUENCY (H5)
-
-
0.100
0.080
0.060
1
0.040
0.020
0.000 -120
_.__. -120 -100 -80 -60 -40 -20 0 20 40 60
.o..
- 3*5- ( 1 _--- 35 _ - - - 1 lo------- - -
-
/ - - - _ - - /__---_ I.
-
I I I I
-100 -80 -60 -40 -20 0 20 40 60 80
T (-GI
Fig. 8. Plot for AMP 0 of tan 6 vs. temperature at frequencies of 3.5, 11,35, and 110 Hz.
0.100
0.080
0.060
1
0.040
0.020
0.000 -120
0.120,
- 3*5- ( 1 _--- 35 _ - - - 1 lo------- - -
-
/ - - - _ - - /__---_ I.
-
I I I I
-100 -80 -60 -40 -20 0 20 40 60 80
I FREQUENCY (H5)
Fig. 9. Plot for AMP 7 of tan 6 vs. temperature at frequencies of 3.5, 11,35, and 110 Hz.
Through the use of the sandwich specimen, the T, of the matrix has also been experimentally determined to be 90.5"C. This T, appears to corre- spond with that of the styrene-acrylonitrile component of the matrix as previously reported for an ABS polymer." The average activation energy of this peak for AMP polymers has been calculated and is shown in Table I to be 137.1 kcal/mole.
The effect of increasing rubber content on the damping properties of AMP polymers is typically shown in Figure 9. The only significant differ- ence between this curve and the damping curve of AMP 0 is the appearance of a low-temperature damping peak at, on the average, -70°C a t a fre-

2954 KRAUSE AND BROUTMAN
TABLE I Annealed AMP Polymer Temperature-Frequency Peaks and Activation Energies
Temperature-frequency peak, "C Activation energy,
AMP 3.5 Hz 11 Hz 35 Hz 110 Hz cal/mole
- 0 1 4 -71.8 7 -70.6
10 - 69.8 13 -69.9 16 -69.0
-
0 0 1 2 4 0 7 4
10 4 13 4 16 6
0 90.0 1 88.5 4 90.3 7 90.0
10 91.8 13 88.4 16 90.4
Rubber To Peak
- - -69.7 -66.4 -69.0 -67.5 -68.4 -67.0 -68.4 -66.8 -67.6 -65.7
Matrix @-Peak 9 22
11 28 12 20 19 20 15 30 17 34 11 38
Matrix To Peak 92.5 95.0 91.6 94.1 92.6 94.0 91.0 95.0 92.4 94.5 91.1 92.5 92.5 94.5
-63.0 32,800 -64.3 53 , 500 -64.2 56 , 100 -64.3 58 , 400 -63.2 52 , 600
Average 50,700
35 17,500 40 14,700 35 18 , 000 45 16,500
50 14,700 50 17,500
Average 16,700
50 18 , 000
96.5 134 , 200 96.5 121 , 300 96.8 140 , 200 96.8 126,600 96.5 149 , 300 95.5 143 , 400 97.0 144 , 700
Average 137,100
quency of 3.5 He. This peak can then be attributed to the styrene- butadiene rubber component. The intensity in terms of peak height versus content has been plotted in Figure 10 and shows a linear correlation. A 4°C to 5°C shift in the peak is also observed as the frequency is increased from 3.5 Hz to 110 Hz. The average activation energy of this peak for annealed AMP polymers has been calculated and is shown in Table I to be 50.7 kcal/mole. It appears that the addition of the rubber component does not affect either the activation energy of the @-matrix peak nor the T, matrix peak.
In Figure 11, the effect of cold rolling on the dynamic mechanical damp- ing is displayed for the unmodified AMP 0 polymer. There are three basic effects that can be readily noted. The first effect is the decrease in the intensity of the @-matrix peak occurring a t 0°C. It was no longer possible to obtain the activation energy of this peak because the exact temperature

RUBBER-MODIFIED ACRYLICS 2955
0.050
Y la Q) Dl
E 0 -4 U Q X Q d
0.040
g! 0 . 0 3 0
E h
0,
al
; a 0 .
0 W
3
E 0 .
.r( In
U E H
0 /
020
010 -
I I I 1 1 I I
8 10 12 14 16 0
0 2 4 6 Rubber Content ( % f
Fig. 10. Effect of rubber content on the intensity of the rubber T, relaxation peak.
0.120
0.100
0.080
- 0.060
9
0.040
0.020
0.000 -1
A N N W ~
COLD ROLL- - I
I I I
20 -100 -80 -60 -40 -20 0 20 40 60 80
Fig. 11. Plot for AMP 0 of tan 6 vs. temperature for annealed and cold-rolled specimens at 3.5 Ha.

2956 KRAUSE AND BROUTMAN
0.100
0.080
0.060
TABLE I1 Cold-Rolled AMP Polymer Temperature-Frequency Peaks and Activation Energies
ANNEAL ___ CRAZE - - - - COLD ROLL- -
- 1 ;
‘ I
,’ / ,‘ I!
-
- / I / I
AMP
Rubber T, peak, “C Activation enegy,
3 . 5 Hz 11 Hz 35 Hz 110 Hz cal/mole
0 1 4 7
10 13 16
- - - -69.1 - -65.7 -64.3 -62.4 -59.7 53,300 -67.0 -65.0 -62.4 -61.1 51,900 -67.0 -65.1 -61.7 -60.4 43,800 -68.4 -65.7 -64.3 -62.4 48,900
Average 49,500
0.120
a t which the peak occurred could no longer be accurately determined. This was found to be true for tests on all subsequent AMP polymers also. The second effect of cold rolling was the appearance of a “shoulder” a t a tem- perature that was higher than the @-matrix peak and lower than the T , of the matrix peak. This shoulder might be considered to be a peak, but its proximity to the T , peak does not allow a clear definition of its appearance. The third feature is the shift to a lower temperature by about 4°C of the rise in tan 6 associated with the To of the matrix peak.
Shown in Figure 12 is the typical effect of the rubber component on the dynamic damping properties of a cold-rolled AMP 7 polymer. The effects of cold rolling on the rubber To peak were found to be the following. The temperature a t which the peak occurs is increased 2°C to 5°C. The in- tensity of the peak is diminished from its original height. The activation energy of the T , rubber peak is 49.5 kcal/mole as shown in Table 11.

RUBBER-MODIFIED ACRYLICS 2957
TABLE I11 Crazed AMP Polymer Temperature-Frequency Peaks and Activation Energies
Rubber T, peak, "C Activation energy, AMP 3 . 5 Hz 11 Hz 35 Hz 110 Hz cal/mole
- - - - 4 7 -64 .3 -63.0 -61.7 -59.7
10 -65.0 -64.9 -63.6 - 60.4 13 -69.7 -67.7 -65.7 -62.8 16 -65.0 -62.5 -61.7 -59 .7
Average
65,200 66 , 300 43,300 56,700 57,800
Shown additionally in Figure 12 is the effect of crazing on the dynamic mechanical damping. In general, the effects on the matrix are the same as for the cold-rolled polymers, although not as severe. In all polymers, the 0- matrix peak is reduced in intensity, although not to as great a degree as that of the cold-rolled polymer. There is a shoulder formed between the p- matrix peak and the T , of the matrix peak, but its intensity is not as great as that for cold-rolled AMP polymers. There is, in all polymers, a shift to a lower temperature by about 2°C of the rise in tan 6 associated with the T, matrix peak. In all polymers, there is an upward shift of the T , rubber peak of 2°C to 4°C in temperature. The peak intensity for crazed poly- mers has been reduced, but in comparison with that of the cold-rolled polymers it has been diffused or broadened to a greater degree. The aver- age activation energy for crazed AMP polymers of the rubber T , peak, as shown in Table 111, is 57.8 kcal/mole.
DISCUSSION
The results for the change in mechanical properties due to the effect of the addition of a rubber component agree, in general, with those of others, for example, Matsuo and Imasawa.12 They have found a reduction in tensile strength and modulus and an increase in elongation with increasing rubber content. Boyer et al.I3 have found an increase in impact strengt,h with an increase in the percentage of the rubber component. In this study, the effect of increasing the rubber content from 0% to 16% has the follow- ing effects on the properties. Figure 6 shows the modulus of elasticity being reduced from an orginal value of 3 X lo5 psi to a value 3oy0 less than that. Figure 7 shows the yield stress being reduced by 45% from an original value of 5.1 X lo3 psi. The Ioad elongation curves in Figure 4 show the elongation to failure being increased by a value of 600y0 from an original value of 0.03 in. Figure 2 shows that the increase in the elonga- tion to failure, or the ductility, is also associated with an increase in the amount of crazing present a t failure.

2958 KRAUSE AND BROUTMAN
The annealed AMP polymers were cold rolled to a roll reduction 25y0. As discussed by Broutman and Patil,4 there will be a general enhancement of mechanical properties due to the orientation of the polymer. The property enhancement will only be in the direction parallel to that of the cold rolling. The changes in properties must be related to a specific polymer. For the AMP polymers, the changes in properties from those of the an- nealed AMP polymers were the following. Figure 6 shows the modulus of elasticity increasing in general by 70%. Figure 7 shows the yield stress in- creasing in general by 11%. The load-elongation curves for cold-rolled AMP polymers in Figure 5 shows the elongation to failure increasing by approximately 100%. Although there is an increase in the elongation to failure, Figure 3 shows a decrease in the amount of crazing present in comparison anneal AMP polymers.
The changes due to cold rolling are generally resolvable in terms of having increased the amount of covalent bonding available in the direction of cold rolling. There appears to be an anomolous result, though, with regard to the decrease in the amount of crazing and the increase in the ductility as seen in elongation to failure. With cold rolling, the potential for elongation and orientation in the crazed material has decreased be- cause the material has now been already partially oriented. This accounts for the decrease in the amount of crazing. But the increase in the ductility must be accounted for by the decrease in the notch sensitivity of the mate- rial due to the presence of the oriented polymer chains. The oriented polymer chains serve to blunt or restrain catastrophic cracks from propagat- ing across the bulk material. This, then, is the reason for the increased ductility at the roll reduction of 25%. It must be considered, though, that if the roll reduction is continually increased, a point will be reached a t which the ability to orient, the mechanism of ductility, will be exhausted and ductility will decrease.
The appearance of a well-defined rubber To damping peak in Figure 9 demonstrates that the rubber component exists as a discrete phase in the brittle glassy matrix. This result is not unusual and agrees with similar conclusions by Boyer et a1.13 and Matsuo et a1.14 and other researchers.
The dynamic damping of the unmodified, or AMP 0, matrix in Figure 8 displays a strong @-transition a t 0°C at a frequency of 3.5 Hz. As demon- strated by Deutsch et aI.,lo this peak is due to the secondary transition of the poly(methy1 methacrylate) component of the matrix. The activation energy determined was 16.7 kcal/mole, which agrees well with a value of 18 kcal/mole as found by Deutsch et al.1° The To of the matrix occurs a t 90.5"C a t a frequency of 3.5 Hz. The activation energy of 137.1 kcal/mole and the temperature a t which the peak occurs agree with the results of Moore and Giewnewski.ll This peak is associated with the acrylonitrile- styrene components of the matrix and the activation energy is in agreement with that determined by Moore and Giewnewski of 11 1 to 147 kcal/mole in creep measurements.

RUBBER-MODIFIED ACRYLICS 2959
The rubber To peak occurs a t -70°C a t a frequency of 3.5 Hz and has an activation energy of 50.7 kcal/mole. As shown in Figure 10, there is a linear relationship between the percentage of the rubber component in the respective AMP polymer and the intensity of the damping of the rubber T , peak. This result concurs with that of Boyer et al.I3 for any series of similarly prepared rubber-modified polymers. This result, though, cannot be generalized in comparing one commercial polymer to another because the method of preparation greatly affects the intensity of the rubber damp- ing peak.
The changes in the dynamic damping response of AMP polymers due to cold rolling are the following. Shown in Figure 12 are the three basic changes in the dynamic damping curve for the unmodified, or AMP 0, polymer. The first effect is a reduction in the intensity of the p-relaxation peak. The second is the appearance of a new “shoulder” or peak a t a tem- perature above that of the p-matrix peak and slightly below that of the T , matrix peak. The third effect is a shift to a lower temperature of the rise in damping associated with the T o of the AMP 0 polymer.
The changes due to cold rolling in the AMP polymer damping curve are similar to those occurring in other polymers such as polycarbonate.15 The reasons for these changes are not well understood a t the present time, but some explanations will be offered. The changes as reported in this study are also similar to those occurring in polymers that have been rapidly quenched from the melt state. This indicates that the effects of two en- tirely different treatments may be similar in the end result. Broutman and Pati14 have shown the presence of residual stresses in quenched or cold- rolled polycarbonate. These residual stresses may be a macroscopic phenomenon of microscopic stresses in the polymer chains. If indeed this is true, there may be a “locking out” of some &segmental motion in the process of stiffening the polymer chains. This would account for the reduc- tion in the intensity of the &molecular relaxation peak. Many of these smaller segments might then remain in the strained state until enough thermal energy is applied to the segments to relax to their former state. This relaxation, then, would manifest itself as a new peak occurring a t a higher temperature. This would account for the appearance of a new “shoulder” just below the T , matrix relaxation peak. The shift in the damping curve at the T o of the matrix could be either a shift in the matrix T , or a broadening of the matrix To. This could be accounted for by either the additional energy stored in the strained polymer chains or the addition of free volume to the matrix which will also produce a lowering of the matrix
The final effect to be noted in regard to cold rolling is with respect to the rubber T , peak. This relaxation peak has been reduced in intensity and shifted upward by 2OC to 4°C. The effect of orientation on the glass transition of natural rubber has been studied by Shen and Johnston, and they have surveyed the literature only to find no consistently agreeable
T,.

2960 KRAUSE AND BROUTMAN
data.16 The explanation offered by this study is that thc modulus and strength of the stretched rubber has increased, thereby requiring a higher activation energy or a higher temperature to activate this relaxation. As considered previously, the strained segments may lose some mobility thereby reducing the intensity of the relaxation.
In crazing, the same effects are found to occur for dynamic damping as with cold rolling. This is reasonable since the crazing involves an orienta- tion process. The only difference will be the appearance of a wide range of orientation process. The only difference will be the appearance of a wide range of orientations which will cause, as seen in Figure 12, a broadening of the damping spectrum a t the T , of the rubber phase. All othcr effects can be related to the discussion in the cold-rolling explanation section.
CONCLUSIONS
1. For annealed AMP polymers, increasing the rubber content from 0% to 16% has the following effects on the mechanical properties: (a) the modulus of elasticity is reduccd by 30% from an original value of 3 X lo5 psi; (b) the yield stress is reduced by 45% from an original value of 5.1 x lo3 psi; (c) the drawing stress is reduced by 27% (at AMP 4) from an original value (at AMP 4) of 7.5 X lo3 psi; (d) the elongation to failure has increased 600% (there has also been a corresponding increase in the amount of crazing in the fracture specimens).
2. Annealed AMP polymers were cold rolled to a roll reduction of 25y0. In comparing cold-rolled AMP polymers to annealed AMP polymers, the effects on the mechanical properties were (a) an increase in the modulus of elasticity of 17%; (b) an increase in the yield stress of 11%; (c) an in- crease in the drawing stress by 17%; (d) an increase in the elongation to failure by 100% (although crazing in the direction of cold rolling had been greatly reduced).
For annealed AMP polymers, the molecular relaxation activation energies can be determined by temperature-frequency measurements. The activation energies are (a) 50.7’kcal/mole at approximately -70°C for the rubber To peak; (b) 16.7 kcal/mole at approximately 2°C for the @-matrix peak; (c) 137.1 kcal/mole at approximately 90°C for the matrix T , peak. The effect of increasing rubber content was a linear increase in the intensity of the rubber To peak.
Changes in the dynamic damping response of AMP polymers due to cold rolling are the following: The rubber T , peak is reduced in intensity and the location of it is shifted to a higher temperature by 2°C to4”C. The ,&matrix peak is reduced in intensity while a t the same time a new “shoul- der” LY peak appears between the @-matrix peak and T , matrix peak. The rise in dynamic damping associated with T , in the annealed polymer is shifted to a lower temperature, thereby indicating a lowering of the To or a possible broadening of the T , peak. The lowering in intensity of the P- matrix peak and the appearance of the shoulder peak near T o are associated
3.
4.

RUBBER-MODIFIED ACRYLICS 2961
with a strain induced locking out of t,hc @-molecular relaxat,ion in some main chain segments. Thcsr scgmcnts will then require additional thermal energy supplied a t a higher tcmperaturc to relax to thcir normal unex- tended state. This relaxation will manifcst itself as a shoulder slightly below the T , matrix peak.
Crazing affects the dynamic damping of A J I P polymers in the same manner as does cold rolling, but the effects are riot as intense since the overall degree of orienta- tion is not as great.
5. Crazing in AMP polymers is reduced by cold rolling.
References 1. R . P. Kambour, Polymer, 5, 143 (1964). 2. S. Newman and S. Strella, J . A p p l . Polym. Sci., 9, 2297 (1965). 3. M. Matsuo, Polym. Eng. Sci., 9, 206 (1969). 4. L. J. Broutman and R . S. Patil, Pollym. Eng. Sci., 11, 165 (1971). 5. P. H. Rothschild and B. Maxwell, J . A p p l . Polym. Sci., 5, S-11 (1961). 6. J. Wilchinsky, SPE J . , March (19N). 7. Matsuoka, Polym. Eng. Sci., 8, 246 (1968). 8. 11. W. Van Krevelen, Propcrtirs of Pol~jmcrs, Corralations zuilh Chcmicnl Stricctzire,
9. ASTM 11 1822-68, ASTM Book of Standards, Part 27, 1972. Elsevier, New York 1972.
10. K. Deutsch, E. A. Hoff, and W. Reddish, J . Polym. Sci., 13, X 5 (1954). 11. 11. S. Moore and C. Giewniewski, Polym. Prcprinl.?, 10, 937 (1969). 12. M. Mat,suo and Y. Tmasawa, Polynz. Eng. Sci., 10, 261 (1970). 13. 11. F. Boyer, H. Keskkula, and S. G. Turley, J. A p p l . Polym. Sci., 15, 3.5 (1971). 14. RI. Matsuo, A. Ueda, and Y. Kondo, Polym. Eng. Sci., 10, 2.53 (1970). 15. S. Krause, Illinois Institute of Technology, Unpublished results. 16. W. V. Johnston and M. Shem, Polym. Prcprints, 1 1 , 154 (1970).
Received January 17, 1974 Revised March 28, 1974