Open versus laparoscopic liver resection for colorectal liver ...
Eur. J . Biochem. 102, 537-547 (1979)
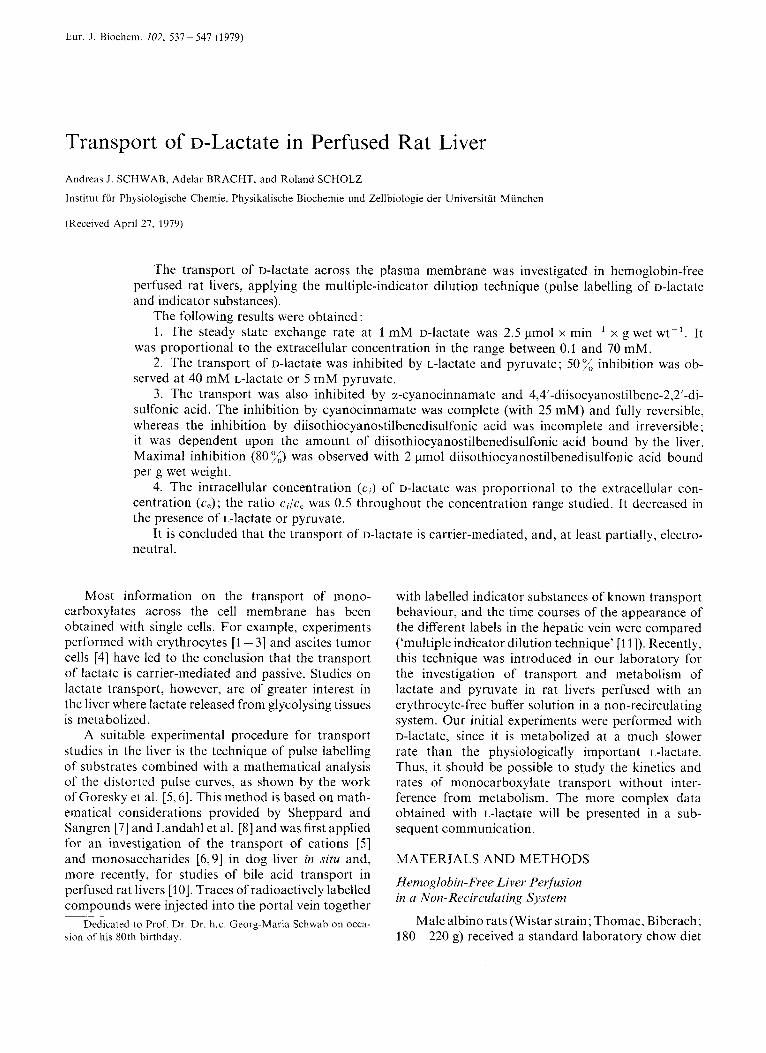
Transport of D-Lactate in Perfused Rat Liver Andreas J. SCHWAB, Adelar BRACHT, and Roland SCHOLZ
Institut fur Physiologische Chemie, Physikalische Biochemie und Zellbiologie der Universitat Munchen
(Received April 27, 1979)
The transport of D-lactate across the plasma membrane was investigated in hemoglobin-free perfused rat livers, applying the multiple-indicator dilution technique (pulse labelling of D-lactate and indicator substances).
The following results were obtained: 1. The steady state exchange rate at 1 mM D-lactate was 2.5 pmol x min-' x g wet wt- ' . It
was proportional to the extracellular concentration in the range between 0.1 and 70 mM. 2. The transport of D-lactate was inhibited by L-lactate and pyruvate; 50% inhibition was ob-
served at 40 mM L-lactate or 5 mM pyruvate. 3. The transport was also inhibited by cc-cyanocinnamate and 4,4'-diisocyanostilbene-2,2'-di-
sulfonic acid. The inhibition by cyanocinnamate was complete (with 25 mM) and fully reversible, whereas the inhibition by diisothiocyanostilbenedisulfonic acid was incomplete and irreversible ; it was dependent upon the amount of diisothiocyanostilbenedisulfonic acid bound by the liver. Maximal inhibition (80 o/,) was observed with 2 pmol diisothiocyanostilbenedisulfonic acid bound per g wet weight.
4. The intracellular concentration (ci) of D-lactate was proportional to the extracellular con- centration ( c e ) ; the ratio ci/c, was 0.5 throughout the concentration range studied. It decreased in the presence of L-lactate or pyruvate.
It is concluded that the transport of D-lactate is carrier-mediated, and, at least partially, electro- neutral
Most information on the transport of mono- carboxylates across the cell membrane has been obtained with single cells. For example, experiments performed with erythrocytes [l - 31 and ascites tumor cells [4] have led to the conclusion that the transport of lactate is carrier-mediated and passive. Studies on lactate transport, however, are of greater interest in the liver where lactate released from glycolysing tissues is metabolized.
A suitable experimental procedure for transport studies in the liver is the technique of pulse labelling of substrates combined with a mathematical analysis of the distorted pulse curves, as shown by the work of Goresky et a]. [5,6]. This method is based on math- ematical considerations provided by Sheppard and Sangren [7] and Landahl et al. [8] and was first applied for an investigation of the transport of cations [5] and monosaccharides [6,9] in dog liver in situ and, more recently, for studies of bile acid transport in perfused rat livers [lo]. Traces of radioactively labelled compounds were injected into the portal vein together
sion of his 80th birthday.
~~ - ~
Dedicated to Prof. Dr. Dr. h.c. Georg-Maria Schwah on occa-
with labelled indicator substances of known transport behaviour, and the time courses of the appearance of the different labels in the hepatic vein were compared ('multiple indicator dilution technique' [11 I). Recently, this technique was introduced in our laboratory for the investigation of transport and metabolism of lactate and pyruvate in rat livers perfused with an erythrocyte-free buffer solution in a non-recirculating system. Our initial experiments were performed with D-lactate, since it is metabolized at a much slower rate than the physiologically important L-lactate. Thus, it should be possible to study the kinetics and rates of monocarboxylate transport without inter- ference from metabolism. The more complex data obtained with L-lactate will be presented in a sub- sequent communication.
MATERIALS AND METHODS
Hemoglobin-Free. Liver Perfusion in u Non-Recirculating System
Male albino rats (Wistar strain; Thomae, Biberach; 180-220 g) received a standard laboratory chow diet
538 Transport of o-Lactate in Perfused Rat Liver
(Altromin) and water ad libitum prior to the surgical removal of the liver under pentobarbital anaesthesia. The perfusion technique has been described elsewhere [12]. The perfusion fluid was Krebs/Henseleit bicar- bonate buffer [I31 pH 7.4, saturated with an oxygen/ carbon dioxide mixture (95j5). It contained the sub- stances to be investigated by pulse labelling in the unlabelled form. Diisothiocyanostilbenedisulfonic acid, cyanocinnamate, D-lactate, L-lactate or pyruvate were infused into the perfusion fluid and the final concentrations were calculated from perfusate flow and infusion rate. The fluid was pumped through a temperature-regulated (37 "C) membrane oxygenator prior to entering the liver via a cannula inserted in the portal vein. The effluent perfusate flowed past an oxygen electrode before being discarded or, in pulse experiments, collected by a fraction collector. The flow rate was adjusted to the metabolic activity of the liver as judged from the venous oxygen concentra- tion. It varied between 5 and 6 ml x g- ' x min-', but it was constant in each individual experiment. At the end of the perfusion experiment, the liver was dissected, blotted with filter paper and weighed. (The reference base 'wet weight', therefore, is lower than the weight of the liver under perfusion conditions.)
Metuholic Parametevs
Samples of the effluent perfusion fluid were col- lected in the intervals between the pulse experiments and were analysed for glucose, L-lactate, D-lactate and pyruvate by standard enzymatic procedures [14]. The oxygen concentration in the perfusate was mon- itored continuously employing a teflon-shielded plati- num electrode. Metabolic rates were calculated from arteriovenous concentration differences and the flow rate and were referred to the wet weight of the liver. Under standard conditions (i.e. livers from fed rats, no substrates or inhibitors added, perfusion time between 30 and 100 min) the rates of oxygen uptake were in the range of 2.2-2.6 pmol x g-' x min-'. Glucose, L-lactate and pyruvate were released by the liver at rates of 1.0-1.3, 1.2-1.5 and 0.3-0.5 pmol x g-' x min-', respectively.
Pulse Experiments
Pulse labelling was performed by injection of trace amounts of labelled substances into the perfusate immediately before entering the liver, (site of injection : silicon rubber tubing 3 cm distal of portal vein can- nula). Up to four substances were dissolved in 50 pl perfusion fluid and were injected within less than 0.5 s employing a precision microsyringe (Hamilton). The following combinations of substances were stu- died: (a) ['4C]sucrose (10 pCi), ['4C]urea (10 pCi), [3H]water (30 pCi), [3H]dextran (30 pCi); (b) D - [ ~ ~ C ] -
lactate (2 pCi), ['4C]sucrose (1 pCi), rH]water (30pCi); (c) ~- [ '~C] lac ta te (2 pCi), [3H]water (30 pCi), [3H]s~- crose (10 pCi). The effluent perfusate was collected in 0.5-s fractions over a period of 90 s following in- jection by means of a specially designed fraction collector. For the determination of recoveries, the perfusate was collected for further 3 min in a single fraction. Up to six pulse experiments were performed consecutively with one liver over the period between 30 and 100 min of perfusion. During this period an interference of the data by aging of the liver seems to be minimal as indicated by the metabolic parameters. When the experimental conditions were changed (e.g. infusion of inhibitors or substrates), at least 8 min were passed before the next pulse experiment was performed.
Analytical
The radioactivity of the injected substances (and their products) in each of the 0.5-s fractions of the effluent perfusate was measured by liquid scintillation spectroscopy (dual channel spectrometer: Packard, model 2425). The following scintillation solutions were used : toluene/methoxyethanol/ethano1(20/10/2) 5 g/l PPO, 0.2 g/l POPOP; toluene/octylphenol de- caethyleneglycol ether (2.3/1) plus 6 g Permablend IIIjl (Packard); Minisolve I (Zinsser Co., Frankfurt, F.R.G.). Quench corrections were made employing internal standards ([3H]toluene or ['4C]toluene).
Since up to four substances labelled with 3H and 14C were injected simultaneously, the substances had to be separated by ion-exchange chromatography or lyophilization prior to the determination of the radio- activity by means of isotopic discrimination. The following procedures were applied : (a) ['4C]sucrose, ['4C]urea, [3H]water and [3H]dextran : aliquots (50 pl) were analysed for total 14C and 3H radioactivity; additional aliquots were alkalized with Tris (pH 9) and treated with urease ( 5 pg) ; the labelled bicarbonate (200 pl) derived from urea was separated from labelled water, dextran and sucrose by anion-exchange chro- matography (columns with 8 cm length and 4 mm inner diameter, filled with Dowex 1x8, formate form, alkalized; elution with 0.05 M Tris plus 1 M NaCI); the aqueous eluate was lyophilized to remove the labelled water; the remaining [3H]dextran and ['4C]sucrose were determined by isotopic discrimination; (b) D-['~C]- lactate, ['4C]sucrose and [3H]water: in aliquots, lac- tate was separated from labelled water and sucrose by anion-exchange chromatography (columns see above ; elution with 1 M formic acid); ['4C]sucrose and [3H]- water were determined by isotopic discrimination; (c) ~-[ '~C]lactate , [3H]water and [3H]sucrose: total 14C and 3H radioactivity was measured in aliquots; other aliquots of the perfusate were first lyophilized to remove the labelled water before ~ - [ '~C] lac t a t e and

A. J. Schwab, A. Bracht, and R. Scholz 539
[3H]sucrose was determined by isotopic discrimina- tion. Labelled carbon dioxide derived from D - [ ~ ~ C ] - lactate as a substrate was determined in aliquots acidified with HCI in closed flasks (Kontex Glass Co., Vineland, N.J., U.S.A.); COZ was trapped in phenyl- ethylamine.
The concentrations of diisothiocyanostilbenedi- sulfonic acid in the perfusate were monitored spectro- photometrically at 365 nm (absorption coefficient : 2.8 x lo4 M-' x cm-') employing an Eppendorf pho- tometer equipped with a flow-through cuvette.
Materials
D-Lactate and all enzymes and coenzymes used in the metabolite assays were products of Boehringer Mannheim GmbH (Tutzing, F.R.G.). L-Lactate (99 % purity, free of D-lactate) was from Sigma (St Louis, Mo., U.S.A.). The reagent grade chemicals were from Merck (Darmstadt, F.R.G.), Roth (Karlsruhe, F.R.G.) or Serva (Heidelberg, F.R.G.). 4,4'=Diisothiocymo- stilbene-2,2'-disulfonic acid was purchased from Pierce Chemicals (Rockford, Ill., U.S.A.). Cyanocinnamate (2-cyano-3-phenylacrylic acid) was prepared according to Lapworth et al. [15]. The following radiochemicals were purchased from Amersham Buchler (Braun- schweig) : [U-'4C]sucrose (CFB.4, 10 Ci/mol), ['"CI- urea (CFA.41, 50 Ci/mol), ~-[U-'"C]lactate (CFB.116, 12 Ci/mol), [6,6'(n)-3H]sucrose (TRA.332,3 Ci/mmol), [3H]dextran ( M , 60- 90000, TRA.382, 10 mCi/g), [3H]water (TRS.l, 5 Ci/ml), [4-3H]toluene (TRA.16), [methyl-'4C]toluene (CFA.317). The radiochemicals were purified by ion-exchange chromatography im- mediately before use in pulse experiments.
Computations
The radioactivity measured in the perfusate follow- ing pulse labelling was expressed as fractions of the total radioactivity of each labelled substance injected which were recovered per second. The time integrals and the mean transit times [16] of the outflow profiles were determined by the trapezoid rule with exponential extrapolation for the interval between the last data point and infinity. Parameter fitting was performed by the procedure of least squares [17]. Intermediate values between data points in the outflow profiles were obtained by a modified spline function [18]. The integral in the theoretical outflow function [Eqn (2)] was evaluated by a modified Romberg algorithm [19]. Experimental errors are given as k standard deviation of at least five determinations. All computations were performed employing the Cyber 175 computer (Con- trol Data Corporation) at the Leibniz Rechenzentrum (Bayerische Akademie der Wissenschaften). The com- puter programmes were written in FORTRAN using subroutines from the library of the Leibniz Rechen-
x 3
a, E 10-2 L a, v
,m c
L
u 10-3 B
3 ; 0
10-4 : . o
0 5 0 15 20 25 30 35 40 45 50 55 60 nrne after injection of tracer (s)
Fig. 1 . Ou(flobv profiles of'indicutor- suhstunces. The liver from a fed rat was perfused in a non-recirculating system with KrebsiHen- seleit bicarbonate buffer containing 1 mM sucrose and 1 mM urea. Trace amounts of ['4C]sucrose (O), [3H]dextran (a), [13C]urea (0) and [3H]water (+) were injected simultaneously into the perfusate prior to entering the liver. The fractions of the injected amount of tracer which appeared in the effluent perfusate per second wcrc plotted versus the time following injection. The dotted line (......) represents a linear transformation of the data from water and urea according to Eqn (1) with to = 2.5 s and 0' = 1.85
zentrum and from International Mathematical and Statistical Libraries (Houston, Texas).
RESULTS
Experimental Procedure In order to estimate the extracellular and intra-
cellular volumes of the perfused liver, the outflow profiles of indicator substances for these spaces were measured in each pulse experiment. The outflow profiles following a simultaneous injection of labelled dextran, sucrose, urea and water are shown in Fig. 1. Dextran and sucrose are assumed to be markers for the extracellular space, since their access to the cells is negligible, whereas urea and water rapidly penetrate the cellular membrane. According to this assumption, the outflow profiles of dextran and sucrose, on the one hand, and urea and water, on the other hand, are identical. The sinusoidal space and the space of Disse cannot be distinguished using dextran (Mr 70000) and sucrose as markers of the extracellular space. More- over, these outflow profiles are similar to those ob- served in dog livers in situ [20], except that peak times and downslopes are accelerated because of the higher flow rates of the perfusate in hemoglobin-free perfused rat livers.
The outflow profiles of these markers can be superimposed following a linear transformation as proposed by Goresky et al. [20] :
1 t - to Q(t)transformed = 1 + 0' x Q (- 1 + 8'

540 Transport of u-Lactate in Perfused Rat Liver
Fig. 2. Outjlon~ profilec of u-lcic.rtrte ciiitl iiidicaror suhstnnces. The liver from a fed rat was perfused with Krebs/Henseleit bicarbonate buffer containing 1 mM u-lactate and 1 mM sucrose. Trace amounts of ~ - [ ‘ ~ C ] l a c t a t e (O), [3H]sucrose (0) and [“Hlwater (0) were in- jected simultaneously. The fractions of the injected iimonnt of tracer which appeared in the effluent perfusate per second were plotted versus the time following injection. The solid line represents the theoretical profile for D-[l4C]hCtate computed according Eqn (2) with lo = 2.5 s, 0’= 2.2, k l = 0.063 s-’ and kl = 0.133 s- ’ . The resolution of the theoretical profile into its components, throughput (. . . . . .) and exchanged tracer (- ---), is shown
0’ I I I
I .0 o.8i
0 ’ 1 I I 1
0.5 1.0 1.5 2.0 25 0 . 41%
Fig. 3 . Dependeme of kinetic pcisunieter.r of rAcictute rrunspori on the rutio ofintracellulrr to extrucdlular volumes (0’) of theperfisedliver. (A) Rare constants for the uptake of ~>-[‘~C]lactate (kl) at 1 mM o-lactate versus 0’; (B) ratio of the rate constants for uptake and release ( k l / k 2 ) versus 0’. k l / k 2 is equal to the ratio of intracellular to extracellular concentrations of D-lactate (c,/c;)
Symbols: Q(t) = fraction of injected radioactivity recovered per second at time t ; to = transit time in the large vessels, (i.e. between site of injection and entrance of the sinusoidal space and between exit of the sinusoidal space and the site where the perfusate is collected); 1 + 8’ = ratio of total volume to extra- cellular volume (0’ = Vi/V,). The parameters to and 8’ are determined by a least-squares fit of the trans- formed water or urea data to the dextran or sucrose data. A good fit is achieved up to 15 s following in- jection. Thereafter, the transformed outflow profiles of water and urea show a minimal but systematic deviation from the dextran or sucrose profiles (see dotted line Fig. 1). The data indicate that the mathe- matical model proposed by Goresky et al. [5,6,20] is a reasonable approximation of the hemodgnamics of the perfused rat liver.
In order to study the transport of lactate without interference with metabolism, pulse experiments with D-lactate were performed. The recovery of ~- [ ‘~C] lac- tate was complete (100 1 %); the production of labelled carbon dioxide was minimal (< 1 %) indicat- ing that D-lactate is metabolically inert, at least for the considerations implicated in this study. D-[14C]- Lactate was injected simultaneously with [14C]sucrose and [3H]water as markers for the extracellular and total aqueous volume of the liver, Sucrose is considered a reference substance for that portion of D-lactate which does not exchange with the intracellular space (throughput). The outflow profile of D-lactate shows a reduced and slightly delayed peak followed by a delayed downslope compared to that of sucrose (Fig.2). This finding is characteristic for an uptake with finite transport rates [ 5 ] .
The outflow profile of ~- [ ‘~C] lac ta te was analysed employing the mathematical model which was pre- viously applied to dog livers in situ for studies of ru- bidium and glucose transport by Goresky et al. [5,9]. In this model, uptake of a tracer by the cell and its release into the perfusate are proportional to the extracellular and intracellular concentrations, re- spectively. This assumption is correct under conditions where the unlabelled substance is in a steady state and where isotopic effects are negligible. Moreover, the convection of the tracer along the sinusoids due to the perfusate flow and the heterogenity of the sinusoidal transit times (7) are assumed to be reflected by the outflow profile of a non-exchangeable substance such as sucrose [Qquc(t)]. The outflow profiles of [“C]- D-lactate [Qlac(t)], therefore, may be described by the following function [5] :
~ ~ ~ ~ ( t ) = esuc(t> exp [- kl 8’ ( t - to)]
+ exp [- k2 ( t - lo)] Sexp [( - k~ 0’ -t k2)t] I - 10
( 2 ) 0

541 A. J. Schwab, A. Bracht, and R. Scholz
Table 1. Parameters of o-lactate trmsport across the plasma membrane in perfused rat liver Data from five individual experiments with different concentrations of D-lactate, L-lactate and pyruvate and from 16 control experiments (mcan k S.D.) with 1 mM D-lactate. The pulse experiments were performed similar to that in Fig.2. The perfusate concentrations are incans of influent and effluent concentrations. The rate constants for uptake ( k , ) and release (k2) were obtained by fitting Eqn (2) to the measured outflow profiles. The ratios of intracellular to extracellular concentrations (c , /ce) were calculated from the rate constants ( k l / k z ) or from mean transit times (T) of D-lactate, sucrose and water according to Eqn (3)
Perfusate concentrations Rate constants
D-lactate lactate pyruvate Uptake Release
Ci/C,
calculated from ~~ ~-
( 'e ki kz kilkz i
m M s-l
~- ._
0.1 0.1 0.05 0.039 0.12 0.30 0.34 0.4 0.059 0.17 0.35 0.44 1.7 0.053 0.15 0.36 0.38 4.7 0.055 0.13 0.41 0.41
0.9 0.2 0.1 0.073 0.14 0.50 0.47 4.1 0.076 0.15 0.50 0.49 7.3 0.077 0.15 0.51 0.51
4.2 0.2 0.05 0.063 0.12 0.51 0.58 8.8 0.065 0.13 0.50 0.60
18.0 0.056 0.11 0.53 0.60 35.0 0.057 0.12 0.47 0.56 68.0 0.056 0.12 0.46 0.52
0.96 0.2 0.06 0.068 0.14 0.51 0.62 4.6 0.13 0.061 0.13 0.48 0.68 8.7 0.15 0.054 0.13 0.42 0.53
19.0 0.17 0.045 0.11 0.41 0.57 38.0 0.17 0.035 0.094 0.37 0.43 54.0 0.17 0.028 0.075 0.38 0.48 73.0 0.17 0.024 0.061 0.39 0.42
0.25 0.08 0.067 0.116 0.58 0.48 0.34 1.9 0.046 0.121 0.38 0.46 0.35 3.8 0.040 0.102 0.39 0.40 0.32 7.5 0.023 0.082 0.28 0.40 0.30 16.0 0.017 0.062 0.27 0.31 0.27 34.0 0.0099 0.056 0.18 0.26 0.25 67.0 0.0074 0.028 0.26 0.19
0.97 0.05 0. I8 0.06 0.06 k 0.01 0.064 0.009 0.14 F 0.02 0.47 0.05 0.52 i- 0.04 I 1 = 16
0.83
The parameters kl and k2 are unimolecular rate con- stants for the rates of uptake (kl) and release (k2) of labelled D-lactate per unit intracellular volume and per unit of extracellular or intracellular concentra- tions. Values for 0' and to are available from the out- flow profiles of the marker substances by means of linear transformation. The ratios of intracellular to extracellular volumes, Q', vary considerably between different experiments (Table 1) due to varying degrees of swelling of the liver. The kinetic constants, how- ever, are not correlated with 6' (Fig. 3).
As shown in Fig.2, the theoretical curve obtained with rate constants of the highest probablity is in good agreement with the measured outflow profile indicating that the processes of D-lactate transport in the liver can be described by this model. Moreover,
the portion of the injected ~- [ '~C] lac ta te which did not enter the cellular space (throughput) and the portion which exchanged at least once with the cells (and for which the rate constants are applicable) can be computed from the first and the second term of Equation 2 and are also shown in Fig. 2. The values for kl and k2 derived from similar experiments are sum- marized in Table 1. At 1 mM D-lactate, the kinetic constants kl and kZ are 0.064 and 0.14 s- l , respec- tively. They seem to be not affected by the D-lactate concentration in the range between 0.1 and 70 mM.
Rates of n-Lactate Transport
From the definition of the kinetic constants it follows that the rate of uptake of unlabelled D-lactate

542
L
Transport of n-Lactate in Perfused Rat Liver
0.1 1 10 100 [o-Lactate] (rnM)
i , ~ , , , , , , , , , , , , , , , , , , , , , ,,,11 1
Fig. 4. Dependence of the rutc 01' i)-luctate transport on the extru- cellular concmtratiorz. The rate constants for the uptake of D-[I4c]-
lactate ( k , ) were computed from pulse experiments similar to that shown in Fig.2. Data from 12 livers perfused with o-lactate con- centrations in the range between 0.1 and 70mM. In several ex- periments, the concentrations were increased in a stepwise manner up to five times and ~ - [ ' ~ C ] l a c t a t e was injected when steady-state conditions had been rcached at each step. The rates of D-lactate transport were calculated by multiplying kl with the concentration in the perfusate (c,)
per unit of intracellular volume is equal to the product ofkl and the extracellular concentration (c,). At 1 mM, the rate is about 60 nmol x s-l x (ml intracellular volume)-' corresponding to 2.5 pmol x min-' x g wet wt-l. (The intracellular volume was determined from the mean transit times of indicator substances [16] and was found in these perfusion experiments to be 0.67 + 0.11 ml per g wet weight of liver.) The rates of uptake are proportional to the extracellular con- centrations (Fig. 4). A saturation of the hypothetical transport system is not detectable in the concentration range up to 70 mM D-lactate.
Inhibition O f D-LUctUte Transport by L-Lactate and Pyruvate
It was previously shown with erythrocytes and ascites tumour cells that D-lactate is transported by the same anion transfer system as L-lactate and pyru- vate [1,2,4]. The stereospecificity of the transport is species-dependent varying from 1 (sheep) to 22 (rat) [2]. If a transfer system with similar properties is present in the plasma membrane of rat liver cells, it should be possible to inhibit D-lactate transport competitively by L-lactate or pyruvate. As shown in Fig. 5, the rates of D-lactate transport are diminished when either substance is infused. In a semi-reciprocal plot (Fig. 5 B) the inhibition appeared to be linear. 50'%; inhibition was observed with 5 mM pyruvate or 40 mM L-lactate suggesting a higher affinity of
\
A
7
5 6 l / O
", I 0'
$11 J ,
B
0 0 0 'XJ 30 4 0 50 60 70 80
lactate] or [Pyruvate] (mM)
Fig. 5 . Inhibition of ri-Iuctate trunsport by r.-luciatc, or pyruvute. Rate constants of n-lactate uptake ( k t ) were computed in pulse experi- ments similar to that shown in Fig.2. Thc u-lactate concentration in the perfusate was 1 mM. Following the control experiment, L-lactate or pyruvate were infused with stepwise increasing con- centrations and ~ - [ ' ~ C ] l a c t a t e was injected after steady-state condi- tions had been reached at each step. The rates obtained in the presence of L-lactate or pyruvate were expressed as percentage of the corresponding control value. Data from five perfusion experi- ments, three with L-lactate (.,.,A) and two with pyruvate (0 ,O) ; different symbols represent different livers. (A) Rates and (B) re- ciprocal rates of D-lactate transport versus L-lactate or pyruvate concentrations
pyruvate than L-lactate or D-lactate to the transport system. The inhibition was fully reversible. In control experiments, the concentrations of lactate and pyru- vate formed by glycolysis from endogenous glycogen were too low to interfere significantly with D-lactate transport (see Table 1).
Inhibition of D-Lactate Transport by Cyanocinnumate and 4,4'-Diisothiocyanostilbene-2,2'-Disuljonic Acid
Recently, it was reported that cyanocinnamate and 4,4'-diisothiocyanostilbene-2,2'-disulfonic acid (DIDS) are able to inhibit the transport of mono- carboxylates across the erythrocyte membrane [l]. In the present study, these inhibitors were employed to elucidate the characteristics of u-lactate transport in perfused rat liver. In pulse experiments, the outflow profiles of ~- [ '~C] lac ta te resemble more the corre- sponding profile of the non-exchangeable ['4C]sucrose in the presence of either compound than in control

A. J . Schwab, A. Bracht, and R. Scholz 543
4 0 10 20 30 40
1 0 4 1 1 1
0 10 20 30 4 0 50 Time after injection of tracer (s)
Fig. 6. FlfJr;.ct of'cyanocinnamate on the outflow proJilr oJ n-lactate. Two pulse experiments with simultaneous injection of ~ - [ ' ~ C ] l a c - tate and [3H]sucrose similar to that of Fig. 2 were performed con- secutively in a liver perfusion experiment, first, in the absence (A) and, second, in the presence of 12 mM cyanocinnamate (B). The fractions of the injected amount of tracer which appeared in the effluent perfusate per second are shown : ~ - [ ' ~ C ] l a c t a t e (0-0); [3H]sucrose (0- --0)
100
c b Q 80 -i
0 - 1 , I , , I , , , I
0 5 10 15 x) 25 [Cyanocinnamate] (mM)
Fig. 7. Inhibition of'r~-lcictcite /rcinsport hq' cycinocinnumate. Rates of D-lactate transport were determined in the absence (control) and presence of cyanocinnamate by pulse experiments similar to that of Fig.2. The D-lactate concentration in the perfusate was 1 mM. Cyanocinnamate was infused in stepwise increasing concentration. ~ - [ ' ~ C ] L a c t a t e was injected 8 min following each increase in the cyanocinnamate concentration. The data from three perfusion experiments (.,.,A) are expressed as percentage of control
experiments (see Fig. 6) indicating that the exchange of the injected ~ - [ l~C] lac t a t e with the cellular space is diminished.
The effect of cyanocinnamate on outflow profiles and computed exchange rates are shown in Fig.6
and 7, respectively. Half-maximal effect was observed with concentrations near 1 mM ; D-lactate transport was completely inhibited at 25 mM cyanocinnamate (Fig. 7). The inhibition was fully reversed 10 min following termination of cyanocinnamate infusion.
It has been reported that inhibition of anion transport in erythrocytes by diisothiocyanostilbenedi- sulfonic acid involves covalent binding of the inhibitor to the membrane [21]. A similar mechanism seems to occur when D-lactate transport in perfused rat liver is inhibited by this compound. When diisothiocyano- stilbenedisulfonic acid was infused into the perfusate at a constant concentration, the absorption of the effluent perfusate increased slowly approaching the value of the influent perfusate after 90 min (Fig.8, left). The increase was slower when lower concentra- tions were infused (not shown). On the other hand, when the infusion was terminated the absorption of the perfusate returned rapidly to the basal value. The amount of diisothiocyanostilbenedisulfonic acid which appeared in the effluent (as represented by the time integral of the absorption) was less than the total dose applied (as represented by the product of the absorption in the influent and the length of the in- fusion period). Thus, a portion of the inhibitor had been retained within the liver. With a subsequent infusion the retention was minimal (Fig. 8, right) suggesting that the binding sites for diisothiocyano- stilbenedisulfonic acid have been fully and irreversibly saturated. Maximal binding was about 2 pmol di- isothiocyanostilbenedisulfonic acid per g liver.
During the period of infusion several pulse experi- ments were performed consecutively and the rates of D-lactate exchange were computed. The rates de- creased gradually with increasing binding of diisothio- cyanostilbenedisulfonic acid reaching 20 % of the control value when diisothiocyanostilbenedisulfonic acid appeared to be maximally bound (Fig. 8, col- umns). This inhibition was not reversible after ter- mination of infusion (in contrast to the inhibition by cyanocinnamate). The data suggest that inhibition of D-lactate transport by diisothiocyanostilbenedisul- fonic acid depends on the amount of the inhibitor bound by the liver rather than on its concentration in the perfusate. This conclusion is further supported by the data presented in Fig.9 where the rates of D-lactate transport are plotted versus the amounts of bound diisothiocyanostilbenedisulfonic acid. A similar relationship was observed irrespective of the different concentrations infused.
Intracellular Concentrations
The pulse experiments also provide information about the steady state distribution of substances based on the following considerations. Since production or

544 Transport of D-Lactate in Perfused Rat Liver
Fig. 8. Binding of 4,4'-diisothioc~unostilbenr-2.2'-cli.sulfonic acid in a pei:fused rut liver und inhibirion of' n-lactate fransporr. Diisothiocyano- stilbenedisulfonic acid was infused twice during the time course of a liver perfusion experiment as indicated by horizontal bars. The concen- tration in the influent perfusate (22 pM) was kept constant by precision infusion pumps. The absorption of the perfusate at 365 nm (indicative for the diisothiocyanostilbenedisulfonic acid concentration) was continuously monitored ; the concentration in effluent perfusate (right scale) is shown as a broken line. Pulse experiments with ~ - [ ' ~ C ] l a c t a t e similar to that of Fig.2 were performed six times as indicated. Rates of D-lactate transport (columns. left scale) were calculated from the computed values for k l and the constant 1,-lactate concentration in the perfusate (1 mM)
04 0 0.5 1.0 1.5 2.0
Diisothiocyanostilbenedisulfonic acid bound (gmolig wet welght)
Fig. 9. Dependence of the inliibitiori qf' u-lactate transport on the amounf of 4,4'-ciii.rothiocyunosti/bene-2,2'-di.~u~onic acid hound by the perJused /iver. Data from three liver perfusion experiments similar to that of Fig. 8 with differcnt diisothiocyanostilbenedi- sulfonic acid concentrations infused: 6 pM (A), 7 pM (m) or 22 pM (0). The rates d u-lactate transport are expressed as per- centage of the corresponding value measured in each experiment before diisothiocyanostilbenedisulfonic acid was infused. The amount of diisothiocyanostilbenedisulfonic acid retained by the liver was calculated from the time integral of the influent-effluent concentration differences up to the time-point of tracer injection (corrected for diisothiocyanostilbenedisulfonic acid washed out after termination of infusion, see Fig. 8)
consumption of D-lactate by the liver can be neglected, the rate of uptake ( k , . ce) is equal to the rate of release from the liver (k2 . ci). Consequently, the ratio kl/k2 reflects the ratio of intracellular and extracellular concentrations (ci/ce). Since the intracellular volume corresponds to the intracellular water content, ci/ce is equal to the ratio of the apparent intracellular
distribution volumes of D-lactate and water, which may be also derived from mean transit times (7) [16]:
where i?,,, iHzo and ilac are the mean transit times of ['4C]sucrose or [3H]sucrose, [3H]water and D-['"C]- lactate, respectively.
As may be seen from Table 1, the values of the concentration ratios computed by both methods (i.e. k l / k 2 and f) agree fairly well. The intracellular con- centration of D-lactate appears to be about half the extracellular concentration. The ratio c Jc, is not significantly affected by variations in the perfusate contration of D-lactate (see Table 1) nor by differences in the ratio of intracellular to extracellular volumes ( O ' , see Fig.3B). Moreovgr, in the presence of di- isothiocyanostilbenedisulfonic acid or cyanocinna- mate, the concentration gradient of D-lactate seems to be unaltered even under conditions where D-lactate transport is considerably inhibited. In contrast, in- hibition by L-lactate and, more pronounced, by pyru- vate is accompanied by a decrease in the intracellular D-lactate concentration (see Table 1).
DISCUSSION
Studies of Metabolite Transport Across the Plasma Membranes in Perfused Liver
Transport phenomena across the plasma mem- brane of cells are difficult to investigate in complex systems, such as in the whole organism or in isolated

A. J . Schwab, A. Bracht, and R. Scholz 545
perfused organs, In the past, therefore, studies on transport were performed predominantly with single cells (for review see [22]) or cells enzymatically isolated from tissues (e.g. hepatocytes [23 - 251). On the other hand, data derived from studies with isolated cells can hardly be extrapolated to the condition in vivo, since the plasma membranes are undoubtedly altered during the isolation procedure. Thus, it is necessary to extend transport studies to intact organs. A possible methodological approach appears to be the ‘multiple indicator dilution technique’ [I 11. The data presented in this communication demonstrate that the math- ematical model proposed by Goresky for livers of anaesthetized dogs [5,6,9,20] is also applicable to the isolated, hemoglobin-free perfused rat liver. Our data disprove a previous notion [20] that a bolus flow requires the presence of erythrocytes. The ratio of extracellular to intracellular volumes (8’) is increased in these livers compared to livers in situ [20] due to the relatively high perfusion pressure [26], a con- sequence of the high flow rate required when oxygen is delivered solely in the dissolved form. Our data, however, indicate that a variation of 8’ (i.e. different degrees of swelling of the liver) is without effect on the transport phenomena studied (Fig. 3).
D-Lactate Transport Across the Plasma Membranes of Hepatocytes: a Currier-Mediated Process V
The experiments described in this communication were performed under conditions where the unlabelled D-lactate was in a steady state. The livers were perfused for several minutes with a constant D-lactate concentra- tion before trace amounts of radioactive D-lactate were injected. The transport rates determined, therefore, are steady-state exchange rates. They may reflect a simple diffusion or a facilitated diffusion or a carrier- mediated exchange of D-lactate. An exchange of D-lactate between the extracellular and intracellular spaces could occur with D-lactate itself or with other anions such as chloride, bicarbonate or hydroxyl ions. It is difficult to differentiate between diffusion and exchange, since other anions in addition to that under investigation will be always present inside the cell.
It has been known for a long time that a carrier is located in the membrane of erythrocytes which trans- ports chloride and bicarbonate in exchange for each other [27]. It was previously suggested [28] that this system is also responsible for the transport of mono- carboxylates. The bulk of data, however, derived from exchange and inhibitor studies does not provide clear-cut evidence as to whether lactate is transported solely via this unspecific anion carrier [28] or via a specific monocarboxylate carrier system in exchange for hydroxyl ions [3] or if both systems are in- volved [l].
In our experiments with perfused rat liver, the transport of D-lactate did not show saturation in the concentration range up to 70 mM (Fig.4). This ob- servation does not necessarily rule out a carrier- mediated mechanism. It could be consistent with a high Michaeli‘s constant for D-lactate as reported for erythrocytes (350 mM [2]). Moreover, one might argue that this phenomenon is due to a competitive inhibition of D-lactate transport by the high chloride concentration in the perfusate. Replacement of chlo- ride by sulfate, however, had no significant effect on the exchange rates (data not shown). On the other hand, inhibition of D-lactate transport by analogous compounds, i.e. L-lactate or pyruvate (Fig.5), is a strong argument in favour of a carrier-mediated mech- anism. Most likely these compounds compete for the same binding site of the hypothetical carrier pro- tein. Assuming a high Michaelis constant for D-lac- tate, the concentrations of L-lactate and pyruvate required for half-maximal inhibition (i.e. 5 and 40 mM, respectively) may reflect binding constants. The values are similar to the reported Michaelis constants for the transport of L-lactate and pyruvate in human erythro- cytes [1,2,28]. Furthermore, the complete and re- versible inhibition of D-lactate transport by cyanocin- namate (Fig. 6) supports the conclusion that lactate transport across the plasma membrane of hepatocy- tes - like in single cells - is predominantly a carrier- mediated process. The contribution of a possible lactate exchange via simple diffusion of the undis- sociated acid appears to be minimal.
In erythrocytes, 4,4‘-diisothiocyanostilbene-2,2’- disulfonic acid inhibits the transport of chloride totally [29], but that of lactate only partially [l]. Both effects are irreversible. On the other hand, the in- hibition by cyanocinnamate is complete. Based on these findings it was proposed that lactate is trans- ported partly by the non-specific anion carrier which is responsible for the chloride transport in exchange for bicarbonate and partly by a specific monocarboxyl- ate carrier which is inhibited competitively by cyano- cinnamate but is insensitive to diisothiocyanostilbene- disulfonic acid [l]. Although our studies with perfused rat livers show a similar pattern of inhibition with these compounds, the linear inhibition of D-lactate transport by L-lactate or pyruvate (Fig.5B) is an argument against the involvement of two carrier systems in hepatocytes unless they would show similar inhibition constants. Moreover, it is unlikely that the non-specific anion carrier described for erythrocytes exists also in the liver, since the steady state exchange of chloride is very slow [23,30]. In fact, pulse-labelling experiments with 36Cl- showed an outflow profile indistinguishable from that of sucrose (data not shown).
Diisothiocyanostilbenedisulfonic acid is bound to a distinct protein moiety of the erythrocyte membrane

546 Transport of [>-Lactate in Perfused Rat Liver
which is considered the anion carrier protein [21]. Inhibition of D-lactate transport in perfused liver by diisothiocyanostilbenedisulfonic acid suggests that a similar protein is also present in hepatocytes. When isolated hepatocytes, however, are treated with a radioactively labelled derivative of diisothiocyano- stilbenedisulfonic acid, labelling of several electro- phoretically different proteins is found [31]. More- over, the binding capacity of hepatocytes (in our experiments: 2 pmol/g liver; with isolated hepato- cytes: 0.1 pmol per cell [31] corresponding to 1 - 2 pmol/g liver) appears to be much greater than that of erythrocytes (0.01 fmol per cell [21]). Further, inhibition of anion transport in erythrocytes depends linearly on the amount of diisothiocyanostilbenedi- sulfonic acid bound [21], whereas linearity was not observed in our experiments (Fig. 9). These findings suggest that in liver the action of diisothiocyanostil- benedisulfonic acid is not specific.
Distribution of D-LUctUte between Extracellular and htracellular Spaces
Our experiments with perfused liver indicate that under steady-state conditions the cellular concentra- tion of D-lactate is about half the corresponding per- fusate concentration (Table 1). It should be noticed that the intracellular concentration determined is an average over the subcellular compartments. Assuming that D-lactate does not penetrate into the mito- chondria, the cytosolic concentration would be about 10 o/, higher than the average. A concentration gradient across the plasma membrane, however, would still exist. On the other hand, the cytosolic concentration would be considerably lower than the average only when D-lactate is accumulated several-fold in the mitochondria.
It is of interest to know whether D-lactate is dis- tributed according to the transmembrane pH gradient or to the membrane potential, because this would give some insight into the mode of D-lactate transport across the plasma membrane, i.e. electroneutral (cou- pled with H + symport or OH- antiport) or electro- genic transport. A compound known to be distributed according to the pH gradient is dimethyloxazolidine- dione, a non-metabolizable acid (pK 6.3) which is frequently used for an estimation of intracellular pH values [32,33]. It was recently shown [34] that its distribution ratio (ci/c,) across the plasma membrane of perfused liver is between 0.4 and 0.6 reflecting a more acidic milieu in the cytosol than in the perfusate. Moreover, it was shown [30] that chloride is dis- tributed according to the electrochemical equilibrium and, therefore, could be used as an indicator for the membrane potential. The distribution ratios of chlo- ride reported for different preparations of hepatocytes vary between 0.2 and 0.3 [23,30,35]. Thus, a value
of 0.5 observed for D-lactate (Table 1) corresponds more to the distribution of dimethyloxazolidinedione than to that of chloride. Our data suggest, therefore, that the pH gradient is the major factor for the distribution of D-lactate and that its transport is mainly electroneutral. This conclusion agrees with those drawn from experiments with isolated dia- phragma [36], perfused liver [37,38], thymocytes [39, 401 and ascites tumour cells [4] concerning the trans- port of lactate [4,36], pyruvate [37,38] and 3-hydroxy- butyrate [39,40].
The expert technical assistance of Barbel Muller, Christiane Noell, Ursula Schwabe and Albert Schallweg are gratefully ack- nowledged. This work was supported by grants of the Deutsche Forschung.sgemeinschaft, Schw 19412 and SFB 51 - D/7. Adelar Bracht is a recipient of a DAAD fellowship. The authors thank Dr Sibylle Soboll for fruitful discussions.
REFERENCES 1. 2.
3.
4.
5.
6.
7.
8. 9.
10.
11. 12.
13.
14.
15.
16. 17. 18. 19.
20. 21.
22. 23. 24. 25. 26.
27.
Halestrap, A. P. (1976) Biochem. J . 1.56, 193-207. Deuticke, B., Rickert, 1. & Beyer, E. (1978) Biochim. Biophys.
Dubinsky, W. R. Sr Racker, E. (1978) J . Membrane Biol. 44,
Spencer, T. L. Sr Lehninger, A. L. (1976) Biochem. J . 154.
Goresky, C. A., Bach, G. G. Sr Nadeau, B. E. (1973) J . C‘lin.
Goresky, C. A,, Bach, G. G. & Nadeau, B. E. (1973) J . Clin.
Sangren, W. C. Sr Sheppard, C. W. (1953) Bull. Math. Biophj.s.
Landahl, H . D . (1954) Bull. Math. Biophyx. 16, 55-58. Goresky, C. A. & Nadeau, B. E. (1974) J . C/in. Ini~est. 53,
Reichen, J. Sr Paumgartner, G. (1976) Am. J . Phy.sio1. 231,
Chinard, F. P. & Enns, T . (1954) An?. J . Physiol. 178, 197-202. Scholz, R., Hansen, W. Sr Thurman, R. G. (1973) Eur. J . Bio-
chrm. 38, 64- 72. Krebs, H. A. & Henseleit, K . (1932) H o p p c ~ - S e ~ k ’ s Z . Ph),sio/.
Chem. 210, 33 -66. Bergmeyer, H. U. (1970) Methoden der enzjwotischen Analj.se,
2nd edn, Verlag Chemie, Weinheim. Lapworth, A. &Baker, W. (1941) in Or~unic,SL.nthese.s(Gilman,
H., ed.) Collective vol. 1, 2nd edn, pp. 181 - 183, John Wiley. New York.
Meier, P. & Zierler, K. L. (1954) J . Appl. Plij,sio/. 6 , 731 -744. Marquardt, D . W. (1963) J . SOC. Ind. Appl. Math. 11.431 -441. Reinsch, H. R. (1971) Numer. Math. 16, 451 -545. de Boor, C. (1971) in Mathematical Sufiwure (Rice, J . R., ed.)
Goresky, C. A. (1963) Am. J . Physiol. 204, 626-640. Ship, S., Shami, Y., Breuer, W. & Rothstein, A. (1977) J . Memhr.
Wilson, D . B. (1978) Annu. Rev. Biochem. 47, 933-965. Kolb, H.-A. &Adam, G. (1976) J . Memhr. Biol. 26, 121-151. Baur, H. & Heldt, H. W. (1977) Eur. J . Riochem. 74, 397-403. Le Cam, A. Sr Freychet, P. (1978) Endocrinology, 102,379- 385. Brauer, R. W., Holloway, R. J . Sr Leong, G. F. (1959) A m . J .
Cabantchik, Z. I., Knauf, P. A. Sr Rothstein, A. (1978) Bio-
Acts, 507, 137-155.
25-36.
405-414.
Invest. 52, 975 -990.
Invest. 52, 991 - 1009.
15, 387 - 394.
634-646.
734- 742.
pp. 417-449, Academic Press, New York.
Biol. 33, 31 1 - 323.
Physiol. 197, 681 - 692.
chim. Biophys. Acto, 515, 239- 302.

A. J . Schwab, A. Bracht, and R. Scholz 541
28. Rice, W. R. Sr Steck, T. L. (1976) Biuchim. Biophys. Acra, 433, 39-53.
29. Cabantchik, Z. I. Sr Rothstein, A. (1972) J . Memhr. Bid . 10, 311-330.
30. Claret. M. Sr Mazet, J . L. (1972)J. Physiol. (Lond.) 223, 279- 295.
31. Petzinger, E., Grundmann, E., Veil, L. B., Frimmer, M. Sr Fasold, H. (1978) Naunyn-Schmiedeber~’.~ A r d . Pharmacd. 304, 303 ~ 307.
32. Waddell. W. J . Sr Butler, T. C. (1959) J . Clin. It7vest. 38, 720- 729.
33. Waddell, W. J. Sr. Bates, R. G. (1969) Pl7y,sio/. Rev. 4Y, 285-329.
34. Soboll, S., Elbers, R., Scholz, R. Sr Heldt, H . W. (1980) Hopp-
35. Williams, J. A. Sr Woodbury, D. M. (1971) J . Ph.~~.sio/. iLo/7t/.i
36. Roos, A. (1975) J . Physiol. (Lond.] 24Y, 1-25. 37. Sics, H. Sr Noack, G. (1972) FEBS Lctt. 22. 193-196. 38. Sies, H., Noack, G. Sr Halder, K. H. (1973) Eur. J . Biochc,m.
39. Andersen, B., Tarpley, H. Sr Regen, D. M . (1978) Biochim.
40. Regen, D . M. Sr Tarpley, H. L. (1978) Biochim. Biophj.~. Acrtr.
Seyler’s Z.. Physiol. Chem. in press.
212, 85-99.
38,241 - 258.
Biophys. Acta, 508, 525- 538.
508, 539 - 550.
A. J . Schwab, A. Bracht, and R . Scholz, Institut fur Physiologische Chemie, Physikalische Biochemie und Zellbiologie der Ludwig-Maximilians-Universitiit Munchen, GoethestraBe 33, D-8000 Munchen 2, Federal Republic of Germany
Copyright © 2022 FDOKUMEN