Transmission network analysis in tuberculosis contact investigations
11
Transmission Network Analysis in Tuberculosis Contact Investigations Victoria J. Cook, 1,2 Sumi J. Sun, 3 Jane Tapia, 4 Stephen Q. Muth, 7 D. Fermín Argüello, 5,a Bryan L. Lewis, 3,a Richard B. Rothenberg, 4 Peter D. McElroy, 6,a and the Network Analysis Project Team b 1 Department of Medicine, University of British Columbia, and 2 Division of TB Control, British Columbia Centre for Disease Control, Vancouver, Canada; 3 Tuberculosis Control Branch, California Department of Health Services, Richmond, California; 4 Institute of Public Health, Georgia State University, 5 Rollins School of Public Health, Emory University, and 6 Division of Tuberculosis Elimination, National Center for HIV/AIDS, Viral Hepatitis, STD, and TB Prevention, Centers for Disease Control and Prevention, Atlanta, Georgia; 7 Quintus-ential Solutions, Colorado Springs, Colorado Background. Social network analysis (SNA) is an innovative approach to the collection and analysis of infectious disease transmission data. We studied whether this approach can detect patterns of Mycobacterium tuberculosis trans- mission and play a helpful role in the complex process of prioritizing tuberculosis (TB) contact investigations. Methods. We abstracted routine demographic and clinical variables from patient medical records and contact interview forms. We also administered a structured questionnaire about places of social aggregation to TB patients and their contacts. All case-contact, contact-contact, case-place, and contact-place dyads (pairs and links) were considered in order to analyze the structure of a social network of TB transmission. Molecular genotyping was used to confirm SNA-detected clusters of TB. Results. TB patients not linked through conventional contact-investigation data were connected through mutual contacts or places of social aggregation, using SNA methods. In some instances, SNA detected connected groups prior to the availability of genotyping results. A positive correlation between positive results of contacts’ tuberculin skin test (TST) and location in denser portions of the person-place network was observed (P .01). Conclusions. Correlation between TST-positive status and dense subgroup occurrence supports the value of collecting place data to help prioritize TB contact investigations. TB controllers should consider developing social network analysis capacity to facilitate the systematic collection, analysis, and interpretation of contact-investigation data. As the number of tuberculosis (TB) cases decreases in the United States and Canada, it becomes more impor- tant and challenging to detect persons recently exposed to Mycobacterium tuberculosis and to treat those with latent M. tuberculosis infection [1–3]. Contact investiga- tion is the principal method used to detect additional TB patients and recently exposed persons with latent M. tu- berculosis infection at risk for progression to TB [4 –7]. TB-detection programs have varying rates of success in eliciting, locating, and evaluating contacts of TB patients and initiating treatment for latent M. tuberculosis infec- tion [9 –12]. These programs often have limited success when they involve high-risk or vulnerable groups [13,14]. Although molecular genotyping of M. tubercu- losis can help identify case clusters and inform some con- tact investigations, additional novel approaches are needed. The term “social network” is used to describe a set of persons (nodes) and the connections (ties) among them. Social network analysis (SNA) measures the nature of these ties (e.g., sexual activity, needle sharing, cohabita- tion, work- or school-associated activity, kinship, and leisure activity) and the effect on activities within a net- work [15] and can help explore the relevance of social structure to transmission of human disease. The basic Received 16 February 2007; accepted 8 June 2007; electronically published 31 October 2007. Potential conflicts of interest: none reported. Financial support: Tuberculosis Epidemiologic Studies Consortium, which is supported by the US Department of Health and Human Services, Public Health Service, Centers for Disease Control and Prevention. a Present affiliations: Division of HIV/AIDS Prevention, Centers for Disease Control and Prevention, Atlanta, Georgia (P.D.M.); Division of Parasitic Disease, Centers for Disease Control and Prevention, Atlanta, Georgia (D.F.A.); Virginia Bioinformatics Institute, Virginia Polytechnic Institute and State University, Blacks- burg, Virginia (B.L.L.). b Study group members are listed after the text. Reprints or correspondence: Dr. Victoria J. Cook, TB Control, British Columbia Centre for Disease Control, 655 W. 12th Ave., Vancouver, Canada, V5Z 4R4 ([email protected]). The Journal of Infectious Diseases 2007; 196:1517–27 © 2007 by the Infectious Diseases Society of America. All rights reserved. 0022-1899/2007/19610-0015$15.00 DOI: 10.1086/523109 MAJOR ARTICLE TB Transmission Network Analysis ● JID 2007:196 (15 November) ● 1517 by guest on July 31, 2013 http://jid.oxfordjournals.org/ Downloaded from
Transcript of Transmission network analysis in tuberculosis contact investigations

Transmission Network Analysis in TuberculosisContact Investigations
Victoria J. Cook,1,2 Sumi J. Sun,3 Jane Tapia,4 Stephen Q. Muth,7 D. Fermín Argüello,5,a Bryan L. Lewis,3,a
Richard B. Rothenberg,4 Peter D. McElroy,6,a and the Network Analysis Project Teamb
1Department of Medicine, University of British Columbia, and 2Division of TB Control, British Columbia Centre for Disease Control, Vancouver,Canada; 3Tuberculosis Control Branch, California Department of Health Services, Richmond, California; 4Institute of Public Health, Georgia StateUniversity, 5Rollins School of Public Health, Emory University, and 6Division of Tuberculosis Elimination, National Center for HIV/AIDS,Viral Hepatitis, STD, and TB Prevention, Centers for Disease Control and Prevention, Atlanta, Georgia; 7Quintus-ential Solutions,Colorado Springs, Colorado
Background. Social network analysis (SNA) is an innovative approach to the collection and analysis of infectiousdisease transmission data. We studied whether this approach can detect patterns of Mycobacterium tuberculosis trans-mission and play a helpful role in the complex process of prioritizing tuberculosis (TB) contact investigations.
Methods. We abstracted routine demographic and clinical variables from patient medical records and contactinterview forms. We also administered a structured questionnaire about places of social aggregation to TB patientsand their contacts. All case-contact, contact-contact, case-place, and contact-place dyads (pairs and links) wereconsidered in order to analyze the structure of a social network of TB transmission. Molecular genotyping was used toconfirm SNA-detected clusters of TB.
Results. TB patients not linked through conventional contact-investigation data were connected through mutualcontacts or places of social aggregation, using SNA methods. In some instances, SNA detected connected groups priorto the availability of genotyping results. A positive correlation between positive results of contacts’ tuberculin skin test(TST) and location in denser portions of the person-place network was observed (P � .01).
Conclusions. Correlation between TST-positive status and dense subgroup occurrence supports the value ofcollecting place data to help prioritize TB contact investigations. TB controllers should consider developing socialnetwork analysis capacity to facilitate the systematic collection, analysis, and interpretation of contact-investigationdata.
As the number of tuberculosis (TB) cases decreases in
the United States and Canada, it becomes more impor-
tant and challenging to detect persons recently exposed
to Mycobacterium tuberculosis and to treat those with
latent M. tuberculosis infection [1–3]. Contact investiga-
tion is the principal method used to detect additional TB
patients and recently exposed persons with latent M. tu-
berculosis infection at risk for progression to TB [4 –7].
TB-detection programs have varying rates of success in
eliciting, locating, and evaluating contacts of TB patients
and initiating treatment for latent M. tuberculosis infec-
tion [9 –12]. These programs often have limited success
when they involve high-risk or vulnerable groups
[13,14]. Although molecular genotyping of M. tubercu-
losis can help identify case clusters and inform some con-
tact investigations, additional novel approaches are
needed.
The term “social network” is used to describe a set of
persons (nodes) and the connections (ties) among them.
Social network analysis (SNA) measures the nature of
these ties (e.g., sexual activity, needle sharing, cohabita-
tion, work- or school-associated activity, kinship, and
leisure activity) and the effect on activities within a net-
work [15] and can help explore the relevance of social
structure to transmission of human disease. The basic
Received 16 February 2007; accepted 8 June 2007; electronically published 31October 2007.
Potential conflicts of interest: none reported.Financial support: Tuberculosis Epidemiologic Studies Consortium, which is
supported by the US Department of Health and Human Services, Public HealthService, Centers for Disease Control and Prevention.
a Present affiliations: Division of HIV/AIDS Prevention, Centers for DiseaseControl and Prevention, Atlanta, Georgia (P.D.M.); Division of Parasitic Disease,Centers for Disease Control and Prevention, Atlanta, Georgia (D.F.A.); VirginiaBioinformatics Institute, Virginia Polytechnic Institute and State University, Blacks-burg, Virginia (B.L.L.).
b Study group members are listed after the text.Reprints or correspondence: Dr. Victoria J. Cook, TB Control, British Columbia
Centre for Disease Control, 655 W. 12th Ave., Vancouver, Canada, V5Z 4R4([email protected]).
The Journal of Infectious Diseases 2007; 196:1517–27© 2007 by the Infectious Diseases Society of America. All rights reserved.0022-1899/2007/19610-0015$15.00DOI: 10.1086/523109
M A J O R A R T I C L E
TB Transmission Network Analysis ● JID 2007:196 (15 November) ● 1517
by guest on July 31, 2013http://jid.oxfordjournals.org/
Dow
nloaded from

unit of analysis in SNA is the tie linking 2 nodes (e.g., person-
person dyads and person-place dyads). The relevance of social
network structure to the transmission of infectious diseases has
been an area of intense investigation [16 –20].
During standard TB contact investigations, considerable data
are collected on individual patients and their contacts. Few TB-
control programs assemble these dyad data to systematically an-
alyze case-contact or case-place characteristics and dynamics. In
contrast, a network-informed perspective uses quantitative
analyses and visual diagrams of these dyads to explore the
emerging patterns and structure of interdependent case-
contact-place nodes linked in a transmission network [21–23].
SNA has been used retrospectively to characterize M. tubercu-
losis outbreaks and highlight the importance of places of social
aggregation in sustaining transmission [24 –28]. However, the
use of SNA to complement routine contact investigation and the
subsequent impact of such a program on TB control have not
been tested [5]. In this study, we implemented a strategy involv-
ing SNA methods to collect and interpret contact tracing data in
order to determine whether important transmission patterns
not otherwise detected by routine contact investigation would
emerge. Traditional case-contact dyad data obtained by routine
contact investigation was supplemented with nontraditional
case-place and contact-place dyad data. We assessed whether
more-densely connected contacts of persons infected with M.
tuberculosis were more likely to have positive tuberculin skin test
(TST) results and compared the occurrence of disease clusters
detected through network connections with clusters detected by
molecular genotyping.
METHODS
Collaborators. A team from the US Centers for Disease Con-
trol and Prevention (CDC) and the Tuberculosis Epidemiologic
Studies Consortium [29] supplemented routine TB contact-
investigation procedures with an interview to record places of
social aggregation [30]. This prospective observational study
was performed in the following 3 demographically and epidemi-
ologically distinct locations: Contra Costa County, California
(2000 population, 948,816; area, 1159 km2); DeKalb County,
Georgia (2000 population, 665,865; area, 431 km2); and the
Downtown Eastside area of Vancouver, Canada (2000 popula-
tion, 50,873; area, 1.6 m2).
Definitions. A confirmed TB patient was one that met the
CDC surveillance criteria for TB [31]. A contact was any person
named by a patient with pulmonary TB during the course of the
routine contact investigation [32]. High-risk contacts were per-
sons with characteristics known to increase the risk of latent M.
tuberculosis infection (e.g., being a contact of a sputum smear–
positive TB patient) or of progression from latent M. tuberculosis
infection to TB (e.g., having HIV infection) [6]. A contact with
latent M. tuberculosis infection was defined as a person with a
positive TST result, either at the time of the current contact in-
vestigation (induration, �5 mm) or through documentation of
a previous positive TST result (induration, �10 mm) [6]. Recent
infection was confirmed if the TST caused an induration �5 mm
in diameter 2–3 months after the result of an initial TST was
negative [5]. All other contact-investigation procedures were de-
fined according to current practices within each TB control ju-
risdiction. A multiply named contact included any person
named by at least 2 TB patients, by a TB patient and a contact, or
by 2 contacts. Places of social aggregation refer to locations
where a TB patient and their contacts regularly shared air space
during the 6-month period preceding TB diagnosis or evalua-
tion as a contact. A multiply named place included any place of
social aggregation named by at least 2 persons.
Study design. During a 6-month study period (1 February
through 31 August 2004), we abstracted routinely collected de-
mographic and clinical information from TB investigation data
forms in each jurisdiction for persons with confirmed TB and
their contacts. A standardized, pretested, staff-administered, in-
person, open-ended interview instrument [30] was used to col-
lect information on places of social aggregation and was used for
all TB patients �70 years of age and for contacts who, on the
basis of jurisdiction-specific criteria, were deemed to be at high
risk for latent M. tuberculosis infection. Multiply named contacts
were also interviewed to elicit the names of their close contacts
(i.e., secondary contacts); this procedure is not usually per-
formed as part of standard TB-control practice. Local TB-
control staff directly involved in routine contact investigation
interviewed TB patients at the time they were initially reported
to the local TB-control programs; contacts were interviewed af-
ter they were identified by TB patients.
Variables. Study variables abstracted for TB patients in-
cluded sociodemographic characteristics (name, address, age,
sex, race or ethnicity, and country of origin), clinical features
(sputum smear and culture results, anatomic site of disease,
chest radiograph findings, and HIV infection status), and geno-
typing results for M. tuberculosis isolates obtained from patients
with culture-confirmed TB. Variables abstracted for contacts in-
cluded similar sociodemographic features, as well TST results
and history of treatment for latent M. tuberculosis infection. Tra-
ditionally collected data for case-contact pairs included contact
environment, categorized as home, work, or leisure; and
strength of relationship, categorized as close (i.e., prolonged, fre-
quent, or intense contact with a person with infectious TB) or
casual (anything other than a close relationship) [32]. The inter-
view to determine places of social aggregation permitted identi-
fication of specific physical structures, categorized and defined
on the data collection forms as daytime (6 AM–5 PM), evening
(5–10 PM), or night (10 PM– 6 AM) for the 6-month period pre-
ceding TB diagnosis or evaluation as a contact.
Genotyping. Molecular genotyping was completed for all
available M. tuberculosis isolates recovered from patients. Iso-
1518 ● JID 2007:196 (15 November) ● Cook et al.
by guest on July 31, 2013http://jid.oxfordjournals.org/
Dow
nloaded from

lates from the 2 US sites were processed through the genotyping
services provided by the CDC, including spoligotyping and mul-
tiple interspersed repetitive units variable number tandem re-
peats (MIRU-VNTR) analyses [33–36]. Isolates with a matching
spoligotype and MIRU-VNTR pattern were then typed using
standard IS6110-based restriction fragment length polymor-
phism (RFLP) analysis to increase the discriminatory power to
distinguish between isolates [36 –37]. M. tuberculosis isolates
from Vancouver were processed and analyzed using standard
RFLP methodology at the British Columbia reference labora-
tory. At the 2 US sites, a TB cluster was defined as �2 patients
from whom M. tuberculosis isolates with matching spoligotype,
MIRU-VNTR, and RFLP patterns were recovered. A TB cluster
at the Vancouver site was defined as �2 patients from whom M.
tuberculosis isolates with the same RFLP pattern were recovered
(isolates with a pattern that deviated by �1 band were not included).
Statistical and network analyses. Statistical analyses were
performed using Epi Info, version 3.3.2 (CDC), and SAS, version
9.0 (SAS Institute). Social network metrics and diagrams were
generated using the software programs UCINET, version 6.101
(Analytic Technologies) [38], and Pajek, version 1.09 [39]. TB
transmission depends on close contact between individuals; the
more closely connected infectious and uninfected persons are to
each other (e.g., by sharing air spaces), the higher the probability
of M. tuberculosis transmission. K-plex modeling, a network
metric for characterizing subgroup formation on the basis of a
group’s degree of cohesion relative to individuals outside the
group, was used to rank the level of cohesiveness of contact be-
tween TB patients and their contacts [40]. Rank scores were cre-
ated to measure the extent of cohesion through Seidman
z-plexes [40], groups of nodes with a higher extent of intercon-
nection. The UCINet output was then processed with SAS. As-
sociation between this group-cohesiveness rank score with the
TST positivity of contacts was examined using a 1-sided Wil-
coxon (i.e., Ridit) test [41, 42]. To determine the degree to which
genotyping results corresponded with how cases were linked in
groups, we considered all combinations of cases, taken 2 at a
time, and evaluated whether both were in the same network-
connected group and had the same genotype; any differences in
proportions were examined with the McNemar test [43].
Study approval. This study protocol was approved by the
local ethics review board at each study site and by the CDC.
Table 1. Demographic and clinical characteristics of patients with tuberculosis (TB), by studysite, February through August 2004.
Variable
No. (%) of patients
Contra Costa(n � 42)
DeKalb(n � 36)
Vancouver(n � 9)
Overall(n � 87) P
Age, mean, years 52 41 40 44 .08a
Male sex 21 (50) 24 (67) 5 (56) 50 (57) .33Race or ethnicity
White 8 (19) 1 (3) 4 (44) 13 (15) �.001Black 7 (17) 25 (69) 0 (0) 32 (37)Hispanic 12 (29) 6 (17) 0 (0) 18 (21)Asian 15 (36) 3 (8) 0 (0) 18 (21)American Indian or Aboriginal 0 (0) 0 (0) 5 (56) 5 (6)Unknown or missing data 0 (0) 1 (3) 0 (0) 1 (1)
Foreign born 30 (71) 21 (58) 0 (0) 51 (59) �.001TB site
Lungsb 32 (76) 29 (81) 9 (100) 70 (80) .26Nonlungs only 10 (24) 7 (19) 0 (0) 17 (20)
Cavitation on chest radiograph 9 (21) 10 (28) 0 (0) 19 (22) .16Result of M. tuberculosis culture
Positive 28 (67) 27 (75) 9 (100) 64 (74) �.001Unknown or not done 5 (12) 4 (11) 0 (0) 9 (10)
Result of AFB sputum smearPositive 19 (45) 13 (36) 8 (89) 40 (46) .009Unknown or not done 9 (21) 2 (6) 0 (0) 11 (13)
Positive for HIVYes 2 (5) 6 (17) 6 (67) 14 (16) �.001Unknown or indeterminate 15 (36) 12 (33) 0 (0) 27 (31)
NOTE. AFB, acid-fast bacilli; M. tuberculosis, Mycobacterium tuberculosis.a By analysis of variance, comparing mean ages across all 3 sites.b Pulmonary cases may include persons with pulmonary only or pulmonary and extrapulmonary disease.
TB Transmission Network Analysis ● JID 2007:196 (15 November) ● 1519
by guest on July 31, 2013http://jid.oxfordjournals.org/
Dow
nloaded from

Written informed consent was obtained from multiply named
contacts prior to eliciting names of their contacts.
RESULTS
TB patients. We enrolled 87 TB patients at the 3 study sites; 42
patients were in Contra Costa, 36 were in DeKalb, and 9 were in
Vancouver (table 1). No significant differences in age or sex were
detected across the 3 sites. The race and ethnicity distribution
varied widely, with Asian, black, and Aboriginal persons making
up the largest proportion of TB patients in Contra Costa, De-
Kalb, and Vancouver, respectively. Foreign-born persons made
up the majority of TB patients in both Contra Costa and DeKalb.
The majority (70 patients [80%]) received a diagnosis of pulmo-
nary TB. The rate of M. tuberculosis culture positivity ranged
from 67% (in Contra Costa) to 100% (in Vancouver), and the
percentage of TB patients with sputum smears positive for acid-
fast bacilli (AFB) ranged from 36% (in DeKalb) to 89% (in Van-
couver). Two-thirds of the TB patients in Vancouver were coin-
fected with HIV. Of 64 patients with culture-confirmed TB, all
but 1 had an isolate genotyped. Genotyping confirmed 5 TB
clusters at the 3 sites; 1 was detected in Contra Costa (a 2-case
cluster [2 copies of IS6110]), 2 in DeKalb (two 2-case clusters [6
and 12 copies of IS6110]), and 2 in Vancouver (one 4-case cluster
[8 copies of IS6110] and one 2-case cluster [11 copies of IS6110]).
Contacts. Contact investigations for the TB patients with
pulmonary disease generated the names of 440 distinct persons
during the study period; 179 contacts were in Contra Costa, 205
were in DeKalb, and 56 were in Vancouver (table 2). The median
number of recorded contacts per TB patient was 5, with no sig-
nificant differences across the sites. The mean age of the contacts
was 29 years, and 51% were male. Although many data were
missing, the race and ethnicity distribution of the contacts mir-
rored those of the patients at each respective site. Only 1 site
(Vancouver) accrued multiply named contacts (n � 6). Addi-
tionally, 2 multiply named Vancouver contacts shared a mutu-
ally identified contact.
Places of social aggregation. We performed 211 interviews
for TB patients and contacts, which elicited 1056 places of social
aggregation (table 3). Vancouver participants identified a
greater median number of places per interview (n � 8) and the
highest number of multiply named places (n � 31). The mean
duration of the interviews to determine places of social aggrega-
Table 2. Demographic characteristics and latent Mycobacterium tuberculosis infection status for contactsof patients with tuberculosis, by study site, February through August 2004.
Variable
No. (%) of contactsa
Contra Costa(n � 179)
DeKalb(n � 205)
Vancouver(n � 56)
Overall(n � 440) P
Contacts per case, median, no. 4 6 7 5 .33b
Age, mean, years 29 27 32 29 .44c
SexMale 97 (54) 95 (46) 33 (59) 225 (51) .002Unknown or missing data 3 (2) 26 (13) 1 (2) 30 (7)
Race or ethnicityWhite 20 (11) 8 (4) 12 (21) 40 (9) �.001Black 23 (13) 126 (61) 0 149 (34)Hispanic 41 (23) 22 (11) 3 (5) 66 (15)Asian 63 (35) 11 (5) 1 (2) 75 (17)American Indian or Aboriginal 0 0 26 (46) 26 (6)Unknown or missing data 32 (18) 38 (19) 14 (25) 84 (19)
BirthplaceForeign site 56 (31) 66 (32) 2 (4) 124 (28) �.001Unknown or missing data 51 (28) 93 (45) 15 (27) 159 (36)
Latent M. tuberculosis infection statusTST placed and read 110 (62) 103 (50) 30 (54) 243 (55)
Positive for M. tuberculosis 28/110 (25) 34/103 (33) 7/30 (23) 69/243 (28) �.001Recent infection with M. tuberculosis 3/110 (3) 1/103 (1) 0 4/243 (2)
Past history of positive TST result 9 (4) 4 (2) 2 (4) 15 (3)Unknown or missing data 60 (34) 98 (48) 24 (41) 181 (41)
NOTE. TST, tuberculin skin test.a Includes 3 persons with tuberculosis who were named as contacts during routine investigation.b By the Wilcoxon rank sum test and the Kruskal-Wallis �2 test.c By analysis of variance, comparing mean ages across all 3 sites.
1520 ● JID 2007:196 (15 November) ● Cook et al.
by guest on July 31, 2013http://jid.oxfordjournals.org/
Dow
nloaded from

tion are also presented in table 3. Demographic characteristics of
TB patients interviewed about places of social aggregation were
not significantly different from those for uninterviewed TB pa-
tients, both at individual sites and overall (data not shown). The
same was true for contacts, with the following exceptions: inter-
viewed contacts from DeKalb were less likely than those from the
other 2 study sites to be foreign born (48% vs. 87%; P � .001),
and all interviewed contacts were more likely than uninter-
viewed contacts to be TST positive (45% vs. 23%; P � .001).
Case-contact, contact-contact, case-place, and contact-
place dyads. A total of 453 case-contact dyads were recorded
at the 3 sites (table 4). The contact environment (i.e., household)
and relationship strength (i.e., close) for these dyads were similar
for Contra Costa and DeKalb, whereas in Vancouver the dyad
ties were more likely to be nonhousehold and casual. In Vancou-
ver, 13 case-contact dyads (19%) involved 5 multiply named
contacts linked in various combinations. Three of the 5 multiply
named contacts from Vancouver consented to an interview to
elicit names of their contacts, resulting in 15 contact-contact
dyads. One secondary contact was named by 2 multiply named
contacts. Case-place versus contact-place dyads are presented in
table 4 and include only dyads comprised of multiply named places
(i.e., places named �2 times). A greater number of daytime places
were elicited at all 3 sites from both patients and contacts.
Network visualizations and metrics. Few interconnections
were found among TB patients in either Contra Costa (figure
1A) or DeKalb (figure 1B). The Contra Costa network showed
that several multiply named places were reported, but common
places did not link any 2 patients together. The patients from the
single genotype cluster in Contra Costa were not linked by SNA
or conventional epidemiologic analysis. Although the DeKalb
network showed a series of TB patients and contacts linked
through multiply named places (arranged at the top of figure
1B), these connected groups were confirmed by genotyping not
to be the same strain. Also, the patients from the 2-case genotype
clusters in DeKalb were not linked by SNA or conventional ep-
idemiologic analysis.
The Vancouver network represented a single connected group
of 9 TB patients, 53 distinct contacts, and 31 multiply named
places of social aggregation (figure 1C). In the absence of the
multiply named places (as would be the case in a traditional
contact investigation), no association was demonstrated be-
tween TST positivity and more-densely connected contacts (fig-
ure 2A) (P � .4). Inclusion of multiply-named places of social
aggregation reveals a single connected network (figure 2B). Two
main groups emerge as connected by 2 multiply named places
and 1 contact, located approximately in the center of the dia-
gram; 1 group includes HIV-negative TB patients, the other in-
cludes HIV-positive TB patients. A positive association
(P � .01) between contacts’ TST positivity and their location in
denser portions of the network can be seen by noting the fre-
quency and size of the nodes nearer the center of the diagram,
Table 3. Characteristics of places of social aggregation named by patients with tuberculosis (TB) and theircontacts in a supplemental interview during routine contact investigation, by study site, February throughAugust 2004.
Variable Contra Costa DeKalb Vancouver Overall P
Interviews conducted, no.Overall 82 101 28 211 �.001TB patients 32 17 9 57Contacts 50 84 19 153
Places named, no.Overall 384 461 211 1056 �.001TB patients 143 84 64 291Contacts 241 377 147 765
Places named per interview, median, no.Overall 4 4 8 5 �.001TB patients 5 5 8 5Contacts 4 4 8 4
Multiply named placesa
Overall 8/384 (2) 15/461 (3) 31/211 (15) 44/1056 (4) �.001TB patients 4/143 (3) 7/84 (8) 24/64 (37) 35/291 (12)Contacts 8/241 (3) 14/377 (4) 31/147 (21) 53/765 (7)
Duration of interviews, median, minOverall 15 15 40 . . . �.001TB patients 15 10 35 . . . �.001Contacts 15 20 45 . . . �.001a Data are no. of multiply named places/total no. of places named per study group (%). TB patients and contacts sometimes named
the same places, causing overlap in reported numbers.
TB Transmission Network Analysis ● JID 2007:196 (15 November) ● 1521
by guest on July 31, 2013http://jid.oxfordjournals.org/
Dow
nloaded from
which represent TST-positive persons. For all 3 sites, the
contact-investigation data and the network visualizations they
generated provided evidence of the presence or absence of case
clustering before genotyping results were available.
DISCUSSION
Achieving TB elimination in the United States and Canada will
require health departments to adopt innovative methods that
augment the commonly used “concentric circle” approach for
TB contact investigations [1, 8]. Yet limited resources have pre-
vented many TB-control programs from benefiting from even
the most basic information-management technologies. In this
study, we implemented a contact-investigation strategy in 3 TB-
control jurisdictions, using readily accessible tools to document,
store, analyze, and interpret contact-tracing data. With the ex-
ception of place data and the identification of secondary con-
tacts, this strategy used data typically collected by TB-control
programs to monitor completeness of contact evaluations or to
track the number of TST-positive contacts eligible for treatment
for latent M. tuberculosis infection. In this study, local TB-
control programs were able to use network analysis and visual-
ization tools to help understand the patterns of M. tuberculosis
transmission in their jurisdictions.
The small social-geographic area and the high population
density of the Vancouver site permitted more-extensive network
analysis and visualization despite the short 6-month period of
data collection. For example, we were able to better visualize how
HIV-infected persons and their associated social venues were
situated with respect to the larger picture of all detected relation-
ships in this TB network (figure 2B). Through this approach, we
were also able to identify the presence or absence of M. tubercu-
losis transmission clusters before genotyping results were avail-
able at the local level. In 3 instances where TB “clusters” were
first identified through rapid PCR– based methods but subse-
quently characterized by RFLP as false matches, SNA instead
found no connections among the patients, simultaneously con-
firming the results of traditional contact tracing methods and
clarifying the sometimes erroneous and confusing genotyping
data. This observation suggests some benefit in using network
analysis to enhance the specificity of PCR-based methods in de-
tecting TB clusters. The converse was also true. In DeKalb, 2
groups of interconnected patients detected by SNA were not
confirmed as transmission clusters by genotyping methods. Al-
though these patients had unique isolates and thus were not con-
sidered to be part of true disease clusters stemming from recent
transmission, we believe the detection of common places of so-
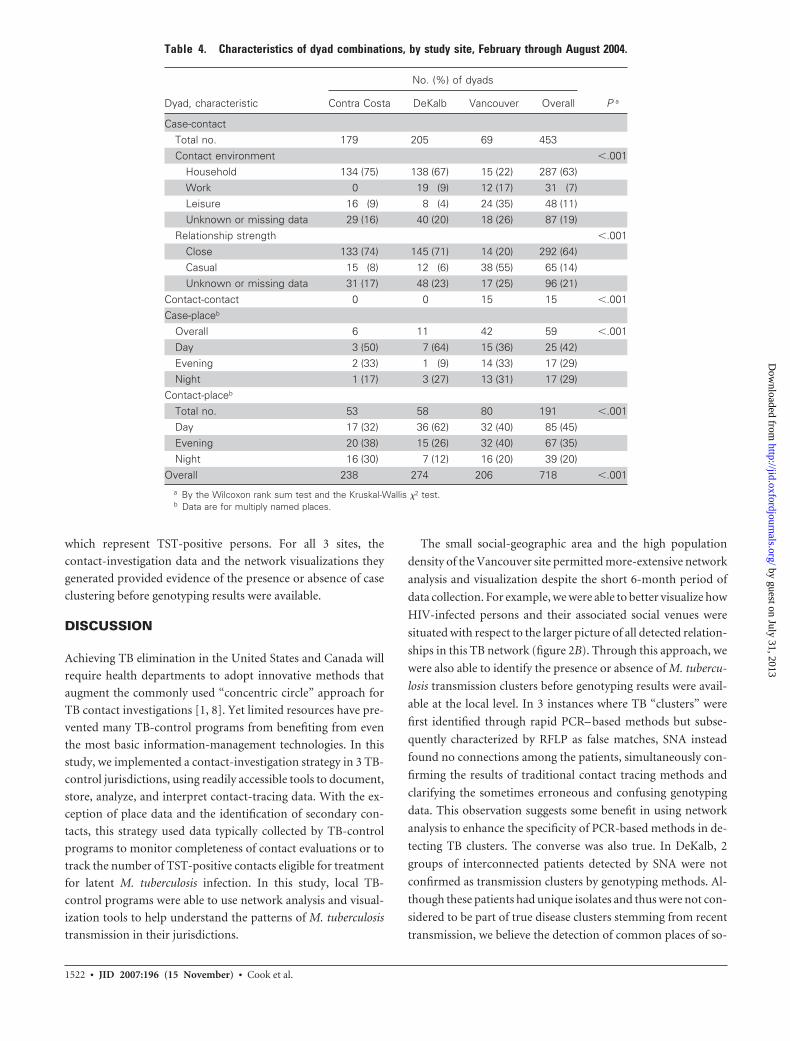
Table 4. Characteristics of dyad combinations, by study site, February through August 2004.
Dyad, characteristic
No. (%) of dyads
Contra Costa DeKalb Vancouver Overall P a
Case-contactTotal no. 179 205 69 453Contact environment �.001
Household 134 (75) 138 (67) 15 (22) 287 (63)Work 0 19 (9) 12 (17) 31 (7)Leisure 16 (9) 8 (4) 24 (35) 48 (11)Unknown or missing data 29 (16) 40 (20) 18 (26) 87 (19)
Relationship strength �.001Close 133 (74) 145 (71) 14 (20) 292 (64)Casual 15 (8) 12 (6) 38 (55) 65 (14)Unknown or missing data 31 (17) 48 (23) 17 (25) 96 (21)
Contact-contact 0 0 15 15 �.001Case-placeb
Overall 6 11 42 59 �.001Day 3 (50) 7 (64) 15 (36) 25 (42)Evening 2 (33) 1 (9) 14 (33) 17 (29)Night 1 (17) 3 (27) 13 (31) 17 (29)
Contact-placeb
Total no. 53 58 80 191 �.001Day 17 (32) 36 (62) 32 (40) 85 (45)Evening 20 (38) 15 (26) 32 (40) 67 (35)Night 16 (30) 7 (12) 16 (20) 39 (20)
Overall 238 274 206 718 �.001a By the Wilcoxon rank sum test and the Kruskal-Wallis �2 test.b Data are for multiply named places.
1522 ● JID 2007:196 (15 November) ● Cook et al.
by guest on July 31, 2013http://jid.oxfordjournals.org/
Dow
nloaded from

cial aggregation that link multiple TB patients is important for
TB-control efforts, because knowledge of these locations may
lead to the detection of a higher than average number of new
cases.
Detection of TB clusters with the help of SNA is also rele-
vant because a high proportion of diagnosed cases are not
confirmed by culture (22% in the United States during 2004)
[44] and thus lack M. tuberculosis isolate for genotyping. In
the absence of SNA or another method, no clear approach
currently exists to accommodate culture-negative TB cases
during investigations of suspected transmission clusters. Ad-
ditionally, molecular clustering does not always indicate re-
cent transmission, and circulating endemic stains can result
in “clusters” of epidemiologically unrelated cases, generating
confusion for outbreak investigators [36, 44, 45]. Combining
the results of SNA with the results of genotyping should help
improve the specificity of molecular genotyping methods and help
avoid unnecessary public health actions.
Figure 1. Networks of relationships between patients with tuberculosis (diamonds), their contacts (circles), and places of social aggregation (houses)in Contra Costa County, California (A), DeKalb County, Georgia (B), and Vancouver, Canada (C), February through August 2004.
TB Transmission Network Analysis ● JID 2007:196 (15 November) ● 1523
by guest on July 31, 2013http://jid.oxfordjournals.org/
Dow
nloaded from

Though electronic management of routine contact-
investigation data is recommended [5], most TB-control pro-
grams’ efforts to store and creatively analyze contact-tracing
data need strengthening [9]. This is particularly important for
higher-population jurisdictions that commonly collect data
from thousands of contacts each year. Many of those contacts
are repeatedly identified over time but are not always immedi-
ately recognized as important links to ongoing transmission.
Figure 2. Network of relationships between patients with tuberculosis (TB), their contacts, and places of social aggregation, Vancouver, Canada,February through August 2004. A, Networks without places; B, networks with places named at least 3 times (the k-plex analysis upon which this diagramis based included all places of social aggregation). Case, contact, and place nodes linked together through social network analysis are referred to as“connected groups.” TB patients are denoted by diamonds that include a plus sign if HIV positive and a minus sign if HIV negative. Contacts are denotedby circles that are black if TST positive, grey if TST negative, and white if the TST status is unknown. Places are denoted by houses, which includea plus sign if frequented by HIV-infected TB patients. Node sizes are directly proportional to the extent of their involvement in more-densely connectedregions of the network. More-densely connected nodes are visualized closer to the center and are larger, whereas less densely connected nodes aresmaller and located closer to the periphery. Connections between TB patients are denoted by solid lines, connections between multiply named contacts andtheir secondary contacts are denoted by dotted lines, and connections between TB patients who named each other as contacts are denoted by double arrows.
1524 ● JID 2007:196 (15 November) ● Cook et al.
by guest on July 31, 2013http://jid.oxfordjournals.org/
Dow
nloaded from

Contact investigations augmented by SNA offer several advan-
tages. Monitoring of the evolution of interconnected cases, con-
tacts, and places may facilitate earlier detection of ongoing trans-
mission and help prioritize which contacts or locations to
investigate. Updated diagrams could be compared with histori-
cal diagrams to highlight critical nodes responsible for expanded
transmission. These “spot reviews” or summary views of contact
investigations could identify specific places for on-site or
location-based screening for TB and latent M. tuberculosis infec-
tion. The network approach could be a resource to outreach
workers planning contact investigations and targeted TST activ-
ities or to TB-control program managers making decisions
about resource allocation [5, 46].
Few sites in North America systematically collect and elec-
tronically store place data, despite current recommendations
[5]. Even where collected, such data are not periodically ana-
lyzed to spot increased reporting of specific locations named by
TB patients and contacts. Our results confirm the importance of
named places in TB transmission, because more TST-positive
contacts in densely connected networks were identified after
places of social aggregation were taken into account. Although
similar observations have been reported, and the cost of record-
ing place data is unlikely to be prohibitive for most TB-control
programs, few practice this strategy. A simple spreadsheet could
be used to cumulatively store place data, with multiply named
places considered for location-based screening activities. Several
SNA software applications, including free noncommercial and
commercial packages, are available. One rate-limiting step for
implementing this strategy is the training of key staff to use the
software and interpret the output. The training strategy success-
fully used to implement TB genotyping at the national level
could serve as a model for educating TB controllers about other
new technologies, including SNA [47].
Despite training, some stressed TB-control programs may be
at their limit for expansion of investigation activities. Nonethe-
less, an expansion of contact lists and ascertainment of place
names may be of value even in a setting where the data are not
computerized or analyzed. Investigators’ memory is a powerful
tool, and simple enumeration of contacts and places, without
further analysis, may provide clues to investigators of possible
clustering of people within places. In addition, the collection of
such data provides the potential for subsequent analysis that
would be otherwise impossible.
Several factors impacted the effectiveness of SNA during this
pilot study. Given the large geographic size of Contra Costa and
DeKalb counties, the 6-month data collection period was likely
too short for elucidation of transmission dynamics in these lo-
cales. The short study duration was chosen to allow for assess-
ment of the burden of implementing the SNA paradigm. A study
period more commensurate with the speed of M. tuberculosis
propagation would permit the accrual of more multiply named
places of importance and could make a greater contribution in
larger, less dense areas such as Contra Costa and DeKalb coun-
ties. The varying yield of multiply named contacts and places
may also be explained by the characteristics of the populations at
the 3 sites and the reduced likelihood of recent transmission. For
example, if the majority of TB cases in a community are due to
reactivation of remotely acquired infection (e.g., as is often the
case for older, foreign-born persons with TB), the usefulness of
SNA as an adjunct to genotyping for the assessment of recent
transmission may not be as convincing. The discrepancy in in-
terview times across the 3 sites may also have influenced the
number of multiply named contacts and multiply named places.
Finally, complete data were missing for many contacts. Our re-
sults, although incomplete, are consistent with findings on the
incompleteness of data in many routine contact investigations [9].
Overall, we found that contact investigations were improved
when data on places of social aggregation were collected and SNA
was implemented. SNA provides the analytic framework for
placing TB patients, their contacts, and the places they frequent
into a social-geographic context. Qualitative SNA measures can
be used as an adjunct to investigation of more well-established
individual-level TB risk factors (e.g., recent TST conversion,
presence of HIV infection, and high infectivity of the source
case) and may offer TB control programs a systematic approach
to prioritizing persons, places, neighborhoods, or entire com-
munities. If the voluminous data from routine contact tracing
can be successfully harnessed, analyzed, and interpreted using SNA,
the pace of TB elimination in North America may be accelerated.
NETWORK ANALYSIS PROJECT TEAM
Henry M. Blumberg, Institute of Public Health, Georgia State Uni-
versity, and Epidemiology Department, Grady Memorial Hospital,
Atlanta, Georgia; J. Mark FitzGerald, Department of Medicine,
University of British Columbia, and Centre for Clinical Epidemiol-
ogy and Evaluation, Vancouver General Hospital, Vancouver, Can-
ada; Jennifer M. Flood, Tuberculosis Control Branch, California
Department of Health Services, Richmond, California; Sheila P.
McCarthy, Department of Medicine, University of British Colum-
bia, Vancouver; Alawode Oladele, Tuberculosis, Refugee Health,
and Richardson Laboratory, DeKalb County Board of Health,
Georgia; Ameisha R. Sampson and Maureen Wilce, Division of Tu-
berculosis Elimination, National Center for Human Immunodefi-
ciency Virus, Viral Hepatitis, Sexually Transmitted Disease, and
Tuberculosis Prevention, Centers for Disease Control and Preven-
tion, Atlanta; and Francie Wise, Tuberculosis Control Program,
Contra Costa County Department of Health, California.
Acknowledgments
We thank the staff members from the tuberculosis-control programs inDeKalb County, Georgia; Contra Costa County, California; and the Down-town Eastside Tuberculosis Program in Vancouver, Canada. Specifically, weacknowledge Beverly DeVoe-Payton, Rose Sales, and the Georgia DHR/Di-vision of Public Health/TB Control Program, as well as the staff at the De-
TB Transmission Network Analysis ● JID 2007:196 (15 November) ● 1525
by guest on July 31, 2013http://jid.oxfordjournals.org/
Dow
nloaded from

Kalb County Board of Health; Mark Condit at the Contra Costa CountyTuberculosis Program; and Dr. Kevin Elwood, Nash Dhalla, Jerry Cyr, andShelley Dean at the Division of TB Control, British Columbia Centre forDisease Control, Vancouver. We are also grateful to the Division of Tuber-culosis Elimination at the US Centers for Disease Control and Prevention(CDC) and the Tuberculosis Epidemiologic Studies Consortium (TBESC)for funding this project. We thank Dr. Rachel Albalak (CDC), Dr. EarlHershfield (University of Manitoba), and Dr. Tom Navin (CDC) for theirleadership in guiding the TBESC during this study. Dr. Patrick Moonan(CDC) provided specific genotyping data at the state and national level.Genotyping for DeKalb County and Contra Costa County isolates was per-formed by one of two contracting reference laboratories: the Division ofInfectious Disease, Bureau of Laboratories, Department of CommunityHealth (Lansing, MI), or the California Department of Health Services, Mi-crobial Disease Laboratory (Richmond, CA). Vancouver isolates were geno-typed by the National Reference Centre for Mycobacteriology, National Mi-crobiology Laboratory (Winnipeg, Canada).
References
1. Institute of Medicine. Ending Neglect: The Elimination of Tuberculosisin the United States. Washington, DC: National Academy Press, 2000.
2. Health Canada. Annual Reports Tuberculosis in Canada (1996-2002).Available at: http://www.phac-aspc.gc.ca/publications_4_e.html
3. Taylor Z, Nolan CM, Blumberg HM; American Thoracic Society, Cen-ters for Disease Control and Prevention, Infectious Diseases Society ofAmerica: Controlling Tuberculosis in the United States. Am J RespirCrit Care Med 2005; 172:1169 –227.
4. Centers for Disease Control and Prevention. Screening for tuberculosisand tuberculosis infection in high-risk populations: recommendationsof the Advisory Committee for Elimination of Tuberculosis. MMWRRecomm Rep 1990; 39:1–7.
5. National Tuberculosis Controllers Association and Centers for DiseaseControl and Prevention (CDC). Guidelines for the investigation of con-tacts of persons with infectious tuberculosis: recommendations fromthe National Tuberculosis Controllers Association and CDC. MorbMortal Wkly Rep Recomm Rep 2005; 54:1– 47.
6. American Thoracic Society and Centers for Disease Control and Preven-tion. Targeted tuberculin testing and treatment of latent tuberculosisinfection. Am J Respir Crit Care Med 2000; 161:S221– 47.
7. Tannenbaum TN, Fanning A. Contact follow-up and outbreak manage-ment in tuberculosis control. In: Long R, ed. Canadian tuberculosisstandards. 5th ed. Ottawa: Canadian Lung Association, Canadian Tho-racic Society and Tuberculosis Prevention and Control Centre for In-fectious Disease Prevention and Control, Health Canada, 2000:175– 86.
8. Etkind S. Contact tracing. In: Reichman LB, Hershfield ES, eds. TB: acomprehensive international approach. New York: Marcel Dekkar,1993:275– 89.
9. Reichler MR, Reves R, Bur S, et al. Evaluation of investigations con-ducted to detect and prevent transmission of tuberculosis. JAMA 2002;287:991–5.
10. Marks SM, Taylor Z, Qualls NL, Shrestha-Kuwahara RJ, Wilce MA,Nguyen CH. Outcomes of contact investigations of infectious tubercu-losis patients. Am J Respir Crit Care Med 2000; 162:2033– 8.
11. Hopewell PC. Targeting tuberculosis prevention. Am J Respir Crit CareMed 2000; 162:2017– 8.
12. Mohle-Boetani JC, Flood J. Contact investigations and the continuedcommitment to control tuberculosis. JAMA 2002; 287:1040 –2.
13. Weis SE, Pogoda JM, Yang Z, et al. Transmission dynamics of tubercu-losis in Tarrant County, Texas. Am J Respir Crit Care Med 2002; 166:36 – 42.
14. Hernandez-Garduno E, Kunimoto D, Wang L, et al. Predictors of clus-tering of tuberculosis in Greater Vancouver: a molecular epidemiologystudy. CMAJ 2002; 167:349 –52.
15. Wasserman S, Faust K. Social network analysis: methods and applica-tions. Cambridge: Cambridge University Press, 1994.
16. Rothenberg RB, Narramore J. Commentary: the relevance of social net-work concepts to sexually transmitted disease control. Sex Transm Dis1996; 23:24 –9.
17. Rothenberg RB, Long DM, Sterk CE, et al. The Atlanta Urban NetworksStudy: a blueprint for endemic transmission. AIDS 2000; 14:2191–200.
18. Galavotti C, Saltzman LE, Sauter SL, Sumartojo E. Behavioral scienceactivities at the Centers for Disease Control and Prevention: a selectedoverview of exemplary programs. Am Psychol 1997; 52:154 – 66.
19. Potterat JJ, Rothenberg RB, Muth SQ. Network structural dynamics andinfectious disease propagation. Int J STD AIDS 1999; 10:182–5.
20. Wylie JL, Cabral T, Jolly AM. Identification of networks of sexuallytransmitted infection: a molecular, geographic, and social network anal-ysis. J Infect Dis 2005; 191:899 –906.
21. Rothenberg RB, McElroy PD, Wilce MA, Muth SQ. Contact tracing:comparing the approaches for sexually transmitted diseases and tuber-culosis. Int J Tuberc Lung Dis 2003; 7:S342– 8.
22. Potterat JJ, Rothenberg RB, Woodhouse DE, Muth JB, Pratts CI, FogelJS. Gonorrhea as a social disease. Sex Transm Dis 1985; 12:25–32.
23. Figueroa JP, Brewer CB, Dale D, Hileman SB, Weir S. An assessment ofsites where persons go to meet sexual partners in St. James, Jamaica,using the PLACE method. Sex Transm Dis 2007; 34:410 –5.
24. Klovdahl AS, Graviss EA, Yaganehdoost A, et al. Networks and tubercu-losis: an undetected community outbreak involving public places. SocSci Med 2001; 52:681–94.
25. McElroy PD, Rothenberg RB, Varghese R, et al. A network-informedapproach to investigating a tuberculosis outbreak: implications for en-hancing contact investigations. Int J Tuberc Lung Dis 2003; 7:S486 –348.
26. Fitzpatrick LK, Hardacker JA, Heirendt W, et al. A preventable outbreakof tuberculosis investigated through an intricate social network. ClinInfect Dis 2001; 33:1801– 6.
27. Sterling TR, Thompson D, Stanley RL, et al. A multi-state outbreak oftuberculosis among members of a highly mobile social network: impli-cations for tuberculosis elimination. Int J Tuberc Lung Dis 20004:1066 –73.
28. Barnes PF, Yang Z, Preston-Martin S, et al. Patterns of tuberculosistransmission in Central Los Angeles. JAMA 1997; 278:1159 – 63.
29. Katz D, Albalak R, Wing JS, Combs V, for the Tuberculosis Epidemio-logic Studies Consortium. Setting the agenda: a new model for collabo-rative tuberculosis epidemiologic research. Tuberculosis 2007; 87:1– 6.
30. Supplemental interview for places of social aggregation. Centers for Dis-ease Control and Prevention and Tuberculosis Epidemiologic StudiesConsortium. Available at: http://www.cdc.gov/tb/Samples/network-forms.htm. Accessed 25 January 2007.
31. American Thoracic Society and Centers for Disease Control and Preven-tion. Diagnostic standards and classification of tuberculosis in adultsand children. Am J Respir Crit Care Med 2000; 161:1376 –95.
32. Centers for Disease Control and Prevention (CDC). Contact investiga-tion for tuberculosis: self-study modules on tuberculosis. Division ofTuberculosis Elimination and Public Health Practice Office, Division ofMedia and Training Services. Atlanta: CDC, 1999.
33. Centers for Disease Control and Prevention. New CDC program forrapid genotyping of Mycobacterium tuberculosis isolates. MMWR MorbMortal Wkly Rep 2005; 54:47.
34. Cowan LS, Diem L, Brake MC, Crawford JT. Transfer of a Mycobacte-rium tuberculosis genotyping method, spoligotyping, from a reverse line-blot hybridization, membrane-based assay to the Luminex multianalyteprofiling system. J Clin Microbiol 2004; 42:474 –7.
35. Supply P, Lesjean S, Savine E, Kremer K, van Soolingen D, Locht C.Automated high-throughput genotyping for study of global epidemiol-ogy of Mycobacterium tuberculosis based on mycobacterial interspersedrepetitive units. J Clin Microbiol 2001; 39:3563–71.
36. Cowan LS, Diem L, Monson T, et al. Evaluation of a two-step approachfor large-scale, prospective genotyping of Mycobacterium tuberculosisisolates in the United States. J Clin Microbiol 2005; 43:688 –95.
1526 ● JID 2007:196 (15 November) ● Cook et al.
by guest on July 31, 2013http://jid.oxfordjournals.org/
Dow
nloaded from

37. van Embden JD, Cave MD, Crawford JT, et al. Strain identification ofMycobacterium tuberculosis by DNA fingerprinting: recommendationsfor a standardized methodology. J Clin Microbiol 1993; 31:406 –9.
38. Borgatti SP, Everett MG, Freeman LC. UCINET 6 for Windows. Har-vard: Analytic Technologies, 2002.
39. Batagelj V, Mrvar A. Pajek—program for large network analysis. Con-nections 1998; 21:47–57.
40. Seidman S, Foster B. A graph theoretic generalization of the clique con-cept. J Math Soc 1978; 6:139 –54.
41. Wilcoxon F. Individual comparisons by ranking methods. Biometrics1945; 1:80 –3.
42. Selvin S. Statistical analysis of epidemiologic data. 2nd ed. New York:Oxford University Press, 1996
43. Fleiss JL. Statistical methods for rates and proportions. 2nd ed. NewYork: John Wiley & Sons, 1981.
44. Centers for Disease Control and Prevention (CDC). Reported tubercu-losis in the United States, 2004. Atlanta: CDC, September 2005.
45. Cowan LS, Crawford JT. Genotype analysis of Mycobacterium tubercu-losis isolates from a sentinel surveillance population. Emerg Infect Dis2002; 8:1294 –302.
46. Andre M, Ijaz K, Tillinghast JD, et al. Transmission network analysis tocomplement routine tuberculosis contact investigations. Am J PublicHealth 2007; 97:470 –7.
47. National Tuberculosis Controllers Association, Centers for Dis-ease Control and Prevention (CDC) Advisory Group on Tuber-culosis Genotyping. Guide to the application of genotyping totuberculosis prevention and control. Atlanta: CDC, 2004. Availableat: http://www.cdc.gov/nchstp/tb/genotyping/toc.htm. Accessed 25January 2007.
TB Transmission Network Analysis ● JID 2007:196 (15 November) ● 1527
by guest on July 31, 2013http://jid.oxfordjournals.org/
Dow
nloaded from