Transcriptome classification of HCC is related to gene alterations and to new therapeutic targets
26
Transcriptome classification of HCC is related to gene alterations and to new therapeutic targets. Sandrine Boyault, David Rickman, Aur´ elien De Reyni` es, Charles Balabaud, Sandra Rebouissou, Emmanuelle Jeannot, Aur´ elie H´ erault, Jean Saric, Jacques Belghiti, Dominique Franco, et al. To cite this version: Sandrine Boyault, David Rickman, Aur´ elien De Reyni` es, Charles Balabaud, Sandra Rebouissou, et al.. Transcriptome classification of HCC is related to gene alterations and to new therapeutic targets.: Transcriptome and HCC classification. Hepatology (Baltimore, Md.), 2007, 45 (1), pp.42-52. <10.1002/hep.21467>. <inserm-00130313> HAL Id: inserm-00130313 http://www.hal.inserm.fr/inserm-00130313 Submitted on 3 Nov 2009 HAL is a multi-disciplinary open access archive for the deposit and dissemination of sci- entific research documents, whether they are pub- lished or not. The documents may come from teaching and research institutions in France or abroad, or from public or private research centers. L’archive ouverte pluridisciplinaire HAL, est destin´ ee au d´ epˆ ot et ` a la diffusion de documents scientifiques de niveau recherche, publi´ es ou non, ´ emanant des ´ etablissements d’enseignement et de recherche fran¸cais ou ´ etrangers, des laboratoires publics ou priv´ es.
-
Upload
independent -
Category
Documents
-
view
0 -
download
0
Transcript of Transcriptome classification of HCC is related to gene alterations and to new therapeutic targets

Transcriptome classification of HCC is related to gene
alterations and to new therapeutic targets.
Sandrine Boyault, David Rickman, Aurelien De Reynies, Charles Balabaud,
Sandra Rebouissou, Emmanuelle Jeannot, Aurelie Herault, Jean Saric,
Jacques Belghiti, Dominique Franco, et al.
To cite this version:
Sandrine Boyault, David Rickman, Aurelien De Reynies, Charles Balabaud, Sandra Rebouissou,et al.. Transcriptome classification of HCC is related to gene alterations and to new therapeutictargets.: Transcriptome and HCC classification. Hepatology (Baltimore, Md.), 2007, 45 (1),pp.42-52. <10.1002/hep.21467>. <inserm-00130313>
HAL Id: inserm-00130313
http://www.hal.inserm.fr/inserm-00130313
Submitted on 3 Nov 2009
HAL is a multi-disciplinary open accessarchive for the deposit and dissemination of sci-entific research documents, whether they are pub-lished or not. The documents may come fromteaching and research institutions in France orabroad, or from public or private research centers.
L’archive ouverte pluridisciplinaire HAL, estdestinee au depot et a la diffusion de documentsscientifiques de niveau recherche, publies ou non,emanant des etablissements d’enseignement et derecherche francais ou etrangers, des laboratoirespublics ou prives.


Boyault et al, HEP 06-0968 revised 1
Transcriptome classification of HCC is related to gene alterations and to
new therapeutic targets
Sandrine Boyault1, 2
*, David S. Rickman3*, Aurélien de Reyniès
3*, Charles Balabaud
4, 5, Sandra
Rebouissou1, 2
, Emmanuelle Jeannot1, 2
, Aurélie Hérault1, 2
, Jean Saric6, Jacques Belghiti
8,
Dominique Franco9, Paulette Bioulac-Sage
4, 7, Pierre Laurent-Puig
10, Jessica Zucman-Rossi
1, 2**
1Inserm, U674; CEPH-Fondation Jean Dausset, Paris France;
2Université Paris 7, IUH, Saint-Louis, Paris, France;
3Bioinformatic department; Ligue nationale contre le cancer; LNCC, Paris, France;
4Inserm, E0362; GREF; Université Bordeaux 2, CHU Bordeaux, France;
Departments of 5Hepatology,
6Surgery, and
7Pathology, Centre Hospitalier Universitaire de
Bordeaux, France;
8AP-HP, Surgery department, hôpital Beaujon, Clichy, France;
9AP-HP, Surgery department, Hôpital Antoine Béclère, Clarmart, France;
10Inserm, U775; Université Paris 5, France;
*Equally contributed to this work
**Corresponding author: Inserm U674, CEPH-Fondation Jean Dausset, IUH-Saint-Louis, 27 rue
Juliette Dodu, 75010 Paris, France. TEL: 33 1 53 72 51 66. FAX: 33 1 53 72 51 58. Email:
Short title: trancriptome and HCC classification
Key Words: tumor suppressor gene; microarray; ß-catenin; AKT pathway; HBV

Boyault et al, HEP 06-0968 revised 2
Abstract
Hepatocellular carcinomas (HCC) are a heterogeneous group of tumors that differ by risk
factors and genetic alterations. We have further investigated transcriptome-genotype-phenotype
correlations in HCC. Global transcriptome analyses were performed on 57 HCC and 3
hepatocellular adenomas and validated by quantitative RT-PCR using 63 additional HCC. We
determined losses of heterozygosity, gene mutations, promoter methylation of CDH1 and
CDKN2A, and HBV DNA copy number for each tumors. Unsupervised transcriptome analysis
identified six robust subgroups of HCC (G1 to G6) associated with clinical and genetic
characteristics. G1-tumors were associated with HBV low copy number and over-expression of
genes expressed in fetal liver and controlled by parental imprinting. G2 included HCCs infected
with a high copy number of HBV and mutations in PIK3CA and TP53. In these first groups, we
detected a specific activation of the AKT pathway. G3-tumors were typified by a mutation of
TP53 and an over-expression of genes controlling the cell-cycle. G4 was a heterogeneous
subgroup of tumors including TCF1 mutated hepatocellular adenomas and carcinomas. G5 and
G6 were strongly related to ß-catenin mutations leading to Wnt pathway activation; and in
particular G6-tumors were characterized by satellite nodules, higher activation of the Wnt
pathway and E-cadherin under-expression. These results have furthered our understanding of the
genetic diversity of human HCC and have provided specific identifiers to classify tumors. In
addition, our classification has potential therapeutic implications since 50% of the tumors were
related to WNT or AKT pathways activation, potentially targeted by specific inhibiting
therapies.
Words Count: 246

Boyault et al, HEP 06-0968 revised 3
Hepatocellular carcinoma (HCC) is one of the most frequent solid tumors worldwide and
represents the third cause of mortality among deaths from cancer(1). Liver cirrhosis of any origin
and dysplastic regenerative nodules have long been considered to be the likely precursors of
HCC because of their frequent association with the HCC occurrence(2, 3). As in other solid
tumors, a large number of genetic alterations accumulate during the carcinogenetic process.
Some of these genetic alterations are specific to HCC etiological risk factors, particularly HBV
infection which can induce chromosome instability or insertional mutagenesis(4). Among the
genetic alterations unrelated to HCC risk factors, microsatellite allelotypes and comparative
genomic hybridization (CGH) studies have demonstrated recurrent chromosome aberrations(5).
Altogether, the principal carcinogenetic pathways known to be deregulated in HCC are the
inactivation of TP53(6), Wnt/wingless activation mainly through CTNNB1 mutations activating
ß-catenin and AXIN1 inactivating mutations(7-9), retinoblastoma inactivation through RB1 and
CDKN2A promoter methylation and rare gene mutations(10, 11), insulin growth factor activation
through IGF2 over-expression and IGF2R inactivating mutations(12, 13).
We have previously shown that genetic alterations are indeed closely associated with
clinical characteristics of HCC defining two mechanisms of hepatocarcinogenesis(14). The first
type of HCC was associated with not only a high level of chromosome instability, frequent TP53
and AXIN1 mutations but also closely linked to HBV infection and a bad prognosis. Conversely,
the second subgroup of HCC tumors was chromosome-stable, having a high incidence of
activating ß-catenin alterations and was not associated with viral infection. To further investigate
genotype-phenotype correlations in HCC, identify pathways and/or biological processes
deregulated in such heterogeneous tumors, we performed a comprehensive analysis at the
clinical, genetic and transcriptomic level in 57 HCC and 3 adenomas and we validated the results
using quantitative RT-PCR in 63 new independent HCCs.

Boyault et al, HEP 06-0968 revised 4
Patients and methods
Tumor samples and clinical data
A series of 120 HCC and 3 hepatocellular adenomas were collected from 123 patients surgically
treated in 3 French surgical departments from 1992 to 1999. A first group of tumors (57 HCC
and 3 hepatocellular adenomas) was used for genome-wide transcriptome microarray analysis
and a second group of 63 independent HCCs was used for validation by quantitative RT-PCR
analysis. All these tumors were clinically characterized as previously described(14)
(supplementary table 1). Briefly, the entire series of patients consisted of the following: 4:1
(M:F) gender ratio, 79% were born in France, mean age was 60. Risk factors for HCC of
hepatitis B virus, hepatitis C virus, alcohol abuse, and hemochromatosis occurred in 30%, 25%,
33% and 5%, respectively. HCCs developed from cirrhotic liver or severe chronic hepatitis
disease in 68% of the cases. The histological grade of tumor differentiation was assigned
according to the Edmondson and Steiner grading system, grade I (7%), II (49%), III (39%) and
IV (4%). Tumor size ranged from 3 to 190 mm (median = 60mm). In 103 cases the preoperative
-fetoprotein serum level was available and over 100 IU/ml for 37 patients. Macroscopic and/or
microscopic vascular invasion was recorded in 38% of the cases. Satellite tumors defined by
nodule(s) found at less than 1 cm from the main tumor was recorded in 42% of the cases. For the
Affymetrix analysis, 5 pools of 3 non-tumor liver tissues matching the analyzed tumors were
used including alcoholic cirrhosis (pool 1), alcoholic non-cirrhotic liver (pool 2), HBV non-
cirrhotic liver (pool 3), HCV cirrhosis (pool 4) and HBV cirrhosis (pool 5). In the QRT-PCR
experiments, we analyzed these 15 non-tumor RNAs and 6 additional normal non-tumor liver
RNAs. We used 19 human fetal liver samples at different stages of development (ranging from
11 to 29 weeks of pregnancy) to test for genes potentially expressed during fetal life using QRT-
PCR. The study was approved by the local Ethics Committee (CCPPRB Paris Saint-Louis), and
informed consent was obtained in accordance with French legislation.
Gene mutations, chromosome imbalance, quantification of HBV genome and DNA
methylation
For each tumor, we screened for gene mutations in TP53, CTNNB1 coding for ß-catenin, AXIN1,
PIK3CA, EGFR, KRAS, NRAS and HRAS using direct sequencing. Primers and protocols are
available upon request and all mutations are described in supplementary Table 2. Genome-wide
Boyault et al, HEP 06-0968 revised 5
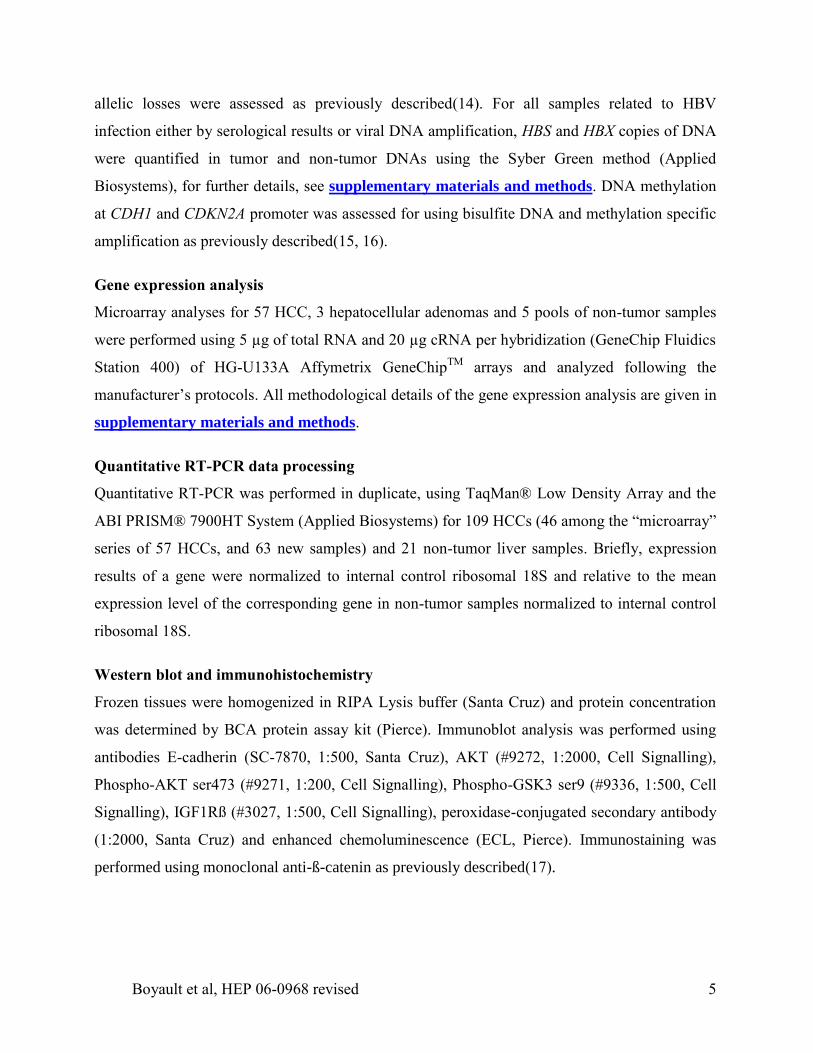
allelic losses were assessed as previously described(14). For all samples related to HBV
infection either by serological results or viral DNA amplification, HBS and HBX copies of DNA
were quantified in tumor and non-tumor DNAs using the Syber Green method (Applied
Biosystems), for further details, see supplementary materials and methods. DNA methylation
at CDH1 and CDKN2A promoter was assessed for using bisulfite DNA and methylation specific
amplification as previously described(15, 16).
Gene expression analysis
Microarray analyses for 57 HCC, 3 hepatocellular adenomas and 5 pools of non-tumor samples
were performed using 5 µg of total RNA and 20 µg cRNA per hybridization (GeneChip Fluidics
Station 400) of HG-U133A Affymetrix GeneChipTM
arrays and analyzed following the
manufacturer’s protocols. All methodological details of the gene expression analysis are given in
supplementary materials and methods.
Quantitative RT-PCR data processing
Quantitative RT-PCR was performed in duplicate, using TaqMan® Low Density Array and the
ABI PRISM® 7900HT System (Applied Biosystems) for 109 HCCs (46 among the “microarray”
series of 57 HCCs, and 63 new samples) and 21 non-tumor liver samples. Briefly, expression
results of a gene were normalized to internal control ribosomal 18S and relative to the mean
expression level of the corresponding gene in non-tumor samples normalized to internal control
ribosomal 18S.
Western blot and immunohistochemistry
Frozen tissues were homogenized in RIPA Lysis buffer (Santa Cruz) and protein concentration
was determined by BCA protein assay kit (Pierce). Immunoblot analysis was performed using
antibodies E-cadherin (SC-7870, 1:500, Santa Cruz), AKT (#9272, 1:2000, Cell Signalling),
Phospho-AKT ser473 (#9271, 1:200, Cell Signalling), Phospho-GSK3 ser9 (#9336, 1:500, Cell
Signalling), IGF1Rß (#3027, 1:500, Cell Signalling), peroxidase-conjugated secondary antibody
(1:2000, Santa Cruz) and enhanced chemoluminescence (ECL, Pierce). Immunostaining was
performed using monoclonal anti-ß-catenin as previously described(17).

Boyault et al, HEP 06-0968 revised 6
Results:
Unsupervised transcriptome analysis defines clusters of tumors closely associated with
clinical data and genetic alterations
In the whole series of 123 tumors (120 HCC and 3 hepatocellular adenomas) we
identified mutations in CTNNB1 (encoding ß-catenin), TP53, AXIN1, TCF1, PIK3CA, KRAS
gene in 34, 31, 13, 5, 2 and 1 cases, respectively (supplementary Table 2). No mutations were
found in NRAS, HRAS and EGFR. Hypermethylation of the CDKN2A and CDH1 promoter were
identified in 35% and 16% of the cases, respectively.
Fifty-seven HCC, 3 hepatocellular adenomas and 5 samples of pooled non-tumor tissues
were analyzed using Affymetrix HG-U133A GeneChipTM
arrays. Based on a hierarchical
clustering analysis using the 6,712 probe sets whose expression vary the most across samples,
we classified tumors into 2 major groups each being further divided into 3 smaller subgroups
(G1 to G6, Figure 1). This classification was found to be extremely robust (mean reproducibility
score was found to be at least 90% for the 2 major groups and the 6 subgroups), and was
conserved across different gene lists and clustering methods.
We observed a high level of association between this HCC classification and genetic
alterations and clinical factors (Table 1). The tumors in groups G1 to G3 are associated with
high level of chromosome instability yielding a significantly higher fractional allelic loss (FAL)
compared to the tumors in groups G4 to G6 (P<10-2
). Among the frequent somatic gene
mutations observed, the G5-G6 subgroups were highly associated with CTNNB1 mutations
(P<10-10
) and the G2-G3 subgroups with TP53 mutations (P=0.03). The rare TCF1 and PIK3CA
mutations were associated with G4 subgroup (P=0.01) and G2 subgroup (P=0.01), respectively.
Hypermethylation of E-cadherin (CDH1) and P16 (CDKN2A) gene promoter were most
frequently observed in G5-G6 and G3 subgroups, respectively. In addition, HCC related to HBV
infection were found in groups G1 to G3 and more specifically, tumors with low number of HBV
DNA copies were related to G1 subgroup (P<10-4
). We validated these associations based on the
classification of a second set of 63 independent tumors using quantitative RT-PCR.

Boyault et al, HEP 06-0968 revised 7
Identification of a predictor of the 6-groups classification
To more easily classify tumors, we sought to define a gene-predictor that would use
quantitative RT-PCR data (for details see supplementary material and method,
supplementary Table 3). We identified a combination of 16 genes (Figure 2) that correctly
classified 45 out of 46 HCC previously characterized in Affymetrix experiment. We then used
this signature to partition the validation series of 63 independent HCC samples into 6 subgroups.
As observed in the first set of tumors analyzed in Affymetrix experiment, significant associations
were found between genetic alterations and the different predicted subgroups (Table 1). These
associations were confirmed using the complete series of 120 HCC tumors either classified using
both Affymetrix and QRT-PCR (n=46), Affymetrix only (n=11) or QRT-PCR only (n=63)
(Table 1 and Figure 3). We further searched to identify deregulated pathways in each groups of
tumors.
Identification of key signaling pathways implicated in HCC subgroups
The HCC groups G1 to G3 (associated with a high rate of chromosome instability) were
enriched with an over-expression of cell cycle/proliferation/DNA metabolism genes (P<0.01, see
supplementary Table 4 and 5).
a- Parentally imprinting genes were over-expressed in HCC subgroup G1
Among the high number of genes specifically over-expressed in the G1 subgroup (HBV
infection with a low number of viral DNA, AXIN1 mutations, a younger age, a high sera level of
AFP and frequent origin from Africa (Figure 3, Table 1 and supplementary Table 4) we found
genes encoding proteins expressed during development: myosin heavy chain IIb, MYH4, the
transcription factor SOX9, and parentally imprinted genes: insulin like growth factor 2 (IGF2),
paternally expressed gene 3 and 10 (PEG3 and PEG10), alpha-fetoprotein (AFP) and
sarcoglycan epsilon (SGCE). The differential expression of all these genes was validated using
QRT-PCR on 109 HCC tumors (Figure 4a). The parentally imprinted genes were highly over-
expressed in normal fetal livers. H19 mRNA was also over-expressed, not only in G1 samples
but also in fetal samples, correlating with the level of IGF2 mRNA expression in these two
groups (R2
=0.4 and 0.6, respectively). Interestingly, in the non-supervised classification, the

Boyault et al, HEP 06-0968 revised 8
mRNA level of expression of AFP was identified as a discriminating marker of the G1 tumors
and correlation with a high AFP sera level was observed (Table 1 and Figure 3).
b- HCC tumors in subgroup G2 included the rare PIK3CA mutated cases
Subgroup G2 tumors was related to HBV infection with a high number of viral DNA
copies, frequent local and vascular invasion and TP53 mutations (Table 1 and Figure 3). An
association with hemochromatosis related tumors was only observed in the validation set may be
due to the overall small number of tested patients (n=6, Table 1). Interestingly, in the whole
series we identified mutations in the PIK3CA gene in only two tumors that belong to G2. These
two samples were closely associated in the non-supervised clustering analysis (HCC189 and
HCC438, Figure 1). We identified 38 genes specifically over-expressed in the PIK3CA mutated
samples when compared with the other tumors in groups G1 to G3. Among these genes, we
validated the over-expression of two genes coding for the protein elongation factor EEF1A2 and
the enterokinase PRSS7, specifically over-expressed in PIK3CA mutated tumors using QRT-PCR
(P=0.001, Figure 4b).
IGF2 over-expression in G1 and PIK3CA mutations in G2 were predicted to activate the
AKT pathway. To test this hypothesis, we searched for a possible activation of the AKT pathway
using western blotting in a series of 44 HCCs representing each of the transcriptomic groups. We
found a specific over-expression of Insulin-like growth factor 1 receptor (IGF1R) in 7 of 9 G1
tumors in contrast to an IGF1R over-expression found in only 9% of the other groups (P<10-4
,
Figure 4c). We also identified a frequent overexpression of AKT in G1 (75%) and G2 (25%),
compared to that found (13%) in the other tumors. Moreover, phosphorylated AKT proteins were
over-expressed in all tumors of G1 and in 58% of the G2 tumors in contrast to only 8% in the
other groups demonstrating a frequent activation of AKT in G1 and G2 groups of tumors (P<10-
3, Figure 4c). Accordingly, GSK3ß, a target of activated AKT, was found to be phosphorylated
in 78% of G1 tumors, in 42% of G2 tumors and in only 9% of the other groups (P<10-3
, Figure
4c).
c- HCCs in subgroup G3 over-expressed genes encoding proteins of the nuclear pore
and controlling cell cycle
The HCC subgroup G3 mainly included tumors with TP53 mutation but without HBV
infection. Significant associations were found with chromosome losses at 17p, 5q, 21q and 22q

Boyault et al, HEP 06-0968 revised 9
(Figure 3 and Table 1), and we frequently observed a high incidence of CDKN2A promoter
hypermethylation (data not shown). Examples of key genes specifically differentially expressed
in G3 are provided in supplementary figure 1. We observed an over-expression of a large
number of genes implicated in cell cycle control (P<0.0003) including those encoding proteins
that control cell cycle checkpoint (CDC6, MAD2L1, BUB1, TTK, SMC1L1), cyclins (CCNA2,
CCNE2) and DNA replication checkpoint (MCM2, MCM3, MCM6, ASK). Interestingly, genes
encoding proteins implicated in nucleus import/export were also over-expressed including 6
proteins of the nuclear pore (KPNB1, RANBP5, XPO1, IPO7, NUP155, NUP107).
d- G4 was a heterogeneous group of HCC tumors
The G4 subgroup of samples was comprised of the 5 sample-pools of non-tumor liver
tissues which clustered tightly together within a large, heterogeneous group containing 20 tumors
(Figure 1). We also observed that 4 tumors, all having a TCF1 mutation, were closely associated
in a small cluster of 5 tumors including the 3 hepatocellular adenomas and 2 well-differentiated
HCCs. These results may suggest a possible continuum of early transcriptome alterations
between non-tumor, benign and HCC tissue. We did not find other recurrent or unifying genetic
and/or clinical characteristics in the remaining small clusters of G4 HCCs (Figure 1).
e- Activation of the Wnt pathway in G5 and G6 with under-expression of cell
adhesion proteins in G6 related to satellite tumor nodules.
G5 and G6 HCCs were highly related to ß-catenin activation (70% and 100% of the
tumors contained CTNNB1 mutations, respectively). No chromosome deletions specific to G5
and/or G6 were identified. In a search for possible ß-catenin targeted genes we found a list of 83
genes to be significantly over-expressed in G5 and/or G6 HCCs (Supplementary Table 4). All
but two of these genes were also found significantly differentially expressed in a supervised test
comparing ß-catenin mutated and non-mutated tumors. In addition to GPR49, GLUL and
PAP/HIP three well known ß-catenin target genes in the liver(18-20), we confirmed, using QRT-
PCR, the over-expression of 6 putative ß-catenin target genes potentially implicated in
tumorigenesis (Figure 5a). We observed an even higher significant level of expression of all
these putative ß-catenin targeted genes in G6 compared to G5, even after exclusion of the
samples without CTNNB1 mutation. We also found a higher over-expression of ß-catenin in G6
tumors relative to the over-expression found in G5 tumors combined with a loss of signal at the

Boyault et al, HEP 06-0968 revised 10
plasma membrane and a strong localization in cytoplasm and nucleus (Figure 5b). Consistent
with this observation, we found an over-expression of LEF1, a transcription factor that interacts
with ß-catenin to activate Wnt-responsive target genes, in G6 tumors. In addition, we found an
under-expression of CDH1 (encoding E-cadherin) in the G6 subgroup (Figure 5a) which may
have accounted for the local invasion of these HCCs as shown by the quasi-constant presence of
satellite nodules found around the principal tumor (Figure 3 and Table 1). We showed that the
level of CDH1 mRNA down-regulation was highly related to the down-regulated expression of
the E-cadherin protein in G6 consistent with the high level of promoter methylation of CDH1 in
these tumors (Figure 5c). Interestingly, in G5 related tumors, we observed an enrichment of
under-expressed genes involved in response to biotic stimuli and immune response such as
ARHGDIB, HLA-DPA1/B1, IFI16, IFI44, PTGER4, STAT1 and CLECSF2 (P<0.003). Finally,
combining transcriptome and immunohistochemical data, we found no evidence of a significant
activation of the ß-catenin pathway in G1 to G4 subgroups of HCCs.

Boyault et al, HEP 06-0968 revised 11
Discussion
In order to elucidate the molecular diversity in HCC tumors without any a priori, we used
non-supervised transcriptome wide approach to classify a large number of tumors that have been
extensively clinically and genetically annotated. Using this approach, we obtained a robust
classification of HCC which yielded 6 main subgroups reflecting the large spectrum of these
tumors (1, 2, 21). This classification was achieved using 16 diagnostic genes by QRT-PCR and
was applied to an independent set of 63 tumors for a total of 120 HCCs studied. Our
classification is in full agreement with previously published transcriptomic analyses of HCC(22-
24), which identified two tumor groups linked to chromosome stability/instability (corresponding
to meta-groups 1 to 3 and 4 to 6). However, our study goes further by exquisitely refining this
classification. Indeed the strength of our study resides in our inclusion of the vast amount of
medical data namely: (1) our series of tumors surgically treated in France included the main
different risk factors of HCC, i.e. HBV and HCV infections, alcohol abuse and
heamochromatosis, as well as, (2) exhaustive number of clinical, histopathological and genetic
annotations. Based on our study, we conclude that the primary clinical determinant of class
membership is HBV infection whereas the other main determinants are genetic and epigenetic
alterations including chromosome instability (FAL > 0.128), CTNNB1 and TP53 mutations and
the parental imprinting (Figure 6).
The natural history of HCC has taught us that HBV related tumors (defining the G1 and G2
subgroups) were strikingly molecularly distinct from the other HCCs. Indeed tumors related to
HCV infection and alcohol abuse are interspersed across subgroups G3 to G6. Our
transcriptomic classification has enabled the identification of new entities of tumors. Subgroup
G1 included HBV related tumors from younger patients (relative to the other HBV HCCs),
frequently from Africa, with an equal sex ratio, low number of viral DNA copies, frequent
AXIN1 mutations, absence of TP53 mutation and over-expression of genes normally imprinted
(Figure 6). These results suggest that HBV infection early in life(25, 26) leads to a specific type
of HCC demonstrating immature features with an abnormal parental gene imprinting selection
possibly through the persistence of fetal hepatocytes or alternatively partial dedifferentiation of
adult hepatocytes. These G1 tumors are related to the high-risk populations found in
epidemiological studies(4, 27). Subgroup G6 has a 100% incidence of CTNNB1 mutation, a high
level of Wnt pathway activation (higher than in G5) and an inactivation of E-cadherin is
Boyault et al, HEP 06-0968 revised 12
consistent with the high invasive potential of these tumors as E-cadherin inactivation is known to
participate in cell invasion process(28). Interestingly, AXIN1 mutated tumors segregated to
different groups that were not characterized with harboring a CTNNB1 mutation suggesting that
ß-catenin and Axin1 may operate by distinct ways to promote carcinogenesis. In human HCC, it
appears that the inactivating mutations of the AXIN1 gene seems to differ strongly from the gain
of function of ß-catenin, as confirmed by in vitro experiments(17).
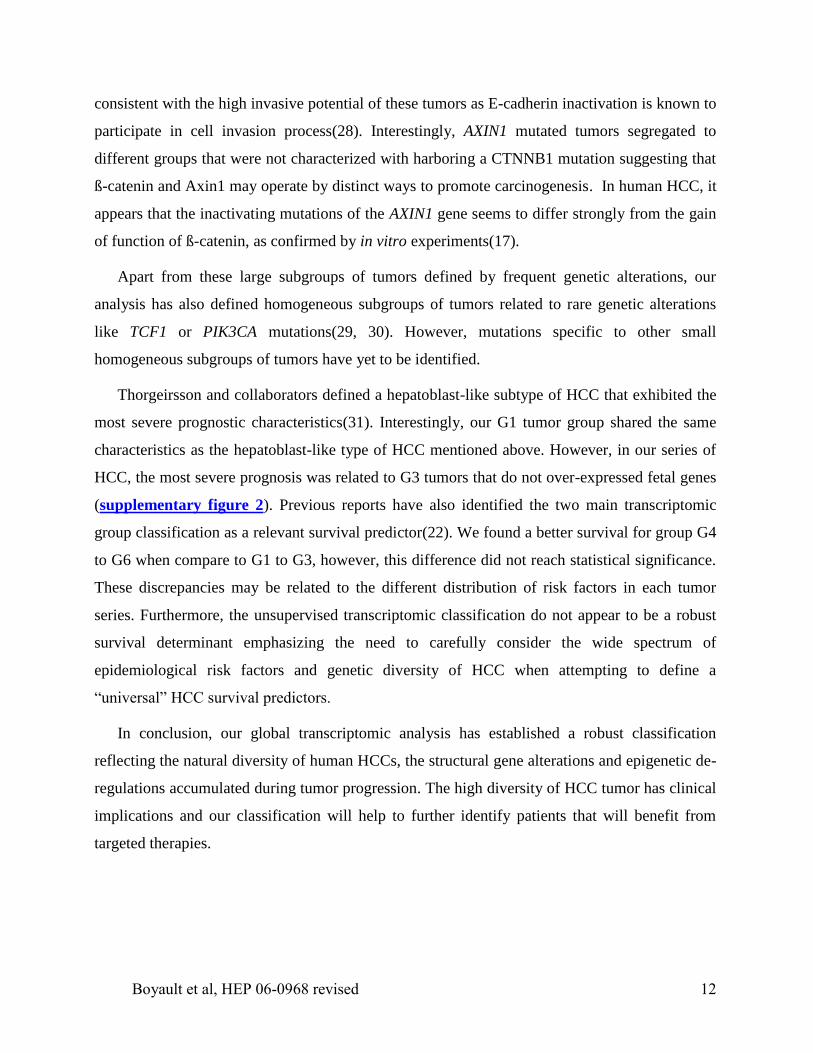
Apart from these large subgroups of tumors defined by frequent genetic alterations, our
analysis has also defined homogeneous subgroups of tumors related to rare genetic alterations
like TCF1 or PIK3CA mutations(29, 30). However, mutations specific to other small
homogeneous subgroups of tumors have yet to be identified.
Thorgeirsson and collaborators defined a hepatoblast-like subtype of HCC that exhibited the
most severe prognostic characteristics(31). Interestingly, our G1 tumor group shared the same
characteristics as the hepatoblast-like type of HCC mentioned above. However, in our series of
HCC, the most severe prognosis was related to G3 tumors that do not over-expressed fetal genes
(supplementary figure 2). Previous reports have also identified the two main transcriptomic
group classification as a relevant survival predictor(22). We found a better survival for group G4
to G6 when compare to G1 to G3, however, this difference did not reach statistical significance.
These discrepancies may be related to the different distribution of risk factors in each tumor
series. Furthermore, the unsupervised transcriptomic classification do not appear to be a robust
survival determinant emphasizing the need to carefully consider the wide spectrum of
epidemiological risk factors and genetic diversity of HCC when attempting to define a
“universal” HCC survival predictors.
In conclusion, our global transcriptomic analysis has established a robust classification
reflecting the natural diversity of human HCCs, the structural gene alterations and epigenetic de-
regulations accumulated during tumor progression. The high diversity of HCC tumor has clinical
implications and our classification will help to further identify patients that will benefit from
targeted therapies.

Boyault et al, HEP 06-0968 revised 13
Acknowledgments:
We warmly thank Jacqueline Godet, François Sigaux and Philippe Dessen managers of the
Carte d’Identité des Tumeurs (CIT) program founded by the Ligue Nationale contre le Cancer;
Daniela Geromin, Christelle Thibault, Patricia Legoix, Damien Gerald, Olivier Bluteau, for their
experimental help; Fabien Petel for his help in the submission of the data to EBI; Philippe Bois
for critical reading of the manuscript. We thank the technicians from the CEPH, Fondation Jean
Dausset for their help in sequencing and all the clinicians that referred the patients. This work
was supported by the Ligue Nationale Contre le Cancer and the Fondation de France. SB, SR
and EJ are supported by a Fondation de France, a Ligue Nationale Contre le Cancer and a
Association pour la Recherche sur le Cancer grant fellowship, respectively.

Boyault et al, HEP 06-0968 revised 14
Figure 1: Unsupervised hierarchical clustering. The dendrogram in the upper panel was
obtained based on the expression profile of 6,712 probe sets whose expression vary the most
across samples from 57 HCC tumors, 3 hepatocellular adenomas and 5 pools of non-tumor
tissues using Ward’s linkage and 1-Pearson correlation coefficient. The different HCC subgroups
(G1 to G6) are indicated in color. The heatmap on the lower shows the level of expression of 493
probe sets corresponding to a subselection of HCC subgroup specific genes (supplementary table
4). For each probe set, data were median centered (black), lowest and highest intensity values are
in green and red, respectively.
Boyault et al, HEP 06-0968 revised 15
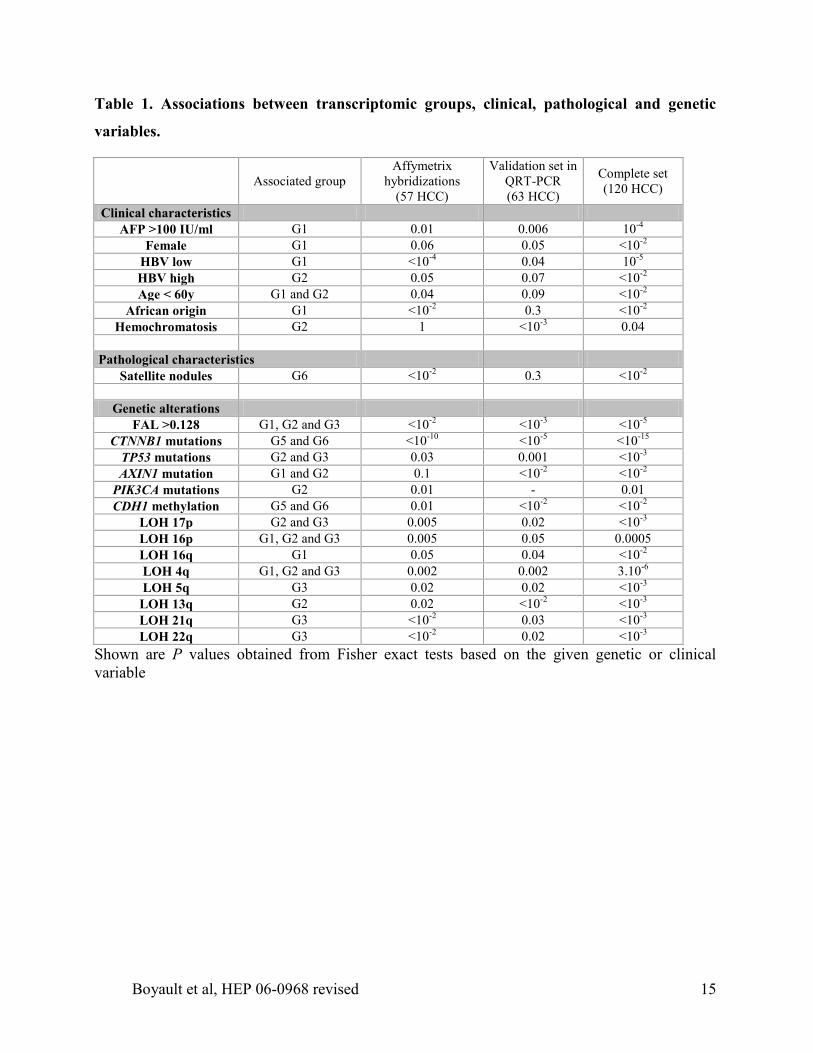
Table 1. Associations between transcriptomic groups, clinical, pathological and genetic
variables.
Associated group
Affymetrix
hybridizations
(57 HCC)
Validation set in
QRT-PCR
(63 HCC)
Complete set
(120 HCC)
Clinical characteristics
AFP >100 IU/ml G1 0.01 0.006 10-4
Female G1 0.06 0.05 <10-2
HBV low G1 <10-4
0.04 10-5
HBV high G2 0.05 0.07 <10-2
Age < 60y G1 and G2 0.04 0.09 <10-2
African origin G1 <10-2
0.3 <10-2
Hemochromatosis G2 1 <10-3
0.04
Pathological characteristics
Satellite nodules G6 <10-2
0.3 <10-2
Genetic alterations
FAL >0.128 G1, G2 and G3 <10-2
<10-3
<10-5
CTNNB1 mutations G5 and G6 <10-10
<10-5
<10-15
TP53 mutations G2 and G3 0.03 0.001 <10-3
AXIN1 mutation G1 and G2 0.1 <10-2
<10-2
PIK3CA mutations G2 0.01 - 0.01
CDH1 methylation G5 and G6 0.01 <10-2
<10-2
LOH 17p G2 and G3 0.005 0.02 <10-3
LOH 16p G1, G2 and G3 0.005 0.05 0.0005
LOH 16q G1 0.05 0.04 <10-2
LOH 4q G1, G2 and G3 0.002 0.002 3.10-6
LOH 5q G3 0.02 0.02 <10-3
LOH 13q G2 0.02 <10-2
<10-3
LOH 21q G3 <10-2
0.03 <10-3
LOH 22q G3 <10-2
0.02 <10-3
Shown are P values obtained from Fisher exact tests based on the given genetic or clinical
variable
Boyault et al, HEP 06-0968 revised 16
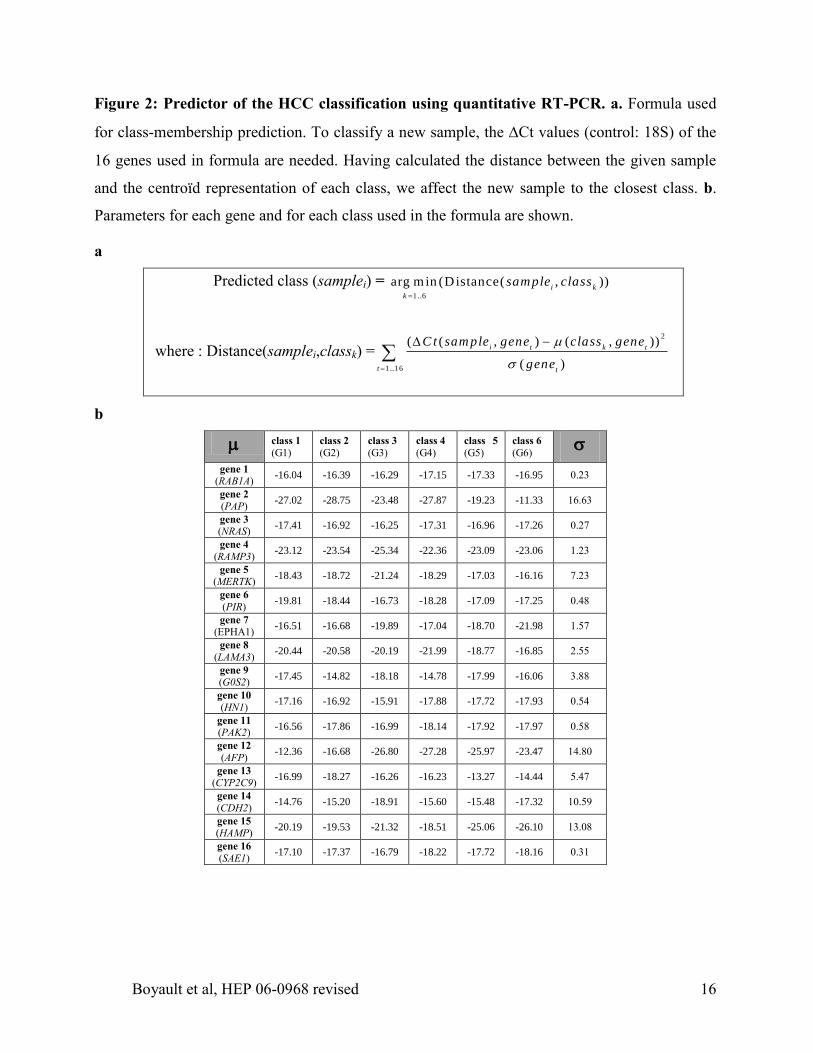
Figure 2: Predictor of the HCC classification using quantitative RT-PCR. a. Formula used
for class-membership prediction. To classify a new sample, the Ct values (control: 18S) of the
16 genes used in formula are needed. Having calculated the distance between the given sample
and the centroïd representation of each class, we affect the new sample to the closest class. b.
Parameters for each gene and for each class used in the formula are shown.
a
Predicted class (samplei) = 1..6
arg min (Distance( , ))i k
k
sample class
where : Distance(samplei,classk) =2
1..16
( ( , ) ( , ))
( )
i t k t
t t
C t sam ple gene class gene
gene
b
class 1
(G1) class 2
(G2) class 3
(G3) class 4
(G4) class 5
(G5) class 6
(G6)
gene 1
(RAB1A) -16.04 -16.39 -16.29 -17.15 -17.33 -16.95 0.23
gene 2
(PAP) -27.02 -28.75 -23.48 -27.87 -19.23 -11.33 16.63
gene 3
(NRAS) -17.41 -16.92 -16.25 -17.31 -16.96 -17.26 0.27
gene 4
(RAMP3) -23.12 -23.54 -25.34 -22.36 -23.09 -23.06 1.23
gene 5
(MERTK) -18.43 -18.72 -21.24 -18.29 -17.03 -16.16 7.23
gene 6
(PIR) -19.81 -18.44 -16.73 -18.28 -17.09 -17.25 0.48
gene 7
(EPHA1) -16.51 -16.68 -19.89 -17.04 -18.70 -21.98 1.57
gene 8
(LAMA3) -20.44 -20.58 -20.19 -21.99 -18.77 -16.85 2.55
gene 9
(G0S2) -17.45 -14.82 -18.18 -14.78 -17.99 -16.06 3.88
gene 10
(HN1) -17.16 -16.92 -15.91 -17.88 -17.72 -17.93 0.54
gene 11
(PAK2) -16.56 -17.86 -16.99 -18.14 -17.92 -17.97 0.58
gene 12
(AFP) -12.36 -16.68 -26.80 -27.28 -25.97 -23.47 14.80
gene 13
(CYP2C9) -16.99 -18.27 -16.26 -16.23 -13.27 -14.44 5.47
gene 14
(CDH2) -14.76 -15.20 -18.91 -15.60 -15.48 -17.32 10.59
gene 15
(HAMP) -20.19 -19.53 -21.32 -18.51 -25.06 -26.10 13.08
gene 16
(SAE1) -17.10 -17.37 -16.79 -18.22 -17.72 -18.16 0.31

Boyault et al, HEP 06-0968 revised 17
Figure 3: Clinical and genetic annotations for the classification of the whole of 120 HCC.
Samples (in columns) are ordered by group G1 to G6, sample names are in grey (56 Affymetrix
classified samples), red (one HCC misclassified by QRT-PCR) or black (independent series of
63 HCC). Features are indicated in black and white boxes when positive and negative. FAL
indicates Fractional Allelic Loss, in black tumors deleting more than 5 chromosome arms; Mut,
mutation; sat. nodules, satellite nodules at less than 1 cm from the principal tumor; AFP, Alpha-
fetoprotein.

Boyault et al, HEP 06-0968 revised 18
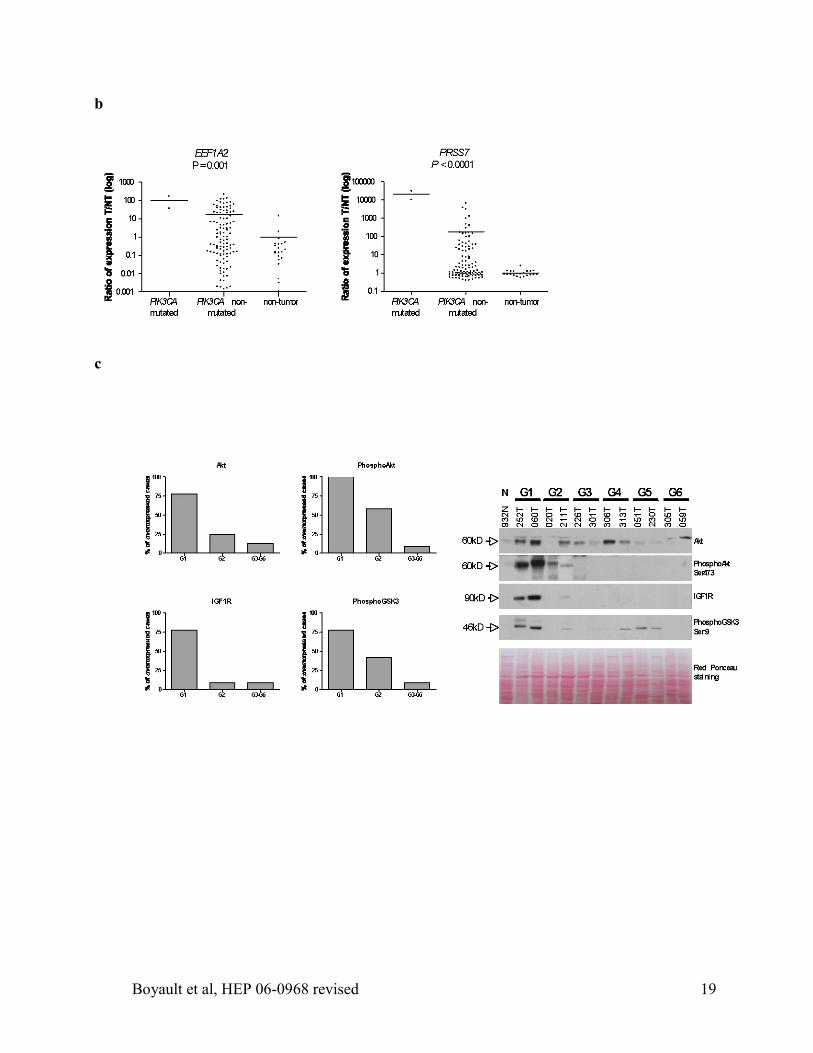
Figure 4: Validation of selected genes and proteins specific of HCC subgroup G1 and G2. a.
Validation of AFP, IGF2, SOX9, PEG3, MYH4 and H19 gene expression using QRT-PCR. Box-
plots (from 25th
percentile to the 75th
percentile with a line at the median) show the range of
relative expression (tumor versus the mean of 21 non-tumor (T/NT)) in the predicted subgroups
G1 (n=10) and G2 to G6 (n=99), 21 non-tumor samples (NT) and 19 fetal liver samples (FL).
The whiskers extend above and below the box to show the first and the 9th
decile. P values from
Kruskal-Wallis test are indicated. b. Validation of EEF1A2 and PRSS7 genes over-expressed in
PIK3CA mutated tumors compared to 107 non-mutated HCC. P values from a t-test are shown.
c. Protein expression analysis of Akt, phosphoAkt (Ser473), PhosphoGSK3ß (Ser9) and IGF1R
was performed using western blotting in 44 HCC distributed in all transcriptomic subgroups.
Graphs represent in G1, G2 and G3 to G6 subgroups the percentage of tumors that over-express
these proteins when compared to non-tumor tissues. Panel on the right illustrates protein
expression profiles obtained in the different HCC subgroups.
a
Boyault et al, HEP 06-0968 revised 19
b
c
Boyault et al, HEP 06-0968 revised 20
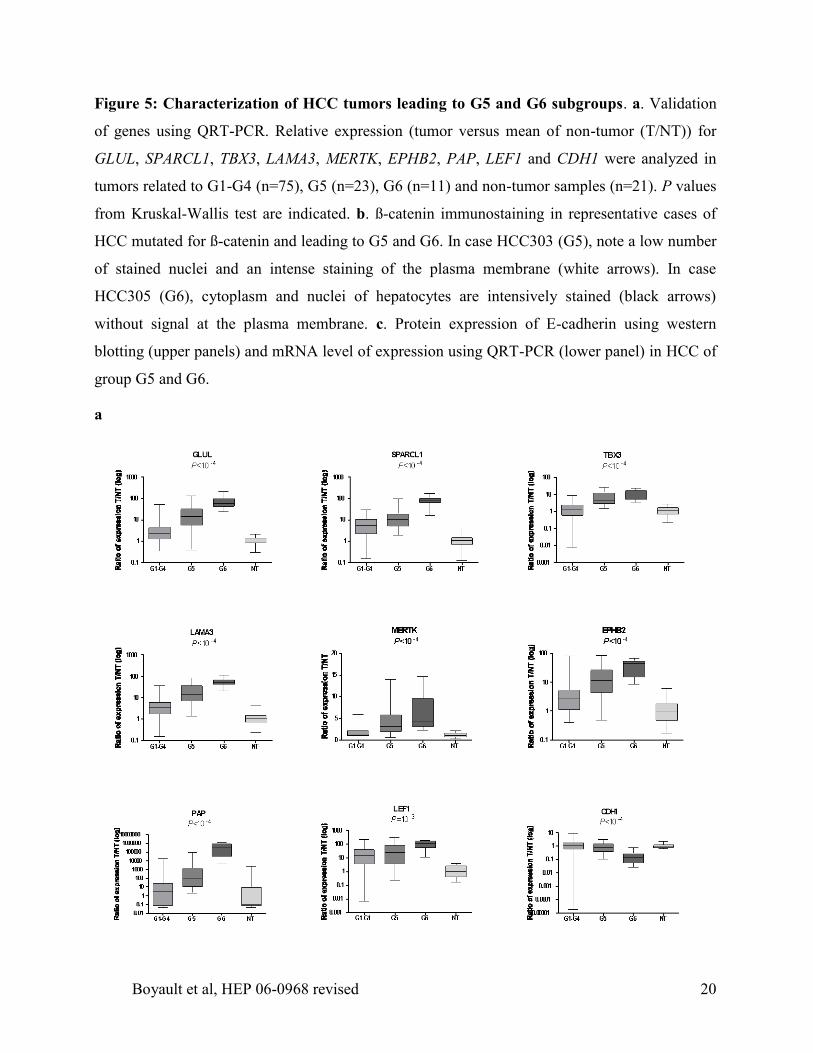
Figure 5: Characterization of HCC tumors leading to G5 and G6 subgroups. a. Validation
of genes using QRT-PCR. Relative expression (tumor versus mean of non-tumor (T/NT)) for
GLUL, SPARCL1, TBX3, LAMA3, MERTK, EPHB2, PAP, LEF1 and CDH1 were analyzed in
tumors related to G1-G4 (n=75), G5 (n=23), G6 (n=11) and non-tumor samples (n=21). P values
from Kruskal-Wallis test are indicated. b. ß-catenin immunostaining in representative cases of
HCC mutated for ß-catenin and leading to G5 and G6. In case HCC303 (G5), note a low number
of stained nuclei and an intense staining of the plasma membrane (white arrows). In case
HCC305 (G6), cytoplasm and nuclei of hepatocytes are intensively stained (black arrows)
without signal at the plasma membrane. c. Protein expression of E-cadherin using western
blotting (upper panels) and mRNA level of expression using QRT-PCR (lower panel) in HCC of
group G5 and G6.
a

Boyault et al, HEP 06-0968 revised 21
b
c

Boyault et al, HEP 06-0968 revised 22
Figure 6: Schematization of the different HCC subgroups defined by transcriptome
analysis with their related clinical, genetic and pathways. G1 to G6 indicates the HCC
subgroups of tumors defined by transcriptome analysis. Vertical lines indicate significant
associated features (see table 1, figure 3 and supplementary Table 5). LOH, loss of
heterozygosity; Hemochrom, haemochromatosis; AFP, alpha-fetoprotein, HBV, hepatitis B
virus. Red and green indicates primarily over- and under-expressed genes in that particular
functional category, respectively. *asterisk indicates rare feature.
G2
G1
G3
G4
G5
G6
CTNNB1
TCF1*
Developmental
and imprinting
genes , IGF216q
5q
21q
22q
TP53
AXIN1
CDKN2A
PIK3CA*
Chromosome
LOH
Gene
Methyl .
Gene
mutation
Clinical
features
Biological
pathways
HBV
Satellite
nodules
High
copy nb
Low
copy nb
Cell cycle
Nucleus pore
Stress and
immune
response
Women
Africa , young
high AFP
Hemochrom .
Chromosomestability
Chromosomeinstability
Mitotic
cell cycle
Amino acid
metabolism
E-cadherin
13q
17p
16p
4q
AKT
activation
CDH1WNT
activation

Boyault et al, HEP 06-0968 revised 23
References
1. Bosch FX, Ribes J, Borras J. Epidemiology of primary liver cancer. Semin Liver Dis
1999;19:271-285.
2. Edmondson HA, Peters RL. Tumors of the liver: pathologic features. Semin Roentgenol
1983;18:75-83.
3. Thorgeirsson SS, Grisham JW. Molecular pathogenesis of human hepatocellular
carcinoma. Nat Genet 2002;31:339-346.
4. Brechot C. Pathogenesis of hepatitis B virus-related hepatocellular carcinoma: old and
new paradigms. Gastroenterology 2004;127:S56-61.
5. Laurent-Puig P, Zucman-Rossi J. Genetics of hepatocellular tumors. Oncogene
2006;25:3778-3786.
6. Bressac B, Galvin KM, Liang TJ, Isselbacher KJ, Wands JR, Ozturk M. Abnormal
structure and expression of p53 gene in human hepatocellular carcinoma. Proc Natl Acad Sci U
S A 1990;87:1973-1977.
7. de La Coste A, Romagnolo B, Billuart P, Renard CA, Buendia MA, Soubrane O, Fabre
M, et al. Somatic mutations of the beta-catenin gene are frequent in mouse and human
hepatocellular carcinomas. Proc Natl Acad Sci U S A 1998;95:8847-8851.
8. Miyoshi Y, Iwao K, Nagasawa Y, Aihara T, Sasaki Y, Imaoka S, Murata M, et al.
Activation of the beta-catenin gene in primary hepatocellular carcinomas by somatic alterations
involving exon 3. Cancer Res 1998;58:2524-2527.
9. Satoh S, Daigo Y, Furukawa Y, Kato T, Miwa N, Nishiwaki T, Kawasoe T, et al. AXIN1
mutations in hepatocellular carcinomas, and growth suppression in cancer cells by virus-
mediated transfer of AXIN1. Nat Genet 2000;24:245-250.
10. Roncalli M, Bianchi P, Bruni B, Laghi L, Destro A, Di Gioia S, Gennari L, et al.
Methylation framework of cell cycle gene inhibitors in cirrhosis and associated hepatocellular
carcinoma. Hepatology 2002;36:427-432.
11. Azechi H, Nishida N, Fukuda Y, Nishimura T, Minata M, Katsuma H, Kuno M, et al.
Disruption of the p16/cyclin D1/retinoblastoma protein pathway in the majority of human
hepatocellular carcinomas. Oncology 2001;60:346-354.
12. De Souza AT, Hankins GR, Washington MK, Orton TC, Jirtle RL. M6P/IGF2R gene is
mutated in human hepatocellular carcinomas with loss of heterozygosity. Nat Genet
1995;11:447-449.
13. Su TS, Liu WY, Han SH, Jansen M, Yang-Fen TL, P'Eng F K, Chou CK. Transcripts of
the insulin-like growth factors I and II in human hepatoma. Cancer Res 1989;49:1773-1777.
14. Laurent-Puig P, Legoix P, Bluteau O, Belghiti J, Franco D, Binot F, Monges G, et al.
Genetic alterations associated with hepatocellular carcinomas define distinct pathways of
hepatocarcinogenesis. Gastroenterology 2001;120:1763-1773.
15. Lee S, Lee HJ, Kim JH, Lee HS, Jang JJ, Kang GH. Aberrant CpG island
hypermethylation along multistep hepatocarcinogenesis. Am J Pathol 2003;163:1371-1378.
16. Zochbauer-Muller S, Fong KM, Virmani AK, Geradts J, Gazdar AF, Minna JD. Aberrant
promoter methylation of multiple genes in non-small cell lung cancers. Cancer Res 2001;61:249-
255.
17. Zucman-Rossi J, Benhamouche S, Godard C, Boyault S, Grimber G, Balabaud C, Sa
Cunha A, et al. Differential effects of inactivated Axin1 and activated ß-catenin mutations in
human hepatocellular carcinomas. Oncogene 2006;In press.

Boyault et al, HEP 06-0968 revised 24
18. Cadoret A, Ovejero C, Terris B, Souil E, Levy L, Lamers WH, Kitajewski J, et al. New
targets of beta-catenin signaling in the liver are involved in the glutamine metabolism. Oncogene
2002;21:8293-8301.
19. Yamamoto Y, Sakamoto M, Fujii G, Tsuiji H, Kenetaka K, Asaka M, Hirohashi S.
Overexpression of orphan G-protein-coupled receptor, Gpr49, in human hepatocellular
carcinomas with beta-catenin mutations. Hepatology 2003;37:528-533.
20. Cavard C, Terris B, Grimber G, Christa L, Audard V, Radenen-Bussiere B, Simon MT, et
al. Overexpression of regenerating islet-derived 1 alpha and 3 alpha genes in human primary
liver tumors with beta-catenin mutations. Oncogene 2006;25:599-608.
21. Bosch FX, Ribes J, Diaz M, Cleries R. Primary liver cancer: worldwide incidence and
trends. Gastroenterology 2004;127:S5-S16.
22. Lee JS, Chu IS, Heo J, Calvisi DF, Sun Z, Roskams T, Durnez A, et al. Classification and
prediction of survival in hepatocellular carcinoma by gene expression profiling. Hepatology
2004;40:667-676.
23. Breuhahn K, Vreden S, Haddad R, Beckebaum S, Stippel D, Flemming P, Nussbaum T,
et al. Molecular profiling of human hepatocellular carcinoma defines mutually exclusive
interferon regulation and insulin-like growth factor II overexpression. Cancer Res 2004;64:6058-
6064.
24. Chen X, Cheung ST, So S, Fan ST, Barry C, Higgins J, Lai KM, et al. Gene expression
patterns in human liver cancers. Mol Biol Cell 2002;13:1929-1939.
25. Davis LG, Weber DJ, Lemon SM. Horizontal transmission of hepatitis B virus. Lancet
1989;1:889-893.
26. Wong VC, Lee AK, Ip HM. Transmission of hepatitis B antigens from symptom free
carrier mothers to the fetus and the infant. Br J Obstet Gynaecol 1980;87:958-965.
27. Yu MC, Yuan JM. Environmental factors and risk for hepatocellular carcinoma.
Gastroenterology 2004;127:S72-78.
28. Behrens J, Mareel MM, Van Roy FM, Birchmeier W. Dissecting tumor cell invasion:
epithelial cells acquire invasive properties after the loss of uvomorulin-mediated cell-cell
adhesion. J Cell Biol 1989;108:2435-2447.
29. Bluteau O, Jeannot E, Bioulac-Sage P, Marques JM, Blanc JF, Bui H, Beaudoin JC, et al.
Bi-allelic inactivation of TCF1 in hepatic adenomas. Nat Genet 2002;32:312-315.
30. Lee JW, Soung YH, Kim SY, Lee HW, Park WS, Nam SW, Kim SH, et al. PIK3CA gene
is frequently mutated in breast carcinomas and hepatocellular carcinomas. Oncogene
2005;24:1477-1480.
31. Lee JS, Heo J, Libbrecht L, Chu IS, Kaposi-Novak P, Calvisi DF, Mikaelyan A, et al. A
novel prognostic subtype of human hepatocellular carcinoma derived from hepatic progenitor
cells. Nat Med 2006;12:410-416.