On the role of Pb 0 atoms on the nucleation and growth of PbSe and PbTe nanoparticles
Upload
ua-birminghamCategory
view
8download
0
IOP PUBLISHING NANOTECHNOLOGY
Nanotechnology 21 (2010) 175702 (9pp) doi:10.1088/0957-4484/21/17/175702
Trajectory control of PbSe–γ -Fe2O3nanoplatforms under viscous flow and anexternal magnetic field
Lioz Etgar1, Arie Nakhmani2, Allen Tannenbaum2,3,Efrat Lifshitz1,4 and Rina Tannenbaum1,5,6
1 Russell Berrie Nanotechnology Institute (RBNI), Technion—Israel Institute of Technology,Haifa 32000, Israel2 Department of Electrical Engineering, Technion—Israel Institute of Technology,Haifa 32000, Israel3 School of Electrical and Computer Engineering, Georgia Institute of Technology, Atlanta,GA 30332, USA4 Schulich Faculty of Chemistry, Technion—Israel Institute of Technology, Haifa 32000, Israel5 Department of Chemical Engineering, Technion—Israel Institute of Technology,Haifa 32000, Israel6 School of Materials Science and Engineering, Georgia Institute of Technology,Atlanta, GA 30332, USA
E-mail: [email protected] and [email protected]
Received 16 December 2009, in final form 9 February 2010Published 6 April 2010Online at stacks.iop.org/Nano/21/175702
AbstractThe flow behavior of nanostructure clusters, consisting of chemically bonded PbSe quantumdots and magnetic γ -Fe2O3 nanoparticles, has been investigated. The clusters are regarded asmodel nanoplatforms with multiple functionalities, where the γ -Fe2O3 magnets serve astransport vehicles, manipulated by an external magnetic field gradient, and the quantum dots actas fluorescence tags within an optical window in the near-infrared regime. The clusters’ flowwas characterized by visualizing their trajectories within a viscous fluid (mimicking a bloodstream), using an optical imaging method, while the trajectory pictures were analyzed by aspecially developed processing package. The trajectories were examined under various flowrates, viscosities and applied magnetic field strengths. The results revealed a control of thetrajectories even at low magnetic fields (<1 T), validating the use of similar nanoplatforms asactive targeting constituents in personalized medicine.
1. Introduction
Several important attributes typify active targeting moieties.They should administer tags or drugs precisely to afflictedcells, leaving the healthy tissues unaffected [1, 2]. Further-more, they should be amenable to visualization, following theirfluorescence [3–5], or to magnetic resonance imaging [6–9].Active targeting moieties should also be soluble in aqueousmedia, stable to fluctuations in the pH of their physiologicalenvironment and under various flow conditions. Althoughbeyond the scope of this work, well-planned targeting com-
plexes should be able to selectively discharge a therapeuticdrug, and eventually be effectively eliminated from the bodyupon completion of their function.
To address this challenge, we developed novel nanostruc-ture clusters that constitute basic nanoplatforms, to which thevarious functions (e.g. drug administration) could potentiallybe tethered. These clusters were created by the chemicalconjugation of water-soluble PbSe colloidal quantum dots(QDs) to superparamagnetic γ -Fe2O3 nanoparticles (NPs),bonded via selective interactions between complementaryfunctional groups [10–16]. The magnetic NPs serve astransport vehicles, manipulated by an external magnetic field
0957-4484/10/175702+09$30.00 © 2010 IOP Publishing Ltd Printed in the UK & the USA1

Nanotechnology 21 (2010) 175702 L Etgar et al
gradient, and the QDs act as fluorescence tags with an opticalwindow in the near-infrared regime.
The QDs exhibit characteristic electronic and opticaltunability that vary according to their size. Currently,PbSe QDs are the focus of extensive attention due totheir distinctive intrinsic properties [17–19], showing well-defined band-edge excitonic transitions tuned between 1 and3.5 μm emission with an optical penetration depth in livingtissue of 5–10 cm [20, 21], a relatively large ground-statecross section of absorption (∼10−15 cm−2), long excitoniclifetime at room temperature (400–500 ns) and exceptionallyhigh room temperature luminescence quantum efficiency(∼80%) [11, 12, 22], altogether making them a model ofin vivo fluorescing tags [15, 16, 23]. Awareness regarding thetoxicity of lead QDs exists; however, this study uses them asa model case, while practical applications would require theirreplacement by a less toxic material (with similar fluorescenceproperties), or the development of a biocompatible surfacecoating for the QDs.
The magnetic responsiveness of the γ -Fe2O3 moietywithin the nanoplatforms is related to a remote manipulation oftheir motion by an externally applied magnetic field, activelyenhancing their accumulation in a target surrounding, whileexplicit bonding to a cell is driven by chemical functionalgroups (attracted by complementary cell receptors). Theclusters join a group of other magnetic nanostructures, workingas therapeutic drug carriers that target specific sites in thebody [24–26]. Together, such nanoplatforms constitute adrastic change, departing from the more common passivetargeting methods, offering preferential partition of drugsadministered into highly vascular tissues [27–34]. It should benoted that the γ -Fe2O3 NPs themselves can serve as magnetictags in magnetic resonance imaging; however, the most recentmethod using these magnetic tags is known as a relativelyexpensive medical diagnostic tool, with a spatial resolutionof ∼μm. In contrast, fluorescence tags with high quantumefficiency should offer an improved spatial resolution downto a submicron for utilization in the human body with a ppbconcentration [35]. Thus, the γ -Fe2O3 NPs are utilized hereonly as a transport vehicle.
Other than the development of novel magnetic cargo,there is very little information about the dynamic behaviorof nanoplatforms under conditions that are similar to theenvironment found in blood vessels [36–42]. Thus, themotion of the newly developed QD–NP nanostructure clusters(∼30 nm in size) in a viscous fluid flow is of crucialimportance. This document describes the transport propertiesof the QD–NP nanoplatforms when examined under differentfluid flow rates (capacitances) and several fluid viscosities(mimicking the viscosity of blood), while applying an externalmagnetic field. All the flow experiments were conductedwith the nanoplatforms’ suspension in aqueous poly(ethyleneglycol) (PEG) solution, recorded by a CCD camera. Theresulting video films were analyzed by a unique softwarepackage, supplying the direction and velocity of the trajectoryof each QD–NP cluster.
2. Results and discussion
2.1. Synthesis and characterization of PbSe QD-γ -Fe2O3 NPnanoplatform
The pure PbSe QDs and the γ -Fe2O3 NPs, with a typicaldiameter of ∼5 nm, were synthesized by colloidal procedures(see section 4). The PbSe QDs were functionalized by 2-aminoethanethiol (AET) surfactants, with the amino groupsfacing the exterior periphery. The γ -Fe2O3 NPs werefunctionalized by hydrophilic polyhedral silsesquioxane (PSS)ligands, containing eight SiO− functional groups. A mix ofequivalent amounts of QD and NP constituents in solutionswith pH between 5 and 7.5 permitted a ligand–ligandinteraction via two different hydrogen bonds between –NH+
3and –SiO− and CH2– and –SiO− chemical groups (seefigure 1(A)), as proved by the NMR investigations (not shown)and energy minimization calculation [14, 43]. Figure 1(B)represents a transmission electron microscope (TEM) image ofPbSe QD–γ -Fe2O3 NP nanoplatforms, deposited onto a TEMgrid from the acidic solution at pH ∼ 5, showing clustering ofparticles into a platform with an average size of 30 ± 10 nm(including ∼10 QDs and 10 NPs). A corresponding electrondiffraction pattern, shown in the inset, reveals the existence ofPbSe (space group Fm3m) and γ -Fe2O3 (space group P4132)particles within a cluster. Further on, a zoomed view overa single nanoplatform (not shown) reveals distinctive latticefringes of the individual QDs and NPs, with a surface-to-surface distance of 1.3 nm between adjacent particles, in goodagreement with the combined AET–PSS molecular length,supporting the formation of a hydrogen bond as mentioned. Aprevious study [43] revealed that the hydrogen bond is stablein solutions with a pH of ∼7 ± 2, while deviation from thiscondition dissociates the QD–NP conjugation.
Figure 1(C) shows the continuous-wave photolumines-cence spectra of PbSe NQD–γ -Fe2O3 NP nanoplatforms (redcurves) and of pure PbSe QDs with an average diameter of5 nm (blue curves), recorded at room temperature. The spectraare composed of a single band, associated with the ground-stateexciton emission. Representative absorption spectra of the purePbSe NQDs and the corresponding QD–NP nanoplatforms areshown in the inset of the figure. The emission and absorptionbands of the nanoplatforms are shifted by 12–14 meV withrespect to the pure QDs. Our previous study [43] correlatedthis shift with the influence of the dielectric environment of theγ -Fe2O3 NPs in the surroundings of the QDs, but excluded adirect electronic interaction (e.g. plasmon–exciton, exciton–exciton) due to a deviation of the plasmonic frequency, or theelectronic band-edge of the NPs from that of the QDs. Inany event, the γ -Fe2O3 NPs do not quench the luminescenceintensity of the PbSe QDs upon conjugation, making the QD–NP clusters suitable diagnostic nanoplatforms.
The magnetic properties of the nanoplatforms wereexamined by following the dependence of their susceptibility(χ ) on the strength of the external magnetic field (H ) atdifferent temperatures. Figure 1(D) shows a representative plotof this dependence, measured at room temperature and at 20 K,compared with that of the pure γ -Fe2O3 NPs. The lack of thehysteretic suggests the existence of superparamagnetism andthe retention of this property within the QD–NP nanoplatform.
2

Nanotechnology 21 (2010) 175702 L Etgar et al
Figure 1. (A) Schematic representation of the chemical connection between the PbSe QDs to the γ -Fe2O3 NPs; (B) transmission electronmicroscope (TEM) image of PbSe QD–γ -Fe2O3 NP nanoplatforms, deposited onto a TEM grid from the acidic solution at pH ∼ 5, showingclustering of particles into a platform with an average size of 30 ± 10 nm. A corresponding electron diffraction pattern, shown in the inset,reveals the existence of PbSe and γ -Fe2O3 particles within a cluster; (C) representative PL spectra of individual PbSe NQDs (blue curve) andof the NQD–NP conjugates (red curve). The spectra were recorded at room temperature. Corresponding absorption spectra of individual PbSeNQDs (blue curve) and of NQD–NP conjugates (red curve) are shown in the inset. The average diameters of the NQDs and the NPs were5 nm; (D) plots of the magnetic susceptibility (χ) versus strength of an external magnetic field of the PbSe NQD–γ -Fe2O3 NP nanoplatforms.The plots were recorded at 20 and 300 K, as indicated in the figure legends.
2.2. Flow trajectory measurements
The flow measurements were carried out by suspending10 μg of QD–NP nanoplatforms into six different aqueouspoly(ethylene glycol) (PEG) solutions with the followingviscosities: 1.25, 1.73, 2.13, 3.71, 4.13 and 6.35 cP. The flowof each solution was measured at several flow rates (0.03, 0.05,0.1, 0.2, 0.3, 0.5, 0.7 and 0.9 ml h−1), with and without theinfluence of an external magnetic field. Control experimentswere done by measuring the flow of pure PEG solutions of thesame viscosities, operating under the same flow rates.
The solutions were injected into a 500 μl sample chamber,which was placed within a beam path of a laser source. Thenanoplatforms were visualized through an optical microscopeas small points of scattered light, and their instantaneousposition was recorded by a CCD camera with a 10 s exposureduration. An electromagnet, with field strength between 0 and1 T, was placed perpendicular to the chamber, distanced fromthe solution by ∼5.5 cm, inducing a magnetic field gradient of
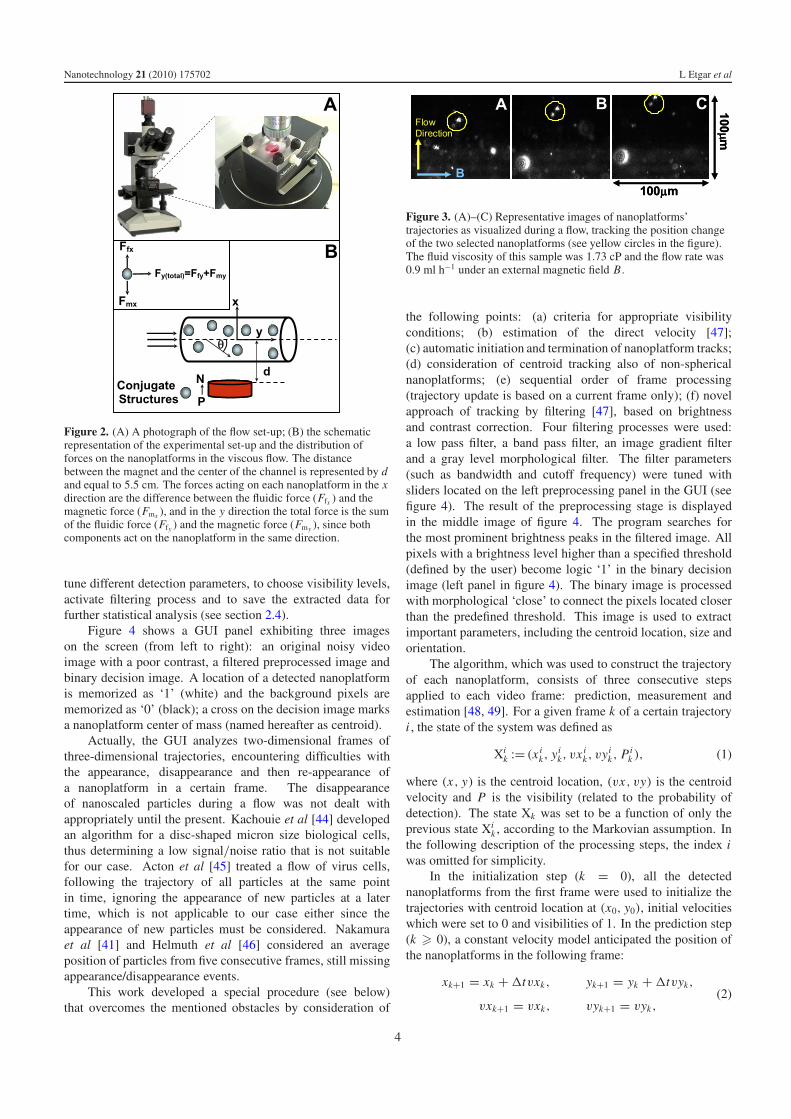
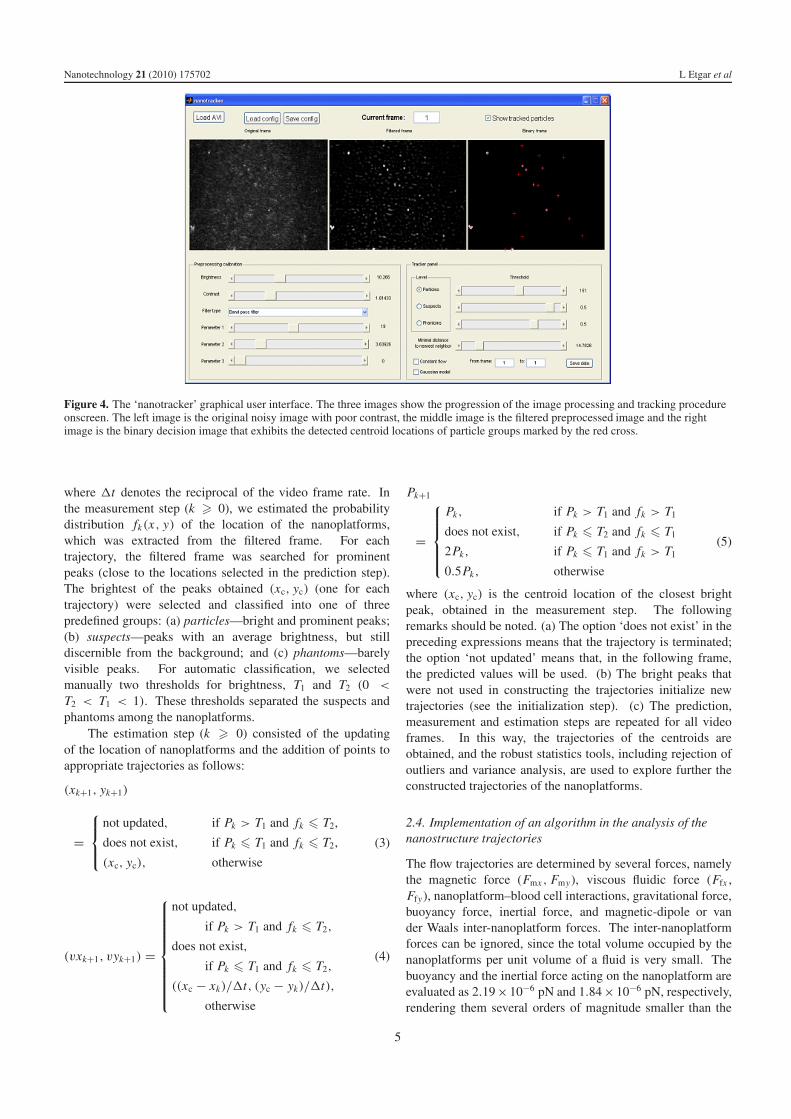
0.01–0.03 T at the center of the chamber. Figure 2(A) showsa photograph of the flow set-up, and additional experimentaldetails are supplied in section 4. Figure 2(B) shows a schematicdrawing of the nanoplatform’s motion in the x–y plane througha chamber and under the influence of a magnetic field gradient.The nanoplatforms are shown by the circles, their deviationfrom the chamber center is labeled by θ and the magnetic fieldis oriented perpendicular to the chamber axis. Figures 3(A)–C show representative images of nanoplatforms’ trajectories asvisualized during a flow, tracking the position change of thetwo selected nanoplatforms (see yellow circles in the figure).
2.3. Unique trajectory processing algorithm
A graphical user interface (GUI) was developed, implementingan algorithm discussed below, enabling automatic determina-tion of the location of a nanoplatform from raw video dataand construction of its trajectory. The GUI was developedwith a MATLAB program. This GUI allows the user to
3
Nanotechnology 21 (2010) 175702 L Etgar et al
Figure 2. (A) A photograph of the flow set-up; (B) the schematicrepresentation of the experimental set-up and the distribution offorces on the nanoplatforms in the viscous flow. The distancebetween the magnet and the center of the channel is represented by dand equal to 5.5 cm. The forces acting on each nanoplatform in the xdirection are the difference between the fluidic force (Ffx ) and themagnetic force (Fmx ), and in the y direction the total force is the sumof the fluidic force (Ffy ) and the magnetic force (Fmy ), since bothcomponents act on the nanoplatform in the same direction.
tune different detection parameters, to choose visibility levels,activate filtering process and to save the extracted data forfurther statistical analysis (see section 2.4).
Figure 4 shows a GUI panel exhibiting three imageson the screen (from left to right): an original noisy videoimage with a poor contrast, a filtered preprocessed image andbinary decision image. A location of a detected nanoplatformis memorized as ‘1’ (white) and the background pixels arememorized as ‘0’ (black); a cross on the decision image marksa nanoplatform center of mass (named hereafter as centroid).
Actually, the GUI analyzes two-dimensional frames ofthree-dimensional trajectories, encountering difficulties withthe appearance, disappearance and then re-appearance ofa nanoplatform in a certain frame. The disappearanceof nanoscaled particles during a flow was not dealt withappropriately until the present. Kachouie et al [44] developedan algorithm for a disc-shaped micron size biological cells,thus determining a low signal/noise ratio that is not suitablefor our case. Acton et al [45] treated a flow of virus cells,following the trajectory of all particles at the same pointin time, ignoring the appearance of new particles at a latertime, which is not applicable to our case either since theappearance of new particles must be considered. Nakamuraet al [41] and Helmuth et al [46] considered an averageposition of particles from five consecutive frames, still missingappearance/disappearance events.
This work developed a special procedure (see below)that overcomes the mentioned obstacles by consideration of
Figure 3. (A)–(C) Representative images of nanoplatforms’trajectories as visualized during a flow, tracking the position changeof the two selected nanoplatforms (see yellow circles in the figure).The fluid viscosity of this sample was 1.73 cP and the flow rate was0.9 ml h−1 under an external magnetic field B.
the following points: (a) criteria for appropriate visibilityconditions; (b) estimation of the direct velocity [47];(c) automatic initiation and termination of nanoplatform tracks;(d) consideration of centroid tracking also of non-sphericalnanoplatforms; (e) sequential order of frame processing(trajectory update is based on a current frame only); (f) novelapproach of tracking by filtering [47], based on brightnessand contrast correction. Four filtering processes were used:a low pass filter, a band pass filter, an image gradient filterand a gray level morphological filter. The filter parameters(such as bandwidth and cutoff frequency) were tuned withsliders located on the left preprocessing panel in the GUI (seefigure 4). The result of the preprocessing stage is displayedin the middle image of figure 4. The program searches forthe most prominent brightness peaks in the filtered image. Allpixels with a brightness level higher than a specified threshold(defined by the user) become logic ‘1’ in the binary decisionimage (left panel in figure 4). The binary image is processedwith morphological ‘close’ to connect the pixels located closerthan the predefined threshold. This image is used to extractimportant parameters, including the centroid location, size andorientation.
The algorithm, which was used to construct the trajectoryof each nanoplatform, consists of three consecutive stepsapplied to each video frame: prediction, measurement andestimation [48, 49]. For a given frame k of a certain trajectoryi , the state of the system was defined as
Xik := (x i
k, yik, vx i
k, vyik, Pi
k ), (1)
where (x, y) is the centroid location, (vx, vy) is the centroidvelocity and P is the visibility (related to the probability ofdetection). The state Xk was set to be a function of only theprevious state Xi
k , according to the Markovian assumption. Inthe following description of the processing steps, the index iwas omitted for simplicity.
In the initialization step (k = 0), all the detectednanoplatforms from the first frame were used to initialize thetrajectories with centroid location at (x0, y0), initial velocitieswhich were set to 0 and visibilities of 1. In the prediction step(k � 0), a constant velocity model anticipated the position ofthe nanoplatforms in the following frame:
xk+1 = xk + �tvxk, yk+1 = yk + �tvyk,
vxk+1 = vxk, vyk+1 = vyk,(2)
4
Nanotechnology 21 (2010) 175702 L Etgar et al
Figure 4. The ‘nanotracker’ graphical user interface. The three images show the progression of the image processing and tracking procedureonscreen. The left image is the original noisy image with poor contrast, the middle image is the filtered preprocessed image and the rightimage is the binary decision image that exhibits the detected centroid locations of particle groups marked by the red cross.
where �t denotes the reciprocal of the video frame rate. Inthe measurement step (k � 0), we estimated the probabilitydistribution fk(x, y) of the location of the nanoplatforms,which was extracted from the filtered frame. For eachtrajectory, the filtered frame was searched for prominentpeaks (close to the locations selected in the prediction step).The brightest of the peaks obtained (xc, yc) (one for eachtrajectory) were selected and classified into one of threepredefined groups: (a) particles—bright and prominent peaks;(b) suspects—peaks with an average brightness, but stilldiscernible from the background; and (c) phantoms—barelyvisible peaks. For automatic classification, we selectedmanually two thresholds for brightness, T1 and T2 (0 <
T2 < T1 < 1). These thresholds separated the suspects andphantoms among the nanoplatforms.
The estimation step (k � 0) consisted of the updatingof the location of nanoplatforms and the addition of points toappropriate trajectories as follows:
(xk+1, yk+1)
=
⎧⎪⎨
⎪⎩
not updated, if Pk > T1 and fk � T2,
does not exist, if Pk � T1 and fk � T2,
(xc, yc), otherwise
(3)
(vxk+1, vyk+1) =
⎧⎪⎪⎪⎪⎪⎪⎪⎪⎨
⎪⎪⎪⎪⎪⎪⎪⎪⎩
not updated,
if Pk > T1 and fk � T2,
does not exist,
if Pk � T1 and fk � T2,
((xc − xk)/�t, (yc − yk)/�t),
otherwise
(4)
Pk+1
=
⎧⎪⎪⎪⎨
⎪⎪⎪⎩
Pk, if Pk > T1 and fk > T1
does not exist, if Pk � T2 and fk � T1
2Pk, if Pk � T1 and fk > T1
0.5Pk, otherwise
(5)
where (xc, yc) is the centroid location of the closest brightpeak, obtained in the measurement step. The followingremarks should be noted. (a) The option ‘does not exist’ in thepreceding expressions means that the trajectory is terminated;the option ‘not updated’ means that, in the following frame,the predicted values will be used. (b) The bright peaks thatwere not used in constructing the trajectories initialize newtrajectories (see the initialization step). (c) The prediction,measurement and estimation steps are repeated for all videoframes. In this way, the trajectories of the centroids areobtained, and the robust statistics tools, including rejection ofoutliers and variance analysis, are used to explore further theconstructed trajectories of the nanoplatforms.
2.4. Implementation of an algorithm in the analysis of thenanostructure trajectories
The flow trajectories are determined by several forces, namelythe magnetic force (Fmx , Fmy), viscous fluidic force (Ffx ,Ffy), nanoplatform–blood cell interactions, gravitational force,buoyancy force, inertial force, and magnetic-dipole or vander Waals inter-nanoplatform forces. The inter-nanoplatformforces can be ignored, since the total volume occupied by thenanoplatforms per unit volume of a fluid is very small. Thebuoyancy and the inertial force acting on the nanoplatform areevaluated as 2.19 ×10⁻⁶ pN and 1.84 ×10⁻⁶ pN, respectively,rendering them several orders of magnitude smaller than the
5

Nanotechnology 21 (2010) 175702 L Etgar et al
other forces. The buoyancy force was calculated accordingto the relation Fb = V g(ρf − ρb) and the gravity force wascalculated according to the relation Fg = ρbV g. ρf, whereρb is the density of the fluid and the conjugate structure,respectively; ρb = 6.67 g cm−3, an average density of the PbSeand Fe2O3 nanoparticles; V is the conjugate volume and g isthe gravity constant. In such a vertical flow, the gravitationalforce is also ignored. Based on these evaluations, this studyshould consider mainly the magnetic and fluidic forces (aslabeled in the inset of figure 2(B)), while the nanoplatform–blood interactions are already taken into consideration bymeasuring the nanoplatform transport through fluids withdifferent viscosities.
The fluidic force is obtained using a Stokes approximationof a drag force acting on a nanoplatform, and for simplicity,assuming a spherical shape [50]:
Ff = −6πηRp(vp − vf), (6)
where η is the fluid viscosity, Rp is the nanoplatform’s radius,vp is the nanoplatform’s velocity and vf is the fluid’s velocity.Considering a motion in the x–y plane (see figure 2(B)), thecomponents of the fluidic force can be defined as
Ffx = −6πηRpvpx (vfx = 0), (7)
Ffy = −6πηRp(vpy − vfy). (8)
The total magnetic force acting on the nanoplatforms isequal to a sum of the magnetic forces acting on each individualnanoplatform [51]:
Fm = μ0 NmpVmp3χmp
(χmp + 3)(H · ∇)H, (9)
where Nmp is the total number of nanoplatforms, Vmp is theirvolume, H is the applied magnetic field, χmp is the nanoplat-forms’ susceptibility, as measured previously by superconduct-ing interference device (SQUID) measurements [43], and μ0 =4π × 10−7 H m−1 is the air permeability. Nmp was evaluatedby counting the number of nanoplatforms that passed through across section of the channel per unit time (using the microscopeuser-friendly program (see section 4)). Furthermore, the totalmagnetic force acting on the nanoplatforms depends on themutual distance between the external magnetic field source andthe center of the flow channel (labeled ‘d’ in figure 2). Thus,the total magnetic forces in the x and y directions are given bythe following equations [52]:
Fmx(x, y) = μ0 NmpVmp3χmp
χmp + 3
×[
Hx(x, y)∂ Hx(x, y)
∂x+ Hy(x, y)
∂ Hx(x, y)
∂y
]
(10)
and
Fmy(x, y) = μ0 NmpVmp3χmp
χmp + 3
×[
Hx(x, y)∂ Hy(x, y)
∂x+ Hy(x, y)
∂ Hy(x, y)
∂y
]
(11)
Hx and Hy correspond to the Cartesian component of themagnetic field. The source magnet has a radius Rmag (4.2 cm)
and magnetization Ms of 1 × 10⁶ A m−1 (a value supplied bythe consumer). Thus, the magnetic field gradient felt by thenanoplatforms, at a distance, d , from the magnet center, and inthe x–y plane, is given by the following equations [51]:
Hx(x, y) = Ms R2mag
2
((x + d)2 − y2)
((x + d)2 + y2)2(12)
Hy(x, y) = Ms R2mag
2
2((x + d)y)
((x + d)2 + y2)2. (13)
Substitution of equations (12) and (13) into equations (10)and (11), leads to the expressions that describe the magneticforces in the x (equation (14)) and y (equation (15)) directions,respectively:
Fmx = −3μ0 NmpVmpχmpM2s R4
mag
χmp + 3
(x + d)
2((x + d)2 + y2)3(14)
Fmy = −3μ0 NmpVmpχmpM2s R4
mag
χmp + 3
y
2((x + d)2 + y2)3. (15)
The trajectories of nanoplatforms are expressed as thedistance traveled in the y direction versus that in thex direction. Representative trajectory plots of severalnanoplatforms measured in a fluid with a viscosity of 1.73 cP,are shown in figure 5(A). The position of the nanoplatformswere followed one frame after the other, equipositioned by theGUI (see section 2.3), while a trajectory was drawn only forthose nanoplatforms that do not disappear for more than threeconsecutive frames. These trajectories show a progress in they direction (along the channel axis) of hundreds of micronsduring an average time of 10 s.
The representative weighted frequency of appearance over300 consecutive frames versus the deviation angle, θ , ofthe trajectory with respect to the chamber axis is plottedin figure 5(B). The deviation is averaged around 90◦ whenmeasured with the influence of an external magnetic field.Similar plots were drawn for measurements taken at eightdifferent flow rates, six different viscosities, and with andwithout an external magnetic field. Thus, 96 different plotsin all, each supplying a distinct θ .
The representative weighted frequency appearance over300 consecutive frames versus the velocity of the nanoplat-forms (as derived by the algorithm mentioned) is plottedin figure 5(C), revealing an average velocity of 48 μm s−1
(when measured in a fluid with a viscosity of 1.73 cP).Thus, the average velocities of the nanoplatforms, in fluidsof six different viscosities and eight different flow rates,were derived in a similar manner when measured with andwithout the influence of the magnetic field gradient. Thus,a correlation between progression distance, directionality (θ )and the average nanoplatforms’ velocity, with/without anexternal magnetic field, could be derived.
The dependence of the deviation of the trajectories withand without an external magnetic field from the channel axis,�θ (radians), on the volumetric flow rate (ml h−1), at a varietyof viscosities values, is shown in figure 6. Each point onthe graph was derived from similar plots to that shown in
6

Nanotechnology 21 (2010) 175702 L Etgar et al
Figure 5. (A) Representative trajectory plots of severalnanoplatforms; (B) representative weighted frequency of appearanceover 300 consecutive frames versus the deviation angle, θ , of thetrajectory with respect to the chamber axis; (C) representativeweighted frequency appearance over 300 consecutive frames versusthe velocity of the nanoplatforms (as derived by the algorithm),revealing an average velocity of 48 μm s−1. Measurements weremade of a fluid with a viscosity of 1.73 cP and flow rate of 0.9 ml h−1
under an external magnetic field B.
figure 5(B). The dependence presents a similar behavior whenmeasured at different viscosities, showing a drastic change atrelatively low flow rates, though, reaching a plateau with aminor change in the directionality of the trajectories, at flowrates >0.2 ml h−1, even in the presence of an external magneticfield.
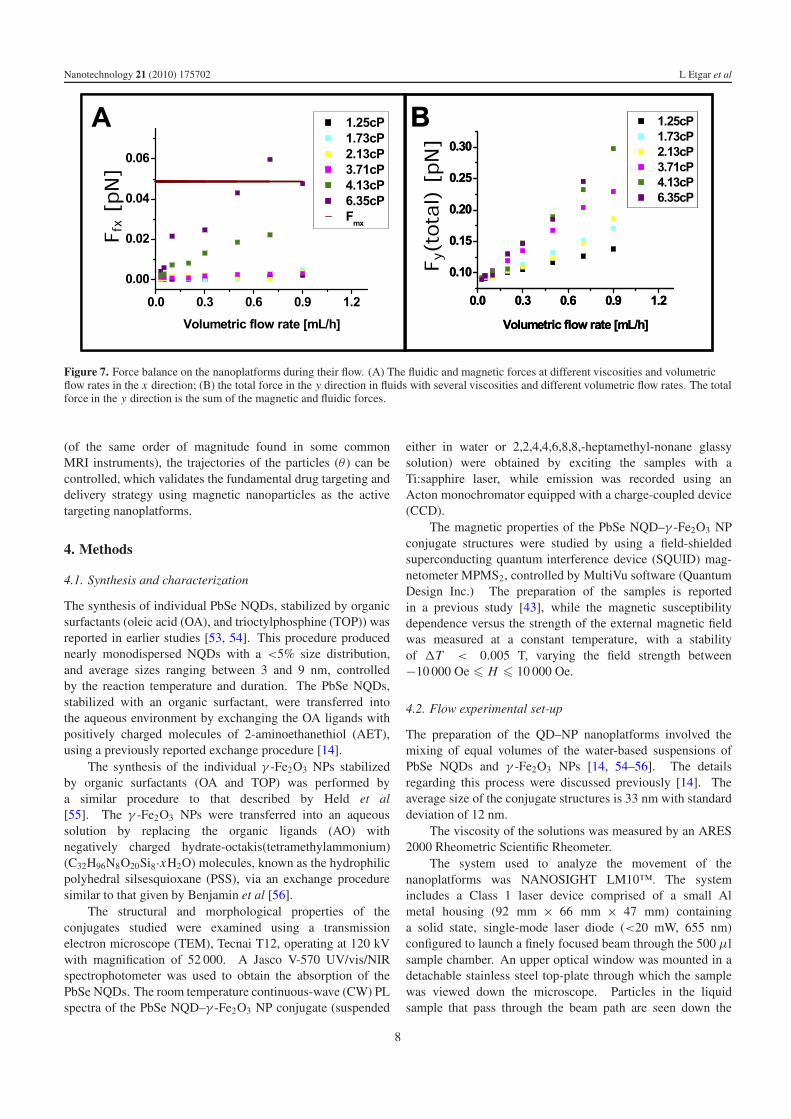
Obviously, the directionality of the trajectory shown infigure 6, and the velocities and motion presented in figure 5 aredetermined by the forces acting on the nanoplatforms duringa flow, as given in equations (7), (8), (14) and (15). Forexample, the fluidic force (pN) in the x direction, derivedfrom equation (7), versus the volumetric flow rate, is plotted infigure 7(A) for several fluid viscosities, as given in the legendof the figure. The magnetic force in that direction, independentof the viscosity parameter (see equation (14)), is plotted bythe brown line. These plots suggest that, in most cases, themagnetic force is larger than the fluidic force in the x direction(see the inset in figure 2(B)), meaning that the magnetic forcedominates the trajectory of the nanoplatforms. The magneticforce dominance of the trajectory direction is reduced only atrelatively high viscosities and large flow rates.
Figure 7(B) represents plots of the total force actingon the nanoplatforms, including the magnetic and fluidic
Figure 6. The influence of an external magnetic field on thenanoplatform trajectories. Flow direction differences (�θ) of theconjugate structures in fluids with different viscosities and volumetricflow rates, under an external magnetic field of 1 T. The directiondifferences were derived from the difference of the deviationbetween nanoplatforms with and without an external magnetic field.
forces in the y direction (along the channel), versus thevolumetric flow rate. The total force was calculated usingequations (8) and (15), when the velocity parameters wereextracted from the statistical plots shown in figure 5(C).The total force acting in the y direction has an additivecontribution, both from the fluidic and magnetic forces, soaccelerating the nanoplatforms in this direction. When largeviscosity demands the application of a larger total force, aswell as a larger flow rate, induces a larger force on thenanoplatform in the y direction. These results have immediatepractical consequences regarding the potential application ofthe nanoplatforms as drug delivery moieties, indicating thepossible parameters that could administer a cargo and drugcomplex into the body. Clearly, the blood stream is a morecomplex fluid than the polymer solution employed in thisstudy. Thus, additional research is necessary to achievea more accurate experimental model. Nevertheless, thiswork represents a significant attempt to tackle this importantissue, resulting in concrete, quantitative relationships betweennanoplatform size, fluid viscosity, flow rates, external magneticfield strength and their effects on the nanoplatform trajectories.
3. Summary
In summary, this study is the first of its kind regarding thequantitative treatment of various crucial aspects related to thepotential application of PbSe–Fe2O3 conjugate nanoparticlesas in vivo, active drug targeting and delivery platforms. Westudied the motion of these conjugate structures in aqueous,viscous flows and in the presence of an external magnetic fieldand developed quantitative relationships between particle size,fluid viscosity, fluid flow rates and magnetic field strengths,and their effects on the particle trajectories and particlecohesion. Moreover, we have demonstrated that, at magneticfields of ∼1 T applied to the flow of the nanoplatforms
7
Nanotechnology 21 (2010) 175702 L Etgar et al
Figure 7. Force balance on the nanoplatforms during their flow. (A) The fluidic and magnetic forces at different viscosities and volumetricflow rates in the x direction; (B) the total force in the y direction in fluids with several viscosities and different volumetric flow rates. The totalforce in the y direction is the sum of the magnetic and fluidic forces.
(of the same order of magnitude found in some commonMRI instruments), the trajectories of the particles (θ ) can becontrolled, which validates the fundamental drug targeting anddelivery strategy using magnetic nanoparticles as the activetargeting nanoplatforms.
4. Methods
4.1. Synthesis and characterization
The synthesis of individual PbSe NQDs, stabilized by organicsurfactants (oleic acid (OA), and trioctylphosphine (TOP)) wasreported in earlier studies [53, 54]. This procedure producednearly monodispersed NQDs with a <5% size distribution,and average sizes ranging between 3 and 9 nm, controlledby the reaction temperature and duration. The PbSe NQDs,stabilized with an organic surfactant, were transferred intothe aqueous environment by exchanging the OA ligands withpositively charged molecules of 2-aminoethanethiol (AET),using a previously reported exchange procedure [14].
The synthesis of the individual γ -Fe2O3 NPs stabilizedby organic surfactants (OA and TOP) was performed bya similar procedure to that described by Held et al[55]. The γ -Fe2O3 NPs were transferred into an aqueoussolution by replacing the organic ligands (AO) withnegatively charged hydrate-octakis(tetramethylammonium)(C32H96N8O20Si8·xH2O) molecules, known as the hydrophilicpolyhedral silsesquioxane (PSS), via an exchange proceduresimilar to that given by Benjamin et al [56].
The structural and morphological properties of theconjugates studied were examined using a transmissionelectron microscope (TEM), Tecnai T12, operating at 120 kVwith magnification of 52 000. A Jasco V-570 UV/vis/NIRspectrophotometer was used to obtain the absorption of thePbSe NQDs. The room temperature continuous-wave (CW) PLspectra of the PbSe NQD–γ -Fe2O3 NP conjugate (suspended
either in water or 2,2,4,4,6,8,8,-heptamethyl-nonane glassysolution) were obtained by exciting the samples with aTi:sapphire laser, while emission was recorded using anActon monochromator equipped with a charge-coupled device(CCD).
The magnetic properties of the PbSe NQD–γ -Fe2O3 NPconjugate structures were studied by using a field-shieldedsuperconducting quantum interference device (SQUID) mag-netometer MPMS2, controlled by MultiVu software (QuantumDesign Inc.) The preparation of the samples is reportedin a previous study [43], while the magnetic susceptibilitydependence versus the strength of the external magnetic fieldwas measured at a constant temperature, with a stabilityof �T < 0.005 T, varying the field strength between−10 000 Oe � H � 10 000 Oe.
4.2. Flow experimental set-up
The preparation of the QD–NP nanoplatforms involved themixing of equal volumes of the water-based suspensions ofPbSe NQDs and γ -Fe2O3 NPs [14, 54–56]. The detailsregarding this process were discussed previously [14]. Theaverage size of the conjugate structures is 33 nm with standarddeviation of 12 nm.
The viscosity of the solutions was measured by an ARES2000 Rheometric Scientific Rheometer.
The system used to analyze the movement of thenanoplatforms was NANOSIGHT LM10™. The systemincludes a Class 1 laser device comprised of a small Almetal housing (92 mm × 66 mm × 47 mm) containinga solid state, single-mode laser diode (<20 mW, 655 nm)configured to launch a finely focused beam through the 500 μlsample chamber. An upper optical window was mounted in adetachable stainless steel top-plate through which the samplewas viewed down the microscope. Particles in the liquidsample that pass through the beam path are seen down the
8

Nanotechnology 21 (2010) 175702 L Etgar et al
microscope as small points of light moving rapidly under theinfluence of the flow.
The motion of the nanoplatforms was filmed by an AVTMarlin F-033B CCD camera with 10 s exposure duration foreach film. The videos were then analyzed using the speciallydesigned software, from which the velocity distribution, flowdirection and the trajectories of each conjugate structure couldbe separately determined.
Acknowledgments
This work was supported by the Marie Curie Grant Programof the European Union (for both AT and RT), and the IsraelScience Foundation (to RT), grant nos. 650/06 and 1182/09.Additional support for this work was received through grantsfrom NSF, AFOSR, ARO and MURI, as well as by a grant fromNIH (NAC P41 RR-13218). This work is part of the NationalAlliance for Medical Image Computing (NAMIC), funded bythe National Institutes of Health through the NIH Roadmap forMedical Research, grant U54 EB005149. Information on theNational Centers for Biomedical Computing can be obtainedfrom http://nihroadmap.nih.gov/bioinformatics.
References
[1] Jain K K 2007 Curr. Opin. Mol. Ther. 9 563–71[2] Zheng G, Chen J, Stefflova K, Jarvi M, Li H and Wilson B C
2007 Proc. Natl Acad. Sci. USA 104 8989[3] Safavy A, Raisch K P, Mantena S, Sanford L L, Sham S W,
Krishna N R and Bonner J A 2007 J. Med. Chem. 50 6284–8[4] Rhyner M N, Smith A M, Gao X, Mao H, Yang L and
Nie S 2006 Fut. Med.—Nanomed. 1 209–17[5] Mulder W J M, Griffioen A W, Strijkers G J, Cormode D P,
Nicolay K and Fayad Z A 2007 Future Med.—Nanomed. 2307–24
[6] Wan J, Cai W, Meng X and Liu E 2007 Chem. Commun.47 5004
[7] Tromsdorf U I et al 2007 Nano Lett. 7 2422–7[8] Hoehn M, Wiedermann D, Justicia C, Ramos-Cabrer P,
Kruttwig K, Farr T and Himmelreich U 2007 J. Physiol.584 25–30
[9] Frullano L and Meade T J 2007 J. Biol. Inorg. Chem.12 939–49
[10] Andreev A D and Lipovskii A A 1999 Phys. Rev. B 59 15402[11] Du H, Chen C, Krishnan R, Krauss T D, Harbold J M,
Wise F W, Thomas M G and Silcox J 2002 Nano Lett.2 1321–4
[12] Wehrenberg B L, Wang C J and Guyot-Sionnest P 2002 J. Phys.Chem. B 106 10634–40
[13] Schaller R D and Klimov V I 2004 Phys. Rev. Lett. 92 186601[14] Etgar L, Lifshitz E and Tannenbaum R 2007 J. Phys. Chem. C
111 6238–44[15] Steckel J S, Coe-Sullivan S, Bulovic V and Bawendi M G 2003
Adv. Mater. 15 1862–6[16] Gaponik N, Radtchenko I L, Gerstenberger M R, Fedutik Y A,
Sukhorukov G B and Rogach A L 2003 Nano Lett. 3 369–72[17] Santoni A, Paolucci G, Santoro G, Prince K C and
Christensen N E 1992 J. Phys.: Condens. Matter 4 6759–68[18] Alivisatos A P 1996 J. Phys. Chem. 100 13226–39[19] Kagan C R, Murray C B and Bawendi M G 1996 Phys. Rev. B
54 8633[20] Kim S et al 2004 Nat. Biotechnol. 22 93–7
[21] Sargent E H 2005 Adv. Mater. 17 515[22] Lifshitz E et al 2006 J. Phys. Chem. B 110 25356–65[23] Klimov V I, McGuire J A, Schaller R D and Rupasov V I 2008
Phys. Rev. B 77 195324[24] Forbes Z G, Yellen B B, Barbee K A and Friedman G 2003
IEEE Trans. Magn. 39 3372–7[25] Asmatulu R, Zalich M A, Claus R O and Riffle J S 2005
J. Magn. Magn. Mater. 292 108–19[26] Dobson J 2006 Drug Dev. Res. 67 55–60[27] Jain K K 2008 Technol. Cancer Res. Treat. 7 1–14[28] Voltz E and Gronemeyer H 2008 Int. J. Biochem. Cell Biol.
40 1–8[29] Duguet E, Vasseur S, Mornet S and Devoisselle J M 2006
Future Med.—Nanomed. 1 157–68[30] Iqbal S S, Mayo W M, Bruno J G, Bronk B V, Batt C A and
Chambers J P 2000 Biosens. Bioelectron. 15 549–78[31] Popplewell J and Sakhnini L 1995 J. Magn. Magn. Mater.
149 72–8[32] Raj K, Moskowitz B and Casciari R 1995 J. Magn. Magn.
Mater. 149 174–80[33] Molday R S and Mackenzie D 1982 J. Immunol. Methods
52 353–67[34] Jung C W and Jacobs P 1995 Magn. Reson. Imag. 13 661–74[35] Medintz I L, Uyeda H T, Goldman E R and Mattoussi H 2005
Nat. Mater. 4 435–46[36] Kulkarni D P, Das D K and Chukwu G A 2006 J. Nanosci.
Nanotechnol. 6 1150–4[37] Kim J, Piao Y and Hyeon T 2009 Chem. Soc. Rev. 38 372–90[38] Jin X, Zhao Y, Richardson A, Moore L, Williams P S,
Zborowski M and Chalmers J J 2008 Anal.133 1767–75
[39] Zhang H, Moore L R, Zborowski M, Williams P S,Margel S and Chalmers J J 2005 Anal. 130 514–27
[40] Zborowski M, Ostera G R, Moore L R, Milliron S, Chalmers J Jand Schechter A N 2003 Biophys. J. 84 2638–45
[41] Nakamura N, Zborowski M, Lasky L C, Margel S andChalmers J J 2001 Exp. Fluids 30 371–80
[42] Chalmers J J, Zhao Y, Nakamura M, Melnik K, Lasky L,Moore L and Zborowski M 1999 J. Magn. Magn. Mater.194 231–41
[43] Etgar L, Leitus G, Fradkin L, Assaraf Y G, Tannenbaum R andLifshitz E 2009 ChemPhysChem 10 2235–41
[44] Kachouie N N, Fieguth P, Ramunas J and Jervis E 2006 Int. J.Biomed. Imag. 2006 1–10
[45] Acton S T, Wethmar K and Ley K 2002 Microvas. Res.63 139–48
[46] Helmuth J A, Burckhardt C J, Koumoutsakos P, Greber U Fand Sbalzarini I F 2007 J. Struct. Biol. 159 347–58
[47] Bar-Shalom Y and Fortmann T E 1988 Tracking and DataAssociation (Boston, MA: Academic)
[48] Rathi Y, Vaswani N and Tannenbaum A 2007 IEEE Trans.Image Process. 16 1370–82
[49] Michailovich O and Tannenbaum A 2008 IEEE Trans. ImageProcess. 17 847–56
[50] Batchelor G K 1970 An Introduction to Fluid Dynamics(London: Cambridge University Press)
[51] Furlani E P and Ng K C 2006 Phys. Rev. E 73 061919[52] Furlani E J and Furlani E P 2007 J. Magn. Magn. Mater.
312 187–93[53] Yu W W, Falkner J C, Shih B S and Colvin V L 2004 Chem.
Mater. 16 3318–22[54] Brumer M, Kigel A, Amirav L, Sashchiuk A, Solomesh O,
Tessler N and Lifshitz E 2005 Adv. Funct. Mater. 15 1111–6[55] Euliss L E, Grancharov S, O’Brien S, Deming T J, Stucky G D,
Murray C B and Held G A 2003 Nano Lett. 3 1489–93[56] Frankamp B L, Fischer N O, Hong R, Srivastava S and
Rotello V M 2006 Chem. Mater. 18 956–9
9
Copyright © 2022 FDOKUMEN