Shape and field-dependent Morin transitions in structured alpha-Fe2O3
7
Shape- and field-dependent Morin transitions in structured a-Fe 2 O 3 Subarna Mitra a , Soumen Das b, , Soumen Basu b,c , Puspendu Sahu d , Kalyan Mandal a a Department of Materials Science, S. N. Bose National Centre for Basic Sciences, Kolkata 700 098, India b Department of Materials Science, Indian Association for the Cultivation of Science, Kolkata 700 032, India c Department of Physics, National Institute of Technology, Durgapur 713 209, India d Department of Physics, Jadavpur University, Jadavpur, Kolkata 700 032, India article info Article history: Received 29 January 2009 Received in revised form 15 April 2009 Available online 23 April 2009 Keywords: a-Fe 2 O 3 Solvothermal Morin transition abstract We report shape- and field-dependent magnetic properties of ellipsoid-, spindle-, flattened- and rhombohedra-shaped a-Fe 2 O 3 samples prepared by solvothermal technique. We observed that a magnetic spin-flip mechanism, mostly known as Morin transition (T M ), depends on the shape of a-Fe 2 O 3 as well as on the applied magnetic field. In each of these structures the obtained value of T M was less than its bulk value of 263 K. We observed that T M shifted from highest 251.4K for ellipsoid to lowest 220.8 K for rhombohedra structure, with intermediate values of T M for the other two structures. However, for rhombohedra structure T M shifted from 220.8 to 177.5K under the external magnetic field of 100 Oe–30 kOe, respectively. The observed lowering of T M in the structured sample was analyzed in terms of elementary size, shape of the nanocrystallites, lattice parameters and occupancy of Fe +3 ions as well. These parameters were determined from the Rietveld refinement process using MAUD software. & 2009 Elsevier B.V. All rights reserved. 1. Introduction Spin axis of a-Fe 2 O 3 (hematite) is oriented along the c-axis [111] [1,2]. It demonstrates the magnetic spin-flip mechanism, known as Morin transition (T M ), at points well below the Ne ´el temperature (T N ¼ 961 K) [3]. Thus, at T N a-Fe 2 O 3 shows anti- ferromagnetic (AF) arrangements, whereas, above T M , the spins are found to flip by 901 from c-axis to c-plane. Under this situation hematite samples show a weak ferromagnetism because a slight spin canting occurs out of the basal plane by the imperfect antiferromagnetic coupling of Fe 3+ ions in the alternating sublattices [1,2,4–6]. In this state neighboring magnetic moments are not perfectly antiparallel and non-zero value of magnetic moment appears in the direction of the c-axis. The small canting of moments results from the anisotropic exchange interaction, popularly known as, Dzialoshinski–Moriya interaction [7,8]. According to Artman et al. [9] Morin transition arises from the coexistence of two competitive anisotropy components with total energy of comparable magnitudes, opposite signs and having different temperature dependences. The first one is the magnetic dipolar anisotropy (K MD o0), which is negative and directs the magnetic easy axis within the c-plane and it falls off as the inverse cube of dipole separation distance. The second one is the local fine structure anisotropy component (K FS 40), which is positive and arises from the higher order of spin–orbit coupling of the individual metal ions. It is short ranged and falling off exponen- tially with the spin separation distance [1]. The positive value of K FS directs the magnetic easy axis along the c-axis. Below T M , the total anisotropy energy is positive as |K FS |4|K MD |. Similarly above T M ,|K FS |o|K MD |, hence total anisotropy energy is negative. The change in total energy sign from one side of T M to another is behind the mechanism of spin-flip transition. The transition is found to depend on various experimental parameters like particle size [10–14], presence of impurity [15,16], applied pressure [17,18], stoichiometry deviations [19,20] and morphology [21,22] of hematite samples. We have studied these possibilities for four a-Fe 2 O 3 samples with different morphologies, such as ellipsoidal, spindle, flattened and rhombohedra. The temperature-dependent hysteresis loop measurements of these samples resulted in explicit evidences of the structure-dependent inherent magnetic phenomena. On the other hand, field-cooled (FC) magnetization measurement reflects the structure sensitive spin-flip Morin transition phenomenon and also proved to be very useful study in this connection. 2. Experimental section Structural hematite (a-Fe 2 O 3 ) was prepared by solvothermal method. The process involved heating of a closed cylindrical teflon-lined stainless steel chamber with a capacity of 130 ml, containing solvent and dissolved metallic salts. A 6.3 g (0.016mol) of Fe(NO 3 ) 3 , 9H 2 O was used as precursor. Ethylenediamine (EN), ethanol (EtOH) (90%) and water were used as solvents, either ARTICLE IN PRESS Contents lists available at ScienceDirect journal homepage: www.elsevier.com/locate/jmmm Journal of Magnetism and Magnetic Materials 0304-8853/$ - see front matter & 2009 Elsevier B.V. All rights reserved. doi:10.1016/j.jmmm.2009.04.044 Corresponding author. E-mail address: [email protected] (S. Das). Journal of Magnetism and Magnetic Materials 321 (2009) 2925–2931
Transcript of Shape and field-dependent Morin transitions in structured alpha-Fe2O3

ARTICLE IN PRESS
Journal of Magnetism and Magnetic Materials 321 (2009) 2925–2931
Contents lists available at ScienceDirect
Journal of Magnetism and Magnetic Materials
0304-88
doi:10.1
� Corr
E-m
journal homepage: www.elsevier.com/locate/jmmm
Shape- and field-dependent Morin transitions in structured a-Fe2O3
Subarna Mitra a, Soumen Das b,�, Soumen Basu b,c, Puspendu Sahu d, Kalyan Mandal a
a Department of Materials Science, S. N. Bose National Centre for Basic Sciences, Kolkata 700 098, Indiab Department of Materials Science, Indian Association for the Cultivation of Science, Kolkata 700 032, Indiac Department of Physics, National Institute of Technology, Durgapur 713 209, Indiad Department of Physics, Jadavpur University, Jadavpur, Kolkata 700 032, India
a r t i c l e i n f o
Article history:
Received 29 January 2009
Received in revised form
15 April 2009Available online 23 April 2009
Keywords:
a-Fe2O3
Solvothermal
Morin transition
53/$ - see front matter & 2009 Elsevier B.V. A
016/j.jmmm.2009.04.044
esponding author.
ail address: [email protected] (S. Das)
a b s t r a c t
We report shape- and field-dependent magnetic properties of ellipsoid-, spindle-, flattened- and
rhombohedra-shaped a-Fe2O3 samples prepared by solvothermal technique. We observed that a
magnetic spin-flip mechanism, mostly known as Morin transition (TM), depends on the shape of a-Fe2O3
as well as on the applied magnetic field. In each of these structures the obtained value of TM was less
than its bulk value of 263 K. We observed that TM shifted from highest 251.4 K for ellipsoid to lowest
220.8 K for rhombohedra structure, with intermediate values of TM for the other two structures.
However, for rhombohedra structure TM shifted from 220.8 to 177.5 K under the external magnetic field
of 100 Oe–30 kOe, respectively. The observed lowering of TM in the structured sample was analyzed in
terms of elementary size, shape of the nanocrystallites, lattice parameters and occupancy of Fe+3 ions as
well. These parameters were determined from the Rietveld refinement process using MAUD software.
& 2009 Elsevier B.V. All rights reserved.
1. Introduction
Spin axis of a-Fe2O3 (hematite) is oriented along the c-axis[111] [1,2]. It demonstrates the magnetic spin-flip mechanism,known as Morin transition (TM), at points well below the Neeltemperature (TN ¼ 961 K) [3]. Thus, at TN a-Fe2O3 shows anti-ferromagnetic (AF) arrangements, whereas, above TM, the spinsare found to flip by 901 from c-axis to c-plane. Under this situationhematite samples show a weak ferromagnetism because a slightspin canting occurs out of the basal plane by the imperfectantiferromagnetic coupling of Fe3+ ions in the alternatingsublattices [1,2,4–6]. In this state neighboring magnetic momentsare not perfectly antiparallel and non-zero value of magneticmoment appears in the direction of the c-axis. The small cantingof moments results from the anisotropic exchange interaction,popularly known as, Dzialoshinski–Moriya interaction [7,8].According to Artman et al. [9] Morin transition arises from thecoexistence of two competitive anisotropy components with totalenergy of comparable magnitudes, opposite signs and havingdifferent temperature dependences. The first one is the magneticdipolar anisotropy (KMDo0), which is negative and directs themagnetic easy axis within the c-plane and it falls off as the inversecube of dipole separation distance. The second one is the local finestructure anisotropy component (KFS40), which is positive andarises from the higher order of spin–orbit coupling of the
ll rights reserved.
.
individual metal ions. It is short ranged and falling off exponen-tially with the spin separation distance [1]. The positive value ofKFS directs the magnetic easy axis along the c-axis. Below TM, thetotal anisotropy energy is positive as |KFS|4|KMD|. Similarly aboveTM, |KFS|o|KMD|, hence total anisotropy energy is negative. Thechange in total energy sign from one side of TM to another isbehind the mechanism of spin-flip transition. The transition isfound to depend on various experimental parameters like particlesize [10–14], presence of impurity [15,16], applied pressure [17,18],stoichiometry deviations [19,20] and morphology [21,22] ofhematite samples.
We have studied these possibilities for four a-Fe2O3 sampleswith different morphologies, such as ellipsoidal, spindle, flattenedand rhombohedra. The temperature-dependent hysteresis loopmeasurements of these samples resulted in explicit evidences ofthe structure-dependent inherent magnetic phenomena. On theother hand, field-cooled (FC) magnetization measurement reflectsthe structure sensitive spin-flip Morin transition phenomenonand also proved to be very useful study in this connection.
2. Experimental section
Structural hematite (a-Fe2O3) was prepared by solvothermalmethod. The process involved heating of a closed cylindricalteflon-lined stainless steel chamber with a capacity of 130 ml,containing solvent and dissolved metallic salts. A 6.3 g (0.016 mol)of Fe(NO3)3, 9H2O was used as precursor. Ethylenediamine (EN),ethanol (EtOH) (90%) and water were used as solvents, either
ARTICLE IN PRESS
S. Mitra et al. / Journal of Magnetism and Magnetic Materials 321 (2009) 2925–29312926
separately or as a mixture taken in a particular ratio. The detail ofsample preparation has been explained elsewhere [23]. In thefollowing section we will denote the ellipsoid sample as SA,spindle as SB, flattened as SC and rhombohedra as SD. The phaseidentification of the specimen was done by X-ray diffraction (XRD)with CoKa radiation (l ¼ 0.170058 nm). The XRD pattern wasfurther subjected to the Rietveld analysis [24] for the estimationof the lattice parameter of different phases and their quantitativeabundances. For performing the Rietveld refinement, we used theprogram MAUD [25], which allowed carrying out structure as wellas microstructural refinement. Another significant advantage ofusing the MAUD program is in the estimation of the particle sizedistribution according to the log normal distribution modelproposed by Popa and Balzar [26] and implemented in theprogram. The detailed description of the methodology is beyondthe scope of the present article and can be found elsewhere [27].The morphology, crystalline sizes and structures of the a-Fe2O3
samples were studied by JSM 6700F field emission scanningelectron microscope (FESEM) and by JEOL 2010 high-resolutiontransmission electron microscope (TEM). Field- and temperature-dependent dc magnetic measurements were studied with anMPMS (Quantum Design). For the zero-field-cooled (ZFC) mea-surement, the sample was cooled from room temperature (300 K)to 5 K in the absence of dc magnetic field. Then 100 Oe magneticfield was applied at low temperature and magnetization datawere recorded with increasing temperature. For FC, the systemwas cooled from room temperature to 5 K in presence of dcmagnetic field (same magnitude which applied during ZFCmeasurement) and the magnetization data were recorded withincreasing temperature.
3. Results and discussion
3.1. Phase study: XRD
Fig. 1 shows the XRD spectra and the Rietveld refinement plotsof all as-prepared samples. All samples revealed well crystalline
30 40 50 60 70 80 90
208
101030
021
4
018
116
024
113
110
104
2θ (degrees)
Ellipsoid
Inte
nsity
(a.u
.)
012
flattened
Spinel
Rhombohedral
Fig. 1. X-ray diffraction spectra of the structured a-Fe2O3 samples. The solid lines
are the experimental spectra (Ie), and the symbol shows simulated spectra (Is) by
Rietveld refinement. The difference (Ie�Is) in spectra are also given in the
corresponding figure.
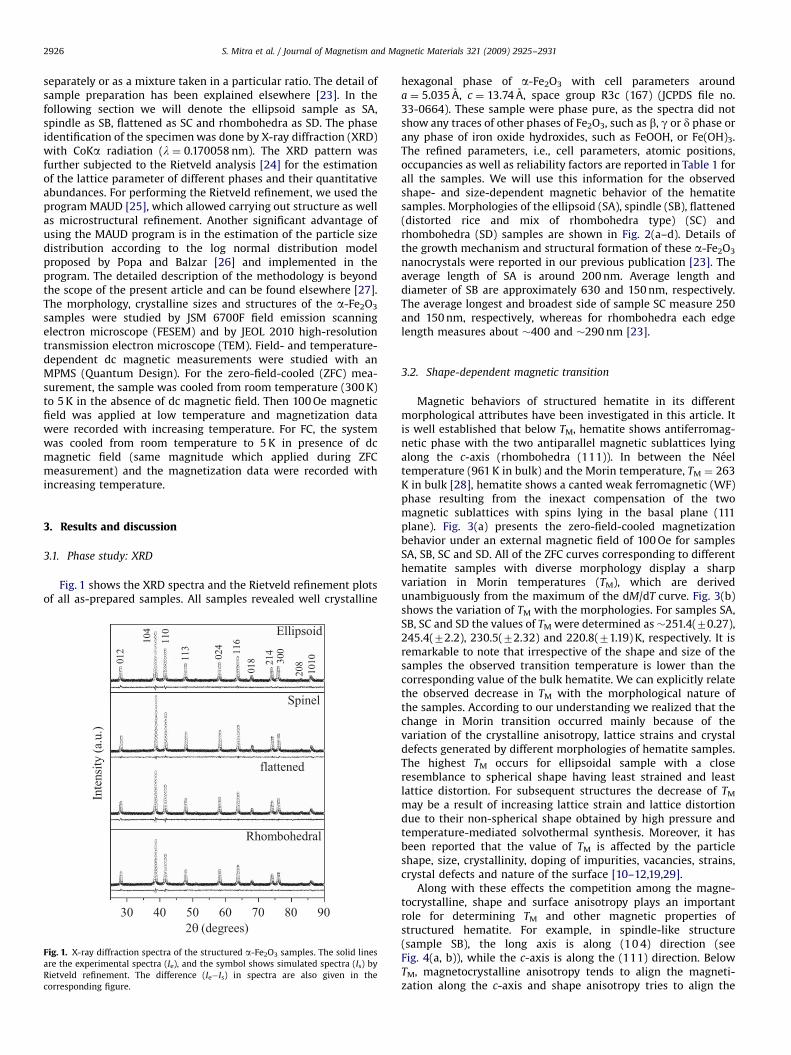
hexagonal phase of a-Fe2O3 with cell parameters arounda ¼ 5.035 A, c ¼ 13.74 A, space group R3c (167) (JCPDS file no.33-0664). These sample were phase pure, as the spectra did notshow any traces of other phases of Fe2O3, such as b, g or d phase orany phase of iron oxide hydroxides, such as FeOOH, or Fe(OH)3.The refined parameters, i.e., cell parameters, atomic positions,occupancies as well as reliability factors are reported in Table 1 forall the samples. We will use this information for the observedshape- and size-dependent magnetic behavior of the hematitesamples. Morphologies of the ellipsoid (SA), spindle (SB), flattened(distorted rice and mix of rhombohedra type) (SC) andrhombohedra (SD) samples are shown in Fig. 2(a–d). Details ofthe growth mechanism and structural formation of these a-Fe2O3
nanocrystals were reported in our previous publication [23]. Theaverage length of SA is around 200 nm. Average length anddiameter of SB are approximately 630 and 150 nm, respectively.The average longest and broadest side of sample SC measure 250and 150 nm, respectively, whereas for rhombohedra each edgelength measures about �400 and �290 nm [23].
3.2. Shape-dependent magnetic transition
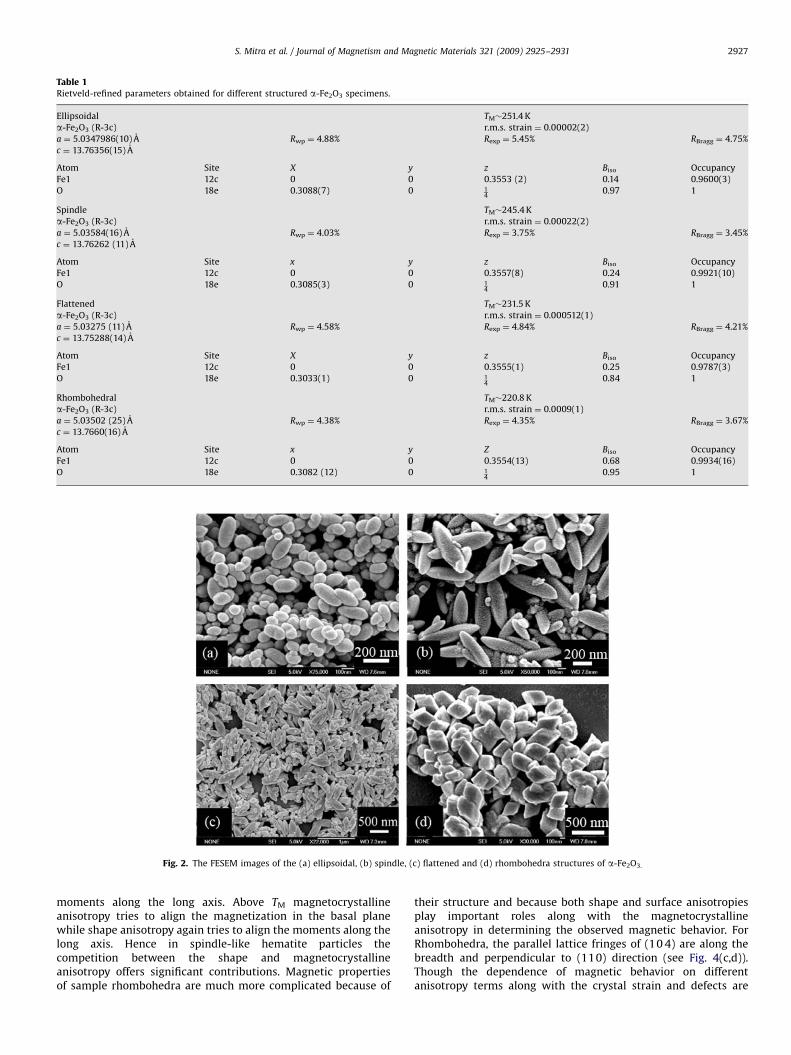
Magnetic behaviors of structured hematite in its differentmorphological attributes have been investigated in this article. Itis well established that below TM, hematite shows antiferromag-netic phase with the two antiparallel magnetic sublattices lyingalong the c-axis (rhombohedra (111)). In between the Neeltemperature (961 K in bulk) and the Morin temperature, TM ¼ 263K in bulk [28], hematite shows a canted weak ferromagnetic (WF)phase resulting from the inexact compensation of the twomagnetic sublattices with spins lying in the basal plane (111plane). Fig. 3(a) presents the zero-field-cooled magnetizationbehavior under an external magnetic field of 100 Oe for samplesSA, SB, SC and SD. All of the ZFC curves corresponding to differenthematite samples with diverse morphology display a sharpvariation in Morin temperatures (TM), which are derivedunambiguously from the maximum of the dM/dT curve. Fig. 3(b)shows the variation of TM with the morphologies. For samples SA,SB, SC and SD the values of TM were determined as �251.4(70.27),245.4(72.2), 230.5(72.32) and 220.8(71.19) K, respectively. It isremarkable to note that irrespective of the shape and size of thesamples the observed transition temperature is lower than thecorresponding value of the bulk hematite. We can explicitly relatethe observed decrease in TM with the morphological nature ofthe samples. According to our understanding we realized that thechange in Morin transition occurred mainly because of thevariation of the crystalline anisotropy, lattice strains and crystaldefects generated by different morphologies of hematite samples.The highest TM occurs for ellipsoidal sample with a closeresemblance to spherical shape having least strained and leastlattice distortion. For subsequent structures the decrease of TM
may be a result of increasing lattice strain and lattice distortiondue to their non-spherical shape obtained by high pressure andtemperature-mediated solvothermal synthesis. Moreover, it hasbeen reported that the value of TM is affected by the particleshape, size, crystallinity, doping of impurities, vacancies, strains,crystal defects and nature of the surface [10–12,19,29].
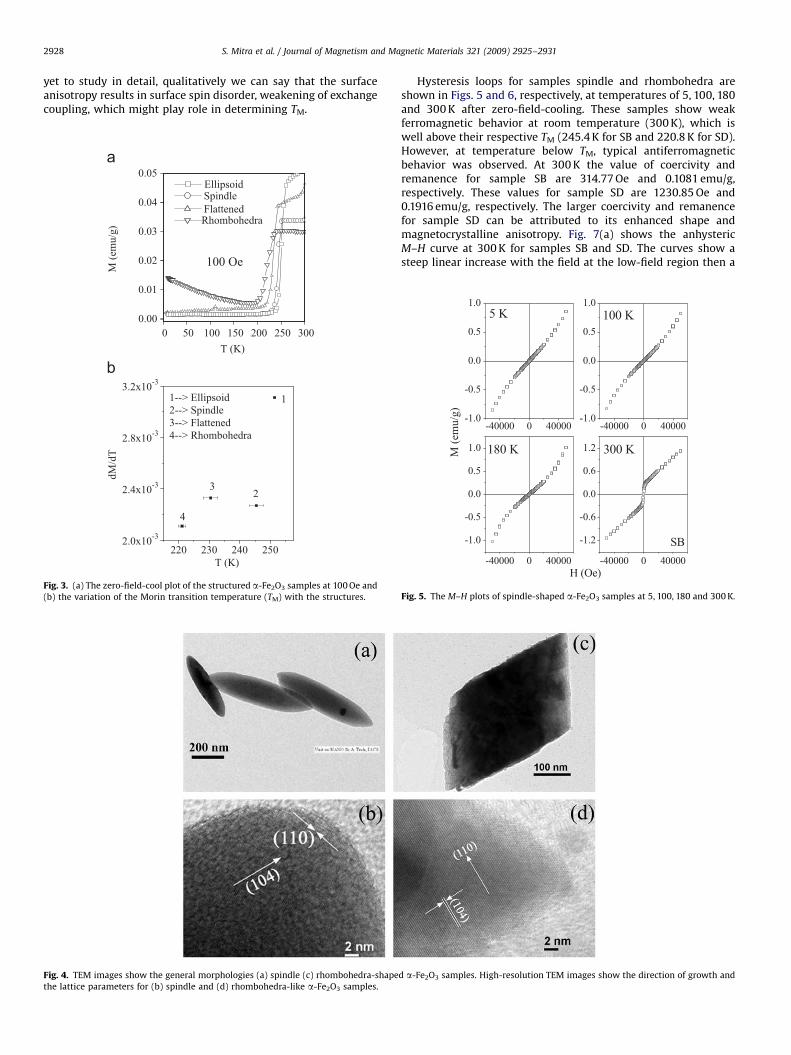
Along with these effects the competition among the magne-tocrystalline, shape and surface anisotropy plays an importantrole for determining TM and other magnetic properties ofstructured hematite. For example, in spindle-like structure(sample SB), the long axis is along (10 4) direction (seeFig. 4(a, b)), while the c-axis is along the (111) direction. BelowTM, magnetocrystalline anisotropy tends to align the magneti-zation along the c-axis and shape anisotropy tries to align the
ARTICLE IN PRESS
Fig. 2. The FESEM images of the (a) ellipsoidal, (b) spindle, (c) flattened and (d) rhombohedra structures of a-Fe2O3.
Table 1Rietveld-refined parameters obtained for different structured a-Fe2O3 specimens.
Ellipsoidal TM�251.4 K
a-Fe2O3 (R-3c) r.m.s. strain ¼ 0.00002(2)
a ¼ 5.0347986(10) A Rwp ¼ 4.88% Rexp ¼ 5.45% RBragg ¼ 4.75%
c ¼ 13.76356(15) A
Atom Site X y z Biso Occupancy
Fe1 12c 0 0 0.3553 (2) 0.14 0.9600(3)
O 18e 0.3088(7) 0 14
0.97 1
Spindle TM�245.4 K
a-Fe2O3 (R-3c) r.m.s. strain ¼ 0.00022(2)
a ¼ 5.03584(16) A Rwp ¼ 4.03% Rexp ¼ 3.75% RBragg ¼ 3.45%
c ¼ 13.76262 (11) A
Atom Site x y z Biso Occupancy
Fe1 12c 0 0 0.3557(8) 0.24 0.9921(10)
O 18e 0.3085(3) 0 14
0.91 1
Flattened TM�231.5 K
a-Fe2O3 (R-3c) r.m.s. strain ¼ 0.000512(1)
a ¼ 5.03275 (11) A Rwp ¼ 4.58% Rexp ¼ 4.84% RBragg ¼ 4.21%
c ¼ 13.75288(14) A
Atom Site X y z Biso Occupancy
Fe1 12c 0 0 0.3555(1) 0.25 0.9787(3)
O 18e 0.3033(1) 0 14
0.84 1
Rhombohedral TM�220.8 K
a-Fe2O3 (R-3c) r.m.s. strain ¼ 0.0009(1)
a ¼ 5.03502 (25) A Rwp ¼ 4.38% Rexp ¼ 4.35% RBragg ¼ 3.67%
c ¼ 13.7660(16) A
Atom Site x y Z Biso Occupancy
Fe1 12c 0 0 0.3554(13) 0.68 0.9934(16)
O 18e 0.3082 (12) 0 14
0.95 1
S. Mitra et al. / Journal of Magnetism and Magnetic Materials 321 (2009) 2925–2931 2927
moments along the long axis. Above TM magnetocrystallineanisotropy tries to align the magnetization in the basal planewhile shape anisotropy again tries to align the moments along thelong axis. Hence in spindle-like hematite particles thecompetition between the shape and magnetocrystallineanisotropy offers significant contributions. Magnetic propertiesof sample rhombohedra are much more complicated because of
their structure and because both shape and surface anisotropiesplay important roles along with the magnetocrystallineanisotropy in determining the observed magnetic behavior. ForRhombohedra, the parallel lattice fringes of (10 4) are along thebreadth and perpendicular to (110) direction (see Fig. 4(c,d)).Though the dependence of magnetic behavior on differentanisotropy terms along with the crystal strain and defects are
ARTICLE IN PRESS
S. Mitra et al. / Journal of Magnetism and Magnetic Materials 321 (2009) 2925–29312928
yet to study in detail, qualitatively we can say that the surfaceanisotropy results in surface spin disorder, weakening of exchangecoupling, which might play role in determining TM.
0.00
0.01
0.02
0.03
0.04
0.05
0 50 100 150 200 250 300
Spindle Flattened
M (e
mu/
g)
T (K)
Rhombohedra
100 Oe
Ellipsoid
220 230 240 2502.0x10-3
2.4x10⁻³
2.8x10⁻³
3.2x10⁻³
T (K)
4
32
11--> Ellipsoid2--> Spindle3--> Flattened4--> Rhombohedra
dM/d
T
Fig. 3. (a) The zero-field-cool plot of the structured a-Fe2O3 samples at 100 Oe and
(b) the variation of the Morin transition temperature (TM) with the structures.
Fig. 4. TEM images show the general morphologies (a) spindle (c) rhombohedra-shape
the lattice parameters for (b) spindle and (d) rhombohedra-like a-Fe2O3 samples.
Hysteresis loops for samples spindle and rhombohedra areshown in Figs. 5 and 6, respectively, at temperatures of 5, 100, 180and 300 K after zero-field-cooling. These samples show weakferromagnetic behavior at room temperature (300 K), which iswell above their respective TM (245.4 K for SB and 220.8 K for SD).However, at temperature below TM, typical antiferromagneticbehavior was observed. At 300 K the value of coercivity andremanence for sample SB are 314.77 Oe and 0.1081 emu/g,respectively. These values for sample SD are 1230.85 Oe and0.1916 emu/g, respectively. The larger coercivity and remanencefor sample SD can be attributed to its enhanced shape andmagnetocrystalline anisotropy. Fig. 7(a) shows the anhystericM–H curve at 300 K for samples SB and SD. The curves show asteep linear increase with the field at the low-field region then a
d a-Fe2O3 samples. High-resolution TEM images show the direction of growth and
-40000 0 40000-1.0
-0.5
0.0
0.5
1.0
-40000 0 40000-1.0
-0.5
0.0
0.5
1.0
-40000 0 40000
-1.0
-0.5
0.0
0.5
1.0
-40000 0 40000
-1.2
-0.6
0.0
0.6
1.2
5 K 100 K
M (e
mu/
g)180 K
SB
H (Oe)
300 K
Fig. 5. The M–H plots of spindle-shaped a-Fe2O3 samples at 5, 100, 180 and 300 K.

ARTICLE IN PRESS
S. Mitra et al. / Journal of Magnetism and Magnetic Materials 321 (2009) 2925–2931 2929
downward curvature followed by almost a linear behaviorup to the highest applied field. Hence there are two maincontributions. The magnetization in this case can be denoted as
-40000 0 40000-2
-1
0
1
2
-40000 0 40000-2
-1
0
1
2
-40000 0 40000-2
-1
0
1
2
-40000 0 40000-2
-1
0
1
2
5 K 100 K
M (e
mu/
g)
180 K
SD
H (Oe)
300 K
Fig. 6. The M–H plots of rhombohedra-shaped a-Fe2O3 samples at 5, 100, 180 and
300 K.
0 15000 30000 450000.0
0.4
0.8
1.2
1.6
2.0
T<TM
1. Spindle2. Rhombohedra
H (Oe)
Hsf
M(e
mu/
g)
2
1
0.0
0.4
0.8
1.2
1.6
0 15000 30000 45000
2. Rhombohedra
M (e
mu/
g)
H (Oe)
1. SpindleT>TM
1
2theoretical fit
Fig. 7. The anhysteresis plots at 300 K of (a) spindle (SB) and (b) rhombohedra
(SD)-shaped a-Fe2O3 samples above their respective Morin transition temperature.
M ¼ Mnc(H)+wH [29]. The initial rapid increase in magnetizationis attributed to the weak ferromagnetic behavior, Mnc in thesamples, which tries to saturate the moment. The non-saturationof moments at high field is probably coming due to residualantiferromagnetism in the samples, and expressed by the termwH, where w is the magnetic susceptibility and H, the magneticfield. Theoretical fit of the experimental curves in Fig. 7 with theabove equation gives the value of 0.257 emu/g (Mnc) and1.754�10�5 cm3/g (w) for spindle (sample SB) and 0.472 emu/g(Mnc) and 2.421�10�5 cm3/g (w) for (sample SD) and is shown bysolid lines in the figure. In Fig. 7(b) the M–H curve for samplespindle (SB) and sample rhombohedra (SD) at 5 K gives a changein their curvature at large field. This denotes a spin-flop transition[29]. The value of spin-flip (Hsf) is taken as the field at the slopeand is shown by an arrow in Fig. 7(b).
Now we try to explain the observed variation in TM with shapeand change in lattice parameters. According to the early work ofKundig et al. [3] it is well known that smaller particle sizes below20 nm do not exhibit a Morin transition down to 4.2 K. However,the findings of Dang et al. in the review work [19] deviate from theperception that for larger particles (420 nm), particle size itselfdoes not play any role; instead, the precise lattice parameters areimportant in understanding the Morin transition. In the presentwork, the occupancies of Fe+3 and the lattice parameters of all thefour specimens at their respective Morin transition temperatures,TM are plotted in Fig. 8(a) and (b). Interestingly, all the parameters
220 225 230 235 240 245 250 255
5.0325
5.0330
5.0335
5.0340
5.0345
5.0350
5.0355
5.0360
13.752
13.754
13.756
13.758
13.760
13.762
13.764
13.766
13.768
c (A
°)
a (A
°)
B
SC
SD
SASB
O=0.9921
O=0.9600
O=0.9787
O=0.9934
O=Occupancy
TM (K)
C
220 225 230 235 240 245 250 2550.955
0.960
0.965
0.970
0.975
0.980
0.985
0.990
0.995
SA
SB
SC
SD
TM (K)
Fe+3
occ
upan
cy
Fig. 8. (a) The variation of lattice parameters (a, c) and the Morin transition
temperature. Respective occupancy of Fe+3 ions is also given, (b) the occupancy of
Fe+3 ions along with the Morin transition temperature.
ARTICLE IN PRESS
S. Mitra et al. / Journal of Magnetism and Magnetic Materials 321 (2009) 2925–29312930
in the figures show similar variation with TM, i.e., first it decreasesin the asymmetric specimen (sample SC) with increase in the TM
followed by an increase in their values in the case of spindlespecimen (sample SB) and finally again decreases in theellipsoidal specimen (sample SA). However, the only exception isthe lattice parameters of the ellipsoidal specimen (SA), whichchange in the opposite direction (see Fig. 8(a)), i.e., ‘a’ valuedecreases and the ‘c’ value increases as compared to the spindlespecimen (SB). The common perception is that with increasinglattice distortions (either in the form of smaller particle size,anisotropic lattice strain, non-stoichiometry) the Morin transitionshould gradually shift to lower temperatures. However, it isimperative from the review work of Dang et al. [19] that the Morintransition is not related in a simple way to any single structural ormicrostructural parameter, such as crystallographic unit cellvolume or mean particle diameter, rather a critical interplayamong the parameters exists. In the present work we can see thatthe occupancy of Fe+3 is significantly low in the ellipsoidal (0.96)and the asymmetrical (0.978) specimens. This deficiency of Fe+3
might be due to the incorporation of OH groups and/orintroduction of lattice defects. This situation increases the non-stoichiometry of the specimens and in turn introduces significantlattice distortions within the unit cell. To explain the observedanomalous variation in the TM and the lattice parameters of theasymmetric and ellipsoidal specimens, we recall our basicunderstanding that this spin flip in Morin transition arises froma competition between the local ionic anisotropy term fromspin–orbit coupling and a long-range dipolar anisotropy term.These two anisotropy terms are of comparable magnitudes buthaving opposite signs and different temperature dependencies.They cross at a particular temperature (TM) thereby changing thesign of the overall anisotropy constant and causing the spin flip.The competition between the two anisotropy terms is dependenton the lattice expansion, crystal defects including vacancies,
0 100 200 3000.00
0.02
0.04
0.06
100 Oe
T (K)
M (e
mu/
g)
0 100 200 300
0.000
0.002 220.8 K
T (K)
dM/d
T
0 100 200 3000.08
0.12
0.16
0.20
0.24
0.28
T (K)
M (e
mu/
g)
1000 Oe
0 100 200 300
0.000
0.003
0.006
T (K)
dM/d
T
61.6
K
218.3 K
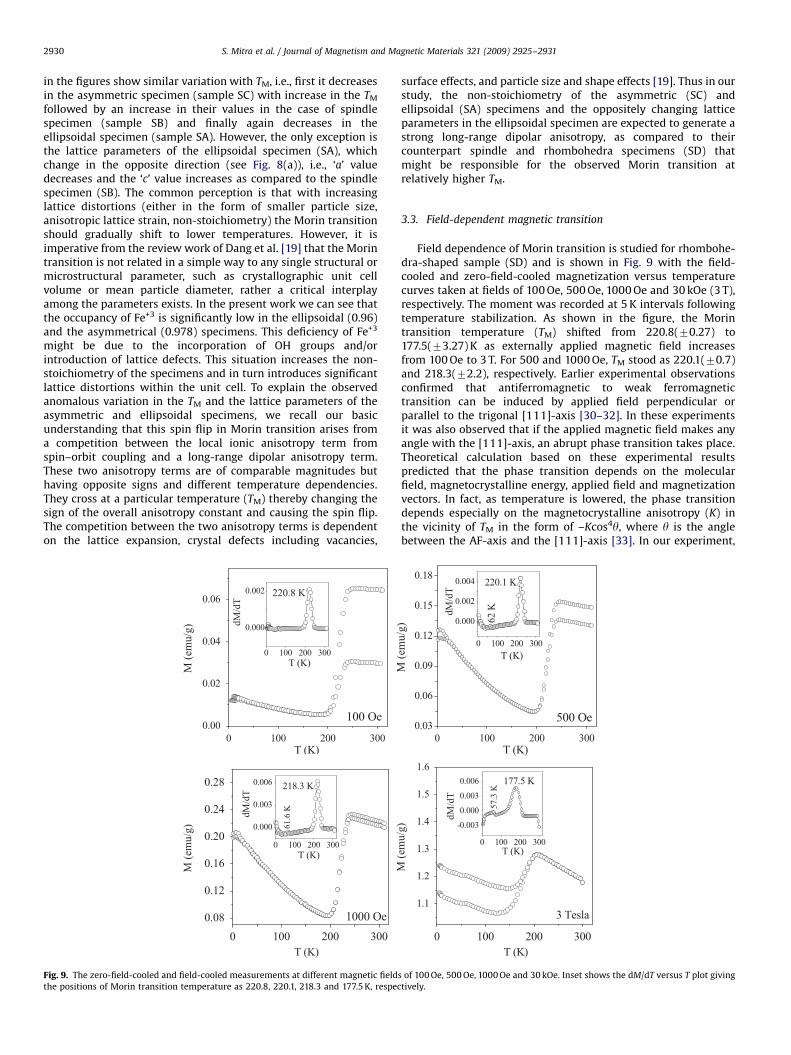
Fig. 9. The zero-field-cooled and field-cooled measurements at different magnetic field
the positions of Morin transition temperature as 220.8, 220.1, 218.3 and 177.5 K, respec
surface effects, and particle size and shape effects [19]. Thus in ourstudy, the non-stoichiometry of the asymmetric (SC) andellipsoidal (SA) specimens and the oppositely changing latticeparameters in the ellipsoidal specimen are expected to generate astrong long-range dipolar anisotropy, as compared to theircounterpart spindle and rhombohedra specimens (SD) thatmight be responsible for the observed Morin transition atrelatively higher TM.
3.3. Field-dependent magnetic transition
Field dependence of Morin transition is studied for rhombohe-dra-shaped sample (SD) and is shown in Fig. 9 with the field-cooled and zero-field-cooled magnetization versus temperaturecurves taken at fields of 100 Oe, 500 Oe, 1000 Oe and 30 kOe (3 T),respectively. The moment was recorded at 5 K intervals followingtemperature stabilization. As shown in the figure, the Morintransition temperature (TM) shifted from 220.8(70.27) to177.5(73.27) K as externally applied magnetic field increasesfrom 100 Oe to 3 T. For 500 and 1000 Oe, TM stood as 220.1(70.7)and 218.3(72.2), respectively. Earlier experimental observationsconfirmed that antiferromagnetic to weak ferromagnetictransition can be induced by applied field perpendicular orparallel to the trigonal [111]-axis [30–32]. In these experimentsit was also observed that if the applied magnetic field makes anyangle with the [111]-axis, an abrupt phase transition takes place.Theoretical calculation based on these experimental resultspredicted that the phase transition depends on the molecularfield, magnetocrystalline energy, applied field and magnetizationvectors. In fact, as temperature is lowered, the phase transitiondepends especially on the magnetocrystalline anisotropy (K) inthe vicinity of TM in the form of –Kcos4y, where y is the anglebetween the AF-axis and the [111]-axis [33]. In our experiment,
0 100 200 3000.03
0.06
0.09
0.12
0.15
0.18
M (e
mu/
g)
T (K)
500 Oe
0 100 200 300
0.000
0.002
0.004
62 KdM
/dT
T (K)
220.1 K
0 100 200 300
1.1
1.2
1.3
1.4
1.5
1.6
3 Tesla
T (K)
M (e
mu/
g)
0 100 200 300
-0.003
0.000
0.003
0.006
57.3
K
177.5 K
T (K)
dM/d
T
s of 100 Oe, 500 Oe, 1000 Oe and 30 kOe. Inset shows the dM/dT versus T plot giving
tively.
ARTICLE IN PRESS
S. Mitra et al. / Journal of Magnetism and Magnetic Materials 321 (2009) 2925–2931 2931
since the direction of the magnetic field was not changedsubstantially, the change in the transition temperature canqualitatively be attributed to the other factors as mentionedearlier.
We also observed another change of slope in the ZFC–FCpattern between 55 and 65 K, which appears as a small peak indM/dT versus T curve, and is more prominent at higher field. Thischange can be attributed to the blocking process of very smallsized superparamagnetic particles present in the sample [29].
Another interesting point is that at low field (100 Oe) the ZFCand FC curves almost superposed each other at low tempe-rature below TM, which is consistent with their antiferromagneticnature, and are separated at close to room temperature (i.e., aboveTM). This may be due to weak ferromagnetic ordering of thehematite samples. With the increase in magnetic field the lowtemperature section remains almost superposed, however, theroom temperature part gets close in. Then at higher magnetic fieldof 30 kOe, the low temperature section of ZFC–FC curve below TM
splits up, whereas above TM it is superposed. This can beattributed to the presence of the competition between the shapeand magnetocrystalline anisotropies. At high magnetic field,ferromagnetic ordering of the hematite samples is dominatingover antiferromagnetic ordering throughout the temperatureranges. As a result, we observed the hysteric behavior ofmagnetization values in FC curve. The superposition of the FCand ZFC curves at higher temperature is related to blockingphenomena of the sample.
4. Conclusions
In summary, we showed spin-flip transition (TM) of a-Fe2O3
samples with the shape and externally applied magneticfield up to 30 kOe. The results revealed interesting behavior ofthe antiferromagnetic to weak ferromagnetic phase transitionwith shape and external magnetic fields. The observed transition(TM) was found to be lower than what is observed forbulk samples. This phenomenon was discussed in terms of thesurface and magnetocrystalline anisotropies, the change inthe lattice parameters and the occupancy of Fe+3 ions withshape and size of the nanocrystals. The results and finding canalso be assessed in determining the magnetocrystalline aniso-tropy, molecular field or magnetization to reveal additionalinformation regarding inherent structure–property relationshipof a-Fe2O3.
Acknowledgement
The authors are very much grateful to Dr. Subham Majumdar,Associate Professor, Department of Solid State Physics, IndianAssociation for the Cultivation of Science, Kolkata, India, for hisuseful comments on the topic.
References
[1] T. Fujii, M. Takano, R. Kakano, Y. Isozumi, Y. Bando, J. Magn. Magn. Mater. 135(1994) 231.
[2] J.C. Papaioannou, G.S. Patermarakis, H.S. Karayianni, J. Phys. Chem. Solids 66(2005) 839.
[3] W. Kundig, H. Bommel, G. Constabaris, R.H. Lindquist, Phys. Rev. 142 (1966)327.
[4] M. Cao, T. Liu, S. Gao, G. Sun, X. Wu, C. Hu, Z.L. Wang, Angew. Chem. Int. Ed.(Communications) 44 (2005) 2.
[5] L. Liu, H.Z. Kou, W. Mo, H. Liu, Y. Wang, J. Phys. Chem. B 110 (2006) 15218.[6] L.P. Zhu, H.M. Xiao, X.M. Liu, S.Y. Fu, J. Mater. Chem. 16 (2006) 1794.[7] I. Dzyalosinsky, J. Phys. Chem. Solids 4 (1958) 241.[8] T. Moriya, Phys. Rev. 117 (1960) 635.[9] J.O. Artman, J.C. Murphy, S. Foner, Phys. Rev. 138A (1965) 912.
[10] S.N. Klausen, K. Lefmann, P.-A. Lindgard, L. Theil Kuhn, C.R.H. Bahl,C. Frandsen, S. Mørup, B. Roessli, N. Cavadini, C. Niedermayer, Phys. Rev. B70 (2004) 214411.
[11] M. Hermanek, R. Zboril, I. Medrik, J. Pechousek, C. Gregor, J. Am. Chem. Soc.129 (2007) 10929.
[12] R. Zboril, M. Mashlan, D. Petridis, Chem. Mater. 14 (2002) 969.[13] R.C. Nininger Jr., D. Schroeer, J. Phys. Chem. Solids 39 (1978) 137.[14] P.J. Besser, A.H. Morrish, C.W. Searle, Phys. Rev. 153 (1967) 637.[15] C. Wu, P. Yin, X. Zhu, C.O. Yang, Y. Xie, J. Phys. Chem. B 110 (2006) 17806.[16] E.D. Grave, L.H. Bowen, D.D. Amarasiriwardena, R.E. Vandenberghe, J. Magn.
Magn. Mater. 72 (1988) 129.[17] R.C. Wayne, D.H. Anderson, Phys. Rev. 155 (1967) 496.[18] C.L. Bruzzone, R. Ingalls, Phys. Rev. B 28 (1983) 2430.[19] M.Z. Dang, D.G. Rancourt, J.E. Dutrizac, G. Lamarche, R. Provencher, Hyperfine
Interact. 117 (1988) 271.[20] L. Liu, H.Z. Kou, W. Mo, H. Liu, Y. Wang, J. Phys. Chem. B 110 (2006) 15218.[21] Y. Zhao, C.W. Dunnill, Y. Zhu, D.H. Gregory, W. Kockenberger, Y. Li, W. Hu,
I. Ahmad, D.G. McCartney, Chem. Mater. 19 (2007) 916.[22] L. Suber, P. Imperatori, G. Ausanio, F. Fabbri, H. Hofmeister, J. Phys. Chem. B
109 (2005) 7103.[23] S. Mitra, S. Das, K. Mandal, S. Chaudhuri, Nanotechnology 18 (2007) 275608.[24] H.M. Rietveld, J. Appl. Cryst. 2 (1969) 65.[25] L. Lutterotti, MAUD, CPD Newsletter, 2001, IUCr.[26] N.C. Popa, D. Balzar, J. Appl. Cryst. 35 (2002) 338.[27] P. Sahu, A.S. Hamada, S. Ghosh Chowdhury, L.P. Karjalainen, J. Appl. Cryst. 40
(2007) 354.[28] F.J. Morin, Phys. Rev. 83 (1951) 1005.[29] R.D. Zysler, D. Fiorani, A.M. Testa, L. Suber, E. Agostinelli, M. Godinho, Phys.
Rev. B 68 (2003) 212408.[30] P.J. Besser, A.H. Morrish, Phys. Lett. 13 (1964) 289.[31] S. Foner, S.J. Williamson, J. Appl. Phys. 36 (1965) 1154.[32] F.J. Flander, S. Shtrikman, Solid State Commun. 3 (1965) 285.[33] G. Cinader, P.J. Flanders, S. Shtrikman, Phys. Rev. 162 (1967) 419.