Trail making test performance in youth varies as a function of anatomical coupling between the...
14
ORIGINAL RESEARCH ARTICLE published: 01 July 2014 doi: 10.3389/fpsyg.2014.00496 Trail making test performance in youth varies as a function of anatomical coupling between the prefrontal cortex and distributed cortical regions Nancy Raitano Lee 1 *, Gregory L. Wallace 2 , Armin Raznahan 1 , Liv S. Clasen 1 and Jay N. Giedd 1 1 Child Psychiatry Branch, Intramural Research Program, National Institute of Mental Health, NIH, Bethesda, MD, USA 2 Department of Speech and Hearing Sciences, George Washington University, Washington, DC, USA Edited by: Nicolas Chevalier, University of Edinburgh, UK Reviewed by: Joseph M. Orr, University of Colorado at Boulder, USA Sandra Wiebe, University of Alberta, Canada *Correspondence: Nancy Raitano Lee, Child Psychiatry Branch, National Institute of Mental Health, NIH, Bldg., 10, Room 4C110, 10 Center Drive, MSC 1367, Bethesda, MD 20892, USA e-mail: [email protected] While researchers have gained a richer understanding of the neural correlates of executive function in adulthood, much less is known about how these abilities are represented in the developing brain and what structural brain networks underlie them. Thus, the current study examined how individual differences in executive function, as measured by the Trail Making Test (TMT), relate to structural covariance in the pediatric brain. The sample included 146 unrelated, typically developing youth (80 females), ages 9–14 years, who completed a structural MRI scan of the brain and the Halstead-Reitan TMT (intermediate form). TMT scores used to index executive function included those that evaluated set-shifting ability: Trails B time (number-letter sequencing) and the difference in time between Trails B and A (number sequencing only). Anatomical coupling was measured by examining correlations between mean cortical thickness (MCT) across the entire cortical ribbon and individual vertex thickness measured at ∼81,000 vertices. To examine how TMT scores related to anatomical coupling strength, linear regression was utilized and the interaction between age-normed TMT scores and both age and sex-normed MCT was used to predict vertex thickness. Results revealed that stronger Trails B scores were associated with greater anatomical coupling between a large swath of prefrontal cortex and the rest of cortex. For the difference between Trails B and A, a network of regions in the frontal, temporal, and parietal lobes was found to be more tightly coupled with the rest of cortex in stronger performers. This study is the first to highlight the importance of structural covariance in in the prediction of individual differences in executive function skills in youth. Thus, it adds to the growing literature on the neural correlates of childhood executive functions and identifies neuroanatomic coupling as a biological substrate that may contribute to executive function and dysfunction in childhood. Keywords: executive function, anatomical covariance, cortical thickness, magnetic resonance imaging, Trail Making Test, brain, child, adolescent INTRODUCTION For over 150 years, scientists studying cognition have noted the important role of the frontal lobes in the regulation of behavior and cognition (see Braver and Ruge, 2006 for a review). While early investigations focused mainly on adult clinical populations, more recent research has described the protracted development of both executive functions and the frontal lobes within the context of normative development. Executive function is an umbrella term referring to a collec- tion of skills (such as working memory, planning, inhibition, and cognitive flexibility) that are thought to be essential for solving unfamiliar problems and coping with changing demands in one’s environment (Lezak et al., 2004). Normative studies indicate that executive function skills develop across childhood and into early young adulthood, with different skills reaching “mature” adult levels at different points in development. Studies of the protracted nature of the development of exec- utive functions within the context of typical development span several decades. Starting with the early work of Welsh and Pennington (1988) and continuing to more recent investigations (Hooper et al., 2004; Luciana et al., 2005; Huizinga et al., 2006; Conklin et al., 2007), a large corpus of data now exists document- ing that youth continue to make gains in performance on several different executive function tasks into the mid to late teens (Luna et al., 2004; Luciana et al., 2005). Complementing these behavioral studies, morphometric stud- ies of the developing brain using structural magnetic resonance imaging have suggested that the prefrontal cortex, thought to be central to the executive functions, is among the latest maturing regions of the brain (e.g., Gogtay et al., 2004). Its protracted devel- opment contrasts with the relatively early development of brain regions thought to contribute to more basic sensory and motor functions, such as the somatosensory cortex. Thus, both behavioral and anatomical data suggest that child- hood and adolescence are times in which studies of the anatom- ical correlates of executive abilities may be most informative www.frontiersin.org July 2014 | Volume 5 | Article 496 | 1
Transcript of Trail making test performance in youth varies as a function of anatomical coupling between the...
ORIGINAL RESEARCH ARTICLEpublished: 01 July 2014
doi: 10.3389/fpsyg.2014.00496
Trail making test performance in youth varies as a functionof anatomical coupling between the prefrontal cortex anddistributed cortical regionsNancy Raitano Lee1*, Gregory L. Wallace2, Armin Raznahan1, Liv S. Clasen1 and Jay N. Giedd1
1 Child Psychiatry Branch, Intramural Research Program, National Institute of Mental Health, NIH, Bethesda, MD, USA2 Department of Speech and Hearing Sciences, George Washington University, Washington, DC, USA
Edited by:
Nicolas Chevalier, University ofEdinburgh, UK
Reviewed by:
Joseph M. Orr, University ofColorado at Boulder, USASandra Wiebe, University of Alberta,Canada
*Correspondence:
Nancy Raitano Lee, Child PsychiatryBranch, National Institute of MentalHealth, NIH, Bldg., 10, Room 4C110,10 Center Drive, MSC 1367,Bethesda, MD 20892, USAe-mail: [email protected]
While researchers have gained a richer understanding of the neural correlates of executivefunction in adulthood, much less is known about how these abilities are representedin the developing brain and what structural brain networks underlie them. Thus, thecurrent study examined how individual differences in executive function, as measuredby the Trail Making Test (TMT), relate to structural covariance in the pediatric brain.The sample included 146 unrelated, typically developing youth (80 females), ages 9–14years, who completed a structural MRI scan of the brain and the Halstead-Reitan TMT(intermediate form). TMT scores used to index executive function included those thatevaluated set-shifting ability: Trails B time (number-letter sequencing) and the differencein time between Trails B and A (number sequencing only). Anatomical coupling wasmeasured by examining correlations between mean cortical thickness (MCT) across theentire cortical ribbon and individual vertex thickness measured at ∼81,000 vertices. Toexamine how TMT scores related to anatomical coupling strength, linear regressionwas utilized and the interaction between age-normed TMT scores and both age andsex-normed MCT was used to predict vertex thickness. Results revealed that strongerTrails B scores were associated with greater anatomical coupling between a large swathof prefrontal cortex and the rest of cortex. For the difference between Trails B and A, anetwork of regions in the frontal, temporal, and parietal lobes was found to be more tightlycoupled with the rest of cortex in stronger performers. This study is the first to highlightthe importance of structural covariance in in the prediction of individual differences inexecutive function skills in youth. Thus, it adds to the growing literature on the neuralcorrelates of childhood executive functions and identifies neuroanatomic coupling as abiological substrate that may contribute to executive function and dysfunction in childhood.
Keywords: executive function, anatomical covariance, cortical thickness, magnetic resonance imaging, Trail
Making Test, brain, child, adolescent
INTRODUCTIONFor over 150 years, scientists studying cognition have noted theimportant role of the frontal lobes in the regulation of behaviorand cognition (see Braver and Ruge, 2006 for a review). Whileearly investigations focused mainly on adult clinical populations,more recent research has described the protracted development ofboth executive functions and the frontal lobes within the contextof normative development.
Executive function is an umbrella term referring to a collec-tion of skills (such as working memory, planning, inhibition, andcognitive flexibility) that are thought to be essential for solvingunfamiliar problems and coping with changing demands in one’senvironment (Lezak et al., 2004). Normative studies indicate thatexecutive function skills develop across childhood and into earlyyoung adulthood, with different skills reaching “mature” adultlevels at different points in development.
Studies of the protracted nature of the development of exec-utive functions within the context of typical development span
several decades. Starting with the early work of Welsh andPennington (1988) and continuing to more recent investigations(Hooper et al., 2004; Luciana et al., 2005; Huizinga et al., 2006;Conklin et al., 2007), a large corpus of data now exists document-ing that youth continue to make gains in performance on severaldifferent executive function tasks into the mid to late teens (Lunaet al., 2004; Luciana et al., 2005).
Complementing these behavioral studies, morphometric stud-ies of the developing brain using structural magnetic resonanceimaging have suggested that the prefrontal cortex, thought to becentral to the executive functions, is among the latest maturingregions of the brain (e.g., Gogtay et al., 2004). Its protracted devel-opment contrasts with the relatively early development of brainregions thought to contribute to more basic sensory and motorfunctions, such as the somatosensory cortex.
Thus, both behavioral and anatomical data suggest that child-hood and adolescence are times in which studies of the anatom-ical correlates of executive abilities may be most informative
www.frontiersin.org July 2014 | Volume 5 | Article 496 | 1

Lee et al. Anatomical coupling and trails performance
in augmenting our understanding of how higher-level cognitiveabilities develop typically and atypically. With regard to atypicalexecutive development, most, if not all, developmental disor-ders are characterized by executive deficits. Examples includeattention-deficit/hyperactivity disorder, conduct disorder, autismspectrum disorders, and intellectual disability, to name a few (forreviews, see Pennington and Ozonoff, 1996; Zelazo and Muller,2002). Furthermore, many psychiatric disorders that develop inlate adolescence or early adulthood, such as schizophrenia anddepression, are characterized by executive deficits (Orellana andSlachevsky, 2013; Snyder, 2013).
Understanding the neuroanatomical correlates of executiveabilities within the context of typical development may informresearch seeking to identify mechanisms that contribute to theatypical development of executive functioning in childhood orin disorders that first manifest in adolescence/early adulthood. Inthe current investigation, we focus on the neuroanatomical cor-relates of a commonly-used measure of executive function, theTrail Making Test (TMT), in a sample of typically-developingyouth, ages 9–14 years. The TMT, like many neuropsychologi-cal assessment tools, was first developed for adult populations.The original task, called the Pathways Test, was included in theArmy Individual Test of General Ability in the 1940s (Partingtonand Leiter, 1949). The TMT is probably best known as being apart of the Halstead-Reitan neuropsychological battery (Reitanand Wolfson, 1993). More recently, modified versions of the TMThave become available, such as the Comprehensive Trail MakingTest (Allen et al., 2012a) and the Trail Making subtest on theDelis-Kaplan Executive Function System (Fine et al., 2011; Allenet al., 2012b).
Here we utilize the Intermediate form of the TMT fromthe Halstead-Reitan neuropsychological test battery (Reitan andWolfson, 1993). This form has two conditions. The first condi-tion, Trails A, requires youth to connect fifteen encircled numbersin order, from 1 to 15, as quickly as possible. The second con-dition, Trails B, requires youth to alternate between connectingnumbers and letters in order (i.e., 1-A-2-B and so on) as quicklyas possible for a total of 15 connections. Performance on bothTrails A and Trails B is thought to tap attention, psychomotorspeed, and sequencing abilities. In addition, Trails B is thoughtto assess set-shifting, a commonly recognized executive functionthat requires individuals to switch their attention between tworules or tasks (Miyake et al., 2000). Often, investigators interestedin studying the more “executive” components of the TMT focuson the difference in completion time for Trails B and Trails A.This difference is thought to partially account for the influence ofbaseline motoric speed or more basic cognitive abilities on perfor-mance and instead focus on the increased higher-order executivedemands placed on participants during the Trails B condition,namely set-shifting. We will examine the neural correlates of thisscore (Trails B – A) as well as Trails B time directly.
The vast majority of studies examining the neural correlatesof the TMT have been conducted with adults. To the best of ourknowledge, only one study (Tamnes et al., 2010) has examinedbrain-behavior relations in typical youth using structural MRIand the TMT. Like the current study, these researchers utilizedcortical thickness as their neuroanatomic phenotype; however,
they directly correlated cortical thickness and TMT performance.As will be described in further detail below, our study examineshow the coupling of cortical thickness values across the cortexvary as a function of TMT performance. Thus, the two studies usedifferent analytic techniques to examine brain-behavior relations.In their study, Tamnes and colleagues examined cortical thicknessand executive function correlations using the TMT and severalother tasks. Surprisingly, the authors reported that most signif-icant correlations between executive function task performanceand cortical thickness were found in posterior brain regions. Onlyone task, another measure of set-shifting, called Plus Minus, wasassociated with precentral gyrus thickness. Thus, this study high-lights the importance of non-frontal regions in accounting forindividual differences in executive function in a pediatric sample.
Because of the scarcity of studies examining the neu-roanatomic correlates of TMT or set-shifting in youth, we willturn to the adult literature to help generate hypotheses for ourstudy. These investigations include studies of patients with lesionsin different anatomic locations as well as both structural andfunctional magnetic resonance imaging (sMRI and fMRI, respec-tively) studies within the context of health, aging, and psychiatricillness. With regard to lesion studies, there is a large corpus ofresearch implicating the frontal lobes in the completion of set-shifting tasks, including the TMT (Eslinger and Grattan, 1993;Stuss et al., 2001; Aron et al., 2004; McDonald et al., 2005; Yochimet al., 2007). However, the importance of the frontal lobes to taskperformance does not appear to be specific, as studies of patientswith non-frontal lesions also demonstrate impairment on theTMT. In fact, a meta-analysis demonstrated that while frontalpatients showed a small but statistically significant disadvantageon Trails A relative to patients with non-frontal lesions, a statisti-cally significant disadvantage was not found for Trails B, as wouldbe expected (Demakis, 2004). Thus, it is clear from this meta-analysis that damage to other brain regions results in impairedperformance on this multifaceted task, consistent with both struc-tural (Pa et al., 2010) and functional neuroimaging (Moll et al.,2002; Zakzanis et al., 2005; Jacobson et al., 2011) studies of typi-cal and atypical populations, which are described in greater detailbelow.
Three fMRI studies conducted with healthy adults utilizingeither a verbal adaptation of the TMT or a version with an MRI-safe stylus implicated the frontal lobes when comparing TrailsB vs. A performance. Two of these studies (Moll et al., 2002;Zakzanis et al., 2005) specifically implicated the left dorsolateralprefrontal cortex, while the third study implicated the right infe-rior and middle frontal gyri (Jacobson et al., 2011) along withthe right precentral gyrus. All of these studies also noted theinvolvement of posterior brain regions while completing the TMT(and in particular when the B vs. A conditions were compared).Moll et al. (2002) noted the involvement of the intraparietal sul-cus bilaterally. Zakzanis et al. (2005) reported left middle andsuperior temporal gyri activation and right cingulate and para-central lobule activity. Finally, Jacobson et al. (2011) reportedinvolvement of the left middle temporal and angular gyri.
Thus, there appears to be support from structural imagingstudies of typical and atypical adults, lesion studies, and func-tional imaging for the importance of both the frontal lobes and
Frontiers in Psychology | Developmental Psychology July 2014 | Volume 5 | Article 496 | 2

Lee et al. Anatomical coupling and trails performance
posterior brain regions in the completion of the TMT. These find-ings fit with current thinking that different cognitive abilities arelikely to be better understood from a functional (or structural)network perspective (for a review, see Park and Friston, 2013).Rather than focus on one modular region of the brain, networkapproaches suggest that it is the functioning of different clus-ters of brain regions that is important for higher-level cognition.Across studies, a number of different functional brain networkshave been described, including the frontoparietal control, dor-sal and ventral attention, somatosensory-motor, visual, language,and default mode networks (for a review, see Lee et al., 2012).
In an effort to add to this literature, the current study inves-tigated how individual differences in structural covariance relateto TMT performance. Structural covariance refers to the obser-vation that ‘. . . inter-individual differences in the structure of abrain region often covary with inter-individual differences inother brain regions (Alexander-Bloch et al., 2013a, p. 322). Ourgroup has examined structural covariance using different meth-ods, including graph analytic techniques (Alexander-Bloch et al.,2013b) and a method developed by Lerch et al. (2006) referredto as MACACC or Mapping Anatomical Correlations AcrossCerebral Cortex. Using the latter technique, Lerch et al. demon-strated that cortical thickness correlation maps between a seedregion in Broca’s area and the rest of the cortex closely resembledwhite matter tractography maps generated from diffusion tensorimaging investigations. These findings suggested that correlationsamong regional gray matter measurements may indeed reflect theunderlying white matter connectivity (and network structure ofregions that are anatomically connected). Thus this techniqueis quite analogous to functional MRI, which relies on examin-ing correlations among BOLD activation foci as a measure offunctional connectivity. The MACACC technique has also iden-tified structural covariance among regions implicated in highlyreplicated functional imaging networks, such as the default mode(Raznahan et al., 2011) and language (Lee et al., 2013) networks.
Furthermore, structural covariance has been found to be pre-dictive of cognitive function (Lerch et al., 2006) and diseasestates (He et al., 2008). With regard to the former, Lerch andcolleagues provided the first evidence that correlations amongregional cortical thickness measurements index individual differ-ences in intellectual abilities in typical youth. Following up onthis, we investigated how individual differences in cortical thick-ness covariance related to vocabulary aptitude (Lee et al., 2013).Similar to Lerch’s findings for intellectual abilities, we found thatgreater cortical thickness covariance among semantic hubs in thebrain was related to higher scores on the Wechsler Vocabularysubtest (Lee et al., 2013).
In the current paper, we have chosen to examine corticalthickness covariance over the covariance of other measures ofbrain morphometry, such as regional surface area or gyrifica-tion, because prior work in our laboratory has demonstrated thatindividual differences in cortical thickness relate to variation inintellectual abilities (Shaw et al., 2006) as well as subclinical autis-tic and antisocial traits (Wallace et al., 2012). Thus, we applied asimilar approach to the one used in Lee et al. (2013) to examinestructural brain networks underpinning individual differences inTMT to test the hypothesis that stronger TMT performance will
be associated with greater cross-cortical covariance in regions ofcortex thought to be relevant to executive function abilities (e.g.,the prefrontal cortex).
MATERIALS AND METHODSPARTICIPANTSThe study’s cross-sectional sample included 146 unrelated,typically-developing youth, ages 9–14 years, participating in anongoing brain imaging study of single- and twin-birth childrenand adolescents being conducted in the Child Psychiatry Branchof the National Institute of Mental Health (NIMH; Giedd et al.,2009). The vast majority of participants were Caucasian (n = 121;83%) and right-handed (n = 128; 88%). Data regarding age, IQ,and Trails Performance can be found in Table 1.
Inclusion criteria were as follows. Participants were requiredto: (a) be free of any developmental, learning, or psychiatricdisorders as well any condition known to affect gross brain devel-opment; and (b) have provided useable data on both the TMTand a structural MRI scan (acquired on a GE 1.5 T scanner) thatwere acquired with 3 months of each other. [The vast majority(∼98%) of participants completed testing and scanning withinthe same week].
Verbal or written assent was obtained from minors alongwith written consent from the parents. The NIMH InstitutionalReview Board approved the protocol.
COGNITIVE MEASURESWechsler Intelligence ScalesThe Wechsler Abbreviated Scale of Intelligence (WASI) wasadministered to all participants (Wechsler, 1999) as an estimateof overall intellectual abilities.
Trail Making TestAll participants completed the Intermediate form of the Halstead-Reitan TMT (Reitan and Wolfson, 1993). As stated earlier, par-ticipants are asked to draw lines between encircled numbers(Part A) or to alternate between connecting encircled numbersand letters arranged on a page (Part B) as quickly as they can.Because the focus of the current study was on relations betweenindividual differences in performance and anatomical coupling,scores on the different TMT measures were age-standardized byregressing the effects of age out of raw scores (i.e., the time tocomplete Trails B or the difference in time between Trails B andTrails A) and saving the standardized residuals (M = 0; SD =1). The two primary variables considered in the current studywere the age-regressed standardized residuals of Trails B Timeand the Difference between Trails B and Trails A Completion
Table 1 | Demographic information about the sample and mean TMT
age-adjusted Z-scores.
Age IQ Trails B (s) Trails B Trails Trails B–A
Age Z-score B–A (s) Age Z-score
M 12.23 114.28 28.50 −0.06 14.92 0.00
SD 1.80 12.08 10.66 0.91 9.08 1.00
Range 9–14 86–147 10–61 −1.76–2.82 0–48 −1.93–3.82
www.frontiersin.org July 2014 | Volume 5 | Article 496 | 3
Lee et al. Anatomical coupling and trails performance
Time (Trails B–A). Note that lower Z-scores denote better (faster)performance.
Prior to conducting primary analyses, data were inspected fornormality and outliers. Of the 153 eligible participants with botha useable scan and TMT data, seven were excluded due to beingoutliers (>3 SD from the mean) on Trails A, Trails B or the differ-ence between Trails B and A. This resulted in the current sampleof 146 participants.
MRI SCAN ACQUISITION AND PROCESSING METHODSAll MRI scans were acquired using the same General Electric1.5 Tesla Signa Scanner at the National Institutes of HealthClinical Center in Bethesda, Maryland. Each participant con-tributed one scan. A three-dimensional spoiled gradient recalledecho sequence in the steady state, designed to optimize distinc-tions between gray matter, white matter, and cerebrospinal fluidwas used to acquire 124 contiguous, 1.5-mm thick slices in theaxial plane (TE/TR = 5/24 ms; flip angle = 45 degrees, matrix =256 × 192, NEX = 1, FOV = 24 cm, acquisition time 9.9 min).
Montreal Neurological Institute’s (MNI) automated CIVETpipeline was used for tissue classification and subsequent corticalthickness measurements. The native MRI scans were registeredinto standardized stereotaxic space and were corrected for non-uniformity artifacts (Sled et al., 1998) using a linear transforma-tion (Collins et al., 1994). Tissue was classified into gray or whitematter, spinal fluid, or background with a neural net classifier(Zijdenbos et al., 2002). Subsequently, the inner (white matter)and outer (pial) cortical surfaces were extracted using deformablesurface-mesh models (MacDonald et al., 2000; Kim et al., 2005),and they were aligned non-linearly toward a standard templatesurface (Robbins et al., 2004).
Cortical thickness was quantified by measuring the linked dis-tance between the white and pial surfaces (t-link metric) in nativespace (MacDonald et al., 2000; Lerch and Evans, 2005). A 30-mmsurface-based diffusion-smoothing kernel (Chung et al., 2003)was utilized. These methods have been validated several ways.Validation methods include (a) manual measurements (Kabaniet al., 2001), (b) population simulation (Lerch and Evans, 2005),and (c) validation within an Alzheimer’s disease sample (Lerchet al., 2005).
All scans passed a two-stage quality assessment process whichensured the absence of (a) visible motion artifacts extending intothe brain parenchyma in native images, and (b) visible errorsin definition of the cortical ribbon based on an inspection of3D reconstructions for the gray-white and pial surfaces in eachscan. Furthermore, we graphically inspected the distribution ofindividual cortical thickness estimates within our sample at statis-tically significant peak foci to screen for outlier effects, as well asquantitatively tested for the lack of distorting outlier effects by re-running analyses after exclusion of any data point with a Cook’sdistance value of greater than 0.03. This value was calculated usingthe following formula: d = 4/n − k − 1 where n is the number ofcases and k is the number of independent variables.
STATISTICAL ANALYSESThe method we employ for analysis of structural covariancerequires regressing the effects of age and sex out of vertex-level
cortical thickness measurements to prevent observed anatomi-cal coupling being confounded by the effects of age and sex onseparate brain regions (Lerch et al., 2006). Age terms that wereremoved from cortical thickness measurements included age andage-squared, consistent with the findings from our laboratory onthe longitudinal trajectory of cortical gray matter developmentfrom childhood to young adulthood (Giedd et al., 1999).
In order to evaluate if children with better scores on the TMTdemonstrate a greater degree of structural covariance (particu-larly in regions such as the prefrontal cortex), an estimate of therelatedness of cross-cortical vertex-based thickness was needed.Analysis of vertex-wise cortical thickness correlations with over-all mean cortical thickness (MCT) provides a computationallyefficient alternative to calculating and then summarizing all pos-sible vertex-vertex correlations in the brain (Lerch et al., 2006).Therefore, in keeping with prior work (Raznahan et al., 2011; Leeet al., 2013), we examine vertex-MCT coupling as a proxy for therelatedness of each vertex with all other vertices. This approachpermits examination of the interaction between MCT and TMTperformance continuously using regression in the complete sam-ple of 146 participants rather than requiring participants to becategorized into arbitrary categories of high vs. low performance.
For primary analyses, regression was used to predict vertexthickness at 40,962 points in each hemisphere using a packagewritten for use in R statistics developed by colleagues at MNI.In particular, we sought to determine if the relationship betweenMCT and the thickness of a particular vertex varied as a func-tion of TMT performance. Thus, we were most interested inidentifying vertices in which there was an interaction betweenMCT and TMT performance. Regression equations to test for thisinteraction were as follows:
Trails B Time:Cortical thickness(vertex j) = Intercept + ß1(MCT1) + ß2
(Trails B time2) + ß3(MCT1 ∗ Trails B time2).Difference in time for Trails B vs. Trails A:Cortical thickness(vertex j) = Intercept + ß1(MCT1) + ß2
(Trails B–A time2) + ß3(MCT1 ∗ Trails B–A time2).A False Discovery Rate (FDR) adjustment (Benjamini and
Hochberg, 1995) was applied to control for multiple comparisons(i.e., 40,962 regression analyses per hemisphere). Specifically,FDR-adjusted q-values were generated for all terms in the regres-sion equation—that is, the main effect of MCT, main effect ofTrails, and the MCT∗TMT performance interaction. The FDRthreshold applied was q < 0.05.
Exploratory age group analysesLastly, given that the focus of this special issue is on the devel-opment of executive functions in childhood, we ran exploratoryanalyses in order to begin to investigate if TMT-coupling rela-tions vary as a function of age in childhood. We did this intwo ways. First, we ran a linear regression predicting vertex-levelcortical thickness using the following dependent variables: MCT
1The MCT measure utilized here was residualized, with the variance associ-ated with age, age2, and sex removed.2The TMT measures utilized here (Trails B and the difference between TrailsB and A) were residualized, with the variance associated age removed.
Frontiers in Psychology | Developmental Psychology July 2014 | Volume 5 | Article 496 | 4
Lee et al. Anatomical coupling and trails performance
(age-standardized), TMT performance (age-standardized), agegroup (above or below the median age of 12.48) and their interac-tions (both two-way interactions and the three-way interaction).Regression equations used for these analyses are as follows.
Trails B Time:Cortical thickness(vertex j) = Intercept + ß1(MCT1) + ß2
(Trails B time2) + ß3 (Age Subgroup) + ß4 (MCT1 ∗ Trails Btime2) + ß5 (MCT1 ∗Age Subgroup) + ß6 (Trails B time2 ∗AgeSubgroup) + ß7 (MCT1 ∗ Trails B time2 ∗Age Subgroup).
Difference in time for Trails B vs. Trails A:Cortical thickness(vertex j) = Intercept + ß1(MCT1) + ß2
(Trails B–A time2) + ß3 (Age Subgroup) + ß4 (MCT1 ∗ TrailsB–A time2) + ß5 (MCT1 ∗Age Subgroup) + ß6 (Trails B–Atime2 ∗Age Subgroup) + ß7 (MCT1 ∗ Trails B–A time2 ∗AgeSubgroup).
For these analyses, we were most interested in the three-way interaction for MCT∗TMT∗Age subgroup, as a significantinteraction would suggest that the relations between anatomi-cal coupling within the context of TMT performance varied asa function of age.
Second, we divided the sample into younger and older partic-ipants by splitting the group at the median age. We then re-ranthe primary regression analyses in the younger and older samplesto qualitatively compare the findings. This will be described ingreater detail in the Results section.
RESULTSIn this manuscript, our primary research question was as fol-lows: Is stronger TMT performance in childhood (as measuredby time to complete Trails B and the difference between Trails Band A) associated with greater cross-cortical covariance in regionsof cortex thought to be relevant to executive functions (e.g., theprefrontal cortex)? Stated another way, is the thickness of the pre-frontal cortex and other cortical regions more highly correlatedwith the thickness of the rest of cortex (as estimated by MCT) inthose with higher TMT scores?
This question was evaluated separately at every vertex in eachhemisphere in the complete sample of 146 participants usingthe regression equations described above in the Materials andMethods section. In particular, we were interested in whetherthe MCT∗TMT performance interaction was significant, as thiswould indicate that the strength of the relationship between MCTand a particular vertex’s thickness varied as a function of TMTperformance.
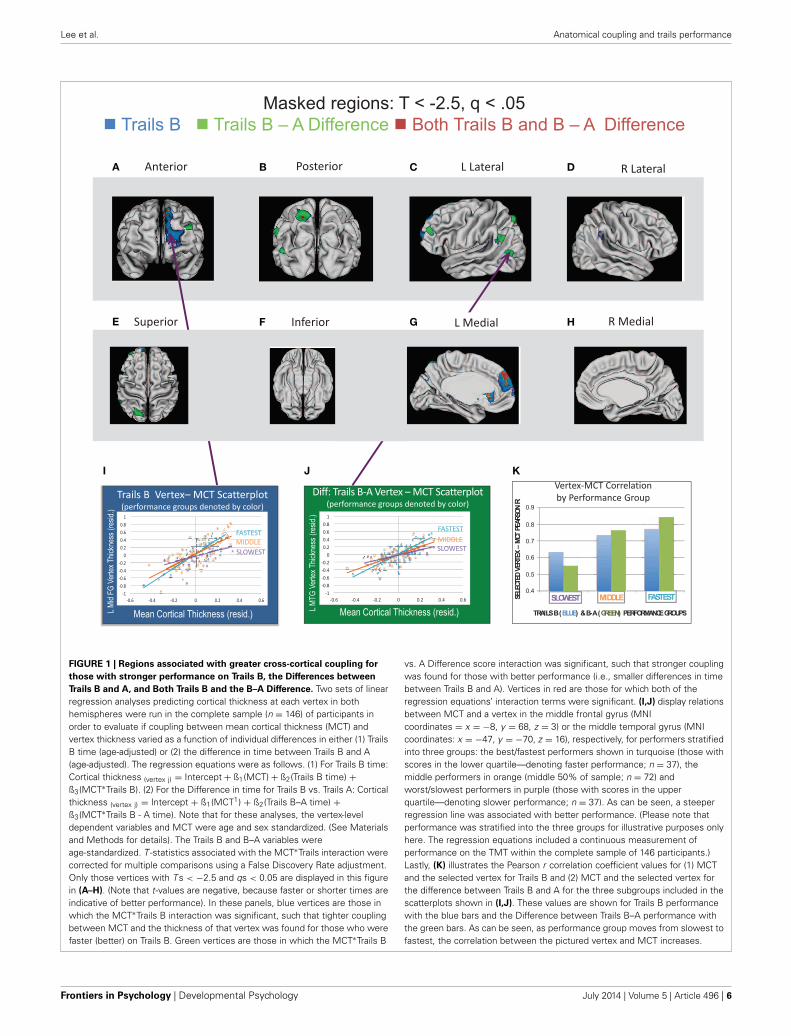
Regions in which statistically significant interactions werefound between MCT and either Trails B Time (age-adjusted)or the Difference between Trails B and A (age-adjusted) arepresented in Figure 1. Blue vertices are those in which theMCT∗Trails B interaction was significant (following FDR correc-tion, q < 0.05 for all terms in the regression equation), such thattighter correlations between MCT and the thickness of that vertexwere found for those who were faster (better) on Trails B. Greenvertices are those in which the MCT∗Trails B vs. A Differencescore interaction was significant, such that stronger coupling wasfound for those with better performance (i.e., smaller differencesin time between Trails B and A). Vertices in red are those forwhich both of the regression equations’ interaction terms were
significant. Because the focus of the manuscript was on regionsof the cortex in which MCT and vertex thickness correlationsvaried as a function of TMT performance, we have elected toleave the findings for main effects of MCT and TMT performanceout of Figure 1. However, this information has been included inSupplementary Figures S1 and S2 for Trails B and Trails B–A,respectively.
As can be seen in Figure 1, a large swath of cortex in the supe-rior and medial prefrontal cortex was more tightly coupled withthe rest of the cortical ribbon in those who were faster at TrailsB. When the difference between Trails B and A was considered,several smaller clusters of vertices were found to be more tightlycoupled with the thickness of the rest of the cortex in better per-formers, including an overlapping region in the medial prefrontalcortex associated with better Trails B performance describedabove (in red in the figure). Additional regions included a clus-ter of vertices in dorsolateral prefrontal cortex, two small clustersnear the temporal-parietal junction, and a cluster of vertices insuperior parietal lobule (including a small region that overlappedwith Trails B performance as shown in red). Lastly, there were alsoa few regions in which tighter coupling between MCT and vertexthickness was associated with poorer TMT performance. Theseresults are summarized in Supplementary Figure S3.
To complement these analyses and demonstrate that the clus-ters of vertices displayed in Figure 1 were associated with agreater degree of coupling with the rest of the cortex in thosewho were better performers (based on age-adjusted scores), wedichotomized the complete sample of 146 participants into thosewith scores in the lower and upper quartiles of the sample basedon their age-adjusted Trails B score (or the difference in timebetween Trails B and A–age-adjusted). We then ran correlationsbetween the thickness of the peak vertex identified in prior anal-yses and all vertices in the left and right hemisphere in the twogroups—high/fast performers (those with scores in the lowerquartile—denoting faster performance) and low/slow perform-ers (those with scores in the upper quartile—denoting slowerperformance).
These findings are summarized for Trails B in Figure 2 and forthe difference between Trails B and A in Figure 3. For Trails B,the vertex in which the highest t-value was found for the inter-action between MCT and TMT performance—referred to as the“peak vertex”—was identified in the medial prefrontal cortex (seeFigure 2A). The thickness of this vertex was correlated with allother vertices in the high/fast and low/slow performing groupsseparately. The resulting correlation coefficients were projectedonto the cortex and are presented in Figure 2B. In order to illus-trate differences in the number of vertices that exceeded differentcorrelation coefficient thresholds, the correlation range evaluatedwas truncated and Figure 2C presents the regions (and numberof vertices) in which the correlation coefficients exceeded the fol-lowing thresholds: r > 0.1, 0.3, 0.5, and 0.7. These values (i.e.,number of vertices falling above and below the different thresh-olds) were compared for high/fast and low/slow performers uti-lizing chi-square. For all comparisons, the chi-square results weresignificant (all χ2s > 100, ps < 0.001) in favor of the higher/fasterperformers having a greater proportion of vertices that exceededthe stated correlation coefficient threshold. Analogously, for the
www.frontiersin.org July 2014 | Volume 5 | Article 496 | 5
Lee et al. Anatomical coupling and trails performance
0.4
0.5
0.6
0.7
0.8
0.9
A B C D
E
I J K
F G H
FIGURE 1 | Regions associated with greater cross-cortical coupling for
those with stronger performance on Trails B, the Differences between
Trails B and A, and Both Trails B and the B–A Difference. Two sets of linearregression analyses predicting cortical thickness at each vertex in bothhemispheres were run in the complete sample (n = 146) of participants inorder to evaluate if coupling between mean cortical thickness (MCT) andvertex thickness varied as a function of individual differences in either (1) TrailsB time (age-adjusted) or (2) the difference in time between Trails B and A(age-adjusted). The regression equations were as follows. (1) For Trails B time:Cortical thickness (vertex j) = Intercept + ß1(MCT) + ß2(Trails B time) +ß3(MCT∗Trails B). (2) For the Difference in time for Trails B vs. Trails A: Corticalthickness (vertex j) = Intercept + ß1(MCT1) + ß2(Trails B–A time) +ß3(MCT∗Trails B - A time). Note that for these analyses, the vertex-leveldependent variables and MCT were age and sex standardized. (See Materialsand Methods for details). The Trails B and B–A variables wereage-standardized. T -statistics associated with the MCT∗Trails interaction werecorrected for multiple comparisons using a False Discovery Rate adjustment.Only those vertices with T s < −2.5 and qs < 0.05 are displayed in this figurein (A–H). (Note that t-values are negative, because faster or shorter times areindicative of better performance). In these panels, blue vertices are those inwhich the MCT∗Trails B interaction was significant, such that tighter couplingbetween MCT and the thickness of that vertex was found for those who werefaster (better) on Trails B. Green vertices are those in which the MCT∗Trails B
vs. A Difference score interaction was significant, such that stronger couplingwas found for those with better performance (i.e., smaller differences in timebetween Trails B and A). Vertices in red are those for which both of theregression equations’ interaction terms were significant. (I,J) display relationsbetween MCT and a vertex in the middle frontal gyrus (MNIcoordinates = x = −8, y = 68, z = 3) or the middle temporal gyrus (MNIcoordinates: x = −47, y = −70, z = 16), respectively, for performers stratifiedinto three groups: the best/fastest performers shown in turquoise (those withscores in the lower quartile—denoting faster performance; n = 37), themiddle performers in orange (middle 50% of sample; n = 72) andworst/slowest performers in purple (those with scores in the upperquartile—denoting slower performance; n = 37). As can be seen, a steeperregression line was associated with better performance. (Please note thatperformance was stratified into the three groups for illustrative purposes onlyhere. The regression equations included a continuous measurement ofperformance on the TMT within the complete sample of 146 participants.)Lastly, (K) illustrates the Pearson r correlation coefficient values for (1) MCTand the selected vertex for Trails B and (2) MCT and the selected vertex forthe difference between Trails B and A for the three subgroups included in thescatterplots shown in (I,J). These values are shown for Trails B performancewith the blue bars and the Difference between Trails B–A performance withthe green bars. As can be seen, as performance group moves from slowest tofastest, the correlation between the pictured vertex and MCT increases.
Frontiers in Psychology | Developmental Psychology July 2014 | Volume 5 | Article 496 | 6
Lee et al. Anatomical coupling and trails performance
difference between Trails B–A, the peak in the superior parietallobule is used as the seed and the corresponding correlations arepresented in Figures 2B,C. Lastly, for Trails B–A, correlation coef-ficient maps for the peak vertices in the middle and superiortemporal lobe clusters and the dorsal and medial prefrontal cortexclusters are provided in Supplementary Figure S4.
EXPLORATORY ANALYSES EXAMINING THE EFFECTS OF AGE ONTMT-ANATOMICAL COUPLING FINDINGSGiven that the focus of the current special issue is on the devel-opment of executive functions, we undertook several exploratoryanalyses to evaluate differential age-effects on the TMTperformance-coupling findings described above for the completesample. Specifically, we ran a linear regression predicting vertex-level cortical thickness using the following dependent variables:MCT (age-standardized), TMT performance (age-standardized),age group (above or below the median age of 12.48) and theirinteractions (both two-way interactions and the three-way inter-action). See the end of the Materials and Methods section for theequations utilized for Trails B and the difference between TrailsB and A. For these analyses, we were most interested in the three-way MCT∗TMT∗Age group interaction, as this would suggest thatthe relations between anatomical coupling within the context ofTMT performance varied as a function of age.
For Trails B, only three small regions were predictedsignificantly by the three-way interaction (q < 0.05). Theseincluded small regions in inferior medial prefrontal cortex, infe-rior somatosensory cortex, and the posterior cingulate. Theapproximate locations of these three regions are identified inSupplementary Figure S5 with asterisks.
For these three-way interactions, results were such that tightercoupling was associated with better performance on Trails B(age-standardized) in the younger but not older subgroup. (Forthe older subgroup, the general trend in the data was fortighter coupling in the three regions being associated with poorerperformance).
For the difference between Trails B and A, no statisticallysignificant three-way interactions were identified, suggestingthat the coupling-TMT performance findings were not modifiedby age. In addition to evaluating the occurrence of three-wayinteractions for Trails B and the difference between Trails B andA, we also divided our sample into two age-based subgroups(Younger: age less than the group median of 12.48; Older:age greater than or equal to the group median) in order toexamine age effects in a more qualitative fashion. We then re-ranthe initial regression equation used to answer the main studyquestions in these two subgroups: vertex thickness ∼ MCT +TMT + MCT∗TMT performance. The MCT∗TMT performanceinteraction results for the age-adjusted Trails B findings and theage-adjusted Trails B–A findings were projected onto the corticalsurface in Supplementary Figures S5, S6, respectively. Coolercolors in these figures represent those in which the MCT∗TMTperformance interaction was significant in the whole sample,the younger subgroup, or both. In contrast, the warm colorsrepresent regions in which the MCT∗TMT interaction wassignificant for the older subgroup or both the older subgroupand the whole sample.
The results of the three-way MCT∗TMT∗Age interaction andthe subgroup analyses suggest that age-effects on TMT-couplingare small within this limited age-range. However, these smalleffects suggest that younger age is associated with coupling amonga greater number of cortical regions. This was tested by com-paring the number of vertices that exceeded the FDR-correctedthreshold (q < 0.05) for the MCT∗TMT interaction for theyounger and older subgroups. For both Trails B and the differencebetween Trials B and A, the chi-square findings were highly sig-nificant. For Trails B, 1229 vertices exceeded the threshold in theyounger subgroup while only 297 exceeded this threshold in theolder subgroup [χ2(1) = 573, p < 0.001]. Similarly, for the B–Adifference, 800 vertices exceeded the threshold for the youngersubgroup compared to 256 in the older subgroup [χ2(1) = 281,p < 0.001].
DISCUSSIONAdding to the literature on the neural correlates of executivefunction in childhood, here we demonstrate that individual dif-ferences on a commonly-administered executive function task,the Halstead-Reitan TMT, relate to the degree of anatomical cou-pling between the left prefrontal cortex and other distributedcortical regions. In particular, we found that for youth who werefaster than their peers on Trails B (age-adjusted scores), there wasgreater coupling between a large swath of the prefrontal cortex,including portions of Brodmann areas 9 (dorsolateral prefrontalcortex) through 11 and the anterior cingulate, and the rest of cor-tex. When the difference between Trails B and A (age-adjusted)was considered, a network of mostly left-lateralized regions wasfound to be more strongly coupled with the rest of cortex,including clusters of vertices in the dorsolateral and dorsome-dial prefrontal cortex, the posterior middle and superior temporalgyri (corresponding roughly to the angular and supramarginalgyri, respectively), and the superior parietal lobule.
These findings are the first to demonstrate how individual dif-ferences in structural (as opposed to functional) covariance relateto performance differences in executive functioning, a group ofhigher-level cognitive abilities that are believed to be impor-tant for academic outcomes (Blair and Razza, 2007) and areimpaired in numerous developmental disorders (Ozonoff andJensen, 1999). Despite the current study’s focus on structuralcovariance, these findings are remarkably consistent with fMRIinvestigations into the functional correlates of TMT performance.Specifically, two studies (Moll et al., 2002; Zakzanis et al., 2005)implicated the left dorsolateral prefrontal cortex when Trails Bperformance was contrasted with Trails A. Furthermore, thesetwo studies and a study conducted by Jacobson et al. (2011)reported the involvement of several posterior brain regions whenTrails B activation was contrasted with Trails A activation. Theseincluded the intraparietal sulcus bilaterally (analogous to oursupramarginal and angular gyri findings; Moll et al., 2002), theleft middle and superior temporal gyri (Zakzanis et al., 2005;Jacobson et al., 2011), the angular gyrus (Jacobson et al., 2011),and the superior parietal lobule (for Trails B performance inparticular; Allen et al., 2011).
Taken together, our structural covariance findings in con-cert with existing fMRI data provide support that a network of
www.frontiersin.org July 2014 | Volume 5 | Article 496 | 7

Lee et al. Anatomical coupling and trails performance
A
B C
FIGURE 2 | Correlations between peak vertex thickness in the medial
prefrontal cortex and the rest of the cortex in high (n = 37) and low
(n = 37) performers on Trails B. The complete sample of 146participants was divided into quartiles based on performance on Trails B(age-adjusted scores). We then ran two sets of correlations between thethickness of the peak vertex identified in prior analyses in medialprefrontal cortex [shown in (A); MNI coordinates: x = −9, y = 51, z = 14]and all vertices in the left and right hemisphere for the group ofhigh/fast performers (those with scores in the lower quartile—denotingfaster performance; n = 37) and the low/slow performers (those with
scores in the upper quartile—denoting slower performance; n = 37). Theresulting correlation coefficients were projected onto the cortical sheetand are presented in (B). In order to illustrate differences in the numberof vertices that exceeded different correlation coefficient thresholds, thecorrelation range evaluated was truncated and (C) presents the regions(and number of vertices) in which the correlation coefficients exceededthe following thresholds: r > 0.1, 0.3, 0.5, and 0.7. These values (i.e.,number of vertices falling above the different thresholds) are providedunder the four images of the brains associated with each threshold forthe high and low groups.
frontal and posterior brain regions is involved with successfulTMT performance. Our study importantly extends the existingliterature to include children for whom executive functioningabilities are developing. In addition, the current study’s findingsconverge with a recent meta-analysis of adult lesion studies thatstrongly demonstrated that damage to brain regions other thanthe frontal lobes was just as likely to impair Trails B (and otherexecutive test) performance as damage to the frontal lobes. Giventhe complexity of executive function tasks and the number of
lower-level cognitive abilities that are involved (e.g., basic visualperception, focused attention, motor coordination and speed), itis not surprising that a network of regions working in unison islikely to underlie successful performance both in adulthood andchildhood.
Analogous to our finding of greater structural covariancebetween the dorsolateral prefrontal cortex and the rest of thecortical ribbon, Cole and colleagues reported higher degrees ofglobal functional connectivity in the lateral prefrontal cortex in
Frontiers in Psychology | Developmental Psychology July 2014 | Volume 5 | Article 496 | 8

Lee et al. Anatomical coupling and trails performance
A
B C
FIGURE 3 | Correlations between peak vertex thickness in the superior
parietal lobule and the rest of the cortex in high (n = 37) and low
(n = 37) performers on the Trails B–A difference score. Analogous to theprocedures described in Figure 2, the complete sample of 146 participantswas divided into quartiles based on performance on the difference in Trails Band A times (age-adjusted scores). We then ran two sets of correlationsbetween the thickness of the peak vertex identified in prior analyses insuperior parietal lobule [shown in (A); MNI coordinates: x = −22, y = −68,z = 62] and all vertices in the left and right hemisphere for the group ofhigh/fast performers (those with scores in the lower quartile—denoting faster
performance; n = 37) and the low/slow performers (those with scores in theupper quartile—denoting slower performance; n = 37). The resultingcorrelation coefficients were projected onto the cortical sheet and arepresented in (B). In order to illustrate differences in the number of verticesthat exceeded different correlation coefficient thresholds, the correlationrange evaluated was truncated and (C) presents the regions (and number ofvertices) in which the correlation coefficients exceeded the followingthresholds: r > 0.1, 0.3, 0.5, and 0.7. These values (i.e., number of verticesfalling above the different thresholds) are provided under the four images ofthe brains associated with each threshold for the high and low groups.
individuals with higher scores on measures of cognitive con-trol (such as classic fluid intelligence tests; Cole et al., 2012).Moreover, an examination of the regions implicated in the cur-rent investigation of the TMT reveals an overlap with regions inthe frontoparietal control and the default mode networks, twonetworks first described in functional connectivity studies (for areview, see Lee et al., 2012). In fact, it has been suggested thatthese networks are two of the most functionally connected in thebrain (Cole et al., 2010). Thus, it is not surprising that higher
degrees of structural covariance in these regions relates to higherperformance on a complex, multifaceted executive function task,such as the TMT.
With regard to the examination of the impact of age on ourTMT-coupling results, we found a small effect on these rela-tions. However, the trend in our data tentatively suggested thatanatomical coupling across multiple regions may be of greaterimportance for TMT success in younger participants, duringa developmental period when executive function abilities are
www.frontiersin.org July 2014 | Volume 5 | Article 496 | 9

Lee et al. Anatomical coupling and trails performance
rapidly developing. In contrast, as children and adolescents age,anatomical coupling in multiple regions may be less crucial forbetter performance. Instead, it could be that with age comes someregional specialization and greater reliance on cross-cortical cou-pling of a few select regions (e.g., reliance on the coupling of thedorsolateral prefrontal cortex in particular).
Given the importance of the prefrontal cortex in the currentstudy and others examining executive functioning using differ-ent methodologies, we would be remiss if we did not focus someof our discussion on the importance of the frontal lobes to exec-utive abilities in particular. In a review paper from 2001, Millerand Cohen provided an integrative theory about the function-ing of the prefrontal cortex (Miller and Cohen, 2001). Based ona synthesis of neuroimaging, neurophysiological, anatomical, andcomputational investigations, they likened the prefrontal cortexto a “switch operator” in a rail system. Using this metaphor, theydescribed the activity of the prefrontal cortex as a map that delin-eates which “tracks” or neural pathways are necessary for thecompletion of different cognitive tasks.
In this review, Miller and Cohen (2001) discussed the impor-tance of the prefrontal cortex in maintaining “active representa-tions” necessary to complete novel tasks requiring goal-directedbehavior and flexibility. They suggested that one of the aspects ofthe prefrontal cortex that makes it unique is its ability to main-tain active representations in the face of interference. Anotherunique feature of the prefrontal cortex is its high level of inter-connectivity with sensory, motor, and limbic systems within thebrain. These two qualities, among others, make the prefrontal cor-tex ideally-suited to serve as a “hub” and coordination center forhigher-level cognitive abilities that require the work of multipleneuroanatomic regions.
In line with Miller and Cohen’s conceptualization, more recentaccounts of prefrontal cortex functioning such as the “gatewayhypothesis” (Burgess et al., 2007) describe the rostral prefrontalcortex (roughly Brodmann area 10), an area implicated in thecurrent investigation, as a “supervisory attentional gateway” thatpermits “stimulus-oriented” or “stimulus-independent” focusedattention. These authors argue that the lateral rostral prefrontalcortex is more associated with the former, while the medial ros-tral prefrontal cortex is more associated with the latter. In thecurrent investigation, both the lateral and medial prefrontal cor-tex were found to be more coupled in youth with higher TMTperformance. Greater coupling in both of these regions certainlyfits with TMT task demands—that is, one must attend to externalstimuli (the encircled symbols on the page) and internal repre-sentations (maintaining a rote sequence of letters and numbers)in order to perform successfully on the task.
The current findings are also in line with the WHACH (what-how, abstract, cold-hot) model of prefrontal cortex functioning(O’Reilly, 2010). This model differentiates dorsal and ventralprefrontal functioning and suggests that the dorsal pathway isassociated with guiding “how” to cope with information (i.e.,“. . . transforming perception into action,” p. 355) while theventral pathway is associated with identifying “what” semanticinformation is relevant for a particular task (i.e., “. . . guidingthe selection and retrieval of semantic/linguistic knowledge,” p.336). O’Reilly points out that the dorsal portions of the prefrontal
cortex appear to be particularly relevant for transforming sensoryinputs into motor outputs and for sequential ordering. These aretwo key aspects of successful TMT performance. Thus, highercoupling of the dorsal prefrontal cortex in better TMT perform-ers provides additional support for the “how” conceptualizationof dorsal prefrontal functioning.
Given the current study’s findings and those of others, it maybe that the prefrontal cortex represents a hub for higher-levelexecutive abilities due to its inclusion in highly interconnectednetworks (dorsal portion of the frontoparietal control networkand dorsal-medial portion of the default mode network). Basedon the work of Buckner et al. (2009), it appears that all of theregions that were found to be more highly coupled in those withbetter TMT performance may indeed be locations of corticalhubs. Why might the “hub” regions implicated here be more cou-pled with the rest of cortex in youth who perform better on theTMT task? One possible explanation draws upon the Hebbianlearning notion that neurons that “fire together, wire together”(Hebb, 1949). Thus, it may be that in youth who are better atexecutive tasks, the coordinated use of different regions of thebrain, including the prefrontal cortex, results in a higher degreeof anatomical coupling among these regions. An alternate expla-nation is that genetic factors contributing to the development ofthese brain regions are shared, and that youth who are better atthese tasks are predisposed to more coordinated development inthese regions.
The cross-sectional nature of this investigation precludesdrawing any conclusions about these alternatives, a limitationof our study design. Another limitation of our study is that wefocused on just one executive task, thus reducing the generaliz-ability of our findings to other executive abilities. Furthermore,given the small age range of the sample studied here (9–14years), we were only able to examine age-TMT-structural covari-ance relations in a preliminary way. A rigorous examination ofage by performance effects on anatomical coupling, particularlywithin the context of a longitudinal study design, will be a crucialnext step in understanding the complex unfolding of the devel-opment of executive abilities and how individual differences inperformance emerge over time.
Despite these limitations, this study is the first of its kindto highlight the importance of structural covariance in relationto individual differences in executive function abilities in youth.Thus, it adds to the growing literature on the neural correlatesof childhood executive functions and identifies neuroanatomiccoupling as a biological substrate that may contribute to typ-ical and atypical executive development. Consistent with fMRIconnectivity work (Lee et al., 2012; Park and Friston, 2013),the present study demonstrates that successful performance ona multiply-determined executive function task is associated withgreater anatomical coupling between the prefrontal cortex andother broadly-distributed cortical regions during childhood andadolescence. Thus, this study of individual differences in the con-text of typical development suggests that disorders of childhoodassociated with executive dysfunction (i.e., lower scores on taskslike the TMT), such as attention deficit hyperactivity disorderand autism spectrum disorder, might demonstrate more localizedanatomical coupling in the frontal lobe and other regions.
Frontiers in Psychology | Developmental Psychology July 2014 | Volume 5 | Article 496 | 10
Lee et al. Anatomical coupling and trails performance
AUTHOR CONTRIBUTIONSNancy Raitano Lee, Gregory L. Wallace, and Jay N. Giedd con-tributed to study design. Liv S. Clasen prepared data for analysis.Nancy Raitano Lee analyzed data and wrote the manuscript.Gregory L. Wallace, Liv S. Clasen, Armin Raznahan, and Jay N.Giedd critically revised the manuscript.
ACKNOWLEDGMENTSThis work was supported by the Intramural Research Programof the National Institutes of Health, National Institute of MentalHealth (NCT00001246; Protocol ID 89-M-0006). We would liketo thank the children and families who made this researchpossible.
SUPPLEMENTARY MATERIALThe Supplementary Material for this article can be found onlineat: http://www.frontiersin.org/journal/10.3389/fpsyg.2014.
00496/abstractSupplementary Figure S1 | Regions in which there were main effects of
mean cortical thickness, Trails B performance, and their interaction in
predicting vertex thickness. This figure supplements Figure 1 in the main
document. Linear regression analyses predicting cortical thickness at each
vertex in both hemispheres were run in the complete sample (n = 146) of
participants in order to evaluate the effects of mean cortical thickness,
Trails B age-adjusted scores, and their interaction. The regression
equation was as follows: Cortical thickness (vertex j) = Intercept +ß1(MCT) + ß2(Trails B time) + ß3(MCT∗Trails B). Note that for these
analyses, the vertex-level dependent variables and MCT were age and sex
standardized. (See Materials and Methods for details). The Trails B
variables were age-standardized. T -statistics associated with each of the
effects in the regression equation were corrected for multiple
comparisons using a False Discovery Rate adjustment. Only those
vertices with qs < 0.05 (associated with a T -threshold of 2.5) are
displayed in this figure in (A–H). Vertices in purple are those in which a
main effect of MCT was found; vertices in blue are those in which main
effects of MCT and Trails B were found such that thinner cortex was
associated with better performance; vertices in turquoise green are those
in which main effects of MCT and Trails B were found such that thicker
cortex was associated with better performance; lastly, vertices in yellow
are those in which an MCT∗Trails B interaction was found such that
greater coupling was associated with better performance.
Supplementary Figure S2 | Regions in which there were main effects of
mean cortical thickness, Trails B–A performance, and their interaction in
predicting vertex thickness. This figure also supplements Figure 1 in the
main document. Linear regression analyses predicting cortical thickness at
each vertex in both hemispheres were run in the complete sample
(n = 146) of participants in order to evaluate the effects of mean cortical
thickness, Trails B–A age-adjusted scores, and their interaction. The
regression equation was as follows: Cortical thickness (vertex j) =Intercept + ß1(MCT) + ß2(Trails B–A time-age-adjusted) + ß3(MCT∗Trails
B–A time- age-adjusted). Note that for these analyses, the vertex-level
dependent variables and MCT were age and sex standardized. (See
Materials and Methods for details). The Trails B–A variables were
age-standardized. T -statistics associated with each of the effects in the
regression equation were corrected for multiple comparisons using a
False Discovery Rate adjustment. Only those vertices with qs < 0.05
(associated with a T -threshold of 2.5) are displayed in this figure in (A–H).
Vertices in purple are those in which a main effect of MCT was found;
vertices in blue are those in which main effects of MCT and Trails B–A
were found such that thinner cortex was associated with better
performance; vertices in turquoise green are those in which main effects
of MCT and Trails B–A were found such that thicker cortex was associated
with better performance; lastly, vertices in yellow are those in which an
MCT∗Trails B–A interaction was found such that greater coupling was
associated with better performance.
Supplementary Figure S3 | Regions associated with greater cross-cortical
coupling for those with poorer performance on Trails B, the Differences
between Trails B and A, and Both Trails B and the B–A Difference. This
figure complements Figure 1 in the main document in that it displays
regions of the cortex in which greater coupling was associated with
poorer performance. Two sets of linear regression analyses predicting
cortical thickness at each vertex in both hemispheres were run in the
complete sample (n = 146) of participants in order to evaluate if coupling
between mean cortical thickness (MCT) and vertex thickness varied as a
function of individual differences in either (1) Trails B time or (2) the
difference in time between Trails B and A. The regression equations were
as follows. (1) For Trails B time: Cortical thickness (vertex j) = Intercept +ß1(MCT) + ß2(Trails B time) + ß3(MCT∗Trails B). (2) For the Difference in
time for Trails B vs. Trails A: Cortical thickness (vertex j) = Intercept +ß1(MCT1) + ß2(Trails B–A time) + ß3(MCT∗Trails B − A time). Note that
for these analyses, the vertex-level dependent variables and MCT were
age and sex standardized. (See Materials and Methods for details). The
Trails B and B–A variables were age-standardized. T -statistics associated
with the MCT∗Trails interaction were corrected for multiple comparisons
using a False Discovery Rate adjustment. Only those vertices with T s >
2.5 and qs < 0.05 are displayed in this figure in (A–H). (Note that t-values
are positive, because slower or longer times are indicative of poorer
performance.) In these panels, blue vertices are those in which the
MCT∗Trails B interaction was significant, such that tighter coupling
between MCT and the thickness of that vertex was found for those who
were slower (worse) on Trails B. Green vertices are those in which the
MCT∗Trails B vs. A Difference score interaction was significant, such that
stronger coupling was found for those with worse performance (i.e.,
greater differences in time between Trails B and A). Vertices in red are
those for which both of the regression equations’ interaction terms were
significant. Lastly, (I,J) display relations between MCT and the thickness
of two vertices in the inferior frontal gyrus—one associated with Trails B
(MNI coordinates: x = 25, y = 28, z = −17) and the other associated with
Trails B − A time (MNI coordinates: x = 20, y = 26, z = −20). Regression
lines are for performers in three groups: the best/fastest performers
shown in turquoise (those with scores in the lower quartile—denoting
faster performance; n = 37), the middle performers in orange (middle
50% of sample; n = 72) and worst/slowest performers in purple (those
with scores in the upper quartile—denoting slower performance; n = 37).
As can be seen, a steeper regression line was associated with poorer
performance. (Please note that performance was stratified into the three
groups for illustrative purposes only here. The regression equations
included a continuous measurement of performance on the TMT within
the complete sample of 146 participants.)
Supplementary Figure S4 | Correlations between peak vertex thickness for
clusters in the middle temporal, superior temporal, dorsolateral
prefrontal, and dorsomedial prefrontal cortex in high (n = 37) and low
(n = 37) performers on the Trails B–A difference score. Analogous to the
procedures described in Figure 3, the complete sample of 146
www.frontiersin.org July 2014 | Volume 5 | Article 496 | 11

Lee et al. Anatomical coupling and trails performance
participants was divided into quartiles based on performance on the
difference in Trails B and A times (age-adjusted scores). We then ran two
sets of correlations between the thickness of the peak vertex identified in
prior analyses in the (A) posterior middle temporal gyrus, (B) posterior
superior temporal gyrus, (C) dorsolateral prefrontal cortex, and
(D) dorsomedial prefrontal cortex and all vertices in the left and right
hemisphere for the group of high/fast performers (those with scores in
the lower quartile—denoting faster performance; n = 37) and the
low/slow performers (those with scores in the upper quartile—denoting
slower performance; n = 37). The resulting correlation coefficients were
projected onto the cortical sheet and can be viewed in (A) through (D).
Note: MNI coordinates for peaks included in this figure were as follows:
(A) posterior middle temporal gyrus: x = −47, y = −70, z = 16; (B)
posterior superior temporal gyrus: x = −57, y = −54, z = 34; (C)
dorsolateral prefrontal cortex: x = −39, y = 51, z = 16; (D) dorsomedial
prefrontal cortex: x = −4, y = 53, z = 29.
Supplementary Figure S5 | Regions in which an interaction between
mean cortical thickness Trails B performance were found for younger
participants (n = 73), older participants (n = 73), and the whole sample
(n = 146). In order to investigate whether TMT-coupling relations vary as
a function of age in childhood, we divided the sample into younger and
older participants by splitting the group at the median age (12.48). We
then re-ran the primary regression analyses [Cortical thickness (vertex j) =Intercept + ß1(MCT) + ß2(Trails B time-age-adjusted) + ß3(MCT∗Trails
B-age-adjusted)] in the younger (n = 73) and older (n = 73) subgroups to
qualitatively compare the findings. Note that for these analyses, the
vertex-level dependent variables and MCT were age and sex
standardized. (See Materials and Methods for details). The Trails B
variables were age-standardized. Vertices exceeding the FDR-adjusted
threshold for MCT∗Trails B interaction (q < 0.05; T -threshold of 2.5)
were projected onto the cortex using the following color code. (1)
Vertices associated with a statistically significant MCT∗Trails B
interaction in the whole sample were coded royal blue; (2) vertices that
were only found to be statistically significant in the younger sample
were coded turquoise blue; (3) vertices associated with a statistically
significant interaction in analyses of both the whole sample and the
younger sample were coded green; (4) vertices with statistically
significant interactions in the older subgroup were coded orange; and (5)
vertices with statistically significant interaction terms in both analyses of
the older subgroup and the whole sample were coded red. In order to
evaluate age-effects using a more rigorous technique statistically, we also
ran a series of linear regression analyses predicting vertex-level cortical
thickness using the following equation: Cortical thickness(vertex j) =Intercept + ß1(MCT) + ß2(Trails B time) + ß3 (Age Subgroup) + ß4
(MCT∗Trails B time-age adjusted) + ß5 (MCT∗Age Subgroup) + ß6
(Trails B time-age adjusted ∗Age Subgroup) + ß7 (MCT∗Trails B time-age
adjusted∗Age Subgroup). Again note that for these analyses, the
vertex-level dependent variables and MCT were age and sex
standardized (see Materials and Methods for details) and the Trails B
variables were age-standardized. Regions with an asterisk (∗) denote the
approximate location of the statistically significant three-way interactions
that survived the FDR adjusted T -value of 2.7 (q < 0.05). For the three
regions in which there was a three-way interaction, the findings were
such that greater coupling was associated with better Trails B
(age-adjusted) performance in younger participants. The general trend in
the data was for the opposite to be true in the older subgroup—that is
tighter coupling was associated with poorer performance.
Supplementary Figure S6 | Regions in which an interaction between mean
cortical thickness Trails B–A performance were found for younger
participants (n = 73), older participants (n = 73), and the whole sample
(n = 146). In order to investigate whether TMT-coupling relations vary as a
function of age in childhood, we divided the sample into younger and
older participants by splitting the group at the median age (12.44). We
then re-ran the primary regression analyses [Cortical thickness (vertex j) =Intercept + ß1(MCT) + ß2(Trails B–A time-age-adjusted) + ß3(MCT∗Trails
B–A-age-adjusted)] in the younger (n = 73) and older (n = 73) subgroups
to qualitatively compare the findings. Vertices with interaction terms
exceeding the FDR-adjusted threshold for regression analyses (T > 2.5;
q < 0.05) were projected onto the cortex using the following color code.
(1) Vertices associated with statistically significant MCT∗Trails B–A
interaction terms in the whole sample were coded royal blue; (2) vertices
that were only found to be statistically significant in the younger sample
were coded turquoise blue; (3) vertices associated with a statistically
significant interaction in analyses of both the whole sample and the
younger sample were coded green; (4) vertices with statistically
significant interactions in the older subgroup were coded orange; and (5)
vertices with statistically significant interaction terms in both analyses of
the older subgroup and the whole sample were coded red. In order to
evaluate age-effects using a more rigorous technique statistically, we also
ran a series of linear regression analyses predicting vertex-level cortical
thickness using the following equation: Cortical thickness(vertex j) =Intercept + ß1(MCT) + ß2(Trails B–A time) + ß3 (Age Subgroup) + ß4
(MCT∗Trails B–A time-age-adjusted) + ß5 (MCT∗Age Subgroup) + ß6
(Trails B–A time-age adjusted ∗Age Subgroup) + ß7 (MCT∗Trails B
time-age adjusted∗Age Subgroup). Again note that for these analyses, the
vertex-level dependent variables and MCT were age and sex standardized
(see Materials and Methods for details) and the Trails B variables were
age-standardized. Unlike Trails B performance, no statistically significant
three-way interactions were found (all qs > 0.05).
REFERENCESAlexander-Bloch, A., Giedd, J. N., and Bullmore, E. (2013a). Imaging structural
co-variance between human brain regions. Nat. Rev. Neurosci. 14, 322–336. doi:10.1038/nrn3465
Alexander-Bloch, A., Raznahan, A., Bullmore, E., and Giedd, J. (2013b). The con-vergence of maturational change and structural covariance in human corticalnetworks. J. Neurosci. 33, 2889–2899. doi: 10.1523/JNEUROSCI.3554-12.2013
Allen, D. N., Thaler, N. S., Barchard, K. A., Vertinski, M., and Mayfield, J.(2012a). Factor structure of the Comprehensive Trail Making Test in chil-dren and adolescents with brain dysfunction. Psychol. Assess. 24, 964–972. doi:10.1037/a0028521
Allen, D. N., Thaler, N. S., Ringdahl, E. N., Barney, S. J., and Mayfield, J. (2012b).Comprehensive Trail Making Test performance in children and adolescents withtraumatic brain injury. Psychol. Assess. 24, 556–564. doi: 10.1037/a0026263
Allen, M. D., Owens, T. E., Fong, A. K., and Richards, D. R. (2011). A func-tional neuroimaging analysis of the Trail Making Test-B: implications for clinicalapplication. Behav. Neurol. 24, 159–171. doi: 10.1155/2011/476893
Aron, A. R., Monsell, S., Sahakian, B. J., and Robbins, T. W. (2004). A componentialanalysis of task-switching deficits associated with lesions of left and right frontalcortex. Brain 127(Pt 7), 1561–1573. doi: 10.1093/brain/awh169
Benjamini, Y., and Hochberg, Y. (1995). Controlling the false discovery rate: a prac-tical and powerful approach to multiple testing. J. R. Stat. Soc. B 57, 289–300.doi: 10.2307/2346101
Blair, C., and Razza, R. P. (2007). Relating effortful control, executive function, andfalse belief understanding to emerging math and literacy ability in kindergarten.Child Dev. 78, 647–663. doi: 10.1111/j.1467-8624.2007.01019.x
Braver, T. S., and Ruge, H. (2006). “Neuroimaging of executive functions,” inHandbook of Functional Neuroimaging of Cognition, 2nd Edn., eds R. Cabeza andA. Kingstone (Cambridge, MA: MIT Press), 307–348.
Frontiers in Psychology | Developmental Psychology July 2014 | Volume 5 | Article 496 | 12
Lee et al. Anatomical coupling and trails performance
Buckner, R. L., Sepulcre, J., Talukdar, T., Krienen, F. M., Liu, H., Hedden, T.,et al. (2009). Cortical hubs revealed by intrinsic functional connectivity: map-ping, assessment of stability, and relation to Alzheimer’s disease. J. Neurosci. 29,1860–1873. doi: 10.1523/JNEUROSCI.5062-08.2009
Burgess, P. W., Dumontheil, I., and Gilbert, S. J. (2007). The gateway hypothesis ofrostral prefrontal cortex (area 10) function. Trends Cogn. Sci. 11, 290–298. doi:10.1016/j.tics.2007.05.004
Chung, M. K., Worsley, K. J., Robbins, S., Paus, T., Taylor, J., Giedd, J. N.,et al. (2003). Deformation-based surface morphometry applied to gray matterdeformation. Neuroimage 18, 198–213. doi: 10.1016/S1053-8119(02)00017-4
Cole, M. W., Pathak, S., and Schneider, W. (2010). Identifying the brain’smost globally connected regions. Neuroimage 49, 3132–3148. doi:10.1016/j.neuroimage.2009.11.001
Cole, M. W., Yarkoni, T., Repovs, G., Anticevic, A., and Braver, T. S. (2012). Globalconnectivity of prefrontal cortex predicts cognitive control and intelligence.J. Neurosci. 32, 8988–8999. doi: 10.1523/JNEUROSCI.0536-12.2012
Collins, D. L., Neelin, P., Peters, T. M., and Evans, A. C. (1994). Automatic 3Dintersubject registration of MR volumetric data in standardized Talairach space.J. Comput. Assist. Tomogr. 18, 192–205. doi: 10.1097/00004728-199403000-00005
Conklin, H. M., Luciana, M., Hooper, C. J., and Yarger, R. S. (2007). Workingmemory performance in typically developing children and adolescents: behav-ioral evidence of protracted frontal lobe development. Dev. Neuropsychol. 31,103–128. doi: 10.1207/s15326942dn3101_6
Demakis, G. J. (2004). Frontal lobe damage and tests of executive processing: ameta-analysis of the category test, stroop test, and trail-making test. J. Clin. Exp.Neuropsychol. 26, 441–450. doi: 10.1080/13803390490510149
Eslinger, P. J., and Grattan, L. M. (1993). Frontal lobe and frontal-striatal substratesfor different forms of human cognitive flexibility. Neuropsychologia 31, 17–28.doi: 10.1016/0028-3932(93)90077-D
Fine, E. M., Delis, D. C., and Holdnack, J. (2011). Normative adjustments to theD-KEFS trail making test: corrections for education and vocabulary level. Clin.Neuropsychol. 25, 1331–1344. doi: 10.1080/13854046.2011.609838
Giedd, J. N., Blumenthal, J., Jeffries, N. O., Castellanos, F. X., Liu, H., Zijdenbos,A., et al. (1999). Brain development during childhood and adolescence: alongitudinal MRI study. Nat. Neurosci. 2, 861–863. doi: 10.1038/13158
Giedd, J. N., Lalonde, F. M., Celano, M. J., White, S. L., Wallace, G. L., Lee, N.R., et al. (2009). Anatomical brain magnetic resonance imaging of typicallydeveloping children and adolescents. J. Am. Acad. Child Adolesc. Psychiatry 48,465–470. doi: 10.1097/CHI.0b013e31819f2715
Gogtay, N., Giedd, J. N., Lusk, L., Hayashi, K. M., Greenstein, D., Vaituzis, A. C.,et al. (2004). Dynamic mapping of human cortical development during child-hood through early adulthood. Proc. Natl. Acad. Sci. U.S.A. 101, 8174–8179. doi:10.1073/pnas.0402680101
He, Y., Chen, Z., and Evans, A. (2008). Structural insights into aberrant topologicalpatterns of large-scale cortical networks in Alzheimer’s disease. J. Neurosci. 28,4756–4766. doi: 10.1523/JNEUROSCI.0141-08.2008
Hebb, D. O. (1949). The Organization of Behavior. New York, NY: Wiley and Sons.Hooper, C. J., Luciana, M., Conklin, H. M., and Yarger, R. S. (2004). Adolescents’
performance on the Iowa Gambling Task: implications for the developmentof decision making and ventromedial prefrontal cortex. Dev. Psychol. 40,1148–1158. doi: 10.1037/0012-1649.40.6.1148
Huizinga, M., Dolan, C. V., and van der Molen, M. W. (2006). Age-relatedchange in executive function: developmental trends and a latent variable anal-ysis. Neuropsychologia 44, 2017–2036. doi: 10.1016/j.neuropsychologia.2006.01.010
Jacobson, S. C., Blanchard, M., Connolly, C. C., Cannon, M., and Garavan, H.(2011). An fMRI investigation of a novel analogue to the Trail-Making Test.Brain Cogn. 77, 60–70. doi: 10.1016/j.bandc.2011.06.001
Kabani, N., Le Goualher, G., MacDonald, D., and Evans, A. C. (2001). Measurementof cortical thickness using an automated 3-D algorithm: a validation study.Neuroimage 13, 375–380. doi: 10.1006/nimg.2000.0652
Kim, J. S., Singh, V., Lee, J. K., Lerch, J., Ad-Dab’bagh, Y., MacDonald, D., et al.(2005). Automated 3-D extraction and evaluation of the inner and outer cor-tical surfaces using a Laplacian map and partial volume effect classification.Neuroimage 27, 210–221. doi: 10.1016/j.neuroimage.2005.03.036
Lee, M. H., Hacker, C. D., Snyder, A. Z., Corbetta, M., Zhang, D., Leuthardt, E.C., et al. (2012). Clustering of resting state networks. PLoS ONE 7:e40370. doi:10.1371/journal.pone.0040370
Lee, N. R., Raznahan, A., Wallace, G. L., Alexander-Bloch, A., Clasen, L. S., Lerch,J. P., et al. (2013). Anatomical coupling among distributed cortical regions inyouth varies as a function of individual differences in vocabulary abilities. Hum.Brain Mapp. 35, 1885–1895. doi: 10.1002/hbm.22299
Lerch, J. P., and Evans, A. C. (2005). Cortical thickness analysis examined throughpower analysis and a population simulation. Neuroimage 24, 163–173. doi:10.1016/j.neuroimage.2004.07.045
Lerch, J. P., Pruessner, J. C., Zijdenbos, A., Hampel, H., Teipel, S. J., and Evans, A.C. (2005). Focal decline of cortical thickness in Alzheimer’s disease identifiedby computational neuroanatomy. Cereb. Cortex 15, 995–1001. doi: 10.1093/cer-cor/bhh200
Lerch, J. P., Worsley, K., Shaw, W. P., Greenstein, D. K., Lenroot, R. K., Giedd,J., et al. (2006). Mapping anatomical correlations across cerebral cortex(MACACC) using cortical thickness from MRI. Neuroimage 31, 993–1003. doi:10.1016/j.neuroimage.2006.01.042
Lezak, M. D., Howieson, D. N., and Loring, D. W. (2004). NeuropsychologicalAssessment, 4th Edn. New York, NY: Oxford University Press.
Luciana, M., Conklin, H. M., Hooper, C. J., and Yarger, R. S. (2005). The devel-opment of nonverbal working memory and executive control processes inadolescents. Child Dev. 76, 697–712. doi: 10.1111/j.1467-8624.2005.00872.x
Luna, B., Garver, K. E., Urban, T. A., Lazar, N. A., and Sweeney, J. A. (2004).Maturation of cognitive processes from late childhood to adulthood. Child Dev.75, 1357–1372. doi: 10.1111/j.1467-8624.2004.00745.x
MacDonald, D., Kabani, N., Avis, D., and Evans, A. C. (2000). Automated 3-Dextraction of inner and outer surfaces of cerebral cortex from MRI. Neuroimage12, 340–356. doi: 10.1006/nimg.1999.0534
McDonald, C. R., Delis, D. C., Norman, M. A., Tecoma, E. S., and Iragui-Madozi,V. I. (2005). Is impairment in set-shifting specific to frontal-lobe dysfunc-tion? Evidence from patients with frontal-lobe or temporal-lobe epilepsy. J. Int.Neuropsychol. Soc. 11, 477–481. doi: 10.1017/S1355617705050484
Miller, E. K., and Cohen, J. D. (2001). An integrative theory of pre-frontal cortex function. Annu. Rev. Neurosci. 24, 167–202. doi:10.1146/annurev.neuro.24.1.167
Miyake, A., Friedman, N. P., Emerson, M. J., Witzki, A. H., Howerter, A., and Wager,T. D. (2000). The unity and diversity of executive functions and their contribu-tions to complex “Frontal Lobe” tasks: a latent variable analysis. Cogn. Psychol.41, 49–100. doi: 10.1006/cogp.1999.0734
Moll, J., de Oliveira-Souza, R., Moll, F. T., Bramati, I. E., and Andreiuolo, P. A.(2002). The cerebral correlates of set-shifting: an fMRI study of the trail mak-ing test. Arq. Neuropsiquiatr. 60, 900–905. doi: 10.1590/S0004-282X2002000600002
O’Reilly, R. C. (2010). The What and How of prefrontal cortical organization.Trends Neurosci. 33, 355–361. doi: 10.1016/j.tins.2010.05.002
Orellana, G., and Slachevsky, A. (2013). Executive functioning in schizophrenia.Front. Psychiatry 4:35. doi: 10.3389/fpsyt.2013.00035
Ozonoff, S., and Jensen, J. (1999). Brief report: specific executive function profilesin three neurodevelopmental disorders. J. Autism Dev. Disord. 29, 171–177. doi:10.1023/A:1023052913110
Pa, J., Possin, K. L., Wilson, S. M., Quitania, L. C., Kramer, J. H., Boxer, A. L., et al.(2010). Gray matter correlates of set-shifting among neurodegenerative disease,mild cognitive impairment, and healthy older adults. J. Int. Neuropsychol. Soc.16, 640–650. doi: 10.1017/S1355617710000408
Park, H. J., and Friston, K. (2013). Structural and functional brain networks: fromconnections to cognition. Science 342, 1238411. doi: 10.1126/science.1238411
Partington, J. E., and Leiter, R. G. (1949). Partington’s pathway test. Psychol. ServiceCenter J. 1, 11–20.
Pennington, B. F., and Ozonoff, S. (1996). Executive functions and developmentalpsychopathology. J. Child Psychol. Psychiatry 37, 51–87. doi: 10.1111/j.1469-7610.1996.tb01380.x
Raznahan, A., Lerch, J. P., Lee, N., Greenstein, D., Wallace, G. L., Stockman, M.,et al. (2011). Patterns of coordinated anatomical change in human corticaldevelopment: a longitudinal neuroimaging study of maturational coupling.Neuron 72, 873–884. doi: 10.1016/j.neuron.2011.09.028
Reitan, R. M., and Wolfson, D. (1993). The Halstead-Reitan NeuropsychologicalTest Battery: Theory and Clinical Interpretation, 2nd Edn. Tuscon, AZ:Neuropsychology Press.
Robbins, S., Evans, A. C., Collins, D. L., and Whitesides, S. (2004). Tuning andcomparing spatial normalization methods. Med. Image Anal. 8, 311–323. doi:10.1016/j.media.2004.06.009
www.frontiersin.org July 2014 | Volume 5 | Article 496 | 13

Lee et al. Anatomical coupling and trails performance
Shaw, P., Greenstein, D., Lerch, J., Clasen, L., Lenroot, R., Gogtay, N., et al. (2006).Intellectual ability and cortical development in children and adolescents. Nature440, 676–679. doi: 10.1038/nature04513
Sled, J. G., Zijdenbos, A. P., and Evans, A. C. (1998). A nonparametric method forautomatic correction of intensity nonuniformity in MRI data. IEEE Trans. Med.Imaging 17, 87–97. doi: 10.1109/42.668698
Snyder, H. R. (2013). Major depressive disorder is associated with broad impair-ments on neuropsychological measures of executive function: a meta-analysisand review. Psychol. Bull. 139, 81–132. doi: 10.1037/a0028727
Stuss, D. T., Bisschop, S. M., Alexander, M. P., Levine, B., Katz, D., and Izukawa, D.(2001). The Trail Making Test: a study in focal lesion patients. Psychol. Assess.13, 230–239. doi: 10.1037/1040-3590.13.2.230
Tamnes, C. K., Ostby, Y., Fjell, A. M., Westlye, L. T., Due-Tonnessen, P., andWalhovd, K. B. (2010). Brain maturation in adolescence and young adulthood:regional age-related changes in cortical thickness and white matter volume andmicrostructure. Cereb. Cortex 20, 534–548. doi: 10.1093/cercor/bhp118
Wallace, G. L., Shaw, P., Lee, N. R., Clasen, L. S., Raznahan, A., Lenroot, R. K.,et al. (2012). Distinct cortical correlates of autistic versus antisocial traits in alongitudinal sample of typically developing youth. J. Neurosci. 32, 4856–4860.doi: 10.1523/JNEUROSCI.6214-11.2012
Wechsler, D. (1999). Wechsler Abbreviated Scale of Intelligence. San Antonio, TX:The Psychological Corporation.
Welsh, M. C., and Pennington, B. F. (1988). Assessing frontal-lobe function-ing in children - views from developmental-psychology. Dev. Neuropsychol. 4,199–230. doi: 10.1080/87565648809540405
Yochim, B., Baldo, J., Nelson, A., and Delis, D. C. (2007). D-KEFS Trail MakingTest performance in patients with lateral prefrontal cortex lesions. J. Int.Neuropsychol. Soc. 13, 704–709. doi: 10.1017/S1355617707070907
Zakzanis, K. K., Mraz, R., and Graham, S. J. (2005). An fMRI studyof the Trail Making Test. Neuropsychologia 43, 1878–1886. doi:10.1016/j.neuropsychologia.2005.03.013
Zelazo, P. D., and Muller, U. (2002). “Executive function in typical andatypical development,” in Handbook of Childhood Cognitive Development,ed U. Goswami (Oxford: Blackwell), 445–469. doi: 10.1002/9780470996652.ch20
Zijdenbos, A. P., Forghani, R., and Evans, A. C. (2002). Automatic “pipeline”analysis of 3-D MRI data for clinical trials: application to multiple sclerosis.IEEE Trans. Med. Imaging 21, 1280–1291. doi: 10.1109/TMI.2002.806283
Conflict of Interest Statement: The authors declare that the research was con-ducted in the absence of any commercial or financial relationships that could beconstrued as a potential conflict of interest.
Received: 07 February 2014; accepted: 06 May 2014; published online: 01 July 2014.Citation: Lee NR, Wallace GL, Raznahan A, Clasen LS and Giedd JN (2014) Trailmaking test performance in youth varies as a function of anatomical coupling betweenthe prefrontal cortex and distributed cortical regions. Front. Psychol. 5:496. doi:10.3389/fpsyg.2014.00496This article was submitted to Developmental Psychology, a section of the journalFrontiers in Psychology.Copyright © 2014 Lee, Wallace, Raznahan, Clasen and Giedd. This is an open-access article distributed under the terms of the Creative Commons Attribution License(CC BY). The use, distribution or reproduction in other forums is permitted, providedthe original author(s) or licensor are credited and that the original publication in thisjournal is cited, in accordance with accepted academic practice. No use, distribution orreproduction is permitted which does not comply with these terms.
Frontiers in Psychology | Developmental Psychology July 2014 | Volume 5 | Article 496 | 14