Visual rightward spatial bias varies as a function of age
26
This article was downloaded by: [Oulu University Library] On: 15 February 2014, At: 05:03 Publisher: Routledge Informa Ltd Registered in England and Wales Registered Number: 1072954 Registered office: Mortimer House, 37-41 Mortimer Street, London W1T 3JH, UK Laterality: Asymmetries of Body, Brain and Cognition Publication details, including instructions for authors and subscription information: http://www.tandfonline.com/loi/plat20 Visual rightward spatial bias varies as a function of age Fiia Takio a b , Mika Koivisto a b , Tuulikki Tuominen c , Seppo J. Laukka c & Heikki Hämäläinen a b a Department of Psychology , University of Turku , Turku , Finland b Centre for Cognitive Neuroscience , University of Turku , Turku , Finland c Learning Research Laboratory (LearnLab) , University of Oulu , Oulu , Finland Published online: 13 Jan 2012. To cite this article: Fiia Takio , Mika Koivisto , Tuulikki Tuominen , Seppo J. Laukka & Heikki Hämäläinen (2013) Visual rightward spatial bias varies as a function of age, Laterality: Asymmetries of Body, Brain and Cognition, 18:1, 44-67, DOI: 10.1080/1357650X.2011.628675 To link to this article: http://dx.doi.org/10.1080/1357650X.2011.628675 PLEASE SCROLL DOWN FOR ARTICLE Taylor & Francis makes every effort to ensure the accuracy of all the information (the “Content”) contained in the publications on our platform. However, Taylor & Francis, our agents, and our licensors make no representations or warranties whatsoever as to the accuracy, completeness, or suitability for any purpose of the Content. Any opinions and views expressed in this publication are the opinions and views of the authors, and are not the views of or endorsed by Taylor & Francis. The accuracy of the Content should not be relied upon and should be independently verified with primary sources of information. Taylor and Francis shall not be liable for any losses, actions, claims, proceedings, demands, costs, expenses, damages, and other liabilities
Transcript of Visual rightward spatial bias varies as a function of age
This article was downloaded by: [Oulu University Library]On: 15 February 2014, At: 05:03Publisher: RoutledgeInforma Ltd Registered in England and Wales Registered Number: 1072954Registered office: Mortimer House, 37-41 Mortimer Street, London W1T 3JH,UK
Laterality: Asymmetries of Body,Brain and CognitionPublication details, including instructions for authorsand subscription information:http://www.tandfonline.com/loi/plat20
Visual rightward spatial biasvaries as a function of ageFiia Takio a b , Mika Koivisto a b , Tuulikki Tuominen c ,Seppo J. Laukka c & Heikki Hämäläinen a ba Department of Psychology , University of Turku ,Turku , Finlandb Centre for Cognitive Neuroscience , University ofTurku , Turku , Finlandc Learning Research Laboratory (LearnLab) , Universityof Oulu , Oulu , FinlandPublished online: 13 Jan 2012.
To cite this article: Fiia Takio , Mika Koivisto , Tuulikki Tuominen , Seppo J. Laukka& Heikki Hämäläinen (2013) Visual rightward spatial bias varies as a functionof age, Laterality: Asymmetries of Body, Brain and Cognition, 18:1, 44-67, DOI:10.1080/1357650X.2011.628675
To link to this article: http://dx.doi.org/10.1080/1357650X.2011.628675
PLEASE SCROLL DOWN FOR ARTICLE
Taylor & Francis makes every effort to ensure the accuracy of all theinformation (the “Content”) contained in the publications on our platform.However, Taylor & Francis, our agents, and our licensors make norepresentations or warranties whatsoever as to the accuracy, completeness, orsuitability for any purpose of the Content. Any opinions and views expressedin this publication are the opinions and views of the authors, and are not theviews of or endorsed by Taylor & Francis. The accuracy of the Content shouldnot be relied upon and should be independently verified with primary sourcesof information. Taylor and Francis shall not be liable for any losses, actions,claims, proceedings, demands, costs, expenses, damages, and other liabilities

whatsoever or howsoever caused arising directly or indirectly in connectionwith, in relation to or arising out of the use of the Content.
This article may be used for research, teaching, and private study purposes.Any substantial or systematic reproduction, redistribution, reselling, loan, sub-licensing, systematic supply, or distribution in any form to anyone is expresslyforbidden. Terms & Conditions of access and use can be found at http://www.tandfonline.com/page/terms-and-conditions
Dow
nloa
ded
by [
Oul
u U
nive
rsity
Lib
rary
] at
05:
03 1
5 Fe
brua
ry 2
014

Visual rightward spatial bias varies as a function of age
Fiia Takio1,2, Mika Koivisto1,2, Tuulikki Tuominen3,Seppo J. Laukka3, and Heikki Hamalainen1,2
1Department of Psychology, University of Turku, Turku, Finland2Centre for Cognitive Neuroscience, University of Turku, Turku,
Finland3Learning Research Laboratory (LearnLab), University of Oulu, Oulu,
Finland
Age-related changes in visual spatial biases in children, young adults, and olderadults were studied with unilateral and bilateral stimulus conditions in fast-pacedlinguistic and non-linguistic attention tasks. Only rightward spatial biases wereobserved. The incidence of the biases changed as a function of age: in childhoodand in old age the rightward spatial biases were more common than in youngadulthood. The present rightward spatial biases were similar to those observed inthe corresponding auditory spatial linguistic and non-linguistic attention tests(Takio, Koivisto, Laukka, & Hamalainen, 2011) and in the dichotic listeningforced-attention task (Takio et al., 2009). We suggest that the multimodal rightwardspatial bias observed under intensive attentional load is related to a right hemispacepreference and modulated by age-dependent changes in executive functions.
Keywords: Visuospatial bias; Executive functions; Age.
The cerebral hemispheres are asymmetrical both functionally and structu-
rally. The asymmetries change as a function of age beginning before birth
and continuing into old age (e.g., Boles, Barth, & Merrill, 2008; Dolcos,
Rice, & Cabeza, 2002; Everts et al., 2009; Hugdahl, 2003; Hugdahl et al.,
2009; McCartney & Hepper, 1999). The main focus of the present study was
Address correspondence to: Fiia Takio, Department of Behavioural Sciences and Philosophy,
University of Turku, 20014 Turku, Finland. E-mail: [email protected]
This study was supported financially by the Nordic Centre of Excellence in Cognitive Control,
by the Finnish Cultural Foundation and by the National Doctoral Programme of Psychology in
Finland. MK was supported by the academy of Finland (project 125175). We thank Teemu Laine
for the programming and Ville Penttila, Mika Rekila, Faramosh Rashid, and Laura Jokiranta for
testing the participants. We also thank Jacqueline Valimaki and Paula Korhonen for providing
language help. Finally we thank all the participants for taking part in the study.
Laterality, 2013
Vol. 18, No. 1, 44�67, http://dx.doi.org/10.1080/1357650X.2011.628675
# 2013 Taylor & Francis
Dow
nloa
ded
by [
Oul
u U
nive
rsity
Lib
rary
] at
05:
03 1
5 Fe
brua
ry 2
014
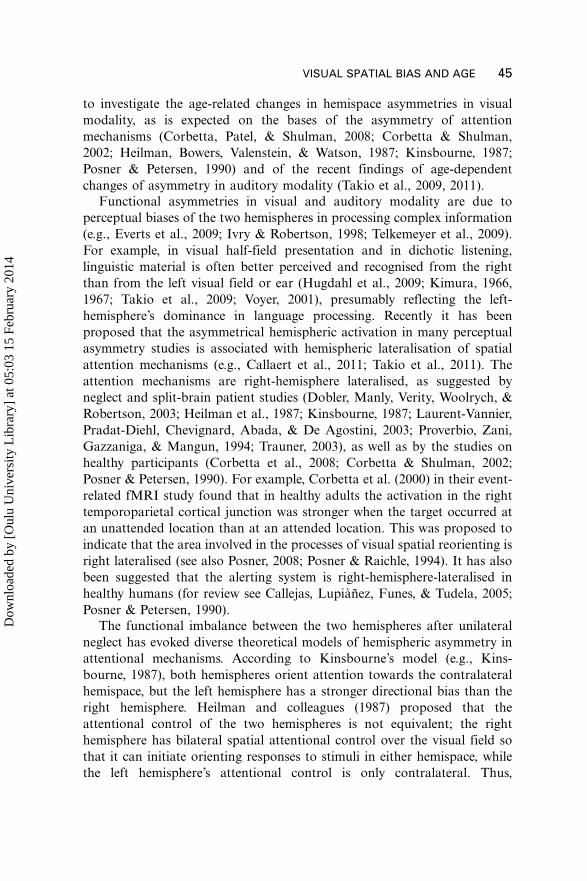
to investigate the age-related changes in hemispace asymmetries in visual
modality, as is expected on the bases of the asymmetry of attention
mechanisms (Corbetta, Patel, & Shulman, 2008; Corbetta & Shulman,
2002; Heilman, Bowers, Valenstein, & Watson, 1987; Kinsbourne, 1987;
Posner & Petersen, 1990) and of the recent findings of age-dependent
changes of asymmetry in auditory modality (Takio et al., 2009, 2011).
Functional asymmetries in visual and auditory modality are due to
perceptual biases of the two hemispheres in processing complex information
(e.g., Everts et al., 2009; Ivry & Robertson, 1998; Telkemeyer et al., 2009).
For example, in visual half-field presentation and in dichotic listening,
linguistic material is often better perceived and recognised from the right
than from the left visual field or ear (Hugdahl et al., 2009; Kimura, 1966,
1967; Takio et al., 2009; Voyer, 2001), presumably reflecting the left-
hemisphere’s dominance in language processing. Recently it has been
proposed that the asymmetrical hemispheric activation in many perceptual
asymmetry studies is associated with hemispheric lateralisation of spatial
attention mechanisms (e.g., Callaert et al., 2011; Takio et al., 2011). The
attention mechanisms are right-hemisphere lateralised, as suggested by
neglect and split-brain patient studies (Dobler, Manly, Verity, Woolrych, &
Robertson, 2003; Heilman et al., 1987; Kinsbourne, 1987; Laurent-Vannier,
Pradat-Diehl, Chevignard, Abada, & De Agostini, 2003; Proverbio, Zani,
Gazzaniga, & Mangun, 1994; Trauner, 2003), as well as by the studies on
healthy participants (Corbetta et al., 2008; Corbetta & Shulman, 2002;
Posner & Petersen, 1990). For example, Corbetta et al. (2000) in their event-
related fMRI study found that in healthy adults the activation in the right
temporoparietal cortical junction was stronger when the target occurred at
an unattended location than at an attended location. This was proposed to
indicate that the area involved in the processes of visual spatial reorienting is
right lateralised (see also Posner, 2008; Posner & Raichle, 1994). It has also
been suggested that the alerting system is right-hemisphere-lateralised in
healthy humans (for review see Callejas, Lupianez, Funes, & Tudela, 2005;
Posner & Petersen, 1990).
The functional imbalance between the two hemispheres after unilateral
neglect has evoked diverse theoretical models of hemispheric asymmetry in
attentional mechanisms. According to Kinsbourne’s model (e.g., Kins-
bourne, 1987), both hemispheres orient attention towards the contralateral
hemispace, but the left hemisphere has a stronger directional bias than the
right hemisphere. Heilman and colleagues (1987) proposed that the
attentional control of the two hemispheres is not equivalent; the right
hemisphere has bilateral spatial attentional control over the visual field so
that it can initiate orienting responses to stimuli in either hemispace, while
the left hemisphere’s attentional control is only contralateral. Thus,
VISUAL SPATIAL BIAS AND AGE 45
Dow
nloa
ded
by [
Oul
u U
nive
rsity
Lib
rary
] at
05:
03 1
5 Fe
brua
ry 2
014
according to both views, attention is more strongly biased toward the right
hemispace.
It has been suggested that young adults are capable of modulating and
balancing the extent and the magnitude of the inherent asymmetries in
auditory modality with the help of executive functions; that is, with skills
necessary for high-level perceptual and cognitive goal-directed behaviour
such as attentional control and cognitive flexibility (e.g., Andersson &
Hugdahl, 1987; Hugdahl & Andersson, 1986; Hugdahl et al., 2009; Jurado &
Rosselli, 2007; Mondor & Bryden, 1991; Posner & Raichle, 1994; Takio et al.,
2009, 2011). For example, in bilateral dichotic stimulation with linguistic
stimuli a typical finding is a stimulus-driven right-ear advantage (REA),
reflecting left hemisphere’s dominance in language processing. Here adults
are capable of changing the REA into a left-ear advantage by directing
attention towards the left-ear stimuli, while children and older adults are
not able to do so (e.g., Hugdahl et al., 2009; Kimura, 1967; Takio et al.,
2009). Moreover, stronger rightward spatial biases have been observed in
childhood and in old age than in young adulthood in fast-paced linguistic
and non-linguistic auditory tests under sufficiently intensive attentional
load (Takio et al., 2011). It has been suggested that these age-related
changes in auditory rightward spatial bias result from early development
and late decline of executive functions (Hamalainen & Takio, 2010; Takio
et al., 2009, 2011; see also Anderson, Anderson, Northam, Jacobs, &
Catroppa, 2001; Jurado & Rosselli, 2007; Luciana, Conklin, Hooper, &
Yarger, 2005; Tsujimoto, 2008).
The purpose of the present study was to determine whether the rightward
spatial bias observed under sufficiently intensive attentional load in auditory
modality is a multimodal phenomenon that also occurs in visual tests
mimicking the fast-paced auditory linguistic and non-linguistic tests applied
in our previous study (Takio et al., 2011), and whether the visual hemispace
biases change as a function of age. As linguistic material is often better
perceived and recognised from the right than from the left visual field, spatial
biases for linguistic stimuli were expected to occur towards the right
hemispace. Since no unequivocal hemispheric advances have been docu-
mented in the processing of non-linguistic stimuli (such as dots), it was
assumed that if any spatial biases in the detection of non-linguistic visual
stimuli (such as dots) under attentional load were to be observed, the biases
would most probably result from hemispheric functional asymmetries in
other than linguistic mechanisms, for example, in the attentional mechan-
isms that are biased towards the right side. Moreover, based on our findings
from the auditory modality (Takio et al., 2009, 2011), we hypothesised that if
any hemispace biases were to be observed, they would be more intensive in
the child and the older adult participants than in the young adults. Two fast-
paced, attention-loading, linguistic and non-linguistic tests were applied for
46 TAKIO ET AL.
Dow
nloa
ded
by [
Oul
u U
nive
rsity
Lib
rary
] at
05:
03 1
5 Fe
brua
ry 2
014
children, young adults, and old adults. In these tests the observers had to
monitor the whole visual field while the stimuli were presented to the left
visual field (LVF), to the right visual field (RVF), or to both visual fields
bilaterally (BVF).
METHOD
Participants
A total of 190 Finnish-speaking participants were tested and divided into
five age groups (see Table 1). Since the development of language abilities has
been shown to influence 5�12-year-old children’s asymmetrical performance
in linguistic spatial attention tasks (e.g., Helland & Asbjørnsen, 2001; Takio
et al., 2009), and many important executive functions have been shown to
reach maturity around the ages of 8�10 years (e.g., Jurado & Rosselli, 2007),
children in children’s day-care aged up to 7 years and children in primary
school from age 7 years on were tested and divided into three age groups:
5�7-year-olds, 8�9-year-olds, and 10�11-year-olds. Furthermore, partici-
pants over 50 years of age have been reported to be unable to overcome the
inherent perceptual asymmetry with the executive control of attention (e.g.,
Hugdahl, 2003; Hugdahl, Carlsson, & Eichele, 2001; Jurado & Rosselli,
2007; Takio et al., 2011; Thomsen et al., 2004), and thus old participants
between 59 and 79 years of age were included in the study. All participants
volunteered and they were right-handed (Oldfield, 1971).
Adult participants gave their written informed consent to participate in
the study, and filled in a questionnaire asking about educational level,
mother tongue, profession, vision, hearing, previous or present neurological
and/or psychiatric disorder(s), dyslexia or brain damage, and possible
medication. Only healthy participants with normal or corrected vision
were included in the study. To assess the adult participants’ working memory
capacity, the numeric short-term memory of the adult participants was tested
with the Wechsler Memory Scale � Revised (Digit Span). To exclude the
possible interference of any depressive symptoms on the visual test results, a
brief Finnish modified version of the Geriatric depression scale was applied
(Yesavage et al., 1983). To screen the possible influence of mild cognitive
impairment (MCI) on the study (e.g., Karrasch, Sinerva, Gronholm, Rinne,
& Laine, 2005), the older adult age group was tested with the Wordlist
learning test and the Wordlist delayed recall in Finnish version of the
Consortium to Establish a Registry for Alzheimer’s Disease (CERAD).
Moreover, the adult participants were asked about possible drug or alcohol
misuse and the amount of sleep during the last 24 hours, in order to evaluate
their alertness at the beginning of the testing.
VISUAL SPATIAL BIAS AND AGE 47
Dow
nloa
ded
by [
Oul
u U
nive
rsity
Lib
rary
] at
05:
03 1
5 Fe
brua
ry 2
014
Before testing the child participants, written permission for the study was
requested from the heads of the children’s day-care centres and of the
comprehensive schools, the teachers and the primary caregivers. Only
healthy participants with normal or corrected vision were included in the
study. None of the children had suffered brain damage or had any untreated
visual, auditory, or neurological deficits during early childhood. Also,
children with dyslexia were not included in the study. The phonological
awareness of children under the age of 9 years was assessed with parts of the
Phonological Awareness Test (Poskiparta, Niemi, & Lepola, 1994; Silven,
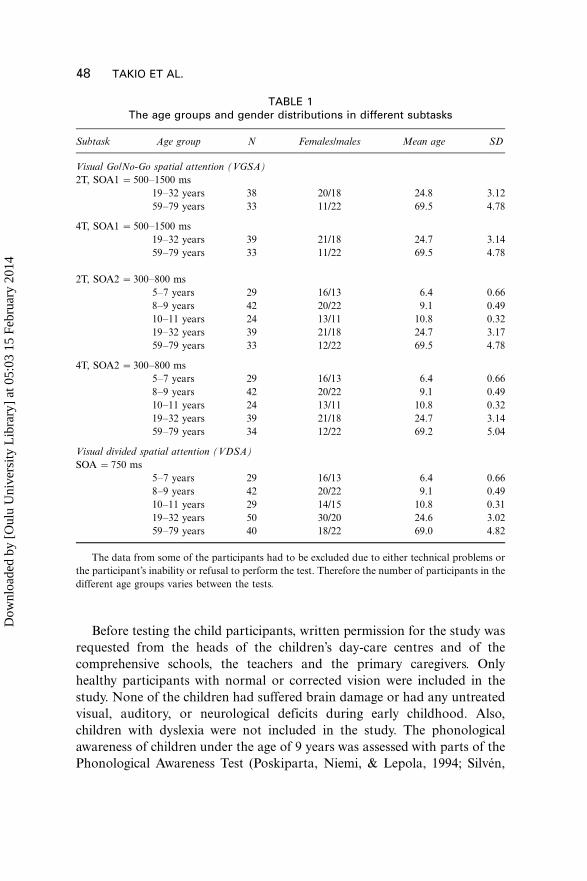
TABLE 1The age groups and gender distributions in different subtasks
Subtask Age group N Females/males Mean age SD
Visual Go/No-Go spatial attention (VGSA)
2T, SOA1 �500�1500 ms
19�32 years 38 20/18 24.8 3.12
59�79 years 33 11/22 69.5 4.78
4T, SOA1 �500�1500 ms
19�32 years 39 21/18 24.7 3.14
59�79 years 33 11/22 69.5 4.78
2T, SOA2 �300�800 ms
5�7 years 29 16/13 6.4 0.66
8�9 years 42 20/22 9.1 0.49
10�11 years 24 13/11 10.8 0.32
19�32 years 39 21/18 24.7 3.17
59�79 years 33 12/22 69.5 4.78
4T, SOA2 �300�800 ms
5�7 years 29 16/13 6.4 0.66
8�9 years 42 20/22 9.1 0.49
10�11 years 24 13/11 10.8 0.32
19�32 years 39 21/18 24.7 3.14
59�79 years 34 12/22 69.2 5.04
Visual divided spatial attention (VDSA)
SOA �750 ms
5�7 years 29 16/13 6.4 0.66
8�9 years 42 20/22 9.1 0.49
10�11 years 29 14/15 10.8 0.31
19�32 years 50 30/20 24.6 3.02
59�79 years 40 18/22 69.0 4.82
The data from some of the participants had to be excluded due to either technical problems or
the participant’s inability or refusal to perform the test. Therefore the number of participants in the
different age groups varies between the tests.
48 TAKIO ET AL.
Dow
nloa
ded
by [
Oul
u U
nive
rsity
Lib
rary
] at
05:
03 1
5 Fe
brua
ry 2
014

Poskiparta, Niemi, & Voeten, 2007): Rhyme task (Riimit), Alliteration task
(Alkusointu), and Phoneme-isolation task (Alkuaanne).
Tests
We used two different visual tests with unilateral and bilateral (left and right
visual fields) stimulation: a linguistic Visual Go/No-Go spatial attention test(VGSA) with pictures of animals or digits, and a non-linguistic Visual
divided spatial attention test (VDSA) with dots of light.
Visual Go/No-Go spatial attention test (VGSA)
Apparatus and stimulus material. Digits 1�9 were visually presented to
the adults and nine different animal drawings to the children with the
Presentation program via a projector (Ask C40 or XGA Hitachi ED-x3280,
Multimedia mobile LCD projector); they were projected into the left (LVF)
and/or right (RVF) visual field in light grey (61 cd/m2) on a dark grey
background (5 cd/m2). A single stimulus was projected 308 to the right and/
or the left from the fixation point (9 cd/m2) measured from the centre of the
fixation point to the nearest edge of the stimulus. The digits wereapproximately 48 high and 28 wide and the pictures of the animals were
approximately 88 high and 108 wide.
Procedure for adult participants. The VGSA test for adults consisted of
four subtasks, which varied according to their cognitive load. Each subtask
included 60 target trials and 180 non-target trials. The target digits were 3, 6,8, or 9, and the non-target digits were 1, 2, 4, 5, and 7. Each stimulus (digit)
was 200 ms in duration. In the 60 target trials 20 were presented in
randomised order unilaterally to the left (LVF), 20 to the right (RVF), and
20 bilaterally to both visual fields (BVF) with simultaneous onset. The side
of the targets was counterbalanced across the participants. The same digit
was never presented bilaterally and the fixation point was presented on the
screen throughout the whole test (see Figure 1A).
The subtasks varied either according to the duration of the stimulus-onsetasynchrony (SOA) time (500�1500 ms or 300�800 ms) and/or the number of
target digits (two targets or four targets). The SOA refers to the randomly
varying time interval between the onsets of two successive stimuli (see Figure
1b). Two of the subtasks had the same SOA (500�1500 ms�SOA1), but they
differed from each other in the number of targets that the participant was to
respond to: two target digits (one target digit to the left and the other to the
right) or four target digits (two target digits to the left and the other two to
the right). The duration of these two subtasks was approximately 4 minutes55 seconds. The two other subtasks also differed from each other in the
VISUAL SPATIAL BIAS AND AGE 49
Dow
nloa
ded
by [
Oul
u U
nive
rsity
Lib
rary
] at
05:
03 1
5 Fe
brua
ry 2
014

number of targets (two target digits or four target digits), while the SOA was
300�800 ms (SOA2) in both subtasks. The duration of these two subtasks
was approximately 3 minutes. In all subtasks the participants’ task was to
fixate their eyes on the fixation point, to monitor the whole visual field, and
Figure 1. (A) An example of the stimulation sequence in the Visual Go/No-Go spatial attention
(VGSA) task for adults. (B). The stimulus-onset asynchrony (SOA) varied randomly between the
onsets of successive stimuli. The figure depicts the stimulus-response sequences and the time windows
for correct responses. For details of each subtask, see the text. Abbreviations: R = right side; L = left
side; SOA = stimulus-onset asynchrony time; T = target; nT = non-target. The relative sizes of the
stimuli and the distances between the fixation point and the stimuli in the picture do not correspond to
the test attributes applied in the actual test.
50 TAKIO ET AL.
Dow
nloa
ded
by [
Oul
u U
nive
rsity
Lib
rary
] at
05:
03 1
5 Fe
brua
ry 2
014
to respond unilaterally to the side where the unilateral target occurred, and
bilaterally to the bilaterally presented targets by pressing buttons on the
computer keyboard as rapidly and accurately as they could with the left and/
or right forefinger only when a target or targets were perceived. The left-
hand button for the LVF targets on the computer keyboard was the leftmost
Control button and the right-hand button for the RVF targets was therightmost Num enter button. In the instructions the order in which the
target digits were introduced to the participants was counterbalanced so that
half of the participants were given the LVF target digits first and the other
half the RVF target digits first. The adult participants always performed first
the two subtasks with the SOA1 (two targets, four targets) and then the two
subtasks with the SOA2 (two targets, four targets). The order of the subtasks
was based on piloting studies conducted in the Centre for Cognitive
Neuroscience, showing that if the order of the subtasks was the opposite,starting with the more difficult subtasks, the performance of old people in
particular was reduced dramatically throughout the test. Perhaps a too-
difficult subtask at the beginning of the testing prevents any learning of the
novel situation, and further reduces the person’s ability to perform even in
the easier subtasks.
The participants were seated 1 metre from the screen. A video camera
(Samsung Digital-Cam, VP-D351) was used to control the central fixation.
Central fixation was encouraged by presenting the stimuli randomly to thevisual fields (LVF and/or RVF), ensuring that the participants were unable to
anticipate the location of the stimulus, and thus were less likely to shift their
fixation from the central location. In addition, the participants were strongly
advised to fixate their eyes on the central fixation point to ensure optimal
performance in this particular test. The experimenter followed the partici-
pant’s central fixation in real time throughout the practice block and the
actual test and, if required, immediately reminded the participant verbally
about the central fixation. Before the actual tests the participants performeda practice block, which included 15 target trials and 45 non-target trials. The
actual test started once the participant and the experimenter were both
confident that the participant was able to perform the test and had
understood the instructions correctly.
Procedure for child participants. The visual tests mimicked our pre-
viously applied auditory tests (Takio et al., 2011), which included digits for
adults and names of animals for children. To ensure that the visual and
auditory tests would be analogical between the auditory and the visual
modality, the stimulus digits in VGSA for adults were changed to pictures of
animals in the children’s version (Figure 2). Children’s ability to stay focused
on cognitively demanding tasks for long periods of time is inferior to that ofadults. On the basis of the pilot studies in the laboratory of the Learning
VISUAL SPATIAL BIAS AND AGE 51
Dow
nloa
ded
by [
Oul
u U
nive
rsity
Lib
rary
] at
05:
03 1
5 Fe
brua
ry 2
014

Research Laboratory (LearnLab), University of Oulu, the VGSA test for
children was shortened to two subtasks. The targets were animal drawings of
‘‘cat’’, ‘‘dog’’, ‘‘sheep’’, and ‘‘rabbit’’, and the non-target drawings were of
‘‘pig’’, ‘‘goose’’, ‘‘cow’’, ‘‘rooster’’, and ‘‘horse’’. The stimulus-onset asyn-
chrony (SOA) varied randomly between 300 and 800 ms (�SOA2) and the
difficulty level varied as a function of the number of targets: two target
animals (one target to the left visual field and the other to the right visual
field) or four target animals (two targets to the left visual field and the other
two to the right visual field). The duration of these two subtasks was
approximately 3 minutes. The participants performed first the subtask that
included two targets and then the subtask that included four targets. All
other conditions corresponded to those in the VGSA test for adults.
To help the children stay focused on the task the experimenter told a
frame story (see Sanders, Stevens, Coch, & Neville, 2006). In the story the
participant was a zookeeper feeding only particular animals (targets) from
either left or right side (LVF or RVF). The participants were asked to fixate
their eyes on the fixation point, to monitor the whole visual field, and to
press the buttons (give food) on the computer keyboard as rapidly and
accurately as they could with the right and/or left forefinger only when they
perceived the targets. Since the performance of children, especially of young
ones, is rather sensitive to task- and stimulus-related factors (Ridderinkhof
& van der Stelt, 2000), all the child participants were first allowed to watch
the stimuli without responding and then carry out a practice block (for
details, see procedure for adult participants) before the actual test took place.
The actual test started after the participant and the experimenter were both
confident that the participant was able to perform the test and had
understood the instructions correctly.
Figure 2. An example of the non-target (rooster) and the target (rabbit) pictures of the animals
presented to child participants in the Visual Go/No-Go spatial attention test (VGSA).
52 TAKIO ET AL.
Dow
nloa
ded
by [
Oul
u U
nive
rsity
Lib
rary
] at
05:
03 1
5 Fe
brua
ry 2
014

Visual divided spatial attention test (VDSA)
Apparatus and stimulus material. Dots of light (28; 63 cd/m2) were
presented with the Presentation program via a projector (XGA Hitachi ED-x3280, Multimedia mobile LCD projector or ASK C40) into the LVF and/or
RVF on a grey background (3 cd/m2). The dots were projected 308 to the
right and/or the left from the fixation point (9 cd/m2), measured from the
centre of the fixation point to the nearest edge of the stimulus.
Procedure. The VDSA test consisted of two subtasks that differed intheir stimulus-onset asynchrony (SOA), which was either 1500 ms or 750 ms.
In both subtasks, of a total of 150 stimuli, 50 were presented in randomised
order to the LVF, 50 to the RVF, and 50 bilaterally to both visual fields
(BVF) with simultaneous onset. Each stimulus was presented on the screen
for 20 ms. The fixation point was presented on the screen throughout the
whole test. The participants’ task was to fixate their eyes on the fixation
point, monitor the whole visual field, and to press the buttons on the
computer keyboard as rapidly and accurately as they could with their rightand/or left forefinger unilaterally to the side where the unilateral stimuli
occurred, and bilaterally to the bilaterally presented stimuli. The left-hand
button on the computer keyboard was the leftmost Control button and the
right-hand button was the rightmost Num enter button. For the details
about controlling for the central fixation, see the VGSA test for adults.
Before the actual tests the participants performed a practice block. The adult
participants and the 10�11-year-old children completed the subtask with the
SOA of 1500 ms first (duration approximately 3 minutes) and then thesubtask with the SOA of 750 ms (duration approximately 2 minutes 5
seconds). The 5�9-year-old participants accomplished only the subtask with
the SOA of 750 ms.
Data analysis
A unilateral response made to the right or the left visual field target/stimulus
was scored as a correct response when it occurred on the same side within150 and 1000 ms after the onset of the target/stimulus in the VGSA and the
VDSA tests. Simultaneous left and right responses were considered as a
correct bilateral response when they occurred in the VGSA within 150�1800
ms and in the VDSA within 150�1000 ms after the onset of a target/stimulus
(see Figure 1B). All these time windows were defined according to pilot
studies carried out in the laboratory of Centre for Cognitive Neuroscience,
University of Turku. The responses that were not made within the specified
time windows were recorded as false alarms in the VGSA test and as extraresponses in the VDSA test. The correct responses, the unilateral responses
VISUAL SPATIAL BIAS AND AGE 53
Dow
nloa
ded
by [
Oul
u U
nive
rsity
Lib
rary
] at
05:
03 1
5 Fe
brua
ry 2
014

for bilateral stimuli/ targets, the false alarms (VGSA), and the extra
responses (VDSA) were converted into percentages. In addition, median
reaction times in correct unilateral responses were analysed.
The accuracy data from the VGSA test were analysed according to the
Signal detection theory (SDT) (Stanislaw & Todorov, 1999). When either
the correct response rate is 1.0 (100%) or the false alarm rate is zero, the
sensitivity (d’) and the decision criterion (c) values have an unlimited numeric
value and cannot be included in the SDT analysis. In order to overcome this
problem the estimates for d’ and c were converted according to Macmillan
and Creelman (2005): proportions of zero were converted to 1/(2N) and
proportions of one were converted to 1 � 1/(2N), with N referring to the
number of trials contributing to the proportion. In SDT the sensitivity (d’)
and decision criterion (c) values were calculated for the left and right side
separately by using all correct responses (i.e., hits) (for both unilateral and
bilateral targets) and all false alarms (for both unilateral and bilateral non-
targets).
First, to test whether the age groups were able to discriminate signals
(targets) from noise (non-targets) and how conservative was the decision
criterion (c) that each age group applied, the sensitivity values (d’) and the
decision criterion (c) values were compared with the test value zero with
One-Sample t-test for each age group separately.
The data from the VGSA test for children were statistically evaluated by a
general 2 (Target: 2 Targets, 4 Targets)�2 (Visual Field: LVF, RVF)�3
(Age group: 5�7; 8�9; 10�11)�2 (Gender: male, female) analysis of variance
(ANOVA). The data from the VGSA test for adults were statistically
evaluated by a general 2 (SOA: SOA1 [500�1500 ms], SOA2 [300�800
ms])�2 (Target: 2 Targets, 4 Targets)�2 (Visual Field: LVF, RVF)�2 (Age
group: 19�32; 59�79)�2 (Gender: male, female) analysis of variance
(ANOVA).
All participants performed the VDSA subtask with the SOA of 750 ms.
The data of the VDSA subtask with the SOA of 750 ms were statistically
evaluated by a general 5 (Age groups: 5�7, 8�9, 10�11, 19�32, 59�79)�2
(Gender: male, female)�3 (Visual Field: LVF, BVF, RVF) ANOVA. Since
three age groups (10�11-year-olds, 19�32-year-olds, and 59�79-year-olds)
also performed another subtask with the SOA of 1500 ms, we analysed these
data by a general 3 (Age groups: 10�11, 19�32, 59�79)�2 (Gender: male,
female) and 3 (Visual Field: LVF, BVF, RVF) ANOVA. Because the result
from the VDSA subtask with the SOA of 1500 ms did not change the
conclusions that could be drawn from the results of the subtask with the
SOA of 750 ms, and the only novel conclusion that could be drawn on
the basis of the results was that increasing presentation speed affected more
the 59�79-year-old adults’ performance than the performance of the young
54 TAKIO ET AL.
Dow
nloa
ded
by [
Oul
u U
nive
rsity
Lib
rary
] at
05:
03 1
5 Fe
brua
ry 2
014

adults or the 10�11-year-olds, we do not report the results from the VDSA
with the SOA of 1500 ms.
In all ANOVAs the significance levels were corrected with the Greenhouse-
Geisser correction when the degrees of freedom were higher than 1.
Significant interactions were followed up by ANOVAs and t-tests. Since the
data in some of the variables were not normally distributed, they were alsoanalysed with the Wilcoxon Signed Ranks non-parametric test. The results
from the non-parametric tests are reported only if they are in conflict with the
significance levels of the parametric and non-parametric tests. Finally, we do
not report the results of Gender because of large inconsistency in the results.
RESULTS
Visual Go/No-Go spatial attention test (VGSA) for children
Sensitivity values (d’). Figure 3A presents the sensitivity values (d’) for
LVF and RVF in the VGSA subtasks with the SOA2 with two targets (2T)and with four targets (4T) for each child age group. One-Sample t-test for
each age group separately showed that in all age groups the sensitivity
values (d’) differed significantly from the test value of zero (ps 5 .003): all
child groups were able to discriminate signals (targets) from noise (non-
targets) in both VGSA subtasks. The general ANOVA for d’ revealed that
increasing the number of targets from two to four decreased the ability to
discriminate the targets from the non-targets, F(1, 89)�16,71, p B.001,
hp2�.16. The performance of 5�7-year-olds was significantly inferior tothat of older children, F(2, 89)�14.05, p B.001, hp2�.24.
Decision criterion (c). Figure 3B presents the decision criterion (c)
values for LVF and RVF in the VGSA subtasks with the SOA2 with two
targets (2T) and with four targets (4T) for each child age group. One-Sample
t-test for each age group separately showed that in all age groups the decision
criterion (c) differed significantly from the test value of zero (psB.001), and
that all values of c were positive. In other words, the decision criteria in all
child age groups were reasonably conservative, and the participants had abias rather not to respond (correct rejection or miss) than to respond
(correct response or false alarm) in both VGSA subtasks. The general
ANOVA for c revealed that increasing the cognitive load lowered the
decision criterion, F(1, 89)�11.30, p�.001, hp2�.11, and the children
responded more readily to the RVF stimuli than to the LVF stimuli
regardless of whether the stimulus was a target or a non-target, F(1,
89)�12.11, p�.001, hp2�.12. Visual inspection of Figure 3B reveals that
the strength of the bias varies in different age groups and separate ANOVAsin each age group indeed showed that only the 5�7-year-old children,
VISUAL SPATIAL BIAS AND AGE 55
Dow
nloa
ded
by [
Oul
u U
nive
rsity
Lib
rary
] at
05:
03 1
5 Fe
brua
ry 2
014
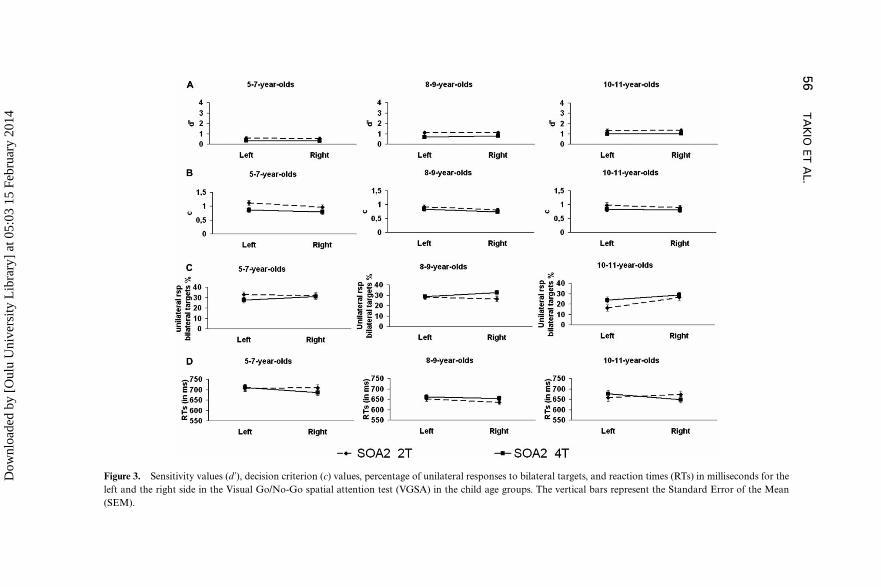
Figure 3. Sensitivity values (d’), decision criterion (c) values, percentage of unilateral responses to bilateral targets, and reaction times (RTs) in milliseconds for the
left and the right side in the Visual Go/No-Go spatial attention test (VGSA) in the child age groups. The vertical bars represent the Standard Error of the Mean
(SEM).
56
TA
KIO
ET
AL.
Dow
nloa
ded
by [
Oul
u U
nive
rsity
Lib
rary
] at
05:
03 1
5 Fe
brua
ry 2
014

F(1, 27)�7.75, p�.010, hp2�.22, and the 8�9-year-old children, F(1,
40)�13.18, p�.001, hp2�.25, had a greater decision criterion (c) for the
LVF stimuli than for the RVF stimuli. In other words, only the children
between 5 and 9 years of age were biased towards the right visual field since
they responded more often towards the right side than towards the left side
irrespective of the presence or the absence of the target.
Unilateral responses to bilaterally presented targets. Figure 3C presents
the unilateral responses to bilaterally presented targets for LVF and RVF in
the VGSA subtasks with the SOA2 with two targets (2T) and with four
targets (4T) for each child age group. The ANOVA for unilateral responsesto the bilateral targets showed a significant main effect for Age group,
F(2, 89)�4.53, p�.013, hp2�.09: the 10�11-year-old children were
significantly better in detecting bilateral targets than their younger counter-
parts (ps 5 .024). The 5�7-year-old and the 8�9-year-old children equally
often made unilateral errors for bilateral targets. Further analyses for the
significant interaction between Age group and Target, F(2, 89)�3.70,
p�.029, hp2�.08, revealed that only the 8�9-year-olds made more
unilateral errors in the four-target subtask than in the two-target, subtask,F(1, 40)�5.13, p�.29, hp2�.11.
Reaction times (RTs). Figure 3D presents the reaction times (RTs) for
LVF and RVF in the VGSA subtasks with the SOA2 with two targets (2T)
and with four targets (4T) for each child age group. The general ANOVA for
reaction times showed a significant main effect for Age group, F(2,85)�7.52, p�.001, hp2�.15. The 5�7-year-olds had the slowest RTs,
which differed significantly from those of the older children (ps5.016).
There were no differences in RTs between the 8�9-year-olds and the 10�11-
year-olds.
Visual Go/No-Go spatial attention test (VGSA) for adults(digits)
Sensitivity values (d’). Figure 4A presents the sensitivity values (d’) forLVF and RVF in the VGSA subtasks with the SOA1 and the SOA2 with two
targets (2T) and with four targets (4T) for the two adult age groups. One-
Sample t-tests for each age group separately showed that the sensitivity
values (d’) differed significantly from the test value of zero (psB.001). Both
age groups were able to discriminate signals (targets) from noise (non-
targets) in all four VGSA subtasks. The general ANOVA for the sensitivity
values (d’) revealed that the 19�32-year-olds were significantly better in
discriminating the targets from the non-targets than the 59�79-year-olds,F(1, 67)�41.82, p B.001, hp2�.38. Decreasing the SOA, F(1, 67)�15.97,
VISUAL SPATIAL BIAS AND AGE 57
Dow
nloa
ded
by [
Oul
u U
nive
rsity
Lib
rary
] at
05:
03 1
5 Fe
brua
ry 2
014
p B.001, hp2�.19, as well as increasing the number of the targets, F(1,
67)�34.23, pB.001, hp2�.34, decreased sensitivity. Further analyses of the
significant interaction between Target and SOA, F(1, 67)�6.90, pB.011,
hp2�.09, showed that at both SOA1 and SOA2, increasing the number of
targets from two to four decreased sensitivity*SOA1: F(1, 67)�33.33,
pB.001, hp2�.33; SOA2: F(1, 67)�20.36, pB.001, hp2�.23*but thechange was more radical at SOA1.
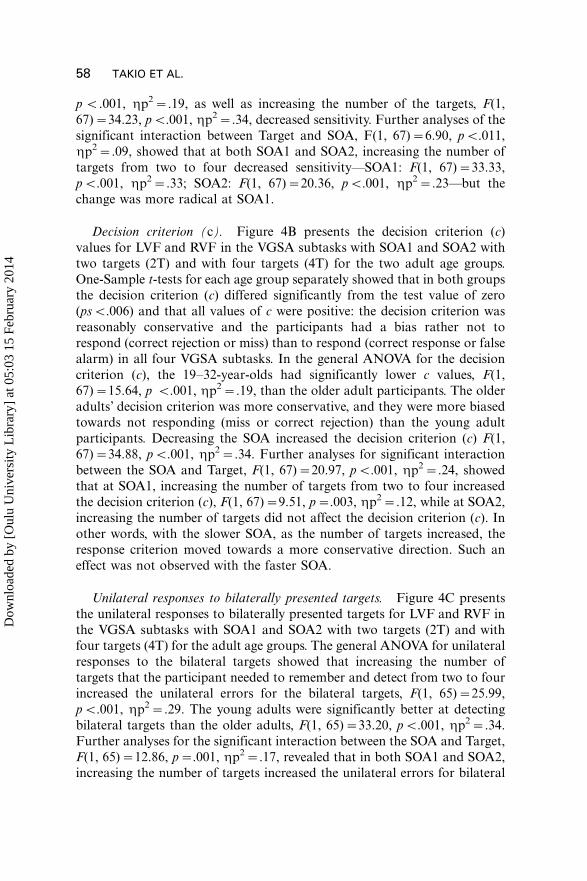
Decision criterion (c). Figure 4B presents the decision criterion (c)
values for LVF and RVF in the VGSA subtasks with SOA1 and SOA2 with
two targets (2T) and with four targets (4T) for the two adult age groups.
One-Sample t-tests for each age group separately showed that in both groupsthe decision criterion (c) differed significantly from the test value of zero
(psB.006) and that all values of c were positive: the decision criterion was
reasonably conservative and the participants had a bias rather not to
respond (correct rejection or miss) than to respond (correct response or false
alarm) in all four VGSA subtasks. In the general ANOVA for the decision
criterion (c), the 19�32-year-olds had significantly lower c values, F(1,
67)�15.64, p B.001, hp2�.19, than the older adult participants. The older
adults’ decision criterion was more conservative, and they were more biasedtowards not responding (miss or correct rejection) than the young adult
participants. Decreasing the SOA increased the decision criterion (c) F(1,
67)�34.88, pB.001, hp2�.34. Further analyses for significant interaction
between the SOA and Target, F(1, 67)�20.97, pB.001, hp2�.24, showed
that at SOA1, increasing the number of targets from two to four increased
the decision criterion (c), F(1, 67)�9.51, p�.003, hp2�.12, while at SOA2,
increasing the number of targets did not affect the decision criterion (c). In
other words, with the slower SOA, as the number of targets increased, theresponse criterion moved towards a more conservative direction. Such an
effect was not observed with the faster SOA.
Unilateral responses to bilaterally presented targets. Figure 4C presents
the unilateral responses to bilaterally presented targets for LVF and RVF in
the VGSA subtasks with SOA1 and SOA2 with two targets (2T) and withfour targets (4T) for the adult age groups. The general ANOVA for unilateral
responses to the bilateral targets showed that increasing the number of
targets that the participant needed to remember and detect from two to four
increased the unilateral errors for the bilateral targets, F(1, 65)�25.99,
pB.001, hp2�.29. The young adults were significantly better at detecting
bilateral targets than the older adults, F(1, 65)�33.20, pB.001, hp2�.34.
Further analyses for the significant interaction between the SOA and Target,
F(1, 65)�12.86, p�.001, hp2�.17, revealed that in both SOA1 and SOA2,increasing the number of targets increased the unilateral errors for bilateral
58 TAKIO ET AL.
Dow
nloa
ded
by [
Oul
u U
nive
rsity
Lib
rary
] at
05:
03 1
5 Fe
brua
ry 2
014
targets*SOA1: F(1, 67)�30.89, pB.001, hp2�.32; SOA2: F(1, 65)�5.79,
p�.019, hp2�.08*but the change was more radical at SOA1. More
unilateral responses to the bilateral targets were made to the right side than
to the left side, F(1, 65)�14.35, pB.001, hp2�.18. Further analyses for the
significant interaction between Age group and Visual Field, F(1, 65)�5.01,
p�.029, hp2�.07, showed that the main effects of Visual Field were
significant for both adult groups*19�32-year-olds: F(1, 34)�5.50, p�.025,
hp2�.14; 59�79-year-olds: F(1, 31)�9.00, p�.005, hp2�.23*but the
magnitude of the rightward bias was stronger for the older adults than for
the young adults. According to Wilcoxon Signed Ranks Test, young adults
made more unilateral responses to the right side than to the left side in both
VGSA subtasks with the SOA of 500-1500 ms (2 targets: Z��2.41,
p�.016; 4 targets: Z��2.00, p B.045), but there were no differences
between the left and right side in either of the VGSA subtasks with the SOA
of 300�800 ms. In the older adults the Wilcoxon Signed Ranks Test revealed
that the difference between the left and right unilateral responses to bilateral
targets was significant in all other subtasks except in VGSA with the SOA of
500�1500 ms with four targets: VGSA 500�1500 ms 2T (Z��2.95,
p�.003), VGSA 300�800 ms 2T (Z��2.79, p�.005) and VGSA 300�800 ms 4T (Z�2.18, p�.029). In other words the older adults more
frequently made right unilateral responses to bilateral targets than did the
young adults.
Reaction times (RTs). Figure 4D presents the reaction times (RTs) for
LVF and RVF in the VGSA subtasks with SOA1 and SOA2 with two targets
(2T) and with four targets (4T) for the adult age groups. The general
ANOVA for reaction times revealed that decreasing the SOA decreased the
reaction times, F(1, 66)�6.65, p�.012, hp2�.09, while increasing the
number of targets that the participant needed to remember and detect
increased the reaction times, F(1, 66)�94.83, pB.001, hp2�.59.
The correct responses to the RVF targets were significantly faster than the
responses to the LVF targets, F(1, 66)�17.62, pB.001, hp2�.21. The
analysis of the significant interaction between SOA and Age group, F(1,
66)�12.70, p�.001, hp2�.16, revealed that only the young adults’ reaction
times decreased when the SOA decreased, F(1, 35)�31.51, pB.001,
hp2�.47. Also, further analysis of the significant interaction between the
SOA and Target, F(1, 66)�8.44, p�.005, hp2�.11, showed that at both
SOA1 and SOA2, increasing the number of targets from two to four
decreased the reaction times, but the change was more radical at SOA1*SOA1: F(1, 66)�83.09, pB.001, hp2�.56; SOA2: F(1, 67)�44.04, pB.001,
hp2�.40.
VISUAL SPATIAL BIAS AND AGE 59
Dow
nloa
ded
by [
Oul
u U
nive
rsity
Lib
rary
] at
05:
03 1
5 Fe
brua
ry 2
014

Visual divided spatial attention subtask (VDSA)
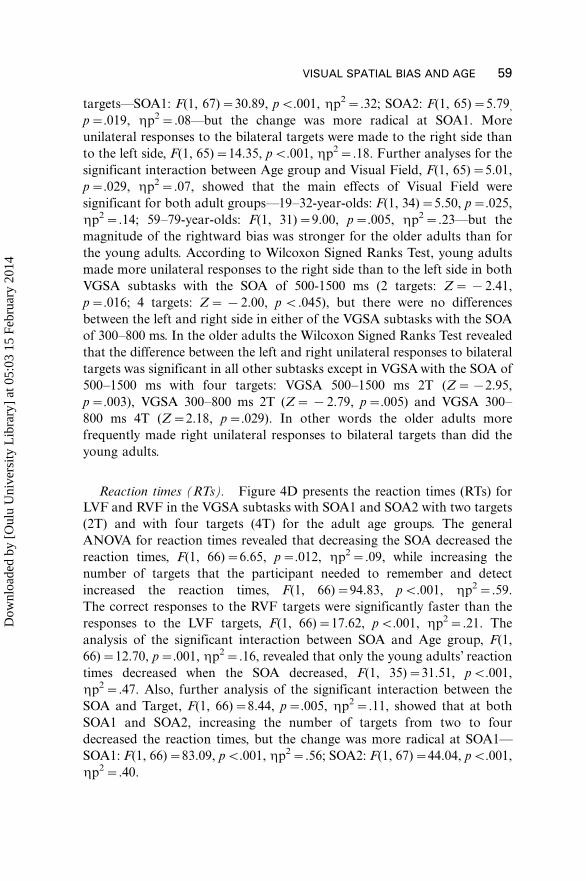
Correct responses. Figure 5A presents the percentages of correctresponses made to the RVF, LVF, and BVF stimuli in the VDSA subtask
with the SOA of 750 ms for all age groups. The general ANOVA for the
correct responses in the VDSA with the SOA of 750 ms showed a significant
main effect for Age group, F(4, 179)�71.63, p B.001, hp2�.62, indicating
that all other age groups differed significantly from each other (ps 5 .042),
except the 10�11-year-olds and the 59�79-year-olds. The young adults made
the most and the 5�7-year-olds made the fewest correct responses. The main
effect for visual field, F(2, 358)�650.53, p B.001, hp2�.78, revealed that
fewest correct responses were made to the bilateral stimuli and the most
correct responses to the RVF stimuli (ps 5 .007). However, further analyses
Figure 4. Sensitivity values (d’), decision criterion (c) values, percentage of unilateral responses to
bilateral targets, and reaction times (RTs) in milliseconds for the left and the right side in the Visual
Go/No-Go spatial attention test (VGSA) in the adult age groups. The vertical bars represent the
Standard Error of the Mean (SEM).
60 TAKIO ET AL.
Dow
nloa
ded
by [
Oul
u U
nive
rsity
Lib
rary
] at
05:
03 1
5 Fe
brua
ry 2
014

of the significant interaction between the Visual Field and Age group, F(8,
358)�11,13, p B.001, hp2�.20, showed that, in all age groups, fewer
correct responses were made to the bilateral stimuli than to the unilateral
stimuli*5�7-year-olds: F(2, 54)�123.65, p B. 001, hp2�.82; 8�9-year-
olds: F(2, 80)�168.77, p B.001, hp2�.81; 10�11-year-olds: F(2,
52)�166.90, p B.001, hp2�.87; 19�32-year-olds: F(2, 96)�106.04,p B.001, hp2�.69; 59�79-year-olds: F(2, 76)�100.44, p B.001, hp2�.73.
In contrast to the other age groups, the 10�11-year-olds and the 59�79-year-
olds made most correct responses to the right unilateral stimuli (left vs. right
unilateral stimuli (ps 5 .007)), while in the other age groups there were no
significant differences between the correct responses to the left and right
unilateral stimuli.
Extra responses. Figure 5B presents the percentage of extra responses
made to the left and the right side in the VDSA subtask with the SOA of 750
ms for all age groups. The general ANOVA for the extra responses showed
that all age groups differed significantly from each other in the number of the
extra responses (ps 5 .011) and the 5�7-year-olds made the most and the
young adults the fewest extra responses, F(4, 180)�46.54, p B.001,
hp2�.51. More extra responses were made to the right than to the left
side, F(1, 180)�7.76, p�.006, hp2�.04. Visual inspection of Figure 3Breveals that this was not the case among all age groups. This finding was
confirmed with paired sample t-tests for each age group separately: only the
5�7-year-old children made significantly more extra responses to the right
side than to the left side, t(28)��2.20, p B.05.
Unilateral responses to bilateral stimuli. Figure 5C presents the percen-
tages of left and right unilateral responses to the bilateral stimuli in theVDSA subtask with the SOA of 750 ms for all age groups. The general
ANOVA for the unilateral responses to the bilateral stimuli showed a main
effect for Age group, F(4, 180)�33.65, p B.001, hp2�.43: all other
differences between the age groups were significant (ps 5 .023), except the
differences between the 5�7-year-olds and the 8�9-year-olds, between the 8�9-year-olds and the 10�11-year-olds, and between the 10�11-year-olds and
the 59�79-year-olds. The 19�32-year-old adults made the fewest, and the
children made the most unilateral responses to the bilateral stimuli. Moreunilateral responses to the bilateral stimuli were made to the right than to the
left side, F(1, 180)�19.10, p B.001, hp2�.10). In other words, the stimulus
in the LVF was missed more often than the stimulus in the RVF in the
bilateral stimulus condition.
Reaction times (RTs). Figure 5D presents the reaction times (RTs) forthe LVF and the RVF in the VDSA subtask with the SOA of 750 ms for all
VISUAL SPATIAL BIAS AND AGE 61
Dow
nloa
ded
by [
Oul
u U
nive
rsity
Lib
rary
] at
05:
03 1
5 Fe
brua
ry 2
014
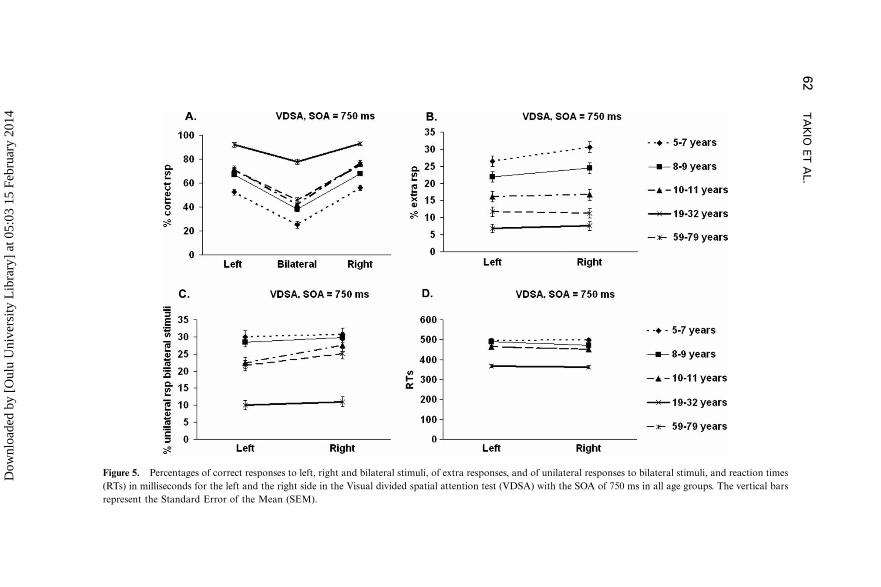
Figure 5. Percentages of correct responses to left, right and bilateral stimuli, of extra responses, and of unilateral responses to bilateral stimuli, and reaction times
(RTs) in milliseconds for the left and the right side in the Visual divided spatial attention test (VDSA) with the SOA of 750 ms in all age groups. The vertical bars
represent the Standard Error of the Mean (SEM).
62
TA
KIO
ET
AL.
Dow
nloa
ded
by [
Oul
u U
nive
rsity
Lib
rary
] at
05:
03 1
5 Fe
brua
ry 2
014
age groups. The general ANOVA on RTs showed that the RTs to the right
were faster than the RTs to the left, F(1, 180)�6.93, p�.009, hp2�.04. The
significant main effect of Age group, F(4, 180)�55.11, p B.001, hp2�.55,
showed that the young adults’ RTs were the fastest and the two youngest
child groups’ RTs were the slowest (ps 5 .033). The RTs of the 5�7-year-olds
and 8�9-year-olds did not differ from each other, nor did the RTs of the
10�11-year-olds and the 59�79-year-old adults.
DISCUSSION
By applying fast-paced visual tasks, which put a sufficiently intensive load on
attention and working memory, we replicated the results of corresponding
auditory tasks (Takio et al., 2011) and demonstrated that solely rightward
spatial biases were observed for linguistic as well as for non-linguistic stimuli
in unilateral and/or bilateral presentation conditions. Furthermore, as
predicted, the incidence of the rightward spatial biases changed as a function
of age: they were more common in the children and in the older adult
participants than in the young adults.
With linguistic stimuli, all age groups were able to discriminate the targets
from the non-targets in both visual fields, and the decision criterion in all age
groups was reasonably conservative. Nevertheless, the children between the
ages of 5 and 9 years responded more often towards the right side than
towards the left side, irrespective of whether the right side stimulus was a
target or a non-target. In other words, their decision criterion was more lax
towards the right hemispace than towards the left hemispace. With non-
linguistic stimuli, the 5�7-year-olds responded more often towards the right
side than towards the left side, even irrespective of whether any stimulus was
presented on that side or not. The same kind of rightward biases as those
observed in the 5�7 and 8�9-year-old children were not observed in the
children between 10 and 11 years or in the adult participants. However, the
10�11-year-old children and the older adults detected the unilateral non-
verbal stimuli (dots) more often in the right than in the left visual field, thus
showing rightward spatial bias. When the dot was presented bilaterally, a
rightward spatial bias was observed in all age groups, whereas only the adult
participants showed a rightward spatial bias also for bilateral linguistic
(digit) stimuli. Interestingly, the older adults more frequently made right
unilateral responses to the bilateral linguistic targets than did the young
adults. Thus the cognitively more demanding bilateral stimulus condition
with linguistic stimuli induces stronger rightward bias in the older adult
participants than in the other participants. Moreover, increasing the
presentation speed (SOA) decreased the older adults’ performance more
than that of the other age groups.
VISUAL SPATIAL BIAS AND AGE 63
Dow
nloa
ded
by [
Oul
u U
nive
rsity
Lib
rary
] at
05:
03 1
5 Fe
brua
ry 2
014

All our participants were right-handed and the possible motor right-hand
preference may partly explain the observed RTresults and perhaps some of the
rightward response bias in the 5�7-year-old and 8�9-year-old children (see
e.g., Goble & Brown, 2008). However, under intensive attentional load, the
stimuli in the right hemispace were also detected more accurately than the
stimuli in the left hemispace. This finding is consistent with the neuropsycho-
logical models proposing that attention is more strongly biased towards the
right hemispace (Heilman et al., 1987; Kinsbourne, 1987). Since the present
rightward spatial biases were independent of the stimulus type, we propose
that they were affected by the hemispheric asymmetry of attentional
mechanisms, producing right hemispace preference in healthy participants
in cognitively demanding tasks.A particular deficit called extinction can be observed in patients with right-
hemisphere damage during bilateral simultaneous stimulation: the patient
may be able to detect a single left-sided event in isolation, but in a bilateral
stimulus condition, the left-sided event is missed (for a review, see Driver &
Vuilleumier, 2001). Difficulties in becoming immediately aware of multiple
targets are also observed in normal healthy humans (for a review, see Driver &
Vuilleumier, 2001). Thus the spatial attentional bias appears when multiple
events compete for attention at the same time. The present findings on right-
side unilateral responses in bilateral stimulus conditions suggest that a mild
extinction-like phenomenon is present throughout the lifespan. Moreover, the
ability to distribute attention to multiple targets simultaneously decreases
especially in the course of ageing.
The present findings showed that the speed and efficiency of the
performance increased in childhood, were well developed in young adulthood,
and decreased again in old age (see also Ridderinkhof & van der Stelt, 2000;
Span, Ridderinkhof, & van der Molen, 2004). Similarly to what was observed
in the auditory tasks (Takio et al., 2011), in visual modality, the 5�7-year-olds’
performance level was inferior to that of older children, while the performance
level of 59�79-year-olds dropped occasionally to the same level as that of the
10�11-year-old children. The skills necessary for goal-directed behaviour
mature slowly during childhood, are well developed in adulthood and decline
as a function of ageing (Jurado & Rosselli, 2007; Luciana et al., 2005; Span
et al., 2004; Tsujimoto, 2008). Thus we propose that the present age-related
changes in the speed and efficiency of the performance and in the rightward
spatial bias are related to the development and decline of the executive control:
the inherent rightward spatial asymmetries are gradually balanced as the child
grows, are best controlled in young adulthood, and reappear as a function of
ageing. Strong asymmetries are not observed in young adults, with the
exception of mild asymmetries in specific bilateral stimulus conditions. Young
adults are probably better at overcoming the inherent rightward spatial biases
with the aid of their advanced executive functions (see Hugdahl et al., 2009;
64 TAKIO ET AL.
Dow
nloa
ded
by [
Oul
u U
nive
rsity
Lib
rary
] at
05:
03 1
5 Fe
brua
ry 2
014

Posner, 2008; Posner & Raichle, 1994; Sætrevik & Specht, 2009). In childhood
the nature and the magnitude of the bias changed between the ages of 5 and 11
years. This indicates that, as the child develops, the more he/she is able to
inhibit responses that are not relevant for performing the tasks. The present
findings converge with the findings from our previous studies in auditory
modality (Takio et al., 2009, 2011) suggesting that some cognitive functions,
such as inhibition and ability to suppress task-irrelevant actions are relatively
well developed around the age of 10�11 years (for a review, see Hale, Bronik, &
Fry, 1997; Jurado & Rosselli, 2007). In old age the rightward spatial biases re-
emerge, especially in the more cognitively demanding bilateral stimulus
conditions. Perhaps in old age the asymmetrical bottom-up processes become
visible, especially in fast-paced perceptual tasks, due to the generalised slowing
of processing speed and the decline in executive functions.
In conclusion, the results showed that visual spatial biases occurred under
attentional load, they were solely towards the right side, and they changed as
a function of age. The age-related changes occurred presumably due to the
development and decline of executive functions. Since similar kinds of results
were also found in auditory modality (Takio et al., 2009, 2011), we propose
that the multimodal rightward spatial bias is related to the rightward
personal hemispace preference.
Manuscript received 28 March 2011
Revised manuscript received 20 July 2011
First published online 17 January 2012
REFERENCES
Anderson, V. A., Anderson, P., Northam, E., Jacobs, R., & Catroppa, C. (2001). Development of
executive functions through late childhood and adolescence in an Australian sample.
Developmental Neuropsychology, 20(1), 385�406.
Andersson, B., & Hugdahl, K. (1987). Effects of sex, age, and forced attention on dichotic listening
in children: A longitudinal study. Developmental Neuropsychology, 3(3/4), 191�206.
Boles, D. B., Barth, J. M., & Merrill, E. C. (2008). Asymmetry and performance: Toward a
neurodevelopmental theory. Brain and Cognition, 66, 124�139.
Callaert, D. V., Vercauteren, K., Peeters, R., Tam, R., Graham, S., Swinnen, S., et al. (2011).
Hemispheric asymmetries of motor versus nonmotor processes during (visuo)motor control.
Human Brain Mapping, 32(8), 1311�1329.
Callejas, A., Lupianez, J., Funes, M. J., & Tudela, P. (2005). Modulations among the alerting,
orienting and executive control networks. Experimental Brain Research, 167, 27�37.
Corbetta, M., Kincade, J. M., Ollinger, J. M., McAvoy, M. P., & Shuman, G. L. (2000). Voluntary
orienting is dissociated from target detection in human posterior parietal cortex. Nature
Neuroscience, 3(3), 292�297.
Corbetta, M., Patel, G., & Shulman, G. L. (2008). The reorienting system of the human brain:
From environment to theory of mind. Neuron, 58, 306�324.
Corbetta, M., & Shulman, G. L. (2002). Control of goal-directed and stimulus-driven attention in
the brain. Nature Reviews. Neuroscience, 3, 201�215.
VISUAL SPATIAL BIAS AND AGE 65
Dow
nloa
ded
by [
Oul
u U
nive
rsity
Lib
rary
] at
05:
03 1
5 Fe
brua
ry 2
014
Dobler, V. B., Manly, T., Verity, C., Woolrych, J., & Robertson, I. H. (2003). Modulation of spatial
attention in a child with developmental unilateral neglect. Developmental Medicine & Child
Neurology, 45, 282�288.
Dolcos, F., Rice, H. J., & Cabeza, R. (2002). Hemispheric asymmetry and aging: Right hemisphere
decline or asymmetry reduction. Neuroscience and Biobehavioral Reviews, 26, 819�825.
Driver, J., & Vuilleumier, P. (2001). Perceptual awareness and its loss in unilateral neglect and
extinction. Cognition, 79, 39�88.
Everts, R., Lidzba, K., Wilke, M., Kiefer, C., Mordasini, M., Schroth, G., et al. (2009).
Strengthening of laterality of verbal and visuospatial functions during childhood and
adolescence. Human Brain Mapping, 30, 473�483.
Goble, D. J., & Brown, S. H. (2008). The biological and behavioural basis of upper limb
asymmetries in sensorimotor performance. Neuroscience and Biobehavioral Reviews, 32, 598�610.
Hale, S., Bronik, M. D., & Fry, A. F. (1997). Verbal and spatial working memory in school-age
children: Developmental differences in susceptibility to interference. Developmental Psychology,
33(2), 364�371.
Hamalainen, H., & Takio, F. (2010). Integrating auditory and visual asymmetry. In K. Hugdahl &
R. Westerhausen (Eds.), The two halves of the brain. Information processing in the cerebral
hemispheres (pp. 417�437). Cambridge, MA: MIT Press.
Heilman, K. M., Bowers, D., Valenstein, E., & Watson, R. T. (1987). Hemispace and hemispatial
neglect. In M. Jeannerod (Ed.), Neurophysiological and neuropsychological aspects of spatial
neglect (pp. 115�150). North-Holland: Elsevier Science Publishers BV.
Helland, T., & Asbjørnsen, A. (2001). Brain asymmetry for language in dyslexic children.
Laterality, 6(4), 289�301.
Hugdahl, K. (2003). Dichotic listening in the study of auditory laterality. In K. Hugdahl &
R. Davidson (Eds.), The asymmetrical brain (pp. 441�476). Cambridge, MA: MIT Press.
Hugdahl, K., & Andersson, L. (1986). The ‘‘forced-attention paradigm’’ in dichotic listening to
CV-syllables. A comparison between adults and children. Cortex, 22, 417�432.
Hugdahl, K., Carlsson, G., & Eichele, T. (2001). Age effects in dichotic listening to consonant-
vowel syllables: Interactions with attention. Developmental Neuropsychology, 20(1), 445�457.
Hugdahl, K., Westerhausen, R., Alho, K., Medvedev, S., Laine, M., & Hamalainen, H. (2009).
Cognition and neuroscience. Attention and cognitive control: Unfolding the dichotic listening
story. Scandinavian Journal of Psychology, 50, 11�22.
Ivry, R. B., & Robertson, L. C. (1998). The two sides of perception. Cambridge, MA: The MIT
Press.
Jurado, M. B., & Rosselli, M. (2007). The elusive nature of executive functions: A review of our
current understanding. Neuropsychology review, 17(3), 213�233.
Karrasch, M., Sinerva, E., Gronholm, P., Rinne, J., & Laine, M. (2005). CERAD test performances
in amnestic mild cognitive impairment and Alzheimer’s disease. Acta Neurologica Scandinavica,
11(3), 172�179.
Kimura, D. (1966). Dual functional asymmetry of the brain in visual perception. Neuropsychologia,
4, 275�285.
Kimura, D. (1967). Functional asymmetry of the brain in dichotic listening. Cortex, 3(2), 163�178.
Kinsbourne, 1987. Mechanisms of unilateral neglect. In M. Jeannerod, Neurophysiological and
neuropsychological aspects of spatial neglect (pp. 69�86). North-Holland: Elsevier Science
Publishers BV.
Laurent-Vannier, A., Pradat-Diehl, P., Chevignard, M., Abada, G., & De Agostini, M. (2003).
Spatial and motor neglect in children. Neurology, 60(2), 202�207.
Luciana, M., Conklin, H. M., Hooper, C. J., & Yarger, R. S. (2005). The development of nonverbal
working memory and executive control processes in adolescents. Child Development, 76, 697�712.
66 TAKIO ET AL.
Dow
nloa
ded
by [
Oul
u U
nive
rsity
Lib
rary
] at
05:
03 1
5 Fe
brua
ry 2
014

Macmillan, N. A., & Creelman, N. A. (2005). Detection theory. A user’s guide (2nd edition).
Cambridge, UK: Cambridge University Press.
McCartney, G., & Hepper, P. (1999). Development of lateralised behaviour in the human fetus from
12 to 27 weeks’ gestation. Developmental Medicine & Child Neurology, 41, 83�86.
Mondor, T. A., & Bryden, M. P. (1991). The influence of attention on the dichotic REA.
Neurospychologia, 29(12), 1179�1190.
Oldfield, R. C. (1971). The assessment and analysis of handedness. The Edinburgh inventory.
Neuropsychologia, 9, 97�113.
Poskiparta, E., Niemi, P., & Lepola, J. (1994). Diagnostiset testit 1: Lukeminen ja kirjoittaminen.
[Diagnostic Tests 1: Reading and Writing]. Finland: University of Turku.
Posner, M. I. (2008). Measuring alertness. Annals of the New York Academy of Sciences, 1129, 193�199.
Posner, M. I., & Petersen, S. E. (1990). The attention system of the human brain. Annual Review of
Neuroscience, 13, 25�42.
Posner, M. I., & Raichle, M. E. (1994). Images of mind. New York: Scientific American Library.
Proverbio, A., Zani, A., Gazzaniga, M. S., & Mangun, G. R. (1994). ERP and RT signs of a
rightward bias for spatial orienting in split-brain patient. NeuroReport, 5, 2457�2461.
Ridderinkhof, K. R., & van der Stelt, O. (2000). Attention and selection in the growing child:
Views derived from developmental psychophysiology. Biological Psychology, 54, 55�106.
Sanders, L. D., Stevens, C., Coch, D., & Neville, H. J. (2006). Selective auditory attention in 3- to 5-
year-old children: An event-related potential study. Neuropsychologia, 44, 2126�2138.
Silven, M., Poskiparta, E., Niemi, P., & Voeten, M. (2007). Precursors of reading skill from infancy
to first grade in Finnish: Continuity and change in a highly inflected language. Journal of
Educational Psychology, 99, 516�531.
Span, M. M., Ridderinkhof, K. R., & van der Molen, M. W. (2004). Age-related changes in the
efficiency of cognitive processing across the life span. Acta Psychological, 117, 155�183.
Stanislaw, H., & Todorov, N. (1999). Calculation of signal detection theory measures. Behavior
Research Methods, Instruments. Computers, 31(1), 137�149.
Sætrevik, B., & Specht, K. (2009). Cognitive conflict and inhibition in primed dichotic listening.
Brain and Cognition, 71, 20�25.
Takio, F., Koivisto, M., Jokiranta, L., Rashid, F., Kallio, J., Tuominen, T., et al. (2009). The effect
of age on attentional modulation in dichotic listening. Developmental Neuropsychology, 34(3),
225�239.
Takio, F., Koivisto, M., Laukka, S. J., & Hamalainen, H. (2011). Auditory rightward spatial bias
varies as a function of age. Developmental Neuropsychology, 36(3), 1�21.
Telkemeyer, S., Rossi, S., Koch, S. P., Nierhaus, T., Steinbrink, J., Poeppel, D., et al. (2009).
Sensitivity of newborn auditory cortex to the temporal structure of sounds. The Journal of
Neuroscience, 29(47), 14726�14733.
Thomsen, T., Specht, K., Hammar, A., Nyttingnes, J., Ersland, L., & Hugdahl, K. (2004). Brain
localization of attentional control in different age groups by combining functional and
structural MRI. NeuroImage, 22(2), 912�919.
Trauner, D. A. (2003). Hemispatial neglect in young children with early unilateral brain damage.
Developmental Medicine & Child Neurology, 45, 160�166.
Tsujimoto, S. (2008). The prefrontal cortex: Functional neural development during early
childhood. The Neuroscientist, 14, 345�358.
Voyer, D. (2001). Reliability and magnitude of visual laterality effects: The influence of attention.
Laterality, 6(4), 315�336.
Yesavage, J. A., Brink, T. L., Rose, T. L., Lum, O., Ayden, M., & Von Leirer, O. (1983).
Development and validation of a geriatric depression scale: A preliminary report. Journal of
Psychiatric Research, 17(1), 37�49.
VISUAL SPATIAL BIAS AND AGE 67
Dow
nloa
ded
by [
Oul
u U
nive
rsity
Lib
rary
] at
05:
03 1
5 Fe
brua
ry 2
014