The effect of polyethylene glycol on some properties of the erythrocyte membrane
Upload
khangminh22Category
view
0download
0
I

FOREWORD
The National Toxicology Program (NTP) is made up of four charter agencies o f the US. Department o f Health and Human Services (DHHS): the National Cancer Institute (NCI), National Institutes o f Health; the National Institute of Environmental Health Sciences (NIEHS), National Institutes of Health; the National Center .for Toxicological Research (NCTR), Food and Drug Administration; and the National Institute for Occupational Safety and Health(NIOSH), Centers for Disease Control. In Juky 1981, the Carcinogenesis Bioassay Testing Program, NCI, was transferred to the NIEHS. The NTP coordinates the relevant programs, staff, and resources from these Public Health Service agenciesrelating to basic and applied research and to biological assay development and validation.
The NTP develops, evaluates, and disseminates scientific information about potentially toxic and hazardous chemicals. This knowledge is used for protecting the health o f the American people and for the primary prevention o f disease.
The studies described in this Technical Report were performed under the direction o f the NIEHS and were conducted in compliance with NTP laboratory health and safety requirements and must meet or exceed all applicable federal, state, and local health and safety regulations. Animal care and use were in aWDrdancewith the Public Health Service Policy on Humane Care and Use ofAnimals. The prechronicandl chronic studies were conducted in compliance with Food and Drug Administration (FDA) Good Laboratory Practice Regulations, and all aspects of the chronic studies were subjected to retrospective qua,lity assurance audits before being presented for public review.
These studies are designed and conducted to characterize and evaluate the toxicologic potential, including carcinogenic activity, of selected chemicals in laboratory animals (usually two species, rats and mice).Chemicals selected for NTP toxicology and carcinogenesis studies are chosen primarily on the bas’eso f human exposure, level of production, and chemical structure. Selection per se is not an indicator of a chemical’s carcinogenic potential.
These NTP Technical Reports are available for sale from the National Technical Information Service, U.S. Department of Commerce; 5285 Port Royal Road, Springfield, VA 22161(703-487-4650). Singlecopies o f this Technical Report are available without charge while supplies last from the NTP Central Data Management, NIEHS, P.O. Box 12233, MD AO-01, Research Triangle Park, NC 27709 (919-541-1371).

N I H Publication NO.93-3144
This report was funded in part by funds from the Comprehensive Environmental Response, Compensation, and Liability Act trust fund by interagency agreement with the Agency for Toxic Substances and Disease Registry U.S. Public Health Service

2 Ethylene Glycol, NTP TR 413
CONTRIBUTORS National ToxicologyProgram Evduated and interpretedresults and reported mgs C.J. Alden, Ph.D. G.A. Boorman, D.V.M., Ph.D. D.A.Bridge, B.S. S.1,. Eustis, D.V.M., PbD. T.J. Goehl, Ph.D. R.A. Griesemer, D.V.M., Ph.D. J.K. Haseman, PLD. C.W. Jameson, Ph.D. M.M. McDonald, D.V.M., Ph.D. G.N. Rao, D.V.M., Ph.D. M,.B.Thompson, D.V.M., Ph.D. K.L. Witt, M.S., OakRidgeAssociatedUniversities
Southern Research Institute Conducted studiq evalwted palhology &dings
J.1). Prejean, Ph.D., PrincipalInvestigator C.H. Farr, Ph.D. J.EL Heath, D.V.M.- R..B. Thompson, D.V.M., Ph.D.
Experimental Pathology Laboratories, Inc. Provided pathologv quality arsesrment
J.F. Hardisty, D.V.M., PrincipalInvestigatorB.F.Hamilton, D.V.M., Ph.D.
IntegratedLaboratorySystems Pnpmed quality as.uuame audits
S.L. Smith, J.D., PrincipalInvestigator
NTP Pathology Working Group Evaluated slides,prepmd pathologv report on mice (24 May 1990)
J.C. Seely, D.V.M., Chair PATHCO,Inc.
S.L. Eustis, D.V.M., Ph.D. National Toxicology Program
J. Everitt, D.V.M. CIIT
B.F. Hamilton, D.V.M., Ph.D. Experimental PathologyLaboratories, Inc.
D. Meuten, D.V.M., Ph.D. NorthCarolinaStateUniversity
M.M. McDonald, D.V.M., Ph.D. National Toxicology Program . .
M.E. Styles,D.V.M. (observer) U.S. Department o f Agriculture
BiotechnicalServices,Inc. Pnpmed Technical Report
D.D. Lambright, PbD., PrincipalInvestigator G.F. Corley, D.V.M. P. Chaffin, MS. J.A. Gregan, M.A.
,
ci

3
ABST.@T . . . . . . . . . . . . . . . . . . . . . . . . . . . . . . . . . . . . . . . . . . . . . . . . . . . . . . . . . . . . . . 5
EXPMATHON OF LEVELS OF EVIDENCE OF CARCINOGENIC ACTIVITY ............. 7
TECHNICALREPORTS RlEVXEW SUBCOMMITTEE ................................ 8
SUMMARY OF TECHNICALREPORTS REVIE" SUBCOMMIT"EE COMMENTS .......... 9
INTRODUCTION . . . . . . . . . . . . . . . . . . . . . . . . . . . . . . . . . . . . . . . . . . . . . . . . . . . . . . . . . nn MATERMIS ANDMETHODS . . . . . . . . . . . . . . . . . . . . . . . . . . . . . . . . . . . . . . . . . . . . . . . . n9
RESULTS . . . . . . . . . . . . . . . . . . . . . . . . . . . . . . . . . . . . . . . . . . . . . . . . . . . . . . . . . . . . . . . . 27
DISCUSSION AND CONCLUSIONS . . . . . . . . . . . . . . . . . . . . . . . . . . . . . . . . . . . . . . . . . . . . 37
REFERENCES .......................... ;................................ 4n
APPENDIXA Summary of LesionsinMaleMice in the &Year Feed Study of Ethylene Glycol . . . . . . . . . . . . . . . . . . . . . . . . . . . . . . . . . . . . . . . . . . . . . 51
APPENDIX B ~ u m m a r yof hsions' in weanale ice in the z -~eau~ e e dstancay of Ethylene Glycol . . . . . . . . . . . . . . . . . . . . . . . . . . . . . . . . . . . . . . . . . . . . . 95
APPENDIXc ~ e n e t i c' F O X ~ C O I O ~. . . . . . . . . . . . . . . . . . . . . . . . . . . . . . . . . . . . . . . . . . . . . 1135
APPENDIXD Organ Weights and Organ-Weight-to-Body- eight Ratios .................. 147
APPENDIXEChemicalCharacterization Studies . . . . . . . . . . . . . . . . . 151and Dose FQUTIN"~O~
APPENDIXG Ingredients.NutrientComposition. and Contaminant Levels in NIH-07 Rat and Mouse Ration .................................. 165

mhyneme mymn
CAS NO.107-21-1
Chemical Formula: CJ&02 Molecular Weight: 62.07
Synnomyms: 1,2dihydroxyethane; ethane-l,2diol; 12ethanediol; ethylene alcohol;ethylenedihydrate; glycob glycol alcohol; 2-hydroxyethanol;monoethylene glycol
Ethylene glycol is a major constituent of motor vehicle antifreeze-coolant fluids and is also found in other commercial products including hydraulic brake fluids,adhesives, printer’s inks, and wood stains. It is usedin the manufacture of polyesterfilms and fibers,polyethylene terephthalate (PET) solid state resins, plasticizers, elastomers, cellophane, and other products. Previous 13-week and 2-year studies of ethylene glycol in F344 rats were considered ade- quate to evaluate the toxicology and carcinogenicity of ethylene glycol in this species and strain; therefore, the present studies were conducted in mice only.Toxicology and carcinogenesis studies wereconducted by administering ethylene glycol (greater than 99% pure) in feed to male and female B6C3Fl mice for 13weeks and 2 years. Genetic toxicology studies wereconducted in Salmonella zyphhurium, mouse lymphoma L5178Ycells, and Chinese hamster ovary cells.
I3-Week Studies: Groups o f 10 male and 10 female mice received feed containing 0,3,20,6,30, 12,500, 25,000 or 50,CHM ppm ethylene glycol. All mice survived to the end of the studies. Final mean bodyweights of dosed male andfemale mice and feed consumption of dosedmales were similar to those of the controls. Feed consumption of dosed females was significantly greater thanthat o f controls. Absoluteand relative organ weights of mice administered ethylene glycol were generally similar
to those o f controls throughout the study. No chemical-related clinical findings were observed.
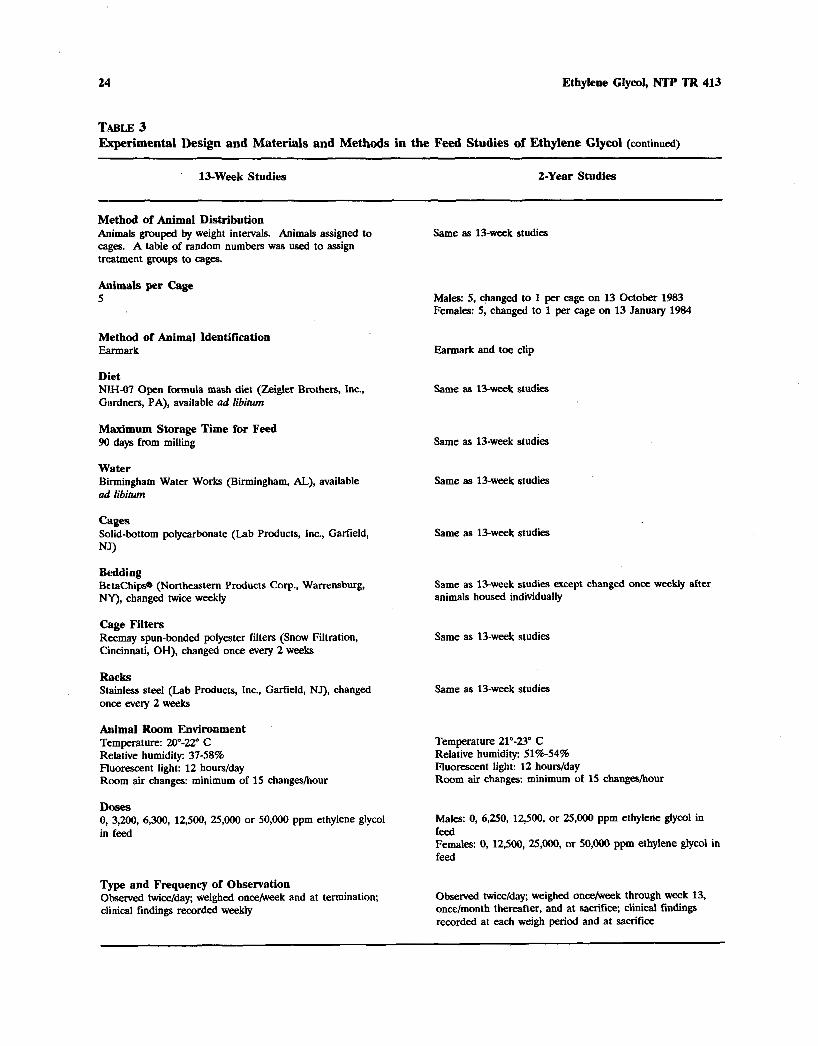
Chemical-related kidney and liver lesions, seen only in 25,000 and 50,000 ppm male mice, consisted of nephropathy and centrilobular hepatocellular hyaline degeneration (cytoplasmic accumulation of non-birefringent, eosinophilic, globular, or crystallinematerial resembling erythrocyte fragments).
2-YearStudies: Groups o f 60 mice received diets containing ethylene glycol for upto 103 weeks (males: 0, 6,250, 12,50, or 25,000 ppm; females: 0, 12,50, 25,000, or 50,000 ppm). These concentra- tions correspond to daily doses o f approximately1,500, 3,000, or 6,000 mgkg bodyweight for male mice and 3,000, 6,000, or 12,000 mgkg for females. Dietary concentrations greater than 50,000 ppm have the potential to affect the nutritional value o f the feed. Interim evaluations were performed on six males and nine or ten females from each dosegroup at 15 months.
Survival, Body Weights, Feed Consumption, C l i n i ~ dFindings im the 2-Year Studies:
At the end o f the 2-year studies, survival rates o f maleandfemale mice exposed to ethylene glycol were similar to those of controls. Mean body weights and feed consumption of exposed male and female groups were also similar to those o f controls.

6 Ethylene Glycol, N T P TR 413
No clinical findings associated with the administration of ethylene glycol were observed.
Patholo& Finiiings: No chemical-related neoplasms were observed in male or female mice in these studies. Hepatocellular hyaline degeneration was seen in mid- and high-dose male and high-dosefemale mice: Pulmonary arterial medial hyperplasiawas observed at an increased incidence in exposedfemales but not in exposed males.Incidence and severity of nephropathy were not affected by treat-ment in. either s e x . Small numbers o f oxalate-like crystals, calculi, or both were noted in renal tubules, urethrae, and/or urinary bladders in a few highdose male mice.
GeneticToxicology: Ethylene glycol did notinduce genemutations in Salmonella typhimurium strains TA98,TA100,TA1535, and TA1537, trifluoro-
thymidine resistance in mouse L5178Y lymphomacells, or sister chromatid exchanges or chromosomal aberrations in Chinese hamster ovary cells. All tests were with exogenousconducted and. without metabolic activation (S9).
Conclusions: Underthe conditions o f these 2-year feed studies, there was no evidence of carcinogenic activity* of ethylene glyql in &le B6C3Fl mice receiving 6,250,12,500, or 25,OOO ppm, or in female B6C3Fl mice 12,500, 25,OOO, orreceiving 50,OOO ppm. Administration of ethylene glycol resulted in hepatocellular hyaline degeneration in male mice fed diets containing 12,500 or 25,OOO ppmand in female mice fed diets containing 50,OOO ppm. An increased incidence o f medial hyperplasia of small pulmonary arteries and arterioles occurred in female mice fed diets containing 12,500, 25,OOO, or 50,OOO ppm ethylene glycol.
. .'..
-
l -lanation of Levels of Evidence of Carcinogenic Activity appears on page 7. A summaG of the Technical Reports Review Subcommittee comments and the public discussion on this Technical Report appear on page 9.
. .
Summary of the 2-YearCarcinogenicity and Genetic Toxicology Studies of Ethylene Glycol
Variable Male B6C3Fl Mice Female B6C3Fl Mi?
0, 6,250, 12,500, or 2 5 , O O O ppmin feed . 0, 12,500, 25,OOO, or 50,OOO ppmin feed
Body weights Dosed groups similar to controls D&.groups similar to.controls
%year survival raies 29\54, 32/54, 32/54, 23\54 33/50, 30150, 30151, 37/50
Nonneoplasticeffects Liver: hyaline Liver: hyalinehepatocytedegeneration degenerationhepatocyte (0154, 0153, 36/54) (0150, 0150, 1151, 26/50)24/53, .,
Lung: medial hyperplasia of the pulmonary arterioles (3/50, 10/50, 10151, 23/50)
Neoplastic effects None None
Level of evidence of carcinogenic activity No evidence No evidence
Genetic toxicology Sabnomlla typhimurhun genemutations:Negativewith and without S 9 instfains TA98, TA100,TA1535, and TAl537 L5178Ymouse lymphomagenemutations:Negativewith and without S 9 Sister chromatid exchanges
Chinesehamster ovary cells in W o : Negativewith and without S 9 Chromosomal aberrations
Chinesehamsterovarycells in vim: Negativewith and without S 9

7 Ethylene Glycol, NTP TR 413
E X l P M A T I O N OF ILIGWEILS OF EVIDENCE OF CARCINOGENIC ACTIwI[W . .
The National Tox@logy Program describes the results of individual experiments on a chemical agent and notes the strength of the evidence for conclusions regarding each study. Negative results, inwhich the study animals do not have a greater incidence of neoplasia than control animals, do not necessarily mean that a chemical is not a carcinogen, inasmuch as the experiments are conducted under a limited set of conditions.Positive results demonstrate that a chemical is carcinogenic for laboratory animals under the conditions of the study and indicate that exposure to the chemical has the potential for hazard to humans. Other organizations, such as the International Agency for Research on Cancer, assign a strength of evidence for conclusions based on an examinationofallavailableevidenceincluding:animal studies such as those conducted by the I", epidemiologic studies, and estimates of exposure. Thus, the actual determination ofrisk to humans from chemicals found to be carcinogenic in laboratory animals requires a wider analysis that extends beyond the purview of these studies.
Five categories of evidence of carcinogenic activity are used in the Technical Report series to summarize the strength of the evidence observed in each experiment: two categories for positive results (clearevidence and some evidence); one category for uncertain findings (equivocal evidence); one category for no observable effects (no evidence); and one category for experiments that because of major flaws cannot be evaluated (inadequate study). These categories of interpretative conclusions were first adopted in June 1983 and then revised in March 1986 for use in the Technical Reports series to incorporate more specifically the concept of actual weight of evidence of carcinogenic activity. For each separate experiment (male rats, female rats, male mice, female mice), one of the following quintet is selected to describe the findings. These categories refer to the strength of the experimental evidence and not to potency or mechanism.
Clear evidence of carcinogenic activity is demonstrated by studies that are interpreted as showing a dose-related (i) increase of malignant neoplasms, (ii) increase of a combination of malignant and benign neoplasms, or (iii) marked increase of benign neoplasms if there is an indication from this or other studies of the ability of such tumors to progress to malignancy. Some evidence of carcinogenic activity is demonstrated by studies that are interpreted as showing a chemical-related increased incidence of neoplasms (malignant, benign, or combined) in which the strength of the response is less than that required for clear evidence. Equivocal evidence of carcinogenic activity describes studies that are interpreted as showing a marginal increase of neoplasms that may be chemical related. No evidence of carcinogenic activity is demonstrated by studies that are interpreted as showing no chemical-related increases in malignant or benign neoplasms. Inadequate study of carcinogenic activity is demonstrated by studies that because of major qualitative or quantitative limitations cannot be interpreted as valid for showing either the presence or absence of carcinogenic activity.
When a conclusion statement is selected for a particular experiment, consideration must be given to key factors that would extend the actual boundary of an individual category of evidence. This should allow for incorporation of scientific experience and current understanding of long-term carcinogenesis studies in laboratory animals, especially for those evaluations that may be on the borderline between two adjacent levels. Theseconsiderationsshouldinclude:
adequacy of.the experimental design and conduct; occurrence of common versus uncommon neoplasia; progression (or lack thereof) from benign to malignant neoplasiaaswell as from preneoplastic to neoplastic lesions; some benign neoplasms have the capacity to regress but others (of the same morphologic type)progress. At present, it is impossible to identify the difference. Therefore, where progression is known to be a possibility, the most prudent course is to assume that benign neoplasms of those types have the potential to become malignant; combining benign and malignant tumor incidences known or thought to represent stages of progression in the same organ or tissue; latency in tumor induction; multiplicity in site-specific neoplasia; metastases; supporting information from proliferative lesions (hyperplasia) in the same site of neoplasia or in other experiments (same lesion in another sex or species); presence or absence of dose relationships; statistical significance of the observed tumor increase; concurrent control tumor incidence as well as the historical control rate and variability for a specific neoplasm; survival-adjusted analyses and false positive or false negative concerns; structure-activity correlations; and in some cases, genetic toxicology.

8 Ethylene Glycol, NTP TR 413
NATIONAL TOXICOLOGYPROGRAM BOARD OF SCIENTIFIC COUNSELORS TECHNICAL REPORTS REVIEW SUBC0M"EE
The members of the Technical Reports Review Subcommittee who evaluated the draft N T P Technical Report on ethylene glycol on July 10, 1991,are listed below. Subcommittee members serve as independent scientists, not as representatives of any institution, company, or governmental agency. In this capacity, Subcommittee members have fwe major responsibilities in reviewing NTP studies:
l to ascertain that all relevant literature data have been adequately cited and interpreted, l to determine if the design and conditions of the NTP studies were appropriate, l to ensure that the Technical Report presents the experimental results and conclusions fully and clearly, l to judge the significance o f the experimental results by scientific criteria, and l to assess the evaluation of the evidence o f carcinogenic activity and other observed toxic responses.
Daniel S.Longnecker, M.D., Chair Jay I. Goodman, Ph.D. Department of Pathology Department of Pharmacology and Toxicology Dartmouth Medical School Michigan State University Lebanon, NH East Lansing, M I
Paul T. Bailey,Ph.D. David W. Hayden, D.V.M, Ph.D., PrincipalReviewer Toxicology Division Department of Veterinary Pathobiology Mobil Oil Corporation College of Veterinary Medicine Princeton, NJ University of Minnesota
St. Paul, MN Louis S.Beliczky,M.S.,M.P.H.
Department o f Industrial Hygiene Curtis D. Klaassen, PbD., PrincipalReviewer United Rubber Workers International Union Department of Pharmacology and Toxicology Akron, OH University o f Kansas Medical Center
Kansas City, KS Gary P. Carlson, Ph.D., PrincipalReviewer
Department o f Phannacology and Toxicology Barbara McKnight, Ph.D. Purdue University Department o f Biostatistics West Lafayette, IN University of Washington
Seattle, WA
Harold Davis, D.V.M., Ph.D. School o f Aerospace Medicine Ellen K. Silbergeld, Ph.D.* Brooks Air Force Base, TX University of Maryland Medical School
Baltimore, MD Robert H. Garman, D.V.M.
Consultants in Veterinary Pathology Lauren Zeise, Ph.D. Murrysville, PA California Department o f Health Services/RCHAS
Berkeley, CA
l Didnot attend

On July 10, 1991, the draft Technical Report on the toxicology and carcinogenesis studies o f ethyleneglycolreceived public review by the National Toxicology Program Board of Scientific Counselors' Technical Reports Review Subcommittee. The review meeting was held at the National Institute of Environmental Wealth Sciences, Research Triangle Park, NC.
Dr. M.M. NIEHS, theMcDonald, introduced toxicology and carcinogenesis studies of ethylene glycolby discussing uses of the chemical and rationale for the study, describing the experimental design, reporting survival and body weighteffects, and reviewing nonneoplastic lesions which developed in mice. The proposed conclusions were no evidence of carcinogenic activity in male or female mice.
Dr. C.D. Waassen, a principal reviewer, agreed with the proposed conclusions. He noted that drinkingwater was not used as the routeo f administration in the studies because o f the concern that ethylene glycolmight decrease animals' intake of water. Dr. Waassen wonderedif, conversely, ethylene glycol mightactually increase waterconsumption. He requested that there be a statement included in the report as to why studies were not performed with rats.
Dr. D.W. Hayden, the second principal reviewer, also agreed with the proposed conclusions, and asked why ethylene glycol was not administered by gavage during the studies. Dr.McDonaldsaid the chemical was administered in the feed to most closely approximate the route of human exposure.Dr. Hayden stated that a reference to hepatocellular erythrophagocytosis should be modified, citinginconclusive evidence that ethylene glycol promoted erythrocy&einclusions. Dr. McDonaldsaid the modification would be made.Dr.Haydenaskedif other chemicals studied by the PaTp with structures
similar to ethylene glycol and its metabolites were associated with the presence o f hepatocellularhyaline degeneration. Dr. McDonald said that degeneration was observed in studies of doxylamine,pentachloroanisole, and polybrominated biphenyls, but that none of the three were structurally related to ethylene glycol.
Dr.G.P. Orlson, the third principal reviewer, also agreed with the proposed conclusions.Dr. Carlson asked why drinking water was not used as the route of administration in the study, since the chemical's sweet taste have increasedmight encouraged consumption. Dr. commentedMcDonald that ethylene glycol is known to cause severe progressive renal disease in species other thanmice. During the final stages o f the disease, she noted, polyuria would be expected to lead to excess consumption o f water and thus to a resultant overdosage o f ethyleneglycol.Dr. Carlson asked if information existed on bioavailability o f ethylene glycol from feed. Dr. McDonald said no such data existed, adding she believed the high incidence o f chemically associated systemic lesions supported adequate bioavailability.
Mr. L.S. Beliczlq commented that occupational exposure to ethylene glycol wouldlikely be byinhalation or dermal absorption. He notedthat epichlorohydrin was among the two percent impurities and this should be referenced. Dr. J. Haartz, NIOSH, reported that occupational exposure to ethylene glycol is rather extensive, citing a potential workplace exposure figure of more than 1.5 million individuals.
Dr. Waassen moved that the Technical Report on ethylene glycol be accepted with the revisions discussed and with the conclusions as written for male and female mice, no evidence of cap.ciplogenic activity. Dr. P.T. Bailey seconded the motion, which was accepted unanimously with 10 votes.

10 Ethylene Glycol, NTP TR 413
. -
PI j
Eubyneme mpn CAS NO. 107-21-1
Chemical Formula: qH,O, Molecular Weight: 62.07
Synonyms:1,2dihydroxyethane;ethane-1.2dioS1,2-ethanediol;ethylenealcohol;ethylenedihydrate;glycol;glycolalcohol; 2-hydroxyethanol;monoethyleneglycol
CHEMICAL AND PnwSICAL PROPERTIES Ethylene glycol is a clear, colorless liquid whichis hygroscopic, odorless, sweet-tasting, and relatively nonvolatile. It is soluble in water and several organic solvents such asacetoneandaliphaticalcohols. Some chemical and physical properties o f ethylene glycol are presented in Table 1 (NPIRI, 1974; CSDSRIC, 1985; HazardousChemicals Data Book, 1986, MerckIndex, 1989).
PRODUCTION AND USE Ethylene glycol is manufactured on a large-scale basis primarily by hydration of ethylene oxide (Kirk-Othmer, 1982). Domestic U.S. production o f ethylene glycol was over 5.3 billion pounds in 1989 (Kiefer, 1989).
industrial commercial applications. Since ethylene glycol Ethylene glycol has numerous and
Physical stale
Boiling point (at 760 mm)
Freezing point (at 760 mm)
specinc gravity (at 4" C)
vapor pressure (at 20" C)
Vapor density (at 19-32" C)
Evaporation prate
Flash p int
colorless, slightly viscous, hygroscopic liquid
197" C
-13" C
1.12
0.05 mm Hg
2.14
0.004 g/cm2-sec
111" c

12 Ethylene Glycol, NTP TR 413
lowers the freezing point of water, a major use is in arntifreeze-coolant mixtures for motor vehicles; it is aLso found in heat-transfer fluids (Clark et aL, 1979; Marshall et aL, 1981) andairport runwaydeicing fluids (Merck Index, 1989). Ethylene glycol is also a componento f hydraulic brake fluids, printer’s inks, wood stains, adhesives, and pesticides (Kirk-Othmer, 1982). Ethylene glycol isusedin themanufacture
polyesterof fiber and films,polyethyleneterephthalate (PET) solid-state resins, glyoxal, safety explosives, plasticizers, and elastomers; as a solvent for borates in electrolytic capacitors; as a softening agent for cellophane; and as an industrial humectant (Kiik-Othmer, 1982; Merck Index, 1989).
E:NVIRONMENTAL EXPOSURE Ethylene glycol may enter the environment in waste waterfrom its production and followingspills and im.proper disposal o f ethylene glycol-containing commercial products (Handbook of Environmental Dota on Organic Chemicals, 1977; Christian and Moorehead, 1985; Reviews of Environmental Con- taminants and Toxicology, 1988). Withthe growing popularity of residential and commercial under- groundheat-pump systems, leakage of ethyleneglycol-containing heat-transfer fluids may be another Source of environmentalcontamination (Lgjkke, 1984; Reviews of Environmental Contaminants and Toxicology,1988).
Ethylene glycol readily undergoes aerobic and anaerobic biodegradation in water(Evansand David, 1974; Pitter, 1976; Child and Willetts, 1978; Dwyer and Tiedje, 1983). Its terrestrial fate is unknown, but rapid biodegradation is likely and adsorption in various soil types is known tobe limited (Ukke, 1984). Dueto its relatively low vapor pressure, evaporation from water or soil is unlikely. Its low octanolMater partition coefficient (log P=1.36, Handbook of Environmental Data on Organic Chemicals, and1977) bioaccumulation factors in activated sludge, green algae, and fish (Freitag etaL, 1985) suggest that bioconcentration in aquatic organisms is unlikely.
HUMANEXPOSURE Acutehumanexposure to ethylene glycol usually occurswhen single, often large, doses are ingested to mimic ethanol intoxication (Bowen et aL, 1978) or in suicide attempts (Parry and Wallach, 1974;
Baud etaL, 1988). Accidental ingestion, especially by children, has also occurred (Moriarty and McDonald, 1974). Antifreeze-coolant fluid is the most common source of ethylene glycol, but toxicity has also resulted from contamination o f potable water systems by ethylene glycol-containing heat- transfer fluids (Morbidity and Mortality Weekly,1987). Based on a survey conducted from 1981 to 1983, the National Institute for Occupational Safety and Health has estimated that morethan 1.5 million workers are potentially exposed to ethylene glycol (NIOSH, 1990). Ocularordermalexposure would mostlikely occur in industrial settings (Sykowski, 1951, as quoted in McDonald et aL, 1973). Occupa-tional inhalation exposure can also result if ethyleneglycol vapors or mists are generated by heating or violent agitation (Triosi, 1950, as quoted in Grant, 1974). A threshold-limit value o f 50 ppm (127 mg/m3) has been set by the AmericanCon-ference o f Governmental Industrial Hygienists(ACGIH) (1990) based on published reports (Winek et al., 1978). A permissible exposure limit (PEL) of 50 ppm ethylene glycol has been set by the Occupa- tional Safety and HealthAdministration (OSHA) (Fed. Regist., 1989).
METABOLISM Following administration by various routes, ethylene glycolisrapidly absorbed, distributed, and Cleared. Plasmahalf-lives in dogs given ethylene glycol intravenously ranged from 3.0 to 4.4 hours (Martis et al., 1982); plasmahalf-lives in rats or dogsgiven ethylene glycol by water gavage were 1.7 and 3.4 hours, respectively (Hewlett et al., 1989). In Sprague-Dawley rats given single, oral doses o f 6 or 9 mL/kgbodyweight, blood levels peaked 1 to 2 hours after dosing; ethylene glycol hadvirtuallydisappeared from the blood after 12 hours (Winek et aL, 1978). Whenratswere exposed to ethylene glycol vapors or condensation aerosols by nose-only inhalation, plasma half-livesranged from 34 to 39 hours and 75% to 80% of the initial body burden was widely distributed in animals examined immediately after exposure (Marshall and Cheng, 1983).
Rates o f metabolism and excretion vary with species, dose, and route o f administration. Generally,metabolism begins immediately after administration, and excretion of most o f the parent compound and metabolites is complete 12 to 48 hours after dosing (McChesney et 1971; Winek et aL, 1978;aL, Hewlett et a/., 1989; Lenk et aL,-1989). The major

I I n t d U C t i O n
excretory end products in rats, rabbits, dogs, and rhesus (MQCQCQpnulana) and pigtail (M.nemestrina) monkeys are carbon dioxide in exhaled air, and glycolate and unchanged ethylene glycol in the urine (Gessner et Q L , 1961;McChesney and Golberg, 1972; Clay and Murphy, 1977; Chou and Richardson, 1978; Marshall, 1982; Marshall and Cheng, 1983; Hewlett et d , 1989; Lenk etaL, 1989). Dependingon the species, variable quantities o f other metabolites such as glyoxylate, hippurate, and oxalate may also be excreted in the urine (Gessner ef aL, 1961; Gessner and Williams, 1961; McChesney et aL, 1971; McChesney and Golberg, 1972; Richardson, 1973; Riley et Q L , 1982).
Metabolism occurs primarily in the liver and kidney (Parry and Wallach, 1974). The initial step is alcohol dehydrogenase-catalyzed conversion o f the parent compound to glycolaldehyde (Gessner et aL, lW, Coenand Weiss, 1966, Patty’s Industrial Hygiene and Toxicology, 1982). Subsequentmetabolic steps are not as well characterized. Systemictoxiceffects o f ethylene glycol, such as metabolic acidosis and renal tubule necrosis, are generally attributed to the action o f metabolites rather than of the parent compound, but the precise roles of various metabolites are uncertain (Jacobsen and McMartin, 1986).
Glycolate mayplay animportantrole in the development of metabolic acidosis and(Clay Murphy, 1977; Gabow et al., 1986, Gabow, 1988, Jacobsen et al., 1988). Male, but not female, rats fed 1.0% to 2.0%glycolic acid in the diet for up to 35 weeksexhibited increased mortality and devel- oped renal lesions similar to ‘those observedin chronic ethylene glycol intoxication (Silbergeld and Carter, 1959). Despite contrary assertions in earlier literature,there is no clear causal relationship between oxalate precipitation alone and renal dam- age in humans and other animals (Bove, 1966, Parryand Wallach, 1974; Jacobsen and McMartin, 1986).
ACUTE TOrsnCHlrrr Susceptibility to ethylene glycol intoxication can vary with species, sex, and individual (Gessner et al., lW,Kersting and Nielsen, 1966, Lyon et aL, l m , Clay and Murphy, 1977; NTP, 1990). Minimal lethal doses and LDso values for several species are presented in Table 2. Ethylene glycol intoxication
n3
via antifreeze-coolant fluid ingestion is common in domestic dogs and cats (Grauer and Thrall, 1982).
Acute toxicity viathe oral route has been extensively studied andclinicallyexperimentally(Hanzlik et Q L , 1931; Holck, 1937; Kersting and Nielsen, 1%; Lyon et aZ., lW, Bordenand Bidwell, lW, and 1%9;Roberts Seibold, Sanyer et Q L , 1973; Clay and Murphy, 197’9; Winek et QL, 1978; Brown et QL, 1983; Cieciura et Q L , 1983; Gabow et at!, 19%, Marshall and Doty, 1 W , Smith et aL, 1990). In human and veterinary medicine, acuteoral ethylene glycol intoxication has been divided into three clinical stages (Berman et ~ l . ,1957; Moriarty and McDonald, 19741; Parry and Wallach, 19741; Grauer and Thrall, 1982). During the initial stage, central nervous systemsigns(ataxia,convulsions, and coma) pre- dominateand areattributed to metabolic acidosis and aldehyde metabolite buildup. Increased anion gap, serum hyperosmolality, hyperglycemia and/orelevated blood urea nitrogen are often present in both clinical and experimental cases (Gabow et d , 1986, Dial et Q L , 1989; Burkhartand Kulig, l m , Khera, metabolic derangements are These often fatal. If the patient suMves, a second, some-whatpoorlydefined, cardiopulmonary stage may occur, characterized tachycardia,by tachypnea,pulmonary edema, and/or cardiac failure. The third stage consists of oliguric or anuric renal failure, whichmay be reversible with appropriate therapy. This stage is usually associated with characteristic lightmicroscopic and ultrastructural renal changes including tubular epithelial degeneration and necro- sis and oxalate crystal deposition in the kidney,lowerurinary tract, and other organs. A fourth stage o f ethylene glycol intoxication, characterized by cranial nerve deficits, has been recently identified in humans (Factor and Lava, 1987; Anderson, 1990).
Toapproximate the usual clinical situation, most experimental studies of acuteoral ethylene glycol toxicity have employed high doses almost certain to cause severe disease and/or death (Kersting and Nielsen, 1966, Beckett and Shields, 1971; Szablowsh and Selye, 1971; Sanyer et aL, 1973; Rushton et QL, 1981). For this reason, only limited data are available on No Observed Effect Levels (NOELS)or possibletoxiceffects o f lower doses. In most experimental animal species, majormorphologiceffects occur in the kidney and lower urinary tract.

14 Ethylene Glycol, NTP TR 413
. . . .
' TAIILE2 Selected Minimal Lethal Doses and LDa Values for EthyleneGlycolinSeveral Species .'
species Route of Dose Reference .. . . . Administration 0 . . .
. ,
Minimal Lethal,Doses I .
I ,
, . . . , ~Riat OralBidwell, and Borden 0.1 1% .. HanzlikIntramuscular et ul , 19314.4 Intravenous 2.8 Hanzlik et uL, 1931
. . ' '
' Subcutaneous . . 5.0 Gessner et d,1961 . , . , .
Fbbbit Intramuscular 7.4 Hanzlik et d,1931L
Intravenous 4.96.2 Hanzlik et d,1931 Subcutaneous 5.0 Gasner et ul , 1%1
'Dog , ' Oral . 6.7-7.4 Kersting and Nielsen, 1% Sanyer et a!, 1973 '
Cat Subcutaneous 1.0 Gessner et aL,. 1961 . .
Human Oral 1986 and 1.57 .Snyder, Andrews
LD,, Values
Mouse Oral 14.7 Laug et d,1939 , ' , Oral 15.4 1954Bommann,
Rat Oral . 6.2 . Laug et d,1939 Oral
,
8.54 Smyth et d,1941 . .
' Oral 4.0 Clark et d ,1979 Subcutaneous 5.3 Mason et oL, 1971
Pig Guinea Oral 8.3 h u g et ut!, 1939 Oral 7.4 Smyth et a l , 1941
. . . -
. .
Ma1.e rats arequite susceptible to ethylene glycol femalerats. Femalerats given 2.92% ethylene toxicity. .Male Porton rats receiving 1.0% ethylene glycol in drinking water died after 6 days; limited glycol in drinking water for 3 weekshadgross histopathologic evaluation did not reveal any micro-evidence o f oxalate scopic lesions (Holck, 1937). FemaleSprague-renal.deposition (Rofe et a[, 1986). In another study male rats given Dawley rats given concentrations o f ,1.0%, 3:0%, or 1.0%ethylene glycol in the drinking water died after 5.0% ethylene glycol in drinking water for 2 weeks about 12 weeks; .limited histopathologic evaluation had oxalate deposits in the kidney, but only females revealed renal tubule degeneration and oxalate receiving 3.0% and 5.0% in the study died or had deposits and centrilobular hepatocellular degenera- anyclinicalfindings(Lyon et aL, 1%). Similarly,tion (Hanzlik et aL, 1947). In , drinking water renal lesions and/or mortality F u r r e d in female studies, similar renal lesions were observed in male Sprague-Dawley rats given doses of 1.0% .to 2.0% rats that,received 0.25% ethylene glycol for 4 weeks ethylene glycol in ,drinking water for 9 0 .days, but (Ge.rshoff, and Andrus, 1962) or l:O% to 2.0% not in those receiving 0.5% to 1.0% ethylene glycol ethylene glycol for 13 weeks (Robinson et aL,,1990). (Robinson et aL, 1990).
In contrast, higher doses o f ethylene glycol are When ethylene glycol was fed to male andfemale generally required to produce typical toxic effects in F344 rats at concentrations o f 3,200,6,300,12,500,

IlUilWKl&QUil
25,O, or 5 0 , O ppm for 13 weeks, 4 of the 10 male rats given 5 0 , O ppm ethylene glycol died @elnick, 1984). Surviving males in the 25,000 and 5 0 , O ppmgroups had moderate to severe renal tubule degeneration, necrosis, and regeneration, as well as renal interstitial fibrosis and oxalate crystals in the kidney, lower urinary tract, and/or brain. All female rats in the study surviv&, mild renal lesions without oxalate precipitation were observed only in the female 50,OOll ppm group. Body weights and body weightgainsweresignificantly decreased in pregnant F344 rats and CD rats receiving ethylene glycol by gavage at doses of 2,500 or 5,000 mgkgbody weightdaily on gestation days 6 through 15 (NIT, 19W, Myers et aL, 1988).
Macaques (M.pn~latta,M. has, and M. radiata) given ethylene glycol in diinking water at doses from 1to 132 m@g body weight for 6 to 13 dayshad renal lesions and/or azotemia, although oxalate precipitation in the kidney and other tissues was noted only in animals given doses o f 15 mL&g or more (Roberts and Seibold, l%9).
WhenpregnantCD-1 mice were given ethylene glycol by gavage at doses of from 50 to 1,550 m a g body weight daily on gestation days 6 through 15, no treatment-related changes in maternal body weights,liver or kidneyweights, waterconsumption, or clinical findings were noted, and no histopathologic lesions were seen in kidneys of high-dosedams 0 1 et c ~ L , 1989b). However, in pregnant New Zealandwhite rabbits given doses from 100 to 2,000 m a g daily by gavage on days 6 through 19 of gestation, maternal mortality and typical renal lesions occurred in the high-dose group (NIT,1990).
Morphologic lesions have occasionally beennoted outside the urinary system following oral ethylene glycol administration. Electroretinographic abnor- malities and retinal and uveal oxalate deposition wereseen in New Zealand white rabbits given drinking water containing 4.0% ethylene glycol @ossa andWeber, 1990). Bone marrow hypo-cellularity and depression of marrowgranulocyte-macrophage progenitor colony (CFU-C) formation occurred in male andfemale MC3Fl mice up to 14 days after administration o f ethylene glycol in water by gavage at doses of 200 to 1,000m@g (Hong et aL , 1988). These changes were most
-~
ns
pronounced at the higher doses. No other gross or histopathologic lesions or hematologic changes were observed in treated mice (the doses selected were not expected to cause severe systemic toxicity).
In general, ethylene glycol is considerably less toxic whengivenby routesotherthan feed (Pany's I u s h l m n e Toxicology, 1982). Renal lesions were not observedwhen ratswere givenethylene glycol by intramuscular injection at a dose level of 180 m a g body weight daily for 40 days (Hamlik et QL, 1831). Mildchemosis, lacrimation, and iridal flare were found in rabbit eyes expod topically or intraocularly to high concentrations o f ethylene glycol (Hanzlik et d , 1831; Latven and Molitor, 1939; McDonald et aL, 1972, 1973, 1977; Clark et d , 1979). Dermal applications of pure ethylene glycol not rabbit skindid irritate (Clark et d , 1979), but intradermal injections of ethylene glycol in guinea pigs did result in skin irritation (Lamen and Molitor, 1939).
Continuous whole-body inhalation exposure o f Sprague-Dawley and Long-Evans rats, guinea pigs, New Zealand white rabbits, beagle dogs, and squirrel monkeys (Saipplin' sciurew) to ethylene glycol at 12 m@m3 resulted only in moderate to severe chemosis, lacrimation, or corneal opacity in rats and rabbits; no toxicfindings wereseenwhen these species had repeated exposure at 10 or 57 mg/m' for 6 weeks (Coon et aL, 1970). No toxic findings werenoted in rats and mice exposed to ethylene glycol 0.3 mg/L, 16 weeksvapor, for (Wiley et aL, 1938a,b).Onlymildtoxic effects (increased liver and/or kidney weights and reduced weight gains) occurred when pregnantCD rats were exposed to whole body aerosols o f ethylene glycol at 2,500 mg/m3daily or when pregnant CD-1 mice were exposed to whole body or nose-only aerosols o f 1 , O to 2,500 mg/mJ daily m1 et aL, 1989a,b).Nystagmus, sometimes accompanied by fainting,occurred in female workers exposed to unknown concentrations o f ethylene glycol vapors '(Triosi, 1950, as quoted in Grant, 1974) and mild contact m l a r irritation has k e n reported in humans (Sykowski,1951, as quoted in McDonald et Q L , 1973). Human volunteers exposed to ethylene glycol aerosols tolerated doses from 3 to 67 mg/mg, but considered 140 m@m3 subjectively irritating and 2 0 mum3 intolerable (Wills et a L , 19'74).

16 Ethylene Glycol, NTP TR 413
CHRONIC TOXICITY Chronic oral administration of ethylene glycol to rats has produced similar results in several studies. In an early study, male rats given 1.0% ethylene glycolin the drinking water died after 12 weeks; limited histopathologic evaluation revealed charac- teristic renal changes andmarked centrilobular hepatocellular degeneration (Handik et aL, 1947).Similarly, another early report described decreased survival; renal tubule degeneration, oxalate crystal deposition, and oxalate urolithiasis; and mild hepatocellular centrilobular atrophy .andfatty change in male albino rats fed a diet containing 1.0% or 2.0% ethylene glycol for up to 2 years; female rats were not as severely affected. (Morris et aL, 1942).
More recently, similar dose-related and sex-related changes including increased incidences of kidneylesions and decreased survival were observed in male and female Sprague-Dawley rats fed diets containing from 0.5% to 4.0% ethylene glycol for up to 2 years (Blood, 1%5). Male and female F344 rats were fed 0.4,0.2, or 1.0 g ethylene glycol per kg o f bodyweight daily for up to 2 years (DePass et al., 1986a). Only high-dose male rats developed urinary system lesions, progressing from renal tubule dilatation and oxalate crystalluria at 6 months to severe chronic nephritis and oxalate lithiasis by 15 months, at which time mortality was 100%. In dosed female rats, mild hepatocellular fatty change was noted. Increased incidences of neoplasia attributable to treatment were not observed.
In:inearly study (Hanzlik et aL, 1947),most male white mice given 3.0% ethylene glycol in the diet died within 12 weeks, but most malesgiven 1.0% survived 7 months; some of the females given 1.5% ethylene glycol survived 1 year. Limited histo- pathologic evaluation revealed renal tubule “calcifi- cation and crystalline deposits.” However,in a more recent study (DePass et aL, 1986a), no clinical findlings or pathologic lesions were seen in male and female CD-1mice fed 0.4 to 1.0 g ethylene glycol per kg body weightin the diet for 2 years. Like-wise, in rhesus monkeys, there were no clinical or pathologic findings in two males given 0.2% and one female given 0.5% ethylene glycol in feed for 3 years (Blood et al., 1%2).
Subcutaneious ethylene glycol inoculation o f 30 to 1,OOO mgkg twice weekly in male and female F344 rats for 1year did not result in anytoxic ’or carcinogenic effects (Mason et al., 1971).
REPRODUCTIVE AND DEVELOPMENTAL TOXICITY Although mortality was increased, no teratogenic changes were noted in chick embryos exposed to ethylene glycol (Gebhardt, 1%8, Ameenuddinand Sunde, 1984). In vitro exposure of rat embryos to 40 pL ethylene glycoVmL culture medium resulted in developmental abnormalities including absence o f yolk sac circulation, absent hindlimb buds, and central nervous system abnormalities (Grafton and Hansen, 1987).
I n vivo studies in rats and mice indicate that only oral administration o f ethylene (versusglycol cutaneous or aerosol exposure) results in reproduc- tive and .teratogenic changes (Myers et a d , 1988, Q l et aL, 1988a,b, 1989a,b; Longzhan et aL, 1989; Bates et a l , 1990, Khera, 1990, Marr et aL, 1990).In several reproductive studies in rats and/or mice, decreased litter size, reduced pup birth weight, reduced pup survival, or fetal craniofacial and/or axial skeletal anomalies werenoted following oral ethylene glycol administration (Maronpot et aL, 1983; N l T , 1984, 1988, Schuler et aL, 1984, Lamb et a l , 1985; Price et a l , 1985; DePass et aL, 1986b, Q l et aL, 1989b). In general, mice exhibited more severe reproductive abnormalities at lower doses than did rats. The NOEL for developmentaltoxicity, including teratogenicity, in CD-1 mice has beendetermined to be 150mgkg(Tj4 et aL, 1989b).
Although maternal toxicity and mortality occurred at 2,OOO mg/kg, no evidence o f teratogenicity or embryotoxicity was when Newseen pregnantZealandwhite rabbits were administered ethylene glycol at doses o f 100 to 2,OOO mgkg body weightdaily on gestation days 6 through 19 ( N T P , 1990).
GENETICT o x r c o ~ o ~ ~ Ethylene glycol is not genotoxic in vitro, andthe results of in vivo studies are either conflicting or not reported in detail. Results from several mutagenicity studies in Salmonella ryphimurium were uniformly negative (McCann et aL, 1975; Clark et aL, 1979; Pfeiffer and Dunkelberg, 1980; Zeiger et aL, 1987) and no growth inhibition due to DNAdamage was observed in repairdeficient Escherichia coli (McCarroll et aL, 1981). Negative results were also obtained in a gene mutation test in

IInU~mcUbnn
yeast, Saccharomyces pornbe (Abbondandolo et aL, 1980). Additional negative results were reported for induction o f aneuploidy in the fungus Neurospora (Griffiths, 1979, 1981), and for induction o f sperm inactivation or dominant lethal mutations, as measured by infertility, in the parasitic wasp, Braconhebktor (Lachanceand Leverich, 1%9). In plants, no induction o f polyploidywas reported in Allium cepa root tips grown for 4 days in ethylene glycol solutions (Kabarity et aL, 1980). Meiotic disruption was reportedly induced in maize microsporocytesfollowing treatment with ethyleneglycol(Maguire,1974), but no information on dosing or chemical purity was presented. Human embryonic fibroblasts treated with ethylene glycol in the absence of exogenous metabolic activation (dosing information not provided) exhibited no increase aberrationsinchromosomal (Oya et aL, 19%).
Ethylene glycol was reported to induce chromosomal aberrations in male rat bone marrow cells harvested 50 hours after single gavage administration o f 1,200 m a g ethylene glycol, and dominant lethal mutations were reportedly induced in the offspring of male rats treated with 120 or 1,200 mgkg ethyl-ene glycol by gavage at thelate spermatid stage (Barilyak and Kozachuk, 1985). However, the purity of ethylene glycol was not provided, control values were unacceptably low, and no primay data were included. For these reasons, the validity of these results is questionable. No dominant lethal mutations or reproductive abnormalities were noted in F344 rats given ethylene glycol in the feed at doses of 0.4 to 1.0 g/kg body weight per day for three generations (DePass et al., 1986b).
Mutagenicity information is available aon single metabolite, glycolate. Tested ata dose of
ns
5 0 puplate, it was negative for induction o f gene mutation in S. zyphimuhm strain TAl00 with andwithout S9 activation Cyamaguchi and Nakagawa, 1983).
STUDY r n r n O N r n E Ethylene glycol was nominated for toxicolopy and carcinogenesis studies to the National Toxicolopy Program (NIT)through an interagency agreement bemeen the NIT and the Environmental Protection Agency to provide toxicologic testing o f chemicals under the Comprehensive Environmental Response,Compensationand Liability Act of 198Q (Superfund). Due to the large production volume and numerous commercial uses of ethylene glycol, there is high potential for widespread workplace and general exposure, as well as environmental contami-nation.
Recent bioassays with I344 rats @ePass et Q L , 19ffi) were considered adequate to evaluate the chronic toxicity and carcinogenicity o f ethylene glycol in this species and strain. Therefore, the present studies were carried out only with MC3F, mice.
Oral administration was chosen because most human exposure would be expected to occur by this route. The gavage route was not selected because adminis- tration o f large bolus doses would not closely approximate the low-level chronic exposure expected for the general human population. Dosed feed was selected because of concernsthat with drinking water exposure, the anticipated renal toxicity mighthave resulted in polydipsia and polyuria which could haveaffected theamounts of ethylene glycol consumed and/or excreted.

18 Ethylene Glycol, NTP TR 413

PROCUREMENT AND C m m C T E R I a T I O N Ethylene glycol obtained from Ashlandwas Chemical Company (Columbus, OH) in one lot (lot AO21180). Identity, purity, and stability analyses were performed by the chemistryanalyticallaboratory, Midwest Research Institute (Kansas City, MO), and confirmed by the study laboratory (Appendix E).
The chemical, a colorless liquid, was identified as ethylene glycol by infrared, ultravioletbisible, and nuclear magnetic resonance spectroscopy. The puritywasfound t o be greaterthan99% by ele-mental analyses, Karl Fischer water analysis, thin- layer chromatography, and gas chromatography. Elemental analyses for carbon and hydrogen were in agreement with the theoretical values for ethylene glycol. Stability studies by gas chromatography indicated that ethylene glycol was stableas a bulk chemical for 2 weeks at temperatures up to 60" C when stored protected from light. The identity and stability o f the bulk chemical was confirmed periodi- cally at the study laboratory with infrared spectros- copy and gas chromatography. Identity was confirmed and no change in purity was observed.
PREPARATION AND ANALYSIS OF DOSE IFORMUUTIONS The dose formulations were prepared by mixingappropriate amounts of ethylene glycol and feed in a blender (Table El). Studies t o determine the homogeneity and stability o f the dosed feed prepa- rations were conducted by the analyticalchemistrylaboratory. Gas chromatographic methods were used to confirm homogeneity as well as the stabil- ity o f dose formulations stored protected from lightfor 2 weeks at 25" C. During the studies, the dose formulations were stored at 5" C before use and at room temperature during use for up to 14 days.
Periodic analysesof the dose formulations of ethylene glycol were conducted at the studylaboratov and the analyticalchemistry laboratoryusinggas chromatography. During the 13-week
studies, the dose formulations were analyzed at the initiation and mid-point of thethe studies (Table E2). During the 2-year studies, the dose formulations wereanalyzed at least once every 8 weeks (Table E3), and 98% (97/99) o f the dose formulations were within 10% o f the target concen- trations. Results of periodic referee analyses per- formed by the analytical chemistry laboratory were in good agreement with the results obtained by the study laboratory (Table E4).
n s v v E E K STUDIES Thirteen-week studies were conducted to evaluate the cumulative toxic effects of repeated exposure to ethylene glycol and to determine the appropriate doses for the 2-year studies.
Male and female B6C3Fl micewere obtained from Harlan Industries (Indianapolis, IN). The animals were quarantined for 19 days and the average age was 63 dayswhen the studies began. Five animals o f each sex were randomly selected and killed prior to study initiation for parasite evaluation and gross observation for evidence of disease. At the end of the studies, serologic analyses were performed on the serum of five control animals of each sex in accordance with the protocols of the NTP Sentinel Animal Program (Appendix H).
Groups o f 10 mice o f each sexwerefed diets containing 0, 6,300, 25,OOO, or3,200, 12,500, 50,000 ppm ethylene glycol. Beginning on day 1, theappropriate feed was available ad libitum for 92 to 96 consecutive days.
Animals were housed five per cage. Water was available ad libitum. Animalswere observed twice daily and weighed once weekly and at the end o f the study. Clinicalfindings were recorded weekly.
Atthe end o f the study, blood samples were collected by cardiac puncture. Urinesamples were collected by expressing the urinary bladder. Table 3 contains the complete list o f clinicalpathology

20 Ethylene Glycol, NTP TR 413
analyses performed on animals in the 13-week studies o f ethylene glycol.
During necropsy, the organsand tissuesof all animals were examined for gross lesions. Organweights were recorded for the brain, heart, right kidney, liver, lungs, and thymus in all mice, and the right testis of all males. Tissues for microscopic examination were embeddedin paraffin, sectioned to a thickness o f 4 to 6 pm, and stained with hematoxylin and eosin. A complete histopathologic examination was performed on all mice that received 0 or 50,OOO ppm. The kidneys and livers of males that received 12,500 or 25,OOO ppm were examined microscopically. Table 3 lists the tissues and organsthat were examined microscopically.
2 - y ~STUDIES StudyDesign Groups o f 60male mice were fed diets containing 0, 6,250, 12,500 or 25,OOO ppm ethylene glycol in feed. Gr'oups of 60 female mice were given diets contain-ing 0, 12,500, 25,OOO or 50,OOO ppm ethylene glycol in feed. The appropriate feed was available ad libitum for 103 weeks. Ten mice per dose group we:re designated for interim evaluations (organweights, clinical andhematology,chemistry,histopathology) after 15 months of chemical administration. However, because o f early deaths in males,sixmales pergroup instead o f ten were evaluated at 15 months.
Source and Specification of Animals The B6C3Flmice used in these studies were obtained from Frederick Cancer Research Facility(Frederick, MD). All animals were quarantined for 19 days, then five mice of each sex were randomly selected for parasite evaluation and gross observa-tion o f evidence o f disease. The average ages o f the animals were 62 days(males) and 55 days(females) when dosing began. Animal health was monitored by serologic analyses during the course of the studies in accordance with the,protocols of the N W Sentinel Animal Program (Appendix H).
Animal Maintenance Male mice were housed five per cage for 54 weeks, then individually until study end. Female mice were housed five per cage for 67weeks, then individually
until study end. Feed andwaterwere available ad libilum. Cages were rotated within racks and racks wererotated within rooms every 2 weeks. Further details on animal maintenance are given in Table 3.
Clinical Examinations and Pathology All animals were observed twik daily and clinical findings were recorded at each weight check. Indi-vidualbody weights were obtained weekly through week 13, monthly thereafter, and at the end o f the study. After 15 months, 6 male and 9 to 10 female micefrom each dose group were evaluated. Organweights were recorded for the brain, right kidney, and liver o f all animals evaluated at 15 months. Blood samples were collected by cardiac puncture. Table 3 contains the complete list o f the clinical pathology analyses performed on animals at the 15-month interim evaluations in the 2-year studies of ethylene glycol.
Necropsy was performed on all animals. Duringnecropsy, all organs and tissues were examined for gross lesions. Tissues for microscopic examination were fixed in 10% neutral buffered formalin, embedded in paraffin, sectioned to a thickness o f 4 to 6 pm, and stained with hematoxylin and eosin. Complete histopathologic examinations were per-formed on all controland high-dose mice and all animals that died early in the low- and mid-dose groups. For all other low- and mid-dose mice, organsand tissues examined included all gross lesions, kidney, liver, and thyroid gland in all mice, lung in females, and urinary bladder in males.
Samples o f formalin-fued liver from selected highdose male and female mice were post-fixed in Fowler's solution (Fowler et al., 1983) for 2 days, post-fixed in 1.0% osmium, dehydrated in ethanol, and infiltrated with Epon 812. Resulting blocks were thin-sectioned (approximately 90 nm), mounted on 100-mesh copper-rhodium grids, stained with 2.7% lead citrate and 5.0% uranyl acetate, and examinedwith a Philips 400 transmission electron microscope.
Microscopic evaluations were completedby the study laboratory pathologist, and the pathology data were enteredinto the Toxicology DataManagement System(TDMSj. The slides, paraffin blocks, and residual wet tissues were sent to the N T P Archives for inventory, slideblock match, and wet tissue audit

for accuracy o f labeling and animal identification and for thoroughness of tissue trimming. The slides, individual animal data records, and pathology tables were evaluated by an independent quality assessment laboratory. The individual animal records and tables were compared for accuracy, slides and tissue counts were verified, and histotechnique was evaluated. A quality assessment pathologist reviewed kidney and liver from male and female mice, thyroid gland and testis from male mice, and lung, ovary, adrenal gland, and mesentery from female mice for accuracyand consistency of lesion diagnosis.
The quality assessment reportand slideswere submitted to the Pathology Working Group (PWG)chair. Representative examples of potential chemical-related nonneoplastic lesions and neoplasms o f kidney,ovary, andliver, lung,thyroidgland, and examples of disagreements in diagnosis between the laboratory and quality assess-ment pathologists were selected by the PWG chair for review by the PWG. The PWG included the quality assessment pathologist as well as other pathologists experienced rodentin toxicologicpathologywhoexamined these tissues without knowledge o f dosegroup or previously rendered diagnoses. When the consensusdiagnosis of the PWG differed that of thefrom laboratorypathologist, the finaldiagnosis was changed to reflect the opinion of the PWG. Details of these review procedures have been described, in part, by Maronpot and Boorman (1982) and Boorman et af. (1985). Forsubsequent analysis ofpathology data, the diagnosed lesions for each tissue type are evaluated separately or combined according to the guidelines of McConnell et af. (1986).
smistian m t ~ l n o ~ s Suwivd h.&ses The probability of survival was estimated by the product-limit procedure of Kaplan and Meier(1958). Animals were censored from the survival analyses at the time they werefounddead from other than natural causes; animals dying from natural causes were not censored. Statistical analyses forpossibledose-related effects on survival used Cox's (1972) method for testing two groups for equality and Tarone's (1975) life table tests to identiq dose- related trends.All reported P values for the survival analyses are two sided.
dlask"ado0n of 10nc&mce The incidences of neoplasms or nonneoplasticlesions as presented in Tables Al, M,B1, and B5 are given as theratio o f the number o f animals bearing such lesions at a specific anatomic site to the number o f animals with that site examined microscopically. For calculation o f statistical signif- icance, the incidences of all nonneoplastic lesions and most neoplasms (Tables A2 and B2) are also given as the ratio o f the number o f affected animals tothe number of animals with the site examined microscopically. whenHowever,macroscopicexamination was required to detect neoplasms (e.g., skin, intestine, Harderian gland, and mammarygland) before microscopic evaluation, or when neoplasms had multiple potential sites of Occurrence (e&,leukemia or lymphoma), the denominators consist of the number of animalson which a necropsy was performed.
h a % y s kof Neopkpa 1nc&ncces The majority o f lesions in these studies were con- sidered to be incidental to the cause o f death or not rapidly lethal. Thus, the primary statistical method used was logistic regression analysis, which assumed that the diagnosed lesions were discovered as the result of death from an unrelated cause and thus did not affect the risk o f death. In this approach, lesion prevalence was modeled as a logistic function o f chemical exposure and time. Both linear and quadratic terms in timewere incorporated initially, and the quadratic term was eliminated if it did not significantly enhance the fit o f the model. The dosed and control groups were compared on the basis o f the likelihood score test for the regression coefficient o f dose. This method of adjusting for intercurrent mortality is the preva- lence analysis of Dime and Lagakos (1983), further described and illustrated by Dime and Haseman (1986). When lesions are incidental, this com-parison of the time-specific lesion prevalences also provides a comparison of the time-specific lesion incidences(McKnight and Crowley, 1984).
In addition to logistic regression, alternative methods of statistical analysis were used, andthe results o f these tests are summarized in the appendixes. These include the life table test (Cox, 1972; Tarone, 1975), appropriate for rapidly lethal lesions, and the Fisher exact test and the Cochran-Armitage trend test (Armitage, 1971;

22 Ethylene Glycol, NTP TR 413
Gart et al., 1979), procedures based on the overall proportion o f lesion-bearing animals.
T a i t s o f significance include pairwise comparisons of each dosed group with controls and a test for an overall dose-response trend. Continuity-corrected tests were used in the analysisof lesion incidence, anti reported P values are one sided. The proce-d u m described above also were used to evaluate selected nonneoplastic lesions. Forfurther discus-sion of these statistical methods, see Haseman (1984).
Analysis of Nonneoplastic Lesion Incidences Because all nonneoplastic lesions in this study were considered to be incidental to the cause of death or notrapidly lethal, the primary statistical analysis usedwas a logistic regression analysis in which lesion prevalence was modeled as a logistic function of chemical exposure and time. For lesions detected at rhe interim evaluation, the Fisher exact test was used, a procedure based on the overall proportion o f affected animals.
Analysis of Continuous Variables Tws approacheswere employed to assess the significance of pairwise comparisons between dosed andcontrolgroups in the analysisof continuous variables. Organand body weight data that had approximately normal distributions were analyzed using the multiple comparison procedures of Williams (1971, . and (1955).1972) Dunnett Jonckheere’s test (Jonckheere, 1954) wasused to assess the significance of the dose-response trends and to determinewhethera trend-sensitive test (Williams’ test) was more appropriate for pairwise comparisonsthana test that does not assumea monotonic dose-response trend (Dunnett’s test).
Hktorical Control Data Although the concurrent control group is always the first and mostappropriatecontrolgroup used for eva:luation, historical control data can be helpful in the overall assessment o f lesion incidence. Conse-quently, control lesion incidences from the NTP historical control database (Haseman et al., 1984, 1985) are included in the NTP reports for lesions appearing to show compound-related effects.
Quality Assurance Methods The 13-week and 2-year studies were conducted in compliance with Food andDrugAdministration.were
GoodLaboratory Practice Regulations (21 CFR, Part 58). In addition, as study records were sub- mitted to the N T P Archives, they were audited by an independent quality assurance contractor. Separate audits covering completeness and accuracy o f the pathology data, pathology specimens, final pathology tables, and preliminary review draft of the NTP Technical Report were conducted. Audit procedures are presented in the reports, which are on file at the NIEHS. Theaudit findings were reviewed and assessed by the NTP staff so that all had been resolved or were otheMrise addressed during the preparation o f the Technical Report.
GENETICTOXICOLOGY The genetic toxicity o f ethylene glycol was assessed by testing its ability to induce mutations in various strains of Salmonella zyphimurium,trifluorothymidine resistance in mouse L5178Y lymphomacells, and sister chromatid exchanges and chromosomal aberra-tions in Chinese hamster ovary cells. The protocolsand results for these studies are given in Appendix C.
The genetic toxicity studies o f ethylene glycol .are part o f a larger effort by the NTP to developa database that would permit the evaluation o f car-cinogenicityin experimental animalsfrom the structure of the chemical and its responses in short-term in vitro and in vivo genetic toxicity tests. These genetic toxicity tests were originally developed to studymechanisms of chemically induced DNA damage and to predict carcinogenicity in animals, based on the electrophilic theory of chemical car- cinogenesis and the somatic mutationtheory (Millerand Miller, 1977; Straw, 1981; Crawford, 1985).
Of the four in vitro tests evaluated by the NTP to date (mutagenicity inS.zyphimurium,mutagenicity in mouse lymphoma cells, chromosomal aberrations in Chinesehamster ovary cells or sister chromatid exchanges in Chinese hamster ovary cells), there is a strong correlation between a chemical’s potential electrophilicity (structural alert to DNA reactivity), mutagenicity in S. zyphimurium, and carcinogenicity in rats and mice or at multiple tissue sites (Ashby and Tennant, 1991). The other in v h o tests do not correlate well with carcinogenicity in rodents (Tennant et al., 1987; Zeiger et al., 1990). Muta-genicity in S. typhimurium was the most predictive for rodent carcinogenicity (89% of the mutagens
carcinogens in rats and/or mice),while

mutations in mouse lymphoma cells or chromosomal aberrations o r sister chromatid exchanges in Chinese hamster ovaq cells were less predictive of carcino-geniciy, 63% of chemicalsinducing mutations in mouse lymphoma cells, 73% of chemicals inducingchromosomal aberrations, and 64% of chemicals inducing sister chromatid exchanges were carcino-genic in rodents. Moreover, no battery of tests that
included the S. typhimuriwn test improved the predictability of the S. fyphimuriumtest alone. The predictivity o f a positive response in bone marrow chromosome aberration or micronucleus tests is not yet defined. Refer to the articles cited above for details regarding the correlation o f structural alerts (orabsence thereof), mutagenicity, and carcinoge- nicity results of 301 chemicals in the FdTp database.
Study Ld.mrratory Southern Research Institute (Birmingham, AL)
SErain and S p i e s B6C3Fl Mice
Animal Source Harlan Industries (Indianapolis, IN)
Time Weld Before Study 19 days
Average Age When Placed on Study 63 days
Date of First D e 2 j May 1981
Duration of Dosing Day 1 to day of sacrifice (days 92-96), dosed feed available ad libitum
Date of Last Dose 28 August 1981
Nwmpsy Draees 24-28 August 1981
MeEhad of Sacrifice Thoracotomy
Average Age W e n Killed 156 days
Size OP Study Groups 10 males and 10 females
Same as 13-week studies
Same as 13-week studies
Frederick Cancer Research Facility (Frederick, MD)
Same as 13-week studies
Males: 62 days Females: 55 days
28 September 1982
Day 1 to day 721, dosed f e e d available ad libh
17 September 1984
Interim: 3-5 January 1984 Terminal: 27 September4 October 1984
CO, asphyxiation
Males: Interim - 527 days Terminal - 797 days
Females: Interim - 520 days Terminal - 790 days
60 males and 60 females
24 Ethylene Glycol, NTP TR 413
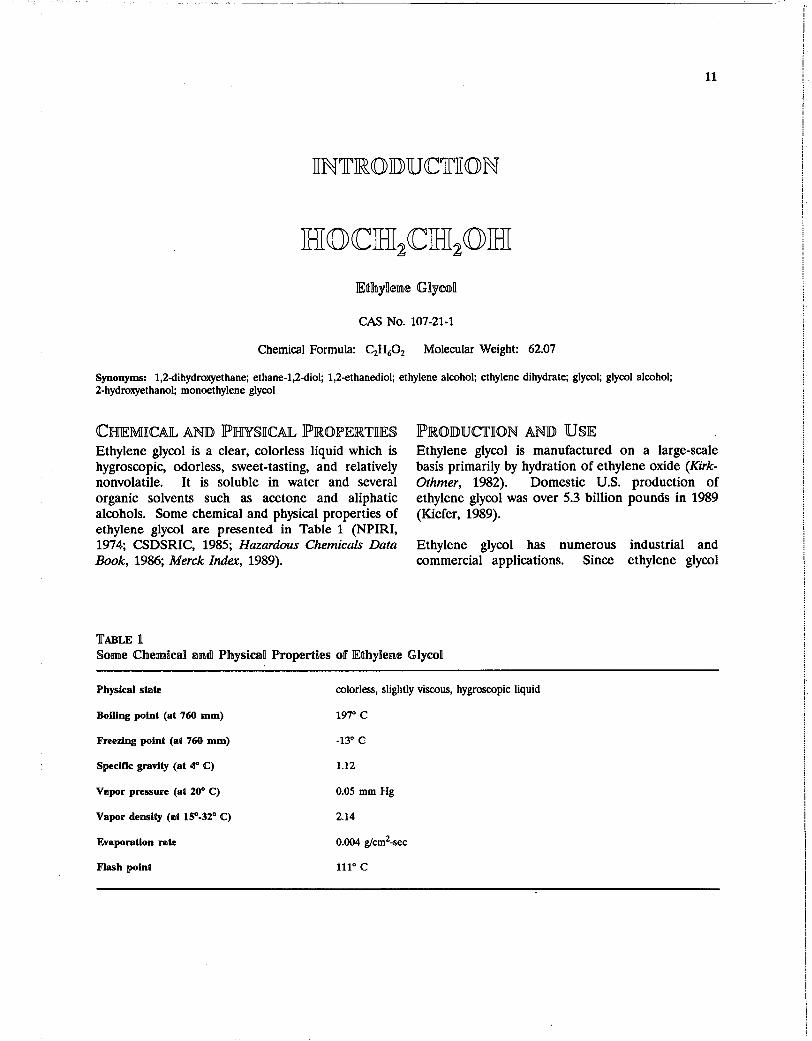
TABLE3 Experimental Design and Materials and Methods in the
Method of Animal Distribution Animals grouped by weight intervals. Animals assigned to cages. A table of random numbers was used to assign treatment groups to cages.
Animals per Cage 5
Method of Animal Identification Farmark
Diet NXH-07 Open formula mash diet (Zeigler Brothers, Inc., Gdners , PA), available ad libitum
Maximum Storage Time for Feed 90 days from milling
Water Birmingham Water Works (Birmingham, AL),available ad libitum
cages Solid-bottom polycarbonate (Lab Products, Inc., Gameld, NJ)
Bedding BetaChipsQ (Northeastern Products Corp., Warnensburg,NY), changed twice weekly
Cage Filters Reemay spun-bonded polyester filters (Snow Filtration, Cincinnati, OH), changed once every 2 weeks
R r l C k S
Stainless steel (Lab Products, Inc., Garfield, NJ), changed once every 2 weeks
Animal Room Environment Temperature: 20"-22" C Relative humidity: 3748% Fluorescent light: 12 houdday Room air changes: minimum o f 15 changeslhour
DaBeS 0, 3,200, 6,300, 12,500, 2 5 , O O O or 50,OOOppm ethyleneglycolMales: in feed
Type and Frequency of Observation O k r v e d twice/day;weighed oncebeek and at termination; Observed clinicalthereafter,findingsweeklyandrecordedonce/month
-
Feed Studies of Ethylene Glycol (continued)
2-YearStudies
Same as 13-week studies
Males: 5, changed to 1per cage on 13 October 1983 Females: 5 , changed to 1per cage on 13January 1984
Earmark and toe clip
Same as 13-week studies
Same as 13-week studies
Same as 13-week studies
Same as 13-week studies
Same as 13-week studies except changed once weekly after animals housed individually
Same as 13-week studies
Same as 13-week studies
Temperature 21"-23O C Relative humidity: 51%-54% Fluorescent light: 12 hours/day Room air changes: minimum of 15 changeshow
0, 6,250, 12,500, or 2 5 , O O O ppm ethylene glycol in f e e d Females: 0, 12,500, 2 5 , O O O , or 50,OOO ppm ethylene glycol in f e e d
twice/day; weighed oncebeek through week 13, at sacrifice; clinicalfindings
recorded at each weigh period and at sacrifice

25 Materials and Methods
13-Week Studies 2-Yerar Studies
Necropsy Examinations Necropsyperformed on all animals. Organweightsrecorded for the brain, heart, right kidney, liver, lungs, and thymus of all animals, and the right testis of all males.
Clinical Pathology Blood samples were collected from all animals. H- hematocrit,hemoglobin,erythrocytes,meancell volume, mean cell hemoglobin, mean cell hemoglobin concentration, total and differential leukocyte counts. CIinicQIc h c m h y blood urea nitrogen, creatinine, sodium, potassium, chloride, partial carbon dioxide, calcium, phosphorus (inorganic), total protein, albumin, albumin/ globulin ratio, total bilirubin, and pH. uiipardbmis:glucose, protein, specific gravity, pH, urobilinogen, bilirubin, blood (hemoglobin), ketones, and nitrite.
Histopathology Complete histopathology was performed on all control and high-doseanimals.Inaddition to tissue masses,gross lesions, and associated regional lymph nodes, the following organs and/or tissues were included: adrenal gland, brain, colon, esophagus, femur including marrow,gallbladder, heart, kidney, liver, lung, mammarygland,mandibularand mesenteric lymph nodes, nose, ovary, pancreas, parathyroid gland, pituitary gland, prostate gland, small intestine, spleen, stomach, testis, thymus, thyroid gland, trachea, urinary blad-der, and uterus. The liver and kidney o f malesin the 12,500 and 2 5 , o o O ppm groups were also examined.
Necropsyperformed on all animals. Organ weights recorded for the brain, right kidney, and liver of all animals evaluated at 15 months.
Blood samples were collected from animals evaluated at 15 months. H- hematocrit,hemoglobin,erythrocytes, total and differential leukocyte counts. C h i d chemhy blood urea nitrogen, creatinine, total bilirubin, alanine aminotransferase, aspartate amino- transferase, lactate dehydrogenase, and sorbitol dehydrogenase.
Complete histopathology was performed on all high-dose and control males and females at the 15-month interim evaluations.Completehistopathologywasalsoperformed on all control and high-dose mice at the end of the 2-year studies and on animals that died before the end of the 2-yearstudies.Inaddition to tissue masses and gross lesions, the following organs and/or tissues were examined: adrenal gland, brain, epididymis, esophagus, femur including marrow, gallbladder, heart, kidney, large intestine (cecum, colon, rectum), liver, lung, mammary gland, mandibular or mesenteric lymph nodes, nose, ovary, pancreas, parathyroid gland, pituitary gland, prostate gland, salivary gland, seminal vesicles, skin, small intestine (duodenum, jejunum, ileum), spleen, stomach, testis, thymus, thyroid gland, trachea, uri-narybladder,anduterus. For all low- and middose mice, organs and tissues examined at the end of the 2-year studies included all gross lesions, kidney, liver, and thyroid gland in males and females; lung in females; and urinary bladder in males.

26 Ethylene Glycol, NTP TR 413

n w v E E K STUDIES Data from the literature were adequate for selecting doses for the 13-week feed studies; therefore, 14-day repeated dose studies were not conducted. Doses for the 13-week studies were 0, 3,20, 6,30, 12,50, 25,000, or 50,000 ppm ethylene glycol in the feed.
Some Of the described &low have beenpreviously reported (Melnick, 1984).
All animals survived to the end o f the studies. The mean body weightgains o f male groupsthat
0 lono 23.0 f 0.3 3,200 lono 22.8 f 0.4 6,300 1ono 23.1 & 0.4
12,500 lono 23.0 & 0.4 2 5 , o l o n o 22.8 f 0.4 5 0 , o l o n o 23.0 & 0.3
received 12,50 or5 0 , O ppm were significantly less than those o f the controls (Table 4). No chemical-related clinical findings were observed, fighting was observed among all exposed and control male mice. No biologicallysignificantchanges in final mean body weights, absolute or relative organ weights (Table Dl), or hematology or clinical chemistry parameters were noted in any dosed group. Results from all serologic analyses for murine vimes were negative(Appendix H).
32.5 f 0.6 9.5 f 0.5 32.4 * 0.8 9.6 f 0.6 10 32.4 f 1.0 9.3 f 0.8 10 30.2 f 1.0 7.2 f 0.9" 93 31.1 f 0.6 8.3 f 0.6 % 30.4 f 0.6 7.4 f 0.6" 94
0 1ono 18.7 f 0.3 0.8 f26.17.4 f 0.7 lono 0.6 f7.0 0.325.1f18.1 f 0.5 %3,200 l o n olono
9718.0 f 0.3 0.7 f7.225.2 f 0.66,30012,500 99 0.3 25.8f18.3 f 0.8 7.5 f 0.7
l o n ol o n o
0.6 f7.3 0.4 25.6f18.3 0.6 f6.8 0.4 24.9f18.1
f 0.3 98 f 0.4 95
2 5 , o 5 0 , o
" Significantly different (PSO.05) from the control group by Williams' or Dunnett's test ID Number of animals surviving/numtm initially in group
Weightsandweightchangesgiven as mean f standard e m c

- -
28 Ethylene Glycol, N T P TR 413
Treatment-related histopathologic lesions were noted only in the kidneys and livers of male mice that received 25,OOO or 50,OOO ppm (Table 5). Hyalinedegeneration in the liver occurred in the centri- lobular hepatocytes. cellsAffected contained cytoplasmic accumulations of nonbirefringent, eosinophilic (hyaline), globular, or crystallinematerial which resembled erythrocytes in size, shape, and tinctorial properties. In some cases,only one or two hepatocytes aroundcentral veinswere affected, in more severe cases, affected hepatocytes were present in several layers of the hepatic cords adjacent to central veins. Nephropathy was characterized by several renal tissue changes that included tubule dilatation, cytoplasmic vacuolation, or regenerative hyperplasia o f tubule epithelial cells. These changes were focal, randomly distributed, and of minimal to mild severity.
In one malethat received 50,OOO ppm, a small birefringent crystal resembling an oxalate crystal was present in the wall o f a meningealartery. In females, no treatment-related lesions were seen in any organ.
DoseSelectionRationale: In male mice, potentially progressive renal lesions were inseen the 25,OOO and 50,OOO ppm groups and significantlydecreased mean weight gain occurred in the 12,500 and 50,OOO ppm male groups. Also, ethyleneglycol is known to be more toxic to males than females in other rodent species (Blood, 1%5; DePass et aL, 1986a). Therefore, a high dose of 25,OOO ppm and lower doses o f 6,250 and 12,500 ppm were selected for male mice in the 2-year feed studies.
Because greater quantities might affect nutritional adequacy, 50,OOO ppm is generally recommended as the maximum concentration o f a test compound which should be administered in the diet. For this reason, 50,OOO ppm ethylene glycol was selected as the high dose for females in the 2-year studies, even though no clinical or pathologic changes were seen at 50,OOO ppm or lower doses in the 13-week studies. The lower doses selected for female mice in the 2-year f e e d studies were 12,500 and 25OOO ppm.
TABLE5 Selected Nonneoplastic Lesions in Male Mice in the 13-Week Feed Study of Ethylene Glycol
Liver: Hyaline Degeneration" Overall ratesb on0 -C - on0 lono- lono-
Kidney: Nephropathyd Overall rates on0 on0 1no sno*
l Significantlydifferent (PSO.05) from the control group by the Fisher exact test * * PSO.01
Diagnostic term used by the study pathologist for this lesion was degeneration. Number of affected animals/number of animals necropsied or number of animals with tissues examined microscopically Not examined histopathologically Diagnostic term used by the study pathologist for this lesion was nephrosis.

%YEAR SlruJDnEs S U W i V d
There were no statistically significant differences in survival between dosed and control groups (Table 6 and Figure 1). Of the high-dose males, 65% (35/54) survived to 18 months. Because o f several early deaths due to extensivefighting, male mice were housed individually after week 54; female mice were housed individually after week 67.
iBldy Weigh9Feed comUmp&m19a d aimllicaanRMimlp The mean body weights o f exposed and control male and female mice were similar (Figure 2and Tables 7
0 PPm
Animals initially in study 60
15-Month interim evaluation 6 Natural deaths 15 Moribund 10 Animals surviving to study termination 29 Percent probability of survival at end of studyb 55 Mean survival (days)' 581
S U M I analysesd P=O.l%
Female 0 PPm
Animals initially in study 60
15-Month interim evaluation 10 Natural deaths 8 Moribund 9 Animals surviving to study termination 33 Percent probability of survival at end ofstudy 66 Mean survival (days) 651
Sulvival analyses P=0.371N
a First day of sacrifice:731 Kaplan-Meier determinations
and 8). No treatment-related clinical findings or gross lesions were noted. Results from all serologic analyses for murine viruses were negative(Appendix PI). Feed consumption by exposed male andfemale micewas similar to that by controls (Tables F1 and a).For male mice, dietary levels o f 0, 6,250, 12,500, and 25,000 ppm resulted in average daily ethylene glycol consumption levels o f approximately 1,50, 3,000, or 6,000 m a gM y weight. For females, dietary levels of 0, 12,500,25,000, or 50,000 ppm resulted in average daily ethylene glycol consumption levels o f approximately 3,000, 4,000, or 12,000m a g bodyweight.
6 8
14 32 60
642
60
10 11 9 30 60
645
P=O.649
6 11 11 32 61
592
60
9 9
12 30 59
638
P.10.554
6 16 15 23 45
524
P=O.305
=,m PPm
60
10 1
12 37 75
656
P=O.541N
Mean ofall deaths (uncensored, censored, and terminal sacrifice).

Ethylene Glycol, NTP TR 413
,...
...................................................................................1.c
0.9
....
a ................................................ ..:..
...... +-&-, ............. .... 0 6,ZSOPPU
0.5 ...... A 12.500 ppy ............. 0 25.000 P R II
0.4 I I 1 I I 1 I 0 15 so 60 75 90 105 D
WEEKS O N STUDY
1.0 . .h:
............... i................. ; ................ i................. i .............0.9
. .-1 4I
...................................................................... ,................2 0.8 3ln
B >- 0.7td mU ag ....... ............0.6
0. w 0 PPY
0 U . 5 O O P P Y
0.5 ....... A 25,000 p W ............ ................. ................
r5 i0 ;s do 90 105 1 0
WEEKS ON STUDY
FIGURE1 Kaplan-Meier Survival Curves for Male and Female Mice Administered Ethylene Glycol in Feed for 2 Years
0.4

0 15 so 6 0 75 90 5
WEEKS ON STUDY

32: Ethylene Glycol, NTP TR 413
TABLE7 M.an Body Weights and Survival of Male Mice in the 2-YearFeed Study of Ethylene Glycol
Study on
Weeks
(g) Survivors Av. W t No. of
0 ppm
(9) controls) Survivors Av. W t W t (% of No. of
6,250 ppm
(g) Av. W t
controls) Survivors W t (% of NO.of 12,500 ppm
(9) controls) Survivors Av. W t W t (% of No. of
25,OOO ppm
1 23.7 60 24.3 103 60 24.0 101 60 24.0 101 60 2 24.8 60 25.6 103 60 25.4 102 60 25.8 104 60 3 25.3 60 27.4 108 60 27.0 107 60 26.9 106 60 4 27.3 60 28.9 106 60 28.6 105 60 28.3 104 60 5 28.4 60 29.6 104 60 28.7 101 60 29.2 103 60 6 29.2 60 29.7 102 60 29.5 101 58 30.0 103 60 7 29.6 60 30.8 104 60 29.9 101 57 29.5 100 60 8 29.4 60 31.2 106 60 30.4 103 56 29.6 101 60 9 30.4 59 31.5 104 60 30.9 102 56 30.9 102 60
10 30.1 59 32.5 108 60 31.4 104 56 31.5 105 59 11 31.1 59 33.1 106 60 32.0 103 56 31.7 102 59 12 31.6 59 32.7 104 60 32.3 102 56 32.4 103 59 13 32.4 59 33.7 104 60 33.5 103 56 33.3 103 59 14 32.4 59 34.2 106 60 32.7 101 56 33.2 103 58 17 33.3 59 35.0 105 59 35.6 107 55 34.3 103 56 21 33.2 55 35.5 107 59 35.5 107 54 34.5 104 54 25 34.2 54 36.4 106 59 36.9 108 54 36.6 107 47 29 35.5 53 38.0 107 58 38.0 107 54 37.8 107 47 33 36.3 52 38.9 107 58 39.1 108 54 38.6 106 46 37 37.3 52 39.6 106 58 39.6 106 54 40.0 107 45 41 37.9 52 40.6 107 58 40.0 106 54 40.1 106 45 45 38.4 52 41.0 107 58 40.2 105 54 41.6 108 45 49 38.7 52 40.7 105 58 41.3 107 54 41.6 108 44 54 38.7 51 40.0 103 57 39.1 101 54 40.3 104 44 58 39.0 50 39.6 102 56 39.8 102 50 38.5 99 43 62 38.9 49 39.3 101 56 40.4 104 50 38.9 100 43 66 39.2 49 39.6 101 56 40.7 104 50 38.6 99 43 70a 40.1 42 40.2 100 50 40.9 102 44 39.3 98 37 74 39.8 42 41.5 104 50 41.6 105 44 39.2 99 36 78 40.0 41 41.1 103 48 41.4 104 42 39.0 98 35 82 39.5 41 39.9 101 48 41.2 104 42 37.7 95 35 86 39.3 39 39.2 100 47 42.1 107 41 37.4 95 33 90 38.6 36 38.6 100 42 40.2 104 37 36.9 96 32 94 38.7 33 38.6 100 40 39.7 103 36 35.6 92 32 98 37.4 31 39.2 105 37 40.0 107 34 36.6 98 30
102 39.0 30 39.6 102 33 40.7 104 32 36.3 93 26
Terminal sacrifice 29 32 32 23
Mean for weeks 1-13 28.7 30.1 105 29.5 103 29.5 103
14-52 35.7 38.0 106 37.9 106 37.8 106 53-102 39.1 39.7 102 40.6 104 38.0 97
a Interimevaluationoccurredduring week70.

Results 33
Weeks 0 ppm 12.500 ppm 25,000 ppm 50,ooO ppm on Av.Wt. No. ofAv.Wt. Wt. (% of No. ofAv.WLWL (% of No. of Av.Wt.Wt. (% of No. of
Sludy (g) Survivors (g) controls)Survivors (9) controls)Survivors (9) controls)Survivors
1 18.7 60 18.8 101 60 18.9 101 60 18.6 100 60 2 19.6 60 18.6 95 60 19.0 97 60 19.6 100 60 3 20.0 60 20.8 104 60 21.1 106 60 20.7 104 60 4 22.0 60 22.1 101 60 22.5 102 60 21.2 96 60 5 22.5 60 22.3 99 60 22.0 98 60 22.5 100 60 6 22.8 60 23.2 102 60 23.3 102 60 23.1 101 60 7 23.5 60 24.0 102 60 23.8 101 60 23.4 100 60 8 24.1 60 24.2 100 60 24.2 100 60 23.6 98 60 9 23.8 60 24.1 101 60 24.1 101 60 23.9 100 60
10 24.4 60 24.1 99 60 24.5 100 60 24.9 102 60 11 25.4 60 25.2 99 60 25.8 102 60 26.2 103 60 12 25.9 60 26.1 101 60 26.3 102 60 26.5 102 60 13 25.8 60 26.1 101 60 26.2 102 60 26.0 101 60 14 25.8 60 26.3 102 60 26.4 102 60 26.0 101 60 17 27.0 60 27.4 102 60 27.2 101 59 27.4 102 60 21 28.8 60 28.3 98 60 29.3 102 59 29.1 101 60 25 29.9 60 30.5 102 60 30.1 101 59 30.5 102 60 29 31.5 60 32.2 102 60 31.9 101 59 32.1 102 60 33 32.8 60 32.9 100 60 32.0 98 59 32.7 100 60 37 33.0 60 34.4 104 60 34.6 105 59 33.9 103 60 41 34.2 60 35.0 102 60 35.8 105 59 34.6 101 60 45 35.1 60 36.7 105 60 36.8 105 59 35.8 102 60 49 36.1 60 37.7 104 60 37.2 103 59 36.9 102 60 54 37.2 60 38.0 102 60 38.2 103 58 37.7 101 60 58 40.8 60 40.0 98 60 40.7 100 58 39.8 98 59 62 42.5 60 42.1 99 60 43.1 101 58 41.0 97 59 66 43.7 60 42.5 97 60 42.7 98 58 41.8 96 59 70a 44.6 49 43.3 97 48 43.4 97 49 42.6 96 47 73 45.5 49 44.5 98 48 45.7 100 47 44.3 97 46 77 45.1 46 43.2 96 46 46.0 102 44 42.8 95 46 81 45.2 45 43.7 97 42 45.7 101 43 43.6 97 45 85 46.9 42 43.4 93 40 45.4 97 42 42.9 92 45 89 46.2 40 43.0 93 39 43.8 95 41 42.5 92 45 93 45.2 40 43.4 96 37 44.8 99 37 43.2 96 43 97 45.7 37 44.4 97 35 44.3 97 35 44.3 97 39
102 46.6 33 44.6 96 32 44.3 95 31 44.0 94 38
Terminal sacrifice 33 30 30 37
Mean for weeks 1-13 23.0 23.0 100 23.2 101 23.1 1 0
14-52 31.4 32.1 102 32.1 102 31.9 102 53-102 44.2 42.8 97 43.7 99 42.3 96
a Interimevaluationoccurredduringweek70.

34 Ethylene Glycol, NTP TR 413
Pathology and Statistical Evaluation Summaries of the incidences o f neoplasmsand nonneoplastic lesions, animalindividual tumor diagnoses, statistical analyses of primary neoplasmsthat occurred at an incidence o f at least 5% in at least one study group, and historical incidences for certain neoplasms are presented in Appendixes A for male mice and B for female mice.
No treatment-related neoplasmswere observed in male or female mice at the15-month interim evaluations orat the end o f the 2-year studies. Several treatment-related or biologically significantnonneoplastic lesions were seen in exposed mice at interim evaluations and in the 2-year studies.
TABLE9
Liver: The incidence of hepatocellular hyaline degeneration was increased in exposed male and female mice at the 15-month interim evaluations (Table 9). Atthe end of the 2-year studies, inci- dences o f centrilobular hepatocyte hyaline degenera- tion were increased in dosed male and female mice andwere considered clearly related to ethyleneglycol administration. Severity did not increase with dose. Under light microscopy, this lesion appeared similar to hyaline degeneration seen in the 13-week studies and the 15-month interim evaluations, and consisted of cytoplasmic accumulations o f non-birefringent, eosinophilic, granular to globularmaterial resembling erythrocytes in size, shape, and tinctorial properties (Plate 1).
Selected Nonneoplastic Lesions in Male and Female Mice in the 2-YearFeed Studies of Ethylene Glycol
15-Month Interim Evaluation Liver: Hyaline degeneration
Overall ratesa Kidney: Nephropathy
Overall rates
2-Year Study Liver: Hyaline degeneration
(herall rates
Female
15-Month Interim Evaluation Liver: Hyaline degeneration
(herall rates Lung: Arterial medial hyperplasia
(herall rates
2-Year Study L i w r Hyaline degeneration
Overall rates Lung: Arterial medial hyperplasia
Cherall rates
316
2/6
0153
12,500 PPm
on0
on0
0150
10/50'
2/6
516
24/53' '
25,OooPPm
3P
O P
1151
lO/5l'
616
6/6'
36/54 ''
%Ooo ppm
lono
3/10
26/50' ' 23/50' '
' Significantly different (PsO.05) from the control group by logistic regression test *' p'so.01 a Number of affected animals/number of animals necropsied or number of animals with tissues examined microscopically

Results 35
This material did not stain when the following stains were applied to representative liver sections from high-dose male and female mice: periodic acid- Schiff (PAS), Ziehl-Neelsen (acid-fast), Heidenhain- Mallory (protein), toluidineblue (metachromasia),and Prussian blue (iron). When examined by transmission electron microscopy, irregularly shaped, pleomorphic, nonmembrane bound, intracytoplasmic inclusions were seen in affected hepatocytes. These inclusions were composed of crystalline parallel arrays of alternatingelectron-denseandelectron-lucent linear structures (8.5 t o 11 nm)with 11 t o 13 nmperiodicity (Plates 3 and 4). Hepatocellular erythrophagocytosis was diagnosed in two high-dosefemale mice (Table B5) and consisted o f subcapsularhepatocytes whose cytoplasm was packed with intact erythrocytes.
Urinary System: The incidence o f nephropathy was increased in male mice at the 15-monthinterim evaluations (Table 9); however, there were no treatment-related changes in the incidence or sever- ity o f nephropathyinmale or female mice at the end o f the 2-year studies (Tables A5 and B5).
Inseveralhigh-dosemales, small numbers o f paleyellow to clear crystals morphologically compatible with oxalate were seen in the renal cortical tubules (8 mice), urethral lumens (12 mice), and/orrenal pelvis (1 mouse) (Table A5). These crystals were birefringent when examined under polarized light. Renal tubule dilatation was often seen in association with renal tubule crystals.Calculicomposed of oxalate-like material were detected grossly or micro- scopically in four high-dose males. Except for one male with both urethral crystals and gross calculus andanother male with pelviccrystals and micro- scopic calculus, there were no simultaneous occur-rences of crystals and calculi. The incidence of urethral suppurative inflammation was increased in high-dose males and that o f urinary bladder chronic inflammation was increased in all exposed males (Table A5).
Except for two deaths at weeks 35 and 46, all male micewith renaltubule crystals died by week 31. Urethraland/or urinary bladder inflammation was also present in most o f these animals. The causes o f death or reasons for moribund kill in these males were severe gross and microscopic urogenital and skin lesions including ulcers o f the penis and
prepuce; alopecia, ulcers, or inflammation o f skin in the posterior body; and seminal vesicle and prostate gland inflammation. These lesions were probably related to fight wound trauma and ascend- ing secondary infections. Infections and trauma may have resulted in dehydration, urine stasis, urinary pH alterations, andother physiological changes which could providedhave microenvironments favorable for oxalate precipitation in the renal tubules. Therefore, it is uncertain if the presence of this oxalate-like material was a direct toxic result o f ethylene glycol administration.
All but three males with urethral or pelvic crystals or urinary bladder calculi survived to study end or were killed in a moribund condition at week 84 or later. In these mice, gross and microscopic uro- genital and skin lesions possibly related to fightwound trauma were absent or of low severity.
Lung: At the 15-monthinterim evaluations, two controlandthree high-dosefemales had medial hyperplasia o f small pulmonary arteriesand/orarterioles (Table 9). Attheend of the 2-year studies, exposed females had an increased incidence o f medial hyperplasia o f the small pulmonary arteries and/or arterioles (Table 9 and Plate 2), but severity did not increase with dose. Affected vessels were distributed randomly and had minimal to mild circumferential thickening o f mural smooth muscle; it was unclear if this thickening was due to smooth muscle hypertrophy, t o hyperplasia, or to both. The vesselswere sometimes surrounded by lymphocytic infiltrates. The increased incidence o f medial hyperplasia was considered to be clearly related to ethylene glycol administration.
Alveolar/bronchiolar adenomas (0/50, 4/50,4/51, 1/50) and combined adenomas and carcinomas (1/50, 6/50,6/51,1/50) were marginally increased in low- and mid-dose females (Table B3). The historical control incidence of combined alveolar/bronchiolar adenomasand carcinomas in female mice from recent NTP dosed feed studies is 70/870 (8%, range2% to 26%; Table B4a). No increased incidences of alveolar epithelial hyperplasia were noted in exposed female mice. Since the incidences o f theseneo-plasms were within the historical control range and these increases were not dose-related,theseneo-plasms were not considered directly related to ethylene glycol administration.

36-
Thyroid Gland: The incidence, but not the severity, o f follicular cell hyperplasia increased in exposed females(8/49,16/50,22/51,14/50; Table B5).
Follicular cell adenomas occurred in one control, one low-dose, one mid-dose, and three high-dosefemales (Table B3). The historical incidence for combinedthyroid follicular cell adenomasand carcinomas in control female mice in recent NTP feed studies is 22/850 (3%, range 0% to 9%). Because the incidences o f follicularcell adenomas and carcinomas were within the historical control range, the increased incidences o f hyperplasia were not dose-related, and the severity of hyperplasia did not increase in exposed females, the thyroid fol-licular cell proliferative changes were not considered to be related to ethylene glycol administration.
Harderian Gland: In male mice, two harderian gland adenomas occurredin the mid-dose group, and two adenomas and one carcinoma occurred in the high-dose group (Table Al). The historical incidences for combined harderian gland adenomas and carcinomas in control male mice from recent N l T feed studies is 48/872 (6%, range 0% to 20%; Table A4). Because the incidences o f harderian gland adenomas and carcinomas were only margin-ally increased and were within the historical control range, these neoplasms were not considered to be related to ethylene glycol administration.
All Organs: In female mice, the incidence of combinedlymphomas had a statistically significantde,crease(17/50,13/50,9/51, 7/50; Table B3). The historical incidence o f combinedlymphomasin
Ethylene Glycol, NTP TR 413
control female mice from recent NTP feed studies is259B70(30%, range 10% to 44%; Table B4b). The relationship of this decrease to ethylene glycol administration is uncertain.
,GENETICTOXICITY Negative results were obtainedinall in vitro genotoxicityassays with ethylene glycol. Ethylene glycol was not mutagenic in Salmonella typhimurium strains TA100, TA1535, TA1537, or TA98 when tested with a preincubation protocol at concentra- tions up to 10,OOO pglplateinthe presence or absence o f Aroclor 1254-induced male Sprague- Dawley rat or Syrian hamster liver S9 (Table C1; Zeiger et aL, 1987). Ethylene glycol (concentrations up to 5,OOO pg/mL) was concluded to be negative,with and without Aroclor 1254-induced male Fischer rat liver S9 activation enzymes, in the mouse lym- phomaassay forinduction o f trifluorothymidine resistance in L5178Y cells (Table c 2 , McGregor etaL, 1991). In the absence o f S9, inconsistent responses were seen among thethree trials; a positive response was obtained in one trial, but this was not reproduced in the other two trials performed without S9. The results o f two trials with S9 werenegative. Results of in vitro cyto-genetic tests forinduction o f sisterchromatid exchanges and chromosomal aberrations with ethyl- ene glycol in Chinesehamster ovary cells were negative with andwithout Aroclor 1254-induced male Sprague-Dawley rat liver S9 (Tables C3 and 04). In the sister chromatid exchange and the chromosomal aberration tests, 'doses toup 5,OOO pglmLethylene glycol were tested. Little or no toxicity was seen in all tests.

UTE 1 Hepatocellular hyaline degeneration in the liver of a male B6C3Fl mouse given 2,500 ppm o f ethylene glycol i n feed for 2 years. Hepatocellularcytoplasmispackedwithcoarselygranular,eosinophilic material(arrows).H&E395x.
mTE 2 Pulmonary arterial hyperplasia (arrow) in the lung of a female B6C3Fl mouse given 5,OOO ppm ethylene glycolinfeed for 2 years. H&E 15oX,
PLATE 3 Liver of a male B6C3Fl mousegiven 2,500 ppm ethyleneglycolinfeedfor 2 years.Hepatocyte(HEP)cytoplasm is packed with irregularly-shapedinclusions(HI)corresponding t o theeosinophilicmaterialseenbylightmicroscopy(PLATE 1). Note erythrocytes (E) inadjacentcapillaries. x 5,400.

PLATE 4 Hepatocellularinclusion(HI) in theliverof a male.B6,QF1mouse given 2,500 ppm ethyleneglycol in feed for 2 years. Note the crystallinearraysofparallellinearstructures (8.5 nm to 11 nm) with 11 nm to 13 nm periodicity. x 54,ooO.

Ethylene glycol has numerous commercial and industrial applications. It is a component o f motor vehicle antifreeze-coolant fluids and many other products. It is also used in the manufacture of polyester fibers, glyoxal, resins, and other substances, and as a solvent, humectant, and softening agent. Ethylene glycol was selected for study because its very large volume production (overfive billion pounds in 1989) and easy availability present a high potential for widespread general and workplace exposure and environmental contamination.
Oral administration was chosen to mostcloselyapproximate the major route of human exposure. Dosed feed was selected because of concernthat with drinking water exposure, polydipsia and/or polyuria resulting from anticipated renal toxicity might the o f ethylene glycolaffect amounts consumed and excreted.
The present studies were carried out only in B6C3Fl mice becausea recent bioassayin F344 rats (DePass et af., 1986a) was considered adequate to evaluate the chronic toxicity and carcinogenicity o f ethylene glycol in this species and strain. In that study, male and femaleF344 rats were administered 0.2,0.4, or 1.0 g ethylene glycol/kg bodyweight in feed daily for 2 years. Decreased survival was seen onlyin high-dose male rats and was attributed to severe renal disease. No treatment-related neoplastic effects were observed in rats.
Repeated-dose studies were not performed because the data available in the literature were considered adequate for dose selection for the 13-week studies. In the 13-week studies, male and femaleB6C3Fl mice were administered 0, 3,200, 6,300, 12,500, 25,000, or 50,000 ppm ethylene glycol in feed. All animals survived to the end of the study and final mean body weights o f exposedmicedid not differ significantly from those o f the controls. Only male mice in the 25,000 and 50,ooO ppm groups exhibited histopathologic andlesions(nephropathyhepatocellular hyaline degeneration).
The renal lesions observed in male mice in the two highest dosegroupswere considered potentially
progressive and life threatening. In other species, males have been shown to be more susceptible than females to ethylene glycol-mediated chronic nephrotoxicity (Morris et af., 1942;Blood,1%5; DePass et af., 1986a). For these reasons, dietary concentrations o f ethylene glycol selected for male mice in the 2-year studies were 0,4,250, 12,500, or 25,000 ppm. Although exposed female mice exhib-ited no toxic or pathologic effects in the 13-week studies, substitution o f more than50,UOfl ppm of the diet with a test compound for 2 years mighthave compromised nutritional (NCI,adequacy 1976; Connerand Newberne,1984). Therefore, dietary concentrations o f ethylene glycol selected for female mice in the 2-year studies were 0, 12,500, 25,000, or 50,000 ppm.
In the 2-year studies, survival o f exposed mice and controls was similar (males: 0 ppm, 29/54; 6,250 ppm,32/54;12,500ppm,32/54; 25,000 ppm, 23/54; females: 0 ppm, 33/50; 12,500 ppm, 30/50; 25,000 ppm, 30/51; 37/50).50,000 ppm, At 18 months, 65% (35/54) of the high-dose males and 78% (42/54) of the mid-dose males were alive. The survival o f control and exposed miceof each sex was considered adequate for evaluation o f the carcinogenic potential of ethylene glycol.
Final mean bodyweightsofdosed groups did not vary significantly from those o f the controls.
No chemical-related neoplasms were observedin male or female mice in the 15-month interim evaluations or in the 2-year studies. However, chemical-related nonneoplastic lesions occurred in the liver, lung, and/or urinary tract.
Centrilobular hepatocellular hyaline degeneration was first seen in exposed male mice in the 13-week studies and occurred at a high incidence in mid- and high-dosemalesin the 2-year studies. However, in femalemice, a high incidence of hyaline degenera- tion was seen only in the high-dose group in the 2-year studies, suggesting that female mice might be less susceptible to development o f this lesion than males. The lesion was not considered life threatening in either sex.

38 Ethylene Glycol, NTP TR 413
Hyaline degeneration appearedtobemorpho-logically distinct from other hepatocellular lesions such as "mild fatty metamorphosis" (DePass et al., 1986a), "fatty degeneration" (Morris et al., 1942), or "hydropic degeneration" (Hanzlik et al., 1947)occasionally noted in rats given ethylene glycol. However, changes histologically similar to hyaline degeneration have occasionally been observed in livers o f B6C3Fl mice and less commonlyin F344 rats (NTP, 1992); the relationship o f hyalinedegeneration to chemical administration in these cases is uncertain.
Hepatocellulardegenerationhyaline was characterized by intracytoplasmic accumulations of granular to globular, nonbirefringent, eosinophilic material with dimensions and tinctorial properties similar tothose o f erythrocytes. Transmission electron microscopy (TEM) revealed'that the eosin- ophilic material in affected hepatocytes consisted of smoothlycontoured to angular intracytoplasmic electron-dense 'inclusions resembledwhich the phagocytized erythrocyte fragments seen i n Kaposi's sarcoma cells (Schenk, 1986, Kao et al., 1990);
The liver is a major site o f ethylene glycol merabolism (Richardson, 1973), and ethylene glycol and its metabolites are known to affect oxidative phosphorylation, glucose metabolism, andother hepatocyte metabolic pathways in vitro (Coenand Weiss, 1966, Bachmann and Golberg, 1971; Ma:nnering and Van Harken, 1974; Rajagopal and Ramakrishnan, 1978; Ebel, 1980). Therefore, it would notbe entirely unexpected that possible ethylene glycol-mediated effects on the hepatocyte phagocytic potential (Gregory et al., 1991)mightresult in uptake o f normal or crystal-containing erythrocytes.
The hepatocellular crystalline arrays observed in the present studies differed from theamorphous to fine granularity o f normal erythrocyte cytoplasm and o f intra-erythrocytic hemoglobin crystals (Ghadially, 1982) and Heinz bodies (Christopher et a L , 1990).Theydid notresemblethe Mallory bodies seen in alcoholic hepatitis and other liver diseases of humans (Cotran et aL, 1989).However, various proteins, including apoferritin and its iron-containing derivative ferritin, are known to und.ergo crystallization artifactually or under different physiological (Kentconditions and Bahu, 1979; Ghadially,1982). The inclusions were apparently not as might bemembrane-bound,
expected for the contents of phagolysosomes;Although inclusions were seen only within hepato- cytes, the possibility that the crystalline arrays were formed prior to hepatocellular uptake could not be excluded (Kao et aL, 1990). Thus, although some evidence supports an erythrocyte origin, the exact identity of the inclusions, whetherand theyrepresent a toxic effect, remains undetermined.
Pulmonary arterial medial hyperplasia occurred with a chemical-related increased incidence in female mice in the 2-year studies. In the present studies, affected mice did not exhibit other vascular changes such as intimal proliferation and fibrosis, elastic membrane reduplication and adventitial fibrosis, which are associated with pulmonary hypertension in humans (Spencer, 1985; Cotran et aL, 1989). Additionally,affected mice did not display clinical signs o f peripheral or pulmonary. hypertensive disease'such as dypsnea, cyanosis, and syncope.
I .
Therefore, the pathogenesis o f pulmonaryarterial medialhyperplasia in the present studies remains undetermined.Important glycoprotein and enzyme components o f the major vasopressor-regulating renin-angiotensin system are produced in the liver andlung(Webband Cockcroft, 1990); treatment-related liver and lung lesions were present in female mice in the 2-year studies. Although direct evidence is lacking, the development of pulmonaryarterial hyperplasiamight be linked tosubtle ethyleneglycol-mediated primary or secondary perturbationsof the renin-angiotensin system. Alternately, the in vitro effects o f ethylene glycol on muscle contractile proteins have been well documented (Clarke et al., 1984,Johnson, 1986,Maruyama et al., 1989; Mushtaq andGreene, 1989). However, it is unknown whether pulmonary arterialhyperplasia was related to direct ethylene glycol toxic effects on vascular smooth muscle.
The incidence and severity of nephropathy were not influenced by ethylene glycol administration in either sex. Other treatment-related urinary system lesions occurred onlyinmales. Small numbers o f oxalate-like crystals and/or calculi were noted in kidneys,urethras, and/or urinary bladders in some high-dose male mice.
Most of the males with urethral crystals, urinary bladder calculi, or both survived to study termina- tion or were killed moribund late in the 2-year studies (week 84 or later)and generally did not

exhibit 'severe skin and urogenital lesions o f the types associated with fight wound traumaand secondary ascending urinary tract infections. However, most of the mice with renal tubule crystals died or were killed moribund early in the 2-yearstudies (before week 31). These male mice did exhibit skin or urogenital lesions typically associated withfightwounds(fighting was widespread in all male mice groups until individual housing was instituted after week 54). In these cases, the skin or urogenital lesions were considered severe enough to havecaused early death or morbidity. Such pro- nounced traumatic and inflammatory lesions may Rave resulted in dehydration, urine stasis, urine pH alterations, and other physiologic derangements which could have favored oxalate precipitation. It is uncertain what role these possible complicating factors may played. development ofhave in detectable oxalate-like deposits. Therefore, it remains undetermined if ethylene glycol administra- tion was directly related to the Occurrence o f renal tubule crystals.
Although ethylene glycol toxicity has notbeen investigated extensively inmice, available evidence indicates that mice are less susceptible than other sp i e s to ethylene glycol intoxication. In previous studies, renal lesions in mice have been absent, or occurred later and were less severe than those seen in rats receiving similar or lower dietary concen-trations o f ethylene glycol (nanzlik et d., 1947; DePass et ~ l . ,198th).
Overall, the results o f the present studies are consistent with these earlier reports. The mechanisms responsible for this apparent speciesdifference in toxicity unknown.are However, metabolismand excretion of ethylene glycol is known to vary among s p i e s . For example, rats, guinea pigs, chinchilla rabbits, cats, and rhesus monkeysgiven ethylene glycol excrete varyingproportions o f the parent compoundandsuch metabolites as oxalate, glycolate, glyoxalate, and hippurate(Gessner et d., 1%1; Gessnerand Williams, l%l;McChesney et ~ l . ,1971;McChesneyand 1972). In the present studies,Goldberg,
variations in the types or proportions of toxic metabolites peculiar to B6C3Fl mice may have played a pathogenic role. Alternately, absorption o f ethylene glycol and disposition of its metabolites may differ in MC3Fl mice compared to other species and strains.
Similarly, differences in absorption, metabolism, and excretion of ethylene glycol between maleand female B6C3Fl mice may have played a role in the sex distribution o f several nonneoplastic lesions in the present studies. This hypothesis is supported by previousfindings that males and females o f the same s p i e s can produce different proportions o f ethylene glycol metabolites (€tichardson, 1%5), and thatmalerats exhibit increased susceptibility to ethylene glycol-associated renal toxicity compared to female rats (Morris et d., 1942;Blood, 1%5; DePass et QZ., 19ffi).
It is possible that male mice in the 2-year studies could have tolerated slightly higher doses. If potential nutritional deficiencyhad not been a factor, female mice in the 2-year studies probably could have tolerated higher doses. However, the doses used in the 2-year studies resulted in increased incidences of treatment-related nonneoplastic lesions in the liver of male mice and in the liver and lung o f females. Therefore, the doses employed were considered adequate to evaluate the carcinogenicpotential o f ethylene glycol.
Conclusbm: Under the conditions of these 2-year feed studies, there was no evidence of carcinogeniz ~ctivity"of ethylene glycol in male B6C3Fl mice receiving 6,250, 12,500, or 25,000 ppm, or in female B6C3Fl mice 12,500, 25,000, orreceiving 5 0 , O ppm. Administration of ethylene glycol resulted in hepatocellular hyaline degeneration in male mice fed diets containing 12,500 or 25,000 ppm and in female mice fed diets containing 50,000 ppm. An increased incidence of medial hyperplasia o f small pulmonary andarteries arterioles occurred in female mice fed diets containing 12,500, 25,000, or 5 0 , O ppm ethylene glycol.
Explanation of Levels of Evidence of Carcinogenic Activity appears on page 7. A summary of the Technical Reports ReviAv Subcommittee comments and the public discussion on this Technical Report appear on page 9.

40 Ethylene Glycol, NTP TR 413

Abbondandolo, A, Bonatti, S.,Corsi, C., Corti, G., Fiorio, R., Leporini, C., Mazzaccaro, A, Nieri, R., Barale, R.,andLoprieno, N. (1980). The use of organic solvents in mutagenicitytesting. Mutat.Res. 79,141-150.
ACGIH, Cincinnati, OH.
Anderson, B. (1930). Facial-auditory nerve oxalosis. Am. J. Med 88, 87-88. (Letter to the editor.)
Andrews, L.S., and Snyder, R.S. (1986). 3rd ed. Toxic effects o f solvents and vapors. In Casarett and Do~l l ' sToxicoZogy (C.D. Waassen, M.O. Amdur, and J. Doull, Eds.), pp. 636-658. Macmillan, New York.
Armitage, P. (1971). Stahtical M e t h d in Medical Research, pp. 362-365. John Wiley and Sons, New York.
Ashby, J., andTennant, R.W. (191). Definitive relationships among chemical structure, carcino-genicity, and mutagenicity for 301 chemicals tested by the U.S. NTP. Mutar. Res. 257, 229-305.
Bachmann, E., and Golberg, L.(1971). Reappraisal o f the toxicology of ethylene glycol. 111. Mitochondrial effects. Food Cosmet. ToxicoL 9, 39-55.
Barilyak, I.R., and Kozachuk, S.Y. (1985). Mutagenic effect o f various alcohols in experiment. TsitoL Genet. 19, 436-442.
Bates, El.#, Price, C.J., George, J.D., Marr, M.C., Emmell, C.A, Morrissey, R.E., and Schwetz, B.A (1990). Postnatal effects o f in utero exposure to ethylene glycol (EG) in the CD@ rat. Toxicologist I@, 38. (Abstr.)
Beman, L.B., Schreiner, G.E., and Feys, J. (1957). The nephrotoxic lesion o f ethylene glycol. Ann. Intm ~~d a,611-619.
B l d , ER. (1%5). Chronic toxicity of ethyleneglycol in the rat. Food Cosmet. ToxicoL 3,229-234.
Blood, EW.,Elliott, G.A, and Wright, M.S. (1%2). ChTonictoxicity o f ethylene glycol in the monkey. ToxicoLAppL PhamacoL 4, 439-4191.
Boorman, G.A, Montgomery, C.A, Jr., Eustis, S.L., Wolfe, M.J., McConnell, E.E., and Hardisty, J.F. (1985). Quality assurance in pathology for rodent carcinogenicity studies. In Handbook of Carcinogen Testing ( H A Milman and E.# Weisburger, Eds.), pp. 345-357. Noyes Publications, Park Ridge, NJ.
krden, T.A, and Bidwell, C.D. (1%). Treatment o f acute ethylene glycol poisoning in rats. Invest. U~OL4, 205210.
Bommann, G. (1954). Grundwirkungen der Glykole Bedeutungnnd fiir die Toxizit&.ihre
Aanehittevorschung 4, 643-6445
Bove, #E. (1966). Ethylene glycol toxicity. Am. J. C l k PathoL 45, 43-50.

42 Ethylene Glycol, NTP TR 413
$owen, D.A.L., Minty, P.S.B., and Sengupta, A. (1978). Two fatal cases o f ethylene glycol poisoning. Med Sci Law 18, 102-107.
Brown, C.G., Trumbull, D., Klein-Schwartz, W., and Walker, J.D. (1983). Ethylene glycol poisoning. Ann. Emerg. Med 12, 501-506.
Burkhart, KK, and Kulig, KW. (1990). The other alcohols: methanol, ethylene glycol, and isopropanol. Emerg Med Clin. North Am. 8, 913-928.
Child, J., and Willetts, A. Microbial(1978). metabolismof aliphatic glycols: bacterial metabolism of ethylene glycol. Biochim.Biophys. Acta 538, 316-327.
Chou, J.Y., and Richardson, ICE. (1978). The effect of pyrazole on ethylene glycoltoxicity and metabolism in the rat. Toxicol. Appl. Phamacol. 43, 33-44.
Christian, ICL., Moorehead, (1985).and W.P. Ethylene dichloride/ethylene glycol spill in a major water resource in British Columbia. J . Environ. Health 47, 192-196.
Christopher, M.M., White, J.G., Eaton, J.W. (1990).Erythrocyte pathology of Heinz body-mediatedhemolysis o f cats. Vet. Pathol. 27, 299-310.
Cieciura, L., Kidawa, Z., Orkisz, S., and Trznadel, K. (1983). Ultrastructuralappearances o f nephrondamage in acute poisoning with ethylene glycol. hoc.Eur. Dial. Transplant Assoc. 20, 636-640.
Clark, C.R., Marshall, T.C., Merickel, B.S., Sanchez, A, Brownstein,D.G., andHobbs, C.H. (1979). Toxicological assessment o f heat transfer fluids proposed for use in solar energy applications. Toxicol. Appl. Pharmacol. 51, 529-535.
Clarke, M.L., Rodger, C.D., and Tregear, R.T.
Res. Cell Motil. 5, 81-96. ethylene glycol in insect flight muscle.(1984). Modification of crossbridge
J. Muscle states by
Clay, KL,and Murphy, R.C.(1977). On the metabolic acidosis of ethylene glycol intoxication. Ttrricol.AppLPharmacol. 39, 39-49.
axle of Federal Regulations (CFR) 21, Part 58.
Coen, G., and Weiss, B. (1966). Oxidation o f ethylene glycol to glycolaldehyde by mammalian tissues. EmymoL BWL Clin. (Basel) 6, 288-2%.
Compendium of Safety Data Sheets for Research and IndustrialChemicals (CSDSRIC)Part I1(1985).(L.H. Keithand D.B. Walters, Eds.), pp.840-841. VCH Publishers, Deerfield Beach, FL. Conner, M.W., and Newberne, P.M. (1984). Drug-nutrient interactions and their implications for safety evaluation. Fundam Appl. T&oL 4, 5,3413,356.
Coon, R.A., Jones, R.A., Jenkins, L.J., Jr., and Siegel, J. (1970). Animal inhalation studies on ammonia,ethylene glycol, formaldehyde, dimethylamine, ethanol. AppLand Toxicol. Phamacol. 16, 646-655.
Cotran, R.S., Kumar, V.,and Robbins, S.L., (1989).4th ed. Pathologic of =ease,Robbins Basis
764-765,pp. 945-946. W.B. Saunders Co., Philadelphia.
Cox, D.R.(1972). Regressionmodelsand life tables. J. R Stat. Soc. B34, 187-220.
Crawford, B.D. (1985). Perspectives on the somatic mutationmodel o f carcinogenesis. In Advances in Modem EnvironmentalToxicology. (W.G. Flamm and R.J. Lorentzen, Eds.), pp. 13-59. Princeton Scientific, Princeton, NJ.
DePass, L.R., Garman, R.H., Woodside, M.D., Giddens, W.E., Maronpot, R.R., and Weil, C.S. (1986a). Chronic toxicity and oncogenicity studies of ethylene glycol in rats and mice. Fundam. Appl. Toxicol. 7, 547-565.
DePass, L.R., Woodside, M.D., Maronpot, R.R., and Weil, C.S. (1986b). Three-generation reproduction and dominant lethal mutagenesis studies of ethylene glycol in the rat. Fundam. Appl. Toxicoh 7, 566-572.
Dial, S.M., Thrall, M.A., and Hamar,, D.W. (1989).4-Methylpyrazole as treatment for naturally acquired ethylene glycol intoxication in dogs. J. Am. Vet. Med Assoc. 195, 73-76.
Dime, G.E., and Haseman, J.K.(1986). Logisticregressionanalysis o f incidental-tumor data from animal carcinogenicity experiments. Fundam. Appl. TOX~COL6, 44-52.

Dinse, G.E., and Lagakos, S.W. (1983). Regression Galloway, S.M., Bloom, AD., Resnick, M., Margolin, analysis o f tumor prevalence data. AppZ. Statist. 32, B.H., Nakamura, E , Archer, P., and Zeiger, E. 236-248. (1985). Development o f a standard protocol for
in vitpo cytogenetic testing with Chinesehamster Dunnett, C.W. (1955). A multiple comparison ovary cells: Comparison of results for 22 procedure for comparing several treatments with a compounds in two laboratories. Environ.Mutagen. control. J. Am. Stat. Alssoc. 50, 1,095-1,121. 7,1-51.
m e r , D.F.,and Tiedje, J.M. (1983). Degradation o f ethylene glycol and polyethyleneglycols bymethanogenic consortia. AppLEnviron. Microbial 4 6 , 185-19).
~ ~ R.E. , Perturbation of the hepatic 1 (1g80). micro soma^ monoolojgenase by ethylene glycol. Fed Ppoc. 39, 948. (Abstr.)
W.H.9 and (lg4)*E*J*Biodegradationof mono-, di-, and triethylene glycols in river waters under controlled laboratoryconditions. WaterResearch 8, 97-1UO.
Factor, S.A, and Lava, N.S. (1987). Ethylene glycol intoxication: a new stage in the clinical syndrome. N.Y State J . Med 87,179-180.
Federal Register (1989). 54, 2,462.
Fowler, B.A, B.M., and Woods, (1983).firdish, J.S. Alteration o f hepatic microsomal structureand function by indium chloride. Lab. Invest. 48, 471-478.
Freitag, D., Ballhorn, L., Geyer, H., and Korte, E (1985). Environmental hazard profile of organicchemicals: an experimental method for the assessment of the behaviour o f organic chemicals in the ecosphere by means o f simple laboratory tests with 1 4 C labelled chemicals. Chemosphere 114, 1,589-1,616.
Gabow, P A (1988). Ethylene glycol intoxication. Am. J . Kidney Dis. 1111, 277-279.
Gabow, P A , Clay, K., Sullivan, J.B., and Lepoff, R. (19%). Organic in glycolacids ethylene intoxication. Ann. Intern. Med 1105, 16-20.
Galloway, S.M., h s t r o n g , M.J., Reuben, C., Colman, S., Brown, B., Cannon, C., Bloom, AD., Nahmura, E , ahmed, M., Duk, S., Rimpo, J., Margolin, B.H., Resnick, M A , Anderson, B., and Zeiger, E. (1987). Chromosome aberrations and sister chromatid exchanges in Chinese hamster ovary cells: Evaluations o f 1 0 chemicals. Envirm MOL Mutagen. 110 (SUPPI. lo), 1-175.
Gart, J.J., Chu, KC., andTarone, R.E. (1979). Statistical issues in interpretation of chronic bioassay t~~ for carcinogenicity. NatZ. Cancep Inst. 62, 957-974.
Gebhardt, D.O.E. (1%$). The teratogenic action of propyleneglycol(propanediol-1,2)and propanediol-1,3 in the chick embryo. Teratology 11, 153-162.
Gershoff, S.N., and h d r u s , S.B. (1%2). Effect of vitamin B, and magnesium on renal dewsition of calcium oxalate hduced by ethyline glycol
A.oc. sot. -. BioL Med nw, 89-1m.
Gessner, P.#, and Williams, R.T. (l%l). The metabolism of 14C-ethanediol (ethylene glycol). Pure AppL Chem. 3, 281-283.
Gessner, P.#, Parke, D.V., and Williams, R.T. (1960). Studies in detoxication $0. The metabolism of glycols. Biochem. J. 74, 1-5.
Gessner, P.K., Parke, D.V., and Williams, R.T. (l%l). Studies in detoxication 86. The metabolism of *4C-labelled ethylene glycol. Biochem. J . 79, 482-489.
Ghadially, EN. (1982). 2nd ed. U l t p ~ ~ ~ ~ ~ t u p r a Z PathoZogy of Cell and Matp.ir, p. 720.the Buttenworths, London.

44 Ethylene Glycol, NTP TR 413
Grafton, T.F., andHansen, D.K. (1987). In vitro embryotoxiceffects of ethylene glycol in rats. Teratogenesis Mutagen.Carcinog. 7, 483-489.
Grant, W.M. (1974). 2nd ed. Toxicology of theEye. p. 475-478. C.C. Thomas, Springfield, IL.
Grauer, G.F., and Thrall, M.A. (1982). Ethyleneglycol (antifreeze) poisoning in the dogand cat. J . A m . Animal Hospital Assoc. 18, 492-497.
Gregory, S., Barczynski, L., and Wing, E. (1991). Hepatocyte-mediated clearance o f bacteria from the bloodstream. Fed Am. Soc. Ekp. 'Bwl. 5, A1095 (Abstr.)
GriEths, AJ.E (1979). Neurospora prototroph selection system for studying aneuploid production. Environ.HealthPerspect. 31, 75-80.
Griffiths, A.J.F. (1981). Neurospora and environmentally induced aneuploidy. In Progress in MutationResearch: Evaluation o f short-term tests for carcinogens (F.J. Serres and J. Ashby, Eds.) Vol. 1, pp. 187-199. Elsevier North Holland, Inc., New York.
Handbook of Environmental Data Organicon Chemicals (1977). 2nd ed. (K. Verschueren, Ed.), p. 322-323. VanNostrandRheinhold Company,New York.
Hanzlik, P.J., Seidenfeld, M A , and Johnson, C.C. (1931). General properties, irritant toxicand actions of ethylene glycol. J. Phamtacol. Exp. Ther. 41, 387-406.
Hanzlik, P.J., Lawrence, W.S., andLaqueur, G.L. (1947). Comparative chronic toxicity o f diethyleneglycol monoethyl ether (carbitol) and some related glycols: results o f continued drinking and feeding. J. I d . m.TOX~CO~.29, 233-241.
Haseman, J.K. (1984). Statistical issues in the design,analysis and o finterpretation animal carcinogenicity studies. Environ.Health Perspct. 58, 385-392.
Haseman, J.K., Huff, J., and Boorman, G.A. (1984). Use o f historical control data incarcinogenicity studies in rodents. Toxicol. Pathol. 12, 126-135.
Haseman, J.K., Huff, J.E., Rao, G.N., Arnold, J.E., Boorman, G.A, McConnell, (1985).and E.E. Neoplasms in and oilobserved untreatedcorn gavage control o f andgroups F344/N rats (C57BW6N x C3H/HeN)F, (B6C3Fl) mice. JNCI 75, 975-984.
Haworth, S.,Lawlor, T., Mortelmans, K, Speck, W., and Zeiger, E. (1983). Salmonella mutagenicity test results for 250 chemicals. Environ.Mutagen. 5 (Suppl. l), 3-142.
HazardousChemicals Data Book (1986). (G.Weiss, Ed.), p. 499. Noyes Data Corporation,Park Ridge, NJ.
Hewlett, T.P., Jacobsen, D., Collins, T.D.,and McMartin, ICE. (1989). Ethylene glycol and glycolate kinetics in ratsand dogs. Vet. Hum. TOX~CO~.31, 116-120.
Holck,H.G.O. (1937). Glycerin, ethylene glycol, propylene glycol and diethylene glycol: Report on feeding experiments in rats. J. Am. Med Assoc. 109, 1517-1520.
Hong, H.L., Canipe, J., Jameson, C.W., and Boorman, G.A (1988). Comparative effects of ethylene glycol and ethylene glycol monomethyl ether exposure on hematopoiesis and histopathology in B6<=3Flmice. J . Environ. Pathol. Toxicol.OncoL a, 27-38.
Jacobsen, D.,and McMartin, ICE. (1986). Methanol and ethylene glycol poisonings: Mechanism of toxicity,clinical course, diagnosis and treatment. Med Toxicol. 1, 309-334.
Jacobsen, D., Hewlett, T.P., Webb, R., Brown, S.T., Ordinario, AT., McMartin, (1988).and ICE. Ethylene glycol intoxication: Evaluation o f kinetics and crystalluria. Am. J. Med 84, 145-152.
Johnson, R.E. (1986). Effect of ethylene glycol fnd C a 2 + onthe binding o f Mgz+* adenyl-5 -yl imidodiphosphate to rabbit skeletal myofibrils. J. Bwl. Chem. 261, 728-732.
Jonckheere, A.R. (1954). A distribution-free k-sample test against ordered alternatives. Bwmetrika 41, 133-145.

45 IW&X@llCtS
Kabarity, A, El-Bayoumi, A, and Habib, k (1980). C-Tumors and polyploidy induced by some alkaloids of opiumand cannabis. Qtologiu (Tokyo) 45, 497-505.
Kao, G.F., Johnson, F.B., Sulica, V.I. (1990). The nature of hyaline (eosinophilic) globules and vascular slits in Kaposi's Am.sarcoma. J . Dematopathol. 12, 256-269.
Kaplan, E.L., and Meier, P. (1958). Nonparametricestimation of incomplete observations. J. Am. Stat. ASSOC.53, 457-481.
Kent, G., and Bahu, R.M. (1999). Iron overload. In Pathology of the Liver (R.N.M.MacSween,P.P. Anthony,and P.J. Scheuer, Eds.), pp. 148-163. Churchill Livingstone, Edinburgh.
Kersting, E.J., and Nielsen, S.W. (1965). Experimental ethylene glycol poisoning in the dog. Am. J. Vet. Res. 27, 574-582.
Khera, RS.(1!BO). Ethyleneglycol-induced maternal acidosis and hyperosmolality: A possible cause o f fetal malformations in rats. Toxicologist 18, 224. (Abstr.)
Kiefer, D.M. (1989). Competition heats up as demand for chemicals cools. Chem. Eng. News 67, 24-26.
#irk-Othmer Encyclopedia of Chemical Technology (1982). 3rd ed., Vol. 11, pp. 933-945. John Wiley and Sons, New York.
Lachance, L.E., and Leverich, k P . (1%9). Chemosterilant studies on Brucon sperm. 11. Studies of selected compounds for induction of dominant lethal mutations or sperm inactivation. Ann. Entomol. Soc. Am. 62, 790-7%.
Lamb, J.C., Maronpot, R.R., Gulati, D.K., Russell, V.S., Hommel, L., and Sabharwal, P.S. (1985). Reproductive and developmental toxicity o f ethyleneglycolin the mouse. Toxicol, Appl. Phannacol. 811, 1m-112.
Latven, AR.,and Molitor, H. (1939). Comparison o f the toxic, hypnotic and irritating properties of eight organic solvents. J. Phamocol. Erp. mer. 65, 89-94.
~~
b u g , E.P., H.O., H.J., andCalvery, Morris, Wwdard, G. (1939). The toxicology o f some glycols and derivatives. J. I . m.Toxkol. 21, 173-201.
Lenk, W., LUhr, D., and Sonnenbichler, J. (1989). Pharmacokineticsand biotransformation of diethylene glycol and ethylene glycol in the rat. Xenobiotica 19,%1-979.
Ukke, M. (1984). Leaching o f ethylene glycol and ethanol in subsoils. Water Air SoilPollut. 22, 373-389.
Longzhan, Y., Zheng, L., Lihua, S.,and Kemin, B. (1989). Teratotogenic and genotoxic effects of ethylene glycol (EG). Environ. Mol. Mutagen. 110, 119. (Abstr.)
Lyon, E.S., Borden, T.A, and Vermeulen, C.W. (1%). Experimental oxalate lithiasis produced with ethylene glycol. Invest.Urol. 0, 143-151.
Maguire, M.P. (1974). Chemically induced abnormal chromosomebehavior at inmeiosismaize. Chromosoma 443, 213-223.
Mannering, G.J., andVanHarken, D. (1994). Stimulation of peroxidative methanol oxidation by ethylene glycol and its metabolites in the intact rat, perfused liver and liver homogenate. InAlcohol and AMehyde Metabolizing Systems (R.G. Thurman, T. Yonetani, J.R. Williamson, and B. Chance, Eds.), p. 532. AcademicPress, New York.
Maronpot, R.R., Boorman, (1982).and G.A Interpretation of rodent hepatocellular proliferative alterations and hepatocellular tumors in chemical safety assessment. Toxicol. Pathol. 18,71-80.
Maronpot, R.R., Zelenak, J.P., Weaver, E.V., and Smith, N.J. (1983). Teratogenicity study o f ethyleneglycolin rats. Drug Chem. ToxicoL 6, 579-594.
Marr, M.C., Price, C.J., Myers, C.B., Morrissey, R.E., and Schwetz, B.A. (1%). Developmental stages o f the CD" rat skeleton after maternalexposure t o ethylene glycol. Teratology 01, 576. (Abstr.)
Marshall, D.A., and Doty, R.L. (1%). Taste responses of dogs to ethylene glycol, propylene glycol, and ethylene glycol-based antifreeze. J. Am. Vet. Med Assoc. 197, 1599-1602.

46 Ethylene Glycol, NTP TR 413
Marshall, T.C. (1982). Dose-dependent disposition of ethylene glycol in the rat after intravenous administration. J. Environ. 10,Toxicol. Health 397-409.
Marshall, T.C., and Cheng, Y . S . (1983). Deposition andfate o f inhaled ethylene glycol vapor and condensation aerosol in the rat. Fundam.AppL Toxicol. 3, 175-181.
Marshall, T.C., Clark, C.R., Brewster,D.W., and Henderson, T.R. (1981).Toxicologicalassessment o f heat transfer fluids proposed for use in solar energy applications, 11. Toxicol. AppL PharmacoL 58, 3 1-38.
Martis, L., Kroes, R.,Darby, T.D., and Woods, E.F. (1982). Disposition kinetics of ethylene oxide, ethylene glycol, and 2-chlorethanol in the dog. J. Toxicol.Environ.Health 10, 847-856.
Maruyama, T., Kometani, K., andYamada, K. (1989). Modification of the contractile properties of rabbit skeletal muscle by ethylene glycol. J. Biochem. (Tokyo) 105, 1009-1013.
Mason, M.M., a t e , C.C., and Baker, J. (1971).T~xicol~gyand carcinogenesis o f various chemicals used in the preparation of vaccines. Clin.Toxicol. 4, 185-204.
“ a n n , J., Choi, E., Yamasaki, E., and Ames, B.N. (1975). Detection of carcinogens as mutagens in the Salmonella/microsome test: o fAssay 300 chemic&. Roc. Natl. Acad Sci USA 72, 5135-5139.
McCarroll, N.E., Piper, C.E., and Keech, B.H. (1981). An E. coli microsuspension assay for the detection of DNA damage induced by direct-acting agents and Environ. 3,promutagens. Mutagen. 429-444.
McChesney,E.W., and Golberg, L. (1972).Reappraisal o f the toxicology of ethylene glycol. IV. Themetabolism of labelled glycollic and glyoxylic acids in the Rhesus monkey. Food Cosmet. Toxicol. 10, 655-670.
McChesney,E.W., Golberg, L., Parekh, C.IC, Russell, J.C., and Min, B.H. (1971). Reappraisal of the toxicology of ethylene glycol. 11. Metabolism studies in laboratory animals. Food Cosmet. ToxicoL 9, 21-38.
McConnell, E.E., Solleveld,H.A.,Swenberg, J.A., andBoorman, G.A. Guidelines(1986). for combining neoplasms for evaluation of rodent carcinogenesis studies. JNCI 76, 283-289.
McDonald, T.O., Roberts, M.D., andBorgmann, A.R. (1972). Ocular toxicity o f ethylenechlorohydrin and ethylene glycol in rabbit eyes. ToricoLAppLPharmacoL 21, 143-150.
McDonald, T.O., Kasten, IC, Hervey, R., Gregg, S., Borgmann, A.R., and Murchison, T. (1973). Acute ocular toxicity of ethylene oxide, ethylene glycol, and ethylene chlorohydrin. Bull Parenter. Drug Assoc. 27, 153-164.
McDonald, T.O., Kasten, IC, Hervey, R., Gregg, S., and Britton, B. (1977). Acute ocular toxicity for normal and irritated rabbit eyes and subacute ocular toxicity for ethylene oxide, ethylene chlorohydrin, and ethylene glycol. Bull. Parenter. Drug Assoc. 31, 25-32.
McGregor, D.B., Brown, A.G., Howgate, S., McBride, D., Riach, C., and Caspary, W.J. (1991). Responses of the L5178Y mouse lymphoma cell forward mutation assay. V. 27coded chemicals. Environ. Mol. Mutagen. 17, 1%-219.
McKnight, B., and Crowley, J. (1984). Tests for differences in tumor incidence based on animal carcinogenesis experiments. J. Am. Stat. Assoc. 79, 639-648.
Melnick,R.L.(1984).Toxicities o f ethylene glycol and ethylene glycol monoethyl ether in Fischer 344/N ratsand B6C3F,mice. Environ.Health PmSpCt. 57, 147-155.
The Merck Index (1989). 11th ed.(S.Budavari, Ed.), p. 599. Merck and Company, Rahway,NJ.

44 R @ f @ E l l C 6 S
Miller, J.A., and Miller, E.C. (1977). Ultimate chemical carcinogens as reactive mutagenic electro- philes. In origins of HumanCancer. (H.H. Yiatt, J.D. Watson, and J.A. Winsten, Eds.), pp. 6005-628. Cold Spring Laboratory, Cold SpringHarbor Harbor, Pay.
MorbidityandMortalityWeek& (1987). Ethyleneglycol intoxication due to contamination of water systems. 36, 611-614.
Moriarty, R.W., and McDonald, R.H., Jr. (1974).The spectrum o f ethylene glycol poisoning. Clin. Toxicol. 7, 583-5%.
Morris, H.J., Nelson, A.A., and Calvery,H.O. (1942). Observations on the chronic toxicities o f propylene glycol, ethylene glycol, diethylene glycol, ethylene glycol mono-ethyl-ether and diethylene glycol mono-ethyl-ether. J . Pharmacol. Exp. Ther. 741, 266-273.
Mushtaq, E., and Greene, L.E. (1989). Effect of ethylene glycol onthe interaction o f different myosin subfragment 1 - nucleotide complexes with actin. Biochemisoy 28, 6,4784,482.
Myers,C.B., Marr, M.C., and Sleet, R.B. (1988). A comparison of developmental toxicity in Fischer 344 (F-344) andCD rats exposed to ethylene glycol (EG). Teratology 37,479. (Abstr.)
National Cancer Institute (NCI) (1976). Guidelines for Carcinogen Bioassay in Small Rodents. Technical Report Series No. 1. NIH Publication No. 76-801. U.S. Department of Health, Education, and Welfare, Public Health Service, National Institutes of Health, Bethesda, MD.
National Institute for Occupational Safety and Health(NIOSH) (1W). National Occupational Exposure Survey (NOES) (1981-1983),unpublishedprovisional data as o f 1 July 1 W .
National Institutes of Health (NIH) (1978). Open Formula Rat and MouseRation (NIH-07). NIH Publication No. 11-1335. U.S. Department of Health, Education, and Welfare, Public Health Service, National Institutes of Health, Bethesda, MD.
NPIRI Raw Materials Data Handbook (1974). (J.M.Fetsko, Ed.). Organic Solvents. Vol. 1, p. 49. National Printing Ink Research Institute, Bethlehem, PA.
National Toxicology (NTP)Program (19$4).Teratologic Evaluation o f Ethylene Glycol (CAS No. 107-21-1)Administered to CD Rats on Gestational Days 6 Through 15. NlT-$4-159. National Institute o f HealthEnvironmental Sciences, Research Triangle Park, NC.
National Toxicology Program (NTP) (19$$).Developmental Toxicity Evaluation of Ethylene Glycol(CASNo. 107-21-1) in CD Rats. ~ - ~ - 0 7 9 .National Institute of Environmental Health Sciences, Research Triangle Park, NC.
National Toxicology (NTP)Program (1990).Developmental Toxicity Evaluation of EthyleneGlycol(CASNo. 107-21-1)Administered to New h l a n d White Rabbits by Gavage on Gestational Days 6 Through 19. NTP-89-CTER-129. National
4,4-~iamino-2,2-stilbenedisulfonicAcid, Disodium
Institute of EnvironmentalHealth Sciences, Research Triangle Park, NC.
Toxicology an: Carcinogenesis National Toxicology (NTP)Program
Studies of (1992).
Salt (CAS No. 7336-20-1)in F344/N Ratsand B6C3FlMice (Feed Studies). Technical Report Series No. 412. NIH Publication No. 92-3143.U.S. Department o f Health and Human Services, Public Health Service, National Institutes o f Health, Research Triangle Park, NC.
Oya, Y.,Yamamoto, K., and Tonomura, A. (19%).The biological activity of hydrogenperoxide: I. Induction of aberrationschromosome-typesusceptible to inhibition by scavengers of hydroxylradicals in human embryonic fibroblasts. Mutat. Res. m , 245-253.
Parry,M.F., and Wallach, R. (1974). Ethylene glycolpoisoning. Am. J . Med 59, 143-150.
Patty3 IndustrialHygieneandToxicology (1982).3rd ed. (G.D. Clayton and F.E. Clayton, Eds.), Vol. 2C, pp. 3817-3908. John Wiley and Sons, New York.
48 Ethylene Glycol, NTP TR 413
Pfeiffer, E.H., and Dunkelberg, H. (1980). Mutagenicity o f ethylene oxide and propylene oxide and o f the glycols and halohydrins formed from themduring the fumigation o f foodstuffs. Food Cosmet. Toxicol. 18, 115-118.
Pitter, P. (1976). Determination of biological degradability o f organic substances. WaterRes. 10, 231-235.
Price, C.J., Kimmel, C.A., 5 1 , R.W., and Marr, M.C. (1985). The developmental toxicity of ethylene glycol in rats and mice. Toxicol. Appl. Pharmacol. 81, 113-127.
Rajagopal, G., and Ramakrishnan, S . (1978). Effect of ethylene glycol toxicity on hepatic carbohydrate metabolism in rats. Toxicol. Appl. Pharmacol. 46, 507-515.
Reviews of ContaminantsEnvironmental and Toxicology (1988). Ethyleneglycol (G.W. Ware, m.),Vol. 106, pp. 133-141.
Richardson, ICE. (1965). Endogenous oxalate synthesis in maleand female rats. Toxicol. Appl. Pharmacol. 7,507-515.
Richardson, ICE. (1973). The effect o f partialhepatectomy on the toxicity o f ethylene glycol, glycolicacid, glyoxylic acid and glycine. Toxicol. Appl. Pharmacol. 24, 530-538.
Riley, J.H., Stahr, H.M., O'Brien, S., and Riley, M.G.I. (1982). and oxalate andUrine tissue hippurate levels in ethylene glycol intoxication in the dog. Vet.Hum.Toxicol. 24, 331-334.
Roberts, J . k , and Seibold, H.R. (1969). Ethyleneglycoltoxicity in the monkey. Toxicol. Appl. Pharmacol. 15, 624-631.
Robinson, M., Pond, C.L., Laurie, R.D., Bercz, J.P., Henningsen, G., and Condie, L.W. (1990). Subacute andsubchronic toxicity o f ethylene glycoladministered in drinking water to Sprague-Dawley rats. Drug Chem.Toxicol. 13, 43-70.
Rofe, A.M., R.,Bais, and Conyers, R.A.J. (1986). The effect of dietary refined sugars and sugaralcohols on renal calcium oxalate deposition in ethylene glycol-treated rats. Food Chem. Toxicol. 24, 3977-403.
Rossa, V., and Weber, U. (1990). Effectof ethylene glycol on rabbit retinas. Ophthalmologica 200, 98-103.
Rushton, H.G., Spector, M., Rodgers, A.L., Hughson, M., and Magura, C.E. (1981). Developmental aspects of calcium oxalate tubular deposits and calculi induced in rat kidneys. Invest. Urol. 19, 52-57.
SadtlerStandardSpectra. IR No. 2166 andNMR No. 6406M. ResearchSadtler Laboratories, Philadelphia.
Sanyer, J.L., Oehme, F.W., and McGavin, M.D. (1973). Systematic treatment o f ethylene glycol toxicosis in dogs. J. Am. Vet. Med Assoc. 34, 527-534.
Schenk,P. (1986). Erythrophagocytosis in Kaposi's sarcoma in acquired immunodeficiency syndrome. J. Oto-Rhino-Layngol Related Specialties48,167-173.
Schuler, R.L., Hardin, B.D., Niemeier, R.W., Booth, G., Hazelden, IC, Piccirillo, V., and Smith, K. (1984). Results of testing fifteen glycol ethers in a short-term in vivo reproductive toxicity assay. Environ.HealthPerspect. 57, 141-146.
Silbergeld, S., and Carter, H.E. (1959). Toxicity o f glycolicacid inmale and female rats. Arch. Biochem.Biophys. 84 , 183-187.
Smith, B.J., Anderson, B.G., Smith, S.A., and Chew, D.J. (1990). Early effects of ethylene glycol on the ultrastructure o f the renal cortex in dogs. J . Am. Vet. Med Assoc. 51, 89-%.
Smyth, H.F., Jr., Seaton, J., and Fischer, L. (1941). The single dose toxicity o f some glycols and derivatives. J. Z n d HE. Toxicol. 23, 259-268.

49 ReFerences
Spencer, H. (1985). 4th ed. Chronic pulmonary hypertension. In Pathology of the Lung, Vol.2, pp.631-704. Pergamon Press, Oxford.
Straus, D.S. (1981). Somatic mutation, cellular differentiation, and cancer causation. JNCZ 49, 233.
Szablowska, M., and Selye, H.(1971). Hormonal influences upon ethylene glycol poisoning. Arch. Environ.Health 23, 13-17.
Tarone,R.E. (1975). Tests for trend in life table analysis. Biome* 42, 679-682.
Tennant, R.W., and Ashby, J. (1991). Classification according to chemical structure, mutagenicity to Salmonella and level of carcinogenicity o f a further 39 chemicals tested for carcinogenicity by the U.S. National Toxicology Program. Mutat.Res. 294, 209-227.
Tennant, R.W., Margolin, B.H., Shelby, M.D. Zeiger, E., Haseman, J.K., J., W.,Spalding,Caspary, Resnick, M.,Stasiewicz, S., Anderson, B., and Minor, R. (1987). Prediction o f chemical carcinogenicityin rodents from in vitro genetic toxicity assays. Science 236,933-941.
Q l , R.W., Ballantyne, B., Fisher, L.C., Fait, D.L., Klonne, D.R., Pritts, LM.,and Do", D.E.(1988a).Developmental toxicity evaluation o f ethylene glycol (EG) aerosol by nose-only (NO) or whole-body(WB)exposure in CD@-l mice. Toxicologist 8, 242. (Abstr.)
Q1, R.W., Fisher, L.C., Kubena, M.F., Vrbanic, M.A., and Losco, P.E.(1988b). Developmentaltoxicity evaluation of ethylene glycol (EG) applied cutaneously to CD@-1 mice. Teratology 37, 498. (Abstr.)
Q 1 , R.W., Ballantyne, B., Fisher, L.C., Fait, D.L., Savine, T .k , Wonne, D.R., Pritts, I.M., and Do", D.E.(1989a). Developmental toxicity o f ethyleneglycol (EG) aerosol by whole-body exposure in CD rats and CD-1 mice. Toxicologist 9,270. (Abstr.)
Q l , R.W., Fisher, L.C., Kubena, M.F., Losco, P.E., and Vrbanic, M.A. (1989b). Determination of a developmental toxicity "no observable effect level" (NOEL) for ethylene glycol (EG) by gavage in CD-1 mice. Teratology 39, 487. (Abstr.)
Webb, D.J., and Cockcroft, J.R. (1990). Circulatingand tissue renin-angiotensin systems: The role of the endothelium. In TheEndothelium: An Introduction to Current Research (J.B. Warren, Ed.), pp. 65-80. Wiley-Lis, Inc., New York.
Wiley, F.H., Hueper, W.C., Bergen, D.S., and Blood, F.R.(1938a). The formation of oxalicacid from ethylene glycol and related solvents. J. Znd Hjg. TOX~CO~.20,269-277.
Wiley, F.H., Hueper, W.C., and von Oettingen, W.F. (1938b). The toxicity and potential dangers of ethylene glycol. J. Znd HE.Toxicol. 118,123-126.
Williams, D . k (1971). A test for differences between treatment means when several dose levels are compared with a zero dose control. Biomem.cs 27, 103-117.
Williams,D.A.(1972). The comparison o f several dose levels with a zero dose control. Biometrics 28, 519-531.
Wills,J.H., Coulston, E , Harris, E.S., McChesney,E.W., Russell, J.C., and Serrone, D.M.(1974). Inhalation of aerosolized ethylene glycol by man. Clin.T ~ x i ~ o l .9, 463-476.
Winelt, C.L., Shingleton, D.P., and Shanor, S.P. (1978). Ethyleneand diethylene glycol toxicity.Clin.T ~ x i ~ o l .113,297-324.
Yamaguchi, T., and Nakagawa, K. (1983).Mutagenicity o f and formation o f oxygen radicals by trioses and glyoxal derivatives. Agric. Biol. Chem. 49, 2461-2465.
Zeiger, E., Anderson, B., Haworth, S., Lawlor,T., Mortelmans, K., and Speck, W. (1987). Salmonella mutagenicitytests: 111. Results from the testing of 255 chemicals. Environ.Mutagen. 9 (Suppl. 9), 1-109.
Zeiger, E., Haseman, J.K., Shelby,M.D. Margolin,B.H., and Tennant, R.W. (19%). Evaluation of four in vitro genetic toxicity tests for predicting rodent carcinogenicity: Confirmation o f earlier results with 41 additional chemicals. Environ. Mol. Mutagen. 114 (Suppl.18),1-14.

50 Ethylene Glycol, NTP TR 413


52 Ethylene Glycol, NTP TR 413 .
TABLEA1 Summary of the Incidence of Neoplasms in Male Mice in the 2-Year Feed Study of Ethylene Glycola
Disposition Summary Animals initially in study 15-month interim evaluation Early deaths
Natural deaths Moribund
Survivors Terminal sacrifice
Animalsexaminedmicroscopically
Alimentary System Gallbladder
Sarcoma Intestine small, duodenum
Polyp adenomatous Intestine small, ileum Intestine small, jejunum
Polyp adenomatous Liver
Cholangiocarcinoma Hemangiosarcoma, multiple, two Hepatocellular carcinoma Hepatocellular carcinoma, multiple, two Hepatocellular carcinoma, multiple, four Hepatocellular adenoma Hepatocellular adenoma, multiple, two Serosa, sarcoma
Mesentery Cholangiocarcinoma, metastatic, liver Hemangiosarcoma Hepatocellular carcinoma, metastatic, liver Sarcoma
Pancreas Salivary glands Stomach, forestomach
Mastcellneoplasmbenign Stomach, glandular Tooth
Cardiovascular System Heart
Adenocarcinoma, metastatic, uncertain primary site
EndocrineSystem Adrenal gland, cortex
Adenoma Capsule, cholangiocarcinoma, metastatic,
liver Capsule, sarcoma Subcapsular, adenoma Subcapsular, adenoma, multiple
0 PPm
60 6
15 10
29
54
(51)1 (2%)
(53)
(53) (54)
2 (4%)
(54)1 (2%) 1 (2%) 10 (19%)
9 (17%)
1 (2%) (5)1 (20%) 1 (20%)
1 (20%) (54) (53) (54)
1 (2%) (54) (21)
(54)
1 (2%)
(54)2 (4%)
1 (2%) 1 (2%) 1 (2%) 1 (2%)
6,250 ppm
60 6
8 14
32
54
(21)
(20)
12,500 ppm
60 6
11 11
32
54
(22)
(21)
25,OOO ppm
60 6
16 15
23
54
(54)
(53)
3 (6%)

53 Lesions in Male Mice
Endocrine System (continued) Adrenal gland, medulla
Pheochromocytoma benign Pituitary gland
Pars intermedia, adenoma Thyroid gland
Follicular cell, adenoma Follicular cell, carcinoma
GeneralBody System Tissue NOS (2)
Sarcoma 1 (50%)
Genital System Epididymis (54) (54)
Hemangioma 1 (2%')Prostate
Sarcoma Seminal vesicle
Sarcoma Testes
Interstitial cell, adenoma
Hematopoietic System Bone marrow
Hemangiosarcoma Lymph node Lymph node, mandibular Spleen
Hemangiosarcoma Thymus
Integumentary System Skin (54) (45) (43) (54)
Basosquamousneoplasmbenign 1 (2%) Mastcellneoplasmbenign 1 (2%)
(4%) Subcutaneous tissue, fibrosarcoma 3 (6%) 8 (18%) 5 (12%) 1 (2%)Subcutaneous tissue, fibrosarcoma, multifocal 1 (2%)Subcutaneous tissue, fibrosarcoma, metastatic,
skin 1 (2%)Subcutaneous tissue, histiocytic sarcoma 2 (4%)Subcutaneous tissue, sarcoma 1 (2%) 1 (2%) 1 (2%) 1 (2%) Subcutaneous tissue, sarcoma, multiple 1 (2%)Subcutaneous tissue, schwannoma malignant 1 (2%)Subcutaneous tissue, schwannoma NOS 1 (2%)
Subcutaneoustissue,fibroma (2%) 1 2 (4%) 2 (4%) 2
i
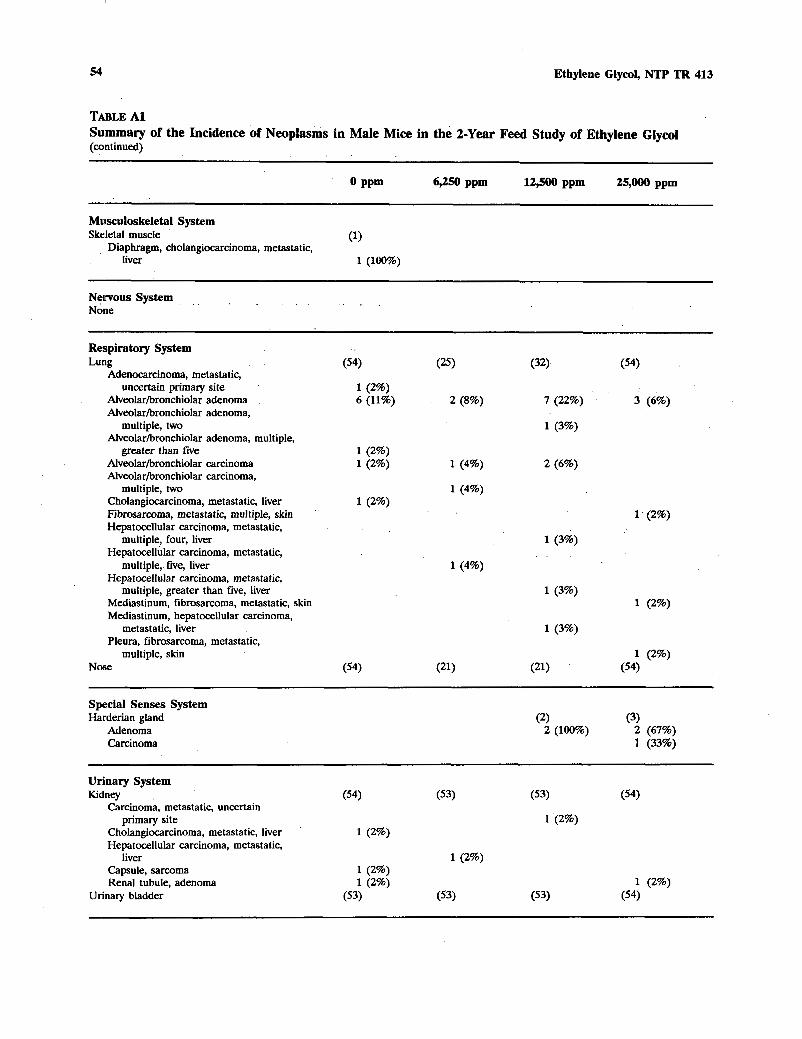
54 Ethylene Glycol, N T P TR 413
TABLEA 1 Summary Of the'Incidence of Neoplasms in Male Mice in the 2-YearFeed Study of Ethylene Glycol (continued)
0 PP" 6,250 ppm 12,500 ppm 25,OOO ppm
Skeletal muscle Musculoskeletal System
Diaphragm, cholangiocarcinoma, metastatic, liver
(1)
1 (100%)
None Nervous System , . .
, _
Lung Respiratory System
Alveolarbronchiolar adenoma
Adenocarcinoma, metastatic,
Alveolarbronchiolar carcinoma
Alveolarbronchiolar adenoma, multiple,
Alveolarbronchiolar adenoma,
Ahreolarbronchiolar carcinoma,
Hepatocellular carcinoma, metastatic, Fibrosarcoma, metastatic, multiple, skin Cholangiocarcinoma, metastatic, liver
Hepatocellular carcinoma, metastatic, multiple, five, liver
Hepatocellular carcinoma, metastatic, multiple, four, liver
Mediastinum, hepatocellular carcinoma, Mediastinum, fibrosarcoma, metastatic, skin
multiple, greater than five, liver
Pleura, fibrosarcoma, metastatic,
uncertainprimary site '
greater than five
multiple, two
multiple, two
multiple, skin
metastatic, liver
Nose
(54)
1 (2%) 6 (11%)
1 (2%)
1 (2%) 1 (2%)
(3)
2 (8%)
1 (4%)
1 (4%)
1 (4%)
1 (3%)
7 (22%)
1 (3%)
(54)
3 (6%)
1 (2%)
1 (2%)
1 (2%) (54)
Special Senses System
Carcinoma Adenoma
Harderian gland (2) 2 (100%)
(3)2 (67%)1 (33%)
Kidney Urinary System
Renal tubule, adenoma Capsule, Sarcoma
Hepatocellular carcinoma, metastatic, Cholangiocarcinoma,metastatic,liver
Carcinoma, metastatic, uncertain primary site
liver
'
(54)
1 (2%)
1 (2%) 1 (2%)
(53)
1 (2%)
(53)
1 (2%)
(54)
1 (2%) Urinary bladder (53) (53)(53) (54)

sysuemic ILesiom Multiple organsb
Lymphoma malignant histiocytic Histiocytic sarcoma
(54) 2 (4%)
(54)
Lymphomamalignant mixed Lymphoma malignant lymphocytic
6 (11%) 3 (6%)
~ @ O p h S ~8MEllmahg.
Total animals with primary neoplasms' 34 36 Total primary neoplasms 67 46
Total animals with benign neoplasms 17 11 Total benign neoplasms 29 14
Total animals with malignant neoplasms 22 28 Total malignant neoplasms 38 31
Total animals with metastatic neoplasms 2 2 Total metastatic neoplasms 7 3
Total animals with malignant neoplasms-uncertain primary site 1
Total animals with neoplasms uncertain-benign or malignant 1
Total uncertain neoplasms 1
a Number of animals examined microscopically at site and number of animals with lesion Number of animals with any tissue examined microscopically PrimaryneopIasms: all neoplasms exceptmetastaticneoplasms
(54)
5 (9%)
31 44 13 17 23 27 2 4
1
(54)
1 (2%) 1 (2%)6 (11%)
33 47 19 24 m 23 1 4

56
TABLEA2 Individual Animal Tumor Pathology of
Number of Days on Study
Carcass ID Number
Alimentary System Esophagus Gallbladder
Sarcoma Intestine large Intestine large, cecum Intestine large, colon Intestine large, rectum Intestine small Intestine small, duodenum Intestine small, ileum Intestine small, jejunum
Polyp adenomatous Liver
Cholangiocarcinoma Hemangiosarcoma,multiple, two Hepatocellular carcinoma Hepatocellular adenoma Serosa, sarcoma
Mesentery Cholangiocarcinoma,metastatic,liver Hemangiosarcoma Sarcoma
Pancreas Salivary glands Stomach Stomach,forestomach ' Mastcell tumor benign
Stomach, glandular Tooth
Cardiovascular System Heart
Adenocarcinoma,metastatic,uncertain primary site
+: Tissue examined microscopically A: Autolysis precludes examination
Ethylene Glycol, NTP TR 413
MaleMice inthe 2-YearFeedStudy of Ethylene Glycol: 0 ppm
0 1 1 1 1 1 1 2 3 3 4 4 5 5 5 5 6 6 6 6 6 6 6 6 7 7 7 7 7 5 2 2 2 3 4 8 1 5 8 1 6 3 8 9 9 0 0 3 3 4 5 6 8 0 3 3 3 3 4 0 3 6 6 5 6 3 0 6 5 9 8 5 5 8 2 2 0 7 9 4 7 2 9 1 1 1 1
0 1 0 0 1 0 1 0 0 0 0 0 0 0 0 1 0 0 0 1 1 0 0 0 0 0 0 0 0 7 1 8 5 1 4 1 1 4 9 2 5 6 1 5 0 7 9 4 0 2 7 6 3 9 1 1 1 2 1 1 1 1 2 1 3 4 3 5 1 5 2 5 4 5 5 2 4 4 3 4 4 5 3 1 2 3 2
. . . . . . . . . . . . . . . . . . . . . . . . . . . . . M M + + M + + + + + + + + + + + + + + + + + + + + + + + +
X . . . . . . . . . . . . . . . . . . . . . . . . . . . . . M + M + + + + + + + + + + + + + + + + + + + + + + + + + + + + M + + + + + + + + + + + + + + + + + + + + + + + + + + . . . . . . . . . . . . . . . . . . . . . . . . . . . . . . . . . . . . . . . . . . . . . . . . . . . . . . . . . . . + + + + M + + + + + + + + + + + + + + + + + + + + + + + + . . . . . . . . . . . . . . . . . . . . . . . . . . . . . . . . . . . . . . . . . . . . . . . . . . . . . . . . . .
. . . . . . . . . . . . . . . . . . . . . . . . . . . . . X
x x x X x x x X X
X + + +
X
X . . . . . . . . . . . . . . . . . . . . . . . . . . . . . + + + + + + + + M + + + + + + + + + + + + + + + + + + + + . . . . . . . . . . . . . . . . . . . . . . . . . . . . . . . . . . . . . . . . . . . . . . . . . . . . . . . . . .
X . . . . . . . . . . . . . . . . . . . . . . . . . . . . .
+ + + + +
. . . . . . . . . . . . . . . . . . . . . . . . . . . . .
X
M:Missingtissue X Lesion present I: Insufficienttissue Blank Not examined

Lesions i n Male Mice
Number of Days on Study
Carcass ID Number
Alimentary System Esophagus Gallbladder
Sarcoma Intestine large Intestine large, cecum Intestine large, colon Intestine large, rectum Intestine small Intestine small, duodenum Intestine small, ileum Intestine small, jejunum
Polyp adenomatous Liver
Cholangiocarcinoma Hemangiosarcoma, multiple, two Hepatocellular carcinoma Hepatocellular adenoma Serosa, sarcoma
Mesentery Cholangiocarcinoma,metastatic,liver Hemangiosarcoma Sarcoma
Pancreas Salivary glands Stomach Stomach,forestomach
Mast cell tumor benign
7 7 7 7 7 7 7 7 7 1 7 7 7 7 7 7 7 7 7 7 7 7 1 7 7 3 3 3 3 3 3 3 ' 3 3 3 3 3 3 3 3 3 3 3 3 3 3 3 3 3 3 1 1 1 1 1 1 1 1 1 1 1 2 2 2 2 2 2 2 2 2 2 5 5 5 5
0 0 0 0 0 0 0 0 0 0 0 0 0 0 0 0 0 0 0 0 0 0 1 1 1 Total 2 2 2 3 3 3 3 4 4 5 5 6 6 6 7 7 8 8 8 8 9 9 0 0 0 Tissues/ 3 4 5 1 2 3 4 2 5 2 3 1 3 5 2 3 2 3 4 5 4 1 1 2 3 Tumors
. . . . . . . . . . . . . . . . . . . . . . . . . 54
. . . . . . . . . . . . . . . . . . . . . . . . . 51 1
. . . . . . . . . . . . . . . . . . . . . . . . . 54
. . . . . . . . . . . . . . . . . . . . . . . . . 52
. . . . . . . . . . . . . . . . . . . . . . . . . 53
. . . . . . . . . . . . . . . . . . . . . . . . . 54
. . . . . . . . . . . . . . . . . . . . . . . . . 54
. . . . . . . . . . . . . . . . . . . . . . . . . 53 + + + + + + + + M + + + + + + + + + + + + + + + + 53 . . . . . . . . . . . . . . . . . . . . . . . . . 54
X X 2 . . . . . . . . . . . . . . . . . . . . . . . . . 54
1 X 1
x x X 10 X x x x x x x 9
1 + + 5
1 X 1
1 . . . . . . . . . . . . . . . . . . . . . . . . . 54 . . . . . . . . . . . . . . . . . . . . . . . . . 53 . . . . . . . . . . . . . . . . . . . . . . . . . 54 . . . . . . . . . . . . . . . . . . . . . . . . . 54
1 Stomach, glandular Tooth
. . . . . . . . . . . . . . . . . . . . . . . . . 54 + + ++ + + + + + + + + + + + + 21
Cardiovascular System Heart . . . . . . . . . . . . . . . . . . . . . . . . . 54
Adenocarcinoma,metastatic,uncertain primaly site 1

58
TABLEA2 Individual Animal Tumor Pathology (continued)
Number of :Days on Study
Carcass ID Number
Endocrine System Adrenal gland Adrenalgland, cortex ,
Adenoma Capsule, cholangiocarcinoma, metastatic, liver
Capsule, Sarcoma Subcapsular, adenoma Subcapsular, adenoma, multiple
Adrenal gland, medulla Pheochromocytoma benign
Islets, pancreatic Parathyroid gland Pituitary gland
Pars intermedia, adenoma Thyroid gland
Follicular cell, carcinoma
General Body System Tissue NOS
Sarcoma
Genital System Epididymis Penis Preputial gland Prostate
Sarcoma Seminal vesicle
Sarcoma Testes
Hematopoietic System Blood Bone marrow
Hemangiosarcoma Lymph node Lymph node, mandibular Spleen
Hemangiosarcoma Thymus
Ethylene Glycol, NTP TR 413
of Male Mice in the 2-YearFeed Study of Ethylene Glycol: 0 ppm
0 1 1 1 1 1 1 2 3 3 4 4 5 5 5 5 6 6 6 6 6 6 6 6 7 7 7 7 7 5 2 2 2 3 4 8 1 5 8 1 6 3 8 9 9 0 0 3 3 4 5 6 8 0 3 3 3 3 4 0 3 6 6 5 6 3 0 6 5 9 8 5 5 8 2 2 0 7 9 4 7 2 9 1 1 1 1
0 1 0 0 1 0 1 0 0 0 0 0 0 0 0 1 0 0 0 1 1 0 0 0 0 0 0 0 0 7 1 8 5 1 4 1 1 4 9 2 5 6 1 5 0 - 7 9 4 0 2 7 6 3 9 1 1 1 2 1 1 1 1 2 1 3 4 3 5 1 5 2 5 4 5 5 2 4 4 3 4 4 5 3 1 2 3 2
. . . . . . . . . . . . . . . . . . . . . . . . . . . . .
. . . . . . . . . . . . . . . . . . . . . . . . . . . . .
X X
X . . . . . . . . . . . . . . . . . . . . . . . . . . . . .
. . . . . . . . . . . . . . . . . . . . . . . . . . . . . + + + + + + + + M + + + + + + + + + + + + + + + + + + + + . . . . . . . . . . . . . . . . . . . . . . . . . . . . .
X + + + + + + + + M + + + + + + + + + + + + + + + + + + + +
X
+ X
. . . . . . . . . . . . . . . . . . . . . . . . . . . . . + + + + +
+ + + + + + . . . . . . . . . . . . . . . . . . . . . . . . . . . . .
X + + + + + + + + + + + + + + + + + + + M + + + + + + + + +
X . . . . . . . . . . . . . . . . . . . . . . . . . . . . .
+ . . . . . . . . . . . . . . . . . . . . . . . . . . . . .
. . . . . . . . . . . . . . . . . . . . . . . . . . . . . + + M + + + + M M + + + + + + + + + + M M + + + + + + + + . . . . . . . . . . . . . . . . . . . . . . . . . . . . .
+ + + + + + + + + + + + + + + + + + + + M + + + + + + + +

59 Lesions in Male Mice
Number OP Drays on Study
Carcrass ID Numker
Endocrine System Adrenal gland Adrenal gland, cortex
Adenoma Capsule, cholangiocarcinoma, metastatic, liver
Capsule, sarcoma Subcapsular, adenoma Subcapsular, adenoma, multiple
Adrenal gland, medulla Pheochromocytoma benign
Islets, pancreatic Parathyroid gland Pituitary gland
Pars intermedia, adenoma Thyroidgland
Follicular cell, carcinoma
General Body System Tissue NOS
Sarcoma
Genital System Epididymis Penis Preputial gland Prostate
Sarcoma Seminal vesicle
Sarcoma Testes
Hematopoietic System Blood Bone marrow
Hemangiosarcoma Lymph node Lymph node, mandibular Spleen
Hemangiosarcoma Thymus
1 1 1 1 1 1 1 1 1 1 1 2 2 2 2 2 2 2 2 2 2 5 5 5 5 3 3 3 3 3 3 3 3 3 3 3 3 3 3 3 3 3 3 3 3 3 3 3 3 3 7 7 7 7 7 7 7 7 7 7 7 7 7 7 7 7 7 7 7 7 7 7 7 7 7
0 0 0 0 0 0 0 0 0 0 0 0 0 0 0 0 0 0 0 0 0 0 1 1 1 2 2 2 3 3 3 3 4 4 5 5 6 6 6 7 7 8 8 8 8 9 9 0 0 0 3 4 5 1 2 3 4 2 5 2 3 1 3 5 2 3 2 3 4 5 4 1 1 2 3
TOQal
Tissues/ Tumors
. . . . . . . . . . . . . . . . . . . . . . . . .
. . . . . . . . . . . . . . . . . . . . . . . . . x x 2
54 54
. . . . . . . . . . . . . . . . . . . . . . . . . x
+ + + + M + + + + + M + + + + + + + + + + + + + + . . . . . . . . . . . . . . . . . . . . . . . . . . . . . . . . . . . . . . . . . . . . . . . . . .
. . . . . . . . . . . . . . . . . . . . . . . . . 1 53 1 52 53 54 1 54 1 1 1 1
+ 1 2
+ + + M + + + + + + + + + + + + + + + + + + + + +
. . . . . . . . . . . . . . . . . . . . . . . . . + + + + + +
. . . . . . . . . . . . . . . . . . . . . . . . . + + + M + + + + + + + + + + + + + + + + + + + + +
53 12 5 54
54 1 52 I
. . . . . . . . . . . . . . . . . . . . . . . . .
. . . . . . . . . . . . . . . . . . . . . . . . . + + + + M + + + + + + + + + + + M M + M + + + + + . . . . . . . . . . . . . . . . . . . . . . . . . . . . . . . . . . . . . . . . . . . . . . . . . .
X
x x 53 2 54 45 54 1 54 I

60 Ethylene Glycol,, NTP TR 413 . .
TABLEA2 Individual Animal Tumor Pathology of Male Mice in the 2-Year Feed Study of Ethylene Glycol: 0 ppm (continued)
Number of Days on Study
Carcass ID Number
Integumentary System Mammary gland Skin
Mast cell tumor benign Subcutaneous tissue, fibroma Subcutaneous tissue, fibrosarcoma Subcutaneous tissue, histiocytic sarcoma
Subcutaneous tissue, sarcoma
Musculoskeletal System Bone Skeletalmuscle
Diaphragm, cholangiocarcinoma, metastatic, liver
Nervous System Brain
Respiratory System Lung
Adenocarcinoma, metastatic, uncertain primary site
Alveolar/bronchiolar adenoma Alveolar/bronchiolar adenoma,
multiple, greater than five Alveolar/bronchiolar carcinoma Cholangiocarcinoma,metastatic,liver
Nose Trachea
Special Senses System None
Urinary System Kidney
Cholangiocarcinoma, metastatic, liver Capsule, sarcoma Renal tubule, adenoma
Urethra Urinary bladder
0 1 1 1 1 1 1 2 3 3 4 4 5 5 5 5 6 6 6 6 6 6 6 6 7 7 7 7 7 5 2 2 2 3 4 8 1 5 8 1 6 3 8 9 9 0 0 3 3 4 5 6 8 0 3 3 , 3 3 4 0 3 6 6 5 6 3 0 6 5 ' 9 8 ' 5 5 8 ' 2 2 0 7 9 4 7 2 9 1 1 1 1
0 1 0 0 1 0 1 0 0 0 0 0 0 0 0 1 0 0 0 1 1 0 0 0 0 0 0 0 0 7 1 8 5 1 4 1 1 4 9 2 5 6 1 5 0 7 9 4 0 2 7 6 3 9 1 1 1 2 1 1 1 1 2 1 3 4 3 5 1 5 2 5 ' 4 5 5 2 4 4 3 4 4 5 3 1 2 3 2
+ M + M + M + + + + + + M M M M M + M M M M M M M M M M M . . . . . . . . . . . . . . . . . . . . . . . . . . . . .
X
X X X . .
X X. X
. . . . . . . . . . . . . . . . . . . . . . . . . . . . . + X
. . . . . . . . . . . . . . . . . . . . . . . . . . . . .
i
. . . . . . . . . . . . . . . . . . . . . . . . . . . . .
X
X . . . . . . . . . . . . . . . . . . . . . . . . . . . . . . . . . . . . . . . . . . . . . . . . . . . . . . . . . .
. . . . . . . . . . . . . . . . . . . . . . . . . . . . . X
X X
+ . . . . . . . . . . . . . . . . . . . . . . . . . . . . .

61 Lesions in Male Mice
Number of Days on Study
Carcass ID Number
Integumentary System Mammary gland Skin
Mastcell tumor benign Subcutaneous tissue, fibroma Subcutaneous tissue, fibrosarcoma Subcutaneous tissue, histiocytic sarcoma
Subcutaneous tissue, sarcoma
MusculoskeletalSystem Bone Skeletal muscle
Diaphragm, cholangiocarcinoma, metastatic, liver
j j NervousSystemi j Brain
j Respiratory System j Lungj Adenocarcinoma, metastatic, uncertain j primary site j Alveolarbronchiolar adenoma I Alveolarbronchiolar adenoma,
multiple, greater than fivei i Alveolarbronchiolar carcinoma ! Cholangiocarcinoma, metastatic, liver
Nose Trachea
Special Senses System None
i Urinary System
Kidney Cholangiocarcinoma, metastatic, liver Capsule, sarcoma Renal tubule, adenoma
Urethra Urinary bladder
1 1 1 1 1 7 1 1 1 1 1 7 1 1 1 1 7 7 7 1 1 1 7 1 1 3 3 3 3 3 3 3 3 3 3 3 3 3 3 3 3 3 3 3 3 3 3 3 3 3 1 1 1 1 1 1 1 1 1 1 1 2 2 2 2 2 2 2 2 2 2 5 5 5 5
0 0 0 0 0 0 0 0 0 0 0 0 0 0 0 0 0 0 0 0 0 0 1 1 1 2 2 2 3 3 3 3 4 4 5 5 6 6 6 1 7 8 8 8 8 9 9 0 0 0 3 4 5 1 2 3 4 2 5 2 3 1 3 5 2 3 2 3 4 5 4 1 1 2 3
M M M M M M M M M M M M + M M M M M M M M + M + M . . . . . . . . . . . . . . . . . . . . . . . . .
x x
. . . . . . . . . . . . . . . . . . . . . . . . .
. . . . . . . . . . . . . . . . . . . . . . . . .
. . . . . . . . . . . . . . . . . . . . . . . . .
X X X x x x
X X
. . . . . . . . . . . . . . . . . . . . . . . . .
. . . . . . . . . . . . . . . . . . . . . . . . .
. . . . . . . . . . . . . . . . . . . . . . . . .
+ + + M + + + + + + + + + + + + + + + + + + + + +
Total Tissues/ Tumors
13 54 1 2 3
2 1
54 1
1
54
54
1 6
1 1 1 54 54
54 1 1 1 1 53
! 1

62 Ethylene Glycol, NTP TR 413
TABLEA2 Individual Animal Tumor Pathology of Male Mice in the 2-YearFeed Study of Ethylene Glycol: 0 ppm (continued)
0 1 1 1 1 1 1 2 3 3 4 4 5 5 5 5 6 6 6 6 6 6 6 6 7 7 7 7 7 Number of Days on Study 5 2 2 2 . 3 4 8 1 5 8 1 6 3 8 9 9 0 0 3 3 4 5 6 8 0 3 3 3 3
4 0 3 6 6 5 6 3 0 6 5 9 8 5 5 8 2 2 0 7 9 4 7 2 9 1 1 1 1
0 1 0 0 1 0 1 0 0 0 0 0 0 0 0 1 0 0 0 1 1 0 0 0 0 0 0 0 0 Carcass ID Number 7 1 8 5 1 4 1 1 4 9 2 5 6 1 5 0 7 9 4 0 2 7 6 3 9 1 1 1 2
1 1 1 1 2 1 3 4 3 5 1 5 2 5 4 5 5 2 4 4 3 4 4 5 3 1 2 3 2
Systemic Lesions Multiple organs . . . . . . . . . . . . . . . . . . . . . . . . . . . . .
Lymphomamalignant mixed Histiocytic sarcoma X
X' X
X

TABLE A2 mnwmn himan T U ~ Wpaauhoncgy Mane ice in uhe 3 - m ~ opil ~~uhynsms QIJ ppmIF& S U ~ Q ~ n p ~ k (continued)
7 7 7 7 7 7 7 7 7 7 7 7 7 7 7 7 7 7 7 7 7 7 7 7 7 Number ~ f fDrays Study 3 3 3 3 3 3 3 3 3 3 3 3 3 3 3 3 3 3 3 3 3 3 3 3 3
1 1 1 1 1 1 1 1 1 1 1 2 2 2 2 2 2 2 2 2 2 5 5 5 5
0 0 0 0 0 0 0 0 0 0 0 0 0 0 0 0 0 0 0 0 0 0 1 1 1 TQhn Carcrass ID P d ” W 2 2 2 3 3 3 3 4 4 5 5 6 6 6 7 7 8 8 8 8 9 9 0 0 0 T i u &
3 4 5 1 2 3 4 . 2 5 2 3 1 3 5 2 3 2 3 4 5 4 1 1 2 3 TUllll~Qm
~J’§h?llliC kklElS Multiple organs . . . . . . . . . . . . . . . . . . . . . . . . . 54
Histiocytic sarcoma 2 Lymphomamalignant mixed X x x X 6

64 Ethylene Glycol, NTP TR 413
TABLE A2 Individual Animal Tumor Pathology of MaleMice inthe2-YearFeedStudy of Ethylene Glycol: 6,250 ppm
Number of Days on Study
Carcass ID Number
Alimentary System Esophagus Gallbladder Intestine large Intestine large, cecum Intestine large, colon Intestine large, rectum , Intestine small Intestine small, duodenum
Polyp adenomatous Intestine small, ileum Intestine small, jejunum Liver
Hepatocellular .carcinoma Hepatocellular carcinoma, multiple, two Hepatocellular carcinoma, multiple, four
Hepatocellular adenoma Mesentery
Hepatocellular carcinoma, metastatic, liver
Pancreas Salivary glands Stomach Stomach,forestomach Stomach, glandular Tooth
Cardiovascular System Heart
Endocrine System Adrenal gland Adrenal gland, cortex Adrenal gland, medulla
Pheochromocytomabenign Islets, pancreatic Parathyroid gland Pituitary gland Thyroid gland
0 1 3 3 5 5 5 5 5 6 6 6 6 6 6 6 6 6 6 6 6 7 7 7 7 7 7 7 7 9 7 4 9 . 1 1 , 7 9 9 0 0 2 2 4 5 5 6 8 9 9 9 0 3 3 3 3 3 3 3 8 5 ' 6 4 4 4 8 9 9 1 1 4 7 1 4 4 ~ 7 2 3 7 7 9 1 1 1 1 1 2 2
4 4 4 4 3 4 3 4 4 3 4 4 3 3 3 3 4 4 4 4 4 4 3 3 3 3 3 3 3 0 0 8 8 7 6 8 2 5 8 4 3 9 8 8 9 4 6 5 3 3 1 7 7 7 7 8 9 9 1 3 , 1 2 5 1 2 1 - 4 5 2 . 5 2 1 . 3 3 1 2 2 3 4 1 1 2 3 4 4 1 4
A + + + + + + + + + + + + + + + + + + + + + A A A + + + + + + + + + + + + + + + + + + + A + A + + + + + + + + + + + + + + + + + + + A A A + + + + + + + + + + + + + + + + + + A + A + + + + + + + + + + + + + + + + + + A + A + + + + + + + + + + + . + + + + + + + A + A + + + + + + + + + + + + + + + + + + + A + A + + + + + + + + + + + + + + + + + + A A A M + + + + + + + + + + + + + + + + + A A A + + + + + + + + + + + + + + + + + + A + + + . + + + + + + + + + + + + + + + + + + $ + + + + + +
x x x x x x x x X
X X X
+ + + X
A + + + + + + + + + + + + + + + + + + + + + + A + + + + + + + + + + + + + + + + + + + + + A + + + + + + + + + + + + + + + + + + + + + A + + + + + + + + + + + + + + + + + + + + A + + + + + + + + + + + + + + + + + + + +
+ + + +
A + + + + + + + + + + + + + + + + + + + + +
A + + + + + + + + + + + + + + + + + + + + + + A + + + + + + + + + + + + + + + + + + + + A + + + + + + + + + + + + + + + + + + + + , +
X A + + + + + + + + + + + + + + + + + + + + + A + + + + + M + + + M + M + + + + + + + + + A + + + + + + + + + + + + + + + + + + + + + A + + + + + + + + + + + + + + + + + + + + + + + + + + + +

Lesions in Male Mice
Alimentary System Esophagus Gallbladder Intestine large Intestine large, cecum Intestine large, colon Intestine large, rectum Intestine small Intestine small, duodenum
Polyp adenomatous Intestine small, ileum Intestine small, jejunum Liver
Hepatocellular carcinoma Hepatocellular carcinoma, multiple, two Hepatocellular carcinoma, multiple, four
Hepatocellular adenoma Mesentely
Hepatocellular carcinoma, metastatic, liver
Pancreas Salivary glands Stomach Stomach, forestomach Stomach, glandular Tooth
Cardiovascular System Heart
Endocrine System Adrenal gland Adrenal gland, cortex Adrenal gland, medulla
Pheochromocytomabenign Islets, pancreatic Parathyroid gland Pituitaly gland Thyroid gland
7 7 7 7 7 7 7 7 7 7 7 7 7 7 7 7 7 7 7 7 7 7 7 7 7 3 3 3 3 3 3 3 3 3 3 3 3 3 3 3 3 3 3 3 3 3 3 3 3 3 2 2 2 2 2 2 2 2 5 5 5 5 5 5 5 5 5 5 5 5 5 5 5 5 5
3 4 4 4 4 4 4 4 4 4 4 4 4 4 4 4 4 4 4 4 4 4 4 4 4 Total 9 0 0 0 1 1 1 1 2 2 2 2 3 3 4 4 4 5 5 5 6 6 6 7 7 Tissues/ 5 2 4 5 2 3 4 5 2 3 4 5 1 2 3 4 5 1 3 5 3 4 5 1 5 Tumors
21 19 20 18 19 19
+ 21 + 20 X 1
17 18
. . . . . . . . . . . . . . . . . . . . . . . . . 53 x x x x x x 15
X 1
1 x x X X 6
3
1 + 23
21 21 20 20 4
21
22 20 21 1
21 18 21
. . . . . . . . . . . . . . . . . . . . . . . . . 53

66 Ethylene Glycol, NTP TR 413
TABLEA2 Individual Animal 'Tumor Pathology of Male Mice in the 2-YearFeed Study of Ethylene Glycol: 6,250 ppm (continued)
. .
0 1 3 3 5 5 5 5 5 6 6 6 6 6 6 6 6 6 6 6 6 7 7 7 7 7 7 7 7 Number of Days on ,Study 9 7 4 9 1 1 7 9 9 0 0 2 2 4 5 5 6 8 9 9 9 0 3 3 3 3 3 3 3
8 5 6 4 4 4 8 9 9 1 1 4 7 1 4 4 7 2 3 7 7 9 1 1 1 1 1 2 2
4 4 4 4 3 4 3 4 4 3 4 4 3 3 3 3 4 4 4 4 4 4 3 3 3 3 3 3 3 Carcass I b Number o o a 8 7 6 . 8 i 5 8 4 3 9 8 8 9 4 6 5 3 3 1 7 7 7 7 8 9 9
1 3 1 2 5 1 2 1 4 5 2 5 2 1 3 3 1 2 2 3 4 1 1 2 3 4 4 1 4 . . . . . . . - . .
General Body System None
Genital System Epididymis A + + + + + + + + + + + + + + + + ? + + + + Penis \ Preputial gland + + + Prostate A M + + , + + + + + + + + + + + + + + + + + + Seminal vesicle . . . . . . . . . . . . . . . . . . . . . . . + Testes . . . . . . . . . . . . . . . . . . . . . .
Interstitialdell,adenoma
Hematopoietic System Blood + + Bone marrow . . . . . . . . . . . . . . . . . . . . . . Lymphnode . . . . . . . . . . . . . . . . . . . . . . + + + Lymphnode,mandibular A + + + + + + + M + + M i - + + + + + + + + , Spleen . . . . . . . . . . . . . . . . . . . . . . . . . . . . . Thymus A + M + + + + . + + + + + + + + + M + + + + +
. .
Integumentary System Mammarygland M M M M + M + + M M M M + + M M M + + + M + Skin . . . . . . . . . . . . . . . . . . . . . . . . . . . .
Basqsquamoustumorbenign Subptaneous tissue, fibroma Subcutaneous tissue,fibrosarcoma X x x X x x Subcutaneous tissue, sarcoma x Subptaneous tissue, schwannoma NOS X
Musculoskeletal System Bone . . . . . . . . . . . . . . . . . . . . . .
Nervous System Brain . . . . . . . . . . . . . . . . . . . . . .

Lesions in Male Mice
TABLEA2 HncPivicBuan h iman T U ~ Q ~ P ~ U B ~ Q ~ W (continued)
Number of Days on Study
Carcass ID Number
GeneralBody System None
Genital System Epididymis Penis Preputial gland Prostate Seminal vesicle Testes
Interstitial ce l l , adenoma
Hematopoietic System Blood Bonemarrow Lymphnode Lymphnode,mandibular Spleen Thymus
Integumentary System Mammarygland Skin
Basosquamous tumor benign Subcutaneoustissue,fibroma Subcutaneoustissue, fibrosarcoma Subcutaneoustissue,Sarcoma Subcutaneoustissue,schwannoma NOS
Musculosk~letal System Bone
Nervous System Brain
~ of ~ ~ h y ~ e n n e~ a t ice IOIe ahe l-~qnrea^ S U U ~ ~ G ~ ~ C C D ~ :~ J S I ppm
1 1 1 1 1 1 1 1 1 1 1 1 1 1 1 1 1 1 1 1 1 1 1 1 1 3 3 3 3 3 3 3 3 3 3 3 3 3 3 3 3 3 3 3 3 3 3 3 3 3 2 2 2 2 2 2 2 2 5 5 5 5 5 5 5 5 5 5 5 5 5 5 5 5 5
3 4 4 4 4 4 4 4 4 4 4 4 4 4 4 4 4 4 4 4 4 4 4 4 4 Total 9 0 0 0 1 1 1 1 2 2 2 2 3 3 4 4 4 5 5 5 6 6 6 1 1 Tissues/ 5 2 4 5 2 3 4 5 2 3 4 5 1 2 3 4 5 1 3 5 3 4 5 1 5 Tumors
21+ 1 + + + 6
20 + 23
+ 22 X 1
+ 3 21
+ + + + + + + + + 33 + 19
. . . . . . . . . . . . . . . . . . . . . . . . . 53
+ + + + + + + + + + X
X X
19
+ + M + + + + + X
X
+
1 1 8 2 1 45 9
21
21

68 Ethylene Glycol, NTP TR 413
TABLEA2 Individual Animal Tumor Pathology (continued)
Number of Days on Study
Carcass ID Number
Respiratory System Lung
Alveolarbronchiolar adenoma Alveolarbronchiolar carcinoma Alveolarbronchiolar carcinoma,
multiple,two Hepatocellular carcinoma, metastatic, multiple,five,liver
Nose Trachea
Special Senses System None
Urinary System Kidney
Hepatocellular carcinoma, metastatic, liver
Urethra Urinary bladder
Systemic Lesions Multiple organs
Lymphomamalignantmixed
of Male Mice in the 2-YearFeedStudy of Ethylene Glycol: 6,250 ppm
0 1 3 3 5 5 5 5 5 6 6 6 6 6 6 6 6 6 6 6 6 7 7 7 7 7 7 7 7 9 7 4 9 1 1 7 9 9 0 0 2 2 4 5 5 6 8 9 9 9 0 3 3 3 3 3 3 3 8 5 6 4 4 4 8 9 9 1 1 4 7 1 4 4 7 2 3 7 7 9 1 1 1 1 1 2 2
4 4 ' 4 4 3 4 3 4 4 3 4 4 3 3 3 3 4 4 4 4 4 4 3 3 3 3 3 3 3 0 0 ' 8 8 7 6 8 , 2 5 8 4 3 9 8 8 9 4 6 5 3 3 1 7 7 7 7 8 9 9 1 3 1 2 5 1 2 1 4 5 2 5 2 1 3 3 1 2 2 3 4 1 1 2 3 4 4 1 4
A + + + + + + + + + + + + + + + + + + + + + + X
X
X A + + + + + + + + + + + + + + + + + + + + + A + + + + + + + + + + + + + + + + + + + + +
A + + + + + + + + + + + + + + + + + + + + + + + + + + + +
X + + +
A + + + + + + + + + + + + + + + + + + + + + + + + + + + +
. . . . . . . . . . . . . . . . . . . . . . . . . . . . X X X

69 Lesions in Male Mice
Number of Days on Study
Carcass ID Number
Respiratory System Lung
Alveolarbronchiolar adenoma Alveolarbronchiolar carcinoma Alveolarbronchiolar carcinoma,
multiple,two Hepatocellularcarcinoma,metastatic, multiple,five,liver
Nose Trachea
Special Senses System None
Urinary System Kidney
Hepatocellular carcinoma, metastatic, liver
Urethra Urinalybladder
Systemic Lesions Multipleorgans
Lymphomamalignantmixed
7 7 7 7 7 7 7 7 7 7 7 7 7 7 7 7 7 7 7 7 7 7 7 7 7 3 3 3 3 3 3 3 3 3 3 3 3 3 3 3 3 3 3 3 3 3 3 3 3 3 2 2 2 2 2 2 2 2 5 5 5 5 5 5 5 5 5 5 5 5 5 5 5 5 5
3 4 4 4 4 4 4 4 4 4 4 4 4 4 4 4 4 4 4 4 4 4 4 4 4 Total 9 0 0 0 1 1 1 1 2 2 2 2 3 3 4 4 4 5 5 5 6 6 6 7 7 Tissues/ 5 2 4 5 2 3 4 5 2 3 4 5 1 2 3 4 5 1 3 5 3 4 5 1 5 Tumors
+ + + 25 X 2
X 1
1
1 21 21
. . . . . . . . . . . . . . . . . . . . . . . . . 53
1 + 4
. . . . . . . . . . . . . . . . . . . . . . . . . 53
. . . . . . . . . . . . . . . . . . . . . . . . . 53 3

70 Ethylene Glycol, NTP TR 413
TABLEA2 Individual Animal Tumor Pathology of Male Mice in the 2-YearFeed Study of Ethylene Glycol: 12,500 ppm
Number of Days on Study
Carcass ID Number
~~ ~ ~~
Alimentary System Esophagus Gallbladder Intestine large Intestine large, cecum Intestine large, colon Intestine large, rectum Intestine small Intestine small, duodenum Intestine small, ileum Intestine small, jejunum Liver
Hepatocellular carcinoma Hepatocellular carcinoma, multiple, two Hepatocellular adenoma
Mesentery Pancreas Salivary glands Stomach Stomach, forestomach Stomach, glandular Tooth
Cardiovascular System Hart
Endocrine System Adrenal gland Adrenal gland, cortex Adrenal gland, medulla Islets, pancreatic Parathyroid gland Pituitary gland Thyroid gland
Follicular ce l l , adenoma
General Body System None
~~ ~~ ~
0 0 0 0 0 1 3 3 3 3 5 5 5 5 6 6 6 6 6 6 6 7 7 7 7 7 7 7 7 3 3 4 4 9 2 8 8 8 8 1 1 8 9 0 2 2 3 5 6 9 0 3 3 3 3 3 3 3 1 2 2 6 3 1 3 4 4 4 3 7 4 8 7 0 2 3 4 7 7 5 1 1 1 1 1 2 2
2 2 2 2 3 3 3 3 3 3 3 3 3 3 2 3 2 2 3 2 3 2 3 3 3 3 3 2 2 8 6 6 9 6 2 0 1 3 3 0 4 0 5 6 0 7 5 2 6 2 5 0 1 1 1 1 5 5 1 1 2 1 1 1 5 3 2 3 3 4 4 4 5 2 1 4 4 4 5 3 1 1 2 4 5 1 2
~ ~~ ~ ~~ ~~ ~~ ~~ ~ ~ ~~
. . . . . . . . . . . . . . . . . . . . . . + + M M + + M A + + + M + + + + + + M + + A + + + + + + + A + + + + + + + + + + + + + + + + + + M + A A + A + + + + + + + + + + + + + + + + + + A A + + + + + + + + + + + + + + + + + + + + + A + + + + + + + + + + + + + + + + + + M + A A + A + + + + + + + + + + + + + + + + M + A A + A + + + + + + + + + + + + + + + + M + A A M A + + + + + + + + . + + + + + + + + M + A A + A + + + + + + + + + + + + + + + + + + + A + + + + + + + + + + + + + + + + + + + + +
X x x x x x x X X
+ + + + + + + A A + + + + + + + + + + + + + + + + + + + + M A + + + + + + + + + + + + + + + + + + + + A + + + + + + + + + + + + + + + + + + + + + A + + + + + + + + + + + + + + + + + + + + + A + + + + + + + + + + + + + + + " +
. . . . . . . . . . . . . . . . . . . . . .
+ + + + + + M + + + + + + + + + + + + + + + + + + + + . + + M + + + + + + + + + + + + + + + + + + + + + M + + + + + + + + + + + + + + + + + + + + + A A + + + + + + . + + + + + + + + + + + + M + + + + + + + + + + + + + + + + + + + + M M M + M + + + + + + M + + + + + + + . . . . . . . . . . . . . . . . . . . . . . . . . . . . .
X

71 Lesions in Male Mice
Alimentary System Esophagus Gallbladder Intestine large Intestine large, cecum Intestine large, colon Intestine large, rectum Intestine small Intestine small, duodenum Intestine small, ileum Intestine small, jejunum Liver
Hepatocellular carcinoma Hepatocellular carcinoma, multiple, two Hepatocellular adenoma
Mesentery Pancreas Salivaly glands Stomach Stomach,forestomach Stomach, glandular Tooth
Cardiovascular System Heart
Endocrine System Adrenal gland Adrenal gland, cortex Adrenal gland, medulla Islets, pancreatic Parathyroid gland Pituitary gland Thyroid gland
Follicular cell, adenoma
General Body System None
7 7 7 7 7 7 7 7 7 7 7 7 7 7 7 7 7 7 7 7 7 7 7 7 7 3 3 3 3 3 3 3 3 3 3 3 3 3 3 3 3 3 3 3 3 3 3 3 3 3 2 2 2 2 2 2 2 2 5 5 5 5 5 5 5 5 5 5 5 5 5 5 5 5 5
2 2 2 2 2 2 2 2 2 2 2 2 2 2 3 3 3 3 3 3 3 3 3 3 3 Total 5 6 7 7 7 7 8 8 8 8 9 9 9 9 2 2 3 3 3 4 4 4 4 5 6 TissuesJ 5 3 2 3 4 5 4 5 2 3 2 3 4 5 2 3 1 4 5 1 2 3 5 5 4 Tumors
22 + 16
21 18 20 21
+ 19 18 17
+ 19 + + + + + + + + + + + + + + + + + + t + + + + + + 53
x x x 10 2
x x x x x 5
+ 21 1
20 21 21 21 1
22
22 21 21 20+ 22 17
. . . . . . . . . . . . . . . . . . . . . . . . . 54 1

72
TABLEA2 Individual Animal Tumor Pathology of (continued)
Number OF Days on Study
Carcass ID Number
Genital System Coagulating gland Epididymis Penis Preputial gland Prostate Seminal vesicle Testes
Hematopoietic System Bone marrow Lymph node Lymph node, mandibular Spleen
Hemangiosarcoma Thymus
Integumentary System Mammary gland Skin
Subcutaneous tissue, fibroma Subcutaneous tissue, fibrosarcoma Subcutaneous tissue, fibrosarcoma, multifocal
Subcutaneous tissue, sarcoma
Musculoskeletal System Bone
Nervous System Brain
Ethylene Glycol, NTP TR 413
MaleMice inthe2-YearFeedStudy of Ethylene Glycol: 12,500 ppm
0 0 0 0 0 1 3 3 3 3 5 5 5 5 6 6 6 6 6 6 6 7 7 7 7 7 7 7 7 3 3 4 4 9 2 8 8 8 8 1 1 8 9 0 2 2 3 5 6 9 0 3 3 3 3 3 3 3 1 2 2 6 3 1 3 4 4 4 3 7 4 8 7 0 2 3 4 7 7 5 1 1 1 1 1 2 2
2 2 2 2 3 3 3 3 3 3 3 3 3 3 2 3 2 2 3 2 3 2 3 3 3 3 3 2 2 8 6 6 9 6 2 0 1 3 3 0 4 0 5 6 0 7 5 2 6 2 5 0 1 1 1 1 5 5 1 1 2 1 1 1 5 3 2 3 3 4 4 4 5 2 1 4 4 4 5 3 1 1 2 4 5 1 2
+ . . . . . . . . . . . . . . . . . . . . . . + + + +
+ + + . . . . . . . . . . . . . . . . . . . . . . + + + + + + + + + + + + + + + + + + + + + + . . . . . . . . . . . . . . . . . . . . . .
. . . . . . . . . . . . . . . . . . . . . .
. . . . . . . . . . . . . . . . . . . . . + + + + + + + + + M M M M + + + + + + + + + + + M + + + + + + + A + + + + + + + + + + + + + + + + + + + + +
X + + + + + + M M + + + + + + + M + + + + + +
+ M + + M M M + M + M M M + M M + + + M + + . . . . . . . . . . . . . . . . . . . . . . . . . . + +
x x X
X X
. . . . . . . . . . . . . . . . . . . . . .
. . . . . . . . . . . . . . . . . . . . . .

73 Lesions in Male Mice
TABLEA2 Individual Anmiman Tumor PaUh~~bgyoff Mane Mice in Uhe %Year Feed BUnndy off Whybne GlycoU: 12,500 ppm (continued)
7 7 7 7 1 1 7 7 7 7 7 1 7 1 7 7 7 7 7 7 7 7 7 7 7 Number of Days on Study 3 3 3 3 3 3 3 3 3 3 3 3 3 3 3 3 3 3 3 3 3 3 3 3 3
2 2 2 2 2 2 2 2 5 5 5 5 5 5 5 5 5 5 5 5 5 5 5 5 5
2 2 2 2 2 2 2 2 2 2 2 2 2 2 3 3 3 3 3 3 3 3 3 3 3 Total Carcass ID Number 5 6 7 7 7 7 8 8 8 8 9 9 9 9 2 2 3 3 3 4 4 4 4 5 6 Tissues/
5 3 2 3 4 5 4 5 2 3 2 3 4 5 2 3 1 4 5 1 2 3 5 5 4 Tumots
Genital System Coagulating gland 1 Epididymis 22 Penis 4 Preputial gland + + + + 7 Prostate 22 Seminal vesicle + 23 Testes 22
Hematopoietic System Bone marrow 22 Lymph node + + + + 27 Lymph node, mandibular 17 Spleen . . . . . . . . . . . . . . . . . . . . . . . . . 53
Hemangiosarcoma 1 Thymus 19
Integumentary System Mammary gland 11 Skin + + + + + + + + + + + + + + + + 43
Subcutaneous tissue, fibroma X 1 Subcutaneous tissue, fibrosarcoma X X 5 Subcutaneous tissue, fibrosarcoma, multifocal 1
Subcutaneous tissue, Sarcoma 1
MusculoskeletalSystem Bone 22
Nervous System Brain 22

74 Ethylene Glycol, NTP TR 413
TABLEA2 Individual Animal Tumor Pathology (continued)
Number of Days on Study
Carcass ID Number
Respiratory System Lung
Ahreolarbronchiolar adenoma Alveolarbronchiolar adenoma, multiple, two
Alveolarbronchiolar carcinoma Hepatocellular carcinoma, metastatic,
multiple, four, liver Hepatocellular carcinoma, metastatic, multiple, greater than five, liver
Mediastinum, hepatocellular carcinoma, metastatic, liver
Nose Trachea
Special Senses System Harderian gland
Adenoma
Urinary System Kidney
Carcinoma, metastatic, uncertain primary site
Urethra Urinary bladder
Systemic Lesions Multiple organs
Lymphoma malignantmixed
of Male Mice in the 2-YearFeed Study of Ethylene Glycol: 12,500 ppm
0 0 0 0 0 1 3 3 3 3 5 5 5 5 6 6 6 6 6 6 6 7 7 7 7 7 7 7 7 3 3 4 4 9 2 8 8 8 8 1 1 8 9 0 2 2 3 5 6 9 0 3 3 3 3 3 3 3 1 2 2 6 3 1 3 4 4 4 3 7 4 8 7 0 2 3 4 7 7 5 1 1 1 1 1 2 2
2 2 2 2 3 3 3 3 3 3 3 3 3 3 2 3 2 2 3 2 3 2 3 3 3 3 3 2 2 8 6 6 9 6 2 0 1 3 3 0 4 0 5 6 0 7 5 2 6 2 5 0 1 1 1 1 5 5 1 1 2 1 1 1 5 3 2 3 3 4 4 4 5 2 1 4 4 4 5 3 1 1 2 4 5 1 2
. . . . . . . . . . . . . . . . . . . . . . . + X
X
X
X
X + + + + + + + + + + + + + + + + + A + + + + . . . . . . . . . . . . . . . . . . . . . .
+ + + + + + + A + + + + + + + + + + + + + + + + + + + + +
X + + + + + + + + + A + + + + + + + + + + + + + + + + + + + + +
. . . . . . . . . . . . . . . . . . . . . . . . . . . . . x x X

75 Lesions in Male Mice
TABLEA2 Individual Animal Tumor Pathology (continued)
Number of Days on Study
Carcass ID Number
Respiratory System Lung
Alveolarbronchiolar adenoma Alveolarbronchiolar adenoma, multiple, two
Alveolarbronchiolar carcinoma Hepatocellular carcinoma, metastatic, multiple, four, liver
Hepatocellular carcinoma, metastatic, multiple, greater than five, liver
Mediastinum,hepatocellularcarcinoma, metastatic, liver
Nose Trachea
Special Senses System Harderian gland
Adenoma
Urinary System Kidney
Carcinoma, metastatic, uncertain primaIy site
Urethra Urinary bladder
Systemic Lesions Multiple organs
Lymphoma malignantmixed
of Male Mice in the 2-YearFeed Study of Ethylene Glycol: 12,500 ppm
7 7 7 7 7 7 7 7 7 7 7 7 7 7 7 7 7 7 7 7 7 7 7 7 7 3 3 3 3 3 3 3 3 3 3 3 3 3 3 3 3 3 3 3 3 3 3 3 3 3 2 2 2 2 2 2 2 2 5 5 5 5 5 5 5 5 5 5 5 5 5 5 5 5 5
2 2 2 2 2 2 2 2 2 2 2 2 2 2 3 3 3 3 3 3 3 3 3 3 3 Total 5 6 7 7 7 7 8 8 8 8 9 9 9 9 2 2 3 3 3 4 4 4 4 5 6 Tissues/ 5 3 2 3 4 5 4 5 2 3 2 3 4 5 2 3 1 4 5 1 2 3 5 5 4 Tumors
+ + X
+ + + + x x x
+ X
+ X
32 7
X X 2
1
1
1 '
22 21 1
+ + 2 X X 2
. . . . . . . . . . . . . . . . . . . . . . . . . 53
1 2
. . . . . . . . . . . . . . . . . . . . . . . . . 53
. . . . . . . . . . . . . . . . . . . . . . . . . 54 X X 5

76 Ethylene Glycol, N T P TR 413
TABLEA2 Individual Animal Tumor Pathology of MaleMice inthe2-Year Feed Study of Ethylene Glycol: 25,OOO ppm
0 0 0 1 1 1 1 1 1 1 1 1 1 2 2 3 3 4 5 5 5 5 6 6 6 6 6 6 7 Number of Days on Study 6 9 9 0 2 2 4 4 4 5 5 6 6 1 4 1 8 9 1 9 9 9 5 6 8 8 8 9 0
0 1 8 1 6 7 4 5 9 0 4 1 8 5 1 7 6 8 9 0 5 7 4 7 1 1 2 7 9
1 2 2 2 1 1 1 1 1 ~ 1 2 2 2 1 1 1 2 1 1 1 1 1 1 1 1 1 1 1 1 Carcass ID Number 9 1 1 1 4 8 3 9 9 9 2 2 0 4 6 5 3 7 8 5 6 7 6 7 6 9 7 5 8
1 1 2 3 1 2 3 2 3 4 2 3 1 2 2 2 1 1 5 5 3 2 4 3 5 5 4 3 1
Alimentary System Esophagus . . . . . . . . . . . . . . . . . . . . . . . . . . . . . Gallbladder + A + + + + + + + + I + + + M A + + + + " + + + + + + + Intestine large + A + + + + + + + + + + A + + ' + + + + + + + + + + + + + + Intestine large, cecum + A ' + + + + + + + + M + ' A + A + + + + + A + + + + + + + + Intestine large, colon + A + + + + + + + + + + A + + + + + + + + + + + + + + + + Intestine large, rectum + A + M M + + + + + M + A + + + + + + + A + + + + + + + + Intestine small + A + + + + + + + + + + A + + A + + + + A + + + + + + + + Intestine small, duodenum + A + M + + + + + + M + A + A A + + + + A + + + + + + + + Intestine small, ileum + ' A + + + + + + + + M M A M A A + + + + A + + + + + + + + Intestine small, jejunum + A + + + + + + + + + + A + + A + + + + A + + + + + + + +
Polyp adenomatous Liver . . . . . . . . . . . . . . . . . . . . . . . . . . . . .
Hepatocellular carcinoma x xx xx x Hepatocellular adenoma X Hepatocellular adenoma, multiple, two X
Mesentery + + + + + Pancreas . . . . . . . . . . . . . . . . . . . . . . . . . . . . . Salivary glands . . . . . . . . . . . . . . . . . . . . . . . . . . . . . Stomach . . . . . . . . . . . . . . . . . . . . . . . . . . . . . Stomach, forestomach . . . . . . . . . . . . . . . . . . . . . . . . . . . . . Stomach, glandular . . . . . . . . . . . . . . . . . . . . . . . . . . . . . Tooth + + +
Cardiovascular System Heart . . . . . . . . . . . . . . . . . . . . . . . . . . . . .
Endocrine System Adrenal gland . . . . . . . . . . . . . . . . . . . . . . . . . . . . . Adrenal gland, cortex + + + + + + + + . . . . . . . . . . . . . . . . . . . .
Subcapsular, adenoma Adrenal gland, medulla + + + + + + + + . . . . . . . . . . . . . . . . . . . . . Islets, pancreatic . . . . . . . . . . . . . . . . . . . . . . . . . . . . . . Parathyroid gland + M + + + + + + + + + + + + + + + + + + + + + + + M + + + Pituitary gland + + M + M M + + M + + + + M + + + + + + + + + + + + + + + Thyroid gland + M + + + + + + + + + + + + + + + + + + + + + + + + + + +
Follicular cell, carcinoma
General Body System None

I
99Lesions in Male Mice
Number of Days on Study
Carcass I D Number
Alimentary System Esophagus Gallbladder Intestine large Intestine large, cecum Intestine large, colon Intestine large, rectum Intestine small Intestine small, duodenum Intestinesmall, ileum Intestine small, jejunum
Polyp adenomatous Liver
Hepatocellular carcinoma Hepatocellular adenoma Hepatocellular adenoma, multiple, two
Mesentery Pancreas Salivary glands Stomach Stomach,forestomach Stomach, glandular Tooth
Cardiovascular System Heart
Endocrine System Adrenal gland Adrenal gland, cortex
Subcapsular, adenoma Adrenal gland, medulla Islets, pancreatic Parathyroid gland Pituitary gland Thyroidgland
Follicular cell, carcinoma
General Body System None
1 1 1 1 1 1 1 1 1 7 1 7 1 1 1 1 1 1 1 1 1 1 7 1 1 0 2 3 3 3 3 3 3 3 3 3 3 3 3 3 3 3 3 3 3 3 3 3 3 3 9 2 1 1 1 1 1 1 1 2 2 2 2 2 2 2 2 2 2 5 5 5 5 5 5
1 2 1 1 1 1 1 1 1 1 1 1 1 1 2 2 2 2 2 2 2 2 2 2 2 8 3 3 3 3 3 4 4 4 5 5 6 1 8 0 0 0 0 1 1 2 2 2 3 3 4 3 1 2 4 5 3 4 5 1 4 1 5 3 2 3 4 5 4 5 1 4 5 4 5
. . . . . . . . . . . . . . . . . . . . . . . . .
. . . . . . . . . . . . . . . . . . . . . . . . .
. . . . . . . . . . . . . . . . . . . . . . . . .
. . . . . . . . . . . . . . . . . . . . . . . . .
. . . . . . . . . . . . . . . . . . . . . . . . .
. . . . . . . . . . . . . . . . . . . . . . . . .
. . . . . . . . . . . . . . . . . . . . . . . . . + A + + + + + + + + + + + + + + + + + + + + + + + + A + + + + + + + + + + + + + + + + + + + + + + + . . . . . . . . . . . . . . . . . . . . . . . . .
X . . . . . . . . . . . . . . . . . . . . . . . . . X X X
x x x x x x X X
+ + . . . . . . . . . . . . . . . . . . . . . . . . . . . . . . . . . . . . . . . . . . . . . . . . . . . . . . . . . . . . . . . . . . . . . . . . . . . . . . . . . . . . . . . . . . . . . . . . . . . . . . . . . . . . . . . . . . . . . . . . . . . . .
+ + + + + + + + + + + + + + +
. . . . . . . . . . . . . . . . . . . . . . . . .
. . . . . . . . . . . . . . . . . . . . . . . . .
. . . . . . . . . . . . . . . . . . . . . . . . . x x X . . . . . . . . . . . . . . . . . . . . . . . . .
. . . . . . . . . . . . . . . . . . . . . . . . . + + + + + + + + + + + + + + + + + + + + + M + M + . . . . . . . . . . . . . . . . . . . . . . . . . . . . . . . . . . . . . . . . . . . . . . . . . .
X
Total Tissues/ Tumors
54 48 52 49 52 48 50 46 45 50 1
54 9 8 2 7
54 54 54 54 54 18
54
54 53 3
53 54 50 49 53 1
!

78
TABLEA2 Individual Animal Tumor Pathology (continued)
Number of Days on Study
Carcass ID Number
Genital System Coagulating gland Ductus deferens Epididymis
Hemangioma Penis Preputial gland Prostate Seminal vesicle Testes
Interstitial cel l . adenoma
Hematopoietic System Blood Bone marrow Lymph node Lymph node, mandibular Spleen Thymus
Integumentary System Mammary gland Skin
Subcutaneous tissue, fibroma Subcutaneous tissue, fibrosarcoma Subcutaneous tissue, fibrosarcoma,
metastatic, skin Subcutaneous tissue, sarcoma Subcutaneous tissue, sarcoma, multiple Subcutaneous tissue, schwannoma malignant
Musculoskeletal System Bone
Nervous System Brain
Ethylene Glycol, NTP TR 413
of Male Mice in the 2-YearFeed Study of Ethylene.Glycol:25,OOO ppm
0 0 0 1 1 1 1 1 1 1 1 1 1 2 2 3 3 4 5 5 5 5 6 6 6 6 6 6 7 6 9 9 0 2 2 4 4 4 5 5 6 6 1 4 1 8 9 1 9 9 9 5 6 8 8 8 9 0 0 1 8 1 6 7 4 5 9 0 4 1 8 5 1 7 6 8 9 0 5 7 4 7 1 1 2 7 9
1 2 2 2 1 1 1 1 1 1 2 2 2 1 1 1 2 1 1 1 1 1 1 1 1 1 1 1 1 9 1 1 1 4 8 3 9 9 9 2 2 0 4 6 5 3 7 8 5 6 7 6 7 6 9 7 5 8 1 1 2 3 1 2 3 2 3 4 2 3 1 2 2 2 1 1 5 5 3 2 4 3 5 5 4 3 1
+ + . . . . . . . . . . . . . . . . . . . . . . . . . . . . .
+ + + + + +
. . . . . . . . . . . . . . . . . . . . . . . . . . . . .
. . . . . . . . . . . . . . . . . . . . . . . . . . . . .
. . . . . . . . . . . . . . . . . . . . . . . . . . . . .
+ . . . . . . . . . . . . . . . . . . . . . . . . . . . . . . . . . . . . . . . . . . . . . . . . . . . . . . . . . . . + . + + + + + + + M + M + + + + + + + + + + + + + + + + + + + A + + + + . + + + + + + + + + + + + + + + + + - + + + + + + + + M + + . + + + + + + + + + + + M + + + + + + + + + + + +
+ M M + + + + + + M + + + + M M + + M M + M M M + M M M M . . . . . . . . . . . . . . . . . . . . . . . . . . . . . .
X
X X '
X
X
. . . . . . . . . . . . . . . . . . . . . . . . . . . . . .
. . . . . . . . . . . . . . . . . . . . . . . . . . . . .

79 Lesions in Male Mice
Genital SystemCoagulating gland Ductus deferens Epididymis
Hemangioma Penis Preputial gland Prastate Seminal vesicle Testes
Interstitial cell, adenoma
Hematopoietic System Blood Bone marrow Lymph node Lymph node, mandibular Spl&n Thymus
Integumentary SystemMammary gland Skin
Subcutaneous tissue, fibroma Subcutaneous tissue, fibrosarcoma Subcutaneous tissue, fibrosarcoma, metastatic, skin
Subcutaneous tissue, sarcoma Subcutaneous tissue, sarcoma, multiple Subcutaneous tissue, schwannoma malignant
Musculoskeletal SystemBone
Nervous SystemBrain
1 2 1 1 1 1 1 1 1 1 1 1 1 1 2 2 2 2 2 2 2 2 2 2 2 Total 8 3 3 3 3 3 4 4 4 5 5 6 7 8 0 0 0 0 1 1 2 2 2 3 3 Tissues/ 4 3 1 2 4 5 3 4 5 1 4 1 5 3 2 3 4 5 4 5 1 4 5 4 5 Tumors
1 1
. . . . . . . . . . . . . . . . . . . . . . . . . 54 X 1 + + + + + 6
+ + + + + + + 12 . . . . . . . . . . . . . . . . . . . . . . . . . . 54 . . . . . . . . . . . . . . . . . . . . . . . . . 54 . . . . . . . . . . . . . . . . . . . . . . . . . 54
X 1
1 . . . . . . . . . . . . . . . . . . . . . . . . . 54 . . . . . . . . . . . . . . . . . . . . . . . . . 54 + + + + + + + + + + + + + + + M + + + + + + + + + 51 . . . . . . . . . . . . . . . . . . . . . . . . . 53 + + + + + + + + + + + + + + + + + + + + + M + + + 51
M + M M M M M + + + + + + M + M + M + + + M M + + 29 . . . . . . . . . . . . . . . . . . . . . . . . . 54
X X 2 1
1 1 1
1
. . . . . . . . . . . . . . . . . . . . . . . . . 54
. . . . . . . . . . . . . . . . . . . . . . . . . 54

80 Ethylene Glycol, NTP TR 413
TABLEA2 Individual Animal Tumor Pathology (continued)
Number of Days on Study
Carcass ID Number
Respiratory System Lung
Alveolar/bronchiolar adenoma Fibrosarcoma,metastatic,multiple,skin Mediastinum,fibrosarcoma,metastatic, skin
Pleura, fibrosarcoma, metastatic, multiple,skin
Nose . I
Trachea
Special Senses System Ear Harderiangland
Adenoma Carcinoma
Urinary System Kidney
Renal, tubule, adenoma Urethra Urinarybladder
Systemic Lesions Multipleorgans
Lymphomamalignanthistiocytic Lymphomamalignantlymphocytic Lymphomamalignantmixed
of Male Mice in the 2-Year Feed Study of Ethylene Glycol: 25,OOO ppm
0 0 0 1 1 1 1 1 1 1 1 1 1 2 2 3 3 4 5 5 5 5 6 6 6 6 6 6 7 6 9 9 0 2 2 4 4 4 5 5 6 6 1 4 1 8 9 1 9 9 9 5 6 8 8 8 9 0 0 1 8 1 6 7 4 5 9 0 4 1 8 5 1 7 6 8 9 0 5 7 4 7 1 1 2 7 9
1 2 2 2 1 1 1 1 1 1 2 2 2 1 1 1 2 1 1 1 1 1 1 1 1 1 1 1 1 9 1 1 1 4 8 3 9 9 9 2 2 0 4 6 5 3 7 8 5 6 7 6 7 6 9 7 5 8 1 1 2 3 1 2 3 2 3 4 2 3 1 2 2 2 1 1 5 5 3 2 4 3 5 5 4 3 1
. . . . . . . . . . . . . . . . . . . . . . . . . . . . . X
X
X
X . . . . . . . . . . . . . . . . . . . . . . . . . . . . . . + M + + + + + + + + + + + + + + + + + + + + + + + + + + +
+ + X
. . . . . . . . . . . . . . . . . . . . . . . . . . . . . + + + + + + + + + + + + . . . . . . . . . . . . . . . . . . . . . . . . . . . . .
. . . . . . . . . . . . . . . . . . . . . . . . . . . . . X
x x

81 Lesions in Male Mice
Number of Days on Study
Carcass ]ID Number
Respiratory System Lung
Alveolarbronchiolar adenoma Fibrosarcoma,metastatic,multiple,skin Mediastinum,fibrosarcoma,metastatic, skin
Pleura,fibrosarcoma,metastatic, multiple,skin
Nose Trachea
Special Senses System Ear Harderiangland
Adenoma Carcinoma
Urinary System Kidney
Renaltubule,adenoma Urethra Urinatybladder
Systemic Lesions Multipleorgans
Lymphomamalignanthistiocytic Lymphomamalignantlymphocytic Lymphomamalignantmixed
7 7 7 7 1 7 7 7 7 1 1 7 7 7 1 1 7 7 7 7 7 7 7 7 7 0 2 3 3 3 3 3 3 3 3 3 3 3 3 3 3 3 3 3 3 3 3 3 3 3 9 2 1 1 1 1 1 1 1 2 2 2 2 2 2 2 2 2 2 5 5 5 5 5 5
1 2 1 1 1 1 1 1 1 1 1 1 1 1 2 2 2 2 2 2 2 2 2 2 2 Total 8 3 3 3 3 3 4 4 4 5 5 6 7 8 0 0 0 0 1 1 2 2 2 3 3 Tissues/ 4 3 1 2 4 5 3 4 5 1 4 1 5 3 2 3 4 5 4 5 1 4 5 4 5 Tumors
. . . . . . . . . . . . . . . . . . . . . . . . . 54 X X 3
1
1
1 . . . . . . . . . . . . . . . . . . . . . . . . . 54 . . . . . . . . . . . . . . . . . . . . . . . . . 53
+ + X
X
. . . . . . . . . . . . . . . . . . . . . . . . . 54 X 1
+ + + + + + 18 . . . . . . . . . . . . . . . . . . . . . . . . . 54
. . . . . . . . . . . . . . . . . . . . . . . . . 54 1
X 1 X X x x 6

82 Ethylene Glycol, NTP TR 413
TABLEA3 Statistical Analysis of Primary Neoplasms in Male Mice in the 2-YearFeed Study of Ethylene Glycol
Adrenal Cortex: Adenoma Overall rates' Adjusted ratesb Terminal rates' FirstincidencedaysA )Life table tests Logistic regression testsd Fisher exact testd
Harderian Gland Adenoma or Carcinoma Overall rates Adjusted rates Terminal rates First incidence (days) Life table tests Logistic regression tests Cochran-Armitage testd Fisher exact test
Liver: Hepatocellular Adenoma Overall rates Adjusted rates Terminal rates First incidence (days) Life table tests Logistic regression tests Cochran-Armitage test Fisher exact test
Liver: Hepatocellular Carcinoma Overall rates Adjusted rates Terminal rates First incidence (days) Life table tests Logistic regression tests Cochran-Armitage test Fisher exact test
Liver: Hepatocellular Adenoma or Carcinoma Overall rates Adjusted rates Terminal rates First incidence (days) Life table tests Logistic regression tests Cochran-Armitage test Fisher exact test
0 PPm
4/54 (7%) 13.8% 4/29 (14%) 731 ( T )
0/54 (0%) 0.0% Of29 (0%) -P=O.O14 P=O.O16 P=0.028
9/54 (17%) 29.3% 8/29 (28%) 469 P=O.180 P=O.229 P=O.374
10/54 (19%) 26.4% 3/29 (10%) 538 P=0.451N P=0.389N P=0.250N
19/54 (35%) 50.2% 11/29 (38%) 469 P=O.448 P=O.526 P=0.309N
6,250 ppm
om (o%)e
0/54 (0%) 0.0% OB2 (0%) ----
6/53 (11%) 17.4% 5/32 (16%) 599 P=0.211N P=0.192N
P=0.303N
17/53 (32%) 41.0% 8/32 (25%) 601 P=O.199 P=O.143
P=0.082
23/53 (43%) 54.3% 13/32 (41%) 599 P=O.472 P=O.457
P=O.251
12,500 ppm
on1 (o%y
2/54 (4%) 6.3% 2/32 (6%) 731 (T) P=O.260 P=O.260
P=O.248
5/53 (9%) 15.6% 5/32 (16%) 731 (T)P=O.l40N P=0.159N
P=0.206N
12/53 (23%) 30.8% 6/32 (19%) 517 P=O.485 P=O.417
P=O.387
16/53 (30%) 41.5% 10132 (31%) 517 P=0.258N P=0.303N
P=0.365N
25,OOO ppm
3/53 (6%) 13.0% 3/23 (13%) 731 (T) P=0.628N P=0.628N P=0.511N
3/54 (6%) 11.7% m 3 (9%) 681 P=O.O95 P=O.O98
P=O.121
10/54 (19%) 38.7% 8/23 (35%) 317 P=O.292 P=O.377
P=O.500
9/54(17%) 28.0% 2/23 (9%) 519 P=O.557 P=O.599N
P=O.500N
18/54 (33%) 56.6% 10123 (43%) 317 P=O.397 P=O.484
P=0.500N

Lesions in Male Mice
Q,23 ppm
2125 (8%)'
2/25 (8%)'
3/25(12%)'
8/54 (15%) 19.8% 4/32 (13%) 514 P=O.168 P=O.116
P=O.101
10/54 (19%) 25.5% 6/32 (19%) 514 P=O.214 P=O.176
P=O.133
12,5M ppm
8/32 (25%)'
2/32 (6%)e
9/32 (28%)'
6/54 (11%) 15.6% 2/32 (6%) 584 P=0.287 P=O.252
P=O.244
6/54 (11%) 15.6% 2/32 (6%) 584 P=O.551 P=O.518
P=O.500
25,W ppm
3/54 (6%) 11.1% 2/23 (9%)386 P=0.260N P=0.211N P=0.160N
Ob4 (0%) 0.0% 0123 (0%) -P=0.546N P=0.546N P=0.5ON
3/54 (6%) 11.1% 2/23 (9%) 386 P=0.260N P=0.211N P=0.160N
1/54 (2%) 3.7% 0/23 (0%)697 P=0.350N P=0.340N
P=0.309N
3/54 (6%) 12.1% 2/23 (9%)697 P=0.456N P=0.426N
P=0.358N
Lung: Alveolar/bronchiolar Adenoma Overall rates Adjusted rates Terminal rates First incidence (days) Life table tests Logistic regression tests Fisher exact test
Lung: Alveolar/bronchiolar Carcinoma Overall rates Adjusted rates Terminal rates Firstincidence(days) Life table tests Logistic regression tests Fisher exact test
Lung: Alveolar/bronchiolar Adenoma or Carcinoma Overall rates Adjusted rates Terminal rates First incidence (days) Life table tests Logistic regression tests Fisher exact test
Skin (Subcutaneous Tissue): Fibrosarcoma Overall rates Adjusted rates Terminal rates First incidence (days) Life table tests Logistic regression tests Cochran-Armitage test Fisher exact test
Skin (Subcutaneous Tissue): Fibroma or Fibrosarcoma
7/54 (13%) 24.1% 7/29 (24%) 731 0
1/54(2%) 3.4% 1/29 (3%) 731 (T>
7/54 (13%) 24.1% 7/29 (24%) 731 (13
3/54 (6%) 8.5% OD9 (0%) 598 P=0.222N P=0.175N P=0.140N
Overall rates Adjusted rates Terminal rates Firstincidence(days) Life table tests Logistic regression tests Cochran-Armitage test Fisher exact test
5/54 (9%) 14.8% 2/29(7%) 598 P=0.263N P=0.213N P=0.153N

84 Ethylene Glycol, NTP TR 413
TABLEA3 Statistical Analysis of Primary Neoplasms in Male Mice in the 2-Year Feed Study of Ethylene Glycol (continued)
0 PPm 6,250 ppm 12,500 ppm 25,OOO ppm
Skin (Subcutaneous Tissue): Fibrosarcoma or Sarcoma Overallrates 4/54 (7%) 9/54 (17%) 7/54 (13%) 3/54 (6%) Adjusted rates 10.5% 21.4% 18.0% 9.7%
on3 (0%)595
Terminal rates OD9 (0%) 4/32 (13%) 2/32 (6%) First incidence (days) 350 514 Life table tests P=0.393N P=O.199
584 P=O.313
Logistic regression tests P=0.305N P=O.107 P=O.267 Cochran-Armitage test P=0.263N Fisher exact test P=O.118 P=O.263 P=0.500N
Skin (Subcutaneous Tissue): Fibroma, Fibrosarcoma, or Sarcoma Overall rates 6/54 (11%) 11/54 7/54 (13%) 5/54 (9%) (20%) Adjusted rates 16.6% 27.1% 18.0% 17.5% Terminal rates 2/29 (7%) 6/32 (19%) 2/32 (6%) m 3 (9%) First incidence (days) 350 514 Life table tests P=0.417N P=O.240
5 8 4 595 P=O.554 P=0.607N
P=O.161 Cochran-Armitage test P=0.261N Fisher exact test P=O.145
Logistic regression tests P=0.334N
All Organs:Hemangiosarcoma Overall rates 3/54 (6%) 0/54 (0%)Adjusted rates 10.3% 0.0% Terminal rates 3/29 (10%) 0/32 (0%)
-First incidence (days) 731 (T )Life table tests P=0.102NP=0.103N Logistic regression tests P=0.102NP=0.103N Cnchran-Armitage test P=0.086N Fisher exact test P=0.121N
All Organs: Hemangioma or Hemangiosarcoma Overallrates 3/54 (6%) 0/54 (0%)Adjustedrates 10.3% 0.0% Terminalrates 3/290/32(10%) (0%)
-First incidence (days) 731 (T ) Life table tests P=0.359NP=0.103N Logistic regression tests P=0.359NP=0.103N Cochran-Armitage test P=0.296N Fisher exact test P=0.12lN
All Organs:Malignant Lymphoma (Histiocytic, Lymphocytic, or Mixed) Overallrates 6/54 (11%) 3/54 (6%)
P=O.511
P=O.500
1/54 (2%) 3.1% 1/32 (3%) 731 ( T )P=0.269N P=0.269N
P=0.309N
1/54 (2%) 3.1% 1/32 (3%) 731 ( T )P =0.269N P=0.269N
P=0.309N
5/54 (9%)
P=0.566N
P=0.500N
0/54 (0%) 0.0% on3 (0%)-
P=0.121N
1/54 (2%) 4.3% 1/23 (4%) 731 (T )P=0.390N P=0.390N
P =0.309N
8/54 (15%) 15.6% 29.4% 19.0% 7.4% Adjusted rates
4/291/32 5/32 (16%) 5/23 (22%) (14%) (3%)Terminal rates 597 637 578 First incidence (days) - 731 ( T )
P=0.438N P =O.Z7P=O.100 P=0.195NLife table tests Logistic regression tests P=O.113 P=0.186N P=0.448N P=0.286 Cochran-Armitage test P=O.201 Fisher exact test P=0.244N P=0.500N P=O.388

317
Lesions in Male Mice
Adjusted rates 15/29lOi32(31%)(41%)(65%)(52%)13i3215/23Terminal rates
731 (??
Fisher exact test Cochran-Armitage test Logistic regression tests
P=O.236 P=O.O75P=O.o49N
P=0.136NP=0.260NP=O.419
P=0.171NP=O.225
All Organs: Malignant Neoplasms Overall rates 22/54(41%)28/54(52%)23/54(43%)20/54(37%)
All Organs: BenignNeoplasms Overall rates 17/54(31%) (20%) 19/5411/54 13/54 (24%) (35%)
40.6% 54.3% 32.7% 69.2%
469 599 First incidence (days) P=O.135 P=0.062NLife table tests P=0.144N P=O.o42
52.1% 57.8% 53.5% 54.9% Adjusted rates Terminal rates (31%)9/29(38%) (38%)12/3212/32 7/23 (30%)
350 514 517 First incidence (days) Life table tests P=O.477=0.401 P P=O.498P=0.517N Logistic regression tests P=O.561P=O.545P=O.271P=0.459N Cochran-Armitage test P=0.236N Fisher exact test P=0.422NP=O.500 P=O.167
All Organs: Benign or Malignant Neoplasms Overall rates 34/5436/54(67%)(57%)33/54(61%)(63%)31/54
79.0% 73.3% 72.1% 86.6%Adjustedrates Terminalrates 20/29(69%)(59%) 18/23(78%)19/32 3/32 (63%)
350 514 517 First incidence (days) Life table tests P=0.226N P=O.229P=O.254 P=0.416N Logistic regression tests P=O.256 P=0.248NP=O.293 P=0.433N Cochran-Armitage test P=0.370N Fisher exact test P=0.347NP=O.420P=0.500N
$??Terminal sacrifice Number of neoplasm-bearing animals/number of animals examined. Denominator is number of animals examined microscopically for adrenal gland, bonemarrow, brain, clitoral gland, epididymis, gallbladder, heart, kidney, larynx, liver, lung, nose, ovary, pancreas, parathyroid gland, pituitary gland, preputial gland, prostate gland, salivary gland, spleen, testes, thyroid gland, and urinary bladder; for other tissues, denominator is number of animals necropsied. Kaplan-Meier estimated neoplasm incidence a t the endof the study after adjustment for intercurrent mortality Obsewed incidence at terminal ki l l Beneath the control incidence are the P values associated wi th the trend test. Beneath the dosed group incidence are the P values corresponding to pairwise comparisons between the controls and that dosed group. The life table analysis regards neoplasms in animals dying prior t o terminal kill as being (directly or indirectly) the cause of death. The logistic regression tests regard these lesions as nonfatal. The Cochran-Armitage and Fisherexact tests comparedirectlytheoverall incidencerates. For all tests, a negative trend or a lower incidence i n a dose group is indicated by N.
e Tissue wasexaminedmicroscopicallyonlywhen it was obsewed to be abnormal a t necropsy; therefore, statistical comparisons with the controls are not appropriate. Not applicable; no neoplasms in animal group
498
317

86 Ethylene Glycol, NTP TR 413
TABLEA4 Historical Incidence of Harderian Gland Neoplasms in Untreated Male B6C3Fl Micea
Incidence in Controls Study Adenomas Carcinomas Adenomas or
Carcinomas
Historical Incidence at Southern Research Institute
C.I. Pigment Red 3 2/50 0/50 2/50 Ethylene Glycol 0/54 0/54 0/54 Nitrofurantoin 2/50 0150 2/50 o-Nitroanisole 9/50 1/50 lOl50 Polysorbate 80 0149 0/49 0/49 Rhodamine 6G 7/50 0150 7/50 Roxarsone 1/50 0/50 1/50
Total 211353 (5.9%) 11353 (0.3%) 22L353 (6.2%) Standard deviation 7.1% 0.8% 7.7% Range 0%-18% 0%-2% 0%-20%
Overall Historical Incidence
Total 45I872 (5.2%) 3/872 (0.3%) 481872 (5.5%) Standard deviation 4.8% 0.8% 5.3% Range 0%-18% 0%-2% 0%-20%
a Data as o f 3 April 1991

Lesions in Male Mice
Animals initially in study 15-month interim evaluation Early deaths
Natural deaths Moribund
SuMvors Terminal sacrifice
Animalsexamined microscopically
Alimentary System Esophagus
Inflammation, chronic Gallbladder
Inflammation Mucosa, hyperplasia
Intestine large, cecum Parasite metazoan
Intestine large, rectum Inflammation, chronic Prolapse
Intestine small, duodenum Mucosa, inflammation, suppurative
Intestine small, ileum Perforation Lymphoid tissue, hyperplasia,
lymphoid Intestine small, jejunum
Hyperplasia, lymphoid Inflammation, suppurative
Liver Angiectasis Autolysis Bacterium Basophilic focus Congestion CystEosinophilic focus Fatty change Fibrosis Focal cellular change Hematopoietic cell proliferation Hyperplasia, lymphoid Hyperplasia, multifocal Infarct Infiltration cellular, mixed cell Inflammation, multifocal Necrosis, multifocal Pigmentation Artery, media, hypertrophy Bile duct, cyst Bile duct, hyperplasia
60 6
15 10
29
54
(54)1 (2%)
1 (2%)
2 (4%)
1 (2%)
2 (4%) 1 (2%)
4 (7%) 6 (11%)
10 (19%)
60 6
8 14
32
54
2 (4%)
2 (4%)
5 (9%) 11 (21%) 6 (11%) 1 (2%)
60 6
11 11
32
54
1 (2%) 1 (2%)
1 (2%) 1 (2%) 3 (6%)
2 (4%) 16 (30%)4 (8%) 1 (2%)
60 6
16 15
23
54
1 (2%) (50)
1 (2%) 1 (2%)
(54)
1 (2%) 2 (4%) 2 (4%) 1 (2%)
1 (2%)
2 (4%)
1 (2%) 2 (4%)
1 (2%) 8 (15%)
13 (24%)8 (15%) 3 (6%) 1 (2%)

88 Ethylene Glycol, NTP TR 413
TABLEA5 Summary of the Incidence of Nonneoplastic Lesions in Male Mice in the 2-YearFeed Study of Ethylene Glycol (continued)
Alimentary System (continued) Liver (continued)
Centrilobular, necrosis Centrilobular, vacuolization nuclear Hepatocyte, cytomegaly Hepatocyte, centrilobular, degeneration,
hyaline Mesentery
Inflammation, chronic Inflammation, granulomatous Inflammation, suppurative Fat, necrosis
Pancreas Atrophy, focal Fibrosis, focal Focal cellular change Inflammation, focal, chronic Necrosis, focal Duct, degeneration, hyaline Duct, dilatation Duct, hyperplasia, papillary Duct, metaplasia Vein, infiltration cellular, mixed c e l l
Salivary glands Atrophy, focal Fibrosis, focal
Stomach,forestomach Mineralization Mucosa, hyperplasia, papillary' Mucosa, ulcer
Stomach, glandular Erosion Inflammation, focal Mineralization Epithelium, metaplasia, squamous Epithelium, vacuolization cytoplasmic,
multifocal Mucosa, cyst Mucosa, erosion
Tooth Incisor, dysplasia Incisor, inflammation, chronic Incisor, inflammation, suppurative
Cardiovascular System Heart
Inflammation, chronic Inflammation, focal Inflammation, suppurative Atrium, thrombus, multiple
0 PPm 6,250 ppm 12,500 ppm 25,OOO ppm
1 (2%) 1 (2%)
36 (67%) ( 5 )
1 (14%)(7)
1 (20%) 1 (14%) 3(43%) 1 (14%)
(54) (54)
1 (2%) 1 (2%)
2 (4%) 1 (2%) 1 (2%) 1 (2%) 1 (2%) 1 (2%) 1 (2%)
1 (2%) (53) (54)
1 (2%)
1 (2%)(54) (54)
2 (4%) 1 (2%)
(54) (54)
1 (2%) 1 (2%) 2 (4%) 1 (2%)
1 (2%) 2 (4%)
1 (2%) (21)18 (86%)
(18)15 (83%)
2 (10%) 1 (5%)
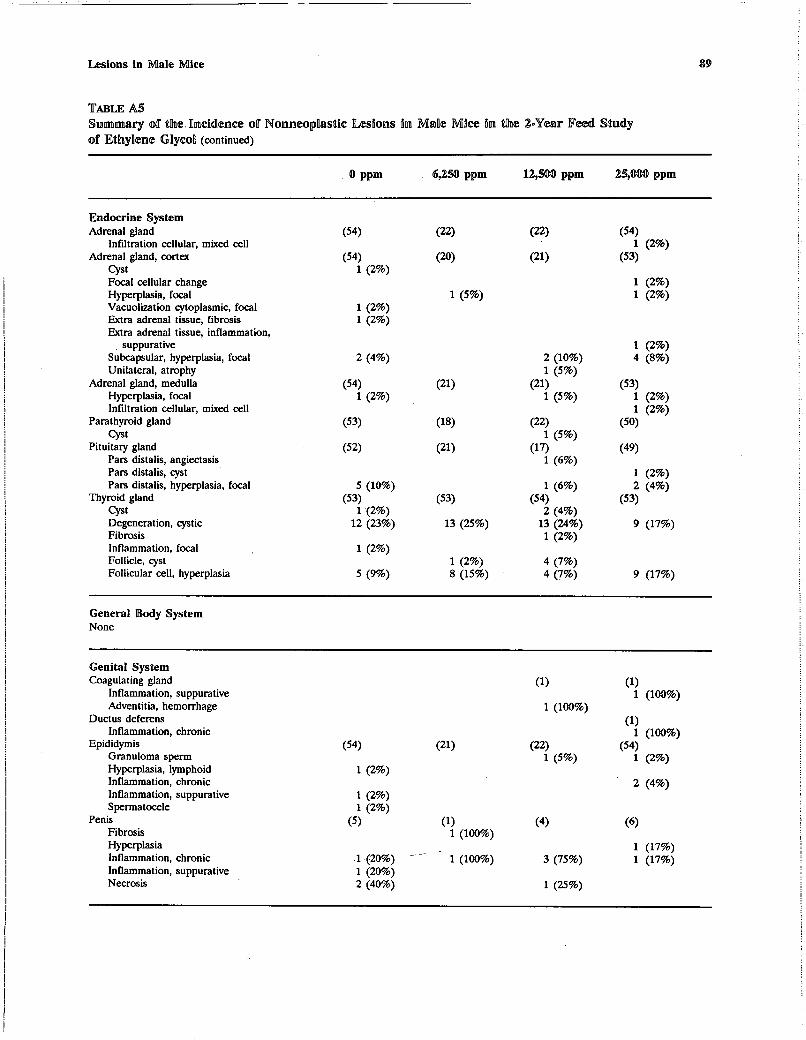
89 k i o n s in Male Mice
Adrenal gland Infiltration cellular, mixed cell
Adrenal gland, cortex CystFocal cellular change Hyperplasia, focal Vacuolization cytoplasmic, focal Extra adrenal tissue, fibrosis Extra adrenal tissue, inflammation,
suppurative Subcapsular, hyperplasia, focal Unilateral, atrophy
Adrenal gland, medulla Hyperplasia, focal Infiltration cellular, mixed c e l l
Parathyroid gland Cyst
Pituitary gland Pars distalis, angiectasis Pars distalis, cyst Pars distalis, hyperplasia, focal
Thyroid gland CystDegeneration, cystic Fibrosis Inflammation, focal Follicle, cyst Follicular cell, hyperplasia
GeneralBody System None
Genital System Coagulating gland
Inflammation, suppurative Adventitia, hemorrhage
Ductus deferens Inflammation, chronic
Epididymis Granuloma sperm Hyperplasia,lymphoid Inflammation, chronic Inflammation, suppurative Spermatocele
Penis Fibrosis Hyperplasia Inflammation, chronic Inflammation, suppurative Necrosis
(54)
(54)1 (2%)
1 (5%)1 (2%)1 (2%)
5 (10%) (53) (53)
1 (2%)12 (23%) 13 (25%)
1 (2%) 1 (2%)
5 (9%) 8 (15%)
(54)
1 (2%)
1 (2%)1 (2%)
( 5 )
-1--(20%) --1 (20%) 2 (40%)
2 (10%)1 (5%)
(21)1 (5%)
1 (6%) (54) 2 (4%)13 (24%) 1 (2%)
4 (7%) 4 (7%)
(1)
1 (100%)
1 (2%) 4 (8%)
(53)1 (2%) 1 (2%)
(50 )
(49)
1 (2%)2 (4%)
(53)
9 (17%)
9 (17%)
(1) 1 (100%)
(1)1 (100%)
(54)1 (2%)
2 (4%)
1 (17%)1 (17%)

90 Ethylene Glycol, NTP TR 413
TABLEA5 Summary of the Incidence of Nonneoplastic Lesions in Male Mice in the 2-Year Feed Study of Ethylene Glycol (continued)
0 PPm 6,250 ppm 12,500 ppm 25,OOO ppm
Genital System (continued) Preputial gland (12) (6) (7) (12)
Degeneration, cystic 8 (67%) 3 (50%) 3 (43%) 6 (50%) Inflammation, suppurative 8 (67%) 5 (83%) 2 (29%) 7 (58%)
Prostate (53) (20) (22) (54)Dilatation 1 (2%) Edema 1 (2%) Inflammation, chronic 6 (11%) 1 (5%) 5 (23%) 10 (19%)
Seminal vesicle (52) (23) (23) (54)4 (7%) (9%)4 (8%) 3(13%) 2Dilatation
Inflammation, chronic 1 (4%) (17%)3(13%)9 8 (15%) Epithelium, hyperplasia 1 (4%)
Testes (54) (22) (22) (54)Inflammation, chronic 1 (2%) Mineralization 1 (2%) 1 (5%) 1 (5%) 3 (6%) Necrosis, multifocal 1 (2%) Geminal epithelium, degeneration 3 (6%) 1 (5%) 1 (5%) 5 (9%)Interstitial ce l l , hyperplasia 1 (2%) Tunic, proliferation connective tissue 1 (5%)
Hematopoietic System B l o o d (1) (3)
Neutrophilia 1(100%) Bone marrow (54) (21) (22) (54)
Atypical cells, focal 1 (2%) Hyperplasia, neutrophil 1 (2%) 1 (5%)
(27) (54)1
(1)
Lymph node (33) (54)3 (6%)Iliac, hyperplasia 1 (2%)
Inguinal,hyperplasia,lymphoid 1 (2%)
(4%) Inguinal,hyperplasia (4%) 2 1 (3%) 4 (15%) 1 (2%)
2 (4%) 1 (2%)Inguinal, inflammation, chronic
Mesenteric, angiectasis 19 (35%) 17 (52%) 11 (41%) 22 (41%) Mesenteric, depletion lymphoid 1 (2%) Mesenteric, hematopoietic cell proliferation 1 (2%) Mesenteric,hyperplasia 3 (6%) Mesenteric,hyperplasia,lymphoid 1 (2%) 2 (6%) 2 (4%) Mesenteric,hyperplasia,reticulum c e l l 1 (2%) Mesenteric, inflammation,granulomatous,
chronic 1 (2%)
Mesenteric, inflammation, suppurative 1 (2%) Mesenteric,thrombus 1 (2%)
Lymph node, mandibular (45) (19) (17) (51)Angiectasis 2 (4%) Depletion lymphoid 1 (2%) Hyperplasia, lymphoid 1 (2%) 4 (8%)
Spleen (54) (53)Angiectasis 1 (2%) Congestion 1 (2%)
Depletion 1 (2%) 3 (6%) 1 (2%) Hematopoietic cell proliferation 17(31%) 25 (47%) 25 (47%) 28 (53%) Hyperplasia,lymphoid 1 (2%) 1 (2%) 2 (4%)
(53) (53)

91 Lesions in Male Mice
Hematopoietic System (continued) Thymus (19) (53) (19) (51)
Atypicalcells 1 (2%)
Cyst 1 (2%) 1 (5%) 1 (2%) Degeneration, cystic 1 (2%) Depletion lymphoid (2%) 12 (11%) 3 (16%) 7 (14%) Hyperplasia, reticulum cell Epithelial cell, hyperplasia, cystic
Integumentary System Skin
Erosion Exudate Fibrosis Hyperplasia, melanocyte Inflammation, chronic Metaplasia, osseous Ulcer Hair follicle, atrophy Prepuce, angiectasis Prepuce, fibrosis Prepuce, foreign body Prepuce, inflammation, chronic Prepuce, ulcer Subcutaneous tissue, edema Subcutaneous tissue, exudate Subcutaneous tissue, fibrosis Subcutaneous tissue, foreign body Subcutaneous tissue, inflammation, chronic Subcutaneous tissue, lymphatic, angiectasis Tail, subcutaneous tissue, inflammation,
granulomatous
Musculoskeletal System Bone
Distal, joint, femur, arthrosis Femur, hyperostosis
Nervous System Brain
Congestion Gliosis Infiltration cellular, mixed cell Inflammation. focal
1 (2%)
(54)
25 (46%)
4 (7%) 1 (2%) 1 (2%) 1 (2%) 1 (2%) 5 (9%) 5 (9%) 1 (2%) 1 (2%)
1 (2%) 1 (2%)
(54)
1 (2%)
(45)
1 (2%)
24 (53%) 1 (2%) 5 (11%) 1 (2%)
1 (2%) 1 (2%) 1 (2%) 1(2%)
1 (2%) 1 (2%)
(21)
(43)
1 (2%) 1 (2%)
27 (63%) 1 (2%) 5 (12%) 2 (5%)
2 (5%) 3 (7%) 1 (2%)
1 (2%)
(22)
1 (5%) 1 (5%)
1 (2%)
(54)1 (2%) 1 (2%)
18 (33%)
9 (17%)
2 (4%) 3 (6%)
1 (2%)
1 (2%)
(54)1 (2%)

(54)
92 Ethylene Glycol, NTP TR 413
. .TABLEA5 Summary of the Incidence of Nonneoplastic Lesions in Male Mice in the 2-Year Feed Study of Ethylene Glycol (continued)
0 PPm 6,250 PPm 12,500 ppm 25,OOO ppm
Respiratory System Lung (54) (25) (32) (54) ' ,
Bacterium 2 (4%) Congestion 5 (9%) 2 (8%) 3 (9%) 3 (6%) Edema 1 (4%) Foreign body 1 (2%) Hemonhage 2 (4%) Hyperplasia, lymphoid 4 (7%) 2 (6%) 4 (7%) Hyperplasia, macrophage 1 (2%) 2 (6%) 1 (2%) Infiltration cellular, mixed cell 8 (15%) 2 (8%) 7 (22%) 8 (15%) Inflammation, granulomatous 1 (2%) Pigmentation 1 (2%). Alveolar epithelium, hyperplasia .- 2 (4%) 2 (6%) Artery, embolus 1 (2%)Interstitium, inflammation 1 (4%) 1 (2%)
Nose (21)2 (10%)
Lumen, foreign body 1 (5%) Nasolacrimal duct, foreign body 1 (2%) Nasolacrimal duct, inflammation,
suppurative 2 (4%) 1 (5%)
Special Senses System None
Urinary System
(21) (54)2 (4%)
(54)Lumen, exudate
Kidney(53)Angiectasis Atrophy, focal Bacterium Congestion Hematopoietic cell proliferation Infiltration cellular, mixed cell Inflammation, suppurative Metaplasia, osseous Mineralization Necrosis Necrosis, focal Nephropathy Papilla, necrosis Pelvis, crystals Pelvis, dilatation Pelvis, inflammation, chronic Pelvis, mineralization Pelvis, transitional epithelium, hyperplasia Renal tubule, crystals Renal tubule, degeneration, hyaline Renal tubule, dilatation Renal tubule, hyperplasia Renal tubule, mineralization Renal tubule, necrosis
(54) (53)
1 (2%) 1 (2%) 1 (2%)
1 (2%) 2 (4%)
1 (2%)
41 (77%) 1 (2%)
7 (13%) 1 (2%) 1 (2%)
1 (2%) 4 (7%)
1 (2%) 4 (7%) 1 (2%) 1 (2%)
2 (4%) 38 (70%)
1 (2%) 2 (4%) 2 (4%) 2 (4%) 1 (2%) 8 (15%) 1 (2%)
13 (24%)
2 (4%) 3 (6%) 1 (2%)
4 (7%) 1 (2%)
39 (72%)
6 (11%)
1 (2%)
1 (2%)
1 (2%) 1 (2%)
44 (83%) 1 (2%)
1 (2%) 2 (4%)
1 (2%)

Urinary System (continued) Kidney (continued)
Renal tubule, epithelium, necrosis Renal tubule, vacuolization cytoplasmic
Fibrosis Urethra
51
(1)
(94%)
(18)
48 (91%)
(2)
52 (%%) 1 (2%)
Hemorrhage 1 (6%)Inflammation, suppurative 1 (100%) 2 (Ma%) 7 (39%) Perforation 1 (100%) Bulbourethral gland, dilatation 1 (6%)Bulbourethral gland, fibrosis Lumen, crystals 12 (67%)
Urinary bladder Calculusobservationgross '
(53) (54)2 (4%)
Calculus micro observation only 2 (4%) Congestion 1 (2%)Hemorrhage 1 (2%) 1 (2%)Hyperplasia, lymphoid 2 (4%) 1 (2%)Inflammation, chronic 1 (2%) 6 (11%) 8 (15%) Ulcer 1 (2%)Artery, serosa, mineralization 1 (2%)Transitional epithelium, hyperplasia 1 (2%)
a Number of animals examined microscopically at site and number of animals with lesion

95

Ethylene Glycol, NTP TR 413

Lesions in Female Mice
15-month interim evaluation Animals initially in study DispositionSummary
10 60
10 60
9 60
10 60
Early deaths Natural deaths 8 11 9 1 Moribund 9 9 12 12
Survivors Terminal sacrifice 33 30 30 37
Animals examined microscopically 50 50 51 50
Alimentary System Esophagus Gallbladder Intestine large, cecum Intestine large, colon
Sarcoma Intestine large, rectum Intestine small, duodenum Intestine small, ileum Intestine small, jejunum Liver
Adenocarcinoma, metastatic, multiple,
Hepatocellular adenoma Hepatocellular carcinoma, multiple, two Hepatocellular carcinoma
Adenocarcinoma, metastatic, multiple,
ovary
Mesentery 8 (16%)
3 (6%)
(17) 8 (16%)
6 (12%)
(15) 7 (14%)
3 (6%)
(7)
Adenocarcinoma, metastatic, ovary
Sarcoma ovary
Pancreas (49) 1 (14%)
(50)
Sarcoma Salivary glands Stomach,forestomach Stomach, glandular
Cardiovascular System Heart
Endocrine System
Adrenal gland, medulla Adrenal gland, cortex
Pheochromocytoma malignant
Islets, pancreatic Pheochromocytoma benign
Adenoma Pituitary gland
Pars distalis, adenoma Pars distalis, carcinoma Pars intermedia, adenoma

98 Ethylene Glycol, NTP TR 413
TABLEB1 Summary of the Incidence of Neoplasms in Female Mice in the 2-YearFeed Study of Ethylene Glycol (continued)
0 PPm 12,500 ppm 25,OOO ppm 50,OOO ppm
Endocrine System (continued) Thyroidgland
Follicular ce l l , adenoma
General Body System Tissue NOS
Sarcoma
Genital System @ary (49)
Adenocarcinoma Cystadenoma, papillary 2 (4%) (4%) 41 (8%) Teratoma NOS 1 (2%)
Oviduct(4) Uterus
(3) (1) (45) (50) (45) (50)
Adenocarcinoma 1 (2%) Leiomyosarcoma Endometrium, polyp stromal
Hematopoietic System Bone marrow Lymph node
Mediastinal, adenocarcinoma, metastatic, ovary
Lymph node, mandibular Spleen
Hemangiosarcoma Thymus
Integumentary System Mammary gland
Adenoacanthoma Adenocarcinoma
3 (6%)
(50) (50)
(43) (49)
(47)
(49)
1 (2%)
3 (7%)
(20) (24)
1 (4%) (21) (29)
(19)
(20)
1 (2%) 1 (2%) 1 (2%)
(21) (50) (22) (50)
(20) (49) (28)
1 (4%) (50)
(19) (47)
(21) (50) 1 (2%)
1 (5%) (43) (40)Skin
Subcutaneous tissue, fibrosarcoma Subcutaneous tissue, hemangiosarcoma Subcutaneous tissue, Sarcoma 1 (2%)
MusculoskeletalSystem Bone
(49) (50)2 (5%) 1 (3%)
(50) (20) (21) (50) Osteosarcoma 1 (5%) 1 (5%)
Skeletal muscle
Thoracic, sarcoma Neck,Sarcoma Abdominal, Sarcoma Osteosarcoma, metastatic, bone
(2) (2)1 (50%)
1 (50%) 1 (50%)
(2) (1)
1 (100%)
Brain Nervous System

99 k i o m inn Female Mice
Adenocarcinoma, metastatic, multiple,
Carcinoma, metastatic, uncertain primary Carcinoma, metastatic, harderian gland Alveolarbronchiolar carcinoma Alveolarbronchiolar adenoma
greater than five, ovary
Osteosarcoma. metastatic, bone
Hepatocellular carcinoma, metastatic, multiple, Hepatocellular carcinoma, metastatic, liver
site
greater than five, liver
Trachea Nose
1 (2%)
1 (2%)
1 (2%)
1 (2%)
Special Senses System
Carcinoma Adenoma
Harderian gland (3)2 (67%)
(2)
1 (50%) 1 (50%)
(2)1 (50%)1 (50%)
(2)
2 (luo%)
Urinary bladder
Kidney ' Wrinary System
Osteosarcoma, metastatic, bone
Multiple organs'. Systemic k i o n s
Lymphoma malignant undifferentiated Lymphomamalignantmixed Lymphoma malignant lymphocytic Lymphoma malignant histiocytic
cell
(50 )
1 (2%)
3 (6%) 13 (26%)
(50)2 (4%) 3 (6%) 8 (16%)
(51)2 (4%) 4 (8%)3 (6%)
(50)1 (2%)
6 (12%)
~~ ~~ ~ ~ ~~ ~~~ ~~~ ~~~~
Neoplasm Summary
Total animals with neoplasms uncertain-
Total animals with malignant neoplasms
Total animals with metastatic neoplasms
Total animals with malignant neoplasms
Total animals with benign neoplasms
Total animals with primary neoplasms'
benign or malignant
uncertain primary site
Total metastatic neoplasms
Total malignant neoplasms
Total benign neoplasms
Total primary neoplasms
Total uncertain neoplasms
23 21 33 29 56 39
2 2
30 21 23 19 53 33
6 2
25 22 24 19 49 31
3 2
17 16 33 26 51 36
2
1
1
2
1
Primaryneoplasms:allneoplasmsexceptmetastaticneoplasms Number o f animals with any tissue examined microscopically Number of animals examined microscopically at site and number o f animals with lesion

100 Ethylene Glycol, NTP TR 413
TABLEB2 Individual Animal Tumor Pathology of Female Mice in the 2-YearFeed Study of Ethylene Glycol: 0 ppm
4 5 5 5 5 5 5 5 6 6 6 6 6 6 6 6 6 7 7 7 7 7 7 7 7 Number of Days on Study 7 1 2 3 4 7 7 8 0 0 5 6 6 9 9 9 9 3 3 3 3 3 3 3 3
2 8 0 6 6 4 8 1 5 6 5 5 5 6 6 7 8 1 1 1 1 1 6 6 6
5 5 5 5 5 5 5 5 5 5 5 4 5 5 5 5 5 4 4 4 4 5 5 5 5 Carcass ID Number 2 6 5 3 2 2 8 7 3 5 5 9 0 3 6 0 1 9 9 9 9 0 0 0 1
1 5 3 2 3 5 3 5 4 1 2 5 3 1 2 1 1 1 2 3 4 2 4 5 2
Alimentary System Esophagus . . . . . . . . . . . . . . . . . . . . . . . . . . Gallbladder A + M + + + + + + + + + + + + + + + + + + + + + + Intestine large A + + + + + + + + + + + + + + + + + + + + + + + + Intestine large, cecum A + + + + + + + + + + + + + . + + + + + + + + + + + Intestine large, colon A + + + - + + + + + + + + + + + + + + + + + + + + + Intestine large, rectum A + + + + + + + + + + + + + + + + + + + + + + + + Intestine small A + + + ' M A + + + + + + + + + + + + + + + + + + + Intestine small, duodenum A + + + M A + + + + + + + + + + + + + + + + + + + Intestine small, ileum A + + + M A + + + + + + + + + + + + + + + + + + + Intestine small, jejunum A + + + M A ' + + + + + + + + + + + + + + + + + + + Liver . . . . . . . . . . . . . . . . . . . . . . . . .
Hepatocellular carcinoma x x X Hepatocellular adenoma x x X
Mesentery + + + + + + + + - + + + Pancreas M + + + + + + . + + + + + + + + + + + + + + + + + + Salivary glands M + . + + + + + + + + + + + + + + + + + + + + + + + Stomach . . . . . . . . . . . . . . . . . . . . . . . . . . . Stomach, forestomach . . . . . . . . . . . . . . . . . . . . . . . . . . . Stomach, glandular A + + . + + + + + + + + + + + , + + + + + + + + + + + Tooth +
~ ~ ~~~ .. . ,
Cardiovascular System Hl3l-t . . . . . . . . . . . . . . . . . . . . . . . . .
Endocrine System Adrenal gland A + + + + + + + + + + + + + + + + + + + + + + + + Adrenal gland, cortex A + + + + + + + + + + + + + + + + + + + + + + + + Adrenal gland, medulla A + + + + + + + + + + + + + + + + + + + + + + + + Islets, pancreatic M + + + + + + + + + + + + + + + + + + + + + + + + Parathyroid gland M + + + + + + + + + + + + + + + + + + + + + + + + Pituitary gland M + + + + + + + + + + + + + + I + + + + + + + + +
Pars distalis, adenoma X X X X X x x Thyroid gland A + + + + + + + + + + + + + + + + + + + + + + + +
Follicular cell, adenoma X
General Body System None
+: Tissue examined microscopically M Missingtissue X:Lesion present A Autolysis precludes examination I: Insufficient tissue Blank Not examined

7 7 7 7 7 7 7 7 7 7 7 7 7 7 7 7 7 7 7 7 7 7 7 7 7 3 3 3 3 3 3 3 3 3 3 3 3 3 3 3 3 3 3 3 3 3 3 3 3 3 6 6 6 6 6 6 6 6 6 6 6 6 6 6 6 6 6 7 7 7 7 7 7 7 7
AhnenaQmKysystem Esophagus
! Gallbladderj Intestine large
i Intestine large, cecumj Intestine large, colon Intestine large, rectum Intestine small Intestine small, dudenum Intestine small, ileum
j Intestine small, jejunum Liver
Hepatocellular carcinoma Hepatocellular adenoma
Mesentery Pancreas Salivary glands Stomach Stomach, forestomach Stomach, glandular Tooth
IEnacrcpiw S p k m Adrenal gland Adrenal gland, cortex Adrenal gland, medulla Islets, pancreatic Parathyroid gland Pituitary gland
Pars distalii, adenoma Thyroid gland
Follicular cell, adenoma
. . . . . . . . . . . . . . . . . . . . . . . . . 50
. . . . . . . . . . . . . . . . . . . . . . . . . 48
. . . . . . . . . . . . . . . . . . . . . . . . . 49
. . . . . . . . . . . . . . . . . . . . . . . . . . 48
. . . . . . . . . . . . . . . . . . . . . . . . . 49 . . . . . . . . . . . . . . . . . . . . . . . . . 49
. . . . . . . . . . . . . . . . . . . . . . . . . 47
. . . . . . . . . . . . . . . . . . . . . . . . . 47
. . . . . . . . . . . . . . . . . . . . . . . . . 47
. . . . . . . . . . . . . . . . . . . . . . . . . 47
. . . . . . . . . . . . . . . . . . . . . . . . . 50 3
x x x x x . 8+ + + + + + 17 . . . . . . . . . . . . . . . . . . . . . . . . . 49 . . . . . . . . . . . . . . . . . . . . . . . . . 49 . . . . . . . . . . . . . . . . . . . . . . . . . 50 . . . . . . . . . . . . . . . . . . . . . . . . . 50 . . . . . . . . . . . . . . . . . . . . . . . . . 49 + 2
. . . . . . . . . . . . . . . . . . . . . . . . . 50
. . . . . . . . . . . . . . . . . . . . . . . . . 49
. . . . . . . . . . . . . . . . . . . . . . . . . 49
. . . . . . . . . . . . . . . . . . . . . . . . . . 48
. . . . . . . . . . . . . . . . . . . . . . . . . 49
. . . . . . . . . . . . . . . . . . . . . . . . . 49
. . . . . . . . . . . . . . . . . . . . . . . . . . 47 X X x x x x x x x x 17 . . . . . . . . . . . . . . . . . . . . . . . . . 49
1
I

102
TABLEB2 IndividualAnimalTumorPathology (continued)
Number of Days on Study
Carcass ID Number
Genital System ovary
Cystadenoma, papillary Oviduct UteNs
Endometrium, polyp stromal
Hematopoietic System Bone marrow Lymph node Lymph node, mandibular Spleen Thymus
Integumentary System Mammary gland
Adenocarcinoma Skin
Subcutaneous tissue, sarcoma
Musculoskeletal System Bone Skeletal muscle
Nervous System Brain
Respiratory System Lung
Alveolar/bronchiolar carcinoma Hepatocellular carcinoma, metastatic, liver
Hepatocellular carcinoma, metastatic, multiple, greater than fne, liver
Nose Trachea
Ethylene Glycol, NTP TR 413
of FemaleMiceinthe 2-YearFeed,Study of EthyleneGlycol: 0 ppm ,
~~~~ ~ ~
. .. 4 5 5 5 5 5 5 5 6 6 6 6 6 6 6 6 6 7 7 7 7 7 7 7 7 7 1 2 3 4 7 7 8 0 0 5 6 6 9 9 9 9 3 3 3 3 3 3 3 3 2 8 0 6 6 4 8 1 5 6 5 5 5 6 6 7 8 1 1 1 1 1 6 6 6
5 5 5 5 5 5 5 5 5 5 5 4 5 5 5 5 5 4 4 4 4 5 5 5 5 2 6 5 3 2 2 8 7 3 5 5 9 0 3 6 0 1 9 9 9 9 0 0 0 1 1 5 3 2 3 5 3 5 4 1 2 5 3 1 2 1 1 1 2 3 4 2 4 5 2
. . . . . . . . . . . . . . . . . . . . . . . . . X X +
. . . . . . . . . . . . . . . . . . . . . . . . . X X
. . . . . . . . . . . . . . . . . . . . . . . . .
. . . . . . . . . . . . . . . . . . . . . . . . . M + + + + + + + + + + + M + + + + + + + + + + + M A + + + + + + + + + + + + + + + + + + + + + + + + A + + + + + + + + + + + + + + + + + + + + + + + +
A + + + + + + + + + + + + + + + + + + + + + + + + X
A + + + + + + + + + + + + + + + + + + + + + + + + X
. . . . . . . . . . . . . . . . . . . . . . . . . + +
. . . . . . . . . . . . . . . . . . . . . . . . .
. . . . . . . . . . . . . . . . . . . . . . . . .
X
X . . . . . . . . . . . . . . . . . . . . . . . . . A + + + + + + + + + + + + + + + + + + + + + + + +

Lesions in Female Mice
Number of Days on Study I
I
Genital System ovary
Cystadenoma,papillary Oviduct Uterus
Endometrium, p o l y p stromal
Hematopoietic System Bone marrow Lymphnode Lymphnode,mandibular Spleen Thymus
Integumentary System Mammarygland
Adenocarcinoma Skin
Subcutaneous tissue, sarcoma
Musculoskelehl System Bone Skeletal muscle
Nervous System Brain
Respiratory System Lung
Alveolar/bronchiolar carcinoma Hepatocellular carcinoma, metastatic, liver
Hepatocellular carcinoma, metastatic, multiple, greater than five, liver
Nose Trachea
7 7 7 7 7 7 7 7 7 7 7 7 7 7 7 7 7 7 7 7 7 7 7 7 7 3 3 3 3 3 3 3 3 3 3 3 3 3 3 3 3 3 3 3 3 3 3 3 3 3 6 6 6 6 6 6 6 6 6 6 6 6 6 6 6 6 6 7 7 7 7 7 7 7 7
5 5 5 5 5 5 5 5 5 5 5 5 5 5 5 5 5 5 5 5 5 5 5 5 5 1 1 1 2 2 3 3 4 4 4 4 4 5 5 6 6 6 7 7 7 7 8 8 8 8 3 4 5 2 4 3 5 1 2 3 4 5 4 5 1 3 4 1 2 3 4 1 2 4 5
+ + + + + + + + + + + + + + + M + + + + + + + + +
+ + . . . . . . . . . . . . . . . . . . . . . . . . .
x
. . . . . . . . . . . . . . . . . . . . . . . . .
. . . . . . . . . . . . . . . . . . . . . . . . . + + + + + + + + M + + + + M + + + + + M M + + + + . . . . . . . . . . . . . . . . . . . . . . . . . . . . . . . . . . . . . . . . . . . . . . . . .
. . . . . . . . . . . . . . . . . . . . . . . . .
. . . . . . . . . . . . . . . . . . . . . . . . .
. . . . . . . . . . . . . . . . . . . . . . . . .
+ + + + + + + + + + M + + + + + + + + + + + + + +
. . . . . . . . . . . . . . . . . . . . . . . . . X
. . . . . . . . . . . . . . . . . . . . . . . . .
. . . . . . . . . . . . . . . . . . . . . . . . .
Totan Tissues/ Tumors
49 2 3
50 3
50 50 43 49 47
49 1
49 1
50 2
49
50 1
1
1 50 49

104 Ethylene Glycol, NTP TR 413
TABLEB2 Individual Animal Tumor Pathology (continued)
Number of Days on Study
Carcass ID Number
Special Senses System Harderian gland
Adenoma
Urinary System Kidney Urinary bladder
Systemic Lesions Multiple organs
Lymphoma malignant lymphocytic Lymphomamalignantmixed Lymphoma malignant undifferentiated
cell type
of Female Mice in the 2-YearFeed Study of Ethylene Glycol: 0 ppm
4 5 5 5 5 5 5 5 6 6 6 6 6 6 6 6 6 7 7 7 7 7 7 7 7 7 1 2 3 4 7 7 8 0 0 5 6 6 9 9 9 9 3 3 3 3 3 3 3 3 2 8 0 6 6 4 8 1 5 6 5 5 5 6 6 7 8 1 1 1 1 1 6 6 6
5 5 5 5 5 5 5 5 5 5 5 4 5 5 5 5 5 4 4 4 4 5 5 5 5 2 6 5 3 2 2 8 7 3 5 5 9 0 3 6 0 1 9 9 9 9 0 0 0 1 1 5 3 2 3 5 3 5 4 1 2 5 3 1 2 1 1 1 2 3 4 2 4 5 2
+ + X
A + + + + + + + + + + + + + + + + + + + + + + + + A + + + + + + + + + + + + + + + + + + + + + + + +
. . . . . . . . . . . . . . . . . . . . . . . . . X X X
x x X
X

Special Senses SystemHarderian gland
Adenoma
Urinary system Kidney Urinarybladder
Systemic Lesions Multiple organs
Lymphomamalignantlymphocytic Lymphomamalignantmixed Lymphomamalignantundifferentiated cell type
5 5 5 5 5 5 5 5 5 5 5 5 5 5 5 5 5 5 5 5 5 5 5 5 5 Total 1 1 1 2 2 3 3 4 4 4 4 4 5 5 6 6 6 7 7 7 7 8 8 8 8 T i s s u d 3 4 5 2 4 3 5 1 2 3 4 5 4 5 1 3 4 1 2 3 4 1 2 4 5 Tumons
+ 3 x 2
. . . . . . . . . . . . . . . . . . . . . . . . . 49
. . . . . . . . . . . . . . . . . . . . . . . . . 49
. . . . . . . . . . . . . . . . . . . . . . . . . 50 3
x x x x x x x x x x 13
1

106
TABLEB2 Individual Animal Tumor Pathology
Number of Days on Study
Carcass ID Number
Alimentary System Esophagus Gallbladder Intestine large Intestine large, cecum Intestine large, colon
Sarcoma Intestine large, rectum Intestine small Intestine small, duodenum Intestine small, ileum Intestine small, jejunum Liver
Adenocarcinoma, metastatic, multiple, ovary
Hepatocellular carcinoma Hepatocellular carcinoma, multiple, two Hepatocellular adenoma
Mesentery Adenocarcinoma, metastatic, multiple, ovary
Sarcoma Pancreas
Adenocarcinoma, metastatic, ovary Sarcoma
Salivary glands Stomach Stomach, forestomach Stomach, glandular Tooth
Cardiovascular System Blood vessel Heart
Ethylene Glycol, NTP TR 413
of Female Mice in the 2-YearFeed Study of Ethylene Glycol: 12,500 ppm
4 4 5 5 5 5 5 5 5 5 6 6 6 6 6 6 6 6 7 7 7 7 7 7 7 7 7 3 3 3 4 5 6 7 9 1 3 4 6 7 8 9 9 1 2 3 3 3 3 3 2 6 3 5 9 3 4 1 7 4 2 3 4 3 9 8 6 6 8 5 6 6 6 6 6
8 9 9 8 8 8 8 8 9 9 9 9 8 8 8 8 8 8 8 9 8 8 8 8 8 8 2 4 7 6 7 9 8 2 1 1 1 9 6 7 5 5 9 8 0 5 5 5 6 6 1 1 4 4 5 3 2 3 5 2 3 4 1 2 2 1 4 5 4 2 2 3 5 1 3
. . . . . . . . . . . . . . . . . . . . + M + + + + + + + + + + + + A + + + + + + + + + + + + + + + + + + + A + + + + + + + + + + + + + + + + + + + A + + + + + + + + + + + + + + + + + + + A + + + + +
X + + + + + + + + + + + + + + A + + + + + + + + + + + + + + + + + + + A + + + + + + + + + + + + + + M + + + + A + + + + + . . . . . . . . . . . . . . . . . . . . + + + + + + + + + + + + + + A + + + + + . . . . . . . . . . . . . . . . . . . . . . . . .
X X X
X + + + + + +
X X
A + + + + + + + + + + + + + + + + + + + X
X . . . . . . . . . . . . . . . . . . . . . . . . . . . . . . . . . . . . . . . . . . . . . . . . . . . . . . . . . . . . . . . . . . . . . . . . . . . . . . . . . + + + +
+ + . . . . . . . . . . . . . . . . . . . .

7 7 7 7 7 7 7 7 7 7 7 7 7 7 7 7 7 7 7 7 7 7 7 7 7 3 3 3 3 3 3 3 3 3 3 3 3 3 3 3 3 3 3 3 3 3 3 3 3 3 6 6 6 6 6 6 6 6 6 6 7 7 7 7 7 7 7 7 7 7 8 8 8 8 8
Alimentary System Esophagus 20 Gallbladder 18 Intestine large 19 Intestine large, cecum 19 Intestine large, colon 19
Sarcoma 1 Intestine large, rectum 19 Intestine small 19 Intestine small, duodenum 18 Intestine small, ileum 19 Intestine small, jejunum 19 Liver . . . . . . . . . . . . . . . . . . . . . . . . . 50
Adenocarcinoma, metastatic, multiple, ovary 1
Hepatocellular carcinoma x x 4 Hepatocellular carcinoma, multiple,two x 1 Hepatocellular adenoma x X x x 5
Mesentery + 7 Adenocarcinoma, metastatic, multiple, ovary 1
Sarcoma 1 Pancreas + + 21
Adenocarcinoma, metastatic, ovary 1 Sarcoma 1
Salivary glands 20 Stomach 20 Stomach, forestomach 20 Stomach, glandular 20 Tooth 4
Cardiovascular System B l o o d vessel 2 Heart 20

10s Ethylene Glycol,NTP TR 413
TABLEB2 Individual Animal Tumor Pathology of Female Mice in the 2-Year Feed Study of Ethylene Glycol: 12,500 ppm (continued)
Number of Dayson Study
Carcass IDNumber
Endocrine System Adrenal gland Adrenal gland, cartex Adrenal gland, medulla
Pheochromocytoma malignant Pheochromocytoma benign
Islets, pancreatic Adenoma
Parathyroid gland Pituitary gland
Pars distalis, adenoma Pars intermedia, adenoma
Thyroid gland Follicular cell, adenoma
General Body System Tissue NOS
Sarcoma
GenitalSystem ovary
Adenocarcinoma Cystadenoma, papillary
Uterus Endometrium, polyp stromal
Hematopoietic System B l o o d Bone marrow Lymph node
Mediastinal, adenocarcinoma, metastatic, ovary
Lymph node, mandibular Spleen Thymus
IntegumentarySystem Mammary gland Skin
4 4 5 5 5 5 5 5 5 5 6 6 6 6 6 6 6 6 7 7 7 7 7 7 7 7 7 3 3 3 4 5 6 7 9 1 3 4 6 7 8 9 9 1 2 3 3 3 3 3 2 6 3 5 9 3 4 1 7 4 2 3 4 3 9 8 6 6 8 5 6 6 6 6 6
8 9 9 8 8 8 8 8 9 9 9 9 8 8 8 8 8 8 8 9 8 8 8 8 8 8 2 4 7 6 7 9 8 2 1 1 1 9 6 7 5 5 9 8 0 5 5 5 6 6 1 1 4 4 5 3 2 3 5 2 3 4 1 2 2 1 4 5 4 2 2 3 . 5 1 3
. . . . . . . . . . . . . . . . . . . .
. . . . . . . . . . . . . . . . . . . .
. . . . . . . . . . . . . . . . . . . .
X A + + + + + + + + + + + + + + + + + + +
X + + M + + + + + + + + + + + + + M + + + . . . . . . . . . . . . . . . . . . . .
X x x X
. . . . . . . . . . . . . . . . . . . . . . . . . X
+ + X
. . . . . . . . . . . . . . . . . . . . . X
. . . . . . . . . . . . . . . . . . . . . . . . . X X
+ . . . . . . . . . . . . . . . . . . . . . . . . . . . . . . . . . . . . . . . . .
X . . . . . . . . . . . . . . . . . . . . . . . . . . . . . . . . . . . . . . . . . + + + + + + + + + + + + + + + A + + + + +
. . . . . . . . . . . . . . . . . . . . .
. . . . . . . . . . . . . . . . . . . . . . + +

Number OP Days on Study
Endmrine System Adrenal gland Adrenal gland, cortex Adrenal gland, medulla
Pheochromocytoma malignant Pheochromocytoma benign
Islets, pancreatic Adenoma
Parathyroid gland Pituitary gland
Pars distalis, adenoma Pars intermedia, adenoma
Thyroid gland Follicular cell, adenoma
General Bady System Tissue NOS
Sarcoma
~~~
Genital System ovary
Adenocarcinoma Cystadenoma, papillary
Uterus Endometrium, pow stromal
Hematopoietic System Blood Bone marrow Lymph node
Mediastinal, adenocarcinoma, metastatic, ovary
Lymph node, mandibular Spleen Thymus
Integumentary System Mammary gland Skin
7 7 7 7 7 7 7 7 7 7 7 7 7 7 7 7 7 7 7 7 7 7 7 7 7 3 3 3 3 3 3 3 3 3 3 3 3 3 3 3 3 3 3 3 3 3 3 3 3 3 6 6 6 6 6 6 6 6 6 6 7 7 7 7 7 7 7 7 7 7 8 8 8 8 8
+ 21 + 21 + 21 x 1
1 19 1 18 + + 22
x x 5 1
. . . . . . . . . . . . . . . . . . . . . . . . . 50
+ + + x
+ + + + + + + + + + + + + + +
+ + '+
+ + + + + + + + 29
19
20 + + + + + + + + + + + + + + + + + + + 43
1
2 1
+ 25 1 1
+ + + + + 45 x 3
1 20 24
1 21

110
TABLEB2 IndividualAnimalTumorPathology (continued)
Number of Days on Study
Carcass ID Number
Musculoskeletal System Bone
Osteosarcoma Skeletal muscle
Osteosarcoma, metastatic, bone Neck, sarcoma Thoracic, sarcoma
Nervous System Brain
~ ~~ ~~
Respiratory System Lung
Adenocarcinoma, metastatic, multiple, greater than five, ovary
Alveolarlbronchiolar adenoma Alveolarlbronchiolar carcinoma
NOX Trachea
Special Senses System Harderian gland
Adenoma Carcinoma
Urinary System Kidney Urinary bladder
Systemic Lesions Multiple organs
Lymphoma malignant histiocytic Lymphoma malignant lymphocytic Lymphoma malignant mixed
Ethylene Glycol, NTP TR 413
of FemaleMiceinthe 2-YearFeed Study of EthyleneGlycol: 12,500 ppm .
4 4 5 5 5 5 5 5 5 5 6 6 6 6 6 6 6 6 7 7 7 7 7 7 7 7 7 3 3 3 4 5 6 7 9 1 3 4 6 7 8 9 9 1 2 3 3 3 3 3 2 6 3 5 9 3 4 1 7 4 2 3 4 3 9 8 6 6 8 5 6 6 6 6 6
8 9 9 8 8 8 8 8 9 9 9 9 8 8 8 8 8 8 8 9 8 8 8 8 8 8 2 4 7 6 7 9 8 2 1 1 1 9 6 7 5 5 9 8 0 5 5 5 6 6 1 1 4 4 5 3 2 3 5 2 3 4 1 2 2 1 4 5 4 2 2 3 5 1 3
. . . . . . . . . . . . . . . . . . . . X + + X
X X
. . . . . . . . . . . . . . . . . . . . _ _ _ _ _ _ _ _ ~ ~~ _ _ _ _ ~
. . . . . . . . . . . . . . . . . . . . . . . . .
X X X X
X . . . . . . . . . . . . . . . . . . . . . . . . . . . . . . . . . . . . . . . .
. . . . . . . . . . . . . . . . . . . . . . . . . A + + + + + + + + + + + + + + + + + + +
. . . . . . . . . . . . . . . . . . . . . . . . . X X
X X X X

Lesions in Female Mice
TABLE B2
8 8 8 8 8 8 8 9 9 9 9 9 9 9 9 9 9 9 9 9 9 9 9 9 9 Total 6 7 7 8 8 9 9 0 0 0 0 1 1 2 2 2 3 3 3 3 3 4 4 4 4 Tissuw 4 1 5 2 5 3 4 1 3 4 5 1 5 2 3 4 1 2 3 4 5 1 2 3 5 Turnom
Musculoskeletal System Bone 20
Osteosarcoma 1 Skeletal muscle 2
Osteosarcoma,metastatic,bone 1 Neck,Sarcoma 1 Thoracic, Sarcoma 1
Nervous System Brain u)
Respiratory System Lung . . . . . . . . . . . . . . . . . . . . . . . . . 50
Adenocarcinoma,metastatic,multiple, greaterthan five, ovary 1
Alveolarbronchiolar adenoma X 4 Alveolarbronchiolar carcinoma X 2
Nose 20 Trachea 20
Special Senses System Harderiangland + + 2
Adenoma X 1 Carcinoma x 1
Urinary System Kidney . . . . . . . . . . . . . . . . . . . . . . . . . 50 Urinarybladder 19
Systemic Lesions Multiple organs . . . . . . . . . . . . . . . . . . . . . . . . . 50
Lymphomamalignanthistiocytic 2 Lymphomamalignantlymphocytic X X 3 Lymphomamalignantmixed X x x x X 8

112 Ethylene Glycol, NTP TR 413
TABLEB2 Individual Animal Tumor Pathology of Female Mice in the 2-YearFeed Study of Ethylene Glycol: 25,OOO ppm
Number of Days on Study
Carcass ID Number
Alimentary System Esophagus Gallbladder Intestine large Intestine large, cecum Intestine large, colon Intestine large, rectum Intestine small Intestine small, duodenum Intestine small, ileum Intestine small, jejunum Liver
Hepatocellular carcinoma Hepatocellular adenoma
Mesentery Pancreas Salivary glands Stomach Stomach, forestomach Stomach, glandular Tooth
Cardiovascular System Heart
Endocrine System Adrenal gland Adrenal gland, cortex Adrenal gland, medulla
Pheochromocytoma benign Islets, pancreatic Parathyroid gland Pituitary gland
Pars distalis, adenoma Pars distalis, carcinoma
Thyroid gland Follicular cell, adenoma
0 3 4 5 5 5 5 5 5 6 6 6 6 6 6 6 6 6 7 7 7 7 7 7 7 9 6 9 0 . 1 3 3 4 7 1 3 3 3 4 6 6 8 9 0 0 3 3 3 3 3 8 7 0 0 1 5 8 8 9 2 4 8 9 4 5 5 1 1 0 8 0 6 6 6 6
8 7 8 7 7 8 8 8 7 8 8 7 7 7 7 8 7 7 7 7 8 7 7 7 7 3 6 0 6 9 0 0 2 8 1 1 6 6 5 9 2 4 3 8 9 1 3 3 3 3 1 1 5 4 1 4 3 5 2 , 4 2 2 3 1 4 3 2 3 4 5 5 1 2 4 5
. . . . . . . . . . . . . . . . . . . . .
. . . . . . . . . . . . . . . . . . . . .
. . . . . . . . . . . . . . . . . . . . . M + + + + + A + + A + + + + + + + + + A A + + + + + + A + + + + + + + + + + ' + + A + + + + + + + A + + A + + + + + + + + + A A + + + + + + A + + A + + + + + + + + + A A + + + + + + A + + A + + ' + + + + + + + A A M + + + + + A + + A + + + + + + + + + A A M + + + + + A + + A + + + + + + + + + A A . . . . . . . . . . . . . . . . . . . . . . . . . .
X X X x x X + + + + + + + + + + + + +
. . . . . . . . . . . . . . . . . . . . . +
. . . . . . . . . . . . . . . . . . . . .
. . . . . . . . . . . . . . . . . . . . .
. . . . . . . . . . . . . . . . . . . . .
. . . . . . . . . . . . . . . . . . . . . +
. . . . . . . . . . . . . . . . . . . . .
. . . . . . . . . . . . . . . . . . . . .
. . . . . . . . . . . . . . . . . . . . .
. . . . . . . . . . . . . . . . . . . . . X
. . . . . . . . . . . . . . . . . . . . . M + + + + + + M + + + M M M M + + M + + + + + + + + + + + + + + + + + + + + + + M +
X x x x X . . . . . . . . . . . . . . . . . . . . . . . . . .

7 7 7 7 7 7 7 7 7 7 7 7 7 7 7 7 7 7 7 7 7 7 7 7 7 7 Number of Days QQ Study 3 3 3 3 3 3 3 3 3 3 3 3 3 3 3 3 3 3 3 3 3 3 3 3 3 3
6 6 6 6 6 6 6 6 6 6 6 7 7 7 7 7 7 7 7 7 7 8 8 8 8 8
7 7 7 7 7 7 7 7 7 7 7 7 7 7 7 7 7 7 8 8 8 7 8 8 8 8 Total 4 4 4 4 5 5 5 , 5 6 7 7 7 7 7 8 8 9 9 0 0 1 8 1 2 2 2 Tissues/ 1 3 4 5 2 3 4 5 5 1 2 3 4 5 1 3 2 3 1 2 1 5 3 1 2 4 Turnom
Alimentary System Esophagus 21 Gallbladder 21 Intestine large 19 Intestine large, cecum 16 Intestine large, colon 19 Intestine large, rectum 17 Intestine small 17 Intestine small, duodenum 17 Intestine small, ileum 16 Intestine small, jejunum 16 Liver . . . . . . . . . . . . . . . . . . . . . . . . . . 51
Hepatocellular carcinoma x x X 6 Hepatocellular adenoma x x x x x 8
Mesentery + + 15 Pancreas 22 Salivary glands 21 Stomach 20 Stomach, forestomach 2 0 .
Stomach, glandular 20 Tooth 1
Cardiovascular System H a r t 21
!I Endocrine Systemii Adrenal gland 21i Adrenal gland, cortex 21I Adrenal gland, medulla 21ij Pheochromocytoma benign 1 I Islets, pancreatic 21 i Parathyroid gland 14 ! Pituitary gland + + + 231
iI
Pars distalis, adenoma x x x 7 Pars distalis, carcinoma 1
‘ Thyroidgland . . . . . . . . . . . . . . . . . . . . . . . . . . 51 Follicular cell, adenoma x 1
I

114 Ethylene Glycol, NTP TR 413
TABLEB2 Individual Animal Tumor Pathology (continued)
Number of Days on Study
Carcass ID Number
General Body System Tissue NOS
Genital System ovary
Cystadenoma, papillary Oviduct Uterus
Endometrium, polyp stromal
Hematopoietic System Bone marrow Lymph node Lymph node, mandibular Spleen
Hemangiosarcoma Thymus
Integumentary System Mammary gland
Adenocarcinoma Skin
Subcutaneous tissue, fibrosarcoma Subcutaneous tissue, hemangiosarcoma
Musculoskeletal System Bone
Osteosarcoma Skeletal muscle
Nervous System Brain
of Female Mice in the 2-YearFeed Study of Ethylene Glycol: 25,OOO ppm
0 3 4 5 5 5 5 5 5 6 6 6 6 6 6 6 6 6 7 7 7 7 7 7 7 9 6 9 0 1 3 3 4 7 1 3 3 3 4 6 6 8 9 0 0 3 3 3 3 3 8 7 0 0 1 5 8 8 9 2 4 8 9 4 5 5 1 1 0 8 0 6 6 6 6
8 7 8 7 7 8 8 8 7 8 8 7 7 7 7 8 7 7 7 7 8 7 7 7 7 3 6 0 6 9 0 0 2 8 1 1 6 6 5 9 2 4 3 8 9 1 3 3 3 3 1 1 5 4 1 4 3 5 2 4 2 2 3 1 4 3 2 3 4 5 5 1 2 4 5
+ + + + + + + + + + + + + + + + + + +
+ + + + . . . . . . . . . . . . . . . . . . . . . . . + X
. . . . . . . . . . . . . . . . . . . . .
. . . . . . . . . . . . . . . . . . . . . + M + + + + + + + M + + + + + + + + + + + + + + + + + + + + + + + + + + + + + + M + ++ + + + + + + M + + + + + + + + + + + + M t
. . . . . . . . . . . . . . . . . . . . . X
. . . . . . . . . . . . . . . . . . . . . . . . X
. . . . . . . . . . . . . . . . . . . . . X
+ +
. . . . . . . . . . . . . . . . . . . . .

115
I
Lesions in Female Mice
TABLEI52 wMmn himan T ~ ~ O Um h o n w (continued)
Number of Days on Study
@- ID Number
General Bady System Tissue N O S
Genital System ovary
Cystadenoma,papillary Oviduct Uterus
Endometrium, polyp stromal
Wematoopoietic System Bonemarrow Lymphnode Lymphnode,mandibular Spleen
Hemangiosarcoma Thymus
Integumentary System Mammarygland
Adenocarcinoma Skin
Subcutaneoustissue,fibrosarcoma Subcutaneoustissue,hemangiosarcoma
Musculoskeletal System Bone
Osteosarcoma Skeletalmuscle
~
Nervous System ~
Brain
pemane MIOE uaae 2 - m ~IF& S O M ~ ~maayneme mpn: E+INTJ ppm
7 7 7 7 7 7 7 7 7 7 7 7 7 7 7 7 7 7 7 7 7 7 7 7 7 7 3 3 3 3 3 3 3 3 3 3 3 3 3 3 3 3 3 3 3 3 3 3 3 3 3 3 6 6 6 6 6 6 6 6 6 6 6 7 7 7 7 7 7 7 7 7 7 8 8 8 8 8
7 7 7 7 7 7 7 7 7 7 7 7 7 7 7 7 7 7 8 8 8 7 8 8 8 8 TohU 4 4 4 4 5 5 5 5 6 7 7 7 7 7 8 8 9 9 0 0 1 8 1 2 2 2 Tisslaesi 1 3 4 5 2 3 4 5 5 1 2 3 4 5 1 3 2 3 1 2 1 5 3 1 2 4 Tumors
+ 1
+ + + + + + 2 5 x 1
4 + + + + + + + + + + + + + + + + + + + + + 45
1
21 + 22 + 20
+ + + + + + 28 X 1
19
21 1 + + + + + + + + + + + + + + + + 40
X 2 X 1
21 1 2
21

116 Ethylene Glycol, NTP TR 413
TABLEB2 Individual Animal Tumor Pathology (continued)
Number of Days on Study
Carcass ID Number
Respiratory System Lung
Ahreolarbronchiolar adenoma Ahreolarbronchiolar carcinoma Carcinoma, metastatic, harderian gland Osteosarcoma, metastatic, bone
Nose Trachea
Special Senses System EyeHarderian gland
Adenoma Carcinoma
Urinary System Kidney
Osteosarcoma, metastatic, bone Urinary bladder
Systemic Lesions Multiple organs
Lymphoma malignant histiocytic Lymphoma malignant lymphocytic Lymphomamalignantmixed
of Female Mice in the 2-YearFeed Study of Ethylene Glycol: 25,OOO ppm
0 3 4 5 5 5 5 5 5 6 6 6 6 6 6 6 6 6 7 7 7 7 7 7 7 9 6 9 0 1 3 3 4 7 1 3 3 3 4 6 6 8 9 0 0 3 3 3 3 3 8 7 0 0 1 5 8 8 9 2 4 8 9 4 5 5 1 1 0 8 0 6 6 6 6
8 7 8 7 7 8 8 8 7 8 8 7 7 7 7 8 7 7 7 7 8 7 7 7 7 3 6 0 6 9 0 0 2 8 1 1 6 6 5 9 2 4 3 8 9 1 3 3 3 3 1 1 5 4 1 4 3 5 2 4 2 2 3 1 4 3 2 3 4 5 5 1 2 4 5
. . . . . . . . . . . . . . . . . . . . . . . . . X
X X
X . . . . . . . . . . . . . . . . . . . . . . . . . . . . . . . . . . . . . . . . . .
+ X
+ + + + + + + + + + + + + + + + + + + A + + + + + X
. . . . . . . . . . . . . . . . . . . . .
. . . . . . . . . . . . . . . . . . . . . . . . . X
X X x x

117 Lesions in Female Mice
Respiratory System Lung
Alveolar/bronchiolar adenoma Alveolar/bronchiolar carcinoma Carcinoma,metastatic,harderiangland Osteosarcoma,metastatic,bone
Nose Trachea
Special Senses System EyeHarderiangland
Adenoma Carcinoma
Urinary System Kidney
Osteosarcoma,metastatic,bone Urinarybladder
Systemic Lesions Multiple organs
Lymphomamalignanthistiocytic Lymphomamalignantlymphocytic Lymphomamalignantmixed
7 7 7 7 7 7 7 7 7 7 7 7 7 7 7 7 7 7 7 7 7 7 7 7 7 7 3 3 3 3 3 3 3 3 3 3 3 3 3 3 3 3 3 3 3 3 3 3 3 3 3 3 6 6 6 6 6 6 6 6 6 6 6 7 7 7 7 7 7 7 7 7 7 8 8 8 8 8
7 7 7 7 7 7 7 7 7 7 7 7 7 7 7 7 7 7 8 8 8 7 8 8 8 8 Total 4 4 4 4 5 5 5 5 6 7 7 7 7 7 8 8 9 9 0 0 1 8 1 2 2 2 Tissues/ 1 3 4 5 2 3 4 5 5 1 2 3 4 5 1 3 2 3 1 2 1 5 3 1 2 4 Tumors
. . . . . . . . . . . . . . . . . . . . . . . . . . 51 x x x 4
x 2 1 1 21 21
+ 1 + 2 x 1
1
. . . . . . . . . . . . . . . . . . . . . . . . . . 50 1 21
. . . . . . . . . . . . . . . . . . . . . . . . . . 51 x 2
x x 4 x 3

118 Ethylene Glycol, NTP TR 413
TABLEB2 Individual Animal Tumor Pathology of Female Mice in the 2-Year Feed Study of Ethylene Glycol: 50,OOO ppm
3 4 4 5 5 6 6 6 6 6 6 6 7 7 7 7 7 7 7 7 7 7 7 7 7 Number of Days on Study 9 5 6 0 4 3 3 5 6 6 , 6 8 0 3 3 3 3 3 3 3 3 3 3 3 3
1 7 9 0 1 4 9 9 5 5 5 2 8 6 6 6 6 6 6 6 6 6 6 6 6
6 6 6 6 6 6 6 6 6 6 6 6 6 6 6 6 6 6 6 6 6 6 6 6 6 Carcass ID Number 2 8 2 4 6 7 1 2 6 6 7 2 5 1 1 1 1 2 3 3 3 3 3 4 4
1 1 2 2 2 5 4 5 4 5 4 3 1 1 2 3 5 4 1 2 3 4 5 1 3
Alimentary System Esophagus . . . . . . . . . . . . . . . . . . . . . . . . . Gallbladder M + + + + + + + + + + + + + + + + + + + + + + + + Intestine large . . . . . . . . . . . . . . . . . . . . . . . . . . Intestine large, cecum . . . . . . . . . . . . . . . . . . . . . . . . . Intestine large, colon . . . . . . . . . . . . . . . . . . . . . . . . . Intestine large, rectum . . . . . . . . . . . . . . . . . . . . . . . . . . Intestine small . . . . . . . . . . . . . . . . . . . . . . . . . . Intestine small, duodenum . . . . . . . . . . . . . . . . . . . . . . . . . Intestine small, ileum . . . . . . . . . . . . . . . . . . . . . . . . . Intestine small, jejunum . . . . . . . . . . . . . . . . . . . . . . . . . Liver . . . . . . . . . . . . . . . . . . . . . . . . . .
Hepatocellular carcinoma x x Hepatocellular adenoma X X X x x
Mesentery + + + + + + I .
Sarcoma X Pancreas . . . . . . . . . . . . . . . . . . . . . . . . . Salivary glands . . . . . . . . . . . . . . . . . . . . . . . . . . Stomach . . . . . . . . . . . . . . . . . . . . . . . . . . Stomach, forestomach . . . . . . . . . . . . . . . . . . . . . . . . . . , .
Stomach, glandular . . . . . . . . . . . . . . . . . . . . . . . . . Tooth +
Cardiovascular System B l o o d vessel Heart . . . . . . . . . . . . . . . . . . . . . . . . .
.. . Endocrine System
Adrenal gland . . . . . . . . . . . . . . . . . . . . . . . . . Adrenal gland, cortex . . . . . . . . . . . . . . . . . . . . . . . . . Adrenal gland, medulla . . . . . . . . . . . . . . . . . . . . . . . . . . . Islets,pancreatic , . . . . . . . . . . . . . . . . . . . . . . . . . . Parathyroid gland + + + + + M M + + + + + + M + + + M + + + + + + + Pituitary gland
'
' M + + + + + + + + + + + + + + + + M + + + + + + + Pars distalis, adenoma x x x x X
. ,Pars intermedia, adenoma X Thyroid gland . . . . . . . . . . . . . . . . . . . . . . . . . . .
Follicular cell, adenoma x x
GeneralBody System None

Alimentary System Esophagus Gallbladder Intestine large Intestine large, cecum Intestine large, colon Intestine large, rectum Intestine small Intestine small, duodenum Intestine small, ileum Intestine small, jejunum Liver
Hepatocellular carcinoma Hepatocellular adenoma
Mesentery Sarcoma
Pancreas Salivary glands Stomach Stomach, forestomach Stomach, glandular Tooth
Cardiovascular System Blood vessel Heart
Endcrcrine System Adrenal gland Adrenal gland, cortex Adrenal gland, medulla Islets, pancreatic Parathyroid gland Pituitary gland
Pars distalis, adenoma Pars intermedia, adenoma
Thyroid gland Follicular cel l , adenoma
7 7 7 7 7 7 7 7 7 7 7 7 7 7 7 7 7 7 7 7 7 7 7 7 7 3 3 3 3 3 3 3 3 3 3 3 3 3 3 3 3 3 3 3 3 3 3 3 3 3 6 6 6 7 7 7 7 7 7 7 7 7 7 8 8 8 8 8 8 8 8 8 8 8 8
6 6 6 6 6 6 6 6 6 6 6 6 6 6 6 6 6 6 6 6 7 7 7 7 7 Total 4 4 5 5 5 5 6 6 7 7 7 8 8 8 8 9 9 9 9 9 0 0 0 0 0 Tissaad 4 5 2 3 4 5 1 3 1 2 3 2 3 4 5 1 2 3 4 5 1 2 3 4 5 Tumors
. . . . . . . . . . . . . . . . . . . . . . . . . 50
. . . . . . . . . . . . . . . . . . . . . . . . . 49
. . . . . . . . . . . . . . . . . . . . . . . . . 50
. . . . . . . . . . . . . . . . . . . . . . . . . 50
. . . . . . . . . . . . . . . . . . . . . . . . . 50
. . . . . . . . . . . . . . . . . . . . . . . . . 50
. . . . . . . . . . . . . . . . . . . . . . . . . 50
. . . . . . . . . . . . . . . . . . . . . . . . . 50
. . . . . . . . . . . . . . . . . . . . . . . . . . 50
. . . . . . . . . . . . . . . . . . . . . . . . . 50
. . . . . . . . . . . . . . . . . . . . . . . . . 50 x 3
x x 7+ 7 1
. . . . . . . . . . . . . . . . . . . . . . . . . 50
. . . . . . . . . . . . . . . . . . . . . . . . . 50
. . . . . . . . . . . . . . . . . . . . . . . . . 50
. . . . . . . . . . . . . . . . . . . . . . . . . 50
. . . . . . . . . . . . . . . . . . . . . . . . . 50 + + 3
+ 1 . . . . . . . . . . . . . . . . . . . . . . . . . 50
. . . . . . . . . . . . . . . . . . . . . . . . . 50
. . . . . . . . . . . . . . . . . . . . . . . . . 50
. . . . . . . . . . . . . . . . . . . . . . . . . 50 . . . . . . . . . . . . . . . . . . . . . . . . . 50 + + + + M + + M + M + + + + + + M + + + + + + + + 42 + + + + + + + + + + + + + M + + + + + + + + + + + 47 x x x x x x x x x x x 16
1 . . . . . . . . . . . . . . . . . . . . . . . . . 50
x 3

120 Ethylene Glycol, NTP TR 413
TABLEB2 Individual Animal Tumor Pathology of Female Mice in the 2-YearFeed Study of Ethylene Glycol: 50,OOO ppm (continued)
Number of Days on Study
Carcass ID Number
Genital System *ary
Cystadenoma, papillary Teratoma NOS
Oviduct Uterus
Adenocarcinoma ,Leiomyosarcoma Endometrium, polyp stromal
Hematopoietic System Bone marrow Lymph node Lymph node, mandibular Spleen Thymus
Integumentary System Mamma7 gland
Adenoacanthoma Skin
Musculoskeletal System Bone Skeletal muscle
Abdominal, sarcoma
Nervous system Brain
Respiratory System Lung
Alveolar/bronchiolar adenoma Carcinoma, metastatic, harderian gland Carcinoma, metastatic, uncertain primary site
NOS&? Trachea
3 4 4 5 5 6 6 6 6 6 6 6 7 7 7 7 7 7 7 7 7 7 7 7 7 9 5 6 0 4 3 3 5 6 6 6 8 0 3 3 3 3 3 3 3 3 3 3 3 3 1 7 9 0 1 4 9 9 5 5 5 2 8 6 6 6 6 6 6 6 6 6 6 6 6
6 6 6 6 6 6 6 6 6 6 6 6 6 6 6 6 6 6 6 6 6 6 6 6 6 2 8 2 4 6 7 1 2 6 6 7 2 5 1 1 1 1 2 3 3 3 3 3 4 4 1 1 2 2 2 5 4 5 4 5 4 3 1 1 2 3 5 4 1 2 3 4 5 1 3
. . . . . . . . . . . . . . . . . . . . . . . . . X X X X
X +
. . . . . . . . . . . . . . . . . . . . . . . . . X
X X
. . . . . . . . . . . . . . . . . . . . . . . . .
. . . . . . . . . . . . . . . . . . . . . . . . . M + + + + + + + + + + + + + + + + + + , + + + + + + . . . . . . . . . . . . . . . . . . . . . . . . . + + + + + + + + + + + + + + + + + M + + + + + + +
. . . . . . . . . . . . . . . . . . . . . . . . . X
. . . . . . . . . . . . . . . . . . . . . . . . .
. . . . . . . . . . . . . . . . . . . . . . . . . + X
. . . . . . . . . . . . . . . . . . . . . . . . .
. . . . . . . . . . . . . . . . . . . . . . . . . X
. . . . . . . . . . . . . . . . . . . . . . . . .
. . . . . . . . . . . . . . . . . . . . . . . . .

lLasionas in Female Mice
TABLE BZ h d i V i d M d h iman ~um011.P ~ U ~ O U ~ in uhe Z-YWI~. mhynene G U ~ C O ~OP Femana: ~ i m IF^ shdy m,m ppm (continued)
Number of Days on Study
Genital System ovary
Cystadenoma,papillary Teratoma NOS
Oviduct Uterus
Adenocarcinoma Leiomyosarcoma Endometrium, polyp stromal
Hematopoietic System Bonemarrow Lymphnode Lymphnode,mandibular Spleen Thymus
Integumentary System Mammarygland
Adenoacanthoma Skin
Musculoskeletal System Bone Skeletal muscle
Abdominal,sarcoma
Nervous System Brain
Respiratory System Lung
Ahreolarbronchiolar adenoma Carcinoma,metastatic,harderiangland Carcinoma,metastatic,uncertain primary site
Nose Trachea
7 7 7 7 7 7 7 7 7 7 7 7 7 7 7 7 7 7 7 7 7 7 7 7 7 3 3 3 3 3 3 3 3 3 3 3 3 3 3 3 3 3 3 3 3 3 3 3 3 3 6 6 6 7 7 7 7 7 7 7 7 7 7 8 8 8 8 8 8 8 8 8 8 8 8
6 6 6 6 6 6 6 6 6 6 6 6 6 6 6 6 6 6 6 6 7 7 7 7 7 ToUd 4 4 5 5 5 5 6 6 7 7 7 8 8 8 8 9 9 9 9 9 0 0 0 0 0 Tissues/4 5 2 3 4 5 1 3 1 2 3 2 3 4 5 1 2 3 4 5 1 2 3 4 5 Tumors
+ + + + + + M + + + + + + M + + + + + + + + + + + 4h 4 1 1
. . . . . . . . . . . . . . . . . . . . . . . . . 50 1 1 1
. . . . . . . . . . . . . . . . . . . . . . . . . 50
. . . . . . . . . . . . . . . . . . . . . . . . . 50
. . . . . . . . . . . . . . . . . . . . . . . . . 49
. . . . . . . . . . . . . . . . . . . . . . . . . 50 + + + + + + + M + + + + + M + + + + + + + + + + + 47
. . . . . . . . . . . . . . . . . . . . . . . . . 50 1
. . . . . . . . . . . . . . . . . . . . . . . . . 50
. . . . . . . . . . . . . . . . . . . . . . . . . 50 1 1
. . . . . . . . . . . . . . . . . . . . . . . . . 50
. . . . . . . . . . . . . . . . . . . . . . . . . 50 1
x 1
X 1 . . . . . . . . . . . . . . . . . . . . . . . . . 50 . . . . . . . . . . . . . . . . . . . . . . . . . 50
I

122 Ethylene Glycol, NTP TR 413
TABLEB2 Individual Animal Tumor Pathology (continued)
Number of Days on Study
Carcass ID Number
Special Senses System EyeHarderiangland
Carcinoma
Urinary System Kidney Urinary bladder
Systemic Lesions Multiple organs
Lymphomamalignanthistiocytic Lymphomamalignantmixed
of Female Mice in the 2-YearFeed Study of Ethylene Glycol: 50,OOO ppm
3 4 4 5 5 6 6 6 6 6 6 6 7 7 7 7 7 7 7 7 7 7 7 7 7 9 , 5 6 0 4 3 3 5 6 6 6 8 0 3 3 3 3 3 3 3 3 3 3 3 3 1 7 9 0 1 4 9 9 5 5 . 5 2 8 6 6 6 6 6 6 6 6 6 6 6 6
6 6 6 6 6 6 6 6 6 6 6 6 6 6 . 6 6 6 6 6 6 6 6 6 6 6 2 8 2 4 6 7 1 2 6 6 7 2 5 1 1 1 3 2 3 3 3 3 3 4 4 1 1 2 2 2 5 4 5 4 5 4 3 1 1 2 3 5 4 1 2 3 4 5 1 3
+ + X
. . . . . . . . . . . . . . . . . . . . . . . . .
. . . . . . . . . . . . . . . . . . . . . . . . .
. . . . . . . . . . . . . . . . . . . . . . . . . X
X x x X

Special senses System EyeHarderian gland
Carcinoma
Urinary System Kidney Urinarybladder
Systemic Lesions Multiple organs
Lymphomamalignanthistiocytic Lymphomamalignant mixed
7 7 7 7 7 7 7 7 7 7 7 7 7 7 7 7 7 7 7 7 7 7 7 7 7 3 3 3 3 3 3 3 3 3 3 3 3 3 3 3 3 3 3 3 3 3 3 3 3 3 6 6 6 7 7 7 7 7 7 7 7 7 7 8 8 8 8 8 8 8 8 8 8 8 8
6 6 6 6 6 6 6 6 6 6 6 6 6 6 6 6 6 6 6 6 7 7 7 7 7 TOM 4 4 5 5 5 5 6 6 7 7 7 8 8 8 8 9 9 9 9 9 0 0 0 0 0 Tissues/ 4 5 2 3 4 5 1 3 1 2 3 2 3 4 5 1 2 3 4 5 1 2 3 4 5 Tomom
1 + 2 x 2
. . . . . . . . . . . . . . . . . . . . . . . . . 50
. . . . . . . . . . . . . . . . . . . . . . . . . 50
. . . . . . . . . . . . . . . . . . . . . . . . . 50 1
x x 6

124 Ethylene Glycol, NTP TR 413
TABLEB3 Statistical Analysis of Primary Neoplasms in Female Mice in the 2-YearFeed Study of Ethylene Glycol
Liver: Hepatocellular Adenoma Overall ratesa Adjusted ratesb Terminal rates' Firstincidencedays6 )Life table tests Logistic regressim testsd Cochran-Armita e testdIFisher exact .test
Liver: Hepatocellular Carcinoma Overall rates Adjusted rates Terminal rates First incidence (days) Life table tests Logistic regression tests Cochran-Armitage test Fisher exact test
Liver: Hepatocellular Adenoma or Carcinoma Overall rates Adjusted rates Terminal rates First incidence (days) Life table tests Logistic regression tests Cochran-Armitage test Fisher exact test
Lung: Alveolar/bronchiolar Adenoma Overall rates Adjusted rates Terminal rates First incidence (days) Life table tests Logistic regreision tests Cochran-Armitage test Fisher exact test
Lung: Alveolar/bronchiolar Adenoma or Carcinoma Overall rates Adjusted rates Terminal rates First incidence (days) Life table tests Logistic regression tests Cochran-Armitage test Fisher exact test
0 PPm
8/50 (16%) 22.7% 6/33 (18%) 696 P=0.444N P=0.505N P=0.553N
3/50 (6%) 7.7% 0133 (0%) 655 P=0.443N P=0.502N P=0.516N
10/50 (20%) 26.5% 6/33 (18%) 655 P=0.484N P=O.515 P=O.468
0/50 (0%) 0.0% OB3 (0%)
e-P=0.566N P=O.568 P=O.570
1/50 (2%) 3.0% 1/33 (3%) 731 (9P=0.337N P=0.384N P=0.388N
12,500 ppm
5/50 (10%) 15.7% 4/30 (13%) 679 P-0.338N P=0.303N
P=0.277N
5/50 (10%) 15.3% 3/30 (10%) 679 P=O.320 P=O.344
P=O.357
9/50 (18%) 27.9% 7/30 (23%)679 P=0.581N P=0.539N
P=0.500N
4/50 (8%) 10.9% 2/30 (7%)472 P-0.058 P=O.o68
P=O.O59
6/50 (12%) 16.6% 3/30 (10%) 472 PsO.051 P=O.o60
PsO.056
25,OOO ppm
8/51(16%) 22.9% 5/30 (17%) 634 €?=OS40 P=O.583
P=0.590N
6/51 (12%) 17.9% 4/30 (13%) 612 P=O.219 P=O.238
P=O.254
14/51(27%) 38.6% 9/30 (30%)612 P=O.195 P=O.218
P=O.260
4/51 (8%) 12.0% 3/30 (10%) 548 P=O.O55 P=O.O63
P=O.O61
6/51(12%) 18.0% 4/30 (13%) 548 P=0.049 P=O.O54
P=O.O59
50,OOO ppm
7/50 (14%) 18.1% 6/37 (16%) 639 P=0.414N P=0.449N
P=0.500N
3/50 (6%) 7.2% 1/37 (3%) 659 P=0.619N P=O.659
P=0.661N
10/50 (20%) 24.4% 7/37 (19%) 639 P=O.500N P=0.573N
P=0.598N
1/50 (2%) 2.7% 1/37 (3%) 731 (9P =OS23 P=O.523
P=O.500
1/50 (2%) 2.7% 1/37 (3%) 731 (9P=0.736N P=0.736N
P=0.753N

125 Lesions in Female Mice
Ovary: Cystadenoma Overall rates Adjusted rates Terminal rates First incidence (days)Life table tests Logistic regression tests Fisher exact test
Pituitary Gland (Pars Distalis): Adenoma Overall rates Adjusted rates Terminal rates First incidence (days) Life table tests Logistic regression tests Fisher exact test
Pituitary Gland (Pam Distalis): Adenoma OP Carcinoma
1/25 (4%)f
5122 (23%)f
5122 (23%)'
1/50 (2%) 2.6% o m (0%).644 P =0.744 P=O.759N
P=0.747N
3/50 (6%) 8.7% 2/30 (7%)539 P=O.626 P=O.662
P=0.661N
1/25(4%)'
7123 (30%)f
8123(35%)'
1/51 (2%) 3.3% 1m (3%) 731 (T)P=O.741 P=O.741
P=O.742N
1/51(2%) 3.2% o m (0%)730 P=0.337N P=0.316N
P=0.301N
4/48 (8%) 10.0% 2/35 (6%) 469 P=O.371 P=0.325 P=0.329
16/47 (34%)45.7% 16/35 (46%)731 (T) P=0.375N P=O.409N P=0.5ON
16/47 (34%)45.7% 16/35(46%) 731 (T)P=0.375N P=0.409N P=0.500N
3/50 (6%) 8.1% 3/37 (8%) 731 (T) P=O.346 P=O.346
P=O.316
1/50 (2%) 2.7% 1/37 (3%) 731 (T)P =O.WON P=0.292N
P=O.309N
a49 (4%) 5.3% OD2 (0%)606
17/47 (36%)47.8% 14/32 (44%) 578
Overall rates Adjusted rates Terminal rates First incidence (days) Life table tests Logistic regression tests Fisher exact test
ThyroidGland (Follicular Cell): Adenoma Overall rates Adjusted rates Terminal rates First incidence (days) Life table tests Logistic regression tests Cochran-Annitage test Fisher exact test
Ukrus: Stmmal Polyp Overall rates Adjusted rates Terminal rates First incidence (days) Life table tests Logistic regression tests Cochran-Armitage test Fisher exact test
17/47 (36%)47.8% 14/32 (44%) 578
1/49 (2%) 3.0% 1/33(3%) 731 (T)P=O.205 P=O.182 P=O.167
3/50 (6%) 8.4% 2/33 (6%) 655 P=O.144N P=0.160N P=0.163N
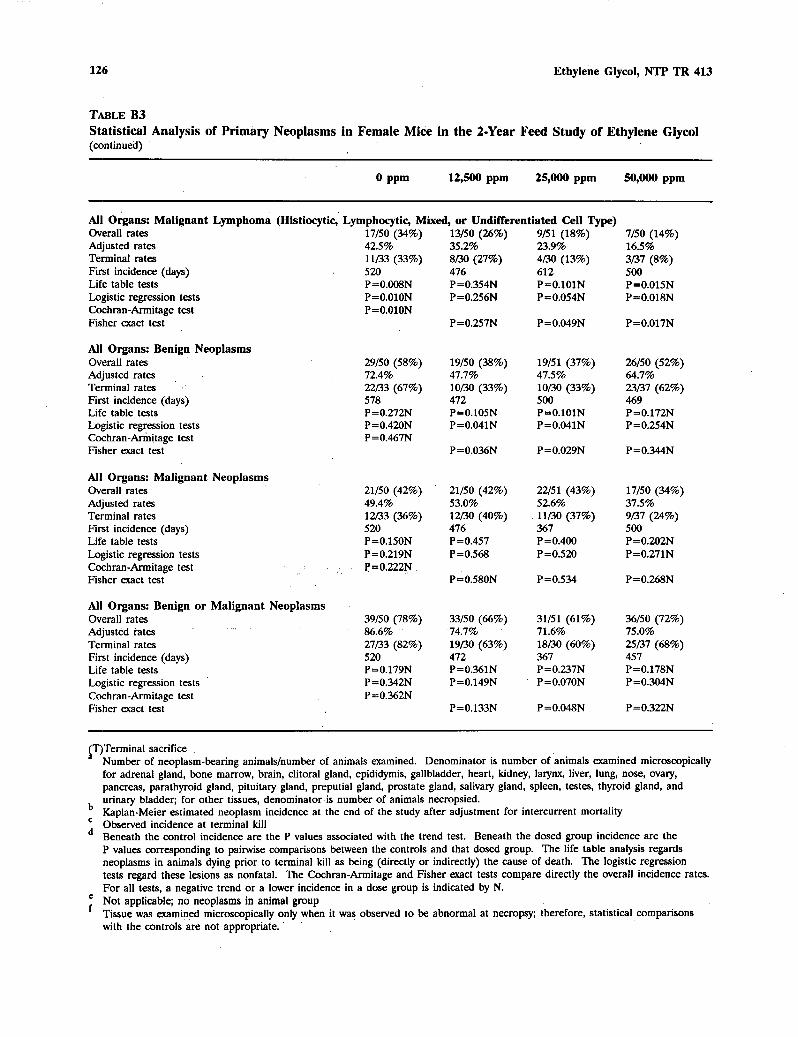
126 Ethylene Glycol, NTP TR 413
TABLEB3 Statistical Analysis of Primary Neoplasms in Female Mice in the 2-Year Feed Study of Ethylene Glycol (continued)
0 PPm 12,500 ppm 25,OOO ppm 50,OOO ppm
All Organs: Malignant Lymphoma (Histiocytic, Lymphocytic, Mixed, or Undifferentiated Cell Type) Overall rates 17/50 (34%) 9/517/5013/50 (26%) (18%)(14%)
42.5% 35.2% 23.9% Adjusted rates 16.5% Terminal rates 11/33 8/30 (27%)(13%)3/37 (8%)(33%) 4/30 First incidence (days) 612 520 476 500 Life table tests P=O.lOlNP=0.008NP=0.015NP=0.354N Logistic regression tests Cochran-Armitage test Fisher exact test
A l l Organs: Benign Neoplasms Overall rates Adjusted rates ,
Terminal rates . ' First incidence (days) Life table tests Logistic regression tests Cochran-Anhitage test Fisher exact test
All Organs: Malignant Neoplasms Overall rates Adjusted rates Terminal rates First incidence (days) Life table tests Logistic regression tests Cochran-Armitage test Fisher exact test
All Organs: Benign or Malignant Neoplasms Overall rates
. . .Adjustedrates Terminal rates First incidence (days) Life table tests Logistic regression tests Cochran-Armitage test Fisher exact test
aT)Terminal sacrifice
P=O.OlONP=0.018NP=0.256NP=0.054N P=O.OlON
P=0.017NP=0.257NP=0.049N
29/50 (58%) 19/50 (38%) 19/51(37%) 26/50 (52%) 72.4% 47.7% 47.5% 64.7% 22/33 (67%) l O / 3 0 (33%) 10/30 (33%) 23/37(62%) 578 472 500 469 P=0.272N P=0.105N P=O.lOlN P=0.172N P=0.420N P=0.041N P=0.041N P =0.254N P=0.467N
P=0.036N P=0.029N P =0.344N
21/50 (42%) 21/50 (42%) 22/51(43%) 17/50 (34%) 49.4% 53.0% 52.6% 37.5% 12/33 (36%) 12/30 (40%) 11/30(37%) 9/37 (24%) 520 476 367 500 P=0.150N P=O.457 P =0.4OO P=0.202N P=0.219N P=O.568 P=O.520 P=O.WlN 9=0.222N
P=0.580N P=O.534 P=0.268N
39/50 (78%) 33/50 (66%) 31/51(61%) 36/50(72%) 86.6% '74.7% 71.6% 75.0% 27/33 (82%) 19/30 (63%) 18/30(60%) 25/37 (68%)520 472 367 457 P=0.179N P=0.361N P =0.237N P=0.178N P=0.342N P=0.149N P=0.070N P=0.304N P=0.362N
P=0.133N P=0.048N P=0.322N
Number of neoplasm-bearing animals/number of animals examined. Denominator is number of .animals examined microscopically for adrenal gland, bone marrow, brain, clitoral gland, epididymis, gallbladder, heart, kidney, larynx, liver, lung, nose, ovary, pancreas, parathyroid gland, pituitary gland, preputial gland, prostate gland, salivary gland, spleen, testes, thyroid gland, and urinary bladder; for other tissues, denominator.is number of animals necropsied. Kaplan-Meier estimated neoplasm incidence a t the end of the study after adjustment for intercurrent mortality Observed incidence at terminal kill Beneath the control incidence are the P values associated wi th the trend test. Beneath the dosed group incidence are the P values corresponding to pairwisecomparisonsbetween the controls and tha t dosed group. The life table analysis regards neoplasms in animals dying prior to terminal ki l l asbeing (directly or indirectly) the cause of death. The logistic regression tests regard these lesions as nonfatal. The Cochran-Armitage and Fisher exact tests compare directly the overall incidence rates. For all tests, a negative trend or a lower incidence in a dose group is indicated by N.
e Not applicable; no neoplasms in animalgroup Tissue was examined microscopically only when it was observed to be abnormal at necropsy; therefore, statistical comparisons with the controls are not appropriate.

Lesions in Female Mice
St" Adenoma
Historical Incidence at Southern Research Institute
C.I. Pigment Red 3 3/50 Ethylene Glycol 0/50 Nitrofurantoin 2/50 o-Nitroanisole 4/50 Polysorbate 80 3/50 Rhodamine 6G 3/50Roxarsone 1/50
Total 161350 (4.6%) Standard deviation 2.8% Range 0%-8%
OverallWistorical Incidence
Total 51#70 (5.9%) Standard deviation 5.8% Range 0%-24%
a Data o f 3as 1991 Includes one animal with both an adenoma and a carcinoma
Study
Historical Incidence at Southern Research Institute
C.I. Pigment Red 3 Ethylene Glycol Nitrofurantoin o-Nitroanisole Polysorbate 80 Rhodamine 6G Roxarsone
Total Standard deviation Range
Overall Historical Incidence
Total Standard deviation Range
Incidence in Controls Crarcinornca
1/50 1/50 1/50 2/50 0150 1/50 2/50
81350 (2.3%) 1.4%
0%4%
20#70 (2.3%) 1.5%
0%-6%
Incidence in Controls
15/50 17/50 12/50 5/50
18/50 16/50 13/50
%1350 (27.4%) 8.8%
0%-36%
259/870 (29.8%) 10.5%
10%-44%
MeIlOQl la QR CmldQOma
4/50 1/50 3/20 6/50 3/50 4/50 3/50
24/350 (6.9%) 3.0%
2%-12%
70#70 (8.0%)b 5.8%
2%-26%
a Data as of 3 April 1991. Includesdata for histiocytic,lymphocytic,mixed, NOS, and undifferentiated cell type malignant lymphomas.

128 Ethylene Glycol, NTP TR 413
TABLEB5 Summary of the Incidence of Nonneoplastic Lesions in Female Mice in the 2-Year Feed Study of Ethylene Glycola
Disposition Summary Animals init ially i n study 15-month interim evaluation Early deaths
Natural deaths Moribund
sulvivors Terminal sacrifice
Animals examined microscopicilly
Alimentary System Gallbladder
Inflammation Intestine large, cecum
Edema Lymphoid tissue, hyperplasia,
lymphoid Intestine large, colon
Inflammation, suppurative Intestine large, rectum
Edema Intestine small, ileum
Amyloid deposition Dilatation Inflammation,chronic Lymphoidtissue,hyperplasia,
lymphoid Lymphoid tissue, inflammation,
granulomatous
0 PPm
60 10
8 9
33
50
12,500 ppm
60 10
11 9
30
50
25,000 ppm
60 9
9 12
30
51
(21)
(16)
(19)
(17)
(16)
1 (6%)1 (6%)
50,000 ppm
60 10
1 12
37
50
(49)1 (2%)
(50)1 (2%)
1 (2%) ( 5 0 )
(50)1 (2%)
(50) 2 (4%)
2 (4%)
1 (2%) Intestine small, jejunum
Amyloid deposition Dilatation
Liver
(47) (19)
(50 ) (50 )
(16) (50 ) 1 (5%) 1 (2%)
1 (6%)
1 (2%) (51) ( 5 0 )
1 (2%) 1 (2%)
1 (2%) 1 (2%)
Angiectasis Basophilic focus Congestion
1 (2%)Cyst 2 (4%) 3 (6%) Fatty change
Fibrosis 1 (270) Hematopoietic cell proliferation 2 (4%) 6 (12%) 7 (14%) 2 (4%) Hyperplasia,lymphoid 14 (28%) 14 (28%) 16 (31%) 12 (24%) Infarct 1 (2%) 1 (2%) 1 (2%) 1 (270)
Infiltration cellular, mixed cell 4 (8%) 10 (20%) 11 (22%) 4 (8%) Inflammation,multifocal 17 (34%) 10 (20%) 19 (37%) 24 (48%) Mineralization 1 (2%) Necrosis,multifocal 2 (4%) 2 (4%) 1 (2%) . 2 (4%) Pigmentation 1 (2%) Bile duct, hyperplasia 1 (2%) Hepatocyte, erythrophagocytosis 2 (4%) Hepatocyte, centrilobular, degeneration,
hyaline 1 (2%) 26 (52%) Portal vein, media,hyperplasia 1 (2%)

129 Lesions in Female Mice
Alimentary System (continued) Mesentery
CystEdema Hemorrhage Inflammation, suppurative Fat, necrosis
Pancreas Atrophy, diffuse Atrophy,focal Ectopic tissue Hyperplasia,lymphoid Inflammation, suppurative Acinar cell, hypoplasia, focal Duct, dilatation Duct, dilatation, multiple
Saiivary glands Hyperplasia,focal
Stomach,forestomach Inflammation,focal Mineralization Mucosa,hyperplasia, papillary
Stomach, glandular Hyperplasia,lymphoid Inflammation,focal Mineralization Epithelium, degeneration, hyaline Epithelium, metaplasia, squamous Mucosa,cyst
Tooth Incisor,dysplasia Incisor, inflammation, suppurative
Cardiovascular System Blood vessel
Aorta, thrombus Mesenteric artery, inflammation,
chronic
0 PPm 12,500 ppm 25,000 ppm 50,Wppm
(17) (7)
1 (14%) 1 (6%) 6 (35%) 2 (29%) 8 (47%) 1 (14%)
(49) (50)
3 (6%) 1 (2%) 2 (4%)
1 (2%) . 1 (2%) 3 (6%)
1 (2%) (49) (50)
1 (2%) (50) (50)
2(4%) 1 (2%) 1 (2%)
1 (2%) (49) (50)
2(4%) 1 (2%) 1 (2%) 4 (8%) 1 (2%) 3 (6%)
2(4%) 1 (2%) 2(4%)
(2) (3)2(100%) 3 (100%)
(2) (1)1 (50%)
1 (50%) 1 (100%) Heart (21) (50) (20) (50)
Infiltration cellular, mixed cell 1 (5%) Inflammation, suppurative 1 (2%) Artery, media, hyperplasia 1 (2%)
Endocrine System (21) (21)Adrenal gland, cortex
Accessory adrenal cortical nodule Amyloid deposition
(49) (50) 1 (2%) 1 (2%)
Angiectasis 1 (2%) Focal cellular change 1 (5%)

130 Ethylene Glycol, NTP TR 413
TABLEB5 Summary of the Incidence of Nonneoplhstic Lesions in Female Mice in the 2-Year Feed Study of Ethylene Glycol (continued)
EndocrineSystem (continued) Adrenal gland, cortex (continued)
Hematopoietic cell proliferation Hemorrhage, focal Hyperplasia, focal Infiltration cellular, mixed cell Inflammation, suppurative Vacuolization cytoplasmic, focal Subcapsular, hyperplasia, focal
Adrenal gland, medulla .
Ectopic tissue Hyperplasia,focal
Parathyroid gland Cyst
Pituitary gland Pars -distalis, angiectasis Pars distalis, bacterium Pars distalis, cyst Pars distalis, focal cellular change Pars distalis, hyperplasia, focal Pars distalis, necrosis, foca l Parsnervosa, inflammation,focal
Thyroid gland Degeneration, cystic Hyperplasia, lymphoid Inflammation,focal C-cell,hyperplasia Follicular c e l l , hyperplasia
General Body System Tissue NOS
Abdominal,foreign body Abdominal, infiltration cellular, lymphocyte
GenitalSystem
Atrophy Fibrosis, f o c a l Granuloma Hemorrhage Hyperplasia, lymphoid Inflammation, chronic Inflammation, suppurative Mineralization Thrombus Follicle, cyst
Follicle, cyst, multiple Oviduct
Hyperplasia, cystic Inflammation, suppurative
0 PPm
1 (2%)
(48)
1 (2%) (49)
1 (2%) (47)
1 (2%) 1 (2%) 2 (4%)
13 (28%)
(49)4 (8%)
3 (6%)
8 (16%)
12,500 ppm
1 (5%)
2(9%)
1 (5%)
(50)6(12%)
16 (32%)
(2)1 (50%)
25,000 ppm
1 (5%)
2(9%) 2 (9%)
1 (4%) (51)
4 (8%)
3 (6%) 1 (2%)
22(43%)
(1)
1 (100%)
50,000 ppm
1 (2%)
1 (2%) 2(4%) 1 (2%)
(50)2(4%) 1 (2%)
(42)
(47)
14 (30%)
(50)4 (8%) 1 (2%) 3 (6%) 1 (2%)
14 (28%)
Ovary (49) , (25)1 (2%)
(48)3 (6%)Angiectasis 2 (8%)
1 (4%)
8 (16%) 10 (40%)
1 (4%) 11 (22%) 5 (20%)
1 (4%)
(3)
2(67%)
1 (4%)
1 (4%) 1 (4%) 9 (36%)
8 (32%)
(4)
4(100%)
2(4%) 1 (2%)
2 (4%)
3 (6%) 2(4%)
9 (19%)
(1)1 (100%)

131 Lesions in Female Mice
Q PPm 12,5QQ ppm 25,OOO ppm §Q,QQO ppm
Genital System (continued) Uterus (45)(45)
4(9%)(50) (50)
Angiectasis (2%) 12 (4%) (2%) 12 (4%) (4%) 24
Hemorrhage Hydrometra 3 (6%)
1 (2%) 4(9%)
Inflammation, suppurative 6 (12%) 7 (16%) (8%)
5 (11%) 3 (6%) Thrombus Endometrium, cyst Endometrium, hyperplasia, cystic
Hematopoietic System Bone marrow
Hyperplasia,neutrophil Lymph node
Iliac,hyperplasia Inguinal, hyperplasia Inguinal, hyperplasia,lymphoid Mediastinal, angiectasis Mediastinal,hyperplasia Mediastinal,hyperplasia,lymphoid Mediastinal, inflammation, suppurative Mesenteric, angiectasis Mesenteric, hyperplasia Mesenteric,hyperplasia, lymphoid Mesenteric, inflammation, suppurative Pancreatic, hyperplasia Renal, hyperplasia Renal, inflammation, suppurative
Lymph node, mandibular Hyperplasia Hyperplasia, lymphoid
Spleen Depletion Fibrosis, focal Hematopoietic cell proliferation Hyperplasia, lymphoid
Thymus CystHyperplasia Hyperplasia,lymphoid
Integumentary System Mammary gland
Dilatation Hyperplasia Inflammation, suppurative Duct, metaplasia, squamous
1 (2%) 44 (88%)
3 (6%) 1 (2%) 5 (10%) 4 (8%) 2 (4%) 5 (10%) 2 (4%)
2 (4%) 1 (2%)
(43)1 (2%) 2 (5%)
(49)1 (2%) 1 (2%)
14 (29%) 11 (22%)
(47)
7(15%)
(49)4 (8%) 2 (4%) 1 (2%) 1 (2%)
1 (2%)
40 (89%)
1 (4%) 3 (13%) 2 (8%) 1 (4%) 2 (8%) 1 (4%)
1 (4%) 1 (4%)
(21)
1 (5%)
(29)
12 (41%) 2 (7%)
(19)1 (5%)
1 (5%)
(20)
40(89%)
(21)1 (5%)
(22)4(18%)
1 (5%)
3 (14%)
1 (5%)
2 (9%) 2 (9%)
1 (5%) 5 (23%)
20 (71%) 6 (21%)
(19)
(21)1 (5%)
2 (4%)47 (94%)
(50)2(4%)
(50 ) 1 (2%) 1 (2%)
1 (2%) 2 (4%)
6 (12%) 2(4%) 7 (14%)
1 (2%)
(49)2(4%) 6 (12%)
(50)
13 (26%) 13 (26%)
(47)1 (2%)1 (2%) 6 (13%)
(50) 6 (12%)

132
~
Ethylene Glycol, NTP TR 413
TABLEB5 Summary of the Incidence of Nonneoplastic Lesions in Female Mice in the 2-Year Feed Study of Ethylene Glycol (continued)
0 PPm 12,500 ppm 25,000 ppm 50,OOO ppm
Integumentary System (continued) (49) (40)
16 (33%) Skin
Inflammation, chronic Subcutaneous tissue, edema Subcutaneous tissue, hyperplasia,
lymphoid Subcutaneous tissue, inflammation,
chronic
MusculoskeletalSystem Bone
Cranium,hyperostosis Distal, joint, femur, arthrosis Femur,hyperostosis
Skeletal muscle Inflammation, suppurative
Nervous System Brain
Compression Gliosis Hemorrhage, multifocal Infiltration cellular, lymphocyte Necrosis, focal Artery, inflammation, chronic Artery, meninges, inflammation,chronic Meninges,hyperplasia,lymphoid Meninges, infiltration cellular,
mixedcell
Respiratory System Lung
Bacterium
(43) ( 5 0 )5 (12%) 11 (22%)
(50)
1 (2%)
(2)
(49)1 (2%)
2(4%)
(50)1 (2%)
(20)
1 (5%) (2)
(20)1 (5%) 1 (5%)
1 (5%)1 (5%)
1 (5%)
6(15%)
(21)
(2)1 (50%)
(21)1 (5%)
1 (5%)
1 (5%)
1 (2%)
1 (270)
2 (4%)
(50)1 (2%)
(1)
(50)3 (6%)
1 (2%)
Congestion 2 (4%) 2 (4%) Hemorrhage 2 (4%) 4 (8%) Hyperplasia,lymphoid 17 (34%) 16 (32%) 15 (29%) 21(42%) Hyperplasia,macrophage 2 (4%) 2 (4%) 1 (2%)
1 (2%)Infiltration cellular, mixed cell 3 (6%) 3 (6%) 3 (6%) Inflammation, granulomatous 2(4%) Inflammation, suppurative 1 (2%) 1 (2%) Mineralization 1 (2%) Pigmentation 1 (2%) Alveolar epithelium, hyperplasia 1 (2%) Artely, inflammation 1 (2%) Artery, media, hyperplasia 3 (6%) 10 (20%) 10 (20%) 23 (46%) Bronchiole,bronchiectasis 1 (2%) Bronchiole,epithelium,hyperplasia 1 (2%) Mediastinum, inflammation, suppurative 1 (2%) 3 (6%) Vein, in t ima , mineralization 1(2%)

133 Lesions in Female Mice
R@spimtorySystem (continued) Nose
Lumen, exudate Lumen, foreign body Mucosa, angiectasis Mucosa, hemorrhage Nasolacrimal duct, inflammation,
suppurative Trachea
Artery, peritracheal tissue, inflammation, chronic
Special Senses System Eye
Atrophy Cataract Fibrosis Retinal detachmentCornea. inflammation
binary System
Bacterium Kidney (49)
1 (2%) (50 )
1 (2%)
Inflammation, chronic Infiltration cellular, mixed c e l lCyst
1 (2%) 1 (2%)
2 (4%)
Inflammation, suppurative 2 (4%) Metaplasia, -ous 1 (2%) 1 (2%) Necrosis, multifocal 1 (2%)
Capsule, inflammation, suppurative Nephropathy 25 (51%)
1 (2%) 20 (40%)
Pelvis, dilatation Renal tubule, degeneration, hyaline 3 (6%) Renal tubule, dilatation Renal tubule, hyperplasia 1 (2%) Renaltubule,mineralization 1 (2%) Renal tubule, pigmentation Renal tubule, vacuolization cytoplasmic
Hyperplasia, lymphoid Urinary bladder (49)
2 (4%) (19)
Inflammation, chronic Ulcer
Transitional epithelium, metaplasia, Transitional epithelium, hyperplasia 1 (5%)
squamous
a Number of animals examined microscopically at site and number o f animals with lesion
(1) 1 (100%)
1 (10%)
(50)
2 (4%) 3 (6%)
33 (66%)
1 (2%)
1 (2%)
(21)
1 (5%)
(1)
1 (100%)
1 (100%) 1 (100%)
(50)
1 (2%) 1 (2%)
28 (56%)
1 (2%) 2 (4%) 1 (2%)
2 (4%)
(50 ) 5 (10%) 1 (2%) 1 (2%)
1 (2%)
~~

134 Ethylene Glycol, NTP TR 413
135
SALMONELLA P R O T O C O L . . . . . . . . . . . . . , . . . . . . . . . . . . . . . . . . . . . . . . . . . . . . . . . . . . . . . nx MOUSELYMPHOMACELLPROTOCOL . . . . . . . . . . . . . . . . . . . . . . . . . . . . . . . . . . . . . . . . . . . . n x CHINESE HAMSTER OVARY CELL CYTOGENETICS ASSAYS . . . . . . . . . . . . . . . . . . . . . . . . . . . . . . . n w RESULTS . . . . . . . . . . . . . . . . . . . . . . . . . . . . . . . . . . . . . . . . . . . . . . . . . . . . . . . . . . . . . . . . 138 TABLE CB Mutagenicity of Ethylene Glycol in SulmoneUa typhit9WiMm . . . . . . . . . . . . . . . . . . . 139 TABLEC2 Induction of Trifluorothymidine Resistance in Mouse U l 7 8 Y Lymphomra Cells
by Ethylene Glycol . . . . . . . . . . . . . . . . . . . . . . . . . . . . . . . . . . . . . . . . . . . . . . . 1410 TABLE C3 Induction of Sister Chromatid Exchanges in Chinese Hamster Ovary Cells
by ~thylene GIYCO~ . . . . . . . . . . . . . . . . . . . . . . . . . . . . . . . . . . . . . . . . . . . . . . . n a TABLEC4 Induction of Chromosomal Aberrations in Chinese Hamster Qvary Cells
by Ethylene Glycol . . . . . . . . . . . . . . . . . . . . . . . . . . . . . . . . . . . . . . . . . . . . . . . 145

136 Ethylene Glycol, NTP TR 413
GENETIC TOXICOLOGY
SALMONELLAPROTOCOL Testing was performed as reported by Haworth et al. (1983) and Zeiger et al. (1987). Ethylene glycol was sent to the laboratory as a coded aliquot from Radian Corporation (Austin, TX). It was incubated with the Salmonella iyphimurium tester strain (TA100, TA1535,TA1537, and TA98) either in buffer or S9 mix (metabolic activation enzymes and cofactors from Aroclor 1254-induced male Sprague-Dawley rat or Syrian hamster liver) for 20 minutes at 37" C prior to the addition o f soft agar supplemented with 1-histidine and d-biotin, and subsequent plating on minimal glucose agar plates. Incubation continued for an additional 48 hours.
Each trial consisted o f triplicate plates of concurrent positive and negative controls and o f at least five doses o f ethylene glycol. High dose did not exceed 10,OOO puplate. All assays were repeated.
In this assay, a positive response is defined as a reproducible, dose-related increase in histidine-independent (revertant) colonies in any one straidactivation combination. An equivocalresponse is defined as an increase in revertants which is not dose-related, not reproducible, or o f insufficient magnitude to support a determination of mutagenicity. A negative response is obtained when no increase in revertant colonies was observedfollowingchemical treatment.
MOUSELYMPHOMACELLPROTOCOL The experimental protocol is presented by McGregor et al. (1991). Ethylene glycol was supplied as a coded aliquot by Radian Corporation (Austin, TX). The highest dose o f ethylene glycol did not exceed 5,OOO pg/mL. Mouse lymphoma L5178Y/Tx cells were maintained at 37" C as suspension cultures in Fischer's medium supplemented with 2 mM 1-glutamine, 110 pglmL sodium pyruvate, 0.05% pluronic F a , antibiotics, and heat-inactivated horse serum; normal cycling time was about 10 hours. To reduce the number o f spontaneously occurring trifluorothymidine (mresistant cells, subcultures were exposed once to medium containing THMG (thymidine, hypoxanthine, methotrexate, glycine) for 1 day, to THG for 1 day, and to normal medium for 3 to 5 days. For cloning, horse serum content was increased and Noble agar was added.Freshly prepared S9 metabolic activation factors were obtained from the livers o f either Aroclor 1254-induced or noninduced Fischer 344bJ male rats.
All treatment levels within an experiment, including concurrent positive and solvent controls, were replicated. Treatedcultures contained 6 x lo6 cells in a 10 mL volume of medium. Thisvolume included the S9 fraction in those experiments performed with metabolic activation. Incubation with ethylene glycol continued for 4 hours, at which time the medium plus chemical was removed and the cells were resuspended in 20 mL o f fresh medium and incubated for an additional 2 days to express the mutant phenotype. Cell density was monitored so that log phase growth was maintained. After the 48-hour expression period, 3 x 10⁶ cells were plated in medium and soft agar supplemented with TFT for selection o f TlT-resistant cells (TIC'-), and 600cells were plated in nonselective medium and soft agar to determine cloning efficiency. Plates were incubated at 37" C in 5% CO, for 10 to 12 days. All data were evaluated statistically for both trend and peak response. Both responses had to be significant (P10.05) for a chemical to be considered capable o f inducing TFI' resistance; a single significant response led to a "questionable" conclusion, and the absence o f both a trend and a peak response resulted in a "negative" call.
Minimum criteria for accepting an experiment as valid and a detailed description of the statistical analysis and data evaluation are presented in McGregor et al. (1991). This assay is initially performed without S9; if a clearly positive response is not obtained, the experiment is repeated with induced S9.

CHINESE -STEW OVARY @ELL CYTOGENETICS &SAYS Testing was performed as reported by Galloway e f al. (1985, 1987) and is presented briefly below. Ethylene glycol was sent to the laboratory as a coded aliquot from Radian Corporation (Austin, TX). It was tested in cultured Chinese hamster ovary (CHO) cells for induction o f sister chromatid exchanges (SCEs) and chromosomal aberrations (Abs) both in the presence and absence o f Aroclor 1254-induced male Sprague-Dawley rat liver S9 and cofactor mix. Cultures were handled under gold lights to prevent photolysis o f bromodeoxyuridine (BrdU)-substituted DNA. Each test consisted o f concurrent solvent and positive controls, and o f at least three doses o f ethylene glycol; the high dose did not exceed 5 , O yg/mL.
In the SCE test without S9, CHO cells were incubated for 26 hours with ethylene glycol in McCoy's 5 8 medium supplemented with 10% fetal bovine serum, 1-glutamine (2mM), and antibiotics. BrdU was added 2 hours after culture initiation. After 26 hours, the medium containing ethylene glycol was removed and replaced with fresh medium plus BrdU and Colcemid, and incubation was continued for 2.5 to 3.5 hours. Cells were then harvested by mitotic shake-off, fmed, and stained with Hoechst 33258 and Giemsa. In the SCE test with S9, cells were incubated with ethylene glycol, serum-free medium, and S9 for 2 hours. The mediumwas then removed and replaced with medium containing BrdU and no ethylene glycol, and incubation proceeded for an additional 26 hours, with Colcemid present for the final 2 hours. Harvesting and staining was the same as for cells treated without S9.
In the Abs test without S9, cells were incubated in McCoy's 5A medium with the ethylene glycol for 10 hours; Colcemid was added and incubation continued for 2 hours. The cells were then harvested by mitotic shake-off, fixed, and stained with Giemsa. For the Abs test with S9, cells were treated with ethylene glycol and S9 for 2 hours, after which the treatment medium was removed and the cells incubated for 10 hours in fresh medium, withColcemid present for the final 2 hours. Cellswere harvested in the same manner as for the treatment without S9.
Cells were selected for scoring on the basis o f good morphology and completeness o f karyotype (21 & 2 chromosomes). All slides were scored blind and those from a single test were read by the same person. For the SCE test, 50 second-division metaphase cells were scored for frequency o f SCEs per cell from each dose level; 100 first-division metaphase cells were scored at each dose level for the Abs test.Classes of Absincluded simple (breaks and terminal deletions), complex (rearrangements and translocations), and other (pulverized cells, despiralized chromosomes, and cells containing 10 or more Abs).
Statistical analyses were conducted on both the slopes of the dose-response curves and the individual dose points. An SCE frequency 20% above the concurrent solvent control value was chosen as a statistically conservative positive response. The probability of this level of difference occurring by chance at one dose point is less than 0.01; the probability for such a chance occurrence at two dose points is less than 0.001. Chromosomal Ab data are presented as percentage o f cellswith Abs. As with the test for SCEs, both the dose-response curve and individual dose points were statistically analyzed.For a single trial, a statistically significant (P10.05)difference for one dose point and a significant trend (P10.015) were considered weak evidence for a positive response (+w); significant differences for two or more doses indicated the trial was positive (+) (Galloway et al., 1987).
I

138 Ethylene Glycol, NTP TR 413
RESULTS Negative results were obtained in all in vitro genotoxicityassayswith ethylene glycol. Ethylene glycol was not mutagenic in S. typhinzuriunz strains TA98, TA100,TA1535, or TA1537 when tested with a preincubation protocol at concentrations up t o 10,OOO /@plate in the presence or absence o f Aroclor 1254-induced male Sprague-Dawley rat liver S9 (Table C1; Zeiger et aZ., 1987). In the mouse lymphoma assay, ethylene glycol was tested in the presence and absence o f Aroclor 1254-induced male Fischer rat liver S9 activation enzymes, and did not induce Tresistance in L5178Y cells (Table c 2 , McGregor et aZ., 1991).In the absence o f S9, inconsistent responses were seen among the three trials; a positive response was obtained in Trial 2, but this was not reproduced in the other two trials performed without S9. The results of two trials with S9 were negative. Results of in vitro cytogenetic tests for induction of SCEs and chromosomal Abs with ethylene glycol in CHO cells were negative, with and without Aroclor 1254-induced male Sprague-Dawley rat liver S9 (Tables C3 and C4). In the SCE and the Abs tests, doses up to 5,000 pg/mL ethylene glycol weretested.

Genetic Toxicology n39
Strain Dose -s9 +1Q% hamster S9 010% mt 89 @&date) Trial 1 Trial 2 Trial 1 ' Trial 2 ~ ~ i a l Tdal 2n
T A l 0 0 160 f 3.4 105 f 7.0 247 f 2.1 222 f 17.5 252 f 6.4 189 f 19.9 1 0 144 f 6.2 101 f 3.2 194 f 11.0 205 f 15.9 226 f 12.7 185 f 7.8 333 132 f 2.2 113 f 13.1 207 f 21.0 179 f 29.3 220 f 9.9 164 f 1.2
137 f 3.2 94 f 2.3 240 f 15.0 208 f 4.9 220 f 7.1 174 * 12.9 3,333 150 f 2.5 112 f 7.4 246 It 13.7 241 f 23.1 1% f 4.1 202 f 44.0 10,o 140 f 14.0 107 f 10.4 238 f 16.2 202 f 14.8 223 f 1.2 165 f 24.0
1 1 0
Trial summary Negative Negative Negative Negative Negative Negative Positive control' 559 f 41.3 371 f 38.6 886 f 18.9 852 f 49.7 494 f 19.7 397 f 38.1
TA1535 0 6 f 2.9 9 f 0.9 11 f 0.3 11 f 1.2 14 f 2.6 13 f 2.7 1 0 13 f 1.5 10 f 2.1 11 f 0.9 9 f 1.0 11 f 0.3 13 f 1.8 333 13 f 1.7 10 f 2.1 12 f 2.2 7 f 2.7 14 f 1.2 13 f 1.3
1 , o 9 f 1.0 9 f 0.9 16 f 1.3 6 f 1.5 22 f 0.3 16 f 4.2 3,333 8 f 2.5 8 f 0.3 17 f 2.3 9 f 1.2 24 f 1.2 15 f 2.3
1 0 , o 7 f 0.3 8 f 1.2 16 f 0.3 8 f 1.2 24 f 2.7 15 f 1.3
Trial summary Negative Negative Negative Negative Negative Negative Positive control 466 f 10.7 449 f 71.8 47 f 11.3 48 f 9.4 42 f 6.9 33 f 3.1
TA1537 0 15 f 0.9 3 f 0.3 14 f 1.7 6 f 0.9 20 f 1.0 6 f 0.9 1 0 12 f 0.3 4 f 1.2 12 f 2.6 5 f 0.3 16 f 2.6 8 f 2.6 333 16 f 3.5 4 f 1.9 14 f 3.5 8 f 2.0 22 f 1.5 7 f 1.3
15 f 1.9 3 f 1.2 15 f 2.6 7 f 0.6 15 f 1.8 10 f 3.5 3,333 13 f 1.0 2 f 0.3 19 f 2.9 8 f 0.9 19 f 2.1 5 f 0.3
10,ooo 12 f 3.0 2 f 0.9 16 f 1.2 5 f 1.3 16 f 2.6 4 f 0.9
Trial summary Negative Negative Negative Negative Negative Negative Positive control 186 f 38.1 154 f 34.8 66 f 7.8 61 f 7.2 51 f 6.3 33 f 5.0
TA98 0 19 f 2.8 16 f 1.7 33 f 4.7 31 f 2.7 32 f 0.7 28 f 2.3 1 0 24 f 0.9 18 f 1.9 38 f 2.7 28 f 4.3 26 f 9.9 24 f 2.9 333 15 f 2.6 14 f 0.7 40 f 7.9 29 f 4.5 29 f 1.2 34 f 4.7
1,000 21 f 4.8 18 f 0.0 37 f 6.4 29 f 3.2 32 f 2.0 28 f 0.6 3,333 24 f 1.5 16 f 3.1 29 f 2.1 32 f 2.9 32 f 5.8 28 f 1.2
1 0 , o 20 f 2.0 15 f 1.2 29 f 1.9 29 f 2.3 32 f 4.3 32 f 2.2
Trial summary Negative Negative Negative Negative Negative Negative Positive control 414 f 5.8 193 f 44.0 704 f107.6 80 f 18.3 310 f 31.7 394 f 23.7
a Studyperformed at Case WesternReserveUniversity.Thedetailedprotocolandthesedata are presented in Zeiger et aL . (1987).
Revertants are presented as mean f standard error from three plates.' 2-aminoanthracene was usedonall strains in thepresence o f S9. In theabsence of metabolic activation,
4-nitro+-phenylenediamine was tested on TA98, sodium azide was tested on TA10 and TA1535, and 9-aminoacridine was tested on TA1537.

140 Ethylene Glycol, NTP TR 413
TABLEC2 Induction of Trifluorothymidine Resistance in Mouse W178Y Lymphoma Cells by Ethylene Glycola
Compound ("L)
Concentration ( W
Efficiency Cloning
( W
Total Growth Count Relative MutantMutant
Fractionb Fraction Mutant Average
Trial 1 -s9
Distilled water
78 98 88 91
105 102 91
102
111 129 101 114
48 44 38 42
43
Methyl methanesulfonate 15 28 27
21 15
264 241
312 296
3048
Ethylene glycol 1,000
79 96 76
73 119 92
100 144 127
42 50 56
49
2,000
89 62 70
97 94 75
103 76
115
39 41 55
45
3,000
69 75
100
89 72
103
119 118 147
58 52 49
53
4,000
75 68 72
106 93 93
125 138 143
55 68 66
63
5,000
83 101 81
72 96
103
134 130 122
54-43 50
49
Trial 2 Distilled water
55 66 56
85 102 112
91 102 75
55 52 45
51
Methyl melhanesulfonate 15 20 27
19 25
163 171
269 211
240.
Ethylene glycol 2,000 42 52
81 91
92 103
73 65
69
3,000 37 44
107 92
100 94
90 71
81
4,000 50 41
95 100
141 132
95 108
101;
5,000 46 101 141 103 39 79 115 98 100;

141 Genetic Toxicology
Compound Concentration @ @ w
-S9 (continued) Trial 3
Distilled water
Ethyl methanesulfonate 250
Methyl methanesulfonate 15
Ethylene g l y c o l 1,000
2,000
3,000
4,0@3
5,000
+s9 Trial 1
Distilled water
Methylcholanthrene 2.5
Ethyleneglycol1,000
2,000
3,000
4,000
5.000
Cloning Efficiency (99
99 84 79 79
49 56
43 38
96 105
73 76
65 76
57 71
63 66
83 88 89 91
52 49
84 82
86 93
81 68
70 71
77
Relative MutantMutant Total Growth Count
( W
101 134 102 142 99 112 98 86
62 487 64 481
23 254 21 204
107 124 116 127
89 120 94 105
85 124 86 138
65 96 I9 161
79 97 79 82
104 91 103 78 88 70
104 79
34 403 30 418
113 71 93 71
92 63 97 79
90 80 93 72
98 65 93 78
111 47
Fraction
45 56 47 36
334 288
198 179
43 40
55 46
63 61
56 76
52 42
37 30 26 29
259 283
28 29
24 28
33 35
31 34
20
Average Mutant Fraction
46
311*
1 8 8 9
42
51
62
66
47
30
271'
29
26
34
32
81 109 79 33 21

142 Ethylene Glycol, NTP TR 413
TABLEC2 Induction of Trifluorothymidine Resistance in Mouse L5178Y Lymphoma Cells by Ethylene Glycol (continued)
Cloning Relative MutantMutant Average Compound Concentration Efficiency Total Growth Count Fraction Mutant
ClldmL) (%) (94 Fraction
+S9 (continued) Trial 2
Distilled water 66 112 86 43 71 84 118 56 71 107 146 69 64 97 % 50 54
Methylcholanthrene 2.5 44 29 558 424 39 22 455 391 407.
Ethylene 1,m 98 161 78glycol 69 69 91 146 71 74
62 73 143 76 66 95 142 72 74
. . 3 , m 55 93 101 61
67 100 133 66 64
4 , m 74 99 174 78 71 88 147 69 73
78 94 198 85 73 111 140 64 75
l Significant positiveresponse (PSO.05)a StudyperformedatInvereskResearchInternational.Theexperimentalprotocolandthesedata are presented by McGregor et al! (1991). Mutantfraction(frequency)is a ratio of the mutant count to the cloning efficiency, divided by three (to anive at MFn x 106 cells treated).
. ..
. ,
i

Genetic Toxicology n43
-s9
T P M 1 Summary:Negative
Medium 50 1,046 404 0.38 8.1 27.5
Mitomycin-C 0.0050 50 1,045 539 0.51 10.8 27.5 33.54 0.0100 10 208 164 0.78 16.4 27.5 104.14
Ethylene glycol 160 50 1,041 400 0.38 8.0 27.5 -0.52 500 50 1,041 388 0.37 7.8 27.5 -3.50
1,600 50 1,047 419 0.40 8.4 27.5 3.61 5,OOo 50 1,040 436 0.41 8.7 27.5 8.54
P=O.o91C
Trial 2 Summary:Negative
Medium 50 1,048 425 0.40 8.5 26.5
Mitomycin-C O.Ooo8 50 1,052 644 0.61 12.9 26.5 50.95 0.0100 10 210 580 2.76 58.0 26.5 581.05
'Ethylene glycol 1;600 50 1,050 420 0.40 8.4 26.5 -1.36 3 , m 50 1,048 395 0.37 7.9 26.5 -7.05 4,Ooo 50 1,049 '. 431 0.41 .8.6 26.5 1.31 5,Ooo 50 1,048 423 0.40 8.5 26.5 -0.47.
PzO.518,
9 s 9
Trial 1 Summary:Negative
Medium 50 1,047 418 0.39 8.4 26.0
Cyclophosphamide 0.3 50 1,044 607 0.58 12.1 26.0 45.63 2.0 10 210 381 1.81 38.1 26.0 354.44
Ethylene glycol 160 50 1,046 450 0.43 9.0 26.0 7.76 500 50 1,045 430 0.41 8.6 26.0 3.07
1,600 50 1,048 435 0.41 8.7 26.0 3.97 5,Ooo 50 1,048 478 0.45 9.6 26.0 14.24
P = O . W

144 Ethylene Glycol, NTP TR 413
TABLEC3 Induction of Sister Chromatid Exchanges in Chinese Hamster Ovary Cells by Ethylene Glycol (continued)
No. of scw Relative S C w Dose Total Chromo- No. of . Chromo- S C W Hrs Chromosome
Compound @g/mL) SCEsCells Cell ( Wsomes in BrdUsome
+S9 (continued)
Trial 2 Summary: Negative
Medium 50 1,046 416 0.39 8.3 26.0
Cyclophosphamide 0.3 50 1,050 605 0.57 12.1 26.0 44.88 2.0 10 209 414 1.98 41.4 26.0 398.08
Ethylene glycol 1,600 50 1,048 430 0.41 8.6 26.0 3.17 3,ooo 50 1,048 409 0.39 8.2 26.0 -1.87 4,000 5,000
50 50
1,050 1,050
427 435 0.41
0.40 8.7 8.5
26.0 26.0
4.17 2.25
P=0.370
a Studyperformed at Environmental HealthResearchandTesting,Inc.SCE=sisterchromatidexchange; BrdU=bromodeoxyuridine. A detailed description of the SCE protocol is presented by Galloway et aL (1985, 1987). Percent increase in SCEs/chromosome of culture exposed to ethylene glycol relative to those of culture exposed to solvent. Values at least 20% above control levels are considered positive. Significance o f relative SCEWchromosome tested by the linear regression trend test vs. log of the dose

Genetic Toxicology I45
Daw @g/mlL)
Total Cells
No. off -89
Abs Abs/ Cell
with Abs
Percent Cells
Dose w m l ~ )
Total C ~ I S
989
No. off ~b
A W cell
u6Rh A h CeIb
Pemnnt
Summary:Negative Trial 1 - Harvesttime: 12.0 hours
Summary:Negative Trial B - Hawest time: 12.0 hours
Medium Medium 1 0 0 0.0 0.0 2 1 00.02
Mitomycin-C Cyclophosphamide 0.250 1 0 23 0.23 17.0 15.0 1 0 42 0.42 29.0 1.m 50 35 0.70 40.0 50.0 50 52 1.04 54.0
Ethylene glycol Ethylene glycol 160 100 0 0.0 0.0 160 1 0 2 0.02 2.0 5 0 1 0 0 0.0 0.0 5 0 1 0 2 0.02 2.0
1,600 1 0 1 0.01 1.0 1,600 1 0 1 0.01 1.0 5 , m 100 2 0.02 2.0 5 , m 1 0 1 0.01 1.o
P=0.020b P=O.776
a Studyperformed at Environmental HealthResearchandTesting,Inc. A h = aberrations. A detailedpresentation o f the technique for detecting chromosomal aberrations is found in Galloway et aL-(1985, 1987). Significance o f percent cells with aberrations tested by the linear regression trend test vs. log of the dose
2.0

146 Ethylene Glycol, NTP TR 413

147
TABLED l Organ Weights andl Qsgan-WeigPlt-to-Body-~e~ghtRatios for Mice i n the B3-Week Feed Studies of Ethylene Glycol ........................... 148
TABLED2 Q ~ a n - ~ e i g h t - t o - B o d y - ~ e i g ~ tQrgrana Weightsand Ratios for Mice at the15-MonthInterimEvaluationsinthe %Year Feed Studies of Ethylene Glycol . . . . . . . . . . . . . . . . . . . . . . . . . . . . . . . . . . . . . . . . . . . . . . . . 149

148 Ethylene Glycol, NTP TR 413
TABLED l Organ Weights and Organ-Weight-to-Body-Weight Ratios for Mice in the 13-WeekFeed Studies of Ethylene Glycola
0 ppm . 3,200 ppm 6,300ppm 12,500 ppm 25,OOO ppm 50,OOO ppm
Male
n 10 10 10 10 10 10 Necropsy body wt 32.4 f 0.6 31.8 f 0.7 32.0 f 1.0 29.4 f 0.9. 32.0 f 0.6 30.3 f 0.6.
Brain Absolute 0.437 f 0.012 0.455 f 0.003 0.445 k 0.007 0.442 f 0.004 0.449 f 0.003 0.441 f 0.006 Relative 0.14 f 0.00 0.14 f 0.00 0.14 f 0.00 0.15 f 0.00. 0.14 f 0.00 0.15 f 0.00
Heart Absolute 0.156 f 0.008 0.158 f 0.006 0.139 f 0.006 0.134 f 0.005. 0.142 f 0.004. 0.140 f 0.006. Relative 4.80 f 0.22 4.% f 0.08 4.37 f 0.19 4.56 f 0.11 4.44 f 0.09 4.63 f 0.21
R.Kidney Absolute 0.254 f 0.012 0.265 f 0.013 0.232 f 0.014 0.226 f 0.007 0.281 f 0.011 0.260 f 0.011 Relative 7.84 f 0.32 8.30 f 0.25 7.25 f 0.43 7.70 f 0.19 8.77 f 0.25 8.58 f 0.31
Liver Absolute 1.49 f 0.05 1.70 f 0.10 1.50 f 0.06 1.26 f 0.04. 1.46 f 0.04 1.37 2 0.05 Relative 46.0 f 1.43 53.2 f 2.50. 46.8 f 1.60 42.9 f 1.27 45.8 f 1.05 45.2 f 1.51 ’
Lungs Absolute 0.166 f 0.003 0.173 f 0.007 0.181 f 0.012 0.168 f 0.006 0.162 f 0.003 0.166 f 0.009 Relative 5.14 f 0.15 5.44 f 0.16 5.65 f 0.30 5.74 f 0.20 5.08 f 0.13 5.50 f 0.31
R. Testis Absolute 0.107 f 0.006 0.116 f 0.010 0.106 f 0.004 0.105 f 0.004 0.106 f 0.003 0.108 f 0.005 Relative 3.30 f 0.18 3.67 f 0.34 3.32 f 0.13 3.58 f 0.10 3.32 f 0.09 3.57 f 0.17
Thymus Absolute 0.048 f 0.006 0.045 f 0.004 0.046 f 0.004 0.042 f 0.003 0.040 f 0.004 0.041 f 0.005 Relative 1.46 f 0.18 1.42 f 0.13 1.40 f 0.10 1.43 f 0.10 1.26 f 0.12 1.35 f 0.17
Female
n 10 10 10 10 10 10 Necropsy body wt 25.5 f 0.6 24.7 f 0.6 24.8 f 0.6 25.6 f 0.7 26.1 f 0.7 24.8 f 0.6
Brain Absolute 0.468 f 0.005 0.475 f 0.006 0.465 f 0.010 0.458 f 0.009 0.459 f 0.008 0.456 f 0.011 Relative 0.18 f 0.00 0.19 f 0.00 0.19 f 0.00 0.18 f 0.01 0.18 f 0.01 0.18 f 0.00
Heart Absolute 0.131 f 0.007 0.114 f 0.003 0.129 f 0.004 0.114 .C 0.003b 0.125 f 0.005 0.120 f 0.005 Relative 5.13 f 0.19 4.63 f 0.13 5.20 f 0.11 4.53 f O . l l b 4.82 f 0.26 4.85 f 0.22
R. Kidney Absolute 0.186 f 0.009 0.170 f 0.007 0.183 f 0.007 0.167 f 0.005 0.176 f 0.008 0.185 f 0.005 Relative 7.28 f 0.25 6.90 f 0.29 7.37 f 0.17 6.55 f 0.20 6.74 f 0.19 7.47 f 0.17
Liver Absolute 1.23 f 0.06 1.07 f 0.03. 1.12 f 0.04 1.13 f 0.03b 1.24 f 0.05 1.14 f 0.04 Relative 48.4 f 2.01 43.3 f 1.37. 45.1 f 0.75 45.1 f 1.07b 47.6 f 1.20 45.8 f 0.71
Lungs Absolute 0.157 f 0.007 0.171 f 0.007 0.162 f 0.004 0.166 f 0.006 0.160 f 0.007b 0.167 f 0.010 Relative 6.15 f 0.20 6.95 f 0.33 6.56 f 0.21 6.50 f 0.24 6.14 f 0.22b 6.70 k 0.29
ThymuAbsolute 0.049 f 0.003 0.050 f 0.004 0.052 f 0.004 0.052 f 0.006 0.050 f 0.003 0.045 f 0.005 Relative 1.93 f 0.13 2.04 f 0.17 2.10 f 0.14 2.02 f 0.22 1.92 f 0.12 1.79 f 0.16
. Significantlydifferent (PSO.05) from thecontrol group by Williams’ or Dunnett’s test a Organ weights and body weights are given’in grams; organ-weight-to-body-weight ratios are given as rng organ weight/g body
weight(mean -+ standard error). n=9
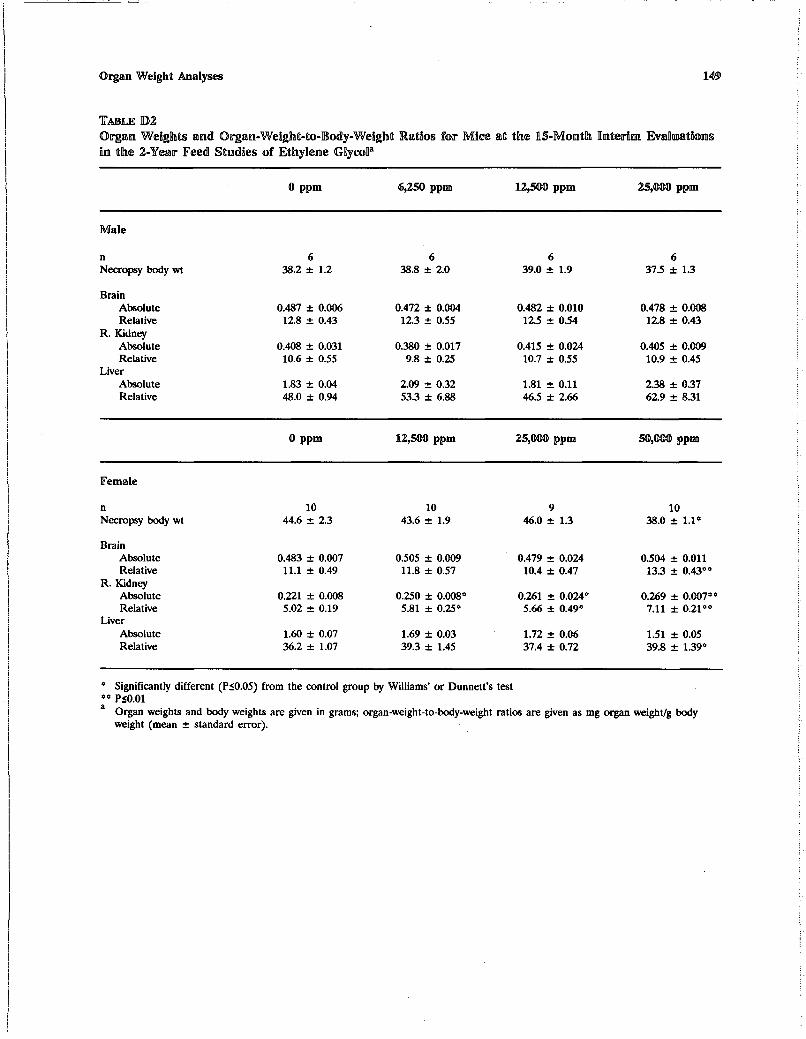
I Male
n 6 6 Necropsy body wt 38.2 f 1.2 38.8 f 2.0
Brain Absolute 0.487 f 0.06 0.472 f 0.004 Relative 12.8 f 0.43 12.3 f 0.55
R. Kidney Absolute 0.408 f 0.031 0.380f 0.017 Relative 10.6 f 0.55 9.8 f 0.25
Liver Absolute 1.83 f 0.04 2-09 f 0.32 Relative 48.0 f 0.94 53.3 f 6.88
Female
n 10 10 Necropsy body wt 44.6 f 2.3 43.6 f 1.9
Brain Absolute 0.483 f 0.007 0.505 f 0.09 Relative 11.1 f 0.49 11.8 f 0.57
R. Kidney Absolute 0.221 f 0.08 0.250 f 0.080 Relative 5.02 f 0.19 5.81 f O . Z O
Liver Absolute 1.60 f 0.07 1.69 f 0.03 Relative 36.2 f 1.07 39.3 f 1.45
O Significantly different (PSO.05) from the control group by Williams' or Dunnett's test * O PSO.01 a Organ weights and body weights are given in grams; organ-weight-to-body-weight ratios
weight(mean f standard error).
6 39.0 f 1.9
0.482 f 0.010 12.5 f 0.54
0.415 f 0.024 10.7 f 0.55
1.81 f 0.11 46.5 f 2.66
9 46.0 f 1.3
0.479 f 0.024 10.4 f 0.47
0.261 f 0.0240 5.66 f 0.49O
1.72 f 0.06 37.4 f 0.72
6 37.5 f 1.3
0.478 f 0 .08 12.8 f 0.43
0.405 f 0.09 10.9 f 0.45
2.38 f 0.37 62.9 f 8.31
10 38.0 f 1.10
0.504 f 0.011 13.3 f 0.43"
0.269 f 0.070° 7.11 f 0.21°0
1.51 f 0.05 39.8 f 1.39O
are given as mg organ weight/g body
i

150 Ethylene Glycol, NTP TR 413

151
PROCUREMENT AWDCHARACTERIZATION OF ETHYLENE GLYCOL .......................... ns2 PREPAlRATIQN AND ANALYSIS OF DOSE FQRMULATIQNS ................................ 152 FIGURE En FIGURE ~2 TABLEE l
TABLEE2
TABLEE3
TABLEE0
I I ~ B ~ ~ M~bsorpt ionspectmm of ~thyleneG U ~ C O U
~uncsear Magnetic R ~ S O I I ~ ~ C ~~pectrumOB ~ t ~ n y ~ e w eG U ~ C Q U Preparation and Storage of Dose Formulations in the Feed Studies
Results OB Analysis of Dose Formulations Administered to Mice
Results of Analysis of Dose Formulations Administered to Mice
Results of Referee Analysis of Dose F ~ m u l a t i o n sAdministered to Mice
......................... . . . . . . . . . . . . . . . . . . .
in the 2-Year Feed Studies of Ethylene GlycoU
in the 13-Week Feed Studies of Ethylene GB~coU
OB~tllmy~eneGBYCO~ . . . . . . . . . . . . . . . . . . . . . . . . . . . . . . . . . . . . . . . . . . . . . . . ..........................
............................
n50
157
156
n5Q
nss
in the 1 3 - ~ e e ~ (rand 2-year ~eecastudies of E ~ A Y B ~ I RG U ~ C O U. . . . . . . . . . . . . . . . . . n u a

152 Ethylene Glycol, NTP TR 413
CHEMICALCHARACTERIZATIONAND DOSE FORMULATION STUDIES
PROCUREMENTAND CHARACTERIZATION OF ETHYLENEGLYCOL Ethylene glycol was obtained from Ashland Chemical Company (Columbus, OH, lot AO21180). Reports from the analytical chemistry laboratory, Midwest Research Institute (MRI; Kansas City, MO), on analyses performed in support o f the ethylene glycol studies are on file at the National Institute of Environmental Health Sciences.
Lot AO21180, a colorless liquid, was identified as ethylene glycol by infrared, ultravioletbisible, and. nuclear magnetic resonance spectroscopy. All spectra (Figures El and E2) were consistent with those expected for the structure and with the literature description for the spectra o f ethylene glycol (Sadtler Standard Spectra).
The purity o f the lot was found to be greater than 99% by elemental analyses, Karl Fischer water analysis,thin-layer chromatography (TLC), and gas chromatography. Elemental analyses for carbon and hydrogenwere in agreement with the theoretical values for ethylene glycol. Karl Fischer water analysis indicated less than 0.25% water. Periodate oxidation followed by iodometric titration indicated a purity of greater than 99%. Titration o f acidic components with sodiumhydroxide indicated 0.7 ppm acetic acid.
TLC was performed on silica gel plates with two solvent systems: 1) acetone:acetic acid (99:l)and 2) acetonitri1e:aceticacid (99:l). After drying, plates were sprayed with0.5 g potassium permanganate dissolvedin 100 mL N sodiumhydroxide and examined under ultraviolet light (254nm). Each system indicated one major spot.
Gas chromatographic analysis was performed with a Varian 3700 gas chromatograph with a nitrogencarriergaslata flow rate o f 70 mL/minute. Two 1.8 m x 4 mm ID glasscolumnswereused: 1) a 6O/SO Tenax-GC column and 2) a 10% Carbowax 20M-TF'A on SO/100 Chromosorb W(AW) column. Gas chromatography using the first column indicated a major peak and two impurities with a total area of 0.30% relative to the major peak. With the second column a major peak and one impurity with a total area o f 0.12% relative t o the major peak was observed.
Stability studies were performed by the analytical chemistry laboratory using gas chromatography and column 1) described above, and with a solution o f 0.5% (wb) ethylene glycol in methanol dntaining 0.5% (vb) hexyl alcohol as an internal standard. These studies indicated that ethylene glycol was stable as a bulk chemical for 2 weeks at temperatures up to 60" C when protected from light. The identity and stability o f the bulk chemical were confirmed periodically at the study laboratory with infrared spectroscopy and gas chromatography methods similar t o those described above. Identity was confirmed and no change in purity was observed.
PREPARATIONAND ANALYSISOF DOSEFORMULATIONS The dose formulations were prepared by mixing ethylene glycol and feed in a blender (Patterson-Kelly Thin Shell with intensifier bar) for 5 minutes with the intensifier bar on and 10 minutes with the intensifier bar off (Table El). Studies were conducted by the analytical chemistry laboratory to determine homogeneity and stability o f the dosed feed preparations. For homogeneity and stability analyses, the formulations were extracted with a solvent o f methano1:water:concentrated hydrochloric acid (500:495:5) and centrifuged. These aliquots were then mixed with a methanolic sodium hydroxidesolution (1.25 g sodium hydroxidein25 mL methanol) and the internal standard solution o f n-amyl

Chemical Chramckriaation rand Dose? Fomuletios
alcohol in methanol. The precipitate was separated by centrifugation and the clear supernatant solution was analyzed using a Varian 3700 gas chromatograph with a glass 1.8 m X 2 mm ID column packed with 100-120mesh Chromosorb 101, and a gas carrier o f nitrogen at 30 mL/minute. Homogeneity was confirmed, stability of the formulations was established for 2 weeks when stored in the dark at temperatures up to 25" C. During the studies, the dose formulations were stored at 5" C for up to 14 days before use and at room temperature during use.
Periodic analyses o f the dose formulations of ethylene glycol were conducted at the study laboratory and the analyticalchemistry laboratory with gaschromatography. During the 13-week studies, the dose formulations were analyzed at the initiation and the midpoint of the studies (Table E2). During the 2-year studies, the dose formulations were analyzed at least once every 8 weeks (Table E3)with 98% (97/99) o f the dose formulations within 10% of the target concentrations. Results of the periodicreferee analysis performed by the analytical chemistry laboratory indicated good agreement with the results obtained by the study laboratory (Table E4).

154 Ethylene Glycol, NTP TR 413
0 m
3 0 cu
v)
' . Q
0 0 0 a) ( o od CJ
(%) NOlSSlVVSNVtll
FIGUREEl Infrared Absorption Spectrum of -EthyleneGlycol

Chemical Characterization and Qose Formulation
i Q 1-
E

156 Ethylene Glycol, NTP TR 413
TABLEE l Preparation and Storage of Dose Formulations in the Feed Studies of Ethylene Glycol
13-Week Studies 2-Year Studies
Preparation Premixwas prepared by mixing ethylene glycol and feed Same as 13-week studies (vh); premix and- remaining feed added to blender wi th intensifier bar and mixedfor 5 minutes with the intensifier bar on and 10 minutes wi th the intensifier bar off.
Lot Numb6r A021180 Same as 13-week studies
Maximum Storage Time 14 days Same as 13-week studies
Storage Stored a t 5" C prior to use and a t roomtemperatureduringSameas13-weekstudies use
TABLEE2 Results of Analysis of Dose Formulations Administered to Mice in the 13-Week Feed Studies of Ethylene Glycol
Target Determined Difference DateDate Concentration Concentration fromPrepared Analyzed
(PPm) (PPW Target (%)
18 May 1981 21 May 1981 6.300 6.200 -2
18 May 1981 4 June 1981 3,200 2,800 -12 12,500 13,400 +7 25,000 2 6 , 9 0 0 +8 50,OOO 53,200 +6
6 July 1981 8 July1981 3,200 3,090 -3 6,300 6,130 -3
12,500 13,700 +10 25,m X O O O -4 50,Ooo 47,400 -5

157 Chemical Characterization and Dose Formulation
Date Prepared Date Analyzed
16September198222September1982
11 November 12 19821982November
6 January1983 7 January1983
3 March1983 4 March1983
28 1983198330AprilApril
3 May 1983 4 May 1983
23 June 1983 23-27 June 1983
18 August1919831983August
Target Concentration
(PPm)
6,250a 6,250a 6,250a
12,500 25,000 50,000a 50,000a
5o.oO0~
6,250 12,500 25,OOO
50.0000
6,250 12,500 12,500 25, o O 0 50,000
6,250 12,500 12,500 25,OOO 25,000 50,000
6,250 12,500 12,500 25,000b 25,000 50,000
25,000c
6,250 12,500 12,500 25,OOO 25,000 50,000
6,250 12,500 12,500 25,000 25,000 50,000
Determined Concentration
(PPW
6,210 6,150 5,880 1,140 2,260 4,930 4,310 4,630
6,190 11,500 23,900 48.200
5,707 11,900 12,000 25,100 48.800
6,200 12,900 12,400 25,700 26,600 52,400
5,800 11,200 11,900 21,200 23,600 48,000
22,400
6,490 11,500 12,Ooo 22,700 24,800 46,500
6,180 12,000 12,300 24,800 24,200 49,800
Difference from
Target (%)
-1 -2 -6 -9
-10 -1
-14 -1
-1 -8 -4 -4
-8 -5 -4
0 -2
-1 +3 -1 +3 +6 +5
-1 -10
-5 -1 5 -6 -4
-10
+4 -8 -4 -9 -1 -1
-1 -4 -2 -1 -3 0

158 Ethylene Glycol, NTP TR 413
TABLEE3 Results of Analysis of Dose Formulations Administered to Mice in the 2-Year Feed Studies of Ethylene Glycol (continued)
DateDatePrepared Analyzed
13 October 1983 13, 14 October 1983
8 December 1983 9 December 1983
16February198416, 17 February1984
12 April 1984 13 April 198412,
24May1984 24 May1984
24May1984 29May19&ld
5 July 1984 5 July1984e
Target Determined Difference Concentration Concentration from
(PP@ (PPm) Target (%)
6,250 6,140 -2 12,500 12,OOO -4 12,500 11,900 -5 25,m 24,100 -4 2 5 , O O O 25,100 0 50,OOO 50,100 0
6,250 6,520 +4 6,250 6,100 -2
12,500 11,700 -6 12,500 11,500 -8 12,500 12,200 -2 25,000 26,200 +5 25,OOO 25,400 +2 50,000 50,OOO 0
6,250 6,300 +1 12,500 12,600 +1 12,500 13,300 +6 12,500 12,600 +1 25,000 25,200 +1 25,OOO 25,200 +1 25,OOO 25,100 0 50,OOO 5 1,OOO +2 50,OOO 51,300 +3
6,250 6,060 -3 12,500 12,400 -1 12,500 11,900 -5 25,OOO 25,300 +1 25,OOO 25,OOO 0 50,000 51,600 +3
6,250 6,540 +5 12,500 12,800 +2 12,500 12,100 -3 25,000 24,400 -2 25,000 25,300 +1 50,000 51,700 +3
6,250 5,960 -5 12,500 12,100 -3 22,500 12,600 +1 25,000 25,200 +1 25,000 25,300 +1 50,OOO 48.800 -2
6,250 5,640 -10 12,500 12,800 +2 12,500 12,700 +2 25,OOO 24,400 -2 25,000 24,700 -1 50,000 49,900 0

159 ChemicalCharacterization and Dose Formulation
TABLEE3 Results of Analysis of Dose Formulations Administered to Mice in the %Yeor Feed Studies off Ethylene Glycol (continued)
Date Prepared Date Analyzed Target
Concentration Determined
Concentration from Difference
(PPm) (PPm) Target (%)
23 198426AugustAugust1984e 6,250a 6,250a
6 , W 6,100
4 -2
6,250a 5,920 -5 12,500 12,600 +1
25,OOO 12,500
24,600 12,100
-2 -3
50,000a 5 0 , m a 25,OOO
49,400 48,700 23,000
-1 -3 -8
50,000a 46,200 -8
a Homogeneityanalysis(topleft,top r i g h t , bottomports,respectively) Preparationout o f specification;notused in study Remix ComparativeanalysisofChromosorb 101 column and a new chromatographiccolumn [0.8% W E E D (tetrahydroxyethylethylene diamine)on 80/100meshCarbopak C; temperaturesforinjector,oven, and detectorwere 160, 115, and 180" C,respectively]
e 0.8%W E E D columnused

160 Ethylene Glycol, NTP TR 413
TABLEE4 Results of Referee Analysis of Dose Formulations Administered to Mice inthe13-Weekand2-YearFeedStudiesofEthyleneGlycol
-
DatePreparedDate Analyzed Target
Concentration Determined
Concentration from Difference
(PPm) (PPm) Target (%)
13-Week Studies 6 July 1981 8 July 1981 25,Ooo 24,100 4
2-Year Studies 16 September 1982 22 September 1982 6,250 6,170 -1
3 March 1983 4 March 1983 12,500 11,900 -5 18 August 1983 19 August 1983 50,Ooo 46,800 -6
16 February 1984 16, 17 February 1984 25,Ooo 2 5 , 9 0 0 +4 5 July 1984 5 July 1984 12,500 11,800 -6

161

162 Ethylene~~Glycol,NTP TR 413
TABLEF1 FeedandCompoundConsumptionbyMaleMicein the 2-Year Feed Study of Ethylene Glycol
17 14 13 11 10 7 6 3 2
6.9 7.4 8.3 8.3 3.5 7.8 6.7
11.8 7.2
33.3 32.4 32.4 31.1 30.1 29.6 29.2 25.3 24.8
7.4 8.5 9.9 8.7 3.4 8.0 7.4 9.5 9.5
35.0 34.2 33.7 33.1 32.5 30.8 29.7 27.4 25.6
1,621 1,561 2,162 2,321
1,323 1,561 1,828 1,649
651 9.1 3.9 7.6 7.4 8.8 8.7
8.3 8.7
10.3
35.6 32.7 33.5 32.0 31.4 29.9 29.5 27.0 25.4
2,927 3,335 3,845 3,539 1,539 3,175 3,136 4,094 4,295
7.7 8.0 9.2 7.8 ' 3.2 7.9. 8.8 9.7 8.6 25.8
26.9 30.0 29.5 31.5 31.7 33.3 33.2 34.3
8,320 9,022 7,317 6,708 2,515 6,153 6,942 6,047 5,586
102 98 94 90 86 82 78 74 70 66 62 58 54 49 45 41 37 33 29 25 21
4.8 5.4 4.8 5.2 5.5 5.1 5.6 5.0 5.4 9.0 9.1 6.6 5.7 4.7
11.3 10.9 12.0 10.6 9.8 8.7 7.8
39.0 37.4 38.7 38.6 39.3 39.5 40.0 39.8 40.1 39.2 38.9 39.0 38.7 38.7 38.4 37.9 37.3 36.3 35.5 34.2 33.2
9.1 8.4 9.2 8.3
4.9 5.3 5.1 5.1 4.9 5.2 5.6 5.3 5.6 8.3 9.1 7.1 6.0 5.0
10.3 9.9
10.7
39.6 39.2 38.6 38.6 39.2 39.9 41.1 41.5 40.2 39.6 39.3 39.6 40.0 40.7 41.0 40.6 39.6 38.9 38.0 36.4 35.5
1,577 1,524 1,688 1,459 1,382 1,578 1,457
767 849 824 829 787 821 856 791 866
1,306 1,448 1,124
944 769
4.8 5.2 5.0 5 .O 5.3 5.2 5.7 5.4 5.5 8.1 9.6 6.9 6.2 5.2
12.7 10.5 12.9 10.4 10.2 9.6 8.6
40.7 40.0 39.7 40.2 42.1 41.2 41.4 41.6 40.9 40.7 40.4 39.8 39.1 41.3 40.2 40.0 39.6 39.1 38.0 36.9 35.5
1,467 1,640 1,571 1,547 1,583 1,567 1,719 1,610 1,667 2,489 2,968 2,179 1,986 1,575 3,950 3,284 4,087 3,328 3,362 3,266 3,037
4.7 :' 5.1. 4.9 : 5.0 5.3 ., 5.0 : 5.6 ! 5.4 :. 7.2 *
10.7 . 12.4 10.8 5.9 5.1.
11.2 10.9 12.0 10.4 10.0 11.2 9.0 34.5
36.6 37.8 38.6 40.0 40.1 41.6 41.6 40.3 38.5 38.9 38.6 39.3 39.2 39.0 37.7 37.4 36.9 35.6 36.6 36.3
6,529 7,683 6,581 6,742 7,508 6,773 6,715 3,057 3,667 6,998 7,984 6,941 4,580 3,473 3,562 3,313 3,572 3,419 3,423 3,507 3,271
Mean for weeks 1-13
14-52 52-102
7.7 9.0 5.9 39.1
35.7 28.9
6.0 8.7 8.1
39.7 38.0 30.4
939 1,432 1,685
6.0 9.7 8.0
40.6 37.9 29.8 3,375
1,846 3,215
6.8 9.5 ' 7.9 29.8
37.8 38.0
6,711 6,3224439
a Grams of feedconsumed per a n i m a l per day; not corrected for spillage or scatter Milligrams o f ethylene glycol consumed per day per kilogram body weight

Body Dose1 Feed
163 Feed and Compound Consumption
TABLEF2 Feed and Compound Consumption by Female Mice I n the %Year Feed Study off Ethylene GUpU
Weeks 0 ppm 12,500 ppm 25,000 ppm 50,000 ppm
Study (g/da~)~(@day)WeightWeightDay(%day)WeightDay onFeed Dose1Body Feed Body Feed
(@day) Body
weight
Dose/ Day
(9) (8)(mg/wdaY)b (9) (“day) (PI ( W W h Y )
7 6 3 2
102 97 93 89 85 81 77 73 70 66 62 58 54 49 45 41 37 33 29 25 21 17 14 13 11 10
6.6 7.1 5.5 6.0 6.9 5.5 6.3 8.9 9.5 5.5 4.6 5.3 5.5 5.3 7.7 6.0 7.4 7.7 6.8 7.6 6.1 6.2 6.7 8.1 8.9 3.5 7.5 6.7 7.8 7.6
46.6 45.7 45.2 46.2 46.9 45.2 45.1 45.5 44.6 43.7 42.5 40.8 37.2 36.1 35.1 34.2 33.0 32.8 31.5 29.9 28.8 27.0 25.8 25.8 25.4 24.4 23.5 22.8 20.0 19.6
6.5 6.4 4.8 6.2 6.8 5.5 5.8 8.4 8.9 5.1 4.8 5.6 5.4 4.9 8.2 6.8 9.0 8.6 7.5 8.5 7.2 7.5 8.0 9.1 9.0 4.1 6.8 7.8 8.5 8.7
44.6 44.4 43.4 43.0 43.4 43.7 43.2 44.5 43.3 42.5 42.1 40.0 38.0 37.7 36.7 35.0 34.4 32.9 32.2 30.5 28.3 27.4 26.3 26.1 25.2 24.1 24.0 23.2 20.8 18.6
1,820 1,812 1,388 1,807 1,964 1,581 1,684 2,367 2,583 1,486 1,438 1,738 1,778 1,639 2,776 2,414 3,279 3,268 2,917 3,479 3,174 3,417 3,781 4,347 4,450 2,109 3,532 4,222 5,094 5,850
5.9 6.6 5.3 6.0 7.3 5.6 5.6
10.9 11.4 6.5 4.8 5.6 5.4 5.4 8.7 7.7 9.1 8.6 6.8 8.8 7.3 7.8 7.8 9.5 9.1 4.0 8.5 8.3 8.1 9.0
44.3 44.3 44.8 43.8 45.4 45.7 46.0 45.7 43.4 42.7 43.1 40.7 38.2 37.2 36.8 35.8 34.6 32.0 31.9 30.1 29.3 27.2 26.4 26.2 25.8 24.5 23.8 23.3 21.1 19.0
3,339 3,741 2,950 3,436 4,020 3,062 3,049 5,976 6,554 3,782 2,776 3,425 3,527 3,619 5,894 5,357 6,600 6,680 5,303 7,272 6,240 7,204 7,429 9,049 8,854 4,116 8,946 8,958 9,654
11,847
5.9 6.2 5.1 6.0 9.0 5.8 6.2
15.2 14.4 7.4 4.8 6.1 5.6 4.9 9.3 7.7 8.9 9.4 7.3 8.2 7.4 7.5 8.1 7.6
10.7 4.1 9.0 8.3 9.6 8.5 19.6
20.7 23.1 23.4 24.9 26.2 26.0 26.0 27.4 29.1 30.5 32.1 32.7 33.9 34.6 35.8 36.9 37.7 39.8 41.0 41.8 42.6 44.3 42.8 43.6 42.9 42.5 43.2 44.3 44.0
21,780 23,300 17,940 19,219 8,288
20,434 14,594 15,605 13,682 12,733 13,451 11,383 14,408 13,158 11,066 12,951 6,602 7,486 7,657 5,866 8,805
16,922 17,197 7,250 6,610
10,509 7,100 5,955 6,989 6,726
Mean for weeks 1-13
14-52 52-102
7.2 6.8 6.4 44.2
31.4 23.1
6.2 7.6 7.7
42.8 32.1 23.1
1,804 3,014 4,229
6.7 7.8 8.1
43.7 32.1 23.4
3,818 6,160 8,775
7.5 7.9 8.3 23.4
31.9 42.3
17,936 12,504 8,852
a Grams o f feedconsumedperday; not corrected for spillage or scatter Milligrams o f ethylene glycol consumed per day per kilogram body weight

164 Ethylene Glycol, NTP TR 413

TABLE 6 1 ~ngsedient~OP NIH-QDSat and MOW ~mtion............................ n a TABLEG2 VitaminsandMinerals in NIH-07 Rat and Mouse Ration .................... 16% TABLE(63 Nutrient Composition of NIM-07 Rat rand Mouse Ration ..................... 169 TABLE641 Contaminant Levels in NIH-07 Ratand Mouse Ration ...................... 148

166 Ethylene Glycol, NTP TR 413
TABLEG1 Ingredients of NIH-07RatandMouseRationa
Ingredientsb . Percent by Weight
Ground #2 yellow shelled &rn 24.50 Ground whole wheat 23.00 Soybeanmeal (49% protein) 12.00 f
Fishmeal (60% protein) 10.00 Wheatmiddlings 10.00 Dried skim m i l k 5.00 Alfalfameal (dehydrated, 17% protein) 4.00 Corn glutenmeal (60% protein) 3.00 Soyoil 2.50 Dried brewer's yeast 2.00 Dly molasses 1.50 Dicalcium phosphate 1.25 Ground limestone 0.50 Salt 0.50 Premixes(vitamin and mineral) 0.25
a NCI, 1976; NIH, 1978 Ingredients ground to pass through a U.S. StandardScreenNo. 16 beforebeingmixed
TABLE62 VitaminsandMineralsinNIH-07RatandMouseRationa
' ' Amount Source
Vitamins
A 5,500,000 IU Stabilized v i t a m i n A palmitate,or acetate D3 4,600,000 I U D-activated animal sterol
2.8 g Menadione d-a-Tocopherol acetate 20,Ooo 1 u Choline 560.0 g Choline chloride Folic acid 2.2 g Niacin 30.0 g &Pantothenic acid 18.0 g d-Calcium pantothenate Riboflavin 3.4 g Thiamine 10.0 g Thiamine mononitrate B l Z 4,000 P g Pyridoxine 1.7 g Pyridoxine hydrochloride Biotin 140.0 mg d-Biotin
K3
Minerals
Iron 120.0 g Iron sulfate Manganese 60.0 g Manganous oxide Zinc 16.0 g Zinc oxide Copper 4.0 g Copper sulfate Iodine 1.4 g Calcium iodate Cobalt 0.4 g Cobalt carbonate
Per ton (2,000 Ib)offinished product

Feed Analyses
Nutrients
Protein (% by weight) Crude Fat (% by weight) Crude Fiber (% by weight) Ash (% by weight)
Amino Acids (46 of total diel) Arginine Cystine Glycine Histidine Isoleucine Leucine Lysine Methionine Phenylalanine Threonine Tryptophan prosine Valine
Essential Fatty Acids (% o f total diel) Linoleic Linolenic
Vitamins Vitamin A ( I U k g ) Vitamin D (IUkg) a-Tocopherol (ppm) Thiamine (ppm) Riboflavin (ppm) Niacin (ppm) Pantothenic acid (ppm) Pyridoxine (ppm) Folic Acid (ppm) Biotin (ppm) Vitamin B12 (ppb) Choline (ppm)
Minerals Calcium (%) Phosphorus (%) Potassium (%) Chloride (%) Sodium (%) Magnesium (%) Sulfur (%) Imn(PPm)Manganese(ppm) Zinc (ppm) Copper ( P P 4 Iodine (ppm) Chromium(ppm) Cobalt (ppm)
Mean 9 Standard Deviation
22.76f 1.16 5.16 f 0.58 3.52k 0.37 6.68f 0.25
1.308k 0.606 0.306f 0.084 1.150f 0.047 0.576k 0.024 0.917k 0.029 1.946f 0.055 1.270f 0.058 0.448f 0.128 0.987f 0.140 0.877f 0.042 0.2362 0.176 0.676f 0.105 1.103k 0.040
2.393f 0.258 0.280f 0.040
11,404f 4,343 4,450f 1,382 37.95 f 9.41 18.50f 3.82 7.92f 0.87
103.38k 26.59 29.54f 3.60 9.55f 3.48 2.25f 0.73 0.254f 0.042 38.45f 22.01 3,089f 328.69
1.23f 0.12 0.95 f 0.05 0.883f 0.078 0.526f 0.092 0.313f 0.390 0.168f 0.010 0.280 f 0.064 360.54f 100 91.97f 6.01 54.72f 5.67 11.06f 2.50 3.37f 0.92 1.79f 0.36 0.681 2 0.14
Range
21.2-25.9 4.26.3 2.8-4.5 6.3-7.3
1.210-1.390 0.1814.400 1.060-1.210 0.5314.607 0.8814.944 1.850-2.040 1.200-1.370 0.306-0.699 0.665-1.110 0.824-0.940 0.1074.671 0.564-0.794 1.050-1.170
1.830-2.570 0.2104.320
4,200-22,OOO 3,OOO-6,300 22.5048.90 12.0-31.0 6.10-9.00 65.0-150.0 23.0-34.0 5.60-14.0 1.80-3.70 0.194.32 10.645.0 2,400-3,430
0.97-1.43 0.86-1.10 0.7724.971 0.380-0.635 0.258-0.371 0.1514.181 0.208-0.420 255.0-523.0 81.70-99.40 46.1044.50 8.090-15.39 1.52-4.13 1.04-2.09 0.4904780
Number of Samples
26 26 26 26
8 8 8 8 8 8 8 8 8 8 8 8 8
7 7
26 4 8
26 8 8 8 8 8 8 8 8
26 26 6 8 8 8 8 8 8 8 8 6 8 4

168 Ethylene Glycol, NTP TR 413
TABLE6 4'
Contaminant Levels in NIH-07 Ratand Mouse Ration
Contaminants . Deviationa Number of SamplesMean 2 Standard Range
Arsenic (ppm) 0.55 f 0.15 0.18-0.77 26 Cadmium (ppm) 0.12 f 0.04 CO.l(M.20 26
(PPm) 0.52 f 0.20 0.24-1.00 26 Mercury(PPm) <0.05 26 Selenium (ppm) 0.31 2 0.06 0.214.45 26 Aflatoxins (ppb) 4 . 0 26 Nitrate nitrogen (ppm) 9.21 2 3.89 2.50-19.0 26 Nitrite nitro en (ppm) 1.07 f 1.37 <O.l(M.lO 26%BHA ( P P 4 4.00 2 4.99 <2.00-20.00 26 BHT (PPmlb 3.04 f 2.58 <1.00-13.00 26 Aerobic plate count (CFU/g)' 146,296 f 143,824 6,600420,OOO 26 Coliform(MPN/g)d 496 f 780 3.00-2,400 26 E.coli (MPN/g)f 3.80 f 2.36 3.00-15.0 25 E.coli (MPN/g) 9.42 f 28.79 3.00-150 26 Total nitrosoamines (ppb)g 5.85 f 5.89 0.80-30.30 26 N-Nitrosodimethylamine(ppb)g 5.01 f 5.88 0.50-30.00 26 N-Nitrosopyrrolidine (ppb)g 0.84 f 0.71 0.30-2.70 26
Pesticides ~ - B H C ~ co.01 26 i3-BHC co.02 26 &BHC <0.01 26 I-BHC co.01 26 Heptachlor <0.01 26 Aldrin <0.01 26 Heptachlor epoxide <0.01 26 DDE co.01 26 DDD <0.01 26 DDT co.01 26 k!CB <0.01 26 Mirex <0.01 26 Methoxychlor co.05 26 Dieldrin <0.01 26 Endrin <0.01 26 Telodrin co.01 26 Chlordane <0.05 26 Toxaphene c0.1 26 EstimatedPCBs <0.2 26 Ronnel co.01 26 Ethion co.02 26 Trithion <0.05 26 Diazinon co.1 26 Methylparathion co.02 26 Ethyl parathion co.02 26 Malathion' 0.15 If: 0.15 0.05-0.81 26 Endosulfan I <0.01 26 Endosulfan I1 <0.01 26 Endosulfan sulfate cO.03 26
For values less than the l imi t o f detection, the detection limit isgiven for the mean. Sources of contamination: soy oil and fishmeal CFU = colony-formingunits MPN = most probable number Mean, standard deviation, and range exclude one large value of 150 MPN/g obtained on 26August 1983. Mean, standard deviation, a n d range include the value of 150 MPN/gobtained on 26 August 1983. Allvalueswere corrected for % recovery. BHC ishexachlorocyclohexane or benzene hexachloride. Fourteen lots contained more than 0.05 ppm.

METHODS . . . . . . . . . . . . . . . . . . . . . . . . . . . . . . . . . . . . . . . . . . . . . . . . . . . . . . . . . . . . . . . n m

170 Ethylene Glycol, NTP TR 413
SENTINEL ANIIMAL PROGRAM
METHODS Rodents used in the CarcinogenesisProgramof the National Toxicology Program are produced in optimally clean facilities t o eliminatepotential pathogens that may affect study results. The Sentinel Animal Program is part o f the periodic monitoring of animal health that occurs during the toxicologicevaluation of chemicalcompounds. The sentinel animals come from the same production source and weanling groups as animals used for the studies o f chemical compounds, and these animals and the study animals are subject to identical environmental conditions.
During the 13-week studies, three male and two female B6C3Fl mice were maintained with the study animals to serve as sentinel animals. At termination of the 13-week studies, blood samples were taken from the sentinel mice. The blood wasallowed to clot, and the serum was separated. The serum was cooled and sent to Microbiological Associates, Incorporated (Bethesda, MD), for determination o f antibody titers. The following tests were performed:
Method o f Analysis Time o f AnalysisHemagglutination Inhibition
PVM (pneumonia virus o f mice) Study termination Reovirus 3 Study termination GDVII (mouse encephalomyelitis virus) Study termination Polyoma virus Study termination Sendai Study termination MVM (minute virus o f mice) Study termination Ectromelia virus (mouse pox) Study termination
Complement Fixation LCM(lymphocytic choriomeningitis virus) Study termination
ELISA MHV (mouse hepatitis virus) Study termination
During the 2-year studies, 15 B6C3Fl mice o f each sex were maintained with the study animals to serve as sentinel animals. Blood wasdrawnfrom four or fivemice of each sex at 6, 12, and 18 months followingstudy initiation. Fiverandomly selected control animals of each sex were bled at study termination (24 months). Bloodcollectedfrom each animal was allowed to clot and the serum was separated. The serum was cooled on ice and shipped to Microbiological Associates, Incorporated (Bethesda, MD), for determination o f antibody titers. The following tests were performed:
Method o f Analysis Time of Analysis Hemagglutination Inhibition
PVM 6, 12, and 18 months Reovirus 3 6, 12, and 18 months GDVII 6, 12, and 18 months Polyoma virus 6, 12,18, and 24 months Sendai 6, 12, and 18 months MVM 6, 12,18, and 24 months Ectromelia virus 6 , 12, and 18 months

171 Sentinel AnimalProgram
Method o f Analysis (continued)
Complement Fixation Mouse adenoma virus LCM
ELISA PVM Reovirus 3 GDVII MHV Mouse adenoma virus Ectromelia virus Sendai Mycoplasnta pulntonis
Immunofluorescence Assay EDIM (epizootic diarrhea of infant mice) Mycoplasnlaarrhriridis
Time o f Analysis (continued)
6, 12, and 18 months 6, 12, 18, and 24 months
24 months 24 months 24 months 12,18, and 24 months 24 months 24 months 24 months 12,18, and 24 months
24 months 24 months
All test results were negative for presence of the above pathogens.

NATIONAL TOXICOLOGY PROGRAM TECHNICAL REPORTS PRINTED AS OF FEBRUARY 1993
TR No. CHEMICAL
201 2,3,7,8-Tetrachlorodibenzo-p-dioxin(Dermal) 206 1,2-Dibromo-3-chloropropane 207 Cytembena 208 FD & C Yellow No. 6 209 2,3,7,8-Tetrachlorodibenzo-p-dioxin(Gavage) 210 1,2-Dibromoethane 211 C.I. Acid Orange 10 212 Di(2-ethylhexy1)adipate 213 ButylBenzyl Phthalate 214 Caprolactam 215 Bisphenol A 216 11-Aminoundecanoic Acid 217 Di(2-Ethylhexy1)phthalate 219 2,6-Dichloro-p-phenylenediamine 220 C.I. Acid Red 14 221 LocustBeanGum 222 C.I. Disperse Yellow 3 223 Eugenol 224 Tara Gum 225 D & C Red No. 9 226 C.I. Solvent Yellow 14 227 Gum Arabic 228 Vinylidene Chloride 229 Guar Gum 230 Agar231 Stannous Chloride 232 Pentachloroethane 233 2-Biphenylamine Hydrochloride 234 Allyl Isothiocyanate 235 Zearalenone 236 D-Mannitol 237 1,1,1,2-Tetrachloroethane 238 Ziram 239 Bis(2-chloro-1-Methylethy1)ether 240 Propyl Gallate 242 Diallyl Phthalate (Mice) 243 Trichlorethylene (Rats and Mice) 244 Polybrominated Biphenyl Mixture 245 Melamine 246 Chrysotile Asbestos (Hamsters) 247 L-Ascorbic Acid 248 4,4'-Methylenedianiline Dihydrochloride 249 Amosite Asbestos (Hamsters) 250 Benzyl Acetate 25 1 2,4- & 2,6-Toluene Diisocyanate 252 Geranyl Acetate 253 Allyl Isovalerate 254 Dichloromethane (Methylene Chloride) 255 1,2-Dichlorobenzene 257 Diglycidyl Resorcinol Ether 259 Ethyl Acrylate 261 Chlorobenzene 263 1,2-Dichloropropane 266 Monuron 267 1,2-Propylene Oxide 269 Telone 11@(1,3-Dichloropropene) 271 HC Blue No. 1 272 Propylene
i
TR No. CHEMICAL
273 Trichloroethylene (Four Rat Strains) 274 Tris(2-ethylhexyl)phosphate275 2-Chloroethanol 276 8-Hydroxyquinoline277 Tremolite 278 2,6-Xylidine279 Amosite Asbestos 280 Crocidolite Asbestos 281 HC Red No. 3 282 Chlorodibromomethane 284 Diallylphthalate (Rats) 285 C.I. Basic Red 9 Monohydrochloride 287 Dimethyl Hydrogen Phosphite 288 1,3-Butadiene 289 Benzene 291 Isophorone293 HC Blue No. 2 294 Chlorinated Trisodium Phosphate 295 Chrysotile Asbestos (Rats) 296 Tetrakis(hydroxymethy1) phosphonium Sulfate &
Tetrakis(hydroxymethy1) phosponium Chloride 298 Dimethyl Morpholinophosphoramidate 299 C.I. Disperse Blue 1 300 3-Chloro-2-methylpropene301 o-Phenylphenol303 4-Vinylcyclohexene304 Chlorendic Acid 305 Chlorinated Paraffins (G,43% chlorine) 306 Dichloromethane (Methylene Chloride)307 Ephedrine Sulfate 308 Chlorinated Pariffins (C,,, 60% chlorine) 309 Decabromodiphenyl Oxide 310 Marine Diesel Fuel and JP-5 Navy Fuel 311 Tetrachloroethylene (Inhalation) 312 n-Butyl Chloride 313 Mirex 314 Methyl Methacrylate 315 Oxytetracycline Hydrochloride 316 1-Chloro-2-methylpropene317 Chlorpheniramine Maleate 318 Ampicillin Trihydrate
,I ~-k 319 1,4-Dichlorobenzene .< 320 Rotenone
321 Bromodichlorornethane 322PhenylephrineHydrochloride 323DimethylMethylphosphonate 324BoricAcid 325 Pentachloronitrobenzene 326 Ethylene Oxide 327Xylenes(Mixed) 328Methyl Carbamate 3291,2-Epoxybutane 3304-Hexylresorcinol 331Malonaldehyde,Sodium Salt 332 2-Mercaptobenzothiazole 333 N-Phenyl-2-naphthylamine 334 2-Amino-5-nitrophenol 335C.1.Acid Orange 3

336 Penicillin VI(, 373 Succinic Anhydride 337 Nitrofurazone 374 Glycidol 338 Erythromycin Stearate 315 Vinyl Toluene 339 2-Amino-4-nitrophenol 376 Allyl Glycidyl Ether 340 Iodinated Glycerol 377 o-Chlorobenzalmalononitrile 341 Nitrofurantoin 378 Benzaldehyde 342 Dichlowos 379 2-Chloroacetophenone 343 Benzyl Alcohol 380 Epinephrine Hydrochloride 344 Tetracycline Hydrochloride 381 d-Cawone 345 Roxarsone 382 Furfural 346 Chloroethane 385 Methyl Bromide 347 D-Limonene 386 Tetranitromethane 348 @-Methyldopa Sesquihydrate 387 Amphetamine Sulfate 349 Pentachlorophenol 388 Ethylene Thiourea 350 Tribromomethane 389 Sodium Azide 351 p-Chloroaniline Hydrochloride 390 3,3'-Dimethylbenzidine Dihydrochloride 352 N-Methylolacrylamide 391 Tris(2chloroethyl) Phosphate 353 2,4-Dichlorophenol 392 Chlorinated Water and Chloraminated Water 354 Dimethoxane 393 Sodium Fluoride 355 Diphenhydramine Hydrochloride 394 Acetaminophen 356 Furosemide 395 Probenecid 357 Hydrochlorothiazide 396 Monochloroacetic Acid 358 Ochratoxin A 397 C.I. Direct Blue 15 359 8-Methoxypsoralen 399 Titanocene Dichloride 360 N,N-Dimethylaniline 401 2,4-Diaminophenol Dihydrochloride 361 Hexachloroethane 402 Furan 362 4-Vinyl-1-Cyclohexene Diepoxide 403 Resorcinol 363 Bromoethane (Ethyl Bromide) 405 C.I. Acid Red 114 364 Rhodamine 6G (C.I. Basic Red 1) 406 y-Butyrolactone 365 Pentaerythritol Tetranitrate 407 C.I. Pigment Red 3 366 Hydroquinone 409 Quercetin 367 Phenylbutazone 410 Naphthalene 368 Nalidixic Acid 411 C.I. Pigment Red 23 369 Alpha-Methylbenzyl Alcohol 412 4,4-Diamino-2,2-StilbenedisulfonicAcid 370 Benzofuran 415 Polysorbate 80 371 Toluene 419 HC Hellow 4 372 3,3-Dimethoxybenzidine Dihydrochlcxide
These NTP Technical Reports are available for sale from the National Technical .,Infomation Service, US. Department o f Commerce, 5285 Port Royal Road, Springfield, VA 22161 (703-487-4650). Single copies of this Technical Report are available without charge (and while supplies last) from the NTP Central Data Management, NIEHS, P.O. Box 12233, MD AO-01, Research Triangle Park, NC 27709.

i
DEPARTMENT OF HEALTH & HUMAN SERVICES
Public Health Service National Toxicology Program Central Data Management P.O. BOX 12233, MD A 0 4 1 Research Triangle Park, NC 27709
Official Business Penalty for Private Use - $300
/
SPECIAL FOURTH-CLASS RATE POSTAGE AND FEES PAID
DHHS/NIH Permit No. G-763
NIH Publication No. 93-3144 . February 1993
Copyright © 2022 FDOKUMEN