![273 No. 9 ] Criminal Code [2004.](https://static.fdokumen.com/doc/165x107/631e00d385e2495e150fb808/273-no-9-criminal-code-2004.jpg)
TR-273: Trichloroethylene (CASRN 79-01-6) in Four Strains of ...
303
NATIONAL TOXICOLOGY PROGRAM Technical Report Series No. 273 STUDIES OF TRICHLOROETHYLENE (CAS NO. 79-01-6) IN FOUR STRAINS OF RATS (ACI, AUGUST, MARSHALL, OSBORNE-MENDEL) (GAVAGE STUDIES) U.S. DEPARTMENT OF HEALTH AND HUMAN SERVICES Public Health Service National Institutes of Health
-
Upload
khangminh22 -
Category
Documents
-
view
1 -
download
0
Transcript of TR-273: Trichloroethylene (CASRN 79-01-6) in Four Strains of ...

NATIONAL TOXICOLOGY PROGRAM Technical Report Series No. 273
STUDIES OF
TRICHLOROETHYLENE
(CAS NO. 79-01-6)
IN FOUR STRAINS OF RATS
(ACI, AUGUST, MARSHALL, OSBORNE-MENDEL)
(GAVAGE STUDIES)
U.S. DEPARTMENT OF HEALTH AND HUMAN SERVICES Public Health Service
National Institutes of Health

NATIONAL TOXICOLOGY PROGRAM
The National Toxicology Program (NTP), established in 1978, develops and evaluates scientific information about potentially toxic and hazardous chemicals. This knowledge can be used for protecting the health of the American people and for the primary prevention of disease. By bringing together the relevant programs, staff, and resources from the U.S.Public Health Service, DHHS, the National Toxicology Program has centralized and strengthened activities relating to toxicology research, testing and test developmenthalidation efforts, and the dissemination of toxicological information to the public and scientific communities and to the research and regulatory agencies.
The NTP is made up of four charter DHHS agencies: the National Cancer Institute (NCI), National Institutes of Health; the National Institute of Environmental Health Sciences (NIEHS), National Institutes of Health; the National Center for Toxicological Research (NCTR), Food and Drug Administration; and the National Institute for Occupational Safety and Health (NIOSH), Centers for Disease Control. In July 1981, the Carcino- genesis Bioassay Testing Program, NCI, was transferred to the NIEHS.
Trichloroethylene, NTP TR 273

NTP TECHNICAL REPORT
ON THE
TOXICOLOGY AND CARCINOGENESIS
STUDIES OF TRICHLOROETHYLENE
(CAS NO. 79-01-6)
IN FOUR STRAINS OF RATS (ACI, AUGUST,MARSHALL, OSBORNE-MENDEL)
( G A V A G E STUDIES) John H. Mennear, Ph.D., Chemical Manager
NATIONAL TOXICOLOGY PROGRAM P.O. Box 12233
Research Triangle Park, NC 27709
April 1988
NTP TR 273
NIH Publication No. 88-2529
U.S. DEPARTMENT OF HEALTH AND HUMAN SERVICES Public Health Service
National Institutes of Health

NOTE TO THE READER
This study was performed under the direction of the National Institute of Environmental Health Sci-ences as a function of the National Toxicology Program. The studies described in this Technical Re- port have been conducted in compliance with NTP chemical health and safety requirements and must meet or exceed all applicable Federal, state, and local health and safety regulations. Animal care and use were in accordance with the U.S.Public Health Service Policy on Humane Care and Use of Ani- mals. All NTP toxicology and carcinogenesis studies are subjected to a data audit before being pre- sented for public peer review.
Although every effort is made to prepare the Technical Reports as accurately as possible, mistakes may occur. Readers are requested to identify any mistakes so that corrective action may be taken. Further, anyone who is aware of related ongoing or published studies not mentioned in this report is encouraged to make this information known to the NTP. Comments and questions about the National Toxicology Program Technical Reports on Toxicology and Carcinogenesis Studies should be directed to Dr. J.E. Huff, National Toxicology Program, P.O. Box 12233,Research Triangle Park, NC 27709 (919-541-3780).
These NTP Technical Reports are available for sale from the National Technical Information Service, U.S.Department of Commerce, 5285 Port Royal Road, Sprin&ield, VA 22161 (703-487-4650). Single copies of this Technical Report are available without charge (and while supplies last) from the NTP Public Information Office, National Toxicology Program, P.O. Box 12233,Research Triangle Park, NC 27709.
Trichloroethylene, NTP TR 273 2

CONTENTS PAGE
NOTE TO THE READER ....................................... i........................... 2
ABSTRACT ............................................................................... 5
EXPLANATION OF LEVELS OF EVIDENCE O F CARCINOGENIC ACTIVITY ...................... 9
CONTRIBUTORS .............................................. t .......................... 10
PEER REVIEW PANEL (DECEMBER 1985) ................................................... 12
SUMMARY OF PEER REVIEW COMMENTS (DECEMBER 1985) ................................. 13
PEER REVIEW PANEL (AUGUST 1986) ...................................................... 15
SUMMARY OF PEER REVIEW COMMENTS (AUGUST 1986) .................................... 16
1. INTRODUCTION ................................................................... 19
II. MATERIALS AND METHODS ........................................................ 27
PROCUREMENT AND CHARACTERIZATION OF TRICHLOROETHYLENE ...............28
PREPARATION AND CHARACTERIZATION OF DOSE MIXTURES ...................... 28
THIRTEEN-WEEK STUDIES ....................................................... 28
TWO-YEAR STUDIES ............................................................. 29
STUDY DESIGN ............................................................... 29
SOURCE AND SPECIFICATIONS OF ANIMALS .................................... 29
ANIMAL MAINTENANCE ....................................................... 31
CLINICAL EXAMINATIONS AND PATHOLOGY .................................... 31
STATISTICAL METHODS ....................................................... 32
III. RESULTS ......................................................................... 35
THIRTEEN-WEEK STUDIES ....................................................... 36
TWO-YEARSTUDIES ............................................................. 37
BODY WEIGHTS AND CLINICAL SIGNS .......................................... 37
SURVIVAL ................................................................... PATHOLOGY AND STATISTICAL ANALYSES OF RESULTS I .........................
37
56
NONNEOPLASTIC LESIONS OF THE KIDNEY ..................................... 56
NEOPLASTIC LESIONS ........................................................ 57
NEGATIVE TRENDS AND LOWER INCIDENCES ................................... 62
IV. DISCUSSION AND CONCLUSIONS .................................................... 67
V. REFERENCES ..................................................................... 73
3 Trichloroethylene. NTP TR 273

APPENDIXES PAGE
APPENDIX A SUMMARY OF LESIONS IN MALE ACI RATS IN THE TWO-YEAR GAVAGE
STUDY O F TRICHLOROETHYLENE ......................................... 79
APPENDIX B SUMMARY OF LESIONS IN FEMALE ACI RATS IN THE TWO-YEAR GAVAGE
STUDY OF TRICHLOROETHYLENE ......................................... 99
APPENDIX C SUMMARY OF LESIONS IN MALE AUGUST RATS IN THE TWO-YEAR
GAVAGE STUDY O F TRICHLOROETHYLENE ............................... 119
APPENDIX D SUMMARY OF LESIONS IN FEMALE AUGUST RATS IN THE TWO-YEAR
GAVAGE STUDY O F TRICHLOROETHYLENE ............................... 141
APPENDIX E SUMMARY OF LESIONS IN MALE MARSHALL RATS IN THE TWO-YEAR
GAVAGE STUDY O F TRICHLOROETHYLENE ............................... 163
APPENDIX F SUMMARY O F LESIONS IN FEMALE MARSHALL RATS IN THE TWO-YEAR
GAVAGE STUDY OF TRICHLOROETHYLENE ............................... 185
APPENDIX G SUMMARY OF LESIONS IN MALE OSBORNE-MENDEL RATS IN THE
TWO-YEAR GAVAGE STUDY OF TRICHLOROETHYLENE ..................... 207
APPENDIX H SUMMARY OF LESIONS IN FEMALE OSBORNE-MENDEL RATS IN THE
TWO-YEAR GAVAGE STUDY O F TRICHLOROETHYLENE ..................... 229
APPENDIX I GENETIC TOXICOLOGY OF TRICHLOROETHYLENE ......................... 251
APPENDIX J CHEMICAL CHARACTERIZATIQN O F TRICHLOROETHYLENE ................257
APPENDIX K IDENTIFICATION OF FOREIGN MATERIAL FOUND I N
TRICHLOROETHYLENE. LOT NO .TB05-206AA ............................... 271
APPENDIX L PREPARATION AND CHARACTERIZATION OF DOSE MIXTURES .............277
APPENDIX M METHODS O F ANALYSIS O F DOSE MIXTURES .............................. 281
APPENDIX N RESULTS OF ANALYSIS OF DOSE MIXTURES .............................. 285
APPENDIX 0 SENTINEL ANIMAL PROGRAM ........................................... 289
APPENDIX P SURVIVAL AND MEAN BODY WEIGHTS OF ACI. AUGUST. AND
MARSHALL RATS IN THE THIRTEEN-WEEK GAVAGE STUDIES OF
TRICHLOROETHYLENE .................................................. 293
APPENDIX Q AUDIT SUMMARY ....................................................... 297
Trichloroethylene. NTP TR 273 4

TR CHLOROETHYLEP E CAS NO.79-01-6
C2HC13 Molecular weight 131.4
Synonyms: Acetylene trichloride; l-chloro-2,2-dichloroethylene;l,l-dichloro-2-chloroethylene; ethinyl trichloride; ethylene trichloride; 1,1,2-trichloroethylene;trichloroethene
Trade names of formulations: Algylen; Anamenth; Benzinol; Blacosolv; Blancosolv; Cecolene; Chlorilen; Chlorylea; Chlorylen; Chorylen; Circosolv; Crawhaspol; Densinfluat; Dow-Tri; Dukeron; Fleck-Flip; Flock Flip; Fluate; Gemalgene; Germalgene; Lanadin; Lethurin; Narcogen; Narkogen; Narkosoid; Nialk; Perma-A-Chlor; Perm-A-Clor; Petzinol; Philex; Threthylen; Threthylene; Trethylene; Tri; Triad; Trial; Triasol; Trichloran; Trichloren; Triclene; Tri-Clene; Trielene; Trielin; Triklone; Trilen; Trilene; Triline; Trimar; Triol; TRI-plus; TRI-plus M; Vestrol; Vitran; Westrosol
ABSTRACT
Trichloroethylene is an industrial solvent used primarily for vapor degreasing and cold cleaning. It was selected for study because of its industrial use and potential for human exposure. (An estimated 3.5 million workers are exposed to trichloroethylene.) In an earlier study (NC1 TR 21, trichloro- ethylene (stabilized with epichlorohydrin and 1,2-epoxybutane) administered by gavage caused hepatocellular carcinomas in male and female B6C3F1 mice. Trichloroethylene administration did not increase the incidence of tumors in male or female Osborne-Mendel rats. However, the survival of dosed rats was reduced, thereby compromising the sensitivity of the study to detect a carcinogenic effect.
The studies described in this report were conducted to compare the sensitivities of four strains of rats (ACI, August, Marshall, and Osborne-Mendel) to diisopropylamine-stabilizedtrichloroethylene. The results of the present studies demonstrate that long-term administration of trichloroethylene pro-duces nephrotoxicity in four strains of rats and that the susceptibilities of these strains to the nephro- toxic effects of the chemical are similar. Because of chemically induced toxicity, reduced survival, and incomplete documentation of experimental data, the studies are considered inadequate for either comparing or assessing trichlorethylene-induced carcinogenesis in these strains of rats.
Toxicology and carcinogenesis studies of trichloroethylene (more than 99% pure, stabilized with 8 ppm diisopropylamine) were conducted by administering the chemical in corn oil by gavage at doses of 0,500, or 1,000mg/kg per day, 5 days per week, for 103 weeks to groups of 50 male and 50 female ACI, August, Marshall, and Osborne-Mendel rats. The doses were selected on the basis of results from 13-week gavage studies in which groups of 10 male and 10 female ACI, August, and Marshall rats received daily doses of trichloroethylene (male: 125-2,000 mg/kg; female: 63-1,000 mg/kg). Doses for Osborne-Mendel rats were selected to conform with doses used in an earlier carcinogenicity study in that strain (NC1 TR 2).
5 Trichloroethylene, NTP TR 273

In the 13-week studies, male ACI and August rats receiving 2,000 mg/kg trichloroethylene and male and female Marshall rats receiving 1,835 mg/kg had final mean body weights 12%-17% lower than those of the vehicle controls. All other dose groups had body weights comparable to those of the vehicle controls. Three male August rats dosed with 2,000 mg/kg died. Histopathologic evaluation of tissues revealed no lesions attributable to trichloroethylene administration in the 13-week studies. This absence of histopathologic findings did not accurately predict the nephrotoxic effects of long- term administration of trichloroethylene to rats.
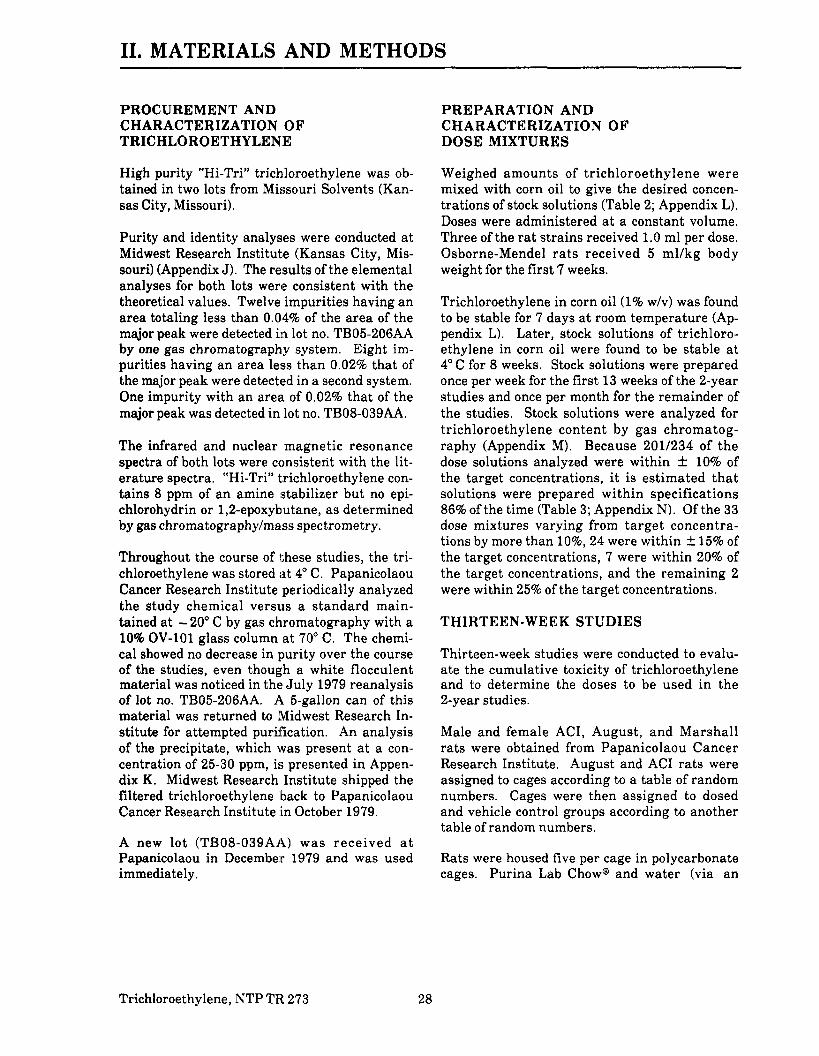
Body Weight and Survival in the Two-year Studies: In the 2-year studies, all dosed groups exhibited some reduction in mean body weights relative to the vehicle controls. Survival relative to vehicle controls was significantly reduced in 7/16 dosed groups (see following table). Also, the survival of high dose male Marshall rats was reduced by a large number of accidental deaths. Nephrotoxicity, reduced survival, and central nervous system toxicity (characterized by sedation, loss of conscious- ness, tremors, and convulsions) showed that the doses of trichloroethylene selected for the 2-year studies were too high.
SUMMARY OF SURVIVAL AND FINAL MEAN BODY WEIGHTS OF ACI, AUGUST, MARSHALL, AND OSBORNE-MENDEL RATS IN THE TWO-YEAR GAVAGE STUDIES OF
TRICHLOROETHYLENE
Final Mean Final Mean Group Survival (a) Body Weight (percent Survival (a) Body Weight (percent
of vehicle control) of vehicle control)
Male Female ACI
Untreated control 39/49 -_ 37/49 _ _ Vehicle control 38/50 _ _ 35/60 _ _ 600 m a g (bE19/50 89.0 20150 91.7 1,000mg/kg (bE 11/50 87.5 (b)19/50 93.0
August
Untreated control 24/60 _ _ 26/50 _ _ Vehicle control 21/50 _ _ 23/50 _ _ 600 melke 13/60 93.5 26/60 94.5 LOO0mg/kg 16/49 87.7 25/50 92.4
Mushall
Untreated control 32/60 _ _ 31/60 _ _ Vehicle control 26/50 _ _ 30150 -.
(b)12/60 93.3 (b)12/50 96.0 hO00mente (c) 6/50 96.8 (b)10/60 89.9
Osborne-Mendel
Untreated control 18/50 _ _ 19/50 -. Vehicle control 22/50 _ _ 20/60 _ _ 600 mg/kg 17/50 97.5 11/50 92.7 1.000 mg/kg 15/50 88.4 (b)7/50 100.7
(a)Proportion of survivorsafter 2years(b)Survival waa significantly (P<0.05)reduced relative to vehicle controls. (c)Twenty-five animala were accidentally killed.
Trichloroethylene, NTP TR 273 6

Renal Effects in the Two-year Studies: Trichloroethylene caused tubular cell cytomegaly in 82%- 100%of all dosed animals. In addition, trichloroethylene produced toxic nephropathy (which was dis- tinguishable from age-related nephropathy) in 17%-80% of the dosed animals. Cytomegaly, karyo- megaly, or toxic nephropathy was not found in untreated or vehicle control animals. Trichloro-ethylene administration was also associated with increased incidences of renal tubular cell adenomas and adenocarcinomas. The incidences of renal lesions are shown in the following table.
Other Pathologic Effects in the Two-year Studies: An increased incidence of interstitial cell tumors of the testis was observed in high dose male Marshall rats (untreated control, 16/46; vehicle control, 17/46; low dose, 21/48; high dose, 32/48; P=0.002). The incidences of pheochromocytomas of the adre- nal gland were significantly reduced in male ACI, female August, female Marshall, and male and fe- male Osborne-Mendel rats.
Genetic Toxicology: Trichloroethylene did not cause mutations in Salmonella typhimurium strains TA98, TA100, TA1535, or TA1537 with or without metabolic activation. In Chinese hamster ovary cells, trichloroethylene did not induce chromosomal aberrations; the results for sister chromatid ex- changes were considered positive. Trichloroethylene was mutagenic to mouse L5178Y lymphoma cells in the presence of rat liver $9.
SUMMARY OF INCIDENCES OF RENAL LESIONS IN THE TWO-YEAR GAVAGE STUDIES OF TRICHLOROETHYLENE
Male Female
Lesion Untreated
Control Vehicle Control
500 mg/kg
1,OOO mg/kg
Untreated Control
Vehicle Control
SO0 mg/kg
1,OOO mg/kg
ACI
No. kidneys examined CytomegalyToxic nephropathy Tubular cell adenoma
49 0 0 0
50 0 0 0
49 40 18 0
49 48 18 0
49 0 0 0
48 0 0 0
47 43 21
2
43 42 19 0
Tubular cell adenocarcinoma 0 0 1 0 0 0 (a)1 1
August
No. kidneys examined CytomegalyToxic nephropathy Tubular cell adenoma
50 0 0 0
50 0 0 0
50 46 10 1
49 46 31
1
50 0 0 0
49 0 0 1
48 46
8 2
50 50 29 0
Tubular cell adenocarcinoma 0 0 1 0 0 0 2 0
Marshall
No. kidneys examined CytomegalyToxic nephropathy Tubular cell adenoma
49 0 0 2
45 0 0 0
50 48 18 1
47 47 23 0
49 0 1 1
50 0 0 1
48 46 30
1
44 43 30 0
Tubular cell adenocarcinoma 0 0 0 1 0 0 1 1
Osborne-Mendel
No. kidneys examined CytomegalyToxic nephropathy Tubular cell adenoma
50 0 0 0
50 0 0 0
50 48 39
6
50 49 35
1
50 0 0 1
50 0 0 0
50 48 30 0
49 49 39
1 Tubular cell adenocarcinoma 0 0 0 1 0 0 0 0
(a)Adenocarcinoma,NOS
7 Trichloroethylene, NTP TR 273

Data Audit: Audits of the experimental data for these 2-year studies of trichloroethylene were con- ducted by the National Toxicology Program (Appendix Q).The results of the audits revealed evidence that the doses of trichloroethylene were too high. In addition, there was insufficient documentation of animal breeding, clinical observations, environmental conditions, and analytical chemistry data. Also, individual animal identification was not always verifiable.
Conclusions: Under the conditions of these 2-year gavage studies of trichloroethylene in male and fe- male ACI, August, Marshall, and Osborne-Mendel rats, trichloroethylene administration caused renal tubular cell cytomegaly and toxic nephropathy in both sexes of the four strains. However, these are considered to be inadequate studies of carcinogenic activity* because of chemically induced toxic- ity, reduced survival, and deficiencies in the conduct of the studies. Despite these limitations, tubular cell neoplasms of the kidney were observed in rats exposed to trichloroethylene and interstitial cell neoplasms of the testis were observed in Marshall rats exposed to trichloroethylene.
SUMMARY OF THE TWO-YEAR GAVAGE STUDIES OF TRICHLOROETHYLENE IN MALE AND FEMALE ACI, AUGUST, MARSHALL, AND OSBORNE-MENDEL RATS
Doses 0,500, and 1,000mg/kg trichloroetlhylene in corn oil, 5 d/wk
Level of evidence of carcinogenic activity Inadequate study
As indicated byChemically induced toxicity, reduced survival, and deficiencies in study conduct
Other toxic effects Renal tubular cytomegaly, toxic nephropathy
Neoplastic effects Uncommon renal tubular cell neoplasms in exposed rats and testicular interstitial cell tumors in male Marshall rats
"Explanation of Levels of Evidence of Carcinogenic Activity is on page 9. Summariesof the Peer Review comments and the public discussions on this Technical Report appear on pages 13-14and 16-17.
Trichloroethylene, NTP TR 273 8

EXPLANATION OF LEVELS OF EVIDENCE OF CARCINOGENIC ACTIVITY These studies are designed and conducted to characterize and evaluate the toxicologic potential, including carcinogenic activity, of selected chemicals in laboratory animals (usually two species, rats and mice). Chemicals selected for NTP toxicology and carcinogenesis studies are chosen primarily on the bases of human exposure, level of production, and chemical structure. Selection per se is not an indicator ofa chemical's carcinogenic potential. Negative results,in which the study animals do not have a greater incidence of neoplasia than control animals, do not necessarily mean that a chemical is not a carcinogen, inasmuch as the experiments are conducted under a limited set of conditions. Positive results dem- onstrate that a chemical is carcinogenic for laboratory animals under the conditions of the study and indicate that exposure to the chemical has the potential for hazard to humans.
The National Toxicology Program describes the results of individual experiments on a chemical agent and notes the strength of the evi- dence for conclusions regarding each study. Other organizations, such as the International Agency for Research on Cancer, assign a strength of evidence for conclusions based on an examination of all available evidence including: animal studies such as those conducted by the NTP, epidemiologic studies, and estimates of exposure. Thus, the actual determination of risk to humans from chemicals found to be carcinogenic in laboratory animals requires a wider analysis that extends beyond the purview of these studies. Five categories of evidence of carcinogenic activity are used in the Technical Report series to summarize the strength of the evidence ob- served in each experiment: two categories for positive results ("Clear Evidence" and "Some Evidence"); one category for uncertain find- ings ("Equivocal Evidence"); one category for no observable effects ("No Evidence"); and one category for experiments that because of ma- jor flaws cannot be evaluated ("Inadequate Study"). These categories of interpretative conclusions were first adopted in June 1983 and then revised in March 1986 for use in the Technical Reports series to incorporate more specifically the concept ofactual weight ofevidence of carcinogenic activity. For each separate experiment (male rats, female rats, male mice, female mice), one ofthe following quintet is se- lected to describe the findings. These categories refer to the strength of the experimental evidence and not to either potency or mechanism.
0 Clear Evidence of Carcinogenic Activity is demonstrated by studies that are interpreted as showing a dose-related (i) in- crease of malignant neoplasms, (ii) increase of a combination of malignant and benign neoplasms, or (iii) marked increase of be- nign neoplasms if there is an indication from this or other studies of the ability of such tumors to progress to malignancy. Some Evidence of Carcinogenic Activity is demonstrated by studies that are interpreted as showing a chemically related in- creased incidence of neoplasms (malignant, benign, or combined) in which the strength of the response is less than that required for clear evidence.
0 Equivocal Evidence of Carcinogenic Activity is demonstrated by studies that are interpreted as showing a marginal in- crease of neoplasms that may be chemically related. No Evidence of Carcinogenic Activity is demonstrated by studies that are interpreted as showing no chemically related in- creases in malignant or benign neoplasms.
0 Inadequate Study of Carcinogenic Activity is demonstrated by studies that because of major qualitative or quantitative limitations cannot be interpreted as valid for showing either the presence or absence of carcinogenic activity.
When a conclusion statement for a particular experiment is selected, consideration must be given to key factors that would extend the ac- tual boundary of an individual category of evidence. This should allow for incorporation of scientific experience and current under- standing of long-term carcinogenesis studies in laboratory animals, especially for those evaluations that may be on the borderline be- tween two adjacent levels. These considerations should include:
The adequacy ofthe experimental design and conduct; 0 Occurrence ofcommon versus uncommon neoplasia; 0 Progression (or lack thereof) from benign to malignant neoplasia as well as from preneoplastic lesions;
Some benign neoplasms have the capacity to regress but others (of the same morphologic type) progress. At present, it is im- possible to identify the difference. Therefore, where progression is known to be a possibility, the most prudent course is to assume that benign neoplasms ofthose types have the potential to become malignant;
0 Combining benign and malignant tumor incidences known or thought to represent stages of progression in the same organ or tissue; Latency in tumor induction;
0 Multiplicity in site-specific neoplasia; Metastases;Supporting information from proliferative lesions (hyperplasia) in the same site of neoplasia or in other experiments (same lesion in another sex or species);
0 The presence or absence ofdose relationships; 0 The statistical significance of the observed tumor increase; 0 The concurrent control tumor incidence as well as the historical control rate and variability for a specific neoplasm; 0 Survival-adjusted analyses and false positive or false negative concerns;
Structure-activity correlations; and In some cases, genetic toxicology.
These considerations together with the definitions as written should be used as composite guidelines for selecting one of the five cate- gories. Additionally, the following concepts (as patterned from the International Agency for Research on Cancer Monographs) have been adopted by the NTPto give further clarification of these issues:
The term chemical carcinogenesis generally means the induction by chemicals of neoplasms not usually observed, the induction by chemicals of more neoplasms than are generally found, or the earlier induction by chemicals of neoplasms that are commonly ob- served. Different mechanisms may be involved in these situations. Etymologically, the term carcinogenesis means induction of cancer,that is, of malignant neoplasms; however, the commonly accepted meaning is the induction of various types of neoplasms or of a combination of malignant and benign neoplasms. In the Technical Reports, the words tumor and neoplasm are used interchangeably.
9 Trichloroethylene, NTP TR 273

CQNTRIBUTORS
The NTP Technical Report on the Toxicology and Carcinogenesis Studies of Trichloroethylene in Four Strains of Rats is based on the 13-week studies that began in March or April 1977 and ended in June or July 1977 at Papanicolaou Research Institute and on the 2-year studies that began between December 1978 and November 1979 and ended between November 1980 and November 1981 a t Papanicolaou Cancer Research Institute (Miami, Florida).
National Toxicology Program (Evaluated Experiment, Interpreted Results, and Reported Findings)
cJohnH. Mennear, Ph.D., Chemical Manager
Jack Bishop, Ph.D. C.W. Jameson, Ph.D. Gary A. Boorman, D.V.M., Ph.D. E.E. McConnell, D.V.M. Joseph K. Haseman, Ph.D. G.N.Rao, D.V.M.,Ph.D. James Huff, Ph.D. B.A. Schwetz, D.V.M.,Ph.D.
NTP Pathology Working Group (Evaluated ACI Rat Slides and Prepared Pathology Report on 2/26/82)
G. Boorman, D.V.M., Ph.D. (NTP) (Chair) R. Kovatch, D.V.M. (Tracor Jitco, Inc.) P. Hildebrandt, D.V.M. (Tracor Jitco, Inc.) E. McConnell, D.V.M. (NTP)
(Evaluated August, Rat Slides and Prepared Pathology Report on 7/27/82)
M. Anver, D.V.M. (Clement Associates) (Chair) S.Eustis, D.V.M., Ph.D. (NTP) G. Boorman, D.V.M., Ph.D. (NTP) R. Kovatch, D.V.M. (Tracor Jitco, Inc.)
(Evaluated Marshall Rat Slides and Prepared Pathology Report on 0/2/81)
G. Boorman, D.V.M., Ph.D. (NTP)(Chair) E. McConnell, D.V.M. (NTP) B. Gupta, B.V.Sc., Ph.D. (NTP) F. Voelker, D.V.M. L. Lomax, D.V.M. (NTP) Burroughs Wellcome Laboratories
(Evaluated Osborne-Mendel Rat Slides and Prepared Pathology Report on 8/13/82)
G. Boorman, D.V.M., Ph.D. (NTP) (Chair) P. Hildebrandt, D.V.M. (Tracor Jitco, Inc.) S. Eustis,D.V.M., Ph.D. (NTP) R. Sauer, V.M.D. (Gillette Research)
(Special Review of Kidney Lesions on 12/13/83)
H. Solleveld, D.V.M., Ph.D. (NTP) (Chair) R. Maronpot, D.V.M. (NTP) G. Boorman, D.V.M., Ph.D. (NTP) C. Montgomery, D.V.M. (NTP) R. Goyer, M.D. (NIEHS) K. Morgan, Ph.D. A. Macklin, D.V.M., Ph.D. Chemical Industry Institute of Technology
Burroughs Wellcome Laboratories
Principal Contributors at Papanicolaou Cancer Research Institute (Conducted Studies and Evaluated Tissues)
Norman Altman, D.V.M. Faze1 Ahmed, Ph.D. Ernest0 Bernal, D.V.M., Pathologist (ACI, August, Herman Seibold, D.V.M., Pathologist .
and Osborne-Mendel rats) (Marshall rats)
Trichloroethylene, NTP TR 273 10

CONTRIBUTORS (Continued)
Principal Contributors at Experimental Pathology Laboratories, Inc. (Conducted Pathology Quality Assurance)
J. Hardisty, D.V.M. ACI Rats C.E. Gilmore, Ph.D. August Rats M.Hamlin, D.V.M. Marshall Rats L. Ackerman, D.V.M. Marshall Rats M.Robl, D.V.M. Osborne-Mendel Rats J.Gauchat Pathology Coordinator
Principal Contributors at Carltech Associates, Inc. (Contractor for Technical Report Preparation)
William D. Theriault, Ph.D. John Warner, M.S. Abigail C. Jacobs, Ph.D.
11 Trichloroethylene, NTP TR 273

PElER REVIEW PANEL (DECEMBER 1985)
The members of the Peer Review Panel who evaluated the draft Technical Report on trichloroethyl- ene on December 9, 1985, are listed below. Panel members serve as independent scientists, not as representatives of any institution, company, or governmental agency. In this capacity, Panel mem- bers have five major responsibilities: (a) to ascertain that all relevant literature data have been ade- quately cited and interpreted, (b) to determine if the design and conditions of the NTP studies were appropriate, (c) to ensure thak the Technical Report presents the experimental results and conclu- sions fully and clearly, (d) to judge the significance of the experimental results by scientific criteria, and (e) to assess the evaluation of the evidence of carcinogenicity and other observed toxic responses.
National Toxicology Program Board of Scientific Counselors Telchnical Reports Review Subcommittee
Jerry B. Hook, Ph.D. (Chair) Vice President, Preclinical Research and Development
Smith Kline & French Laboratories, Philadelphia, Pennsylvania
Frederica Perera, Dr. P.H. Division of Environmental Sciences School of Public Health, Clolumbia University New York, New York
James Swenberg, D.V.M., Ph.D. (Principal Reviewer) Head, Department of Biochemical
Toxicology and Pathobiology Chemical Industry Institute of Toxicology Research Triangle Park, North Carolina
Act Hoc Subcommittee Panel of Experts John J . Crowley, Ph.D. (Principal Reviewer)
Division of Public Health Science The Fred Hutchinson Cancer Research Center Seattle, Washington
Kim Hooper, Ph.D. (Principal Reviewer) Hazard Evaluation System and
Information Services Department of Health Services State of California Berkeley, California
Thomas C. Jones, D.V.M. Professor, Comparative Pa.thology New England Regional Primate Research Center Harvard Medical School Southborough, Massachusetts
Richard J. Kociba, D.V.M., Ph.D. Dow Chemical USA Midland, Michigan
David Kotelchuck, Ph.D.* Environmental Health Science Program Hunter School of Health Sciences New York, New York
*Unableto attend
Franklin E. Mirer, Ph.D. Director, Health and Safety Department International Union, United Auto
Workers, Detroit, Michigan
I.F.H.Purchase,B.V.Sc.,Ph.D.,F.R.C.Path. Director, Central Toxicology Laboratory Imperial Chemical Industries, PLC Alderley Park, England
Robert A. Scala, Ph.D. Senior Scientific Advisor, Medicine and
Environmental Health Department Exxon Corporation East Millstone, New Jersey
Steven R. Tannenbaum, Ph.D. Professor, Department of Nutrition and
Food Science Massachusetts Institute of Technology Cambridge, Massachusetts
Bruce W. Turnbull, Ph.D. Professor and Associate Director College of Engineering Cornel1 University Ithaca, New York
Trichloroethylene, NTP TR 273 12

SUMMARY OF PEER REVIEW COMMENTS ON THE TOXICOLOGY AND CARCINOGENESIS STUDIES OF
TRICHLOROETHYLENE (DECEMBER 1985)
On December 9, 1985, the draft Technical Report on the toxicology and carcinogenesis studies of tri-chloroethylene received peer review by the National Toxicology Program Board of Scientific Coun- selors, Technical Reports Review Subcommittee and associated Panel of Experts. The review meeting was held at the National Institute of Environmental Health Sciences, Research Triangle Park, North Carolina.
Dr. J. Mennear, NTP Chemical Manager, introduced the toxicology and carcinogenesis studies of tri-chloroethylene by reviewing the experimental designs, results, and proposed conclusions:
These 2-year gavage studies of trichloroethylene in male and female ACI, August, Marshall, and Osborne-Mendel rats are considered to be inadequate studies of carcino- genicity because of insuffcient survival in dosed animals and incomplete documentation of the conduct of the studies. However, under the conditions of these studies trichloro- ethylene administration was strongly associated with renal tubular cell cytomegaly and karyomegaly and toxic nephropathy in both sexes of the four strains. In addition, an in- creased incidence of renal tubular cell neoplasms in male Osborne-Mendel rats, and possibly in female ACI and female August rats, and an increased incidence of testicular interstitial cell tumors in male Marshall rats may have been associated with the ad- ministration of trichloroethylene.
Dr.Hooper, a principal reviewer, agreed with the proposed conclusions. He discussed deficiencies in study design, conduct, and recordkeeping. With regard to the large numbers of “accidental” or “ga-vage-related,’ deaths, he argued that gavage trauma is lethal when accompanied by the toxicity of tri-chloroethylene. Dr. Hooper proposed that inhalation studies in both rats and mice be designed to con- firm or deny the assertion that trichloroethylene is a tissue- and species-specific carcinogen (mouse liver). He asked that reference be included to a 1983Japanese inhalation study in which trichloro- ethylene was reported to produce pulmonary adenocarcinomas in female ICR mice.
As a second principal reviewer, Dr. Swenberg agreed with the conclusions but stated that these stud- ies were inadequately designed, failing to utilize a previous study with Osborne-Mendel rats in dose selection. Beginning with the Abstract, it should be stated that the doses used exceeded the maxi- mum tolerated dose in all four strains of rats. He detailed a number of suggested revisions. However, he said that the last sentence regarding kidney tumors should be deleted as the findings described have not been reproduced in several negative studies and are difficult to assess due to the severe renal toxicity.
As a third principal reviewer, Dr. Crowley also suggested that the last sentence should be deleted from the conclusions. He also asked for clarification concerning the relationship of gavage trauma with chemical toxicity in causation of “accidental” deaths. Dr. Mennear responded that the mortality originally termed “gavage-related deaths” was likely to be associated with toxicity of trichloroethylene.
Dr. E. McConnell, NIEHS, said that despite the deficiencies in these studies, the NTP considered the toxic renal lesions to be real and consistent with effects seen with other halogenated solvents.
13 Trichloroethylene, NTP TR 273

In other discussion, Dr. Tannenbaum pointed out that the major metabolite of trichloroethylene in humans and rats is trichloroacetic acid, and this compound could be the cause of the nephrotoxicity, thus raising the question of whether there might be a threshold effect. Dr. Mirer cautioned against minimizing the importance of'the renal toxicity in view of the fact that the doses used were in the same range as the occupationally permitted exposure levels in air. Dr. Perera spoke against deleting the last sentence of the conclusions, arguing that if the nontumor toxic effects should not be dismissed despite the deficiencies of the studies, then neither should the neoplastic effects. Dr. McConnell said that the toxic renal lesions were observed a t very high incidence whereas the neoplastic changes were found at very low incidence. Dr. Swenberg stated that conclusions about carcinogenicity cannot be drawn from an inadequate study of carcinogenicity.
Dr.Scala said that the audit report findings suggest these studies are flawed and should not be pub- lished as an NTP Technical Report. The data on the kidney lesions could be reported separately. Dr. Jones said that the information should be made readily available. Dr. Purchase thought it difficult to recommend publication or not based on the present report. He suggested that the report be redrafted and brought back to the Panel.
Dr. Hooper moved that the report be deferred for extensive revision and then brought back to the Panel. Dr. Swenberg seconded the motion. Dr. Kociba requested that more information from the Audit Report be included in the redraft. Dr. Swenberg asked that information also be provided on the findings from an independent audit by the Halogenated Solvent Industry Alliance (HSIA). Dr. J. Huff,NIEHS,said that a revised Technical Report could be ready for consideration a t the summer 1986 meeting. Dr. Hook summarized the motion to say that the Technical Report would be rewritten, adding a more extensive summary of the findings from audits conducted by both the NTP and HSIA and returned to the Panel for review. The Panel approved the motion by nine affirmative votes with two abstentions (Dr. Kociba and Dr. Purchase).
Trichloroethylene, NTP TR 273 14

PEER REVIEW PANEL (AUGUST 1986)
The members of the Peer Review Panel who evaluated the draft Technical Report on trichloro- ethylene on August 19,1986, are listed below. Panel members serve as independent scientists, not as representatives of any institution, company, or governmental agency. In this capacity, Panel mem- bers have five major responsibilities: (a)to ascertain that all relevant literature data have been ade- quately cited and interpreted, (b) to determine if the design and conditions of the NTP studies were appropriate, (c) to ensure that the Technical Report presents the experimental results and conclu- sions fully and clearly, (d) to judge the significance of the experimental results by scientific criteria, and (e) to assessthe evaluation of the evidence of carcinogenicity and other observed toxic responses.
National Toxicology Program Board of Scientific Counselors Technical Reports Review Subcommittee
Robert A. Scala, Ph.D. (Chair) Senior Scientific Advisor, Medicine and Environmental Health Department
Research and Environmental Health Division, Exxon Corporation East Millstone, New Jersey
Michael A. Gallo, Ph.D. Frederica Perera, Dr. P.H. Associate Professor, Director of Toxicology Division of Environmental Sciences Department of Environmental and Community School of Public Health, Columbia
Medicine, UMDNJ - Rutgers Medical School University Piscataway, New Jersey New York, New York
Ad Hoc Subcommittee Panel of Experts Charles C. Capen, D.V.M., Ph.D.
Department of Veterinary Pathobiology Ohio State University Columbus, Ohio
Vernon M. Chinchilli, Ph.D. Department of Biostatistics Medical College of Virginia Virginia Commonwealth University Richmond, Virginia
John J . Crowley, Ph.D. (Principal Reviewer) Division of Public Health Science The Fred Hutchinson Cancer Research Center Seattle, Washington
Kim Hooper, Ph.D. (Principal Reviewer) Hazard Evaluation System and
Information Services Department of Health Services State of California Berkeley, California
Donald H. Hughes, Ph.D. Scientific Coordinator, Regulatory Services
Division, The Procter and Gamble Company Cincinnati, Ohio
Franklin E. Mirer, Ph.D. Director, Health and Safety Department International Union, United Auto
Workers, Detroit, Michigan
James A. Popp, D.V.M., Ph.D. (Principal Reviewer) Head, Department of Experimental Pathology and Toxicology
Chemical Industry Institute of Toxicology Research Triangle Park, North Carolina
I.F.H. Purchase,B.V.Sc.,Ph.D.,F.R.C.Path. Director, Central Toxicology Laboratory Imperial Chemical Industries, PLC Alderley Park, England
Andrew Sivak, Ph.D. Vice President, Biomedical Science Arthur D. Little, Inc. Cambridge, Massachusetts
15 Trichloroethylene, NTP TR 273

SUMMARY OF PEER REVIEW COMMENTS ON THE TOXICOLOGY AND CARCINOGENESIS STUDIES OF
TIEICHLOROETHYLENE (AUGUST 1986)
On August 19, 1986, the draft Technical Report on the toxicology and carcinogenesis studies of tri-chloroethylene received peer review by the National Toxicology Program Board of Scientific Coun- selors’ Technical Reports Review Subcommittee and associated Panel of Experts. The review meeting was held at the National Institute of Environmental Health Sciences, Research Triangle Park, North Carolina.
Dr. J. Mennear, NTP, introduced the studies by reviewing the experimental design, results, and pro- posed conclusions (inadequate studies of carcinogenic activity in the four strains of rats).
Dr. Hooper, a principal reviewer, stated that this version was improved considerably over the pre- vious draft, especially in justifying dose selection, comparing renal toxicity in five rat strains (includ- ing F344),eliminating mention of gavage trauma as the major cause of decreased survival, and sum- marizing audit findings and deficiencies in the execution of the studies. Among many comments, Dr. Hooper suggested that signilicant carcinogenic effects should be included in the summary, even though the overall studies were judged inadequate for assessing carcinogenicity, and he cited specific increases in renal and testicular tumors. He asked for a clarifying discussion on what is meant by “accidental” deaths, since some of the excessive mortality could be due to anesthetic or toxic proper- ties of the chemical. Dr. Hooper suggested that a more balanced discussion be given to the carcino- genic effects of chlorinated alliphatics, including findings from inhalation studies in which the car- cinogenic responses appeared to be broader in terms of site.
As a second principal reviewer, Dr. Popp basically agreed with the conclusion that these were inade- quate studies but felt that the report should more clearly and specifically state the basis for the studies’ inadequacies. Dr. Popp indicated that statements in the text about significant increases in renal tumors could lead to a misunderstanding that these were positive studies. He thought that these statements could be better qualified.
As a third principal reviewer, Dr. Crowley questioned whether the report yet comes to grips with how serious the data problems are. For example, the results of the data audit indicate that analyses by dose group and evaluations of Idose response may be potentially misleading. He said that if these were inadequate studies, the significant tumor findings should be downplayed or not presented at all. Dr. Crowley noted a possible exception, testicular tumors in Marshall rats, which did not involve a com-promised organ and were statistically significant regardless of dose identification.
Most of the discussion was concerned with the weight that should be given to the renal and testicular tumors observed and whether statistical significances should be given within the context of inade- quate studies. One viewpoint as supported by Dr. Purchase, Dr. Crowley, and Dr. Popp was that con- clusions about carcinogenic activity from inadequate studies are unwarranted, as are statements about the statistical significance of low incidence rates in animals with uncertain identification. A second viewpoint, supported by Dr. Hooper, Dr. Mirer, and Dr. Perera, was that, although conclusions cannot be drawn from inadequate studies, more emphasis could be given to the tumor data if it is be-lieved that there is a probable association between chemical administration and increased tumor in- cidence. Dr. J. Huff, NIEHS, stated that NTP staff agreed that these renal tumors were related to tri-chloroethylene administration, and he reported that combining data from male and female animals for both vehicle control and dosed groups shows only 2 renal tumors in vehicle controls versus 26 in dosed animals. Dr. S. Eustis, NIEHS, noted that there was an overemphasis regarding the purported misidentification of animals. Dr. J . Selkirk, NIEHS, said that the audit summary reinforced the idea
Trichloroethylene, NTP TR 273 16

that animals were indeed identifiable and could be separated easily into dosed and vehicle control animals.
Dr. Hooper moved that the Technical Report on trichloroethylene be accepted with the conclusions as written, inadequate studies of carcinogenic activity in the four strains of rats, and with the addition of a statement to the summary that there were increased incidences of renal tubular cell tumors observed in dosed rats and an increased incidence of interstitial cell tumors of the testes in dosed Marshall rats. Dr. Mirer seconded the motion, and it was approved by six reviewers with three dissenting (Dr. Capen, Dr. Crowley, and Dr. Popp) and one abstaining (Dr. Purchase).
17 Trichloroethylene, NTP TR 273

Trichloroethylene,NTP TR 273 18

I. INTRODUCTION
Use Chemical and Physical Properties of
Trichloroethylene Exposure and Production Teratogenicity and Embryotoxicity Genetic Toxicology Carcinogenicity Study Rationale
19 Trichloroethylene, NTP TR 273

I. INTRODUCTIOIN
Cl \ 7'
Hi =c\ Cl
TRICHLOROETHYLENE CAS NO. 79-01-6
C2HC13 Molecular weight 131.4
Synonyms: Acetylene trichloride; l-chloro-2,2-dichloroethylene;l,l-dichloro-2-chloroethylene; ethinyl trichloride; ethylene trichloride; 1,1,2-trichloroethylene;trichloroethene
Trade names of formulations: Algylen; Anamenth; Benzinol; Blacosolv; Blancosolv; Cecolene; Chlorilen; Chlorylea; Chlorylen; Chorylen; Circosolv; Crawhaspol; Densinfluat; Dow-Tri; Dukeron; Fleck-Flip; Flock Flip; Fluate; Gemalgene; Germalgene; Lanadin; Lethurin; Narcogen; Narkogen; Narkosoid; Nialk; Perma-A-Chlor; Perm-A-Clor; Petzinol; Philex; Threthylen; Threthylene; Trethylene; Tri; Triad; Trial; Triasol; Trichloran; Trichloren; Triclene; Tri-Clene; Trielene; Trielin; Triklone; Trilen; Trilene; Triline; Trimar; Triol; TRI-plus; TRI-plus M; Vestrol; Vitran; Westrosol
Use
Trichloroethylene is an industrial solvent used primarily for vapor degreasing and cold cleaning of fabricated metal parts. Trichloroethylene has been used as a carrier solvent for the active in- gredients of insecticides and fungicides; as a sol- vent for waxes, fats, resins, and oils; as a spot re- mover; as an anesthetic for medical, dental, and veterinary use; and as an extractant for spice oleoresins and for caffeine from coffee. Trichlo- roethylene may be found in printing inks, varnishes, adhesives, paints, lacquers, spot re-movers, rug cleaners, disinfectants, and cos- metic cleansing fluids. Tric.hloroethy1ene may be used as a chain terminator in polyvinyl chlo- ride production and as an intermediate in the production of pentachloroethane (Kirk-Othmer, 1963, 1979; IARC, 1979; Defalque, 1961; Wetterhahn, 1972;USCFR, 1'976;Valle-Riestra, 1974). Trichloroethylene is no longer used with food, drugs, or cosmetics (IARC, 1979;Food Chemical News, 1978). Before 1976,tolerances for trichloroethylene in decaffeinated ground coffee were set a t 25 ppm (USCFR, 1976). Tri-chloroethylene is no longer used in the de- caffeination of coffee.
Chemical a n d Physical Properties of Trichloroethylene
Selected physical and chemical properties of tri- chloroethylene are presented in Table 1. Seven reviews on trichloroethylene are available (Huff, 1971;Waters et al., 1976, 1977; Mercier, 1977; Lyman, 1978;IARC, 1979;v. Apeldoorn, 1984; WHO, 1985).
Exposure a n d Production
The general population is exposed to trichloro- ethylene at low concentrations (in the parts per billion range) in air, water, and food. Reduction of the use of the chemical in anesthesia, solvent extraction and fumigation of foodstuffs, and dry- cleaning of textiles has reduced exposure from these sources. Exposure during the production of trichloroethylene is relatively low because of the nature of the process. Industrial uses, such as metal degreasing, can involve high exposures. The respiratory route is the principal route of ex- posure with dermal exposure being an addi- tional route. Oral intake is insignificant in industrial settings (WHO, 1985). In 1981,pro-duction of trichloroethylene was 117 million kg
Trichloroethylene, NTP TR 273 20

TABLE 1. SELECTED CHEMICAL AND PHYSICAL PROPERTIES OF TRICHLOROETHYLENE
Description: Colorless liquid Boilingpoint: 87'6 Density: 1.4642 g/ml a t 20"C Refractiue index: n = 1.4773 a t 20" C Spectroscopy ciato: kap<200 nm Solubility: Water, 0.1%w/v a t 20OC; miscible with acetone, ethanol, diethyl ether, chloroform, and oils Volatility: Vapor pressure, 77 mm a t 25°C Vapordensity: 4.54 (air = 1)Stability: Nonflammable; when pure and containing a stabilizer, it is stable in presence of air, moisture, and light and in contact with metals up to 130"C. When heated with ozone, it decomposes rapidly into products such as hydrogen chloride, phosgene, carbon monoxide, and chlorine peroxide. At 700"C and above, the vapor decomposes to give a mixture of dichloro-ethylene, tetrachloroethylene, carbon tetrachloride, chloroform, and methyl chloride. Upon contact with certain metals, high temperatures, open flame, or ultraviolet light, it decomposes almost instantly to phosgene and/or hydrogen chloride, chlorine, and dichloroacetyl chloride. In the presence of alkali, trichloroethylene decomposes to dichloroacetylene. Reactioity: The most important reaction of trichloroethylene is its oxidative breakdown by atmospheric oxygen, greatly accelerated by elevation of temperature and exposure to light, especially ultraviolet light; not hydrolyzed by water under normal conditions; reacta with alkali under pressure a t 150"C to produce glycolic acid and with sulfuric acid to give mono- chloroacetic acid Conoersionfactor: 1ppm in air is equivalent to 5.37mg/m3
(USITC, 1982). An estimated 3.5 million workers are exposed to trichloroethylene (Page, 1979).
The recommended threshold limit value for in- dustrial exposure to trichloroethylene is 50 ppm (ACGIH, 1985-86), and the Federal OSHA standard for trichloroethylene is 100 ppm. The California standard is set a t 25 ppm.
Teratogenicity and Embryotoxicity
Trichloroethylene has been studied for terato- genic and embryo/fetotoxicologic potential in mice, rats, and rabbits. The results of these studies have not revealed consistent adverse ef- fects in these species.
Mice: Swiss-Webster mice were exposed by in- halation to trichloroethylene at 300 ppm in air 7 hours per day on days 6-15 of gestation (Schwetz et al., 1975). The mice were observed daily throughout pregnancy, and maternal weights were recorded on days 6, 10, and 18of gestation. No effects were observed on the average number of implantation sites per litter, litter size, inci- dence of fetal resorptions, fetal sex ratios, or fe-tal body measurements on day 18 of gestation. The incidences of gross and microscopic anoma- lies were not significantly greater among ex- posed than among control litters (Leong et al., 1975; Schwetz et al., 1975).
Rats: Exposure of Sprague Dawley and Charles River rats to trichloroethylene a t 300 ppm pro- duced no evidence of teratogenicity or maternal toxicity (Leong et al., 1975; Schwetz et al., 1975). Inhalation exposure of Sprague Dawley rats to trichloroethylene (500 ppm trichloroethylene, 7 hours per day, 5 days per week) during a 3-week pregestational period and on days 0-18 or days 6-18 of gestation caused no maternal or em-bryonal/fetal toxicity (Beliles e t al., 1980). These authors concluded that neither the fre- quency nor character of the macro- or micro-scopic findings in the dosed groups indicated an adverse effect.
Female Long-Evans rats exposed to trichloro- ethylene a t 1,800 ppm via inhalation 6 hours per day, 5 days per week, for 2 weeks before mating andor on days 0-20 of gestation did not exhibit any signs of maternal toxicity (Dorfmueller et al., 1979). There was no indication of embryonic toxicity, and no significant compound-related ef- fects were found in the number of corpora lutea, implantation sites per litter, fetal body weights, resorbed fetuses per litter, or sex ratios. No sig-nificant compound-related effects were observed in the analysis of total soft-tissue anomalies. However, prenatal exposure a t 1,800 ppm tri- chloroethylene caused a n elevation of incom- plete ossification of the s ternum, possibly indicative of delays in maturation but not con- sidered to be a major malformation. The study
21 Trichloroethylene, NTP TR 273

I. INTRODUCTIOIN
indicated no compound-related effects on gen- eral postnatal behavior, but there was a small depression of postnatal weight gains in offspring of the premating exposure group.
Rabbits: Female New Zealand white rabbits were exposed to trichloroethylene at 500 ppm in air 7 hours per day, 5 days per week, for 3 weeks pregestation and on days 0-21 or on days 7-21 of gestation (Beliles et al., 19810). The results re- vealed no evidence of maternal toxicity or em-bryotoxicity. The authors did report the occur- rence of external hydrocephalus in a few fetuses in one of the study groups (four fetuses per two litters), but no definitive conclusion was made from these findings.
Genetic Toxicology
Trichloroethylene has been reported to be weakly mutagenic or nonmutagenic for Salmo-nella typhmurium strain TAlOO (Baden et al., 1979; Bartsch et al., 1979; Simmon et al., 1977; Waskell, 1978). Cerna and Kypenova (1977) re- ported that trichloroethylene was mutagenic (without metabolic activation) in S . typhimuri-um strains TA1535 and TA1538 and in host- mediated assays with TA1950, TA1951, and TA1952. Greim et al. (1975) reported that mi- crosomally activated reagent-grade trichloro- ethylene was slightly mutagenic for Escherichia coli K12, but Loprieno et all. (1979) found no mutagenic activity in a series of short-term tests using a distilled pure sample of trichloro- ethylene. Some of this variability may be due to differences in testing protocoll, and some may be due to the presence of various stabilizers used in trichloroethylene. NTP studies demonstrated that epichlorohydrin, one chemical frequently used to stabilize trichloroethylene, is clearly mu- tagenic in Salmonella s t r a i n s TAlOO and TA1535, inducing base-subst,itution mutations (Canter et al., 1986). In conl;rast, diisopropyla- mine, which was the stabilizer in the trichloro- ethylene used in the NTP l3-week and 2-year rodent studies, is not mutagenic in Salmonella strains TA100, TA1535, TA11537, or TA98 when tested in a preincubation protocol with or with-out metabolic activation from Aroclor 1254- induced male Sprague Dawley rat or Syrian hamster liver S9 at doses up to 10,000 pg/plate (Mortelmans et al., 1986). Eilacik-Erben et al.
(1980) studied trichloroethylene (99.5% pure) in a dominant lethal test with male Han/BGA NMRI mice and found no mutagenic activity. The trichlorethylene used in that study was sta-bilized with 100 mg/liter triethanolamine, a nonmutagenic chemical (Mortelmans et al., 1986; Gulati et al., 1985; Yoon et al., 19851,
In studies conducted by the NTP (Appendix I), trichloroethylene, stabilized with diisopropyla- mine, did not cause mutations in S. typhimuri-um strains TA98, TA100, TA1535, or TA1537, with or without metabolic activation by Aroclor 1254-induced male Sprague Dawley rat or male Syrian hamster liver S9 by a liquid-incubation procedure (Mortelmans et al., 1986). Trichloro- ethylene did not induce chromosomal aberra- tions in Chinese hamster ovary cells with or without metabolic activation; the results for sis-ter chromatid exchanges were considered posi- tive (Gulati et al., 1985). Trichloroethylene was mutagenic to mouse L5178Y lymphoma cells with but not without activation by Aroclor 1254- induced male F344 rat liver S9.
Carcinogenicity
Evidence for a carcinogenic effect of industrial- grade (greater than 99% pure) trichloroethylene was reported by the National Cancer Institute after the completion of studies in B6C3F1 mice and Osborne-Mendel rats (NCI, 1976). Tri-chloroethylene was administered by gavage for 78 weeks; rats were then observed for a n addi- tional 32 weeks and mice for 12 weeks. In mice, time-weighted-average gavage doses of 1,170 and 2,340 mg/kg in males and 870 and 1,740 mg/kg in females were associated with signifi- cant increases in the incidences of hepatocellu- lar carcinomas. Trichloroethylene administra- tion was associated with increased incidences of alveolarhronchiolar adenomas and carcinomas in male and female mice (male: vehicle control, 0/20;low dose, 5/50; high dose, 1/48; female: 1/20; 5/50; 7/47). These incidences were not sta- tistically significant and were not considered to be evidence of carcinogenicity in mice. In Os-borne-Mendel rats, time-weighted-average ga- vage doses of 550 and 1,100 mg/kg (both sexes) did not increase the incidences of primary tu- mors. However, as in several other carcinogen- icity s tudies of chlorinated e t h a n e s a n d
Trichloroethylene, NTP TR 273 22

I. INTRODUCTION
ethylenes (hexachloroethane, NCI, 1978a; 1,1,2,2-tetrachloroe thane, NCI, 1978b; l,l,a-tri- chloroethane, NCI, 1978c;tetrachloroethylene, NCI, 1977;pentachloroethane, NTP, 19831, the survival of the rats was compromised by the dose regimen.
The results of most of these carcinogenicity stud- ies have been summarized (Weisburger, 1977) and reviewed (IARC, 1979). The International Agency for Research on Cancer (IARC) consid- ered the trichloroethylene studies in Osborne- Mendel rats to be inadequate for evaluation and the studies in B6C3F1 mice to provide limited evidence of carcinogenicity; that is, trichloro- ethylene was found to be carcinogenic in one species (IARC, 1979). IARC evaluated trichloro- ethylene as being “carcinogenic to mice after its oral administration, producing liver and lung neoplasms” (IARC, 1982).
The interpretation of the earlier trichloro- ethylene study (NCI, 1976) was complicated by the presence of certain additives, particularly epichlorohydrin (0.09%) in the study material. Epichlorohydrin* had been previously shown to induce local sarcomas in mice following subcuta- neous injection (Van Duuren et al., 1974) and was subsequently shown to cause nasal carcino- mas in rats after inhalation exposure (Laskin et al., 1980). Further, epichlorohydrin is a muta-gen for S. typhimurium strain TA100 (Simmon, 1977). Therefore, although the carcinogenicity of industrial-grade trichloroethylene (contain- ing epichlorohydrin) in B6C3F1 mice was firmly established, unequivocal statements regarding the carcinogenicity of pure trichloroethylene in mice could not he made.
Results of long-term inhalation studies with purified trichloroethylene (less than 0.25 ppm of each of five chlorinated hydrocarbon impurities as analyzed by gas chromatography/mass spec- trophotometry, stabilized with 15 ppm tri- ethanolamine) have been reported (Henschler et al., 1980). In these studies, male and female Wistar rats, NMRI mice, and Syrian hamsters were exposed to air containing up to 500 ppm tri- chloroethylene for 18months (6 hours per day, 5 days per week). This regimen did not produce compound-relat#ed increases in primary tumors in these species. The investigators did report an
increase in the incidence of malignant Zympho- mas in female mice (control, 9/29; low dose, 17/30; high dose, 18/28), but the relationship of this lesion to trichloroethylene exposure was considered questionable because of the high inci- dence of lymphomas in control mice.
In an inhalation experiment, Fukuda e t al . (1983) exposed female ICR mice and SD rats to 50, 150, or 450 ppm trichloroethylene (contain- ing 0,019% epichlorohydrin) 7 hours per day, 5 days per week for 104 weeks. These workers re- ported increased incidences of pulmonary adeno- carcinomas in dosed mice (control, 1/49; 50 ppm, 3/50; 150 ppm, 8/50;450 ppm, 7/46). No increase in liver tumors was reported. There were no in-creases in the incidences of tumors in female rats.
Henschler and coworkers compared the car- cinogenicity of trichloroethylene stabilized with triethanolamine (0.0015%), epichlorohydrin (0.8%),1,2-epoxybutane (0.8%),or epichloro-hydrin plus 1,2-epoxybutane (0.25% and 0.25%) to that of industrial-grade trichloroethylene in groups of 50 male and 50 female ICWHA-Swiss mice (Henschler et al., 1984). The study com- pounds were administered by gavage in corn oil 5 days per week. The original doses were 2.4 and 1.8 g/kg of trichloroethylene in males and fe- males, respectively. Because of dose-related tox- icity, administration was stopped after 34 weeks and then resumed during week 41 with doses that were one-half the original doses. The ani- mals were not dosed during week 65, and dosing was terminated after week 68. Animals were ob- served until week 106. Amine-stabilized trichlo- roethylene did not cause an increased incidence of tumors in either sex. Trichloroethylene sta- bilized with epichlorohydrin, l,2-epoxybutane, or both and industrial-grade trichloroethylene caused increases in the incidences of fore- stomach papillomas and squamous cell carcino- mas. Although these results indicate that both epichlorohydrin- and 1,2-epoxybutane-stabilized trichloroethylene are carcinogenic in mice, no conclusion regarding amine-stabilized trichloro- ethylene can be reached because the shortened duration of administration (61 weeks) reduced the sensitivity of the studies for detecting carcinogenesis.
23 Trichloroethylene, NTP TR 273

I. INTRODUCTI0N
In a more recent study (NTP TR 243, in prepara- tion), epichlorohydrin-free trichloroethylene, ad- ministered by gavage, was found to produce hepatocellular neoplasms in male and female B6C3F1 mice and renal tulbular cell adenomas and adenocarcinomas in male F344/N rats. The interpretation of the rat portion of the studies was confounded by the fact that both doses used (500 and 1,000 mg/kg per daay) produced signifi- cant nontumor renal pathologic effects and sig- nificantly reduced the survival of male rats; therefore, the male rat study was judged to be in- adequate to evaluate the presence or absence of a carcinogenic response to trichloroethylene. The most striking effect that trichloroethylene pro- duced in rats was toxic nephrosis; it was found in 98% of the dosed males, in all of the dosed fe- males, and in none of the controls. The lesion was first noticed in dosed rats that died early in the studies and was shown microscopically as frank enlargement of the nucleus and cytoplasm of scattered individual tubular cells that had brush borders and were located near the cortico- medullary junction. The renal lesion was pro- gressive, as shown by the fact that, as exposure time increased, the affected tubular cells were enlarged and the number of affected tubules and tubular cells was increased. Occasionally, some tubules were enlarged or dilated to the extent that they were difficult to identify as tubules. In animals that survived longer, there was a de- crease in the number of enlarged cells, the cor-responding tubules were dilated, and portions of the basement membrane had a stripped ap- pearance. Periodic acid Schiff's stain was not useful in attempts to determine if the apparently stripped basement membrane was in fact naked or covered by a thin cytoplasmic membrane ex- tending from the one or more remaining cyto- megalic tubular cells. In 'the most advanced stage, the lesion extended to the subcapsular cortex, where enlarged tubular cells were readi- ly found. Development of cytomegaly did not completely overshadow development of the normal aging rat nephropat,hy, which was also present.
Although Fukuda et al. (11983) reported in- creased incidences of pulmonary adenocarcino- mas in mice that inhaled trichloroethylene for up to 104 weeks, most of the evidence for the car- cinogenicity of trichloroethylene, like that of the
chlorinated ethanes and ethylenes studied earlier (hexachloroethane, NCI, 1978a; 1,1,2,2- tetrachloroethane, NCI, 1978b; 1,1,2-trichloro- ethane, NCI, 1978~; tetrachloroethylene, NCI, 1977; pentachloroethane, NTP, 1983) comes from data obtained in gavage studies in mice. The interpretation of chemically induced carci- nogenicity for these materials is based on in- creases in the incidences of hepatocellular neo- plasms in male and female B6C3F1 mice. Because this is a relatively common tumor in male mice of this strain (seen in approximately 32% of corn oil vehicle control males and 7% of vehicle control females), the significance of the lesion is frequently debated. Also, the reason for the apparent relative insensitivity of Osborne- Mendel and F344/N rats to the carcinogenic ef- fects of members of this chemical class remains unknown. Possibly increased tumor incidences were not seen in rats because the animals did not survive long enough to develop the lesions.
Inter- or intraspecies differences in susceptibil- ity to the effects of chemicals can be mediated through inherited pharmacokinetic mecha- nisms. Stott et al. (1982) reported that B6C3F1 mice metabolize more trichloroethylene (per body weight) than do Osborne-Mendel rats. A similar difference in trichloroethylene metabo- lism between B6C3F1 mice and Sprague Dawley rats has been reported (Parchman and Magee, 1982). Prout et al. (1985) compared the metabo- lism of trichloroethylene in B6C3F1 and Swiss Webster mice and Osborne-Mendel and Wistar- derived rats. These investigators reported that in mice the metabolism of a single oral dose of trichloroethylene was linear over a dose range of 10-2,000 mg/kg. In rats, however, metabolism was independent of dose a t 1,000 mg/kg and above. Consequently, a t doses in excess of 1,000 mg/kg, mice are exposed to relatively higher concentrations of trichloroethylene metabolites. If a carcinogenic effect of trichloroethylene re-quires biotransformation of the parent molecule to a reactive metabolite, B6C3F1 mice might be expected to be more susceptible than Osborne- Mendel or Sprague Dawley rats because the mice are exposed to higher concentrations of me- tabolites. Trichloroethylene epoxide has been suggested as an electrophilic metabolite of tri- chloroethylene (Van Duuren, 1975), but Miller and Guengerich (1982) have reported the results
Trichloroethylene, NTP TR 273 24

I. INTRODUCTION
of in vitro experiments which suggest that the epoxide may not be an intermediate in trichloro- ethylene metabolism.
Elcomb et al. (1985) administered 10 daily 'doses of 500, 1,000, or 1,500 mg/kg trichloroethylene by gavage to (Osborne-Mendel and Wistar-de- rived rats and B6C3F1 and Swiss Webster mice. The dose regimen increased liver weight and de- creased hepatic DNA content in both species and increased hepatic DNA synthesis in mice but not in rats. Also, trichloroethylene increased he- patic peroxisomes in mice but not in rats. A re- lationship between peroxisome proliferation and hepatocarcinogenesis has been suggested (Reddy and Lalwani, 1983). If such a relationship
exists, the insensitivity of rats to trichloroethyl- ene-induced peroxisome proliferation might ex- plain the species differences in hepatocellular responses to the chemical.
Study Rationale
To determine the effects of trichloroethylene in various strains of rats, the National Cancer In- stitute initiated a series of 2-year toxicology and carcinogenesis studies of trichloroethylene in several strains. The results obtained with F344/N rats and B6C3F1 mice have been re- ported (NTP TR 243, in preparation), and the present report describes the results of studies in four additional strains of rats (ACI 9935, August 28807, Marshall 520, and Osborne-Mendel).
25 Trichloroethylene, NTP TR 273
.I

Trichloroethylene,NTP TR 273 26

II. MATERIALS AND METHODS
PROCUREMENT AND CHARACTERIZATION OF TRICHLOROETHYLENE
PREPARATION AND CHARACTERIZATION OF DOSE MIXTURES
THIRTEEN- WEEK STUDIES
TWO-YEAR STUDIES Study Design Source and Specifications of Animals Animal Maintenance Clinical Examinations and Pathology Statistical Methods
27 Trichloroethylene, NTP TR 273
II. MATERIALS AND METHODS
PROCUREMENT AND CHARACTERIZATION OF TRICHLOROETHYLENE
High purity "Hi-Tri" trichloroethylene was ob- tained in two lots from Missouri Solvents (Kan- sasCity, Missouri).
Purity and identity analyses were conducted at Midwest Research Institute (Kansas City, Mis- souri) (Appendix J). The results of the elemental analyses for both lots were consistent with the theoretical values. Twelve impurities having an area totaling less than 0.04% of the area of the major peak were detected in lot no. TB05-206AA by one gas chromatography system. Eight im- purities having an area letss than 0.02% that of the major peak were detected in a second system. One impurity with an area of 0.02% that of the major peak was detected in lot no. TB08-039AA.
The infrared and nuclear magnetic resonance spectra of both lots were consistent with the lit- erature spectra. "Hi-Tri" t,richloroethylene con- tains 8 ppm of an amine !stabilizer but no epi- chlorohydrin or 1,2-epoxybutane, as determined by gas chromatography/mass spectrometry.
Throughout the course of these studies, the tri- chloroethylene was stored iat 4" C. Papanicolaou Cancer Research Institute periodically analyzed the study chemical versus a standard main- tained at -20"C by gas chromatography with a 10% OV-101 glass column a t 70" C. The chemi- cal showed no decrease in purity over the course of the studies, even though a white flocculent material was noticed in the! July 1979 reanalysis of lot no. TB05-206AA. A 5-gallon can of this material was returned to Midwest Research In- stitute for attempted purification. An analysis of the precipitate, which was present at a con- centration of 25-30 ppm, i:; presented in Appen- dix K. Midwest Research Institute shipped the filtered trichloroethylene back to Papanicolaou Cancer Research Institute in October 1979.
A new lot (TB08-039AA) was received a t Papanicolaou in December 1979 and was used immediately,
PREPARATION AND CHARACTERIZATION OF DOSE MIXTURES
Weighed amounts of trichloroethylene were mixed with corn oil to give the desired concen- trations of stock solutions (Table 2; Appendix L). Doses were administered a t a constant volume. Three of the rat strains received 1.0 ml per dose. Osborne-Mendel rats received 5 ml/kg body weight for the first 7 weeks.
Trichloroethylene in corn oil (1% w/v) was found to be stable for 7 days at room temperature (Ap- pendix L). Later, stock solutions of trichloro- ethylene in corn oil were found to be stable a t 4" C for 8 weeks. Stock solutions were prepared once per week for the first 13weeks of the 2-year studies and once per month for the remainder of the studies. Stock solutions were analyzed for trichloroethylene content by gas chromatog- raphy (Appendix M). Because 201/234 of the dose solutions analyzed were within k 10% of the target concentrations, it is estimated that solutions were prepared within specifications 86% of the time (Table 3; Appendix N). Of the 33 dose mixtures varying from target concentra- tions by more than lo%, 24 were within It 15% of the target concentrations, 7 were within 20% of the target concentrations, and the remaining 2 were within 25%of the target concentrations.
THIRTEEN-WEEK STUDIES
Thirteen-week studies were conducted to evalu- ate the cumulative toxicity of trichloroethylene and to determine the doses to be used in the 2-year studies.
Male and female ACI, August, and Marshall rats were obtained from Papanicolaou Cancer Research Institute. August and ACI rats were assigned to cages according to a table of random numbers. Cages were then assigned to dosed and vehicle control groups according to another table of random numbers.
Rats were housed five per cage in polycarbonate cages. Purina Lab Chow@ and water (via an
Trichloroethylene, NTP TEl273 28

TABLE 2. PA(EPARATI0N AND STORAGE OF DOSE MIXTURES IN THE GAVAGE STUDIES OF TRICHLOROETHYLENE
Thirteen-Week Studies Two-year Studies
Preparation Trichloroethylene mixed with 100ml corn oil to preparestock solution foil: 1wk
Trichloroethylene mixed with corn oil in mixing cylinder to prepare stock solution
Maximum Storage Time Generally 10d 1wk for the first 13 wk, then 1mo
Storage Conditions T - 5 O c 2 O - 5 ' C
TABLE 3. SUIMMARY OF RESULTS OF ANALYSIS OF DOSE MIXTURES IN THE TWO-YEAR GAVAGE STUDIES OF TRICHLOROETHYLENE
Mean (percent of target concentration) Standard deviation Cclefficientof variation (percent) Range (percent of target concentration) Number of samples
automatic w a k i n g system) were available ad libi tum.
Groups of 10male ACI and August rats were ad- ministered 0, 125, 250, 500, 1,000, or 2,000 mg/kg trichloroethylene in corn oil by gavage 5 days per week for 13weeks. Groups of 10 female August and ACI rats were administered 0, 62.5, 125,250,500,or 1,000mg/kg on the same sched- ule. Groups of 10 male Marshall rats were ad- ministered 0, 268, 308, 495, 932, or 1,834mg/kg and groups of 10 female Marshall rats were ad- ministered 0,134,153,248,466,or 918mg/kg on the same schedule. Further experimental de- tails are summarized in Table 4.
Animals were checked twice daily; moribund animals were killed. Individual animal weights were recorded weekly. Clinical examinations were performed weekly.
At the end of the 13-week studies, survivors were killed. A necropsy was performed on all animals except those excessively autolyzed or cannibalized. Groups examined are listed in Ta- ble 4.
102.2 6.61 6.5
77.0-121.I 234
TWO-YEAR STUDIES
Study Design
Groups of 50 rats of each sex of four strains (ACI, August, Marshall, Osborne-Mendel) were ad- ministered 0, 500,or 1,000mg/kg trichloro- ethylene in corn oil by gavage 5 days per week for 103weeks. Groups of 50 rats ofeach sex and strain served as untreated controls.
Source and Specifications of Animals
The ACI 9935,August 28807,and Marshall 520 rats used in these studies were produced under strict barrier conditions a t Papanicolaou Re- search Institute under a contract to the Carcino- genesis Program. The Osborne-Mendel ra ts were produced under similar conditions a t CAMM Research Laboratory. Breeding stock for the foundation colonies a t the production facili- ties originated a t the National Institutes of Health Repository. The animals were progeny of defined microflora-associated parents that were transferred from isolators to barrier-maintained rooms. Animals were transferred to the study
29 Trichloroethylene, NTP TR 273

TABLE 4. EXPERIMENTAL DESIGN AND MATERIALS AND METHODS IN THE GAVAGE STUDIES O F TRICHLOROETHYLENE
Thirteen-Week Studies
EXPERIMENTAL DESIGN
Study Laboratory Papanicolaou Cancer Research Institute (Miami, FL)
Size of Study Groups 10 males and 10 females of each strain
Doses ACI and August r a t s male--0,125,250,500,1,000,or 2,000 mg/kg trichloroethylene in corn oil by gavage; ACI and August rats: female--0,62.5,125,250,500, or 1.000 mg/kg; Marshall rata: mde--O,268,308, 495,932, or 1,834 mg/kg; female--0,134,153,248,466, or 918 mg/kg; 1 ml dose volume
Date of First Dose ACI: 3128177
Date of Last Dose
Duration of Dosing5dlwkfor13wk
Type and Frequency of Observation Marshall rats observed 2 X d; weighed 1 X wk
Necropsy and Histologic Examination Necropsy performed on all animals; all vehicle control and high dose animals examined microscopically
ANIMALS AND ANIMAL MAINTENANCE
Strain and Species ACI rate, August rats, Marshall rata
Animal Source Papanicolaou Cancer Research Institute
Time Held Before Study
Age When Placed on Study
Age When Killed
Two-year Studies
Papanicolaou Cancer Research Institute (Miami, FL)
50 males and 50 females of each strain
0,500,or 1,000 mg/kg trichloroethylene in corn oil by gavage; groups of untreated controls also included; 1 ml dose vol (except Osborne-Mendel for the first 7 wk, dose vol--5 mVkg)
ACI: 2/1/79;August: 10/15/79;Marshall: 1211 1/78; Osborne-Mendel: 11130/79
ACI: 1/22/81;August: 10/2/81;Marshall: 11/28/80;Osborne-Mendel: 11/30/81
5 d/wk for 103 wk
Observed 2 X d; palpated weekly; weighed 1 X wk for 12-15wk and then 1 X mo
Necropsy performed on all animals; histologic exam performed on all animals; tissues examined include: gross lesions and tissue masses, skin, mesenteric lymph nodes, mammary gland, salivary glands, thigh muscle, lungs and mainstem bronchi, heart, thyroid gland, parathyroids, esophagus, stomach, duodenum, ileum, colon, liver, vertebrae with bone marrow, thymus, larynx, trachea, pancreas, spleen, kidneys, adrenal glands, urinary bladder, brain, pituitary gland, spinal cord, eyes, seminal vesicledprostateltestes or ovaries/uterus
ACI 9935 rats; August 28807 rata; Marshall 520 rats; Osborne-Mendel rata
Papanicolaou Cancer Research Institute; except Osborne- Mendel: CAMM Research Lab Animals (Wayne, NJ)
ACI: 3.5 wk; August: 2 wk; Marshall: 4 wk; Osborne-Mendel: 3 wk
ACI: 6.5 wk; August: 8wk; Marshall: 7wk; Osborne-Mendel: 8wk
ACI and August: 17-18wk; Marshall: 110-111wk
Trichloroethylene, NTP TI1273 30

TABLE 4. EXPERIMENTAL DESIGN AND MATERIALS AND METHODS IN THE GAVAGE STUDIES OF TRICHLOROETHYLENE (Continued)
Thirteen -WeekStudies Two-year Studies ~
ANIMALS AND11 ANIMAL MAINTENANCE (Continued)
Necropsy Dates ACI: 6/27/17;Augp~ust: 7/19/71; Marshall: 6/13/77
Method of Animal Distribution August and ACI: assigned to cages and then to dose groups according IDtables of random numbers; Marshall: nonsysiamatized randomization
Feed Purina Lab Chow@'; available ad libitum
BeddingWood chips
Water Edstrom automatic watering system (Waterford, W);available ad libitum
Cages Polycarbonate; chringed 2 X wk
Cage Filters Filter covers (Monaanto Co., St. Louis, MO)
Animals per Cage 5
Animal Room Environment Temp-not recorded; hum--not recorded; fluorescent light 12 h/d; 18-20 room air change&
laboratory at 3-6weeks of age and were quar- antined for 2-4 weeks. Thereafter, a complete necropsy was performed on five animals of each sex and species to assess their health stalus. The rodents were placed on study a t 6-8 weeks of age. The health of the animals was monitored during the course of the studies according to the protocols of the NTP Sentinel Animal Program (Appendix 0).
Animal Maintenance
Rats were housed five per cage in polycarbonate cages. Food and water were available ad libi- tum. Details of animal maintenance are sum- marized in Table 4.
ACI: 1/29/81-2/17/81; August: 1011 2/81 - 10/15/8 1; Marshall: 12/8/80-12/16/80; Osborne-Mendel: 11/30/81-12/2/81
Two-step randomization
Purina Lab Chow 5001 Pelletsa (O.K. Feed Store, Miami, FL); available ad libitum
Sani-chip hardwood (Pinewood Products Co., O.K. Feed Store, Miami, FL)
Edstrom automatic watering system (Waterford, W);available ad libitum
Polycarbonate (Lab Products, Rochelle Park, NJ); changed 2 X wk
Cerex-spun nylon (Florida Filters, Miami, FL); changed 2 X mo
6
Av temp-23' C; humidity--52%-78%; fluorescent light 12 Wd; 10-15room air change&
Clinical Examinations and Pathology
All animals were observed twice daily, and clin- ical signs were recorded once per week. Body weights by cage were recorded once per week for the first 12-15weeks of the studies and once per month thereafter. Mean body weights were cal- culated for each group. Animals found mori- bund and those surviving to the'end of the stud- ies were humanely killed. A necropsy was performed on all animals including those found dead, unless they were excessively autolyzed or cannibalized, missexed, or found missing. Thus, the number of animals from which particular or- gans or tissues were examined microscopically
31 Trichloroethylene, NTP TR 273

II. MATERIALS AND METHODS
varies and is not necessarily equal to the num- ber of animals that were placed on study.
During necropsy, all organs and tissues were ex- amined for grossly visible lesions. Tissues were preserved in 10% neutral buffered formalin, em- bedded in paraffin, sectioned, and stained with hematoxylin and eosin. Tissues examined mi- croscopically are listed in Table 4.
When the pathology evaluation was completed, the slides, paraffin blocks, and residual wet tis- sues were sent to the NCI/NTP Archives for in- ventory, slide/block match, and wet tissue audit. The slides, individual animal data records, and pathology tables were sent to an independent quality assessment laboratory. The individual animal records and tables were compared for ac- curacy, slides and tissue counts were verified, and histotechnique was evaluated. All tumor di- agnoses, all target tissues, and all tissues from a randomly selected 10% of the animals were eval- uated by a quality assessment pathologist. The quality assessment report and slides were sub- mitted to the Pathology Working Group (PWG) Chairperson, who reviewed all target tissues and those about which there was a disagreement between the laboratory and quality assessment pathologists.
Representative slides selected by the Chairper- son were reviewed by the PWG, which includes the laboratory pathologist, without knowledge of previously rendered diagnoses. When the con- sensus diagnosis of the PWG differed from that of the laboratory pathologist, the laboratory pa- thologist was asked to reconsider the original di-agnosis. This procedure h.as been described, in part, by Maronpot and E3oorman (1982) and Boorman et al. (1985). The final diagnoses rep- resent a consensus of contr,actor pathologists and the NTP Pathology Working Group. For subse-quent analysis of pathology data, the diagnosed lesions for each tissue type are combined accord- ing to the guidelines of McConnell et al. (1986).
Slides/tissues are generally not evaluated in a blind fashion (i.e,, without knowledge of dose group) unless the lesions in question are subtle or unless there is an inconsistent diagnosis of le- sions by the laboratory pathologist,. Nonneo-plastic lesions are not examined routinely by the
quality assessment pathologist or PWG unless they are considered part of the toxic effect of the chemical.
Statistical Methods
Data Recording: Data on this experiment were recorded in the Carcinogenesis Bioassay Data System (Linhart et al., 1974). The data elements include descriptive information on the chemi- cals, animals, experimental design, survival, body weight, and individual pathologic results, as recommended by the International Union Against Cancer (Berenblum, 1969).
Survival Analyses: The probability of survival was estimated by the product-limit procedure of Kaplan and Meier (1958) and is presented in the form of graphs. Animals were censored from the survival analyses a t the time they were found to be missing or dead of other than natural causes; animals dying from natural causes were not cen- sored. Statistical analyses for a possible dose- related effect on survival used the method of Cox (1972) for testing two groups for equality and Tarone’s (1975) life table test for a dose-related trend. All reported P values for the survival analysis are two-sided.
Calculation of Incidence: The incidence of neo- plastic or nonneoplastic lesions is given as the ratio of the number of animals bearing such le- sions at a specific anatomic site to the number of animals in which that site was examined. In most instances, the denominators include only those animals for which the site was examined histologically. However, when macroscopic ex- amination was required to detect lesions (e.g., skin or mammary tumors) prior to histologic sampling or when lesions could have appeared at multiple sites (e.g., lymphomas), the denomina- tors consist of the number of animals on which a necropsy was performed.
Analysis of Tumor Incidence: Three statistical methods are used to analyze tumor incidence data. The two that adjust for intercurrent mor- tality employ the classical method for combining contingency tables developed by Mantel and Haenszel (1959). Tests of significance included pairwise comparisons of high dose and low dose groups with vehicle controls and tests for overall dose-response trends.
Trichloroethylene, NTP TR 273 32

II. MATERIALS AND METHODS
For studies in which compound administration has little effect on survival, the results of the three alternative analyses will generally be sim- ilar. When differing results are obtained by the three methods, the final interpretation of the data will depend on the extent to which the tu- mor under consideration is regarded as being the cause of death. Continuity-corrected tests are used in the analysis of tumor incidence, and re- ported P values are one-sided.
Life Table Anarlysis--The first method of analy- sis assumed that all tumors of a given type ob- served in animals dying before the end of the study were “fatal”; i.e., they either directly or in-directly caused the death of the animal. Accord- ing to this approach, the proportions of tumor- bearing animals in the dosed and vehicle control groups were compared a t each point in time a t which an animal died with a tumor of interest. The denominators of these proportions were the total number of animals at risk in each group. These results, including the data from animals killed a t the end of the study, were then com- bined by the Mantel-Haenszel method to obtain an overall P value. This method of adjusting for intercurrent mortality is the life table method of Cox (1972)and of Tarone (1975). The under- lying variable considered by this analysis is time to death due to tumor. If the tumor is rapidly lethal, then time to death due to tumor closely appoximates time to tumor onset. In this case, the life table test also provides a comparison of the time-specific tumor incidence.
Incidental Tumor Analysis--The second method of analysis assumed that all tumors of a given type observed in animals that died before the
end of the study were “incidental”; i.e., they were merely observed at necropsy in animals dy- ing of an unrelated cause. According to this ap- proach, the proportions of tumor-bearing ani- mals in dosed and vehicle control groups were compared in each of five time intervals: weeks 0-52,weeks 53-78,weeks 79-92,week 93 to the week before the terminal-kill period, and the terminal-kill period. The denominators of these proportions were the number of animals actually examined for tumors during the time interval. The individual time interval comparisons were then combined by the previously described method to obtain a single overall result. (See Haseman, 1984,for the computational details of both methods.)
Unadjusted Analyses--Primarily, survival-ad- justed methods are used to evaluate tumor in- cidence. In addition, the results of the Fisher exact test for pairwise comparisons and the Cochran-Armitage linear trend test (Armitage, 1971;Gart et al., 1979)are given in the appen- dixes containing the analyses of primary tumor incidence. These two tests are based on the over- all proportion of tumor-bearing animals and do not adjust for survival differences.
Historical Control Data: Although the concur- rent control group is always the first and most appropriate control group used for evaluation, there are certain instances in which historical control data can be helpful in the overall assess- ment of tumor incidence. Consequently, control tumor incidences from the NTP historical con- trol data base (Haseman et al., 1984, 1985) are included for those tumors appearing to show compound-related effects.
33 Trichloroethylene, NTP TR 273

Trichloroethylene, NTP TR 273 34

III. RESULTS
THIRTEEN-WEEK STUDIES
TWO-YEAR STUDIES Body Weights and Clinical Signs Survival Pathology and Statistical Analyses of Results Nonneoplastic Lesions of the Kidney Neoplastic Lesions Negative Trends and Lower Incidences
35 Trichloroethylene,NTPTR 273

III. RESULTS
THIRTEEN-WEEK STUDIES
Thirteen- week studies were conducted on male and female ACI, August, and Marshall rats. Data from previous studies of Osborne-Mendel rats (NC], 1976) were used to set doses for the 2- year studies of the Osborne-Mendel strain. The results of the current 13-week studies are con- densed, for comparative purposes ,and presented in Tables 5 and 6. More detailed information is presented in Appendix P.
Doses used for ACI and August rats ranged from 125 to 2,000 mg/kg for males and 62.5 to 1,000 mg/kg for females. Doses for Marshall ra ts ranged from 268 to 1,834 mg/kg for males and 134 to 9113 mg/kg for females.
With the exception of three male August rats that received 2,000 mg/kg, all animals survived to the end of the 13-week experimental period. In male rats, the highest dose administered re- duced final mean body weights (relative to ve- hicle controls) in all three strains by more than 10%. These reductions ranged from 12% in Mar- shall rat:; to 17% in ACI rats. In females, final mean body weights relative to vehicle controls were somewhat depressed; however, none was depressed in excess of 8%(August). Body weight changes l(percent) in female rats administered the highest dose (1,000 mg/kg in ACI and Au- gust; 918 mg/kg in Marshall) were comparable
to those in males administered similar doses (1,000 mg/kg in ACI and August; 932 mg/kg in Marshall). No behavioral effects attributable to trichloroethylene administration were recorded. Similarly, the administration of the chemical for 13 weeks was not associated with histopatho- logic changes.
Dose Selection Rationale: Doses selected for the 2-year studies in ACI, August, Marshall, and Osborne-Mendel rats (both sexes) were 0, 500, and 1,000 mg/kg in corn oil by gavage, adminis- tered 5 days per week. The selection of these doses was based on survival (all rats dosed with 1,000 mg/kg trichloroethylene for 13 weeks sur- vived for the entire study), body weight gains (in male rats, mean body weights of dosed animals at the end of the 13-week studies were from 91% to 96% those of vehicle controls; in females, final mean body weights of dosed animals were from 93% to 96% those of vehicle controls), and ab- sence of histopathologic changes produced in ACI, August, and Marshall rats during the 13-week studies. Doses for the Osborne-Mendel rats (also 0, 500, and 1,000 mg/kg per day) were similar to the doses used in the earlier 2-year studies (NCI, 1976). The doses in those studies, expressed as time-weighted averages, were 550 and 1,100 mg/kg and significantly reduced sur- vival in each sex. Both untreated control and corn oil vehicle control groups were used in the present studies.
TABLE 51. COMPARISON OF EFFECTS OF TRICHLOROETHYLENE ON SURVIVAL AND BODY WEIGHTS IN MALE ACI, AUGUST, AND MARSHALL RATS IN THE THIRTEEN-WEEK
GAVAGE STUDIES (a)
ACI August Marsh all Dose Survival Final Body Dose Survival Final Body Dose Survival Final Body
(rng/kgl Weight Relative (mg/kg) Weight Relative (mg/kg) Weight Relative to Veh. Cont. to Veh. Cont. toVeh. Cont.
(percent) (percent) (percent)
0 10/10 _ _ 0 10/10 _ _ 0 10/10 _ _ 125 10/10 99.6 125 10/10 101.2 268 10110 103.2 250 10/10 94.2 250 10/10 96.7 308 10110 104.9 600 10/10 97.7 500 10110 95.9 495 10/10 100.8
1,000 10/10 90.7 1,000 10110 95.9 932 10/10 93.9 2,000 10/10 82.6 2,000 7/10 84.6 1,834 loll0 87.9
(a)Trichloroethylene wasmixed with corn oil and administered by gavage 5 d/wk for 13 weeks.
Trichloroethylene, NTP TR 273 36

TABLE 6. COMPARISON OF EFFECTS OF TRICHLOROETHYLENE ON SURVIVAL AND BODY WEIGHTS IN FEMALE ACI, AUGUST, AND MARSHALL RATS IN THE THIRTEEN-WEEK
GAVAGE STUDIES (a)
ACI August Marshall Dose Survival Final Body Dose Survival Final Body Dose Survival Final Body (mm?) Weight Relative (mg/kg) Weight Relative (mg/kg) Weight Relative
to Veh. Cont. to Veh. Cont. to Veh. Cont. (percent) (percent) (percent)
0 10/10 _ _ 0 loll0 _ _ 0 10/10 _ _ 62.5 10/10 99.4 62.5 10/10 101.4 134 loll0 101.2 125 10110 94.8 125 10/10 100.5 153 10110 102.9 250 10/10 98.9 250 10/10 100.5 248 10/10 102.3 500 10/10 92.0 500 10/10 98.6 466 10/10 97.1
1.000 10/10 93.1 1,000 10/10 92.8 918 10110 95.9
(a)Trichloroethylene was mixed with corn oil and administered by gavage 5 d/wk for 13 weeks.
TWO-YEAR STUDIES female rats of all strains exhibited sporadic ataxia, lethargy, convulsions, and hindlimb
Body Weights and Clinical Signs paralysis after dosing. On several occasions, animals in all dosed groups lost consciousness. Detailed data for each strain are presented in These effects were generally transient; however, Tables 7 through 10 and in Figures 1through 4. later in the studies, some animals convulsed The final body weights (relative to vehicle con- before dosing and during weighing periods. trols) and percent of animals surviving to termi-
nal kill are summarized in Table 11. Survival
The final mean body weights of all dosed groups except for high dose female Osborne-Mendel rats Estimates of the probabilities of survival for were somewhat lower than those of the vehicle each strain of male and female rats a t the doses controls. Trichloroethylene at the 1,000 mg/kg used in these studies and for untreated and vehi- dose reduced mean final body weight by 10% or cle controls are shown in Table 12 and in the more in ACI, August, and Osborne-Mendel Kaplan and Meier curves in Figures 5 , 7 , 9 , and males and Marshall females. Final mean body 11. Unadjusted survival curves are presented in weights in other high dose groups ranged from Figures 6,8,10, and 12; in these curves, animals 3% lower in Marshall males to 8% lower in killed accidentally have not been censored. August females. Final mean body weight de- pression at the 500 mg/kg dose exceeded 10%
Survival was significantly reduced in ACI malesonly in the ACI males. Final body weight decre- and high dose females, in high dose female Os-ments in other low dose groups ranged from 3% borne-Mendel rats, and in female Marshall rats. in Osborne-Mendel males to 8%in ACI females. Survival of male Marshall rats a t both doses was
Clinical signs of central nervous system toxicity reduced because of mortality that occurred du- were observed in dosed animals. Male and ring the administration of the chemical.
37 Trichloroethylene, NTP TR 273 \

TABLE 7. MEAN BODY WEIGHTS AND SURVIVAL OF ACI RATS IN THE TWO-YEAR GAVAGE STUDIES OF TRICHLOROETHYLENE
Weeks on
Study
Vehicle Control Av. Wt. No. of (grams) Survivors
Av. Wt. (grams)
500 mnntn Wt.(percent of veh. controls)
No. of Survivors
1.OOO mnntn Av. Wt. Wt. (percent of (grams) veh. controls)
NO. of Survivors
MALE 0 1 2 3 4 5 6 7 8 9
10 11 12 13 14 15 17 21 28 30 34 38 39 42 45 50 54 58 61 65 69 73 71 81 85 69 94 97 98
101 103
FEMALE
8 9
10 11 12 18 14 15 17 21 26 so 34 38 39 42 45 50 54 58 61 65 69 13 71 81 85 89 94 97 98
101 103
169 188 205 220 233 241 252 260 210 215 280 288 283 283 289 291 296 296 327 342 339
340
344 350
343 345 350 351 351 361 364 358 355 361 359 357 353 353
129 139 148 155 151 169 173 171 182 112 181 180 187 180 184 184 185 188 206 218 216
212
213 211
224 226 225 230 232 238 240 237 239 246 244 243 242 242
50 50 50 50 50 50 50 50 50 50 50 50 49 49 49 49 49 49 49 49 49
48
41 46
46 45 45 45 44 43 40 39 39 39 39 39 38 38
50 50 50 50 50 50 50 50 50 50 50 50 50 50 49 49 49 49 48 48 48
48
47 47
45 45 45 44 44 44 44 43 43 42 39 39 36 35
158 182 198 213 221 231 242 255 258 264 253 259 268 261 260 260 266 216 297 311 316 308
318 325 321 319 320 325 320 328 321 330 344 323 319 316 313 312 313 314
121 139 141 150 151 164 166 113 112 174 161 115 118 180 182 182 181 186 198 200 201 202
205 211 212 203 209 213 210 213 214 222 211 217 219 219 221 218 222 222
93 91 91 91 97 96 96 98 96 96 90 90 95 94 92 89 90 93 91 91 93
94 93
93 94 91 92 92 91 95 90 90 88 81 81 89 89
98 100 95 98
100 91 96
101 95
101 89 91 95 95 99 99 98 99 96 92 93
99 98
93 94 93 93 92 93 88 92 92 89 91 90 92 92
50 50 50 50 50 49 49 48 41 47 41 47 45 45 45 45 45 45 41 40 36 36
36 33 32 29 29 29 21 26 26 26 26 25 24 21 20 20 20 19
50 50 50 50 50 50 50 50 50 50 50 49 49 48 48 48 41 45 45 45 44 44
44 44 41 40 40 40 35 33 31 29 29 28 23 21 21 21 20 20
182 189 199 211 221 231 239 249 252 260 260 251 262 264 256 256 268 274 299 306 310 318
301 314 314 301 310 311 313 322 316 323 322 319 316 314 309 315 311 309
126 131 144 151 156 162 165 171 112 115 112 111 181 181 118 118 186 186 201 205 201 204
205 208 213 205 214 211 214 220 211 223 221 221 224 221 226 229 227 225
96 91 91 96 95 94 95 96 93 95 93 89 93 93 90 88 91 93 91 89 91
91 90
90 90 89 90 89 89 88 89 89 81 86 88 88 88
98 99 91 99 99 96 95
100 95
102 95 98 91 96 97 97
101 99 98 94 96
98 98
96 96 95 96 91 94 92 93 94 92 93 94 94 93
50 50 50 49 49 48 41 41 41 47 46 46 45 42 42 42 42 40 38 35 32 30
30 28 26 23 23 22 19 19 18 14 14 14 13 13 12 12 12 11
50 50 50 50 50 49 49 49 49 48 41 41 46 46 46 46 43 43 41 39 39 39
38 36 36 33 31 31 21 21 25 24 24 22 21 21 21 20 20 19
Trichloroethylene, NTP TR 273 38

400 .0
350.0
300.0
250.0
200.0
150.0
100.0
WEEKS ON STUDY
4 0 0 . 0 -- 400.0
........................... ..........................350.0 350.0
......................... ..........................5 0 0 . 0 500.0
........................... ...................... .......................... ..R250.0 250.0
' I I .......................... ........I.......Q ..b....0.....o..: ......... ..............................200.0 200.0
; a
........................... ..........................150.0 150.0
100.0 100.0 4 S'O 0'0
WEEKS ON STUDY
FIGURE 1. GROWTH CURVES FOR ACI RATS ADMINISTERED TRICHLOROETHYLENE IN CORN OIL BY GAVAGE FOR TWO YEARS
39 Trichloroethylene, NTP TR 273
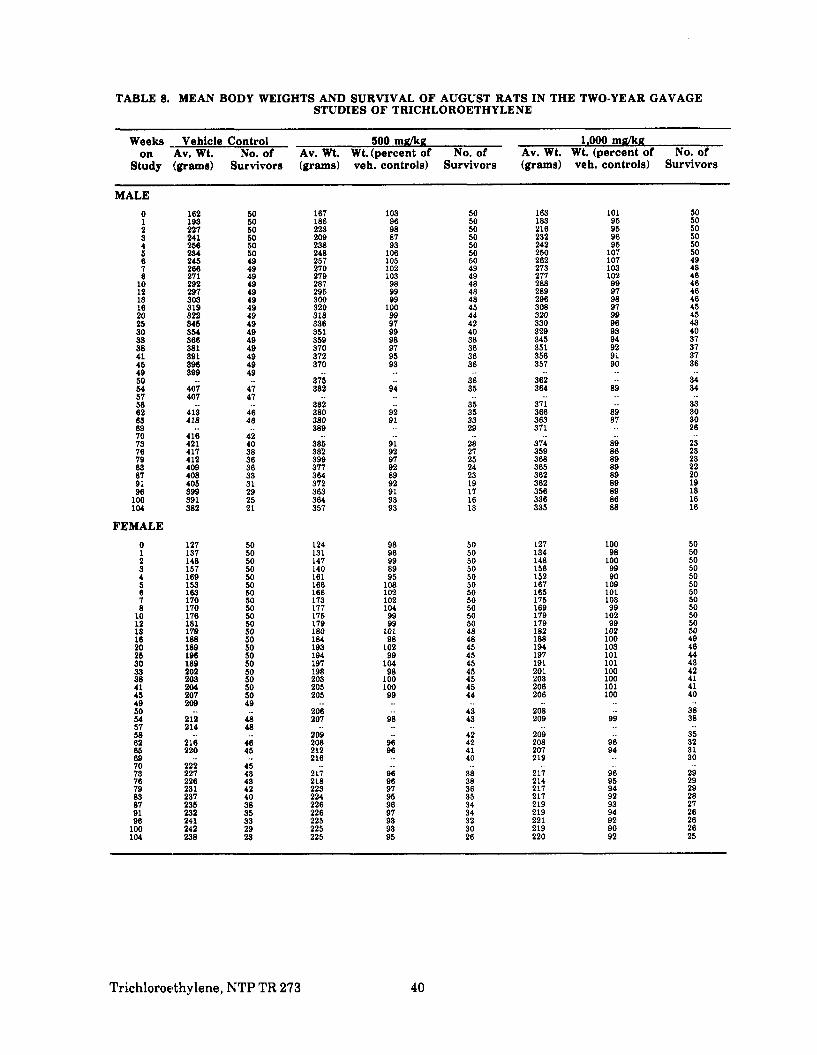
TABLE 8. MEAN BODY WEIGHTS AND SURVIVAL OF AUGUST RATS IN THE TWO-YEAR GAVAGE STUDIES OF TRICHLOROETHYLENE
Weeks - Vehicle Control 500 mg/kg 1,000 m a g on Av. Wt. No. of Av. W. Wt.(percent of No. of Av. Wt. Wt. (percent of No. of
Study ~[grams) Survivors (grams) veh. controls) Survivors (grams) veh. controls) Survivors
MALE 0 1 2 3 4 5 8 7 8 10 12 13 18 20 25 30 38 38 41 45 49 50 54 57 58 62 85 69 70 73 78 79 83 87 91 98 100 104
FEMALE 0 1 2 3 4 5 6 7 8 10 12 13 18 20 25 30 3.9 38 41 45 49 50 54 57 5a 62 85 89 70 73 76 79 83 87 91 98 100 104
162 193 227 241 258 234 245 288 271 292 297 303 319 322 M 5 354 366 381 391 396 399
407 407
413 418
418 421 417 412 409 408 405 399 391 382
127 137 148 157 189 153 163 170 170 176 181 179 188 189 198 189 202 203 204 207 209
212 214
216 220
222 227 228 231 237 235 232 241 242 238
50 50 50 50 50 50 49 49 49 49 49 49 49 49 49 49 49 49 49 49 49
47 47
46 48
42 40 38 36 38 33 31 29 25 21
50 50 50 50 50 50 50 50 50 50 50 50 50 50 50 50 50 50 50 50 49
48 48
46 45
45 43 43 42 40 38 35 33 29 23
167 186 223 209 238 248 257 270 279 287 295 300 320 318 336 351 359 370 372 370
375 382
382 380 380 389
385 382 399 377 364 372 363 364 357
124 131 147 140 181 166 166 173 177 175 179 180 184 193 194 197 198 203 205 205
206 207
209 208 212 218
217 218 223 224 226 226 225 225 225
103 96 98 87 93 106 105 102 103 96 99 99 100 99 97 99 98 97 95 93
94
92 91
91 92 97 92 89 92 91 93 93
98 96 99 89 95 108 102 102 104 99 99 101 98 102 99 104 98 100 100 99
98
96 96
98 96 97 95 98 97 93 93 95
50 50 50 50 50 50 50 49 49 48 48 48 45 44 42 40 38 36 38 36
36 35
35 35 33 29
28 27 25 24 23 19 17 18 13
50 50 50 50 50 50 50 50 50 50 50 48 46 45 45 45 45 45 45 44
43 43
42 42 41 40
38 38 36 35 34 34 32 30 26
163 183 218 232 242 250 262 273 277 286 289 296 308 320 330 329 345 351 356 357
362 364
371 366 363 371
374 359 368 365 362 362 356 336 335
127 134 148 156 152 187 165 175 189 179 179 182 188 194 197 191 201 203 206 206
208 209
209 208 207 219
217 214 217 217 219 219 221 219 220
101 95 95 96 95 107 107 103 102 99 97 98 97 99 98 93 94 92 91 90
89
89 87
89 86 89 89 89 89 89 86 88
100 98 100 99 90 109 101 103 99 102 99 102 100 103 101 101 100 100 101 100
99
98 94
96 95 94 92 93 94 92 90 92
50 50 50 50 50 50 49 48 46 46 46 46 45 45 43 40 37 31 37 36
34 34
33 30 30 26
23 23 23 22 20 19 18 16 16
50 50 50 50 50 50 50 50 50 50 50 50 49 46 44 43 42 41 41 40
38 38
35 32 31 30
29 29 29 28 27 26 26 26 25
Trichloroethylene, NTP TR 273 40

-- -- , r 4 5 0 . 0
......................... i........................... .I
8 I
00 8 A.................e..
ii
A i “ 1 ....... ............................ j .............................. iI ............................... 3 0 0 . 0
IIjI iii ..... .................1.............................. 1............................... 2 5 0 . 0
ii i
i
1.......................... .......................... 4............................................
I I l- 2 0 0 . 0II s= UNTREATED
0 =VEHICLEI !150 0 ............................. i .......................... .......................... ........................... i.......................... ................. 150.0IlI ii
100.0 1 1 1 100.0 0 15 I 6 0 75 90 105
WEEKS ON STUDY
450 .0 -
I:
400.0 _ ....................................................... j
3 5 0 0 .................................................... .....
~
300.0 _ ......................................................... ........................I 2 5 0 0 _ .............................. 1........................... ............................ *,.............................. 1............................................................ 2 5 0 . 0
I iI i
.............................. .................. *......L.@... ............................. - 2 0 0 . 0 Q E””’ !ii j
150.0 ........................... ........................ ............................ f ......................... ...........i - 150.0 ij
iI, ii
100.0 I I I I 1 100.0 0 15 6 0 7 5 9 0 105
WEEKS ON STUDY
FIGURE 2. GROWTH CURVES FOR AUGUST RATS ADMINISTERED TRICHLOROETHYLENE IN CORN OIL BY GAVAGE FOR TWO YEARS
41 Trichloroethylene,NTP TR 273

TABLE D. MEAN BODY WEIGHTS AND SURVIVAL OF MARSHALL RATS IN THE TWO-YEAR GAVAGE STUDIES OF TRICHLOROETHYLENE
~~
Weeks on
Study
IVehicle Control Av. Wk No. of (grams) Survivors
Av. Wt. (grams)
500 m a n Wt.(percent of veh. controls)
No. of Survivors
LOO0 mg/kgAv. Wt. Wt. (percent of (grams) veh. controls)
No. of Survivors
MALE 1 2 3 4 5 6 7 8 9 10 11 12 16 20 24 28 31 32 35 39 43 47 51 54 58 62 66 67 70 74 78 82 86 90 94 96 98 100 102
196 217 292 241 251 260 280 24.9 262 269 273 274 292 295 302 311
324 323 323 319 311 299 309 313 313
310 315 314 315 308 317 315 315 312 313 313 315
50 50 50 50 50 50 50 50 50 50 50 50 50 50 49 49
49 49 49 48 48 47 45 42 41
40 38 38 38 36 33 31 28 28 26 26 26
199 217 231 238 246 238 254 250 258 265 269 271 281 296 302 307 313
322 326 319 312 310 304 311 306 291
296 294 300 291 300 307 299 302 299 292
102 100 100 99 98 92 98 101 98 99 99 99 96 100 100 99
100 101 100 100 104 98 99 98
94 94 95 94 95 97 95 97 96 93
50 50 50 50 50 50 50 49 49 49 46 45 43 41 36 35 34
33 32 31 29 27 25 24 23 19
14 12 12 12 12 12 12 12 12 12
189 200 218 225 232 240 243 242 247 255 256 257 272 281 287 281 296
303 308 308 304 298 300 299 296 282
296 292 300 298 298 302 299 307 304 303
96 92 94 93 92 92 93 98 94 95 94 94 93 95 95 90
94 95 97 98 100 97 96 95
94 93 95 97 94 96 95 98 97 97
50 50 50 50 50 49 49 49 49 49 49 48 48 46 46 43 41
39 39 37 35 32 31 24 24 23
21 18 16 14 12 9 9 9 9 7
lo9 300 12 307 7
FEMALE 1 2
144 155
50 50
140 149
97 96
50 50
143 152
99 98
50 50
3 4 5 6 7 8 9 10 11 12 16 20 24 28 31 32
161 165 171 169 174 168 178 182 179 187 198
216
229
% -
50 50 50 50 50 50 50 50 50 50 50 50 so 50
50
155 161 161 167 169 172 174 179 181 180 190 200202 208 213
96 97 94 99 97 102 98 98 101 96 97 98 9s 96
50 50 50 50 50 50 50 50 50 50 49 48 48 48 48
157 161 161 165 170 172 171 178 177 178 189 199 200 199 206
98 97 94 98 98 102 96 98 99 95 96 9792 92
50 50 50 50 50 50 46 48 48 48 48 4848 46 42
35 39 43 47 51 54 58 62 66 67
298 2s7 241 234 B 5 241 245 UI
243
50 50 50 50 49 49 49 49
49
225 230 229 227 232 2% 236 232 240
97 97 95 97 99 95 96 95
47 47 47 41 46 45 44 43 40
219 222 223 216 222 222 224 222 224
94 94 93 93 94 92 91 91
40 40 39 39 39 38 33 31 30
70 74 78 82 86 90 94 96 98 100 102 lo9
255 253 257 289 259 258 251 252 2 4 247 247
47 47 44 44 43 40 37 36 36 31 30
238 238 244 239 240 240 237 236 2-36 237
235
93 94 95 91 93 93 92 94 95 96
37 35 27 24 23 21 20 18 17 14
13
228 228 231 224 228 236 231 231 227 222
227
89 90 90 85 88 91 90 92 92 90
27 23 21 19 18 13 13 13 11 10
10
Trichloroethylene, NTP TR 273 42

3 5 0 . 0 7 , 5 5 0 . 0
3 0 0 . 0
4 ............................. 250.0 2 5 0 . 0 iI t
2 0 0 0 .........................
!
tI-1 MALE R A T S
........................ ................. 150.0150.0
100.01 0 0 . 0 ~ . 90 1s S O 4 s t 1 1 5 90 10s
WEEKS ON STUDY
3 5 0 . 0 350.0
I i
........................ ........................ 4 ............................. 5 0 0 . 0 3 0 0 . 0 I i I
j1 ......................... ........................ 4 ............................. 250.0 2 5 0 . 0
0
. 'b A A .b b ........................ ..&....8.. ............................. 200.0 '&i2 0 0 . 0
Ii1I I
I1 ........................... .......................... .=UNTREATED ................................... ".." ........................ 4 ~ 5 0 . 0 150.0 =VEHICLE ! l ; = S O O M ~ i Gj i A=1,000 G / K G
~~ 100.0100.0 I5 6 0 7b 0'0 1 1s o
W E K S ON STUDY
FIGURE 3. GROWTH CURVES FOR MARSHALL RATS ADMINISTERED TRICHLOROETHYLENE IN CORN OIL BY GAVAGE FOR TWO YEARS
43 Trichloroethylene, NTP TR 273

TABLE 10. MEAN BODY WEIGHTS AND SURVIVAL OF OSBORXE-MENDEL RATS IN THE TWO- YEAR GAVAGE STUDIES OF TRICHLOROETHYLENE
Weeks 'Vehicle Control Study (grtu!$ S&drs
on Xv. 0. 0 & k % j
V. 500 m a g
%!. contrhf . percen o
Sfiviv& 0: 0
&a% V.
1,000 m a g
%h! controtls;percen o
Sfivivo'rs0; 0
MALE 0 1 2 3 4 5 0 I 8 9 10 11 12 13 11 20 23 20 29 33 31 41 40 50 53 54 50 51 61 e4 01 09 IO 13II 81
191 252 285 301 329 338 352 364 312 315 390 394 403 402 415 431 446 450 410 410 418 489 493 502 511
498
520 532 533 530
534 539 533
50 50 50 50 50 50 50 50 50 50 50 50 50 50 50 50 50 50 50 49 49 49 49 49 49
41
41 41 40 44
43 41 40
191 240 212 280 315 338 341 360 370 370 381 393 385 391 412 432 441 440 450 461 412 472 482 481
494
499 502 501 503
509 509 495 503
100 98 95 91 96 100 99 99 99 100 99 100 90 99 99 99 99 98 97 98 99 91 98 90
91 95 94
95 92 94
50 50 50 50 50 50 50 50 50 50 49 49 48 48 48 48 48 48 47 45 45 45 44 44
44
44 44 43 42
40 40 40 30
199 247 269 289 312 337 345 353 348 359 365 373 376 387 391 400 416 420 433 435 442 445 444 446
488
466 467 410 461
469 487 458 461
101 98 94 94 95 100 98 97 94 96 94 95 93 96 94 92 93 93 92 91 92 91 90 89
90 88 86
81 85 88
50 50 50 50 49 49 49 49 49 49 49 49 48 48 48 48 47 46 45 45 43 42 39 37
35
33 33 32 31
31 30 29 21
84 85 90 93 91 100 104
530
532 519 511 499 410
38
35 31 28 24 22
504 503 491 490 478 404
95 95 95 96 91
32 28 26 25 18 17
458 452 440 438 410 421
85 85 85 82 88
24 23 21 19 17 14
FEMALE 0 1 2 3 4 5 0I 8
160 190 201 224 227 234 238 244 241
50 50 50 50 50 50 50 49 49
160 186 203 211 230 240 240 240 250
100 98 98 94 101 103 101 101 101
50 50 50 50 50 50 50 50 50
167 187 206 210 230 241 240 251 248
101 98 100 94 101 103 101 103 100
50 50 50 50 50 50 50 50 50
9 249 49 253 102 50 252 101 50 10 11
250 259
49 49
256 262
100 101
48 48
255 258
100 100
50 50
12 13 11 20 23 26 29 9s 31 SB 41 40 50 53 54 50 51 61 e4 6 1 09 IO 13 II 81 84
289 205 215 210 283 290 290 298 293 293 291 296 301 303
302
310 301 301 308
313 315 316 311
49 49 48 48 48 48 48 48 40 40 45 45 44 43
43
43 41 41 40
39 31 35 32
260 262 211 283 286 285 290 298 300
290 295 298
297
290 304 301 305
312 310 300 309
101 99 101 103 101 98 100 100 102
100 100 99
98 90 99
99 95 98
48 48 48 48 48 48 48 48 46
45 44 44
44
44 42 41 41
41 39 33 32
266 268 276 279 219 284 284 296 293
286 288 292
289
291 300 299 300
306 308 298 312
101 101 100 101 99 98 98 99 100
96 97 91
91 97 98
98 95 99
50 50 49 41 41 47 46 40 40
46 40 45
45
45 43 43 42
41 39 37 29
85 90 93 91 100 104
322 319 311 319 303
31 30 26 22 18
305 302 296 301 302 281
94 93 95 95 93
31 23 21 11 15 10
313 306 297 306 301 305
95 93 97 96 101
28 22 21 18 15 7
Trichloroethylene, NTP TR 273 44

___
6 0 0 . 0j
. . . . . . . . . . . . . . . ;....................................................... i......................... m
i m !. +................t'.....I,. 1...... ......... 5 5 0 . 0
~ ....0....n...... ................. .......
e.....Ls.....4....... ............................. 4 5 0 . 0 i A A
6 0 0 . 0 -
.. . . . . . .! .................... i.. .................... j.........................5 5 0 . 0 -
....................... ............................ 1..............................5 0 0 0 _v,I Q
jCL: . . . . . . . . i.............................. i.............................. i..............................
z ii
4 5 0 , 0 - .
c . . . . . . . .,.;............................. i............................. ..;..............................I 4 0 0 . 0 -c3
! ' ' . . . . . . ...;.......................... ..;............................ i..........................3 5 0 . 0 -* n
m .......................... ,,,*....%,,g.....h....g ,+0 3 0 0 , o -z 6 8" ............................... ............................
. . . . . . . . . . . . .........................................................................................
W 2 5 0 . 0 -
2 0 0 .0-a. /e
i............................I............................. 3 5 0 . 0
i ........................... 1.............................. 3 0 0 . 0
i i ~~~~ 60 0 .0
j j
.i............................. ;.............................. i.............. 5 5 0 . 0 i ; 1
1j .......................I 1 5 0 0 . 0 ............................. ...........
jj j i 1 ...................... ......................................................... - 4 5 0 . 0
i

TABLE 11. COMPARISON O F EFFECTS ON SURVIVAL AND FINAL BODY WEIGHTS IN ACI, AUGUST, MARSHALL, AND OSBORNE-MENDEL RATS IN THE TWO-YEAR
GAVAGE STUDIES O F TRICHLOROETHYLENE (a)
Final Weight Relative to Survival Final Weight Relative to Survival Group Vehicle Control (percent) (percent) Vehicle Control (percent) (percent)
ACI (b) A u m s t (c)MALE
Untreated control 102.8 78 105.2 48 Vehicle control _ _ 76 _ _ 42 500mg/kg 89.0 (d) 38 93.5 26 1,OOOmg/kg: 87.5 (d) 22 87.7 32
FEMALE
Untreated control 111.6 74 96.6 52 Vehicle conlxol 70 _ _ 46 500mg/kg 91.7 40 94.5 52 1,OOO mg/kg 93.0 (d) 38 92.4 50
Marshall (e) Osborne-Mendel (c)
MALE
Untreated control 99.4 64 109.2 42 Vehicle control -- 52 .. 44 mmg/kg 93.3 (d) 24 97.5 34 1.000 mg/kg 96.8 12 88.4 30
FEMALE
Untreated control 103.2 62 107.9 38 Vehicle control _ _ 60 _ _ 40 m m g / k g 96.0 (d) 24 92.7 22 I.OOOmg/kg 89.9 (d) 20 100.7 (d) 14
(a)Trichloroeth.ylene was mixed in corn oil and administered by gavage 5 days per week. (b)Final body weight recorded week 103 (c)Final body weight recorded week 104 (d)Survival waia significantly (P<0.05) reduced relative to vehicle controls. (e)Finalbody weight recorded week 100
Trichloroethylene, NTP TR 273 46

TABLE 12. SURVIVAL OF RATS [N THE TWO-YEAR GAVAGE STUDIES OF TRICHLOROETHYLENE (a)
Untreated Control Vehicle Control 500 m a g 1,OOO m g k g
MALE ACI RATS (b) Nonaccidental deaths before termination (c) Accidentally killed Animals missing Killed at termination
10 0 1
36
12 0 0
37
20 11 0
19
21 18 0
11 Died during termination period Survival Pvalues (d)
3 _ _ 1 0.001
0 0.019
0 0.002
FEMALE ACI RATS (b) Nonaccidental deaths before termination (c) Accidentally killed Animals missing Killed a t termination
12 0 1
36
13 2 0
33
16 14 0
20
20 12 0
17 Died during termination period Survival Pvalues (d)
1 _ _ 2 0.021
0 0.202
(e)2 0.034
MALE AUGUST RATS (0 Nonaccidental deaths before termination (c) Accidentally killed Animals missexed
25 1 0
23 6 0
25 12 0
22 11 1
Killed at termination 24 21 13 15 Died during termination period Survival Pvalues (d)
0 --
0 0.252
0 0.163
1 0.302
FEMALE AUGUST RATS (D Nonaccidental deaths before termination (c) Accidentally killed Killed a t termination
24 0
26
26 1
23
18 6
26
12 13 24
Died during termination period Survival P values (d)
0 _ _ 0 0.136
0 0.371
1 0.186
MALE MARSHALL' RATS (g) Nonaccidental deaths before termination (c) Accidentally killed Animals missing Killed at termination Survival Pvalues (d)
16 1 1
32 _.
22 2 0
26 0.137
26 12 0
12 0.007
19 25 0 6 0.123
FEMALE MARSHALL RATS (g) Nonaccidental deaths before termination (c) Accidentally killed Killed at termination Survival Pvalues (d)
18 1
31 *_
17 3
30 0.002
24 14 12 0.01 1
22 18 10 0.005
MALE OSBORNE-MENDEL RATS (h) Nonaccidental deaths before termination (c) Accidentally killed Killed a t termination
29 0
18
27 1
22
27 6
17
28 7
14 Died during termination period SurvivalP values (d)
3 ._ 0 0.173
0 0.657
1 0.195
FEMALE OSBORNE-MENDEL RATS (h) Nonaccidental deaths before termination (c) Accidentally killed Killed a t termination
31 0
19
22 8
18
33 6
10
37 6 7
Died duringtermination period Survival P values (d)
0 _ _ 2 0.008
1 0.052
0 0.009
(a)Fifty animals initially in each study (b) Terminal-kill period: weeks 104-106 (c)Includes animals killed in a moribund condition (d)The result of the life table trend test is in the vehicle control column, and the results of the life table pairwise comparisons with the vehicle controls are in the dosed columns. (e)Includes one accidentally killed animal; this animal is also included among those accidentally killed. (DTerminal-kill period: week 104 ( )Terminal-kill period: male--weeks 104-105;female--week 104(E,T erminal-kill period: weeks 104-105
47 Trichloroethylene, NTP TR 273

J 4
LL 0 >!z 2 m 4 m 0 a a.
FIGURE 5. KAPLAN-MEIER SURVIVAL CURVES FOR ACI RATS ADMINISTERED TRICHLOROETHYLENE IN CORN OIL BY GAVAGE FOR TWO YEARS
Trichloroethylene, NTP TR 273 48

-rq%
j
.................. ...................i......................... + ....................... . . . . . . . . . . . . ~
4
0 8 _ ......................... .............
I ii
.......................................... i
0 7 _ ......................... .......................
0 6 _ ........................ ........................
5-: 8 I
0 5 ................. ..................... ....... .......................
jj b- 4.-.-,
0 .4 I I 1 1 0 15 30 45
WEEKS ON STUDY
I.0
...................... + ...................0.9
J a .\ ....................2> 0 . 1
e 3 lf7 LL 0 0 7 ................... .......................... .......................... ............. ........................ ...................................... >-c-4 m 4 m o 6 _ ..................... .... ....................... .............. ........ 0 a L
0 5 - ................. ............... .......................... ..................
i 0 .4 I I I I 1 I I
6 0 75 90 1050 15 30 45
WEEKS ON STUDY
- 0.7
1.0
0 . 9
0 . 8
0 .7
0.6
0 . 5
0 . 4 3
FIGURE 6. UNADJUSTED SURVIVAL CURVES FOR ACI RATS ADMINISTERED TRICHLOROETHYLENE IN CORN OIL BY GAVAGE FOR TWO YEARS
49 Trichloroethylene, NTPTR 273

J 42.> K 3 In I& 0 > t--I m U m 0 a n
J
-4> > K 3 In I& 0 > t-J m 4 m 0 m n
I . ( 1.0
0.1 0 . 9
0.11 0 . 8
........................0.7 0.7
0 . 6 0.6
.........................0 .5 0 . 5
O = !.............0.4 0 .4
0 . 3 1 0 . 3 1 S’O i s 6 0 I;
~~~
90 1 WEEKS ON STUDY
1.0
0.9
0 . 0
0.7
0.6
0 . 5
0.4
0 . 3
FIGURE 7. KAPLAN-MEIER SURVIVAL CURVES FOR AUGUST RATS .ADMINISTERED TRICHLOROETHYLENE IN CORN OIL BY GAVAGE
FOR TWO YEARS
Trichloroeithylene, NTP TR 273 50

1.0
0 . 9
-J 0 . 04
3.> II: 3 v) 0.7 LL 0 > !=1 0 . 6 m 4 m 0 Lz: 0 . 5 a
0 . 4
Y . " , I I I 0 . 3 0 15 3 0 i s 6 0 ;S 90 165
WEEKS ON STUDY
1.0 1.0
0 . 9 0 . 9
J . . . . . . . . . . . . . . . . . . . . . . . . , . . . . . . . . . . . . . . . . . . . . . . . , , 4 0 . 8 0 . 81> II: I) v) 0 . 7 0 . 7 LL 0 > k
0 . 6 0 . 6i m 4 m 0 E 0 . 5 0 . 5 [L
0 . 4 0 . 4
0 . 3 I I I I 1 1 0 . 3 15 3 0 45 6 0 75 90 I (
W E E K S ON STUDY
FIGURE 8. UNADJUSTED SURVIVAL CURVES FOR AUGUST RATS ADMINISTERED TRICHLOROETHYLENE IN CORN OIL BY GAVAGE
FOR TWO YEARS
51 Trichloroethylene, NTPTR 273

1.0
0 .9
0 . 8
0 .7
0 . 6
0.5
0 . 4
0 . J
1.0
0 .9
0 . 8
0.7
0 . 6
0.5
0.4
0.2
I i
1.0
.....................
...........................
............................
.-.(........& .............,... .................... ; &-?
i............................. i...............&1 .........
o+-,: (+Jt-.--. ----. c i!
j ii
& .................. I
ij !
- 0.9
- 0 . 8
- 0.7 I
- 0.6
j ! .......................... ;............................ 4 .............................
MALC R A T S =UNTREATED =VEHICLE
........................................
j1
I 1
0 15 5'0 4 5 80 WEEKS ON STUDY
I
75 I
9'0
1
- 0.5
- 0 .4
! 0 . 3 105
1.0
0 .9
0 , 8
0.7
0 . 6
0 . 5
0 . 4
W E E K S ON STUDY
0 . 3 I
FIGURE 9. KAPLAN-MEIER SURVIVAL CURVES FOR MARSHALL RATS ADMINISTERED TRICHLOROETHYLENE IN CORN OIL BY GAVAGE
FOR TWO YEARS
Trichloroethylene,NTP TR 273 52

1.0 1.0
j
j . .............I ............................. i.......................0 . 9 0 . 9. .
................................. +............................0 . 8 0 . 8
0 .7 0.7
0 . 6 0 . 6
j
I -* jj
0.s ............................ i.............................. i.............................. .............................. i.............................. 1........................... 0.s I MALE RATS :--& fa =UNTREATED
=VEHICLE j j
0 . 4 ............... ........................... ............................. i :.......
, ......... .............................. i............................. 0 . 4 i
0 . 3 I I 0 . 3 1; 310 i s 6 0 7; 90 1'
WEEKS ON STUDY
1.0 1.0
0 . 9 0.9
0 . 8 0 . 8
0 . 7 0 . 7
0 . 6 . ......................... .................... ...I .............................. ...................... ............. ........................... .................. 0 . 6
.......................... 4............................ .;.............................. ;..0 . 9 . - 0 . 5 FEMALE RATS
0 . 4 - ............. ........................... - 0.4
! j L :+.--.& 0 . 3 - I I I 1 I I
I 15 3 0 45 6 0 75 eo 105 WEEKS ON STUDY
FIGURE 10. UNADJUSTED SURVIVAL CURVES FOR MARSHALL RATS ADMINISTERED TRICHLOROETHYLENE IN CORN OIL BY GAVAGE
FOR TWO YEARS
53 Trichloroethylene, NTP TR 273

J 42> K 3 v)
LL 0 > cd m a m 0 K n
WEEKS ON STUDY
1.0
0.9
0.8
0.7
0.6
0.1
0.4
0.s
0.2
0.1
J 4 3> K 2 v)
LL 0 > k 2 m 4 m 0 a a
FIGURE 11. KAPLAN-MEIER SURVIVAL CURVES FOR OSBORNE-MENDEL RATS ADMINISTERED TRICHLOROETHYLENE IN CORN OIL BY GAVAGE
FOR TWO YEARS
Trichloroethylene, NTP TR 273 54

1.0
0.9
0 . 8 J a2 0.7> IL: 3 v)
0.6LL 0 >-r- 0.5-J m a m 0.40 e a
0 . 3
0.2
0.1
W E E K S ON STUDY
7' .O 0.9
...... . ........ .. ....,.. .. 0 . 8 J a1> 0.7 IL: I> v)
LL 0.6 0 >-c r' 0.5
m a m 0 0.4 E a
0 . 3
0 . 2
0.1 I I I I 1 0.1 0 15 30 45 6 0 75 9 105
W E E K S ON STUDY
FIGURE 12. UNADJUSTED SURVIVAL CURVES FOR OSBORNE-MENDEL RATS ADMINISTERED TRICHLOROETHYLENE IN CORN OIL BY GAVAGE
FOR TWO YEARS
55 Trichloroethylene, NTP TR 273

III. RESULTS
Pathology anti Statist ical Analyses of Results
This section describes the significant or notewor-thy changes in the incidences of rats with neo- plastic or nonneoplastic lesions of the kidney, testis, hematopoietic system, subcutaneous tissue, adrenal gland, pituitary gland, mam- mary gland, thyr'oid gland, and uterus.
Lesions in male irats are summarized in Appen- dixes A, C, E, and G. Lesions in female rats are summarized in A.ppendixes 13, D, F, and H. His- topathologic findings on neoplasms are summa- rized in Tables Al , C l , E l , and G1 (male rats) and B1, D1, F1, and H1 (female rats). Tables A2, C2, E2, and G2 (male rats) ;and B2, D2, F2, and H2 (female rats) give the survival and tumor status for individual rats. Tables A3, C3, E3, and G3 (male rats) and B3, D3, F3, and H3 (fe- male rats) contain the statistical analyses of those primary tumors that occurred, with an inci- dence of at least 5% in the vehicle control or in one of the dosed groups. The! statistical analyses used are discussed in Chapter II (Statistical Methods) and Tables A3, C3,E3, and G3 (male rats) and B3, D3, F3, and H:3 (female rats) (foot- notes). Finding!; on nonneoplastic lesions are summarized in Table A4, C4, E4, and G4 (male rats) and B4, D4, F4, and H4 (female rats). Sta- tistical comparisons were made between vehicle control and dosed groups.
Nonneoplastic Lesions of the Kidney
Administration of trichloroe thylene caused cyto- megaly ofrenal t,ubular epithelial cells and toxic nephropathy in all four strains of rats (Tables 13 and 14). The inner cortex arid outer stripe of the outer medulla were the primary areas affected. The epithelial cells of the ]pars recta (pars de- scendens) of the proximal tubule were enlarged and contained nuclei several times their normal
size (karyomegaly). The enlarged nuclei were often hyperchromatic and irregular to oblong in shape. In kidneys with more extensive changes, tubular epithelial cells located in more super- ficial areas of the cortex were also affected. Other lesions observed in severely affected kid- neys were diagnosed as toxic nephropathy to dis- tinguish them from the common spontaneous nephropathy of aging rats. Toxic nephropathy occurred only in dosed rats and consisted of dila- ted tubules lined by elongated and flattened epi- thelial cells. The degree of flattening was often severe and was roughly proportional to the de- gree of dilation. The lumens of the affected tu- bules were empty or contained wisps of eosino-philic material.
Tubular cell hyperplasia occurred a t low inci- dences in dosed male and female Osborne- Mendel rats and less frequently in untreated or vehicle control rats. One animal in each of the high dose male and female August and female Marshall and low dose male Marshall groups also had renal tubular cell hyperplasia. Tubular cell hyperplasia generally consisted of one or two tubules with stratified epithelium that partially or completely filled the tubular lumens. The af- fected tubular epithelial cells were large with abundant eosinophilic or basophilic cytoplasm and vesicular nuclei containing prominent nu- cleoli. Cells in mitosis were variable in number or absent. This lesion was distinctly different from the background tubular regeneration that is a component of spontaneous chronic progres- sive rat nephropathy. The latter lesion consists of cortical tubules lined by a single layer of cu- boidal cells with small amounts of basophilic cy- toplasm, vesicular nuclei, and variable mitoses.
No additional nonneoplastic lesions were ob- served which could be attributed to trichloro- ethylene administration.
Trichloroethylene, NTP TR 273 56

TABLE 13. INCIDENCES OF RENAL CYTOMEGALY IN ACI, AUGUST, MARSHALL, AND OSBORNE-MENDEL RATS IN THE TWO-YEAR GAVAGE STUDIES OF TRICHLOROETHYLENE (a)
Group ACI August Marshall Osborne-Mendel
MALE
Vehicle control 0150 0150 0149 0150 500 rngkg 40149 (82%) 46/50 (92%) 48/50 (96%) 48/50 (96%)
1,000mgkg 48/49 (98%) 46/49 (94%) 47/47 (100%) 49/50 (98%)
FEMALE
Vehicle control 0148 0149 0150 0150 500mgkg 43/47 (91%) 46/48 (96%) 46/48 (96%) 48/50 (96%)
1,000mg/kg 42/43(98%) 50150 (100%) 43/44 (98%) 49/49 (100%)
(a)All incidences in dosed groups significantly greater (PCO.01)than those in the vehicle controls
TABLE 14. INCIDENCES OF TOXIC NEPHROPATHY IN ACI, AUGUST, MARSHALL, AND OSBORNE-MENDEL RATS IN THE TWO-YEAR GAVAGE STUDIES OF TRICHLOROETHYLENE (a)
~ ~~
Group ACI August Marshall Osborne-Mendel ~~ ~ ~ ~~
MALE
Vehicle control 0150 0150 0149 0150 500 mg/kg 18/49 (37%) 10150(20%) 18/50 (36%) 39/50(78%)
1,000rngkg 18/49 (37%) 31/49(63%) 23/47 (49%) 35/50(70%)
FEMALE
Vehicle control 0148 0149 0150 0150 500rngkg 21/47 (45%) 8/48 (17%) 30148 (63%) 30150 (60%)
1,000mg/kg 19/43 (44%) 29/50 (58%) 30144 (68%) 39/49(80%)
(a)All incidences in dosed groups significantly greater (PCO.01)than those in the vehicle controls
Neoplastic Lesions tumor cells general ly showed more pleo-morphism than did the tumor cells of the tubular
Kidney: Neoplastic lesions of the kidney were cell adenomas. characterized according to the following criteria. Tubular cell adenomas were discrete masses of Proliferative renal cortical lesions were diag- epithelial cells with cytologic features similar to nosed in all strains of rats. The incidences of foci of tubular hyperplasia. The adenomas ex- these lesions are summarized in Table 15, and hibited loss of tubular structure, although the the statistical analyses for the incidences in tumor cells were arranged in irregular clusters male Osborne-Mendel rats are shown in Ta- incompletely separated by basement mem- ble 16. Dosing with trichloroethylene signifi- branes. Tubular cell adenocarcinomas were cantly increased the incidence of renal tubular larger than the adenomas, less discrete, and cell adenomas in male Osborne-Mendel rats a t more heterogeneous in growth pattern. These the low, but not the high, dose level.
57 Trichloroethylene, NTP TR 273

TABLE 15. INCIDENCES OF RENAL CORTICAL PROLIFERATIVE LESIONS IN ACI, AUGUST, MARSHALL, AND) OSBORNE-MENDEL RATS IN THE TWO-YEAR GAVAGE STUDIES
OF TRICHLOROETHYLENE
Group
MALE
ACI Untreated control Vehicle c'ontrol 500 mgkg 1,000 mgkg
August Untreated control Vehicle c~ontrol 500 mgkg 1,000 mgkg
Marshall Untreated control Vehicle c'ontrol 500 mgkg 1,000 mgkg
Osborne-Mendel Untreated control Vehicle c~ontrol 500 mgkg 1,000 mgkg
FEMALE
ACI Untreated control Vehicle clmtrol 500 mg/kg 1,000 mgkg
August Untreated control Vehicle control 500 mgkg 1,000 mgkg
Marshall Untreated control Vehicle cmtrol 500 mgkg 1,000 mg.kg
Osborne-Mendel Untreated control Vehicle c~~nt ro l 500 mg/kg 1,000 mgkg
(a)Adenocarcinoma, NOS
Tubular Cell Hyperplasia
0149 0150 0149 0149
0150 0150 0150 1/49
0149 0149 1150 0147
0150 0150 5/50 3/50
0149 0148 0147 0143
0150 0149 Of48 1150
1/49 1/50 0148 1 I44
0150 1/50 1/50 3/49
Tubular Cell Adenoma
0149 0150 0149 0149
0150 0150 1/501/49
2/49 0149 1150 0147
0150 0150 6/50 1/50
0149 0148 2/47 0143
0150 1/49 2/48 0150
1149 1/50 1/48Of44
1/50 0150 0150 1/49
Tubular Cell Adenocarcinoma
0149 0150 1149 0149
0150 0150 1/50 Of49
0149 0149 0150 1/47
0150 0150 0150 1/50
0149 0148
(a)1/471/43
0150 0149 2/48 0150
0149 0150 1/481/44
0150 0150 0150 0149
Trichloroethylene, NTP TR 273 58

TABLE 16. ANALYSIS OF TUBULAR CELL RENAL LESIONS IN MALE OSBORNE-MENDEL RATS IN THE TWO-YEAR GAVAGE STUDY OF TRICHLOROETHYLENE (a)
Untreated Vehicle Control Control 600 mg/kg 1,OOO msnte
HyperplasiaOverall Rates 0150 (0%) 0150(0%) 5/50 (10%) 3/50 (6%)
Adenoma Overall Rates 0150(0%) 0150 (0%) 6/50 (12%) 1/50 (2%) AdjustedRates 0.0% 0.0% 32.2% 6.7% Terminal Rates 0/21(0%) on2 (0%) 5/17 (29%) 1/15(7%) Life Table Test P=0.246 P=0.007 P=0.424 Incidental Tumor Testa P=0.243 P=0.007 P=0.424
Adenoma or Adenocarcinoma (b)Overall Rates 0150 (0%) Ob0 (0%) 6/50(12%) 2/50(4%) ,
Adjusted Rates 0.0% 0.0% 32.2% 10.9% Terminal Rates on1 (0%) on2 (0%) 5/17 (29%) 1/15(7%)Life Table Tests Pr0.125 P=0.007 P=0.158 Incidental Tumor Testa P=0.122 P=0.007 P=0.158
(a)The statistical analyses used are discussed in Chapter II (Statistical Methods) and Appendix G,Table G3. (b)No historical data are available.
Testis: Interstitial cell tumors occurred with a increasing trend is evident (vehicle control, positive trend in male ACI rats; the incidence in 36/43;low dose, 23/26;high dose, 17/17). In male the high dose group was not significantly Marshall rats, interstitial cell tumors and inter- greater than that in the vehicle controls by the stitial cell tumors or malignant interstitial cell incidental tumor test (Table 17). The overall in- tumors (combined) occurred with posit ive cidences in the dosed groups were lower than trends, and the incidences in the high dose group that in the vehicle controls, but if incidences are were significantly greater than those in the ve- based on those animals surviving until the hicle controls (Table 18). appearance of the first tumor (week 751, a n
59 Trichloroethylene,NTP TR 273

TABLE 17. ANALYSIS OF TESTICULAR LESIONS IN MALE ACI RATS IN THE TWO-YEAR GAVAGE STUDY OF TRICHLOROETHYLENE
Untreated Vehicle Control Control 300 mg/kg 1,000m g k g
Interstitial Cell Hyperplasia Overall Rates dW47 (9%) 5/49 (10%) 5/49 (10%) 3/49 (6%)
Interstitial Cell Tumor Overall Rates 38/47 (81%) 36/49 (73%) 23/49 (47%) 17/49 (35%) Adjusted Rates !30.4% 94.7% 95.8% 100.0% Terminal Rates 34/38 (89%) 36/38 (95%) 18/19 (95%) 1111 1 (100%)Incidental TumorTests P=O.O19 P10.223 P=0.074
TABLE 18. ANALYSIS OF TESTICULAR LESIONS IN MALE MARSHALL RATS IN THE TWO-YEAR GAVAGE STUDY OF TRICHLOROETHYLENE
Untreated Vehicle Control Control 300 m g k g 1,000 m g k g
Interstitial Cell Hyperplasia Overall Rates 2/46 (4%) 1/46 (2%) 6/48(13%) 5/48 (10%)
Interstitial Cell Tumor Overall Rates 16/46 (35%) 17/46 (37%) 21/48 (44%) 31/48 (65%) Adjusted Rates 46.9% 55.7% 95.1% 100.0% Terminal Rates 14/32 (44%) 13/26(50%) 11/12 (92%) 616 (100%) Incidental TumorTesta P<0.001 P<O.OOl P<O.OOl
Interstitial Cell Tumor, Malignant Overall Rates 0146 (0%) 0/46(0%) 0148 (0%) 1/48 (2%)
Interstitial Cell Tumor or Interstitial Cell Tumor, Malignant Overall Rates 16/46 (35%) 17/46 (37%) 21/48 (44%) 32/48 (67%) Adjusted Rates 46.9% 55.7% 95.1% 100.0% Terminal Rates 14/32 (44%) 13/26 (50%) 11/12 (92%) 6/6 (100%) Incidental Tumor Testa P<0.001 PCE 0.001 P<0.001
Trichloroethylene, NTP TjR 273 60

III. RESULTS
Hematopoietic System: Leukemia occurred in vehicle controls in the pairwise comparisons (Ta- female August rats with a statistically signifi- ble 20). cant positive trend, but the incidences in the Adrenal Gland: Adrenal cortical adenomas oc-dosed groups were not significantly greater than curred in female Osborne-Mendel rats with a that in the vehicle controls in the pairwise com- significant positive trend by the life table test, parisons (Table 19). and the incidence in the high dose group was sig-
nificantly greater than that in the vehicle con-Subcutaneous Tissue: Sarcomas occurred in trols by the life table test (Table 21). The inci- male August rats with a significant positive dental tumor test, a more appropriate statistical trend, but the incidences in the dosed groups test for this generally nonlethal neoplasm, re- were not significantly greater than that in the vealed no statistically significant differences.
TABLE 19. ANALYSIS OF LEUKEMIA IN FEMALE AUGUST RATS IN THE TWO-YEAR GAVAGE STUDY OF TRICHLOROETHYLENE
Untreated Vehicle Control Control 500 mg/kg 1,000 mg/kg
Overall Rates 0/50(0%) 1/50(2%) 0150 (0%) 5/50(10%)Adjusted Rates 0.0% 2.2% 0.0% 18.2% Terminal Rates 0/26(0%) OD3(0%) 0/26 (0%) 3/25 (12%) Life Table Tests P=0.027 P =0.523N P=0.078 Incidental Tumor Tests P=0.020 P=0.469N P-0.059
TABLE 20. ANALYSIS OF SUBCUTANEOUS TISSUE SARCOMAS IN MALE AUGUST RATS IN THE TWO-YEAR GAVAGE STUDY OF TRICHLOROETHYLENE
Untreated Vehicle Control Control 500 mg/kg 1,000 mg/kg
Overall Rates 1/50 (2%) 0/50(0%) 1/50(2%) (a) 3/49(6%)Adjusted Rates 3.8% 0.0% 2.9% 15.0% Terminal Rates 0/24(0%) OD1 (0%) 0/13 (0%) 1/16 (6%) Life Table Tests P=0.033 P=0.440 P-0.064 Incidental Tumor Tests P=0.032 P=0.519 P=0.050
(a)Includes one sarcoma, unclear primary or metastatic
TABLE 21. ANALYSIS OF ADRENAL GLAND LESIONS IN FEMALE OSBORNE-MENDEL RATS IN THE TWO-YEAR GAVAGE STUDY OF TRICHLOROETHYLENE
Untreated Vehicle Control Control 500 mg/kg 1.000 mg/kg
HyperplasiaOverall Rates 1/49(2%) 1/50(2%) 4/50 (8%) 0/49(0%)
Cortical Adenoma Overall Rates 13/49(27%) 16/50(32%) 13/50 (26%) 19/49 (39%) Adjusted Rates 54.8% 55.6% 66.3% 92.7% Terminal Rates 9/19 (47%) 9/20 (45%) 6111 (55%) 6R (86%) Life Table Tests P=0.008 P=0.365 P=O.Oll Incidental Tumor Tests P=0.100 P=0.484N P=0.127
61 Trichloroethylene, NTP TR 273

III. RESULTS
Negative Trends and Lower Incidences Mammary Gland: Fibromas or fibroadenomas (combined) occurred in female August rats with a significant negative trend by life table analy- Adrenal Gland: Pheochromocytomas and pheo- sis. The incidence of fibroadenomas in low dose chromocytomas or malignant pheochromocyto- female Marshall rats was significantly lower mas (combined) occurred with significant nega- than that in the vehicle controls by the inciden- tive trends in all strains and sexes except female tal tumor test. ACI, male August, and male Marshall rats (Ta-
bles 22 to 25). Thyroid Gland: C-cell adenomas occurred with significant negative trends in male August and
Several statistically Significant negative trends male and female Osborne-Mendel rats. and lower incidences of neoplasms were detected Uterus: Endometrial stromal polyps occurred in various strains (Appendixes A-H). with a significant negative trend in female Au-
gust rats, and the incidence of endometrial stro- Pituitary Gland: Adenomas occurred with sig- mal polyps in low dose Osborne-Mendel females nificant negative trends in male and female was significantly lower than that in the vehicle August rats and in female Marshall rats. controls by the incidental tumor test.
TABLE 22. ANALYSIS OF ADRENAL GLAND LESIONS IN MALE ACI RATS IN THE TWO-YEAR GAVAGE STUDY OF TRICHLOROETHYLENE
Untreated Vehicle Control Control 500 mg/kg 1,000 mg/kg
HyperplasiaOverall Rates 0148 (0%) 1/48 (2%) 0144(0%) 1/45 (2%)
PheochromocytomaOverall Rates 4/48(8%) 8/48 (17%) 0144(0%) 0145 (0%)Adjusted Rates 10.3% 21.1% 0.0% 0.0% Terminal Rates 4/39(10%) 8/38 (21%) 0118(0%) 0111 (0%)LifeTable Testa P= 0.017N P =0.047N P=0.117N Incidental Tumor Testa P=0.017N P =0.047N P=0.117N
Trichloroethylene, NTP TI3 273 62

TABLE 23. ANALYSIS OF ADRENAL GLAND LESIONS IN AUGUST RATS IN THE TWO-YEAR GAVAGE STUDIES OF TRICHLOROETHYLENE
Untreated Vehicle Control Control 500 m g k g 1,000
MALE
Hyperplasia Overall Rates 4/49 (8%) 2/50 (4%) 3/49 (6%) 1/47(2%)
Pheochromocytoma Overall Rates Adjusted Rates Terminal Rates Life Table Testa
16/49 (33%) 63.7% 15/24 (63%)
10150(20%)41.O% 7/21 (33%) P = 0.039N
5/49 (10%) 33.9% 4/13 (31%) P = 0.455N
2/47 (4%) 12.5% 2/16 (13%) P=0.049N
Incidental Tumor Tests P=0.053N P=0.460N P=0.073N
Pheochromocytoma, Malignant Overall Rates 0149 (0%) 0150 (0%) 1/49(2%) 1/47 (2%)
Pheochromocytoma o r Pheoc hromocytoma, Malignant Overall Rates 16/49 (33%) 10150(20%)Adjusted Rates 63.7% 41.0% Terminal Rates 15/24(63%) 7/21 (33%) Life Table Tests P =0.090N
6/49 (12%) 41.3% 5/13 (38%) P = 0.602N
3/47 (6%) 18.8% 3/16 (19%) P=0.1 04N
Incidental Tumor Tests P=0.119N P=0.610N P -0.150N
FEMALE
Hyperplasia Overall Rates 10/50 (20%) 5/48 (10%) 12/48 (25%) 0150 (0%)
Pheochromocytoma Overall Rates Adjusted Rates Terminal Rates Life Table Testa
6/50(12%)20.5% 4/26 (16%)
9/48 (19%) 33.2% 6/23 (26%) P<O.OOlN
2/48 (4%) 7.7% 2/26 (8%)P =0.019N
0150 (0%)0.0% OD5 (0%)P=0.003N
Incidental Tumor Tests P=0.001N P=0.034N P=0.009N
63 Trichloroethylene, NTP TR 273

TABLE 24. ANALYSIS OF ADRENAL GLAND LESIONS IN MARSHALL RATS IN THE TWO-YEAR GAVAGE STUDIES O F TRICHLOROETHYLENE
Untreated Vehicle Control Control 500 mg/kg
MALE
Hyperplasia Overall Rates 13/48 (17%) 6/48 (13%) 5/43 (12%)
Pheochromocytoma or Pheochromocytoma, Malignant Overall Rates !13/48 (48%) 25/48(52%) 12/43 (28%) Adjusted Rates 65.4% 75.1% 84.8% Terminal Rates 19/31 (61%) 18/26 (69%) 911 1 (82%) Life Table Testa P=0.035 P=0.353 Incidental Tumor Testa P=0.239 P=0.158
FEMALE
Hyperplasia Overall Rates 16/47 (34%) 4/49 (8%) 5/47 (11%)
Pheochromocytoma Overall Rates 30147 (64%) 39/49 (80%) 15/47 (32%) Adjusted Rates i4.a% . 92.7% 76.5% Terminal Rates 21/31 (68%) 26/29 (90%) 8/12 (67%) Life Table Tests P =0.050N P =0.263N Incidental Tumor Tests P< 0.001N P=0.002N
Pheochromocytoma, Malignant Overall Rates 4/47 (9%) 4/49(8%) 0147 (0%)
Pheochromocytoma or Pheochromocytoma, Malignant Overall Rates 32/47 (68%) 40149 (82%) 15/47 (32%) Adjusted Rates 79.8% 95.1% 76.5% Terminal Rates 23/31 (74%) 27/29 (93%) 8/12 (67%) Life Table Testa P=0.036N P=0.222N Incidental TumorTesta P<O.OOlN P< 0.001N
1,000 mg/kg
3/43 (7%)
12/43(28%) 90.9% 516 (83%) P=0.037 P=0.288
2/43 (5%)
9/43 (21%) 67.0% 6/10 (60%) P =0.067N P< 0.001N
1143(2%)
9/43 (21%) 67.0% 6110 (60%) P=0.050N P<0.001N
Trichloroethylene, NTP TR 273 64

TABLE 25. ANALYSIS OF ADRENAL GLAND LESIONS IN OSBORNE-MENDEL RATS IN THE TWO-YEAR GAVAGE STUDIES OF TRICHLOROETHYLENE
Untreated Vehicle Control Control 500 mg/kg 1,OOo mg/kg
MALE
Hyperplasia Overall Rates 6/50 (12%) 4/50 (8%) 3/49 (6%) 5/50 (10%)
Pheochromocytoma Overall Rates Adjusted Rates Terminal Rates Life Table Tests
(a) 9/50 (18%) 34.8% 6/21 (29%)
(b) 13/50 (26%) 42.9% 7/22(32%)P=O.O28N
6/49 (12%) 3 1.6% 5/17 (29%) P=0.154N
3/50 (6%) 18.7% 2/15 (13%) P =0.052N
Incidental Tumor Tests P=0.023N P = 0.128N P=0.043N
FEMALE
HyperplasiaOverall Rates 1/49 (2%) 1/50(2%) 2/50 (4%) 2/49 (4%)
Pheochromocytoma Overall Rates Adjusted Rates Terminal Rates Life Table Tests
4/49 (8%) 16.1% 2/19 (11%)
8/50 (16%) 30.4% 4/20 (20%) P=O.O80N
4/50 (8%)18.8% 1111(9%) P=0.394N
1/49 (2%) 6.7% or7 (0%)P=0.118N
Incidental Tumor Testa P=0.009N P = 0.178N P=0.020N
Pheochromocytoma, Malignant Overall Rates 0149 (0%) 1/50 (2%) 2/50 (4%) 0149 (0%)
Pheochromocytoma or Pheochromocytoma, Malignant Overall Rates 4/49 (8%) 9/50 (18%)Adjusted Rates 16.1% 33.1% Terminal Rates 2/19 (11%) 4/20 (20%)L i e Table Testa P=0.073N
6/50 (12%) 26.0%
P=0.564N1/11(9%)
1/49 (2%) 6.7%
P=0.084N OR (0%)
Incidental Tumor Tests P =0.004N P=0.252N P=0.009N
(a)One pheochromocytoma, malignant, was also observed. (b)One pheochromocytoma, malignant, was also observed in an animal bearing a benign pheochromocytoma.
65 Trichloroethylene, NTP TR 273

Trichloroethylene, NTP TR 273 66

IV. DISCUSSION AND CONCLUSIONS
Thirteen- Week Studies Two-year Studies Conclusions
67 Trichloroethylene, NTP TR 273

IV. DISCUSSION AND CONCLUSIONS
The possibility of a strain difference in rat sus- ceptibility to trichloroethylene prompted the National Cancer Institute to initiate a series of %year toxicology and carcinogenesis studies of trichloroethylene in five strains of rats. The re- sults obtained with F344/N rats have been re- ported separately (NTP TR 243, in preparation), and the present report describes the results of studies in four additional strains (ACI, August, Marshall, and Osborne-Mendel). For compara- tive purposes, some data from the study in F344/N rats have been summarized in this discussion.
Thirteen-Week Studies
The results of the 13-week gavage studies of tri-chloroethylene in ACI, August, and Marshall rats were similar to those of previous 8- or 13-week studies in Osborne-Mendel or F344/N rats, respectively (NCI, 1976; NTP TR 243, in prep- aration). In males, trichloroethylene a t the highest dose given, 2,000 mg/kg (1,834 mgkg in Marshall males), consistently reduced final body weights by 12%-17%. Three of 10 male August rats died in the 2,000 mg/kg group. All male F344/N rats dosed with 2,000 mg/kg for 1 3 weeks survived (NTP TR '243, in preparation), and 5/5 Osborne-Mendel males dosed with 3,160 mg/kg per day, 5 days per week for 8 weeks, sur- vived (NCI, 1976).
The highest dose studied in females for 13 weeks in the present studies (1,000 mg/kg in ACI and August; 918 mg/kg in Marshall) was not lethal but caused from 4% to 7% reductions in final body weights. In female F344/N rats, the 1,000 mg/kg dose produced a 3% decrease in final body weight (NTP TR 243, in preparation), and 3,160 mg/kg per day, 5 days per week for 8 weeks re- duced final body weights of female Osborne- Mendel rats by 13% (NCI, 1976).
As in the earlier studies in rats, the chronic nephrotoxic effect of trichloroethylene observed in the 2-year studies was not predicted by the re- sults of the short-term stualies. In the studies in F344/N rats (NTP TR 249, in preparation), 13 weeks of dosing with trichloroethylene produced minimal to mild cytomegaly and karyomegaly of the tubular epithelial cells in the inner renal
cortex in both sexes. These changes were so subtle that they were diagnosed only during a reevaluation of tissues which was prompted by the detection of more pronounced renal effects during the 2-year studies.
Two-year Studies
The audits of the experimental data from the present studies revealed insufficient documenta- tion of animal breeding, clinical observations, environmental conditions, and analytical chem- istry data (Appendix Q).In addition, the produc- tion of central nervous system toxicity (char- acterized by sedation, loss of consciousness, tremors, and convulsive seizures) and reduced survival indicate that the doses selected for these studies were too high. For these reasons, these studies were considered inadequate to evaluate the presence or absence of carcinogenic potential of trichloroethylene in ACI, August, Marshall, and Osborne-Mendel rats. The stud- ies do, however, demonstrate a clear nephrotoxic effect of trichloroethylene in rats.
Survival and body weights: All dosed groups ex- cept high dose female Osborne-Mendel rats ex- hibited some degree of final body weight depres- sion. This depression was 10%-12% in five of the dose groups (all high dose males except Mar- shall, low dose ACI males, and high dose Mar- shall females). Final mean body weight decre- ments in other groups ranged from 3% in low dose Osborne-Mendel males to 8% in low dose ACI females. In the earlier studies in F344/N rats, trichloroethylene at 1,000 mg/kg reduced mean body weight gain of males by 13% and at 500 and 1,000 mg/kg reduced body weight gains of females by 12% and 18%, respectively.
Trichloroethylene administered at both doses significantly reduced the survival of ACI males and Marshall females. Trichloroethylene a t 1,000 mg/kg also reduced the survival of female Osborne-Mendel and ACI rats. The low dose, but not the high dose, reduced the survival of male Marshall rats. In the earlier gavage stud- ies of trichloroethylene in F344/N rats, both the 500 and 1,000 mg/kg doses significantly reduced the survival of males, whereas neither dose re-duced the survival of females. It is not clear
Trichloroethylene, NTP TR 273 68

IV. DISCUSSION AND CONCLUSIONS
whether the excessive mortality observed in many dosed groups was caused by gavage- related trauma, the anesthetic properties of the chemical, nephrotoxicity, or a combination of these factors.
The absence of a dose-response relationship in survival of male Marshall rats may be related to the high accidental death rate in the high dose group. Fifty percent of the animals in this group were accidentally killed, and animals that are considered to have died from accidental causes are not included in the Kaplan-Meier probabil- ity of survival calculation after the t ime of death. The incidences of accidental deaths also were high in other dosed groups. A total of 24% of all dosed animals died of accidental causes. This rate contrasts with an overall accidental death rate of 5% in vehicle control animals. All groups of dosed animals were affected, and the overall combined incidences were dose related (male: vehicle control, 9/200;low dose, 41/200; high dose, 611200; female: 141200; 401200; 49/200).High accidental death rates were ob- served in other NTP studies in which trichloro- ethylene or tetrachloroethylene was adminis- tered by gavage. As suggested earler (NTP TR 243,in preparation), perhaps some effect of tri-chloroethylene and related chemicals pre- disposes repeatedly dosed animals to gavage accidents,
The survival of untreated and vehicle control Osborne-Mendel rats of each sex was poor rela- tive to the other three strains and to historical survival of F344/N rats. However, survival of Osborne-Mendel control animals in the present study was similar to that of controls in the NC1 studies (NCI, 1976) (male, 40/100,and female, 37/100,in the present study vs male, 26/100,and female, 51/100,in the earlier study).
Renal toxicity (nonproliferative changes): Earli-er studies of trichloroethylene administered by gavage (NCI, 1976; NTP TR 243,in preparation) identified the kidney of Osborne-Mendel and F344/Nrats and B6C3F1 mice as a target organ for the production of nonneoplastic pathologic changes characterized as cytomegaly, karyo- megaly, and toxic nephrosis of the tubular
epithelial cells in the inner renal cortex. The identical lesion was reported in male and female F344/N rats exposed to tetrachloro- ethylene by inhalation (NTP, 1986). Neither Henschler et al. (1980)nor Fukuda et al. (1983) reported the presence of nonproliferative renal lesions in mice, rats, or hamsters exposed to tri- chloroethylene by inhalation. The results of the present studies show that the kidneys of ACI, August, and Marshall rats are affected simi- larly. The incidences of these lesions in five strains of rats are summarized in Table 26.
The nonneoplastic renal changes diagnosed in these studies were clearly attributable to the ad- ministration of trichloroethylene, since none of the untreated or vehicle control animals had the lesions. In the case of renal cytomegaly, the inci- dence of the change ranged from 82% to 100% in the dosed groups. Cytomegalic changes were di- agnosed in dosed rats that died after as few as 26 weeks of exposure to trichloroethylene. The se- verity of the change appeared to be directly pro- portional to the duration of dosing.
Toxic nephropathy, which was clearly dis- tinguishable from the spontaneous nephropathy of aging rats, was observed a t increased inci- dences in dosed rats of each sex and strain but was noted only infrequently in animals that died before week 52. This lesion also appeared to in- crease in severity with longer exposure.
Renal toxicity (proliferative changes): Trichloro-ethylene produced a statistically significant in- crease in the incidence of renal tubular cell ade- nomas or adenocarcinomas (combined) in low dose male Osborne-Mendel rats. In addition, tu- bular cell hyperplasia was present in 5/50 low dose and 3/50high dose Osborne-Mendel male rats. No proliferative tubular cell lesions were diagnosed in either control group. Although not statistically significant, proliferative lesions also were diagnosed in dosed male and female ACI and August rats, whereas no such lesions were detected in any of the control groups. Pro- liferative lesions of the renal tubular cells were diagnosed in dosed Marshall male and female rats, but these changes were also present in un- treated and vehicle control rats.
69 Trichloroethylene, NTP TR 273

TABLE 26. INCIDENCES OF RENAL CORTICAL LESIONS IN ACI, AUGUST, MARSHALL, OSBORNE- MENDEL, AND F334/N RATS IN THE TWO-YEAR GAVAGE STUDIES OF TRICHLOROETHYLENE
Toxic Tubular Cell Tubular Cell Tubular Cell Group Nephropathy Hyperplasia Adenoma Adenocarcinoma
MALE
ACI Untreated control 0149 0149 0149 0149 Vehicle control 500 mg/kg1,000mgkg
0150 18149 18149
0/500149 0149
0150 0149 0149
0150 1149 0149
August IJntreated control Vehicle control
0150 0150
0150 0150
0150 0150
0150 0150
500 mg/kg1,000mg/kg
10150 31149
0/501149
1/501149
1/50 0149
Marshall IJntreated control Vehicle control
0149 0149
0149 0149
2/490149
0149 0149
500 mg/kg1,000mgkg
18/5023147
1/500147
1/500147
0/501147
Osborne-Mendel Untreated control 0150 0150 0150 0150 Vehicle control 500mg/kg1,000mg/kg
0150 39150 35/50
0150 5150 3150
0150 6150 1150
0/500150 1/50
F344/N (a) Untreated control Vehicle control
0149 OJ48
0149 0148
0149 0148
0149 0148
500 mg/kg 1.000 mg/kg
48149 48149
0149 1/49
2/490149
0149 3/49
FEMALE
ACI Untreated control 0149 0149 0149 0149 Vehicle control 0148 0148 0148 0148 500 mgkg1,000mg/kg
21147 19143
OJ47 0143
2/470143
( b) 1147 1/43
August Vehicle control 500 mg/kg1,000mg/kg
Untreated control 0150 0149 8148 29/50
0150 0149 0148 1150
0150 1/492/48 0150
0150 0149 2/480150
Mars hall Vehicle control Untreated control 0/49
0150 1/49 1150
1/491150
W49 0150
500 mgkg1,000mg/kg
30148 30144
0148 1144
1/480144
1/481144
Osborne-Mendel Untreated control 0150 Of50 1150 0150 Vehicle control 500 mgkg1,000mg/kg
0150 30150 39/49
1/501/503/49
0/500150 1/49
0150 0/50Of49
F344/N (a) Untreated (control Vehicle control 500 mg/kg1,000mg/kg
0149 0150
48/4848/49
0/490/500149 0148
0149 0150 0/490148
0/490150 0149 1/48
(a)Data for F344/N rats obtained from NTP Technical Report No. 243;toxic nephropathy was designated as cytomegaly in that report.(b)Adenocarcinoma, NOS
Trichloroethylene, NTP TR 273 70

IV. DISCUSSION AND CONCLUSIONS
Increased incidences of renal tubular cell adenomas or adenocarcinomas (combined) were found in five male F344/N r a t s dosed with trichloroethylene (NTP TR 243, in preparation), and a tubular cell adenocarcinoma was found in a low dose (time-weighted-average dose of 549 mg/kg of trichloroethylene) male Osborne- Mendel rat (NCI, 1976). The incidences of these lesions in the five strains of rats are shown in Table 26. Henschler et al. (1980) reported a total of four renal tumors (adenomas, cystadenomas, adenocarcinomas) in 60 male WIST rats exposed to trichloroethylene by inhalation at 100 or 500 ppm. No renal tumors were reported in male control rats.
Because the rats could not always be unequi- vocally assigned to a high or low dose group, tu- mor incidences in dosed groups of the same sex and strain were pooled and compared with inci- dences in the corresponding vehicle control groups. By this analysis, the incidence of renal tubular cell tumors in dosed male Osborne- Mendel rats was still elevated (tubular cell ade- nomas: vehicle control, 0150; pooled dosed, 71100; adenomas or adenocarcinomas (com- bined): vehicle control, 0150; pooled dosed, 8/100). For all five rat strains studied, a total of 32 renal tubular cell neoplasms were observed in dosed animals, compared with 3 in all the vehi- cle control groups and 3 in all the untreated con- trol groups.
Nonneoplastic kidney effects are common re- sponses o€ F344 rats to the long-term adminis- tration of chlorinated ethanes and ethylenes. The NTP has also noted these effects in gavage studies of pentachloroethane (NTP, 1983) and trichloroethylene (NTP TR 243, in preparation) and in inhalation studies of tetrachloroethylene (NTP, 1986). Since these changes appear consis- tently in dosed rats but not in controls, they are considered to be due to trichloroethylene admin- istration. This spectrum of kidney lesions ap- pears to be similar to that described in male rats exposed to petroleum products (Mehlman et al., 1984). Unlike the petroleum-induced lesions, however, those produced by chlorinated ethanes and ethylenes appear in both male and female rats as well as in both sexes of mice (NTP TR 243, in preparation).
Testicular interstitial cell tumors: The inci- dences of testicular interstitial cell tumors were increased in dosed male ACI and Marshall rats. In ACI rats, these lesions showed a dose-related increase when based on animals surviving until the appearance of the first tumor. In Marshall rats, the incidence of interstitial cell tumors or malignant interstitial cell tumors (combined) in the high dose group was significantly increased and may be due to trichloroethylene. For ACI rats, the increased incidence at the high dose was significant only by life table analysis. This marginal effect was not considered to be chem- ically related.
Other tumors: Leukemia in female August rats and subcutaneous tissue sarcomas in male Au- gust rats occurred with positive trends, but the incidences in dosed groups were not significantly elevated relative to vehicle controls. In earlier studies in F344/N and Osborne-Mendel rats, the incidences of leukemia and subcutaneous neo- plasms were not influenced by the administra- tion of trichloroethylene.
Negative trends: Several negative trends in tu- mor incidences were observed in these studies. The majority of these findings were discounted either because there were nonsignificant dif- ferences in pairwise comparisons or because only the incidence in the low dose group was signifi- cantly reduced relative to the vehicle controls.
There were, however, more consistent negative trends in the incidences of adrenal gland pheo- chromocytomas in male ACI, female Marshall, and male and female August and Osborne- Mendel rats. We are unable to explain this ef- fect. In the earlier study in F344/N rats, the in- cidence of pheochromocytomas appeared to be somewhat decreased in males (vehicle control, 4/45; low dose, 3/42; high dose, 1/44),but neither trend nor pairwise comparisons revealed statis- tically significant differences. No pheochromo-cytomas were diagnosed in any group of Os-borne-Mendel rats dosed with trichloroethylene in an earlier study (NCI, 1976).
The results of these comparative studies of the toxicity of orally administered trichloroethylene
71 Trichloroethylene, NTP TR 273

IV. DISCUSSION AND CONCLUSIONS
in four strains of rats show that there are few no- table differences in the responsiveness of the strains to toxic doses of the chemical. Further, the responses of these four strains of rats were found to be similar to the response of F344/N rats.
The experimental and tabulated data for the NTP Technical Report on trichloroethylene were examined for accuracy, consistency, and compli- ance with Good Laboratory Practice require- ments. As summarized in Appendix &, the au- dits revealed problems with the conduct of the studies and with collection and documentation of the experimental data. Discrepancies were found that influenced the final interpretation of the results of these studies. The NTP also has reviewed a partial draft of an independent audit sponsored by the Halogenated Solvent Industry Alliance (HSIA)for which the findings were
similar to those of the NTP audit. The findings of all audits were taken into consideration during the interpretation of the results of these studies and the preparation of this report.
Conclusions: Under the conditions of these 2-year gavage studies of trichloroethylene in male and female ACI, August, Marshall, and Os-borne-Mendel rats, trichloroethylene adminis- tration caused renal tubular cell cytomegaly and toxic nephropathy in both sexes of the four strains. However, these are considered to be in-adequate studies of carcinogenic activity* be-cause of chemically induced toxicity, reduced survival, and deficiencies in the conduct of the studies. Despite these limitations, tubular cell neoplasms of the kidney were observed in rats exposed to trichloroethylene and interstitial cell neoplasms of the testis were observed in Mar-shall rats exposed to trichloroethylene.
*Explanation of Levels of Evidence of Carcinogenic Activity is on page 9. Summaries of the Peer Review comments and the public discussions on this Technical Report appear on pages 13-14and 16-17.
Trichloroethylene, NTP TR 273 72

V. REFERENCES
73 Trichloroethylene, NTP TR 273

V. REFERENCES
1 . American Conference of Governmental Indus- trial Hygienists (ACGIH) (1985-86) Threshold Limit Values and Biological Exposure Indices for 1985-86.
2. Armitage, P. (1971) Statistical Methods in Medical Research. New York: John Wiley & Sons, Inc., pp. 362-365.
3. Bachman, K.; Zimmerli, A.; Simons, E. (1950) Vapor-liquid equilibria a t subatmospheric pressures. Trichloroethylene-tetrachloroethyl-ene and ethyl phenyl acetate-ethyl a-phenyl bu- tyrate. Ind. Eng. Chem. 42:2569-2575.
4. Baden, J.; Kelly, M.; Mazze, R.; Simmon, V. (1979)Mutagenicity of inhalation anaesthetics-- trichloroethylene, divinyl ether, nitrous oxide and cyclopropane. Br. J.Anaesth. 51:417-421.
5 . Bartsch, H.; Malavielle, C.; Barbin, A.; Planche, G. (1979) Mutagenic and alkylating metabolites of haloethylenes, chlorobutadienes and dichlorobutenes produced by rodent or hu-man liver tissues: Evidence for oxirane forma- tion by P45O-linked microsomal mono-oxy- genases. Arch. Toxicol. 41:249-277.
6. Beliles, R.; Brusick, D.; Mecler, F. (1980) Ter-atogenic-Mutagenic Risk of Workplace Contami- nants: Trichloroethylene, Perchloroethylene and Carbon Disulfide. Contract No. 210-77-047. Litton Bionetics, Inc., Kensington, MD.
7. Berenblurn, I., Ed. (1969) Carcinogenicity Testing: A Report of the Panel on Carcino- genicity of the Cancer Research Commission of UICC, Vol. 2. Geneva: International Union Against Cancer.
8. Boorman, G.; Montgomery, C., Jr.;Eustis, S.; Wolfe, M.; McConnell, E.; Hardisty, J. (1985) Quality assurance in pathology for rodent carci- nogenicity studies. Milman, H.; Weisburger, E., Eds.: Handbook of Carcinogen Testing. Park Ridge, NJ: Noyes Publications, pp. 345-357.
9. Canter, D.; Zeiger, E.; Haworth, S.; Lawlor, T.; Mortelmans, K.; Speck, W. (1986) Comparative mutagenicity of aliphatic epoxides in Salmo- nella. Mutat. Res. 172:105-138.
10. Cerna, M.; Kypenova, H. (1977) Mutagenic activity of chloroethylenes analyzed by screen- ing system tests. Mutat. Res. 46:214-215.
11. Clive, D.; Johnson, K.; Spector, J.; Batson, A.; Brown, M. (1979) Validation and characteri- zation of the L5178Y/TK+'- mouse lymphoma mutagen assay system. Mutat. Res. 59:61-108.
12. Cox, D. (1972) Regression models and life tables. J.R. Stat. SOC.B34:187-220.
13. Defalque, R. (1961) Pharmacology and tox- icity of trichloroethylene. Clin. Pharmacol. Therap. 2:665-688.
14. Dorfmueller, M; Henne, S.; York, R.; Bornschein, R.; Manson, J. (1979) Evaluation of teratogenicity and behavioral toxicity with in- halation exposure of maternal rats to trichloro- ethylene. Toxicology 14:153-166.
15. Elcombe, C.; Rose, M.; Pratt, I. (1985) Bio-chemical, histological, and ul t ras t ructural changes in rat and mouse liver following the ad- ministration of trichloroethylene: Possible rele- vance to species differences in hepatocarcino- genicity. Toxicol. Appl. Pharmacol. 79:365-376.
16. Food Chemical News (1978) January 3, pp. 41-42.
17. Fukuda, K.; Takemoto, K.; Tsuruta , H. (1983) Inhalation carcinogenicity of trichloro-ethylene in mice and rats. Ind. Health 21:243-254.
18. Gallant, R. (1966) Physical properties of hy- drocarbons. VI. Chlorinated ethylenes. Hydro- carbon Process. Petrol. Refiner 45:153-160.
19. Gart, J . ; Chu, K.; Tarone, R. (1979) Sta-tistical issues in interpretation of chronic bio- assay tests for carcinogenicity. J. Natl. Cancer Inst. 62:957-974.
20. Goto, K.; Maeda, S.; Kano, Y.; Sugimura, T. (1978) Factors involved in differential Giemsa- staining of sister chromatids. Chromosoma 66~351-359.
Trichloroethylene, NTP TR 273 74

V. REFERENCES
21. Greim, H.; Bonse, G.; Radwan, Z.; Reichert, D.; Henschler, D. (1975) Mutagenicity in vitro and potential carcinogenicity of chlorinated ethylenes as a function of metabolic oxirane formation. Biochem. Pharmacol. 24: 201 3-20 17.
22. Gulati, D.; Sabharwal, P.; Shelby, M. (1985) Tests for the induction of chromosomal aberra- tions and sister chromatid exchanges in cultured Chinese hamster ovary (CHO) cells. Ashby, J.; de Serres, F.; Draper, M.; Ishidate, M., J r . ; Mar- golin, B.; Matter, B.; Shelby, M., Eds.: Evalu-ation of Short-Term Tests for Carcinogens. Amsterdam: Elsevier Science Publishers, Inc., pp. 413-426.
23. Haseman, J . (1984) Statistical issues in the design, analysis and interpretation of animal carcinogenicity studies. Environ. Health Per- spect. 58:385-392.
24. Haseman J.; Huff, J.; Boorman, G. (1984) Use of historical control data in carcinogenicity studies in rodents. Toxicol. Pathol. 12:126-135.
25. Haseman, J.; Huff, J.; Rao, G.; Arnold, J . ; Boorman, G.; McConnell, E. (1985) Neoplasms observed in untreated and corn oil gavage con- trol groups of F344/N rats and (C57BL/6N X C3H/HeN)F1 (B6C3F1) mice. J. Natl. Cancer Inst. 75:975-984.
26. Haworth, S.; Lawlor, T.; Mortelmans, K.; Speck, W.; Zeiger, E. (1983) Salmonella muta- genicity test results for 250 chemicals. Environ. Mutagen. (Suppl. 1) 5:3-142.
27. Henschler, D.; Romen, W.; Elsasser, H.; Reichert, D.; Eder, E.; Radway, Z. (1980) Car-cinogenicity study of trichloroethylene by long- term inhalation in three animal species. Arch. Toxicol. 43:237-248.
28. Henschler, D.; Elsasser, H.; Romen, W.; Eder, E. (1984) Carcinogenicity study of tri- chloroethylene, with and without epoxide sta- bilizers, in mice. J . Cancer Res. Clin. Oncol. 107:149- 156.
29. Huff, J. (1971) New evidence on the old prob- lems of trichloroethylene. Ind. Med. 40:25-33.
30. International Agency for Research on Cancer (IARC) (1979) IARC Monographs on the Car- cinogenic Risk of Chemicals to Humans. Tri-chloroethylene. Lyon, France: World Health Organization 20:429-572.
31. International Agency for Research on Cancer (IARC) (1982) Trichloroethylene. IARC Mono- graphs on the Evaluation of the Carcinogenic Risk of Chemicals to Humans. Some Chemicals, Industrial Processes and Industries Associated with Cancer in Humans, IARC Monographs, Vols. 1 to 29. IARC Monographs Supplement 4. Lyon, France: IARC, pp. 247-249.
32. Kaplan, E.; Meier, P. (1958) Nonparametric estimation of incomplete observations. J. Am. Stat. Assoc. 53:457-481.
33. Kirk-Othmer Encyclopedia of Chemical Technology (1963) Vol. 2, 2nd ed. New York: John Wiley & Sons Inc., p. 400.
34. Kirk-Othmer Encyclopedia of Chemical Technology (1979) Vol, 3, 3rd ed. New York: John Wiley & Sons Inc., pp. 745-753.
35. Lacher, J . ; Hummel, L.; Bohmfalk, E.; Park, J. (1950)The near ultraviolet absorption spectra of some fluorinated derivatives of methane and ethylene. J . Am. Chem. Soc. 72:5486-5489.
36. Laskin, S.; Sellakumar, A.; Kuschner, M.; Nelson, N.; La Mendola, S.; Rusch, G.; Katz, G.; Dulak, N.; Albert, R. (1980) Inhalation carcino- genicity of epichlorohydrin in non-inbred Sprague-Dawley rats. J. Natl. Cancer Inst . 65:751-757.
37. Leong, B.; Schwetz, B.; Gehring, P. (1975) Embryo and fetotoxicity of inhaled trichloro- ethylene, perchloroethylene, methyl chloroform and methylene chloride in mice and rats. Toxi- col. Appl. Pharmacol. 33:136 (abstract no. 34).
38. Linhart, M.; Cooper, J.;Martin, R.; Page, N.; Peters, J. (1974) Carcinogenesis Bioassay Data System. Comput. Biomed. Res. 7:230-248.
75 Trichloroethylene, NTP TR 273

V. REFERENCES
39. Loprieno, N.; Barale, R.; Presciuttini, S.; Rossi, A.; Sbrana, I.; Stretti, G.; Zaccaro, L.; Ab- bondandolo, A.; Bonatti, S.; Fiorio, R. (1979) Comparative data with different test systems using micro-organisms and mammalian cells on references and environmental mutagens. Mu-tat. Res. 64:119.
40. Lyman, W. (1978) Report on trichloro- ethylene. Berkowitz, J., Ed.: Literature Re- view--Problem Definition Studies on Selected Chemicals. Cambridge, MA: Arthur D. Little, Inc., pp. 19-69.
41. Mantel, N.; Haenszel, W. (1959) Statistical aspects of the analysis of data from retrospective studies of disease. J. Natl. Cancer Inst. 225’19- 748.
42. Maronpot, R.; Boorman, G. (1982) Inter- pretation of rodent hepatocellular proliferative al terat ions and hepatocellular tumors in chemical safety assessment. Toxicol. Pathol. 10:71-80.
43. McConnell, E.; Solleveld, H.; Swenberg, J.; Boorman, G. (1986) Guidelines for combining neoplasms for evaluation of rodent carcino- genesis. J. Natl. Cancer Inst. 76:283-289.
44. Mehlman, M.; Hemstreet, G.; Thorpe, J . ; Weaver, N., Eds. (1984) Renal effects of petrole- um hydrocarbons. Advances in Modern En- vironmental Toxicology, Vol. 7. Princeton, NJ: Princeton Scientific Publishers, Inc.
45. Mercier (1977) Criteria (Exposure/Effect Re- lationships) for Organo-Solvents, V/F/177-4, Luxembourg, Commission of the European Communities, pp. 123-190.
46. Miller, R.; Guengerich, F. (1982) Oxidation of TCE by liver microsomal cytochrome p-450: Evidence for chlorine migration in a transition state not involving trichloroethylene oxide. Bio- chemistry 21 :1090- 1097.
47. Mortelmans, K.; Haworth, S.; Lawlor, T.; Speck, W.; Tainer, B.; Zeiger, E. (1986) Sal- monella mutagenicity tests: II. Results from the testing of 270 chemicals. Environ. Mutagen. ~ ( S U P P ~ .7):1-119.
48. National Cancer Institute (NCI) (1976) Bio- assay of Trichloroethylene for Possible Carcino- genicity. NC1 TR 2. U.S.Department of Health, Education, and Welfare, Bethesda, MD.
49. National Cancer Institute (NCI) (1977) Bio-assay of Tetrachloroethylene for Possible Car- cinogenicity. NC1 TR 13. U.S.Department of Health, Education, and Welfare, Bethesda, MD.
50. National Cancer Institute (NC11 (1978a) Bio- assay of Hexachloroethane for Possible Carcino- genicity. NC1 TR 68. U.S.Department of Health, Education, and Welfare, Bethesda, MD.
51. National Cancer Institute (NCI) (1978b) Bio- assay of 1,1,2,2-Tetrachloroethanefor Possible Carcinogenicity. NC1 TR 27. U.S.Department of Health, Education, and Welfare, Bethesda, MD.
52. National Cancer Institute (NCI) (1978~) Bio-assay of l ,1,2-Trichloroethane for Possible Car- cinogenicity. NC1 TR 74. U.S. Department of Health, Education, and Welfare, Bethesda, MD.
53. National Toxicology Program (NTP) (1983) Carcinogenesis Bioassay of Pentachloroethane in F344/N Rats and B6C3F1 Mice. NTP TR 232. IJS. Department of Health and Human Serv- ices, Bethesda, MD. 149 p.
54. National Toxicology Program (NTP) (1986) Toxicology and Carcinogenesis Studies of Tetra- chloroethylene in F344/N Rats and B6C3F1 Mice (Inhalation Studies). NTP TR 311. U S . Depart-ment of Health and Human Services, Public Health Service, National Institutes of Health. 197 p.
55. National Toxicology Program (NTP) (in preparation) Toxicology and Carcinogenesis Studies of Trichloroethylene in F344/N Rats and B6C3F1 Mice. NTP TR 243. U.S.Department of Health and Human Services, Public Health Service, National Institutes of Health.
56. Page, N. (1979) Assessment of trichloroethyl- ene as an occupational carcinogen. Davis, W.; Rosenfeld, C., Eds.: Carcinogenic Risks: Strate- gies for Intervention. IARC Scientific Publica- tions No. 25, INSERM Symposium Series, Vol. 74. Lyon, France: International Agency for Research on Cancer.
Trichloroethylene, NTP TR 273 76

57. Parchman, L.; Magee, P. (1982) Metabolism of 14carbon trichloroethylene to W02and inter- action of a metabolite with liver DNA in rats and mice. J.Toxicol. Environ. Health 9:797-813.
58. Perry, P.; Wolff, S. (1974) New Giemsa method for the differential staining of sister chromatids. Nature (London) 251:156-158.
V. REFERENCES
68. U.S. Code of Federal Regulations (USCFR) (1976)2lCFR 8.305.
69. U.S. International Trade Commission (USITC) (1982) Synthetic Organic Chemicals, United States Production and Sales 1981. USITC Publication No. 1292. Washington, DC: Government Printing Office.
59. Prout, M.; Provan, W.; Green, T. (1985) Species differences in response to trichloro-ethylene. I. Pharmacokinetics in rats and mice. Toxicol. Appl. Pharmacol. 79:389-400.
60. Reddy, J . ; Lalwani, N. (1983) Carcinogenesis by hepatic peroxisome proliferators: Evaluation of the risks of hypolipidemic drugs and in- dustrial plasticizers to humans. CRC Crit. Rev. Toxicol. 13:l-58.
61. Sadtler Research Laboratories, Sadtler Standard Spectra. Philadelphia: Sadtler Re- search Laboratories; IR No. 185;NMR No. 9266.
62. Schwetz, B.; Leong, B.; Gehring, P. (1975) The effect of maternally inhaled trichloro- ethylene, perchloroethylene, methyl chloroform, and methylene chloride on embryonal and fetal development in mice and rats. Toxicol. Appl. Pharmacol. 32234-96.
63. Simmon, V. (1977) Structural correlations of carcinogenic and mutagenic alkyl halides. Asher, I.; Zervos, C., Eds.: Symposium on Struc- tural Correlates of Carcinogenesis and Muta- genesis. U.S. Food and Drug Administration, Officeof Science, Rockville, MD, pp. 163-171.
64. Simmon, V.; Kauhanen, K.; Tardiff, R . (1977) Mutagenic activity of chemicals iden- tified in drinking water, Dev. Toxicol, Environ. Sci. 2:249-258.
65. Slacik-Erben, R.; Roll, R.; Franke, G.; Vehleke, H. (1980)Trichloroethylene vapours do not produce dominant lethal mutations in male mice. Arch. Toxicol. 45:37-44
66. Stott, W.; Quast, J.; Watanabe, P. (1982) Pharmacokinetics and macromolecular inter- actions of trichloroethylene in mice and rats. Toxicol. Appl. Pharmacol. 62:137-151.
67. Tarone, R. (1975)Tests for trend in life table analysis. Biometrika 62:679-682.
70. v. Apeldoorn, M. (1984)Toxicological Evalu- ation of Trichloroethene. Report 668310-001. National Institute of Public Health and En- vironmental Hygiene, The Netherlands.
71. Valle-Riestra, J. (1974)Food processing with chlorinated solvents. Food Technol. 28:25-32.
72. Van Duuren, B. (1975)On the possible mech- anism of carcinogenic action of vinyl chloride. Ann. N. Y. Acad. Sci. 246:258-268.
73. Van Duuren, B.; Goldschmidt, B.; Katz, C.; Seidman, I.; Paul, J. (1974) Carcinogenic ac- tivity of alkylating agents. J. Natl. Cancer Inst. 531695700.
74. Waskell, L. (1978) A study of the muta- genicity of anesthetics and their metabolites. Mutat. Res. 57:141-153.
75. Waters, E.; Gerstner, H.; Huff, J. (1976) Trichloroethylene. I . An Impact Overview. II. An Abstracted Literature Collection. Oak Ridge National Laboratory ORNWIRC-7612.
76. Waters, E.; Gerstner, H.; Huff, J. (1977) Tri-chloroethylene. I. An overview. J. Toxic. En- viron. Health 2:671-707. 78. Weisburger, E. (1977) Carcinogenicity stud- ies on halogenated hydrocarbons. Environ. Health Perspect. 21:7-16.
79. Wetterhahn, J. (1972) Eye make-up. Bal-sam, M.; Sagarin, E., Eds.: Cosmetics Science and Technology. New York: John Wiley & Sons Inc., p. 419.
80.World Health Organization (WHO) (1985) Environmental Health Criteria Document on Trichloroethylene.
81. Yoon, J.;Mason, J.; Valencia, R.; Woodruff, R.; Zimmering, S. (1985) Chemical mutagenesis testing in Drosophila. IV. Results of 45 coded compounds tested for the National Toxicology Program. Environ. Mutagen. 7:349-367.
77 Trichloroethylene, NTP TR 273

Trichloroethylene, NTPTR 273 78

APPENDIX A
SUMMARY OF LESIONS IN MALE ACI RATS
IN THE TWO-YEAR GAVAGE STUDY OF
TRICHLOROETHYLENE
PAGE
TABLE Al SUMMARY OF THE INCIDENCE OF NEOPLASMS IN MALE ACI RATS IN THE TWO-YEAR GAVAGE STUDY OF TRICHLOROETHYLENE 81
TABLE A2 INDIVIDUAL ANIMAL TUMOR PATHOLOGY OF MALE ACI RATS IN THE TWO-YEAR GAVAGE STUDY OF TRICHLOROETHYLENE 84
TABLE A3 ANALYSIS OF PRIMARY TUMORS IN MALE ACI RATS IN THE TWO-YEAR GAVAGE STUDY OF TRICHLOROETHYLENE 92
TABLE A4 SUMMARY OF THE INCIDENCE OF NONNEOPLASTIC LESIONS IN MALE ACI RATS IN THE TWO-YEAR GAVAGE STUDY OF TRICHLOROETHYLENE 94
79 Trichloroethylene, NTP TR 273

Trichloroethylene, NTP TR 273 80

TABLE A l . SUMMARY OF T,HE INCIDENCE OF NEOPLASMS IN MALE ACI RATS IN THE TWO-YEAR GAVAGE STUDY OF TRICHLOROETHYLENE
CONTROL (UNTR) CONTROL (VEH) LOW DOSE HIGH DOSE
ANIMALS INITIALLY IN STUDY 50 50 50 50 ANIMALS MISSING 1 ANIMALS NECROPSIED 49 50 49 50 ANIMALS EXAMINED
HISTOPATHOLOGICALLY 49 50 49 50
INTEGUMENTARY SYSTEM
Squamous cell carcinoma Basal cell carcinoma
+Skin (49) (50) 1 (2%) 1 (2%)
(49) (50)
RESPIRATORY SYSTEM "Tracheal lumen
Fibrosarcoma, metastatic (49)
#LungTransitional cell carcinoma, metastatic
(48)
Alveolar/bronchiolar adenoma Tubular cell adenoca, metastatic Fibrosarcoma, metastatic
HEMATOPOIETIC SYSTEM +Multiple organs
Leukemia, NOS Monocytic leukemia
Malignant lymphoma, NOS #Thymus
(49)
2 (4%)(3)
(50) 1 (2%)2 (4%)
(7)
(49)
1 (8%)(12)
(50)
(24)
CIRCULATORY SYSTEM Whin
Hemangiosarcoma
DIGESTIVE SYSTEM #Liver (49)
Hepatocellular carcinoma #Pancreas (46)
Acinar cell adenoma
URINARY SYSTEM #Kidney
Tubular cell adenocarcinoma #Kidney/pelvis
Transitional cell papilloma Transitional cell carcinoma
#Urinary bladder Squamous cell papilloma Transitional cell papilloma Transitional cell carcinoma
ENDOCRINE SYSTEM #Pituitary (48) (39) (33) (29)
Adenoma, NOS 8 (17%) 6 (15%) 4 (12%) 3 (10%) #Adrenal (48) (48) (44) (45)
Cortical adenoma 8 (17%) 6 (13%) 1 (2%) Pheochromocytoma 4 (8%) 8 (17%)
81 Trichloroethylene, NTP TR 273

TABLE A l . SUMMARY OF THE INCIDENCE OF NEOPLASMS IN MALE ACI RATS IN THE TWO-YEAR GAVAGE STUDY OF TRICHLOROETHYLENE (Continued)
CONTROL (UNTR) CONTROL (VEH) LOW DOSE HIGH DOSE
ENDOCRINE SYSTEM (Continued) #Thyroid
#Pancreatic islets
Follicular cell adenoma C-cell adenoma
Islet cell adenoma
(48)
(46) 1 (2%)
(46)
(50)
1 (2%)
1 (2%)
(40)
(47)
(39)
(44)
REPRODUCTIVE SYSTEM
Carcinoma, NOS Adenoma, NOS Adenocarcinoma, NOS
Interstitial cell tumor
#Prostate
#Testis
(48)
(47)38 (81%)
(49)
3 (6%) 1 (2%)
(49)36 (73%)
(45) 1 (2%)
(49)23 (47%)
(43)
(49)17 (35%)
NERVOUS SYSTEM #Braidmeninges
Granular cell tumor, NOS (49)
SPECIAL SENSE ORGANS None
MUSCULOSKELETAL SYSTEM None
BODY CAVITIES *Thorax
Sarcoma, NOS *Peritoneum
Mesothelioma, NOS 'Tunica vaginalie
Mesothelioma, NOS
ALL OTHER SYSTEMS Neck
TailNeurilemoma, malignant
Fibrosarcoma
ANIMAL DISPOSITION SUMMARY Animals initially in study
Natural death 50 9
50 8
50 18
50 18
Moribund sacrifice 4 5 2 3 Terminal sacrifice 36 37 19 11 Dosing accident Accidentally killed, NOS Animal missing 1
1 10
1 17
Trichloroethylene, NTP TR 273 82

TABLE A l . SUMMARY OF THE INCIDENCE OF NEOPLASMS IN MALE ACI RATS IN THE TWO-YEAR GAVAGE STUDY OF TRICHLOROETHYLENE (Continued)
CONTROL (UNTR) CONTROL (VEH) LOW DOSE HIGH DOSE
TUMOR SUMMARY Total animals with primary tumors** 45 44 27 17
Total primary tumors 70 72 38 24 Total animals with benign tumors 42 39 24 17
Total benign tumors 61 61 32 21 Total animals with malignant tumors 7 9 6 2
Total malignant tumors 7 10 6 2 Total animals with secondary tumors## 1 2
TotaI secondary tumors 2 2 Total animals with tumors uncertain--
benign or malignant 2 1 1 Total uncertain tumors 2 1 1
* Number of animals receiving complete necropsy examination; all gross lesions including masses examined microscopically. ** Primary tumors: all tumors except secondary tumors # Number of animals examined microscopically a t this site ## Secondary tumors: metastatic tumors or tumors invasive into an adjacent organ
83 Trichloroethylene,NTP TR 273

TABLE A2. INDIVIDUAL ANIMAL TUMOR PATHOLOGY OF MALE ACI RATS IN THE TWO-YEAR GAVAGE STUDYOFTRICHLOROETHYLENE: UNTREATEDCONTROL
NUMBER
WEEKSON STUDY
Lun and bronchi Tracyea
Bone marrow SDleen L' mph nodes TKymus
M Heart
Salivary glandLiver Bile duct Gallbladder (L common bile duct Pancreas
:t%Y Small intestine Large intestine
KidneyKidneyKidnoy/pelvisKidnoy/pelvis
TransitionalTransitional cellcell papillomapapillomaTraniitionalTraniitionalcallcall carcinomacarcinoma
UrinaryUrinary bladderbladder TransitionalTransitional cellcell papillomapapilloma
PituitaryAdenoma, NOS
Adrenal Cortical adenoma Pheochromocytoma
Th mid &cell adenoma
Parathyroid
Mammary glandTestis
Interstitial call tumor Proatate
Brain
Pleura Sarcoma. NOS
Peritoneum Mesothelioma, NOS
Tunica va 'nalis Mewthafoma. NOS
Multiple organs NOS Monocytic l e d e m i a
Chin Hemangiosarcoma
8 6 6 8 8 8 8 8 8 8 8 6 7 7 7 7 7 7 7 7 7 7 7 7 ~ 5 5 5 8 7 7 7 7 8 9 9 9 0 0 1 2 2 2 2 3 4 4 5 5 8 1 2 5 3 2 8 7 9 8 3 6 9 0 7 2 0 3 8 7 4 1 7 1 8
1 1 1 1 1 1 1 0 1 1 0 1 0 0 1 1 1 0 1 1 0 1 1 1 0 0 0 0 0 0 0 0 8 0 0 5 0 8 7 0 0 0 9 0 0 9 0 0 0 7 7 4 7 7 7 7 7 1 7 7 9 7 7 0 7 7 7 3 7 0 9 7 4 7 ~ ~~ ~ ~ ~~ ~ ~ ~~ ~
+ + + + + + + + + + + M + + + + + + + + + + - + ++ + + + + - + + - + + M + + + + + + + + + + + + +
+ + + + + + + + + + + M + + + + - + + + + + + + + + + + + + + + + + + + M + + + + + + + + + + + + ++ + + - + + + + - + + M + - - + + + - + + + + + +- - - - - - - - + - - M - - - - - - - - - - - + -
+ + + + + + + + + + + M + + + + + + + + + + + + +
+ + + - + + + + + + + M + + + + + + + + + + - + + + + + + + + + + + + + M + + + + + + + + + + + + + + + + + + + + + + + + M + + + + + + + + + + + + +N N N N N N N N + N N M N N N N N N N N N N N N N + + + + + + + + + + + M + + + + + + + + + + - + + + + + + + + + + + + + M + + + + + + + + + + + + + + + + + + + + + + + + M + + + + + + + + + + + + + + + + t + + + t + + + M + - + + + + + + + + + + + + + + + + + + + + + + M + - + + + + + + + + + + +
~ ~ ~ ~ ~ ~ ~ ~ ~
+ + + + + + + + + + + M * + + + + + + + + + + + + + + + + + t + + + t + + M + + + + + + + + + + + + +
X X
+ + + + + - + + + - + M + - + + + + + + + + + + + X
+ + + + + + + + + - + M + + + + + + + + + + + + + X X X X + + + + + + + + + + + M + - + + + + + + + + + + + X x x
1
1 + + + + + + + + + + + M + + + - + + + + + + + + +
+ + + - + - + - - - + M + + - - + + + + - - + + +
+ N + + + + + + N + + M + N N + N + N N N + N + + + + + + + + + + + + + M + - + + + + + + + + - + + x x x x x x x x x x x x x x x X+ + + + + + + + + + + M + - + + + + + + + + + + +
+ + + + + + + + + + + M + + + + + + + + + + + + +
N N N N N N N N N N N M N N N N N N N N N N N N N X
N N N N N N N N N N N M N N N N N N N N N N N N N
+ + + + + + + + + + + M + N + + + + + + + + N + +
N N N N N N N N N N N M N N N N N N N N N N N N N X
M x
+: Tissue examined microscopically . No tissue information submitted -. Required tiiiua not examined microscopically Ci Necropsy, no histology due to protocolXi Tumor incidence A: AutolysisN Necropsy, no autolysis, no microscopic examination M: Animal missingS: Animal missexed B No necropsy parformed
Trichloroethylene, NTP TR 273 84

TABLE A2. INDIVIDUAL AhlIMAL TUMOR PATHOLOGY OF MALE ACI R A T S UNTREATED CONTROL
NUMBER
WEEKS ONSTUDY
Lun and bronchi T r a x e a
Bone marrow SpleenL mphnodenTKymua
Heart
Salivary gland Liver Bile duct Gallbladder h common bile duct Pancnaa%%zglllSmall intestine Large intestine
KidneyKidney/plvir
Transitional cell papilloma Transitional cell carcinoma
Urinary bladdar Tranaitional cell papilloma
Pi tu i tayMenoma,NOS
M n n a l Cortical adenoma Pheochromocytoma
Th mid &cell adenoma
Parathyroid
Mammary gland Testis
Intantitial cell tumor Prostate
Brain
Pleura Sarcoma. NOS
Multiple organs,NOS Monocytic leukemia
Chin Hemangiosarcoma
Animals necropsied
(Continued) I I 7 7 1 1 7 7 1 7 1 8 8 8 8 8 8 8 8 a 8 8 e . 8 8 6 6 6 7 7 7 8 8 8 9 9 0 0 0 0 1 1 1 1 2 2 2 2 3 4 0 1 4 2 5 7 1 2 6 2 3 1 2 4 7 1 2 3 8 0 3 4 5 4 0
TOTAL: 1 1 1 1 1 1 1 1 1 1 1 1 1 1 1 1 1 1 1 1 l l U U l TISSUES 0 0 0 0 0 0 0 . 0 0 0 0 0 0 0 0 0 0 0 0 0 0 0 0 5 0 TUMORS 7 7 1 7 1 7 1 7 7 7 5 1 2 7 1 7 7 7 1 7 1 1 1 6 1
. . . . . . . . . . . . . . . . . . . . . . . . . 48 . . . . . . . . . . . . . . . . . . . . . . . . . 46
. . . . . . . . . . . . . . . . . . . . . . . . . 41 . . . . . . . . . . . . . . . . . . . . . . . . . 49 . . . . . . . . . . . . . . . . . . . . . . . . . 40+ - - 3
. . . . . . . . . . . . . . . . . . . . . . . . . 49
. . . . . . . . . . . . . . . . . . . . . . . . . 46 . . . . . . . . . . . . . . . . . . . . . . . . . 49 . . . . . . . . . . . . . . . . . . . . . . . . . 49N N N N N N N N N N N N N N N N N N N N N N N N N *49 . . . . . . . . . . . . . . . . . . . . . . . . . 46 . . . . . . . . . . . . . . . . . . . . . . . . . 49 . . . . . . . . . . . . . . . . . . . . . . . . . 49 . . . . . . . . . . . . . . . . . . . . . . . . . 48 . . . . . . . . . . . . . . . . . . . . . . . . . 4a
. . . . . . . . . . . . . . . . . . . . . . . . . 49 . . . . . . . . . . . . . . . . . . . . . . . . . . 49. . . . . . . . . . . . . . . . . . . . . . . . . . .X
. . . . . . . . . . . . . . . . . . . . . . . . . 48X x x x 8 . . . . . . . . . . . . . . . . . . . . . . . . . 48 x x X X X 8
X X X 4 . . . . . . . . . . . . . . . . . . . . . . . . . 48 X 1+ + - - + + + + + + - + + - + + + + + + + + - - - 33
+ + N + + + + + N + + N N + + N + + + N + + N N N *49 . . . . . . . . . . . . . . . . . . . . . . . . . 41 x x x x x x x x x x x x x x x x x x x x x x 38 . . . . . . . . . . . . . . . . . . . . . . . . . 48
. . . . . . . . . . . . . . . . . . . . . . . . . 49
N N N N N N N N N N N N N N N N N N N N N N N N N '49 1
N N N N N N N N N N N N N N N N N N N N N N N ~ N *49X 1+ . . . . . . . . . . . . . . . . . . . . . . . . '49
X 1
N N N N N N N N N N N N N N N N N N N N N N N N N *49 X r
a5 Trichloroethylene, NTP TR 273

TABLE M. INDIVIDUALANIMAL TUMOR PATHOLOGY OF MALE ACI RATS IN THE TWO-YEAR GAVAGE 8TUDY OF TRICHLOROETHYLENE: VEHICLE CONTROL
6 6 6 6 6 6 6 6 6 6 7 7 7 7 7 7 7 7 7 NUMBER 6 6 6 7 1 6 8 8 9 9 0 0 0 1 1 1 2 2 3
5 7 9 1 9 0 4 1 2 7 1 2 5 1 3 6 1 8 0
1 1 0 1 1 1 0 1 1 0 0 1 0 1 1 1 1 1 0 0 0 7 0 0 0 8 0 0 7 1 0 1 0 0 0 0 0 5 5 5 1 5 5 5 1 0 5 6 2 5 4 5 5 5 5 8 0
M Skin N + + + + + + + + + + N + + + + + + + + + + N + +
Squamouscall eareinom X 8 . ~ 1call ureinom X
Y Lung and bronchi . . . . . . . . . . . . . . . . . . . . . . . . .
Fibmumma, metastatic X Trachea . . . . . . . . . . . . . . . . . . . . . . . . .
. . . . . . . . . . . . . . . . . . . . . . . . . . . . . . . . . . . . . . . . . . . . . . . . . . . . . . . . . . . . . . . . . . . . . . . . . . . - - - + - - - - + - - - + - - + + - + - - - - - +Thymus
Heart . . . . . . . . . . . . . . . . . . . . . . . . .
Salivarygland . . . . . . . . . . . . . . . . . . . . . . . . . Livar . . . . . . . . . . . . . . . . . . . . . . . . . _.._.
Hepatem1lul.r careinom X Bile duct . . . . . . . . . . . . . . . . . . . . . . . . . Gallbladderh commonbile duct N N N N N N N N N N N N N N N + N N N N N N N N NPanereu . . . . . . . . . . . . . . . . . . . . . . . . . . . . . . . . . . . . . . . . . . . . . . . . . . . . . . . . . . . . . . . . . . . . . . . . . . . . . . . . . . . . . . . . . . . . . . . . . . . . Large intaatina . . . . . . . . . . . . . . . . . . . . . . . . .
Kidney . . . . . . . . . . . . . . . . . . . . . . . . . . . U r i ~ r ybladder . . . . . . . . . . . . . . . . . . . . . . . . .
Traniitioml call urcinom X
Pituitary + + + - - + + + - + + + + + - - - + - + + + + + + Menom, N08 X X X x x . . . . . . . . . . . . . . . . . . . . . . . . .
x x X X A
Thymid . . . . . . . . . . . . . . . . . . . . . . . . . Follicular cell adenoma
Parathyroid + - - - + - + + + + + + - + + - - - - + + - - + -Pancreatic islati . . . . . . . . . . . . . . . . . . . . . . . . .
blot ml1adenoma X
Mammary gland N N N N N N N + N N + + N N + N N + N N N N N N N Testin . . . . . . . . . . . . . . . . . . . . . . . . .
Interstitial ml1tumor x x x x x x x x X x x x x x Prostate . . . . . . . . . . . . . . . . . . . . . . . . .
Menoma NOS X Menourknom, NOS X
Brain . . . . . . . . . . . . . . . . . . . . . . . . . Granular NU tumor,NOS X
N N N N N N N N N N N N N N N N N N N N N N N N N X
X
X Tail
Fibrosarcoma X Tracheal lumen
Fibmurooma, metastatic X
Trichloroethylene, NTPTR 273 86

TABLE A2. INDIVIDUAL ANIMAL TUMOR PATHOLOGY OF MALE ACI RATS: VEHICLE CONTROL (Continued)
-I-
rmAL: WEEKS ON 1 1 1 1 1 1 1 1 0 1 1 1 1 1 1 1 1 1 1 1 0 1 1 0 1 'ISSUES STUDY 0 0 0 0 0 0 0 0 8 0 0 0 0 0 0 0 0 0 0 0 ~ 0 0 6 0 'UMORS
5 5 5 6 5 5 4 5 5 5 5 5 5 5 5 5 5 5 5 6 8 5 6 6 5
Skin . . . . . . . . . . . . . . . . . . . . . . . . . '50Squamous cell carcinoma 1 Basal cell carcinoma 1
M Lune and bronchi . . . . . . . . . . . . . . . . . . . . . . . . . 49
Fibrosarcoma, metastatic 1 Trachea . . . . . . . . . . . . . . . . . . . . . . . . . 46
Bone marrow . . . . . . . . . . . . . . . . . . . . . . . . . 50 Spleen . . . . . . . . . . . . . . . . . . . . . . . . . 50 L mpbncdes . . . . . . . . . . . . . . . . . . . . . . . . . 45 Txymus _ - - _ - - _ - - _ - _ _ _ _ _ _ _ _ _ _ _ _ _ _I
Heart . . . . . . . . . . . . . . . . . . . . . . . . . 49
Salivary gland . . . . . . . . . . . . . . . . . . . . . . . . . 46Liver . . . . . . . . . . . . . . . . . . . . . . . . . . 50
Hepatocellular carcinoma 1 Bile duct . . . . . . . . . . . . . . . . . . . . . . . . . 50Gallbladder L common bile duct N N N N N N N N N N N N N N N N N N N N N N N N N '50Pancreas . . . . . . . . . . . . . . . . . . . . . . . . . 50 . . . . . . . . . . . . . . . . . . . . . . . . . 49:::W . . . . . . . . . . . . . . . . . . . . . . . . . 49Small intestine . . . . . . . . . . . . . . . . . . . . . . . . . 49 L a r p intestine . . . . . . . . . . . . . . . . . . . . . . . . . 48
Kidney . . . . . . . . . . . . . . . . . . . . . . . . . 50Urinary bladder . . . . . . . . . . . . . . . . . . . . . . . . . U
Transitional cell carcinoma 1-M Pituitary . . . . . . . . . . . . . . . . . . . . . . . . . . 39
Adenoma, NOS A 6 Adrenal . . . . . . . . . . . . . . . . . . . . . . . . . 48
Cortical adenoma X X X x x 6 Phewhromocytoma I x X X X 8
Thyroid . . . . . . . . . . . . . . . . . . . . . . . . . 46 Follicular cell adenoma X 1
Parathyroid + - + + + + - + - - + + - + + + + - - + - + + + + 30Pancreatic islets . . . . . . . . . . . . . . . . . . . . . . . . . 50
Islet cell adenoma 1 -
Mammary gland N + + + + + + N N + N N N + + N N N N N N N + N + *50Testis . . . . . . . . . . . . . . . . . . . . . . . . . 49
Interstitial cell tumor x x x x x x x x x x x x x x x x x x x x x x 36 Prostate . . . . . . . . . . . . . . . . . . . . . . . . . 49
Adenoma, NOS X X 3 Adenwarcinoma, NOS 1
Brain . . . . . . . . . . . . . . . . . . . . . . . . . 50 Granular cell tumor, NOS 1
S Multi le organs,NOS N N N N N N N N N N N N N N N N N N N N N N N N N '50
L e J e m i a , NOS 1 Monocytic leukemia I X 2
Neck, NOS Neurilemoma. malignant
Tail Fibrosarcoma
Tracheal lumen Fibrosarcoma. metastatic
Animals necropsied
87 Trichloroethylene, NTP TR 273

~ ~ ~ ~ ~ u ~ ~ o ~ o ~ ~ ~ ~ ~ ~ ~
TABLE Aa. INDIVIDUAL ANIMAL TUMOR PATHOLOGY OF MALE ACI RATS IN THE TWO-YEAR GAVAGE STUDY OF TRICHLOROETHYLENE: LOW DOSE
8 8 8 8 8 8 6 8 8 8 8 8 6 7 7 7 1 7 7 7 7 7 7 7 7 NUMBER 4 5 5 5 8 8 7 7 8 8 8 8 9 0 0 1 1 1 2 2 3 3 3 3 3
8 7 8 9 6 8 0 5 2 9 5 8 0 3 8 0 5 9 2 9 1 2 5 8 9
~ o o o ~ ~ ~ 0 5 8 8 4 0 0 1 0 0 0 0 1 9 4 3 2 4 3 0 3 0 0 0 0 4 0 1 4 7 4 4 9 2 4 4 4 1 2 3 4 7 5 4 4 4 5 4 4 4
L u n p and bronchi . . . . . . . . . . . . . . . . . . . . . . . . . Traniitional ml1 carcinoma, m e t a h t i c Alveolarhronchiolar adenoma x x Tubular call adenocarcinoma, metastatic
Trachea + + + + + + + + + + + + + - - - + + A + - + + + + ~~ ~
Bone marrow . . . . . . . . . . . . . . . . . . . . . . . . . Soleen + + + + + + + + + + + + + + + + + A A + + + + + + L. mph nodes + - + - + + + - + + - + - + + - - + A + - + + + +TK - - - - + - - + + - - - - + - + - A A - + + - - -mus
dalignant lymphoma. NOS X ~~ ~~
Heart + + + + + + + + + + + + + + + + + + A + + + + + +
Salivary gland . . . . . . . . . . . . . . . . . . . . . . . . . Liver . . . . . . . . . . . . . . . . . . . . . . . . .
He ab%llular carcinoma BileXuct + + + + + + + + + + + + + + + + + + A + + + + + + Gallbladder k common b ih duct N N N N N N N N N N N N N N N N N N A N N N N N N Pancnar . . . . . . . . . . . . . . . . . . . . . . . . .
Acinar cell adenoma + + + + + + + + + + + + + + - + + + A + + + + + +:Zr + + + + + + + + + + + + + + + + + A A + + + + + +
Small intmtinr . . . . . . . . . . . . . . . . . . . . . . . . . Large intaitino + + + + + + + + + + + + + + + + - A A + + + + + +
Kidnoy . . . . . . . . . . . . . . . . . . . . . . . . . Tubular cell adenocarcinoma
Kidne y/polvir . . . . . . . . . . . . . . . . . . . . . . . . . Transitional cell carcinoma
Urinary bladdor . . . . . . . . . . . . . . . . . . . . . . . . . Traniitionnl cell papillomaTransitional call carcinoma
Pituitary + + + + + + + - + + + + - - - + - + A + - - + + + Adenoma. NOS x x
Adnnal + + + + + + + + + + + + + + - - - A A + + + + + + Cortlcal adenoma
Thyroid + + + + + - + + + + + + - - - - + + A + - + + + + Parathyroid + - + + + - + - + + - + - - - - + A A - - - - + +
Mammary gland + N N N N + N N + N N N N N N N N N A N N N + N N Taatis + + + + + + + + + + + + + + + + + + A + + + + + +~ . . . ~ ~
Intentitial cell tumor X x x x x x x x x x x Prostate . . . . . . . . . . . . . . . . . . . . . . . . .
Carcinoma, NOS
Brain . . . . . . . . . . . . . . . . . . . . . . . . .
Trichloroethylene, NTPTR 273 88

TABLE A2. INDIVIDUAL ANIMAL TUMOR PATHOLOGY OF MALE ACI R A T S LOW DOSE
WEEKS ON STUDY
M Lungs and bronchi
Transitional cell carcinoma. metastatic Alveolar/brPnchiolar adenoma Tubular cell adenocaminoma. metait
Trachea
Bone marrow SpleenL mphnoderT k m u r
alignant lymphoma. NOS
Heart
Salivary gland Liver
Hepatocellular carcinoma Bile duct Gallbladder IL common bile duct Pancreas
Acinar cell adenoma
::::guI Small intestina Large intestine
M Kidnev
Tubdar cell adonocarcinoma Kidney/pdvin
Transitional cell carcinoma Unnary bladder
Tranaitional-1. papillomaTranaitional cell camnoma
RtuitaryAdenoma. NOS
Adrenal Cortical adenoma
ThymidParathymid
Mammary glandTestis
Interstitial cell turcor Prostatr
Carnnoma. NOS
Brain
* Animal8 necropsied
(Continued) 9 ? 7 7 7 7 7 7 7 7 7 ? 7 ? 7 7 8 8 a 8 a a a a a 4 4 4 4 5 5 5 6 8 7 7 7 7 8 8 9 1 1 1 2 2 2 3 3 4 0 2 5 9 2 5 ? 6 ? 0 4 6 8 5 9 8 0 5 7 1 6 9 3 8 1
D l 0 0 1 0 ' 1 0 0 1 0 0 0 0 0 1 0 0 0 0 1 0 1 1 1 9 0 0 5 0 9 0 2 8 0 5 8 8 9 1 0 9 0 2 4 0 2 0 0 0 1 4 7 4 4 6 4 0 4 4 3 4 9 1 2 4 1 6 5 5 4 5 4 4 4
. . . . . . . . . . . . . . . . . . . . . . . . . 47X 1
2 x 1 . . . . . . . . . . . . . . . . . . . . . . . . . 4.9
. . . . . . . . . . . . . . . . . . . . . . . . . 45 . . . . . . . . . . . . . . . . . . . . . . . . . 48+ + - + + + + - + + + + + - - + + - + - + + + + + 35- - + - - - - + + - - - - - - - - - + + - - - - - 12 1
. . . . . . . . . . . . . . . . . . . . . . . . . 48
+ + + + + + + - - + + + + + + + + + + - + + + + + 45 . . . . . . . . . . . . . . . . . . . . . . . . . 49X 1 . . . . . . . . . . . . . . . . . . . . . . . . . 49N N N N N N N N N N N N N N N N N N N N N N N N N '49 . . . . . . . . . . . . . . . . . . . . . . . . . 41
X 1 . . . . . . . . . . . . . . . . . . . . . . . . . 47 . . . . . . . . . . . . . . . . . . . . . . . . . 48 . . . . . . . . . . . . . . . . . . . . . . . . . 48 . . . . . . . . . . . . . . . . . . . . . . . . . 46
. . . . . . . . . . . . . . . . . . . . . . . . . 49X 1 . . . . . . . . . . . . . . . . . . . . . . . . . 49
X 1 . . . . . . . . . . . . . . . . . . . . . . . . . 47X 1
X 1
+ + - + + + + - + + - - + + - + - - - + + - + + + 33 x x 4 . . . . . . . . . . . . . . . . . . . . . . . . . 44X 1 . . . . . . . . . . . . . . . . . . . . . . . . . 40+ + - - + - + - + + - + - - - - - - + - - - - - - 19
+ + N N N N N N N + N N N N N + + N N N N N ~ N N '49 . . . . . . . . . . . . . . . . . . . . . . . . . 49 x x x x x x x x x x x x 23 . . . . . . . . . . . . . . . . . . . . . . . . . 45X 1
. . . . . . . . . . . . . . . . . . . . . . . . . 47
89 Trichloroethylene, NTP TR 273

TABLE A2. INDIVIDUAL ANIMAL TUMOR PATHOLOGY OF MALE ACI RATS IN THE TWO-YEAR GAVAGE STUDY OF TRICHLOROETHYLENE: HIGH DOSE
a 8 8 6 8 8 8 8 8 8 8 8 6 6 8 7 7 1 7 7 7 7 7 7 7NUMBER 4 4 4 5 5 5 8 7 7 8 8 9 9 9 9 0 0 0 1 1 1 2 2 3 3
3 5 7 0 8 6 1 4 8 1 9 1 4 5 8 4 6 9 4 1 8 4 5 3 8
WEEKS ON o o o o o o l o o o u l o o o o u o o l o o l o STUDY 0 2 2 2 3 7 8 0 7 9 6 0 0 9 3 4 1 3 3 5 0 7 6 0 1
4 8 2 8 4 1 9 4 4 1 3 3 4 4 5 7 3 5 3 3 2 5 5 4 3
Lun and bronchi + - - + + + + + + + + + + + + - A + + + + + + + + Tracyea . . . . . . . . . . . . . . . . . . . . . . . . .
Bane marrow + + + + + + + + + + - - + + + + A - + + + + + + + + + + + + + + + + - + + + + + + A + + + + + + + + + - - - + - + + - - + + + - + + A + - + + + + + -- + + + - + - - + - + + - - - + A - + - + + - - +
Heart + + + + + + + + + + + + + + + + A + + + + + + + +
Salivary gland + + + + - + + + - + + + + - + + A + - + + + + + -Liver + + + + + + + + + + + + + + + + A + + + + + + + +-
He atocellular camnoma X Bile %uct + + + + + + + + + + + + + + + + A + + + + + + + + Gallbladder Scommon bile duct N N N N N N N N N N N N N N N N N N N N N N N N N Pan c reas + + + + + + + + + - + + + + + + A + + + + + + + +
+ + + + + + - + + + + + + + + + A + + + + + + + + + + + + + + + + + + + + + + + + A + + + + + + + +
Small intestine + + + + + + + + + - + + + + + + A + + + + + + + + Large inteatine + + + + + + - + + - + + - + + + A + + + + + + + +
:22gllll
Kidney . . . . . . . . . . . . . . . . . . . . . . . . . Kidney/plvia + + + + + + + + + + + + + + + + A + + + + + + + +
Transitional cell carcinoma Urinarybladder + + + - + + + + + + + + + + - + A + + + + + + + +
Squamous cell papilloma
Pituitary + + - - + + + + + - + - + + + + A + + - + - + + -Adenoma, NOS X X
Adrenal + + + + + + + + + + + + + + + + A - + + + - + + + Thymid + + + + + + + + - + + - + + + + A - - - + + + + -Parathy mid - + - + + - + + - - - - + - - + A - - - - + - - -
Mammary gland + N N N N N N N N N N N N N N N N N N N + N N N N Teati8 . . . . . . . . . . . . . . . . . . . . . . . . .
Interstitial cell tumor X x x x x x x x x Prostate . . . . . . . . . . . . . . . . . . . . . . . . .
Brain + + + + + + + + + + + + + + + + A + + + + + + + +
Tunica va 'nalis . . . . . . . . . . . . . . . . . . . . . . . . . Mesothefooma.NOS
Trichloroethylene, NTP TR 273 90

TABLE A% INDIVIDUAL ANIMAL TUMOR PATHOLOGY OF MALE ACI RATS: HIGH DOSE
NUMBER
Lun and bronchi Tracyea
AFMATOP-Bone marmw SpleenL mphnodes d y m u s
Heart
Salivary gland Liver
Hepatmellular carcinoma Bile duct Gallbladder & common bile duct Pan c IWas
::::kg""Small intestine Large intestine
KidneyKidney/pelvis
Traneitional cell carcinoma Urinary bladder
Squamoui cell papilloma
PituitaryAdenoma, NOS
Adrenal ThyroidParathy mid
Mammary gland Testis
Interstitial cell tumor Prostate
Brain
Tunica va nalis Mesothefoma, NOS
* Animals necropsied
(Continued) 7 7 7 7 7 7 7 7 7 7 7 7 7 a a a a a a a g a a 4 5 5 5 5 6 6 7 8 8 8 9 9 9 9 0 1 1 1 2 2 3 3 3 3 4 0 3 4 6 2 3 3 0 3 7 0 1 7 9 8 3 4 9 2 7 5 6 1 9
6 1 0 0 0 0 1 0 0 0 1 1 0 0 0 0 0 1 0 1 0 0 0 1 0 1 0 2 2 7 4 0 0 0 6 0 0 1 0 5 2 5 0 4 0 2 5 4 0 7 2 4 0 9 0 5 4 9 5 1 4 4 1 5 0 ~ 3 4 a 4 0 3 5 4
. . . . . . . . . . . . . . . . . . . . . . . . . . . . . . . . . . . . . . . . . . . . . . . . . .
. . . . . . . . . . . . . . . . . . . . . . . . . . . . . . . . . . . . . . . . . . . . . . . . . . + + + - + + - - - - + - - - + - + + + + - + + + + + - - - + - - + + + - + - + - - - - + - + + + - + . . . . . . . . . . . . . . . . . . . . . . . . .
+ + + + - - + + - + + + + + + - + + + + + + + + + . . . . . . . . . . . . . . . . . . . . . . . . . . . . . . . . . . . . . . . . . . . . . . . . . . N N N N N N N N N N N N N N N N N N N N N N N N N . . . . . . . . . . . . . . . . . . . . . . . . . . . . . . . . . . . . . . . . . . . . . . . . . . . . . . . . . . . . . . . . . . . . . . . . . . . . . . . . . . . . . . . . . . . . . . . . . . . . . . . . . . . . . . . . . . . . . . . . . . . . .
. . . . . . . . . . . . . . . . . . . . . . . . . . . . . . . . . . . . . . . . . . . . . . . . . . X+ + + + + + + - - + + + + - + + + + + + - + - + +
X
- + - - - + - - - + + + - - + - + + + + - + + - -X . . . . . . . . . . . . . . . . . . . . . . . . . + + - + + - + + + + + + + + - - + + + + + + + + +
- + - + + - + + - - - - + - - - - + - + - + - + -
N + N N N N N N N N + + N N N N N N N + N N N + N . . . . . . . . . . . . . . . . . . . . . . . . . x X x x x x x x . . . . . . . . . . . . . . . . . . . . . . . . .
. . . . . . . . . . . . . . . . . . . . . . . . .
. . . . . . . . . . . . . . . . . . . . . . . . . X
m A L : ?ISSUES WMORS
7
46 45
4s 44 30 24
48
40 49 1
49 *50 44 47 46 46 43
49 49 142 1
29 3 45 39ia
*so 49 17 43
47
*J0 1
91 Trichloroethylene, NTPTR 273

TABLE A3. ANALYSIS OF PRIMARY TUMORS IN MALE ACI RATS IN THE TWO-YEAR GAVAGE STUDY O F TRICHLOROETHYLENE
Untreated Control
Hematopoietic System: Leukemia Overall Rates (a) 2/49 (4%) Adjusted Rates (b) 4.6% Terminal Rates (c) 0139 (0%)Life Table Tests (d) Incidental Tumor Tests (d) Cochran-Armitage Trend Test (d) Fisher Exact Test
Pituitary: Adenoma Overall Rates (a) 8/48 (17%) Adjusted Rates (b) 19.9% Terminal Rates (c) 6/38 (16%) Life Table Tests (d) Incidental Tumor Testa (d) Cochran-Armitage Trend Test (d) Fisher Exact Test
Adrenal: Cortical Adenoma Overall Rates (a) 8/48 (17%) Adjusted Rates (b) 19.9% Terminal Rates (c) 7/39 (18%) Life Table Tests (d) Incidental Tumor Tests (d) Cochran-Armitage Trend Test (d) Fisher Exact Test
Adrenal: Pheochromocytoma Overall Rates (a) 4/48 (8%)Adjusted Rates (b) 10.3% Terminal Rates (c) 4/39 (10%) Life Table Tests (d) Incidental Tumor Tests (d) Cochran-Armitage Trend Test (d) Fisher Exact Test
Prostate: Adenoma Overall Rates (a) 0148 (0%)Adjusted Rates (b) 0.0% Terminal Rates (c) 0/39(0%)Life Table Testa (d)Incidental Tumor Tests (d) Cochran-Armitage Trend Test (d)Fisher Exact Test
Prostate: Adenoma, Adenocarcinoma, or Carcinoma
Vehicle Control 500 m g k g
3/50 (6%) 0149 (0%) 7.2% 0.0% 1/38(3%) 0119 (0%) P=0.139N P=0.239N P=0.093N P=0.121N P =0.038N
P =0.125N
6/39 (15%) 4/33 (12%) 16.9% 19.5% 5/34 (15%) 3/19 (16%) P =0.257 P=0.522 P=0.478 P =0.547N P =0.329N
P =0.480N
6/48(13%) 1/44(2%) 15.8% 5.6% 6/38 (16%) 1/18 (6%) P =0.080N P=0.260N P =0.080N P=0.260N P =0.006N
P=0.070N
8/48 (17%) 0144 (0%)21.1% 0.0% 8/38 (21%) 0118 (0%) P =0.017N P =0.047N P =0.017N P=0.047N P = 0,001 N
P=0.004N
3/49 (6%) 0145 (0%) 7.9% 0.0% 3/38 (8%) 0119 (0%)P=0.153N P =0.266N P = 0.153N P=0.266N P=0.046N
P=0.137N
1,000 m g k g
0150 (0%)0.0% 0111(0%) P=0.384N P =0.423N
P=0.121N
3/29 (10%)28.7% 219 (22%)P=0.3 15 P=0.607
P =0.409N
014.5 (0%) 0.0% 0111(0%) P=0.191N P=0.191N
P =0.016N
0145(0%)0.0% 0111(0%)P-O.117N P=O.l17N
P = 0.004N
0143 (0%) 0.0% 011 1(0%)P=0.403N P =0.403N
P =0.147N
0143 (0%)0.0% 0111(0%)P =0.311N P =0.31 1N
P=0.076N
17/49 (35%) 100.0% 11/11 (100%) P <0.001 P=0.074
P<0.001 N
Overall Rates (a) 0148 (0%)Adjusted Rates (b) 0.0% Terminal Rates (c) 0139 (0%)Life Table Tests (d) Incidental Tumor Testa (d) Cochran-Armitage Trend Test (d) Fisher Exact Test
Testis: Interstitial Cell Tumor Overall Rates (a) 38/47 (81%)Adjusted Rates (b) 90.4% Terminal Rates (c) 34/38 (89%) Life Table Tests (d) Incidental Tumor Testa (d)Cochran-Armitage Trend Test (d) Fisher Exact Test
4/49 (8%) 1/45(2%) 10.5% 5.3% 4/38(11%) 1/19(5%) P=0.176N P=0.435N P =0.176N P=0.435N P=0.034N
P =0.208N
36/49 (73%) 23/49 (47%) 94.7% 95.8% 36/38 (95%) 18/19 (95%) P<O.OOl P=0.024 P=O.O19 P=0.223 P <0.001 N
P =0.006N
Trichloroethylene, NTP TR 273 92

TABLE A3. ANALYSIS OF PRIMARY TUMORS IN MALE ACI RATS IN THE TWO-YEAR GAVAGE STUDY OF TRICHLOROETHYLENE (Continued)
(a)Number of tumor-bearing animals/number of animals examined a t the site (b)Kaplan-Meier estimated tumor incidence a t the end of the study after adjusting for intercurrent mortality (c)Observed tumor incidence at terminal kill (d)Beneath the control incidence are the P values associated with the trend test. Beneath the dosed group incidence are the P values corresponding to pairwise comparisons between that dosed group and the vehicle controls. The life table analysis regards tumors in animals dying prior to terminal kill as being (directly or indirectly) the cause of death. The incidental tumor test regards these lesions as nonfatal. The Cochran-Armitage and Fisher exact tests compare directly the overall incidence rates. A negative trend or lower incidence in a dosed group is indicated by (N).
93 Trichloroethylene, NTP TR 273

TABLE A4. SUMMARY OF THE INCIDENCE OF NONNEOPLASTIC LESIONS IN MALE ACI RATS IN THE TWO-YEAR GAVAGE STUDY OF TRICHLOROETHYLENE
CONTROL (UNTR) CONTROL (VEH) LOW DOSE HIGH DOSE
ANIMALS INITIALLY IN STUDY 50 50 50 50 ANIMALS MISSING 1 ANIMALS NECROPSIED 49 50 49 50 ANIMALS EXAMINED
HISTOPATHOLOGICALLY 49 50 49 50
INTEGUMENTARY SYSTEM *Subcutaneous tissue (49)
Inflammation, acute Necrosis, NOS
RESPIRATORY SYSTEM *Nasal cavity (49) (50) (49) (50)
Inflammation, chronic 1 (2%)Inflammation, chronic focal 1 (2%)
*Tracheal lumen (49 ) (49) (50)Hemorrhage 3 1 (2%) 5 (10%)
*Larynx (49) (49) (50)Inflammation, NOS 1 (2%)Inflammation, necrotizing 1 (2%)
#Trachea (46) (46) (43) (45)Hemorrhage 2 (4%)Inflammation, necrotizing 1 (2%)
#Lung (49) (47) 46)Emphysema, alveolar 1 (2%) Congestion, NOS 1 (2%) 3 (7%)Edema, NOS 1 (2%) 2 (4%) Hemorrhage 1 (2%) 4 (8%) 4 (9%) 14 (30%)Inflammation, NOS 23 (47%) 6 (13%) 2 (4%)Inflammation, focal 4 (8%) 1 (2%) 2 (4%)Idammation, acute focal 1 (2%)Inflammation, chronic focal 1 (2%) 3 (6%)Foreign material, NOS 13 (27%) 5 (11%) 3 (7%)Pigmentation, NOS 1 (2%)
#Lung/alveoli (49) (47) (46)Hemorrhage 1 (2%) 1 (2%)
HEMATOPOIETIC SYSTEM #Bone marrow (47) (50) (45) (45)
Hyperplasia, NOS 1 (2%)Hyperplasia, granulocytic 1 (2%) 1 (2%)
#Spleen (49) (50) (48) (44)Congestion, NOS 1 (2%)Hemorrhage 1 (2%) 1 (2%)Hemosiderosis 1 (2%)Hyperplasia, lymphoid 1 (2%)Hematopoiesis 1 (2%)
#Mediastinal lymph node (40) (45) (35) (30)Hemorrhage 1 (3%)
#Mesenteric lymph node (40) (45) (35) (30)Hemorrhage 1 (2%) 2 (7%)
#Thymus (3) (7) (12) (24) Multiple cysts 2 (8%)Hemorrhage 3 (13%)
CIRCULATORY SYSTEM #Trachea (46)
Embolus, septic
Trichloroethylene, NTP TR 273 94

TABLE A4. SUMMARY OF THE INCIDENCE OF NONNEOPLASTIC LESIONS IN MALE ACI RATS I N THE TWO-YEAR GAVAGE STUDY OF TRICHLOROETHYLENE (Continued)
CIRCULATORY SYSTEM (Continued) #Lung
Thrombosis, NOS #Heart
Inflammation, focal Inflammation, acute/chronic Inflammation, chronic Inflammation, chronic focal Fibrosis, focal Necrosis, focal Calcification, focal
*Aorta Mineralization Calcification, NOS Calcification, metastatic
*Pulmonary artery Calcification, metastatic
DIGESTIVE SYSTEM #Liver
Hemorrhage Inflammation, acute focal Inflammation, chronic focal Necrosis, focal Metamorphosis, h t t y Cytoplasmic vacuolization Basophilic cyto change Clear cell change Cyblogic alteration, NOS Hepatocytomegaly Angiectasis
#Liver/centrilobular Necrosis, NOS
#Bile duct Dilatation, NOS Inflammation, chronic Hyperplasia, NOS
#Pancreas HemorrhageInflammation, chronic Inflammation, granulomatous Atrophy, focal Atrophy, granular
#Pancreatic duct Degeneration, cystic
#Pancreatic acinus Atrophy, NOS Atrophy, focal Atrophy, granular
*Esophageal lumen Hemorrhage
#EsophagusDilatation, NOS HemorrhageInflammation, necrotizing Abscess, chronic
#Stomach Calcification, metastatic Hyperplasia, epithelial
#Gastric mucosa Hyperplasia, NOS
CONTROL (UNTR)
1 (2%) (46)
1 (2%)
1 (2%) (46
1 (2%) (46)
2 (4%)
(49) 7 (14%)
(49)1 (2%) 1 (2%)
CONTROL (VEH)
(49)
(49) 1 (2%) 1 (2%) 6 (12%) 2 (4%)
(50) 1 (2%)
(50)
(50) 1 (2%)
1 (2%) 2 (4%) 1 (2%) 2 (4%) 1 (2%) 1 (2%)
(50)
(50) 1 (2%) 1 (2%)
(50)
(49)
(49)1 (2%)
LOW DOSE
1 (2%)
(49)1 (2%)
2 (4%)
1 (2%)
(47) 1 (2%)
(47)
(47)
(49) 6 (12%)
(47)
(48)
(48)
HIGH DOSE
(49)1 (2%)
1 (2%) 1 (2%)
(49)
‘(49)
(44)
1 (2%)
1 (2%)
(441
(44)
1 (2%) 1 (2%)
(46)
2 (4%) (46)
95 Trichloroethylene, NTP TR 273

TABLE A4. SUMMARY OF THE INCIDENCE OF NONNEOPLASTIC LESIONS IN MALE ACI RATS IN THE TWO-YEAR GAVAGE STUDY OF TRICHLOROETHYLENE (Continued)
CONTROL (UNTR) CONTROL (VEH) LOW DOSE HIGH DOSE
DIGESTIVESYSTEM (Continued)#Forestomach (49) (49) (48) (46)
Hyperplasia, epithelial Hyperkeratosis
Hemorrhage #Duodenum
1 (2%) 1 (2%)
(48) (49) (48) 1 (2%)
(46)
Parasitism #Colon (48) (48)
1 (2%) (46)
1 (2%)(43)
URINARY SYSTEM #Kidney
Mineralization Cast, NOS Hydronephrosis Hemorrhage Inflammation, NOS Pyelonephritis, acute Inflammation, acute Pyelonephritis, acutelchronic Inflammation, chronic Pyelonephritis, chronic Nephropathy Nephropathy, toxic Necrosis, NOS Necrosis, focal Infarct, NOS Calcification, focal CytomegalyHyperplasia, epithelial Angiectasis
Cyst, NOS
Necrosis, NOS
Dilatation, NOS HemorrhageInflammation, NOS Inflammation, focal Inflammation, suppurative Inflammation, acute Inflammation, chronic Hyperplasia, epithelial
# Kidneylcortex
# Kidneyhubule
# Kidneylpelvis
(49) 39 (80%)
5 (10%)
1 (2%)
1 (2%) 48 (98%)
2 (4%)
2 (4%) 6 (12%)
1 (2%) 1 (2%)
1 (2%) 1 (2%)
19 (39%)
(49)
(49)
(49)
(50)28 (56%)
1 (2%) 4 (8%)
1 (2%) 1 (2%)
49 (98%)
1 (2%)1 (2%)
5 (10%)
1 (2%)
15 (30%)
(50)
(50)
(50)
(49) 14 (29%)
5 (10%) 3 (6%)
1 (2%)
1 (2%)
40 (82%)18 (37%)
7 (14%) 40 (82%)
1 (2%)
(49)
(49)
(49) 1 (2%)
1 (2%)
12 (24%)
(49) 9 (18%)
5 (10%)
1 (2%) 2 (4%)
43 (88%)18 (37%)
1 (2%)11 (22%) 48 (98%)
1 (2%)
1 (2%) (49)
(49)
(49)
1 (2%) 1 (2%) 1 (2%) 2 (4%)
6 (12%)
Cast, NOS Hemorrhage Inflammation, suppurative Inflammation, acute Inflammation, acute diffuse Inflammation, acute suppurative Inflammation, acute/chronic Inflammation, chronic Hyperplasia, epithelial Hyperplasia, papillary
#Urinary bladder
2 (5%) 1 (2%)
1 (2%)
1 (2%) 2 ( 5 % )1 (2%)
(44) 1 (2%) 2 (5%)
1 (2%)
(44) (47)
3 (6%)
2 (4%)
1 (2%) 1 (2%) 1 (2%) 3 (6%)
(42)
1 (2%)
1 (2%)
1 (2%)
2 (5%) 1 (2%)
Trichloroethylene, NTP TR 273 96

TABLE A4. SUMMARY OF THE INCIDENCE OF NONNEOPLASTIC LESIONS IN MALE ACI RATS IN THE TWO-YEAR GAVAGE STUDY OF TRICHLOROETHYLENE (Continued)
CONTROL (UNTR) CONTROL (VEH) LOW DOSE HIGH DOSE
ENDOCRINE SYSTEM
Hamartoma Pigmentation, NOS Hyperplasia, focal
Accessory structure HemorrhageInflammation, acute focal
#Adrenal cortex HemorrhageDegeneration, NOS Metamorphosis, fatty Lipoidosis Hyperplasia, focal
Hyperplasia, focal
HemorrhageInflammation, necrotizing Hyperplasia, C-cell
#Pituitary
#Adrenal
#Adrenal medulla
#Thyroid
(48)
2 (4%) 1 (2%)
1 (2%) 1 (2%) 1 (2%)
(48)
(48)
1 (2%) 2 (4%)
(48)
(48)
1 (2%)
(39) 1 (3%) 1 (3%) 1 (3%)
(48)
(48)
1 (2%)
1 ( 2 % )
1 (2%) (48)
(46)
(33)
2 (5%)
(44)
(40) 1 (3%) 1 (3%)
(29)
1 (2%)
1 (2%) (45)
(39)
1 (3%)
REPRODUCTIVE SYSTEM *Mammary gland
Hyperplasia, epithelial Lactation
Dilatation, NOS Hemorrhage Inflammation, NOS Inflammation, focal Inflammation, suppurative Inflammation, acute Inflammation, acute diffuse Inflammation, acute suppurative Abscess, NOS Inflammation, acute/chronic Inflammation, chronic Inflammation, chronic focal Inflammation, chronic suppurative Abscess, chronic Corpora amylacea Foreign material, NOS Pigmentation, NOS Atrophy, NOS Hyperplasia, epithelial Hyperplasia, focal
Congenital hypoplasia Dilatation, NOS Hemorrhage Inflammation, NOS Inflammation, acute Inflammation, acute focal Inflammation, acute suppurative Inflammation, acutekhronic Inflammation, chronic suppurative Abscess, chronic Fibrosis Hypoplasia, NOS Atrophy, NOS
#Prostate
*Seminal vesicle
(49)
3 (6%) (48)
2 (4%)
1 (2%) 1 (2%)
2 (4%)
1 (2%)
(49)
1 (2%) 1 (2%)
1 (2%) 1 (2%) 1 (2%)
(50)
(49)
2 (4%)
2 (4%)
2 (4%) 1 (2%)
1 (2%) 1 (2%) 1 (2%)
2 (4%) 1 (2%)
(50)
2 (4%)
1 (2%)
(49)
1 (2%)
1 (2%)6 (13%) 1 (2%)
3 (7%) 3 (7%)
1 (2%)
1 (2%) 1 (2%)
(45)
(49) 1 (2%)
4 (8%)
3 (6%)
1 (2%)
(50) 1 (2%) 1 (2%)
3 (7%) 2 (5%)
2 (5%) 1 (2%)
1 (2%) 1 (2%) 1 (2%)
(43)
2 (5%) 1 (2%)
1 (2%) (50)
1 (2%) 1 (2%) 1 (2%) 1 (2%)
1 (2%)
1 (2%)
1 (2%)
97 Trichloroethylene, NTP TR 273

TABLE A4. SUMMARY OF THE INCIDENCE OF NONNEOPLASTIC LESIONS IN MALE ACI RATS IN THE TWO-YEAR GAVAGE STUDY OF TRICHLOROETHYLENE (Continued)
CONTROL (UNTR) CONTROL (VEH) LOW DOSE HIGH DOSE
REPRODUCTIVE SYSTEM (Continued) #Testis (47) (49) (49) (49)
Necrosis, focal 1 (2%) Infarct, acute 1 (2%) Calcification, focal 1 (2%)Atrophy, NOS 1 (2%) 8 (16%) 4 (8%) 4 (8%) Atrophy, focal 1 (2%) 3 (6%) Atrophy, difFuse 1 (2%) 1 (2%) 3 (6%) 2 (4%) Aspermatogenesis 1 (2%) 1 (2%) 2 (4%) Hypospermatogenesis 1 (2%) Hyperplasia, interstitial cell 4 (9%) 5 (10%) 5 (10%) 3 (6%)
NERVOUS SYSTEM #Braidmeninges (49)
Pigmentation, NOS #Brain (49)
Corpora amylacea ~
SPECIAL SENSE ORGANS None
MUSCULOSKELETAL SYSTEM *Skeletal muscle (49) (50) (49) (50)
Abscess, NOS 1 (2%) *Muscle of neck (49) (50) (49) (50)
Inflammation, NOS 1 (2%) Necrosis, focal 1 (2%)
BODY CAVITIES *Mediastinum (49) (50) (49) (50)
Inflammation, focal 1 (2%)*Pleura (49) (50) (49) (50)
Inflammation, focal 1 (2%) *Mesentery (49) (50) (49) 60)
Inflammation, granulomatous 1 (2%)
ALL OTHER SYSTEMS *Multiple organs (49) (50) (49) (50)
Hemorrhage 1 (2%) 1 (2%) Axilla
Abscess, chronic 1
SPECIAL MORPHOLOGY SUMMARY Animal missingho necropsy I Autohecropsyhisto perf 1 1 Autolysidno necropsy 1
* Number of animals receiving complete necropsy examination; all gross lesions including masses examined microscopically. # Number of animals examined microscopically a t this site
Trichloroethylene, NTP TR 273 98

APPENDIX B
SUMMARY OF LESIONS IN FEMALE ACI RATS
IN THE TWO-YEAR GAVAGE STUDY OF
TRICHLOROETHYLENE
PAGE
TABLE B1 SUMMARY OF THE INCIDENCE OF NEOPLASMS IN FEMALE ACI RATS IN THE TWO-YEAR GAVAGE STUDY OF TRICHLOROETHYLENE 101
TABLE B2 INDIVIDUAL ANIMAL TUMOR PATHOLOGY OF FEMALE ACI RATS IN THE TWO-YEAR GAVAGE STUDY OF TRICHLOROETHYLENE 104
TABLE B3 ANALYSIS OF PRIMARY TUMORS IN FEMALE ACI RATS IN THE TWO-YEAR GAVAGE STUDY OF TRICHLOROETHYLENE 112
TABLE B4 SUMMARY OF THE INCIDENCE OF NONNEOPLASTIC LESIONS IN FEMALE ACI RATS IN THE TWO-YEAR GAVAGE STUDY OF TRICHLOROETHYLENE 114
99 Trichloroethylene, NTP TR 273

100Trichloroethylene, NTP TR 273

TABLE El . SUMMARY OF THE INCIDENCE OF NEOPLASMS IN FEMALE ACI RATS IN THE TWO- YEAR GAVAGE STUDY OF TRICHLOROETHYLENE
CONTROL (UNTR) CONTROL (VEH) LOW DOSE HIGH DOSE
ANIMALS INITIALLY IN STUDY ANIMALS MISSING ANIMALS NECROPSIED ANIMALS EXAMINED
HISTOPATHOLOGICALLY
50 1
49
49
50
50
49
50
50
50
50
46
45
INTEGUMENTARY SYSTEM 'Subcutaneous tissue
Adenoma, NOS Sarcoma, NOS
-
RESPIRATORY SYSTEM #Lung
Carcinoma, NOS, metastatic Transitional cell carcinoma, metastatic Alveolar/bronchiolar adenoma Tubular cell adenocarcinoma, metastatic Endometrial stromal sarcoma, metastatic
(49) 1 (2%)
(49) (47)
1 (2%) 1 (2%)
(42)
1 (2%) 1 (2%)
HEMATOPOIETIC SYSTEM *Multiple organs
#Lymph node
#Liver
#Thymus
Monocytic leukemia
Carcinoma, NOS, metastatic Sarcoma, NOS, metastatic
Leukemia, NOS
Malignant lymphoma, lymphocytic type Thymoma, malignant
(49)
(43)
(49)
(10)
2 (4%)
1 (2%)
1 (10%)
(50)
(47)
(49)
(7 )
1 (14%) 1 (14%)
(501
(36)
(46)
(19)
2 (11%)
(46)
(28)
(39)
(14)
1 (4%)
1 (3%)
CIRCULATORY SYSTEM XUterw
Angiosarcoma (48)
1 (2%) (49) (48) (40)
DIGESTIVE SYSTEM #Liver
Neoplastic nodule
URINARY SYSTEM #Kidney
Adenocarcinoma,NOS Tubular cell adenoma Tubular cell adenocarcinoma Sarcoma, NOS Nephroblastoma
Transitional cell papilloma Transitional cell carcinoma
#Kidney/pelvis
101 Trichloroethylene,NTP TR 273

TABLE B1. SUMMARY OF THE INCIDENCE OF NEOPLASMS IN FEMALE ACI RATS IN THE TWO- YEAR GAVAGE STUDY OF TRICHLOROETHYLENE (Continued)
CONTROL (UNTR) CONTROL (VEH) LOW DOSE HIGH DOSE
ENDOCRINE SYSTEM #Pituitary
Carcinoma, NOS Adenoma, NOS Adenocarcinoma, NOS Chromophobe adenoma Chromophobe carcinoma
#Adrenal Cortical adenoma Cortical carcinoma Pheochromocytoma Pheochromocytoma, malignant
#Thyroid Follicular cell adenoma
REPRODUCTIVE SYSTEM *Mammary gland
Adenoma, NOS Adenocarcinoma, NOS Papillary adenoma Fibroadenoma
#Uterus Carcinoma, NOS Adenocarcinoma, NOS Endometrial stromal polyp Endometrial stromal sarcoma
#Cervix uteri Endometrial stromal sarcoma
XUterudendometrium Carcinoma. NOS
#OvaryLuteoma
NERVOUS SYSTEM #Brain
Granular cell tumor, NOS
SPECIAL SENSE ORGANS +Zymbal gland
Adenosquamous carcinoma
MUSCULOSKELETAL SYSTEM +Skeletal muscle
Sarcoma,NOS
BODY CAVITIES None
(47)
24 (51%)
(49)I (2%)
1 (2%)
(46)
(49)
(49)
(49)
(42)
18 (43%) 1 (2%) 1 (2%) 1 (2%)
(48) 2 (4%) 1 (2%) 3 (6%)
(47 )
(50)1 (2%) 1 (2%)
1 (2%) (49)
4 (8%)
(36) (32) 1 (3%)
7 (19%) 7 (22%)
(44) (40) 1 (2%) 3 (8%)
2 (5%) 1 (2%)
(44) (38) 1 (3%)
(50) (46) 1 (2%)
1 (2%)
(48) (40)
3 (6%) 2 (5%) 1 (3%)
(48) (40) 1 (2%)
(48) (40) 1 (3%)
(46) (38)
Trichloroethylene, NTP TR 273 102

TABLE B1. SUMMARY OF THE INCIDENCE OF NEOPLASMS IN FEMALE ACI RATS IN THE TWO-YEAR GAVAlGE STUDY OF TRICHLOROETHYLENE (Continued)
CONTROL (UNTR) CONTROL (VEH) LOW DOSE HIGH DOSE
ALL OTHER SYSTEMS *Multiple organs
Sarcoma, NOS (49)
Periorbital region Sarcoma, NOS 1
ANIMAL DISPOSITION SUMMARY Animals initially in study
Natural death 50 11
50 5
50 12
50 17
Moribund sacrifice 2 10 4 4 Terminal sacrifice 36 33 20 17 Dosing accident Accidentally killed, NOS Animal missing 1
2 2
12 3 9
TUMOR SUMMARY Total animals with primary tumors**
Total animals with benign tumors
Total animals with malignant tumors
Total animals with secondary tumors # #
Total animals with tutnors uncertain-
Total primary tumors
Total benign tumors
Total malignant tumors
Total secondary tumors
34 42 28 31
9 10 1 2
33 46 27 30 12 13
21 26 15 16 10 10 1 1
18 25 14 16 8 8 3 3
benign or malignant Total uncertain tumors
1 1
3 3
1 1
* Number of animals receiving complete necropsy examination; all gross lesions including masses examined microscopically. ** Primary tumors: all tumors except sec'ondary tumors # Number of animals examined microscopically a t this site # # Secondary tumors: metastatic tumorci or tumors invasive into an adjacent organ
103 Trichloroethylene, NTP TR 273

TABLE B2. INDIVIDUAL ANIMAL TUMOR PATHOLOGY OF FEMALE ACI RATS IN THE TWO-YEAR GAVAGE STUDYOFTRICHLOROETHYLENE: UNTREATEDCONTROL
0 0 0 0 0 0 0 0 0 0 0 o o o o o a 8 a 8 a a 8 a 8 NUMBER 0 0 0 0 1 2 2 2 2 2 2 3 3 3 4 4 4 6 8 8 7 7 7 1 9
5 e 7 a 7 2 4 5 1 a 9 9 7 9 0 2 a 3 7 8 i 2 5 9 3
1 1 1 1 1 1 0 1 1 1 0 0 1 1 0 1 1 0 1 1 1 0 0 1 0 0 0 0 0 0 0 5 0 0 0 9 5 0 0 8 0 0 5 0 0 0 9 9 0 7 6 4 8 8 6 6 9 6 6 6 8 5 8 6 4 8 6 2 8 2 6 9 8 8 3
Subcutaneous tissue + + + + + + M + + + + + + + + + + + + + + + + + + Adenoma, NOS X
Lungs and bronchi . . . . . . . . . . . . . . . . . . . . . . . . . Carcinoma, NOS,metastatic
Trachea + + + + + + M + + + + - + + + + + + + + + + + + -
Bone marrow + + + + + + M + + + + + + + + + + + + + + + + + + Splean + + + + + + M + + + + + + + + + - + + + + + + + + Lymph nodes + + + + + + M + + + + + + - + + + + + + + + + - -
Carcinoma, NOS,metastatic Th mu6
dalignant lymphoma, lymphocytic type
Heart + + + + + + M + + + + + + + + + + + + + + + + + +
Salivary gland . . . . . . . . . . . . . . . . . . . . . . . . . Liver + + + + + + M + + + + + + + + + + + + + + + + + +
Neoplastic nodule Bile duct + + + + + + M + + + + + + + + + + + + + + + + + + Gallbladder8 common bile duct N N N N N N M N N N N N N N N N N N N N N N N N N Pancreas + + + + + + M + + + + - + + + + + + + + + + + + +
+ - + + + + M + + + + + + + + + + + - + + + + + + :E:Y + + + + + + M + + + + + + + + + + + + + + + + + + Small intestine + + + + + + M + + + + + + + + + + + + + + + + + + Large intestine + - + + + + M + + + + + + + + + + + + + + + + + +
Kidney ' + + + + + + M + + + + + + + + + + + + + + + + + + Sarcoma. NOS X
Kidney/pdvis + + + + + + M + + + + + + + + + + + + + + + + + + Transitional call carcinoma
U r i ~ r ybladder + + + + + + M + + + + + + + + + + + + - + + + + +
Pituitary + + + + + + M + + + + - + + + + + + + + + + + + -Adenoma, NOS x x x x X x x x X X
Adrenal + + + + + + M + + + + + + + + + + + + + + + + + + Cartical adenoma Pheqchromocytoma X
Thyroid + - + + + + M + + + + + + + + + + + + + + + + + -Parathyroid + - + + + - M + + + + + + - - - - + + + + + + - -
+ + + + + + M + + + + N + + + + + + + + + + + + +
X Uterus + + + + + + M + + + + + + + + + + + + + + + + + +
Carcinoma NOS Adenocarcinoma NOS X Endometrial sttrdmal polypAngiomreoma
. . . . . . . . . . . . . . . . . . . . . . . . . O X o m a X
Brain + + + + + + M + + + + + + + + + + + + + + + + + +
Multiple organs NOS N N N N N N M N N N N N N N N N N N N N N N N N N Monocytic leulkemia X X
Periorbital re 'on M Sarcoma,N&
+: Tissue examined microscopically ' No tissue information submitted -. Requirud tissue not examined microscopically Ci Necropsy, no histology due to protocolXl Tumor incidenca A: AutolysisN Necropsy, no autolysis. no microscopic examination M: Animal missing S: Animal misuxed B No necropsy parformed
Trichloroethylene, NTP TR 273 104

0 0 0 0 0 0 0
TABLE B% INDIVIDUAL
NUMBER
WEEKS ONSTUDY
Subcutaneous tissue Adenoma, NOS
M L u n p and bronchi
Carcinoma, NOS,metastatic Trachea
Bone marrow SpleenLymph nodes
Carcinoma, NOS,metastatic Th mu8
dalignant lymphoma, lymphocytic type
Heart
Salivary gland Liver
Neoplastic nodule Bile duct Gallbladder 8 common bile duct PaIIErea8
:t%%--Small intestine Large intestine
KidneySarcoma NOS
Kidney/p\virTransitional cell carcinoma
Urinary bladdar
PituitaryAdenoma. NOS
Adrenal Cortical adenoma Pheochromocytoma
ThyroidParathyroid
Mammary gland Adenocarcinoma, NOS Papillary adenoma Fibmadonoma
Uterus Carcinoma NOS Adenocarci’noma NOS Endometrial ctm’md polypAnpioarcoma
OVLZoma
Brain
Multiple organa NOSS
Monocytic leukemia Periorbital re on
Sarcoma,N& ~
* Animala necmpsied
ANIMAL ‘IUMOR PATHOLOGY OF FEMALE ACI R A T S 1JNTREATED CONTROL (Continued)
9 9 9 9 9 9 9 9 9 9 9 9 9 9 9 9 ~ o i i i a s 4 4 5 5 ~ 7 1 1 7 1 1 8 8 9 9 9 9 9 2 6 4 5 9 8 9 0 9 0 6 9 0 5 6 1 8 9 1 4 0 1 2 4 61 7 7 9 1 9 9 6 9 8
1 1 1 1 1 1 1 1 1 5 0 9 ~ ~ ~ s ~ ~ ~ 0 ~ ~ ~ ~ ~ 0 ~ 4 6 9 6 6 6 4 6 6 6 6 6 6 6 6 6 6 6 6 6 6 6 6 6 6mi . . . . . . . . . . . . . . . . . . . . . . . . . 049
1
. . . . . . . . . . . . . . . . . . . . . . . . . 49 X 1 . . . . . . . . . . . . . . . . . . . . . . . . . 46
. . . . . . . . . . . . . . . . . . . . . . . . . 49 . . . . . . . . . . . . . . . . . . . . . . . . . 48+ + + + + - - - + + + + + + + + + + + + + + + + + 43X 1- - - - - - + - - + - - - - + - + - + - - - - - - 10
X 1
49. . . . . . . . . . . . . . . . . . . . . . . . .
+ + t + + + - + + + + + + + + t + t + + + + + + +45 . . . . . . . . . . . . . . . . . . . . . . . . . 49 X 1
. . . . . . . . . . . . . . . . . . . . . . . . . 49N N N N N N N N N N N N N N N N N N N N N N N N N 049 . . . . . . . . . . . . . . . . . . . . . . . . . 48 . . . . . . . . . . . . . . . . . . . . . . . . . 47 . . . . . . . . . . . . . . . . . . . . . . . . . 49 . . . . . . . . . . . . . . . . . . . . . . . . . 49 . . . . . . . . . . . . . . . . . . . . . . . . . 48
. . . . . . . . . . . . . . . . . . . . . . . . . 49 1 . . . . . . . . . . . . . . . . . . . . . . . . . 49
X 1 . . . . . . . . . . . . . . . . . . . . . . . . . 47
. . . . . . . . . . . . . . . . . . . . . . . . . . 47x x x x x x x x x x x x x x 24
. . . . . . . . . . . . . . . . . . . . . . . . . . 49 X 1
1 . . . . . . . . . . . . . . . . . . . . . . . . . 46- - C - + + + + + - + - + + - - - + + + - - + + + 31
. . . . . . . . . . . . . . . . . . . . . . . . . 049X 1
X 1 1
. . . . . . . . . . . . . . . . . . . . . . . . . 48X 1
1X 1
X 1 t + - + + + + + + + + + + + + + + + + + + + + + + 48
1
. . . . . . . . . . . . . . . . . . . . . . . . . 49
V N N N N N N N N N N N N N N N N N N N N N N N N 049 2
P 1
105 Trichloroethylene, NTP TR 273

TABLE BB. INDIVIDUAL ANIMAL TUMOR PATHOLOGY OF FEMALE ACI RATS IN THE TWO-YEAR GAVAGE STUDY OF TRICHLOROETHYLENE: VEHICLE CONTROL
NUMBER
WEEKS ONSTUDY
Subcutaneous tissue . . . . . . . . . . . . . . . . . . . . . . . . . Sarcoma, NOS
MLun and bronchi . . . . . . . . . . . . . . . . . . . . . . . . . Tracyaa . . . . . . . . . . . . . . . . . . . . . . . . .
Bone marrow . . . . . . . . . . . . . . . . . . . . . . . . . Spleen . . . . . . . . . . . . . . . . . . . . . . . . . . . . . . . . . . . . . . . . . . . . . . . . . .
+ - - -X
Heart I + + + t + + + + + + + + + + + + + + + + + + + + + I
Salivary gland . . . . . . . . . . . . . . . . . . . . . . . . . Livar . . . . . . . . . . . . . . . . . . . . . . . . .
Neoplastic nodule X X Bile duct . . . . . . . . . . . . . . . . . . . . . . . . . Gallbladder 8 common bile duct N N N N N N N N N N N N N N N N N N N N N N N N N Pancreas . . . . . . . . . . . . . . . . . . . . . . . . . . . . . . . . . . . . . . . . . . . . . . . . . . . . . . . . . . . . . . . . . . . . . . . . . . . Small intestine . . . . . . . . . . . . . . . . . . . . . . . . . Largm intestine . . . . . . . . . . . . . . . . . . . . . . . . .
Kidney . . . . . . . . . . . . . . . . . . . . . . . . . Nephroblastoma
Kidney/pelvin . . . . . . . . . . . . . . . . . . . . . . . . . Transitional call carcinoma X x x
Urinary bladder . . . . . . . . . . . . . . . . . . . . . . . . .
Pituitary . . . . . . . . . . . . . . . . . . . . . . . . . Adenoma NOS x x x x x x x x x x x 1 Adenocarhnoma NOS Chromophobe adsnoma Chromophobe carcinoma X
Adrenal . . . . . . . . . . . . . . . . . . . . . . . . . Cortical adenoma X X Cortical carcinoma X Pheochromocytoma X
Thyroid . . . . . . . . . . . . . . . . . . . . . . . . . Parathyroid + + - + - - - + + - + + - + - + + + - - - + + + +
Mammary gland . . . . . . . . . . . . . . . . . . . . . . . . . Menoma NOS X Msnocarhnoma. NOS X Fibroadenoma
UlrUS . . . . . . . . . . . . . . . . . . . . . . . . . Endometrial stromal polyp X X X
Ovary . . . . . . . . . . . . . . . . . . . . . . . . .
Brain . . . . . . . . . . . . . . . . . . . . . . . . . Granular cell tumor, NOS X
ANS Zymbal gland N N N N N + N N N N N N N N N N N N + N N N N N N
Menosquamous cercinoma
Trichloroethylene, NTP TR 273 106

TABLE B2. INDIVIDUAL ANIMAL TUMOR PATHOLOGY OF FEMALE ACI R A T S VEHICLE CONTROL (Continued)m 9 9 9 91 9 9 91 91 9 9 9 9 9 9 9 9 91 9 9 9 91 9
NUMBER 0 0 0 1 2 2 8 4 4 4 4 5 5 5 6 6 6 7 8 8 8 8 6 9 9 5 7 ~ ~ e 9 0 1 ~ 4 5 1 2 5 0 4 ~ 9 0 3 5 ~ ~ 9 5
WEEKS ON STUDY
Subcutaneous tissue Sarcoma, NOS
TU-Lun end bronchi Tracyea
Bone marrow Snleen L* mph nodes Ti{mui
ymoma, mali ant Malignant lympcma, lymphocytic typo
Heart
Salivary gland Liver
Neoplastic nodule Bile duct Gallbladder 8 common bih, duct Pancreas
E:2r Small intestine L a r p intestine
KidneyNephroblaatoma
KidneylpelvisTranritional call carcinoma
Urinary bladder
PituitaryAdenoma NOS Adenwarhorna NOS Chromophobe adenoma Chromophobe carcinoma
Adrenal Cortical adenoma Cortical carcinoma Pheochromocytoma
ThyroidParathyroid
Mammary gland Adenoma NOS Adenocarfinoma. NOS Fibroadenoma
Uterus Endometrial stromal polyp
Ovary
Brain Granular cell tumor, NOS
ANS Zymbal gland
Adenosquamoui carcinoma
* Animals necropsied
+ + N + + + + + + + + + + + + N + + + + + + + + + *J0 X 1
+ + + + + + + + + + + + + + + A + + + + + + + + + 49 + + + + + + + + + + + + + + + A + + + + + + + + + 47
. . . . . . . . . . . . . . . . . . . . . . . . . 48
. . . . . . . . . . . . . . . . . . . . . . . . . 49
. . . . . . . . . . . . . . . . . . . . . . . . . 47- - - - - - + - - - - + - + - A - - + - - - - - - 7 1
X 1
. . . . . . . . . . . . . . . . . . . . . . . . . 48
+ + + + + + + + - + - + + + + A + + - + + + + + + 45 . . . . . . . . . . . . . . . . . . . . . . . . . 49
2 + + + + + + + + + + + + + + + A + + + + + + + + + 49N N ~ ~ N N N N N N N N N N N N N N N + N N ~ N N N *50 . . . . . . . . . . . . . . . . . . . . . . . . . 48 . . . . . . . . . . . . . . . . . . . . . . . . . 47 . . . . . . . . . . . . . . . . . . . . . . . . . 47 + + + + + + + + + + + + + + + A + + + + + + + + + 49 . . . . . . . . . . . . . . . . . . . . . . . . . 47
. . . . . . . . . . . . . . . . . . . . . . . . . 48 X 1
48. . . . . . . . . . . . . . . . . . . . . . . . . X 4 + + + + + + + + + + - + + - + A + + - + + + + + + 4.3
. . . . . . . . . . . . . . . . . . . . . . . . . 42 x x X x x x X 18X 1
X 1 1
+ + - + + + + + + + + + + + + A + + - + + + + + + 48 2 1
X X 3 . . . . . . . . . . . . . . . . . . . . . . . . . 47- - . . . . . . . . . . . . . . . . . . . . . . . 35-+ + H + + + + + + + + + + + + N N + + + N + + + + '50
1 1
X 1 + + + + + + + + + + + + + + + A + + + + + + + + + 49
X 4 + + + + + + + + + + + + + + - A - + + + + + + - t 46
+ + + + + + + + + + + + + + + A + + - + + + + + + 48
N N W N + + N N N N N N N N N N N N N N + N N N N '50 x 1
107 Trichloroethylene, NTP TR 273

TABLE B2. INDIVIDUAL ANIMAL TUMOR PATHOLOGY OF FEMALE ACI RATS IN THE TWO-YEAR GAVAGE STUDY OF TRICHLOROETHYLENE: LOW DOSE
0 0 0 0 0 0 0 0 0 0 0 0 0 8 8 6 8 8 8 8 8 8 8 8 8 NUMBER 0 0 1 1 1 1 2 2 3 3 3 4 4 4 4 4 5 5 5 6 6 7 7 7 9
2 4 4 5 6 9 3 6 4 5 6 1 3 3 6 7 4 5 7 2 5 3 4 7 1
WEEKS ON 0 1 0 0 0 1 1 1 0 0 1 0 0 1 0 0 1 1 0 0 1 0 0 0 0 STUDY 6 0 6 1 9 0 0 0 4 8 0 8 6 0 4 9 0 0 7 8 0 1 3 7 8
4 1 4 41 5 8 7 41 5 81 51 7 0 4 5 6 51 4 6 0 94 4 1 2/ L u n p and bronchi . . . . . . . . . . . . . . . . . . . . . . . . .
Transitional cell carcinoma, metastatic X Alveolar/bronchiolar adenoma
Trachea + + + + + + + + + + + A + + + - + + - - + + + + +
BoneBone marrowmarrow . . . . . . . . . . . . . . . . . . . . . . . . . SpleenSpleen + + + + + + + + + + + A + + + + + + - + + + + + + $mEt;odes$mEt;odes 1 - + + + + + + + + + + A - + + - + + - + + - - - i
- - - + - - - - + - - A - - + - + - + + - + - + + ahgnantahgnant lymphoma,lymphoma, lymphocyticlymphocytic typetype
Heart . . . . . . . . . . . . . . . . . . . . . . . . .
Salivary gland . . . . . . . . . . . . . . . . . . . . . . . . . Liver + + + + + + + + + + + A + + + + + + - + + + + + + Bile duct + + + + + + + + + + + A + + + + + + - + + + + + + Gallbladder & common bile duct N N N N N N N N N N N N N N N N N N N N N N N N N Pancreas + + + + + + + + + + + A + + + + + + - + + + + + + . . . . . . . . . . . . . . . . . . . . . . . . .
+ + + + + + + + + + + A + + + + + + - + + + + + + Small inteatine + + + + + + + + + + + A + + + + + + - + + + + + + Larm inteatine + + + + + + + + + + + A + + + + + + - + + + + - +
:::::r
Kidney + + + + + + + + + + + A + + + + + + - + + + + + + Adenocarcinoma NOS X Tubular cell adeAoma x
Kidney/pelvia . . . . . . . . . . . . . . . . . . . . . . . . . Tranaitional cell papilloma X X Transitional cell carcinoma . x X
Urinary bladder + + + + + + + + + + + A - + + + + + + + + + + + +
M Pituitary + + - - + - + + + + + + + + + - + + - + + - - + -
Adenoma, NOS X X X Adrenal . . . . . . . . . . . . . . . . . . . . . . . . . .
Cortical adenoma A Phrochromocytoma, malignant X
Thyroid . . . . . . . . . . . . . . . . . . . . . . . . . Parathyroid - - + + - - + - + - + + - + - - - + - - - + + + +
Mammary gland + + + + + + + + + N + N + + + + + + + N + + + + + Adenocarcinoma, NOS X
Uterus + + + + + + + + + + + A + + + + + + + + + + + + + Endometrial stromal polyp X Endometrial stromal mrcoma
Ovary - + + + + + + + + + + A + + + + + + - + + + + + +
Brain . . . . . . . . . . . . . . . . . . . . . . . . .
Multiple or ns NOS N N N N N N N N N N N N N N N N N N N N N N N N N Sarcoma,F o ~ X
Trichloroethylene, NTP TR 273 108

TABLE B% INDIVIDUAL ANIMAL TUMOR PATHOLOGY OF FEMALE ACI RATS: LOW DOSE (Continued)
NUMBER
WEEKS ON STUDY
Lunm and bmnchi . . . . . . . . . . . . . . . . . . . . . . . . . 47 Transitional cell carcinoma. metastatic 1 Alveolar/bronchiolar adanoma X 1
Trachea . . . . . . . . . . . . . . . . . . . . . . . . . 41
Bone marrow . . . . . . . . . . . . . . . . . . . . . . . . . 48 Spleen + + + + + + + + + + + + + A + + + + + + + - + + + 46
TKL mphnodes . . . . . . . . . . . . . . . . . . . . . . . . . 36 mur 19- + - - - - + + + - + - - A + + - - + + - - - + -
dalignant lymphoma, lymphocytic type X X 2
Heart. . . . . . . . . . . . . . . . . . . . . . . . . . 49
Salivary gland . . . . . . . . . . . . . . . . . . . . . . . . . 45 T.ivar + + + + + + + + + + + + + A + + + + + + + - + + + 48Bile duct . . . . . . . . . . . . . . . . . . . . . . . . . 48Gallbladder k common bile duct N N N N N N N N N N N N N N N N N N N N N N N N N '50Pancreas . . . . . . . . . . . . . . . . . . . . . . . . . 46
. . . . . . . . . . . . . . . . . . . . . . . . . 49 :t%Y . . . . . . . . . . . . . . . . . . . . . . . . . 45Small intestine . . . . . . . . . . . . . . . . . . . . . . . . . 45 Large intestine + - + + + + + + + + + + + A + + + + + + + + + + + 45
Kidney . . . . . . . . . . . . . . . . . . . . . . . . . 47 Adenocarcinoma NOS 1 Tubular cell adeioma x 2
Kidneylplvis . . . . . . . . . . . . . . . . . . . . . . . . . 47 Transitional cell papilloma 2 Transitional cell carcinoma X 3
Urinary bladder . . . . . . . . . . . . . . . . . . . . . . . . . 45
Pituitary . . . . . . . . . . . . . . . . . . . . . . . . . 38 Adenoma, NOS X x x X 7
Adrenal . . . . . . . . . . . . . . . . . . . . . . . . . 44 Cortical adenoma 1 Pheochromocytoma. malignant 1
Thyroid + + + + + + + + + + + + + A + + + + + + + + + + + 44 Parathyroid - + + - - + + + - - + - + A + - + + - - - - + + + 25
Mammary gland '50 Adenocarcinoma, NOS 1 Uterus . . . . . . . . . . . . . . . . . . . . . . . . . 48
Endometrial stromal polyp X X 3 Endometrial stromal sarcoma X 1
Ovary . . . . . . . . . . . . . . . . . . . . . . . . . 48
Brain + + t + + + + + + + + + + A + + + + + + + + + + + 49 ~~ ~ ~ ~
Multiple or an6 NOS N N N N N N N N N N N N N N N N N N N N N N N N N '50 Sarcoma. k08 1
* Animala necropsied
109 Trichloroethylene, NTP TR 273

TABLE B!d. INDIVIDUAL ANIMAL TUMOR PATHOLOGY OF FEMALE ACI RATS IN THE TWO-YEAR GAVAGE STUDY OF TRICHLOROETHYLENE: HIGH DOSE -
0 0 0 0 0 0 0 0 0 0 0 0 8 8 8 8 8 8 8 8 8 8 8 0 8NUMBER 0 0 0 1 1 1 1 1 3 3 3 4 5 5 5 6 8 7 8 8 8 8 8 9 9
1 3 9 0 1 2 3 8 0 1 8 4 1 2 3 1 4 6 1 4 8 7 8 5 6
0 1 0 1 0 0 1 0 0 0 1 0 0 0 1 1 1 1 1 0 1 0 1 1 1 1 0 6 0 8 2 0 4 5 5 0 1 8 7 0 0 0 0 0 6 0 1 0 0 0 3 4 2 4 4 8 4 5 8 2 4 5 9 1 1 4 4 4 4 3 4 1 4 4 4
~
Suhcutaneoucticme + + + + + + + + + N + A N + + + + N + + + + + + + Sarcoma, NOS X
. . . . . . . . . . . . . . . . . . . . . . . . . X
X . . . . . . . . . . . . . . . . . . . . . . . . .
. . . . . . . . . . . . . . . . . . . . . . . . . + + + + + + + + + + + A - + + + + + + + + + + + + + + - - - - + - + - + A - - + - + + + + + - - + +
X+ + - - - - - - - - - A - + - - - + - + - + - - -
Heart . . . . . . . . . . . . . . . . . . . . . . . . .
Salivary gland . . . . . . . . . . . . . . . . . . . . . . . . . Liver + - + + + + + + + - + A - + + + + - + + + + + + +
Leukemia, NOS X Bile duct + - + + + + + + + - + A - + + + + - + + + + + + + Gallbladder & common bile duct N N N N N N N N N N N A N N N N N + N N N N N N N Pancmac + + + + + + + + + + + A - + + + + + + + + + + + +
. . . . . . . . . . . . . . . . . . . . . . . . . + + + + + + + + + + + A - + + + + + + + + + + + + . . . . . . . . . . . . . . . . . . . . . . . . . . . . . . . . . . . . . . . . . . . . . . . . . .
Kidnev + + + + + + + + + + + A + + + + + + + + + + + + + X
+ + + + + + + + + + + A + + + + + + + + + + + + + X
. . . . . . . . . . . . . . . . . . . . . . . . .
Pituitary . . . . . . . . . . . . . . . . . . . . . . . . . Carcinoma, NOS X Adenoma. NOS X x x x
Admnal + + + + + + + + + + + A - + + + + + + + + + + + + Cortical adenoma X X Pheochromocytoma X X
Thyroid + + - + - + + + + - + A - + + + + + + + + + + + + Follicular cell adenoma X
Parathyroid + + - + - + + + - - + A - + + + + + - - + - - + +
Mammary gland . . . . . . . . . . . . . . . . . . . . . . . . . Adenoma. NOS X
Utemc . . . . . . . . . . . . . . . . . . . . . . . . . Carcinoma, NOS Endometrial stromal polyp X X Endometrial stromal sarcoma X
Ovary . . . . . . . . . . . . . . . . . . . . . . . . .
Brain + + + + + + + + + - + A - + + + + + + + + + + + + Granular cell tumor, NOS X
Munch N N + N N + N + + + N A N N N N N N N N N + N N N Sarcoma, NOS X
Trichloroethylene, NTPTR 273 110

TABLE B2. INDIVIDUAL ANIMAL TUMOR PATHOLOGY OF FEMALE ACI RATS HIGH DOSE
NUMBER
Subcutaneoustissue Sarcoma, NOS
EM Lun and bronchi
Turular cell adenoearcinoma metastatic Endometrial stromal sarcom;, metal
Trachea
Bone marmw SpleanL mphnodes
garcoma, NOS.metastatic Thymus
Heart
Salivary gland Liver
Lsukemia. NOS Bile duct Gallbladder & common bile duct Pancreas
:2r Small intestine Large intestine
KidnayTubular cell adenocarcinoma
Kidney/pelvisTransitional cell carcinoma
Urinary bladder
Adrenal Cortical adenoma Pheochromocytoma
ThyroidFollicular cell adenoma
Parathyroid
Mammary gland Adenoma. NOS
Uterus Carcinoma NOS Endomatnil stromal polyp Endomatrial stromal sarcoma
Ovary
Brain Granular cell tumor, NOS
Muscle Sarcoma, NOS
* Animals necropsied
(Continued)
A N + + + + + + + N N + N + + N + + N A + A + + + '46 1
A - + + + + + + + + A + + + + + + + + A + A + + - 42 I 1
A + + + + + + + - + A + + + + + + + + A + A + + - 40
A + + + + - + + A + - + + + + + - A + A + + + 40 A - - . + + + + t + + A + - + + + + + + A + A + + + 42 A - - I + + + + - - + A + + - + - + + + A + A - + + 20
1 A T . - - - + - + - + A - - + - + - + + A + A - - - 14
A - + + + + + + + + A + + + + + + + + A + A + + - 42
A + k + + + + + + + A + + + + + + + + A + A - + - 39 A - t + + + + + + + A + - + + + + + + A + A + + + 39
1 A - t + + + + + + + A + - + + + + + + A + A + + + 39 A N N N N N N N N N N N N N N N N N N A N A N N N '46 A - t + + + + + + + A + - + + + + + + A + A + + + 42 A + t + + + + + + + A + + + + + + + + A + A + + - 43 A - t + + t + + + + A + - + + + + + + A + A + + + 42 A - t + + + + + + + A + - + + + + + + A + A - + + 41 A - t + + + + + + + A + - + + + t + + A + A - + + 38
A - + + + + + + + + A + - + + + t + + A + A + + + 43 1
A - + + + + + + + + A + - + + + + + + A + A + + + 43 1
A - + + + + + + + - A + - + + + + + - A + A - + - 35
A - + + + + + + - + A + - - + - + + - A - A - + - 32 1
X X X 7 A - + + + + + + + + A + - + + + t + - A + A + + - 40
X 3 2
A + + + + + + + - + A + + + + + t + + A + A - + - 38 1
A + + + + + + - - + A + + - - - t - - A + A - + - 27
A N N + + N + N + N N + N + + + t + N A + A + N N '46 1
A - + + + + + + + + A + - + + + + + + A + A - + - 40 X 1
2 1
A - + + + + + + + - A + - + + + + + + A + A - + - 38
A + + + + + + + + + A + + + + + + + + A + A + + - 42 1
A N N N N + N + + + N N N + N + N N + A + A N N N *46 1
111 Trichloroethylene, NTP T R 273

TABLE 83. ANALYSIS O F PRIMARY TUMORS IN FEMALE ACI RATS IN THE TWO-YEAR GAVAGE STUDY OF TRICHLOROETHYLENE
Untreated Vehicle Control Control
Kidney: Transitional Cell Carcinoma Overall Rates (a) 1/49 (2%) 4/48 (8%)Adjusted Rates (b) 2.7% 11.8% Terminal Rates (c) 1/37 (3%) 4/34(12%)Life Table Tests (d) P =0.346N Incidental Tumor Tests (d) P =0.264N Cochran-Armitage Trend Test (d) P=0.160N Fisher Exact Test
Kidney: Transitional Cell Papilloma or Carcinoma Overall Rates (a) 1/49 (2%) Adjusted Rates (b) 2.7% Terminal Rates (c) 1/37 (3%) Life Table Tests (d) Incidental Tumor Tests (d) Cochran-Armitage Trend Test (d) Fisher Exact Test
Kidney: Adenoma or Adenocarcinoma Overall Rates (a) 0149 (0%) Adjusted Rates (b) 0.0% Terminal Rates (c) 0137 (0%) Life Table Tests (d) Incidental Tumor Tests (d) Cochran-Armitage Trend Test (d) Fisher Exact Test
Pituitary: Adenoma Overall Rates (a) 24/47 (51%) Adjusted Rates (b) 59.8% Terminal Rates (c) 21/37 (57%) Life Table Tests (d) Incidental Tumor Tests (d) Cochran-Armitage Trend Test (d) Fisher Exact Test
4/48 (8%)11.8% 4/34 (12%) P=0.427N P =0.299N P=0.193N
0148 (0%) 0.0% 0134 (0%)P=O.200 P=0.310 P =0.343
19/42 (45%) 52.1% 16/33 (48%) P=0.095N P=0.068N P=0.015N
Pituitary: Adenoma, Adenocarcinoma, or Carcinoma Overall Rates (a) 24/47 (51%) Adjusted Rates (b) 59.8% Terminal Rates (c) 21/37(57%) Life Table Tests (d) Incidental Tumor Tesb (d)Cochran-Armitage Trend Test (d) Fisher Exact Test
Adrenal: Cortical Adenoma Overall Rates (a) 1/49 (2%) Adjusted Rates(b) 2.7% Terminal Rates (c) 1/37 (3%) Life Table Tests (d) Incidental Tumor Testa (d)Cochran-Armitage Trend Test (d) Fisher Exact Test
Adrenal: Cortical Adenoma or Carcinoma Overall Rates (a) 1/49 (2%) Adjusted Rates (b) 2.7% Terminal Rates (c) 1/37 (3%) Life Table Tests (d) Incidental Tumor Tests (d)Cochran-Armitage Trend Test (d) Fisher Exact Test
21/42 (50%) 55.9% 17/33 (52%) P=0.085N P=0.052N P=O.OllN
2/48 (4%) 5.7% 2/35 (6%) P =0.179 P=0.179 P=0.329
3/48 (6%) 8.6% 3/35 (9%)P=0.314 P=0.314 P =0.514
500 m g k g
3/47 (6%) 12.6% 2/20 (10%) P =0.549 P =0.642N
P=0.512N
5/47(11%) 20.6% 3/20 (15%) P=0.216 P =0.407
P=0.486
3/47 (6%) 13.9% 2/20 (10%) P =0.044 P=0.104
P=0.117
7/36 (19%) 33.7% 6/19 (32%) P =0.144N P=0.073N
P =0.014N
7/36 (19%) 33.7% 6/19 (32%) P = 0.076N P =0.029N
P=0.005N
1/44(2%) 5.0% 1/20 (5%) P=0.692N P=0.692N
P=0.533N
1/44(2%)5.0% 1/20(5%)P =0.519N P=0.519N
P=0.342N
1,000 m g k g
1/43(2%) 5.3% 1/19(5%)P=0.388N P=0.388N
P = 0.217N
1/43(2%) 5.3% 1/19 (5%) P=0.388N P=0.388N
P = 0.217N
1/43(2%) 4.3% 0119 (0%) P=0.375 P=0.581
P=0.473
7/32 (22%) 36.8% 7/19 (37%) P =0.149N P=0.109N
P=0.032N
8/32 (25%) 40.0% 7/19 (37%) P =0.146N P=O.OESN
P=0.025N
3/40 (7%) 15.8% 3/19 (16%) P=0.235 P =0.235
P=0.413
3/40 (7%) 15.8% 3/19 (16%) P = 0.363 P=0.363
P=0.571
Trichloroethylene, NTP TR 273 112

TABLE B3. ANALYSIS OF PRIMARY TUMORS IN FEMALE ACI RATS IN THE TWO-YEAR GAVAGE STUDY OF TRICHLOROETHYLENE (Continued)
Untreated Vehicle Control Control 500 mg/kg 1,000 mg/kg
Adrenal: Pheochromocytoma Overall Rates (a) 1149(2%) 3/48 (6%) 0/44 (0%) 2/40 (5%) Adjusted Rates (b) 2.7% 7.9% 0.0% 10.5% Terminal Rates (c) 1/37 (3%) 2/35 (6%) on0(0%) 2/19 (1 1%) Life Table Tests (d) P=0.594 P = 0.227N P=0.599 Incidental Tumor Tests (d) P =0.582N P=O.l39N P=0.650 Cochran-Armitage Trend Test (d) P=0.456N Fisher Exact Test P = 0.138N P=0.587N
Adrenal: Pheochromocytoma or Pheochromocytoma, Malignant Overall Rates (a) 1/49(2%) 3/48 (6%) 1/44(2%) 2/40 (5%) Adjusted Rates (b) 2.7% 7.9% 3.6% 10.5% Terminal Rates (c) 1/37 (3%) 2/35 (6%) 0120 (0%) 2/19 (11%) Life Table Tests (d) P=0.541 P=0.492N P =0.599 Incidental Tumor Tests (d) P =0.578N P=0.267N P =0.650 Cochran-Armitage Trend Test (d) P=0.472N Fisher Exact Test P =0.342N P =0.587N
Mammary Gland: Adenoma, Papillary Adenoma, Fibroadenoma, or Adenocarcinoma Overall Rates (a) 3/49 (6%) 3/50 (6%) 1/50 (2%) 1/46 (2%) Adjusted Rates (b) 8.1% 7.5% 4.2% 5.3% Terminal Rates (c) 3/37 (8%) 1/35 (3%) 0/20 (0%) 1/19 (5%) Life Table Tests (d) P =0.428N P=0.547N P=0.555N Incidental Tumor Tests (d) P =0.466N P=0.545N P=0.658N Cochran-Armitage Trend Test (d) P=0.222N Fisher Exact Test P =0.309N P =0.341N
Uterus: Endometrial Stromal Polyp Overall Rates (a) 1/48(2%) 4/49 (8%) 3/48(6%) 2/40 (5%) Adjusted Rates (b) 2.7% 10.7% 15.0% 10.5% Terminal Rates (c) 1/37 (3%) 3/35 (9%) 3/20 (15%) 2/19 (11%)Life Table Tests (d) P =0.580N P =0.505 P =0.641N Incidental Tumor Tests (d) P=0.546 P =0.434 P=0.668 Cochran-Armitage Trend Test (d) P=0.348N Fisher Exact Test P=0.512N P=0.440N
Uterus: Endometrial Stromal Polyp or Sarcoma Overall Rates (a) 1/48(2%: 4/49 (8%) 4/48 (8%) 3/40 (7%) Adjusted Rates (b) 2.7% 10.7% 18.3% 13.8% Terminal Rates (c) 1/37(3%:1 3/35 (9%) 3/20 (15%) 2/19(11%)Life Table Tests (d) P =0.370 P=0.321 P=0.491 Incidental Tumor Tests (d) P =0.428 P=0.369 P=0.594 Cochran-Armitage Trend Test (d) P=0.535N Fisher Exact Test P =0.63 1 P =0.613N
(a)Number of tumor-bearing animals/number ofanimals examined a t the site (b)Kaplan-Meier estimated tumor incidence at the end of the study after adjusting for intercurrent mortality (c)Observed tumor incidence a t terminal kill (d)Beneath the control incidence are the P values associated with the trend test. Beneath the dosed group incidence are the P values corresponding to pairwise comparisons between that dosed group and the vehicle controls. The life table analysis regards tumors in animals dying prior to terminal kill as being (directly or indirectly) the cause of death. The incidental tumor test regards these lesions as nonfatal. The Cochran-Armitage and Fisher exact tests compare directly the overall incidence rates. A negative trend or lower incidence in a dosed group is indicated by (N).
113 Trichloroethylene, NTP TR 273

TABLE B4. SUMMARY OF THE INCIDENCE OF NONNEOPLASTIC LESIONS IN FEMALE ACI RATS IN THE TWO-YEAR GAVAGE STUDY OF TRICHLOROETHYLENE
CONTROL (UNTR) CONTROL (VEH) LOW DOSE HIGH DOSE
ANIMAlS INITIALLY IN STUDY ANIMALS MISSING ANIMAlS NECROPSIED ANIMALS EXAMINED
HISTOPATHOLOGICALLY
50 1
49
49
50
50
49
50
50
50
50
46
45
INTEGUMENTARY SYSTEM *Subcutaneous tissue
Inflammation, acute suppurative Inflammation, acute/chronnc Inflammation, chronic
(49)
1 (2%)
(50)1 (2%)
(50) (46)
1 (2%)
~~ ~-
RESPIRATORY SYSTEM *Nasal cavity
Inflammation, suppurative *Tracheal lumen
Hemorrhage#Trachea
Hemorrhage#Peritracheal tissue
Inflammation, acute #Lung/bronchus
Inflammation, acute focal #Lung
Congestion, NOS Edema, NOS Hemorrhage Inflammation, NOS Inflammation, focal Intlammation, multifocal Pneumonia, lipid Inflammation, acute Inflammation, acute focal Abscess,NOS Inflammation, chronic Inflammation, chronic focal Inflammation, granulomatous Inflammation granulomatous focal Granuloma, foreign body Parasitism Foreign material, NOS Pigmentation, NOS Hemosiderosis Alveolar macrophages
Hemorrhage#Lung/alveoli (49)
(49)
6 (12%) 12 (24%) 3 (6%) 2 (4%)
7 (14%) 1 (2%)
(49) 1 (2%)
2 (4%)7 (15%) 8 (17%)
1 (2%)
1 (2%)
1 (2%) 5 (11%) 1 (2%) 2 (4%) 1 (2%)
3 (6%)
1 (2%) 1 (2%)
(47)
(46)
(46)
(40)
(40)
(42)
(42)
1 (2%)
1 (2%)
2 (5%)
1 (2%)3 (7%) 1 (2%)
1 (2%)
1 (2%) 2 (5%)
2 (5%)
(42)
HEMATOPOIETIC SYSTEM #Spleen
Hemosiderosis Depletion, lymphoid Hematopoiesis
#Splenic capsule HemorrhageFibrosis
#Lymph node Necrosis, focal Pigmentation, NOS
(48)3 (6%)
1 (2%)
1 (2%) 1 (2%)
(48)
(43)
(49)3 (6%) 1 (2%)
(49)
(47) 1 (2%)
(46)
2 (4%) (46)
(36)
(42) 1 (2%)
2 (5%) (42)
(28)
1 (4%)
Trichloroethylene, NTP TR :273 114

TABLE B4. SUMMARY OF THE INCIDENCE OF NONNEOPLASTIC LESIONS IN FEMALE ACI RATS IN THE TWO-YEAR GAVAGE STUDY OF TRICHLROETHYLENE (Continued)
HEMATOPOIETIC SYSTEM (Continued) #Mesenteric lymph node
Hemorrhage Inflammation, NOS
#Liver Hematopoiesis
#JejunumHyperplasia, lymphoid
#Thymus Cyst, NOS Multiple cysts Hemorrhage
CIRCULATORY SYSTEM #Heart
Mineralization Inflammation, acute focal Inflammation, chronic Inflammation, chronic focal Fibrosis, focal Calcification, metastatic
DIGESTIVE SYSTEM #Liver
Traumatic abnormality Congestion, NOS HemorrhageInflammation, focal Necrosis, NOS Necrosis, focal Metamorphosis, fatty Pigmentation, NOS Hemosiderosis Basophilic cyto change Clear cell change Cytologic alteration, NOS Hepatocytomegal y
#Liver/centrilobular Necrosis, NOS
#Bile duct Inflammation, acute Inflammation, acutehhronic Hyperplasia, NOS Hyperplasia, focal Hyperplasia, diffuse
#Pancreas Cytoplasmic vacuolization
*Esophageal lumen Hemorrhage
#Esophagus Inflammation, acute Inflammation, acute focal Inflammation, granulomatous Granuloma, foreign body
#Esophageal mucosa Necrosis, NOS
#Stomach Mineralization Necrosis, focal Calcification, metastatic Hyperplasia, epithelial
CONTROL (UNTR)
(49)
1 (2%)
3 (6%) 1 (2%)
(49)
(49)
2 (4%) 1 (2%)
(48)
(49) 3 (6%)
(47)
(47)
(49) 1 (2%) 1 (2%)
1 (2%)
CONTROL (VEH)
(49)
1 (2%) 1 (2%)
3 (6%)
1 (2%)
1 (2%) 1 (2%) 3 (6%)
(49) 1 (2%)
(49)
1 (2%)
1 (2%) (48)
1 (2%) (50)
2 (4%) (47)
1 (2%) 1 (2%) 1 (2%)
(47) 1 (2%)
(47)
1 (2%)
LOW DOSE
(36)
(46) 1 (2%)
(45)
(19) 5 (26%) 4 (21%)
(46)
1 (2%) 1 (2%)
4 (9%) 1 (2%)
5 (11%)
(46)
(46)
(46)
(50) 8 (16%)
(49
1 (2%) (49)
(45)
HIGH DOSE
(28)
(39) 1 (3%)
(41)
(14)2 (14%)
(39) 1 (3%)
5 (13%)
1 (3%) 3 (8%)
6 (15%) (39)
(39) 1 (3%)
1 (3%)
(42)
(46) 8 (17%)
(43)
(43)
(42)
115 Trichloroethylene, NTP TR 273

TABLE B4. SUMMARY OF THE INCIDENCE OF NONNEOPLASTIC LESIONS IN FEMALE ACI RATS IN THE TWO-YEAR GAVAGE STUDY OF TRICHLOROETHYLENE (Continued)
CONTROL (UNTR) CONTROL (VEH) LOW DOSE HIGH DOSE
DIGESTIVE SYSTEM (Continmd) #Forestomach
Hyperplasia, epithelial #Duodenum
Hemorrhage #Ileum
Parasitism #Colon
HemorrhageParasitism
URINARY SYSTEM #Urinary bladddcavity
#KidneyHemorrhage
Mineralization Hydronephrosis Cyst, NOS Hemorrhage Inflammation, acute/chroni,c Pyelonephritis, acute/chronic Inflammation, chronic Nephropathy Nephropathy, toxic Nephrosis, hemoglobinuric Infarct, acute Calcification, NOS Calcification, focal Calcification, metastatic Hemosiderosis CytomegalyHyperplasia, epithelial Angiectasis
#Renal papilla Mineralization
(47)
(49) 1 (2%)
38 (78%) 3 (6%)
1 (2%)
1 (2%)
46 (94%)
5 (10%) 1 (2%)
2 (4%)6 (12%)
(49)
(43)
(48) 1 (2%)
38 (79%) 3 (6%)
47 (98%)
1 (2%)
5 (10%)
1 (2%)
(45)
(47) 21 (45%)
4 (9%) 1 (2%) 1 (2%) 1 (2%)
1 (2%) 42 (89%) 21 (45%)
1 (2%)1 (2%)
14 (30%)
43 (91%) 1 (2%) 1 (2%)
(47)
(35)
(43) 16 (37%) 4 (9%)
40 (93%) 19 (44%)
15 (35%)
42 (98%) 1 (2%) 1 (2%)
(43)
XKidneykubule Degeneration, NOS
#Kidney/pelvisHemorrhage Hematoma, NOS Inflammation, suppurative Inflammation, acute Hyperplasia, epithelial Angiectasis
#Urinary bladder Hemorrhage Inflammation, NOS Hyperplasia, epithelial
(49)
(49)
22 (45%)
(47)
22 (46%) 1 (2%)
1 (2%)(43)
1 (2%)
1 (2%) 19 (40%)
(45) 1 (2%) 1 (2%) 2 (4%)
(43)
(43)
1 (2%)
11 (26%) 2 (5%)
(35)
ENDOCRINE SYSTEM
Cyst, NOS Pigmentation, NOS Hyperplasia, focal Angiectasis
#Pituitary (47)1 (2%)
(42)1 (2%)
2 (5%)2 (5%)
(36) 1 (3%)
1 (3%)
(32) 1 (3%) 1 (3%)
Trichloroethylene, NTP TR 273 116

TABLE B4. SUMMARY OF THE INCIDENCE OF NONNEOPLASTIC LESIONS IN FEMALE ACI RATS IN THE TWO-YEAR GALVAGE STUDY OF TRICHLOROETHYLENE (Continued)
CONTROL (UNTR) CONTROL (VEH) LOW DOSE HIGH DOSE
ENDOCRINE SYSTEM (Continued) #Adrenal
Necrosis, focal Lipoidosis Pigmentation, NOS Angiectasis
#Adrenal cortex HemorrhageLipoidosisCytomegaly
#Adrenal medulla Hyperplasia, focal
#Thyroid Cyst, NOS Follicular cyst, NOS Inflammation, chronic Hyperplasia, C-cell
#Parathyroid Hyperplasia, NOS
REPRODUCTIVE SYSTEM *Mammary gland
Lactation #Uterus
Hydrometra HemorrhageHematometra
#Uterus/endometrium Accessory structure Cyst, NOS Hemorrhagic cyst Hyperplasia, cystic Decidual alteration, NOS
#OvaryCyst, NOS Follicular cyst, NOS
NERVOUS SYSTEM #Braidmeninges
Pigmentation, NOS *Central canal spinal cord
Retention fluid #Brain
Hydrocephalus, internal HemorrhageInflammation, acute focal Inflammation, chronic Malacia
*Spinal cord Hemorrhage
SPECIAL SENSE ORGANS *Eye/cornea
Inflammation, acute suppurative
(49) (48) (44) (40) 1 (2%) 1 (2%)
1 (3%) 1 (2%)
(49)
1 (3%) (44) (40)
1 (2%) (44) (38)
1 (3%)
(49)
1 (2%) 1 (2%)
1 (2%) 6 (12%) 1 (2%)
(48) (46) (46) (38) 1 (2%)
3 (6%) 2 (4%) 1 (3%)
(49)
(49)
(49) 1 (2%) 1 (2%) 1 (2%)
(49) 1 (2%)
(49) (50) (50) (46) 1 (2%)
117 Trichloroethylene, NTP TR 273

TABLE B4. SUMMARY OF THE INCIDENCE OF NONNEOPLASTIC LESIONS IN FEMALE ACI RATS IN THE TWO-YEAR GAVAGE STUDY OF TRICHLOROETHYLENE (Continued)
CONTROL (UNTR) CONTROL (VEH) LOW DOSE HIGH DOSE
MUSCULOSKELETAL SYSTEM *Skeletal muscle (49)
Abscess, chronic *Muscle of neck (49)
Inflammation, chronic
BODY CAVITIES *Mediastinum (49)
Inflammation, NOS Abscess, chronic
*Peritoneum (49)Inflammation, NOS
+Pleura (49)Inflammation, acute focal
ALL OTHER SYSTEMS Site unknown
Inflammation, granulomatoils 1
SPECIAL MORPHOLOGY SUMMARY No lesion reported Animal missing/no necropsy Autolnecropsyhisto perf Autalnecropsylno histo Autolysidno necropsy
1
1
2
2
1
1 4
* Number of animals receiving complete necropsy examination; all gross lesions including masses examined microscopically. # Number of animals examined miicroscopically at this site
Trichloroethylene, NTP TR 273 118

APPENDIX C
SUMMARY OF LESIONS IN MALE AUGUST RATS
IN THE TWO-YEAR GAVAGE STUDY OF
TRICHLOROETHYLENE
PAGE
TABLE C l SUMMARY OF THE INCIDENCE OF NEOPLASMS IN MALE AUGUST RATS IN THE TWO-YEAR GAL'AGE STUDY OF TRICHLOROETHYLENE 121
TABLE C2 INDIVIDUAL ANIMAL TUMOR PATHOLOGY OF MALE AUGUST RATS IN THE TWO-YEAR GAVAGE STUDY OF TRICHLOROETHYLENE 124
TABLE C3 ANALYSIS OF PRIMARY TUMORS IN MALE AUGUST RATS IN THE TWO-YEAR GAVAGE STUDY OF TRICHLOROETHYLENE 132
TABLE C4 SUMMARY OF THE INCIDENCE OF NONNEOPLASTIC LESIONS IN MALE AUGUST RATS IN THE TWO-YEAR GAVAGE STUDY OF TRICHLOROETHYLENE 134
119 Trichloroethylene, NTP TR 273

Trichloroethylene, NTPTR 273 120

TABLE C l . SUMMARY OF THE INCIDENCE OF NEOPLASMS IN MALE AUGUST RATS IN THE TWO-YEAR GAVAGE STUDY OF TRICHLOROETHYLENE
CONTROL (UNTR) CONTROL (VEH) LOW DOSE HIGH DOSE
ANIMALS INITIALLY IN STUDY 50 50 50 50 ANIMALS NECROPSIED 50 50 50 49 ANIMALS EXAMINED
HISTOPATHOLOGICALLY 50 50 50 49
INTEGUMENTARY SYSTEM *Skin (50) (50) (50) (49)
Squamous cell carcinoma 1 (2%) 1 (2%)
*Subcutaneous tissue (50) Basal cell carcinoma 1 (2%)
Sarcoma, NOS 1 (2%) Sarcoma, NOS, unclear primary or metasta Fibroma 1 (2%)
(50) (50)1 (2%)
(49)2 (4%) 1 (2%) 1 (2%)
RESPIRATORY SYSTEM #Lung
Squamous cell carcinoma Alveolar/bronchiolar adenoma Sarcoma, NOS, metastatic
(50)
1 (2%)
(50)
1 (2%)
(50) 1 (2%)
(49)
HEMATOPOIETIC SYSTEM *Multiple organs
Malignant lymphoma, NOS Malignant lymphoma, histiocytic type Leukemia, NOS Monocytic leukemia
(50)
1 (2%) 2 (4%)
(50)
1 (2%)
(50) 1 (2%)
(49) 2 (4%)
CIRCULATORY SYSTEM *Skeletal muscle
#Heart Hemangioma
Carcinoma, NOS Carcinoma, NOS, metastatic
(50)
(50) 1 (2%)1 (2%)
(50)
(50)
(50)
(50) 1 (2%)
(49)
(49)
DIGESTIVE SYSTEM #Salivary gland
#Liver Sarcoma, NOS,unclear primary or metast
Bile duct adenoma Neoplastic nodule
Papilloma, NOS
Squamous cell papilloma
#Stomach
#Forestomach
URINARY SYSTEM #Kidney
Squamous cell carcinoma Tubular cell adenoma Tubular cell adenocarcinoma
Transitional cell papilloma Transitional cell carcinoma
#Urinary bladder
(50)
1 (2%) (50)
(50)
1 (2%) 1 (2%)
(50)
(50) 1 (2%)1 (2%) 1 (2%)
(47)
(49)
1 (2%)
(44)
121 Trichloroethylene, NTP TR 273

TABLE Cl . SUMMARY OF THE INCIDENCE OF NEOPLASMS IN MALE AUGUST RATS IN THE TWO. YEAR GAVAGE STUDY OF TRICHLOROETHYLENE (Continued)
CONTROL (UNTR) CONTROL (VEH) LOW DOSE HIGH DOSE
ENDOCRINE SYSTEM #Pituitary
Carcinoma, NOS Adenoma, NOS Chromophobe adenoma
Cortical adenoma PheochromocytomaPheochromocytoma, malignant
#Adrenal medulla Pheochromocytoma Neurilemoma
#Thyroid C-cell adenoma C-cell carcinoma
#ParathyroidAdenoma, NOS
#Pancreatic islets islet cell adenoma
#Adrenal
(46)
15 (33%) 1 (2%)
6 (12%) 15 (31%)
(49)
(44) 3 (7%)
23 (52%)
(50) 5 (10%)
10 (20%)
(50)
1 (2%)
7 (15%) 1 (2%)
(46)
(26)
(50)5 (10%)
(41)
6 (15%) 1 (2%)
3 (6%) 5 (10%) 1 (2%)
(49)
(49)
(44)
(32)
(49) 1 (3%)
4 (10%)
(47)5 (11%) 2 (4%) 1 (2%)
(47)
(45)
(24)
(48)1 (2%)
REPRODUCTIVE SYSTEM +Mammary gland
*Preputial gland
#Testis
Adenoma, NOS Fibroma Fibroadenoma
Carcinoma, NOS Adenoma, NOS
Interstitial cell tumor
(50)
(50)
(50)
1 (2%)
1 (2%)
36 (72%)
(50)
(50)
(50)
1 (2%)
1 (2%)
34 (68%)
(50)
(50)
(50)
1 (2%)
30 (60%)
(49)
(49)
(49)
1 (2%)
1 (2%)
26 (53%)
NERVOUS SYSTEM #Brain
Granular cell tumor, NOS Granular cell tumor, malignant AstrocytomaOligodendroglioma
Astrocytoma *Spinal cord
(50) 1 (2%)
1 (2%)
1 (2%) (50)
(50) 1 (2%)
1 (2%)
(50)
(50)
1 (2%)
(50)
(49) 1 (2%)
(49)
SPECIAL SENSE ORGANS None
MUSCULOSKELETAL SYSTEM None
Trichloroethylene,NTP TR 273 122

TABLE C l . SUMMARY OF THE INCIDENCE OF NEOPLASMS IN MALE AUGUST RATS IN THE TWO-YEAR GAVAGE STUDY OF TRICHLOROETHYLENE (Continued)
CONTROL (UNTR) CONTROL (VEH) LOW DOSE HIGH DOSE
BODY CAVITIES *Mediastinum (50)
Sarcoma,NOS,unclear primary or metast
ALL OTHER SYSTEMS None
ANIMAL DISPOSITION SUMMARY Animals initially in study
Natural death 50 16
50 10
50 17
50 17
Moribund sacrifice 9 13 8 6 Terminal sacrifice 24 21 13 15 Dosing accident Accidentally killed, NOS Animal missexed
1 2 4
3 9
7 4 1
TUMOR SUMMARY Total animals with primary tumors** 43 45 32 27
Total primary tumors 98 98 58 52 Total animals with benign tumors 40 43 32 27
Total benign tumors 88 88 49 42 Total animals with malignant tumors 8 8 7 5
Total malignant tumors 9 8 8 6 Total animals with secondary tumors# # 1 1
Total secondary tumors 1 1 Total animals with tumors uncertain--
benign or malignant 1 1 1 Total uncertain tumors 1 1 1
Total animals with tumors uncertain-- primary or metastatic 1
Total uncertain tumors 1
* Number of animals receiving complete necropsy examination; all gross lesions including masses examined microscopically. ** Primary tumors: all tumors except secondary tumors # Number of animals examined microscopically at this site # # Secondary tumors: metastatic tumors or tumors invasive into an adjacent organ
123 Trichloroethylene, NTP TR 273

TABLE C2. INDIVIDUAL ANIMAL TUMOR PATHOLOGY OF MALE AUGUST RATS IN THE TWO-YEAR GAVAGE: STUDY OF TRICHLOROETHYLENE: UNTREATED CONTROL
ANIMAL 1 1 1 1 1 1 1 1 1 1 1 1 1 2 2 2 2 2 2 2 2 2 2 2 2 NUMBER 5 5 5 5 6 6 6 7 8 8 9 9 9 0 0 1 2 2 2 2 2 3 3 3 4
1 2 7 9 ' 2 8 9 9 0 6 0 7 9 2 8 9 3 4 6 8 9 2 3 9 6
WEEKS ON 0 0 0 1 0 1 1 1 1 0 1 1 0 1 0 0 1 1 0 0 1 1 1 1 0 STUDY 8 7 8 0 8 0 0 0 0 3 0 0 7 0 6 7 0 0 9 8 0 0 0 0 7
5 7 7 4 2 4 1 3 4 4 4 4 0 4 2 9 4 4 7 1 4 4 4 4 0
Skin . . . . . . . . . . . . . . . . . . . . . . . . . Squamous cell carcinoma X Basal cell carcinoma X
Subcutaneous tissue . . . . . . . . . . . . . . . . . . . . . . . . . Sarcoma, NOS Fibroma X
Lungs and bmnchi . . . . . . . . . . . . . . . . . . . . . . . . . Alveolar/bmnchiolar adenoma X
Trachea . . . . . . . . . . . . . . . . . . . . . . . . .
Bone marrow . . . . . . . . . . . . . . . . . . . . . . . . . Spleen . . . . . . . . . . . . . . . . . . . . . . . . . L mphnodes . . . . . . . . . . . . . . . . . . . . . . . . . Txymus - - - - - - - - - + - - - - + + - - - - - - - - -
Heart Carnnoma, NOS Carcinoma. NOS, metastatic
~ ~
Salivary gland . . . . . . . . . . . . . . . . . . . . . . . . . Liver . . . . . . . . . . . . . . . . . . . . . . . . .
Bile duct adenoma Bile duct + Gallbladder (L common bile duct N Pancreas ++++-
Kidney . . . . . . . . . . . . . . . . . . . . . . . . . Urinary bladder . . . . . . . . . . . . . . . . . . . . . . . . .
Transitional call papilloma
Pituitary . . . . . . . . . . . . . . . . . . . . . . . . . Adenoma. NOS X X X x x x x Chromophobe adenoma X
Adrenal . . . . . . . . . . . . . . . . . . . . . . . . . Cortical adenoma X X X Pheochromocytoma X X X X x x x
Th mid . . . . . . . . . . . . . . . . . . . . . . . . . &cell adenoma X
Parathy mid . . . . . . . . . . . . . . . . . . . . . . . . . Pancreatic isletr . . . . . . . . . . . . . . . . . . . . . . . . .
Islet cell adenoma X X X
Mammary gland + + + + + + + + + N + + N + + + + + N + + + + + N Fibroadenoma X .Testis..... . . . . . . . . . . . . . . . . . . . . . . . . .
Interstitial cell tumor x x x x x x x x x x x x x x x x x x x Prostate . . . . . . . . . . . . . . . . . . . . . . . . . Pre utiel/clitorsl gland N N N N N N N N N N N N N N N N N N N N N N N N N
A&noma, NOS X
Brain . . . . . . . . . . . . . . . . . . . . . . . . . Granular cell tumor, NOS Oligodendmglioma
Spinal cord . . . . . . . . . . . . . . . . . . . . . . . . . Astrocytoma
Multiple organs, NOS N N N N N N N N N N N N N N N N N N N N N N N N N Malignant lym homa. histiocytic type Leukemia, N& X X
+: Tissue exnmined microscopically ' No tissue information submitted -: Required tissue not examined microscopically C: Necropsy, no histology due to protocol X: Tumor incidence A AutolysisN: Necropsy. no autolysis, no microscopic examination M: Animal missing S: Animal missexed B: No necropsy performed
Trichloroethylene, NTP TR 273 124

TABLE C2. INDIVIDUAL ANIMAL TUMOR PATHOLOGY OF MALE AUGUST RATS UNTREATED
ANIMAL NUMBER
WEEKS ON STUDY
Skin Squamous cell Carcinoma Basal cell carcinoma
Subcutaneous tissue Sarcoma, NOS Fibroma
Lungs and bronchi Alveolar/bronchiolar adenoma
Trachea
M Bone marrow SpleenL mphnodes Tiyrnus
Heart Carcinoma, NOS Carcinoma, NOS,metastatic
Salivary gland Liver
Bile duct adenoma Bile duct Gallbladder & common bile duct Pancreas
Eoo::Ifls Small intestine Large intestine
KidneyUnnary bladder
Transitional cell papilloma
PituitaryAdenoma NOS ChrornopAobe adenoma
Adrenal Cortical adenoma Pheochromocytoma
ThyroidC cell adenoma
ParathyroidPancreatic islets
Islet cell adenoma
Mammary gland Fibroadenoma
Testis Interstitial cell tumor
Prostate Pre utial/chtoral gland
Aienoma, NOS
Brain Granular cell tumor, NOS Oligodendroglioma
Spinal cord Astrocytoma
ALL OTH-Multiple organs, NOS
Malignant lym homa, histiocytic type Leukemia. NOg
*Animals necropsied
CONTROL (Continued)
. . . . . . . . . . . . . . . . . . . . . . . . .
+ + + N + + + + + + + + + + + + + + + + + + N + + X
. . . . . . . . . . . . . . . . . . . . . . . . . .
. . . . . . . . . . . . . . . . . . . . . . . . .
. . . . . . . . . . . . . . . . . . . . . . . . . .
. . . . . . . . . . . . . . . . . . . . . . . . . .
. . . . . . . . . . . . . . . . . . . . . . . . . .
. . . . . . . . . . . . . . . . . . . . . . . . .
X
. . . . . . . . . . . . . . . . . . . . . . . . .
. . . . . . . . . . . . . . . . . . . . . . . . . X . . . . . . . . . . . . . . . . . . . . . . . . .
N N N N N N N N N N N N N N N N N N N N N N N N N . . . . . . . . . . . . . . . . . . . . . . . . . . . . . . . . . . . . . . . . . . . . . . . . . . . . . . . . . . . . . . . . . . . . . . . . . . . . . . . . . . . . . . . . . . . . . . . . . . . . + + S f + + + + + + + + + + + + + + + + + + + + +
. . . . . . . . . . . . . . . . . . . . . . . . . . . . . . . . . . . . . . . . . . . . . . . . . . X
. . . . . . . . . . . . . . . . . . . . . . . . . X x x X X x x X
. . . . . . . . . . . . . . . . . . . . . . . . . X X X x x x x x x x X X . . . . . . . . . . . . . . . . . . . . . . . . .
X Y + - + - + + + + + - + - + + + + + + - + + + - - + . . . . . . . . . . . . . . . . . . . . . . . . .
X X
N + + N N + + + + + + + + + + + + + N + + N N + +
. . . . . . . . . . . . . . . . . . . . . . . . . x x x x x x x x x x x x x x x x x . . . . . . . . . . . . . . . . . . . . . . . . . N N N N N N N N N N N N N N N N N N N N N N N N N
. . . . . . . . . . . . . . . . . . . . . . . . . X
X+ + + + + + + + + + + + + + + + + + + + + + + N +
X
N N N N N N N N N N N N N N N N N N N N N N N N N X
*50 1 1
*50 1 1
50 1
49
50 49 48
6
50 1 1
47 50
1 50
*50 49 50 50 49 49
50 50 1
46 15 1
49 6
16 49
3 40 49
5
'50 1
50 36 50
*50 1
50 1 1
'50 1
'50 1 2
125

- --
X
TABLE C2. INDIVIDUAL ANIMAL TUMOR PATHOLOGY OF MALE AUGUST RATS IN THE TWO-YEAR GAVA(GE STUDY OF TRICHLOROETHYLENE: VEHICLE CONTROL
I_~ M A L NUMBER
WEEKS ON STUDY
L u n e and bronchi Sarcoma, NOS,metastatic
Trachea
Bone marrow SpleenL mphncdesTxymus
Heart
DIOESTIVE-Salivary gland Liver Bile duct Gallbladder & common bile duct Pancreas
2:kr Squamous cell papilloma
Small intestine Large intestine
KidneyUnnary bladder
Transitional cell papilloma Transitional cell carcinoma
ENDOCRWESYSTEM Pituitary
Carcinoma, NOS Adenoma, NOS
Adrenal Cortical adenoma PheochromocytomaNeunlemoma
ThyroidC-cell adenoma C-cell carcinoma
ParathyroidPancreatic ialets
Islet cell adenoma
Mammary gland Fibroadenoma
Teatia Interstitial CEII tumor
Prostate PreputiaVclitoral gland
Carcinoma, NOS EM
Brain Granular cell tumor, NOS Astrocytoma
WMediastinum Sarcoma,NOS,unclear primary or metastatic
Multiple organs,NOS Monocytic leukemia
1 1 1 1 1 1 1 1 1 1 1 1 1 1 1 2 2 2 2 2 2 2 2 2 2 4 4 4 5 5 6 6 7 7 7 7 7 8 8 9 0 0 0 1 1 l l l l l 2 4 8 0 8 6 7 0 5 6 7 8 1 5 2 1 5 7 0 2 3 4 5 7 8
- c i 0 1 0 1 1 1 1 0 0 0 1 1 1 1 1 1 0 0 1 0 0 0 0 l 9 7 0 7 0 0 0 0 5 8 7 0 0 0 0 0 0 0 9 0 8 9 7 6 0 7 3 4 9 3 4 4 4 1 3 2 4 4 4 4 4 4 6 0 4 8 2 8 9 4
. . . . . . . . . . . . . . . . . . . . . . . . .
. . . . . . . . . . . . . . . . . . . . . . . . .
. . . . . . . . . . . . . . . . . . . . . . . . . . . . . . . . . . . . . . . . . . . . . . . . . .
. . . . . . . . . . . . . . . . . . . . . . . . . _ - _ _ _ _ _ _ _ _ _ _ _ _ _ _ - _ - - _ _ _ _ _
. . . . . . . . . . . . . . . . . . . . . . . . .
. . . . . . . . . . . . . . . . . . . . . . . . .
. . . . . . . . . . . . . . . . . . . . . . . . .
. . . . . . . . . . . . . . . . . . . . . . . . . N N N N N N N N N N N N N N N N N N N N N N N N N . . . . . . . . . . . . . . . . . . . . . . . . . . . . . . . . . . . . . . . . . . . . . . . . . . . . . . . . . . . . . . . . . . . . . . . . . . .
X . . . . . . . . . . . . . . . . . . . . . . . . . . . . . . . . . . . . . . . . . . . . . . . . . .
. . . . . . . . . . . . . . . . . . . . . . . . . . . . . . . . . . . . . . . . . . . . . . . . . . X
. . . . . . . . . . . . . . . . . . . . . . . . . x x x x x x x x x x x x x x . . . . . . . . . . . . . . . . . . . . . . . . .
X X X X X x x x X
Y . . . . . . . . . . . . . . . . . . . . . . . . .
x x x X x x + - - - + + - + - + - - + - + + + - + + + - - - -. . . . . . . . . . . . . . . . . . . . . . . . .
x x x
N N + N N + + + N + + + + + + + + N + + + + N + +
. . . . . . . . . . . . . . . . . . . . . . . . . R X X x x x x x x x x x x x x x x x X . . . . . . . . . . . . . . . . . . . . . . . . . N N N N N N N N N N N N N N N N N N N N N N N N N
. . . . . . . . . . . . . . . . . . . . . . . . . X
X
V N N N N N N N N N N N N N N N N N N N N N N N N X
Y N N N N N N N N N N N N N N N N N N N N N N N N X
Trichloroethylene, NTP TR 273 126

__
TABLE C2. INDIVIDUAL ANIMAL TUMOR PATHOLOGY OF MALE AUGUST RATS: VEHICLE CONTROL
ANIMAL NUMBER
WEEKS ON STUDY
Lungs and bronchi Sarcoma,NOS,metastatic
Trachea
M Heart
Salivary gland Liver Bile duct Gallbladder 8i common bile duct Pancreas
:;:::RusSquamous cell papilloma
Small intestine Large inteatine
KidneyUnnary bladder
Transitional cell papilloma Transitional cell carcinoma
Adenoma, P Adrenal
Cortical adenoma PheoehmmocytomaNeurilemoma
ThyroidC-cell adenoma C-cell carcinoma
ParathyroidPancreatic islets
Islet cell adenoma
Mammary gland Fibroadenoma
Testis Interstitial cell tumor
Prostate PreputiaUclitoral gland
Carcinoma. NOS
Brain Granular cell tumor, NOS Astrocytoma
S Mediastinum
Sarcoma,NOS,unclear pnm or metastat
Multiple organs NOS Monocytic leukemia
* Animals necropsied
(Continued) 2 2 2 2 2 2 2 2 2 2 2 2 2 2 2 2 2 3 3 3 3 3 3 . 3 3 2 2 3 3 4 4 4 4 4 5 6 7 7 8 8 9 9 0 0 1 3 3 3 3 3 2 5 4 7 3 4 7 8 9 4 0 8 9 8 9 2 6 4 6 6 3 4 5 6 7
0 0 0 0 0 0 1 0 0 0 0 0 1 1 0 0 1 1 1 1 1 1 1 1 1 5 9 6 6 9 8 0 9 5 7 7 6 0 0 8 9 0 0 0 0 0 0 0 0 0 0 9 8 5 8 3 4 5 7 8 6 8 1 3 6 9 4 4 4 4 3 4 4 4 4
. . . . . . . . . . . . . . . . . . . . . . . . .
. . . . . . . . . . . . . . . . . . . . . . . . .
. . . . . . . . . . . . . . . . . . . . . . . . . . . . . . . . . . . . . . . . . . . . . . . . . . . . . . . . . . . . . . . . . . . . . . . . . . . - - - - - - - - - - + - - - - - - - - - - - - - -
. . . . . . . . . . . . . . . . . . . . . . . . . ~ ~~~~~~~~ ~~~~~
. . . . . . . . . . . . . . . . . . . . . . . . . . . . . . . . . . . . . . . . . . . . . . . . . . . . . . . . . . . . . . . . . . . . . . . . . . . N N N N N N N N N N N N N N N N N N N N N N N N N . . . . . . . . . . . . . . . . . . . . . . . . . . . . . . . . . . . . . . . . . . . . . . . . . . . . . . . . . . . . . . . . . . . . . . . . . . . . . . . . . . . . . . . . . . . . . . . . . . . . . . . . . . . . . . . . . . . . . . . . . . . . .
. . . . . . . . . . . . . . . . . . . . . . . . . . . . . . . . . . . . . . . . . . . . . . . . . . X
. . . . . . . . . . . . . . . . . . . . . . . . . x x X
X X X x x x x x x . . . . . . . . . . . . . . . . . . . . . . . . . X X X
X x x . . . . . . . . . . . . . . . . . . . . . . . . .
X X- + - - + + + + - - + - + + + - + - + + + - - + -. . . . . . . . . . . . . . . . . . . . . . . . .
X X
N N N N N + + N + N + N N + + N + + + + + + + + + X . . . . . . . . . . . . . . . . . . . . . . . . .
X x x x x x x x x x x x x x x . . . . . . . . . . . . . . . . . . . . . . . . . N N N N N N N N N N N N N N N N N N N N N N N N N
X
. . . . . . . . . . . . . . . . . . . . . . . . .
N N N N N N N N N N N N N N N N N N N N N N N N N
V N N N N N N N N N N N N N N N N N N N N N N N N
-
POTAL: 'ISSUES 'UMORS
-50 1
48 -
50 50 45 1
so
50 50 50
*50 50 48 50 1
48 50
50 50 1 1
44 3
23 50 5
10 1
46 7 1 26 50 5
*50 1
50 34 50
'50 1
50 1
-1
*50 1
'50 1 -
127 Trichloroethylene, NTP TR 273

TABLE C2. INDIVIDUAL ANIMAL TUMOR PATHOLOGY OF MALE AUGUST RATS IN THE TWO-YEAR GAVAGE STUDY OF TRICHLOROETHYLENE: LOW DOSE
ANIMAL 1 1 1 1 1 1 1 1 1 1 1 1 1 1 1 1 1 1 2 2 2 2 2 2 2 NUMBER 4 4 4 4 4 5 6 6 7 7 7 7 8 8 8 8 8 9 0 0 0 0 1 2 3
1 3 6 7 9 4 0 5 1 2 3 4 2 3 4 7 9 5 0 3 4 9 6 0 6
1 0 0 0 0 1 0 0 1 0 0 0 0 1 0 0 1 1 0 0 1 0 0 1 0 0 8 7 0 5 0 2 1 0 7 3 9 1 0 6 2 0 0 3 8 0 9 7 0 6 4 9 6 8 3 4 5 0 0 1 4 2 2 4 7 0 4 4 4 3 4 2 3 4 6
Skin . . . . . . . . . . . . . . . . . . . . . . . . . Squamous cell carcinoma
Subcutaneouatissue . . . . . . . . . . . . . . . . . . . . . . . . . Sarcoma. NOS
~ ~~ ~~ ~ ~
Lung8 and bronchi . . . . . . . . . . . . . . . . . . . . . . . . . Squamous call carcinoma
Trachea . . . . . . . . . . . . . . . . . . . . . . . . .
Bonemarmw . . . . . . . . . . . . . . . . . . . . . . . . . Spleen . . . . . . . . . . . . . . . . . . . . . . . . . L mphnodes . . . . . . . . . . . . . . . . . . . . . . . . . Tgymus - - + + - - - + - - + - + - - + - - + - - - - - -
Heart . . . . . . . . . . . . . . . . . . . . . . . . . M
Salivary gland . . . . . . . . . . . . . . . . . . . . . . . . . Liver ~ + + + + * + + + + + t + + + + + + + + t + + + + + l
Neoplastic nodule X Bile duct . . . . . . . . . . . . . . . . . . . . . . . . . Gallbladder & common bile duct N N N N N N N N N N N N N N N N N N N N N N N N N Pancreas . . . . . . . . . . . . . . . . . . . . . . . . . . . . . . . . . . . . . . . . . . . . . . . . . . :;::W . . . . . . . . . . . . . . . . . . . . . . . . . Small intestine . . . . . . . . . . . . . . . . . . . . . . . . . . Large intestine . . . . . . . . . . . . . . . . . . . . . . . . .
Kidney . . . . . . . . . . . . . . . . . . . . . . . . . Squamous cell carcinoma Tubular cell adenoma X Tubular cell adenocarcinoma X
Urinary bladder . . . . . . . . . . . . . . . . . . . . . . . . .
Pituitary - + + A + + - - + + + + + - - - + + + + + + + + -Adenoma, NOS X Chromophobe adenoma X
Adrenal . . . . . . . . . . . . . . . . . . . . . . . . . x iCortical adenoma Pheochromocytoma X X X Pheochromocytoma. malignant X
Thyroid . . . . . . . . . . . . . . . . . . . . . . . . . Parathyrold + + - + + + - - + + + - - + + - + + - + + - - + +
Adenoma. NOS l x Mammary gland
Fibroma ( + + + N N + N N + + N + N + N N + + N + t + N ++ I Testis . . . . . . . . . . . . . . . . . . . . . . . . .
Interstitial cell tumor x x x X X x x x x x x x - - x x x i Prostate . . . . . . . . . . . . . . . . . . . . . . . . . -Brain . . . . . . . . . . . . . . . . . . . . . . . . .
Granular cell tumor, malignant
Muscle N + N + N N + + N N N N + N N + N N N N N N N N N Hemanporna 1 x
Multiple organs, NOS N N N N N N N N N N N N N N N N N N N N N N N N N Malignant lymphoma, NOS X
Trichloroethylene, NTPTR 273 128

TABLE C2. INDIVIDUAL ANIMAL TUMOR PATHOLOGY OF MALE AUGUST RATS LOW DOSE
ANIMAL NUMBER
WEEKSON STUDY
Slun Squamous cell carciooma
Subcutaneoustissue Sarcoma, NOS
Lungs and bronchi Squamous cell carcinoma
Trachea
Bone marrow SpleenL mphnodesTiymus
Heart
Salivary gland Liver
Neoplastic nodule Bile duct Gallbladder & common bile duct Pancreas
Et%Y Small intestine Large intestine
KidneySquamous cell carcinoma Tubular cell adenoma Tubular cell adenocarcinoma
Unnary bladder
M Pituitary
Adenoma, NOS Chromophobe adenoma
Adrenal Cortical adenoma PheochromocytomaPheochromocytoma, malignant
ThyroidParathyroid
Adenoma, NOS
Mammary gland Fibroma
Testis Interstitial cell tumor
Prostate
Brain Granular cell tumor, malignant
Muscle Hemangioma
Multiple organs, NOS Malignant lymphoma, NOS
* Animals necropsied
(Continued) 2 3 3 3 3 3 3 3 3 3
4 5 5 5 6 6 6 7 7 7 8 8 9 9 9 9 0 1 1 2 2 2 2 2 3 m222222221212221 2 7 , 8 2 6 7 1 2 5 2 4 0 1 7 8 9 2 7 0 2 4 5 6 0 TOTAL: PISSUES rUMOR5
. . . . . . . . . . . . . . . . . . . . . . . . . $50 1 . . . . . . . . . . . . . . . . . . . . . . . . . '50
X 1
. . . . . . . . . . . . . . . . . . . . . . . . . 50 X 1 . . . . . . . . . . . . . . . . . . . . . . . . . 42
. . . . . . . . . . . . . . . . . . . . . . . . . 49 . . . . . . . . . . . . . . . . . . . . . . . . . 48 . . . . . . . . . . . . . . . . . . . . . . . . . 43- - - - - - - - + - - - - - - - - - - - - - - + - 9
. . . . . . . . . . . . . . . . . . . . . . . . . 50
+ + + + + + t + + + + + + + + + + + + + + + + t t 49 . . . . . . . . . . . . . . . . . . . . . . . . . 50 1 . . . . . . . . . . . . . . . . . . . . . . . . . 50
N N N N N N N N N N N N N N N N N N N ! N N + N N *50+ + + + + + + + + + + + + + + + + + + + + + + + 49 . . . . . . . . . . . . . . . . . . . . . . . . . 48 . . . . . . . . . . . . . . . . . . . . . . . . . 50 . . . . . . . . . . . . . . . . . . . . . . . . . 48 . . . . . . . . . . . . . . . . . . . . . . . . . 50
. . . . . . . . . . . . . . . . . . . . . . . . . 50 X 1
1 1 . . . . . . . . . . . . . . . . . . . . . . . . . 47
. . . . . . . . . . . . . . . . . . . . . . . . . 41 X x x x 6
1 . . . . . . . . . . . . . . . . . . . . . . . . . 49 X x x 3
X 5 1 . . . . . . . . . . . . . . . . . . . . . . . . . 44+ + + + - - - + - + + + + + - + + - - + - + + - + 32
X 1 ~ ~~ ~ ~_ _ _ ~
N + N N + N N + N N N + N + N + + N N N N + + N N '50 1 . . . . . . . . . . . . . . . . . . . . . . . . . 50
x x x x x x x x x x x x x x x 30 . . . . . . . . . . . . . . . . . . . . . . . . . 48
. . . . . . . . . . . . . . . . . . . . . . . . . 50 X 1
+ N N N N N N N + N N N N N N N N + N + N N N + N '50 1
V N N N N N N N N N N N N N N N N N N N N N N N N *50 1
129 Trichloroethylene, NTP TR 273

TABLE CB. INDIVIDUAL ANIMAL TUMOR PATHOLOGY OF MALE AUGUST RATS IN THE TWO-YEAR GAVAGE STUDY OF TRICHLOROETHYLENE: HIGH DOSE
ANIMAL NUMBER
WEEKS ON STUDY
Subcutaneous tissue Sarcoma NOS Sarcoma: NOS, unclear pnmary or metastatic Fibroma
Lun and bronchi T r a x e a
Bone marrow SpleenL mphnodea Tiyrnus
Heart
Salivary gland Sarcoma, NOS,unclear pnmary or metastatic
Liver Neoplastic nodule
Bile duct Gallbladder b common bile duct Pancreas
:;::krPa illoma NOS
s m a t inteaiine Large intestine
KidneyTubular eel1 sdanoma
Unnary bladder
PituitaryAdenoma, NOS
Adrenal Cortical adenoma PheochromocytomaPheochromocytoma. malignant
ThyroidParathyroidPancreatic lslets
Islet cell adenoma
Mammary gland Adenoma, NOS
Testis
Brain Granular ml1tumor, NOS
Multiple organs, NOS Malignant lymphoma, NOS
1 1 1 1 1 1 1 1 1 1 1 1 1 2 2 2 2 2 2 2 2 2 2 2 2 4 5 5 5 6 6 6 8 9 9 9 9 9 0 1 2 2 3 3 3 3 4 4 4 5 5 3 5 6 1 3 4 8 1 3 4 6 8 6 1 1 7 0 1 5 8 0 2 5 1
0 0 1 1 0 0 0 1 0 1 0 0 0 0 0 0 0 0 0 0 0 1 1 0 0 2 6 0 0 6 0 3 0 7 0 6 5 2 9 2 9 0 5 3 3 1 0 0 7 6 1 7 4 4 7 8 2 4 2 4 8 8 9 7 9 5 6 5 0 2 3 4 4 3 8
. . . . . . . . . . . . . . . . . . . . . . . . . + + + + + - - + + + + - + + + + S + + + + + + + +
. . . . . . . . . . . . . . . . . . . . . . . . .
. . . . . . . . . . . . . . . . . . . . . . . . . + + + + + - - + - + - + + + + + s - - + - + + + ++ - - - - + - - - - - - - - - - s - + - + - - - -
. . . . . . . . . . . . . . . . . . . . . . . . .
. . . . . . . . . . . . . . . . . . . . . . . . . X
+ + + + + + + + + + + + - + + + S f + + + + + + +
+ + + + + + + + + + + + - + + + S f + + + + + + + N N N N N N N N N N N N N N N N S N N N N N N N N + + + + + + + + + + + - + + + + S + + + + + + + + . . . . . . . . . . . . . . . . . . . . . . . . . . . . . . . . . . . . . . . . . . . . . . . . . .
X . . . . . . . . . . . . . . . . . . . . . . . . . . . . . . . . . . . . . . . . . . . . . . . . . .
. . . . . . . . . . . . . . . . . . . . . . . . .
+ + + + - + - + - + + + + + + + s + + + + + + - +
+ - + + + + + + + + + + + + + + s + + + + + + + , +X
. . . . . . . . . . . . . . . . . . . . . . . . . x
X
. . . . . . . . . . . . . . . . . . . . . . . . . - + + + + - - + + + - - + + + + S f + - + - + - -. . . . . . . . . . . . . . . . . . . . . . . . .
N N N + + N N + + N N N N + N N S N N N + + N + + X
. . . . . . . . . . . . . . . . . . . . . . . . . x x x x x x x x x x x x + + + + + + + + + + + + + + + + S f + + + + + + + N N N N N N N N N N N N N N N N S N N N N N N N N
. . . . . . . . . . . . . . . . . . . . . . . . .
N N N N N N N N N N N N N N N N S N N N N N N N N X
Trichloroethylene, NTP TR 273 130

TABLE C2. INDIVIDUAL ANIMAL TUMOR PATHOLOGY OF MALE AUGUST RATS: HIGH DOSE (Continued)
ANIMAL 2 3 3 3 3NUMBER 5 5 5 5 8 8 6 8 8 8 9 9 0 0 1 1 1 1 2 2 2 2 3 3 4
3 5 6 9 3 4 5 9 0 8 3 4 3 7 4 5 8 9 1 3 7 9 2 9 1
WEEKS ON 1 1 0 0 0 1 1 0 0 1 0 ~ 0 0 l 0 1 0 0 0 0 1 ~ 1 1 SRlDY 0 0 2 0 5 0 0 8 9 0 4 6 2 8 0 0 0 4 5 8 5 0 7 0 0
4 4 3 7 9 4 4 9 9 4 7 9 8 5 4 8 4 5 0 1 9 4 2 4 4
Subcutaneous tissue *49 Sarcoma, NOS 2 Sarcoma, NOS.unclear prim or metasta 1 Fibroma 1
Lun and bronchi . . . . . . . . . . . . . . . . . . . . . . . . . 49 Tracyea . . . . . . . . . . . . . . . . . . . . . . . . . 42
Bone marrow . . . . . . . . . . . . . . . . . . . . . . . . . 49 Spleen . . . . . . . . . . . . . . . . . . . . . . . . . 49 L mphnodes + + - + - + + + + + - - - + + - + - + - + + - + + 33
+ - - - - - -dymus - - + + - - - - - - - - - - - + - - 8
Heart . . . . . . . . . . . . . . . . . . . . . . . . . 49
Sa:ivery gland . . . . . . . . . . . . . . . . . . . . . . . . . 46 Sarcoma, NOS.unclear pnm or metasta 1
Liver . . . . . . . . . . . . . . . . . . . . . . . . . 48 Neoplastic nodule X 1
Bile duct . . . . . . . . . . . . . . . . . . . . . . . . . 48 Gallbladder b common bile duct N N N N N N N N N N N N N N N N N N N N N N N N N '49 Pancreas . . . . . . . . . . . . . . . . . . . . . . . . . 48 . . . . . . . . . . . . . . . . . . . . . . . . . 47:sOof:fY . . . . . . . . . . . . . . . . . . . . . . . . . 49
Pa illoma, NOS 1 SmaPi intestine + + + + + + + + + + t + + t + - - + + + + + + + + 44 Large intestine . . . . . . . . . . . . . . . . . . . . . . . . . 44
Kidney . . . . . . . . . . . . . . . . . . . . . . . . . 49 Tubular cell adenoma X 1
Unnary bladder . . . . . . . . . . . . . . . . . . . . . . . . . 44
Pituitary + + - - - + + - + + + - + + + - - + + + + + + + + 41 Adenoma. NOS X X X 4
Adrenal . . . . . . . . . . . . . . . . . . . . . . . . . 47 Cortical adenoma x x x X 5Pheochromocytoma X 2 Pheochromocytoma, malignant X 1
Thyroid . . . . . . . . . . . . . . . . . . . . . . . . . 45 Parathyroid + + - - + - - + + + - - - - - - + - - - + - - + - 24 Pancreatic islets . . . . . . . . . . . . . . . . . . . . . . . . . 48
Islet cell adenoma X 1
Mammary gland N N N N + + N + N N N + N + N N N N N + N N + + N *49 Adenoma, NOS 1
Testis . . . . . . . . . . . . . . . . . . . . . . . . . 49 Interstitial cell tumor x x x x x x x x x x x x x x 28
Prostate . . . . . . . . . . . . . . . . . . . . . . . . . 48 Preputial/clitoral gland N N N N N N N N N N N N N N N N N N N N N N N N N *49
Carcinoma, NOS X 1
M Brain . . . . . . . . . . . . . . . . . . . . . . . . . 49
Granular cell tumor, NOS X 1
A-S Multiple organa. NOS '49
Malignant lymphoma. NOS 2
* Animals necropsied
131 Trichloroethylene, NTP TR 273

TABLE C3. ANALYSIS OF PIRIMARY TUMORS IN MALE AUGUST RATS IN THE TWO-YEAR GAVAGE STUDY OF TRICHLOROETHYLENE
Uintreated Ve hicle Control Control 500 m g k g 1,000 mg/kg
Subcutaneous Tissue: Sarcoma or Sarcoma, Unclear Primary or Metastatic Overall Rates (a) 1150(2%) 0/50 (0%) 1/50(2%) Adjusted Rates(b) 3.8% 0.0% 2.9% Terminal Rates (c) 0124 (0%) 0121 (0%) 0/13 (0%)Life Table Tests (d) P=0.033 P =0.440 Incidental Tumor Tests (d) P=0.032 P =0.519 Cochran-Armitage Trend Test (d) P=0.058 Fisher Exact Test P =0.500
3/49 (6%) 15.0% 1/16 (6%) P=0.064 P=0.050
P=0.117
Pituitary: Adenoma Overall Rates (a) 16/46 (35%) Adjusted Rates (b) 55.5% Terminal Rates (c) 11/23 (48%) Life Table Tests (d) Incidental Tumor Tests (d) Cochran-Armitage Trend Test (d) Fisher Exact Test
23/44 (52%) 70.3% 12/21 (57%) P = 0.001N P<0.001 N P<O.OOlN
7/41 (17%) 34.9% 2/11 (18%) P =0.069N P =0.010N
P =0.001N
4/41 (10%) 26.7% 4/15 (27%) P =0.002N P<0.001N
P <0.001N
Pituitary: Carcinoma Overall Rates (a) 0/46 (0%) Adjusted Rates (b) 0.0% Terminal Rates (c) 0123 (0%)Life Table Tests (d) Incidental Tumor Tests (d)Cochran-Armitage Trend Test (d) Fisher Exact Test
3/44 (7%) 14.3% 3/21 (14%) P =0.074N P=0.074N P=0.042N
0/41(0%) 0.0% 0/11(0%)P =0.252N P =0.252N
Pr0.134N
0141 (0%) 0.0% 0/15 (0%) P=O.l83N P=0.183N
P=0.134N
Pituitary: Adenoma or Carcinoma Overall Rates (a) 16/46 (35%)
Terminal Rates(c) 11/23 (48%) Life Table Tests (d) Incidental Tumor Testa (d) Cochran-Armitage Trend Test (d) Fisher Exact Test
Adjusted Rates (b) 55.5% 26/44 (59%)
15/21 (71%)
P<O.OOlN
80.2%
P<0.001N
P <0.001N
7/41 (17%)
2/11 (18%) P =0.027N P =0.002N
P <0.001 N
34.9% 4/41 (10%)26.7% 4/15 (27%) P<0.001N P<0.001N
P<0.00 1N
Adrenal: Cortical Adenoma Overall Rates (a) 6/49 (14%) Adjusted Rates (b) 23.5% Terminal Rates (c) 5/24 (21%) Life Table Tests (d) Incidental Tumor Tests (d) Cochran-Armitage Trend Test (d) Fisher Exact Test
5/50 (10%) 20.0% 3/21 (14%) P =0.356 P=0.271 P=0.533
3/49 (6%) 20.4% 2/13 (15%) P =0.627N P = 0.633N
P =0.369N
5/47 (11%)29.4% 4/16 (25%) P = 0.414 P=0.333
P =0.590
Adrenal: Pheochromocytoma Overall Rates (a) 16/49 (33%) Adjusted Rates (b) 63.7% Terminal Rates ( c ) 15/24 (63%) Life Table Tests (d) Incidental Tumor Tests (d) Cochran-Armitage Trend Test (d) Fisher Exact Test
10150(20%J 41.0% 7/21 (33%) P=0.039N P=0.053N P=0.012N
5/49 (10%) 33.9% 4/13 (31%) P =0.455N P=0.460N
P =0.140N
2/47 (4%) 12.5% 2/16 (13%) Pr0.049N P=0.073N
P =O.O18N
Adrenal: Pheochromocytoma or Pheochromocytoma, Malignant Overall Rates (a) 16/49 (33%) 10150 (20%) Adjusted Rates(b) 63.7% 41.0% Terminal Rates (c) 15/24 (63%) 7/21 (33%) Life Table Tests (d) P =0.090N Incidental Tumor Tests (d) Cochran-Armitage Trend Test (d) Fisher Exact Test
P=0.1 19N P = 0.033N
6/49 (12%) 41.3% 5/13 (38%) P =0.602N P=0.61ON
P =0.220N
3/47 (6%) 18.8% 3/16 (19%) P =0.104N P =0.150N
P =0.046N
Trichloroethylene, NTP TR 273 132

TABLE C3. ANALYSIS OF PRIMARY TUMORS IN MALE AUGUST RATS I N THE TWO-YEAR GAVAGE STUDY OF TRICHLOROETHYLENE (Continued)
Untreated Vehicle ControI Control 500 mg/kg 1,ooO
Thyroid: C-cell Adenoma Overall Rates (a) 3/49 (6%) 7146 (15%) 0144 (0%) 0145 (0%) Adjusted Rates (b) 13.0% 27.1% 0.0% 0.0% Terminal Rates (c) 3/23 (13%) 4/21 (19%) 0113(0%) 0116 (0%) Life Table Tests (d) P=0.005N P=0.041N P=0.030N Incidental Tumor Tests (d) P=0.005N P =0.035N P=0.030N Cochran-Armitage Trend Test (d) P =0.001N Fisher Exact Test P =0.007N P- 0.007N
Thyroid: C-Cell Adenoma or Carcinoma Overall Rates (a) 3/49 (6%) 8/46 (17%) 0144 (0%) 0145 (0%) Adjusted Rates (b) 13.0% 31.4% 0.0% 0.0% Terminal Rates (c) 3/23 (13%) 5/21 (24%) 0113 (0%) 0116(0%) Life Table Tests (d) P =0.003N P=0.027N P=O.O18N Incidental Tumor T e s t td) P =0.003N P =0.023N P=O.O18N Cochran-Armitage Trend Test (d) P<0.001 N Fisher Exact Test P=0.003N P=0.003N
Pancreatic Islets: Islet Cell Adenoma Overall Rates (a) 5/49 (10%) 5/50 (10%) 0149 (0%) 1/48 (2%) Adjusted Rates (b) 19.8% 22.0% 0.0% 6.3% Terminal Rates (c) 4/24(17%) 4/21 (19%) 0113 (0%) 1/16(6%)Life Table Tests (d) P=0.079N P=0.088N P = 0.181N Incidental Tumor Tests (d) P=0.094N P =0.098N P=0.210N Cochran-Armitage Trend Test (d) P =0.040N Fisher Exact Test P=0.030N P=0.112N
Testis: Interstitial Cell Tumor Overall Rates (a) 36/50 (72%) 34/50 (68%) 30150 (60%) 26/49 (53%) Adjusted Rates (b) 97.2% 97.1% 96.7% 100.0% Terminal Rates (c) 23/24 (96%) 20121 (95%) 12113 (92%) 16/16 (100%) Life Table Tests (d) P =0.279 Pz0.049 P=0.385 Incidental Tumor Tests (d) P=0.129 P=0.055 P=0.179 Cochran-Armitage Trend Test (d) P=0.078N Fisher Exact Test P=0.267N P=0.094N
(a)Number oftumor-bearing animals/number ofanimals examined at the site (b)Kaplan-Meier estimated tumor incidence at the end of the study after adjusting for intercurrent mortality (c) Observed tumor incidence at terminal kill (d)Beneath the control incidence are the P values associated with the trend test. Beneath the dosed group incidence are the Pvalues corresponding to pairwise comparisons between that dosed group and the vehicle controls. The life table analysis regards tumors in animals dying prior to terminal kill as being (directly or indirectly) the cause of death. The incidental tumor test regards these lesions as nonfatal. The Cochran-Armitage and Fisher exact tests compare directly the overall incidence rates. A negative trend or lower incidence in a dosed group is indicated by (N).
133 Trichloroethylene, NTPTR 273

TABLE C4. SUMMARY OF THE INCIDENCE NONNEOPLASTIC LESIONS OF MALE AUGUST RATS IN THE: TWO-YEAR GAVAGE STUDY OF TRICHLOROETHYLENE
CONTROL (UNTR) CONTROL (VEH) LOW DOSE HIGH DOSE
ANIMALS INITIALLY IN STUDY 50 50 50 50 ANIMALS NECROPSIED 50 50 50 49 ANIMALS EXAMINED
HISTOPATHOLOGICALLY 50 50 50 49
INTEGUMENTARY SYSTEM 'Subcutaneous tissue
Hemorrhage Abscess, chronic
(50) 1 (2%)
(50) (50)
1 (2%)
(49)
1 (2%)
RESPIRATORY SYSTEM
Hemorrhage
Inflammation, acute Foreign material, NOS
Hemorrhage
Aspiration, foreign body Emphysema, alveolar Congestion, NOS Edema, NOS HemorrhageInflammation, NOS Inflammation, focal Inflammation, multifocal Inflammation, interstitial Pneumonia, aspiration Bronchopneumonia, acute Inflammation, acute Inflammation, acutekhronic Inflammation, chronic Pneumonia, interstitial chronic Inflammation, chronic focal Inflammation, granulomatous Inflammation, granulomatous focal Foreign material, NOS Alveolar macrophages
Hemorrhage
*Tracheal lumen
#Trachea
#Tracheal submucosa
#Lung
KLunglalveoli
(50)
(49)1 (2%) 2 (4%)
(49)
(50)
2 (4%) 2 (4%) 4 (8%) 1 (2%) 1 (2%)
3 (6%) 4 (8%)
1 (2%)
1 (2%) 5 (10%) 6 (12%) 2 (4%)
1 (2%) (50)
(50)
(48) 1 (2%)
1 (2%)(48)
(50)
4 (8%) 1 (2%)7 (14%) 2 (4%)
1 (2%)
1 (2%)
3 (6%)
4 (8%) 4 (8%)
19 (38%) 3 (6%)
(50)
(50)
(42) 1 (2%)
2 (5%) (42)
(50) 1 (2%)
3 (6%) 1 (2%)
13 (26%) 2 (4%) 1 (2%) 1 (2%)
1 (2%) 2 (4%) 1 (2%)
4 (8%) 2 (4%)
16 (32%) 10 (20%)
1 (2%) (50)
(49)
(42)
3 (7%)
1 (2%) (42)
(49)
2 (4%) 8 (16%) 4 (8%)
12 (24%)
2 (4%) 1 (2%)
1 (2%) 5 (10%)
1 (2%) 1 (2%) 2 (4%) 3 (6%)
12 (24%) 8 (16%) 1 (2%)
(49)
HEMATOPOIETIC SYSTEM #Bone marrow
#Spleen Hyperplasia, granulocytic
Congestion, NOS Hemorrhage Hyperplasia, lymphoid Hematopoiesis
#Lymph node Congestion, NOS
#Pancreatic lymph node Hemorrhage
#Mesenteric lymph node Congestion, NOS Hemorrhage
Hematopoiesis #Liver
(50)
(49)
6 (12%) (48)
(48)
(48)
1 (2%)
1 (2%) (50)
(50)
(50)
1 (2%)5 (10%)
(45)
(45)
(45)
(50)
(49)
(48) 2 (4%) 1 (2%)
2 (4%)
2 (5%)
1 (2%)
(43)
(43)
(43)
2 (5%) (50)
(49)
(49) 1 (2%)
2 (4%)
8 (16%) (33)
(33)
(33) 2 (6%) 2 (6%)
(48)
Trichloroethylene, NTP TR 273 134

TABLE C4. SUMMARY OF THE INCIDENCE OF NONNEOPLASTIC LESIONS IN MALE AUGUST RATS IN THE TWO-YEAR GAVAGE STUDY OF TRICHLOROETHYLENE (Continued)
~
CONTROL (UNTR) CONTROL (VEH) LOW DOSE HIGH DOSE
HEMATOPOIETIC SYSTEM (Continued) #Thymus
Hemorrhage Karyorrhexis
(6) (1) (9)2 (22%) 1 (11%)
(8)1 (13%)
CIRCULATORY SYSTEM
Mineralization #Heart (50)
Hemorrhage Inflammation, focal Inflammation, chronic Inflammation, chronic focal Fibrosis, focal Degeneration, NOS
Degeneration, NOS
Hyperplasia, focal
Calcification, focal
#Myocardium
#Endocardium
*Pulmonary artery
1 (2%) 1 (2%) 1 ( 2 % ) 1 ( 2 % )
(50)
(50)
(50)
1 (2%)
1 ( 2 % )
1 (2%) 1 (2%)
1 (2%)(50)
(50)
(50) 1 (2%)
(50)
(50)
(50) 1 (2%)
1 (2%)
(49)
(49)
(49) 1 (2%)
DIGESTIVE SYSTEM #Salivary gland
Inflammation, chronic focal Atrophy, focal
Congestion, NOS Congestion, passive Congestion, acute passive HemorrhageInflammation, NOS Inflammation, focal Inflammation, acute Inflammation, chronic
#Liver
(47)
(50) 1 (2%)
1 ( 2 % )
1 (2%)
(50)
2 (4%) (50)
1 ( 2 % )
(49)
1 (2%)(50)
(46) 1 (2%)
1 (2%) 1 (2%) 1 (2%)
2 (4%)
1 ( 2 % )
(48)
Inflammation, granulomatous focal Fibrosis, focal Necrosis, focal Necrosis, diffuse Necrosis, hemorrhagic Necrosis, central Necrosis, peripheral Metamorphosis, fatty LipoidosisCytoplasmic change, NOS Basophilic cyto change Focal cellular change Eosinophilic cyto change Clear cell change Cytologic alteration, NOS Hepatocytomegaly
#Liver/centrilobular Necrosis, NOS Necrosis, hemorrhagic Metamorphosis, fatty
# LiverhepatocytesNecrosis, NOS
3 (6%)
1 (2%) 3 (6%)
9 (18%)
2 (4%)
6 (12%) 1 (2%) 2 (4%)
(50)
1 ( 2 % )
(50) 1 (2%)
4 (8%) 1 (2%)
2 (4%)1 (2%) 4 (8%)2 (4%) 4 (8%)
2 (4%)
(50) 1 (2%)
(50)
2 (4%)
2 (4%)
1 ( 2 % )
1 (2%)
1 (2%)
(50)
1 (2%)(50)
1 (2%) 1 (2%)5 (10%) 1 (2%)
1 (2%)
2 (4%)
1 (2%)
1 ( 2 % )
(48)
(48)
135 Trichloroethylene, NTP TR 273

TABLE C4. SUMMARY OF THE INCIDENCE OF NONNEOPLASTIC LESIONS IN MALE AUGUST RATS IN THE TWO-YEAR GAVAGE STUDY OF TRICHLOROETHYLENE (Continued)
CONTROL (UNTR) CONTROL (VEH) LOW DOSE HIGH DOSE
DIGESTIVE SYSTEM (Continued) #Bile duct
Inflammation, chronic Inflammation, chronic focal Fibrosis Sclerosis Hyperplasia, NOS Hyperplasia, focal
#Pancreas Hemorrhage Inflammation, focal Inflammation, acute focal Atrophy, NOS Atrophy, focal
#Pancreatic acinus Atrophy, NOS Atrophy, focal Atrophy, diffuse
*Esophageal lumen Hemorrhage
#EsophagusDilatation, NOS Inflammation, interstitial Inflammation, acute Inflammation, granulomatous
#Stomach Edema, NOS Inflammation, acutekhronic
(50) 1 (2%) 1 (2%)
5 (10%)
(49) 1 (2%)
1 (2%) 2 (4%)
(49) 20 (41%) 12 (24%) 1 (2%)
(50) 1 (2%)
(50)
1 (2%)
(50)
(50) 4 (8%)
1 (2%)
6 (12%) 1 (2%)
(50) 1 (2%)
1 (2%)
1 (2%) (50)
2 (4%)29 (58%) 3 (6%)
(50) 2 (4%)
(48) 2 (4%)
1 (2%) 1 (2%)
(50)
(50) 1 (2%)
1 (2%) 1 (2%)
(49)1 (2%)
2 (4%) (49)
2 (4%) 17 (35%)
2 (4%) (50)
2 (4%) (48)
(48)
1 (2%)
4 (8%) (48)
13 (27%)
(49) 2 (4%)
(47)
(49) 1 (2%)
#Gastric mucosa Erosion
(50) (49)
Hyperkeratosis #Gastric submucosa
Inflammation, focal (50)
1 (2%) (49)
Inflammation, chronic Inflammation, granulomatow
#Forestomach Ulcer, NOS
(50) (49)
Inflammation, acutekhronic Degeneration, NOS Hyperplasia, epithelial Hyperkeratosis
#Colon Hemorrhage Parasitism
*Rectum Ulcer, acute
5 (10%) 2 (4%)
(49)
2 (4%)(50)
(50)1 (2%)
(50) 1 (2%)
URINARY SYSTEM #Kidney
Mineralization Cast, NOS Hydronephrosis Cyst, NOS Inflammation, chronic focal NephropathyNephropathy, toxic Infarct, healed Pigmentation, NOS CytomegalyHyperplasia, tubular cell
(50) 1 (2%)
1 (2%) 2 (4%) 2 (4%)
43 (86%)
1 (2%)
(50)
1 (2%) 1 (2%) 3 (6%) 1 (2%)
47 (94%)
(50 )
2 (4%)
32 (64%) 10 (20%) 1 (2%)
46 (92%)
(49)
1 (2%)
36 (73%) 31 (63%)
46 (94%) 1 (2%)
Trichloroethylene, NTP TR 2173 136

TABLE C4. SUMMARY OF THE INCIDENCE OF NONNEOPLASTIC LESIONS IN MALE AUGUST RATS IN THE TWO-YEAR GAVAGE STUDY OF TRICHLOROETHYLENE (Continued)
CONTROL (UNTR) CONTROL (VEH) LOW DOSE HIGH DOSE
URINARY SYSTEM (Continued) #Kidney/tubule
Dilatation, NOS Degeneration, NOS Atypia, NOS
# Kidney/pelvis Hyperplasia, epithelial
#Urinary bladder Hemorrhage
#Urinary bladder/mucosa Hyperplasia, papillary
ENDOCRINE SYSTEM #Pituitary
Cyst, NOS Hemorrhage Hyperplasia, NOS Hyperplasia, focal Angiectasis
#Adrenal Congestion, NOS Inflammation, focal Inflammation, chronic focal Necrosis, cortical Lipoidosis
#Adrenal cortex LipoidosisFocal cellular change Hyperplasia, NOS Hyperplasia, focal
#Adrenal medulla Cytomegaly Hyperplasia, NOS Hyperplasia, focal
#Thyroid Follicular cyst, NOS Inflammation, granulomatous focal Hyperplasia, C-cell
#Pancreatic islets Hyperplasia, NOS Hyperplasia, focal
REPRODUCTIVE SYSTEM *Mammary gland
Pigmentation, NOS Hyperplasia, NOS Lactation
#Prostate Edema, NOS HemorrhageInflammation,NOS Inflammation, focal Inflammation, acute Inflammation, acute focal Inflammation, acute/chronic Inflammation, chronic Inflammation, chronic focal Fibrosis, focal Hyperplasia, epithelial
(46) 3 (7%)
1 ( 2 % ) 2 (4%) 2 (4%)
(49) 1 (2%)
(49) 2 (4%)
(49) 1 (2%) 1 (2%) 3 (6%)
(49)
1 (2%) (49)
(50)
1 (2%)2 (4%)
(50)
(44) 1 (2%)
2 (5%)
(50)
1 (2%) (50)
1 (2%) 1 (2%) 1 (2%) 4 (8%)
(50)
1 (2%) 1 ( 2 % )
(46)
3 (7%) (50)
1 (2%)
(50)
3 (6%) (50)
(50)
1 (2%) (50)
(47) 1 (2%)
(47)
(41)
4 (10%) 1 ( 2 % )
(49)
1 (2%) 1 (2%)
(49)
(49)
1 (2%) 2 (4%)
(44) 1 (2%)
(49)
1 (2%)
(50)
1 (2%) 1 (2%)
(48)
1 (2%) 1 ( 2 % )
1 (2%)
1 (2%) 1 (2%)
(49)1 (2%) 1 (2%) 1 (2%)
(49)
(44) 1 (2%)
(44)
(41)
1 (2%)
1 (2%)
(47)
1 (2%)
(47)
(47)
1 (2%) (45)
1 (2%)
(48)
(49) 1 (2%)
1 (2%) (46)
1 (2%) 1 (2%)
1 (2%)
1 (2%)
1 ( 2 % )
137 Trichloroethylene, NTP TR 273

TABLE C4. SUMMARY OF THE INCIDENCE OF NONNEOPLASTIC LESIONS IN MALE AUGUST RATS IN THE TWO-YEAR GAVAGE STUDY OF TRICHLOROETHYLENE (Continued)
_ _ ~ ~
REPRODUCTIVE SYSTEM (Continued) #Prostatic duct
Polyp, NOS +Seminal vesicle
Hemorrhage Inflammation, NOS
#Testis Edema, interstitial HemorrhageFibrosis, dif€use Degeneration,NOS Syncytial alteration Atrophy, NOS Atrophy, diffuse Hyperplasia, interstitial cell
#Testidtubule Degeneration,NOS Atrophy, focal
NERVOUS SYSTEM #Braidmeninges
Fibrosis #Brain
Hydrocephalus, internal Cyst, NOS Hemorrhage
SPECIAL SENSE ORGANS *Harderian gland
Inflammation, focal Inflammation, chronic Inflammation, chronic focal
*Middle ear Inflammation, acute suppurative
MUSCULOSKELETAL SYSTEM *Muscle of neck
Inflammation, granulomatow
BODY CAVITIES *Mediastinum
Inflammation, acute suppurative
ALL OTHER SYSTEMS *Multiple organs
Hemorrhage Inflammation, hemorrhagic
Adipose tissue Inflammation, NOS
CONTROL (UNTR) CONTROL (VEH)
(50)1 (2%)
(50)
(50) 1 (2%)
5 (10%) 1 (2%)7 (14%)
(50) 1 (2%) 1 (2%)
(50) (50) 1 (2%)
(50) (50) 1 (2%) 2 (4%)
1 (25%) 1 (2%)
(50)
(50)
(50)
(50)
(50) (50) 1 (2%)
LOW DOSE
(48)
(50) 1 (2%) 1 (2%)
(50)
1 (2%)
1 (2%)
5 (10%)
6 (12%) (50)
(50)
(50)
(50)
1
HIGH DOSE
(46)
(49)
(49)
1 (2%)
2 (4%) 1 (2%) 5 (10%)
10 (20%) (49)
1 (2%)
(49)
(49)
2 (4%)
(49)
1 (2%)
Trichloroethylene, NTP TR 273 138

TABLE C4. SUMMARY OF THE INCIDENCE OF NONNEOPLASTIC LESIONS IN MALE AUGUST RATS IN THE TWO-YEAR GAVAGE STUDY OF TRICHLOROETHYLENE (Continued)
CONTROL (UNTR) CONTROL (VEH) LOW DOSE HIGH DOSE
SPECIAL MORPHOLOGY SUMMARY Animal missexedho necropsy Autolnecropsyhisto perf 1
1
* Number of animals receiving complete necropsy examination; all gross lesions including masses examined microsopically. # Number of animals examined microscopically at this site
139 Trichloroethylene, NTP TR 273

Trichloroethylene,NTPTR 273 140

APPENDIX D
SUMMARY OF LESIONS IN FEMALE AUGUST RATS
IN THE TWO-YEAR GAVAGE STUDY OF
TRICHLOROETHYLENE
PAGE
TABLE D1 SUMMARY OF THE INCIDENCE OF NEOPLASMS IN FEMALE AUGUST RATS IN THE TWO-YEAR GAVAGE STUDY OF TRICHLOROETHYLENE 143
TABLE D2 INDIVIDUAL ANIMAL TUMOR PATHOLOGY OF FEMALE AUGUST RATS IN THE TWO-YEAR GAVAGE STUDY OF TRICHLOROETHYLENE 146
TABLE D3 ANALYSIS OF PRIMARY TUMORS IN FEMALE AUGUST RATS IN THE TWO-YEAR GAVAGE STUDY OFTRICHLOROETHYLENE 154
TABLE D4 SUMMARY OF THE INCIDENCE OF NONNEOPLASTIC LESIONS IN FEMALE AUGUST RATS IN THE TWO-YEAR GAVAGE STUDY OF TRICHLOROETHYLENE 157
141 Trichloroethylene,NTP TR 273

142Trichloroethylene, NTP TR 2'13

TABLE D1. SUMMARY OF THE INCIDENCE O F NEOPLASMS IN FEMALE AUGUST RATS IN THE TWO- YEAR GAVAGE STUDY OF TRICHLOROETHYLENE
~~
CONTROL (UNTR) CONTROL (VEH) LOW DOSE HIGH DOSE
ANIMALS INITIALLY IN STUDY ANIMALS NECROPSIED ANIMALS EXAMINED
HISTOPATHOLOGICALLY
50 50
50
50 50
50
50 50
50
50 50
50
INTEGUMENTARY SYSTEM
Squamous cell carcinoma Malignant melanoma
"Subcutaneous tissue Sarcoma, NOS
"Skin
RESPIRATORY SYSTEM #Lung
Undifferentiated carcinoma, metastatic Squamous cell carcinoma, metastatic Alveolar/bronchiolar adenoma Sarcoma, NOS, metastatic
(50)
1 (2%)
1 (2%)
(50) 1 (2%)
(50)
1 (2%)
(50)
HEMATOPOIETIC SYSTEM "Multiple organs
Malignant lymphoma; NOS Leukemia, NOS Monocytic leukemia
Leukemia, NOS #Liver
(50)
(50)
CIRCULATORY SYSTEM None
DIGESTIVE SYSTEM #Liver
Neoplastic nodule (50)
URINARY SYSTEM #Kidney
Tubular cell adenoma Tubular cell adenocarcinoma Sarcoma, NOS, metastatic
(50)
1 (2%)
(49) 1 (2%)
(48)2 (4%) 2 (4%)
(50)
ENDOCRINE SYSTEM #Pituitary
Adenoma, NOS Chromophobe adenoma Meningioma
Cortical adenoma Cortical carcinoma Pheochromocytoma
Follicular cell adenoma C-cell adenoma C-cell carcinoma
#Adrenal
#Thyroid
(49)42 (86%)
4 (8%)
6 (12%)
1 (2%)
(50)
(50)
(49)32 (65%) 3 (6%)
6 (13%) 1 (2%) 9 (19%)
(48)
(49)
(47) 26 (55%)
6 (13%)
2 (4%)
2 (4%) 3 (6%) 1 (2%)
(48)
(49)
(43) 18 (42%)
1 (2%)
5 (10%)
1 (2%)
(50)
(50)
143 Trichloroethylene, NTP TR 273

TABLE D1. SUMMARY OF THE INCIDENCE OF NEOPLASMS IN FEMALE AUGUST RATS IN THE TWO-YEAR GAVAGE STUDY OF TRICHLOROETHYLENE (Continued)
CONTROL (UNTR) CONTROL (VEH) LOW DOSE HIGH DOSE
ENDOCRINE SYSTEM (Continued) #Pancreatic islets
Islet cell adenoma Islet cell carcinoma
(50) 1 (2%)
(49) (48) 1 (2%) 1 (2%)
(48) 1 (2%)
REPRODUCTIVE SYSTEM *Mammary gland
Undifferentiated carcinoma Adenoma, NOS Adenocarcinoma, NOS Fibroma Fibroadenoma
"Clitoral gland Carcinoma,NOS
#Uterus Sarcoma,NOS LeiomyosarcomaEndometrial stromal polyp Carcinosarcoma
(50)1 (2%) 4 (8%)1 (2%) 2 (4%)
10 (20%) (50)
(49)1 (2%)
3 (6%)
(50)
4 (8%)
8 (16%) (50)
(48)
1 (2%)
(50)
1 (2%)
4 (8%)
1 (2%) (50)
(49)
Luteoma #Ovary (47)
NERVOUS SYSTEM *Peripheral nerve
#Brain Neurofibrosarcoma
Granular cell tumor, NOS Granular cell tumor, malignant EpendymomaAstrocytoma
(50)
(50) 1 (2%) 1 (2%)
(50)
(49) 1 (2%)
(50)
(50) 1 (2%)
1 (2%)2 (4%)
1 (2%)
(50)
(50) 1 (2%)
1 (2%)
SPECIAL SENSE ORGANS None
MUSCULOSKELETAL SYSTEM None
BODY CAVITIES None
ALL OTHER SYSTEMS *Multiple organs
Adenoma, NOS Thigh
Sarcoma,NOS 1
Trichloroethylene, NTP TR !273 144

TABLE D1. SUMMARY OF THE INCIDENCE OF NEOPLASMS IN FEMALE AUGUST RATS IN THE TWO- YEAR GAVAGE STUDY OF TRICHLOROETHYLENE (Continued)
CONTROL (UNTR) CONTROL (VEH) LOW DOSE HIGH DOSE
ANIMAL DISPOSITION SUMMARY Animals initially in study 50 50 50 50
Natural death 4 4 5 6 Moribund sacrifice 20 22 13 7 Terminal sacrifice 26 23 26 24 Dosing accident 1 3 6 Accidentally killed, nda 1 Accidentally killed, NOS 2 7
TUMOR SUMMARY Total animals with primary tumors** 45 43 35 29
Total primary tumors 81 79 69 39 Total animals with benign tumors 44 40 32 24
Total benign tumors 73 70 56 29 Total animals with malignant tumors 5 6 11 9
Total malignant tumors 7 6 12 9 Total animals with secondary tumors# # 2 1
Total secondary tumors 1 Total animals with tumors uncertain-.
benign or malignant 3 1 1 Total uncertain tumors 3 1 1
* Number of animals receiving complete necropsy examination; all gross lesions including masses examined microscopically. ** Primary tumors: all tumors except secondary tumors # Number of animals examined microscopically a t this site # # Secondary tumors: metastatic tumors or tumors invasive into an adjacent organ
145 Trichloroethylene, NTP TR 273

TABLE D% INDIVIDUAL ANIMAL TUMOR PATHOLOGY OF FEMALE AUGUST RATS IN THE TWO-YEAR GAVAGE STUDY OF TRICHLOROETHYLENE: UNTREATED CONTROL
NUMBER
Skin Squamous cell carcinoma
Subnrtaneous tissue Sarcoma, NOS
Lung# and bronchi Squamous cell carcinoma metastatic Sarcoma. NOS.metastati)c
Trachea
Bone marrow SpleenL mphnodei Tgymus
M Heart
Salivary gland Liver Bile duct Gallbladder & common bile duct Pancreas
:t23Y Small intestine Large intnstine
M Kidney
Sarcoma NOS metastatic Urinary biadde;
TEM Pituitary
Adenoma. NOS M n n a l
Cortical adenoma Pheochromocytoma
ThyroidFollicular cell adenoma
ParathyroidPancreatic islet#
Islet call adenoma
Mammary gland Adenoma, NOS Fibroma Fibroadenoma
Utwus Sarcoma,NOS Endometrial stromal polypCarcinosarcoma
ovary
Brain Granular cell tumor NOS Granular cell tumor: malignaiit
Multiple organs NOS Adenoma NOS
Thigh NOS sarcbma, NOS
+, Tissue examined microscopically -: Rmquind tissue not examined microscopically X: Tumor incidence
3 3 3 3 3 3 3 3 3 3 3 3 3 3 4 4 4 4 4 4 4 4 4 4 4 4 4 5 5 5 5 5 6 7 7 7 8 9 9 1 1 1 2 2 2 3 3 3 3 4 2 6 1 3 4 5 7 0 0 5 9 8 2 6 4 7 9 2 4 6 1 3 5 9 0
. . . . . . . . . . . . . . . . . . . . . . . . .
. . . . . . . . . . . . . . . . . . . . . . . . .
. . . . . . . . . . . . . . . . . . . . . . . . .
. . . . . . . . . . . . . . . . . . . . . . . . .
. . . . . . . . . . . . . . . . . . . . . . . . . . . . . . . . . . . . . . . . . . . . . . . . . . . . . . . . . . . . . . . . . . . . . . . . . . . - - - - - - - - - _ _ _ - - _ _ _ - - - _ _ _ _ _
. . . . . . . . . . . . . . . . . . . . . . . . .
. . . . . . . . . . . . . . . . . . . . . . . . . . . . . . . . . . . . . . . . . . . . . . . . . . . . . . . . . . . . . . . . . . . . . . . . . . . N N N N N N N N N N N N N N N N N N N N N N N N N . . . . . . . . . . . . . . . . . . . . . . . . . . . . . . . . . . . . . . . . . . . . . . . . . . . . . . . . . . . . . . . . . . . . . . . . . . . . . . . . . . . . . . . . . . . . . . . . . . . . . . . . . . . . . . . . . . . . . . . . . . . . .
~~~ ~~
. . . . . . . . . . . . . . . . . . . . . . . . .
. . . . . . . . . . . . . . . . . . . . . . . . .
. . . . . . . . . . . . . . . . . . . . . . . . . x x x x x x x x x x x x x x x x x x x x x x . . . . . . . . . . . . . . . . . . . . . . . . . X X X X X . . . . . . . . . . . . . . . . . . . . . . . . .
X+ + + - - + - + - + + - + + - + + + + + + + + + -. . . . . . . . . . . . . . . . . . . . . . . . .
. . . . . . . . . . . . . . . . . . . . . . . . . X
X X X X X . . . . . . . . . . . . . . . . . . . . . . . . .
X X
. . . . . . . . . . . . . . . . . . . . . . . . .
. . . . . . . . . . . . . . . . . . . . . . . . . X
X
N N N N N N N N N N N N N N N N N N N N N N N N N X
: No ti i iua information submitted C: Necropqy. no histology due to protocol Ar Autdvsia
N: Necropsy, noauiolysis. no microscopic examination M: G&[-ijssing S Animal miseexed B No necropsy parformed
I .
Trichloroethylene, NTP TR 273 146

TABLE D2. INDIVIDUAL ANIMAL TUMOR PATHOLOGY OF FEMALE AUGUST R A T S UNTREATED
NUMBER
WEEKS ON STUDY
Skin Squamous cell carcinoma
Subcutaneous tissue Sarcoma, NOS
Lungs and bronchi Squamous cell carcinoma, metastatic Sarcoma. NOS,metastatic
Trachea
Bone marrow SpleenL mphnodes TKymus
Heart
Salivary gland Liver Bile duct Gallbladder & common bile duct Pancreas:;:zff.'"Small intestine Large intestine
KidneySarcoma NOS metastatic
Urinary biadde;
PituitaryAdenoma, NOS
Adrenal Cortical adenoma Pheochromocytoma
ThymidFollintlar cell adenoma
ParathyroidPancreatic islets
Islet cell adenoma
Mammary gland Adenoma. NOS Fibroma Fibroadenoma
Uterus Sarcoma NOS Endomet'nal stromal polypCarnnoaarcoma
Ovary
Brain Granular cell tumor, NOS Granular cell tumor, malignant
*Animals necropsied
CONTROL (Continued) 4 4 4 4 4 4 4 4 4 4 4 4 4 5 5 5 5 5 5 5 5 5 5 5 5 4 4 5 5 6 6 7 7 7 7 7 9 9 0 0 0 0 0 1 1 2 2 3 3 4 4 6 3 9 3 5 1 3 5 8 9 4 7 1 5 6 7 8 0 3 2 7 2 4 2
TOTAL 1 0 0 0 1 1 1 1 1 0 1 0 0 0 1 1 1 0 1 1 1 1 0 1 0 rISSUES 0 5 5 9 0 0 0 0 0 6 0 9 9 9 0 0 0 6 0 0 0 0 9 0 6 rUMORS 4 3 8 2 3 3 4 4 4 ~ 4 7 7 5 4 4 4 7 4 4 3 4 3 4 6
~ ~~ ~
. . . . . . . . . . . . . . . . . . . . . . . . . '50 x 1 . . . . . . . . . . . . . . . . . . . . . . . . . *50 X 1
. . . . . . . . . . . . . . . . . . . . . . . . . 50X 1
X 1 . . . . . . . . . . . . . . . . . . . . . . . . . 50
. . . . . . . . . . . . . . . . . . . . . . . . . 50 . . . . . . . . . . . . . . . . . . . . . . . . . 50 . . . . . . . . . . . . . . . . . . . . . . . . . 47- - - - - - - - - _ - _ - _ - - - _ - - _ - - - - 0
. . . . . . . . . . . . . . . . . . . . . . . . . 50
. . . . . . . . . . . . . . . . . . . . . . . . . 50 . . . . . . . . . . . . . . . . . . . . . . . . . 50 . . . . . . . . . . . . . . . . . . . . . . . . . 50N N N N N N N N N N N N N N N N N N N N N N N N N *50 . . . . . . . . . . . . . . . . . . . . . . . . . 50 . . . . . . . . . . . . . . . . . . . . . . . . . 50 . . . . . . . . . . . . . . . . . . . . . . . . . 50 . . . . . . . . . . . . . . . . . . . . . . . . . 49 . . . . . . . . . . . . . . . . . . . . . . . . . 50
. . . . . . . . . . . . . . . . . . . . . . . . . 50X 1 . . . . . . . . . . . . . . . . . . . . . . . . . 48
. . . . . . . . . . . . . . . . . . . . . . . . . 49X x x x x x x x x x x x x x x x x x x x 42 . . . . . . . . . . . . . . . . . . . . . . . . . J0
X X 4X X X 6 . . . . . . . . . . . . . . . . . . . . . . . . . 50
1 . . . . . . . . . . . . . . . . . . . . . . . . . 38 . . . . . . . . . . . . . . . . . . . . . . . . . 50X 1
+ + + + + + + + + + + + + + + + + + , + + + + + + + *so X X 3
1 x x x x x x x X X 13 . . . . . . . . . . . . . . . . . . . . . . . . . 50X 2
1X 1 . . . . . . . . . . . . . . . . . . . . . . . . . 49
. . . . . . . . . . . . . . . . . . . . . . . . . 50 1 1
N N N N N N N N N N N N N N N N N N N N N N N N N e50 1
X 1
147 Trichloroethylene, NTP TR 273

TABLE D!& INDIVIDUAL ANIMAL TUMOR PATHOLOGY OF FEMALE AUGUST RATS IN THE TWO-YEAR GAVAGE STUDY OF TRICHLOROETHYLENE: VEHICLE CONTROL
ANIMAL 3 3 3 3 3 3 3 3 3 3 3 3 3 3 4 4 4 4 4 4 4 4 4 4 4NUMBER 4 4 5 5 6 6 6 6 7 7 9 9 9 9 0 0 1 2 3 3 3 4 4 5 5
5 7 8 9 2 4 7 8 1 2 3 4 5 7 1 7 0 3 0 2 4 2 7 2 4
WEEKS ON 0 1 1 1 1 0 0 1 1 0 1 0 1 t 0 0 1 1 0 0 l l l l O STUDY 6 0 0 0 0 7 8 0 0 9 0 7 0 0 6 8 0 0 9 4 0 0 0 0 9
5 4 0 4 4 2 8 4 4 8 4 2 4 0 2 3 4 4 1 8 4 4 4 4 8
Subcutaneous tissue . . . . . . . . . . . . . . . . . . . . . . . . . Sarcoma, NOS
Lungs and bronchi . . . . . . . . . . . . . . . . . . . . . . . . . Undserentiated camnoma. metastatic X
Trachea . . . . . . . . . . . . . . . . . . . . . . . . .
Bone marrow . . . . . . . . . . . . . . . . . . . . . . . . . Spleen . . . . . . . . . . . . . . . . . . . . . . . . . L mphnodes . . . . . . . . . . . . . . . . . . . . . . . . . Txymus . . . . . . . . . . . . . . . . . . . . . . . . .
Heart . . . . . . . . . . . . . . . . . . . . . . . . .
Salivary gland . . . . . . . . . . . . . . . . . . . . . . . . . Liver . . . . . . . . . . . . . . . . . . . . . . . . .
Neoplastic nodule X Bile duct . . . . . . . . . . . . . . . . . . . . . . . . . Gallbladder & common bile duct N N N N N N N c N N N N N N N N N N N N N N N N N Pancreas . . . . . . . . . . . . . . . . . . . . . . . . . . . . . . . . . . . . . . . . . . . . . . . . . . : t % r . . . . . . . . . . . . . . . . . . . . . . . . . Small intestine . . . . . . . . . . . . . . . . . . . . . . . . . Large intestine - + + + + - - - + + + - + + + + + - + + + + + + + P Kidney . . . . . . . . . . . . . . . . . . . . . . . . .
Tubular cell adenoma X Unnary bladder . . . . . . . . . . . . . . . . . . . . . . . . .
Pituitary . . . . . . . . . . . . . . . . . . . . . . . . . Adenoma, NOS x x x x x x x x x x x x x x x x Chromophobe adenoma X X X
Adrenal . . . . . . . . . . . . . . . . . . . . . . . . . Cortical adenoma X X Cortical carcinoma Pheochromocytoma x x x X X
Thyroid . . . . . . . . . . . . . . . . . . . . . . . . . Parathyroid . . . . . . . . . . . . . . . . . . . . . . . . .
Mammary gland N + + + + N + + + + + + + + N + + + + + + + + t + Undflerentiated camnoma X Adenoma NOS X X Adenocarkoma. NOS Fibroma Fibroadenoma x x
Uterus . . . . . . . . . . . . . . . . . . . . . . . . . Sarcoma NOS Endomet'nal stromal polyp x x
Ovary . . . . . . . . . . . . . . . . . . . . . . . . .
Brain . . . . . . . . . . . . . . . . . . . . . . . . . Granular cell tumor. NOS X
ALL O T P Multi leorgans NOS N N N N N N N N N N N N N N N N N N N N N N N N N
LeJemia . N ~ S X
Trichloroethylene, NTP TR 273 148

TABLE D2. INDIVIDUAL AMMAL TUMOR PATHOLOGY OF FEMALE AUGUST RATS VEHICLE
WEEKS ON
Subcutaneous tissue Sarcoma, NOS
Lungb and bronchi Undiff. carcinoma, metastatic
Trachea
Heart
Salivary gland Liver
Neoolastic nodule Bile diet Gallbladder & common bile duct Pancreas
:t%lflll Small intestine Large intestine
KidneyTubular cell adenoma
Urinary bladder
PituitaryAdenoma, NOS Chmmoohobe adenoma
Adrenal . Cortical adenoma Cortical camnoma Pheochromocytoma
ThymidParathyroid
Mammary gland Undifferentiated carcinoma Adenoma NOS Adenocarhoma. NOS Fibroma Fibroadenoma
Utems Sarcoma,NOS Endometrial stromal polyp
Ovary
M Brain
Granular cell tumor, NOS
S Multi le organs. NOS
Ledemia , NOS
* Animals necropsied
CONTROL (Continued)
TOTAL: TISSUES
. . . . . . . . . . . . . . . . . . . . . . . . . '50X 1
. . . . . . . . . . . . . . . . . . . . . . . . . 50 1 . . . . . . . . . . . . . . . . . . . . . . . . . 48
. . . . . . . . . . . . . . . . . . . . . . . . . 47 . . . . . . . . . . . . . . . . . . . . . . . . . 49 . . . . . . . . . . . . . . . . . . . . . . . . . 43- _ - _ - - - _ _ _ _ _ _ - _ _ _ _ _ _ - - - - _0
. . . . . . . . . . . . . . . . . . . . . . . . . 50
. . . . . . . . . . . . . . . . . . . . . . . . . 48+ + + + + + + + + - + + + + + + + + + + + + + + + 48 X 2 . . . . . . . . . . . . . . . . . . . . . . . . . 48
N N N N N N N N N + N N N N N N N N N N N N ~ N N '50 . . . . . . . . . . . . . . . . . . . . . . . . . 49 . . . . . . . . . . . . . . . . . . . . . . . . . 49 . . . . . . . . . . . . . . . . . . . . . . . . . 48 . . . . . . . . . . . . . . . . . . . . . . . . . 48 . . . . . . . . . . . . . . . . . . . . . . . . . 43
. . . . . . . . . . . . . . . . . . . . . . . . .
. . . . . . . . . . . . . . . . . . . . . . . . . 1 : : I
. . . . . . . . . . . . . . . . . . . . . . . . . x x x x x x x x x x x x x x x x i ii I
. . . . . . . . . . . . . . . . . . . . . . . . . 48 X X X X 6
X 1 X X X X 9+ + + + + + + + + + + + + + + + + + + + + + + + + 49- - . . . . . . . . . . . . . . . . . . . . . . . 42
+ N + + + + + + + + + + + + + + + + + + + + + + + '50 1
X X 4 X 1
X X 2 x x x x x x x x 10 . . . . . . . . . . . . . . . . . . . . . . . . . 49 X 1
X 3 . . . . . . . . . . . . . . . . . . . . . . . . . 41
. . . . . . . . . . . . . . . . . . . . . . . . . 49 1
N N N N N N N N N N N N N N N N N N N N N N N N N '50 1
149 Trichloroethylene, NTP TR 273

TABLE D2. INDIVIDUAL ANIMAL TUMOR PATHOLOGY OF FEMALE AUGUST RATS IN THE TWO-YEAR GAVAGE STUDY OF TRICHLOROETHYLENE: LOW DOSE
NUMBER
WEEKS ON STUDY
skin Malignant melanoma
EM Lungs and bronchi
Alveolarhmnchiolar adenoma Trachea
Bone marrow SpleenL mphnodesTKymua
Heart
Salivary gland Liver Bile duct Gallbladder b common bile duct Pancreas
::::gUs Small intestine Large intestine
KidneyTubular cell adenoma Tubular cell adenocarcinoma
Urinary bladder
7 Adenoma. NOS
Adrenal Cortical adenoma Phewhmmwytoma
ThyroidFollicular cell adenoma C.cell adenoma C a l l carcinoma
ParathyroidPancreatic islets
Islet cell adenoma Islet cell carcinoma
Mammary gland Adenoma, NOS Fibroadenoma
UtslUS Leiomyoaarcoma
QZoma
N.PJ.8 Neurofibrosarcoma
Brain Granular cell tumor NOS Granular cell tumor: malignant lb t rcq toma
Multiph organs. NOS Malignant lymphoma, NOS
5 3 3 3 3 3 3 3 3 3 3 3 4 4 4 4 4 4 4 4 4 4 4 4 4 4 ~ 7 7 7 a 8 a ~ ~ ~ 9 0 0 0 0 1 1 2 2 2 8 0 3 4 6 2 4 5 6 7 9 0 4 5 8 9 3 0 1 7 ~ 7 ~
0 0 1 0 1 1 1 1 1 1 0 0 1 1 1 0 1 1 1 0 1 1 1 1 1 7 4 0 7 0 0 0 0 0 0 5 1 0 0 0 8 0 0 0 1 0 0 0 0 0 2 4 4 0 4 4 4 4 4 4 4 1 4 4 4 6 2 4 4 2 4 4 4 4 4
N + + + + + + + + + + + + + + + + + + + + + + + +X
. . . . . . . . . . . . . . . . . . . . . . . . . X . . . . . . . . . . . . . . . . . . . . . . . . .
. . . . . . . . . . . . . . . . . . . . . . . . . . . . . . . . . . . . . . . . . . . . . . . . . . . . . . . . . . . . . . . . . . . . . . . . . . . - + - - - - - - - - + - - - - - - - - + - - - - -
. . . . . . . . . . . . . . . . . . . . . . . . .
. . . . . . . . . . . . . . . . . . . . . . . . . . . . . . . . . . . . . . . . . . . . . . . . . . . . . . . . . . . . . . . . . . . . . . . . . . . N N N N N N N N N N N N N N N N N N N N N N N N N . . . . . . . . . . . . . . . . . . . . . . . . . . . . . . . . . . . . . . . . . . . . . . . . . . . . . . . . . . . . . . . . . . . . . . . . . . . . . . . . . . . . . . . . . . . . . . . . . . . . . . . . . . . . . . . . . . . . . . . . . . . . .
. . . . . . . . . . . . . . . . . . . . . . . . . X X . . . . . . . . . . . . . . . . . . . . . . . . .
+ + + + + + + + + + + - + + + + + + + + + A + + +
X x x x x x x x x x x x x x . . . . . . . . . . . . . . . . . . . . . . . . .
X x x X . . . . . . . . . . . . . . . . . . . . . . . . .
X X X X
X - - - + - + - - - + - - + + - + + - + + - + - - + . . . . . . . . . . . . . . . . . . . . . . . . . X
X
+ + + + + + + + + + + + + + + +
. . . . . . . . . . . . . . . . . . . . . . . . .
N N N N N N N N N N N N N N N N N N N N N N N N N
. . . . . . . . . . . . . . . . . . . . . . . . . X
X x ~ ~~~~
N N N N N N N N N N N N N N N N N N N N N N N N N
3 3 4 4 1 5
Trichloroethylene, NTP TR 273 150

TABLE D2. INDIVIDUAL ANIMAL TUMOR PATHOLOGY OF FEMALE AUGUST RATS: LOW DOSE (Continued)
-- W WEEKS ON STUDY
Skin Malignant melanoma
TEM Lungs and bronchi
Alveolar/bronchiolar adenoma Trachea
M Bone marrow SpleenL mphnodesTgymus
Heart
Salivary gland Liver Bile duct Gallbladder & common bile duct Pancreas
ECr Small intestine Large intestine
KidneyTubular cell adenoma Tubular cell adenocarcinoma
Urinary bladder
PituitaryAdenoma, NOS
Adrenal Cortical adenoma Pheochromocytoma
ThyroidFollicular cell adenoma C-cell adenoma C-cell carcinoma
ParathyroidPancreatic islets
Islet cell adenoma Islet cell carcinoma
Mammary gland Adenoma, NOS Fibroadanoma
Uterus Leiomyosarcoma
%Eoma
Neurofibrosarcoma Brain
Granular cell tumor, NOS Granular cell tumor, malignant Astrocytoma
S Multiple organs NOS
Malignant lydphoma. NOS
* Animals necropsied
u 1 1 0 1 0 1 0 1 0 0 1 0 u 0 1 0 1 0 1 ~ 9 0 0 7 0 4 0 2 0 6 8 0 9 7 6 0 9 0 1 0 1 0 0 0 0 2 4 4 8 4 7 4 0 4 4 0 0 4 8 6 4 9 4 2 0 9 4 4 3 0
. . . . . . . . . . . . . . . . . . . . . . . . .
. . . . . . . . . . . . . . . . . . . . . . . . .
. . . . . . . . . . . . . . . . . . . . . . . . . ~ ~~ ~ ~
. . . . . . . . . . . . . . . . . . . . . . . . . . . . . . . . . . . . . . . . . . . . . . . . . . . . . . . . . . . . . . . . . . . . . . . . . . . - - - - - - - - - - - - - - - - - - + - - - - - -
. . . . . . . . . . . . . . . . . . . . . . . . .
. . . . . . . . . . . . . . . . . . . . . . . . . . . . . . . . . . . . . . . . . . . . . . . . . . . . . . . . . . . . . . . . . . . . . . . . . . . N N N N N N N N N N N N N N N N N N N N N N N N N . . . . . . . . . . . . . . . . . . . . . . . . . . . . . . . . . . . . . . . . . . . . . . . . . . . . . . . . . . . . . . . . . . . . . . . . . . . . . . . . . . . . . . . . . . . . . . . . . . . . . . . . . . . . . . . . . . . . . . . . . . . . .
. . . . . . . . . . . . . . . . . . . . . . . . . X X
. . . . . . . . . . . . . . . . . . . . . . . . .
. . . . . . . . . . . . . . . . . . . . . . . . . x x x x x x x x x x x x . . . . . . . . . . . . . . . . . . . . . . . . . X x x
X . . . . . . . . . . . . . . . . . . . . . . . . . X
+ - - - - - + - + - + + + - - - + + - - - + + + + . . . . . . . . . . . . . . . . . . . . . . . . .
. . . . . . . . . . . . . . . . . . . . . . . . . X x x X . . . . . . . . . . . . . . . . . . . . . . . . .
. . . . . . . . . . . . . . . . . . . . . . . . . X
N N N N N N N N N N N N N N N N N N + N + N N N N X . . . . . . . . . . . . . . . . . . . . . . . . .
X
N N N N N N N N N N N N N N N N N N N N N N N N N x x
PGTAL: ~ l ~'ISSUES ~ 'UMORE
'50 1
50 1
47
49 48 49 4
50
47 48 48
'50 48 49 48 47 48
48 2 2
41
47 26 48
6 2
49 2 3 1
23 40
1 1
'50 4 8
48 1
47 1
'50 1
50 1 2 1
'50 2
151 Trichloroethylene, NTP TR 273

,
TABLE DB. INDIVIDUAL ANIMAL TUMOR PATHOLOGY OF FEMALE AUGUST RATS IN THE TWO-YEAR GAVAGE STUDY OF TRICHLOROETHYLENE: HIGH DOSE
NUMBER
WEEKS ONSTUDY
Lun and bmnchi Traeyea
Heart
Salivary gland Liver
LAukemia. NOS Bile duct Gallbladder EL common bile duct
KidneyUrinary bladdnr
PituitaryManoma. NOS Meninfioma
Mmnal Cortical adenoma
Th mid C?ceC.ll adenoma
ParathyroidPancreatic islats
Inlet cell adenoma
Mammary gland Minocarcinoma, NOS Zibmadenoma
PmputiaYclitoral land Carcinoma,NO#
Uterus Ovary
Brain Granular cell tumor,NOS Ependymoma
S Multi leorgans NOS
k&mia. N ~ S Monocytic Ieukrmia
3 3 3 3 3 3 3 3 3 3 3 3 3 3 3 3 3 4 4 4 4 4 4 4 4 4 4 4 5 5 5 6 6 6 7 7 8 8 8 9 9 9 0 0 0 0 1 1 1 1 3 4 9 0 2 6 1 3 9 7 8 0 1 3 1 8 9 0 2 3 6 1 2 5 8
D l l O O o l O l O O o O O l l O l l l l o o o o 6 0 0 1 1 8 0 2 0 6 5 3 6 2 0 0 4 0 0 0 0 4 8 5 2 0 4 4 5 7 7 4 4 4 9 6 4 3 0 4 4 4 4 4 4 3 6 9 9 4
. . . . . . . . . . . . . . . . . . . . . . . . . . . . . . . . . . . . . . . . . . . . . . . . . . . . . . . . . . . . . . . . . . . . . . . . . . . - - - + - - - + - - - + - - - - + - - - - - - - +
. . . . . . . . . . . . . . . . . . . . . . . . .
. . . . . . . . . . . . . . . . . . . . . . . . . . . . . . . . . . . . . . . . . . . . . . . . . .
. . . . . . . . . . . . . . . . . . . . . . . . . N N N N N N N N N N N N N N N N N N N N N N N N N . . . . . . . . . . . . . . . . . . . . . . . . . . . . . . . . . . . . . . . . . . . . . . . . . . . . . . . . . . . . . . . . . . . . . . . . . . . . . . . . . . . . . . . . . . . . . . . . . . . . . . . . . . . . . . . . . . . . . . . . . . . . .
. . . . . . . . . . . . . . . . . . . . . . . . . . . . . . . . . . . . . . . . . . . . . . . . . .
. . . . . . . . . . . . . . . . . . . . . . . . . x x X x x x x X
. . . . . . . . . . . . . . . . . . . . . . . . . x x X . . . . . . . . . . . . . . . . . . . . . . . . . - + + - - + - - + - - - - - + + + + + + + - + + -. . . . . . . . . . . . . . . . . . . . . . . . .
X
+ + + N + + + + + + N + N + + + + + + + + + + + +
XN N N N N N N N N N N N N N N N N N N N N N N N N
X . . . . . . . . . . . . . . . . . . . . . . . . . . . . . . . . . . . . . . . . . . . . . . . . . .
. . . . . . . . . . . . . . . . . . . . . . . . . X
Trichloroethylene, NTP TR 273 152

TABLE D2. INDIVIDUAL ANIMAL TUMOR PATHOLOGY OF FEMALE AUGUST RATS HIGH DOSE
NUMBER
WEEKS ONSTUDY
Lun and bronchi T r a g e a
Bone marrow SpleenL mphnodes TKymus
Heart
Salivary gland Liver
Leukemia. NOS Bile duct . Gallbladder 8 common bile duct Pancreas
2u:F" Small intestine Larga intestine
M KidneyUrinary bladder
PituitaryAdenoma, NOS Meningioma
Adrenal Cortical adenoma
ThyroidC-cell adenoma
Mammary gland Adenocarcinoma, NOS Fibroadenoma
PreputiaVciitoral gland Carcinoma, NOS
Uterus Ovary
Brain Granularcell tumor, NOS Ependymoma
S Multi leorgans NOS
LeuEmia N ~ S Monocytidleukemia
*Animals aecropaied
(Contimed) 4 4 4 4 4 4 4 4 4 4 4 4 4 4 4 4 5 5 5 5 5 5 5 5 5 2 2 2 3 4 5 6 6 6 7 8 8 8 9 9 9 0 0 0 1 2 3 S 3 4 0 5 9 6 3 0 6 7 9 7 0 1 8 2 5 8 0 2 4 8 8 5 7 9 0
~ 1 0 0 1 1 1 1 1 1 0 1 1 0 0 ~ ~ 1 ~ 4 0 7 1 0 0 0 0 0 0 3 0 0 6 2 5 0 0 8 0 0 5 0 0 0 9 4 1 9 4 4 4 4 4 4 3 4 4 0 9 6 4 4 2 4 4 6 4 4 4
. . . . . . . . . . . . . . . . . . . . . . . . . . . . . . . . . . . . . . . . . . . . . . . . . .
. . . . . . . . . . . . . . . . . . . . . . . . . . . . . . . . . . . . . . . . . . . . . . . . . . . . . . . . . . . . . . . . . . . . . . . . . . . + - - + - - - - - - + - - - + + - - - - - - - - -
. . . . . . . . . . . . . . . . . . . . . . . . .
. . . . . . . . . . . . . . . . . . . . . . . . . . . . . . . . . . . . . . . . . . . . . . . . . . x x . . . . . . . . . . . . . . . . . . . . . . . . . N N N N N N N N N N N N N N N N N N N N N N N N N . . . . . . . . . . . . . . . . . . . . . . . . . . . . . . . . . . . . . . . . . . . . . . . . . . . . . . . . . . . . . . . . . . . . . . . . . . . . . . . . . . . . . . . . . . . . . . . . . . . . . . . . . . . . . . . . . . . . . . . . . . . . .
. . . . . . . . . . . . . . . . . . . . . . . . . . . . . . . . . . . . . . . . . . . . . . . . . .
. . . . . . . . . . . . . . . . . . . . . . . . . X x x x x x x x x x x
. . . . . . . . . . . . . . . . . . . . . . . . . X X . . . . . . . . . . . . . . . . . . . . . . . . .
X+ - - - + + + + + + + + + + - - - + - - + - + - + . . . . . . . . . . . . . . . . . . . . . . . . .
N + + + + + + + + + N + + + + + + + + + + N + + + X
X X XN N N N N N N N N N N N N N N N N N N N N N N N N
. . . . . . . . . . . . . . . . . . . . . . . . . . . . . . . . . . . . . . . . . . . . . . . . . .
. . . . . . . . . . . . . . . . . . . . . . . . . X
N N N N N N N N N N N N N N N N N N N N N N N N N X
X
ma. 1 l 0 1 'ISSUES 'UMORS
50 47
50 49 44 10
50
47 50
2 50
$50 48 49 48 46 41
50 44
18 1
50 5
50 1
28 48 1
$50 1 4
'50 1
49 46
so 1 1
'50 1 2
4.9
~ ~
153 Trichloroethylene, NTP TR 273

TABLE D3. ANALYSIS OF PRIMARY TUMORS IN FEMALE AUGUST RATS IN THE TWO-YEAR GAVAGE STUDY O F TRICHLOROETHYLENE
Untreated Vehicle Control Control 500 m g k s 1,000m g k g
Hematopoietic System: Leukemia Overall Rates (a) 0150(0%) Adjusted Rates (b) 0.0% Terminal Rates(c) 0126(0%)Life Table Testa (d) Incidental Tumor Tests (d) Cochran-Armitage Trend Test (d) Fisher Exact Test
1/50 (2%) 2.2% 0123(0%)P=0.027 P=0.020 P=0.037
0150(0%)0.0% 0126(0%)P=0.523N P=0.469N
P=0.500N
5/50 (10%) 18.2% 3/25(12%)P=0.078 P=0.059
P=0.102
Kidney: Tubular Cell Adenoma or Adenocarcinoma Overall Rates (a) 0150(0%) 1/49(2%)
Terminal Rates (c) 0126(0%) 1/23(4%)Life Table Tests (d) P=0.390N Incidental Tumor Testa (d) P=0.570N Cochran-Armitage Trend Test (d) P=0.384N Fisher Exact Test
Adjusted Rates (b) 0.0% 4.3% 4/48(8%)13.6% 2/26(8%)P=0.210 P=0.123
P=0.174
0/50(0%)0.0% 0125(0%)P=0.483N P=0.483N
P=0.495N
Pituitary Gland: Chromophobe Adenoma Overall Rates (a) 0149(0%) Adjusted Rates (b) 0.0% Terminal Rates (c) OD6(0%) Life Table Testa (d) Incidental Tumor Testa (d) Cochran-Armitage Trend Test (d) Fisher Exact Test
3/49 (6%) 6.4% Of23 (0%)P=0.062N P=0.015N P=0.044N
0147(0%)0.0% Of26(0%)P=0.150N P =0.058N
P=0.129N
0143(0%)0.0% 0125(0%)P=0.197N P=0.053N
P= 0.147N
Pituitary Gland: Adenoma Overall Rates (a) 42/49 (86%)
Terminal Rates (c) 25/26 (96%) Life Table Testa (d) Incidental Tumor Testa (d) Cochran-Armitage Trend Test (d) Fisher Exact Test
Adjusted Rates (b) 97.7% 35/49 (71 96)
17/23 (74%) P=0.001N P=0.033N P=0.003N
84.9% 26/47 (55%) 76.0% 18/26 (69%) P=0.053N P=0.173N
P=0.077N
18/43 (42%) 66.6% 16/25 (64%) P=0.003N P=0.055N
P=0.004N
Adrenal Gland: Cortical Adenoma Overall Rates (a) 4/50(8%)Adjusted Rates (b) 14.0% Terminal Rates (c) 3/26(12%)Life Table Testa (d) Incidental Tumor Testa (d) Cochran-Armitage Trend Test (d) Fisher Exact Test
6/48 (13%) 22.4% 4/23 (17%) P=0.401N P=0.520N P=0.409N
6/48 (13%) 23.1% 6/26(23%)P=0.550N P=0.604N
P=0.621
5/50 (10%) 20.0% 5/25(20%)P=0.480N P=0.599
P=0.471N
Adrenal Gland: Cortical Adenoma or Carcinoma Overall Rates (a) 4/50(8%)Adjusted Rates (b) 14.0% Terminal Rates (c) 3/26 (12%) Life Table Testa (d) Incidental Tumor Tests (d) Cochran-Armitage Trend Test (d) Fisher Exact Test
7/48(15%)26.5% 5/23(22%)P= 0.281 N P=0.384N P=0.296N
6/48 (13%) 23.1% 6/26 (23%) P=0.420N P=0.472N
P=0.500N
5/50 (10%) 20.0% 5/25(20%)P=0.353N P=0.534N
P=0.351N
Adrenal Gland: Pheochromocytoma Overall Rates (a) 6/50(12%)Adjusted Rates (b) 20.5% Terminal Rates (c) 4/26 (15%) Life Table Testa (d) Incidental Tumor Testa (d) Cochran-Armitage Trend Test (d) Fisher Exact Test
9/48 (19%) 33.2% 6/23 (26%) P<0.001N P=0.001N P<0.001N
2/48 (4%) 7.7% 2/26(8%)P =0.019N P=0.034N
P=0.025N
0150(0%)0.0% 0125(0%)P=0.003N P=0.009N
P=0.001N
Trichloroethylene, NTP TR 273 154

TABLE D3. ANALYSIS O F PRIMARY TUMORS IN FEMALE AUGUST RATS IN THE TWO-YEAR GAVAGE STUDY O F TRICHLOROETHYLENE (Continued)
Untreated Control
Thyroid: C-cell Adenoma Overall Rates (a) 0150(0%)Adjusted Rates (b) 0.0% Terminal Rates (c) 0126 (0%) Life Table Tests (d)Incidental Tumor Tests (d) Cochran-Armitage Trend Test (d) Fisher Exact Test
Thyroid: C-cell Adenoma or Carcinoma Overall Rates (a) 0150 (0%)Adjusted Rates (b) 0.0% Terminal Rates (cl 0126 (0%) Life Table Tests (d) Incidental Tumor Tests (d) Cochran-Armitage Trend Test (d) Fisher Exact Test
Mammary Gland: Adenoma Overall Rates (a) 3/50 (6%) Adjusted Rates (b) 8.2% Terminal Rates (c) 0126 (0%) Life Table Tests (d) Incidental Tumor Tests (d) Cochran-Armitage Trend Test (d) Fisher Exact Test
Vehicle Control
0149(0%) 0.0% 0123(0%)P=O.403 P=0.403 P=0.385
0149(0%)0.0% 0123(0%) P =0.418 ?=0.418 P=0.398
4/50(8%)12.5% 1/23 (4%) P =0.069N P=0.135N P =0.060N
Mammary Gland: Adenoma, Adenocarcinoma. or Carcinoma Overail Rates (a) 3/50 (6%)Adjusted Rates (b) 8.2% Terminal Rates(c) 0126 (0%)Life Table Testa (d) Incidental Tumor Test (d) Cochran-Armitage Trend Test (d) Fisher Exact Test
Mammary Gland: Fibroadenoma Overall Rates (a) 13/50 (26%) Adjusted Rates (b) 38.2% Terminal Rates (c) 6/26 (23%) Life Table Testa (d)Incidental Tumor Test (d) Cochran-Armitage Trend Test (d)Fisher Exact Test
Mammary Gland: Fibroma or Fibroadenoma Overall Rates (a) 14/50 (28%) Adjusted Rates (b) 39.8% Terminal Rates (c) 6/26 (23%) Life Table Tests (d) Incidental Tumor Tests td) Cochran-Armitage Trend Test (d) Fisher Exact Test
Mammary Gland: All Tumors (e)Overall Rates (a) 17/50 (34%) Adjusted Rates (b) 44.9% Terminal Rates (c) 6/26 (23%) Life Table Tests (d) Incidental Tumor Tests (d)Cochran-Armitage Trend Test (d) Fisher Exact Test
6/50 (12%) 16.3% 1/23 (4%) P =0.058N P =0.079N P= 0.042N
10150 (20% j 33.1% 4/23 (17%) P=0.072N P=0.356N P =0.060
12/50 (24%) 36.9% 4/23 (17%) P=0.031N P=0.240N P=0.020N
17/50 (34%) 45.7% 5/23 (22%)P=O.OO8N P = 0.061N P =0.003N
500 m g k g
3/49 (6%)12.0% 3/25 (12%) P=0.134 P=0.134
P=O.121
4/49 (8%)16.0% 4/25 (16%)P =0.011 P=0.071
P =0.059
4/50 ( 8 % )14.4% 3/26 (12%) P-0.612N P =0.562
P=0.643
41'50 (8%)14.4% 3/26 (12%) P=0.367N P =0.429N
P=0.370N
8/50 (16%) 25.9% 4/26 (15%) P=0.353N P=0.563
P=0.398N
8/50(16%)25.9% 4/26 (15%) P =0.210N P=0.512N
P=0.227N
12/50 (24%) 38.1% 1/26 (27%) P =0.188N P =0.440N
P=0.1 89N
1,000 mg/kg
1/50(2%)4.0% 1/25 (4%) P=0.517 P=0.517
P=0.505
1/50(2%) 4.0% 1/25 (4%) P=0.517 P=0.517
P=0.505
0150(0%) 0.0% 0125 (0%) P =0.090N P=0.132N
P=0.059N
1/50(2%)4.0% 1/25 (4%) P =0.097N P=0.075N
P=0.056N
4/50 (8%) 14.3% 3/25 (12%) P =0.090N P= 0.385N
P=0.074N
4/50 (8%)14.3% 3/25 (12%) P=0.045N P = 0.304N
P = 0.027N
5/50 (10%) 18.2% 4/25 (16%) P = 0.013N P=0.058N
P=0.004N
155 Trichloroethylene, NTP TR 273

TABLE D3. ANALYSIS OF PRIMARY TUMORS IN FEMALE AUGUST RATS IN THE TWO-YEAR GAVAGE STUDY OF TRICHLOROETHYLENE (Continued)
Untreated Vehicle Control Control 500 mg/kg 1,000 mg/kg
Uterus: Endometrial Stromal Polyp Overall Rates (a) 1/50 (2%) 3/49 (6%) 0148 (0%) 0149 (0%)Adjusted Rates (b) 3.8% 13.0% 0.0% 0.08 Terminal Rates (c) 1/26 (4%) 3/23 (13%) 0126 (0%) 0125 (0%)Life Table Tests (d) P=0.030N P =0.098N P=0.105N Incidental Tumor Tests (d) P=0.030N P=0.098N P=0.105N Cochran-Armitage Trend Test (d) P=0.038N Fisher Exact Test P=0.125N P=0.121 N
Brain: Granular Cell Tumor Overall Rates (a) 2/50 (4%) 1/49 (2%) 3/50 (6%) 1/50 (2%) Adjusted Rates (b) 7.7% 4.5% 11.5% 4.0% Terminal Rates (c) 2/26 (8%) 1/22 (5%) 3/26 (12%) 1/25 (4%) Life Table Tests (d) P =0.567N P =0.365 P=0.734N Incidental Tumor Tests (d) P=0.567N P =0.365 P=0.734N Cochran-Armitage Trend Test (d) P=0.603N Fisher Exact Test P=0.316 P=0.747N
(a) Number oftumor-bearing animals/number of animals examined a t the site (b)Kaplan-Meier estimated tumor incidence a t the end of the study after adjusting for intercurrent mortality (c)Observed tumor incidence a t terminal kill (d)Beneath the control incidence are the P values associated with the trend test. Beneath the dosed group incidence are the Pvalues corresponding to pairwise comparisons between that dosed group and the vehicle controls. The life table analysis regards tumors in animals dying prior to terminal kill as being (directly or indirectly) the cause of death. The incidental tumor test regards these lesions as nonfatal. The Cochran-Armitage and Fisher exact tests compare directly the overall incidence rates. A negative trend or lower incidence in a dosed group is indicated by (N). (e)Includes undifferentiated carcinoma, adenoma, adenocarcinoma, fibroma, and fibroadenoma
Trichloroethylene, NTP TR 273 156

TABLE D4. SUMMARY OF THE INCIDENCE OF NONNEOPLASTIC LESIONS IN FEMALE AUGUST RATS IN THE TWO-YEAR GAVAGE STUDY OF TRICHLOROETHYLENE
CONTROL (UNTR) CONTROL (VEH) LOW DOSE HIGH DOSE
ANIMALS INITIALLY IN STUDY 50 50 50 50 ANIMALS NECROPSIED 50 50 50 50 ANIMALS EXAMINED
HISTOPATHOLOGICALLY 50 50 50 50
INTEGUMENTARY SYSTEM *Skin (50) (50) (50) (50)
Ulcer, NOS 1 (2%) 1 (2%)Inflammation, chronic 1 (2%) 2 (4%)Ulcer, chronic 1 (2%)Inflammation, chronic diffuse 1 (2%)Inflammation, granulomatous focal 1 (2%)
*Subcutaneous tissue (50) (50) (50) (50)Hemorrhage 1 (2%)Inflammation, necrotizing 1 (2%)Abscess, NOS 1 ( 2 % )Inflammation, granulomatous 1 (2%)Foreign material, NOS 2 (4%)
RESPIRATORY SYSTEM *Nasal cavity (50) (50) (50) (50)
Inflammation, acute suppurative 1 (2%) *Tracheal lumen (50) (50) (50) (50)
Hemorrhage 1 (2%) 4 (8%)*Larynx (50) (50) (50) (50)
Inflammation, chronic 1 (2%)Foreign material, NOS 1 (2%)
#Trachea (50) (48) (47) (47)Inflammation, chronic 1 (2%)Foreign material, NOS 1 (2%) 4 (9%)
#Lung (50) (50) (50) (50) Bronchiectasis 1 (2%) 1 (2%) Atelectasis 1 (2%) Congestion, NOS 2 (4%) 2 (4%) Edema, NOS 1 (2%) Hemorrhage 1 (2%) 2 (4%) 4 (8%) 3 (6%) Inflammation, NOS 2 (4%) 1 (2%) Inflammation, focal 1 (2%) 2 (4%) 3 (6%) 2 (4%)Inflammation, multifocal 1 (2%) 4 (8%) Pneumonia,aspiration 1 (2%)Bronchopneumonia, acute 1 (2%) 2 (4%)Inflammation, acute 1 (2%) 1 (2%)Inflammation, acute focal 1 (2%)Inflammation, chronic 1 (2%) 1 (2%)Inflammation, chronic focal 3 (6%) 3 (6%) 3 (6%) Inflammation, granulomatous 2 (4%) 1 (2%) 2 S4%) 3 (6%) Inflammation, granulomatous focal 11 (22%) 12 (24%) 18 (36%) 17 (34%) Foreign material, NOS 4 (8%) 4 (8%) 4 (8%) 10 (20%) Hemosiderosis 1 (2%)
157 Trichloroethylene, NTP TR 273

TABLE D4. SUMMARY OF THE INCIDENCE OF NONNEOPLASTIC LESIONS IN FEMALE AUGUST RATS IN THE TWO-YEAR GAVAGE STUDY OF TRICHLOROETHYLENE (Continued)
____(.
HEMATOPOIETIC SYSTEM #Bone marrow
Hyperplasia, granulocytic #Spleen
Congestion, NOS Hemosiderosis Hyperplasia, lymphoid Hematopoiesis
#Lymph node Congestion, NOS Abscess, NOS
#Mesenteric lymph node Congestion, NOS Hemorrhage
#Liver Hematopoiesis
#Thymus Hemorrhage
CIRCULATORY SYSTEM *Multiple organs
Periarteritis #Heart
Thrombosis, NOS Inflammation, chronic focal Inflammation, chronic diffuse
+Pulmonary artery Calcification, focal
"Sup. panc-duod. artery Thrombosis, NOS Degeneration, hyaline
#Pancreas Periarteritis
~~ ~~~~~
DIGESTIVE SYSTEM #Salivary gland
Inflammation, chronic Inflammation, granulomatous focal
#Liver Congestion, NOS Congestion, chronic passive HemorrhageInflammation, focal Inflammation, acute focal Inflammation, acutekhronic Inflammation, chronic Inflammation, chronic focal Necrosis, NOS Necrosis, focal Necrosis, central Metamorphosis, fatty LipoidosisPigmentation, NOS Mitotic alteration Focal cellular change Clear cell change Hepatocytomegaly AngiectasisRegeneration, NOS
XLiverhnidlobular Lipoidosis
CONTROL (UNTR)
(50)
(50)
3 (6%)
14 (28%) (47)
1 (2%)
(47) 1 (2%)
(50)
(50)
(50)
(50) 1 (2%)
(50)
2 (4%)
1 (2%)
1 (2%)1 (2%) 2 (4%)
1 (2%)
2 (4%)
(50)
CONTROL (VEH)
(47)
(49) 1 (2%)1 (2%) 1 (2%)
16 (33%)(43)
(48)
(48)
1 (2%)
2 (4%)
3 (6%)
3 (6%)
5 (10%)
(48)
LOW DOSE
(49)
(48) 1 (2%) 2 (4%)
15 (31%) (49)
1 (2%) (49)
1 (2%)
(48) 1 (2%)
(4) 1 (25%)
(47)
(48)
2 (4%)1 (2%)
2 (4%)1 (2%)
3 (6%) 1 (2%)1 (2%)
(48)1 (2%)
HIGH DOSE
(50)1 (2%)
(49) 2 (4%) 2 (4%)
8 (16%) (44)
(44)
2 (5%) (50)
(10)1 (10%)
(47)
1 (2%)(50)
1 (2%)
1 (2%) 1 (2%)
1 (2%)2 (4%) 1 (2%)
1 (2%) 1 (2%) 1 (2%)1 (2%)
1 (2%) (50)
Trichloroethylene, NTPTR 273 158

TABLE D4. SUMMARY OF THE INCIDENCE OF NONNEOPLASTIC LESIONS IN FEMALE AUGUST RATS IN THE TWO-YEAR GAVAGE STUDY O F TRICHLOROETHYLENE (Continued)
CONTROL (UNTR) CONTROL (VEH) LOW DOSE HIGH DOSE
DIGESTIVE SYSTEM (Continued) #Bile duct
Dilatation, NOS Inflammation, chronic Fibrosis Sclerosis Hyperplasia, NOS Hyperplasia, focal
#Pancreas Inflammation, acutekhronic Inflammation, chronic Fibrosis, multifocal Atrophy, focal
#Pancreatic duct Inflammation, acute
#Pancreatic acinus Atrophy, NOS Atrophy, focal Atrophy, diffuse
*Esophageal lumen Hemorrhage
#EsophagusPenetrating wound Inflammation, NOS Foreign material, NOS' Hyperkeratosis
#Periesophageal tissue Inflammation, NOS Inflammation, acute
#Stomach Edema, NOS Inflammation, NOS
#Gastric submucosa Inflammation, granulomatous
#Forestomach Hyperplasia, epithelial Hyperkeratosis
#Colon HemorrhageParasitism
URINARY SYSTEM #Kidney
Calculus, gross observation only Mineralization Cast, NOS HydronephrosisCyst, NOS Inflammation, acute focal Inflammation, chronic Inflammation, granulomatous Fibrosis, diffuse NephropathyNephropathy, toxic Calcification, focal CytomegalyHyperplasia, tubular cell
# Kidneyltubule Dilatation, NOS Degeneration, NOS Atypia, NOS
(50)1 (2%) 5 (10%) 1 (2%) 4 (8%) 2 (4%)
1 (2%)
1 (2%) 47 (94%)
(50)
(49)
3 (6%)
1 (2%) 2 (4%)
37 (76%)
1 (2%)
(49) 1 (2%)
(48)
3 (6%)
3 (6%) 1 (2%)
1 (2%)
42 (88%)8 (17%)
46 (96%)
(48)
1 (2%) 1 (2%)
(50)
1 (2%) 1 (2%)
42 (84%) 29 (58%)
2 (4%)50 (100%)
1 (2%) (50)
159 Trichloroethylene, NTP TR 273

TABLE D4. SUMMARY OF THE INCIDENCE OF NONNEOPLASTIC LESIONS IN FEMALE AUGUST RATS IN THE TWO-YEAR GAVAGE STUDY OF TRICHLOROETHYLENE (Continued)
URINARY SYSTEM (Continued) XKidneylpelvis
Dilatation, NOS Hemorrhage Hyperplasia, epithelial
#Urinary bladder Inflammation, NOS Inflammation, acute diffuse Hyperplasia, epithelial Angiectasis
ENDOCRINE SYSTEM #Pituitary
Cyst, NOS Congestion, NOS Hyperplasia, NOS Hyperplasia, focal Angiectasis
#Adrenal Cyst, NOS Congestion, NOS Hemorrhage Necrosis, cortical Lipoidosis Angiectasis
#AdrenaYcapsuleInflammation, chronic
#Adrenal cortex Congestion, NOS Hemorrhage Inflammation, focal Lipoidosis Focal cellular change Cytomegaly Hyperplasia, NOS Hyperplasia, focal
#Adrenal medulla Focal cellular change Hyperplasia,NOS Hyperplasia, focal
#ThyroidInflammation, chronic focal Hyperplasia, C-cell
REPRODUCTIVE SYSTEM *Mammary gland
Cyst, NOS Degeneration, cystic Hyperplasia, NOS Hyperplasia, focal Hyperplasia, cystic Lactation
*Vaginal mucosa Degeneration, NOS
CONTROL (UNTR)
(50)
3 (6%) 10 (20%)
(48) 1 (2%)
1 (2%)
(50)
3 (6%)
1 (2%)
(50) 1 (2%) 2 (4%)8 (16%)
(50) 1 (2%) 1 (2%)
(50)
1 (2%)
30 (60%) (50)
3 (6%)
CONTROL (VEH)
(49)
1 (2%) (46)
1 (2%)
(49)
2 (4%) 1 (2%)
(48)
(48)
1 (2%) 1 (2%) 1 (2%) 1 (2%)4 (8%)
(48) 1 (2%)
5 (10%) (49)
2 (4%)
21 (42%) (50) 3 (6%)
LOW DOSE
(47) 1 (2%)
2 (4%) 1 (2%)
2 (4%) (48)
1 (2%) (48)
1 (2%) 1 (2%) 1 (2%)
1 (2%) 1 (2%)
1 (2%)(48)
12 (25%) (49)
2 (4%)
1 (2%)
20 (40%)(50)
HIGH DOSE
(43) 1 (2%)
3 (7%)
(50)
1 (2%)
1 (2%) (50)
(50)
1 (2%)
1 (2%) 1 (2%) 7 (14%)
(50)
Trichloroethylene, NTP TR 273 160

TABLE D4. SUMMARY OF THE INCIDENCE OF NONNEOPLASTIC LESIONS IN FEMALE AUGUST RATS IN THE TWO-YEAR GAVAGE STUDY OF TRICHLOROETHYLENE (Continued)
~~
REPRODUCTIVE SYSTEM (Continued) #Uterus
Dilatation, NOS Hydrometra HemorrhageInflammation,NOS Inflammation, acute Inflammation, acutekhronic Metaplasia, squamous
XUterudendometrium Cyst, NOS Inflammation, acute Degeneration, NOS Hyperplasia, NOS Hyperplasia, cystic
#Ovary Cyst, NOS Follicular cyst, NOS
NERVOUS SYSTEM #Brain
Hydrocephalus, internal Hemorrhage
SPECIAL SENSE ORGANS *Middle ear
Inflammation, acute suppurative
MUSCULOSKELETAL SYSTEM None
BODY CAVITIES *Mediastinum
Abscess, NOS *Pleura
Inflammation, acute/chronic *Pericardium
Inflammation, acute/chronic
ALL OTHER SYSTEMS None
SPECIAL MORPHOLOGY SUMMARY None
~~ ~ ~~
CONTROL (UNTR) CONTROL (VEH)
(50) (49)
1 (2%) 1 (2%)
1 (2%)
1 (2%)(50) (49)
1 (2%)
1 (2%) 1 (2%)
(49) (47) 2 (4%) 1 (2%)
(50) (49)
1 (2%)
(50)
(50)
(50)
(50)
LOW DOSE HIGH DOSE
(48) (49) 4 (8%)
4 (8%) 2 (4%) 1 (2%) 1 (2%)
1 (2%)
(48) (49)
1 (2%) 1 (2%)
(47) (46) 3 (6%) 2 (4%) 3 (7%)
(50) (50)1 (2%)
3 (6%) 1 (2%)
* Number of animals receiving complete necropsy examination; all gross lesions including masses examined microscopically. # Number of animals examined microscopically a t this site
161 Trichloroethylene, NTP TR 273

162Trichloroethylene, NTP TR 273

APPENDIX E
SUMMARY OF LESIONS IN MALE MARSHALL RATS
IN THE TWO-YEAR GAVAGE STUDY OF
TRICHLOROETHYLENE
PAGE
TABLE E l SUMMARY OF THE INCIDENCE OF NEOPLASMS IN MALE MARSHALL RATS IN THE TWO-YEAR GAVAGE STUDY OF TRICHLOROETHYLENE 165
TABLE E2 INDIVIDUAL ANIMAL TUMOR PATHOLOGY OF MALE MARSHALL RATS IN THE TWO-YEAR GAVAGE STUDY OF TRICHLOROETHYLENE 168
TABLE E3 ANALYSIS OF PRIMARY TUMORS IN MALE MARSHALL RATS IN THE TWO-YEAR GAVAGE STUDY OF TRICHLOROETHYLENE 176
TABLE E4 SUMMARY OF THE INCIDENCE OF NONNEOPLASTIC LESIONS IN MALE MARSHALL RATS IN THE TWO-YEAR GAVAGE STUDY OF TRICHLOROETHYLENE 178
163 Trichloroethylene, NTP TR 273

Trichloroethylene, NTP TR 273 164

TABLE E l . SUMMARY OF THE INCIDENCE OF NEOPLASMS IN MALE MARSHALL RATS IN THE TWO-YEAR GAVAGE STUDY OF TRICHLOROETHYLENE
CONTROL (UNTR) CONTROL (VEH) LOW DOSE HIGH DOSE
ANIMALS INITIALLY IN STUDY 50 50 50 50 ANIMALS MISSING 1 ANIMALS NECROPSIED 49 50 50 50 ANIMALS EXAMINED
HISTOPATHOLOGICALLY 49 50 50 50
INTEGUMENTARY SYSTEM *Skin
Trichoepithelioma+Subcutaneous tissue
Sarcoma,NOS Teratoma, benign
RESPIRATORY SYSTEM #Lung (47) (49) (50) (47)
Neoplasm, NOS, unclear primary or metas 1 (2%)Alveolar/bronchiolar adenoma 1 (2%)Tubular cell adenocarcinoma, metastatic 1 (2%)Pheochromocytoma, metastatic 1 (2%) 3 (6%) 1 ( 2 % ) 1 (2%)
HEMATOPOIETIC SYSTEM *Multiple organs (49)
Malignant lymphoma, histiocytic type
CIRCULATORY SYSTEM #Spleen (46)
Hemangiosarcoma #Heart (47)
Tubular cell adenocarcinoma, metastatic Pheochromocytoma, metastatic
DIGESTIVE SYSTEM #Liver (47) (49) (50) (47)
Carcinoma, NOS, metastatic 1 (2%)#Cecum 141) (45) (43) (43)
Adenocarcinoma in adenomatous polyp 1 (2%)
URINARY SYSTEM #Kidney (49) (49) (50) (47)
Tubular cell adenoma 2 (4%) 1 (2%)Tubular cell adenocarcinoma 1 (2%) Interstitial cell tumor, invasive 1 (2%)
#Urinary bladder (41) (45) (41) (44)Transitional cell carcinoma 1 (2%)
ENDOCRINE SYSTEM #Pituitary (36) (21) (25) (28)
Chromophobe adenoma 1 (3%) 2 (10%)#Adrenal (48) (48) (43) (43)
Cortical adenoma 2 (4%) Pheochromocytoma 19 (40%) 21 (44%) 12 (28%) 11 (26%) Pheochromocytoma, malignant 4 (8%) 5 (10%) 1 (2%) 2 (5%)
#Thyroid (41) (41) (41) (40) C-cell adenoma 8 (20%) 4 (10%) 5 (12%) 2 ( 5 % ) C-cell carcinoma 4 (10%) 1 (2%) 1 (3%)
165 Trichloroethylene, NTP TR 273

TABLE El . SUMMARY OF THE INCIDENCE OF NEOPLASMS IN MALE MARSHALL RATS IN THE TWO-YEAR GAVAGE STUDY OF TRICHLOROETHYLENE (Continued)
CONTROL (UNTR) CONTROL (VEH) LOW DOSE HIGH DOSE
ENDOCRINE SYSTEM (Continued) #Parathyroid
#Pancreatic islets Adenoma, NOS
Islet cell adenoma
(15)
(42) 1 (2%)
(16)
(49) 2 (13%)
1 (2%)
(21)
(46)
(18)
(46) 1 (6%)
REPRODUCTIVE SYSTEM #Testis
Interstitial cell tumor Interstitial cell tumor, malignant
(46) 16 (35%)
(46) 17 (37%)
(48) 21 (44%)
(48) 31 (65%)
1 (2%)
NERVOUS SYSTEM #Brain
Glioma, NOS Astrocytoma
Meningioma*Spinal cord
(45)
(49)
SPECIAL SENSE ORGANS None
MUSCULOSKELETAL SYSTEM *Skull
*Vertebra Mixed mesenchymal tumor, benign
Meningioma, invasive
(49)
(49)
BODY CAVITIES *Mediastinum
Carcinoma, NOS *Peritoneum
Sarcoma, NOS Mesothelioma, NOS Mesothelioma, malignant
*Peritoneal mesothelium Mesothelioma, NOS
*Tunica vaginalis Mesothelioma, NOS
ALL OTHER SYSTEMS None
ANIMAL DISPOSITION SUMMARY Animals initially in study
Natural death 50 13
50 14
50 20
50 16
Moribund sacrifice 3 8 6 3 Terminal sacrifice 32 26 12 6 Dosing accident Accidentally killed, NOS Animal missing
1 1
1 1 12 25
Trichloroethylene, NTP TR 273 166

TABLE E l . SUMMARY OF THE INCIDENCE OF NEOPLASMS IN MALE MARSHALL RATS IN THE TWO-YEAR GAVAGE STUDY OF TRICHLOROETHYLENE (Continued)
CONTROL (UNTR) CONTROL (VEH) LOW DOSE HIGH DOSE
TUMOR SUMMARY Total animals with primary tumors**
Total animals with benign tumors
Total animals with malignant tumors
Total animals with secondary tumors##
Total animals with tumors uncertain-
Total primary tumors
Total benign tumors
Total malignant tumors
Total secondary tumors
38 63 35 50 11 11 1 1
37 61 35 50 9 9 5 6
23 46 22 41 2 2 1 1
32 57 32 46 7
10 3 4
benign or malignant Total uncertain tumors
2 2
2 2
2 2
1 1
Total animals with tumors uncertain-- primary or metastatic
Total uncertain tumors 1 1
* Number of animals receiving complete necropsy examination; all gross lesions including masses examined microscopically. ** Primary tumors: all tumors except secondary tumors # Number of animals examined microscopically a t this site #R Secondary tumors: metastatic tumors or tumors invasive into an adjacent organ
167 Trichloroethylene, NTP TR 273

TABLE E2. INDIVIDUAL ANIMAL TUMOR PATHOLOGY OF MALE MARSHALL RATS IN THE TWO-YEAR GAVAGE STUDY OF TRICHLOROETHYLENE: UNTREATED CONTROL
NUMBER
Skin Trichoepithelioma
Subcutaneoushasue Sarcoma, NOS
Lungs and bronchi Alveolar/bronchiolar adenoma Pheochromocytoma, metaatatic
Trachea
Bone marrow SpleenL mphnodesT$mus
Heart
Salivary gland Liver Bih duct Gallbladder k common bile duct Pancreas
:;:2rSmall intantine b r intestine
A&ocarcinoma in adenomatous polyp
KidneyTubular cell adenoma
Urinary bladder Transitional cell carcinoma
PituitaryChromophobe adenoma
Adnnal PheochromocytomaPheochromocytoma, malignant
Th mid $cell adenoma C-call carcinoma
ParathyroidPancreatic islets
Islet cell adenoma
Mammary gland Tertis
Interstitial call tumor Prostate
B n i n
Peritonrum Meaothel?oma. NOS
Tunicava n a b Meaothefoma, NOS
+: Tiiiur examined microscopically -. Required tissue not examined microscopically Xi Tumor incidence
8 8 6 7 7 7 7 7 7 7 7 7 7 7 7 7 7 7 7 7 7 7 7 7 8 9 9 9 0 0 1 1 2 3 3 4 4 4 5 5 8 7 7 7 7 8 8 9 9 0 8 8 9 1 5 1 8 0 3 6 1 2 6 0 2 4 2 4 8 8 6 9 2 6 2
1 1 0 1 1 1 1 0 1 1 1 0 1 1 1 0 1 0 1 0 0 1 1 0 1 0 0 4 0 0 0 0 5 0 0 0 8 0 0 0 8 0 4 0 9 9 0 0 5 0 5 5 4 5 5 5 5 2 5 5 5 9 5 5 5 7 5 6 5 8 1 5 5 1 . 5
. . . . . . . . . . . . . . . . . . . . . . . . .
. . . . . . . . . . . . . . . . . . . . . . . . . X
~~ ~ ~~~~
. . . . . . . . . . . . . . . . . . . . . . . . . X
X . . . . . . . . . . . . . . . . . . . . . . . . .
. . . . . . . . . . . . . . . . . . . . . . . . . . . . . . . . . . . . . . . . . . . . . . . . . . + + - - + + + - + + + - + - + + - - + + + - + - +_ _ _ _ _ _ _ _ _ _ - _ _ - - - _ _ _ _ _ _ _ _ _
. . . . . . . . . . . . . . . . . . . . . . . . .
. . . . . . . . . . . . . . . . . . . . . . . . . . . . . . . . . . . . . . . . . . . . . . . . . . . . . . . . . . . . . . . . . . . . . . . . . . . N N N N N N N N N N N N N N N N N N N N N N N N N . . . . . . . . . . . . . . . . . . . . . . . . . . . . . . . . . . . . . . . . . . . . . . . . . . . . . . . . . . . . . . . . . . . . . . . . . . . . . . . . . . . . . . . . . . . . . . . . . . . . . . . . . . . . . . . . . . . . . . . . . . . . . .
. . . . . . . . . . . . . . . . . . . . . . . . .
. . . . . . . . . . . . . . . . . . . . . . . . .
- + + + + + + - + + + - + + + + - - + - + + + + -X . . . . . . . . . . . . . . . . . . . . . . . . . .
X x x x x x x x x x x h . . . . . . . . . . . . . . . . . . . . . . . . .
X X X X X x x x+ - - + + - + - - - + - - + - - - - - - - + + - + . . . . . . . . . . . . . . . . . . . . . . . . .
X
+ + N N N N N N N N N N + + N N + N + N N + N N N . . . . . . . . . . . . . . . . . . . . . . . . . X X X x x . . . . . . . . . . . . . . . . . . . . . . . . .
. . . . . . . . . . . . . . . . . . . . . . . . . ~ ~~ ~~~ ~ ~
N N N N N N N N N N N N N N N N N N N N N N N N N X
. . . . . . . . . . . . . . . . . . . . . . . . .
' No tissue information submitted CI Necropsy, no histology dua to protocol A: Autolysis
N: Necropiy, no autolysis, no microacopic axamination M: Animal misaingS Animal missaxed B: No necropsy parformed
Trichloroethylene, NTP TR 273 168

TABLE Ea. INDIVIDUAL ANIMAL TUMOR PATHOLOGY OF MALE MARSHALL RATS UNTREATED CONTROL (Continued)
8 8 8 8 8 8 8 8 8 6 a a a 8 a a 8 a a 0 8 0 0 0 6 NUMBER 1 2 2 2 2 3 9 3 3 3 4 4 4 4 5 5 5 6 8 6 7 0 0 9 9
0 0 1 2 6 0 3 4 7 8 0 4 5 8 1 7 0 1 4 7 2 6 9 1 2
skin Trichoepithelioma
Subcutaneous tissue Sarcoma, NOS
Lungs and bronchi Alveolarhronchiolar adenoma Pheochromocytoma. metastatic
Trachea
Bone marrow SpleenL mphnodei TKymus
Heart
Salivary gland Liver Bile duct Gallbladder 8 common bile duct Pancreas
:t%Y Small intestine Lar intestine
A&ocarcinoms in adenomatous polyp
KidneyTubular cell adenoma
Urinary bladder Transitional cell carcinoma
PituitaryChromophobe adenoma
Adrenal PheochromocytomaPheochromocytoma. malignant
Thvroid C-cell adenoma
Islet cell adenoma
Mammary gland Tertii
Interstitial cell tumor Prostate
M Brain
-Peritoneum
Mesothelioma, NOS Tunica va 'nalis
Mesothefoma, NOS
* Animals necropsied
1 1 1 0 0 0 1 1 1 0 1 0 0 1 1 0 1 1 1 ~ ~ 1 1 1 1 0 0 0 9 6 7 b 0 0 0 0 4 3 0 0 9 0 0 0 6 9 0 0 0 0 5 5 3 0 6 3 5 5 5 1 5 4 8 5 5 9 5 5 5 3 7 5 5 5 5
+ + + + M + + + + + + + + + N + + + + + + + + + + $49X X 2
+ + + + h f + + + + + + + + + N + + + t + + + + + + '49 1
+ + + + M + + + + A + + + + + + + + + + + + + + + 47 1 1
+ + + + M + + + + A + + + + + + + - + + - + + + + 41
+ + + + M + + + + A + - + + + + + + + + + + + + + 46 + - + - M + + + + + + - + + + + + + + + + + + + + 46+ + + + M + - + + + + - - + + + + + + + - + + + + 30 - - - - M - - - - A - - - - - - - - - - - - - - - 0
+ + + + M + + + + A + + + + + + + + + + + + + + + 47
- + - + M + + + - A + - + + + + + + + + + + + + + 40 + + + + M + + + + A + + + + + + + + + + + + + + + 47 . . . . . . . . . . . . . . . . . . . . . . . . . 47 N N N N M N N N N N N N N N N N N N N N N N N N N '49 + + + - M + + + + A + - + + + + + + + r + + + + + 42 + + + + M + + + + A + + + + + + + + + - - + + + + 45 . . . . . . . . . . . . . . . . . . . . . . . . . 47 + + + - M + + + + + + - + + + + + + + + + + + + + 43 + + + - - M + + + + + + - + + + - + + + + + + + + + 41
X -1
+ + + + M + + + + + + + + + + + + + + + + + + + + 49 x x 2 + + + - M + + + + + + - + + + + + + + - - + + + + 41 X 1
+ + - + M - + + + A + + + + - + + + - + + + - + + 36 1
. . . . . . . . . . . . . . . . . . . . . . . . . 48 x x X X x x x X 19 X x x 4
+ + + + M + + + + A + - + + + + + + + + - + + + + 41X x x a
X 4 + - - + M - + - - A + - - - - + - - - - - - - + - 15 . . . . . . . . . . . . . . . . . . . . . . . . . 42
1
N N + N M + N N + N N N N + N + + + N N + N N + + '49+ + + + M + + + + + + - + + + + + + + + + + + + +46 x x x x x x x x x x x 16 + + + + M + + + + A + - + + + + + + + + - + + + + 44
+ + + + M + + + + A + + + + + + + + + + + + + + + 45
N N N N M N N N N N N N N N N N N N N N N N N N N *49 1
+ + + + M + + + + + + N + + + + + + + + + + + + + *49 X 1
169 Trichloroethylene,NTP TR 273

TABLE E2. INDIVIDUAL ANIMAL TUMOR PATHOLOGY OF MALE MARSHALL RATS IN THE TWO-YEAR GAVAGE STUDY OF TRICHLOROETHYLENE: VEHICLE CONTROL
NUMBER
WEEKS ON STUDY
L u n p and bronchi Pheochromocytoma, metastatic
Trachea
Bone marrow SpleenL mphnodei Tzymus
Heart Pheochromocytoma. metastatic
Salivary gland Liver
Carcinoma. NOS.metastatic Bile duct Qallbladder & common bile duct Pancreas:t%w Small inteatine Large intestine
KidneyUrinary bladder
PituitaryChromophobe adenoma
Adrenal Cortical adenoma PheochromocytomaPheochromocytoma, malignant
Th mid &cell adenoma Cesll carcinoma
ParathyroidMenoma,,NOS
Panematic islets Islet cell adenoma
Mammary gland Testis
Interatitial cell tumor Pm8hte
Brain S inalcord
heningioma
Bone Mixed mesanchymal tumor, benign Meningioma, invasive
Mediastinum Carcinoma, NOS
Peritoneum Sarcoma NOS Mesothelioma. NOS
8 0 0 0 7 7 7 7 7 7 7 7 7 7 7 7 7 7 7 7 7 7 7 7 7 9 9 9 9 0 0 1 1 1 2 2 3 3 4 4 5 5 5 0 0 0 0 7 7 7 3 4 5 7 7 0 2 3 7 4 0 5 7 3 5 3 5 8 1 5 7 8 0 1 7
1 0 1 1 1 0 1 1 1 0 1 1 1 0 1 0 0 1 1 1 1 1 1 0 0 0 8 0 0 0 5 0 0 0 2 0 0 0 9 0 0 9 0 0 0 0 0 0 9 7 5 0 5 5 5 7 5 5 4 4 5 5 5 3 5 2 7 4 5 5 5 5 4 2 9
. . . . . . . . . . . . . . . . . . . . . . . . .
. . . . . . . . . . . . . . . . . . . . . . . . . ~ ~ ~~ ~~
. . . . . . . . . . . . . . . . . . . . . . . . . . . . . . . . . . . . . . . . . . . . . . . . . . . . . . . . . . . . . . . . . . . . . . . . . . . - - - - - - - - - - - - - - + - - - - + - - - - -
. . . . . . . . . . . . . . . . . . . . . . . . .
. . . . . . . . . . . . . . . . . . . . . . . . . . . . . . . . . . . . . . . . . . . . . . . . . .
. . . . . . . . . . . . . . . . . . . . . . . . . N N N N N N N N N N N N N N N N N N N N N N N N N . . . . . . . . . . . . . . . . . . . . . . . . . . . . . . . . . . . . . . . . . . . . . . . . . . . . . . . . . . . . . . . . . . . . . . . . . . . . . . . . . . . . . . . . . . . . . . . . . . . . + + + + + + + + - - + + + + + + + + + + + + + + +
. . . . . . . . . . . . . . . . . . . . . . . . . . . . . . . . . . . . . . . . . . . . . . . . . .
+ + - - - + + - - + - - - + + + - - - - - - + - -X X . . . . . . . . . . . . . . . . . . . . . . . . .
X x x x x X x x x x x x x x x X . . . . . . . . . . . . . . . . . . . . . . . . .
x x x - - - + + + + - - - - - - - + + - + - + + - - - -x x . . . . . . . . . . . . . . . . . . . . . . . . .
+ N N N + N N N N N + N + + N N N + + + N N N N N . . . . . . . . . . . . . . . . . . . . . . . . . x x X x x x x x x x x . . . . . . . . . . . . . . . . . . . . . . . . .
. . . . . . . . . . . . . . . . . . . . . . . . .
. . . . . . . . . . . . . . . . . . . . . . . . . X
N N N N N + N N N N N N N N N N N N N N N N N N N
X
N N N N N N N N N N N N N N N N N N N N N N N N N
N N N N N N N N N N N N N N N N N N N N N N N N N X
X
Trichloroethylene, NTP TR 273 170

TABLE E2. INDIVIDUAL ANIMAL TUMOR PATHOLOGY OF MALE MARSHALL RATS: VEHICLE CONTROL (Continued)
ANIMAL 7 7 1 7 a e . a 8 8 8 8 8 8 8 8 8 8 8 0 8 8 8 8 NUMBER
TOTAL: WEEKS ON 0 0 1 1 0 1 1 0 1 1 0 0 0 1 0 0 0 0 0 0 0 1 1 TISSUES STUDY
Lungs and bronchi . . . . . . . . . . . . . . . . . . . . . . . . . 49 Pheochromocytoma, metastatic
Trachea 1 - + + :+ + - - + + + - + + X+ + + + X- - - + t + - l 383 Bone marrow . . . . . . . . . . . . . . . . . . . . . . . . . 49 Spleen . . . . . . . . . . . . . . . . . . . . . . . . . 48 L mphnodes + - - + + - - + + + - - + + - + - - - + - + + + - 33 Tgymus + - - - - - - - + - + - - - + - - - - - + - - - - 7
Heart . . . . . . . . . . . . . . . . . . . . . . . . . 49 Pheochromocytoma, metastatic X I i
~~ ~ ~ ~ ~~ ~ ~~~~~~
Salivary gland . . . . . . . . . . . . . . . . . . . . . . . . . 43 Liver . . . . . . . . . . . . . . . . . . . . . . . . . 49
Carcinoma, NOS,metastatic X 1
..
Bile duct . . . . . . . . . . . . . . . . . . . . . . . . . 49 Gallbladder & common bile duct N N N N N N N N N N N N N N N N N N N N N N N N N $50 Pancreas . . . . . . . . . . . . . . . . . . . . . . . . . 49
. . . . . . . . . . . . . . . . . . . . . . . . . 47E%r . . . . . . . . . . . . . . . . . . . . . . . . . 47 Small intestine . . . . . . . . . . . . . . . . . . . . . . . . . 44 Large intestine . . . . . . . . . . . . . . . . . . . . . . . . . 45
Kidney . . . . . . . . . . . . . . . . . . . . . . . . . Urinary bladder . . . . . . . . . . . . . . . . . . . . . . . . .
Pituitary - + - - . + + - + - + - - + + + + + + - - - - - + - 21 Chromophobe adenoma 2
Adrenal + + + t. + + + + + + + + + + + + - + + + + + + + + 48 Cortical adenoma X 2 Pheochromocytoma X X x x X x x 21 Pheochromocytoma, malignant X X X X 5
Thymid - + + 4- + + - - + + + + + + + + + + - - - + + - - 41 C--cell adenoma X 4
X 1 - + + + - - - - - - - + + - - + - - - - - + - - - 16
2 Pancreatic islets . . . . . . . . . . . . . . . . . . . . . . . . . 49
Islet cell adenoma X 1
M Mammary gland N N N N N N + N + + N + + + N N N N N N N N N N + '50 Testis . . . . . . . . . . . . . . . . . . . . . . . . . 46
Interstitial cell tumor x x x x x X 17 Prostate . . . . . . . . . . . . . . . . . . . . . . . . . 41
I l-. . . . . . . . . . . . . . . . . . . . . . . . . Brain
Spinal cord N + + + + N + + + + + + + + + + + + + + + + + + + MeninEpoma
M Bone N N N N + N N N N N N N + N N + + + N + N N N N N $50
Mired mesenchymal tumor, benign X 1 Meninpama. invasive 1
S Mediastinum N N N N N N N N N N N N N N N N N N N N N N N N N '50
Carnnoma. NOS X 1 Pentoneum N N N N N N N N N N N N N N N N N N N N N N N N N $60
Sarcoma NOS MesotheIioma, NOS X
I I-
* Animals necropsied
171 Trichloroethylene, NTP TR 273

TABLE E2. INDIVIDUAL AMMAL TUMOR PATHOLOGY OF MALE MARSHALL RATS IN THE TWO-YEAR GAVAGE STUDY OF TRICHLOROETHYLENE: LOW DOSE
ANIMAL NUMBER
Skin Tnchoepnhelioma
Subcutaneous tissue Teratoma, benign
L u n p and bronchi Neoplasm, NOS unclear primary or metastatic Pheochromocvtdma. metastatic
Trachea
Bone marrow
Sik:angosarcomaL mphncdes Tgymus
Heart
P Salivary gland Liver Bile duct Gallbladder & common bile duct Pancreas
:s:::,, Small intestine Largs intestine
M Kidney
Tubular cell adenoma Urinary bladder
PituitaryAdrenal
PheochromocytomaPheochromocytoma, malignant
Th mid d[cell adenoma
Parathyroid
Mammary gland Testis
Interstitial cell tumor Prostate
Brain
Peritoneum Mesothelioma,NOS
Tunica va 'nalia Mesothefornoma,NOS
a l O l O l O i O o O l O O O o O o o O ~ ~ ~ ~ ~ 6 0 1 0 6 0 6 0 1 1 2 0 6 5 1 1 3 2 6 5 1 0 0 6 2 6 4 1 4 9 4 5 4 0 0 3 4 9 0 4 7 2 0 5 7 1 4 4 6 2
+ + + + + + + N + + + N + + N N + N + + N + + + + X
+ + + + + + + N + + + N + + N N + N + + N + + + + X
. . . . . . . . . . . . . . . . . . . . . . . . . X
. . . . . . . . . . . . . . . . . . . . . . . . .
+ + - + + + + + - - + + + - - - + + + + - + - + + . . . . . . . . . . . . . . . . . . . . . . . . .
. . . . . . . . . . . . . . . . . . . . . . . . .
. . . . . . . . . . . . . . . . . . . . . . . . . . . . . . . . . . . . . . . . . . . . . . . . . . . . . . . . . . . . . . . . . . . . . . . . . . . N N N N N N N N N N N N N N N N N N N N N N ~ N N . . . . . . . . . . . . . . . . . . . . . . . . . . . . . . . . . . . . . . . . . . . . . . . . . . . . . . . . . . . . . . . . . . . . . . . . . . . . . . . . . . . . . . . . . . . . . . . . . . . . . . . . . . . . . . . . . . . . . . . . . . . . .
. . . . . . . . . . . . . . . . . . . . . . . . . X
+ + + + + + - + + + + + + - + + + + + + - - + + +
+ + - + + + + + - - - + + - - - + - - - - + + + -. . . . . . . . . . . . . . . . . . . . . . x x x x X : + +
. . . . . . . . . . . . . . . . . . . . . . . . . X X - - + - - + + - + - + + - - + - - - - - - + + + -
+ + N + N N N N N N N N N N N N N N + N N + + N N . . . . . . . . . . . . . . . . . . . . . . . . . x x x x x x x x x x x x . . . . . . . . . . . . . . . . . . . . . . . . .
. . . . . . . . . . . . . . . . . . . . . . . . .
N N N N N N N N N N N N N N N N N N N N N N ~ N N X . . . . . . . . . . . . . . . . . . . . . . . . .
X
Trichloroethylene, NTP TR 273 172

TABLE E2. INDIVIDUAL ANIMAL TUMOR PATHOLOGY OF MALE MARSHALL RATS LOW DOSE
NUMBER
WEEKS ON STUDY
Skin Trichoepithelioma
Subcutaneous tissue Teratoma, b n i g n
Lungs and bronchi Neoplasm, NOS,unclear prim or meta Pheochromocytoma, metastatic
Trachea
Bone marrow Soleen
Heart
Salivary gland Liver Bile duct Gallbladder 8 common bile duct Pancreas Esopha s StomacRl Small intestine Large intestine
KidneyTubular cell adenoma
Unnary biadder
M Rtui taryAdrenal
PheochromocytomaPheochromocytoma, malignant
Th roid dlceli adenoma
Parathyroid
Mammarr gland . -Testis
Interstitial cell tumor Prostate
Brain
Peritoneum Mesothelioma. NOS
Tunica va 'nalia Mesothe%moma, NOS
* Animals necropsied
(Continued) 88 8 8 8 9 9 0 0 0 0 1 1 1 2 2 2 3 3 4 4 5 5 5 6 7 1 7 9 8 4 9 0 1 6 9 1 2 6 3 4 5 1 5 3 7 2 3 6 3 1 5 9 0
TOTAL: rISSUESD o l o o l o l o l o o o o o ~ o o o D o D l o ~
5 2 0 5 4 0 5 0 4 0 6 8 3 7 5 4 2 1 0 2 7 1 0 6 2 KrMORS 1 1 4 1 6 4 5 4 2 4 8 6 8 4 9 4 7 2 7 8 1 8 4 5 2
+ N + + + + + + + + + + + + N + + N N + + N + + + *50 1
+ N + + + + + + + + + + + + N + + N N + + N + + + *50 1
. . . . . . . . . . . . . . . . . . . . . . . . . 50 1
X 1+ + + - - + + + + + + + - + + + + + + + - + + - + 41
+ + + + - - + + + + + + + + + + + - - + - - + + + 36 . . . . . . . . . . . . . . . . . . . . . . . . . 43 X 1 - - + - + + + - + - + + + - + + - - + + - - + + + 25
- - - + - + - - - + - - - - - - - + + - - + + - + 18
. . . . . . . . . . . . . . . . . . . . . . . . . 50
. . . . . . . . . . . . . . . . . . . . . . . . . 42 . . . . . . . . . . . . . . . . . . . . . . . . . 50 . . . . . . . . . . . . . . . . . . . . . . . . . 50N N N N N N N N N N N N N N N N N N N N N N N N N '50 . . . . . . . . . . . . . . . . . . . . . . . . . 46 . . . . . . . . . . . . . . . . . . . . . . . . . 44 . . . . . . . . . . . . . . . . . . . . . . . . . 48 . . . . . . . . . . . . . . . . . . . . . . . . . 48 . . . . . . . . . . . . . . . . . . . . . . . . . 43
. . . . . . . . . . . . . . . . . . . . . . . . . 50 1 . . . . . . . . . . . . . . . . . . . . . . . . . . 41
- - - + - + + + + + - + + + + - - - - - - - + + - 25 . . . . . . . . . . . . . . . . . . . . . . . . . 43 X X x x x x 12
X 1+ + + - + + - + + + + + - + + + + + - + - - + + + 41X X X 5
+ - + - + + - - - - * - - - + + - - - + - - + + + 21
N N N N N + N + N + + N N N N N N N N N N N N N N *50 . . . . . . . . . . . . . . . . . . . . . . . . . 48 X x x x x x x x x 21
44+ + + i f + + + + + + + + - f - + + - + + + + + +
. . . . . . . . . . . . . . . . . . . . . . . . . 50
N N N N N N N N N N N N N N N N N N N N N N N N N '50 1
+ + + + + + + + + + + + + N + N + + + + + + + + + *50 1
173 Trichloroethylene, NTP TR 273

TABLE E2. INDIVIDUAL ANIMAL TUMOR PATHOLOGY OF MALE MARSHALL RATS IN THE TWO-YEAR GAVAGE STUDY OF TRICHLOROETHYLENE: HIGH DOSE
NUMBER 1 0 0
7 0 9
7 1 0
7 1 9
7 2 3
7 2 5
7 2 7
7 2 8
7 3 1
7 3 4
7 3 8
7 4 7
7 5 1
7 5 9
7 6 2
7 6 8
7 6 9
7 7 3
7 7 5
7 7 9
7 8 1
7 8 3
7 8 4
7 8 5
7 9 5
WEEKS ON STUDY
~ 5 8
0 5 7
0 6 8
0 2 5
0 7 8
0 8 0
1 0 4
0 2 5
0 0 5
0 0 0 0 8 5 2 1 4 9 3 4 1 8
0 6 8
0 4 3
0 1 7
0 8 7
0 0 4
1 6 3
0 3 0
0 8 3
0 S 5
0 7 2
0 2 8
0
Skin Trichoepithelioma
. . . . . . . . . . . . . . . . . . . . . . . . .
T u g l a r cell adenocarcinoma, metastatic Pheochromocytoma, metastatic
TEM Lun and bronchi
Trachea
+
-
+
+
+
+
+
+
+
+
A
+
+
+
+
+
+ + + + + A + + + + + +X
- + + + - A + + + + + + -
- + + +
+ + + -
+
Bone marrow SpleenL mphncdeaTlymus
+ + + + + + + + + + + - - A + + + + + + + + + + + + + + + A + + + + + + + A + + + + + + - + + -+ + - - - A + + - + + - + A - + + + + + - - + + -- + - - - A - - + + + - + A - + + - - - - + - + +
+ +
Heart Tubular eel1 adenocarcinoma, metastatic
+ + + + + + + + + + + + + A + + + + X
+ + - + + + +
Salivary gland Liver Bile duct Gallbladder & common bile duct Pancreas
Small intestine Large intestine
E:kgllll
. . . . . . . . . . . . . . . . . . . . . . . . . + + + + + A + + + + + + + A + + t + + + + + + + + . . . . . . . . . . . . . . . . . . . . . . . . . N N N N N N N N N N N N N N N N N N N N N N N N N . . . . . . . . . . . . . . . . . . . . . . . . . . . . . . . . . . . . . . . . . . . . . . . . . . + + + + + A + + + + + + + A + + + + + + - + + + + . . . . . . . . . . . . . . . . . . . . . . . . . + + + + + A + + + + + + + A + + + + + + + - + + +
Kidntlv T;-d;lar cell adsnocamnoma Intsrstitial cell tumor. invasive
Unnary bladder
.
+
.
+
.
+
.
+
.
+
.
A
.
+
.
+
.
+
.
+
.
+
.
+
.
+
.
A
.
+
.
+
.
+
. . X
- + -
.
-
.
+
.
+
.
+
.
+
.
PituitaryAdnna.
Thyroid
Parathyroid
EM
PheochromocytomaPheochromocytoma. malignant
C cell adenoma C.cell carnnoma
Adenoma, NOS
+ + + + + A - - -t + + + + A + + +
X X . . . . . . . . .
+ - - - A + + + - - + - + + + -+ + + + A + + + + + + - + + + +
X
X. . . . . . . . . . . . . . . .
Mammary gland Testis
Prostate
Interstitial cell tumor Interstitial cell tumor. malignant
N N N N + + + N N + N N N N + N + N + N N N N + N + + + + + A + + + + + + + A + + + + + + + + + + + R X X x x X x x x x x x x x + + + + - A + + + + + + + A + + + + + + + + + + +
Brain Glioma. NOS Astrocytoma
. . . . . . . . . . . . . . . . . X
. . . . . . . .
Peritoneum Mesothelioma. NOS Mesothelioma, malignant
N N N N N N N N N N N N N N N N N N N N N N N N N X
X S
Multiple organa NOS Malignant lydphoma, histiocytic type
N N N N N N N N N N N N N N N N N N N N N N N N N
Trichloroethylene, NTP TR 273 174

TABLE E2. INDIVIDUAL ANIMAL TUMOR PATHOLOGY OF MALE MARSHALL RATS HIGH DOSE
NUMBER
Skin Trichoepithelioma
Lun and bronchi T u E l a r cell adenocarcinoma metastatic Pheochromocytoma. metaitaiic
Trachea
Bone marrow SpleenL mphnodes d y m u s
Heart Tubular cell adenocarcinoma, metastatic
Salivary gland Liver Bile duct Gallbladder & common bilr duct Pancreas
:::Y Small intestine Large intestine
KidneyTubular cell adenocarcinoma Interstitial cell tumor, invasive
Urinary bladder
PituitaryAdrmnal
PheochromocytomaPheochromocytoma, malignant
Th mid d[call adenoma C-cell carcinoma
ParathyroidAdenoma, NOS
Mammary gland Testis
Interstitial cell tumor Interstitial cell tumor, malignant
Prostate
Brain Glioma, NOS Astrocytoma
Peritoneum Mesothalioma NOS Masothelioma: malignant
Multiple organs NOS Malignant lyldphoma.. hilitiocytic ty-pa
~~
*Animals necmpaed
(Continued) 88 9 0 0 0 1 1 1 1 2 2 2 3 3 4 4 4 5 5 0 6 1 1 7 8 8 1 3 5 8 0 3 4 5 1 a 9 2 0 2 0 9 4 5 2 8 0 0 ~ ~ 5
. . . . . . . . . . . . . . . . . . . . . . . . . *50X 1
. . . . . . . . . . . . . . . . . . . . . . . . . 41 1
X 1 . . . . . . . . . . . . . . . . . . . . . . . . . 41
. . . . . . . . . . . . . . . . . . . . . . . . . 45 . . . . . . . . . . . . . . . . . . . . . . . . . 40 + - - - - + + - + + + - e + - + + + - - + - - - + 21 - + + - + - + - + - - + - + - + - - + + + - - - - 21
. . . . . . . . . . . . . . . . . . . . . . . . . 48 1
. . . . . . . . . . . . . . . . . . . . . . . . . 41 . . . . . . . . . . . . . . . . . . . . . . . . . 47 . . . . . . . . . . . . . . . . . . . . . . . . . 41 N N N N N N N N N N N N N N N N N N N N N N N N N '50 . . . . . . . . . . . . . . . . . . . . . . . . . 40 . . . . . . . . . . . . . . . . . . . . . . . . . 41 . . . . . . . . . . . . . . . . . . . . . . . . . 41 . . . . . . . . . . . . . . . . . . . . . . . . . 44+ + + + + + + - + + e + - + + + + + + - + + + + -43
. . . . . . . . . . . . . . . . . . . . . . . . . 47 1
X 1 . . . . . . . . . . . . . . . . . . . . . . . . . 44
+ + - + - + + + + + - - - + - + + - - - + + - + + 28 . . . . . . . . . . . . . . . . . . . . . . . . . 43x x x x x x x x 11 x x 2 . . . . . . . . . . . . . . . . . . . . . . . . . 40X 2 x 1+ + + - + + + - - - + - + - - + - + + - + + - - + 18
X 1
+ N N N N + N N + + N N + N + N N + N N N + N N N *50 . . . . . . . . . . . . . . . . . . . . . . . . . 48 x x x x x x x x x x x x x x x x x 31 x 1 . . . . . . . . . . . . . . . . . . . . . . . . . 47
. . . . . . . . . . . . . . . . . . . . . . . . . 41 1
X 1
N N N N N N N N N N N N N N N N N N N N N N N N N *LO 1
X 2
N N N N N N N N N N N N N N N N N N N N N N N N N *50X 1
175 Trichloroethylene, NTP TR 273

TABLE E3. ANALYSIS OF PRIMARY TUMORS IN MALE MARSHALL RATS IN THE TWO-YEAR GAVAGE STUDY OF TRICHLOROETHYLENE
Untreated Vehicle Control Control 500 mg/kg 1,000mg/kg
Adrenal: Pheochromocytoma Overall Rates (a) 19/48 (40%) Adjusted Rates (b) 55.6% Terminal Rates (c) 16/31 (52%) Life Table Testa (d) Incidental Tumor Testa (d) Cochran-Armitage Trend Test (d) Fisher Exact Test
21/48 (44%) 69.1% 17/26 (65%) P=0.014 P=0.095 P =0.040N
12/43 (28%) 84.8% 9111 (82%)P=0.147 P=O.119
P=0.088N
11/43 (26%) 89.4% 516 (83%) P=0.021 P=0.127
P=0.055N
Adrenal: Pheochromocytoma, Malignant Overall Rates (a) 4/48 (8%) Adjusted Rates (b) 12.1% Terminal Rates (c) 3/31 (10%) Life Table Testa (d) Incidental Tumor Tests (d) Cochran-Armitage Trend Test (d) Fisher Exact Test
5/48 (10%) 16.2% 2/26(8%)P=0.517 P=0.440N P=0.165N
1/43 (2%) 9.1% 1111 (9%)P=0.420N P=0.695
P=0.129N
2/43 (5%) 2 1.4% 016(0%)P=0.524 P=0.500N
P=0.266N
Adrenal: Pheochromocytoma or Pheochromocytoma, Malignant Overall Rates (a) 23/48 (48%) 25/48 (52%) Adjusted Rates (b) 65.4% 75.1% Terminal Rates(c) 19/31 (61%) 18/26 (69%) Life Table Tests (d) Incidental Tumor Testa (d) Cochran-Armitage Trend Test (d) Fisher Exact Test
P=0.035 P=0.239 P=0.010N
12/43 (28%) 84.8% 9/11 (82%) P=0.353 P=0.158
P=0.016N
12/43 (28%) 90.9% 5/6 (83%) P=0.037 P=0.288
P= 0.016N
Thyroid: C-Cell Adenoma Overall Rates (a) 8/41 (20%) Adjuated Rates (b) 25.0% Terminal Rates (c) 8/32 (25%) Life Table Testa (d) Incidental Tumor Tests (d) Cochran-Armitage Trend Test (d) Fisher Exact Test
4/41 (10%) 14.0% 3/25 (12%)
P=0.292N
P=0.129 P=0.172
5/41 (12%) 41.7% 5/12 (42%) P=0.113 P=0.153
P=0.500
2/40(5%)40.0% 215 (40%)P=0.385 P=0.513
P=0.350N
Thyroid C-Cell Adenoma or Carcinoma Overall Rates (a) 12/41 (29%) Adjusted Rates (b) 37.5% Terminal Rates (c) 12/32 (38%) Life Table Tests (d) Incidental Tumor Tests (d) Cochran-Armitage Trend Test (d) Fisher Exact Test
5/41 (12%) 17.9% 4/25 (16%) P=0.078 P=0.170 P=0.308N
5/41 (12%) 41.7% 5/12 (42%) P= 0.1 78 P=0.228
P= 0.631N
3/40 (7%) 47.5% 2/5 (40%) P=0.206 P=0.424
P= 0.370N
Testis: Interstitial Cell Tumor Overall Rates (a) 16/46 (35%) Adjusted Rates (b) 46.9% Terminal Rates (c) 14/32 (44%) Life Table Tests (d) Incidental Tumor Tests (d) Cochran-Armitage Trend Test (d) Fisher Exact Test
17/46 (37%) 55.7% 13/26 (50%) PCO.001 Pc0.001 P=0.005
21/48 (44%) 95.1% 11/12 (92%) PCO.001 PCO.001
P=0.323
31/48 (65%) 100.0% 6/6 (100%) PCO.001 Pco.001
P=0.007
Testis: Interstitial Cell Tumor or Interstitial Cell Tumor, Malignant Overall Rates (a) 16/46 (35%) 17/46 (37%) Adjusted Rates(b) 46.9% 55.7% Terminal Rates (c) 14/32 (44%) 13/26(50%)Life Table Tests (d) P<O.OOI Incidental Tumor Tests (d) Pc0.001 Cochran-Armitage Trend Test (d) P=0.003 Fisher Exact Test
21/48 (44%) 95.1% 11/12 (92%) P<O.OOl PCO.001
P=0.323
32/48 (67%) 100.0% 616 (100%)P < O . O O l P co.001
P=0.004
Trichloroethylene, NTP TR 273 176

TABLE E3. ANALYSIS OF PRIMARY TUMORS IN MALE MARSHALL RATS IN THE TWO-YEAR GAVAGE STUDY OF TRICHLOROETHYLENE (Continued)
Untreated Vehicle Control Control 500 mg/kg 1,m m f l g
All Sites: Mesothelioma Overall Rates (a) 2/49 (4%) 2/50 (4%) 2/50(4%) 3/50(6%)Adjusted Rates (b) 5.5% 6.0% 16.7% 24.5% Terminal Rates (c) 1/32(3%) 0/26(0%) 2/12 (17%) 016(0% 1 Life Table Tests (d) P=0.063 P=0.356 P= O X 7 Incidental Tumor Tests (d) P=0.244 P=0.090 P=0.496 Cochran-Armitage Trend Test (d) P=0.406 Fisher Exact Test P=0.691N P=0.500
(a)Number of tumor-bearing animals/number of animals examined a t the site (b)Kaplan-Meier estimated tumor incidence a t the end of the study after adjusting for intercurrent mortality (c)Observed tumor incidence at terminal kill (d)Beneath the control incidence are the P values associated with the trend test. Beneath the dosed group incidence are the P values corresponding to pairwise comparisons between that dosed group and the vehiclecontrols. The life table analysis regards tumors in animals dying prior to terminal kill as being (directly or indirectly) the cause of death. The incidental tumor test regards these lesions as nonfatal. The Cochran-Armitage and Fisher exact tests compare directly the overall incidence rates. A negative trend or lower incidence in a dosed group is indicated by (N).
177 Trichloroethylene, NTP TR 273

TABLE E4. SUMMARY OF THE INCIDENCE OF NONNEOPLASTIC LESIONS IN MALE MARSHALL RATS IN THE TWO-YEAR GAVAGE STUDY OF TRICHLOROETHYLENE
CONTROL (UNTR) CONTROL (VEH) LOW DOSE HIGH DOSE
ANIMALS INITIALLY IN STUDY ANIMALS MISSING ANIMALS NECROPSIED ANIMALS EXAMINED
HISTOPATHOLOGICALLY
50 1
49
49
50
50
50
50
50
50
50
50
50
INTEGUMENTARY SYSTEM
Epidermal inclusion cyst HemorrhageAbscess, chronic
*Subcutaneous tissue Granuloma, NOS
*Skin
RESPIRATORY SYSTEM *Nasal cavity
Vegetable foreign body Impaction, NOS HemorrhageInflammation,NOS Inflammation, suppurative Inflammation, acute Inflammation, acute suppurative
Wound, NOS Lacerated wound Penetrating wound Foreign material, NOS
Abscess, chronic
Emphysema, alveolar CollapseCongestion, NOS Edema, NOS HemorrhageBronchopneumonia, NOS Bronchopneumonia, focal Inflammation, focal Pneumonia, lipid Pneumonia, aspiration Bronchopneumonia, acute Inflammation, chronic focal Inflammation, granulomatous focal Granuloma, pyogenic Fibrosis, focal Foreign material, NOS Hemosiderosis Alveolar macrophages Hyperplasia, adenomatous
#Trachea
#Peritracheal tissue
#Lung
(49)
(41)
(41)
(47)
11
4 1
19
1 3
(23%)
(9%) (2%)
(40%)
(2%) (6%)
(50)
2 (4%) 1 (2%)
(38)
1 '(3%)
1 (3%)
1 (3%)
1 (2%) 1 (2%)
1 (2%)
(38)
(49)
8 (16%)
6 (12%)
29 (59%) 1 (2%)
1 (2%)
1 (2%) 6 (12%) 1 (2%) 1 (2%)
1 (2%)
1 (2%)
(50) 1 (2%)
1 (2%)
4 (8%) 1 (2%)
(41)
1 (2%) (41)
(50) 1 (2%) 1 (2%)
21 (42%) 3 (6%)
12 (24%)
14 (28%)
1 (2%)
14 (28%)
4 (8%)
1 (2%)
(50)
1 (2%)
2 (4%)
1 (2%)
1 (2%) 2 (5%) 1 (2%) 2 (5%)
(41)
(41)
(47)
19 (40%) 5 (11%)
15 (32%)
6 (13%)
1 (2%)
10 (21%) 4 (9%) 1 (2%) 1 (2%)
11 (23%)
HEMATOPOIETIC SYSTEM *Harderian gland
Mastocytosis*Blood
Leukocytosis, NOS Hypochromasia
Hyperplasia, granulocytic #Bone marrow
Trichloroethylene, NTP TR 273 178

TABLE E4. SUMMARY OF THE INCIDENCE OF NONNEOPLASTIC LESIONS IN MALE MARSHALL RATS IN THE TWO-YEAR GAVAGE STUDY OF TRICHLOROETHYLENE (Continued)
-
HEMATOPOIETIC SYSTEM (Continued) #Spleen
Hamartoma Congestion, NOS Hemosiderosis Atrophy, NOS Hematopoiesis Erythropoiesis Myelopoiesis
#Lymph node Plasmacytosis
#Mandibular lymph node Hemorrhage
#Mesenteric lymph node HemorrhageInflammation, chronic focal Fibrosis, focal
#Liver Hematopoiesis
#Peyers patch Hyperplasia, lymphoid
#Thymus Hemorrhage Involution, NOS
CIRCULATORY SYSTEM #Lung
Perivasculitis #Heart
Thrombosis, NOS Thrombus, organized Inflammation, focal Inflammation, interstitial Inflammation, chronic Fibrosis, focal Endocardiosis
#Endocardium Endocarditis, verrucous
#Cardiac valve Thrombus, organizedFibrosis
*ArteryMineralization Periarteritis
*Pulmonary artery Calcification, focal
DIGESTIVE SYSTEM #Salivary gland
Inflammation, chronic #Liver
Cyst, NOS Multilocular cyst Congestion, NOS Congestion, chronic passive HemorrhageInflammation, NOS Inflammation, focal Inflammation, acutekhronic
CONTROL (UNTR)
(46)
2 (4%)
4 (9%)
(36) 1 (3%)
(36) 1 (3%)
(36) 7 (19%)
1 (3%) (47)
(43) 1 (2%)
(47)
(47)
1 (2%) 1 (2%)3 (6%)
(47) 1 (2%)
(47)
1 (2%) (49)
(49) 1 (2%)
(40)
(47) 1 (2%) 1 (2%)1 (2%) 1 (2%)
22 (47%)
CONTROL (VEH)
(48) 1 (2%)
1 (2%) 1 (2%) 1 (2%)
1 (2%) (33)
(33) 1 (3%)
(33) 4 (12%)
(49) 1 (2%)
(44)
(7)
(49)
(49)
1 (2%) 1 (2%)
2 (4%) 1 (2%)
(49)
(49)
(50) 1 (2%) 1 (2%)
(50) 4 (8%)
(43)
(49)
2 (4%)
31 (63%)
1 (2%)
LOW DOSE
(43)
2 (5%) 1 (2%)
(25)
(25)
(25)
(50)
(48)
(18)2 (11%) 1 (6%)
(50) 1 (2%)
(50)
1 (2%) 1 (2%)
6 (12%)
(50)
(50)
(50)
(50)
(42)1 (2%)
(50)
1 (2%)
3 (6%) 6 (12%)2 (4%)
-~
HIGH DOSE
(41)
(47)
3 (6%)
1 (2%)
1 (2%)
179 Trichloroethylene, NTP TR 273
TABLE E l . SUMMARY OF THE INCIDENCE OF NONNEOPLASTIC LESIONS IN MALE MARSHALL RATS IN THE TWO-YEAR GAVAGE STUDY OF TRICHLOROETHYLENE (Continued)
DIGESTIVE SYSTEM #Liver (Continued)
Degeneration, NOS Necrosis, focal Necrosis, hemorrhagic Necrosis, central Metamorphosis, fatty Nuclear enlargement Basophilic cyto change Clear cell change Cell size alteration Depletion, glycogen
XLiverlperiportal Atrophy, NOS
#Pancreas Inflammation, chronic focal Necrosis, hemorrhagic Atrophy, NOS Atrophy, focal
*Pharynx Granuloma, foreign body
#Esophagus Lacerated wound Penetrating wound Inflammation, granulomatous focal Perforation, inflammatory
#Gastric mucosa Calcification, metastatic
#Small intestine Impaction, NOS
#Colon Parasitism
'Rectum Parasitism
URINARY SYSTEM #Kidney
Congenital hydronephrosis Hydronephrosis Cyst, NOS Congestion, NOS HemorrhagePyelonephritis, NOS Glomerulonephritis, focal Pyelonephritis, focal Glomerulonephritis, acute Glomerulonephritis, subacute Glomerulonephritis, chronic Inflammation, granulomatous focal Nephropathy Nephropathy, toxic Nephrosis, NOS Necrosis, medullary Calcification, focal Pigmentation, NOS CytomegalyHyperplasia, tubular cell
#Renal papilla Inflammation, acute
CONTROL (UNTR)
(47)
1 (2%) 1 (2%) 2 (4%) 7 (15%)
1 (2%) 5 (11%) 1 (2%)
(47) 1 (2%)
(42)1 (2%) 1 (2%) 1 (2%) 1 (2%)
(49)
(45)
(47)
(43)
(41)3 (7%)
(49)
(49) 10 (20%)
1 (2%) 1 (2%) 1 (2%) 2 (4%)
1 (2%)
1 (2%)
45 (92%)
1 (2%)
21 (43%)
(49)
CONTROL (VEH)
(49) 7 (14%) 1 (2%)
1 (2%) 1 (2%)
1 (2%)
1 (2%)
49 (100%)
14 (29%)
(49)
LOW DOSE
(50) 1 (2%)5 (10%)
7 (14%) 1 (2%)
3 (6%)
(50)
(46)
(50)
(44) 1 (2%)
1 (2%)
(48)
(48) 1 (2%)
(43) 2 (5%)
(50)
(50)5 (10%) 3 (6%)
1 (2%)
1 (2%)
1 (2%) 47 (94%) 18 (36%)
1 (2%) 8 (16%)
48 (96%)1 (2%)
(50) 1 (2%)
HIGH DOSE
(47)
2 (4%)
(47)
(46)1 (2%)
(50)
(47) 2 (4%) 1 (2%)
1 (2%) (47)
(44)
(43) 6 (14%)
(50)
(47)1 (2%) 1 (2%) 1 (2%)
46 (98%) 23 (49%)
5 (11%) 1 (2%)
47 (100%)
(47)
Trichloroethylene, NTP TR 273 180

TABLE E4. SUMMARY OF THE INCIDENCE OF NONNEOPLASTIC LESIONS IN MALE MARSHALL RATS IN THE TWO-YEAR GAVAGE STUDY OF TRICHLOROETHYLENE (Continued)
-~~ ~~ ~ ~~ ~~ ~
CONTROL (WNTR) CONTROL (VEH) LOW DOSE HIGH DOSE
BODY CAVITIES *Thorax
Inflammation, necrotizing *Peritoneal cavity
(50) (50)
Hemoperitoneum*Pleural cavity
Hemorrhage
ALL OTHER SYSTEMS *Multiple organs
Hemorrhage (49) (50) (50)
1 (2%) (50)
SPECIAL MORPHOLOGY SUMMARY No lesion reported Animal missingho necropsy AutoJnecropsy/histo perf
1 1
1
2
* Number of animals receiving complete necropsy examination; all gross lesions including masses examined microscopically. # Number of animals examined microscopically a t this site
183 Trichloroethylene,NTP TR 273

Trichloroethylene,NTP TR 273 184

TABLE E4. SUMMARY OF THE INCIDENCE OF NONNEOPLASTIC LESIONS IN MALE MARSHALL RATS IN THE TWO-YEAR GAVAGE STUDY OF TRICHLOROETHYLENE (Continued)
~ ~ ~ ~ ~~~
CONTROL (UNTR) CONTROL (VEH) LOW DOSE HIGH DOSE
URINARY SYSTEM (Continued) XKidneylpelvis (49) (50) (47)
Inflammation, NOS Inflammation, suppurative Inflammation, acute Hyperplasia, epithelial
#Urinary bladder Calculus, unknown grossor micro HemorrhageInflammation, NOS Inflammation, hemorrhagic Inflammation, acute Inflammation, acute focal Inflammation, acute hemorrhagic
#Urinary bladder/mucosa (41)Hyperplasia, papillary
'Urethra (49)Inflammation, acute
ENDOCRINE SYSTEM
Cyst, NOS Hyperplasia, chromophobe cell
Hemorrhage Hyperplasia, focal Angiectasis
#Adrenal cortex Hemorrhage Degeneration, lipoid Hyperplasia, focal Angiectasis
#Adrenal medulla Hyperplasia, NOS Hyperplasia, focal
Cyst, NOS Follicular cyst, NOS Hyperplasia, C-cell
#Pituitary
#Adrenal
#Thyroid
6 (15%)
(21)
(48) 1 (2%) 1 (2%)2 (4%)
2 (4%) 1 (2%) 1 (2%)
(48)
(48) 1 (2%)5 (10%)
1 (2%)
10 (24%)
(411
(43)
1 (2%) 1 (2%)
5 (12%)
2 (5%) 4 (10%)
(43)
(41)
(43)
3 (7%) (40)
1 (3%)
REPRODUCTIVE SYSTEM 'Mammary gland
#ProstateHyperplasia, cystic
Retention of content HemorrhageInflammation, NOS Inflammation, focal Inflammation, multifocal Inflammation, suppurative Inflammation, hemorrhagic Inflammation, acute Inflammation, acute suppurative Inflammation, acute hemorrhagic Inflammation, acute Inflammation, acute suppurative Inflammation, acute hemorrhagic Inflammation, acutekhronic Inflammation, chronic Inflammation, chronic focal
4 (9%)30 (68%)
1 (2%)
1 (2%)
1 (2%)
2 (5%)
5 (11%)29 (62%)
1 (2%)
2 (4%)
2 (4%)
2 (4%)
(50)
(44)
1 (2%) 2 (5%)
14 (32%)
3 (7%)
2 (5%)
2 (5%)
1 (2%)
(50)
(47) 1 (2%)
3 (6%)16 (34%) 1 (2%)
1 (2%) 1 (2%)
1 (2%) 1 (2%) 2 (4%) 1 (2%)
181 Trichloroethylene, NTP TR 273

TABLE E4. SUMMARY OF THE INCIDENCE OF NONNEOPLASTIC LESIONS IN MALE MARSHALL RATS IN THE TWO-YEAR GAVAGE STUDY OF TRICHLOROETHYLENE (Continued)
CONTROL (UNTR) CONTROL (VEH) LOW DOSE HIGH DOSE
REPRODUCTIVE SYSTEM #Prostate (Continued)
Abscess, chronic (47) (44)
Inflammation, granulomatous focal Granuloma, pyogenic Corpora amylacea Hyperplasia,NOS Hyperplasia, papillary
Congenital hypoplasia Retention ofcontent
*Seminal vesicle
1 (2%)
38 (81%) 1 (2%)
(50)
19 (43%) 1 (2%) 1 (2%)
2 (4%) (50)
Hemorrhage Inflammation, NOS Inflammation, focal Inflammation, suppurative Inflammation, hemorrhagic Inflammation, acute Inflammation, acute suppurative Inflammation, acute hemorrhagic Abscess, NOS Inflammation, acutekhronic Inflammation chronic suppurative Atrophy, NOS
AgenesisHemorrhageLipogranulomaCalcification, focal Syncytial alteration Atrophy, NOS Atrophy, focal Aspermatogenesis Hypospermatogenesis Hyperplasia, interstitial cell Dysplasia, NOS
Hyperplasia, NOS
Inflammation, focal Inflammation, interstitial
#Testis
#Rete testis
*Epididymis
1 (2%) 1 (2%) 1 (2%)1 (2%)
2 (4%)
2 (4%)
(46) 2 (4%) 1 (2%)
1 (2%) 1 (2%)
1 (2%) 2 (4%)
1 (2%)
(46)
(50)
2 (4%)
2 (4%)
1 (2%)
1 (2%)
(48)
1 (2%)
1 (2%) 1 (2%)
1 (2%) 6 (13%)
(48)
(50)
1 (2%)
NERVOUS SYSTEM *Spinal cord
Hemorrhage (49)
SPECIAL SENSE ORGANS *Harderian gland
Inflammation, focal Inflammation, acute focal Inflammation, chronic Inflammation, chronic focal
Inflammation, suppurative *Middle ear
(49)
(49)
(50)
2 (4%) (50)
(50)
1 (2%) 3 (6%) 7 (14%)
(50) 2 (4%)
(50)1 (2%)
1 (2%) 8 (16%)
(50)
MUSCULOSKELETAL SYSTEM
Degeneration, NOS Atrophy, serous
*Muscle hiplthigh (49)
Trichloroethylene, NTP TR 273 182

APPENDIX F
SUMMARY OF LESIONS IN FEMALE MARSHALL RATS
IN THE TWO-YEAR GAVAGE STUDY OF
TRICHLOROETHYLENE
PAGE
TABLE F1 SUMMARY OF THE INCIDENCE OF NEOPLASMS IN FEMALE MARSHALL RATS IN THE TWO-YEAR GAVAGE STUDY OF TRICHLOROETHYLENE 187
TABLE F2 INDIVIDUAL ANIMAL TUMOR PATHOLOGY OF FEMALE MARSHALL RATS IN THE TWO-YEAR GAVAGE STUDY OF TRICHLOROETHYLENE 190
TABLE F3 ANALYSIS OF PRIMARY TUMORS IN FEMALE MARSHALL RATS IN THE TWO-YEAR GAVAGE STUDY OF TRICHLOROETHYLENE 198
TABLE F4 SUMMARY OF THE INCIDENCE OF NONNEOPLASTIC LESIONS IN FEMALE MARSHALL RATS IN THE TWO-YEAR GAVAGE STUDY OF TRICHLOROETHYLENE 201
185 Trichloroethylene, NTP TR 273

Trichloroethylene,NTP TR 273 186

TABLE F1. SUMMARY OF THE INCIDENCE OF NEOPLASMS IN FEMALE MARSHALL RATS IN THE TWO-YEAR GAVAGE STUDY OF TRICHLOROETHYLENE
CONTROL (UNTR) CONTROL (VEH) LOW DOSE HIGH DOSE
ANIMALS INITIALLY IN STUDY ANIMALS NECROPSIED ANIMALS EXAMINED
HISTOPATHOLOGICALLY
50 50
50
50 50
50
50 50
50
50 48
48
INTEGUMENTARY SYSTEM
Squamous cell carcinoma Basal cell tumor Basal cell carcinoma Trichoepithelioma
*Skin (50)
RESPIRATORY SYSTEM #Lung
Neoplasm, NOS, metastatic Squamous cell carcinoma, metastatic Pheochromocytoma, metastatic Sarcoma, NOS, metastatic
(50)
3 (6%)
(49)
3 (6%)
(49) 1 (2%) 1 (2%)
1 (2%)
(46)
1 (2%)
HEMATOPOIETIC SYSTEM *Multiple organs
Malignant lymphoma, NOS Malignant lymphoma, undiffer type Malignant lymphoma, lymphocytic type Malignant lymphoma, histiocytic type Lymphocytic leukemia
(50) 1 (2%)
1 (2%)
(50)
1 (2%)
1 (2%)
(50)
1 (2%)
(48)
CIRCULATORY SYSTEM *Axilla
#Lung Hemangiosarcoma
Hemangiosarcoma, metastatic
(50)
(50)
DIGESTIVE SYSTEM *Buccal mucosa
#Stomach Undifferentiated carcinoma
Squamous cell papilloma
(50)
(49)
URINARY SYSTEM #Kidney
Tubular cell adenoma Tubular cell adenocarcinoma
Transitional cell papilloma Transitional cell carcinoma
Transitional cell papilloma
# Kidney/pelvis
#Urinary bladder
(49 )
(49)
(45)
1 (2%)
1 (2%)
(50)
(50)
(46)
1 (2%)
1 (2%)
(48)
(48)
(40)
1 (2%) 1 (2%)
2 (4%)
1 (3%)
(44)
(44)
(40)
1 (2%)
1 (2%) 2 (5%)
187 Trichloroethylene, NTP TR 273

TABLE F1. SUMMARY OF THE INCIDENCE OF NEOPLASMS IN FEMALE MARSHALL RATS IN THE TWO-YEAR GAVAGE STUDY O F TRICHLOROETHYLENE (Continued)
ENDOCRINE SYSTEM #Pituitary
Carcinoma, NOS Chromophobe adenoma Chromophobe carcinoma Acidophil adenoma Acidophil carcinoma
#Adrenal Cortical adenoma PheochromocytomaPheochromocytoma, malignant
#ThyroidAdenoma, NOS C-cell adenoma C-cell carcinoma
#Pancreatic islets Islet cell adenoma
REPRODUCTIVE SYSTEM *Mammary gland
Adenocarcinoma, NOS Fibroadenoma
'Vagina Papilloma, NOS
#Uterus Endometrial stromal polyp
XUterudendometrium Carcinoma, NOS
#Ovary Granulosa cell carcinoma
NERVOUS SYSTEM #Brain
Chromophobe carcinoma, invasive Acidophil carcinoma, invasive
SPECIAL SENSE ORGANS None
MUSCULOSKELETAL SYSTEM *Mandible
Sarcoma, NOS
BODY CAVITIES *Thorax
Fibrosarcoma *Mediastinum
Nonchrornafin paraganglioma
ALL OTHER SYSTEMS None
CONTROL (UNTR)
(42)1 (2%)22 (52%)1 (2%)
1 (2%) (47)
4 (9%) 30 (64%)
4 (9%) (48)
1 (2%)12 (25%)1 (2%)
(48) 2 (4%)
(50) 1 (2%) 7 (14%)
(50)
(47) 6 (13%)
(47)
(47)
(50)
1 (2%)
(50)
(50)
(50)
CONTROL (VEH)
(45)
18 (40%) 1 (2%)1 (2%)
(49)5 (10%)
39 (80%) 4 (8%)
(43)
10 (23%)
(49)
(50) 3 (6%)
11 (22%) (50)
(50) 3 (6%)
(50)
(48)1 (2%)
(50)1 (2%)
LOW DOSE
(38)
8 (21%)
(47) 2 (4%)15 (32%)
(46)
5 (11%)2 (4%)
(46)
(50)
HIGH DOSE
(42)
6 (14%)
(43) 3 (7%) 9 (21%) 1 (2%)
(43)
4 (9%)1 (2%)
(42)
(48)
Trichloroethylene, NTP TR 273 188

TABLE F1. SUMMARY OF THE INCIDENCE OF NEOPLASMS IN FEMALE MARSHALL RATS IN THE TWO-YEAR GAVAGE STUDY OF TRICHLOROETHYLENE (Continued)
CONTROL (UNTR) CONTROL (VEH) LOW DOSE HIGH DOSE
ANIMAL DISPOSITION SUMMARY Animals initially in study
Natural death 50 10
50 7
50 14
50 19
Moribund sacrifice 8 10 10 3 Terminal sacrifice 31 30 12 10 Accidentally killed, NOS 1 3 14 18
TUMOR SUMMARY Total animals with primary tumors**
Total animals with benign tumors
Total animals with malignant tumors
Total animals with secondary tumors##
Total primary tumors
Total benign tumors
Total malignant tumors
Total secondary tumors
46 97 45 85 10 12 4 4
47 104 46 90 11 14 5 5
31 50 28 42 8 8 3 3
22 38 19 31
7 7 1 1
* Number of animals receiving complete necropsy examination; all gross lesions including masses examined microscopically. ** Primary tumors: all tumors except secondary tumors # Number of animals examined microscopically a t this site # # Secondary tumors: metastatic tumors or tumors invasive into an adjacent organ
189 Trichloroethylene, NTP TR 273

TABLE F2. INDIVIDUAL ANIMAL TUMOR PATHOLOGY OF FEMALE MARSHALL RATS IN THE TWO-YEAR GAVAGE STUDY OF TRICHLOROETHYLENE: UNTREATED CONTROL
ANIMAL-NUMBER
Lungs and bronchi Pheochromocytoma. metastatic
Trachea
BoneBone marrowmarrow SpleenSpleenI.,L mphnodesTgymuiThyrnul
Heart
P Salivary glandLiver Bile duct Gallbladder & common bile duct Pancreas
Large inteatine
KidneyTubular cell adenoma
KidneylpelvisTransitional cell papilloma
Urinary bladder
P Pituitary
Carcinoma. NOS Chromophobe adenoma Chromophobe camnoma Acido hi1 camnoma
AdrenayCortical adenoma PheochromocytomaPheochromocytoma, malignant
ThyroidAdenoma, NOS C-cell adenoma C-cell camnoma
ParathyroidPancreatic islets
Islet cell adenoma
EM Mammary gland
Adenocarcinoma, NOS Fibroadenoma
Uterus Endometrial stromal polyp
Ovary
7 Acidophil carcinoma, invasive
Multiple organs,NOS Malignant lymphoma NOS Malignant lymphoma: histiocytic type
+: Tissue examined microscopically -: h q u i r e d tissue not examined microscopicallyX Tumor incidence
_-__________-__-0 1 0 1 0 1 0 0 1 1 0 1 1 0 0 1 0
8 7 0 0 0 7 9 0 9 0 8 0 4 0 5 6 0 0 7 0 0 9 7 0 8 9 4 5 5 3 8 2 5 9 5 3 5 0 5 5 1 5 5 9 5 5 5 1 5 6
. . . . . . . . . . . . . . . . . . . . . . . . .
. . . . . . . . . . . . . . . . . . . . . . . . .
. . . . . . . . . . . . . . . . . . . . . . . . .
. . . . . . . . . . . . . . . . . . . . . . . . . - - + + - - J r + + + - + - - - + + + + + + - + + ++ - - - - - + - - - - - + - - + - - - - - - + - +
. . . . . . . . . . . . . . . . . . . . . . . . .
. . . . . . . . . . . . . . . . . . . . . . . . . . . . . . . . . . . . . . . . . . . . . . . . . .
. . . . . . . . . . . . . . . . . . . . . . . . . N N N N N N N N N N N N N N N N N N N N N N N N N . . . . . . . . . . . . . . . . . . . . . . . . . . . . . . . . . . . . . . . . . . . . . . . . . . . . . . . . . . . . . . . . . . . . . . . . . . . . . . . . . . . . . . . . . . . . . . . . . . . .+ + + + - - + + + + + + - - + + + - + + + + + + +
. . . . . . . . . . . . . . . . . . . . . . . . .
. . . . . . . . . . . . . . . . . . . . . . . . .
. . . . . . . . . . . . . . . . . . . . . . . . .
+ - + + - + + + + - + + + - + + - + + + + - + + + X
X x x x x x x x x x
. . . . . . . . . . . . . . . . . . . . . . . . . X x x X x x x - x x x x x x x x x x
1 . . . . . . . . . . . . . . . . . . . . . . . . . X
X X x x xX
+ - - + + + - - + - - - - - - + - + + + - - - + + . . . . . . . . . . . . . . . . . . . . . . . . .
+ + + + + + + + + + + + + + + N + + + + N N + + +
X x x . . . . . . . . . . . . . . . . . . . . . . . . . X X x x . . . . . . . . . . . . . . . . . . . . . . . . .
. . . . . . . . . . . . . . . . . . . . . . . . .
N N N N N N N N N N N N N N N N N N N N N N N N N
’ No tissue information submitted Ci Necropsy, no histology due to protocolA: Autolysis
N Necropsy. no autolysis. no microscopic examination M: Animal missingS Animal missexed B: No necropsy performed
Trichloroethylene, NTP TR 273 190
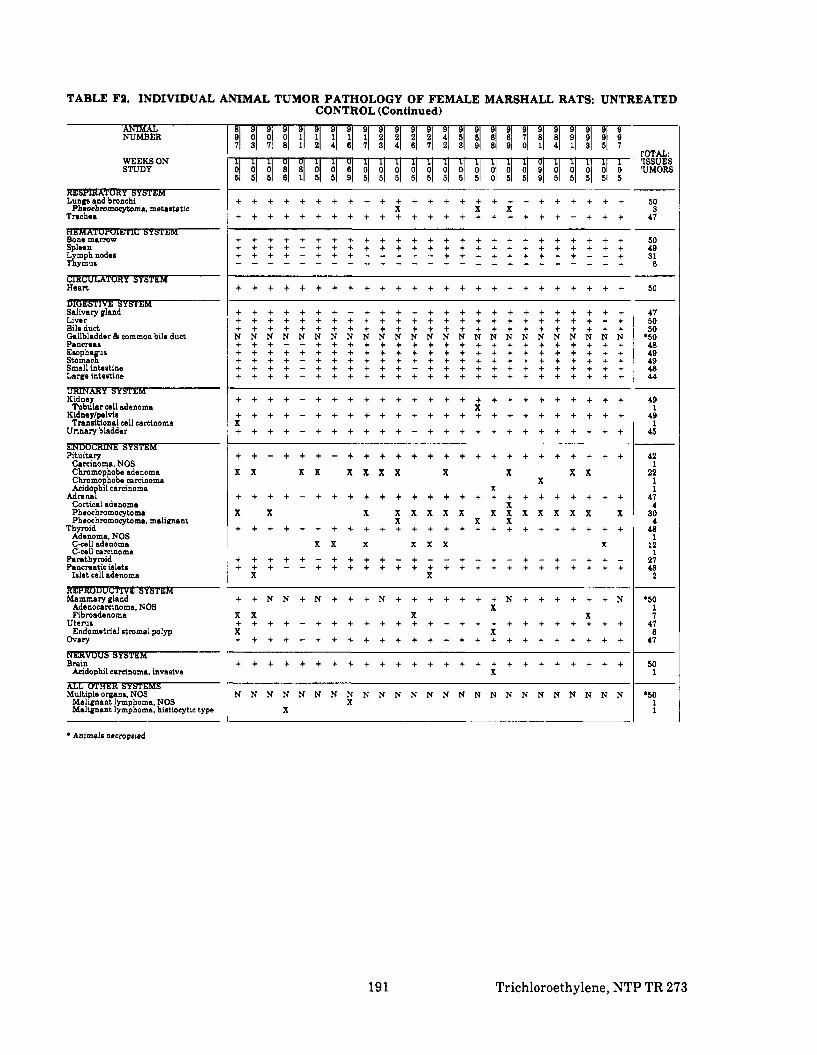
TABLE Fa. INDIVIDUAL ANIMAL TUMOR PATHOLOGY OF FEMALE MARSHALL R A T S UNTREATED CONTROL (Continued)
m A L : WEEKS ON 1 1 1 0 0 1 1 U 1 1 1 1 1 1 1 1 1 1 1 O l l l l l 'ISSUESSTUDY 0 0 0 8 8 0 0 6 0 0 0 0 0 0 0 0 0 0 0 9 0 0 0 0 0 'UMORS
5 5 5 6 1 5 5 9 5 5 5 5 5 5 5 5 0 5 5 9 5 5 5 5 5
Lungn and bronchi . . . . . . . . . . . . . . . . . . . . . . . . . 50Pheochromocytoma. metastatic X x x 3
Trachea . . . . . . . . . . . . . . . . . . . . . . . . . 41
Bona marrow . . . . . . . . . . . . . . . . . . . . . . . . . 50Spleen . . . . . . . . . . . . . . . . . . . . . . . . . 49L mphnoder + + + + - + + + - - - - - + + - + + + + - + - - + 31 TKymus . . . . . . . . . . . . . . . . . . . . . . . . . 6
Heart . . . . . . . . . . . . . . . . . . . . . . . . . 50
Salivary gland . . . . . . . . . . . . . . . . . . . . . . . . . 41 Liver . . . . . . . . . . . . . . . . . . . . . . . . . 50 Bile duct . . . . . . . . . . . . . . . . . . . . . . . . . 50Gallbladder b common bile duct N N N N N N N N N N N N N N N N N N N N N N N N N *50 Pancreas . . . . . . . . . . . . . . . . . . . . . . . . . 48 . . . . . . . . . . . . . . . . . . . . . . . . . 49FtZQffll . . . . . . . . . . . . . . . . . . . . . . . . . 49Small intestine . . . . . . . . . . . . . . . . . . . . . . . . . 48Large intestine . . . . . . . . . . . . . . . . . . . . . . . . . 44
Kidney . . . . . . . . . . . . . . . . . . . . . . . . . 49Tubular cs!l adenoma X 1
Kidney/pslvls . . . . . . . . . . . . . . . . . . . . . . . . . 49 Transitional cell carcinoma 1
Urinary bladder 11. . . . . . . . . . . . . . . . . . . . . . . . . 45
Pituitary . . . . . . . . . . . . . . . . . . . . . . . . . 42 Carcinoma, NOS 1 Chromophobe adenoma x x x x x x X X x x 22 Chromophobe carcinoma X X 1i xAcido hi1carcinoma 1
Adnna? + + + + - + + + + + + + + + + + + + + + + + + 41 &&al adenoma X 4 Pheochromocytoma X X X X x x X x x x X X x x X 30Pheochromocytoma. malignant X X X 4+ + + + + + + + + + + + + + + + + + + + + + + 48
x x x x x 12C.cell carcinoma 1
Parathyroid + + + + + - + + + + - + - - + - + - + - + - + + - 21Pancreatic islats . . . . . . . . . . . . . . . . . . . . . . . . . 48
Islet cell adenoma X 2l x 1
Mammary gland + + N N + N + + + N + + + + + + + N + + + + + + N *50 Adenocarcinoma. NOS X 1 Fibroadenoma x x X X I
U h N S . . . . . . . . . . . . . . . . . . . . . . . . . 41 Endometrial stromal polyp X X 6
Ovary . . . . . . . . . . . . . . . . . . . . . . . . . 41
Brain . . . . . . . . . . . . . . . . . . . . . . . . . 50Acidophil carcinoma, invasive X 1
ALL c m m r m m m s Multiple organa NOS N N N N N N N N N N N N N N N N N N N N N N N N N $50
Malignant lym'phoma NOS X 1Malignant lymphoma: histiocytic type X 1
* Animals necropsied
191 Trichloroethylene, NTP TR 273

TABLE F2. INDIVIDUAL ANIMAL TWO-YEAR GAVAGE
NUMBER
WEEKS ONSTUDY
M Skin
Basal cell tumor Basal cell carcinoma Trichoepithelioma
Lungs and bronchi Pheochromocytoma, metastatic Hemangiosarcoma. metastatic
Trachea
Bone marmw SpleenL mphnodesTxymus
Heart
7 Salivary gland Liver Bile duct Gallbladder 8 common bile duct Pancreas:oo::r Small intestine Large intestine
KidneyTubular call adenoma
KidneylpelvisTransitional cell carcinoma
Unnary bladder
Rtui taryChromophobe adenoma Chromophobe camnoma Ando hi1 adenoma
Mmna?
C 4 l adenoma Parathyroid
P Mammary gland
Adenocarcinoma, NOS Fibroadenoma
U b N S Endometrial stromal polyp
%Zulosa cell carcinoma
7 Chromophobe carcinoma, invasive
v Multiple organs, NOS
Malignant lymphoma, lymphocytic typ+ Lymphoc tic leukemia
Axilla, NOS Hemangiosarcoma
TUMOR PATHOLOGY OF FEMALE MARSHALL RATS IN THE STUDY OF TRICHLOROETHYLENE: VEHICLE CONTROL
0 0 0 0 0 0 0 0 0 0 0 0 0 0 0 0 0 0 0 0 0 0 8 8 9 0 0 0 1 1 1 2 2 2 3 4 4 4 5 5 8 7 7 8 8 9 9 9 9 0 2 3 5 2 8 7 3 5 8 9 2 3 4 3 9 9 1 8 0 2 0 2 5 8 0
1 0 0 1 0 1 1 0 1 0 1 1 1 0 0 0 0 1 1 1 0 1 1 1 1 0 7 7 0 9 0 0 5 0 8 0 0 0 8 7 8 9 0 0 0 9 0 0 0 0 4 8 8 0 1 4 4 1 4 4 4 4 4 7 8 8 9 4 4 0 9 4 4 4 4
+ + + + N + + + N + + + + + + + + + N + + + + + +
. . . . . . . . . . . . . . . . . . . . . . . . . X X I + + + - + + + - - + + + + + + - + + + + - + - - +
. . . . . . . . . . . . . . . . . . . . . . . . . . . . . . . . . . . . . . . . . . . . . . . . . . + - - + + + - - - - - - + + - - + + + - + + - + + - + + - - - - + - - - - - + - - - - - - - - - - -
. . . . . . . . . . . . . . . . . . . . . . . . . . . . . . . . . . . . . . . . . . . . . . . . . . . . . . . . . . . . . . . . . . . . . . . . . . . .
. . . . . . . . . . . . . . . . . . . . . . . . . . . . . . . . . . . . . . . . . . . . . . . . . . . . . . . . . . . . . . . . . . . . . . . . . . . + + + + + + + + + - + + + + + - - + + + + + + + + . . . . . . . . . . . . . . . . . . . . . . . . . .
. . . . . . . . . . . . . . . . . . . . . . . . .
. . . . . . . . . . . . . . . . . . . . . . . . .
. . . . . . . . . . . . . . . . . . . . . . . . .
. . . . . . . . . . . . . . . . . . . . . . . . . x x x x X x x x x X
. . . . . . . . . . . . . . . . . . . . . . . . . X X x x x x x x x x x x x x x x x x x x x x
X X X . . . . . . . . . . . . . . . . . . . . . . . . . X x x X X+ + + - - - + - - - + + + - + - + - + - - - + + +
~ ~
. . . . . . . . . . . . . . . . . . . . . . . . . X X x x x x X X x x . . . . . . . . . . . . . . . . . . . . . . . . .
X . . . . . . . . . . . . . . . . . . . . . . . . .
. . . . . . . . . . . . . . . . . . . . . . . . . X
N N N N N N N N N N N N N N N N N N N N N N N N N X x i
Trichloroethylene, NTP TR 273 192
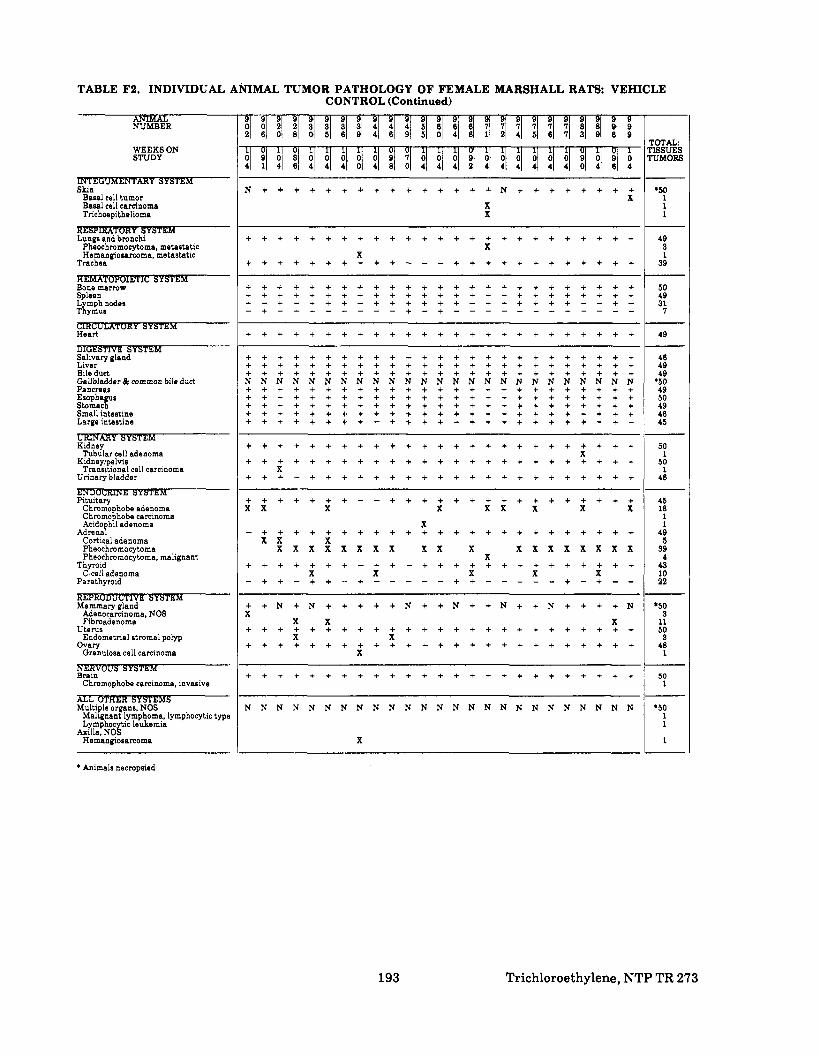
TABLE F2. INDIVIDUAL AMIMAL TUMOR PATHOLOGY OF FEMALE MARSHALL RATS VEHICLE
NUMBER
WEEKSON STUDY
Skin Basal cell tumor Basal cell carcinoma Trichoepithelioma
Bone marrow SpleenL mphnodes Tgymur
Heart
Salivary gland Liver Bile duct Gallbladder& common bile d u d Pancreas:;:::rSmall inteatine Large intestine
KidneyTubular cell adenoma
Kidney/palvlsTransitional cell carcinoma
Urinary bladder
PituitaryChromophobe adenoma Chromophobe carcinoma Acido hi1 adenoma
AdrenayCortical adenoma PheochromocytomaPheochromocytoma, malignant
ThyroidC-cell adenoma
Parathyroid
Mammary gland Adenocarcinoma, NOS Fibroadenoma
Utems Endometrial stromal polyp
OvgarLosa cell carcinoma
Brain Chromophobe carcinoma, invasive
ALL Multiple organs, NOS
Malignant lymphoma, lymphocytic type Lymphoc tic leukemia
Axilia, NC$ Hemannosarcoma
* Animals necropsied
CONTROL (Continued) 9 9 9 9 9 9 9 9 9 9 9 9 9 9 9 9 9 9 9 9 9 9 9 9 9 0 0 2 2 3 3 3 3 4 4 4 5 0 0 6 7 7 7 1 7 1 8 8 9 9 2 0 0 8 0 5 0 9 4 0 9 5 0 4 0 1 2 4 5 0 1 3 9 0 9
mu: 1 0 1 0 1 1 1 1 1 0 0 1 1 1 0 1 1 1 1 1 TSSUES
TJMORS
X X 1
1I
. . . . . . . . . . . . . . . . . . . . . . . . . X
X 4:39 . . . . . . . . . . . . . . . . . . . . . . . . .
l -. . . . . . . . . . . . . . . . . . . . . . . . . . . . . . . . . . . . . . . . . . . . . . . . . . + - + - + + + - + + + + + + - + + + + + + - - + -+ - - - - - - - - + - + - - - - - - - - - - - -
49
. . . . . . . . . . . . . . . . . . . . . . . . . 40 . . . . . . . . . . . . . . . . . . . . . . . . . 49 . . . . . . . . . . . . . . . . . . . . . . . . . 49N N N N N N N N N N N N N N N N N N N N N N N ~ N '50 . . . . . . . . . . . . . . . . . . . . . . . . . 49 . . . . . . . . . . . . . . . . . . . . . . . . . so . . . . . . . . . . . . . . . . . . . . . . . . . 49 . . . . . . . . . . . . . . . . . . . . . . . . . 40 . . . . . . . . . . . . . . . . . . . . . . . . . 45
. . . . . . . . . . . . . . . . . . . . . . . . . 50X . . . . . . . . . . . . . . . . . . . . . . . . .
X 1 . . . . . . . . . . . . . . . . . . . . . . . . . 40
. . . . . . . . . . . . . . . . . . . . . . . . . 45 x x X X x x x X X 18 1
X 1 . . . . . . . . . . . . . . . . . . . . . . . . . 49 x x X 5 x x x x x x x x x x x x x x x x x x x 39 X 4 . . . . . . . . . . . . . . . . . . . . . . . . . 49
X X X X X 10 - + + - + + - + - - - - - + + - - - - - + - + - - 22
+ + N + N + + + + + N + + N + + N + + N + + + + N *50I X 3 x x X 11 . . . . . . . . . . . . . . . . . . . . . . . . . 501 . - x X 3 . . . . . . . . . . . . . . . . . . . . . . . . . 48
X 1
+ + + t + + + + + + + + + + + + + + + + + + + + +
N N N N N N N N N N N N N N N N N N N N N N N N N
X
-1
193 Trichloroethylene, NTP TR 273

TABLE F2. INDIMDUAL ANIMAL TUMOR PATHOLOGY OF FEMALE MARSHALL RATS IN THE TWO-YEAR GAVAGE STUDY OF TRICHLOROETHYLENE: LOW DOSE
7 0 0 0 0 0 0 0 0 0 0 0 0 0 0 0 0 0 0 0 0 8 8 9 9 NUMBER 0 1 2 3 3 4 4 5 5 6 8 7 7 7 7 7 8 8 8 8 9 9 9 0 0
1 1 9 0 1 1 6 1 6 5 8 0 3 4 5 9 1 3 5 7 1 4 6 1 9
0 0 0 1 0 0 0 1 1 0 0 0 0 0 0 0 0 0 0 0 1 0 1 0 0 9 5 8 0 9 7 7 0 0 5 9 7 7 7 8 8 3 9 8 5 0 7 0 9 7 9 2 4 4 5 8 5 0 4 8 4 6 9 5 8 7 2 0 8 9 4 3 0 6 5
Skill . . . . . . . . . . . . . . . . . . . . . . . . . Squamous cell carcinoma
M Lungs and bronchi . . . . . . . . . . . . . . . . . . . . . . . . .
Neoplaim. NOS,metastatic Squamous cell camnoma, metastatic Sarcoma, NOS,metastatic . . . . . . . . . . . . . . . . . X . . . . . . . . . .
Trachea
Bone marrow . . . . . . . . . . . . . . . . . . . . . . . . . . . . . . . . . . . . . . . . . . . . . . . . . . + + + + + - - + - + - - - - + + - + - + + + - - + + + - - - - + - - + - - - - + + + - - - - - - - -
Heart . . . . . . . . . . . . . . . . . . . . . . . . .
Oral cavity N N N N N N N N N N N N N N N N N N N N N N N N N UnditZerantiatsd carcinoma
Salivary gland . . . . . . . . . . . . . . . . . . . . . . . . . Liver . . . . . . . . . . . . . . . . . . . . . . . . . Bile duct . . . . . . . . . . . . . . . . . . . . . . . . . Gallbladder 8 common bile duct N N N N N N N N N N N N N N N N N N N N N N N N N Pancreas . . . . . . . . . . . . . . . . . . . . . . . . . . . . . . . . . . . . . . . . . . . . . . . . . . :t%:r . . . . . . . . . . . . . . . . . . . . . . . . . Small intestine . . . . . . . . . . . . . . . . . . . . . . . . . Large intestine . . . . . . . . . . . . . . . . . . . . . . . . .
P Kidney . . . . . . . . . . . . . . . . . . . . . . . . . .
Tubular cell adenoma Tubular d l adenocarcinoma X
Kidney/pelvis . . . . . . . . . . . . . . . . . . . . . . . . . Transitional cell papilloma X
Urinary bladder + - + + + - + + + - + + + + + + - + + + + + - + -Transitional cell papilloma X P Pltuitary . . . . . . . . . . . . . . . . . . . . . . . . .
Chromophobe adenoma x x X Adrenal . . . . . . . . . . . . . . . . . . . . . . . . .
Cortical adenoma Pheochromocytoma I X X X x x x I
Th mid . . . . . . . . . . . . . . . . . . . . . . . . . &ell adenoma X C-cell carcinoma X X
Parathyroid + - + + - - - - + + + + - + - + + - - - + + + + +
Mammary gland + + + + N + + + N + + + + + + + N + + + + + + N + Fibroadenoma
Uterus . . . . . . . . . . . . . . . . . . . . . . . . . Endometrial stromal polyp X
Ovary . . . . . . . . . . . . . . . . . . . . . . . . . ~
Brain . . . . . . . . . . . . . . . . . . . . . . . . . + I Bone
Sarcoma, NOS
Pleura N N N N N N N N N N N N N N N N N N N N N N N N N. Fibrosarcoma
Mediastinum N N N N N N N N N N N N N N N N N N N N N N N N N N o n c h r o d n paraganglioma X
ALL OT-s Multiple organs,NOS XI N N N N N N N N N N N N N N N N N N N N N N N N N I
Malignant lymphoma, undifTer type
Trichloroethylene, NTP TR 273 194

TABLE F2. INDIVIDUAL ANIMAL TUMOR PATHOLOGY OF FEMALE MARSHALL RATS LOW DOSE
ANIMAL NUMBER
WEEKS ON STUDY
Skin Squamous cell carcinoma
TORY SYSTEM Lungs and bronchi
Neoplasm. NOS,metastatic Squamous cell carcinoma, metastatic Sarcoma, NOS,metastatic
Trachea
Bone marrow SpleenL mphnodesTiymus
Heart
Oral cavity Undifferentiated carcinoma
Salivary gland Liver Bile duct Gallbladder L common bile duct Pancreas
:tz2ff18 Small intestine Large intestine
KidneyTubular cell adenoma Tubular cell adenocarcinoma
Kidne y/pelvis Transitional cell papilloma
Urinary bladder Transitional cell papilloma
PituitaryChromophobe adenoma
Adrenal Cortical adenoma Pheochromocytoma
Th roid dlcell adenoma C-cell carcinoma
Parathyroid
Mammary gland Fibroadenoma
Uterus Endometnal stromal polyp
Ovary
Brain
Bone Sarcoma, NOS
Pleura Fibrosarcoma
Mediastinum Nonchromaffin paraganglioma
ALL UTHrrmTEm Multiple organs, NOS
Malignant lymphoma. undiffer type
* Animals necropsied
(Continued) 9 9 9 9 9 9 9 9 9 9 9 9 9 9 9 9 9 9 9 9 9 9 9 9 9 i i i 2 2 2 3 3 3 4 4 4 5 5 5 5 5 6 ~ 7 7 8 8 8 a 3 5 8 1 2 9 1 2 3 3 5 7 0 1 2 4 7 3 5 8 9 2 6 7 8
roTAL: ~ 0 0 0 1 1 1 0 0 0 1 0 0 0 1 1 1 0 1 0 l 0 1 1 0 'ISSUES 8 6 6 4 0 0 0 9 6 7 0 7 7 1 0 0 0 8 0 1 0 7 0 0 8 'UMORS 1 8 6 8 4 4 4 7 2 6 4 7 1 2 4 4 4 3 3 7 4 8 4 9 0
. . . . . . . . . . . . . . . . . . . . . . . . . '50X 1
. . . . . . . . . . . . . . . . . . . . . . . . . 49X 1
X 1 1 . . . . . . . . . . . . . . . . . . . . . . . . . 45
. . . . . . . . . . . . . . . . . . . . . . . . . 48 . . . . . . . . . . . . . . . . . . . . . . . . . 47+ - + - + - + + + - + + + + - - - + - + - + + + - 29 + + - - - - - - - + - - + + - - + - - + - + - - + 16
. . . . . . . . . . . . . . . . . . . . . . . . . 50
N N N N N N N N N N N N N N N N N N N N N N N N N '50X 1 . . . . . . . . . . . . . . . . . . . . . . . . . 47 . . . . . . . . . . . . . . . . . . . . . . . . . 48 . . . . . . . . . . . . . . . . . . . . . . . . . 48 N N N N N N N N N N N N N N N N N N N N N N N N N '50 . . . . . . . . . . . . . . . . . . . . . . . . . 46 . . . . . . . . . . . . . . . . . . . . . . . . . 50 . . . . . . . . . . . . . . . . . . . . . . . . . 46 . . . . . . . . . . . . . . . . . . . . . . . . . 45 . . . . . . . . . . . . . . . . . . . . . . . . . 43
. . . . . . . . . . . . . . . . . . . . . . . . . 48 X 1
1 ......................... 48
X 2 . . . . . . . . . . . . . . . . . . . . . . . . . 40 1
- + + - + + + + + + + + - - + - + + - - + + + + + 38 X x x X 8 . . . . . . . . . . . . . . . . . . . . . . . . . 47X X 2 x x X X x x x x x 15 . . . . . . . . . . . . . . . . . . . . . . . . . 46
X X X X 5 2
27
+ + + N + N + + N + + + + N N + + N + + + + + + + '50 x x 2 . . . . . . . . . . . . . . . . . . . . . . . . . 45 x x X X 5 . . . . . . . . . . . . . . . . . . . . . . . . . 45
. . . . . . . . . . . . . . . . . . . . . . . . . 50
N + N N N N N N + N N N N N N N N N N N N N N N N '50 1
N N N N N N N N N N N N N N N N N N N N N N N N N '50X. 1
N N N N N N N N N N N N N N N N N N N N N N N N N '50 1
N N N N N N N N N N N N N N N N N N N N N N N N N ' 50 1
195 Trichloroethylene, NTP TR 273

TABLE Fa. INDIVIDUAL ANIMAL TUMOR PATHOLOGY OF FEMALE MARSHALL RATS IN THE TWO-YEAR GAVAGE STUDY OF TRICHLOROETHYLENE: HIGH DOSE
a 0 0 0 0 0 0 0 0 0 0 0 0 0 0 0 0 0 0 0 0 0 0 0 0NUMBER 0 0 0 1 1 1 2 2 2 3 3 3 4 4 4 4 5 5 5 6 6 6 6 8 8
8 7 9 3 5 8 1 4 1 3 4 8 0 7 8 9 2 4 8 1 2 4 7 4 6
l o o o o o o o o o o l o o o l o o l o o l o o o 0 6 6 7 7 3 8 8 7 7 5 0 4 5 6 0 9 8 0 7 8 0 1 8 3 4 8 4 3 4 0 9 7 0 4 4 4 1 5 8 4 6 2 4 8 1 4 2 9 4
Lunm and bronchi . . . . . . . . . . . . . . . . . . . . . . . . . Pheochromocytoma, metastatic
Trachea . . . . . . . . . . . . . . . . . . . . . . . . .
Bone marrow . . . . . . . . . . . . . . . . . . . . . . . . . Spleen . . . . . . . . . . . . . . . . . . . . . . . . . L mphnodri - - + + - A - + - - + - - - - + - - + + + + + + + Tgymuc - + - - - A - + + - + - + + + - + - - + + + + + -
Heart . . . . . . . . . . . . . . . . . . . . . . . . .
Salivary gland . . . . . . . . . . . . . . . . . . . . . . . . . Liver . . . . . . . . . . . . . . . . . . . . . . . . . Bile duct + + + + + A + + + + + + + + + + + + + + + + + + + Oallbladdrr EL common bile duct N N N N N A N N N N N N N N N N N N N N N N N N N Pancreai . . . . . . . . . . . . . . . . . . . . . . . . .
. . . . . . . . . . . . . . . . . . . . . . . . . - + + + + A + + + + + + + - + + + + + + + + + + +
. . . . . . . . . . . . . . . . . . . . . . . . .
. . . . . . . . . . . . . . . . . . . . . . . . .
Kidney . . . . . . . . . . . . . . . . . . . . . . . . . Tubular cell adenocarcinoma X
Kidney/plvis . . . . . . . . . . . . . . . . . . . . . . . . . Transitional cell papillomaTransitional cell carcinoma X
Urinary bladder . . . . . . . . . . . . . . . . . . . . . . . . .
Pituitary . . . . . . . . . . . . . . . . . . . . . . . . . Chromophobe adenoma X
Adrenal . . . . . . . . . . . . . . . . . . . . . . . . . Cortical adenoma X X Pheochromocytoma x x x X Phsochromocytoma. m a l i p a n t
Th mid . . . . . . . . . . . . . . . . . . . . . . . . . dIesll adenoma x x Ccall carcinoma X
Parathy mid - - + - - A - - + - - + - + + + + + + - - + - + -
Mammary gland + + + N + A + + + + + + + + + + + + + + + + + + + Fibroadenoma x x
Vagina N N N N N A N N N N N N N N N N N N N N N N N N N Papilloma, NOS
UbrUS + + + + + A + + + + + + + - + + + + + + + + + + + Carcinoma NOS Endomatrih stromal polyp
Ovary + + + + + A + + + + + + + - + + + + + + + + + + +
Brain + + + + + A + + + + + + + + + + + + + + + + + + +
Trichloroethylene, NTP TR 273 196

I o ~ ~ ~ ~ ~ ~ ~ ~ ~ ~ ~ ~
TABLE Fa. INDIVIDUAL ANIMAL TUMOR PATHOLOGY OF FEMALE MARSHALL RATS: HIGH DOSE (Continued)
0 8 9 9 9 9 9 9 9 9 9 9 9 9 9 9 9 9 9 9 9 9 9 9 9 NUMBER 8 9 0 0 1 1 2 3 3 3 4 4 4 5 5 8 6 6 1 8 8 9 9 9 9
9 9 4 5 0 9 5 4 1 8 0 1 8 6 8 1 2 7 3 0 5 0 2 4 8 rwrAL:
WEEKS ON 1 1 1 'ISSUESSTUDY 1 ~ 8 I ~ ~ . o o WMORSI ~ ~
1 6 0 9 5 5 4 4 3 8 2 7 4 6 4 8 5 1 7 8 0 4 0 1 0
Lungs and bronchi A + + - + + + + + + + + + + + + + + + + + + A + + 46 Phrochromoeytoma, metastatic X 1
Trachea A + + + + + - + - + - + - + - + + + + + + + A + - 38
Bone marrow A + + + + + + + + - + + + + + + - + + + + + A + + 44 Spleen A + + - + + + + - + + + + + + + + + + - + + A + + 43L mphnodri A - + - + + + - - - + + + - + - - - + - - - A + + 23 TKymur A + + - + - - - - + - + - + - + - + - - - - A - - 21
Heart A + + - + + + + + + + + + + + + + + + + + + A + + 46
Salivary gland + + + + + + - + - + + + + + + + + + + + + + A - + 44 Livar A . . . . . . . . . . . . . . . . . . . . . . . . 46 Bile duct A . . . . . . . . . . . . . . . . . . . . . . . . 46 O.llb1adder k common bile duct N N N N N N N N N N N N N N N N N N N N N N A N N '48 Pancraaa A + + - + + + + - + + + + + + + + + + - + + A + + 42
. . . . . . . . . . . . . . . . . . . . . . . . . 4682:Y . . . . . . . . . . . . . . . . . . . . . . . . . 43Quaprous cell papilloma X 1
Small intestine . . . . . . . . . . . . . . . . . . . . . . . . . 42l a r p intostin. A + + - + + + + - + + + + + + + + + - + + + A + + 41
~~M Kidnw . . . . . . . . . . . . . . . . . . . . . . . . . 44
Tubular call adrnocarcinoma 1Tu1 Kidney/prlvirKidney/prlvir A + + - + + + + + + + + + + + + + + + - + + A + + 44
TransitionalTransitional crllcrll papillomapapilloma X 1 TransitionalTransitional e111e111 carcinomacarcinoma X 2
UrinaryUrinary bladderbladder A + + - + + + + - + + + + + + + - + + + + - A + + 40
Pituitary A + + + + + + + + + + + + - + + + + + + + + A + + 42 Chromophobe adenoma X X X x x 6
M m n a l A + + - + + + + + + + + + + + + + + + - + + A + + 43 Cortical adenoma h 3 Pheochromocytoma x x X X X 9Pheochromocytoma, malignant X 1
Th mid A + + + + + + + - + - + + - + + + + + + + + A + + 43&ell adenoma X X 4 C.cd carcinoma 1
Parathyroid A + - - - + + + - - - - - - + + - - + + + + A + - 22
Mammary gland N N + N + + N + + N + + N + + + + N + + + N A + N *48 Fibroadenoma x x 4
Vagina N N N N N N N N N N N N N N N N N N N N N ~ A N N *48 PaDilloma.NOS X 1
Uteiua ' A + + - + + + + - + + + + + + + + + + + + + A + + 44 Carcinoma NOS X X 2 Endomatrih stromal polyp X X 2
Ovary A + + - + + + + - + + + + + + + + + + + + + A + + 44
Brain + + + + + + + + + + + + + + + + + + + + + + A + + 48
* Animals nacropried
197 Trichloroethylene, NTP TR 273

TABLE F3. ANALYSIS OF PRIMARY TUMORS IN FEMALE MARSHALL RATS IN THE TWO-YEAR GAVAGE STUDY OF TRICHLOROETHYLENE
Untreated Vehicle Control Control
Kidney: Transitional Cell Papilloma or Carcinoma Overall Rates (a) 1/49 (2%) Adjusted Rates (b) 3.2% Terminal Rates (c) 1/31 (3%) Life Table Tests (d) Incidental Tumor Tests (d) Cochran-Armitage Trend Test (d) Fisher Exact Test
Pituitary: Chromophobe Adenoma Overall Rates (a) 22/42 (52%) Adjusted Rates (b) 64.4% Terminal Rates (c) 15/26(58%) Life Table Tests (d) Incidental Tumor Tests (d) Cochran-Armitage Trend Test (d) Fisher Exact Test
Pituitary: Chromophobe Adenoma or Carcinoma Overall Rates (a) 23/42 (55%) Adjusted Rates (b) 65.5% Terminal Rates (c) 15/26(58%)Life Table Tests (d) Incidental Tumor Tests (d) Cochran-Armitage Trend Test (d) Fisher Exact Test
Pituitary: Adenoma Overall Rates (a) 22/42 (52%) Adjusted Rates (b) 64.4% Terminal Rates (c) 15/26(58%)Life Table Testa (d) Incidental Tumor Tests (d) Cochran-Armitage Trend Test (d) Fisher Exact Test
Pituitary: Adenoma or Carcinoma Overall Rates (a) 25/42 (60%) Adjusted Rates (b) 67.3% Terminal Rates (c) 15/26(58%)Life Table Tests (d) Incidental Tumor Tests (d)Cochran-Armitage Trend Test (d) Fisher Exact Test
Adrenal: Cortical Adenoma Overall Rates (a) 4/47 (9%) Adjusted Rates (b) 12.1% Terminal Rates (c) 3/31 (10%) Life Table Tests (d) Incidental Tumor Tests (d) Cochran-Armitage Trend Test (d) Fisher Exact Test
Adrenal: Pheochromocytoma Overall Rates (a) 30/47 (64%) Adjusted Rates tb) 74.8% Terminal Rates (c) 21/31 (68%)Life Table Tests (d) Incidental Tumor Tests (d) Cochran-Armitage Trend Test (d) Fisher Exact Test
1/50(2%) 3.3% 1/30 (3%) P =0.060 P =0.205 P =0.184
18/45 (40%) 51.7% 11/26 (42%) P=0.412N P =0.036N P =0.004N
19/45 (42%) 53.1% 11/26 (42%) P =0.357N P =0.023N P =0.002N
19/45 (42%) 54.9% 12/26 (46%) P =0.354N P=0.026N P =0.002N
20145 (44%) 56.2% 12/26 (46%) P =0.304N P=0.016N P = 0.001N
5/49 (10%) 15.9% 4/29 (14%) P =0.346 P=0.551 P=0.333N
39/49 (80%) 92.7% 26/29 (90%) P =0.050N P < 0.001N P < 0.001 N
500 mg/kg
2/48 (4%) 6.7% 0/12 (0%)P=0.302 P = 0.515
P=0.485
8/38 (21%) 36.3% 2/11 (18%) P=0.482N P =0.097N
P =0.052N
8/38 (21%) 36.3% 2/11 (18%) P =0.427N P =0.062N
P =0.034N
8/38 (21%) 36.3% 2/11 (18%) P=0.429N P =0.075N
P =0.034N
8/38 (21%) 36.3% 2/11 (18%) P =0.376N P =0.047N
P=0.021N
2/47 (4%) 13.4% 1/12(8%)P =0.620N P=0.514N
P=0.235N
15/47 (32%) 76.5% 8/12 (67%) P=0.263N P=0.002N
P<0.001N
1,000 mg/kg
3/44 (7%) 15.5% 1/10 (10%) P =0.095 P=0.278
P=0.262
6/42 ( 14%) 39.2% 219 (22%) P=0.506N P=0.079N
P=0.007N
6/42 ( 14%) 39.2% 219 (22%) P = 0.458N P=0.057N
P =0.004N
6/42 (14%) 39.2% 219 (22%) P=0.453N P =0.062N
P =0.004N
6/42 ( 14%) 39.2% 219 (22%) P =0.408N P =0.044N
P =0.002N
3/43 (7%) 18.8% 1/10 (10%) P=0.394 P=0.649N
P = 0.433N
9/43 (21%) 67.0% 6/10 (60%)P =0.067N P < 0.001N
P<O.OOlN
Trichloroethylene, NTP TR 273 198
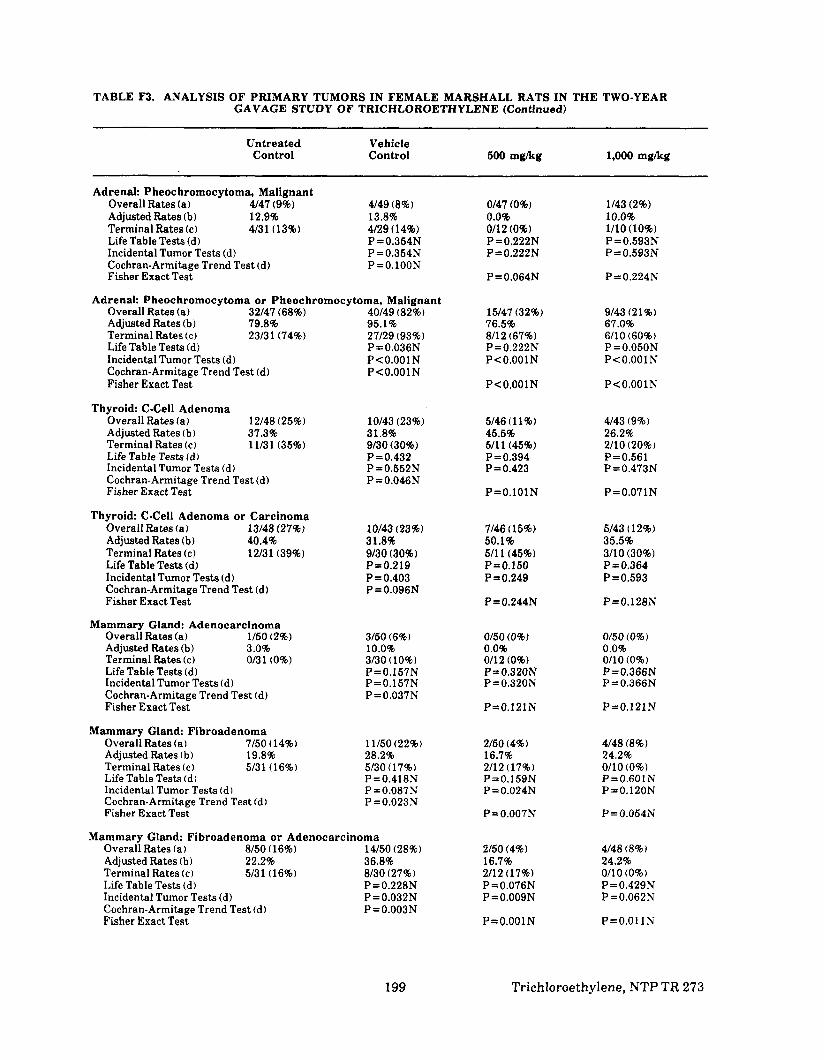
TABLE F3. ANALYSIS O F PRIMARY TUMORS IN FEMALE MARSHALL RATS IN THE TWO-YEAR GAVAGE STUDY OF TRICHLOROETHYLENE (Continued)
Untreated Vehicle Control Control
Adrenal: Pheochromocytoma, Malignant Overall Rates (a) 4/47 (9%) 4/49 (8%) Adjusted Rates (b) 12.9% 13.8% Terminal Rates (c) 4/31 (13%) 4/29 (14%) Life Table Tests (d) P =0.354N Incidental Tumor Tests (d) P =0.354N Cochran-Armitage Trend Test (d) P=0.lOON Fisher Exact Test
Adrenal: Pheochromocytoma or Pheochromocytoma, Malignant Overall Rates (a) 32/47 (68%) Adjusted Rates (b) 79.8% Terminal Rates (c) 2313 1 (74%) Life Table Tests (d) Incidental Tumor Tests (d) Cochran-Armitage Trend Test (d) Fisher Exact Test
Thyroid: C-cell Adenoma Overall Rates (a) 12/48(25%) Adjusted Rates (b) 37.3% Terminal Rates (c) 11/31 (35%) Life Table Tests id) ,
Incidental Tumor Tests id) Cochran-Armitage Trend Test (d) Fisher Exact Test
Thyroid C-cell Adenoma or Carcinoma Overall Rates (a) 13/48 (27%) Adjusted Rates (b) 40.4% Terminal Rates (c) 12/31 (39%) Life Table Tests (d) Incidental Tumor Tests (d) Cochran-Armitage Trend Test (d) Fisher Exact Test
Mammary Gland: Adenocarcinoma Overall Rates (a) 1/50(2%)Adjusted Rates (b) 3.0% Terminal Rates (c) 0131 (0%) Life Table Tests (d) Incidental Tumor Tests (d) Cochran-Armitage Trend Test (d) Fisher Exact Test
Mammary Gland: Fibroadenoma Overall Rates (a) 7/50 (14%) Adjusted Rates (b) 19.8% Terminal Rates (c) 5/31 (16%) Life Table Tests (d)Incidental Tumor Tests (d) Cochran-Armitage Trend Test (d) Fisher Exact Test
40/49 (82%) 95.1% 27/29 (93%) P =0.036N P<O.OOlN P <0.001N
10143 (23%) 31.8% 9/30 (30%)P=0.432 P =0.552N P =0.046N
10143 (23%) 31.8% 9/30 (30%)P=0.219 P =0.403 P =0.096N
3/50 (6%)10.0% 3/30 (10%) P=0.157N P =0.157N P=0.037N
11/50(22%)28.2% 5/30 (17%) P=0.418N P=O.O87N P=0.023N
Mammary Gland: Fibroadenoma or Adenocarcinoma Overall Rates (a) 8/50(16%) 14/50 (28%) Adjusted Rates (b) 22.2% 36.8% Terminal Rates (c) 5/31 (16%) 8/30 (27%) Life Table Tests (d) P=0.228N Incidental Tumor Tests id) P=0.032N Cochran-Armitage Trend Test (d) P=0.003N Fisher Exact Test
500 mg/kg
0147 (0%) 0.0% 0112(0%)P=0.222N P=0.222N
P =0.064N
15/47 (32%) 76.5% 8/12 (67%) P=0.222N P<O.OOlN
P <0.001N
5/46 ( 11%) 45.5% 5111(45%)P =0.394 P=0.423
P=O.lOlN
7/46 (15%) 50.1% 5111(45%)P=0.150 P =0.249
P = 0.244N
0/50(0%) 0.0% 0112 (0%) P=0.320N P=0.320N
P = 0.121N
2/50 (4%) 16.7% 2/12 (17%) P=0.159N P=0.024N
P=0.007N
2/50 (4%) 16.7% 2/12(17%) P =0.076N P=0.009N
P=O.OOlN
1,000 mg/kg
1/43 (2%) 10.0% 1/10 (10%) P =0.593N P = 0.593N
P=0.224N
9/43 (21%) 67.0% 6/10 (60%) P =0.050N P<0.001N
P<0.001N
4/43 (9%) 26.2% 2/10 (20%) P=0.561 P =0.473N
P =0.071N
5/43 (12%) 35.5% 3/10 (30%) P=0.364 P =0.593
P=O.l28N
0/50(0%) 0.0% 0110 (0%) P=0.366N P=0.366N
P=0.121N
4/48 (8%)24.2% o n 0 (0%)P=0.601N P=0.120N
P =0.054N
4/48 (8%) 24.2% 0110 (0%) P=0.429N P=0.062N
P=O.OllN
199 Trichloroethylene, NTP TR 273

TABLE F3. ANALYSIS OF PRIMARY TUMORS IN FEMALE MARSHALL RATS IN THE TWO-YEAR GAVAGE STUDY OF TRICHLOROETHYLENE (Continued)
Untreated Vehicle Control Control 500 mg/kg 1,000 mg/kg
Uterus: Endometrial Stromal Polyp Overall Rates (a) 6/47(13%) 3/50 (6%) 5/45(11%) 2/44(5%) Adjusted Rates (b) 17.0% 8.2% 23.2% 20.0% Terminal Rates (c) 3/30 (10%) 1/30(3%) 2/12(17%) 2/10 (20%) Life Table Tests (d) P=0.244 P= 0.107 P=0.409 Incidental Tumor Tests (d) P=0.533 P=0.386 P=0.505 Cochran-Armitage Trend Test (d) P=0.489N Fisher Exact Test P=0.300 P= 0.561
(a)Number oftumor-bearing animals/number of animals examined a t the site (b)Kaplan-Meier estimated tumor incidence a t the end of the study after adjusting for intercurrent mortality (c)Observed tumor incidence a t terminal kill (d)Beneath the control incidence are the P values associated with the trend test, Beneath the dosed group incidence are the P values corresponding to pairwise comparisons between that dosed group and the vehicle controls. The life table analysis regards tumors in animals dying prior to terminal kill as being (directly or indirectly) the cause of death. The incidental tumor test regards these lesions as nonfatal. The Cochran-Armitage and Fisher exact tests compare directly the overall incidence rates. A regular trend or lower incidence in a dosed group is indicated by (N).
Trichloroethylene, NTP TR 273 200

TABLE F4. SUMMARY OF “HE INCIDENCE OF NONNEOPLASTIC LESIONS IN FEMALE MARSHALL RATS IN THE TWO-YEAR GAVAGE STUDY OF TRICHLOROETHYLENE
CONTROL (UNTR) CONTROL (VEH) LOW DOSE HIGH DOSE
ANIMALS INITIALLY IN STUDY 50 50 50 50 ANIMALS NECROPSIED 50 50 50 48 ANIMALS EXAMINED
HISTOPATHOLOGICALLY 50 50 50 48
INTEGUMENTARY SYSTEM *Subcutaneous tissue (50)
Inflammation, necrotizing Foreign material, NOS
RESPIRATORY SYSTEM *Nasal cavity (50) (50) (50) (48)
Inflammation, NOS 1 (2%)Inflammation, suppurative 2 (4%) 6 (12%) 1 (2%)Inflammation, acuteJchronic 1 (2%)Inflammation chronic suppurative 1 (2%)
*Larynx (50) (50) (50) (48)Granuloma, foreign body 1 (2%)
#Trachea (47) (39) (45) (38)Wound, NOS 1 (2%)Lacerated wound 1 (3%)Penetrating wound 1 (3%)Inflammation, acute focal 1 (2%)Foreign material, NOS 1 (2%) 2 (4%) 3 (8%)
#Peritracheal tissue (47) (39) (45) (38)Abscess, chronic 1 (2%)
#Lung (50) (49) (49) (46)Emphysema, alveolar 2 (4%)Collapse 2 (4%) 3 (6%) 1 (2%)Congestion, NOS 5 (10%) 6 (12%) 10 (20%) 12 (26%) Congestion, chronic passive 1 (2%)Edema, NOS 1 (2%) 1 (2%) 3 (6%) 2 (4%)Hemorrhage 5 (10%) 6 (12%) 9 (18%) 10 (22%) Bronchopneumonia, NOS 2 (4%) 1 (2%)Bronchopneumonia, focal 2 (4%)Inflammation, focal 1 (2%) 19 (39%) 10 (20%) 2 (4%)Inflammation, interstitial 1 (2%)Inflammation, necrotizing 1 (2%)Bronchopneumonia, acute 2 (4%) 2 (4%) 2 (4%) 1 (2%)Inflammation, acute focal 1 (2%)Abscess, NOS 1 (2%)Inflammation, chronic focal 6 (12%) 11 (22%) 7 (15%)Inflammation, granulomatous focal 3 (6%) 6 (12%) 1 (2%) 11 (24%)Foreign material, NOS 1 (2%) 1 (2%) 5 (10%) 9 (20%) Hemosiderosis 1 (2%)Russell body 1 (2%)Alveolar macrophages 1 (2%) 1 (2%) 1 (2%)Hyperplasia, alveolar epithelium 1 (2%) 1 (2%)
HEMATOPOIETIC SYSTEM #Bone marrow (50) (50) (48) (44)
Hyperplasia, granulocytic 2 (4%)#Spleen (49) (49) (47) (43)
Congestion, NOS 1 (2%) 1 (2%)Hemosiderosis 4 (8%) 2 (4%) 2 (4%)Hematopoiesis 6 (12%) 12 (24%) 5 (11%) 3 (7%)Erythropoiesis 1 (2%)
#Mandibular lymph node (31) (31) (29) (23)Hemorrhage 1 (3%) 1 (4%)
201 Trichloroethylene, NTP TR 273

TABLE FQ. SUMMARY OF THE INCIDENCE OF NONNEOPLASTIC LESIONS IN FEMALE MARSHALL HATS IN THE TWO-YEAR GAVAGE STUDY OF TRICHLOROETHYLENE (Continued)
HEMATOPOIETIC SYSTEM (Continued) #Mesenteric lymph node
HemorrhageInflammation, chronic focal
#Liver Hematopoiesis
#ThymusMultiple cysts HemorrhageInvolution, NOS
CIRCULATORY SYSTEM *Multiple organs
Arteriolosclerosis #Lung
Thrombosis, NOS Perivasculitis
#Heart Thrombus, mural Thrombus, fibrin Inflammation, focal Fibrosis Fibrosis, focal Periarteritis Calcification, focal
"Aorta Poly angiitis Calcification, metastatic
*Pulmonary artery Calcification, focal
#Pancreas Periarteritis
*Mesentery Periarteritis
DIGESTIVE SYSTEM #Salivary gland
Inflammation, NOS Inflammation, acute Inflammation, chronic Atrophy, focal
#Liver Congestion, NOS Congestion, passive Congestion, acute passive Inflammation, focal Necrosis, NOS Necrosis, focal Necrosis, central Metamorphosis, fatty Mitotic alteration Basophilic cyto change Eosinophilic cyto change Clear cell change Atrophy, NOS Depletion, glycogen
CONTROL (UNTR)
(31)2 (6%) 1 (3%)
(50)
(6)
1 (2%) 2 (4%) 2 (4%)
1 (2%) (50)
(47)
1 (2%) 1 (2%) 2 (4%) 1 (2%) 1 (2%)
CONTROL (VEH)
(50)
(49) 1 (2%)
(49) 1 (2%)
(46)
1 (2%) (49)
2 (4%)1 (2%)
1 (2%) 1 (2%)
1 (2%) 1 (2%) 1 (2%)
7 (14%)
LOW DOSE
(50) 1 (2%)
(49)
1 (2%) (50)
1 (2%)
1 (2%)
(50)
(48) 1 (2%)
1 (2%) 1 (2%)
2 (4%) 1 (2%)3 (6%)
HIGH DOSE
(48)
(46)
(46)
1 (2%)
(46) 1 (2%) 1 (2%)
1 (2%) 1 (2%) 2 (4%) 1 (2%)
2 (4%)
Trichloroethylene, NTP TR 273 202

TABLE F4. SUMMARY OF THE INCIDENCE OF NONNEOPLASTIC LESIONS IN FEMALE MARSHALL RATS IN THE TWO-YEAR GAVAGE STUDY OF TRICHLOROETHYLENE (Continued)
DIGESTIVE SYSTEM (Continued) #Esophagus
Lacerated wound Diverticulum Impaction, NOS Inflammation, granulomatous
#Stomach Calcification, metastatic
#Gastric mucosa Inflammation, focal Hyperkeratosis
#Colon Hemorrhage Parasitism
*Rectum Parasitism
URINARY SYSTEM #Kidney
Congenital hydronephrosis Calculus, unknown gross or micro Hydronephrosis Hemorrhage Pyelonephritis, NOS Pyelonephritis, acute Pyelonephritis, healed Nephropathy Nephropathy, toxic Degeneration, hyaline Calcification, focal Cytomegaly Hyperplasia, tubular cell Angiectasis
#Renal papilla Necrosis, focal
#Kidney/pelvis Calculus, unknown gross or micro Dilatation, NOS Hemorrhage Hematoma,NOS Calcium deposit Hyperplasia, epithelial Metaplasia, squamous
#Urinary bladder Calculus, unknown gross or micro HemorrhageHyperplasia, epithelial Metaplasia, squamous
ENDOCRINE SYSTEM #Pituitary
Cyst, NOS Multiple cysts Hemorrhage Hyperplasia, focal Hyperplasia, chromophobe cell
CONTROL (UNTR)
(49)
2 (4%)
(49)
(49)
(49)23 (47%)
1 (2%) 49 (100%)
1 (2%) 19 (39%)
1 (2%)
(49)
(49) 6 (12%)
1 (2%) 2 (4%) 1 (2%)
(45)
1 (2%)
(42) 1 (2%)
1 (2%) 2 (5%)
CONTROL (VEH)
(50)3 (6%)
1 (2%) (49)
(49)
(50)21 (42%)
1 (2%)
50 (100%)
11 (22%)
1 (2%)
(50)
(50)
1 (2%) 1 (2%)
(46)
(45)
1 (2%) 2 (4%)
2 (4%)
LOW DOSE HIGH DOSE
(60) (46) 3 (6%) 6 (13%)
1 (2%)
(46) (43)1 (2%)
(46) (43) 1 (2%) 1 (2%)
(43) (41) 1 (2%)
2 (5%) 4 (10%) (50) (48)
1 (2%)
(48) (44) 17 (35%) 12 (27%)
1 (2%) 1 (2%) 5 (11%)
1 (2%) 1 (2%)
47 (98%) 39 (89%) 30 (63%) 30 (68%)
12 (25%) 13 (30%) 46 (96%) 43 (98%)
1 (2%) 1 (2%)
(48) (44) 1 (2%)
(48) (44)
1 (2%)
2 (4%) 1 (2%)
(40) (40) 1 (3%) 1 (3%) 1 (3%) 1 (3%)
(38) (42) 1 (3%)
1 (2%)
4 (11%) 2 (5%)
203 Trichloroethylene, NTP TR 273

TABLE F4. SUMMARY OF THE INCIDENCE OF NONNEOPLASTIC LESIONS IN FEMALE MARSHALL RATS IN THE TWO-YEAR GAVAGE STUDY OF TRICHLOROETHYLENE (Continued)
ENDOCRINE SYSTEM (Continued) #Adrenal
Cyst, NOS Hemorrhage Hematoma, NOS Degeneration, lipoid Hyperplasia, focal Angiectasis
#Adrenal cortex Hemorrhage Hematoma, NOS Degeneration, lipoid Necrosis, focal Metamorphosis, fatty LipoidosisAtrophy, NOS Atrophy, diffuse Hyperplasia, focal Hyperplasia, diffuse Angiectasis
#Adrenal medulla Hyperplasia, focal
#ThyroidFollicular cyst, NOS Hyperplasia, C-cell Angiectasis
#ParathyroidHyperplasia, NOS
REPRODUCTIVE SYSTEM 'Mammary gland
Galactocele Hyperplasia, cystic Lactation
#Uterus HydrometraHematometra PyometraHemosiderosis
#Cervix uteri Cyst, NOS Multiple cysts Inflammation, focal
XUteruslendometrium Multilocular cyst Inflammation,NOS Hemosiderosis
#OvaryCyst, NOS Luteinized follic cyst Multiple cysts Parovarian cyst Hemosiderosis
CONTROL (UNTR)
(47)
1 (2%)
1 (2%) 2 (4%)
(47)6 (13%)
4 (9%)
9 (19%)
4 (9%) (47)
16 (34%) (48)
11 (23%) 1 (2%)
(27)
(50)
4 (8%) (47)
1 (2%)
(47)
(47) 4 (9%)
CONTROL (VEH)
(49) 1 (2%) 1 (2%) 1 (2%) 1 (2%)
5 (10%) (49)
3 (6%)
3 (6%)
1 (2%) 5 (10%) 1 (2%) 1 (2%)
(49) 4 (8%)
(43)
6 (14%)
(22)
(50)
(48)4 (8%)
1 (2%)
1 (2%)
LOW DOSE
(47)
1 (2%) 1 (2%) 1 (2%)
9 (19%) (47)
7 (15%)
4 (9%) 1 (2%)
1 (2%)
4 (9%)
5 (11%) (47)5 (11%)
(46) 1 (2%)5 (11%)
(27)
(50) 1 (2%)
1 (2%) (45)
1 (2%)
1 (2%) (45)
1 (2%) (45)
(45)2 (4%) 1 (2%)
1 (2%)
HIGH DOSE
(43)
1 (2%) 1 (2%) 1 (2%)
6 (14%) (43)
5 (12%) 1 (2%) 3 (7%)
1 (2%)
1 (2%)
3 (7%)
2 (5%) (43)
2 (5%) (43)
6 (14%)
(22) 1 (5%)
(48)
(44) 3 (7%)
(44)
Trichloroethylene, NTP TR 273 204

TABLE F4. SUMMARY OF THE INCIDENCE OF NONNEOPLASTIC LESIONS IN FEMALE MARSHALL RATS IN THE TWO-YEAR GAVAGE STUDY OF TRICHLOROETHYLENE (Continued)
CONTROL (UNTR) CONTROL (VEH) LOW DOSE HIGH DOSE
NERVOUS SYSTEM #Brain
Hemorrhage Calcification, focal
SPECIAL SENSE ORGANS *Eye
Retinopathy Cataract
+Harderian gland Inflammation, acutekhronic Inflammation, chronic Inflammation, chronic focal Atrophy, focal
(50)
1 (2%) 1 (2%)
(50)
(50)
(50)
(50)
2 (4%)
(50)
2 (4%)
(48) 1 (2%) 1 (2%)
2 (4%)
4 (8%)
(48)
MUSCULOSKELETAL SYSTEM None
BODY CAVITIES +Pleural cavity (50)
Hydrothorax 'Pericardium (50)
Inflammation, chronic
ALL OTHER SYSTEMS Lumbar region
Fracture, NOS 1 Lower leg
Abscess, chronic I
SPECIAL MORPHOLOGY SUMMARY Autohecropsyhisto perf 1 Autolysidno necropsy 2
* Number of animals receiving complete necropsy examination; all gross lesions including masses examined microscopically. # Number of animals examined microscopically a t this site
205 Trichloroethylene, NTP TR 273

206Trichloroethylene, NTP TR 273

APPENDIX G
SUMMARY OF LESIONS IN
MALE OSBORNE-MENDEL RATS
IN THE TWO-YEAR GAVAGE STUDY OF
TRICHLOROETHYLENE
PAGE
TABLE G1 SUMMARY OF THE INCIDENCE OF NEOPLASMS IN MALE OSBORNE-MENDEL RATS IN THE TWO-YEAR GAVAGE STUDY OF TRICHLOROETHYLENE 209
TABLE G2 INDIVIDUAL ANIMAL TUMOR PATHOLOGY OF MALE OSBORNE-MENDEL RATS IN THE TWO-YEAR GAVAGE STUDY OF TRICHLOROETHYLENE 212
TABLE G3 ANALYSIS OF PRIMARY TUMORS IN MALE OSBORNE-MENDEL RATS IN THE TWO-YEAR GAVAGE STUDY OF TRICHLOROETHYLENE 220
TABLE G4 SUMMARY OF THE INCIDENCE OF NONNEOPLASTIC LESIONS IN MALE OSBORNE-MENDEL RATS IN THE TWO-YEAR GAVAGE STUDY OF TRICHLOROETHYLENE 223
207 Trichloroethylene, NTP TR 273

Trichloroethylene, NTP TR 273 208

TABLE G1. SUMMARY OF THE INCIDENCE OF NEOPLASMS IN MALE OSBORNE-MENDEL RATS IN THE TWO-YEAR GAVAGE STUDY OF TRICHLOROETHYLENE
ANIMALS INITIALLY IN STUDY ANIMALS NECROPSIED ANIMALS EXAMINED
HISTOPATHOLOGICALLY
INTEGUMENTARY SYSTEM *Skin
!3quamous cell carcinoma Keratoacanthoma Fibroma
*Subcutaneous tissue Sarcoma,NOS Fibroma
RESPIRATORY SYSTEM *Nasal cavity
Carcinoma, NOS #Lung
Alveolar/bronchiolar adenoma Alveolar/bronchiolar carcinoma Sarcoma,NOS, metastatic
HEMATOPOIETIC SYSTEM *Multiple organs
Leukemia, NOS Monocytic leukemia
+Thorax Plasma cell myeloma
#Pancreas Malignant lymphoma, NOS
#Ileum Malignant lymphoma, NOS
CIRCULATORY SYSTEM None
DIGESTIVE SYSTEM #Salivary gland
Adenoma, NOS #Liver
Bile duct adenoma Neoplastic nodule Hepatocellular carcinoma
#Pancreas Acinar cell adenoma
#Stomach Squamous cell carcinoma
#Forestomach PapillomatosisSquamous cell carcinoma
#Duodenum Adenocarcinoma, NOS
#JejunumCarcinoma, NOS
CONTROL (UNTR) CONTROL (VEH)
50 50 50 50
50 50
(50) (50) 1 (2%)
(50) (50) 2 (4%) 3 (6%) 4 (8%)
(50) (50)1 (2%)
(50) (50) 1 (2%) 1 (2%)
(50)
1 (2%) (50)
(50) 1 (2%)
(48)
(47)
(50)
1 (2%)
(50)
LOW DOSE
50 50
50
(50)
1 (2%) 1 (2%)
(50) 2 (4%) 3 (6%)
(50)
(50)
1 (2%)
HIGH DOSE
50 50
50
(50)
2 (4%) (50)
(50)
(50) 1 (2%)
(47)
(49) 1 (2%) 1 (2%)1 (2%)
(50) 1 (2%)
(50) 1 (2%)
(50)
209 Trichloroethylene, NTP TR 273

TABLE G1. SUMMARY OF THE INCIDENCE OF NEOPLASMS IN MALE OSBORNE-MENDEL RATS IN THE TWO-YEAR GAVAGE STUDY OF TRICHLOROETHYLENE (Continued)
URINARY SYSTEM #Kidney
Tubular cell adenoma Tubular cell adenocarcinoma Liposarcoma Nephroblastoma
ENDOCRINE SYSTEM #Pituitary
Carcinoma, NOS Adenoma, NOS
#Adrenal Cortical adenoma Cortical carcinoma PheochromocytomaPheochromocytoma, malignant
#ThyroidFollicular cell adenoma C-cell adenoma C-cell carcinoma
#Thyroid follicle Cystadenoma, NOS
#ParathyroidAdenoma, NOS
#Pancreatic islets Islet cell adenoma Islet cell carcinoma
REPRODUCTIVE SYSTEM *Mammary gland
Cystadenoma, NOS Fibroma Fibroadenoma
#Prostate Adenoma, NOS
#Testis Interstitial cell tumor
NERVOUS SYSTEM *Nerve tract
Neurilemoma #Brain
Granular cell tumor, NOS #Cerebellum
Medulloblastoma
SPECIAL SENSE ORGANS None
MUSCULOSKELETAL SYSTEM *Skeletal muscle
Sarcoma, NOS
CONTROL (UNTR)
(50)
(46) 1 (2%)16 (35%)
(50)11 (22%)
9 (18%) 1 (2%)
(48)
4 (8%)
(48)
(33)2 (6%)
(50)L (2%)
(50)
1 (2%)1 (2%)
(49)
(50 ) 1 (2%)
(50)
CONTROL (VEH)
(50)
1 (2%)
(42)
11 (26%) (50)
9 (18%) 1 (2%)13 (26%)1 (2%)
(49)
8 (16%) 1 ( 2 % )
(49)
(38)
(49)3 (6%) 1 (2%)
(50)
(49) 1 (2%)
(49)
LOW DOSE
(50) 6 (12%)
(45)
7 (16%) (49)
11 (22%)
6 (12%)
(48)
4 (8%)
(48)1 (2%)
(30)
(50) 2 (4%)
(50)
(50)
(50)
HIGH DOSE
(50) 1 (2%) 1 (2%)
1 (2%)
(38)
10 (26%)(50)
11 (22%)
3 (6%)
(48) 1 (2%) 1 (2%)
(48)
(33)
(50)
(50) 1 (2%)
(50) 1 ( 2 % )
(501 1 (2%)
Trichloroethylene, NTP TR 273 210

TABLE GI. SUMMARY OF' THE INCIDENCE OF NEOPLASMS IN MALE OSBORNE-MENDEL RATS IN THE TWO-YEAR GAVAGE STUDY OF TRICHOLORETHYLENE (Continued)
CONTROL (UNTR) CONTROL (VEH) LOW DOSE HIGH DOSE
BODY CAVITIES *Tunica vaginalis
Mesothelioma, NOS
ALL OTHER SYSTEMS *Multiple organs
Squamous cell carcinoma Sarcoma,NOS, metastatic
Forearm Mesenchymoma, malignant
ANIMAL DISPOSITION SUMMARY Animals initially in study
Natural death Moribund sacrifice Terminal sacrifice Dosing accident Accidentally killed, NOS
TUMOR SUMMARY Total animals with primary tumors**
Total primary tumors Total animals with benign tumors
Total benign tumors Total animals with malignant tumors
Total malignant tumors Total animals with secondary tumors##
Total secondary tumors Total animals with tumors uncertain--
benign or malignant Total uncertain tumors
(50)
1 (2%)
50 22 10 18
39 66 34 50 13 14
1 1
2 2
(50) 1 (2%) .,
50 19 8
22
1
37 66 35 52 11 12
2 2
(50) (50)
1
50 50 18 22 9 7
17 14 6 2
5
35 29 52 44 29 22 44 35 8 8 8 8 1 1
1 1
* Number of animals receiving complete necropsy examination; all gross lesions including masses examined microscopically. ** Primary tumors: all tumors except secondary tumors # Number ofanimals examined microscopically a t this site # # Secondary tumors: metastatic tumors or tumors invasive into an adjacent organ
211 Trichloroethylene, NTP TR 273

X
TABLE C2. INDIVIDUAL ANIMAL TUMOR PATHOLOGY OF MALE OSBORNE-MENDEL RATS IN THE TWO-YEAR GAVAGE STUDY OF TRICHLOROETHYLENE: UNTREATED CONTROL
m A L 0 0 0 0 0 0 0 0 0 0 0 0 0 0 0 0 0 0 0 0 0 0 0 0 1NUMBER 0 0 0 1 1 1 1 2 2 4 4 4 5 5 5 6 7 7 7 8 8 8 9 9 0
3 8 9 0 1 7 8 0 1 2 5 9 1 4 8 7 3 8 9 1 2 3 0 4 5
1 1 0 1 0 1 0 1 0 0 0 1 0 0 0 1 1 1 1 0 0 0 0 1 1 0 0 5 0 9 0 9 0 6 9 9 0 8 9 2 0 0 0 0 5 9 8 8 0 0 5 5 4 5 0 2 1 5 3 3 0 5 5 8 6 5 3 5 5 2 5 5 7 5 5
Skin . . . . . . . . . . . . . . . . . . . . . . . . .Squamous cell carcinoma
Subcutaneoustissue . . . . . . . . . . . . . . . . . . . . . . . . . Samoma. NOS XFibroma
R z s p m m m P L u n p and bronchi . . . . . . . . . . . . . . . . . . . . . . . . .
. . . . . . . . . . . . . . . . . . . . . . . . . N N N N N N N N N N N N N N N N N N N N N N N N N
Bone marrow + + + e + + + + + + + + + + + + + + + + + + + + + Spleen . . . . . . . . . . . . . . . . . . . . . . . . . L mphnodes . . . . . . . . . . . . . . . . . . . . . . . . . Tiymus - - - - - - - - - - - - - - + - - - - + - - + - -
entmmmm-Heart . . . . . . . . . . . . . . . . . . . . . . . . .
Salivary gland . . . . . . . . . . . . . . . . . . . . . . . . .Liver . . . . . . . . . . . . . . . . . . . . . . . . .
Naoplaatic nodule Bile duct . . . . . . . . . . . . . . . . . . . . . . . . . . Gallbladder 8 common bile duct N N N N N N N N N N N N N N N N N N N N N N N N NPancreas . . . . . . . . . . . . . . . . . . . . . . . . .
Malignant lymphoma, NOS . . . . . . . . . . . . . . . . . . . . . . . . .:::W . . . . . . . . . . . . . . . . . . . . . . . . .
PapillomatosirSquamous cell carcinoma X x x X
Small intestine . . . . . . . . . . . . . . . . . . . . . . . . . Adenocarnnoina, NOS
Large intestine . . . . . . . . . . . . . . . . . . . . . . . . . -
Kidney . . . . . . . . . . . . . . . . . . . . . . . . . Unnary bladder . . . . . . . . . . . . . . . . . . . . . . . . .
PituitaryPituitary . . . . . . . . . . . . . . . . . . . . . . . . . Carcinoma,Carcinoma, NOSNOS Adenoma,Adenoma, NOSNOS x xx x x xx x xx XX
AdnnalAdnnal .. .. .. .. .. .. .. .. .. .. .. .. .. .. .. .. .. .. .. .. .. .. .. .. .. CorticalCortical adenomaadenoma T T XXx x XY
PheochromocytomaPheochromocytoma X X XXPheochromocytoma.Pheochromocytoma. malignantmalignant
ThTh midmid . . . . . . . . . . . . . . . . . . . . . . . . . &cell&cell adenomaadenoma
ParathyroidParathyroid + + - + - - - + + + - + + + + + - + - + + + + + - Adenoma,Adenoma, NOSNOS X x
PancnaticPancnatic isletsislets . . . . . . . . . . . . . . . . . . . . . . . . . IsletIslet cellcell adenomaadenoma x
Mammary - ~ N + N N + + + + + N + t N + N + + + + N N + + N N ~Fibroma gland . ~
Fibroadenoma Testis . . . . . . . . . . . . . . . . . . . . . . . . .
Interstitial cell tumor Pmstatn . . . . . . . . . . . . . . . . . . . . . . . . .x i Brain . . . . . . . . . . . . . . . . . . . . . . . . .
Tunica va nalis . . . . . . . . . . . . . . . . . . . . . . . . .Mesotheroma. NOS X
Multiple or ans, NOS N N N N N N N N N N N N N N N N N N N N N N N N NSarcoma. ROS, metastatic XMonocytic leukemia
+: Tissueexamined microscopically ' No tissue information submitted -' Raquired tissue not examined microscopically CI Necropsy, no histology due to protocolXi Tumor incidence A: AutolysisN: Necropsy, no autolysis. no microscopic examination M: Animal missingS: Animal miseexed B: No necropsy performed
Trichloroet#hylene,NTP TR 273 212

TABLE G2. INDIVIDUAL 'ANIMAL TUMOR PATHOLOGY OF MALE OSBORNE-MENDEL RATS:
ANIMAL NUMBER
WEEKS ON STUDY
Skin Squamous cell carcinoma
Subcutaneoustillsue Sam-, NOS Fibroma
Lun and bronchi TracyeaNasal cavity
Carcinoma. NOS
Bone marrow SpleenL mphnodesTgymus
Heart
M Salivary gland Liver~~ ~
Neoplastic nodule Bile duct Gallbladder & common bile duct Pancnas
Malignant lymphoma, NOS 2:Y
PapillomatosisSquamous cell carcinoma
Small intestine Adenocarcinoma,NOS
Large intestine
KidneyUrinary bladder
PituitaryCarcinoma NOS Adenoma. kOS
Admnal Cortical adenoma PheochromocytomaPheochromocytoma. malignant
Th mid d[cell adenoma
ParathyroidManoma. NOS
Pancmatic islets Islet call adenoma
Mammary gland Fibroma Fibroadenoma
Testis Interstitial cell tumor
Prostate
Brain
Tunica va 'nalis Mecotheroma, NOS
Multiple organs, NOS Sarcoma NOS metastatic Monocytic Ieul&mia
* Animals necropsied
UNTREATED CONTROL (Continued) 1 1 1 1 1 1 1 1 1 1 1 1 1 1 1 1 1 1 1 1 1 1 1 1 1 0 1 1 1 2 2 3 3 3 4 4 5 5 5 6 8 6 7 7 8 8 8 9 9 9 7 1 6 8 1 4 3 5 9 2 7 2 6 7 3 5 9 6 7 3 5 7 5 7 8
TOTAL: 1 1 0 0 0 0 1 1 1 1 0 1 1 1 0 0 1 0 1 1 1 1 1 rISSUES 0 0 2 8 9 9 0 0 0 0 7 0 9 0 0 9 8 0 6 0 0 9 0 0 0 rwow 4 5 2 7 6 7 . 4 5 5 5 8 4 1 3 1 8 7 5 6 5 2 5 5 2 5
. . . . . . . . . . . . . . . . . . . . . . . . . '50 X 1 . . . . . . . . . . . . . . . . . . . . . . . . . *50
X 2 x x 3
. . . . . . . . . . . . . . . . . . . . . . . . . 50 . . . . . . . . . . . . . . . . . . . . . . . . . 50 N N N N N N N N N N N N + N N N N N N N N N N N N '50
X 1
. . . . . . . . . . . . . . . . . . . . . . . . . 50 . . . . . . . . . . . . . . . . . . . . . . . . . 50 . . . . . . . . . . . . . . . . . . . . . . . . . 49_ _ _ _ _ _ _ - _ _ - _ - _ - _ _ - _ - - - - - -3
. . . . . . . . . . . . . . . . . . . . . . . . . 50
. . . . . . . . . . . . . . . . . . . . . . . . . 47 . . . . . . . . . . . . . . . . . . . . . . . . . 50 X 1
. . . . . . . . . . . . . . . . . . . . . . . . . 50 N N N N N N N N N N N N N N N N N N N N N N N N N *50 . . . . . . . . . . . . . . . . . . . . . . . . . 50
X 1 . . . . . . . . . . . . . . . . . . . . . . . . . 50 . . . . . . . . . . . . . . . . . . . . . . . . . 50 X 1
X 5 . . . . . . . . . . . . . . . . . . . . . . . . . 48
X 1 . . . . . . . . . . . . . . . . . . . . . . . . . 48
. . . . . . . . . . . . . . . . . . . . . . . . . 50 . . . . . . . . . . . . . . . . . . . . . . . . . 50
. . . . . . . . . . . . . . . . . . . . . . . . . 46 X 1
x x x x x x x x X 16 . . . . . . . . . . . . . . . . . . . . . . . . . 50X X X x x x X 11 x x X X X X 9
X 1 . . . . . . . . . . . . . . . . . . . . . . . . . 48 X X X X 4+ + - - + + - - + + - - + + - + + + - - + + + + + 33
2 . . . . . . . . . . . . . . . . . . . . . . . . . 50 1
+ + N + N + N + + N + + N + + N + + + + + + + + N *50 X 1
1 . . . . . . . . . . . . . . . . . . . . . . . . . 50 1 . . . . . . . . . . . . . . . . . . . . . . . . . 49
. . . . . . . . . . . . . . . . . . . . . . . . . 49
. . . . . . . . . . . . . . . . . . . . . . . . . * S O 1
V N N N N N N N N N N N N N N N N N N N N N N ~ N * S O 1
X 1
213 Trichloroethylene, NTP TR 273

TABLE G2. INDIVIDUAL ANIMAL TUMOR PATHOLOGY OF MALE OSBORNE-MENDEL RATS IN THE TWO-YEAR GAVAGE STUDY OF TRICHLOROETHYLENE: VEHICLE CONTROL
0 0 0 0 0 0 0 0 0 0 0 0 0 0 0 0 0 0 0 0 0 0 0 0 0NUMBER 0 1 1 1 2 2 3 4 4 5 5 5 5 5 5 8 6 6 7 7 7 7 8 8 8
7 4 5 9 4 7 0 0 3 2 3 5 6 7 9 1 2 4 0 1 2 6 0 4 6
WEEKS ON 1 1 0 1 1 1 0 0 1 1 1 1 0 1 0 1 0 1 0 0 0 1 1 1 0STUDY 0 0 8 0 0 0 3 6 0 0 0 0 9 0 9 0 9 0 7 6 8 0 0 0 9
5 0 8 5 5 5 0 7 5 5 2 5 6 5 3 5 3 5 0 7 2 5 5 0 5
Subcutaneous tissue + + + + + + + + + + + + + + + N + + + + + + + + + Fibroma
L u n e and bronchi . . . . . . . . . . . . . . . . . . . . . . . . . Alveolar/bronchiolar adenoma X Alveolar/bronchiolar camnoma X
Trachea . . . . . . . . . . . . . . . . . . . . . . . . .
Bone marrow . . . . . . . . . . . . . . . . . . . . . . . . . Spleen . . . . . . . . . . . . . . . . . . . . . . . . . L mphnodes + + + + + + + A + + + + + + + + + + + + + + + + + A y m u s - _ - _ - -+ A - _ _ _ _ _ _ _ - - _ - A - - - -
-7 . . . . . . . . . . . . . . . . . . . . . . . . . -P
Salivary gland + + + + + + + + + + + + + + + + + + + + + + + + + Adenoma, NOS
Liver . . . . . . . . . . . . . . . . . . . . . . . . . Bileduct adenoma X Neoplastic nodule
Bile duct . . . . . . . . . . . . . . . . . . . . . . . . . Gallbladder & common bile duct N N N N N N N N N N N N N N N N N N N N N N N N N Pancreas . . . . . . . . . . . . . . . . . . . . . . . . . . . . . . . . . . . . . . . . . . . . . . . . . . 2:%r . . . . . . . . . . . . . . . . . . . . . . . . .
Squamous cell camnoma x x x Small intestine . . . . . . . . . . . . . . . . . . . . . . . . .
Malignant lymphoma, NOS Large intsstine . . . . . . . . . . . . . . . . . . . . . . . . .
-Kidney . . . . . . . . . . . . . . . . . . . . . . . . .
Liposarcoma X Unnary bladder . . . . . . . . . . . . . . . . . . . . . . . . .
7 . . . . . . . . . . . . . . . . . . . . . . . . . Adenoma, NOS X X X X
Adrenal . . . . . . . . . . . . . . . . . . . . . . . . . Cortical adenoma x x x X XCortical camnuma Pheochromocytoma X X x x x X X Pheochromocytoma, malignant X
Thyroid + + + + + t + A + + + + + + + + + + + + + + t + +C-celladenoma x x x xC-cell camnoma
Parathyroid + + + + + - + A + + + + + + + + + - - + + - - + + Pancreatic islets . . . . . . . . . . . . . . . . . . . . . . . . .
Islet call adenoma x x Islet call carcinoma
p-Mammary gland + N + + N + N + + + + + N + N N N + + N + N N + + Testis . . . . . . . . . . . . . . . . . . . . . . . . . Pmstata . . . . . . . . . . . . . . . . . . . . . . . . .
Adenoma, NOS X -
Brain . . . . . . . . . . . . . . . . . . . . . . . . .
Granular cell tumor, NOS
m p -Multiple organa. NOS Y N N N N N N N N N N N N N N N N N N N N N N N N
Squamous cell carcinoma XMonocytic leukrrmia X
Trichloroethylene, NTP TR 273 214

TABLE 62, INDIVIDUAL ANIMAL TUMOR PATHOLOGY OF MALE OSBORNE-MENDEL RATS: VEHICLE CONTROL (Continued)
TOTAL: WEEKS ON STUDY
Subcutaneous tissue . . . . . . . . . . . . . . . . . . . . . . . . . *50Fibroma X X x x 4
Y SYSTEM Lungs and bronchi . . . . . . . . . . . . . . . . . . . . . . . . . 50
Alveolarbronchiolar adenoma Alveolar/bronchiolar carcinoma :
Trachea . . . . . . . . . . . . . . . . . . . . . . . . . 4:
Bone marmw . . . . . . . . . . . . . . . . . . . . . . . . . 49 Spleen . . . . . . . . . . . . . . . . . . . . . . . . . 49 L mphnodes . . . . . . . . . . . . . . . . . . . . . . . . . 46 d y m u s + 3- - - - - - + - - - - - - - - - - - - - - - - -
Heart . . . . . . . . . . . . . . . . . . . . . . . . . 50 -I I-
Salivarygland . . . . . . . . . . . . . . . . . . . . . . . . . Adenoma, NOS X
Liver . . . . . . . . . . . . . . . . . . . . . . . . . Bile duct adenoma Neoplastic nodule X 1
Bile duct . . . . . . . . . . . . . . . . . . . . . . . . . 50 Gallbladder EL common bile duct N N N N N N N N N N N N N N N N N N N N N N N N N *50 Pancreas . . . . . . . . . . . . . . . . . . . . . . . . . 49 . . . . . . . . . . . . . . . . . . . . . . . . . 50:0::2Y . . . . . . . . . . . . . . . . . . . . . . . . . 50
Squamous cell carcinoma 3 Small intestine . . . . . . . . . . . . . . . . . . . . . . . . . 49
Malignant lymphoma, NOS X 1 Large intestine . . . . . . . . . . . . . . . . . . . . . . . . . 47
d
Kidney . . . . . . . . . . . . . . . . . . . . . . . . . 50 Liposarcoma 1
Unnary bladder . . . . . . . . . . . . . . . . . . . . . . . . . 46 -
Pituitary . . . . . . . . . . . . . . . . . . . . . . . . . 42 Adenoma, NOS X X X X X x x 11
Adrenal . . . . . . . . . . . . . . . . . . . . . . . . . 50Cortical adenoma x x x x 9 Cortical camnoma X 1 Pheochmmocytoma I x x x x x X 13 Pheochmmoeytoma, malignant 1
Thyroid . . . . X . . . . . . . . . . . . . . . . . . . . . . 49X x x C cell adenoma 8 C cell camnoma X 1
Parathyroid + + - + + + - + + + - + + + - + + + + + + + - + - 36 Pancreahc islets . . . . . . . . . . . . . . . . . . . . . . . . . 49
Islet call adenoma X 3 Islet cell a m n o m a X 1
REPRODUCTIVE-Mammary gland + + + N + + N + + N N + N + N + + + + N N N N + N '50 Testis . . . . . . . . . . . . . . . . . . . . . . . . . 49 Prostate . . . . . . . . . . . . . . . . . . . . . . . . . 49
Adenoma. NOS 1 -
. . . . . . . . . . . . . . . . . . . . . . . . . 49 X 1
N N N N N N N N N N N N N N N N N N N N N N N N N *50 1 1
'Animals necropsied
215 Trichloroethylene, NTP TR 273

TABLE G2. INDIVIDUAL ANIMAL TUMOR PATHOLOGY OF MALE OSBORNE-MENDEL RATS IN THE TWO-YEAR GAVAGE STUDY OF TRICHLOROETHYLENE: LOW DOSE
0 0 0 0 0 0 0 0 0 0 0 0 0 0 0 0 0 0 0 0 0 1 1 1 1 0 0 1 1 1 2 2 3 3 3 4 4 5 6 6 6 6 7 8 9 9 0 0 2 2 1 6 2 3 8 3 8 2 4 5 1 4 0 0 5 8 9 7 7 8 9 4 6 2 8
- l 0 0 1 1 0 0 0 1 1 1 1 1 1 0 1 0 0 0 0 0 0 0 1 0 0 9 8 0 0 1 8 9 0 0 0 0 0 0 7 0 7 8 3 8 6 9 2 0 0 4 4 8 4 4 1 4 1 4 4 4 4 4 0 0 4 8 3 0 1 8 8 8 0 9
~~ ~7'"""+ t + + t + t + t t t t t t t t t t t t + + t + + Keratoacanthoma Fibroma
Subcutaneous tissue Sarcoma, NOS Fibroma
P Lungs and bronchi
Sarcoma, NOS,metastatic Trachea
-SYSTEM Bone marrow SpleanL mphnodes TKymua
Heart
Salivary gland Liver
Bile duct adenoma Bile duct Gallbladder & common bile duct Pancreas
:t%,,Squamous eel1 carcinoma
Small intartine Carcinoma. NOS
Large intestme
EM Kidney
Tubular cell adenoina Unnary bladder
-m Pituitary
Adenoma, NOS Adrenal
Cortical adenoma Pheochmmoeytome
Th mid dlcell adenoma Cystadenoma, NOS
ParathymidPancreatic islets
Ialet cell adenoma
Mammary gland Testis Prostate
Brain
ETAL SYSTEM Muscle
Sarcoma, NOS
X
+ + + + t + t t + + + t + t + t + + + t t t + + +
X X
+ t + + t + t + + t t t + t t t + + t + t t + t t
+ t + + t t t + + + + + t t t + t + - + t t - + -
+ + t t t t + t + t t + + t + + + + t t + + t + t t + t + + t t + + t + t + + + + + + + + t + + + + + t + t t + t t t t t + + t + t t + t t + + t + t - - - - - + - - - - - - - - - - - - + - t - + - +
t + + t t t + t + + + t + + + t + t + + t t + + t
~~
t t t + t + t + t t t + + + + + t t t + - t t t t t t t + t + t + + t t + t t t + + + + t t t + + t
t + + t t t + + + t + + + + t t + t + t t t t + + N N N N N N N N N N N N N N N N N N N N N N N N N t + t + + t t t + + + t + + + t + + t t + + + t + + t + + + + t t + + t t + + t t t + + + + + + t t + + + + t + + t t + + + + + + + t + + + + + + t t
X t t + + t t t + + + t t t + t t + + + t + t t t +
t + t + t + t + + t + + t + + t + + + t + t + t +
t t + t t t t t + + t + t t + t + + + t + t t t t X x x
t t t t + t + t + + t + + + t t t t + t t t t + t
'. x x x + t + t + t t t t t + + t t t + t + - t t t t t -
X XX
+ t + + t t t t t - - + - - - - - + - - - t - + - t t t t t t + + t t + + t t t + t t t + + + t t t
X
t N t t t N t + t + N t t N + + t N N t + + N + N t + t t + + t t + t + + + t + + t + + + t t t t t t + t t + t t t t t t t t + t t t + t t + t t t t
~ ~~~ ~
t + t t + t + + t + t t t t t + t + t + + + + t t
Trichloroethylene, NTP TR 273 216

TABLE G2. INDIVIDUAL ANIMAL TUMOR PATHOLOGY OF MALE OSBORNE-MENDEL RATS: LOW DOSE (Continued)
ANIMAL 1 1 1 1 1 1 1 1 1 1 1 1 1 1 1 1 1 1 1 1 1 1 1 1 1 NUMBER 3 3 3 3 4 4 4 5 5 5 6 6 6 1 7 7 7 7 8 8 8 8 9 9 9
0 1 2 8 1 3 9 0 1 9 4 7 8 2 3 4 5 9 0 2 6 9 2 6 9 TOTAL
WEEKS ON 1 1 0 i o o 0 i i 1 o 0 i o i o o 0 o 0 0 0 0 l o TISSUES STUDY 0 0 3 0 9 9 8 0 0 0 4 6 0 8 0 8 1 8 9 8 9 7 6 0 9 TUMORS
4 4 0 4 2 9 6 4 4 3 2 1 4 0 4 8 8 1 8 9 9 1 6 4 8
. . . . . . . . . . . . . . . . . . . . . . . . . '50 1
X 1 + + + + + + N + + + + + + + + + + + + + + + + + + *50
x x 2 X 3
. . . . . . . . . . . . . . . . . . . . . . . . . 50 X 1
. . . . . . . . . . . . . . . . . . . . . . . . . 47 .~
. . . . . . . . . . . . . . . . . . . . . . . . . 50 . . . . . . . . . . . . . . . . . . . . . . . . . 50 . . . . . . . . . . . . . . . . . . . . . . . . . 49- - + - - - - - - - + + - - - - - - - - - - - - - 8
Heart . . . . . . . . . . . . . . . . . . . . . . . . .
. . . . . . . . . . . . . . . . . . . . . . . . .
. . . . . . . . . . . . . . . . . . . . . . . . . X 1 . . . . . . . . . . . . . . . . . . . . . . . . . 50
N N N N N N N N N N N N N N N N N N N N N N N N N '50 . . . . . . . . . . . . . . . . . . . . . . . . . 50 . . . . . . . . . . . . . . . . . . . . . . . . . 50 . . . . . . . . . . . . . . . . . . . . . . . . . 50
Squamous cell carcinoma X X Small intestine . . . . . . . . . . . . . . . . . . . . . . . . .
Carcinoma, NOS X Large intestine . . . . . . . . . . . . . . . . . . . . . . . . . 49
Kidney . . . . . . . . . . . . . . . . . . . . . . . . . 50 Tubular cell adenoma x x X
Unnary bladder . . . . . . . . . . . . . . . . . . . . . . . . . 5:I Pituitary . . . . . . . . . . . . . . . . . . . . . . . . . 4s
Adenoma, NOS X X 7 Adrenal . . . . . . . . . . . . . . . . . . . . . . . . . 49
Cortical adenoma X X X X 11 Pheochromocytoma X 6
Thyroid . . . . . . . . . . . . . . . . . . . . . . . . . 48 C-cell adenoma X X 4 Cystadenoma, NOS 1
Parathyroid + + + - + + + - + + - + - - + - + + + + - + - + + 30 Pancreatic islets . . . . . . . . . . . . . . . . . . . . . . . . . 50
Islet cell adenoma X 2
Mammary gland + N N + N + N + + + N N + + N + + + + + + + + N + Testis . . . . . . . . . . . . . . . . . . . . . . . . . 50pi-Prostate . . . . . . . . . . . . . . . . . . . . . . . . .
Brain . . . . . . . . . . . . . . . . . . . . . . . . . 150 Muscle N N N N N N N N N N N N N N N N N N N N N N ~ N N '50
Sarcoma, NOS ALL - /L-Nerve tract
Neurilemoma 1 Forearm NOS
Mesendhymoma, malignant 1 I
Animals necropsied
1-1
217 Trichloroethylene, NTP TR 273

--
TABLE G2. INDIVIDUAL ANIMAL TUMOR PATHOLOGY OF MALE OSBORNE-MENDEL RATS IN THE TWO-YEAR GAVAGE STUDY OF TRICHLOROETHYLENE: HIGH DOSE
ANIMAL NlJMBER
WEEKS ON STUDY
Skin Fibroma
-STEM L u n e and bronchi
Alveolar/bronchiolar adenoma Trachea
- F M Bone marrow SpleenL m p h n d e s Tgymus
C I K C m ; A F U K Y S P s T E nHeart
M Salivary gland Liver
Bile duct adenoma Neoplastic nodule Hepatocellular carcinoma
Bile duct Gallbladder & common bile duct Pancreas
Acinar cell adenoma
:22Y Squamous cell carcinoma
Small intestine Large intestine
mnmnmsysFFlcTKidney
Tubular cell adenoma Tubular cell adenocarcinoma NephroblastomaUrinary bladder
PituitaryAdenoma, NOS
Adrenal Cortical adenoma Pheochromocytoma
ThyroidFollicular cell adenoma C-cell adenoma
Parathyroid
MImmary gland Cystadenoma, NOS
Testis Interstitial cell tumor
Prostate Adenoma, NOS
Medulloblastoma -Pleura
Plasma cell myeloma
Multi le organs NOS Leuemia. NO^ Monocytic leukemia
0 0 0 0 0 0 0 0 0 0 0 0 0 0 0 0 0 0 0 0 0 0 0 0 0 0 0 0 2 2 2 2 3 3 3 3 3 3 4 4 4 6 6 7 7 a a a g 9 2 4 5 2 5 6 9 1 3 6 7 8 9 6 7 8 3 6 4 5 5 8 9 2 3
. . . . . . . . . . . . . . . . . . . . . . . . .
. . . . . . . . . . . . . . . . . . . . . . . . .
. . . . . . . . . . . . . . . . . . . . . . . . .
. . . . . . . . . . . . . . . . . . . . . . . . . . . . . . . . . . . . . . . . . . . . . . . . . . . . . . . . . . . . . . . . . . . . . . . . . . . - - _ - - - - - - - + - - - - - - - + - - + + + -
. . . . . . . . . . . . . . . . . . . . . . . . .
. . . . . . . . . . . . . . . . . . . . . . . . .
. . . . . . . . . . . . . . . . . . . . . . . . .
X . . . . . . . . . . . . . . . . . . . . . . . . . N N N N N N N N N N N N N N N N N N N N N N N N N . . . . . . . . . . . . . . . . . . . . . . . . .
X . . . . . . . . . . . . . . . . . . . . . . . . . . . . . . . . . . . . . . . . . . . . . . . . . . . . . . . . . . . . . . . . . . . . . . . . . . . . . . . . . . . . . . . . . . . . . . . . . . . .
. . . . . . . . . . . . . . . . . . . . . . . . . X
X . . . . . . . . . . . . . . . . . . . . . . . . .
+ + + - - + + + + + + + + + + + + + - + + - - - + X x x X X . . . . . . . . . . . . . . . . . . . . . . . . . X X X X
X . . . . . . . . . . . . . . . . . . . . . . . . .
+ + + - + + + + + + - + + + + + + - + - + - + + -
+ N + + N + N + N N N + + N + + N + N N N N N N +
. . . . . . . . . . . . . . . . . . . . . . . . . . . . . . . . . . . . . . . . . . . . . . . . . . . X
. . . . . . . . . . . . . . . . . . . . . . . . . X
N N N N N N N N N N N N N N N N N N N N N N N N N X
N N N N N N N N N N N N N N N N N N N N N N N ~ N
Trichloroethylene, NTP TR 273 218

TABLE G2. INDIVIDUAL ANIMAL TUMOR PATHOLOGY OF MALE OSBORNE-MENDEL RATS: HIGH DOSE (Continued)
ANIMAL 0 1 1 1 1 1 1 1 1 1 1 1 1 1 1 1 1 1 1 1 1 1 1 1 1 NUMBER 9 0 0 0 0 1 1 1 1 2 2 3 4 4 4 5 5 6 7 7 8 8 9 9 9
5 1 2 8 9 0 2 3 7 3 9 4 4 5 6 4 5 1 1 8 1 4 0 3 4 TOTAL:
WEEKS ON 1 0 1 1 0 0 1 0 0 o 0 1 1 0 0 0 0 0 0 1 1 0 0 0 1 TISSUES STUDY 0 8 0 0 6 5 0 5 8 3 7 0 0 9 4 0 9 3 8 0 0 5 2 4 0 TUMORS
4 1 4 3 2 5 4 0 9 6 7 0 4 7 6 3 6 8 1 4 4 1 1 5 4
EM Shn . . . . . . . . . . . . . . . . . . . . . . . . . 5 0
Fibroma X X 2
R E S i € W i i EM Lungs and bronchi . . . . . . . . . . . . . . . . . . . . . . . . . 50
Alveolar/bronchiolar adenoma X 1 Trachea . . . . . . . . . . . . . . . . . . . . . . . . . 46
~~~~ ~~ ~
Bone marmw . . . . . . . . . . . . . . . . . . . . . . . . . 50 Spleen . . . . . . . . . . . . . . . . . . . . . . . . . 50 L mphnodes . . . . . . . . . . . . . . . . . . . . . . . . . 44 TKymus + - - - - + - - - + - - - - + + - + - - - + + - - 13
M Heart . . . . . . . . . . . . . . . . . . . . . . . . .
Salivary gland . . . . . . . . . . . . . . . . . . . . . . . . . 47 Liver . . . . . . . . . . . . . . . . . . . . . . . . . 49I _.Bile duct adenoma 1
Neoplastic nodule X 1 Hepatocellular carcinoma 1
Bile duct . . . . . . . . . . . . . . . . . . . . . . . . . 49 Gallbladder & common bile duct N N N N N N N N N N N N N N N N N N N N N N N N N *50 Pancreas . . . . . . . . . . . . . . . . . . . . . . . . . 50
Acinar cell adenoma 1 . . . . . . . . . . . . . . . . . . . . . . . . . 50!s:%r . . . . . . . . . . . . . . . . . . . . . . . . . . 50 Squamous cell carcinoma X 1
Small intestine . . . . . . . . . . . . . . . . . . . . . . . . . 48 Large intestine . . . . . . . . . . . . . . . . . . . . . . . . . 48
Kidney . . . . . . . . . . . . . . . . . . . . . . . . . Tubular cell adenoma X Tubular cell adenocarcinoma Nephroblastoma
Unnary bladder . . . . . . . . . . . . . . . . . . . . . . . . . 49 -~IIp-
Pituitary + + + + - - + - + + + + + + - - + + + + + + + - + 38 Adenoma, NOS X X x x x 10
Adrenal . . . . . . . . . . . . . . . . . . . . . . . . . x Cortical adenoma X x x x x X 5011 Pheochromocytoma X x 3
Thyroid . . . . . . . . . . . . . . . . . . . . . . . . . 48 Follicular cell adenoma X 1 C-cell adenoma X 1
Parathyroid + - + + - - + - - - + - + - + + + - + + - - + + + 33
Mammary gland N + N + N + N N N N + + N + N N + N + + N N N N N *50 Cystadenoma. NOS X 1
T e a h a - --_.- . . . . . . . . . . . . . . . . . . . . . . . . . 50 Interstitial cell tumor X 1
Prostate . . . . . . . . . . . . . . . . . . . . . . . . . 50 Adenoma, NOS 1
I-Brain . . . . . . . . . . . . . . . . . . . . . . . . . 50 NEKVoUS-
Medulloblastoma 1
p- I-Pleura I N N N N N N N N N N N N N N N N N N N N N N N N N *50
Plasma cell myeloma 1
P O T H E R S Y S T E M S
Multi leorgans NOS N N N N N N N N N N N N N N N N N N N N N N N N NI x ,
Leufernla, NOS X Monocytic leukemia
* Animals necropsied
219 Trichloroethylene, NTP TR 273

TABLE 63. ANALYSIS OF PRIMARY TUMORS IN MALE OSBORNE-MENDEL RATS IN THE TWO-YEAR GAVAGE STUDY OFTRICHLOROETHYLENE
Untreated Control
Subcutaneous Tissue: Fibroma Overall Rates (a) 3/50 (6%) Adjusted Rates (b) 9.8% Terminal Rates (c) 0121(0%)Life Table Tests (d) Incidental Tumor Tests (d) Cochran-Armitage Trend Test (d) Fisher Exact Test
Integumentary System: Fibroma Overall Rates (a) 3/50 (6%) Adjusted Rates (b) 9.8% Terminal Rates (c) 0121 (0%)Life Table Tests (d)Incidental Tumor Tests (d) Cochran-Armitage Trend Test (d) Fisher Exact Test
Integumentary System: Fibroma o r Sarcoma Overall Rates (a) 4/50 (8%) Adjusted Ratw (b) 15.0% Terminal Rates (c) 2/21 (10%) Life Table Tests (d) Incidental Tumor Tests (d) Cochran-Armitage Trend Test (d) Fisher Exact ‘rest
S tomach Squamous Cell Carcinoma Overall Rates (a) (e)5/50 (10%)Adjusted Rates (b) 18.4% Terminal Rates (c) 2/22 (9%) Life Table Tests (d) Incidental Tumor Tests (d) Cochran-Armitage Trend Test (d) Fisher Exact Test
Kidney: Tubular Cell Adenoma Overall Rates (a) 0/50(0%) Adjusted Rates (b) 0.0% Terminal Rates (c) 0/21(0%)Life Table Testa (d) Incidental Turnor Tests (d)Cochran-Armitage Trend Test (d) Fisher Exact Test
Vehicle Control
4/50 (8%) 13.6% 1/22(5%) P=0.112N P =0.095N P=0.049N
4/50 (8%)13.6% 1122(5%)P=0.468N P=0.451N P=0.274N
4/50 (8%) 13.6% 1/22(5%)P =0.509N P=0.489N P =0.290N
3/50 (6%) 11.5% 2/22 (9%) P=0.342N P =0.053N P =0.238N
0150 (0%) 0.0% 0/22 (0%)P =0.246 P=0.243 P=0.406
Kidney: Tubular Cell Adenoma or Adenocarcinoma Overall Rates (a) 0150 (0%) 0150 (0%)Adjusted Rates (b) 0.0% 0.0% Terminal Rates (c) 0121 (0%) 0122 (0%)Life Table Tests (d) P=0.125 Incidental Tumor Tests (d) P=0.122 Cochran-Armitage Trend Test (d) P=0.252 Fisher Exact Test
Pituitary: Adenoma Overall Rates ( a ) (D 16/46(35%) 11/42 (26%) Adjusted Rates (b) 55.4% 42.0% Terminal Rates (c) 9/21 (43%) 8/22 (36%) Life Table Tests (d) P =0.277 Incidental Tumor Tests (d) P=0.287 Cochran-Armitage Trend Test (d) P =0.542N Fisher Exact Test
SO0 mg/kg
3/50 (6%) 14.0% 2/17 (12%) P=0.612N P =0.547N
P =0.500N
4/50 (8%)19.8% 3/17 (18%) P-0.519 P=0.582
P-0.643
6/50 (12%) 24.7% 3/17 (18%) P =0.255 PssO.340
P=0.370
3/50 (6%) 7.3% 0/17 (0%)P=0.583 P =0.431N
P = 0.661
6/50 (12%) 32.2% 5/17 (29%) P=0.007 P =0.007
P=0.013
6/50(12%)32.2% 5/17 (29%) P=0.007 P =0.007
P=0.013
7/45 (16%) 35.0% 5/17 (29%)P =0.419N P=0.334N
P=0.169N
1.000 mg/kg
0/50 (0%) 0.0% 0115(0%) P=0.129N P =0.130N
P=0.059N
2/50 (4%) 11.6% 1/15(7%10)P =0.528N P=0.548N
P=0.339N
2/50 (4%) 11.6% 1115 (7%) P=0.528N P=0.548N
P=0.339N
1/50 (2%) 2.1% 0/15 (0%)P =0.421N P=0.230N
P =0.309N
1/50 (2%) 6.7% 1/15 (7%) P =0.424 P=0.424
P=0.500
2/50 (4% ) 10.9% 1/15 (7%) P =0.158 P=0.158
P =0.247
10/38(26%) 50.6% 6/15 (40%) P=0.294 P =0.300
P =0.595
Trichloroethylene, NTP TR 273 220

TABLE 63. ANALYSIS OF PRIMARY TUMORS IN MALE OSBORNE-MENDEL RATS IN THE TWO-YEAR GAVAGE STUDY OF TRICHLOROETHYLENE (Continued)
Untreated Vehicle Control Control 500 mg/kg 1,000 mg/kg
Adrenal: Cortical Adenoma 11/49(22%)41.1% 3/17(18%)P=0.215 P =0.327
P =0.382
11/49(22%)41.1% 3/17 (18%) P=0.286 P =0.435
P =0.479
6/49 (12%) 31.6% 5/17 (29%) P=0.154N P =0.128N
P=0.068N
4/48 (8%)21.4% 3/17 (18%) P =0.312N P=0.299N
P = 0.188N
4/48 (8%) 21.4% 3/17 (18%) P =0.224N P=0.211N
P =0.124N
2/50 (4%)11.8% 2/17 (12%) P=0.602N P =0.590N
P =0.490N
2/50 (4%) 11.8% 2/17 (12%) P=0.448N P=0.435N
P=0.329N
11/50(22%)54.4% 7/15 (47%) P=0.115 P=0.160
P =0.402
11/50(22%)54.4% 7/15 (47%) P=0.165 P = 0.221
P=0.500
3/50 (6%) 18.7% 2/15(13%) P=0.052N P =0.043N
P =0.006N
1/48(2%)6.7% 1/15 (7%) P=0.055N P=0.057N
P=0.017N
1/48(2%) 6.7% 1/15(7%) P=0.038N P=0.039N
P =O.OO8N
0150 (0%)0.0% 0115 (0%)P=0.203N P=0.213N
P=0.1 17N
0/50 (0%) 0.0% 0/15(0%)P=0.127N P=0.133N
P=0.056N
Overall Rates (a) 11/50(22%)Adjusted Rates (b) 40.3% Terminal Rates (c) 7/21 (33%) Life Table Tests (d) Incidental Tumor Tests (d) Cochran-Armitage Trend Test (d) Fisher Exact Test
Adrenal: Cortical Adenoma or Carcinoma Overall Rates (a) 11/50(22%)Adjusted Rates (b) 40.3% Terminal Rates (c) 7/21 (33%) Life Table Tests (d) Incidental Tumor Tests (d)Cochran-Armitage Trend Test (d) Fisher Exact Test
Adrenal: PheochromocytomaOverall Rates (a) ( g )9/50 (18%) Adjusted Rates (b) 34.8% Terminal Rates (c) 6/21 (29%) Life Table Tests (d) Incidental Tumor Tests (d) Cochran-Armitage Trend Test (d)Fisher Exact Test
Thyroid: C-cell Adenoma Overall Rates (a) 4/48(8%)Adjusted Rates (b) 19.0% Terminal Rates (c) 4/21 (19%) Life Table Testa (d) Incidental Tumor Tests (d) Cochran-Armitage Trend Test (d) Fisher Exact Test
Thyroid: C-cell Adenoma or Carcinoma Overall Rates (a) 4/48 (8%) Adjusted Rates (b) 19.0% Terminal Rates (c) 4/21 (19%) Life Table Tests (d)Incidental Tumor Tests (d) Cochran-Armitage Trend Test (d) Fisher Exact Test
Pancreatic Islets: Islet Cell Adenoma Overall Rates (a) 1/50(2%)Adjusted Rates (b) 4.8% Terminal Rates (c) 1/21(5%)Life Table Tests (d) Incidental Tumor Tests (d) Cochran-Armitage Trend Test (d) Fisher Exact Test
Pancreatic Islets: Islet Cell Adenoma or Carcinoma
9/50 (18%) 32.4% 5/22 (23%) P =0.094 P =0.109 Pa0.356
10150(20%)34.4% 5/22 (23%) P=0.137 P-0.161 Pm0.452
(h)13/50 (26%) 42.98 7/22 (32%) P=0.028N P=0.023N P=0.004N
8/49 (16%) 33.9% 7/22 (32%) P =0.038N P =0.038N P=0.01 1N
9/49 (18%) 36.3% 7/22 (32%) P =0.022N P=0.022N P =0.005N
3/49 (6%) 12.0% 1/22 (5%) P =0.152N P=0.155N P =0.079N
Overall Rates (a) 1/50(2%) Adjusted Rates (b) 4.8% Terminal Rates (c) 1/21(5%) Life Table Testa (d) Incidental Tumor Tests (d) Cochran-Armitage Trend Test (d) Fisher Exact Test
4/49 (8%) 16.1% 2/22(9%)P =0.082N P =0.083N P=0.035N
221 Trichloroethylene, NTP TR 273

TABLE G3. ANALYSIS OF PRIMARY TUMORS IN MALE OSBORNE-MENDEL RATS IN THE TWO-YEAR GAVAGE STUDY OF TRICHLOROETHYLENE (Continued)
(a)Number oftumor-bearing animals/number of animals examined a t the site (b)Kaplan-Meier estimated tumor incidence a t the end of the study after adjusting for intercurrent mortality (c)Observed tumor incidence at terminal kill (d) Beneath the control incidence are the P values associated with the trend test. Beneath the dosed group incidence are the P values corresponding to pairwise comparisons between that dosed group and the vehicle controls. The life table analysis regards tumors in animals dying prior to terminal kill as being (directly or indirectly) the cause of death. The incidental tumor test regards these lesions as nonfatal. The Cochran-Armitage and Fisher exact tests compare directly the overall incidence rates. A negative trend or lower incidence in a dosed group is indicated by (N). (e)One instance of papillomatosis was also observed. (D One carcinoma, NOS,was also observed. (g) One malipiant pheochromocytoma was also observed. (h)One animal also had a malignant pheochromocytoma.
Trichloroethylene, NTP TR 273 222

TABLE 6 4 . SUMMARY OF THE INCIDENCE OF NONNEOPLASTIC LESIONS IN MALE OSBORNE- MENDEL RATS IN THE TWO-YEAR GAVAGE STUDY OF TRICHLOROETHYLENE
ANIMALS INITIALLY IN STUDY ANIMALS NECROPSIED ANIMALS EXAMINED
HISTOPATHOLOGICALLY
INTEGUMENTARY SYSTEM *Skin
Cyst, NOS *Subcutaneous tissue
HemorrhageInflammation, NOS Inflammation, acute Abscess, NOS Inflammation, granulomatous
~
RESPIRATORY SYSTEM *Tracheal lumen
Hemorrhage*Bronchial lumen
Hemorrhage *Larynx
Inflammation, acute necrotizing #Lung
Vegetable foreign body Emphysema, alveolar Atelectasis Congestion, NOS Edema, NOS HemorrhageInflammation, NOS Inflammation, focal Bronchopneumonia, acute Inflammation, acute Inflammation, acute necrotizing Inflammation, chronic Inflammation, chronic focal Inflammation, granulomatous Inflammation, granulomatous focal Foreign material, NOS Hyperplasia, epithelial
XLunglalveoliHemorrhage
HEMATOPOIETIC SYSTEM #Bone marrow
Hyperplasia, NOS #Spleen
HemorrhageHyperplasia, reticulum cell Hyperplasia, lymphoid Hematopoiesis
#Lymph node HemorrhageInflammation, NOS Inflammation, chronic Necrosis, focal Angiectasis
CONTROL (UNTR)
50 50
50
(50)
(50)
4 (8%) 2 (4%) 8 (16%)
1 (2%) 2 (4%)
(50)
(50) 2 (4%)
(50) 1 (2%J
4 (8%) (49)
CONTROL (VEH)
50 50
50
(50)
(50)
(50)
(50)
1 (2%) 1 (2%) 5 (10%) 1 (2%) 2 (4%) 1 (2%)
1 (2%)
(49)
(49)
1 (2%) 3 (6%)
(48)
1 (2%)
LOW DOSE
50 50
50
1 (2%) 3 (6%) 1 (2%) 6 (12%)
1 (2%) 1 (2%) 1 (2%) 1 (2%)
5 (10%) 1 (2%)
(50)
(50)
(50) 1 (2%)
4 (8%) (49)
3 (6%)
1 (2%) 1 (2%) 1 (2%)
HIGH DOSE
50 50
50
(50) 1 (2%)
(50)1 (2%)
(50)
(50)2 (4%) 1 (2%)
11 (22%) 3 (6%) 2 (4%)
2 (4%)
3 (6%)
1 (2%) 6 (12%) 2 (4%)
(50) 1 (2%)
(50)
(50)
1 (2%) 1 (2%) 4 (8%)
(44)
223 Trichloroethylene, NTP TR 273

TABLE G4. SUMMARY OF THE INCIDENCE OF NONNEOPLASTIC LESIONS IN MALE OSBORNE- MENDEL RATS IN THE TWO-YEAR GAVAGE STUDY OF TRICHLOROETHYLENE (Continued)
HEMATOPOIETIC SYSTEM (Continued) #Pancreatic lymph node
Edema, NOS Hemorrhage Inflammation,NOS Inflammation, chronic Hyperplasia, NOS Angiectasis Hyperplasia, lymphoid
#Mesenteric lymph node Hemorrhage
#Liver Hematopoiesis
#Colon Hyperplasia, lymphoid
#Thymus HemorrhageInflammation, chronic Hyperplasia, lymphoid
CIRCULATORY SYSTEM #Lung
Perivasculitis #Heart
Thrombo!ais,NOS Inflammation, focal Inflammation, interstitial Inflammation, active chronic Inflamma tion, chronic focal Fibrosis Fibrosis, focal Endocardiosis Calcification, focal
#Auricular appendage Thrombosis, NOS
#Endocardium Inflammation with fibrosis
*Coronary artery Calcification, NOS
*Pulmonary iirtery Calcification, focal
#Pancreas Periarteritis
*Esophageal lumen Thrombosis, NOS
#Testis Periarteriiis
DIGESTIVE SYSTEM #Salivary gland
Inflammation, chronic Inflammation, chronic focal Degeneration, NOS Metamorphosis, fatty Cytoplasmic vacuolization Atrophy, focal Atrophy, di.ffuse
CONTROL (UNTR)
(49) 1 (2%)
1 (2%)
(49) 1 (2%)
(50) 1 (2%)
(48) 2 (4%)
(3 ) 1 (33%)
(50)
(50)
1 (2%)
(50) 1 (2%)
47 ) 1 (2%) 1 (2%)
1 (2%)
1 (2%)
CONTROL (VEH)
(48)
1 (2%) 1 (2%)
1 (2%) 1 (2%)
(48) 2 (4%)
(50)
(47)
(3) 2 (67%)
(48)
1 (2%)
1 (2%) 1 (2%)
LOW DOSE
(49)
1 (2%)
(49)
(50)
(49)
(8) 2 (25%)
1 (2%)
149) 1 (2%) 1 (2%)
1 (2%)
HIGH DOSE
(44)
1 (2%)
(44) 2 (5%)
(49)
(48)
(13) 2 (15%) 1 (8%)I (8%)
(50)
(50)
1 (2%)
1 (2%)
(47) 1 (2%)
2 (4%)
Trichloroethylene, NTP TR 273 224

TABLE G4. SUMMARY OF THE INCIDENCE OF NONNEOPLASTIC LESIONS IN MALE OSBORNE- MENDEL RATS IN THE TWO-YEAR GAVAGE STUDY OF TRICHLOROETHYLENE (Continued)
DIGESTIVE SYSTEM (Continued) #Liver
Congestion, NOS He mor rhage Inflammation, focal Inflammation, chronic Fibrosis, multifocal Necrosis, focal Necrosis, central Metamorphosis, fatty LipoidosisCytoplasmic change, NOS Basophilic cyto change Focal cellular change Clear cell change Cytologic alteration, NOS Angiectasis
#Liver/centrilobular Necrosis, NOS Metamorphosis, fatty
#Bile duct Dilatation, NOS Inflammation, chronic Fibrosis, focal Hyperplasia, NOS Hyperplasia, cystic
#Pancreas Dilatatiodducts Inflammation, fibrinous Inflammation, chronic Inflammation, granulomatous
#Pancreatic acinus Atrophy, NOS Atrophy, focal
*Esophageal lumen Hemorrhage
#Stomach Mineralization Cyst,NOS Inflammation,NOS Inflammation, chronic Inflammation, chronic focal
#Gastric mucosa Inflammation, NOS Erosion Hyperkeratosis
#Forestomach Edema, NOS Ulcer, NOS Inflammation, chronic Hyperplasia, epithelial Hyperkeratosis
#Colon Parasitism
#Cecum Parasitism
+Rectum Parasitism
CONTROL (UNTR) CONTROL (VEH)
(50) 1 (2%) 1 (2%)
2 (4%)
1 (2%) 1 (2%)
13 (26%)
1 (2%)
1 (2%) (50)
1 (2%)
(50)
2 (4%)
6 (12%)
(49)
1 (2%) 1 (2%) 1 (2%)
(49)
6 (12%) (50)
(50)
1 (2%) (50)
(50) 1 (2%)
2 (4%) 1 (2%)
(47)11 (23%)
(47)
(50)
LOW DOSE
(50)
2 (4%) 1 (2%)
5 (10%)
1 (2%)
16 (32%) 1 (2%)
1 (2%) 1 (2%)
(50)
(50)2 (4%) 1 (2%) 1 (2%) 3 (6%) 1 (2%)
(50)
1 (2%)
(50) 1 (2%) 3 (6%)
(50) 1 (2%)
(50)1 (2%)
1 (2%)
1 (2%) (50)
1 (2%)
(50)
(49) 11 (22%)
(49)
(50)
HIGH DOSE
225 Trichloroethylene, NTP TR 273

TABLE G4. SUMMARY OF THE INCIDENCE OF NONNEOPLASTIC LESIONS IN MALE OSBORNE- MENDEL RATS IN THE TWO-YEAR GAVAGE STUDY OF TRICHLOROETHYLENE (Continued)
URINARY SYSTEM #Kidney
Mineralization Cast, NOS HydronephrosisCyst, NOS Congestlion, NOS Hemorrhage Inflammation, acute Nephropathy Nephropathy, toxic Calcification, focal CytomegalyHyperplasia, tubular cell Hyperplasia, cystic
# Kidneylmedulla Hyperplasia, epithelial
#Kidney/tuliule Dilatation, NOS
RKidneylpelvis Hemorrhage Hyperplasia, epithelial
#Urinary bladder Calculus, gross observation only Cast, NOS Hemorrhage Inflammation, NOS Inflammation, acutekhronic Hyperplasia, epithelial
ENDOCRINE SYSTEM #Pituitary
Cyst, NOS Abscess, NOS Hyperplasia, focal
#Adrenal Cyst, NOS Hemorrhage Inflammation, chronic focal Necrosis, NOS Necrosis, focal Metamorphosis, fatty LipoidosisCytop1asmi.c vacuolization Focal cellular change Hyperplasia, NOS Angiectasis
#Adrenal cortex Hemorrhage Metamorphosis, fatty Lipoidosis Focal cellular change Cytologic alteration, NOS Hyperplasia, NOS Hyperplasia, focal
#Adrenal medulla Hyperplasia, NOS Hyperplasia, focal
CONTROL (UNTR)
(50) 1 (2%) 2 (4%)
1 (2%) 1 (2%) 1 (2%)
50 (100%)
1 (2%)(50)
1 (2%)(50)
(50)
1 (2%) (50)
(46) 2 (4%) 1 (2%) 3 (7%)
(50) 2 (4%)
1 (2%) 6 (12%) 1 (2%)
1 (2%)(50)
1 (2%) 1 (2%) 1 (2%)
(50)2 (4%) 4 (8%)
CONTROL (VEH)
(50) 1 (2%)
1 (2%)
50 (100%)
(50) 2 (4%)
(50)
(50)
(46)
2 (4%)
1 (2%)
LOW DOSE
(45) 1 (2%)
1 (2%) (49)
1 (2%)
1 (2%)
8 (16%)
4 (8%) (49)
3 (6%)
1 (2%)
1 (2%) (49)
3 (6%)
HIGH DOSE
(50)
1 (2%)
1 (2%) 47 (94%) 35 (70%)
1 (2%) 49 (98%) 3 (6%)
(50)
(50)
(50)
(49) 1 (2%) 1 (2%)
1 (2%)
(38)
(50)
1 (2%)
5 (10%)
2 (4%) (50)
1 (2%)
1 (2%) 1 (2%)
(50) 1 (2%) 4 (8%)
Trichloroethylene, NTP TR 273 226

TABLE G4. SUMMARY OF THE INCIDENCE OF NONNEOPLASTIC LESIONS IN MALE OSBORNE- MENDEL RATS IN THE TWO-YEAR STUDY OF TRICHOLOETHYLENE (Continued)
ENDOCRINE SYSTEM (Continued) #Thyroid
Cyst, NOS Follicular cyst, NOS Hyperplasia, C-cell Hyperplasia, follicular cell
#Parathyroid Hyperplasia, NOS
#Pancreatic islets Hyperplasia, focal
*Preputial gland Abscess, NOS
#Prostate Cyst, NOS HemorrhageInflammation, focal Inflammation, acute Inflammation, acute focal Inflammation, acute suppurative Inflammation, acute necrotizing Inflammation, acute/chronic Inflammation, chronic Iflammation, chronic focal Inflammation, granulomatous Hyperplasia, NOS
"Seminal vesicle Inflammation, acute focal
*Coagulating gland Hyperplasia, focal
#Testis Atrophy, NOS Atrophy, focal Atrophy, diffuse Hyperplasia, interstitial cell
NERVOUS SYSTEM #Brain
Cyst, NOS Congestion, NOS Hemorrhage
*Spinal cord HemorrhageCalcification, focal
*Pineal body Degeneration, NOS
SPECIAL SENSE ORGANS "Eyeflacrimal gland
Inflammation, chronic Inflammation, chronic focal Atrophy, NOS
MUSCULOSKELETAL SYSTEM *Pharyngeal muscle
Inflammation, acute necrotizing
CONTROL (UNTR)
(48)
1 (2%) 2 (4%)
(33)
(50) 1 (2%)
(50) 1 (2%)
(49)
1 (2%)2 (4%)
1 (2%)
(50)
(50)
(50)1 (2%)
1 (2%)
(49)
1 (2%) (50)
(50)
(50)
CONTROL (VEH)
(49)
5 (10%)
(38) 1 (3%)
(49)
(50)
(49) 1 (2%)
1 (2%)
1 (2%) 1 (2%) 1 (2%) 1 (2%)1 (2%) 1 (2%)
(50)
(50)
(49)7 (14%)
1 (2%)
LOW DOSE
(48) 2 (4%)
5 (10%)
(30) 1 (3%)
(50)
(50)
(50)
1 (2%)
(50)
(50)
(50)1 (2%) 1 (2%)
HIGH DOSE ~
(48) 4 (8%)1 (2%)3 (6%)
(33)
(50)
(50)
(50)
2 (4%)1 (2%)
1 (2%)
1 (2%)
(50)1 (2%)
(50)1 (2%)
(50 )2 (4%)
227 Trichloroethylene, NTP TR 273

TABLE G4. SUMMARY OF THE INCIDENCE OF NONNEOPLASTIC LESIONS IN MALE OSBORNE- MENDEL RATS IN THE TWO-YEAR GAVAGE STUDY OF TRICHLOROETHYLENE (Continued)
CONTROL (UNTR) CONTROL (VEH) LOW DOSE HIGH DOSE
BODY CAVITIES *Thorax
*Mediastinum Abscess, chronic
(50)
~ ~
(50) (50)1 (2%)
HemorrhageAbscess, NOS Inflammation, active chronic
*Abdominal cavity Necrosis, fat
*EpicardiumInflammation, chronic
ALL OTHER S'YSTEMS *Multiple organs
Hemorrhage (50)
SPECIAL MORPHOLOGY SUMMARY None
* Number of animals receiving complete necropsy examination; all gross lesions including masses examined microscopically. # Number of animals examined microscopically at this site
Trichloroethylene, NTP TR 273 228

APPENDIX H
SUMMARY OF LESIONS IN FEMALE
OSBORNE-MENDEL RATS IN THE
TWO-YEAR GAVAGE STUDY OF TRICHLOROETHYLENE
PAGE
TABLE H1 SUMMARY OF THE INCIDENCE OF NEOPLASMS IN FEMALE OSBORNE-MENDEL RATS IN THE TWO-YEAR GAVAGE STUDY OF TRICHLOROETHYLENE 231
TABLE H2 INDIVIDUAL ANIMAL TUMOR PATHOLOGY OF FEMALE OSBORNE-MENDEL RATS IN THE TWO-YEAR GAVAGE STUDY OF TRICHLOROETHYLENE 234
TABLE H3 ANALYSIS OF PRIMARY TUMORS IN FEMALE OSBORNE-MENDEL RATS IN THE TWO-YEAR GAVAGE STUDY OF TRICHLOROETHYLENE 242
TABLE H4 SUMMARY OF THE INCIDENCE OF NONNEOPLASTIC LESIONS IN FEMALE OSBORNE-MENDEL RATS IN THE TWO-YEAR GAVAGE STUDY OF TRICHLOROETHYLENE 245
229 Trichloroethylene,NTP TR 273

230Trichloroethylene, NTPTR 273

TABLE H1. SUMMARY OF THE INCIDENCE OF NEOPLASMS IN FEMALE OSBORNE-MENDEL RATS IN THE TWO-YEAR GAVAGE STUDY OF TRICHLOROETHYLENE
CONTROL (UNTR) CONTROL (VEH) LOW DOSE HIGH DOSE
ANIMALS INITIALLY IN STUDY ANIMALS NECROPSIED ANIMALS EXAMINED
HISTOPATHOLOGICALLY
INTEGUMENTARY SYSTEM *Subcutaneous tissue
Fibroma
RESPIRATORY SYSTEM #Lung
Carcinoma, NOS, metastatic Squamous cell carcinoma, metastatic Alveolar/bronchiolar adenoma Alveolar/bronchiolar carcinoma Osteosarcoma, metastatic
HEMATOPOIETIC SYSTEM *Multiple organs
Malignant lymphoma, NOS Malignant lymphoma, lymphocytic type Monocytic leukemia
*Mediastinum Malignant lymphoma, undiffer type
#Liver Leukemia, NOS
CIRCULATORY SYSTEM #Liver
Angioma
DIGESTIVE SYSTEM #Liver
Carcinoma, NOS, metastatic Bile duct carcinoma Neoplastic nodule
#Pancreas Squamous cell carcinoma, metastatic Adenocarcinoma, NOS, metastatic
#Stomach Squamous cell carcinoma
#Forestomach Papillomatosis
#Duodenum Adenocarcinoma,NOS
URINARY SYSTEM #Kidney
Tubular cell adenoma Nephroblastoma
#Urinary bladder Adenocarcinoma, NOS, metastatic
50 50 50 50 50 50 50 50
50 50 50 50
(50) (50) (50) 2 (4%)
(50) 1 (2%)
(50) (50) (50) 1 (2%) 1 (2%)
(50)
1 (2%) 1 (2%)
1 (2%)
(50) 1 (2%)
2 (4%) (50)
(50)
(50) (50) (50)1 (2%)
(49)
(50) (50) (50) 1 (2%)1 (2%)
(49)
1 (2%)
1 (2%)
(50)
(50)
(50)
(50) 1 (2%)
(50)
(48)
(48)
(48)
1 (2%) 1 (2%)
(48)
(50)
(50)
(49)
2 (4%)
1 (2%)
(49)
(49)
(49)
(49)
(50)1 (2%)
(48)
(50)
(48)
(50)
1 (2%) (49)
(49) 1 (2%)
1 (2%)(50)
231 Trichloroethylene, NTP TR 273

TABLE H1. SUMMARY OF THE INCIDENCE O F NEOPLASMS IN FEMALE OSBORNE-MENDEL RATS IN THE TWO-YEAR GAVAGE STUDY OF TRICHLOROETHYLENE (Continued)
ENDOCRINE SYSTEM #Pituitary
Carcinoma, NOS Adenoma, NOS Papillary adenoma Chromophobe adenoma
#Adrenal Cortical adenoma Pheochromocytoma Pheochromocytoma, malignant
#Adrenal medulla Pheochromocytoma Pheochromocytoma, malignant
#Thyroid Follicular cell adenoma C-cell adenoma
#Parathyroid Adenoma, NOS
#Pancreatic ,slets Islet cell adenoma
REPRODUCTIVE SYSTEM 'Mammary gland
Adenoma, NOS Adenocarcinoma, NOS Fibroma Mixed tumor, benign Fibroadenoma
+Vagina Squamous cell carcinoma
#Uterus Carcinoma, NOS Carcinoma, NOS, metastatic Papillomatosis Squamous cell papilloma Squamous cell carcinoma Adenoma, .NOS Adenocarcinoma, NOS Multiple polyposis Sarcoma, NOS Endometrial stromal polyp Carcinosarcoma
XUteruslendometrium Carcinoma, NOS Adenocarcinoma, NOS
#OvaryCarcinoma, NOS Papillary adenoma Granulosa cell tumor Granulosa cell carcinoma
NERVOUS SYSTEM +Nerve tract
Neurilemoma
SPECIAL SENSE ORGANS None
CONTROL (UNTR)
(47)
13 (28%)
1 (2%) (49)
13 (27%) 3 (6%)
(49) 1 (2%)
(49) 1 (2%) 5 (10%)
(37)
(50)
(50)
17 (34%) (50)
(50) 1 (2%)
1 (2%)
1 (2%) 4 (8%)
(50)
(49)
CONTROL (VEH)
(46) 1 (2%)
13 (28%) 1 (2%)
(50)16 (32%) 8 (16%) 1 (2%)
(50)
(49) 1 (2%)
15 (31%) (32)
(50)3 (6%)
(50) 1 (2%) 1 (2%) 1 (2%)
14 (28%) (50)
(49) 1 (2%)
1 (2%)
1 (2%)
6 (12%)
(49)
1 (2%) (48)
LOW DOSE
(47)
9 (19%)
(50)13 (26%) 4 (8%) 1 (2%)
(50)
1 (2%) (49)
5 (10%) (32)
(48) 1 (2%)
(50) 1 (2%) 1 (2%) 1 (2%) 1 (2%) 7 (14%)
(50)
(49)2 (4%) 1 (2%) 1 (2%)
1 (2%)
5 (10%) 1 (2%)
1 (2%)
(49)
(49) 1 (2%)1 (2%) 1 (2%)
HIGH DOSE
(46)
8 (17%)
(49)19 (39%)
1 (2%)
(49)
(49)
1 (2%) (32)
1 (3%)(49)
(50) 1 (2%) 1 (2%) 1 (2%)
11 (22%) (50)
1 (2%) (50)
1 (2%)
2 (4%)
6 (12%) 1 (2%)
(50) 1 (2%)
(49)
1 (2%)
Trichloroethylene, NTP TR 273 232

TABLE H1. SUMMARY OF THE INCIDENCE OF NEOPLASMS IN FEMALE OSBORNE-MENDEL RATS IN THE TWO-YEAR GAVAGE STUDY OF TRICHLOROETHYLENE (Continued)
CONTROL (UNTR) CONTROL (VEH) LOW DOSE HIGH DOSE
MUSCULOSKELETAL SYSTEM *Maxilla
Osteosarcoma (50) (50) (50) (50)
1 (2%) *Skeletal muscle
Rhabdomyosarcoma (50) (50) (50) (50)
1 (2%)
BODY CAVITIES *Abdominal cavity (50)
Bile duct carcinoma, metastatic
ALL OTHER SYSTEMS *Multiple organs (50) (50) (50) (50)
Carcinoma, NOS 2 (4%) Undifferentiated carcinoma 1 (2%) Carcinosarcoma, metastatic 1 (2%) Mesothelioma, malignant 1 (2%)
Lower leg Sarcoma, NOS 1
Site unknown Carcinoma, NOS 1
ANIMAL DISPOSITION SUMMARY Animals initially in study 50 50 50 50
Natural death 14 7 16 16 Moribund sacrifice 17 17 18 21 Terminal sacrifice 19 18 10 7 Dosing accident 6 4 5 Accidentally killed, NOS 2 2 1
TUMOR SUMMARY Total animals with primary tumors** 44 40 36 37
Total primary tumors 69 90 72 68 Total animals with benign tumors 40 39 29 32
Total benign tumors 62 80 49 52 Total animals with malignant tumors 6 8 19 12
Total malignant tumors 6 10 22 14 Total animals with secondary tumors## 5 3
Total secondary tumors 7 3 Total animals with tumors uncertain--
benign or malignant 1 1 2 Total uncertain tumors 1 1 2
* Number of animals receiving complete necropsy examination; all gross lesions including masses examined microscopically. ** Primary tumors: all tumors except secondary tumors # Number of animals examined microscopically a t this site # # Secondary tumors: metastatic tumors or tumors invasive into an adjacent organ
233 Trichloroethylene, NTP TR 273

TABLE H% INDIVIDUAL AMMAL TUMOR PATBOLOGY OF FEMALE OSBORNE-MENDEL RATS IN THE TWO-YEAR GAVAGE STUDY OF TRICHLOROETHYLENE: UNTREATED CONTROL -
2 2 2 2 2 2 2 2 2 2 2 2 2 2 2 2 2 2 2 2 2 2 2 2 2 o o o i i 2 2 2 3 3 3 4 4 4 5 5 e e 6 ~ ~ 7 7 a a 1 4 7 ~ 9 2 4 a 7 a 9 0 2 4 7 a o i 2 7 s ~ a i 2
WEEKSON 1 0 1 0 1 0 1 1 1 0 0 1 0 1 1 0 0 1 1 0 0 1 1 0 0 STUDY o ~ o ~ o 9 o o o ~ 9 o 7 o o 9 a o o 3 7 o o a 7
5 5 5 , 2 1 3 5 5 5 8 2 5 8 0 0 7 2 5 5 5 1 5 5 3 9
Lun and bronchi + t + + + + + t + + + + + + + + + + + + t + + t t T r a x e a . . . . . . . . . . . . . . . . . . . . . . . . .
HEMATO-Bone mama + + t t + t + t + + + + + + t + + + + + + + + + + Spleen . . . . . . . . . . . . . . . . . . . . . . . . . L mphnodes t + + - + + + + + + t t + + + + + + + - + + + + + Txymus - - _ + - - - - - - - - - - - - - - - + A - - - -
Heart . . . . . . . . . . . . . . . . . . . . . . . . . -Salivary gland . . . . . . . . . . . . . . . . . . . . . . . . . Liver . . . . . . . . . . . . . . . . . . . . . . . . .
Neoplastic nodule Bile duct . . . . . . . . . . . . . . . . . . . . . . . . . Gallbladder & common bile duct N N N N N N N N N N N N N N N N N N N N N N N N N P a n c reas . . . . . . . . . . . . . . . . . . . . . . . . . - . . . . . . . . . . . . . . . . . . . . . . . . . !t%gU8 . . . . . . . . . . . . . . . . . . . . . . . . .
Pa illomatosis sma% intestine + + + + t + + + t + + + + + + + + + + + + + + t + Large intastins t + + t + + + + + + + + + + + + + + t + t + + + +
Kidney + + + + + + + + + + t t + + t + t + + + + + + + + Tubular cell adenoma X
Urinary bladder . . . . . . . . . . . . . . . . . . . . . . . . .
Pituitary + + + - + t + t + + + + + + + + + + + + + + + t + Adenoma, NOS x x X x x XChromophobe adenoma
Adrenal . . . . . . . . . . . . . . . . . . . . . . . . . Cortical adenoma x x x x X XPheochromocytoma X
Thymid + + + + + + + + + + + + + + + t t t + + + t + + + Follicular cell adenomii C-cell a&noma X X X
Parathymid . . . . . . . . . . . . . . . . . . . . . . . . .
Mammary gland + + + + t t + + + + N + t + + t + t + + N + + t + Fibroadenoma x x x x x X X
Uterua + + + + + + + + t + + t + + + + + t + + + t + + + Carcinoma. NOS Adenoma. NOS Sarcoma NOS Endommirial stromal polyp X
Ovary t + + + + t + + + t + + + + + + + + + + + t + + +
7 . . . . . . . . . . . . . . . . . . . . . . . . .
Nerve tract Neurilemoma X
Multiple omns NOS N N N N N N N N N N N N N N N N N N N N N N N N NMesothelioma,' malignant Malignant lymphoma, NOS MonocyticIedernia X
+ : b u s examined microscopically . No tissue information submitted -. Raquimd tissur not examined mworopically C: Necropsy. no histology due to protocol XI Tumor incidence A AutolysisN: Necropsy. no aut )lysis. no micmacopic examination M: Animal missingS Animal misaexed B. No necropsy performed
Trichloroethylene, NTP TR 273 234

TABLE HZ. INDIVIDUAL ANIMAL TUMOR PATHOLOGY OF FEMALE OSBORNE-MENDEL RATS:
NUMBER
Lun and bronchi Tr&a
Bone marrow SpleenL mphnodes T%ymus
Heart
UNTREATED CONTROL (Continued) 2 2 3 3 3 3 3 3 3 3 3 3 3 3 3 3 3 3 3 3 3 3 3 3 3 8 9 0 1 1 1 1 1 2 2 3 3 3 4 5 5 5 5 5 6 7 7 8 8 8 5 1 0 0 2 4 5 7 3 4 1 5 7 8 0 3 6 8 9 0 4 6 5 7 8
0 0 1 1 1 0 0 0 1 1 0 0 0 1 1 1 0 0 0 0 0 1 0 1 0 7 9 0 0 0 7 7 9 0 0 7 6 7 0 0 0 8 9 4 9 5 0 6 0 6 9 7 5 5 5 6 5 1 5 5 8 2 0 3 5 5 5 2 8 0 4 5 5 5 0
. . . . . . . . . . . . . . . . . . . . . . . . . 50 . . . . . . . . . . . . . . . . . . . . . . . . . 49
. . . . . . . . . . . . . . . . . . . . . . . . . 50 . . . . . . . . . . . . . . . . . . . . . . . . . 49 . . . . . . . . . . . . . . . . . . . . . . . . . 47- - - - - - - - - - - - - - - - - - - - + - - - - 3
. . . . . . . . . . . . . . . . . . . . . . . . . 50
p-Salivary gland Liver
Neoplastic nodule Bile duct Gallbladder & commonbile duct Pancraaa
Small intestine Large intestine
KidneyTubular cell adenoma
Urinary bladder
PituitaryAdenoma, N09 Chmmophob. adenoma
Adrenal Cortical adenoma Pheochromocytoma
T h F i E l a r cell denoma C.cell adenoma
Parathyroid
Mammary #land Fibroadenoma
U t e m Carcinoma NOS Adrnoma, kOS Sarcoma NOS Endomeha1 stromal polyp
ovary
Brain
ALL OTImR-mmm Nerve tract
Neurilemoma Multiplr orga6. NOS
Marothrlioma malignantMalignant lymphoma. NOS Monocytic leukemm
*Animals necropsied
. . . . . . . . . . . . . . . . . . . . . . . . . 46 . . . . . . . . . . . . . . . . . . . . . . . . . 50 X 1 . . . . . . . . . . . . . . . . . . . . . . . . . 50
+ N N N N N N N N N N N N N N N N N N N N N N N N *50 . . . . . . . . . . . . . . . . . . . . . . . . . 50 . . . . . . . . . . . . . . . . . . . . . . . . . 50 . . . . . . . . . . . . . . . . . . . . . . . . . 50
X 1 . . . . . . . . . . . . . . . . . . . . . . . . . 50 . . . . . . . . . . . . . . . . . . . . . . . . . 50
. . . . . . . . . . . . . . . . . . . . . . . . . 50 1 . . . . . . . . . . . . . . . . . . . . . . . . . 48
. . . . . . . . . . . . . . . . . . . . . . . . . 47 X x x x x x x 13
X 1 . . . . . . . . . . . . . . . . . . . . . . . . . 49 x x X x x x x 13
X X X 4 . . . . . . . . . . . . . . . . . . . . . . . . . 49
h 1 X X 5+ - + - + + - + + + + + - + + + + + - - - - + + - 37
~~~~~ ~~
+ + + + + + + + + + + + + + + N + + N + + + + + + *50 x x x x x x x x x X 17 . . . . . . . . . . . . . . . . . . . . . . . . . 50
X 1 X 1
X 1 x x X 4 . . . . . . . . . . . . . . . . . . . . . . . . . 49
. . . . . . . . . . . . . . . . . . . . . . . . . 50
1 N N N N N N N N N N N N N N N N N N N N N N N N N '50
X 1 X 1
X 2
235 Trichloroethylene, NTP TR 273

TABLE H2. INDIVIDUAL ANIMAL TUMOR PATHOLOGY OF FEMALE OSBORNE-MENDEL RATS IN THE TWO-YEARGAVAGE STUDY OF TRICHLOROETHYLENE: VEHICLE CONTROL
WEEKS ON STUDY
Lun and bronchi Tracyea
HEMATORXFTRTYSTEM Bone marrow SpleenL mphnodes d y m u s
Heart
-7 Salivary gland Liver Bile duct Gallbladder b common bile duct Pancreas
:;::2rSmall intestine
Adenocarcinoma, NOS Large intestine -KidneyUnnary bladder
-7 Pituitary
Carcinoma, NOS Adenoma. NOS Papillary adenoma
Adrenal Cortical adenoma PheochromocytomaPheochromocytoma, nalignant
ThyroidFollicular cell adenoma C-cell adenoma
ParathyroidPancreatic islets
Islet cell adenoma
Mammary gland Adenoma NOS Adenocarfinoma. NOS Fibroma Fibroadenoma
Uterus Carnnoma. NOS
uamous cell papillona 3enocamnoma. NOS;Endometnal stromal polyp
Ovar)i -Brain
BODYCAVITIES Mediastinum
Malignant lymphoma, undiffemntieted type
Multiple organs, NOS Malignant lymphoma. NOS
S ~ t eunknown Carcinoma, NOS
2 2 2 2 2 2 2 2 2 2 2 2 2 2 2 2 2 2 2 2 2 2 3 3 3 o o i i 2 3 3 4 4 4 5 5 5 6 7 a a a 9 9 g g o i i 3 9 0 8 1 0 5 3 6 7 1 2 5 9 0 6 7 9 0 2 3 6 1 1 3
D 0 1 0 l 0 1 1 1 0 1 0 0 0 0 1 0 1 1 0 1 0 1 1 7 9 0 9 0 3 0 0 0 8 0 6 6 9 4 0 9 0 0 7 0 4 7 0 0 4 6 5 9 5 3 5 5 5 3 5 8 2 5 0 5 6 5 5 4 1 6 3 5 5
. . . . . . . . . . . . . . . . . . . . . . . . . . . . . . . . . . . . . . . . . . . . . . . . . .
. . . . . . . . . . . . . . . . . . . . . . . . . . . . . . . . . . . . . . . . . . . . . . . . . .
. . . . . . . . . . . . . . . . . . . . . . . . . - - - - - + - - - - - - - + t - - - - - - - - - -
. . . . . . . . . . . . . . . . . . . . . . . . .
. . . . . . . . . . . . . . . . . . . . . . . . .
. . . . . . . . . . . . . . . . . . . . . . . . . . . . . . . . . . . . . . . . . . . . . . . . . . N N N N N N N N N N N N N N N N N N N N N N N N N . . . . . . . . . . . . . . . . . . . . . . . . . . . . . . . . . . . . . . . . . . . . . . . . . . . . . . . . . . . . . . . . . . . . . . . . . . . . . . . . . . . . . . . . . . . . . . . . . . . .
X . . . . . . . . . . . . . . . . . . . . . . . . .
. . . . . . . . . . . . . . . . . . . . . . . . .
. . . . . . . . . . . . . . . . . . . . . . . . .
. . . . . . . . . . . . . . . . . . . . . . . . . A x x x x x X x x
X . . . . . . . . . . . . . . . . . . . . . . . . . X x x x x x x x x X
X X XY
. . . . . . . . . . . . . . . . . . . . . . . . . X
x x x x x x X x x X- + + + + - + - - + + + - - + + + + - + + + - - + . . . . . . . . . . . . . . . . . . . . . . . . . X X
t + + + + + + + + N + + + + N + + + + + + N + + +
X
x x x x x X . . . . . . . . . . . . . . . . . . . . . . . . .
X X X
t + + + + + + + + + + + - + + + t + + + + + t + +
. . . . . . . . . . . . . . . . . . . . . . . . .
q N N N N N N N N N N N N N N N N N N N N N N N N
i N N N N N N N N N N N N N N N N N N N N N N N N X
X
Trichloroethylene, NTP TR 273 236

TABLE H2. INDIVIDUAL ANIMAL TUMOR PATHOLOGY OF FEMALE OSBORNE-MENDEL RATS:
ANIMAL NUMBER
WEEKSON STUDY
Lun and bronchi TracTea
Heart
Salivary gland Liver Bile duct Gallbladder & common bile duct Pancreas
EZ2fl"" Small intestine
Adenocarnnoma, NOS Large intestine
KidneyUnnery bladder
PituitaryCarcinoma, NOS Adenoma, NOS Papillary adenoma
Adrenal Cortical adenoma Ptaochromocfloma Pheochromocytoma. malignant
ThyroidFollicular cell adenoma C-cell adenoma
Parathy mid Pancreatic islets
Islet cell adenoma
Mammary gland Adenoma, NOS Adenocarcinoma. NOS Fibroma Fibroadenoma
Uterus Camnoma, NOS S uamous cell papilloma A%enocarnnoma NOS Endometnal strdmal polyp
Ovary
VEHICLE CONTROL (Continued)
. . . . . . . . . . . . . . . . . . . . . . . . . . . . . . . . . . . . . . . . . . . . . . . . . .
. . . . . . . . . . . . . . . . . . . . . . . . . . . . . . . . . . . . . . . . . . . . . . . . . .
. . . . . . . . . . . . . . . . . . . . . . . . . - _ _ _ - - _ _ - - - - - -+ - - - - - - - - - -
. . . . . . . . . . . . . . . . . . . . . . . . .
. . . . . . . . . . . . . . . . . . . . . . . . .
. . . . . . . . . . . . . . . . . . . . . . . . .
. . . . . . . . . . . . . . . . . . . . . . . . . N N N N N N N N N N N N N N N N N N N N N N N N N . . . . . . . . . . . . . . . . . . . . . . . . .+ + + + + + + + + + + + + + - + + + + + + + + + + . . . . . . . . . . . . . . . . . . . . . . . . . + - + + + + + + + + + + + + + + + + + + + + + + + . . . . . . . . . . . . . . . . . . . . . . . . .
. . . . . . . . . . . . . . . . . . . . . . . . .
. . . . . . . . . . . . . . . . . . . . . . . . .
+ + + - + + + + + + + + + + - - + + + + + I + + +
X X X X X
. . . . . . . . . . . . . . . . . . . . . . . . . x x X X x x
X X X x x . . . . . . . . . . . . . . . . . . . . . . . . . X X x x x + - + - + + + + - + + + + + - - - + - - + - + + + . . . . . . . . . . . . . . . . . . . . . . . . .
X
+ N + + + + + + + + N + + + + + + + + + + + N + + X
X x x x x x x X X . . . . . . . . . . . . . . . . . . . . . . . . .
X X
X X x x X
. . . . . . . . . . . . . . . . . . . . . . . . .
7-Mediastinum N N N N N N N N N N N N N N N N N N N N N N N N N
Malignant lymphoma, undiffer type X
N N N N N N N N N N N N N N N N N N N N N N N N N
*Animals necropsied
roTAL:'ISSUES 'UMORS
50 50
50 49 40
4
49
50 50 50 '50 50 48 46 48
1 48
50 48
46 1 13 1 50 16 8 1
49 1 15 32 50
3
' 50 1 1 1 14 49 1 1 2 6
4a
50
' 50 1
'50 1
1
237 Trichloroethylene, NTP TR 273

TABLE H2. INDIVIDUAL ANIMAL TUMOR PATHOLOGY OF FEMALE OSBORNE-MENDEL RATS IN THE TWO-YEAR GAVAGE STUDY OF TRICHLOROETHYLENE: LOW DOSE
WEEKS ON S'I'UDY
Subcutaneous tissue Fibroma
-rsTEM Lunps and bmnchi
Carcinoma NOS metastatic p m o u s bell ca'rcinoma, metastatic
veolarhronchiolar camnoma Trachea
v-Bone marrow SpleenL mphnodes Ttymus
-rsTEM Heart
V% Salivary gland Liver
Carnnoma NOS metastatic Bile duct cdrcinomi Anpoma Laukemia. NOS
Bile duct Gallbladder & common bile duct Pancreas
uamous cell carcinoma. metastatic 3enocarcinoma, NOS, metastatic
%2r Small intestine Large inustine -Kidney
NephroblastomaUnnary bladder
PltuitsryAdenoma, NOS
Adrenal Cortical adenoma PheochromocytomaPheochromocytoma, malignant
Th mid d ; d l adenoma
ParathyroidPancreatic islets
Islet cell adenoma
Mammary gland Adenoma, NOS Adenocamnoma. NOS Fibroma Mixed tumor benipFibroadenom).
Uterus Carcinoma NOS Camnoma' NOS, metastatic r m a i o s i s
uamous cell c a m n m a enocamnoma, NC6
Multiple pol posisEndometnarstmmal polyp
OvaryCarnnoma, NOS Papillary adenoma Granulosa cell tumor -
Brain
BODYCAVITIES Pentoneum
Bile duct carcinoma. rietastatic
Multiple organs NOS Camnoma, NOS Undifferentiated carcinoma Malignant lymphoma, lymphocytic type Monocytic leukemia
2 2 2 2 2 2 2 2 2 2 2 2 2 2 2 2 2 2 2 2 2 2 2 2 2 1 1 1 1 2 3 3 3 3 4 4 5 5 6 6 6 7 7 7 8 8 9 9 9 9 1 2 3 7 9 2 3 4 8 1 6 0 9 5 6 8 3 6 9 3 8 4 7 8 9
~ 0 1 1 1 0 1 0 1 0 1 0 0 0 0 0 0 0 0 0 0 0 l 0 0 7 9 0 0 0 9 0 1 0 8 0 4 3 8 9 7 7 8 8 6 8 0 0 4 6 0 3 4 4 3 6 0 0 4 1 4 1 5 9 3 5 3 0 7 0 7 9 4 2 0
. . . . . . . . . . . . . . . . . . . . . . . . . X
. . . . . . . . . . . . . . . . . . . . . . . . . X
X . . . . . . . . . . . . . . . . . . . . . . . . .
. . . . . . . . . . . . . . . . . . . . . . . . . . . . . . . . . . . . . . . . . . . . . . . . . . + - + + + + + + + + + - - + + + + + + + + + + + + - - - - - - - + - - - + + - - - - - - + - + - + -
. . . . . . . . . . . . . . . . . . . . . . . . .
. . . . . . . . . . . . . . . . . . . . . . . . .
. . . . . . . . . . . . . . . . . . . . . . . . . x
X . . . . . . . . . . . . . . . . . . . . . . . . . N N N N N N N N N N N N N N N N N N N N N N N N N . . . . . . . . . . . . . . . . . . . . . . . . .
. . . . . . . . . . . . . . . . . . . . . . . . .
. . . . . . . . . . . . . . . . . . . . . . . . . . . . . . . . . . . . . . . . . . . . . . . . . . . . . . . . . . . . . . . . . . . . . . . . . . .
. . . . . . . . . . . . . . . . . . . . . . . . . X . . . . . . . . . . . . . . . . . . . . . . . . .
. . . . . . . . . . . . . . . . . . . . . . . . . x x X X . . . . . . . . . . . . . . . . . . . . . . . . .
Y X X X
X . . . . . . . . . . . . . . . . . . . . . . . . .
X X+ - - + + - - + + + - + - - + - - + + + + + + - + . . . . . . . . . . . . . . . . . . . . . . . . .
. . . . . . . . . . . . . . . . . . . . . . . . . X
XX
X X . . . . . . . . . . . . . . . . . . . . . . . . . X
X X
X
. . . . . . . . . . . . . . . . . . . . . . . . . X
X
. . . . . . . . . . . . . . . . . . . . . . . . .
Y N N N N N N N N N N N N N N N N N N N N N N N N X
~ ~ ~~~~~ ~~~
V N N N N N N N N N N N N N N N N N N N N N N N N
X X
X
Trichloroethylene, NTP TR 273 238

TABLE H2. INDIVIDUAL ANIMAL TUMOR PATHOLOGY OF FEMALE OSBORNE-MENDEL RATS: LOW
ANIMAL NUMBER
WEEKS ON STUDY
Subcutaneoustissue Fibroma
m P I R A T O R Y SYSTEM Lunps and bronchi
Carcinoma,NOS,metastatic uamous cell carcinoma, metastatic 2veolarhmnchiolar carcinoma
Trachea
Bone marrow SpleenL mphncdesTgymus
Heart
Salivary gland Liver
Carcinoma, NOS.metastatic Bile duct carcinoma AngtomaLeukemia, NOS
Bile duct Gallbladder (h common bile duct Pancreas
uamous cell carcinoma metastatic 3enocarnnoma. NOS, ;etastatic
:;l%rSmall intestine Large intestine
KidneyNephroblastoma
Unnary bladder
PltUltaryAdenoma, NOS
Adrenal Cortical adenoma PheochromocytomaPheochromocytoma, malignant
ThyroidC-cell adenoma
ParathyroidPancreatic islets
Islet cell adenoma
DOSE (Continued)
TOTAL:TISSUES TUMOR!
. . . . . . . . . . . . . . . . . . . . . . . . . *50 X 2
. . . . . . . . . . . . . . . . . . . . . . . . . 50 1
X 1 1 . . . . . . . . . . . . . . . . . . . . . . . . . 47
. . . . . . . . . . . . . . . . . . . . . . . . . 50 . . . . . . . . . . . . . . . . . . . . . . . . . 48 . . . . . . . . . . . . . . . . . . . . . . . . . 45- - - - - - - - + - - - - + - - - - - - - - - - - 8
. . . . . . . . . . . . . . . . . . . . . . . . . 50
. . . . . . . . . . . . . . . . . . . . . . . . . 50 . . . . . . . . . . . . . . . . . . . . . . . . . 50 X 1
1 X 1
1 . . . . . . . . . . . . . . . . . . . . . . . . . 50 N N N N N N N N N N N N N N N N N N N N N N N N N *50 . . . . . . . . . . . . . . . . . . . . . . . . . 48
X 1 X 1 . . . . . . . . . . . . . . . . . . . . . . . . . 50 . . . . . . . . . . . . . . . . . . . . . . . . . 50 . . . . . . . . . . . . . . . . . . . . . . . . . 49 . . . . . . . . . . . . . . . . . . . . . . . . . 41
. . . . . . . . . . . . . . . . . . . . . . . . . 50 1 . . . . . . . . . . . . . . . . . . . . . . . . . 49
. . . . . . . . . . . . . . . . . . . . . . . . . 41 X X X X X 9 . . . . . . . . . . . . . . . . . . . . . . . . . 50x x x x x x x x x x X 13
x x 4 X 2
+ + + + + + + + + + + + + + + + + + + + + A A - + 49 5 32 40
1
Mammary gland Adenoma, NOS Menocamnoma, NOS Fibroma Mued tumor, benign Fibroadenoma
Uterus Carnnoma. NOS Carnnoma. NOS,metastatic
enocarnnoma. NOS Multiple pol ponsEndometnarstromal polyp
%Zinoma, NOS Papillary adenoma Granulosa cell tumor
p- *+ + + N N + + + + + + + + + + + + + + + + + + + + 50 1 1 1
X 1X X X x x I . . . . . . . . . . . . . . . . . . . . . . . . . 49
X 2 1 1
X 1 x x X X 5 X 1
X 1 . . . . . . . . . . . . . . . . . . . . . . . . . 49 1 1
X 1 ~~~7-+ + + + + + + + + + + + + + + + + + + + + + + + +
BODYCAVITIES-Pentoneum
Bile duct carcinoma, metastatic
Multiple organs, NOS Camnoma, NOS Undflerentiated carcinoma Malignant lymphoma, lymphocytic type Monocytic leukemia
* Animals necropsied
N N N N N N N N N N N N N N N N N N N N N N N N N ' 50 1
N N N N N N N N N N N N N N N N N N N N N N N N N X X
X
'50 2 1 1 2
239 Trichloroethylene, NTP TR 273
50

- i
TABLE H2. INDIVIDUAL ANIMAL TUMOR PATHOLOGY OF FEMALE OSBORNE-MENDEL RATS IN THE TWO-YEAR GAVAGE STUDY OF TRICHLOROETHYLENE: HIGH DOSE
2 2 2 2 2 2 2 2 2 2 2 2 2 2 2 2 2 2 2 2 2 2 2 2 2 0 0 0 0 1 1 2 2 2 2 2 3 4 4 5 5 5 6 6 7 7 7 8 8 9 2 5 6 8 4 5 0 3 5 6 7 1 5 9 3 4 6 3 4 1 2 4 0 4 5
WElEKS ON 0 0 1 0 0 1 0 1 0 0 1 0 0 0 0 1 1 1 0 1 0 0 0 0 0 STUDY 8 7 0 1 1 0 1 0 2 6 0 7 9 6 7 0 0 0 7 0 8 8 8 8 9
9 8 3 9 7 1 8 4 7 0 3 9 8 9 4 4 4 4 1 1 9 0 9 5 7
-sPsTEM subcutanwustissue . . . . . . . . . . . . . . . . . . . . . . . . . .
Fibroma
FP ~
Lungs and bronchi Alvrokrlbronchiolai~ adenoma Osteorareoma, metaitatic
Trachea
-PsTEn Bone rmrmw SpleenL mphnodesTKymus
Heart -Salivary gland Liver
Neoplastic nodule Bile d u d Qallbladder b commor bile duct Pancreas
%2r Squamous cell carcinoma
Small intestine Larm inbetine -Kidney
Tubularcell adenoma Unnary bladder
Menocamnoma. N03.metastatic
. . . . . . . . . . . . . . . . . . . . . . . . . X . . . . . . . . . . . . . . . . . . . . . . . . .
. . . . . . . . . . . . . . . . . . . . . . . . . . . . . . . . . . . . . . . . . . . . . . . . . . . . . . . . . . . . . . . . . . . . . . . . . . . - - - + + - - - - - - - - - - - - - - - - - - - -
. . . . . . . . . . . . . . . . . . . . . . . . .
. . . . . . . . . . . . . . . . . . . . . . . . . X . . . . . . . . . . . . . . . . . . . . . . . . .
N N N N N N N N N N N N N N N + N N N N N N N N N . . . . . . . . . . . . . . . . . . . . . . . . . . . . . . . . . . . . . . . . . . . . . . . . . . . . . . . . . . . . . . . . . . . . . . . . . . .
X . . . . . . . . . . . . . . . . . . . . . . . . . . . . . . . . . . . . . . . . . . . . . . . . . .
. . . . . . . . . . . . . . . . . . . . . . . . .
. . . . . . . . . . . . . . . . . . . . . . . . . X
-I Pituitary
Adenoma, NOS Adrenal
Cortical adenoma Pheochromocytoma
Th mid d l n ~ adenoma Parathyroid
Menoma. NOS
K E P K U F D C m P F S Y S T E M Mammarq gland
Adenoma NOS Adenourknoma,NOS Fibroma Fibroadenoma
VagmaSquamouscell carcinaina
Uterus Camnoma NOS AdenocamLoma NOS Endotuetnal stm'mal polypCamnosarcoma
OvaryGranulosacell carcinoma -
Brain
-sYsTEM Bone
Osteosareoma Muscle
Rhabdomyosarcoma
Multiple organs,NOS Carcinosareoma metastatic Mal' ant I mphoma, NOS
Lowexg,N& Sarmma. NOS
. . . . . . . . . . . . . . . . . . . . . . . . . X x x X X . . . . . . . . . . . . . . . . . . . . . . . . . x x x x x x x x . . . . . . . . . . . . . . . . . . . . . . . . . + + - - - - - - + - + + + - + + + - - - + t + + -
. . . . . . . . . . . . . . . . . . . . . . . . . X
X
X x xN N N N N N N N N N N N N N N N N N N N N N N N N
. . . . . . . . . . . . . . . . . . . . . . . . . X
X X X
. . . . . . . . . . . . . . . . . . . . . . . . . X
. . . . . . . . . . . . . . . . . . . . . . . . .
Y N N + + N + N N N N N N N + + N N N N N N N N N X
U N N + + N + N N N N N N N N + N N N N N N N N N
J N N N N N N N N N N N N N N N N N N N N N N N N
X X
Trichloroethylene, NTP TR 273 240
X

TABLE H2. INDIVIDUAL ANIMAL TUMOR PATHOLOGY OF FEMALE OSBORNE-MENDEL RATS HIGH
ANlMAL NUMBER
WEEKS ON STUDY
Subcutaneoustissue Fibroma
R ? S m M Lungs and bronchi
Alveolar/bronchiolar adenoma Osteosarcoma, metastatic
Trachea
Bone marmw SpleenL mphnodesTKymur
Heart
Salivary eland Liver
Neoplastic nodule Bile duct Gallbladder & common bile duct Pancreas
:t%Y Squamous cell carcinoma
Small intestine Large intestine
URINWP-Kidney
Tubular cell adenoma Unnary bladder
Adenocarnaoma, NOS,metastatic
GNDUCRnrESYSTEa-
PheochromocytomaTh mid
&cell adenoma Parathyroid
Adenoma, NOS REPRDIlUCTIVF-Mammary gland
Adenoma, NOS Adenocarcinoma, NOS Fibroma Fibroadenoma
Vanna Squamous cell carcinoma
Uterus Carnnoma NOS Adenocamhoma, NOS Endomstnal stromal polypCarcinosarcoma
OvgZuiosa cell camnoma
M Brain
Bone Osteosarcoma
iduscle Rhabdomyosarcoma
S Multiple organs. NOS
Camnosarcoma metastatic ~ a ~ iant I mphoma, NOS
LowerTg, N& Sarcoma, NOS
* Animals necropsied
DOSE (Continued)
0 0 0 2 2 2 3 4 4 4 4 4 6 8 6 1 1 7 7 8 8 8 9 9 9 3 5 7 5 6 7 0 0 1 2 3 6 1 3 6 0 1 3 1 0 6 9 4 5 8
1 0 0 1 0 0 0 0 0 0 1 0 0 0 0 1 1 0 1 0 1 TOTAL: rISSUES PUMOR5
t t + t t t + t t + t t + t + + t t + t + + t t t *50 X 1
t t t t t t + t t t t t + + + + t t t t t t t t t 50 X 1
1 t t + + + + + t + + + + t + - t t + t + t t + + + 47
t t t + + t t t + + + + + + t + + t + + + + + + + 49 + + + + t t t + t t + + t + t + t + + t t t + + + 49 + + + + + + t + t t + + + - + + + + + + + + + + + 46 - - - - - + - - - - - - - - - - - - - - - - - - - 3
t + + + + t + + t t + t + - t t t t + t + t t + t 49
t + + + t t + t t t t + t + t t t + + t + + t - t 47 t + t + + + t t t t t t t t + t t t + t t + t + + 49
x 2 + t t + + + + t t t + + + t + t t t t t t + + + t 49 N N N N N N N N N N N N N N N N N N N N N N N N N '50 t t + + t + t + t t t t t + t t t + t t t + t t t 49 t + t + + t + t + + + + + + + + t t t t t + t t + 50 + t + + t t t I + t t t t t t t t t t + + + + t +49
1 + t t t + + + + t t t t + + t + t t + t t + t + + 49 + t t + + + t + + + t + + t t t t t t + + t + t + 50
t t + + t + + t t t + + t + t t t t t + t + + + + 49 X 1
+ + + + t + + t t t t t t t + t t t t t + + + + + 50 1
t t + t t - + t + + + t + t t + + + + t t t + t + 46 x x X 8
+ + t + + + t + t + t + + t t + t + t t t t + t t 49 x x x x x x x x X x x 19 X 1
+ + + + + t t t t t t t t t t t t + t t t t t + t 49 x 1
t + t t + - + t + + + + - - - t t t - + - t t t t 32 X 1
t + + + + t t t t + t t + t t t t t t + N t t t t '50 1 1
X 1 r X x x X X X X 11 50
X 1 t t + + t t + + + t t t t + t t t t + + t t t + t 50
X 2 X 2
V N N N N N N N N N N N N N N N N N N N N N N N N
X X X X 6 X 1
t + t t t t t t + t t t + t t t t t + + + + + + + 49 1
t t + t + t t t t t t t t + + t t + t t t + t t t 49 -
i N N N N N N N N N N N N N N N N N N N N N N N N *50 1
i N N N N N N N N N N N N N N N N N N N N N N N N '50 X 1
P N N N N N N N N N N N N N N N N N N N N N N N N *50 X 1
2
1
241 Trichloroethylene,NTP TR 273

TABLE H3. ANALYSIS OF PRIMARY TUMORS IN FEMALE OSBORNE-MENDEL RATS IN THE TWO- YEAR GAVAGE STUDY OF TRICHLOROETHYLENE
Untreated Vehicle Control Control
Hematopoietic: System: Leukemia Overall Rates (a) 2/50 (4%) Adjusted Rates(b) 6.5% TerminalRates (c) 011 9 (0%)Life Table Tests (d) Incidental Tumor Testa (d)Cochran-Armitage Trend Test (d) Fisher Exact Test
0/50(0%)0.0% 0/20 (0%)P =0.528 P =0.596 P =0.640
3/50 (6%) 13.9% 1/11 (9%) P=O.O89 P=0.109
P=0.121
0/50(0%)0.0% on (0%) (e)(e)
(e)
Pituitary: Adenoma Overall Rates (a) 14/47 (30%) Adjusted Rates tb) 62.4% Terminal Rates (c) 11/19(58%) Life Table Tests (d) Incidental Tumor Tests (d) Cochran-Armitage Trend Test (d) Fisher Exact Test
(014/46 (30%) 56.5% 10/20(50%) P=0.387 P=0.353N P=O.O84N
9/47(19%) 57.9% 5111(45%)P =0.519 P=0.466N
P=0.154N
8/46 (17%) 50.6% 217 (29% P=0.458 P =0.364N
P =O.l l lN
Pituitary: Adenoma or Carcinoma Overall Rates (a) 14/47 (30%) Adjusted Ratm (b) 62.4% Terminal Rates (c) 11/19(58%)Life Table Tests (d) Incidental Tumor Testa (d) Cochran-Armitage Trend Test (d) Fisher Exact :rest
15/46 (33%) 58.5% 10/20(50%)P =0.475 P =0.250N P =0.054N
9/47 (19%) 57.9% 5/11 (45%) P=0.599 P=0.355N
P=0.106N
8/46 (17%) 50.6% 2/7 (29%) P =0.541 P=0.258N
P =0.074N
Adrenal: Cortical Adenoma Overall Rates (a) 13/49 (27%) Adjusted Rates (b) 54.8% Terminal Rates (c) 9/19 (47%) Life Table Tes k (d) Incidental Tumor Tests (d) Cochran-Armitage Trend Test (d) Fisher Exact ‘Test
16/50 (32%) 55.6% 9/20 (45%) P =0.008 P =0.100 P=0.272
13/50 (26%) 66.3% 6/11 (55%) P=0.365 P=0.484N
P=0.330N
19/49 (39%) 92.7% 6/7 (86%) P=O.O11 P=0.127
P=0.310
Adrenal: Pheochromocytoma Overall Rates (a) 4/49 (8%) Adjusted Rates:(b) 16.1% Terminal Rate3 (c) 2/19 (11%) Life Table Tests (d) Incidental Tumor Tests (d) Cochran-Armilage Trend Teat (d) Fisher Exact Test
8/50(16%) 30.4% 4/20 (20%)P=O.OSON P=0.009N P =0.01 1N
4/50 (8%) 18.8% 1111(9%) P=0.394N P=0.178N
P=0.178N
1/49 (2%) 6.7% OR (0%)P=0.118N P=0.020N
P=0.017N
Adrenal: Pheochlromocytoma or Pheochromocytoma, Malignant Overall Rates (,L) 4/49 (8%) 9/50 (18%)Adjusted Rates (b) 16.1% 33.1% Terminal Rates (c) 2/19 (11%) 4/20 (20%) Life Table Tests (d) P=0.073N Incidental Tumor Tests (d) P = 0.004N Cochran-Armitage Trend Test (d) P = 0.008N Fisher Exact Test
6/50 (12%) 26.0% 1111(9%)P=0.564N P=0.252N
P=0.288N
1/49 (2%) 6.7%oil (0%)P =0.084N P =0.009N
P =0.009N
Thyroid: C-Cell Adenoma Overall Rates (a,) 5/49 (10%) Adjusted Rates I b) 24.2% Terminal Rates (c) 4/19 (21%) Life Table Tests (d)Incidental Tumor Tests (d)Cochran-Armita ge Trend Test (d) Fisher Exact Tent
15/49 (31%) 60.7% 11/20(55%)P=0.006N P<0.001 N P <0.001 N
5/49 (10%) 32.7% 2/11(18%)P =0.127N P=0.053N
P =O.OllN
1/49 (2%) 6.7% OR (0%) P=0.013N P=0.003N
P<0.001 N
Trichloroethyhe, NTP TR 273 242

TABLE H3. ANALYSIS OF PRIMARY TUMORS IN FEMALE OSBORNE-MENDEL RATS IN THE TWO. YEAR GAVAGE STUDY OF TRICHLOROETHYLENE (Continued)
Untreated Vehicle Control Control 500 mg/kg 1,000 mg/kg
Pancreatic Islets: Islet Cell Adenoma Overall Rates (a) 0/50 (0%)Adjusted Rates (b) 0.0% Terminal Rates (c) 0/19 (0%) Life Table Tests (d) Incidental Tumor Tests (d) Cochran-Armitage Trend Test (d) Fisher Exact Test
Mammary Gland: Fibroadenoma Overall Rates (a) 17/50 (34%) Adjusted Rates (b) 50.0% Terminal Rates (c) 5/19 (26%) Life Table Tests (d) Incidental Tumor Tests (d) Cochran-Armitage Trend Test (d) Fisher Exact Test
Mammary Gland: Fibroma or Fibroadenoma Overall Rates (a) 17/50 (34%) Adjusted Rates (b) 50.0% Terminal Rates (c) 5/19 (26%) Life Table Tests (d) Incidental Tumor Tests (d) Cochran-Armitage Trend Test (d) Fisher Exact Test
Mammary Gland: All Tumors (8) Overall Rates (a) 17/50 (34%) Adjusted Rates (b) 50.0% Terminal Rates (c) 5/19 (26%) Life Table Tests (d) Incidental Tumor Tests (d) Cochran-Armitage Trend Test (d) Fisher Exact Test
Uterus: Adenocarcinoma Overall Rates (a) (h)0/50 (0%)Adjusted Rates (b) 0.0% Terminal Rates (c) 0/19 (0%)Life Table Tests (d)Incidental Tumor Tests (d) Cochran-Armitage Trend Test (d) Fisher Exact Test
Uterus: Endometrial Stromal Polyp Overall Rates (a) 4/50 (8%)Adjusted Rates (b) 14.540 Terminal Rates (c t 2/19 ( 1 1 % ) Life Table Tests (d) Incidental Tumor Tests (d) Cochran-Armitage Trend Test (d) Fisher Exact Test
Multiple Organs: Carcinoma Overall Rates (a) 0/50 (0%) Adjusted Rates (b) 0.0% Terminal Rates (c) 011 9 (0%)Life Table Tests (d) Incidental Tumor Tests ( d ) Cochran-Armitage Trend Test (d) Fisher Exact Test
3/50 (6%) 14.1% 2/20 (10%)P=0.153N P=0.078N P=0.063N
14/50 (28%) 45.1% 6/20 (30%) P =0.335 P=0.289N P=0.271N
15/50 (30%) 46.9% 6/20 (30%) P=0.320 P =0.240N P=0.277N
16/50 (32%) 48.2% 6/20 (30%) P =0.202 P=372N P =0.366N
2/49 (4%) 9.3% 1/20(5%)P-0.234 P =0.426 P=0.573N
6/49 (12%) 19.8% 2/20 (10%) P=0.365 P=0.379N P = 0.558N
( i ) 1/50 (2%) 3.8% 0120 (0%)P=0.482N P=0.203N P =0.378N
1/48(2%) 3.2% 0/11(0%)P =0.456N P =0.365N
P =0.324N
7/50(14%) 39.4% 2/11 (18%)P =0.291N P =0.104N
P =0.070N
8/50 (16%) 42.2% 2/11 (18%) P =0.324N P=0.096N
P=0.077N
9/50 (18%) 48.6% 3/11 (27%)P =0.352N P =O.106N
P=0.083N
5/49 (10%) 32.7% 3/11 (27%) P =0.080 P=0.151
P=0.218
1/49(2%)4.3% 0/11 (0%)P =0.122N P =0.039N
P =0.056N
3/50 (6%) 10.9% 0/11 (0%) P =0.227 P =0.434
P=0.309
0/49 (0%) 0.0% on (0%)P =0.294N P =0.221N
P =0.125N
11/50(22%) 56.3% 2/7 (29%) P =0.350 P=0.330N
P=0.322N
12/50(24%) 57.7% 2/7 (29%) P =0.338 P =0.262N
P =0.326N
14/50 (28%)69.5% 3/7 (43%) P=0.229 P =0.367N
P =0.414N
2/50 (4%) 19.3% 117 (14%) P=0.422 P=0.580
P =0.684N
6/50 (12%)24.9% OM (0%)P=0.386 P=0.414N
P'=O.SOSN
0150 (0%) 0.0% 017 (0%)P=0.602N P=0.433N
P=0.500N
243 Trichloroethylene, NTP TR 273

TABLE H3. ANALYSIS OF PRIMARY TUMORS IN FEMALE OSBORNE-MENDEL RATS IN THE TWO- YEAR GAVAGE STUDY OF TRICHLOROETHYLENE (Continued)
(a)Number of tumor-bearing animals/number of animals examined a t the site (b)Kaplan-Meier estimated tumor incidence a t the end of the study after adjusting for intercurrent mortality (c)Observed tumor incidence at terminal kill (d)Beneath the control incidence are the P values associated with the trend test. Beneath the dosed group incidence are the P values corresponding to pairwise comparisons between that dosed group and the vehicle controls. The life table analysis regards tumors in animals dying prior to terminal kill as being (directly or indirectly) the cause of death. The incidental tumor test regards these lesions as nonfatal. The Cochran-Armitage and Fisher exact testa compare directly the overall incidence rates. A negative trend or lower incidence in a dosed group is indicated by (N). (e)No P value is reported because no tumors were observed in the 1,000 mg/kg and vehicle control groups. (DIncidence includes one papillary adenoma. (g)Includes adenoma, adenocarcinoma, fibroma, and fibroadenoma. A mixed tumor, benign, was observed in a low dose animal that also had a fibroadenoma. (h)One adenoma, NOS, was present. (i)Carcinoma,NOS;site unknown.
Trichloroethylene, NTP TR 273 244

TABLE H4. SUMMARY OF THE INCIDENCE OF NONNEOPLASTIC LESIONS IN FEMALE OSBORNE-MENDEL RATS IN THE GAVAGE STUDY OF TRICHLOROETHYLENE
CONTROL (UNTR) CONTROL (VEH) LOW DOSE HIGH DOSE
ANIMALS INITIALLY IN STUDY 50 50 50 50 ANIMALS NECROPSIED 50 50 50 50 ANIMALS EXAMINED
HISTOPATHOLOGICALLY 50 50 50 50
INTEGUMENTARY SYSTEM *Subcutaneous tissue (50) (50) (50) (50)
Abscess, chronic 2 (4%) 1 (2%)
RESPIRATORY SYSTEM *Nasal cavity (50) (50)
Ulcer, NOS *Tracheal lumen (50) (50)
Vegetable foreign body 1 (2%) #Trachea (49) (47)
Inflammation, NOS Inflammation, chronic 1 (2%) Inflammation, chronic focal 1 (2%) Hyperplasia, epithelial 1 (2%)
#Lung (50) (50) (50) (50) Vegetable foreign body 3 (6%) 3 (6%) Emphysema, alveolar 1 (2%) 1 (2%) 2 (4%) Collapse 1 (2%) Congestion, NOS 1 (2%) 2 (4%) 4 (8%) 5 (10%) Edema, NOS 1 (2%) 1 (2%) 3 (6%) 3 (6%) Hemorrhage 2 (4%) 3 (6%) 6 (12%) 3 (6%) Inflammation, NOS 1 (2%) 1 (2%) Bronchopneumonia, focal 1 (2%) Inflammation, focal 3 (6%) 5 (10%) 1 (2%) 1 (2%) Inflammation, necrotizing 1 (2%) Bronchopneumonia, acute 1 (2%) Inflammation, acute/chronic 1 (2%) Inflammation, chronic 2 (4%) 2 (4%) Inflammation, chronic focal 1 (2%) 1 (2%) 1 (2%) Inflammation, granulomatous 1 (2%) 4 (8%) 2 (4%) 2 (4%) Inflammation, granulomatous focal 3 (6%) 1 (2%) 4 (8%) 8 (16%) Inflammation necro granulomatous 1 (2%) Infection, bacterial 1 (2%) Proteinosis, alveolar 1 (2%) Calcification, metastatic 1 (2%)Foreign material, NOS 1 (2%) 1 (2%)
#Lung/alveoli (50) (50) (50) (50) Histiocytosis 1 (2%)
HEMATOPOIETIC SYSTEM #Bone marrow (50) (50) (50) (49)
Hyperplasia, granulocytic 1 (2%) #Spleen (49) (49) (48) (49)
Congestion, NOS 1 (2%) Hemorrhage 1 (2%)Abscess, NOS 1 (2%)Inflammation, granulomatous focal 1 (2%)Necrosis, focal 2 (4%) Hemosiderosis 2 (4%) 1 (2%) 1 (2%) Depletion, lymphoid 1 (2%) Hyperplasia, lymphoid 1 (2%) Hematopoiesis 11 (22%) 8 (16%) 14 (29%) 11 (22%)
245 Trichloroethylene,NTP TR 273

TABLE H4. SUMMARY O F THE INCIDENCE O F NONNEOPLASTIC LESIONS IN FEMALE OSBORNE- MENDEL RATS IN THE TWO-YEAR GAVAGE STUDY OF TRICLOROETHYLENE (Continued)
CONTROL (UNTR) CONTROL (VEH) LOW DOSE HIGH DOSE
HEMATOPOIETIC SYSTEM (Continued) #Lymph node
Congestion, NOS Hemorrhage Degeneration, cystic
#Mandibular lymph node HemorrhagePlasmacytosis
#Mesenteric lymph node Inflammation, chronic
(47)
Hyperplasia, reticulum cell #Liver
Hematopoiesis
Congestion, NOS Hemorrhage
#Thymus
CIRCULATORY SYSTEM #Lung
Thrombosis, NOS (50)
#Heart Hemorrhage Inflammation, chronic
(49)
Inflammation, chronic focal Endocardiosis Necrosis, focal
*Coronary artery Calcification, metastatic
+Pulmonary artery Mineralization Calcification, focal Calcification, metastatic
#Liver Perivasculitis
#Pancreas Periarteritis
DIGESTIVE SYSTEM #Salivary gland
Atrophy, NOS Atrophy, focal
#Liver Congestion, NOS HemorrhageInflammation, focal Inflammation, active chronic
(46)
(50)
Inflammation, chronic focal Peliosis hepatis Necrosis, focal Necrosis, diffuse Necrosis, central Metamorphosis, fatty LipoidosisPigmentation, NOS Cytoplasmic change, NOS Basophilic cgto change Focal cellular change Clear cell change Cytologic alteration, NOS Hepatocytornegaly
1 (2%) 1 (2%) 1 (2%)
1 (2%)
1 (2%) 2 (4%)1 (2%) 1 (2%)
1 (2%)
1 (2%)
1 (2%)
1 (2%) 1 (2%)
5 (10%)
1 (2%) 1 (2%)
1 (2%)
1 (2%) 2 (4%)
2 (4%)
1 (2%)2 (4%)
1 (2%)
Trichloroethylene, NTP TR 273 246

TABLE H4. SUMMARY OF THE INCIDENCE OF NONNEOPLASTIC LESIONS IN FEMALE BSBORNE- MENDEL RATS IN THE TWO-YEAR GAVAGE STUDY OF TRICHLOROETHYLENE (Continued)
CONTROL (UNTR) CONTROL (VEH) LOW DOSE HIGH DOSE
DIGESTIVESYSTEM (Continued) XLiverlcentrilobular
Necrosis, NOS #Bile duct
Dilatation, NOS Inflammation, chronic Hyperplasia, NOS Hyperplasia, focal Hyperplasia, diffuse
#Pancreas HemorrhageInflammation, acutekhronic Inflammation, chronic Inflammation, chronic focal Atrophy, focal
#Pancreatic acinus Atrophy, NOS Atrophy, focal
*Esophageal lumen Hemorrhage
#EsophagusHyperkeratosis
#Thoracic esophagus Granulation tissue
#Stomach Inflammation, suppurative Calcification, metastatic
#Gastric mucosa Inflammation, NOS Hyperplasia, epithelial Hyperkeratosis
#Forestomach Inflammation, NOS Hyperplasia, epithelial Hyperkeratosis
#JejunumHemorrhage
#Colon Parasitism
URINARY SYSTEM #Kidney
Mineralization Cast, NOS Hydronephrosis Cyst, NOS HemorrhageInflammation, acute focal Idammation, acutekhronic Inflammation, chronic Inflammation, chronic focal Inflammation, granulomatous focal Fibrosis NephropathyNephropathy, toxic Necrosis, focal Calcification, focal Calcification, metastatic Cytomegaly Hyperplasia, tubular cell
# Kidneykortex Degeneration,NOS
(50)
(50)
1 (2%) 5 (10%)
(50)
(50) 1 (2%) 3 (6%)
(50) 2 (4%)
(50) 1 (2%)
(50)
(50)
(50) 1 (2%) 1 (2%) 1 (2%)
(50) 1 (2%) 1 (2%) 1 (2%)
(50)
(50) 7 (14%)
(50)8 (16%) 4 (8%) 2 (4%) 2 (4%)
1 (2%)
1 (2%)
43 (86%)
1 (2%) 1 (2%)
(50)I (2%)
(50) (50) 3 (6%) 3 (6%) 7 (14%) 2 (4%)
1 (2%) 1 (2%) 1 (2%)
1 (2%)
1 (2%)
43 (86%) 41 (82%)30 (60%)
4 (8%) 2 (4%) 1 (2%)
48 (96%) 1 (2%) 1 (2%)
(50) (50)
(491 1 (2%)
(49) 1 (2%) 1 (2%) 1 (2%)
(49)
1 (2%) 1 (2%)
(49)
3 (6%) (50)
1 (2%) (50)
(50) 1 (2%)
(49) 1 (2%)
(49)
(49)
(49)
(50) 7 (14%)
(49)
1 (2%) 4 (8%)
1 (2%)
1 (2%) 47 (96%) 39 (80%)
2 (4%)
49 (100%) 3 (6%)
(49)
247 Trichloroethylene,NTP TR 273

TABLE H4. SUMMARY OF THE INCIDENCE O F NONNEOPLASTIC LESIONS IN FEMALE OSBORNE- MENDEL RATS IN THE TWO-YEAR GAVAGE STUDY O F TRICHLOROETHYLENE (Continued)
URINARY SYSTEM (Continued) #Kidney/medulla
Hyperplasia, NOS Hyperplasia, epithelial
#KidneyhubuleDilatation,NOS
#Kidney/pelvisHemorrhageInflammation, acute Hyperplasia, epithelial
#Urinary bladder Hemorrhage Inflammation, acute Inflammation, acute/chronic Inflammation, chronic Hyperplasia, epithelial
ENDOCRINE SYSTEM #Pituitary
Cyst, NOS Congestion, NOS HemorrhageHyperplasia, focal
#Adrenal Congestion, NOS HemorrhageDegeneration, NOS Degeneration, cystic Necrosis, focal Metamorphosis, fatty Lipoidosis Angiectasis
#Adrenal cortex Degeneration, NOS LipoidosisFocal cellular change Atrophy, NOS Hyperplasia, NOS Hyperplasia, focal Angiectasis
#Adrenal medulla Hyperplasia, NOS Hyperplasia, focal
#Thyroid Cyst, NOS Inflammation, chronic Hyperplasi.a, C-cell
REPRODUCTIVE SYSTEM *Mammary gland
Cyst, NOS Hemorrhage Degeneration, NOS Hyperplasia, NOS Lactation
*VaginaHyperplasia, epithelial
*Vaginal mucosa Hyperplasia, cystic
CONTROL (UNTR)
(50) 1 (2%)6 (12%)
(50)
(50) 2 (4%) 1 (2%) 2 (4%)
(48)
1 (2%) 1 (2%) 1 (2%)
(47)
1 (2%) (49)
1 (2%)
2 (4%) 3 (6%)
(49)
4 (8%)
~
CONTROL (VEH)
(50)
5 (10%) (50)
(50)
1 (2%)4 (8%)
(48) 1 (2%) 1 (2%) 1 (2%)
1 (2%)
2 (4%)6 (12%)
(50)
1 (2%)
(50)
1 (2%) (49)
2 (4%) 1 (2%) 1 (2%)
~ ~~
LOW DOSE
(50)
2 (4%)(50)
1 (2%) (50)
5 (10%) (49)
(47) 2 (4%)
1 (2%) 1 (2%)
(50)
2 (4%)
1 (2%) 1 (2%)
9 (18%) (50)
3 (6%) 1 (2%)
1 (2%) 3 (6%)
(50)
2 (4%) (49)
3 (6%)
2 (4%)
HIGH DOSE
(49)
(49)
(49)
6 (12%) (50)
(46) 1 (2%)
2 (4%) (49)
1 (2%)
2 (4%)
1 (2%)
12 (24%) (49)
1 (2%) 1 (2%)
(49) 1 (2%) 1 (2%)
(49)6 (12%)
1 (2%)
Trichloroethylene, NTP TR 273 248

TABLE H4. SUMMARY OF THE INCIDENCE OF NONNEOPLASTIC LESIONS IN FEMALE OSBORNE- MENDEL RATS IN THE TWO-YEAR GAVAGE STUDY OF TRICHLOROETHYLENE (Continued)
REPRODUCTIVE SYSTEM (Continued) #Uterus
Dilatation, NOS HydrometraEpidermal inclusion cyst HemorrhageHematometra Inflammation, NOS Ulcer, NOS Pyometra Inflammation, acute Inflammation, acute focal Inflammation, acute necrotizing Inflammation, acute/chronic Inflammation, chronic Necrosis, hemorrhagic Pigmentation, NOS Hyperplasia, epithelial HyperkeratosisMetaplasia, NOS Metaplasia, squamous
BUteruslendometrium Cyst, NOS Ulcer, NOS Inflammation, acute Hyperplasia, NOS Hyperplasia, cystic Metaplasia, NOS Metaplasia, squamous
#OvaryCyst, NOS Follicular cyst, NOS Inflammation, suppurative Inflammation, acute
NERVOUS SYSTEM #Brain
Cyst, NOS Hemorrhage Abscess, NOS Inflammation, chronic focal
*Spinal cord Hemorrhage
SPECIAL SENSE ORGANS *Harderian gland
Inflammation, chronic Inflammation, chronic focal
MUSCULOSKELETAL SYSTEM None
CONTROL (UNTR)
(50) 4 (8%) 6 (12%)
3 (6%)1 (2%)1 (2%)
3 (6%)1 (2%)
1 (2%)
1 (2%)
1 (2%)(50)
12 (24%) 3 (6%) 1 (2%)
(49)3 (6%)1 (2%)
1 (2%)
(50)
(50)
(50)
CONTROL (VEH)
(49) 7 (14%) 2 (4%) 1 (2%)
1 (2%)2 (4%)
1 (2%)
1 (2%)2 (4%) 1 (2%) 3 (6%)
(49)
1 (2%)
1 (2%) 8 (16%) 1 (2%) 2 (4%)
(48) 4 (8%)2 (4%) 1 (2%) 1 (2%)
(50) 1 (2%)1 (2%)
(50)
(50) 1 (2%)
LOW DOSE
(49)2 (4%) 8 (16%)
1 (2%) 4 (8%)1 (2%) 4 (8%) 3 (6%) 1 (2%)
1 (2%)2 (4%) 1 (2%)
1 (2%)
1 (2%)1 (2%)7 (14%)
(49) 1 (2%)
1 (2%) 2 (4%) 9 (18%) 1 (2%) 1 (2%)
(49) 1 (2%) 1 (2%)
(50)
2 (4%) 1 (2%) 1 (2%)
(50) 1 (2%)
(50)
HIGH DOSE
(50)6 (12%)6 (12%)
1 (2%) 1 (2%) 2 (4%)
3 (6%) 1 (2%) 1 (2%)
1 (2%) 1 (2%)
4 (8%)(50)
1 (2%) 3 (6%) 4 (8%)
2 (4%) (49)
5 (10%) 2 (4%)
(49)
(60)
(50) 1 (2%) 1 (2%)
249 Trichloroethylene, NTP TR 273

TABLE H4. SUMMARY OF THE INCIDENCE OF NONNEOPLASTIC LESIONS IN FEMALE OSBORNE- MENDEL RATS IN THE TWO-YEAR GAVAGE STUDY OF TRICHLOROETHYLENE (Continued)
CONTROL (UNTR) CONTROL (VEH) LOW DOSE HIGH DOSE
BODY CAVITIES "Peritoneum
Inflammation, acute focal "Pleura
Inflammation, acute "Pericardium
Inflammation, chronic Inflammation, chronic focal
ALL OTHER SYSTEMS "Multiple organs
Hemorrhage (50)
SPECIAL MORPHOLOGY SUMMARY Autolnecropsyhisto perf 1
* Number of animals receiving complete necropsy examination; all gross lesions including masses examined microscopically. # Number of animals examined microscopically a t this site
Trichloroethylene, NTP TR 273 250

APPENDIX I
GENETIC TOXICOLOGY OF
TRICHLOROETHYLENE
PAGE
TABLE I1 MUTAGENICITY OF TRICHLOROETHYLENE IN SALMONELLA TYPHIMURIUM 252
TABLE I2 MUTAGENICITY OF TRICHLOROETHYLENE IN L5178Y MOUSE LYMPHOMA CELLS IN THE ABSENCE OF S9 253
TABLE I3 MUTAGENICITY OF TRICHLOROETHYLENE IN L5178Y MOUSE LYMPHOMA CELLS IN THE PRESENCE OF S9 264
TABLE I4 INDUCTION OF SISTER CHROMATID EXCHANGES IN CHINESE HAMSTER OVARY CELLS BY TRICHLOROETHYLENE 255
TABLE I5 INDUCTION OF CHROMOSOMAL ABERRATIONS IN CHINESE HAMSTER OVARY CELLS BY TRICHLOROETHYLENE 255
25 1 Trichloroethylene, NTP TR 273

TABLE I1 , MUTAGENICITY OF TRICHLOROETHYLENE IN SALMONELLA TYPHlMURlUM
Strain Dose (pdplate)
-s9 Revertants/plate (a,b)
t S9 (rat) tS9 (hamster)
TA 100 0 148 f 4.6 136 f 9.3 139 f 5.0 10 151 f 2.0 131 f 5.5 136 f 10.8 33
100 137 f 5.2 143 f 6.1
114 f 11.9 115 f 10.9
152 f 6.1 143 f 11.3
333 128 f 4.2 135 f 6.6 130 f 0.9 1,000 (c) 123 f 2.9 (c) 134 f 13.7 (c) 141 f 5.2
TA1535 0 29 f 2.0 11 f 0.6 14 f 1.3 10 28 k 0.6 16 f 1.5 14 k 1.2 33 27 f 1.0 11 f 2.2 14 f 1.0
100 333
22 f 2.9 24 k 0.9
11 f 0.3 17 f 3.5
12 f 1.7 15 f 3.2
1.ooo (c) 11 f. 4.3 (c) 8 f 3.5 (c) 10 f 0.9
TA98 0 10
19 f 2.1 21 f 2.0
24 f 3.8 21 is 1.2
28 f 1.2 28 f 1.3
33 100
16 f 2.3 18 f 1.5
29 2 0.3 26 f 4.5
38 f 2.3 28 f 3.5
333 19 f 4.0 25 f 2.6 24 f 0.0 1,000 (c) 17 f 3.0 (c) 25 f 3.8 (c) 25 f 2.2
TA1537 0 7 f 1.5 6 f 1.0 4 f 0.9 10 7 f 2.0 8 f 1.2 8 f 0.3 33 7 f 0.7 7 f 2.7 9 f 0.9
100 6 f 0.6 6 k 1.5 7 f 1.5 333 9 k 0.7 6 f 1.9 7 f 2.7
1,000 (c) 5 f 0.6 (c) 6 f 1.8 (c) 6 f 0.3
(a)The S9 fractions were prepared from the liver of Aroclor 1254-induced male Sprague-Dawley rats and male Syrian hamsters. Cells and study compound or dimethyl sulfoxide were incubated for 20 minutes a t 37" C in the presence of either S9 or buffer. After the addition of soft agar, the contents of each tube were poured onto minimal medium, and the plates were in- cubated at 37' C for 48 hours (Haworth et al., 1983). The experiment was performed twice, each in triplicate; because the re- sults were similar,data from only one experiment are shown. (b)Mean f standard error (c)Slight toxicity
Trichloroethylene, NTP TR 273 252

TABLE 12. MUTAGENICITY OF TRICHLOROETHYLENE IN L5178Y MOUSE LYMPHOMA CELLS IN THE ABSENCE OF 59 (a)
Compound Concentration Total
Mutant Clones Cloning Efficiency (percent)
Relative Total Growth
(percent)
Mutation Frequency (rnutants/lOe
clonable cells)
DMSO 1% 68 114.8 110 20 74 94.0 98 26 94 105.5 99 30 68 111.7 91 20
Ethylmethane sulfonate 250Pgflrg 1,188 67.8 33.8 584
Trichloroethylene W m l ) 25.0 69 103.2 95.0 22
04 98.7 85.6 28 56 94.8 89.2 20
50.0 49 95.0 92.5 17 74 91.8 66.1 27 83 110.5 73.3 25
100.0 46 99.8 62.5 15 53 97.3 80.9 18 107 124.3 66.3 29
200.0 63 90.3 55.7 23 72 104.7 45.2 23 58 79.8 17.4 24
(a)Experiments were performed twice, and all doses were tested in duplicate or triplicate. Because the results were similar, data from only one experiment are shown. The protocol was basically that of Clive et al. (1979).Cells (6X lOJ/ml) were treated for 4hours at 37' C in medium, washed, resuspended in medium, and incubated for 48hours at 37'C. After expression, 3 X 10⁶ cells were plated in medium supplemented with trifluorothymidine for selection of cells that were mutant at the thymidine kinase (TK) locus, and 600 cells were plated in nonselective medium to determine the percentage of viable cells.
253 Trichloroethylene, NTP TR 273

TABLE 13. MUTAGENICITY OF TRICHLOROETHYLENE IN L5178Y MOUSE LYMPHOMA CELLS IN THE PRESENCE OF S9 (a)
Total Relative Mutation Frequency Compound Concentration Mutant Clones Cloning Efficiency Total Growth (mutantsllO8
(percent) (percent) clonable cells)
DMSO 1% 227 107.2 102 71 178 93.0 114 64 233 113.0 102 69 261 105.8 98 82
3-Methylcholanthrene 2.5 y g h l 802 83.2 35.2 321
813 90.5 44.6 299 775 79.5 21.5 325
Trichloroethylene (nl/ml) 25.0 331 98.7 65.6 112
265 96.0 73.7 92 308 104.7 73.9 98
50.0 342 105.8 55.8 108 311 108.3 60.6 96 284 108.0 59.9 88
100.0 403 89.5 48.0 150 382 99.8 39.2 128 257 81.7 38.7 105
200.0 498 95.0 17.2 175 448 94.3 19.9 158 441 99.8 15.9 147
(a)Experiments were performed twice, and all doses were tested in duplicate. Because the results were similar, data from only one experiment are shown. The protocol was basically that of Clive et al. (1979). Cells (6X lO5/ml) were treated for 4 hours a t 37' C in medium, washed, resuspended in medium, and incubated for 48 hours a t 37" C. After expression, 3 X 10⁶ cells were plated in medium supplemented with trifluorothymidine for selection of cells that were mutant a t the thymidine kinase (TK)locus, and 600 cells were plated in nonselective medium to determine the percentage of viable cells. S9 was prepared from the liver ofAroclor 1254-induced male F344 rats.
Trichloroethylene,NTPTR 273 254

TABLE 14. INDUCTION OF SISTER CHROMATID EXCHANGES IN CHINESE HAMSTER OVARY CELLS BY TRICHLOROETHYLENE (a)
-S9 (b) +SQ (c)Dose SCEs/Cell (d) Dose SCEs/Cell (d)
(pglrnl) (pglrnl)
DMSO(10 pl) 7.6 DMSO (10pl) 8.4
Trichloroethylene 499 7.7 40 1 10.1 596 8.2 499 10.1 700 9.1 596 9.5
Mitomycin C Cyclophosphamide 0.005 20.4 1.5 20.0
(a)SCE = sister chromatid exchange (b)In the absence of S9, Chinese hamster ovary cells were incubated with study compound or solvent for 2 hours a t 37" C. Then 10pM bromodeoxyuridine (BrdU) was added, and incubation was continued for 24 hours. Cells were washed, fresh medium containing BrtlU (10 pM) and colcemid (0.1 pg/ml) was added, and incubation was continued for 2-3 hours. (c)In the presence of S9,Chinese hamster ovary cells were incubated with study compound or solvent for 2 hours a t 37" C. Then cells were washed, and medium containing 10 pM BrdU was added. Cells were incubated for a further 26 hours, with colcemid (0.1 pdrnl)present for the final 2-3 hours. S9 was from the liver ofAroclor 1254-induced male Sprague-Dawley rats. (d)Cells were then collected by mitotic shake-off, treated for 3 minutes with KCl (75 mM), washed twice with fixative, and dropped onto slides and air-dried. Staining was by a modified technique (after Perry and Wolff, 1974;Goto et al., 1978).
TABLE 15. [NDUCTION OF CHROMOSOMAL ABERRATIONS IN CHINESE HAMSTER OVARY CELLS BY TRICHLOROETHYLENE (a)
-S9 (b) +SQ ( C l Dose AbsllOO Cells Dose Abs/100 Cells
(pdrnl) (percent cells with abs) (pghnl) (percent cells with abs)
DMSO (10 pl) 7 (7) DMSO (10pl) 2 (2)
Trichloroethylene 745 2 (2) 499 801 4 (4) 700
745 14,900 4 (3) 14,900
Mitomycin C Cyclophosphamide 0.500 24(18) 50 94 (35)
(a) Abs = aberrations (b) In the absence of S9, Chinese hamster ovary cells were incubated with study compound or solvent for 8-10 hours a t 37" C. Cells were then washed, and fresh medium containing colcemid (0.1 pg/ml) was added. After a further 2-3 hours of incubation, cells were harvested by mitotic shake-off, fixed, and stained in 6% Giemsa. (c) In the presence of S9, cells were incubated with study compound or solvent for 2 hours a t 37" C. Cells were then washed, medium was added, and incubation was continued for 8-10 hours. Colcemid (0.1 pg/ml) was added for the last 2-3 hours of incubation; then cells were harvested and fixed a s above. S9 was from the liver of Aroclor 1254-induced male Sprague-Dawley rats.
255 Trichloroethylene, NTP TR 273

Trichloroethylene, NTP TR 273 256

APPENDIX J
CHEMICAL CHARACTERIZATION
OF TRICHLOROETHYLENE
257 Trichloroethylene, NTP TR 273

APPENDIX J. CHEMICAL CHARACTERIZATION
I. Identity and Purity Determinations of Lot No. TB05-206AAPerformed by the Analytical Chemistry Laboratory
A. Physical properties
1. Boilingpoint:
2. Index of refraction:
3. Density:
B. Spectral data
1. Infrared
Instrument:
Cell:
Results:
2. Ultraviolet/visible
Instrument:
Concentration:
Solvent:
Results:
Determined
86.0"k 0.8(6)"C a t 737 mm (visual, micro boiling point); 84.5"-87"C (Dupont 900 DTA)
$0: 1.4766 k O.O002(S)D
d22: 1.46315 & 0.00002(6) g/ml 23
Beckman IR-12
0.015-mm liquid cell, sodium chloride windows
See Figure J-1
Cary 118
1 mg/ml
Methanol
No absorbance between 800 and 350 nm. No maximum between 208 and 350 nm, but a gradual increase in absorbance toward the solvent cutoff a t 208 nm.
Literature Values
86.7"C a t 760 mm (Gallant, 1966)
n20: 1.4776D
(Bachman et al., 1950)
d23: 1.458(read from graph) (Gallant, 1966)
Consistent with literature spectrum (Sadtler Standard Spectra)
0.0002%
Methanol
No maximum observed in the near ultraviolet range (Lacher et al., 1950)
Trichloroethylene, NTP TR 273 258

I 'I ' It1)I'
W UI (D
2 i;'5 I%
- . m3 3-Y,(P3 (P
3 vel FIGURE J-1. INFRARED ABSORPTION SPECTRUM OF TRICHLOROETHYLENE (LOT NO. TB05-20C N

APPENDIX J. CHEMICAL CHARACTERIZATION
3. Nuclear magnetic resonance
Determined Literature Values
Instrument: Varian HA-100
Solvent: Neat, with added tetramethylsilane
Assignments: See Figure 5-2 Consistent with literature spectrum (Sadtler Standard Spectra)
Chemical shift (6): s, 6.34ppm
Integration ratios: 1.00
C. Water analysis (Karl Fischer): 0.0097%+_ O.O02O(S)%
D. Elemental analysis
Element C H Cl
Theory 18.28 0.77 80.95
Deter mined 18.31 18.45
0.78 0.80
80.69 80.85
Trichloroethylene, NTP TR 273 260

1
I
4 FIGURE 5-2. NUCLEAR MAGNETIC RESONANCE SPECTRUM O F TRICHLOROETHYLENE (LOT NO. TB05-206AA) 3

APPENDIX J. CHEMICAL CHARACTERIZATION
E. Gas chromatography
Instrument: Tracor MT 220 Detector: Flame ionization Inlet temperature: 200" C Detector temperature: 255" C
System 1
Column: 10% Carbowax 2OM-TPA on 80/100 Chromosorb W(AW), 1.8m X 4 mm ID, glass Oven temperature program: 50"C, 5 min; 50"-200" C at 10" C/min
Results: Major peak and 12 impurities. The total area of the impurities is less than 0.04% of the major peak.
Retention Time Area
Peak No. Retention Time (min)
Relative to Major Peak
(percentof major peak)
1 0.3 0.10 trace, < 0.001 2 1.2 0.40 trace, < 0.001 3 1.4 0.47 0.002 4 2.0 0.67 0.001 5 2.1 0.70 trace, < 0.001 6 2.4 0.80 0.001 7 3.0 1.00 100 8 7.4 2.47 0.001 9 7.9 2.63 0.02
10 9.8 3.27 trace, < 0.001 11 10.3 3.43 0.003 12 11.8 3.93 trace, < 0.001 13 12.4 4.13 0.003
Trichloroethylene, NTP TR 273 262

APPENDIX J. CHEMICAL CHARACTERIZATION
System 2
Column: 20% SP2100/0.1% Carbowax 1500 on 80/100 Supelcoport, 1.8m X 4 mm ID, glassOven temperature program: 50"C, 5 min; 50"-170"C at 10"C/min
Results: Major peak and eight impurities. All impurities have areas less than 0.01%of the major peak. The total area of the impurities is less than 0.02%of the major peak.
Retention Time Area Retention Relative to (percent of
Peak No. Time (min] Major Peak maior Desk)
2.6 0.50 0.0005 3.8 0.73 0.004 5.2 1.00 100 7.4 1.42 0.002 7.7 1.48 0.002 8.8 1.69 0.004 9.4 1.81 0.0005
10.2 1.96 0.0005 13.9 2.67 0.002
263 Trichloroethylene, NTP TR 273

APPENDIX J. CHEMICAL CHARACTERIZATION
II. Identity and Purity of Lot No. TBOS-039AA
A. Spectral data
1. Infrared
Instrument:
Cell:
Results:
2. Ultraviolet/visible
Instrument:
Solvent:
Results:
3. Nuclear magnetic resonance
Instrument:
Determined
Beckman IR-12
Thin film between silver chloride plates
See Figure J-3
Cary 118
Methanol
No absorbance between 800 and 350nm at a concentration of 1%(v/v). No absorbance maximum between 350 and 215 nm but a gradual increase in absorbance toward 215 nm at a concentration of 0.0004% (v/v).
Varian HA-100
Solvent: Neat, with added tetramethylsilane
Assignments: See Figure J-4
Chemical shift (6): s, 6.43ppm
Literature Values
Spectrum consis tent with literature spectrum (Sadtler Standard Spectra)
Methanol
No maximum observed in the near ultraviolet range. (Lacher et al., 1950)
Spectrum consistent with literature spectrum (Sadtler Standard Spectra)
Trichloroethylene, NTP TR 273 264

FIGURE 5-3. INFRARED ABSORPTION SPECTRUM OF TRICHLOROETHYLENE (LOT NO. TBOS-039AA)

.
FIGURE 5-4. NUCLEAR MAGNETIC RESONANCE SPECTRUM OF TRICHLOROETHYLENE (LOT NO. TBOS-O39AA)

APPENDIX J. CHEMICAL CH:ARACTERIZATION
B. Elemental analysis
Element C H Cl
Theory 18.28 0.77 80.95
De termin ed 18.29 0.80 80.78 18.15 0.81 80.95
C. Water analysis (Karl Fischer): <0.003%
D. Gas chromatography
Instrument: Varian 3700 Detector: Flame ionization Inlet temperature: 200" C Carrier gas: Nitrogen, 70 ml/min
System 1
Column: 10%Carbowax 20M-TPA on 80/100 Chromosorb W (AW), 1.8 m X 4 mm ID, glass Oven temperature program: 50"C, for 5 min; 50"-201D0C at 10" C/min Sample injected: Neat liquid (3.5 pl) and solutions of 1.0%and 0.5% (v/v) trichloroethylene in o-dichlorobenzene to quantitate the major peak and check for detector overload
Results: Major peak and one impurity after the major peak with an area 0.02%of the major peak.
Retention Time Area Reten tion Relative to (percent of
Peak No. Time (min) Maior Peak ga.ior peak)
1 3.9 1.00 100 2 11.2 2.87 0.02
267 Trichloroethylene, NTP TR 273

APPENDIX J. CHEMICAL CHARACTERIZATION
System 2
Detector temperature: 240" C Column: 20% SP2100/0.1% Carbowax 1500on 100/120 Supelcoport, 1.8m X 4 mm ID, glass Oven temperature program: 50"C,for 5 min; 50"-170" C at 10"C/min Samples injected: Neat liquid (3pl) and solutions of 1.0%and 0.5% trichloroethylene in o-dichlorobenzene to quantitate the major peak and check for detector overload.
Results: Major peak and one impurity after the major peak with an area of 0.02%of the major peak.
Retention Time Area
Peak No. Retention
Time (min) Relative to Ma-ior Peak
(percent of ma.ior peak)
1 6.3 1.oo 100 2 8.3 1.32 0.02
III. Quantitation of Impurity Present in Lot No. TB05-206AA
Analysis by gas chromatography
A. System
Instrument: Varian 3700 Detector: Flame ionization Inlet temperature: 200"C Detector temperature: 250" C Carrier gas: Nitrogen, 70 ml/min Column: 80/100 Carbopack C/O.1%SP1000; 1.8 m X 4 mm ID, glass Oven temperature program: 50"C, isothermal
B. Results: Trichloroethylene, when injected as a neat liquid on the above system, had a reten-tion time of 16.0 minutes and contained a peak with a retention time of 7.2 minutes with a shoulder a t 7.6 minutes. The shoulder was enhanced by addition of an epichlorohydrin standard to the sample (O.OOl%, v/v, relative to trichloroethylene).
C. Conclusions: Calculation of the amount of epichlorohydrin present in the unspiked sample by the standard addition method showed that, if epichlorohydrin was present in this lot of trichloroethylene, it was a t a level less than or equal to 0.001%(v/v).
Trichloroethylene, NTP TR 273 268

APPENDIX J. CHEMICAL CHARACTERIZATION
IV. Identification of the Impurity in Lot No. TB05-206AA
Analysis by gas chromatography/mass spectrometry
A. System
Instrument: Varian 311-A Mass Spectrometer interfaced via a single-stage glass jet separator to a Varian 2700 Gas Chromatograph. Data han'dled by an Incos 2300 Data System Column: 80/100 Carbopack (20.1% SP1000; 1.8m X 2 mm ID, glass Column oven temperature: Ambient Heated zone temperatures
Inlet: 170°C Transfer line: 300" C Helium separator: 275" C
Carrier: Helium, 30 ml/min Scan range: 5-350 amu Scan times (sec): up: 2.50 top: 0.00
down: 0.00 bottom: 0.50 Accelerator voltage: 3000 Electron multiplier voltage: -2000 Resolution: 801 Sample injected: 5 p1 of neat trichloroethylene
B. Results: The impurity corresponding to the peak reported1 in 1II.B. (with a retention time of 7.2 minutes) eluted in 9.65 minutes on this system. The spectrum obtained from this peak and a literature spectrum of a-pentane are given below.
Spectrum of Impurity Literature Spectrum of n-Pentane Relative Abundance Relative Abundance
-d e b e r c e n t of m/e 43) -m/e h e r c e n t of m/e 43)
43 100 43 100 41 62 42 59 42 61 41 41 39 26 27 34 27 25 29 25 29 17 39 14 57 11 57 13 72 7 72 9
C. Conclusions: The impurity with the retention time of 7.2 :minutes, reported in III.B., was identified on the basis of its mass spectrum as n-pentane.
269 Trichloroethylene, NTP TR 273

APPENDIX J. CHEMICAL CHARACTERIZATION
V. Chemical Stability at the Study Laboratory
A. Storage conditions: The chemical was stored at -20°C.
B. Bulk analysis
Instrument: Varian 3700 with CDS111Data System Detector: Flame ionization Temperature
Detector: 200"C Injector: 130"C Oven: 70" C, isothermal
Carrier gas: Nitrogen, 60 mllmin Column: 10% OV-101 on lOOl120 Supelcoport Sample injected: Neat liquid (1pl)
C. Results
Date of Purity (percent) Analysis Lot No. -Bulk Reference
04/12/79 TB05206AA -- 99.96 0713 1/79 99.15 12/17/79 99.96 99.99 04/23/80 99.96 99.96 08/19/80 99.15 100.00 11/20/80 TB08039AA -- 99.95 12/03/80 99.95 99.94 03/13/81 99.95 99.95 0311 7/81 99.96 99.95 06122181 99.95 99.94 12/21/81 99.97 99.98
D. Conclusion: No notable degradation was observed.
Trichloroethylene, NTP TR 273 270

APPENDIX K
IDENTIFICATION OF FOREIGN MA.TERIAL FOUND
IN TRICHLOROETHYLENE, LOT NO. TB05-206AA
271 Trichloroethylene, NTP TR 273

APPENDIX K. IDENTIFICATION OF FOREIGN MATERIAL
I. Analysis
A. Undissolved solids: The original sample of this lot of trichloroethylene was received in a 55-gallon drum and then transferred to 5-gallon drums. In July 1979, two drums were re-turned to Midwest Research Institute for analysis of flocculent material. The contents of two of these drums was filtered through ashless filter paper. The material was air dried and then weighed. Ten gallons (85 kg) of trichloroethylene was found to contain 260 mg of un- dissolved solid material. This represents undissolved solids at a level of 3 ppm. The empty drums were then cut open and visually inspected. None of the solids had remained in the drums. The drums were found to be uncoated on the inside and patches of light corrosion were found, probably due to the action of hydrochloric acid.
B. Dissolved solids: The amount of dissolved solids was determined by evaporating 100-ml aliquots of filtered trichloroethylene to dryness and weighing the residue. The trichloro- ethylene was found to contain dissolved solids at a level of 25.6 f 1.76)ppm.
C. Melting point determination: A Buchi Model 510@melting point apparatus was used to determine the melting characteristics of the foreign material. No melting was observed. At 110' C, the sample began to darken and continued to darken until complete decomposition was evident a t 290' C.
D. Elemental analysis (a)
Element
C H N Cl
Percent Found in Foreign Material
41.29 4.21
<0.05 0.95
(a)Analysis performed by Galbraith Laboratories, Inc., 2323 Sycamore Drive, Knoxville, Tennesee 37921
Trichloroethylene, NTP TR 273 272

APPENDIX K. IDENTIFICATION OF FOREIGN MATERIAL
E. Spark-source mass spectrometry (a)
Uranium <1.2 Iodine 2.9 Calcium >1.0% Thorium <2.4 Tellurium Potassium >0.5% Bismuth 2.5 Tin 3.1 Chlorine =1,800 Lead 31 Indium Internal Sulfur =1,600 Thallium <3.0 standard Phosphorus =4,000 Mercury NR Yttrium 6.2 Silicon >0.5% Rhenium Internal Strontium 39 Aluminum 600
standard Bromine 17 Magnesium >1.0% Tungsten <1.2 Arsenic <1.2 Sodium >1.0% Hafnium <2.8 Zinc 380 Fluorine 300 Erbium <1.8 Copper 990 Oxygen NR Samarium c 1.2 Nickel 1.4 Nitrogen NR Neodymium <1.8 Cobalt 1.3 Carbon NR Cerium 2.0 Iron -3,100 Boron 10 Lanthanum 1.6 Manganese 360 Lithium 8.6 Barium 3.4 Chromium 38 Cesium Titanium 58
(a)Analysis performed by Camp Dresser and McKee, Inc., 11455W. 48th Avenue, Wheat Ridge, Colorado 80033. Data are expressed in parts per million (byweight) of foreign material unless otherwise noted. All elements for which values are not entered are < 1.0ppm. NR = not reported
F. Free acid titration: Titration of aliquots of trichloroethylene with 0.01 N sodium hydroxide indicated the presence of 6.14 f 0.256)ppm free acid (ashydrochloric acid).
G. Infrared spectroscopy
Instrument: Beckman IR-12 Cell: Thin film on silver chloride plates Sample preparation: Toluene suspension of precipitated material
Results: The absorbances at 2,530, 1,795, 1,440, and 700 lcm-1 are characteristic of calcium carbonate. The other absorbances a t 2,930,2,860,967,and 912 cm-1 are compatible with an unsaturated hydrocarbon (Figure K-1).
H. Direct inlet mass spectrometry: The 70 eV mass spectirum (Table K1) was obtained from the foreign material. The spectrum indicates that the marterial was a mixture. Alkane and alkene fragmentation series were clearly evident. However, it was felt that the spectrum ob-tained may not be representative of the compound because of the nonvolatile and thermally unstable nature of the material (see Section I.C.). Spectra obtained from low density poly- ethylene, silicon rubber, and Teflon@ did not correspond to the spectrum of the foreign material.
273 Trichloroethylene, NTP TR 273

c3
N40
N4 P
I *.I
FIGURE K-1. INFRARED ABSORPTION SPECTRUM O F PRECIPITATE FOUND IN TRICHLOROETHYLENE (LOT NO. TB05-206AA)

_
TABLE K1. ANALYSIS BY DIRECT INLET MASS SPECTROMETRY OF FOREIGN MATERIAL FOUND IN TRICHLOROETHYLENE
Relative Abundance Rielative Abundance d e (percent of d e 69) d e (percent of d e 69)
~~ ~ ~ ~~ ~ ~~ ~ ~~~ ~ -~~ ~ _
69 100 137 18 55 94 121 18 98 92 99 18 83 75 59 17 57 60 54 17 97 60 87 17 81 56 125 17 129 55 108 16 73 52 151 15 95 51 80 15 43 50 93 15 41 49 42 14 67 48 79 14 44 41 124 14 71 38 39 14 60 36 239 13 85 36 94 13 84 35 107 13 311 35 138 13 96 35 152 12 135 34 171 12 70 32 53 12
111 32 126 11 109 30 101 11 56 30 29 11 112 26 143 11 313 26 72 11 236 24 61 10 123 22 89 10 339 21 91 10 110 21 113 10 116 21 149 10 237 20 157 10 185 19 165 10
115 10
275 Trichloroethylene, NTP TR 273

APPENDIX K. IDENTIFICATION OF FOREIGN MATERIAL
II. Summary of Analytical Data
The precipitated material was present in trichloroethylene at a level of 3 ppm. Nonvolatile and nonfilterable residue was present a t a level of 25.6 k 1.7(6)ppm. The results of elemental anal- ysis indicated that the precipitate contained 41.29% carbon, 4.21% hydrogen, 0.95% chlorine, and no detectable nitrogen. Spark-source mass spectrometry indicated the presence of calcium, magnesium, and sodium at levels greater than 1% and potassium a t levels greater than 0.5%. The dried precipitate was a fibrous-type material that decomposed on heating. Decomposition began at 110" C and was completed at 290" C. The infrared spectroscopy (see Figure K-1) in- dicated that the material was a mixture of calcium carbonate and probably an unsaturated hydrocarbon. Mass spectroscopy also indicated that the material was a mixture probably con- taining alkane and alkene materials.
Trichloroethylene, NTP TR 273 276

APPENDIX L
PREPARATION AND CHARACTERIZATION
OF DOSE M1XTURE:S
277 Trichloroethylene, NTP TR 273

APPENDIX L. PREPARATION AND CHARACTERIZATION
I. Stability of Trichloroethylene in Corn Oil at Room Temperature
A. Sample preparation: A 1% (w/v) solution of trichloroethylene in corn oil was prepared for each day of the study as follows: 10ml of corn oil was transferred into a 50-ml Hypo-vial, the vial was sealed, and then approximately 95 mg of trichloroethylene (measured exactly for each sample) was added via a 100-1.11syringe. The samples were shaken and stored at room temperature from 1to 7days.
B. Extraction and analysis: Each sample was extracted with 20 ml of methanol, which was injected into the sample vial via a 10-ml syringe. Samples for analysis were withdrawn directly from the top methanol layer in the vial and analyzed by gas chromatography with the following system.
Instrument:Tracor MT 220 Column: Chromosorb 102,60/80 mesh, 1.8 m X 2mm ID, glass Detection: Flame ionization Oven temperature: 160' C, isothermal Detector temperature: 260' C Inlet temperature: 200' C Retention time of compound: 4.15 min
C. Results
Average Percent Trichloroethylene End of Day in ChemicaVVehicle Mixture (a)
1.00k 0.05 0.96 k 0.05 0.99 f 0.05 0.98 k 0.05 1.00 f 0.05 0.98 k 0.05 0.99 k 0.05
(a)Corrected for an average spiked recovery yield of 61.7% f 0.9%. Target concentration of chemicalhehicle mixture, 1 .OO%.
D. Conclusion: Trichloroethylene mixed with corn oil is stable for 7days at room temperature.
Trichloroethylene, NTP TR 273 278

APPENDIX L. PREPARATION AND CHARACTERIZATION
II. Stability of Trichloroethylene in Corn Oil at 4°C
A. Sample preparation and analysis: Sample preparation and analysis procedures were the same as for the room temperature study.
B. Results
Number of Weeks Target Concentration (a) After Mixing -59.5 -235.5
60.4 240 59.2 236.9 56.9 236.9 58.4 236.9 56.9 235.3 57.3 235.3 55.4 227.6 55.8 239.6
~ ~~
(a)Milligrams trichloroethylenelmillilitersample
C. Conclusions: Trichloroethylene mixed with corn oil is stable for 4weeks at 4' C.
279 Trichloroethylene,NTP TR 273

280Trichloroethylene, NTP TR 273

APPENDIX M
METHODS OF ANALYSIS OF DOSE MIXTURES
281 Trichloroethylene, NTP TR 273

APPENDIX M. METHODS OF ANALYSIS
I. Study Laboratory
A. System
Instrument: Varian 3700 with CDS III Integrator Detector: Flame ionization Detector temperature: 200' C Injector temperature: 130' C Oven temperature: 70' C (isothermal) Carrier: Nitrogen, 30 ml/min Column: 10% OV-101 on 100/120 Supelcoport; 10 foot X 1/8inch stainless steel until 4/28/80, then 15 foot X 1/4 inch glass column
B. Procedure: Initially, the concentration of trichloroethylene in dose mixtures was cal- culated from the percent recovery after the trichloroethylene/corn oil mixture was extracted into methanol. The recovery for this method was usually about 65% and was replaced on March 16,1979, with a more reliable procedure, the internal-standard method.
A 2-ml aliquot of a trichloroethylene/corn oil mixture was diluted to 25 ml with an internal- standard solution containing 1.5 mg octanelml chloroform. A 3-pl aliquot of this mixture was injected into the gas chromatograph. If the sample was too concentrated (i.e., if the peak went offscale), the solution was rediluted as stated above with 2- to 25-ml portions of internal-standard solution.
Trichloroethylene, NTP TR 273 282

APPENDIX M. METHODS OF ANALYSIS
II. Analysis Performed at Midwest Research Institute
A. Extraction and analysis: The samples were allowed to equilibrate to room temperature; aliquots (approximately 5 g) of the chemical/vehicle mixture were transferred into 50-ml septum vials and accurately weighed. Methanol (5 ml) was added to each aliquot. Blanks and standards were prepared by weighing corn oil (5 g) into septum vials and spiking each sample with methanol or trichloroethylene in methanol ( 5 ml). Two standard solutions of trichloroethylene were prepared, and the standards were diluted further with methanol and added to the corn oil samples to give standards bracketing the concentration range of the sample. The samples were extracted immediately after spiking as follows.
Methanol (10-20 ml) containing n-butyl alcohol (6 or 11.34 mg/ml) or n-hexyl alcohol (1.8or 2.5 mg/ml) as an internal standard was added to each sample. The septum vials were sealed and the compound extracted into the methanol by mechanical mixing on a vortex mixer for 30 seconds followed by 30 seconds in an ultrasonic vibratory bath. The vials were cen- trifuged for 3 minutes to separate the corn oil/methanol layers and sampled directly from the top methanol layer for analysis by gas chromatography.
Instrumental parameters
Instrument: .Tracor MT-220 with Hewlett-Packard 3380A integrator or Varian 3700 with autosampler and Varian CDS III-C integrator Column: GP 20% SP2100/0.1% Carbowax 1500, on 100/120 mesh Supelcoport, 1.8m X 4 mm ID, glass, silanized Detection: Flame ionization
Tracor MT-220 Varian 3700 Temperatures
Inlet: 230"C 200"c Oven: 65"C, isothermal 80"C, isothermal Detector: 230"C 250"C
Carrier gas: Nitrogen, 70 ml/min Nitrogen, 30 ml/min Volume of solution
injected: 5 P1 3 P1 Retention time of
trichloroethylene: 3.7-4.1min 2.3-5.5min Retention time of
internal standard: 2.8-3.1min 4.2min (n-butyl alcohol) 6.5-10.6min (hexyl alcohol)
B. Quality control procedures: Analyses were performed in triplicate for the study chemical/vehicle sample and in duplicate for the blank corn oil sample. Spiked samples were prepared from two separately weighed standard solutions. The chemical/vehicle samples, the blank corn oil samples, and the spiked samples were all extracted and prepared for analysis in the same manner. Blank samples showed no interference from the corn oil a t the retention time of the major component. A calibration curve was established with the spiked sample extracts.
283 Trichloroethylene, NTP TR 273

APPENDIX M. METHODS OF ANALYSIS
III. Analysis Performed by Raltech Scientific Services, Inc.
A. Standard preparation: Trichloroethylene (6.25 g) was weighed into a 25-ml volumetric flask and diluted to volume with methanol. This stock solution was 250 mg/ml. Dilutions of the stock standard were made to obtain working standards of 5,25,50, and 125 mg/ml. Dilu- tions were made in methanol. n-Butanol (5 g) was weighed into a 500-ml volumetric flask and diluted to volume with methanol to obtain a 10 mg/ml internal standard solution.
B. Sample preparation and analysis: Sample aliquots (5 g) were transferred into 50-ml septum vials along with 5 ml of methanol and 20 ml of the methanol internal standard. The septum vials were sealed with Teflon@-faced septa, mixed on a Vortex mixer for 1 minute, and placed in an ultrasonic bath for 30 seconds. The vials were centrifuged for 5 minutes, and the upper methanol layer was sampled directly by syringe for gas chromatographic analysis.
C. Instrumental operating parameters
Instrument: Hewlett-Packard 5730 A Gas Chromatograph Detector: Flame ionization Column: 1.8m X 4 mm ID glass on-column injection Column packing: 20% SP2100/0.1%Carbowax 1500by weight on 100/120Supelcoport Carrier gas: Nitrogen, 50 ml/min Temperatures
Column: 70°C Detector: 250" C Injector: 200"C
Injection volume: 5 p1
Data were generated and analyzed on a Hewlett-Packard 3350 laboratory automation system.
D. Quality assurance: The sample was analyzed in triplicate. Duplicate blanks were pre- pared by adding 5 ml of methanol and 20 ml of methanol internal standard to 5 g of blank corn oil and extracting. Aliquots (5 ml) of the working trichloroethylene standards, ranging from 5 to 50 mg/ml, were added to 5 g of blank corn oil along with 20 ml of methanol internal standard. These extracted standards were equivalent to 5-250 mg/g of trichloroethylene in corn oil.
Trichloroethylene, NTP TR 273 284

APPENDIX N
RESULTS OF ANALYSIS OF DOSE MIXTURES
PAGE
TABLE N1 RESULTS OF ANALYSIS OF DOSE MIXTURES IN THE TWO-YEAR GAVAGE STUDIES OF TRICHLOROETHYLENE 286
TABLE N2 RESULTS OF REFEREE ANALYSIS OF DOSE MIXTURES IN THE TWO-YEAR GAVAGE STUDIES OF TRICHLOROETHYLENE 288
285 Trichloroethylene, NTPTR 273

TABLE N1. RESULTS OF ANALYSIS OF DOSE MIXTURES IN THE TWO-YEAR GAVAGE STUDIES OF TRICHLOROETHYLENE
Date Mixed
11/16/76 12/08/7812114/78
12/21/7012/28/7801/04/790111 1/79
01118~19 01/25/7901/31/79
02/07/79
02/14/79
02/21/79
02/28/79
03/07/79
03/14/79 03/21/79 03/28/79 04/04/79
0411 1/79 04113/79 04/25/7905/01/79
05130n9
06/27/79
07/19/7907/25/79
07/31/7908/15/79 08/21/79
08/27/79 09/13/7909/19/79
Concentration (mdml) Target (T) Determined (D) (a)
333.5 164.3 72.5
170.0 334.5 189.5 200.0 218.4 78.5
356.6 225.4 232.0 240.2 243.0 161.8 357.5
74.9 242.2 182.8 246.9 198.5 510.0 423.0 512.3 441.2 699.8 514.9 462.9 156.0 477.0 497.6 492.9 728.4 156.9 68.0
544.2 519.8 519.0 512.9 524.5 729.8 161.9 561.6 524.5 751.6 573.0 535.2 156.5 161.2 730.2 561.2 548.2 591.0 755.0 164.4 597.4 606.5
85.4 716.2 612.5 615.8 732.8 164.8
322.1 164.4 66.6
175.4 273.2 145.9 210.6 214.7 77.2
354.8 2 14.7 238.2 214.7 236.6 150.8 364.1 69.0
251.2 175.4 255.1 191.8 537.1 434.5 519.2 441.6 727.7 525.1 460.9 168.4 513.7 499.2 517.8 765.1 165.8 69.8
570.6 545.9 511.7 542.7 543.0 736.9 175.8 601.4 562.0 756.1 602.1 547.1 164.5 166.6 731.0 584.5 567.8 567.0 778.1 164.6 573.6 578.6
84.7 680.5 557.5 572.1 662.0 161.5
Percent DI"
96.6 100.1 91.9
103.2 81.7 77.0
105.3 98.3 98.3 99.5 95.3
102.7 89.4 97.4 93.2
101.8 92.1
103.7 96.0
103.3 96.6
105.3 102.7 101.3 100.1 104.0 102.0 99.6
107.9 107.7 100.3 105.1 105.0 105.7 102.6 104.9 105.0 98.6
105.8 103.5 101.0 108.6 107.1 107.1 100.6 105.1 102.2 105.1 103.3 100.1 104.2 103.6 95.9
103.1 100.1 96.0 95.4 99.2 95.0 91.0 92.9 90.3 98.0
Date Mixed
09/26/79 10112/79 10/15/79 1011 7/79
10/19/79 11/21/7912/10/79121 14/79 1211 7/79 12/20/7901IO 2/80 01/09/80
0111 6/80 01/24/80 02/06/80
02/07/80
02/14/80
02/22/80
02/27/80
02/28/80
03/05/80
0311 2/80 0311 9/80
03/26/80
Concentration (mg/ml) Percent Target (T) Determined (D) (a) DI"
619.8 615.9 325.3 164.8 730.0 365.4 499.5 546.0 553.3 628.8 566.1 600.8 663.6 577.2 628.4 696.2
70.6 70.6 74.4 74.4
339.4 182.5 218.7 218.7 122.3 122.3 306.9 160.5 204.5 204.5 101.6 101.6 308.3 183.7 183.7 159.9 159.9 91.7 91.7
116.1 116.1 592.6 153.2 153.2 130.6 130.5 198.3 330.4
75.8 75.8 69.4 69.4
218.7 218.7 214.3 319.5 319.5 158.8 158.8 224.0 224.0 282.1 282.1
597.4 581.7 319.1 157.1 664.0 351.0 479.6 506.8 512.6 582.6 522.8 602.4 625.7 566.7 592.6 666.7
79.4 70.3 84.8 76.8
364.8 184.6 240.1 203.1 140.3 119.5 335.3 172.9 225.4 187.4 113.7 98.5
337.7 206.4 173.2 178.6 149.8 105.3 94.5
135.5 119.4 619.2 175.7 145.8 138.5 118.7 205.8 358.9 88.0 74.3 78.6 69.5
258.2 204.7 222.7 344.6 342.2 175.1 148.4 248.1 211.1 314.2 261.4
96.4 94.4 98.1 95.3 91.0 96.1 96.0 92.8 92.6 92.7 92.4
100.3 94.3 98.2 94.3 95.8
112.5 (b)99.6
114.0 tb) 103.2
107.5 101.2 109.8
(b)92.9114.7
(bj97.7109.3 107.7 110.2
(b)91.6 111.9
(b)96.9 109.5 112.4
(b)94.3 111.7
(b)93.7 114.8
(b )103.1 116.7
(b )102.8 104.5 114.7
tb)95.2 106.0
( b )91.0 103.8 108.6 116.1
(b)98.0 113.3
(b )100.1 118.1
(b)93.6 103.9 107.9 107.1 110.3
( b )93.5 110.8
(b)94.2 111.4
tb) 107.9
Trichloroethylene, NTP TR 273 286

TABLE N1. RESULTS OF ANALYSIS OF DOSE MIXTURES IN THE TWO-YEAR GAVAGE STUDIES OF TRICHLOROETHYLENE (Continued)
Date Concentration (mg/ml) Percent Date - Concentration (mg/ml) Percent Mixed Target (T) Determined (D) (a) Dfl' Mixed Target (T) Determined (D) (a) DIT
03/27/80
04/02/80
04/08180 04/09/80
04/16/80
0412 218 0
04/23/8004/30/80
05/07/80
05/13/80
0512 2/8 0
06/04/80
06/11/80
06/18/80
06/25/80
07/02/80
07/09/80
07/16/80
07/23/80
07/30/80
08/13/80
08/20/80
08/27/80
09/03/8009/10/80
09/17/80
09/24/80
10/01/80
391.6 275.5 275.5 174.2 69.7 66.0
121.9 162.6 106.4 198.4 96.8
215.7 141.8 148.1 118.9 225.4
65.1 73.8
327.3 313.4 213.7 416.4 278.7 216.5 329.1 292.2 228.4 106.2 163.8 99.1
179.5 149.7 121.7 228.0 145.1 315.8 210.7 350.9 203.3 298.0 223.8 435.4 295.8 185.8 102.5 149.8 149.8 120.5 120.3 236.2 149.8 171.9 356.5 206.4 30 1.9 235.8 444.7 286.0 319.0 220.9 187.7 187.7 102.9 102.9
421.0 305.4 254.4 168.4 72.2 68.9
137.0 170.9 111.0 199.7 101.1 220.1 146.0 140.8 120.3 230.3
68.0 79.6
330.2 324.0 221.8 429.5 279.9 220.7 323.2 286.1 233.8 113.1 164.8 96.4
173.9 153.6 128.0 238.4 151.4 323.0 220.0 355.7 213.4 279.5 211.6 403.1 275.4 198.8 105.6 168.2 162.1 137.8 132.3 245.9 159.3 163.2 371.5 216.9 293.0 253.2 453.3 300.5 335.6 232.0 227.3 193.6 122.1 102.7
107.5 110.9
(b) 92.3 96.7
103.6 104.4 112.4 105.1 104.3 100.7 104.4 102.0 103.0 95.1
101.2 102.2 104.5 107.9 100.9 103.4 103.8 103.1 100.4 101.9 98.2 97.9
102.4 106.5 100.6 97.3 96.9
102.6 105.2 104.6 104.3 102.3 104.4 101.4 105.0 93.8 94.5 92.6 93.1
107.O 103.0 112.3
tb) 108.2 114.4
tb) 110.0 104.1 106.3 94.9
104.2 105.1 97.1
107.4 101.9 105.1 105.2 105.0 121.1
( b )103.1 118.7
(b)99.8
10/08180
10117/80
10123180
10129l80
11/05/80
11/13/80
11/18/80
11/25/80
12110180
12/17/80
12/23/80
01107/8 1
01120/81
02f 1718 1
02/i8/8 1
02/24/81
02/25/81 0311 718 1
04/28/81
05/26/81
06/23/8 1
149.3 149.3 118.6 118.6 240.8 240.8 147.7 147.7 159.3 109.6 191.0 103.5 304.0 226.6 240.4 149.1 313.9 226.7 370.6 209.4 247.2 148.4 157.0 110.6 189.9 189.9 104.1 465.9 297.5 363.2 207.0 194.3 107.8 107.8 107.8 370.7 218.7 253.6 150.6 108.0 108.0 108.0 373.6 217.8 461.3 299.5 192.4 192.4 111.1 111.1 254.8 254.8 155.1 155.1 458.3 297.9 364.9 217.5 182.3 113.6 113.6 252.1 154.1 361.7
176.9 154.5 138.7 126.5 266.0 238.1 162.9 146.7 165.2 110.0 193.5 107.0 303.5 227.4 235.5 156.0 316.3 232.1 363.6 215.8 250.9 155.0 164.3 115.6 218.4 215.3 113.8 454.5 297.6 354.8 200.9 205.3 119.9 120.7 114.8 370.7 232.7 266.5 161.1 122.7 113.6 116.8 360.5 214.3 449.1 295.9 189.2 177.9 117.0 110.0 246.1 244.8 160.6 154.6 475.6 312.2 383.1 224.4 172.3 99.4
103.3 229.9 147.8 339.2
118.5 (b) 103.5
116.9 (b) 106.7
110.5 (bi 98.9
110.3 (b)99.3
103.7 100.4 101.3 103.4 99.8
100.4 98.0
104.6 100.8 102.4 98.1
103.1 101.5 104.4 104.6 104.5 115.0
(b)113.4 109.3 97.6
100.0 97.7 97.1
105.7 111.2
tb) 112.0 tbi 106.5
100.0 106.4 105.1 107.0 113.6
(b)105.2 108.1 96.5 98.4 97.4 98.8 98.3
tb,c) 92.5 105.4
(b,cr99.0 96.8
tb,ci96.1 103.5
tb,ci 99.7 103.8 104.8 105.0 103.2 94.5
( d i87.5 (b,di90.9
91.2 95.9 93.8
287 Trichloroethylene, NTP TR 273

TABLE NI. RESULTS OF ANALYSIS OF DOSE MIXTURES IN THE TWO-YEAR GAVAGE STUDIES OF TRICHLOROETHYLENE (Continued)
Date Mixed
Concentration (mg/ml) Percent Target (T)Determined (D) (a) DIT
06l2318 1 219.4 217.0 98.9 154.1' 142.8 92.7
0710 118 1 110.0 111.7 101.5 07l2118 1 361.9 345.9 95.6
218.8 203.8 93.1 458.0 446.2 97.4 312.4 295.8 94.7
08/18/81 181.4 181.4 112.6
172.9 173.2 113.6
95.3 (b,c)95.5
100.9 112.6 112.9 (b,c) 100.3
Mean (percent of target)Standard deviation Coefficient of variation (percent) Range (percent of target) Number of samples
(a )Results of duplicate analysis (b)Repeat analysis; not included in mean (c)Ditrerent sample preparation method used (d)Not used in the studies
Date Mixed
Concentration (mg/ml) Percent Target (T) Determined (D) (a) DIT
~ ~~
251.3 254.1 101.1 25 1.3 151.3
246.2 148.9
tb,c) 98.0 98.4
0911 518 1 151.3 336.4
144.6 318.2
tb,c) 95.6 94.6
219.2 205.0 93.5 440.4 416.6 94.4 297.1 284.9 95.9
1011 3/8 1 246.2 237.6 96.9 150.6 148.5 98.6
102.2 6.61 6.6
77.0- 121.1 234
TABLE N2. RESULTS OF REFEREE ANALYSIS OF DOSE MIXTURES IN THE TWO-YEAR GAVAGE STUDIES OFTRICHLOROETHYLENE
Determined Concentration Date
Mixed
0311 9180 0311718 1omwai 09115181
(a )Resultsof duplicate analysis (b)Resultsof triplicate analysis
Target Concentration (mg/ml)
158.8 217.8 154.1 336.4
Study Laboratory (a)
175.1 214.3 147.8 318.2
Referee Laboratory (b)
160.4 221.1 150.0 329.0
Trichloroethylene, NTP TR 273 288

APPENDIX 0
SENTINEL ANIMAL PROGRAM
PAGE
TABLE 0 1 MURINE VIRUS ANTIBODY DETERMINATIONS FOR RATS IN THE TWO-YEAR GAVAGE STUDIES OF TRICHLOROETHYLENE
289 Trichloroethylene,NTP TR 273
291

APPENDIX 0. SENTINEL ANIMAL PROGRAM
I. Methods
Rodents used in the Carcinogenesis Program of the National Toxicology Program are produced in op- timally clean facilities to eliminate potential pathogens that may affect study results. The Sentinel Animal Program is part of the periodic monitoring of animal health that occurs during the toxicologic evaluation of chemical compounds. Under this program, the disease state of the rodents is monitored via viral serology on sera from extra (sentinel) animals in the study rooms. These animals are un-treated, and these animals and the study animals are both subject to identical environmental condi- tions. The sentinel animals come from the same production source and weanling groups as the ani- mals used for the studies of chemical compounds.
Fifteen rats of each strain and sex are selected a t the time of randomization and allocation of the ani- mals to the various study groups. Five animals of each designated sentinel group are killed a t 6,12, and 18months on study. Data from animals surviving 24months are collected from 5/50 randomly selected vehicle control animals of each sex and species. The blood from each animal is collected and clotted, and the serum is separated. The serum is cooled on ice and shipped to Microbiological Asso-ciates' Comprehensive Animal Diagnostic Service for determination of the viral antibody titers. The following tests are performed:
Hemagglutination Inhibition
Complement Fixation
PVM (pneumonia virus of mice) Sendai (August, 18mo;
RCV (rat coronavirus) Sendai
Marshall, 24mo) M. Ad. (mouse adenovirus) KRV (Kilham rat virus) H-1(Toolan's H-1virus) MHV (mouse
(Marshall, 24mo)
Reo 3 (reovirus type 3) hepatitis virus) (Marshall, 24mo) (Marshall, 24mo)
Poly (polyoma virus) (Marshall, 24mo)
Ectro (infectious ectromelia) (Marshall, 24mo)
II. Results
Results are presented in Table 01.
Trichloroethylene, NTP TR 273 290

TABLE 01. MURINE VIRUS ANTIBODY DETERMINATIONS FOR RATS IN THE TWO-YEAR GAVAGE STUDIES OF TRICHLOROETHYLENE (a)
No. of Positive Serologic Interval (months) Animals Reaction for
18 10110 PVM 1/10
10110 KRV Sendai
8110 RCV
August
6 7/10 9/10
PVM RCV
18 7/10 PVM
Mars hall
18 919 PVM 919 Sendai 919 RCV
24 919 PVM 819 Sendai 319 RCV
Osborne-Mendel
12 _- None positive
(a)Blood samples were taken from sentinel animals at 6,12, and 18 months aRer the start ofdosing and from the vehicle control animals just before they were killed; samples were sent to Microbiological Associates (Bethesda, MD) for determination of antibody titers.
291 Trichloroethylene,NTP TR 273

Trichloroethylene, NTPTR 273 292

APPENDIX P
SURVIVAL AND MEAN BODY WEIGHTS OF ACI, AUGUST,
AND MARSHALL RATS IN THE THIRTEEN-WEEK
GAVAGE STUDIES OF TRICHLOROETHYLENE
PAGE
TABLE P1 SURVIVAL AND MEAN BODY WEIGHTS OF ACI RATS IN THE THIRTEEN-WEEK GAVAGE STUDIES OF TRICHLOROETHYLENE 294
TABLE P2 SURVIVAL AND MEAN BODY WEIGHTS OF AUGUST RATS IN THE THIRTEEN-WEEK GAVAGE STUDIES OF TRICHLOROETHYLENE 294
TABLE P3 SURVIVAL AND MEAN BODY WEIGHTS OF MARSHALL RATS IN THE THIRTEEN- WEEK GAVAGE STUDIES OF TRICHLOROETHYLENE 296
293 Trichloroethylene, NTP TR 273

TABLE P1. SURVIVAL AND MEAN BODY WEIGHTS O F ACI RATS IN THE THIRTEEN-WEEK GAVAGE STUDIES OF TRICHLOROETHYLENE
Mean Body Weights (grams) Final Weight Relative Dose Survival (a) Initial Final Change to Vehicle Controls
hg /kg ) (percent)
MALE
0 10/10 46 258 +212 _ _ 125 10/10 67 257 +190 99.6 250 10110 57 243 +186 94.2 500 10/10 55 252 +197 97.7
1,000 10/10 52 234 +182 90.7 2,000 10110 52 213 +161 82.6
FEMALE
0 10/10 45 174 + 129 .-62.5 10110 63 173 + 110 99.4 125 1011 0 51 165 +I14 94.8 250 10/10 51 172 +1.21 98.9 500 10/10 45 160 +115 92.0
1,000 loll0 37 162 +125 93.1
(a)Number surviving/number in group
TABLE P2. SURVIVAL AND MEAN BODY WEIGHTS OF AUGUST RATS IN THE THIRTEEN-WEEK GAVAGE STUDIES OF TRICHLOROETHYLENE
Mean Body Weights (grams) __ Final Weight Relative Dose Survival (a) Initial Final Change to Vehicle Controls
b%kg) (percent)
MALE
0 10/10 79 338 +259 -_ 125 1011 0 88 342 +254 101.2 250 10/10 94 327 +233 96.7 500 10/10 91 324 +233 95.9
1,000 10/10 94 324 +230 95.9 2.000 7/10 81 286 +205 84.6
FEMALE
0 10/10 78 207 +129 --62.5 10/10 80 210 +130 101.4 125 10110 82 208 +1'26 100.5 250 10/10 78 208 +130 100.5 500 10/10 76 204 +128 98.6
1.000 10110 73 192 +119 92.8
(a)Number surviving/number in group
Trichloroethylene, NTP TR 273 294

TABLE P3. SURVIVAL AND MEAN BODY WEIGHTS OF MARSHALL RATS IN THE THIRTEEN-WEEK GAVAGE STUDIES OF TRICHLOROETHYLENE
Mean Body Weights @rams) Final Weight Relative Dose Survival (a) Initial Final Change to Vehicle Controls
(mg/kg) (percent)
MALE
0 10110 112 247 + 135 _ _ 268 10/10 140 255 +115 103.2 308 10/10 134 259 +125 104.9 495 1.0/10 118 249 +131 100.8 932 10110 111 232 + 121 93.9
1,834 10/10 128 217 +89 87.9
FEMALE
0 10110 95 171 +76 _ _ 134 10110 114 173 +59 101.2 153 10110 109 176 +67 102.9 248 10110 108 175 +67 102.3 466 10110 96 166 +70 97.1 918 10110 34 164 +70 95.9
(a)Number surviving/number in group
295 Trichloroethylene,NTP TR 273

296Trichloroethylene, NTP TR 273

APPENDIX Q
AUDIT SUMMARY
297 Trichloroethylene, NTPTR 273

APPENDIX Q. AUDIT SUMMARY
The experimental data, documents, and pathology materials for the NTP Technical Report on the 2-year toxicology and carcinogenesis studies of trichloroethylene administered by gavage in corn oil to ACI, August, Marshall, and Osborne-Mendel rats were examined for completeness, consistency, and accuracy. These studies, initiated by the National Cancer Institute under a prime contract to Tracor Jitco, Inc., were conducted at the Papanicolaou Cancer Research Institute, Miami, Florida, be- tween December 1978 and November 1981. The experiments were started before the NTP required compliance with Good Laboratory Practice (GLP) regulations of the Food and Drug Administration (implemented by the NTP October 1,1981). The following three contractors conducted the audits:
(1) Immuquest Laboratories, Inc., Rockville, Maryland: Toxicology and pathology data for studies in ACIand August ruts (October through November 1983)and chemistry data for all studies (November 1983). Personnel conducting the audits were Pamela Errico, M.A.; Caroline Reese; Karen Witkin, Ph.D.; and Ronald Schueler, D.V.M.
(2) Argus Research Laboratories, Inc., Horsham, Pennsylvania: Toxicology and pathology data for studies in Marshall ruts (March 1984). Personnel conducting the audit were Jane Goeke, Ph.D., and F. Garner, D.V.M.
(3) Clement Associates, Inc., Washington, DC: Pathology data for studies conducted in Osborne-Mendel rats (March 1984). The audit was conducted by Miriam Anver, D.V.M., Ph.D. The toxicology portion of the studies in Osborne-Mendel rats was not auditedl.
The audit reports are on file at the National Institute of Enivironmental Health Sciences, Research Triangle Park, North Carolina. The audits included a review of
(1) Inlife toxicology data for 5%-10% of the study animals. (2) All records concerning dosing, clinical signs, and mortality of study animals. (3) All Individual Animal Data Records to examine for correspondence between necropsy obser-
vations and histologic findings. (4) Wet tissues from a random 10%sample of the study animals to verify animal identification
and to examine for untrimmed masses. (5) All slides and blocks of tissue from both sexes of all strains in the high dose and vehicle con-
trol groups to examine for proper match and inventory. (6)All available analytical chemistry and dose mixture data.
The audit of the inlife phase of these studies, which were conducted before implementation of GLP re- quirements, identified a number of omissions in study documentation. These included: (1)absence o€ complete study protocol, (2) absence of animal breeding and husbandry records, and (3) absence of environmental condition records. The clinical observation rlecords showed inconsistent recording of palpable masses and other clinical signs, missing or incorrectly recorded body weights, and occasional discrepancies between mortality and clinical records which, taken collectively, leave open the possibility that some animals may have been misidentified. during the studies. The records also documented clinical observation of toxicity associated with administration of doses. In addition, there were incidents recorded where malfunctions in automated watering systems resulted in flooding of animal cages.
The contract governing the conduct of these studies did not require the retention of animal carcasses containing individual animal identifying markers; however, examination of the residual, forma- lin-fixed tissues (wet tissues) revealed that ears but not feet, for most animals had been preserved. Ears contained the first two digits of the three- and four-digit identification numbers used. Review of the wet tissues for 240 rats showed that 237 of them had an ear punch that matched the bag label. The slide/block audit showed good match up, but sections taken from a number of blocks appeared to
Trichloroethylene, NTP TR 273 298

APPENDIX Q. AUDIT SUMMARY
be incomplete (i.e., the blocks did not always have corresponding full-fface sections). Instances of gross observations without corresponding microscopic diagnoses and untrimmed potential lesions in wet tissues which were detected by the audit were reviewed by NTP staff and were either resolved satis- factorily or believed to have no impact on interpretation of the study results.
Original records documenting the chemical analyses performed by the study laboratory were not available to fully validate the chemistry portion of the studies. Those records that were available in- dicated that samples taken from seven chemicalhehicle preparations were shipped to Midwest Re- search Institute (MRI) for analysis. The analyses performed by MRI were well documented and showed good agreement with those reported by the study laboratory. The bulk chemical purity was documented by the MRI records. Audit of the study laboratory’s cheimical use log indicated that dose preparation calculations were valid and that sufficient chemical was available for the conduct of the studies. Comparison of the chemical use log with the dose preparation log showed that the amount of chemical used matched the amount checked out.
These studies were not required to be Conducted under GLP standards. Nevertheless, retrospective audit of the available documents and materials shows that recordkeeping was less than adequate to fully document all of the procedures followed and the original data generated. The Tracor Jitco State- ment of Work, applicable under the terms of the contract governing this study, is presumed to have been followed in lieu of a formal study protocol and system for documenting procedures actually fol- lowed. The most significant audit findings from review of the existing study records and data in- volved inconsistent recording of inlife records of clinical observations and palpable masses and the ab- sence of complete carcass identification information in wet tissues. Thus, the possibility that some animals may have been mixed up during the conduct of the studies cannot be excluded. Because of the characteristic kidney lesions produced by trichloroethylene, it is unlikely that dosed and vehicle control animals were confused. It is recognized, however, that total confidence cannot be placed in the differentiation of all high dose from low dose animals. Incidents of niisdosing (animals dosed twice in 1 day or given incorrect doses) were reported. Tissue accountability for the kidney was generally adequate. Despite incomplete chemistry records, the original data. that are available indicate that animals were dosed with trichloroethylene and that dose mixtures were prepared properly.
The NIEHS/NTP concludes that the incomplete documentation for these studies reveals certain gaps and inconsistencies that have been considered in the interpretations given in the Technical Report.
* U . S .COVERNmEN1 P R I N T I N G OFFICE: 1988- 201-778161228 299 Trichloroethylene, NTP TR 273


NATIONAL TOXICOLOGY PROGRAM TECHNICAL REPORTS PUBLISHED AS OF JANUARY 1988
T R No. CHEMICAL TR No. CHEMICAL
201 2,3,7,8-Tetrachlorodibenzo-p-dioxin(Dermal) 263 1,2-Dichloropropane 206 Dibromochloropropane 267 Propylene Oxide 207 Cytembena 269 Telone II* 208 FD& C Yellow No. 6 271 HC Blue No. 1 209 2,3,7,8-Tetrachlorodibenzo-p-dioxin(Gavage) 272 Propylene 210 1,a-Dibrornoethane (Inhalation) 274 Tris(2-ethylhexy1)phosphate 211 C.I. Acid Orange 10 275 2-Chloroethanol 212 Di(2-ethylhesy1)adipate 276 8-Hydroxyquinoline 213 Butylbenzyl Phthalate 281 H.C.Red No. 3 214 Caprolactam 282 Chlorodibromomethane 215 Bisphenol A 284 Diallylphthalate (Rats) 216 11-Aminoundecanoic Acid 285 C.I. Basic Red 9 Monohydrochloride 217 Di(2-ethylhexy1)phthalate 287 Dimethyl Hydrogen Phosphite 219 2,6-Dichloro-p-phenylenediamine 288 1,3-Butadiene 220 C.I.Acid Red 14 289 Benzene 221 LocustBean Gum 291 Isophorone 222 C.I.Disperse Yellow 3 293 HC Blue No. 2 223 Eugenol 294 Chlorinated Trisodium Phosphate 224 Tara Gum 295 Chrysotile Asbestos (Rats) 225 D & C Red No. 9 296 Tetrakis(hydroxymethy)phosphonium Sulfate and 226 C.I. Solvent Yellow 14 Tetrakis(hydroxymethy)phosphonium Chloride 227 Gum Arabic 298 Dimethyl Morphalinophosphoramidate 228 Vinylidene Chloride 299 C.I. Disperse Blue 1 229 Guar Gum 300 3-Chloro-2-methylpropene 230 Agar 301 o-Pheny Iphenol 231 Stannous Chloride 303 4-Vinylcyclohexene 232 Pentachloroethane 304 Chlorendic Acid 233 2-Biphenylamine Hydrochloride 305 Chlorinated Paraffins 43% chlorine) 234 Allyl Isothiocyanate 306 Dichloromethane 235 Zearalenone 307 Ephedrine Sulfate 236 o-Mannitol 308 Chlorinated Paraffins (C12, 60% chlorine) 237 1,1,1,L-Tetrachloroethane 309 Decabromodiphenyl Oxide 238 Ziram 310 Marine Diesel Fuel and JP-5Navy Fuel 239 Bis(2-chloro-1 -methylethyl)ether 311 Tetrachloroethylene (Inhalation) 240 Propyl Gallate 312 n-Butyl Chloride 242 Diallyl Phthalate (Mice) 314 Methyl Methacrylate 244 Polybrominated Biphenyl Mixture 315 Oxytetracycline Hydrochloride 245 Melamine 316 1.Chloro-2-methylpropene 247 L-Ascorbic Acid 317 Chlorpheniramine Maleate 248 4,4'-Methylenedianiline Dihydrochloride 318 Ampicillin Trihydrate 249 Amosite Asbestos 319 1,4-Dichlorobenzene 250 Benzyl Acetate 321 Bromodichloromethane 251 Toluene Diisocyanate 322 Phenylephrine Hydrochloride 252 Geranyl Acetate 323 Dimethyl Methylphosphonate 253 Allyl Isovalerate 324 Boric Acid 255 1,2-Dichlorobenzene 325 Pentachloronitrobenzene 257 Diglycidyl Resorcinol Ether 326 Ethylene Oxide 259 Ethyl Acrylate 327 Xylenes (Mixed). 261 Chlorobenzene 328 Methyl Carbamate
These NTP Technical Reports are available for sale from the National Technical Information Service, U.S.Department of Commerce, 5285 Port Royal Road, Springfield, VA 22161 (703-487-4650). Single copies of this Technical Report are avail- able without charge (and while supplies last) from the NTP Public Information Ofice, National Toxicology Program, P.O. Box 12233, Research Triangle Park, NC 27709.