Doctoral Thesis Creating and validating UML class diagrams ...
Upload
independentCategory
view
2download
0
Oceanological and Hydrobiological Studies I n t e r n a t i o n a l J o u r n a l o f O c e a n o g r a p h y a n d H y d r o b i o l o g y
Volume 40, Issue 4
ISSN 1730-413X (11–20)
eISSN 1897-3191 2011
DOI: 10.2478/s13545-011-0036-1
Original research paperReceived:Accepted:
June 02, 2011September 06, 2011
Copyright© of Institute of Oceanography, University of Gdansk, Poland www.oandhs.org
Towards validating a last generation, integrated wave-current-sediment numerical model in coastal regions using video measurements Sandro Carniel1*, Mauro Sclavo1, Renata Archetti2 1Institute of Marine Sciences (CNR-ISMAR) Castello 2737-F, I-30122 Venice, Italy 2University of Bologna, DICAM, Italy Key words: sediment transport, shoreline evolution, littoral management, ROMS, ARGUS.
Abstract
This paper presents the first steps in the implementation of a morphological numerical model to be applied in the Bevano River region, a shallow water area in the Adriatic Sea, with the aim of helping the identification and assessment of erosional patterns and bottom morphological modifications induced by severe marine storms. The numerical modeling, performed using a fully 3D coupled wave-current-sediment version of the ROMS model, has been complemented with in situ data analysis and observations: a first qualitative validation of the results was given by the analysis of images acquired via an ARGUS video station.
Hydrodynamic modeling highlighted how shear bottom stresses and bottom currents fields were heavily influenced by severe storm situations, and had large effects on the morphology of shallow regions. The correlation between the wave-current induced bottom stresses and the resulting topography was investigated. Nearshore hydrodynamics modeling results demonstrated the dominant role played by alongshore sediment
* Corresponding author: [email protected]
transport, with the magnitude of both cross- and along-shore wave-induced currents strongly depending on wave height and direction.
We found a good qualitative conformity between the results of the numerical models applied during a “Bora” storm and the corresponding video observations; both techniques indicated the migration of the existing sandbar within the range of about 40 m seaward.
Results show how integrated numerical open source tools, often used in oceanography, are becoming suitable for both preliminary investigations and for planning the effective littoral management, and how their calibration can be supported by the use of new low cost techniques, such as video measurements. INTRODUCTION
Complex, integrated wave-current-sediment numerical models that simulate near-shore processes need to account for several processes, such as wave-current interactions, turbulent mixing, wetting and drying processes, bottom-boundary layer interactions and sediment re-suspension and transport (Warner et al. 2008, Warner et al. 2010). Nevertheless, in the last years it has become possible for these integrated numerical tools to increasingly support the decision makers in the field of coastal erosion and vulnerability (e.g. beach protection design, maritime structures design, “search and rescue” activities, maritime engineering operations, etc.), and therefore to support engineering approaches, such as groins or rocks deployment, usually followed to protect littoral areas (Carniel et al. 2007, Archetti and Zanuttigh 2010).
Several national and international projects have been dealing with the issue of coastal areas protection in the Mediterranean Sea (e.g. BEACHMED-e, Strategic management of beach protection for sustainable development of Mediterranean coastal zones, see http://www.beachmed.it/) or more specifically in the Adriatic basin (e.g. VECTOR, VulnErability of the Italian coastal area and marine ecosystems to
12 | Sandro Carniel, Mauro Sclavo, Renata Archetti
Copyright© of Institute of Oceanography, University of Gdansk, Poland www.oandhs.org
climatic changes and their role in the Mediterranean carbon cycles, see http://vector.conismamibi.it/), also following the recent EU regulations, especially in the perspective of the effects induced by severe storms. The complexity of these applications is generally increased by the fact that very often coastal areas constitute also a relevant economic resource to be exploited in terms of aquaculture activities and tourist attraction, which requires for instance indications for periodic nourishment with sandy sediments.
A large number of codes for coastal hydrodynamics and morphodynamics simulation are available to end users and researchers: commercial software (e.g. Mike21, Delft3D, Telemac) where the source code is generally not directly available and open sources code (Refdif, Shorecirc and others). The Regional Ocean Modeling System (http://www.myroms.org) is a well-known oceanographic code − originally developed for open ocean studies; after recent developments, the fully 3-D, integrated, coupled wave-currents-sediment version (Warner et al. 2008, Warner et al. 2010) is being employed in coastal, high resolution applications (Carniel et al. 2007).
In addition to this, very recently numerical results have started being interpreted with the help of available data and images acquired by means of video systems (e.g. Kroon et al. 2007, Ranasinghe et al. 2004).
With the aim to describe the geo-morphological and hydrodynamic conditions in a shallow region induced by a particularly intense Bora storm (see also Boldrin et al. 2009), we present here a very high resolution numerical application focused on the NW Adriatic coast, the Bevano River region, close by Ravenna (Fig. 1) with the use of ROMS. The results are qualitatively validated with the morphodynamics observations carried out by the analysis of an ARGUS video station installed in Lido di Dante, a beach area close to the study site.
The paper is organized as follows: after this short Introduction, the study area is described and the numerical tests performed to simulate the nearshore dynamics during a typical marine storm are presented. The results are then discussed, with the help of available data and images acquired by means of an ARGUS video system installed close to the study site (Archetti 2009). Finally, a summary of the lessons learnt and some suggestions for future activities are presented.
THE STUDY AREA
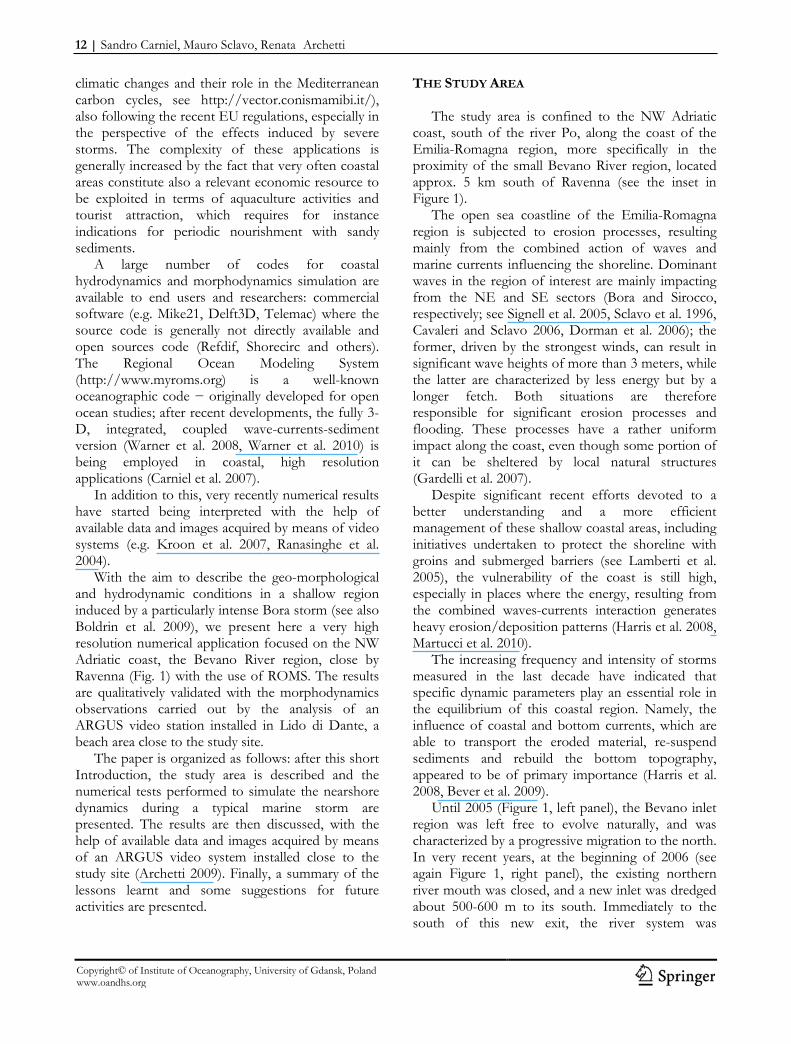
The study area is confined to the NW Adriatic coast, south of the river Po, along the coast of the Emilia-Romagna region, more specifically in the proximity of the small Bevano River region, located approx. 5 km south of Ravenna (see the inset in Figure 1).
The open sea coastline of the Emilia-Romagna region is subjected to erosion processes, resulting mainly from the combined action of waves and marine currents influencing the shoreline. Dominant waves in the region of interest are mainly impacting from the NE and SE sectors (Bora and Sirocco, respectively; see Signell et al. 2005, Sclavo et al. 1996, Cavaleri and Sclavo 2006, Dorman et al. 2006); the former, driven by the strongest winds, can result in significant wave heights of more than 3 meters, while the latter are characterized by less energy but by a longer fetch. Both situations are therefore responsible for significant erosion processes and flooding. These processes have a rather uniform impact along the coast, even though some portion of it can be sheltered by local natural structures (Gardelli et al. 2007).
Despite significant recent efforts devoted to a better understanding and a more efficient management of these shallow coastal areas, including initiatives undertaken to protect the shoreline with groins and submerged barriers (see Lamberti et al. 2005), the vulnerability of the coast is still high, especially in places where the energy, resulting from the combined waves-currents interaction generates heavy erosion/deposition patterns (Harris et al. 2008, Martucci et al. 2010).
The increasing frequency and intensity of storms measured in the last decade have indicated that specific dynamic parameters play an essential role in the equilibrium of this coastal region. Namely, the influence of coastal and bottom currents, which are able to transport the eroded material, re-suspend sediments and rebuild the bottom topography, appeared to be of primary importance (Harris et al. 2008, Bever et al. 2009).
Until 2005 (Figure 1, left panel), the Bevano inlet region was left free to evolve naturally, and was characterized by a progressive migration to the north. In very recent years, at the beginning of 2006 (see again Figure 1, right panel), the existing northern river mouth was closed, and a new inlet was dredged about 500-600 m to its south. Immediately to the south of this new exit, the river system was
Towards validating a last generation, integrated wave-current-sediment numerical model in coastal regions | 13
www.oandhs.org
connected to the open sea via a floodway, that should allow the water to exit directly to the sea in case of river flood. The new river mouth was then protected by a timber structure in order to limit the typical northward migration of the river mouth, mostly due to the action of SE waves and spring tides (Gardelli et al. 2007).
The first monitoring results of this new configuration have shown that the southern edge of the new inlet has been progressively eroded in its NE sector, and at the same time partially encroaching upon the river bed in its most northern edge, therefore slowing down the river flow in case of large discharges.
At the time being, however, an attempt to use high resolution integrated numerical models to describe the nearshore region in front of the Bevano stream is still missing. MATERIALS AND METHODS
To address the issues briefly discussed in the Introduction, a combined approach has been followed.
First, the shoreline region has been video observed and the resulting images have been recorded and analyzed in order to detect its
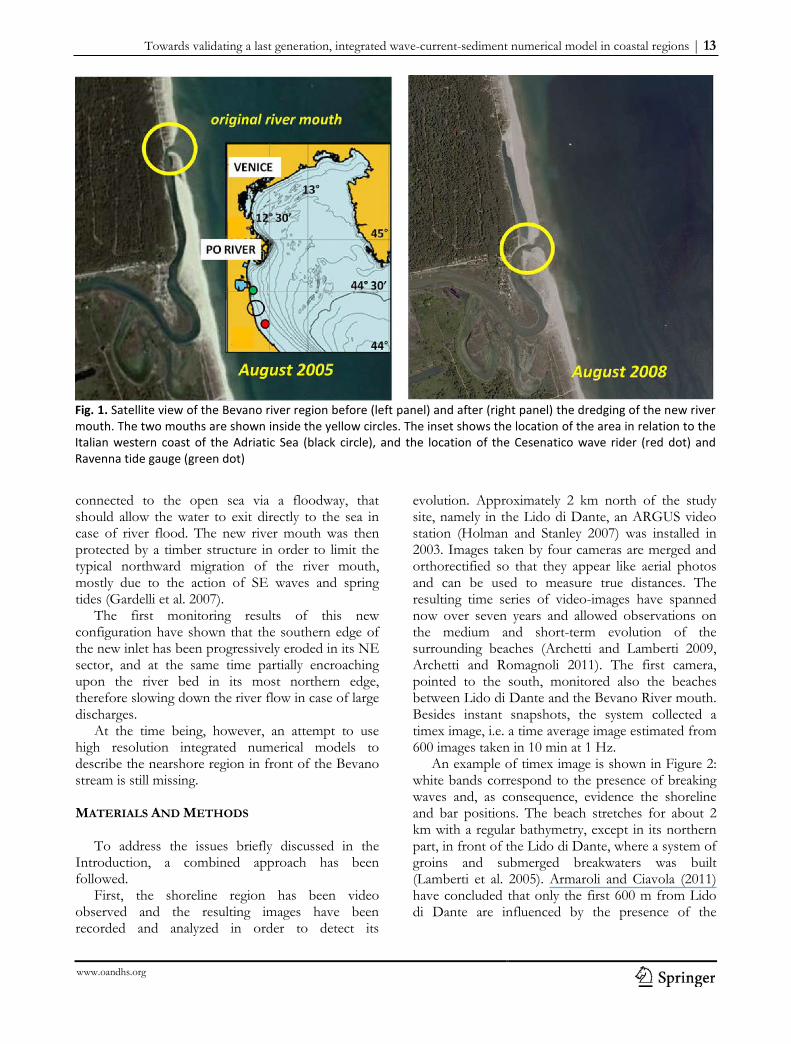
evolution. Approximately 2 km north of the study site, namely in the Lido di Dante, an ARGUS video station (Holman and Stanley 2007) was installed in 2003. Images taken by four cameras are merged and orthorectified so that they appear like aerial photos and can be used to measure true distances. The resulting time series of video-images have spanned now over seven years and allowed observations on the medium and short-term evolution of the surrounding beaches (Archetti and Lamberti 2009, Archetti and Romagnoli 2011). The first camera, pointed to the south, monitored also the beaches between Lido di Dante and the Bevano River mouth. Besides instant snapshots, the system collected a timex image, i.e. a time average image estimated from 600 images taken in 10 min at 1 Hz.
An example of timex image is shown in Figure 2: white bands correspond to the presence of breaking waves and, as consequence, evidence the shoreline and bar positions. The beach stretches for about 2 km with a regular bathymetry, except in its northern part, in front of the Lido di Dante, where a system of groins and submerged breakwaters was built (Lamberti et al. 2005). Armaroli and Ciavola (2011) have concluded that only the first 600 m from Lido di Dante are influenced by the presence of the
Fig. 1. Satellite view of the Bevano river region before (left panel) and after (right panel) the dredging of the new river mouth. The two mouths are shown inside the yellow circles. The inset shows the location of the area in relation to the Italian western coast of the Adriatic Sea (black circle), and the location of the Cesenatico wave rider (red dot) and Ravenna tide gauge (green dot)
14 | Sandro Carniel, Mauro Sclavo, Renata Archetti
Copyright© of Institute of Oceanography, University of Gdansk, Poland www.oandhs.org
boundary groin. The Bevano River is located at -2500 along the y-axis of the local reference system.
A full description of the system and the acquired images are presented in Davidson et al. (2007), and a description of its accuracy in the detection of morphologies is given in Archetti (2009) and in Armaroli and Ciavola (2011).
In addition to these observations, a state-of-the-art, integrated wave-currents-sediment numerical model has been set up and implemented, being capable of describing the morphological evolution of
the new river mouth region as a consequence of ordinary (tidal) or extreme (river flood, wave storms) events. The numerical model adopted is ROMS, a 3-D, free-surface, sigma-coordinate tool adopted in its two-way coupled version with the wave model SWAN (www.wldelft.nl/soft/swan) and a dedicated sediment transport module.
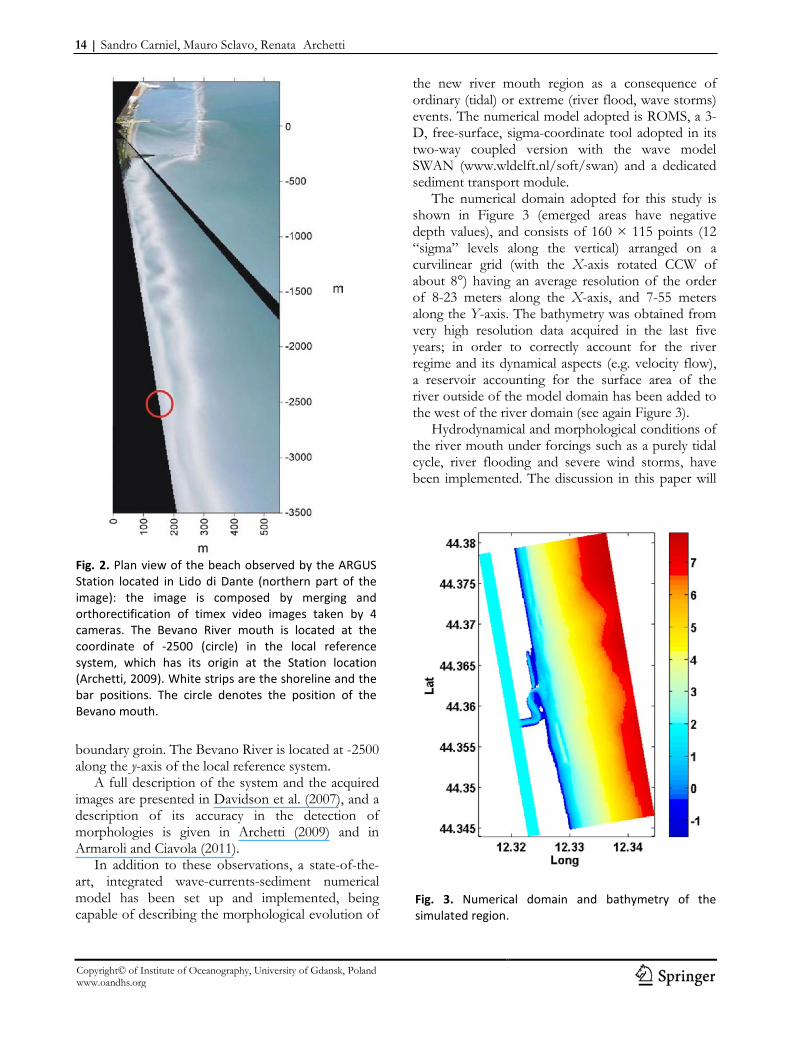
The numerical domain adopted for this study is shown in Figure 3 (emerged areas have negative depth values), and consists of 160 × 115 points (12 “sigma” levels along the vertical) arranged on a curvilinear grid (with the X-axis rotated CCW of about 8°) having an average resolution of the order of 8-23 meters along the X-axis, and 7-55 meters along the Y-axis. The bathymetry was obtained from very high resolution data acquired in the last five years; in order to correctly account for the river regime and its dynamical aspects (e.g. velocity flow), a reservoir accounting for the surface area of the river outside of the model domain has been added to the west of the river domain (see again Figure 3).
Hydrodynamical and morphological conditions of the river mouth under forcings such as a purely tidal cycle, river flooding and severe wind storms, have been implemented. The discussion in this paper will
Fig. 2. Plan view of the beach observed by the ARGUS Station located in Lido di Dante (northern part of the image): the image is composed by merging and orthorectification of timex video images taken by 4 cameras. The Bevano River mouth is located at the coordinate of -2500 (circle) in the local reference system, which has its origin at the Station location (Archetti, 2009). White strips are the shoreline and the bar positions. The circle denotes the position of the Bevano mouth.
Fig. 3. Numerical domain and bathymetry of the simulated region.
Towards validating a last generation, integrated wave-current-sediment numerical model in coastal regions | 15
www.oandhs.org
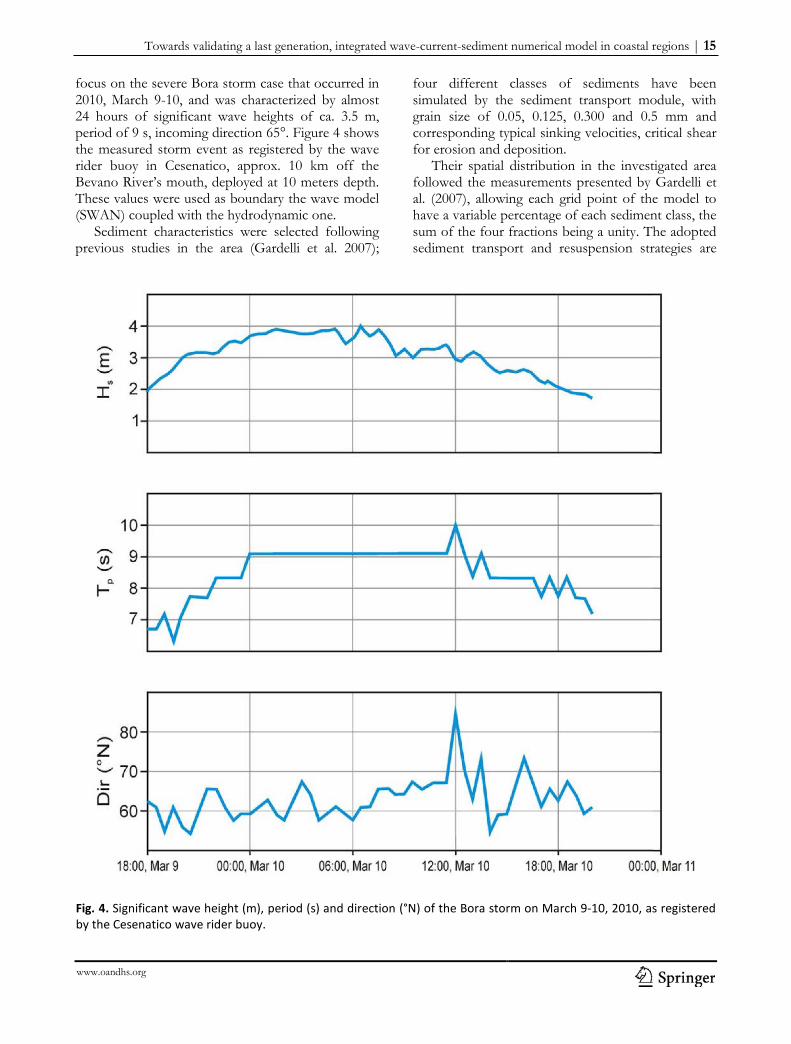
focus on the severe Bora storm case that occurred in 2010, March 9-10, and was characterized by almost 24 hours of significant wave heights of ca. 3.5 m, period of 9 s, incoming direction 65°. Figure 4 shows the measured storm event as registered by the wave rider buoy in Cesenatico, approx. 10 km off the Bevano River’s mouth, deployed at 10 meters depth. These values were used as boundary the wave model (SWAN) coupled with the hydrodynamic one.
Sediment characteristics were selected following previous studies in the area (Gardelli et al. 2007);
four different classes of sediments have been simulated by the sediment transport module, with grain size of 0.05, 0.125, 0.300 and 0.5 mm and corresponding typical sinking velocities, critical shear for erosion and deposition.
Their spatial distribution in the investigated area followed the measurements presented by Gardelli et al. (2007), allowing each grid point of the model to have a variable percentage of each sediment class, the sum of the four fractions being a unity. The adopted sediment transport and resuspension strategies are
Fig. 4. Significant wave height (m), period (s) and direction (°N) of the Bora storm on March 9-10, 2010, as registered by the Cesenatico wave rider buoy.
16 | Sandro Carniel, Mauro Sclavo, Renata Archetti
Copyright© of Institute of Oceanography, University of Gdansk, Poland www.oandhs.org
thoroughly discussed in Warner et al. (2008). Since the modeling focused on a relative short
wind storm case, the model started from a sea level situation at rest, with a stable density profile. The values of sea surface elevation at the sea boundary were imposed from the measurements registered by the tide gauge at Punta Corsini (Ravenna) and the wind fields from a local-area meteo model (Signell et al. 2005).
Finally, the coupled model run was performed, adopting a wetting/drying option which is able to flood the grids progressively in case of a rising sea surface level, and with the capability of reproducing nearshore currents via radiation stresses as described in Warner et al. (2008) and following. Vertical mixing was modeled using a two-equation second order moment closure (k-ε) via the GLS approach as in Carniel et al. (2009). RESULTS
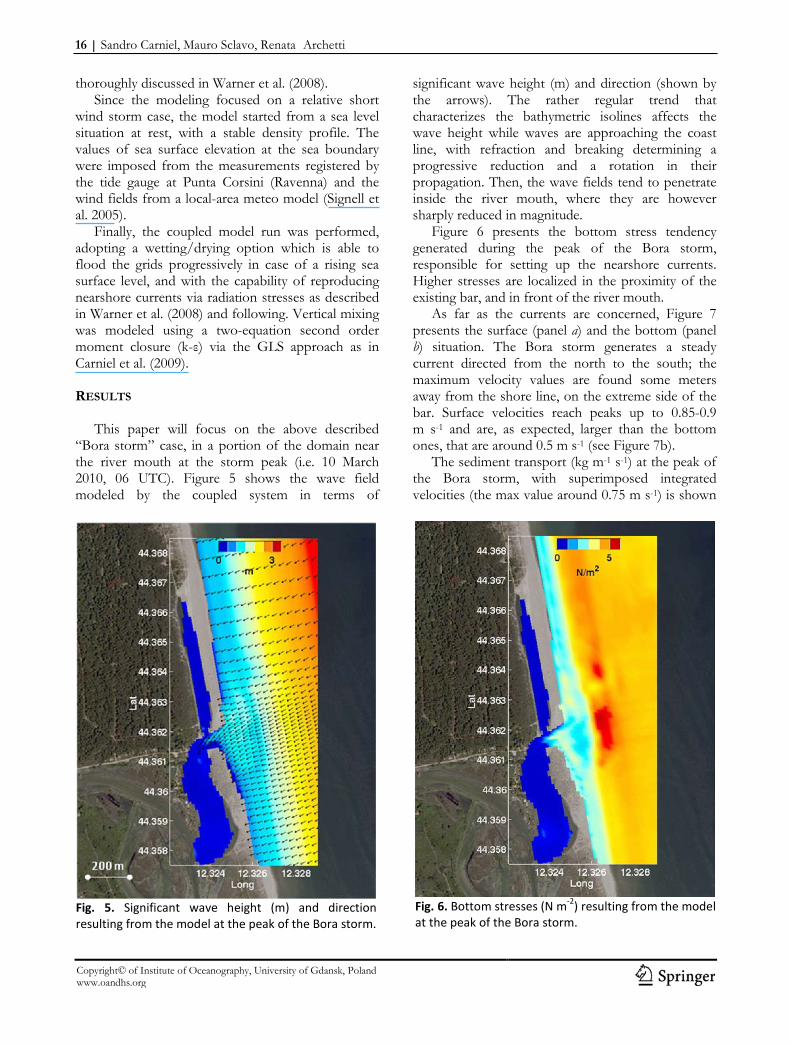
This paper will focus on the above described “Bora storm” case, in a portion of the domain near the river mouth at the storm peak (i.e. 10 March 2010, 06 UTC). Figure 5 shows the wave field modeled by the coupled system in terms of
significant wave height (m) and direction (shown by the arrows). The rather regular trend that characterizes the bathymetric isolines affects the wave height while waves are approaching the coast line, with refraction and breaking determining a progressive reduction and a rotation in their propagation. Then, the wave fields tend to penetrate inside the river mouth, where they are however sharply reduced in magnitude.
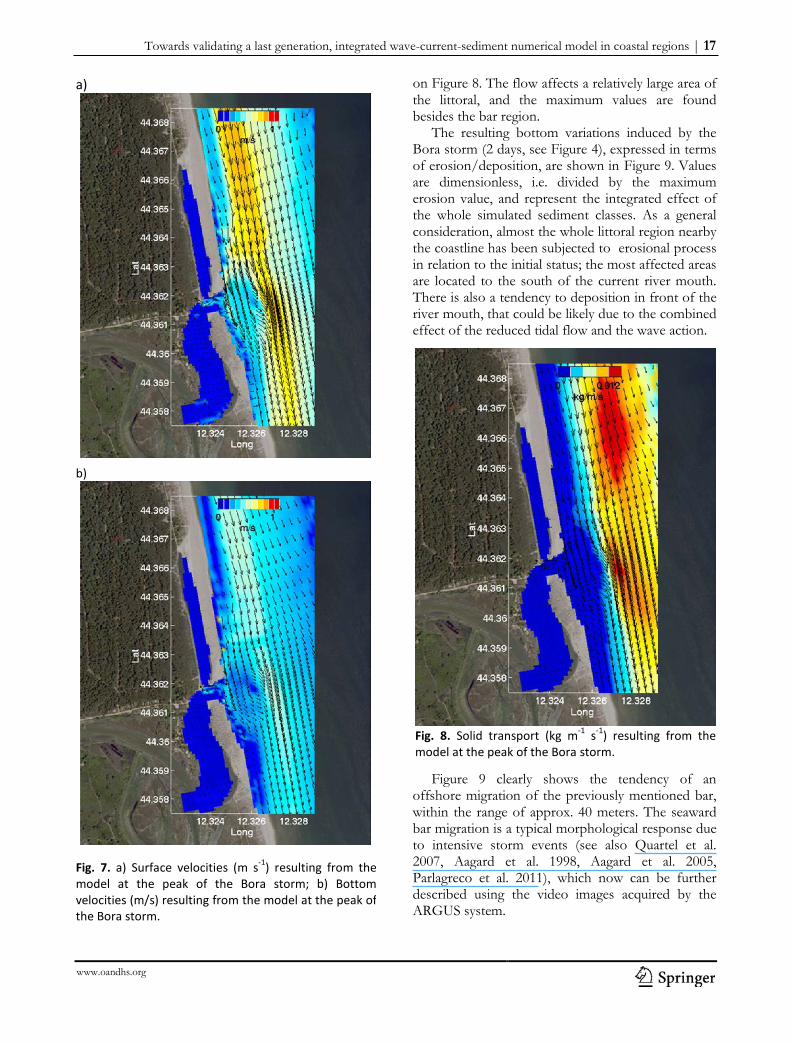
Figure 6 presents the bottom stress tendency generated during the peak of the Bora storm, responsible for setting up the nearshore currents. Higher stresses are localized in the proximity of the existing bar, and in front of the river mouth.
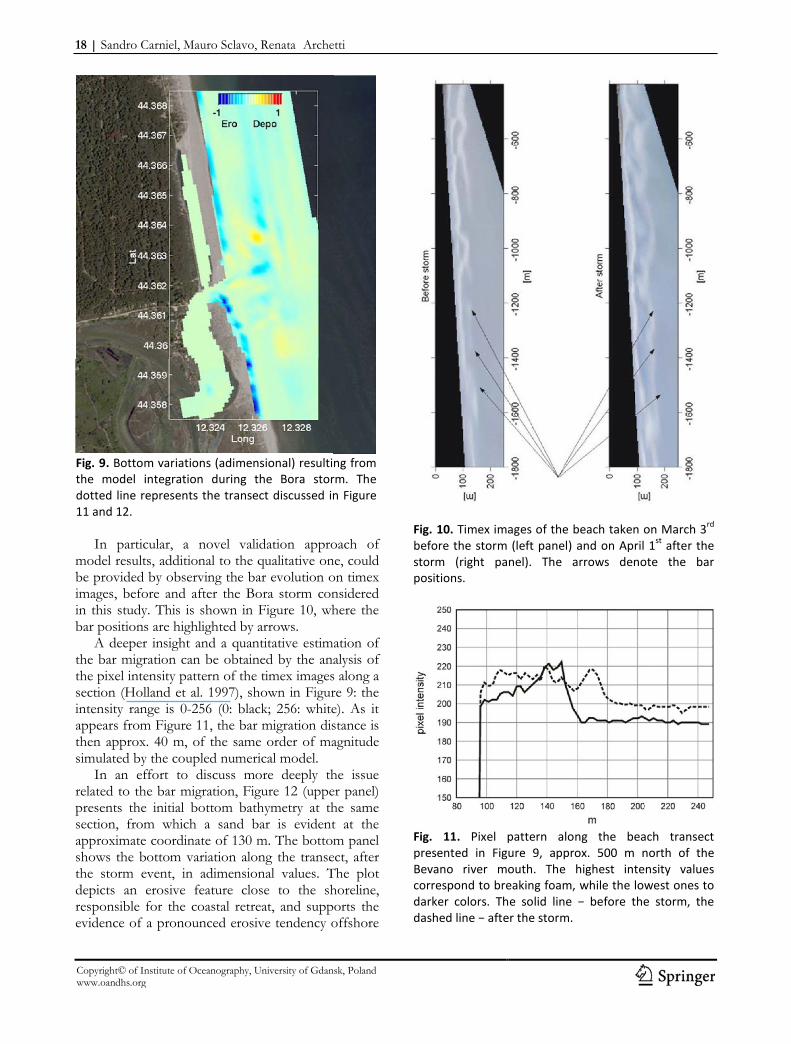
As far as the currents are concerned, Figure 7 presents the surface (panel a) and the bottom (panel b) situation. The Bora storm generates a steady current directed from the north to the south; the maximum velocity values are found some meters away from the shore line, on the extreme side of the bar. Surface velocities reach peaks up to 0.85-0.9 m s-1 and are, as expected, larger than the bottom ones, that are around 0.5 m s-1 (see Figure 7b).
The sediment transport (kg m-1 s-1) at the peak of the Bora storm, with superimposed integrated velocities (the max value around 0.75 m s-1) is shown
Fig. 5. Significant wave height (m) and direction resulting from the model at the peak of the Bora storm.
Fig. 6. Bottom stresses (N m-2) resulting from the model at the peak of the Bora storm.
Towards validating a last generation, integrated wave-current-sediment numerical model in coastal regions | 17
www.oandhs.org
on Figure 8. The flow affects a relatively large area of the littoral, and the maximum values are found besides the bar region.
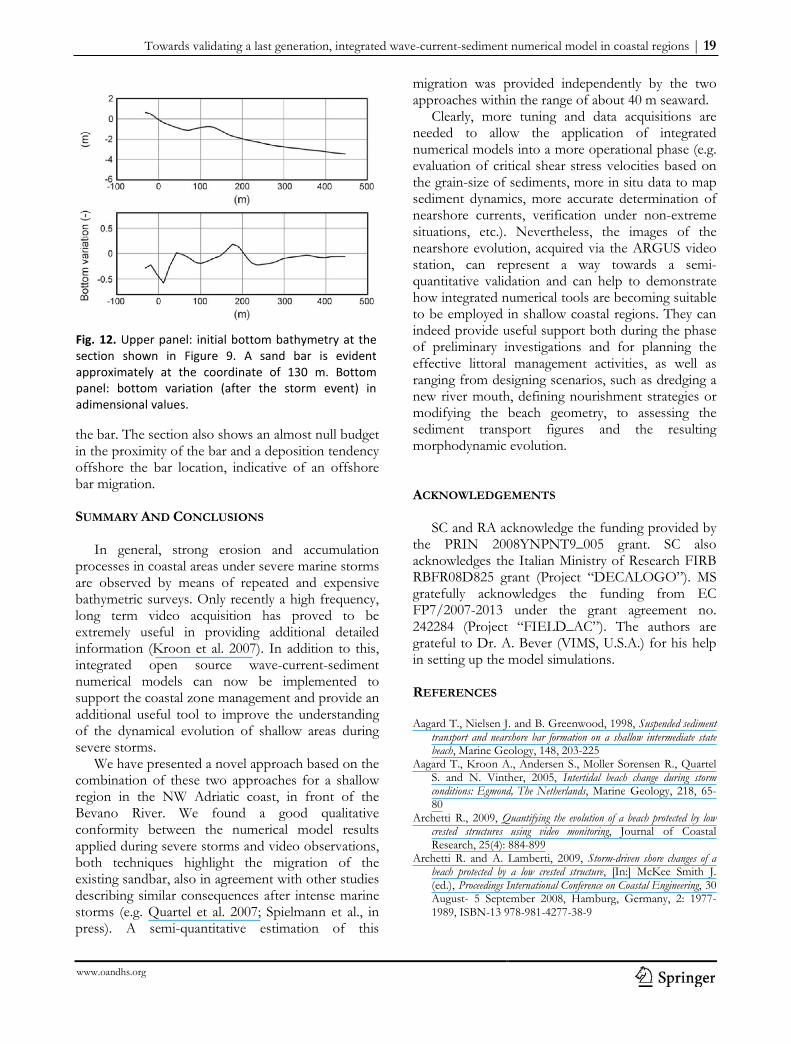
The resulting bottom variations induced by the Bora storm (2 days, see Figure 4), expressed in terms of erosion/deposition, are shown in Figure 9. Values are dimensionless, i.e. divided by the maximum erosion value, and represent the integrated effect of the whole simulated sediment classes. As a general consideration, almost the whole littoral region nearby the coastline has been subjected to erosional process in relation to the initial status; the most affected areas are located to the south of the current river mouth. There is also a tendency to deposition in front of the river mouth, that could be likely due to the combined effect of the reduced tidal flow and the wave action.
Figure 9 clearly shows the tendency of an offshore migration of the previously mentioned bar, within the range of approx. 40 meters. The seaward bar migration is a typical morphological response due to intensive storm events (see also Quartel et al. 2007, Aagard et al. 1998, Aagard et al. 2005, Parlagreco et al. 2011), which now can be further described using the video images acquired by the ARGUS system.
a)
b)
Fig. 7. a) Surface velocities (m s-1) resulting from the model at the peak of the Bora storm; b) Bottom velocities (m/s) resulting from the model at the peak of the Bora storm.
Fig. 8. Solid transport (kg m-1 s-1) resulting from the model at the peak of the Bora storm.
18 | Sandro Carniel, Mauro Sclavo, Renata Archetti
Copyright© of Institute of Oceanography, University of Gdansk, Poland www.oandhs.org
In particular, a novel validation approach of model results, additional to the qualitative one, could be provided by observing the bar evolution on timex images, before and after the Bora storm considered in this study. This is shown in Figure 10, where the bar positions are highlighted by arrows.
A deeper insight and a quantitative estimation of the bar migration can be obtained by the analysis of the pixel intensity pattern of the timex images along a section (Holland et al. 1997), shown in Figure 9: the intensity range is 0-256 (0: black; 256: white). As it appears from Figure 11, the bar migration distance is then approx. 40 m, of the same order of magnitude simulated by the coupled numerical model.
In an effort to discuss more deeply the issue related to the bar migration, Figure 12 (upper panel) presents the initial bottom bathymetry at the same section, from which a sand bar is evident at the approximate coordinate of 130 m. The bottom panel shows the bottom variation along the transect, after the storm event, in adimensional values. The plot depicts an erosive feature close to the shoreline, responsible for the coastal retreat, and supports the evidence of a pronounced erosive tendency offshore
Fig. 9. Bottom variations (adimensional) resulting from the model integration during the Bora storm. The dotted line represents the transect discussed in Figure 11 and 12.
Fig. 10. Timex images of the beach taken on March 3rd
before the storm (left panel) and on April 1st after the storm (right panel). The arrows denote the bar positions.
Fig. 11. Pixel pattern along the beach transect presented in Figure 9, approx. 500 m north of the Bevano river mouth. The highest intensity values correspond to breaking foam, while the lowest ones to darker colors. The solid line − before the storm, the dashed line − after the storm.
Towards validating a last generation, integrated wave-current-sediment numerical model in coastal regions | 19
www.oandhs.org
the bar. The section also shows an almost null budget in the proximity of the bar and a deposition tendency offshore the bar location, indicative of an offshore bar migration. SUMMARY AND CONCLUSIONS
In general, strong erosion and accumulation processes in coastal areas under severe marine storms are observed by means of repeated and expensive bathymetric surveys. Only recently a high frequency, long term video acquisition has proved to be extremely useful in providing additional detailed information (Kroon et al. 2007). In addition to this, integrated open source wave-current-sediment numerical models can now be implemented to support the coastal zone management and provide an additional useful tool to improve the understanding of the dynamical evolution of shallow areas during severe storms.
We have presented a novel approach based on the combination of these two approaches for a shallow region in the NW Adriatic coast, in front of the Bevano River. We found a good qualitative conformity between the numerical model results applied during severe storms and video observations, both techniques highlight the migration of the existing sandbar, also in agreement with other studies describing similar consequences after intense marine storms (e.g. Quartel et al. 2007; Spielmann et al., in press). A semi-quantitative estimation of this
migration was provided independently by the two approaches within the range of about 40 m seaward.
Clearly, more tuning and data acquisitions are needed to allow the application of integrated numerical models into a more operational phase (e.g. evaluation of critical shear stress velocities based on the grain-size of sediments, more in situ data to map sediment dynamics, more accurate determination of nearshore currents, verification under non-extreme situations, etc.). Nevertheless, the images of the nearshore evolution, acquired via the ARGUS video station, can represent a way towards a semi-quantitative validation and can help to demonstrate how integrated numerical tools are becoming suitable to be employed in shallow coastal regions. They can indeed provide useful support both during the phase of preliminary investigations and for planning the effective littoral management activities, as well as ranging from designing scenarios, such as dredging a new river mouth, defining nourishment strategies or modifying the beach geometry, to assessing the sediment transport figures and the resulting morphodynamic evolution. ACKNOWLEDGEMENTS
SC and RA acknowledge the funding provided by the PRIN 2008YNPNT9_005 grant. SC also acknowledges the Italian Ministry of Research FIRB RBFR08D825 grant (Project “DECALOGO”). MS gratefully acknowledges the funding from EC FP7/2007-2013 under the grant agreement no. 242284 (Project “FIELD_AC”). The authors are grateful to Dr. A. Bever (VIMS, U.S.A.) for his help in setting up the model simulations. REFERENCES Aagard T., Nielsen J. and B. Greenwood, 1998, Suspended sediment
transport and nearshore bar formation on a shallow intermediate state beach, Marine Geology, 148, 203-225
Aagard T., Kroon A., Andersen S., Moller Sorensen R., Quartel S. and N. Vinther, 2005, Intertidal beach change during storm conditions: Egmond, The Netherlands, Marine Geology, 218, 65-80
Archetti R., 2009, Quantifying the evolution of a beach protected by low crested structures using video monitoring, Journal of Coastal Research, 25(4): 884-899
Archetti R. and A. Lamberti, 2009, Storm-driven shore changes of a beach protected by a low crested structure, [In:] McKee Smith J. (ed.), Proceedings International Conference on Coastal Engineering, 30 August- 5 September 2008, Hamburg, Germany, 2: 1977-1989, ISBN-13 978-981-4277-38-9
Fig. 12. Upper panel: initial bottom bathymetry at the section shown in Figure 9. A sand bar is evident approximately at the coordinate of 130 m. Bottom panel: bottom variation (after the storm event) in adimensional values.
20 | Sandro Carniel, Mauro Sclavo, Renata Archetti
Copyright© of Institute of Oceanography, University of Gdansk, Poland www.oandhs.org
Archetti R. and C. Romagnoli, 2011, Analysis of the effects of different storm events on shoreline dynamics of an artificially embayed beach, Earth Surface Processes and Landforms, in press
Archetti R. and Zanuttigh B., 2010, Integrated monitoring of the hydro-morphodynamics of a beach protected by low crested detached breakwaters, Coastal Engineering, 57(10): 879-891
Armaroli C. and P. Ciavola, 2011, Dynamics of a nearshore bar system in the northern Adriatic: A video-based morphological classification, Geomorphology, 126(1-2): 201-216
Bever A.J., Harris C.K., Sherwood C.R. and R.P. Signell, 2009, Deposition and flux of sediment from the Po River, Italy: An idealized and wintertime numerical modeling study, Marine Geology, 260(1-4): 69-80, DOI:10.1016/j.margeo.2009.01.007
Boldrin A., Carniel S., Giani M., Marini M., Bernardi Aubry F., Campanelli A., Grilli F. and A. Russo, 2009, The effect of Bora wind on physical and bio-chemical properties of stratified waters in the Northern Adriatic, Journal of Geophysical Research – Ocean, 114, C08S92, DOI:10.1029/2008JC004837
Carniel S., Sclavo M., Warner J.C. and M. Tondello, 2007, Predicting sediment transport at coastal structures: an integrated model approach [In:] Proceedings of the 5th Coastal Structures Intern. Conf., CSt 2007, 2-4 July, Venice, Vol. II, pp. 1047-1057 (Franco, Tomasicchio and Lamberti Eds.), DOI 10.1142/9789814282024_0092
Carniel S., Warner J.C., Chiggiato J. and M. Sclavo, 2009, Investigating the impact of surface wave breaking on modelling the trajectories of drifters in the Northern Adriatic Sea during a wind-storm event, Ocean Modeling, 30: 225-239, DOI:10.1016/j.ocemod.2009.07.001
Cavaleri L. and M. Sclavo, 2006, The calibration of wind and wave model data in the Mediterranean Sea, Coastal Engineering, 53: 613-627
Davidson M., Van Koningsveld M., De Kruif A., Rawson J., Holman R., et al., 2007, The CoastView project: Developing video-derived Coastal State Indicators in support of coastal zone management, Coastal Engineering, 54: 463-475
Dorman C.E., Carniel S., Cavaleri, L., Sclavo, M., Chiggiato J., et al., 2006, February 2003 marine atmospheric conditions and the Bora over the Northern Adriatic, Journal of Geophysical Research–Ocean, 111, C03S03. DOI: 10.1029/2005JC003134
Gardelli M., Caleffi S. and P. Ciavola, 2007, Evoluzione morfodinamica della foce del Torrente Bevano, Studi Costieri, 13: 53-74 (in Italian)
Harris C.K., Sherwood C.R., Signell R.P., Bever A. and J.C. Warner, 2008, Sediment dispersal in the northwestern Adriatic Sea, J. Geophys. Res., 113, C11S03, DOI:10.1029/2006JC003868
Holland K.T., Holman R.A., Lippmann T.C., Stanley J. and N.G. Plant, 1997, Practical use of video imagery in nearshore oceanographic field studies, Journal of Oceanic Engineering, 22(1): 81–92
Holman RA, Stanley J., 2007, The History, Capabilities and Future of Argus, Coastal Engineering, 54(6-7): 477-491
Kroon A., Aarninkhof S.G.J., Archetti R., Armaroli C., Gonzalez M., et al., 2007, Application of remote sensing video systems for coastline management problems, Coastal Engineering, 54(6-7): 493-505
Lamberti A., Archetti R., Kramer M., Paphitis D., Mosso C., M. Di Risio, 2005, European experience of low crested structures for coastal management, Coastal Engineering, 52(1011): 841–866, ISSN: 0378-3839
Martucci G., Carniel S., Chiggiato J., Sclavo M., Lionello P., M.B. Galati, 2010, Statistical trend analysis and extreme distribution of significant wave height from 1958 to 1999. An application to the Italian seas, Ocean Science, 6: 525-538, DOI: 10.5194/os-6-525-2010
Parlagreco L. Archetti R., Simeoni U. and S. Devoti, 2011, Video-monitoring of a barred nourished beach (latium, central Italy), Journal of Coastal Resarch, 64: 110 – 114
Quartel S., Ruessink B.G. and A. Kroon, 2007, Daily to seasonal cross-shore behavior of quasi-persistent intertidal beach morphology. Earth Surf. Process, Landforms 32: 1293–1307, DOI: 10.1002/esp.1477
Ranasinghe R., Symonds G., Black K. Holman R., 2004, Morphodynamics of intermediate beaches: a video imaging and numerical modelling study, Coastal Engineering, 51(7): 629-655
Sclavo M., Liberatore G., R. Ridolfo, 1996, Waves in front of the Venetian littoral, Il Nuovo Cimento C, 19(1): 125-150, DOI: 10.1007/BF02511837
Signell R.P., Carniel S., Cavaleri L., Chiggiato J., Doyle J., Pullen J., M. Sclavo, 2005, Assessment of wind quality for oceanographic modeling in semi-enclosed basins, Journal of Marine System, 53(1-4): 217-233, DOI: 10.1016/j.marsys.2004.03.006
Spielmann K., R. Certainc, D. Astruca, J.-P. Barusseauc, (in Press), Analysis of submerged bar nourishment strategies in a wave-dominated environment using a 2DV process-based model. Coastal Engineering
Warner J.C., Sherwood C.R., Signell R.P., Harris C., H. Arango, 2008, Development of a three-dimensional, regional, coupled wave, current, and sediment-transport model, Computers and Geosciences, 34: 1284-1306
Warner J.C., Armstrong B., He R., Zambon J.B., 2010, Development of a Coupled Ocean-Atmosphere-Wave-Sediment Transport (COAWST) Modeling System, Ocean Modelling, 35: 230-244
Copyright © 2022 FDOKUMEN