TESFAYE_THESIS LAST of last.pdf
108
St. MARY’S UNIVERSITY SCHOOL OF GRADUATE STUDIES FACULTY OF BUSINESS ORGANIZATIONAL PERFORMANCE AND CHALLENGES OF TYRE MANUFACTURING IN ETHIOPIA: THE CASE OF HORIZON ADDIS TYRE FACTORY BY TESFAYE GEBREHANNA ANFWATTE (SGS/0224/2009A) JUNE 2018 ADDIS ABABA, ETHIOPIA
-
Upload
khangminh22 -
Category
Documents
-
view
0 -
download
0
Transcript of TESFAYE_THESIS LAST of last.pdf

St. MARY’S UNIVERSITY
SCHOOL OF GRADUATE STUDIES
FACULTY OF BUSINESS
ORGANIZATIONAL PERFORMANCE AND CHALLENGES OF
TYRE MANUFACTURING IN ETHIOPIA: THE CASE OF
HORIZON ADDIS TYRE FACTORY
BY
TESFAYE GEBREHANNA ANFWATTE (SGS/0224/2009A)
JUNE 2018
ADDIS ABABA, ETHIOPIA

ORGANIZATIONAL PERFORMANCE AND CHALLENGES OF
TYRE MANUFACTURING IN ETHIOPIA: THE CASE OF
HORIZON ADDIS TYRE FACTORY
BY
TESFAYE GEBREHANNA ANFWATTE
ID SGS/0224/2009A
A THESIS SUBMITTED TO THE SCHOOL OF GRADUATE STUDIES OF
St MARY’S UNIVERSITY IN PARTIAL FULFILLMENT OF THE
REQUIREMENTS FOR THE DEGREE OF MASTER OF BUSINESS
ADMINISTRATION (MBA)
JUNE 2018
SMU
ADDIS ABABA, ETHIOPIA

St. MARY’S UNIVERSITY
SCHOOL OF GRADUATE STUDIES
FACULTY OF BUSINESS
ORGANIZATIONAL PERFORMANCE AND CHALLENGES OF TYRE
MANUFACTURING IN ETHIOPIA: THE CASE OF HORIZON ADDIS
TYRE FACTORY
BY
TESFAYE GEBREHANNA ANFWATTE
APPROVED BY BOARD OF EXAMINERS
_________________________ ________________ ________
Dean graduate Studies Signature Date
_________________________ _________________ ________
Advisor Signature Date
_________________________ ________________ ________
External Examiner Signature Date
___________________________ ____________________ _________
Internal Examiner Signature Date

ii
Declaration about the Research
I the undersigned affirm that this research paper is my original work; prepared under the
guidance ao Dereje Tklemariam (Ph.D) and all references are acknowledged.
Finally, I also assure that this thesis has not been employed and submitted in any way to any
educational institutions for a requirement of getting a degree award.
Tesfaye Gebrehanna
Signature

iii
ENDORSEMENT
This paper shall be submitted to St. Mary’s University School OF Graduate Studies for
examination with my approval as a university advisor,
_______________________
Dereje Teklemariam, PhD Signature
St. Mary’s University
June 2018
SMU

iv
Acknowledgements
In the first place this is what I can and should say, Praises and Glory be to GOD, my Heavenly
Father, for His indescribable and immeasurable gift, unfailing love, guidance and protection
throughout my life.
Then, I am indebted to give my heartily gratitude and praise to my advisor Dereje Teklemariam
(PhD) for his follow up, guidance and unreserved and weariless support from the start and finish
of the research.
I hereby again, want to express my appreciation to the management and staff of the Horizon
Addis Tyre S.C, as a whole because naming could create embarrassment, for their willingness
and support in getting all data and information and their precious time in responding to my
interview.
I further would like express my genuine respect and appreciation to my Sebategna branch staff of
Addis International Bank for their unreserved support and encouragement to reach to this end.
Here, I want to say thank you to my dearest friend Alemayehu Tsegaye who facilitated and
introduced me with the management group of the company. I have special thanks to Ato
Andargachew Worku and Ato Mosissa Kejela for their guidance and advice to begin at the
University.
Finally, let my gratitude and appreciation reach to my friends and relatives for their financial
support for without their support it would hardly be easy to achieve the goal.

v
Contents
1 INTRODUCTION ........................................................................................................................ 1
1.1 Background of the Study ..................................................................................................... 1
1.2 Statement of Problem................................................................................................... 4
1.3 The research Questions ................................................................................................ 6
1.4 Objective of the study (Research) ................................................................................. 6
1.4.1 General Objective ................................................................................................................. 6
1.4.2 Specific Objective ................................................................................................................. 6
1.5 Significance of the Study ............................................................................................. 6
1.6 Scope of the Study....................................................................................................... 7
1.8 Organization of the Study............................................................................................. 7
CHAPTER TWO ................................................................................................................................ 8
2 LITERATURE REVIEW ............................................................................................................. 8
2.1 Theoretical Review ................................................................................................... 8
2.1.1 The Evolution of Tyre Production ............................................................................ 8
2.1.2 Definition of Performance ...................................................................................... 11
2.1.3 Performance Measurement ..................................................................................... 11
2.1.4 The Evolution of Performance Measurement ......................................................... 12
2.1.5 Overview of Performance Measurement Systems .................................................. 13
2.1.5.1 Financial Performance Measures .......................................................................... 13
2.1.5.2 Balanced Scorecared…………………………………………………….………13
2.1.5.3 The strategic Measurement Analysis and Reporting Technique………………...15
2.1.5.4 Performance Measurement Questionnaire (PMQ)………………………………15
2.1.5.5 DuPont Model …………………………………………………………………..16
2.1.5.6 The Results and determinants framework……………………………………… 16
2.2 Value chain analysis: Integrating marketing and production performance ............ 19
2.3 Empirical Literature ................................................................................................ 20
2.3.1 List of tyre manufacturers those have nearly the same age or younger with Addis
Tyre ……………………………………………………………………………………20
2.3.2 Tyre Industry in Sub Sahara Countries ................................................................... 24
2.3.3 Challenges of Tyre Manufacturing ......................................................................... 27
2.4 Conceptual Framework for the Study ..................................................................... 27

vi
CHAPTER THREE........................................................................................................................... 32
3 METHODOLOGY............................................................................................................... 32
3.1 Research Design & Approach................................................................................. 32
3.2 Data Type................................................................................................................ 33
3.3.1 Primary data source............................................................................................................. 33
3.3.2 Secondary data source......................................................................................................... 33
3.4 Target Population and Sample ................................................................................ 34
3.4.1 The target Population.............................................................................................. 34
3.4.2 Sample Size and Determination.............................................................................. 34
3.5 Data Collection Tools ............................................................................................. 35
3.5.1 Structured Questionnaire..................................................................................................... 35
3.5.2 3.5.2. Interviews...................................................................................................... 35
3.5.3 Document Review................................................................................................... 36
3.6 Data Analysis and Presentation .............................................................................. 36
3.6.1 Descriptive data analysis......................................................................................... 36
3.6.2 Production performance analysis (P1) .................................................................... 36
3.6.3 Market performance and determinants:customer decision to buy Addis Tires (P2)
……………………………………………………………………………………37
3.7 Ethical Considerations ............................................................................................ 40
CHAPTER FOUR............................................................................................................................. 42
4 RESULTS AND DISCUSSION ................................................................................................. 42
4.1 Results ............................................................................................................................ 42
4.1.1 Introduction......................................................................... Error! Bookmark not defined.
4.1.2 Tyre Manufacturing Inbound Logistics ............................................................................. 42
4.1.3 The Tyre Production value chain in Horizon Addis Tyre SC. ............................................ 43
4.1.4 Performance of the Tyre Manufacturing Processes and Productivity................................. 44
4.1.5 Outbound Logistics ............................................................................................................. 50
4.1.6 Marketing Performance…………………………………………………………………...52
4.1.7 The Support Activity........................................................................................................... 54
4.2 Customers’ Satisfaction Survey .............................................................................. 57
4.2.1 Places of Survey of Customers and Users........................................................................... 58
4.2.2 Users and Customers Survey .............................................................................................. 58

vii
4.2.3 Durability of the Tyre ......................................................................................................... 59
4.2.4 Criterion for choosing the Horizon Addis Tyre .................................................................. 59
4.2.5 Users and Customers Satisfaction with the Tyre ................................................................ 60
4.2.6 Intention of Shifting............................................................................................................ 60
4.2.7 Users but not Customers- Codes of the Vehicles................................................................ 61
4.2.8 Durability of the Tyre ......................................................................................................... 61
4.2.9 Criterion for choosing the Horizon Addis Tyre .................................................................. 62
4.2.10 Intention for Shifting........................................................................................................... 62
4.2.11 Reasons for Shifting............................................................................................................ 63
4.2.12 Mixed Brand Usage and Inner Tube Problem..................................................................... 63
4.2.13 Distributors of the Tyre -Durability .................................................................................... 64
4.2.14 Customer Service of the Company ..................................................................................... 64
4.2.15 Cooperativeness for Compensation of Defective Tyre ....................................................... 65
4.2.16 The Extent of Making Customers Happy............................................................................ 65
4.2.17 Distributors’ Faced Problems.............................................................................................. 66
4.2.18 Attention Given to Distributors........................................................................................... 66
4.2.19 Evaluation of the Quality of the Tyre ................................................................................. 66
4.3 Customers’ Satisfaction………………………………………………….………..67
4.4 Problems restraining the tyre manufacturing process.............................................. 68
4.5 Measures taken to tackle tyre manufacturing problems ......................................... 68
4.6 Discussion of the Results ........................................................................................ 69
4.6.1 A discussion on production performance analysis:- ........................................................... 73
4.7 The Challenges of Horizon Addis Tyre S.C ........................................................... 77
CHAPTER FIVE............................................................................................................................... 78
5 SUMMARY, CONCLUSION AND RECOMMENDATION......................... 79
5.1 Summary of the findings......................................................................................... 79
5.2 Conclusion .............................................................................................................. 80
5.3 Limitation of the study ………………………………………………....…………….…83
5.4 Recommendation ..................................................................................................... 83
REFERENCE ................................................................................................................................ i-iv
Customer Survey Questionnaire …………………………………………………………….……..v-x
Appendix 2: Key informant interview ………………………………………………...……………..xi

viii
List of Tables
Table: 2.1 China ………………………………………………………………………………...…20
Table: 2.2 India ………………………………………………………………………….……...…21
Table: 2.3 Indonesia ………………………………………………………………………….……21
Table: 2.4 Vietnam ……………………………………………………………………………...…22
Table: 2.5 Taiwan ………………………………………………………………………...….……22
Table: 2.6 Japan …………………………………………………………...………………………22
Table: 2.7 Czech Republic and Germany- EX-Friends……...……….……………………………22
Table: 2.8 Countries that Exported the Highest Dollar Value……………………………………..23
Table: 4.1.1 Raw Materials Purchase Expenditure ……………………………………...……...…43
Table 4.1.2 Cycle Time of Curing ………………………………………………………...………45
Table 4.1.3 Production Capacity and Actual Performance……………………………………..….46
Table 4.1.4 Productivity Measured in Value Added and Total Productivity Methods……….……47
Table 4.1.5 Financial Performance Measures …………………………………………………..…48
Table4.1.6 Customer Types of Horizon Addis Tyre S.C…………………………………………..50
Table 4.1.7 Total Sales Trend by Customer Group …………………………………………….....51
Table 4.1.8 Defect Percentage………………………………………………………………….….51
Table 4.1.9 Market Share…………………………………………………………………….....…52
Table 4.1.10 Volume and Value Tyres Imported.….……….………………………………....…..53
Table 4.1.11 Major Suppliers of Tyres……………………………………………………….....…53
Table 4.1.12 Compensation and Fringe Benefits Trend Ttarting from 2013 to December 2017….54
Table 4.13 Training Given for Employees from 2013-2017)………………………………...……54
Table 4.1.14 Rewarded Employees in 2017………………………………………………….……55
Table 4.1.15 Turn Over of Employee ……………………………………………………….….…55
Table 4.1.16 Investment ……………………………………………………………………..……56
Table 4.1.17 Planning Accuracy……………………………………………………………..……56
Table 4.1.18 New Development Sales Trend…………………………………………………...…57
Table 4.2.1 Cities of Survey…………………………………………………………………….…58
Table 4.2.2 Codes of the Vehicles…………………………………………………………………58

ix
Table 4.2.3 Durability of the Tyre…………………………………………………………………59
Table 4.2.4 Criterion for Choosing the Tyre Brand……………………………………………..…59
Table 4.2.5 Satisfaction with the Tyre Employed….…………………………………………...….60
Table 4.2.6 Intention to Shift to other Types of Tyre………………………………………….…. 60
Table 4.2.7 Codes of the Vehicles………………………………………………………………... 61
Table 4.2.8 Durability of the Tyre………………………………………………………………... 61
Table 4.2.9 Criterion for Choosing the Horizon Addis Tyre………………………………...…… 62
Table 4.2.10 Intention for Shifting……………………………………………………………...…62
Table 4.2.11Reasons for Shifting………………………………………………………………….63
Table 4.2.12 Mixed Brand Usage and Inner Tube Problem……………………………………….63
Table 4.2.13Durability of the Tyre………………………………………………………………...64
Table 4.2.14 Customer Service of the Company…………………………………………………..64
Table 4.2.15 Cooperation in Replacing New Tyre for Defected Products…………………….…..65
Table 4.2.16The Extent Customers’ Happiness and Satisfaction on Horizon Addis Tyre……...…65
Table 4.2.17 Problems Distributors Facing Regarding the Tyre…………………………………..66
Table 4.2.18 Given Attention for Customers………………………………………………………66
Table 4.2.19 Evaluation of the Quality of the Tyre……………………………………………..…66
Table 4.2.20 Determinants of Customer Satisfaction…………………………………………...…67

x
List of Figures
Figure 2.1 The Balanced –Scorecard ……………………………………………………………14
Fig. 2.2 The SMART Performance Pyramid …………………………………………………....15
Fig 2.3 The Performance Measurement Questionnaire …………………………………………16
Fig. 2.3 The DuPont model: A flow Chart Representation of the DuPont Model………….….17
Fig. 2.4 The Results and Determinants Framework Fitzgerald ………………………………..18
Fig. 2.5 Primary and Secondary Activities in Firm’s Value Chain. Adapted from Lanen et al...20
Figure 2.8 Challenges of Tyre Manufacturing………………………………………………..…28
Figure 2.9: Conceptual Framework of the Study, Tire Production Performance and Challenges 30
Figure 4.1: Tyre Value-Chain Map as Observed in the Horizon Addis Pyre Plc…………… .....46

xi
AbstractThe evolution of manufacturing such as tyre went back to early 19th century and matured technologically and
automated in the 1980s. Ethiopia joined the tyre industry in 1970sin the name of Addis Tyre SC(currently Horizon
Addis Tyre SC); however, the tyre manufacturing stayed stagnant since then owing to various internal and external
factors. The case is more serious and lures scientific inquiry when it is seen from the context of Ethiopia which is
with a single tyre manufacturing company that operates below 40% capacity; on the other hand the hard-currency
scarce developing country is importing 85% of the tyre from abroad. The general objective of the study is to
investigate its performance and challenges through mapping its value chain for better understanding of the process
and evaluate the performance as well as bottlenecks. Data is collected using a multiple of approaches. Desktop data
was mined, survey was conducted on 385 respondents, observation was made to understand and map out the tyre
production process, seven detailed key informant interviews were carried out. Data were analyzed both in
descriptive and econometric applications, i.e., descriptive analyses were made about performance and performance
measurements while econometric analysis (i.e., ordinal logistic regression) is used to identify the determinants of
customers’ satisfaction. In terms of results, the production value-chain map was developed where three grand stages
and ten-specific sub processes were indentified. The company is extremely dependent on the imported raw materials
where about 98% raw materials and technology were imported with a value of 317 million - 716 million Birr
annually. In terms of capacity utilization, in all three production process sections, the company is performing below
40% which is much below the target due to foreign currency scarcity. In terms of financial performance indicators,
it is performing with 12.1-33.4% (ROI), 11.4-23.3% (ROS), and 14.1-29.8 (GPM). In terms of market share, it
covers 14.97% and of customer satisfaction, the result depicted that 35.4% and 58.7% were very satisfied and
satisfied respectively. With regard to the determinants of customer satisfaction, the product related attributes (i.e.,
‘important’), such as design, raw material, price, sales and after sales services and most importantly price
significantly contribute to the satisfaction of customers at 5% level of significance. Moreover, customers’ level of
education has a significantly positive relationship with level of customer satisfaction at 5% level of significance.
Finally, durability of the product has a strong positive effect upon the satisfaction level of customers with 5% level
of significance. To conclude, although Horizon Addis is producing strategically vital product, its operational
performance is far much below both from its target and from the demand of the product at domestic market. The
company is under a number of operational and managerial intricacies which require serious attention both from the
owners and government so that the company plays its role both in fulfilling the domestic tyre demand and in saving
the country’s economy which is already struck by the most serious hard currency deficit in the economic history of
Ethiopia.
Keywords: Performance measurements, tyre value-chain, tyre customer survey, tyre import, productivity, and return
on investment (ROI)

xii
ACCRONYM
ATC= ADDIS TYRE COMPANY
BSC= BALANCED SCORE CARD
EFQM = EUROPEAN FOUNDATION FOR QUALITY MANAGEMENT
GPM= GROSS PROFIT MARGIN
HAT S.C = HORIZON ADDIS TYRE SHARE COMPANY
IDPMS= INTEGRATED DYNAMIC PERFORMANCE MEASUREMENT SYSTEM
IPMS= INTEGRATED PERFORMANCE MEASUREMENT SYSTEM
PMQ= PERFORMANCE MEASUREMENT QUESTIONNAIRE
PMS= PERFORMANCE MEASUREMENT SYSTEM
ROE= RETURN ON EQUITY
ROI= RETURN ON INVESTMENT
RONA= RETURN ON NET ASSETS
ROS= RETUEN ON ASSETS
SMART= STRATEGIC MEASUREMENT ANALYSIS AND REPORTING TECHNIQUE

1
CHAPTER ONE
INTRODUCTION
1.1 Background of the StudyThe rapid global changes that companies face today affect not only the production system,
equipment and technology usage but also organizational performance and management
philosophies. Hence, this has brought in the introduction and employment of performance
measurement for it is a strategic and integrated approach to increasing the effectiveness of
organizations by improving the performance of people who work with them and by developing
the capabilities of teams and individual contributors (Armstrong & Baron, 1998). It, moreover, is
both necessary and vital. On the other hand, an organization operating without performance
measurement is likened to a chief executive officer operating without a strategic plan. In recent
times, companies may have performed poorly due to the fact that they lack effective and efficient
performance management frameworks and strategies to adequately and judiciously allocate
resources to meet organizational goals.
It should be noted that performance is not only measured to know how a business is performing
but mostly to enable it perform better. So the ultimate aim of conducting the measure of
performance of an organization and or its workers is to improve performance to provide better
customer satisfaction, create conducive working environment for employees and growth for the
owners and other stakeholders. Performance measurement enables an organization to plan,
measure, and control its performance according to a pre-defined strategy. In general,
performance measurement management helps a business to achieve its desired goals and to
create shareholder value.
It is identified that good performance measurement systems must consist of two basic
components; that is, performance management feedback for individuals as well as teams and the
second is reward packages. Organizational factors such as job definitions, adequate job
evaluation, designs and feedbacks are theoretical instead of being practical. This is due to mainly
the absence of clear definition, monitoring, measurement and feedback on performance. Formal
performance measurement sometimes yields disappointing results owing to there is no
commonly accepted method or efficient approach to evaluating the effectiveness or success of
the measurement of the performance of an organization based on a well set of variables in the

2
manufacturing industry. Identifying and organizing the most important variables in performance
measurement has proved to be a challenging task to both researchers and practitioners. As a
whole, the challenge for organizations today is how to match and align performance measures
with business strategy, structures and corporate culture, the type and number of measures to use
the balance between the merits and costs of introducing these measures and how to deploy these
measures so that the results are used and acted upon.
The history of tyre industry is closely interwoven with those of rubber and automobiles.
Although metal tyres existed before the discovery of rubber, the true meaning of the word is
intimately related with use of elastomers. Rubber got its name from its capacity to rub out pencil
marks. According to Ernst (2013), the evolvement of tyre is vindicated in the following manner.
The first rubber tires appeared in the mid-1800s. They were solid or cushion tyres in which the
rubber itself carried the load, absorbed shocks, and resisted cutting and abrasions. The pneumatic
or air-filled tyre, which carried the load and absorbed shocks by the compressed air in the tyre
casing, was patented as early as 1845. Solid rubber tyres were preferred over pneumatic tires
because of their durability, and then pneumatic tyres fell into disuse. The popularity of bicycles
in the late 1800s revived the idea of the pneumatic tyre, and in 1888 a Belfast veterinary surgeon
named John Boyd Dunlop obtained a patent for a pneumatic bicycle tyre.
According to the company official report of 2013, The production of tyres in Ethiopia goes back
to 1972 GC, when Addis Tyre S.C. (ATC) the first of its kind in the country, was established
with a yearly production capacity of 60,000 tyres and 45,000 tubes and a total labor force of 260
people. Addis Tyre S.C. (ATC) was established in 1972 G.C as state owned company with the
help of the then Czechoslovakia government. It started production in 1972 G.C by producing 200
diagonal tires per day with the help of 7 Czechoslovakia experts. In the meantime, the company
sold its 30% share to Japanese Yokohama Rubber Company in 1973 G.C and replaced 7
Czechoslovakia experts with 13 Japanese experts. The company, however, incurred continuous
loses in the following years and the government of Ethiopia suggested that the debt of the
company had to be covered by Yokohama Rubber Company and the Ethiopian government. But
Yokohama Rubber Company refused to cover the debt; therefore the Ethiopian government
covered all the debt so that the share of Yokohama Rubber Company decreased to 6%. Lately,
subsequent joint venture formation between Addis Tyre S.C. (Government Owned) and the

3
Slovakian renowned tyre manufacturer, MATADOR A.S. was established in June 2004GC and
the operation commenced in July 2004GC with the hybrid trade name MATADOR-Addis Tyre
S.C.
However, due to shift in business focus, MATADOR-Addis Tyre S.C. transferred its share to
Continental AG on October 23, 2007GC. Then, Continental AG, the world known German tyre
manufacturer company, had bought all Matador holding companies in Slovakia, Russia and
Ethiopia. Even so, due to lack of concentration of continental AG, there was no significant
progress on the commitment of MATADOR-Addis Tyre S.C. in terms of upgrading the existing
bias tyre technology and commencement of Truck Radial tyre production. Thus, Continental AG
rather preferred to sale its share to a potential strong national investor to Mohammed H. Al-
Amoudi. The captioned investor decided to buy the share of Continental AG through one of his
group company’s name, Horizon Plantation P.L.C. in January 2011GC.Thus, since then the name
of the company changed to Horizon Addis Tyre S. C. and according to the key informant
currently the Horizon Plantation P.L.C has owned 100% share of the company.
Major inputs and raw materials (98%) for tyre manufacturing are imported from Malaysia, India,
China, Indonesia, Egypt and Europe. Natural Rubber is one of the major inputs. The future
perspective of Horizon Addis Tyre S.C includes, among others, of improving quality and
performance of existing products, introducing new product categories. Innovation in
manufacturing practices for higher productivity and consistent with quality products and
developing technical know- how are in the immediate programs of the company. In the long run,
its goal is to compete internationally by enhancing its core competency per the strategic plan of
2017-2021 of the company.
As a result technical Assistance Agreement has been signed with continental AG that enabled
Horizon Addis Tyre S.C. to acquire technology know- how and capacity building of making 15”
& 16” light truck radial tyres that are already successfully commercialized. In line with the
company’s product diversification projects, the company also launched the manufacturing of
Bajaj tyre, Farm tyre, OTR tyre and Industry tyre and stated delivering them to the local market.
Moreover, Flotation Tyres which are used by sugar factories are at the development stage. The
project study for the manufacturing of truck and bus radial tyres is also finalized. Currently, the
company has created job opportunity, for 777workers while the number will increase to 850 with

4
the full implementation of the ongoing projects and will be much more when the Truck and Bus
Radial tyre production project will be implemented.
Having the aforementioned facts and contributions of Addis Tyre S.C. (ATC) can be enhanced
through the improvement in the performance of the company. On the other hand, there is a
sporadic preliminary evidence of ERCAs five year tyre imported and the production of the
company ratios which indicate that the performance of the company is stagnated, i.e., no growth
12%-14.9% is its market share. The cause of performance stagnation as well as accompanied
performance challenges have not yet explored which require a rigorous analysis which is the
concern of this study.
1.2 Statement of ProblemIn this dynamic and volatile business environment, business firms are exposed to various kinds
of uncertainties and risks. Hence a company to survive and stay competent it should operate
effectively and efficiently and should have a well-established marketing strategies and optimal
operations. Moreover, the rapid global changes that companies face today affect not only the
production system, equipment and technology usage but also organizational performance and
management philosophies. Thus, performance measurement is a strategic and integrated
approach to increasing the effectiveness of organizations by improving the performance of
people who work in them and by developing the capabilities of teams and individual contributors
(Armstrong & Baron, 1998). It, moreover, is both necessary and vital. On the other hand, an
organization operating without performance measurement is likened to a chief executive officer
operating without a strategic plan. In addition, Performance is not only measured to know how a
business is performing but mostly to enable it perform better. So, the ultimate aim of conducting
the measure of performance of an organization and or its workers is to improve performance to
provide better customer satisfaction, to create conducive working environment for employees
and growth for the owners and other stakeholders. And hence, performance measurement enables
an organization to plan, measure, and controls its performance according to a pre-defined
strategy and enables a business to achieve its desired goals and to create shareholder value
(Johnson, 2007).
Horizon Addis Tyre S.C. has been in the market since its inception in 1972/73 producing the
same product, of course it has passed under different kinds of constraints owing to being under

5
four ownerships and/or joint ventures and as a sole manufacturer of the product. Regardless
favorable situations such as better market opportunities, availability of improved technology, and
state support programs its market share is restricted. For instance, according to the six years audit
report which covered the period 2011- 2016, the market share of the company is limited to 15%.
In relation with this Asian countries such as China, India, Taiwan, S.Korea Indonesia, Vietnam
who entered in the industry in the same period and later on have grown, developed and almost
automated in the manufacturing process and flooding the global market. Nevertheless, Horizon
Addis is infant and stagnant. Moreover, according to preliminary sources, there is no demand
problem since almost all public and government organizations and individuals are consumers of
the product. There is an excellent replaced tire market opportunity for the imported vehicles is
growing tremendously; couples of vehicles’ assembly have started already and others are on
process to begin the assembly. The neighboring country can be considered as a market
opportunity it had started to export to South Sudan but failed due to foreign currency problem to
buy raw materials.
Furthermore, there is no capital constraint for it is owned by the better off the owner allotted all
proceeds to for the enhancement of same beginning from 2013. Above all, there seems also a
monopoly advantage as the only producer and distributor of its product being the only
manufacturer. It also utmost cannot withstand its competitors who import different kinds of
tyres(1.2 million tyres were imported in 2012 and reached 2.45 million in 2017) from around the
globe that kept its market share stand still in six years period 2012-2017 it was between 12% and
14.9% and hasn’t shown a progress as it should have been. The purpose of this research is
therefore, to look into the company’s performance and identify the underlying performance
constraints that have kept from proper growth so that the stakeholders could appropriately
deliberate on the findings to enhance its core competency.
6
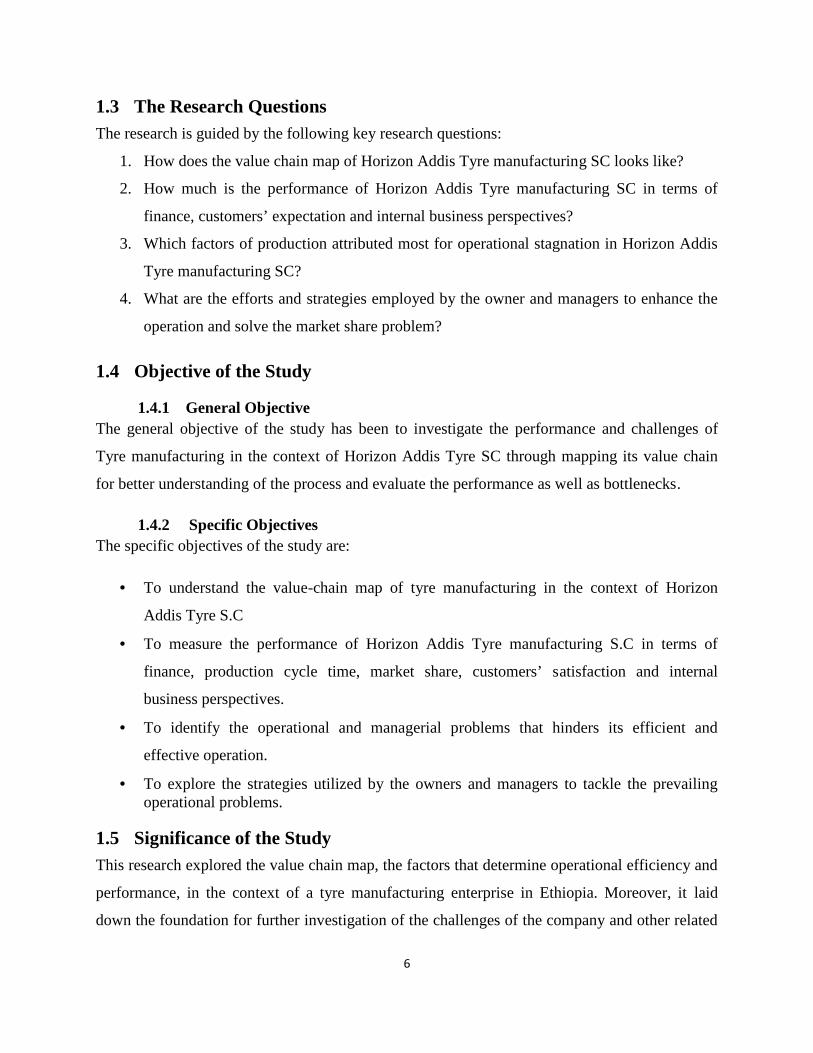
1.3 The Research QuestionsThe research is guided by the following key research questions:
1. How does the value chain map of Horizon Addis Tyre manufacturing SC looks like?
2. How much is the performance of Horizon Addis Tyre manufacturing SC in terms of
finance, customers’ expectation and internal business perspectives?
3. Which factors of production attributed most for operational stagnation in Horizon Addis
Tyre manufacturing SC?
4. What are the efforts and strategies employed by the owner and managers to enhance the
operation and solve the market share problem?
1.4 Objective of the Study
1.4.1 General ObjectiveThe general objective of the study has been to investigate the performance and challenges of
Tyre manufacturing in the context of Horizon Addis Tyre SC through mapping its value chain
for better understanding of the process and evaluate the performance as well as bottlenecks.
1.4.2 Specific ObjectivesThe specific objectives of the study are:
To understand the value-chain map of tyre manufacturing in the context of Horizon
Addis Tyre S.C
To measure the performance of Horizon Addis Tyre manufacturing S.C in terms of
finance, production cycle time, market share, customers’ satisfaction and internal
business perspectives.
To identify the operational and managerial problems that hinders its efficient and
effective operation.
To explore the strategies utilized by the owners and managers to tackle the prevailingoperational problems.
1.5 Significance of the StudyThis research explored the value chain map, the factors that determine operational efficiency and
performance, in the context of a tyre manufacturing enterprise in Ethiopia. Moreover, it laid
down the foundation for further investigation of the challenges of the company and other related

7
companies. Furthermore, as tyre market of Ethiopia is dominated by imported tyres (85%) which
costs and erodes the country’s huge amount of foreign currency this research would help the
stakeholders to deliberate on the issues so as to enhance the core competency of the company.
Finally, the research would create awareness about the usefulness of the employment of non-
financial performance measurement systems to enhance the competitive advantage by alleviating
the constraints.
1.6 Scope of the StudyThe research is limited to review the performance and challenges of tire manufacturing in the
context of a single tire manufacturing company in a single country. In terms of time dimension,
the study employed a five year operational data coupled with cross-sectional survey data that was
run both for primary customers (individuals), organizations, and distributing agencies.
Furthermore, the impact of the marketing mix on the performance of the company was not
explored in the research owing to its relevance in line with the specific objectives of the study.
Moreover, perceptions of relevant respondents are included for analysis yet perception may not
exactly represent the reality on the ground.
1.7 Organization of the StudyThe research is organized into five chapters. Chapter one covers the introductory chapter that
comprises the background of the study, problem statement and objectives of the study, scope and
limitation of the study. It will introduce and focus upon delivering the reader an overview of the
study’s development.
The second chapter presents the related literature review that covers concepts, theoretical
framework and empirical literature of performance and conceptual framework of the research.
Chapter three presents in detail a discussion and explanation of the research methodology. It
begins with a discussion of the research design, population of the study, sampling techniques,
sample size, data collection instruments, the data collection procedures and ends with data
analysis approach. Chapter four discussed the data presentation and data analysis of the study.
Finally, chapter five presented the findings, conclusions, and recommendations of the study.

8
CHAPTER TWO
LITERATURE REVIEW
2.1 Theoretical Review
2.1.1 The Evolution of Tyre Production
According Radder.F (2017) on his ‘Tire Recappers News’, the first use of pneumatic tyres for
automobiles was pioneered by the Michelin brothers, André and Édouard. They equipped a car
with pneumatic tyres and drove it in the 1895 Paris-Bordeaux road race. Though André and
Édouard didn’t win the race, they generated popular interest in pneumatic tyres, and Michelin &
CST became a leading producer of tyres in Europe. At the same time, solid rubber tyres
disappeared from the highways, mostly because of legislation that discouraged their use because
they were hard on the roads.
In 1898 Goodyear Tyre and Rubber Company—named after George Goodyear, the discoverer of
vulcanized rubber—was formed in America by Frank Seiberling. Then Firestone Tyre & Rubber
Company was started by Harvey Firestone in 1900. Thereafter, other tyre makers followed.
For the next fifty years automobile tyres were made up of an inner tube that contained
compressed air and an outer casing that protected the inner tube and provided traction. The
rubber that made up the casing was reinforced by layers or "plys" of rubberized fabric cords
embedded in the rubber. The tyres made during this period were known as bias-ply tyres because
the plys ran across the tyre in alternating diagonal layers at about a 55 degree angle to the wheel
rim. Bias-ply tyres continue to be made and are sold as authentic equipment for antique and
collector cars that were made during this period. Michelin first introduced steel-belted radial
tyres in Europe in 1948. Radial tires are so named because the ply cords radiate at a 90 degree
angle from the wheel rim, and the casing is strengthened by a belt of steel fabric that runs around
the circumference of the tyre. In radial tyres the ply cords are made of nylon, rayon, or polyester.
The advantages of radial tyres include longer tread life, better steering characteristics, and less
rolling resistance, which increases gas mileage. Again, radials have a harder riding quality, and
since they are technologically more complex than bias-ply tires, they are about 45 percent more

9
expensive to make. Because of their construction, radial tyres require a different suspension
system from that used by cars designed for bias-ply tyres. It is however, recommended that radial
tyres not be used on cars designed for bias-ply tyres (Radder 2017).
These days’ radial tyres became standard on new cars outside of America. Michelin in France,
Bridgestone in Japan, Pirelli in Italy, and Continental in Germany became powerful radial tyre
manufacturers. Automobile tyres everywhere became tubeless as tyre technology improved. Both
the American automobile manufacturers and the tyre companies sought the radial tyre. Detroit,
home of the American automobile, was afraid of how much it would cost to redesign automobile
suspensions to accept radial tyres. The tyre industry was afraid of how much it would cost to
retool the entire American tyre industry to make the more costly radial tyres. Not happy with the
threat of having to make tremendous investments, most American automobile makers and tyre
manufacturers wrote off the radial tyre as a freak product that isn’t going anywhere (Ernst 2013).
With the notable exception of B.F. Goodrich, the American tire companies decided that the
American public wasn’t ready to pay a lot more for the harder ride that radials produced, and
they stuck to making bias ply tyres. Goodrich bucked this trend by investing heavily in radial
tyre technology, only to have their tyre—the Silvertown Radial 900, introduced in 1965—
snubbed by the American automobile industry. Eventually Goodrich sold its tyre operations and
got out of the tyre business (Ernst 2013).
In 1967, Goodyear, the world’s largest tyre company, introduced their response to the radial, a
bias-belt product called the Custom Super wide Polyglass. The bias-belted tyre simply added a
fiberglass belt to the bias-ply tyre. The bias-belted tyre would last 30,000 miles compared to
40,000 for radial and 23,000 for bias-ply tyres. It could be used on cars designed for bias-ply
tyres. Best of all, it could be made on existing bias-ply tyre-making machines, which made its
cost not much more than a bias-ply tyre (Ernst 2013).
Fueled by a Goodyear advertising blitz, bias-belted tyre sales rose from 2 percent of the original-
equipment market in 1968 to 87 percent by the early 1970s. In advertisements touting their bias-
belted tyres, Goodyear ridiculed radials for their hard ride and their high cost. The American tyre
and automobile industry was confident that the bias-belted tire would keep the radial tyre wolf

10
from the door for a while and expected to have plenty of time to develop their own radial tyre
expertise at their own pace. Then in 1973 came the gasoline crisis. Gas went from 30 cents to a
dollar a gallon. Americans demanded more economical cars. That year, imported cars
represented 15% of American auto sales, but by the early 1980s imports were 28 percent. Of
course, each foreign car came equipped with radial tyres. Americans clamored for radial tyres
when they found that they improved gas mileage. Companies like Michelin and Bridgestone
were only too happy to supply the American market.
Alas, in the mid-seventies Firestone Tyre decided to get into radials on the cheap, fabricating
radial tyres on machines made for building bias tyres. The tyres came apart in a spectacular
manner. Firestone recalled close to 9 million of its Firestone 500 steel-belted radial tyres. From
1977 to 1980, Firestone’s tyre business dropped 25 percent, resulting in the layoff of 25,000
workers. The company went from a $110 million profit to $106 million loss, and its stock
dropped from $15 down to $10 a share. Firestone was rescued when Bridgestone Tyre bought
them in 1988.
Goodyear finally produced a radial tyre in 1977 by investing billions of dollars in radial
technology. Other American Brand Finance tire companies either merged or were bought out.
All American new cars came with radial tyres by 1983. Currently Goodyear holds about 20
percent of the global market share in radial tires, both original equipment and replacement;
Michelin, 19 percent; Bridgestone, 17 percent; Continental, 9 percent; Pirelli, 5 percent; and the
others, 30 percent (Ernst 2013).
According to Workman (2016), there are 102 countries that export various types of tyres across
the globe. A report shows that a ranking of the 10 most valuable Tyre Brands in the World are
Bridgestone, Michelin, Continental, Goodyear, Pirelli, Sumitomo, Hankook, Dunlop, Yokohama,
and CST in descending order. Each brand has been assigned a brand rating based on a
benchmark study of the strength, risk and future potential of a brand relative to its competitor set,
as well as a Brand Value- a summary measure of the financial strength of the brand.
Today the global industry encompasses around 400 factories worldwide producing more than
one billion units per annum. The peak of the industry’s dynamics in the modern era was reached
in the late 1980s when a series of dramatic restructuring occurred. Currently, the world tire

11
industry is led with nine ultimate parent companies that have annual sales in excess of $1 billion
each. These nine companies account for 80 percent of world tire sales (Ita and Gross, 1995).
Four of the nine companies have their headquarters in Japan (Bridgestone Corporation,
Sumitomo Rubber Industries Ltd., Yokohama Rubber Co. Ltd., and Toyo Tire and Rubber Co.
Ltd.), three are based in Europe (Groupe Michelin, Continental A.G., and Pirelli), and two are
headquartered in the United States (Goodyear and Cooper) (Bradley, 2000).
2.1.2 Definition of PerformancePerformance is a widely used concept in many areas. Mostly, it is a measurement of how well a
mechanism or process achieves its purpose. Moullin (2003) defines an organization’s
performance as how well the organization is managed and the value the organization delivers for
customers and other stakeholders. This implies that it is the measurement of the effectiveness
and efficiency of both the organization and the workers, where effectiveness refers to the extent
to which stakeholder requirements are met, while efficiency is a measure of how economically
the organizations resources are utilized when providing a given level of stakeholder and
customer satisfaction. Hence, performance can be defined as the use of resources both efficiently
and effectively in the achievement of its expected objectives.
2.1.3 Performance MeasurementAlthough much research has been conducted on performance measurement, its definition is still
widely questioned. ‘‘Performance measurement is a set of systems of metrics used to quantify
both the efficiency and effectiveness of actions’’ (Neely et al., 2000). Moulin (2005) defined
performance measurement as ‘‘the evaluation of how well organizations are managed and the
value they deliver for customers and stakeholders’’. He argued that his definition clearly shows
the purpose of performance measurement and emphasizes both the value the organization gives
to its stakeholders and the way the organization is managed.
Amaratunga and Baldry (2002) provided a more specific definition of performance
measurement which says that measurement provides the basis for an organization to assess how
well it is progressing towards its predetermined objectives, helps to identify areas of strengths
and weaknesses, and decides on future initiatives, with the goal of improving organizational
performance. This definition entails both the role and process of performance measurement
clearly from different aspects. Performance measurements are said to be appropriate when the

12
measures are those which enables the organization to direct their actions towards achieving their
strategic objectives (Dixon et al., 1990).
Moreover, performance measurement is the cohesive and well analyzed systematic approach
that improves organizational performance, with aims of achieving strategic objectives and
organization’s vision, missions and values (Salem 2003). The practices performance
measurement started in the late 1970s due to inaccuracies of using traditional backward
looking accounting systems. In relation with this manufacturing firms started the use of
financial measures to evaluate performance. Such measures typically assess current
performance against previous periods. They then realized that focusing entirely on financial
related measures was not effective enough to maintain performance and competitiveness in the
global market. This led to the establishment of emphasis on non-financial aspects of the
organization which led to development of integrated performance measurement systems
There are several considerations in the implementation of performance management models
strategic planning, operationalization and review (Robinson et al., 2005). The critical part is
choosing an appropriate strategic framework to integrate the business objectives. And hence,
operationalization of the strategic plan by developing a set of performance measures to monitor
corporate strategy and objectives necessary to assess continuous performance improvement is the
next stage (Basu, 2001). The final phase requires a review of results, the implications for
learning and knowledge management and performance improvement initiatives to reach key
business goals. By the term key performance indicators (KPI) we mean the set of performance
measures that lead to the achievement of current and future business success (see Parmanter,
2007).
2.1.4 The Evolution of Performance MeasurementPerformance measurement has its roots in early accounting systems of how a pre-industrial
organization could maintain a good account of external transactions and stock. Thus, before the
1980’s, performance measurement was largely evolved within the large industrial firms focusing
on the achievement of a limited number of key financial measures (Johnson & Kaplan, 1987).
But by the early 1980’s, as the increasing complexity of organizations and the markets in which
companies compete, it was no longer appropriate to use financial measures as the sole criteria for

13
assessing success (Kennerley& Neely 2002). Yeniyurt (2003) and Gomes, Yasin and Lisboa
(2004) summarize the major inadequacies of traditional metrics in their literature review.
2.1.5 Overview of Performance Measurement SystemsPerformance measurement system (PMS) supports a performance management philosophy and is
situated at the heart of performance management process (Lebas, 1995, Bitici et al., 1997).
Wagner et al., (2009) defines a PMS as a system which consists of components that are
individual performance measures through which we describe the elements, their characteristics
and relationships within examined model for performance measuring.
In terms of strategy and performance measurement, the various frameworks have been
introduced by many researchers such as the Balance Score Card (BSC) (Kaplan & Norton,
1996), Strategic Measurement and Reporting Technique (SMART) (Cross & Lynch, 1989),
Performance Measurement Questionnaire (PMQ) (Dixon, 1990), Performance Prism
(Kennerley& Neely 2002, Dixon et al. 1991), Integrated Performance Measurement System
(IPMS) (Bititci, 1997), Integrated Dynamic Performance Measurement System (IDPMS)
(Ghalayini, 1997) and European Foundation for Quality Management (EFQM) Model (The
EFQM Excellence Model 1999, EFQM, 2003)-which are overviewed as follow.
2.1.5.1 Financial Performance MeasuresFinancial performance measures are used to monitor the inflows (revenue) and outflows (costs)
and the overall management of money in the business. These measures focus on information
available from the Statement of profit or loss and Statement of financial position of a business.
Financial measures can be used to record the performance of cost centers, profit centers and
investment centers within a responsibility accounting system but they can also be used to assess
the overall performance of the organization.
2.1.5.2 Balanced ScorecardThe balanced scorecard was developed by Norton and Kaplan (1992) and is perhaps the most
well-known performance measurement framework. It is formulated to include financial measures
that report results on customer satisfaction, internal processes, and the improvement activities –
operational activities or measures that are drivers for the future financial performance (Kaplan
and Norton, 1992). The Balance Scorecard suggests that managers should view organization’s

14
performance from four perspectives, namely; customer, financial, internal and innovation and
learning perspectives.
Financial
Perspective
GOALS MEASURES
How do What must
Customers we excel at?
See us?
Internal perspective
GOALS MEASURES
Innovation and
Learning Perspective
GOALS MEASURES
Figure 2.1 The Balanced –Scorecard; Source: Kaplan and Norton (1992)
The four perspectives in the Balance Scorecard model are regarded as a chain of cause-and-
effect. For example, financial performance depends on a customer’s loyalty, which is influenced
by an enterprise’s internal/business processes. Similarly, internal business processes are
dependent on employee’s skills (leaning and growth). A good Balanced Scorecard should have
an appropriate mix of outcomes (lagging indicators) and performance drivers (leading indicators)
of the business unit’s strategy (Kaplan & Norton 1996).
However, the BSC cannot view the performance at manufacturing level. Also, the BSC has a
weakness to measure long term vision and fails to identify the performance measurement
specific level such as employees, suppliers and stakeholder. Again, this research will attempt to
Customer Perspective
GOALS MEASURES
Can we continue
to improve?
Create value?

15
use this measurement system to vindicate the performance of this case study to bring out reliable
output.
2.1.5.3 The Strategic Measurement Analysis and Reporting Technique(SMART) System
The Strategic Measurement Analysis and Reporting Technique (SMART) system wasdeveloped by Wang Laboratories to overcome the limitation of traditional performancemeasurement, with objectives to integrate both financial and non-financial performanceindicators (Cross & Lynch, 1989). The SMART system is designed as a four step performancepyramid as it depicted on Fig. 2.2. The SMART system can integrate organization objectiveswith operational performance indicators but that excludes continuous improvement (Ghalayini,1997).
Fig. 2.2 The SMART Performance Pyramid (Cross & Lynch, 1989)
2.1.5.4 Performance Measurement Questionnaire (PMQ)
The Performance Measurement Questionnaire was developed by Dixon et al. (1990, 1991), with
the purpose of assessing the existing performance measurement used in an

16
organization/company. The PMQ frame work consist of two main parts (Dixon, 1991): (1) to
evaluate the particular improvement areas and the current performance improvement that is
already used in the company, (2) to evaluate the particular long term importance of improvement
that will be achieved by the company. In terms of the improvement areas, Dixon et al. (1990)
identified three categories i.e. quality, labor efficiency and machine efficiency; it can be seen on
Fig. 3. The PMQ has the weakness of being relative light on management time during the audit
phase and lack of the management involve in the audit processes (Bourne & Neely, 2003). In
addition, the PMQ does not pay attention to the continuous improvement concept (Ghalayini &
Noble, 1996). This is also another option to go through the performance of the company.
Long-run importance
of improvement
Improvement areas Effect of current
Performance measures on
improvement
None >>>> Great
1 2 3 4 5 6 7
1 2 3 4 5 6 7
1 2 3 4 5 6 7
Quality
Labor efficiency
Machine efficiency
Inhibit >>>> Support
1 2 3 4 5 6 7
1 2 3 4 5 6 7
1 2 3 4 5 6 7
Fig 2.3 The Performance Measurement Questionnaire (Dixon.1990)
Source: International Journal of Lean Thinking (June 2013)
2.1.5.5 DuPont ModelThis is one of the original performance measurement systems that was developed by Du Pont,
the American chemicals giant, and is based on cost accounting theories and practices. Du Pont
developed a structure by linking accounting measures and financial ratios – such as Return On
Net Assets (RONA), Return On Investment (ROI) and Return On Equity (ROE) – to more
operational indicators and measures. RONA is commonly used to evaluate the effective use of
assets by measuring the ratio of profit margins (net income) to asset turnover (average total
assets). ROI is used to evaluate the efficiency of an investment by comparing the ratio of profit
and investment cost. ROE is the ratio of net income to shareholders’ equity, which shows the
amount of profit generated from the money invested by shareholders. One of the advantages of
Du Pont’s model is its structure, which integrates financial measures with operational indicators.

17
In contrast, the main drawback is that it is mainly focused on financial measures and has been
criticized for being myopic and short-term oriented.
Plus
Plus
Plus
Plus
Fig. 2.3 The DuPont model: A flow chart representation of the DuPont Model
Return OnNet Assets
Earnings as %Of Sales
Tumover
Sales
Earnings
Sales
Cost of sales
Production Costs
SellingExpenses
Administrative
Inventories
AccountsReceivable
Cash
Current Assets
Fixed Assets
PlusTotalAssets
Sales

18
2.1.5.6 The Results and Determinants FrameworkThe Results and Determinants Framework (Fitzgerald et al., 1991) has a structure composed of
six performance dimensions classified under two categories: results and determinants (Figure
A.3)
Dimension of performance Types of measure
RE
SUL
TS
Lag
ging
Ind
icat
ors
Competitveness Relative market share and positionSales growthMeasures of the customer baseProfitability
Financial performance LiquidityCapital structureMarket ratiosReliablity responsivenessAesthetics /appearanceCleanliness/tidinessComfortFriendliness
Quality of service Communication
DE
TE
RM
INA
NT
SL
eadi
ng I
ndic
atio
rs
CourtesyCompetenceAccessAvailabilitySecurtiyVolume flexibility
Flexibility Delivery speed flexibllitySpecification flexibilityProductivity
Resource utilisation EfficiencyPerformance of the innovation process
Innovation Performance of the individual innovations
Fig. 2.4 The Results and Determinants Framework Fitzgerald (1991)
The results category covers financial- and competitiveness-related performance measures. Theframework conceptualizes these measures as lagging indicators that reflect the ultimateobjectives of an organization. The determinants category includes performance measures forservice quality, flexibility, resource utilization and innovation, which are conceptualized asleading indicators.

19
2.2 Value Cchain Aanalysis: Integrating Mmarketing and Pproductionperformance
The term “value chain” was originally introduced in Michael Porter's book “Competitive
Advantage - Creating and Sustaining Superior Performance" (Porter1985). The value chain
analysis is based on Michael Porter’s generic value chain model (Porter 2001), developed in
1985 and used to explore Porter's model of competitive advantages through differentiation or
cost leadership strategy.
Porter breaks companies’ value chains down into single activities. The method allows the firm to
understand which parts of its operations create value and which do not (Ketchen and Hult 2007).
The aim is to cut the entire complicated supply chain of a company into smaller units. Hergert
and Morris (1989) state that the fundamental thinking in the value chain analysis is that a product
gains value as it passes through the vertical stream of production within the firm. When created
value exceeds costs a profit is generated. The model was originally introduced for companies in
the manufacturing industry (Armistead and Clark 1993, Ketchen and Hult 2007), as the Fig. 2.5
shows, the value chain is segmented into primary and support activities.
Primary Activities
The value Chain
Secondary Activities
Fig. 2.5 Primary and secondary activities in firm’s value chain. Adapted from Lanen et al (2008)
Source: http://www.ifm.eng.cam.ac.uk/research/dstools/value-chain-/ drawing on Porter, Michael E.,
"Competitive Advantage". 1985, pp 11-15. The Free Press, New York. (Accessed 19/01/15)
InboundLogistics
OperationsOutboundLogistics
Marketingand sales
Services
Procurement Human Resource ManagementInfrastructure Technological Development

20
Based on the tyre manufacturing process observation, this study will explore how the value
adding processes are undertaken and then will be compared to the standards set by the company
to see into the performance of same.
2.3 Empirical Literature
2.3.1 List of Tyre Mmanufacturers those have nearly the Same Age orYounger with Addis Tyre
As a whole, the reason why these countries were mentioned here was to depict their performance progress
in the tyre industry of the world whereas ours remaining stagnant for about five decades. When Addis Tyre
founded in 1972, it had a relationship with pioneers of tyre producer such as Czech Republic, Yokohama
and Matador (Continental AG).
The reviews of following tyre producing countries were considered to have relatively same year of
foundation (a little bit older or younger) to start manufacturing tyre. Most of the tyre manufacturers of
China were younger than Horizon Addis Tyre S.C and yet they became popular and dominant low priced
tyre producers and exporters of the world. As it was obtained from a website China produced 950 million
tyres in 2016. In relation with this for example, in 2017 we imported over 660 thousand tyres from same
(table 4.1.10)
A, China’s Number of Factories (1965-2003)
CompanyCountry of origin Year founded Brands
Aeolus tyre Co Ltd China 1965 Aeolus
Fullrun tyre China 2003 Fullrun, fullway
Hangzhou China 1958 CYT, Chaoyang
Shandong HengfengRubber
china 1995 Cachland tires, Hengfeng
Shanghai Huavi GroupCompany
China - Double coin
Triangle Group China 1976 triangle
Wanli china Wanli
Source: Wikipedia-List of Tyre Manufacturing Companies 2017

21
Secondly, India is among the major competitors in the tyre industry of the globe and our country was
flooded by tyres of same. In general, the India tyre industry had created 1 million job opportunities for its
citizens until 2015. We annually import over 300 thousands of tyre from there. TATA bus BAJAJS, light
trucks and truck tyres were dominantly used by our country as was observed during customer survey.
B India’s Number of Factories (1954-2016)
Company Country of origin Year founded Brands
Apollo Tyre Ltd 1972 Apollo
Asian Tyre Factory 1993 ATF
MetroTyres 1968 Metro Tyres
Birla Tyres 1991 BirlaTyres
Balkrishna Industry 1987 BKT Tyres
TVS Tyre 1981 TVS Tyres
CEAT Ltd 1958 CEAT
J.K Organization 1991 Affinity
MRF Tyres 1946 MRF
MRL Tyres 1954 MRL
Tychee Juno
Speciality Tyre Ltd
2016 TJ Tyres, BPPC Tyres
Source: Wikipedia-List of Tyre Manufacturing Companies 2017
C. Indonesia’s Number of Factories (1951-1988)
Company Country of
origin
Year
founded
Brands
Bateng Pratama Rubber PT 1981 Mizzle lucking stone
Gajah Tungai PT,TBK 1951 GT radial,Gajah Tunggal
Multistrada Arah Sarana PT TBK 1988 Achilles, corsa
United Kingland 1977 kingland
Source: Wikipedia-List of Tyre Manufacturing Companies 2017

22
D, Vietnam’s Number of Factories (1960-1993)
Company Country of
origin
Year
founded
Brands
NGUYEN DINH Rubber Co Ltd 1982 Tires
Saovang Rubber Company 1960 Saovang
Danang Rubber Company 1993 DRC
Casumina 1976 Casumina ,Euromina
Source: Wikipedia-List of Tyre Manufacturing Companies 2017
E. Taiwan’s Number of Factories (1954-1967)
Company Country of
origin
Year
founded
Brands
Cheng Shin Rubber Ltd 1967 CST, Ching Shin
Federal Corporatin 1954 Federal Hero
Kend Rubber Industrial Company 1962 Kenda Kend radial
Nankang Rubber 1959 Nankang, Sonar
Source: Wikipedia-List of Tyre Manufacturing Companies 2017
F. Japan’s Number of Factories (1910-1953)
Company Country of
origin
Year
founded
Brands
Bridgestone 1931 Bridgestone
Panaracer 1953 Panaracer
Sumitomo Rubber Industries 1909 Dunlop, Goodyear,Sumitomo
Toyo Tyre and Rubber Company 1943 Nitto, Silverstone, Toyo
Yokohama Rubber Company 1910 Mohawk, Yokohama
Source: Wikipedia-List of Tyre Manufacturing Companies 2017
G. Czech Republic and Germany- EX-friends
Company Country
of origin
Year
founded
Brands
Mitas a.s. Czech
Republic
1933 Mitas
Continental AG Germany 1871 Continental. Matador
Source: Wikipedia-List of Tyre Manufacturing Companies 2017

23
Below are the 15 Countries that Exported the Highest Dollar Value Worth of
New Rubber Tires during 2016:
China US$12.9 billion 18.6% of total rubber tires exports
Germany $5.5 billion 7.9%
Japan $4.5 billion 6.9%
United States 4.5 billion 6.4
Thailand 3.6 billion 5.1
South Korea 3.4 billion 4.9
France 2.5 billion 3.6
Netherlands 2.2 billion 3.2
Spain 2 billion 2.9
Czech Republic 2 billion 2.9
Poland 2 billion 2.8
Slovakia 1.8 billion 2.5
Canada 1.7 billion 2.5
Indonesia 1.6 billion 2.3
Hungary 1.5 billion 2.2
Source: Wikipedia-List of Tyre Manufacturing Companies 2017
The listed 15 countries shipped three-quarters (74.7%) of global rubber tires exports in 2016 by
value. Global sales from rubber tires exports by country amounted to US$69.6billion in 2016.
Overall, the value of rubber tires exports were down by an average 21% for all exporting countries
since 2012 when rubber tires shipments were valued at $88 billion. Year over year, the value of
global rubber tires exports dropped by -4.4% from 2015 to 2016.
Among continents, Asian countries accounted for the highest dollar worth of rubber tires exports
during 2016 with shipments amounting to $31.1billion or 44.7% of exported tire sales. European
exporters shipped 41.6% of the global total, while 10.2% of the value of new rubber tire shipments
came from North America.
Latin America (excluding Mexico) and the Caribbean were responsible for 2.9%, with African
suppliers coming in at 0.5%. Oceania countries Australia plus New Zealand accounted for an even
smaller percentage at 0.1%.

24
Bridgestone Corp. retained the No. 1 spot for the ninth straight year, with tire-related sales of $22.1 billion,
comfortably ahead of Group Michelin's $21.1 billion and Goodyear's $13.5 billion, according to Tire
Business research.
2.3.2 Tyre Industry in Sub Sahara Countries
Competition heats up as tyre manufacturers engage in uphill battle to gain market supremacy in
Africa. As a matter of fact, when it comes to tyres, the African continent is one of the fastest
growing markets for the global tyre industry. This has been attributed to the rapid growth of the
middle class in many African countries that has pushed demand for automobiles to an all-time high
– in turn creating a growing market for all kinds of tyres.
The rising demand for tyres in Africa has led to stiff rivalry among tyre producers from all over the
world looking to acquire a major share of the market for tyres in the new and emerging African
markets. Traditionally, European tyre producers had had a monopoly over the African markets and
many European brands were top selling tyres in many African markets.
However, in recent times, European tyre firms have started to lose ground to Chinese and other
Asian brands in many emerging markets not only in Africa, but around the world. Chinese tyres
have got popularity in several African markets. Many underdeveloped countries, especially in
Africa, are price-sensitive markets and seek to import low-priced Chinese tyres rather than the
expensive European and American brands. Hence, China has emerged as a leading exporter of
tyres to many African countries in recent times including Ethiopia.
Players in the tyre industry worldwide are not famous for fair trade practices and Ethiopia is no
exception. In our country, for instance, significant bulks of unaccustomed and inferior quality
products have entered the local market. There is import duty tax on the tyres imported, however
our tyre company complained that said retail and wholesale prices of some foreign products in the
market are well below the expected minimum if costs of production, transport, insurance and duty
were taken, an implication of illegal dumping and smuggling.
Besides new inferior poor qualities tyres, there are also low-quality second-hand ones which soon
wear out on the country's rough roads. As the key informant management group said, most used
tyres are dumped into the African market after exceeding the legal use limit in European and other

25
developed countries. The thread of the tyres is so shallow that it makes nonsense of the cheap
prices, and they also have a poor surface grip.
In relation with this an increase in tyre import duties had been requested for Africa owing to the
large quantity of substandard tyres that are being brought into the country from China. The cheaper
tyres provide unfair competition for local tyre manufacturers, who are concerned with the risk the
thinner tyres pose to the safety of heavy vehicles such as taxis, minibuses and light trucks.
So despite the best efforts of the most developed country in the African continent, the onslaught of
the Chinese manufacturers continued. Chinese tyre manufacturers have, in a way, broken the myth
about European technological superiority by producing high quality tyres at fraction of the cost.
The European brands, used to charging high prices for their products have finally been challenged
and are now being forced to roll back their profit margins and compete with Chinese
manufacturers. In surface area, Africa is one of the biggest world regions but in terms of the
market size for tires it is one of the smallest. However, the last decade has seen rapid growth in
most economies and it is forecast to be the most rapidly growing region in the next decade. In the
fifteen years between 1995 and 2010, the 45 countries in sub-Saharan Africa averaged a growth in
GDP of 5% a year; a performance almost equaling that of China. The only country in sub-Saharan
Africa with both a sophisticated market for tires and a substantial manufacturing capability is
South Africa.
However, there are some very large and potentially wealthy markets elsewhere in Africa. Nigeria
has an estimated population of 170 million, more than three times that of South Africa, and
Ethiopia too is almost twice the size. In addition a number of countries are approaching middle-
income status at which point the tire market will grow rapidly.
The South African Tyre Manufacturing Industry comprises the continental AG, Bridgestone,
Goodyear, Dunlop and Sumitomo Rubber and are subsidiaries of the parent companies in Asia
and Europe. According Haffejee.R 2015, the aggregate contribution of the industry to the
nation’s economy in employment and job opportunity came to 7000 people directly and 4000
people indirectly through value chain. Moreover, it serves as original equipment manufacturers
for the automotive industry of the country and replacement tyres for the existing vehicles.
Furthermore, 11 million (63%) tyres were sold locally; 2millions (11%) were exported and

26
5millions (28%) imported. At present all countries in this region, including South Africa, are
importing increasing quantities of tires, particularly from Asia. At the same time many of these
countries have had relatively sophisticated tire manufacturing plants which have either closed
down completely or are operating at a fraction of their potential. As a result there is a lot of
interest in ways to revive tire manufacturing in Nigeria, Kenya, Mozambique and Ethiopia
amongst others.
Major technological breakthroughs such as the vulcanization process (Charles Goodyear 1839)
and the pneumatic tyre (Robert William Thomson in 1846; the Michelin brothers for automobiles
in 1895) led to the establishment of the first tyre companies at the beginning of the twentieth
century (Krammer, 2009).
Currently, the global tyre industry encompasses over 400 factories worldwide making more than
one billion units of tyre per annum. In relation with this, there have been continuous
improvements in the tyre industry since the inception of pneumatic tyre invention. The most
important of which are invention of tyre treads and maintainable rims in 1904; the use of carbon
black as reinforcement materials in 1920s; the introduction of synthetic rubber in 1930s; and the
radial tyre design in 1940s.
Furthermore, the most active current areas of research focus pay attention on reducing rolling
resistance, improving handling, increasing endurance, prolonging the service life and advancing
safety feature. Tyre is an engineering and technology product. Research and Development is a
constant activity in tyre industry to improve the performance of tyres. Innovations are taking
place to make permanent tyre and eco-friendly tyres for future. Tyre manufacturing process has
also undergone major changes time to time. One of the major changes was the automatic tyre
building machine development. Traditionally, tyre building was a laborious activity and the
productivity is dependent on the tyre builders’ ability to build tyres. Also, the quality is
dependent on the efficiency of the employee to build the tyre which required immense physical
effort. Finally; automated tyre building machine has helped the tyre manufacturers to constantly
maintain the quality of tyre and increasing the productivity. In relation with this, tyre
manufacturers in United States and European countries have almost fully automated the tyre
manufacturing process. That is to say that the process is automated through robotics and
conveyor system is deployed and the tyre is carried automatically to different sections of

27
processing (extrusion, building, curing and inspection) and hence the efficiency and productivity
have increased significantly Krammer, 2009).
In summary, advances in general purpose technologies have helped tremendously the major
design issues. In addition with this, tyre technology has made enormous progress in recent years
such as its being becoming lighter, capable of higher speed, and shorter braking, less rolling
resistance and longer durable.
2.3.3 Challenges of Tyre ManufacturingChallenges of tyre manufacturing depend on growth of tyre producing countries. For instance,
the challenges of the highly developed tyre manufacturing countries such as Japan, France, Italy,
USA and the like worry about the durability, comfortableness, capability of high speediness.
On the other hand, the challenges of the world tyre manufacturing countries imply technology,
skill gap, capital constraint, raw material scarcity, efficiency and effectiveness (low
productivity), unable to compete with highly developed global rivals and management capacity
gap. To put in a more vivid manner the following description of challenges of tyre manufacturing
depict
Figure 2.8 Challenges of Tyre Manufacturing
Source: United Nations, Department of Economic and Social Affairs adapted fromV.K. Misra JK Tyre(2016)
2.4 Conceptual Framework for the StudyIn order to arrive at a refined conceptual framework for the study (Figure 2.9), in accordance
with the stated research objectives, an objectively adequate assessment of valuable frameworks
People (skill development)Higher manpower cost vis-a-Vis Developing nation
Operational Excellence(Quality, Productivity, Cost,
Delivery)
Threat from China… Low cost import
Economy of scaleTechnology and R&D
InfrastructureDigitization
Ease of doing businessSustainability
Economic (Volatility, Uncertainty,Complexity & Ambiguity)
Govt. Policy & Reforms
CHALLENGES

28
and concepts was reviewed. Therefore, as performance is the combined result of many activities
which can be categorized as primary and secondary.
Primary activities are those involved with a product’s physical creation, sales and distribution,
and after-sales service. In detail, this involves the product interrelations inbound logistic and
operations and the market interrelations outbound logistic, marketing, sales and after-sales
service (Ireland et al. 2009, Mowen and Hansen 2011). Primary activities are always defined as
value-added activities which are “those that customers perceive as adding utility to the goods or
services they purchase” (Lanen et al. 2008, p. 4).
The value chain is, according to the handbook for value chain research by Kaplinsky and Morris
(2002) the full range of activities which are required to bring a product or service from
conception, through the different phases of production (involving a combination of physical
transformation and the input of various producer services), delivery to final consumers, and final
disposal after use.
Support activities provide the assistance necessary for primary activities. In detail, this involves
the infrastructure interrelations firm's infrastructure and human resource management,
technological interrelations (technology development) and procurement interrelations
(procurement) (Ireland et al. 2009, Mowen and Hansen 2011). Those activities are not part of the
closer value chain they are included in every function of the value chain (Lanen et al. 2008).

29
Figure 2.9: Conceptual framework of the study, tire production performance and challenges
Source: Own construction with inputs from Porter (1985), Lanen et al (2008), Chavda and Patil(2011) and Kaplan (2015)
As indicated in Figure 2.9, in the tire manufacturing operation, there are 11 key sub-processes.
According to Chavda and Patil (2011) and Grover (2002) and the tire manufacturing process
involves the following steps where each step has its own effects on overall productivity.
1. Mixing: involves weighing and combining various ingredients (natural and synthetic rubbers,
oil, carbon black, zinc oxide, sulfur, and other chemicals) to create a homogenous rubber
compound that is discharged to a drop mill.
2. Milling: creates warm malleable sheets that are cooled and coated with an “antitack solution.”
These sheets are then fed into an extruder.
3. Extruding: It forces the rubber compound through a shaped slot called a die that forms the
compound into various shapes.
4. Calendaring: involves coating fibers of cloth or steel with a rubber compound, and then
curing it in an irradiation oven that bevel cuts it to a desired length, width, and angle.

30
5. Bead making: involves the creation of beads that provide a proper seal between the tire and
the wheel rim when a tire is mounted on the rim and inflated. In the bead building process,
bundles of wire are passed through an extrusion die where a coat of rubber is added, and the
wires are then wound into a hoop.
6. Cementing and marking: processes are used at various stages throughout the tire building
process. Cements (adhesives or solvents) are added to improve the adhesion of different
components to each other throughout the process. Cement usage can vary significantly among
facilities depending on the type of tire being manufactured and the process being used. Marking
inks are used to aid in identifying the components being managed. Typically they are applied to
extruded tread stocks to aid in identifying and handling cured tires. Marking practices can also
vary significantly among facilities.
7. Cooling and culture: The various tire components go through cooling and culture prior to tire
building. From the milling and extruding operations, the rubber sheets are placed onto long
conveyor belts that, through the application of cool air or cool water, lower their temperature.
8. Tire building: The two main components of the tire-building process are the tire carcass
buildup drum and the tread application drum. These drum machines assemble the cut carcass
plies and belts plus the extruded tread, sidewall, and beads into tires. The process begins with the
application of a thin layer of rubber compound, the inner liner, to the innermost carcass ply. The
carcass plies are placed on the drum one at a time, after which the beads are set in place and the
plies (reinforcing layers of cord and rubber) are turned up around them. At this stage the belts
and tread rubber are added.
9. Lubricating: involves preparing the uncured (green) tire for curing. The green tire may be
coated with a lubricant (green tire spray). The function of the green tire spray is to ensure the
cured tire does not stick to the curing mold during extraction of the tire after curing.
10. Curing: involves collapsing the drum and loading the green tire into an automatic tire press
to be cured (vulcanized) at high temperature and pressure. The vulcanization process converts
the rubber and also bonds the various parts of the tire into a singular unit.
11. Tire finishing: may involve some of the following processes: trimming, white sidewall
grinding, buffing, balancing, blemish painting, whitewall/raised letter protectant painting, and
quality control inspections. Some facilities also apply a puncture sealant during production.

31
With regard to performance, it is framed from and seen from two dimensions, i.e., Operational
performance (P1) and Market performance (P2) (Figure 2.9). In both cases there are Critical
success factors (CSFs) and Key Performance Indicators (KPIs) are the essential areas of the
business that must be performed well if the mission, objectives and goals of the business are to
be achieved. CSFs act as a common point of reference to measure the success of the business.
They constitute important elements such as competitiveness, resource utilization, quality of
service, customer satisfaction etc (Kaplan, 2015) where each of which has their own KPI.

32
CHAPTER THREE
METHODOLOGY
3.1 Research Design & ApproachMixed research design with both descriptive and explanatory research components are used to
investigate the manufacturing performance and challenges of the tire manufacturing firm. As
such the research method makes it possible for the presentation of facts that concern the nature
and status of the situation, as it exists at the time of the study as well as describing the present
conditions, events or systems based on the impression or reaction of the respondents of the
research (Durrheim, 1999). To achieve the objective of a mixed-research approach which
constituted both qualitative and quantitative research approach were employed. This type of
design helps to explore facts, triangulate facts, and examine the determinants of the dependent
variable, in this research case the level of employee turnover and organizational citizenship/or
attachment(Creswell, 2009). Accordingly, determinants of productivity as expressed in terms of
market performance (refer conceptual framework, figure 2.9) is determined which require
quantitative analysis.
According to Leedy & Ormrod (2013), the qualitative analysis or approach was employed to
answer questions about the complex nature of an existing phenomenon, having the purpose of
describing and understanding it from the view of points of the participants or target groups. This
was particularly indispensable to interpret results about the challenges of tire manufacturing in
the company under consideration. Qualitative research methods produce social explanations to
intellectual puzzles in the society. It is expected that those social explanations can be helpful to
produce generalizations (Mason, 1996). According to Berg (2004), qualitative researchers are
effective in terms of producing deep reports and intensive understanding of the chosen research
topic. As explained by Durrheim (1999), qualitative research is both holistic and naturalistic, and
is therefore usually applied to inductively explore a situation or phenomena and provide ‘thick’
descriptions. On the other hand, quantitative research is primarily focused on the numeric
analysis and statistical interpretation of data (Creswell, 2009).

33
3.2 Data TypeBoth primary and secondary data were used for the study. Primarily data were those which were
collected a fresh and for the first time and they are believed to be original in character (Kothari,
2004). Primary data are collected to provide information regarding a specific topic and secondary
data are data previously collected and analyzed. This study used both primary and secondary
data sources to address the research aims, purposes and questions. To vindicate the fundamental
challenge and observe performance of the captioned company and to investigate its contribution
to the country economic development, employing the models in the literature review, primary
data collection from operational data of the company and imported finished good of same from
Ministry of Customs and Revenue and from other concerned organs. Moreover, the value adding
process of manufacturing of the product through observation, survey, structured and unstructured
interview were conducted and secondary data from various sources were seen through.
Furthermore, secondary data of performance measurement standards to measure and compare the
productivity and effectiveness and deviation from the standard was employed to indicate its gap
and challenges (threats) in general.
3.2.1 Primary Data SourceIn general the primary data sources are categorized as observation, survey method,
experimentation, and unpublished written and recorded document. To this specific research
purpose the Addis Tire PLC production system and its market were sources of primary data. To
this end, both survey and relevant data bases were used. In addition to this, data acquisition
guidelines, semi-structured, unstructured and face-to face interview were conducted so as to dig
out the overall performance and constraints of the company. Finally, unpublished document were
employed to look into the performance and input utilization trend.
3.2.2 Secondary Data SourcePublished and official reports and audited financial statements were used as data sources. More
prominently, official strategic and performance reports from the case study company, national
and internal reports and performance guidelines are used as supplementary data sources. Here,
the employment of secondary data attributed particularly in providing standards for tire
production process, bench marking to improve the overall performance and in acquiring
technology know-how.

34
3.4 Target Population and Sample
3.4.1 The Target PopulationIn line with the objective of the study, the target population of the research was divided into two.
(i) To investigate the Production performance component (P1), as indicated in the conceptual
framework (Figure 2.9) and (ii) To investigate market performance (P2). For the first part, the
target population of the study was executives, top management, line and operational
management, supervisors and professional experts and experienced staff. For the second part, the
target populations of the study are customers in the tire market.
3.4.2 Sample Size and DeterminationThere is no universally accepted single formula to determine sample size for different studies;
Different researchers used the different formula to determine sample size based on their situation
and population characteristics. Sample size depends on nature of the universe (population),
number of classes proposed, nature of the study, type of sampling and level of accuracy expected
from the investigation (Kothari, 2004). The selection of sample size is depending on nature of
the research design, availability of finance and the level of confidence and the nature of target
population the researcher needs to study (Kothari, 2004).
For selecting respondents from the study organization, all the executives and production mangers
are selected and a total of 7 respondents are selected. For selecting respondents from the market
(i.e., buyers or potential customers), considering a maximum likelihood of the sample proportion
(P) is considered where p= 0.50 and hence q= 1-p. p = 0.5 in which case sample size ‘n’ was the
maximum and the sample yielded at least the desired precision. This was the most conservative
sample size (Kothari, 2004). Accordingly, the following sample size is used:
Where;
n= Sample size

35
p= Sample proportion, q= 1-p; where p= q= 0.50
z = The value of the standard variate at a 95% confidence level which is 1.96
e = acceptable error (the precision) which is 0.05
Accordingly, n= [(1.96)2x0.5x0.5]/ (0.05)2 = [3.8416 (0.25)]/0.0025 = 385
Therefore, a sample of 385 respondents were selected.
Based on the historical customer information of Addis Tire SC, its customers are both
individuals and organizations (government and non-government). Accordingly, 45 % of the tire
is sold directly for individuals and the rest (55%) for individual car owners. Therefore, the total
sample size (n= 385) is proportionally allocated as 0.45 (385) = 173 organizations and 0.55
(385= 212 individual car owners.
3.5 Data Collection ToolsBoth structured questionnaire and key informant interview guide were used to collect data.
3.5.1 Structured Questionnaire
According to Johnson & Christensen (2008), questionnaires encourage the respondents to be
honest since they are answered anonymously, and they are more economical than interviews.
Moreover, it has the ability to solicit information from several respondents within short period of
time. The scaled items, according to McMillan and Schumacher (2010), allow the respondents to
choose. The details of each standardized instruments presented here under. The questionnaire
consists of information regarding respondents personal back ground and their views regarding
the questions related to performance and challenges of tire manufacturing in Addis Tire PLC.
The questionnaires will be distributed for 385 respondents in the tire market.
3.5.2. InterviewsFace to face interview method is preferred due to its flexibility and ability to provide new ideas
on the subject. Moreover, it enables to obtain in-depth information about participants' thought,
beliefs, knowledge, reasoning, motivation, and feeling about the issue under study (Kothari,
2004). In order to get detail information from the informants about the performance and
challenges of tire manufacturing in Addis Tire PLC. The student researcher conducted in-depth
interviews with 7 from the top, executive and operational position who have been working for
many years in the organization by using non probability purposive sampling technique. They

36
were selected as they are the individual who facilitate the realization of organization goal; the
researchers assume that they have necessary information on performance and challenges of tire
manufacturing.
3.5.3 Document ReviewThe researchers also ask the documents pertaining to the rules and regulations that govern the
employees in the crime prevention sector. It is the main data collection instrument for gathering
information from secondary sources. Further to collect the required data from available
documents about the performance (production and marketing performance measures) of tire
production performance and challenges in the context to Addis Tire PLC.
3.6 Data Analysis and Presentation
3.6.1 Descriptive Data AnalysisDescriptive data analysis involving both measures of central tendency (mean, median, and mode)
and measures of dispersion (standard deviation) were computed. Descriptive statistics allows
describing the data and examining relationships between variables, while inferential statistics
allows examining causal relationships, testing the research hypothesis and drawing conclusion
about the population from which the sample is drawn beyond calculating parameters. The
summary of descriptive statistics provides general descriptions about the data (both dependent
and independent variables). So as to achieve the stated objective, the collected data were
analyzed using descriptive statistics analysis.
3.6.2 Production Performance Analysis (P1)CSFs help everyone in the team to know exactly what they need to do to ensure the success
of the business. This helps employees perform their own work in the right context and so pull
together towards the same overall aims to achieve goal congruence. CSFs are related to the
mission and goals of the business. Measurement of CSFs is possible by the creation of key
performance indicators (KPIs). KPIs can be based on financial and nonfinancial information.
• The mission focuses on the overall long term aims and what is ultimately to be achieved
• Objectives break down the mission into quantifiable goals
• CSFs are the essential areas that must be perfected to achieve the objectives and therefore the
mission of the business. The table below shows a number of performance indicators grouped

37
against CSFs. The organization will formulate its own, specific KPIs which best suit its business
as indicated by Kaplan (2015), Table 3.1.
Table 3.1: Performance measurement techniques
Critical Success Factors (CSF’s) Key Performance Indicators (KPI’s)Competitiveness • sales growth by product or service • measures of customer base
• relative market share and positionResource Utilization • efficiency measurements of resources planned against consumed
• measurements of resources available against those used• productivity measurements
Quality of Service • quality measures in every unit• evaluate suppliers on the basis of quality• number of customer complaints received• number of new accounts lost or gained
Customer Satisfaction • speed of response to customer needs• informal listening by calling a certain number of customers eachweek• number of customer visits to the factory or workplace• number of factory and non-factory manager visits to customers
Quality of Working Life • days absent • labor turnover• overtime • measures of job satisfaction
Innovation • proportion of new products and services to old one• new product or service sales levels
Responsiveness • order entry delays and errors• wrong blueprints or specifications• long setup times • high defect count• machines that break down
Quality of Output • returns from customers • reject rates• reworking costs • warranty costs
Flexibility • product/service introduction flexibility• product/service mix flexibility• volume flexibility • delivery flexibility• time to respond to customer demands
Source: Kaplan (2015)
3.6.3 Market Performance and Determinants: Customer Decision to BuyAddis Tyres (P2)
Once market share was determined, the factors that determine the purchasing decision of
customers to buy Addis Tire product (tire) a binary logistic regression model were employed.
Binary because a respondent has purchased Addis Tire’s product i.e., p (buy) =1 or not, i.e., p
(buy) = 0. This is because the classical linear methods are inappropriate for dichotomous choices
since they can lead to heteroscedasticity variances. To deal with heteroskedasticity, the logit or
binary logistic regression with flexible functional forms in the independent variables tends to
work well.

38
In making purchase decisions, a car tire marketer evaluates the benefit. If the benefit of
purchasing a tire which is from Addis tire SC is higher than the cost of purchasing from the
same, the benefit (B) for purchase, assuming monotonic relationship between purchase and
benefits, has been higher than the purchase. Suppose an individual buyer’s benefit after purchase
for a given vector of socioeconomic factors (Z) is denoted by BBuy (Z), and the benefit without
participation by BNBuy (Z). Then, the preference for participation or not to participate can be
defined as linear relationship
BBuy(Z) = ZβBuy +ɛBuy ……………………..…………….(1)
YNBuy(Z) = ZβNBuy +ɛNBuy--------------------------------------(2)
Where, βBuy, βNBuy andɛBuy, ɛNBuy, are response coefficients, and random disturbances associatedwith the purchase and non-purchase in ‘Buy decision’ activities respectively. By assuming thatthe qualitative variable Y indexes the purchase decision, then Y has taken a value of 1 if the tirebuyer purchases tire from Addis Tire SC and zero if the tire buyer does not purchases tire fromAddis Tire SC. The probability that a given buyer participated can be expressed as a function ofZ as follows (Greene, 2008):
P(Y=1) = P (BBuy > BNBuy)
= P (ZβBuy + ɛBuy > ZβNBuy + ɛNBuy)
= P (ZβBuy - βNBuy) > (ɛNBuy - ɛBuy)
=P (Zβ > ɛ) = F (Zβ) ------------------------------------------------- (3)
where P is a probability function, ɛ =ɛNBuy - ɛBuy is a random disturbance term, β = (βBuy - βNBuy)
is a vector of unknown parameters which can be interpreted as the net influence of the vector of
the independent variables on participation in buy or purchasing, and F(Zβ) is the cumulative
distribution function for ɛ and Zβ.
The exact distribution of F depends on the distribution of the random term, ɛ. The probit model
arises from assuming a normal distribution, and a logit model arises from assuming a logistic
distribution. Under the standard assumptions about the error term, there is no a prior reason to
prefer probit to logit estimation (Greene, 2008). Accordingly, in most applications, it seems not
to make much difference. Considering all these aspects, a logit model was used to study the
factors affecting tire buyer’s decision to buy from Addis Tire SC.

39
According to the logit model, the probability of buyer's participation, given the respondents’
characteristics (Z) is P (Buy|Z) and can be specified as:
P(Buy|Z) = exp(Zβ +ɛ) ----------------------------------------------------------(4)
1+exp(Zβ +ɛ)
Where α < Zβ <α.
The probability of not participate in Buy, P ( NBuy|Z), is therefore,
P ( NBuy|Z) = 1-P(Buy|Z) = exp(Zβ +ɛ) = 1 -----------------------(5)
1+exp (Zβ +ɛ) 1+exp (Zβ +ɛ)
The relative odds of participating versus not participating in Buy are given by:
P(Buy|Z) = [exp (Zβ +ɛ) Ι1+ exp (Zβ +ɛ)] =exp (Zβ +ɛ) ---------------- (6)
P( NBuy|Z) [1+exp(Zβ +ɛ)]
By taking the natural logarithms of both sides gives:
In[P(Buy|Z)] = Zβ +ɛ --------------------------------------------------------(7)
P ( NBuy|Z)
The formula can be used in predicting changes in the probability of participating in buy which
can be employed to estimate the changes in the number of purchase decisions (Woolridge, 2000).
The maximum likelihood estimation approach can be used to estimate the above equation.
The logit model is preferred in this study because of its simplicity to work with. Given the
logarithms function which says:
Zβ +ε
Where P(Buy|Z) is the probability of purchasing Addis’s tire, P(NBuy/Z) is the probability of not
purchasing Addis’s tire, and Z is a set of explanatory variables. STATA version 13.0 was used to
run the model.
The goal of the maximum likelihood (MLE) approach is to estimate the unknown parameters,
denoted by β and ɛ in equation 7. The MLE entails finding the set of parameters for which the
probability of the observed data is greatest. The maximum likelihood estimates are the values for

40
β s that maximize the likelihood function. The critical points of a function, which are the maxima
and minima occurs when the first derivative equals 0.
So, from equation 6 and 7, β =β0, β1, -------- β10 which are the unknown parameters to be estimated,
Z is a vector of independent variables Z1, Z2 ------------- Z10, where
To estimate this β s, let be equal to L
Maximizing equation 7 with respect to the β s and setting them equal to 0 gives:
First Order Conditions
= 0 ……………………………………….. (8)
= 0 ……………………………………….. (9)
.. = 0 ………………………………… (10)
The solution of these equations gives the MLEs, β0, β1, ------- β10. However, there is no explicit
solution for β0, β1, ------- β10 unless the unrestricted least squares estimator satisfies the restriction,
the Lagrangean multipliers equaled zero and β equals b but this is unlikely (Greene, 2008). These
ML estimators have to be solved numerically. This was done by using the STATA version 13.0
to run the logit model.
3.7 Ethical ConsiderationsAccording to De Vos et al. (2005), Ethics is a set of moral principles that are suggested by an
individual or group, are subsequently widely accepted, and offer rules and behavioral
expectations about the most correct conduct towards experimental subjects and participants,
sponsors, employers, assistants, students and other researchers. Since human beings are the
objects of social science studies, there are unique ethical challenges to be seriously considered,
which are normally not prevalent in other pure, clinical laboratory contexts of natural science
(De Vos et al., 2005). As described by Babbie and Mouton (2001), studies should consider and
be aware of the general agreements about the appropriate and inappropriate acts in conducting
scientific investigation. Informed consent is vital for a scientific study (Spicker, 2007). All these
requirements were fulfilled throughout the process of this study.
41
As stipulated by Leedy and Ormrod (2005), while dealing with stakeholders who had direct or
indirect relationships with the study, the researcher considered the following ethical issues;
Protection from harm: The researcher not exposed research participants to undue harm of
physical or psychological in nature. Interviews held in a safe environment and in the comfort
of interviewees’ workplace. No tacit or implicit pressure exerted on participants to answer
questions in a specific manner. The researcher has also assured the anonymity and
confidentiality of the participants by not letting write their names on the interviewing
questions and asking them individually and separately;
Right to privacy: The researcher ensured the participants’ right to privacy and not disclosed
responses received from any of the participants. Furthermore, the identities of participants
will be respected by referring to them as ‘participants’ in the dissertation (Denscombe, 2002).
A code or number will also be allocated to each participant. Assuring the willingness of
participants and if a participant would not willing the researcher replaced the nearest
participant from the target population;
Informed consent: First of all, through preliminary discussion, permission to conduct
interviews will be arranged from the respective organization of EFPCPS. Next, all
participants will be informed about the nature of the study to be made; the participants are
given choices of participation in the study or not. The researcher informs the participants that
it is their right to withdraw from the study whenever they want to do so. Once informed
consent is secured, proper orientation about the purpose of the research is provided to the
participants.
Honesty with professional colleagues: The researcher reports his findings completely and
without any bias. No misrepresentations which may mislead others about the nature of the
findings will be made.

42
CHAPTER FOUR
RESULTS AND DISCUSSION
4.1 Results
4.1.1 IntroductionThe core of the subject matter of this research referred to the performance and challenges of Tyre
Manufacturing in Ethiopia-the Case Study of Horizon Addis Tyre S.C. So as to vindicate vividly
the research, the researcher designed a conceptual framework deemed to be appropriate. Hence,
based on the conceptual framework designed, the results (findings) and discussions of the results
are presented in this chapter. The conceptual framework designed so as to search, identify and
assess statement of the problem and answers to the research questions and comprised inbound
logistics, operation (value chain), outbound logistics, marketing and sales, customer survey,
critical success factors and their performance indicators. Thus, the results of findings per
conceptual frameworks designed are presented and there after discussed.
4.1.2 Tyre Manufacturing -Inbound LogisticsTo begin, Horizon Addis Tyre S.C. manufactures tyre entirely from imported raw material and
hence has been extremely dependent on the imported raw materials, equipment and machines. As
the company’s annual report indicated, about 98% raw materials and technology are imported.
The following expenditure in millions to import the captioned items could verify the dependency
on import. The reason why the firm extremely dependent has been owing to most of the major
components are not available in the country-synthetic and natural rubber, carbon black …etc that
are fuel (oil) by products. Natural rubber, of course, available but it is not that much significant
to support the firm in a way it desired and expected for a various reasons. The table here below
shows that millions of birr that ranges from Birr 317million to 716million was expended to buy
raw materials, machineries and necessary accessories from the foreign markets during the past
six years period (2012-2017) as per the record of ERCA.

43
Table 4.1.1 Raw Materials Purchase Expenditure
Year Purchase in ,000 birr
2012 316,502
2013 447,057
2014 519,245
2015 736,356
2016 651,414
2017 569,060
Source: ERCA Total Import of Horizon Addis (2012-2017)
Here, in addition to its dependency on the imported raw materials, foreign currency required
for the purchase is huge and has become extremely scarce. In relation with the raw material
constraint, the firm could not utilize the rubber plantation locally available in the country,
which was under the factory when the firm owned by government now detached from its
ownership during privatization and hence its contribution is regarded as insignificant, owing
to proper management problem and very poor in quality and productivity. Raw material
procurement is a tough and difficult task for the company. Here, the scarcity of foreign
currency limited the purchase of raw materials required and would be by far more than the
already spent on same if there were no foreign constraint as the operation section unutilized
capacity and underperformance showed compared with capacity of machines normally made
.
4.1.3 The Tyre Production Value Chain in Horizon Addis Tyre SC.
In the production of tyre, there are primary, secondary and tertiary activities. Primary activities
are those involved with a product’s physical creation, sales and distribution, and after-sales
service. In detail, this involved the product interrelations inbound logistic and operations and the
market interrelations outbound logistic, marketing, sales and after-sales service (Ireland et al.
2009, Mowen and Hansen 2011). Primary activities are always defined as value-added activities

44
which are “those that customers perceived as adding utility to the goods or services they
purchased” (Lanen et al. 2008, p. 4).
The value chain is, according to the handbook for value chain research by Kaplinsky and Morris
(2002) the full range of activities which were required to bring a product or service from
conception, through the different phases of production (involving a combination of physical
transformation and the input of various producer services), delivery to final consumers, and final
disposal after use.
Figure 4.1: Tyre value-chain map as observed in the Horizon Addis Tyre SC
(Drawn by Tesfaye Gebrehanna, 2018)
4.1.4 Performance of the Tyre Manufacturing Processes and Productivity
The production section of the company is segmented into three major sections; namely,
preparation, building and curing section. The preparation section comprised mixing
(compounding), treading (duplex), apex, cord rubberizing, cutting cord, cushion & liner, bead
wiring, and steel breaker. The preparation section prepares different components of tyre to be
built by the building section. The second major section of the operation process refers to building
section. As the name implied it builds the seven semi- finished components of tyre prepared by

45
the preparation section to yield green tyre in the form of cylinder shape of various sizes. Finally,
the last section of the operation was a curing section that pressed or molded to yield the finished
tyre of different sizes. So, the five years performance of the operations based on the given
sections is depicted on the table 4.1.3.
This table depicts the underperformance and the availability of too much unutilized capacity.
Again numerically it indicates the overall performance of the company is about 28.7% and
32.5% as indicated on the building and curing sections respectively, which is the final product
processing sections and the total capacity utilized by the company referred to below 40% on
average.
Table 4.1.2 Cycle Time for CuringSize Cycle Time Handling Time Total Time400x8HT60 22 minutes 3 minutes 25 minutes45x10HT60 25 minutes 3 minutes 28 minutes560x13-4TR 17 minutes 3 minutes 20 minutes185x70R14MP22 15 minutes 3 minutes 18 minutes
185x70R13MP2215.5minutes 3 minutes 18.5 minutes
650x14HT60 30 minutes 3 minutes 33 minutes700x16HT90-10TR 45 minutes 5minutes 50 minutes50x16HT40 49 minutes 5 minutes 54 minutes750x16HT90 49minutes 5 minutes 54 minutes750x16HT99 46 minutes 5 minutes 51 minutes700x15AT15-12PR 29 minutes 5 minutes 34 minutes700x16-12PR 31 minutes 5 minutes 36 minutes
14.9x28HTF44483.5minutes 7 minutes 90.5 minutes
1400x24HTG11183.5minutes 7 minutes 90.5 minutes
1200x20NB70 70 minutes 7 minutes 77 minutes1200x20AT20-18TR 62 minutes 7 minutes 69 minutes195x65R15MA33 16 minutes 1.5 minutes 17.5 minutes195xR15TMA310 19minutes 1.5 minutes 20.5 minutes
Source: compiled from each mould (curing) machine body serial notice mark
The above table vindicates the time taken to produce finished tyres of various sizes from semi-
finished green tyres of building section and ranges from 15minutes to 83.5minutes. The cycle

46
time taken to produce different component in the preparation and building sections are
complicated and are not clearly recorded in the company.
Table 4.1.3 PRODUCTION CAPACITY AND ACTUAL PERFORMANCE
2013 2014 2015 2016 2017
Preparation Capa/yr UNIT Actual Actual Actual Actual Actual
1.Mixing 31500 Ton 11482 12179 12879 15136 13321
2. Tread 2,099,700 Meter 336257 267347 302429 342816 407422
3. Apex 1,053,000 Meter 19904 48081 24650 15931 52394
4. Rubberizing 3,510,000 Meter 877947 869,718 1,133,563 952,375 1,294,770
5. Cut Cord 4,316,400 Meter 854759 951,825 1,063,049 1,126,194 1,304,5906. Cushion &Liner 279,000 Roll 60911 59954 66376 65530 71470
7. Beadwire 2,619,900 Pieces 410266 508658 588268 634525 769082
8. Steel breaker 1,227,600 Meter 31112 94318 57834 38088 83154
Building1. Green tyre 1,035,300 Pieces 187943 251811 292079 328813 425778
Curing1.Finished Tyre 855,000 Pieces 201641 255696 270247 296523 364868
Rate of Capacity Utilized2013 2014 2015 2016 2017
Preparation Capacity Measurement Percentage (%) of Capacity utilized
1.Mixing 31500 Ton 36.5 38.7 40.9 48.1 42.3
2. Tread 2,099,700 Metre 16 12.7 14.4 16.3 19.4
3. Apex 1,053,000 Metre 1.9 4.6 2.3 1.5 5
4. Rubberizing 3,510,000 Metre 25 24.8 32.3 27.1 36.9
5. Cut Cord 4,316,400 Metre 19.8 22.1 24.6 26.1 30.16. Cushion &Liner 279,000 Roll 21.8 21.5 23.8 23.5 25.6
7. Bead wire 2,619,900 Pieces 15.7 19.4 22.5 24.2 29.4
8. Steelastic 1,227,600 Metre 2.5 7.7 4.7 3.1 6.8
Building Section
1. Green tyre 1,035,300 Pieces 18.2 24.3 28.2 31.8 41.1
Curing Section
1.Finished Tyre 855,000 Pieces 23.6 29.9 31.6 34.7 42.7Source: Daily production of the company from 2013-2017

47
As a whole, the performance and capacity utilization in each operation section was very low as
one easily could verify from the table above. The capacity of the plant, for instance, is used to
produce over 1millions of different sizes of tyres annually. Yet, it is operating on a far below its
capacity, 1/3 of its capacity. For a detail reference of the objective fact, look into the table 4.1.3
In relation with this, the productivity of the operation section in value chain and total
productivity measurement methods were given on the table 4.1.4. From this table it could be seen
that productivity and resource utilization, among other things, of the operation section was
improving as both the value added and total productivity methods showed 23.9%, to37.4%
and1.0% to 1.66% respectively in the analysis periods. The rate of defective product and scrap
was very low in the six years period.
Table 4.1.4 Productivity measured in value added and total productivity Methods
A Productivity in value added(‘000)
2012 2013 2014 2015 2016 2017
Wages and salaries 17,940 22,479 27,009 52,066 60,099Depreciation 26,876 27,786 26,751 22,249 25,631Rent, rates & Insurance 6328 5108 5134 5218 5932Employee Benefits 1887 9598 8202 8595Other overhead expenses 1524 732 535 509 2605Interest paid 7045 4349 3229 14323 12253Profit before Taxation 39,496 97,000 111,456 107,803 105,641
Total VA 101096 167052 182316 197363 212161Working days 297 290 300 302 304 320No workers 593 689 758 803 777 726W.Days x No of Workers 4227 4795 5458 5820 5669
B Productivity of VA method 23.92 34.84 33.40 33.91 37.42Total Productivity MeasurementSales (output) 471,026 542,027 506,574 594,310 602,954Cost of sales (input) 404,567 417,379 355,658 429,509 450,076Total Productivity 1.16 1.30 1.42 1.38 1.34
C Total output in volume 176,697 212,846 269,206 286,619 314,472 385,279W days x No employees 176,121 199,810 227,400 241,703 236,208 232,310Output/ input 1.00 1.07 1.18 1.19 1.33 1.66
Source: Audited Financial Statement of HAT 2012-2016 not yet prepared 2017’s

48
Table 4.1.5 Financial Performance Measures
Return on capital Employed = Operating profit ÷ (Non-current liability + Total Equity) X %
Item/particularYear
2012 2013 2014 2015 2016
a. Operating profit 53586 105698 117914 136449 130147
b. Non-current liability + Total Equity 311741 372407 455163 578346 617557
(a ÷ b) % 17.2 28.4 25.9 23.6 21.1
Return on investment = Net Income ÷ Net Equity X %
a. Net in come 30904 68260 78687 85110 82026
b. Net Equity 25504 25041 25504 25041 25041
a ÷ b % 12.1 26.8 30.9 33.4 32.2
Return on sales = (Operating ÷ profit Revenue )%
a. Operating Profit 53586 105698 117914 136449 594310
b. Revenue 471026 542047 506574 594310 602954
(a ÷ b) X % 11.4 19.5 23.3 23 21.6
Gross Margin = (Gross Profit ÷ Revenue) %
a. Gross Profit 66458 124668 150916 164802 152878
b. Revenue 471026 542047 506574 594310 602954
Gross Margin % 14.1 23 29.8 27.7 24.4
Measuring Liquidity
5.1 Current Ratio = Current Assets ÷ current liability
2012 2013 2014 2015 2016
a. Current Assets 332879 393029 518235 611127 629205
b. Current Liability 125132 143321 182673 184537 195151
Current Ratio 2.7 2.7 2.8 3.3 3.2
5.2 Acid Test (Quick Ratio = (Current Asset - Inventory) ÷ Current Liability
a. Current Assets - Inventory 112399 182686 206662 243470 263608
b. Current Liability 125132 143321 182673 184537 NA
Quick Ratio 0.9 1.3 1.1 1.3 NA
Measuring Activity
6.1 Asset Turnover = Revenue ÷ Capital Employed
a. Revenue 471026 542047 506574 594310 602954
b. Capital Employed 297279 365539 409707 495220 577246
Asset turnover 1.6 1.5 1.2 1.2 1
6.2 Inventory days = (Inventory ÷ Cost of Goods sold) X 365
a. Inventory 220480 210343 311573 367657 392597
b. Cost of Goods Sold 404567 417379 355658 429509 450076

49
Inventory days 198.9 183.9 323.9 312.4 318.4
6.3 Receivable days = (Receivables ÷ Credit Sales) X 365
2012 2013 2014 2015 206
a. Receivables 92945 175719 107623 216388 216671
b. Credit sales (Revenue) 471026 542047 506574 594310 602954
c. Receivables days 72 118.3 77.5 132.9 131.2
6.4 Payables days = Payables ÷ Credit purchase (Cost of Goods sold) 365
a. Payables 21090 40248 29238 38202 51290
b. Cost of Goods sold 404567 417379 355658 429509 450076
c. Payables day 19.1 35.2 30 32.5 41.67.Measuring Risk
7.1 Capital Gearing = Non-current Liability ÷ Equity
a. Non-Current Liability 14463 6868 45456 83126 40311
b. Equity 255041 255041 255041 255041 255041
c. Capital Gearing 5.7 2.7 17.8 32.6 15.8
7.2 Interest Cover = Operating profit ÷ Finance cost
a. Operating profit 53586 105698 117914 136449 130147
b. Finance cost 7046 4349 3229 14329 12253
c. Interest Cover 7.6 24.3 45.8 9.5 106Source: Audited Financial Statements (2012-2017)
In general, the financial performance of the company depicted that it was good and financially
reliable to meet its obligation, profitable, liquid, low risk and well organized financially. The
profitability has been in between 17.2% and 28.4%; the return on investment ranged from
12.1%-32.2%; return on sales on average during the research period was 19.8%; liquidity ratio
was in between 2.7%-3.3% in the five years period. Again to see the more detail of financial
performance results refer to table 4.1.4. Moreover, the returns on investment and on sales ranged
12.1%-33.4 and 11.4- 23.3% respectively. Furthermore, its liquidity position (quick ratio) was in
between 0.9-1.3 and the risk position ranged from 2.7-32.6

50
4.1.5 Outbound LogisticsHorizon Addis Tyre S.C has had various customers of its output categorized as Distributors,
Associations, Government Offices, Individuals, companies and Non-Government Organizations.
The output had been distributed through 26 Major distributors. 6 of them were based in Addis
Ababa and the remaining outside Addis Ababa. Among the customers mentioned above Guna
Trading, Ambassel Tradings, Wondo Investment Group, Trans Ethiopia and Wholesale Trade
and Commodities Enterprise have been the giant consumers of the product. Though their
consumption were declining Government Offices were among the major customers of the
company.
So as to see the clear picture, the percentage consumption of the captioned customers is depicted
on the table 4.1.6. The associations’ consumption trend declined to the level of 0.4% in 2017;The
government offices’ also decreased 40.4% in 2011 to 19.7% in 2017 and in the same way as
individuals’, NGOs’ and private companies’ reduced from 18.3% in 2013 to 10.6% 2017.
However, the consumption of distributors’ increased steadily from 44.4% in 2011 to 69.3% in
2017.
Table 4.1.6 Customer Types of Horizon Addis Tyre S.C
Years association Distributors Government Individuals NGO &
private comp
2011 0.4 44.4 40.4 14.8
2012 0.2 46.2 37.8 15.8
2013 1.2 46.1 34.4 18.3
2014 1.6 44.8 39.6 14
2015 1.3 52.8 31.7 14.3
2016 1.0 57.0 28.1 13.9
2017 0.4 69.3 19.7 10.6%
Source: Horizon Addis Tyre S.C. 2012-2017 Annual Report

51
Table 4.1.7 Total Sales Trend by Customer Group (000)
2012 2013 2014 2015 2016 2017
a. Distributors 238498 267555 244477 346700 381323 558782
b. Government 195530 199357 216217 208006 187725 158902
c. Individuals & NGO 81644 106379 76415 93582 93167 85547
d. Associations 1067 6802 8598 8212 6730 3275
Total Sales 516739 58093 545706 656502 668945 806505
Sales volume2012 2013 2014 2015 2016 2017
Total sales involume
171521 201641 255696 270247 296523 364868
Total sales in value 471,026 542,027 506,574 594,310 602,954 NA
% sales growth involume
17.4 26.7 5.5 10 29.9
% sales growth invalue
15.1 -6.5 17.2 1.5 NA
Source: Annual Reports of the Company (2012-2017)
On table 4.1.7 the trend of total sales by customer group is depicted for an easy reference.
The volume and value of sales under the study period were fluctuating and growth was very lowas shown on the table above. For instance the volume of sales in 2014 grew by 26.7% and 2016grew only by 10%.
Table 4.1.8 Defect percentage
2012 2013 2014 2015 20162017
Defective TyreOutput 3322 1571 464 5565
8949
Total Tyre output 201641 255696 270247 296523364868
% of defective tyre 1.65 0.61 2.4 1.92.5
Scrap percentage
Scrap 2896 2937 2972 2898 3521
Total tyre output 201641 255696 270247 296523 364868
% of scrap 1.44 1.15 1.1 0.98 0.1
Source: Annual Reports of the Company (2012-2017)

52
The defect and wastage rates were not more than 1.8% and 0.95% on average during the fiveyears period respectively. Specifically, the defective rate scrap ranged from 0.61%-2.5% and0.1%-1.44% respectively.
4.1.6 Marketing PerformanceTable 4.1.9 market share
Particular Measurement 2012 2013 2014 2015 2016 2017
a. Tyre produced 171521 201641 255696 270247 296523 364868
b. Tyres imported 1,121,050 1651935 1883440 1833091 2229414 2452509
c. Market Share in % 15.3 12.2 13.6 14.7 13.3 14.9
Customer Complaints & Solveda. Complaints Total 204 304 473 NA NA 346
b. ComplaintsSolved/compensated 72 161 383 81 148
218
c. Out Put (T-tyres produced) 17152 201641 255696 270247 296523 364868
d. Complaint Rates (%) 0.12 0.08 0.15 0.03 0.05 0.06
Compensated Rates (90) 0.04 0.04 0.04 0.1 0.05 0.04
Marketing Cost as a % of salesa. Advertisement & promotion(000) 60 2124 3172 5338 3676
NA
b. Total Sales 471026 542047 506574 594310 602954 NA
c. % of Marketing cost 0.01 0.4 0.6 0.9 0.6 NA
Source: Annual Reports of the Company (2012-2017) NA=not available
Regarding marketing and sales the expenditure on the advertisement and promotion ranged from
0.01% to 0.9% of total sales, which was very minute and insignificant as indicated on the audited
financial reports. The firm confessed that it employed mouth to mouth (face to face) promotion
so as to be effective and compete with the undammed low cost tyre imports from the global
giants of the industry. In addition to this, the market share of the product showed to be about
15% in 2017 and lower than this before.
In the meantime, the flooding of low cost as well as high quality tyre deemed to be extremely
threatening to the firm. For example, in order to see the imports of tyre from all over the globe,
the record of Ethiopian Customs and Revenue Authority about the imported tryes indicated that
about 2.45millions of different sizes of tyres were imported and 3.78billions birr were spent for
same in 2017 (table 4.1.9).

53
Table 4.1.10 Volume and Value Tyres ImportedYear Total tyre in volume (Qty) Imported in value
2012 1,121,050 2,453,386,012
2013 1,651,935 3,183,563,792
2014 1,883,440 3,164,536,266
2015 1,833,091 3,000,620,562
2016 2,229,469 3,505,773,390
2017 2,452,509 3,775,192,435
Source: ERCA Total Tyre Imported from 2012-2017
Specifically, the company was not able even to produce 50% of the tyre imported from China
and millions of dollars spent for its import. Again for a vivid comprehension the seriousness of
the issue, for example, 666,283 of tyres were imported from China whereas horizon Addis
produced 364,868 tyres in 2017(See table 4.1.10). In addition to this, many Far East Asian
countries Taiwan, Indonesia, Vietnam and S.Korea who entered to the industry contemporarily
with us and lately are by far in the take off stages and have started dominating the global market
(refer empirical review section).
Table 4.1.11 Major Suppliers of TyresCountry Meas Year
2012 2013 2014 2015 2016 2017
China Qty 203,283 393,926 595,629 502,493 617,661 666,283
value 433,765,978 417,867,978 831,055,355 821,506,700 1,179,494,491 1,134,850,285
India Qty 148,803 2010,637 344,441 247,196 332,530 399,491
Value 295,717,210 419,181,169 277,172,226 480,215,861 683,350,253 487,523,033
Japan Qty 292,756 175,027 175,465 128,652 192,696 173,892
Value 579,042,843 483,169,865 433,437 016 113,825,793 235,708,762 442,327,053
Source: ERCA 2012-2017

54
4.1.7 The Support ActivityThe support depart of the firm was composed of human resource management, procurement,
infrastructure and technological development. This section contribution deemed to be close to
the operation section. The owner had never withdrawn dividend since the inception of the
purchase of the firm but had allowed for the expansion and investment of new technology to
raise capacity for the production of modern passenger cars’ tyre. To verify the genuineness of
what was stated refer to table here under. The Horizon Addis Tyre S.C. trains its employees and
motivates them by providing adequate compensation and fringe benefits such as tuition fee,
medical expense, canteen and protective drink, awarding for best performers cost coverage as
declared here under on table 4.1.12-14.
Table 4.1.12 Compensation and fringe benefits trend starting from 2013 to December 2017Item Year
2013 2014 2015 2016 2017Salary 1896538 2233388 3203817 3559887 3808468Tuition fee paid 0 18,937 24,180 111,083 123705Medical Expense 618,230.00 1,033,308.00 1,167,743.00 1,905,295.00 2,179,445.00Canteen,protective drink&refreshment
2536961 3292944 3656366 5083722 4234411
Source: HR Annual Report
In relation with this, the company adopted different kinds of motivational activities to increase
the commitment of the staff such as promotion, prizes for best performers, and all important
human resource policies and procedures manuals for transparent operational management
system. For instance in 2017, 164 employees were awarded in various departments for their best
performance. Again, about 12 policy and procedure manuals were prepared to go along with
strategic management set. Furthermore, the firm budgeted for training purpose to be delivered
internally and externally so as to improve the overall performance the company.
Table 4.1.13 Training Given for Employees from 2013-2017)
YEAR
TRAINING TYPE
IN HOUSE LOCAL FOREIGN2017 1209 53 9
2016 1365 139 32015 1166 44 -2014 234 60 -2013 415 12 -
Source: HR Annual Report 2017

55
Table 4.1.14 Rewarded Employees in 2017No. Department No. of Employees
Awarded1 General Manager 12 DGM(o) 13 Production 434 Plant Engineering 345 PIQA 236 Commercial 177 HRA 158 Finance and Economy 89 Store Administration 510 Industrial safety and security 17
Source: HR Annual Report 2017
In addition to this, there is a “Quality Circle Meeting” every morning to discuss on the
challenges regarding the quality issues and other related problems, which is inherited from the x-
owner Yokohama Tyre Company of Japan.
Finally, to motivate the women employees the company was on the process of opening day care
center and preparing a place for same.
On other hand, to look into the employee satisfaction with the firm, the result of the rate of
turnover was given on table 4.14 which had declined to some extent since 2015.
Table 4.1.15 Turn Over of EmployeeItem Year
2013
2014 2015 2016 2017
No ofemployees
666
758 771 777 786
Totalturnover
88 164 131 98 --
Rate of turnover
13 21.6 17 12.6 --
Source: HR Annual Report

56
Table 4.1.16 Investment (000)
2013 2014 2015 2016
Plan 68341 111865 110477 130563
Actual 37484 33078 39078 71105
% Variation 55 30 35 54New Products Introduced
a. In Qty 3 3 36 107
(000) Value 9765 10063 124621 165742
b. Total output (product) Qty 202 256 270 297
% of new product 1.5 1.2 13.3 36Source: Annual Reports of the Company (2012-2017)
The firm also introduced different sizes tyre as per the demand of the market as table 4.1.16.
Currently by making huge investment, new machines were installed and tested the desirability
and performance of same so as to start producing the tyres for the latest models of passengers’
cars.
Table 4.1.17 Planning Accuracy
2013 2014 2015 2016 2017
Sales Plan 259200 259200 351138 377510 408580
Actual 201641 265696 270247 296523 364868
% Variation 81 84 77 79 89
Productionplan 215100 257627 344699 377520
488151
Actual 201641 255696 270247 296523 364868
% variation 94 99 78 7975
Source: Source: Annual Reports of the Company (2012-2017)
The sales and production plans accuracy depicted above range from 77%-89% and 75%-99%
respectively.

57
Table 4.1.18 New Development Sales Trend
2013 2014 2015 2016 2017
BAJAJ 2858 44366 90808
PCD 2294
LTD 2523 2314 23548 48779 116906
TBD 181 392 9336 10856 8138
LTR 2973 1825
INDUSTRY 265 103
GRADER 10 308
FARM 50 453 1485
LOADER 40Source: Annual Reports of the Company (2012-2017)
4.2 Customers’ Satisfaction SurveySo as to look into the performance and the constraints of Horizon Addis Tyre from customers
and distributors dimension a survey was made. Assuming the unknown number of population,
385 sample sizes of customers were taken randomly and 339 (150organization and 189
individuals) responded properly. These randomly selected samples were users of Horizon Addis
Tyre. Most of the target populations were drivers, owners, distributors and authorized and
assigned responsible process owners in government offices to buy the tyre. Again to verify the
reliability and dependability of the survey, it was tried to see the view of the respondents of
outside Addis Ababa (52.7%). Hence, in addition to Addis Ababa survey, the data were collected
from the respondents of Hawassa (22.6%), Shashemene (12.5%), Arsi Negele, Sebeta, Burayou
and Sulilta. Furthermore, the sample deemed to be representative of consumers of the product
under this paper for the areas selected are heavy duty and highly congested which would enable
to see the performance of the tyre and its problem. As the field of livelihood (field of work),
driving mostly left to men although there might be few women drivers as a livelihood in this case
100% male. That is to say that no single female came across in the sample. The levels of
education of the customer show that 20.7 illiterate; 20.4% read and write; 7.9% grade 1-8;
30.2%; grade 9-12; 50.8% diploma and 1.8% degree. Meanwhile, the purpose of the customer
survey was just to see the brief customers’ overview about the performance of the tyre in

58
general, and the after sale services of the company. Finally the reliability test for the customer
survey referred to 84.2% for customer and users of the product from sample size of 189.
Thereby, the results of relevant questionnaires responses of users and customers; users but not
customers and distributors were given as follows.
4.2.1 Places of Survey of Customers and UsersTable 4.2.1 Cities of Survey
Frequency Percent Valid Percent CumulativePercent
A.A 96 52.7 52.8 52.8Shashemane 17 9.0 9.2 60.0Hawassa 52 27.5 28.1 88.1
Arsi Negele 7 3.7 3.8 93.5Alemgena 2 1.1 1.1 94.6Bur 2 1.1 1.1 95.7Sebeta 6 3.2 3.2 98.9Sululta 2 1.1 1.1 100.0Total 185 97.9 100.0
Total 189 100.0
Source: own customer satisfaction survey
4.2.2 Users and Customers Survey1.1 Codes of the Vehicles
Table 4.2.2 codes of the vehicles
Frequency Percent ValidPercent
Cumulative Percent
Code-1 81 42.9 43.1 43.1Code-2 10 5.3 5.3 48.4Code-3 60 31.7 31.9 80.3Code-4 36 19.0 19.1 99.5police 1 .5 .5 100.0Total 188 99.5 100.0
Missing System 1 .5Total 189 100.0
Source: own customer satisfaction survey

59
In order to see the performance of the tyre, again different code numbers of vehicles were used
such as code-1taxis;code-2,private automobiles-very few; code-3 individuals’, companies’,
public enterprises’ and code-4 government’s. So, the results of code of vehicles surveyed
depicted that 42.9%; 5.3%; 31.7%; 19.1% of codes 1-4 respectively.
4.2.3 Durability of the TyreTable 4.2.3 Durability of the Tyre
Frequency Percent Valid Percent Cumulative Percent< 6 months 27 14.3 14.3 14.37-12 months 108 57.1 57.1 71.412-18 months 42 22.2 22.2 93.719-24 months 12 6.3 6.3 100.0Total 189 100.0 100.0
Source: own customer satisfaction survey
The responses of all codes users together about the durability of the tyre said that ≤6months; 7-
12months; 12-18months and 19-24months 27%; 57.1%; 22.2%; and 6.3% respectively
4.2.4 Criterion for Choosing the Horizon Addis TyreTable 4.2.4 Criterion for Choosing the Tyre Brand
Frequency Percent Valid
Percent
Cumulative Percent
Price 98 51.9 52.1 52.1
Quality 87 46.0 46.3 98.4
Sales service 3 1.6 1.6 100.0
Total 188 99.5 100.0
Total 189 100.0
Source: own customer satisfaction survey
As it was found on the survey, 51.9% of the users and customers of Horizon Addis Tyre said
their criterion for preferring the tyre was the relatively lower price than imported tyre and 46%
owing to its quality.

60
4.2.5 Users and Customers Satisfaction with the TyreTable 4.2.5 Satisfaction with the Tyre Employed
Frequency Percent Valid
Percent
Cumulative Percent
Strongly
dissatisfied3 1.6 1.6 1.6
Dissatisfied 3 1.6 1.6 3.2
Neutral 5 2.6 2.6 5.8
Satisfied 111 58.7 58.7 64.6
Very satisfied 67 35.4 35.4 100.0
Total 189 100.0 100.0
Source: own customer satisfaction survey
Again, regarding the satisfaction of customers with tyre they used, the result depicted that 35.4%
and 58.7% were very satisfied and satisfied respectively. Moreover, 94.2% of them didn’t have
intention to shift to another brand of tyre. (Table 4.2.5)
4.2.6 Intention of ShiftingTable 4.2.6 Intention to Shift to Other Types of Tyre
Frequency Percent Valid Percent Cumulative Percent
Yes 10 5.3 5.3 5.3
No 178 94.2 94.7 100.0
Total 188 99.5 100.0
Total 189 100.0
Source: own customer satisfaction survey

61
4.2.7 Users but not Customers- Codes of the VehiclesThe results of the users but not customers group survey codes of the vehicles indicated that 38%
code-1; 2.9% code-2; 50.3% code-3 and 7.9% code-4.
Table 4.2.7 Codes of the Vehicles
Frequency Percent Valid Percent Cumulative Percent
Valid
Code-1 54 38.8 38.8 38.8
Code-2 4 2.9 2.9 41.7
Code-3 70 50.4 50.4 92.1
Code-4 11 7.9 7.9 100.0
Total 139 100.0 100.0
Source: own customer satisfaction survey
4.2.8Durability of the TyreTable 4.2.8 Durability of the Tyre
Frequency Percent ValidPercent
Cumulative Percent
< 6 months 16 11.5 11.6 11.67-12 months 82 59.0 59.4 71.012-18 months 16 11.5 11.6 82.619-24 months 20 14.4 14.5 97.131-36 Months 2 1.4 1.4 98.6More than 36months
2 1.4 1.4 100.0
Total 138 99.3 100.0Missing System 1 .7Total 139 100.0
Source: own customer satisfaction survey
The findings about durability of the tyre for users but not customers were that 11.5% for less
than 6 months; 59.4% from 7-12 months; 14.4% from 12-18 months and the remaining for more
than 30 months.

62
4.2.9 Criterion for Choosing the Horizon Addis Tyre
The result of this questionnaire depicted that price stood for 56.8% and quality for 41.7% as
users but not customers responded.
Table 4.2.9 Criterion for choosing the Horizon Addis Tyre
Frequency Percent Valid
Percent
Cumulative
Percent
Price 79 56.8 56.8 56.8
Quality 58 41.7 41.7 98.6
After sale and delivery
service2 1.4 1.4 100.0
Total 139 100.0 100.0
Source: own customer satisfaction survey
4.2.10 Intention for ShiftingTable 4.2.10 Intention for Shifting
Frequency Percent Valid
Percent
Cumulative Percent
Yes 107 77.0 77.0 77.0
No 32 23.0 23.0 100.0
Total 139 100.0 100.0
Source: own customer satisfaction survey
As table 4.2.10 indicated, 77% of them intended to shift and 84.9% of same confessed about
quality problem. So the customers have an intention of shifting. In addition to this, they raised
the price issue as a reason for their intention to shift.

63
4.2.11 Reasons for ShiftingTable 4.2.11 Reasons for Shifting
Frequency Percent ValidPercent
CumulativePercent
Because I intend tochange the model of mycar
16 11.5 11.5 11.5
Because the quality of thecurrent tyre is gettinglower (quality relatedreason)
118 84.9 84.9 96.4
Because the price of thecurrent tyre is increasing(price related reason)
5 3.6 3.6 100.0
Total 139 100.0 100.0
Source: own customer satisfaction survey
4.2.12 Mixed Brand Usage and Inner Tube Problem
During the survey, it was noted that two or more different kinds of brands were fixed on one
vehicle. For instance from 139 vehicles surveyed 68(48.9%) vehicles were fixed with different
kinds of brands. Horizon Addis tyres were employed as rear tyres and front other brands. They
also complained about the inner tube sold together with the tyres (table4.2.12).
Table 4.2.12 Mixed Brand Usage and Inner Tube Problem
Frequency Percent ValidPercent
Cumulative Percent
Mixed Brand 68 48.9 48.9 48.9Inner tube pin 65 46.8 46.8 95.7Inner tube pin andMixed
1 .7 .7 96.4
inner tube pin andcrack
2 1.4 1.4 97.8
98.6break board 2 1.4 1.4 100.0Total 139 100.0 100.0
Source: own customer satisfaction survey

64
4.2.13 Distributors of the Tyre -DurabilityTable 4.2.13 Durability of the Tyre
Frequency Percent ValidPercent
Cumulative Percent
<6 month 2 18.2 18.2 18.27-12 month 8 72.7 72.7 90.912-18month
1 9.1 9.1 100.0
Total 11 100.0 100.0Source: own customer satisfaction survey
Regarding durability of the tyre, 18.2% the distributors said that the tyre would serve for less
than 6 months; 72.7% of them regarded it would serve from 7-12 months: and the remaining
9.1% for over 12-18 months.
4.2.14 Customer Service of the Company
Table 4.2.14 Customer Service of the Company
Frequency Percent Valid Percent Cumulative
Percent
Very fast and good 4 36.4 36.4 36.4
fast and good 4 36.4 36.4 72.7
Medium 3 27.3 27.3 100.0
Total 11 100.0 100.0
Source: own customer satisfaction survey
The finding regarding customer service referred to be 36.4% for being very fast; again 36.4% for
being fast and 27.4% for being satisfactory.
The reflection of the extent company’s attention for distributors was responded as a very great,
great, medium and low extent percentages as 36 %, 45.5%, 9.1% and 9.1% respectively.

65
4.2.15 Cooperativeness for Compensation of Defective Tyre
Table 4.2.15 Cooperation in replacing new tyre for defected products
Frequency Percent Valid Percent Cumulative Percent
Strongly Agree 4 36.4 36.4 36.4
Agree 3 27.3 27.3 63.6
neutral 3 27.3 27.3 90.9
Disagree 1 9.1 9.1 100.0
Total 11 100.0 100.0
Source: own customer satisfaction survey
Cooperativeness of the regarding making compensation for the defective product was vindicated
by the finding as 63.7% of the customers agreed with the company cooperativeness, 9.15%
disagreed and the remaining 27.3% as indifferent This could show that the firm is relatively
cooperative though the indifferent group may show the company should work hard to cross the
fence of indifference by satisfying same.
4.2.16 The Extent of Making Customers HappyThe results of extent of customers’ happiness (satisfaction) with the company were 9.1% very
dissatisfied; 9.1% dissatisfied; 9.1% indifferent; 63.6 satisfied; and 9.1% very satisfied (table
4.2.16).The implication of this result there are significant number of customer who were not
happy most probably because of poor quality, inner tube problem and other customer service.
Table 4.2.16 The Extent customers’ happiness and satisfaction on Horizon Addis
Tyre
Frequency Percent Valid
Percent
Cumulative Percent
very dissatisfied 1 9.1 9.1 9.1
dissatisfied 1 9.1 9.1 18.2
Neutral 1 9.1 9.1 27.3
Satisfied 7 63.6 63.6 90.9
very Satisfied 1 9.1 9.1 100.0
Total 11 100.0 100.0
Source: own customer satisfaction survey

66
4.2.17 Distributors’ Faced ProblemsTable 4.2.17 Problems Distributors Facing Regarding the Tyre
Frequency Percent ValidPercent
Cumulative Percent
price 2 18.2 18.2 18.2supply problem 8 72.7 72.7 90.9no problem 1 9.1 9.1 100.0Total 11 100.0 100.0
Source: own customer satisfaction survey.
Distributors also complained about the price and shortage of the product. Thence, 72% of the
distributors complained about the supply problem and 18.2% of them complained about its high
price. The distributors do not get the product on time because of raw material shortage per the
marketing department response.
4.2.18 Attention Given to Distributors
Table 4.2.18 Given Attention for CustomersFrequency Percent Valid Percent Cumulative
Percentto very great extent 4 36.4 36.4 36.4to great extent 5 45.5 45.5 81.8to medium extent 1 9.1 9.1 90.9to very low extent 1 9.1 9.1 100.0Total 11 100.0 100.0
Source: own customer satisfaction survey
4.2.19 Evaluation of the Quality of the TyreIn the eyes of distributors, the quality of the tyre lied on medium level as regarded by 54.5% of
them. Some distributors (18.2%) also regarded it as low quality and the rest 27% considered as
high quality. This refers to the problem of adequate skill, technology and power problem.
Table 4.2.19 Evaluation of the Quality of the TyreFrequency Percent Valid Percent Cumulative Percent
very high 1 9.1 9.1 9.1high 2 18.2 18.2 27.3medium 6 54.5 54.5 81.8low 1 9.1 9.1 90.9very low 1 9.1 9.1 100.0Total 11 100.0 100.0
Source: own customer satisfaction survey

67
4.3 Customers’ Satisfaction
Satisfaction of customers is determined by a multitude of factors with varied degree of influence.
In the context of Horizon Addis Sc, a STATA output is generated from the customer satisfaction
survey- which is one of the proxy indicators for market performance (Mike and Andy, 2003).
Accordingly, model output is generated as indicated in Table 4.2.20.
Table 4.2.20 Determinants of Customer Satisfaction in the Context of Horizon Addis Sc.
As indicated in Table 4.2.20, the product related attributes (i.e., ‘important’), such as design,
raw material, price, sales and after sales services and most importantly price significantly
contribute to the satisfaction of customers at 5% level of significance. This finding is in line
with the suggestion provided in a comprehensive product attribute study by Moullin (2003).
Moreover, customers’ level of education has a significantly positive relationship with level of
customer satisfaction at 5% level of significance. This implies that, the more educated the
customer are the better the awareness they have about a country’s product and hence the more
sensitive or the better affiliated to the sole domestic tire producer, Horizon Addis Sc. Finally,
durability of the product has a strong positive effect upon the satisfaction level of customers with
5% level of significance.

68
4.4 Problems Restraining the Tyre Manufacturing ProcessAccording annual reports of the company and confirmation of the management team, the first
and foremost problem restraining the tyre manufacturing process of Horizon Addis Tyre S.C
had been raw materials shortage owing to foreign currency scarcity for the purchase of same.
The second main restraining factor the tyre manufacturing process had been the accustomed
mechanical and machine breakdown of the old and worn out machines. The third serious
holding back problem was to be the frequent power or electrical interruption. Fourth, lack of
adequate skilled manpower and the absence of the existing ones, in the case of emergency,
would interrupt the tyre production process.
Fifth, the management team confesses that there is a capacity problem in two different
dimensions; one, the firm is not able to employ the already available capacity which
operating below 30% currently; and two, its type of production capacity is limited to a
certain type of vehicles and no capacity to produce tyre to latest models of vehicles among
other things. That is to say that the firm has the volume and type flexibility capacity problem.
Finally, the company had capacity problem of producing tyres for the latest models of
passengers’ vehicles-very big share of the total of the vehicles in the country.
In relation with the constraints and operational performance, key informant management
team has given important information about their company performance and challenges and
strategies set to tackle the problems and how to raise their capacity. In sum, the key
informant team has confirmed the prevalence of the restraining problems captioned in this
section and strategies they have set to raise the market share, and capacity and volume and
type of production flexibility.
4.5 Measures Taken to Tackle Tyre Manufacturing ProblemsPer the interview made with key informant management team, the management team of the
company had been trying their best to get solution for the recurrent and serious raw material
shortage by dealing with different banks and further discussing with concerned government
body to get foreign currency to buy the raw materials required even though the output was
limited. So as to avoid mechanical breakdown and mitigate the machine breakdown, the
operators, mechanics, and engineers had been solving the problems on the spot by modifying

69
the damaged of spares as per the annual reports of the firm and response of key informant of
the operation department.
In addition to this, as the researcher and confirmed by the operation department there is a
quality circle group composed of operation’s sections managers, operators, engineers, and
foremen to solve the mechanical and quality problems. Furthermore, the firm was replacing the
old and obsolete machines by new ones bit by bit as the yearly investments showed (table
4.1.15). Finally, the company is on the process of starting production of new tyres by installing
new machines to solve its capacity problems by buying new technology and machines that
would enable it to produce the tyre demanded by the latest model vehicles. This might solve
the type flexibility capacity problem as the management team believes and fully committed to
enhance the overall performance of the company.
4.6 Discussion of the ResultsBased on the framework employed on the result section of this chapter the results had been
discussed in the following manner.
To begin, Horizon Addis Tyre S.C. has been extremely dependent on the import of raw
materials, technology and equipment. Being dependent on the import of the captioned inputs was
not by itself a problem as such. The problem lied on the scarcity of foreign currency and its
scarcity has been absolute. The management has been walking in from bank to bank in searching
and imploring for foreign currency. It, in general, has become a nationwide issue.
The outlay of raw materials, equipment and machine was greater than 0.5billion Birr as the
annual expenditure on the captioned items indicated on the (table 4.1.1).The outlay would be in
billions of birr if there were adequate foreign currency supply for purchase of inputs wanted by
the firm and if it were operating at full capacity.
Hence, as a result of the scarcity of foreign currency, the operation of the firm had been forced to
perform far below its capacity, about 30%; its market share below 15%; and production
performance below 40% on average during the year 2013-2017 as indicated on the value chain.
Meanwhile, the company’s productivity was very nice, efficiency and effectiveness was
dependable, given the limited amount of raw material supply. The cost of nonconformance was
low rate of defective product (2.5%) and wastage (0.98%)-during the analysis period (table 4.1.4

70
and 4.1.5) which implied the efficiency and effectiveness of the employees. Moreover, the
profitability of company had been dependable.
In the meantime, however, profitability declined yearly from 28.4% to 21.1% from 2013-2016
periods of time owing to increment of cost of sales particularly the cost of imported inputs. In
addition to this, it has as well established paid up capital and the yearly dividend had been
allowed to be invested for the expansion and purchase of new technology so to raise and
diversify its capacity. The debt structure was minimal, which was 15.8% of the equity and could
meet its obligation easily for it was liquid and profitable as the financial statement of five years
depicted (Table 4.1.6).
Furthermore, it has been financially sound and low risk company as the overall financial
performance reports of the five years indicated. The implications of these refer to that the there is
no problem in the traditional financial performance and labor productivity is in the acceptable
position based on the resources available on hand.
Moreover, the company claimed there was no market problem for its product but the critical
problem found to be shortage of imported inputs owing to foreign currency constraint. Currently
it seems that there is no demand problem as the firm claims, however, as the finding of
customers’ category survey depicted, it is losing the well-established market of government
offices.
In the seven years period from 2011-2017, for example, the share of consumption of same
declined from 40.4% to 19.7% due to internal and external problems of the company. Most
transport vehicles owners whether they are individuals, private companies or government, the
choice and preference of tyre brand is decided and instructed by the respective drivers without
good and convincing reasons. This indicates the need for proper promotion and advertisement
scheme to tackle the problem and should work hard to catch up with this segment of the market.
It moreover, might require the intervention of the senior government officials and other
stakeholders.
During customers satisfaction survey, for instance, the researcher had visited about 20
government offices in Hawassa, the researcher found and noted that no a single general service
process owner able to tell about the tyre they ordered to buy. The entire process owner of the

71
general service division pinpointed same to get the information about the tyre from the respective
drivers. So there seems to be biases without a solid and sound reason for the choice of tyre brand.
Hence, the decentralized government offices had been buying tyres by the recommendation and
preference of drivers and drivers preferred not Horizon but mostly Bridgestone, especially for the
elites of the respective offices.
Horizon Addis Tyre S.C had made unfailing endeavor to catch up with market by making
contacts to the concerned offices to reason out the problem with its product but no sound and
convincing reason for shifting to another brand and hence the firm had doubts on the prevailing
of corruption in the areas of concerned decision making parties as key informants responded. By
unfailing endeavor, the company has been able the convince the Region 3 governors to use its
tyre and the regional government offices were then complied with the given instruction of same
to buy Horizon Addis Tyre for their vehicles. The remaining regional states, as key informant
said, are still homework for the company to convince. So customers’ satisfaction question is yet
to be handled properly and reliably.
On the other hand, regarding marketing and sales, the expenditure for advertisement is
insignificant, less than 1%. And its market share showed to be about 15% in the past five years.
In addition, the threat of low cost imported tyre and contraband was trying to stand on its neck.
Annually the country imported over 2 million tyres. In 2017, for example, about 2.45millions of
tyre were imported and cost the country about 3.3billion Birr in the same year to import the
number of tyres mentioned above.
Being stayed in the market for over 4 decades, this low market share could be taken as a poor
performance. Problems might be many and complicated such as the many times ownership
transferring and their transitions’ periods; the type government leadership attitudes;
technological knowhow; commitment problems of the stakeholders and so on. Thus, these all
would demand for involvement of all the concerned stakeholders and looking for solution on
how to raise production and maintain increase its market share.
Regarding the product and ownership, most customers’ knowledge about the tyre including in
Addis Ababa was blared and not clear cut as noted during the customers’ satisfaction survey. So
this confusion should be removed and cleared out employing different marketing strategies and

72
by supplying its product adequately. Again, having a vision to dominate the local market initially
and then to exploit the opportunity in the neighboring countries it would be difficult to reach the
goal unless proper marketing scheme would be used. In relation to the customers’ satisfaction, in
order to look in their views and attitude the survey has been made among three types of
customers- users and customers, users but not customers and distributors.
The purpose of employing three groups of respondents in the survey was to take the reliable
respective views about the tyre performance and its limitation. Moreover, so as to balance and
make it dependable the survey, major code numbers of the vehicles were taken into consideration
in the survey. In relation with this, heavily and intensively used vehicles like taxis, light trucks
and buses were surveyed under codes 1, 3 and 4.
As a result, the majority of the respondents about the durability and quality responded that the
tyre would serve 7-12 months when intensively and heavily used. For example, 57% of users and
customers; 59.4% of users but not customers and 72.7% of the distributors verified and by this
the company claimed was justified by this survey. Depending on how intensively and heavily the
tyre employed the tyre would serve for more than 24 months. There was a complaint however,
questioning the durability and quality and argued that the maximum service period was less than
6 months if it is intensively and being heavily on the road.
Additionally, they argued that the tyre would burst being new and would bulge out. Hence, the
users but not customers avoided fixing altogether horizon and they used mixed brands.
Specifically they said they fixed as rear tyre to minimize risk of accident (see table 4.2.12).
Moreover, the reason why users but not customers wanted to shift to another brands was owing
to quality problem as 84.9% of same claimed.
Regarding customer satisfaction, 94.1% of the users and customers and 72.8% of the distributors
responded as satisfied due to relatively low price, service delivery, fast claim response to
defective product and relatively quality of the product. On the other hand, 84.9% of users but not
customers questioned the quality of the tyre, wanted to shift to another brand and used the tyre
by mixing with other brands. As a matter of fact 56.8% of those who claimed to be users and
customers and 56.8% of those only users of the company responded that they selected or

73
preferred the tyre because of its relatively lower price but the quality. Thus this implied that both
groups had questions on the quality issue.
In the mean time, when the support activity of the firm scrutinized it indicated the support has
been dependable on every dimension. The appetite for investment in new technology deemed to
be dependable and reliable to produce tyres demanded by the prevailing market for the owner
retains the dividend for this purpose since the inception of ownership, and the information
technology is begun to support the production process (refer table 4.1.16)
On the other hand, Horizon Addis Tyre is striving to introduce new tyres with different size for
the latest models passengers’ cars which were not available before. Thus, the company bought
and installed new machines to produce different sizes of tyres of latest models’ vehicles that
would solve the capacity problem in producing the latest models of passengers’ cars and would
increase the flexibility.
In relation with the supporting activity, the company was committed to satisfy and motivate its
employees by providing the necessary fringe benefits and competitive compensation system as
strategic investment in people, process, information system and organizational culture were
applied to monitor acquisition, cultivation and exploitation of core competencies- a good
beginning for the strategy set to develop. In sum, the value chain of production process has
shown the underutilization of its available capacity (30% of its capacity); financial performance
implies sound, reliable, and profitable and customers’ satisfaction is yet to be handled and
addressed through volume, quality and type flexibility.
4.6.1 A Discussion on Production Performance Analysis:-Key Success Factors and Key Performance Indicators
A. Competitiveness
Competitiveness as a critical success factor was measured by the performance indicators such as
sales growth by product, customer base and market share and position. HAT’s in this regard
placed itself in a difficult position due to inputs constraints. Foreign currency shortage, obsolete
and worn out machineries, shortage of skilled manpower, power interruption were the foremost
problems, as reported on daily production reports and verified by operation managers. Moreover
low cost tyre imports and contraband aggravated the problem.

74
Even though, the 5 years audited financial statement showed growth of profitability and its gross
margin, but it was with fluctuation from year to year (Refer table 4.1.4)
On the other hand it had lost and is losing the well-established government offices market owing
to irrational and unsound biases created by the respective government offices drivers and process
owners who determined the brand of tyre to be purchased and owing to prejudice and ignorance
of same. HAT’s management group was doing its best to maintain and put the market back as it
had been by visiting the concerned government offices. Region 3 offices almost returned and the
rest on deal and discussion. The key informant group is still working hard to catch up with the
lost market of government offices.
The market share as a key performance indicator for a critical success factor applied in HAT
depicted low performance because the market share on average was below 15% for the past five
years due to aforementioned reasons like capacity problems, input problems owing to foreign
currency scarcity, old and worn out machines and inadequate skilled manpower and electrical
power interruption.
B. Resource Utilization
This success factor was measured by employing key performance indicators such as
productivity, resources available against those utilized and efficiency of resources planned
against consumed. Hence, HAT’s performance in this regard depicted underemployment of
resources owing to operating under capacity of machineries (capital) as a result of foreign
currency extremely severe shortage to buy raw materials. This problem is the serious issue for
the management team and troubled and puzzled how to solve it.
In relation with this productivity of labor among other things, is efficient and effective (Refer
Table 4.1.4). This could imply that the labor productivity was adequate enough in employing the
resources at hand.
In general, productivity implied the reduction in wastage of resources, labor, raw materials,
power, space, time and capital. So, HAT’s employee’s productivity showed efficiency and
effectiveness by reducing wastage of raw materials and defective products. During the five

75
years’ time the average annual defective output and wastages in the production (1.8% and 1.1%
respectively) of the yearly total output (Table 4.1.4).
C. Quality of Services
Quality of services was usually measured through cost of quality that comprises prevention costs,
appraisal costs and non conformance cost, which was very difficult to get the identified cost of
each captioned item in the company but could be seen in the low rate of defective product and
scrap. One thing noticed in the company was there is quality circle meeting every morning to
deliberate on the production problems faced in each working day. With regard to quality of
services, hence the rate of complaints received/compensated could be said in an acceptable status
as the five years rate of complaints received and solved indicated, 0.07% on average which was
just a little bit greater than the standard set by the firm (0.05%) on average.
D. Quality of Working Life
Taking quality of working life as critical success factor, it was tried to look in to the company’s
performance indicator labor turnover. It was a quite high (12.9% in 2014) owing to hazardous
working environment as it was informed by the key informant management team. Although there
are a lot of fringe benefit and good compensation, quite number of employees left the firm just
by being absent (Refer Table 4.1.15).
E. Innovation
The proportion of new products introduced showed growth from year to year 15%, 16.8% &
24.9% in from 2015-2017, which could be regarded as a beginning of expansion for it was
verified by stable demand by the product and the same volume of output (Table 4.1.16 and
4.1.18)
F. Responsiveness
Timely responsiveness, as it is well known, was critical success factor. HAT in this regard
lagged behind because of foreign currency scarcity to buy raw materials and now and then
mechanical breakdown machines to cope up with the plans set to produce when there was no

76
material shortage as per the daily production reports of the past five years and the gap between
the operational plan and actual performance depicted see table 4.1.17.
As already discussed earlier in this section the defect rate was low and the commercial section
department responded that they were responsive and sensitive in responding to the complaints of
defective products. In addition to this, the marketing department prepares trainings and has
frequent visiting programs to agents and retail distributors about any problems related to the tyre.
G. Quality of Output
This was usually indicated by low reworking and warranty costs and low reject rates. Here, the
company under this research operated in a high efficiency and effectiveness for the quality of
output performance measurement indicators showed during the past five years. For instance, the
defective rate, reworking warranty costs were not greater than 2.5%, 0.97% and 0.06%
respectively in 2017 and the past trend in this regard was quite stable and low. Here, as
understood from the key informant group, their tyre is by far better than some of the tyres
imported and still working hard without fail to improve the quality of their tyre by investigating
the defects and solving the problem through quality circle and have established a department
called Plant Industrialization and Quality Assurance. They have daily meeting regarding the
quality issues raised and give solutions as much as possible.
H. Flexibility
HAT has flexibility problem in introducing new product, product mix, volume and delivery
owing to the foreign currency constraint that hindered to buy new technology to produce tyres
highly demanded by the latest models vehicles and raw materials and shortage of skilled
manpower. However, they introduced tyres for BAJAJs, tractors, and grader machines in the past
three years. So, the capacity limitation of product mix, type, and size flexibility would be solved
by the already installed new technology that would produce latest models’ passenger cars. As a
whole this section could indicate the firm’s internal performance status and its endeavor for
survival through the mirror of key success factors and the performance indicators though there
are a lot of constraints. Here, the management team has assured that the flexibility problem could
be solved if the foreign currency constraint is solved for there is adequate investment fund
allotted for to buy the technology.

77
4.7 The Challenges of Horizon Addis Tyre S.CThe challenges facing the global tyre industry depend on the growth, development and
employment of modern technology in each firm in the industry. Economic volatility, uncertainty,
complexity and ambiguity; sustainability and technology; Threat of low cost manufacturers and
economies of scale; government policy and reform; infrastructure; operational excellence and
skill development have been the challenges worth mentioning. Coming to the challenges of the
firm under this study specifically, they are multifaceted as briefly mentioned here under.
To begin with Horizon Addis Tyre S.C. had been extremely dependent on the imported raw
materials, equipment and machines, as the company’s annual report indicated about 98% raw
materials and technology as a whole. Being dependable on imported raw materials and
technology could not be a challenge by itself but the scarcity of foreign currency required to buy
the captioned items really have been genuine and severe constraints of the firm. The expenditure
in millions to import the captioned items could verify the dependency on import. The reason why
the firm was extremely dependent owing to most of the major components have not been
available in the country-synthetic and natural rubber, carbon black …etc that are fuel (oil)
byproducts.
Here, in addition to its dependency on the imported raw materials, the challenges have been
severely aggravated by foreign currency constraint according to the response of the informant
group. In relation with the inputs constraint, again the key informants dissatisfied with the rubber
plantation which was under the factory when the firm owned by government now detached from
its ownership during privatization and its rubber supply taken as insignificant, very poor in
quality and productivity. Hence, rubber is also among the major imported inputs.
Moreover, according to the annual reports of the firm from (2012-2017) the operation excellence
and productivity were suffered from now and then mechanical breakdowns, electrical power
interruption, worn out and obsolescence of machines in addition to the underutilization of its
capacity. This brought about the rise of cost of quality, wastage of inputs and underutilization of
resources. As per the response of the management group and verified by the finding, the firm has
been operated below 40% of its capacity among other things. Meanwhile, the global giant tyre
manufactures have made technological paradigm shift in processing and automated at high level
high product and volume flexibilities that has flooded the global market including ours.

78
Furthermore, the unavailability of adequate skilled manpower in the area contributed
significantly to the poor operational excellence and underutilization of the firm’s capacity. In
relation with this, the existing employees’ mind setup on the relationship between quality and
productivity is not yet fully developed as the yearly reports of the company had shown.
On the other hand, the firm was threatened by uncontrolled and unlimited low cost tyre imports
form giants of the global tyre industry. Moreover, there is no standard and regulation for the
tyres imported as well as the vehicles. Furthermore, the threat is aggravated by contraband, poor
quality and second hand import of same. So as to see this problem, total tyre imported from
2012-2017, refer table 4.1.9. As a result of this giant multinational low cost tyre flooding the
country, the big customers of the firm such as government offices, private individuals, NGOs
consumption declined as the reports of the firm indicated, a serious challenge.
The government offices especially are the established markets; hence their consumption
decrement could affect its market now and in the future too. On the other hand, the promotion
and advertisement scheme of the firm became insignificant and very low and possibly could
yield adverse result for it is not yet known by most customers as the survey indicated and most
government and people who have transport business buy tyre by the recommendation and
instruction of the respective drivers who are biased and ignorant about tyre performance and its
quality.
In addition to this, the company complains that the government support and protection is very
limited and low. Moreover, the volatile, ambiguous, uncertain and complex global economic
situation had influenced the performance of the firm adversely in the price of the product and
input and foreign currency shortage. Furthermore, the stakeholder’s limited support and being
indifferent and limited concern in providing foreign currency also adversely affected the growth
and expansion of the firm.
Finally, as the challenges of the firm are many and complicated; cooperation, collaboration, and
coordination of the concerned stakeholders deemed to be loose and fragmented which is
vindicated by the irregular supply of foreign currency, being indifferent to motivate to produce
more to save foreign currency consumed to import tyre which is huge as is seen on the findings
section (Table 4.1.10).

79
CHAPTER FIVE
SUMMARY, CONCLUSION AND RECOMMENDATION
5.1 Summary of the FindingsThe evolvement of modern tyre went back to 19th century and has reached to its peak in its
components, design and quality in the late 1980s. As it’s well known it is the only part of modern
transports that touches the ground. Hence, the tyre industry is working hard to ensure its safety
and reliability. It is a type of product highly demanded around the globe by vehicles’
manufacturers to fix as original equipment for the vehicles and replacement for the vehicles
already on the road. Seeing this thing Ethiopia has joined the market as a manufacturer of tyre in
the Addis Tyre since 1972.
Its development in every dimension is not in way that has been desired and expected for various
reasons. After two years of its inception, in 1974 the socialist government confiscated it and
being a complacent regime it stagnated for about 17 years, followed by the current government
doing nothing and privatized to different investors. Finally, it has become one of the properties
of Sheh Mohammed Al Amudin in the Horizon Addis since April 2011. Its growth and
performance, however, has not been in way that it was originally desired and expected owing to
various reasons.
As a result this paper has tried to see into, identify and evaluate the performance and challenges
why it has been stagnant since its inception of operation. Hence, so as to look into, identify and
evaluate its status of performance and constraints that hindered its development, the value chain
analysis, tools of operational performance measurements, financial and non financial
measurements, key success factors and performance indicators, and survey of customer
satisfaction were employed.
Thereby, it was found that the company had been suffering from foreign currency scarcity for the
purchase of inputs 98% of which are to be imported from around the globe. Moreover, the
technology employed are worn out and obsolete, which was exposed to frequent damage and the
volume mix and capacity of the technology to produce mostly demanded tyre is highly limited.
Furthermore, the company process of production was interrupted by power fluctuation and

80
finally the skilled manpower shortage was another bottleneck. Externally, the cooperation,
coordination, support and commitment of the all concerned stakeholders deemed to be
insignificant. Therefore, the stagnation, low capacity utilization, underperformance and low
market share status were caused by these captioned bottlenecks.
In relation with operational performance success, efficiency and effectiveness, the management
and employees of the company have been committed to make their company the best performer
as their past six years overall performance vindicated. They had set five years strategic plan to
bring about growth and better achievements so as to increase its market share by supplying best
quality of product and volume mixes. The owner also allowed the retaining earning generated to
employ it for the expansion and development of the firm.
Finally, in order to bring about success, expansion and development of the firm the involvement,
commitment and unreserved support of owner, the management team, employees and at large the
development state of the nation is indispensable for the company by itself cannot achieve it for it
requires very huge capital investment and other resources. The value chain map of the operation
process of the company showed that it is operating far below the normal capacity; financial
performance is sound, customer satisfaction is under question in relation with quality, capacity
and supply problems; raw material shortage owing to foreign currency is the critical and serious
challenge of the company, among other things and the innovation and capacity building under
process to introduce new models’ vehicles tyre by making huge investments to buy new
technology.
5.2 ConclusionThe purpose of this paper has been to look into, identify and evaluate the performance and
challenges that hindered the growth of Horizon Addis Tyre S.C.by employing different
performance measurements and value adding processes and other research tools. Hence, when
the researcher started searching for cause of stagnation, in the first place the researcher wondered
how the value chain the company looked like so as to look into and identify where the problems
were in the production process. Then the researcher wanted to know the financial and non-
financial performances (customer satisfaction, learning and growth and internal business
processes).

81
Finally, the researcher wondered what strategies and efforts were made by the owner and the
management team so as to enhance operation and raise and solve the market share problem.
Thus, to answer the captioned wonders of the research, the researcher deeply searched to all
areas of the enquires and then it was found that the operational performance, the capacity
utilization and market share were about 40%, 30% and 15% respectively.
The main factors contributing for such situations referred to foreign currency scarcity to buy
inputs and technology; the breaking down of the old and obsolescence machines; the now and
then power interruption; scarcity of required skilled manpower; capacity and the limited
cooperation, involvement and support of the concerned stakeholders. There is also a capacity
problem genuinely speaking because what it produces is limited type and sizes of tyres. It does
not produce tyres for the latest models passengers’ cars. There upon, it can be concluded that the
above mentioned factors have contributed for the stagnation, low market share and low capacity
performance. Again, when the details of all categories financial performance were seen into
deeply, it can be generalized that the traditional financial performance is sound, profitable and
dependable to meet its obligations.
Moreover, from the customer satisfaction survey made it can be concluded that the quality of the
tyre is in question, significant number of customers (48.9% of 139 customers surveyed) fixed
different brands for their vehicles, which might show low confidence on the quality of the
product and there is confusion about the tyre in many angles which is an indication of weak
marketing performance. It is also noted that the firm is losing its well established market of
government offices tyre consumption.
Furthermore, the availability of committed management team and industrious workforce,
however, made the company to survive by making the available limited resources on hand
efficiently and effectively (high productivity as indicated by the result of key success factors and
their key performance indicators) and by repairing and modifying the old and obsolete machines
as indicated on the achievements of the overall operational and financial performances’
assessments of the research. The owner also allowed employing the total income for expansion
and enhancement of the company starting from 2013. Here, allotting the income for the
captioned purpose is one thing but being indifferent to manage and handle the constraint is
another thing. This implies that it is like one of the Ethiopia sayings ‘giving meat without a

82
knife’ because the owner has the capacity and alternatives to solve foreign currency constraint of
the firm.
Meanwhile, the company has started buying new technologies to raise and diversify its capacity
and replacing the old machines by new ones. Hence, this is a good beginning to be claimed by
the company. However, there seems to be little commitment, involvement and support of the
concerned stakeholders as it is indicated on the low capacity performance (30%), low market
share (15%) and low operational performance (40%) as a result of unbelievable and
unconvincing foreign currency shortage for the owner has a lot of alternatives to solve the
foreign currency issues.
In general, the government being developmental state and giving priority to manufacturing
sectors, the involvement, commitment and support seems to be minute. Finally, from their
marketing performance result there is unseen and unvalued problem of the firm, little value to
promotion and advertisement that could severely affect it now and in the future owing to
complacency of status quo.. In addition to the internal problems mentioned above, the firm has
been affected by external problems of foreign currency shortage; lack of involvement support of
the concerned stakeholders; the frequent power interruption; low-priced, low quality, second
hand and contraband of imported tyres.
Finally, it can be concluded that the favorable market opportunities are untapped and will to be
favorable among other thing. Moreover, the available idle capacity of the firm comes to be about
70% implying that if the constraint of foreign currency solved it would be able to produce more
than one million of different sizes of tyres, which would come to be and cover 50% of the total
market share.
In effect, this would decline the import of the low standard and poor quality tyre and hence saves
foreign currency to be spent for import of tyres. If this is so thus, broadly speaking, the value
added chain impact of the firm to the nation would be multifaceted in many dimensions.
5.3 Limitation of the StudyThe study explored the performance and challenges of tire manufacturing in the context of a
single country. The study is focused on a single company and hence the conclusions from the
study may not represent the macro level reality about tire manufacturing in general. Moreover,

83
with specific reference to methodological approach, it could have been more informative had the
study followed a comparative research methodology whereby the case at hand (Horizon Addis
SC) was compared with other tire producers such as those in Taiwan, Indonesia, and Thailand.
5.4 RecommendationThe issues raised on this research paper like foreign currency scarcity for the purchase of inputs
and technology demand the involvement, commitment and unreserved support of all concerned
stakeholders. In the first place, the owner himself can solve the problem if he is willing for he
can and has ample of alternatives. Allotting the dividend for the expansion and enhancement is
necessary but not sufficient condition. The owner should involve with full commitment to handle
the foreign currency constraint. Especially, the identified problems in this paper require the
ultimate support of the government, being the developmental state, whose due attention is giving
priority to the manufacturing sectors.
The government also should look for solution for the pending rubber plantation ownership which
is indispensable and among the major inputs for tyre production. The government further should
motivate the company to expand and exploit the competitive advantage and to operate at the
economies of scale to raise its market share so as to save foreign currency of the country.
Moreover, the attitude of the company’s management for promoting the products of the company
should be changed because there is confusion and it is not known in the market as such. The
well-established market of government offices should be maintained for diversion or shifting to
individuals is not the best solution but expansion to satisfy both. Furthermore, the overall
business and operational existence of the company is at risk which requires a comprehensive
overhaul to boost the contribution of the company both to the owners and to the country.
Thereby, there is a serious, professional, and interdisciplinary investigation (action research) of
the current bottlenecks of the company that investigate its economic, strategic, and legal
environment so as to devise a short term, mid-term and long-term business strategic objectives of
the company.

i
REFERENCE
Amaratunga, D., & Baldry, D. (2002). Moving from performance measurement to performance
management. Facilities 20(5), 217-223.
Armstead, C. and Clark, G. (1993) “Resource Activity Mapping: The value Chain in Operations
strategy,” The Service Industries Journal 13 PP 221-239
Armstrong, M., & Baron A. (1998). Performance Management, Boston, USA: Irwin/McGraw-
Hill.
Babbie, E. & Mouton, J. 2001. The practice of social research. Cape Town: Oxford University
Press.
Basu, R. (2001). New criteria for performance management: a transition from enterprise to
collaborative supply chain. Measuring Business Excellence, 5, pp. 7 12.
Berg, B. 2004.Qualitative Research Methods for the Social Sciences,5th edition. Boston: Pearson
Education, Inc.Bitici, S., Carrie, A.S. & Mcdevitt, L. (1997). Integrated performance
measurement systems: a development guide. International Journal of Operations &
Production Management, Vol. 17, No. 5, pp. 522-534.
Bruce Davis, (2017) World Top Exports Rubber tyre exports by country http://www.
Worldtopexports.com-tires-exports-country Tire Business Global tire rankings
http://www. Tire business. com/ articles /20170905/ News/global-tire-rankings
Chavda, A., Patil, MY. 2011. Increased Productivity of Tyre Manufacturing Process using Lean
Methodology. Institute of Technology, Nirma University, Ahmed Abad-382 481, 08-10
Cranfield University International Journal Business Performance Management Vol 5, No. 1,
2003 Implementing performance measurement systems
Chauda, A., Patil, Y. 2011. Rubber processing industries in Asia. Spiceland Cengage Learning
Services, p. 27.
Creswell, J.W. 2009. Research Design, Qualitative, Quantitative & Mixed Method Approaches.
3rdedition. Thousand Oaks: Sage Publications.
Cross, K.F. and Lynch, R.L. (1989) The SMART way to define and sustain success. National
Productivity Review, 9(1), 23–33.
Daniel Workman, (2016) Worlds’ Top Exports Rubber Tyres exports by world rubber industry
corner

ii
Dixon, J.R., Nanni, A.J. and Vollmann, T.E. (1990) The New Performance Challenge: Measuring
operations for world class competition, Dow Jones-Irwin: Homewood, IL.
Denscombe, M. 2002. Ground Rules for Good Research: A 10 Point Guide for Social
Researchers. Buckingham: Open University Press.
De Vos, A.S.; Strydom, H.; Fouché, C.B. and Delport, C.S.L. 2005. Research at grass roots for
the social sciences and human service professions. 3rd edition. Pretoria: Van Schaik
Publishers.
Drucker, P. (1954), The Practice of Management, Harper, New York, NY.
Durrheim, K. 1999. Research Design. In Terre Blanche, M. & Durrheim, K. (eds.) 1999.
Research in Practice: Applied Methods for the Social Sciences. Cape Town: University of
Cape Town Press.
Fafchamps, Marcel. 2004. Market Institutions and Sub-Saharan Africa: Theory and Evidence.
Cambridge, MA: MIT Press.
Fitzgerald, L., Johnston, R., Brignall, S., Silvestro, R. and Voss, C. (1991), Performance
Measurement in Service Business, CIMA, London.
Freddy Radder 2017 the evolution of tyre, tire recappers news https://www. Hemmings.
Com/blog/2013/12/10/this-day-in-history Economic Analysis of the Rubber Tyre
Manufacturing
Ghalayini, A. M., & Noble, J. S. (1996). The changing basis of performance measurement.
International journal of Operations & Production Management, 16(8), 63-80.
Gomes, C. F., Yasin, M. M., & Lisboa, J. V. (2004). A literature review of manufacturing
performance measures and measurement in an organizational context: a framework and
direction for future research. Journal of Manufacturing Technology Management, 15(6),
511-518.
Gordner, H., & Soderquist, E. (2004). The disciplined mind. New York: Simon and Schuster.
Hudson, M., Smart, A., & Bourne, M. (2001). Theory and practice in SME performance
measurement systems. International Journal of Operations & Production Management,
21(8), 96-115.
Greene, W.H. 2008. Econometric Analysis. 6 edition. Prentice Hall.
Grover, MR. 2011. Tire manufacturing process. Guidelines for value cahin analysts. NJ: Prentice
Hall.

iii
Ireland RD, Covin JG, Kuratko DF. 2009. Conceptualizing corporate entrepreneurship strategy.
Entrepreneurship Theory and Practice 33(1): 19-46.
Ita, P.A., and A.C. Gross 1995 “Business Economics 30(1)
Johnson, H. T., & Kaplan. R. S. (1987). Relevance Lost: The Rise and Fall of Management
Accounting. Boston: Harvard Business School Press.
Kaplan, R. 2015. Performance measurement techniques, Kaplan Publishing Limited.
Ketchen, D.J. Sr, Hult G.T.M /2007 “Bridging organization theory and supply chain management
the case of best supply chains” Journal of Operations Management, vol 25 (2) PP 573-880
Kothari, C.R. 2004. Research Methodology (Methods and Techniques): Second RevisedEdition.
New Delhi: New Age International.
Kaplan, R. S., & Norton D. P. (1996). The Balanced Scorecard: Translating Strategy into
Kaplan, R. S., & Norton, D. P. (1992). The Balanced Scorecard: Measures that drive
performance. Harvard Business Review: 1, 71-79.
Kaplinsky, R. and M. Morris (2001) A Handbook for Value Chain Research, Prepared for the
International Development Research Centre (IDRC), p.4-6 (emphasis added) (Accessed
19/01/15)
Kothari, C.R. 2004. Research Methodology (Methods and Techniques): Second RevisedEdition.
New Delhi: New Age International.
Lanen, W. N., Anderson, S. W. and Maher, M.W. 2008. Fundamentals of cost accounting. New
York: McGraw-Hill/Irwin, p. 4.Lebas, M.J. (1995). Performance measurement and
performance management. International Journal of Production Economics, Vol. 41, No.
1-3, pp. 23-35.
Leedy, P. D., & Ormrod, J. E. 2013. Practical research: Planning and design 10th ed. Upper
Saddle River, NJ: Prentice Hall.
Lillian G. Bradley 2000 Economic Analysis of the rubber Tire Centre for economic research U.S.
Environmental Protection Agency Research Triangle Park.
Mike Bourne and Andy Neely, (2003) Centre for Business Performance, School of Management
Mason, J. 1996. Qualitative Researching. London: Sage Publications.
Moullin, M. (2003). Defining Performance Measurement. Perspectives on Performance, 2(2), 3.
Moullin, M. (2003), “Defining performance measurement”, Perspectives on Performance, Vol. 2
Nos 1/2, p. 3.

iv
Moullin, M. (2003), “Defining performance measurement”, Perspectives on Performance, Vol. 2
Nos 1/2, p. 3.
Mowen, M.M. and Hansen, D.R. 2011. Introduction to cost accounting (International edn).
Spiceland Cengage Learning Services, p. 27.
Neely, A. D. (1998). Beyond Balance: Three Key Roles for Measurement. Business Intelligence
Conference, London.
Neely, A.D., Marr, B., Adams, C., & Kapashi, N. (2001). Measuring eBusiness Performance” in
“Business Performance Measurement: Theory and Practice, Neely, A. D. (ed),
Cambridge University Press, Cambridge.
Parmanter, D (2007). Key Performance Indicators: Developing, Implementing and Using Winning
KPIs. New Jersey: Hohn Wiley & sons. Key Performance Indicators. ISBN 978-0-470-
09588-1
Porter, M.E., (1985) Competitive advantage: creating and sustaining superior performance. Nova
science publisher.
Porter, M.E., (2001) Competitive advantage: “Strategy and internet” Harvard business review
2001, pp.63-78
Robinson, H.S., Carrillo, P.M., Anumba, C.J., & Al-Ghassani, A.M. (2005). Review and
implementation of performance management models in construction engineering
organizations. Construction Innovation, 5, pp. 203 217.
Salem, M. A., Hasnan, N., & Osman, N.H. (2012), Balanced scorecard: Weaknesses, strengths,
and its ability as performance.
Spicker, P. 2007. Research without consent. Social research update, Thompson, P. 2011. The
trouble with HRM, Human Resource Management Journal, Vol.21, No.1, 355–67.
Wagner. J, Petera .P, & Mensik.M, (2012), Strategic performance measurement system, Journal
of Competitiveness. Vol.Issue 4 pp 67-85
Woolridge, J. 2000. Introductory Econometrics: A Modern Approach. New York: Southwestern
Publishers.
Yeniyurt, S. (2003). A Literature Review and Integrative Performance Measurement Framework
for Multinational Companies. Marketing Intelligence and Planning, 21(3), 134-142.

v
Appendix 1: Questionnaire
ST. Mart’s UniversitySchool of Graduate Studies, MBA Program
Customer Survey QuestionnaireDear Respondent,First of all, thank you for your willingness to be part of the survey. This questionnaire is prepared by Mr.Tesfaye Gebrehana, Masters Degree student of St. Mary’s University to collect data to be analyzed for amasters thesis [study] which is a requirement for a student to accomplish his masters study program. Thetitle of the study is “Performance and challenges of Tyre manufacturing in Ethiopia: The case of HorizonAddis Tyre Factory”. The objective of the study is to identify and map-out the value chain of Tyremanufacturing for better understanding of the process and evaluate the performance as well as bottlenecksin the context of Horizon Addis Tyre. Finally, I want to assure you that the information which you will sharewith me will be kept confidential and only used for the academic purpose. No individual’s responses will beidentified as such and the identity of persons responding will not be published or released to anyone. Allinformation will be used for academic purposes only.
Thank you again for your kind cooperation and time!Date of survey: _____________ Respondent code: _________;
SECTION I: RESPONDENTS’ BASIC PROFILE
1. Address: City________________, District_________2. Age [1] 18-25 [2] 25-32 [3].36-40 [3]. 41-50 [4]. 51-60 [5]. 61-70 [6]. > 70
3. Gender: [1] Male______; [0] Female________4. Marital status: [1] Single: [2] Married/Living together: [3] Widowed: [4] Divorced: [5] Separated5. Family size:_________6. Religion: [1] Orthodox: [2] Catholic: [3] Muslim: [4] Protestant: [5] Other, _________7. Level of education:
1=Illiterate 2=Read and write [traditional Educ.] 3 =1-8 Grade 4 = 9-12 Grade
5= TVET graduate 6= College Diploma 7=Degree 9= Above degree

vi
8. For how long [for how many years] do you use your car? __________9. What is the code of your car: [1] Code-1 [2] Code-2 [3] Code-3 [4] Code-4 [5 ] Code-5 [6] Other10. Customer type: [1] Distributors [2] Government [3] Individuals and NGOs [4] Associations
SECTIONII: TYRE PURCHASE DECISSION AND RELTATED QUESTIONS11. So far, how many times have you purchased tyre for your car? ______________12. Durability: For how long [months] do you use the tyre?
[1] < 6 months [2] 7-12 months [3] 12-18 months [4] 19-24 months[5] 25-30 months [6] 31-36 Months [7] More than 36 months
13. Which brand of tyre did you purchase/prefer the most?[1] Horizon Addis [2] Dunlop [3] Bridgestone [4] MRF [5] Pirilli [6] [7] Other
14. Ref Q13, what is your criterion to choose the type of tyre [brand]?(1) Price [2] Quality [3] Sales service [4] After sale and delivery service[5] Payment method [6] other factor[s] [Mention_________________]
15. From whom do you usually purchase the tyre?[1] From the factory’s outlets [2] From other wholesalers [3] Other retailers[4] Others [Mention_________________]
SECTIONIII: BUYERS’ LEVEL OF SATISFACION AND RELATED QUESTIONS16. How much are you satisfied with the tyre you are you using now?
[1] Strongly dissatisfied [2] Dissatisfied [3] Neutral [4] Satisfied [5] Very satisfied17. Do you have intention to shift other types of tyre? [1] Yes [2] No18. Ref Q.16, if ‘No’ go to Q19; If ‘Yes’ why do you intend to shift to other type of tyre?
[1] Because I intend to change the model of my car[2] Because the quality of the current tyre is getting lower (quality related reason)[3] Because the price of the current tyre is increasing (price related reason)[4] Because other tyre sellers have netter additional after sale service (service related reason)[5] Because of other reason(s)
19. What do you think is the most important product related variable for tyres to be used by cars?[1] Design [2] Raw material [3] Price [4] Sales service [5] After sales service [6] Other
20. Do you identify yourself as the customer of Horizon Addis Tyre? [1] Yes [2] No21. Ref Q 20, If ‘Yes’, Answer the questions stated under SECTION IV in the next page.

vii
SECTION IV: TO FILLED BY THOSE WHO IDENTIFY THEMSELVES AS CUSTOMERS OF HORIZONADDIS TYRE
Horizon Addis Tyre SC StronglyDisagree
StronglyAgree
Its modern looking factor contributes to the quality of its service. 1 2 3 4 5 6 7
Its physical facilities add to the quality of its service. 1 2 3 4 5 6 7
Its personnel attractive appearance positively affects the quality of its service. 1 2 3 4 5 6 7
Its services such as its promotions contribute to its service quality. 1 2 3 4 5 6 7
Its timely delivery of promised services contributes to overall service quality. 1 2 3 4 5 6 7
Its management is interest to solve your problem whenever it occurs related tothe tyre the company sells 1 2 3 4 5 6 7
It get things right the first time that positively affects its service and productquality.
1 2 3 4 5 6 7
It gets things punctually that contributes to its product-service quality. 1 2 3 4 5 6 7
Its error-free records add value on the product and service quality. 1 2 3 4 5 6 7
The services offered by its personnel satisfies customers and this affects itsproduct and service quality. 1 2 3 4 5 6 7
The willingness of Horizon Addis tyre to help customers positively is high 1 2 3 4 5 6 7
It creates the environment that makes customers to feel safe that contributesto its product and service quality. 1 2 3 4 5 6 7
Its effort to provide individual attention to customers positively affects itscustomers’ loyalty 1 2 3 4 5 6 7
Its convenient operating hours to all its customers adds to its product andservice quality. 1 2 3 4 5 6 7
Its products are more preferable than competitors’ 1 2 3 4 5 6 7

viii
በሆራይዘን አዲስ ጎማ አከፋፋዮች የሚሞላ መጠይቅ1. አድራሻ ከተማ ________________ ወረዳ ________________
2. እድሜሀ/ 20-30 ለ/ 31-40 ሐ/ 41-50 መ/ 51-60 ሠ/ >60
3. ጾታ ወንድ ሴት
4. የጋብቻ ሁኔታ ያላገባ ባለትዳር
5. የቤተሰብ ብዛት _________
6. የትምህርት ደረጃ
ማንበብና መጻፍ አንደኛ ደረጃ መለስተኛ ሁለተኛ ደረጃ ሁለተኛ ደረጃተግባረዕድ ዲፕሎማ የመጀመሪያ ዲግሪ ከመጀመሪያ ዲግሪ በላይ
7. በማከፋፈል ስራ ላይ ለምን ያህል ጊዜ ቆይተዋል?ሀ/ 1-5 ለ/ 6-10 ሐ/ 11-15 መ/ 16-20 ሠ/ ከ >20
8. ጎማው ለምን ያህል ጊዜ ያገለግላል?ሀ/ እስከ 6 ወር ለ/ ከ7-12 ወራት ሐ/ 12-18 ወራት መ/ 19-24 ወራት
9. ደንበኞቻችሁ በሆራይዘን ጎማ ምን ያህል ደስተኞች ናቸው?ሀ/ በጣም ደስተኛ አይደሉም ለ/ ደስተኛ አይደሉም ሐ/ ግድ የላቸውምመ/ ደስተኛ ናቸው ሠ/ በጣም ደስተኛ ናቸው ረ/ እጅግ በጣም ደስተኛ ናቸው
10. ስለጎማው የገጠመዎት ችግር ምንድነው?ሀ/ የጥራት ችግር ለ/ የዋጋ ችግር ሐ/ የአቅርቦት ችግርመ/ የገበያ እጦት ችግር ሠ/ ሌላ ካለዎት ……………………………………………
11. ከጎማ ጋር በተገናኘ በተሽከርካሪዎች መጠቀም (መመረጥ) አለበት ብለው የሚያስቡትንይግለጹልን፡፡ሀ/ ጥራት ለ/ ጥሬ እቃ ሐ/ ዲዛይንመ/ ዋጋ ሠ/ ሌላካለዎት……………………………………………….…
12. ሆራይዘን ጎማ በገበያ ላይ ምን ያህል ይታወቃል?ሀ/ እጅግ በጣም ይታወቃል ለ/ በጣም ይታወቃል ሐ/ መካከለኛመ/ አይታወቅም ሠ/ በጣም አይታወቅም
13. የፋብሪካው የምርት አቅርቦት በተፈለገ መጠንና አይነት የማቅረብ አቅሙ ምን ያህል ነው?ሀ/ በጣም ከፍ ያለ ለ/ ከፍ ያለ ሐ/ መጠነኛመ/ ዝቅተኛ ሠ/ በጣም ዝቅተኛ
14. የፋብሪካው የደንበኞች አገልግሎት ሲገመገምሀ/ እጅግ በጣም ጥሩና ቀልጣፋ ለ/ በጣም ጥሩና ቀልጣፋሐ/ ጥሩና ቀልጣፋ መ/ ደካማና ዝግ ያለ ሠ/ መጥፎናዘገምተኛ

ix
15. የሆራይዘን አዲስ ምርቶች ከተፎካካሪዎች ምርቶች ምን ያህል ተመራጭ ናቸው?ሀ/ እጅግ በጣም ተመራጭ ለ/ በጣም ተመራጭ ሐ/ ተመራጭመ/ ተመራጭ አይደለም ሠ/ በጣም ተመራጭ አይደለም
16. ፋብሪካው ብዙ ማስታወቂያዎችን በየቦታው በመስቀል ምርቱን ያስተዋውቃል ብለው ያስባሉ?ሀ/ በጣም ያስታውቃል ለ/ ያስተዋውቃል ሐ/ አነስተኛ ነው መ/ በጣም አነስተኛ ነው
17. ድርጅቱ ደንበኞች ስጋት እንዳይገባቸው የሚያደርግበት ሁኔታ ምን ያህል ነው?ሀ/ እጅግ በጣም ጥሩ ለ/ በጣም ጥሩ ሐ/ ጥሩመ/ አነስተኛ ሠ/ በጣም አነስተኛ
18. የምርት ግድፈት ባጋጠመ ጊዜ ምርቱን ለመተካት የፋብሪካው ትብብርሀ/ እጅግ በጣም ጥሩ ለ/ በጣም ጥሩ ሐ/ ጥሩመ/ አነስተኛ ሠ/ በጣም አነስተኛ
19. ለእያንዳንዱ አከፋፋይ ፋብሪካው የሚሰጠው ትኩረትሀ/ እጅግ በጣም ጥሩ ለ/ በጣም ጥሩ ሐ/ ጥሩመ/ አነስተኛ ሠ/ በጣም አነስተኛ
20. እርስዎ ለራስዎ ተሽከርካሪ የሚጠቀሙት ጎማሀ/ የሆራይዘን አዲስ ለ/ ብሪጅስቶን ሐ/ አፖሎመ/ ኤም አር ኤፍ ሠ/ ዮኮሀማ ረ/ ኤኦለስሰ/ ሌላ ካለዎት………………………….……
21. ፋብሪካው ማሻሻልና መለወጥ አለበት የሚሉት ሃሳብ ካለዎት

x
SECTION IV: TO FILLED BY THOSE WHO IDENTIFY THEMSELVES AS CUSTOMERSOF HORIZON
ADDIS TYRE
ተ.ቁ Horizon Addis Tyre SCStronglyDisagree
StronglyAgree
1 አንድ ጎማ ዘመናዊነት መላበሱ ለጥራት አገልግሎት አስተዋጽኦ ያበረክታልIts modern looking factor contributes to the quality of its service.
1 2 3 4 5 6 7
2 የጎማ ሙሉ አገልግሎቶች መሟላት ጥራቱን ይጨምራሉIts physical facilities add to the quality of its service.
1 2 3 4 5 6 7
3 የሻጮቹ ባለቤቶች መስህብነት በጎማው ጥራት ላይ በበጎ ጎኑ አስተዋጽኦ ያደርጋልIts personnel attractive appearance positively affects the quality of its service.
1 2 3 4 5 6 7
4 የሽያጭ ማስታወቂያዎቹ በጎማው ላይ የአገልግሎት ጥራት ይጨምራሉIts services such as its promotions contribute to its service quality.
1 2 3 4 5 6 7
5 በወቅቱ በተፈለገ ጊዜ ጎማውን ለገበያ ማቅረብ የአገልግሎት ጥራትን ያሳያልIts timely delivery of promised services contributes to overall service quality.
1 2 3 4 5 6 7
6 የድርጅቱ ማኔጅመንት ሁሌም ከጎማው ሽያጭ ጋር የተዛመደ ችግሮዎትን ለማቃለልፍላጎት አላቸውIts management is interest to solve your problem whenever it occurs related to the tyre thecompany sells
1 2 3 4 5 6 7
7 በመጀመሪያ ባጋጠመ ችግር ድርጅቱ ነገሮችን ማስተካከል ለምርት ጥራትና አገልግሎትበጎ የሆነ ተጽእኖ አለውIt get things right the first time that positively affects its service and product quality.
1 2 3 4 5 6 7
8 ምርትን በተፈለገ ጊዜና ወቅት ማቅረብ በምርትና አገልግሎት ላይ በጎ ተጽእኖ አለውIt gets things punctually that contributes to its product-service quality.
1 2 3 4 5 6 7
9 ከግድፈት ነፃ የሆነ አሠራር በምርትና አገልግሎት ጥራት ላይ ዋጋ አለውIts error-free records add value on the product and service quality.
1 2 3 4 5 6 7
10 የድርጅቱ ሠራተኞች ደንበኞችን የሚያረካ አገልግሎት በምርቱና በአገልግሎት ጥራቱተጽእኖ ይኖረዋልThe services offered by its personnel satisfy customers and this affects its product andservice quality.
1 2 3 4 5 6 7
11 የሆራይዘን አዲስ ጎማ ሠራተኞች በበጎነት ደንበኞችን ለማገልገል ያላቸው ተነሳሽነትከፍተኛ ነውThe willingness of Horizon Addis tyre to help customers positively is high
1 2 3 4 5 6 7
12 ድርጅቱ ደንበኞች ስጋት እንዳይገባቸው የሚያደርግበት ሁኔታ ለምርትና አገልግሎትጥራት ተጽእኖ አለውIt creates the environment that makes customers to feel safe that contributes to its productand service quality.
1 2 3 4 5 6 7
13 ለእያንዳንዱ ደንበኛ የሚሰጠው ልዩ ትኩረት ደንበኛው ቋሚና ታማኝ እንዲሆን የማድረግተጽእኖ አለውIts effort to provide individual attention to customers positively affects its customers’loyalty
1 2 3 4 5 6 7
14 የተመቻቸ የሥራ ሰዓት ለሁሉም ደንበኛ መጠቀሙ ለምርትና ለአገልግሎት ጥራትአስተዋጽኦ ያደርጋልIts convenient operating hours to all its customers adds to its product and service quality.
1 2 3 4 5 6 7
15 ምርቶቹ ከተፎካካሪዎች ምርቶች ይልቅ ተመራጭ ናቸውIts products are more preferable than competitors’ 1 2 3 4 5 6 7

xi
Appendix 2: Key informant interview
To be answered by top management
1. What are the tyre manufacturing processes?
2. How is performance measurement of HAT measured?
3. What are the key financial and non-financial indicators that you employ for performance
measurement?
4. What are the important indicators to map the company performance?
5. What are the main components that make up effective performance measurement system?
6. What is the impact of government regulation on the company performance?
7. What is the government support for the success and growth of the company?
8. What are the challenges of the firm on its performance?
9. Please discuss [explain] the internal and internal factors affecting your performance.
10. What are the critical success factors?
11. How do you market and channel your output?
12. What strategies do you use to tackle threats of the company?
13. How do you meet customers’ demand of better quality, greater speed and lower costs?
14. What kind of after-sale service do you give?
15. What strategic measures do you use to improve customer organization relationship?


!["A Man of the Last Hour" (1998 [1991])](https://static.fdokumen.com/doc/165x107/6332ccf74e0143040300d61f/a-man-of-the-last-hour-1998-1991.jpg)