
Towards Representative Metallurgical Sampling and Gold ...
47
minerals Article Towards Representative Metallurgical Sampling and Gold Recovery Testwork Programmes Simon C. Dominy 1,2, * ID , Louisa O’Connor 2 ID , Hylke J. Glass 1 ID , Saranchimeg Purevgerel 3 and Yuling Xie 4 ID 1 Minerals Engineering Research Group, Camborne School of Mines, University of Exeter, Penryn, Cornwall TR10 9FE, UK; [email protected] 2 Department of Mining and Metallurgical Engineering, Western Australian School of Mines, Curtin University, Bentley, WA 6102, Australia; [email protected] 3 Department of Mineral and Energy Economics, Western Australian School of Mines, Curtin University, Murray Street, Perth, WA 6000, Australia; [email protected] 4 Department of Mineral Resources Engineering, School of Civil and Environmental Engineering, University of Science and Technology Beijing, Beijing 100083, China; [email protected] * Correspondence: [email protected] Received: 5 March 2018; Accepted: 19 April 2018; Published: 4 May 2018 Abstract: When developing a process flowsheet, the risks in achieving positive financial outcomes are minimised by ensuring representative metallurgical samples and high quality testwork. The quality and type of samples used are as important as the testwork itself. The key characteristic required of any set of samples is that they represent a given domain and quantify its variability. There are those who think that stating a sample(s) is representative makes it representative without justification. There is a need to consider both (1) in-situ and (2) testwork sub-sample representativity. Early ore/waste characterisation and domain definition are required, so that sampling and testwork protocols can be designed to suit the style of mineralisation in question. The Theory of Sampling (TOS) provides an insight into the causes and magnitude of errors that may occur during the sampling of particulate materials (e.g., broken rock) and is wholly applicable to metallurgical sampling. Quality assurance/quality control (QAQC) is critical throughout all programmes. Metallurgical sampling and testwork should be fully integrated into geometallurgical studies. Traditional metallurgical testwork is critical for plant design and is an inherent part of geometallurgy. In a geometallurgical study, multiple spatially distributed small-scale tests are used as proxies for process parameters. These will be validated against traditional testwork results. This paper focusses on sampling and testwork for gold recovery determination. It aims to provide the reader with the background to move towards the design, implementation and reporting of representative and fit-for-purpose sampling and testwork programmes. While the paper does not intend to provide a definitive commentary, it critically assesses the hard-rock sampling methods used and their optimal collection and preparation. The need for representative sampling and quality testwork to avoid financial and intangible losses is emphasised. Keywords: metallurgical sampling; metallurgical testwork; geometallurgy; gold mineralisation; representative sampling; Theory of Sampling; quality assurance/quality control Minerals 2018, 8, 193; doi:10.3390/min8050193 www.mdpi.com/journal/minerals
-
Upload
khangminh22 -
Category
Documents
-
view
0 -
download
0
Transcript of Towards Representative Metallurgical Sampling and Gold ...

minerals
Article
Towards Representative Metallurgical Samplingand Gold Recovery Testwork Programmes
Simon C. Dominy 1,2,* ID , Louisa O’Connor 2 ID , Hylke J. Glass 1 ID , Saranchimeg Purevgerel 3
and Yuling Xie 4 ID
1 Minerals Engineering Research Group, Camborne School of Mines, University of Exeter, Penryn,Cornwall TR10 9FE, UK; [email protected]
2 Department of Mining and Metallurgical Engineering, Western Australian School of Mines, CurtinUniversity, Bentley, WA 6102, Australia; [email protected]
3 Department of Mineral and Energy Economics, Western Australian School of Mines, Curtin University,Murray Street, Perth, WA 6000, Australia; [email protected]
4 Department of Mineral Resources Engineering, School of Civil and Environmental Engineering,University of Science and Technology Beijing, Beijing 100083, China; [email protected]
* Correspondence: [email protected]
Received: 5 March 2018; Accepted: 19 April 2018; Published: 4 May 2018�����������������
Abstract: When developing a process flowsheet, the risks in achieving positive financial outcomesare minimised by ensuring representative metallurgical samples and high quality testwork.The quality and type of samples used are as important as the testwork itself. The key characteristicrequired of any set of samples is that they represent a given domain and quantify its variability.There are those who think that stating a sample(s) is representative makes it representativewithout justification. There is a need to consider both (1) in-situ and (2) testwork sub-samplerepresentativity. Early ore/waste characterisation and domain definition are required, so thatsampling and testwork protocols can be designed to suit the style of mineralisation in question.The Theory of Sampling (TOS) provides an insight into the causes and magnitude of errors thatmay occur during the sampling of particulate materials (e.g., broken rock) and is wholly applicableto metallurgical sampling. Quality assurance/quality control (QAQC) is critical throughout allprogrammes. Metallurgical sampling and testwork should be fully integrated into geometallurgicalstudies. Traditional metallurgical testwork is critical for plant design and is an inherent part ofgeometallurgy. In a geometallurgical study, multiple spatially distributed small-scale tests are used asproxies for process parameters. These will be validated against traditional testwork results. This paperfocusses on sampling and testwork for gold recovery determination. It aims to provide the readerwith the background to move towards the design, implementation and reporting of representativeand fit-for-purpose sampling and testwork programmes. While the paper does not intend to providea definitive commentary, it critically assesses the hard-rock sampling methods used and their optimalcollection and preparation. The need for representative sampling and quality testwork to avoidfinancial and intangible losses is emphasised.
Keywords: metallurgical sampling; metallurgical testwork; geometallurgy; gold mineralisation;representative sampling; Theory of Sampling; quality assurance/quality control
Minerals 2018, 8, 193; doi:10.3390/min8050193 www.mdpi.com/journal/minerals

Minerals 2018, 8, 193 2 of 47
1. Introduction
1.1. Sampling along the Mine Value Chain
Sampling is a vital component during all stages of the Mine Value Chain (MVC). It includes thesampling of in-situ material and broken rock for geological, metallurgical (including plant balances),geometallurgical and geoenvironmental purposes [1–5].
Sampling error is defined in the context of TOS, where actions may lead to uncertainty and createan overall measurement error [6,7]. TOS attempts to break down this error into a series of contributionsalong the sampling value chain (e.g., the planning to assay-measurement process: Table 1).
Table 1. Sampling value chain. Sampling errors are defined in Table 3.
Location Site/Field Laboratory
StagePlanning Collection Transport Preparation Testwork Assaying
1 2 3 4 5 6
ActivityScope
DevelopExecute
ObserveCollect Bag and tag
QAQCIntegrity/securityChain of custody
Integrity/securityChain of custody
Equipment operationEquipment clean
QAQCIntegrity/security
Equipment operationEquipment clean
QAQCIntegrity/security
Equipment operationEquipment clean
QAQCIntegrity/security
Sampling errorsIn-situ nugget effect
FSE, GSEDE, EE, WE
PE FSE, GSEDE, EE, WE, PE
FSE, GSEDE, EE, WE, PE
PEAE
Dominant effect on results PrecisionBias Bias
Precision(if splitting)
Bias
Precision(if splitting)
BiasBias
Material risk assumingaverage practice High Low Moderate Moderate Low
Material risk assumingoptimised practice Moderate Low Low Low Low
FSE: fundamental sampling error; GSE: grouping and segregation error; DE: delimitation error; EE: extraction error;PE: preparation error; WE: weighting error; AE: analytical error.
Errors are additive throughout the sampling value chain and generate both monetary andintangible losses [8–10]. The aim is to collect representative samples to accurately describe the materialin question. Sample collection is followed by reduction in both mass and fragment size to providea sub-sample for testwork or assay. An assay is the quantitative measurement of the concentration(e.g., mass fraction such as g/t gold) of a metal by a given methodology, for example a 30 g fire assayfollowed by measurement of gold using an instrumental method (e.g., atomic absorption spectroscopy).This entire process can be particularly challenging in the gold environment and may require specialprotocols [11–14].
1.2. Metallurgical Sampling and Testwork
Metallurgical testwork is the laboratory-based bench-scale physical (e.g., gravity) orhydrometallurgical (e.g., cyanide leach) extraction of gold (or other metal/mineral) via a definedmethodology [15–19]. Large-scale testwork includes pilot plant and ultimately demonstration ortrial plant processing. The results from metallurgical testwork are used to support design studiesfor new plants and expansions, in short- to long-term mine plans, and to make decisions in anoperating plant [20]. Key testwork outcomes relate to the definition of: recovery and comminutiondomains, domain variability and identification of problem ore types (e.g., deleterious elements andrefractory ores).
After collection, sampling errors propagate throughout all subsequent processes contributingto uncertainty in testwork (e.g., measurements) and any decisions made thereon [21]. Across theMVC, these errors generate financial and intangible losses. In essence, poor-quality unrepresentativemetallurgical samples increase project risk [22] and may lead to incorrect project valuation [23].McCarthy [9] reports that metallurgical sampling and testwork issues are responsible for 15% of plantcommissioning and operational under-performance. The consequences of poor metallurgical samples

Minerals 2018, 8, 193 3 of 47
can be significant and relate to: incorrect recovery factors applied to Ore Reserve estimates, poor projectdevelopment decisions, incorrectly designed process plants, poor mine-to-mill reconciliation,halted projects and/or reduced mine life and incorrect financial models and project valuations.
The difference between geological and metallurgical sampling programmes, and the definitionof a representative sample, is illustrated by the number of samples collected. It is not unusual that>5000 samples are collected for resource estimation, but only 25–50 samples collected for metallurgicaltesting on the same deposit. The ratio of reserve definition samples to metallurgical samples oftenremains much the same for complex or heterogeneous mineralisation, despite a shift in risk from thereserve head grade to the characteristics that control plant performance (e.g., recovery). In reality,hundreds of metallurgical samples are likely to be required depending on mineralisation complexityand size. The modern geometallurgical approach aims to model variability based on correlatingmetallurgical testwork with rapid small-scale tests and by calibrating metallurgical properties withother features (e.g., proxies) that can be realised from resource drilling [11,24,25]. In the context ofgeometallurgical programmes, metallurgical sampling and testwork are a critical input.
1.3. Current Practice and Focus of This Contribution
Current mining industry practice frequently fails to place proper consideration on representativemetallurgical sampling and quality testwork programmes to produce fit for purpose results.Despite its general acceptance for resource grade sampling, TOS is rarely applied during metallurgicalprogrammes. In addition, few metallurgical campaigns apply QAQC. These deficiencies are indeference to the requirements of international reporting codes, where for example both the AustralianJORC Code [26] and Canadian NI43-101 [27] require specific comment on the representativity ofmetallurgical samples and applicability of testwork.
This paper focusses on sampling and testwork (Stages 1 to 5 of the sampling value chain:Table 1) for gold metallurgical recovery determination (e.g., Leach, GRG and flotation methods).It should be noted that metallurgical testwork also includes comminution and geoenvironmentalparameters, though these are not specifically discussed in this contribution. Whilst it focusses ongold, the conclusions are applicable to other commodities. It aims to provide the reader with thebackground to move towards improved design, implementation and reporting of representative andfit for purpose metallurgical testwork programmes. The paper does not intend to provide a definitivecommentary, but rather be a first foray for improvement. It critically assesses the sampling methodsused, and their optimal collection and preparation through the application of TOS. A case studyillustrates the need for better designed sampling and testwork to avoid substantial financial andintangible losses. It demonstrates many of the issues discussed throughout this contribution.
2. Mineralisation Characteristics
2.1. Geological Characteristics
The physical and spatial characteristics of gold mineralisation have a strong influence on anysampling programme. Mineralisation may comprise (i) an individual vein up to 5 m wide or (ii)numerous individual veins forming a larger composite lode up to 20 m wide. Additionally, mineralisedsystems may comprise large complex structures ranging from 20 to 100 m in width such as igneousintrusives, skarns, alteration/replacement zones, and networks of cross-cutting (e.g., stockworks) orsub-parallel (e.g., sheeted vein systems) veins.
The nature and style of mineralisation and gangue material should be considered to determinetheir impact on recovery. Key characteristics that influence sampling include, but are not limitedto: mineral species and composition, grain size and morphology, texture and mineral associations.The sampling process can be particularly challenging in the presence of coarse gold particles, which areconsidered to be those >100 µm in size. Where it constitutes more than 10% of all gold present,problems are likely to be encountered during sampling, testwork and assaying.

Minerals 2018, 8, 193 4 of 47
There is evidence to suggest that relationships exist between increased gold grade and larger,potentially clustered gold particles [28]. In some cases, fine- and coarse-gold particles may be part ofoverprinted paragenetic stages [29]. Fine gold particles are more likely to be disseminated throughoutthe mineralisation and responsible for a “background” grade, whereas coarse particles may be moreclustered and related to high-grade zones that are difficult to sample effectively [28,29].
2.2. Metallurgical Characteristics
Gold ores are commonly classified as either free-milling or refractory [30]. Free-milling oresare defined as those where over 90% of gold can be recovered by conventional cyanide leaching.Refractory ores are those that give a low recovery from conventional cyanide leaching. Mineralogyhas a significant impact on gold recovery, where the key factors are (Table 2): mineralogy (includingparticle size and deportment), geochemistry (e.g., carbon, silver and copper content, and surfacechemistry), grade (grade-recovery relationships) and texture (e.g., liberation).
Table 2. General recovery methods based on gold liberation size and host mineralogy.
Liberation Size Quartz Pyrite Arsenopyrite High Silver
Very coarse: >1000 µm Jigs, tables Jigs, tables Jigs, tables Jigs, tables
Coarse: 100–1000 µm Gravity, CIL/CIP Gravity, CIL/CIP Gravity, CIL/CIP Gravity, CILMerrill Crowe
FlotationFine: 50–100 µm CIL/CIP CIL/CIP, Flotation CIL/CIP, Flotation
Very fine: 10–50 µm CIL/CIP Flotation Flotation -
Sub-microscopic: <10 µm - POX, BIOX POX, BIOX -
CIL: carbon-in-leach; CIP: carbon-in-pulp; POX: pressure oxidation; BIOX: bio-oxidation; Gravity: gravityrecoverable gold (GRG) is a recovery parameter based on liberated gold or high-grade composite gold particles thatcan be recovered by physical separation methods.
In addition, the proportion of sub-microscopic (<10 µm) gold is important. Sub-microscopic goldrefers to gold contained in the structure of other minerals in a minor or trace quantity. Gold particlesize issues during metallurgical processes relate to liberated gold after grinding. Generally, gold oresare milled to 80% passing (P80) 75 µm and 300 µm. As such the true in-situ particle size does notcontrol metallurgical recovery per se, though it has a marked influence given that coarser gold particleswill require more grinding to reduce particle size. For coarse-gold dominated mineralisation, the focusshould be on liberation and the early removal of coarse particles from the mill circuit by gravityconcentration or gold traps. Finer gold particles will require more grinding to liberate prior to flotationor cyanide extraction.
3. Theory of Sampling
3.1. Overview
TOS was developed in the 1950s by Dr. Pierre Gy to improve sampling within the miningindustry [6]. It defines and provides guidelines for the reduction of sampling errors throughout theMVC [6,10], though its application to metallurgical sampling has been minimal [31]. Some resistanceto its application relates to the use of the Fundamental Sampling Error (FSE) equation and confusionas to its calibration and application [6,10]. TOS has a wider usage than simply the FSE equation andincludes a number of errors that must be considered to achieve representative samples (Table 3). It isoften forgotten that the application of TOS includes the mandatory use of QAQC.
3.2. Nugget Effect
The heterogeneity (variability) of mineralisation can be quantified by the nugget effect and has adirect link to TOS [32–34]. The nugget effect is a quantitative geostatistical term describing the inherentvariability between samples at very small separation distances; though in reality has a wider remit

Minerals 2018, 8, 193 5 of 47
than just differences between contiguous samples [13,34,35]. It is effectively a random componentof variability that is superimposed on the regionalised variable, and is defined in a variogram as thepercentage ratio of nugget variance to total variance (the sill). Deposits that possess a nugget effectabove 50% and particularly above 75% are the most challenging to evaluate. The magnitude of thetotal nugget effect relates to:
• Geological (geological or in-situ nugget effect: GNE) heterogeneity of the mineralisation.
# Distribution of single grains or clusters of gold or sulphide-hosting gold particlesdistributed through the ore to larger continuous zones.
# Continuity of structures such as high-grade gold carriers within the main structure orvein-lets within wall rocks.
• Sampling induced error variability (sampling nugget effect: SNE).
# Sample support (sample size—volume-variance).# Sample density (number of samples at a given spacing—information effect).# Sample collection, preparation, testwork and assay procedures.
A clear indication of the GNE is where two halves of a drill core (e.g., on the cm-scale) are assayedand show order of magnitude or more difference in assay grades, or where two closely spaced facesamples for example also show an order of magnitude or more difference. A high GNE leads to highdata variability, particularly where samples are too small and protocols not optimised. The presenceof visible gold in mineralisation is often an early sign of grade variability and a flag for variability inmetallurgical recovery testwork results.
The SNE component is related to errors induced by inadequate sample size, sample collection,preparation methods and analytical procedures. In some instances, the SNE is the dominant part ofthe total nugget effect and reflects non-optimal protocols. Throughout the MVC, optimised samplingprotocols aim to reduce the SNE thereby also reducing: total nugget variance, skewness of the datadistribution, and number of extreme data values. All sampling errors contribute to the SNE.
3.3. Sampling Errors
TOS provides an insight into the causes and magnitude of errors that may occur during thesampling of particulate materials (e.g., broken rock). It does not strictly include sampling of in-situmaterial such as drill core or linear samples, as the sample does not have an equiprobable chance ofbeing collected. However, its application is relevant and highlights some of the challenges of fieldsampling through analysis of the so-called incorrect sampling errors (ISE; Table 3) during the samplecollection process [36–39].
The correct sampling errors are considered unavoidable because they cannot be removed byperfect sampling (CSE; Table 3). They relate to the inherent heterogeneity of the material beingsampled and control precision. Precision specifically relates to the constitution heterogeneity of thematerial in question and leads to the fundamental sampling error (FSE). Poor precision in samplesgenerates ore/waste misclassification. The FSE can be estimated via the FSE equation [6,10]; it iscontrolled via the optimisation of sample mass and size reduction process (Table 4).
In practice, the grouping and segregation error (GSE) cannot be measured but may have a materialeffect on the total sample error. It is controlled by accumulating many small increments to form acomposite sample. Although segregation can theoretically be reduced by homogenisation, this is afutile exercise in the presence of liberated gold particles where it promotes further segregation.

Minerals 2018, 8, 193 6 of 47
Table 3. Definition of key TOS errors.
Sampling Error Acronym Error Type Effect on Sampling Source of Error Error Definition
Fundamental FSE
Correct Sampling Error (CSE)Random Errors-Precision
Generator
Characteristics of the oretype. Relates to
Constitution andDistribution
Heterogeneity
Results from grade heterogeneity of the broken lot. Of all sampling errors, the FSE does notcancel out and remains even after a sampling operation is perfect. Experience shows thatthe total nugget effect can be artificially high because sample masses are not optimal
Grouping and Segregation GSE Relates to the error due to the combination of grouping and segregation of rock fragmentsin the lot. Once rock is broken, there will be segregation of particles at any scale
Delimitation DE
Incorrect Sampling Error (ISE)
Systematic Errors-Bias Generator
Sampling equipment andmaterials handling
Results from an incorrect shape of the volume delimiting a sample
Extraction EE Results from the incorrect extraction of a sample. Extraction is only correct when allfragments within the delimited volume are taken into the sample
Weighting WE Relates to collecting samples that are not of a comparable support. Samples shouldrepresent a consistent mass per unit
Preparation PERefers to issues during sample transport and storage (e.g., mix-up, damage, etc.),preparation (e.g., contamination and/or losses), and intentional (e.g., sabotage and salting)and unintentional (e.g., careless work practices) actions
Analytical AE - Analytical processRelates to errors during the assay and analytical process, including issues related to rockmatrix effects, careless work practices, and analytical machine maintenance and calibration.In the testwork context also refers to test machine operation parameters and maintenance
Table 4. Cause, effect and solutions to TOS errors.
Sample Type Error Type Cause Error Effect Nugget Effect Component Solution
In-situ (e.g., linear samples and core)
Random (CSE)
In-situ heterogeneity (nugget effect) Local representativity Poor precision Geological Larger samplesMore samples
Broken rock (from rock chips to blastedmaterial and laboratory pulps)
Constitution Heterogeneity FSE Poor precision SamplingOptimised protocols
Larger samplesMore samples
Constitution and DistributionHeterogeneity GSE Poor precision Sampling Optimised protocols
More sample increments
Systematic (ISE) Poor quality samplingprotocols—sampling errors DE, EE, WE, PE and AE High bias Sampling
Optimised protocolsEfficient training
Strict QAQC

Minerals 2018, 8, 193 7 of 47
Preparation errors (PE) in the sampling context are non-selective operations without changeof mass, such as crushing, grinding, mixing, sample transfer, drying, etc. These issues are oftenignored during metallurgical sample preparation and testwork, though their effect can be marked.Typical errors include sample contamination, sample loss (e.g., due to sample spillage), moisture loss,and operator mistakes, such as mixing up sample labels. These errors can be eliminated using correctsampling equipment and practices. For example, care also needs to be taken to ensure that the finerparticles are not lost in crushers or mills or during sample division due to excessive air flow from dustextraction systems installed in sample preparation laboratories.
Table 4 shows the cause and effect of the sampling errors and provides some solutions. The ISEarise as a consequence of the physical interaction between the material being sampled and thetechnology employed to extract the sample. They result in bias, which can be reduced by the correctapplication of sampling methods, equipment and procedures.
3.4. Fundamental Sampling Error (FSE)
3.4.1. Background
The FSE results from grade heterogeneity of the broken lot [6,10]. Of all the sampling errors,the FSE does not cancel out and remains even after a sampling operation is perfect. Experience showsthat the total nugget effect can be high because sample masses are not optimal (e.g., the FSE is toohigh). The FSE can be estimated before material is sampled, provided certain characteristics aredetermined [6,10]. The FSE equation addresses key questions in respect of broken rock sample massand degree of crushing and grinding required.
3.4.2. Calibration of FSE Equation Inputs
The key parameter that requires determination is the gold liberation diameter—a particle sizeparameter [6,10,40]. For gold mineralisation, it can be defined as the screen size that allows 95% ofgold given a theoretical liberated lot to pass (d` or d95Au—[34,40]. If gold particles cluster, then d95Au
should be redefined as the cluster diameter—dAuClus [28,34]. Approaches to d95Au determinationrange from guesswork to the implementation of Heterogeneity Tests (HT) or Duplicate Series Analysis(DSA). The results of both HT and DSA can be used to calibrate the FSE equation—effectively definingd95Au through estimating the sampling constant K [6,10,41].
The value of K is dependent on the microscopic geostatistical properties of the minerals, and varieswith gold grade and liberation diameter. The higher the K value, the more challenging an ore type isto sample effectively. K values between 1000 and 5000 indicate some major sampling challenges thatare likely to require specialised protocols. Values >5000 indicate the need for specialised protocols andpotentially bulk sampling.
The HT is most commonly applied calibration method in the mining industry. The DSA approachis both complex and time consuming to apply, so relatively rare compared to the HT. The HT is proneto severe precision problems, particularly when coarse gold is present [12]. A further problem isthat it provides values for K only at the fragment size at which the calibration exercise is carried out(often 10 mm). It has been shown that in such cases the values for d` are far too low. In the presence ofcoarse gold, the HT approach may require samples of hundreds of kilogrammes in size. The methodmay not be a standard industry approach, since it is likely only to provide a correct value whenmineralisation is disseminated.
The authors recommend a holistic approach to characterisation which provides a range of outputsincluding [42–44]:
• Realisation of gold deportment, in particular the partitioning of gold as free gold, gold in sulphidesand refractory gold.
• Gold particle size curve(s), including effects of clustering and relationship between gold particlesize and grade (e.g., high grade versus background grade).

Minerals 2018, 8, 193 8 of 47
• Definition of key FSE equation inputs (e.g., d95Au versus dAuClus) and the sampling constant K.• Recommendations as to optimum in-situ sample mass requirements.
A direct approach to d95Au is recommended, which can include a combination of particlesize determination via detailed core logging and underground/surface rock observation, opticaland automated microscopy, X-ray tomography, and crush-screen-concentration [1,42,44–46].Characterisation studies allow the practitioner to set the sampling expectations across a numberof d95Au-grade scenarios. Where this requires specialist and potentially costly protocols, then it willbe possible to determine the level of risk involved in using more practical methods. In essence, a gapanalysis between the theoretical need and practical reality of sampling can be undertaken.
3.4.3. Applicability to Gold Ores
Some authors question the applicability of the FSE equation applied to gold; as with anymodel-based approach ultimate validation with reality is required. Controlling the FSE duringmetallurgical sampling and testwork is critical, since any sample splitting/size process will result inthe generation of an FSE. François-Bongarçon and Gy addressed key issues and proposed a modifiedequation [40]. The modified equation has been applied successfully by practitioners to optimisesampling campaigns. The use of the FSE equation represents an idealised expectation that may or maynot be attained in practice, but it provides a starting point from which protocols can be optimised.The standard approach optimising the sampling of gold ores is to apply the FSE equation to goldgrade. If there is a strong correlation between gold and sulphides (e.g., pyrite), then the pyrite FSEcan be modelled. Sulphides will require sulphur assays, potentially plus base metals depending uponmineralogy, to estimate their abundance.
3.5. Sample Representativity
3.5.1. Representative Sampling
A sample is representative when the analytical or testwork results are within acceptable levels ofbias and precision. For a primary sample to be representative, it should provide a realistic estimateof the parameter in question (e.g., grade, GRG, etc.). Precision (reproducibility) can be determinedfrom duplicate samples and resolved into the magnitude of sampling, preparation and analyticalerror components [14,47,48]. Sampler bias can be accessed via sampling proficiency testing [49] andanalytical bias can be determined from certified reference material results analysis [50,51].
In order for a sample to be deemed representative of the population from which it was extracted,it must contain similar relative proportions of all original constituent elements present in the population.In the case of gold, this implies that the sample should contain an identical grade to the original material,not only overall grade, but also on a size-by-size basis. Given gold’s relatively low abundance in mostmineralisation, this can be a difficult criterion to meet [1,34,52].
The 2013 Danish Horizontal Standard (DS3077) uses the relative sampling variability (RSV)metric to measure total sampling variability: the percentage coefficient of variation for repeat samplevalues [53]. The higher the RSV, the poorer the precision indicating that the sampling procedurerequires improvement. RSV measures the total empirical sampling variance influenced by theheterogeneity of the lot sampled under the current sampling procedure [53]. The RSV comprisesall stages of the sampling protocol and includes errors that are incurred by mass reduction as well asthe total analytical error. DS3077 applies the RSV at the 68% reliability, though it can be calculated atthe 90% and 95% reliabilities if required [53].
The accepted value of RSV is up to the practitioner and based upon the nature of the mineralisationin question, the data quality objectives and what is cost-effective and practical. The RSV for agiven sample support can be reduced through TOS and QAQC application [54]. In reality, the trulyrepresentative field sample probably does not exist, unless a bulk sample is collected and processed.Sub-samples taken from the original field sample should be representative and can be optimised using

Minerals 2018, 8, 193 9 of 47
the FSE equation [6,10]. Assays (measurements) undertaken in the laboratory to support testwork canalso be validated [13,50,55].
3.5.2. Fit for Purpose Samples
A sampling, testwork and assaying programme must produce data that are fit-for-purpose. In thiscontext, fit-for-purpose refers to the production of data that enables the practitioner to make technicallycorrect decisions [56]. In the mining context, results must be able to contribute to a Mineral Resourceand/or Ore Reserve and can be reported in accordance with The 2012 JORC Code [26] or other codes.
Development of sampling protocols in the context of TOS must be based on the specificmineralisation. This will need to consider sample density and number of samples, where for example,clustered samples or samples located from solely high-grade zones are unlikely to be fit-for-purposefor plant design. Sampling and sub-sampling should result in representative samples. A criticalinput is that of QAQC to maintain data quality through documented procedures, sample security,and monitoring of precision and bias. If a batch of samples is deemed to be representative and assayingcomplies with QA documentation and QC metrics, then it is fit-for-purpose.
3.5.3. Data Quality Objectives
The data quality objective (DQO) is the level of total error that the sampling value chain isdesigned to achieve (Table 1). It is quoted as a precision value reported at a given confidence limit,usually the 68%, 90% and 95% limits. The confidence limits can be defined as the “reliability”, where forexample 90% means that the testwork results will lie within the give precision 90 out of 100 times [57].
Pitard [34,58] states that the total relative error for resource and grade control sampling shouldnot be more than ±32%, with the FSE component not more than ±16%. In the mining context, FSE isgenerally reported at the 68% reliability. It is up to the practitioner as to which relative error andreliability to accept, but for metallurgical samples to achieve a minimum FSE of ±15% at 68% isoptimal. If mineralisation is highly heterogeneous, then ±20% at 68% may be a more practical target.For validation work (e.g., bulk sample or trial mining programmes), then a reliability of 68% or 90%and relative error ±5–15% can be applied.
All sampling errors are cumulative and contribute to the total, which in turn contributes to thesampling nugget effect. In reality, the FSE and GSE may contribute up to 90%, with DE, EE and AE upto 25% of the total [10]. Analytical (measurement) error generally accounts for between 1% and 13% ofthe relative error [48]. It is generally recognised that the total sampling value chain error is dominatedby the sampling process, which can be in the range of 15% to 60% [37,48,51].
3.5.4. Approaches to Sampling Optimisation
Early in the MVC (Table 5; Exploration-early evaluation) when minimal information is available onthe ore type(s) present, the application of the model-based FSE equation to evaluate sampling protocolsis required [6,10]. As a project develops, then duplicate samples permit an empirical approach to theestimation of uncertainty through the analysis of field, coarse and laboratory duplicates [21,47,48,59,60].
In practical terms, duplicate sampling during metallurgical programmes is rarely undertakenand often difficult at the field stage. Many metallurgical samples are composites from remaininghalf-core, therefore field duplicates are impossible. Coarse duplicates after crushing may be available,though in many cases the paucity of material available for testwork may preclude their use. Laboratorytest duplicates are the most likely to be available, particularly during assay of concentrates and tailssamples. Duplicates are an important part of the QAQC process (see Section 9) and can be planned forin a dedicated metallurgical programme.

Minerals 2018, 8, 193 10 of 47
Table 5. General MVC showing broad metallurgical-geometallurgical activities, inputs and outputs (after [11]).
Stage Strategic Geometallurgy Tactical Geometallurgy
Exploration-Early Evaluation Resource Definition Drilling Reserve Definition Drilling Feasibility Mining
Study Scoping (SS) Pre-feasibility (PFS) - Feasibility (FS) (Grade/ore control)(Expansion studies)
Resources/Reserves Inferred Mineral Resources Inferred and IndicatedMineral Resources
Mineral Resources andOre Reserves Mineral Resources and Ore Reserves Mineral Resources
and Ore Reserves
Key activity Develop orebody knowledge;Drilling and sampling
Develop orebody knowledge;Drilling and sampling;
Data analysis and modelling
Develop orebody knowledge;Drilling and sampling;
Data analysis and modelling
Develop orebody knowledge;Drilling and sampling;
Data analysis and modelling
Develop orebody knowledge;Drilling and sampling;
Data analysis and modelling
Inputs
Core logging;Develop proxy tests;
Mineralogy;Geochemistry;Met. testwork;
Physical testing
Core logging;Proxy tests;Mineralogy;
Geochemistry;Met. testwork;
Physical testing
Core logging;Proxy tests;Mineralogy;
Geochemistry;Met. testwork;
Physical testing
Core logging;Proxy tests;Mineralogy;
Geochemistry;Met. testwork, incl. pilot or trial plant testing;
Physical testing
Core logging;Proxy tests;Mineralogy;
Geochemistry;Met. testwork;
Physical testing
Outputs
Establish databasePrelim.; characteristics of
mineralisation;Geological model;Geoenvironmental
Expanded database;Geomet. domains;
Block model;Prelim. mine plan;Geomet. models;
Prelim. process design;Geoenvironmental
Expanded database
Expanded database;Geomet. domains;
Block model;Mine plan;
Geomet. models;Flow sheet;
Scenario analysis;Economic analysis
Expanded database;Geomet. domains;
Block model;Mine plan;
Geomet. models;Forecasts;
Reconciliation

Minerals 2018, 8, 193 11 of 47
4. Geometallurgy
A critical development over the past ten years is that of geometallurgy, essentially a life-of-mineoptimisation process [11,25]. Geometallurgy seeks to resolve grade, metallurgical and miningvariability based on information such as geochemistry, mineralogy, grade and lithology obtainedfrom spatially distributed samples or measurement points. Multiple spatially distributed small-scaletests are used as proxies for grade, mineralogy, process parameter and rock mass variability.
Geometallurgy can be conveniently sub-divided into two approaches: strategic and tactical [25].Strategic and tactical geometallurgy programmes can be described in terms of a logical process flowthat begins with planning and, importantly, ends with reconciliation to the plan. Key stages in theprocess flow are: planning, timeframe, team, drilling, testwork, data management, modelling, and inthe case of tactical geometallurgy, mining and processing [25]. The two clearly overlap, though differin timeframe. This two-fold approach to geometallurgy forms a systematic process that needs to beplanned and implemented in an integrated manner. Both strategic and tactical geometallurgy can beworked on by the same professionals, who can share data, methodologies and potentially models [25].
The pre-geometallurgical approach focussed on plant design through the testing of a number ofcomposite samples that are reported to be “representative” of the ore body [61]. Testwork is carriedout to determine factors such as grindability, floatability, leach recovery and/or other parameters.Subsequently, a process plant is constructed and commissioned and at some point, often within thefirst year of operation, found to be not performing to design. The common reason for this relates toinsufficient and unrepresentative samples and potentially inappropriate testwork. The traditionalapproach generally fails to represent the orebody and likely variability within [31,61]. Geometallurgyaims to resolve such variability, but still requires high-quality metallurgical testwork based onrepresentative samples.
Traditional metallurgical sampling and testwork are critical for plant design and are an inherentpart of geometallurgy [11,31,62]. In a geometallurgical study, multiple spatially distributed small-scaletests are used as proxies for grade, mineralogy, process parameter, etc. These will generally be validatedagainst traditional testwork results [63]. In the context of geometallurgical programmes, metallurgicalsampling and testwork are a critical input. Traditional testwork programmes yield hundreds of resultsat feasibility level, where a strategic geometallurgical programme will result in thousands of spatiallydistributed data points [64–66].
5. Project Studies
Three types of project studies are recognised within the mining industry: from a scoping studythrough pre-feasibility to a feasibility study. These studies describe investigations of increasing detail,which is supported by greater volumes of metallurgical sampling and testwork (Table 5). The leveland focus of metallurgical sampling and testwork changes from laboratory-dominated to pilot-scaletestwork (Table 6). Scoping testwork serves to support order-of-magnitude assessment. Pre-feasibilitytestwork should be sufficient to develop project design criteria, performance predictions and productanalyses. The feasibility testwork should be confirmatory in nature and should be carried out usingsamples representative of the final mine plan, with emphasis on the first five years of production.
Table 6. Recommended scale of metallurgical testwork for engineering studies (after [17]).
Type of Testwork Scoping Pre-Feasibility Feasibility
Laboratory/bench scale Yes Yes MaybeSmall/mini-pilot scale Maybe Yes Yes
Pilot scale No Maybe YesDemo/trial or full plant No Maybe Maybe

Minerals 2018, 8, 193 12 of 47
The need for, and type of, pilot scale testwork is a project by project decision. It will beaffected by factors such as the nature of the mineralisation (e.g., mineralogical complexity and/orheterogeneity), project size, availability of suitable sample material, process complexity and/or novelty,and requirements of finance providers.
6. Sampling for Metallurgical Testwork
6.1. Introduction
The context of sampling merits attention because metallurgical parameters are a function ofgeological factors such as grade, lithology, alteration, mineralogy, texture, spatial relationships andspecific gravity. It is essential to use this information in order to optimise the sampling strategy [17,31].Although limited sample sets were previously considered appropriate for metallurgical testwork,there is a realisation that as mineralogy and geology change throughout an orebody/domain, so dometallurgical characteristics. Samples should be both geologically and metallurgically representative.Mineralogical studies must be integrated with metallurgical testwork, as this is crucial in supportingprocess flow sheet design [67,68].
Metallurgical samples are required at all stages of the MVC, ranging from exploration, scoping,pre-feasibility and feasibility studies, and production (Table 5). The number of samples collected andtested can vary widely across different projects and stages. There is an expected increase in the numberof samples at the feasibility stage, plus the use of bulk sampling/trial mining programmes. Based onthe review of some 65 technical study reports, the number of samples is still relatively small, rangingfrom 0.07 to 2.8 samples per 100,000 t of resource. It is interesting to note that studies on relativelysmall deposits (e.g., <1 Mt) often bear a greater number of samples, ranging from 1.6 to 87 samplesper 100,000 t. It should be noted that composite samples are predominantly used, compared to singlesource variability samples.
Early stage integrated geological and metallurgical sampling and testing are required to checkfor issues such as refractory ores, deleterious elements, complex textures/mineralogy, etc. Samplesshould cover different geological domains within the orebody and their full spatial extent. As a projectadvances, geometallurgical domains will be identified. At the early evaluation stage, at least twosamples should be collected from each domain identified and where possible, samples should becollected in different grade zones within each domain. The total number of samples will continue toincrease with increasing spatial extent and ore variability, which depends upon the mineralisation typeand heterogeneity (nugget effect) within domain(s).
6.2. “Sampling for Sampling”—Characterisation for Sampling Programme Scoping and Development
At an early project stage, it is important to review mineralisation characteristics prior tometallurgical sampling programme design. In an existing project, enough information may beavailable to make this process relatively simple. Collaboration between geologists, geometallurgists,metallurgists, minerals engineers, mining engineers and environmental geoscientists is critical foreffective execution. At this stage and throughout the MVC, there is much information that can beshared between disciplines across grade distribution and ore/waste properties including alteration,mineralogy, texture, geochemistry and physical rock properties. Review of resource grade drilling ismost likely to provide a measure of mineralogical and textural variability. The training of geologists tothink metallurgy when logging core is critical [69].
In a new or relatively unknown project, a sampling-for-sampling programme is required toevaluate the nature of the mineralisation. This can initially be in the form of simple observationfollowed by testwork [70]. It is critical, even if visible gold is not observed in exposure or drill core, thata number of samples are collected and tested to check for coarse gold. Low-grade gold ores dominatedby fine-coarse gold, particularly if it clusters, can be particularly problematic to sample [71]. Simpleobservation may not always pick up the presence of or potential impact of coarse gold.

Minerals 2018, 8, 193 13 of 47
An important part of the sampling for sampling stage is the preliminary definition ofgeometallurgical recovery domains. This may require specialised tests to determine the presence ofrefractory gold [19,72] and preg-robbing potential [73]. This will be a long-term on-going process,but an early start in the MVC is advantageous. It is likely that different domains will have differentsampling characteristics and may require a unique protocol based on a stratified approach [74,75].
6.3. Metallurgical Sample Mass Requirements
6.3.1. Testwork Mass Requirements
From a metallurgical recovery perspective, sample sizes are principally dictated by the testworkrequirements [15,17]. Most fall into the broad categories of physical and hydrometallurgical treatment(Table 7). An individual sample is rarely collected for one test; rather a composite will be subjected to anumber of tests, both for recovery and comminution.
Table 7. Typical metallurgical recovery testwork and test mass required for project studies (modifiedfrom [17]). X: expected application; (X): potential application.
Type of Test Indicative MassType of Study
Scoping Pre-Feasibility Feasibility
Flotation
Rougher 1–2 kg X X XCleaner test (grind-grade recovery) 15 kg X X XLocked-cycle 15–25 kg - X XCircuit design (optimisation/variability) 100–500 kg - X XMini-pilot plant (Andrade et al., 2005) 200 kg (X) (X) (X)Pilot plant >10 t - (X) X
Physical Separation
Gravity (gravity recoverable gold: GRG) 25–150 kg X X XGravity (continuous gravity recovery: CGR) 25–100 kg X X XHeavy liquid 0.5 kg X X XMagnetic or electrostatic 50–100 kg X X XPilot plant 1–20 t - (X) X
Leaching
Bottle roll Up to 5 kg X X XDiagnostic leaching 1–2 kg X (X) (X)Batch agitation (CIL/CIP) 2–5 kg - (X) XSemi-continuous (CIL/CIP) 30–50 kg - - XSmall diameter columns 9 kg X X XIntermediate diameter columns 80 kg - X XLarge diameter columns 60 t - - X
6.3.2. Theoretical In-Situ Sample Mass Evaluation
The theoretical in-situ sample mass requirement for grade samples can be estimated by knowledgeof mineral particle size models. Metallurgical recovery functions such as GRG and leaching areprimarily controlled by gold particles which reflect grade. Thus a gold particle driven approach is areasonable tool for GRG or leaching sample mass estimation [76]. With discrete gold particles, use of aPoisson-based method provides an indication of the sample mass that may be required to yield a givenprecision [33,34,77,78]. Poisson distributions are suitable for modelling low-grade deposits containingdiscrete particles with the property of interest. For gold deposits with discrete gold, there is a highprobability of drawing non-gold particles. Hence, if a sample is too small, it will contain no gold.
The Poisson model is a limiting case of the Binomial model where the proportion (p) of the rarecomponent (e.g., gold) is very small, while the proportion of the material surrounding the gold (q) ispractically unity (where q = 1 − p). It can be applied to both liberated and non-liberated (i.e., in-situ)cases, since on the sample scale gold particles are rare events and can be considered as being discrete.

Minerals 2018, 8, 193 14 of 47
The method assumes a model (the equant grain model—[79]) where: (1) particles are free withno composite particles; (2) particles are either nuggets or gangue minerals; (3) nuggets have the samesize, shape and composition; (4) the gold occurs only in the nuggets; (5) a small number of nuggets arepresent in samples; and (6) a large number of gangue grains are present in the samples. The criticalassumptions are (3) and (5) above. Assumption (3) is unlikely to be true since the population will havevariable particle sizes and shapes. For Assumption (5), the larger nuggets will be rare, but the finebackground gold is likely to be more abundant and disseminated. The Poisson approach defines amaximum theoretical sample mass based on the largest gold nuggets present.
Sample mass is estimated at a given precision and generally reported at the 90% reliability.A precision of ±15–20% is acceptable, though this can be increased or reduced as appropriate.The precision defined at this stage is the target precision of the field sample; it does not includethe TOS errors. It is the optimum mass to overcome the in-situ nugget effect (Table 3).
The reliability can be reduced for highly heterogeneous mineralisation. For example, goldmineralisation at a mean grade of 3.5 g/t Au and a sampling liberation diameter of 1 mm, requires a250 kg theoretical sample mass to yield a precision of ±20% at 90% reliability. If the mineralisation isevaluated by PQ diamond core (wireline diamond drilling that yields approximately 15 kg/m of corebased on a 122.6 mm drill bit), then with a mean width of 2.5 m each intersection yields nominally37.5 kg of whole core sample. In this case, seven intersections will yield a total mass of 263 kg. Whilsteach individual sample may be locally unrepresentative, the seven spatially distributed samples willprovide a composite that is representative of that domain.
The theoretical sample mass required for GRG testwork in a low-grade (4–6 g/t Au) coarse-goldmineralisation was up to 3 t [71]. Actual sample masses of 50 kg undercalled the measured GRG,essentially negating the use of gravity recovery despite its proven applicability. Improved representativitywas gained with larger samples, where those over 250 kg provided a strong indication for GRG potential,but still understated reality. Only 3 t pilot and 16 t bulk samples provided the best GRG evaluation.Samples of 50 kg yielded an RSV of 155% for head grade. This reduced to 75% respectively for 250 kgsamples, and 30% for the 3 t samples [71].
In another case study, moderate- to high-grade mineralisation required a theoretical samplemass of 200 kg for high-grade core zone (21 g/t Au) mineralisation [37,80]. Whole diamond core(17 kg) and development bulk (140 t each) sampling was used to determine gold grade, and GRG andleach recovery parameters. Grade RSV values were 138% and 27% respectively for the core and bulksamples. Whilst the resource 17 kg 2 m whole-core composites were not individually representativeof the mineralisation, they permitted construction of grade and recovery block models, which weresubsequently validated by bulk sampling, trial mining and production.
6.3.3. Sampling Domains
The practitioner needs to review the optimum sample mass in the light of geometallurgicaldomains. In the simplest case oxide, transition and primary domains are likely to have differentsample mass requirements. More complex local domains may also exist, where different theoreticalsample masses are also required (Tables 8 and 9).
The example given in Table 8 shows a relative consistency of theoretical sample mass requirementsacross the three domains. The sample mass requirement per domain needs to take into account thewidth of the domain, and can be presented as the mass per unit width. In this case the mass per unitwidth varies from 52 to 150 kg/m.
In the second example (Table 9), both the theoretical mass and mass per unit width varyconsiderably from 5 to 620 kg and 3 kg/m to 1.2 t/m respectively. This marked difference reflects thenarrow coarse gold-bearing high-grade laminated vein domain which requires a large sample mass.
In previous examples (Tables 8 and 9), the mineralisation and local domain widths are relativelynarrow. Wider mineralisation domains may also require different theoretical sample masses (Table 10).

Minerals 2018, 8, 193 15 of 47
In this case, the vein-bearing skarn theoretical sample mass can be applied to both zones, which is apractical outcome particularly as the domains intermingle.
It is impractical to continuously change the sample mass collected across each domain, particularlyas they may vary in spatial location from being separated to intermingled. The sampling andcharacterisation of each domain would be a favourable outcome, though it may not be practical.Optimisation is best achieved using the expected underground stope width or open cut benchheight. Early in a project this may not be known, so a pragmatic approach is required. Within anydomain, there is also likely to be a d95Au-grade relationship indicating local variations in sample massrequirements [29]. Characterisation studies will allow sampling expectations to be set across a numberof d95Au-grade scenarios, thus allowing the worst case scenario to be applied via an achievable protocolacross the mineable width.
In the narrow vein examples (Tables 8 and 9), a diluted stope width variability sample mass of300 kg and 1 t was extracted from underground locations. Thirty-two and 16 samples were collectedrespectively from each example. In the massive skarn example (Table 10), samples were compositedacross 5 m wide zones. Whole PQ-core samples yielding 75–80 kg per 5 m were extracted via adedicated metallurgical variability drilling programme. Ten mineralisation width samples werecollected for each domain (e.g., vein-bearing and massive skarns). In the three cases (Tables 8–10),the testwork head grade RSV values are 45%, 52% and 49% respectively. These results are notunreasonable given the optimum mass estimate at ±20% plus all other errors constitute the RSV value.
The definition of geometallurgical sampling domains is an iterative process. Early in the MVCthere will be less information, and therefore less resolution of domains. As a project progresses throughpre-feasibility to feasibility, resolution will improve. The authors reiterate the importance of early stagecharacterisation and liaison with other technical disciplines.
6.4. Number of Samples
A commonly asked question early in a programme is how many (metallurgical) samples arerequired? The best response will be as many as are required to describe the variability. Once theproject has reached the scoping stage, sample number can potentially be investigated by variographyand TOS, with the aim of understanding the continuity of recovery response. Once the key drivers(e.g., sulphide mineral distribution) are understood, then additional samples and testwork can be usedto further resolve continuity for spatial modelling.
Too few metallurgical samples are typically related to poor liaison between geologists and mineralsengineers. Early planning is required to ensure that sufficient samples of the correct mass and spatialdistribution are available. The greater the budget allocated to early characterisation, the better therepresentativity will be and the less uncertainty later on.
Recommendations on the number of samples required are not simple. It is inappropriate to designa plant on one or two samples. At an early stage (e.g., Scoping), a given domain probably requires atleast two to three composites and variability samples, although further down the project developmentchain twenty or more may be required (Table 11).

Minerals 2018, 8, 193 16 of 47
Table 8. Example of sampling characteristics for mesothermal lode/sheeted vein mineralisation across local domains (after [54]).
Local Domain Type Characteristic Average Domain Width (m) Grade (g/t Au) d95Au (µm) Sampling Constant (K) (g/cm1.5) Theoretical Mass (90 ± 20%) (kg) Theoretical Mass perunit Length (kg/m)
HW Hangingwall Wallrock alteration withveinlets with visible gold 5 5.5 1100 12,800 340 68
CZ Core (lode) zone Composite laminatedvein with visible gold 2 19 1600 6500 300 150
FW Footwall Wallrock alteration withveinlets with visible gold 5 4 900 13,000 260 52
All - - 11.5 9.5 1400 10,600 400 35
DSW Diluted mine stope width 2.3 17.2 1500 6500 280 122
Table 9. Example of sampling characteristics for epithermal vein mineralisation across local domains.
Local Domain Type Characteristic Average Domain Width (m) Grade (g/t Au) d95Au (µm) Sampling Constant (K) (g/cm1.5) Theoretical Mass (90 ± 20%) Theoretical Mass perunit Length (kg/m)
HW Hangingwall Wallrock alteration withminor veining 1.5 4 50 170 10 kg 7
LV Laminated veinComposite laminatedvein with abundant
visible gold0.5 30 2500 8000 620 kg 1200
BV Brecciated vein Matrix-supported brecciavein with sulphides 1.5 10 250 760 10 kg 7
FW Footwall Wallrock alteration withminor veining 1.5 4 50 170 5 kg 3
All - - 5 8.5 2000 20,300 1.1 t 220
DSW Diluted mine stope width 2.3 13.6 2200 14,600 930 kg 404
Table 10. Example of sampling characteristics for massive skarn mineralisation across local domains.
Local Domain Type Characteristic Average Domain Width (m) Grade (g/t Au) d95Au (µm) Sampling Constant (K) (g/cm1.5) Theoretical Mass (90 ± 20%) (kg) Theoretical Mass perunit Length (kg/m)
VSK Vein skarnMSK with multiple veinsof quartz, calcite, epidoteand chlorite ±sulphides
15 5 1000 12,200 300 20
MSK Massive skarn Garnet, pyroxenite andwollastonite skarn 20 6.5 250 1200 10 0.5
Minerals 2018, 8, 193 17 of 47
Table 11. General recommendation for the number of metallurgical recovery samples (composite,variability and pilot/trial) for different project stages based on gold deposit heterogeneity. Numbers ofsamples per metallurgical type/domain. Any one composite may yield a number of tests dependingon sample mass and project need.
Project StageLow Heterogeneity High Heterogeneity
Composite Variability Pilot Composite Variability Pilot
Scoping 2–5 2–5 No 5–15 5–10 NoPre-feasibility 10 10 No 20 20 Maybe
Feasibility 10 10 Maybe 20 20 YesTotal at FS >25 >25 Maybe >50 >50 Yes
Heterogeneity plays a major part in determining the number of samples required. Whereheterogeneity (nugget effect) is high, a large number of samples will be required (Table 11).In many cases, a bulk sampling/trial mining programme to support pilot or test processing isrequired [54,77,81].
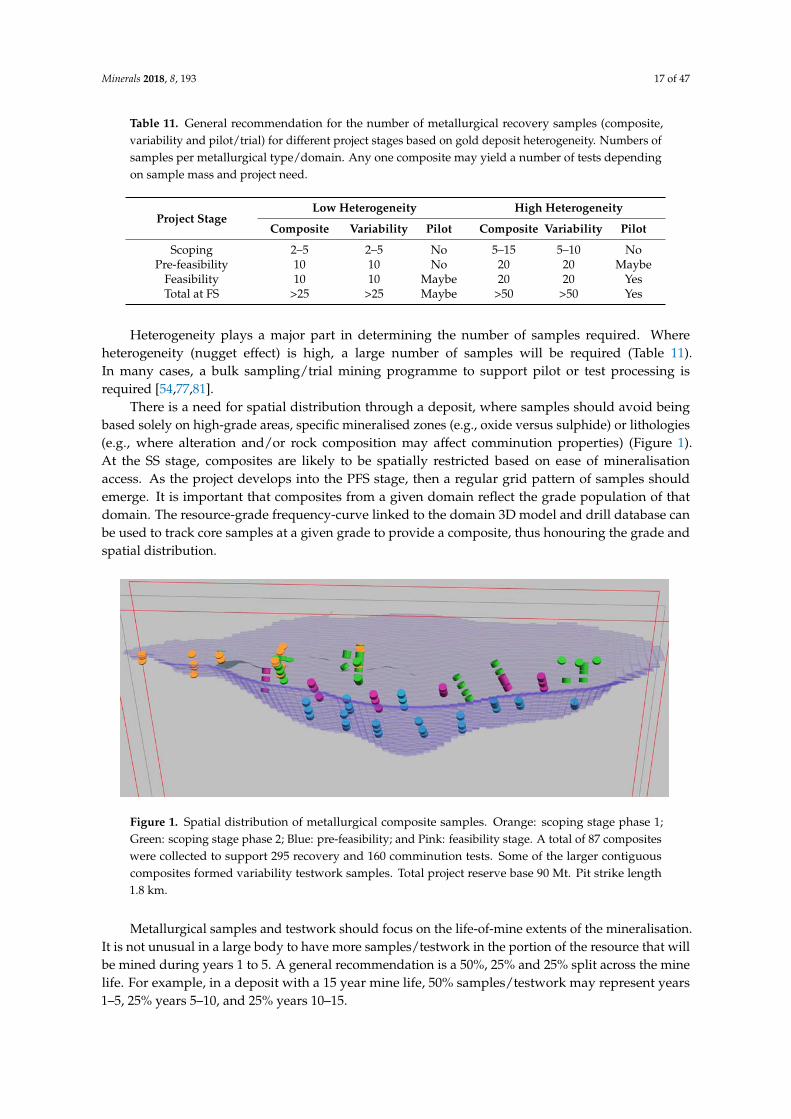
There is a need for spatial distribution through a deposit, where samples should avoid beingbased solely on high-grade areas, specific mineralised zones (e.g., oxide versus sulphide) or lithologies(e.g., where alteration and/or rock composition may affect comminution properties) (Figure 1).At the SS stage, composites are likely to be spatially restricted based on ease of mineralisationaccess. As the project develops into the PFS stage, then a regular grid pattern of samples shouldemerge. It is important that composites from a given domain reflect the grade population of thatdomain. The resource-grade frequency-curve linked to the domain 3D model and drill database canbe used to track core samples at a given grade to provide a composite, thus honouring the grade andspatial distribution.
Minerals 2018, 8, x FOR PEER REVIEW 17 of 46
Table 11. General recommendation for the number of metallurgical recovery samples (composite,
variability and pilot/trial) for different project stages based on gold deposit heterogeneity. Numbers
of samples per metallurgical type/domain. Any one composite may yield a number of tests depending
on sample mass and project need.
Project Stage Low Heterogeneity High Heterogeneity
Composite Variability Pilot Composite Variability Pilot
Scoping 2–5 2–5 No 5–15 5–10 No
Pre‐feasibility 10 10 No 20 20 Maybe
Feasibility 10 10 Maybe 20 20 Yes
Total at FS >25 >25 Maybe >50 >50 Yes
Heterogeneity plays a major part in determining the number of samples required. Where
heterogeneity (nugget effect) is high, a large number of samples will be required (Table 11). In many
cases, a bulk sampling/trial mining programme to support pilot or test processing is required
[54,77,81].
There is a need for spatial distribution through a deposit, where samples should avoid being
based solely on high‐grade areas, specific mineralised zones (e.g., oxide versus sulphide) or
lithologies (e.g., where alteration and/or rock composition may affect comminution properties)
(Figure 1). At the SS stage, composites are likely to be spatially restricted based on ease of
mineralisation access. As the project develops into the PFS stage, then a regular grid pattern of
samples should emerge. It is important that composites from a given domain reflect the grade
population of that domain. The resource‐grade frequency‐curve linked to the domain 3D model and
drill database can be used to track core samples at a given grade to provide a composite, thus
honouring the grade and spatial distribution.
Figure 1. Spatial distribution of metallurgical composite samples. Orange: scoping stage phase 1;
Green: scoping stage phase 2; Blue: pre‐feasibility; and Pink: feasibility stage. A total of 87 composites
were collected to support 295 recovery and 160 comminution tests. Some of the larger contiguous
composites formed variability testwork samples. Total project reserve base 90 Mt. Pit strike length 1.8
km.
Metallurgical samples and testwork should focus on the life‐of‐mine extents of the
mineralisation. It is not unusual in a large body to have more samples/testwork in the portion of the
resource that will be mined during years 1 to 5. A general recommendation is a 50%, 25% and 25%
split across the mine life. For example, in a deposit with a 15 year mine life, 50% samples/testwork
may represent years 1–5, 25% years 5–10, and 25% years 10–15.
Figure 1. Spatial distribution of metallurgical composite samples. Orange: scoping stage phase 1;Green: scoping stage phase 2; Blue: pre-feasibility; and Pink: feasibility stage. A total of 87 compositeswere collected to support 295 recovery and 160 comminution tests. Some of the larger contiguouscomposites formed variability testwork samples. Total project reserve base 90 Mt. Pit strike length1.8 km.
Metallurgical samples and testwork should focus on the life-of-mine extents of the mineralisation.It is not unusual in a large body to have more samples/testwork in the portion of the resource that willbe mined during years 1 to 5. A general recommendation is a 50%, 25% and 25% split across the minelife. For example, in a deposit with a 15 year mine life, 50% samples/testwork may represent years1–5, 25% years 5–10, and 25% years 10–15.

Minerals 2018, 8, 193 18 of 47
6.5. Sample Type and Collection
6.5.1. Composites versus Variability Samples
Metallurgical samples may be either: (i) composite; (ii) variability or (iii) variabilitycomposite samples:
• Composite samples should represent a given domain and comprise samples from differentintersections (e.g., drill holes) or locations (e.g., other sample types) in that domain.
• Variability samples will be individual samples taken across a zone and submitted separately toinvestigate variability within the domain. Where possible, variability samples are preferable asthey provide a measure of likely variability.
• Variability composite samples represent composites that are combined from samples with minimalspatial separation. As such they are composites, but reflect variability between localised areas.
Composites smooth variability and may hide the true picture of the orebody and potential plantfeed. There are warnings as to the compositing of so-called “average ore” composites, which canbe misleading and nothing like the orebody or domain in question [17]. It is critical to ensure thatcomposites take account of: deposit limits, mining sequence, ore type (geometallurgical domains)and dilution.
Sample lengths should represent the mineralisation as the mineable width. For wide orebodies(>5 m) with variable mineralogy, etc., composite or variability samples taken over the entire widthmay be misleading if the orebody will be selectively mined across strike, for example if the footwallzone only is extracted. Similarly in a large orebody that will be extracted by an open pit, there is littlepoint basing a composite on a 100 m intersection where the bench height will be 5 m. In this case aseries of intersections along the same horizon will best form the composite. One strategy is to collectvariability or variability composites on a domain basis, subject them to the required testwork, and thenaverage the results to form larger composites [82].
Fixed testwork masses may be generally appropriate for comminution testing, though notnecessarily for metallurgical recovery testwork which require the presence of the critical ore minerals(e.g., gold or gold-bearing sulphides in this discussion). Non-representative testwork samples(even if the collection and splitting process was optimal) may affect the results of all recoverymethods across flotation, physical separation and leaching. The effect can be particularly markedfor coarse gold-bearing (high-nugget) GRG testwork results [71]. In such cases, a preliminarycharacterisation stage is required to evaluate sampling needs. Representativity issues are also relevantto sulphide-hosted gold particles where the sulphides are patchy.
Where composites are collected, it is critical that (1) individual composites or (2) master compositeshonour the grade frequency distribution. In the case of individual composites, these may be collectedfrom a given domain as individual samples to represent grades across, for example: cut-off, low,run-of-mine (ROM) and high. These are generally formed by identifying core (whole or half) that haveassays close to the required grade. A number of different intersections will then be composited toyield a given mass at the required grade. For master composites, these will generally aim to achievea ROM grade and will comprise different intersections across the grade frequency distribution toachieve this aim. It is important to interrogate the grade frequency distribution from the original coreor block model to ensure that each grade range (e.g., decile) is proportionally represented within themaster composite. Given that the definition of composites is not always universal, it is critical that thepractitioner communicates exactly how composites have been formed and from where.
6.5.2. Sample Type
A number of different sample types are available to the minerals engineer for testwork, acrossdiamond core and reverse circulation drilling, linear samples and bulk samples (Tables 12 and 13).

Minerals 2018, 8, 193 19 of 47
Table 12. Characteristics of sample types (modified from [17]).
SampleCharacteristics
Type of Sample
Grab Linear Reverse Circulation(RC) Cuttings Small Core Large Core Bulk
Spatial coverage Poor Good Good Good Varies Poor
Mass of sample Low-good Low-good Low Moderate-high Good Best
Particle sizedistribution Poor Fair-good Poor Fair-good Good Good
Cost Low Low Moderate Moderatelyhigh High High-very high
Mass Up to 10 kgUp to 10 kg
100 s kg for panelsamples
Up to 60 kg/m 1.5–16 kg/m 49–90 kg/m >1 t
Table 13. Summary of sampling errors and related risk rating for different sample types. Errors arebest case scenarios, based on optimised sample collection; Red: high; Orange: moderate; Green: low(modified from [37]).
Minerals 2018, 8, x FOR PEER REVIEW 19 of 19
Table 12. Characteristics of sample types (modified from [17]).
Sample
Characteristics
Type of Sample
Grab Linear
Reverse
Circulation
(RC) Cuttings
Small Core Large Core Bulk
Spatial coverage Poor Good Good Good Varies Poor
Mass of sample Low‐good Low‐good Low Moderate‐high Good Best
Particle size
distribution Poor Fair‐good Poor Fair‐good Good Good
Cost Low Low Moderate Moderately high High High‐very high
Mass Up to 10 kg Up to 10 kg
100 s kg for panel samples Up to 60 kg/m 1.5–16 kg/m 49–90 kg/m >1 t
Table 13. Summary of sampling errors and related risk rating for different sample types. Errors are
best case scenarios, based on optimised sample collection; Red: high; Orange: moderate; Green: low
(modified from [37]).
Sample Type Summary Incorrect Sampling Errors Risk Rating for
Metallurgical Use DE EE WE
Linear (underground workings or surface pits and trenches)
Chip/chip‐channel
(hand cut)
Relatively easy to collect and fast
Moderately high number can be collected High
Channel
(hand cut)
Less easy to collect, requires effort
Moderately high number can be collected Moderate
Channel
(saw cut)
Requires effort and specialist equipment
Moderate number can be collected Low
Panel
Medium‐large sample size
Less easy to collect
Moderate number can be collected
Low
Broken rock (underground and surface rock piles)
Grab
Relatively easy to collect
Moderate number can be collected
Prone to very high FSE and GSE
High
Drilling
Diamond core Well established method
Good geological information Low
Large diamond
drill core
Well established method
Good geological information
Provides much larger sample mass per m drilled
Low
RC
FSE potentially moderate‐high when sub‐sample
split from original
Potential loss of fines
Fines generation during drilling problematic for
metallurgical purposes
Moderate
Sludge
FSE and GSE potentially very high when collecting
and/or splitting at the rig
Loss of fines and fines generation problematic for
metallurgical purposes
High
Bulk (underground or surface)
Bulk
Well established approach to gain large sample
mass from 1 t to 1000 s t
FSE and GSE potentially high if sub‐sampling
Careful planning required
Excellent geological and geotechnical information
Low
The sample types best suited to metallurgical testing are either HQ (wireline diamond drilling
that yields 63.5 mm diameter core to give approximately 8.7 kg/m of core) or PQ (wireline diamonddrilling that yields 85 mm diameter core to give approximately 15.6 kg/m of core) diameter diamonddrill core or underground/surface linear samples (Table 13). Large diamond drill core provides up to90 kg/m of sample for testwork (Figure 2) [17].

Minerals 2018, 8, 193 20 of 47
Minerals 2018, 8, x FOR PEER REVIEW 20 of 46
Figure 2. Eight‐inch (200 mm) large diameter diamond drill core (after [83]).
RC chips are rarely appropriate, given their relatively finely ground nature and strong risk of
mineral liberation leading to segregation errors. If RC samples are used for recovery tests, then
particular care should be taken when sub‐samples are extracted, otherwise the effects of the FSE and
GSE can be large. RC drilling generally produces between 30 and 50 kg/m of sample. In fine gold‐
dominated mineralisation, then a sub‐sample split of between 3 and 8 kg may be appropriate to
achieve an FSE of below ±20%. For coarse gold mineralisation the entire sample is likely to be
required, effectively reducing the FSE to zero as no sample mass reduction takes place (e.g., whole
core sampling and full sample assay by LeachWELL) [84]. If the rejects to be sampled have lain for a
while, then GSE will be material. Sub‐sampling must be via a riffle splitter, preferably a rotary sample
divider. Scooping from the top of the bag would be grab sampling (Table 13).
Rejects from any source (e.g., RC drilling, and laboratory coarse or pulp rejects) should be used
with care. Time may have led to deterioration such as oxidation, together with container integrity
and/or labelling issues. As with any broken rock material, the effects of FSE and GSE must be
considered during sample collection and sub‐sampling.
Rock face samples (e.g., panel samples; Figure 3) should be collected within the framework of
TOS to ensure minimal bias through reduced DE and EE. In particular fly rock from channel or panel
samples can result in both sample loss and contamination. Where underground workings or surface
trenches or pits are available, samples can be collected from walls and floors (Figure 3).
Figure 3. Collection of metallurgical sample via underground panel sampling.
Figure 2. Eight-inch (200 mm) large diameter diamond drill core (after [83]).
RC chips are rarely appropriate, given their relatively finely ground nature and strong riskof mineral liberation leading to segregation errors. If RC samples are used for recovery tests,then particular care should be taken when sub-samples are extracted, otherwise the effects of the FSEand GSE can be large. RC drilling generally produces between 30 and 50 kg/m of sample. In finegold-dominated mineralisation, then a sub-sample split of between 3 and 8 kg may be appropriateto achieve an FSE of below ±20%. For coarse gold mineralisation the entire sample is likely to berequired, effectively reducing the FSE to zero as no sample mass reduction takes place (e.g., wholecore sampling and full sample assay by LeachWELL) [84]. If the rejects to be sampled have lain for awhile, then GSE will be material. Sub-sampling must be via a riffle splitter, preferably a rotary sampledivider. Scooping from the top of the bag would be grab sampling (Table 13).
Rejects from any source (e.g., RC drilling, and laboratory coarse or pulp rejects) should be usedwith care. Time may have led to deterioration such as oxidation, together with container integrityand/or labelling issues. As with any broken rock material, the effects of FSE and GSE must beconsidered during sample collection and sub-sampling.
Rock face samples (e.g., panel samples; Figure 3) should be collected within the framework ofTOS to ensure minimal bias through reduced DE and EE. In particular fly rock from channel or panelsamples can result in both sample loss and contamination. Where underground workings or surfacetrenches or pits are available, samples can be collected from walls and floors (Figure 3).
Minerals 2018, 8, x FOR PEER REVIEW 20 of 46
Figure 2. Eight‐inch (200 mm) large diameter diamond drill core (after [83]).
RC chips are rarely appropriate, given their relatively finely ground nature and strong risk of
mineral liberation leading to segregation errors. If RC samples are used for recovery tests, then
particular care should be taken when sub‐samples are extracted, otherwise the effects of the FSE and
GSE can be large. RC drilling generally produces between 30 and 50 kg/m of sample. In fine gold‐
dominated mineralisation, then a sub‐sample split of between 3 and 8 kg may be appropriate to
achieve an FSE of below ±20%. For coarse gold mineralisation the entire sample is likely to be
required, effectively reducing the FSE to zero as no sample mass reduction takes place (e.g., whole
core sampling and full sample assay by LeachWELL) [84]. If the rejects to be sampled have lain for a
while, then GSE will be material. Sub‐sampling must be via a riffle splitter, preferably a rotary sample
divider. Scooping from the top of the bag would be grab sampling (Table 13).
Rejects from any source (e.g., RC drilling, and laboratory coarse or pulp rejects) should be used
with care. Time may have led to deterioration such as oxidation, together with container integrity
and/or labelling issues. As with any broken rock material, the effects of FSE and GSE must be
considered during sample collection and sub‐sampling.
Rock face samples (e.g., panel samples; Figure 3) should be collected within the framework of
TOS to ensure minimal bias through reduced DE and EE. In particular fly rock from channel or panel
samples can result in both sample loss and contamination. Where underground workings or surface
trenches or pits are available, samples can be collected from walls and floors (Figure 3).
Figure 3. Collection of metallurgical sample via underground panel sampling. Figure 3. Collection of metallurgical sample via underground panel sampling.

Minerals 2018, 8, 193 21 of 47
6.5.3. Core Sample Collection
The best quality metallurgical samples generally come from recently drilled diamond-drill corerelated to resource development programmes. The traditional paradigm sees geologists take half-coreand submit it to a laboratory for assay. The other half is retained for reference. It is this remaininghalf-core that is generally available for metallurgical studies. The industry norm is to cut the half-coreinto two quarters, retain one and use the other for metallurgical compositing (Figure 4).
An alternate solution is to leave a so-called fillet, which is a segment of core that is retained as ageological sample. The remaining core is then cut in half to provide an original sample and a duplicate.Designing a core-cutting template will automate this procedure in a safe way. It is recommended thatat least 70% of the core, the original plus duplicate, is submitted for testwork and/or assaying leaving30% as the reference filet. In the case of PQ core for example, the filet would represent approximately4.5 kg/m of core.
Minerals 2018, 8, x FOR PEER REVIEW 21 of 46
6.5.3. Core Sample Collection
The best quality metallurgical samples generally come from recently drilled diamond‐drill core
related to resource development programmes. The traditional paradigm sees geologists take half‐
core and submit it to a laboratory for assay. The other half is retained for reference. It is this remaining
half‐core that is generally available for metallurgical studies. The industry norm is to cut the half‐
core into two quarters, retain one and use the other for metallurgical compositing (Figure 4).
An alternate solution is to leave a so‐called fillet, which is a segment of core that is retained as a
geological sample. The remaining core is then cut in half to provide an original sample and a
duplicate. Designing a core‐cutting template will automate this procedure in a safe way. It is
recommended that at least 70% of the core, the original plus duplicate, is submitted for testwork
and/or assaying leaving 30% as the reference filet. In the case of PQ core for example, the filet would
represent approximately 4.5 kg/m of core.
Figure 4. (Left): Half NQ2 core prior to quarter cutting for testwork. NQ2 is a standard wireline
diamond drill type, where the core diameter is 50.6 mm to yield approximately 5.5 kg/m for whole
core; (Right): Quarter cut core bagged prior to transportation to the laboratory. This intersection was
combined with another to form a 50 kg composite sample for GRG testwork.
Core should be re‐logged, with emphasis on ore and waste mineralogy, and detail of mineral
grain size and shape, associations and textures. The usual geological features such as rock type,
alteration and structure should be recorded or re‐checked from the original log. It is good practice to
liaise with geologists to embed geometallurgical observations into routine logging.
The sample collection process is of concern, given that this stage can impart substantial errors
into the sampling programme. A major issue with core is that of total core recovery and quality [85].
From a sampling perspective, perfect core drilling shows low DE and EE. However, due to poor
ground conditions and/or poor drilling control, EE may be high as seen in poor core recovery (e.g.,
core fragmentation and/or material loss) [85]. In such a case, metallurgical test work, either
comminution or recovery tests must be interpreted with caution or preferably avoided. If a sample
must be taken from a poor recovery zone—this is not recommended—the only option is to take all
core for testing. As an alternate option, all the core can be collected, crushed to around P90 > 2–4 mm
and split in half, with one half retained and the other taken for testwork. In this case, the crush/split
error must be reviewed, as the FSE value could range from acceptable (below ±15%) to above ±150%.
Additional bias during diamond drilling is related to the plucking of gold particles from the core
surface as a result of the drilling process. This is not a consistent issue, but is known to occur and
leads to a negative grade bias—in effect EE. Core sawing can also lead to gold loss in the cuttings
[7,84]. A metre of NQ core can yield up to 200 g of cuttings, assuming a 3 mm blade. NQ is a standard
wireline diamond drill type, where the core diameter is 48 mm to yield approximately 5 kg/m for
whole core. Whilst not necessarily a consistent issue, it can lead to gold loss and sometimes loss of
the only gold in the core (i.e., cuttings return a gold grade, whereas the two halves return none). To
Figure 4. (Left): Half NQ2 core prior to quarter cutting for testwork. NQ2 is a standard wirelinediamond drill type, where the core diameter is 50.6 mm to yield approximately 5.5 kg/m for wholecore; (Right): Quarter cut core bagged prior to transportation to the laboratory. This intersection wascombined with another to form a 50 kg composite sample for GRG testwork.
Core should be re-logged, with emphasis on ore and waste mineralogy, and detail of mineral grainsize and shape, associations and textures. The usual geological features such as rock type, alterationand structure should be recorded or re-checked from the original log. It is good practice to liaise withgeologists to embed geometallurgical observations into routine logging.
The sample collection process is of concern, given that this stage can impart substantial errorsinto the sampling programme. A major issue with core is that of total core recovery and quality [85].From a sampling perspective, perfect core drilling shows low DE and EE. However, due to poorground conditions and/or poor drilling control, EE may be high as seen in poor core recovery(e.g., core fragmentation and/or material loss) [85]. In such a case, metallurgical test work, eithercomminution or recovery tests must be interpreted with caution or preferably avoided. If a samplemust be taken from a poor recovery zone—this is not recommended—the only option is to take allcore for testing. As an alternate option, all the core can be collected, crushed to around P90 > 2–4 mmand split in half, with one half retained and the other taken for testwork. In this case, the crush/spliterror must be reviewed, as the FSE value could range from acceptable (below ±15%) to above ±150%.
Additional bias during diamond drilling is related to the plucking of gold particles from the coresurface as a result of the drilling process. This is not a consistent issue, but is known to occur and leadsto a negative grade bias—in effect EE. Core sawing can also lead to gold loss in the cuttings [7,84].A metre of NQ core can yield up to 200 g of cuttings, assuming a 3 mm blade. NQ is a standard wirelinediamond drill type, where the core diameter is 48 mm to yield approximately 5 kg/m for whole core.Whilst not necessarily a consistent issue, it can lead to gold loss and sometimes loss of the only gold in

Minerals 2018, 8, 193 22 of 47
the core (i.e., cuttings return a gold grade, whereas the two halves return none). To achieve minimalsampling error and reduce the nugget effect, the taking of whole core samples is an option.
An alternate approach to the half or quarter-core paradigm is to integrate metallurgical testworkwith resource grade determination. This option involves taking half or whole core samples andprocessing the entire sample by, for example, the single-stage GRG test [18], large-scale screen fireassay and/or bulk leaching.
Dominy et al. [37,80] applied whole HQ 2-m composites (approximately 17 kg samples) to acoarse gold orebody. A single-stage GRG test with tails leach (and some flotation testwork) was usedto provide data for GRG and tails leach recovery, and head grade. The data was applied to a resourcemodel reported in accordance with The 2012 JORC Code.
6.5.4. Sample Integrity and Chain of Custody
For sulphide-rich mineralisation such as some lode-gold styles and massive sulphide deposits,oxidation can be a major issue. Samples will need to be purged with nitrogen and sealed in plastic bags,or stored in freezers. Hydrocarbon contaminants (e.g., oil, grease, drilling muds and surfactants) canalso be an issue that leads to depressed flotation responses or preg-robbing during leaching. This canbe minimised by good drilling practice, including effective housekeeping to remove oil/grease andwashing the core immediately to remove any drilling chemicals.
Chain of custody procedures must provide a documented, legally defensible record of the custodyof samples from collection through analysis [86]. A sample is considered to be in custody if it meets atleast one of the following conditions, where the sample is: in someone’s physical possession or view,secured to prevent tampering or secured in an area restricted to authorised personnel.
Chain of custody may be defined as “an unbroken trail of accountability that ensures the physicalsecurity of samples, data, and records”. This definition relates to secure traceability. Complianceimplies that it should be known and documented who has custody of a sample(s) at any moment.As long as this principal is followed, the chain of custody concept is respected.
The greatest risk of sample tampering is during collection and bagging, prior to sealing of thesample bag(s). Similarly, at the laboratory once a bag seal is broken there is some risk. At collection,samples should bagged, tagged and sealed as soon as is possible and preferably in the presence of anindependent observer (Figure 5). Once sealed, samples must be stored in a restricted access and securecompound prior to transportation.
Minerals 2018, 8, x FOR PEER REVIEW 22 of 46
achieve minimal sampling error and reduce the nugget effect, the taking of whole core samples is an
option.
An alternate approach to the half or quarter‐core paradigm is to integrate metallurgical testwork
with resource grade determination. This option involves taking half or whole core samples and
processing the entire sample by, for example, the single‐stage GRG test [18], large‐scale screen fire
assay and/or bulk leaching.
Dominy et al. [37,80] applied whole HQ 2‐m composites (approximately 17 kg samples) to a
coarse gold orebody. A single‐stage GRG test with tails leach (and some flotation testwork) was used
to provide data for GRG and tails leach recovery, and head grade. The data was applied to a resource
model reported in accordance with The 2012 JORC Code.
6.5.4. Sample Integrity and Chain of Custody
For sulphide‐rich mineralisation such as some lode‐gold styles and massive sulphide deposits,
oxidation can be a major issue. Samples will need to be purged with nitrogen and sealed in plastic
bags, or stored in freezers. Hydrocarbon contaminants (e.g., oil, grease, drilling muds and
surfactants) can also be an issue that leads to depressed flotation responses or preg‐robbing during
leaching. This can be minimised by good drilling practice, including effective housekeeping to
remove oil/grease and washing the core immediately to remove any drilling chemicals.
Chain of custody procedures must provide a documented, legally defensible record of the
custody of samples from collection through analysis [86]. A sample is considered to be in custody if
it meets at least one of the following conditions, where the sample is: in someone’s physical
possession or view, secured to prevent tampering or secured in an area restricted to authorised
personnel.
Chain of custody may be defined as “an unbroken trail of accountability that ensures the
physical security of samples, data, and records”. This definition relates to secure traceability.
Compliance implies that it should be known and documented who has custody of a sample(s) at any
moment. As long as this principal is followed, the chain of custody concept is respected.
The greatest risk of sample tampering is during collection and bagging, prior to sealing of the
sample bag(s). Similarly, at the laboratory once a bag seal is broken there is some risk. At collection,
samples should bagged, tagged and sealed as soon as is possible and preferably in the presence of an
independent observer (Figure 5). Once sealed, samples must be stored in a restricted access and
secure compound prior to transportation.
(a) (b)
Figure 5. Cont.

Minerals 2018, 8, 193 23 of 47
Minerals 2018, 8, x FOR PEER REVIEW 23 of 46
(c) (d)
Figure 5. (a) Plastic buckets (25 kg capacity), (b) metal core trays, (c) 205 litre drums (250–350 kg
capacity) and (d) plastic sample bag sealed to prevent spillage and tampering.
The secure handling of samples during transport to the laboratory is important and can be aided
by the use of sealable containers (Figures 5 and 6).
Figure 6. Bagged and sealed metallurgical samples packed for road transport to prevent spillage and
tampering.
An important consideration during testwork is that of security, which includes samples, rejects
and concentrates, most importantly the security of any liberated gold, where accidental or intentional
loss constitutes a PE. Concentrate streams should be monitored 24/7 and concentrates stored in a
secure and restricted area.
7. Sample Preparation, Testwork and Assaying
7.1. Overview
Beyond the actual testwork itself, a frequently forgotten aspect of metallurgical testwork is the
associated preparation, sub‐sampling and assaying of feed, head, concentrate and tails samples.
Laboratory activities include, weighing, drying, fragment size reduction (crushing and grinding),
sample mass reduction, sample blending and assaying.
7.2. Drying and Weighing
The dry and weighing stages are relatively simple operations, though can impart sampling
errors. The optimal drying temperature is 100 °C ± 10 °C, where it is important to check whether some
sulphide‐rich ores are reactive and heating results in oxidation. Care should be taken to avoid dust
Figure 5. (a) Plastic buckets (25 kg capacity), (b) metal core trays, (c) 205 litre drums (250–350 kgcapacity) and (d) plastic sample bag sealed to prevent spillage and tampering.
The secure handling of samples during transport to the laboratory is important and can be aidedby the use of sealable containers (Figures 5 and 6).
Minerals 2018, 8, x FOR PEER REVIEW 23 of 46
(c) (d)
Figure 5. (a) Plastic buckets (25 kg capacity), (b) metal core trays, (c) 205 litre drums (250–350 kg
capacity) and (d) plastic sample bag sealed to prevent spillage and tampering.
The secure handling of samples during transport to the laboratory is important and can be aided
by the use of sealable containers (Figures 5 and 6).
Figure 6. Bagged and sealed metallurgical samples packed for road transport to prevent spillage and
tampering.
An important consideration during testwork is that of security, which includes samples, rejects
and concentrates, most importantly the security of any liberated gold, where accidental or intentional
loss constitutes a PE. Concentrate streams should be monitored 24/7 and concentrates stored in a
secure and restricted area.
7. Sample Preparation, Testwork and Assaying
7.1. Overview
Beyond the actual testwork itself, a frequently forgotten aspect of metallurgical testwork is the
associated preparation, sub‐sampling and assaying of feed, head, concentrate and tails samples.
Laboratory activities include, weighing, drying, fragment size reduction (crushing and grinding),
sample mass reduction, sample blending and assaying.
7.2. Drying and Weighing
The dry and weighing stages are relatively simple operations, though can impart sampling
errors. The optimal drying temperature is 100 °C ± 10 °C, where it is important to check whether some
sulphide‐rich ores are reactive and heating results in oxidation. Care should be taken to avoid dust
Figure 6. Bagged and sealed metallurgical samples packed for road transport to prevent spillageand tampering.
An important consideration during testwork is that of security, which includes samples, rejectsand concentrates, most importantly the security of any liberated gold, where accidental or intentionalloss constitutes a PE. Concentrate streams should be monitored 24/7 and concentrates stored in asecure and restricted area.
7. Sample Preparation, Testwork and Assaying
7.1. Overview
Beyond the actual testwork itself, a frequently forgotten aspect of metallurgical testwork isthe associated preparation, sub-sampling and assaying of feed, head, concentrate and tails samples.Laboratory activities include, weighing, drying, fragment size reduction (crushing and grinding),sample mass reduction, sample blending and assaying.

Minerals 2018, 8, 193 24 of 47
7.2. Drying and Weighing
The dry and weighing stages are relatively simple operations, though can impart sampling errors.The optimal drying temperature is 100 ◦C ± 10 ◦C, where it is important to check whether somesulphide-rich ores are reactive and heating results in oxidation. Care should be taken to avoid dustand contamination during drying. As a sample(s) progresses to dryness, opening the dryer door orhandling the sample may cause dust release. All weighing devices must be calibrated on a regularbasis as recommended by the unit manufacturer. It is important to ensure that all samples in the dryerare properly labelled to ensure trays or vessels are not mixed-up.
7.3. Sample Mass and Size Reduction
Mass reduction entails making the sample mass smaller, but should preserve the size distributionof the sample. Size reduction entails preserving the mass of the sample, but reducing the sizedistribution in order to generate more particles. Mass reduction is necessary for assaying purposessince the laboratory is unlikely to be able to assay many kilogrammes of sample. Size reduction isnecessary to preserve the assayed grade: by reducing the size distribution, more gold particles becomeliberated from each other, which in theory increases the probability of representative sub-sampling [8].This becomes a significant problem, as coarse gold becomes progressively liberated it does notcomminute effectively because of its malleability. As noted previously, in this case then whole sampleassaying is likely to be required.
Core or broken rock samples can be submitted directly to the metallurgical laboratory. Assumingthat an appropriate mass is available, after drying they can pass directly to crushing and testwork.In this case it is assumed that no sample splitting is required.
If a sample requires crushing and sub-sampling for other or duplicate tests (e.g., a head gradeassay) then care is required. Crushing and particularly splitting invokes a number of samplingerrors [13]. Both the FSE and GSE will have a material impact on splitting unless it is done effectively.The entire sample should be crushed to a size that minimises the liberation of gold, potentially betweena P80 of 0.5 cm to 1.5 cm. If gold is coarse and the grade relatively low, splitting at a coarse crush maylead to a high FSE. In this case, FSE calculations will indicate the need for a finer crush (e.g., a fewmm), thus potentially liberating gold and/or sulphides prior to testing. Compromise will be requiredwith respect of sample mass and crush size. If gold is liberated during crushing and/or grinding, thena rotary sample splitter should be used (Figure 7).
Minerals 2018, 8, x FOR PEER REVIEW 24 of 46
and contamination during drying. As a sample(s) progresses to dryness, opening the dryer door or
handling the sample may cause dust release. All weighing devices must be calibrated on a regular
basis as recommended by the unit manufacturer. It is important to ensure that all samples in the dryer
are properly labelled to ensure trays or vessels are not mixed‐up.
7.3. Sample Mass and Size Reduction
Mass reduction entails making the sample mass smaller, but should preserve the size
distribution of the sample. Size reduction entails preserving the mass of the sample, but reducing the
size distribution in order to generate more particles. Mass reduction is necessary for assaying
purposes since the laboratory is unlikely to be able to assay many kilogrammes of sample. Size
reduction is necessary to preserve the assayed grade: by reducing the size distribution, more gold
particles become liberated from each other, which in theory increases the probability of
representative sub‐sampling [8]. This becomes a significant problem, as coarse gold becomes
progressively liberated it does not comminute effectively because of its malleability. As noted
previously, in this case then whole sample assaying is likely to be required.
Core or broken rock samples can be submitted directly to the metallurgical laboratory.
Assuming that an appropriate mass is available, after drying they can pass directly to crushing and
testwork. In this case it is assumed that no sample splitting is required.
If a sample requires crushing and sub‐sampling for other or duplicate tests (e.g., a head grade
assay) then care is required. Crushing and particularly splitting invokes a number of sampling errors
[13]. Both the FSE and GSE will have a material impact on splitting unless it is done effectively. The
entire sample should be crushed to a size that minimises the liberation of gold, potentially between
a P80 of 0.5 cm to 1.5 cm. If gold is coarse and the grade relatively low, splitting at a coarse crush may
lead to a high FSE. In this case, FSE calculations will indicate the need for a finer crush (e.g., a few
mm), thus potentially liberating gold and/or sulphides prior to testing. Compromise will be required
with respect of sample mass and crush size. If gold is liberated during crushing and/or grinding, then
a rotary sample splitter should be used (Figure 7).
Figure 7. Laboratory rotary sample divider.
In some cases a reference sample will be split from the primary sample to facilitate additional or
check testwork. However, it is important to ensure that the reference sub‐sample is representative or
it becomes a pointless exercise. Similarly a head sample is often taken to facilitate a head assay
determination. Again, it is important to ensure that the head sample is representative or it also
becomes a pointless exercise. When the sub‐sample is taken, the FSE of the split can be calculated via
the FSE equation, but also the FSE of the primary sample less the remaining sample (e.g., mass of
primary less the head/reference sample).
Figure 7. Laboratory rotary sample divider.

Minerals 2018, 8, 193 25 of 47
In some cases a reference sample will be split from the primary sample to facilitate additionalor check testwork. However, it is important to ensure that the reference sub-sample is representativeor it becomes a pointless exercise. Similarly a head sample is often taken to facilitate a head assaydetermination. Again, it is important to ensure that the head sample is representative or it also becomesa pointless exercise. When the sub-sample is taken, the FSE of the split can be calculated via the FSEequation, but also the FSE of the primary sample less the remaining sample (e.g., mass of primary lessthe head/reference sample).
Sample splitting methods such as fractional shovelling, alternate shovelling and coning andquartering are considered outdated and prone to high bias [13]. Both may impart RSV values of 20% ormore (key errors: FSE, GSE, DE, EE and PE). However, if the actual sub-sample is selected at randomthen the often overwhelming effect of the DE is reduced [10]. The rotary sample splitter has beendemonstrated to show relative error values down to 0.5% and riffle splitters around 3% [13].
7.4. Sample Blending
Samples may be delivered to the laboratory as separate parts of a single composite. In such acase the various parts need to be blended together. If the entire composite is taken for a given testand not split, then blending of the individual samples is not an issue. However, if the composite issubsequently going to be sub-sampled, then a blending process is required. A traditional approachmay be to feed alternate core pieces from each sample through the crusher, thus providing a blendedproduct. A better option is to crush each sample and then feed them alternately through a rotarysample splitter (Figure 8). It should be remembered that all sample handling in the laboratory posesrisk of both loss (EE) and contamination (PE).
Minerals 2018, 8, x FOR PEER REVIEW 30 of 46
Planning of blasting in relation to stope width (underground) or bench height (surface pits) and
minimising of dilution to match that which is likely during mining (e.g., DE reduction).
Avoidance of over‐blasting that results in the excessive liberation and loss of gold and/or gold‐
bearing sulphides (e.g., EE).
Mucking of blasted material, in particular fines, with the potential use of vacuum devices to
ensure maximum recovery (e.g., EE reduction).
Management system, involving tagging and chain of custody actions, to ensure that bulk sample
mucked material is kept separate from other broken rock and trucked to the required stockpile
or bulk transport bag.
Figure 8. The collection of surface (Left) or underground bulk samples must be undertaken with care
to ensure full sample extraction, transport and storage (Right) prior to processing.
10.3. Sample Processing
Sample lot processing options range from the full lot to a sub‐sample from the lot (Table 15).
Option (1) provides the most defendable results given that, assuming rigorous design and operation,
all material is processed and actual gold grade and recovery determined. Option (2) is likely to result
in Option (1), providing that all individual lots are processed. The processing of selected lots of may
lead to a high FSE from the lot. Option (3) may be problematic on a lot‐by‐lot basis, unless the sub‐
sampling protocol is rigorously defined (e.g., FSE and all other errors optimised). The decision of
whether to use a plant or sample splitting tower is related to a number of issues which includes
programme aims, availability, cost, minimisation of sampling errors, and nature of the
mineralisation.
Table 15. Bulk sample/trial mining material processing options.
Lot/Process Option Laboratory Bench Pilot Plant Demo/Full Plant
Whole lot ‐ (1) (1)
Lot batch ‐ (2) (2)
Lot sub‐sample (3) (3) ‐
Pilot/demo programmes also require a QAQC system to be put in place. The scale of samples
makes the use of CRMs impossible, but blanks may be passed through the circuit. In addition, all
associated assays can be subjected to normal QAQC procedures. In the case of bulk samples, field
duplicates can be taken and coarse duplicates after crushing.
10.4. Limitations
Whilst bulk sampling/trial mining programmes are important, they are not necessarily the
panacea of metallurgical or grade evaluation. It is possible, for example, that a bulk lot may represent
Figure 8. The collection of surface (Left) or underground bulk samples must be undertaken with careto ensure full sample extraction, transport and storage (Right) prior to processing.
Samples can be fed individually into the rotary sample splitter or in an interleaved fashion therebyenabling blending. To maximise the blending effect of the rotary sample splitter, the composite sampleshould be fed at least twice through the rotary sample splitter, before forming the two or more requiredsplits. This process effects blending and minimises the GSE.
The sample blending process is time consuming and labour intensive. A more efficient option isreported in Whittaker [87], where the time to blend 200 kg of broken core is reduced from five daysto around three hours. The process involves two-stage crushing (jaw and Boyd crushers) of brokencore to −1.7 mm. The product is then screened, with the oversize re-crushed and the fines stored inbarrels. On completion of crushing, the material is fed to a 150 kg or 1 t capacity conical screw mixerfor blending, and then passed to a rotary sample splitter for splitting.

Minerals 2018, 8, 193 26 of 47
7.5. Testwork
Testwork imparts sampling errors, particularly through loss (EE) and contamination (PE),poor equipment operation (AE) and careless work practices (PE and AE). Key needs relate to:ensuring equipment maintenance and calibration, optimal equipment operating parameters to ensurereproducibility between samples, cleaning of all equipment and associated pipework, pumps, etc.between samples and avoidance of careless work practice covering equipment usage, sample mix-upsand general bad and/or unsafe and inefficient practice (Table 1).
7.6. Tailings Sampling
Metallurgical recovery tests generally produce tailings (residues) which require an assay(s) topermit head grade and recovery reconciliation. In most cases, tails are fine-grained (generally, 1 mm)and of a low grade that allow a sample to be taken easily. Best practice should see the use of a rifflesplitter or preferably a rotary sample splitter to ensure an effective sub-sample for assay. Scooping orgrab sampling from bags or buckets should be avoided. For any ore type, consideration should be givento the tailings based on ore characteristics. For example, in some coarse gold ores, relatively-rare butcoarse influential particles may get into the tails stream and require larger samples to be representative.
7.7. Assay Sub-Sample Preparation and Assaying
Once a head, concentrate or tails sub-sample has been delivered to the assay laboratory, it isimportant that it be prepared and assayed correctly. Particular care is required in the presence ofcoarse gold, with possibilities for gold loss and/or contamination [88]. Large pulverisers such asthe LM5 (maximum capacity approximately 3 kg) are useful, however removal of the pulp needs tobe maximised (EE) and contamination controlled (PE). It is recommended that laboratories includea barren flush after coarse gold-bearing samples or concentrates. Assaying of the pulveriser wash(e.g., sand) is recommended at a rate of between 1 in 10 and 1 in 20.
The traditional paradigm of crushing and pulverising the entire sample (e.g., testwork head ortails sample) and taking a 30–60 g sub-sample for fire assay is potentially flawed [1,7,54]. The approachis prone to high correct and incorrect sampling errors (Table 3), particularly when the assay chargeis scooped from the pulp [1]. The propensity of gold not to pulverise efficiently (exacerbated in thepresence of coarse gold, which may still be present in a tails sample for example), promotes FSEand GSE, and potentially loss or contamination (e.g., PE) during sub-sampling for the fire assaycharge [88,89]. The use of whole samples is a potential option. Whole samples followed by full sampleassay effectively yields FSE and GSE values of zero. With good laboratory practice, the PE and AE canbe minimised.
There are a number of techniques employed to measure gold concentration, these includetraditional fire assay and large charge methods such as screen fire assay (SFA), LeachWELL (LW)and pulverise and leach (PAL). The Chrysos Photon Assay method provides potential for fast assays,based on 0.5 kg crushed samples [90]. Sample assay protocols should not be left solely to the laboratoryto decide, but established by the project team based on material characteristics.
7.8. Reject and Residue Materials
Sampling and testwork programmes produce reject and residue materials. Rejects generallycomprise primary sample material that is either purposively split-off as a reference sub-sample or notrequired for testwork. Residues comprise material that is left after testwork, generally tailings with themajority of the critical metal or mineral removed. In the case of rejects, it is critical to ensure that theyare split from the primary lot with all errors minimised, particularly the FSE. If a later programme willuse rejects for testwork, it must be possible to demonstrate that the rejects are representative. All rejectsand residues must be contained and stored carefully for future usage.

Minerals 2018, 8, 193 27 of 47
8. Mineralogical Sampling and Analyses
8.1. Mineralogical Analysis
Mineralogical studies play an important role in optimising gold recovery processes. It is widelyused to characterise gold in ores and mill products, and to determine potential problem(s) causinggold losses. The information acquired can be used as a basis for metallurgical testwork programmedesign or optimization. Ideally, a mineralogical study should be conducted prior to the start of, or atthe early stage of a testwork programme. Mineralogical studies are utilised throughout the stages of amine’s operation to closure, adding essential information to the MVC.
Automated mineralogical analysis (AMA) is an analysis method which is deemed as routine andutilises scanning electron microscopy (e.g., Mineralogic, Mineral Liberation Analyser, QEMSCAN,etc.) [68]. These are specialised systems with applied software, exclusively for the characterisation ofores. Specific programmes are tailored for minerals of interest (e.g., gold), which present challengingtextures, or rarity of abundance. Programmes may also be manipulated to capture the internalelemental differences through increasing X-ray measurement times. This is particularly useful whentrying to understand stoichiometry/elemental substitutions. For example, auriferous pyrite or goldgrains with substituted elements.
8.2. Sampling and Preparation
Sample selection at each stage of the MVC can be different, largely due to the nature of thematerials being collected. Study media will be based on either: (1) rock samples, rock chips or drillcores or (2) granulated material (e.g., mill products or reject material). Granulated samples can bepre-concentrated and sized into fractions. Rock chips or drill cores can be crushed for sub-sampling.For complete analysis, each fraction will need be analysed. Samples for AMA are usually mounted inepoxy resin 25 or 30 mm diameter blocks or glass slides. Various methodologies for sample preparationand analysis are reported: [42,68,73,91–93].
Samples can be taken directly from drilling programmes (Tables 14 and 15). Size distributionsand a size by size analysis of RC samples can provide preliminary details on mineral deportment.Diamond drill core provides the best material for AMA, where tiles can be cut, prepared and mountedin the SEM. Cores can also be halved, quartered, crushed and sized. It is recommended that crushedsamples are analysed by on a size by size basis. Mixed sized samples are hard to measure on the SEM,textures can be “over measured” or conversely, missed. Replicate and duplicate samples must befactored into the sample collection.
AMA software provides modal mineralogy and has internal assay reconciliation. As part of theQAQC process, each size by size sample should have a further sample taken for X-ray diffraction (XRD)and assay (fire assay, etc.). If analyses are staged, then it is prudent to understand the deportments.Deportment should highlight the potential opportunity to pre-concentrate the samples before lookingat analysis programmes such as liberation by free surface or particle composition.

Minerals 2018, 8, 193 28 of 47
Table 14. Metallurgical sampling and testwork validation actions across the MVC.
Validation Type Project Stage Activity Comment Validation Target
Duplicate samplesAdvancedexploration toFeasibility
Field duplicates
Based on field duplicates (variabilitysamples) taken proximal to each other,or duplicate composites taken fromthe same drill holes and intersectionsvia half or quarter-core. In reality,rarely taken duringmetallurgical sampling
Total relative error: ±50%Sampling error: ±40%
Coarse duplicates Splits of laboratory crushed material Total relative error: ±25%Preparation error: ±20%
Laboratory (pulp) duplicates Splits taken from final testworksub-samples after grinding
Total relative error: ±15%Analytical error: ±15%
Pilot testing Pre-feasibilityand/or Feasibility
Processing of composite orvariability samples throughpilot plant
Tonnes-scale of material taken fromcore or bulk samples. Comparestestwork prediction (model) withsmall process tonnage Within ±20% of prediction
for a given tonnage
Demo/full plant testing FeasibilityProcessing of composite orvariability lots throughprocess plant
Material taken from bulk sample ortrial mining programmes. Comparestestwork prediction (model) withlarge process tonnage
Production plant Production Processing of orethrough plant
Production mining. Comparestestwork prediction (model) withactual mining
Within ±20% of predictionover a given time period(e.g., month)
Table 15. Bulk sample/trial mining material processing options.
Lot/Process Option Laboratory Bench Pilot Plant Demo/Full Plant
Whole lot - (1) (1)Lot batch - (2) (2)
Lot sub-sample (3) (3) -
8.3. Optimal Sampling Plan
Understanding that a polished block requires approximately 5 g of materials to form a mono-layerof particles poses a challenge to create a representative sample. Liberation and pre-concentration isthe best option [77,91,93–95]. Any sample for pre-concentration needs to be sub-sampled from anoptimised field sample in the light of TOS. Henley [92] recommends a minimum sample mass of5 kg for the pre-concentration approach, whereas [91] use a 10–50 kg sample and Goodall, Scales andButcher [73] a 100 kg sample. Any sub-sampling of the field sample requires minimisation of the FSE.
Stages of sample mass reduction include rotary sample divider or micro-riffle splitting to anoptimum size, usually in the 38–150 µm range. Jones and Cheung [96] emphasise the challenges,where a sample of 1 g/t Au at a grain size of 1 µm requires two polished sections to be theoreticallyrepresentative. If the gold grain size was 100 µm, then some 20,000 polished sections would be required.
Lane and McComb [93] present a case study where sixteen 25 mm polished blocks of a6.5 g/t Au ore were produced from drill core, and only three small gold particles were identified.They subsequently took a composite core sample of 5 kg, crushed it, used heavy liquid separation toremove the low density phases and produced a gold concentrate by Superpanner. The coarse, middlingand tails products from the Superpanner were studied by AMA. Some 275 gold particles up to 2 mmin size were identified.
9. Quality Assurance/Control and Validation
9.1. Quality Assurance and Quality Control
Quality assurance (QA) and quality control (QC) are the key components of a quality managementsystem [86,97]. QA is the collation of all actions necessary to provide adequate confidence that aprocess (e.g., sampling, testwork and assaying) will satisfy quality requirements. QC refers to theoperational techniques and activities that are used to satisfy quality requirements. QC includes thesystem of activities to verify if the QC activities are effective. While QA deals with prevention ofproblems, QC aims to detect them. In practical terms, QC procedures monitor precision and bias of

Minerals 2018, 8, 193 29 of 47
the measurement values, as well as possible sample contamination during preparation, testwork andassaying [86].
Resource drilling and assaying programmes will have a QAQC component; however this isgenerally ignored during metallurgical sampling and testwork [64]. The principles of QAQC must beapplied to metallurgical programmes, although there are metallurgical specific considerations in bothgenerating and analysing the data. Key metallurgical QAQC considerations are:
• Duplicate field samples that are spatially distributed within a given domain to honour thegold grade frequency distribution. Field duplicates are rarely collected during metallurgicalprogrammes due to the relative lack of material available, quantity of material required and highcost of testwork.
• Sub-sampling must be controlled by the FSE equation to ensure that they are representative.• Assays to be supported by certified reference materials (CRM) and blanks to quantify analytical
bias and contamination.• Blanks should be inserted after known high-grade samples.• Duplicate tests (e.g., two separate tests from same primary sample) should be undertaken on a
regular basis (target 5% of the time) to monitor precision.• Second test in alternate (umpire) laboratory.• Introduction of reference material for leach and/or flotation testwork.• Written and audited laboratory procedures with appropriate staff supervision to ensure compliance.
QAQC of metallurgical programmes provides a number of benefits across:
• Quantitative assessment of laboratory performance, enabling review and investigation ofany issues.
• Experimental error for key parameters.• Data to support design of testwork programmes.• Compliance for public reporting and use in resource/reserve estimates.
A key part of QAQC is documentation and training. Written protocols and procedures, stafftraining, periodic auditing of protocols and people, and re-training are required. DS3077 [53] providesa framework on which to produce transparent protocols. Control is through the examination oflaboratory and audit procedures results, and adherence to standard or industry-accepted operatingprocedures. The quality of the laboratory should be verified by the project manager and, in the case ofcomplex or novel processes, they should visit the facility performing the work.
9.2. Validation of Metallurgical Sampling and Testwork Programmes
Critical to any sampling and testwork/assaying programme is validation to indicate robustness ofthe results and in particular representativity of samples and quality of testwork. The level of validationis dependent upon project stage; the more advanced the project the better the validation. Approachesrange from duplicate field and coarse crush samples through to trial mining lots through a processplant (Table 14). Duplicate sample data can be analysed to determine the sampling, preparation andanalytical errors [14,48,97].
Duplicate samples measure variability across the sampling value chain (Table 1). For example,field duplicates provide the cumulative error across the GNE, sample collection, preparation activities(including comminution and splitting) and testwork/assaying. Whereas a laboratory (pulverised)duplicate, provides the pulp sub-sampling error and testwork/assaying error. Duplicate results arepresented as pairwise precision values, where precision improves from the field to pulp duplicates.Pilot and demo/full plant testing provide a different level and scale of validation, through thereconciliation of modelled recovery based on testwork with processing at different scales.

Minerals 2018, 8, 193 30 of 47
10. Large Sample Pilot and Demo Plant Testing
10.1. Introduction
Validation and scale-up work generally involves the use of pilot plant testing of bulk samplesor processing of trial mining lots [75,77,98]. Such large-scale activities are often a critical part of thefeasibility stage, though require careful planning and management to ensure that they are providingappropriate validation of a given grade and/or metallurgical model [54,77,81].
The collection of large samples (e.g., >1 t to a few 1000 t) from surface and/or undergroundlocations characterises the pilot to demo/full plant test stage. Bulk sampling (>1 t to 500 t) and trialmining (>500 t to 10,000 t or more) programmes are used to verify grade and metallurgical parametersin complex deposits. Bulk samples tend to be smaller (from a few tonnes to 250 t), more numeroussamples from single locations or grouped together from underground development (e.g., 30,000 t atNalunaq, Greenland [99]) or surface trenches. In relatively rare cases, bulk sampling may be the onlyway to evaluate gold grade. In some cases, a bulk composite of 1 t or more may be formed from drillcore material. Trial mining activities tend to represent underground stope lots or open pit benches.Such lots may yield thousands of tonnes of mineralisation for processing (e.g., 10,000 t at Brucejack,Canada [81] and 3150 t at San Antonio [37,80]).
In cases where the nugget effect is high, such programmes may be the only way to assessgold grade. They are typically undertaken during feasibility studies and are seen as an insurancepolicy to avoid surprises once production commences by verifying grade estimates and metallurgicalflow-sheets [77,81,84]. The tonnage of material extracted is dependent upon the heterogeneity andcomplexity of the mineralisation and project stage. For a small project a few 100 t may be taken, thoughthis may rise to 10,000 t or greater for large projects (e.g., 40,000 t at Bendigo, Australia [100].
A well-planned bulk sampling or trial mining programme will account for mineralisationvariability, resolution of which may require a number of sample collection areas in specificgeometallurgical domains. In addition, the programme needs to account for grade variability and notjust focus on high-grade or ROM mineralisation.
10.2. Sample Collection
During sample extraction/mining a number of matters should be considered (Figure 8) [77]:
• Planning of blasting in relation to stope width (underground) or bench height (surface pits) andminimising of dilution to match that which is likely during mining (e.g., DE reduction).
• Avoidance of over-blasting that results in the excessive liberation and loss of gold and/orgold-bearing sulphides (e.g., EE).
• Mucking of blasted material, in particular fines, with the potential use of vacuum devices toensure maximum recovery (e.g., EE reduction).
• Management system, involving tagging and chain of custody actions, to ensure that bulk samplemucked material is kept separate from other broken rock and trucked to the required stockpile orbulk transport bag.
10.3. Sample Processing
Sample lot processing options range from the full lot to a sub-sample from the lot (Table 15).Option (1) provides the most defendable results given that, assuming rigorous design and operation,all material is processed and actual gold grade and recovery determined. Option (2) is likely to result inOption (1), providing that all individual lots are processed. The processing of selected lots of may leadto a high FSE from the lot. Option (3) may be problematic on a lot-by-lot basis, unless the sub-samplingprotocol is rigorously defined (e.g., FSE and all other errors optimised). The decision of whether to usea plant or sample splitting tower is related to a number of issues which includes programme aims,availability, cost, minimisation of sampling errors, and nature of the mineralisation.

Minerals 2018, 8, 193 31 of 47
Pilot/demo programmes also require a QAQC system to be put in place. The scale of samplesmakes the use of CRMs impossible, but blanks may be passed through the circuit. In addition,all associated assays can be subjected to normal QAQC procedures. In the case of bulk samples,field duplicates can be taken and coarse duplicates after crushing.
10.4. Limitations
Whilst bulk sampling/trial mining programmes are important, they are not necessarily thepanacea of metallurgical or grade evaluation. It is possible, for example, that a bulk lot may representits local area well but not describe the wider orebody due to strong variability. During programmeplanning, the practitioner must consider the nature of the test area and what the results will mean.Sample collection and pilot/plant processing is likely to cost millions of dollars.
11. Case Study
11.1. Project Background
A vein-gold mine, located in South America, was evaluated to resume underground operations,including: 6800 m of HQ diamond core drilling, underground working re-access, and metallurgicalsampling and testwork. HQ is a standard wireline diamond drill type, where the core diameteris 63.5 mm to yield approximately 8.5 kg/m for whole core. The resulting total Indicated MineralResource for the Main Reef was 350,000 t at 16.8 g/t Au (±22% at 80% reliability). Resource precisionwas estimated via Conditional Simulation, where the distribution of multiple-simulated grades allowsthe inherent estimation uncertainty to be reported at a given reliability, usually 80%. A geologicallyidentical South Reef lies sub-parallel and 35 m away from Main Reef, with a drill-only Inferred MineralResource of 300,000 t at 15.2 g/t Au (±46% at 80% reliability). An underground mine plan was basedon 50,000 t for year one, ramping up to 100,000 t early in year two and thereon. A pre-existing plantwas relocated to site and updated to provide an annual capacity of 125,000 t.
Mineralisation is dominated by quartz veins with 1.5 m to 2 m widths. Economic grades arerelated to sub-vertical ore shoots, which extend around 75–150 m along strike and >350 m downplunge. The core high grade zone (“HZ”) of the Main Reef contains high-grades of 20–60 g/t Au,compared to 4–8 g/t Au in the peripheral zones (“PZ”). Mineralisation contains coarse gold up to2.5 mm in size, particularly in the HZ. Coarse gold up to 0.5 mm with a strong fine-gold componentis common in the PZ. Gold is hosted in quartz and pyrite in both zones, though the pyrite host issubstantial in the PZ. Stoping was across both the PZ and HZ mineralisation.
11.2. Metallurgical Sampling and Testwork
During evaluation, two 50 kg diamond half-core and two 50 kg underground panel samplecomposites were collected from the HZ mineralisation. Two 50 kg diamond half-core samplecomposites were collected from the PZ mineralisation. Core quality was excellent, with total corerecovery above 95%. Samples were placed into large polyweave sacks and tied with wire. They weretransported by road to the laboratory. No chain-of-custody was in place and there were no writtenprotocols for the process.
All samples were crushed to P90 −3 mm and 20 kg split off for three-stage GRG testing. A 10 kgcrushed sub-sample was split from all samples and subjected to flotation (rougher and cleaner)testwork. The results show high levels of GRG associated with high grades from the HZ (Table 16).Similarly, reasonably high grades were obtained from the PZ. A small amount of gold was recoveredin pyrite from the PZ.

Minerals 2018, 8, 193 32 of 47
Table 16. Summary of original evaluation testwork results.
Sample Nos. Number of Samples Domain Head Grade Range (g/t Au) GRG Range (%) Flotation Range (%)
C.01–04 4 HZ 43–95 91–98 TraceC.05B and 06 2 PZ 15–26 40–79 3–11
11.3. Plant Design and Performance
Based on the testwork results, a gravity plant was re-located and commissioned based on twoKnelson concentrators processing 15 t per hour. The tailings from the primary Knelson were passedthrough the secondary to facilitate additional gold recovery. The gravity feed product was P90 −250 µm.The design expectation of the plant was to achieve an overall gold recovery in the range 80–85%,with the increased gold recovery compared to the testwork results based on using two Knelson units.Within a few months of commencement, a head grade of 6 g/t Au was achieved with gold recoveriesin the 45–55% range. The original mine plan was for a 15 g/t Au head grade with 85% gold recovery.
11.4. What Went Wrong?
A number of issues relating to metallurgical sampling and geological interpretationwere identified:
• HZ samples and sub-samples were unrepresentative, as they were biased to very high grademineralisation which gave high GRG values.
• PZ samples and sub-samples were unrepresentative, as they were biased to relatively high-gradematerial that was occasionally present in the PZ, and thus gave high GRG values.
• Primary PZ samples and sub-samples did not represent the sulphide mineralisation, thus theflotation response was low.
• Too few samples were collected.• Testwork laboratory used was not certificated and had a poor reputation.• No QAQC was undertaken anywhere in the sampling chain, including during assaying.• Geological interpretation of the HZ focused on a continuous zone down the centre of the shoot
(considered to be 50% of the shoot). This was not the case, in reality there is a series of high-gradesub-shoots, forming a discontinuous zones within the main-shoot forming 25% of the shoot zone.The mine plan did not honour the geology or grade distribution.
• No mineralogical studies were undertaken.
During sample preparation, the crushing and splitting of the primary 50 kg samples to 20 kg and10 kg sub-samples yielded a high FSE (Table 17). In all cases, the FSE values were greater than ±25%.
Table 17. FSE values for sub-sampling. All FSEs at 90% reliability.
Domain/FSE Value Grade Range (g/t Au) d95Au Range (mm) GRG Sub-Sampling FSE (%) Flotation Sub-Sampling FSE (%)
HZ 43–95 1–2.5 ±25–35 ±40–55PZ 15–26 0.2–0.5 ±25–45 ±40–70
Based on knowledge of both ore types, the samples should not have been split, but tested in theirentirety. Taking a representative primary split for flotation testwork was problematic. However, it wasclear that flotation should only be used after gravity concentration and thus a tailings sub-sampleof 5 kg could be optimally split with an FSE of less than ±5%. The splitting process after crushingwas based on shovelling 20 kg directly into buckets from a pile. The splitting of sub-samples froma primary composite is a key issue, where the split process was not representative. This is furthercompounded when the primary sample is not representative either. In this case, the sub-samplingprocess was prone to enhanced FSE, GSE, DE and PE.

Minerals 2018, 8, 193 33 of 47
11.5. Corrective Metallurgical Sampling and Testwork Campaign
11.5.1. Historical Data Review
A review of historical data and inspection of mine workings revealed that previous stoping inthe early 1900s was highly selective in the HZ (30–90 g/t Au head grade). Historical plant recoverieswere in the range 50–60% using a simple gravity and amalgamation circuit. It was clear from thehistorical stoping patterns that the HZ comprised small, potentially 100–400 t high-grade discontinuoussteeply-plunging pods.
11.5.2. Sampling Strategy
A corrective metallurgical sampling and testwork programme was undertaken. Estimates oftheoretical sample mass for HZ and PZ ROM ore yielded 100 kg to 1 t, and up to 50 kg respectivelyto achieve ±20% at 90% reliability. At the extreme, a sample mass of 4 t could be required for cut-offgrade mineralisation with gold clustering present, though this was considered rare. A mass of 150 kgwas accepted for the HZ and PZ mineralisation, given that it theoretically represented the criticalcut-off (5 g/t Au) and ROM (11 g/t Au) grades, and was a practical mass to collect and handle. In theunderground sampling area, the vein width varied between 1.7 and 2.2 m, which equates to a massper unit width of 75–85 kg/m. Up to 0.3 m of wallrock material was included in the samples to diluteto the mining width of 2 m.
Given access to four mine levels which represented the first year of production, the sampleswere collected from development drives. In addition to the underground samples, four half HQcore composites were also collected and tested. These were taken from intersections outside of theunderground development area, representing years 2 and 3 of production.
11.5.3. Underground Metallurgical Samples
The PZ samples were collected on an approximate 15 m (dip) by 15 m (strike) grid,with 7–9 samples per level. The HZ were collected on an approximate 15 m (dip) by 5–25 m (strike) grid,with 6–8 samples per level. The uneven grid of the HZ samples reflects its poddy nature. The sampledarea represented 60,000 t of Indicated Mineral Resource.
All samples were panel cut by hand with the assistance of a compressed air pick from wallsand backs [37]. Sample material was captured on tarpaulins laid on top of rubber matting (Figure 3).All material was then placed into 25 kg capacity double-plastic bags. Each set of six 25-kg bagscomprised one composite sample, which were packed into steel drums, sealed and transported tothe laboratory. Samples were collected from the same location, hence they were variability samples.Thirty samples were collected from the HZ and twenty-eight from the PZ. Sample collection was fullydocumented and independently supervised.
11.5.4. Core Composite Metallurgical Samples
Five composites were taken from half HQ core retained from the previous drilling campaign.The composites allowed for the relative proportions of HZ and PZ mineralisation acrosslow-grade/cut-off grade, ROM grade and ROM high-grade. Intersections were selected based onspatial location, domain and grade. Given the difficulty of preparing 150 kg composites from half-core,a composite mass of 70–75 kg was accepted. This approximated to 9–12 intersections per composite,based on half-core yielding 4 kg/m. All core pieces were placed into 25 kg capacity double-plasticbags. Each set of three 25-kg bags comprised one composite sample, which were packed into steeldrums, sealed and transported to the laboratory. Sample collection was fully documented andindependently supervised.

Minerals 2018, 8, 193 34 of 47
11.5.5. Testwork Programme
Entire samples were subjected to three-stage GRG testwork. Tailings sub-samples of 20 kg werecut by rotary sample splitter for both leach and flotation testing. Testwork data variability is quantifiedvia the RSV (Table 18). Head grades determined from the GRG test display the highest variabilityfor both HZ and PZ. However, compared to the original half-core drilling results, which yieldedRSVs of 179% and 165% respectively, the variability is reduced and within expectation for coarse-goldmineralisation. The flotation RSV is relatively low and reflects the more disseminated nature of thegold-bearing sulphides, particularly in the PZ. The GRG shows higher variability in the HZ, with smallvariability in the PZ where there is less coarse gold.
Table 18. RSV values for underground sampling and testwork programme.
Domain Number of Samples Ave. Primary Sample Mass (kg) RSV Head Grade (%) RSV GRG (%) RSV Flotation (%)
HZ 30 156 46 35 15PZ 28 154 32 17 27
The core composites displayed similar results, albeit lower overall recoveries likely due to thesmaller sample mass (Table 19).
Table 19. Summary of core composite testwork results.
Sample Domain DomainFraction
GradeType
CompositeMass (kg)
Est. Head Grade(g/t Au)
Head Grade(g/t Au)
GRG(Au %)
FlotationRecovery (Au %)
Total Recovery(Au %)
DCM.1 PZ 1.0 Low/COG 71 3.9 4.2 15 66 81DCM.2 HZ/PZ 0.2/0.8 ROM 71 10.5 11.5 61 26 87DCM.3 HZ/PZ 0.3/0.7 ROM 75 13.3 13.6 60 24 84DCM.4 HZ/PZ 0.4/0.6 ROM high 69 17.4 18.1 65 20 85DCM.5 HZ/PZ 0.5/0.5 ROM high 73 19.9 17.7 71 15 86DCM.6 HZ/PZ 0.6/0.4 ROM high 71 23.7 21.0 76 13 89
The testwork in the HZ confirmed the high-GRG nature of the mineralisation (61–76%), but withlower values than previously. The PZ testwork indicated low GRG (<15%), with most of the gold beingsub-100 µm and dominantly sulphide-hosted. Flotation testwork on the gravity tails indicated thatan additional 13–26% of gold could be recovered in a pyrite concentrate depending on feed gradeand relative proportion of PZ ore. After initial grinding to P100 −850 µm for the GRG test, 5 kg ofsub-sample was split off by rotary sample splitter from each sample. The sub-sample from the 150 kgprimary sample yielded, at the 90% reliability, FSE values of ±6% and ±10% for the PZ and HZrespectively. Each sample was then fed to a micro-panner and the concentrate isolated. The tailswere re-ground to P90 −100 µm and fed through the micro-panner and the concentrate isolated.Both concentrates were set in resin and inspected by both optical and automated mineralogy. In the PZ,studies confirmed the deportment of gold (20–150 µm and rarely up to 500 µm in size) within pyrite.
11.5.6. Pilot Programme
Based on the new testwork results, seven one-tonne master variability-composite samples werecollected underground for pilot testwork. These allowed for the relative proportions of HZ and PZmineralisation across very-low grade, low-grade/cut-off grade, ROM grade, ROM high-grade andvery-high grade ore (Table 20).
Samples were collected and composited from various locations to provide the required samplegrade. All samples were collected from pre-mapped and channel sampled drive backs using handand compressed air pick(s). In a few cases, very small explosive charges were used to pre-split therock prior to sampling. Broken material was collected on the floor by tarpaulins underlain by rubbermatting. This material was subsequently placed into cut down drums designed to contain 150 kg ofsample, which were transported out of the mine on rail wagons. At surface the drums were emptied

Minerals 2018, 8, 193 35 of 47
into purpose-built plastic-lined wooden crates, each designed to contain 750 kg. The crates were placedinto a secure shipping container for transport to the laboratory.
Table 20. Summary of pilot plant testwork results.
Sample Domain DomainFraction Grade Type Head Grade
(g/t Au) GRG (Au %) Flotation Recovery(Au %)
Total Recovery(Au %)
PVC.1 PZ 1.0 Very low 1.9 5 49 53PVC.2 PZ 1.0 Low/COG 5.3 18 70 88
PVC.3A HZ/PZ 0.3/0.7 ROM 11.0 64 29 93PVC.3B HZ/PZ 0.4/0.6 ROM 13.2 66 24 90PVC.5 HZ/PZ 0.5/0.5 ROM high 23.4 73 21 94PVC.5 HZ/PZ 0.8/0.2 ROM high 21.6 77 18 95
PVC.6B HZ 1.0 Very high 32.9 82 14 96
The pilot plant was designed to mirror the production plant across crushing, grinding andscreening, primary and secondary Knelson units, followed by tailings grinding and flotation.The flotation sulphide concentrates were intensive leached to recover the gold.
11.5.7. Quality Assurance/Quality Control
All bench- and pilot-scale samples were sent to an independent accredited laboratory.The laboratory was audited by both company staff and its consultants. It instigated a QAQCprogramme throughout testwork and associated assaying (Table 21). Sample preparation and testworkequipment was cleaned between every sample.
Table 21. Summary of corrective programme QAQC.
Action/Activity Rate/Responsibility Performance Expectation Actual Performance
Sample security: chain of custody Project and laboratory Full compliance No security breachesNo seals broken or samples lost
Duplicates See next Section 11.5.8
Certified reference material (CRM): Tailsand concentrate assays from GRG and
flotation testwork
1 in 5 Project andlaboratory
Limits:±2δ–3δ (“warning”)
>±3δ (“action”)Relative bias: within ± 10%
Within limits:95% of CRM results < ± 2δ5% of CRM results ± 2δ–3δ0% of CRM results > ± 3δ
Relative bias:Low CRM (2.9 g/t Au) + 5.5%
Moderate CRM (8.7 g/t Au) + 3.1%High CRM (24.4g/t Au) + 7.9%
Blanks 1 in 5 Project andlaboratory Blank assay <0.1 g/t Au 98% <0.1 g/t Au
Barren “sand” flush of GRG circuitfor all samples 1 in 10 Laboratory <1% gold loss in blank material
compared to sample head grade 100% <1% gold loss
Laboratory audit Project Full compliance acrossall procedures
A number of minor non-material issueswere noted. All matters resolved
11.5.8. Duplicate Sample Analysis of Underground Panel Programme
Duplicate sample analysis across the sampling and laboratory process allows errors to beapportioned to each component of activity [21,48]. The results demonstrate the dominance of samplingerror (component error 38%), which provides 78% of the total variability (Table 22). The preparationand analytical component errors are within expectation (Table 14). The theoretical sample mass of150 kg (refer Section 11.5.2.) is essentially validated, where it was optimised to achieve ±20% precision.The sampling error calculated includes the collection errors (e.g., DE and EE), whereas the theoreticalsample mass value only reflects in-situ variability (e.g., the GNE).
It is noted that the field and coarse duplicate data are relatively small. Both data sets representthe grade frequency distribution, reflecting 80% of the population above 1 g/t Au. Therefore theirapplication to error analysis is deemed appropriate.

Minerals 2018, 8, 193 36 of 47
Table 22. Evaluation of errors across the underground-panel metallurgical-sample testwork programmebased on duplicate samples. All FSE values reported at 90% reliability. Component relative errorcalculated via method presented in [14].
Duplicate Type Explanation Mass Number(Frequency)
EstimatedStage FSE
ComponentError
ComponentRelative Error
Proportionof Total
Field Panel samples collected atthe same location 150 kg 15 (1 in 4) - Sampling 38% 78%
CoarsePanel samples crushed to P90−1.5 mm and rotary sample
divider split75 kg 15 (1 in 4) <±15% Preparation 18% 18%
Laboratory pulp 1:concentrate
GRG concentrate split priorto intensive leach 30 g 58 (1 in 1) <±5% Analytical 4% 1%
Laboratory pulp 2:tailings
Core and panel sample tailsafter GRG stage-3 at P90−100 µm rotary sample
divider split
10 kg 58 (1 in 1) <±5% Analytical 8% 3%
- - - - <±15% Total 43% 100%
In reality the total error is closer to 39%, since during testwork the entire sample was processedthrough the GRG protocol, therefore the preparation error component is close to zero. Some minorerror may be imparted through gold contamination or loss, though the QAQC programme records thisat a minimal level (Table 21). The component errors are sampling at 38% and total analytical at 9%.In this case the sampling error represents 95% of the total variability.
11.5.9. Sampling Validation and Ore Characteristics
The pilot study results were used to validate the sampling strategy, providing characterisationdata across the domains (Table 23). The estimated d95Au values were established from size-by-assayof the gravity concentrates. The results validate the practical choice of 150 kg samples to support thenew sampling and testwork campaign. For higher grades, the precision values for ROM high- andvery-high grades are ±28–31%, which is not unreasonable.
Table 23. Summary of sampling characteristics based on pilot plant results.
Sample Head Grade (g/t Au) Est. d95Au (µm) Theoretical Mass (kg) Theoretical PrecisionBased on 150 kg Sample
PVC.1 1.9 120 15 ±1%PVC.2 5.3 250 25 ±3%
PVC.3A 11.0 1000 140 ±14%PVC.3B 13.2 1100 155 ±16%PVC.4 23.4 2000 530 ±28%PVC.5 21.6 2100 660 ±31%
PVC.6B 32.9 2300 570 ±29%
The grade RSV values for the HZ and PZ domains are 46% and 32% respectively (Table 18),where the RSV includes all sampling errors (Table 3). The overall results are deemed to be acceptable.In addition, the duplicate sample data also provide validation of the programme (Table 22).
11.6. Communicating Sample Representativity, Testwork Quality and Fit-for-Purpose Results
It is critical that sample representativity, testwork quality and overall fit-for-purpose applicationof results are communicated to stakeholders. In many cases, results will be publically releasedrequiring transparent and material reporting. Tables 24 and 25 provide an overview of representativityand fit-for-purpose nature of testwork results for the case study, for both the original andcorrective programmes.

Minerals 2018, 8, 193 37 of 47
Table 24. Risk review of metallurgical sampling and testwork for case study original programme.
Key Parameter Comment Material Errors Risk Rating
1 Spatial distribution andnumber of samples
Samples biased to spatially restricted (clustered) areasand high gradesToo few samples. Only 6 in total
GNE High
2 Sample mass Samples too small compared to theoretical mass GNE High
3 Degree of domaining HZ and PZ defined, but unrepresentativeHZ domain interpretation incorrect GNE Moderate
4 Collection and handling
Original core samples moderate-poor quality based oncore recoveries in the 60–80% rangeNo details on how underground samples were collectedNo written protocols to comply with TOSAll samples placed in plastic sample bags with wire ties
DE, EE, PE Moderate
5 Transport and securityBags placed in unsecured wooden boxes on the back ofan open truck and transported to the laboratoryNo chain of custody recorded
PE Moderate
6 Preparation Composite blending via shovellingSub-sample splitting sub-optimal
FSE, GSE, DE, EE,PE High
7 Testwork (incl. QAQC)
Potential for some contamination between samples dueto poor laboratory practiceNo QAQCNon accredited laboratory
PE Moderate
8 Assay (incl. QAQC)No issues with assay procedure usedNo QAQCNon accredited laboratory
AE Moderate
9 Validation
Via plant, poor reconciliationGrade reconciliation in the −60% to −75% range on amonthly basisRecovery 50% of that predicted on a monthly basis
- High
Sample representativity (1)–(5) Low/poor
Testwork-measurement quality (6)–(8) Moderate
Fit-for-purpose rating (1)–(9) Low/poor
Table 25. Risk review of metallurgical sampling and testwork for case study corrective workprogramme. Refer to Tables 21 and 22 for QAQC performance.
Key Parameter Comment Material Error Risk Rating
1 Spatial distribution andnumber of samples
Even spatial resolution along development drivesMore samples across domains. 58 panel variability samples,six core composite and seven pilot variability composites
- Low
2 Sample mass Optimised to theoretical mass. Dominance of 150 kg samples,supported by 1 t pilot samples - Low
3 Degree of domaining Refined HZ and PZ domains - Low
4 Collection and handling
All samples collected according to protocols written to complywith TOSAll samples placed in steel drums and sealed prior totransportation
- Low
5 Transport and securityChain of custody procedures in placeAll sample drums secured into locked container fortransportation
- Low
6 PreparationComposites blended via rotary sample splitterAll splitting optimised to FSEAll equipment cleaned between samples
- Low
7 Testwork (incl. QAQC)
Good QAQC, with documentation across sample collection,preparation and testworkRigorous cleaning of laboratory equipmentNo contaminationAccredited laboratory
- Low
8 Assay (incl. QAQC)
Good QAQC, with full documentation across samplecollection, preparation and assayingRigorous cleaning of laboratory equipmentAccredited laboratoryNo contaminationAcceptable analytical error and CRM relative bias
- Low
9 Validation
Pilot programme verified testworkUltimately optimised plant acceptable reconciliation, wheregrade reconciliation in the ±15% range and recovery aspredicted on a monthly basis
- Low
Sample representativity (1)–(5) High/good
Testwork-measurement quality (6)–(8) High/good
Fit-for-purpose rating (1)–(9) High/good

Minerals 2018, 8, 193 38 of 47
Parameters (1) to (5) provide a measure of sample representativity and parameters (6) to (8) thequality of the testwork. A rating of overall programme fit-for-purpose is given. Any activity that isdeemed as low risk is clearly acceptable and contributes to the overall ratings. In the context of thecase study, Table 24 indicates the high risk and overall low quality of the entire original programme.The corrective programme indicates a low risk throughout (Table 25).
11.7. Conclusions
Key issues related to:
• Poor liaison between geologists and metallurgists for sampling programme design.• Poor geological interpretation and over-reliance on an old model.• Too few samples collected.• Unrepresentative (too small) sample composites and sub-samples.• Poor laboratory practice during preparation and testwork.• Lack of documentation and QAQC
A geological reinterpretation of the Main Reef was undertaken to account for the nature of the HZsub-shoots. A revised Indicated Mineral Resource estimate totalled 200,000 t at 11 g/t Au (±20% at80% reliability) representing the first 2 years of production. An Inferred Mineral Resource of 400,000 tat 15 g/t Au (±42% at 80% reliability) provided a future base for the project. A new flotation circuitwas added, preceded by a grinding circuit. After further controls on mining, head grades increasedto around 10 g/t Au and recoveries up to 90% (gravity and flotation combined; up to 75% and 68%respectively dependent upon feed grade). Subsequent optimisation of mining, stockpile blendingand processing has led to an increased head grade of 12.5 g/t Au and recovery to 94%. As of thecurrent date (April 2018), the operation has stabilised at 120,000 t per annum production to yieldaround 1400 kg gold (45,300 ounces gold). On-going diamond drilling and underground developmentincrementally increases the resource base each year.
These issues led to disruption over 18 months and are estimated to have cost the companyaround US$ 36M in lost gold sales (US$ 31M) and corrective expenditure (US$ 5M) during 2013–2014.Intangible losses related to company and staff reputation, particularly with the workforce, localcommunity, government regulators and investors, and reduced project value (estimated to be around60% in 2013).
12. Public Reporting of Metallurgical Sampling and Testwork Programmes
The public reporting of metallurgical sample and testwork results are as important as graderesults, but frequently receive less rigor. The 2012 JORC Code [26] has global application for thereporting of exploration results, resources and reserves. It requires the Competent Person(s) to providecommentary on any sampling and testwork/assaying process. From a metallurgical perspective,Table 1 Section 4 of The Code requires disclosure as part of reporting Ore Reserves (Table 26).
Table 26. Extract from The 2012 JORC Code Table 1 (Section 4) pertaining to metallurgical testwork [26].
Metallurgical factorsor assumptions
1 The metallurgical process proposed and the appropriateness of that process tothe style of mineralisation
2 Whether the metallurgical process is well-tested technology or novel in nature
3The nature, amount and representativeness of metallurgical test workundertaken, the nature of the metallurgical domaining applied and thecorresponding metallurgical recovery factors applied
4 Any assumptions or allowances made for deleterious elements
5 The existence of any bulk sample or pilot scale test work and the degree to whichsuch samples are considered representative of the orebody as a whole
6 For minerals that are defined by a specification, has the ore reserve estimationbeen based on the appropriate mineralogy to meet the specifications?

Minerals 2018, 8, 193 39 of 47
Items (3) and (5) in Table 26 are the most relevant to metallurgical sampling and testworkprogrammes. Item (3) looks for clarification around the “what, where and how” of sampling, whereas(5) focusses on validation via bulk sampling and/or pilot work. Both look for some discussion onrepresentativity. The general format presented in Tables 24 and 25 provide a framework in which tocommunicate a number of The 2012 JORC Code Items (e.g., 3 and 5).
Within Canada, the CIM Definition Standard [101] is referenced in context of National Instrument43-101 (NI 43-101) [27], which in turn references best practice guidelines [102]. Like The 2012 JORCCode, reporting within the NI43-101 framework requires disclosure of sample selection and testwork(Table 27).
Table 27. Extract from NI43-101 Item 13 pertaining to metallurgical testwork (from [27]).
Mineral processing andmetallurgical testing
(a) the nature and extent of the testing and analytical procedures, and provide asummary of the relevant results
(b) the basis for any assumptions or predictions regarding recovery estimates
(c) to the extent known, the degree to which the test samples are representative ofthe various types and styles of mineralisation and the mineral deposit as a whole
(d) to the extent known, any processing factors or deleterious elements that couldhave a significant effect on potential economic extraction
In NI 43-101, Items 13(a) and 13(c) are the most relevant to this discourse, again requiringdisclosure with respect of sample representativity and testwork quality.
Both The 2012 JORC Code [26] Section 4 Item 3 and NI43-101 [27] Item 13(c) require specificcomment on the representativity of metallurgical samples. Project study reports often fail to detailthe spatial extent of metallurgical sampling, or the number of composites collected and their relativemasses. It is not unusual for a feasibility study report to state; “the sampling and testwork programmeshave been extensive and due care was taken in selecting and compositing representative samples”or “the testwork samples were deemed to be representative” with little or no justification as to whysamples are considered representative.
The 2012 JORC Code [26] Table 1 Section 1 (Sampling techniques and data) is aimed at thegeologist and ultimate resource model. However, it covers disclosure on key matters such as: samplingtechniques; sub-sampling techniques and sample preparation; quality of assay and laboratory tests;verification sampling and assaying; location of data points; data spacing and distribution; orientationof data in relation to geological structure; sample security; and audits or reviews. These criteria arerelevant to metallurgical sampling programmes. The authors contend that the Table 1 Section 1 criteriashould be used to support Table 1 Section 4 criteria, particularly Items 3 and 5.
13. Driving Representativity: Design of a Sampling and Testwork Programme
A truly representative sample generally does not exist, given that we are trying to sample extensiveand often complex geological entities. The GNE impacts in-ground sample representativity, whererepresentativity in low-GNE mineralisation is likely to be high, whereas in high-GNE mineralisationrepresentativity is likely low and may require pilot or bulk sampling. Practitioners can makesubstantive progress into making samples more representative and reduce project risk by goodplanning, realistic implementation of TOS guidelines and evaluation of the data produced. The designand execution of a programme can be based on five steps to achieve representative samples andfit-for-purpose testwork results (Table 28).

Minerals 2018, 8, 193 40 of 47
Table 28. Summary of steps to achieve optimal metallurgical sampling programmes (modifiedfrom [37]).
Steps/Key Activity
1: Scope
• Present business case to support introduction or improvement• Define data quality objectives and what is required to ensure that results will be fit-for-purpose• Understand deposit geology, grade and mineralogical distribution (as appropriate for project stage)• Undertake a characterisation programme to determine preliminary metallurgy, gold particle size
distribution metrics and domains
2: Develop
• Select a sample strategy based on deposit characteristics and heterogeneity• Consider sampling method(s)• Ensure that sample collection, testwork and assaying protocols are designed with reference to the
expected ore type(s)• Ensure TOS and QAQC are applied• Document within the framework of DS3077
3: Execute
• Ensure that staff are properly equipped and trained, with a focus on reducing sampling errors andincreasing sample quality
• Ensure regular staff supervision during sample collection/compositing• Ensure measures to reduce risk of sample tampering and enforce chain-of-custody protocol
4: Validate
• Ensure regular review and auditing of sampling strategy• QC analysis and action• Reconciliation with pilot or demo plant testing, or production (if appropriate)• Review sample representativity and confirm that data are fit-for-purpose
5: Refine • Update as required and/or return to stages 2 and 3 for further work
14. Conclusions
(1) Correctly collected and prepared metallurgical samples to support testwork are critical toeffective gold processing plant design. There is often a paucity of material for sampling andoften only half-core from resource drilling. Not only is sample material required for recoverytestwork, but also for comminution and geoenvironmental testwork. Metallurgical samplingprogrammes should be integrated into strategic geometallurgical studies to ensure maximisationof data usage and better decision making. Early stage consideration of metallurgical samplingand testwork will lead to better decision-making with respect of resource delineation anddevelopment, more focused metallurgical studies as a project develops and ultimately optimisedshareholder value.
(2) During programme scoping, a sampling for sampling step should be undertaken to permitpreliminary characterisation. Any in-situ coarse to very-coarse fraction (or similarly gold-bearingsulphides) will be the most material to testwork result quality. Reviewing geological and gradeinformation as early as possible helps determine the likely heterogeneity (e.g., degree of nuggeteffect) and potential domains. Multi-disciplinary core logging will go a long way to resolvedomains and their variability in consideration of (2) above.
(3) Representativity is based on appropriate sample mass to improve precision and samplingprotocols to reduce bias. An estimate of theoretical sample mass can be defined by the applicationof Poisson statistics, with a target precision of ±20% at 90% reliability. Subsequent sub-samplingfor testwork can be controlled via the FSE equation with a target precision of ±15% at 90%reliability. The selection of precision and reliability levels depend on mineralogical assessmentand practitioner judgement.
(4) All samples must be collected within the framework of TOS. Where broken rock samples(e.g., crushed material) are used, the FSE equation can be applied. Large diameter diamonddrill core provides the best quality samples on which to undertake testwork. The traditionalparadigm is to form metallurgical composites from quarter resource evaluation core. Improvedcore logging, digital photography and data collection methods now provide an opportunity touse half or whole core samples for metallurgical testwork. For high-GNE mineralisation, multiplelarge diamond drill core and/or bulk samples may be the most appropriate.

Minerals 2018, 8, 193 41 of 47
(5) During testwork, laboratory crushing, grinding, splitting and blending should be optimisedin the light of TOS. Reduction of sample loss and contamination is paramount, and should becontrolled via appropriate hygiene procedures. Testwork errors must be minimised. Ensure thattestwork sub-samples are representative of the original sample. Particular attention is requiredacross: equipment maintenance and operating parameters, cleaning of equipment and associatedpipework, and reducing careless work practices.
(6) Testwork must be accompanied by mineralogical studies which play a critical role in optimisinggold recovery processes. Mineralogy is widely applied in the characterisation of gold ores andmill products, and to determine potential issue(s) that may cause gold losses. The informationacquired can be used as a basis for metallurgical testwork programme design or optimisation.Ideally, a mineralogical study should be conducted prior to the start of, or at the early stage of atestwork programme.
(7) A QAQC programme must be introduced to ensure on-going quality control of samplingand testwork. The association of QAQC with TOS is unequivocal. A key part of QAQC isdocumentation and training. Written protocols and procedures, staff training, periodic auditingof protocols and people, and re-training are required. The new DS3077 provides a framework onwhich to produce transparent protocols [53]. Control is through the examination of laboratory andaudit procedures results, and adherence to standard or industry-accepted operating procedures.Samples must be handled to ensure their integrity and security. A chain-of-custody mustbe enacted.
(8) Measures are recommended to reduce risk of the tampering of samples. These include:maintaining increased security between the sample site (e.g., exposure and/or drill rig) andsample shipment; recording who has access to samples between collection and shipping, andmaintaining a secure copy of that record through the project life; and employing an outsideagency with no vested interest in the project, to maintain custody and security over samples.
(9) Technical teams should consider bulk sampling to support pilot or trial testing programmesto evaluate grade and metallurgy as part of pre-feasibility or feasibility studies. This maybe particularly important in high GNE mineralisation or where high variability relates tomineralogical and/or textural complexities that impact on recovery.
(10) Early collaboration across technical disciplines is required to design and implement metallurgicalsampling and testwork programmes. As a multi-disciplinary approach, geometallurgyemphasises technical collaboration and is gradually producing more dual discipline professionals.Discipline sharing should be considered a key development for the future of the mining industry.
(11) There is now a need to move towards proper quantification of sampling and analytical errors.A first step is the application of the RSV defined in DS3077 [53]. Beyond this, resolutionof component relative errors across sampling, preparation and analysis can be gained fromduplicate sample pairs [21,47,48]. Measurement uncertainty analysis also provides value in thisquest [21,50,55,103].
Author Contributions: S.D. conceived the paper. S.D., L.O. and S.P. reviewed metallurgical sampling and testworkstudies in publically available reports. L.O. and Y.X. wrote the mineralogical related matter. S.D. and H.G. wrotethe TOS related matter. S.D. compiled the case study. All authors contributed to writing and editing of the paper.
Acknowledgments: The authors acknowledge a number of companies across Australia, Africa, the Americas,East Asia and Europe for the opportunity to input into (geo)-metallurgical sampling and testwork studies.S.D. acknowledges discussions with the late A.G. (Bon) Royle, Dick Minnitt and Kim Esbensen on many aspectsof TOS and sampling. The case study was compiled within a Confidentiality Agreement; the project operatorsare acknowledged for permission to publish. Thanks are due to the Minerals reviewers for helpful comments onthe manuscript.
Conflicts of Interest: The authors declare no conflict of interest.

Minerals 2018, 8, 193 42 of 47
References
1. Dominy, S.C. Importance of good sampling practice throughout the gold mine value chain. Min. Technol.2016, 125, 129–141. [CrossRef]
2. Giblett, A.; Dunne, R.; McCaffery, K. Defining practical metallurgical accounting discrepancy limits for goldoperations. In Landmark Papers by Practicing Metallurgists; Australasian Institute of Mining and Metallurgy:Melbourne, Australia, 2017; pp. 365–372.
3. Minnitt, R.C.A. Sampling: The impact on costs and decision making. J. S. Afr. Inst. Min. Metall. 2007, 107,451–462.
4. Parbhakar-Fox, A.; Dominy, S.C. Sampling and blending in geoenvironmental campaigns–current practiceand future opportunities. In Proceedings of the World Conference on Sampling and Blending, Perth,Australia, 9–11 May 2017; Australasian Institute of Mining and Metallurgy: Melbourne, Australia, 2017;pp. 45–53.
5. Pitard, F.F. Sampling correctness: A comprehensive guide. In Proceedings of the World Conference onSampling and Blending, Sunshine Coast, Australia, 10–12 May 2005; Australasian Institute of Mining andMetallurgy: Melbourne, Australia, 2005; pp. 55–66.
6. Gy, P.M. Sampling of Particulate Materials: Theory and Practice; Elsevier: Amsterdam, The Netherlands,1982; p. 431.
7. Pitard, F.F. From errors to uncertainty—A clarification for proper use by the Theory of Sampling.In Proceedings of the World Conference on Sampling and Blending, Perth, Australia, 9–11 May 2017;Australasian Institute of Mining and Metallurgy: Melbourne, Australia, 2017; pp. 355–358.
8. Bazin, C.; Hodouin, D.; Mermillod-Blondin, R. Reproducibility of low grade ore batches prepared formetallurgical testing. In Proceedings of the World Conference on Sampling and Blending, Lima, Peru,19–22 November 2013; Gecamin: Santiago, Chile, 2013; pp. 419–433.
9. McCarthy, P.L. Managing technical risk for mine feasibility studies. In Proceedings of the Mining RiskManagement Conference, Sydney, Australia, 9–12 August 2003; Australasian Institute of Mining andMetallurgy: Melbourne, Australia, 2003; pp. 21–27.
10. Pitard, F.F. Pierre Gy’s Sampling Theory and Sampling Practice; CRC Press: Boca Raton, FL, USA, 1993; p. 488.11. Dominy, S.C.; O’Connor, L. Geometallurgy–beyond conception. In Proceedings of the International
Geometallurgy Conference, Perth, Australia, 15–16 June 2016; Australasian Institute of Mining andMetallurgy: Melbourne, Australia, 2016; pp. 3–10.
12. Dominy, S.C.; Xie, Y. Optimising sampling protocols via the heterogeneity test: Challenges in coarse goldmineralisation. Min. Technol. 2016, 125, 103–113. [CrossRef]
13. Petersen, L.; Dahl, C.K.; Esbensen, K.H. Representative mass reduction in sampling—A critical survey oftechniques and hardware. Chemom. Intell. Lab. Syst. 2004, 74, 95–114. [CrossRef]
14. Thompson, M.; Howarth, R.J. A new approach to the estimation of analytical precision. J. Geochem. Exp.1978, 9, 23–30.
15. Angove, J.; Acar, S. Metallurgical testwork: Gold processing options, physical ore properties and cyanidemanagement. In Advances in Gold Ore Processing; Elsevier: Amsterdam, The Netherlands, 2016; pp. 131–140.
16. Goodall, W.R.; Leatham, J.D.; Scales, P.J. A new method for the determination of preg-robbing in gold ores.Miner. Eng. 2005, 18, 1135–1141. [CrossRef]
17. Hanks, J.; Barratt, D. Sampling a mineral deposit for metallurgical testing and the design of comminutionand mineral separation processes. In Proceedings of the Mineral Processing Plant Design, Practice andControl, Vancouver, BC, Canada, 20–24 October 2002; Society for Mining, Metallurgy and Exploration:Littleton, CO, USA, 2002; pp. 99–116.
18. Laplante, A.R.; Spiller, D.E. Bench-Scale and Pilot Plant Test Work for Gravity Concentration Circuit Design.In Proceedings of theMineral Processing Plant Design, Practice and Control, Vancouver, BC, Canada,20–24 October 2002; Society for Mining, Metallurgy and Exploration: Littleton, CO, USA, 2002; pp. 160–175.
19. Lorenzen, L.; Tumilty, J.A. Diagnostic leaching as an analytical tool for evaluating the effect of reagents onthe performance of a gold plant. Miner. Eng. 1992, 5, 503–512. [CrossRef]
20. Anderson, M.A. Planning the mineral processing plant. In Mineral Property Evaluation: Handbook for FeasibilityStudies and Due Diligence; Society for Mining, Metallurgy and Exploration: Englewood, CO, USA, 2018;pp. 175–208.

Minerals 2018, 8, 193 43 of 47
21. Ramsey, M.H.; Ellison, S.L.R. Measurement Uncertainty Arising from Sampling: A Guide to Methods andApproaches (EURACHEM/CITAC Guide); Eurachem: Olomouc, Czech Republic, 2007; p. 102.
22. Rendu, J.-M. Risk Management in Evaluating Mineral Deposits; Society for Mining, Metallurgy and Exploration:Littleton, CO, USA, 2017; p. 310.
23. Anderson, W. The scheduling, costing and importance of metallurgical testwork programmes in processplant feasibility studies. In Proceedings of the International Congress on Mineral Processing and ExtractiveMetallurgy, Melbourne, Australia, 11–13 September 2000; Australasian Institute of Mining and Metallurgy:Melbourne, Australia, 2000; pp. 79–89.
24. Dunham, S.; Vann, J.; Coward, S. Beyond geometallurgy–gaining competitive advantage by exploiting thebroad view of geometallurgy. In Proceedings of the International Geometallurgy Conference, Brisbane,Australia, 5–7 September 2011; Australasian Institute of Mining and Metallurgy: Melbourne, Australia, 2011;pp. 115–123.
25. McKay, N.; Vann, J.; Ware, W.; Morley, C.S.; Hodkiewicz, P. Strategic versus tactical geometallurgy—Asystematic process to add and sustain resource value. In Proceedings of the International GeometallurgyConference, Perth, Australia, 15–16 June 2016; Australasian Institute of Mining and Metallurgy: Melbourne,Australia, 2016; pp. 29–36.
26. JORC. Australasian Code for Reporting of Exploration Results, Mineral Resources and Ore Reserves—The JORCCode; Joint Ore Reserves Committee of the Australasian Institute of Mining and Metallurgy, AustralianInstitute of Geoscientists and Minerals Council of Australia: Melbourne, Australia, 2012; p. 44.
27. NI43-101. National Instrument 43-101, Standards of Disclosure for Mineral Projects; Canadian SecuritiesAdministrators: Montreal, QC, Canada, 2011; p. 44.
28. Dominy, S.C.; Platten, I.M. Clustering of gold particles and implications for sampling. Appl. Earth Sci. 2007,116, 130–142. [CrossRef]
29. Dominy, S.C.; Xie, Y.; Platten, I.M. Gold particle characteristics in narrow vein deposits: Implicationsfor evaluation and metallurgy. In Proceedings of the Narrow Vein Mining Conference, Ballarat, Australia,14–15 October 2008; Australasian Institute of Mining and Metallurgy: Melbourne, Australia, 2008; pp. 91–104.
30. Lewis, P.J. Metallurgical input to the determination of Ore Reserves. In Mineral Resource and Ore ReserveEstimation; Australasian Institute of Mining and Metallurgy: Melbourne, Australia, 2014; pp. 433–441.
31. Guresin, N.; Lorenzen, L.; Dominy, S.C.; Muller, H.; Cooper, A. Sampling and testwork protocols for processplant design. In Proceedings of the Sampling Conference, Perth, Australia, 21–22 August 2012; AustralasianInstitute of Mining and Metallurgy: Melbourne, Australia, 2012; pp. 95–107.
32. Dominy, S.C. Predicting the unpredictable–evaluating high-nugget effect gold deposits. In Mineral Resourceand Ore Reserve Estimation; Australasian Institute of Mining and Metallurgy: Melbourne, Australia, 2014;pp. 659–678.
33. François-Bongarçon, D.M. Fishy samples: How big a sample to avoid the infamous Poisson effect.In Proceedings of the World Conference on Sampling and Blending, Cape Town, South Africa,21–23 October 2009; Southern African Institute of Mining and Metallurgy: Johannesburg, South Africa, 2009;pp. 43–46.
34. Pitard, F.F. Pierre Gy’s Theory of Sampling and Ingamells Poisson Process Approach: Pathways to RepresentativeSampling and Appropriate Industry Standards; Aalborg University: Esbjerg, Denmark, 2009; p. 309.
35. Clark, I. Statistics or geostatistics-sampling error or the nugget effect? In Proceedings of the World Conferenceon Sampling and Blending, Cape Town, South Africa, 21–23 October 2009; Southern African Institute ofMining and Metallurgy: Johannesburg, South Africa, 2009; pp. 13–18.
36. Carrasco, P.C.; Carrasco, P.; Jara, E. The economic impact of incorrect sampling and analysis practices in thecopper mining industry. Chemom. Intell. Lab. Syst. 2004, 74, 209–214.
37. Dominy, S.C.; Glass, H.J.; O’Connor, L.; Lam, C.K.; Purevgerel, S.; Minnitt, R.C.A. Integrating the Theory ofSampling into underground grade control strategies. Minerals 2018. under review.
38. Fourie, D.; Minnitt, R.C.A. Review of gold reef sampling and its impact on the mine call factor. J. S. Afr. Inst.Min. Metall. 2013, 116, 1001–1019. [CrossRef]
39. Minnitt, R.C.A. Sampling in the South African mining industry. In Proceedings of the Sampling and AnalysisConference, Muldersdrift, South Africa, 4–6 June 2013; Southern African Institute of Mining and Metallurgy:Johannesburg, South Africa, 2013; pp. 1–28.

Minerals 2018, 8, 193 44 of 47
40. François-Bongarçon, D.M.; Gy, P.M. The most common error in applying Gy’s formula in the theory ofmineral sampling and the history of the Liberation factor. J. S. Afr. Inst. Min. Metall. 2002, 102, 475–479.
41. Minnitt, R.C.A.; Assibey-Bonsu, W. A comparison between the duplicate series method and the heterogeneitytest as methods for calculating the sampling constants. J. S. Afr. Inst. Min. Metall. 2010, 110, 251–268.
42. Dominy, S.C.; Platten, I.M.; Xie, Y. Determining gold particle size in gravity ores for sampling andmetallurgical characterisation: Discussion and test protocol. In Proceedings of the Gravity Gold Conference,Ballarat, Australia, 21–22 September 2010; Australasian Institute of Mining and Metallurgy: Melbourne,Australia, 2010; pp. 83–95.
43. Dominy, S.C.; O’Connor, L.; Xie, Y. Sampling and testwork protocol development for geometallurgicalcharacterisation of a sheeted vein gold deposit. In Proceedings of the International GeometallurgyConference, Perth, Australia, 15–16 June 2016; Australasian Institute of Mining and Metallurgy: Melbourne,Australia, 2016; pp. 97–112.
44. Pitard, F.F. The advantages and pitfalls of conventional heterogeneity tests and a suggest alternative.TOS Forum 2015, 5, 13–18.
45. Gonzalez, P.; Cossio, S. A review of sampling protocol for a gold ore based on liberation study. In Proceedingsof the World Conference on Sampling and Blending, Porto Alegre, Brazil, 23–25 October 2007; FundacaoLuiz Englert: Porto Alegre, Brazil, 2007; pp. 163–174.
46. Villanova, F.L.S.P.; Heberle, A.; Chieregati, A.C. Heterogeneity tests and core logging: A final reconciliation.In Proceedings of the Eighth World Conference on Sampling and Blending, Perth, Australia, 9–11 May 2017;Australasian Institute of Mining and Metallurgy: Melbourne, Australia, 2017; pp. 107–113.
47. Carswell, J.T.; Yulia, K.; Lesmana, D.; Steamy, K. Grade control sampling quality assurance/qualitycontrol in a high-grade gold mine—Gosowong, Indonesia. In Proceedings of the International MiningGeology Conference, Perth, Australia, 17–19 August 2009; Australasian Institute of Mining and Metallurgy:Melbourne, Australia, 2009; pp. 283–290.
48. Stanley, C.R.; Smee, B.W. Strategies for reducing sampling errors in exploration and resource definitiondrilling programmes for gold deposits. Geochem. Explor. Environ. Anal. 2007, 7, 329–340. [CrossRef]
49. Ramsey, M.H.; Geelhoed, B.; Wood, R.; Damant, P. Improved evaluation of measurement uncertainty fromsampling by inclusion of between-sampler bias using sampling proficiency testing. Analyst 2011, 136,1313–1321. [CrossRef] [PubMed]
50. Magnusson, B.; Ornemark, U. The Fitness for Purpose of Analytical Methods: A Laboratory Guide to MethodValidation and Related Topics; Eurachem: Olomouc, Czech Republic, 2014; p. 62.
51. Roden, S.; Smith, T. Sampling and analysis protocols and their role in mineral exploration and new resourcedevelopment, In Mineral Resource and Ore Reserve Estimation; Australasian Institute of Mining and Metallurgy:Melbourne, Australia, 2014; pp. 53–60.
52. Pitard, F.F. Practical and theoretical difficulties when sampling for gold. In Proceedings of the MineralProcessing Plant Design, Practice and Control, Vancouver, Canada, 20–24 October 2002; Society for Mining,Metallurgy and Exploration: Littleton, CO, USA, 2002; pp. 77–98.
53. DS3077. Representative Sampling–Horizontal Standard; Danish Standards Foundation: Copenhagen, Denmark,2013; p. 41.
54. Dominy, S.C.; O’Connor, L.; Xie, Y.; Glass, H.J. Geometallurgical sampling protocol validation by bulksampling in a sheeted vein gold deposit. In Proceedings of the World Conference on Sampling and Blending,Perth, Australia, 9–11 May 2017; Australasian Institute of Mining and Metallurgy: Melbourne, Australia,2017; pp. 185–196.
55. Ellison, S.L.R.; King, B.; Rosslein, M.; Salit, M.; Williams, A. Traceability in Chemical Measurement: A Guide toAchieving Comparable Results in Chemical Measurement; Eurachem: Olomouc, Czech Republic, 2003; p. 37.
56. Lyman, G.J.; Bourgeois, F.S. Sampling, corporate governance and risk analysis. In Landmark Papers byPracticing Metallurgists; Australasian Institute of Mining and Metallurgy: Melbourne, Australia, 2017;pp. 349–354.
57. Glass, H.J.; Zegers, T.W. Statistical aspects of sampling particulate matter. In Proceedings of the SurfaceMining Conference, Johannesburg, South Africa, 30 September–4 October 1996; Southern African Institute ofMining and Metallurgy: Johannesburg, South Africa, 1996; pp. 157–164.
58. Pitard, F.F. Guidelines for acceptable allotted sampling uncertainty. In Proceedings of the World Conferenceon Sampling and Blending, Lima, Peru, 19–22 November 2013; Gecamin: Santiago, Chile, 2013; pp. 89–98.

Minerals 2018, 8, 193 45 of 47
59. Lyn, J.A.; Ramsey, M.H.; Damant, A.P.; Wood, R. Empirical versus modelling approaches to the estimation ofmeasurement uncertainty caused by primary sampling. Analyst 2007, 132, 1231–1237. [CrossRef] [PubMed]
60. Vallée, M.A. Sampling optimisation. In Guide to the Evaluation of Gold Deposits; CIM: Montreal, QC, Canada,1992; pp. 45–62.
61. Williams, S. Metallurgy and geometallurgy—Whats the difference. SEG Newslett. 2012, 88, 30–31.62. David, D. Geometallurgical guidelines for miners, geologists and process engineers—Discovery to design.
In Mineral Resource and Ore Reserve Estimation; Australasian Institute of Mining and Metallurgy: Melbourne,Australia, 2014; pp. 443–450.
63. Kojovic, T.; Michaux, S.; Walters, S. Developments of new comminution testing methodologies forgeometallurgical mapping of ore hardness and throughput. In Proceedings of the International MineralProcessing Congress, Brisbane, Australia, 6–10 September 2010; Australasian Institute of Mining andMetallurgy: Melbourne, Australia, 2010; pp. 891–899.
64. Ehrig, K.; Liebezeit, V.; Smith, M.; Macmillan, E.; Lower, C. Geologists and the value chain–howmaterial characterisation by modern mineralogy can optimise design and operation of processing facilities.In Proceedings of the International Mining Geology Conference, Adelaide, Australia, 18–20 August 2014;Australasian Institute of Mining and Metallurgy: Melbourne, Australia, 2014; pp. 5–13.
65. Ehrig, K.; Pitard, F.F. Sampling the supergiant Olympic Dam iron-oxide Cu-U-Au-Ag deposit,South Australia. In Proceedings of the World Conference on Sampling and Blending, Perth, Australia,9–11 May 2017; Australasian Institute of Mining and Metallurgy: Melbourne, Australia, 2017; pp. 21–27.
66. Ehrig, K.; Liebezeit, V.; Macmillan, E. Metallurgical QAQC–who needs it? The Olympic Damexperience. In Proceedings of the Metallurgical Plant Design and Operating Strategies, Perth, Australia,11–12 September 2017; Australasian Institute of Mining and Metallurgy: Melbourne, Australia, 2017;pp. 31–44.
67. Lorenzen, L.; Barnard, M.J. Why is mineralogical data essential for designing a metallurgical testworkprogramme for process selection and design? In Proceedings of the International Geometallurgy Conference,Brisbane, Australia, 5–7 September 2011; Australasian Institute of Mining and Metallurgy: Melbourne,Australia, 2011; pp. 163–172.
68. Zhou, J.; Gu, Y. Geometallurgical characterisation and automated mineralogy of gold ores. In Advances inGold Ore Processing; Elsevier: Amsterdam, The Netherlands, 2016; pp. 95–111.
69. Leichliter, S. From the core logger to the metallurgist—A geometallurgists views on ore geology. SEG Newslett.2013, 95, 15.
70. Dominy, S.C.; Platten, I.M.; Xie, Y.; Cuffley, B.W.; O’Connor, L. Characterisation of gold ore from the NickO’Time shoot (Tarnagulla, Australia) using high resolution X-ray computed tomography. In Proceedingsof the International Geometallurgy Conference, Perth, Australia, 15–16 June 2016; Australasian Institute ofMining and Metallurgy: Melbourne, Australia, 2016; pp. 241–254.
71. Dominy, S.C. Effects of sample mass on gravity recoverable gold test results in low grade ores. Appl. Earth Sci.2014, 123, 234–242. [CrossRef]
72. Lorenzen, L. Some guidelines to the design of a diagnostic leaching experiment. Miner. Eng. 1995, 8, 247–256.[CrossRef]
73. Goodall, W.R.; Scales, P.J.; Butcher, A.R. The use of QEMSCAN and diagnostic leaching in the characterisationof visible gold in complex ores. Miner. Eng. 2005, 18, 877–886. [CrossRef]
74. Kormos, L.; Sliwinski, J.; Oliveira, J.; Hill, G. Geometallurgical characterisation and representativemetallurgical sampling at Xstrata process support. In The Annual Canadian Mineral Processors OperatorsConference; CIM: Montreal, QC, Canada, 2013; pp. 3–14.
75. Lotter, N.O. Stratified sampling of drill core. In Proceedings of The Annual Canadian Mineral ProcessorsConference, Ottawa, ON, Canada, 19–21 January 2010; CIM: Montreal, QC, Canada, 2010; pp. 163–179.
76. Giblett, A.; Napier-Munn, T.J. Measuring the influence of sample size on the precision and accuracy ofgravity gold estimation. In Landmark Papers by Practicing Metallurgists; Australasian Institute of Mining andMetallurgy: Melbourne, Australia, 2017; pp. 361–364.
77. Dominy, S.C.; Platten, I.M.; Xie, Y. Bulk sampling of complex gold deposits: Material characterisation,programme design and management. In Proceedings of the Sampling Conference, Perth, Australia,27–29 May 2008; Australasian Institute of Mining and Metallurgy: Melbourne, Australia, 2008; pp. 41–57.
78. Rem, P.C.; Glass, H.J. Automated sampling of recycled glass. Glass 1996, 12, 524–527.

Minerals 2018, 8, 193 46 of 47
79. Clifton, H.E.; Hunter, R.E.; Swanson, F.J.; Phillips, R.L. Sample Size and Meaningful Gold Analysis; ProfessionalPaper 625-C; United States Geological Survey: Washington, DC, USA, 1969; p. 19.
80. Dominy, S.C.; O’Connor, L.; Glass, H.J.; Xie, Y. Geometallurgical study of a gravity recoverable gold orebody.Minerals 2018, 8, 186. [CrossRef]
81. Clark, I.; Dominy, S.C. Underground bulk sampling, uniform conditioning and conditionalsimulation-unrealistic expectations? In Proceedings of the World Conference on Sampling and Blending,Perth, Australia, 9–11 May 2017; Australasian Institute of Mining and Metallurgy: Melbourne, Australia,2017; pp. 3–19.
82. Gonzalez, P. Sampling gold ores for metallurgical process design by cyanidation. In Proceedings of theWorld Conference on Sampling and Blending, Lima, Peru, 19–22 November 2013; Gecamin: Santiago, Chile,2013; pp. 353–361.
83. Jacobs, P.J. Large diameter core sampling. In Proceedings of the Sampling Conference, Perth, Australia,29–30 July 2014; Australasian Institute of Mining and Metallurgy: Melbourne, Australia, 2014; pp. 71–76.
84. Dominy, S.C. Sampling coarse gold-bearing mineralisation-developing effective protocols and a case studyfrom the Ballarat mine, Australia. In Proceedings of the World Conference on Sampling and Blending, Perth,Australia, 9–11 May 2017; Australasian Institute of Mining and Metallurgy: Melbourne, Australia, 2017;pp. 3–19.
85. Annels, A.E.; Dominy, S.C. Core recovery and quality: Important factors in mineral resource evaluation.Appl. Earth Sci. 2003, 112, 305–312. [CrossRef]
86. Simon, A.; Gosson, G. Considerations on quality assurance/quality control and sample security.In Proceedings of the Sampling Conference, Perth, Australia, 27–29 May 2008; Australasian Institute ofMining and Metallurgy: Melbourne, Australia, 2008; pp. 135–140.
87. Whittaker, P.J. Process mineralogy at Xstrata Process Support. In Geometallurgy and Applied Mineralogy ShortCourse; Conference of Metallurgists; CIM: Montreal, QC, Canada, 2009; p. 34.
88. Royle, A.G. The Design of Sampling Programmes; University of Leeds: Leeds, UK, 1983; p. 70.89. Royle, A.G. Splitting gold assay pulps containing coarse gold. J. Leeds Univ. Min. Assoc. 1989, 89, 63–68.90. Tickner, J.; Ganly, B.; Lovric, B.; O’Dwyer, J. Improving the sensitivity and accuracy of gamma activation
analysis for the rapid determination of gold in mineral ore. Appl. Radiat. Isot. 2017, 122, 28–36. [CrossRef][PubMed]
91. Coetzee, L.L.; Theron, S.J.; Martin, G.J.; van der Merwe, J.-D.; Stanek, T.A. Modern gold deportments and itsapplication to industry. Miner. Eng. 2011, 24, 565–575. [CrossRef]
92. Henley, K.J. A combined mineralogical/metallurgical approach to determine the nature and location of goldin ores and mill products. Miner. Eng. 1989, 2, 459–470. [CrossRef]
93. Lane, G.; McComb, M. The Effects of Nuggety Gold on Gold Deportment—Lessons from Beaton CreekPaleo-Placer Gold Project, Australia. In Proceedings of the 47th Annual Canadian Mineral ProcessorsConference, Ottawa, ON, Canada, 20–24 January 2015.
94. Lastra, R.; Price, J.; Cabri, L.J.; Rudashevsky, N.S.; Rudashevsky, V.N.; McMahon, G. Gold characterisation ofa sample from Malartic East (Quebec) using concentration by hydroseparator. In The International Treatmentof Gold Ores Symposium; CIM: Montreal, QC, Canada, 2005; pp. 17–29.
95. Zhou, J.; Jago, B.; Martin, C. Establishing the Process Mineralogy of Gold Ores; Technical Bulletin 2004-03;SGS Minerals Ltd.: Lakefield, ON, Canada, 2004; p. 16.
96. Jones, M.P.; Cheung, T.S. Automatic method for finding gold grains in ores and mill products. In Proceedingsof the Asian Mining Conference; Institution of Mining and Metallurgy: London, UK, 1988; pp. 73–81.
97. Sketchley, D.A. Gold deposits: Establishing sampling protocols and monitoring quality control.Explor. Min. Geol. 1998, 7, 129–138.
98. Andrade, V.L.L.; Santos, N.A.; Goncalves, K.L.C.; Wyslouzu, H.; Davila, G. Obtaining metallurgical datafrom drill core samples using a mini pilot plant. In Proceedings of the International Mining Congress ofTurkey, Izmir, Turkey, 9–12 June 2005; Chamber of Mining Engineers: Ankara, Turkey, 2005; pp. 195–206.
99. Dominy, S.C.; Petersen, J.S. Sampling coarse gold-bearing mineralisation-developing effective protocolsand a case study from the Nalunaq mine, Southern Greenland. In Proceedings of the World Conference onSampling and Blending, Sunshine Coast, Australia, 10–12 May 2005; Australasian Institute of Mining andMetallurgy: Melbourne, Australia, 2005; pp. 151–165.

Minerals 2018, 8, 193 47 of 47
100. Johansen, G.F.; Dominy, S.C. Development of sampling and assaying protocols at the new Bendigo goldproject, Victoria, Australia. In Proceedings of the World Conference on Sampling and Blending, SunshineCoast, Australia, 10–12 May 2005; Australasian Institute of Mining and Metallurgy: Melbourne, Australia,2005; pp. 175–183.
101. CIM. Definition Standards for Mineral Resources and Mineral Reserves; CIM: Montreal, QC, Canada, 2014; p. 9.102. CIM. Best Practice Guidelines for Mineral Processing; CIM: Montreal, QC, Canada, 2011; p. 26.103. Esbensen, K.H.; Wagner, C. Theory of Sampling (TOS) versus measurement uncertainty (MU)—A call for
integration. Trends Anal. Chem. 2014, 57, 93–106. [CrossRef]
© 2018 by the authors. Licensee MDPI, Basel, Switzerland. This article is an open accessarticle distributed under the terms and conditions of the Creative Commons Attribution(CC BY) license (http://creativecommons.org/licenses/by/4.0/).