Radiographic Testing - Mookambika Metallurgical Solutions
696
-
Upload
khangminh22 -
Category
Documents
-
view
1 -
download
0
Transcript of Radiographic Testing - Mookambika Metallurgical Solutions


User's Instructions for this CD 10/29/02 1:28 PM Page 1
Nondestructive Testing Handbook, third edition:Volume 4, Radiographic Testing on CD-ROM
The content of the printed book has been reproduced exactly in portable documentformat (pdf) files accessed with the Adobe Acrobat Reader. (Adobe Acrobat Reader withSearch for Windows and Macintosh are provided on this CD.) Additional featuresof the CD-ROM version include video, more than 50 color illustrations, bookmarkedlinks for navigating from point to point and searchable text.All text has been indexed for electronic search. Use the Find tool to locate text inindividual documents. Use the Search tool to look in all documents. Acrobat Readerwith Search generates a list of documents containing your search request in order ofgreatest incidence first. Click an item in the list to open it. Every instance of thesearch results is highlighted. Click Go to Next View arrow to increment forward, Go toPrevious View arrow to increment back. Parts within chapters contain Article Threads thatfacilitate reading from column to column. Click with the Hand tool within a columnto automatically enlarge the view and increment text. The Adobe Acrobat Reader Guidehas comprehensive instructions. Click here to open.
Explanation of Linking Structure• Open any pdf document. All are interconnected and it is not necessary to access
them in any particular order.• Each document is designed to open to the title page of a chapter or the first page of
a book segment. The Bookmark Pane appears on the left. Bookmarks link to a viewwithin the current document or to a view in another document. Click to open theview. An arrow or triangle to the left of a bookmark indicates a subhead. Click toexpand for additional links. Click again to close.
• Each Bookmark Pane has these basic Bookmarks.
User’s Introduction to this CD-ROMFront Matter with Table of ContentsMultimedia ContentsLinks to ChaptersIndexFigure SourcesMovie Sources
• User’s Introduction to this CD — instructions for tools and linking structure.• Front Matter with Table of Contents — publishing info and links to contents.• Multimedia Contents — pages with text links to video files.• Links to Chapters — comprehensive links to subheads, figures, tables and equations
within the current document and a single link to every other chapter.• Index — index for the complete volume.

User's Instructions for this CD 10/29/02 2:01 PM Page 2
Navigation Tools
Installers for the Adobe Acrobat Reader with Search provided on this CD-ROM alsoinstall online help called Reader Guide under the Help menu (or click this link).Complete instructions for tools are there.
Acrobat Reader toolbar.
Page turners for current document — first page, previous page, next page, and last page.
Go to Previous View or Go to Next View along viewing path.
Adjust size of document in view window — 100 percent, fit in window, or fit width
Hand tool moves document within window. Indicates an action by changing to pointinghand when passing over a link or article thread.
Find tool — enter a text string to search for a word or words within the current document.
Search all indexed documents. First icon opens Adobe Acrobat with Search. Click indexes... toselect Radiographic Testing (browse to locate xcatalog.pdx on CD-ROM). Enter text string inFind Results Containing Text field. Click Search. Second icon will list all documents containinginstances of search request in order of greatest incidence first. Click to select a document.Remaining two tools step forward or back to each highlighted instance of text search. Fordetailed instructions for this advanced search feature, click this link.

HANDBOOKNONDESTRUCTIVE TESTING
Technical EditorsRichard H. BossiFrank A. IddingsGeorge C. Wheeler
EditorPatrick O. Moore
FOUNDED 1941
®
American Society for Nondestructive Testing
Third Edition
RadiographicTesting
Volume 4
3RT00FM(i-xii) 10/14/02 2:39 PM Page i

Copyright © 2002AMERICAN SOCIETY FOR NONDESTRUCTIVE TESTING, INC.All rights reserved.
No part of this book may be reproduced, stored in a retrieval system or transmitted, in any form or by any means —electronic, mechanical, photocopying, recording or otherwise — without the prior written permission of the publisher.Nothing contained in this book is to be construed as a grant of any right of manufacture, sale or use in connection withany method, process, apparatus, product or composition, whether or not covered by letters patent or registeredtrademark, nor as a defense against liability for the infringement of letters patent or registered trademark.
The American Society for Nondestructive Testing, its employees, and the contributors to this volume assume noresponsibility for the safety of persons using the information in this book.
Copyright © 2002 by the American Society for Nondestructive Testing, Incorporated. All rights reserved. ASNT is notresponsible for the authenticity or accuracy of information herein, and published opinions and statements do notnecessarily reflect the opinion of ASNT. Products or services that are advertised or mentioned do not carry theendorsement or recommendation of ASNT.
ACCPSM, IRRSPSM, Level III Study GuideSM, Materials EvaluationSM, NDT HandbookSM, Nondestructive Testing HandbookSM,The NDT TechnicianSM and www.asnt.orgSM are service marks of the American Society for Nondestructive Testing.ASNT®, Research in Nondestructive Evaluation® and RNDE® are registered trademarks of the American Society forNondestructive Testing.
ASNT exists to create a safer world by promoting the profession and technologies of nondestructive testing.
American Society for Nondestructive Testing, Incorporated1711 Arlingate LanePO Box 28518Columbus, OH 43228-0518(614) 274-6003; fax (614) 274-6899www.asnt.org
ErrataErrata if available for this printing may be obtained from ASNT’s Web site, www.asnt.org, or as hard copy by mail from ASNT,free on request addressed to the NDT Handbook Editor at the address above.
Library of Congress Cataloging-in-Publication DataRadiographic Testing / technical editors, Richard H. Bossi, Frank A. Iddings,
George C. Wheeler; . -- 3rd ed.p. cm. — (Nondestructive testing handbook ; v. 4)
Includes bibliographic references and index.ISBN 1-57117-046-61. Radiography, industrial. I. Bossi, R. H. II. Iddings, F.A. III. Wheeler, G.C.
IV. Moore, Patrick O. V. American Society for Nondestructive Testing.IV. Series: Nondestructive testing handbook (3rd ed.) ; v. 4.TA417.25 .R32 2002 2002012672620.1’1272--dc21
Published by the American Society for Nondestructive Testing
PRINTED IN THE UNITED STATES OF AMERICA
NOTE:Information presented on this page (highlighted in gray) is specific for theprinted version of this publication. For Library of Congress Cataloging-in-Publication data pertaining to the CD-ROM edition, please click this link.
ii Radiographic Testing
3RT00FM(i-xii) 10/28/02 2:30 PM Page ii
iiiRadiographic Testing
The twenty-first century has now arrivedand we are aware that technology willcontinue to accelerate at blinding speed.As these changes occur, adaptation andimplementation by the end user mustkeep pace with proven innovations. Asmanagers and engineers we have beenquick to defend the status quo and havebeen slow to change when change isneeded. Currently we are seeing asignificant lag in the usage of suchinnovations as digital radiography. Thenew challenge for practitioners andregulatory bodies will be the acceptanceand integration of this already proventechnology.
The vitality and future of the AmericanSociety for Nondestructive Testing dependon the creation, improvement andsharing of information so that safety andreliability stay at the forefront of productdevelopment.
This volume represents the efforts ofmany dedicated professionals who haveembraced change and given freely of theirtime with the mission of making adifference in their chosen profession.ASNT commends each and everycontributor for their efforts in bridgingtoday’s technology with tomorrow’spossibilities.
There were more than 100 individualcontributors and reviewers, representingboth volunteers and staff in an essentialongoing partnership. Each has given apiece of themselves that can never berepaid.
A special thanks is due to technicaleditors Richard Bossi, Frank Iddings andGeorge Wheeler for their commitment tothis project. This job requires an in-depthunderstanding of the component parts ofthe technology. The job is long andtedious and must be driven from the heartand the mind.
I must also thank the ASNT staff andNDT Handbook Editor Patrick Moore fortheir guidance and continued pursuit ofexcellence. Year in and year out they havemade the necessary sacrifices to ensurequality and value.
Finally, reflective tribute must go to anindividual who crossed paths with my
ASNT career briefly in 1974. His start inthe NDT profession came as aradiographer in the Boston ship yards. Hisname was Philip Johnson. He was thearchitect and founder of this society. Hewas the visionary who saw the need todraw upon our collective differences andunite for a common cause.
Johnson served as the organization’sSecretary from 1941 to 1965. He alsoassumed the dual role of editor for manyof those years. In addition Johnson servedas our Executive Director from 1965through 1974. Phil provided thecontinuity and focus that must sustainany organization in those formative years.As you read through this book rememberthat it was Johnson that made possiblethe process of cooperative collaboration.
Stephen P. BlackASNT President, 2001-2002
President’s Foreword
3RT00FM(i-xii) 10/14/02 2:39 PM Page iii

iv Radiographic Testing
Aims of a HandbookThe volume you are holding in your handis the fourth in the third edition of theNondestructive Testing Handbook. Now is agood time to reflect on the purposes andnature of a handbook.
Handbooks exist in many disciplines ofscience and technology, and certainfeatures set them apart from otherreference works. A handbook shouldideally give the basic knowledge necessaryfor an understanding of the technology,including both scientific principles andmeans of application.
The typical reader may be assumed tohave completed three years of collegetoward a degree in mechanicalengineering or materials science andhence has the background of anelementary physics or mechanics course.Additionally this volume provides apositive reinforcement for the use ofcomputer based media that enhances itseducational value and enlightens all levelsof education and training.
Note that any handbook offers a viewof its subject at a certain period in time.Even before it is published, it can begin toget obsolete. The authors and editors dotheir best to be current but thetechnology will continue to change evenas the book goes to press.
Standards, specifications,recommended practices and inspectionprocedures may be discussed in ahandbook for instructional purposes, butat a level of generalization that isillustrative rather than comprehensive.Standards writing bodies take great painsto ensure that their documents aredefinitive in wording and technicalaccuracy. People writing contracts orprocedures should consult the actualstandards when appropriate.
Those who design qualifyingexaminations or study for them draw onhandbooks as a quick and convenient wayof approximating the body of knowledge.Committees and individuals who write oranticipate questions are selective in whatthey draw from any source. The parts of ahandbook that give scientific background,for instance, may have little bearing on apractical examination except to providethe physical foundation to assist handlingof more challenging tasks. Other parts ofa handbook are specific to a certain
industry. This handbook provides acollection of perspectives on its subject tobroaden its value and convenience to thenondestructive testing community.
The present volume is a worthyaddition to the third edition. The editors,technical editors and many contributorsand reviewers worked together to bringthe project to completion. For theirscholarship and dedication I thankthem all.
Gary L. WorkmanHandbook Development Director
Foreword
3RT00FM(i-xii) 10/14/02 2:39 PM Page iv

vRadiographic Testing
Radiographic testing has been apreeminent method of nondestructivetesting since the discovery of X-rays in1895. Film radiography in particular hasbeen the backbone of industrialapplications of penetrating radiation. It isfundamentally a very elegant analogprocess that provides an internalevaluation of solid objects. Although filmradiography remains the most widelyused method of radiographic testing,many other penetrating radiationtechniques for nondestructive testinghave been developed. In recent years theadvancements in speed and capability ofdigital data processing have increased theapplication of digital methods forpenetrating radiation inspections. Thetransition from analog to digitaltechnology will continue into the future.
This volume of the NondestructiveTesting Handbook, third edition, combinesessential information on the traditionalpenetrating radiation testing techniquesand incoming techniques using digitaltechnology. Building on material in thefirst edition (1959) and the second edition(1985), the many contributors of thisvolume have assembled the basic body ofknowledge for radiographic testing. Muchof the information in the second editionradiography volume has been maintainedand enhanced, while some dated or rarelyused material has been dropped. The firstand second editions thus remain usefulreferences — not only for historicalpurposes but for material that could notlonger be included in the present edition.
Considerable new information hasbeen added, particularly in the area ofdigital imaging, data processing anddigital image reconstruction. Othermaterial has been updated with recentinformation in such areas as radiationsources, standards, interpretation andapplications. Techniques such asbackscatter imaging and computedtomography were not covered in earliereditions but have their own chapter inthis edition.
The team of contributors has tried toprepare as useful a text as possible. Inmany cases, items are discussed inmultiple chapters to keep the continuityof the discussion in that particularchapter. This also provides multiplecontexts for understanding concepts andtechniques. In other cases the handbook
may rely on other chapters for details ona particular concept. The reader isencouraged to refer to the index to findinformation on items of interest inmultiple chapters. Because of the currentrate of change in technology, it is notpossible to have a handbook that iscompletely up to date. This handbookcontains the fundamental, as well as themost recent material available at the timeof its writing. Where possible, tables andfigures are used to serve as a quick andready means of finding essential technicalinformation. The references for eachchapter should be helpful for the readerseeking additional material. Readers arealso encouraged to use the internet andASNT’s Web site to find supplementalmaterial on equipment and topics that aresubject to change with technologicaladvancement.
It has been the pleasure of thetechnical editors to work with the authorsand ASNT’s Nondestructive TestingHandbook staff to provide this thirdedition of the radiography handbook. Wewish to thank all the contributors,including those named in the currentvolume, those who provided material tothe contributors and may not have beennamed, and those whose contributions toearlier editions have been carried over tothis edition. We hope this edition provesuseful as both a quick reference fortechnical details and a source offundamental information forcomprehensive understanding.
Richard H. BossiFrank A. IddingsGeorge C. Wheeler
Preface
3RT00FM(i-xii) 10/14/02 2:39 PM Page v

Radiographic testing was the dominantmethod of nondestructive testing duringthe first two decades of the AmericanSociety for Nondestructive Testing (ASNT),founded in 1941. When this handbookwas first envisioned in the 1940s, it wasprojected to be a single volume devotedentirely to radiography.
In 1959, when the first edition of theNondestructive Testing Handbook finallyappeared, a fourth of it was devoted toradiographic testing. In the twenty-firstcentury, the first edition still sells scoresof copies every year.
A quarter century was to pass beforethat presentation of radiographic testingwas replaced. The second edition gave acomplete volume to the method when, in1985, ASNT published Radiography andRadiation Testing. Much of the volume inthe present third edition is based directlyon that second edition.
The process of outlining this thirdedition volume and recruiting volunteersfor it began in 1996. Richard Bossi andGeorge Wheeler deserve the gratitude ofASNT for the planning that launched theproject. In 2001 Frank Iddings, who hadalready edited several chapters, wasappointed as the third technical editor.
Seven ASNT past Presidentsparticipated in the writing and review ofthis volume, demonstrating ASNT’sstrength as a truly technical society.
This series is not a collection of articlesbut a work of collective authorship byASNT, so authors are called contributors.Volunteers whose contributions to thesecond edition have been updated for thisedition are listed if they were able toparticipate and to approve the product.
In the list below, people listed ascontributors were also reviewers but arelisted only once, as contributors.
It has been an honor to work withASNT’s volunteers, whose technicalexpertise is matched by their generosity insharing it.
I would like to thank staff membersHollis Humphries and Joy Grimm fortheir contributions to the art, layout andtext of the book and also thankPublications Manager Paul McIntire foryears of encouragement.
Patrick O. MooreNDT Handbook Editor
Acknowledgments
Handbook DevelopmentCommitteeGary L. Workman, University of Alabama,
HuntsvilleMichael W. Allgaier, GPU NuclearAlbert S. Birks, AKZO Nobel ChemicalsRichard H. Bossi, The Boeing CompanyLisa Brasche, Iowa State UniversityWilliam C. Chedister, Circle SystemsJames L. Doyle, Northwest Research
Associates, Inc.Nat Y. Faransso, Halliburton CompanyFrançois Gagnon, Vibra-K ConsultantsRobert E. Green, Jr., Johns Hopkins
UniversityMatthew J. Golis, Advanced Quality
ConceptsGerard K. Hacker, Teledyne Brown
EngineeringHarb S. Hayre, Ceie SpecsFrank A. IddingsCharles N. Jackson, Jr.John K. Keve, DynCorp Tri-Cities ServicesLloyd P. Lemle, Jr., BP Oil CompanyXavier P.V. Maldague, University LavalPaul M. McIntire, ASNTMani Mina, Iowa State UniversityRon K. Miller, Physical Acoustics
CorporationScott D. Miller, Saudi AramcoPatrick O. Moore, ASNTStanley NessLouis G. Pagliaro, Technical Associates of
CharlotteEmmanuel P. Papadakis, Quality Systems
ConceptsStanislav I. Rokhlin, Ohio State UniversityFrank J. SattlerFred Seppi, Williams InternationalAmos G. Sherwin, Sherwin IncorporatedKermit S. SkeieRoderic K. Stanley, Quality TubingHolger H. Streckert, General AtomicsStuart A. Tison, Millipore CorporationNoel A. Tracy, Universal Technology
CorporationSatish S. Udpa, Michigan State UniversitySotirios J. Vahaviolos, Physical Acoustics
CorporationMark F.A. Warchol, Aluminum Company
of AmericaGlenn A. Washer, Federal Highway
AdministrationGeorge C. Wheeler
vi Radiographic Testing
Editor’s Preface
3RT00FM(i-xii) 10/14/02 2:39 PM Page vi

ContributorsRichard D. Albert, Digiray CorporationRichard C. Barry, Lockheed Martin
Missiles and SpaceGarry L. Balestracci, Balestracci UnlimitedJohn P. BartonGeorge L. BeckerHarold Berger, Industrial Quality,
IncorporatedBruce E. Bolliger, Agilent TechnologiesRichard H. Bossi, The Boeing Company,
SeattleLisa Brasche, Iowa State UniversityRoy L. BuckropClifford Bueno, General Electric CompanyWilliam D. BurnettPaul Burstein, Skiametics IncorporatedHerbert ChapmanFrancis M. CharbonnierKenneth W. Dolan, Lawrence Livermore
National LaboratoryC. Robert EmighToshiyasu FukuiDonald J. HagemaierJerry J. Haskins, Lawrence Livermore
National LaboratoryCharles J. Hellier III, Hellier and
AssociatesEiichi HirosawaFrank A. IddingsTimothy E. Kinsella, Carpenter
Technology CorporationGary G. Korkala, Security Defense SystemsAndreas F. Kotowski, Rapiscan Security
ProductsLawrence R. LawsonHarry E. Martz, Lawrence Livermore
National LaboratoryWilliam E.J. McKinneyMasahisa NaoeJames M. Nelson, The Boeing Company,
SeattleStig Oresjo, Agilent TechnologiesWilliam B. RivkinStanislav I. Rokhlin, Ohio State UniversityEdward H. RuescherFrank J. SattlerDaniel J. Schneberk, Lawrence Livermore
National LaboratorySamuel G. SnowGeorge R. Strabel, Howmet Research
CorporationHolger H. Streckert, General AtomicsMarvin W. Trimm, Westinghouse
Savannah River CompanyGeorge C. WheelerGerald C. WicksWilliam P. Winfree, National Aeronautics
and Space Administration
ReviewersArthur E. Allum, Blacksburg, South
CarolinaVijay Alreja, VJ TechnologiesJohn K. AmanRingo C. BeaumontBoyd D. Howard, Westinghouse Savannah
River CompanyMark Branecki, NRay ServicesJack S. Brenizer, Pennsylvania State
UniversityJoseph F. Bush, Jr., NDT TrainingRichard E. Cameron, General Electric
Nuclear EnergyW. Dennis Cabe, Duke Energy CompanyEugene J. Chemma, Bethlehem Steel
CorporationThomas N. Claytor, Los Alamos National
LaboratoryRobert L. Crane, Air Force Research
LaboratoryClaude D. Davis, Unified Testing ServicesJohn Deboo, The Boeing CompanyDonny Dicharry, Source Production and
EquipmentPaul DickLouis J. Elliott, Lockheed Martin Tactical
Defense SystemsHugh W. Evans, Amersham CorporationJonathan C. Fortkamp, ABB Automation
IncorporatedWilliam D. Friedman, Lockheed MartinSteven G. Galbraith, INEEL, Idaho FallsBryan C. Goode, Faxitron X-Ray
CorporationThorsten Graeve, Rad-Icon Imaging
CorporationJoseph N. Gray, Iowa State UniversityNand Gupta, Omega International
TechnologiesDavid P. Harvey, Oremet-Wah ChangManfred P. Hentschel, Federal Institute for
Materials Research and Testing, Berlin,Germany
Michael R. Holloway, Eastman KodakCompany
James W. Houf, American Society forNondestructive Testing
Bruce G. Isaacson, ISAChester W. Jackson, WestinghouseJames H. Johnson, Varian Industrial
ProductsThomas S. Jones, Howmet Research
CorporationJim F. Kelly, Rivest Testing USA/IUOEBradley S. Kienlen, Entergy OperationsRichard Kochakian, Agfa CorporationJeffrey Kollgaard, The Boeing CompanyJames R. Korenkiewicz, Samsung
Aerospace, Pratt and WhitneyJoseph L. Mackin, International Pipe
Inspectors AssociationK. Dieter MarkertNick Martinsen, Varian Industrial
ProductsRobert W. McClung
viiRadiographic Testing
3RT00FM(i-xii) 10/14/02 2:39 PM Page vii

Thomas E. McConomy, Special MetalsCorporation
Claude H. McDanielRobert M. McGee, Ford Motor CompanyRichard D. McGuire, National Board of
Boiler and Pressure Vessel InspectorsWilliam D. Meade, The Boeing CompanyJohn Munro IIIAntonio G. Pascua, The Boeing Company,
Canoga ParkJ.A. Patsey, US Steel Tubular ProductsPatrick Pauwels, Agfa-Gevaert, MortselThea Philliou, Thermo EberlineDavid H. Phillips, Hytec, IncorporatedRobert F. Plumstead, Lucius Pitkin
IncorporatedWilliam C. Plumstead, Sr., PQT ServicesRita Pontefract, Yxlon International,
AkronJoergen Rheinlaender, InnospeXion ApS,
Hvalsø, DenmarkWade J. Richards, McClellan Air Force
BaseScott D. Ritzheimer, Allegheny Ludlum
Steel CompanyMorteza Safai, FMC FoodTechRobert L. Schulte, Digtome CorporationRussell G. Schonberg, Schonberg Research
CorporationNoel D. Smith, NDS ProductsJoel Henebry, Test and Measurement
OrganizationJana Knezovich, Agilent TechnologiesHabeeb H. Saleh, WJE AssociatesFred J. Schlieper, TeradynePeter Soltani, Direct Radiography
CorporationDennis S. Smith, McDonnell Douglas
AerospaceRichard C. StarkBrian Sterling, TimcoRichard Z. Struk, Shellcast Foundries,
Montreal, CanadaBarry N. Taylor, National Institute of
Standards and TechnologyJay D. Thompson, Lockheed Martin
Missiles and SpaceMichael L. Turnbow, Tennessee Valley
AuthorityRay Tsukimura, Aerotest OperationsJerry A. Tucker, Industrial NuclearThomas B. Turner, BWX TechnologiesJohn J. VenoMark F.A. Warchol, Alcoa, IncorporatedRandall D. Wasberg, Amcast AutomotiveGlenn A. Washer, Federal Highway
AdministrationAmy Waters, Varian Industrial ProductsGene A. Westenbarger, Ohio UniversityDwight S. Wilson, The Boeing Company,
Long BeachCharles B. Winfield, Tru-Tec Services,
IncorporatedSik-Lam Wong, Maxwell Physics
InternationalDaniel A. Wysnewski, Agfa Corporation
Additional AcknowledgmentsFor Chapter 8, “RadiographicInterpretation,” the contributors andeditors gratefully acknowledge thecontributions by Newport NewsShipbuilding and Drydock Company (R.R.Hardison, L.S. Morris, D.L. Isenhour andR.D. Wallace) and by the NationalInstitute of Standards and Technology(G. Yonemura). Appreciation is alsoexpressed to Eastman Kodak Company,Electric Power Research Institute, ASTMInternational and the Southwest ResearchInstitute for permission to useillustrations.
The applications presented inChapter 13, “Image Data Analysis,” arethe result of many collaborative efforts.Thanks to Ford Nondestructive EvaluationLaboratory (R. McGee and staff); toVJ Technologies (V. Alreja,S. Nagabhushana and V. Butani); toChrysler Kokomo Casting (R. Nicholson,D. Guthrie and W. Kendricks); toCaterpillar, Incorporated (C. Andersen andG. Happoldt); to the Boeing Company(W. Meade and M. Negley); and toLawrence Livermore National Laboratory(D. Chinn and others).
Sources of illustrations areacknowledged in a section at the end ofthis book.
viii Radiographic Testing
3RT00FM(i-xii) 9/6/02 3:19 PM Page viii

Chapter 1. Introduction toRadiographic Testing . . . . . . . . . . 1
Part 1. Nondestructive Testing . . . . 2Part 2. Management of
Radiographic Testing . . . . 12Part 3. History of Radiographic
Testing . . . . . . . . . . . . . . . 21Part 4. Units of Measure for
Radiographic Testing . . . . 29
Chapter 2. Radiation and ParticlePhysics . . . . . . . . . . . . . . . . . . . . 37
Part 1. Elementary Particles . . . . . 38Part 2. Properties of Radioactive
Materials . . . . . . . . . . . . . 42Part 3. Electromagnetic
Radiation . . . . . . . . . . . . . 48
Chapter 3. Electronic RadiationSources . . . . . . . . . . . . . . . . . . . 55
Part 1. Physical Principles . . . . . . 56Part 2. Basic Generator
Construction . . . . . . . . . . 59Part 3. Megavolt Radiography . . . 67
Chapter 4. Isotope Radiation Sourcesfor Gamma Radiography . . . . . . 73
Part 1. Selection ofRadiographic Sources . . . . 74
Part 2. Source HandlingEquipment . . . . . . . . . . . . 79
Chapter 5. Radiation Measurement . . 89Part 1. Principles of Radiation
Measurement . . . . . . . . . . 90Part 2. Ionization Chambers and
Proportional Counters . . . 91Part 3. Geiger-Müller Counters . . 96Part 4. Scintillation Detectors . . . 100Part 5. Luminescent
Dosimetry . . . . . . . . . . . 102Part 6. Neutron Detection . . . . . 104Part 7. Semiconductors . . . . . . . 106Part 8. Film Badges . . . . . . . . . . . 108
Chapter 6. Radiation Safety . . . . . . . 113Part 1. Management of Radiation
Safety . . . . . . . . . . . . . . . 114Part 2. Dose Definitions and
Exposure Levels . . . . . . . 119Part 3. Radiation Protection
Measurements . . . . . . . . 121Part 4. Basic Exposure Control . . 127Part 5. Shielding . . . . . . . . . . . . . 130Part 6. Neutron Radiographic
Safety . . . . . . . . . . . . . . . 134
Chapter 7. Principles of FilmRadiography . . . . . . . . . . . . . . 139
Part 1. Film Exposure . . . . . . . . . 140Part 2. Absorption and
Scattering . . . . . . . . . . . . 152Part 3. Radiographic Screen . . . . 159Part 4. Industrial X-Ray Films . . 163Part 5. Radiographic Image
Quality and DetailVisibility . . . . . . . . . . . . 170
Part 6. Film Handling andStorage . . . . . . . . . . . . . . 177
Part 7. Film Digitization . . . . . . . 180
Chapter 8. RadiographicInterpretation . . . . . . . . . . . . . 185
Part 1. Fundamentals ofRadiographicInterpretation . . . . . . . . 186
Part 2. Viewing in RadiographicTesting . . . . . . . . . . . . . . 189
Part 3. Densitometers . . . . . . . . 194Part 4. Radiographic
InterpretationReporting . . . . . . . . . . . . 199
Part 5. Radiographic Artifacts . . . 202Part 6. Discontinuity
Indications . . . . . . . . . . 207
Chapter 9. Radiographic FilmDevelopment . . . . . . . . . . . . . . 219
Part 1. Radiographic LatentImage . . . . . . . . . . . . . . 220
Part 2. Chemistry of FilmRadiography . . . . . . . . . 230
Part 3. Darkroom . . . . . . . . . . . . 237Part 4. Processing Technique . . . 241Part 5. Silver Recovery . . . . . . . . 247
ixRdiographic Testing
C O N T E N T S
3RT00FM(i-xii) 10/15/02 1:26 PM Page ix

Chapter 10. Radioscopy . . . . . . . . . . 253Part 1. Fundamentals of
Radioscopic Imaging . . . 254Part 2. Light Conversion . . . . . . 256Part 3. Image Quality . . . . . . . . . 261Part 4. Imaging Systems . . . . . . . 265Part 5. Cameras . . . . . . . . . . . . . 269Part 6. Viewing and Recording . . 275Part 7. System Considerations . . 277
Chapter 11. Digital RadiographicImaging . . . . . . . . . . . . . . . . . . 283
Part 1. Overview of DigitalImaging . . . . . . . . . . . . . 284
Part 2. Principles of DigitalX-Ray Detectors . . . . . . . 286
Part 3. Image Contrast andSignal Statistics . . . . . . . 289
Part 4. X-Ray DetectorTechnology . . . . . . . . . . 296
Chapter 12. ComputedTomography . . . . . . . . . . . . . . 303
Part 1. Introduction to ComputedTomography . . . . . . . . . 304
Part 2. Laminography . . . . . . . . 306Part 3. Principles of Computed
Tomography . . . . . . . . . 310Part 4. Resolution and
Contrast . . . . . . . . . . . . 316Part 5. Computed Tomographic
Systems . . . . . . . . . . . . . 318Part 6. Applications of Computed
Tomography . . . . . . . . . 323Part 7. Reference Standards
for ComputedTomography . . . . . . . . . 328
Chapter 13. Image Data Analysis . . . 345Part 1. Fundamental Properties
of Digital Images andProcessing Schemes . . . . 346
Part 2. Image AnalysisTechniques andRadiographic Tests . . . . . 353
Part 3. Automated TestingTechniques . . . . . . . . . . 354
Chapter 14. Backscatter Imaging . . . 379Part 1. Physical Principles . . . . . 380Part 2. Backscatter Imaging
Techniques . . . . . . . . . . 388Part 3. Reconstruction and Image
Processing Techniques . . 392Part 4. Applications of
Backscatter Imaging . . . . 394
Chapter 15. Special RadiographicTechniques . . . . . . . . . . . . . . . 403
Part 1. Microfocus RadiographicTesting . . . . . . . . . . . . . . 404
Part 2. Flash Radiography . . . . . 409Part 3. Reversed Geometry
Radiography withScanning Source . . . . . . 414
Part 4. Stereo Radiography . . . . . 419Part 5. X-Ray Diffraction and
X-Ray Fluorescence . . . . 427
Chapter 16. NeutronRadiography . . . . . . . . . . . . . . 437
Part 1. Applications of NeutronRadiography . . . . . . . . . 438
Part 2. Static Radiography withThermal Neutrons . . . . . 440
Part 3. Special Techniques ofNeutron Radiography . . 446
Chapter 17. Radiographic Testing ofMetal Castings . . . . . . . . . . . . . 453
Part 1. Introduction toRadiographic Testingof Metal Castings . . . . . . 454
Part 2. General RadiographicTechniques for MetalCastings . . . . . . . . . . . . . 455
Part 3. Radiographic Indicationsfor Metal Castings . . . . . 461
Part 4. Radiographic Testing andProcess Scheduling . . . . . 465
Part 5. Problems in RadiographicTesting of MetalCastings . . . . . . . . . . . . . 467
Chapter 18. Radiographic Testingof Welds . . . . . . . . . . . . . . . . . 473
Part 1. Introduction toRadiographic Testingof Welds . . . . . . . . . . . . 474
Part 2. Weld Design . . . . . . . . . . 475Part 3. Discontinuities in
Welds . . . . . . . . . . . . . . . 478Part 4. Technique
Development . . . . . . . . . 482Part 5. Standards and Specifications
for Radiographic Testingof Welds . . . . . . . . . . . . 489
Part 6. Radiography of WeldDiscontinuities . . . . . . . 491
Part 7. In-Process Radioscopy ofArc Welding . . . . . . . . . . 502
Part 8. False Indications inRadiographs ofAluminum AlloyWelds . . . . . . . . . . . . . . . 507
x Radiographic Testing
3RT00FM(i-xii) 10/15/02 1:26 PM Page x

Chapter 19. Radiographic Testing inUtility, Petroleum and ChemicalIndustries . . . . . . . . . . . . . . . . . 513
Part 1. Overview . . . . . . . . . . . . 514Part 2. Pipe and Tubing
Applications . . . . . . . . . 515Part 3. Vessel and Component
Applications . . . . . . . . . 526Part 4. Nuclear Fuel
Applications . . . . . . . . . 530Part 5. Other Uses for
Radiographic Testing . . . 537
Chapter 20. Aerospace Applicationsof Radiographic Testing . . . . . 543
Part 1. Film Radiography ofAviation Components . . 544
Part 2. Radiographic Testingof Space FlightComponents . . . . . . . . . 550
Part 3. Techniques for AdvancedMaterials . . . . . . . . . . . . 559
Chapter 21. Other Applications ofRadiographic Testing . . . . . . . . 569
Part 1. Radiation Gaging ofDensity or Thickness . . . 570
Part 2. Radioscopy ofElectronics . . . . . . . . . . . 578
Part 3. Radiographic Testing ofConsumer Goods . . . . . . 584
Part 4. Radiographic Testing inSecurity Systems . . . . . . 588
Part 5. InfrastructureApplications ofRadiographic Testing . . . 591
Part 6. Radiographic Testing inConservation of HistoricBuildings and MuseumObjects . . . . . . . . . . . . . 594
Chapter 22. AttenuationCoefficients . . . . . . . . . . . . . . . 609
Part 1. Introduction toAttenuationCoefficients . . . . . . . . . . 610
Part 2. Attenuation CoefficientTables . . . . . . . . . . . . . . 612
Chapter 23. Radiographic TestingGlossary . . . . . . . . . . . . . . . . . . 653
Index . . . . . . . . . . . . . . . . . . . . . . . . 675
Figure Sources . . . . . . . . . . . . . . . . . . 691
xiRadiographic Testing
3RT00FM(i-xii) 10/15/02 1:26 PM Page xi

Copyright © 2002AMERICAN SOCIETY FOR NONDESTRUCTIVE TESTING, INC.All rights reserved.
No part of this book may be reproduced, stored in a retrieval system or transmitted, in any form or by any means —electronic, mechanical, photocopying, recording or otherwise — without the prior written permission of the publisher.Nothing contained in this book is to be construed as a grant of any right of manufacture, sale or use in connection withany method, process, apparatus, product or composition, whether or not covered by letters patent or registeredtrademark, nor as a defense against liability for the infringement of letters patent or registered trademark.
The American Society for Nondestructive Testing, its employees, and the contributors to this volume assume noresponsibility for the safety of persons using the information in this book.
Copyright © 2002 by the American Society for Nondestructive Testing, Incorporated. All rights reserved. ASNT is notresponsible for the authenticity or accuracy of information herein, and published opinions and statements do notnecessarily reflect the opinion of ASNT. Products or services that are advertised or mentioned do not carry theendorsement or recommendation of ASNT.
ACCPSM, IRRSPSM, Level III Study GuideSM, Materials EvaluationSM, NDT HandbookSM, Nondestructive Testing HandbookSM,The NDT TechnicianSM and www.asnt.orgSM are service marks of the American Society for Nondestructive Testing.ASNT®, Research in Nondestructive Evaluation® and RNDE® are registered trademarks of the American Society forNondestructive Testing.
ASNT exists to create a safer world by promoting the profession and technologies of nondestructive testing.
American Society for Nondestructive Testing, Incorporated1711 Arlingate LanePO Box 28518Columbus, OH 43228-0518(614) 274-6003; fax (614) 274-6899www.asnt.org
ErrataErrata if available for this printing may be obtained from ASNT’s Web site, www.asnt.org, or as hard copy by mail from ASNT,free on request addressed to the NDT Handbook Editor at the address above.
Library of Congress Cataloging-in-Publication DataRadiographic Testing [computer file] / technical editors, Richard H. Bossi, Frank
A. Iddings, George C. Wheeler; . -- 3rd ed.1 computer optical disc; 4 3/4 in. — (Nondestructive testing handbook; v. 4)System requirements for Windows: 486 or Pentium PC; 8 MB RAM (16 MB
RAM for windows NT); Windows 95/98 or windows NT 4.0 with Service Pack 3or later; Adobe Acrobat Reader 5.0 (included); CD-ROM drive.
System requirements for Macintosh: Apple Power Macintosh; 4.5 MB RAM;System 7.1.2 or later; 8 MB free hard disk space; Adobe Acrobat Reader 5.0(included); CD-ROM drive.
Title from disc label.Audience: Quality control engineers and inspectorsSummary: ISBN 1-57117-098-7
NOTE:Information presented on this page is specific for the CD-ROM version of thispublication. For Library of Congress Cataloging-in-Publication data pertaining tothe printed edition, please click this link.
3RT00FM(i-xii) 10/16/02 4:34 PM Page xiii

Rdiographic Testing
M U L T I M E D I A C O N T E N T S
Chapter 4. Isotope Radiation Sourcesfor Gamma Radiography . . . . . . 73
Movie. Isotopic source . . . . . . . . . 74Movie. Collimators . . . . . . . . . . . 82
Chapter 6. Radiation Safety . . . . . . . 113Movie. Radiation injury . . . . . . . 114Movie. Survey meters . . . . . . . . . 117Movie. Check equipment . . . . . . 121Movie. Personnel Monitoring
Devices . . . . . . . . . . . . . 124Movie. Warning tape and signs . 128
Chapter 7. Principles of FilmRadiography . . . . . . . . . . . . . . 139
Movie. Conventionalradiography givesshadow image . . . . . . . . 140
Chapter 10. Radioscopy . . . . . . . . . . 253Movie. Automated wheel
inspection . . . . . . . . . . . 279
Chapter 12. ComputedTomography . . . . . . . . . . . . . . 303
Movie. Second generation(rotate and translate) . . . 319
Movie. Third generation(rotate only) . . . . . . . . . 319
Movie. Electronic deviceon turntable . . . . . . . . . 327
Movie. Images of electronicdevice . . . . . . . . . . . . . . 327
Movie. Tomographic dataimage of electronicdevice . . . . . . . . . . . . . . 327
Movie. Image slices of device,top to bottom . . . . . . . . 327
Movie. Slices showdelaminations incomposite fastenerhole . . . . . . . . . . . . . . . . 327
Movie. Transverse image ofdelaminations infastener hole . . . . . . . . . 327
Chapter 13. Image Data Analysis . . . 345Movie. Exfoliation corrosion,
thin to thick . . . . . . . . . 374Movie. General corrosion,
thin to thick . . . . . . . . . 374Movie. Cracks around fasteners . 374Movie. Cracks around fasteners,
in layers from top . . . . . 374
Chapter 14. Backscatter Imaging . . . 379Movie. Backscatter scan of
undamaged area . . . . . . 397Movie. Moving source and
sensor into place . . . . . . 397Movie. Pillowing and corrosion . 397
Chapter 20. Aerospace Applicationsof Radiographic Testing . . . . . 543
Movie. Automated inspectionof rocket motor . . . . . . . 551
Chapter 21. Other Applications ofRadiographic Testing . . . . . . . . 569
Movie. Inspection of printedcircuit boards . . . . . . . . . 583
Movie. Radiographicinspection of light bulb . 587
Movie. Cargo scanning . . . . . . . 589Movie. Image acquisition and
evaluation . . . . . . . . . . . 589Movie. Images at 3 MV
and 6 MV . . . . . . . . . . . 589Movie. Contraband in water
tank . . . . . . . . . . . . . . . . 589
3RT00FM(i-xii) 10/28/02 2:19 PM Page xv

Harold Berger, Industrial Quality, Incorporated,Gaithersburg, Maryland (Part 3)
Holger H. Streckert, General Atomics, San Diego,California (Part 4)
Marvin W. Trimm, Westinghouse Savannah RiverCompany, Aiken, South Carolina (Parts 1 and 2)
1C H A P T E R
Introduction toRadiographic Testing
3RT01_LAYOUT(001_036) 10/14/02 2:44 PM Page 1

2 Radiog
PART 1. Nondestructive Testing1
3RT01_LAYOUT(001_036) 10/2/02 1:34 PM Page 2
Nondestructive testing (NDT) has beendefined as comprising those test methodsused to examine or inspect a part ormaterial or system without impairing itsfuture usefulness.1 The term is generallyapplied to nonmedical investigations ofmaterial integrity.
Strictly speaking, this definition ofnondestructive testing includesnoninvasive medical diagnostics. X-rays,ultrasound and endoscopes are used byboth medical and industrialnondestructive testing. Medicalnondestructive testing, however, has cometo be treated by a body of learning soseparate from industrial nondestructivetesting that today most physicians do notuse the word nondestructive.
Nondestructive testing is used toinvestigate specifically the materialintegrity of the test object. A number ofother technologies — for instance, radioastronomy, voltage and amperagemeasurement and rheometry (flowmeasurement) — are nondestructive butare not used specifically to evaluatematerial properties. Radar and sonar areclassified as nondestructive testing whenused to inspect dams, for instance, butnot when they are used to chart a riverbottom.
Nondestructive testing asks “Is theresomething wrong with this material?” Incontrast, performance and proof tests ask“Does this component work?” It is notconsidered nondestructive testing whenan inspector checks a circuit by runningelectric current through it. Hydrostaticpressure testing is another form of prooftesting, one that may destroy the testobject.
Another gray area that invites variousinterpretations in defining nondestructivetesting is future usefulness. Some materialinvestigations involve taking a sample ofthe inspected part for testing that isinherently destructive. A noncritical partof a pressure vessel may be scraped orshaved to get a sample for electronmicroscopy, for example. Although futureusefulness of the vessel is not impaired bythe loss of material, the procedure isinherently destructive and the shavingitself — in one sense the true test object —has been removed from servicepermanently.
The idea of future usefulness is relevantto the quality control practice of
raphic Testing
sampling. Sampling (that is, less than100 percent testing to draw inferencesabout the unsampled lots) isnondestructive testing if the tested sampleis returned to service. If the steel is testedto verify the alloy in some bolts that canthen be returned to service, then the testis nondestructive. In contrast, even ifspectroscopy used in the chemical testingof many fluids is inherentlynondestructive, the testing is destructive ifthe samples are poured down the drainafter testing.
Nondestructive testing is not confinedto crack detection. Other discontinuitiesinclude porosity, wall thinning fromcorrosion and many sorts of disbonds.Nondestructive material characterizationis a growing field concerned with materialproperties including materialidentification and microstructuralcharacteristics — such as resin curing, casehardening and stress — that have a directinfluence on the service life of the testobject.
Nondestructive testing has also beendefined by listing or classifying thevarious techniques.1-3 This sense ofnondestructive testing is practical in that ittypically highlights methods in use byindustry.
Purposes ofNondestructive TestingSince the 1920s, the art of testing withoutdestroying the test object has developedfrom a laboratory curiosity to anindispensable tool of fabrication,construction and manufacturingprocesses. No longer is visual testing ofmaterials, parts and complete productsthe principal means of determiningadequate quality. Nondestructive tests ingreat variety are in worldwide use todetect variations in structure, minutechanges in surface finish, the presence ofcracks or other physical discontinuities, tomeasure the thickness of materials andcoatings and to determine othercharacteristics of industrial products.Scientists and engineers of manycountries have contributed greatly tonondestructive test development andapplications.
The various nondestructive testingmethods are covered in detail in the

FIGURE 1. Facausing deat(April 1988).
3RT01_LAYOUT(001_036) 10/2/02 1:34 PM Page 3
literature but it is always wise to considerobjectives before details. How isnondestructive testing useful? Why dothousands of industrial concerns buy thetesting equipment, pay the subsequentoperating costs of the testing and evenreshape manufacturing processes to fit theneeds and findings of nondestructivetesting?
Modern nondestructive tests are usedby manufacturers (1) to ensure productintegrity and, in turn, reliability; (2) toavoid failures, prevent accidents and savehuman life (see Figs. 1 and 2); (3) to makea profit for the user; (4) to ensurecustomer satisfaction and maintain themanufacturer’s reputation; (5) to aid inbetter product design; (6) to controlmanufacturing processes; (7) to lowermanufacturing costs; (8) to maintainuniform quality level; and (9) to ensureoperational readiness.
These reasons for widespread andprofitable nondestructive testing aresufficient in themselves but paralleldevelopments have contributed to itsgrowth and acceptance.
Increased Demand on MachinesIn the interest of greater speed andreduced cost for materials, the designengineer is often under pressure to reduceweight. This can sometimes be done bysubstituting aluminum alloys, magnesiumalloys or composite materials for steel oriron but such light parts may not be thesame size or design as those they replace.The tendency is also to reduce the size.These pressures on the designer havesubjected parts of all sorts to increasedstress levels. Even such commonplaceobjects as sewing machines, sauce pansand luggage are also lighter and moreheavily loaded than ever before. The stressto be supported is seldom static. It often
tigue cracks caused damage to aircraft fuselage,h of flight attendant and injury to passengers
fluctuates and reverses at low or highfrequencies. Frequency of stress reversalsincreases with the speeds of modernmachines and thus parts tend to fatigueand fail more rapidly.
Another cause of increased stress onmodern products is a reduction in thesafety factor. An engineer designs withcertain known loads in mind. On thesupposition that materials andworkmanship are never perfect, a safetyfactor of 2, 3, 5 or 10 is applied. However,because of other considerations, a lowerfactor is often used that depends on theimportance of lighter weight or reducedcost or risk to consumer.
New demands on machinery have alsostimulated the development and use ofnew materials whose operatingcharacteristics and performance are notcompletely known. These new materialscreate greater and potentially dangerousproblems. As an example, an aircraft partwas built from an alloy whose workhardening, notch resistance and fatiguelife were not well known. After relativelyshort periods of service some of theseaircraft suffered disastrous failures.Sufficient and proper nondestructive testscould have saved many lives.
As technology improves and as servicerequirements increase, machines aresubjected to greater variations and towider extremes of all kinds of stress,creating an increasing demand forstronger or more damage tolerantmaterials.
Engineering Demands for SounderMaterialsAnother justification for nondestructivetests is the designer’s demand for sounder
3Introduction to Radiographic Testing
FIGURE 2. Boilers operate with high internal steam pressure.Material discontinuites can lead to sudden, violent failurewith possible injury to people and property.

4 Radio
3RT01_LAYOUT(001_036) 10/2/02 1:34 PM Page 4
materials. As size and weight decrease andthe factor of safety is lowered, moreemphasis is placed on better raw materialcontrol and higher quality of materials,manufacturing processes andworkmanship.
An interesting fact is that a producer ofraw material or of a finished productsometimes does not improve quality orperformance until that improvement isdemanded by the customer. The pressureof the customer is transferred toimplementation of improved design ormanufacturing. Nondestructive testing isfrequently called on to deliver this newquality level.
Public Demands for Greater SafetyThe demands and expectations of thepublic for greater safety are apparenteverywhere. Review the record of thecourts in granting high awards to injuredpersons. Consider the outcry for greaterautomobile safety, as evidenced by therequired automotive safety belts and thedemand for air bags, blowout proof tiresand antilock braking systems. Thepublicly supported activities of theNational Safety Council, UnderwritersLaboratories, the Occupational Safety andHealth Administration and the FederalAviation Administration in the UnitedStates, as well as the work of similaragencies abroad, are only a few of theways in which this demand for safety isexpressed. It has been expressed directlyby passengers who cancel reservationsfollowing a serious aircraft accident. Thisdemand for personal safety has beenanother strong force in the developmentof nondestructive tests.
Rising Costs of FailureAside from awards to the injured or toestates of the deceased and aside fromcosts to the public (because of evacuationoccasioned by chemical leaks), considerbriefly other factors in the rising costs ofmechanical failure. These costs areincreasing for many reasons. Someimportant ones are (1) greater costs ofmaterials and labor; (2) greater costs ofcomplex parts; (3) greater costs because ofthe complexity of assemblies; (4) greaterprobability that failure of one part willcause failure of others because ofoverloads; (5) trend to lower factors ofsafety; (6) probability that the failure ofone part will damage other parts of highvalue; and (7) part failure in an integratedautomatic production machine, shuttingdown an entire high speed productionline. When production was carried out onmany separate machines, the broken onecould be bypassed until repaired. Today,one machine is tied into the production
graphic Testing
of several others. Loss of such productionis one of the greatest losses resulting frompart failure.
Applications ofNondestructive TestingNondestructive testing is a branch of thematerials sciences that is concerned withall aspects of the uniformity, quality andserviceability of materials and structures.The science of nondestructive testingincorporates all the technology fordetection and measurement of significantproperties, including discontinuities, initems ranging from research specimens tofinished hardware and products in service.By definition, nondestructive testingmethods are means for examiningmaterials and structures withoutdisruption or impairment of serviceability.Nondestructive testing makes it possiblefor internal properties or hiddendiscontinuities to be revealed or inferredby appropriate methods.
Nondestructive testing is becomingincreasingly vital in the effective conductof research, development, design andmanufacturing programs. Only withappropriate nondestructive testingmethods can the benefits of advancedmaterials science be fully realized. Theinformation required for appreciating thebroad scope of nondestructive testing isavailable in many publications andreports.
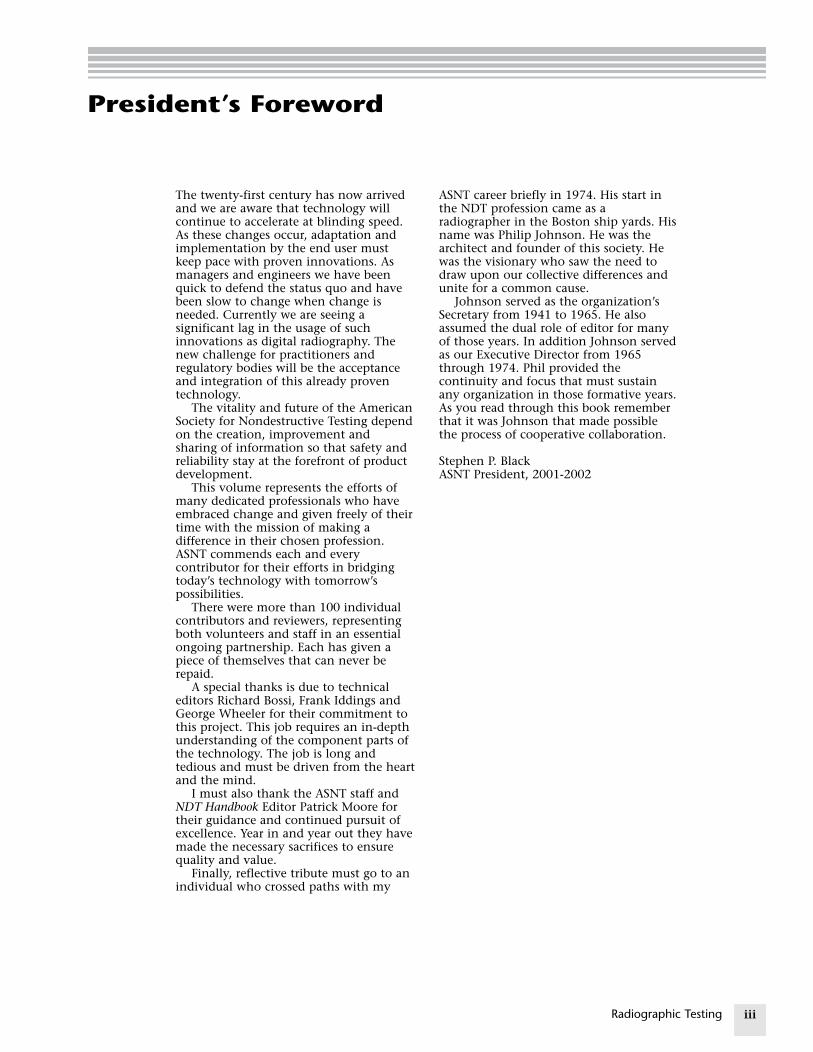
Classification of MethodsIn a report, the National MaterialsAdvisory Board (NMAB) Ad HocCommittee on Nondestructive Evaluationadopted a system that classifiedtechniques into six major methodcategories: visual, penetrating radiation,magnetic-electrical, mechanical vibration,thermal and chemical/electrochemical.3 Amodified version is presented in Table 1.1
Each method can be completelycharacterized in terms of five principalfactors: (1) energy source or medium usedto probe object (such as X-rays, ultrasonicwaves or thermal radiation); (2) nature ofthe signals, image or signature resultingfrom interaction with the object(attenuation of X-rays or reflection ofultrasound, for example); (3) means ofdetecting or sensing resultant signals(photoemulsion, piezoelectric crystal orinductance coil); (4) method of indicatingor recording signals (meter deflection,oscilloscope trace or radiograph); and(5) basis for interpreting the results (director indirect indication, qualitative orquantitative and pertinent dependencies).

TABLE 1. N
Cat
Basic Cate
Mechanica
Penetratin
Electroma
Sonic and
Thermal a
Chemical
Auxiliary
Image gen
Signal ima
3RT01_LAYOUT(001_036) 10/2/02 1:34 PM Page 5
The objective of each method is toprovide information about the followingmaterial parameters: (1) discontinuitiesand separations (cracks, voids, inclusionsdelaminations and others); (2) structure ormalstructure (crystalline structure, grainsize, segregation, misalignment andothers); (3) dimensions and metrology(thickness, diameter, gap size,discontinuity size and others); (4) physicaland mechanical properties (reflectivity,conductivity, elastic modulus, sonicvelocity and others); (5) composition andchemical analysis (alloy identification,impurities, elemental distributions andothers); (6) stress and dynamic response(residual stress, crack growth, wear,vibration and others); (7) signatureanalysis (image content, frequencyspectrum, field configuration and others);and (8) abnormal sources of heat.
Terms used in this block are furtherdefined in Table 2 with respect to specificobjectives and specific attributes to bemeasured, detected and defined.
The limitations of a method includeconditions required by that method:conditions to be met for methodapplication (access, physical contact,preparation and others) and requirementsto adapt the probe or probe medium tothe object examined. Other factors limitthe detection or characterization ofdiscontinuities, properties and otherattributes and limit interpretation ofsignals or images generated.
ondestructive testing method categories.
egories
gories
l and optical color; cracks; dimensions; film thicknefinish; surface flaws; through-cracks
g radiation cracks; density and chemistry variationmisalignment; missing parts; segregat
gnetic and electronic alloy content; anisotropy; cavities; coldcorrosion; cracks; crack depth; crystal treatment; hot tears; inclusions; ion copolarization; seams; segregation; shrin
ultrasonic crack initiaion and propagation; crackdegree of sintering; delaminations; demechanical degradation; misalignmenstress; tensile, shear and compressive s
nd infrared anisotropy, bonding; composition; emthermal conductivity; thickness; voids;corrosion
and analytical alloy identification; composition; crackmacrostructure; porosity; segregation;
Categories
eration dimensional variations; dynamic perfodistribution; anomaly propagation; ma
ge analysis data selection, processing and displayenhancement; separation of multiple v
Classification Relative to TestObjectNondestructive testing techniques may beclassified according to how they detectindications relative to the surface of a testobject. Surface methods include liquidpenetrant testing, visual testing, grid andmoiré testing. Surface/near-surfacemethods include tap, potential drop,holography and shearography, magneticparticle and electromagnetic testing.When surface or surface/near-surfacemethods are applied during intermediatemanufacturing processes, they providepreliminary assurance that volumetricmethods performed on the completedobject or component will reveal fewrejectable discontinuities. Volumetricmethods include radiography, ultrasonictesting, acoustic emission testing and lesswidely used methods such asacoustoultrasonic testing and magneticresonance imaging. Through-boundarytechniques described include leak testing,some infrared thermographic techniques,airborne ultrasonic testing and certaintechniques of acoustic emission testing.Other less easily classified methods arematerial identification, vibration analysisand strain gaging.
No one nondestructive testing methodis all revealing. That is not to say that onemethod or technique of a method israrely adequate for a specific object orcomponent. However, in most cases ittakes a series of test methods to do acomplete nondestructive test of an object
5Introduction to Radiographic Testing
Objectives
ss; gaging; reflectivity; strain distribution and magnitude; surface
s; elemental distribution; foreign objects; inclusions; microporosity;ion; service degradation; shrinkage; thickness; voids work; local strain, hardness; composition; contamination;
structure; electrical conductivities; flakes; heatncentrations; laps; lattice strain; layer thickness; moisture content;kage; state of cure; tensile strength; thickness; disbondss, voids; damping factor; degree of cure; degree of impregnation;nsity; dimensions; elastic moduli; grain size; inclusions;t; porosity; radiation degradation; structure of composites; surfacetrength; disbonds; wearissivity; heat contours; plating thickness; porosity; reflectivity; stress; cracks; delaminations; heat treatment; state of cure; moisture;
s; elemental analysis and distribution; grain size; inclusions; surface anomalies
rmance; anomaly characterization and definition; anomalygnetic field configurations
; anomaly mapping, correlation and identification; imageariables; signature analysis
6 Rad
TABLE 2. O
Obj
Discontin
Surface aSurface coInternal a
Structure
Microstru
Matrix str
Small struGross stru
Dimensio
DisplacemDimensioThickness
Physical a
Electrical MagneticThermal pMechanic
Surface p
Chemical
ElementaImpurity MetallurgPhysioche
Stress an
Stress; strMechanicChemicalOther damDynamic
Signature
ElectromaThermal fAcoustic s
RadioactivSignal or
3RT01_LAYOUT(001_036) 10/2/02 1:34 PM Page 6
or component. For example, if surfacecracks must be detected and eliminatedand the object or component is made offerromagnetic material, then magneticparticle testing would be the obviouschoice. If that same material is aluminumor titanium, then the choice would beliquid penetrant or electromagnetictesting. However, for either of these
situations, if internal discontinuities wereto be detected, then ultrasonic testing orradiography would be the selection. Theexact technique in either case woulddepend on the thickness and nature ofthe material and the types ofdiscontinuities that must be detected.
iographic Testing
bjectives of nondestructive testing methods.
ectives Attributes Measured or Detected
uites and separations
nomalies roughness; scratches; gouges; crazing; pitting; inclusions and imbedded foreign materialnnected anomalies cracks; porosity; pinholes; laps; seams; folds; inclusions
nomalies cracks; separations; hot tears; cold shuts; shrinkage; voids; lack of fusion; pores; cavities; delaminations;disbonds; poor bonds; inclusions; segregations
cture molecular structure; crystalline structure and/or strain; lattice structure; strain; dislocation; vacancy;deformation
ucture grain structure, size, orientation and phase; sinter and porosity; impregnation; filler and/or reinforcementdistribution; anisotropy; heterogeneity; segregation
ctural anomalies leaks (lack of seal or through-holes); poor fit; poor contact; loose parts; loose particles; foreign objectsctural anomalies assembly errors; misalignment; poor spacing or ordering; deformation; malformation; missing parts
ns and metrology
ent; position linear measurement; separation; gap size; discontinuity size, depth, location and orientationnal variations unevenness; nonuniformity; eccentricity; shape and contour; size and mass variations; density film, coating, layer, plating, wall and sheet thickness; density or thickness variations
nd mechanical properties
properties resistivity; conductivity; dielectric constant and dissipation factor properties polarization; permeability; ferromagnetism; cohesive forceroperties conductivity; thermal time constant and thermoelectric potential; diffusivity; effusivity; specific heatal properties compressive, shear and tensile strength (and moduli); Poisson’s ratio; sonic velocity; hardness; temper and
embrittlementroperties color; reflectivity; refraction index; emissivity
composition and analysis
l analysis detection; identification, distribution and/or profileconcentrations contamination; depletion; doping and diffusantsical content variation; alloy identification, verification and sortingmical state moisture content; degree of cure; ion concentrations and corrosion; reaction products
d dynamic response
ain; fatigue heat treatment, annealing and cold work effects; residual stress and strain; fatigue damage and life (residual)al damage wear; spalling; erosion; friction effects damage corrosion; stress corrosion; phase transformation
age radiation damage and high frequency voltage breakdownperformance crack initiation and propagation; plastic deformation; creep; excessive motion; vibration; damping; timing of
events; any anomalous behavior
analysis
gnetic field potential; strength; field distribution and patternield isotherms; heat contours; temperatures; heat flow; temperature distribution; heat leaks; hot spots; contrastignature noise; vibration characteristics; frequency amplitude; harmonic spectrum and/or analysis; sonic and/or
ultrasonic emissionse signature distribution and diffusion of isotopes and tracers
image analysis image enhancement and quantization; pattern recognition; densitometry; signal classification, separation;and correlation; discontinuity identification, definition (size and shape) and distribution analysis;discontinuity mapping and display
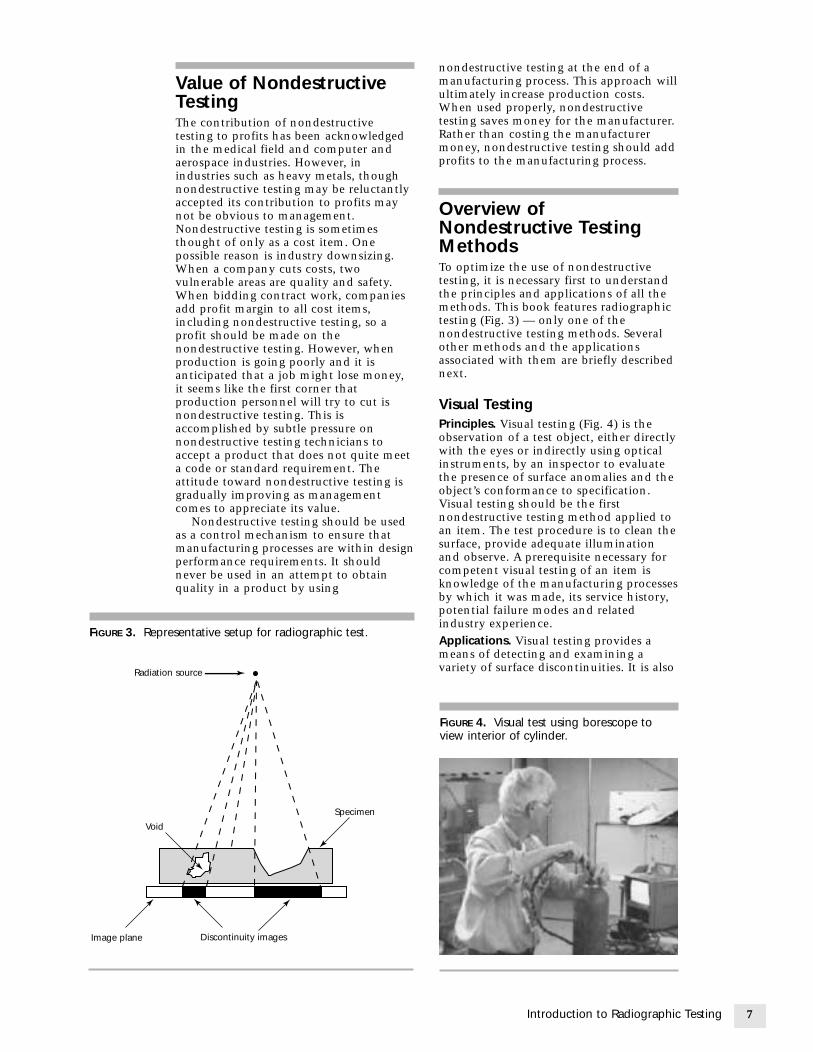
FIGURE 3. Re
Radia
Vo
Image plane
3RT01_LAYOUT(001_036) 10/2/02 1:34 PM Page 7
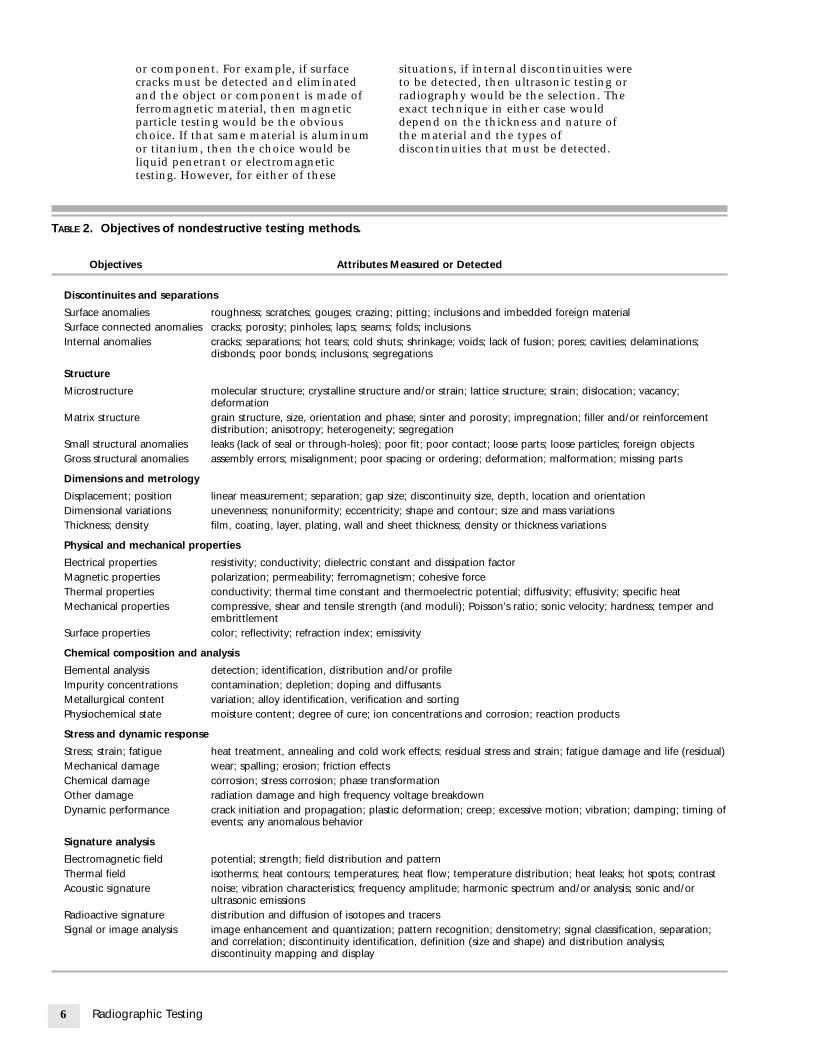
Value of NondestructiveTestingThe contribution of nondestructivetesting to profits has been acknowledgedin the medical field and computer andaerospace industries. However, inindustries such as heavy metals, thoughnondestructive testing may be reluctantlyaccepted its contribution to profits maynot be obvious to management.Nondestructive testing is sometimesthought of only as a cost item. Onepossible reason is industry downsizing.When a company cuts costs, twovulnerable areas are quality and safety.When bidding contract work, companiesadd profit margin to all cost items,including nondestructive testing, so aprofit should be made on thenondestructive testing. However, whenproduction is going poorly and it isanticipated that a job might lose money,it seems like the first corner thatproduction personnel will try to cut isnondestructive testing. This isaccomplished by subtle pressure onnondestructive testing technicians toaccept a product that does not quite meeta code or standard requirement. Theattitude toward nondestructive testing isgradually improving as managementcomes to appreciate its value.
Nondestructive testing should be usedas a control mechanism to ensure thatmanufacturing processes are within designperformance requirements. It shouldnever be used in an attempt to obtainquality in a product by using
presentative setup for radiographic test.
tion source
Specimen
id
Discontinuity images
nondestructive testing at the end of amanufacturing process. This approach willultimately increase production costs.When used properly, nondestructivetesting saves money for the manufacturer.Rather than costing the manufacturermoney, nondestructive testing should addprofits to the manufacturing process.
Overview ofNondestructive TestingMethodsTo optimize the use of nondestructivetesting, it is necessary first to understandthe principles and applications of all themethods. This book features radiographictesting (Fig. 3) — only one of thenondestructive testing methods. Severalother methods and the applicationsassociated with them are briefly describednext.
Visual TestingPrinciples. Visual testing (Fig. 4) is theobservation of a test object, either directlywith the eyes or indirectly using opticalinstruments, by an inspector to evaluatethe presence of surface anomalies and theobject’s conformance to specification.Visual testing should be the firstnondestructive testing method applied toan item. The test procedure is to clean thesurface, provide adequate illuminationand observe. A prerequisite necessary forcompetent visual testing of an item isknowledge of the manufacturing processesby which it was made, its service history,potential failure modes and relatedindustry experience.Applications. Visual testing provides ameans of detecting and examining avariety of surface discontinuities. It is also
7Introduction to Radiographic Testing
FIGURE 4. Visual test using borescope toview interior of cylinder.

8 Radio
FIGURE 6. Representative setup for eddy current test.
Coil in eddy current probePrimary electromagnetic field
3RT01_LAYOUT(001_036) 10/2/02 1:34 PM Page 8
the most widely used method fordetecting and examining for surfacediscontinuities associated with variousstructural failure mechanisms. Even whenother nondestructive tests are performed,visual tests often provide a usefulsupplement. For example, when the eddycurrent testing of process tubing isperformed, visual testing is oftenperformed to verify and more closelyexamine the surface condition. Thisverification process can impact theevaluation process associated with othernondestructive test methods being used.The following discontinuities may bedetected by a simple visual test: surfacediscontinuities, cracks, misalignment,warping, corrosion, wear and physicaldamage.
Liquid Penetrant TestingPrinciples. Liquid penetrant testing (Fig. 5)reveals discontinuities open to thesurfaces of solid and nonporous materials.Indications of a wide spectrum ofdiscontinuity sizes can be found regardlessof the configuration of the workpiece andregardless of discontinuity orientations.Liquid penetrants seep into various typesof minute surface openings by capillaryaction. The cavities of interest can be verysmall, often invisible to the unaided eye.The ability of a given liquid to flow over asurface and enter surface cavities dependsprincipally on the following: cleanlinessof the surface, surface tension of theliquid, configuration of the cavity, contactangle of the liquid, ability of the liquid towet the surface, cleanliness of the cavityand size of surface opening of the cavity.Applications. The principal industrial usesof liquid penetrant testing are finaltesting, receiving testing, in-processtesting and quality control, maintenanceand overhaul in the transportationindustries, in plant and machinerymaintenance and in testing of largecomponents. The following are some ofthe typically detected discontinuities:
graphic Testing
FIGURE 5. Liquid penetrant indication ofcracking.
surface discontinuities, seams, cracks, laps,porosity and leak paths.
Magnetic Particle TestingPrinciples. Magnetic particle testing is amethod of locating surface and slightlysubsurface discontinuities inferromagnetic materials. It depends on thefact that when the material or part undertest is magnetized, discontinuities that liein a direction generally transverse to thedirection of the magnetic field will cause aleakage field to be formed at and abovethe surface of the part. The presence ofthis leakage field and therefore thepresence of the discontinuity is detectedby the use of finely divided ferromagneticparticles applied over the surface, withsome of the particles being gathered andheld to form an outline of thediscontinuity. This generally indicates itslocation, size, shape and extent. Magneticparticles are applied over a surface as dryparticles or as wet particles in a liquidcarrier such as water or oil.Applications. The principal industrial usesof magnetic particle testing are for final,receiving and in-process testing; forquality control; for maintenance andoverhaul in the transportation industries;for plant and machinery maintenance;and for testing of large components. Someof the typically detected discontinuitiesare surface discontinuities, seams, cracksand laps.
Eddy Current TestingPrinciples. Based on electromagneticinduction, eddy current testing (Fig. 6) isused to identify or differentiate among a
Direction ofprimary current
Eddy current strengthdecreases withincreasing depth
Direction of eddycurrents
Conducting specimen
Induced field

3RT01_LAYOUT(001_036) 10/2/02 1:34 PM Page 9
wide variety of physical, structural andmetallurgical conditions in electricallyconductive ferromagnetic andnonferromagnetic metals and metal parts.The method is based on indirectmeasurement and on correlation betweenthe instrument reading and the structuralcharacteristics and serviceability of theparts being examined.
With a basic system, the part is placedwithin or adjacent to an electric coil inwhich high frequency alternating currentis flowing. This excitation currentestablishes an electromagnetic fieldaround the coil. This primary field causeseddy current to flow in the part becauseof electromagnetic induction. Inversely,the eddy currents affected by allcharacteristics (conductivity, permeability,thickness, discontinuities and geometry)of the part create a secondary magneticfield that opposes the primary field. Theresults of this interaction affect the coilvoltage and can be displayed in a varietyof methods.
Eddy currents flow in closed loops inthe part or air. Their two most importantcharacteristics, amplitude and phase, areinfluenced by the arrangement andcharacteristics of the instrumentation andtest piece. For example, during the test ofa tube the eddy currents flowsymmetrically in the tube whendiscontinuities are not present. However,when a crack is present, then the eddycurrent flow is impeded and changed indirection, causing significant changes inthe associated electromagnetic field.
FIGURE 7. Representative setups for ultrasonic tetechnique.
Transducer
Crack
Bolt
Time
Crack
Back
(a)
Applications. An important industrial useof eddy current testing is on heatexchanger tubing. For example, eddycurrent testing is often specified for thinwall tubing in pressurized water reactors,steam generators, turbine condensers andair conditioning heat exchangers. Eddycurrent testing is also used often inaircraft maintenance. The following aresome of the typical materialcharacteristics that can be evaluated byeddy current testing: cracks, inclusions,dents and holes; grain size and hardness;coating and material thickness;dimensions and geometry; composition,conductivity or permeability; and alloycomposition.
Ultrasonic TestingPrinciples. Ultrasonic testing (Fig. 7) is anondestructive method in which beams ofsound waves at a frequency too high tohear are introduced into materials for thedetection of surface and subsurfacediscontinuities in the material. Theseacoustic waves travel through the materialwith some attendant loss of energy(attenuation) and are reflected atinterfaces. The reflected beam is displayed(or reduces the display of transmittedsound) and is then analyzed to define thepresence and locations of discontinuitiesor discontinuities.Applications. Ultrasonic testing of metalsis widely used, principally for thedetection of discontinuities. This methodcan be used to detect internal
9Introduction to Radiographic Testing
sting: (a) longitudinal wave technique; (b) shear wave
surface
Crack
Entry surface
Crack
Skip distance
(b)
a b

10 Rad
FIGURE 8. Acoustic emission testing setup in which eightsensors permit computer to calculate location of crackpropagation.
Computer
Preamplifier
Testobject
Acousticevent
3RT01_LAYOUT(001_036) 10/2/02 1:34 PM Page 10
discontinuities in most engineeringmetals and alloys. Bonds produced bywelding, brazing, soldering and adhesivebonding can also be ultrasonicallyexamined. Inline techniques have beendeveloped for monitoring and classifyingmaterials as acceptable, salvageable orscrap and for process control. Otherapplications include testing of piping andpressure vessels, nuclear systems, motorvehicles, machinery, structures, railroadrolling stock and bridges and thicknessmeasurement.
Leak TestingPrinciples. Leak testing is concerned withthe flow of liquids or gases frompressurized or into evacuated componentsor systems intended to hold fluids. Theprinciples of leak testing involve thephysics of fluid (liquids or gases) flowingthrough a barrier where a pressuredifferential or capillary action exists.Leaking fluids (liquid or gas) canpropagate from inside a component orassembly to the outside, or vice versa, as aresult of a pressure differential betweenthe two regions or as a result ofpermeation through a barrier. Theimportance of leak testing depends on thesize of the leak and on the medium beingleaked. Leak testing encompassesprocedures that fall into these basicfunctions: leak location, leakagemeasurement and leakage monitoring.Applications. Like other forms ofnondestructive testing, leak testing has agreat impact on the safety andperformance of a product. Reliable leaktesting decreases costs by reducingnumber of reworked products, warrantyrepairs and liability claims. The mostcommon reasons for performing a leaktest are to prevent the loss of costlymaterials or energy; to preventcontamination of the environment; toensure component or system reliability;and to prevent the potential for anexplosion or fire.
Acoustic Emission TestingPrinciples. Acoustic emissions are stresswaves produced by sudden movement instressed materials. The classic source ofacoustic emission is discontinuity relateddeformation processes such as crackgrowth and plastic deformation. Suddenmovement at the source produces a stresswave that radiates out into the structureand excites a sensitive piezoelectric sensor.As the stress in the material is raised,emissions are generated. The signals fromone or more sensors are amplified andmeasured to produce data for display andinterpretation.
iographic Testing
The source of acoustic emission energyis the elastic stress field in the material.Without stress, there is no emission.Therefore, an acoustic emission test(Fig. 8) is usually carried out during acontrolled loading of the structure. Thiscan be a proof load before service; acontrolled variation of load while thestructure is in service; a fatigue, pressureor creep test; or a complex loadingprogram. Often, a structure is going to beloaded hydrostatically anyway duringservice and acoustic emission testing isused because it gives valuable additionalinformation about the expectedperformance of the structure under load.Other times, acoustic emission testing isselected for reasons of economy or safetyand a special loading procedure isarranged to meet the needs of the acousticemission test.Applications. Acoustic emission is anatural phenomenon occurring in thewidest range of materials, structures andprocesses. The largest scale eventsobserved with acoustic emission testingare seismic and the smallest are smalldislocations in stressed metals.
The equipment used is highly sensitiveto any kind of movement in its operatingfrequency (typically 20 to 1200 kHz). Theequipment can detect not only crackgrowth and material deformation but also

3RT01_LAYOUT(001_036) 10/2/02 1:34 PM Page 11
such process as solidification, friction,impact, flow and phase transformations.Therefore, acoustic emission testing is alsoused for in-process weld monitoring,detecting tool touch and tool wear duringautomatic machining, detecting wear andloss of lubrication in rotating equipment,detecting loose parts and loose particles,detecting and monitoring leaks,cavitation, flow, preservice proof testing,in-service weld monitoring and leaktesting.
Infrared and Thermal TestingPrinciples. Conduction and convectionare the primary mechanisms of heattransfer in an object or system. However,electromagnetic radiation is emitted froma heated body when electrons in thatbody change to a lower energy state.Thermal testing involves themeasurement or mapping of surfacetemperatures when heat flows from, to orthrough a test object. Temperaturedifferentials on a surface, or changes insurface temperature with time, are relatedto heat flow patterns and can be used todetect anomalies or to determine the heattransfer characteristics of an object. Forexample, during the operation of anelectrical breaker, a hot spot detected atan electrical termination may be causedby a loose or corroded connection (seeFig. 9). The resistance to electrical flow
FIGURE 9. Infrared thermography ofautomatic transfer switches of emergencydiesel generator. Hot spots appear bright inthermogram.
through the connection produces anincrease in surface temperature of theconnection.Applications. There are two basiccategories of infrared and thermal testapplications: electrical and mechanical.The specific applications within these twocategories are numerous. Electricalapplications include transmission anddistribution lines, transformers,disconnects, switches, fuses, relays,breakers, motor windings, capacitorbanks, cable trays, bus taps and othercomponents and subsystems. Mechanicalapplications include insulation (in boilers,furnaces, kilns, piping, ducts, vessels,refrigerated trucks and systems, tank carsand elsewhere), friction in rotatingequipment (bearings, couplings, gears,gearboxes, conveyor belts, pumps,compressors and other components) andfluid flow (steam lines; heat exchangers;tank fluid levels; exothermic reactions;heating, ventilation and air conditioningsystems; leaks above and below ground;cooling and heating; tube blockages;systems; environmental assessment ofthermal discharge; boiler or furnace airleakage; condenser; turbine air leakage;pumps; compressors; and other systemapplications).
Other MethodsThere are many other methods ofnondestructive testing, including opticalmethods such as holography,shearography and moiré imaging; materialidentification methods such as chemicalspot testing, spark testing andspectroscopy; strain gaging; and acousticmethods such as vibration analysis andtapping.
11Introduction to Radiographic Testing

12 Radio
PART 2. Management of Radiographic Testing
3RT01_LAYOUT(001_036) 10/2/02 1:34 PM Page 12
Radiography may be considered the mosteffective nondestructive testing methodmerely because of its universal use andacceptance in industry. Radiography canbe used to test most types of solidmaterial. Exceptions include materials ofvery high or very low density. Neutronradiography, however, can often be usedin such cases. There is wide latitude bothof material thickness that can be testedand in the techniques that can be used.Usually conditions that result in a twopercent or greater difference inthrough-section thickness can usually bedetected.
Radiography has three mainadvantages: (1) detection of internaldiscontinuities, (2) detection of significantvariations in composition and(3) permanent record of test data.
Compared to other nondestructive testmethods, radiography can be expensive.Large capital costs and space allocationsmay be required for radiographicactivities. Cost may be reduced ifequipment of smaller size or lower energyrequirement can be used. The magnitudeof potential test activities, however, mustbe considered before limits are placed onthe test facility.
There are three major limiting factorsthat must be considered beforeradiography becomes the method ofchoice.
1. Discontinuity detection depends onradiation beam orientation. In general,radiography can detect only featuresthat have a thickness change in adirection parallel to the radiationbeam.
2. Radiography typically involves thetransmission of radiation through thepart or component, in which caseboth sides of the part must beaccessible.
3. Radiation safety is always necessary toa successful operation.
In addition, radiographic images (inthe form of film or digital images) mayneed to be stored for years to comply withquality assurance or regulatoryrequirements.
graphic Testing
Management ofRadiographic TestingProgramsManagement of a radiographic testingprogram will require consideration ofmany items before a program can producethe desired results. Six basic questionsmust be answered before a true directioncan be charted. They are as follows.
1. Are regulatory requirements in placethat mandate program characteristics?
2. What is the magnitude of the programthat will provide desired results?
3. What provisions must be made forpersonnel safety and for compliancewith environmental regulations?
4. What is the performance date for aprogram to be fully implemented?
5. Is there a cost benefit of radiographictesting?
6. What are the available resources inpersonnel and money?
Once these questions are answered, then arecommendation can be made todetermine the best path forward. Threeprimary paths are (1) service companies,(2) consultants and (3) in-house programs.
Though these are primary paths, someprograms may on a routine or onas-needed bases require support personnelfrom a combination of two or more ofthese sources. Before a final decision ismade, advantages and disadvantages ofeach path must be considered. Therefore,the following are details that must beconsidered.
Service Companies
1. Who will identify the componentswithin the facility to be examined?
2. Will the contract be for time andmaterials or have a specific scope ofwork?
3. If a time and materials contract isawarded, who will monitor the timeand materials charged?
4. If a scope of work is required, who istechnically qualified to develop andapprove it?
5. What products or documents (testreports, trending, recommendations,root cause analysis and others) will beprovided once the tests are completed?

3RT01_LAYOUT(001_036) 10/2/02 1:34 PM Page 13
6. Who will evaluate and accept theproduct (test reports, trending,recommendations, root cause analysisand others) within your company?
7. Do the service company workerspossess qualifications andcertifications required by contract andby applicable regulations? Will othercontractors be required to take care ofrelated matters such as radiationsafety?
8. Do the service company workersrequire site specific training (confinedspace entry, electrical safety, hazardousmaterials and others) or clearance toenter and work in the facility?
9. If quantitative tests are performed, doprogram requirements mandateequipment calibration?
10. Does the service company retain anyliability for test results?
Consultants
1. Will the contract be for time andmaterials or have a specific scope ofwork?
2. If a scope of work is required, who istechnically qualified to develop andapprove it?
3. Who will identify the requiredqualifications of the consultant?
4. Is the purpose of the consultant todevelop or update a program or is it tooversee and evaluate the performanceof an existing program?
5 Will the consultant have oversightresponsibility for tests performed?
6. What products (trending,recommendations, root cause analysisand others) are provided once the testsare completed?
7. Who will evaluate the consultant’sperformance (test reports, trending,recommendations, root cause analysisand other functions) within yourcompany?
8. Does the consultant possessqualifications and certificationsrequired by contract and by applicableregulations?
9. Does the consultant require sitespecific training (confined space entry,electrical safety, hazardous materialsand others) or clearance to enter andwork in the facility?
10. Does the consultant retain anyliability for test results?
In-House Programs
1. Who will determine the scope of theprogram? Will the radiation source beisotopes or X-ray machines? Will theimages be recorded on film or ondigital media?
2. What are the regulatory requirements(codes and standards) associated withprogram development andimplementation?
3. Who will develop a cost benefitanalysis for the program?
4. How much time and resources areavailable to establish the program?
5. What are the qualificationrequirements (education, training,experience and others) for personnel?
5. Do program personnel requireadditional training (radiological safety,confined space entry or others) orqualifications?
6. Are subject matter experts required toprovide technical guidance duringpersonnel development?
7. Are procedures required to performwork in the facility?
8. If procedures are required, who willdevelop, review and approve them?
9. Who will determine the technicalspecifications for test equipment?
Test Procedures forRadiographic TestingThe conduct of facility operations(in-house or contracted) should beperformed in accordance with specificinstructions from an expert. This istypically accomplished using writteninstructions in the form of a technicalprocedure. In many cases codes andspecifications will require the use of atechnical procedure to perform requiredtests.
The procedure process can take manyforms, including general instructions thataddress only major aspects of testtechniques. Or a procedure may bewritten as a step-by-step process requiringa supervisor’s initial or signature aftereach step. The following is a typicalformat for an industrial procedure.
1. The purpose identifies the intent of theprocedure.
2. The scope establishes the latitude ofitems, tests and techniques coveredand not covered by the procedure.
3. References are specific documents fromwhich criteria are extracted ordocuments satisfied byimplementation of the procedure.
4. Definitions are needed for terms andabbreviations that are not commonknowledge to people who will read theprocedure.
5. Statements about personnel requirementsaddress specific requirements toperform tasks in accordance with theprocedure — issues such as personnelqualification, certification, accessclearance and others.
13Introduction to Radiographic Testing

14 R
3RT01_LAYOUT(001_036) 10/2/02 1:34 PM Page 14
6. Equipment characteristics, calibrationrequirements and model numbers ofqualified equipment must be specified.
7. Safety issues must be addressed becauseof the nature of penetrating radiation.
8. The test procedure provides a sequentialprocess to be used to conduct testactivities.
9. Acceptance criteria establish componentcharacteristics that will identify theitems suitable for service.
10. Reports (records) provide the means todocument specific test techniques,equipment used, personnel performingactivity, date performed, test results,compliance with environmentalregulations and safety procedures.
11. Attachments may include (if required)items such as report forms, instrumentcalibration forms, qualified equipmentmatrix, schedules and others
Once the procedure is completed,typically an expert in the subject matterperforms a technical evaluation. If theprocedure is deemed adequate (meetingidentified requirements), the expert willapprove it for use. Some codes andstandards also require the procedure to bequalified — that is, demonstrated to thesatisfaction of a representative of aregulatory body or jurisdictionalauthority.
Test Specifications forRadiographic TestingA radiographic specification mustanticipate a number of issues that ariseduring testing.
Source SelectionThe radiation source requirements (energylevel, intensity and physical size) to detectthe target discontinuities must bedetermined.
1. The selected means of imaging maydictate source energy and intensitylevels.
2. The radiation source may need to bemobile for use in various locations.
3. The energy level (ability to penetrate)of the radiation sources affectsradiographic contrast. Radiographiccontrast is an element of imagesensitivity.
4. The physical size of the radiationemitting surface affects the geometricunsharpness of the radiographicimage.
5. High energy levels may increase safetyissues because of increased shieldingrequirements.
adiographic Testing
6. The source intensity (total quantity ofpenetrating rays) will directly affectthe exposure time. Increased exposuretime may affect safety requirements.
Selection of ImagingTypically an image is the end product of aradiographic examination. The image maybe the captured output of a radioscopic orelectronic imaging system. Its format maybe a hard copy (film or paper), a computerimage file or a video monitor displayingan image in real time.
1. The first consideration is the ability todetect discontinuities of interest.
2. Examination environment.3. Image handling requirements include
provisions for processing, evaluationand transmitting of images.
InterpretationInterpretation may be complex. Theinterpreter must have a knowledge of thefollowing: (1) the radiographic process(radiation source, exposure technique,image storage system and other meansused to obtain the image); (2) the itembeing examined (its configuration,material characteristics, fabricationprocess, potential discontinuities andother aspects); and (3) the acceptancecriteria.
Standards andSpecifications forRadiographic TestingStandards have undergone a process ofpeer review in industry and can beinvoked with the force of law by contractor by government regulation. In contrast,a specification represents an employer’sinstructions to employees and is specificto a contract or work place. Specificationsmay form the basis of standards through areview process. Standards andspecifications exist in three basic areas:equipment, processes and personnel.
1. Standards for equipment includecalibrated electronic radiation sourcesand isotope sources. Standardizedreference objects such as image qualityindicators (penetrameters), calibrateddensity strips and radiation surveymeters would also fit into thiscategory.

3RT01_LAYOUT(001_036) 10/2/02 1:34 PM Page 15
2. ASTM International and otherorganizations publish standards fortest techniques. Some other standardsare for quality assurance proceduresand are not specific to a test methodor even to testing in general. Tables 3and 4 list some of the standards usedin radiographic testing. A source fornondestructive testing standards is theAnnual Book of ASTM Standards.5
3. Qualification and certification of testpersonnel are discussed below, withspecific reference to recommendationsof ASNT Recommended Practice No.SNT-TC-1A.4
Personnel Qualificationand CertificationOne of the most critical aspects of the testprocess is the qualification of testpersonnel. Nondestructive testing issometimes referred to as a special process.The term simply means that it is verydifficult to determine the adequacy of atest by merely observing the process orthe documentation generated at itsconclusion. The quality of the test islargely dependent on the skills andknowledge of the inspector.
The American Society forNondestructive Testing (ASNT) has been aworld leader in the qualification andcertification of nondestructive testingpersonnel for many years. By 1999, theAmerican Society for NondestructiveTesting had instituted three majorprograms in place for the qualificationand certification of nondestructive testingpersonnel.
1. ASNT Recommended PracticeNo. SNT-TC-1A provides guidelines forpersonnel qualification andcertification in nondestructive testing.This recommended practice identifiesthe specific attributes that should beconsidered when qualifyingnondestructive testing personnel. Itrequires the employer to develop andimplement a written practice(procedure) that details the specificprocess and any limitation in thequalification and certification ofnondestructive testing personnel.4
2. ANSI/ASNT CP-189, Standard forQualification and Certification ofNondestructive Testing Personnelresembles SNT-TC-1A but alsoestablishes specific attributes for thequalification and certification ofnondestructive testing personnel.However, CP-189 is a consensusstandard as defined by the AmericanNational Standards Institute (ANSI). Itis recognized as the American standardfor nondestructive testing. It is notconsidered a recommended practice; it isa national standard.6
3. The ASNT Central Certification Program(ACCP), unlike SNT-TC-1A andCP-189, is a third party certificationprocess. Currently it has identifiedqualification and certificationattributes for Level II and Level IIInondestructive testing personnel. TheAmerican Society for NondestructiveTesting certifies that the individual hasthe skills and knowledge for manynondestructive testing methodapplications. It does not remove theresponsibility for the finaldetermination of personnelqualifications from the employer. Theemployer evaluates an individual’sskills and knowledge for application ofcompany procedures using designatedtechniques and identified equipmentfor specific tests.7
Selections fromASNT Recommended PracticeNo. SNT-TC-1ATo give an overview of the contents ofthese documents, the following items arespecified in the 1996 edition ofSNT-TC-1A. (For the purpose of thisdiscussion the quantities cited are thosethat address radiographic testing only.)Scope. This recommended practice hasbeen prepared to establish guidelines forthe qualification and certification ofnondestructive testing personnel whosespecific jobs require appropriateknowledge of the technical principlesunderlying the nondestructive test theyperform, witness, monitor or evaluate.This document provides guidelines for theestablishment of a qualification andcertification program.Written Practice. The employer shallestablish a written practice for the controland administration of nondestructivetesting personnel training, examinationand certification. The employer’s writtenpractice should describe the responsibilityof each level of certification fordetermining the acceptability of materialsor components in accordance withapplicable codes, standards, specificationsand procedures.
15Introduction to Radiographic Testing

16 Radiographic Testing
Table 3. Some radiographic standards published by ASTM International.
C 638-92 (1997), Standard Descriptive Nonmenclature of Constituents of Aggregates for Radiation-Shielding ConcreteE 94-00, Standard Guide for Radiographic ExaminationE 155-00, Standard Reference Radiographs for Inspection of Aluminum and Magnesium CastingsE 170-99e1, Standard Terminology Relating to Radiation Measurements and DosimetryE 186-98, Standard Reference Radiographs for Heavy-Walled (2 to 4 1/2-in. [51 to 114-mm]) Steel CastingsE 192-95 (1999), Standard Reference Radiographs for Investment Steel Castings of Aerospace ApplicationsE 242-95 (2000), Standard Reference Radiographs for Appearances of Radiographic Images as Certain Parameters Are ChangedE 272-99, Standard Reference Radiographs for High-Strength Copper-Base and Nickel-Copper Alloy CastingsE 280-98, Standard Reference Radiographs for Heavy-Walled (4 1/2 to 12-in. [(114 to 305-mm]) Steel CastingsE 310-99, Standard Reference Radiographs for Tin Bronze CastingsE 390-95, Standard Reference Radiographs for Steel Fusion WeldsE 431-96, Standard Guide to Interpretation of Radiographs of Semiconductors and Related DevicesE 446-98, Standard Reference Radiographs for Steel Castings Up to 2 in. (51 mm) in ThicknessE 505-96, Standard Reference Radiographs for Inspection of Aluminum and Magnesium Die CastingsE 592-99, Standard Guide to Obtainable ASTM Equivalent Penetrameter Sensitivity for Radiography of Steel Plates 1/4 to 2 in. (6 to 51 mm) Thick
with X Rays and 1 to 6 in. (25 to 152 mm) Thick with Cobalt-60E 666-97, Standard Practice for Calculating Absorbed Dose from Gamma or X RadiationE 689-95 (1999), Standard Reference Radiographs for Ductile Iron CastingsE 746-02, Standard Test Method for Determining Relative Image Quality Response of Industrial Radiographic FilmE 747-97, Standard Practice for Design, Manufacture and Material Grouping Classification of Wire Image Quality Indicators (IQI) Used for RadiologyE 748-95, Standard Practices for Thermal Neutron Radiography of MaterialsE 801 (2001), Standard Practice for Controlling Quality of Radiological Examination of Electronic DevicesE 802-95 (1999), Standard Reference Radiographs for Gray Iron Castings Up to 4 1/2 in. [114 mm]) in ThicknessE 803, Standard Test Method for Determining the L/D Ratio of Neutron Radiography BeamsE 975-00, Standard Practice for X-Ray Determination of Retained Austenite in Steel with Near Random Crystallographic OrientationE 999-99, Standard Guide for Controlling the Quality of Industrial Radiographic Film ProcessingE 1000-98, Standard Guide for RadioscopyE 1025-98, Standard Practice for Design, Manufacture, and Material Grouping Classification of Hole-Type Image Quality Indicators (IQI) Used for RadiologyE 1030-00, Standard Test Method for Radiographic Examination of Metallic CastingsE 1032-95, Standard Test Method for Radiographic Examination of WeldmentsE 1114-92 (1997), Standard Test Method for Determining the Focal Size of Iridium-192 Industrial Radiographic SourcesE 1161-95, Standard Test Method for Radiologic Examination of Semiconductors and Electronic ComponentsE 1165-92 (2002), Standard Test Method for Measurement of Focal Spots of Industrial X-Ray Tubes by Pinhole ImagingE 1254-98, Standard Guide for Storage of Radiographs and Unexposed Industrial Radiographic FilmsE 1255-96, Standard Practice for RadioscopyE 1320-00, Standard Reference Radiographs for Titanium CastingsE 1390-90 (2000), Standard Guide for Illuminators Used for Viewing Industrial RadiographsE 1411-95, Standard Practice for Qualification of Radioscopic SystemsE 1441-00, Standard Guide for Computed Tomography (CT) ImagingE 1453-93 (1996), Standard Guide for Storage of Media That Contains [sic] Analog or Digital Radioscopic DataE 1475-97, Standard Guide for Data Fields for Computerized Transfer of Digital Radiological Test DataE 1496-97, Standard Test Method for Neutron Radiographic Dimensional MeasurementsE 1570-00, Standard Practice for Computed Tomographic (CT) ExaminationE 1647-98a, Standard Practice for Determining Contrast Sensitivity in RadioscopyE 1648-95 (2001), Standard Reference Radiographs for Examination of Aluminum Fusion WeldsE 1672-95 (2001), Standard Guide for Computed Tomography (CT) System SelectionE 1734-98, Standard Practice for Radioscopic Examination of CastingsE 1735, Standard Test Method for Determining Relative Image Quality of Industrial Radiographic Film Exposed to X-Radiation from 4 to 25 MVE 1742-00, Standard Practice for Radiographic ExaminationE 1814-96, Standard Practice for Computed Tomographic (CT) Examination of CastingsE 1815-96 (2001), Standard Test Method for Classification of Film Systems for Industrial RadiographyE 1894-97, Standard Guide for Selecting Dosimetry Systems for Application in Pulsed X-Ray SourcesE 1931-97, Standard Guide for X-Ray Compton Scatter TomographyE 1936-97, Standard Reference Radiograph for Evaluating the Performance of Radiographic Digitization SystemsE 1955-98, Standard Radiographic Examination for Soundness of Welds in Steel by Comparison to Graded ASTM E 390 Reference RadiographsE 2002-98, Standard Practice for Determining Total Image Unsharpness in RadiologyE 2033-99, Standard Practice for Computed Radiology (Photostimulable Luminescence Method)E 2116-00, Standard Practice for Dosimetry for a Self-Contained Dry-Storage Gamma-Ray IrradiatorF 629-97, Standard Practice for Radiography of Cast Metallic Surgical ImplantsF 947-85 (1996), Standard Test Method for Determining Low-Level X-Radiation Sensitivity of Photographic FilmsF 1035-91 (1997), Standard Practice for Use of Rubber-Cord Pie Disk to Demonstrate the Discernment Capability of a Tire X-Ray Imaging System
3RT01_LAYOUT(001_036) 10/2/02 1:34 PM Page 16

17Introduction to Radiographic Testing
TABLE 4. Some standards and practices for radiographic testing and for radiation safety.
Issuing Organization Representative Standards and Related Documents
American National Standards Institute ANSI N43.9-1991, Gamma Radiography — Specifications for Design and Test of Apparatus(revision and redesignation of ANSI N432-1980)
ANSI PH2.8-1975, Sensitometry of Industrial X-Ray Films for Energies up to 3 Million ElectronVolts, Method for.
See also ASME and ASNT.American Society of Mechanical Engineers ANSI/ASME B31.1, Power Piping
ANSI/ASME B31.3, Process PipingASME Boiler and Pressure Vessel Code: Section I — Power BoilersASME Boiler and Pressure Vessel Code: Section III — ComponentsASME Boiler and Pressure Vessel Code: Section V — Power BoilersASME Boiler and Pressure Vessel Code: Section VIII — Pressure VesselsASME Boiler and Pressure Vessel Code: Section XI — Inservice Inspection of Nuclear VesselsASME PTC 19-1, Performance Test Codes, Supplement on Instruction and Apparatus
American Society for Nondestructive Testing ASNT Recommended Practice No. SNT-TC-1AANSI/ASNT CP-189, ASNT Standard for Qualification and Certification of Nondestructive Testing
PersonnelAmerican Society for Testing and Materials See Table 3American Petroleum Institute API 510, Pressure Vessel Inspection Code: Maintenance Inspection, Rating, Repair and Alteration
API 570, Piping Inspection Code: Inspection, Repair, Alteration, and Rerating of In-Service PipingSystems
API 650, Welded Steel Tanks for Oil StorageAPI 1104, Welding, Pipelines and Related Facilities
American Water Works Association AWWA D100-96, Welded Steel Tanks for Water StorageAmerican Welding Society AWS D1.1, Structural Welding Code — Steel
AWS D1.5, Bridge Welding CodeCanadian General Standards Board CAN/CGSB-48-GP-2M, Spot Radiography of Welded Butt Joints in Ferrous Materials
CAN/CGSB-48.3-92, Radiographic Testing of Steel CastingsCAN/CGSB-48.5-95, Manual on Industrial RadiographyCAN/CGSB-48.9712-95, Non-Destructive Testing — Qualification and Certification of Personnel
Deutsche Institut für Normung DIN 6814, Terms and Definitions in the Field of Radiological TechniquesDIN 6832-2, Radiographic Cassettes; Test for Light-Proofness and Test for Contact between
Radiographic Film and Intensifying ScreenDIN 25 430, Safety Marking in Radiation ProtectionDIN 54 115, Non-Destructive Testing; Radiation Protection Rules for the Technical Application of
Sealed Radioactive SourcesDIN EN 444, Non-Destructive Testing; General Principles for the Radiographic Examination of
Metallic Materials Using X-Rays and Gamma-RaysDIN EN 12 681, Founding — Radiographic InspectionDIN EN 14 096, Non-Destructive Testing - Qualification of Radiographic Film Digitisation Systems
European Committee for Standardization CEN 584, Non Destructive Testing — Industrial Radiographic FilmEN 12 679, Non-Destructive Testing — Determination of the Size of Industrial Radiographic
Sources — Radiographic MethodInternational Organization for Standardization ISO 2504, Radiography of Welds and Viewing Conditions for Films — Utilization of
Recommended Patterns of Image Quality Indicators (I.Q.I.)ISO 7004, Photography — Industrial Radiographic Film — Determination of ISO Speed and
Average Gradient When Exposed to X- and Gamma-RadiationISO 3999, Apparatus for Gamma RadiographyISO 9712, Nondestructive Testing — Qualification and Certification of PersonnelISO 9915, Aluminium Alloy Castings — Radiography TestingISO 11 699, Non-Destructive Testing — Industrial Radiographic Films
Japanese Standards Association K 7091, Testing Method for Radiography of Carbon Fibre Reinforced Plastic Panels Edition 1K 7521, Dimensions for Photographic Film in Sheets and Rolls for Medical, Industrial and Dental
RadiographyZ 4560, Industrial Gamma-Ray Apparatus for Radiography
Korean Standards Association A 4907, Film Marker of RadiographyA 4921, Industrial X-Ray Apparatus for RadiographyM 3910, Dimensions for Photographic Film in Sheets and Rolls for Medical, Industrial and Dental
RadiographyNational Council on Radiation Protection NCRP 61, Radiation Safety Training Criteria for Industrial RadiographyOccupational Safety and Health Administration 29 CFR 1910, Occupational Safety and Health Standards [Code of Federal Regulations:
Title 29, Labor]Society of Automotive Engineers SAE AMS 2635C, Radiographic Inspection
SAE ARP 1611A, Quality Inspection Procedure, Composites, Tracer Fluoroscopy and RadiographySAE AS 1613A, Image Quality Indicator, RadiographicSAE AS 7114/4, NADCAP Requirements for Nondestructive Testing Facility Radiography
3RT01_LAYOUT(001_036) 10/2/02 1:34 PM Page 17

18 Ra
TABLE 5. RradiograpASNT Reco
RadiographHigh schoTwo yearsWork expe
Neutron RaHigh schoTwo yearsWork expe
a. Or equb. Compl
sciencec. Work t
experiebeing qexperieLevel IIrequire
3RT01_LAYOUT(001_036) 10/2/02 1:34 PM Page 18
Education, Training, ExperienceRequirements for Initial Qualification.Candidates for certification innondestructive testing should havesufficient education, training andexperience to ensure qualification inthose nondestructive testing methods forwhich they are being considered forcertification. Table 5 lists therecommended training and experiencefactors to be considered by the employerin establishing written practices for initialqualification of Level I and II individualsfor radiographic testing. Training Programs. Personnel beingconsidered for initial certification shouldcomplete sufficient organized training tobecome thoroughly familiar with theprinciples and practices of the specifiednondestructive test method related to thelevel of certification desired andapplicable to the processes to be used andthe products to be tested.Examinations. For Level I and IIpersonnel, a composite grade should bedetermined by a simple averaging of theresults of the general, specific andpractical examinations described below.Examinations administered forqualification should result in a passingcomposite grade of at least 80 percent,with no individual examination having apassing grade less than 70 percent. Theexamination for near vision acuity shouldensure natural or corrected near distanceacuity in at least one eye such thatapplicant can read a minimum of jaegersize 2 or equivalent type and size letter ata distance of not less than 305 mm
diographic Testing
ecommended training and experience forhic testing personnel according tommended Practice No. SNT-TC-1A.4
Level I Level II
ic Testingol graduatea 39 h 40 h of collegeb 29 h 35 hriencec 3 mo 9 mo
diographic Testingol graduatea 28 h 40 h of collegeb 20 h 40 hriencec 6 mo 24 mo
ivalent.etion with a passing grade of at least two years of engineering or study in a university, college or technical school.ime experience per level. Note: for Level II certification, thence shall consist of time as Level I or equivalent. If a person isualified directly to Level II with no time at Level I, the requirednce shall consist of the sum of the times required for Level I and and the required training shall consist of the sum of the hoursd for Level I and Level II.
(12 in.) on a standard jaeger test chart.This test should be administered annually.Written Examination for NDT Levels Iand II. The minimum number ofquestions that should be administered inthe written examination for radiographictest personnel is as follows: 40 questionsin the general examination and 20questions in the specific examination. Thenumber of questions is the same for LevelI and Level II personnel.Practical Examination for NDT Level Iand II. The candidate should demonstrateability to operate the necessarynondestructive test equipment, recordand analyze the resultant information tothe degree required. At least one selectedspecimen should be tested and the resultsof the nondestructive test analyzed by thecandidate.Certification. Certification of all levels ofnondestructive testing personnel is theresponsibility of the employer.Certification of nondestructive testingpersonnel shall be based ondemonstration of satisfactory qualificationin accordance with sections on education,training, experience and examinations, asmodified by the employer’s writtenpractice. Personnel certification recordsshall be maintained on file by theemployer.Recertification. All levels ofnondestructive testing personnel shall berecertified periodically in accordance withthe following: evidence of continuingsatisfactory performance; reexaminationin those portions of examination deemednecessary by the employer’s NDT Level III.Recommended maximum recertificationintervals are three years for Level I andLevel II and five years for Level III.
These recommendations fromSNT-TC-1A are cited only to provide aflavor of the specific items that must beconsidered in the development of anin-house nondestructive testing program.However, if an outside agency iscontracted for radiographic test services,then the contractor must have aqualification and certification program tosatisfy most codes and standards.
Central CertificationAnother standard that may be a source forcompliance is contained in therequirements of the InternationalOrganization for Standardization (ISO).The work of preparing internationalstandards is normally carried out throughtechnical committees of the InternationalOrganization for Standardization, aworldwide federation of nationalstandards bodies. Each ISO member bodyinterested in a subject for which atechnical committee has been established

3RT01_LAYOUT(001_036) 10/2/02 1:34 PM Page 19
has the right to be represented on thatcommittee. International organizations,governmental and nongovernmental, inliaison with the InternationalOrganization for Standardization, alsotake part in the work.
Technical Committee ISO/TC 135,Non-Destructive Testing SubcommitteeSC 7, Personnel Qualification, preparedinternational standard ISO 9712,Nondestructive Testing – Qualification andCertification of Personnel.8 In its statementof scope, ISO 9712 states that it“establishes a system for the qualificationand certification, by a certification body,of personnel to perform industrialnondestructive testing (NDT) using any ofthe following methods: (a) eddy currenttesting; (b) liquid penetrant testing;(c) magnetic particle testing; (d)radiographic testing; (e) ultrasonictesting” and that the “system described inthis International Standard may alsoapply to visual testing (VT), leak testing(LT), neutron radiography (NR), acousticemission (AE) and other nondestructivetest methods where independentcertification programs exist.” Theapplicability of ISO 9712 to radiographictesting therefore depends on activity ofthe national certifying body.
Safety in RadiographicTestingTo manage a radiographic testingprogram, as with any test program, thefirst obligation is to ensure safe workingconditions. The following are componentsof a safety program that may be requiredor at least deserve serious consideration.
1. Identify the safety and operationalrules and codes applicable to the areas,equipment and processes beingexamined before work is to begin.
2. Provide proper safety equipment(protective barriers, hard hat, safetyharnesses, steel toed shoes, hearingprotection and others).
3. Provide necessary training in radiationsafety.
4. Before the test, perform a thoroughvisual survey to determine all thehazards and identify necessarysafeguards to protect test personneland equipment.
5. Notify operative personnel to identifythe location and specific equipmentthat will be examined. In addition, adetermination must be made if signsor locks restrict access by personnel.Be aware of equipment that may beoperated remotely or may started bytime delay.
6. Be aware of any potentially explosiveatmospheres. Determine whether it issafe to take your equipment into thearea.
7. Do not enter any roped off or no entryareas without permission andapproval.
8. When working on or around movingor electrical equipment, remove pens,watches, rings or objects in yourpockets that may touch (or fall into)energized equipment.
9. Know interplant communication andevacuation systems.
10. Never let unqualified personneloperate equipment independentlyfrom qualified supervision.
11. Keep a safe distance between you andany energized equipment. In theUnited States, these distances can befound in documents from theOccupational Safety and HealthAdministration, the National FirePrevention Association (NationalElectric Code),9 the Institute ofElectrical and Electronics Engineers(National Electrical Safety Code)10 andother organizations.
12. Be aware of the personnelresponsibilities before entering aconfined space. All such areas must betested satisfactorily for gas and oxygenlevels before entry and periodicallythereafter. If odors are noticed, orunusual sensations such as earaches,dizziness or difficulty in breathing areexperienced, leave the areaimmediately.
13. Notice that the safety considerationslisted above are applicable to manytest methods. Because ionizingradiation can hurt people, additionalprecautions are needed forradiographic testing and are discussedin a separate chapter.
Most facilities in the United States arerequired by law to follow therequirements in the applicable standard.Two Occupational Safety and HealthStandards in the United States that shouldbe reviewed are Occupational Safety andHealth Standards for general industry11 andthe Occupational Safety and HealthStandards for the Construction Industry.12
Personnel safety is always the firstconsideration for every job.
Ensuring Reliability of TestResultsWhen a test is performed, there are fourpossible outcomes: (1) a discontinuity canbe found when a discontinuity is present;(2) a discontinuity can be missed evenwhen a discontinuity is present; (3) adiscontinuity can be found when none is
19Introduction to Radiographic Testing

20 Rad
3RT01_LAYOUT(001_036) 10/2/02 1:34 PM Page 20
present; and (4) no discontinuity is foundwhen none is present. A reliable testingprocess and a qualified inspector shouldfind all discontinuities of concern with nodiscontinuities missed (no errors as incase 2, above) and no false callouts(case 3, above).
To achieve this goal, the probability offinding a discontinuity must be high andthe inspector must be both proficient inthe testing process and motivated toperform a maximum efficiency. A recklessinspector may accept parts that containdiscontinuities, with the resultantconsequences of possible inservice partfailure. A conservative inspector mayreject parts that contain discontinuitiesbut the inspector also may reject partsthat do not contain discontinuities, withthe resultant consequences of unnecessaryscrap and repair. Neither inspector isdoing a good job.
SummaryAs noted in this discussion, many factorsmust be considered before a program ofradiographic testing can begin at a facility.To manage a nondestructive testingprogram many options must beconsidered. The final decision for a pathforward must be based on requirementdocuments (codes, standards orspecifications) and what is best for yourcompany. If a person in a position ofresponsibility lacks the expertise for thiscritical decision, the industry has manytalented individuals willing to assist. TheAmerican Society for NondestructiveTesting is a place to begin the decisionmaking process.
iographic Testing

PART 3. History of Radiographic Testing13
FIGURE 10. Wilhelm Conrad Röntgen.
3RT01_LAYOUT(001_036) 10/2/02 1:34 PM Page 21
RöntgenWilhelm Conrad Röntgen (Fig. 10) madehis momentous discovery of X-rays onFriday, 8 November 1895, in hislaboratory at the University of Würzburgin Germany. The importance of this newkind of ray was recognized immediatelyThe see-through property of X-rays createda sensation, not only in the scientificcommunity but also in the popular press.By early January 1896, newspapers aroundthe world carried news of these new raysand their ability to pass through flesh andother materials. The newspaper accountscorrectly predicted the tremendous impactthat X-rays were to have on medicaldiagnosis. Röntgen and other early X-rayworkers showed X-ray images of things:Röntgen took X-ray images of hisshotgun, a compass and weights in a box.Much experimental work ensued in analmost playful atmosphere, as researchersradiographed hundreds of different kindsof objects. Industrial applications of a sortwere found almost immediately, in thesense that artillery shell casings wereamong the objects so examined. It wasdecades before nonmedical uses of X-raysbecame important.
Clearly, the practical uses for X-rayshave gone well beyond the early concepts.Immediate medical uses foreseen includedsetting of broken bones and location offoreign objects — bullets, pins, coins andothers. Medical applications have nowexpanded to include diagnosis of diseasessuch as tuberculosis, malfunctions such asblockages of the circulatory system andthe detection of many abnormalities suchas tumors and calcium loss in bones.X-rays are now used for medical therapy,to identify and analyze materials, toinspect industrial materials and, a use allairplane travelers recognize, to inspectbaggage and packages. The methodsinclude fluoroscopy and film radiography— the two methods Röntgen used — andmore modem techniques such aselectronic radioscopy, tomography,backscatter imaging, radiation gaging,diffraction, fluorescence and others.
Preliminary WorkRöntgen was a respected scientist beforethe X-ray discovery, having publishedwork on specific heat, optical phenomena
and compressibility of liquids. As adirector of the Physical Institute atWürzburg, Röntgen had freedom topursue scientific ideas that were ofinterest to him. In 1895, he begancollecting the equipment needed toinvestigate luminescence effects. Hestudied early work by people before him— Faraday, Geissler, Hittorf and Crookes,for example — as well as the more currentwork of fellow German scientist PhilippLenard. These scientists and others hadstudied luminescence in gases and solidsusing a partially evacuated tube, popularlyknown as a crookes tube.14 This wastypically a pear shaped glass tube,containing two electrodes. When a highvoltage was put between the electrodes,the positively charged ions from the gasbombarded the negative electrode,causing the release of electrons, thencalled cathode rays. The electrons causedluminescence in the partial gas filling, inthe glass walls of the tube or in othermaterials placed in their path.
21Introduction to Radiographic Testing

22 R
3RT01_LAYOUT(001_036) 10/2/02 1:34 PM Page 22
DiscoveryRöntgen was an institute director, withgraduate students and assistants availableas needed. However, as was his usualcustom, Röntgen did many experimentalstudies himself. His laboratory was onlyone floor down from his living quarters inthe Physical Institute, so it was easilyavailable to him as he desired. All was inreadiness on the afternoon of Friday,8 November 1895. Röntgen had hiscovered tube and a darkened laboratorywhen he energized the cathode ray tubeand noticed luminescence from a bariumplatinocyanide screen on a table about2 m (7 ft) away. The luminescence wasdefinitely associated with the tube,turning on only when the tube wasenergized. Röntgen knew the effect couldnot be cathode rays, because theypenetrate only a short distance in air. Hewas intrigued; he investigated.
He quickly learned about thepenetrating power of these new rays; theypenetrated paper, wood, metal and flesh.The rays made shadow pictures onfluorescent screens and on film.Nevertheless, he was skeptical about hisdiscovery. As he became totally consumedin a seven week intensive study hecommented to his friend, Theodor Boveri,“I have discovered something interestingbut I do not know whether or not myobservations are correct.” At the sametime, as a scientist, he was excited. Heknew he must report his findings andobtain feedback from fellow scientists.Because the new rays darkened aphotographic plate, he could take picturesand share them with others. One of theseearly pictures in December 1895 was a15 min exposure showing the bones inthe hand of his wife, Bertha. Other earlypictures taken with the new rays includedweights in a box, a compass, a piece ofmetal and a shotgun. He recognized thathe must publish his results so that theycould be shared with others in thescientific community. His first technicalpaper on X-rays, “On a New Kind of Rays:A Preliminary Communication,” waspublished in the annals of the WürzburgPhysical Medical Society in December1895.15 The reprints were ready by thenew year. As he mailed reprints andphotographs to colleagues, Röntgen saidto Bertha, “Now the devil will be to pay,”clearly a premonition of the comingdrastic change in his life.
FameRöntgen was apprehensive as he sentreprints and pictures to colleagues inJanuary 1896, but he probably had noidea of what was in store for him. Therewas tremendous interest in his new rays,both from the scientific community and
adiographic Testing
the general public. One of his mailed setof reprints and photographs went to hisfriend Ernst Warburg in Berlin. Warburgdisplayed the material as a poster exhibitat the 50th anniversary meeting of theBerlin Physical Society in 1896. Many sawthe exhibit in one corner of the hall.
Another of his private communicationswent to a second college friend, ProfessorFranz Exner in Vienna. Exner showed thepictures to several fellow scientists. One ofthem, Professor Ernst Lecher visiting fromPrague, was so fascinated by the picturesthat he asked Exner if he could borrowthem overnight. Lecher shared thepictures with his father, Z. Lecher, editorof the Vienna Presse newspaper. Lecher’sJanuary 1896 article in the Vienna Pressenewspaper extolled the potential of thesenew X-rays, correctly pointing out thebenefits for medical diagnosis. The newsquickly spread around the world,appearing in many newspapers within thefollowing week. Röntgen received morethan 1000 pieces of mail in the first weekfollowing the press announcement.Within days, scientists everywhere, usingcrookes tubes, were repeating Röntgen’sobservations and confirming his results.
Once the news was out, there weremany offers of honors, lectures and visits.However, Röntgen turned down mostsuch overtures. One he could not refusewas a royal invitation. Röntgen gave ademonstration of X-rays before KaiserWilhelm II and his court in January 1896.As a result of this summons to the court,Röntgen was awarded the Royal Order ofMerit, an award that permits one to usethe title von, as an indication of nobility.Röntgen never made the formalapplication for the noble rank and refusedto use the term von in his name.
Another summons he could not turndown was a call from his own university.In January 1896, he lectured on hisdiscovery before the Physical MedicalSociety in Würzburg and gave the firstpublic demonstration before anoverflowing audience. The image ofRöntgen’s lecture was captured in a 1961painting (Fig. 11). During the lectureRöntgen radiographed the hand of hisfellow university professor and wellknown anatomist, Albert von Kolliker.Kolliker was so enthused by the discoverythat he announced that the new raysshould be called roentgen rays, as they arestill in Europe and within the medicalcommunity. The lecture anddemonstration were greeted withenthusiastic applause. It was to beRöntgen’s only formal public lecture onX-rays.
The commercial community took noteof Röntgen’s discovery.14,16 An Americanindustrial group was said to offer Röntgena fortune for rights to his discovery.
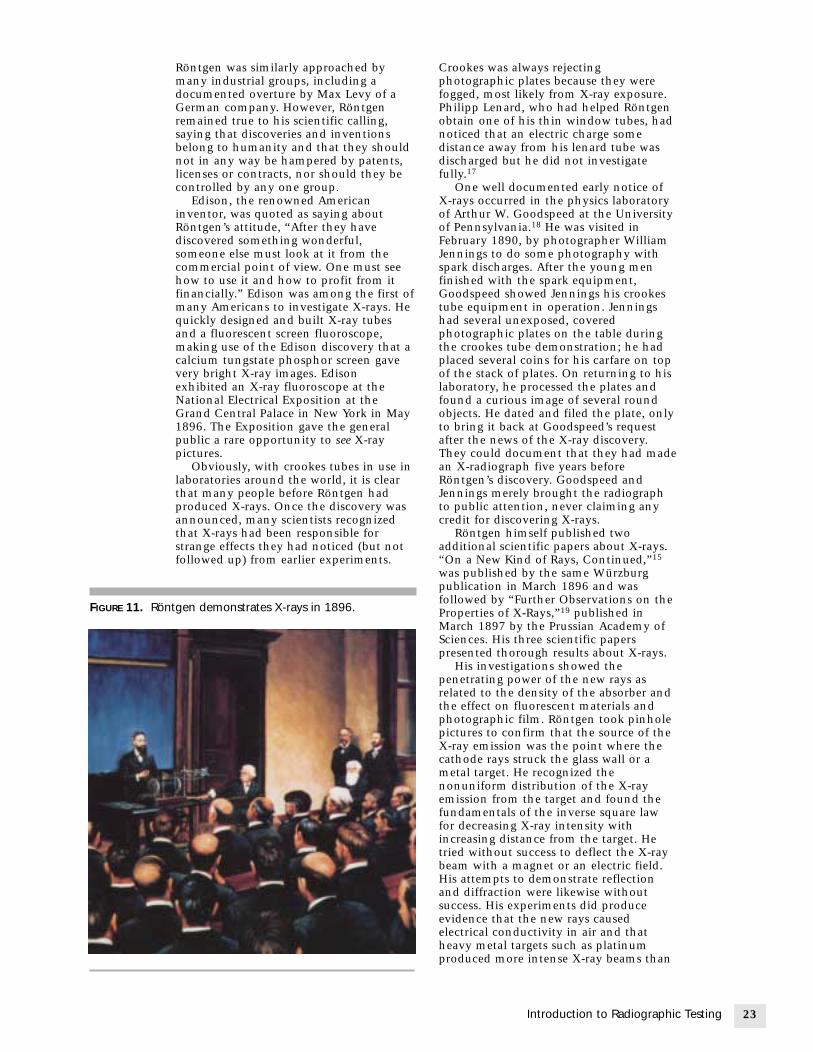
FIGURE 11
3RT01_LAYOUT(001_036) 10/2/02 1:34 PM Page 23
Röntgen was similarly approached bymany industrial groups, including adocumented overture by Max Levy of aGerman company. However, Röntgenremained true to his scientific calling,saying that discoveries and inventionsbelong to humanity and that they shouldnot in any way be hampered by patents,licenses or contracts, nor should they becontrolled by any one group.
Edison, the renowned Americaninventor, was quoted as saying aboutRöntgen’s attitude, “After they havediscovered something wonderful,someone else must look at it from thecommercial point of view. One must seehow to use it and how to profit from itfinancially.” Edison was among the first ofmany Americans to investigate X-rays. Hequickly designed and built X-ray tubesand a fluorescent screen fluoroscope,making use of the Edison discovery that acalcium tungstate phosphor screen gavevery bright X-ray images. Edisonexhibited an X-ray fluoroscope at theNational Electrical Exposition at theGrand Central Palace in New York in May1896. The Exposition gave the generalpublic a rare opportunity to see X-raypictures.
Obviously, with crookes tubes in use inlaboratories around the world, it is clearthat many people before Röntgen hadproduced X-rays. Once the discovery wasannounced, many scientists recognizedthat X-rays had been responsible forstrange effects they had noticed (but notfollowed up) from earlier experiments.
. Röntgen demonstrates X-rays in 1896.
Crookes was always rejectingphotographic plates because they werefogged, most likely from X-ray exposure.Philipp Lenard, who had helped Röntgenobtain one of his thin window tubes, hadnoticed that an electric charge somedistance away from his lenard tube wasdischarged but he did not investigatefully.17
One well documented early notice ofX-rays occurred in the physics laboratoryof Arthur W. Goodspeed at the Universityof Pennsylvania.18 He was visited inFebruary 1890, by photographer WilliamJennings to do some photography withspark discharges. After the young menfinished with the spark equipment,Goodspeed showed Jennings his crookestube equipment in operation. Jenningshad several unexposed, coveredphotographic plates on the table duringthe crookes tube demonstration; he hadplaced several coins for his carfare on topof the stack of plates. On returning to hislaboratory, he processed the plates andfound a curious image of several roundobjects. He dated and filed the plate, onlyto bring it back at Goodspeed’s requestafter the news of the X-ray discovery.They could document that they had madean X-radiograph five years beforeRöntgen’s discovery. Goodspeed andJennings merely brought the radiographto public attention, never claiming anycredit for discovering X-rays.
Röntgen himself published twoadditional scientific papers about X-rays.“On a New Kind of Rays, Continued,”15
was published by the same Würzburgpublication in March 1896 and wasfollowed by “Further Observations on theProperties of X-Rays,”19 published inMarch 1897 by the Prussian Academy ofSciences. His three scientific paperspresented thorough results about X-rays.
His investigations showed thepenetrating power of the new rays asrelated to the density of the absorber andthe effect on fluorescent materials andphotographic film. Röntgen took pinholepictures to confirm that the source of theX-ray emission was the point where thecathode rays struck the glass wall or ametal target. He recognized thenonuniform distribution of the X-rayemission from the target and found thefundamentals of the inverse square lawfor decreasing X-ray intensity withincreasing distance from the target. Hetried without success to deflect the X-raybeam with a magnet or an electric field.His attempts to demonstrate reflectionand diffraction were likewise withoutsuccess. His experiments did produceevidence that the new rays causedelectrical conductivity in air and thatheavy metal targets such as platinumproduced more intense X-ray beams than
23Introduction to Radiographic Testing

24 Rad
3RT01_LAYOUT(001_036) 10/2/02 1:34 PM Page 24
glass or aluminum targets. His threepapers on X-rays gave the basicinformation about X-rays to the world.20
Early Medical ApplicationsThe medical use of X-rays beganimmediately. It was straightforward torecognize the usefulness of X-rays to findforeign objects in the body and to helpset broken bones. There are manydocumented instances of suchapplications as early as January andFebruary 1896. The first recorded X-raypicture in the Americas was taken byArthur W. Wright of Yale University, inJanuary 1896. This was quickly followedby X-ray work at other universities.
Men recognized for early work in whathas become medical radiology includeFrancis H. Williams, a doctor at theBoston City Hospital, and William J.Morton, a New York City physician.21
Williams used X-rays to study anatomy,both diseased and normal. He usedfluoroscopy and film radiography to studythe thorax, for determining the outline ofthe heart, for diagnosis of tuberculosisand other medical studies. Williams hadthe advantage of working with twoMassachusetts Institute of Technologyscientists, Charles Norton and RalphLawrence, whose work advanced earlyX-ray technology. Morton’s wide rangingpioneering X-ray work included the
iographic Testing
FIGURE 12. Marie Sklodowska Curie (1928).
recognition that gas in the body can helpoutline organs, an early concept of acontrast medium.
Introduction of AdditionalRadiation SourcesIn 1898 Marie Sklodowska Curie (Fig. 12)and Pierre Curie published researchshowing the discovery of two newradioactive elements, polonium andradium, laying the foundation for gammaradiography.
The early X-ray tubes were partiallyevacuated glass bulbs. Metal targets andcurved cathodes were quickly added toincrease X-ray output. Nevertheless, it wasa challenge to operate these early gastubes consistently The gas pressurechanged because of outgassing of thewalls and other heating effects. One ofthe first X-ray related patents was for atechnique of controlling the tube gaspressure (issued March 1896 to Siemens).Among the early uses of radioscopy,fluoroscopes similar to those at today’sairports were used during World War I toinspect packages for contraband(Fig. 13).22
It was in this background that WilliamD. Coolidge (Fig. 14) of General Electricintroduced the hard vacuum, hot cathodeX-ray tube, truly a significant advance inX-ray technology.23 This new X-ray tubeconcept brought much improvedreproducibility and ease of operation toX-ray technology and prepared the wayfor high energy X-ray use. The patent forthis landmark X-ray development wasissued in 1916.24
FIGURE 13. Radioscopic system for detection of contraband(circa 1910).

FIGURE 14(a) posin
(a)
(b)
3RT01_LAYOUT(001_036) 10/2/02 1:34 PM Page 25
X-Rays for NondestructiveTesting
X-Ray DiffractionRöntgen’s early X-ray work includedunsuccessful attempts to show diffractioneffects by directing the rays through a fineslit. This effect was successfully shownlater following the 1909 work of Walterand Pohl.25 It was Max von Laue who firstthought of using the regular order of acrystal to diffract X-rays. Experimentalconfirmation of this now important andwidespread use of X-rays came fromLaue’s work with Friedrich and
. William Coolidge, inventor of X-ray tube:g with 1 MeV tube; (b) X-ray tube.
Knipping26,27 and from the pioneeringwork of the father and son Bragg team.28,29 X-ray diffraction is a widely usedmethod to identify and analyzematerials.25 Some idea of the impact thatX-ray diffraction has had on science isgiven by noting that twenty Nobelphysics prizes have been awarded forachievements in crystallography.30
RadiographyEarly advances in X-ray nondestructivetesting were being made in manycountries around the world.Documentation of early X-ray work in theUnited Kingdom and in Germanydescribes work going back to the time ofWorld War I. The early work in the UnitedKingdom, particularly the armamentrelated X-ray nondestructive testing workof V.E. Pullin, is well described byHalmshaw.31 An excellent description ofearly work in Germany shows manyexamples of radiographic nondestructivetesting, including field test systems datingfrom the 1920s.32 A recent summary ofX-ray history is given in the X-raycentennial issue of Insight, includingarticles about X-ray development in theUnited Kingdom and in Germany.33
Early work in the United States isdocumented in patents.34,35 Despite theseearly efforts and many demonstrations ofX-rays for material examination,24
radiographic nondestructive testing didnot become important commercially untilWorld War II. In the United States,workers in nondestructive testing cite theearly work of Horace Lester (Fig. 15) at the
25Introduction to Radiographic Testing
FIGURE 15. Horace Lester.

26 Rad
FIGURE 16.Arsenal, Wa
3RT01_LAYOUT(001_036) 10/2/02 1:34 PM Page 26
Watertown Arsenal (Fig. 16) as laying thegroundwork for our present use ofradiography.36,37 Lester’s work wassignificant because it clearly demonstratedthat X-rays could be used to locateinternal discontinuities in castings, weldsand other metal forms and that thesediscontinuities could lead to prematurefailure. Lester’s contributions were alsoimportant because of his preeminentposition in the metallurgical field.38,39
However, there was significant work donein the United States in radiographicnondestructive testing even before Lester’slandmark research. An excellent review ofearly X-ray nondestructive testing work isgiven in the 1929 Fink and Archer paperfor ASM International, when it was calledthe American Society for Steel Treating.40
The paper cites 108 references, with 46 ofthese dating during the period 1915-1921.Prominent among the early citations isthe work of Wheeler R. Davey, who didresearch on radiographic nondestructivetesting at the General Electric ResearchLaboratory (1914 to 1926) and later atPenn State University. The Alcoa team ofFink and Archer described X-ray exposuretechniques for aluminum and steel,including the use of fluorescent and leadscreens. This 1929 paper is given credit forthe first public description for the use oflead intensifying screens.41
iographic Testing
Laboratory of Horace Lester at Watertowntertown, Massachusetts.
Horace Lester attended this 1929 X-raylecture and contributed to the discussionincluded with the published article.Lester’s comment discussed the increasinguse of steel forgings and welded structuresinstead of castings because engineersbelieved that “these substitutes forcastings are free from hidden defects andtherefore more reliable.” He went on topoint that his work at Watertown Arsenalshowed that the assumption of soundnessfor forgings and welds was not true.Wheeler Davey also attended the lectureand contributed to the discussion. Davey’scomment may strike a responsive chordeven today: “the authors bring out thefact, previously emphasized by Lester, thatthere are few cases where it is goodeconomic sense to use radiography for100 per cent inspection.”
It was in this environment ofunfavorable economics for widespread useof nondestructive testing that theAmerican Society for NondestructiveTesting began.
American Society forNondestructive TestingThe society was started officially by acharter from the state of Massachusettsdated August 1941. Prominent among thenine signers of the original charter are thefirst two names, Philip D. Johnson andCarlton G. Lutts. Lutts served as the firstpresident of the American IndustrialRadium and X-Ray Society during itsinitial year of operation, 1941-1942. Thenew society’s first conference was held atMassachusetts Institute of Technology inOctober, 1941, highlighted by apresentation (later called the Mehl HonorLecture) by Charles W. Briggs.
Formed as it was in late 1941, thesociety was in place as the United Statesentered World War II in December 1941.The war effort required increasingemphasis on product reliability andnondestructive testing. The fledglingsociety was there to provide a neededforum for the exchange of nondestructivetesting information. The new societyjournal, first called Industrial Radiographyand issued in the summer of 1942, playeda key role in spreading knowledge aboutnondestructive testing.
Ralph Turner, ASNT national presidentduring 1971-1972 and an ASNT historian,reflected on the early years of the Society:“The Society has not done badly. Perhapsthe most fortunate event was itsinadvertent birth just before WorldWar Il.”42 Clearly the war years gave aneeded push to help the new societysurvive and grow during the crucialformative years.

3RT01_LAYOUT(001_036) 10/2/02 1:34 PM Page 27
An early recognition was thatnondestructive testing included methodsother than radiography. Liquid penetrantsand magnetic particles were in wide useand other methods such as ultrasonictesting were becoming important. WithVolume 5 in the summer of 1946, thejournal name and mission were expandedto Industrial Radiography & Non-DestructiveTesting. In the fall of 1947 the name ofthe society was changed to the Society forNon-Destructive Testing. The hyphen inthe name disappeared in 1952. Thejournal expanded publication tobimonthly (instead of quarterly) in 1953and became a monthly journal in 1964, atthe same time changing the journal nameto Materials Evaluation.43 By 1967 manyother countries had nondestructive testingsocieties and there had been fiveInternational Conferences onNondestructive Testing (now called WorldConferences), so it seemed appropriate tochange the society name again; it becamethe American Society for NondestructiveTesting (ASNT).
ASNT can be proud of its role inadvancing the state-of-the-art ofnondestructive testing and X-raytechnology. The national conferences, thesection meetings for local informationexchange, the topical conferences, thesociety’s international participation, theNondestructive Testing Handbook series andeducational and personnel activities allprovided opportunities for exchange ofnondestructive testing information. Theearly issues of the journal were heavilyweighted toward X-ray technology,reflecting the original name of the society.Early contributors to the journal includedmany respected engineers and scientists.Early issues contained articles by ArthurBarkow, Charles Barrett and George Clark(all of whom made early contributions tothe advancement of X-ray diffraction),James Bly and Gerold Tenney (whosework included developments in highenergy radiography), Donald O’Connor(whose group at the Naval OrdnanceLaboratory, with colleagues EdwardCriscuolo and Daniel Polansky,contributed much to the early X-raynondestructive testing standards), LeslieBall (an early user of X-ray technology inthe aircraft field), Donald Kerst, thedeveloper of the betatron, film researchworkers Herman Seeman and GeorgeCorney and many others whose namesand works were well known.
Along the way there have been manynoteworthy radiographic applications.Materials Evaluation readers may recall thefollowing: the Vatican Pieta (June 1964),the world’s largest radiograph (November1964), the Liberty Bell (February 1976), alighthouse (March 1980), the United
States Capitol (September 1985) and theStatue of Liberty (October 1985).
The journal has also provided anopportunity for commercial developmentof X-ray technology. Early advertisers inthe journal included equipment supplierssuch as General Electric, Keleket, NorthAmerican Philips, Picker andWestinghouse, film suppliers such asAgfa-Ansco, DuPont and Eastman Kodak;and tube/accessory suppliers such asBar-Ray Products, Machlett, Pako and RayProof Corporation. Only a few of theseearly X-ray companies continue to supplythe X-ray nondestructive testing marketin the 21st century; others, Keleket andMachlett, for example, have disappearedcompletely.
Many of the society honors and awardshave had a radiation connection. TheCoolidge Award, named for William D.Coolidge, the inventor of the hardvacuum X-ray tube (Fig. 14), waspresented from 1953 to 1964 foroutstanding contributions “to theadvancement of nondestructive testingusing X-rays.” The Lester Honor Lecture,named for the X-ray pioneer HoraceLester (Fig. 15), has been presented since1943. The Mehl Honor Lecture, named forRobert Mehl, an early contributor togamma radiography,44 has been presentedsince 1941. Although the honor lecturesare named for men known for their workin radiation, the topics of the lecturescover the entire field of nondestructivetesting.
Throughout the society history therehas been a clear division of effort inadvancing nondestructive testing betweenthe American Society for NondestructiveTesting and the American Society forTesting and Materials Committee E-7 onNondestructive Testing, organized in1938.45 The American Society for Testingand Materials activity produces consensusstandards for nondestructive testingmethods and applications. The AmericanSociety for Nondestructive Testing effortsprovide a forum for informationexchange, education and personnelcertification. The role of the twoorganizations was recognized early, asindicated in a 1942 letter from HoraceLester, Chairman of American Society forTesting and Materials E-7.
There are many individuals whoremain active in both the AmericanSociety for Testing and MaterialsCommittee E-7 and the American Societyfor Nondestructive Testing, therebyproviding a strong link between the twonondestructive testing organizations.
27Introduction to Radiographic Testing

28 Rad
3RT01_LAYOUT(001_036) 10/2/02 1:34 PM Page 28
Advances in RadiographicTechnologyThe period from 1935 to 1960 sawimprovements in technology andtechniques for radiation safety,46 gammaradiography,47-49 portable X-raymachines,49,50 high voltageradiography51-53 and nucleonic gaging.54
Radiographic testing found newapplications, in metals,55 shipbuilding56
and particularly in the aviationindustries.57-59
Although radiographic testing is stillperformed essentially in the samethrough-transmission, direct shadowingway that Röntgen used 100 years ago, thetwenty-first century has much betterX-ray sources, detectors andunderstanding of image quality factorslike scatter and unsharpness. In addition,of course, the industry today has a largearsenal of techniques — for example,electronic radioscopy, computedtomography, backscatter imaging,laminography, dual energy,microradiography, flash techniques andin-motion radiography. The commercialX-ray market for equipment, accessoriesand supplies is still primarily weightedtoward medical fields but other X-rayapplications contribute to what isestimated to be a $12 billion annualmarket. In addition to the medical andtraditional nondestructive testingapplications, industry uses X-raydiffraction and other analytical methodssuch as fluorescence, radiation methodsfor material modification, X-raylithography, radiation gaging and the everexpanding use of X-rays for security.
Looking toward the future, only onething is clear — the technology willcontinue to advance. Obvious directionsare the increasing use of computerizedinstrumentation, automated testing andgreater use of nondestructive testtechniques in process controlapplications. Regardless of the newdirections that nondestructive testing andX-ray technology may take in the comingcentury the American Society forNondestructive Testing’s roles ofeducation, information exchange andpersonnel certification will continue.
Thanks to the superb investigativetalents of Wilhelm Conrad Röntgen, ourgeneration enjoys many benefits fromRöntgen’s rays. The new edition of theNondestructive Testing Handbook is a goodtime to remember past achievements.
iographic Testing

PART 4. Units of Measure for RadiographicTesting
TABLE 7. SI derived units with special names.a
Relationto Other
Quantity Units Symbol SI Unitsb
Capacitance farad F C·V–1
Catalytic activity katal kat s–1·molConductance siemens S A·V–1
Energy joule J N·mFrequency (periodic) hertz Hz 1·s–1
Force newton N kg·m·s–2
Inductance henry H Wb·A–1
Illuminance lux lx lm·m–2
Luminous flux lumen lm cd·srElectric charge coulomb C A·sElectric potentialc volt V W·A–1
Electric resistance ohm Ω V·A–1
Magnetic flux weber Wb V·sMagnetic flux density tesla T Wb·m–2
Plane angle radian rad 1Power watt W J·s–1
Pressure (stress) pascal Pa N·m–2
Radiation absorbed dose gray Gy J·kg–1
Radiation dose equivalent sievert Sv J·kg–1
Radioactivity becquerel Bq 1·s–1
Solid angle steradian sr 1Tempersature, celsius degree celsius °C KTimea hour h 3600 sVolumea liter L dm3
3RT01_LAYOUT(001_036) 10/2/02 1:34 PM Page 29
Origin and Use of SISystemIn 1960 the General Conference onWeights and Measures established theInternational System of Units. Le SystémeInternational d’Unités (SI) was designed sothat a single set of measurement unitscould be used by all branches of science,engineering and the general public.Without SI, this Nondestructive TestingHandbook volume could have contained aconfusing mix of obsoletecentimeter-gram-second (CGS) units,imperial units and the units preferred bycertain localities or scientific specialties.
SI is the modern version of the metricsystem and ends the division betweenmetric units used by scientists and metricunits used by engineers and the public.Scientists have given up their units basedon centimeter and gram and engineersmade a fundamental change inabandoning the kilogram-force in favor ofthe newton. Electrical engineers haveretained their ampere, volt and ohm butchanged all units related to magnetism.
Table 6 lists the seven SI base units.Table 7 lists derived units with specialnames. Table 8 gives examples ofconversions to SI units. In SI, the unit oftime is the second (s) but hour (h) isrecognized for use with SI.
For more information, the reader isreferred to the information availablethrough national standards organizationsand specialized information compiled bytechnical organizations.60-63
TABLE 6. SI base units.
Quantity Unit Symbol
Length meter mMass kilogram kgTime second sElectric current ampere ATemperature kelvin KAmount of substance mole molLuminous intensity candela cd
MultipliersIn science and engineering, very large orvery small numbers with units areexpressed by using the SI multipliers,prefixes of 103 intervals (Table 9). Themultiplier becomes a property of the SIunit. For example, a millimeter (mm) is0.001 meter (m). The volume unit cubiccentimeter (cm3) is (0.01 m)3 or 10–6 m3.Unit submultiples such as the centimeter,decimeter, dekameter (or decameter) andhectometer are often avoided in scientificand technical uses of SI because of theirvariance from the 103 interval. However,dm3 and cm3 are commonly used. Notethat 1 cm3 is not equal to 0.01 m3.Nevertheless, in equations, submultiplessuch as centimeter (cm) or decimeter (dm)are often avoided because they disturb the
29Introduction to Radiographic Testing
a. Hour and liter are not SI units but are accepted for use with the SI.b. Number one (1) expresses dimensionless relationship.c. Electromotive force.

30 Ra
TABLE 8.
Angle
AreaDistance
Energy
PowerSpecific h
Force (torPressureFrequencIlluminan
Luminanc
RadioactiIonizing rMassTemperatTemperatTemperat
TABLE 9. SI prefixes and multipliers.
Prefix Symbol Multiplier
yotta Y 1024
zetta Z 1021
exa E 1018
peta P 1015
tera T 1012
giga G 109
mega M 106
kilo k 103
hectoa h 102
deka (or deca)a da 10decia d 10–1
centia c 10–2
milli m 10–3
micro µ 10–6
nano n 10–9
pico p 10–12
femto f 10–15
atto a 10–18
zepto z 10–21
yocto y 10–24
a. Avoid these prefixes (except in dm3 and cm3) forscience and engineering.
3RT01_LAYOUT(001_036) 10/2/02 1:34 PM Page 30
convenient 103 or 10–3 intervals thatmake equations easy to manipulate.
In SI, the distinction between upperand lower case letters is meaningful andshould be observed. For example, themeanings of the prefix m (milli) and theprefix M (mega) differ by nine orders ofmagnitude.
SI Units for RadiographyThe original discoveries of radioactivityhelped establish units of measurementbased on observation rather than precisephysical phenomena. Later, scientists whoworked with radioactive substances (orwho managed to manufacture radioactivebeams) again made circumstantialobservations that were then used formeasurement purposes. This practicalapproach was acceptable at the time, buta broader understanding of physics andthe modern practice of using only oneunit for a quantity has led to themodification of many of the original units(see Tables 10 to 12). In the SI system,radiation units have been givenestablished physical foundations and newnames where necessary.
diographic Testing
Examples of conversions to SI units.
Quantity Measurement in Non-SI Unit Multiply by To Get Measurement in SI Unit
minute (min) 2.908 882 × 10–4 radian (rad)degree (deg) 1.745 329 × 10–2 radian (rad)square inch (in.2) 645 square millimeter (mm2)angstrom (Å) 0.1 nanometer (nm)inch (in.) 25.4 millimeter (mm)British thermal unit (BTU) 1.055 kilojoule (kJ)calorie (cal), thermochemical 4.184 joule (J)British thermal unit per hour (BTU·h–1) 0.293 watt (W)
eat British thermal unit per pound 4.19 kilojoule per kilogram per kelvin (kJ·kg–1·K–1)degree fahrenheit (BTU·lbm
–1·°F–1)que, couple) foot-pound (ft-lbf) 1.36 joule (J)
pound force per square inch (lbf·in.–2) 6.89 kilopascal (kPa)y (cycle) cycle per minute 60–1 hertz (Hz)ce footcandle (ftc) 10.76 lux (lx)
phot (ph) 10 000 lux (lx)e candela per square foot (cd·ft–2) 10.76 candela per square meter (cd·m–2)
candela per square inch (cd·in.–2) 1 550 candela per square meter (cd·m–2)footlambert (ftl) 3.426 candela per square meter (cd·m–2)lambert 3 183 (= 10 000/π) candela per square meter (cd·m–2)nit (nt) 1 candela per square meter (cd·m–2)stilb (sb) 10 000 candela per square meter (cd·m–2)
vity curie (Ci) 37 gigabecquerel (GBq)adiation exposure roentgen (R) 0.258 millicoulomb per kilogram (mC·kg–1)
pound (lbm) 0.454 kilogram (kg)ure (difference) degree fahrenheit (°F) 0.556 kelvin (K) or degree celsius (°C)ure (scale) degree fahrenheit (°F) (°F – 32)/1.8 degree celsius (°C)ure (scale) degree fahrenheit (°F) (°F – 32)/1.8) + 273.15 kelvin (K)

3RT01_LAYOUT(001_036) 10/2/02 1:34 PM Page 31
Physical QuantitiesThree physical quantities in particular arewidely used as measurement units — theelectronvolt (eV), the speed of light (c)and the unified atomic mass unit (u).Their precise values, however, areobtained experimentally.Electronvolt. The electronvolt is thekinetic energy acquired by an electron inpassing through a potential difference of1 V in vacuum; 1 eV = 1.602 176 462 ×10–19 J with a combined standarduncertainty of 6.3 × 10⁻²⁷ J.63,64 Theelectronvolt is accepted for use with SI.Speed of Electromagnetic Radiation. Thequantity c represents the speed of light,that is, the speed of electromagneticwaves in vacuum; 1 c = 299 792 458 m·s–1
exactly (670 616 629 mi·h–1). The speed oflight is a physical quantity but can beused as a unit of measure.Unified Atomic Mass Unit. The unifiedatomic mass unit (u) is 12–1 of the mass ofthe atom of the nuclide carbon-12; 1 u =1.660 538 7310–27 kg with a combinedstandard uncertainty of ±1.3 ×10⁻³⁴ kg.63,64
Radiation MeasurementBecause of existing practice in certainfields and countries, the InternationalCommittee for Weights and Measures(CIPM, Comité Internationale des Poids et
TABLE 10. Physical quantities used as units. Vamay only be approximated in SI. Conversions
Physical Quantity Sy
Electronvolt a
Speed of electromagnetic waves in vacuumUnified atomic mass unit a,b
a. Approved for use with SI.b. Mass of unified atomic mass unit is 12–1 of the mass of
TABLE 11. Conversion to SI radiographic units
Traditional Unit Symbol Multiply by
Curie Ci 3.7 × 10¹⁰
37
Rad rad a 10–2
10
Rem rem 10–2
10
Roentgen R 2.58 × 10⁻⁴
258
a. The abbreviation rd may be used for radiation absorbed(rad), the SI unit for plane angle.
Mesures) permitted the units given inTable 11 (curie, roentgen, rad and rem) tocontinue to be used with the SI until1998.61-63 However, these units must notbe introduced where they are notpresently used. The National Institute ofStandards and Technology stronglydiscourages the continued use of curie,roentgen, rad and rem.61-63 The AmericanNational Standards Institute, theAmerican Society for Testing andMaterials, the Institute of Electrical andElectronics Engineers, the InternationalOrganization Standardization (ISO) andand the American Society forNondestructive Testing all support thereplacement of older English units with SIunits.Becquerel Replaces Curie. The originalunit for radioactivity was the curie (Ci),simply the radiation of one gram ofradium. Eventually all equivalentradiation from any source was measuredwith this same unit. It is now known thata curie is equivalent to 3.7 × 10¹⁰
disintegrations per second. In SI, the unitfor radioactivity is the becquerel (Bq),which is one disintegration per second.Because billions of disintegrations arerequired in a useful source, the multiplierprefix giga (109) is used and the unit isnormally seen as gigabecquerel (GBq).Coulomb per Kilogram ReplacesRoentgen. The unit for quantity ofelectric charge is the coulomb (C), where
31Introduction to Radiographic Testing
lues of physical quantities are experimentally obtained and are provided here for descriptive purposes.
mbol Multiply by SI Unit SI Symbol
eV 1.6 × 10⁻¹⁹ joule Jc 2.997 924 58 × 108 meter per second m·s–1
u 1.66 x 10⁻²⁷ kilogram kg
the atom of the nuclide carbon-12.
.
Resulting SI Unit SI Symbol
becquerel Bqgigabecquerel GBq
gray Gymilligray mGy
sievert Svmillisievert mSv
coulomb per kilogram C·kg–1
microcoulomb per kilogram µC·kg–1
dose where there is possibility of confusion with radian

32 Rad
TABLE 12. Compound radiographic units.
Traditional Multiply ResultingUnit by SI Unit
R·Ci–1·h–1 at 1 m 0.27 mSv·GBq–1·h–1 at 1 mCi·min·in.–2 50 GBq·min.·cm–2
R·min–1 a 0.01 Gy·min–1
R·min–1 b 0.01 Sv·min–1
R 2.58 × 10⁻⁴ C·kg–1
a. Absorbed dose.b. Dose absorbed by human body.
3RT01_LAYOUT(001_036) 10/2/02 1:34 PM Page 32
1 C = 1 A × 1 s. The original roentgen (R)was the quantity of radiation that wouldionize 1 cm3 of air to 1 electrostatic unitof electric charge, of either sign. It is nowknown that a roentgen is equivalent to258 microcoulombs per kilogram of air(258 µC·kg–1 of air). This corresponds to1.61 × 1015 ion pairs per 1 kg of air, whichhas then absorbed 8.8 mJ (0.88 rad, whererad is the obsolete unit for radiationabsorbed dose, not the SI symbol forradian).Gray Replaces Rad. The roentgen (R) wasan intensity unit but was notrepresentative of the dose absorbed bymaterial in a radiation field. The radiationabsorbed dose (rad) was first created tomeasure this quantity and was based onthe erg, the energy unit from the oldcentimeter-gram-second (CGS) system. Inthe SI system, the unit for radiation doseis the gray (Gy). The gray is useful becauseit applies to doses absorbed by matter at aparticular location. It is expressed inenergy units per mass of matter or injoules per kilogram (J·kg–1). The mass isthat of the absorbing body.Sievert Replaces Rem. The SI system’s unitfor the dose absorbed by the human body(formerly rem for roentgen equivalent man;also known as ambient dose equivalent,directional dose equivalent, dose equivalent,equivalent dose and personal dose equivalent)is similar to the gray but includes qualityfactors dependent on the type ofradiation. This absorbed dose has beengiven the name sievert (Sv) but itsdimensions are the same as the gray, thatis, 1 Sv = 1 J·kg–1.
Compound UnitsExposure to ionizing radiation could bemeasured in roentgens with an ionizationchamber that, when placed 1 m (39 in.)from the radiation source, providednecessary information — one roentgenper curie per hour at one meter (R·Ci–1·h–1
at 1 m), for example. The numbers,however, had limited physical meaningand could not be used for differentapplications such as high voltage X-raymachines.
The roentgen per hour (R·h–1) was usedto designate the exposure to an ionizingradiation of the stated value. Because theradiation received from 1 R·h–1 wasconsidered about equal to 1 rem, therelationship is approximated as 1 R·h–1 =0.01 Gy·h–1 = 10 mGy·h–1.
A previously popular unit, roentgen percurie per hour at one meter (R·Ci–1·h–1 at1 m), is expressed in SI units asmillisievert per gigabecquerel per hour atone meter (mSv·GBq–1·h–1 at 1 m), suchthat 1 mSv·GBq–1·h–1 at 1 m =3.7 R·Ci–1·h–1 at 1 m. In this relationship,
iographic Testing
roentgen converts to millisieverts on aone-to-ten basis.
Exposure charts were often made byusing curie minutes at a source-to-filmdistance in inches squared. This waswritten Ci·min·in.–2. Exposure chartsmade in SI use gigabecquerel minutes fora source-to-film distance in centimeterssquared, where 1 Ci·min·in.–2 =50 GBq·min·cm–2. Table 12 lists some ofthese compound units.

1. Nondestructive Testing Handbook,second edition: Vol. 10, NondestructiveTesting Overview. Columbus, OH:American Society for NondestructiveTesting (1996).
2. Wenk, S.A. and R.C. McMaster.Choosing NDT: Applications, Costs andBenefits of Nondestructive Testing in YourQuality Assurance Program. Columbus,OH: American Society forNondestructive Testing (1987).
3. Nondestructive Testing Methods.TO33B-1-1 (NAVAIR 01-1A-16)TM43-0103. Washington, DC:Department of Defense (June 1984).
4. ASNT Recommended Practice No.SNT-TC-1A. Columbus, OH: AmericanSociety for Nondestructive Testing.
5. Annual Book of ASTM Standards:Section 3, Metals Test Methods andAnalytical Procedures. Vol. 03.03,Nondestructive Testing. WestConshohocken, PA: ASTMInternational (2001).
6. ANSI/ASNT CP-189, Standard forQualification and Certification ofNondestructive Testing Personnel.Columbus, OH: American Society forNondestructive Testing.
7. ASNT Central Certification Program(ACCP), Revision 3 (November 1997).Columbus, OH: American Society forNondestructive Testing (1998).
8. ISO 9712, Nondestructive Testing —Qualification and Certification ofPersonnel. Geneva, Switzerland:International Organization forStandardization.
9. NFPA 70, National Electric Code, 2002edition. Quincy, MA: National FirePrevention Association (2001).
10. National Electrical Safety Code, 2002edition. New York, NY: Institute ofElectrical and Electronics Engineers(2001).
11. 29 CFR 1910, Occupational Safety andHealth Standards [Code of FederalRegulations: Title 29, Labor.]Washington, DC: United StatesDepartment of Labor, OccupationalSafety and Health Administration;Government Printing Office.
12. 29 CFR 1926, Occupational Safety andHealth Standards for the ConstructionIndustry [Code of Federal Regulations:Title 29, Labor]. Washington, DC:United States Department of Labor,Occupational Safety and HealthAdministration; Government PrintingOffice.
13. Berger, H. “100 Years of X-Rays —Industrial Use of NDT and the Role ofASNT.” Materials Evaluation. Vol. 53,No. 11. Columbus, OH: AmericanSociety for Nondestructive Testing(November 1995): p 1253-1258, 1260.
14. Glasser, O. Wilhelm Conrad Roentgenand the Early History of X-Rays.Springfield, IL: Charles C. Thomas(1934). English version of an earlierbiography in German published inBerlin, Germany: Springer-Verlag(1931).
15. Röntgen, W.C. “Eine Neue Art vonStrahlen” [“A New Kind of Rays”].Verhandlungen und Sitzungsberichte derPhysikalisch-Medizinische Gesellschaft zuWürzburg. Würzburg, Germany:Physikalisch-Medizinische Gesellschaftzu Würzburg (December 1895): p 132.Continued (March 1986): p 11, 17.
16. Eisenberg, R.L. Radiology — AnIllustrated History. Saint Louis, MO:Mosby Yearbook Publishing (1992).
17. Lenard, P. “On Cathode-Rays in Gasesunder Atmospheric Pressure and in theExtreme Vacuum.” Annalen der Physik.Vol. 51. Berlin (1894): p 225-267.
18. Grigg, E.R.N. The Trail of the InvisibleLight. Springfield, IL: Charles C.Thomas (1965).
19. Röntgen, W.C. [“Further Observationson the Properties of X-Rays.”] Berichteder Prussische Akademie derWissenschaft. Berlin, Germany:Berlin-Brandenburgische Akademie derWissenschaften [formerly thePreussische Akademie derWissenschaften] (May 1897).
20. Henning, D. “The German RöntgenMuseum.” Materials Evaluation.Vol. 45, No. 5. Columbus, OH:American Society for NondestructiveTest (May 1987): p 536-537.
21. Brecher, R. and E. Brecher. The Rays:A History of Radiology in the U.S. andCanada. Baltimore, MD: Williams andWilkins (1969).
33Introduction to Radiographic Testing
References
3RT01_LAYOUT(001_036) 10/2/02 1:34 PM Page 33

22. St. John, A. and H.R. Isenburger.Industrial Radiography. New York, NY:John Wiley and Sons (1934).
23. “Dr. W.D. Coolidge — The Scientist.”Industrial Radiography. Columbus, OH:American Society for NondestructiveTesting (Summer 1944): p 33-35.
24. Coolidge, W.D. Vacuum Tube. UnitedStates Patent 1 203 495 (1916).
25. Ewald, P.P., ed. Fifty Years of X-RayDiffraction. Utrecht, Netherlands:International Union ofCrystallography (1962).
26. Friedrich, W., P. Knipping andM. Laue. Berichte — BayerisheAcademie der Wissenschaft. Munich,Germany: Bayerische Akademie derWissenschaften (1912): p 303.
27. Friedrich, W., P. Knipping andM. Laue. Annalen der Physik. Vol. 41.Berlin, Germany: Wiley (1913): p 971.
28. Bragg, W.H. and W.L. Bragg.Proceedings of the Royal Society ofLondon: Series A, Mathematical andPhysical Sciences. Vol. 88. London,United Kingdom: Royal Society (1913):p 428.
29. Bragg, W.H. and W.L. Bragg.Proceedings of the Royal Society ofLondon: Series A, Mathematical andPhysical Sciences. Vol. 89. London,United Kingdom: Royal Society (1913):p 246.
30. Hasek, J. X-Ray and Neutron StructureAnalysis in Materials Science. New York,NY: Plenum Press (1989).
31. Halmshaw, R. “A History of IndustrialRadiography in the UK.” British Journalof Non-Destructive Testing. Vol. 30,No. 5. Northampton, UnitedKingdom: British Institute ofNon-Destructive Testing (September1988): p 325-331.
32. Krüger, G. and H. Weeber. DieEntwicklung der TechnischenDurchstrahlungsprüfung in Deutschland:Streiflichter aus der Geschichte derDGZfP. Berlin, Germany: DeutscheGesellschaft für ZerstörungsfreiePrüfung (1983).
33. Special Feature Issue: 100 Years ofX-Rays. Insight. Vol. 37, No. 9.Northampton, United Kingdom:British Institute of Non-DestructiveTesting (September 1995).
34. Jackson, L.R., H.M. Banta, R.C.McMaster and T.P. Nordin. “A Surveyof Patents, Publications onNon-Destructive Tests.” The DrillingContractor. Houston, TX: InternationalAssociation of Drilling Contractors(April and June 1948).
35. McMaster, R.C. and S.A. Wenk.“A Basic Guide for Management’sChoice of Nondestructive Tests.”Symposium on the Role ofNon-Destructive Testing in the Economicsof Production. Special TechnicalPublication 112. West Conshohocken,PA: ASTM International (1951).
36. Lester, H.H. “Radiography of Metals.”Army Ordnance. Vol. 3 (1922):p 210-215.
37. Lester, H.H. “X-Ray Examination ofSteel Castings.” Chemical andMetallurgical Engineering. Vol. 28,No. 6. New York, NY: McGraw-Hill(February 7, 1923). Reprint inWenk, S.A. “The Past Perfect.”Materials Evaluation. Vol. 27, No. 1.Columbus, OH: American Society forNondestructive Testing(January 1969): p 1-10.
38. Wenk, S.A. “The Past Perfect.”Materials Evaluation. Vol. 27, No. 1.Columbus, OH: American Society forNondestructive Testing (January 1969):p 1-10.
39. Norton, M.R. “The Founder ofIndustrial Radiography: Personal Noteson Horace H. Lester.” MaterialsEvaluation. Vol. 44, No. 3. Columbus,OH: American Society forNondestructive Testing (March 1986):p 408-410.
40. Fink, W.L. and R.S. Archer.“Radiography as a Tool in the MetalIndustry.” Transactions of the AmericanSociety for Steel Treating. Vol. 16.Materials Park, OH: ASM International(1929): p 551-599.
41. Heidt, H. Private communication.Weimar, Germany (1994).
42. Turner, R. and D.D. Dewey. Picturesand Passages: ASNT 1941-1991.Columbus, OH: American Society forNondestructive Testing (1991).
43. Berger, H. “Fifty Years of the SocietyJournal: A Personal Look Back.”Materials Evaluation. Vol. 50, No. 8.Columbus, OH: American Society forNondestructive Testing (August 1992):p 953-955.
44. Lambert, R.H. “In Memoriam: RobertF. Mehl.” Materials Evaluation. Vol. 34,No. 7. Columbus, OH: AmericanSociety for Nondestructive Testing(July 1976): p 37A.
45. Borucki, J.S. “Overview of ASTM E-7Nondestructive Testing Standards”Nondestructive Testing Standards —Present and Future. Special TechnicalPublication 1151. Philadelphia, PA:American Society for Testing andMaterials (1992).
34 Radiographic Testing
3RT01_LAYOUT(001_036) 10/2/02 1:34 PM Page 34
46. Morgan, K.Z. “History of RadiationProtection.” Materials Evaluation.Vol. 29, No. 3. Columbus, OH:American Society for NondestructiveTesting (March 1971): p 19A–20A,22A, 24A–27A, 32A.
47. Briggs, C.W. “Developments inGamma Ray Radiography: 1928-41.”Industrial Radiography. Vol. 1, No. 1.Columbus, OH: American Society forNondestructive Testing (Summer1942): p 7-10+. Reprinted MaterialsEvaluation. Vol. 39, No. 3 (March1981): p 356-359.
48. Moore, P.O. “A Gamma-Radiographerof Pipeline Welds.” MaterialsEvaluation. Vol. 43, No. 9. Columbus,OH: American Society forNondestructive Testing (August 1985):p 1084-1086+.
49. Bell, R.D. “Field Radiography —Images from the Past.” MaterialsEvaluation. Vol. 42, No. 7. Columbus,OH: American Society forNondestructive Testing (June 1984):p 849-851.
50. Hovland, H. “Developments in FieldX-Radiography, 1931-62.” MaterialsEvaluation. Vol. 43, No. 11. Columbus,OH: American Society forNondestructive Testing (October1985): p 1386-1390.
51. O’Connor, D.T. and B.G.Cunningham. “Installation of theFlexible 10 MeV Betatron.”Non-Destructive Testing. Vol. 7, No. 4.Columbus, OH: American Society forNondestructive Testing (Spring 1949):p 20-23.
52. Straw, R. “‘If I Had a Million!’ TheEarly Years of High-EnergyRadiography.” Materials Evaluation.Vol. 42, No. 3. Columbus, OH:American Society for NondestructiveTesting (March 1984): p 264-268.
53. Straw, R. “‘If I Had Ten Million!’ AMan and His Laboratory.” MaterialsEvaluation. Vol. 42, No. 4. Columbus,OH: American Society forNondestructive Testing (April 1984):p 374-375.
54. Davis, R.S. “Early Development ofProcess Automation with NucleonicMeasurement Gages.” MaterialsEvaluation. Vol. 47, No. 10. Columbus,OH: American Society forNondestructive Testing (October1989): p 1190-1191.
55. Henry, E.B. “The Role ofNondestructive Testing in theProduction of Pipe and Tubing” [1988Lester Honor Lecture]. MaterialsEvaluation. Vol. 47, No. 6. Columbus,OH: American Society forNondestructive Testing (June 1989):p 714–715, 718, 720, 722–724.
56. Lutts, C.G. “Ten Years’ Cooperationbetween the Society forNondestructive Testing and theAmerican Society for Metals.”Nondestructive Testing. Vol. 12, No. 1.Columbus, OH: American Society forNondestructive Testing(January-February 1954): p 31-36.
57. Itoh, G. “A Review of the History ofNondestructive Testing in Japan.”Materials Evaluation. Vol. 40, No. 11.Columbus, OH: American Society forNondestructive Testing (October1982): p 1138+.
58. Straw, R. “Voices in the Air — TheEarly Days of Aircraft NDT.” MaterialsEvaluation. Vol. 42, No. 2. Columbus,OH: American Society forNondestructive Testing (February1984): p 152-160.
59. Hagemaier, D.J. “AerospaceRadiography — The Last ThreeDecades.” Materials Evaluation. Vol. 43,No. 10. Columbus, OH: AmericanSociety for Nondestructive Testing(September 1985): p 1262-1264+.
60. IEEE/ASTM SI 10-1997, Standard for Useof the International System of Units (SI):The Modernized Metric System. WestConshohocken, PA: ASTMInternational (1996).
61. Taylor, B.N. Guide for the Use of theInternational System of Units (SI).National Institute of Standards andTechnology Special Publication 811,1995 edition. Washington, DC: UnitedStates Government Printing Office(1995).
62. Taylor, B.N., ed. Interpretation of the SIfor the United States and FederalGovernment and Metric ConversionPolicy. NIST Special Publication 814,1998 Edition. Washington, DC: UnitedStates Government Printing Office(1998).
63. Taylor, B.N., ed. The InternationalSystem of Units (SI), 2001 edition. NISTSpecial Publication 330. WashingtonDC: United States GovernmentPrinting Office (2001).
64. Mohr, P. J. and B.N. Taylor. “CODATARecommended Values of theFundamental Physical Constants:1998.” Reviews of Modern Physics. Vol.72, No. 2. Melville, NY: AmericanInstitute of Physics (April 2000):p 351.
35Introduction to Radiographic Testing
3RT01_LAYOUT(001_036) 10/2/02 1:34 PM Page 35

C. Robert Emigh, Los Alamos, New Mexico
Frank A. Iddings, San Antonio, Texas
Radiation and ParticlePhysics1
2C H A P T E R
3RT02_Layout_(037-054) 10/2/02 1:39 PM Page 37

38 Radi
PART 1. Elementary Particles
TABLE 1. Electron characteristics.
Quantity Measurement
Charge 1.602 × 10⁻¹⁹ CRest mass 9.109 × 10⁻³¹ kgClassical radius 2.818 × 10⁻¹⁵ mMagnetic moment –9.285 × 10⁻²⁴ J·T–1
Compton wavelength 2.426 × 10⁻¹² m
3RT02_Layout_(037-054) 10/2/02 1:39 PM Page 38
Historical BackgroundThe understanding of penetratingradiations and radioactivity begins withthe discovery of X-rays by Wilhelm C.Roentgen in Germany in 1895. Detectionof the natural radioactivity of uranium byBecquerel along with the separation andidentification of radium and polonium byPierre Curie and Marie Curie in Francefollowed Roentgen’s discovery in justthree years.
In England by 1905, Ernest Rutherfordand his students reported theidentification of two kinds of radiations— alpha and beta particles — while inFrance, P.V. Villard and Antoine-HenriBecquerel proposed the electromagneticnature of gamma radiation. At the sametime, Einstein formulated the equationrelating mass and energy as E = mc2.
Experiments in Rutherford’s labs led tothe following advances in the next15 years: (1) the nuclear atom wasconceived, with the nucleus beingpositively charged and possessing most ofthe mass of the atom; (2) Niels Bohrdetermined that the atom’s nucleus issurrounded by electrons in fixed orbits;(3) Aston separated the isotopes of neonand built a mass spectrometer thatdetermines that atomic weights are notexact integers; and (4) nucleartransformations were performed.
The 1930s ushered in nuclear sciencewith the invention or discovery of (1) thegeiger müller tube, (2) the van de graaffand cockcroft walton accelerators and thecyclotron, (3) the neutron by JamesChadwick, (4) artificial radioactivity byIrene Joliot-Curie and FredericJoliot-Curie, (5) neutron interactions withthe elements by Enrico Fermi and(6) fission by Otto Hahn and F. Strassman.
After the demonstration of the nuclearreactor and nuclear weapons in the early1940s, peaceful uses of radioisotopes andradiation were developed for industry,medicine, agriculture and research. Thiscontributed to the status of radiographyin the world.
ographic Testing
Simple Atomic Structure
ElectronVery early experiments such as rubbingvarious materials together gave evidencefor the existence of electrical charge. Thekite flying and other experiments ledBenjamin Franklin to suggest, in 1750,that the flow of electricity was a flow ofdiscrete charges. The 1833 announcementby Michael Faraday of the laws ofelectrolysis supported Franklin’shypothesis. By 1874, G. Johnston Stoneycalculated the average charge carried byan ion in solution and named this chargethe electron.
Later experiments by William Crookes,Arthur Schuster and J.J. Thomson foundthat the cathode rays in discharge tubeswere negatively charged electrons.Thomson calculated a ratio e·m–1 ofcharge to mass for the electron.
Continuing experiments byJ.J. Thomson, J.S.E. Townsend and finallyby Robert A. Millikan in 1909 measuredthe charge on an electron as 1.5196 ×10⁻¹⁹ C. This was the smallest value ofcharge, or multiples of it, that Millikanfound on oil droplets suspended in anelectric field. The value has been refinedby experiments with X-ray diffraction toaccurately determine Avogadro’s number.The accurately known Avogadro’s numberis then combined with the quantity ofelectrical charge, called a faraday, whichdeposits one gram relative atomic mass ofan element. The combination results in avery accurate value for the charge of anelectron. The most recent data on electroncharacteristics are given in Table 1.

3RT02_Layout_(037-054) 10/2/02 1:39 PM Page 39
ProtonJust as experiments in the late 1880sbegan to define the electron, similarexperiments discovered particles with apositive charge and a mass much greaterthan that of an electron. Wein found thatthe ratio e·m–1 of the charge to massdepended on the type of gas used at lowpressures in a discharge tube and was at amaximum value for hydrogen.
Based on mass spectrograph and massspectrometer information from Aston,Bainbridge, Dempster and others, thehydrogen ion seemed to be a basicbuilding block for atoms. The simplestatom, hydrogen, has one proton and isatomic number one. The number ofprotons in the nucleus is known as theatomic number of the atom or element.
The name proton is from the Greekword προτοσ, protos, which means first.Proton characteristics are given in Table 2.
NeutronFor many years after the proton andelectron became comfortable concepts forbuilding models of the atoms of theelements but explanations eludedresearchers for the existence of isotopesand the extremely penetrating radiationemitted by the bombardment of lightelements with alpha particles. In 1932,Chadwick described a neutral particlewith a mass equal to a proton that hecalled a neutron. The neutron explainedmany observations concerning radiationand particle physics and the concept wasrapidly accepted. Neutron characteristics
are given in Table 3.TABLE 2. Proton characteristics.
Quantity Measurement
Charge 1.602 × 10⁻¹⁹ CRest mass 1.673 × 10⁻²⁷ kgClassical radius 1.534 × 10⁻¹⁸ mMagnetic moment +1.411 × 10⁻²⁶ J·T–1
Compton wavelength 1.321 × 10⁻¹⁵ m
TABLE 3. Neutron characteristics.
Quantity Measurement
Charge neutralRest mass 1.675 × 10⁻²⁷ kgClassical radius 1.532 × 10⁻¹⁸ mMagnetic moment –9.662 × 10⁻²⁷ J·T–1
Compton wavelength 1.320 × 10⁻¹⁵ m
PositronAs Chadwick was describing the neutronin 1932, Anderson discovered a particle ina cloud chamber whose tracks wereidentical to those of electrons except thatthey were deflected in the oppositedirection in a magnetic field. Thesepositrons had been predicted by PaulAdrien Maurice Dirac. Experiments byPatrick Maynard Stuart Blackett andG.P.S. Occhialini in 1933 revealed thatcosmic rays interacted with matter toproduce showers of electrons andpositrons in about equal numbers.
The positron is now accepted to beidentical to an electron in rest mass andrest energy, with a positive chargenumerically equal to the electron’snegative charge.
Positrons in a solid are short lived (10–7
to 10–10 s) and combine with electrons toform annihilation radiation, which ismost often two photons with energies of0.51 MeV.
NeutrinoFermi postulated the neutrino in 1934 toexplain an apparent contradiction of thelaw of conservation of energy in betaparticle emission. The particle with nocharge and no mass, or nearly no mass,was needed to carry away the energymissing when beta particles emergewithout the full energy released in thebeta decay process. Evidence tosubstantiate the existence of the neutrinocomes from research by C.L. Cowan andF. Reines of Los Alamos NationalLaboratory, Los Alamos, New Mexico.
Other ParticlesIn research using high energy machinesand detectors such as bubble chambersand huge scintillation arrays, moreparticles have been discovered. Theseinclude the mesons postulated byH. Yukawa in 1934, extra heavy particlesknown as hyperons and the antiparticleanalogs of the known particles indicatedby E. Segre and his collaborators. Thisnuclear zoo of from 30 to 40 particles isbest examined elsewhere.
Bohr AtomAs the particles that make up an atombecame known in the early 1900s, effortsto understand how the particles fit into astructure began. A structure was needed toexplain some of the results of experimentsperformed on and properties displayed byvarious atoms. The English plum duff atomwas likened to a pudding with protonsand electrons evenly mixed through itsvolume.
39Radiation and Particle Physics

40 Ra
FIGURE 1. The bohr atom has concentric clouds or shells ofelectrons. The electrons in the outermost subshell are calledvalence electrons.
s s p s p d s p d f
Electron orbits
Nucleus2 2 6 2 6 10 2 6 10 14
K L M N
LegendK = innermost shell, of two electronsL = shell of eight electrons
M = shell of eighteen electronsN = shell of thirty-two electronss = innermost subshell, of two electronsp = subshell of six electronsd = subshell of ten electronsf = subshell of fourteen electrons
FIGURE 2. Pin the lege
IUO
Group CA
1 ANESAW
2 ANESAW
3 ANESAW
4 ANESAW
5 ANESAW
6 ANESAW
7 ANESAW
LegendIUPAC =
Old =CAS =AN =ES =
AW ===
La
A
3RT02_Layout_(037-054) 10/2/02 1:39 PM Page 40
Ernest Rutherford described the atomas having a nucleus containing most ofthe mass and described the volume of theatom as containing mostly electronsorbiting the nucleus.
Niels Bohr, Rutherford’s student, thencalculated that the electrons would be indiscrete, calculatable orbits. Bohrpostulated that the positive chargedprotons would be in a tiny nucleus withelectrons in discrete orbits or energy levelsaround the nucleus. These energy levels orshells, described by quantum mechanicalconditions that describe the energy,angular momentum, spin and number ineach orbit, set electrons at specific energyorder in the atom, as seen in neon(Fig. 1).
The shells are designated by the lettersK, L, M, N, O, P and Q in order ofpositions farther from the nucleus. For
diographic Testing
eriodic table of elements.2 Three systems used to number the periods are named in the top row and are identifiednd below. For element symbols, see Table 4.
PAC 1 2 3 4 5 6 7 8 9 10 11 12 13 14 15 16 17 18ld IA IIA IIIA IVA VA VIA VIIA VIIIA VIIIA VIIIA IB IIB IIIB IVB VB VIB VIIB VIIIBS IA IIA IIIB IVB VB VIB VIIB VIII VIII VIII IB IIB IIIA IVA VA VIA VIIA VIIIA
1 2H He
1.01 4.00
3 4 5 6 7 8 9 10Li Be B C N O F Ne
6.94 9.01 10.81 12.01 14.01 16.00 19.00 20.18
11 12 13 14 15 16 17 18Na Mg Al Si P S Cl Ar
22.99 24.31 26.98 28.09 30.97 32.07 35.45 39.95
19 20 21 22 23 24 25 26 27 28 29 30 31 32 33 34 35 36K Ca Sc Ti V Cr Mn Fe Co Ni Cu Zn Ga Ge As Se Br Kr
39.10 40.08 44.96 47.87 50.94 52.00 54.94 55.85 58.93 58.69 63.55 65.39 69.72 72.61 74.92 78.96 79.90 83.80
37 38 39 40 41 42 43 44 45 46 47 48 49 50 51 52 53 54Rb Sr Y Zr Nb Mo Tc Ru Rh Pd Ag Cd In Sn Sb Te I Xe
85.47 87.62 88.91 91.22 92.91 95.94 (98) 101.07 102.91 106.42 107.87 112.41 114.82 118.71 121.76 127.60 126.90 131.29
55 56 57 72 73 74 75 76 77 78 79 80 81 82 83 84 85 86Cs Ba La Hf Ta W Re Os Ir Pt Au Hg Tl Pb Bi Po At Rn
132.91 137.33 138.91 178.49 180.95 183.84 186.21 190.23 192.22 195.08 196.97 200.59 204.38 207.20 208.98 (209) (210) (222)
87 88 89 104 105 106 107 108 109 110 111 112 (113) 114 (115) 116 (117) 118Fr Ra Ac Rf Db Sg Bh Hs Mt Uun Uuu Uub Uut Uuq Uup Uuh Uus Uuo
(223) (226) (227) (261) (262) (266) (264) (269) (268) (271) (272) ( ) — ( ) — ( ) — ( )
period numbering system (1 to 18) used by International Union of Pure and Applied Chemistryperiod system (with roman numerals) formerly used by International Union of Pure and Applied Chemistryperiod numbering system (with roman numerals) used by Chemical Abstracts Serviceatomic number.element symbolatomic weightlanthanide series occurs hereactinide series occurs here
nthanide series AN 58 59 60 61 62 63 64 65 66 67 68 69 70 71ES Ce Pr Nd Pm Sm Eu Gd Tb Dy Ho Er Tm Yb LuAW 140.12 140.91 144.24 (145) 150.36 151.96 157.25 158.93 162.50 164.93 167.26 168.93 173.04 174.97
ctinide series AN 90 91 92 93 94 95 96 97 98 99 100 101 102 103ES Th Pa U Np Pu Am Cm Bk Cf Es Fm Md No LrAW 232.04 231.04 238.03 (237) (244) (243) (247) (247) (251) (252) (257) (258) (259) (262)

Symbol Element
Ac actiniumAg silverAl aluminumAm americiumAr argonAs arsenicAt astatineAu goldB boronBa bariumBe berylliumBh bohrium (AN 107)a
Bi bismuthBk berkeliumBr bromineC carbonCa calciumCd cadmiumCe ceriumCf californiumCl chlorineCm curiumCo cobaltCr chromiumCs cesiumCu copperDb dubnium (AN 105)a
Dy dysprosiumEr erbiumEs einsteiniumEu europium
Symbol Element
F fluorineFe ironFm fermiumFr franciumGa galliumGd gadoliniumGe germaniumH hydrogenHe heliumHf hafniumHg mercuryHo holmiumHs hassium (AN 108)a
I iodineIn indiumIr iridiumK potassiumKr kryptonLa lanthanumLi lithiumLr lawrenciumLu lutetiumMd mendeleviumMg magnesiumMn manganeseMo molybdenumMt meitnerium (AN 109)a
N nitrogenNa sodiumNb niobiumNd neodymium
Symbol Element
Ne neonNi nickelNo nobeliumNp neptuniumO oxygenOs osmiumP phosphorusPa protactiniumPb leadPd palladiumPm promethiumPo poloniumPr praseodymiumPt platinumPu plutoniumRa radiumRb rubidiumRe rheniumRf rutherfordium
(AN 104)a
Rh rhodiumRn radonRu rutheniumS sulfurSb antimonySc scandiumSe seleniumSg seaborgium (AN 106)a
Si siliconSm samariumSn tin
Symbol Element
Sr strontiumTa tantalumTb terbiumTc technetiumTe telluriumTh thoriumTi titaniumTl thalliumTm thuliumU uraniumUub ununbium (AN 112)a
Uuh ununhexium(AN 116)a
Uun ununnilium (AN 110)a
Uuo ununoctium(AN 118)a
Uup ununpentium(AN 115)a,b
Uuq ununquadium(AN 114)a
Uus ununseptium(AN 117)a,b
Uut ununtrium (AN 113)a,b
Uuu unununium (AN 111)a
V vanadiumW tungstenXe xenonY yttriumYb ytterbiumZn zincZr zirconium
TABLE 4. Element symbols. (See periodic table in Fig. 2.)
a. AN = atomic numberb. Element not discovered as of 30 July 2001.
3RT02_Layout_(037-054) 10/2/02 1:39 PM Page 41
example, the uranium atom has2 electrons in the K shell, 8 in the L, 18 inthe M, 32 in the N, 18 in the O, 12 in theP and 2 in the Q or outermost shell.
The outer shell of electrons gives atomsthe chemical properties exhibited by aparticular element. For instance, elementswhose atoms have a full orbit of electrons(2 for the K shell or 8 for the other shells)make up the noble gases. By arrangingelements with similar electron outer orbits(or similar chemical properties), into setsof columns, a periodic table of theelements can be made as shown byFigure 2.2 Table 4 presents a list ofelement symbols for use with the periodictable.
Group 1 has one electron in the outerorbit of their atoms and is the veryreactive alkali metals group. Group 2contains the alkaline earth metals, atomshaving 2 electrons in the outer orbits.Group 3 is the aluminum family. Group 3
atoms have 3 electrons in the outer orbitand may have more than 8 electrons inan inner orbit. Such an organization ofgroups or columns of elements continuesacross the period table through group 7known as the halogens with 7 electrons inthe outer orbit and group 8 alreadyidentified above as the noble gases.
41Radiation and Particle Physics

42 Rad
PART 2. Properties of Radioactive Materials
Table 5. Half lives versus remaining lives.
Elapsed Time Amount Remaining(half lives) (percent)
0 1001 502 253 12.54 6.255 3.12
3RT02_Layout_(037-054) 10/2/02 1:39 PM Page 42
Radioactive materials have existed sincethe earth was created. All elements withatomic numbers greater than 83, bismuth,exist only as radioactive elements andmany elements below atomic number 83have radioactive isotopes that exist innature.
The difference between a stable ornonradioactive atom of an element andan unstable or radioactive atom is in theenergy content of the nucleus. Most oftenan excess or deficiency in the number ofneutrons in the nucleus provides theexcess energy or instability.
As an example: most hydrogen innature exists as atoms with only 1 protonand 1 electron. About 15 of every 100 000atoms of hydrogen have a neutron plusthe proton in the nucleus, giving theatom a mass of 2 or twice the mass ofmost hydrogen atoms. Mass 2 hydrogen iscalled deuterium or heavy hydrogen andis stable. When a second neutron is addedto the nucleus of hydrogen, the atom hasa mass of 3, is called tritium and isradioactive. The tritium atom is producedin nature by cosmic bombardment toproduce a pre-1952 concentration innature of between 1 to 10 tritium atomsper 1018 hydrogen atoms.
Radiation UnitsThe nucleus of a radioactive atom emitsenergy and most often a particle. Theenergy released is usually the kineticenergy of the emitted particle but alsomay be shared by gamma or X-rayphotons. When only a single chargedparticle is released, the number of protonsin the nucleus changes. The changedatom is an atom of a different element.
Each change in the nucleus of an atomis called a disintegration or decay. Theamount of a radioactive material ismeasured in terms of the rate ofdisintegration. The first unit used todescribe the quantity of radioactivity orrate of disintegration was the curie (Ci).The curie was 3.7 × 10¹⁰ disintegrationsper second or 2.22 × 10¹² disintegrationsper minute.
The metric unit for quantity ofradioactivity is the becquerel (Bq) and isdefined as one disintegration per second.A useful conversion is 1 Ci ≅ 3.7 × 10¹⁰ Bq≅ 37 GBq.
iographic Testing
Half LifeObviously, if the number of radioactiveatoms are decreasing or decaying withtime, a way of keeping track of theamount of radioactive material available isneeded. The most convenient concept isthat of half life.
Half life is the time required for half ofthe original number of atoms to decay orchange. It is really a probability of decaybut when expressed for large numbers ofatoms, half life is more convenient thanthe probability λ of an atomdisintegrating per unit time (also calledthe decay constant, or fraction of atoms perunit time). The number of atoms decayingper unit time can be expressed as λ timesthe total number N of parent atoms:
(1)
The half life T is related to the decayconstant as shown in Eq. 1:
(2)
where 0.693 is the natural logarithm of 2.The number of radioactive atomsdecaying per unit time changesexponentially with time. That is, half ofthe original quantity at the beginning of ahalf life period remains at the end of thehalf life period. Table 5 shows thisexponential property.
This exponential change with time canbe expressed mathematically:
T == 0.693λ
DisintegrationsTime
= λ N

FIGURE 3. Radioactivity versus time.
Radi
atio
n re
mai
ning
(pe
rcen
t)
100
80
60
40
20
10
8
6
4
2
10 1 2 3 4 5
Time (half lives)
3RT02_Layout_(037-054) 10/2/02 1:39 PM Page 43
(3)
in which N is the number of atoms orquantity of radioactive material after nhalf lives of decay time from an originalnumber of atoms or quantity No.
A more convenient expression in termsof time t and half live T would be:
(4)
or the logarithmic form:
(5)
or
(6)
Therefore, the plot of quantity ofradioactive material versus time results ina straight line if semilogarithmiccoordinates are used, as in Fig. 3.
Modes of RadioactiveDecayRadioactive atoms disintegrate by one ormore of five primary modes: (1) emissionof an alpha particle (helium nucleus),(2) emission of a beta particle (electron),(3) electron capture or positron emission,(4) emission of a gamma ray (photon) or(5) spontaneous fission.
Emission of a gamma ray photon mayfollow some of the first threedisintegration modes and only rarelyoccurs alone. A few radioactive atomsdecay by competing modes so that someof the parent atoms result in one daughterwhile others result in another. Such dualdecay modes are called branching andfixed amounts of each mode or branch areobserved.
Emission of Alpha ParticleThe relatively heavy nuclei of helium(2 protons and 2 neutrons) from aradioactive nucleus generally carry withthem considerable kinetic energy, between2 and 6 MeV. A megaelectronvolt (MeV) isthe energy that would be acquired if aunit charged particle moved across a gaphaving a million volt potential difference.Alpha particle emitters are obviously largenuclei such as in radium, polonium
ln .NN
tT
0 0 693==
ln .NN
tT0
0 693== −−
NN
t
tT
o== −−(( ))
== −−
exp
exp.
λ
0 693
NN
n
o==
12
(shown below) and uranium atoms. Alphaparticles are easily stopped by smallamounts of matter such as a sheet ofpaper because they possess such largemass and high charge.
(7)
Note that there is a decrease of 4 in themass and a decrease of 2 in the atomicnumber of the parent atom to form thedaughter atom plus alpha.
Emission of Beta ParticleBeta particles are identical to high speedelectrons, although they may be eitherpositively charged (positrons) ornegatively charged (negatrons). They areemitted with energies continuouslydistributed up to a maximum valuecharacteristic of the particular isotope.The distribution of the number of betaparticles, as a function of particle energy,is known as a fermi distribution. It typicallyrises to a peak at energies of one third toone half the maximum energy for thatparticular isotope. The radioisotopes thatemit beta particles from their nucleus areneutron rich as compared to stableisotopes of the same element, such as
210 206Po Pb→→ ++ α
43Radiation and Particle Physics

44 Rad
3RT02_Layout_(037-054) 10/2/02 1:39 PM Page 44
shown by the equation for decay ofcarbon-14 below. Beta particles are usuallystopped by thin layers of metal.
(8)
Note that there is an increase of one inthe atomic number of the daughtercompared to the parent atom when thebeta particle and neutrino are emitted.
Electron CaptureIf the nucleus is a high atomic numberand is neutron deficient as compared tothe stable isotopes of the element, thenthe nucleus can capture one of the atomicorbital electrons. Because the innermostor K shell electrons are usually caught, theprocess is often called K capture. Theprocess creates an electron vacancy. Aselectrons move from outer shells to fillthe vacancy, characteristic X-rays arereleased and give evidence that theprocess has occurred. In some moderateatomic number isotopes, the electroncapture process competes with positronemission in the decay process. Thedaughter atom is the same for eitherprocess, as shown for the decay reactionsof zinc-65.
(9)
(10)
where EC indicates electron capture.
Gamma Ray EmissionGamma ray emission generally followsalpha or beta decay, except for a very fewradioactive isotopes where isomerictransition or release of only gammaradiation occurs. The gamma rays arereleased from the nucleus of an atom thatcontains excess energy. In some alpha andbeta decay, no excess energy is left in thenucleus. Like X-rays, the gamma rays areelectromagnetic radiation but the gammarays originate in the nucleus rather thanin the electron orbits and aremonoenergetic. Because the gamma rayscarry neither charge nor rest mass, theiremission does not change the mass oratomic number of the nucleus but thenucleus is in a more stable state.
Gamma rays range in energy from afew thousand electron volts (keV) toseveral million electron volts (MeV). Eachgamma emitter has its own unique,characteristic gamma energy or set ofgamma energies and is often used toidentify the isotope. The gamma rays arethe chief radiation used in isotope
65 EC 65Zn Cu →→
65 65Zn Cu→→ ++ ++++β ν
14 14C N→ + +−β ν
iographic Testing
radiography. Three of the more familiarisotopes used in radiography areiridium-192 (over 20 different gamma rayswith 0.310 MeV predominate),cesium-137 (0.661 MeV) and cobalt-60(1.17 and 1.33 MeV). The spectra arediscussed in the chapter on gammaradiography.
Spontaneous FissionNuclear species with masses greater than200 can decay by the process ofspontaneous fission. Most fissionprocesses are initiated by absorption of aneutron in the nucleus of the atom.Uranium-138 and californium-252 decayby spontaneous fission with alpha decayas competing processes. The large nucleussplits into two smaller nuclei with therelease of 2 to 4 neutrons and severalgamma rays. The process of spontaneousfission becomes predominant in theextremely large nuclei and they may beused as neutron sources.
Secondary ProcessesDuring disintegration of a nucleus by anyof the preceding processes, secondaryprocesses may take place, often resultingin emission of X-ray radiation. Internalconversion occurs when the energy of agamma ray usually released from thenucleus is transferred to an orbitalelectron close to the nucleus. The electronleaves the atom with the energy of thegamma ray minus the electron’s orbitalbinding energy. Other electrons fill thevacancy of the ejected orbital electroncreating characteristic X-rays of the atom,just as in the case of electron capture.
As high speed beta particles deceleratein the matter they penetrate, a wide range(0 to the maximum energy of the betaparticle) of X-ray energies are produced.This continuum of energies is also calledbremsstrahlung. The radiation is very muchlike the radiation generated in an X-raytube. In practice, the lower energyradiation is largely absorbed by the matterthat produces it.
Attenuation of RadiationAttenuation of radiation from the pointsources of radiation used in radiographyoccurs as the result of two processes:inverse square law (radiation intensitydecreases as the square of the distanceincreases) and absorption of the radiationby the matter through which it passes.
Inverse Square LawRadiation leaves a point source ofradioactive material in all directions. It

FIGURE 4. Ionization by alpha particle that ejects orbitalelectron from atom. Specific ionization is number of ion pairsgenerated by particle per unit path. Total ionizationdesignates number of ion pairs produced by particle alongits entire path.
Eo ~Eo
3RT02_Layout_(037-054) 10/2/02 1:40 PM Page 45
may be thought to cover the surface of asphere with a radius equal to the distancefrom the source. The area of the spherecovered by the radiation from the sourceincreases as the square of the distancefrom the source, so the intensity of theradiation, usually measured in seiverts persecond (Sv·s–1) or milliroentgens per hour(mR·h–1), decreases as the square of thedistance from the source. The formulaused in inverse square calculations is:
(11)
in which I is the intensity of radiation atdistance d.
Distance becomes very important indecreasing the exposure of a radiographerbecause the radiation attenuation decreaseoccurs as the square of the distance fromthe source; that is, as compared to a unitdistance d from the source, the radiationintensity is 0.25 at twice the distance (2d),0.11 at 3d and 0.01 at 10d.
Absorption by MatterEach kind of radiation is absorbed bymatter in at least one of a variety ofdifferent ways. Alpha, beta and neutronabsorption is discussed in a very simplefashion below with absorption ofelectromagnetic radiation being discussedin more detail.
Alpha ParticlesAlpha particles are easily absorbed by athin layer of material such as a sheet ofpaper. The mass of four and the positivecharge of two make interactions of thealpha particles with the electron cloudsaround atoms very probable. The positivecharge interacts with the electrons eitherto move them from their atomic orbits(ionization) or to move them to higherorbits around the atom (excitation). Eitherprocess removes kinetic energy from thealpha particle equal to the energy gainedby the electron. Figure 4 illustrates theionization of an atom by an alphaparticle.
As the alpha particle slows down, itinteracts with more atoms and slowsdown faster until it slows to the molecularmotion of a helium atom when it gainstwo orbital electrons. In air, the trail of analpha particle will be fairly straight withtens of thousands of ion pairs (atomsdeficient in electrons and the removedelectrons) per centimeter along its path.This trail of high ionization is what isseen in a cloud chamber. Path length inair is about 10 mm (0.4 in.) per 1 MeV oforiginal kinetic energy.
I d I d1 12
2 22(( )) == (( ))
Beta ParticlesBeta particles, or electrons, also interactmainly with the orbital electrons of theatoms along their path. Because they arevery light, they travel faster than alphaparticles with equivalent energy. Becausethey are faster and have only half thecharge of an alpha particle, they interactless frequently. Because they have littlemass compared to the atoms, the path ofthe electrons is very tortuous or zigzaggedwith many reversals in direction.
Thin layers of metal or about 0.1 m(several inches) of air are sufficient toabsorb or stop beta particles. Ionizationand excitation are the major interactionswith the production of X-rays likely forhigh energy beta particles.
If the beta particle is positivelycharged, it will annihilate with anelectron at the end of its path as it losesits kinetic energy. The annihilation willresult in two gamma rays moving apart at180 degrees and each having an energy of0.51 MeV (the energy equivalent to therest mass of an electron).
NeutronsNeutrons produced by fission, acceleratornuclear reactions or radioisotope sourceshave considerable kinetic energy. Thiskinetic energy is most often lost byscattering interactions with or absorptionin the nuclei of the atoms in their path.Absorption of the neutron is followed byrelease of electromagnetic radiation orlarge particles such as protons, multipleneutrons, deuterons or alpha particles.Interactions with the orbital electronscontribute negligibly to the absorption ofneutrons by matter.
The nucleus is much smaller than theelectron orbits, so neutron interactionsare less frequent than those of alpha or
45Radiation and Particle Physics

46 Rad
3RT02_Layout_(037-054) 10/2/02 1:40 PM Page 46
beta particles. And because the neutronhas no charge, ionization and excitationare not major absorption processes.
Elastic ScatteringFor elastic scattering, the neutron collideswith the nucleus and bounces off, leavingthe nucleus unchanged. This type ofcollision can be treated straightforwardlyas a mechanical billiard ball type ofcollision. In the collision the energy ofthe neutron is shared by the nucleus, thuseach collision reduces the energy of theneutron. After a number of collisions withthe nuclei, the energy is reduced to thesame average kinetic energy as that of theabsorbing medium. This energy is oftenreferred to as the thermal energy becauseit depends primarily on the temperature.Neutrons at thermal equilibrium withtheir surroundings are thermal neutrons.At 20 oC (68 °F), a thermal neutron wouldhave a kinetic energy of about 0.025 eVand a velocity of 2200 m·s–1
(4900 mi·h–1).The transfer of energy from the
neutron to the nucleus is greater for lightnuclei. Therefore, low atomic nucleicontaining materials such as water,hydrocarbons, graphite and beryllium areused to reduce neutron energies. Suchmaterials are called moderators. Hydrogennuclei have essentially the same mass asneutrons and can undergo nearlycomplete kinetic energy transfer in asingle collision. Energy transfer to largernuclei require many collisions.
Inelastic ScatteringHere the neutron collides with thenucleus leaving the nucleus in an excitedstate. In this process, the nucleus mayeither stay in the excited state (n,n’) as ametastable isomer or will immediatelyemit gamma radiation (n,γn) and return tothe ground or original state.
Nuclear Neutron AbsorptionAs the neutron has no charge, it canapproach the nucleus until the close rangeattractive forces of the nucleus begin tooperate. In this process, the neutron iscaptured, forming a compound nucleus.Because there is no charge barrier, eventhe slowest neutron can be readilycaptured. As the binding energy of aneutron into a compound nucleus isnearly 8 MeV, even the capture of thermalneutrons can result in a highly excitedstate for the nucleus. This excited nucleuscan attain relative stability by ejecting aproton, ejecting an alpha particle, oremitting the excess energy as gammaradiation. When a particle is ejected, thenucleus becomes a new element; then theprocess is also known as nuclear
iographic Testing
transmutation. The discovery oftransmutation by slow neutrons led to therealization of nuclear fission.
The simplest capture reaction is that ofcapture of slow neutrons with emission ofgamma rays (n,γ). Thermal neutronreaction with cobalt is an example:
(12)
In heavy nuclei, the capture of a slowneutron, followed by the emission ofgamma radiation, increases theneutron-to-proton ratio — usually makingthe nucleus radioactive with decay byelectron emission likely. Moreinformation on production of radioactivematerial by neutron capture may befound in the discussion of radioactivematerials.
As the energy of the impingingneutron is made larger, a charged particlecan be ejected. However, a chargedparticle, because of the short rangeattractive forces of the nuclei, is hinderedfrom leaving the nucleus and processessuch as (n,p), (n,α) and (n,d) can only takeplace when the incident neutron suppliessufficient energy to overcome the bindingenergies of the particles in the nucleus.For heavy nuclei these forces areappreciable and the requisite neutronenergy becomes greater. Thus, forexample, a particle ejection is possibleonly if the neutron has sufficient energyto overcome the binding energy of thealpha particle; that is, the neutron mustbe a fast neutron.
In the (n,α) reaction, the productnucleus contains one neutron and twoprotons less than the original nucleus.The neutron-to-proton ratio is increasedand the transmutation usually produces aradioactive nucleus that decays by theemission of an electron (betadisintegration).
As the energy of the incident neutronapproaches 30 MeV, the compoundnucleus can eject three neutrons (n, 3n) ortwo neutrons and a proton (n, 2np) as wellas other combinations of particles. Ateven higher energies, more particles maybe ejected until the nucleus essentiallydisappears (spallation).
Finally, nuclear fission (n,f), where thenucleus breaks up with the release ofseveral larger particles and severalneutrons, can be induced in certain largenuclides, such as uranium-235, byneutrons of almost any energy, whereas inother nuclides, fast or energetic neutronsare required.
Nuclear Cross SectionsBecause of many reactions possible forabsorbing neutrons and their complicated
59 60Co + Co +n →→ γ

TABLE 6. Capture cross sections σσ ofstrongly absorbing elements for neutronsin approximate thermal equilibrium at
FIGURE 5. Aresonance
Tota
l cro
ss s
ectio
n (m
2 )
10–24
10–25
10–26
10–27
1
3RT02_Layout_(037-054) 10/2/02 1:40 PM Page 47
energy and mass dependencies, there isno simple way to present the totalabsorption effect. However, theprobability of any interaction betweenneutrons and matter can be madequalitative by means of the concept ofcross sections. The cross section σ is theeffective target area of the nucleus as seenby the impinging neutron of a givenenergy. The number of interactions perunit time will be nvNσ, where n is thenumber of neutrons per unit volumemoving with velocity v towards the targetof N nuclei. The quantity nv is theneutron flux density (neutrons per squarecentimeter second). The cross section σ isusually expressed in square meters (m2) orbarns (b), where 1 b = 10–24 cm2 =10–28 m2.
In discussing the variation of nuclearcross section with energy of the incidentneutrons, certain generalizations of abroad character can be made. In general,there are three regions that can bedistinguished. First is the low energyregion, which includes the thermal range,where the cross section decreases steadilywith increasing neutron energy. The totalcross section is the sum of two terms, onedue to neutron scattering is quite smalland almost constant, the otherrepresenting absorption by the nucleus isinversely proportional to the velocity.This low energy range is termed the v–1
region, where the time spent by theneutron near the nucleus is proportionalto v–1. Second, following the somewhatindefinite v–1 region, many elementsexhibit peaks called resonance peaks,where the neutron cross sections risesharply to high values for certain energies,then fall to lower values again. Dependingon the element, the number of such peaks
bsorption of neutrons by cadmium, showing peak at 0.176 eV.
0–3 10–2 10–1 1 10 102 103 104
Neutron energy (eV)
may number three or more. These peaksmay be found mostly in the energy range0.1 to 1 eV, although in a few elementslike uranium-238, they may be found upto energies of 10 eV. These reactions are ofthe (η,γ) type. And third, with neutrons ofhigh energy in the MeV range, the crosssections are very low, less than 10–27 m2
(10 b), compared to the very high crosssections of 4 × 10–25 m2 (several thousandbarns, ~4000 b) at low energies.
A simple example of the totalabsorption cross section is that ofcadmium, shown in Fig. 5. The v–1 regionis shown up to about 0.03 eV, theresonance at 0.176 eV and the low crosssection region for energies greater thanabout 2 MeV.
The dramatic increase in cross sectionsat the resonance have been worked out bythe theory of G. Breit and E.P. Wigner. Inits simplicity, if the energy of the neutronis such that a compound nucleus can beformed at or near one of its energy levels,then the probability of capture of theseneutrons will be exceptionally high. Allelements do not show the resonantabsorption effect; for example, boron hasno measurable resonance and the crosssection follows the v–1 law from 0.01 eVto over 1000 eV. However, its cross sectionfor (n,α) is so large for neutrons of lowenergy that this reaction is often used forneutron detectors. Table 6 shows thedramatic variation of cross section forabsorbing thermal neutrons of some ofthe better neutron absorbers.
47Radiation and Particle Physics
300 K (27 °C = 80 °F).
CrossAtomic Section
Element Number (10–24 m2)
Lithium 3 65Boron 5 540Chlorine 17 40Cobalt 27 35Rhodium 45 125Silver 47 55Cadmium 48 3 000Indium 49 300Mercury 80 450Samarium 62 4 260Europium 63 3 400Gadolinium 64 22 200Dysprosium 66 1200Holmium 67 340Rhenium 75 90Iridium 77 285Gold 79 90

48 Radio
PART 3. Electromagnetic Radiation
FIGURE 6. Elec
106
Radio
10–9
TABLE 7. Photon characteristics.
Quantity Expression
Velocity cFrequency ν = c·λ–1
Wavelength λ = c·ν–1
Energy E = hνPlanck’s constant E ·ν–1
Mass hν·c–2
Momentum hν·c–1
3RT02_Layout_(037-054) 10/2/02 1:40 PM Page 48
Electromagnetic radiation released duringradioactive atom decay includes bothX-rays and gamma rays. These penetratingradiations are related to other types ofelectromagnetic radiation (Fig. 6).
Although the X-ray and gamma ray areproduced very differently, their absorptionby matter is the same because there is nodifference between photons of the twodifferent kinds of radiation at the sameenergy once they have been generated.(X-ray generation by electronic means isdiscussed in another chapter.) Thephotons of electromagnetic radiation haveno rest mass, no charge and no magneticmoment but do have a dual character inthat they sometimes act like particles andother times like waves. Photoncharacteristics are listed in Table 7.
This dual nature of electromagneticradiation photons was being postulated atthe turn of the century and was hinted atby the quantum theory as put forth byMax Planck. Planck proposed that thephoton energy was contained in a packetof energy, known as a quantum, and wasproportional to its frequency. Photoncharacteristics are listed in Table 7.
(13)
in which E is the quantum energy of thephoton, h is Planck’s constant(6.626176 × 10⁻³⁴ J·Hz–1) and ν is thefrequency of the electromagneticradiation. This equation has helped toexplain many physical phenomena.
Penetrating electromagnetic radiationinteractions with matter provide themechanics for several familiar andimportant applications such as medicalradiology, thickness gaging, density
E hv=
graphic Testing
tomagnetic spectrum.
Radiation wavelength (n
105 104 103 102 10 1 10–
Infrared
Visi
ble
light
UltravioletX–ray
10–8 10–7 10–6 10–5 10–4 10–3 10–2
Photon energy (MeV
measurement, compositiondetermination, industrial radiography andexperimental physics. Emphasis here willbe on the major interactions of X-raysand gamma radiation. The three majorinteractions important for the energyranges encountered in radiography are(1) the photoelectric effect, (2) comptonscattering and (3) pair production.
Other interactions such as resonantabsorption, photodisintegration andcoherent scattering are not important forradiography and will not be discussedhere.
Photoelectric EffectIn a photoelectric interaction, a photoncompletely transfers its energy to anelectron in an inner shell of an atom ofthe absorbing material. If the energy ofthe photon exceeds the binding energy ofthe electron, it leaves the atom with akinetic energy Ek of the photon equal tothe original energy Eo minus the bindingenergy Eb of the electron to the atom
m)
1 10–2 10–3 10–4 10–5 10–6
s
Gamma raysCosmic rays
10–1 1 10 102 103
)

FIGURE 7. Porbital elec
LegendEb = energEo = origin
FIGURE 8. Absorption and scattering curves for uranium showvarious components of total attenuation coefficient asfunction of energy.
Mas
s at
tenu
atio
n co
effic
ient
, m2 ·
kg–1
(cm
2 ·g–
1 )
L1, L2 and L3 Absorption edges
Total
K absorption edge
Totalscattering
Comptonscattering
Photoelectric Pair production
Energy (MeV)
1000 (100)
100 (10)
10 (1.0)
1.0 (0.1)
0.1 (0.01)0.01 0.1 1 10 100
3RT02_Layout_(037-054) 10/2/02 1:40 PM Page 49
(Fig. 7). Most X-ray and gamma radiationpossess sufficient energy to remove anelectron from the atom — that is, toionize the atom.
Photoelectric interactions predominatewhen (1) the absorbing material is of highatomic number and density, such as lead(increasing as the atomic number Z tobetween the fourth and fifth power), and(2) the energy of the photon is less than1 MeV. If the binding energy of theelectron is greater than the energy of thephoton, the electron is temporarilymoved to a higher orbit. When thephoton energy equals the binding energyof a particular shell of electrons, there is asharp increase in amount of absorption ofthose photons over lower and higherenergies. These dramatic changes inabsorption for the K and L shell electronscan be seen in photoelectric and totalabsorption curves in Fig. 8 and are calledabsorption edges.
Compton ScatteringAbove 0.5 MeV, compton scatteringbecomes important in attenuating a beamof photons. As the name implies,compton scattering is not true absorption.A part of the photon’s initial energy ismerely redirected, with some of theenergy being taken as kinetic energy of anelectron. Compton scattering occurs whenthe photon collides with an orbitalelectron and gives up part of its energy tothe electron. The electron is ejected fromthe atom and the remainder of thephoton energy leaves the atom as a lowerenergy photon, usually traveling in adifferent direction to the original photonas depicted in Fig. 9. The direction of thescattered photon may be at any angle,even 180 degrees, to the direction of theoriginal photon, hence the scatteringdescription for this interaction. Largeangles of scatter occur and most of the
photon energy goes to the electron.hotoelectric interaction of incident photon withtron.
Eo
Eo – Eb
y binding electron to atomal energy of photon
Compton scattering remains the majorcontribution to radiation attenuationuntil photon energies exceed severalmegaelectronvolts for high atomicnumber absorbers, as seen in Fig. 8. Forlow to moderate atomic numberabsorbers, compton scattering constitutesthe major interaction from below 0.5 toabove 10 MeV. This scatter produces thefogging of radiographic films andradiation levels higher than expectedoutside of a radiation beam.
49Radiation and Particle Physics
FIGURE 9. Compton scattering. Incident photon ejectselectron and ejects lower energy scattered photon.
Eo
Ee < Eo
LegendEe = lower energy of scattered photonEo = original energy of photon
Ee

50 Radi
FIGURE 10. Paincident pho
Eo
Legendc = speed of E = energy of
E + = energy ofE – = energy ofm = electron m
3RT02_Layout_(037-054) 10/2/02 1:40 PM Page 50
Pair ProductionAt 1.02 MeV the important attenuationprocess of pair production begins to occur.High energy photons traveling close tothe nucleus with a high atomic numbercan convert into a pair of particles: anelectron and a positron (see Fig. 10). Thereason that the process begins at1.02 MeV is that the photon has nocharge and therefore must convert to apair of particles that have equal andopposite charges to preserve neutrality.The energy needed for conversion(E = mc2) to the mass of an electron or apositron is 0.51 MeV each.
As the energy of photons exceeds the1.02 MeV by greater amounts, thelikelihood of the pair production reactionincreases (Fig. 8) until it becomes thepredominant mode of interaction. Also,the higher the atomic number of theabsorber, the more likely pair productionbecomes. Any excess energy above1.02 MeV possessed by the originalphoton becomes kinetic energy for thetwo particles. The particles lose energy, asdescribed before for beta particles, withthe positron annihilating at the end of itspath.
Attenuation Coefficientsand EquationsAttenuation of X-ray or gamma rayphotons from a beam traveling throughmatter follows an exponentialrelationship similar to that covered earlierin this section for half lives. Theattenuation results from a summation ortotal of the radiation removed from thebeam by each of the three modes ofinteraction just discussed. The heavy linein Fig. 8 is this total probability ofinteraction, or coefficient of attenuation
ographic Testing
ir production of electron and positron fromton.
E+
light incident photon positron negative electronass
Eo = E+ + E– + 2mc2
E–
for each radiation energy and kind ofmatter involved. That is, the totalprobability per atom of attenuation of aphoton of the original energy is the sumof the probabilities of each of the modesof interaction:
(14)
in which σ is the total attenuationcoefficient per atom, σpe is the absorptioncoefficient for photoelectric interactionsper atom, σcs is the scattering coefficientfor compton scattering per atom and σppis the scattering coefficient for pairproduction. Attenuation coefficient tablesare in another chapter.
If any other modes of interactioncontributed significantly, their absorptionor scattering coefficient would be addedto the others to produce the totalattenuation coefficient. Although theattenuation coefficients are probabilitiesper atom, they are expressed in squarecentimeters and for that reason arereferred to as the cross section.
The cross section is used in calculationsrelated to the attenuation of the radiationfrom a narrow beam of that single energyof radiation passing through a singlematerial. Each thickness of the materialremoves the same fraction of theradiation from the beam. The intensity ofthe original beam incident on a thicknessof a material is related to the intensity ofthe beam transmitted through thatthickness:
(15)
in which I is the transmitted intensity ofradiation beam; Io is the original intensityof radiation beam; n is the number ofatoms per cubic centimeter; σ is the totalatomic cross section (cm2) per atom or isthe probability of interaction per atom;x is the thickness of the absorber incentimeters.
As with half life, the equation may bechanged to the logarithmic form:
(16)
or
(17)
Most tables of cross sections provide thatinformation in terms of the massattenuation coefficient µm or the linearattenuation coefficient µ. The conversionfrom atomic attenuation coefficient tolinear attenuation coefficient is made by
lnII
n xo
== σ
lnII
n xo
== −− σ
I I e n x== −−0
σ
σ σ σ σ== ++ ++pe cs pp

TABLE 8. Ha
Source
Cobalt-60Cesium-1Iridium-1
FIGURE 11. G
Inte
nsity
(pe
rcen
t)
1009080706050
40
30
20
1098765
4
3
2
1
3RT02_Layout_(037-054) 10/2/02 1:40 PM Page 51
using Avogadro’s number N, which is thenumber of atoms in one gram relativeatomic mass A, and by using the density(g·cm–3) of the material:
(18)
in which the mass attenuation coefficientµm is measured in square centimeter pergram (cm2·g–1) and the linear attenuationcoefficient µ is measured as reciprocallength or reciprocal distance incentimeters (cm–1).
In many cases, the thickness ofmaterial that reduces the intensity of theradiation beam to half of its originalintensity is known or is desired. This halfvalue thickness, or half value layer as it iscommonly known, can be extremelyconvenient to calculate the shieldingthickness needed to reduce radiationintensity or to calculate the radiation
n xNA
x xmσ σρ µ ρ== == (( ))
lf value thickness for some common materials.
Energy Half Value Thickness (mm)__________________________(MeV) Lead Iron Concrete
1.17 and 1.33 12.5 22.1 68.637 0.662 6.4 17.2 53.392 0.34 average 4.8 — 48.3
amma attenuation with and without scatter.
With scatter
Without scatter
0 1 2 3 4 5
Half value layers
intensity that will come through a knownthickness of absorber. Tables of suchvalues are handy for common materialsand for frequently used radiation energies.The equation for converting linearattenuation coefficient to half valuethickness or vice versa is:
(19)
Some convenient values for half valuethickness are given in Table 8. Thesevalues of half thickness includeattenuation of the scattered radiationoutside of a narrow beam but should notbe depended on for great accuracybecause of the effects of scatteredradiation and variations in the densityand uniformity of materials.
An equation that attempts to handlescattered radiation is:
(20)
The effect of Eq. 20 is to increase theradiation intensity transmitted through athickness of material. The increasedintensity is from radiation scattered backinto the measurement point by thematerial. The effect of scatter on theradiation attenuation can be seen inFig. 11.
I I x xo≅≅ ++(( )) −−(( ))1 µ µexp
ln ln lnII
x
o
==
== (( ))
== ==
12
0 693
12
. µ
51Radiation and Particle Physics

52 Rad
PART 4. Production of Radioactive Materials
3RT02_Layout_(037-054) 10/2/02 1:40 PM Page 52
Natural RadioactivitySome of the radioactive materials used inindustry, medicine and research havecome from those radioactive species thatexist in nature. These uses have dwindledto a tiny amount except for thoseelements used in nuclear power andweapons where use is still quite large.
Radioactive elements found in naturecome from three sources: (1) thoseradioactive species with half livescomparable to the age of the earth,(2) decay products of the long livedspecies and (3) those formed by cosmicray bombardment.
Although all elements above atomicnumber 83 (bismuth) exist only in aradioactive form, only a few are or havebeen important commercially. Three arethe precursors of many of the radioactivespecies found in nature and form longdecay series. The thorium series beginswith thorium-232 and ends with lead-208after 10 decay steps. The uranium decayseries starts with uranium-238 and stopswith lead-206. Radium-226 is a decayproduct of the uranium decay series andone of the few radioisotopes to find largeindustrial and medical application. Thethird decay series, known as the actiniumseries, has uranium-235 at the beginningof the series with lead-207 as the stableend product. Uranium-235 is thefissionable part of uranium with anabundance in nature of 0.71 percent ofthe uranium.
Some 17 nuclides below bismuth inatomic number have half lives longenough to exist in nature. Potassium-40with an abundance of only 0.0119 percentand a half life of 1.3 × 10⁹ years is theonly one frequently encountered inradiation measurements.
Cosmic bombardment of the earth’satmosphere produces a field of fastneutrons and protons that interact withthe nitrogen, oxygen and argon in theatmosphere to produce detectableamounts of such radioactive species ashydrogen-3 (tritium), carbon-14,beryllium-10, argon-39 and some 15 othernuclides. Tritium is produced at the rateof about 2500 atoms per square meter ofsurface area per second and carbon 14 isproduced at almost ten times that rate.Until the testing of nuclear weapons inthe atmosphere, cosmic production
iographic Testing
yielded a stable concentration of theseradioisotopes. At present, nuclear weaponrelease has increased the amount of theseand other radioisotopes in theenvironment.
Neutron ActivationIn the section on neutron interactionswith materials, neutron capture wasbriefly discussed. This technique, coupledwith the large fields of neutrons availablein nuclear reactors, produces most of theradioisotopes used in radiography.cobalt-60 and iridium-192 come fromthermal neutron bombardment of thestable isotopes (cobalt-59 andiridium-191) of these two elements.
Production of the radioactivity can bepredicted by Eq. 21:
(21)
in which A is the activity produced indisintegrations per second, N is number oftarget atoms being bombarded, f is theneutron flux (in neutrons per centimetersecond), σ is the cross section for neutroncapture (in square centimeter), ti is theirradiation time in the same units as thehalf life and T is the half life of theradioisotope produced.
The exponential portion of theequation corrects the production of theradioactive material for the amount thatdecays away while more is being made.This leads to the point of diminishingreturns for production in that after aboutfive half lives, almost as much of theradioactive material is decaying as is beingproduced per each increment of neutronbombardment time.
Also, the equation is correct only forthin samples of the bombarded material.Absorption of neutrons in the outer layersof the sample (usually a metal pellet)reduces the number of neutrons incidenton the interior atoms. This self-shieldingof neutrons coupled with a self-absorptionof gamma rays released by radioactiveatoms inside of the sample gives a gammaoutput considerably lower thancalculated.
A NftTi== −− −−
σ 1 0 693exp .

3RT02_Layout_(037-054) 10/2/02 1:40 PM Page 53
Fission FragmentsWhen uranium-235 or other fissionableatom undergoes fission, multiple neutronsand two major fragments of the nucleusare released. The two fragments are calledfission fragments and are a source ofradioactive materials for industrial,medical and research use. The fragmentsare usually of unequal size and aregrouped in two distributions around massnumbers 96 and 138. One of the majorproducts is cesium-137, which can bechemically separated from the otherfission fragments for use as a gamma raysource in radiography, medical therapyand large irradiation facilities forpreservation of food and for sterilizationof medical supplies.
Accelerator ProductionLarge particle accelerators such aslinatrons, van de graaff generators andcyclotrons can provide appreciableneutron fluxes or streams of high energyparticles including protons, deuterons andhelium nuclei. When appropriate targetmaterials are bombarded by theseparticles, radioactive nuclei can beproduced. Although radioactive materialsfor medical use are being produced in thisfashion, generally radiographic sources arenot commercially produced in thisfashion.
53Radiation and Particle Physics

1.Nondestructive Testing Handbook, secondedition: Vol. 3, Radiography andRadiation Testing. Columbus, OH:American Society for NondestructiveTesting (1985).
2. CRC Handbook of Chemistry andPhysics, 80th edition. Boca Raton, FL:CRC Press (1999): inside front cover.
BibliographyAllison, S.K. and S.D. Warshaw. “Passage
of Heavy Particles through Matter.”Reviews of Modern Physics. Vol. 25,No. 4. Melville, NY: American PhysicalSociety (1953): p 779-817.
Bethe, H.A. and J. Ashkin. “The Passage ofHeavy Particles through Matter.”Experimental Nuclear Physics. Vol. 1,Part 2. New York, NY: Wiley (1953).
Breit, G. and E.P. Wigner. Physical Review.Vol. 49, No. 7. Melville, NY: AmericanPhysical Society (1936): p 519-531.
Bohr, N. “Neutron Capture and NeutronConstitution.” Nature. Vol. 137.London, United Kingdom: MacmillanPublishers, Nature Publishing Group(1936): p 344-351.
Choppin, G.R. and J. Rydberg. NuclearChemistry: Theory and Applications.New York, NY: Pergamon Press (1980).
Emigh, C.R. “Thick Target BremsstrahlungTheory.” Los Alamos ScientificLaboratory report LA-4097-MS. LosAlamos, NM: Los Alamos NationalLaboratory (1970).
Fano, U. “Gamma-Ray Attenuation:Part 1, Basic Processes.” Nucleonics.Vol. 11, No. 8. New York, NY:McGraw-Hill (1953): p 8.
Fano, U. “Gamma Ray Attenuation:Part 2, Analysis of Penetration.”Nucleonics. Vol. 11, No. 9. New York,NY: McGraw-Hill (1953): p 55.
Fano, U. “Penetration of X- andGamma-Rays to Extremely GreatDepths.” Journal of Research of theNational Bureau of Standards. Vol. 51.Gaithersburg, MD: National Instituteof Standards and Technology (1953):p 95.
Glasstone, S. Source Book of Atomic Energy.New York, NY: D. Van Nostrand(1950).
Heitler, W. The Quantum Theory ofRadiation, second edition. London,United Kingdom: Oxford UniversityPress (1950).
Hogerton, J.F. and R.C. Grass, eds. TheReactor Handbook I: Physics. AECD3645. Washington, DC: United StatesAtomic Energy Commission (1955).
Lapp, R.E. and H.L. Andrews. NuclearRadiation Physics. second edition.Upper Saddle River, NJ: Prentice-Hall(1954).
Marshall, J.S. and A.G. Ward. “AbsorptionCurves and Ranges for Homogeneousβ-Ray.” Canadian Journal of Research.Vol. 15A. Boucherville, Canada:National Research Council (1937):p 39.
Morgan, R.H. and K.E. Corrigan. Handbookof Radiology. Chicago, IL: YearbookPublishers (1955).
Reines, F. and C.L. Cowan. “TheNeutrino.” Nature. Vol. 178. London,United Kingdom: MacmillanPublishers, Nature Publishing Group(1956): p 446-449.
Richardson, H.D. Industrial RadiographyManual. Contract AT-(40-1)-3112.Washington, DC: United States AtomicEnergy Commission (1964).
Stephenson, R. Introduction to NuclearEngineering. New York, NY:McGraw-Hill (1954).
54 Radiographic Testing
References
3RT02_Layout_(037-054) 10/2/02 1:40 PM Page 54

George C. Wheeler, Materials and ProcessesConsultants, Schenectady, New York
3C H A P T E R
Electronic RadiationSources
3RT03_Layout(055_072) 10/2/02 1:51 PM Page 55

56 Radi
PART 1. Physical Principles
Wavelength (µm)
0.1 0.2 0.3 0.4
FIGURE 1. Typical X-ray spectrum.
Rela
tive
inte
nsity
Characteristic peaks
3RT03_Layout(055_072) 10/2/02 1:51 PM Page 56
Radiation of an unknown type and originwas discovered in the year 1895 byWilhelm Roentgen. Dubbed X-rays bytheir discoverer, they were soon found tobe a form of electromagnetic radiationwith extremely short wavelengths. TheX-radiation is called ionizing because X-rayabsorption kicks out an electron from anatom of absorption material, creating anion. The production of ionizing radiationis well covered in the literature.1-5
Technological advances in imageprocessing, flash radiography, real timeradiography, microfocus and metalceramic tubes have sustained interest inthe electronic production of ionizingradiation. The versatility of an electronicsource is difficult for an isotopic source tomatch, even for specific applications. Theadvent of solid state components hasovercome many of the objections relatedto size, weight and durability of electronicsources.
This chapter discusses the basicphysics, construction and application ofelectronic sources. The emphasis will beon industrial X-ray machines widely usedin radiography and radiology. Wherespecial details are significant to particularapplications, these are discussed in theappropriate chapters of this volume.
Conservation of EnergyElectromagnetic theory had longpredicted that a charged particleundergoing deceleration would emitradiation. This theory can be used toqualitatively explain the continuousportion of a typical X-ray spectrum (seeFig. 1). Although a complete study of thecontinuous spectrum requires modernphysics, an understanding of its basicprinciples may be gained by consideringjust one of the fundamental laws ofphysics, the conservation of energy. Thislaw states that energy can neither becreated nor destroyed, although it ispossible to change it from one form toanother.
In the case of X-rays, fast movingcharged particles, usually electrons, strikea target material and are slowed orstopped. In some specialized applications,high energy electrons are acceleratedradially by a strong magnetic field,producing X-rays without the use of a
ographic Testing
target. Much of the energy of theelectrons’ motion, called kinetic energy, istransformed into heat energy as thestream strikes the target. In fact, exceptfor the case of very high energygenerators, almost all of the electrons’kinetic energy (more than 97 percent) isconverted into heat; disposal of thisthermal energy is an important designconsideration.
BremsstrahlungA small portion of the energy will also begiven off as packets of electromagneticenergy, called photons. The X-ray photonscan have energies ranging from a fewthousand volts to a maximum determinedby the original kinetic energy of theelectron and how rapidly the electron isdecelerated by interaction with a targetatom nucleus. This process produces thecontinuous portion of the X-ray spectrumand is known by the German termBremsstrahlung for braking radiation.
Energies of the electrons (and theX-rays) are frequently given in terms ofkiloelectronvolt (keV) or megaelectronvolt(MeV). The meaning of this unit becomesclear if the charged electron is considered.Under the influence of a voltagedifference (technically called a potentialdifference), charged particles willexperience a force that causes them toaccelerate. A negatively charged particle,such as an electron, will move from aplace of low voltage (–) to a place ofhigher voltage (+) and increase its kinetic

3RT03_Layout(055_072) 10/2/02 1:51 PM Page 57
energy as it does so. Thus the unitkiloelectronvolt (keV) corresponds to theamount of kinetic energy that an electronwould gain while moving between twopoints that differ in voltage by 1 kV.Similarly, an electron would gain 1 MeVof kinetic energy while moving betweentwo points that differ by 1 MV. The pointsof differing voltage are called the cathode(–) and the anode (+) and will be discussedlater in this section.
Characteristic X-RaysIn addition to the bremsstrahlung thereare several characteristic peaks in a typicalX-ray spectrum. These intensity spikes arecaused by interaction between theimpinging stream of high speed electronsand the electrons that are bound tightlyto the atomic nuclei of the targetmaterial. If an atom is visualized as aplanetary system, with the nucleus ofprotons and neutrons at the center of thesystem and with the electrons moving inorbits around the nucleus (see Fig. 2), thelaw of energy conservation can again beapplied to describe the origin ofcharacteristic radiation.
Modern physics predicts that theseorbital electrons near the nucleus willhave very well defined energies, withelectrons in different orbits having
FIGURE 2. Planetary model of atomicstructure.
N
N
N
P
P
P
E
E
E
LegendE = electronN = neutronP = proton
different energy levels. If a vacancy in aparticular level were created by knockingan electron from its orbit, an electronfrom a higher energy level would, after atime, drop down to fill the void. To dothis, it would have to lose (emit) energy.Because the energy levels of an atom arewell specified, the exact amount of energylost by an electron making such atransition would also be discrete.
According to the law of conservation ofenergy, the energy is not really lost butgiven off as electromagnetic radiation inthe form of an X-ray photon. Becauseeach atomic element has its own distinctset of energy levels, the line spectrumproduced in such a manner ischaracteristic of the particular targetmaterial. Interest in these characteristicX-rays lies in their application to X-raydiffraction and other analyticalapplications. By a combination offiltration and signal processing,characteristic X-rays can be used toproduce a nearly monoenergetic beam ofX-rays.
Thermionic EmissionTwo final concepts are of interest in thisbrief treatment of the basic physics ofX-ray production. The first process,thermionic emission, provides theelectrons that are to be accelerated tohigh speeds by the voltage differencebetween the cathode and anode of anX-ray source.
When metal (in this case the X-raytube filament) is heated to incandesence,a small portion of the free electrons areactually able to escape the surface of thematerial. Without an accelerating voltage,the electrons would form a cloudy spacecharge around the filament. Under theinfluence of a potential difference,however, the electrons are quicklyaccelerated toward the anode of the tube.
AbsorptionThe second concept is X-ray absorption,discussed in greater detail in the chapteron radiation and particle physics. AsX-rays pass into or through a material,they are absorbed, or attenuated, in amanner that depends on the energy of theX-radiation and on the density of thematerial. In equation form, the intensity Ias a function of thickness has a standardexponential form:
(1)
where I is the intensity after passingthrough the material; x is the thickness of
I I eox== µµ–
57Electronic Radiation Sources

58 Radio
3RT03_Layout(055_072) 10/2/02 1:51 PM Page 58
the absorbing material; Io is the initialintensity; and µ is the linear absorptioncoefficient (characteristic of the materialfor a particular X-ray energy range). Theimportance of absorption in selection ofmaterials for tube construction, beamfiltration and shielding are discussedbelow.
graphic Testing

PART 2. Basic Generator Construction
FIGURE 3. Glass X-ray tube.
Glass envelope
Focusing cup
Filament
Target mountingstructure
Target
3RT03_Layout(055_072) 10/2/02 1:51 PM Page 59
A conventional X-ray generator consists ofthree main components: (1) X-ray tube,(2) high voltage source and (3) controlequipment. Although each of the majorcomponents are examined in some detail,it should be remembered that allconventional units will have similarconstruction.
X-Ray TubesEarly X-ray tubes used gas filled tubes anda cold cathode from which electrons werefreed by positive ion bombardment.Modern tubes used in radiography are ofthe high vacuum variety, allowing forreduction in size, extended tube life andmore stable operation.
Electrons are supplied by thermionicemission from the filament. Theaccelerating potential and the tubecurrent can then be varied independently,with the exception that, at lowaccelerating voltages, tube current isaffected by the space charge thataccumulates around the cathode.
EnvelopeEnvelopes for X-ray tubes are usually glassor a combination of metal and ceramic(Figs. 3 and 4). Glass envelope tubes,although still in common use, are farmore susceptible to thermal andmechanical shock than the metal ceramic
FIGURE 4. Metal ceramic X-ray tube.
Metal eCeramic disk insulator
Filamentmountingstructure
Filament
envelope and have been replaced in mostindustrial applications with the moredurable metal ceramic tubes.
The vacuum envelope of the metalceramic tubes consists of a metal cylindercapped on both ends with ceramic disks,usually composed of aluminum oxide.These ceramic insulators are designed toallow for more effective use of theinsulation characteristics of both theceramic and the high tension grease usedin sealing connections between the high
59Electronic Radiation Sources
nvelope
Target
Targetmountingstructure

60 Rad
FIGURE 5. Ill
Objec
LegendD = distance F = focal spot = thicknessUg = geometr
3RT03_Layout(055_072) 10/2/02 1:51 PM Page 60
voltage source and the tube. This designallows for reduction in the size of the tubehousing, especially important for higherenergy units.
CathodeThe cathode includes the tungstenfilament that provides the thermalelectrons for acceleration. The filament isusually powered by alternating current(50 to 60 Hz) from a separately controlledtransformer, although in some units thefilament current is fixed or automaticallycontrolled to maintain a constant tubecurrent. Normally, filament currents rangefrom 1 to 10 A. The tube current, passingbetween the cathode and anode by meansof the high speed electrons, ranges fromless than 300 µA for microfocus units toover 20 mA for conventional industrialradiographic units.
Beam FocusingAt times the filament is located in a recessin the cathode called a focusing cup. Thissurrounds the emerging beam of electronswith an electric field that repels the beamaway from the cup wall and into a morelocalized form. The importance of a welldefined beam of electrons arises from thefact that the sharpness or unsharpness ofan image depends on the focal spot size(Fig. 5 and the chapter on radiographic
iographic Testing
ustration of geometric unsharpness.
D
F
t
Ug Ug
t
Image
Discontinuity
from focal spot to targett size of test objectic unsharpness
principles). The relationship for geometricunsharpness Ug is:
(2)
where geometric unsharpness Ug is ameasure of the penumbra of the focalspot, F is the focal spot size, D is thedistance from the target (focal spot to thesource surface of the object) and t is thethickness of the object plus its distance tothe image plane.
In accordance with Eq. 2, geometricunsharpness Ug increases directly as thefocal spot size increases. Because theelectron beam originates at the filament,reduction of the filament size might seemto solve geometrical unsharpness byreducing the beam size but this approachis limited by the durability of thefilament.
One alternative, called line focusing, isto project the virtually rectangular beamproduced by the filament onto a targetangled with respect to the beam (about21 degrees). By masking all of the X-raybeam except that emitted toward oneside, the useful X-ray beam appears toissue from a focal spot with about equallateral dimensions (Fig. 6). In practice,this technique allows production of unitswith effective focal sizes in the range of1.0 to 3.0 mm (0.04 to 0.12 in.).
By use of a deep focusing cup,advantage can also be taken of the screeneffect (Fig. 7). This refers to the removal ofthe lower energy electrons producedduring that portion of the alternatingcurrent cycle where the potentialdifference between cathode and anode issignificantly less than maximum. Inpractice this improvement is not without
UFDt
F tDg = = ⋅
FIGURE 6. Diagram of line focusing setup.
Electronbeamsize
Effectivefocal size
Actual focal size

spot on such units can be reduced to less
FIGURE 7.
Tube
cur
rent
(re
lativ
e sc
ale)
0
FIGURE 8. Rotating anode.
3RT03_Layout(055_072) 10/2/02 1:51 PM Page 61
cost to the output of the unit. A loss ofabout 25 percent is experienced in unitswith high screen effect. This can becompensated for, in part, with higherfilament current although this currentadversely affects the lifetime of thefilament. An alternate technique ofremoving low energy components of theelectron beam is found in the discussionon constant potential units.
If still further focus of the beam isdesired, as in microfocus radiography andsome analytical applications, additionaltechniques may be used: (1) conversion ofthe conventional diode arrangement ofcathode and anode into a triodearrangement, including a focusingelectrode or grid, and (2) electrostatic ormagnetic deflection systems.
For the triode arrangement used widelyin the microfocus industry, a negative biasof up to –150 V is applied to the thirdelement of the tube to further focus thebeam and remove lower energycomponents. This configuration allows areduction of beam size, producing focalspots at least as small as 10 µm (4 ×10⁻⁴ in.) and a consequent drop in tubecurrent.
In the case of electrostatic deflection,even more elements are included withinthe envelope whereas a magneticdeflection system is external to the tube.These types of deflection systems have anadditional advantage in that the beammay also be deflected to various areas ofthe target for added service life. Units thatincorporate their own vacuum systemsusually allow for replacement of bothfilament and target components. Thesetypes, though formerly limited toanalytical and research units, are availableoff the shelf as standard microfocus andanalytical units.
Graph of screen effect.
Time (half cycles)
0.5 1.0
Kilovolt peak
High screen effect
Low screen effect
AnodeAs mentioned previously, heat is themajor form of energy produced as theelectrons strike the target. Uncontrolled,this heat would quickly cause the surfaceof the target to erode, which in turnreduces the definition of the focal spot. Inaddition, the vaporized target materialreduces the high vacuum of the tube andleads to premature failure due toconduction within the tube. To avoidoverheating of the target, the anode towhich it is attached is composed of amaterial with high thermal conductivity,such as copper. If the cooling demands arerelatively low, as for a low energy unit orintermittent use, cooling is oftenaccomplished by means of a conductorthat passes through the tube end forconnection to the high voltage source;this allows for radiation of heat into anoil or gas reservoir surrounding the tube.Although such a design is not the mostefficient, the weight of such a tube isminimal because pumps and heatexchangers are absent.
For higher energy units in continuoususe, it is usually necessary to cool theanode by injecting coolant directly into it.This is accomplished by hollowconstruction of the anode conductor.
Another way of alleviating the problemof localized heating of the target is with arotating anode in which the target, atungsten disk, is driven as shown inFig. 8. This allows the tube current to beincreased by as much as ten times thevalue for a stationary target. The focal
61Electronic Radiation Sources
Electron beam
X-ray beam

62 Rad
FIGURE 10. Electron beam distributions: (a) conventionalbeam; (b) microfocus beam.
(a)
3RT03_Layout(055_072) 10/2/02 1:51 PM Page 62
than 1 mm (0.04 in.) for short exposuretimes, which is of value in medical as wellas some specialized industrialapplications, such as high speed imaging.
TargetIn radiographic applications, the target isusually tungsten and is bonded to thecopper anode; however, analytical unitsuse several other target materials to takeadvantage of the characteristic X-raysproduced. Some of these materials includecopper, iron and cobalt.
The orientation of the target withrespect to the electron beam stronglyinfluences the size and shape of the focalspot. Orientations from 0 degrees to30 degrees are used for variousapplications. For example, zero is theangle used for panoramic units. An angleof 20 degrees is commonly selected fordirectional units because, in this case, thedistribution of X-rays is predominantly ina direction perpendicular to the tube axis.This is shown graphically in Fig. 9. Theactual maximum of intensity occurs at+12 degrees. For radiography of objectswhose lateral dimensions are less thanhalf the focus-to-film distance (objectsthat subtend an angle of less than30 degrees) the variation seldom matters.
Another cause for intensity variation isthe electron beam itself. A cross section ofthe electron beam from the filamentwould resemble Fig. 10a, with relative
iographic Testing
FIGURE 9. X-ray distribution graph.
Angle –20 –13 –10 0 10 13 20(degrees)
Intensity 31 70 80 100 104 105 95(percent)
20 degrees
beam intensity also shown. Figure 10bshows a similar representation for amicrofocus beam. The beam distributionin Fig. 10b is said to be gaussian (bellshaped) because of the shape of theintensity curve. Such a beam profile isrequired when it is necessary to definevery closely spaced objects, such asmicrocircuitry components.
HoodAddition of a hood to the anode providesthe two fold function of (1) eliminating aportion of the X-ray beam outside thecentral cone of radiation and(2) electrically shielding the insulatingportions of the envelope (glass or ceramic)from charge buildup due to electronsscattered from the tungsten target orreleased by the photoelectric effect (seeFig. 11).
Removing the unused radiation directlyat the anode reduces the amount ofradiation shielding that must be providedexternally or incorporated into the tubehousing. The hood, normally constructedof copper, may have materials with highatomic numbers, such as tungsten,incorporated to increase absorption. Theelectrical shielding function of the hood
(b)
0 0.5 1.0
Elec
tron
bea
m in
tens
ity(r
elat
ive
scal
e)
Distance across target
0 0.5 1.0
Elec
tron
bea
m in
tens
ity(r
elat
ive
scal
e)
Distance across target

FIGURE 11.
FIGURE 12. Standard high voltage circuit designs for portabletank-type units: (a) cathode grounded; (b) center grounded;(c) anode grounded.
(a)
(b)
mA
3RT03_Layout(055_072) 10/2/02 1:51 PM Page 63
may be improved by the addition of aberyllium window over the X-ray port. Awindow 3 or 4 mm (0.1 or 0.2 in.) inthickness will stop electrons withnegligible effect on the overall X-raybeam.
Rod AnodeThe rod anode (sometimes referred to asan oxtail) is another adaptation of theanode. This type of tube arrangementrequires special circuit considerations thatallow the anode to be grounded. Thistube, developed for use through smallopenings, has been partially replaced bythe metal ceramic tube, which can have adiameter of less than 50 mm (2 in.) andtube head diameter as small as 75 mm(3 in.). The target of such an end groundedtube can be cooled by circulating water indirect contact with the anode. Beamfocusing is often required for longer tubes.
CoolantWith the exception of the end groundedconfigurations and units designed for lowenergy output (less than 50 kV), the tubeinsert is surrounded by an insulatingcoolant and encased in a housing calledthe tube head.
The coolant may be highly dielectricgas or oil. If oil is used, simple convectionmay be sufficient for lower output units.For larger units, an oil circulating pumpmay be combined with a heat exchangereither internal or external to the tubehead.
For units using a fixed amount of oil inthe tube and a circulating pump tocirculate it within the tube head, an oilresistant bellows is incorporated to allowfor expansion and contraction of the oil.Because of the compressibility ofinsulating gases, this is not required forgas filled heads but a pressure gage isnormally included to monitor possibleloss of coolant insulation.
Hooded anode tube.
Anode hoodCathode
Berylliumwindow
Tank HeadFor a tank head, the housing itselfstructurally protects the tube, contains thecoolant and forms the structural supportfor the tube insert, electrical connections,fittings, pumps, thermal and high voltageoverload sensors and radiation shieldingcontained in the head. For a tank unit,the tube head also houses the highvoltage and filament transformers. If theunit has separate components, the tubehead will also provide for connection tothe high voltage source.
High Voltage SourcesFrom line voltages in the range of 100 to460 V, the high tension circuitry suppliespotential differences to the tube from5 kV to as much as 420 kV for the largerindustrial radiographic units. Severalstandard circuit designs are used forvarious applications. A portable tank unittypically uses one of the designs shown inFig. 12.
These circuits are all self-rectified; theX-ray tube itself limits the flow ofelectrons to one direction in the circuit.When the anode is at negative potential
63Electronic Radiation Sources
(c)
mA
mA

64 Rad
FIGURE 14. Graetz grounded anode circuit:(a) circuit; (b) waveform.
(a)
To filamenttransformer
To highvoltagecontrol
(b)
olta
ge
X-ray tube
3RT03_Layout(055_072) 10/2/02 1:51 PM Page 64
with respect to the cathode, no tubecurrent flows.
One drawback of the self-rectifiedsystem is the possibility of tube backfire.If the target or anode overheats, reverseconduction can occur during the negativehalf cycle. This type of unit is normallyused for tubes producing X-rays in therange of 50 to 300 kV peak and tubecurrents from 2 to 8 mA.
With the addition of capacitors anddiode rectifiers, the transformer isnormally placed in a tank separate fromthe head. The additional elements allowthe current to be rectified by means ofvalve tubes or solid state diodes and to befiltered and smoothed to provide a morenearly constant accelerating voltage.Several popular grounded circuits areshown in Figs. 13 to 15.Villard Circuit. An extension of the halfwave system, the villard circuit allowsproduction of accelerating potentials oftwice the transformer peak voltage.Capacitors are charged during one half ofthe cycle and discharged when currentpasses through the tube, augmenting thevoltage produced by the transformer.Graetz Circuit. The full wave circuit, orgraetz circuit allows use of both halves ofthe alternating current cycle with asubstantial increase in tube output per
iographic Testing
FIGURE 13. Villard grounded anode circuit:(a) circuit; (b) waveform.
(a)To filament transformer
To high voltage control
(b)
Transformer
Time
Volta
ge
X-ray tube
unit time. This system is widely used inmedical applications but is used less thanconstant potential units in industrialapplications.Greinacker Circuit. As can be seen fromthe output waveform, the greinackercircuit is of the constant potential type.Basically a variation of the villard circuit,
Rectifiedalterations
Time
V
FIGURE 15. Greinacker grounded anodecircuit: (a) circuit; (b) waveform.
(a)To filament transformer
To highvoltagecontrol
(b)
Transformer
Time
Volta
ge
X-ray tube

3RT03_Layout(055_072) 10/2/02 1:51 PM Page 65
in which capacitors are charged duringboth halves of the cycle, the voltage is notonly doubled but remains near maximumvalue throughout the cycle. This givesenhanced high energy output andeliminates the electrical stress placed onthe tube and insulation. Enhanced tubelife, as well as about 30 percent reductionin radiographic exposure times, are theresults.
A common misconception is thatconstant potential units provide a beamof constant energy X-rays. Although theelectron beam is nearly monoenergetic,the X-rays are produced during randomdeceleration processes that give thestatistical energy distribution shown inFig. 1. The absence of low energyelectrons reduces the quantity of lowenergy X-rays but does not eliminatethem.
Cathode Grounded CircuitThe main advantage of the cathodegrounded configuration is that it allowsthe filament transformer to be external tothe tank, because the cathode is at groundpotential and does not require isolation.The tube head can be reduced in size andweight and is often gas filled to furtherdecrease weight.
Center Grounded CircuitBoth center grounded and anodegrounded units require isolated filamenttransformers that must be insulatedadequately. For the center grounded unit,this is justified by the reduction of thehigh tension transformer insulation. Thetransformer needs to supply only one halfof the potential difference to eachelectrode, rather than having either thecathode or anode held at ground potentialand supplying the entire acceleratingvoltage to the other electrode.
In the range of 200 to 420 kV peakwith beam currents up to 15 mA, centergrounded systems can be made smallerthan comparable end grounded units.
Anode Grounded CircuitFor the anode or end grounded system,the advantage lies in the specialized use ofthe rod anode tube or metal ceramic tubefor access through small openings. Asmentioned earlier, cooling of the target isalso simplified. This type of unit isnormally used for tubes producing X-raysin the range of 30 to 200 kV.
Alternative Circuit DesignsA technique for improving tube outputthat can be used with any of the abovecircuits including those in tank units, isthe use of a higher frequency waveform to
power the high tension transformer.Although this requires additionalelectronic circuitry or a motor generator,the core of the high tension transformercan be reduced in size because ofincreased reactance at higher frequencies.The smaller transformer can be anadvantage in portable or mobile units.Also, if filtering is to be done, thevariation or ripple of the output voltagecan be reduced even further.
A variation of this technique is to usethree phase input power with the hightension transformer. Commonly used inmedical X-ray generators, this techniqueis used by several industrial manufacturersas well.
Another approach is to use an outputwaveform other than the standard sinewave. Approximate square wave outputs,in conjunction with both phase inversioncircuitry and a high frequencytransformer, can provide acceleratingpotentials with extremely low ripplecharacteristics. Such units are available forindustrial applications.
High Tension ConnectionsAlso important for conventional highvoltage sources is the connection of thehigh tension transformer to the tube. Fortank units this is not a majorconsideration, because the transformercan be connected directly to the tubeelectrodes. However, for units withseparate components, insulation andconnection of leads (which may carryvoltages in excess of 200 kV) areimportant considerations. The hightension cables themselves are shielded toprovide protection against electricalshock. Cables used at lower energies arerelatively flexible but as the amount ofinsulation is increased, the flexibilitydecreases and sharp bends duringinstallation should be avoided.
The cables are inserted intoterminations usually made of phenolic(thermosetting plastic) or ceramics andare sealed against air by use of insulatingepoxy materials called potting compound.Figure 16 shows the phenolic termination,used primarily with glass and lowerenergy metal ceramic tubes.
These connectors are larger than theceramic terminations used primarily withhigher energy metal ceramic tubes. Bothstyles use high dielectric grease to seal outair at joining surfaces. Because of thetendency for the long male-to-femaleconnections to trap air and substantiallyreduce the insulation capabilities of thegrease, these joints are normally rated atabout one tenth their theoretical values,or at about 10 kV per 10 mm (0.4 in.).The linear dimensions of such atermination must be correspondingly
65Electronic Radiation Sources

66 R
FIGURE 16(a) pheno
(a)
(b)
Conhig
g
3RT03_Layout(055_072) 10/2/02 1:51 PM Page 66
increased. At the transformer tank, thissize increase is not so important but at thetube head the increase in size and weightcan make the unit very cumbersome andbulky. For a 400 kV tube head, 200 kV isapplied to each electrode. This requires atermination of 180 to 200 mm (7 or 8 in.)in length at each end of the tube forproper insulation.
A ceramic insulator can make full useof the dielectric strength of the insulatinggrease by providing rigid, flat matingsurfaces that exclude air from the joint.This allows for a substantial decrease inthe length of the joint. This design hasbeen incorporated into tubes used byseveral equipment manufacturers for unitsup to 420 kV.
As stated above, a transformer is usedto provide the potential difference forconventional X-ray units. As theaccelerating voltages are increased toward1 MeV, standard transformer andinsulation technologies becomeinadequate. Higher energy X-raygenerators are needed.
adiographic Testing
. High voltage transformer terminations:lic connection; (b) ceramic connection.
Connector to tubeAir space
Connector tohigh tensiongenerator
Connector to tubenector toh tensionenerator
Air space

PART 3. Megavolt Radiography6
3RT03_Layout(055_072) 10/2/02 1:51 PM Page 67
Resonant transformer X-ray machineswere developed in the late 1930s toprovide X-ray energies above 500 keV. Thetechnology of high voltage X-radiographyis well documented.5-21
Resonating the high voltage circuit tothe frequency of the alternating currentpower supply obviates an iron transformercore. In addition, insulating the highvoltage sections withdichlorodifluoromethane (refrigerant-12)or sulfur hexafluoride (SF6) obviatestransformer oil. These changes permit alarge reduction in the size and weight ofthe machines, making them much morepractical.
The resonant transformer X-raymachines, similar to Fig. 17, consist of anoperating console, 180 cycles per secondalternating current motor generator set,motor controller, heat exchanger and alarge steel tank. An air core transformer issecured to the base of the steel tank byinsulating glass rods. A multisection X-raytube is mounted coaxially with thetransformer stack. A heated filamentprovides the free electrons in the tube andeach section of the multisectional tube isconnected to an appropriate tap on thetransformer. Acceleration of the electronsthrough the tube is accomplished byuniform voltage distribution throughoutthe length of the tube. The electronsstrike a water cooled tungsten target atthe end of the tube, thereby generatingX-rays.
Most X-rays are available in theforward direction but opening portsaround the lead collimator makes it
FIGURE 17. Resotron, 2 MeV.
possible to extract a 360 degreecircumferential beam from the machine.The focal spot size is typically as large as10 mm (0.4 in.) in diameter in thetransmitted direction. The apparent sizeof the target will depend on the anglethat is measured from the flat plane of thetarget. The radiation output from thesemachines is about 25 mGy·s–1
(150 rad·min–1) when measured at 1.0 m(39 in.) from the target.
These machines are very durable, manyhaving been in service for over 30 yearsand one having been in daily use for over60 years.
Electrostatic GeneratorsVan de graaff X-ray machines (Fig. 18)operate on the principle illustrated inFig. 19. The van de graaff electrostaticgenerator shown in Fig. 18 has undergonesome changes since its origin in the early1930s. However, the basic principles ofoperation presented in Fig. 19 remain thesame. The machine consists of a controlconsole and a metal tank that housespower supplies, drive motors, an insulatedcharging belt, a generator column, highvoltage terminals and electricalconnections. An accelerator tube, which ishighly evacuated, extends through thegenerator column. This metal tank ispressurized with nitrogen, carbon dioxideand sulfur hexafluoride to about 2.6 MPa(375 lbf·in.–2) to prevent high voltage
67Electronic Radiation Sources
FIGURE 18. Van de graaff 2.5 MeVelectrostatic generator.

68 Rad
FIGURE 19. O
LegendA. Electric chB. Belt carriesC. Charge traD. CompresseE. Heated catF. Charged pG. Potential dH. Particle be
3RT03_Layout(055_072) 10/2/02 1:51 PM Page 68
arcing. Within the tank, electron sprayersdeposit electrons onto a moving belt thatcarries them to a terminal shell. Some ofthese electrons are emitted into theaccelerator tube as beam current througha direct connection to the filament. Thefilament, when properly heated, emitselectrons that are replaced from theterminal shell. The electrons flow throughthe accelerator tube at an energydetermined by the terminal shell voltage.A target is located at the end of theaccelerator tube. This design results in adirect current, constant potential X-raymachine. Constant potential machinesmade in the 1990s are in the 2.5 MeVrange, have a 2.5 mm (0.1 in.) target andproduce about 28.3 mGy·s–1 at 1 m(170 rad·min–1 at 40 in.).
iographic Testing
peration of electrostatic generator.
A
C
D
E
BF
G
H
arge is sprayed on belt. charge to terminal.nsferred from belt to terminal establishes lower voltage.d nitrogen insulates terminal from accelerator shell.hode provides electrically charged particles.articles escape via vacuum tube.ifference between terminal and lower end accelerates particles.am bombards targets to make X-rays.
BetatronsThe first successful betatron was built in1941. It produced 2.3 MeV X-rays and hadan X-ray output equivalent to 1 g ofradium. Later, machines producing X-rayenergies up to 300 MeV or more werebuilt, though the most commonradiographic machines operated at24 MeV.
To accelerate electrons to high speed,the betatron (Fig. 20) uses the magneticinduction effect used in a transformer.The primary winding in a transformer isconnected to an alternating currentvoltage source that establishes a varyingflux in an iron core. The secondarywinding on this core has induced in it avoltage equal to the product of (1) thenumber of turns in the secondarywinding and (2) the flux time rate ofchange. The resulting electric current ismade up of the free electrons present inthe wire. The betatron (as shown inFig. 21) is essentially such a transformerexcept that, instead of wire, the secondaryis a hollow circular tube. This tube, calleda doughnut, is used to contain theelectrons for many thousand revolutions.
The doughnut tube is usually made ofporcelain and is coated on the inside witha conductive layer of palladiumconnected to a ground. The doughnut isplaced between the poles of anelectromagnet that produces a pulsating
FIGURE 20. Betatron, 25 MeV.

(a)
FIGURE 21. D(b) cross se
Equilibri
coa
Hr
H
(b)
3RT03_Layout(055_072) 9/6/02 3:15 PM Page 69
field. Electrons injected into the tube asthe magnetic field increases will beaccelerated in a circular path. The forceacting on the particles is proportional tothe rate of change of flux and themagnitude of the field. Because theelectrons circle the orbit many timesbefore striking the target, there is a largeamount of energy gain. For example, in a24 MeV betatron, the electrons circle theorbit about 350 000 times, traveling adistance of 418 km (260 mi). The averagevoltage gain per turn at the orbit is about70 V, which gives about 24 MeV. As theelectrons reach maximum energy, they aredeflected by an electrical pulse and causedto spiral outward until they strike thetarget. Betatrons are equipped withplatinum wire targets with dimensions of0.13 × 0.25 mm (0.005 × 0.010 in.) andhave a radiation output of 25 mGy·s–1
(150 rad·min–1) when measured at 1 m(40 in.) from the target.
iagram of betratron generator: (a) top view;ction.
Lower Pole
Upper Pole
um orbit
Earth ground
Expanded orbit
Target structure
Injector
X-ray beam
Palladiumted interior
Steel wafer
Doughnut
Electronorbit
Electrons moving toward reader at this point
HH
Hr
Steel wafer
Electron LinearAcceleratorsElectron linear accelerators, similar to theone shown in Fig. 22, are commonlyreferred to as linacs. Linear acceleratorsaccelerate electrons down a guide bymeans of radio frequency voltages. Thesevoltages are applied so that the electronreaches an acceleration point in the fieldat precisely the proper time. Theaccelerator guide consists of a series ofcavities that causes gaps when the radiofrequency power is applied. The cavitieshave holes in each end that allowelectrons to pass to the next cavity. Whenan electron is injected at the proper timeit gains energy as it is accelerated acrossthese gaps and out the other end of thecavity. When the radio frequency power isphased properly, increased acceleration isachieved. Figure 23 shows the generalarrangement of a linear accelerator’scomponent parts.
For research purposes, heavier particleshave been accelerated by linearaccelerators. An example of this typelinear accelerator is the 3.2 km (2 mi)long Stanford linear accelerator. There aretwo general types of radiographic linearaccelerators: (1) one using the principle ofthe traveling wave and (2) the other usinga standing wave technique ofacceleration.
Radiographic linear accelerators havebeen produced that have X-ray energies of1 to 16 MeV and with output as high as4.17 Gy·s–1 (25 krad·min–1) measured at1 m (40 in.). Although not as durable aslower voltage machines, some have beenin service for over 30 years. Increasedoperating frequencies, up to 9.3 GHz,permit smaller, lighter X-ray heads.Configurations exist that allow for theoperation of the accelerator and beam
69Electronic Radiation Sources
FIGURE 22. Electron linear accelerator.

70 R
FIGURE 23. General arrangement of linear accelerator.
Radio frequency sourceRadio
frequencysystem
Laser
Pulse transformer
Electrongun
Accelerator
Collimator
3RT03_Layout(055_072) 10/2/02 1:51 PM Page 70
collimator at a distance from the radiofrequency source; the source suppliespower through a flexible wave guide. Thetotal weight of the X-ray head is greatlyreduced, permitting easy positioning forfield inspection of pipelines, valves andother test objects of limited accessibility.One such system is being used forinservice inspection of nuclear powerplants.
adiographic Testing

1. Beiser, A. Concepts of Modern Physics,fifth edition. New York, NY:McGraw-Hill Book Company (1963).
2. Halliday, D., R. Resnick and J. Walker.Fundamentals of Physics, sixth edition,extended. New York, NY: John Wileyand Sons (2001).
3. Industrial Radiography Manual.Washington, DC: United States Officeof Education, Division of Vocationaland Technical Education; and UnitedStates Atomic Energy Commission,Division of Nuclear Education andTraining (1968).
4. Lapp, R.E. and H.L. Andrews. NuclearRadiation Physics, fourth edition.Upper Saddle River, NJ: Prentice-Hall(1972).
5. Nondestructive Testing Handbook, firstedition. Columbus, OH: AmericanSociety for Nondestructive Testing(1959).
6. Brunty, B.J. “High-EnergyRadiography.” Nondestructive TestingHandbook, second edition. Columbus,OH: American Society forNondestructive Testing (1985):p 256-298.
7. Wilshire, W.J., ed. A Further Handbookof Industrial Radiology. London, UnitedKingdom: Edward Arnold andCompany (1957).
8. Nondestructive Testing Handbook, firstedition. Columbus, OH: AmericanSociety for Nondestructive Testing(1959).
9. Hogarth C.A. and J. Blitz. Techniques ofNondestructive Testing. London, UnitedKingdom: Butterworth and Company(1960).
9. McGonnagle, W.J. NondestructiveTesting. New York, NY: McGraw-HillBook Company (1961).
10. Halmshaw, R., ed. Physics of IndustrialRadiology. New York: American ElsevierPublishing Company (1966).
11. Radiography in Modern Industry.Rochester, NY: Eastman KodakCompany.
12. Halmshaw, R. Industrial RadiologyTechniques. London: WykehamPublishing Company (1971).
13. High-Energy X-Ray Applications forNondestructive Testing. RAD-1936. PaloAlto, CA: Varian Associates (1982).
14. Pollitt, C.G. “Radiography withHigh-Energy Radiation.” Journal of theBritish Steel Castings ResearchAssociation. Sheffield, UnitedKingdom: British Steel CastingsResearch Association (1962).
15. O’Connor, D.T. and B.G.Cunningham. “Installation of theFlexible 10 MeV Betatron.”Non-Destructive Testing. Vol. 7, No. 4.Columbus, OH: American Society forNondestructive Testing (Spring 1949):p 20-23.
16. Halmshaw, R. and C.C. Pollitt.“Radiology with High-Energy X-Rays.”Progress in Nondestructive Testing,Vol. 2. London, United Kingdom:Heywood and Company (1959).
16. Cusick, J.H. and J. Haimson. “10-MeVRotating Target Linear Accelerator forRadiography of Large Rocket Motors.”Proceedings: Missiles and RocketsSymposium. Concord, CA: UnitedStates Naval Ammunition Depot(1961).
18. Haimson, J. “Radiography of LargeMissiles with the Linear ElectronAccelerator.” Nondestructive Testing.Vol. 21, No. 2. Columbus, OH:American Society for NondestructiveTesting (March-April 1963): p 102-112.
19. Bly, J.H. and E.A. Burrill. “High-EnergyRadiography in the 6 to 30 MeVRange.” Special Technical PublicationNo. 278. West Conshohocken, PA:ASTM International (1959).
20. Morgan, R.H. and K.E. Corrigan, eds.Handbook of Radiology. Chicago, IL:Year Book Publishers (1955).
21. Wheeler, G.C. “Radiography of Steelwith the 25,000 R/min Linac.”Paper B-41. Conference Proceedings:The Seventh International Conferenceon Nondestructive Testing [Warsaw,Poland, June 1973]. Vol. 1. Warsaw,Poland: Instytut PodstawowychProblemów Techniki PolskiejAkademii Nauk (1973): p 241-249.
71Electronic Radiation Sources
References
3RT03_Layout(055_072) 10/2/02 1:51 PM Page 71

Frank A. Iddings, San Antonio, Texas
Isotope Radiation Sourcesfor Gamma Radiography1
4C H A P T E R
3RT04 _Layout(073_088) 10/2/02 1:53 PM Page 73
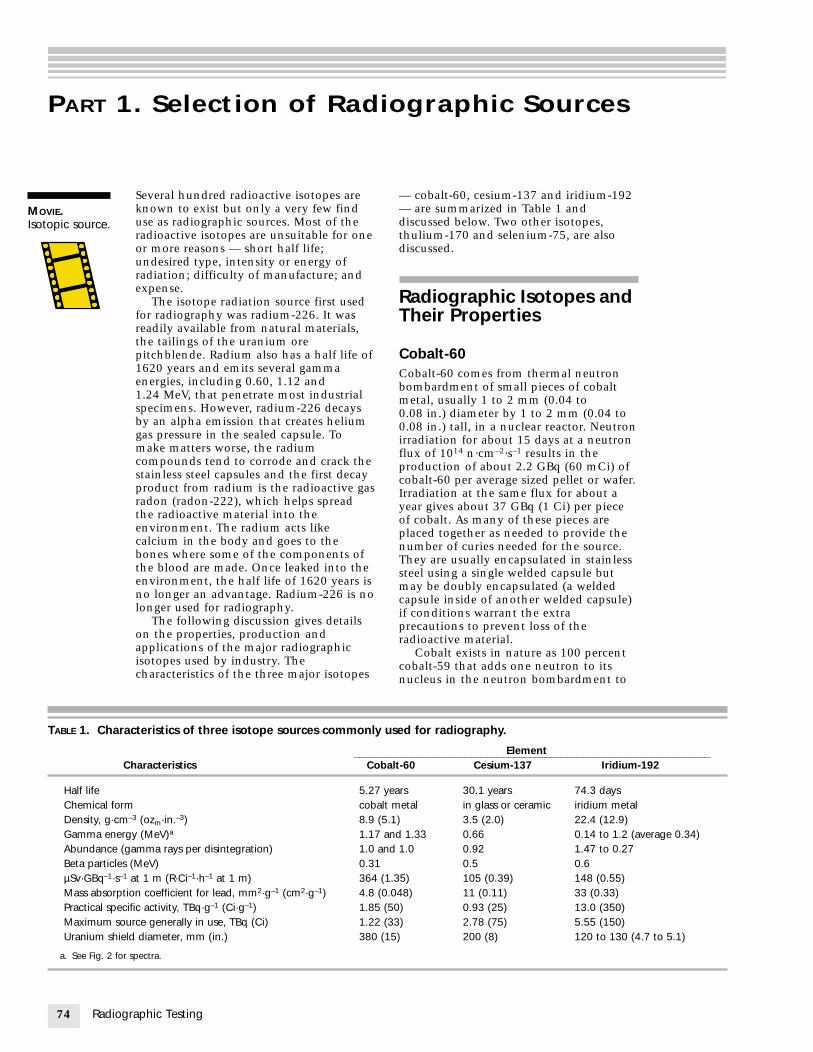
74 Radiog
PART 1. Selection of Radiographic Sources
TABLE 1. Char
Half lifeChemical forDensity, g·cmGamma enerAbundance (Beta particleµSv·GBq–1·s–
Mass absorpPractical specMaximum soUranium shie
a. See Fig. 2 fo
MOVIE.Isotopic source.
3RT04 _Layout(073_088) 10/2/02 1:53 PM Page 74
Several hundred radioactive isotopes areknown to exist but only a very few finduse as radiographic sources. Most of theradioactive isotopes are unsuitable for oneor more reasons — short half life;undesired type, intensity or energy ofradiation; difficulty of manufacture; andexpense.
The isotope radiation source first usedfor radiography was radium-226. It wasreadily available from natural materials,the tailings of the uranium orepitchblende. Radium also has a half life of1620 years and emits several gammaenergies, including 0.60, 1.12 and1.24 MeV, that penetrate most industrialspecimens. However, radium-226 decaysby an alpha emission that creates heliumgas pressure in the sealed capsule. Tomake matters worse, the radiumcompounds tend to corrode and crack thestainless steel capsules and the first decayproduct from radium is the radioactive gasradon (radon-222), which helps spreadthe radioactive material into theenvironment. The radium acts likecalcium in the body and goes to thebones where some of the components ofthe blood are made. Once leaked into theenvironment, the half life of 1620 years isno longer an advantage. Radium-226 is nolonger used for radiography.
The following discussion gives detailson the properties, production andapplications of the major radiographicisotopes used by industry. Thecharacteristics of the three major isotopes
raphic Testing
acteristics of three isotope sources commonly
_____Characteristics Co
5.27m coba
–3 (ozm·in.–3) 8.9 (gy (MeV)a 1.17gamma rays per disintegration) 1.0 as (MeV) 0.311 at 1 m (R·Ci–1·h–1 at 1 m) 364 tion coefficient for lead, mm2·g–1 (cm2·g–1) 4.8 (ific activity, TBq·g–1 (Ci·g–1) 1.85urce generally in use, TBq (Ci) 1.22ld diameter, mm (in.) 380
r spectra.
— cobalt-60, cesium-137 and iridium-192— are summarized in Table 1 anddiscussed below. Two other isotopes,thulium-170 and selenium-75, are alsodiscussed.
Radiographic Isotopes andTheir Properties
Cobalt-60Cobalt-60 comes from thermal neutronbombardment of small pieces of cobaltmetal, usually 1 to 2 mm (0.04 to0.08 in.) diameter by 1 to 2 mm (0.04 to0.08 in.) tall, in a nuclear reactor. Neutronirradiation for about 15 days at a neutronflux of 1014 n·cm–2·s–1 results in theproduction of about 2.2 GBq (60 mCi) ofcobalt-60 per average sized pellet or wafer.Irradiation at the same flux for about ayear gives about 37 GBq (1 Ci) per pieceof cobalt. As many of these pieces areplaced together as needed to provide thenumber of curies needed for the source.They are usually encapsulated in stainlesssteel using a single welded capsule butmay be doubly encapsulated (a weldedcapsule inside of another welded capsule)if conditions warrant the extraprecautions to prevent loss of theradioactive material.
Cobalt exists in nature as 100 percentcobalt-59 that adds one neutron to itsnucleus in the neutron bombardment to
used for radiography.
Element______________________________________________________________balt-60 Cesium-137 Iridium-192
years 30.1 years 74.3 dayslt metal in glass or ceramic iridium metal5.1) 3.5 (2.0) 22.4 (12.9) and 1.33 0.66 0.14 to 1.2 (average 0.34)nd 1.0 0.92 1.47 to 0.27
0.5 0.6(1.35) 105 (0.39) 148 (0.55)0.048) 11 (0.11) 33 (0.33) (50) 0.93 (25) 13.0 (350) (33) 2.78 (75) 5.55 (150)(15) 200 (8) 120 to 130 (4.7 to 5.1)

FIGURE 2. Gamma spectra: (a) cobalt-60; (b) cesium-137;(c) iridium-192.
(c)
106
Energy (MeV)
(b)A
ctiv
ity (
rela
tive
unit)
0 0.66 1.33
(a)
Act
ivity
(re
lativ
e un
it)
0 0.66 1.33
Energy (MeV)
105
104
103
102
10
104
102
10
3RT04 _Layout(073_088) 10/14/02 9:02 AM Page 75
become cobalt-60 (see this volume’sdiscussion of radiation and particlephysics). The neutron capture crosssection of 24 × 10–24 cm2) makes cobaltone of the most readily available andgenerally useful isotopes. The cobalt is ahard, gray, magnetic metal with a meltingpoint of 1480 °C (2700 °F) and a densityof 8.9 g·cm–3 (556 lbm·ft–3). The metal isrelatively free from oxidation andchemical attack under ambientconditions.
Cobalt-60 decays with a half life of5.27 years by the emission of a soft betaparticle followed by two gamma rays (seeFig. 1 for decay diagram and Fig. 2a forspectrum) with energies of 1.17 and1.33 MeV. The cobalt-60 has a highoutput of these photons, yielding364 µSv·GBq–1·h–1 at 1 m (1.35 R·Ci–1·h–1
at 1 m) from the source. These highenergies combined with high output letradiographers inspect iron, brass, copperand other medium weight metals with athickness greater than 25 mm (1.0 in.).
Other more dense metals such astantalum or uranium can be radiographedwith cobalt-60. Typical range forapplication in steel is for a specimen witha thickness of 20 to 200 mm (0.8 to8.0 in.). This is about radiographicallyequivalent to a 3 MeV X-ray generator butthe cobalt-60 is not as intense a source.Use of cobalt-60 for radiography ofthinner or lower density materials resultsin a loss of definition for anydiscontinuities present and use for thickeror higher density materials results in longexposure times.
Cesium-137Cesium-137 originally was used in thechloride form that often induces stresscorrosion cracking in the stainless steelencapsulation materials. The chlorideform is now usually converted into a glassor ceramic form before encapsulation.Also, it is doubly encapsulated (a weldedcapsule inside another welded capsule) to
FIGURE 1. Disintegration of cobalt-60, withhalf life of 5.27 years.
Cobalt-60
310 keV beta rays
1.17 MeV gamma rays
Nickel-60
1.33 MeV gamma rays
prevent loss of the radioactive material tothe environment. The moderate output of91 µSv·GBq–1·h–1 at 1 m (0.34 R·Ci–1·h–1 at1 m) from the source per each curie fromthe single gamma ray on 92 percent of thedecaying nuclei, as shown in Fig. 3, hasnot overcome the early history of leakage
75Isotope Radiation Sources for Gamma Radiography
Act
ivity
(re
lativ
e un
it) 105
104
103
102
10
0 0.66 1.33
Energy (MeV)

76 R
FIGURE 4.
1064 ke
690 ke
484 ke
383 ke
0
3RT04 _Layout(073_088) 10/14/02 9:11 AM Page 76
problems and bulky source size problems.Although it has a long half life of30.1 years and has a moderate gamma rayenergy of 0.66 MeV, cesium-137 is lessoften used as a radiographic source thaneither cobalt-60 or iridium-192. SeeFig. 2b for gamma spectrum ofcesium-137. It is frequently used as asource for industrial thickness and densitygages.
Cesium-137 is not produced byneutron bombardment as are cobalt-60and iridium-192. This radioactive materialis a fission fragment from the neutron
adiographic Testing
FIGURE 3. Disintegration of cesium-137, withhalf life of 31 years.
Cesium-137
92 percent510 keVbeta rays
0.66 MeVgamma rays
Barium-137
8 percent 1.17 MeV beta rays
Disintegration scheme of iridium-192. Numbers in arr
Osmium-192 Iridium-192 Platinu
V
V
V
V
0
5.2
0.8
3.5
0.15 0.5
induced fission of uranium-235 (see thisvolume’s section on particle physics). Thecesium-137 must be recovered from theunused uranium and all of the otherfission fragments left in the fuel rods froma nuclear reactor. The cesium-137 is oneof the most probable products of nuclearfission, resulting from about 6 percent offission events. The cesium chloriderecovered from spent fuel containscesium-133 and cesium-135 as well as thecesium-137, limiting the specific activityto about 925 GBq (25 Ci) per gram ofcesium chloride. Self-absorption andabsorption by the double encapsulationmay be as much as 30 percent of theintensity of a 1850 GBq (50 Ci) source.
Iridium-192Iridium-192 provides a major part of theisotope radiography business. This isbecause of the 74.3 day half life thatrequires replacement of the source aboutevery six months and because the gammaenergies emitted by the source are usefulfor thin steel specimens that make upmost of the industrial work. With anaverage energy of about 0.34 MeV (seeFig. 4 for the decay diagram of gammarays actually emitted and Fig. 2c forgamma spectrum), the iridium-192 is usedfor the radiography of steel in the
ows are numbers of gamma rays per 100 disintegrations.
m-192
1456 keV
1359 keV
1201 keV1155 keV
920.9 keV
784.5 keV
612.5 keV
316.5 keV
0
77
7.7
26
0.05 57 0.8
10 28 2.6
0.9
6.4 0 1.0
0.8
0 0 0.5
0.05

FIGURE 6. Radiation emergent from 50 mg (1.76 × 10⁻³ ozm)thulium-170 source, compressed 2 × 2 mm (0.08 × 0.08 in.),pellet in 2 cm3 (0.12 in.3) solution.
3RT04 _Layout(073_088) 10/14/02 9:11 AM Page 77
thickness range of 3.2 to 76 mm (0.125 to3.0 in.). Also, the low average energy ofthe photons requires little shielding andpermits portable exposure devicesweighing only 24 kg (53 lb). Usefulradiographic sources of cobalt-60 orcesium-137 generally require wheels onthe equipment for portability.
Iridium-192 is produced by neutronbombardment in a nuclear reactor. Theiridium metal is a very hard, brittle, whitemetal of the platinum family with adensity of 22.4 g·cm–3 (1400 lbm·ft–3) amelting point of 2350 °C (4260 °F) and aneutron cross section of 10–25 m2 foriridium-191. Natural iridium occurs as twoisotopes, 38 percent iridium-191 and62 percent iridium-193. Even with the38 percent abundance, the high crosssection results in most neutrons’ beingabsorbed in the outer layers of the iridiumtarget metal. Even with this severeself-absorption of neutrons, the wafers orpellets of iridium metal yield up to925 GBq (25 Ci) from 2 mm diameter by1 mm (0.08 × 0.04 in.) thick and up to1850 GBq (50 Ci) from 3 mm diameter by1 mm thick (0.12 by 0.04 in.). Theseactivities require about a six monthsbombardment at over 1014 neutrons per1 cm2·s–1 in a reactor. Such small sourcesapproximate point sources to give goodradiographic geometry.
Figure 2 contains the simplified gammaspectra for the following isotope sources:(a) cobalt-60, (b) cesium-137 and(c) iridium-192. Comparison of thesespectra helps radiographers to understandthe different uses of the isotopes thatdepend on the energies of the gamma raysemitted.
Thulium-170Thulium-170 replaces an X-ray machinein some industrial circumstances thatwould make the machine impractical.Such circumstances are uncommon butdo exist.
FIGURE 5. Disintegration of thulium-170,with half life of 129 days.
Thulium-170
24 percent 0.884 MeV beta rays
84 keV gamma rays
Ytterbium-170
76 percent 968 keV beta rays
Thulium-170 decays with a half life of129 days with the emission of a 1 MeVbeta particle. In 24 percent of thedisintegrations, the nucleus is left in anexcited state, which becomes stable byeither (1) the emission of an 84 keVgamma ray or (2) the internal conversionand ejection of an orbital electron. Thisdecay is diagrammed in Fig. 5.
Further analysis of the decay ofthulium-170 shows that 3.1 percent of thedisintegrations result in the 84 keVgamma ray emission, 4.9 percent inejection of a K shell orbital electron and16 percent in ejection of an L shellelectron or M shell electron (see thisvolume’s discussion of radiation andparticle physics). When these orbitalelectrons are replaced, the atom emitsX-rays characteristic of ytterbium: 52 keVX-ray for the K shell, 7 keV for the L shelland 1 keV for the M shell. The lowerenergy photons are too weak to emergefrom the source capsule. For radiographicpurposes, the sources appear to produceabout 3 percent of the 84 keV and5 percent of the 52 keV radiation in thedisintegrations of the thulium-170 nuclei.Two approximate spectra of the radiationfrom the thulium-170 are shown in Fig. 6for pellet or solution forms.
The element thulium is chemically oneof the rare earths, is physically a silvermetal with a density of about 9 g·cm–3
(560 lbm·ft–3) and consists of the singleisotope thulium-169. Because the metal isextremely difficult to produce, thematerial is generally handled asthulium(III) oxide (Tm2O3), either as anencapsulated powder with a density of
77Isotope Radiation Sources for Gamma Radiography
Inte
nsity
(re
lativ
e un
its)
40 100 150 200 250 300
Energy (keV)
Thulium-170
Pellet
Solution
78 R
3RT04 _Layout(073_088) 10/2/02 1:54 PM Page 78
about 4 g·cm–3 (250 lbm·ft–3) or sinteredinto pellets with a density of about7 g·cm–3 (440 lbm·ft–3). The isotopethulium-169 has a thermal neutron crosssection of 1.2 10–22 cm–2 to producethulium-170. No other comparableneutron reactions take place.
Source strengths of radiographicsources depend on the amount ofthulium-169 irradiated in the reactor, thelength of time in the reactor and theneutron flux at the site of the irradiation.An 18 weeks irradiation can yield 1.5 to11 TBq (40 to 300 Ci) of thulium-170from 150 mg of the oxide and slightlyhigher yields from metal pellets or wafers.Radiation yields are between 6 and56 nSv·s–1 (2 and 20 mR·h–1) at 1.0 m(40 in.) from the source per 37 GBq (1 Ci).The gamma radiation intensity increasesper curie as larger, more compacted sourcematerial is used. The enhanced 84 keVgamma comes at the expense of the52 keV X-ray, which is decreased by larger,more dense source material. Thethulium-170 sources approximate 600 keVX-ray machine radiation in radiographicquality because the energies are uniquerather than white (all energies up to amaximum value) radiation.
Application of the thulium-170 sourcesincludes radiography of a steel thicknessas low as 0.8 mm (0.03 in.) or analuminum thickness of 13 mm (0.5 in.)while achieving 2 percent radiographicsensitivity. It is useful for inspection ofinternal assemblies such as aerospacecomponents and composite materials.
Selenium-75Selenium-75 has found limited use inEurope as a replacement for iridium-192.The selenium-75 has a longer half life of120 days (versus iridium-192 at 74 days)and a lower gamma energy spectrum of66 to 401 keV (versus iridium-192 at 206to 612 keV with some even high gammaenergies present). Besides providing asomewhat better image quality on thinspecimens such as pipe, the exposureequipment is significantly lighter.2
adiographic Testing

PART 2. Source Handling Equipment
IGURE 7. Double encapsulated source with pigtail:) capsule; (b) diagram of pigtail; (c) drive cables and pigtail
onnectors made by different companies.
Outer capsule Inner capsuleSpacersand lid
Outer capsule lidand connecter
Ir-192 pellets
Capsule
Flexible drive cable
Cable stop
Connector
)
)
)
3RT04 _Layout(073_088) 10/2/02 1:54 PM Page 79
Encapsulation of IsotopeSourcesAll radiographic isotope sources must beencapsulated. This enclosure of theradioactive material in a welded shutstainless steel container prevents loss ofthe radioactive material to theenvironment when the source is exposedto make a radiograph. The radioactivematerials always have tiny particles ofloose source material coating their surfacethat are formed by oxidation or otherprocesses. Without encapsulation, theseparticles can contaminate theenvironment with possible seriousconsequences. In most cases, the sourcewill be double encapsulated. Doubleencapsulation means that after theradioactive material is sealed inside of astainless steel capsule that is weldedclosed, that first capsule is sealed inside ofanother stainless steel capsule that is alsowelded closed.
After encapsulation according to thespecifications for that source design (setup by the manufacturer under criteriaestablished or approved by one or more oforganizations such as the AmericanNational Standards Institute (ANSI),International Atomic Energy Agency(IAEA), International Organization forStandardization (ISO), Nuclear RegulatoryCommission (NRC) and United StatesDepartment of Transportation.
Diagrams and photographs of thecapsules and their contents are featured inmany manufacturers’ brochures. Eachcapsule is tested for radioactive materialleakage and for structural integrity. Eachdesign and manufacturing technique istested for leakage and serviceability.
The assembly and welding of thecapsules occur in a special, shieldedstructure called a hot cell, which hasthick, dense walls for radiation shieldingand remote manipulators for handing thepieces in the high radiation environment.Windows in the hot cells are made of aspecial, high density glass. Often thewindows have a dense, transparentaqueous solution of an inorganic salt,such as zinc bromide, held between theinside and outside layers of glass.
The capsule is attached to a flexiblecable (pigtail) or fixed into a rotatingcylinder for handling in an exposure
daecsNe
F(ac
(a
(b
(c
evice by a radiographer. Figure 7 showsn idealized diagram of a doublencapsulated source attached to a flexibleonnector to form a pigtail. This type ofource holder is placed in Americanational Standards Institute Type I
xposure devices and is discussed below.
79Isotope Radiation Sources for Gamma Radiography

80 Radio
FIGURE 8. Ope(a) stored poposition.
(a)
Crankout
Drive
(b)
(c)
FIGURE 9. Exposure device for up to 7.4 TBq (200 Ci) ofiridium-192: (a) cross section; (b) photograph.
(a)
Lock module
Release plunger
Acrylicpotting
compound
Handleassembly
Depleteduranium shield
Foam fill ~35 to 45 kg·m–3
(~2 to 3 lbm·ft–3)
Protectiveflange
Outlet endflangeattachmentboss
Lock capassembly
3RT04 _Layout(073_088) 10/2/02 1:54 PM Page 80
Type II devices with a rotating cylinderare discussed below, after the Type Idevices.
Exposure Devices
ANSI Type I Exposure DevicesAmerican National Standards Institute(ANSI) Type I exposure devices forradiography permit exposure of the sourceby moving it from a shielded positionthrough a guide tube to a remote positionoutside the shield. Figures 8 to 11 presentdiagrams and photographs of exposuredevices using drive cables operated byturning a hand held cranking device. Insome of the diagrams, the source capsuleand its attached pigtail can be seen.
The major parts of a Type I exposuredevice are (as can be seen in part in Fig. 8and in more detail in Figs. 9a and 10b:(1) a rigid, wear resistant tube to guide thesource pigtail through the shieldingmaterial; (2) shielding material (mostoften depleted uranium but tungsten mayalso be used for critical machined parts);(3) a metal case to protect and hold theshielding, guide tube and othercomponents in a fixed position; (4) a lockto prevent accidental movement of thesource out of the shielded position or its
graphic Testing
ration of ANSI Type I source handling device:sition; (b) source in transit; (c) exposure
Lock
Source
Exposure device
cable
Handle
Collimator
removal from that end of the device;(5) connectors for the drive cable andcrankout device to the pigtail end of thedevice and for a guide tube to the otherend; (6) protectors for the connectorswith one having a short flexible cable toprevent movement of the source out ofthat end of the device; and (7) a handle tocarry the device and radiation, warningand information tags to identify thedevice and its hazardous nature.
The design of an exposure device forradiography shows great improvementand increase in safety for the radiographerand the public. Earliest techniques were
Sourceassembly
Outlet panelassembly
Safety plugassembly
Positioningshim
Tiedown
hole
(b)

FIGURE 10.iridium-19
(a)
(b)
Lockingmechanism
Plunger loc
ass
Remotecontrol
connector
3RT04 _Layout(073_088) 10/2/02 1:54 PM Page 81
nothing more than bamboo poles with astring running from tip of the pole to thesource. Shielding was completely ignoredor just a lead bucket in the corner of theoffice. Now the design includes thefeatures noted in the above list.
The tube inside of the shieldingmaterial is now a hard, wear resistantmaterial such as titanium metal orzirconium alloy. This hardness keeps thetube from wearing out early because ofmovement of the drive cable for sourceexposure. Earlier materials wore awayearly in the life of an exposure device andexposed the shielding material. When theshielding material is depleted uranium, aworn out tube allows this radioactivematerial to be carried into theenvironment. Leak tests suggested thatthe encapsulated source was leaking.
Why use a radioactive material,depleted uranium, to shield a radiationsource? The depleted uranium providesmore shielding of the radiographic sourceper unit of mass than the originalshielding material, lead. Also, most of theradiation from the uranium is alpharadiation and is stopped by the case of thedevice. A coating of paint prevents loss ofthe uranium from the shield just as an
intact inner tube does.Exposure device for up to 5.6 TBq (150 Ci) of2: (a) photograph; (b) diagram.
Outletport andguide tubeconnector
Titanium S tube
k
Welded shield containerProtective plasticjacket withcarrying handle
Sourceembly
Depleted uranium shield
Depleted uranium is the uranium-238that remains when the fissionableuranium-235 is removed for nuclearreactor fuel or nuclear weaponmanufacture. The uranium-238 is98.28 percent of the natural uranium anduranium-235 is only 0.72 percent soconsiderable uranium-238 remains afterdepletion of the uranium-235. Thisdepleted uranium allows the exposuredevice to be carried by hand and berelatively portable with lower externalradiation hazard than if the device weremade from lead. Also, the uranium shieldgives better protection from fire than leadshielding would. Commercial exposuredevices do not use lead shielding. Theuranium shield is generally cast aroundthe inner tube ready to be fitted into thecase without any machining. Ifmachining is required, a piece of tungstenmetal is machined and used with uraniumto complete the necessary shielding.
The metal case protects the uraniumshield from loss of the uranium and stopsthe alpha radiation from reaching theenvironment as long as the inner tube isintact. Also, the case protects thealignment of parts, the lock andconnections from likely damage. Thecases are made from heavy gagealuminum or stainless steel in most of thecommercial devices available today. Thisis to prevent broken locks and connectorsthat might allow the source capsule toescape from the shielding accidentally.
All exposure devices require a lockingdevice that uses a key. A regulatoryrequirement is that the lock cannot beopened unless the drive cable is attachedto the pigtail. Often, this is accomplishedby requiring a reverse cranking motion torelease the lock. This prevents the sourcebeing moved out of the shield to the endof the guide tube without a good physicalconnection between the two. If the drivecable is not connected to the pigtail, thesource could be driven to the end of theguide tube but not retrieved when thedrive cable is returned. Several severeaccidental overexposures have occurred inthe past and the above regulatoryrequirement works to reduce such
81Isotope Radiation Sources for Gamma Radiography
FIGURE 11. Exposure device with crankout and guide tube.

82 Rad
FIGURE 12. Gexposure: (a
(a)
(b)
FIGURE 13. Photographs of two AmericanNational Standards Institute Type Icobalt-60 exposure devices: (a) ontwo-wheeled dolly, for up to 9.25 TBq(250 Ci) of cobalt-60; (b) on four-wheeled
MOVIE.Collimators.
3RT04 _Layout(073_088) 10/2/02 1:54 PM Page 82
disconnects as they were called. Also, thelock should automatically lock the sourcein its stored position when it is returnedto the shield. If the source is locked, itcannot be moved to an exposed position.
Special connectors, often of aproprietary design as shown in Fig. 7c (pigtails) permit the drive cable and guidetube to be connected to the exposuredevice. Connectors or protective caps,similar to those of the drive cable andguide tube, stay on the device to protectthe connection to the lock and exit pointsand to prevent movement of the sourcefrom its shielded position. This is bestseen in Fig. 9a.
The handle of the device may simplyserve as a convenient handle for carryingthe device and may also serve to store theprotective connectors. In Figs. 9 to 11 canbe seen the various radiation, warningand information tags that identify thedevice and potential hazards. One taggives information for calling the properauthorities should the device be foundwhen not in the direct custody of aradiographer.
The guide tube that carries the sourcefrom the shielded position in theexposure device to the place whereradiographic exposure is made shouldmeet applicable codes or specifications,
iographic Testing
uide tube collimators for reducing personnel) cross sections; (b) photographs.
Setscrew
Source placement
Sourcecollimation
such as those in ANSI N43.9.3 The end ofthe guide tube is a metal part that alignsthe source for exposure. A collimator(Fig. 12) may be added to the end of theguide tube to reduce radiation in alldirections except as needed for exposureof the radiograph. By reducing extraneousradiation, closer boundaries for exclusionof nonradiation workers may be set upmaking the radiographer’s job mucheasier and more efficient.
Capacity of the exposure devicesshown in Figs. 9 to 11 vary from about4.4 to 5.5 TBq (120 to 150 Ci) ofiridium-192. Regulations and designchanges may alter these values at anytime.
Cobalt-60 exposure devices are not soportable but they may be wheeled fromplace to place for exposures in the field.Movement of cobalt-60 exposure devicesover a few yards generally requires cranesor other large lifting and transportequipment. Figure 13 shows two
dolly.(a)
(b)

FIGURE 1(a) exchexchansource position
(b)
(a)
3RT04 _Layout(073_088) 10/2/02 1:54 PM Page 83
photographs of American NationalStandards Institute Type I cobalt-60exposure devices available for fieldradiography. Capacity of these and similardevices ranges from 1.2 to 12.2 TBq (33 to330 Ci).
Source Exchanger EquipmentWhen short lived sources such asiridium-192 have decayed to an unusablelevel, a new source may be exchangedwith the old source in the field (usually atthe facilities of the exposure device’sowner). Figure 14 shows a pair of photosan exposure device fitted with a shortexchange tube and the closed exchangershowing (Fig. 14a) and the exposuredevice connected to the exchanger readyfor source transfer from exchanger to theexposure device (Fig. 14b). Note the old,used source pigtail can be seen in thestorage position on the left. The crankouthandle and cable cannot be seen in thephoto but are attached to the other end ofthe exposure device. Both the exposuredevice and the exchanger must beunlocked to make the source movements,first the old source into the exchangerand second the new source from theexchanger into the exposure device. Otherdesigns are available to accomplish thesame procedure.
ANSI Type II Exposure DevicesOne design representative of ANSI Type IIexposure devices moves the source capsulefrom the storage position in the center of
4. Exposure device with source exchanger:anger (left) closed, exposure device fitted with short
ge tube; (b) exchanger open and attached, ready fortransfer to exchanger (note source pigtail in storage, on the left).
the shield in the exposure device to aposition on the outside surface of theshield (see Fig. 15). The 180 degreerotation of the eccentric cylinder carryingthe source may be made manually(1) with a the operator remaining behindthe exposure device shield relative to theaperture for the exposed source or (2) byturning a crank attached to the device bya metal drive cable. Again, the shieldmaterial is usually depleted uranium(uranium with almost all of thefissionable uranium-235 removed, leavinguranium-238).
Depleted uranium offers moreshielding per unit mass than similarshields made of lead. A lead shield for100 Ci of iridium-192 might weigh over30 kg (66 lb); a uranium shield would becloser to 20 kg (44 lb). The eccentriccylinder may be tungsten, which can bemachined more easily than depleteduranium, or a precision cast uraniumwheel or disk that is then attached to therotation handle or knob.
Figure 16 shows a diagram andphotograph of an American NationalStandards Institute Type II exposuredevice. Note that the device has astainless steel housing with carryinghandle. There is also a lock to preventrotation of the source into an exposedposition as well as indication on the on/offknob as to the position of the source.Such devices most often find use forradiography of piping and can carry as
83Isotope Radiation Sources for Gamma Radiography
FIGURE 15. Diagram of one type of American NationalStandards Institute Type II exposure device: (a) sourcestored; (b) source exposed.
(a)
(b)

84 Radio
FIGURE 16. Amexposure devic
Optionalextension
handle
Stainless hou
Sou
On/off knobrotates
180 degreesto expose
source
(b)
(a)
3RT04 _Layout(073_088) 10/2/02 1:54 PM Page 84
much as 3.7 TBq (100 Ci) of iridium-192.The manufacturer or other licensedcompany must do source replacements forAmerican National Standards InstituteType II devices. The exchange of sourcesrequires a hot cell for remote, shieldedhandling.
graphic Testing
erican National Standards Institute Type IIe; (a) diagram; (b) photograph.
steelsing
Handle
Depleteduranium shield
Stop pin Plungertype lock
On/offknob
Shaft
Aluminumbottom plate
Depleteduraniumwheel
rce
1. Nondestructive Testing Handbook,second edition: Vol. 3, Radiography andRadiation Testing. Columbus, OH:American Society for NondestructiveTesting (1985).
2. Ewert, U. and J. Stade. “ComparativeAnalysis of Image Quality from X-RayRadiography and Gamma RadiographyUsing Selenium 75 and Iridium 192.”Materials Evaluation. Vol. 57, No. 2.Columbus, OH: American Society forNondestructive Testing (February1999): p 117-121.
3. ANSI N43.9, Gamma-Radiography —Specifications for Design and TestingApparatus. New York, NY: AmericanNational Standards Institute (1991).
BibliographyAnderson, M.B. “Radiographic Sensitivity
Data for the Isotopes Cobalt-60,Iridium-192, Cesium-137,Thulium-170 and Thorium-228.”Nondestructive Testing. Vol. 17, No. 6.Columbus, OH: American Society forNondestructive Testing(November-December 1959):p 365-370.
Berger, H. “Nuclear Methods for NDT.”National Bureau of Standards inInstrumentation Technology. Vol. 23,No. 8 (1976): p 45-50.
Berman, A.I. “Radioactivity Units andRadiography.” Non-Destructive Testing.Vol. 9, No. 2. Columbus, OH:American Society for NondestructiveTesting (Fall 1950): p 11-15.
Blair, J.S. “Iron and Steel WorksApplications of Radioactive Isotopesfor Radiography.” Iron and Coal TradesReview. Vol. 163. London, UnitedKingdom: Industrial Newspapers1951): p 1349, 1405.
Bokshpan, S. and D. Kedem. “Detection ofImperfections by Means of NarrowBeam Gamma Scattering.” MaterialsEvaluation. Vol. 33, No. 10. Columbus,OH: American Society forNondestructive Testing (October1975): p 243.
Clarke, E.T. “Investigation of Isotopes forAircraft Radiography.” Wright AirDevelopment Center Technical Report;ASTIA Document No. AD 118224(1957): p 56-440.
Clack, B.N. “Natural and Artificial Sourcesfor Gamma Radiography.” Engineer.Vol. 194. London, United Kingdom:Office for Advertisements andPublication (1957): p 329.
Cosh, T.A. “An Exposure Calculator forIsotope Radiography.” Journal ofScientific Instrumentation. Vol. 34(1957): p 329.
Doan, G.E. and S.S. Yound. “Gamma-RayRadiography.” ASME Proceedings.Vol. 38, Pt. 2. New York, NY: AmericanSociety of Mechanical Engineers(1938): p 292.
Evans, R.D. The Atomic Nucleus. New York:McGraw-Hill Book Company (1955).
Evans, R.D. and R.O. Evans. “Studies ofSelf-Absorption in Gamma-RaySources.” Reviews of Modern Physics.Vol. 20. Melville, NY: AmericanPhysical Society (1948): p 305.
Faulkenberry, B.H., R.H. Johnson andC.E. Cole. “Radioautographs ShowQuality of Panel Brazing.” Nucleonics.Vol. 19, No. 4. New York, NY:McGraw-Hill (1961): p 126-130.
Fletcher, L.S. “Radiographic InspectionAssures Good Welds in ProvidenceDistribution Line.” Welding Engineer.Vol. 38, No. 6. Chicago, IL: JeffersonPublications (June 1953): p 50-52.
Frazier, P.M., C.R. Buchanan andG.W Morgan. “Radiation Safety inIndustrial Radiography withRadioisotopes.” Report AECU 2967.Washington, DC: United States AtomicEnergy Commission (1954).
Gardner, R.P. and R.L. Ely, Jr. RadioisotopeMeasurement Applications in Engineering.New York, NY: Reinhold PublishingCorporation (1967).
Gilbert, E. “Applications ofNondestructive Testing in thePetroleum Industry.” NondestructiveTesting. Vol. 21, No. 4. Columbus, OH:American Society for NondestructiveTesting (July-August 1963): p 235-237.
Goldstein, H. and J.E. Wilkins, Jr.“Calculation of Penetration of GammaRays.” Report NYO-3075. Washington,DC: United States Atomic EnergyCommission (1954).
85Isotope Radiation Sources for Gamma Radiography
References
3RT04 _Layout(073_088) 10/2/02 1:54 PM Page 85

Halmshaw, R. “The Factors Involved in anAssessment of RadiographicDefinition.” Journal of PhotographicScience. Vol. 3. Bury Saint Edmonds,Suffolk, United Kingdom: ProfessionalEngineering Publishing, for the RoyalPhotographic Society (1955): p 161.
Handbook on Radiography, revised edition.Ottawa: Atomic Energy of Canada,Ltd. (1950).
Harrington, E.L., H.E Johns, A.P. Wilesand C. Garrett. “The FundamentalAction of Intensifying Screens inGamma Radiography.” CanadianJournal of Research. Vol. 28.Boucherville, Canada: NationalResearch Council (1948): p 540.
Iddings, F.A. “Editorial” [Back to Basics].Materials Evaluation. Vol. 37, No. 11.Columbus, OH: American Society forNondestructive Testing (October1979): p 20.
“Interpreting Weld Radiographs.” WeldingEngineer. Vol. 56, No. 6. Chicago, IL:Jefferson Publications (June 1976).
Karrer, C.A. “Safe and Economical Use ofIsotopes in the Steel Industry.”Nondestructive Testing. Vol. 13, No. 2.Columbus, OH: American Society forNondestructive Testing (March-April1955): p 29-31.
Kiehle, W.D. “Radiography.” NondestructiveTesting. Vol. 16, No. 4. Columbus, OH:American Society for NondestructiveTesting (July-August 1958): p 313-318.
Landalt, J.F. “A Technique for PlacingKnown Defects in Weldments.”Materials Evaluation. Vol. 31, No. 10.Columbus, OH: American Society forNondestructive Testing (October1973): p 214-216.
Mehl, R.F. “How Gamma Ray RadiographyCame About” [1971 Mehl HonorLecture]. Materials Evaluation. Vol. 30,No. 3. Columbus, OH: AmericanSociety for Nondestructive Testing(March 1972): p 17A-19A.
Memorandum on Gamma-Ray Sources forRadiography, revised edition. London,United Kingdom: Institute of Physics(1954).
“Methods and Limitations for In ServiceInspection of Nuclear Power Plant.”Nuclear Engineering International.London, United Kingdom:Heywood-Temple IndustrialPublications Limited (October 1976):p 61-64.
O’Conner, D.T. and E.L. Criscuolo. “TheQuality of Radiographic Inspection.”ASTM Bulletin. No. 213. WestConshohocken, PA: ASTMInternational (1956): p 53.
Polansky, D., D.P. Case and E.L. Criscuolo.“The Investigation of Radioisotopes forthe Inspection of Ship Welds.”Nondestructive Testing. Vol. 17, No. 1.Columbus, OH: American Society forNondestructive Testing (1959): p 21.
“Radiographic Inspection — An AdaptableTool.” Quality Progress. Vol. 7, No. 6.Milwaukee, WI: American Society forQuality (June 1974): p 10-11.
Radiography in Modern Industry, thirdedition. Rochester, NY: Eastman KodakCompany (1969).
Radioisotope Techniques. Vol. 2. London:Her Majesty’s Stationery Office (1952).
Reiffel, L. “Beta-Ray Excited Low-EnergyX-Ray Sources.” Nucleonics. Vol. 13,No. 3. New York, NY: McGraw-Hill(1955): p 22.
Richardson, H.D. Industrial RadiographyManual. Catalog Number FS5.284:84036. Washington, DC:Superintendent of Documents (March1968).
Rummel, W.D. and B.E. Gregory. “‘GhostLack of Fusion’ in Aluminum AlloyButt Fusion Welds.” MaterialsEvaluation. Vol. 23, No. 12. Columbus,OH: American Society forNondestructive Testing (December1965): p 586-588.
“Take a Look at Nuclear Gages.”Instrumentation and Control Systems.Vol. 49. Radnor, PA: Chilton Company(December 1976): p 41-44.
Cesium-137Dutli, J.W. and G.M. Taylor. “Application
of Cesium 137 to IndustrialRadiography.” Nondestructive Testing.Vol. 12, No. 2. Columbus, OH:American Society for NondestructiveTesting (March-April 1954): p 35-38.
Dutli, J.W. and D.E. Elliott. “TheApplication of Cesium-134 toIndustrial Radiography.” NondestructiveTesting. Vol. 14, No. 2. Columbus, OH:American Society for NondestructiveTesting (March-April 1956): p 24-27.
Rhoten, M.L. “Cesium-137 As a VersatileRadiographic Tool.” NondestructiveTesting. Vol. 16, No. 3. Columbus, OH:American Society for NondestructiveTesting (May-June 1958): p 261-264.
Thompson, J.M. and P.A. Glenn. “CesiumRadioisotope — New Tool for PartsInspection.” Iron Age. Vol. 172, No. 11.Newton, MA: Cahners BusinessInformation, Division of Reed Elsevier(1953): p 174.
Cobalt-60“Exposures for Cobalt-60 Radiography of
Steel.” Metals Progress. Vol. 58.Materials Park, OH: ASM International(1950): p 80.
86 Radiographic Testing
3RT04 _Layout(073_088) 10/2/02 1:54 PM Page 86

Hile, J. “Automatic Radiography withCobalt-60.” Materials and Methods.Vol. 40. New York, NY: ReinholdPublishing Corporation (1954): p 108.
Isenburger, H.R. “Exposure Charts forCobalt-60 Radiography.” ModernCastings [American Foundryman].Vol. 18. Des Plaines, IL: AmericanFoundrymen’s Society (1950): p 48.
Kastner, J. “Units Used in IndustrialRadiography to Describe Strength ofCobalt-60 Sources.” NondestructiveTesting. Vol. 11, No. 1. Columbus, OH:American Society for NondestructiveTesting (Fall 1952): p 21-23.
“Material Required to Carry OutRadiography with Cobalt-60 orRadium.” Report 2008. Boucherville,Canada: National Research Council(1949).
Morrison, A. “Radiography withCobalt-60.” Nondestructive Testing.Vol. 9, No. 4. Columbus, OH:American Society for NondestructiveTesting (1951): p 14.
Nir-El, Y. “Accurate Calibration of a Co-60Gamma Radiographic Source.”Materials Evaluation. Vol. 54, No. 2.Columbus, OH: American Society forNondestructive Testing (February1996): p 138-139.
O’Conner, D.T. and J.J. Hirschfield. “SomeAspects of Cobalt Radiography.”Nondestructive Testing. Vol. 10, No. 1Columbus, OH: American Society forNondestructive Testing (Summer1951): p 33-39. Errata, Vol. 11, No. 1(Summer 1952): p 34.
“Radiography with Cobalt-60.” Nucleonics.Vol. 5, No. 6. New York, NY:McGraw-Hill (1949).
Reed, M.E. Cobalt-60 Radiography inIndustry. Boston, MA: TracerlabIncorporated (1954).
Schwinn, W.L. Economics and PracticalApplications of Cobalt-60 inRadiographic Inspection of SteelWeldments. ASME Special TechnicalPublication 112. New York, NY:American Society of MechanicalEngineers (1951): p 112.
Iridium-192Halmshaw, R. “Use and Scope of
Iridium-192 for the Radiography ofSteel.” British Journal of Applied Physics.Vol. 5. London, United Kingdom:Institute of Physics (1954): p 238.
Johns, M.W. and S.V. Nablo.“Disintegration of Iridium 192 andIridium 194.” Physics Review. Vol. 96,No. 6. Melville, NY: American PhysicalSociety (1954): p 1599-1607.
Landauer, R.S., Jr., and E.T. Clarke. “FieldDetermination of Output and EffectiveSize of Iridium-192 RadiographicSources.” Materials Evaluation. Vol. 37,No. 12. Columbus, OH: AmericanSociety for Nondestructive Testing(November 1979): p 35-37.
Larabie, P. “Iridium-192 Production.”Materials Evaluation. Vol. 50, No. 9.Columbus, OH: American Society forNondestructive Testing (September1992): p 1022-1023, 1025-1026.
Morrison, A. “Iridium 192 for Gamma-RayRadiography.” Nondestructive Testing.Vol. 10, No. 1. Columbus, OH:American Society for NondestructiveTesting (Summer 1951): p 26-28.
Munro, J.J. “Calculation of ScatteredRadiation Intensities of 192 IridiumGamma Rays from a Steel Slab.”Materials Evaluation. Vol. 35, No. 2.Columbus, OH: American Society forNondestructive (February 1977):p 51-53.
Rigbey, J.V. and C.F. Baxter. “Iridium-192in Industrial Radiography.”Nondestructive Testing. Vol. 11, No. 1.Columbus, OH: American Society forNondestructive Testing (Fall 1952):p 34-40.
Ritz, V.H. “Broad and Narrow BeamAttenuation of Iridium-192 GammaRays in Concrete, Steel and Lead.”Nondestructive Testing. Vol. 16, No. 3.Columbus, OH: American Society forNondestructive Testing (1958): p 269.
Wolf, R.V. and K.P.W. Wolf. “AnInvestigation of the Application ofIridium 192 Gamma Radiation to theRadiography of Light Metal Castings.”Nondestructive Testing. Vol. 12, No. 1.Columbus, OH: American Society forNondestructive Testing(January-February 1954): p 26-29.
Yeomans, C. and S. Bellanca. “Iridium-192Proves Useful Inspection Tool in theAircraft Industry.” NondestructiveTesting. Vol. 14, No. 4. Columbus, OH:American Society for NondestructiveTesting (July-August 1956): p 32, 34.
Selenium-75Grimm, R. and J.J. Munro III. “Gamma
Radiography Using the RadioisotopeSelenium 75 in the Chemical andPetroleum Industry.” ASNT’sInternational Chemical and PetroleumIndustrial Inspection Technology (ICPIIT)IV Topical Conference [Houston, TX].Columbus, OH: American Society forNondestructive Testing (June 1995):p 51-53.
87Isotope Radiation Sources for Gamma Radiography
3RT04 _Layout(073_088) 10/2/02 1:54 PM Page 87

McCutcheon, D. “Experimental WorkEmploying Radioisotopes Cobalt andSelenium.” Non-Destructive Testing.Vol. 7, No. 3. Columbus, OH:American Society for NondestructiveTesting (Winter 1948-49): p 7-14.
Thallium-204Kereiakes, J.G. and G.R. Kraft.
“Thallium-204 X-Radiography.”Nondestructive Testing. Vol. 16, No. 6.Columbus, OH: American Society forNondestructive Testing (1958): p 490.
Thulium-170Carpenter, A.W. “Complete Portable Field
X-Ray Unit.” Army Medical ResearchLaboratories Report No. 168 (1954).
Clarke, E.T. “Gamma Radiography ofLight Metals.” Nondestructive Testing.Vol. 16. Columbus, OH: AmericanSociety for Nondestructive Testing(1958): p 265.
Graham, R.L., J.L. Wolfson and R.E. Bell.“The Disintegration of Thulium-170.”Canadian Journal of Physics. Vol. 30.Boucherville, Canada: NationalResearch Council (1952): p 459.
Halmshaw, R. “Thulium-170 for IndustrialRadiography.” British Journal of AppliedPhysics. Vol. 6. London, UnitedKingdom: Institute of Physics (1955):p 8.
West, R. “Low-Energy Gamma RaySources.” Nucleonics. Vol. 11, No. 2.New York, NY: McGraw-Hill (1953):p 20.
Radium“Exposures for Radium Radiography of
Steel.” Metals Progress. Vol. 57.Materials Park, OH: ASM International(1950): p 780.
Gezelius, R.A. and C.W. Briggs. Radium forIndustrial Radiography. New York, NY:Radium Chemical Co., Inc. (1946).
Johns, H.E. and C. Garrett. “Sensitivityand Exposure Graphs for RadiumRadiography.” Nondestructive Testing.Vol. 8, No. 3. Columbus, OH:American Society for NondestructiveTesting (Winter 1949-50): p 16-25.
Kahn, N.A., E.A. Imbembo and J. Bland. AUniversal Exposure Calculator for RadiumRadiography and Its Application toCurrent Radiographic Films andTechniques. ASME Special TechnicalPublication 96. New York, NY:American Society of MechanicalEngineers (1950).
Radiological Health Handbook, revisededition. PB 121784R. Washington, DC:United States Department of Health,Education and Welfare (1960).
Morrison, A. and E.M. Nodwell. “RadiumRadiography of Thin Steel Section.”ASTM Bulletin. No. 127. WestConshohocken, PA: ASTMInternational (1944): p 29.
RadonMorrison, A. “Use of Radon for Industrial
Radiography.” Nondestructive Testing.Vol. 6, No. 2. Columbus, OH:American Society for NondestructiveTesting (Fall 1947): p 24-26.
Pullin, V.E. “Radon, Its Place inNondestructive Testing.” Welding.Vol. 18. London, United Kingdom:Institute of Welding (1950): p 166.
88 Radiographic Testing
3RT04 _Layout(073_088) 10/2/02 1:54 PM Page 88

Frank A. Iddings, San Antonio, Texas
William B. Rivkin, Highland Park, Illinois
Gerald C. Wicks, Durham, North Carolina
Radiation Measurement1
5C H A P T E R
3RT05_LAYOUT(089_112) 10/21/02 10:43 AM Page 89

90 Rad
PART 1. Principles of Radiation Measurement
BLE 1. Effect of detected and measured ionization.
Effect Type of Instrument Detector
Electrical ionization chamber gasElectrical proportional counter gasElectrical geiger müller counter gasElectrical solid state semiconductorChemical film emulsion photographicChemical chemical dosimeter solid or liquidLight scintillation counter crystal or liquidLight cerenkov counter crystal or liquidThermoluminescence dosimeter crystalHeat calorimeter solid or liquid
3RT05_LAYOUT(089_112) 10/21/02 10:43 AM Page 90
Emissions from radioactive nuclei andradiation from that portion of theelectromagnetic spectrum beyond theultraviolet energies can cause theionization of atoms and molecules.
Ionizing radiation occurs as threeforms: (1) charged particles such as alphaparticles, beta particles and protons,(2) uncharged particles such as neutronsand (3) electromagnetic radiation in theform of X-rays and gamma rays.
Radiation DetectionSystemsSome forms of radiation, such as light andheat, can be detected by human senseorgans; ionizing radiation, however, canbe detected only by the aftereffect of itsionizing properties. If ionizing radiationdoes not interact with matter, itsdetection and measurement is impossible.For this reason, the detection process usessubstances that respond to radiation, aspart of a system for measuring the extentof that response.
The ionization process is used by alarge class of detection systems, includingion chambers, proportional chambers,geiger-müller counters and semiconductordevices (Table 1).
Some systems depend on the excitationand molecular dissociation that occurwith ionization. These processes are usefulin scintillation counters and chemicaldosimeters. Although other types ofdetection systems exist, they are notgenerally used in radiation surveyinstruments.
Radiation Detection forSafetySeveral widely used technologies forpersonnel dosimetry are discussed in thechapter on radiation safety.
TA
iographic Testing

PART 2. Ion Chambers and Proportional Counters
FIGURE 2. Basic ionization chamber with highvalue resistance R and voltage V.
Anode
Cathode
V
∆V
R
3RT05_LAYOUT(089_112) 10/21/02 10:43 AM Page 91
Principles of IonizationThe mechanism most widely used inradiation survey applications is theionization principle: charged particlesproducing ion pairs by direct interaction.These charged particles may (1) collidewith electrons and remove them fromtheir atoms or (2) transfer energy to anelectron by the interaction of their electricfields (Fig. 1). If the energy transfer is notsufficient to completely remove anelectron, the atom is left in a disturbed orexcited state.
Gamma and X-ray photons interactwith matter mainly by photoelectricabsorption, compton scattering and pairproduction, each of which produceselectrons and ions that may be collectedand measured. The average energyexpended in the creation of an ion pair,in air and most gases, is about 34 eV.
The number of ion pairs produced perunit of path length is called specificionization. Specific ionization is affectedby the energy of the particle or photon byits change and by the nature of theionized substance.
Ionization ChambersIn an ionization chamber, an electric fieldis applied across a volume of gas, betweentwo electrodes. Often the chamber’s
FIGURE 1. Ion pair (showing ejected electronand vacancy in electron orbit of atom).
Legend= electron= vacancy
geometry is cylindrical, a cylindricalcathode enclosing the gas and an axial,insulated rod anode (Fig. 2).
Charged particles, photons or both passthrough the chamber and ionize theenclosed gas. When an electric field isapplied to the gas, ions drift along theelectrical lines of force to produce anionization current. Under normalconditions, electrons drift at speeds ofabout 104 m·s–1 (22 000 mi·h–1). The driftvelocity of positive ions is many orders ofmagnitude less.
When the electric field is increasedslightly from zero and a detector is placedin the constant radiation field thecollected ions still will be few in numberbecause many recombine. As the voltageis further increased, recombination yieldsto ionization, where all ions are collected(Fig. 3).
91Radiation Measurement
FIGURE 3. Pulse size as function of voltage in gas ionchamber.
Puls
e si
ze
Reco
mbi
natio
n
Ion
chan
ger
Prop
ortio
nal r
egio
n
Lim
ited
pro
por
tiona
lity
Gei
ger
thre
shol
d
Gei
ger-
mül
ler
Voltage
Con
tinuo
us d
isch
arge

92 R
3RT05_LAYOUT(089_112) 10/21/02 10:43 AM Page 92
Ion current chambers have a responsemagnitude proportional to the absorbedenergy and are therefore widely used formaking dose measurements. When(1) recombination is negligible, (2) gasamplification does not occur and (3) allother charges are efficiently collected,then the steady state current produced isan accurate measurement of the rate atwhich ion pairs are formed within thegas. Measurement of this ionizationcurrent is the principle behind the directcurrent ion chamber.
Ion chambers may be constructed ofseveral different materials and, because
adiographic Testing
FIGURE 4. Energy and directional response of tyof response curve; (b) comparison of several re
(a)
1.2
1.0
0.8
0.6
0.45 10 100
Effective photon en
Legend= Parallel to long axis, cap on= Parallel to long axis, cap off= Perpendicular to long axis
CP = constant potential
Ratio
of
indi
cate
d to
act
ual r
esp
onse
(b) 1.3
1.2
1.1
1.0
0.9
0.8
0.7
0.6
0.5
0.4
0.3
0.2
0.1
06 8 10 20 40 606.7
Effective ph
Ratio
of
indi
cate
d to
ac
tual
res
pon
se
7 kV CP
20 kV CP
40 kV CP
50 kV CP
50 kV CP
100
radiation must penetrate the wall of thechamber to ionize the gas volume,chambers are chosen for the specificradiation energy being evaluated. Whenconsidering a particular instrument theenergy response curve should always beconsulted (Fig. 4). Some instruments mayalso have an angular dependence (moresensitivity in some directions), whichshould also be considered when makingmeasurements. Radio frequency shieldedionization chambers are available formeasurements made near high level radiofrequency sources.
pical ion chamber survey meters: (a) examplesponse curves.
1000 2000
ergy (keV)
80 100 200 400 600 10001250
oton energy (keV)
kV CP
150 kV CP
200 kV CP
250 kV CP Cesium-137
Cobalt-60

FIGURE 5. O
Ion cham
Collectipotent
FIGURE 6. Principle of vibrating reedelectrometer; oscillations of capacitanceinduce alternating current voltageproportional to steady state signal current.
Signalcurrent
3RT05_LAYOUT(089_112) 10/21/02 10:43 AM Page 93
Output CurrentMeasurementsThe ionization current collected in theion chamber flows through an externalcircuit for measurement. Although inprinciple an ammeter could be placed inthe external circuit to read the ioncurrent, in practice the ammeter is notplaced there, for the current is very small.A 440 cm3 (27 in.3) ion chamber typicallyproduces about 4 × 10–15 A·µSv–1
(4 × 10–14 A·mR–1) at standard temperatureand pressure. A high valued load resistor(on the order of 1010 Ω) is placed in thecircuit and the voltage drop across theresistor is measured with a sensitiveelectrometer. A metal oxide silicon fieldeffect transistor (MOSFET) is used in someelectrometers. The metal oxide siliconfield effect transistor produces an inputimpedance on the order of 1015 Ω toamplify the collected current (Fig. 5).
Vibrating ReedElectrometersAn alternative approach to ion currentmeasurement is to convert the signal fromdirect current to alternating current at anearly stage. This allows a more stableamplification of the alternating currentsignal in subsequent operations. Theconversion is accomplished in a dynamiccapacitor or vibrating reed electrometer,by collecting the ion current across aresistive capacitive circuit. Thecapacitance is then changed rapidly,
perational configuration of current amplifier.
ber
Feedbackelement
– +Current
Calibrationcontrolon
ial
Meter
Directcurrentgainselector
–
+
–
+
1000
300
100
30
10
3
Metal oxidesilicon fieldeffect transistorelectrometer
compared to the time constant of thecircuit. The induced alternating currentvoltage is proportional to the ionizationcurrent (Fig. 6).
Integrating InstrumentsThe instruments described above (Fig. 7)are generally rate meters; that is, theyindicate the radiation at the time ofexposure and, depending on its timeconstant, will return to background levelsas the source is removed.
Some instruments may have anintegration switch that introduces acapacitor to the circuit to accumulate thecharge. Leaving such an instrument at anoperator’s location will indicate the totalamount of ionizing radiation that area hasreceived, from the time the instrument isengaged.
Personnel MonitoringInstruments
Pocket ChambersPersonnel monitoring instruments, somethe size of a ball point pen, are usually
93Radiation Measurement
Alternatingcurrent electrometerCapacitor Resistor
FIGURE 7. Examples of ionization chamberslocated externally on survey instruments.Protective caps are removed, showing thinwindows for low energy X-ray or betadetection.

94 R
FIGURE 9. Cross section of pocket (directreading) ionization chamber.
Eyepiece
Scale
ChargerMercury drop
Objective
Connectionbetweencharger andfiber
3RT05_LAYOUT(089_112) 10/21/02 10:43 AM Page 94
the integrating type and contain anionization chamber. One version, thepocket chamber, requires the applicationof an initial charge of 150 to 200 V by anexternal instrument. Zero dose is thenindicated on a scale contained in thecharging unit. Exposure of the chamber toionization decreases the initial charge.When the chamber is reconnected to thecharging unit the reduced charge istranslated to the level of exposure (Fig. 8).
Direct Reading DosimetersThe direct reading dosimeter operates onthe principle of the gold leaf electroscope(Fig. 9). A quartz fiber is displacedelectrostatically by charging it to apotential of about 200 V. An image of thefiber is focused on a scale and viewedthrough a lens at one end of theinstrument. Radiation exposure of thedosimeter discharges the fiber, allowing itto return to its original position.Personnel dosimeters may have a full scalereading of 1 to 50 mSv (100 mR to 5 R)and may have other scales according toapplicable regulations.
Chambers are available with thin wallsfor sensitivity to beta radiation over1 MeV and may be coated on the insidewith boron for neutron sensitivity.
adiographic Testing
FIGURE 8. Cross section of quartz fiber pocketdosimeter.
Legend1. Low atomic number wall2. Graphite coated paper shell3. Aluminum terminal head4. Aluminum terminal sleeve5. Polystyrene support bushing6. Central electrode, graphite coated7. Polyethylene insulating washer8. Polystyrene fixed bushing9. Electrode contact
10. Retaining ring11. Aluminum base cap12. Polyethylene friction bushing
1
23
4
5 6 7 8
9
10 11
12
Figure 10 demonstrates the energyresponse of self-reading pocketdosimeters. Table 2 lists performancespecifications of dosimeters in general.2
Proportional CountersIf the electric field in an ion chamber israised above the ionization potential butbelow saturation potential, enough energyis imparted to the ions for production ofsecondary electrons by collision and gasamplification.
Ionizationchamber
Commutatorassociatedwith hood
Hermeticjoints
Quartz fiber
Support
FIGURE 10. Energy dependence of response of differentcommercial self-reading dosimeters.
Dos
imet
er r
eadi
ng (
per
cent
of
true
dos
e)
300
200
100
Quantum energy (keV)
± 30
30 40 50 70 100 150 200 300

TABLE 2. General performance specifications for dosimeters.2
Characteristic Performance Specification
Accuracy ±12 percent at 95 percent confidenceEnergy dependence ±10 percent over given rangeSensitivity adjustment sealedExterior surface smoothRuggedness withstands drop of 1.2 m (4 ft)Temperature +50 to –10 °C (+122 to +14 °F)Humidity 0 to 90 percentDischarge no more than 2 percent of full scale in 24 hAngular dependence more than 70 percent at angles greater than 50 degrees from direction of
maximum response
3RT05_LAYOUT(089_112) 10/21/02 10:43 AM Page 95
Operation at this electric potentialovercomes the difficulty of the smallcurrents in the ionization region yet takesadvantage of pulse size dependence forseparating various ionizing energies.When an ionization chamber is operatedin this region it is called a proportionalcounter.
The size of the output pulse isdetermined by, and proportional to, thenumber of electrons collected at theanode and the voltage applied at thedetector. By careful selection of gases andvoltages, a properly designed proportionalcounter can detect alphas in the presenceof betas, or higher energy beta andgamma radiation in the presence of lowerenergies. Proportional counters are oftenused in X-ray diffraction applications.
95Radiation Measurement

96 Radi
PART 3. Geiger-Müller Counters
FIGURE 11. Resolving time, dead time and recovery time forgeiger-müller system.
Ionizingevents
Pote
ntia
l diff
eren
ce
Trigger level
Dead time
Resolving timeRecovery time
Puls
e am
plit
ude
3RT05_LAYOUT(089_112) 10/21/02 10:43 AM Page 96
Operating Voltage LevelIncreasing voltage beyond theproportional region (Fig. 3) will eventuallycause the gas avalanche to extend alongthe entire length of the anode wire. Whenthis happens, the end of the proportionalregion is reached and the geiger-müllerregion begins.
An instrument operating in thisvoltage range, using a sealed gas filleddetector, is referred to as a geiger-müllercounter, a GM counter or simply a geigertube. This instrument was introduced in1928 and its simplicity and low cost havemade it the most popular radiationdetector since then. Geiger-müllercounters complement the ion chamberand proportional counter and comprisethe third category of gas filled detectorsbased on ionization.
PropertiesExtension of the gas avalanche increasesthe gas amplification factors so that 109 to1010 ion pairs are formed in the discharge.This results in an output pulse largeenough (0.25 to 10 V) to require nosophisticated electronic amplificationcircuitry for readout. At this voltage, thesize of all pulses, regardless of the natureof the ionization, is the same.
When operated in the geiger-müllerregion, a counter cannot distinguishamong the several types of radiation andtherefore is not useful for spectroscopy orfor the detection of one energy event inthe presence of another. An externalshield is often used to filter out alpha andbeta particles in the presence of gammaenergies.
Resolving TimeAs an ionizing event occurs in thecounter, the avalanche of ions paralyzesthe counter. The counter is then incapableof responding to another event until thedischarge dissipates and proper potentialis established. The time it takes toreestablish the electric field intensity isreferred to as the resolving time. Averageresolving time for a geiger-müller counter
ographic Testing
is about 100 ms, which must be correctedat high level readings.
Resolving time τ of a counter may bedetermined by counting two sourcesindependently (R1 and R2), then together(R1, R2). The background count is Rb.
(1)
Correct counting rate R can be calculatedfrom observed counting rate Ro andresolving time τ in the following equationfor nonparalyzable systems:
(2)
Dead TimeThe relationship of resolving time to deadtime and recovery is illustrated in Fig. 11.Resolving time may be a function of thedetector alone or of the detector and itssignal processing electronics. Its effect onthe real counting rate depends onwhether the system design is paralyzableor nonparalyzable.
Nonparalyzable SystemsIn Fig. 12, a time scale is shownindicating six randomly spaced events inthe detector.3
At the bottom of the illustration is thecorresponding dead time behavior of a
RR
R=
−o
o1 τ
τ =+ − −
− −
R R R R
R R R1 2 1 2
1 22
12
22
,
,
b

FIGURE 12and nonp
Deadlive
Event
Deadlive
Legendτ = resolvin
FIGURE 13. Assortment of geiger-müllercounters demonstrating availability of sizesand shapes. Smallest counter shown is
3RT05_LAYOUT(089_112) 10/21/02 10:43 AM Page 97
detector assumed to be nonparalyzable.A fixed time τ follows each event thatoccurs during the live period of thedetector. Events occurring during the deadtime have no effect on the detector,which would record four counts from thesix interactions.
Paralyzable SystemsThe top line of Fig. 12 illustrates aparalyzable system. Resolving time τfollows each interaction, whether it isrecorded or not. Events that occur duringresolving time τ are not recorded andfurther extend the dead time by anotherperiod τ. The chart indicates only threerecorded events from the six interactions.In this case, τ increases with increasednumber of interactions.3
It can be demonstrated that with aparalyzable system (at increasingly higherinteraction rates), the observed countingrates can actually decrease with anincreased number of events. When usinga counting system that may beparalyzable, extreme caution must betaken to ensure that low observedcounting rates correspond to lowinteraction rates, rather than very highinteraction rates with accompanying, longdead time. It is possible for a paralyzablesystem to record the first interaction andthen be paralyzed, recording zero countsin high radiation fields.
QuenchingAs positive ions are collected after a pulse,they give up their kinetic energy bystriking the wall of the tube; ultravioletphotons and/or electrons are liberated,producing spurious counts. Prevention ofsuch counts is called quenching.
Quenching may be accomplishedelectronically (by lowering the anodevoltage after a pulse) or chemically (byusing a self-quenching gas).
. Processing of detector interactions in paralyzablearalyzable systems.3
Paralyzable
s in detector Time
Nonparalyzable
τ
g time
τ
Electronic QuenchingElectronic quenching is accomplished byintroducing a high value of resistance intothe voltage circuit. This will drop theanode potential until all the positive ionshave been collected.
Self-Quenching GasA self-quenching gas is one that canabsorb ultraviolet (UV) photons withoutbecoming ionized. One way to use thischaracteristic is to introduce a smallamount of organic vapor, such as alcoholor ether, into the tube. The energy fromthe ultraviolet photons is then dissipatedby dissociating the gas molecule. Such atube is useful only as long as it has asufficient number of organic molecules todissociate, generally about 108 counts.
To avoid the problem of limitedlifetime, some tubes use halogens(chlorine or bromine) as the quench gas.The halogen molecules also dissociate inthe quenching process but they arereplenished by spontaneousrecombination at a later time. Halogenquench tubes have an infinite lifetimeand are preferred for extendedapplications.
Reaction products of the dischargeoften produce contamination of the gas ordeposition on the anode surface andgenerally limit the lifetimes ofgeiger-müller tubes.
Design VariationsGeiger-müller counters (Fig. 13) areavailable in various shapes and sizes. Themost common form is that of a cylinderwith a central anode wire. If low energybeta or alpha particles are to be counted, a
97Radiation Measurement
about 30 mm (1 in.) long.

98 Rad
FIGURE 14. Dpersonnel ra
Ratio
of
indi
cate
d to
true
dos
e ra
te
1.2
1.0
40
3RT05_LAYOUT(089_112) 10/21/02 10:43 AM Page 98
unit with a thin entrance window (1 to4 mg·cm–2) should be selected.
For surveying large surfaces, pancake orlarge window counters are available. Highcount rate instruments, greater than0.14 mSv·s–1 (50 mR·h–1), generally
iographic Testing
ose rate ratio versus effective energy fordiation monitor.
60 80 100 200 300 400500 1000
Effective energy (keV)
Cesium-137 Cobalt-60
FIGURE 15. Typical energy response curves for ge(b) radiation incident on side versus front; (c) exlong axis of probe; (d) radiation incident norma
Ratio
of
indi
cate
d to
act
ual
exp
osur
e ra
te
(a)
Bare tube
Tube inprobe, betashield open
Beta shield closed
Probe axis perpendicular to incident radiation
1086
4
2
10.80.6
0.4
0.2
0.110 50 100 500 1000
Cesium-137 Coba
Ratio
of
indi
cate
d to
act
ual
exp
osur
e ra
te
(b)
Effective energy (keV)
Side
Fron
2.2
2.0
1.8
1.6
1.4
1.2
1.0
0.8
0.6
0.4
0.2
20 50 100 500 1000
Effective energy (keV)
Cesium-137 Cobalt-60
contain a small tube to minimizeresolving time of the system; large volumedetectors may require significantcorrection.
A geiger-müller counter response togamma rays occurs by way of gamma rayinteraction with the solid wall of the tube.The incident gamma ray interacts withthe wall and produces a secondaryelectron that subsequently reaches thegas. The probability of gamma rayinteraction generally increases with higherdensity wall material.
Alarming Rate Meters(Personnel Monitors)Small geiger-müller tubes are used inpocket-sized units for personnelmonitoring. They generally emit a highfrequency chirp at a rate proportional tothe subjected dose rate. United States
iger-müller counters (a) shielded versus unshielded;posure ratio close to ideal with radiation incident normal tol to long axis of probe.
Effective energy (keV)
lt-60
Probe shield open
Probe shield closed
2
1
010 50 100 500 1000
Ratio
of
indi
cate
d to
act
ual
exp
osur
e ra
te(c)
t
Ratio
of
indi
cate
d to
act
ual
exp
osur
e ra
te
(d)
6
5
4
3
2
1
10 50 100 500 1000
Effective energy (keV)
Cesium-137 Cobalt-60
Probe shield open
Probe shield closed
Cesium-137 Cobalt-60

3RT05_LAYOUT(089_112) 10/21/02 10:43 AM Page 99
regulations specify an alarm threshold of500 mSv·h–1 (500 mR·h–1) for field gammaradiography. The energy dependencecurve for one such instrument is shown inFig. 14.
ApplicationsGeiger-müller counters are the mostwidely used, general purpose radiationsurvey instruments. It must beremembered that geiger-müller counters,unlike current ionization chambers, readpulses (regardless of their energy orionizing potential) and register in countsper minute. Some instruments have ascale calibrated in milliroentgens per hour(mR·h–1); however, this is an arbitraryscale calibrated on the radiation fromradium-226, cesium-137 or some otherenergy (Fig. 15). Another scale ismicrosieverts per second (µSv·s–1). Asensitivity versus energy table shouldalways be consulted before makingmeasurements with a geiger-müllerinstrument.
99Radiation Measurement

100 Radio
PART 4. Scintillation Detectors
TABLE 3. Com
Scintillato
Sodium iodLithium iodiZinc sulfideBismuth ger
a. Many otherradiation su
b. Parentheses
3RT05_LAYOUT(089_112) 10/21/02 10:43 AM Page 100
Soon after the discovery of X-rays andradioactivity, it was observed that certainmaterials emit visible light photons afterinteracting with ionizing radiation. Theselight photons appear to flash or sparkleand the materials are said to scintillate.Scintillators commonly used withradiation survey instruments are solidmaterials. Being denser than gases, thesescintillators have greater detectionefficiencies and are useful for low levelmeasurements. For gamma photons,scintillators have detection efficiencies 106
times greater than typical gas ionizationchambers. Detection of alpha and betaparticles, neutrons and gamma photons ispossible with various scintillator systems(Table 3).
Scintillation ProcessRadiation interactions with matterproduce excitation as well as irrigation.Ionization refers to the removal of anelectron from an atom and excitationrefers to the elevation of an electron’senergy state. The return of excitedelectrons to their normal, lower energystate is called deexcitation. Scintillatorsexcited by ionizing radiation return tolower energy states quickly and emitvisible light during the deexcitationprocess. Radiation detection is possible bymeasuring the scintillator’s light output(Fig. 16).
Materials andCharacteristicsScintillation materials come in gaseous,liquid and solid forms. Organic liquids
graphic Testing
mon scintillators.
Chemical Radiation ra Symbolb Type Detected
ide NaI(Tl) gammade LiI(Eu) gamma, neutrons
ZnS(Ag) alphamanate Bi4Ge3O12 gamma
scintillators are available but are not commonly used withrvey instruments. indicate impurity used as activator.
and solids, as well as inorganic gases andsolids, are common scintillators. Organic,solid scintillators are available as crystals,plastics and gels. Inorganic solidscintillators are usually alkali halidecrystals. The scintillation process ininorganic materials requires the presenceof small amounts of an impurity, oractivator. Inorganic solid scintillators arecommonly used with radiation surveyinstruments and are listed in Table 3.
Desirable ScintillatorCharacteristicsA useful and practical scintillator needs tohave most of the characteristics listedbelow. Not all of these characteristics areideally satisfied by each scintillator andoften a compromise is acceptable.
1. The scintillator should be of highdensity and large enough to ensureadequate interaction with the ionizingradiation.
2. Efficient conversion of the electron’skinetic energy into visible light isrequired and the light yield should belinearly related to the depositedelectron kinetic energy.
3. The scintillator should be of goodoptical quality, transparent to itsemitted light and free of hydroscopiceffects, and should have an index ofrefraction close to that of glass.
4. The wavelength of the emitted lightshould be appropriate for matching toa photomultiplier tube.
Photomultiplier TubesBefore the advent of photomultipliertubes (PMTs), scintillation light photonshad to be visually counted. This limitedthe use and development of scintillators.In the 1940s, the photomultiplier tube
FIGURE 16. Energy diagram of scintillation process.
Band gap
Conduction band
Valence band
Scintillation photon
Activator excited states
Activator ground state

FIGURE 17.showing crvoltage div
Dynod
Photoelect
Photocatho
Reflec
Light phot
Ionizing
Incident p
FIGURE 18. Comparison of sodium iodide (thallium activated)and germanium detectors for gamma spectroscopy.
Act
ivity
(lo
g sc
ale)
0.6621.09
1.17
1.291.33
Sodium iodide(thallium activated)detector
3RT05_LAYOUT(089_112) 10/21/02 10:43 AM Page 101
was developed and dramatically increasedthe use of scintillators, to the point wherescintillators are preferred over otherradiation detectors for many surveyapplications.
The photomultiplier tube’s function isto convert the scintillator’s light outputinto a electrical pulse. Thephotomultiplier tube is composed of aphotosensitive layer, called thephotocathode, and a number of electronmultiplication structures called dynodes.Conversion of the scintillation light intophotoelectrons is accomplished by thephotocathodes through the photoelectriceffect. To maximize the informationcontained in the scintillation light, thephotomultiplier tube photocathodeshould be matched to the scintillator; thescintillator and photomultiplier tubeshould be optically coupled to minimizelight losses.
Electron multiplication, or gain, isaccomplished by positively charging thedynodes in successive stages, so that thetotal voltage applied to thephotomultiplier tube is around 1000 V.Electrons emitted by the photocathodeare focused toward the first dynode; moreelectrons are emitted than were initiallyincident on the dynode. This is repeatedat each dynode stage. The photocathodeand dynodes are positioned in a glassenclosed vacuum so that air moleculeswill not interfere with the collection ofelectrons. The net result of thephotomultiplier tube may be an electron
Cutaway drawing of photomultiplier tube,ystal, photocathode, collecting dynodes andider network.4
Output pulse
Highvoltage
es
ron
de
tor
on
event
hoton Crystal
Path of primary ionizing particle
Focusing electrode
gain up to 1010 per emittedphotoelectron. Figure 17 illustrates thestructure of a photomultiplier tube.4
System ElectronicsOnce the output pulse from aphotomultiplier tube is generated, it isamplified and analyzed. The pulse height,or amplitude, is proportional to theamount of energy deposited within thescintillator and can be correlated to acount rate or scale of microsievert persecond (µSv·s–1) or milliroentgen per hour(mR·h–1) when calibrated against a knownenergy source. (See Fig. 18.)
101Radiation Measurement
Germanium detector
0 0.2 0.4 0.6 0.8 1.0 1.2 1.4 1.6
Energy (MeV)

102 Rad
PART 5. Luminescent Dosimetry
FIGURE 19. T
Unstable state
Metastable stat
Ground stat
Legendx = electrono = electron v
FIGURE 20. Typical glow curve. Integratedarea under curve is measure of radiationexposure.5
3RT05_LAYOUT(089_112) 10/21/02 10:43 AM Page 102
ThermoluminescentDosimetryThermoluminescence is the emission oflight from previously irradiated materialsafter gentle heating. The radiation effectin thermoluminescent (TL) materials issimilar to that observed in scintillators,except that light photon emission doesnot occur in thermoluminescent materialsuntil some heat energy is supplied(Fig. 19).5 Measurement of the lightphotons emitted after heating permitscorrelation to the amount of ionizingradiation energy that was absorbed in thethermoluminescent material.Thermoluminescent dosimetry (TLD) ispossible for beta, gamma and neutronradiations, if the appropriatethermoluminescent material is used.
Lithium Fluoride PropertiesThe most common thermoluminescentphosphor used in gamma and neutronpersonnel dosimetry is lithium fluoride.Other thermoluminescent phosphors areavailable for personnel dosimetry but, forvarious reasons, are not as well suited aslithium fluoride. The advantages oflithium fluoride include its (1) usefulnessover a wide dose range, (2) linear doseresponse, (3) near dose rate independence,(4) reusability, (5) stability, (6) short
iographic Testing
hermoluminescence process.5
e
Photon
eUnirradiated Irradiated Heated
X-rays
Time
acancy
readout time and (7) near tissueequivalence. Disadvantages include theloss of information after readout and lackof information about the incidentradiation energy.
Both gamma photons and neutronsproduce ionization indirectly. Gammaphotons interact with matter, releasingelectrons that in turn cause ionization.Lithium fluoride undergoes interactionswith gamma photons and is thereforeused in gamma dosimetry. Slow neutronsrequire the presence of the lithiumfluoride enriched with lithium-6 fordetection of the (n, α) nuclear reaction.Fast neutron detection with lithiumfluoride would only be possible if the fastneutrons were slowed down to thermalenergies before reaching the lithiumfluoride thermoluminescent dosimeter.Nearly complete elimination of neutronresponse in lithium fluoride is possiblewith lithium fluoride enriched withlithium-7. In a mixed gamma and slowneutron field, distinction of gamma andneutron doses is possible by comparingthe readings of two lithium fluoridethermoluminescent dosimeters withdifferent lithium-6 contents.
Ligh
t em
itted
(re
lativ
e un
it)
0 8 16 24
Time (s)

3RT05_LAYOUT(089_112) 10/21/02 10:43 AM Page 103
Thermoluminescent DosimetricReadout SystemsThermoluminescent dosimetric readoutsystems are commonly made up of asample holder, heating system,photomultiplier tube (light detector), highvoltage supply, signal amplifier and arecording instrument. Thethermoluminescent dosimetric sample isheated indirectly, using electricalresistance heat applied to a pan orplanchette. The photomultiplier tubeconverts the light output into anelectronic pulse that is then amplifiedbefore recording. The recordinginstrument may be a plotter or any otherinstrument that can measure theamplified photomultiplier tube outputsignal. A plot of the output signal versustime is equivalent to emitted lightintensity versus heat and results in a glowcurve. The area under the glow curve isproportional to the absorbed dose(Fig. 20).5
Uses of thermoluminescentmeasurement of radiation includepersonnel dosimetry, medical dosimetry,environmental monitoring andarcheological and geological dating.
Optically StimulatedLuminescence DosimetryOptically stimulated luminescencedosimeters typically have aluminum oxidedetectors and are available in plasticholders, or body badges, that are worn atcollar level to measure full body dose.They can measure gamma ray and X-raydoses from 10µSv to 10Sv (1 mrem to1 krem).
103Radiation Measurement

104 Rad
PART 6. Neutron Detection
3RT05_LAYOUT(089_112) 10/21/02 10:43 AM Page 104
CharacteristicsThe neutron is a part of the nucleus, hasno charge and is somewhat larger in massthan the proton. It is similar to thephoton in that it has no charge andproduces ionization indirectly; it isdifferent from the photon because it is anuclear particle and not a unit ofelectromagnetic energy. Because theneutron is an uncharged particle, itsinteractions with matter are different fromthose of charged particles or photons.
Ionization by neutrons is indirect: as aresult of neutron interactions with matter,recoil nuclei, photons or charged particlesare produced and then interact withmatter by various mechanisms that causeionization.
Neutron SourcesNeutrons are classified according to theirenergies as shown in Table 4.
Some radionuclides (such ascalifornium-252) may decay byspontaneous fission and emit neutronswith fission fragments, photons andelectrons. Induced fission reactions, suchas those occurring in a nuclear reactorwith uranium, emit about 2.5 neutronsper fission. Fission neutrons range inenergy from 0.025 eV to about 16 MeV.Other neutron sources are the result ofvarious nuclear reactions and produceeither a spectrum of neutron energies ormonoenergetic neutrons. Commonneutron producing nuclear reactions arethe (γ, n), (α, n), (p, n), (d, n) and (α, 2n)reactions and may use radionuclideemissions or accelerated particles toinitiate the reaction. Neutron radiography
iographic Testing
TABLE 4. Neutron classification.
Class Energy
Thermal < 0.3 meVEpithermal >1 eVSlow 30 meV to 100 eVIntermediate 100 eV to 10 keVFast 10 keV to 10 MeVRelativistic greater than 10 MeV
usually uses radionuclides that emit alphaor gamma photons and produce neutronsby (α, n) and (γ, n) reactions with varioustarget materials.
Neutron DetectorsThere are several mechanisms and devicesused to detect neutrons of variousenergies. Ionization chambers,proportional counters, scintillators,activation foils, track etch detectors, filmemulsions, nuclear emulsions andthermoluminescent phosphors are someof the many devices used to detectneutrons. The main mechanisms used todetect neutrons in these devices are the(n, α), (n, p), (n, d), (n, f ) and (n, γ)nuclear reactions.
Proportional Neutron DetectorsMany fast and slow neutron counters useproportional counting chambers filledwith boron trifluoride (BF3) gas, oftenenriched in boron-10. The interaction ofthermal (slow) neutrons with boron gasreleases an alpha particle of severalmegaelectronvolts that is easily detectedin the proportional mode. Fast neutronsare detected by a similar counter, inwhich thermal neutrons are absorbed inan external cadmium shield; the fastneutrons that pass through the shield arethermalized in hydrogen rich materialand counted in the proportionalchambers.
ScintillationScintillators containing lithium-6,boron-10 and hydrogenous plastics havebeen used as neutron detectors. Lithium-6is used as lithium iodide (europiumactivated) and in lithium glasses to detectslow and fast neutrons. Scintillatorsloaded with boron-10 are used for slowneutron detection. Plastic scintillatorswith high hydrogen content are used infast neutron detection and spectroscopyby measuring the energy deposited byrecoil protons.
Activation FoilsIntroducing certain materials to anincident neutron flux will result in thesematerials becoming radioactive. The

3RT05_LAYOUT(089_112) 10/21/02 10:43 AM Page 105
process is called activation and gaininginformation about the incident neutronflux and energy is possible by analyzingthe radiations emitted from the activatedfoil. Activation foils rely on (n, γ), (n, p),(n, α), (n, f ) and other nuclear reactionsto cause the activation. Selection of theproper activation foil can give a roughestimate of the neutron energy spectrum.In high neutron flux fields, whereinstruments would fail, activation foils areused as integrating detectors.
Miscellaneous Neutron DetectorsTrack etch detectors, nuclear emulsionsand film have all been used to detectneutrons. Various neutron interactionswith the detector material or foils inintimate contact with the detectors allowthese systems to operate as integratingdosimeters.
105Radiation Measurement

106 Rad
PART 7. Semiconductors
TABLE 5. Ra
_________Charged P
x————————
3RT05_LAYOUT(089_112) 10/21/02 10:43 AM Page 106
Certain semiconductor crystals, whenexposed to ionizing radiation, becomeconductors and may be used as radiationdetectors. Semiconductors are most oftenused for low level spectroscopicmeasurements of alpha particles, betaparticles and gamma rays in laboratorysettings and in X-ray diffractionequipment (Table 5).
The most widely used semiconductordevices are diffused p-n junction, surfacebarrier and lithium drifted detectors.Semiconductor detectors have found theirbroadest application in the field ofspectroscopy, although lithium drifteddetectors are also being used for gammaray detection.
Diffused p-n JunctionDetectorThe diffused p-n junction detector(Fig. 21a) gets its name from itsmanufacturing process. A slice of p type(electron depleted) silicon or germaniumcrystal, with a layer of n type (electronrich) impurity (usually phosphorus)deposited on the surface, is heated toform a p-n junction just below the surface.The phosphorus may also be painted ontothe silicon and made to diffuse into it byapplying heat. Because the n type materialhas an excess of electrons and the p typehas an excess of holes (holes may bethought of as unit positive charges), thenatural action of the combined materialstends to align the electrons on one side ofthe junction and the holes on the other.Thus a difference of potential is built upacross the junction.
By applying an external voltage to thecrystal of such polarity as to oppose the
iographic Testing
diation detector types.
Radiation Type______________________________article Gamma Ray X-Ray
—— —— Silicon surface bar—— x Silicon (lithium act
x —— Coaxial germaniumx x Coaxial pure germx x Planar, pure germa
of 2 to 200 keV
natural movement of electrons and holes(reverse bias), the potential barrier acrossthe junction is increased and a depletionregion is produced.
This depletion region is the sensitivepart of the detector and is analogous tothe gas volume in a gas ionizationdetector. Charged particles, on enteringthe depletion region, produce electronhole pairs analogous to the ion pairsproduced in gas ionization chambers.Because an electric field exists in thisregion, the charge produced by theionizing particle is collected, producing apulse of current. The size of the pulse isproportional to the energy expended bythe particle.
Surface Barrier DetectorsThe operation of surface barrier andlithium drifted detectors is the same as forthe p-n junction: a depletion region isproduced, in which there exists an electricfield. The means of producing thedepletion region (as well as its dimensionand location within the crystal) vary fromone type of detector to another.
The operation of a surface barrierdetector (Fig. 21b) depends on the surfaceconditions of the silicon or germanium.At the surface of a piece of pure crystal,an electric field exists such that bothholes and electrons are excluded from athin region near the surface. For n typecrystals, the field repels free electrons. If ametal is joined to the crystal, the freeelectrons are still repelled but aconcentration of holes is produceddirectly under the surface. If a reverse biasis then applied, a depletion region isproduced.
Detector Type
rier detectorsivated) detector systems for X-ray detection exclusively below 30 keV (lithium activated) detectors
anium detectorsnium detectors: low energy photon spectrometer for energy range

FIGUR(b) su
(a)
elec
Ele
Deplereg
(b)
elec
Elec
Depletreg
FIGURE 22. Cross section of lithium drifted detector.
Uncompensated p type
Lithiumdiffused layer
Gold contactsurface barrier
Incident particle
Lithiumcompensated layer
Guard ring
± ± ± ±
3RT05_LAYOUT(089_112) 10/21/02 10:43 AM Page 107
Surface barrier detectors give betterresolution for particle spectroscopy thanp-n junctions but wider depletion regionsare possible with the latter. (The wider thedepletion region, the higher the energy ofparticles can be analyzed because aparticle must expend all its energy in adepletion region.)
Lithium Drifted DetectorsThe lithium drifted detector (Fig. 22) isproduced by diffusing lithium into lowresistivity p-type silicon or germanium.When heated under reverse bias, thelithium ions serve as an n type donor.These ions drift into the silicon orgermanium in such a way that a widelayer of the p type material iscompensated by the lithium, yielding aneffective resistivity comparable to that ofthe intrinsic material. Wider depletionregions can be obtained with the lithiumdrift process than by any other means.Consequently, lithium drifted detectorsare most useful in gamma spectroscopywork.
Silicon detectors can be operated atroom temperatures but exhibit lowefficiency for gamma rays. Germanium
detectors have higher gamma efficienciesE 21. Cross sections: (a) diffused p-n junction detector;rface barrier detector.
Contact fortrical leadoff
Charged particlesenter from this side n type region produced by
diffussion in phosphorus
Metal electrode
p type silicon
ctrical lead
tionion
Contact fortrical leadoff
Charged particlesenter from this side
Thin gold electrode
Metal electrode
n type silicon
trical lead
ionion
but must be operated at liquid nitrogentemperatures. For these reasons, coupledwith the small sensitive volumesobtainable to date, semiconductordetectors have not received widespreadapplication in radiation surveyinstruments.
107Radiation Measurement

108 Radio
PART 8. Film Badges1,5-7
3RT05_LAYOUT(089_112) 10/21/02 10:43 AM Page 108
One of the most important uses ofradiographic film as a means of measuringradiation is in film badges. Individualswho work with isotope radiation sourcesand X-ray machines are required by codesto wear badges indicating cumulativeexposure to ionizing radiation. Filmbadges are discussed in this volume’schapter on radiation safety andelsewhere.2,5,6
Latent Image FormationLatent image formation is a very subtlechange in the silver halide grain of film.The process may involve the absorption ofonly one or, at most, a few photons ofradiation and this may affect only a fewatoms out of some 109 or 1010 atoms in atypical photographic grain. Formation ofthe latent image, therefore, cannot bedetected by direct physical or analyticalchemical means. The process that madean exposed photographic grain capable oftransformation into metallic silver (by themild reducing action of a developer)involved a concentration of silver atomsat one or more discrete sites on thephotographic grain.
In industrial radiography, the imageforming effects of X-rays and gamma rays,rather than those of light, are of primaryinterest. The agent that actually exposes afilm grain (a silver bromide crystal in theemulsion) is not the X-ray photon itselfbut rather the electrons (photoelectric andcompton) resulting from an absorptionevent.
The most striking difference betweenX-ray and visible light exposures arisesfrom the difference in the amounts ofenergy involved. The absorption of asingle photon of light transfers a verysmall amount of energy to the crystal —only enough energy to free a singleelectron from a bromide (Br–) ion. Severalsuccessive light photons are required tomake a single grain developable (toproduce within it, or on it, a stable latentimage). The passage of an electronthrough a grain can transmit hundreds oftimes more energy than the absorption ofa light photon. Even though this energy isused inefficiently the amount is enoughto make the grain developable.
In fact, a photoelectron or comptonelectron can have a fairly long path
graphic Testing
through a film emulsion and can rendermany grains developable. The number ofgrains exposed per photon interactionvaries from one (for X-radiation of about10 keV) to 50 or more (for a 1 MeVphoton).
Because a grain is completely exposedby the passage of an energetic electron, allX-ray exposures are, as far as theindividual grain is concerned, extremelyshort. The actual time that an electron iswithin a grain depends on the electronvelocity, the grain dimensions and thesquareness of the hit. A time on the orderof 10–13 s is representative. (In the case oflight, the exposure time for a single grainis the interval between the arrival of thefirst photon and the arrival of the lastphoton required to produce a stable latentimage.)
DevelopmentMany materials discolor with exposure tolight (some kinds of wood and humanskin are examples) and could be used torecord images. Most of these materialsreact to light exposure on a 1:1 basis —one photon of light alters one molecule oratom. In the silver halide system ofradiography, however, a few atoms ofphotolytically deposited silver can, bydevelopment, be made to trigger thesubsequent chemical deposition of some109 or 1010 additional silver atoms,resulting in an amplification factor on theorder of 109 or greater. This amplificationprocess can be uniform and reproducibleenough for quantitative radiationmeasurements.
Development is essentially a chemicalreduction in which silver halide isconverted to metallic silver. To retain thephotographic image, however, thereaction must be limited largely to thosegrains that contain a latent image; that is,to those grains that have received morethan a prescribed minimum radiationexposure.
Compounds that can be used asphotographic developing agents are thosein which the reduction of silver halide tometallic silver is catalyzed (speeded up) bythe presence of metallic silver in thelatent image. Those compounds thatreduce silver halide, in the absence of acatalytic effect by the latent image, arenot suitable developing agents because

3RT05_LAYOUT(089_112) 10/21/02 10:43 AM Page 109
they produce a uniform overall density onthe processed film.
ClosingMore information on the radiographiclatent image, its formation and processingare available elsewhere.1,7 The correct useof film badges is especially important forsafety in the conduct of radiographictesting programs and is discussed in thisbook’s chapter on radiation safety andelsewhere.2,5,6
109Radiation Measurement

1. Rivkin W.B. and G. Wicks. Ch. 4,“Radiation Detection and Recording.”Nondestructive Testing Handbook,second edition: Vol. 3, Radiography andRadiation Testing. Columbus, OH:American Society for NondestructiveTesting (1985): p 152-185.
2. ANSI N13.5-1972 (R1989), DirectReading and Indirect Reading PocketDosimeters for X- and Gamma-Radiation,Performance, Specifications for. NewYork, NY: American NationalStandards Institute (1989).
3. Knoll, G.F. Radiation Detection andMeasurement, second edition. NewYork, NY: John Wiley and Sons (1989).
4. Cember, H. Introduction to HealthPhysics, second edition. New York, NY:Pergamon Press (1983).
5. Cameron, J.R., N. Suntharalingam andG.N. Denney. ThermoluminescentDosimetry. Madison, WI: University ofWisconsin Press (1968).
6. Bush, J. Gamma Radiation Safety StudyGuide, second edition. Columbus, OH:American Society for NondestructiveTesting (2001).
7. Quinn, R.A. and C.C. Sigl, eds.Radiography in Modern Industry,fourth edition. Rochester, NY: EastmanKodak Company (1980).
Bibliography
Radiation MeasurementAttix, F.H. and W.C. Roesch. Radiation
Dosimetry. Vol. 2. New York, NY:Academic Press (1966).
Attix, F.H., ed. Luminescence Dosimetry.Symposium Series No. 8. WashingtonDC: Atomic Energy Commission(1967).
A Handbook of Radioactivity MeasurementsProcedures. NCRP Report 58.Washington, DC: National Council onRadiation Protection andMeasurements (1978).
Lapp, R.E. and H.L. Andrews. NuclearRadiation Physics. Upper Saddle River,NJ: Prentice-Hall (1972).
Price, W.J. Nuclear Radiation Detection,second edition. New York, NY:McGraw-Hill (1964).
Radiation SafetyAerna, V. Ionizing Radiation and Life. Saint
Louis, MO: C.V. Mosby Company(1971).
Alpen, E.L. Radiation Biophysics. UpperSaddle River, NJ: Prentice Hall (1990).
Basic Radiation Protection Criteria. NCRPReport 39. Washington, DC: NationalCouncil on Radiation Protection andMeasurements (1971).
Hine, G. Instrumentation in NuclearMedicine. New York, NY: AcademicPress. Vol. 1 (1967).
Instrumentation and Monitoring Methods forRadiation Protection. NCRP Report 57.Washington, DC: National Council onRadiation Protection andMeasurements (1978).
International Commission on RadiologicalProtection. Ann. ICRP 21 (1-3), 1990Recommendations of the InternationalCommission on Radiological Protection.ICRP Publication 60. Oxford, UnitedKingdom: Pergamon Press (1991).
Ionizing Radiation: Sources and BiologicalEffects. New York, NY: United NationsScientific Committee on the Effects ofAtomic Radiation (1982).
Martin, A. and S.A. Harbison. AnIntroduction to Radiation Protection,third edition. London, UnitedKingdom: Chapman and Hall (1986).
Moe, H.J. Radiation Safety TechnicianTraining Course. Prepared for theUnited States Atomic EnergyCommission under contractW-31-109-Eng-38. Argonne, IL:Argonne National Laboratory (May1972).
Morgan, K.Z. and J.E. Turner. Principles ofRadiation Protection. New York, NY:John Wiley and Sons (1973).
National Research Council, Committee onthe Biological Effects of IonizingRadiations. Health Effects of Exposure toLow Levels of Ionizing Radiations.Washington, DC: National AcademyPress (1990).
Personnel Dosimetry Systems for ExternalRadiation Exposures. Technical ReportSeries No. 109. Vienna, Austria:International Atomic Energy Agency(1970).
110 Radiographic Testing
References
3RT05_LAYOUT(089_112) 10/21/02 10:43 AM Page 110

Rivkin, W.B. Personnel Monitoring RadiationSafety and Protection in IndustrialApplications: Proceedings of aSymposium. DHEW PublicationNo. (FDA) 73-8012. Washington, DC:Department of Health, Education andWelfare (1973).
Rollo, F.D., ed. Nuclear Medicine Physics,Instrumentation and Agents. Saint Louis,MO: C.V. Mosby and Company (1977).
Shapiro, J. Radiation Protection: A Guide forScientists and Physicians. Cambridge,MA: Harvard University Press (1990).
Shleien, B. and M. Terpilak. The HealthPhysics Handbook. Olney, MD: NuclearLectern Associates (1984).
Simmons, G.H. A Training Manual forNuclear Medicine Technologists.DMRG 70-3. Washington, DC: Bureauof Radiological Health [1970].
Turner, J. Atoms, Radiation, and RadiationProtection, second edition. New York,NY: John Wiley and Sons (1995).
StandardsANSI N13.15-1985, Dosimetry Systems,
Performance of PersonnelThermoluminescence. New York, NY:American National Standards Institute(1985).
ANSI N13.2-1969 (R1982), AdministrativePractices in Radiation Monitoring (AGuide for Management). New York, NY:American National Standards Institute(1982).
ANSI N13.27-1981 (R1992), Dosimeters andAlarm Ratemeters, PerformanceRequirements for Pocket-Sized Alarm.New York, NY: American NationalStandards Institute (1992).
ANSI N13.7-1983 (R1989), PhotographicFilm Dosimeter Performance, Criteria for.New York, NY: American NationalStandards Institute (1989).
ANSI N42.5-1965, American NationalStandard for Bases for GM CounterTubes. New York, NY: Institute ofElectrical and Electronics Engineers(1965).
ANSI N43.3-1993, General Radiation Safety— Installations Using Non-MedicalX-Ray and Sealed Gamma-Ray Sources,Energies up to 10 MeV. New York, NY:American National Standards Institute(1993).
ASTM E 1894-97, Standard Guide forSelecting Dosimetry Systems forApplication in Pulsed X-Ray Sources.West Conshohocken, PA: ASTMInternational (1997).
ASTM E 2116-00, Standard Practice forDosimetry for a Self-ContainedDry-Storage Gamma-Ray Irradiator. WestConshohocken, PA: ASTMInternational (1900).
ASTM E 666-97, Standard Practice forCalculating Absorbed Dose from Gammaor X Radiation. West Conshohocken,PA: ASTM International (1997).
IEEE/ANSI N323-1978, American NationalStandard Radiation ProtectionInstrumentation Test and Calibration.New York, NY: Institute of Electricaland Electronics Engineers (1978).
IEEE 309-1999 / ANSI N42.3-1999, IEEEStandard Test Procedures and StandardBases for Geiger-Mueller Counters. NewYork, NY: Institute of Electrical andElectronics Engineers (1999).
IEEE N42.20-1995, ANSI PerformanceCriteria for Active Personnel RadiationMonitors. New York, NY: Institute ofElectrical and Electronics Engineers(1995).
Occupational Safety and HealthAdministration: 29 CFR 1910,Occupational Safety and HealthStandards [Code of Federal Regulations:Title 29, Labor]. Washington, DC:United States Government PrintingOffice.
111Radiation Measurement
3RT05_LAYOUT(089_112) 10/21/02 10:43 AM Page 111

William D. Burnett, Albuquerque, New Mexico
Garry L. Balestracci, Balestracci Unlimited,Charlestown, Rhode Island
Frank A. Iddings, San Antonio, Texas
Radiation Safety1
6C H A P T E R
3RT06 LAYOUT(113_138) 10/14/02 2:50 PM Page 113

114 Radiog
PART 1. Management of Radiation Safety
MOVIE.Radiationinjury.
3RT06 LAYOUT(113_138) 10/14/02 2:50 PM Page 114
IntroductionThere are many considerations involvedin setting up and outfitting a saferadiographic facility. Commercialconsulting firms specializing in personneldosimetry and radiation protection mayhelp with this goal. Regardless of whoestablishes or monitors the program, it isvitally important that radiation exposuresto personnel be reduced to as low a levelas is practical. To this end, eachradiographic facility should appoint aradiation safety officer, who is responsiblefor systematically assuring managementthat a safe operation exists. The functionsof the radiation safety officer are discussedlater in this part.
In the twenty-first century, somepublications of the 1970s2-5 are still usefulto document information in laterpublications. However, all guidelines,standards, regulations and handbookshave a shelf life beyond which some oftheir information is obsolete. It is theduty of inspectors and safety personnel tobecome familiar with the literature andrefer to up-to-date documents for criticaldecisions.
Because of potential changes in safetyrequirements, radiation safety officers andall personnel active in the field ofradiography should consult the mostup-to-date publications and regulationsbefore making a determination on thesafety of a radiographic facility. Manypublications are written specifically todescribe in detail the requirements andtechniques involved. The followingdiscussion is an overview of radiationsafety and personnel protection and doesnot attempt to duplicate the informationavailable elsewhere — for example, in theworks cited in the references andbibliography at the end of this chapter.Unsealed radioactive sources and theassociated health protection requirements,internal dosimetry, instrumentation andrelated subjects are not covered in thischapter. Note also that safety regulationsmay vary with locality.
raphic Testing
Radiation SafetyInspections and Audits
Government Licensing6
Most manufacturers specify that radiationproducing devices should be operatedonly by qualified personnel. Most statesrequire the registration of radiationmachines and provide survey servicesduring compliance audits. Licenses topossess byproduct materials (radioisotopesother than radium) are issued by theNuclear Regulatory Commission (NRC) orstates operating under its rules (agreementstates).
Radiation Safety OfficerPersonnel responsible for work withradiation are also responsible for radiationsafety. A radiation safety officer (RSO) needsto be appointed if fields may beexperienced in excess of 1 mSv(100 mrem) per work week in accessibleregions inside or outside externallyapplied shielding. The radiation safetyofficer is responsible for: (1) technicalassistance in planning and execution ofwork insofar as radiation safety isconcerned, (2) appraisal of safe operationof the radiation source through surveysand personnel monitoring,(3) notification of personnel workingaround the source of any special hazards,(4) reporting of radiation hazards orunsafe practices to the proper authorities,(5) seeking advice from qualified expertswhen necessary, (6) keeping records ofpersonnel exposures and area dose levels,(7) keeping informed of any changes inthe mode of operation of the source and(8) periodically providing radiation safetytraining.
A good radiation safety officer has theconfidence and support of companymanagement and the radiographypersonnel. Fair and honest treatment,knowledge of the regulations and openmindedness to ideas and needs of thoseinvolved builds a good workingrelationship. This relationship helps toensure that corrective actions are taken,however unsavory. The radiation safetyofficer must have access to any level ofmanagement necessary to ensure thecompliance with regulations and

3RT06 LAYOUT(113_138) 10/14/02 2:50 PM Page 115
procedures to provide for a safe workenvironment.
Written ProceduresAll radiographic work must be covered bywritten procedures that are reviewed andupdated annually. The radiation safetyofficer needs to work with operatingpersonnel and management in preparingthese procedures so that adequate safetyprocedures are integrated with the needsand goals of the workplace environment.The radiation safety officer can recommendapproval of a written procedure but onlymanagement can approve the procedurewith a signature.
The level of management required forapproval depends on the level of risk foroperation. Where first level managementis delegated to approve some procedures,a written delegation of authority from topmanagement should be on file in theradiation safety officer’s records.
EmergenciesWritten procedures should exist foractions to be taken in case of anemergency. While the radiation safetyofficer may have considerable authority ina radiation emergency situation, thewritten procedures should make it clearthat management is responsible forassuming the level of risk for any actiontaken in case of an emergency.
The case of a radiographic source thatbecause of mechanical problems cannotbe returned to its storage containerprovides an example. In this situation, allpersonnel should know from existinggeneral procedures to evacuate to a safedistance or location where a specific,written procedure, even handwritten, canbe prepared and approved for restoringthe source.
In a case where an injured orunconscious person is exposed to ahazardous radiation dose rate, time is veryimportant. Written procedures prepared inadvance with assignments of roles andresponsibilities, combined with periodictraining and practice scenarios, canfacilitate the rapid recovery of animmobile person without unacceptableradiation exposures to recovery personnel.
Internal Inspections7
An internal inspection system is essentialto maintaining a quality industrialradiography program. Internal inspectionprograms are mandated by regulationsand are vital to ensure safe operations andthe welfare of radiography workers as wellas of the general public.
Required internal inspections consist ofsemiannual radiographer audits, anannual overview audit of the entire
radiation protection program, an annualreview of the quality assurance programand a continuous review of the companyprogram to keep personnel exposures aslow as reasonably achievable (ALARA).Audit procedures for gamma radiographyor X-radiography are basically the same,just as observations of temporary fieldsites are conducted in a manner similar tocell or permanent facility audits. Thesecomponents make up the internalinspection system.
The single most important part of theinternal inspection system is the radiationsafety officer. The radiation safety officershould have sufficient experience andexpertise to observe radiographyoperations and immediately recognizeinfractions or violations as well as goodpractices. The radiation safety officershould be able to make a valid assessmentof the conditions observed and providecorrective actions or recommendations tothose involved. Any and all discrepanciesshould immediately be pointed out to theresponsible individuals with a followupnotification to the appropriatesupervision.
The radiation safety officer shouldconduct audits in person and takeappropriate actions to stop violations orunsafe practices. Unfortunately someregulations are instituted as a result of theactions of a few individuals. The integrityof the radiation safety officer and theradiographers are important to a goodradiation safety program. A goodrelationship between regulators andlicensees is also important to a qualityprogram. Regulators should not be fearedor shunned: avoidance gives theimpression that people have something tohide.
A number of factors can affect how anindividual reacts to situations. Very fewpeople start out with the intention tobreak the rules. But good intentions, lackof training, lack of proper equipment ormisunderstanding of the requirementscan result in problems. Many factors cancontribute to the situation, such as tightschedules, cost implications and themental health or morale of the personsinvolved. Maybe there is a bonus offeredto finish the job early. Radiographers thatcircumvent the regulations or take shortcuts around procedural requirements rungreater risk of accidents or overexposuresthan those that continuously operate bythe book. Audits are necessary to detectand correct breaches of safety procedure.
What makes up an audit or observationvaries. Simply questioning a radiographycrew can often provide a false idea of howthe crew normally operates. Anexperienced auditor can usually perceivemore while approaching a radiographyjob site and observing the normal work
115Radiation Safety

116 Rad
3RT06 LAYOUT(113_138) 10/14/02 2:50 PM Page 116
practices than can be obtained byspending eight hours sitting on a job andinterviewing radiographers. During thatamount of time when the auditor’spresence is not known, work ethics aredemonstrated and the real story is told.Followup interviews should be conductedto verify the details that must be noted:serial numbers, calibration dates anditems that need to be checked andvalidated.
This is not to suggest in any way thatobservations should be conducted, assome audits are conducted, from a longdistance by hidden auditors withbinoculars. Audits should be openexchanges of information. All partiesinvolved should be treated with thedignity and respect expected in anybusiness encounter. All involved shouldparticipate in a professional manner.
The radiographers should be aware thatthe sole purpose of the radiation safetyofficer, observer or auditor at the job siteis to validate that the radiography team isoperating to the established proceduresand within the restraints of governingregulations, not to try to catch theparticipants committing infractions.Systematic or generic deficiencies shouldbe addressed to appropriate managementfor long term corrective actions. The auditprocess should be a positive experiencerather than a traumatic one. A morecasual, relaxed, audit allows anopportunity to experience the way thingsare done.
Careful observation of details, such asradiation levels at the posted boundaries,can be conspicuously determined whileapproaching the job site. Propersurveillance techniques, area controlprocedures and adherence to properoperating procedures should becomeobvious as the auditor approach theradiography operation.
The better the auditor understandsoperations, the better the ability toidentify existing or potential problems.Experience provides a higher potential toensure the safety of personnel involved aswell as the general public. Large scaleoperations with many radiographers ormultiple locations may require assistantradiation safety officers or radiation safetyofficer delegates to be assigned to providethe support and coverage needed toensure compliance.
Temporary Field Sites versusPermanent Facilities for IsotopicSources7
At temporary field sites specific restraintsapply. Generally each field site operationoffers a new challenge. The site should beexamined and assessed to determineproblems that might arise. Location and
iographic Testing
overall conditions at the work site affectthe operations. Distances to radiation areaboundaries need to be calculated andposted as required to preventunauthorized entry into the radiographyarea. Conditions may require thatnonradiography personnel must work inclose proximity to the radiographyboundaries. Surveillance is required tomaintain control of the established area.Specific transportation requirements andregulations mandate how the radiographicexposure device and equipment aretransported to the work location.Radiation surveys must be performed toensure compliance with establishedprocedural requirements. Peak readingsneed to be documented. Emergencyprocedures and points of contact shouldbe reviewed to afford timely response inthe event of an accident or emergency. Bythe nature of the operation, anoverexposure or other accident is morelikely during a temporary field operation.
Permanent facilities are constructedand evaluated to determine restrictionsfor use. These restrictions allow somerelaxation of the requirements associatedwith temporary field site operations. Ifpermanent cells are used within theparameters established, radiation levelsoutside the facility will always be atacceptable limits. The safety inspectormust confirm that activities are within theestablished parameters. Exposure cellsmust be outfitted with alarms andwarning devices and these devices nowrequire a daily operability check. Accessesto the facility must be locked or guardedwhile exposures are being completed.
In industrial radiography operations,high radiation exists in permanentexposure cells — for example, facilitiesequipped with cobalt-60 exposure devicesof 14 TBq (385 Ci). Some permanentfacilities also serve as long term storageareas for radiography exposure devices.When established as a storage area,additional radiation surveys and postingsare required and should be checked.When it is necessary to operate anexposure cell outside of the establishedparameters for use, the cell can beestablished as a temporary field site.Additional considerations needed for atemporary site will then apply. If an alarmor warning device malfunctions, apermanent facility may be used as atemporary field site but currentregulations must be checked to find outhow long.
Semiannual Isotopic SourceAudits7
Field audits of radiography are required tobe conducted semiannually, quarterly insome locations. Every person,

MOVIE.Survey meters.
3RT06 LAYOUT(113_138) 10/14/02 2:50 PM Page 117
radiographer, radiographer’s assistant orradiation safety officer that operatesradiography equipment or participatesdirectly in a radiography operation mustbe observed. A checklist should be used toensure that each specific point is properlyaddressed. A regular semiannualinspection should cover the following.
1. Determine the source and exposuredevice being used. Verify the serialnumber of the source and theexposure device.
2. Check that the source is safe fromunauthorized removal or tampering.
3. Check the condition of the equipmentin use. Are a sufficient numberproperly functioning, calibrated surveymeters available on the job site? Arethe exposure device, control assemblyand source guide tubes in goodworking condition? Does theequipment appear to have receivedadequate inspection and maintenancefor the conditions of use?
4. Check to ensure that the equipment isbeing operated properly and inaccordance with establishedprocedures. Are good collimators andshielding being used? Are practicesbeing followed to keep exposures aslow as reasonably achievable? Aretrainees and assistants being properlysupervised?
5. Do all persons involved with theoperation have required personnelmonitoring devices? Is each dosimeterwithin calibration, not dischargedbeyond its range? Is athermoluminescent dosimeter badgeor film badge available and beingused? Is an alarming rate meteravailable and within calibration?
6. Ensure that the area is adequatelyposted in accordance with applicableprocedures. Signs must be posted forrestricted and high radiation areaboundaries.
7. Check to ensure that the highradiation is under constant directsurveillance at all times while thesource is exposed. Are adequatecontrols established to keepunauthorized personnel out of theradiography area?
8. Are procedures being properlyfollowed? Are surveys being taken asrequired? Do the people involveddisplay adequate competence for thetasks involved?
9. Check the records to ensure that thesource use log agrees with the sourceand equipment in use. Is all requiredinformation properly documented?Are the transportation records inorder?
Personnel Certification forRadiation SafetyThe United States Nuclear RegulatoryCommission (NRC) has published rulesthat govern the use of nuclear, or gamma,radiation in those states that choose tofollow federal regulations, the NRC states.In contrast, states that wish to use theirown regulations, which must meet orexceed Nuclear Regulatory Commissionrequirements, are known as agreementstates and their regulations are in force fornuclear radiation in those states. BecauseX-rays (unlike gamma rays) are notgenerated by nuclear materials, theNuclear Regulatory Commission does nothave jurisdiction over X-ray radiographyand each state is responsible for regulatingX-radiography. Radiographers working inany state must be aware of who hasjurisdiction over radiation safety and mustadhere to the requirements that govern inthat state. In some instances, largemetropolitan areas also have requirementsand these must also be met when workingin those areas.
Safety Personnel CertificationIn May 1997, the Nuclear RegulatoryCommission published a rule requiringthat all industrial radiographers usingradioactive materials be certified througheither an approved independent certifyingorganization (ICO) or an agreement stateprogram that complied with the criteria in10CFR [Code of Federal Regulations:Title 10], Part 34, Appendix A.8 The finaldeadline for compliance was set asJuly 1999 for Nuclear RegulatoryCommission states and as July 2000 foragreement states.
The American Society forNondestructive Testing (ASNT), in aneffort to provide a service to industry,developed the American Society forNondestructive Testing’s IndustrialRadiography Radiation Safety Personnel(IRRSP) program,9,10 which was sent to theNuclear Regulatory Commission forreview in late 1997. In May 1998, TheNuclear Regulatory Commission formallyapproved the American Society forNondestructive Testing as an independentcertifying organization and accepted theradioactive materials (RAM) portion of theIndustrial Radiography Radiation SafetyPersonnel examinations.
The Nuclear Regulatory Commissiondoes not take responsibility for radiationproducing machines, such as X-raymachines used in radiographic testing.Each individual state was responsible fordetermining their own certificationrequirements for radiographers usingX-radiation. The agreement states, to
117Radiation Safety

118 Ra
3RT06 LAYOUT(113_138) 10/14/02 2:50 PM Page 118
minimize duplication and establishuniformity between the States’certification requirements, formed theConference for Radiation ControlProgram Directors (CRCPD). In early1998, the American Society forNondestructive Testing asked theConference for Radiation ControlProgram Directors to review the IndustrialRadiography Radiation Safety Personnelprogram to determine if it would meet therequirements of the agreement states.
In September 2001, after detailedreview and some revision of the program,the Conference for Radiation ControlProgram Directors formally approved theAmerican Society for NondestructiveTesting as an independent certifyingorganization and recommendedacceptance of the radioactive materialsexaminations and X-ray examinations foruse by agreement states. This decision wassent to all agreement states, because eachstate makes its own decision whether ornot to accept recommendations of theConference for Radiation ControlProgram Directors.
Radiographer CertificationRadiographers are generally required tocarry two types of certification, one basedon technical competence and the otherbased on the knowledge of safetyregulations. The requirements listed incommercial codes, standards andspecifications are predominantly technicaland rely on the contractor (theradiographer’s employer) to ensure that allapplicable safety requirements are met.The safety requirements are detailed bythe local, state or federal governmentregulatory agencies that have jurisdictionover radiography in the locale where thework is to be performed.
Technical certification is required bythe code or standard governing a specificproject. The purpose of this certification isto ensure that the radiographer can makeproper exposures and accurately interpretradiographs in accordance with therequirements of the governing code orspecification. Each code or specificationhas varying technical requirements andeach will specify that a radiographer becertified somehow before working onprojects governed by those documents. Acertified radiographer will be able toproduce acceptable radiographs thataccurately show that the quality ofworkmanship required by the designerhas been achieved.
Safety certification is required by local,state and federal regulatory agencies.Because of the dangers of penetratingradiation, these agencies want to ensurethe safety of the general public andrequire that all radiographers demonstrate
diographic Testing
their knowledge of safety regulations bysuccessfully completing a safetyexamination on the type of radiation tobe used in the course of their work. To beeligible to sit for these safetyexaminations, radiographers must be ableto show that they have had adequatetraining and experience in performingradiography.
Transportation ofRadioactive MaterialsRadioactive material is consideredhazardous material. As a result itsshipment within the United States iscontrolled by the Department ofTransportation under the Code of FederalRegulations, Title 49, Subtitle B,Parts 171-177.11 These regulationsprescribe the rules and procedures forpackaging, marking, labeling, placardingand shipping.
Additional requirements for theinternational shipment of such materialsby air are set forth by the InternationalAir Transport Association (IATA).
Except for very minor quantities, use ofthe Postal Service for transport ofradioactive materials is prohibited.
Finally the Inter-GovernmentalMaritime Consultative Organization(IMCO) and the International AtomicEnergy Agency (IAEA, an office of theUnited Nations) represent the collectionof nations around the world that regulatethe international transport of dangerousgoods by sea.
DisposalThe disposal of leaking sources,contaminated equipment or sourcesdecayed below useful levels must beaccording to the Code of FederalRegulations, Title 10.12 Generally, acommercial radioactive waste disposalservice licensed by the Nuclear RegulatoryCommission is used for this purpose,either directly by the owner of the sourceor indirectly by returning the source tothe manufacturer.

PART 2. Dose Definitions and Exposure Levels
3RT06 LAYOUT(113_138) 10/14/02 2:50 PM Page 119
Radiation Quantities andUnitsRadiation is measured by theInternational System of Units (SI),described elsewhere in this volume. SIunits include the becquerel, coulomb,sievert and gray. The literature forradiation safety also uses older units, suchas roentgen, curie, rad and rem. Becauseof the widespread use of the older units inthe United States, especially in regulatorydocuments dealing with health and safety,the United States Department ofCommerce in 1998 accepted these olderunits with SI.13 All these units arediscussed briefly below.1,14
Disintegration Rate. Disintegration rate isthe rate at which a radionuclide decays.In SI, the unit for radioactivity is thebecquerel (Bq), one disintegration persecond. Because billions of disintegrationsare required in a useful source, themultiplier prefix giga- (109) is used andthe unit is normally seen as gigabecquerel(GBq). An older unit is the curie (Ci),simply the radiation of 1 g of radium. Acurie is equivalent to 37 GBq, that is, to3.7 × 1010 disintegrations per second.Exposure. Exposure is a measure ofX-radiation or gamma radiation based onthe ionization produced in air by X-raysor gamma rays. The unit for quantity ofelectric charge is the coulomb (C), where1 C = 1 A × 1 s. The original roentgen (R)was the quantity of radiation that wouldionize 1 cm3 of air to 1 electrostatic unit(ESU) of charge (where 1 ESU =3.3356 × 10⁻¹⁰ C) of either sign.A roentgen is equivalent to258 microcoulombs per kilogram of air(1 R = 258 µC·kg–1 of air). Thiscorresponds to 1.61 × 10¹⁵ ion pairs per1 kg of air, which has then absorbed8.8 mJ (0.88 rad, where rad is the obsoleteunit for radiation absorbed dose, not theSI symbol for radian).Absorbed Dose. Absorbed dose is themean energy imparted to matter byionizing radiation per unit mass ofirradiated materials at the place ofinterest. The roentgen (R) was an intensityunit but was not representative of thedose absorbed by material in the radiationfield. The radiation absorbed dose (rad)was first created to measure this value andwas based on the erg, the energy unit
from the old centimeter-gram-second(CGS) system. In the SI system, the unitfor radiation dose is the gray (Gy). Thegray is useful because it applies to dosesabsorbed by matter at a particularlocation. It is expressed in energy unitsper mass of matter or in joules perkilogram (J·kg–1). The mass is that of theabsorbing body. One gray equals 100 radequals 10 000 ergs per gram(1 Gy = 100 rad = 10 000 erg·g–1).Dose Equivalent. Dose equivalent H is aquantity used for radiation protectionthat expresses on a common scale for allirradiation incurred by exposed persons.The SI unit of dose equivalent is thesievert, equal to 100 rem (1 Sv = 100 rem).The SI system’s unit for the dose absorbedby the human body (formerly rem forroentgen equivalent man; also known asambient dose equivalent, directional doseequivalent, dose equivalent, equivalent doseand personal dose equivalent) is similar tothe gray but includes quality factorsdependent on the type of radiation. Thisabsorbed dose has been given the namesievert (Sv) but its dimensions are thesame as the gray (J·kg–1), that is,1 Sv = 1 J·kg–1.Quality Factor. Quality factor15-18 is amodifying factor used in determining thedose equivalent. The quality factorcorrects for the dependence of biologicalfactors on the energy and type of theradiation. A formerly commonly usedterm, relative biological effect, is restrictedin use to radiobiology. For practical
TABLE 1. Radiation weighting factors.31
Radiation Type Quality Factora
X-rays 1Gamma rays 1Beta rays 1Neutrons 2 to 11b
Neutrons of unknown energy 10High energy protons 10Alpha particles 20Multiple charged particles 20Fission fragments 20Heavy particles of unknown charge 20
a. Value of quality factor at point where doseequivalent is maximum in 300 mm (12 in.) diametercylinder tissue equivalent phantom.
b. Quality factor depends on energy of neutron.
119Radiation Safety

120 Rad
TABLE 2. Macalendar ye
Radi
Whole bActive blLens of eGonadsHands anFeet andSkin of w
a. These numrespective
b. All reasonforearms w
3RT06 LAYOUT(113_138) 10/14/02 2:50 PM Page 120
purposes the quality factors in Table 1 areconservative. For example, consider anabsorbed dose in the lens of the eye of1 mGy (0.1 rad) from 2 MeV neutrons.The dose equivalent is:
(1)
Compound UnitsRoentgens could be measured with anionization chamber that, when placed1.0 m (39 in.) from the radiation source,provided necessary information — oneroentgen per hour at one meter (1 R·h–1 at1 m), for example. The roentgen per hour(R·h–1) was used to designate the exposureto an ionizing radiation of the statedvalue. The SI unit used for this exposurerate is the sievert (Sv), 100 times as largeas the compound unit it replaces:1 Sv·h–1 = 100 R·h–1. The radiationreceived from 1 R·h–1 appeared equal toabout 1 rem, so the relationship isapproximated as1 R·h–1 = 0.01 Gy·h–1 = 10 mGy·h–1.
A previously popular unit, roentgen percurie per hour at one meter (R·Ci–1·h–1 at1 m), is expressed in SI units asmillisievert per gigabecquerel per hour atone meter (mSv·GBq–1·h–1 at 1 m), suchthat 1 mSv·GBq–1·h–1 at 1 m =3.7 R·Ci–1·h–1 at 1 m. In this relationship,roentgen converts to millisievert on aone-to-ten basis.
Exposure charts were often made byusing curie minutes at a squared distancefrom source to sensor in inches. This waswritten Ci·min·in.–2. Exposure chartsmade in SI use gigabecquerel minutesfor a squared distance from sourceto sensor in centimeters, where1 Ci·min·in.–2 = 50 GBq·min·cm–2.
H =
×
= ×=
Dose inmilligray
Qualityfactor
1 mGy 10
10 mSv
iographic Testing
ximum permissable dose per quarter ofar (3 mo) for whole body irradiation.19
Dose per Quartera______________________ation Workers mSv (rem)
ody; head and 12 (1.25)ood forming organs 12 (1.25)yes 12 (1.25)
12 (1.25)d forearmsb 188 (18.75)
ankles 188 (18.75)hole body 75 (7.5)
bers are obtained by dividing annual doses of 5, 75 and 30,ly, by 4.able efforts should be made to keep exposure of hands and
ithin the general limit for skin.2,15-18
Permissible Doses
Concept of ALARA (As Low AsReasonably Achievable)19
All persons should make every reasonableeffort to maintain radiation exposures aslow as is reasonably achievable, takinginto account the state of technology andthe economics of improvements inrelation to benefits to the public healthand safety. In this sense, the termpermissible dose is an administrative termmainly for planning purposes.
Prospective Annual Limit forOccupationally Exposed PersonnelThe maximum permissible prospectivedose equivalent for whole body irradiationis 50 mSv (5 rem) in any one year.15 TheNuclear Regulatory Commission19 hasfurther restricted for its licensees the rateat which this planned annual dose maybe received by averaging over calendarquarters rather than calendar years. Thismaximum dose and limits for other partsof the body are summarized in Table 2.
Permissible Levels of Radiation inUnrestricted Areas19
Nonoccupationally exposed personnel orall personnel in unrestricted areas (seebelow) shall not receive more than1.0 mSv (0.1 rem) to the whole body inany period of one calendar year.
Restricted AreasA restricted area needs to be establishedwhere either (1) a dose in excess of 20 µSv(2 mrem) can be received in any 1 h or(2) a dose in excess of 1.00 mSv(100 mrem) can be received in a calendaryear.
Exposure of Minors19
An individual under 18 years of age mustnot be exposed to greater than 10 percentof the limits for occupationally exposedworkers, that is, 10 percent of 12 mSv(1.25 rem) per quarter to the whole bodyand similarly for the hands, forearms,feet, ankles and skin of the whole body.
Exposure of FemalesDuring the entire nine months ofgestation the maximum permissible doseequivalent to the fetus from occupationalexposure of the declared pregnant womanshould not exceed 5 mSv (0.5 rem) evenlydistributed over the entire pregnancy.15-21

PART 3. Radiation Protection Measurements
FIGURE 1. Radiation survey meter incorporates air filledionization chamber vented to atmosphere, with fiveselectable linear ranges: 0 to 50 µSv·h–1 (0 to 5 mR·h–1),0 to 500 µSv·h–1 (0 to 50 mR·h–1), 0 to 5 mSv·h–1
(0 to 500 mR·h–1), 0 to 50 mSv·h–1 (0 to 5 R·h–1),0 to 500 mSv·h–1 (0 to 50 R·h–1).
MOVIE.Checkequipment.
3RT06 LAYOUT(113_138) 10/14/02 2:51 PM Page 121
Personnel Dosimetry21,22
RequirementsPersonnel monitoring must be performedon all occupationally exposed personswho may receive in a calendar quartermore than one fourth of the applicabledoses in Table 2. Occasional visitors torestricted areas, including messengers,servicemen and deliverymen, can beregarded as nonoccupationally exposedpersons who do not need to be providedpersonnel monitors when it is improbablethat they would receive in one year a doseequivalent exceeding the nonoccupationallimit of 5 mSv (0.5 rem). Long termvisitors in an installation should beregarded as occupationally exposed if theyare likely to receive a dose equivalentgreater than 5 mSv (0.5 rem) per year.
X-Rays, Gamma Rays andElectronsFor radiation protection measurement, thechoice lies among ionization chambers,film badges, photoluminescent glassesand thermoluminescent dosimeters.(These and other dosimetric technologiesare discussed in the chapter on radiationmeasurement.)Ionization Chambers. The principaladvantages of ionization chambers(Fig. 1), particularly those of theself-reading type, are the simplicity andspeed with which readings are made. Theyare useful, therefore, particularly formonitoring exposures during nonroutineoperations or during transient conditionsor for monitoring short term visitors to aninstallation. Chambers should be testedfor leakage periodically and those thatleak more than a few percent of full scaleover the period of use should be removedfrom service. Most of these ionizationchambers are small, about the size of apencil, and are charged on a separatedevice. They read from a few hundredthsto a few sievert (a few tens to a fewhundred milliroentgen) of exposure.Film Badges. Small badges containingspecial X-ray films are popular personneldosimeters (Fig. 2a). The sensitivity ofavailable emulsions is sufficient to detectabout 2.6 µC·kg–1 (10 mR) of cobalt-60
gamma radiation and about 0.8 µC·kg–1 (afew mR) of 100 keV X-rays. A useful rangeis from about 0.8 µC·kg–1 (a few mR) to500 mC·kg–1 (2 kR) can be covered by twocommonly available films or twoemulsions of different sensitivity on onefilm base. For energies below 200 keV,film overresponds where, for example, thephotographic density per roentgen at40 keV is about 20 times higher than for1 MeV photons. Metallic filters coveringportions of the film provide additionalreadings that help determine the incidentradiation energy and afford a means ofcomputing a dose from appropriatecalibration curves. Film has severalundesirable characteristics. Fogging mayresult from mechanical pressure, elevatedtemperatures or exposure to light. Fadingof the latent image may result in
121Radiation Safety

122 Radi
3RT06 LAYOUT(113_138) 10/14/02 2:51 PM Page 122
decreased sensitivity but may beminimized by special packaging toexclude moisture and by storage in arefrigerator or freezer before distribution.Film dosimeters also exhibit directionaldependence, particularly for the densitiesrecorded behind metal filters.Photoluminescent Glasses. Silver activatedmetaphosphate glasses, when exposed toionizing radiation, accumulate fluorescentcenters that emit visible light when theglass is irradiated with ultraviolet light.The intensity of the light is proportionalto radiation exposure up to 250 mC·kg–1
(1000 R) or more. Glass dosimeters exhibitenergy dependence below 200 keV andare also subject to fading. They are usefuldown to only 250 µC·kg–1 (1 R).Thermoluminescence. A commontechnique of personal radiation exposuremeasurement is thermoluminescentdosimetry (Fig. 2b). The desirablecharacteristics of thermoluminescentdosimeters (TLDs) include their widelinear range; short readout time; relativeinsensitivity to field conditions of heat,light and humidity; reusability; and forsome phosphors, energy independence.Response is rate independent up to1 GSv·s–1 (100 GR·s–1), which can beuseful in flash X-ray radiographic
ographic Testing
FIGURE 2. Clip-on personal radiationdosimeters: (a) film badges;(b) thermoluminescent dosimeters (TLDs).21
(a)
(b)
installations. Very smallthermoluminescent dosimeters can beused to measure exposure to specific partsof the body. They probably represent thetechnique of choice for measurement offinger, hand or eye dose. They have auseful range down to 1 µC·kg–1 (severalmR) for lithium fluoride and even lowerfor more exotic thermoluminescentdosimetric materials.Others. Electronic dosimeters and hybridtechnologies are also available.
NeutronsFor neutron fields the practical devices arenuclear track film, thermoluminescentdosimeters containing lithium-6 fluorideand fission track counting systems. Thenuclear track films do not respond toneutrons below 0.5 MeV in energy; inpractice, a substantial fraction of theneutrons may be below this energy. Trackcounting is a relatively insensitivetechnique of neutron dosimetry. For lowdoses, counting of a statisticallysignificant number of tracks is too timeconsuming to be warranted. On the otherhand, at high doses it is difficult todistinguish tracks from one another sothat they can be counted. Fading occursand, as a result, short tracks maydisappear. For these reasons, nuclear trackfilm is more useful in demonstrating thatlarge neutron doses have not beenreceived than in measuring actual lowdoses.
The lithium-6 fluoride and fission trackcounting systems do not suffer from thesedisadvantages and will providemeasurements at permissible dose levels.These techniques are sensitive down todoses of about 30 or 40 µGy (3 or 4 mrad)and down to thermal neutron energies.
Boron trifluoride neutron radiationdetector tubes provide high gammarejection up to about 5 Sv·h–1 (500 R·h–1)and detect neutrons with energies fromthermal to about 10 MeV (Fig. 3).23 Othermeans of neutron dosimetry, includingion chambers, have been investigated ordeveloped.23-25
Radiation Detection andMeasurement22
In an area survey, measurements are madeof radiation fields to provide a basis forestimating the dose equivalents thatpersons may receive. Changes inoperating conditions (such as beamorientations and source outputs) cancause changes both in field intensity andpattern. The number of measurementsdepends on how much the radiation fieldvaries in space and time and on how
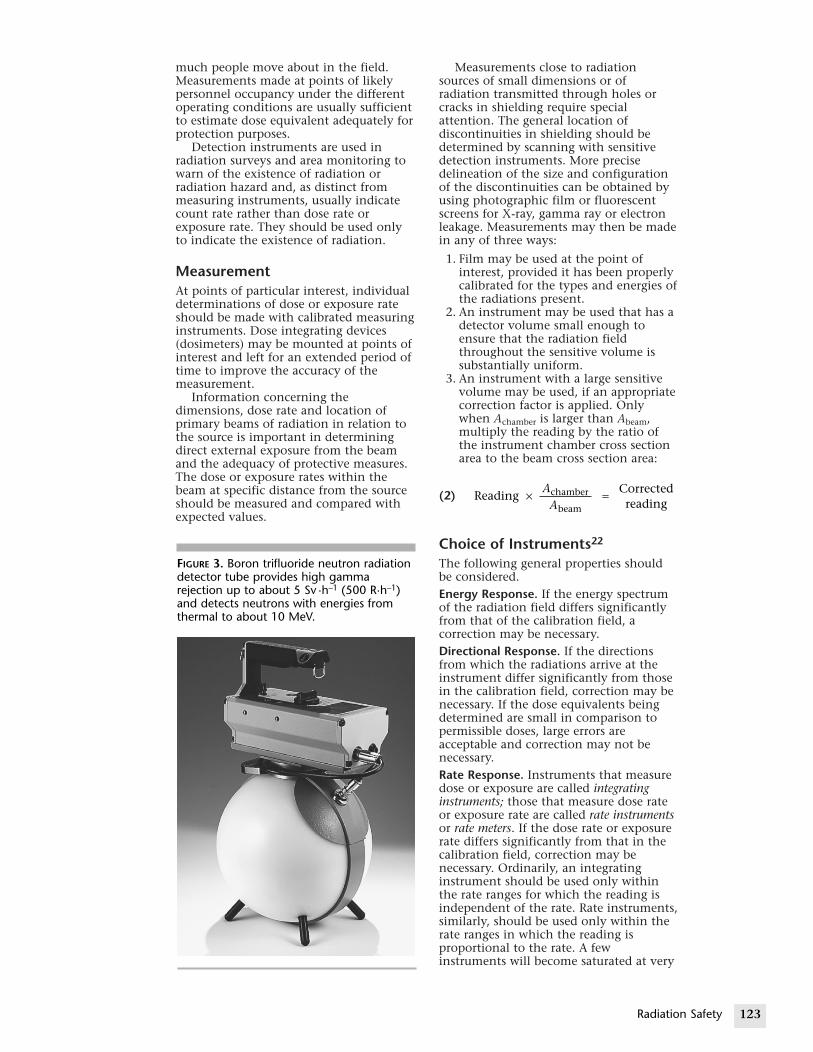
3RT06 LAYOUT(113_138) 10/14/02 2:51 PM Page 123
much people move about in the field.Measurements made at points of likelypersonnel occupancy under the differentoperating conditions are usually sufficientto estimate dose equivalent adequately forprotection purposes.
Detection instruments are used inradiation surveys and area monitoring towarn of the existence of radiation orradiation hazard and, as distinct frommeasuring instruments, usually indicatecount rate rather than dose rate orexposure rate. They should be used onlyto indicate the existence of radiation.
MeasurementAt points of particular interest, individualdeterminations of dose or exposure rateshould be made with calibrated measuringinstruments. Dose integrating devices(dosimeters) may be mounted at points ofinterest and left for an extended period oftime to improve the accuracy of themeasurement.
Information concerning thedimensions, dose rate and location ofprimary beams of radiation in relation tothe source is important in determiningdirect external exposure from the beamand the adequacy of protective measures.The dose or exposure rates within thebeam at specific distance from the sourceshould be measured and compared withexpected values.
FIGURE 3. Boron trifluoride neutron radiationdetector tube provides high gammarejection up to about 5 Sv ·h–1 (500 R·h–1)and detects neutrons with energies fromthermal to about 10 MeV.
Measurements close to radiationsources of small dimensions or ofradiation transmitted through holes orcracks in shielding require specialattention. The general location ofdiscontinuities in shielding should bedetermined by scanning with sensitivedetection instruments. More precisedelineation of the size and configurationof the discontinuities can be obtained byusing photographic film or fluorescentscreens for X-ray, gamma ray or electronleakage. Measurements may then be madein any of three ways:
1. Film may be used at the point ofinterest, provided it has been properlycalibrated for the types and energies ofthe radiations present.
2. An instrument may be used that has adetector volume small enough toensure that the radiation fieldthroughout the sensitive volume issubstantially uniform.
3. An instrument with a large sensitivevolume may be used, if an appropriatecorrection factor is applied. Onlywhen Achamber is larger than Abeam,multiply the reading by the ratio ofthe instrument chamber cross sectionarea to the beam cross section area:
(2)
Choice of Instruments22
The following general properties shouldbe considered.Energy Response. If the energy spectrumof the radiation field differs significantlyfrom that of the calibration field, acorrection may be necessary.Directional Response. If the directionsfrom which the radiations arrive at theinstrument differ significantly from thosein the calibration field, correction may benecessary. If the dose equivalents beingdetermined are small in comparison topermissible doses, large errors areacceptable and correction may not benecessary.Rate Response. Instruments that measuredose or exposure are called integratinginstruments; those that measure dose rateor exposure rate are called rate instrumentsor rate meters. If the dose rate or exposurerate differs significantly from that in thecalibration field, correction may benecessary. Ordinarily, an integratinginstrument should be used only withinthe rate ranges for which the reading isindependent of the rate. Rate instruments,similarly, should be used only within therate ranges in which the reading isproportional to the rate. A fewinstruments will become saturated at very
ReadingCorrectedreading
chamber
beam× =A
A
123Radiation Safety

124 Radio
3RT06 LAYOUT(113_138) 10/14/02 2:51 PM Page 124
high rates; that is, they will cease tofunction and the reading will drop to zeroor close to zero. It is particularly necessaryto know the rate response of instrumentsto be used near machines that produceradiation in short pulses. Rate instrumentsused near repetitively pulsed machines
need only to indicate the average rate forradiation protection purposes.Mixed Field Response. Because someradiations (such as neutrons) have higherquality factors than others, mixed fieldmonitoring is necessary. This can be doneeither by using two instruments that are
graphic Testing
FIGURE 4. Gamma and X-radiation sensing devices incorporating geiger-müller tubes:(a) survey meter for range selectable from 0 to 20 mSv·h–1 (0 to 2 R·h–1) and automatic auralalarm over 2.5 mSv·h–1 (250 mR·h–1); (b) survey meter with on/off switch for auralmonitoring; (c) for high noise areas, personal rate alarm with flashing light and optionalearplug for aural alarm; (d) area monitor with standard 20 µSv·h–1 (2 mR·h–1) trip point,audio piezo alert and large red strobe warning light; (e) visual alarm for gamma and X-raysfrom 80 keV to 1.5 MeV and adjustable alarm threshold.
(a) (c)
(d)
(b)
(e)
MOVIE.Personnelmonitoringdevices.

FIGURE 5. Radiation detector with scintillationcounter measurement of low energy gammaradiation.
3RT06 LAYOUT(113_138) 10/14/02 2:51 PM Page 125
each sensitive to only one radiation or byusing two instruments that are sensitiveto both but to a different extent.Unwanted Response. Interference byenergy forms that an instrument is notsupposed to measure can be a problem.Response to heat, light, radiofrequencyradiations and mechanical shock areexamples.Fail Safe Provision. To avoid unknowinglyexposing personnel to radiation,malfunctions of an instrument should bereadily recognizable or should alwaysresult in readings that are too high.Precision and Accuracy. Typically, precisionof a few percent should be obtained onsuccessive readings with the same surveyinstrument. At the level of a maximumpermissible dose a measurement accuracyspecified by regulations should beachieved. At levels less than 0.25 themaximum permissible dose a lower levelof accuracy (say, a factor of 2) isacceptable.Calibration. Instruments used forradiation protection are not absoluteinstruments; that is, they requirecalibration in a known radiation field orcomparison with instruments whoseresponse is known. Many users ofradiation protection instruments mustrely on the manufacturer to calibrate theirinstruments properly. Users shouldarrange a reproducible field in which theinstruments are placed and readfrequently at least semianually. Thepossibility of reading error due toimprecision is minimized by computingthe mean of several readings. If changesin the mean reading are detected, theinstruments should be recalibratedpromptly.Time Constant. An importantcharacteristic of a rate instrument is thetime constant, an indication of the timenecessary for the instrument to attain aconstant reading when suddenly placed ina constant radiation field. Time constantsare generally given as the time required toarrive at 1 – e–1 (that is, 0.63) of the finalreading. Typical time constants of goodrate meters are 1 s or less. The responsetime of a rate instrument is defined as thetime necessary for it to reach 90 percentof full response. It is equal to 2.3 timeconstants.
Radiation Surveying and AreaMonitoringVarious technologies for radiationsurveying and area monitoring areavailable. The following can be used forsealed gamma ray sources and for sourcesof X-rays. (More information on thesetechnologies can be found in the chapteron radiation measurement.)
Ionization Chambers. Many gamma rayand X-ray exposure rate measurements aremade with portable ionization chambers(Fig. 1). Ionization chambers with separatereaders are useful for measuring eithervery high or very low exposure rates. Ionchambers made of plastic or other lowatomic number materials usually giveexposure readings independent of photonenergy down to 50 keV. Ionizationchambers are available for exposure ratesto over 20 Sv·h–1 (3 or 4 kR·h–1).Geiger-Müller Counters. The dead time ingeiger-müller counters (Fig. 4) sets a limitto their count rate that, in turn, limitstheir use to exposure rates up to about0.03 nSv (a few µR·h–1). The countersrespond to the number of ionizing eventswithin them independent of energy andthus do not yield equal count rates forequal exposure rates of different energies.Geiger-müller counters are better suitedfor radiation detection than formeasurement.Scintillation Instruments. Scintillationdevices (Fig. 5) also have count ratelimitations because of the duration of thelight flashes but can count much fasterthan geiger-müller counters. In the sameexposure field, scintillation count rates arehigher than geiger-müller count rates, soscintillation counters are useful forlocating weak X-ray and gamma ray fields.
125Radiation Safety

126 Radi
3RT06 LAYOUT(113_138) 10/14/02 2:51 PM Page 126
Instrument CalibrationThe National Institute of Standards andTechnology (NIST) is the point of recordfor reference standards. Laboratoriescalibrate according to the NationalInstitute of Standards and Technology.Laboratory standard instruments formeasuring exposure from photons ofhigher energies from 1 to 1000 mSv(0.1 to 100 R) or exposure rate from 0.1 to150 mSv·min–1 (0.01 to 15 R·min–1) canbe calibrated by the National Institute ofStandards and Technology by comparisonwith either cesium-137 or cobalt-60calibrated sources. These laboratorystandard instruments or secondarystandards may then be used to calibrateradiation protection survey instrumentsby comparison in radiation fields ofsimilar quality. Consideration must begiven to beam width, uniformity ofradiation over the calibration area andchanges in radiation quality caused byscattered radiation.
Neutron instrument calibration can beafforded by exposure to fields fromNational Institute of Standards andTechnology calibrated neutron sources.One type of such a source is made bymixing a radionuclide such as plutonium,polonium or radium with a material suchas beryllium or boron. The neutrons areproduced in (α, n) reactions in the lattermaterials. Radium sources are difficult touse because they also emit intense gammaradiation.
Leak Testing of Isotope SealedSources26
All sealed sources must be tested forleakage of radioactive material beforeinitial use, at intervals not exceeding sixmonths, whenever damage ordeterioration of the capsule or seal issuspected or when contamination ofhandling or storage equipment isdetected.
The leak test should be capable ofdetecting the presence of 185 Bq (5 nCi)of removable activity from the source.Sources that are in the United States andthat are leaking greater than 185 Bq(5 nCi) of removable activity, based onthe tests described below, should bereported to the Nuclear RegulatoryCommission within five days. Records ofleak test results should be specific in unitsof disintegrations per minute ormicrocuries. Leak test records should bekept until final disposition of the source isaccomplished.
A small sealed capsule may be tested bywashing for a few minutes in a detergentsolution. An aliquot of this solutionshould then be counted. An absorbentliner in the storage container normally in
ographic Testing
contact with the source will also revealleakage if it is contaminated.
Leak tests of devices from which theencapsulated source cannot be removed oris too large to handle should be made bywiping the accessible surface or apertureof the device nearest to the storageposition of the source.
Detection of contaminants on thehousing or surface of a neutron sourcemay not indicate source leakage but maybe due to induced activity. Confirmationof leakage may require identification ofthe contaminant.
In leak testing of radioactive sources,special equipment may be necessary forradiation exposure control. Depending onthe activity of the source, shielding maybe required to keep the leak tester’sexposure as low as possible. The actualleak test wipe should be done by usingtongs or forceps and not the fingers.Rubber gloves should be used to minimizehand contamination. The wipes should betaken quickly and the source returned toits designated container.

PART 4. Basic Exposure Control
3RT06 LAYOUT(113_138) 10/14/02 2:51 PM Page 127
Physical Safeguards andProcedural Controls22
As long as the radiation source remainsexternal, exposure of the individual maybe terminated by removing the individualfrom the radiation field, by removing thesource or by switching off a radiationproducing machine. If the externalradiation field is localized, exposure toindividuals may be limited readily byshielding or by denying access to the fieldof radiation.
Physical SafeguardsPhysical safeguards include all physicalequipment used to restrict access ofpersons to radiation sources or to reducethe level of exposure in occupied areas.These include shields, barriers, locks, alarmsignals and source shutdown mechanisms.
Planning and evaluation of physicalsafeguards should begin in the earlyphases of design and construction of aninstallation. Detailed inspection andevaluation of the radiation safety ofequipment are mandatory at the time ofthe installation’s initial use. Additionalinvestigations are necessary periodically toensure that the effectiveness of thesafeguards has not decreased with time oras a result of equipment changes.
Procedural ControlsProcedural controls include allinstructions to personnel regarding theperformance of their work in a specificmanner for the purpose of limitingradiation exposure. Training programs forpersonnel often are necessary to promoteobservance of such instructions. Typicalinstructions concern mode of use ofradiation sources, limitations on proximityto sources, exposure time and occupancy ofdesignated areas and the sequence orkinds of actions permitted during workwith radiation sources.
Periodic area surveys and personnelmonitoring are necessary to ensure theadequacy of and compliance withestablished procedural controls.
Classes of Installations forX-Rays and Gamma RaysThere are four types of nonmedical X-rayand gamma ray installations: protective,enclosed, unattended and open.3,26
Protective InstallationThis class provides the highest degree ofinherent safety because the protectiondoes not depend on compliance with anyoperating limitations. The requirementsinclude the following.
1. Source and exposed objects are in apermanent enclosure within which noperson is permitted during irradiation.
2. Safety interlocks are provided toprevent access to the enclosure duringirradiation.
3. If the enclosure is of such a size or isso arranged that occupancy cannot bereadily determined by the operator,the following requirements shouldalso be provided: (a) fail safe audibleor visible warning signals to indicatethe source is about to be used;(b) emergency exits; (c) effectivemeans within the enclosure ofterminating the exposure (sometimescalled scramming).
4. The radiation exposure 50 mm(2.0 in.) outside the surface of theenclosure cannot exceed 5 µSv(0.5 mR) in any 1 h.
5. Warning signs of prescribed wordingat prescribed locations.
6. No person may be exposed to morethan the permissible doses. The lowallowable exposure level necessitatesgreater inherent shielding. At highenergies in the megavolt region withhigh workloads, the requiredadditional shielding may be extremelyexpensive. For example, in the case ofcobalt-60, the required concretethickness will have to be about 0.3 m(1 ft) greater than for the enclosedtype.
Enclosed InstallationThis class usually offers the greatestadvantages for fixed installations with lowuse and occupancy. With proper supervisionthis class offers a degree of protection
127Radiation Safety

128 Ra
MOVIE.Warning tapeand sign.
3RT06 LAYOUT(113_138) 10/14/02 2:51 PM Page 128
similar to the protective installation. Therequirements for an enclosed installationinclude items 1, 2, 3, 5 and 6, above, plusa different item 4.
4. The exposure at any accessible andoccupied area 0.3 m (1 ft) from theoutside surface of the enclosure doesnot exceed 100 µSv (10 mR) in any1 h. The exposure at any accessibleand normally unoccupied area 0.3 m(1 ft) from the outside surface of theenclosure does not exceed 1 mSv(100 mR) in any 1 h. This class ofinstallation requires administrativeprocedures to avoid exceeding thepermissible doses. The tradeoffbetween (1) the intrinsic but initiallyexpensive safety of a protectiveinstallation and (2) the requiredcontinuing supervision andconsequences of an overexposure inan enclosed installation should becarefully considered in the planningstages of a new facility.22
Unattended InstallationThis class consists of automaticequipment designed and manufactured bya supplier for a specific purpose that doesnot require personnel in attendance foroperation. The requirements for this classinclude the following.
1. The source is installed in a singlepurpose device.
2. The source is enclosed in a shield,where the closed and open positionsare identified and a visual warningsignal indicates when the source is on.
3. The exposure at any accessiblelocation 0.3 m (1 ft) from the outsidesurface of the device cannot exceed20 µSv (2 mR) in any 1 h.
4. The occupancy in the vicinity of thedevice is limited so that the exposureto any individual cannot exceed5 mSv (0.5 R) in a year.
5. Warning signs are used.
diographic Testing
TABLE 3. Gamma ray sources.3,15,27
AtomicNumber Half Energ
Radionuclide (Z) Life (MeV
Cesium-137 55 30 yr 0.662Chromium-51 24 28 d 0.323Cobalt-60 27 5.3 yr 1.17, 1Gold-198 79 2.7 d 0.412Iridium-192 77 74 d 0.136, Radium-226 88 1622 yr 0.047 tTantalum-182 73 155 d 0.066 t
6. Service doors to areas where exposurecan exceed the measurements in items3 and 4 above must be locked orsecured with fasteners requiringspecial tools available only to qualifiedservice personnel.
Open InstallationThis class can only be used whenoperational requirements prevent otherclasses, such as in mobile and portableequipment where fixed shielding cannotbe used. Mobile or portable equipmentused routinely in one location should bemade to meet the requirements of one ofthe fixed installation classes. Adherence tosafe operating procedures is the mainsafeguard to overexposure. Therequirements include the following.
1. The perimeter of any area in whichthe exposure can exceed 1 mSv(100 mR) in any 1 h must be posted asa very high radiation area.
2. No unauthorized or unmonitoredperson may be permitted in the highradiation area during irradiation. Incases of unattended operation, positivemeans, such as a locked enclosure,shall be used to prevent access.
3. The perimeter of any area in whichthe radiation level exceeds 50 µSv(5 mR) in any 1 h must be posted as aradiation area.
4. The equipment essential to the use ofthe source must be inaccessible tounauthorized use, tampering orremoval. This shall be accomplishedby the attendance of a knowledgeableperson or other means such as alocked enclosure.
5. No person can be exposed to morethan the permissible doses.
6. For reasons of safety and security,restricted areas must be clearly definedand marked. Means of surveillance toenforce the restrictions are needed.
y Gamma Ray Constant________________________________________) mSv·GBq–1·h–1 at 1 m (R·Ci–1·h–1 at 1 m)
0.086 (0.320)0.005 (0.018)
.33 0.351 (1.300)0.062 (0.230)
1.065 0.135 (0.500)o 2.4 0.223 (0.825)o 1.2 0.162 (0.600)

TABLE 4. Fortarget.3,27,3
Peak Voltag(MV)
0.0500.0700.1000.2501.0002.0005.00010.00015.00020.000
3RT06 LAYOUT(113_138) 10/14/02 2:51 PM Page 129
Output of RadiationSourcesTable 3 lists some data on gamma raysources of interest for industrial purposes.
Table 4 lists some typical radiationmachine outputs for varying voltages.
Working TimeThis is the allowable working time inhours per week for a given exposure rate.For example, for an exposure rate of100 µSv·h–1 (10 mR·h–1) to the wholebody:
(3)
Working DistanceThe inverse square law applied toradiation states that the dose rate from apoint source is inversely proportional tothe square of the distance from the originof the radiation source provided that(1) the dimensions of the radiation sourceare small compared with the distance and(2) no appreciable scattering or absorptionof the radiation occurs in the mediathrough which the radiation travels. Inpractice, the first requirement is satisfiedwhenever the distance involved is at leastten times greater than the largest sourcedimension. In situations where there is
Workingtime
Permissable occupationaldose per week
Exposure dose rate
1000 Sv wk
100 Sv h
100 mR wk
10 mR h
10 h wk
–1
–1
–1
–1
–1
=
= µ ⋅µ ⋅
= ⋅⋅
= ⋅
ward X-ray intensity from optimum2
e Intensity at 1 m (40 in.)__________________________________kSv·min–1·mA–1 (R·min–1·mA–1)
0.005 (0.05)0.01 (0.1)0.04 (0.4)
0.2 (2.0)2.0 (20)28 (280)
500 (5000)3000 (30 000)
10 000 (100 000)20 000 (200 000)
insignificant scattering or absorption, theprimary beam is the total radiation field.
For example, consider a 3.7 GBq(100 mCi) iridium-192 source in air in theshape of a pencil, 6.3 mm (0.25 in.)diameter and 0.13 m (5.0 in.) long. Whatwould the working time be at 3.0 m? First,solve for 1 m. From Table 3, the gammaray constant for iridium-192 is135 µSv·GBq–1·h–1 at 1 m (0.5·Ci–1·R·h–1 at1 m). Therefore:
(4)
(5)
Because 3.0 m is obviously more than10 times 0.13 m (5.0 in.), the inversesquare law applies. Also, scattering is nota problem. Using the inverse square lawgives the exposure rate at 3 m:
(6)
(7)
Equations 8 and 9 finally give theworking time at 3 m:
(8)
(9)Working
time100 mR wk
5.5 mR h
18 h wk
–1
1
–1
= ⋅⋅
= ⋅
−
Workingtime
mSv wk
55 Sv h
18 h wk
–1
1
–1
= ⋅µ ⋅
= ⋅
−1
Exposurerate
0.05 R Ci h
at 1 m
1 m3 m
= 5.5 mR h
–1 –1
–1
= ⋅ ⋅
×
⋅
2
Exposurerate
0.5 mSv h
at 1 m
1 m3 m
55 Sv h
–1
–1
= ⋅
×
= µ ⋅
2
Exposurerate
0.5 R Ci h
at 1 m
Ci
= 0.05 R h
–1 –1
–1
= ⋅ ⋅
×
⋅
0 1.
Exposurerate
0.135 mSv GBq h
at 1 m
3 GBq
.5 mSv h
–1 –1
–1
= ⋅ ⋅
×
= ⋅
.7
0
129Radiation Safety

130 Radio
PART 5. Shielding
3RT06 LAYOUT(113_138) 10/14/02 2:51 PM Page 130
Protective EnclosuresBecause of scattered radiation, protectionfor the operator and other personnelworking in the neighborhood oftenrequires shielding of the part beingradiographed and any other materialexposed to the direct beam, in addition tothe shield for the source itself. Preferablythe source and materials being examinedshould be enclosed in a room or hoodwith the necessary protectionincorporated into the walls (Fig. 6).
Shields can be classified as eitherprimary or secondary. Primary shields are
graphic Testing
FIGURE 6. Rooms offering radiation shielding:(a) concrete shooting booth; (b) modularradiation enclosure.
(a)
(b)
Concrete Securedentrance
designed to shield against the primaryradiation beam; secondary shields areonly thick enough to protect against tubehousing leakage and scattered radiation.Therefore, the X-ray tube or source shouldnot be pointed toward secondary shields.For this reason, mechanical stops shouldbe used to restrict tube housingorientations toward primary barriers.Operating restrictions, such as notpointing the beam at certain walls or theceiling, should be spelled out in theoperating procedures.
Protective materials are available inpanels so that radiation barriers may becustomized for work areas of various sizes.Mobile work rooms with modular designsare also available, offering the sameflexibility in size and location (Fig. 6b).
When changes in operating conditionsare contemplated, the radiation safetyofficer (RSO) should be contacted forconsultation and for surveys as needed todetermine additional shieldingrequirements.
For design purposes, the primary beamshould not be pointed at a high personneloccupancy space and the distance fromthe radiation source to any occupied spaceshould be as great as is practical. Scatteredradiation usually has a lower effectiveenergy than the primary beam and may,therefore, be easier to shield.
Skyshine28
In the design of facilities, there is often aquestion concerning the magnitude ofshielding required for the roof over thebuilding. As an ordinary weather roof
FIGURE 7. Shielding above radiation source reduces radiationreflected from atmosphere. Such radiation is calledskyshine.28
Radiationsource
Controlled area
d1
ds
Solid angleΩ
Skyshine
Observationpoint
Alternativeshieldingpositions

FIGURE 8. Menergy in v
Max
imum
ran
ge o
f be
ta p
artic
les,
mm
(in
.)
25 00
250
25
2
2.
0.2
0.02
FIGURE 9. Transmission through lead of gamma rays fromselected radionuclides.3
Tran
smis
sion
(ra
tio)
1
10–1
10–2
10–3
10–4
10–5
Iridium-192
Gold-198
Cesium-137
Cobalt-60Radium
0 125 250(5) (10)
Thickness of lead, mm (in.)
3RT06 LAYOUT(113_138) 10/14/02 2:51 PM Page 131
provides little if any attenuation forradiation directed up, there is a significantprobability that radiation reflected backfrom the atmosphere will be unacceptablein the immediate area of the facility. SeeFig. 7 for X-rays and gamma rays thisradiation (1) increases roughly as Ω1.3,where Ω is the solid angle subtended bythe source and shielding walls,(2) decreases with (ds)2, where ds is thehorizontal distance from the source to theobservation point and (3) decreases with(di)2, where di is the vertical distance fromthe source to about 2 m (6.5 ft) above theroof.
The shield thickness necessary toreduce the radiation to an acceptable levelmay be calculated according to publishedtechniques28 and may alternatively bedesigned into the roof structure ormounted over the source with a lateralarea sufficient to cover the solid angle Ω.Similar statements apply to neutronskyshine, except that the functionaldependences of the radiation at ds areslightly different for Ω and ds.
MaterialsCommon materials such as concrete andlead can be used as absorbers or shields toreduce personnel exposures.29 Beta orelectron radiation is completely stopped bythe thicknesses of material shown inFig. 8.30 The thickness of any materialthat will halve the amount of radiationpassing through the material is referred to
aximum range of beta particles as function ofarious materials indicated.30
Glass
Air
1 2 3 4
Acrylic
Concrete
Aluminum
Iron Lead
Copper
Energy (MeV)
Water
0 (103)
0 (102)
0 (101)
5 (100)
5 (10–1)
5 (10–2)
5 (10–3)
as the half value layer (HVL). Similarly, thethickness that will reduce the radiation toone tenth is referred to as the tenth valuelayer (TVL). (See Tables 5 and 6 and seeFigs. 9 and 10.1,3)
131Radiation Safety
FIGURE 10. Transmission through concrete (density of2.35 g·cm–3 [147 lbm·ft–3]) of gamma rays from radium,cobalt–60, gold-198 and iridium-192.3
0 0.25 0.50 0.75 1.00 1.25 1.50 1.75(10) (20) (30) (40) (50) (60) (70)
Concrete slab thickness, m (in.)
Tran
smis
sion
(ra
tio)
1
10–1
10–2
10–3
10–4
10–5
Iridium-192
Gold-198
Cesium-137
Cobalt-60
Radium

132 Radi
TABLE 6. Shieand concret
PeakVoltage
(kV)
5070
100125150200250300400500
100020003000400060001000
3RT06 LAYOUT(113_138) 10/14/02 2:51 PM Page 132
These terms imply an exponentialfunction for transmitted radiation interms of shield thickness. Figures 9 and10, however, show that the transmissioncurves are not completely linear on asemilogarithmic plot.1,3 Hence, the listedhalf value layers and tenth value layers inTables 5 and 6 are approximate, obtainedwith large attenuation.
Table 7 lists densities of commercialbuilding materials. For X-radiation andgamma radiation, the absorption processdepends largely on compton absorptionand scattering, which in turn increasewith the atomic electron density. As a firstapproximation, electron density variesdirectly with the mass density of amaterial. Hence, the denser buildingmaterials are usually better shieldingmaterials for a given thickness of material.On a mass basis, shielding materials aremuch the same above about 500 keV.Where space is a problem, lead is oftenused to achieve the desired shield
ographic Testing
Table 5. Shielding equivalents: approximate thicknesses in lead and concrete for several g
Lead_______________________________Half Value Layers Tenth Value _______________ ____________
Source mm (in.) mm (in
Radium-226 56 (2.20) 16 (0.Cobalt-60 41 (1.60) 12 (0.Cesium-137 21 (0.84) 6 (0.Iridium-192 20 (0.79) 6 (0.Gold-198 11 (0.43) 3 (0.
lding equivalents: approximate half value layerse for various X-ray tube potentials.3,27
Lead___________________________________________Half Value Layers Tenth Value Layers_________________ __________________
mm (in.) mm (in.)
0.05 (0.002) 0.16 (0.006)0.15 (0.006) 0.50 (0.020)0.24 (0.009) 0.80 (0.031)0.27 (0.011) 0.90 (0.035)0.29 (0.011) 0.95 (0.037)0.48 (0.019) 1.60 (0.063)0.90 (0.035) 3.00 (0.118)1.40 (0.055) 4.60 (0.181)2.20 (0.087) 7.30 (0.287)3.60 (0.142) 11.90 (0.469)7.90 (0.311) 26.00 (1.024)
12.70 (0.500) 42.00 (1.654)14.70 (0.579) 48.50 (1.909)16.50 (0.650) 54.80 (2.157)17.00 (0.669) 56.60 (2.228)16.50 (0.650) 55.00 (2.165)
attenuation. Lead, however, requires extrastructural support because it is notself-supporting. Concrete is by far themost commonly used shielding materialfor economic, structural and localavailability reasons — in addition todesirable shielding characteristics. Wherespace considerations are importantdepleted uranium shields are expensivebut offer excellent solutions to difficultproblems.
Table 5 lists half value layers and tenthvalue layers for several commonly usedgamma ray emitting radionuclides.Table 6 lists similar information for X-raypeak voltages. Figures 9 and 10 showactual transmission through lead andconcrete for the gamma ray emittingradionuclides. Figure 11 shows arepresentative transmission throughconcrete. Similar charts are available forsteel, lead and other materials for X-raybeams of various peak energies.1,28
tenth (TVL) and half value (HVL) layeramma ray sources.3,27
Concrete______ _____________________________________Layers Half Value Layers Tenth Value Layers_____ _________________ _______________.) mm (in.) mm (in.)
65) 234 (9.2) 69 (2.7)49) 218 (8.6) 66 (2.6)25) 157 (6.2) 48 (1.9)24) 140 (5.5) 41 (1.6)13) 140 (5.5) 41 (1.6)
(HVL) and tenth value layers (TVL) for lead
Concrete___________________________________________Half Value Layers Tenth Value Layers_________________ __________________
mm (in.) mm (in.)
4.32 (0.170) 15.10 (0.594)8.38 (0.330) 27.95 (1.100)
15.10 (0.594) 50.80 (2.000)20.30 (0.799) 66.00 (2.598)22.35 (0.880) 73.60 (2.898)25.40 (1.000) 83.80 (3.299)27.95 (1.100) 94.00 (3.701)31.21 (1.229) 104.00 (4.094)33.00 (1.299) 109.10 (4.295)35.55 (1.400) 116.80 (4.598)44.45 (1.750) 147.10 (5.791)63.50 (2.500) 210.40 (8.283)73.60 (2.898) 241.20 (9.496)91.40 (3.598) 304.48 (11.987)
104.00 (4.094) 348.00 (13.701)116.80 (4.598) 388.50 (15.295)

TABLE 7. D
AluminuBricks: fiBricks: kBricks: siBricks: cCement:Cement:ConcreteConcreteConcreteConcreteConcreteConcreteGlass: boGlass: leGlass: plIronLeadAcrylic (Rock: grRock: limRock: saSandSand plaSteel: TySteel: 1 UraniumUraniumWater
a. One pb. Barite c. One p
FIGURE 11. Transmission through concrete (density of2.35 g·cm–3 [147 lbm·ft–3]) of X-rays produced by 0.1 to0.4 MeV electrons under broad beam conditions. Fourcurves shown represent transmission in dose equivalentindex ratio. First three electron energies were accelerated byvoltages with pulsed wave form. Fourth electron energy(0.4 MeV) was accelerated by constant potential generator.
3RT06 LAYOUT(113_138) 10/14/02 2:51 PM Page 133
These charts present broad beamshielding information, which includes allscattered radiation resulting fromdeflection of the primary gamma orX-rays within the shield as well asabsorption of the primary radiation. Mostengineering applications need to considerbroad beam geometry. Narrow beamgeometry, where only the primary beamneeds consideration, is seldomencountered in practice.
Thickness of ShieldingWallsThe shielding in the walls of theenclosures should be of sufficientthickness to reduce the exposure in alloccupied areas to a value as low asreasonably achievable (ALARA). In thedesign the desired thickness can bedetermined with reasonable accuracy by
ensities of commercial building materials.3,27
Average Density_____________________Material g·cm–3 (lbm·ft–3)
m 2.7 (169)re clay 2.05 (128)aolin clay 2.1 (131)lica 1.78 (111)lay 2.2 (137) colemanite borated 1.95 (122 portland and sanda 2.07 (129): barite 3.5 (218): barite with boron frit 3.25 (203): barite with limonite 3.25 (203): barite with otherb 3.1 (194): iron portland 6.0 (375): portlandc 2.2 (137)rosilicate 2.23 (139)
ad (high density) 6.4 (399)ate (average) 2.4 (150)
7.86 (491)11.34 (708)
polymethyl methacrylate) 1.19 (74)anite 2.45 (153)estone 2.91 (182)
ndstone 2.40 (150)2.2 (137)
ster 1.54 (96)pe 347 stainless 7.8 (487)percent carbon 7.83 (489)
18.7 (1167) hydride 11.5 (718)
1.0 (62)
art portland cement and two parts sand.with calcium aluminate and colemanite.art cement, two parts sand and four parts gravel.
reference to tables or by calculations. Seethe applicable standard.3,28,29
In many cases an additional tenthvalue layer can be induced at little extracost and will increase the margin of safetyconsiderably. A series of measurements oftransmitted radiation in occupied areas,called a radiation survey, is necessary todocument the adequacy of the facility’sdesign. Such a radiation survey can bederived from a combination of portableinstrument readings and personneldosimeters placed at appropriate locationsin the facility (called badge plants).
133Radiation Safety
Top scale indicates required mass thickness, or mass per unitarea, g·cm–2 (lbm·in.–2). Concrete of different density may beused if required mass thickness is achieved. Where weight isconsidered, this scale can be used in selection of optimumshielding material.28
A B C D
LegendA. 0.10 MeV.B. 0.15 MeV.C. 0.25 MeV.D. 0.40 MeV.
Tran
smis
sion
(ra
tio)
1
10–1
10–2
10–3
10–4
10–5
10–6
0 25 50 75 100 125 150 175(51) (102) (154) (205) (256) (307) (358)
Required mass thickness, g·cm–2 (lbm·in.–2)
0 0.1 0.2 0.3 0.4 0.5 0.6 0.7(4) (8) (12) (16) (20) (24) (28)
Concrete slab thickness, m (in.)

134 Radi
PART 6. Neutron Radiographic Safety
3RT06 LAYOUT(113_138) 10/14/02 2:51 PM Page 134
IntroductionNeutrons are of interest in radiographybecause their interaction with matter issignificantly different from X-rays orgamma rays. Neutrons are absorbed andscattered more in low atomic numbered(low Z) materials than high Z materials.Thus, plastics, explosives and someorganic materials can be examined fordiscontinuities with little interferencefrom encapsulating metals and electronicparts and wiring.
Neutron Sources24
Radioactive Neutron SourcesRadiation measurement techniquesspecific to neutron radiation are discussedelsewhere.23-25
Spontaneous Fission NeutronSourcesThese sources are attractive because oftheir fissionlike spectrum, relatively lowgamma ray yield and their small mass.Californium-252 has been used forstationary and mobile systems.
Accelerator SourcesConstant voltage accelerators such as vande graaff and cockcroft-waltonaccelerators can produce energies up toabout 20 MeV for protons and deuteronsand still higher energies for alpha particlesand heavy ions. Small accelerators usingdeuterons of 100 to 200 keV energy canproduce large numbers of 14 MeVneutrons when using a tritiated target.High frequency positive ion acceleratorsinclude the cyclotron, synchrocyclotron,proton synchrotron and heavy ion linearaccelerator. These are capable ofproducing a wide range of neutronenergies. Protons above 10 MeV willproduce neutrons when striking almostany material.
High frequency electron acceleratorssuch as the betatron produce X-raysthrough the interaction of the acceleratedelectrons with the target. The X-rays inturn produce photoneutrons, most withenergies of a few MeV but with some
ographic Testing
neutrons having energies up to near themaximum energy of the accelerator.
Nuclear Reactor SourcesNeutron production in reactors occurs as aresult of the fission process. In the usualoperating mode the number of fissions(and neutrons) is essentially constant intime. The neutron energies range fromthermal to 15 MeV with the number over10 MeV being small.
Shielding
Fast NeutronsAdequate shielding against neutrons willoften attenuate gamma radiation toacceptable levels at both reactors andaccelerators. Water and otherhydrogenous shields may constitute animportant exception to this rule. Ordinaryor heavy aggregate concrete or earth arethe recommended materials in mostinstallations. Any economy achieved bywater filled tanks is likely to be offset bymaintenance difficulties. Both paraffinand oil, although good neutron absorbers,are fire hazards and should not be used inlarge stationary shields. Techniques ofshielding calculations are discussed indetail elsewhere.24
The importance of concrete as astructural and shielding material meritsspecial mention. Its use for gamma andX-ray shielding has been previouslydiscussed. Because of its relatively highhydrogen and oxygen content, it is also agood neutron shield. The subject ofshielding calculations for neutrons iscomplex and should be performed byspecialists. Benchmarks includeapproximate tenth value layers of250 mm (10 in.) of concrete for 14 MeVneutrons and 150 mm (6 in.) for 0.7 MeVneutrons.
Thermal NeutronsGenerally the energies associated withthermal neutrons are less than 1 eV. Forradiation protection the most importantinteraction of thermal neutrons withmatter is radioactive capture. In thisprocess, the neutron is captured by thenucleus with the emission of gamma

3RT06 LAYOUT(113_138) 10/14/02 2:51 PM Page 135
radiation. A shield adequate for fastneutrons usually will be satisfactory forthermal neutrons. The low quality factor(QF = 2) for thermal neutrons (0.025 eV)makes their biological consequenceconsiderably less than for fast neutrons.
135Radiation Safety

1. Burnett, W.D. “Radiation Protection.”Nondestructive Testing Handbook,second edition: Vol. 3, Radiography andRadiation Testing. Sec. 18. Columbus,OH: American Society forNondestructive Testing (1985):p 732-758.
2. NCRP Report No. 39, Basic RadiationProtection Criteria. Bethesda, MD:National Council on RadiationProtection and Measurements (1971).
3. General Safety Standard for InstallationsUsing Non-Medical X-Ray and SealedGamma-Ray Sources, Energies up to10 MeV. NBS Handbook 114, UnitedStates Department ofCommerce/National Bureau ofStandards (1975). United StatesGovernment Printing Office,Washington, DC 20402 (SD CatalogNo. C13.11: 114).
4. American College of Obstetricians andGynecologists. DHEW publication(NIOSH) 78-118, Guidelines onPregnancy and Work. Washington, DC:United States Department of Health,Education, and Welfare [DHEW],National Institute for OccupationalSafety and Health [NIOSH];Superintendent of Documents, UnitedStates Government Printing Office(1978). Superceded by NTISPB 83-179-952. Springfield, VA:National Technical InformationService (1983).
5. Nuclear Regulatory Guide 8.10,Operating Philosophy for MaintainingOccupation Radiation Exposures As LowAs Reasonably Achievable, 1975.Revised. Washington, DC: UnitedStates Nuclear Regulatory Commission(1977).
6. 10 CFR 30, Rules of GeneralApplicability to Licensing of ByproductMaterial [Code of Federal Regulations:Title 10, Energy]. Part 30. Washington,DC: United States GovernmentPrinting Office (2001).
7. Balestracci, G.[L.] “IndustrialRadiography Internal Inspections.”Industrial Radiography Radiation SafetyPersonnel (IRRSP) Program RegulatoryCompliance Seminar: Post-ConferenceSeminar [Pittsburgh, PA, October1997]. Columbus, OH: AmericanSociety for Nondestructive Testing(1997): p 5-8.
8. 10 CFR 34, Licenses for IndustrialRadiography and Radiation SafetyRequirements for Industrial RadiographicOperations [Code of Federal Regulations:Title 10, Energy]. Part 34, Appendix A.Washington, DC: Nuclear RegulatoryCommission; United StatesGovernment Printing Office (2001).
9. ASNT Practice No. ASNT-CP-IRRSP-1A,Industrial Radiography Radiation SafetyPersonnel. [This recommended practiceis revised frequently. The currentversion is available from the AmericanSociety for Nondestructive Testing.]Columbus, OH: American Society forNondestructive Testing.
10. Industrial Radiography Radiation SafetyPersonnel (IRRSP) Program RegulatoryCompliance Seminar: Post-ConferenceSeminar [Pittsburgh, PA, October1997]. Columbus, OH: AmericanSociety for Nondestructive Testing(1997).
11. 49 CFR [Code of Federal Regulations:Title 49, Transportation]. Subtitle B,Other Regulations Relating toTransportation: Parts 171-176.Washington, DC: Department ofTransportation; United StatesGovernment Printing Office (2000).
12. 10 CFR, Code of Federal Regulations:Title 10, Energy. Washington, DC:Department of Energy; United StatesGovernment Printing Office (2001).
13. Taylor, B.N., ed. The InternationalSystem of Units (SI). NIST SpecialPublication 330, 2001 edition.Gaithersburg, MD: National Instituteof Standards and Technology (2001):p iii.
14. IEEE/ASTM SI 10-1997, Standard for Useof the International System of Units (SI):The Modern Metric System. New York,NY: Institute of Electrical andELectronics Engineers (1997).
15. NCRP Report 58, A Handbook ofRadioactivity Measurements Procedures,second edition. Bethesda, MD:National Council on RadiationProtection and Measurements (1985).
16. NCRP Report 59, Operational RadiationSafety Program. Bethesda, MD: NationalCouncil on Radiation Protection andMeasurements (1978).
17. NCRP Report 127, OperationalRadiation Safety Program. Bethesda,MD: National Council on RadiationProtection and Measurements (1998).
136 Radiographic Testing
References
3RT06 LAYOUT(113_138) 10/14/02 2:51 PM Page 136

18. NCRP Report 134, OperationalRadiation Safety Training. Bethesda,MD: National Council on RadiationProtection and Measurements (2000).
19. 10 CFR 20, Standards for Protectionagainst Radiation [Code of FederalRegulations: Title 10, Energy]. Part 20.Washington, DC: United StatesGovernment Printing Office (2001).
20. NCRP Report 128, RadionuclideExposure of the Embryo/Fetus. Bethesda,MD: National Council on RadiationProtection and Measurements (1998).
21. Bush, J.[F., Jr.]. Gamma Radiation SafetyStudy Guide, second edition.Columbus, OH: American Society forNondestructive Testing (2001).
22. NCRP Report 57, Instrumentation andMonitoring Methods for RadiationProtection. Bethesda, MD: NationalCouncil on Radiation Protection andMeasurements (1978).
23. Wernli, C. Advanced Methods of ActiveNeutron Dosimetry for IndividualMonitoring and Radiation Field Analysis.Report, Project BBW 95.0560. Bern,Switzerland: Federal Office forEducation and Science (1998).
24. NCRP Report 38, Protection againstNeutron Radiation. Bethesda, MD:National Council on RadiationProtection and Measurements (1971).
25. NCRP Report 25, Measurement ofAbsorbed Dose of Neutrons, and ofMixtures of Neutrons and Gamma Rays.Bethesda, MD: National Council onRadiation Protection andMeasurements (1961).
26. NCRP Report 40, Protection againstRadiation from Brachytherapy Sources.Bethesda, MD: National Council onRadiation Protection andMeasurements (1972).
27. ANSI N43.3-1993, General Safety —Installations Using Non-Medical X-Rayand Sealed Gamma-Ray Sources, Energiesup to 10 MeV. McLean, VA: HealthPhysics Society (1993).
28. NCRP Report 51, Radiation ProtectionDesign Guidelines for 0.1-100 MeVParticle Accelerator Facilities. Bethesda,MD: National Council on RadiationProtection and Measurements (1977).
29. NCRP Report 49, Structural ShieldingDesign and Evaluation for Medical Use ofX Rays and Gamma Rays of Energies upto 10 MeV. Bethesda, MD: NationalCouncil on Radiation Protection andMeasurements (1976).
30. SRI Report No. 361, The Industrial Usesof Radioactive Fission Products. Stanford,CA: Stanford Research Institute.
31. 10 CFR 20.1004, Units of RadiationDose [Code of Federal Regulations: Title10, Energy]. Part 20. Standards forProtection against Radiation].Washington, DC: United StatesGovernment Printing Office (2001).
32. Patterson, H.W. and R.H. Thomas.Accelerator Health Physics. New York,NY: Academic Press (1973).
Bibliography10 CFR 20, Standards for Protection against
Radiation [Code of Federal Regulations:Title 10, Energy]. Part 20. Washington,DC: United States GovernmentPrinting Office.
10 CFR 34, Licenses for IndustrialRadiography and Radiation SafetyRequirements for Industrial RadiographicOperations [Code of Federal Regulations:Title 10, Energy]. Part 34. Washington,DC: United States GovernmentPrinting Office (2001).
29 CFR 1926, Occupational Safety andHealth Standards for the ConstructionIndustry [Code of Federal Regulations:Title 29, Labor]. Part 1926.Washington, DC: United StatesDepartment of Labor, OccupationalSafety and Health Administration;Government Printing Office (2001).
Centers for Disease Control andPrevention (CDC) Radiation SafetyCommittee. Radiation Safety Manual.Atlanta, GA: United States Departmentof Health and Human Services, Officeof Health and Safety, Public HealthService, Centers for Disease Controland Prevention (August 1999).
DOE-STD-1095-95 (proposed), DOEStandard Department of EnergyLaboratory Accreditation Program forPersonnel Dosimetry Systems.Washington, DC: United StatesDepartment of Energy LaboratoryAccreditation Program (1995).
Draft DG-8010, Nuclear RegulatoryGuide 8.34, Monitoring Criteria andMethods to Calculate OccupationalRadiation Doses. Washington, DC:United States Nuclear RegulatoryCommission (1991).
Health (Radiation Safety) Regulations 1994.Version No. 011, incorporatingamendments as at 27 April 1998.S.R. No. 165/1994. Victoria, Australia:State Government of Victoria (1998).
Knoll, G.F. Radiation Detection andMeasurement, third edition. New York,NY: John Wiley and Sons (2000).
McGuire, S.A. and C.A. Peabody. WorkingSafely in Gamma Radiography: ATraining Manual for IndustrialRadiographers. NUREG/BR-00024.Washington, DC: United StatesNuclear Regulatory Commission;United States Government PrintingOffice (1982; reprinted 1995).
137Radiation Safety
3RT06 LAYOUT(113_138) 10/14/02 2:51 PM Page 137

NCRP Report 101, Exposure of the U.S.Population from Occupational Radiation.Bethesda, MD: National Council onRadiation Protection andMeasurements (1989).
NCRP Report 102, Medical X-Ray, ElectronBeam and Gamma-Ray Protection forEnergies Up to 50 MeV. (SupersedesNCRP Report No. 33). Bethesda, MD:National Council on RadiationProtection and Measurements (1989).
NCRP Report 104, The Relative BiologicalEffectiveness of Radiations of DifferentQuality. Bethesda, MD: NationalCouncil on Radiation Protection andMeasurements (1990).
NCRP Report 112, Calibration of SurveyInstruments Used in Radiation Protectionfor the Assessment of Ionizing RadiationFields and Radioactive SurfaceContamination. Bethesda, MD:National Council on RadiationProtection and Measurements (1991).
NCRP Report 114, Maintaining RadiationProtection Records. Bethesda, MD:National Council on RadiationProtection and Measurements (1992).
NCRP Report 115, Risk Estimates forRadiation Protection. Bethesda, MD:National Council on RadiationProtection and Measurements (1993).
NCRP Report 116, Limitation of Exposure toIonizing Radiation. (Supersedes NCRPReport No. 91). Bethesda, MD:National Council on RadiationProtection and Measurements (1993).
NCRP Report 117, Research Needs forRadiation Protection. Bethesda, MD:National Council on RadiationProtection and Measurements (1993).
NCRP Report 126, Uncertainties in FatalCancer Risk Estimates Used in RadiationProtection. Bethesda, MD: NationalCouncil on Radiation Protection andMeasurements (1997).
NCRP Report 130, Biological Effects andExposure Limits for “Hot Particles.”Bethesda, MD: National Council onRadiation Protection andMeasurements (1999).
NCRP Report 136, Evaluation of theLinear-Nonthreshold Dose-ResponseModel for Ionizing Radiation. Bethesda,MD: National Council on RadiationProtection and Measurements (2001).
NCRP Report 30, Safe Handling ofRadioactive Materials. Bethesda, MD:National Council on RadiationProtection and Measurements (1964).
NCRP Report 32, Radiation Protection inEducational Institutions. Bethesda, MD:National Council on RadiationProtection and Measurements (1966).
NCRP Report 52, Cesium-137 from theEnvironment to Man: Metabolism andDose. Bethesda, MD: National Councilon Radiation Protection andMeasurements (1977).
NCRP Report 61, Radiation Safety TrainingCriteria for Industrial Radiography.Bethesda, MD: National Council onRadiation Protection andMeasurements (1978).
NCRP Report 82, SI Units in RadiationProtection and Measurements. Bethesda,MD: National Council on RadiationProtection and Measurements (1985).
NCRP Report 88, Radiation Alarms andAccess Control Systems. Bethesda, MD:National Council on RadiationProtection and Measurements (1987).
NCRP Report 96, ComparativeCarcinogenicity of Ionizing Radiation andChemicals. Bethesda, MD: NationalCouncil on Radiation Protection andMeasurements (1989).
“Nuclear Regulatory Commission’s Reporton Radiography Control AssemblyDrive Cable Failures.” MaterialsEvaluation. Vol. 58, No. 6. Columbus,OH: American Society forNondestructive Testing (June 2000):p 715.
OSH Answers: Radiation — Quantities andUnits of Ionizing Radiation. Hamilton,Ontario, Canada: Canadian Centre forOccupational Health and Safety(1999).
138 Radiographic Testing
3RT06 LAYOUT(113_138) 10/14/02 2:51 PM Page 138

Timothy J. Kinsella, Carpenter Technology Corporation,Reading, Pennsylvania (Part 7)
Principles ofFilm Radiography1-3
Parts 1 to 6 from Radiography in Modern Industry. © 1980, Eastman Kodak Company.Reprinted with permission by the American Society for Nondestructive Testing.
7C H A P T E R
3RT07 LAYOUT(139_184) 10/14/02 2:57 PM Page 139

140 Radio
PART 1. Film Exposure
{ {
FIGURE 1. Diagram of setup for making industrial radiographwith X-rays.
Anode
Focal spot
Diaphragm
Specimen
Front screen
Film
Low densityin radiograph
Back screen
High densityin radiograph
Sheet of lead
MOVIE.Conventionalradiographygives shadowimage.
3RT07 LAYOUT(139_184) 10/14/02 2:57 PM Page 140
Making RadiographsRadiography is one of the oldest and mostwidely used of nondestructive testingtechniques. Despite its establishedposition, new developments areconstantly modifying the radiographictechniques applied by industrial andscientific users, thereby producingtechnical or economic advantages, orboth, over previous techniques. Thisprogressive trend continues with suchspecial equipment and techniques asmicrofocus X-ray generators, portablelinear accelerators, radioscopy, neutronradiography, imaging on paper, digitalimage analysis and image enhancement.
A radiograph is a photographic recordproduced by the passage of penetratingradiation through an object onto a film(Fig. 1). When film is exposed to X-rays,gamma rays or light, an invisible changecalled a latent image is produced in thefilm emulsion. The areas so exposedbecome dark when the film is immersedin a developing solution, the degree ofdarkening depending on the amount ofexposure. After development, the film isrinsed, preferably in a special bath, to stopdevelopment. The film is next put into afixing bath, which dissolves theunexposed parts of the emulsion’ssensitive salt. The film is washed toremove the fixer and dried so that it maybe handled, interpreted and filed. Thedeveloping, fixing and washing of theexposed film may be done manually or inautomated processing equipment.
The diagram in Fig. 1 shows theessential features in the exposure of aradiograph. The focal spot is a small areain the X-ray tube from which theradiation emanates. In gammaradiography, it is the capsule containingthe radioactive material that is the sourceof radiation (for example, cobalt-60). Ineither case the radiation proceeds instraight lines to the object; some of therays pass through and others are absorbed— the amount transmitted depending onthe nature of the material and itsthickness. For example, if the object is asteel casting having a void formed by agas bubble, the void produces a reductionof the total thickness of steel to bepenetrated. Hence, more radiation willpass through the section containing thevoid than through the surrounding metal.
graphic Testing
A dark spot, corresponding to theprojected position and shape of the void,will appear on the film when it isdeveloped. Thus, a radiograph is a kind ofshadow picture — the darker regions onthe film representing the more penetrableparts of the object and the lighter regionsrepresenting those more opaque togamma radiation or X-radiation.
Industrial radiography is tremendouslyversatile. Radiographed objects range, insize, from microscopic electronic parts tomammoth missile components, inproduct composition through virtuallyevery known material and inmanufactured form over an enormouslywide variety of castings, weldments andassemblies. Radiographic examination hasbeen applied to organic and inorganicmaterials, to solids, liquids and even to

FIGURE 2. Curves illustrating effect of changein milliamperage on intensity of X-ray beam.
Inte
nsity
(re
lativ
e un
it)
Lowmilliamperage
Wavelength (µm)
Highmilliamperage
3RT07 LAYOUT(139_184) 10/14/02 2:57 PM Page 141
gases. An industry’s production ofradiographs may vary from the occasionalexamination of one or several pieces tothe examination of hundreds ofspecimens per hour. This wide range ofapplications has resulted in theestablishment of independent,professional X-ray laboratories as well asradiographic departments withinmanufacturing plants. Radiographictesting performed by industry usescustomer specifications or industrystandards provided by technical societiesand regulatory bodies.
To meet the growing and changingdemands of industry, research anddevelopment in the field of radiographyare continually producing new sources ofradiation such as neutron generators andradioactive isotopes; lighter, morepowerful, more portable X-ray equipmentas well as multimegavolt X-ray machinesdesigned to produce highly penetratingradiation; new and improved radiographicfilms and automatic film processors; andimproved or specialized radiographictechniques. These factors, plus theactivities of many dedicated people,broadly expand radiography’s usefulnessto industry.
Factors GoverningExposureGenerally speaking, the optical density(called photographic density or simplydensity) of any radiographic imagedepends on the amount of radiationabsorbed by the sensitive emulsion of thefilm. This amount of radiation in turndepends on several factors: the totalamount and type of radiation emitted bythe X-ray tube or gamma ray source; theamount of radiation reaching thespecimen; the amount of radiationspecifically absorbed that is characteristicof the test material; secondary andscattered radiation; filtration; and theintensifying action of screens, if used.Photographic density is discussedelsewhere in this chapter.
Emission from X-Ray SourceThe total amount of radiation emitted byan X-ray tube depends on tube current(milliamperage), voltage, target (source)material and the time the tube isenergized.
When the other operating conditionsare held constant, a change inmilliamperage causes a change in theintensity (quantity of radiation leaving theX-ray generator per unit time) of theradiation emitted, the intensity beingapproximately proportional to themilliamperage. The high voltage
transformer losses and voltage waveformcan change with tube current but acompensation factor is usually applied tominimize the effects of these changes. Innormal industrial radiographic practice,the variation from exact proportionality isnot serious and may usually be ignored.
Figure 2 shows spectral emission curvesfor an X-ray tube operated at twodifferent currents, the higher being twicethe milliamperage of the lower. Therefore,each wavelength is twice as intense in onebeam as in the other. Note that nowavelengths present in one beam areabsent in the other. Hence, there is nochange in X-ray quality or penetratingpower.
As would be expected, the totalamount of radiation emitted by an X-raytube operating at a certain kilovoltage andmilliamperage is directly proportional tothe time the tube is energized.
Because the X-ray output is directlyproportional to both milliamperage andtime, it is directly proportional to theirproduct. (This product is often referred toas the exposure in units such asmilliampere minutes.) Algebraically, thismay be stated E = MT, where E is theexposure, M the tube current and T theexposure time. The amount of radiationwill remain constant if the exposureremains constant, no matter how theindividual factors of tube current andexposure time are varied. This permitsspecifying X-ray exposures in terms suchas milliampere minutes (mA·min) ormilliampere seconds (mA·s), withoutstating the specific individual values oftube current and time.
The kilovoltage applied to the X-raytube affects not only the quality but alsothe intensity of the beam. As thekilovoltage is raised, X-rays of shorterwavelength and hence of morepenetrating power, are produced as well asmore X-rays of the same wavelength as at
141Principles of Film Radiography

142 Radio
3RT07 LAYOUT(139_184) 10/14/02 2:57 PM Page 142
lower voltages. Shown in Fig. 3 arespectral emission curves for an X-ray tubeoperated at two different kilovoltages butat the same milliamperage. Notice thatsome shorter wavelengths present in thehigher kilovoltage beam are absent fromthe lower kilovoltage beam. Further, allwavelengths present in the lowerkilovoltage beam are present in the morepenetrating beam and in greater amount.Thus, raising the kilovoltage increasesboth the penetration and the intensity ofthe radiation emitted from the tube.
Emission from Gamma Ray SourceThe total amount of radiation emittedfrom a gamma ray source during aradiographic exposure depends on theactivity of the source (in becquerels orcuries) and the time of exposure. For aparticular radioactive isotope, theintensity of the radiation is approximatelyproportional to the activity (in becquerelsor curies) of the source. If it were not forabsorption of gamma rays within theradioactive material itself, thisproportionality would be exact. In normalradiographic practice, the range of sourcesizes used in a particular location is smallenough so that variations from exactproportionality are not serious and mayusually be ignored.
Thus, the gamma ray output is directlyproportional to both activity of the sourceand time and hence is directlyproportional to their product.Analogously to the X-ray exposure, thegamma ray exposure E may be statedE = MT, where M is the source activity inbecquerels or curies and T is the exposuretime; the amount of gamma radiationremains constant so long as the productof source activity and time remains
graphic Testing
FIGURE 3. Curves illustrating effect ofchange in kilovoltage on composition andintensity of X-ray beam.
Inte
nsity
(re
lativ
e un
it)
Wavelength (µm)
Wavelengthsadded byincreasing
kilovoltage
Wavelengthsincreased inintensity byincreasingkilovoltage
Lowkilovoltage
Highkilovoltage
constant. This permits specifying gammaray exposures in becquerel hours or curiehours without stating specific values forsource activity or time.
Because the gamma ray energy dependson the isotope, there is no variable tocorrespond to the kilovoltage factorencountered in X-radiography. The onlyway to change the radiation penetratingpower when using gamma rays is tochange the source, for example, higherpenetration cobalt-60 in place of lowerpenetration iridium-192.
Geometric PrinciplesBecause X-rays and gamma rays obey thecommon laws of light, their shadowformation may be simply explained interms of light. It should be borne in mindthat the analogy is not perfect because allobjects are, to a greater or lesser degree,transparent to X-rays and gamma rays andbecause scattering presents greaterproblems in radiography than in optics.However, the same geometric laws ofshadow formation hold for both light andpenetrating radiation.
Suppose that, as in Fig. 4a, there islight from a point L falling on a whitecard C and that an opaque object O isinterposed between the light source andthe card. A shadow of the object will beformed on the surface of the card.
This shadow cast by the object willnaturally show some enlargement becausethe source is smaller than the object andthe object is not in contact with the card;the degree of enlargement will varyaccording to the relative distances of theobject from the card and from the lightsource. For a point source, or one muchsmaller than the object, the law governingthe size of the shadow may be stated: thediameter of the object is to the diameter ofthe shadow as the distance of the light fromthe object is to the distance of the light fromthe card.
Mathematically, the degree ofenlargement may be calculated with thefollowing equations:
(1)
which may also be expressed as Eq. 2:
(2)
where Do = distance from radiation sourceto object; Di = distance from radiationsource to image recording surface (orradiographic film); So = size of object; andSI = size of shadow (or radiographicimage).
S SDDo i
o
i==
SS
DD
o
i
o
i==

FIGURE 4. Ge(a) planes offrom point s(c) perpendimidrange nofilm planes, not parallel,
(a)L
LegendC = film planL = radiationO = test obje
O
C
L
O
C
(b)
L
O
C
(c)
3RT07 LAYOUT(139_184) 10/14/02 2:57 PM Page 143
The degree of sharpness of any shadowdepends on the size of the light sourceand on the position of the object betweenthe light and the card — whether nearerto or farther from one or the other. When
ometric principles of shadow formation: object and film perpendicular to X-ray directionource; (b) perpendicular, near nonpoint source;cular, distant nonpoint source; (d) perpendicular,npoint source; (e) oblique, parallel object and
point source; (f) oblique, object and film planespoint source.
e sourcect
(d)
L
O
C
(e)
L
O
C
(f)
L
O
C
the source of light is not a point but asmall area, the shadows cast are notperfectly sharp (Figs. 4b to 4d) becauseeach point in the source of light casts itsown shadow of the object and each ofthese overlapping shadows is slightlydisplaced from the others, producing anill defined image.
When the source is larger than theobject, as when imaging a crack, theshadow will be smaller than the object.Depending on the distance from object tofilm the image may be undetectablebecause only the black shadow is usuallydetectable.
The form of the shadow may also differaccording to the angle that the objectmakes with the incident light rays.Deviations from the true shape of theobject as exhibited in its shadow imageare referred to as distortion ormisalignment.
Figure 4a to 4f shows the effect ofchanging the size of the source and ofchanging the relative positions of source,object and card. From an examination ofthese drawings, it will be seen that thefollowing conditions must be fulfilled toproduce the sharpest, truest shadow of theobject.
1. The source of light should be small,that is, as nearly a point as can beobtained (compare Fig. 4a and 4c).
2. The source of light should be as farfrom the object as practical (compareFig. 4b and 4c).
3. The recording surface should be asclose to the object as possible(compare Fig. 4b and 4d).
4. The light rays should be directedperpendicularly to the recordingsurface (see Fig. 4a and 4e).
5. The plane of the object and the planeof the recording surface should beparallel (compare Fig. 4a and 4f).
Radiographic ShadowsThe basic principles of shadow formationmust be given primary consideration toensure satisfactory sharpness and freedomfrom distortion in the radiographic image.A certain degree of distortion will exist inevery radiograph because some parts willalways be farther from the film thanothers, the greatest magnification orimage shrinkage being evident in theimages of those parts at the greatestdistance from the recording surface.
Note, also, that there is no distortion ofshape in Fig. 4e — a circular object havingbeen rendered as a circular shadow.However, under circumstances similar tothose shown in Fig. 4e, it is possible thatspatial relations can be distorted. In Fig. 5the two circular objects can be renderedeither as two circles (Fig. 5a) or as a figure
143Principles of Film Radiography

144 Radi
3RT07 LAYOUT(139_184) 10/14/02 2:57 PM Page 144
eight shaped shadow (Fig. 5b). It shouldbe observed that both lobes of the figureeight have circular outlines.
Distortion cannot be eliminatedentirely but, with an appropriatesource-to-film distance, can be lessened toa point where it will not be objectionablein the radiographic image.
Application to RadiographyThe application to the geometricprinciples of shadow formation toradiography leads to five general rules.Although these rules are stated in terms ofradiography with X-rays, they also applyto gamma radiography.
ographic Testing
FIGURE 5. Depending on direction ofradiation, two circular objects can berendered: (a) as two separate circles; (b) astwo overlapping circles.
LegendC = film planeO1 = first test objectO2 = second test object
(a)
O1
C
O2
(b)
O1
C
O2
1. The focal spot should be as small asother considerations will allow, forthere is a definite relation between thesize of the focal spot of the X-ray tubeand the definition in the radiograph. Alarge focus tube, although capable ofwithstanding large loads, does notpermit the delineation of as muchdetail as a small focus tube. Longsource-to-film distances will aid inshowing detail when a large focus tubeis used but it is advantageous to usethe smallest focal spot permissible forthe exposures required. Figures 6b and6h show the effect of focal spot sizeon image quality. As the focal spot sizeincreases from 1.5 mm (0.06 in.) inFig. 6b to 4.0 mm (0.16 in.) in Fig. 6h,the definition of the radiograph startsto degrade. This change is especiallyevident at the chamber edges that areno longer sharp.
2. The distance between the anode andthe material examined should alwaysbe as great as practical. Comparativelylong source-to-film distances shouldbe used in the radiography of thickmaterials to minimize the fact thatstructures farthest from the film areless sharply recorded than those nearerto it. At long distances, radiographicdefinition is improved and the imageis more nearly the actual size of theobject. Figures 6a to 6d show theeffects of source-to-film distance onimage quality. As the source-to-filmdistance is decreased from 1730 mm(68 in.) to 305 mm (12 in.) the imagebecomes more distorted until at305 mm (12 in.) it is no longer a truerepresentation of the casting. This isparticularly evident at the edges of thecasting where the distortion isgreatest.
3. The film should be as close as possibleto the object being radiographed. Inpractice, the film (in its cassette orexposure holder) is placed in contactwith the object. In Fig. 6b and 6e, theeffects of object-to-film distance areevident. As the object-to-film distanceis increased from zero to 102 mm(4 in.), the image becomes larger andthe definition begins to degrade.Again, this is especially evident atchamber edges that are no longersharp.
4. The central ray should be as nearlyperpendicular to the film as possibleto preserve spatial relations.
5. As far as the shape of the specimenwill allow the plane of maximuminterest should be parallel to the planeof the film.
In Fig. 6f and 6g, the effects ofobject-film-source orientation are shown.When compared to Fig. 6b, the image inFig. 6f is extremely distorted; although the

FIGURE 6. Effects on image quality when geometric exposure factors are changed: (a) 1.75 m (68 in.) source-to-film distance,0 mm (0 in.) object-to-film distance; (b) 1.5 mm (0.06 in.) focal spot, 0 mm (0 in.) object-to-film distance; (c) intermediatefocal spot size, intermediate source-to-film distance; (d) 0.30 m (12 in.) source-to-film distance; (e) 100 mm (4 in.)object-to-film distance; (f) perpendicular film-to-source angle and 45 degree object-to-film angle; (g) perpendicularfilm-to-source angle, parallel object-to-film angle; (h) 4.0 mm (0.10 in.) focal spot.
(a)
(b)
(c)
(d)
(e)
(f)
(g)
(h)
3RT07 LAYOUT(139_184) 10/14/02 2:57 PM Page 145
film is perpendicular to the central ray,the casting is at a 45 degree angle to thefilm and spatial relationships are lost. Asthe film is rotated to be parallel with thecasting (see Fig. 6g), the spatialrelationships are maintained and thedistortion is lessened.
Calculation of GeometricUnsharpnessThe width of the fuzzy boundary of theshadows in Fig. 4c and 4d is known as thegeometric unsharpness Ug. Because thegeometric unsharpness is a calculablemeasure of the sharpness of the imageand can strongly affect the appearance ofthe radiographic image, it is frequentlynecessary to determine its magnitude.From the laws of similar triangles (seeFig. 7), it can be shown that:
(3)
or
(4)
where Do = source-to-object distance;F = size of radiation source; d = theobject-to-film distance; andUg = geometric unsharpness.
Because the maximum unsharpnessinvolved in any radiographic procedure isusually the significant quantity, theobject-to-film distance d is usually takenas the distance from the source side of thespecimen to the film.
Do and d must be measured in the sameunits — say, millimeters or inches. So longas Do and d are in the same units, Eq. 3 or
U Fd
Dgo
=
U
Fd
Dg
o==
145Principles of Film Radiography

146 Rad
LegendDo = sourcd = objecF = radiatUg = geom
FIGURE 7. GunsharpnessEq. 4.
Film plane
O
FIGURE 8. Graph relating geometric unsharpness Ug tospecimen thickness and source-to-object distance, for 5 mm(0.2 in.) source size.
1.0 (40)
(10
in.)
(20
in.)
3RT07 LAYOUT(139_184) 10/14/02 2:57 PM Page 146
4 will always give the geometricunsharpness Ug in whatever units wereused to measure the dimensions of thesource. The projected sizes of the focalspots of X-ray tubes are usually stated inmillimeters and Ug will also be inmillimeters. If the source size is stated ininches, Ug will be inches.
For rapid reference, graphs of the typeshown in Fig. 8 can be prepared withthese equations. The graphs relatesource-to-film distance, object-to-filmdistance and geometric unsharpness. Notethat the lines of Fig. 8 are all straight.Therefore, for each source-to-objectdistance, it is only necessary to calculatethe value of Ug for a single specimenthickness and then draw a straight linethrough the point so determined and theorigin. It should be emphasized, however,that a separate graph of the type shown inFig. 8 must be prepared for each size ofsource.
Geometric EnlargementIn most radiography, it is desirable tohave the specimen and the film as closetogether as possible to minimizegeometric unsharpness. An exception tothis rule occurs when the source ofradiation is extremely minute, that is, afraction of a millimeter, as in a microfocussource or betatron. In such a case, the
iographic Testing
e-to-object distancet-to-film distanceion sourceetric unsharpness
eometric construction for determining geometric Ug where source is smaller than object. See
F
Do
d
Ug
bject
Source
film may be placed at a distance from thespecimen rather than in contact with it(Fig. 9). Such an arrangement results in anenlarged radiograph without introducingobjectionable geometric unsharpness.Enlargements of three to ten diameters bythis technique are useful in the detectionof fine structures otherwise invisibleradiographically. As the enlargementincreases, the effective field of view(inspection area) decreases. This can resultin the requirement of multiple exposuresto cover an entire part. A benefit ofgeometric enlargement is a decrease in theamount of object scattered radiationreaching the image plane. This effect canimprove contrast sensitivity.
Inverse Square LawWhen the X-ray tube output is heldconstant or when a particular radioactivesource is used, the radiation intensityreaching the specimen (object) is
Geo
met
ric u
nsha
rpne
ss,
mm
(10
–3in
.)
0.9 (36)
0.8 (32)
0.7 (28)
0.6 (24)
0.5 (20)
0.4 (16)
0.3 (12)
0.2 (8)
0.1 (4)
0
Sour
ce-t
o-ob
ject
dis
tanc
e 25
0 m
m
500
mm
750
mm
(30
in.)
1.00
m (4
0 in
.)
1.25
m (5
0 in.
)1.50 m
(60 in
.)
1.75 m (7
0 in.)
2.00 m (8
0 in.)
0 25 50 75 100 125 150(1) (2) (3) (4) (5) (6)
Specimen thickness, mm (in.)

3RT07 LAYOUT(139_184) 10/14/02 2:57 PM Page 147
governed by the distance between thetube (source) and the specimen, varyinginversely with the square of this distance.The explanation that follows is in termsof X-rays and light but applies to gammarays as well.
Because X-rays conform to the laws oflight they diverge when they are emittedfrom the anode and cover an increasinglylarger area with lessened intensity as theytravel from their source. This principle isillustrated in Fig. 10. In this example, it isassumed that the intensity of the X-raysemitted at the anode A remains constantand that the X-rays passing through theaperture B cover an area of 25.8 cm2
(4 in.2) on reaching the recording surfaceC1, which is 305 mm (12 in.) from theanode (distance D).
When the recording surface is moved305 mm (12 in.) farther from the anode,to C2, so that the distance (2D) from theanode is 610 mm (24 in.) or twice itsearlier value, the X-rays will cover103.4 cm2 (16 in.2) — an area four timesas great as that at C1. It follows, therefore,that the radiation per square centimeteron the surface at C2 is only one fourth of
FIGURE 9. With very small focal spot,enlarged image can be obtained. Degree ofenlargement depends upon ratio ofsource-to-film and source-to-specimendistances.
Anode
Focal spot
Diaphragm
Void
Film andcassette
Specimen
that at the level C1. The exposure thatwould be adequate at C1 must beincreased four times to produce at C2 aradiograph of equal density. In practice,this can be done by increasing the time orby increasing the milliamperage.
The inverse square law can beexpressed algebraically as follows:
(5)
where I1 and I2 are the intensities atdistances D1 and D2, respectively.
Relations of SourceStrength (Milliamperage),Distance and TimeWith a given kilovoltage of X-radiation orwith the gamma radiation from aparticular isotope, the three factorsgoverning the exposure are themilliamperage (for X-rays) or sourcestrength (for gamma rays), time and
II
D
D1
2
22
12
==
147Principles of Film Radiography
FIGURE 10. Schematic diagram illustratinginverse square law.
A
B
C1
C2
D
2D
LegendA = radiation sourceB = focal pointC1 = first film planeC2 = second film planeD = source-to-film distance

148 Rad
3RT07 LAYOUT(139_184) 10/14/02 2:57 PM Page 148
source-to-film distance. The numericalrelations among these three quantities aredemonstrated below, using X-rays as anexample. The same relations apply forgamma rays, provided the number ofbecquerels (curies) in the source issubstituted wherever milliamperageappears in an equation.
The necessary calculations for anychanges in focus-to-film distance D,milliamperage M or time T are matters ofsimple arithmetic and are illustrated inthe following example. As noted earlier,kilovoltage changes cannot be calculateddirectly but must be obtained from theexposure chart of the equipment or theoperator’s log book.
Relationship of Source Strengthand DistanceRule: If exposure time is held constant, themilliamperage (M) required for a givenexposure is directly proportional to the squareof the source-to-film distance (D). Theequation is expressed as follows:
(6)
or
For example, suppose that with a givenexposure time and kilovoltage, a properlyexposed radiograph is obtained with 5 mA(M1) at a distance of D1 of 120 mm(30 in.) and that it is desired to increasethe sharpness of detail in the image byincreasing the focus-to-film distance D2 to240 mm (60 in.). The correctmilliamperage M2 to obtain the desiredradiographic density at the increaseddistance D2 may be computed from theproportion:
(7)
or
or
When very low kilovoltages, say 20 kVor less, are used, the X-ray intensitydecreases with distance more rapidly than
clorract
RRteo
(
o
RReMp
(
o
tdmt
(
rd
TSPPmTtmatds
i
M2
2
25
60
305
3600900
5 4 20
= × = ×
= × = mA
5 30
602
2
2M=
5 30 6022 2: :M =
MM
D
D1
2
12
22
==
M M D D1 2 12
22: :==
iographic Testing
alculations based on the inverse squareaw would indicate because of absorptionf the X-rays by the air. Most industrialadiography, however, is done withadiation so penetrating that the airbsorption need not be considered. Theseomments also apply to theime-to-distance relations discussed below.
elationship of Time and Distanceule: If tube current (mA) is held constant,
he exposure time T required for a givenxposure is directly proportional to the squaref the focus-to-film distance D:
8)
r
elation of Milliamperage to Timeule: If distance is held constant butxposure must be changed, the milliamperage
required for a given exposure is inverselyroportional to the time T:
9)
r
Another way of expressing this is to sayhat for a given set of conditions (voltage,istance and others), the product ofilliamperage and time is constant for
he same photographic effect. Thus:
10)
This commonly referred to as theeciprocity law. (Important exceptions areiscussed below.)
abular Solution of Sourcetrength, Time and Distanceroblemsroblems of the types discussed aboveay also be with a table similar to
able 1. The factor between the new andhe old exposure time, milliamperage, or
illiampere minute (mA·min) valueppears in the box at the intersection ofhe column for the new source-to-filmistance and the row for the oldource-to-film distance.
Note that some approximation isnvolved in such a table because the
M T M T M T
C1 1 2 2 3 3== ==
== (a constant)
MM
TT
1
2
2
1==
M M T T1 2 2 1: :==
TT
D
D1
2
12
22
==
T T D D1 2 12
22: :==

3RT07 LAYOUT(139_184) 10/14/02 2:57 PM Page 149
values in the boxes are rounded off to twosignificant digits. However, the errorsinvolved are always less than 5 percentand, in general, are insignificant in actualpractice. Also, a table of this type cannotinclude all source-to-film distances.However, in any one radiographicdepartment, only a few source-to-filmdistances are used in the great bulk of thework and a table of reasonable size can bemade using only these few distances.
Reciprocity LawIn the preceding text, it has been assumedthat exact compensation for a decrease inthe time of exposure can be made byincreasing the milliamperage according tothe relation M1T1 = M2T2. This may bewritten MT = C and is an example of ageneral photochemical law: the sameeffect is produced for IT = constant, whereI is intensity of the radiation and T is thetime of exposure. This is called thereciprocity law and is true for direct X-rayand lead screen exposures. For exposure tolight, it is not quite accurate and, becausesome radiographic exposures are madewith the light from fluorescentintensifying screens, the law cannot bestrictly applied.
Formally defined, the Bunsen-Roscoereciprocity law states that the result of aphotochemical reaction is dependent onlyon the product of radiation intensity I andthe duration of the exposure T and isindependent of absolute values of eitherquantity.
Errors that result for assuming thevalidity of the reciprocity law are usuallyso small that they are not noticeable inexamples of the types given here.
TABLE 1. Value of source strength–time (mA·msource-to-film distance is changed. (The samexample, multiply by same factor if both oldmillimeters.)
OldSource-to-Film ___________________________Distance (mm) 250 300 350 400
250 1.0 1.4 2.0 2.6300 0.70 1.0 1.4 1.8350 0.51 0.74 1.0 1.3400 0.39 0.56 0.77 1.0450 0.31 0.45 0.60 0.7500 0.25 0.36 0.49 0.6550 0.21 0.30 0.40 0.5600 0.17 0.25 0.34 0.4650 0.15 0.21 0.29 0.3700 0.13 0.18 0.25 0.3750 0.11 0.16 0.22 0.2800 0.10 0.14 0.19 0.2
Departures may be apparent, however, ifthe intensity is changed by a factor of 4 ormore. Because intensity may be changedby changing the source-to-film distance,failure of the reciprocity law may appearto be a violation of the inverse square law.Applications of the reciprocity law over awide intensity range sometimes arise andthe relation between results andcalculations may be misleading unless thepossibility of reciprocity law failure is keptin mind. Failure of the reciprocity lawmeans that the efficiency of a lightsensitive emulsion in responding to thelight energy depends on the lightintensity.
Exposure FactorThe exposure factor is a quantity thatcombines milliamperage (X-rays) or sourcestrength (gamma rays), time and distance.Numerically the exposure factor equals
(11)
and
(12)
Activity is measured in becquerels (Bq) orcuries (Ci), where 3.7 × 10¹⁰ Bq = 37 GBq= 1.0 Ci.
Radiographic techniques are sometimesgiven in terms of kilovoltage andexposure factor, or radioactive isotope andexposure factor. In such a case, it isnecessary merely to multiply the exposurefactor by the square of the distance to
Activity Time
Distance
Gamma rayexposure
factor
×× ==2
Milliamperes Time
Distance
X - rayexposure
factor
×× ==2
149Principles of Film Radiography
in) is multiplied by factor shown in this table whene factors apply regardless of unit of distance — for and new distance are measured in inches instead of
New Source-to-Film Distance (mm)_____________________________________________________________450 500 550 600 650 700 750 800
3.2 4.0 4.8 5.6 6.8 7.8 9.0 10.02.3 2.8 3.4 4.0 4.8 5.4 6.3 7.11.6 2.0 2.5 3.0 3.4 4.0 4.6 5.21.3 1.6 1.9 2.2 2.6 3.1 3.5 4.0
9 1.0 1.2 1.5 1.8 2.1 2.4 2.8 3.24 0.81 1.0 1.2 1.4 1.7 2.0 2.2 2.63 0.67 0.83 1.0 1.2 1.4 1.6 1.9 2.14 0.56 0.69 0.84 1.0 1.2 1.4 1.6 1.88 0.48 0.59 0.72 0.85 1.0 1.2 1.3 1.53 0.41 0.51 0.62 0.74 0.86 1.0 1.1 1.38 0.36 0.45 0.54 0.64 0.75 0.87 1.0 1.15 0.32 0.39 0.47 0.56 0.66 0.77 0.88 1.0

150 Rad
3RT07 LAYOUT(139_184) 10/14/02 2:57 PM Page 150
find, for example, the milliampereminutes or the curie hours required.
Determination of ExposureFactors
X-RaysThe focus-to-film distance is easy toestablish by actual measurement, themilliamperage can conveniently bedetermined by the milliammeter suppliedwith the X-ray machine and the exposuretime can be accurately controlled by agood time switch. The tube voltage,however, is difficult and inconvenient tomeasure accurately. Furthermore, designsof individual machines differ widely andmay give X-ray outputs of a differentquality and intensity even when operatedat the nominal values of peak kilovoltageand milliamperage.
Consequently, although specifiedexposure techniques can be duplicatedsatisfactorily in the factors ofsource-to-film distance, milliamperageand exposure time, one apparatus maydiffer materially from another in thekilovoltage setting necessary to producethe same radiographic density. Because ofthis, the kilovoltage setting for a giventechnique should be determined by trialon each X-ray generator. In thepreliminary tests, published exposurecharts may be followed as an approximateguide. It is customary for equipmentmanufacturers to calibrate X-ray machinesat the factory and to furnish suitableexposure charts. For the unusual problemsthat arise, it is desirable to record in alogbook all the data on exposure andtechniques. In this way, operators willsoon build up a source of informationthat will make them more competent todeal with difficult situations.
For developing trial exposures, astandardized technique should always beused so that any variation in the qualityof the trial radiographs may then beattributed to the exposure alone. Thistechnique obviates many of the variablefactors common to radiographic work.
Because an increase of kilovoltageproduces a marked increase in X-rayoutput and penetration (see Fig. 3), it isnecessary to maintain a close control ofthis factor to secure radiographs ofuniform density. In many types ofindustrial radiography where it isdesirable to maintain constant exposureconditions for source-to-film distance,milliamperage and exposure time, it iscommon practice to vary the kilovoltagein accordance with the thickness of thematerial to be examined to secure properdensity in the radiographic image.
iographic Testing
Suppose, for example, it is desired tochange from radiographing 38 mm(1.5 in.) thick steel to radiographing50 mm (2 in.) thick steel. For a givenX-ray machine, the 50 mm (2 in.) thicksteel will require more than 10 times theexposure in milliampere minutes at170 kV than the 38 mm (1.5 in.) thicksteel requires. However, increasing thekilovoltage to a little more than 200 willyield a comparable radiograph with thesame milliampere minutes.
Therefore, kilovoltage is an importantvariable because economic considerationsoften require that exposure times be keptwithin fairly narrow limits. It is desirable,as a rule, to use as low a kilovoltage as otherfactors will permit. In the case of certainhigh voltage X-ray machines, thetechnique of choosing exposureconditions may be somewhat modified.For instance, the kilovoltage may be fixedrather than adjustable at the will of theoperator, leaving only milliamperage,exposure time, film type and focus-to-filmdistance as variables.
Gamma RaysWith radioactive materials, the variablefactors are more limited than with X-rays.Not only is the quality (energy orwavelength) of the radiation fixed by thenature of the radiation emitter, but alsothe intensity is fixed by the amount ofradioactive material in the particularsource. The only variables under thecontrol of operators and the onlyquantities they need to determine are thesource-to-film distance, film type and theexposure time. As in the case ofX-radiography, it is desirable to developtrial exposures using the gamma raysources under standardized conditionsand to record all data on exposures andtechniques.
Radiographic ContrastIn a radiograph, the various intensitiestransmitted by the specimen are renderedas different densities in the image. Thedensity differences from one area toanother constitute radiographic contrast.Details in the image are visible by reasonof the contrast between them and theirbackground. Within appropriate limits,the greater the contrast or densitydifferences in the radiograph, the moredefinitely various details will stand out.However, if overall contrast is increasedtoo much, there may be an actual loss indetail visibility in both the thick and thethin regions of the specimen as the imageis too light or too dark to display usefulcontrast (see discussion of film contrast,below).

L
FIGURE 11. Adecreases. Mand thin secexposure behalf value laget two half
(a)
II= 016
Hal
3RT07 LAYOUT(139_184) 10/14/02 2:57 PM Page 151
Radiographic contrast is the result ofboth subject contrast and film contrast.Subject contrast is governed by the rangeof radiation intensities transmitted by thespecimen. A flat sheet of homogeneousmaterial of nearly uniform thicknesswould have very low subject contrast.Conversely, a specimen with largevariations in thickness, which transmits awide range of intensities, would have highsubject contrast. Overall subject contrastcould be defined as the ratio of thehighest to the lowest radiation intensitiesfalling on the film. The subject contrast isaffected by the X-ray kilovoltage. Asshown in Fig. 11, a lower kilovoltage willincrease subject contrast and so increasesensitivity to small variations in theobject. Contrast is also affected byscattered radiation, removal of whichincreases subject contrast, and by theenergy of the primary radiation.
Choice of FilmDifferent films have different contrastcharacteristics. Thus, a film of highcontrast may give a radiograph ofrelatively low overall contrast if thesubject contrast is very low; conversely, afilm of low contrast may give aradiograph of relatively high overallcontrast if the subject contrast is veryhigh. With any given specimen, thecontrast of the radiograph will depend onthe kilovoltage or quality of the X-rays orgamma rays, the contrast characteristics ofthe film, the type of screen, scatter, the
ow kV
s kilovoltage increases, subject contrastore wavelengths penetrate subject in both thick
tions, thus reducing overall difference intween them: (a) low kilovoltage selected for fouryers in thick section; (b) kilovoltage increased to value layers in thick section.
High kV
(b)
II= 04
II= 04
II= 02
f value layer
Half value layer
density to which the radiograph isexposed and film processing.
The classification of film types andtheir speeds are discussed in the chapteron film processing.
Radiographic SensitivityRadiographic sensitivity refers to the sizeof the smallest detail that can be seen in aradiograph or to the ease with which theimages of small details can be detected.
Sensitivity depends on the sharpnessand the contrast of the radiograph. Thus,the grain size of the film, as well as itscontrast and other factors such as theexposure geometry and radiation energy,affect sensitivity.
In radiography of materials ofapproximately uniform thickness, wherethe range of transmitted X-ray intensitiesis small, a technique producing highcontrast may satisfactorily render allportions of the area of interest and theradiographic sensitivity will usually begreater than with a technique producinglow contrast. If, however, the partradiographed transmits a wide range ofX-ray intensities, then a techniqueproducing lower contrast may benecessary to achieve radiographicsensitivity in all regions of the part.
151Principles of Film Radiography

152 Radi
PART 2. Absorption and Scattering
FIGURE 12. Sgamma ray eElectrons froradiographicimportant.
Se
3RT07 LAYOUT(139_184) 10/14/02 2:57 PM Page 152
Radiation Absorption inSpecimenWhen X-rays or gamma rays strike anabsorber (Fig. 12), some radiation isabsorbed or deflected and some passesthrough undeviated. It is the intensityvariation of the undeviated radiation fromarea to area in the specimen that formsthe useful image in a radiograph. Theradiation that is scattered is not imageforming. Scattered radiation will exposethe film and thus tend to obscure theuseful radiographic image. Therefore,scatter must be carefully controlled.(Scattered radiation and the means forreducing its effects are discussed in detailbelow.) Another portion of the originalbeam’s energy is spent in liberatingelectrons from the absorber. The electrons
ographic Testing
chematic diagram of some ways X-ray ornergy is dissipated on passing through matter.
m specimens are usually unimportantally; those from lead foil screens are very
Primary radiation
Absorber
Electronscondary X–rays or
gamma rays
Unabsorbedprimary radiation(image forming)
from the specimen are usuallyunimportant radiographically; those frommaterials in contact with the film, such asscreens of lead or other materials, are veryimportant.
Radiographic Equivalency ofMaterialsBecause various wavelengths exist inX-rays and gamma rays and becauseconsiderable scattered radiation reachesthe film, the laws of radiation absorptionmust be given in a general way.
The absorption of a specimen dependson its thickness, on its density and on theatomic composition of the material.Comparing two specimens of the samecomposition, the thicker or the moredense will absorb more radiation and sorequire more kilovoltage or exposure, orboth, to produce the same photographicresult.
However, the atomic elements in aspecimen often exert a far greater effectupon X-ray absorption than either thethickness or the density. For example, leadis about 1.5 times as dense as ordinarysteel but at 220 kV, 2.5 mm (0.1 in.) oflead absorbs as much as 30.5 mm (1.2 in.)of steel. Brass is only about 1.1 times asdense as steel, yet, at 150 kV, the sameexposure is required for 6.4 mm (0.25 in.)of brass as for 8.9 mm (0.35 in.) of steel.
Table 2 gives approximate radiographicequivalence factors. It should beemphasized that this table is approximateand is intended merely as a guide becauseit is based on a compilation of data frommany sources. In a particular instance, theexact value of the radiographicequivalence factor will depend on thequality of the X-radiation and thethickness of the specimen. It will be notedfrom this table that the relativeabsorptions of the different materials arenot constant but change with kilovoltageand that as the kilovoltage increases thedifferences between all materials tend tobecome less. In other words, askilovoltage is increased, the radiographicabsorption of a material becomes lessdependent on the atomic numbers of itsconstituents.
For X-rays generated at voltages morethan 1 MeV and for materials notdiffering too greatly in atomic number(steel and copper, for example), the

TABLE 2. Approximate radiographic equivalence factors.a
X-Rays (kV) Gamma Rays___________________________________________________ ______________________________________________Material 50 100 150 220 400 1000 2000 4 to 25b Iridium-192 Cesium-137 Cobalt-60 Radium
Magnesium 0.6 0.6 0.5 0.08Aluminum 1.0 1.0 0.12 0.18 0.35 0.35 0.35 0.402024 aluminum alloy 2.2 1.6 0.16 0.22 0.35 0.35 0.35Titanium 0.45 0.35Steel 12.0 1.0 1.0 1.0 1.0 1.0 1.0 1.0 1.0 1.0 1.0Steel alloyc 12.0 1.0 1.0 1.0 1.0 1.0 1.0 1.0 1.0 1.0 1.0Copper 18.0 1.6 1.4 1.4 1.3 1.1 1.1 1.1 1.1Zinc 1.4 1.3 1.3 1.0 1.1 1.0 1.0 1.0Brassd 1.4 1.3 1.3 1.2 1.2 1.0 1.1 1.1 1.1 1.1Nickel alloye 16.0 1.4 1.3 1.3 1.3 1.3 1.0 1.3 1.3 1.3 1.3Zirconium 2.3 2.0 1.0Lead 14.0 12.0 5.0 2.5 3.0 4.0 3.2 2.3 2.0Uranium 25.0 3.9 12.6 5.6 3.4
a. Aluminum is the standard metal at 50 kV and 100 kV; steel is the standard metal with high voltages and gamma rays. The thickness of another metal ismultiplied by the corresponding factor to obtain the approximate equivalent thickness of the standard metal. The exposure applying to this thickness of thestandard metal is used. Example: to radiograph 12.7 mm (0.5 in.) of copper at 220 kV, multiply 12.7 mm (0.5 in.) by the factor 1.4, obtaining an equivalentthickness of 17.8 mm (0.7 in.) of steel.
b. 4 to 25 MeV.c. Alloy consisting of 18 percent chromium, 8 percent nickel.d. Tin or lead alloyed in brass will increase these factors.e. Alloy consisting of 73 percent nickel, 15 percent chromium.
3RT07 LAYOUT(139_184) 10/14/02 2:57 PM Page 153
radiographic absorption for a giventhickness of material is roughlyproportional to the density of thematerial. However, even at high voltagesor with penetrating gamma rays, theeffect of composition on absorptioncannot be ignored when dealing withmaterials that differ widely in atomicnumber. For instance, the absorption oflead for 1 MeV X-rays is about five timesthat of an equal thickness of steel,although its density is only 1.5 times asgreat.
Scattered RadiationWhen a beam of X-rays or gamma raysstrikes any object, some of the radiation isabsorbed, some is scattered and somepasses straight through. The electrons ofthe atoms constituting the object scatterradiation in all directions, much as light isdispersed by fog. The wavelengths ofmuch of the radiation are increased bythe scattering process and hence thescatter is of longer wavelength and issomewhat softer, or less penetrating, thanthe unscattered primary radiation. Anymaterial — whether specimen, cassette,tabletop, walls or floor — that receives thedirect radiation is a source of scatteredradiation. Unless suitable measures aretaken to reduce the effects of scatter, itwill reduce the contrast over the wholeimage or parts of it. Scatter forms fog ofnonuniform density.
Scattering of radiation occurs and is aproblem in radiography with both X-raysand gamma rays. In the text whichfollows, the discussion is in terms ofX-rays but the same general principlesapply to gamma radiography.
In the radiography of materials that arethick relative to the radiation energy,scattered radiation forms most of the totalradiation. For example, in the radiographyof a 19 mm (0.75 in.) thickness of steel,the scattered radiation from the specimenis almost twice as intense as the primaryradiation; in the radiography of a 50 mm(2 in.) thickness of aluminum, thescattered radiation is 2.5 times as great asthe primary radiation. Preventing scatterfrom reaching the film markedly improvesthe quality of the radiographic image.
As a rule, the greater portion of thescattered radiation affecting the film isfrom the specimen under examination (Ain Fig. 13). However, any portion of thefilm holder or cassette that extendsbeyond the boundaries of the specimenand thereby receives direct radiation fromthe X-ray tube also becomes a source ofscattered radiation that can affect thefilm. The influence of this scatter is mostnoticeable just inside the borders of theimage (B in Fig. 13) and is often referredto as undercut. In a similar manner,primary radiation striking the film holderor cassette through a thin portion of thespecimen will cause scattering into theshadows of the adjacent thicker portions.
153Principles of Film Radiography

154 Rad
3RT07 LAYOUT(139_184) 10/14/02 2:57 PM Page 154
Another source of scatter that mayundercut a specimen is shown as C inFig. 13. If a filter is used near the tube,this too will scatter X-rays. However,because of the distance from the film,scattering from this source is negligible.Any other material, such as wall or floor,on the film side of the specimen may alsoscatter an appreciable quantity of X-raysback to the film, especially if the materialreceives the direct radiation from theX-ray tube or gamma ray source (Fig. 14).This is referred to as backscatteredradiation.
Reduction of ScatterAlthough scattered radiation can never becompletely eliminated, a number ofmeans are available to reduce its effect.The various techniques are discussed interms of X-rays. Although most of thesame principles apply to gamma andmegavolt X-ray radiography, differences inapplication arise because of the highlypenetrating radiation emitted by megavolt
iographic Testing
FIGURE 13. Sources of scattered radiation.
Anode
Focal spot
Diaphragm
Filter
Specimen
Film and cassette
LegendA = transmitted scatterB = scatter from cassetteC = diffraction scatter
AA
A AC
B B B
and gamma ray sources. For example, amask (see Fig. 15) for use with 200 kVX-rays could easily be light enough forconvenient handling. A mask for use withcobalt-60 radiation, on the other hand,would be thick, heavy and probablycumbersome. In any event, with eitherX-rays or gamma rays, the means forreducing the effects of scattered radiationmust be chosen on the basis of cost,convenience and effectiveness.
Lead Foil ScreensLead screens, mounted in contact withthe film, diminish the effect on the filmof scattered radiation from all sources.They are beyond doubt the leastexpensive, most convenient and mostuniversally applicable means ofcombating the effects of scatteredradiation. Lead screens lessen the scatterreaching the films regardless of whetherthe screens permit a decrease ornecessitate an increase in the radiographicexposure. The nature of the action of lead
FIGURE 14. Intense backscattered radiationmay originate in the floor or wall.Collimating, masking or diaphragmingshould be used. Backing the cassette withlead may give adequate protection.
Anode
Focal spot
Diaphragm
Floor or wall
Specimen
Film

FIGURE 15. lessening scradiographiradiographewith lead stfilled with fi
Fine metallic
3RT07 LAYOUT(139_184) 10/14/02 2:58 PM Page 155
screens is discussed more below. Definitemeans must be provided to ensure goodcontact with the film to ensure imagesharpness.
Many X-ray holders or cassettesincorporate a sheet of lead foil in the backfor the specific purpose of protecting thefilm from backscatter from the table orother objects. This lead will not serve asan intensifying screen — first because itusually has a paper facing and secondbecause it often is not lead of radiographicquality.
When radiographic film cassettes fittedwith a sheet of lead foil in the back forprotection against backscatter are usedwith gamma rays or with X-rays above200 kV, the film should always beenclosed between double lead screens;otherwise, the secondary radiation fromthe lead backing is sufficient to penetratethe intervening felt or paper and cast ashadow of this material on the film givinga granular or mottled appearance.
Combined use of metallic shot and lead mask forattered radiation is conducive to goodc quality. If several round bars are to bed, they may be separated along their lengthsrips held on edge by wooden frame and voidsne shot.
shot
Anode
Focal spot
Diaphragm
Lead mask
Specimen
Film and cassette
Masks and DiaphragmsScattered radiation originating in matteroutside the specimen is most serious forspecimens that have high absorption forX-rays because the scattering fromexternal sources may be large compared tothe primary image forming radiation thatreaches the film through the specimen. Ifmany specimens of the same article are tobe radiographed, it may be worthwhile tocut an opening of the same shape, butslightly smaller, in a sheet of lead andplace this on the object. The lead serves toreduce the exposure in surrounding areasand thus to reduce scattered radiationfrom this source. Because scatter alsoarises from the specimen itself, it is goodpractice, wherever possible, to limit thecross section of an X-ray beam to coveronly the area of the specimen that is ofinterest in the examination.
For occasional pieces of work with lowenergy radiation, where a cutoutdiaphragm would not be economical,barium clay packed around the specimenmay serve the same purpose. The clayshould be thick enough so that the filmdensity under the clay is somewhat lessthan that under the specimen. Otherwise,the clay itself contributes appreciablescattered radiation.
One of the most satisfactoryarrangements, combining effectivenessand convenience, is to surround theobject with copper or steel shot having adiameter of about 0.25 mm (0.01 in.) orless (Fig. 15). Steel is best for objects oflow atomic number; copper, for steel andobjects of higher atomic number thaniron. The materials flow and are effectivefor filling cavities or irregular edges ofobjects, such as castings, where a normalexposure for thick parts would result in anoverexposure for thinner parts. Of course,it is preferable to make separate exposuresfor thick and thin parts but this is notalways practical.
In some cases, a lead diaphragm or leadcone on the tube head may be aconvenient way to limit the area coveredby the X-ray beam. Such lead diaphragmsare particularly useful where the desiredcross section of the beam is a simplegeometric figure, such as a circle, squareor rectangle.
FiltersIn general, filters are limited toradiography with X-rays below 1 MeV. Asimple metallic filter mounted in theX-ray beam near the X-ray tube (Fig. 16)may adequately serve the purpose ofeliminating overexposure in the thinregions of the specimen and in the areasurrounding the part (Table 3). Such afilter is particularly useful for reducingscatter undercut in cases where a mask
155Principles of Film Radiography

156 Rad
TABLE 3. Ef
Regio
Outside speThin sectionMedium seThick sectio
3RT07 LAYOUT(139_184) 10/14/02 2:58 PM Page 156
around the specimen is impractical. Ofcourse, an increase in exposure ofkilovoltage will be required to compensatefor the additional absorption.
The underlying principle of thetechnique is that the filter absorbs moreof the softer radiation of the primarybeam than it does the harder radiation.This causes a greater change in theamount of radiation passing through thethin parts than through the thicker parts.
iographic Testing
FIGURE 16. Filter placed near X-ray tubereduces subject contrast and eliminatesmuch of secondary radiation, which tends toobscure detail in periphery of specimen.
AnodeFocal spot
Diaphragm
Filter
Specimen
Film and cassette
fect of metallic filter on X-ray intensity.
OriginalX-Ray Intensity
Specimen Remaining afterThickness Addition of Filter_______________ __________________
n mm (in.) (percent)
cimen 0 (0) < 106.4 (0.25) ~ 30
ction 12.7 (0.50) ~ 40n 25.4 (1.0) ~ 55
In regions of strong undercut, thecontrast is increased by a filter because theonly effect of the undercutting radiationis to obscure the desired image. In regionswhere the undercut is negligible, a filterhas the effect of decreasing the contrast inthe finished radiograph.
A filter reduces excessive subjectcontrast (and hence radiographic contrast)by hardening the radiation. The longerwavelengths do not penetrate the filter toas great an extent as do the shorterwavelengths. Therefore, the beamemerging from the filter contains a higherproportion of the more penetratingwavelengths (see Fig. 17).
The choice of a filter material shouldbe made on the basis of availability andease of handling. For the same filteringeffect, the thickness of filter required isless for those materials having higherabsorption. In many cases, copper or brassis the most useful, because filters of thesematerials will be thin enough to handleeasily yet not so thin as to be delicate (seeFig. 18).
Rules for filter thicknesses are difficultto formulate exactly because the amountof filtration required depends not only onthe material and thickness range of thespecimen but also on the distribution ofmaterial in the specimen and on theamount of scatter to be eliminated. In theradiography of aluminum, a filter ofcopper about 4 percent of the greatestthickness of the specimen should providethe thickness necessary. With steel, acopper filter should ordinarily be about20 percent, or a lead filter about 3percent, of the greatest specimenthickness for the greatest useful filtration.The foregoing values are maximumvalues; depending on circumstances,useful radiographs can often be madewith far less filtration.
FIGURE 17. Curves illustrating effect of filteron composition and intensity of X-ray beam.
Inte
nsity
(re
lativ
e un
it)
Wavelengthsreduced inintensity byaddition of filter
Unfilteredbeam
Filteredbeam
Wavelength (relative unit)

FIGURE 18. M
Mat
eria
l thi
ckne
ss (
rela
tive
unit)
2.5
2.25
2.0
1.75
1.5
1.25
1.0
0.75
0.5
0.25
FIGURE 19. Schematic diagram showing how primary X-rayspass between lead strips of potter-bucky diaphragm. Most ofscattered X-rays are absorbed because they strike sides ofstrips.
Anode
Focal spot
3RT07 LAYOUT(139_184) 10/14/02 2:58 PM Page 157
In radiography with X-rays up to atleast 250 kV, a 0.125 mm (0.005 in.) frontlead screen is an effective filter for thescatter from the bulk of the specimen.Additional filtration between specimenand film only tends to contributeadditional scatter from the filter itself andharden the beam unnecessarily.
Grid DiaphragmsOne of the most effective ways to reducescattered radiation from an object beingradiographed at energies up to 400 kV iswith a potter-bucky diaphragm. Thisapparatus (Fig. 19) consists of a movinggrid, composed of lead strips held inposition by intervening strips of amaterial transparent to X-rays. The leadstrips are tilted, so that the plane of eachis in line with the focal spot of the tube.The slots between the lead strips areseveral times as deep as they are wide. Thelead strips have the function of absorbingthe very divergent scattered rays from theobject being radiographed, so that most ofthe exposure is made by the primary raysemanating from the focal spot of the tubeand passing between the lead strips.During the course of the exposure, thegrid is moved, or oscillated (out ofsynchronization with the X-ray pulse) in aplane parallel to the film as shown by the
aximum filter thickness for aluminum and steel.
0 1.0 2.0 3.0
Filter thickness (relative unit)
Steel (lead filter)
Aluminum (copper filter)
Steel (copper filter)
black arrows in Fig. 19. Thus, the shadowsof the lead strips are blurred to the pointthat they do not appear in the finalradiograph.
The potter-bucky diaphragmcomplicates industrial radiographic testingand necessarily limits the flexibility of thearrangement of the X-ray tube, thespecimen and the film. Grids can,however, be of great value in theradiography of beryllium more than75 mm (3 in.) thick and in theexamination of other low absorptionmaterials of moderate and greatthicknesses.
Special forms also have been designedfor the radiography of steel with voltagesas high as 200 to 400 kV. Thesediaphragms are not used at highervoltages or with gamma rays becauserelatively thick lead strips would beneeded to absorb the radiation scatteredat these energies. This in turn wouldrequire a potter-bucky diaphragm, with
157Principles of Film Radiography
Diaphragm
Potter-bucky diaphragm
Specimen
Film and cassette

158 Radio
3RT07 LAYOUT(139_184) 10/14/02 2:58 PM Page 158
the associated mechanism, of anuneconomical size and complexity.
Mottling Caused by X-RayDiffractionA special form of scattering caused byX-ray diffraction is encounteredoccasionally. It is most often observed inthe radiography of fairly thin metallicspecimens whose grain size is largeenough to be an appreciable fraction ofthe part thickness. The radiographicappearance of this type of scattering ismottled and may be confused with themottled appearance sometimes producedby porosity or segregation. It can bedistinguished from these conditions bymaking two successive radiographs, withthe specimen rotated slightly (1 to5 degrees) between exposures, about anaxis perpendicular to the central beam. Apattern caused by porosity or segregationwill change only slightly; however, onecaused by diffraction will show a markedchange. The radiographs of somespecimens will show a mottling from botheffects and careful observation is neededto differentiate between them.
Relatively large crystal or grain in arelatively thin specimen may in somecases diffract an appreciable portion of theX-ray energy falling on the specimen,much as if it were a small mirror. This willresult in a light spot on the developedradiograph corresponding to the positionof the particular crystal and may alsoproduce a dark spot in another location ifthe diffracted, or reflected, beam strikesthe film. Should this beam strike the filmbeneath a thick part of the specimen, thedark spot may be mistaken for a void inthe thick section. This effect is notobserved in most industrial radiography,for most specimens are composed of amultitude of very minute crystals orgrains variously oriented; hence scatter bydiffraction is essentially uniform over thefilm area. In addition, the directlytransmitted beam usually reduces thecontrast in the diffraction pattern to apoint where it is no longer visible on theradiograph.
The mottling caused by diffraction canbe reduced and in some cases eliminatedby raising the kilovoltage and by usinglead foil screens. The former is often ofpositive value even though theradiographic contrast is reduced. Becausedefinite rules are difficult to formulate,both approaches should be tried in a newsituation and perhaps both used together.
It should be noted, however, that insome instances, the presence or absenceof mottling caused by diffraction has beenused as a rough indication of grain size
graphic Testing
and thus as a basis for the acceptance orthe rejection of parts.
Scattering in High VoltageMegavolt RadiographyLead screens should always be used in the1 or 2 MeV range. The commonthicknesses, 0.125 mm (0.005 in.) frontand 0.25 mm (0.010 in.) back, are bothsatisfactory and convenient. Some users,however, find a 0.25 mm (0.010 in.) frontscreen of value because of its greaterselective absorption of the scatteredradiation from the specimen.
At these voltages filtration at the tubeoffers no improvement in radiographicquality. Filters at the film improve theradiograph in the examination of uniformsections but give poor quality at the edgesof an image because of undercut ofscattered radiation from the filter itself.Hence, filtration should not be used inthe radiography of specimens containingnarrow bars, for example, no matter whatthe thickness of the bars in the directionof the primary radiation. Also, filtrationshould be used only where the film canbe adequately protected againstbackscattered radiation.
Lead filters are most convenient forthis voltage range. When used betweenspecimen and film, filters are subject tomechanical damage. Care should be takento reduce this to a minimum, lest filteranomalies be confused with structures inor on the specimen. In radiography withmegavolt X-rays, specimens of uniformsections may be conveniently divided intothree classes. Below 38 mm (1.5 in.) ofsteel, filtration affords little improvementin radiographic quality. Between 38 and100 mm (1.5 and 4.0 in.) of steel, thethickest filter, up to 3 mm (0.125 in.)lead, that allows a reasonable exposuretime, may be used. Above 100 mm(4.0 in.) of steel, filter thicknesses may beincreased to 6.3 mm (0.25 in.) of lead,economic considerations permitting. Itshould be noted that in the radiographyof extremely thick specimens withmegavolt X-rays, fluorescent screens mayincrease the photographic speed to apoint where filters can be used withoutrequiring excessive exposure time.
A very important point is to block offall radiation except the useful beam withheavy (12.7 to 25.4 mm [0.5 in. to 1 in.])lead at the tubehead. This step is calledcollimation. Unless this is done, radiationstriking the walls of the X-ray room willscatter back enough to seriously affect thequality of the radiograph. This will beespecially noticeable if the specimen isthick or has parts projecting relatively farfrom the film.

PART 3. Radiographic Screens
3RT07 LAYOUT(139_184) 10/14/02 2:58 PM Page 159
Functions of ScreensRadiographic screens help radiographersto use more fully the X-ray or gamma rayenergy reaching the film. The physicalprinciples underlying the action of bothlead foil and fluorescent screens arediscussed elsewhere and only the practicalapplications are discussed here.
When an X-ray or gamma ray beamstrikes a film, usually less than onepercent of the energy is absorbed. Becausethe formation of the radiographic image isgoverned by the absorbed radiation, morethan 99 percent of the available energy inthe primary radiation reaching the filmperforms no useful photographic work.Obviously, any means of more fully usingthis wasted energy, without complicatingthe technical procedure, is highlydesirable. Three types of radiographicscreens are commonly used for thispurpose — lead, fluorescent andfluorometallic (metal phosphor). Metalsother than lead are sometimes used inmegavolt radiography. Lead screens maybe in the form of thin foil, usuallymounted on a thin cardboard or plasticsheet, or in the form of a lead compound,usually lead oxide, evenly coated on athin support. The lead compound screensare usually used only for radiographybelow 150 kV.
Lead Foil ScreensFor radiography with X-ray or gamma rayenergies between 150 kV and 2 MeV, leadfoil screens in intimate contact with bothsides of the film, within the film holder,will reduce exposure times and improveradiographic quality by reducing scatter.Foils as thin as 0.10 to 0.15 mm (0.004 to0.006 in.) are commonly used. To reducebackscatter from the table or floor of theroom an additional lead sheet 3 to 6 mm(0.12 to 0.25 in.) thick is usually placedbehind the film holder.
The choice of screens and filters forradiography above 1 to 2 MeV is morecomplicated, as discussed in the sectionon high energy radiography.
Effects of Lead ScreensLead foil in direct contact with the filmhas three principal effects: (1) it increases
the photographic action on the film,largely by reason of the electrons emittedand partly by the secondary X-raysemitted by the lead; (2) it absorbs thelonger wavelength scattered radiationmore than the primary; and (3) itintensifies the primary radiation morethan the scattered radiation. Thedifferential absorption of the secondaryradiation and the differentialintensification of the primary radiationresult in diminishing the effect ofscattered radiation, producing greatercontrast and clarity in the radiographicimage. This reduction in the effect of thescattered radiation decreases the totalintensity of the radiation reaching thefilm and lessens the net intensificationfactor of the screens. The absorption ofprimary radiation by the front lead screenalso diminishes the net intensifying effect;and, if the incident radiation does nothave sufficient penetrating power, theactual exposure required may be evengreater than without screens. At best, theexposure time is one half to one third ofthat without screens but the advantage ofscreens in reducing scattered radiationstill holds.
The quality of the radiation necessaryto obtain an appreciable intensificationfrom lead foil screens depends on the typeof film, the kilovoltage and the thicknessand nature of the material through whichthe rays must pass (Fig. 20). In theradiography of aluminum, for example,using a 0.125 mm (0.005 in.) front screenand a 0.25 mm (0.010 in.) back screen,the thickness of aluminum must be about150 mm (6 in.) and the kilovoltage ashigh as 160 kV to secure any advantage inexposure time with lead screens. In theradiography of steel, lead screens begin togive appreciable intensification withthicknesses in the neighborhood of6.3 mm (0.25 in.), at voltages of 130 to150 kV. In the radiography of 32 mm(1.25 in.) steel at about 200 kV, leadscreens permit an exposure of aboutone third of that without screens(intensification factor of 3). Withcobalt-60 gamma rays, the intensificationfactor of lead screens is about 2. Lead foilscreens, however, do not detrimentallyaffect the definition or graininess of theradiographic image to any material degreeso long as the lead and the film are inintimate contact.
159Principles of Film Radiography

160 Radi
FIGURE 20. Efof lead screen
Den
sity
diff
eren
ce (
rela
tive
unit)
Intensification
Absorption
LegendA. 0.05 mm (B. 0.12 mm (C. 0.25 mm (
FIGURE 21. Upper area shows decreaseddensity caused by paper between leadscreen and film. Electron shadow picture ofpaper structure has also been introduced.
FIGURE 22. Between film and lead foilscreens: (a) good contact gives sharp image;(b) poor contact gives fuzzy image.
(a)
3RT07 LAYOUT(139_184) 10/14/02 2:58 PM Page 160
Lead foil screens also diminish theeffect of scattered radiation. Scatteredradiation from the specimen itself is cutalmost in half by lead screens,contributing to maximum clarity of detailin the radiograph; this advantage isobtained even under conditions where thelead screen makes an increase in exposurenecessary.
In radiography with gamma rays orhigh voltage X-rays, films loaded in metalcassettes without screens are likely torecord the effect of secondary electronsgenerated in the lead covered back of thecassette. These electrons, passing throughthe felt pad on the cassette cover, producea mottled appearance because of thestructure of the felt. Films loaded in thecustomary lead backed cardboardexposure holder may also show thestructure of the paper that lies betweenthe lead and the film (Fig. 21). To avoidthese effects, film should be enclosedbetween double lead screens, care beingtaken to ensure good contact betweenfilm and screens. Thus, lead foil screensare essential in practically all radiographywith gamma rays or megavolt X-rays. If,for any reason, screens cannot be usedwith these radiations, a lightproof plasticholder with no metal backing should beused.
Contact between the film and the leadfoil screens is essential to goodradiographic quality. Areas lacking contactproduce fuzzy images, as shown inFig. 22b.
ographic Testing
fects of kilovoltage on intensification propertiess.
1.0
0.8
0.6
0.4
0.2
0
–0.2
–0.4
A
B
C
50 75 100 125 150 175 200 225
Kilovoltage
0.002 in.) lead oxide, 0.01 mm (0.0004 in.) lead equivalent.0.005 in.).0.01 in.) lead.
(b)

FIGURE 24. Number of electrons emitted (per surface unit oflead) is essentially uniform. More electrons can reach film in
3RT07 LAYOUT(139_184) 10/14/02 2:58 PM Page 161
Selection and Care of LeadScreensLead foil for screens must be selected withextreme care. Commercially pure lead issatisfactory. An alloy of 6 percentantimony and 94 percent lead, beingharder and stiffer, has better resistance towear and abrasion. Tin coated lead foilshould be avoided, because irregularitiesin the tin cause a variation in theintensifying factor of the screens,resulting in mottled radiographs. Minorblemishes do not affect the usefulness ofthe screen but large blisters or cavitiesshould be avoided.
Most of the intensifying action of alead foil screen is caused by the electronsemitted under X-ray or gamma rayexcitation. Because electrons are readilyabsorbed even in thin or light materials,small flakes of foreign material — forexample, dandruff or tobacco — willlikewise produce light spots on thecompleted radiograph. For this samereason, protective coatings on lead foilscreens should be removed before use.The coating should not produce staticelectricity when rubbed against or placedin contact with film (see Fig. 23).
Deep scratches on lead foil screens, onthe other hand, will produce dark lines onthe radiograph (Fig. 24).
Surface contaminants may be removedfrom lead foil screens with a mildhousehold detergent or cleanser and asoft, lint-free cloth. If more thoroughcleaning is necessary, screens may be verygently rubbed with the finest grade of
FIGURE 23. Static marks result from poorfilm handling. Static marks may also betreelike or branching.
steel wool. If this is done carefully, theshallow scratches left by the steel woolwill not produce dark lines in theradiograph.
Films could be fogged if left betweenlead foil screens longer than is reasonablynecessary, particularly under conditions ofhigh temperature and humidity. Whenscreens have been freshly cleaned with anabrasive, this effect will be increased;prolonged contact between film andscreens should be delayed for 24 h aftercleaning.
Fluorescent ScreensCertain chemicals fluoresce; that is, theyhave the ability to absorb X-rays andgamma rays and immediately emit light;the intensity of the emitted light dependson the intensity of the incident radiation.These fluorescent materials can be used inradiography by first being finelypowdered, mixed with a suitable binder,then coated in a thin, smooth layer on aspecial cardboard or plastic support.
For the exposure, film is clampedfirmly between a pair of these fluorescentscreens. The photographic effect on thefilm, then, is the sum of the effects of theX-rays and of the light emitted by thescreens. For example, in the radiographyof 12.7 mm (0.5 in.) steel at 150 kV, afactor as high as 125 has been observed.
161Principles of Film Radiography
vicinity of scratch, resulting in dark line on radiograph. (Forillustrative clarity, electron paths have been shown as straightand parallel; actually, electrons are emitted diffusely.)
X-rays
Film
Electrons from lead foil
ScratchBack lead screen

162 Rad
FIGURE 25. Light and ultraviolet radiationfrom typical fluorescent screen spreadsbeyond X-ray beam that excitesfluorescence.
Fluorescentlayer
X-rays
Visible light
3RT07 LAYOUT(139_184) 10/14/02 2:58 PM Page 162
In radiography of 19.1 mm (0.75 in.) steelat 180 kV, factors of several hundred havebeen obtained experimentally.
Under these latter conditions, theintensification factor has about reachedits maximum and diminishes both forlower voltage and thinner steel and forhigher voltage and thicker steel. Usingcobalt-60 gamma rays for very thick steel,the factor may be 10 or less.
LimitationsDespite their great effect in reducingexposure time, fluorescent screens are notwidely used in industrial radiography.This is mainly because they may give poordefinition, compared to a radiographmade directly or with lead screens. Thepoorer definition results from thespreading of the light emitted from thescreens, as shown in Fig. 25. The lightfrom any particular portion of the screenspreads out beyond the confines of theX-ray beam that excited the fluorescence.
The other reason fluorescent screensare seldom used in industrial radiographyis because they may produce screen mottleon the finished radiograph. This mottle ischaracteristic in appearance, very muchlarger in scale and much softer in outlinethan the graininess associated with thefilm itself. Screen mottle is associated withpurely statistical variations in thenumbers of absorbed X-ray photons, fromone tiny area of the screen to the next.Thus, screen mottle tends to becomegreater as the kilovoltage of the radiationincreases. The higher the kilovoltage, themore energetic, on the average, are theX-ray photons. Therefore, on absorptionin the screen, a larger burst of light isproduced. The larger the bursts, the fewerthat are needed to produce a givendensity and the greater is the purelystatistical variation in the number ofphotons from one small area to the next.
iographic Testing

PART 4. Industrial X-Ray Films
FIGURE 27. Cross section of unprocessedemulsion on one side of radiographic film(2000 diameters). Note greater quantity ofgrains as compared to developed grains ofFig. 28.
3RT07 LAYOUT(139_184) 10/14/02 2:58 PM Page 163
Modern radiographic films for generalradiography consist of an emulsion(gelatin containing a radiation sensitivesilver halide compound) and a flexible,transparent base that sometimes containsa tint. Usually, the emulsion is coated onboth sides of the base in layers about0.0125 mm (5 × 10⁻⁴ in.) thick (see Fig. 26and 27). Putting emulsion on both sidesof the base doubles the amount ofradiation sensitive silver compound andthus increases the speed. At the sametime, the emulsion layers are thin enoughso that developing, fixing and drying canbe accomplished in a reasonable time.However, some films for radiography inwhich the highest detail visibility isrequired have emulsion on only one sideof the base.
When X-rays, gamma rays or lightstrike the grains of the sensitive silvercompound in the emulsion, a changetakes place in the physical structure of thegrains. This change cannot be detected byordinary physical techniques. However,when the exposed film is treated with achemical solution (called a developer), areaction takes place, causing theformation of black, metallic silver. It is
FIGURE 26. Silver bromide grains ofradiographic film emulsion(2500 diameters). Grains have beendispersed to show shape and relative sizesmore clearly; in actual coating, crystals aremuch more closely packed.
this silver, suspended in the gelatin onboth sides of the base, that constitutes theimage (see Fig. 28).
163Principles of Film Radiography
FIGURE 28. Cross section showingdistribution of developed grains inradiographic film emulsion exposed to givemoderate density.

164 Rad
FIGURE 29. high speed
Screewith
s
TABLE 4. Transmittance, percent transmittance, opacity
3RT07 LAYOUT(139_184) 10/14/02 2:58 PM Page 164
Although an image may be formed bylight and other forms of radiation, as wellas by gamma rays or X-rays, the propertiesof the latter two are of distinct characterand, for this reason, the sensitiveemulsion must be different from thoseused in other types of photography.
Selection of Films forIndustrial RadiographyAs pointed out above, industrialradiography now has many widely diverseapplications. There are manyconsiderations to be made in obtainingthe best radiographic results, for example:(1) the composition, shape and size of thepart being examined — and, in somecases, its weight and location as well;(2) the type of radiation used — whetherX-rays from an X-ray machine or gammarays from a radioactive material; (3) thekilovoltages available with the X-rayequipment; (4) the intensity of thegamma radiation; (5) the kind ofinformation sought — whether it issimply an overall inspection or the criticalexamination of some especially importantportion, characteristic or feature; and(6) the resulting relative emphasis ondefinition, contrast, density and timerequired for proper exposure. All of thesefactors are important in the determinationof the most effective combination ofradiographic method and radiographicfilm.
The selection of a film for theradiography of any particular partdepends on the thickness and material ofthe specimen and on the voltage range ofthe available X-ray machine. In addition,the choice is affected by the relativeimportance of high radiographic qualityor short exposure time. Thus, an attemptmust be made to balance these twoopposing factors. As a consequence, it isnot possible to present definite rules onthe selection of a film. If high quality isthe deciding factor, a slower (lesssensitive) and finer grained film should besubstituted for a faster (more sensitive)one — for instance, for the radiography of
iographic Testing
Choice of film depends on relative emphasis onor high radiographic quality.
Improving quality
n type filmfluorescentcreens
Fast direct exposure
type film
Slow direct exposure
type film
Increasing speed
steel up to 6.3 mm (0.25 in.) thick at 120to 150 kV, film Y might be substituted forfilm X. If short exposure times areessential, a faster film (or fastercombination of film and screen) can beused. For example, 38 mm (1.5 in.) steelmight be radiographed at 200 kV usingfluorescent screens with a film particularlysensitive to blue light, rather than a directexposure film with lead screens.
Figure 29 indicates the direction thatthese substitutions take. The directexposure films may be used with orwithout lead screens, depending on thekilovoltage and the thickness and shapeof the specimen.
Fluorescent intensifying screens mustbe used in radiography requiring thehighest possible photographic speed. Thelight emitted by the screens has a muchgreater photographic action than theX-rays either alone or combined with theemission from lead screens. To secureadequate exposure within a reasonabletime, screen type radiographic filmssandwiched between fluorescentintensifying screens are often used inradiography of steel in thicknesses greaterthan about 50 mm (2 in.) at 250 kV andgreater than 75 mm (3 in.) at 400 kV.
Photographic DensityPhotographic density refers to thequantitative measure of film blackeningand is also called optical density andsensitometric density. When no danger ofconfusion exists, photographic density isusually spoken of merely as density.Density is defined by the equation:
(13)
where D = density; Io = light intensityincident on film; and It = light intensitytransmitted.
Table 4 illustrates some relationsbetween transmittance, percent
DIIt
= log 0
and density relationships.
PercentTransmittance Transmittance Opacity Density
I t · I o–1 I t · I o
–1 × 100 Io· I t–1 log Io· I t
–1
1.00 100 1 00.50 50 2 0.30.25 25 4 0.60.10 10 10 1.00.01 1 100 2.00.001 0.1 1000 3.00.0001 0.01 10 000 4.0

FIGURE 30. Typical X-ray exposure chart for steel may beapplied to film X (see Fig. 33), with lead foil screens, at1.5 film density and 1.0 m (40 in.) source-to-film distance.
Log
exp
osur
e
1.8
1.5
1.2
0.9
0.6
0.3
0
100
80
60
40
30
20
10
8
6
4
3
2
1
Exp
osur
e (m
A·m
in)
0 6.4 12.7 19 25.4 31.8 38.1(0.25) (0.50) (0.75) (1.00) (1.25) (1.50)
Equivalent thickness, mm (in.) of steel
100
kV
120
kV
140
kV
160
kV18
0 kV
200
kV22
0 kV
3RT07 LAYOUT(139_184) 10/14/02 2:58 PM Page 165
transmittance, opacity and density. Itshows that an increase in density of 0.3reduces the light transmitted to half of itsformer value. In general, because densityis a logarithm, a certain increase in densityalways corresponds to the same percentagedecrease in transmittance.
DensitometersA densitometer is an optical instrumentfor measuring photographic densities.Film density to a required range is usuallyspecified in radiographic procedures. Thedensitometer must be available to see thatspecifications are met. The densitometer isessential for creating characteristic curves,discussed elsewhere.
Different types of densitometers, bothvisual and photoelectric, are availablecommercially. For purposes of practicalindustrial radiography there is no greatpremium on high accuracy in adensitometer. A much more importantproperty is reliability, that thedensitometer should reproduce readingsfrom day to day.
X-Ray Exposure ChartsAn exposure chart is a graph showing therelation between material thickness,kilovoltage and exposure (Figs. 30 to 32).In its most common form, an exposurechart resembles Fig. 30. These graphs areadequate for determining exposures in theradiography of uniform plates but theyserve only as rough guides for objects,such as complicated castings, having widevariations of thickness.
Exposure charts are usually availablefrom manufacturers of X-ray equipment.Because, in general, such charts cannot beused for different X-ray machines unlesssuitable correction factors are applied,individual laboratories sometimes preparetheir own.
Preparing an Exposure ChartA simple technique for preparing anexposure chart is to make a series ofradiographs of a pile of metal plates (ofequal thickness but different lengths)consisting of a number of steps. This steptablet, or stepped wedge, is radiographedat several different exposure times at eachof a number of kilovoltages. The exposedfilms are all processed under conditionsidentical to those that will later be usedfor routine work. Each radiograph consistsof a series of photographic densitiescorresponding to the X-ray intensitiestransmitted by the different thicknesses ofmetal. A certain density, for example 1.5,is selected as the basis for the preparation
of the chart. Wherever this density occurson the stepped wedge radiographs, thereare corresponding values of thickness,milliampere minutes and kilovoltage. It isunlikely that many of the radiographs willcontain a value of exactly 1.5 in densitybut the correct thickness for this densitycan be found by interpolation betweensteps. Thickness and milliampere minutevalues are plotted for the differentkilovoltages in the manner shown inFig. 30.
Another technique, requiring fewerstepped wedge exposures but morearithmetical manipulation, is to make onestep tablet exposure at each kilovoltageand to measure the densities in theprocessed stepped wedge radiographs. Theexposure that would have given thechosen density (in this case 1.5) underany particular thickness of the steppedwedge can then be determined from thecharacteristic curve of the film used. Thevalues for thickness, kilovoltage andexposure are then plotted.
Note that thickness is on a linear scaleand that milliampere minutes are on anonlinear scale. The logarithmic scale isnot necessary but is very convenientbecause it compresses an otherwise longscale. A further advantage of thelogarithmic exposure scale is that itusually allows the location of the points
165Principles of Film Radiography

166 Rad
FIGURE 32. Typical gamma ray exposure chart for
3RT07 LAYOUT(139_184) 10/14/02 2:58 PM Page 166
for any one kilovoltage to be wellapproximated by a straight line.
An exposure chart usually applies onlyto a single set of conditions, determinedby (1) the X-ray machine used; (2) acertain source-to-film distance; (3) aparticular film type; (4) processingconditions used; (5) the film density onwhich the chart is based; (6) the type ofscreens (if any) that are used; and (7) thematerial tested.
Only if the conditions used in makingthe radiograph agree in all particularswith those used in preparation of theexposure chart can values of exposure beread directly from the chart. Any changerequires the application of a correctionfactor. The correction factor applying toeach of the above conditions is discussedseparately.
1. It is sometimes difficult to find acorrection factor to make an exposurechart prepared for one X-ray machineapplicable to another. Different X-raymachines operating at the samenominal kilovoltage andmilliamperage settings may give notonly different intensities but alsodifferent qualities (energies) ofradiation.
iographic Testing
FIGURE 31. Typical X-ray exposure chart foruse when exposure and distance are heldconstant and kilovoltage is varied toconform to specimen thickness. Film X (seeFig. 33), exposed with lead foil screens todensity of 1.5, source-to-film distance is1.0 m (40 in.) and exposure is 50 mA·min.
220
200
180
160
140
120
100
80
60
Kilo
volta
ge (
kV)
0 7 13 19 25 31 38(0.25) (0.50) (0.75) (1.00) (1.25) (1.50)
Steel thickness, mm (in.)
2. A change in source-to-film distancemay be compensated for by theinverse square law. Some exposurecharts give exposures in terms ofexposure factor rather than in terms ofmilliampere minutes or milliampereseconds. Charts of this type are readilyapplied to any value of source-to-filmdistance.
3. A different type of film can becorrected by comparing the differencein the amount of exposure necessaryto give the same density on both films(from relative exposure charts such asthose described below). For example,to obtain a density of 1.5 using film Y,0.6 more log exposure is required thanfor film X (Fig. 33).This log exposure differencecorresponds to an exposure factor of3.99. To obtain the same density onfilm Y as on film X, multiply theoriginal exposure by 3.99 to get thenew exposure. Conversely, if goingfrom film Y to film X, divide theoriginal exposure by 3.99 to obtain thenew exposure.
iridium-192, based upon the use of film X (see Fig. 33).
Exp
osur
e fa
ctor
, G
Bq·m
in·c
m–2
(Ci·m
in·in
.–2 )
0 25 50 75 100(1) (2) (3) (4)
Steel thickness, mm (in.)
500 (10.0)
400 (8.0)
300 (6.0)
200 (4.0)
150 (3.0)
100 (2.0)
50 (1.0)
40 (0.8)
30 (0.6)
20 (0.4)
15 (0.3)
10 (0.2)
5 (0.1)
D = 2.5
D = 2.0
D = 1.5

FIGURE 33. Characteristic curves of three typical X-ray films,exposed between lead foil screens.
Den
sity
D
0 0.5 1.0 1.5 2.0 2.5 3.0
4.0
3.5
3.0
2.5
2.0
1.5
1.0
0.5
0
Log relative exposure
Film Z Film XFilm Y
3RT07 LAYOUT(139_184) 10/14/02 2:58 PM Page 167
These procedures can be used tochange densities on a single film aswell. Simply find the log E differenceneeded to obtain the new density onthe film curve; read the correspondingexposure factor from the chart; thenmultiply to increase density or divideto decrease density.
4. A change in processing conditionscauses a change in effective film speed.If the processing of the radiographsdiffers from that used for theexposures from which the chart wasmade, the correction factor must befound by experiment.
5. The chart gives exposures to produce acertain density. If a different density isrequired, the correction factor may becalculated from the film’scharacteristic curve.
6. If the type of screen is changed — forexample, from lead foil to fluorescent— it is easier and more accurate tomake a new exposure chart than todetermine correction factors
7. Material can be changed by using thematerial equivalence table (Table 2).
In some radiographic operations, theexposure time and the source-to-filmdistance are set by economicconsiderations or on the basis of previousexperience and test radiographs. The tubecurrent is, of course, limited by the designof the tube. The specimen and thekilovoltage are variables. When theseconditions exist, the exposure chart maytake a simplified form as shown in Fig. 31,which allows the kilovoltage for anyparticular specimen thickness to bechosen. Such a chart will be particularlyuseful when uniform sections must beradiographed in large numbers byrelatively untrained persons. This type ofexposure chart may be derived from achart similar to Fig. 30 by following thehorizontal line corresponding to thechosen milliampere minute value andnoting the thickness corresponding to thisexposure for each kilovoltage. Thesethicknesses are then plotted againstkilovoltage.
Gamma Ray ExposureChartsA typical gamma ray exposure chart isshown in Fig. 32. It is somewhat similarto Fig. 30; however, with gamma rays,there is no variable factor correspondingto the kilovoltage. Therefore, a gamma rayexposure chart contains one line, orseveral parallel lines, each of whichcorresponds to a particular film type, filmdensity or source-to-film distance. Gammaray exposure guides are also available inthe form of linear or circular slide rules.
These contain scales on which the variousfactors of specimen thickness sourcestrength and source-to-film distance canbe set and from which exposure time canbe read directly.
Characteristic CurveThe characteristic curve, sometimesreferred to as the sensitometric curve or theH and D curve (after Hurter and Driffield,who first used it in 1890), expresses therelation between the exposure applied toa photographic material and the resultingphotographic density. The characteristiccurves of three typical films, exposedbetween lead foil screens to X-rays, aregiven in Fig. 33. Such curves are obtainedby giving a film a series of knownexposures, determining the densitiesproduced by these exposures and thenplotting density against the logarithm ofrelative exposure.
Relative exposure is used because thereare no convenient units, suitable to allkilovoltages and scattering conditions, inwhich to express radiographic exposures.The exposures given a film are expressedin terms of some particular exposure,giving a relative scale. In practicalradiography, this lack of units for X-rayintensity or quantity is no hindrance, aswill be seen below. The logarithm of the
167Principles of Film Radiography
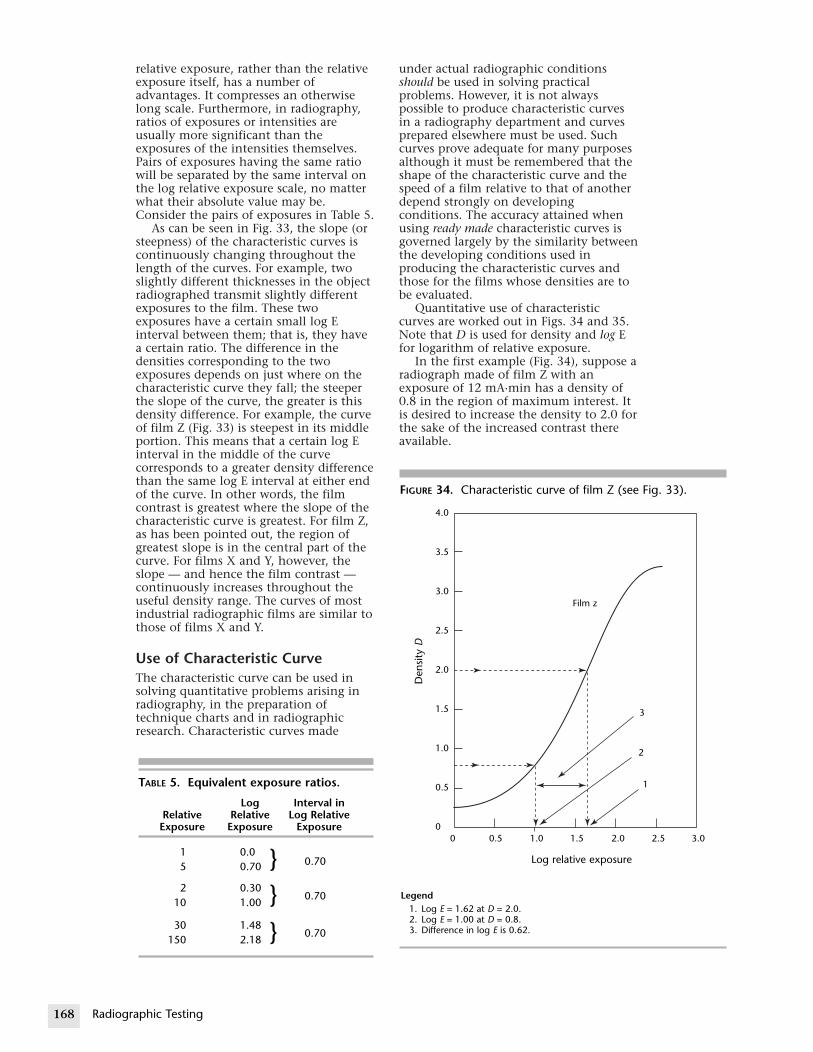
168 Rad
FIGURE 34. Characteristic curve of film Z (see Fig. 33).
Den
sity
D
4.0
3.5
3.0
2.5
2.0
1.5
1.0
Film z
3
3RT07 LAYOUT(139_184) 10/14/02 2:58 PM Page 168
relative exposure, rather than the relativeexposure itself, has a number ofadvantages. It compresses an otherwiselong scale. Furthermore, in radiography,ratios of exposures or intensities areusually more significant than theexposures of the intensities themselves.Pairs of exposures having the same ratiowill be separated by the same interval onthe log relative exposure scale, no matterwhat their absolute value may be.Consider the pairs of exposures in Table 5.
As can be seen in Fig. 33, the slope (orsteepness) of the characteristic curves iscontinuously changing throughout thelength of the curves. For example, twoslightly different thicknesses in the objectradiographed transmit slightly differentexposures to the film. These twoexposures have a certain small log Einterval between them; that is, they havea certain ratio. The difference in thedensities corresponding to the twoexposures depends on just where on thecharacteristic curve they fall; the steeperthe slope of the curve, the greater is thisdensity difference. For example, the curveof film Z (Fig. 33) is steepest in its middleportion. This means that a certain log Einterval in the middle of the curvecorresponds to a greater density differencethan the same log E interval at either endof the curve. In other words, the filmcontrast is greatest where the slope of thecharacteristic curve is greatest. For film Z,as has been pointed out, the region ofgreatest slope is in the central part of thecurve. For films X and Y, however, theslope — and hence the film contrast —continuously increases throughout theuseful density range. The curves of mostindustrial radiographic films are similar tothose of films X and Y.
Use of Characteristic CurveThe characteristic curve can be used insolving quantitative problems arising inradiography, in the preparation oftechnique charts and in radiographicresearch. Characteristic curves made
iographic Testing
TABLE 5. Equivalent exposure ratios.
Log Interval inRelative Relative Log Relative
Exposure Exposure Exposure
1 0.0 } 0.705 0.70
2 0.30 } 0.7010 1.00
30 1.48 } 0.70150 2.18
under actual radiographic conditionsshould be used in solving practicalproblems. However, it is not alwayspossible to produce characteristic curvesin a radiography department and curvesprepared elsewhere must be used. Suchcurves prove adequate for many purposesalthough it must be remembered that theshape of the characteristic curve and thespeed of a film relative to that of anotherdepend strongly on developingconditions. The accuracy attained whenusing ready made characteristic curves isgoverned largely by the similarity betweenthe developing conditions used inproducing the characteristic curves andthose for the films whose densities are tobe evaluated.
Quantitative use of characteristiccurves are worked out in Figs. 34 and 35.Note that D is used for density and log Efor logarithm of relative exposure.
In the first example (Fig. 34), suppose aradiograph made of film Z with anexposure of 12 mA·min has a density of0.8 in the region of maximum interest. Itis desired to increase the density to 2.0 forthe sake of the increased contrast thereavailable.
0.5
00 0.5 1.0 1.5 2.0 2.5 3.0
Log relative exposure
Legend1. Log E = 1.62 at D = 2.0.2. Log E = 1.00 at D = 0.8.3. Difference in log E is 0.62.
2
1

FIGURE 35. with lead fo
Den
sity
D
4
3
3
2
2
1
1
0
0
Legend1. Log E = 12. Log E = 13. Difference
3RT07 LAYOUT(139_184) 10/14/02 2:58 PM Page 169
1. Log E at D = 2.0 is 1.62.2. Log E at D = 0.8 is 1.00.3. The difference in log E is 0.62. The
antilogarithm of this difference is 4.2.
Therefore, the original exposure ismultiplied by 4.2 giving 50 mA·min toproduce a density of 2.0.
In the second example (see Fig. 35),film X has higher contrast than film Z atD = 2.0 and also a finer grain. Supposethat, for these reasons, it is desired tomake the radiograph on film X with adensity of 2.0 in the same region ofmaximum interest.
1. Log E at D = 2.0 for film X is 1.91.2. Log E at D = 2.0 for film Z is 1.62.3. The difference in log E is 0.29. The
antilogarithm of this differenceis 1.95.
Therefore, the exposure for D = 2.0 onfilm Z is multiplied by 1.95, giving97.5 mA·min for a density of 2.0 onfilm X.
169Principles of Film Radiography
Characteristic curves of two X-ray films exposedil screens.
.0
.5
.0
.5
.0
.5
.0
.5
0 0.5 1.0 1.5 2.0 2.5 3.0
Log relative exposure
.91 at D = 2.0.
.62 at D = 2.0. in Log E is 0.29.
Film Z
3
2
1
Film X

170 Radi
PART 5. Radiographic Image Quality and DetailVisibility
TABLE 6. Fac
___________Subject
Affec
Specimen thRadiation quScattered ra
3RT07 LAYOUT(139_184) 10/14/02 2:58 PM Page 170
Controlling FactorsBecause the purpose of most radiographictesting is to examine specimens forheterogeneity, a knowledge of the factorsaffecting the visibility of detail in thefinished radiograph is essential. Table 6shows the relationships of the variousfactors influencing image quality andradiographic sensitivity; following are afew important definitions.
Radiographic sensitivity is a general orqualitative term referring to the size of thesmallest detail that can be seen in aradiograph or to the ease with which theimages of small details can be detected.Phrased differently, it is a reference to theamount of information in the radiograph.Note that radiographic sensitivity dependson the combined effects of twoindependent sets of factors: radiographiccontrast (the density difference between asmall detail and its surroundings) anddefinition (the abruptness and thesmoothness of the density transition). SeeFig. 36.
Radiographic contrast is the difference indensity between two areas of aradiograph. It depends on both subjectcontrast and film contrast.
Subject contrast is the ratio of X-ray orgamma ray intensities transmitted by twoselected portions of a specimen. Subjectcontrast depends on the nature of thespecimen, on the energy (spectralcomposition, hardness or wavelengths) ofthe radiation used and on the intensityand distribution of the scattered radiationbut is independent of time, milliamperageor source strength, distance and thecharacteristics or treatment of the film(Fig. 11).
ographic Testing
tors controlling radiographic sensitivity.
Radiographic Contrast____________________________________________________ Contrast Film Contrastted by Affected by
ickness variations Type of filmality Development time, temperature and
diation DensityActivity of the developer
Film contrast refers to the slope(steepness) of the characteristic curve ofthe film. It depends on the type of film,on the processing it receives and density.It also depends on whether the film’sexposure is direct, with lead screens orwith fluorescent screens. Film contrast isindependent, for most practical purposes,of the wavelengths and distribution of theradiation reaching the film and hence isindependent of subject contrast.
The steepness of the characteristiccurve is sometimes referred to as gamma(Γ). Higher gamma films have morecontrast.
Definition refers to the sharpness ofoutline in the image. It depends on thetypes of screens and film used, theradiation energy (wavelengths) and thegeometry of the radiographic setup.
Subject ContrastSubject contrast decreases as thekilovoltage is increased. The decreasingslope (steepness) of the lines of theexposure chart (Fig. 30) as kilovoltageincreases illustrates the reduction ofsubject contrast as the radiation becomesmore penetrating. For example, consider asteel part containing two thicknesses, 19and 25 mm (0.75 and 1 in.), which isradiographed first at 160 kV and then at200 kV.
In Table 7, column 3 shows theexposure in milliampere minutes requiredto reach a density of 1.5 through eachthickness at each kilovoltage. These dataare from the exposure chart in Fig. 30. Itis apparent that the milliampere minutesrequired to produce a given density at any
Radiographic Definition________ ___________________________________________________Geometrical Factors Graininess Factors
Affected by Affected by
Focal spot size Type of filmagitation Distance from focal point to film Type of screen
Distance from specimen to film Radiation qualityAbrupt specimen thickness variations DevelopmentContact of screen to film

TABLE 7. Exposure of steel part containing twothicknesses.
Exposure toVoltage Thickness Give D = 1.5 Relative Ratio of
(kV) mm (in.) (mA·min) Intensity Intensities
160 20 (0.75) 18.5 3.8 } 3.825 (1.0) 70.0 1.0
200 20 (0.75) 4.9 14.3 } 2.525 (1.0) 11.0 5.8
FIGURE 36. Radiographic definition:(a) advantage of higher contrast is offset bypoor definition; (b) despite lowercontrast better rendition of detail is obtainedby improved definition.
(b)
(a)
3RT07 LAYOUT(139_184) 10/14/02 2:58 PM Page 171
kilovoltage are inversely proportional tothe corresponding X-ray intensitiespassing through the different sections ofthe specimen. Column 4 gives theserelative intensities for each kilovoltage.Column 5 gives the ratio of theseintensities for each kilovoltage.
Column 5 shows that, at 160 kV, theintensity of the X-rays passing throughthe 19 mm (0.75 in.) section is 3.8 timesgreater than that passing through the25 mm (1 in.) section. At 200 kV, theradiation through the thinner portion isonly 2.5 times that through the thicker.Thus, as the kilovoltage increases, theratio of X-ray transmission of the twothicknesses decreases, indicating a lowersubject contrast.
Film ContrastThe dependence of film contrast ondensity must be kept in mind whenconsidering problems of radiographicsensitivity. In general, the contrast ofradiographic films, except those designedfor use with fluorescent screens, increasescontinuously with density in the usabledensity range. Therefore, for films thatexhibit this continuous increase incontrast, the best density to use is thehighest that can be conveniently viewedwith the illuminators available. Adjustablehigh intensity illuminators arecommercially available and greatlyincrease the maximum density that canbe viewed.
High densities have the furtheradvantage of increasing the range ofradiation intensities that can be usefullyrecorded on a single film. InX-radiography, this in turn permits use ofthe lower kilovoltage, resulting inincreased subject contrast andradiographic sensitivity.
The slope of screen film contrastbecomes steep at densities greater than2.0. Therefore, other things being equal,the greatest radiographic sensitivity willbe obtained when the exposure isadjusted to give this density.
Film Graininess and ScreenMottleThe image on an radiographic film isformed by countless minute silver grains,the individual particles being so smallthat they are visible only under amicroscope. However, these small particlesare grouped together in relatively largemasses visible to the naked eye or with amagnification of only a few diameters.These masses result in a visual impressioncalled graininess.
171Principles of Film Radiography

172 Rad
3RT07 LAYOUT(139_184) 10/14/02 2:58 PM Page 172
All films exhibit graininess to a greateror lesser degree. In general, the slowerfilms have lower graininess. Thus, film Y(Fig. 33) would have a lower graininessthan film X.
The graininess of all films increases asthe radiation energy increases, althoughthe rate of increase may be different fordifferent films. The graininess of theimages produced at high kilovoltagesmakes the slow, inherently fine grainfilms especially useful in the megavoltand multimegavolt range. When sufficientexposure can be given, fine grain films arealso useful with gamma rays.
Lead screens have no significant effecton film graininess. However, graininess isaffected by processing conditions, beingdirectly related to the degree ofdevelopment. For instance, ifdevelopment time is increased for thepurpose of increasing film speed, thegraininess of the resulting image islikewise increased and vice versa.However, adjustments in developmenttechnique made to compensate forchanges in temperature or activity of adeveloper will have little effect ongraininess, because they are made toachieve the same degree of developmentas would be obtained in the freshdeveloper at a standard processingtemperature.
Another source of irregular density inuniformly exposed areas is the screenmottle encountered in radiography withfluorescent screens. The screen mottleincreases markedly as hardness of theradiation increases. This mottle limits theuse of fluorescent screens at high voltageand with gamma rays. Yet another sourceof mottle occurs when some films areexposed to megavolt radiation. This ismost noticeable in radiography ofmaterials of uniform thickness.
Image Quality IndicatorsA standard test piece is usually includedin every radiograph as a check on theadequacy of the radiographic method.The test piece is commonly referred to asa penetrameter or an image quality indicator(IQI). The image quality indicator is asimple geometric form made of the samematerial as, or a material similar to, thespecimen being radiographed. It containssome small structures (holes, wires andothers), the dimensions of which bearsome numerical relation to the thicknessof the part being tested. The image of theimage quality indicator on the radiographis permanent evidence that theradiographic examination was conductedunder proper conditions.
Codes or agreements between customerand vendor may specify the type of image
iographic Testing
quality indicator, its dimensions and howit is to be employed. Even if image qualityindicators are not specified, their use isadvisable because they provide aneffective check on the quality of theradiographic inspection and evidence thatradiographic sensitivity is achieved.
Hole Image Quality IndicatorsA common image quality indicator in theUnited States consists of a smallrectangular piece of metal, containingseveral (usually three) holes, the diameterof which are related to the thickness ofthe image quality indicator (Fig. 37).
The ASTM International plaque typeimage quality indicator4 contains threeholes of diameters T, 2T, and 4T, where Tis the thickness of the image qualityindicator. Because of the practicaldifficulties in drilling tiny holes in thinmaterials, the minimum diameters ofthese three holes are 0.25, 0.50 and1.00 mm (0.01, 0.02, and 0.04 in.),respectively. Thick image qualityindicators of the hole type would be verylarge because of the diameter of the 4Thole. Therefore, image quality indicatorsmore than 0.46 mm (0.180 in.) thick arein the form of disks, the diameters ofwhich are four times the thickness (4T)and which contain only two holes, ofdiameters T and 2T. Each image qualityindicator is identified by a lead numbershowing the thickness in thousandths ofan inch.
The ASTM International image qualityindicator permits the specification of anumber of levels of radiographicsensitivity, depending on therequirements of the job. For example, thespecifications may call for a radiographicquality level of 2-2T. The first symbol, 2,indicates that the image quality indicatorshall be 2 percent of the thickness of thespecimen; the second symbol (2T)indicates that the hole having a diametertwice the image quality indicatorthickness shall be visible on the finishedradiograph. The quality level 2-2T isprobably the one most commonlyspecified for routine radiography.However, critical components may requiremore rigid standards and require a level of1-2T or 1-1T. On the other hand, theradiography of less critical specimens maybe satisfactory if a quality level of 2-4T or4-4T is achieved. The more critical theradiographic examination — that is, thehigher the level of radiographic sensitivityrequired — the lower the numericaldesignation for the quality level.
Another ASTM International imagequality indicator design required by somespecifications is the wire type that consistsof sets of wires arranged in order ofincreasing diameter (Fig. 38).

173Principles of Film Radiography
FIGURE 37. Image quality indicator of ASTM International, according to ASTM StandardE 1025: (a) design for image quality indicator type numbers 5 to 20, with tolerances of±0.0005; (b) design for image quality indicator type numbers 21 to 59 with tolerances of±0.0025 in. and for image quality indicator type numbers 60 to 179, with tolerance of±0.005 in.; (c) design for image quality indicator type numbers over 180, with tolerances of±0.010 in. (Except for relative thickness T, all measurements in these diagrams are in inches;1.00 in. = 25.4 mm.)
(a)
Identificationnumber
4 T diameter
0.5 in.
T
0.438 in.
T diameter
2 T diameter
0.25 in.
0.75 in.
0.25 in.
1.5 in.
(b)
(c)
2 T
1.33 T
4 T
0.83 T
T
T
Identificationnumber
4 T diameter
1.0 in.
T
T diameter
2 T diameter
0.375 in.
0.75 in.
2.25 in.
1.375 in.
0.375 in.
3RT07 LAYOUT(139_184) 10/14/02 2:58 PM Page 173

174 Rad
FIGURE 38. Examples of wire type image quality indicators:(a) ASTM Standard E 747 (set B, Alternate 2); (b) DeutscheIndustrie Norm 54109, German standard image qualityindicator.
(a)
(b)
6.35 mm (0.25 in.)minimum lead letters
and numbersLargest wire number
Encapsulatedbetween clear vinylplastic of 1.52 mm(0.06 in.)maximumthickness
Length minimum25.4 mm (1.0 in.)for sets A and B
5.08 mm (0.200 in.) (minimumdistance between axis of wires is
not less than 3 times wirediameter and not more than
5.08 mm [0.200 in.])
6 wiresequallyspaced
Setidentification
number
Materialgrade
number
3RT07 LAYOUT(139_184) 10/14/02 2:58 PM Page 174
All sections of the ASME Boiler andPressure Vessel Code require an imagequality indicator identical to the ASTMplaque or wire type image qualityindicator.5
Equivalent Image QualityIndicator SensitivityIdeally, the image quality indicator shouldbe made of the same material as thespecimen. However, this is sometimesimpossible because of practical oreconomic difficulties. In such cases, theimage quality indicator may be made of aradiographically similar material — thatis, a material having the sameradiographic absorption as the specimenbut which is better suited to the makingof image quality indicators. Tables ofradiographically equivalent materials havebeen published, grouping materials withsimilar radiographic absorptions. Inaddition, an image quality indicator madeof a particular material may be used in theradiography of materials having greaterradiographic absorption. In such a case,there is a certain penalty on radiographictechnicians because they are setting morerigid radiographic quality standards forthemselves than those which are actuallyrequired. This penalty is often outweighedby avoiding the problems of obtainingimage quality indicators for an unusualmaterial.
In some cases the materials involveddo not appear in published tabulations.Under these circumstances thecomparative radiographic absorption oftwo materials may be determinedexperimentally. A block of the materialunder test and a block of the materialproposed for image quality indicators,equal in thickness to the part beingexamined, can be radiographed side byside on the same film with the techniqueto be used in practice. If the film densityunder the proposed image qualityindicator material is equal to or greaterthan the film density under the specimenmaterial, that proposed material issuitable for fabrication of image qualityindicators.
In practically all cases, the imagequality indicator is placed on the sourceside of the specimen, in the leastadvantageous geometric position. In someinstances, however, this location for theimage quality indicator is not feasible. Anexample would be the radiography of acircumferential weld in a long tubularstructure, using a source position withinthe tube and film on the outer surface. Insuch a case film side image qualityindicator must be used. Some codesspecify the film side image qualityindicator that is equivalent to the source
iographic Testing
side image quality indicator normallyrequired.
When such a specification is not made,the required film side image qualityindicator may be found experimentally. Inthe example above, a short section of tubeof the same dimensions and materials asthe item under test would be used in theexperiment. The required image qualityindicator would be placed on the sourceside and a range of image qualityindicators on the film side. If the sourceside image quality indicator indicated thatthe required radiographic sensitivity wasbeing achieved, the image of the smallest

3RT07 LAYOUT(139_184) 10/14/02 2:58 PM Page 175
visible hole or wire size in the film sideimage quality indicators would be used todetermine the image quality indicator andthe hole or wire size to be used on theproduction radiographs.
Although the smallest visible holecriterion is the best one in most cases forplaque image quality indicators, in somecases the best criterion is the smallestvisible hole in the thinnest image qualityindicator. In rare cases neither of theserules of thumb is correct. Therefore, forcritical applications, the best criterion forequivalent sensitivity should bedetermined by calculations based on thevisible features of the film side imagequality indicators and using the equationsgiven in the appendix to ASTM E 1025.4
Sometimes the shape of the part beingexamined precludes placing the imagequality indicator on the part. When thisoccurs, the image quality indicator maybe placed on a block of radiographicallysimilar material of the same thickness asthe specimen. The block and the imagequality indicator should be placed as closeas possible to the specimen.
Wire Image Quality IndicatorsA number of wire image quality indicatordesigns are in use. The ASTM E 747 imagequality indicator6 and the European wireimage quality indicator7,8 (Fig. 38) arewidely used. These consist of a number ofwires of various diameters sealed in aplastic envelope that carries the necessaryidentification symbols. The image qualityis indicated by the thinnest wire visibleon the radiograph. The system is suchthat only three image quality indicators,each containing seven wires, can cover avery wide range of specimen thicknesses.Sets of Deutsche Industrie Norm imagequality indicators are available inaluminum, copper and steel whereasASTM image quality indicators areavailable in three light metal and fiveheavy metal groups.
Comparison of Image QualityIndicator DesignsThe hole type image quality indicator is, ina sense, a go/no-go gage; that is, it indicateswhether or not a specified quality level hasbeen attained but, in most cases, does notindicate whether requirements have beenexceeded or by how much. The wire imagequality indicator on the other hand is aseries of image quality indicators in asingle unit. As such, they have theadvantage that the radiographic qualitylevel achieved can often be read directlyfrom the processed radiograph.
The hole image quality indicator canbe made of any material that can beformed into thin sheets and drilled but
the wire image quality indicator is onlymade from materials that can be formedinto wires. A quality level of 2-2T may bespecified for the radiography of, forexample, commercially pure aluminumand 2024 aluminum alloy, even thoughthese have appreciably differentcompositions and radiation absorptions.The hole image quality indicator would,in each case, be made of the appropriatematerial. To achieve the same quality ofradiographic inspection for equalthicknesses of these two materials, itwould be necessary to specify differentwire diameters — that for 2024 alloywould probably have to be determined byexperiment.
Special Image Quality IndicatorsSpecial image quality indicators have beendesigned for certain classes ofradiographic testing. An example is theradiography of electronic components inwhich some of the significant factors arethe continuity of fine wires or thepresence of tiny balls of solder. Specialimage quality indicators have beendesigned consisting of fine wires andsmall metallic spheres within a plasticblock.9
The block is covered on top andbottom with steel about as thick as thecase of the electronic component.
Image Quality Indicators andVisibility of DiscontinuitiesIt should be remembered that even if acertain hole in an image quality indicatoris visible on the radiograph, a cavity ofthe same diameter and thickness may notbe visible. The image quality indicatorholes, having sharp boundaries, result inabrupt, though small, changes in metalthickness whereas a natural cavity havingmore or less rounded sides causes agradual change. Therefore, the image ofthe image quality indicator hole is sharperand more easily seen in the radiographthan is the image of the cavity.
Similarly, a fine crack may be ofconsiderable extent but if the X-rays orgamma rays pass from source to film in adirection other than parallel to the planeof the crack, its image on the film maynot be visible because of the very gradualor small transition in photographicdensity. Thus, an image quality indicatoris used to indicate the quality of theradiographic method and not to measurethe size of flaw which can be shown.
In the case of a wire image qualityindicator, the visibility of a wire of acertain diameter does not ensure that adiscontinuity of the same cross sectionwill be visible. The human eye perceivesmuch more readily a long boundary than
175Principles of Film Radiography

176 Rad
3RT07 LAYOUT(139_184) 10/14/02 2:58 PM Page 176
it does a short one, even if the densitydifference and the sharpness of the imageare the same. However, the equivalencybetween the hole and wire ASTMInternational image quality indicators wasdeveloped on the basis of empirical dataas well as theoretical numbers.
Viewing and InterpretingRadiographsThe viewing of the finished radiograph isdiscussed elsewhere in this volume.
iographic Testing

PART 6. Film Handling and Storage
3RT07 LAYOUT(139_184) 10/14/02 2:58 PM Page 177
Film HandlingRadiographic film should always behandled carefully to avoid physicalstrains, such as pressure, creasing,buckling, friction and others. The normalpressure applied in a cassette to providegood contacts is not enough to damagethe film. However, when films are loadedin semiflexible holders and externalclamping devices are used, care should betaken to ensure that this pressure isuniform. If a film holder bears against afew high spots, such as those that occuron an unground weld, the pressure maybe great enough to produce desensitizedareas in the radiograph. Precaution isparticularly important when usingenvelope packed films.
Crimp marks or marks resulting fromcontact with fingers that are moist orcontaminated with processing chemicalscan be avoided if large films are graspedby the edges and allowed to hang free. Aconvenient supply of clean towels is anincentive to dry the hands often and well.Envelope packed films avoid theseproblems until the envelope is opened forprocessing. Thereafter, of course, the usualcare must be taken.
Another important precaution is toavoid withdrawing film rapidly fromcartons, exposure holders or cassettes.Such care will materially help to eliminateobjectionable circular or treelike blackmarkings in the radiograph, the results ofstatic electric discharges.
The interleaving paper must beremoved before the film is loadedbetween either lead or fluorescent screens.When using exposure holders withoutscreens, the paper should be left on thefilm for the added protection that itprovides. At high voltage, direct exposuretechniques are subject to the problemsmentioned earlier: electrons emitted bythe lead backing of the cassette orexposure holder may reach the filmthrough the intervening paper or felt andrecord an image of this material on thefilm. This effect is magnified by lead orfluorescent screens. In the radiography oflight metals, direct exposure techniquesare the rule and the paper folder shouldbe left on the interleaved film whenloading it in the exposure holder.
Ends of a length of roll film factorypacked in a paper sleeve should be sealed
in the darkroom with black pressuresensitive tape. The tape should extendbeyond the edges of the strip 7 to 13 mm(0.25 to 0.5 in.) to provide a positive lighttight seal.
Identifying RadiographsBecause of their high absorption, leadnumbers or letters affixed to the filmholder or test object furnish a simplemeans of identifying radiographs. Theymay also be used as reference marks todetermine the location of discontinuitieswithin the specimen. Such markers can beconveniently fastened to the film holderor object with adhesive tape. A code canbe devised to minimize the amount oflettering needed. Lead letters arecommercially available in a variety of sizesand styles. The thickness of the chosenletters should be great enough so thattheir image is clearly visible on exposureswith the most penetrating radiationroutinely used. Under some circumstancesit may be necessary to put the lead letterson a radiation absorbing block so thattheir image will not be burned out. Theblock should be considerably larger thanthe legend itself.
Flash box identification should beincluded where a corner of a radiograph isblocked with lead to minimize exposure.The unexposed corner is flashed withlight transmitted through typed or handwritten information exposed onto thefilm.
Shipping of UnprocessedFilmsIf unprocessed film is to be shipped, thepackage should be carefully andconspicuously labeled, indicating thecontents, so that the package may besegregated from any radioactive materials,high heat or pressure. It should further benoted that customs inspection ofshipments crossing internationalboundaries sometimes includesfluoroscopic inspection. To avoid damagefrom this cause, packages, personnelbaggage and the like containingunprocessed film should be plainlymarked and the attention of inspectorsdrawn to their sensitive contents.
177Principles of Film Radiography

178 Radi
3RT07 LAYOUT(139_184) 10/14/02 2:58 PM Page 178
Storage of UnprocessedFilm
X-Ray Film StorageWith X-rays generated up to 200 kV, it isfeasible to use storage compartments linedwith a sufficient thickness of lead toprotect the film. At higher kilovoltages,protection becomes increasingly difficult;film should be protected not only by theradiation barrier for protection ofpersonnel but also by increased distancefrom the source.
At 100 kV, a 3 mm (0.125 in.) thicknessof lead should normally be adequate toprotect film stored in a room adjacent tothe X-ray room if the film is not in theline of the direct beam. At 200 kV, thelead thickness should be increased to6.4 mm (0.25 in.).
With megavolt X-rays, films should bestored beyond the concrete or otherprotective wall at a distance at least fivetimes farther from the X-ray tube than thearea occupied by personnel. The storageperiod should not exceed the timesrecommended by the manufacturer.
These rules of thumb may be ignored ifsuitable radiation surveys indicateradiation levels low enough to avoidfogging during the maximum time periodthat the film will be stored.
Storage near Gamma RaysWhen radioactive material is not in use,the shielding container in which it isstored helps provide protection for film.In many cases, however, the container fora gamma ray source will not providesatisfactory protection to storedradiographic film. In such cases, theemitter and stored film should beseparated by a sufficient distance toprevent fogging.
Heat, Humidity and FumesThe effects of heat, humidity and fumeson stored film are discussed elsewhere.2
Storage of Exposed andProcessed FilmArchival storage is a term commonly usedto describe the keeping quality ofradiographic film. It has been defined bythe American National Standards Institute(ANSI) as those storage conditions suitablefor the preservation of photographic filmhaving permanent value. The AmericanNational Standards Institute does notdefine archival storage in years but interms of the thiosulfate content (residual
ographic Testing
fixer) permissible for storage ofradiographs.
Although many factors affect thestorage life of radiographs, one of themost important is the residual thiosulfateleft in the radiograph after processing anddrying. Determined by the methyleneblue test, the maximum level is 2 mg·cm–2
on each side of coarse grain radiographicfilms. For short term storagerequirements, the residual thiosulfatecontent can be at a higher level but thislevel is not specified by the AmericanNational Standards Institute.
Washing of the film after developmentand fixing, therefore, is very important.The methylene blue test and silverdensitometric test are laboratoryprocedures performed on clear areas ofthe processed film.
Temperature and humidity should becarefully controlled. Radiographic filmshould be stored with precautionsspecified in ASTM E 1254.10
Storage SuggestionsRegardless of the length of time aradiograph is to be kept, these suggestionsshould be followed to provide formaximum stability of the radiographicimage.
1. Avoid storage in the presence ofchemical fumes.
2. Avoid short term cycling oftemperature and humidity.
3. Place each radiograph in its ownfolder to prevent possible chemicalcontamination by the glue used inmaking the storage envelope (negativepreserver). Several radiographs may bestored in a single storage envelope ifeach is in its own interleaving folder.
4. Never store unprotected radiographsin bright light or sunlight.
5. Avoid pressure damage caused bystacking a large number of radiographshorizontally in a single pile or byforcing more radiographs than cancomfortably fit into a single filedrawer or shelf.
Radiographic film offers a means ofprecise discontinuity detection anddocumentation. Despite the introductionof digital means of image capture, displayand storage, film radiography willcontinue to be an important part ofnondestructive testing well into thetwenty first century.
MicrofilmRadiographic film images can be copied tomicrofilm and microfiche for storage. Amicrofiche the size of a postcard can storemore than a hundred radiographic

3RT07 LAYOUT(139_184) 10/14/02 2:58 PM Page 179
images. Like film negatives, microfilm andmicrofiche require climate control toprevent degradation of the medium whenstored for years.
In the twenty-first century,microfilming services offer imagedigitization and will provide the imageson compact disks or digital video disks.Film digitization is discussed below.
179Principles of Film Radiography

180 Radio
PART 7. Film Digitization
3RT07 LAYOUT(139_184) 10/14/02 2:58 PM Page 180
Film digitization is the conversion ofexisting radiographic film images to adigital format for electronic imageanalysis, management, transmission andstorage. Film digitization also permitsdisposal of film that would degrade overtime.
In film digitization, film densities areconverted into digital values by measuringlight transmitted through the film andassigning each measurement a digitalvalue and a particular location. Threeprimary parameters affect the resultingimage quality of film digitization: densityrange, density resolution and spatialresolution (pixel size).
Optical density (OD) is a logarithmicfunction. This means that at opticaldensity 0, 100 percent of the incidentphotons are transmitted through the film;at 1.0 optical density, only 10 percentmake it through; at 2.0 optical density,only 1 percent; and at 3.0 optical density,only 0.1 percent. It is difficult to measurehigher densities with the same accuracyand precision as lower densities.
There are two basic methods ofdigitizing film. The first method makesthe measurement using a diffuse lightsource and a charge coupled device (CCD)whereas the second uses a combination ofa laser and a photomultiplier tube(PMT).11,12
Charge Coupled DeviceFilm Digitization SystemsA charge coupled device film digitizerilluminates the full width of the film witha diffuse light source and then uses a lenssystem to focus the light down to the sizeof the charge coupled device elements.The charge coupled device is a siliconsemiconductor device consisting of a largenumber of gridlike elements sensitive tolight. When light energy impinges on thecharge coupled device elements, thephotons generate a charge within eachelement. Periodically, the element isdischarged and the amplitude of thecharge is measured. In this way, lightamplitude can be converted to aproportionate electrical signal related tothe density at any given point.
In film digitization systems, a lineararray of charge coupled device elements isused with optics to focus the film image
graphic Testing
onto the much smaller charge coupledelement. A narrow line of diffuse light ispassed through the film and thetransmitted light is focused onto thecharge coupled device array, one line at atime. Once one line of data is collected, asecond line is then scanned.
The total density range of chargecoupled devices can be affected if, whenthere is a rapid and drastic change in lightlevel, the charge coupled devicemomentarily becomes saturated. Theimage may be corrected by changing thesampling time (integration period). Athigh light levels, the integration period isreduced to avoid saturation of the chargecoupled device whereas at low light levels,the integration period is increased toachieve an adequate ratio of signal tonoise. To obtain optical density dynamicranges up to five, multiple scans may beperformed at varying charge coupleddevice integration periods and scanspeeds.
The density resolution of chargecoupled device digitizers is determined bythe conversion of the logarithmic densityscale to a linear voltage scale. Forexample, at an optical density of zero,maximum light passes through the film,so the charge coupled device elementproduces the maximum voltage. Becauseoptical density is a logarithmic function,only 10 percent of the light transmitted atan optical density of 0 will be detected atan optical density of 1. If the chargecoupled device’s maximum voltage iscalibrated to be 10 V, then the voltageoutput at an optical density of 1 is 1.0 V,at 2 it is 0.1 V, at 3 it is 0.01 V and at 4 itis 0.001 V. Therefore, if the chargecoupled device output of 10 V is digitizedat 12 bits or 4096 density levels, then anoptical density from 0 to 1 will producean output of 9 V, which equates to3686 density levels (90 percent of 4096).The output of densities from 1 to 2 willequate to 369 levels; densities from 2 to 3,to 37 levels; and densities from 3 to 4,4 levels. While this results in a nonlineardensity resolution, it is similar to theoriginal image and as a result is adequatefor many purposes. It is important thatthe application and image analysisrequirements are thoroughly understoodbefore a particular digitizer is used.
Another aspect of charge coupleddevices is spatial resolution. The elements

3RT07 LAYOUT(139_184) 10/14/02 2:58 PM Page 181
can be arrayed along one or twodimensions. The array’s resolution issometimes given as the element sizebecause all charge coupled device chipshave a large number of elements (forexample, 4000 or 6000) that in theory canbe digitized into a like number of pixels.For example, the 1 cm2 chip in a videocamera is said to have a resolution ofabout 20 µm. Once the various focusinglens aberrations are coupled together, thetrue resolving capability of the chargecoupled device chip is low. A home videocamera is surely not able to discernobjects 20 µm apart.
Therefore, it is important todifferentiate between the chipspecifications versus those of the imagingsystem. The resolution of the imagingsystem depends in part on the quality ofthe focusing optics and in part on thecross talk between charge coupledelements (as when one photon activatesmore than one element).
Laser Film DigitizationSystemsLaser scanners use a nonimagingphotomultiplier tube to detect lighttransmitted through the film. The laserbeam is a focused beam of coherent lightof known value and is transmittedthrough the film at one discreet point.The transmitted light is then detected bythe photomultiplier tube and digitizedinto a value directly proportional to thedensity of the film at that point.
The photomultiplier tube has a widedynamic range, a good ratio of signal tonoise and uses a log amplification processsuch that a uniform density resolution ismaintained over the entire range. The logamplifier normalizes the extremely highnumber of photons detected at lowoptical densities versus the relatively lownumber of photons detected at highoptical densities. For example, if a laserfilm digitizer converts each optical densitymeasurement into a pixel value 1000× theoptical density at that point, then thereare 1000 levels from 0 to 1 optical density,from 1 to 2 optical density, from 2 to 3optical density, and so on. This wouldprovide a density resolution of 0.001optical density at all levels.
The spatial resolution of a laser scanneris determined by the point of laser lightthat impinges on the film. Because thereis only a single beam, there is no crosstalk between pixels and a true limitingresolution equal to the laser spot size canbe achieved. Typical laser spot sizes are100 µm (0.004 in.) and 50 µm (0.002 in.).However, the actual resolution will
depend on overall laser beam quality,detector noise and electronic noise.
It is important that the application andimage analysis requirements of aparticular digitizer are thoroughlyunderstood before it is used. There areseveral ways to determine experimentallythe performance of a film digitizer. Onemethod is to scan a modulation transferfunction (MTF) pattern to validateperformance. Another, simpler method, isto place a strip of cellophane tape overthe image of a step wedge. Thistranslucent tape will produce a densitydifference of about 0.03 optical density.The idea here is to demonstrate (1) thedynamic range of the system (when thesteps begin to be difficult to differentiate)and (2) the density resolution (at whatdensity the tape can no longer be seen).
Other ConsiderationsBeyond the technical issues of thescanning scheme, other issues are relatedto image size relative to the display andstorage medium. All the information maybe captured in memory, but both theprocessor size and monitor size limit whatcan be worked with or displayed.
For example, let us assume that eachpixel contains 12 bits of grayscaleinformation plus 4 bits of headerinformation. This equates to 16 bits or2 bytes. The image size then, is the totalnumber of pixels times two bytes. If thescan resolution is 100 µm (0.004 in.),then a 14 × 17 in. image would contain3500 pixels (14 in. ÷ 0.004 in.) ×4300 pixels (17 in. ÷ 0.004 in.) or a totalof about 1.5 × 107 pixels. Having 2 bytesof information per pixel results in animage size of 30 megabytes. If the scanresolution were increased to 50 µm(0.002 in.), then the image size wouldincrease by 4× to 120 megabytes.
Some monitors may not be able todisplay the entire image. For example,cathode ray tubes may have displayresolutions of 1200 × 1600 or 2000 ×2500. Therefore, it is important toremember that, depending on themagnification of the image on themonitor, there may actually be more rawdata available than are displayed. Todisplay an image that has either more orfewer data displayed than are in the rawimage, pixel mapping techniques areused. Pixel replication or pixelinterpolation are used when magnifyingbeyond the image resolution. Whenreducing the image size, pixel averaging isused.
Digital images may contain 12-bit (ormore) digital data that must be displayedon a monitor that only displays 8 bits(about what the human eye can discern).
181Principles of Film Radiography

182 Ra
3RT07 LAYOUT(139_184) 10/14/02 2:58 PM Page 182
A method must then be employed to mapthe original 4096 gray scale levels of dataonto the available 256 display levels. Thisis commonly done either (1) by selectingwhich 256 levels of the original 4096 aredisplayed or (2) by equally dividing the4096 levels over the available 256.
diographic Testing

1.Quinn, R.A. and C.C. Sigl, eds.Radiography in Modern Industry, fourthedition. Rochester, NY: EastmanKodak Company (1980).
2.Nondestructive Testing Handbook,second edition: Vol. 3, Radiography andRadiation Testing. Columbus, OH:American Society for NondestructiveTesting (1985).
3.Nondestructive Testing Handbook,second edition: Vol. 10, NondestructiveTesting Overview. Columbus, OH:American Society for NondestructiveTesting (1996).
4.ASTM E 1025, Standard Practice forDesign, Manufacture, and MaterialGrouping Classification of Hole-TypeImage Quality Indicators (IQI) Used forRadiology. Philadelphia, PA: AmericanSociety for Testing and Materials.
5.ASME Boiler and Pressure Vessel Code.New York, NY: American Society ofMechanical Engineers.
6.ASTM E 747, Standard Practice forDesign, Manufacture and MaterialGrouping Classification of Wire ImageQuality Indicators (IQI) Used forRadiology. West Conshohocken, PA:ASTM International.
7.DIN 54109. Non-Destructive Testing;Image Quality of Radiographs;Recommended Practice for DeterminingImage Quality Values and Image QualityClasses. Berlin, Germany: DeutscheInstitut für Normung [GermanInstitute for Standardization] (1989).Superseded by EN 462 (DIN).
8.EN 462 P1 (DIN), Non-DestructiveTesting — Image Quality of Radiographs— Image Quality Indicators (Wire Type)and Determination of Image QualityValue. Brussels, Belgium: EuropeanCommittee for Standardization(1994).
9.ASTM E 801, Standard Practice forControlling Quality of RadiologicalExamination of Electronic Devices. WestConshohocken, PA: ASTMInternational (2001).
10.ASTM E 1254, Standard Guide forStorage of Radiographs and UnexposedRadiographic Film. WestConshohocken, PA: ASTMInternational (1998).
11.“CCD Versus Laser Film DigitizationSystems.” Liberty Technologies,Incorporated, Imaging SystemsDivision.
12.Soltani, P.K., C.R. Chittick, T. Chuang,M.J. Dowling, G.R. Kahley andT.E. Kinsella. “Advances in 2DRadiography for IndustrialInspection.” Presented at theInternational Conference on QualityControl by Artificial Vision. Le Creusot,France: Institut Universitaire deTechnologie (May 1997).
183Principles of Film Radiography
References
3RT07 LAYOUT(139_184) 10/14/02 2:58 PM Page 183

Charles J. Hellier III, Hellier and Associates, Niantic,Connecticut
George C. Wheeler, Materials and ProcessesConsultants, Schenectady, New York
RadiographicInterpretation
8C H A P T E R
3RT08_Layout(185_218) 10/2/02 2:04 PM Page 185

186 Radiog
PART 1. Fundamentals of RadiographicInterpretation
3RT08_Layout(185_218) 10/2/02 2:04 PM Page 186
Radiographic interpretation is the art ofextracting the maximum pertinentinformation from a radiographic image.This requires subjective judgment by theinterpreter and is influenced by theinterpreter’s knowledge of (1) thecharacteristics of the radiation source andits energy levels with respect to thematerial being examined; (2) thecharacteristics of the recording media inresponse to the selected radiation sourceand its energy levels; (3) the processing ofthe recording media with respect toresultant image quality; (4) the objectbeing radiographed; (5) the possible andmost probable types of discontinuitiesthat may occur in the test object; and(6) the possible variations of thediscontinuities’ images as affected byradiographic technique and other factors.
Accurate interpretation is stronglyinfluenced, not only by the viewingconditions and by the interpreter’s visionacuity, but also by the interpreter’sknowledge and experience. Therefore,training of the interpreter is essential tothe reliability of the results of theinterpretation. Because the experience andknowledge of interpreters vary widely,training is also an essential factor inimproving the agreement level betweeninterpreters.
In a program conducted by a researchlaboratory,1,2 a comparison was madeamong five certified film interpreters whowere trained by a master apprenticeprogram. These five certified filminterpreters reviewed 350 radiographs andreached agreement on 238 radiographs ordisagreed 32 percent of the time.
The results of this research were thenincorporated into a unified trainingprogram, using discontinuity categoriesfrom the welding process. Subsequently, aprocedure was developed wherein ninecertified film interpreters trained underthe unified training program werecompared to nine certified filminterpreters trained under the masterapprentice program. Using 96radiographs, the master apprentice groupdisagreed 44 percent of the time; theunified training group disagreed only17 percent of the time.
In a similar study of medicalradiology,3 the reproducibility of atuberculosis diagnosis was examined. Thisstudy revealed an average disagreement in
raphic Testing
one out of three cases or 67 percentagreement. On a second independentreading of the same radiographs, aphysician would disagree with his or herown previous diagnosis in an average ofone out of five cases or 80 percentagreement.
Under the best circumstances oftraining and experience, qualified filminterpreters may disagree. Therefore, in allapplications where quality of the finalproduct is critical for safety or reliability, aminimum of two qualified interpretersshould evaluate and pass judgment on theradiographs.
Reference radiographs are a valuabletraining and interpretation aid. Anin-house library of radiographs andaccompanying photographs ofmacrosections of various discontinuitiesare also recommended.
Steps of RadiographicTestingThe five essential steps of radiographicnondestructive testing are the following:(1) supplying a suitable form anddistribution of radiation from an externalsource to the object being tested;(2) modification of the radiationdistribution within the test object as aresult of the variations in radiationabsorption within the object caused bydiscontinuities or differences in materialproperties that correlate withserviceability of the object; (3) detectionof these changes in radiation distributionby a sensitive detector such asphotosensitive film or paper or anelectronic system; (4) recording thisradiation distribution in a form, such as aradiographic image, suitable forinterpretation; and (5) interpretation ofthe image to comply with applicablecodes and standards or to provide otherinformation sought about the object.
Specifying NondestructiveTests4-6
Nondestructive tests must be designedand specified for validity and reliability ineach individual application. The tests arespecific to the problem; no nondestructive

FIGURE 1. Schematic diagram of effective (orprojected) focal spot of X-ray tube.
True focal spot
20 degrees
Effective focal spot
Normal X-ray axis
3RT08_Layout(185_218) 10/2/02 2:04 PM Page 187
test is applicable to every kind of material,part, structure, function, or operatingcondition. Instead, each nondestructivetest must be based on a thoroughunderstanding of (1) the nature andfunction of the part being tested,(2) workmanship standards duringmanufacturing and fabrication, and(3) the conditions of the part’s service.
These fundamentals are part of thebasic experience and knowledge that aradiographic interpreter must possess.Specific radiographic procedures must beprepared and adhered to in both theproduction and the interpretation of theresultant radiographic image. Theseprocedures should be based on applicablespecifications, codes and standards andthe interpreter must be thoroughlyfamiliar with their requirements toproperly assess the image and productquality.
Interpretation of RadiographicImagesThe basic steps in interpretation of imagesproduced by radiography, whether film,paper or electronic images, are thefollowing.
1. Ensure by appropriate tests that theinterpreter has adequate vision acuityunder proper viewing conditions.
2. Establish proper viewing conditions toensure that the interpreter can usethat vision acuity in interpreting theimages.
3. Assess the quality of the radiographicimages that are to be interpreted,including presence of requiredidentification information, freedomfrom artifacts that might maskdiscontinuities, display of the requiredpenetrameter (image quality indicator)quality level and display of the correctstation/location markers.
4. Assess the quality of the object beingtested in the areas of interest. This isthe step that requires the greatesttraining, experience and knowledge,particularly in understanding of theradiographic process and its effects onthe radiographic image.
Some aids useful in detection andidentification of discontinuities includethe following.
1. Slowly moving the radiograph backand forth often helps in detectingsmall or low contrast details, becausethe eye is sensitive to moving objects.
2. Tilting the film or changing theviewing angle will also improve theapparent contrast of low contrastdetails. This may aid in differentiatingfilm artifacts from discontinuityimages.
3. Limiting the area being viewed mayimprove detection of fine details.
4. Use a good 2× or 3× magnifying glassto assess some indications.
5. Use a transparent scale or ruler tomeasure indications may be useful indifferentiating acceptable fromrejectable indications.
6. Visually examine the test object, ifpossible, whenever there is anyquestion as to whether an indicationrepresents a surface condition.
7. When evaluation of an image or detailis uncertain, radiograph the areaagain, if possible, for verification.Change the exposure geometry if adiscontinuity may be unfavorablyoriented or is near the edge of the film(Figs. 1 and 2) except for transmittedbeam radiographs.
8. When the depth of a discontinuity(within the thickness of the object) isimportant use triangulation exposuresto determine its depth.
Standards, Codes andSpecificationsAll radiography (except research anddevelopment) should be performed inaccordance with written proceduresdeveloped from applicable standards,codes or specifications, as required bycontractual agreement. This means thatthe radiographic interpreter must haveboth a working knowledge of and readyaccess to pertinent documents to verifythe technique and quality levelrequirements of (1) the radiography and(2) the product.
However, radiographic personnelshould understand that specified quality
187Radiographic Interpretation

188 Rad
3RT08_Layout(185_218) 10/2/02 2:04 PM Page 188
levels may vary depending on thespecifications in effect and thatradiographic quality levels are consideredminimum requirements that may beexceeded.
Product quality levels should be basedon the service (use) of the componentbeing examined, even though this is notalways addressed in the governing code orspecification. Ideally, the product qualitylevel should be established by appropriateengineering personnel in conjunctionwith the radiographic specialist, thusproviding the maximum degree ofinspectability and ensuring that the mostcritical discontinuities can be detected.
Carlton H. Hastings succinctly definedmaterial as a “collection of defects, withacceptable material being a [fortunate]arrangement of defects and rejectablematerial being an unfortunatearrangement of defects.”7 The message is
iographic Testing
FIGURE 2. Diagram showing change of shapeand size of projected X-ray focal spot asfunction of position in X-ray field.
(a) Target focus
Film
(b)
A
B
C C
LegendA. Nominal center film, directly in line with orthogonal
projection from X-ray tube window, may giveaverage sized focal spot projection.
B. Optimum focal spot projection in this example.C. Poor projection
clear: regardless of the radiographictechnique used, there can never be theassurance of a component totally free ofdiscontinuities. Hence, a thoroughunderstanding of radiography’slimitations is essential for choosing theoptimum techniques to achieve thedesired radiographic quality level.

PART 2. Viewing in Radiographic Testing
FIGURE 3. Examples of reference acuity testsshowing line orientations and dimensions:(a) vertical, contrast 0.85, sharp; (b) rotated90 degrees, horizontal, contrast 0.85, sharp;(c) oblique/left, contrast 0.1, blurred;(d) oblique, rotated 90 degrees, contrast0.1, blurred.
(a)
FRONT BACK
13 mm(0.5 in.)
S
V
H0.85
S 0.85
(b)
30 mm(1.2 in.)
S
V H0.85
S
0.85
(c)
50 mm(2 in.)
B
B L0.1
R
(d)
B B
L 0.1 R
0.1
3RT08_Layout(185_218) 10/2/02 2:04 PM Page 189
Vision Acuity andPerceptionVision acuity as it applies to radiographyrequires both the observation of finedetail and the detection of smalldifferences in brightness or contrast. It issignificantly affected by environmental,physiological and psychological variables.The major controllable factors are theambient light level in the viewing areaand the light level illuminating theradiographic image, that is, passingthrough the film, falling on the paper oremitted from a fluorescent or real timedisplay.
The vision acuity of an individual mayvary from moment to moment, hour tohour and day to day, as well as overlonger time periods, depending on manyvariables. These include emotions, fatigue,light levels and wavelength of the light,light and dark adaptation of the eyes andthe characteristics of the images beingsought, that is, their shape, size andcontrast.
Acuity alone, as usually measured, doesnot guarantee detection. The eye and thebrain together must discriminate patternsfrom the background. This requiresthorough knowledge of the target patternsand how they may vary as a function ofradiographic exposure techniquevariables. Discrimination also depends onthe scanning technique, which includes,as in ultrasonic testing, the pattern,coverage and speed of scanning.
Annual vision examinations cannotaccount for all of these variables. Theyestablish only the ability, at the time ofthe examination, to detect known targetswith simple shapes (letters, numbers andothers) that usually have high contrastrelative to their background. This suggeststhat, for highly critical work, morefrequent examinations with morevariables should be used or that multipleinterpreters should be used for such work.
The vision test described below wasdeveloped using microdensitometer scansof discontinuities taken from actualradiographs.8 Samples of the acuity testslides are presented in Fig. 3. Theoptotype (acuity test target) is a thin linedarker than the background. Lineorientation serves two importantfunctions: (1) it increases the number of
possible responses (two with noorientation, four with orientation) and(2) it includes astigmatic effects. The fourorientations are horizontal H, vertical V,oblique right R and oblique left L.
189Radiographic Interpretation

190 Radi
TABLE 1. Visi
Varia
Figure andBackgrounContrastLine width
Line widthViewing diBlurLine orient
Light sourcTotal (com
a. The unit for per square m(ftl), is equa
b. The unit for (rad), equalwhere 1 deg
3RT08_Layout(185_218) 10/2/02 2:04 PM Page 190
The recommended parameters for thistest are summarized in Table 1. Thebackground luminance (brightness) of thetest chart is kept constant at 85 ± 5 cd·m–2
or 25 ± 1.5 ftl (see footnotes to Table 1 fordefinitions of these units). Three contrastlevels and line widths are recommended.The length of the lines is kept constant at107 min of arc. These angular measuresare based on a viewing distance of400 mm (16 in.). Two levels of linesharpness are included: one with a sharpedge similar to most optotypes used invision testing and one with a blurred edgelike that in many actual radiographs.
These slides are designed for self-testingas well as testing by designated examiners.The front of the slides contain only theoptotypes (Fig. 3) with all necessaryinformation given on the reverse side.This procedure assumes that forself-testing the examinee will look at theside giving the correct response (H, V, R orL) only after evaluating the targetorientation.
Viewing Conditions andEquipmentViewing conditions are important forachieving good interpretation andevaluation results. Interpretation andevaluation of radiographic images shouldbe done under conditions that affordmaximum visibility of detail togetherwith a maximum of comfort and aminimum of fatigue for the interpreter.
ographic Testing
on acuity test parameters.
Quantity ofble Conditions Conditions
ground 1 Dark on lightd luminancea 1 85 ± 5 cd·m–2 (25 ± 1.5 ftL)
3 0.1, 0.3, 0.85 (plane angle) 3 220 µrad (0.75 min),
290 µrad (1.0 min) and440 µmrad (1.5 min)
(plane angle) 1 31.13 mrad (107 min)stance 1 400 mm (16 in.)
2 sharp, blurredation 4 perpendicular or horizontal,
oblique right, oblique lefte (viewer) 1 Incandescent, fluorescentbinations) 72
luminance in the International System of Units (SI) is candelaeter (cd·m–2). The English unit for luminance, the footlambert
l to 3.426 cd·m–2.plane angle in the International System of Units (SI) is radianto 3437.75 minutes (min) and equal to 52.296 degrees (deg), = 60 min = 1.745 × 10⁻² rad.
In most cases subdued lighting in theviewing area is preferable to totaldarkness. However, when relatively broadareas, about 6 mm (0.25 in.) wide ormore, of very low contrast and lowsharpness, such as shallow, blendeddepressions or microshrinkage, must bedetected or their dimensions measured, itmay be desirable or even necessary for theinterpreter to practice extended darkadaptation. Adaptation times of as muchas 30 to 45 min have sometimes beenfound necessary to ensure adequate visionto resolve such features.9,10
The room lighting must be arranged sothat there are no reflections from thesurface of the image being interpreted.Adequate table surface must be providedon either side of the viewing device toaccommodate film and to provide awriting surface for recording theinterpretation. Quick and easy accessshould be provided to a suitabledensitometer; reference radiographs; andapplicable codes, standards andspecifications. In addition, it is importantfor the film interpreter to be free ofdistractions, including telephone andvisitors, to maintain concentration.
For radioscopic techniques that requireviewing of a computer screen or electronicimaging console, the same generalconditions apply but may vary dependingon the specific system being used. Directviewing generally requires darkadaptation: 20 min of dark adaptation isconsidered good practice. Red light up to30 times brighter than white will notaffect dark adapted eyes. Red gogglesoutside the viewing area and red light inthe viewing rooms are useful to maintaineye sensitivity. A remote viewing systemwith a video presentation allowsindividual control of brightness andcontrast for maximum vision acuity.9
If the interpretation of the radiographicimage is to be meaningful, it is essentialthat proper viewing equipment be ingood working condition. If slight densityvariations in the radiographs are notobserved, rejectable conditions may gounnoticed. In many cases, various types ofdiscontinuities are barely distinguishableeven with optimized techniques and finegrained film. To optimize the interpreter’sability to properly evaluate theradiographic image, appropriate viewingconditions and suitable equipment areabsolutely necessary.
High Intensity IlluminatorsA radiograph that meets the densityrequirements of current codes andspecifications will permit only a smallfraction of the incident light to passthrough it. The optical density of a

FIGURE 5. High intensity combinationilluminator with iris diaphragm spot viewer
3RT08_Layout(185_218) 10/2/02 2:04 PM Page 191
radiographic film can be expressed as alogarithmic function:
(1)
where Density is the degree of blacknessresulting from radiographic exposure; Io isthe incident light intensity (from the highintensity illuminator or densitometer);and It is the light transmitted through aspecific region of the radiograph.
If a film is perfectly clear, the opticaldensity will be 0:
A film that permits 1 percent of theincident light to be transmitted will havean optical density of 2.0.
Following the same procedure, it canbe seen that a film optical density of 3.0permits only 0.1 percent of the incidentlight to pass through and a film opticaldensity of 4.0, a mere 0.01 percent.
Typically, radiographic densityrequirements through the area of interestrange between 2.0 (1 percent lighttransmission) and 4.0 (0.01 percent lighttransmission); this explains the need for asource of high intensity viewing light.
There are many types and styles ofhigh intensity illuminators, although theyare generally classified into four groups:(1) spot viewers, (2) strip film viewers,(3) area viewers and (4) combination spotand area viewers.
Spot viewers provide a limited field ofillumination, typically 76 to 102 mm(3 to 4 in.) in diameter. These viewers areusually the most portable and leastexpensive.
The strip film viewer (Fig. 4) permitsinterpretation of strip film including90 × 430 mm (3.5 × 17 in.), 115 ×430 mm (4.5 × 17 in.), 100 × 250 mm(4 × 10 in.) and 125 × 175 mm (5 × 7 in.)and the 35 mm or 70 mm sizes. The
Density == == (( )) ==log log100100
1 0
Densityt
== logII0
FIGURE 4. High intensity illuminator designedfor viewing strip film.
viewing area is rectangular and the area ofillumination may be adjusted to conformto the film dimension by using metal orcardboard masks.
The area viewers are designed toaccommodate large films up to360 × 430 mm (14 × 17 in.). Theillumination is generally provided byfluorescent lights or a bank ofphotographic flood bulbs. The fluorescentlight intensity may not have suitablebrightness to permit effective examinationthrough the higher densities and thiscould result in a serious limitation. Thecombination spot and area viewers (Fig. 5)provide the interpreter with spotcapability while allowing the viewing of alarge area of film. A switch determineswhich light source will be activated.Heat. Because light of high intensity alsogenerates significant amounts of heat, it isnecessary that the illuminator have ameans of dissipating or diverting the heatto avoid damaging the radiographic filmwhile viewing. Light sources inilluminators of typical film viewers consistof one or more photographic flood bulbs.Other light sources such as flood lightsand tungsten halogen bulbs are also used.Diffusion. To minimize variation in theintensity of light across the area beingviewed it is also important that the lightbe diffused over the area used for viewing.This diffusing is accomplished with adiffusing glass, usually positioned betweenthe light source and the viewing area, orwith a white plastic screen at the front ofthe viewer.Intensity Control. Another essentialfeature of the illuminator is the variableintensity control. This permits subduedintensity when viewing lower densitiesand maximum intensity as required forthe high density portions of theradiograph.
191Radiographic Interpretation
and large viewer.

192 Rad
FIGURE 6. Comparator with etched glassreticle: (a) comparator; (b) reticle.
(a)
(b) Comparesholediameters
Comparesthicknesses
Measureslinear
dimensions
3RT08_Layout(185_218) 10/2/02 2:04 PM Page 192
Masks. Masks can be extremely helpfulwhen attempting to evaluate a smallportion of a larger radiograph or when theradiograph is physically small. The intentis to illuminate that portion of theradiograph identified as the area ofinterest, while masking other light fromthe eyes of the interpreter. Some spotviewers are equipped with an irisdiaphragm that permits the spot size to bevaried with the simple adjustment of alever. This feature is especially helpfulwhen small areas or fine details must beexamined.Precautions. The illuminator’s front glassor screen touches the film and shouldalways be clean and free of blemishes onboth sides. Scratches, nicks, dirt or otherimperfections on the front glass or screenwill cast shadows on the radiograph,causing unnecessary images.
Another precaution will help minimizefilm scratches. The front of the viewershould be carefully examined to ensurethat there are no sharp edges or otherobstructions; these could cause scratchesto the sensitive surface of the radiographas it is moved or positioned on the viewer.
MagnifiersNormally, radiographs can be effectivelyevaluated without magnification devices.There may be occasions, however, whensuch devices are helpful. For example, ifthe article being radiographed containsvery small discontinuities or consists ofminute components, magnification maybe essential. This application willgenerally require fine grained film thatcan be suitably magnified. Some of thecoarser grained films are difficult to viewwith magnification because the graininessis also enlarged; this can makediscernment of slight optical densitychanges impossible.
There is a wide assortment ofmagnifiers appropriate for the evaluationof radiographs. The most common is thehandheld magnifying glass, available inmany shapes, sizes and powers. Forconvenience, a gooseneck magnifier maybe employed. Because this magnifier isfree standing and attached to a weightedmetal base, it leaves the interpreter’shands free during use. One device thatoffers magnification and measuringcapabilities is a comparator with anetched glass reticle (Fig. 6).
If any form of magnification isemployed, it should be done with cautionand limited to only those applicationswhere it is necessary.
Viewing AccessoriesAdditional accessories that aid theinterpreter and should be available in the
iographic Testing
film reading area, include (1) supply ofwax marking pencils to mark the film;(2) rulers (the most appropriate would beclear, flexible plastic); (3) a smallflashlight to reflect light off theradiographic film to assist in theidentification of film artifacts such asscratches, roller marks, dirt and others;(4) gloves, usually cotton or nylon, tominimize direct contact between the filmand the fingers of the interpreter;(5) charts, tables and other technical aidsthat will assist in the promptestablishment of density range (forexample, see Table 2), determination ofgeometric unsharpness and other datarelated to the applicable codes orspecifications.
Viewing Paper RadiographsTypically, paper radiographs are reviewedunder normal lighting conditions usingwhite light reflected from the radiograph.It is essential that the light be of suitable

3RT08_Layout(185_218) 10/14/02 10:07 AM Page 193
intensity and, in some cases, positioned atan angle to prevent glare. Various lightingsources have been successful, includingthe high intensity reading lamps andspecular lights (light focused from areflector). Magnifiers containingfluorescent bulbs also provide an effectivemeans of evaluating the paper radiograph,while magnifying the image. Highmagnification (above 5×) is not usuallybeneficial because of the normalgraininess and lack of sharpness inherentin the paper radiograph. See discussions ofpaper radiography elsewhere for moreinformation.
193Radiographic Interpretation
TABLE 2. Density range table based ondensities of +30 percent and –15 percent.Densities less than 2.0 and more than 4.0are considered unacceptable by somecodes and specifications.
Density through Maximum MinimumPenetrameter (+30 percent) (–15 percent)
1.5 1.95 1.281.6 2.08 1.361.7 2.21 1.451.8 2.34 1.531.9 2.47 1.622.0 2.60 1.702.1 2.73 1.792.2 2.86 1.872.3 2.99 1.962.4 3.12 2.042.5 3.25 2.132.6 3.38 2.212.7 3.51 2.302.8 3.64 2.382.9 3.77 2.473.0 3.90 2.553.1 4.03 2.643.2 4.16 2.723.3 4.29 2.813.4 4.42 2.893.5 4.55 2.983.6 4.68 3.063.7 4.81 3.153.8 4.94 3.233.9 5.07 3.324.0 5.20 3.40

194 Radio
PART 3. Densitometers
3RT08_Layout(185_218) 10/2/02 2:05 PM Page 194
The densitometer is an instrument thatmeasures film density (Figs. 7 and 8).Before the invention of portabledensitometers, densities were estimated bycomparing the radiographic density to acomparator strip. The strip contained aseries of densities established bycumbersome and unwieldy earlydensitometers. Many of these earlyradiographic density determinations weresimple, visual estimates.
graphic Testing
FIGURE 7. Digital transmission densitometer.
FIGURE 8. Battery powered densitometer.
The operation of moderndensitometers is quite simple. Aftercalibration, using a density strip withknown values for a number of differentdensities, the radiograph is positionedbetween the light source, usually locatedat the base of the densitometer, and thehead, which contains a photomultiplier.Because the transmitted light intensitydecreases as radiographic film densityincreases, less light reaches thephotosensitive surface in the head andthe voltage output from thephotomultiplier (to the meter or digitaldisplay) will indicate a higher densityreading. Conversely, as more light passesthrough a lower density region of theradiographic film and interacts with thephotosensitive surface in the head, alower density is indicated on the meter ordigital display.
An aperture is installed near the lightsource to establish the precise region ofthe film that is being measured. Changingapertures requires recalibration.
ProcedureThe first step in the proper use of thedensitometer is warmup. Mostinstruments now contain solid statecircuitry and warmup time is minimal. Itis good practice to wait at least fiveminutes after the densitometer has beenturned on before taking density readings.This provides ample time for electronicstabilization.
The next step is the most importantone. No matter how simple thedensitometer may appear to be, it must becalibrated. Calibration is accomplishedwith a calibrated density strip. Becausedifferent densitometers have differentcontrols and procedures for calibration,the specific instruction manuals should beconsulted. After calibration isaccomplished, a series of readings for anumber of density steps should be takenusing the calibrated strip. This should berepeated frequently during thedensitometry to detect electrical shifts orinadvertent changes to the controls.
It is good practice to record calibrationreadings in a daily log book. Some codesand specifications require a master densitystrip traceable to a standards organization.The master strip can be used to calibrate

3RT08_Layout(185_218) 10/2/02 2:05 PM Page 195
other density strips that are typically usedfor daily calibration. As the dailycalibration strips wear out or becomedamaged from use, new ones can beprepared by comparison to the masterstrip.
After calibration, the densitometer isready to use.
PrecautionsSeveral precautions should be kept inmind.
1. The densitometer is a sensitiveelectronic instrument and must betreated with care.
2. The densitometer must be kept cleanat all times. The aperture, glassportions of the head and the reflectivemirror (if used) should be cleaned withcare using a cotton swab moistenedwith alcohol.
3. To avoid damaging the densitometerand to ensure accurate readings, nevertake density readings if the film is notcompletely dry. (Wet film density isnot the same as dry film density.)
4. When replacing the bulb, exerciseextreme care; make sure thedensitometer is unplugged and taketime to remove smudges resultingfrom handling.
5. Keep both the daily and mastercalibration strips in a protective coveror envelope.
It is reasonable to expect readings withan accuracy of ±0.02 when thedensitometer is properly maintained.Repeatability should generally fall within±0.01. If the readings vary from thesetolerances, the equipment should bechecked for possible corrective action.
Optical Density of PaperRadiographsDensity readings of radiographic film aremade using a transmission densitometer.In the case of paper radiographs, densitymust be measured with a reflectiondensitometer because light cannot betransmitted effectively through paper.
Reflection density can be determinedby using Eq. 2:
(2)
where DR is the reflection density, Io is theincident light intensity and IR is thereflected light intensity.
While this equation is similar to theone used to determine the transmissiondensity in radiographic film, density
DIIR0
R== log
readings of paper radiographs areachieved by measuring reflected light.There are a number of commerciallyavailable reflection densitometers andseveral transmission densitometers thatalso have the ability to read reflecteddensities.
ScanningMicrodensitometersDensitometry for conventionalradiographic equipment and procedures isdone with the transmission densitometer.This instrument is generally suitable forensuring compliance with radiographictechnique requirements. However, it maynot provide sufficient information forcertain specialized radiographic analyses.The transmission densitometer is limited,in certain respects, by its relatively largeaperture and by its inability toautomatically scan a film or produce apermanent record. These limitations maydramatically affect the accuracy of relativedensity determinations, especially if thearea of interest on a film is small (two orthree millimeters). The scanningmicrodensitometer (SMD), which is alsocalled a recording microdensitometer, wasdesigned to overcome these limitations.
The scanning microdensitometerautomatically scans a predetermined areaon a film and produces a graphicdepiction of the density changesoccurring in the scan path. The accuracyof the scanning microdensitometer isgreatly enhanced by its adjustableaperture, which may be set for openingsas small as 3 µm (1.2 × 10⁻⁴ in.), hencethe prefix micro. The scanningmicrodensitometer concept is based onthe synchronous combination of anelaborate densitometry system and acompatible scanning/recording system.
Description of Equipment andOperationThe principle of operation forconventional scanning microdensitometerequipment (Fig. 9) is based on a truedouble beam light system, in which twobeams, emanating from a single lightsource, are switched alternately to a singlephotomultiplier. One of the light beams isdirected, through a series of prisms andmirrors, to the aperture that actually scansthe film; the other light beam is directedto an aperture that sends it through amobile calibrated gray wedge.
Any differences in light intensity areautomatically corrected so that bothapertures transmit the same lightquantity. During a scan, the film is placedon an automatically propelled carriage
195Radiographic Interpretation

196 Radi
FIGURE 9. Do
Rpen
Gra
Ape
S
3RT08_Layout(185_218) 10/2/02 2:05 PM Page 196
that transports the film across theaperture’s light beam (the apertureremains stationary). As the film traversesthe light beam, continuous densityreadings are transmitted to a computerthat feeds these readings to the graywedge portion of the apparatus.
The mobile gray wedge (which iscalibrated based on degree of densitychange per centimeter) will shift itsposition so that the density through thegray wedge matches the density of thefilm being scanned. The mobile graywedge is mechanically attached to arecording pen assembly; the recordingpen is in contact with graph paper that ismounted on a graph carriage moving atthe same rate as the film carriage. The endresult of this system is a graphic depictionof the density changes occurring in thescan path of the film:
(3)
where A is shim thickness; ∆D1 is filmdensity change from area of base metal tothat of base metal plus shim; ∆D2 is thefilm density change from base metal tototal weld thickness; and B is thicknessdifference between weld area and basematerial. The definition of B is furtherspecified in Eq. 4:
AD
BD∆ ∆1 2
==
ographic Testing
uble beam microdensitometry schematic.
Recording carriageGraph paper
Density plot
Aperture Light beamecordingassembly
y wedge
Electronicprocessing unit
Ligh
t so
urce
Lightbeam
rture Film
canpath
Specimen (film)carriage
Control panel
(4)
where FR is face reinforcement thicknessand RR is root reinforcement thickness.These values are shown in the crosssectional drawing of Fig. 10 and thescanning microdensitometric graphs ofFig. 11.
Advantages and Limitations ofScanning MicrodensitometryThe scanning microdensitometer wasdesigned to overcome the scanning,recording and accuracy limitations ofconventional densitometry equipment.With these limitations eliminated, a broadarray of information can be derived fromthe scanning microdensitometer.
The instrument provides numerousmeans by which accuracy can beenhanced or optimized. The apertureopening may be set as small as threemicrometers to provide informationassociated with film grain dispersion andgrain size. The ratio arm will allow forgraph-to-scan path ratios of 1:1, 2:1, 5:1and so on, which is very beneficial forscanning small areas. The ratio armsetting can also be used to optimizeaccuracy, provided other equipmentadjustments are set accordingly. The scangraph itself can be incorporated intoradiographic records to demonstrateverification of dimensional tolerances oradherence to density tolerances. Thescanning microdensitometer can be a veryuseful and cost effective radiographic tool;however, its limitations should not beoverlooked.
The major limitation of this equipmentis ensuring that it will produceinterpretable results. Some graph peaks
B == ++FR RR
FIGURE 10. Typical convexity scan path.
LegendA = shim thicknessB = total material thickness difference between weld
area and base metalFR = additional thickness at face reinforcementRR = additional thickness at root reinforcement
∆D1 = film density change from base metal to shim∆D2 = film density change from base metal to total
weld thickness
Shim A
∆D1∆D2
FR
RR

FIGURE 11.
Den
sity
cha
nge
∆D
Legend∆D1 = film∆D2 = film
3RT08_Layout(185_218) 10/2/02 2:05 PM Page 197
are signals (relevant) and others are noise(nonrelevant). The ability to distinguishbetween signal and noise is highlydependent on the aperture opening andits relation to the film being scanned. If avery grainy high contrast film is scanned,a large aperture (90 µm, or 3.5 × 10⁻³ in.)should be used. Otherwise, thesignal-to-noise ratio of the scan graph willmake interpretation difficult. Conversely,if a fine grained film is scanned, a smallaperture opening is appropriate.
The scanning microdensitometeroperator should be thoroughly familiarwith the variables of the equipment sothat the scanning technique can beoptimized on the basis of the objective ofthe scan and the data producingcapabilities of the film.
ApplicationsScanning microdensitometry equipmentcan be very useful for certain industrialradiography applications. Among theseapplications are X-ray focal spotmeasurements and determination of totalradiographic unsharpness. A commonapplication of the scanningmicrodensitometer in industrialradiography is verification of dimensionaltolerances of questionable piping weldroot conditions.
The ideal technique for verifying thedimensional tolerances of a given weldroot condition is by performing a visualtest and actually measuring the condition
Scanning microdensitometry graph.
Average
Shim scan
∆D1 = 0.37
Film sca
density change from base metal to shim density change from base metal to total weld thickness
involved. Ideal situations are infrequentin pipe radiography, however, and themajority of pipe weld joints areinaccessible for visual testing of the weldroot. In a large portion of these situations,an additional radiograph, showing aprofile view of the questionablecondition, will provide the informationnecessary to support or determine thefilm interpreter’s judgment. Additionalradiography is normally an effectivemeans for determining the accept/rejectstatus of a radiograph; however, theadditional time, cost and materialrequired with this technique frequentlymake scanning microdensitometry moresuitable.
The scanning microdensitometer graph(Fig. 11) allows conversion of densitydifferences to material thicknessdifferences (provided there is an item ofknown thickness on the radiograph, suchas a shim). This, in turn, allows the X-rayfilm interpreter to determine the degree ofthe weld condition without additionalradiography. (A shim of known thicknesscan be used as a visual reference forgo/no-go thicknesses of reinforcements onwelds.)
The scanning microdensitometer is alsoused for determining adherence todimensional tolerances of assemblies suchas nuclear fuel elements, artillery fusesand other assemblies where hiddencomponent tolerances are critical. Wherephysical density variations are a matter ofconcern, the scanning densitometer is
197Radiographic Interpretation
Weld scan
∆D2 = 0.42
Lowest point
n path (2:1 scale)
Average
Average

198 Rad
3RT08_Layout(185_218) 10/2/02 2:05 PM Page 198
useful for controlling the density ofmatrix and composite materials.
In an unusual application, high voltageradiography and a microdensitometerwith a double light beam source wereused to measure the stress in rockspecimens when mine rock anchor boltsof various types were inserted.11
The scanning microdensitometer willgenerally transfer certain informationfrom a radiograph to a medium (a graph)that can be understood bynonradiographic personnel. It should benoted, however, that some degree ofinterpretation is necessary to understandfully the information provided by themicroscan graph. Therefore, themicroscan graph should only beinterpreted by knowledgeable andqualified personnel.
The limitations of scanningmicrodensitometer systems must berealized. The actual scanning techniquemust be devised based on the objective ofthe resultant graph.
iographic Testing

PART 4. Radiographic Interpretation Reporting
3RT08_Layout(185_218) 10/2/02 2:05 PM Page 199
When reporting and documenting theresults of radiographic film interpretation,complete and accurate information mustaccompany the radiographs.
Consistent with the importance ofaccurate information is correctterminology. Slang should be discouragedin any formal reports. Furthermore,interpretation reports should useterminology consistent with acceptancecriteria. As an example, where theacceptance criteria limit roundedindications, a report identifying porositymay be misleading or even incorrect — asmall void with a tail may meet thedescription of an elongated or linearindication (and rounded and linearindications may have different sizelimits).
Subsequent customer review andregulatory agency review may not occuruntil long after the completion of theradiographic test and acceptance by thefabricator or supplier. Lack of explanatoryinformation and documentation canresult in costly delays for resolvingapparent or suspect indications on theradiographs. This information is typicallydocumented on the film reader’sinterpretation report, sometimes called areader’s sheet.
Suppose, for example, that there is asurface discontinuity in a casting moldand this results in a number of castingsthat have the same discontinuity. Thecastings are subsequently radiographedand the radiographs reveal the sameindication. The condition of the mold iswell known to the initial film interpreter,who might therefore neglect to make noteof it. Later reviewers will not have thisbasic information and must then developit. This generally requires reconstructionof the shooting sketch and visualexamination of the casting, frequently atime consuming task, particularly if theshooting sketch does not adequatelyidentify reference points and theindication is on an inside surface. Tofurther complicate matters, the castingmay be unavailable for routine visualexamination.
Documentation needed to minimizeconfusion during interpretation includes,but is not limited to, the following items.
1. The contract or purchase order shouldclearly delineate the applicable codes,standards, specifications andprocedures, including acceptancecriteria and personnel qualificationrequirements. Exceptions to codes,standards or specificationrequirements, if any, should also benoted.
2. Required quality levels and techniquesas referenced in the applicable codes,multifilm techniques if used, sectionthicknesses, penetrameter (imagequality indicator) selection andplacement for each thickness rangecovered.
3. General exposure techniques usedinclude the following: (a) shootingsketches, including film coverage andidentification; (b) kilovoltage, time,milliamperage, target-to-film distanceand target size (for X-rays); source typeand becquerel (or curie) strength,source-to-film distance and physicalsource size (for gamma rays); (c) filmtypes and intensifying screens used;(d) calculated geometric unsharpness;(e) blocking and masking; (f) manualor automatic processing; (g) qualitylevel required and obtained; and(h) film density required and obtained.
4. Repairs should be documented so thatthe ultimate reviewer knows the causeand corrective action as an aid tointerpretation. Radiographs taken afterrepair should be so indicated. Also,indications determined to be surfaceconditions on the test object shouldbe recorded as such, together with anycorrective action. If not radiographedafter corrective action, that fact shouldbe noted.
5. Disposition of each radiograph shouldbe noted. All relevant indications(indications requiring evaluation)within the allowable acceptancecriteria should be classified and sized(for example, “Station No. 7, slag,6 mm long”) and entered on theinterpretation report.
These data are typically entered on theinterpretation report. Figure 12 is anexample of such a form for weldinterpretation; Fig. 13, for castings.
199Radiographic Interpretation

200 Radiographic Testing
FIGURE 12. Typical radiographic interpretation report (reader’s sheet) for welds.
3RT08_Layout(185_218) 10/2/02 2:05 PM Page 200
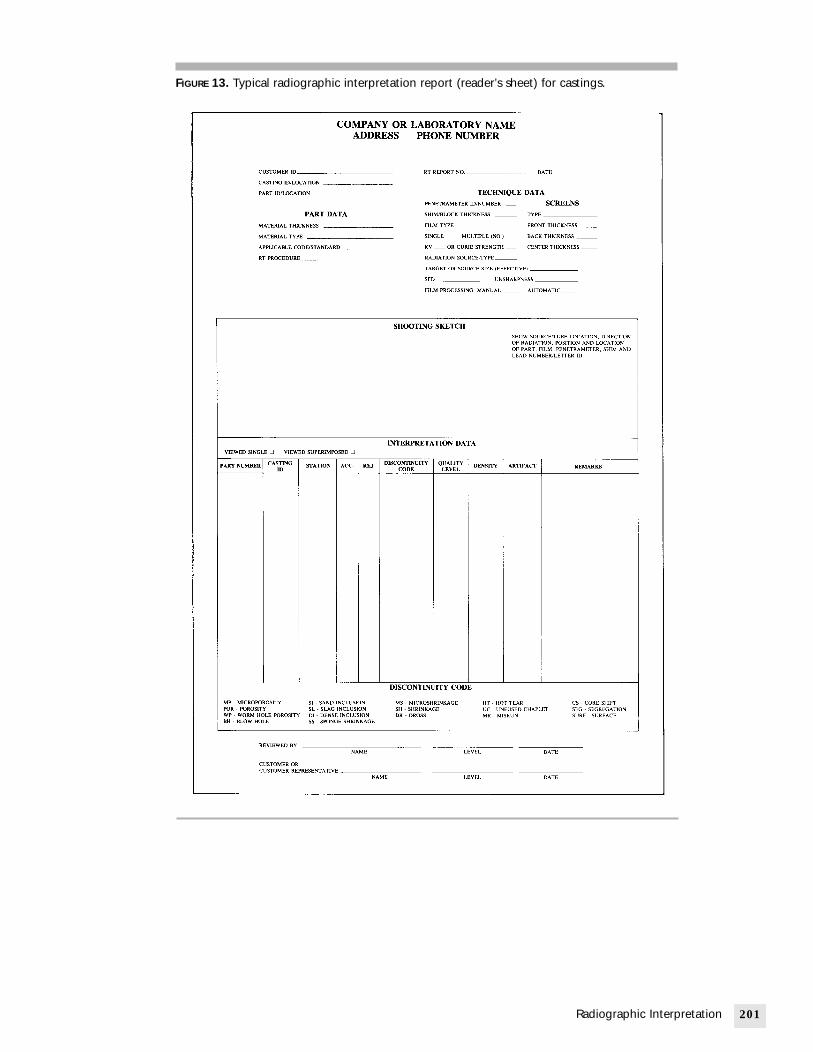
201Radiographic Interpretation
FIGURE 13. Typical radiographic interpretation report (reader’s sheet) for castings.
3RT08_Layout(185_218) 10/2/02 2:05 PM Page 201

202 Radio
PART 5. Radiographic Artifacts
FIGURE 14. Crimp marks resulting from poor handling ofindividual sheet of film: (a) before exposure; (b) afterexposure.
(b)(a)
3RT08_Layout(185_218) 10/2/02 2:05 PM Page 202
Indication DescriptionBecause most nonrelevant indications canbe readily related to their actual causes,this category of indications iscomparatively easy to interpret. False andactual discontinuity indications will bepresented here to provide guidance forthe radiographic film interpreter.
The interpretation of radiographs is nota precise science. As mentioned earlier inthis chapter, even those qualified filminterpreters with years of experience willoften disagree on the nature ofdiscontinuities and their disposition. Thedescriptions and illustrations12 containedin this chapter may be used as a generalguideline to help identify similarindications encountered during theinterpretation process.
False Indications (FilmArtifacts)The radiographic process is very intolerantof dirt and careless handling of therecording media. Violations of gooddarkroom practice in film loading,unloading and processing will result inartifacts that must be recognized for whatthey are, not what they may appear to be.
Erroneous interpretations may be madeas the result of not recognizing artifacts.Emulsion scratches are a common causeof such misinterpretation. These andmany other artifacts are quicklyrecognizable by viewing both surfaces ofthe film with reflected light.
The double film technique is one ofthe most effective steps in recognizingartifacts, by simply comparing the area ofinterest on both films. If the indication ison one film and not the other, is not inthe same place or has changed inappearance, it is an artifact.
There are many different types ofartifacts, some of which can be confusedwith actual discontinuities. It is extremelyimportant to identify these falseindications and to note their presence inthe film interpreter’s report. In some casesthe existence of artifacts in the area ofinterest may require reradiography. It istherefore important to take everyreasonable step to minimize artifacts.
graphic Testing
Artifacts Caused beforeProcessing
Film ScratchesRadiographic film emulsion is quitesensitive and scratches can be caused bymost abrasive materials; fingernails andrough handling during loading orunloading are examples. Film scratchescan be identified by reflecting light at anangle to the film surface.
Crimp MarksCrimp marks are caused by bending thefilm abruptly, usually when loading andunloading the film holder. If the film iscrimped before exposure, it will produce acrescent shaped indication that is lighterin density than the adjacent film density(Fig. 14). If crimped after exposure, thefilm will produce an indication that isdarker than the adjacent film density.

3RT08_Layout(185_218) 10/2/02 2:05 PM Page 203
Pressure MarksPressure marks are caused by severelocalized applications of pressure to thefilm. For example, a part may be droppedon the film holder during setup. This willproduce an artifact on the processed film(Fig. 15).
Static MarksStatic charges may develop when theradiographic film is handled roughly ormoved rapidly during loading orunloading the film holder. It may also becaused by rapid removal of the paperwrapper used as an interleaf. Theappearance of static marks will range frombranchlike, jagged dark lines to irregular,abrupt dark spots.
Screen MarksScratches and other blemishes in a leadscreen will become intensified and cancreate significant indications on the filmimage. This may be especially noticeablewhen the film holder containing the leadscreens is bent to accommodate partconfiguration. Dirt on fluorescent screenswill interfere with light transmission tothe film and a light area will result afterthe film is processed. Dirt on lead screensinterferes with electron bombardment ofthe film and also produces a light area inthe image (Fig. 16). Screens should have aunique serial number inscribed in a cornerto identify these problems and to make iteasier to locate the faulty screen.
Small bits of foreign material (such aslint, tobacco, paper or dandruff) betweenthe film and fluorescent or lead screenswill cause light spots in the processedfilm. To minimize false indications from
FIGURE 15. Pressure mark caused beforeexposure, visible as low density.
screens, it is imperative that they beabsolutely clean, smooth, free ofimperfections and foreign matter.
A word of caution: manufacturers ofscreens often apply a thin plastic coatingto protect the screen from scratchesduring processing. This coating must beremoved before using a new screen as itwill absorb much of the emissions thatwould otherwise provide the desiredintensification.
FogFog is an overall, small density increasecaused when unexposed film is exposedto some chemicals, low levels of radiation,high humidity, small darkroom light leaksor an inadequate safelight. Informationregarding safe light intensity limits can beobtained from the film manufacturer.
Light LeaksExposure to light usually results innoticeable local film blackening (Fig. 17).
FIGURE 16. Words front and back scratched inthe surface of front and back lead foilscreens before radiography of a 25 mm(1.0 in.) welded steel plate. Hairs placedbetween respective screens and film arevisible as light marks preceding inscribedwords.
203Radiographic Interpretation
FIGURE 17. Light leaks.

204 Radio
FIGURE 19. Light spots caused beforedevelopment: (a) by stop bath splashed onfilm; (b) by fixer splashed on film.
(b)
(a)
FIGURE 20. Dark spots caused beforedevelopment: (a) by water splashed on film;
3RT08_Layout(185_218) 10/2/02 2:05 PM Page 204
Film holders should be examinedregularly to eliminate the problem.
Finger MarksMarks such as fingerprints are normallyeasy to recognize. They may be darker orlighter images on the film.
Artifacts Caused duringProcessing
Chemical StreaksDuring manual processing, streaks on thefilm may result if chemicals from previousprocessing are not adequately removedfrom the hanger clips (Fig. 18). Overallfilm streaking may also result when thefilm is placed directly into a water rinsewithout first placing it into the stop bathsolution. Developer carryover into thefixer may cause an overall streakingcondition. A further cause of streaking isinsufficient agitation of the film hangerduring development.
SpottingIf fixer solution comes in contact with thefilm before development, light areas orspots will result (Fig. 19). If drops ofdeveloper or water inadvertently reach thefilm before placing it into the developer,dark spots can result (Fig. 20).
graphic Testing
FIGURE 18. Streaking caused by inadequatelycleaned film hangers.
(b) by developer splashed on film.
(b)
(a)
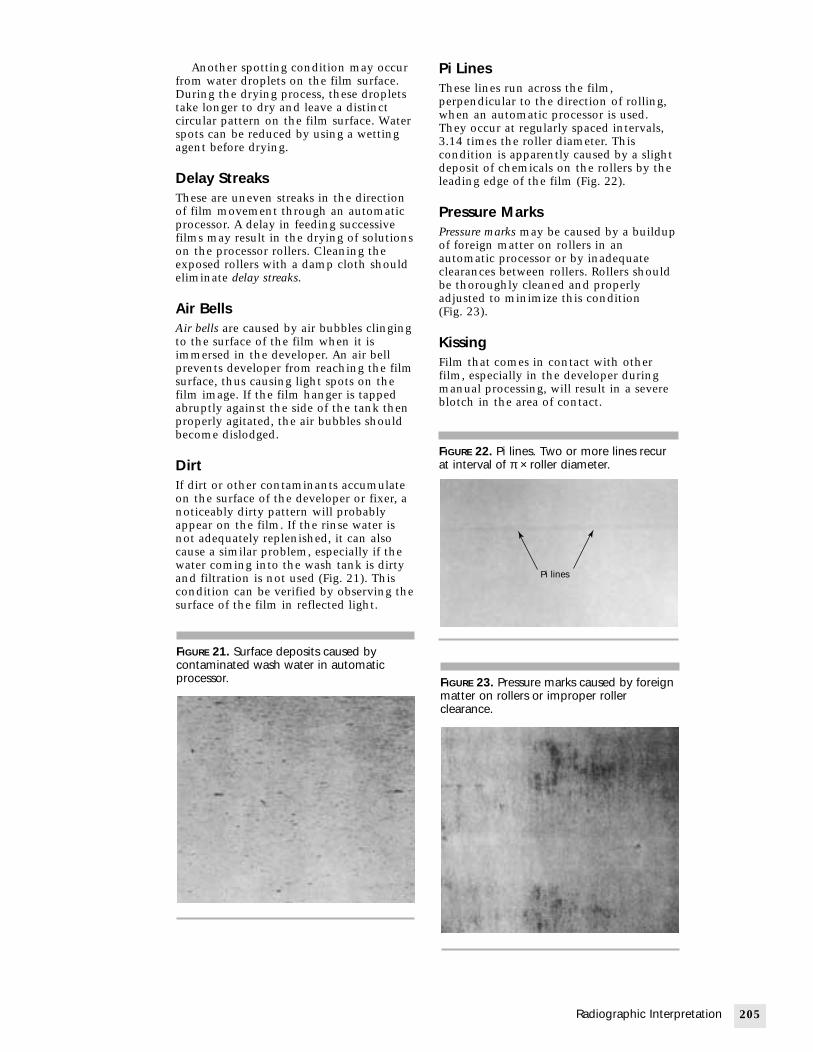
FIGURE 22. Pi lines. Two or more lines recurat interval of π × roller diameter.
Pi lines
3RT08_Layout(185_218) 10/2/02 2:05 PM Page 205
Another spotting condition may occurfrom water droplets on the film surface.During the drying process, these dropletstake longer to dry and leave a distinctcircular pattern on the film surface. Waterspots can be reduced by using a wettingagent before drying.
Delay StreaksThese are uneven streaks in the directionof film movement through an automaticprocessor. A delay in feeding successivefilms may result in the drying of solutionson the processor rollers. Cleaning theexposed rollers with a damp cloth shouldeliminate delay streaks.
Air BellsAir bells are caused by air bubbles clingingto the surface of the film when it isimmersed in the developer. An air bellprevents developer from reaching the filmsurface, thus causing light spots on thefilm image. If the film hanger is tappedabruptly against the side of the tank thenproperly agitated, the air bubbles shouldbecome dislodged.
DirtIf dirt or other contaminants accumulateon the surface of the developer or fixer, anoticeably dirty pattern will probablyappear on the film. If the rinse water isnot adequately replenished, it can alsocause a similar problem, especially if thewater coming into the wash tank is dirtyand filtration is not used (Fig. 21). Thiscondition can be verified by observing thesurface of the film in reflected light.
FIGURE 21. Surface deposits caused bycontaminated wash water in automaticprocessor.
Pi LinesThese lines run across the film,perpendicular to the direction of rolling,when an automatic processor is used.They occur at regularly spaced intervals,3.14 times the roller diameter. Thiscondition is apparently caused by a slightdeposit of chemicals on the rollers by theleading edge of the film (Fig. 22).
Pressure MarksPressure marks may be caused by a buildupof foreign matter on rollers in anautomatic processor or by inadequateclearances between rollers. Rollers shouldbe thoroughly cleaned and properlyadjusted to minimize this condition(Fig. 23).
KissingFilm that comes in contact with otherfilm, especially in the developer duringmanual processing, will result in a severeblotch in the area of contact.
205Radiographic Interpretation
FIGURE 23. Pressure marks caused by foreignmatter on rollers or improper rollerclearance.

206 Rad
3RT08_Layout(185_218) 10/2/02 2:05 PM Page 206
Artifacts Caused afterProcessing
ScratchesScratches result from rough handling.Even after processing, the emulsion issensitive to all types of abrasion and careshould be taken to minimize damage tothe emulsion.
FingerprintsThese occur when improperly handlingthe film, as can happen duringinterpretation. Film should be handledwith care by the edges or cornerswhenever possible. To preventfingerprints, radiographs should behandled with cotton or nylon gloves.
Radioscopic ArtifactsRadioscopic artifacts are also operatordependent and must be recognized. Theyare caused primarily by electronic noisegenerated in video systems and can becorrected by filtering. Dust on the lenssurface is another common cause of realtime artifacts. When using imageenhancement techniques on radiographs,a very careful examination of the filmshould be made to identify all artifactsbefore enhancement. Otherwise, theartifacts will also be enhanced and couldpossibly be difficult to identify insubsequent evaluations. This is also truewhen radiographs are duplicated ormicrofilmed.
iographic Testing

PART 6. Discontinuity Indications
FIGURE 24. Porosity: (a) photomacrograph;(b) radiographic image.
(b)
(a)
3RT08_Layout(185_218) 10/2/02 2:05 PM Page 207
Discontinuity Indicationsfor WeldsThe various discontinuities found inweldments are illustrated and describedhere strictly as representative conditions.Cross sectional photographs or sketchesare also shown. These examples are forillustrative purposes; actual discontinuitiesvary in shape, size and severity.
PorosityThese are voids that result from gas beingentrapped as the weld metal solidifies(Fig. 24). Porosity is generally sphericalbut may be elongated. In some cases,porosity may appear to have a tail as aresult of the gas attempting to escape ormove while the weld metal is still in theliquid state. Porosity is often uniformlyscattered to different degrees of severitybut may also appear as a cluster wherethere is a concentration of pores in arelatively small area. Linear porosity is acondition that involves a number of poresaligned and separated by a distanceusually stipulated in the acceptancestandards. Piping porosity is severelyelongated gas holes that are well definedand may vary in length from very short toas long as 380 mm (15 in.) or more. Thistype of porosity is sometimes referred toas worm hole porosity. Hollow bead (Fig. 25)is an elongated gas void that is usuallycentrally oriented in the root pass andmay also extend for a significant length.
In general, porosity is not considered acritical discontinuity unless (1) it ispresent in large quantities (a percentage,according to specification, of the crosssection in which it occurs), (2) it containssharp tails or (3) it is aligned in significantnumbers in a relatively short distance.The severity of piping and wormholeporosity or hollow bead conditions isgenerally determined by length andamount.
Slag or InclusionsAlso referred to as nonmetallics, theseindications are caused by nonmetallicmaterials — usually silica or complexsulfides or oxides — entrapped in theweld metal between weld passes orbetween weld metal and base metal(Fig. 26). Inclusions occur in all shapes
and sizes but can be generally categorizedas an inclusion (short, isolated piece) or asa slag line (relatively narrow but havinglength). Inclusions are evaluated based onsize, quantity and length.
In welds, slag inclusions are oftenelongated or linear, often aligned with thelength of a weld. This condition isassociated with multipass welding
207Radiographic Interpretation

208 Radi
3RT08_Layout(185_218) 10/2/02 2:05 PM Page 208
processes that provide a slag covering toretard heat loss. When this slag layer isnot properly cleaned it becomes trappedbetween weld layers.
Dense InclusionsDense inclusions have greaterradiographic density than the weld metal,so they appear as light spots in theradiograph. They are generally rounded inshape and sharply defined but sometimesmay blend gradually into the surroundingmetal. The most common denseinclusions are pieces of tungsten electrodethat have broken off and been entrappedin the weld metal (Fig. 27).
ographic Testing
FIGURE 25. Hollow bead:(a) photomacrograph; (b) radiographicimage.
(b)
(a)
Incomplete PenetrationIncomplete penetration or inadequatepenetration is an area of nonfusion in theroot area (Fig. 28).
Incomplete penetration is characterizedby one or both weld joint sides’ not beingmelted and fused at the toe or toes of theroot. For double-sided weld jointsincomplete penetration occurs near themidpoint through the weld thickness, orweld throat.
This may result from inadequate heatwhile the root pass is being deposited. Itmay also be caused by faulty joint designor problems with the welding procedure.This condition is considered more severe
FIGURE 26. Slag inclusion:(a) photomacrograph at 4.7×;(b) radiographic image at 1.1×.
(b)
(a)

3RT08_Layout(185_218) 10/2/02 2:05 PM Page 209
than the porosity or slag discontinuitiesbecause it is more of a stress raiser.Incomplete penetration is usually easy todetect and identify radiographicallybecause of its location in the weld and itsrelatively straight, well defined image.
Lack of FusionLack of fusion is an area of nonadhesionbetween successive weld passes orbetween a weld pass and the side wall ofthe base material (Fig. 29). It is primarilythe result of improper welding techniquesor poor joint design. Many lack-of-fusionconditions are relatively narrow and insome cases angularly oriented, so this
FIGURE 27. Tungsten inclusion:(a) photomacrograph at 4.5×;(b) radiographic image at 1.2×.
(b)
(a)
discontinuity is not always readilydetected by radiography. When it isobserved, it may not be clearly definedbut will have a telltale linear alignment,running in the same direction that theweld was deposited.
UnderfillUnderfill is a condition where the weldjoint is not completely filled, as evidencedby a depression or lack of weld metal atthe face of the weld. This condition isreadily observed by an increase in the filmdensity in the weld area; the extentshould be confirmed by physicalmeasurement.
209Radiographic Interpretation
FIGURE 28. Incomplete or inadequatepenetration: (a) photomacrograph;(b) radiographic image.
(b)
(a)

210 Rad
3RT08_Layout(185_218) 10/2/02 2:05 PM Page 210
UndercutUndercut is generally described as a grooveor depression located at the junction ofthe weld and base material (the fusionzone) on the weld surface (Fig. 30). Thisdepression is caused by a melting away ofthe base metal during the welding processand can occur at the weld root. Undercutcan be readily seen and identified on aradiograph but the extent should bemeasured physically, if possible.Generally, undercut is not considered tobe a serious condition if it is relativelyshallow (within specificationrequirements) and not sharp.
iographic Testing
FIGURE 29. Side wall incomplete fusion:(a) photomacrograph at 4.5×;(b) radiographic image at 1.1×.
(b)
(a)
OverlapOverlap is an extension of unfused weldmetal beyond the fusion zone. In manycases the overlap forms a tight stress risernotch and is not easily seen in theradiograph. It is generally consideredsevere when it is detected and confirmedvisually.
Excessive PenetrationThis is sometimes referred to as convexityand results from excessive heat inputwhile the root pass is being deposited
FIGURE 30. Undercut on outside diameter:(a) photomacrograph at 4.6×;(b) radiographic image at 1×.
(b)
(a)

3RT08_Layout(185_218) 10/2/02 2:05 PM Page 211
(Fig. 31). The reinforcement of the rootbecomes excessive and, in some cases,results in a corner or notch condition onthe inside surface at the toe of the weld.When excessive penetration occurs inshort or intermittent droplets, it may bereferred to as icicles and is usuallyaccompanied by a burnthrough area thatlacks weld metal (Fig. 32).
ConcavityConcavity is a concave condition in theroot pass face that results frominsufficient heat input while depositingthe root pass (Fig. 33). Concavity causes adimensional change in the thickness of
FIGURE 31. Excessive penetration:(a) photomacrograph at 4.5×;(b) radiographic image at 1.2×.
(b)
(a)
the weld that may then be less than therequired thickness. Because the conditionis usually a gradual dimensional change,it shows as a slight and gradual densitychange in the radiograph. The extentshould be determined by physicalmeasurement but may be estimated bydensity measurements.
High LowHigh low and mismatch are terms thatdenote a misalignment in pipe welds thatresults in an offset union of the twosections being welded (Fig. 34).
211Radiographic Interpretation
FIGURE 32. Burnthrough area:(a) photomacrograph; (b) radiographicimage.
(b)
(a)

212 Rad
3RT08_Layout(185_218) 10/2/02 2:05 PM Page 212
CracksCracks are fractures or ruptures of theweld metal occurring when the stresses ina localized area exceed the weld metal’sultimate tensile strength. Hot cracks occuras tears while the weld metal is in theplastic condition whereas cold cracks anddelayed cracks occur after the weld metalhas cooled. Delayed cracks are cold cracksthat may occur hours after the weldmenthas cooled. There are a number of cracktypes associated with weldments.Longitudinal Crack. Longitudinal cracks(Fig. 35) are oriented along the length orapproximately parallel to the longitudinalaxis, of the weld.
iographic Testing
FIGURE 33. Concave root surface:(a) photomacrograph at 4.3×;(b) radiographic image at 1.2×.
(b)
(a)
Transverse Crack. Transverse cracks(Fig. 36) are approximately perpendicularto the longitudinal axis of the weld.Underbead Crack. Underbead cracks formin the heat affected zone and are usuallyshort but may also be an extensivenetwork.Toe Crack. Toe cracks begin at the toe ofthe weld and propagate along the plane ofhighest stress.Root Crack. Root cracks (Fig. 37) arelongitudinal cracks located in the rootpass.Crater Crack. Crater cracks are usually starshaped patterns that occur in the crater (adepression at the end of a weld bead).
FIGURE 34. High low defect, also calledmismatch: (a) photomacrograph at 4.4×;(b) radiographic image at 1.1×.
(b)
(a)

3RT08_Layout(185_218) 10/2/02 2:05 PM Page 213
Discontinuity Indicationsfor CastingsCasting discontinuities, as with welddiscontinuities, will vary in shape, sizeand appearance depending on manyvariables, including material type, molddesign, casting process, casting size andfoundry control. The examples used toillustrate the various discontinuities foundin castings are typical and are not
FIGURE 35. Longitudinal crack:(a) photomacrograph at 4.5×;(b) radiographic image without collimatedsource at 1.1×; (c) radiographic image at1.1× with same conditions as Fig. 35b butwith collimation.
(b)
(a)
(c)
intended for any purpose other thanguidance.
PorosityPorosity occurs when gas dissolved in themetal, entrained by turbulence duringpouring or given off by the mold material,is entrapped in the casting duringsolidification. Porosity can be individuallyidentified and defined in the radiographas distinct, globular gas voids (Fig. 38).Individual pores may vary in size andconcentration and these characteristics areused for classification of porosity. Suchvoids may be present at the surface of thecasting or throughout the cross section.
213Radiographic Interpretation
FIGURE 36. Transverse crack:(a) photomacrograph; (b) radiographicimage.
(b)
(a)

214 Rad
3RT08_Layout(185_218) 10/2/02 2:05 PM Page 214
Gas VoidsThe most serious gas voids are referred toas gas holes (Fig. 39), wormhole porosity orblow holes. A larger, darker (film density)porosity condition is called a gas hole todistinguish it as a more severe conditioncompared to typical porosity. Wormholeporosity is so named because of itslikeness to a wormhole. The shape iscaused by the tendency of entrapped gasto escape during solidification and this, inturn, occurs because the gas isconsiderably lighter in density than thecast metal. During its escape attempt, thegas forms a tail like linear patternresembling a wormhole.
The most severe gas voids are calledblow holes: severe, well defined cavities
iographic Testing
FIGURE 37. Crack adjacent to root:(a) photomacrograph; (b) radiographicimage.
(b)
(a)
that occur when the hot, molten metal isdeposited into a mold containingmoisture or other impurities. Theextremely hot metal causes the moistureor impurity to change rapidly to steam orgas that develops a series of linear voidsextending into the metal from the surface.
InclusionsSand Inclusion. Sand inclusions are piecesof sand that have broken off the sandmold. Radiographically, they resemble apocket of sand with a granular appearanceif observed closely.Slag Inclusion. Slag inclusions (Fig. 40) areimpurities introduced into the mold withthe molten metal. They may also be theresult of oxide or impurities that did notrise to the surface before metalsolidification.Dross. Dross is sometimes referred to asthe scum of the melt. Dross may becomeentrapped, resulting in a general zone of
FIGURE 38. Porosity.
FIGURE 39. Gas holes, also called blow holes.
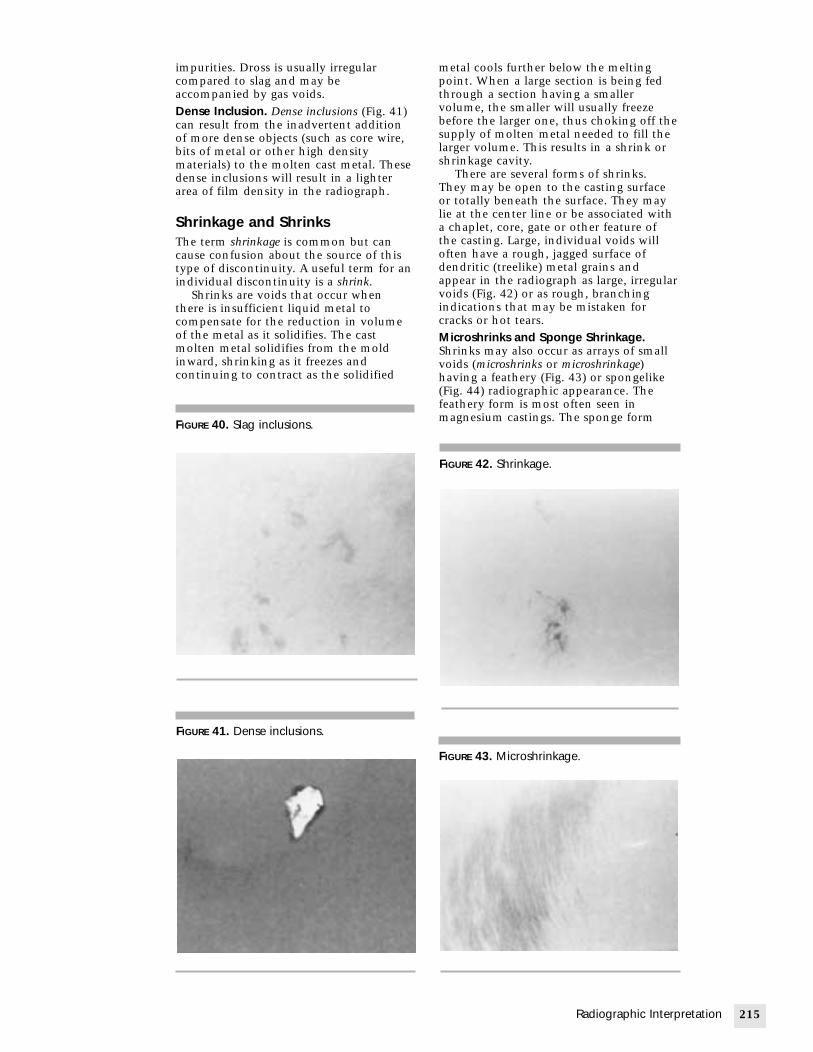
3RT08_Layout(185_218) 10/2/02 2:05 PM Page 215
impurities. Dross is usually irregularcompared to slag and may beaccompanied by gas voids.Dense Inclusion. Dense inclusions (Fig. 41)can result from the inadvertent additionof more dense objects (such as core wire,bits of metal or other high densitymaterials) to the molten cast metal. Thesedense inclusions will result in a lighterarea of film density in the radiograph.
Shrinkage and ShrinksThe term shrinkage is common but cancause confusion about the source of thistype of discontinuity. A useful term for anindividual discontinuity is a shrink.
Shrinks are voids that occur whenthere is insufficient liquid metal tocompensate for the reduction in volumeof the metal as it solidifies. The castmolten metal solidifies from the moldinward, shrinking as it freezes andcontinuing to contract as the solidified
FIGURE 40. Slag inclusions.
FIGURE 41. Dense inclusions.
metal cools further below the meltingpoint. When a large section is being fedthrough a section having a smallervolume, the smaller will usually freezebefore the larger one, thus choking off thesupply of molten metal needed to fill thelarger volume. This results in a shrink orshrinkage cavity.
There are several forms of shrinks.They may be open to the casting surfaceor totally beneath the surface. They maylie at the center line or be associated witha chaplet, core, gate or other feature ofthe casting. Large, individual voids willoften have a rough, jagged surface ofdendritic (treelike) metal grains andappear in the radiograph as large, irregularvoids (Fig. 42) or as rough, branchingindications that may be mistaken forcracks or hot tears.Microshrinks and Sponge Shrinkage.Shrinks may also occur as arrays of smallvoids (microshrinks or microshrinkage)having a feathery (Fig. 43) or spongelike(Fig. 44) radiographic appearance. Thefeathery form is most often seen inmagnesium castings. The sponge form
215Radiographic Interpretation
FIGURE 42. Shrinkage.
FIGURE 43. Microshrinkage.

216 Rad
3RT08_Layout(185_218) 10/2/02 2:05 PM Page 216
often occurs in nickel base and cobaltbase alloys. The small voids forming theseshrinks are sometimes difficult for thenaked eye to see on a polished surface.Relatively large areas of such shrinks mayproduce only faint, barely detectableradiographic images. In coarser form,sponge shrinkage occurs in many metals.Hot Tears. Hot tears (Fig. 45) are cracksthat form before complete solidificationof the metal section. They are usuallycaused by stresses resulting from unevencooling of a large volume of metaladjacent to a smaller volume of metal,such as where a thick flange meets thewall of a valve body. They are almostalways open to the surface and haverounded edges at the surface. Whenexposed, the crack face often shows arough, heavily oxidized, dendritic surface.
iographic Testing
FIGURE 44. Sponge shrinkage.
FIGURE 45. Hot tears.
Radiographically, hot tears appear asjagged linear indications, sometimesbranching.Cracks. Cracks (Fig. 46) are formed afterthe metal has completely solidified andwhile it is cooling to ambienttemperature. If open to the surface, theywill have sharp edges. When exposed theydisplay oxidized surfaces if crackingoccurred while the casting was still quitehot or no oxidation if cracking occurrednear room temperature. Radiographically,they will be less open (narrower) than hottears and usually show little if anybranching.
Cold ShutsCold shuts are essentially a lack of fusionbetween adjoining portions of the castmetal. They may be caused by excessiveoxidation of one or more portions of themolten metal, by too low a temperatureof the molten metal or by entrapment ofa thin layer of slag or dross between theadjoining portions of molten metal. In aradiograph, cold shuts usually appear assmooth straight or curved lines.
Unfused Chaplets and InsertsChaplets are metal devices used tosupport the core inside the mold or toseparate parts of the mold to fit a wallthickness or other dimension of thecasting. Chaplets are usually made of thesame material as the casting and generallywill be consumed when the molten metalcomes in contact with them. If this doesnot occur or if only part of the chapletmelts, the condition that results isreferred to as an unfused chaplet.
Unfused chaplets and other unfusedinserts are special cases of cold shuts inthat they exhibit a lack of fusion.However, in these cases it is lack of fusionof the casting metal with solid metalportions of the mold structure that hadbeen intended to be fused into the
FIGURE 46. Cracks.

3RT08_Layout(185_218) 10/2/02 2:05 PM Page 217
finished casting. Unfused chaplets appearas circular (Fig. 47) or short rectangularlines, depending on the shape of thechaplet post or as segments of circles orrectangles. Unfused inserts appear asstraight or curved lines corresponding toall or part of the shape of the insert.
ShiftsA shift is a mismatch of two parts of acasting at the parting line or anunintended variation in wall thicknessbecause of a core having shifted duringcasting (Fig. 48). Both are often clearlyevident on radiographs unless the shift isslight or only one wall is imaged on theradiograph.
MisrunsA misrun is failure of the metal to fill themold, either because of trapped gas orinsufficient molten metal reaching a partof the mold cavity. Misruns (Fig. 49) areeasy to identify radiographically and,
FIGURE 47. Unfused chaplet.
FIGURE 48. Core shift.
when the surface can be observed arevisually apparent.
SegregationSegregation is a local deviation from theaverage composition of the metal in thecasting. Certain alloys of some metalssuch as copper, often exhibit segregationbecause some constituents of the alloyfreeze at a substantially highertemperature than other constituents.Radiographically, segregation may appearas mottled areas or banded areas of greateror lesser density, depending on thematerials that have segregated,Radiographically detectable segregationmay be of engineering concern,depending on its severity and location, aswell as the intended use of the casting.
ConclusionThere are many of structures, assemblies,materials and components that can beeffectively radiographed. Interpretation, ifit is to be meaningful, must only beattempted with a complete understandingof the following: (1) material, (2) partdimensions and configuration,(3) radiographic technique used,(4) processing used on test object,(5) applicable code, (6) acceptancestandard and (7) other informationdesired from the examination.
The key to successful interpretation,after all other variables are optimized,rests with the individual doing theinterpretation. Judgment must be basedon complete knowledge of theradiographic process and a thoroughunderstanding of the test object, coupledwith extensive radiographic interpretationexperience and training.
217Radiographic Interpretation
FIGURE 49. Misrun.

1. Megling, R.C. and M.L. Abrams.Relative Roles of Experience/Learning andVisual Factors on Radiographic InspectorPerformance. Research ReportSRR73-22. San Diego, CA: NavalPersonnel and Training ResearchLaboratory (June 1973).
2. Berock, J.F., R.G. Wells and M.L.Abrams. Development and Validation ofan Experimental Radiographic ReadingTraining Program. Report AD-782-332.San Diego, CA: Navy PersonnelResearch and Development Center(June 1974).
3. Lusted, L.B. “Signal Detectability andMedical Decision-Making.” Science.Vol. 171 (March 1971): p 1217-1219.
4. McMaster, R.C. and S.A. Wenk. A BasicGuide for Management’s Choice ofNondestructive Tests. Special TechnicalPublication No. 112. Philadelphia, PA:American Society for Testing Materials(1951).
5. Nondestructive Testing Handbook, firstedition. Vol. 1, Sections 1 and 4.Columbus, OH: American Society forNondestructive Testing (1959).
6. McClung, R.W. “An Introspective Viewof Nondestructive Testing” (1974ASNT Lester Honor Lecture). MaterialsEvaluation. Vol. 33, No. 2. Columbus,OH: American Society forNondestructive Testing (February1975): p 16A-19A, 43A-45A.
7. Hastings, C.H. “Nondestructive TestingAs an Aid to Fracture PreventionMechanics.” Journal of the FranklinInstitute. Vol. 290, No. 6. Philadelphia,PA: Franklin Institute (December1970).
8. Yonemura, G.T. Report NBS-TW 1143.Washington, DC: National Bureau ofStandards (June 1981).
9. Nondestructive Testing Handbook,second edition: Vol. 3, Radiography andRadiation Testing. Columbus, OH:American Society for NondestructiveTesting (1985): p 610-611.
10. Nondestructive Testing Handbook,second edition: Vol. 8, Visual andOptical Testing. Columbus, OH:American Society for NondestructiveTesting (1993): p 36.
11. Foster, B.E., S.D. Snyder, R.W.McClung and W.J. Godzinsky.“Development of High VoltageRadiography and DualMicrodensitometric Techniques forEvaluating Stressed Rock Specimens.”Materials Evaluation. Vol. 31, No. 11.Columbus, OH: American Society forNondestructive Testing (November1973): p 229-236.
12. Quinn, R.A. and C.C. Sigl, eds.Radiography in Modern Industry, fourthedition. Rochester, NY: Eastman KodakCompany (1980): p 147-153.
218 Radiographic Testing
References
3RT08_Layout(185_218) 10/2/02 2:05 PM Page 218

William E.J. McKinney, Naples, Florida (Parts 2 to 5)
Radiographic FilmDevelopment1
Part 1 adapted from Radiography in Modern Industry. © 1980, EastmanKodak Company. Reprinted with permission.
9C H A P T E R
3RT09_Layout(219_252) 10/2/02 2:07 PM Page 219

220 Radio
PART 1. Radiographic Latent Image1,2
FIGURE 1. Localized sites on grains.
FIGURE 2. Localized silver in printout image.This is a T grain, a form used with softintensifying screens.
3RT09_Layout(219_252) 10/2/02 2:07 PM Page 220
More information on the radiographiclatent image, its formation and processingare available elsewhere.1-4
IntroductionThroughout much of photography’shistory, the nature of the latent image wasunknown. The first public announcementof Daguerre’s photographic process wasmade in 1839 but it was not until 1938that a satisfactory and coherent theory ofphotographic latent image formation wasproposed.5 That theory has beenundergoing refinement and modificationever since.
Some of the investigational difficultyarose because latent image formation isactually a very subtle change in the silverhalide grain. The process may involve theabsorption of only one or, at most, a fewphotons of radiation and this may affectonly a few atoms out of some 109 or 1010
atoms in a typical photographic grain.Formation of the latent image, therefore,cannot be detected by direct physical oranalytical chemical means.
A good deal was known about thelatent image’s physical nature. It wasunderstood, for example, that the latentimage was localized at certain discretesites on the silver halide grain. If aphotographic emulsion was exposed tolight, developed, fixed and then examinedunder a microscope (Fig. 1), the change ofsilver halide to metallic silver was visibleat only a limited number places on thecrystal. Because small amounts of silversulfide on the surface of the grain wereknown to be necessary for highphotographic sensitivity, it seemed likelythat the spots where the latent imageformed were also concentrations of silversulfide.
It was further known that the materialof the latent image was probably silver.For one thing, chemical reactions thatoxidized the silver also destroyed thelatent image. It was also a commonobservation that photographic materialsgiven prolonged exposure to lightdarkened spontaneously, without theneed for development. This darkening wasknown as the printout image. Theprintout image contained enoughmaterial to be identified chemically asmetallic silver. By microscopic
graphic Testing
examination, the silver of this image wasalso discovered to be localized at certaindiscrete areas of the grain (Fig. 2), just asthe latent image.
Thus, the process that made anexposed photographic grain capable oftransformation into metallic silver (by themild reducing action of a developer)involved a concentration of silver atoms
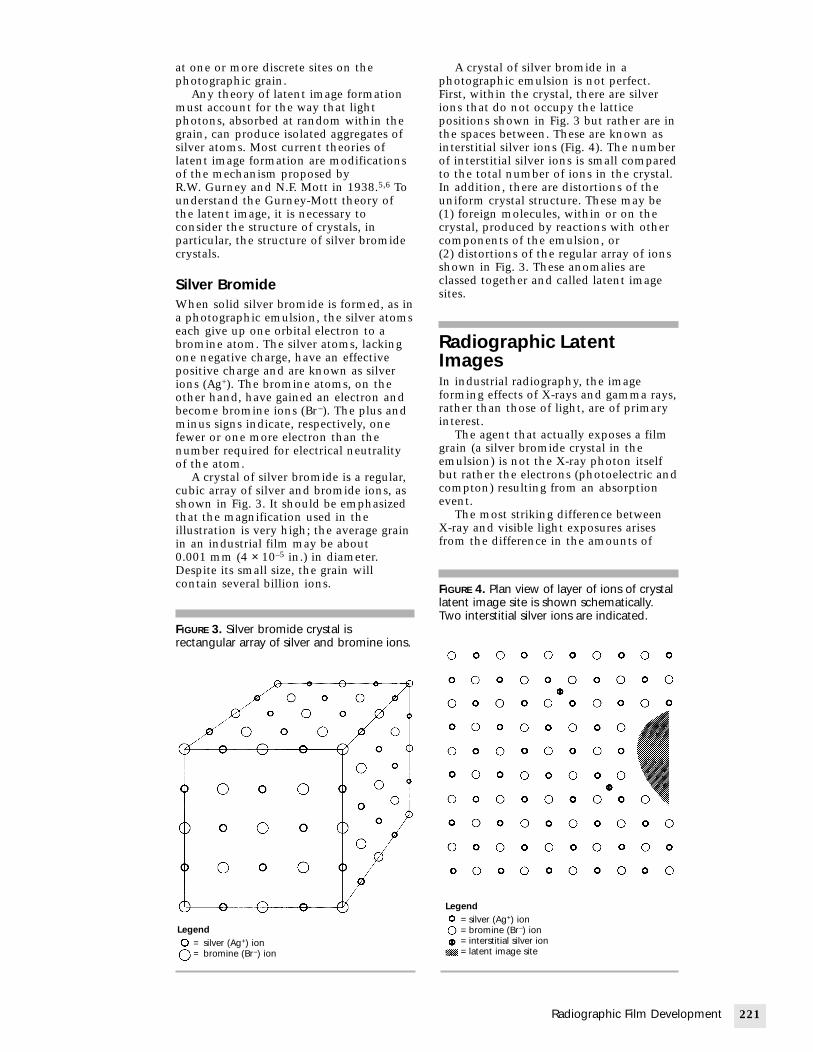
IGURE 4. Plan view of layer of ions of crystal
3RT09_Layout(219_252) 10/2/02 2:07 PM Page 221
at one or more discrete sites on thephotographic grain.
Any theory of latent image formationmust account for the way that lightphotons, absorbed at random within thegrain, can produce isolated aggregates ofsilver atoms. Most current theories oflatent image formation are modificationsof the mechanism proposed byR.W. Gurney and N.F. Mott in 1938.5,6 Tounderstand the Gurney-Mott theory ofthe latent image, it is necessary toconsider the structure of crystals, inparticular, the structure of silver bromidecrystals.
Silver BromideWhen solid silver bromide is formed, as ina photographic emulsion, the silver atomseach give up one orbital electron to abromine atom. The silver atoms, lackingone negative charge, have an effectivepositive charge and are known as silverions (Ag+). The bromine atoms, on theother hand, have gained an electron andbecome bromine ions (Br–). The plus andminus signs indicate, respectively, onefewer or one more electron than thenumber required for electrical neutralityof the atom.
A crystal of silver bromide is a regular,cubic array of silver and bromide ions, asshown in Fig. 3. It should be emphasizedthat the magnification used in theillustration is very high; the average grainin an industrial film may be about0.001 mm (4 × 10⁻⁵ in.) in diameter.Despite its small size, the grain willcontain several billion ions.
pFiptiotIu(cc(scs
RIIfri
gebce
Xf
F
Legend= silver (Ag+) ion= bromine (Br–) ion
FIGURE 3. Silver bromide crystal isrectangular array of silver and bromine ions.
A crystal of silver bromide in ahotographic emulsion is not perfect.irst, within the crystal, there are silverons that do not occupy the latticeositions shown in Fig. 3 but rather are inhe spaces between. These are known asnterstitial silver ions (Fig. 4). The numberf interstitial silver ions is small comparedo the total number of ions in the crystal.n addition, there are distortions of theniform crystal structure. These may be1) foreign molecules, within or on therystal, produced by reactions with otheromponents of the emulsion, or2) distortions of the regular array of ionshown in Fig. 3. These anomalies arelassed together and called latent imageites.
adiographic Latentmagesn industrial radiography, the imageorming effects of X-rays and gamma rays,ather than those of light, are of primarynterest.
The agent that actually exposes a filmrain (a silver bromide crystal in themulsion) is not the X-ray photon itselfut rather the electrons (photoelectric andompton) resulting from an absorptionvent.
The most striking difference between-ray and visible light exposures arises
rom the difference in the amounts of
221Radiographic Film Development
Legend= silver (Ag+) ion= bromine (Br–) ion= interstitial silver ion= latent image site
latent image site is shown schematically.Two interstitial silver ions are indicated.

222 Ra
FIGURE 5. TX-ray expo
4.0
3.5
3.0
2.5
2.0
1.5
1.0
0.5
Net
den
sity
3RT09_Layout(219_252) 10/2/02 2:07 PM Page 222
energy involved. The absorption of asingle photon of light transfers a verysmall amount of energy to the crystal —only enough energy to free a singleelectron from a bromide (Br
_) ion. Several
successive light photons are required tomake a single grain developable, that is,to produce in or on it a stable latentimage.
The passage of an electron through agrain can transmit hundreds of timesmore energy than the absorption of alight photon. Even though this energy isused inefficiently, the amount is sufficientto make the grain developable.
In fact, a photoelectron or comptonelectron can have a fairly long paththrough a film emulsion and can rendermany grains developable. The number ofgrains exposed per photon interactionvaries from one (for X-radiation of about10 keV) to 50 or more (for a 1 MeVphoton).
For higher energy photons, there is lowprobability for a single interaction thattransfers all the photons’ energy. Mostcommonly, high photon energy isimparted to several electrons by successivecompton interactions. Also, high energyelectrons usually pass out of a filmemulsion before all of their energy istransferred. For these reasons, there are,on the average, five to ten grains madedevelopable per photon interaction athigh energy.
diographic Testing
ypical net density versus exposure curves for directsures.
Fast film
Slow film
0 10 20 30 40 50 60
Exposure (s)
For lower exposure values, eachincrement of energy exposes (on theaverage) the same number of grains. This,in turn, means that a curve of net densityversus exposure is a straight line passingthrough the origin (Fig. 5). This curve isnonlinear only when the exposure is sogreat that appreciable energy is wasted onpreviously exposed grains. Forcommercially available fine grain films,for example, the density versus exposurecurve may be essentially linear up todensities of 2.0 or higher.
The fairly extensive straight linerelation between exposure and density isvery useful for determining exposurevalues and for interpretation of densitiesobserved on the resulting films.
If the curves shown in Fig. 5 arereplotted as characteristic curves (densityversus the logarithm of exposure), bothcharacteristic curves are the same shape(Fig. 6) and are separated along the logexposure axis. The similarity in toe shapehas been experimentally observed forconventional processing and manycommercial photographic materials.
Because a grain is completely exposedby the passage of an energetic electron, allX-ray exposures are, as far as theindividual grain is concerned, extremelyshort. The actual time that an electron iswithin a grain depends on the electronvelocity, the grain dimensions and thesquareness of the hit. (In the case of light,the exposure time for a single grain is theinterval between the arrival of the firstphoton and the arrival of the last photonrequired to produce a stable latent image.)
FIGURE 6. Characteristic curves plotted fromdata of Fig. 9.
Net
den
sity
4.0
3.5
3.0
2.5
2.0
1.5
1.0
0.5
Fast film
Slow film
1.5 0 0.5 1.0 1.5 2.0 2.5
Log exposure
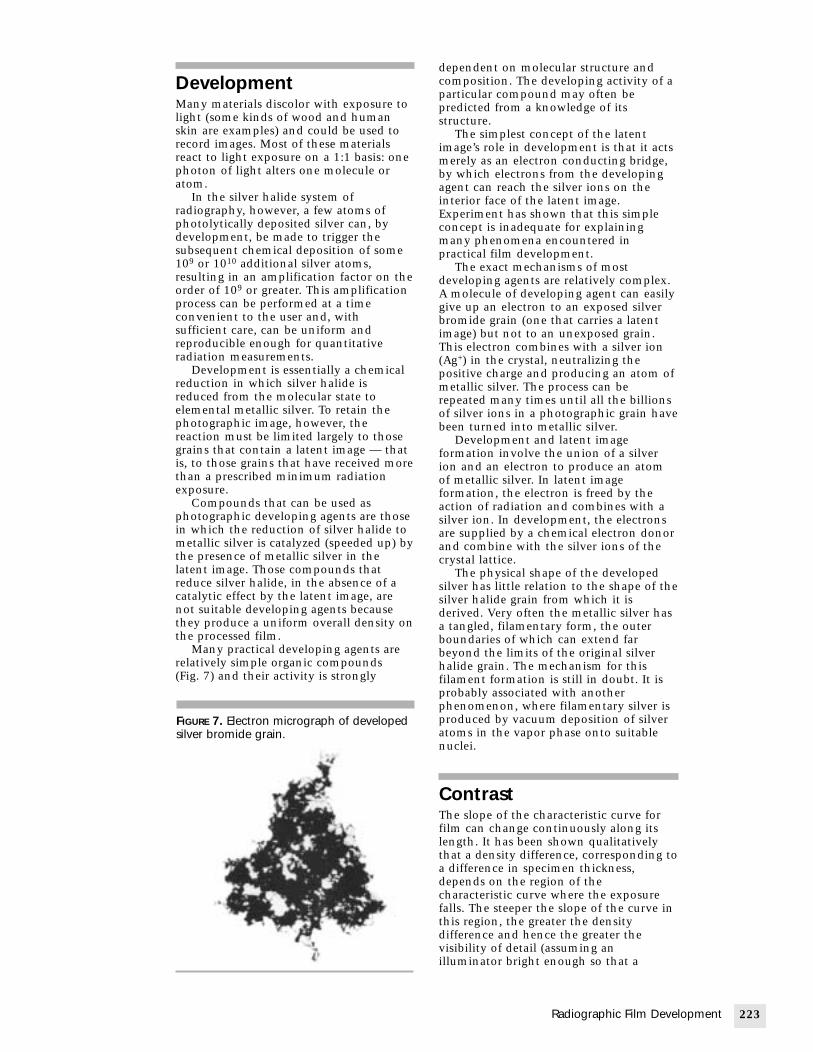
3RT09_Layout(219_252) 10/2/02 2:07 PM Page 223
DevelopmentMany materials discolor with exposure tolight (some kinds of wood and humanskin are examples) and could be used torecord images. Most of these materialsreact to light exposure on a 1:1 basis: onephoton of light alters one molecule oratom.
In the silver halide system ofradiography, however, a few atoms ofphotolytically deposited silver can, bydevelopment, be made to trigger thesubsequent chemical deposition of some109 or 1010 additional silver atoms,resulting in an amplification factor on theorder of 109 or greater. This amplificationprocess can be performed at a timeconvenient to the user and, withsufficient care, can be uniform andreproducible enough for quantitativeradiation measurements.
Development is essentially a chemicalreduction in which silver halide isreduced from the molecular state toelemental metallic silver. To retain thephotographic image, however, thereaction must be limited largely to thosegrains that contain a latent image — thatis, to those grains that have received morethan a prescribed minimum radiationexposure.
Compounds that can be used asphotographic developing agents are thosein which the reduction of silver halide tometallic silver is catalyzed (speeded up) bythe presence of metallic silver in thelatent image. Those compounds thatreduce silver halide, in the absence of acatalytic effect by the latent image, arenot suitable developing agents becausethey produce a uniform overall density onthe processed film.
Many practical developing agents arerelatively simple organic compounds(Fig. 7) and their activity is strongly
FIGURE 7. Electron micrograph of developedsilver bromide grain.
dependent on molecular structure andcomposition. The developing activity of aparticular compound may often bepredicted from a knowledge of itsstructure.
The simplest concept of the latentimage’s role in development is that it actsmerely as an electron conducting bridge,by which electrons from the developingagent can reach the silver ions on theinterior face of the latent image.Experiment has shown that this simpleconcept is inadequate for explainingmany phenomena encountered inpractical film development.
The exact mechanisms of mostdeveloping agents are relatively complex.A molecule of developing agent can easilygive up an electron to an exposed silverbromide grain (one that carries a latentimage) but not to an unexposed grain.This electron combines with a silver ion(Ag+) in the crystal, neutralizing thepositive charge and producing an atom ofmetallic silver. The process can berepeated many times until all the billionsof silver ions in a photographic grain havebeen turned into metallic silver.
Development and latent imageformation involve the union of a silverion and an electron to produce an atomof metallic silver. In latent imageformation, the electron is freed by theaction of radiation and combines with asilver ion. In development, the electronsare supplied by a chemical electron donorand combine with the silver ions of thecrystal lattice.
The physical shape of the developedsilver has little relation to the shape of thesilver halide grain from which it isderived. Very often the metallic silver hasa tangled, filamentary form, the outerboundaries of which can extend farbeyond the limits of the original silverhalide grain. The mechanism for thisfilament formation is still in doubt. It isprobably associated with anotherphenomenon, where filamentary silver isproduced by vacuum deposition of silveratoms in the vapor phase onto suitablenuclei.
ContrastThe slope of the characteristic curve forfilm can change continuously along itslength. It has been shown qualitativelythat a density difference, corresponding toa difference in specimen thickness,depends on the region of thecharacteristic curve where the exposurefalls. The steeper the slope of the curve inthis region, the greater the densitydifference and hence the greater thevisibility of detail (assuming anilluminator bright enough so that a
223Radiographic Film Development
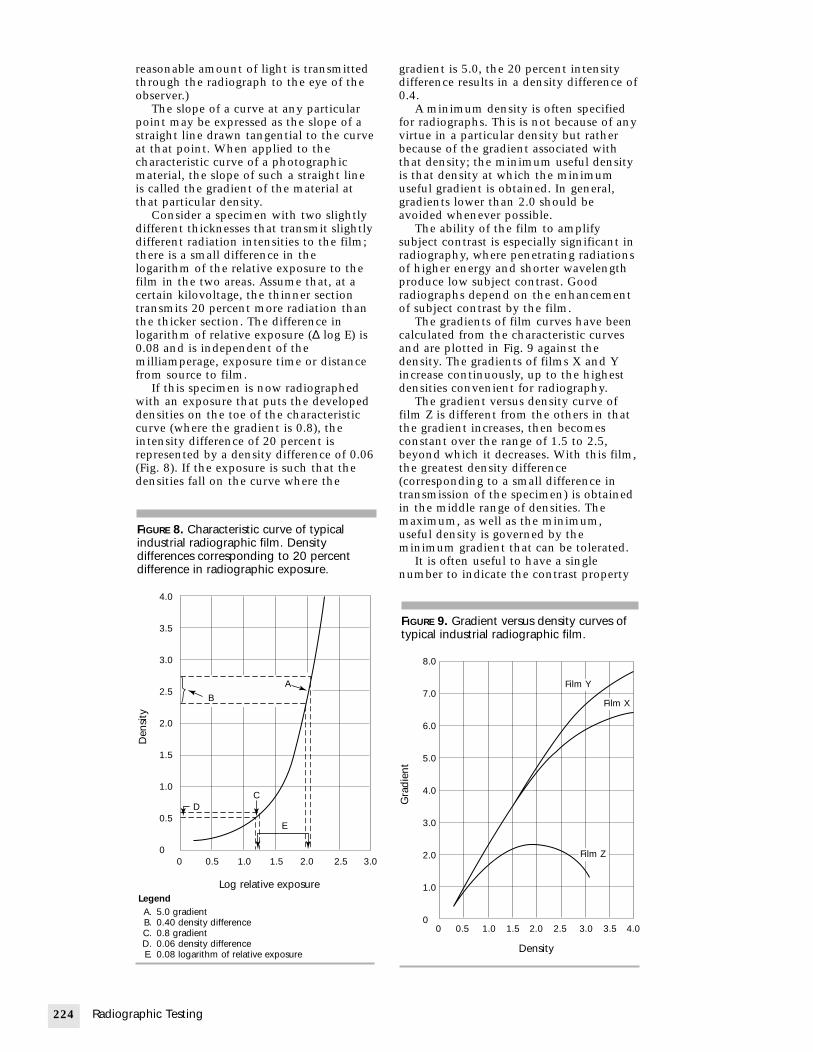
224 Rad
3RT09_Layout(219_252) 10/2/02 2:07 PM Page 224
reasonable amount of light is transmittedthrough the radiograph to the eye of theobserver.)
The slope of a curve at any particularpoint may be expressed as the slope of astraight line drawn tangential to the curveat that point. When applied to thecharacteristic curve of a photographicmaterial, the slope of such a straight lineis called the gradient of the material atthat particular density.
Consider a specimen with two slightlydifferent thicknesses that transmit slightlydifferent radiation intensities to the film;there is a small difference in thelogarithm of the relative exposure to thefilm in the two areas. Assume that, at acertain kilovoltage, the thinner sectiontransmits 20 percent more radiation thanthe thicker section. The difference inlogarithm of relative exposure (∆ log E) is0.08 and is independent of themilliamperage, exposure time or distancefrom source to film.
If this specimen is now radiographedwith an exposure that puts the developeddensities on the toe of the characteristiccurve (where the gradient is 0.8), theintensity difference of 20 percent isrepresented by a density difference of 0.06(Fig. 8). If the exposure is such that thedensities fall on the curve where the
iographic Testing
FIGURE 8. Characteristic curve of typicalindustrial radiographic film. Densitydifferences corresponding to 20 percentdifference in radiographic exposure.
CD
E
Den
sity
4.0
3.5
3.0
2.5
2.0
1.5
1.0
0.5
0
A
B
0 0.5 1.0 1.5 2.0 2.5 3.0
Log relative exposureLegendA. 5.0 gradientB. 0.40 density differenceC. 0.8 gradientD. 0.06 density differenceE. 0.08 logarithm of relative exposure
gradient is 5.0, the 20 percent intensitydifference results in a density difference of0.4.
A minimum density is often specifiedfor radiographs. This is not because of anyvirtue in a particular density but ratherbecause of the gradient associated withthat density; the minimum useful densityis that density at which the minimumuseful gradient is obtained. In general,gradients lower than 2.0 should beavoided whenever possible.
The ability of the film to amplifysubject contrast is especially significant inradiography, where penetrating radiationsof higher energy and shorter wavelengthproduce low subject contrast. Goodradiographs depend on the enhancementof subject contrast by the film.
The gradients of film curves have beencalculated from the characteristic curvesand are plotted in Fig. 9 against thedensity. The gradients of films X and Yincrease continuously, up to the highestdensities convenient for radiography.
The gradient versus density curve offilm Z is different from the others in thatthe gradient increases, then becomesconstant over the range of 1.5 to 2.5,beyond which it decreases. With this film,the greatest density difference(corresponding to a small difference intransmission of the specimen) is obtainedin the middle range of densities. Themaximum, as well as the minimum,useful density is governed by theminimum gradient that can be tolerated.
It is often useful to have a singlenumber to indicate the contrast property
FIGURE 9. Gradient versus density curves oftypical industrial radiographic film.
8.0
7.0
6.0
5.0
4.0
3.0
2.0
1.0
0
Gra
dien
t
Film Y
Film X
Film Z
0 0.5 1.0 1.5 2.0 2.5 3.0 3.5 4.0
Density

3RT09_Layout(219_252) 10/2/02 2:07 PM Page 225
of a film. This need is met by a quantityknown as the average gradient, defined asthe slope of a straight line joining twopoints of specified densities on thecharacteristic curve (Table 1).
These two densities are often themaximum and minimum useful densitiesfor a particular application. The averagegradient indicates the average contrastproperties of the film over this usefulrange; for a given film and developmenttechnique, the average gradient dependson the density range chosen.
Experiments have shown that theshape of the characteristic curve is, forpractical purposes, largely independent ofthe radiation wavelength (Fig. 10 for thecharacteristic curve of a typical industrialfilm). Therefore, a characteristic curvebased on any radiation quality may beapplied to exposures based on anotherquality, to the degree of accuracy usuallyrequired in practice; the same is true forvalues of gradient or average gradientderived from the curve.
TABLE 1. Average gradient.
Density Range_________________________Film 0.5 to 2.5 2.0 to 4.0
X 2.3 5.7Y 2.6 6.3Z 1.7 ——
FIGURE 10. Characteristic curve of typicalindustrial radiographic film. Averagegradient is calculated over two densityranges.
Den
sity
4.0
3.5
3.0
2.5
2.0
1.5
1.0
0.5
0
Averagegradient = a’·b’–1 = 5.7
a’
b’
a
b
0 0.5 1.0 1.5 2.0 2.5 3.0
Log relative exposure
Averagegradient = a·b–1 = 2.3
The influence of kilovoltage or gammaray quality on contrast in the radiograph,therefore, is the result of its action on thesubject contrast and only very slightly, ifat all, the result of any change in thecontrast characteristics of the film.
Radiographic contrast can also bemodified by choosing a film of differentcontrast or by using a different densityrange with the same film. Contrast is alsoaffected by the degree of development butin industrial radiography, films aredeveloped to their maximum or nearlymaximum contrast.
In the early stages of development,both density and contrast increase quiterapidly with time of development. Inmanual processing, the minimumrecommended development time givesmost of the available density and contrast.With certain of the direct film types,somewhat higher speed and, in somecases, slightly more contrast are gained byextending the development; in no caseshould the maximum time recommendedby the manufacturer be exceeded becausesilver halide molecules may break downand produce fog.
A special situation arises when, fortechnical or economic reasons, there is amaximum allowable exposure time. Insuch cases, an increase in kilovoltageincreases the radiation intensitypenetrating the specimen and the filmwill contain a higher density. This mayresult in a decrease in radiographiccontrast.
Table 2 lists densities obtained through13 to 16 mm (0.5 to 0.6 in.) sections,using an exposure of 8 mA·min. Thesedata show that, when the exposure time isfixed, the density difference between thetwo sections increases. The contrast alsoincreases as the kilovoltage is raised.
The improvement in detail visibilityoccurs in spite of the decrease in subjectcontrast (caused by the increase inkilovoltage) and is the direct result ofusing higher densities where the filmgradient is higher. In this particular case,the film contrast increases (as a result ofincreased density) faster than the subjectcontrast decreases (as a result of increasedkilovoltage).
225Radiographic Film Development
TABLE 2. Densities obtained through 13 to 16 mm (0.5 to0.6 in.) steel sections by using exposure of 8 mA·min.
RelativeEnergy Density Radiographic Radiographic_________________
(kV) DB DA Contrast Contrast
120 0.50 0.27 0.23 20140 1.20 0.67 0.53 46160 2.32 1.30 1.02 88180 3.48 2.32 1.16 100

226 Rad
TABLE 3. Rel
Film
XYZ
FIGURE 11. Density versus exposure curve fortypical industrial radiographic film exposedto direct X-rays or with lead screens.
Den
sity
4.0
3.5
3.0
2.5
2.0
3RT09_Layout(219_252) 10/2/02 2:07 PM Page 226
Influence of Film SpeedIt has been shown that the film contrastdepends on the shape of the characteristiccurve. The other significant valueobtained from the characteristic curve isthe relative speed governed by thelocation of the curve, along the log E axis,in relation to the curves of other films.
The spacing of the curves along the logE axis arises from differences in relativespeed; the curves for the faster films lietoward the left, slower films toward theright. From these curves, relativeexposures for producing a fixedphotographic density can be determined.For some industrial radiographic purposes,a density of 1.5 is an appropriate level atwhich to compute relative speeds.However, the increasing trend towardhigh densities, with all radiographsviewed on high intensity illuminators,makes a density of 2.5 more suitable formost industrial radiography. Relativespeed values derived from characteristiccurves, for two given density levels, areshown in Table 3, where film X has beenassigned a relative speed of 100 at bothdensities. Note that the relative speedscomputed are not the same; this isbecause of the differences in curve shapefrom one film to another.
Although the shape of thecharacteristic curve is practicallyindependent of changes in radiationquality, the location of the curve alongthe log relative exposure axis, with respectto the curve of another film, does dependon radiation quality. Thus, if characteristiccurves were prepared at a differentkilovoltage, the curves would bedifferently spaced — that is, the filmswould have different speeds relative to thefilm that was chosen as a standard ofreference.
Relation of Density toExposureThe most common way of expressing therelation between film response andradiation intensity is the characteristic
curve (the relation between the densityiographic Testing
ative speed values.
Density = 1.5 Density = 2.5_____________________ ____________________Relative Relative Relative RelativeSpeed Exposure Speed Exposure
100 1.0 100 1.024 4.2 26 3.9
250 0.4 150 0.7
and the logarithm of the exposure). Ifdensity is plotted against relative exposureto X-rays or gamma rays, in many casesthere is a linear relation over a more orless limited density range (Fig. 11). If netdensity (density above base density andfog), rather than gross density, is plottedagainst exposure, the straight line passesthrough the origin.
The linear relation cannot be assumedbut must be checked for the particularapplication because of variations in filmand processing conditions. The linearrelation between density and exposuremay be extremely useful in theinterpretation of diffraction patterns andthe evaluation of radiation monitoringfilms, provided that the limited linearrange of the curve is considered.
Effect of DevelopmentTime on Speed andContrastAlthough the shape of the characteristiccurve is relatively insensitive to changesin X-ray or gamma ray quality, it isaffected by changes in degree ofdevelopment. Degree of development, inturn, depends on the type of developer, itstemperature and its activity; the time ofdevelopment increases the speed andcontrast of any radiographic film. If,however, development is carried too far,the contrast of the film, based on acertain net density, ceases to increase and
1.5
1.0
0.5
00 10 20 30 40 50 60
Relative exposure

3RT09_Layout(219_252) 10/2/02 2:07 PM Page 227
may even decrease. In this case, fogincreases and contrast may decrease.
GraininessGraininess is defined as the visualimpression of nonuniformity in thedensity of a radiographic (orphotographic) image. With fast filmsexposed to high kilovoltage radiation,graininess is easily visible with unaidedvision; with slow films exposed to lowkilovoltage X-rays, moderatemagnification may be needed. In general,graininess increases with increasing filmspeed and with increasing radiationenergy.
The clumps of developed silverresponsible for the impression ofgraininess do not each arise from a singledeveloped photographic grain. Theparticle of black metallic silver caused bythe development of a single photographicgrain in an industrial radiographic film israrely larger than 1.0 µm (4 × 10⁻⁵ in.)and is usually less. The unaided humaneye cannot see an individual grain.
The visual impression of graininess iscaused by the random, statistical groupingof these individual silver particles. Eachquantum (photon) of X-radiation orgamma radiation absorbed in the filmemulsion exposes one or more tinycrystals of silver bromide. Theseabsorption events occur at random. Evenin a uniform radiographic beam, thenumber of absorption events will differfrom one small area of the film to thenext, for purely statistical reasons. Thus,the exposed grains will be randomlydistributed and their numbers will have astatistical variation from one area to thenext.
With a very slow film, it might benecessary for 10 000 photons to beabsorbed in a small area to produce adensity of, for example, 1.0. With anextremely fast film it might require only100 photons in the same area to producethe same density. When only a fewphotons are required to produce thedensity, the random positions of theabsorption events become visible in theprocessed film as film graininess. On theother hand, the more X-ray photons thatare required, the less noticeable thegraininess in the radiographic image,when all other conditions are equal.
In general, the silver bromide crystalsin a slow film are smaller than those in afast film and thus will produce less lightabsorbing silver when they are exposedand developed. At low kilovoltages, oneabsorbed photon will expose one grain, ofwhatever size. Thus, more photons willhave to be absorbed in the slower film
than in the faster film to produce aparticular density.
The increase in graininess withincreasing kilovoltage can also beunderstood on this basis. At lowkilovoltages, each absorbed photonexposes one photographic grain; at highkilovoltages, one photon will exposemany grains. At high kilovoltages, then,fewer absorption events are required toproduce a given density. Fewer absorptionevents, in turn, mean a greater relativedeviation from the average and hencegreater graininess.
ScreensThe above discussion of graininess appliesalso to exposures made with lead screens.As stated earlier, the grains in a filmemulsion are exposed by high speedelectrons. Silver bromide cannotdistinguish between electrons from anabsorption event within the filmemulsion and those from a lead screen.
The quantum mottle observed inradiographs made with fluorescentintensifying screens has a statistical originsimilar to that of film graininess. In thiscase, however, the number of photonsabsorbed in the screens is significant. Thegrain size of a fluorescent crystal is greaterthan that of silver bromide, so a spreadfunction also contributes tononuniformity.
X-Ray Spectral SensitivityThe shape of the characteristic curve of aradiographic film is unaffected, forpractical purposes, by the wavelength ofthe exposing X-rays or gamma rays.However, the sensitivity of the film (thenumber of coulombs per kilogram, orroentgens, required to produce a givendensity) is strongly affected by thewavelength of the exposing radiation.
Figure 12 shows the number ofroentgens needed to produce a density of1.0, for a particular radiographic film andspecific processing conditions (exposureswere made without screens).
The spectral sensitivity curves for allradiographic films have roughly the samefeatures as the curves shown in Fig. 12.Details, among them the ratio ofmaximum to minimum sensitivity, differwith film type.
The spectral sensitivity of a film ordifferences in spectral sensitivity betweentwo films, need rarely be considered inindustrial radiography. Usually suchchanges in sensitivity are automaticallytaken into account in the preparation ofexposure charts and tables of relative filmspeeds. The spectral sensitivity of a film isvery important in radiation monitoring,
227Radiographic Film Development

228 Radi
Table 4. Cla
Ima__________Speed
——LowMediumHigh
3RT09_Layout(219_252) 10/2/02 2:07 PM Page 228
because here an evaluation of the numberof roentgens incident on the film isrequired.
Film ClassificationRadiographic film systems can beclassified on the basis of their imagequality performance. The classification offilms provides a means of specifyingradiographic film and film systemswithout mentioning film brand names.
This specifying of film is according tomeasurable physical characteristics suchas the minimum film gradient at filmdensity 2.0, minimum film gradient atfilm density 4.0, maximum granularityand the minimum ratio of film gradientto granularity.7 ASTM E 18158 and
ographic Testing
FIGURE 12. Typical X-ray spectral sensitivity curequired to produce density of 1.0 for various
Hea
10 20 30 40 60 8
Radi
atio
n fo
r de
nsity
of
1.0,
MC
·kg-
1(R
)
516 (2.00)
258 (1.00)
206 (0.80)
155 (0.60)
103 (0.40)
52 (0.20)
26 (0.10)
21 (0.08)
15 (0.06)
10 (0.04)
8 (0.03)
ssification of industrial X-ray films.7 D = density
ge Quality Factor Classification M_______________________ _______________ __Contrast Granularity ASTM8 ISO9 D
—— —— special T1very high very low I T2high low II T3medium high III T4
ISO 11699-19 are examples of two filmclassifications. Table 4 compares filmslisted according to the ASTM classificationwith the corresponding ISO classificationlevel.7
Reciprocity Law FailureThe Bunsen-Roscoe reciprocity law statesthat the density of a photochemicalreaction depends only on the product ofthe radiation intensity and the durationof the exposure and is independent of theabsolute values of either quantity. Appliedto radiography, this means that thedeveloped density in a film depends onlyon the product of X-ray or gamma rayintensity reaching the film and the timeof exposure.
rve of radiographic film, showing radiation radiation qualities.
vy filtration
Light filtration
Energy (kV peak)
0 100 200 400 600 8001000 2000
.
Ratio of Gradientinimum Gradient Granularity to Granularity________________
= 2.0 D = 4.0 D = 2.0 D = 2.0
4.5 7.5 0.018 3004.1 6.8 0.028 1503.8 6.4 0.032 1203.5 5.0 0.039 100
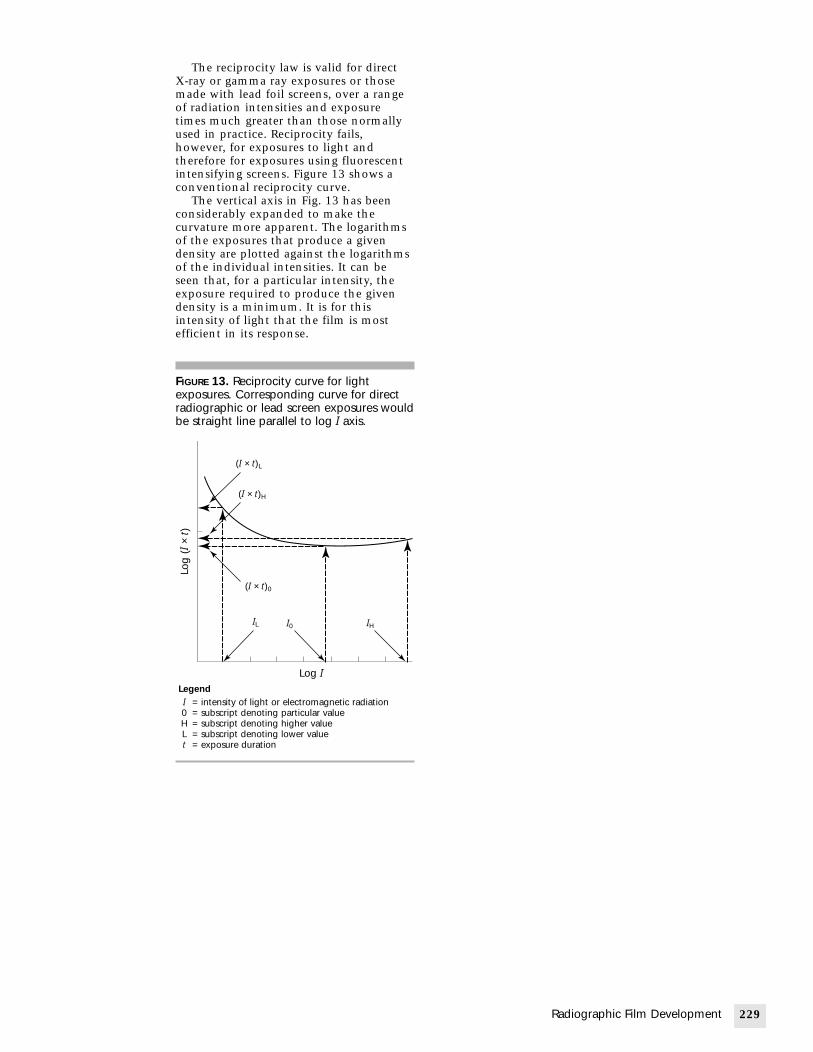
3RT09_Layout(219_252) 10/2/02 2:07 PM Page 229
The reciprocity law is valid for directX-ray or gamma ray exposures or thosemade with lead foil screens, over a rangeof radiation intensities and exposuretimes much greater than those normallyused in practice. Reciprocity fails,however, for exposures to light andtherefore for exposures using fluorescentintensifying screens. Figure 13 shows aconventional reciprocity curve.
The vertical axis in Fig. 13 has beenconsiderably expanded to make thecurvature more apparent. The logarithmsof the exposures that produce a givendensity are plotted against the logarithmsof the individual intensities. It can beseen that, for a particular intensity, theexposure required to produce the givendensity is a minimum. It is for thisintensity of light that the film is mostefficient in its response.
229Radiographic Film Development
FIGURE 13. Reciprocity curve for lightexposures. Corresponding curve for directradiographic or lead screen exposures wouldbe straight line parallel to log I axis.
Log
(I×
t)
(I × t)L
(I × t)H
(I × t)0
IL I0 IH
Log ILegendI = intensity of light or electromagnetic radiation0 = subscript denoting particular valueH = subscript denoting higher valueL = subscript denoting lower valuet = exposure duration

230 Radio
PART 2. Chemistry of Film Radiography3
3RT09_Layout(219_252) 10/2/02 2:07 PM Page 230
Most radiographers are highly skilled,motivated and generally interested in thechallenges of creating an image on film.Much training goes into being able toselect the correct exposure. However, theimage or exposure is useless until it isdeveloped. This invisible image is called alatent image. It is through the chemicalprocess called development that thehidden (latent) image is transformed intothe useful visible image. For aradiographer or laboratory personnel toknow only about latent image formationand not visible image formation is toknow only half of film radiography. Filmradiographers must be knowledgeable andskilled in both areas if they are to controlthe efficiency, economics and the qualitythey are responsible for.
The basic steps in processing are(1) development (to transfer the latentimage into the visible image); (2) fixation(to stop development and remove allremaining underdeveloped crystals andunexposed crystals); (3) washing (toremove fixer to ensure archival quality);and (4) drying.
All of the chemical reaction steps arecontrolled by elements of (1) time(immersion time in solution);(2) temperature (of the solution); and(3) activity (replenishment, agitation,moisture).
Time, temperature and activity, in turn,depend on six electromechanical systems:(1) transport (time factor); (2) temperaturecontrol; (3) replenishment; (4) circulationand filtration (agitation, uniformity ofchemicals), (5) electrical systems; and(6) dryer systems. These sixelectromechanical systems constitute theprocessor (manual or automatic), whichsupport a seventh system: chemistry(developer, fixer and wash).
Though the developer has its ownrelationship of time, temperature andactivity (as do the fixer and wash), one ofthe controlling factors of the developer isthe fixer. If the fixer is not washed outproperly the film is damaged. Also, if thefixer is weak, the developer is notneutralized quickly and development isprotracted. Thus the chemistry systemincludes developer, fixer and wash.
How does the radiographer know thatthe processor is working right? How it isknown that the processing is correct? Willthe radiographer get a good radiograph? If
graphic Testing
a technically accurate exposure (exposedradiograph with a latent image) is putinto a processor, will it come out okay?Will it be free of artifacts and have thecorrect density and contrast? What if theradiographer is unsure that the exposuretechnique is optimal or that the qualityachieved on the visible film is the resultof bad exposure, bad processing or both?The answer to all of these questions,which are quite common in industrialradiography, is in two parts.
1. There is no condition better thancorrect exposure with fulldevelopment. Overdevelopment,underdevelopment, overexposure andunderexposure are inappropriate andinefficient. The processing completeswhat the exposure started; it cannotadd information.
2. The sum total of the radiographer’sefforts is to produce a useful visibleimage, whose density levels andcontrast may be measured. To monitorand control processing and the totalvisible image production, sensitometryis used. Sensitometry is the quantitativemeasure of the film’s response toexposure and development.
The total value of the visible image is theresult of exposure and development. Toknow only how to make exposures is toknow only half of the technologyrequired.
Latent ImageWhen a radiographic film is exposed to aradiation energy source, it forms what iscalled a latent image. When the film isprocessed in chemicals, a visible imageappears. This is, in its simplest terms, thechemistry of radiography. Because thechemistry actually allows radiography toexist, however, it is most important that itbe better understood. Radiographicchemistry means the total concept of thechemical constituents and mechanisms offilm, processing chemistries and thereactions during exposure.

3RT09_Layout(219_252) 10/2/02 2:07 PM Page 231
Chemistry of Film
Film BaseModern plastic bases such as polyethyleneterephthalate have important features:strength, clarity, superior transportcharacteristics, stability and the fact thatthey do not absorb water.
Polyester bases require an adhesive sothat the emulsion will adhere properly tothe smooth surface. The adhesive isapplied to both sides of the base as asubstrate layer. The tint, composed of adelicate balance of many dyes, is usuallyfound as an integral part of the base.
Film EmulsionOnce the film base is made ready toreceive the emulsion, the emulsion isapplied to both sides of the base. Theemulsion is composed of a silver haliderecording media and a binder of gelatinmanufactured from collagen. Collagen is anaturally occurring fibrous protein and isa major component of animal skin, boneand certain tissues. Collagen is treatedwith lime or an acid that breaks down theprotein into a very pure gelatin. Thegelatin has a great affinity for water; thatis, it can absorb great quantities of waterby swelling and is very important in filmprocessing.
To the gelatin is added a sensitizedsilver halide. Silver halide is usually silverbromide. Other useful members of thehalide group are chlorine and iodine. Thehalide might also be a combination suchas chlorobromide or iodobromide.
Silver bromide is formed in this way:
(1)
(2)
The silver bromide is sensitized with asulfur compound and mixed into thegelatin. Several washing operations followuntil the emulsion is ready to be coatedonto the base. And, of course, all of thesesteps must be carried out in totaldarkness.
Exposing of Film
Latent Image FormationGurney and Mott developed a theory thatis the accepted basis for explaining imageformation.4 In the above formula, thelatent image is composed of metallic silverand the crystalline silver bromide is
2AgNO KBr AgBr KNO3 3+ → +↓
2 2 2Ag NHO AgNO H3 3 2° + → +
undisturbed. Gurney and Mott found thatcrystals (silver bromide) sensitized with aforeign sulfur compound were easier toexpose. They called these sensitizerssensitivity specks. At the moment ofexposure the energy of exposure initiatesan autocatalytic (self-completing)reaction:
(3)
where Agoi is interstitial silver. The crystal
is coated with an excess of bromide ionscontaining excess electrons. At exposure,some of these electrons are released andare trapped at the sensitivity specks —now termed sensitivity sites. The brominebecomes gas and is absorbed in thegelatin. Because the sensitivity sitecontains numerous electrons, it is of anegative value and exerts a magnetic pullon silver ions floating in the crystal latticestructure. This unbonded silver, whichneeds one or more electrons and is termedinterstitial silver (Ag+
i), will deposit andthereby constitute a development site.Without this site the crystal will notdevelop.
Chemistry of ProcessingAfter the exposure has been made andbefore development, both exposed andunexposed silver bromide crystals existwithin the film emulsion. This is thelatent image. The exposed crystals will bemade visible as black metallic silver byreducing the structural silver bromide tosimple metallic silver and by clearingaway the unexposed crystals. This actionis the basis of chemical processing andhas an important role in the field ofradiography.
In this discussion speed denotes thefilm’s sensitivity, that is, its response toexposure; Dmax is the maximum densityfor the maximum exposure; Dmin is theminimum density for the minimumexposure; and contrast is a difference indensities for a range of exposures.
DevelopmentThe film emulsion is now composed oftwo types of crystals: unexposed andexposed. The developer selectively seeksout the exposed crystals containing adevelopment site made up of five atomsof interstitial silver and converts them toblack metallic silver. The entire crystalbecomes metallic silver and now contains1 × 109 atoms of silver. The amplificationfactor of about 109 is the result of theoxidation reduction reaction whereby thedeveloper is consumed (oxidation) and
AgBr AgBr AgSilver bromide Energy
i
Latent image
+ → +hv o
231Radiographic Film Development

232 Ra
TABLE 5. Developer components.
GeneralChemical Function Specific Function
Phenidone reducer quickly produces gray tonesHydroquinone reducer slowly produces blacksSodium carbonate activator provides alkaline media;
swells emulsionPotassium bromide restrainer prevents reduction of
unexposed crystalsSodium sulfite preservative maintains chemical balanceWater solvent dissolves chemicalsGluteraldehyde hardener permits transport of films by
controlling swelling
3RT09_Layout(219_252) 10/2/02 2:07 PM Page 232
the crystal is reduced from a compound toa simple element (reduction).
Equations 4 and 5 describe thissequence of events:
(4)
and
(5)
where Agoi is interstitial silver and X is one
or more halides, such as chlorine, iodine,bromine or hybrids.
This reaction is controlled, as are allchemical reactions, by elements of time,temperature and activity. To keep thedeveloper chemical strength (activity) at aconstant level a manual or automaticreplenishment system is used.Constituents of a typical radiographicdeveloper can be seen in Table 5.
The primary function of the developeris to reduce silver ions to black metallicsilver. However, there are five criteria for amodern developing agent:
1. It should provide a reducing agent forsilver ions; that is, a source ofelectrons to reduce silver ions (Ag+) toblack metallic silver (Ag°).
2. It should provide reduction of theexposed silver halide in preferenceover the unexposed crystals.
3. It should be water soluble or soluble inan alkaline media.
4. It should be reasonably stable andresistant to aerial oxidation.
5. It should yield colorless, solubleoxidation products.
Reducing Agents. Developers composed ofmethylaminophenol sulfate andhydroquinone are referred to as MQdevelopers. Modern developers arecomposed of phenidone andhydroquinone and are called PQdevelopers. The basic reaction might bewritten:
Ag Agi + Developer
e
Ag +Oxidizeddeveloper
e
atoms
Latent image
Conditions
TimeTemperature
Activityatoms
Visibleimage
X +↓−
→ °↓−
o
1 24444 34444
123
5
109
Ag Ag AgiSilver
bromidesalt crystal
Photonof
energy
Latentimage
X hv X+ → + o
diographic Testing
(6)
It is important to notice that thedeveloper is oxidized. Oxidized developerbecomes a deep brown color and thisindicates exhaustion. Because the rate ofdevelopment is pH dependent, pH isstandardized with buffers against theeffect of different water supplies andworking conditions. Buffering means thatthe formulas are designed so thatadditional hydrogen or hydroxyl groupscause an internal rearrangement thatprevents any appreciable alteration of pH.
The single most important function ofthe developer is the action of the reducingagents. The reducing agent or developingagent supplies the electrons necessary toenable the essential reaction ofdevelopment to occur.
In addition to aiding and controllingthe developer agent reactions undernormal conditions, buffering agents alsoretard the influences of oxidation anddifferent solvent conditions. The generalhardness solvent is tap water, which variesin pH and general hardness depending onthe city.Solvent. Water is the solvent and is over80 percent of the developer solution.Water should be of drinking quality with acarbonate hardness of between 40 and150 parts per million. Metal ions in watercan accelerate developer oxidation andresult in high fog.Temperature Influence on DeveloperAction. Developing agents are temperaturedependent, resulting in temperaturecoefficients. There is about a ±0.05 pHchange per each temperature difference of10 °C (18 °F). Sensitometrically theoptimal developer temperature occurswhen it produces the maximum or aspecific gamma (contrast) level. Optimalmeans achieving the best levels of speed,
AgBr exposed + Developer
Ag Developeroxidized
HBrhydrobromic
acid
( )→ ° +
( )+

3RT09_Layout(219_252) 10/2/02 2:07 PM Page 233
Dmax and Dmin for optimum contrast.Deviation in either direction because oftemperature change will generally resultin lower contrast (see Fig. 14).Agitation. Agitation increases both therate of development and the rate ofreduction. To clarify, development rate isincreased because agitation permits aconstant mixing of the solution and aidsin washing bromine and the oxidizeddevelopers out of the emulsion. Agitationaids reduction by constantly swirling thereducing agents in and around the silverhalide crystal lattice. When replenishmentsystems are used, agitation helps keep thestronger replenishment solution properlymixed into the working solution.Agitation also helps in the filtration ofreaction byproducts, mostly gelatin, bycirculating the chemicals through a filter.Finally, agitation keeps the temperatureuniform.Replenishment. Chemically defined,replenishment is only a replacement ofquantity, of volume, a maintenance of apreset amount. Regeneration is the secondfunction of an adequate replenishmentsystem and its job is to ensure consistentactivity by a replacement of spentchemicals. It is the purpose of developerregeneration to ensure that thecharacteristics of the finished radiograph— its speed, contrast level, fog level andmaximum density — remain substantiallyconstant.
A good replenishment andregeneration system will prolong the lifeof chemistries, aid in the maintenance ofconsistent quality and may lead toimproved sensitometric quality. Theproper replenishment or regenerationsystem means that chemicals need to bechanged less often. Althoughreplenishment keeps the chemicalconservation constant the system
FIGURE 14. Gamma versus temperatureresponse curve.
Dmax
Contrast
Speed
Baseand fog
Developer temperature, °C (°F)
DmaxOptimal
Speed
Contrast
Baseand fog
28 30 32 34(82) (86) (90) (93 )
chemicals should be changed periodicallyto eliminate particulates andcontaminants from accumulating.Changing out chemistry once a month orevery two to six weeks should be bychoice and convenience and neverbecause the activity has been lost.Starter Solution. This is an acid solution(pH 2 approximately) containingbromides that is added to fresh developereach time the automatic processor isfilled. Between 20 and 25 mL·L–1 (2.5 and3.2 oz per 1 gal) of developer are added tothe processor, depending on themanufacturer. Each manufacturer’s brandof starter should be used with thecorresponding brand of developer. Starteris not normally added to thereplenishment chemistry.
Starter gets its name from the fact it isused when a fresh batch of developer isfirst used. Its acid nature primarilydeactivates the developer to help controlfog. Its bromides are added to simulateused developer and thereby provideconsistent, reproducible quality frombatch to batch. For Class I films, whichbenefit from higher bromide levels, thestarter both lowers pH and increases thedevelopment rate.
The developer chemistry manufacturerprovides guidance on the amount of timeand temperature to use with its product.The manufacturer’s recommendations arebased on the assumption that allinstructions have been carefully followed,including the addition of the correctamount of the correct brand of starter.Faults from Developer. Types of faults dueto developer include too much or toolittle density (toe, straight line, shoulderareas), too much contrast or too littlecontrast. See Table 6 for faults related tothe developer.Automatic versus Manual Processing andChemistry. Automatic developers containgluteraldehyde as a hardening agent tocontrol emulsion (gelatin) swelling.Because manual developers have no
233Radiographic Film Development
TABLE 6. Faults from developer.
Processing Action Underdevelopment Overdevelopment
Temperature low highTransport rate fast slowSolution level low not applicableAgitation low not applicableChemical reaction; oxidation high not applicableContamination high highClass I film replenishment over underClass II film replenishment under overClass III film replenishment under overClass IV film replenishment under over
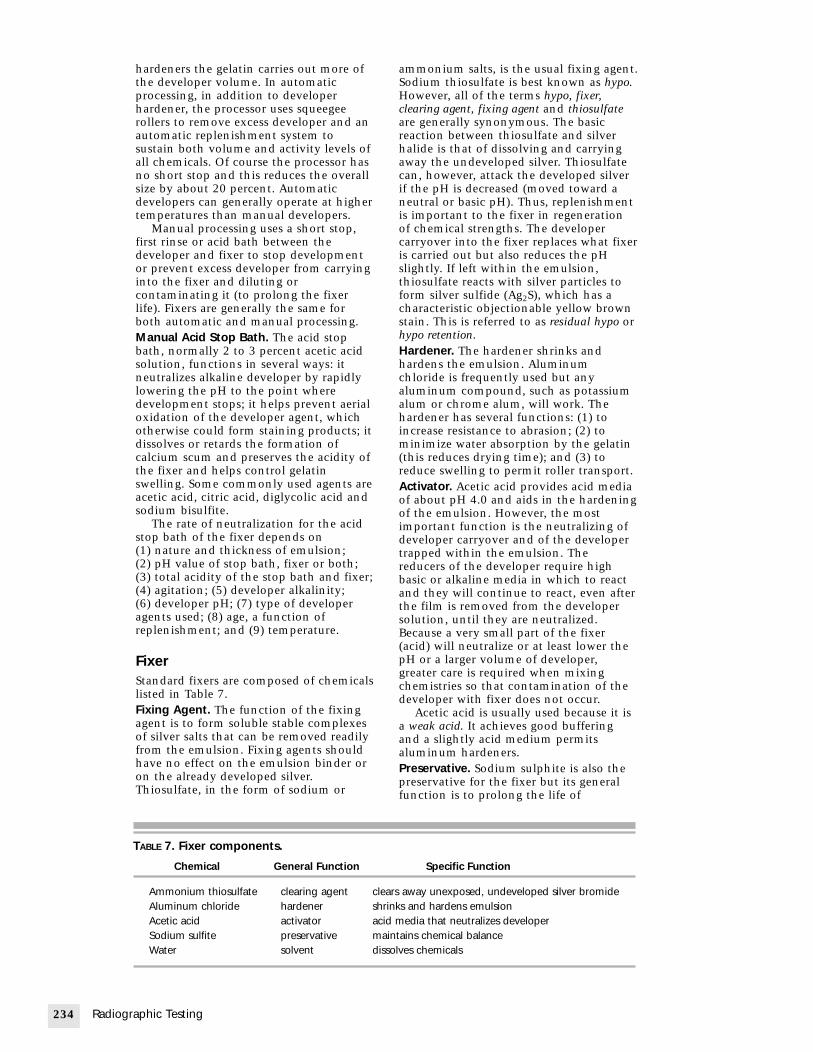
234 Rad
3RT09_Layout(219_252) 10/2/02 2:07 PM Page 234
hardeners the gelatin carries out more ofthe developer volume. In automaticprocessing, in addition to developerhardener, the processor uses squeegeerollers to remove excess developer and anautomatic replenishment system tosustain both volume and activity levels ofall chemicals. Of course the processor hasno short stop and this reduces the overallsize by about 20 percent. Automaticdevelopers can generally operate at highertemperatures than manual developers.
Manual processing uses a short stop,first rinse or acid bath between thedeveloper and fixer to stop developmentor prevent excess developer from carryinginto the fixer and diluting orcontaminating it (to prolong the fixerlife). Fixers are generally the same forboth automatic and manual processing.Manual Acid Stop Bath. The acid stopbath, normally 2 to 3 percent acetic acidsolution, functions in several ways: itneutralizes alkaline developer by rapidlylowering the pH to the point wheredevelopment stops; it helps prevent aerialoxidation of the developer agent, whichotherwise could form staining products; itdissolves or retards the formation ofcalcium scum and preserves the acidity ofthe fixer and helps control gelatinswelling. Some commonly used agents areacetic acid, citric acid, diglycolic acid andsodium bisulfite.
The rate of neutralization for the acidstop bath of the fixer depends on(1) nature and thickness of emulsion;(2) pH value of stop bath, fixer or both;(3) total acidity of the stop bath and fixer;(4) agitation; (5) developer alkalinity;(6) developer pH; (7) type of developeragents used; (8) age, a function ofreplenishment; and (9) temperature.
FixerStandard fixers are composed of chemicalslisted in Table 7.Fixing Agent. The function of the fixingagent is to form soluble stable complexesof silver salts that can be removed readilyfrom the emulsion. Fixing agents shouldhave no effect on the emulsion binder oron the already developed silver.Thiosulfate, in the form of sodium or
iographic Testing
TABLE 7. Fixer components.
Chemical General Function
Ammonium thiosulfate clearing agentAluminum chloride hardenerAcetic acid activatorSodium sulfite preservativeWater solvent
ammonium salts, is the usual fixing agent.Sodium thiosulfate is best known as hypo.However, all of the terms hypo, fixer,clearing agent, fixing agent and thiosulfateare generally synonymous. The basicreaction between thiosulfate and silverhalide is that of dissolving and carryingaway the undeveloped silver. Thiosulfatecan, however, attack the developed silverif the pH is decreased (moved toward aneutral or basic pH). Thus, replenishmentis important to the fixer in regenerationof chemical strengths. The developercarryover into the fixer replaces what fixeris carried out but also reduces the pHslightly. If left within the emulsion,thiosulfate reacts with silver particles toform silver sulfide (Ag2S), which has acharacteristic objectionable yellow brownstain. This is referred to as residual hypo orhypo retention.Hardener. The hardener shrinks andhardens the emulsion. Aluminumchloride is frequently used but anyaluminum compound, such as potassiumalum or chrome alum, will work. Thehardener has several functions: (1) toincrease resistance to abrasion; (2) tominimize water absorption by the gelatin(this reduces drying time); and (3) toreduce swelling to permit roller transport.Activator. Acetic acid provides acid mediaof about pH 4.0 and aids in the hardeningof the emulsion. However, the mostimportant function is the neutralizing ofdeveloper carryover and of the developertrapped within the emulsion. Thereducers of the developer require highbasic or alkaline media in which to reactand they will continue to react, even afterthe film is removed from the developersolution, until they are neutralized.Because a very small part of the fixer(acid) will neutralize or at least lower thepH or a larger volume of developer,greater care is required when mixingchemistries so that contamination of thedeveloper with fixer does not occur.
Acetic acid is usually used because it isa weak acid. It achieves good bufferingand a slightly acid medium permitsaluminum hardeners.Preservative. Sodium sulphite is also thepreservative for the fixer but its generalfunction is to prolong the life of
Specific Function
clears away unexposed, undeveloped silver bromideshrinks and hardens emulsionacid media that neutralizes developermaintains chemical balancedissolves chemicals

3RT09_Layout(219_252) 10/2/02 2:07 PM Page 235
thiosulfate in the fixer by reacting withfree sulphur in the presence of theactivator to regenerate the thiosulfatecomplex.
(7)
Solvent. Water is again the solvent and aswith the developer it need be only ofdrinking quality.Rate of Fixation. The rate of fixationdepends primarily on: (1) the diffusionrate of the fixing agent into the emulsion;(2) the solubility of the silver halidegrains; and (3) the diffusion rate of thecomplex silver ions out of the emulsion.Thus it can be seen that adequateagitation and replenishment areimportant to proper fixation.
The rate of fixation is the amount oftime required to totally fix the emulsion,including clearing of all unexposed silverhalide from the emulsion and hardeningof the emulsion. In general it is said thatthe fixer clears and fixes. The rate isdetermined by this rule of thumb: thetotal fixing time is twice the clearingtime. A simple clearing time test mightbe: using a 70 × 30 mm (3 × 1 in.) strip offresh unexposed, unprocessed film, placea drop of fixer on both sides of the film,wait for 10 s, then dunk the strip into thefixer, agitate gently and watch for the spotto disappear. The clearing time is the timeuntil the overall film is as clear as thespots, which had a head start. Additionaltime will not make it any clearer. Clearingtime is critical for industrial films,especially in automatic processors whereimmersion time is fixed. Normally filmswill clear in 20 °C (70 °F) fixer in 20 to60 s, depending on brand and class offilm.
Faults from fixer include (1) rise in pH(decreased hardening), wet films andpoorer archival quality; (2) dichroic stain(reaction of developer with silver loadedfixer); (3) streaks from nonuniformremoval (that is, from nonuniformneutralization of the developer);(4) precipitation resulting from too lowpH; (5) brown stain (produced by theformation of hydroquinonemonosulfanate) from electrolyticoxidation of carryover developer, with lowsulfite content.
WaterWash water is a photographic processingchemical whose purpose is to dilute orwash out the residual fixer chemicals.Water’s action is to swell the emulsionand the rate is usually 11 L·min–1 =180 mL·s–1 (3 gal·min–1).
Na SO + S Na S O2 3Sodium
sulfite
Sulfur2 2 3
Sodiumthiosulfite
→
Washing steps are included inphotographic processing to removereagents that might adversely affect lateroperations — and at the end of processingto eliminate all soluble compounds thatmight impair the stability of the film.Water removes fixing salts contaminatedwith dissolved silver compounds in theform of complexes with the thiosulfate.Failure to remove these silver compoundseventually causes stain in the highlightsand the unexposed areas, whereas thepresence of thiosulfate, its oxidationproduct tetrathionate and otherpolythionates will, with time, cause slowsulfiding of the image. This stain is silversulfide (Ag2S) and is called hypo retentionstain. The rate of diffusion of thiosulfatefrom emulsion is affected by (1) amountof silver image present, (2) pH of the fixer,(3) type of thiosulfate, (4) degree of fixerexhaustion, (5) temperature of wash,(6) agitation rate, (7) water flow rate and(8) wash apparatus design.
In the counter current principle, the waterenters at the point where the films exit,the films leave uncontaminated water.One thousand square feet of film willdeposit about four troy ounces of silver ina stagnant water tank. Agitation isnormally supplied as a function of thewater volume (replenishment flow rate)and directly affects efficiency.Hypo Retention. Hypo retention is theamount of residual hypo or thiosulfateremaining in the emulsion after the filmis processed. Hypo retention levels willvary with different brands of film. Thetype of processor, processing cycle and thesituation of the chemistries haveinfluence on hypo retention levels. Theamount of residual hypo, which affectsthe archival qualities of the radiograph, ismeasured in microgram of thiosulfate persquare inch of film (µg·in.–2) ormicrogram per square centimeter(µg·cm–2). The upper limit of 4 µg·cm–2
(25 µg·in.–2) of retained thiosulfate isaccepted for storage in excess of five years.A retention level higher than this maycause a general brown stain to appear onthe film. Film with a level of 500 willusually last only one year before stainappears and the film becomes legallyuseless.
Hypo retention tests, requiring thenormal processing of an unexposed film,should be made twice a year. Write downthe processing conditions (time,temperature, chemical age, processornumber, date and so on) and submit to atechnical representative to have ananalytical test made. Hypo estimator kitsare available from X-ray film dealers andare used on a daily basis to indicate ageneral go/no-go status. These kits areconvenient and very useful but are onlyestimators. It is important to have an
235Radiographic Film Development

236 Radio
3RT09_Layout(219_252) 10/2/02 2:07 PM Page 236
analytical test made periodically and tocompare the test results to the estimates.
However, the most important aspect ofsilver sulfide formation is the storageconditions. Films held in long termstorage require the same ambientconditions as fresh film: 21 °C (70 °F) orcooler and ≤60 percent relative humidity.Even with low hypo retention levels,unwanted stain can result from improperstorage — for example, 32 °C (90 °F) and90 percent relative humidity. If films mustbe kept, then they must be kept withoutstain.Water’s Mechanical Function. Water isrequired primarily to wash the fixer out ofthe film; this is its chemical function.Mechanically, the wash water is either thesource of heat for the developer solutionor the primary developer temperaturestabilizer in automatic processors. Inmanual processors, the developer andfixer tanks sit in a larger tank filled withcirculating water at a selectedtemperature. The water controls thetemperature of the other chemistries. Inautomatic processors, the wash waterflows through a heat exchanger at about3 °C (5 °F) less than the desired developertemperature. The cooler water and thewarmer developer are in proximity with acommon steel wall. The cooler water picksup heat from the developer, causing thedeveloper thermostat and heater torespond more rapidly and thereby providegreater stability. The fixer tank in anautomatic unit is usually heated by thedeveloper on one side and cooled by thewash on the other side. The wash watertank also provides an insulation barrierbetween the hot dryer section and thechemical section.
Summary of Film DevelopmentChemistryChemistry necessitates reaction controls,such as the time and temperaturetechnique of processing. Filtration,circulation, pumping, metering,replenishment system, emulsioncharacteristics, transport systems, aerialoxidation, contamination and chemistryaging are all various aspects of thechemistry system in the processing ofradiographs. It is these things that greatlyinfluence the processing of radiographs toobtain optimal informational integrity. Ithas been rightly stated that “radiographybegins and ends in the darkroom” andthat “processing completes what theexposure started.”
The only real difference betweenmanual and automatic processingchemistries is the developer hardener andthe only real difference in the twotechniques is the increased degree ofconsistency derived from the machine.
graphic Testing
Manual processing can be as fast asautomatic but there are many variableswith the human operator controllingtime, agitation, replenishment and otherfactors. On the other hand, the automaticprocessor, although consistent, is notentirely automatic and may produceconsistently good or consistently badproduct depending on the knowledge ofand control by the operator.

PART 3. Darkroom3
3RT09_Layout(219_252) 10/2/02 2:07 PM Page 237
Darkroom Technique
PrincipleThe radiographic darkroom is two things:a scientific laboratory and a dark room. Adarkroom, where the lighting is kept at avery low level with special filters, must beconstantly tested to ensure that it isindeed dark. The reason is that the X-rayfilm is sensitive to light and will turnblack when developed. X-ray orradiographic film can be affected by heat,light, humidity, static electricity, pressure,chemical fumes and radiation. Toestablish and maintain a desired level ofquality, all variables that can alter thescientific processes in the darkroom mustbe known and eliminated. A routinesystem of checking these variables mustbe made.
To reinforce the idea that the darkroomis indeed a scientific laboratory, eventhough it exists in the dark, two pointsmay be considered.
1. Radiographers strive to makeradiographs with excellent quality.The most common cause ofunsatisfactory radiographs is fog, anoninformational density or blacknessfrom silver deposits that occur in thewrong place and mask over thevisibility of detail. As mentionedabove, many forms of energy causeradiographic film to become blackwhen developed. Once radiationexposure has been made theradiographic film becomes at leasttwice as sensitive to all types of energy,so extreme care is required in workingin the darkroom laboratory.
2. The darkroom laboratory existsbecause processing in a very precisemanner is required to change thelatent image formed by the exposureinto the useful visible image.Processing is an exact science based ona scientific principle called the timeand temperature technique ofprocessing. This time and temperatureprinciple is based on a controlled levelof chemical activity monitored by thetechnician. Processing is completelyvital to radiography and must beperformed completely.
The darkroom laboratory should be, by itsdescriptive name, light tight and shouldhave all of the requirements andequipment of a laboratory. Mostlaboratories are well ventilated, wellorganized, clean, pleasant and safe placesto work.
DesignThe basic requirement for designing adarkroom is usually available space. It ismost unfortunate when the darkroom isconsidered so unimportant that it iscrowded into a former closet or basementarea. Any darkroom must be designed sothat there is a smooth and orderly workflow pattern.
The layout of a darkroom is generallyconsidered to be either for centralizedprocessing or decentralized (dispersion)processing. Centralized processing has,until recently, been the mostadvantageous system. However, somelarge industrial facilities have found that,with the convenience of automaticprocessors, dispersion processing anddarkroom location are suited to the needsand requirements of increased workloads.
Darkroom layout should first bedesigned for convenience and safety.Consideration must be given to savingsteps and time for the darkroompersonnel, because darkroom efficiency isdirectly related to exposure planningefficiency. Because the darkroom is alaboratory, every applicable safetystandard must be followed. Separate thedarkroom into a wet and a dry area andkeep these areas as far apart as possible.Keep surfaces dry and clean. There shouldbe adequate ventilation to provide asufficient supply of fresh, clean air. Dust isvery destructive in the darkroom becauseit scratches films, salt screens andequipment, resulting in permanentdamage. Metal filings (carried byradiographers’ hair or clothes into thedarkroom) can adversely affect thedeveloper and cause artifacts on the film.
Near the darkroom should be a viewingroom, sometimes referred to as thelightroom, in which processed films aresorted and organized and some suppliesmay be stored. The most important aspectof this area is the availability of viewboxes.
237Radiographic Film Development

238 Radi
3RT09_Layout(219_252) 10/2/02 2:07 PM Page 238
Equipment and Practice
MaintenanceIs is a recommended practice to spongeoff routinely the outside and inside of amanual solution tank cover. Alwaysreplace tank covers when solutions arenot in use to minimize oxidation,contamination and dust. Dust sticks to awet surface, so always wipe up spills asthey occur and buff surfaces dry.Periodically wipe down walls and shelves(including side walls of shelves). Makesure the room is light tight, free of strongchemical fumes and radiation protectedthrough the establishment andcontinuation of a regular maintenanceschedule. Time, money and effort aresaved through a few minutes ofpreventive maintenance per day.
Inspect the darkroom at the beginningand end of each shift or work day. Cleanup and put things in their places. Makesure adequate supplies are on hand foreach day’s workload.
Every darkroom should have a mopand bucket for floors and sponges forcleaning walls, surfaces and the processingequipment. A source of hot water isnecessary for cleaning, lintless rags forwiping surfaces dry, a calibrated bimetallicor electronic thermometer for checkingtemperature and nonmetallic scouringpads for removing chemical encrustations.Do not use soaps or detergent around theprocessing solutions. Protective waxes canbe applied to the exterior surface. Sparesafelight bulbs, laboratory brushes,beakers, funnels, graduates and carryingbuckets are all useful. Keep everything inits place so that it is easy to locate, evenin the dark.
Darkroom LightingFor general darkroom lighting, eitherdirect or indirect sources of light aresatisfactory. White or light colored wallsand tested ceiling safelight fixtures givegood overall illumination. Directsafelights may be located over the loadingbench and processing tanks or theprocessors.
SafelightsAll illuminators should be testedthoroughly and frequently to avoid lightfog. This testing procedure is suggested:expose a film to very low intensityradiation to produce an approximatedensity of 0.50. Unload the film in totaldarkness and place it under a mask underone safelight. Turn on the safelight.Uncover sections of the film at oneminute intervals until a maximum
ographic Testing
exposure of ten minutes has been given.Turn off the safelight. Develop the filmnormally but in total darkness. Processand test the film. The time required toproduce an increased trace of fog indicatesthe time limit for the safelight fixture.
Extraneous light in the darkroom isjust as bad as stray X-radiation and mustbe eliminated. Possible sources of whitelight leaks are doors, windows, keyholes,ventilators, joints in walls and partitions.To monitor monthly for stray light, enterthe darkroom and wait for the eyes toadjust for 15 min. Move around lookingfor light leaks. Look high and low. Makesure all lights are on in adjacent rooms.Correct any leaks and retest. Keep records.
The highest sensitivity of X-ray film isin the blue region of the spectrum.Therefore, safelights should be made withamber or red filters. Filters speciallydesigned for X-ray darkrooms areavailable from X-ray film dealers.
Unwanted RadiationBecause X-ray films are highly sensitive,they must be protected from accidentalexposure to sources of X-rays and gammarays.
If fogging of film occurs, the storageroom, if located near sources of radiation,should be checked for possible strayradiation coming from radium, radonneedles, radioactive isotopes, X-ray tubesor other sources. It is advisable to performthis test every six months as a precaution.
The following is a simple, inexpensivetest. Attach a small coin or equivalentpenetrameter with adhesive tape to eachof several X-ray films (use fastest speed) inplastic bags or cardboard holders (daypack works very well) and place them onthe bin and on the walls or the room inwhich films are stored. The coin is towardeach possible source of radiation. Aftertwo weeks, develop the films. If an imageof the coin appears on any of them,radiation may be reaching the stored filmsand should be eliminated.
Another technique is to use normalradiation testing devices such as apersonnel film badge or an ion chamberdevice. In the latter case, tests must bemade during full exposure. Film as atesting device provides indication ofaccumulated dose, if any.
VentilationIt is important that the darkroom be wellventilated. Ventilation provides comfortto the darkroom personnel and makes thedarkroom a better place to work.Ventilation helps to maintain properambient (room) temperature and relativeconditions vital to the proper storage offilm. Ventilation also helps to prevent

3RT09_Layout(219_252) 10/2/02 2:07 PM Page 239
artifacts from static electricity, handling ormoisture. In addition, adequateventilation is needed to keep harmfulchemical fumes from accumulating andaffecting either the darkroom personnelor the radiographic film.
Cleaning TanksCorrosion seldom occurs when the tanksare full of normal chemical solutions andare kept clean.
Deposits often form on the walls of thedeveloper tanks because of the actionbetween mineral salts dissolved in thewater and carbonate in the developingsolutions. These deposits can be removedby using commercially prepared stainlesssteel tank cleaner. Follow the directions ofthe manufacturer, being sure to rinse thetank walls with fresh water. Wipe the tankout with a clean cloth or cellulose sponge.
Clean the exterior stainless steel beforeany deposits can attack the surface. Wipewith a cloth and warm soapy water andthen rinse, making sure no soap depositsget into the chemistry. Once a week, use astainless steel cleaner according to thedirections on the label.
Always give special attention whencleaning welds and corners where depositscan cling. If deposits are heavy, removethe worst of them with fiber brush orplastic cleaning pad, then polish with astainless steel cleaner. If an abrasive isrequired, use a very fine sandpaper.
Use caution never to use metallicabrasives, steel wool or wire brushes, asthey can contaminate the surface ofstainless steel. Any foreign metal particleswill cause corrosion and may contaminatechemicals. Do not use commercial steelwool pads or strong detergents, becausethese are hard on the stainless steel andcould react unfavorably with thechemistry.
Cleaning IlluminatorsQuite frequently, good radiographs willappear dull because they are viewed onfaulty illuminators. Illuminators are faultywhen the glass plate is dirty or bulbs ofdifferent wattage, age, color or size areused. Old interior paint that is dull ordusty will cause the radiograph to appeardull. Use a regular photographic exposuremeter to test the illuminator. Identicalradiographic studies should be viewed atthe same intensity. An amperage metercan be installed to control uniformoutput.
Wash the outside of the viewing glassplate every day. Once a month wash outthe inside of the view box. Always usebulbs with similar intensities. Whenconditions indicate paint deterioration,unplug the illuminator, remove the front
diffuser and wash it. Then paint theinside with a good, durable white enamelfinish.
Avoiding StaticThere are two ways to avoid markings onX-ray films. One is to prevent thegeneration of static electricity; the other isto cause such charges, once generated, toleak off gradually rather than to dischargerapidly, which is what causes damage.
The most successful procedure is tokeep a high relative humidity in thesurrounding atmosphere. An accurateinstrument for measuring relativehumidity, called a psychrometer, is avaluable addition to any radiographicdarkroom. Periodic checks on prevailingdarkroom humidity enable one to takespecial precautions necessary to minimizethe generation and discharge of staticelectricity. The relative humidity in thedarkroom should be between 40 and60 percent.
The following precautions will be ofassistance in overcoming the mostcommon causes of static:
1. If using X-ray film that hasinterleaving paper, handle film gently.Let the interleaving paper fall awayfrom the film and place film in thecassette gently, without sliding it overthe screen.
2. Following X-ray exposure, the cassetteor holder should be opened slowlyand the film removed carefully. Thereason for careful handling is that thefilm is more than twice as susceptibleto an energy source once it is exposed.Thus, a film will react to much smallerelectrical discharges after exposure.
3. Move slowly when handling the film.4. Make sure everything is grounded.5. Use X-ray antistatic salt screen cleaner
regularly.6. Avoid static generating synthetic
clothing.
Grounding. Electrically ground the metaltop of the film loading bench, film bin,X-ray table, pass boxes and otherequipment such as processors. In thedarkroom, avoid nonconductive floorcovering (rubber tile), hard floor waxes onconcrete, rubber soled and plastic soledshoes, intensifying salt screens with wornsurfaces and using a dry cloth to cleanintensifying screens. A camel hair brushor vacuum cleaner should be used fordusting and a lintfree cloth and screencleaner with antistatic solution should beused for washing intensifying salt screensurfaces. In periods of low ambienthumidity (winter time or northernclimates), when static is prone to occur,antistatic solution can be applied to
239Radiographic Film Development

240 Rad
3RT09_Layout(219_252) 10/2/02 2:07 PM Page 240
intensifying screens as added protectionagainst static discharges.Common Static Marks. Three kinds ofstatic markings are illustrated in Fig. 15.Crown and tree are considered to be resultsof heavier electric discharges. They can begenerated by very rapid motions, such asoccur when film is removed frominterleaving paper, when interleavingpaper breaks contact with the film orwhen the film is touched by fingers.Smudge static markings may result fromphotographic exposure to visible lightproduced by sparks in air next to the film.Smudge static is produced when relativelylow potential discharges occur over a largearea.
Color ConditioningSurfaces above the working area should befinished with a dark matte paint tominimize reflected light.
Storing X-Ray FilmRecommended storage conditions for alltypes of X-ray films are temperaturesbetween 18 and 24 °C (65 and 75 °F) and40 to 60 percent relative humidity.
Usually most radiographic facilities willhave two storage areas. One area is forlong term supplies and another, usuallythe darkroom, is for short term needs. Ineither case, it is required that a stockrotation plan be instituted. The plan isquite simple in that as new film arrives, itis placed on the right side of the supply.As the film is needed, it is removed fromthe left side. This is called a FIFO system:first in, first out. To assist in rotating filmboxes, remember that all film boxes havean emulsion number and an expirationdate on the end label. A system many
iographic Testing
FIGURE 15. Static electricity markings:(a) smudge; (b) tree; (c) crown.
(a)
(b)
(c)
people use is to write on each box thedate when it is received. Whatever systemis used, be sure to keep records and alwaysuse the oldest film first. Film must bestored and inventoried by expiration date,film brand, type (class) and speed.
Film boxes should be stored on theiredges. This distributes the weight andhelps protect the film from pressuremarks.
When using one box at a time or whenthere is no film bin, always be sure to foldover or close the bag and to replace thelid after each film is removed. Film ispackaged in hermetically sealed light tightand moisture proof pouches — forexample, black polyethylene oraluminized plastic. Once the pouch isopened to expose the fresh film there isstill enough bag remaining to fold over tomake the bag light tight again. Thisfeature is not to obviate the box top orfilm bin but is an added safeguard.
Cassettes should not be stored forprolonged periods of time loaded withfilm. Load cassettes and holders with freshfilm before each use.

PART 4. Processing Technique3
3RT09_Layout(219_252) 10/2/02 2:07 PM Page 241
PrincipleProcessing completes what the exposurestarts. After the exposure is made, the filmis removed from the cassette and placedon a hanger. The film is processed. This isthe simplicity of radiographic processingbut there is obviously more to forming avisible image radiograph.
There is indeed an exactness to manualprocessing. This is a controlled scientificprocess in which something in one form(the latent image) is converted intoanother form (the visible image). Nomatter how superior the exposuretechniques are, if anything less thanoptimal processing technique is permittedthen an image less than optimal willresult.
Equipment and Practice
ThermometersIn developing X-ray films by the time andtemperature system, an accuratethermometer is of the utmost importance.Service thermometers should be checkedat regular intervals against a thermometerwhose accuracy is known. They should begraduated in degrees or, better, in halfdegrees.
A thermometer should be read while itis inserted in the thoroughly mixedsolution. To avoid parallax, thethermometer should be held so that animaginary line from the eye forms a rightangle to the axis of the thermometer. Tofurther avoid this problem, a bimetallic orelectronic thermometer might beconsidered.Safety Warning. Never use glassthermometers containing mercury oriodine. If the glass breaks, the mercury oriodine can be hazardous to personnel anddeveloper.
Mixing SolutionsMake sure the solution tanks are clean.Carefully read the instructions on thechemical container. Mix as recommendedat the suggested temperature to ensuresatisfactory performance. Avoid hightemperatures, inclusion of air andcontamination during preparation. Stir
thoroughly but not too violently or toolong.
If the processing solutions do not seemto be working well enough, answer thesefour questions.
1. Are the tanks really clean?2. Are solutions properly mixed? Were
they mixed in the right sequence?Were they overagitated?
3. Are temperature and timer accurate?4. Are the exposure techniques accurate?
Water for ProcessingThe water temperature for mixing shouldbe ± 3 °C (±5 °F) of the manufacturer’srecommendation.
The rule of thumb is to use water ofdrinking quality. In spite of the variety ofimpurities in water supplies, most citywater in the United States is pure enoughfor photographic processes.
Time and Temperature TechniqueThe time and temperature techniqueprovides the controlled basis for obtainingconsistent, optimal radiographicinformation. This scientific technique alsopermits alteration of the processing cycleto suit specific needs and requirements.
Regardless of the optimal time andtemperature recommendations for a givenchemistry and film, it must beremembered that everyone has differentlikes and desires. With this in mind,consider that faster processing, higher orlower contrast, greater speed, less densityand other considerations can be alteredthrough the judicious use of the time andtemperature technique. At a giventemperature, longer times willoverdevelop the film, increasing density.At a given time, higher temperatures willcause overdevelopment fogging (increasednoninformational density) of the film.This does not mean that sightdevelopment is advocated. No one shoulduse anything but the specific time andtemperature technique.
DevelopersOptimal radiographs require correctdevelopment. The developing time to befollowed differs with the processed filmtype, the developer type and theprocessing solution temperature.
241Radiographic Film Development

242 Rad
3RT09_Layout(219_252) 10/2/02 2:07 PM Page 242
Radiographs require just the rightamount of contrast. Too much reducesthe range of densities covered by a singleexposure; the thinner parts become toodark and the thickness ones too light.Conversely, insufficient contrast, thoughit affords more latitude in exposure,lessens the total differentiation, therebyobscuring fine details. To achieve an idealcontrast, a given type of X-ray film shouldbe developed in the same brand ofsolutions using the time and temperatureand replenishment characteristicssupplied by the manufacturer.
Compensating for DeveloperExhaustionReplenisher Technique. Replenishersreplace the reducing agents as they areexhausted and, if added correctly, obviateadjustment of developing time tomaintain constant density and contrastover the useful life of the developer.Replenishers should be mixed as directedon the label and should be addedfrequently and in small amounts tomaintain the developer level; if anamount greater than 10 percent of thedeveloper tank volume is added at onetime, fog may increase. The remainingreplenisher should be kept in a tightlystoppered bottle or in a plastic jug or tankwith a floating lid and dust cover.
Because developer exhaustion dependson the type of film emulsion and the filmdensity as well as the film area, thequantity of replenisher per 355 × 430 mm(14 × 17 in.) film will not be constant. Asa rule, about 90 cm3 (3 oz) of replenisherare required for each 355 × 430 mm(14 × 17 in.) film processed.
Quality Control ofProcessingMaintenance of the time and temperaturetechnique of processing depends on somesystem of quality control. Quality controlkits are available to give experience tooperators and help them set up their ownprogram. A simple quality control test isto use the same cassette or film holderand a step wedge with known exposure,film and processing techniques. Establisha control film and routinely make testfilms that can be compared to the controlfilm. Keep exact records as a personalteaching and record file.
Processing of a radiograph is done inan automated processor to achieveconsistent quality. The processing systemis a chemical process with specificconditions of time and temperature basedon a given chemical activity. Goodprocessing makes good radiographs.
iographic Testing
Processing quality control is a procedureof monitoring to see if, and to whatextent, there is consistency. Consistency isnecessary before quality can be improved,because the variables of processing mustbe identified, their degree of fluctuationand cycling patterns noted and the limitsof acceptability established. Once theuncontrolled variables are identified, thebest control measure will be moreapparent. Sometimes, the variable mayhave to be compensated for, minimized oreliminated. Also, in this process ofidentifying and controlling the variables,indications are often provided as to thebest way to consistently achieve optimumquality.
SensitometryThe study and measurement ofrelationships between exposure,processing conditions and film responseto exposure are known as sensitometry. Theproperties of a film that affect or governthe relationships are known assensitometric properties. Quality is definedby the sensitometry of the visible image.Processing is the vital link between thelatent image and the visible imageradiograph; careful control of the manyfactors involved is essential. Establishingprocessor quality control to maximizeuniformity is desirable.Control Strips. Each day control strips areprocessed periodically and read on adensitometer. The changes in densitylevels of the exposure are plotted and thecharacteristic curve is generated. Speedand contrast can be determined. Thissystem is the professional approach toquality control. The matched exposureradiographs are easily duplicated from dayto day. Check the processor, note theconditions mentioned below and processthe control strip. This control stripbecomes the master and subsequent dailystrips are simply matched to it. Deviationsfrom the master strip necessitateinterpretation, investigation, andcorrective actions. The master test stripshould be processed under optimumconditions of chemistry and processorperformance.Density. Density and adequate differencesin density (contrast) are considered themost important of all properties in theradiograph. Proper densities and adequatecontrast make visible the structural detailswithin the image of the object.Radiographic density has been defined asthe amount of film blackening that is theresult of metallic silver deposits remainingon the film after exposure and processing.A useful way to measure the amount offilm blackening is to measure itsinterference with a beam of light passingthrough a radiograph. The amount of

FIGURE 17. Speed shifts.
3RT09_Layout(219_252) 10/2/02 2:07 PM Page 243
light absorbed by the film is measuredwith a densitometer.
Sensitometrically, density is defined asthe common logarithm of the ratio of theamount of light striking one side of theradiograph compared to the amount oflight that passes out the other side. Whenthe metallic silver in the emulsion allowsone tenth of the light to pass through,this ratio is 10:1. The common logarithmof 10 equals 1 and the silver deposit issaid to have a density of 1. Density cannow be defined by the equation:
(8)
where D is density, Ii is intensity of lightincident to the film and It is intensity oflight output transmitted through the film.
The data obtained by sensitometricprocedures are usually plotted in the formof graphs. Figure 16 shows a typicalcharacteristic curve of an X-ray filmexposed with intensifying salt screens.The portion of the curve designated as thetoe demonstrates the nonlinear responseof the emulsion to relatively smallamounts of radiant energy. With uniformincreases in exposure, the density buildsup slowly until the linear response part ofthe curve. Along this straight line thedensity increases uniformly with thelogarithm of the exposure until thenonlinear shoulder of the curve is reached.The shoulder is produced when slatscreens are used. Additional exposureresults in smaller increases in density to apoint where additional exposure does notproduce greater density.Contrast. Contrast by definition is thedifference between two densities. As aradiograph is viewed on an illuminator,the difference in brightness of the variousparts of the image is called radiographiccontrast. This is the product of twodistinct factors: (1) film contrast, inherentin the film and influenced by thedeveloping process; and (2) subjectcontrast, a result of differential absorption
DII
= log i
t
FIGURE 16. Characteristic curves.
Den
sity
5.0
4.0
3.0
2.0
1.0
1 2 3 4 5
Relative log E
Class IV filmsalt screens
Class II filmdirect exposure
Shoulder
Straight lineportion
Toe
of radiation by the subject. Althoughradiographic contrast can be altered bychanging one or both of these factors, it isgood practice to standardize the film andprocessing procedure and to controlradiographic contrast by changing subjectcontrast. Contrast can be changed easilyby adjusting the kilovoltage or generalexposure technique to alter the quality ofradiation. Sensitometrically, contrast refersto the slope or steepness of thecharacteristic curve of the film; this is alsocalled gamma.Gamma. Gamma is the slope or steepnessof the straight line portion of thecharacteristic curve. In plotting acharacteristic curve, density (a logarithmicvalue) is most often plotted against logrelative exposure. Exposure is defined asthe intensity multiplied by the time; itcan be expressed in exposure units, suchas J·cm–2 (107 erg·cm–2) of X-radiation.Relative exposure is much moreconvenient and equally useful.X-radiography exposure is expressed interms of milliampere seconds (mA·s) ormilliampere minutes (mA·min). Then ifthe amperage is doubled, the exposure isdoubled, kilovoltage peak remainingconstant. If the kilovoltage remainsconstant, the ratios of the exposurereaching the film through two differentregions of the subject are always the same,no matter what the values ofmilliamperage, time or distance from focalpoint to film. For example, two exposures,one of which is twice the other, willalways be separated by 0.3 on thelogarithmic exposure scale (the logarithmof 2 being 0.3).Speed. It has been determined that thecontrast of a film is indicated by the shapeof the characteristic curve. Speed isindicated by the location of the curvealong the exposure axis. The faster filmwill lie toward the left of the graph. InFig. 17, film A is faster than film B but has
243Radiographic Film Development
5.0
4.0
3.0
2.0
1.0
Den
sity
1 2 3 4 5
Relative log E
Class II film
Class I filmClass IVwith
salt screens
A B

244 Rad
3RT09_Layout(219_252) 10/2/02 2:07 PM Page 244
the same contrast. The separation of thefilms is a measure of the speed difference.Film A requires less exposure to achieve aspeed point of density 2.00 above baseplus fog. Film B requires more exposure,so it is said to respond slower or be lessfast. The convenience of using relativeexposure also applies to speed. The speedof one film can be expressed on a basisrelative to another film when one is madethe standard of comparison. Thisreference film can be assigned anyarbitrary speed value, such as 100. Ifanother film requires only half theexposure to reach the same density as thereference film, the faster film will have arelative speed of 200. A density of 2.00above base plus fog has been designatedas the density to compute film speed. Thisdensity has been chosen because itrepresents the minimum useful densityrange for much of radiography. For lowerdensity films, speeds are often calculatedat the lower density of 1.00.
FixerFailure to fix a film sufficiently results inits discoloring with age. A good rule ofthumb for determining the minimumfixing time is as follows. After a film hascleared, leave it in the fixer an additionaltwo times as long as it took to clear. Forexample, if it takes 1 min for a film toclear, then it should be left in the fixer atleast an additional 2 min or a total periodof 3 min.
To prepare fixing baths from liquidconcentrate fixer, it is essential thatdirections on the container be followed.Attention is paid only to the temperatureof the developer, because fixertemperature is less critical; however, athigh temperatures, it is important that theprocessing baths be maintained at aboutthe same temperature. Changes intemperature cause the gelatin of theemulsion to swell and contract. When thetemperatures of two baths differexcessively, this change in the gelatintakes place so abruptly that unevenness islikely to result. The effect produced onthe film is known as reticulation — thegelatin breaks, producing fine cracks.Archival Quality. The importance ofadequate fixing to archival keepingquality cannot be overemphasized. Poorlyfixed films will not deteriorate until manymonths after processing. The lighterportion of a radiograph may becomeyellow and the image may tend to fade.This delayed action may be traced back tothe nature of the fixing process, which isbelieved to consist of two steps.Undeveloped silver halide is firstconverted to silver thiosulfate complexesthat are only slightly soluble. The reaction
iographic Testing
then proceeds to form soluble compoundsthat are removed by washing.
Inadequate fixing leaves small amountsof these complexes that cannot beremoved by normal washing. In time,these residues break down and react withthe silver image to form silver sulfide(Ag2S). This sulfide is usually yellow butmay range from pink to brown. It cannotbe easily removed from the radiograph.Extremely minute amounts of residualthiosulfates are sufficient to cause seriousdeterioration. Therefore, the radiographmay appear transparent and at the sametime be inadequately fixed. For thisreason, close attention to recommendedfixing technique is mandatory.
WashingRadiographs must be washed thoroughlyto prevent discoloration with age and toensure preservation of the image.
DryingAvoid temperatures above 49 °C (120 °F)in drying and maintain a steady volumeof air across the film surface. Anexcessively low relative humidity withinthe dryer may cause water spot dryingmarks and streaks on the film surface.
SafetyDeveloper, with its hydroquinone andalkalinity, forms a very hazardoussolution. Always use good ventilationwhen mixing chemicals. A nose filter orrespirator is suggested when powderedchemicals are mixed. Goggles are requiredby the United States Occupational Safetyand Health Administration to protect theeyes.10 In addition an eye wash station isrequired. If developer gets into the eye theworker must begin washing within 15 sand continue washing for 15 minminimum. Washing for 1 h is preferred.
The developer is most hazardous butcare must be taken when working withfixers also. In addition to the above,rubber gloves will protect the skin andkeep chemicals out of cuts; rubberized orplastic aprons will protect the worker andclothing.
Clearing Film BaseLiquid laundry bleach will dissolve thegelatin and produce a clean, clear sheet ofbase plastic. Warm solutions work faster.Enzymes could be used but are veryhazardous.

3RT09_Layout(219_252) 10/2/02 2:07 PM Page 245
Removing Developer Stains fromHandsDeveloper solutions should be consideredhazardous and hands should not beroutinely submerged in them. Rubbergloves should be worn. When manuallyprocessing or working on automaticprocessor rack components where contactis prevalent, be sure to rinse handsfrequently in fresh water. In manualprocessing make sure hands are rinsedwhile rinsing or fixing the film.
Automatic ProcessingAutomatic processing is a chemicalreaction performed in a machine; it isoften spoken of as if the machine werethe important part. However, since theintroduction in 1957 of a roller transportprocessor, processors have providedimproved consistency over manualprocessing. But humans control themachine as they control manualprocessing, only less frequently. Keep inmind that automatic processing producesconsistent quality; the quality will beconsistently good or bad depending onthe operator.
There are three distinct advantages toautomatic processing: consistent quality,improved quality and economy of timeand labor. Given a well functioning,properly adjusted machine, film after filmwill be of better quality from the machinethan from a person sight developing. As aresult, processors have found their wayinto small and large laboratories, trailersand the backs of pickup trucks.
Automatic processing developerchemistry has a hardener that isextremely important in controlling theamount of emulsion swell. Anoverswollen film can result inoverdevelopment fog, uncleared films,poorer archival quality, wet films andincreased transport problems. Automaticchemistry is usually replenishedautomatically to sustain volume andactivity.
In an institution or laboratory all theprocessors may be located in one centraldarkroom and processing area or inseveral areas. The major advantage ofcentralization is that one darkroomperson can feed several processors, savingspace and manpower. The main advantageof dispersed or decentralized processing isthat the processor can be placed indifferent areas, such as production,quality control and research, to reducedown time and the confusion ofintermixed films. The major disadvantageis increased space and manpower. It is agood idea, with dispersed processing, tocentralize the mixing and distribution of
chemicals to various locations and toreturn spent fixer to central collection andrecovery area.Daylight Installation. In daylight, a filmdispenser dispenses films into hardcassettes. After exposure the film is feddirectly into a processor, sitting in alighted area, by means of an unloading,feeding device. Film is never touched byhumans until after processing. Processorscan be placed virtually anywhere there areutilities. There is no darkroom orassociated personnel.Darkroom Installation. In a conventionaldarkroom, the processor may be installedtotally inside the darkroom. The best wayis to put the bulk of the unit outside thedarkroom to reduce heat inside. Somepeople put the bulk of the unit inside thedarkroom so that any jams can be clearedin the dark. The disadvantage of thissystem is that all service requiring whitelight necessitates closing down thedarkroom. An alternative would be to putthe bulk of the unit in the outer room butconstruct the room so that it can becomea darkroom.
All processors should have a minimumof 600 mm (24 in.) access on a side. If thisis not possible the processor can be madeportable on wheels or skids with quickdisconnects to allow easy service. Near theprocessor there should be a floor sink forwashing racks or the entire processor maybe placed over a large grill work with adrain below.Automatic Feeders. Automatic feeders areavailable for some makes of processors,which allow a stack of films to be placedin the feeder and the lid closed; theoperator can do other jobs as the feederautomatically feeds films. Feeders requireadjustment and periodic monitoring. Inaddition, it may take twice as long to feedone sheet of film automatically as itwould manually, because of the cycle timeand delay of the mechanism, especially atthe faster processing times (in excess of7 min).
Darkroom WorkflowAn automatic processing darkroom sharesmany of the features of a conventionaldarkroom but there are significantdifferences. No provision need be madefor hangers or hanger storage. Deep tanksfor developing and fixing solutions andfor washing and drying may beeliminated, because these operations takeplace within the automatic processor;however, deep tanks may be retained fortraining and emergency use. Only theinput end of the processor needs to belocated within the darkroom. Dualprocessor installation is convenient. Tohandle peak loads, both machines are
245Radiographic Film Development

246 Rad
3RT09_Layout(219_252) 10/2/02 2:07 PM Page 246
operated simultaneously; one suffices atother times.
Processing ChemicalsProcessing chemicals for automaticequipment differ from deep tankchemicals. Never attempt to useconventional chemicals in automaticprocessors. Although the basic chemicalreactions are similar, automatic processingchemicals are especially formulated forhigh speed roller operation. Modernautomatic processing chemicals makepossible maximum ease of use anduniformity of finished radiographs,regardless of the make of processor.
Although all chemicals operateefficiently with any make or speed of film,they generally provide best results withthe same brand of film. In addition, usingcompanion products causes fewervariables and is better understood by amanufacturer.
All ingredients, plus full instructions,are included in each package of developer,fixer and starter solution. These chemicalsare prepared in strict conformity withbasic formulas known to produceexcellent results. When properly mixedand cared for, they operate efficiently overlong periods of time.
Finally, clean the work area andequipment and put the equipment away.Then install the crossovers and preparethe processor for operation. Thisinstallation of fresh chemistry should beentered in the processor log book.
Cleanup and InspectionOperating instructions for each processoralso include suggestions for cleaning andinspection. In general, these proceduresrequire little time and trouble but thisdoes not minimize their importance. Theycontribute substantially to efficientoperation and to maintenance ofoptimum film quality.
Solution ServicesIn many localities, specializedorganizations handle the mixing andmaintenance of chemicals for automaticprocessing equipment. These servicesinclude routine inspection, cleaning andrefilling. Although the services areprovided by professionals, it is still goodpolicy for each X-ray department to haveits own in-house specialists and toperform routine, daily inspection.
iographic Testing

PART 5. Silver Recovery3
3RT09_Layout(219_252) 10/2/02 2:07 PM Page 247
The scarcity and high price of silver makeits recovery from fixing baths importantfor ecological, environmental andeconomic reasons. Fixer contains about40 percent of the original silver in thefilm. Laws and standards in the UnitedStates establish limits for dissolved silverand forbid its disposal in drains.10,11 Thisconsideration is in addition to silver’sscarcity and value. Even the smallest usershould treat the used fixer to removesilver — the money recovered will pay forthe effort.
Recovery TechniquesThe techniques of recovery are chemical(which includes precipitation and metallicreplacement) and electrolytic. Metallicreplacement is simplest but requires a lowvolume continuously. Electrolysis isrecommended for higher volumeprocessors.Metallic Replacement. If a fixer solutioncontaining silver ions is brought intocontact with a metal, the less noble metal(such as steel wool, zinc, copper or steelturnings) is replaced by the silver. Thesilverless fixer cannot be reused.
Metallic replacement units, also calledbuckets or cartridges, contain steel woolor zinc screen and are usually used intandem. As the acid fixer breaks down theless noble steel, the more noble silvermetal precipitates as metallic silver. Asludge of iron oxide and silver forms inthe bottom of the container.
This technique is both inexpensive andefficient. It can remove 60 to 95 percentof the silver: 1 kg (2.2 lbm) of steel woolwill collect 3 to 4 kg (6 to 9 lbm) of silver.However, efficiency is based on a slow,steady, continuous flow of silver ladenfixer. Efficiency is about perfect for thefirst 25 percent of the unit’s lifeexpectancy, 400 to 800 L (100 to 200 gal)of silver laden fixer and then oftenbecomes only 30 percent effective. Also,the sludge produced by this technique isexpensive to ship and refine.Chemical Precipitation. Precipitation is achemical reaction that separates the silverfrom the solution in an insoluble, solidform. This type of unit, particularly thosethat use sodium sulfide and zinc chloride,produces toxic and volatile fumes and soshould be avoided. The units usingsodium borohydride are very efficient and
safe but require constant pH adjustmentby a technician.Electrolytic Recovery. Silver is recoveredby passing an electric current (directcurrent) through the silver laden fixer.Electrolytic recovery systems (called cells)are classified as agitated or nonagitated,high or low current density units. The twoterminals (electrodes) are a positivelycharged anode (usually graphite) and anegatively charged cathode of stainlesssteel. Positively charged silver ions (Ag+),are attracted to the cathode, where theyplate out as metallic silver (Ag°), calledflake. This is the most efficient techniquefor medium or larger installations.
Efficiency of Silver RecoveryEquipmentDuring processing, the developer convertsthe latent image bearing silver halidecrystals into a visible image — blackmetallic silver. Those crystals exposed butnot developed and those not exposed arewashed out in the fixer. In industrialradiography the silver is dissolved into thefixer in a ratio of more than 6 g·L–1
(1 troy oz·gal–1) of fixer. Silver recovery orreclamation is the process of convertingthe silver to metallic silver. Understandingthe factors that control the efficiency ofthis operation will help in understandingand upgrading existing systems or ingenerating specifications for new systems.Dwell Time. Sufficient time is required forthe reaction to occur. Electrolytic units(cells) are rated in troy ounce per hourcapacity. Buckets are rated in cubiccentimeters per minute or gallons perhour of fixer flow. Exceeding these limitswill result in silver going through the unitand down the drain.Agitation. Buckets provide agitation byflowing the fixer over the many wirefilaments. Electrolytic cells use pumps orimpellers. Greater physical agitationincreases the unit’s efficiency inproducing metallic silver and allowshigher plating currents to be used.However, agitation should not be soviolent as to cause splatter, spillover orexcess evaporation.Surface Area. The larger the surface areathe higher the plating current can be in acell. In any unit, increased area increasesrecovery rate.
247Radiographic Film Development
248 Rad
3RT09_Layout(219_252) 10/2/02 2:07 PM Page 248
Edge Effect. The edge effect is related tosurface area and electron flow efficiency;the more edges or surface area, the betterthe efficiency.Electrolysis. As the acid fixer enters thebucket the steel wool is attacked,producing chemical electrolysis. The steelbecomes oxidized to iron oxide and thesilver in solution becomes metal. Cellscontain an anode and a cathode, arectifier and a transformer to pass directcurrent through the solution. The higherthe current, the greater the efficiency. Toohigh a current (usually when little silver ispresent) can break down the fixer, this iscalled sulfurization and is to be avoided.Maintenance. All units require records,regular inspection and regularmaintenance to ensure proper use.Buckets can clog, back up or leak. Cellscan become too loaded with silver, shortout, blow a fuse or burn up an agitationpump. The amperage should beautomatically or manually adjustedaccording to the film (silver) volumeduring the day.Centralization. Centralized recovery is themost efficient system where three or moreunits are involved. A holding tank feeds asingle cell a continuous supply foroptimal efficiency.
Silver EstimationSilver estimating paper, which indicatesthe relative amount of silver per gallon ofused fixer, can be readily purchased frommost silver reclaimers. The test strips areused just like pH paper strips. Industrialradiography usually operates at a level ofabout 10 g·L–1 (1.2 ± 0.2 troy oz·gal–1).
An even simpler technique ofdetermining if there is any silver in thesolution is to put a brightly polishedcopper tube in the solution. Any silver inthe used fixer will quickly adhere to thecopper tube and give it a gray color.
Purchase tailing or central electrolyticunits according to the calculated capacityin gram per second. Collect the fixer inthe processor at cleaning time. If a silverrecovery unit malfunctions, disconnect itor isolate it so that it cannot ruinradiographs being processed.
Silver Recovery InstallationsTailing units may be buckets or cellsplaced individually or in tandem on eachprocessor. Usually buckets are used intandem, with the second becoming thefirst after every 400 to 1300 L (100 to300 gal) of fixer, depending on brand andsize. Properly sized cells should notrequire a tailing unit.
Recirculation cells take the fixer fromthe processor, remove most of the silverand return the fixer to the processor. This
iographic Testing
reduces fixer consumption and silver lostinto the wash. The major disadvantagesare increased cost of the cell andpotentially higher hypo retention levelsbecause of reduced fixer efficiency. Fixercan only be recirculated from cells —never from buckets or precipitation.The following precautions should beobserved when installing or operating anysilver recovery units:
1. Make sure than fixer overflow to thesilver recovery unit is a continuousdownward flow.
2. Clean the standpipe on metalexchange units regularly.
3. Ensure against air locks in electrolyticunits.
4. Be sure there is an air break(electrolytic break) between thesolution in the electrolytic recoveryunit and the incoming fixer. Withoutone, there is danger of plating silver inthe processor fixer tank.
5. Use the highest amperage possible foroptimal recovery — but keep it shortof sulphurization (characterized byyellow color and smell of rotten eggs).High amperage produces soft, blacksilver; low amperage produces hard,shiny silver but of approximatelyequal quality. The higher amperagehelps to ensure removal of most of thesilver.
Scrap FilmFilms that are to be discarded also havevalue for their silver content. About60 percent of the original silver remainsin the film to form the visible image. Bothwaste film and outdated records arevaluable and should be sold for theirsilver content.
Security and Selling RecoveredSilverIn radiography, business economicsrevolve around the cost of producing avisible image versus the value or price ofthe product. The single largest budgetitem is manpower, which must be usedefficiently.
Radiographic film is expensive. It mustbe kept in the best possible condition andprotected against abuse and theft,whether in its fresh or used form, throughinventory controls such as records, policyprocedures and security. Such programswill pay for themselves in improvedearnings.
Silver should be recovered from usedfixer and used films to reduce the cost ofthe original fresh stock. Because asubstantial value is represented byrecovered silver, it is important to imposeinventory and security controls.

3RT09_Layout(219_252) 10/2/02 2:07 PM Page 249
Fresh green (unexposed) film and blackor scrap (processed or discarded green)film represent money that is easilytransported or lost. Both conditions ofX-ray film require inventory controlsincluding records, proper storageconditions and security.
Of all the silver in the film, 40 percentgoes into the fixer and 60 percent remainson the film. Ninety percent of the silverfrom the fixer and 70 percent of the filmsilver may be recovered, giving a total ofof about 75 percent of the original silverthat is recoverable. Considering that thefilm costs are about five times the price ofsilver, only 10 to 15 percent of the film’sretail price may be recovered.
Specific SuggestionsSilver flake is derived from scraping off thecollection plate of an electrolytic silverrecovery unit (cell). There is littlesignificance whether it is silver coloredand hard (result of low current levels) orblack and soft (result of high currentlevels). A properly sized cell will collect 90to 95 percent of the silver, which will be95 percent pure. Dry the silver beforeweighing. (If weighed wet, deduct fivepercent of the weight for trappedmoisture).
Silver sludge from buckets should beshipped in solution in the bucket.Draining the fixer exposes the sludge toair and an exothermic reaction producesheat. If possible, the sludge should bedried in a large open pan and thenshipped. The sludge damages the refiner’scrucibles and the refiner charges more tohandle sludge than flake.
249Radiographic Film Development

1. Rivkin, W.B. and G. Wicks. Sec. 4,“Radiation Detection and Recording.”Nondestructive Testing Handbook,second edition: Vol. 3, Radiography andRadiation Testing. Columbus, OH:American Society for NondestructiveTesting (1985): p 174-185.
2. Quinn, R.A. and C.C. Sigl, eds.Radiography in Modern Industry,fourth edition. Rochester, NY: EastmanKodak Company (1980).
3. McKinney, W.E.J. Sec. 7, “RadiographicLatent Image Processing.”Nondestructive Testing Handbook,second edition: Vol. 3, Radiography andRadiation Testing. Columbus, OH:American Society for NondestructiveTesting (1985): p 299-376.
4. McKinney, W.E.J. RadiographicProcessing and Quality Control.Philadelphia, PA: J.B. LippincottCompany (1988).
5. Gurney, R.W. and N.F. Mott.Proceedings of the Royal Society ofLondon: Series A, Mathematical andPhysical Sciences. Vol. 164. London,United Kingdom: Royal Society (1938):p 151.
6. Gurney, R.W. and N.F. Mott. ElectronicProcesses in Ionic Crystals. Oxford,United Kingdom: Clarendon Press(1940).
7. Marstbloom, K., R. Kochakian,B. Vaessen and P. Willems. “AnalogFilm Radiography TechnologyAdvancements.” ASNT Fall Conferenceand Quality Testing Show 2001 PaperSummaries Book. Conference [Columbus,OH, October 2001]. Columbus, OH:American Society for NondestructiveTesting (2001): p 165-167.
8. ASTM E 1815-96, Standard Test Methodfor Classification of Film Systems forIndustrial Radiography. WestConshohocken, PA: ASTMInternational (2001).
9. ISO 11699-1, Non-Destructive Testing —Industrial Radiographic Films. Geneva,Switzerland: InternationalOrganization for Standardization(1998).
10. 29 CFR 1210, Occupational Safety andHealth Standards. Code of FederalRegulations: Title 29, Labor.Washington, DC: United StatesDepartment of Labor, OccupationalSafety and Health Administration;Government Printing Office.
11. 2001 TLVs® and BEIs®. Cincinnati,OH: American Conference ofGovernmental Industrial Hygienists(2001).
Bibliography
BooksBruce, H.F. Your Guide to Photography,
second edition. New York, NY: Barnesand Noble (1974).
Bunting, R.K. The Chemistry ofPhotography. Normal, IL: PhotoglassPress (1987).
Control Techniques in Film Processing. NewYork, NY: Society of Motion Pictureand Television Engineers (1960).
Eaton, G.T. Photographic Chemistry inBlack-and-White and Color Photography,fourth edition, revised. Dobbs Ferry,NY: Morgan and Morgan (1986).
Feininger, A. Darkroom Techniques. GardenCity, NY: Amphoto (1974).
Folts, J.A., R.P. Lovell and F.C. Zwahlen, Jr.Handbook of Photography, fifth edition.Albany, NY: Delmar ThomsonLearning (2001).
Gray, J.E. Photographic Processing, QualityControl and the Evaluation ofPhotographic Materials, Vol. 2. HEWPublication 77-8018. Rockville MD:Bureau of Radiologic Health (1977).
Gray, R.H., ed. Applied Processing: Practiceand Techniques. Washington, DC:Society of Photographic Science andEngineering (1968).
Gregg, D.C. Principles of Chemistry, thirdedition. Boston, MA: Allyn and Bacon(1968).
Haist, G. Modern Photographic Processing,Vols. 1 and 2. New York, NY: WileyInterscience (1979).
Herz, R.H. The Photographic Action ofIonizing Radiations in Dosimetry andMedical, Industrial, Neutron, Auto- andMicroradiography. New York, NY: WileyInterscience (1969).
James, T.H., ed. The Theory of thePhotographic Process, fourth edition.New York, NY: Macmillan (1977).
James, T.H. and G.C. Higgins.Fundamentals of Photographic Theory,second edition. New York, NY: Morganand Morgan (1960).
250 Radiographic Testing
References
3RT09_Layout(219_252) 10/2/02 2:07 PM Page 250

John, D.H.O. Radiographic Processing inMedicine and Industry. London, UnitedKingdom: Focal Press (1967).
Marcus, A. Basic Electricity. Upper SaddleRiver, NJ: Prentice-Hall (1958).
Mason, L.F.A. Photographic ProcessingChemistry. New York, NY: Focal Library(1975).
Mitchell, J.W., ed. FundamentalMechanisms of Photographic Sensitivity[Bristol, United Kingdom, March1950]. London, United Kingdom:Butterworths Scientific Publications(1951).
Pauling, L. College Chemistry: AnIntroductory Textbook of GeneralChemistry, fourth edition. SanFrancisco, CA: W.H. Freeman (1964).
Silver Recovery for Hospitals. Chicago, IL:American Hospital Association (1980).
Stiles, E. Handbook for Total QualityAssurance. Waterford, CT: NationalForeman’s Institute (1965).
Todd, H.N. Photographic Sensitometry: ASelf-Teaching Text. New York, NY:Wiley-Interscience (1976).
Todd, H.N. and R.D. Zakia. PhotographicSensitometry: The Study of ToneReproduction. New York, NY: Morganand Morgan (1969).
Standards
ANSI IT1.15, Photography (Films) —Industrial Radiographic Film (Roll andSheet) and Metal Intensifying Screens —Dimensions. New York, NY: AmericanNational Standards Institute (1994).
ANSI IT1.48, Photography (Films) —Medical Hard Copy Imaging Film —Dimensions and Specifications. NewYork, NY: American NationalStandards Institute (1997).
ANSI IT2.46, Photography — IndustrialRadiographic Film — Determination ofISO Speed and Average Gradient WhenExposed to X- and γ-Radiation. NewYork, NY: American NationalStandards Institute (1997).
ANSI IT9.1-1988, American NationalStandard for Imaging Media (Film) —Silver Gelatin Type — Specification forStability. New York, NY: AmericanNational Standards Institute (1988).
ANSI IT9.18, Imaging Materials — ProcessedPhotographic Plates — Storage Practices.New York, NY: American NationalStandards Institute (1996).
ANSI IT9.2-1991, American NationalStandard for Photography (Processing) —Processing Films, Plates, and Papers —Filing Enclosures and Containers forStorage. New York, NY: AmericanNational Standards Institute (1991).
ANSI IT9.9-1990, American NationalStandards Institute. Standard for ImagingMedia (Film) — Stability of ColorPhotographic Methods. New York, NY:American National Standards Institute(1990).
ANSI PH1.28-1984, Specifications forPhotographic Film for Archival Records,Silver Gelatin Type on Cellulose EsterBase. New York, NY: AmericanNational Standards Institute (1984).
ANSI PH4.32-1986, American NationalStandard for Photography (Processing) —Methods for Evaluating Processing withRespect to the Stability of the ResultantImage — Black-and-White Papers. NewYork, NY: American NationalStandards Institute (1986).
ANSI PH1.41-1984, Photographic Film forArchival Records, Silver Gelatin Type onPolyester Base, Specifications for; WhenTested by ANSI Standard PH4.8-1984,Methylene Blue Method for MeasuringThiosulfate and Silver DensitometricMethod for Measuring ResidualChemicals in Films, Plates, and Papers;and Stored in Accordance with ANSIStandard PH1.43-1983, Storage ofProcessed Safety Photographic Film,Practices for. New York, NY: AmericanNational Standards Institute (1984).
ANSI PH4.8-1985, American NationalStandard for Photography (Chemicals) —Residual Thiosulfate and OtherChemicals in Films, Plates, and Papers —Determination and Measurement. NewYork, NY: American NationalStandards Institute (1985).
ANSI/AIIM MS26-1990, American NationalStandard for Determining IlluminationUniformity. New York, NY: AmericanNational Standards Institute (1990).
ASTM E 999-99, Standard Guide forControlling the Quality of IndustrialRadiographic Film Processing. WestConshohocken, PA: ASTMInternational (2002).
ASTM E 1254-98, Standard Guide for Storageof Radiographs and Unexposed IndustrialRadiographic Films. WestConshohocken, PA: ASTMInternational (2002).
FED-STD-125D, Film, Photographic andFilm, Photographic Processed (forPermanent Records Use). FederalStandard. Washington, DC: GeneralServices Administration (1977).
251Radiographic Film Development
3RT09_Layout(219_252) 10/2/02 2:07 PM Page 251

Kenneth W. Dolan, Lawrence Livermore NationalLaboratory, Livermore, California
Jerry J. Haskins, Lawrence Livermore NationalLaboratory, Livermore, California
Radioscopy1
10C H A P T E R
3RT10_Layout(253_282) 10/14/02 3:04 PM Page 253

254 Rad
PART 1. Fundamentals of Radioscopic Imaging
3RT10_Layout(253_282) 10/14/02 3:04 PM Page 254
PrinciplesRadioscopy is a nondestructive testingtechnique, a subset of the radiographictesting method, that uses penetratingradiation to produce images viewedduring irradiation. Radioscopic imaging andreal time radiography mean the same asradioscopy.
The arrangement of radiation source,object and image plane in radioscopicimaging are similar to film radiography.Whereas traditional radiography uses filmas the imaging medium, radioscopy uses afluorescent screen to convert radiation tolight for direct viewing or electronicimaging. With electronic imaging systems,the image signal is amplified andpresented as an analog signal for viewingon a television monitor, video recording,analog processing or for converting todigital for computer display, storage andanalysis.
Radioscopy is a powerful and versatiletechnique for rapid testing of objects andstructures and for imaging dynamicevents. For assembly line inspection,robotics and remote positioning allowrapid testing at many locations ororientations of an object and provide aninspector the freedom to review details ofinterest or to move on to other locations.Accept or reject decisions may be madeimmediately without the delay or expensethat would be incurred in film processing.The same applies to large structures suchas aircraft or pipelines where roboticspositioning systems can be applied totesting of large areas. For dynamic events,radioscopic imaging is typically used attelevision frame rates of 30 frames persecond, providing time resolution in afraction of a second. High rate events canbe captured with high speed cameras thatoperate at tens of thousands of frames persecond.
Fluorescent screens consist of aphosphor material deposited on asubstrate. Radiation interacts with thephosphor to produce light. The thicknessof the phosphor coating and thecoarseness of the grains affect both lightconversion efficiency and resolution. Finegrain, thinner coatings provide higherresolution but lower light output. Screenbrightness or light conversion efficiencyalso depends on the energy of theincident radiation. Light conversion
iographic Testing
efficiency is generally lower for higherenergy radiation.
Light from fluorescent screens may beviewed directly by the human eye,amplified in an image intensifier tubewith video output, or imaged directly by alow light level video camera. Lowbrightness level, operator dependentvision acuity and radiation safety aresignificant disadvantages for viewing bythe human eye. Electronic imaging byimage intensifiers and low light levelvideo provides both remote viewing forradiation safety and improved signal.Image intensifier tubes amplify the lightsignal by converting the light to electronsin a photocathode layer adjacent to theinput phosphor layer, accelerating theelectrons and then converting back tolight in an output phosphor layer. A videocamera provides output signal by imagingthe output phosphor. Low light levelvideo cameras are more recentdevelopments that provide additionaloptions for imaging higher outputphosphor screens.
Many of the principles of filmradiography apply directly to radioscopicimaging. The geometric rules forunsharpness and magnification areexamples. Radioscopic imagingtechnology, however, is significantlydifferent from film based imaging andtherefore the emphasis in some of theradiographic principles is different.Dynamic range and sensitivity, forinstance, are examples of differencesbetween these techniques. This chapterpresents radioscopic imaging based imageacquisition by fluoroscopic screen andvideo technology. Digital imaging systemsthat use discrete detectors and imageanalysis are discussed elsewhere.
BackgroundRadioscopic imaging has it roots in thediscovery of X-rays. Roentgen usedphosphorescent (or fluorescent) screensfor X-ray detection. The earliest form ofthe radioscopic imaging technique wascalled fluoroscopy. With this technique,X-rays from a source pass through anobject and strike a fluorescent screen. Thescreen emits light observed by the humaneye. Human vision acuity and darkadaptation were very important for

FIGURE 1. Ra
3RT10_Layout(253_282) 10/14/02 3:04 PM Page 255
optimum interpretation. Modernphosphors developed for fluoroscopysystems have changed dramatically overthe years, resulting in improvements inboth quantum efficiency and resolution.
The advent of image intensifiers, videocameras and television systems in the1950s provided dramatic improvements inthe radioscopic imaging technique andimproved safety by allowing the operatorto be remote from the X-ray source.Digital imaging and computer systemshave further increased the possibilities ofimage acquisition, enhancement,information storage and display. Roboticsystems, automated data acquisitionsystems and both online and offlineimage processing have made radioscopicimaging a very versatile, sensitive, rapidand safe technique for radiographictesting in both industry and medicine.
An industrial radioscopic test system isshown in Fig. 1. The source (X-ray tube),part manipulator and detector (imageintensifier tube) are located in a shieldedradiation chamber. The parts, already on atray, are introduced into the chamber byconveyor belt and positioned by robotics.The source and detector system arelocated on radial arms and arerepositioned in fixed orientation to eachother to provide different angular viewsincluding different geometricmagnifications. The controls for the X-raysource, part manipulator, imageprocessing and image display are locatedat a computer workstation (not shown).Variations in the size of the radiationchamber make it possible to image smalleror larger items such as such as castings,transmission cases and wheels for theautomotive industry, munitions androcket motors for the defense andaerospace industries and electroniccomponents and assemblies for the
dioscopic imaging system.
electronics industry. This chapterdiscusses the fluorescent screens forconversion of X-rays to light, imageintensifier tubes and video cameratechnologies and how they can beeffectively used for radioscopic imaging.
255Radioscopy

256 Rad
PART 2. Light Conversion
FIGURE 2. Sttypical path
Legend= Excited= Absorp
3RT10_Layout(253_282) 10/14/02 3:04 PM Page 256
Fluorescent Screens
Principles of OperationFluorescent screens consist of phosphorparticles dispersed in a binder and coatedon a reflecting, supporting base. The basicfunction of the fluorescent screen is toconvert X-ray energy to light. Thishappens in three steps.
1. Absorbed X-ray energy is converted tohigh energy electrons.
2. Part of the kinetic energy of the highenergy electrons is used to produceexcited states within the phosphormaterial.
3. Light emission occurs when theexcited states return to their normalstate.
As shown in Fig. 2, an X-ray or gammaray photon striking the screen depositsenergy in a grain of phosphor at the pointz releasing high energy electrons, whichcause formation of excited states andemission of light photons. Typical pathsfollowed by the photons are illustrated.
A light photon generated in the screenphosphor has a probability of leaving theemitting surface, depending on (1) thenumber of scattering events; (2) theprobability of absorption at each collisionwith phosphor particles; (3) the depth at
iographic Testing
ructure of typical X-ray intensifying screen ands followed by light photons.
X-rays
z
X-ray photon
Base
Reflective layer
Phosphor
Protective coating
Light emission
z
graintion of light photon
which the light photon originates(dependent on the X-ray stopping powerof the phosphor); and (4) the spatialorientation of the free path lengthsbetween collisions.
Light emitted simultaneously with theexcitation energy (X-ray absorption) iscalled fluorescence. By contrast, light thatpersists after the excitation source isremoved is called phosphorescence.
Screen Types and ConstructionFluorescent screens use a variety ofsupports, depending on the application.Typical screens have a white plastic orcardboard base, about 0.4 mm (0.02 in.)thick, as a support for the phosphormaterial layer. The screen base must bechemically inert so as not to reactunfavorably with the luminescentmaterial. It must be uniformly radiolucentand cannot contain radiopaqueinclusions, which might cause shadowson the fluorescent image. The supportmust also be durable enough for use inthe radiation fields to be encountered.
The phosphor material is in the formof small grains. This material is combinedwith a suitable binder and is coated onthe support in a uniform layer. Grain sizeand thickness of the phosphor layer areconstruction parameters affectingperformance. The final packing density ofthe phosphor particles is usually on theorder of 50 percent. A protective surface isoften added to the screen to help it resistmarkings and abrasive wear and to permitcleaning.
In X-ray image intensifier tubes, thefluorescent layer is deposited on theinside of a vacuum tube envelope. In thiscase, phosphors whose physical propertiesare unacceptable for use in air, such ashydroscopic sodium activated cesiumiodide (CsI[Na]), can be used. Thedepositing technique is often proprietary.
Screen CharacteristicsFluorescent screens are characterized bytheir efficiency, spectral emission,persistence, unsharpness and gamma.Table 1 contains parameters of typicalscreen phosphors.

3RT10_Layout(253_282) 10/14/02 3:04 PM Page 257
EfficiencyThe overall efficiency of the fluorescentscreen in converting X-rays to light, iscomposed of three terms: (1) the incidentX-ray absorption efficiency na; (2) theintrinsic absorbed X-ray to lightconversion efficiency nc; and (3) the lighttransmission efficiency nτ determined bythe path length of light in the screencoatings.
Hence the overall efficiency can beexpressed in Eq. 1 as:
(1)
The absorption efficiency na, which isthe fraction of the incident flux absorbedby the screen, can be calculated when theincident X-ray spectrum and thecomposition of the screen are known. Atlow energy, where X-ray absorptionpredominates over scatter, the absorptionefficiency is about equal to theattenuation of the radiation beam. A highabsorption efficiency is important formaximizing the signal-to-noise ratio inthe detection process.
The conversion efficiency nc is aboutequal to the phosphor efficiency undercathode ray excitation, which can bemeasured separately. The transmissionefficiency nτ can be estimated if thescattering and absorption parameters ofthe screen are measured and if surfaceconditions are known. Experimentalmeasurements of light photon output forX-ray photon input with typicalfluorescent screen materials results in anenergy efficiency in the range of 1 to 7percent at low X-ray energies (20 to 100kV peak).2
n n n n= × ×a c τ
TABLE 1. Phosphor parameters.
ChemPhosphor Sym
Zinc sulfide ZnS(AZinc cadmium sulfide ZnCdSSodium activated cesium iodide CsI(NaCalcium tungstate CaWOTerbium activated gadolinium oxysulfide Gd2O2
TABLE 2. Relative light yield as function of
Chemical EmScreen Symbol C
Zinc cadmium sulfide ZnCdS greeGadolinium oxysulfide Gd2O2S yelloCalcium tungstate CaWO4 violeLanthanum bromide LaOBr blue
Spectral EmissionAlthough the spectral emission ofphosphors is broad band the emissionspectra are characterized by a maximumintensity at a characteristic wavelength.Spectral emission is used to match thephosphor to application, whether forhuman eye in a direct viewingfluoroscopy system, a low light levelcamera in a camera based fluoroscopysystem or photocathode for an imageintensifier tube. Figure 3a is a plot of thespectral emission of four types of screens:calcium tungstate (CaWO4), lanthanumoxybromide (LaOBr), gadoliniumoxysulfide (Gd2O2S) and zinc cadmiumsulfide (ZnCdS).
The effect of spectral emission isdemonstrated in Table 2 where therelative light yield for different phosphorsat 140 kVp X-ray energy are compared forphototopic response (the human eye) anda multialkali photocathode. Whenmeasured with a multialkaliphotocathode, the calcium tungstate andlanthanum oxybromide screens (whichemit in the blue) show an increase inresponse over the photopic response,which has a maximum in the green.
PersistenceThe persistence of a fluorescent screen isthe time over which it continues to emitlight following excitation. Persistencecurves are a characteristic of phosphors.Some curves have an exponential decay,whereas others have long decay tails. Anestimate of the persistence can be madeby assuming an exponential decay andthen assigning a decay constant (time for
257Radioscopy
ical Density Emission Decaybol (g·cm–3) Peak (nm) Constant (µs)
g) 4.1 450 0.060(Ag) 4.5 550 0.085) 4.5 420 0.6504 6.1 430 6.00S(Tb) 7.3 544 480.0
detector measurement.
ission Photopic Multialkali Photocathodeolor (relative yield) (relative yield)
n 100 100w green 50 50t 7 32
4 25

258 Radiographic Testing
LegendCesium iodideGadolinium(III) oxysulfideHigh speed, calcium tungstateLanthanum(I) hypobromiteZinc cadmium sulfide
FIGURE 3. Fluorescent screen phosphors: (a) spectralemission; (b) mass absorption coefficient as function ofenergy.
Radi
atio
n in
tens
ity (
µW·c
m–2
·nm
)
6 x 10⁻⁵
4 x 10⁻⁵
2 x 10⁻⁵
0360 400 450 500 550
Wavelength (nm)
(a)
(b)
Mas
s ab
sorp
tion
coef
ficie
nt (
cm2 ·
gm–1
)
100
10
1
0.110 30 50 70 90 110 130 150
Energy (keV)
3RT10_Layout(253_282) 10/14/02 3:04 PM Page 258
the phosphor to decay by a factor of e–1,where e is the natural logarithmic base). Afew typical decay constants are listed inTable 1. The persistence, particularly withrapid decay phosphors, can varysignificantly depending on the purity andthe manufacturing process.
UnsharpnessUnsharpness in images formed byfluorescent screens is primarily a functionof the grain size of the phosphor and thescreen thickness, increasing as theparameters increase. Light transmissioncharacteristics of the screen can also affectthe unsharpness. Figure 4a demonstrateshow unsharpness can affect the detectionof a sharp edged discontinuity byspreading the edge shape. Here, Crepresents the contrast in percentage ofbrightness change, d represents width ofdiscontinuity and U represents screenunsharpness. For a fixed value of U, achange in contrast C produces a change inthe slope of the unsharp edge. It can beseen from Fig. 4b that when d is smallerthan 2U, the discontinuity will vanish
FIGURE 4. Effect of unsharpness ondiscontinuity detection: (a) spread of edgeshape; (b) discontinuity above minimumcontrast level.
(a)
Radiation
Object
ImageC
UU
d
LegendC = ContrastC1 = Minimum observable brightness differenced = DimensionU = Screen unsharpness
(b)
C1
U
d
C

3RT10_Layout(253_282) 10/14/02 3:04 PM Page 259
unless Cl is above the minimumobservable contrast level. Equations 2 to 4show the relationships among variables inFig. 4:
(2)
(3)
(4)
The following relationship may beobtained from Fig. 4b:
(5)
Typical values of screen unsharpnessfor commercially available screens varyfrom U = 0.50 mm (0.02 in.) toU = 1.0 mm (0.04 in.).
Screen GammaThe fluorescent screen gamma γ is ameasure of the contrast ratios between theoutput screen image brightness B and theinput X-radiation intensity I:
(6)
As in film radiography, the outputimage must have a minimum brightnessratio between adjacent image areas fordetection by an observer or an imageintensifying component. For mostfluorescent screens at industrialradiography energies, the screen gamma isvery close to 1.0. So the fluorescent screenitself is very seldom the limiting factor asfar as the total imaging system gamma isconcerned.
Radiation Energy EffectsThe efficiency of fluorescent screens is afunction of the energy of the radiation.This is shown in Fig. 3b where the massabsorption coefficient is plotted as afunction of X-ray energy for differentphosphor materials. These data arecalculated from X-ray cross sectiontabulations.3 The K absorption edge of theheaviest element in each phosphor isindicated by the step in the coefficientplot. Other than at the K absorption edge,the absorption coefficient (and henceefficiency) decreases with increasingphoton energy.
The absorption efficiency is given byEq. 7:
∆ ∆BB
II
= γ
dC UC
C C= ≤2 11for
d
CUC
2
1=
dC UC
≤ 2 1
C C1 ≤
(7)
where µ·ρ–1 is the mass absorptioncoefficient, T the phosphor thickness andP the packed phosphor density.
The energy spectrum of the source,such as the continuum spectrum of anX-ray machine, must be considered whendetermining screen efficiency. The totalabsorption efficiency na is found byintegrating the absorption efficiency andphoton intensity over energy.
The X-ray energy spectrum incident onthe screen will be changed by thepresence of an object; the directtransmitted beam is hardened. At thesame time, lower energy scatteredradiation is generated in the object forwhich screens generally have higherabsorption efficiency.
Special Screens
Neutron Sensitive ScreensReal time radiography may be performedusing neutron beams when thefluorescent screen is a good neutronabsorber. Elements with high thermalneutron cross sections, such as lithium-6,boron-10 and gadolinium are used inneutron sensitive screens. Plasticscintillation materials can be used forradioscopy with fast neutrons.
The characteristics of screencomposition and construction are moreimportant in neutron imaging than inX-ray imaging because the intensity ofavailable neutron sources is generallylower than for X-ray sources. It isimportant that the screen absorb asufficient quantity of neutrons to obtainan acceptable light yield for adequatecontrast.
High Energy ScreensSome materials, when absorbing X-rays,emit secondary electrons copiously. Thephosphor materials used in fluorescentscreens are generally more sensitive toelectrons than to primary X-rays. At highX-ray energies, the electrons from suitablesecondary electron emitters can be used toenhance the imaging process. Heavymetals such as lead, tungsten or tantalumare often used in MeV radiography,serving both as secondary electronemitters and low energy X-ray filters.Along with the production of secondaryelectrons to increase the absorbed energyin the adjacent fluorescent screen, theheavy metal will shield the screen from
n TPa 1 –= −
exp
µρ
259Radioscopy

260 Rad
TABLE 3. Scintillator materials and some of their properties.
Emission Light Yield PrimaryChemical Density Maximum (103 photons × Decay Afterglow
Scintillator Symbol (g·cm–3) (nm) MeV–1·g–1) (ns) (percent)
Bismuth germinate (BGO) Bi4Ge3O12 7.13 480 8 to 10 300 —Europium activated calcium fluoride CaF2(Eu) 3.18 435 19 0.94 < 0.3 after 6 msCadmium tungstate CdWO4 7.9 470/450 12 to 15 20/5 0.1 after 3 msThalium activated cesium iodidea CsI(Tl) 4.51 550 52 to 56 1 0.5 to 5.0 after 6 msThalium activated sodium iodideb NaI(Tl) 3.67 415 38 250 —Terbium activated high density glass — 3.5 to 3.8 543 — 3400 <0.5 after 300 ms
a. Slightly hygroscopic.b. Hygroscopic.
3RT10_Layout(253_282) 10/14/02 3:04 PM Page 260
low energy scattered X-rays. Both of theseprocesses improve the contrast sensitivity.
Scintillator PlatesScintillators are optically clear, generallysingle-crystal, phosphor materials thatproduce very short pulses of light as aresult of X-ray interactions. In addition,the amount of light emitted is generallyproportional to energy deposited in theX-ray interaction. Because scintillators areoptically clear (that is, transparent to theirown emission wavelengths) andsingle-crystal components, they can beused in thicknesses not possible withpolycrystalline phosphor materials thatform the light emitting coatings forfluorescent screens. Scintillators can bemade as single crystals, monolithic platesor fiber optic plates. The increasedthickness provides a more efficient meansfor absorbing X-ray energy, which isparticularly important for high energy(megavolt) X-rays. In addition,scintillators are not limited in spatialresolution by material grain size as arefluorescent screens. Some scintillatortypes are available in sizes up to 0.30 m(12 in.) diameter or more, withthicknesses ranging from 2 mm (0.1 in.)to 100 mm (4.0 in.) or more. Typicalscintillator materials and their propertiesare given in Table 3.
To be useful for radioscopic imaging,the scintillator must be nearly flawlessand must be large enough in area toprovide the desired field of view. Thescintillator plate must be thin enough toallow lens focusing at limited depth offield associated with fast lenses and thickenough for adequate conversion of X-rayenergy to light. Light emission must be inthe wavelength compatible with cameraimaging and afterglow must be low.
One of the highest density scintillatorswith emission in the green is cadmiumtungstate (CdWO4). This scintillator isavailable nearly flaw free in diameters of10 to 20 mm (0.4 to 0.8 in.) and
iographic Testing
thicknesses of 1 to 2 mm (0.04 to0.08 in.). It provides an efficient imagingmedium at high resolution for small fieldsof view. Features as small as 4 µm havebeen resolved with this material using aplate thickness of 0.7 mm (0.03 in.).4
The terbium activated high densityglass is an innovation that provides alarge area imaging, 250 to 300 mm (10 to12 in.) diameter, and thicknesses from2 mm (0.08 in.) to 12 mm (0.5 in.) andgreater. This is available as a monolithicplate and as a fiber optic plate with fiberdiameter as small as 10 µm. Spatialresolution with these materials has beendemonstrated in excess of 20 line pairsper millimeter for low X-ray energies (lessthan 120 kV).5

PART 3. Image Quality
TABLE 4. Ima
Aspe
Subject conSystem con
Definition, g
Definition, m
3RT10_Layout(253_282) 10/14/02 3:04 PM Page 261
The factors that limit resolution inradioscopic imaging are similar to those innormal film radiography. Some aspects ofradioscopic image quality are given inTable 4.
In radioscopic imaging only the X-rayenergy absorbed during the scan time ofthe image pickup system will add to eachsingle image. For a direct viewingfluoroscopic system, this is the imagesummation time of the human eye (0.2 s).With the increased sophistication ofradioscopic imaging systems, the limits ofobject thickness penetrated and contrastof details detected are only restricted bythe quantum structure of the radiationand the noise introduced by each stage ofthe imaging process.
Each detail, as defined by size andcontrast, can be described by a number ofradiation quanta that is proportional tothe intensity of the radiation. The relativestatistical fluctuation of radiationintensity is proportional to the reciprocalof the square root of intensity. In general,radiation contrast in the image elementmust exceed the value of this fluctuationto yield detail.
Contrast
Subject ContrastSubject contrast for fluorescent screens isdefined as the fractional change inbrightness resulting from a change ∆x inabsorber thickness. The nearly linearrelationship between screen brightness Bin candela per square meter (ormillilambert) and X-ray intensity I on thescreen in gray (or roentgen) per minutemay be written as:
ge quality.
ct Factor
trast thickness, scatter, radiation hardeningtrast screen gamma, intensifier, camera,
monitoreometric source focal spot size, source-to-object
distance, object-to-screen distance,screen thickness, motion
ottle quantum fluctuations, screen gain, rasterscan of monitor
(8)
or
(9)
where m is the proportionality constant.The absorption law for monochromaticradiation is:
(10)
Differentiating Eq. 10 gives:
(11)
where µ is the linear absorptioncoefficient and x is the absorber thickness.Combining the above equation givesEq. 12:
(12)
where C is contrast.The effect of X-ray energy on subject
contrast C manifests itself through theabsorption coefficient µ, which varieswith X-ray energy. The efficiency of thefluorescent screen affects subject contrastby its ability to convert the incomingX-ray photons to light and manifests itselfthrough the screen brightness response B.
Observed ContrastThe observed contrast in radioscopicimaging is affected by several factorsbeyond the screen response. The effects ofall system components must be included.This is done by defining proportionalityfactor γ for the contrast ratio of outputintensity B to the input intensity I (seealso Eq. 6):
(13)
or
(14)∆ ∆BB
x= − γ µ
γ =
∆
∆
BBI
I
∆ ∆BB
x C= −µ =
∆ ∆I I x= −µ
I I x= −µ[ ]0 exp
∆ ∆B m I=
B mI=
261Radioscopy

262 Radi
3RT10_Layout(253_282) 10/14/02 3:04 PM Page 262
where µ is the linear absorptioncoefficient and ∆x is the change in thethickness of the absorber material. Thecombined system gamma is the productof the individual components in theimaging chain. In a vidicon televisionchain, for example, the system gammawould be given by:
(15)
where γ = overall system gamma,γa = electron amplifier chain gamma,γc = vidicon tube gamma, γk = televisionpicture tube gamma and γs = fluorescentinput screen gamma.
For a typical case, the fluorescentscreen gamma is taken as γs = 1.0, aconventional closed circuit televisionamplifier chain provides γa = 1.0(maximum), the vidicon tube provides aγc = 0.9 and the television picture tubegamma is typically γk = 3.0.6 Although itappears that considerable contrast gain ispossible in a television chain, the finalimaging element, the human eye, mustalso be considered. The human eyegamma is nonlinear and is less than one.A typical value of the human eye gammais 0.3. With increased viewing roombrightness or glare, this value dropsrapidly.
Effects of ScatterScattered radiation affects contrast influorescent screens by effectively raisingthe background brightness level. Thescattered radiation affects only theprimary imaging component of aradioscopic system, the fluorescent screen.Here, the contrast is defined as:
(16)
If however, scattering is not eliminated,the equation for contrast becomes
(17)
where Is is the scattered radiationintensity. Now, if Is = KI, where K is thescattering factor, the equation for screencontrast becomes
(18)
As this equation illustrates, it is importantto keep the scattered radiation incidenton the fluorescent screen to a minimumto keep the contrast at an acceptable level.
C
II
K=
+
∆
1
CI
I I=
+∆
s
CB
BI
I= =∆ ∆
γ γ γ γ γ= a c k s
ographic Testing
Control of ScatterScattered radiation comes from manysources in a radioscopic imaging setup.There is scatter from the room, object,fixtures and air path in the primaryradiation beam and scatter from objectsplaced in the path of the beam. Thecontrol of scatter for radioscopic imagingis the same as for normal radiography.Specific techniques to reduce scatter arelisted below.
1. Collimate the primary beam to theminimum viewing area necessary.
2. Shield the setup to reduce roomscatter from walls, ceiling and floor.
3. Filter the primary beam to remove thelow energy portion of the spectrum.
4. Filter the radiation beam between theobject and the fluorescent screenbecause many filters preferentiallyremove the lower energy scatteredradiation.
5. Use antiscatter grids, both fixed andmoving, between the object and thefluorescent screen.
6. Use projection magnification toincrease the distance of the fluorescentscreen from the object scatter.
In general, it is very important inradioscopic imaging to consider all areaswhere scattered radiation can beintroduced and to attempt to eliminate orreduce their effect to improve imagecontrast.
Definition
Unsharpness and OptimumMagnificationThe same rules that apply for unsharpnessand optimum magnification in filmradiography apply to radioscopic imaging.Unsharpness and optimum magnificationare discussed elsewhere.1
Motion BlurIn radioscopic imaging, unsharpness dueto object movement can limit imagedefinition. Determining factors for thisare the X-ray excitation rate, the decaytime of the fluorescent screen phosphorand the delay time or scan time of theimaging system components. Typically,radioscopic systems are used withcontinuous or rapid pulse rate X-rayexcitation (120 pulses per second orgreater), rapid decay phosphor (on theorder of milliseconds or faster) and framerates of 30 frames per second.

3RT10_Layout(253_282) 10/14/02 3:04 PM Page 263
Quantum MottleQuantum mottle is the statisticalfluctuation of brightness on fluorescentscreens and is due to the randomness ofX-ray production and absorption andneeds to be considered in any radioscopicimaging. The following list shows thenumerous sources of this fluctuation:(1) X-ray photon production, (2) X-rayphoton absorption in the object, (3) X-rayphoton absorption in the screen,(4) conversion of X-ray photons to lightphotons, (5) fraction of the light photonsreaching the eye after traversing theimaging system and (6) light photonabsorption in the retina.
These fluctuation obey poissonstatistics so that the standard deviation σis equal to the square root of theintensity n:
(19)
Because radioscopic imaging involves aseries of processes, the standard deviationfor the total sequence is:
(20)
Certain stages in the process will causeeither an increase or decrease in theintensity. The relationship can be shownto a first approximation:
(21)
where g is the amplification of the process(from the state of lowest intensity to thefinal observation by the retina) and n isthe final intensity.7
To observe detail in the light imagereaching the retina, there must be a detailintensity difference greater than thestandard deviation:
(22)
where ∆n is the smallest difference in thenumber of detectable photons in theretinal image and k is a constant termedthe threshold contrast to standarddeviation ratio.
Contrast is defined as:
(23)
Then:
(24)
Because n is the total photon intensity inthe retinal camera image, it is equal to the
Ck g
n=
Cn
n= ∆
∆n k= σ
σ2 = gn
σ σ σ σ212
22 2= + + … + n
σ = n
number of photons arriving per second,times the storage time of the detector t.Therefore:
(25)
where:
(26)
Here d is the diameter of the object underobservation and n0 is the number ofphotons reaching the detector per unitarea of the fluorescent screen per second.7
Now contrast is defined again:
(27)
or
(28)
The smallest discernible object size thatcan be detected is seen from Eq. 28 toimprove with increasing contrast andnumber of stimulating photons. Detailsensitivity in an image will be limited bystatistical fluctuations as long as d isgreater than the unsharpness of thesystem.
The statistical fluctuations offluorescent screen brightness, which aredue to the randomness of the process, areimportant at low brightness levels, whichusually occur with low intensity sources.Most industrial X-ray machines producesufficient intensity to render the statisticalfluctuation unimportant for mostapplications. Much of the effect ofquantum fluctuation in cases where it isimportant can be removed in near realtime by video frame averaging orsumming.
Radiation SourcesThe radiation source plays an importantrole in radioscopic imaging. In choosing aradiation source, consideration must begiven to the types of materials to betested, densities, thicknesses, smallestfeature size to be resolved, smallestthickness change to be detected, responseof the radioscopic imaging system andrate of image acquisition. High output,high stability, constant potential X-raysystems are available for theseapplications. Minifocus and microfocusX-ray tubes expand the possibilities ofradioscopic imaging to include highspatial resolution applications.
dk g
C tn=
π
2
0
Ck g
d tn=
π
2
0
nd n
r = π 20
4
n t nr =
263Radioscopy

264 Rad
TABLE 5. Half value layer thicknessesassociated with different values of µx.
Thickness Value Contrast Transmission(half value of ∆I·I–1 I0·I–1
layers) µx (percent) (percent)
1.45 1.0 2 362.17 1.5 3 222.89 2.0 4 133.62 2.5 5 84.33 3.0 6 55.05 3.5 7 35.78 4.0 8 1.86.50 4.5 9 1.17.22 5.0 10 0.677.94 5.5 11 0.418.66 6.0 12 0.259.40 6.5 13 0.15
10.00 7.0 14 0.09
3RT10_Layout(253_282) 10/14/02 3:04 PM Page 264
Limitations of generator wave form are nolonger a consideration with theavailability of high frequency generators.
Projection magnification is one of themost advantageous applications ofradioscopic systems. A small focal spotpermits the object to be moved away fromthe detector, allowing easy roboticmanipulation. The projection increasesmagnification so that fine detail can beimaged with a detector whose resolutionis relatively poor. Magnifications of 2× to50× are common in microfocusradioscopic systems.
Linear accelerators for high energyapplications, for example, greater than1 MeV, use resonant waveguides toaccelerate electrons to a target. Theradiation is produced in pulses typically of3 to 4 µs width and at repetition rates of60 to 420 Hz. Radioscopic imagingcomponents may need shielding fromradiofrequency fields produced byaccelerator operation and from direct highintensity X-rays. Setup configuration,synchronization of the imaging system tothe accelerator pulse rate and image frameaveraging can be used to reduce oreliminate these effects.
Neutron radioscopic imaging isaccomplished with portable acceleratorneutron sources and neutron reactorswith beam ports suited for radioscopicimaging. The effective focal spot ofneutron sources is typically large. Formost neutron sources, whether acceleratortype or reactor type, the focal spot isdefined by the collimator opening at theneutron source. To transport a reasonablenumber of neutrons down the beam tube,these collimator openings are necessarilylarger than the focal spots possible withX-ray machines and linear accelerators.
Radiation EnergyThe size of the object to be imaged andthe material type will determine theradiation type and energy to be used. Asa general rule, the radiation type andenergy should be selected so that theobject thickness to be penetrated is threeto five half value layers. One half valuelayer reduces the transmitted radiationintensity by 50 percent. Satisfactoryresults can also be obtained if deviationfrom the rule is no greater than a factor of2 (that is, in the range from 1.5 to 10 halfvalue layers). Configuration of the part isof some importance because scatteringfrom the part will reduce contrast.
The half value layer (HVL) can beequated with values of µx from theabsorption law stated in Eqs. 10 and 11:
iographic Testing
(29)
or
(30)
Table 5 presents this result in tabularform. The image contrast, or detectionpercentage, given in this table is based ona subject contrast of ∆x·x–1 = 2 percent.The image contrast is seen to increaseconsiderably for larger thicknessesexpressed as µx. This improvement is onlyrealized in practice if the transmittedintensity is large enough to produce astatistically accurate measurement.
∆ ∆ ∆II
x xx
x= −µ = −µ ⋅
I I x= −µ( )0 exp

PART 4. Imaging Systems
TABLE 6. Ra
C
Silicon seGermaniuCapacitorResistorsCeramicsPlastics
FIGURE 5. X-ray image intensifier tube design.
Protectivevacuumenvelope
Focusing electrodes
3RT10_Layout(253_282) 10/14/02 3:04 PM Page 265
IntroductionImaging systems with video pickup forremote viewing offer advantages ofradiation shielding for operatorprotection, display monitor with lightingadjusted for vision acuity, video signal forimage enhancement and computeranalysis. The fluorescent screen convertsradiation to light and either an imageintensifier is used to boost light intensityto a level suitable for pickup by a solidstate or television camera or a low lightlevel camera is used to image the screendirectly. The signal from the camera issent to a television monitor or computervideo card and monitor for viewing. Avideo or digital recorder is used to providepermanent record of the test.
At X-ray energies above 1 MeV,shielding is used to protect the electroniccomponents from radiation with cameraplaced out of the direct line of radiationby use of folding mirrors. Below 300 kV,the intensifier and camera can be placedin the direct line of the radiation.Typically, radiation damage occurs inelectronics such as transistors at 103 Gy(105 rad) and will discolor opticalcomponents at 103 to 104 Gy (105 to106 rad). Table 6 lists radiation damagethresholds for a few components. Giventime outside the radiation field, mostmaterials will recover from the damage.Specialized equipment such as cameratubes can be made to tolerate up to106 Gy (108 rad).
Glass may fluoresce under strongirradiation resulting in undesired lightsignals. Noise may also be generated inthe electronics, increasing with theradiation intensity. Good shieldingpractice is desirable for medium energy
diation damage thresholds.
Threshold_____________________________omponent kGy (Mrad)
miconductor 70.0 (7.00)m semiconductor 0.50 (0.05)s 3000 to 7000 (300 to 700)
2000 to 5000 (200 to 500), glass, optical 0.20 (0.02)
0.20 (0.02)
systems and very important in highenergy operations. Shielding for personnelprotection is a necessary feature.
Image Intensifier TubesThe image intensifier tube convertsphotons to electrons, accelerates theelectrons and then reconverts them tolight. Figure 5 shows a generalizeddiagram of an intensifier tube. Intensifierstypically operate in the range of 30 to10 000 light amplification factors. Theintensification is not necessarily solelyelectronic but may also include areduction in image area where electronsfrom a large area input screen are focusedon a small area output screen.
The earliest type of image intensifiersfor X-ray applications used a zinccadmium sulfide (ZnCdS) layer inside theglass envelope to convert the X-rays tolight. The photocathode adjacent to thefluorescent layer converted the light toelectrons. The original X-ray tube used a25 kV potential between thephotocathode and output phosphor. Eventhough only 10 percent of the lightphotons from the fluorescent screenwould generate electrons at thephotocathode and only 10 percent of theaccelerated electrons would produce lightat the output phosphor, a 10× to 15×increase in luminous flux was generatedby the acceleration. The tube had acurved input screen with a 130 mm (5 in.)
265Radioscopy
X-ray window
Output phosphor
Intensifiedlightoutput
Photocathode layer
Inputconversion
screen
InputX-rays

266 Rad
3RT10_Layout(253_282) 10/14/02 3:04 PM Page 266
diameter and an output screen with a15 mm (0.6 in.) diameter. The ninefoldreduction in diameter from thefluorescent screen to the viewing screenprovided an additional factor of 80 inbrightness gain. The total gain wasbetween 800 and 1200.8
Technical improvements in electronicgain, fluorescent and photocathode layerefficiencies and electron optics have mademodern X-ray image intensifiers veryuseful in both medical and industrialapplications.9-13 Sodium activated cesiumiodide (CsI[Na]) is now commonly used asthe fluorescent layer because it has twicethe X-ray absorption of zinc cadmiumsulfide and because its crystallinestructure minimizes lateral light diffusion.Rare earth phosphors such as gadoliniumoxysulfide (Gd2O2S) are also found to besuperior to zinc cadmium sulfide. At X-rayenergies below 100 kV, sodium activatedcesium iodide is very good; at higherX-ray energies, the rare earths are moreuseful.13
Modern tubes are available with 100 to400 mm (4 to 16 in.) input diameters,multiple modes that electronically selectvariable field size of the input andfiberoptic output for direct cameracoupling. A typical 210 mm (8 in.) tubeperforms with resolution on the order of4 line pairs per millimeter and gains onthe order of 10 000. Resolution is at amaximum at the center of theseintensifiers and decreases somewhat at theedges.
The advantages of these tubes are therelatively low cost, generally compact sizeand high resolution and contrast. Adisadvantage is that minification willincrease image unsharpness. Also, becausea ratio of length to diameter of from1.0:1.0 to 1.5:1.0 is required for theelectron optics, large diameter inputsrequire large tubes. This requirement notonly increases bulk but creates a potentialimplosion hazard. The curved inputscreens in these tubes cause distortion.The tubes are sensitive to voltage drifts,stray magnetic fields and space chargedefocusing at high dose levels.12 Electronscattering, thermionic emission and lightreflection on interior surfaces are causesfor loss of contrast from intensifiers.Fabrication techniques in the latestgeneration tubes minimize theseproblems.
Tubes with 360 mm (14 in.) input havebeen manufactured.14 The advancedvacuum tube technology requires a metaltube body. A titanium membrane is usedfor the entrance window to withstandatmospheric pressure and maintaintransparency to X-rays. The titaniumproduces less scatter than a glass windowthat improves contrast. An accelerationvoltage of 35 kV is used. Limiting
iographic Testing
resolution in the large format is specifiedat 3.6 line pairs per 1 mm (91 line pairsper 1.0 in.). Tubes as large as 400 mm(16 in.) diameter have also beenmarketed.
Channel ElectronMultiplierThe channel electron multiplier ormicrochannel plate (MCP) is an assembly ofsmall tubes for amplifying an electronsignal using secondary emission. Thechannels are glass coated or ceramiccoated with a high resistance material onthe inside. A potential difference of 500 to1000 V is applied across the channelplate. An electron entering the channelwill strike a wall causing one or moresecondary electrons to be released. Thesewill continue to strike the channel wallyielding more electrons as they areaccelerated by the electric field along thechannel. The gain of the channelmultiplier depends on the applied voltageand the ratio of length to diameter.
Channel electron multipliers arelimited only by the technology forfabricating small diameter channels thatdo not break down in the electron field.With 10 kV and a length-to-diameter ratioof 50, a typical gain is about 104. Theresolution of the device is limited by thesize of the channel spacing.15,16 Figure 6shows a diagram for a microchannelelectron multiplier.
The channel electron multiplier is usedin conjunction with an electrostatic imageintensifier tube to form what is called asecond generation or third generation imageconverter. In these devices, a photocathodeis coated on the inside surface of theinput window. A voltage applied betweenthe photocathode and the microchannelplate accelerates the photoelectrons to theinput surface of the small channels thatmake up the electron multiplier. Electronmultiplication occurs as described above.A high voltage applied between theoutput of the microchannel plate and aphosphor screen coated and the insidesurface of the output window acceleratesthe electrons between the two. Theelectron image is converted back into aphotonic image at the output window.
The simplest electron optics forfocusing electrons in second generationand third generation microchannelelectron multiplier image intensifiers isbased on proximity planar electrodedesign. The proximity image intensifierconsists of an input window(photocathode surface), microchannelplate and the output window (phosphorsurface), all parallel and in close relativeposition to each other. Appropriate

FIGURE 6. M
Photoca
Pr
Se
FIGURE 7. Photocathode response spectrum.
sitiv
ity (
rela
tive
unit)
S-20
S-25
3RT10_Layout(253_282) 10/14/02 3:04 PM Page 267
voltages are applied between the elementsto provide minimum electron spread for adistortion free image at the outputwindow. Proximity focused imageintensifiers offer small size with littleincrease in length as the diameter is madelarger.
Direct X-ray sensitive microchannelplates can be made. A metallic converterthat emits secondary electrons following ahigh energy photon excitation (200 kVand above) serves as the input. Theseelectrons are amplified in the channels.17
Spectral MatchingImage intensifiers rely on a photocathodeto convert input light radiation toelectrons. The X-ray image intensifiershave a fluorescent screen ahead of thephotocathode to convert X-rays to light.The spectral response and sensitivityvaries among photocathode materials. SeeFig. 7 for the spectral response of several
icrochannel plate.
Channel plate
thode
Phosphor
imary electrons
condary electrons
V
typical photocathodes. Desirablecharacteristics include high efficiency atthe wavelength of light being observedand a low dark current (the signal levelwhen no light is falling on thephotocathode).
The light emitted from the intensifieris generated by the action of electrons ona phosphor. The spectral emissioncharacteristics of some commonphosphors are shown in Fig. 8.
267Radioscopy
Sen
S-11S-1
0 200 400 600 800 1000 1200
LegendS-1 = Ag+ Cs2O, 10–10 to 10–13 A·cm–2
S-11 = Cs3Sb, 10–14 to 10–15 A·cm–2
S-20 = Na2KSb+Cs, 10–15 A·cm–2
S-25 = Na2KSb+Cs3Sb, 10–15 A·cm–2
Wavelength (nm)
Gre
enYe
llow
Red
Viol
etBl
ue
FIGURE 8. Phosphor spectrum.
Spec
tral
effi
cien
cy(r
elat
ive
unit)
P-22B
P-11 P-20
P-4
300 400 500 600 700
Viol
et
Blue
Gre
en
Yello
w
Red
Wavelength (nm)Legend
P-4 = ZnS:Ag + ZnCdS:AgP-11 = ZnS:Ag (Ni)P-20 = ZnCdS:Ag
P-22B = ZnS:AgP-24 = ZnO:Zn
P-24
268 Rad
3RT10_Layout(253_282) 10/14/02 3:04 PM Page 268
StatisticsThe image intensifier system can improveimaging by boosting the light output sothat the statistical limitation in the imageprocess is not at the eye but at the inputfluorescent screen. The intensifier itselfoperates on a statistical process for thegeneration of electrons and theregeneration of light. The sources offluctuation are essentially independent, sothe Eqs. 19 and 20 apply.
Amplification g (where g = σ2·n–1, perEq. 20) may be used for improving detailsensitivity in an intensifier system. Thisimprovement is accomplished bychoosing that amplification that makesthe number of light quanta (used by theobserver’s eye) equal to the number ofradiation quanta used by the inputfluorescent screen.
iographic Testing
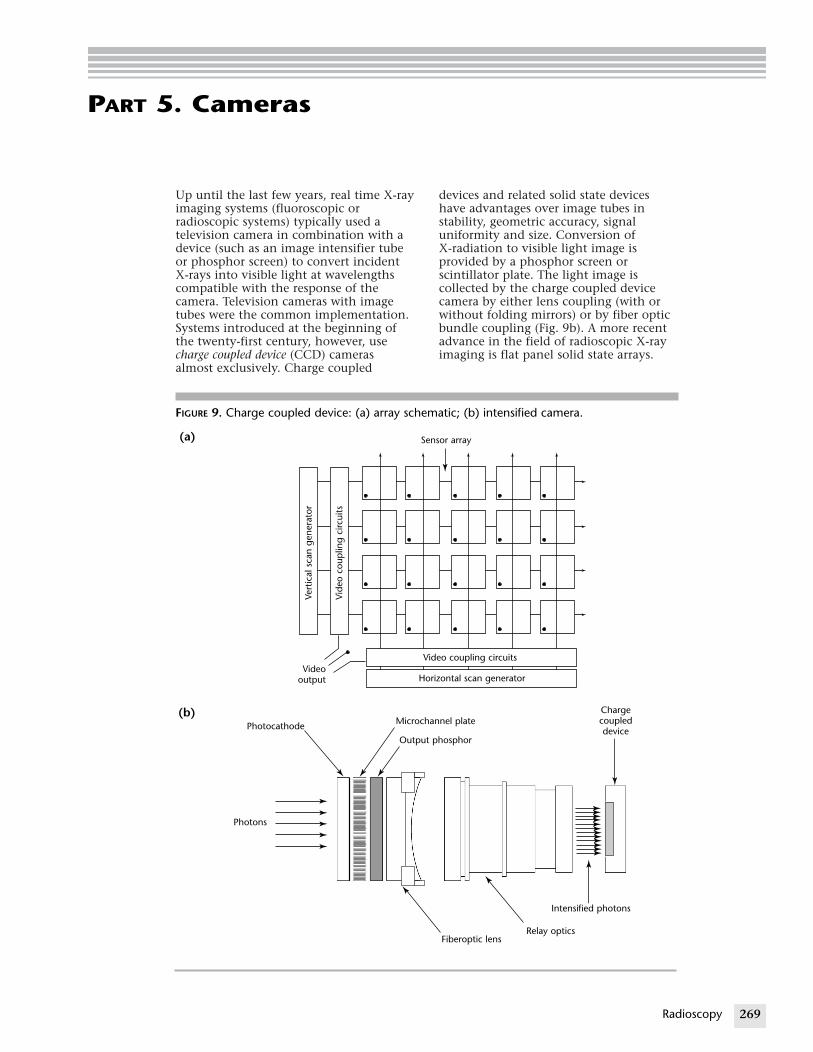
PART 5. Cameras
3RT10_Layout(253_282) 10/14/02 3:04 PM Page 269
Up until the last few years, real time X-rayimaging systems (fluoroscopic orradioscopic systems) typically used atelevision camera in combination with adevice (such as an image intensifier tubeor phosphor screen) to convert incidentX-rays into visible light at wavelengthscompatible with the response of thecamera. Television cameras with imagetubes were the common implementation.Systems introduced at the beginning ofthe twenty-first century, however, usecharge coupled device (CCD) camerasalmost exclusively. Charge coupled
FIGURE 9. Charge coupled device: (a) array sch
Vide
o co
uplin
g ci
rcui
ts
Vert
ical
sca
n ge
nera
tor
Videooutput
(a)
(b)MicroPhotocathodeOutp
Photons
devices and related solid state deviceshave advantages over image tubes instability, geometric accuracy, signaluniformity and size. Conversion ofX-radiation to visible light image isprovided by a phosphor screen orscintillator plate. The light image iscollected by the charge coupled devicecamera by either lens coupling (with orwithout folding mirrors) or by fiber opticbundle coupling (Fig. 9b). A more recentadvance in the field of radioscopic X-rayimaging is flat panel solid state arrays.
269Radioscopy
ematic; (b) intensified camera.
Sensor array
Video coupling circuits
Horizontal scan generator
channel plate
ut phosphor
Chargecoupleddevice
Intensified photons
Relay opticsFiberoptic lens

270 Radi
3RT10_Layout(253_282) 10/14/02 3:04 PM Page 270
These devices are discussed in with digitalimaging elsewhere in this volume.
Charge Coupled DevicesCharge coupled devices and related solidstate cameras use an array of photodiodesor charged coupled devices as thesensitive layer. These arrays may be linearor area arrays of individually addressableelements. The solid state cameras aresmall and have wide spectral response(Fig. 10), reduced lag, higher quantumyields (50 percent) and (depending on theapplication) may have equivalentresolution capabilities when compared tocommercially available vidicon cameras.Solid state cameras are rugged, are notdamaged by intense light images and donot require the scanning electron beamfound in vidicons.
The photodiode arrays in solid statecameras are simple photon detectors,typically reverse biased siliconphotodiodes, that absorb incidentphotons and liberate current carriers. Thisgives rise to a current referred to as thephotocurrent signal, proportional to thearrival rate of the incident photon. Theefficiency of the photodiode stronglydepends on its material and constructionas well as the wavelength of the incidentphotons. The diodes consist of p typeislands in an n type substrate. Standardarrays are available with 128 × 1024diodes with a center spacing as small as25 µm. A dynamic range of 100:1 istypical.18
ographic Testing
FIGURE 10. Sensitivity of a photodiode array(solid state) camera versus vidicon camera.
Sens
itivi
ty,
(µA
·µW
–1)
10
0.1
0.01
Silicon photodiode array
Vidicon
0.4 0.5 0.6 0.7 0.8 0.9 10 1.1
Optical wavelength (µm)
Charge coupled devices work likephotodiodes.19-21 A photon, incident onthe depletion region of a charge coupleddevice, will create an electron hole pair ifabsorbed. This creates a current flow that,in a charge coupled device, is stored inthe potential well of the device. Theamount of charge collected at thepotential well is in direct proportion tothe amount of local light intensity.
The charge coupled device is fabricatedwith a combination of thin filmtechnology and silicon technology. Arraysare available in a variety ofconfigurations, such as 768 × 512, 1536 ×1472 and 2184 × 1472 with photoelementcenter spacing typically ranging from 9 to23 µm. More recently, diode arrays aslarge as 4000 × 4000 and even 8000 ×8000 have become available. A dynamicrange of 1000:1 (10 bits) is typical but4000:1 (12 bits), 16 000:1 (14 bits) and64 000:1 (16 bits) are common.
The image on the solid state array iscoupled to video circuitry by horizontaland vertical scan generators that read thecharge level at the detector elements.Figure 9 shows the schematic of a chargecoupled device array. The output of thevideo can be specified to fit a particularvideo format. The clock sequence, whichsequentially reads the charge level oneach device, is started after a suitableimage integration time. This integrationtime can be adjusted, making solid statecameras useful for low light levelapplications, provided the detectionelement can retain the charge over theintegration period.
The interesting feature of solid statecameras is that individual pixel elementsmay be addressed and the signalsprocessed digitally. With individuallyaddressable elements, the integration timeand the video output format may besimply specified. The cost of solid statecameras increases significantly withincreasing array size and the electroniccircuit complexity required to scan largearrays. Each element must be individuallycalibrated for uniform responsethroughout the field. This feature can beused to correct nonuniform fields inradiography. Because each element isindependent, blooming can be controlled;a bright element does not spill over into aneighboring dark element.
The imaging in real time radiographicapplications may be accomplished withoptical focusing of the light from ascintillation screen onto the solid statedetector. In this case, the image formatand resolution are similar to conventionaltelevision cameras. Also, scintillationmaterials may be deposited directly on thearray. Each element becomes anindependent radiation detector and the

3RT10_Layout(253_282) 10/14/02 3:04 PM Page 271
resolution is dependent on the elementspacing.
Intensified ChargeCoupled Device CamerasIntensified charge coupled device camerasconsist of a microchannel plate imageintensifier tube with relay optics to acharge coupled device incorporated into asingle camera body. Proximity focusedmicrochannel plate image intensifiersoffer smallest camera body size asdescribed above. Relay optics transmitsthe image by exiting the intensifier to thecharge coupled device image array asshown in Fig. 9. Typical luminance gain is18 000 at 20 µlx (2 × 10–6 ftc) input. Thelimiting resolution of the intensifier istypically 30 line pairs per millimeter.
Automatic brightness control can bebuilt into the electronics to automaticallylimit the maximum output of theintensifier to prevent saturating thecharge coupled device array. The outputcan be limited by sensing the current inthe microchannel plate and adjusting themicrochannel plate voltage accordingly.Automatic brightness control is used notonly to protect the charge coupled devicefrom saturation but also allows intrascenedynamics (very dark and bright areas inthe same image) to be viewed with goodcontrast at both extremes.
Optical CouplingTo couple optical signals betweencomponents, real time imaging systemsuse fluorescent screens for conversionfrom X-radiation to light and systems usechains connecting intensifiers totelevision camera. Mirrors or lenses arethe most common means of coupling.
Front faced silver mirrors must be usedto avoid ghost images caused by multiplereflections in back faced mirrors. Opticallenses provide good coupling, dependingon the f number and transmissioncharacteristics. The illuminance E on apickup surface, coupled by a lens in asimple optical system, is given by:
(31)
where B is the luminance of the outputphosphor, T is the lens transmission, M isthe magnification and f is the f number,or relative aperture of the lens — that is,the ratio of focal distance to aperturediameter. The lower the f number, themore light is collected for imaging.
EBT
f M= π
+( )4 12 2
Simple lenses are not often used incoupling because of the low opticalefficiency. For example, if a reduction inimage size by a factor of 2 is requiredfrom the coupling, the distance fromphosphor to lens must be twice thedistance from lens to pickup surface. Fromthe lens formula, the distance fromphosphor to lens will be three times thefocal length of the lens, giving poor lightcollection efficiency. With a coupling ofone to one, this distance is still twice thefocal length.
Collimated optics are superior becausethe objective lens, focused at infinity, islocated at its focal length from thephosphor. Collection efficiency is nineand four times greater, respectively, forthe two magnifications discussed above(2×, 1×). The second lens will determinethe image size at the pickup surface bythe ratio of its focal length to the focallength of the objective lens. Vignetting, areduction in light intensity at the edges,does occur in collimated optics. Thisreduction is minimized when the lensesare close to each other. Some real timeimaging systems in the 1980s usedspecialized optics such as bouwers-schmidt lenses, where concentricmirrors provide a low f number22 — forexample, 0.65. Since then, the lightcollection efficiency of cameras haveobviated extreme lens coupling systems.
Fiber optics may also be used forcoupling. Intensifier tubes often havefiber optic input and output surfaces.These may be coupled directly to othercomponents with similar surfaces byusing an optical gel. Fiber optic lightguides can be considered for moving lightfrom one location to another (that is,from the fluorescent or phosphor screento the camera). The potential advantagesof this are greater retention of the light,one-to-one size transfer, improvedcontrast by suppression of undesirablereflections and shortening of the systemdimensions. Fiber optic connections canalso be used over considerable distance oraround unusual obstructions.
Fibers for fiber optic systems are glassor plastic with diameters of 1 or 2 µm to50 µm. The fiber optic array operates ontotal internal reflection. To reduce leakageeach fiber is coated with a material havinga lower index of refraction. Losses in thefiber optic system are due mainly to theopacity of the fibers in long systems orthe acceptance angle of the light in shortlengths.
Image TubesA wide variety of television cameras andimage tubes are available for use on realtime imaging systems. Many different
271Radioscopy

272 Radi
3RT10_Layout(253_282) 10/14/02 3:04 PM Page 272
camera configurations can be used toaccommodate test requirements. On oneextreme is the small compact camera withno user adjustments. At the other extremeis the larger, two-piece camera, with manycontrols for optimizing image quality. Inaddition to solid state cameras asdiscussed above, a variety of image tubesare also available. The most commontypes for radioscopic applications are(1) vidicons, (2) silicon intensifier targets,(3) image isocons and (4) X-ray sensitivetubes.
VidiconsThe vidicon is a small, rugged and simpletube. An electron beam scans a lightsensitive photoconductive target. A signalelectrode of transparent material is coatedonto the front of the photoconductor.The scanning electron beam charges thetarget to the cathode potential. Whenlight is focused on the photoconductor,the target conductivity increases,changing the charge to more positivevalues. The signal is read by the electronbeam that deposits electrons on thepositively charged areas, causing acapacitively coupled signal at the signalelectrode (Fig. 11).
The vidicon has a number ofvariations, depending on the selection ofthe photoconductive material. Thestandard vidicon uses an antimonytrisulphide layer. The plumbicon uses alead oxide junction layer. The newvicon
ographic Testing
Semitransparentconducting coating
on glass(+20 V direct current)
0 V in dark
Photoconductor
Electron beam
Fine m
Electron b
Video signal
Connected to semitransparentconduction coating on glass
Focused image ofscene viewed
Photons
Glass
R
FIGURE 11. Vidicon television camera.
uses cadmium and zinc telluride and thesilicon diode tube uses a silicon diodearray target structure.
Silicon Intensifier TargetsAnother type of tube called the siliconintensifier target (SIT) uses a photocathodeas an image sensor and focuses thephotoelectrons onto a silicon mosaicdiode target. Readout is similar to thevidicon. The design allows for very highlight gains in the pickup by acceleratingthe photoelectrons to high energies(perhaps 10 keV) before they strike thetarget. The silicon intensifier target tubeand intensified silicon intensifier tubes (ISIT)are used extensively for low light levelapplications.
Image IsoconsThe image isocon tube (Fig. 12) was widelyused in radioscopic applications in the1980s. The image on its photocathodeforms a photoelectron pattern focused byan axial magnetic field onto a thin,moderately insulating target. Thephotoelectrons striking the target causesecondary emission electrons collected ina nearby mesh, leaving a net positivecharge on the target. The beam from anelectron gun scans the target, depositingelectrons on the positively charged areas.The scattered and reflected components inthe return beam are separated. Only thescattered component enters the electronmultiplier surrounding the electron gun.
esh screen
Electron gun
Cathode
eam
0 V+ –20 V
– +300 V

FIGURE 12. Im
Photoelect
Photocathode
3RT10_Layout(253_282) 10/14/02 3:04 PM Page 273
This signal is amplified to become thevideo output.
X-Ray Sensitive CamerasAlthough the usual input to a televisioncamera is a light signal, for radioscopicpurposes it is possible to make the camerasensitive directly to X-radiation. Thevidicon camera in particular may bemodified for X-ray sensitivity and hasbeen found useful for obtaining direct realtime radiographic images. Two alterationsof the vidicon are needed for good results:an X-ray window and an efficient target.Thin glass or beryllium X-ray windowslocated close to the target replace theheavy optical glass windows inconventional tubes. Although the normalvidicon photoconductive targets willrespond to X-ray, they are so thin thatabsorption of radiation is minimal.Suitable thick targets must be used.Selenium has been found to be veryeffective, having adequate response andlow lag.6 Lead oxide targets are morecommon, having a high density for goodX-ray absorption and resultingsensitivity.23
The X-ray sensitive vidicon is animaging system for small objects and lowkilovoltages, 150 kV or less. The X-rayintensity must be high, in the range of8 to 80 mSv·s–1 (50 to 500 R·min–1). Thevidicon tube typically has a sensing areaof only 9.5 × 12.5 mm (0.37 × 0.5 in.).Presentation of the image on a 480 mm(19 in.) television screen results in betterthan 30 times magnification. With a525-line scan rate, the resolution in theobject is better than 0.02 mm (0.0008 in.).The X-ray sensitive vidicon camera has agamma on the order of 0.7 to 1.0. Image
age isocon television camera.
Focusingcoil
Deflectionyokes
Scatteredreturn beam
Signal output
ElectrongunElectron
multiplierScanning
beam
Reflectedbeam
Field mesh
Target
rons
quality indicator sensitivities of twopercent have been obtained. The camerashave experienced problems withdeterioration, possibly due to localoverheating in the target layer, poorbonding to the heat sink layer, substrateirregularities or incompatibility betweenberyllium and target materials.
Camera SystemCharacteristicsThe performance criteria for camera tubesare based on the sensitivity, dynamicrange, resolution, dark current and lag. Aplot of signal output versus faceplateilluminance for some typical camera tubesis shown in Fig. 13 and the slope of thesecurves is called the tube gamma. The lightsource for illuminance is important in theresponse characteristics of the tubes.
In X-ray imaging applications, imageisocon television tubes are commonlyused because of their low light levelsensitivity and high dynamic range;unfortunately, isocons are very expensive.Vidicons are often used in combinationwith X-ray sensitive image intensifiertubes; vidicons are simple as well asinexpensive. The newvicon is moresensitive than the plumbicon or theantimony trisulfide vidicon. siliconintensifier target tubes are used with lowlight level systems when high dynamicrange is not required. Table 7 listscharacteristics for television tubes used inreal time radiographic applications. Lag isgiven as the percentage of the originalsignal present after 50 ms.
273Radioscopy
FIGURE 13. Television camera output versus light input with2856 K tungsten source.
Sign
al o
utp
ut (
nA)
104
103
102
10
1
SIT
Imag
e iso
con
Newvic
on
Plum
bico
n
Vidicon
10–5 10–4 10–3 10–2 10–1 1 10 10010–6 10–5 10–4 10–3 10–2 1–1 1 10
Faceplate illuminance lx (ftc)
Silico
n di
ode
arra
y

274 Ra
TABLE 8. Common adjustments for television cameras.
Control Effects
Beam current controls electron beam in image tube; usuallyset only to discharge picture highlights
Focus electrostatic focus adjustment for electronbeam
Gamma correction electronic change of slope characteristic(gamma) of tube
Pedestal level voltage adjust for black level of picturePolarity reverse inverts black and white areas of imageTarget voltage sets positive potential on image tube target
fixed voltage for most tubes; is variable onsulfide vidicons and controls sensitivity
TABLE 7. Typical characteristics of television camera tubes.
Dynamic Typical Resolution Current LagTube Type Range (television lines) (nA) (percent) Gamma
Image Isocon 2000 1000 0 7 1.0Antimony trisulfide vidicon 300 900 20 20 0.65Newvicon 100 800 8 20 1.0Lead oxide vidicon 300 700 3 4 0.95Silicon intensifier target 100 700 8 12 1.0
3RT10_Layout(253_282) 10/14/02 3:04 PM Page 274
Camera MatchingThe standard scanning rate for cameratubes is 30 frames per second. Each frameimage is created in a 33 ms exposure time.The frame is composed of two fields inwhich the electronically scanned 525vertical lines are interlaced. The first fieldin 60–1 s contains the odd numbered linesand the second field contains the evennumbered lines.
In some applications, where very lowradiation intensities are experienced, it isnecessary to use a slower scanning rate.The target of the television camera can bemade to integrate the incoming signal forseveral minutes and then scan it toprovide one frame of information. Fasterscanning rates may be used to image rapiddynamic systems, provided a sufficientlight intensity is present and the lagfeatures are acceptable.
Television cameras require electricaladjustments to set up the operatingparameters of the image tube and signalprocessing electronics. Cameras may beone-piece or two-piece systems. Theone-piece camera is usually self-containedwith few (or no) user adjustable controls.The two-piece camera is much moreversatile. The camera head can be mademuch smaller, decreasing bulk and weightfor restricted mounting requirements. Thecamera control unit will have all controlsreadily accessible to the user foroptimizing image quality. Commonadjustable controls or switches found inmost cameras are described in Table 8.
The beam, target and focus controlsoptimize the image tube’s performance.Other control features (such as pedestal,gamma correction and polarity reversal)enhance image quality and ease ofoperation. The polarity reverse feature, forexample, is a comparatively simple andadvantageous option. Small detail againsta bright background is difficult to detect;however, inverting the polarity andhaving details appear against a darkbackground makes them more visible tothe observer.
diographic Testing

PART 6. Viewing and Recording
3RT10_Layout(253_282) 10/14/02 3:04 PM Page 275
MonitorsTelevision monitors for observing videosignals are cathode ray tubes using amodulated electron beam to write on theoutput phosphor. In North America thestandard format is 525 lines, interlaced.Interlacing means that the total pictureframe is composed of two fields: the firstfield uses every other line on the screen;the second writes between the lines of thefirst. The television camera provides themonitor with the appropriate operatingformat in the video signal.
Other systems are used routinely inEurope and have various numbers of linesthat can be as high as 1200, tripleinterlaced. The tubes vary in size,deflection system and component design.Contrast controls can be adjusted toincrease or decrease the gamma over arange of values, typically 0 to 10.
To see an object, there must be asufficient number of scan lines in thetelevision image; following is onedescription of scan line requirements.22 Tovisualize n objects there must be 2n lines.Allowing for random orientation, thisshould be increased by a factor of2 percent. To see a mesh with 5 holes per1 mm (125 holes per 1.0 in.) wouldrequire 14 lines per 1 mm (350 holes per1.0 in.) scan rate. Horizontally, theresolution is determined by thebandwidth of the signal. One cycle ofbandwidth is required to see the mesh(half cycle for the holes and half cycle forthe spacing between holes). In aconventional system, the viewing matrixuses a 3 × 4 aspect ratio, the horizontalbeing larger than the vertical. If 525 scanlines are used, then the horizontal willrequire 4 × 525 × (√2)–1 half cycles, orabout 250 cycles, to maintain the sameresolution. Using 30 frames per secondscanning and a factor of 1.2 for retracetime, the required bandwidth is on theorder of 525 × 250 × 30 × 1.2 = 4.7 MHz.
Although it may appear that resolutioncould be improved by increasing thenumber of scan lines, two problems result:(1) the charge capacity on the camera’starget elements will be reduced inproportion to the area change that mayreduce the sensitivity and (2) an increasein bandwidth will be required thatincreases the noise in the electronics inproportion to the square root of the
bandwidth. The result is that the standardnumber of scan lines is often as good asor superior to higher scan linesystems.22,24
Many cameras and television monitorsare designed for higher bandwidthoperation (10 MHz and greater). Thisprovides greater resolution horizontally(800 lines or more) than vertically.Because the 525-line vertical is standard,the resolution of video systems is oftenquoted by the horizontal resolution value,a function of bandwidth.
Recording EquipmentRecording the video signal provides apermanent record of the radioscopicresults. Technology in this area changesrapidly with new options appearingfrequently.
Recording of video data generallyoccurs in either of two ways. It can berecorded as an analog signal on someform of video tape or it can be recordeddigitally. When the output of the videosystem is analog the signal is firstconverted to digital form and thenrecorded on some form of digital mediasuch as digital audio tape (DAT), compactdisk (CD), digital video disk (DVD) orhard disk.
Cassette video tape recorders are stillthe most common means of saving videoinformation. They are easily operated butare limited to about 2 h of playback. Theratio of signal to noise in the recordimproves with tape width, which variesfrom 13 to 51 mm (0.5 to 2.0 in.).
Video tape recorders may be equippedwith pause and slow motion modes. Thepause mode, however, shows only onefield rather than the full two-field frame.This limitation results in a reduction ofinformation by half.
In place of the second field, someexpensive recording equipment repeatsthe first field of information in the pausemode. This improves the visual displaybut still represents a reduction ininformation. The reason for showing onlyone field is to eliminate interfield jittercaused by movement between field scansof the camera.
Slow motion modes are quite useful forreplaying rapid events. Unfortunately inslow motion replay a broadband
275Radioscopy

276 Radio
TABLE 9. File formats widely used for bitmapped graphics.
Abbreviation Format
BMP bit mapped pictureDIB device independent bitmapGIF graphics interchange formata
JFF JPEG file formatb
JIF JPEG image formatb
JPEG Joint Photographic Experts GroupJPG JPEGb
PIC PICSb
PICS platform for internet content selectionPICT picturePNG portable network graphicsRLE run length encodingTIF TIFFb
TIFF tagged image file format
a. GIFSM is a service mark of CompuServe Incorporated.b. For compatibility with the disk operating system (DOS) many file names
end with a file extension consisting of a period followed by three letters.For this reason, some format abbreviations consist of three letters orhave been shortened to three letters so the format abbreviation can beappended as an extension to the file name.
3RT10_Layout(253_282) 10/14/02 3:04 PM Page 276
synchronizing signal is reproduced on thevideo screen, sweeping by at each frame.This signal is not easily removed and canbe very distracting when evaluatingimages; removal of the synchronizingsignal noise is possible with furtherinvestment in video replay equipment.
All video recording devices alter thevideo signal in some way. When linkingthe output of the recording camera tomonitors and recorders, the strength ofthe signal is reduced in proportion to thenumber of devices. This results in aweaker signal at the recorder and a poorerrecord. Repeated copying results in adegradation of the image as the signalbecomes successively reduced. Playbackfrom recorded images will be inferior tothe original image. It is also important toconsider the bandwidth capability ofrecording equipment. To maintain asmuch information as possible, bandwidthshould be matched to the bandwidthrequired in the original image. Thestandard television broadcast is 4.2 MHz,to which many video recording devicesare matched.
Digital recording of the video signal isgenerally more expensive but has thepotential of providing a high qualityrecord if the digital signal has a largedynamic range. Digital video disk (DVD)technology offers a high quality recordingin a compact storage medium capable ofholding large amounts of data (4 to10 gigabytes).
The technology of digital storage mediain the two decades from 1982 to 2002 hasundergone the following developments.
1. Optical media have beensupplementing or replacing magneticmedia.
2. Media have become more economical.3. Media have become able to store more
bytes of data.4. Media have become more compact.5. Platforms have become mutually
intelligible, so media formatted by onecomputer or program are more likelyto be able to be read by anothercomputer.
Similar trends affect instruments as well asmedia. These trends seem likely tocontinue in the twenty-first century.
Electronic Soft and HardCopyHard copy of a single frame image is oftendesirable and a radioscopic system shouldbe capable of generating hard copy.Photographic imagers that capture asingle frame from a video input areavailable. Using a video capture card orsimilar hardware enhancements in acomputer, however, is very useful. The
graphic Testing
captured image can then be displayed onthe computer monitor for imageenhancement. It can be processed into anumber of digital formats (see Table 9)that can be output to any printer.
The images can also be stored ortransmitted as electronic files. Multipleframe averaging with video capture canimprove the image quality. Noise isreduced by the square root of the numberof frames averaged.
The frame averaging technique iscommonly a running average:
(32)
where F is the displayed image frame, Fc isthe current row frame, Fp is the previousaveraged frame and n is the number offrames in the running average. Whenviewed in real time, running averagesreduce noise but create image lag or blurfor moving objects, depending on thenumber of frames averaged.
FFn
F n
n= +
−( )c p 1

PART 7. System Considerations
FIGURE 14. Modulation transfer function of system.
Resp
onse
(p
erce
nt)
100
80
60
40
20
0
Optical coupling
Fluorescentscreen
Total system
Image orthicon
0.2 0.1 1 10(5.0) (2.5) (25) (250)
Scan density, lines per 1 mm (lines per 1.0 in.)
3RT10_Layout(253_282) 10/14/02 3:04 PM Page 277
System Evaluation
Image Quality IndicatorsThe most common means for evaluationof radiographic sensitivity is to use apenetrameter, or image quality indicator.The penetrameter is a thin plaque of thesame material as the object. The plaquethickness is a certain percentage of theobject thickness. The penetrameter hasholes with diameters one, two and fourtimes its thickness. The radiographicquality of the imaging system is thenlisted as the smallest percentagepenetrameter detectable and the smallesthole detectable. Other types ofpenetrameters are in use, such as theGerman Industry Standard, DeutscheIndustrie Norm (DIN), penetrameter inEurope.26 This penetrameter uses wires ofgraded diameters, made of the samematerial as the object. The smallest wiredetected is the quality level.
Many experimenters use their ownmeasurement systems for evaluating thequality of an imaging system. These aregenerally called an image quality indicator(IQI). Image quality indicators vary indesign but commonly contain a stepwedge of material from which thesmallest percentage change (in material orcontrast level) can be determined.Resolution may be measured by thesmallest hole size detectable. Because theability to observe a certain diameter holeis a function of the depth of the hole, it iscommon to specify resolution using ahigh contrast object.
Wire meshes are commonly used toevaluate real time imaging systems. Thewire mesh is an object whose finestructure is repetitive. Wire meshes areoften used to indicate the quality level ofinspection at certain speeds of movement.
Modulation Transfer FunctionAnother technique of system evaluation,more rigorous in its approach, is themodulation transfer function (MTF). Themodulation transfer function is the ratioof the image amplitude to the objectamplitude, as a function of sinusoidalfrequency variation in the object:
(33)
where I(ω) is the image amplitude, O(ω)the object amplitude and R(ω) is the sinewave response.
This approach to system evaluation canbe understood by imagining a bar pattern.As the pattern becomes finer and finer,the image response begins to losecontrast. A plot of this response is calledthe square wave response (when a barpattern is used) and is very similar to themodulation transfer function. Squarewave response factors can be used toevaluate imaging systems and undercertain conditions may be corrected to thesine wave response or modulation transferfunction equivalence.27,28
The true modulation transfer function,generated by an object having sinusoidalvariations in intensity, is measuredroutinely for optical components such aslenses, intensifiers and cameras. Normally,in radiography, determining themodulation transfer function for such anobject is prohibitively difficult. Instead,the modulation transfer function isderived by generating the edge spreadfunction, differentiating to obtain the line
RI
Oω
ωω
( ) =( )( )
277Radioscopy

278 Rad
3RT10_Layout(253_282) 10/14/02 3:04 PM Page 278
spread function and fourier transformingto yield the modulation transfer function.Derivations of this and examples may befound in the literature.29-33
The importance of the modulationtransfer function in evaluating systems isthat the total system modulation transferfunction is the product of the individual
modulation transfer functions of thecomponents:
(34)
This is shown in Fig. 14, where themodulation transfer functions for the
MTF MTF MTF MTFsystem 1 2 3= × ×
iographic Testing
FIGURE 15. Assembly line radioscopy for automotive parts using automated part positioning:(a) top view; (b) front view.
(b)
Offloadingdoor
Test pieceTestpiece
Test piece
Conveyor
Conveyor
Maintenance door
Loadingdoor
Transportshuttle
Front door
Detectorpositioningapparatus
Transportshuttle
(a)
Radiationsource
Testpiece

MOVIE.Automatedwheelinspection.
3RT10_Layout(253_282) 10/14/02 3:04 PM Page 279
fluorescent screen, optical coupling,image orthicon camera and total systemare shown.34,35 The components of asystem are analyzed quantitatively andthe poorest is easily determined. Thistechnique allows for the prediction of aproposed system’s performance from dataon the individual components.
System DesignGeneral purpose remote reviewingsystems are usually of three types: X-rayimage intensifier with charge coupleddevice or vidicon camera; fluorescentscreen with intensified charge coupleddevice or isocon camera; and scintillatorplate with charge coupled device camera.Amorphous silicon digital flat panels(discussed elsewhere in this volume) havebeen implemented in remote viewingradioscopic systems. Additionalequipment should include a high qualityvideo monitor, a video tape recorder, avideo disk for dynamic recording and acomputer based frame digitizing andimage enhancement system for real timesumming, running average or contrastadjustments plus edge enhancement andsubtraction techniques. The computerdata acquisition system provides digitaldata storage and hard copy outputcapabilities.
The X-ray image intensifier systems areusually less expensive. They operate bestat the low and intermediate X-rayenergies for which they are designed.Scintillator plates are appropriate for bothlow to intermediate range and megavoltX-ray energies but may not provideenough sensitivity for video framing rates.
The intensified charge coupled deviceand isocon camera systems are moreversatile. Because the fluorescent screen ischangeable, the system can be adjustedfor optimum performance at any energy.Intensified charge coupled device and
FIGURE 16. Radioscopy systems forautomotive wheel inspection.
isocon camera systems may also be usedfor X-ray or neutron detection. Bothsystems can perform in the 1.5 to2.0 percent sensitivity range. Theresolution limit will generally depend onthe input field size, the video bandwidthused and the input phosphor.
The digital flat panel detectors aregenerally more expensive than traditionalradioscopic imaging components. Theyare expected, however, to command alarge share of the market because of theirperformance advantages.
A cabinet system incorporates many ofthe modern features of radioscopicimaging, using an image intensifier tubewith remote viewing and radiationprotection for the operator. Assembly lineradioscopy in a larger enclosure usingrobotics to position automotive parts isshown in Fig. 15 and a radioscopy systemfor automotive wheel inspection is shownin Fig. 16.
279Radioscopy

1. Bossi, R.H., C. Oien and P. Mengers.Sec. 14, “Real-Time Radiography.”Nondestructive Testing Handbook,second edition: Vol. 3, Radiography andRadiation Testing. Columbus, OH:American Society for NondestructiveTesting (1985): p 593-640.
2. Ludwig, G.W. and J.S. Prener.“Evaluation of Gd2O2S:Tb as aPhosphor for the Input of X-RayImage Intensifier.” Schenectady, NY:General Electric Corporate Researchand Development (1972).
3. Storm, E. and H.E. Israel. “PhotonCross Sections from 0.001 to 100 MeVfor Elements 1 through 100.” ReportLA-3753. Los Alamos, NM: Los AlamosNational Laboratory (1967).
4. Kinney, J.H. and M.C. Nichols. “X-RayMicroscopy (XTM) Using SynchrotronRadiation.” Annual Review of MaterialsScience. Vol. 22. Palo Alto, CA: AnnualReviews (2002): p 121-152.
5. Placious, R.C., D. Polansky, H. Berger,C. Bueno, C.L. Vosberg, R.A. Betz andD.J. Rogerson. “High-Density GlassScintillator for Real-Time X-rayInspection.” Materials Evaluation.Vol. 49, No. 11. Columbus, OH:American Society for NondestructiveTesting (November 1991):p 1419-1421.
6. McMaster, R.C., L.R. Merle andJ.P. Mitchell. “The X-Ray VidiconTelevision Image System.” MaterialsEvaluation. Vol. 25, No. 3. Columbus,OH: American Society forNondestructive Testing (March 1967):p 46-52.
7. Sturm, R.E. and R.H. Morgan. “ScreenIntensification Systems and TheirLimitations.” American Journal ofRoentgenology and Radium Therapy.Vol. 62, No. 5. Leesburg, VA: AmericanRoentgen Ray Society (1949).
8. Teves, M.C. and T. Tol. “ElectronicIntensification of FluoroscopicImages.” Philips Technical Review.Vol. 14, No. 2. Eindhoven,Netherlands: Philips ResearchLaboratory (1952): p 33-43.
9. Bates, C.W., Jr. “Concepts andImplementation in X-Ray ImageIntensification.” Real-Time RadiologicImaging; Medical and IndustrialApplications. Special TechnicalPublication 716. West Conshohocken,PA: ASTM International (1980):p 45-65.
10. Diakides, N.A. “Phosphors.” SPIEProceedings, Vol. 42. Bellingham, WA:International Society for OpticalEngineering (1973): p 83-92.
11. Schagen, P. “X-Ray Imaging Tubes.”NDT International. Vol. 14, No. 1.Guildford, United Kingdom:Butterworth-Heinemann (1981):p 9-14.
12. Wang, S.P., D.C. Robbins andC.W. Bates, Jr. “A Novel ProximityX-Ray Image Intensifier Tube.” SPIEProceedings, Vol. 127: OpticalInstruments in Medicine VI. Bellingham,WA: International Society for OpticalEngineering (1977): p 188-194.
13. Vosburg, K.G., R.K. Swank andJ.M. Houston. “X-Ray ImageIntensifiers.” Advances in Electronicsand Electron Physics. Vol. 43. Orlando,FL: Academic Press (1977).
14. Kuhl, W. and J.E. Schrijvers. “A New14-Inch X-Ray Image Intensifier Tube.”Medicamundi. Vol. 22. Eindhoven,Netherlands: Philips Electronics(March 1977).
15. Fink, D.G. and D. Christiansen, eds.Electronic Engineers’ Handbook, thirdedition. New York, NY: McGraw-Hill(1989).
16. Woodhead, A.W. and G. Eschard.“Microchannel Plates and TheirApplications.” Acta Electronica. Vol. 14,No. 2. Limeil Brévannes, France:Laboratoires d’Électronique et dePhysique Appliquée (1971): p 181-200.
17. Chalmetron, V. “Microchannel X-RayImage Intensifiers.” Real-TimeRadiologic Imaging: Medical andIndustrial Applications. SpecialTechnical Publication 716. WestConshohocken, PA: ASTMInternational (1980): p 66-89.
18. Hobson, G.S. Charged Transfer Devices.New York, NY: Holsted Press (1978).
19. Biberman, L.M. and S. Nudelman, eds.Photoelectric Imaging Devices. New York,NY: Plenum Press. Vol. 2 (1971).
20. Howe, M.J. and D.V. Morgan. ChargeCouple Devices and Systems. New York,NY: Interscience (1979).
21. Titus, J. “How Do CCDs CaptureImages?” Test and Measurement World.Newton, MA: Cahners BusinessInformation (April 1999).
280 Radiographic Testing
References
3RT10_Layout(253_282) 9/6/02 3:13 PM Page 280

22. Siedband, M. “Electronic ImagingDevices II.” Physics of DiagnosticRadiology. USDHEW PublicationNo. (FDA) 74-8006. Washington, DC:United States Department of Health,Education, and Welfare [DHEW](1971).
23. Jacobs, J.E. “X-Ray–Sensitive TelevisionCamera Tubes.” Real-Time RadiologicImaging: Medical and IndustrialApplications. Special TechnicalPublication 716. West Conshohocken,PA: ASTM International (1980):p 90-97.
24. Webster, E.W. “Electronic ImagingDevices I.” Physics of DiagnosticRadiology. USDHEW PublicationsNo. (FDA) 74-8006. Washington, DC:United States Department of Health,Education, and Welfare [DHEW](1971).
25. Webster, E.W., R. Wipfelder andH.P. Prendergrass. “High Definitionversus Standard Television in TelevisedFluoroscopy.” Radiology. Vol. 88, No. 2.Easton, PA: Radiological Society ofNorth America (1967): p 355-357.
26. ASTM E 1647-98a, Standard Practice forDetermining Contrast Sensitivity inRadioscopy. West Conshohocken, PA:ASTM International (1998).
27. Bossi, R.H., J.L. Cason andC.N. Jackson, Jr. “The ModulationTransfer Function and Effective FocalSpot As Related to NeutronRadiography.” Materials Evaluation.Vol. 30, No. 5. Columbus, OH:American Society for NondestructiveTesting (May 1972): p 103-108, 112.
28. Coltman, J.W. “The Specification ofImaging Properties by Response to aSine Wave Input.” Journal of the OpticalSociety of America. Vol. 44.Washington, DC: Optical Society ofAmerica (June 1954): p 468.
29. Klingman, E. “Theory and Applicationof an Edge Gradient System forGenerating Optical TransferFunctions.” NASA TN D-6424.Washington, DC: National Aeronauticsand Space Administration (1971).
30. Mees, C.K. Theory of the PhotographicProcess. New York, NY: MacMillanCompany (1942).
31. Morgan, R.H. “The FrequencyResponse Function.” American Journalof Roentgenology and Radium Therapy.Vol. 88. Leesburg, VA: AmericanRoentgen Ray Society (January 1962):p 175.
32. Morgan, R.H., L.M. Bates,U.V. Gopalarao and A. Marinaro. “TheFrequency Response Characteristics ofX-Ray Films and Screens.” AmericanJournal of Roentgenology, RadiumTherapy and Nuclear Medicine. Vol. 92.Leesburg, VA: American Roentgen RaySociety (February 1964): p 426.
33. Smith, F.D. “Optical Image Evaluationand the Transfer Function.” AppliedOptics. Vol. 2, No. 4. Washington, DC:Optical Society of America (1963):p 335.
34. Halmshaw, R. “Direct-ViewRadiological Systems.” ResearchTechniques in Nondestructive Testing.Vol. 1. Orlando, FL: Academic Press(1970): p 241-268.
35. Halmshaw, R. “Fundamentals ofRadiographic Imaging.” Real-TimeRadiologic Imaging: Medical andIndustrial Applications. SpecialTechnical Publication 716. WestConshohocken, PA: ASTMInternational (1980): p 5-21.
BibliographyBates, C.W., Jr. “New Trends in X-Ray
Image Intensification.” Application ofOptical Instrumentation in Medicine III.SPIE Proceedings, Vol. 47. Bellingham,WA: International Society for OpticalEngineering (1974): p 152-158.
Cassen, B. and R.C. McMaster.“Fluoroscopic Methods of Inspectionof Metallic Materials, Part VII.” WPBContract W-138. Pasadena, CA:California Institute of Technology(1945).
Chamberlain, W.E. “Fluoroscopes andFluoroscopy.” Radiology. Vol. 38.Easton, PA: Radiological Society ofNorth America (1942): p 383-412.
Coltman, J.W. “Fluoroscopic ImageBrightening by Electronic Means.”Radiology. Vol. 51. Easton, PA:Radiological Society of North America(1948): p 359-367.
Criscuolo, E.L. and D. Polansky.“Improvements in High SensitivityFluoroscopic Technique.”Nondestructive Testing. Vol. 14, No. 1.Columbus, OH: American Society forNondestructive Testing (January1956): p 30-31, 40.
Csorba, I.P. Image Tubes. Indianapolis, IN:Howard W. Sams and Company(1985).
Curtis, L.R. “Fluoroscopic Inspection ofAluminum and Magnesium Castings.”Nondestructive Testing. Vol. 7, No. 4.Columbus, OH: American Society forNondestructive Testing (Spring 1949):p 24-27.
Dalberg, R.C. “Real-Time Digital ImageFiltering and Shading Correction.”Applications of Digital ImageProcessing III. SPIE Proceedings,Vol. 207. Bellingham, WA:International Society for OpticalEngineering (1979)
281Radioscopy
3RT10_Layout(253_282) 10/14/02 3:04 PM Page 281

Halmshaw, R. Physics of IndustrialRadiography. London, UnitedKingdom: Heywood Books. New York,NY: American Elsevier PublishingCompany (1966).
Hampe, W.R. “Modern FluoroscopyPractices.” Nondestructive Testing.Vol. 14, No. 1. Columbus, OH:American Society for NondestructiveTesting (January 1956): p 36-40.
Hecht, S. and Yun Hsia. “Dark AdaptationFollowing Light Adaptation to Red andWhite Light.” Journal of the OpticalSociety of America. Vol. 35.Washington, DC: Optical Society ofAmerica (1945): p 261.
Klasens, H.A. “Measurement andCalculation of UnsharpnessCombinations in X-Ray Photography.”Philips Research Reports. Eindhoven,Netherlands: Philips ResearchLaboratories (1946): p 241.
O’Connor, D.T. “Industrial Fluoroscopy.”Nondestructive Testing. Vol. 11, No. 2.Columbus, OH: American Society forNondestructive Testing (Fall 1952):p 11-22.
Rossi, R.D. and W.R. Hendree. “SomePhysical Characteristics of Rare-EarthImaging Systems.” Application ofOptical Instrumentation in Medicine IV.SPIE Proceedings, Vol. 70. Bellingham,WA: International Society for OpticalEngineering (1975): p 224.
Smith, W.J. Modern Optical Engineering: TheDesign of Optical Systems. New York,NY: McGraw-Hill (1976).
Wagner, R.E. “Noise EquivalentParameters in General MedicalRadiography: The Present Picture andFuture Pictures.” Photographic Scienceand Engineering. Vol. 21, No. 5.Springfield, VA: Society for ImagingScience and Technology (1977).
282 Radiographic Testing
3RT10_Layout(253_282) 10/14/02 3:04 PM Page 282

Clifford Bueno, General Electric Company, Niskayuna,New York
11C H A P T E R
Digital RadiographicImaging
3RT11_Layout(283_302) 10/14/02 3:09 PM Page 283

284 Radi
PART 1. Overview of Digital Imaging
3RT11_Layout(283_302) 10/14/02 3:09 PM Page 284
DefinitionThe digital imaging chapter of thisvolume presents approaches available toobtain digital radiographs by electronicmeans. The discussion and examples inthe present chapter include techniques ofconversion of X-rays to light and then toelectronic images, photoconductiveconversion of X-rays to electronic images,photostimulable phosphors, arraydetectors, line scan imaging and scanningelectron beams.
Radioscopic digital imaging is relatedto radioscopy. In radioscopic imaging themajor emphasis is on the conversion ofX-rays to analog electronic data that areviewed as video signals in real time.Digitization of these analog signals is atechnique of digital imaging. Many of theprinciples for X-ray detection areidentical, particularly where digital basedcameras such as charge coupled devicecameras are used. The present chapter, ondigital radiographic imaging, differs fromradioscopic imaging in that the systemsare not video based (although in somecases video could be output). Rather,digital systems use discrete sensors withthe data from each detection pixel beingread out into a file structure to form thepixels of the digital image file.
An exception to the discrete sensorbased systems discussed in this chapter isthe photostimulable phosphor systemthat forms a latent image (similar to film)on a storage phosphor imaging plate. Thescreen is read out electronically using aspecial laser scanner. The pixelization inthis case is based not on the X-raysensitive phosphor but in the laserscanner process.
DevelopmentThe ability to develop digital imagingtechnology that would be useful forradiographic testing is due in large part tothe growth in the speed and memory ofcomputer systems. In the 1980s images of512 × 512 pixels 8 bits deep of data(256 kilobytes) were considered large andcreated storage and display problems forthe computer systems at that time. By thetwenty-first century, image files of1500 × 2000 with 16 bits of data(6 megabytes) are common and can be
ographic Testing
transported, stored and displayed withrelatively inexpensive computer systems.
The medical community has led thedevelopment of digital X-ray imaging,where the demand for imaging systemsallows significant investment in thedevelopment of the tools. Spinoff fromthe medical community has occurred,allowing the introduction of digitalimaging technology for the industrialradiography community.
In the early 1980s, digital imaging forradiographic purposes was primarily doneby electronic digitization of the videosignal from a radioscopic system.1 Chargecoupled device cameras were available butthe most common application was as avideo output camera. Developments indirect digital image output for thesecameras resulted in charge coupled devicearrays in the 1990s that consisted ofmillions of pixels.
Also developed in the 1970s and 1980swere digital imaging systems using linescan detector arrays. To form the image,either the part or the detector array wasphysically scanned in the dimensionperpendicular to the array. In the late1970s to early 1980s the photostimulablephosphor array was developed for medicaluse and was used in industry in the 1990s.
In the 1990s the development of largethin film transistor arrays provided thetool that could make large area X-rayimagers using either amorphous silicon oramorphous selenium possible.
Detectors for DigitalImagingDigital radiographic detectors are used innumerous industries from airport baggagescanning to medical diagnosis. Inaddition to these widely usedapplications, digital radiography is findingan increasing role for inservicenondestructive testing, as a diagnostictool in the manufacturing process, foronline production line testing and withconveyer handling systems. Digitalradiographic detectors are also being usedas hand held devices for pipelineinspections, as film replacement devices,in industrial and medical computedtomography systems and as part of largerobotic scanning systems for coverage oflarge structures.

3RT11_Layout(283_302) 10/14/02 3:09 PM Page 285
The digital image by its nature willprovide numerical results important formetrology and thickness measurements.The development of a wide range ofdigital X-ray imaging productscomplements the recent digital revolutionand provides digital image data andresults that can be incorporated into themassive digital manufacturing andservices databases that have emerged tohelp manage the life cycles of productsand structures.
In the field of industrial digitalradiography, there is really no singlestandard X-ray system to address allapplications. Economics, speed, qualityand the impact on the overallmanufacturing or service processes are keyin designing and building digitalradiographic systems. A large aspect ofthat design is the consideration of thedigital X-ray detection device itself. Forthis selection, there are almost as manychoices of detectors as there are ways toconfigure the overall test system. Thedifferent digital detector technologiesavailable are discussed below.
285Digital Radiographic Imaging

286 Radi
PART 2. Principles of Digital X-Ray Detectors
TABLE 1. Pro
Detector
Amorphoussilicon
Amorphousselenium
Charge coupdevices
Storagephosphors
Linear arrays
Reversedgeometry
3RT11_Layout(283_302) 10/14/02 3:09 PM Page 286
The detection devices that support thelarger imaging systems already mentionedare the following: (1) phosphors depositedon amorphous silicon thin film transistordiodes; (2) photoconductors such asamorphous selenium deposited on thinfilm transistors; (3) phosphors depositedor coupled through fiber optic lenses ontocharge coupled device based detectors andcomplementary metal oxide silicon baseddetectors; (4) photostimulable storagephosphors; (5) phosphors deposited onlinear array systems; and (6) X-rayscanning source reversed geometrydetectors. Further details are provided inTable 1.
Each of these devices has an X-raycapture material as its primary means fordetecting X-rays. This material is either anX-ray phosphor material combined with aphotoelectric device (diode,photomultiplier tube or charge coupleddevice) or is an X-ray photoconductormaterial that is then followed by anelectronic readout device. The mostcommon of these detection systems inoperation today are the flat paneldetection systems based on amorphoussilicon and amorphous seleniumstructures, the camera systems based oncharge coupled device technology and the
storage phosphor systems. Theographic Testing
perties of digital radiographic detectors.
Size Range Square (mm) Pixels Size (µ
200 × 200, 1024 x 1024, 100, 127 230 × 190, 2304 × 1920,410 × 410 or 2048 × 2048 or280 × 410 2304 × 3200
350 × 430 to 2560 × 3072 139
led small to 100 × 100; to 4096 × 4096 9 to 50; elarger with lenses larger w
optics
small to 1550 × 430 to 15 500 × 4300 25 to 250
small to 500 to 4096 10 to 200
small to 450 × 450 to 2048 × 2048 25 to 200
amorphous silicon, amorphous seleniumand charge coupled device technologiesare described below.
Each of these devices can be used toreplace film radiographic techniquesdepending on the size of the applicationand on the spatial resolution, imagecontrast and speed required. As noted inTable 1, the detectors have variable modesof operation or are available in differentarchitectures to address diverseapplications. There are numerous pixelarchitectures of amorphous silicondetectors but it is important to note thatcurrently not all detector choices allowreal time operation of 30 frames persecond.
Charge Coupled DevicesScientific charge coupled devices,although they are typically small in size,have been made with high pixel densities.The fields of photography, astronomy andmicroscopy have demanded this and thenondestructive testing industry has been abeneficiary of these developments. Table 1illustrates these small pixel dimensions(9 to 50 µm pixels).
Charge coupled devices have not beenfabricated into larger arrays because the
Image Atomic NumberPixel Acquistion Conversion Z of Conversionm) Speed (min) Material Material
or 200 < 1 (real time) thallium activated cesium 55/53 or 64iodide or terbiumactivated gadoliniumoxysulfide
< 1.0 to 1.5 selenium 34
ffectively < 1 (real time) thallium activated cesium 55/53 or 64ith other iodide or terbium activated
gadolinium oxysulfide
< 1 to 4 europium activated 56/35barium fluorobromide
< 1 (real time) thallium activated cesium 55/53 or 64iodide or terbium activatedgadolinium oxysulfide
< 1 (real time) thallium activated sodium 11/126iodide

3RT11_Layout(283_302) 10/14/02 3:09 PM Page 287
charge coupled device is based oncrystalline silicon, which has traditionallybeen cut from silicon wafers available insizes only as large as 100 to 150 mm (4.0to 6.0 in.) in diameter or less. A largerfield of view can be accomplished withcharge coupled devices through tiling ofthe charge coupled devices or through alens or a fiber optic transfer device to viewan X-ray conversion (phosphor) screen.The downside of the lens approach is thatit has very poor light collection efficiency.Fiber optics or tiling do not provide largefields of view but will result in moreefficient light collection. A more detaileddiscussion of charge coupled devicetechnology may be found elsewhere.2
Thin Film TransistorLarger amorphous silicon and amorphousselenium detectors based on thin filmtransistor technology have been madecommercially available with a pixel pitchsmaller than 75 µm. Amorphous siliconthrough large area amorphous silicondeposition and processing/etchingtechniques offers a solution to the sizeconstraints of charge coupled deviceswhile maintaining good light collectionefficiency from the phosphor orphotoconductor (selenium) material.Because the phosphor layer is typicallydeposited directly onto the silicon,efficient light transfer is easily obtained.However, the readout circuitry (describedelsewhere) in these devices requires a largepixel space to accommodate the thin filmtransistor (TFT) and data lines and scan(gate) lines required for operation, thuslimiting how small a pixel this device canpermit.
Light Collection TechnologyThe amorphous silicon thin filmtransistor circuitry has a fill factor ofactive photodiode ranging from 65 to90 percent. Charge coupled devices use atransparent polysilicon gate structure forreading out the device and have a fillfactor of close to 100 percent.2 On a perpixel basis, the charge coupled device istherefore more efficient in collecting thelight produced from the phosphormaterial. For small field of viewapplications, the directly coupled chargecoupled device approach will providehigh spatial resolution and high lightcollection efficiency. For large field ofview applications, the amorphous siliconapproach offers excellent light collectionefficiency (no lenses), in a thin, compact,robust package.
Radiation Conversion MaterialThe amorphous selenium device is similarto the amorphous silicon based detector.They both use thin film transistor readoutcircuitry. The difference lies in the X-rayconversion material. The amorphousselenium detector relies on the seleniumphotoconductive material (not aphosphor layer) as a means to detectX-rays. The selenium converts X-rays toelectron hole pairs that then get separatedby the internal bias of the device andcaptured by an electrode structure. Theamorphous silicon thin film transistorcircuitry beneath the selenium layerprovides readout of the charge with theaid of field effect transistors (FETs) in asimilar manner to that of the amorphoussilicon detectors. The selenium layer istypically 500 µm (0.02 in.) thick.3
For applications with large fields ofview, amorphous selenium offers directX-ray collection efficiency in a compact,robust package.
Storage PhosphorsStorage phosphors trap X-ray inducedcharge carriers in the color centers of suchphosphor materials as europium activatedbarium fluorobromide (BaFBr:Eu).4Although prompt phosphorescence occursduring X-ray exposure, some of the chargetrapped in the phosphor material is storedin these discontinuity color centers in thecrystalline structure. The carriers stored atthese discontinuity centers can be releasedwhen stimulated by infrared or red laserlight. The rerelease of trapped carrierssubsequently creates photostimulatedluminescence of the same emissionwavelength that the prompt emissionprocess produces.
A photomultiplier tube converts theemitted photostimulated luminescence toan electrical signal that is then amplifiedand sampled.5 These systems have apractical spatial resolution and contrastsensitivity and have been widely used inproduction radiography. Additionally,they are used like film and are somewhatflexible (moldable about parts), portablelike film in the field and fully reusable.Similarly these screens have to betransferred to a laser processor before theycan be interpreted. This removal processstep is where this technology departs fromthe other digital approaches.Photostimulable luminescence techniquescan be more productive when imagingplates can be used in the field in acollection or batch that covers large areasfor each exposure.
The main advantage of phosphorscreens over film is the reduction of filmuse, the ability to digitally acquire a film
287Digital Radiographic Imaging

288 Ra
3RT11_Layout(283_302) 10/14/02 3:09 PM Page 288
quality image, the dynamic range and thecorresponding benefits of that digitalimage file, such as easy archival andretrieval.
Linear ArraysLinear array detectors are much likecharge coupled devices, except that theytypically only have pixels in 1 dimensionor they may be composed of a smallrectangular array such as a 32 × 1024 pixelarray. The advantage of linear arrays istheir intrinsic scatter rejection capability.X-ray scatter exiting a specimen underexamination can be a large contributionto the degradation of the contrast in theimage. The linear array system acquires itsimage by being scanned one line (or agroup of lines) at a time across anobject.6,7 The key is that the radiationbeam is masked or collimated to matchthe size of the detector. This dramaticallydecreases the object’s scatter field. Thescatter detected at each of those lines issubstantially less than that of individuallines in an area array. Linear arrays havebeen successfully used in computedtomography applications and have alsobeen found to be effective for digitalradiographs.
Scanning Beam, ReversedGeometryThe reversed geometry system8-10 goes onestep further in reducing X-ray scatter inthe examination. In this case the data areacquired with a small thallium activatedsodium iodide (NaI:Tl) scintillator coupledto a photomultiplier tube. A large scannedX-ray source with a target diameter ofabout 250 mm (10 in.) is used to definethe image. The X-ray source operates in amanner similar to a video monitor. Anelectron beam is electronically rasteredover the inner surface of the front of theX-ray source. Where the electrons collidewith the inner surface of the tube, X-raysare generated. By electronically scanningthe electron beam, the instantaneousposition of the X-ray source is scannedover an area of the front surface of thetube. The size and location of the scannedregion is user definable, variable from0.25 to 16 s. The acceleration voltage isalso user definable from 55 to 160 kVwith an electron beam current up toabout 0.5 mA. The diameter of theelectron beam spot at the inner surface ofthe tube is about 25 µm (0.001 in.).
The specimen under examination isplaced on top of the X-ray source. This isthe opposite of conventional radiographywhere the object is placed near the
diographic Testing
imaging detector and the source is aboutthe size of a point source. The dataacquisition computer also controls therastering of the electron beam. Byacquiring the output of the detector as afunction of electron beam position, thecomputer can generate a real timeradiograph of the specimen underexamination.
Because a single small area detector isused and the object is placed at thesource, not at the detector, the X-rayscatter from the object is essentially nil.The disadvantage of this approach is that,because it is reversed geometry, theeffective focal spot size is that of thedetector size. The detector size is typicallymuch larger than a typical industrialX-ray focal spot. So that any specimenthat has some thickness will showsignificant unsharpness as the feature ofinterest moves away from the X-raysource.
Detection EfficiencyWith the exception of thephotoconductive selenium based detector,all detectors listed use a phosphor layer ofone sort or another to capture andconvert the X-ray intensity. The selectionof the phosphor or photoconductivematerial, its thickness and effectiveatomic number will impact the totalnumber of X-rays absorbed in theconversion material. Once energy isabsorbed each material, phosphor orphotoconductor, has its own efficienciesfor conversion of this energy into eitherlight or charge carriers. There are othercoupling steps following this to transferthe signal onto the pixelized readoutcircuitry. The performance of the X-raydetector to convey the information in theradiation beam is then dependent on theefficiency of each step in the X-rayconversion process leading to anelectronic signal. The signal-to-noise ratioof the detector and thus the imagecontrast are therefore dependent on thetransfer of information along the imagingchain. Digital imaging chain statistics andthe relation with image contrast arediscussed immediately below.

PART 3. Image Contrast and Signal Statistics
FIGURE 1. Q
Qua
ntity
of
qua
nta
or e
lect
rons
105
104
103
102
10
0
Legendg = gainN = quanta
N
3RT11_Layout(283_302) 10/14/02 3:09 PM Page 289
The transmitted X-ray beam signalpropagates through various energyconversion stages of an imaging system,as discussed elsewhere.11,12 In Fig. 1, N0quanta are incident on a specified area ofthe detector surface (stage 0). A fraction ofthese, given by the absorption efficiency(quantum efficiency) of the phosphormaterial, interact (stage 1). Here it isimportant that the absorption efficiencybe high, or a larger X-ray dose would beneeded to arrive at a desired signal level.
The mean number N1 of quantainteracting represents the primaryquantum sink of the detector. Thefluctuation about N1 is σN1 = √(N1). Thisdefines the signal-to-noise ratio of theimaging system, which increases as thesquare root of the number of quantainteracting with the detector. Regardlessof the value of the X-ray quantumefficiency, the maximum signal-to-noiseratio of the system will occur at thispoint. If the signal-to-noise ratio of theimaging system is essentially determinedthere, the system is said to be X-rayquantum limited in performance. The
uantum statistics of X-ray imager.
Scintillating gain to light photons
Exitance efficiency
Optical efficiency
Quantumefficiency ofdiode or chargecoupled device
Poor quantum efficiency, secondary
quantum sink
Incident radiation
AbsorptionN1
g1
1 2 3 4 5
Stage
0
g2
phosphor layer typically creates a largegain factor at this point. Following this,any subsequent inefficiencies in emittingthe light and capturing it by thephotodiode will result in losses andadditional sources of noise. If the numberof quanta falls below the primaryquantum sink, then a secondary quantumsink will be formed and becomes anadditional important noise source.
For most detection systems discussedhere, where the phosphor is in directcontact with the diode as in the flat paneldetectors, the limiting source of noise isthe quantum efficiency of the X-rayconversion material. Noise characteristicsof digital detectors are discussedelsewhere.12
In efficient systems, because the noiseis related to the square root of the numberof X-ray quanta absorbed, it is crucial tohave a sufficient signal level to avoidquantum mottling. Quantum mottlingmakes detection of smaller features moredifficult. In medical imaging, regulationsallow a certain maximum dose to thepatient and optimal signal levels may notbe obtainable. In this scenario, it is criticalto absorb as many X-ray photons aspossible and not to allow secondaryquantum sinks. In nondestructive testing,it may be possible to increase signal levelsby selecting any or all of the following:a longer exposure time, a higher beamflux, a higher radiation beam energy(assuming absorption is still high at thoseenergies) or a closer working distancebetween source and detector. Thesetechniques will provide improved imagecontrast throughout the spatial frequencyspectrum of the device. Some of thesetechniques, however, may not meet othergoals, such as throughput or allowablespace needed for a specimen between thedetector and the X-ray tube and tradeoffsmust be made.
As just discussed, the phosphor istherefore an important component of thesystem. For the amorphous silicondetector, the phosphor of choice has beencesium iodide with thallium as theluminescent activator in the material (seeFig. 2).13 This phosphor is ideal because ithas the following beneficial properties.
289Digital Radiographic Imaging

290 R
3RT11_Layout(283_302) 10/14/02 3:09 PM Page 290
1. Cesium iodide can be formed intoneedles on top of the diode structureto direct the light to the photodiodeswithout significant light scatter. Theneedles are separated by small air gapsand the high refractive indexmismatch between the cesium iodideneedles and air ensures a high totalinternal reflection of the light as it isdirected to the photodiode.
2. The needle structure enables thickphosphor layers, which improvesX-ray absorption.
3. The cesium iodide has a high effectiveatomic number (Z) which alsocontributes to good X-ray absorptionefficiency.
One disadvantage of the thalliumactivated cesium iodide material is that itis sensitive to moisture and thishygroscopic nature can degrade thespatial resolution of the phosphor andtherefore the device over time if allowedto be in contact with ambient humidconditions. Manufacturers of cesiumiodide based systems provide sealedenclosures. A sealed enclosure maytypically add 20 percent or more to thecost relative to other phosphors and mayreduce the robustness of the system.Another disadvantage is that thephosphor is prone to afterglow andpotential variations in light output as afunction of increasing X-ray dose.
Nevertheless, the thallium activatedcesium iodide phosphor has shownincreasing use on the amorphous silicondetector,13 the charge coupled devicedetector and the linear array detector.Other inorganic phosphor materials, suchas terbium activated gadoliniumoxysulfide (Gd2O2S:Tb),14 high densityglass fiber optic scintillators (FOSs)15 andhybrid combinations of gadoliniumoxysulfide and fiber optic scintillators16
have also been used successfully as X-ray
adiographic Testing
FIGURE 2. Photograph of cesium iodidefibers grown onto a photodiode array.
phosphor material on these same detectorstructures. The fiber optic scintillatorstructure and the hybrid analogs (Fig. 3)provide a similar light guiding capability,provide high X-ray absorptivity withoutsensitivity to moisture and permit controlof afterglow17-19 but are not as bright anX-ray converter as is the cesium iodide.
Because the gain in the fiber opticscintillators materials is not as high as incesium iodide, a potential secondaryquantum sink is possible especially in alens based charge coupled device system.This lower gain will clearly lead to ahigher noise level for a given exposure orto a much longer exposure time togenerate similar statistics. If the detectionsystem used leads to a strictly quantumlimited configuration for any of thephosphor systems mentioned, then theyall should provide similar image quality,assuming the resulting signal levels arehigh enough above the noise floor of thedetection system to render the detectornoise negligible.
On the other hand, if a phosphor istoo bright under a range of X-rayconditions, then it is possible for thediodes to be filled too quickly and amottled image can result simply becauseof the low number of X-ray photonsactually transmitting the part. One way tosolve this problem is to use a lower gainphosphor or the fiber optic scintillatorsand use an extended exposure in a singleframe. Another way is to average multipleframes with the faster phosphor until thedesired image quality is produced.
To summarize, the selection of thephosphor is as important as the selectionof the readout electronics and imageacquisition software. All three have to beconsidered together in the design andpurchase of a system, as well as in theoperation of the system.
The selenium photoconductivematerial has been the photoconductivematerial of choice as a direct means ofconverting X-rays directly into chargedcarriers and avoiding the production oflight.3 This is described in more detailelsewhere. The obvious advantage here isthat the image forming carriers can bemore effectively and efficiently directed tothe electrode structure than is possiblewith light. The image sharpness and speedthat results can be very high. Themodulation transfer function can inprinciple be higher than that of phosphorbased systems for a given pixel pitch. Thedisadvantage of the selenium material,however, is that it does not have as highan atomic number as cesium iodide orgadolinium oxysulfide. For nondestructivetesting applications where the X-rayenergy is typically above 50 kV, to obtainsimilar X-ray sensitivity to the higher Zphosphor materials, the selenium layer
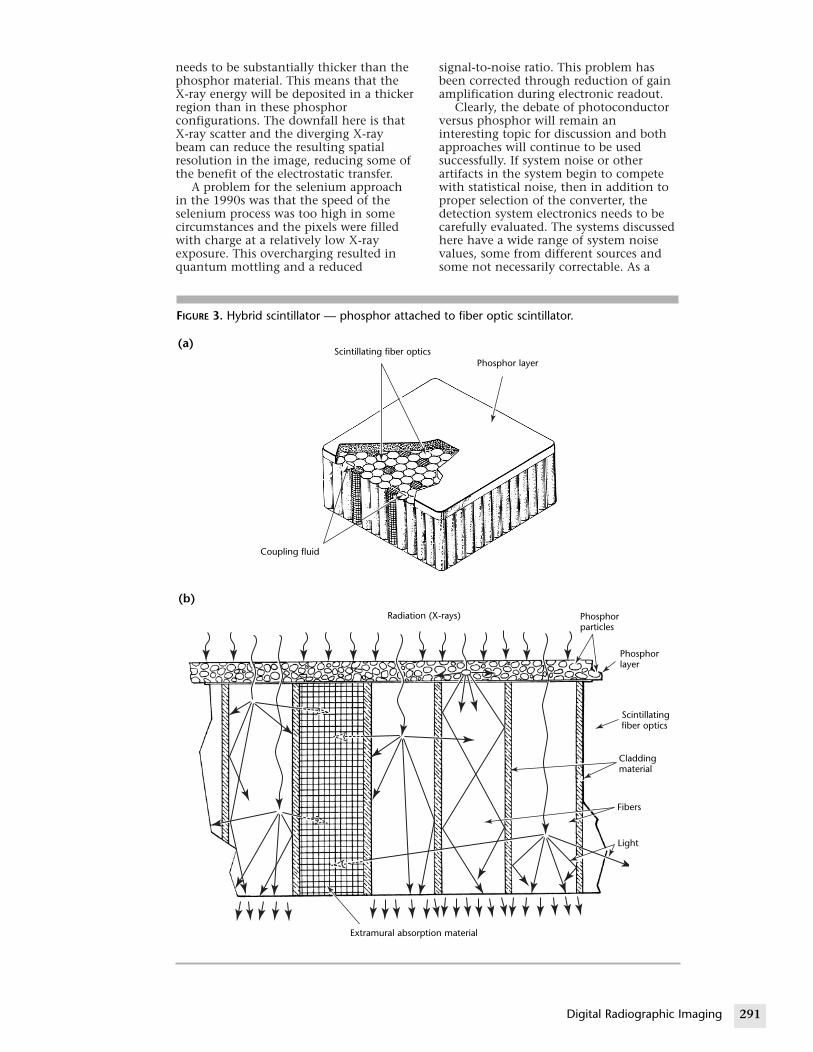
3RT11_Layout(283_302) 10/14/02 3:10 PM Page 291
needs to be substantially thicker than thephosphor material. This means that theX-ray energy will be deposited in a thickerregion than in these phosphorconfigurations. The downfall here is thatX-ray scatter and the diverging X-raybeam can reduce the resulting spatialresolution in the image, reducing some ofthe benefit of the electrostatic transfer.
A problem for the selenium approachin the 1990s was that the speed of theselenium process was too high in somecircumstances and the pixels were filledwith charge at a relatively low X-rayexposure. This overcharging resulted inquantum mottling and a reduced
FIGURE 3. Hybrid scintillator — phosphor attac
Scintillating fiber op
Radiati
Coupling fluid
Extramural abso
(a)
(b)
signal-to-noise ratio. This problem hasbeen corrected through reduction of gainamplification during electronic readout.
Clearly, the debate of photoconductorversus phosphor will remain aninteresting topic for discussion and bothapproaches will continue to be usedsuccessfully. If system noise or otherartifacts in the system begin to competewith statistical noise, then in addition toproper selection of the converter, thedetection system electronics needs to becarefully evaluated. The systems discussedhere have a wide range of system noisevalues, some from different sources andsome not necessarily correctable. As a
291Digital Radiographic Imaging
hed to fiber optic scintillator.
ticsPhosphor layer
on (X-rays) Phosphorparticles
Phosphorlayer
Scintillatingfiber optics
Claddingmaterial
Fibers
Light
rption material

292 R
FIGURE 4. Examples of modulation transfer function curves,showing localized variations in modulation transfer functioncurve in some regions of spatial frequency domain.Maximum spatial resolution for detector is 10 line pairs permillimeter.
Mod
ulat
ion
tran
sfer
fun
ctio
n (r
atio
, lo
g sc
ale)
1
0.1
0.01
Low frequency
drop (lightscatter within
scintillator)
Scintillating fiberoptic plates
Phosphor screenreduces spatial
resolution
Spatial resolution (line pairs per millimeter)
0 2 4 6 8 10
3RT11_Layout(283_302) 10/14/02 3:10 PM Page 292
final check, it is best to test the system forthe application at hand.
Spatial ResolutionConsiderationsThe efficiency of the energy conversionprocess relates to the speed of the test, thethroughput and the tradeoff with contrastsensitivity (the ability to detect a smallchange in thickness or density).
Detector ResolutionThe spatial resolution of the detectordetermines if features in the object aredetectable from a pixel samplingconsideration. The selection of the spatialresolution of the detector is alsoimportant in designing or selecting adetection system. From the aspect ofimage contrast and spatial resolution, it isdesirable to have the largest pixel that willallow detection of the features of interestin the radiographic examination. Forexample, it is not necessary to select a39 µm pixel pitch if the application is forthe detection of large foreign objects leftbehind in an engine nacelle. Similarly,fatigue crack detection is probably notgoing to be too successful with a pixelpitch of 200 µm or larger.
Pixel Pitch
The predominant factor that governs thespatial resolution of a detector is the pixelpitch. The pixel size of a number of digitaldetectors is provided in Table 1. Theselection of the X-ray conversion screenthen becomes important. Here thearchitecture of the X-ray conversionmaterial will dictate to what degree thefull spatial resolution of the detector canbe realized.
As the pixel pitch is reduced to increaseresolution, the total number of pixels inthe image increases for a constant field ofview. The file sizes for typical images runfrom 2 to 8 megabytes. However, fordigital images at radioscopic (real time)frame rates of 30 frames per second, theimage size must be closer to about1 megabyte at current technology.Therefore tradeoffs are made in selectinglarger pixels for smaller fields of view fordigital radioscopy.
The selection of a high atomic numberX-ray conversion material that canprovide a signal gain sufficient to notallow secondary quantum sinks followingabsorption is critical. Forming thismaterial into a shape that directs thesignal onto a single pixel, as is done withcesium iodide, is then crucial tomaintaining good image detail. As theatomic number of the conversion material
adiographic Testing
selected goes down, the percentage ofX-ray information in the radiation beamwill diminish and poor image contrastwill result.
To compensate for this imagedegradation, the conversion material canbe made thicker or, if time permits, alonger total exposure time can be selectedto capture more X-ray quanta. Making theconversion layer thicker can impact thespatial resolving power of the devicebecause both X-ray cross talk and signal(light or electron hole carriers) cross talkwill yield a breakdown in the modulationof the signal somewhere in the spatialfrequency range of the detector.
Modulation Transfer Function
A good measure of the spatial resolutiontherefore is the modulation transferfunction (MTF). The modulation transferfunction measures the signal modulationas a function of spatial frequency and istypically computed using a fouriertransform of a line spread functionacquired on an angled tungsten edgeplaced directly on the detector.13 Figure 4shows the power of a modulation transferfunction for revealing a breakdown inspatial resolution throughout the spatialfrequency regime of the detector. If thespatial resolution drops near the 0 linepairs per millimeter spatial frequencyregime, this drop can be interpreted as asevere degradation in image contrast andwill result in poor density discrimination.If the modulation transfer function is lowat high spatial frequencies, near thesampling limit of the detector, this

3RT11_Layout(283_302) 10/14/02 3:10 PM Page 293
indicates that the conversion material isnot a good choice for detection of the finefeatures that the system was designed todetect. Another choice should be selected.Balancing the spatial resolving powers ofa conversion material with its quantumefficiency has been an active area ofresearch and development in digitalradiography since 1985.
Gain and Offset CorrectionImagery from digital detectors arefrequently normalized for pixel-to-pixelgain variations and also adjusted tosubtract out the background or offset. Theoffset or background signal is usually asmall percentage of the maximum signaland is common to all digital detectors. Itis important to subtract this backgroundsignal to provide a wider linear range andto subtract any latent images on thedetector. In performing a gain correction,not only are pixel-to-pixel variationsreduced but also variations in the opticalcomponents feeding these pixels will bediminished. Performing this gaincorrection can also be used to flatten theradiation intensity distribution across thedetector panel. Making the radiationbeam intensity more uniform across thedetector can result in wider latitude(viewable thickness range) in the image.This normalization is really not possiblewith film radiography.
The gain correction is accomplished bytaking an image with a radiationtechnique similar to that planned forproduction but without an object in thebeam (an air image) and with a muchreduced X-ray intensity. By simplyperforming an image division by the gainfactor on a pixel-by-pixel basis, the offsetcorrected air image is then used to correcteach subsequent image of an object.Following gain and offset correction,detection sensitivity improves in relationto an image that does not have thiscorrection. For the air image, it is criticalthat the image be free of transient latentimages, have the correct intensity andalso not contain an object of any sort(such as a fixture) in the beam. If any ofthese occur, then every subsequentcorrected object image will containartifacts and the correction will do moredamage than good.
Radiation DamageIn digital imaging devices, there arenumerous elements of the detectorassembly that can be damaged by theionizing radiation. Every component inthe imaging chain not shieldedappropriately from X-rays or gamma rayscan be damaged. The term radiation
damage is a general term that can refer toany range of damage to a component inthe detection chain. The damage can leadto subtle changes in performance, all theway to failure. Most digital detectors aredesigned so that the electroniccomponents behind the X-ray conversionmaterial are either shielded from theX-rays (for example, by the conversionmaterial itself or by fiber optic transfercomponents behind it) or are sufficientlythin to absorb only a small portion of theX-rays that impinge on the component.The damage that occurs in the electroniccircuitry can result in an increase in theelectronic noise of the device andeventually to failure as the accumulateddose to the component increases. Eachmanufacturer uses proprietary circuitryand various forms of shielding elementsto prevent these effects. Each system isdifferent, so the reader is referred to ageneral text on radiation effects on siliconcircuitry.20
The X-ray conversion material, beingthe primary X-ray absorption component,is exposed to the highest levels ofradiation within the imaging chain.Phosphors such as cesium iodide andphotoconductive materials such asselenium have discontinuity centerswithin their band structures that will trapelectron and hole carriers produced by theionizing radiation. In manycircumstances, thermally released carriersfrom these traps will yield a delayedluminescence or a delayed release ofcharge. This form of radiation damageknown as afterglow or lag usually increasesas a function of radiation dose until anequilibrium occurs where the number ofcarriers being trapped equals the numberbeing thermally released.
Another form of radiation damage toX-ray conversion materials that occurs iswhen the carriers are permanentlytrapped in deep centers within the bandgap. This trapping is sometimes associatedwith a darkening of the conversionmaterial and usually results in a rapiddecrease in signal that can only be healedby heat annealing of the material or byslow thermal release at room temperature.This form of damage is known as a gaindecrease. In other materials, it is possibleto observe a rapid signal gain increase as afunction of increased radiation dose.Although the mechanism of gain decreaseis not widely understood, both gainchanges can impart spatial artifacts into acurrent image created by the variation inradiation intensity across a prior specimenimage. In most cases these gain changesare not long term or permanent. If thesystem is prone to these radiation inducedgain changes, it is important tocontinually update gain and offset data,even if the actual examination is not
293Digital Radiographic Imaging

294 Rad
3RT11_Layout(283_302) 10/14/02 3:10 PM Page 294
changing, so that these artifacts can bereduced. If the problem becomes severe itmight warrant a new phosphor.
The storage phosphor used incomputed radiography systems, europiumactivated barium fluorobromide(BaFBr:Eu), inherently has discontinuitycenters when prepared under certainreducing conditions in the presence of apartial pressure of hydrogen (H2) gas in anotherwise inert atmosphere.4,21,22 In thisphosphor, this radiation damage has beenused in a novel way by storing thesecharge carriers in the phosphor materialand then later reexciting those carriers(with red light emitting diodes or ahelium neon laser) to produce a delayedluminescence. In storage phosphors, thisradiation damage is beneficial but, inpromptly emitting materials such ascesium iodide, is to be avoided if possible.
Selection of Systems toMatch ApplicationSome of the key characteristics that mightbe considered in the selection of a digitalradiographic imaging system are thefollowing: (1) detection precision andaccuracy; (2) system speed to match thatof manufacturing and test processes;(3) area of the detector to matchmanufacturing throughput needs;(4) volume of the device for access totight locations in an assembly;(5) presence of artifacts that can impactdetection capability.
If a large area detector is needed andthere is a requirement to work at real timeframe rates of 30 frames per second, thenan amorphous silicon detector or chargecoupled device based detector should beselected.23 Note that technology in 2002may limit digital radioscopy frames toabout one million pixels. If static imagingis required but the highest spatialresolution is needed and the object size isnot large, then a system using a low noisephosphor or charge coupled device shouldbe selected. For this same application, alarge area flat panel detector operating instatic mode can also be selected if used incombination with a microfocus X-ray tubebut only if the application can withstandthe longer exposure times associated withmagnification radiography.24
If super high resolution is required, forexample, very tight small crack detection,then magnification may be required withthe high resolution charge coupled devicedevices.
As mentioned above, it is important tohave the largest pixel that can be acceptedfrom a feature detection (spatialresolution) standpoint. This parameterthen provides the highest throughput
iographic Testing
possible because larger pixels can producea higher signal-to-noise ratio for a givenX-ray exposure. Larger pixels will alsoallow a lower exposure for a constantsignal-to-noise ratio. Larger pixels permitthicker X-ray conversion materials, againpotentially adding speed to the test.Finally larger pixels will result in a largeroverall field of view (larger throughput).For example, a four million pixel array of200 µm pixels will have 16× the field ofview of a four million pixel array of50 µm pixels. As mentioned earlier, thesize of the detector and the size of thepixel still go hand in hand using today’stechnology. It is be possible to have a10 000 × 10 000 pixel array of 25 µmpixels resulting in a 250 × 250 mm device.That said, if a smaller pixel device isselected, it might be possible to averagepixels into larger superpixels to enhancespeed and part throughput. The minordrawbacks of such superpixels is that theX-ray conversion material may not be ofoptimal thickness for the larger size pixeland the percent of active pixel (becausethe amorphous silicon approach may besumming four field effect transistors) maynot be as great as if the pixel weredesigned with a single set of readoutcircuitry. Finally, the noise of averagingfour pixels is a little higher than the noiseof a similar detector element of the samesize.
For tight locations, small detectorsbased on charge coupled device orcomplementary metal oxide silicontechnology can be used. Some of thesedevices are being used for dentalradiography and they are beginning tofind application in nondestructive testing.
Where the requirement is to simplyreplace film in favor of a lower cost digitalsolution, then storage phosphors can beused quite successfully. However, if accessis not an issue, then the other digitalapproaches may be more cost effectiveover the long term because they are moreamenable to high speed mechanizedautomation of the detector and X-ray tubeto scan about a part or conversely for thepart to be scanned through the stationarytube and detector configuration.
Linear arrays can be used in anassembly line configuration, as can thereal time flat panel and charge coupleddevice detector based systems. Linescanners offer the advantage of reducedsensitivity to X-ray scatter in relation toarea array systems.22
The scanning beam, reversed geometrysystem has shown promise in reducedaccess applications. This detector isnatural because the detector module isquite small. The reversed geometry systemis probably the best system for reducedsensitivity to X-ray scatter because thedetector is essentially a point based

3RT11_Layout(283_302) 10/14/02 3:10 PM Page 295
sensor. However, it is important to notethat the detector is typically much largerthan an X-ray tube focal spot. Because ofthe effective focal spot size of the system,there may be some geometric constraintsplaced on this system in terms of imageunsharpness.
Artifacts have been prevalent in digitalradiographic systems. The presence ofartifacts, therefore has to be evaluatedalmost on a detector-to-detector basis.
295Digital Radiographic Imaging

296 Radi
PART 4. X-Ray Detector Technology
FIGURE 5. Sci
Transistor arra
Glasssubstrate
FIGURE 6. Circuitry of amorphous silicondetector array.
Row
driv
ers
Read amplifiersOne pixel
Bias supplyPhotodiode
Thin filmtransistor
switch
FIGURE 7. Photomicrograph of amorphous silicon detectorcircuitry.
Rowline
Dataline
Biasline
Thin filmtransistorswitch
3RT11_Layout(283_302) 10/14/02 3:10 PM Page 296
Amorphous SiliconDetectors23
Most new amorphous silicon designs arebased on a flat glass panel that hasundergone a deposition process resultingin a coating on one side that containsseveral million amorphous silicontransistors. These transistors are arrangedin a precise array of rows and columns.Bias and control lines are brought to theedge of the panel for each individualtransistor. The length and makeup ofthese control lines play a role in how fastimage data can be scanned out of thearray. On large receptors the control linesare typically brought out from the middleto both sides of the panel to minimize thetrack lengths.
Figure 5 illustrates a cutaway view of atypical panel design. This configuration istypical of a receptor incorporating aphosphor conversion layer. The phosphorlayer converts the X-ray photons to lightphotons. The light photons are in turnconverted to electrons by the amorphoussilicon array and the readout electronics.
The next layer of the assembly (shownin Fig. 5) is the amorphous silicontransistor array. Deposited on a glasssubstrate to provide a rigid and very flatsurface, this layer converts the lightphotons, from the phosphor, intoelectrons that can be read out, amplified,digitized and stored as an image. Eachelement of the amorphous silicon array ismade up of a transistor and a photodiode. See Fig. 6 for a schematicrepresentation of a small section of thereceptor. The light from the phosphor iscaptured by the photodiode and then readout through the transistor in a very high
ographic Testing
ntillator attached to amorphous silicon array.
Scintillator
y
speed and synchronized process. Eachcharge is digitized by an analog to digitalconverter and then stored in a precisememory location in the image processingcomputer. Once every transistor issampled and read out, a complete imagewill be displayed on the viewing monitor.
With regard to flat panel receptors, apixel is the area of one transistor and onephoto diode.24 Typically these pixelsrange is size from 100 × 100 µm
One pixel
Photodiode

FIGURE 8. Schdetector usiniodide scinti
X-
Cesiumiodide
Photodio
3RT11_Layout(283_302) 10/14/02 3:10 PM Page 297
(0.004 × 0.004 in.) to 400 × 400 µm(0.016 × 0.016 in.). A typical pixel isshown in Fig. 7.
Figure 8 shows a cross sectional view ofan amorphous silicon receptor that uses acesium iodide scintillator. This viewsuggests the path taken by the X-ray beamas it exits the object being tested andenters the input of the receptor. Figure 9shows an image receptor assembly withthe electronics folded out from behindthe panel during assembly and testing.The large dark area at the right center ofthe picture is the amorphous silicon array.Around the edges of the array are all theelectronics required to control and readout the image data.
The micrograph in Fig. 7 shows themechanical makeup of the amorphoussilicon layer. The bias and data linesprovide the ability to properly control
ematic cross section of photodiode X-rayg amorphous silicon receptor with cesium
llator.
rays
Visible photons
Row select
Bias
de
Output
FIGURE 9. Photograph of amorphous silicondetector with electronics mounted to side ofpanel in position where they can beshielded from X-rays.
each pixel and the connections used toget the image data out.
The high resolution view of analuminum tube weld in Fig. 10 wasobtained with an amorphous silicon paneloriginally acquired at 4× geometricmagnification with a microfocus X-raysource. In the lower portion of the imageis the placement of a 75 µm (0.003 in.)thick ASTM aluminum plaque imagequality indicator. The central hole in thisplaque is 250 µm (0.010 in.) in diameterand is clearly visible through the thinaluminum walls, about 1.25 mm(0.050 in.) thick. This image illustratesthat very small diameter porosity can bedetected in these structures: comparingthe gray scale and size of the pores in theweld with the holes of the image qualityindicator reveals porosity much smaller indiameter than the 1T (250 µm [0.010 in.])hole. Figure 10b provides a high pass filterrendition of this image. Once filtered,contrast may be added to the image sothat high contrast can be observed acrossthe entire thickness range of the object.This now provides information on theweld almost to the tangent point andassists the operator in identifyingdiscontinuities over a wider range ofthickness in a single view.
Most flat panel receptors availabletoday are designed to provideradiographic acquisition capability at arate of one image about every 5 to 10 s.Some designs take more or less time toput the image on the monitor but mostfall into this range. This speed is certainly
297Digital Radiographic Imaging
FIGURE 10. Aluminum tube weld image acquired withamorphous silicon detector with 4X geometricmagnification. (a) porosity as small as 125 µm (0.005 in.)can be detected in gray scale image; (b) high pass filterprovides high contrast over wider thickness range in singleview, making porosity evident almost to tangent point ofweld.
(a) (b)

298 Radi
FIGURE 11. ScX-ray detect
Top bias e
Field lines
P
3RT11_Layout(283_302) 10/14/02 3:10 PM Page 298
much faster than what can be achievedwith film cassettes. This technologyrepresents an advance in practicality sincethe 1990s.
Amorphous SeleniumDetectorsIn flat panel arrays using an amorphousselenium converter (or otherphotoconductors), the X-ray to electricalcharge conversion process is referred to asdirect because no intermediate steps arerequired. As shown in Fig. 11, the highvoltage bias field applied to anamorphous selenium layer creates vertical
ographic Testing
hematic cross section of amorphous seleniumor.12
lectrode Positive voltage
Amorphous selenium
Pixel electrode
DrainInsulator
Source
Gate Glass substrate
Trapped holes
ixel electrode
Drain Source
Gate
++++
FIGURE 12. Charge couple device based X-ray coupled device through phosphor (phosphoroptic scintillator coupled directly to charge co
(a)
Charge couple device array
(b)Fiber optic protectiscintillator, 1 to 25
Charge couple device array
field lines. Because the field lines areparallel to the incident X-ray beam (otherthan for oblique angles), the fieldprevents the charge from lateral scatteringand thus there is virtually no blur.Intuitively, this would seem to suggestthat the amorphous selenium conversionlayer (excluding the pixel electrodes)should exhibit extremely high resolution.In fact, measurements prove this to be thecase.
Charge Coupled DeviceRadiographic SystemsCharge coupled devices are used in X-rayimaging systems in combination withX-ray phosphors or scintillators withoutthe need for electronic imageintensification. A charge coupled device isan integrated circuit formed by depositinga series of electrodes, called gates on asemiconductor substrate to form an arrayof metal oxide semiconductor (MOS)capacitors. By applying voltages to thegates, the material below is depleted toform charge storage wells. These storecharge injected into the charge coupleddevice or generated within thesemiconductor by photoelectricabsorption of optical quanta. If thevoltages over adjacent gates are variedappropriately, the charge can betransferred from well to well under thegates, much in the way that boats willmove through sets of locks as thepotential (water heights) are adjusted.12
detector: (a) X-rays directly excite charge does not provide enough shielding); (b) fiberuple device provides shielding to sensor.
Phosphor layer, 0.05 to 0.20 mm(0.002 to 008 in.) thick
on plate or fiber opticmm (0.04 to 1.0 in.) thick X-rays
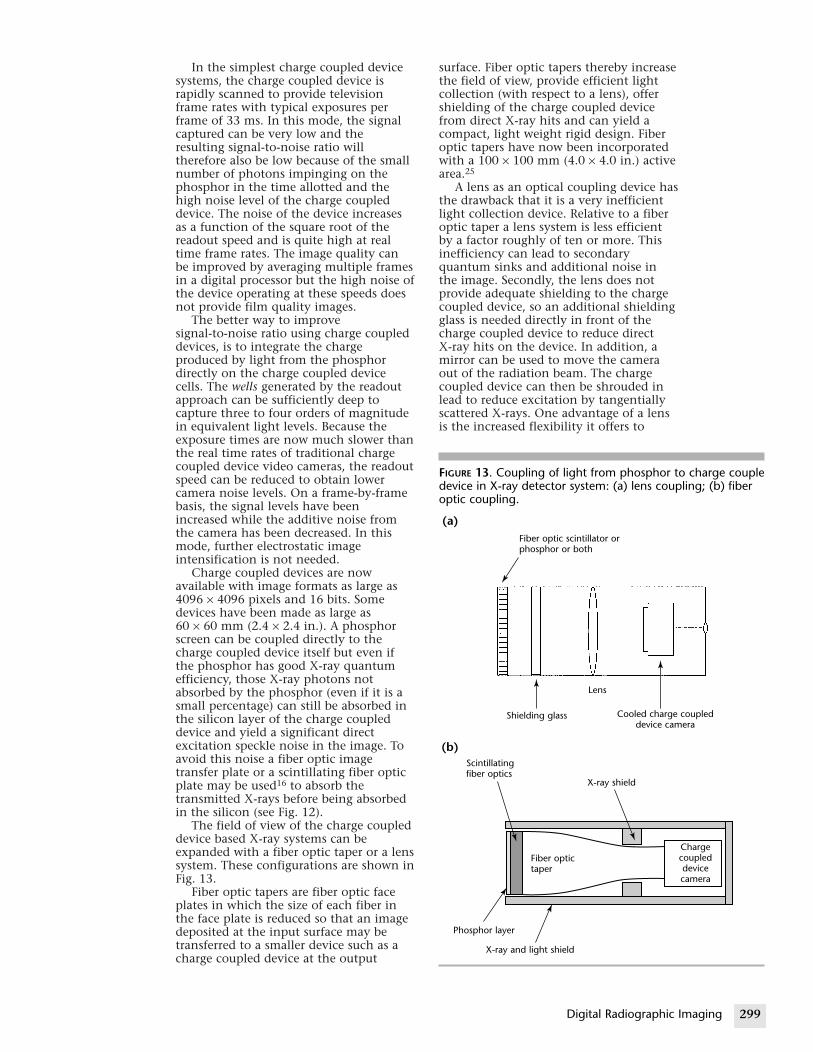
FIGURE 13. Coupling of light from phosphor to charge coupledevice in X-ray detector system: (a) lens coupling; (b) fiberoptic coupling.
Fiber optic scintillator orphosphor or both
Shielding glass
Lens
Cooled charge coupleddevice camera
(a)
(b)
Chargecoupleddevicecamera
X-ray shield
Scintillatingfiber optics
Fiber optictaper
X-ray and light shield
Phosphor layer
3RT11_Layout(283_302) 10/14/02 3:10 PM Page 299
In the simplest charge coupled devicesystems, the charge coupled device israpidly scanned to provide televisionframe rates with typical exposures perframe of 33 ms. In this mode, the signalcaptured can be very low and theresulting signal-to-noise ratio willtherefore also be low because of the smallnumber of photons impinging on thephosphor in the time allotted and thehigh noise level of the charge coupleddevice. The noise of the device increasesas a function of the square root of thereadout speed and is quite high at realtime frame rates. The image quality canbe improved by averaging multiple framesin a digital processor but the high noise ofthe device operating at these speeds doesnot provide film quality images.
The better way to improvesignal-to-noise ratio using charge coupleddevices, is to integrate the chargeproduced by light from the phosphordirectly on the charge coupled devicecells. The wells generated by the readoutapproach can be sufficiently deep tocapture three to four orders of magnitudein equivalent light levels. Because theexposure times are now much slower thanthe real time rates of traditional chargecoupled device video cameras, the readoutspeed can be reduced to obtain lowercamera noise levels. On a frame-by-framebasis, the signal levels have beenincreased while the additive noise fromthe camera has been decreased. In thismode, further electrostatic imageintensification is not needed.
Charge coupled devices are nowavailable with image formats as large as4096 × 4096 pixels and 16 bits. Somedevices have been made as large as60 × 60 mm (2.4 × 2.4 in.). A phosphorscreen can be coupled directly to thecharge coupled device itself but even ifthe phosphor has good X-ray quantumefficiency, those X-ray photons notabsorbed by the phosphor (even if it is asmall percentage) can still be absorbed inthe silicon layer of the charge coupleddevice and yield a significant directexcitation speckle noise in the image. Toavoid this noise a fiber optic imagetransfer plate or a scintillating fiber opticplate may be used16 to absorb thetransmitted X-rays before being absorbedin the silicon (see Fig. 12).
The field of view of the charge coupleddevice based X-ray systems can beexpanded with a fiber optic taper or a lenssystem. These configurations are shown inFig. 13.
Fiber optic tapers are fiber optic faceplates in which the size of each fiber inthe face plate is reduced so that an imagedeposited at the input surface may betransferred to a smaller device such as acharge coupled device at the output
surface. Fiber optic tapers thereby increasethe field of view, provide efficient lightcollection (with respect to a lens), offershielding of the charge coupled devicefrom direct X-ray hits and can yield acompact, light weight rigid design. Fiberoptic tapers have now been incorporatedwith a 100 × 100 mm (4.0 × 4.0 in.) activearea.25
A lens as an optical coupling device hasthe drawback that it is a very inefficientlight collection device. Relative to a fiberoptic taper a lens system is less efficientby a factor roughly of ten or more. Thisinefficiency can lead to secondaryquantum sinks and additional noise inthe image. Secondly, the lens does notprovide adequate shielding to the chargecoupled device, so an additional shieldingglass is needed directly in front of thecharge coupled device to reduce directX-ray hits on the device. In addition, amirror can be used to move the cameraout of the radiation beam. The chargecoupled device can then be shrouded inlead to reduce excitation by tangentiallyscattered X-rays. One advantage of a lensis the increased flexibility it offers to
299Digital Radiographic Imaging

300 Rad
FIGURE 15. X-radiographic images of barrels and contentsmade with linear detector arrays: (a) first barrel; (b) secondbarrel.
(a) (b)
3RT11_Layout(283_302) 10/14/02 3:10 PM Page 300
adjust the field of view for testing of bothlarge and small objects.
The amorphous silicon, the amorphousselenium (Fig. 14) and the charge coupleddevice approach each provides imagecharacteristics of interest. Charge coupleddevices can provide high resolution witha small field of view whereas the largeramorphous detectors will providemoderate resolution with a large field ofview.
Linear Detector ArraysThe linear detector array based systemsare ideally suited for productionenvironments. Many industries —including automotive manufacture, cargotransport, food inspection, munitions,security and nuclear waste containment— use linear arrays of X-ray detectors fortheir inspection needs. Thousands ofthese units have been installed. Figure 15shows images of various objectssuspended in barrels and detected withlinear arrays.
iographic Testing
FIGURE 14. Radiographic image of nickelalloy bucket blade with enlarged view offinning effect. Image was acquired with400 kV exposure of 350 × 430 mm(14 × 17 in.) field of view with part onamorphous selenium detector.

1. Nondestructive Testing Handbook,second edition: Vol. 3, Radiography andRadiation Testing. Columbus, OH:American Society for NondestructiveTesting (1985).
2. Janesick, J. and T. Elliot. “History andAdvancement of Large Area ArrayScientific CCD Imagers.” AstronomicalCCD Observing and Reduction [Tucson,AZ]. Conference Series 91. Vol. 23.Chelsea, MI: Bookcrafters (1992): p 1.
3. Soltani, P.K., D. Wysnewski andK. Swartz. “Amorphous SeleniumDirect Radiography for IndustrialImaging.” Proceedings — ComputerizedTomography for Industrial Applicationsand Image Processing in Radiology[Berlin, Germany]. DGZIP ProceedingsBB 67-CD. Berlin, Germany: DeutscheGesellschaft für ZerstörungsfreiePrüfung (March 1999): p 1-10.
4. Takahashi, K., J. Miyahara andY. Shibahara. “PhotostimulableLuminescence (PPL) and Color Centersin BaFX:Eu2+(X=CI,BrI) Phosphors.”Journal of the Electrochemical Society.Vol. 132, No. 6. Pennington, NJ:Electrochemical Society (1985):p 1492-1494.
5. ASTM E 2007-00, Standard Guide forComputed Radiology (PhotostimulableLuminescence (PSL) Method). WestConshohocken, PA: ASTMInternational (2002).
6. Spees, G., B. Munier, G. Roziere,P. Prieur and H. Rougeot. “Solid-StateLinear Detector for X-Ray DigitalImaging.” Materials Evaluation. Vol. 48,No. 3. Columbus, OH: AmericanSociety for Nondestructive Testing(March 1990): p 326-327.
7. Koskinen, J. “LDA Technology Todayand Possibilities in the Future.” Paperpresented at Digital Imaging 4[Mashantucket, CT]. Columbus, OH:American Society for NondestructiveTesting (August 2001).
8. Albert, R.D. “X-Ray Scanning Methodand Apparatus.” United States Patent3 949 229 (April 1976).
9. Winfree, W.P., N.A. Cmar-Mascis andF.R. Parker. “Enhanced Imaging ofCorrosion in Aircraft Structures withReverse Geometry X-Ray ®.” Paper7C2. Third Joint Conference on AgingAircraft [Albuquerque, NM]. Arlington,VA: Galaxy Scientific, for the FederalAviation Administration,Airworthiness AssuranceNondestructive Inspection ValidationCenter, Sandia National Laboratories,Albuquerque, NM (September 1999).
10. Albert, R., W. Pember, J. Garrison andD. Reyna. “Aircraft Inspection with aPortable, Filmless X-Ray System UsingReverse Geometry.” MaterialsEvaluation. Vol. 58, No. 5. Columbus,OH: American Society forNondestructive Testing (May 2000):p 634-638.
11. Ter-Pogossian, M.M. The PhysicalAspects of Diagnostic Radiology. NewYork, NY: Harper and Row Publishers,Hoeber Medical Division (1967).
12. Yaffe, M.J. and J.A. Rowlands. “X-RayDetectors for Digital Radiography.”Physics in Medicine and Biology. Vol. 42.London, United Kingdom: Institute ofPhysics in association with theAmerican Institute of Physics and theAmerican Association of Physicists inMedicine (1997): p 1-39.
13. Granfors, P.R. and R. Aufrichtig.“Performance of a 41 × 41-cm2
Amorphous Silicon Flat Panel X-RayDetector for Radiographic ImagingApplications.” Medical Physics. Vol. 27,No. 6. Melville, NY: American Instituteof Physics for the AmericanAssociation of Physicists in Medicine(June 2000): p 1324-1331.
14. Weisfeld, R.L., M.A. Hartney,R.A. Street and R.B. Apte. “NewAmorphous-Silicon Image Sensor forX-Ray Diagnostic Medical ImagingApplications.” Medical Imaging 1998:Physics of Medical Imaging. SPIEProceedings, Vol. 3336. Bellingham,WA: International Society for OpticalEngineering (July 1998): p 444-452.
15. Bueno, C., M.D. Barker, P.E. Condonand R.A. Betz. “Solid State X-RayImaging Methodology.” Final Report,Contract No. F33615-89-C-5617,WL-TR-92-4003. Wright-Patterson AirForce Base, OH: Wright Laboratory,Materials Directorate, Air ForceSystems Command (March 1992).
301Digital Radiographic Imaging
References
3RT11_Layout(283_302) 10/14/02 3:10 PM Page 301

16. Placious, R.C., D. Polansky, H. Berger,C. Bueno, C.L. Vosberg, R.A. Betz andD.J. Rogerson. “A High Density GlassScintillator for Real-Time X-RayInspection.” Materials Evaluation.Vol. 49, No. 11. Columbus, OH:American Society for NondestructiveTesting (November 1991):p 1419-1421.
17. Bueno, C., R.L. Rairden, R.A. Betz,R.W. Mead and J. Ellis. “HybridLuminescent Device and Method forImaging Penetrating Radiation.”United States Patent 5 636 299 (June1997).
18. Bueno, C., R.L. Rairden and R.A. Betz.“Hybrid Luminescent Device forImaging of Ionizing and PenetratingRadiation.” United States Patent5 594 253 (January 1997).
19. Bueno, C., R.A. Betz and R.L. Rairden.“Hybrid Scintillators for X-RayImaging.” Medical Imaging 1996:Physics of Medical Imaging. SPIEProceedings, Vol. 2708. Bellingham,WA: International Society for OpticalEngineering (1996): p 469-481.
20. Messenger, G.C. The Effects of Radiationon Electronic Systems. New York, NY:Van Nostrand Reinhold (1986).
21. Crawford, M.K., L.H. Brixner andK. Somaiah. “X-Ray ExcitedLuminescence Spectroscopy of BariumFluorohalides.” Journal of AppliedPhysics. Vol. 66, No. 8. Melville, NY:American Institute of Physics (October1989): p 3758-3762.
22. Crawford, M.K. and L.H. Brixner.“Photostimulable Phosphors for X-RayImaging: Applications andMechanism.” Journal of Luminescence.Vol. 48-49, Part 1. New York, NY:Elsevier (January-February 1991):p 37-42.
23. Budner, G. “High Energy DigitalImaging Techniques with aSi FlatPanel Imagers.” Paper presented atDigital Imaging 4 [Mashantucket, CT].Columbus, OH: American Society forNondestructive Testing (August 2001).
24. Gilblom, D., R. Colbeth, M. Batts andB. Meyer. “Real-Time X-Ray Imagingwith Flat Panels.” Process Control andSensors for Manufacturing. SPIEProceedings, Vol. 3399. Bellingham,WA: International Society for OpticalEngineering (1998): p 213.
25. Bueno, C., M. Barker, K. Lauraitis,R. Barry and J. Ryder. “HighResolution Real-Time X-RayRadiography Advanced Development.”Vol. 1, Final Report, Contract No.F33615-91-C-5623, WL-TR-97-4035.Wright-Patterson Air Force Base, OH:Air Force Research Laboratory, AirForce Materiel Command (February1997).
BibliographyASTM E 1000-98, Standard Guide for
Radioscopy. West Conshohocken, PA:ASTM International (1998).
ASTM E 1255-96, Standard Practice forRadioscopy. West Conshohocken, PA:ASTM International (2002).
ASTM E 1453-93, Standard Guide for Storageof Media That Contains Analog or DigitalRadioscopic Data. West Conshohocken,PA: ASTM International (1996).
ASTM E 2033-99, Standard Practice forComputed Radiology (PhotostimulableLuminescence Method). WestConshohocken, PA: ASTMInternational (1999).
Kano, T. “X-Ray Imaging System UtilizingPhotostimulable Phosphor Detector.”Medical Imaging Technology. Vol. 5.Tokyo, Japan: Japanese Society ofMedical Imaging Technology (1987):p 179.
302 Radiographic Testing
3RT11_Layout(283_302) 10/14/02 3:10 PM Page 302

Richard H. Bossi, The Boeing Company, Seattle,Washington
Paul Burstein, Skiametics Incorporated, Winchester,Massachusetts
James M. Nelson, The Boeing Company, Seattle,Washington
Computed Tomography
12C H A P T E R
3RT12_Layout(303_344) 10/2/02 3:02 PM Page 303

304 Rad
PART 1. Introduction to Computed Tomography
FIGURE 1. Clplane of int
(a)
Image p
3RT12_Layout(303_344) 10/2/02 3:02 PM Page 304
Standard radiography uses superpositionof information to create two-dimensionalimages of three-dimensional objects. For agreat many objects, this effect isacceptable. However, in complicatedobjects this superposition can causedifficulty in interpretation. It is desirablein such cases to be able to view interiorregions of interest without interference.The term tomography comes from theGreek τοµοσ, tomos, “cut” or “slice.”Several techniques of tomographicimaging have been developed to slice orsection an object radiographically.
Classical body scan tomography hasbeen used for many years in the medicalfield. In this technique the source, objectand detector planes can be manipulatedduring the imaging process in asynchronous manner such that a singleplane of interest remains in focus whileother planes in the object are blurred.Figure 1 is a simple schematic of theapproach where the object remainsstationary while the source and imageplane detector are moved synchronously,keeping one plane of the object in focus.The source and image plane need notnecessarily be moved in a linear fashionbut may have a circular or other motion
iographic Testing
assical body scan tomography method where sourcerest remains in focus: (a) early in scan; (b) interrog
Source
Focus plane
Object
lane
(b)
pattern, so long as one plane remains infocus.
This approach has not been widelyapplied for industrial objects, althoughthere has been interest in the electronicsindustry for circuit board inspection.Multiple applications of synchronousmotion are required to focus on differentplanes in the object. With the applicationof digital imaging, however, it is possibleto generalize the technique as shown inFig. 2. By using a digital imager andcollecting multiple data sets at differentprojection views from the source, the datamay be reconstructed digitally to create aseries of focused planes through theobject. Again, the position of the source,object and detector may be manipulatedin a number of ways, so long asregistration is maintained for digitalfocusing on a plane of interest. Thistechnology is sometimes referred to aslaminography or tomosynthesis. Commercialequipment can be purchased to performthis data acquisition and reconstruction.The reconstruction can include not onlythe laminar planes but otherreconstruction surfaces as desired.
Computed tomography (CT) is apowerful digital data reconstructiontechnique for radiographic information
e and image detector are moved synchronously such that oneating beam normal to plane of interest; (c) late in scan.
(c)

FIGURE 2. Digitare taken withdetector, allowreconstructed
View 1
IGURE 3. Computed tomography using a collimated faneam and linear detector array data acquisition toeconstruct cross section of object.
Detectorarray
Z
3RT12_Layout(303_344) 10/2/02 3:02 PM Page 305
that was conceived in the early 1960s.Computed tomography usesmeasurements of X-ray transmission frommany angles about a component tocompute the relative X-ray linearattenuation coefficient of small volumeelements and presents them in crosssectional image maps (tomograms).Computed tomography can providequantitative information about thedensity or constituents and dimensions ofthe features imaged.
Computed tomography is used for bothmedical and industrial applications.Medical systems are designed for highthroughput and low dosages specificallyfor humans and human sized objects.These systems can be applied to industrialobjects that have low atomic number andare less than 0.5 m (20 in.) in diameter.
Industrial computed tomographicsystems do not have dosage and sizeconstraints. They are built in various sizesfor applications ranging from evaluationof small (millimeter scale) materialsamples using low energy X-ray sources,to the inspection of small jet engineturbine blades using medium energy(hundreds of kilovolt) X-ray sources, tothe inspection of large intercontinentalballistic missiles requiring high (megavoltscale) X-ray energies.
A typical computed tomographic
Xadpct1motowetdtsars
Fbr
configuration is shown in Fig. 3. The
al laminographic method where 1 to n images various orientations of source object anding multiple focus planes in part to befrom data set.
View 2 View n
Source
Feature
Example plane ofreconstruction
Object
Detector
Image 1 feature locationImage 2 feature locationImage n feature location
Reconstructed imagealigns features at planereconstruction
-ray beam is collimated to a narrow slitnd aligned with a detector array toefine a computed tomographic slicelane in the component. The slitollimation reduces scatter and improveshe signal-to-noise ratio in the image. For00 percent coverage of an object,ultiple, contiguous slices must be taken
ver the entire component. It is possibleo perform volume computed tomographyr cone beam computed tomography,here the source is uncollimated and the
ntire cone of radiation passing throughhe object is measured using an areaetector. This is potentially a higherhroughput technique than the standardingle slice, high collimation technique,lthough there are limitations in theeconstruction and an increase in scatterignal level.
305Computed Tomography
Objects onturntable X-ray source
CollimatorData transfer
Computer reconstructedmap of slice throughthe object from multipleX-ray projections
Y
X
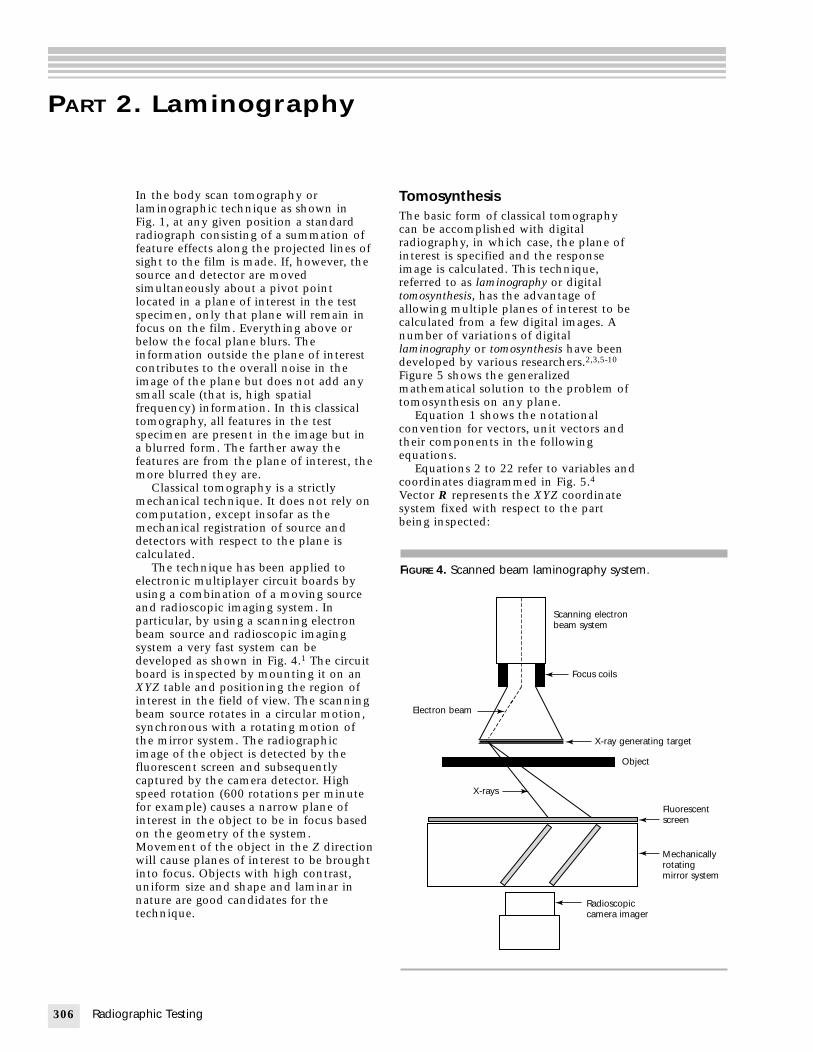
306 Radio
PART 2. Laminography
FIGURE 4. Scanned beam laminography system.
Electron beam
Scanning electronbeam system
Focus coils
X-ray generating target
Object
X-rays
Fluorescentscreen
Mechanicallyrotatingmirror system
Radioscopiccamera imager
3RT12_Layout(303_344) 10/2/02 3:02 PM Page 306
In the body scan tomography orlaminographic technique as shown inFig. 1, at any given position a standardradiograph consisting of a summation offeature effects along the projected lines ofsight to the film is made. If, however, thesource and detector are movedsimultaneously about a pivot pointlocated in a plane of interest in the testspecimen, only that plane will remain infocus on the film. Everything above orbelow the focal plane blurs. Theinformation outside the plane of interestcontributes to the overall noise in theimage of the plane but does not add anysmall scale (that is, high spatialfrequency) information. In this classicaltomography, all features in the testspecimen are present in the image but ina blurred form. The farther away thefeatures are from the plane of interest, themore blurred they are.
Classical tomography is a strictlymechanical technique. It does not rely oncomputation, except insofar as themechanical registration of source anddetectors with respect to the plane iscalculated.
The technique has been applied toelectronic multiplayer circuit boards byusing a combination of a moving sourceand radioscopic imaging system. Inparticular, by using a scanning electronbeam source and radioscopic imagingsystem a very fast system can bedeveloped as shown in Fig. 4.1 The circuitboard is inspected by mounting it on anXYZ table and positioning the region ofinterest in the field of view. The scanningbeam source rotates in a circular motion,synchronous with a rotating motion ofthe mirror system. The radiographicimage of the object is detected by thefluorescent screen and subsequentlycaptured by the camera detector. Highspeed rotation (600 rotations per minutefor example) causes a narrow plane ofinterest in the object to be in focus basedon the geometry of the system.Movement of the object in the Z directionwill cause planes of interest to be broughtinto focus. Objects with high contrast,uniform size and shape and laminar innature are good candidates for thetechnique.
graphic Testing
TomosynthesisThe basic form of classical tomographycan be accomplished with digitalradiography, in which case, the plane ofinterest is specified and the responseimage is calculated. This technique,referred to as laminography or digitaltomosynthesis, has the advantage ofallowing multiple planes of interest to becalculated from a few digital images. Anumber of variations of digitallaminography or tomosynthesis have beendeveloped by various researchers.2,3,5-10
Figure 5 shows the generalizedmathematical solution to the problem oftomosynthesis on any plane.
Equation 1 shows the notationalconvention for vectors, unit vectors andtheir components in the followingequations.
Equations 2 to 22 refer to variables andcoordinates diagrammed in Fig. 5.4Vector R represents the XYZ coordinatesystem fixed with respect to the partbeing inspected:

FIGURE 5
(
LegendABdi,jk
m,npS
X,Y,Z
3RT12_Layout(303_344) 10/2/02 3:02 PM Page 307
(1)
The view image raster is (I + 1) × ( J + 1)pixels. The laminogram image raster is(M + 1) × (N + 1) pixels, where I,J and M,Nrepresent the horizontal and vertical sizes,respectively, of each image in units ofpixel spacings. The laminographyintegration steps are as follows. First, picka destination pixel in the laminogram(m,n), then solve Eqs. 2 to 4 for theconstants c1, c2 and c3:
(2)
(3)
(4)
Define U, V and W:
(5)
(
(
T1
(
(
(
asK
(
(U R R= p p2 1–
Zp c Xp c Yp c3 1 3 2 3 3= ∗ ∗+ +
Zp c Xp c Yp c2 1 2 2 2 3= ∗ ∗+ +
Zp c Xp c Yp c1 1 1 2 1 3= ∗ ∗+ +
RRR
=
= =
X
Y
Z
r
r
r
r
,1
2
3
. Generalized laminography mathematical solution.4
X-ray tube
(XSk, YSk, ZSk)
S
(Xp3, Yp3, Zp3)
Part being inspected
Z
Y
XB
mn
Xp1, Yp1, Zp1)(Xp2, Yp2, Zp2)
(Xd3k, Yd3k, Zp3k)
(Xd1k, Yd1k, Zd1k) (Xd2k, Yd2k, Zd2k)
Aij
Radiographic detector array
= point in detector surface= point in laminographic focus plane= subscript designating detector= position in detector surface= subscript designating source/detector configuration= position in laminographic focus plane= subscript designating corner points of laminographic focus plane= radiation source= cartesian coordinates
6)
7)
hen solve the 3 × 3 system of Eqs. 8 to0 for RB:
8)
9)
10)
Continuing with reference to variablesnd dimensions in Fig. 5, the remainingteps are performed for each image (k of). Solve 3 × 3 Eqs. 11 to 13 for ei:
11)
12)
(13)
Define T:
(14)
Solve 4 × 4 Eqs. 15 and 16 for RA and d:
(15)
(16)
Then compute the vectors:
(17)
(18)
(19)
Finally, calculate the indices of the imagepixel to be summed:
(20)
(21) j J d= −( ) ⋅R RhHA 1
i I d= −( ) ⋅R RfFA 1
H G G f f= ⋅( )–
G R R= d d3 1–
F R R= d d2 1–
Z e X e Y eA A A += ∗ + ∗1 2 3
R R tA S= + d
T R R= −A S
Zd e Xd e Yd e3 1 3 2 3 3= +∗ + ∗
Zd e Xd e Yd e2 1 2 2 2 3= +∗ + ∗
Zd e Xd e Yd e1 1 1 2 1 3= +∗ + ∗
Z c X c Y cB B B+ += ∗ ∗1 2 3
nN
p= ( ) ⋅R RwWB – 1
mM
p= ( ) ⋅R RuUB – 1
W V V u u= ⋅( )–
V R R= p p3 1–
307Computed Tomography

308 R
FIGURE 6.(a) radiogtomogra
(a)
Slic
e
FIGURE 7. Digital laminographic reconstructions of pocketarmy knife: (a) first layer; (b) second layer; (c) third layer.10
(a)Phillips screwdriver
Small blade
Tweezers
Ring holder
Large blade
Awl with hole
Openers
(b)
(c)
FIGURE 8. Digital tomosynthesisreconstructions of weld shows verticalreconstructions through pores and notch todetermine depth information: (a) plan view;(b) vertical view through both pores;(c) vertical view through notch.10
3RT12_Layout(303_344) 10/2/02 3:02 PM Page 308
And perform the sum into the completedlaminogram L:
(22)
Implementation of LaminographicTechniquesLaminography of this type can beperformed in a variety of ways. Computedtomography (see below) is one techniquewhere the geometry is known because ofprecision of the stage mechanisms. Byusing the digital radiographic imagingmode of computed tomographic scanningsystems a series of digital images atvarious geometric locations can beobtained and reconstructed for the dataset.6 The computed tomographic systemprovides precise encoding of the geometrylocations for the reconstruction. It ispossible however to simply use fiducialsin the image to generate the requiredgeometry data and reconstruction.7Techniques of laminography using aobject motion apparatus with fixed sourceand detector positions have beendevised.8,9 These techniques provide arelatively simple implementation of themethodology.
The key issue for laminography is theeffective image aperture. Figure 6demonstrates how the position of theX-ray source affects the aperture. In thecase of the single source position of aconventional radiograph, the image canbe considered to have an effective infinitedepth of field and the entire object is theslice (compression of all information intoone plane). As the angles of thelaminographic data acquisition become
L m n L m n I i jk( , ) ( , ) + ( , )=
larger, an effectively narrower depth of
adiographic Testing
Graphical representation of effective apertures:raphy; (b) laminography; (c) computed
phy.45
(b)
Slice
(c)
field is created. Computed tomography isthe limiting case for the effective slicethickness through the object. Theresulting images from the techniquesshow an increase in contrast sensitivityfor features as the depth of field isnarrowed.
Figure 7 is an example oflaminographic reconstruction from only
(a)
InclusionsNotch
Pores
16.08 mm(0.633 in.)
3.99 mm(0.157 in.)
(b)
(c)

3RT12_Layout(303_344) 10/2/02 3:02 PM Page 309
eight digital images.10 In this example,several layers of a pocket knife are imagedby focusing on the several differentdepths in the object. Figure 8 is anexample of a weld radiograph with twodigital tomosynthesis reconstructions. Byreconstructing a series of laminographicplanes through the object, the volumeinformation on the part is obtained.Tomosynthesis of any arbitrary surfacethrough that volume is now possible. InFig. 8 two vertical planes have beenreconstructed to demonstrate the abilityto obtain depth information on features.
309Computed Tomography

310 Rad
PART 3. Principles of Computed Tomography
3RT12_Layout(303_344) 10/2/02 3:02 PM Page 310
BackgroundThe development of modern computedtomography hinges on advances in anumber of different fields. X-rays hadbeen known since before the turn of thecentury. Medical X-ray films wereroutinely made as early as 1900. As thetechnology improved, these projectionradiographs became better and better,with reasonably good diagnostic qualitybeing reached in the 1930s. The imagesreturned by those medical systemscontained useful information but muchinformation was obscured by tissue andbone on either side of the region ofinterest. This was especially true inmaking images of the brain and otherinterior sections of the skull. Earlymedical researchers reasoned, that if aseries of X-ray absorption measurementscould be made around the periphery ofthe head, the X-ray density of the interiorcould be reconstructed. This wouldremove the superposition difficultiesinherent in projection radiography. Theproblem could be viewed as a giant matrixof equations; however, solving theequation matrix for useful spatialresolution would require too muchcomputation unless an algorithm could befound.
The existence theorem for thatalgorithm was proved by J.H. Radon in1917. He showed that an arbitrarydistribution of material can bereconstructed on a point-by-point basis bymeasuring the line integrals — that is,summing the elements of the distributionalong a series of lines through thedistribution — and plugging them into aformula. Unfortunately, although Radonproved the existence of the formula, heneeded a mathematical transformationthat would make the problem tractable.
Although this existence theorem forcomputed tomography had been knownsince World War I, there was no impetusto find a technique of reconstruction,because it was clear that whatevertechnique was used, the number ofcalculations would be staggering. In themid-1950s, however, the impetus to find aset of basis functions for the practicalsolution to the problem came from radioastronomy. Ronald N. Bracewell had takena series of radioastronomy measurements.These amounted to long, narrow apertures
oppausifBam
ApctbdpcsbCeaian
bHecrmcgwiim(Nc
tmrcafocwteos
iographic Testing
n the sky — strip integrations thatrovided measurements of a number ofoint sources but integrated over thesepertures. Bracewell solved this problemsing fourier transforms for a relativelymall number of sources and passes. Themportant point, however, is that he hadound a transformation that worked.racewell deconvolved the data and wasble to derive the positions of theultiple point radio sources in his data.In the period from 1957 to 1963,
lan M. Cormack, a mathematicalhysicist, was struck by the fact that thehild of a friend had died of a brainumor that was inoperable, perhapsecause it could not be detected orelimited by conventional X-rayrojection radiography. Cormack,onvinced that he could provide aolution, proposed a set of mathematicalasis functions — the jacobi polynomials.ormack actually conducted a crudexperiment, tabulated the results by handnd reconstructed a crude line of voxelsn a phantom. The seminal papersppeared in 1963 and almost escapedotice.11,12
In the late 1960s Geoffrey Hounsfielduilt a computed tomographic system.ounsfield was very much a hands-on
xperimenter who was absolutelyonvinced that he could provide aeconstruction means, whether rigorouslyathematical or not. Before the
onvolve-and-backproject technique wasenerally used, Hounsfield experimentedith algebraic reconstruction and other
terative solutions. Hounsfield’s originalnstrument is the basis of all modern
edical computed tomography.13
Cormack and Hounsfield shared theobel Prize in Medicine for their work on
omputed tomographic scanning.)The two main drivers for computed
omography are development of goodathematical algorithms for
econstruction and inexpensiveomputers. The combination of thevailability of both was what allowed theield to develop technically. The promisef a strong United States market foromputed tomographic equipment ishat prompted the sponsors to provide
he capital. Much work on codes hasvolved at various institutions for all sortsf specialized applications. But what gavecientific experimenters access to

3RT12_Layout(303_344) 10/2/02 3:02 PM Page 311
nonmedical computed tomography wasthe availability of codes in the publicdomain. These codes, such as SNARK orthe Berkeley Donner Laboratory package,could be run on a general purposeminicomputer.14,15 These codes allowedanybody who wanted the opportunity achance to try computed tomography.
The other successful implementationsof reconstructive schemes are positronemission tomography (PET) and nuclearmagnetic resonance imaging (MRI).Positron emission tomography uses aninjected radioactive chemical that ismetabolized in certain organs. The degreeof uptake of that chemical in the bodydepends on how well (or poorly) theorgan functions. The radioactive tracerelement undergoes a decay, resulting in apositron electron pair product. Thepositron goes only a short distance beforeannihilating by collision with anotherelectron, emitting two 511 keV photons.Positron emission tomography detectsthese photons. The algorithms aresomewhat different, because the source isdistributed. Some algorithms look forsingle 511 keV photons; some look onlyfor coincidences. All require areconstructive geometry along lineintegrals.
Nuclear magnetic resonance imaging isreally a radio frequency measurement thatuses gradient alternating magnetic fieldssuperimposed on a static magnetic field atright angles. The nuclear magneticmoment of atoms will allow absorptionand subsequent decay only at certainfrequencies. Following excitation theatoms will emit radio waves at specificfrequencies dependent on theirgyromagnetic constant and the strengthof the magnetic field. By propermanipulation of magnetic fields it ispossible to effectively measure lineintegrals representing the presence ofspecific atoms (for example, hydrogen) inan object. These integrals may be treatedsimilarly to computed tomographic datafor image reconstruction.
Physical PrinciplesComputed tomography differs fromconventional radiographic imaging inthat it uses X-ray transmissioninformation from numerous angles aboutan object to computer reconstruct crosssectional images (that is, slices) of theinterior structure. To generate a computedtomographic image, X-ray transmission ismeasured by an array of detectors (seeFig. 3). Data are obtained by translatingand rotating the object so that manyviewing angles about the object are used.A computer mathematically reconstructsthe cross sectional image from the
multiple view data collected. Thisreconstructed image is a two-dimensionalpresentation of a two-dimensional crosssectional cut through the object. Aprimary benefit of computed tomographyis that features are not superimposed inthe image, thus making it easier tointerpret than radiographic projectionimages. The image data points are smallvolumetric measurements directly relatedto the X-ray attenuation coefficient of thematerial present in the volume elementsdefined by the slice thickness and theimage plane resolution of the computedtomographic system. The computedtomographic image values and locationsprovide quantitative data for dimensionalmeasurements and measurements ofmaterial density and constituents.
The computed tomography process isfundamentally different from other formsof radiographic imaging. Ordinaryprojection radiography makes intuitivesense. It is relatively straightforward toimagine X-rays coming off an anode or agamma source, being absorbed andscattered by the test specimen and finallyinteracting in a film. The image on film isa projection of everything along the lineof sight between the source and the film.You can imagine the film to be a kind ofmurky image, with objects close to thefilm being clearer than those farther away.All the associated details of projectionradiography — for example, geometricunsharpness due to finite source size — make good sense.
What happens when the depthlocation of a feature found in aradiograph is important? The mostcommon technique for discovering theposition along the line of sight where thefeature lies is to use triangulation. Thisconsists of obtaining a second film of thearea in question but with the source in adifferent angular position relative to thetest specimen than was obtained on thefirst exposure. The geometry is carefullylaid out on a piece of paper; measuredpositions of source, test specimenanomalous feature on the films are noted;and the position of the anomalous featurealong the intersecting lines of sight isdetermined as shown in Fig. 9. Distancesfrom discontinuities to the image planeare calculated by using triangulation asshown in Eqs. 23 and 24.
(23)
(24)
Triangulation is a rudimentarytomographic reconstruction that contains
hd
s22
2=
+δ
δ
hd
s11
1=
+δ
δ
311Computed Tomography

312 R
FIGURE 10. Computed tomography data acquisition and backprojection reconstruction: (a) source-object-detectorgeometry; (b) back projection reconstruction from multipleviews.
X-ray beam Object Detector array Pq
(a)
FIGURE 9.tomograpnormal tointerroga
(a)
Sour
Object
Imageplane
Legendd = dist
h1 = disth2 = dist
s = souδ1 = appδ2 = app
3RT12_Layout(303_344) 10/2/02 3:02 PM Page 312
the essentials elements of computedtomography. The first step is to recognizethe features of interest. When more thanone image is used, the mind can detectand locate these features as beingsomehow different. The eye-and-brainsystem filters out the other information,so that the mind is left only with thefeatures of interest in both radiographs.The second step is to correlate the testspecimen, the source position theradiographic image together for bothexposures. This correlation in space allowsthe information from the two exposuresto be overlaid constructively. Finally, thethird step is to note the position of theattenuation corresponding to theanomalous feature to project it back tothe source along the original attenuationline. This backprojection is performed foreach exposure and the combined effectsof these two backprojections is theconstructive interference of the twoattenuation patterns.
In computed tomography the basicmethodology can be considered in asimilar manner. The X-ray beam iscollimated to a narrow slit and alignedwith a solid state X-ray detector array todefine a computed tomographic slice
adiographic Testing
Example of triangulation as basis for computedhy: (a) first image, with line of interrogation sensor plane; (b) second image, with line of
tion oblique to sensor plane.
ce
Image 1 Image 2
s
d
h2
δ1
ance from source to image planeance from round discontinuity to image planeance from square discontinuity to image planerce travel distancearent travel distance of round discontinuity in image planearent travel distance of square discontinuity in image plane
(b)
δ2
h1
plane in the object. The slit collimationreduces scatter, improving the signal tonoise in the image. Data are obtained bytranslating and rotating the object so thatmany viewing angles about the object areacquired.
Figure 10a shows how a data projectioncan be taken through a part. Thetransmitted X-ray intensity at eachdetector element position in the detectorarray is converted to a digital output leveland transmitted to a computer as aprojection for the particular anglethrough the object. The projection dataare analogous to a series of slitradiographs taken at numerousorientations (projections) about theobject. The resulting slit radiographs yieldan attenuation that is an average over theslit thickness.
Transmittedintensity
(b)
Pq1
Pq2
Pq3
Pq4
Legendp = projectionq = subscript that designates angle

3RT12_Layout(303_344) 10/2/02 3:02 PM Page 313
When a series of projections are takenfrom many angles about a part, theprojection data can be backprojected asshown in Fig. 10b to create an image. Asthe number of projections increase, theability to more exactly reconstruct theobject increases. In a computedtomographic system, the projections areactually subjected to an incredibleamount of mathematical massaging butthe steps are effectively the same asinvolved in the manual triangulation.
The computed tomography image, thecross sectional representation of thedensities within an object, depends on thethree basic processes: (1) convolution orfiltering of the data with specialmathematical operators; (2) correlation ofthe projection data in an absolute space;(3) backprojecting the convolvedattenuation data along its original spatialvectors. The mathematics of the imagereconstruction can be found in a numberof references.4,16-18
The intensity of an attenuated X-raybeam passing through an object is givenby the line integral:
(25)
where I is the beam intensity at thedetector, Io(E) is the beam intensity withno object, E is energy of the X-rays, µ(E,x)is the linear attenuation coefficient and xis the transmitted distance through theobject. Most computed tomographicsystems use X-rays generated by abremststrahlung source that creates abroad spectrum defined here as IO(E). Thetransmitted intensity is an integrationover the energy spectrum and along theray path through the object as a functionof the distribution of linear attenuationcoefficient µ(E,x). For predictive purposes,it is useful to change Eqs. 25 to 26:
(26)
where Eeff is an effective energy and auniform material is assumed. The effectiveenergy is that specific energy, where thetransmitted intensity of a monoenergeticbeam would be equivalent to that of anintegrated spectrum. The effective energyis influenced by the type and amount ofmaterial penetrated because, as theattenuation or path length increases, thelower energy photons are preferentiallyattenuated, resulting in higher effectiveenergies or harder beams. In computedtomographic applications, attenuations of104 and higher are not uncommon,although attenuations of 101 to 102 arepreferred.
I I E x= − ( )[ ]o effexp µ
I I E E x dx dEo= ( ) − ( )[ ]{ }∫∫ exp ,µ
The measured intensity at the detectoris normalized based on the calibration ofthe detector array and the measuredintensity for no object in the beam. Bytaking the logarithm of the normalizedintensity, the value of the projection Pq(r)is proportional to the linear attenuationcoefficient:
(27)
where Pq is the projection at angle q and Ris the position of the ray along thatprojection (see Fig. 10b).
The backprojection of the data willtherefore create an image distributionwhere the values in the image areproportional to the linear attenuationcoefficient. The backprojection is given byEq. 28:
(28)
where δ is the dirac delta function. Thisequation effectively distributes the valuesof the projections Pq(R) to all points (X,Y)that lie on the projection line. Byintegrating over angle q the totalreconstructed image will be formed:
(29)
This reconstruction is crude because,intuitively, a point object (or deltafunction) will be reconstructed with thecrossing of radial lines creating a stareffect. This is evident in Fig. 10b and isshown in Fig. 11. This point response canbe shown to be a 1·r–1 blurring of theimage points (where r is the distance fromthe point). Reconstructions must thereforeuse filtering to remove this effect.
The filtering is usually performed by aconvolution function C(R) such that:
(30)
Each projection is convolved with afunction and the result is backprojected.Figure 11 demonstrates the benefit of thefiltering. The convolution function C(R) isa filtering operation that can be selectedto enhance various characteristics of theimage. Innumerable filters are possible foruse in the convolution. The two mostpopular (and extreme) filters are theramachandran filter, used to emphasizesharpness, and the shepp and logan filter,
f x y P R CR
x q y q R dRdq
,
cos sin
( ) = ( ) ∗
× + −( )∫∫ q
δ
f x y P R x q
y q R dRdq
, cos
sin
( ) = ( ) × (+ − )
∫∫ q δ
b x y P R
x q y q R dR
q q,
cos sin
( ) = ( )× + −( )
∫δ
P RIIqo
( ) = ∝ µln
313Computed Tomography

314 Ra
FIGURE 11.original pr
(a)
(b)
Pq1
Pq1
Legendp = projecq = subscr
3RT12_Layout(303_344) 10/2/02 3:02 PM Page 314
used to emphasize contrast. It is alsoconvenient in some cases to perform thefiltering by fast fourier transforming theprojection, multiplying by a filterfunction, inverse transforming andbackprojecting. The mathematics of thefiltering is easier to visualize in thefrequency domain but is equivalent to theconvolution technique of Eq. 30.
Alternative reconstruction techniquesto the filtered backprojection techniqueare available including fourier transformtechniques and iterative reconstruction.The fourier transform technique fills atwo-dimensional frequency space with thetransform of each projection. Atwo-dimensional inverse transform isrequired to create the reconstructedimage. The two-dimensional fouriertransform technique requires that all the
dwabiaatpitataca
cro(
diographic Testing
Filtering of back projection: (a) backprojection ofofiles: (b) backprojection of filtered profiles.
Pq2Pq3
Pq4
Pq2Pq3
Pq4
tionipt that designates angle
ata be taken before reconstruction,hereas filtered backprojection has thedvantage of allowing reconstruction toegin on each projection data set. Theterative reconstruction techniquessumes a solution for the image matrixnd iteratively compares projectionshrough the image to the measuredrojection data. With each iteration the
mage matrix is altered until a match ofhe calculated and measured projectionsre within an acceptable accuracy. Thisechnique is useful when limited anglesre available but can become very timeonsuming for data taken from manyngles.
X-ray computed tomography can beonsidered the high end application ofadiation measurements because the databtained are quantitative measuresdirectly related to the X-ray linear
attenuation coefficient) for each volumeelement throughout an object. Thecomputed tomographic image is digitalwith an image intensity value assigned toeach pixel of the image. The pixel isactually a voxel because it represents thetwo-dimensional cross section plus a thirddimension (depth) defined by the slicethickness. The medical field uses thehounsfield notation for the image data:
(31)
where H is the hounsfield number, µ isthe measured attenuation coefficient andµw is the attenuation number coefficientfor water. Using this scale, water takes onthe value of zero, vacuum (or air) is –1000and bone is 1000. This range used inmedical computed tomographic scannerscorresponds to a density range of about0 to 2.0 g·cm–3. A change of one integerin the hounsifeld scale is a 0.1 percentchange in attenuation value. Medicalfacilities maintain a regular calibrationschedule of their equipment to maintainproper hounsfield readings. Table 1 showsa numerical scale for hounsfield units.Medical scanners can be used for higher
H = µ − µµ
1000 w
w
TABLE 1. Hounsfield units.
Material Hounsfield Value
Air –1000Water 0Bone 1000Acrylic 110Carbon 580Aluminum 1900Iron 24 000

3RT12_Layout(303_344) 10/2/02 3:02 PM Page 315
density materials than bone but readingsbeyond 4000 hounsfield units are usuallynot suitable.
Industrial computed tomographicsystems do not use the hounsfield scalebut use the numerical values from theirreconstructions. For most scanners thedata will be 16 bit or represent an imagegray scale range from 0 to 64 000 K values(K values being increments of blackness inthe image). Calibration of thereconstructed values to true density mustbe performed by scanning a standard.
315Computed Tomography
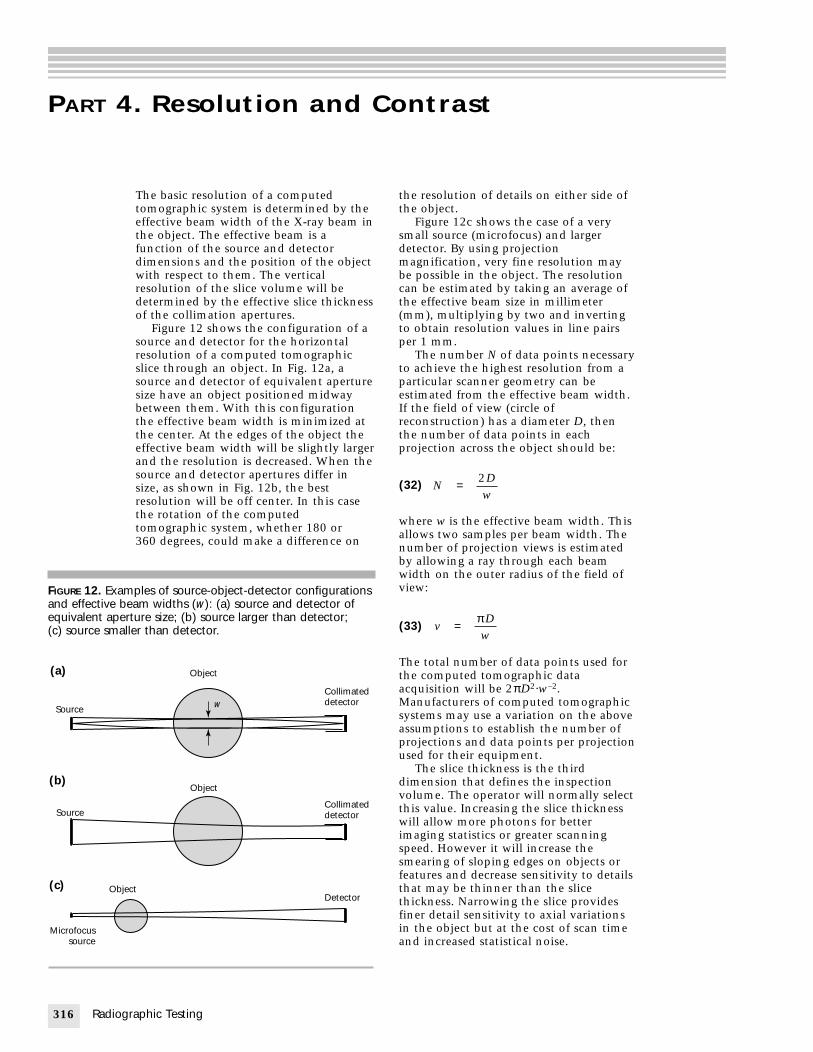
316 R
PART 4. Resolution and Contrast
FIGURE 12and effecequivalen(c) source
(a)
Source
(b)
Source
(c)
Microfocussource
3RT12_Layout(303_344) 10/2/02 3:02 PM Page 316
The basic resolution of a computedtomographic system is determined by theeffective beam width of the X-ray beam inthe object. The effective beam is afunction of the source and detectordimensions and the position of the objectwith respect to them. The verticalresolution of the slice volume will bedetermined by the effective slice thicknessof the collimation apertures.
Figure 12 shows the configuration of asource and detector for the horizontalresolution of a computed tomographicslice through an object. In Fig. 12a, asource and detector of equivalent aperturesize have an object positioned midwaybetween them. With this configurationthe effective beam width is minimized atthe center. At the edges of the object theeffective beam width will be slightly largerand the resolution is decreased. When thesource and detector apertures differ insize, as shown in Fig. 12b, the bestresolution will be off center. In this casethe rotation of the computedtomographic system, whether 180 or360 degrees, could make a difference on
adiographic Testing
. Examples of source-object-detector configurationstive beam widths (w): (a) source and detector oft aperture size; (b) source larger than detector; smaller than detector.
Object
wCollimateddetector
Collimateddetector
Detector
Object
Object
the resolution of details on either side ofthe object.
Figure 12c shows the case of a verysmall source (microfocus) and largerdetector. By using projectionmagnification, very fine resolution maybe possible in the object. The resolutioncan be estimated by taking an average ofthe effective beam size in millimeter(mm), multiplying by two and invertingto obtain resolution values in line pairsper 1 mm.
The number N of data points necessaryto achieve the highest resolution from aparticular scanner geometry can beestimated from the effective beam width.If the field of view (circle ofreconstruction) has a diameter D, thenthe number of data points in eachprojection across the object should be:
(32)
where w is the effective beam width. Thisallows two samples per beam width. Thenumber of projection views is estimatedby allowing a ray through each beamwidth on the outer radius of the field ofview:
(33)
The total number of data points used forthe computed tomographic dataacquisition will be 2πD2·w–2.Manufacturers of computed tomographicsystems may use a variation on the aboveassumptions to establish the number ofprojections and data points per projectionused for their equipment.
The slice thickness is the thirddimension that defines the inspectionvolume. The operator will normally selectthis value. Increasing the slice thicknesswill allow more photons for betterimaging statistics or greater scanningspeed. However it will increase thesmearing of sloping edges on objects orfeatures and decrease sensitivity to detailsthat may be thinner than the slicethickness. Narrowing the slice providesfiner detail sensitivity to axial variationsin the object but at the cost of scan timeand increased statistical noise.
vD
w= π
ND
w= 2

TABLE 2. Com
Param
Object diamAttenuationBeam widtNumber ofPhoton rateIntegrationRay spacingSignal to nNumber ofContrast ra
3RT12_Layout(303_344) 10/2/02 3:02 PM Page 317
The contrast sensitivity in computedtomographic images is inherently highbecause each reconstructed volumeelement is composed of backprojectedrays from many orientations about theobject. Equation 34 shows an estimate ofthe signal-to-noise ratio (SNR) in a voxelelement as a function of variouscomputed tomographic systemcharacteristics for a reconstruction ofcylindrical object:19
(34)
In this equation, µ is the linearattenuation coefficient, w is the X-raybeam width, v is the number of views, n isthe photon intensity rate at the detector,t is the integration time of the detectors,∆p is the ray spacing and R is the radius ofthe object. The contrast ratio will be givenby:
(35)
where Z is the number of pixels overwhich the contrast is observed. Table 2shows an example of calculations basedon Eqs. 34 and 35. Computedtomographic systems often providecontrast sensitivity measurements in therange of 0.1 to 1.0 percent. What theequations show is that the signal-to-noiseratio improves with increases in computedtomographic system characteristics ofX-ray beam width, number of views,X-ray beam intensity and integrationtime. The signal-to-noise ratio will also beimproved by decreasing the ray spacingand object diameter. These computedtomographic system characteristics reflectthe tradeoffs in optimizing a computedtomographic system. Fast scan times, fineresolution, high contrast sensitivity and
lare
racalimlasethfethimtha siefThapbevodismn
Contrast ratioSNR
=×
6
Z
SNR = µ − π( )0 665 21 5. exp.wvnt
pR
∆
puted tomography contrast ratio calculation.
eter Symbol Quantification
eter D 150 mm (6.0 in.) coefficient µ 0.24 cm–1
h w 0.08 mm (0.003 in.) views v 588
n 108 s–1
time t 10 ms∆p 2 mm (0.08 in.)
oise ratio SNR 324 pixels Z 9tio CR 0.0062 = 0.62 percent
rge object size are mutually exclusive,quiring compromise in system design.Because of the high signal-to-noise
tio in any voxel, computed tomographyn detect features below the resolutionit of the image. For features that are
rger than a single voxel the contrastnsitivity improves by the square root ofe number of pixels making up theature. For a feature smaller than a pixel,e apparent density is averaged over theage voxel and therefore the signal forat image voxel is reduced. This is calledpartial volume effect. Although thegnal is reduced by the partial volumefect, the feature may still be detected.is is a significant point about theplication of computed tomographycause very often relatively large imagexels (compared to very finescontinuities) may be used — the veryall features are still detected but not
ecessarily resolved.
317Computed Tomography

318 Ra
PART 5. Computed Tomographic Systems
3RT12_Layout(303_344) 10/2/02 3:02 PM Page 318
The computer reconstructed computedtomographic image is a two-dimensionalimage of a two-dimensional plane in theobject. The data in the image is composedof information in small voxel units thatare composed of the X,Y reconstructionmatrix element sizes and averaged overthe slice thickness of the computedtomographic collimation scheme. Bytaking a series of contiguous computedtomographic slices through the object avolumetric data set can be created fromwhich cross section images in any planethrough the object may be extracted. Theslice thickness used determines thevertical resolution of the volume data set.The horizontal resolution is determinedby the effective X-ray beam size in theobject and the reconstruction matrix size.
Computed tomography requires moresophisticated equipment for dataacquisition and reconstruction thanconventional radiography. The total timerequired to inspect an objectvolumetrically can also be relatively long,making computed tomography asignificantly more expensive inspection.However, for many structures computedtomography provides unique information.
System ConfigurationsComputed tomography has severalvariations from its basic concept of Fig. 3.Figure 13 shows four generations ofcomputed tomographic systemconfigurations.
1. The essential characteristics of firstgeneration geometry are a singlesource and a single detector. Thesource and detector are lockedtogether (or at least their relativepositions are constant) and the entiresource and detector unit made totraverse the test specimen. A singletraverse yields a series of attenuationmeasurements (recall that eachattenuation measurement is a ray andthat the series across the test specimenis a view), thus generating a singleview. The most importantcharacteristic of this view is that it is aseries of parallel rays. If the testspecimen is rotated by an angle θ andanother such traverse is made, anotherview of attenuation data but displacedby angular rotation θ will be made.
diographic Testing
The entire test specimen can becovered if the procedure is repeated ntimes where n = 180·θ–1 in theory (inpractice, 360 rather than 180 issometimes required.)
2. Second generation geometry uses thesame principle as first generationgeometry. The difference is thatinstead of having only a singledetector, there is typically a bank ofdetectors arranged to subtend a fanbeam of the source. (The fan beam iscollimated so that the fan lies in theplane of interest.) Thus the centraldetector acquires the same data on asingle traverse as the first generationsystem described above. The nextdetector might be placed so that itscenter as seen from the source focalspot is displaced by angle θ from thecentral detector. Simultaneously withthe first traverse, that next detectorgathers the identical information thatwould, in a first generationconfiguration, be gatheredsequentially on the second traverse. Infact, second generation geometry letsall views in the fan angle of the sourcebe obtained on the same traverse.After traversing the fan, the objectrotates the number of degrees of thefan and transverses back across the fanbeam. Rotations continue until 180 or360 degrees have been covered.
3. Third generation geometry uses asingle source and a bank of detectorsthat span the test specimen as seenfrom the source. The detectors providea single view simultaneously of a seriesof fan shaped measurements ratherthan parallel ray measurements. Bycontinuously turning the testspecimen and taking data, many fanviews are acquired for reconstruction.In third generation scanning eachdetector will not see all of the objectas in second generation. Thus detectorimbalance causes ring artifacts in theimage.
4. Fourth generation geometry uses asingle moving source and a bank ofstationary detectors configured into acircular ring. As the source rotatesinside the detector ring, a single viewmight be made at one time; instead,the view data is constructed fromsimultaneous positions of the sourcewith respect to a single detector. Like

FIGURE 13. Co(a) first genertranslate); (c)generation.
(a)
(b)
(c)
(d)
MOVIE.Secondgeneration(rotate andtranslate).
MOVIE.Thirdgeneration(rotate only).
3RT12_Layout(303_344) 10/2/02 3:02 PM Page 319
the third generation geometry, thisfourth generation configuration uses afan beam view structure. The mainreason for using the fourth generationgeometry is that each view is made
mputed tomographic system generations:ation; (b) second generation (rotate and third generation (rotate only); (d) fourth
Source
Object
Detector
Source
Object Detector
Detector
Source
Object
Detectorring
Source
with a single detector; this presents anadvantage over third generationgeometry where searching for changesin small scale signals is frequentlyoverwhelmed with interdetectornormalization problems. The fourthgeneration use of one detector foreach view obviates interdetectordetector normalization problem.
The most useful forms for industrialcomputed tomography are secondgeneration and third generation. Bothtechniques use a collimated fan beam ofX-rays and one-dimensional array ofdetectors.
Rotate-and-TranslateConfiguration AdvantagesThe second generation scheme, therotate-and-translate scheme, is commonlyused for industrial objects because objectslarger than the X-ray beam fan angle canbe accommodated. The main reasons forthis implementation are three:
1. The spatial resolution is determined bythe spacing between samplingpositions and is not dependent on thenumber of detectors or theinterdetector spacing.
2. The problems of false large scale radialdensity variations (cupping or capping— very common in third generationgeometry) are largely avoided. Hence,true absolute densities, an importantfactor for nondestructive test systems,especially for composites, are easilyobtained.
3. The interdetector normalizationrequirements compared with thirdgeneration systems are relaxed by afactor of about 100.
This last point is especially importantbecause, in gathering the series of raymeasurements necessary for a single view(one-dimensional projection), it is thesmall scale variations in response thatdetermine the visibility of any particularfeature. In second generation geometry, aview is made by successive measurementswith the same detector element.
Third Generation ConfigurationIn third generation geometry, a view ismade by the simultaneous measurementsof all the detector elements. Thus,variations in response between adjacentdetectors can mimic the response of asmall feature present in the object. Inthird generation systems, complexsmoothing algorithms usually are used tomitigate the effects of the second andthird objections.
The third generation, or rotate only,scanning approach is used on smallindustrial objects because it is faster than
319Computed Tomography

320
3RT12_Layout(303_344) 10/2/02 3:02 PM Page 320
second generation. Both the second andthird generation techniques only image ina single computed tomography scan oneslice location through the part. That sliceinspection volume is the size of the fanbeam height collimation.
Other ConfigurationsVolume Computed Tomgraphy. Anothertechnique, volume computed tomographyor cone beam computed tomography, usesa two-dimensional area detector and anuncollimated cone of radiation such thatthe entire object may be inspected in onescan. This technique sacrifices some detailin the image quality for a higherthroughput when the entire object mustbe inspected with computed tomographyand has limitations on the applicable partsize. It also generally works well only forrelatively small objects.Limited Angle Tomography. Limitedangle, tangential and annularreconstruction computed tomography arealso techniques that can be beneficial tolarge composite structure. Limited anglecomputed tomography does not requirethat the computed tomographic data betaken from all angles completely aboutthe part. This can be particularlyadvantageous for large planar compositestructure. Tangential and annularreconstruction offer advantages for largecylindrical structures where information isonly needed along annular rings,particularly near the outside of thestructure.
Mechanical HandlingThe primary technical considerations forcomputed tomographic systemconfigurations are X-ray source, detectors,computer processing hardware andsoftware, algorithms, speed and visibilityof anomalous conditions. Mechanicalhandling systems for computedtomographic systems are mature. Theadvent of microprocessor control, highresolution encoder and feedback systemsand the ability to use fire-on-position dataacquisition rather than a freerunningclock have actually eased the mechanicalhandling tasks.
Mechanical handling has been easedbecause the smoothness of motion andaccuracy of position required of previousera systems have been supplanted byknowledge-of-position systems. In manymodern computed tomographic systemsfor nondestructive testing, especiallythose that are designed with a range ofapplications, incorporation of theknowledge of position is done routinelyand results in considerably moreflexibility than is possible with systems
Radiographic Testing
relying on strictly mechanical motions.The penalty is in a more complexinterface between motion subsystems andthe control computer and in a morecomputationally intensive algorithm forarriving at a reconstructed image.
Mechanical handling system tolerancebudgets are almost always expressed interms of the spatial resolution. For secondgeneration geometry, the total stackingtolerance is given as 0.25× to 0.33× thespatial resolution. Thus, for a resolutioncorresponding to good spatialdiscrimination of adjacent pixels of size1.0 mm (0.04 in.) the nominal tolerancestackup would be 0.33 mm (0.013 in.).This means that all the imprecisions inthe individual mechanical componentsmust, when added together, be less thanthis absolute tolerance. This applies torandom errors — for example, runout in abearing. The limit for systematic errorstends to be about ten times morestringent although each individualcontributor must be analyzed separately.Because the reconstruction process addsdata taken from many different positionsa systematic error produces an artifactthat is characteristic of the selectivereinforcement of the particular error.20
System DesignBecause computed tomographic systemsrequire more precise equipment and dataprocessing than traditional nondestructiveevaluation hardware, it is important toconsider the components in a computedtomographic system and discuss theirramifications.
Figure 14 shows a generic design ofcomputed tomographic systemcomponents. The major subsystems thatgo into a computed tomographic systeminclude the mechanical handlingsubsystem, the data acquisition subsystemand the computer interface and softwaresubsystem. These major subsystemscategories can be further broken downinto components and characteristics thatare essential for a computed tomographicsystem to operate for the desired output.The selection of certain componentattributes or system characteristics willaffect the selection of other componentsor the overall performance and cost of acomputed tomographic system.
Table 3 lists key attributes of acomputed tomographic system and theramifications of selections of theattributes on system component selection.In the selection of a computedtomographic system to performnondestructive inspections it is importantto be able to define the desired inspectioncharacteristics, particularly specimen (size,type, weight), inspection parameters

321Computed Tomography
FIGURE 14. Generic computed tomographic system components.
X-ray beam precollimator
X-raysource
Testspecimen
X-raydetectors
Detectorelectronics
Motionhardware
Positionencoding
X-ray bay
X-ray intensityand
frequency signal
Motionprocessor
Detectorprocessor
Dataacquisition
Specializedprocessors Memory
Control room
Main bus
Hostcentral
processingunit
Disk storageOperator’s
consoleImage
processor Hard copy ArchivesSignaloutput
Imagedisplay
TABLE 3. Computed tomography system attributes and their major ramifications.
Attribute Ramifications
Test specimen size, weight and shape mechanical handling equipment, loading and unloadingTest specimen X-ray penetrability X-ray source
X-ray detector typedynamic range of detector and front end electronics
Spatial resolution accuracy of mechanical handling equipmentconfiguration of source, object and detectorsource and detector aperture size
Contrast sensitivity strength of X-ray sourceintegration time
Artifact level reconstruction algorithm softwareaccuracy of mechanical handling equipment
Speed of computed tomographic process size of objectX-ray source strengthnumber and configuration of detectorsbus structurespeed and architecture of processorsmechanical hardware — motors, brakes and others
Number of pixels in image number and configuration of detectorsamount of data acquiredchoice of computer and hardware
Slice thickness range detector configurationsystem dynamic range
Operator interface instrument control panelimage processing systemcontrol softwareinterface to remote workstation
Archival requirements choice of computer and hardware
3RT12_Layout(303_344) 10/2/02 3:02 PM Page 321

322 R
FIGURE 15
Size
, m (
in.)
3.0 (12
2.5 (10
2.0 (8
1.5 (6
1.0 (4
0.5 (2
0
FIGURE 16. Computed tomographic system size versussensitivity to detail.
3RT12_Layout(303_344) 10/2/02 3:02 PM Page 322
(spatial resolution, contrast sensitivity,slice thickness, time for inspection) andthe operator interface (system controlpanel, image display, processing functionsand data archiving).
The most significant point of Table 3 ishow the specimen to be inspecteddetermines many of the principlecharacteristics of the computedtomographic system. For this reason,different computed tomographic systemsare designed for different sized objects.The object size and X-ray penetrabilitydetermines the mechanical handlingcharacteristics. As the object becomeslarger, higher energy X-ray sources andlarger mechanical systems are required.The result of this is higher cost for thecomputed tomographic system. Figure 15shows the effect of object size and energyon the cost of a computed tomographicsystem.
The sensitivity to fine detail ofcomputed tomographic systems is afunction of resolution and contrastsensitivity. The computed tomographicresolution is fundamentally determinedby the beam width of the X-ray opticsdesign and is driven by the selection ofsource and detector aperture sizes and thesource, object and detector distances. Thebeam width, size of the object computedtomographic image reconstruction matrixmust all be considered in a system design.
A typical reconstruction matrix size forcomputed tomography at the turn of thecentury was 1024 × 1024. A firstapproximation would make the resolutionlimit roughly one part in 1000 and thesystem would be designed to match theX-ray optics to 0.001× the size of the part.For example, a system designed to handlea 0.5 m (20 in.) size part might allow for0.5 mm (0.02 in.) size beam width and asystem designed for a 10 mm (0.4 in.) size
adiographic Testing
. Computed tomographic system size versus cost.
0)
0)
0)
0)
0)
0)
Size
Energy
9
8
7
6
5
4
3
2
1
0
Ener
gy (
MV)
0.5 1 1.5 2 2.5 3
Cost (millions of dollars in 2001)
part might have a 0.01 mm (0.0004 in.)beam width.
It is of course possible, and routinelyperformed, to reconstruct the 1024 × 1024matrix over subregions of a component sothat a higher resolution beam width finerthan 1 part in 1000 of the object can beused effectively. However, the scan muststill cover the full size of the part. As thepart size increases, the distance fromsource to detector increases and X-rayintensity at the detector falls offquadratically. Thus, it is impractical to usea very small beam width on large partsbecause of the very long scan time thatwill result. Practical resolutions forcomputed tomographic systems thathandle large components greater than0.30 m (12 in.) in diameter are in therange of 1 to 2 line pairs per 1 mm (25 to50 line pairs per 1.0 in.). For componentsless than 300 mm (12 in.) diameter, 2 to 4line pairs per 1 mm (50 to 100 line pairsper 1.0 in.) can be obtained. For higherresolution, greater than 4 line pairs per1 mm (100 line pairs per 1.0 in.) andfeature sensitivity on the order of0.125 mm (0.005 in.), the computedtomographic systems are designed tohandle objects of only 30 or 40 mm(about 1 or 2 in.) in size.
Figure 16 shows how the size anddetail sensitivity of computedtomographic systems are related by thedesign. Each type of system (A though D)represents a range of capability that canfound in commercially availablecomputed tomographic systems but noone computed tomographic system canprovide both large object inspection andvery fine resolution.
Obj
ect
size
, m (
in.)
Type A
Type B
Type C
Type D
0 0.1 0.2 0.3 0.4 0.5 0.6 0.7 0.8 0.9 1.0(4) (8) (12) (16) (20) (24) (28) (32) (36) (40)
Resolution, mm (10–3 in.)
2.0 (80)
1.8 (72)
1.6 (64)
1.4 (56)
1.2 (48)
1.0 (40)
0.8 (32)
0.6 (24)
0.4 (16)
0.2 (8)
0

PART 6. Applications of Computed Tomography
TABLE 4. C
Point o
VolumetricQuantitaDataDisbond
Detail SensResolutio
Density
Artifacts
Parts HandPenetratSize and
3RT12_Layout(303_344) 10/2/02 3:02 PM Page 323
Computed tomographic data allowsaccurate evaluation of dimensions,locations in three-dimensional objectspace or material density (as related toX-ray linear attenuation coefficient) to beperformed in any orientation throughoutthe volume of an object that has beenscanned with the computed tomographicsystem. Table 4 summarizes computedtomography’s capability and typicalsensitivity ranges and limitations.
In general, the benefit of X-raycomputed tomography over alternativenondestructive evaluation methodologiesis its ability to map the relative X-raylinear attenuation coefficient of smallvolume elements throughout acomponent, permitting the extraction ofdimensional and material characteristicsof features and anomalies. With thesecharacteristics, derived from thecomputed tomographic data, engineerscan perform a variety of analyses to arriveat quantitative measurements ofparameters to improve the overallproduct. For objects that fit theconstraints of size and shape for propercomputed tomographic examination, thecomputed tomographic data offerunparalleled capability for featuredetection and measurement. Ascomplexity of design increases, the valueof computed tomographic measurementcapability increases.
apabilities of computed tomography.
f Interest
Measurementtive features volumetric feature detection and confi
digital; three-dimensional detection must have separationitivityn large structures: typically 0.5 mm (0.0
small structures, <250 mm (10 in.): typmeasurement multiple materials must differ in X-ray
(0.01 to 0.1 percent for large areas,large aspect ratios cause streak artifactdetail sensitivity in low density materia
lingion X-ray transmission is limited by size, de shape Access to 360 degrees around the part
Present computed tomographictechnology is relatively expensive. Thevalue of computed tomography istherefore realized in applications wherethe objects are of critical value oradequate measurements cannot be madeby other means. A primary example isrocket motors. Computed tomography isused extensively on rocket motors becausethe objects are very valuable and are usedin critical applications, so that the cost ofcomputed tomography remains a smallfraction of the overall mission value.Complex, high value turbine blades areanother example where computedtomography is worth the cost because ofdimensional accuracy better than thatfrom other techniques.
Beyond these few examples, computedtomography is not routinely applied toobjects as a final inspection process.Rather, computed tomography is appliedas an engineering tool and enablingtechnology to support productdevelopment activities, speeding productsto market. Table 5 summarizes costeffective applications for computedtomography.
The application of computedtomography as a measurement tool forengineering and manufacturing provides acost benefit to a number of processes.Computed tomography is used byengineers on prototypes to fully
323Computed Tomography
Technical Capability
guration control
2 in.) features are resolved, smaller high contrast features can be detectedically 0.002 to 0.004 parts per thousand are resolved
linear attenuation coefficients (density and atomic number) for detection >1.0 mm (0.04 in.) diameters (>15:1 is difficult)l near high density features is compromised
nsity and atomic number of the part and by the available X-ray energy

324 Ra
TABLE 5. Betomograph
F
Engineer
Manufac
3RT12_Layout(303_344) 10/2/02 3:02 PM Page 324
characterize the object. Computedtomography measurements can beperformed on test articles to validateprototypes and models before testing,during certain types of testing and posttesting, including noninvasivemicrographic evaluations. Computedtomography permits geometry acquisition(often referred to as reverse engineering),providing a direct cost saving overtraditional approaches to translatingexisting components into digital modelsin computer aided design (CAD)workstations and computer aidedengineering (CAE) workstations.Computed tomography is particularlyeffective during product failure analysisby noninvasively inspecting the interiorcondition of articles, including scansunder various operational conditions.Computed tomography evaluation ofmaterials also is useful in performanceprediction based on the measurementsobtained from the computed tomographicdata. This is where engineering andnondestructive evaluation need tocollaborate to create the most costeffective products.
Computed tomography can be animportant tool in the manufacturing andprocess development stages of product lifecycles by providing feature and anomalylocation, configuration control and thedirect measurement of dimensions forengineering acceptance. The value ofcomputed tomographic evaluation is highfor ensuring a development process hasbeen brought into control. For routineproduction quality control the applicationof computed tomographic depends on therelation between the object value,computed tomographic scanning cost andthe cost of alternatives. The morecomplex and costly an assembly, the morelikely that computed tomography can bea cost effective tool.
Ultimately computed tomography canallow the acceptance of a product on thebasis of quantitative measurements andengineering criteria. Such an engineering
diographic Testing
neficial application areas for computedy.
ield Application
ing prototype evaluationgeometry acquisitionfailure analysisperformance prediction
turing process developmentfeature and anomaly locationconfiguration controlacceptance by engineering criteria
analysis rather than qualitative inspectionstandards has considerable potential forreducing scrap and increasing componentreliability. Maintenance, repair and failureanalysis activities benefit from computedtomography measurements by providinginformation for making decisions onirreversible steps and/or eliminatingdisassembly or destructive testing toobtain critical data. The long range valueof computed tomography technology isthat it closes the loop between theengineering and the manufacturingoperations by providing quantitative datathat can be accessed by engineers at theirworkstations.
Because the output of computedtomography is a digitized, quantitativemap of the density, the computedtomographic image can be analyzed byquantitative, computer based techniques.Subtle deviations in density from a hostdensity can be identified and measuredmuch more precisely than with any othermeans. The important point aboutcomputed tomography is its datapresentation: a clear, unambiguous imagein digital, computer readable format.Although traditional projectionradiography does deliver an image,foreground and background material canobscure the clarity of the image in theregion of interest. Computed tomographyprovides great sensitivity to the mostsubtle variations in density; typically,computed tomography provides 10 to 100times greater sensitivity to density thanprojection radiography. Compared toother inspection modalities, computedtomography works best in complex, thickobjects. Figure 17 and Table 6 show howobject geometry influences the testtechnique.
The major disadvantage toconventional computed tomography liesin having to make X-ray measurementsover the entire periphery of a testspecimen for each slice. Thus, as shown inFig. 17, graphic slices that do not have topenetrate through much material presentthe best computed tomographic images;computed tomographic slices that suffermassive amounts of absorption do notprovide images as good as those takenwith projection radiographs taken from adifferent perspective where the path is notso heavily absorbed, as shown in the flatpancake shape of Fig. 17.
An important point, usuallyoverlooked, is illustrated by the pancakeshape: computed tomographic images andprojection radiography images thatpresent substantially the cross sectionalpicture are taken from entirely differentperspectives. In this case, the projectionradiography would be taken with thesource above and the recording filmbelow (or vice versa) so that the X-ray

3RT12_Layout(303_344) 10/2/02 3:02 PM Page 325
paths are essentially perpendicular to thepancake plane. The computedtomographic image would be acquiredwith source and detectors confined to thepancake plane and relative motion wouldbe induced between them so that theX-ray paths are always within the plane.
The test specimen diversity in sizes,materials, anomalies and time constraintsof industrial objects is such that no singleX-ray computed tomographic system isappropriate for even a major fraction ofthe range of applications. Thus, theinvestment required in the developmentof a single computed tomographic systemdesign for nondestructive testing cannot,in general, be amortized over a variety ofapplications. Computed tomographicsystems are slow and expensive. Withseveral exceptions, nondestructive testingcomputed tomography has beendeveloped in several very specific sets ofcircumstances: (1) the finished product isvery expensive, such as a ballisticmissile,21 (2) a relatively inexpensivecomponent becomes a critical item in a
FIGURE 17. Object shapes referred to incomparison of computed tomography withconventional radiography: (a) oblongcylinder; (b) regular cylinder; (c) short andwide cylinder; (d) flat or pancake cylinder.See Table 6.
(a)
(b)
(c)
(d)
larger assembly, such as rocket nozzles,and (3) computed tomographic samplingyields information as an engineering toolfor process control, such as geometryacquisition for dimensional control.
Because computed tomography is adirect, full imaging mode, manydeveloped systems, especially thoseconceived with a more general use,provide the capability for inspectionsbased on techniques derivative ofcomputed tomography. Among thesecapabilities are laminography and othertechniques based on reconstructiveimaging, such as limited angle(incomplete views) computed tomographyor high resolution annular computedtomography.
Other nonimaging modes peculiar tothe particular problem at hand are alsopossible — for example, precisemeasurement of an internal sealclearance. Indeed, such computedtomography derivative techniques maypresent the most fruitful of approaches forsolving specific inspection problems.Why? In most nondestructive testingproblems, there is a great deal of a prioriknowledge and anomalies tend to fall invery narrow, well defined categories. Thus,digital signal processing of nonimagedsignature data may provide quick,efficient schemes for specific kinds ofanomalies that traditional computedtomographic imaging cannot provide.Some of these applications are discussedbelow.
Computed TomographyExamplesFigures 18 to 21 show examples ofcomputed tomographic images ofmaterials and structures.
The detailed evaluation of complexcastings is an excellent application ofcomputed tomographic technology.22-26
Figure 18 shows a comparison ofcomputed tomography with conventional
325Computed Tomography
TABLE 6. Shape inspectability by computed tomographyversus conventional radiography. See Fig. 17.
Object ShapeRadiographic Technique
_________________________________________________________
Computed ConventionalDescription Figure Tomography Radiography
Cylinder, oblong 17a satisfactorya satisfactory
Cylinder, regular 17b excellent poor
Cylinder, short and wide 17c excellent poor
Cylinder, flat (pancake) 17d poor excellent
a. With sensor plane parallel to test object.

326 Ra
FIGURE 19. Computed tomographic image ofgraphite epoxy woven J stiffener showingply condition and consolidation.31
13 mm (0.5 in.)
3RT12_Layout(303_344) 10/2/02 3:02 PM Page 326
radiography for a turbine blade casting.The part contains a complex internalgeometry. The radiograph is unable toevaluate the internal cross sectionalconfiguration of the part. The computedtomographic slice shows the wallthickness of the casting directly and willshow discontinuities in the cast material ifthey are present at the location of theslice plane.
The ability of computed tomographicimages to show internal materialvariations is particularly advantageous forcomposite material inspection.27-33
Figure 19 shows a computed tomographicimage of a composite J stiffener, where thevariations in the consolidation and theply layups can be evaluated, particularlyat T junctions.
diographic Testing
FIGURE 18. Computed tomographicevaluation of casting turbine blade with400 kV computed tomographic systemshowing internal feature condition and wallthickness measurement: (a) digitalradiograph; (b) computed tomographicslice.
(a)
5 mm (0.2 in.)
(b)
FIGURE 20. Cruise missile engine: (a) projection radiographshowing complex superposition of information;(b) longitudinal computed tomographic slice along axis ofengine obtained with 2.5 MV computed tomographicsystem showing internal details.49
(b)
1.0 m (40 in.)
(a)

FIGUREsmall sdetectsurface(b) hosurface
(a)
(b)
MOVIE.Electronicdevice onturntable.
MOVIE.Image slices ofdevice, top tobottom.
3RT12_Layout(303_344) 10/28/02 2:39 PM Page 327
Figure 20 shows a radiograph and alongitudinal computed tomographic slicethrough a cruise missile engine using a9 MV X-ray source. This exampledemonstrates the power of computedtomography for complex structureevaluation overcoming superpositioncommon in radiography to reveal superiorinformation about the internalconfiguration of systems.
Figure 21 is an example of volumetriccomputed tomographic scanning.
327Computed Tomography
21. Volumetric computed tomographic system data ofingle battery flashlight data by using area arrayor. Multiple slice reconstruction and three-dimensional rendering are possible: (a) digital radiograph;
rizontal slices; (c) vertical slice; (d) three-dimensional rendering.49,50
(c)
(d)
MOVIE.Images ofelectronicdevice.
MOVIE.Slices showdelaminationsin compositefastener hole.
MOVIE.Transverseimage ofdelaminationsin fastener hole.
MOVIE.Tomographicdata image ofelectronicdevice.

328 Rad
PART 7. Reference Standards for ComputedTomography
3RT12_Layout(303_344) 10/2/02 3:02 PM Page 328
BackgroundThe initial developments of computedtomography were directed at medicaldiagnostic applications. The medicalcommunity has generated comprehensiveliterature on the theory and performanceof computed tomography for biomedicalapplications. The basic references on thefundamentals of computed tomographycome from medical users.
Medical computed tomographic systemperformance measurement requirementshave been described with thedevelopment of appropriate phantoms.McCullough and others,34 Payne andothers35 and Bergstrom51 discussmeasurements for performanceevaluation, for acceptance testing and forongoing quality assurance of computedtomographic scanning systems. Theydiscuss possible phantom types that canbe constructed to test parameters ofinterest. Goodenough and others36 andWhite and others37 describe thedevelopments of phantoms to be used inmeasuring various parameters. TheAmerican Association of Physicists inMedicine (AAPM) also describes aphantom.38 Table 7 indicates theparameters, generally agreed on in theliterature, that require evaluation inmedical computed tomographic systems.
iographic Testing
TABLE 7. Parameters of interest for compu
Parameter
Alignment image artifacaccuracy
Slice thickness and geometry vertical covetomograp
Spatial uniformity variation of
Noise random varistatistical
Low contrast sensitivity ability to de
Spatial resolution ability to disshould be
Modulation transfer function quantitative
Effective energy and linearity of monochromtomography numbers to results
Accuracy and precision reliability an
Dose patient expo
The phantoms used in medical computedtomographic evaluation have variouscomponents that test these parameters.
The theory of image quality considersthe modulation transfer function (MTF)and the noise power spectrum as theessential defining characteristics ofimaging systems.39 These principles havebeen applied to medical computedtomographic imaging. Judy describesusing the line spread function40 to obtainthe modulation transfer function andBischof and Ehrhardt describe the pointspread function18 to obtain it. Hanson41
describes the noise power spectrummeasurement. Hansen considersprobability distributions to indicate signaldetection probabilities in computedtomographic imaging. Resolution andnoise can be combined in detectabilitylimit curves that plot contrast needed todetect an object versus the object size fordifferent dose levels of medical imaging.These are referred to as contrast detaildose (CDD) curves. Bergstrom51 shows anexample contrast detail dose curve fromresearch data and discusses the difficultiesin creating a phantom for suchmeasurement. Cohen and Di Bianca42 usethe contrast detail dose diagram toevaluate a computed tomographicscanner.
As computed tomography hasexpanded from the medical to industrial
ted tomography standards.
Notes
ts caused by mechanical alignment; dimensional
rage; alignment and uniformity of computedhic plane in object
computed tomography measurement across scan plane
ation in attenuation measurements (measured byvariation or noise power spectrum)
tect small contrast changes (mainly limited by noise)
tinguish two objects as separate (measurement under noise free conditions)
measurement of high contrast spatial resolution
atic photon energy that would give result equivalentfrom polychromatic spectrum used
d stability of computed tomography measurements
sure (for medical computed tomography)

TABLE 8. Phtechnique
Typ
Resolution
Contrast
Material a
Dimensionand dis
Slice thick
3RT12_Layout(303_344) 10/2/02 3:02 PM Page 329
applications, industrial users havediscussed the issue of standards. Dennis43
describes computed tomographicfundamentals and the image qualityparameters from an industrial computedtomography perspective. The AmericanSociety for Testing and Materials (ASTM)CT Standardization Committee E7.01.03has also developed a document describingthe basic principles of industrialcomputed tomography and advocates themodulation transfer function and contrastdetail dose for measurement of systemperformance.44-46 For industrialapplications, the contrast detail dosecurve is referred to the contrastdiscrimination curve (CDC). Sivers andSilver have described the theoreticalbackground and experimental results ofusing modulation transfer functionmeasurements and contrastdiscrimination curves on industrialcomputed tomographic systems.47 Jacobyand Lingenfelter describe the use of a testphantom for monitoring industrialcomputed tomographic systemperformance over time.48
The parameters listed in Table 7 may bemeasured from data taken by a phantomthat contains features that represent theparameter. A single phantom unit maycontain a variety of subsections that willmeasure various parameters. Theparameters themselves are notindependent but often are differentmanifestations of the fundamentalperformance characteristics of the system.Table 8 lists some key categories for aphantom and potential techniques of
RRtMpvmcddTs
dmurasbobnimAfsim
dpdBmm
obtaining the measurements.
antom categories and measurement.
e Construction or Technique
holessquaresline pairspins and wirescalculation of modulation transfer functionsignal to noise in a uniform material samplesmall density variation
nd density various solidsliquids of different mixture percentagesporous material compaction
al accuracy pin setstortion hole setsness pyramids
conesslanted edgesspiral slit
esolutionesolution refers to the ability to sensehat two features are distinct.
easurements of resolution with ahantom can be performed in a wideariety of ways. Holes in a uniformaterial of either fixed diameter and
hanging separation, or decreasingiameter with separations that alsoecrease accordingly, are very common.he resolution is defined as the minimumeparation detectable.
Plates of alternating high and lowensity material (that is, plastic to air,etal to air or metal to plastic) can be
sed to make line pair gages. Theesolution limit is determined by thebility to see the line pairs. The loss inensitivity is due to a loss of modulationetween the high and low density featuresf the line pairs as the plate thicknessecomes smaller. This can be monitoredumerically by a data trace across the
mage of the line pairs to measure theodulation as a function of line pair size. plot of the modulation values as a
unction of the line pair value is thequare wave response of the system. Thiss related but not equivalent to the
odulation transfer function.The modulation transfer function is
efined for a sinusoidal varying testattern; however, such a pattern is veryifficult to construct for use with X-rays.ecause of the definition of theodulation transfer function, it can beeasured by mathematical calculation of
the fourier transform of theone-dimensional line spread function(LSF) or the two-dimensional point spreadfunction (PSF). The line spread functionand/or point spread function is obtainedby measurement of the spreading of theimage from a delta function input such asa pin or wire. If the pin is small enoughthe point spread function is given directly.If not, the size of the pin must bedeconvolved from the results. Because ofthe problem of finding an adequate lineor point source phantom, the line spreadfunction is very often measured bydifferentiation of the edge spread function(ESF). The edge spread function is readilyobtained from a data trace across a sharpedge in the image.
The modulation transfer functionoutput is a curve of the response of asystem as a function of frequency. It isoften useful to have a single numericvalue to be used for relative comparisonof performance. In the case of themodulation transfer function an arbitraryvalue from the curve may be taken, suchas the frequency at which the modulationis decreased to 10 percent. The width ofthe line spread function or point spread
329Computed Tomography

330 R
FIGURE 23. Computed tomography of line pair phantom:(a) tomographic image; (b) density trace evaluation.
(a)
3RT12_Layout(303_344) 10/2/02 3:02 PM Page 330
function can also be used as a singlenumeric value for comparison ofresolution. By measuring the full width athalf maximum (FWHM) of the line spreadfunction a relative value that is related tothe system resolution is obtained.
Resolution is most commonlymeasured in the computed tomographicimage, which is a slice through the object.However, computed tomographic data arefundamentally volumetric in nature,multiple contiguous computedtomographic slices result in a volume database. Depending on the use of the data, itmay be important to consider theresolution in the axial orientation of thecomputed tomographic data acquisition.This resolution will be for the most partdetermined by the effective slice thicknessand axial step spacing used in thescanning sequence and may be quitedifferent from the individual sliceresolution. In addition, the effective slicethickness often will vary over the field ofview, leading to additional resolutioncharacterization requirements. In the caseof direct volume computed tomographicimaging using cone beam geometries, thedata are usually taken and reconstructedso that resolution is about the same in alldirections in the volume.
Figure 22 is a photograph of a line pairresolution phantom. The phantomconsists of sets of metallic and acrylicplates of specified thickness. Line pairs of0.5, 1, 2 and 4 line pairs per 1 mm(12, 25, 50 and 100 line pairs per 1.0 in.)are formed by the phantom. The entire
adiographic Testing
FIGURE 22. Photograph of line pair phantom
assembly is bolted together and the linepair plates can be changed if additional ora different range of line pairs is desired.After computed tomography scanning thereconstructed image is analyzed bymeasuring the modulation of thecomputed tomography numbers obtainedfrom a trace across the line pairs. Themodulation at each line pair set ismeasured as a percentage, where themodulation measured between the 3 mm(0.12 in.) thick metal and 3 mm (0.12 in.)thick acrylic steps is taken to be100 percent. The resolution phantom hasbeen fabricated in two forms: (1) steel andacrylic and (2) aluminum and acrylic. Thesteel and acrylic phantom is for systemsof 300 kV and up, the aluminum andacrylic phantom is for systems under300 kV.
Figure 23 shows a computedtomographic image of the steel resolutionphantom obtained from a relatively highresolution computed tomographic system.The computed tomographic image densitycontour line across the phantom indicatesmodulation for the respective line pairmeasurements at about 82 percent at
.
Mag
nitu
de (
coun
ts)
4000
3500
3000
2500
2000
1500
1000
500
0
Computedtomographicscan
Densitytrace
A BC
D
0 30 60 90 120 150 180
Distance (pixels)
LegendA. Reference bar.B. 0.5 line pairs per 1 mm (13 line pairs per 1 in.).C. 1 line pairs per 1 mm (25 line pairs per 1 in.).D. 2 line pairs per 1 mm (50 line pairs per 1 in.).E. 4 line pairs per 1 mm (100 line pairs per 1 in.).
E(b)

FIGURE 24tomograp
Nor
mal
ized
res
pons
e
0.12
0.1
0.08
0.06
0.04
0.02
0
–0.02–0.
(–0.0
FIGURE 25. Modulation transfer function of system D,showing effects of asymmetric and symmetric line spreadfunctions.
Mod
ulat
ion
tran
sfer
fun
ctio
n1.2
1
0.8
0.6
0.4
0.2
0
Air half
Total
Aluminum half
Frequency, line pairs per 1 mm (per 1 in.)
0 0.5 1.0 1.5 2.0 2.5 3.0 3.5 4.0(13) (25) (38) (50) (63) (75) (88) (100)
3RT12_Layout(303_344) 10/2/02 3:02 PM Page 331
0.5 line pairs per 1 mm (12 line pairs per1.0 in.), 46 percent at 1 line pair per1 mm (25 line pairs per 1.0 in.), 4 percentat 2 line pairs per 1 mm (50 line pairs per1.0 in.) and 0 percent at 4 line pairs per1 mm (100 line pairs per 1.0 in.).
The modulation transfer functionprovides a measurement of the resolutionof a system by plotting the signalmodulation that the system can provideas a function of frequency. Themodulation transfer functioncharacterization can be obtained bydifferent techniques. One of the easiesttechniques is to calculate the modulationtransfer function from line trace dataacross the edge of a phantom. In thefollowing, the edges used for themeasurement are from the contrastsensitivity disk phantom discussed inbelow. The process involves usingmultiple traces across the edge of the diskfrom numerous angles. This provides edgetraces from all orientations in thecomputed tomographic image. Thesetraces are averaged to form the edgespread function, then differentiated toform the line spread function and finallyfourier transformed to generate themodulation transfer function.
Figure 24 shows the line spreadfunction for each of three differentcomputed tomographic systems. Theshape of the line spread function is animportant characteristic of the system.The full width at half maximum (FWHM)of the line spread function is a measure ofthe relative resolution capability of eachsystem. The shape of the line spreadfunction should be symmetric. In Fig. 24data System I is symmetric, System K isslightly asymmetric and System D is veryasymmetric. The asymmetry may be dueto a variety of causes. Aliasing in the dataacquisition — that is, under sampling,truncating or clipping the edge spread
. Line spread function for three computedhic systems.
System D
System K
System I
2 –0.1 0 0.1 0.28) (–0.04) (0.04) (0.08
Position, mm (in.)
function — and detector cross talk are allpossible causes.
The modulation transfer function maybe calculated directly from theasymmetric line spread function or theline spread function may be processed toform a symmetric function. Figure 25shows three possible modulation transferfunctions for System D data. By taking theline spread function and mirroring it atthe peak, symmetric line spread functionsare generated for the air and aluminumhalves of the edge spread function. Figure25 shows that modulation transferfunction curves for each of these threeapproaches to handling the System D datawill create significantly different curves.
Figure 26 shows the results ofmodulation transfer functionmeasurements for several computedtomographic systems. The modulationtransfer function measurements were
331Computed Tomography
)
FIGURE 26. Modulation transfer function measurements ofseveral computed tomographic systems.
Mod
ulat
ion
tran
sfer
fun
ctio
n
1.2
1
0.8
0.6
0.4
0.2
0
Frequency, line pairs per 1 mm (per 1 in.)
0 0.5 1.0 1.5 2.0 2.5 3.0 3.5 4.0(13) (25) (38) (50) (63) (75) (88) (100)
KBA
H
I
D

332 Ra
TABLE 9. Mand 20 pe
__System 5
ABDHIK
3RT12_Layout(303_344) 10/2/02 3:02 PM Page 332
analyzed by obtaining an average edgespread function, using a three pointrunning average over the curve,differentiating, repeating a three pointrunning average and then taking thefourier transform. For Systems B and D,the line spread function has beenmodified to be symmetric by mirroringthe aluminum side of the edge spreadfunction. One system demonstratesmodulation transfer function valuesgreater than expected, which can becaused by frequency enhancement in thereconstruction algorithms.
Table 9 tabulates the modulationtransfer function values for 5, 10 and20 percent contrast from the two sets ofmodulation transfer function calculationsof Fig. 26. Five percent contrast is usuallyconsidered the limit of resolution. The
diographic Testing
odulation transfer function frequency for 5, 10rcent contrast.
Frequency (line pairs per Full Width at1 mm) for Contrast Levels Half Maximum_______________________________ _______________
percent 10 percent 20 percent mm (in.)
0.84 0.77 0.67 1.10 0.0431.41 1.28 1.05 0.60 0.0242.10 1.93 1.31 0.30 0.0120.80 0.70 0.56 1.10 0.0430.70 0.58 0.51 1.30 0.0511.08 1.00 0.92 0.80 0.031
FIGURE 27. Probability distribution analysis fo
Rela
tive
prob
abili
ty
Signal a
Background
LegendFN = false negativeFP = false positivep = FP level units of σmq = FN level units of σm
∆µ = contrast discriminationµc = signal threshold in decision process
σm = standard deviation of mean over some specified
FWHM values of the line spread functionsare also listed. The modulation transferfunctions are less than 1 line pair per1 mm (25 line pairs per 1.0 in.) for lowerresolution systems, typically for testobjects greater than 750 mm (30 in.) indiameter. The higher resolution systems(B and D) are designed for smaller testobjects, that is, 150 to 300 mm (6 to12 in.) in diameter.
Contrast SensitivityContrast sensitivity refers to thegraininess in an image. The best way tomeasure contrast sensitivity is to obtain ahistogram of pixel values in a region ofuniform density of a test specimen.Contrast sensitivity is then defined as thefractional standard deviation of thedistribution. The inverse of this contrastsensitivity value is also commonlyreferred to as a signal-to-noisemeasurement of the system. The bestcontrast sensitivity phantom is anabsolutely featureless uniform diskcomposed of a material whose X-rayabsorption and density mimic those ofthe actual class of inspection objects.
In practice it is of interest to measurethe contrast sensitivity as a function ofthe feature size. Materials of very close butdiffering densities can be used for this.Normally plugs of slightly differentdensities are inserted into a background
r feature detection.
mplitude (relative scale)
∆µ
pσm
Signal
FN FP
µc
qσm
σm
feature size

FIGURE 28. Computed tomographic image of aluminumcontrast sensitivity phantom: (a) slice image; (b) densitytrace.
(a)
Mag
nitu
de (
coun
ts)
40
30
20
10
0
–10
–200 100 200 300 400 500 600
Distance (pixels)
(b)
3RT12_Layout(303_344) 10/2/02 3:03 PM Page 333
material. The size of the plugs is avariable. Evaluators then determine whichlevel of contrast they can detect as afunction of feature size. This type ofphantom can cause a contrastdiscrimination curve. By plotting the sizeof feature with its percentage contrast fordetectability, the curve is generated.Numerous samples, however, may berequired. The contrast detectability willchange with exposure and multiple curvesare created as a function of the patient (orobject) dose. The visual perception of thedetectability of features will be differentfor different individuals. Thus a largenumber of interpreters should be used todevelop a curve where, for example,50 percent of the interpreters sense thecontrast level for detection of variousfeature sizes.
An alternative technique to obtain thecontrast discrimination curve is tocalculate it on the basis of noisemeasurements as a function of region ofinterest size in a uniform phantom andweight the curve for loss of contrast as afunction of resolution by using themodulation transfer function. Thecontrast required to detect a feature willdepend on the statistical confidence, interms of false positive or false negatives,that one is willing to accept. Figure 27shows the statistical variation in thebackground and signal that could beobserved in an image. The contrastdiscrimination ∆µ necessary for detectiondepends on the values of acceptable falsepositive (FP) and false negative (FN),respectively, where σm is the standarddeviation of the mean over some specifiedfeature size, p is the false positive, q is theFN level in units of σm and µc is thecritical value used in the decision processto decide if a signal is present or not. Acontrast discrimination curve can becreated for any combination of falsepositive and false negative values bymultiplying the σm values in the noisecurve by the sum of p and q and dividingby the modulation transfer functionmodulation. The contrast discriminationcurve determines the minimum contrastthat a feature must have to be detectableat the statistical discrimination levelsselected. The exposure level is a variablein data acquisition, which is a factor inthe noise measurements as a function offeature size.
A contrast sensitivity phantom can bemade from a uniform disk of materialsuch as aluminum, 25 mm (1.0 in.) thick.Different sizes such as 140 mm (5.5 in.) indiameter and 70 mm (2.8 in.) in diametermay be appropriate for differentcomputed tomographic systems. Thesmaller diameter size is used on systemswith small fields of view or low kV.Figure 28 shows an example of a
computed tomographic slice of the largealuminum contrast sensitivity phantomwith the corresponding density trace.
The measurement of contrastsensitivity is obtained by taking a regionin the center of the reconstructed imageand determining the average and standarddeviation for all computed tomographicnumbers in the region. A typical regionsize of 10 mm (0.4 in.) diameter is used.Readings are usually taken at the center ofthe disk. The ratio of the average to thestandard deviation is used as a signal tonoise measurement. The inverse is ameasure of contrast sensitivity. Themeasurement of signal to noise for theimage shown in Fig. 28 is about 6.
The signal-to-noise ratio is animportant measure of systemperformance. The values improve withhigher signal strengths. Large slicethickness and longer scan times will alsoimprove signal to noise. Thesignal-to-noise ratio will also improvewith smoothing algorithms in thereconstruction; however, this will decreasethe resolution. Thus, the signal-to-noiseratio and resolution must be consideredtogether in assessing performance.
333Computed Tomography

334 Ra
FIGURE 29.tomograph
Erro
r in
mea
n (p
erce
nt)
10
9
8
7
6
5
4
3
2
1
0S
0.1(0.004)
IGURE 30. Contrast discrimination curves for severalomputed tomographic systems (A, B, H, I, K) at 10 percentalse positive and false negative values.
Con
tras
t di
scrim
inat
ion
(per
cent
) 100
10
1
0.10 0.5 1.0 1.5 2.0 2.5 3.0 3.5 4.0 4.5
(0.02) (0.04) (0.06) (0.08) (0.10) (0.12) (0.14) (0.16) (0.18)
Feature size, mm (in.)
I
H
B
A
K
3RT12_Layout(303_344) 10/2/02 3:03 PM Page 334
A means of combining signal-to-noiseratio and resolution is the contrastdiscrimination curve. The contrastdiscrimination is affected by the featuresize. Low contrast changes are easier todetect over larger areas than in small areaswhere they are easily masked by noise.This effect can be calibrated by measuringthe statistical variations in the values ofthe means of the computed tomographicnumbers as a function of the size of theregion of interest. Figure 29 plots the errorin the mean of the computedtomographic value (standard deviation σmof the mean) for a number of readings asa function of the feature size (size of theregion of interest) on several computedtomographic systems.
From this curve and the modulationtransfer function, it is possible to generatethe contrast discrimination curve asdiscussed above. The conversion ofmodulation transfer function line pairvalues to the feature size is obtained bymultiplying the line pair per millimeterby two and inverting to providemodulation as a function of feature size.
Figure 30 shows the contrastdiscrimination curve for five computedtomographic systems. The contrastdiscrimination curves are plotted for10 percent false positive and false negativediscrimination levels. The lower thecontrast discrimination value on thecurve, the easier it should be to detectfeatures. Thus, systems such as H and Kwould be most likely to detect lowcontrast changes in an object. It isinteresting that system K, a medicalscanner, has excellent contrastdiscrimination. Medical systems can playa useful role in industrial computedtomography for components that can bepenetrated with the lower kV and that fitwithin the medical gantry system size.The contrast discrimination curve data are
slsshtogt
plc
MAecmqd
Fcf
diographic Testing
Standard deviation σm of mean of computedic readings, as function of feature size.
System D
System B
System A
ystem K
System H
System I
1.0 10(0.04) (0.4)
Feature size, mm (in.)
can time dependent. Thus scanningonger or with larger slice thicknesshould drive the curves lower. Theystems shown in this figure, of course,ave been operated at different scan
imes, slice thicknesses and X-ray energiesr intensities that are appropriate for theoal of that particular computedomographic system design.
Figure 31 shows the effects of the falseositive and false negative discrimination
evels on the contrast discriminationurve.
aterial Densityn important phantom function is tostablish the correlation betweenomputed tomographic value andaterial density. Such a phantom can be
uite difficult to manufacture because it isifficult to change density significantly
FIGURE 31. Contrast discrimination curves at 1, 10 and30 percent false positive and false negative values.
Con
tras
t di
scrim
inat
ion
(per
cent
) 100
10
1
0.1
1 percent
10 percent
30 percent
0 1.0 2.0 3.0 4.0 5.0 6.0 7.0 8.0 9.0 10.0(0.04)(0.08)(0.12)(0.16)(0.20) (0.24)(0.28) (0.32)(0.36)(0.40)
Feature size, mm (in.)

FIGURE 32view; (b) measuring±0.0025 m
(a)
(b)
13 mm
3
4
Legend1. Air g2. High3. Nylo4. Nylo5. Acry6. Acet7. Mag8. Fluo9. Alum
10. Titan
3RT12_Layout(303_344) 10/2/02 3:03 PM Page 335
without changing atomic number. TheX-ray attenuation coefficient is dependenton both density and atomic number. Athigh X-ray energies where the comptoneffect dominates the attenuation, thecalibration is not difficult. At lowenergies, where photoelectric effects areinvolved in the attenuation, it is a realproblem. The range of high or low energydepends on the material being tested. Atmedical computed tomographic energiesof 80 keV effective, carbon materials canbe used for density calibration. At 150 keVeffective for a 300 kV X-ray system, evenmagnesium and aluminum may distortthe density calibration.
The traditional density phantoms usedin medical computed tomography havebeen liquid mixtures, such as glycerin and
. Example of material density phantom: (a) topside view. Each density phantom is a cylinder 13 mm (0.05 in.) diameter x 25 mm (1.0 in.)m (0.001 in.).
(0.5 in.) diameter
140 mm(5.5 in.)
25 mm(1.0 in.)
50 mm(2.0 in.)
44 mm(1.75 in.)
1
2
5
6
7
8
9
10
ap. molecular weight polyethylene, density 0.95 g·cm–3.n, density 1.16 g·cm–3.n, lubricant filled, density 1.17 g·cm–3.lic plexiglas (core material), density 1.19 g·cm–3.al homopolymer, density 1.51 g·cm–3.nesium, density 1.78 g·cm–3.rocarbon resin, density 2.18 g·cm–3.inum, density 2.70 g·cm–3.ium, density 4.42 g·cm–3.
isopropyl alcohol or dilutions ofpotassium iodide. These can be used tocreate steps of density over a very narrowrange. Various polymers, such as acrylicand nylon, have also been used. Theyhave inherent manufacturing variationsthat will result in differing attenuationmeasurements between samples that canbe used to develop a phantom.Carbon-to-carbon composite specimenscan be manufactured to varying levels ofdensification in the range of about 1.3 to1.8 g·cm–3, which makes a usefulphantom for low density calibration.Densification of ceramic powders is alsofeasible for ranges of about 60 percent tofull densification.
A phantom that consists of differingmaterials of significant density variationfor a wide range of industrial materialapplications may be fabricated. However,the evaluation of the results from such aphantom must consider the X-ray energyand the atomic elements involved whenextrapolating to other materials notincluded in the phantom.
An example material calibrationphantom is shown in Fig. 32. It consistsof an acrylic disk of 140 mm (5.5 in.)diameter with inserts of ten variousmaterials. The inserts are machined tospecific tolerances and weighed to obtainthe density. The accuracy of the densityvalue is estimated to be better than onepercent. The acrylic disk is 50 mm(2.0 in.) thick but the inserts are only25 mm (1.0 in.) long, which leaves in thephantom a uniform acrylic disk area thatcan be used for other measurements, suchas the modulation transfer function andthe contrast detail dose.
A computed tomographic scan of thematerial calibration phantom is shown inFig. 33. The computed tomographicnumbers for each insert from thereconstructed image are plotted againstthe measured densities to serve as acalibration curve for the system. Theinsert materials vary in atomic numberthat adds another variable in the processwhen the X-ray energy is such that thephotoelectric effects are significant. Thephantom is useful for generating a generaldensity calibration curve for a computedtomographic system. Figure 34 shows aplot of material density versus computedtomographic density for one system.
Other Functions ofPhantomsNumerous phantoms of all sizes andshapes have been made to evaluatevarious characteristics of a system. Mostcommonly, pyramids or slanting edges ofsome type or other have been used to
335Computed Tomography

336 R
FIGURE 33.phantom4
Legend1. Most
10. Least
3RT12_Layout(303_344) 10/2/02 3:03 PM Page 336
assess the slice plane thickness and fielduniformity of computed tomographicsystems. Phantoms that represent actualparts that are discontinuity free or haveanomalies of known dimensions areexcellent for monitoring inspectionsensitivity day to day and should beimplemented if possible.
Artifacts are features present in theimage that are not present in the object.All imaging systems, even the human eye,will have artifacts at some level. Artifactsin computed tomographic systems rangefrom those associated with the particularcomputed tomographic configurationsuch as circular rings in third generation(rotate-only computed tomography) tothose that are computed tomographicprocess dependent such as partial volumestreaks. Beam hardening is a primarysource of artifacts from polychromaticsources. Mechanical inaccuracies, materialdensities and partial voluming effects canalso produce artifacts. It is important tobe able to recognize an artifact as suchand to understand the limitation theartifact places on the recognition ofanomalies or measurement of somecritical characteristic. Artifacts must notmask the presence of anomalies forunambiguous interpretation. This isaccomplished if the artifact noise levelcan be kept below the required signallevel for anomaly detection. No particular
adiographic Testing
Computed tomographic scan of material density9.
10
1
dense.dense.
phantoms are necessary to monitorartifacts, although pin phantoms arenormally used for mechanical systemalignment. The artifact pattern generatedfrom the pin is used to adjust thecomputed tomographic systemconfiguration for minimal artifacting.
Extraction of positional anddimensional information from complexassemblies represents an importantapplication of X-ray computedtomography. Examples includenoninvasively measuring gaps andmeasuring deformations undermechanical load. Such information isextracted also where no photogrammetryor mechanical technique is possible toproduce accurate, dimensionedrepresentations of assemblies.
A basic assumption made in thesecalculations is the absolute equivalence ofthe computed tomographic image frameof reference and the scanned object frameof reference. Because this equivalencedepends on a variety of factors includingmechanical, motion, physical element,analysis techniques, softwareimplementation and calibrationtechniques, this assumption ofequivalence may introduce significanterrors. A dimensional measurementphantom (DMP) is needed to establishprecision of a computed tomographicimaging system.
An example of a dimensionalmeasurement phantom consists of a16.5 mm (0.65 in.) thick disk, 200 mm(7.87 in.) in diameter with forty-nine8.6 mm (0.34 in.) diameter precisiondrilled holes forming a rectangular matrixat equal spacings of 20.0 mm (0.787 in.)plus or minus 0.006 mm (2.5 × 10⁻⁴ in.).Three additional, precisely located, smallholes were drilled adjacent to two cornersof the large hole matrix, two at one
FIGURE 34. Plot of material density versus computedtomographic density for material density phantom.
Mea
sure
d de
nsity
(g·
cm–3
)
5
4
3
2
1
0
–1
System I
Computed tomographic density (arbitrary scale)
0 500 1000 1500 2000 2500 3000 3500 4000

FIGURE 36. Dimensional phantom metric Γ: (a) image;(b) object; (c) example Γ map for particular test.
(a)Y
X
(c)
(b) y
x
3RT12_Layout(303_344) 10/2/02 3:03 PM Page 337
corner and one at the adjacent corner toserve as reference points during imageanalysis. Figure 35 shows a computedtomographic scan of the dimensionalmeasurement phantom in the nominalorientation used for the measurementsdiscussed below.
The dimensional phantom provides ametric for the precise dimensionalanalysis of scanned parts. Figure 36 andEq. 36 show the concept of the metric Γ,which measures distortion.
(36)
The metric uses the local jacobian of thetransformation matrix between the partand its computed tomographic imagerepresentation to provide a quantitativemeans of assessing the inherent geometricaccuracy of any given computedtomographic system.
Table 10 summarizes the outcome ofphantom measurements for threecomputed tomographic systems. The firstcolumn identifies the system. The secondshows the mean value of the dimensionaldistortion metric (Γij) measured for eachof the systems. This index of the overallimage distortion shows that it wasextremely small. The third column givesthe ratio of the 6σ width of the deduceddistribution of principal diagonalmeasurements ratioed to the nominaldimension. It is a measure of systemprecision. The last column indicatessystem accuracy. It is the offset of thepeak of the probability distribution for thediagonal length from the nominal value.
Γ =
−
∂∂
∂∂
∂∂
∂∂
det
Xx
Xy
Yx
Yy
1
2
FIGURE 35. Computed tomographic image odimensional metric phantom.
It probably overstates the inaccuracy forsystem L that had a forced offset because ofprobable slight misalignment and thecalibration technique used. The accuracydetermined for the other two systems fallswell within the uncertainty in partdimension that would be associated with
337Computed Tomography
f
TABLE 10. Summary of dimensional fidelity measurementsmetric on dimensional measurement phantom.
Maximum DimensionalAverage Dimensional Inaccuracy in
Distortion G* Precision, 170 mm (6.7 in.)______________________System (dimensionless) 6σ (percent) µm (10–3 in.)
A 4.0 × 10⁻⁶ 0.93 15.2 0.6H 3.5 × 10⁻⁶ 0.04 2.54 0.1L 4.2 × 10⁻⁶ 0.05 55.9 2.2

338 Rad
3RT12_Layout(303_344) 10/2/02 3:03 PM Page 338
normal temperature variations in theworking environment, ±6 °C (±10 °F), fora coefficient of thermal expansion ofaluminum of 1.22 × 10⁻⁵.
The methodology adopted in this studyshould be easily transportable to othersystems for which an inherent geometryaccuracy (IGA) is desired. Location of thecenters of an array of precision machinedholes in the computed tomographicimage of a test article for comparison withthe location of the holes in the part itselfis an excellent means of deriving theelements of the local transformationmatrix for inherent geometry accuracydetermination. The success of thetechnique relies on the fact that the holecenter location is insensitive to thecriterion used for finding the hole edge,particularly because the hole centercoordinates are highly overdetermined.Techniques that rely on precisedetermination of edges (for example,finding the absolute diameter of the testarticle) will be less successful because theyare sensitive to the definition of an edgein the image.
iographic Testing

1. Adams, J. “Scanned-BeamLaminography Breaks through the 3-DBarrier.” Proceedings of the TechnicalProgram — National Electronic Packagingand Production Conference (West)[NEPCON West ‘89] (Anaheim, CA,March 1989). Des Plaines, IL: CahnersExposition Group (1989).
2. Grant, D.B. “Tomosynthesis: AThree-Dimensional RadiographicImaging Technique.” IEEE Transactionson Biomedical Engineering. Vol. 19. NewYork, NY: Institute of Electrical andElectronics Engineers (1972): p 20-28.
3. Miller, E.R, E.M. McCurry andB. Hruska. “An Infinite Number ofLaminograms from a Finite Number ofRadiographs.” Radiology. Vol. 98. OakBrook, IL: Radiological Society ofNorth America (1971): p 249-255.
4. Nelson, J. and H.H. Tat. “WebDeployed Design for Radiography.”JANNAF [Joint Army-Navy-NASA-AirForce] Propulsion Meeting Proceedings[Salt Lake City, UT, July 2001].Baltimore, MD: Johns HopkinsUniversity, Chemical PropulsionInformation Agency, for the JANNAFInteragency Propulsion Committee(2001).
5. Maravilla, K.R., R.C. Murry, Jr. andS. Horner. “Digital Tomosynthesis:Technique for ElectronicReconstructive Tomography.” AmericanJournal of Roentgenology. Vol. 141.Leesburg, VA: American Roentgen RaySociety (1983): p 497-502.
6. Buchele, S.F., H. Ellinger andF. Hopkins. “Forming Laminograms onObject-Dependent Surfaces.” MaterialsEvaluation. Vol. 48, No. 5. Columbus,OH: American Society forNondestructive Testing (May 1990):p 618-622.
7. Webber, R., R. Horton, D. Tyndall andJ. Ludlow. “Tune-Aperture ComputedTomography (TACT).” Winston-Salem,NC: Cerberus Technologies (1996).
8. Kirchner, T., P. Burstein, M. Barker andF. Sequin. “High-Resolution ArealTomosynthesis for RapidNondestructive Inspection ofLarge-Scale Aerospace Materials,Structures and Components.”Columbia, MD: Johns HopkinsUniversity, Chemical PropulsionInformation Agency (1994).
9. Gondrom, S. and S. Schröpfer. “DigitalComputed Laminography andTomosynthesis — FunctionalPrinciples and IndustrialApplications.” Proceedings— Computerized Tomography forIndustrial Applications and ImageProcessing in Radiology [Berlin,Germany]. DGZfP Proceedings BB 67-CD. Berlin, Germany: DeutscheGesellschaft für ZerstörungsfreiePrüfung (March 1999).
10. Schulte, R. “Full Volumetric X-RayImaging Using a Digital Flat PanelDetector.” Presented at ASNT FallConference and Quality Testing Show[Columbus, OH, October 2001].
11. Cormack, A.M. “Representations of aFunction by Its Line Integrals, withSome Radiological Applications.”Journal of Applied Physics. Vol. 34,No. 9. Melville, NY: American Instituteof Physics (September 1963):p 2722-2727.
12. Cormack, A.M. “Representations of aFunction by Its Line Integrals, withSome Radiological Applications, II.”Journal of Applied Physics. Vol. 35,No. 10. Melville, NY: AmericanInstitute of Physics (October 1964):p 2908-2913.
13. Hounsfield, G.N. “ComputerizedTransverse Axial Scanning(Tomography): Part 1, Description ofSystem.” British Journal of Radiology.Vol. 46. London, United Kingdom:British Institute of Radiology (1973):p 1016-1022.
14. Herman, G. and S. Rowland. “SNARK:A Programming System for ImageReconstruction from Projections.”Technical Report Number 130. Buffalo,NY: State University of New York atBuffalo (1978).
15. Huesman, R., G. Gullberg,W. Greenberg and T. Budinger.“RECLBL Library Users Manual,Donner Algorithms for ReconstructionTomography.” Publication 214.Berkeley, CA: Lawrence BerkeleyLaboratory, University of California(October 1977).
16. ASTM, E 157-93, Standard Guide forComputed Tomography (CT) Imaging.West Conshohocken, PA: ASTMInternational (1993).
339Computed Tomography
References
3RT12_Layout(303_344) 10/2/02 3:03 PM Page 339

17. ASTM E 1570-95, Standard Practice forComputed Tomographic (CT)Examination. West Conshohocken, PA:ASTM International (1995).
18. Bischof, C.J. and J.C. Ehrhardt.“Modulation Transfer Function of theEMI CT Head Scanner.” MedicalPhysics. Vol. 4, No. 2. Melville, NY:American Institute of Physics, forAmerican Association of Physicists inMedicine (1977): p 163-167.
19. Barret, H.H. and W. Swindell.Radiological Imaging: The Theory ofImage Formation, Detection andProcessing. Vols. 1 and 2. New York,NY: Academic Press (1981).
20. Shepp, L.A. and J.A. Stein. “SimulatedReconstruction Artifacts inComputerized X-Ray Tomography.”Reconstruction Tomography in DiagnosticRadiology and Nuclear Medicine.Baltimore, MD: University Park Press(1977).
21. Burstein, P., R. Mastronardi andT. Kirshner. “ComputerizedTomography Inspection of TridentRocket Motors: A CapabilityDemonstration.” Materials Evaluation.Vol. 40, No. 11. Columbus, OH:American Society for NondestructiveTesting (November 1982): p 40.
22. Bossi, R.H. and G.E. Georgeson.“Computed Tomography Analysis ofCastings.” Report WL-TR-91-4121.Wright-Patterson Air Force Base, OH:Air Force Research Laboratory(January 1992).
23. Bossi, R.H., J.L. Cline, E.G. Costelloand B.W. Knutson. “X-Ray ComputedTomography of Castings.” ReportWRDC-TR-89-4138. Wright-PattersonAir Force Base, OH: Air Force ResearchLaboratory (March 1990).
24. Georgeson, G.E. and R.H. Bossi,“X-Ray Computed Tomography ofFull-Scale Castings.” ReportWL-TR-91-4049. Wright-Patterson AirForce Base, OH: Air Force ResearchLaboratory (October 1991).
25. Georgeson, G.E. and R.H. Bossi.“Computed Tomography for CastingDevelopment.” ReportWL-TR-92-4032. Wright-Patterson AirForce Base, OH: Air Force ResearchLaboratory (September 1992).
26. Georgeson, G.E., R.H. Bossi andR.D. Rempt. “Computed TomographyDemonstration for Castings.” ReportWL-TR-93-4048. Wright-Patterson AirForce Base, OH: Air Force ResearchLaboratory (May 1993).
27. Friddell, K.D., A.R. Lowrey andB.M. Lempriere. “Application ofMedical Computed Tomography (CT)Scanners to Advanced AerospaceComposites.” Review of Progress inQuantitative Nondestructive Evaluation.Vol. 4. New York, NY: Plenum Press(1985): p 1239-1246.
28. Bossi, R.H., K.K. Cooprider andG.E. Georgeson. “X-Ray ComputedTomography of Composites.” ReportWRDC-TR-90-4014. Wright-PattersonAir Force Base, OH: Air Force ResearchLaboratory (July 1990).
29. Bossi, R.H., K.D. Friddell andA.R. Lowrey. “ComputedTomography.” Non-Destructive Testingof Fibre-Reinforced Plastics Composites.Ch. 4. London, United Kingdom:Elsevier Science Publishers (1990).
30. Georgeson, G.E. and R.H. Bossi.“Computed Tomography for AdvancedMaterials and Processes.” ReportWL-TR-91-4101. Wright-Patterson AirForce Base, OH: Air Force ResearchLaboratory (June 1992).
31. Bossi, R.H., G.E. Georgeson andR.D. Rempt. “X-Ray ComputedTomography for Emerging AerospaceMaterials and Processes Development.”Report WL-TR-93-4054.Wright-Patterson Air Force Base, OH:Air Force Research Laboratory(May 1993).
32. Bossi, R.H. and G.E. Georgeson.“Composite Structure DevelopmentDecisions Using X-Ray CTMeasurements.” Materials Evaluation.Vol. 53, No. 10. Columbus, OH:American Society for NondestructiveTesting (October 1995): p 1198-1203.
33. Boyd, J.E. “Limited-Angle ComputedTomography for Sandwich StructuresUsing Data Fusion.” Journal ofNondestructive Evaluation. Vol. 14,No. 2. New York, NY: Plenum Press(1995): p 61-76.
34. McCullough, E.C., J.T. Payne,H.L. Baker, Jr., R.R. Hattery, P.F.Sheedy, D.H. Stephens and E.Gedgaudus. “Performance Evaluationand Quality Assurance of ComputedTomography Scanners, withIllustrations from the EMI, ACTA, andDelta Scanners.” Radiology. Vol. 120.Oak Brook, IL: Radiological Society ofNorth America (July 1976): p 173-188.
35. Payne, J.T., E.C. McCullough, T. Stoneand E. Gedgaudas. “AcceptanceTesting of a ComputerizedTomographic Scanner.” OpticalEngineering. Vol. 16, No. 1.Bellingham, WA: International Societyfor Optical Engineering(January-February 1977): p 28-31.
340 Radiographic Testing
3RT12_Layout(303_344) 10/2/02 3:03 PM Page 340

36. Goodenough, D.J., K.E. Weaver andD.O. Davis. “Development of aPhantom for Evaluating Assurance ofImage Quality in CT Scanning.”Optical Engineering. Vol. 16, No. 1.Bellingham, WA: International Societyfor Optical Engineering(January-February 1977): p 62-65.
37. White, D.R., R.D. Speller andD.M. Taylor. “Evaluating PerformanceCharacteristics in ComputerizedTomography.” British Journal ofRadiology. Vol. 54. London, UnitedKingdom: British Institute ofRadiology (1981): p 221-231.
38. AAPM 1977, Phantoms for PerformanceEvaluation and Quality Assurance of CTScanners. Report No. 1. New York:American Institute of Physics, forAmerican Association of Physicists inMedicine (1977).
39. Mees, C.K. Theory of the PhotographicProcess. New York, NY: MacMillanCompany (1942).
40. Judy, P.F. “The Line Spread Functionand Modulation Transfer Function of aComputed Tomography Scanner.”Medical Physics. Vol. 3, No. 4. Melville,NY: American Institute of Physics, forAmerican Association of Physicists inMedicine (1976): p 233-236.
41. Hanson, K.M. “Detectability inComputed Tomographic Images.”Medical Physics. Vol. 6, No. 5. Melville,NY: American Institute of Physics, forAmerican Association of Physicists inMedicine (1979): p 441-451.
42. Cohen, G. and F. Di Bianca. “The Useof Contrast-Detail-Dose Evaluation ofImage Quality in a CT Scanner.”Journal of Computer AssistedTomography. Vol. 3, No. 2. New York,NY: Raven Press (1979): p 189-195.
43. Dennis, M.J. “Industrial ComputedTomography.” Metals Handbook, ninthedition: Vol. 17, NondestructiveEvaluation and Quality Control.Materials Park, OH: ASM International(1989): p 358-386.
44. ASTM E 1441-95, Standard Guide forComputed Tomography (CT) Imaging.West Conshohocken, PA: ASTMInternational (1995).
45. ASTM E 1672-95, Standard Guide forComputed Tomography (CT) SystemSelection. West Conshohocken, PA:ASTM International (1995).
46. ASTM E 1695-95, Standard Test Methodfor Measurement of ComputedTomography (CT) System Performance.West Conshohocken, PA: ASTMInternational (1995).
47. Sivers, E.A. and M.D. Silver.“Performance of X-Ray ComputedTomographic Imaging Systems.”Materials Evaluation. Vol. 48, No. 6.Columbus, OH: American Society forNondestructive Testing (June 1990):p 706-713.
48. Jacoby, M.H. and D.E. Lingenfelter.“Monitoring the Performance ofIndustrial Computed TomographyInspection Systems.” MaterialsEvaluation. Vol. 47, No. 10. Columbus,OH: American Society forNondestructive Testing(October 1989): p 1196-1199.
49. Bossi, R.H., J.L. Cline and B.W.Knutson. “Computed Tomography ofThermal Batteries and Other ClosedSystems.” Report WRDC-TR-89-4113.Wright-Patterson Air Force Base, OH:Air Force Research Laboratory(December 1989).
50. Hytec Incorporated. “Small FlashlightResults.” Technical Report,HT 107990-0003. Los Alamos, NM:Hytec Incorporated (February 2001).
51. Bergstrom, M. “PerformanceEvaluation of Scanners.” Radiology ofthe Skull and Brain: Vol. 5, TechnicalAspects of Computed Tomography.Chapter 123. Saint Louis, MO:C.V. Mosby Company (1981):p 4212-4227.
BibliographyArmistead, R.A. “CT: Quantitative 3D
Inspection.” Advanced Materials andProcesses. Materials Park, OH: ASMInternational (March 1988): p 42-48.
Bossi, R.H. and B. Knutson. “TheAdvanced Development of X-RayComputed Tomography Applications.”Report WL-TR-93-4016.Wright-Patterson Air Force Base, OH:Air Force Research Laboratory(May 1993).
Bossi, R.H. and R.J. Kruse. “X-RayTomographic Inspection of PrintedWiring Assemblies and ElectricalComponents.” WRDC-TR-90-4091.Wright-Patterson Air Force Base, OH:Air Force Research Laboratory(October 1990).
Bossi, R.H. and W. Shepherd. “ComputedTomography for Failure AnalysisInvestigations.” ReportWL-TR-93-4047. Wright-Patterson AirForce Base, OH: Air Force ResearchLaboratory (May 1993).
341Computed Tomography
3RT12_Layout(303_344) 10/2/02 3:03 PM Page 341

Bossi, R.H., A.R. Crews andG.E. Georgeson. “X-Ray ComputedTomography for Failure Analysis.”Report WL-TR-92-4017.Wright-Patterson Air Force Base, OH:Air Force Research Laboratory(August 1992).
Bossi, R.H., J.L. Cline and G.E. Georgeson.“High Resolution X-Ray ComputedTomography.” Report WL-TR-91-4102.Wright-Patterson Air Force Base, OH:Air Force Research Laboratory(July 1992).
Bossi, R.H., R.J. Kruse and B.W. Knutson.“Computed Tomography ofElectronics.” ReportWRDC-TR-89-4112. Wright-PattersonAir Force Base, OH: Air Force ResearchLaboratory (December 1989).
Brooks, R.A. and G. Di Chiro. “Principlesof Computer Assisted Tomography(CAT) in Radiographic andRadioscopic Imaging.” Physics inMedicine and Biology. Vol. 21, No. 5.London, United Kingdom: Institute ofPhysics in association with theAmerican Institute of Physics and theAmerican Association of Physicists inMedicine (1976).
Bueno, C., M.D. Barker, R.A. Betz,R.C. Barry and R.A. Buchanan.“Nondestructive Evaluation of AircraftStructures Using High-ResolutionReal-Time Radiography.” NondestructiveEvaluation of Aging Aircraft, Airports,Aerospace Hardware and Materials. SPIEProceedings, Vol. 2455. Bellingham,WA: International Society for OpticalEngineering (June 1995).
Burstein, P. and R.H. Bossi. “A Guide toComputed Tomography SystemSpecifications.” ReportWRDC-TR-90-4026. Wright-PattersonAir Force Base, OH: Air Force ResearchLaboratory (August 1990).
Copley, D., J. Eberhard and G. Mohr.“Computed Tomography: Part 1,Introduction and IndustrialApplications.” JOM. Warrendale, PA:Minerals, Metals and Materials Society[TMS] (January 1994): p 14-26.
Crews, A.R. and R.H. Bossi. “X-RayComputed Tomography for WholeSystem Evaluation (Small JetEngines).” Report WL-TR-91-4109.Wright-Patterson Air Force Base, OH:Air Force Research Laboratory(May 1992).
Crews, A.R., R.H. Bossi andG.E. Georgeson. “X-Ray ComputedTomography for GeometryAcquisition.” Report WL-TR-93-4036.Wright-Patterson Air Force Base, OH:Air Force Research Laboratory(March 1993).
Feldkamp, L.A. and G. Jesion. “3D X-RayComputed Tomography.” Review ofProgress in Quantitative NondestructiveTesting. IS-4923. New York, NY:Plenum Press (1986): p 555-566.
Gupta, N. and V. Alreja. “TangentialScanner for Waste Drum Inspection.”ASNT Industrial Computed TomographyTopical Conference [Huntsville, AL,May 1996]. Columbus, OH: AmericanSociety for Nondestructive Testing(1996): p 85-88.
Hendee, W.R. The Physical Principles ofComputed Tomography. Boston, MA:Little, Brown and Company (1983).
Herman, G.T. Image Reconstructions fromProjections: The Fundamentals ofComputerized Tomography. New York,NY: Academic Press (1980).
Kak, A.C. and M. Slaney. Principles ofComputerized Tomographic Imaging.New York, NY: IEEE Press (1987).
Kropas, C.V., T.J. Moran and R.N. Yancey.“Effects of Composition on DensityMeasurement by X-Ray ComputedTomography.” Materials Evaluation.Vol. 49, No. 4. Columbus, OH:American Society for NondestructiveTesting (April 1991): p 487-490.
Macovski, A. Medical Imaging. UpperSaddle River, NJ: Prentice-Hall (1983).
Mandelkorn, F. and H. Stark.“Computerized Tomosynthesis,Stereoscopy and Coded-ScanTomography.” Applied Optics. Vol. 17.Washington, DC: Optical Society ofAmerica (1978): p 175-80.
Marshall, C. The Physical Basis ofComputed Tomography. Saint Louis,MO: Warren H. Green, Incorporated(1982).
Newton, T.H. and D.G. Potts, ed. Radiologyof the Skull and Brain: Vol. 5, TechnicalAspects of Computed Tomography. SaintLouis, MO: C.V. Mosby (1981).
Perceptics Corporation. High-ResolutionThree-Dimensional ComputedTomography. Wright Laboratory FinalReport, WLTR-96-4117. WrightPatterson Air Force Base, OH: UnitedStates Air Force (October 1996).
Radon, J.H. “Über die Bestimmung vonFunktionen durch ihre Integralwertelängs gewisser Mannigfaltigkeiten.”Berichte Sächsische Akademie derWissenschaften [Berichte über dieVerhandlungen der Königlich SächsischenGesellschaft der Wissenschaften zuLeipzig]. Vol. 69. Leipzig, Germany:Math.-Phys. Klasse (1917): p 262-277.
Schneberk, D.J., S.G. Azevedo, H.E. Martzand M.F. Skeate. “Sources of Error inIndustrial TomographicReconstructions.” Materials Evaluation.Vol. 48, No. 5. Columbus, OH:American Society for NondestructiveTesting (May 1990): p 609.
342 Radiographic Testing
3RT12_Layout(303_344) 10/2/02 3:03 PM Page 342

Seeram, E. Computed TomographyTechnology. Philadelphia, PA:W.B. Saunders Company (1982).
Smith, B.D. “Cone-Beam Tomography:Recent Advances and a TutorialReview.” Optical Engineering. Vol. 29,No. 5. Bellingham, WA: InternationalSociety for Optical Engineering (May1990).
Stanley, J. “Standards for ComputedTomography.” ASNT 1993 FallConference and Quality Testing Show[Long Beach, CA]. Columbus, OH:American Society for NondestructiveTesting (November 1993).
Stanley, J. and J. LePage. “CT SystemPerformance Evaluation.” JointArmy-Navy-NASA-Air Force 1990 NDESubcommittee Meeting [Idaho Falls,ID, April 1990].
343Computed Tomography
3RT12_Layout(303_344) 10/2/02 3:03 PM Page 343

Daniel J. Schneberk, Lawrence Livermore NationalLaboratory, Livermore, California
Harry E. Martz, Lawrence Livermore NationalLaboratory, Livermore, California
Image Data Analysis
13C H A P T E R
3RT13_Layout (345_378) 10/14/02 3:15 PM Page 345

346
PART 1. Fundamental Properties of DigitalImages and Processing Schemes
3RT13_Layout (345_378) 10/14/02 3:15 PM Page 346
Image analysis can be described as theprocess that relates the features in theimage to the state of the object beingtested. Not all features in an image carrythe same significance for the test, nor areall features in an image necessarily relatedto the object. Operations applied toimages can highlight, enhance andsometimes remove certain features in theimage. Image analysis proceeds bydeveloping a sensible rationale for thesteps and procedures connecting featuresin an image to an interpretation about thestate of the object. Depending on thesituation the amount of image analysisapplied to a particular image can beminimal or very extensive.
The goal of the test drives the imagedata analysis for any image. Tests arealways about measuring a property of anobject, with some precision andrepeatability. Operator based tests useimage analysis techniques to extract thenecessary information about the objectfrom the image. Automated test systemsembed an analysis of the image in theprocessing. The role of image analysis isto develop the techniques formanipulating the image data and at thesame time assess the weaknesses of theprocedure. It is best when an imageanalysis technique can be reduced to a setof image quality standards for the inputimages. These standards can alsohighlight some fundamental aspect of theradiographic method, for thatradiographic source and that detector.Consequently, evaluating an imageanalysis technique and its potential forconveying reliable information about theobject involves a whole matrix ofissues — from the fidelity of the image inspace, the particular detector used and theprocedures used for evaluating the digitalimage. Problem areas and limitations ofimage analysis schemes can result fromdetector choices as well as processingschemes. For an understanding of theseissues some recognition of thefundamentals of digital images and thelandscape of acquisition and processingfor digital images is useful.
Three properties of digital images arefundamental: (1) signal-to-noise ratio,(2) spatial resolution and (3) contrastsensitivity (defined below). Eachidentifiable feature corresponds to somechange in measured intensity in the
iiomt
aocctai
rcwsItsu
CTTppeodbdtsfiadtdpfXd
(
(
Radiographic Testing
mage. To decide whether this change inntensity derives from the state of thebject or is some artifact of the scanningodality requires an assessment of these
hree properties of the imaging system.The image performance achieved on
ny acquisition is the result of a numberf factors. Digital radiographic images oromputed tomographic images are theombined result of the radiographicechnique used, the detection scheme andll the processing steps that result in themage used for the test.
The entire imaging process for digitaladiography and computed tomographyan be represented in sequential phases,ith digital radiography requiring fewer
teps than computed tomography (Fig. 1).ndeed, the properties of the computedomographic reconstructed image dependtrongly on the properties of thenderlying digital radiographic images.
omponents of X-Rayransmission Imageshe radiographic beam is the startingoint for all radiographic scanners. Theroperties of the beam, its shape andnergy content and the geometry of thebject with respect to the beam are crucialeterminants of imaging quality. Theeam generates an image in space and theetector samples the X-ray intensity ofhis beam. The sampling has both apatial and energy discriminating aspector some position in space. Before thentroduction of any detector or detectornd collimation scheme a number ofifferent sources of signal are present inhe transmission measurements. For anyetector position (some three-dimensionalosition on the other side of the objectrom the X-ray beam), the transmitted-ray photons intersecting this solid angleivide into different types as follows:
1)
2) N N
N
S E d S E d
S E d
S , Sbk ,
Sobj ,+
( )[ ] ( )[ ]( )[ ]
=
N N NS E d S E d S E dT , P , S ,+( )[ ] ( )[ ] ( )[ ]=

3RT13_Layout (345_378) 10/14/02 3:15 PM Page 347
(3)
The schema above decomposes the totalphoton flux from an X-ray source S(E), forthe solid angle subtended by detectorposition d, into primary photons NP andscattered photons NS. Further there aretwo types of scattered photons:background scatter NSbk and object scatterNSobj. Most X-ray measurements have ameans for taking into account theradiation field independent of the object,NT0. Typically this measurement containssome background scattered photons fromthe supporting fixtures in theradiographic scanner or in the detectionhardware, as well as the primary photonslaunched by the X-ray source NPO.
The attenuation of electromagneticradiation — for example, X-rays passingthrough matter — involves threemechanisms, each accompanied bysecondary processes. The three
N N
N
S E d S E d
S E d
TO , PO ,
Sbk ,+
( )[ ] ( )[ ]( )[ ]
=
FIGURE 1. Imaging process for digitalradiography and computed tomography.
Image at somedetector plane
in space
X-ray or gammaray interactions
with object
Acquisition ofdigital imagefrom detector
Digital radiographicimage processing fordisplay and analysis
Digital radiographic orcomputed tomographic
processing of transmission image
Computed tomographicimage reconstruction
Computed tomographicimage display and
analysis
mechanisms are photoelectric effect,compton scattering and pair production.
1. In the photoelectric effect an X-raydissipates its entire energy byknocking out an electron from anatom.
2. In compton scattering, the X-rayimparts some energy to an electronbut survives with a lower energy anddifferent direction.
3. In pair production an X-ray isabsorbed to create an electron positronpair. For pair production to occur theincident X-ray must have an energyequal to or greater than the rest massof an electron positron pair. Thisenergy is 1.02 MeV because the restmass of each is 0.511 MeV.
A more complete discussion of theseprocesses can be found elsewhere in thisvolume and in books by Evans andHeitler.1,2
The different attenuation mechanismcombine in any scan to produce signalfrom a variety of secondary processes. Forexample, a photoelectric electron interactswith the material and creates scatteredX-rays. Likewise, scattered X-rays at lesserenergy than the initial flux undergophotoelectric attenuation before reachingan exit plane in the object. At lowerenergies the secondary processes are notprominent. However, at medium tohigher energy regimes the secondary andancillary processes can dominate imagingquality.
The performance of imagingtechniques using penetrating radiationfollows from the properties and theproportions of the different classes ofX-ray photons in the image. The primaryX-ray photons account for theperformance of the transmission image.These straight line projections through thematerials best conform to the idealized raypath implicit to computed tomographicreconstruction algorithm textbooks.3,4
Spatial resolution of the primary photonsis bounded by the spot size blur and inthe case of heavily collimated systems theeffective width of the source and detectorapertures. The contrastive properties ofthe primary photons have the distributionof an X-ray gage with standard deviationproportional to the inverse of the squareroot of N.
Primary photon flux NP includes thetotal X-ray photons emitted by the X-raysource and transmitted straight throughthe object, undergoing the differentattenuation processes. As shownelsewhere, photons emitted from theX-ray source are a poisson randomvariable and total X-ray attenuation isrepresented as distributed binomial. Thetwo variables taken together result inEq. 4:
347Image Data Analysis

348 Ra
3RT13_Layout (345_378) 10/14/02 3:15 PM Page 348
(4)
where µι(ρ,Z) is the X-ray attenuationcoefficient of the ith material withthickness xI in the direction subtended bythe detector element looking back at theX-ray source through the object.Following this development NT is apoisson random variable with mean NT,variance also equal to NT and standarddeviation NT
–1.3Contrastive performance of a
transmission image is that ability todetect intensity changes due to somechange in the attenuation of the objectalong some ray path. All measurementsystems involve some noise. One boundon the contrast in an image is the ratio ofthe change in intensity of the signal tothe random intensity variations caused bythe noise in the system. For some changein attenuation ∆ and by using the poissonvariable N, the signal-to-noise ratio can bewritten:
(5)
Feature contrast in an object is directlyrelated to the number of transmitted anddetected photons. In the limit too fewphotons (weak signal) will always result inpoor contrast.
The photons scattered in the object aremore difficult to interpret. The line orpath of the scattered photons is energydependent, usually forward peaked andalways broader than the path of theprimary photons.3 Object scatter can varythroughout the image because of thechange in the lengths and types ofmaterial in the specimen. Highlyattenuating sections of an object adjacentto low attenuating elements will generatesubstantial signal for the image of the lowattenuating sections. In radiography thecontrast in the low attenuating sections issimply compromised and this effect isindependent of the detector. Forcomputed tomographic reconstructedimages scatter results in streak artifactsalong the directions of the longest chordlengths or highest attenuation.4 Thespatially variant character of object scattermakes removal of this source of artifactsdifficult.
Background scatter is the fluence thatarises from the detector and itsenvironment, for example, cabinet androom hardware, independent of theobject. If there was no detector or cabinethardware there would be no photons ofthis type but then there would be noimage. Consequently, this category isincluded as always part of any acquired
SN
N
NN= =∆ ∆P
PP
N N
Z x
S E d S E dP , PO ,
i i
( )[ ] ( )[ ]=
× − ( )[ ]exp ,Σµ ρ
diographic Testing
image, even though the photons arepresent because of the detector itself. Thedetector hardware includes all the aspectsof collimation, scatter from adjacent partsof the cabinet or detector enclosure,fluence from the fixturing from theobject, as well as sources of scatter withinthe detector (blooming in the scintillatorand other sources). Background scatterfills up the detector dynamic range withcounts that do not carry informationabout the object.
As indicated above, contrast is alsoaffected by the types of photons detectedat that position in the image. A signalthat arrives at the detector element fromadjacent ray paths will blur the contentsof the ray in straight lines through theobject. Consequently, certain features inthe object will be masked by adjacentfeatures. By substituting Eqs. 1 to 3 intoEq. 5, this effect can be quantified:
(6)
Contrast is reduced in two ways, from thepresence of object scatter and backgroundscatter in the detector package. The twoquantities in the denominator of Eq. 6 areusually referred to as scatter-to-primaryratios. Here the effects of the two differenttypes of scatter are separated out becauseof their separate physical mechanisms. Acouple of different techniques areavailable for measuring these quantities5
and these measurements arerecommended as elements in anystandard image calibration procedure.
Spatial resolution is nominally definedas the size of the smallest detectablefeature. Notice the necessary involvementof contrastive performance. The featuremust be detectable to be sized or beattributed some dimensionality. Imagecontrast must be at some minimal level inorder for spatial resolution to be assessedat all. Alternatively, poor spatialresolution because of some source ofuncontrolled blur (background scatter orobject scatter) can compromise the bestcontrastive performance. The modulationtransfer function (MTF)6 for a systemprovides a good view of the contrastiveperformance at different spatialfrequencies. The point spread function(PSF), the fast fourier transform pair to themodulation transfer function, alsoprovides a useful measure of the spatialresolution of a digital radiographic orcomputed tomographic imaging system.Good estimates of these functions for an
SN
N
N
N
N
NNN
=
=
+ +
∆
∆
P
T
P
Sobj
P
Sbk
P1

3RT13_Layout (345_378) 10/14/02 3:15 PM Page 349
imaging system are invaluable forsubsequent image analysis.6
Obtaining good estimates for thesefunctions for a system requires carefulprocedures.
1. All procedures for digital radiographyand computed tomography involveobtaining an image containing amaterial edge, where the edge spread isdue only to the imaging system notthe object. For radiographic systemsthis requires a perpendicularorientation of the flat aspect of theobject to the X-ray beam.
2. There should be some transmissionthrough the object or the edgesharpness is artificially created by theopaqueness of the object and masksthe imaging of the edge by the system.
3. Data acquisition for the image shouldbe typical of system operations. It isimportant to know and monitor theproperties of the regular image beingacquired every day.
The photons arising in the course ofX-ray attenuation mechanisms can beorganized into classes and the differentclasses do not have the same propertiesfor imaging the object. The contrastiveperformance and spatial resolution for thedifferent classes of photons are differentand the system performance will reflectthe proportions of the different types ofphotons. Better imaging performance willenable more reliable image data analysisand interpretations. Lastly, much of theimage processing for digital radiographicand computed tomographic images isbased on an idealized ray path model ofX-ray attenuation. This is the kind ofimaging one would expect if the receivedsignal was composed exclusively ofprimary photons. Imaging artifacts areoften the result of this mismatch betweentheory and actual measurement. Thismismatch varies with each particularscanner. Whereas the actual properties ofthe photons in space before digitizationcan be somewhat elusive, it is importantto know the general properties of thedifferent photons. Hopefully thisknowledge can guide the analyst indeciding whether a particular image effectis just the radiation doing its job or whethersome particular source of the effect can beremediated.
Digitizing TransmissionImagesAcquiring digital radiographic andcomputed tomographic data involvessome mechanism for digitizing the imagein space, which involves its own set ofissues. Whereas the performance of digitalradiographic and computed tomographic
systems can be accounted for byanalyzing the properties of the differenttypes of photons, images and tests arebuilt on the measured intensities,I[S(E),d] and I0[S(E),d], the digitizedversion of NT and NT0. Digitization of thephoton flux has two aspects: (1) a changeinto a more measurable energy deposition(for example, X-rays converted by ascintillator into visible light or X-raysconverted by high purity germaniumcrystal into current) and (2) some readoutof the energy deposition into a digitizedquantity (bit depth). The issues forconverting the X-ray energy pivot aboutthe treatment of the incoming X-rayenergy spectrum.
Scintillators differ in their sensitivity todifferent energy ranges and their ability torecord much of the signal for high energyX-rays. On occasions, the energywindowing character of X-ray detectors isan advantage. For computed tomographythe choice of scintillator directly affectsthe amount of beam hardening in thereconstructed image. This effect can bemore significant for industrial computedtomography where the energies aresubstantially higher than in medicalcomputed tomography. The act ofdigitizing the signal adds noise to thesignal and can be more significant forsystems involving signal amplification aspart of digitization (such as imageintensifiers). Independent of otherconsiderations lower noise and higher bitdepth will provide the most faithfulacquisition of X-ray images in space.
The physical configuration of thedetector fundamentally affects theproportions of the above quantitiesdetected for X-ray imaging. Indeed thedetector performs a sampling of the X-rayimage for both the intensity of thespectrum and the spatial landscape of thetransmission through the object.Additionally, the internal configuration ofthe X-ray detector determines importantpractical performance properties. Ingeneral, there are three types of X-raydetectors (1) highly collimatedsingle-detector systems, (2) linear detectorarrays and (3) area detector systems. Bytheir physical arrangement each of thesedetector modalities treats the classes ofphotons in the transmission differently.
1. For the single-detector system, boththe source and detector are highlycollimated. This is the closest physicalrealization of the idealized ray pathused in computed tomographic theorytexts.
2. Linear detector arrays use collimationon both sides of the short aspect ofthe array. Background scatter andobject scatter are much reduced fromthe collimation.
349Image Data Analysis

350
3RT13_Layout (345_378) 10/14/02 3:15 PM Page 350
3. Area detectors use less collimation andare susceptible to more effects ofscatter. However, area detectors makegood use of the radiation envelopegenerated by the X-ray source andhave inherent speed advantages oversingle detectors or linear arraydetectors for the same source output.For three-dimensional applications,system speed is limited by the efficientuse of source output.
The best detector for the application isthe choice that best meets the specificgoals, which involves all kinds of practicalconsiderations. However to clearlydescribe the strengths and weaknesses ofspecific modalities, imagers can becategorized according to five properties:(1) ratio NP·NS
–1 of primary to scatteredphoton flux, (2) detector blur, (3) numberof internally scattered photons, (4) sourceefficiency and (5) quantum efficiency.Together these properties defineimportant tradeoffs that result from thedifferent detector designs (Table 1).
The greater range of choices forindustrial scanners provides opportunitiesand tradeoffs for a particular application.For data quality, the best choice is thespectroscopy digital radiographic andcomputed tomographic based systems.7This is the experimental analogue ofimaging with the primary photons.Sources of scatter are removed bycollimation or from the energy resolutionin the detector. However, the impact onsystem speed is dramatic (factor of athousand).
Slit collimated linear detector array(LDA) systems offer the next bestalternative for acquiring digitalradiographic and computed tomographicdata with the greatest proportion ofprimary photons.8 The difficulty is whenthe focus of the application is onobtaining higher spatial resolution or fullthree-dimensional test data. In this case
Radiographic Testing
TABLE 1. Performance characteristics of diffe
Ratioof P
to ScDetector Pho
Area ArrayFilm lowFlat panel lowCamera or scintillator with small cone lowCamera or image intensifier with large cone m
Linear ArraySlit collimated with septa hiSlit without septa m
Single DetectorSingle detector with spectroscopy hi
area detectors can improve system speedby a factor of 20. However, all types ofarea detectors include varying amounts ofscatter blur, which directly reduces thedynamic range of the system.9
Contrastive performance for anyscanner is limited by the system dynamicrange that varies by the scanner and bythe application. The dynamic range of thesystem is not simply the number of bits inthe detector or the number of bitssubtracting the readout noise. Rather,dynamic range in a particular area of theimage is bit depth minus readout noise,minus the background scatter signal inthe system. For certain medium energysystems the proportion of backgroundscatter signal can be as high as 20 percentof the detected fluence, reducing theeffective dynamic range greatly. Thesekinds of considerations are important forscanner selection and for interpretingscans of objects with high scatterfractions.
Depending on the system, differentprocedures have been developed tocorrect for some of the effects in themeasured signals resulting from theparticular scanner configuration. The goalof these procedures is to process thetransmission data into the ray path modelthat is the basis for image reconstruction.Industrial computed tomographicscanners can be classified according tohow many processing steps are applied totransmission data before reconstruction(see Table 1). Only minimal processing isneeded for single-detector spectroscopysystems, because they are the closestphysical realization of the ideal ray path.Linear detector arrays require a bit moreprocessing but much less than areadetector arrays.
It is typical for linear detector arrayscanners to involve some detectorbalancing or detector linearity corrections.Area arrays involve at least the application
rent detector designs.
NP·NS–1 Quantity
rimary NS ofattered Detector Scattered Quantum Sourcetons Blur Photons Efficiency Efficiency
small low low mediumsmall to medium medium high highmedium to high high low high
edium high high high high
gh small low high lowedium medium to small low medium low
ghest smallest smallest medium lowest

FIGURcomp
Syste
3RT13_Layout (345_378) 10/14/02 3:15 PM Page 351
of some detector balancing correction andin some cases involve a correction forspatial distortions. Each one of thesecorrections can create scanning artifacts(ring artifacts or spatial distortions) initself and can mask features in the object,depending on the location of the feature.
Fundamental issues for applications ofcomputed tomography to industrialobjects involve this recognition of artifactcontent in different computedtomographic scanners. All of the differenttypes of scanners can provide quality testdata for a particular application (seebelow). At the same time differentapplications are better suited for differenttypes of scanners. As indicated above,some artifacts (for example, object scatter)are part of the transmission image inspace independent of the detectionscheme. A fully optimized scanner stillhas some artifacts that sometimescompromise test performance. At bestthey are benign features in the image.Also, the detector configuration cancontribute its own set of artifacts thatmask the imaging of object features. Theimportance of scanner characterizationthrough computed tomographicphantoms (well known three-dimensionalobjects) cannot be overestimated.Phantoms are the main means fordistinguishing artifacts from featureswithin the object.
In summary, the different industrialdigital radiographic and computedtomographic scanners can be plotted on afour axis scale as in Fig. 2. At the four axesare spatial resolution, contrast resolution,energy resolution and system speed.Experience suggests that improvement inany two of the parameters results in aworsening of at least one of the othertwo. More collimation will improve imagecontrast and with smaller apertures betterspatial resolution can be obtained.However, the cost in system speed can beprohibitive for even the hottest X-raysource. Obtaining more scanning speedusually sacrifices image contrast and
E 2. Tradeoffs in industrial digital radiographic versusuted tomographic detectors.
Energyresolution
m speed Contrast resolution
Spatialresolution
Central pivot
resolution. Reducing the energy spectrumfor the scanning makes for slower scansfor most conventional X-ray sources.Making tradeoffs is required — the testdesigner must understand the applicationwell enough to make the best choice.
Practical Considerationsfor Digital ImagingThere are a number of practical limits onthe performance of digital imagery. Forspatial resolution, the performance of alltechniques applied to digital images arebounded in the limit by the pixel sizesand spacing.6 Features at the detector thatare smaller than a detector element or onthe size of the pixel spacing are difficultto image. If the spatial fidelity of theimage in space is less than a digitizedpixel the contrast change for the featurewill be averaged over the pixel and onlysome fraction of the change in intensitywill be recorded in that pixel. Themodulation transfer function arising froma particular size of a rectangular discretedetector element has been described indetail elsewhere.6
Contrastive performance is limited bythe effective dynamic range of theimaging system.10 Implicit in the abovedecomposition of the photons in spaceinto the different types, determining thedynamic range of a system requiresmeasurements with standards for theparticular technique. The first bound fordynamic range for any image is bit depth,that is, the range of discrete digital countspossible in the detector system.Digitization generates some noise in theimage, which subtracts from the totalrange of counts. Lastly, for the particulartechnique, the contrastive performance ofthe system is limited by the number ofbackground scattered counts recorded bythe detector.
(7)
where EDR = effective dynamic range,BD = bit depth, NR = readout noise andNSbk = background scatter. Effectivedynamic range defines the best aninspector can do with a particular systemfor a particular technique. Actual resultswill likely include less performance.
From the above it would seem thelimits of digital X-ray detection would beadvanced by smaller pixel sizes, lowerreadout noise and higher bit depth. Thisis certainly true but there are a number ofpractical issues to consider. As mentionedearlier smaller pixels will require moreX-ray flux. Cutting the pixel size in halfin both dimensions reduces the solidangle by one fourth. For the same
EDR + BD R Sbk= − −N N
351Image Data Analysis

352
3RT13_Layout (345_378) 10/14/02 3:15 PM Page 352
detection scheme the X-ray flux needs tobe four times greater to obtain equivalentsignal in the smaller pixel in the sameamount of time. Likewise, if more bitdepth increases the readout time by somefactor (this is usually the case) or if thedetector cost increases by a factor, thegreater dynamic range may be no bargain.On another level, if the backgroundscatter in the particular cabinet orphysical configuration is large, noincrease in bit depth can provide thenecessary dynamic range.
One practical technique for obtaininggreater dynamic range on any imageframe based system is frame averaging orsummation. Readout noise is mostlyrandom, with some exceptions. For therandom components, image averagingreduces the variation leaving more bitdepth for the changes in the transmissionimage through the object. One of thedifferences in systems is in the amount offrame averaging required to achieve acertain contrastive performance. Thesekinds of measurements have to beacquired on the particular system and theperformance metered with the appropriatestandards of the American Society forTesting and Materials. Frame averagingalways requires more time but is astraightforward technique for increasingimaging performance. Averaging frames isnot to be confused with integration time,the duration of time the sensor is exposedto the X-ray flux. Effective dynamic rangeis ultimately driven by the number ofphotons arriving at a detector position inspace. In circumstances where only asmall number of photons are available,frame averaging may be of marginalutility.
Radiographic Testing

PART 2. Image Analysis Techniques andRadiographic Tests
3RT13_Layout (345_378) 10/14/02 3:15 PM Page 353
The following discussion supposes anin-hand digital image, which includesenough fidelity to convey somethingabout the object. Analysis techniquesdivide into groups depending on thetechnique for final determination of thetest: (1) visual evaluation of the rawimage, (2) visual evaluation of atransformed image, (3) computerevaluation with a human visualcheckpoint and (4) computerizedautomated inspection.
Also, analysis techniques get more orless complicated depending on theintrinsic characteristics of the test object:(1) discontinuity or dimensions of afeature in a single-thicknesssingle-material section of an object,(2) discontinuity or dimensions of afeature in a single-material varyingthickness section of an object,(3) discontinuity or dimensions of afeature in a single-thickness butmultiple-material section of an object and(4) discontinuity or dimensions of afeature in a multiple-materialmultiple-thickness section of an object.The simplest type of image analysis toconfigure is the visual evaluation for adiscontinuity in a single-materialsingle-thickness section of an object. Atthe other end of the spectrum isautomated inspection of amultiple-material object, through asection of multiple-material thicknesses.Image analysis techniques play a role ineach of these different types of tests.
The following discussion pertains tothe performance and oversight of the test.Suppliers of digital radiographic testequipment have access to an everincreasing array of image processing andimage manipulation technologies. As well,the choices of modalities in digitalimaging are changing rapidly. New andnovel image transform and analysisalgorithms are being developed equallyfast for a wide variety of imagingapplications. However, not all techniquesdeveloped for other imaging modalitiesapply well to radiographic transmissionimages. As described above, the content ofradiometric images follows from thephysical mechanisms of X-ray interaction.This results in images with some peculiarand subtle properties. These differencesshould be carefully noted.
Recent advances in detector technologyhave resulted in rather extensivecalibration schemes for generating moreradiometric images free of artifacts. Manytests are performed on calibrated imagesconfigured to resemble film or the outputof an image intensifier. The process hasbecome more explicit: specialized gaincorrections that were the task of analoghardware have become digital transforms.However, this has introduced anothervariable into the whole job of systemmaintenance and optimization; maintainthe source, maintain the detector andmaintain a good set of calibration data.Because system calibration is crucial it isbest to develop quick measurements ofimage degradation due to calibration drift.If planned for ahead of time, imagequality indicators can be imbedded inpart holders, or procedures for salting thetest can be inserted into the process.
Visual Enhancement ofDigital ImagesImage enhancement encompasses a widevariety of techniques for evaluating,manipulating and transforming images.The image enhancement for visualizationis divided into two types: (1) interactivetechniques and (2) transform basedtechniques. The first class includes thevariety of interactive operations to extractpixel information, colorize the content ofthe image and accentuate the features ofan image to enable a better visualdetermination.
The second class of techniquestransform the image with the interest ofamplifying a certain class of features, atthe expense of other features in theimage. In the present discussion theorganizing principle for imageenhancement is visualization, andquantitative properties of the enhancedimage are not of central importance.
Interactive ToolsInteractive image enhancementtechniques are usually provided in toolbarsthat can be accessed on the desktopdisplay of the control information for thesoftware package. There are three types oftoolbars of which two are important inthis discussion: (1) point processing
353Image Data Analysis

354
FIGURE 3. Different data structures and elements forcolorizing of digital image in computer memory.
Digital image inglobal access
computermemory
Image scaled tocertain displayminimum and
display maximumfor video display
Hardware formanipulatingdisplay; colorlook up table;scroll bars etc.
Displaymonitor
FIGURE 4. Linear lookup table with gamma = 1.0 applied toimage (valued 0 to 255) for three different color maps.
3RT13_Layout (345_378) 10/14/02 3:15 PM Page 354
toolbars, (2) color manipulation toolbarsand (3) image modification, drawing ortext annotating tool sets.Point Processing. Point processing toolsets at a minimum should include pixelvalue query, lineout extraction, imagezoom and region-of-interest extraction.With these tools, the values of the imagescan be directly examined.
1. The pixel query tool makes it possibleto click on a position in the image andsee the values or a neighborhood ofvalues.
2. The lineout extraction tool makes itpossible to draw line across a positionin the image, extract the values alongthat line and view the extracted signalas a vector plot.
3. Image zoom tools display resampled orpixel replicated versions of an imageor region of the image.
The pixel query and lineout extractiontools permit the operator to view thevalues in the image and make it possibleto change intensity in the region ofinterest. In images with a lot of detailthese kinds of tools can verify the natureof the intensity change in the image.Statistics. Related to these tools is somestatistics capability, which can calculatemeans and standard deviations of small orselected areas.Archiving. It is advantageous if thesoftware allows for archiving someextracted part of an image for latercomparison.
Access to these tools is crucial forevaluating the state of an inspection. It isimportant to know the fundamentaldifference in pixel value that accounts forthe identification of a feature. Algorithmsfor visual or computerized testing canhighlight very small changes in pixelintensity that indicate real changes in theobject. Actually looking at the numbers inthe image is the only way to assess thestate of the imaging system. Experienceshows that most test systems degrade inthe field over time. The antidote for thispossibility is to be able to accurately trackimage quality in a rigorous way asdiscussed below and elsewhere.
Color Tools and Lookup TablesTools for manipulating the colorizing ofan image fall into two categories. First,the type that manipulates the colorlookup table (LUT) in the display for thecomputer (see Figs. 3 to 8). Second thetypes that rescale the intensities of theimage to a particular displayminimum — display maximum, selectedby the user or by selecting a region ofinterest and thereby restrict the numberof colors to a small range in the image.
Radiographic Testing
The schema in Fig. 3 contains thedifferent data structures and elements forcolorizing a digital image in computermemory.
The process for viewing an image on acomputer monitor involves two steps,scaling the image for copying to thedisplay hardware and manipulating thelookup table that maps the pixel values ofthe image in the display hardware intocolors displayed on the monitor. Oneadded feature here is the particular stateof the display as configured in theoperating system. The simplest type ofmapping is a linear lookup table over theminimum and maximum of the image.This kind of display is shown in Fig. 4,where the same image is displayed withthree different color lookup tables. Theimage is a 0 to 255 linear ramp with thedisplay minimum is set to 0, the displaymaximum is set to 255 (the total range ofthe image) and the 256 gray scale colorsare mapped directly from the minimumto the maximum, one gradation of colorfor each value of the image.
Most color tools allow for a way tochange the slope of the transfer functionfor applying the color map to the image

FIGUREimage
FIGURE 7. Image of synchronous dynamicrandom access memory chip withgamma = 2.0, linear lookup table.
3RT13_Layout (345_378) 10/14/02 3:15 PM Page 355
being displayed. In Fig. 5 the displayminimum has been increased, the displaymaximum reduced and the slopeincreased to 2. For this state of the colormap the values in the higher ranges of theimage have been set to one value, as havethe values in the lower ranges. The colorsare now distributed over a smaller rangeof the total intensity of the imageallowing a more detailed look at thosepixel values in the middle of the intensityrange of the image. The intensity valuesof the image have been bundled up into asmaller set of colors. A segmentation ofthe image has been performed andfeatures that differ along thosesegmentation boundaries are easier toview.
To illustrate the significance of thistype of image enhancement Fig. 6contains a radiograph of a synchronousdynamic random access memory(SDRAM) memory chip acquired with anamorphous silicon flat panel. Theeffective dynamic range of this particular
5. Linear lookup table with gamma = 2.0 applied to (valued 0 to 255) for three different color maps.
FIGURE 6. Digital image of synchronousdynamic random access memory chip withlinear lookup table.
system is about 2500 to 1, with spatialresolution on the order of four line pairsper millimeter. With the slope of thetransfer function set to one and the fullrange of colors spread over the minimumand maximum of the image a wide rangeof details of this electronic componentcan be viewed.
Choosing different lookup tables ordifferent display minimum and displaymaximums can make the differencebetween seeing a feature or missing thefeature completely. It is often the casethat an automated visual evaluation willhave a number of lookup tables forinspecting the different features in animage. In Fig. 7, the same image isdisplayed with different lookup tables(color based segmentation) applied andthe operator makes a judgement as to thepresence or absence of a feature. Figure 8
355Image Data Analysis
FIGURE 8. Digital radiograph of steel fuelinjector with two different lookup tablesettings: (a) high intensity, low contrastsetting; (b) high constrast setting.
(a) (b)
356
3RT13_Layout (345_378) 10/14/02 3:15 PM Page 356
shows a similar result for a differentapplication.
Repeatability of visual evaluationdepends on a variety of physicalcomponents, not to mention the alertnessof the operator. Monitors can and dodegrade over time. Perhaps moreimportantly, calibrating monitors toensure operators in different places atdifferent times are viewing the sameimage is not a simple task. As expected,small degradations in image quality, (thatis, larger noise content) can undo thevisual content of any lookup tablesegmented image. Similarly, growth in thespot size can lower spatial resolution,thereby masking features. For anyparticular test that uses the colorization ofan image it is a good idea to calculate thesmallest difference that accounts for thevisual identification. Next, it is a goodidea to calculate a local standarddeviation for the image values andcompare this value to the difference inthe pixel values being accentuated by thelookup table.
Image TransformTechniquesDigital images have the distinct advantageof residing in a memory location enablingdirect manipulation by a wide variety ofalgorithms. Image transforms directlymanipulate the values of the image toemphasize certain features and suppressothers. Some image transforms proceed bydecomposing the image into a particularfeature space where aspects of the imageare sifted for relevant information aboutthe object. The importance of imagetransforms follows from their availability,the easy way in which commonplacecomputers can perform the operationsand the interesting way transforms caneasily show discontinuities or imagefeatures in certain circumstances.
Moreover, transforms can be strungtogether in a sequence to performsophisticated image enhancement.Transforms can be particularly useful forexploratory analyses of digitalradiographs. This is especially true forhigh bit depth (14 to 16 bit) digitalradiographic data where everydaymonitors and lookup table techniques arehard pressed to reflect the large dynamicrange of the data.
In an important sense the interactiveoperations discussed above are simplethresholding transforms. The image viewedthrough the lookup table organizes thepixel intensities in such a way as to makeall pixels lower than a certain value onecolor. Also, at the high end, all valuesgreater than a certain pixel intensity are
lithosovtrbin
trag
Mofotopth
CTMaTiminainincostwthRathindasoinfein
oathcaFo
Radiographic Testing
kewise one color. The value of thisreshold is an estimate of some property
f the object. Consequently, this value hasme real significance — in its mean and
ariance and error properties. Theseansforms are considered more explicitlyelow, evaluating the resultant image forformation about the test object.The present discussion classifies image
ansforms used for digital radiographicnd computed tomographic data into fiveroups.
1. Low level transforms are used tocalibrate or account for artifactualfeatures in the raw image.
2. Spatially invariant transforms areapplied through image kernel basedprocessing.
3. Morphological transforms involveerosion and dilation operators.
4. Specialized numerical processingalgorithms involve taking projectionson a single axis of an image,shrinkwrap operations and freemanchain code algorithms for findingcurvilinear boundaries.
5. There are multiscale, multiresolutiontransforms.
any good texts and papers are availablen these different transform options. Thellowing illustrative examples may help focus the investigation for any
articular test at issue. Table 2 comparese transform techniques discussed below.
alibration and Low Levelransformsany properties of an X-ray image are not
result of some property of the object.he barrel distortion or veiling glare in
age intensifier images5 is a result of thener workings of the image intensifier
nd is not related to the object. Bad pixels X-ray panel images are discontinuities the detector. Saturated pixels in chargeupled device scintillator images are
ray X-rays that have come in contactith the charge coupled device chip (andis can occur from any direction).
eadout lines or bands in somemorphous silicon detectors are part ofe structure of the detector. Finally,tensity differences and edge distortion
ue to beam divergence and large conengles are the result of the X-rayurce-to-detector geometry. The artifacts images from these sources can maskatures of interest and make imageterpretation difficult.One approach to removing these types
f artifacts from image data is to acquiredditional data that include the source ofese artifacts and divide out, subtract orlibrate out those aspects of the image.
igure 9 includes two images of nine ballsf a ball grid array from a charge coupled

FIGURE 9. Ball grid arrays: (a) raw image;(b) image after attenuation transform.
(a)
(b)
3RT13_Layout (345_378) 10/14/02 3:15 PM Page 357
device camera scintillator system, onewith no correction applied, one with anattenuation correction applied from animage of the radiation without the objectin the field. This digital radiograph isfrom a system with a microfocal sourceand magnification of 20. Notice how theattenuation correction flattens theintensity of the beam divergence. Alsonotice how the transform in thelogarithmic scale enables a clearer view ofthe higher attenuating features in theimage. The attenuation correctionproceeds by dividing the object image Iobjwith the image of the radiation (noobject) Irad and taking the naturallogarithm of the result. In terms of thedigitized quantities I[S(E),d], and Io[S(E),d],the attenuation image A can be defined as
(8)
where the expression [S(E),d] merelydesignates the digitized d signal S of theenergy E.
It is common for flat panel baseddetector manufacturers to provideschemes for calibrating their detectors.The calibration scheme requires theacquisition of images at differing levels ofdetector saturation. From these images amuch clearer and more linear image isgenerated. Bad pixels or errant pixels arethose intensity values in the image thatcarry no information about the object orhave received a hit from the radiation. Anumber of reliable bad pixel removal
Ao
S E dI S E d
I S E d( )[ ] = −
( )[ ]( )[ ], ln
,
,
TABLE 2. Comparison of transform techniqu
TransformTechnique
Tfo
ResourcesRequired for Use
Image calibrationtransforms
can bmust imag
significantmaintenance
Morphologicaloperators
morestand
hardware and softwarereadily available
Specializednumericaltransforms
can binteninten
input requirements canbe demanding
Wavelet basedtransforms
pyramstructchoic
software packagesmust be evaluatedrelative to application
Multiscalemultiresolutiontransforms
usualthan
software packagesmust be evaluatedrelative to application
Spatially invariantkernel basedtransforms
with hardwis alm
hardware and softwarereadily available
routines exist, most based on localneighborhood statistics for the pixels inthe image. Figure 10 contains images ofan aluminum casting before and aftercalibration and bad pixel correction.
Properly acquired calibration data canproduce much clearer images. Artifacts of
357Image Data Analysis
es.
ime Requiredr Application
Advantages forApplication Drawbacks
e substantial —be applied to every
e
eliminatestroublesome artifactscorrectly
errors or problems incalibration data have bigimpacts
significant thanard kernels
can show importantfeatures independentof single-pixel noise
large changes to imagecontent — will simplyremove certain featuresfrom the image
e computersive and disksive
will address a specificanalysis need inimage data
algorithms are not wellknown and errorproperties are not readilyavailable
idlike applicationure provides manyes
different and noveltransforms of images
difficult to assess the errorproperties of thesetransforms
ly more significantstandard kernels
good decompositionof images into theircomponent parts
difficult to assess the errorproperties of the differentmultiscale transforms
specializedare, time requiredost insignificant
many proven choiceswith well knownproperties
will not handle spatiallyvarying aspects ofradiographs

358
(a)
FIGURE 11. Images of casting in Fig. 10:(a) calibrated image; (b) attenuation image;(c) unsharp mask image.
3RT13_Layout (345_378) 10/14/02 3:15 PM Page 358
the detector are removed using thecharacteristic patterns within the detector.Beam divergence artifacts can be reducedby acquiring background images. Whencombined with the natural logarithmictransform, artifact reduction can easilyreveal detail on the more attenuatingparts of the object. Bad pixel correctionsare usually recommended and mask theeffects of troublesome pixels, enabling aclearer view of the rest of the image.
Proper calibration is both critical andproblematic for tests. In many cases thebest image analysis routines are thesimplest. For the single-material,single-thickness test image, thresholdingcan help identify discontinuities in astraightforward and reliable way. In thistype of operation a pixel value is chosenthat represents the not anomalousintensity level and pixels on one side orthe other of that value are identifiedindicating the presence of a discontinuity.
Figure 11 includes a calibrated image,background corrected image andprocessed image of the casting in Fig. 10.Without calibration the identification of auseful threshold is complicated by thebeam divergence in this particular
Radiographic Testing
FIGURE 10. Aluminum casting: (a) raw flatpanel image; (b) image after calibration andbad pixel correction.
(a)
(b)
technique. The outer edges of the imagewould require a different threshold thanthe inner parts of the image because thepixel intensities are different with thebeam divergence of the X-ray source. Thisis even more important for some imageintensifiers where distortion can accountfor a 30 percent change in the pixel valuesindependent of the object. Dividing outthe background image sufficiently flattensthe image to enable the subsequentapplication of a simple thresholdtechnique.
(b)
(c)

FIGURE 12. Four different kernel basedtransforms of digital radiograph ofelectronic component: (a) original image;(b) unsharp mask image; (c) sharpenedimage; (d) gradient transform image.
(a)
(b)
(c)
(d)
3RT13_Layout (345_378) 10/14/02 3:15 PM Page 359
Extensive calibration schemes bringtheir own set of issues. To acquire animage for testing it is necessary to acquiremany different images. Tests take moretime and resources. Both the images fortesting and the calibration images need tobe maintained and possibly archived totrack system performance over time. Moreimportantly, the image being used to testthe object now includes the error varianceof all the calibration images. Poorlyacquired calibration data can ruin a test.Consequently, it pays to take very goodcalibration images (that is, lots of frameaverages). Also, there is a limit to badpixel removal. Clusters of pixels greaterthan 3 × 3 are problematic. It is best tospecify a limit on the number of badpixels clusters and bad lines in thedetector before purchase.
Image thresholding techniques are usedthroughout image analysis in a widevariety of contexts, on raw, calibrated andtransformed images. There are two basictypes: (1) fixed thresholds and(2) histogram derived thresholds. Fixedthresholds are determined from a set ofconsiderations, usually an analysis of thisclass of images, and are independent ofthe particular image being analyzed. Thevalue of the threshold is known beforethe analysis of the image. For histogramderived thresholds, the value of thethreshold is not known before analysis.Rather, the histogram of the image iscalculated first and a threshold value isdetermined from an analysis of thehistogram. Consequently, the thresholdwill vary with the particular image. Thereare a variety of rules and approaches forchoosing the value of the threshold fromthe histogram.11 Histogram basedtechniques have the advantage ofcorrectly changing with small intensitychanges due to X-ray source fluctuationsbut are more complicated to develop andapply. As indicated above, the viability ofthresholding techniques strongly dependson consistent quality in the analyzedimages. This implicates the raw andcalibration data.
Spatially Invariant Kernel BasedTransformsThis class of image transforms afford themost variety. This is the class of imagetransforms covered in most signal andimage processing books.12–14 Within thisclass of transforms are the mostcommonly referred to routines forsmoothing, edge detection and imagesharpening. Figure 12 contains images ofa section of a digital radiograph withtransforms applied: original image,unsharp mask image, sharpened imageand gradient transform image. Thesedifferent representations of this image
emphasize the different aspects of thisobject — the position of the grid arrayballs, the porosity in the balls and thearray of bond wires to the left of theimage.
For digital radiographic imaging,lookup tables and interactive visualenhancement tools can be very timeconsuming on multiple-material,multiple-thickness images. Field flatteningtransforms can be useful in quicklyinspecting different regions of an image ina single view. This is especially true forhigh bit depth detectors (12 bits or
359Image Data Analysis

360
3RT13_Layout (345_378) 10/14/02 3:15 PM Page 360
greater). Figure 13 includes raw and fieldflattened (also called unsharp masktransforms) images of objects withmultiple thickness and multiple materials.The transformed image provides an easieridentification of indications in differentregions of the objects. The output of thesefield flattened transforms can be thenthresholded for more detailed orautomated identification of features (seeFig. 13).
A large variety of kernel basedtransforms have been developed for anumber of different types of radiographictesting. In most cases, these differentkernels were developed to sift a particularfeature from the image. As such, thesedifferent transforms apply to a certainclass of images where that feature ispresent. Specific to radiographic datasome analyses have led to kernel basedtransformations for removing the effectsof veiling glare5 and in some cases theeffect of background scatter. These typesof transforms have been shown to resultin an image that shows features difficultto visualize with more standardtechniques.
Automated and semiautomated testsoften involve one or more of thesetransforms as one step in the process. Thelaplacian gaussian transforms are
Radiographic Testing
FIGURE 13. Electronic circuit board: (a) rawimage; (b) field flattened image.
(a)
(b)
commonly used for edge detection and incombination with some thresholdingoperation discontinuities and the edges ofan object can be identified. Once edgesare identified the object can then besegmented out of the image or somebackground feature taken out to enableclearer processing of the parts of theimage of interest. Automated processingfor many different visible light tests havebeen developed using these tools andthese results are illustrated in differenttexts and articles.4 These transforms willbe mentioned again in the discussion onautomated processing.
Limitations for this whole class oftransforms stems from the spatiallyinvariant character of how the transformgoes about its work. The effects of each ofthe transforms in this class can beexplained from the fourier representationof the processed image. To the extentnoise is substantial in the image,emphasizing the high frequencycomponents of the image will increase theproportion of noise in the image. To theextent the high spatial frequency contentis suppressed, noise is reduced, the edgesof the object in the image will besomewhat compromised. This difficultycan usually be addressed byacknowledging the tradeoff in processing.The fundamental problem in radiographicimages is the presence of artifacts in boththe high frequency and low frequencycontent of the image.
The various kinds of noise present inradiographic images are mostly highfrequency. However, background scatter,beam hardening and object scatter are alllow frequency effects. Consequently,image regions through long chords ofmaterial contain more noise and containmore blur (object scatter).
In spite of the nonspatially invariantcharacter of some effects in radiographicimages, useful kernel based transformswill continue to emerge as useful tools inmany circumstances. Many softwarepackages include highly developedoptions for kernel based processing.Hardware for performing the operations iscommonplace and will continue toperform this kind of imaging operationwith more ease and accuracy.
Morphological TransformsImage morphological operators areimportant tools for the identification of avariety of features of an image. Manygood texts are available on morphologicaloperators and image analysis.15
Single-pixel noise (also called quantumnoise) in computed tomographic imagescan make the process of extractingfeatures from computed tomographicreconstructed images difficult.3 For digital
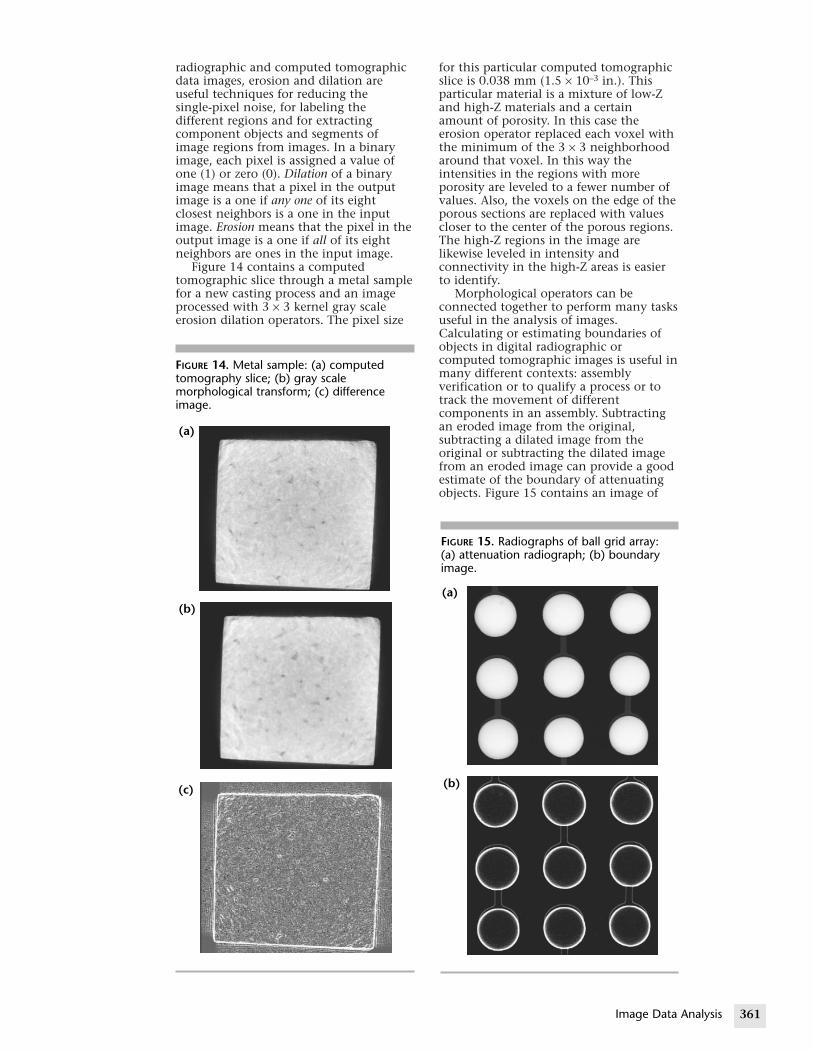
3RT13_Layout (345_378) 10/14/02 3:15 PM Page 361
radiographic and computed tomographicdata images, erosion and dilation areuseful techniques for reducing thesingle-pixel noise, for labeling thedifferent regions and for extractingcomponent objects and segments ofimage regions from images. In a binaryimage, each pixel is assigned a value ofone (1) or zero (0). Dilation of a binaryimage means that a pixel in the outputimage is a one if any one of its eightclosest neighbors is a one in the inputimage. Erosion means that the pixel in theoutput image is a one if all of its eightneighbors are ones in the input image.
Figure 14 contains a computedtomographic slice through a metal samplefor a new casting process and an imageprocessed with 3 × 3 kernel gray scaleerosion dilation operators. The pixel size
FIGURE 14. Metal sample: (a) computedtomography slice; (b) gray scalemorphological transform; (c) differenceimage.
(a)
(b)
(c)
for this particular computed tomographicslice is 0.038 mm (1.5 × 10⁻³ in.). Thisparticular material is a mixture of low-Zand high-Z materials and a certainamount of porosity. In this case theerosion operator replaced each voxel withthe minimum of the 3 × 3 neighborhoodaround that voxel. In this way theintensities in the regions with moreporosity are leveled to a fewer number ofvalues. Also, the voxels on the edge of theporous sections are replaced with valuescloser to the center of the porous regions.The high-Z regions in the image arelikewise leveled in intensity andconnectivity in the high-Z areas is easierto identify.
Morphological operators can beconnected together to perform many tasksuseful in the analysis of images.Calculating or estimating boundaries ofobjects in digital radiographic orcomputed tomographic images is useful inmany different contexts: assemblyverification or to qualify a process or totrack the movement of differentcomponents in an assembly. Subtractingan eroded image from the original,subtracting a dilated image from theoriginal or subtracting the dilated imagefrom an eroded image can provide a goodestimate of the boundary of attenuatingobjects. Figure 15 contains an image of
361Image Data Analysis
FIGURE 15. Radiographs of ball grid array:(a) attenuation radiograph; (b) boundaryimage.
(a)
(b)

362 R
3RT13_Layout (345_378) 10/14/02 3:15 PM Page 362
the electronic component radiograph inFig. 9 and an image of the boundaries ofthe different materials generated bysubtracting the eroded image from animage of the digital radiograph.
Morphological operators are used inselected steps in automated image analysiscontexts. As objects get more complicated(multiple-material, multiple-thickness),automated analysis routines use a numberof processing steps to generate theidentification of a discontinuity or to findsome feature out of tolerance in an object.Erosion and dilation operations cangenerate an image by showingconnectivity between pixels or bygrouping a number of pixels together in abinary image.
Issues surrounding the application ofmorphological operators depend on thetest. Erosion and dilation operators cansignificantly change the values of thepixels in the transformed image. For largerkernels (greater than 3 × 3), smallerfeatures are completely removed.Although this can be crucial for ananalysis of larger features in an image, it isimportant to be aware of just what imagecontent was left behind. It is best whenthe motivation for the image analysis canbe developed into a determination of akernel size and a justification applied tothe extracted image content. It is alsouseful if a residual image is calculated andsaved to track the features excluded.
Specialized Numerical TransformsA number of specialized image operationshave been developed for particular taskscommon in image analysis of digitalradiographic data. Only a few of thepossibilities are mentioned here but eachaddresses particular problems inradiographic tests. Also, each showcasessome possibilities of digital data.
In many circumstances the region ofthe object to be tested sits on top of astructure in the material that is not ofinterest to the test. A number ofapproaches have been developed tosubtract out the structure independent ofthe object to be tested. One class of thesetechniques involves curve fitting thestructure with some function that leavesthe important part of the test alone. Inone example of this technique, thirddegree polynomials were used to subtractout the underlying structure for theautomated testing of welds in railroadrails16 (see the discussion of automaticdiscontinuity recognition for an exampleof subtracting trends). A second approachinvolves using prior knowledge of thediscontinuity types to generate syntheticprofiles or templates of discontinuities forextraction or identification of
adiographic Testing
discontinuity signatures within a structureof an object.17,18
Weld testing often involves featuresorganized in a vertical or horizontaldimension of the digital radiograph. Insome of these circumstances it can be anadvantage to sum the contents of theimage into a single vector by averagingthe rows or columns of a region of thedigital image. The average vector hasbetter signal to noise properties than theindividual rows (columns) of the imageand it can turn out that the signature ofthe discontinuities are preserved in thesingle vector. This vector can be used forcorrelation to signatures of discontinuitiesor can be decomposed into suspectdiscontinuity sites.
A number of radiographic tests involvenumbers of the same structures organizedin some way in the image. Sometimes thisis by design where a large area detector isused to test large numbers of small objects(that is, film radiographs of spark plugs,small aluminum castings and otherobjects). In these circumstances it is anadvantage if the computer can pick theobjects out of the image and eitherpresent them for analysis or provide someanalysis of the constituent parts.
One such example are the ball gridarray images in Figs. 9, 12 and 15. Inthese images the constituent balls are acentral component for the test. Blobanalysis19 can be an important tool forthe analysis of these images. Thisalgorithm finds contiguous groups ofpixels satisfying a pixel intensitythreshold, then identifies and extractsthose segments for further processing. Forthe automated analysis of ball grid arrayimages this routine finds the balls in thecircuit board and extracts the imagesegments from the rest of the image.These image segments can then besubsequently passed on to other analysisalgorithms.
In some tests, neither segmentation orpixel classification is the importantfeature for the analysis; rather theboundary of an object or objectcomponent is central to the test. Thiskind of analysis is applied more often tocomputed tomographic reconstructedimages where the boundaries of objectcomponents are not obscured by otherstructures in the path of the X-rays. Assuch these techniques can be applied totwo-dimensional or three-dimensionaldata. A number of different techniqueshave been developed to find boundariesin complicated objects.
This operation is different than theabove transforms. By using othertransforms edges of high attenuating orlow attenuating materials can behighlighted. Likewise, with morphologicaltransforms images can be generated that

3RT13_Layout (345_378) 10/14/02 3:15 PM Page 363
show the outline of material boundaries.In these transforms the output is not animage but a set of boundary points(sometimes referred to as a point cloud).
Shrinkwrap codes are one way toestimate material boundaries in computedtomographic scans. The routines work byexpanding some kind of wave frontthrough the pixels or voxels in the image;then at a particular threshold theexpansion stops, resulting in a set ofcoordinates measuring where the wavefront stopped. There are different meansfor expanding the wave front anddifferent means for controlling thepositions for stopping around curvedsurfaces.
A second type of technique used is thefreeman chain code, which finds aboundary point and then uses a circularsewing operation to find the nextboundary point and this processcontinues until the original boundarypoint is found. This type of routine canfind boundaries of many different types ofobjects. Figure 16 illustrates the operationof this code applied to the computedtomographic scan of an automotive part.
(a)
(b)
FIGURE 16. Computed tomographic images:(a) shrink wrap routine applied; (b) freemanchain code routine applied.
Advanced Transforms forMultiscale, MultiresolutionAnalysisThe need for a different kind of imageanalysis has arisen out of the differentproblems encountered by the abovetechniques. Just how to determine thediameter of the kernels used is a matter ofsome controversy in medical andindustrial imaging. The question ofoptimal kernel size is difficult within aparticular application and completelyintractable across different tests. Digitalimages are getting deeper in bit depth,possess greater latitude, are lower in noise,are larger in extent (sometimes larger thanany available monitor) and can includesubstantial spatial resolution. Viewingthese images on devices having much lessdynamic range is a challenge. Techniquescovered above each glean some set offeatures from the image at the expense ofothers. Unsharp mask transformshighlight the high frequency content ofthe image but can amplify the noise tooverwhelm the low contrast features. It isoften the case that the choice of kernel,lookup table or imaging transform is acompromise between competing andlegitimate testing requirements and thelosses in any one choice can besignificant.
The process in multiscale,multiresolution analysis is one way ofdealing with the image content atdifferent scales in a more explicit fashion.The first step involves transforming theoriginal image into a family of images.Each of the decomposed images containsa subband of the scale and contrast spaceof the image. In different terms, the imageis split into componentlike images, eachcomponent represents a class of featuresof the image at a particular scale. Thecomponent images can then bemanipulated, transformed or amplifiedand then recombined to obtain atransformed image with a contrastiveperformance matching the viewing rangeof the monitor or making the best of thecontrast in the image (taking into accountthe noise). The low contrast features ofthe image, mostly found in some of thecomponent images can be amplifiedsomewhat independently of the noisecontent. Figure 17 is a pictorialrepresentation of this process used in acommercial image enhancementprocess.20
Wavelet based transforms also featurethis concept of decomposing images intodifferent scales and resolutions. Althoughthis varies with the particulars of thewavelet generating transform, differentnumbers of subimages are obtained froma particular transform.21 Depending onthe image each subimage contains
363Image Data Analysis

364
FIGURE 1
Densplot alocenter li
Decom
position
3RT13_Layout (345_378) 10/14/02 3:15 PM Page 364
information at a different scale or in adifferent region. Matched filters can beapplied to the sets of subimages, or filterscan be applied that are derived fromtemplates of an object of interest.22 Thesubimages are combined and the inversetransform results in a transformed image.
Multiscale, multiresolution analysisprovides the best context for explicitmanipulation of both the spatial contentand the contrastive information in aparticular image. The transformed imageis built up of the weighted andtransformed subimages and this providesa means for enhancing images and takinginto account the radiation contrast of aset of features. A number of differentstudies have shown the benefit of thesetransforms for object identification andoptimal image contrast.
All of this image manipulation can beimplemented in a compact andcomputationally efficient way. Once theinitial transform is complete the bulk ofthe computations are performed onsmaller, less complicated pieces of theimage. This aspect of the analysis can be abig advantage for images with largenumbers of pixels (that is, 3000 × 2000),where even fast computers are hardpressed to repeatedly process the image atits full size.
The benefits of multiscale,multiresolution analysis notwithstanding,there are issues with this class oftechniques. These techniques may providethe best means for managing the tradeoffinherent in showing high bit depthimages on monitors with much less rangeor in providing a means for extracting lowcontrast features without losing edge
Radiographic Testing
7. Multiresolution multiscale image enhancement.
Original Enhanced result
ityngne
Multiscalepresentation
Reconstruction
Contrastequalization
Coarsest layer
Finest layer
definition. However, making the most ofimage contrast for display purposes isdifferent from reliably indicating the sizeor even the presence of a discontinuity.Low signal-to-noise images make poorinput data for qualitative work.Compromises like these exist at all levelsof the image formation and analysisprocess (see Fig. 2).
Furthermore, at this juncture thestatistical properties of these transformsare not well understood. Low contrastfeatures wrestled out of the noise have atendency to disappear with changes in thescanner. As indicated above, imageformation is a statistical process.Radiographic scanners degrade in the fieldover time. Running a large number ofsamples through a scanner and analgorithm to establish the error propertiesof a routine may miss the point.
Subtleties of Radiographic ImagesTransmission images from X-ray sourcesinclude a number of subtle features notfound in other imaging modalities. Asexplained above, each pixel in aradiographic image includes content fromthe scatter in the detector and scatter inthe object. Neither the scatter profile ofthe detector nor the scatter profile for theobject at that particular orientation to theX-rays is necessarily spatially invariant.Perhaps more important, these effectsoccupy both high and low spatialfrequencies in the image. Figure 18includes an image of a step wedge from acamera scintillator system and a lineoutthrough the step wedge. This particularradiograph was acquired with the stepwedge at 1.17 m (46 in.) from the sourcewhereas the detector was 1.22 m (48 in.)from the X-ray source. The wedge wasshot at 200 kV peak to ensure goodtransmission through all the steps in thiswedge. The step sizes are 3.175 mm(0.125 in.) and the image has beenprocessed by dividing out the backgroundimage and taking the natural logarithm ofthe result (units of the image are inattenuation units).
Notice the sharpness of the edges forthe different levels in the step wedge andthe noise levels in the steps as indicatedin the lineout. The crispness of the edgesdecreases and the noise over the flatportions of the steps increases withattenuation. The noise levels are easilyexplained by the fewer photonstransmitted through the steps (and this isa circumstance in which there is ampletransmission through each of the steps).The more blurry edges and some of theincreased noise can be explained asgreater proportions of background andobject scatter in the pixels behind thethicker sections of aluminum. Also, notice

3RT13_Layout (345_378) 10/14/02 3:15 PM Page 365
the nonlinearity in the relativeattenuation value of each step thickness.
Figure 19 contains the image of thewedge and the histogram of the image.This is another way of showing the sameresult. Notice the spacing between thepeaks and the width of each peak. As theattenuation increases, the noise in the flatsections of the wedges also increases asshown by the larger width of the peaks.Also, the spacing of the peaks gets slightlycloser together with larger attenuationvalues. This is the combined effect ofsmall amounts of scatter in the object,scatter in the detector and beamhardening.
Kernel based processing techniques,applied to the entire image, operate on allthe spatial frequencies in an image in auniform fashion (spatial invariance). Asshown in many texts,23 the effects of anyparticular kernel based transform can beevaluated from the fourier representationof the transform. From this representationit can be seen just what gets multiplied towhat spatial components of an image, thesharp features of an image (highfrequency) and the smoother more
FIGURE 18. Step wedge: (a) attenuation im
(a)
(b) 0.430.42
0.40
0.38
0.36
0.34
0.32
0.30
0.28
0.26
0.24
0.22
0.20
0.18
0.15
0 12.7 25.4(0.50) (1.00
Rela
tive
atte
nuat
ion
(abi
trar
y un
it)
constant intensity parts of the image (lowfrequency).
The problem with these techniques forradiometric transmission images is theartifactual image content at nearly allfrequency components of the image.Techniques that apply processing kernelsto the entire image to enhance aparticular feature will invariably do thewrong thing to other components in theimage.
The subtleties of digital radiographicimages mentioned here do not make thesetransforms a uniformly bad choice forprocessing and analysis. Many successfulprocessing schemes have been developedfor digital radiographs and computedtomography images based on thesetechniques. The most important aspectsof particular image transforms are theirlimitations. All transforms emphasizesome features and suppress or eliminateothers. Depending on the nature of thetest this selectivity can be good or bad.
The point is to understand the natureof why some procedures do not performand how this might relate to the nature ofthese images. A technique developed forreflected light images is not always a good
365Image Data Analysis
age; (b) lineout through wedge.
38.1 50.8 63.5 76.2) (1.50) (2.00) (2.50) (3.00)
Location, mm (in.)

366
3RT13_Layout (345_378) 10/14/02 3:15 PM Page 366
choice for transmission images. There isno substitute for thorough testing ofimage analysis operations. Thoroughnessentails running a sufficient number ofimages of different types through aparticular algorithm to enable somestatistical evaluation of image analysisperformance.
Although it is typical to perform avariety of tests for any algorithm thisstrategy may have limitations. It is oftenthe case that digital radiographic orcomputed tomographic systems degradein the field. There are a number of reasonsfor this degradation. Scintillators becomeless sensitive over time and produce lesslight. Cameras, intensifier tubes andamorphous panels become increasinglynoisy with extensive use.
The degradation is not fast but ispersistent. Consequently, the images fedto an algorithm when the system is freshmay not be typical of the images fed tothe system after it has been operating fora while.
Simulated radiographic images canhelp the operator to assess thedegradation. A set of simulated images
lmdattdngla
DMTofttpeae(c
Radiographic Testing
FIGURE 19. Step wedge: (a) attenuation imag
(a)
(b) 10321000
900
800
700
600
500
400
300
200
100
0
Pixe
l cou
nt
0.146 0.176 0.206 0.236
Relativ
ike the features to be detected oreasured can be produced and later
egraded with computer generated noisend blur in a precise way without runninghe system. In this way the point at whichhe algorithm stops working can beetermined. By increasing the amount ofoise and blur in a particular image in araduated and precise way the effectsikely to occur over time can be estimatednd maintenance intervals adjusted.
imensionaleasurements
here are a variety of techniques forbtaining dimensional measurementsrom digital radiographic or computerizedomographic images. Three types ofechniques are common: (1) interactiveoint and click procedures, (2) lineoutxtraction techniques with somelgorithm applied to the lineout afterxtraction from the image and3) boundary identification techniques forontour estimation. The first two types of
e; (b) histogram of image.
0.266 0.296 0.327 0.357 0.387 0.417 0.447
e attenuation (arbitrary unit)

3RT13_Layout (345_378) 10/14/02 3:15 PM Page 367
techniques are common for obtainingwall thickness measurements, althoughthe third set of techniques are usedmostly in obtaining boundaries fromthree-dimensional computed tomographicdata. All three of these differenttechniques produce a dimensionalmeasurement of a component in animage, with more or less accuracy.
Application to Copper PipeTo illustrate these techniques andcompare accuracy a flat panel computed
toebtamrr49tr6o
FIGURE 20. Digital radiograph and computedtomographic slices of copper pipe:(a) digital radiograph; (b) cross section;(c) cross section; (d) cross section.
(a)
(b)
(c)
(d)
omographic data set for a 75 mm (3 in.)utside diameter copper pipe wasvaluated. This type of data set includesoth digital radiographic and computedomographic data and more importantlyllows easy access for a physicaleasurement of the wall thickness as a
eference. The data consist of 360 digitaladiographic images acquired with a 300 ×00 mm (12 × 16 in.) flat panel and aMeV linear accelerator. The computed
omographic scan was performed withotational scanning only. The detector was m (20 ft) away from the source and thebject 0.50 m (20 in.) away from the
detector.Digital radiographic images were
calibrated with the two-gain coefficienttechnique and then processed intoattenuation radiographs by dividing outthe background image in the logarithmicscale. For this scan the digitalradiographic data generate a volume ofcomputed tomographic data with widthand height roughly corresponding to thewidth and height of the digitalradiographs (the computed tomographicdata set will be a little smaller because ofmagnification but this is small in this dataset). Figure 20 contains digitalradiographic and computed tomographicimages from this scan; these images areadduced in subsequent discussion.
Interactive point and click techniquesmeasure the number of pixels betweentwo clicks of a mouse or pointer. For eachclick the closest x,y coordinate is returnedfrom the interaction and the cartesiandistance calculated between the two setsof x,y pairs of points. After this operation,the pixel distance is converted to objectdistance by multiplying by the pixel sizeat that magnification of the object. Fordigital radiographic images orientation isimportant: only walls 90 degrees to theX-ray beam–to–detector envelope can bemeasured. The goal for this operation is topick the position of maximum chordlength (the position of the inner wall) andthe position of the outer edge of the part(the outer boundary). For computedtomographic images the goal is simply topick the inner and outer edges.
Using these techniques a number ofmeasurements of wall thickness weretaken on the digital radiograph andcomputed tomographic slices in Fig. 20.The positions of these measurements areindicated in Fig. 21 (these are not thelines drawn for the measurements — justindicators of the position). Because thereis substantial porosity in this particularsample an explicit attempt was made toavoid taking computed tomographicmeasurements in locations of porosity orcorrosion on the inner wall. Six differentmeasurements of wall thickness weremade for the digital radiographic and
367Image Data Analysis

368 R
3RT13_Layout (345_378) 10/14/02 3:15 PM Page 368
computed tomographic data. Results forthe digital radiographic measurementswere 4.53, 4.65, 4.76, 4.88, 4.76 and4.65 mm (0.178, 0.183, 0.187, 0.192,0.187 and 0.183 in.). Results for thecomputed tomographic measurements are4.332, 4.55, 4.3, 4.13, 4.46 and 4.36 mm(0.1706, 0.179, 0.169, 0.163, 0.176 and0.172 in.).
Error variance for measurementsperformed with point-and-click
adiographic Testing
FIGURE 21. Digital radiographic image andcomputed tomographic slices of copperpipe with locations of measurementsidentified: (a) digital radiograph; (b) crosssection; (c) cross section; (d) cross section.
(a)
(b)
(c)
(d)
techniques depend strongly on theaccuracy of the operator, precision of themeasurements of pixel size at the objectand somewhat on pixel size itself. In thehands of a seasoned operator thesetechniques can produce accurate results.Alternatively, cavalier clicks on the imageresult in sloppy estimates and lack ofprecision. It is best to train operators witha standards set of images, with differentlevels of noise, contrastive performanceand spatial resolution.
Pixel size at the object is determinedfrom a measurement of the pixel size atthe detector and the X-ray magnificationor from the radiograph of an object thatincludes a dimensional standard. It is bestwhen both techniques are used toproduce an estimate of pixel size at theobject and used for comparison. Fordigital data, the operation ofpointing-and-clicking will only be good toa pixel, because everything is in terms ofpixels. Given these sources of error, itsdifficult to understand how thismeasurement can be better than a coupleof pixels, with substantial variation fromoperator to operator. At the same time, forsome tests, this accuracy may be goodenough.
A second more rigorous techniqueinvolves the extraction of a lineout acrossthe feature and then an analysis of thatlineout. The typical example of this typeof approach is for measuring a wallthickness from a computed tomographicslice image of a cylinder. There are threesteps.
1. The user draws a lineout across thewall, taking care to orient the lineoutas perpendicular to the wall aspossible.
2. The extracted lineout is processed witha code combining derivativecalculation and fitting.
3. The pixel distance between theselected positions in the lineout arecalculated and the physical size of thepixel is applied to the pixel distance.
Knowing the physical pixel size is stilla source of measurement error in thistechnique. Also, not orienting the lineoutperpendicular to the wall to be measuredwill result in some variability frommeasurement to measurement. Lastly, thenoise in the lineout can be problematicfor the processing applied to the lineout.Most processing schemes apply aderivative filter to the lineout, resulting intwo peaks, each measuring the line spreadfunction of the system. The two peaks arethen put through some kind of fittingcode to determine the center of the peakand the distance between the two fittedvalues is the pixel distance. Thistechnique was applied to the differentlineouts around the wall in the computed

FIGURE 22. Computed tomographic slice with lineoutindicated and line trace with derivative displayed.
(a)
(b)
Rela
tive
atte
nuat
ion
(abi
trar
y un
it)
0.016
0.015
0.014
0.013
0.012
0.011
0.010
0.009
0.008
0.007
0.006
0.005
0.004
0.003
0.002
0.001
0.000
–0.001
–0.0020.00 1.74 3.49 5.23 6.98 8.72 10.46 12.21
(6.9) (13.7) (20.6) (27.5) (34.3) (41.2) (48.1)
Location, mm (10–3 in.)
3RT13_Layout (345_378) 10/14/02 3:15 PM Page 369
tomographic scan and resulted inmeasurements with an average of 4.3 mm(0.17 in.). When properly extracted, thesetechniques can produce subpixel accuracyfor wall thicknesses imaged clearly bycomputed tomographic scanners.Figures 22 and 23 display one of thecomputed tomographic slices from thecopper pipe scan and illustrate the resultsof transforming and fitting the vectordrawn across the wall of the copper pipe.
The last technique — in this case, aclass of techniques — builds on some ofthe transform techniques mentionedabove. Any transforms mentioned thatcan convert the inner and the outer edgesof the computed tomographic data toboundary measurements qualify as adimensioning techniques. For examplethe shrinkwrap, freeman chain codealgorithm was applied to one of thecomputed tomographic slices in thecopper pipe data set. Figure 24 shows theresults of the application of this algorithmto this data set. Using these boundarypoints and taking distances the averagewall thickness was measured at 4.45 mm(0.175 in.).
It is hard to assess the accuracy of thedifferent techniques. A variety ofmeasurements were acquired around thepipe with a micrometer. The physicallymeasured thickness values ranged from4.2 to 4.7 mm (0.165 to 0.185 in.). Thisobject is a copper pipe with substantialpitting and corrosion on its inner wall.The corrosion can be seen in thecomputed tomographic scans. Themeasurements of the wall thickness fromthe digital radiographic images are hardpressed to account for the loss of materialon the inner wall and this explains whythe measurements are a little high.
Indeed, the very nature of theintegration over the tangent to the wallperformed by the radiation is anaveraging operation. The computedtomographic point-and-clickmeasurements were a little higher thanthe fitted measurements because of thesubpixel estimation done by thenonlinear fitting to the lineout. Theaverage measurements from the boundaryimage are close to all the other computedtomographic measurements. On a pointby point basis the boundary imagetechniques used in this comparisonoverestimate the wall thickness because ofthe stopping at a pixel boundary inherent inthe routine.
This class of techniques generates setsof boundary points fromthree-dimensional computed tomographicvolumes. The sets can be used in a varietyof applications. The boundary points canbe used in the process of generatingthree-dimensional solid models, computeraided design and computer aided
manufacture models or models can beinput to finite element analysis meshgenerating codes. It is important toemphasize here that these sets ofboundary points (often referred to as pointclouds) are performing a measurementoperation and have an error variancepossibly greater than the abovetechniques and the error variance is notconstant throughout the computedtomographic volume data.
There is a special character to blurs incomputed tomographic reconstructedimages. It is usually the case that theinner edges of computed tomographicreconstructed images include more blurthan the outside edges. The reason forthis is in the nature of X-ray imaging, thebeam that is imaging the inner edges hasmore scatter than the beam that imagesthe outer edges. This greater blur on theinside edges is less true for highly
369Image Data Analysis

370 R
FIGURE 23. Derivative of line trace and levalier-marquart gaussian fit.
Rela
tive
atte
nuat
ion
(abi
trar
y un
it)
0.00 1.74 3.49 5.23 6.98 8.72 10.46 12.21 13.95(6.9) (13.7) (20.6) (27.5) (34.3) (41.2) (48.1) (54.9)
2.62.42.22.01.81.61.41.21.00.80.60.40.20.0
–0.2–0.4–0.6–0.8–1.0–1.2–1.4–1.6–1.8
Location, mm (10–3 in.)
FIGURE 24. Cross section images;(a) computed tomographic slice;(b) freeman-chain code estimate of innerand outer boundaries.
(a)
(b)
3RT13_Layout (345_378) 10/14/02 3:15 PM Page 370
collimated computed tomographicscanners and more true for area detectorscanners with less collimation, that is,area detector based scanners. Thisproperty is present in the copper pipedata and can be seen in the skew of thelineouts on the inner edge. Consequentlythickness of walls and inner features caneasily be overestimated.
The problem with all of thesetechniques is the absence of a real errorbar connected to any of thesemeasurements. All of the measurementsare interesting and suggestive. Also, somestudies have been performed comparinglots of computed tomographic wallthickness measurements to othermodalities.7 In the first case computedtomographic measurements were found tobe lacking in measurement accuracy, inthe second the accuracy was equal to anyof the other techniques used. Both ofthese studies were conducted on realobjects, not standards blocks (althoughstandards blocks were used in thecalibration). In each case it was verydifficult to get a physical measurement ofa physically concealed feature. Forcomputed tomographic dimensionalmeasurements to emerge from aninteresting technique to a metrology toolmore quantitative investigations arenecessary. This problem gets worse forautomated three-dimensional tools thatfind the boundaries of inner walls andattribute a physical significance to anestimate of unknown accuracy.
adiographic Testing

PART 3. Automated Testing Techniques
3RT13_Layout (345_378) 10/14/02 3:15 PM Page 371
Need for AutomatedSystemsThe need for fast tests, the added cost ofoperators and the known issues withvariability in operator scoring haveemphasized the need for automated testsystems. Improvements in computerspeeds and increased detector sensitivityhave made automated techniques a goodpossibility for many applications.
Despite the relatively largebibliography of articles on automateddiscontinuity recognition techniques, thenumber of successful automateddiscontinuity recognition systems remainssmall. There are a variety of reasons forthis, many of which are not part of theimage analysis for a test. Design changesand changes in criteria are increasinglycommon in manufacturing operations.The effective lifetime for parts andcomponents is getting smaller. In theautomotive industry, continuous qualityimprovement programs and weightreduction programs can change theproperties of a component to the pointwhere a new test is required. Developingrobust test techniques can be expensive intime and resources. For nondestructivetesting systems, it is difficult to beresponsive to every new change in a partor component. Consequently, there is adisinclination to enter expensivedevelopment programs with short payofflifetimes.
Automated X-ray nondestructivetesting systems face a growing list ofexpectations. Fielded systems inmanufacturing operations are increasinglymore connected to the other systems onthe factory floor. Statistical processcontrol functions are part of thisconnection with each component systemreporting status and results. X-raynondestructive testing systems are notalways as connected as other systems.
Furthermore, reporting functionswithin a system are not common andmaintenance intervals can be problematic.It is rare for radiographic nondestructivetesting systems to include recognition ofan error variance in their measurementseven though these measurements includesubstantial variability. Radiographicnondestructive testing systems are oftentreated as a special case and this is
expensive in both factory floor time andpart flow. Radiographic nondestructivetesting systems will be a mature part ofmanufacturing operations when theymore easily fit into factory operations andpossess the same reliability for both theautomated testing and connectivity asother systems.
In spite of all of these issues thedemand for automatic discontinuityrecognition systems is high and growing.The details of any particular automaticdiscontinuity recognition system areusually proprietary. What follows is anoverview of the elements in mostautomatic discontinuity recognitionroutines followed by an example andrecommendations for fielding andmaintenance.
Discontinuity RecognitionAutomated testing techniques areintentionally application specific. Just asits difficult to decide on one kerneldiameter, no single automaticdiscontinuity recognition routine worksfor all tests. Tests involving penetratingradiation can be classified into fourclasses: (1) single material, singlethickness, (2) single material, multiplethickness, (3) multiple material,single thickness and (4) multiple material,multiple thickness. A second layering onthis classification is whether the testinvolves digital radiography or computedtomography. Automatic discontinuityrecognition routines are more commonfor the first two types of tests and muchmore common for digital radiographythan computed tomographic systems.
Automatic discontinuity recognitionroutines include a similar number ofsteps. Underneath each system is somedefinition of a suspect pixel within theobject.
1. The first step usually involvessubtracting out or extracting out theportions of the object that get in theway of clearly identifying thediscontinuity. In digital radiographythis is usually referred to as trendremoval or subtracting out the object.Other algorithms compare indicationsignals to some template of anacceptable object at this point.
371Image Data Analysis

372 Ra
3RT13_Layout (345_378) 10/14/02 3:15 PM Page 372
2. After trend removal the processedimage is in the best scale to identifythe discontinuity. Some segmentationroutine is applied at this point, usuallyguided by a threshold, to pick out thepixels that are part of some segment ofa discontinuity.
3. Next, a connectivity routine is appliedto bundle pixels that are close togetherand have been identified asanomalous. At the end of this step abinary image of the anomalous andnot anomalous pieces of theradiograph can be generated to showthe results of the operation.
4. Lastly, the discontinuity criteria areapplied to the different segments ofdiscontinuity locations and decisionsare made about whether the object isgood or bad.
The different steps in automaticdiscontinuity recognition routines arebuilt up from the transforms coveredabove. The same thresholding transformsare used throughout the process on the
diographic Testing
FIGURE 25. Tube weld: (a) 0 degree view;(b) 90 degree view.
(a)
(b)
processed images. Connectivity analysisroutines like blob analysis mentionedabove can be useful as well. In differentapplications trend removal is performed bya least squares fit to a simple function totake out the changing lengths in the partat that place. The automatic discontinuityrecognition routine is the sum of all thesteps combined and the robustness of theentire routine is a function of the matchbetween the data presented and theroutines used.
Evaluation of Indications
Application to Pipe WeldsTo illustrate this process, a techniquesimilar to work presented by Doering andBasart16 is applied to digital radiographsof pipe welds. In this case the welds are insmall tubes, 25 mm (1.0 in.) outsidediameter. Figure 25 contains two digital
(b)
FIGURE 26. Digital radiographic image oftube weld: (a) 0 degree view; (b) boundaryimage.
(a)

FIGURE 27. Extracted portion of tube weld:(a) before processing ; (b) results of fit;(c) result of 2 sigma fixed threshold.
(c)
(a)
(b)
3RT13_Layout (345_378) 10/14/02 3:15 PM Page 373
radiographs of the tubes taken at 0 and 90degrees. Because evaluating thediscontinuities on the long tangentchords of the tube is more difficult, thetwo views will be used and those sectionsof the object will be avoided. The firststep is an automated extraction of thecenter portion of the tube. To extractfrom the center of the tube in anautomated way the boundary points areused to calculate an extracted innerrectangle.
Figure 26 includes one of the digitalradiographs and the boundary pointimage. The discontinuities that sit on theintegration through the double wallswithout the tangents can be identifiedwith a polynomial least squares fit appliedrow wise to the extracted pieces. Theresult is the discontinuities on anotherwise flat image.
Now that the discontinuities have beenisolated from the tube shape, a fixedthreshold of minus two standarddeviations of the noise calculated fromthe center of the tube in an unweldedarea. Pixels less than this value areconsidered to be reliable indicators of lessmass in the weld of the object. After thethreshold is applied only thediscontinuities are left against a binaryimage. Figure 27 contains the results ofthis operation.
At this point the image has beenprocessed to identify discontinuities witha two-sigma fixed criterion. In this case anumber of different segmentationschemes (that is, blob analysis) can beapplied to extract out the discontinuities.From these extracted segments, a numberof different quantities can be calculated:total discontinuity area, largestdiscontinuity and others. If the imageshave been calibrated into material length,it is also possible to calculate the totalmass lost, in total and per discontinuityarea. In spite of all these calculations,more information is needed to classifythese different image segments intocategories. Then still more information isrequired to accumulate the differentdiscontinuity indications in the differentcategories and make a determination of agood or bad weldment.
Discontinuity Detection CriteriaIn the automatic discontinuityrecognition process there are a number ofimportant roles for product engineers.
1. It is important to specify thediscontinuity or discontinuities to bedetected. Full part drawings are usefulas well as any assistance in precisemounting that can be offered.
2. Developing the criteria for findingdiscontinuity indications should be acooperative effort.
373Image Data Analysis
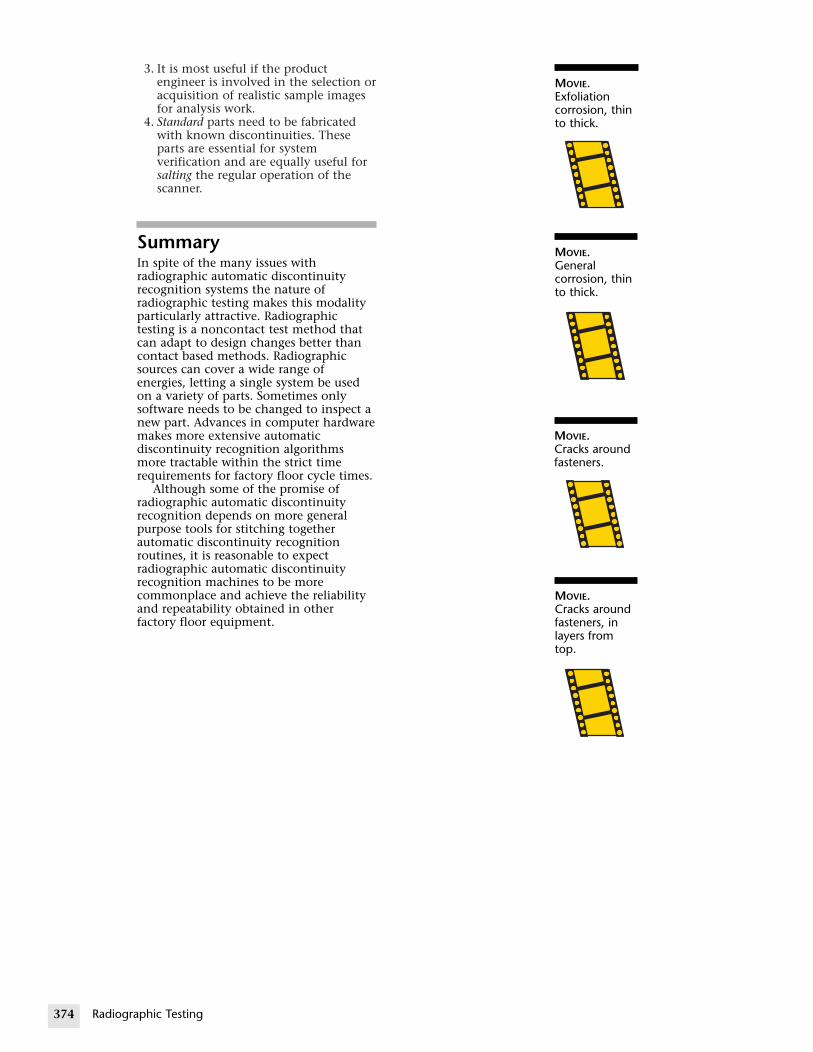
374
MOVIE.Exfoliationcorrosion, thinto thick.
MOVIE.Generalcorrosion, thinto thick.
MOVIE.Cracks aroundfasteners, inlayers fromtop.
MOVIE.Cracks aroundfasteners.
3RT13_Layout (345_378) 10/14/02 3:15 PM Page 374
3. It is most useful if the productengineer is involved in the selection oracquisition of realistic sample imagesfor analysis work.
4. Standard parts need to be fabricatedwith known discontinuities. Theseparts are essential for systemverification and are equally useful forsalting the regular operation of thescanner.
SummaryIn spite of the many issues withradiographic automatic discontinuityrecognition systems the nature ofradiographic testing makes this modalityparticularly attractive. Radiographictesting is a noncontact test method thatcan adapt to design changes better thancontact based methods. Radiographicsources can cover a wide range ofenergies, letting a single system be usedon a variety of parts. Sometimes onlysoftware needs to be changed to inspect anew part. Advances in computer hardwaremakes more extensive automaticdiscontinuity recognition algorithmsmore tractable within the strict timerequirements for factory floor cycle times.
Although some of the promise ofradiographic automatic discontinuityrecognition depends on more generalpurpose tools for stitching togetherautomatic discontinuity recognitionroutines, it is reasonable to expectradiographic automatic discontinuityrecognition machines to be morecommonplace and achieve the reliabilityand repeatability obtained in otherfactory floor equipment.
Radiographic Testing

1. Evans, R.D. The Atomic Nucleus. NewYork, NY: McGraw Hill (1955).
2. Heitler, W. Elementary Wave Mechanicswith Applications to Quantum Chemistry,second edition. Oxford, UnitedKingdom: Clarendon Press (1955).
3. Barrett, H.H. and W. Swindell.Radiological Imaging. New York, NY:Academic Press (1981).
4. Kak, A.C. and M. Slaney. Principles ofComputerized Tomographic Imaging.New York: IEEE Press (1987).
5. Bushberg, J.T., J.A. Seibert, E.M.Leidholdt, Jr. and J.M. Boone. TheEssential Physics of Medical Imaging,second edition. Philadelphia, PA:Lippincott Williams & Wilkins (1994).
6. Dainty, J.C. and R. Shaw. Image Science:Principles Analysis and Evaluation ofPhotographic Type Imaging Processes.New York, NY: Academic Press (1974).
7. Martz, H., D. Schneberk, C. Logan andJ. Haskins. “New Modalities in X-RayDetection and Their Use for IndustrialDR/CT.” Presented at InternationalSymposium on Computerized Tomographyfor Industrial Applications and ImageProcessing in Radiology [Berlin,Germany, March 1999]. Berlin,Germany: Deutsche Gesellschaft fürZerstörungsfreie Prüfung (March1999).
8. Macovski, A. Medical Imaging Systems.Upper Saddle River, NJ: Prentice-Hall(1983).
9. Martz, H.E., D.J. Schneberk,G.P. Roberson and S.G. Azevedo.Computed Tomography.UCRL-ID-112613. Livermore, CA:Lawrence Livermore NationalLaboratory (September 1992).
10. Johns, H.E. and J.R. Cunningham. ThePhysics of Radiology, fourth edition.Springfield, IL: Charles C. Thomas(1983).
11. Sahoo, P.K., S. Soltani andA.K.C. Wong. “A Survey ofThresholding Techniques.” ComputerVision, Graphics, and Image Processing.Vol. 41. San Diego, CA: AcademicPress (1988): p 233-260.
12. Oppenheim, A.V. and R.W. Schafer.Discrete-Time Signal Processing. UpperSaddle River, NJ: Prentice Hall (1999).
13. Lim, J.S. Two-Dimensional Signal andImage Processing. Upper Saddle River,NJ: Prentice Hall (1990).
14. Bracewell, R.N. The Fourier Transformand Its Applications, third edition.Boston, MA: McGraw-Hill (2000).
15. Serra, J. and P. Soille, eds. MathematicalMorphology and Its Applications to ImageProcessing. Dordrecht, Netherlands:Kluwer Academic Publishers (1994).
16. Doering, E.R. and J.P. Basart. “TrendRemoval in X-Ray Images.” Review ofProgress in Quantitative NondestructiveEvaluation. Vol. 7. New York, NY:Plenum Press (1988): p 785-794.
17. Gayer, A., A. Saya and A. Shiloh.“Automatic Recognition of WeldingDefects in Real-Time Radiography.”NDT International. Vol. 23, No. 3.Oxford, United Kingdom: ElsevierScience Limited (1990): p 131-136.
18. Kaftandjian, V., A. Joly, T. Odievre,M. Courbière and C. Hantrais.“Automatic Detection andCharacterisation of Aluminium WeldDefects: Comparison betweenRadiography, Radioscopy and HumanInterpretation.” 7th EuropeanConference on Non-Destructive Testing[Copenhagen, Denmark]. Vol. 2.Copenhagen, Denmark: 7th ECNDTCopenhagen (May 1998):p 1179-1186.
19. Davis, K. and C. Lazinsky. “The Questfor Speed, Precision and High Yield.”Imaging Insight. Vol. 2, No. 3. Dorval,Quebec, Canada: Matrox ElectronicSystems Limited (Fall 2000): p 4-5.
20. Vuylsteke, P. and E. Shoeters. “ImageProcessing in ComputedRadiography.” International Symposiumon Computerized Tomography forIndustrial Applications and ImageProcessing in Radiology [Berlin,Germany, March 1999]. DGZfPProceedings BB 67-CD. Berlin,Germany: Deutsche Gesellschaft fürZerstörungsfreie Prüfung (March1999): p 87-101.
21. Jawerth, B.D., M.L. Hilton andT.L. Huntsberger. “Local Enhancementof Compressed Images.” Journal ofMathematical Imaging and Vision.Vol. 3, No. 1. Norwell, MA: KluwerAcademic Publishers (1993): p 39-49.
375Image Data Analysis
References
3RT13_Layout (345_378) 10/14/02 3:15 PM Page 375

22. Strickland, R.N. and H.I. Hahn. “Wavelet Transform Methods for ObjectDetection and Recovery.” IEEETransactions on Image Processing. Vol. 6,No. 5. New York, NY: Institute ofElectrical and Electronics Engineers(May 1997).
23. Brigham, E.O. Fourier Transforms.Upper Saddle River, NJ: Prentice Hall(1974).
BibliographyAzevedo, S.G., H.E. Martz, D.J. Schneberk
and G.P. Roberson. “QuantitativeMeasurement Tools for DigitalRadiography and ComputedTomography Imagery.”UCRL-53868-94. Livermore, CA:Lawrence Livermore NationalLaboratory (1994).
Berger, H. Neutron Radiography — Methods,Capabilities and Applications.Amsterdam, Netherlands: Elsevier(1965).
Berger, H., ed. Practical Applications ofNeutron Radiography and Gaging.Special Technical Publication 586.West Conshohocken, PA: ASTMInternational (1976).
Bossart, P.-L., H.E. Martz, H.R. Brand andK. Hollerbach. “Application of 3DX-Ray CT Data Sets to Finite ElementAnalysis.” Review of Progress inQuantitative Nondestructive Evaluation.Vol. 15. New York, NY: Plenum Press(1996): p 489-496.
Brand, H.R., D.J. Schneberk, H.E. Martz,P.-L. Bossart and S.G. Azevedo. Progressin 3-D Quantitative DR/CT.UCRL-53868-95. Livermore, CA:Lawrence Livermore NationalLaboratory (1995).
Chinn, D., J. Haskins, C. Logan, D. Haupt,S. Groves, J. Kinney and A. Waters.“Micro-X-Ray Computed Tomographyfor PBX Characterization, EngineeringResearch, Development andTechnology.” UCRL-53868-98. Centerfor Nondestructive Characterization,UCRL-ID 132770. Livermore, CA:Lawrence Livermore NationalLaboratory (February 1999).
Dolan, K.W., H.E. Martz, J.J. Haskins andD.E. Perkins. “Digital Radiography andComputed Tomography forNondestructive Evaluation ofWeapons.” Thrust Area Report.UCRL-53868-94. Livermore, CA:Lawrence Livermore NationalLaboratory, Engineering Research,Development and Technology (1994).
Dolan, K.W., J.J. Haskins, D.E. Perskinsand R.D. Rikard. “X-Ray Imaging:Digital Radiography.” Thrust AreaReport. UCRL 53868-93. Livermore,CA: Lawrence Livermore NationalLaboratory, Engineering Research,Development and Technology (1993).
Espinal, F., T. Huntsberger, B.D. Jawerthand T. Kubota. “Wavelet-Based FractalSignature Analysis for AutomaticTarget Recognition.” OpticalEngineering. Vol. 37, No. 1.Bellingham, WA: International Societyfor Optical Engineering (1998):p 166-174.
Feldkamp, L.A. L.C. Davis and J.W. Kress.“Practical Cone-Beam Algorithm.”Journal of the Optical Society of America.Vol. 1. Washington, DC: OpticalSociety of America (1984): p 612-619.
Freedman, M. and N.H. Strickland.“Digital Radiology and PACS: ImageProcessing in ComputedRadiography.” Grainger & Allison’sDiagnostic Radiology: A Textbook ofMedical Imaging. Edinburgh, UnitedKingdom: Churchill Livingstone(1997).
Goebbels, J., U. Zscherpel and W. Bock.Computertomographie undBildverarbeitung [Proceedings,International Symposium onComputerized Tomography for IndustrialApplications and Image Processing inRadiology, Berlin, Germany, 1999].DGZfP Proceedings BB 67-CD. Berlin,Germany: Deutsche Gesellshaft fürZerstörungsfreie Prüfung (1999).
Goodman, D.M., E.M. Johansson andT.W. Lawrence. Chapter 11, “OnApplying the Conjugate GradientAlgorithm to Image ProcessingProblems.” Multivariate Analysis: FutureDirections. New York, NY: ElsevierScience Publishers (1993).
Grangeat, P. “Analysis d’un Systemed’Imagerie 3D par Reeconstruction áPartir de Radiographies X enGéométrie Conique.” Ph.D.Dissertation. Grenoble, France: L’EcoleNationale Superieure desTelecommunications (1987).
Grozdins, L. “Optimum Energies forX-Ray Transmission Tomography ofSmall Samples.” Nuclear Instrumentsand Methods in Physics Research.Vol. 206. Amsterdam, Netherlands:North-Holland Publishing Company(1983): p 541.
Grodzins, L. “Critical AbsorptionTomography of Small Samples.”Nuclear Instruments and Methods inPhysics Research. Vol. 206. Amsterdam,Netherlands: North-HollandPublishing Company (1983): p 547.
376 Radiographic Testing
3RT13_Layout (345_378) 10/14/02 3:15 PM Page 376

Haddad, W.S., I. McNulty, J.E. Trebes,E.H. Anderson, R.A. Levesque andL. Yang. “Ultrahigh-Resolution X-RayTomography.” Science. Vol. 266.Washington, DC: AmericanAssociation for the Advancement ofScience (1994): p 1213.
Herman, G.T. Image Reconstruction fromProjections: The Fundamentals ofComputerized Tomography. New York,NY: Academic Press (1980).
Hollerbach, K. and A. Hollister.“Computerized Prosthetic Modeling.”BioMechanics. Albany, NY: CMP UnitedBusiness Media (September 1996):p 31-38.
Horstemeyer, M., K. Gall, A. Gokhale,M. Dighe and K. Dolan. “Visualization,Quantification and Prediction ofDamage Evolution in Cast A356Aluminum using High ResolutionExperimental and NumericalTechniques.” Manuscript (1999).
Jain, A.K. “Image Data Compression:A Review.” Proceedings IEEE. Vol. 69,No. 3. New York, NY: Institute ofElectrical and Electronics Engineers(March 1981): p 349-389.
Jain, A.K. Fundamentals of Digital ImageProcessing. Upper Saddle River, NJ:Prentice Hall (1989).
Keswani, R., S. Gangotra, S. Muralidhar,P.M. Ouseph, K.C. Sahoo andD.S.C. Purushotham. “ComputedTomography of Irradiated Nuclear FuelElements.” 15th World Conference onNondestructive Testing [Rome, Italy,October 2000]. Brescia, Italy:Associazione Italiana Prove nonDistruttive e MonitoraggioDiagnostica (2000).
Kinney, J.H., S.R. Stock, M.C. Nichols,U. Bonse et al. “NondestructiveInvestigation of Damage inComposites Using X-Ray TomographicMicroscopy (XTM).” Journal ofMaterials Research. Vol. 5, No. 5.Pittsburgh, PA: Materials ResearchSociety (May 1990): p 1123-1129.
Kinney, J.H. and M.C. Nichols. “X-RayTomographic Microscopy UsingSynchrotron Radiation.” AnnualReviews of Materials Science. Vol. 22.Palo Alto, CA: Annual Reviews (1992):p 121-152.
Kinney, J.H., D.L. Haupt, M.C. Nichols,T.M. Breunig. G.W. Marshall andS.J. Marshall. “The X-Ray TomographicMicroscope: 3-DimensionalPerspectives of EvolvingMicrostructure.” Nuclear Instrumentsand Methods in Physics Research:Section A, Accelerators, Spectrometers,Detectors and Associated Equipment.Vol. 347. Amsterdam, Netherlands:Elsevier Science Publishers (1994):p 480-486.
Kinney, J.H., T.M. Breunig, T.L. Starr,D. Haupt et al. “X-Ray TomographicStudy of Chemical Vapor InfiltrationProcessing of Ceramic Composites.”Science. Vol. 260, No. 5109.Washington, DC: AmericanAssociation for the Advancement ofScience (1993): p 789-792.
Knoll, G.F. Radiation Detection andMeasurement. New York, NY: JohnWiley and Sons (1989).
Logan, C., J. Haskins, K. Morales,E. Updike, D.J. Schneberk, K. Springer,K. Swartz, J. Fugina, T. Lavietes,G. Schmid and P. Soltani. “Evaluationof an Amorphous Selenium Array forIndustrial X-Ray Imaging.” EngineeringNDE Center Annual Report.UCRL-ID-132315. Livermore, CA:Lawrence Livermore NationalLaboratory (1998).
Martz, H.E. “Computed Tomography ofBridge Pins, Cast AluminumAutomotive Components and HumanJoints.” Report No. UCRL-JC-133573.6th Nondestructive Evaluation TopicalConference [San Antonio, TX, April1999]. New York, NY: AmericanSociety of Mechanical Engineers(April 1999).
Martz, H.E. “The Role of NondestructiveEvaluation in Life CycleManagement.” Frontiers of Engineering:Reports on Leading Edge Engineering from1997 NAE Symposium on Frontiers ofEngineering [Third Annual Symposiumon Frontiers of Engineering].Washington DC: National AcademyPress (1998) p 56-71.
Martz, H.E., S.G. Azevedo, D.J. Schneberk,M.F. Skeate, G.P. Roberson andD.E. Perkins. Computerized Tomography.UCRL-53868-90. Livermore, CA:Lawrence Livermore NationalLaboratory (October 1991).
Physics Today. Special issue celebrating thecentenary of Röntgen’s discovery ofX-rays. Vol. 48, No. 11. Melville, NewYork: American Institute of Physics(November 1995).
Pontau, A.E., A.J. Antolak, D.H. Morse,A.A. Ver Berkmoes, J.M. Brase,D.W. Heikkinen, H.E. Martz andI.D. Proctor. “Ion MicrobeamMicrotomography.” Nuclear Instrumentsand Methods in Physics Research:Section B, Beam Interactions withMaterials and Atoms. Vol. B40/41.Amsterdam, Netherlands: ElsevierScience Publishers (1989): p 646.
Proceedings of ASNT Topical Conference onIndustrial Computerized Tomography[Seattle, WA, July 1989]. Columbus,OH: American Society forNondestructive Testing, (1989).
377Image Data Analysis
3RT13_Layout (345_378) 10/14/02 3:15 PM Page 377

Real-Time Radioscopy Radioscopy and DigitalImaging [Manshantucket, Connecticut,August 1998]. Topical ConferencePaper Summaries Book. Columbus,OH: American Society forNondestructive Testing (1998).
Rowlands, J. and S. Kasap. “AmorphousSemiconductors Usher in Digital X-RayImaging.” Physics Today. Vol. 50,No. 11. Melville, NY: AmericanInstitute of Physics (1997): p 24.
Savona, V., H.E. Martz, H.R. Brand,S.E. Groves and S.J. De Teresa.“Characterization of Static- andFatigue-Loaded Carbon Composites byX-Ray CT.” Review of Progress inQuantitative Nondestructive Evaluation.Vol. 15. New York, NY: Plenum Press(1996): p 1223-1230.
Scott, V.D. and G. Love. QuantitativeElectron-Probe Microanalysis. Chichester,United Kingdom: Ellis HorwoodLimited (1983).
Seibert, J.A., O. Nalcioglu and W.W.Roeck. “Removal of Image IntensifierVeiling Glare by MathematicalDeconvolution Techniques.” MedicalPhysics. Vol. 12, No. 3. Melville, NY:American Institute of Physics, for theAmerican Association of Physicists inMedicine (May/June 1985).
Sengupta, S.K. “IMAN-3D: A SoftwareTool-Kit for 3-D Image Analysis.”Engineering Research, Developmentand Technology, UCRL 53868-98.Livermore, CA: Lawrence LivermoreNational Laboratory (1998).
Smith, B.D. “Cone-Beam Tomography:Recent Advances and a TutorialReview.” Optical Engineering. Vol. 29,No. 5. Bellingham, WA: InternationalSociety for Optical Engineering (1990):p 524-534.
Soltani, P.K., D. Wysnewski and K. Swartz.“Amorphous Selenium DirectRadiography for Industrial Imaging.”DGZfP Proceedings BB 67-CD,Computerized Tomography for IndustrialApplication and Image Processing inRadiology [Berlin, Germany, March1999]. Berlin, Germany: DeutscheGesellschaft für ZerstörungsfreiePrüfung (1999).
Strickland, R.N. and H.I. Hahn. “WaveletTransforms for DetectingMicrocalcifications in Mammograms.”IEEE Transactions on Medical Imaging[1995]. Vol. 15, No. 2. New York, NY:Institute of Electrical and ElectronicsEngineers (April 1996): p 422-425.
Tabb, M. and N. Ahuja. “Multiscale ImageSegmentation by Integrated Edge andRegion Detection.” IEEE Transactionson Image Processing. Vol. 6, No. 5. NewYork, NY: Institute of Electrical andElectronics Engineers (May 1997).
Tonner, P.D. and J.H. Stanley.“Supervoltage Computed Tomographyfor Large Aerospace Structures.”Materials Evaluation. Vol. 12, No. 12.Columbus, OH: American Society forNondestructive Testing (December1992): p 1434-1438, 1445.
Van der Meulen, M.C.H. “MechanicalInfluences on Bone Development andAdaption.” Frontiers of Engineering:Reports on Leading Edge Engineering from1997 NAE Symposium on Frontiers ofEngineering [Third Annual Symposiumon Frontiers of Engineering].Washington DC: National AcademyPress (1998): p 12-15.
Varian Corporation. Flashscan 30 Manual.Palo Alto, CA: Varian Corporation [nodate].
Waters, A.M., H. Martz, K. Dolan,M. Horstemeyer, D. Rikard andR. Green. “Characterization of DamageEvolution in an AM60 MagnesiumAlloy by Computed Tomography.”Proceedings of NondestructiveCharacterization of Materials IX. AIPConference Proceedings 497 [Sydney,Australia, June-July 1999]. Melville,NY: American Institute of Physics(1999): p 616-621.
Weisfield, R.L., M.A. Hartney, R.A. Streetand R.B. Apte. “NewAmorphous-Silicon Image Sensor forX-Ray Diagnostic Medical ImagingApplications.” SPIE Medical Imaging:Physics of Medical Imaging. Vol. 3336.Bellingham, WA: International Societyfor Optical Engineering (1998):p 444-452.
378 Radiographic Testing
3RT13_Layout (345_378) 10/14/02 3:15 PM Page 378

Lawrence R. Lawson, Bradford, Pennsylvania
Backscatter Imaging
14C H A P T E R
3RT14_Layout(379_402) 10/2/02 3:06 PM Page 379

380 Rad
PART 1. Physical Principles
3RT14_Layout(379_402) 10/2/02 3:06 PM Page 380
Backscatter imaging involves thesingle-sided collection of scatteredradiation rather than the transmittedradiation to form an image. Although in atypical X-ray test configuration at least asmany photons are scattered as aretransmitted, imaging with them is muchmore difficult. Consequently, backscatterimaging is usually a digital technique. Thedevelopment of backscatter imaging hasfollowed the evolution of digitalradiography.
The motivations for backscatterimaging have been several. Perhaps theforemost has been the desire to imagefrom one side. Furthermore, thebackscatter technique can image a volumerather than a plane. For these reasons,backscatter imaging has been found usefulfor such applications as aircraft pressurebulkhead inspections where access to bothsides of the bulkhead is impracticable.
Other motivations for using backscatterimaging include its ability to beconfigured for direct measurement of theelectron density of the object beingmeasured. This property has been used inmedical measurements of bone density. Itwas soon recognized that this propertycould be exploited to detect the differencebetween filled and unfilled voids withinsteel casings. The case in point was that ofartillery shells. The shells themselves areof heavy material while detonators arenearly transparent radiographically.Transmission radiography could notalways detect whether or not ordnanceshells were armed. Backscatterradiography could. In fact, inspection ofbaggage for explosives and contrabandhas been the major driving force in thedevelopment of backscatter radiography.
Another motivation for usingbackscatter radiography is that it canperform a certain amount of chemicalanalysis on the object being imaged. Thisfaculty is most acute at very low (1 keV)and very high (>2 MeV) energies. Atenergies around 60 keV, the dual energytechnique permits the estimation of theatomic number of the material beinginspected through comparison ofscattering and absorption coefficients.
Scattering takes place through theinteraction of an X-ray or gamma rayphoton’s oscillating electromagnetic fieldwith either the charge of an electron or ofthe nucleus. For imaging purposes
iita
TTctff
lctatiidXsccmcsmtatamasecpumtldeso
seaftcihi
iographic Testing
nteraction with electrons is mostmportant. In most interactions, there is aransfer of energy between the photonnd the electron.
ypes of Scatteringhere are four scattering processesurrently used for backscatter imaging inhe broadest sense. These are elastic,luorescence, compton and resonanceluorescence.
Elastic scattering involves no energyoss. It is also called rayleigh scattering oroherent scattering. It is significant whenhe photon wavelength is on the order oftomic dimensions. Because it is coherent,he wave function of the scattered photons predictably related to that of thencident photon, it gives rise toiffraction effects. The entire field of-ray diffraction is based on elastic
cattering. Elastic scattering fromrystalline materials takes place only atertain angles. Hence it is possible toeasure the amount of some crystalline
onstituent using elastic scattering atelected angles. In noncrystallineaterials, statistical parameters describing
he spatial distribution of neighboringtoms can be determined from analyzinghe scattered X-rays using techniques suchs X-ray absorption spectroscopy. Byeasuring small changes in the scattering
ngles, elastic strains and hence residualtresses can be measured. But because thenergies involved are on the order of aouple thousand electronvolts,enetration is limited. Elastic scattering issed primarily for one-dimensionaleasurements at a point. An example is
he measurement of thin coatings withow energy X-rays. In this case, the sourceetector geometry can be configured toxclude reflection from the (steel)ubstrate, because that reflection willccur only at specific angles.
Similar to elastic scattering comptoncattering is also scattering by thelectrons that surround the nuclei oftoms. In this case there is energy lossrom the incident photon to the electronhat recoils in what amounts to aollision. Compton scattering ismportant in the range of tens toundreds of thousands of electronvolts. It
s the basis for most of the attenuation of

3RT14_Layout(379_402) 10/2/02 3:06 PM Page 381
high energy photons, for example,gamma rays. It is also the basis of mostbackscatter imaging techniques.
There are definite relations between theamount of energy lost and the angle ofscatter. Phase information is essentiallylost in the scattering process. So, unlikeelastic scattering, diffraction effects do nottake place detectably. Compton scatteringis not isotropic but varies with the energy.At high energies, forward scatteringpredominates. Compton scatteringcompetes with the photoelectric effect asa means of consuming photon energy.Hence, in low Z materials, where thephotoelectric effect for X-rays is weak,compton scattering is relatively intensecompared with high Z materials in whichphotons are actually lost because ofphotoelectric absorption. Thus comptonscattering is particularly useful fordetecting electronically dense low Zmaterials such as opiate drugs and highexplosives.
In the event that a photon is absorbedin a photoelectric process, a high energyelectron is generated. This secondaryelectron may itself be a K or L shellelectron. It may also interact with otheratoms to eject K or L shell electrons. Thecascade that results to refill the missing Kor L shell electron may result in theemission of a photon of the energycorresponding to the difference betweenthat and some higher shell. For high Zmaterials these photons can have energiesin thousands of electronvolts. This processis called fluorescence.
As with radiation used for elasticscattering, fluorescence radiation haslimited penetration. Backscattered X-rayfluorescence imaging is the basis ofseveral chemical analysis tools used bysurface scientists. Most of these requireplacing the part to be examined in avacuum chamber and are thereforedestructive testing. X-ray and gamma rayfluorescence has also been used in probesto sort alloys, to detect and measure thelead in paint coatings and to performsimilar tasks.
Another type of fluorescence occurs atvery high energies and is called resonancefluorescence. At energies in the vicinity of10 MeV, incident photons can causechanges in the energy of the nuclei ofatoms. After absorption of a photon thenucleus relaxes emitting other photons atlower energies but still in the millions ofelectronvolts range. These fluorescencephotons, like their lower energycounterparts, are emitted at randomangles nearly isotropically. This isotropymeans that nuclear resonancefluorescence makes backscatter imagingpossible at energies above those wherecompton scattering would only take placein the forward direction. This technique
hteas
hriearr1
CCuofMemror
(
w(fmsdbetctwf
(
wir(teiltdc(dt
as advantages for the examination ofhick or dense structures and like lownergy fluorescence facilitates chemicalnalysis from the backscatter energypectrum.
The resonance fluorescence techniqueas drawbacks. Particle accelerators areequired to generate the incident X-rayllumination. These are bulky andxpensive. Another drawback is thatbove 500 keV, it is possible to generateesidual radioactivity. This residualadioactivity problem is significant at0 MeV for some materials.
ompton Scatterompton scattering is the type most oftensed in backscatter imaging. In this typef scattering the electron receives energyrom the incident photon and recoils.
omentum is conserved and a lowernergy scattered photon emerges. Becauseomentum is conserved, it is possible to
elate the scattering angle to the amountf energy lost by the photon. This givesise to the relationship:
1)
here ν0 is incident photon frequencyreciprocal second), ν´ is scattered photonrequency, hν0 is incident photon energy,c2 is about 500 keV and 2θ is the
cattering angle (in the sense used iniffractometry). Multiplying up and downy h, Planck’s constant, shows that thexpression is equal to the ratio of incidento scattered photon energies. Theompton scattering process is described byhe well known klein-nishina formula,hich for ray pencils can be written, apart
rom specific geometry factors:
2)
here l is the total path length (meter), Ns the number of atoms per cubic meter,02 is the classical electron radius constantwhere r 2
0 = 7.94 × 10⁻³⁰ m2), t is thehickness (meter) of the scatteringlement in the incident beam direction, Zs the average atomic number, µ is theinear attenuation coefficient (m–1), θ ishe beam angle (radian is preferred butegree is conventional, depending onhoice of sin), Ψ is the photon fluxphotons per second) and Ωd is theetector solid angle (steradian) into whichhe photon is scattered. Figure 1a
Ψ Ψ Ωout in d= ′
×′
+ ′ − ( )
× −( )
rZN
t
02
0
2
0
0
2
2
2
νν
νν
νν
θ
µ
sin
exp l
νν
ν θ0 02
1 1 2′
= + − ( )[ ]h
mccos
381Backscatter Imaging

382
FIGUREdifferenscatteri
(a)
Inciden
(b)
3RT14_Layout(379_402) 10/2/02 3:06 PM Page 382
illustrates the scattering pattern given byEq. 2. It gives the number scattering crosssection per electron per unit of solid anglein units of 10–30 m2.
Because the solid angle per incrementof scattering angle at the poles is zero, thisgraph may be confusing. Figure 1b replotsthe data for 50 keV in terms of incrementof scattering angle where the solid angleincrement is in terms of the scatteringangle 2θ:
(3)
The units are again 10–30 m2.Compton scatter also contributes to
attenuation in that it scatters photons outof a beam and consumes energy at thesame time. The total linear attenuationcoefficient µT is composed of compton
d dΩ = ( ) ( )2 2 2π θ θsin
Radiographic Testing
1. Compton scattering pattern: (a) polar plot oftial scattering cross section; (b) incrementalng angle for 50 keV. Unit of angle is the degree.
Num
ber
cros
s se
ctio
n
9060
30
0
330
300270
240
210
120
1 keV50 KeV 200 keV
876543210
ce direction
Num
ber
cros
s se
ctio
n
90
60
30
0
330
300
270
240
210
12030
25
20
15
10
5
0
component µc, and of elastic scattering µe(significant at low energies) ofphotoelectron component µp:
(4)
Compton scattering is, in fact, the maincause of attenuation at energies overabout 55 kV. In Fig. 1a., a polar plot of thedifferential scattering cross section,scattering is very roughly isotropic at theenergy of 50 keV and below. The amountof backscatter however becomesdiminished at 200 keV. Further increasesin energy result in further reductions inbackscatter intensity by the comptonmechanism.
Because the amount of scattering in avolume element depends on the incomingflux, proportional to the area of theelement, times the thickness of theelement, the intensity of the radiationscattered from a material volume elementof ∆V, a voxel, inside an object, can beexpressed as
(5)
where K is a constant including thestrength of the incident beam, Ne is theelectron density of the material within thevoxel and µ̄ is an average linearattenuation coefficient over the total pathof length l, starting where theto-be-scattered photon enters the materialand ending where it leaves it. Theattenuation coefficient not only is afunction of the material through whichthe photons pass but also is affected bythe compton shift, that is, by the energychange on scattering. In addition to theflux intensity Isc given above, there arealso background and a componentresulting from multiple scatter, photonsscattered more than once. Multiple scatterwithin the voxel may augment the signalbut a system would probably be poorlydesigned if that were significant because itimplies a great deal of fuzziness in theimage. The balance of the multiple scatterappears as enhanced background or noise.In fact, most of the background inbackscatter scanning appears to resultfrom multiple scatter rather than naturalradioactivity and X-ray leakage. Makingthe multiple scatter background negligibleis a matter of good design, proper choiceof energies (frequencies) and softwarecorrections.
Scatter As Function of MaterialDuring their passage through material,X-rays are both absorbed and scattered.Figures 2 and 3 illustrate the relativeamounts of these two processes for leadand aluminum respectively. The curve
I KN Vsc e= −( )∆ exp µl
µ µ µ µT c p e= + +

FIGURE 2
Att
enua
tion
coef
ficie
nt (
cm–1
)
100
10
1
0.1
0.0
FIGURE 3
Att
enua
tion
coef
ficie
nt (
cm–1
)
10
1
0.1
0.0
3RT14_Layout(379_402) 10/2/02 3:06 PM Page 383
shown for scattering is composed of bothelastic and inelastic scattering but theformer is not significant at energies near100 keV and above.
Lead has a high atomic number andshows considerable photoelectricabsorption relative to compton scatter atenergies of 1 MeV. Another absorptionmechanism is also shown: pairproduction. This occurs in all materialsbut is only significant at energies greaterthan 1 MeV above the usual range forbackscatter imaging. Aluminum has a lowatomic number and consequentlyphotoelectric absorption exceeds comptonscattering only at very low energies. Thismakes aluminum a suitable material forinspection by backscatter imaging.
Figure 4 compares the significance ofcompton scattering to photoelectricabsorption by showing the compton
fraeveremAt binbecforaccreg
enwiencloeffonobdedethe
gaithr
. Scattering and absorption for lead.
1
Photoelectric absorption
Compton scattering
Pair production
0 1 2 3 4 5 6 7
Energy (MeV)
. Scattering and absorption for aluminum.
1
Photoelectric absorption
Compton scattering
0 1 2 3 4 5 6 7
Energy (MeV)
ction of total scattering. Notice thatn near 120 keV, compton scatteringains the minority process in iron.
low incident photon energies, theding of the electron to the nucleusomes significant. The klein-nishinamula given as Eq. 2 is no longer strictlyurate, because electrons cannot all bearded as being free.At high incident energies, the bindingergy of the electron is trivial comparedth its recoil energy. When the incidentergy is so low that the binding energy isse to the recoil energy, two types ofects are observed. Line broadening ise effect that can in principle beserved up to several tens of keVpending on the energy sensitivity of thetector and the monochromatic purity of source.Much chemical information can bened about the bonding of electronsough studies of compton broadening.
At still lower energies the scatteringcoefficients themselves vary. Figure 5illustrates this effect through comparingthe scattering coefficients for two ionshaving the same total number ofelectrons, 21, but different nuclearcharges.1 The ions are titanium (Ti+) andvanadium (V+2). The compton scatteringintensity (divided by the breit recoilfactor) is plotted versus an energy lossparameter, sin(θ)·λ–1 where λ is thewavelength in units of 0.1 nm. At largeenergy losses, the scattering intensities arenearly the same for both ions. But at lowenergies, they differ. Such differences canin principle be observed by comparingimages made at two different energies. Inpractice, these effects are not easilyobserved in backscatter.
383Backscatter Imaging
FIGURE 4. Compton fraction of total scattering compared tophotoelectric absorption. Even near 120 keV, comptonscattering remains the minority process in iron.
Com
pton
fra
ctio
n (r
atio
)
1
0.8
0.6
0.4
0.2
0
Oxygen
Aluminum
Iron
40 50 60 70 80 90 100 110 120
Incident energy (keV)

384 Ra
FIGURE 5. Crecoil fact(sinθ·λ–1),
Scat
terin
g in
tens
ity(t
hom
pson
uni
ts p
er e
lect
ron)
10
10
3RT14_Layout(379_402) 10/2/02 3:06 PM Page 384
Other modalities such as fluorescenceand coherent scattering are less often usedfor nondestructive testing. Coherentscattering, X-ray diffraction, is often areflection technique. Because of the lowenergies involved, however, penetration isminimal.
X-ray diffraction also tends to be slow.Scans can be performed but they are evenslower. For this reason X-ray diffraction isseldom used as an imaging techniqueexcept in the highly specialized task ofinspecting large crystals for discontinuitiesin structure.
The main advantage of X-raydiffraction is that it measures compositionby crystal structure. Hence, it is usedcommercially to detect diamonds indiamond mining. Low energy X-ray orgamma fluorescence has been used incommercial paint gages to detect andmeasure lead paint. Resonancefluorescence is a high energy techniquerecently developed.
Resonance fluorescence involvestransitions between energy levels withinthe nucleus itself. It was predicted beforeit was discovered. Early attempts usingisotope sources to detect it were nothighly successful because the narrowenergy ranges of these sources did notmatch the energies favorable forresonance transitions. The developmentof small accelerators providing broadband bremsstrahlung in the 10 MeV rangehas made resonance fluorescence availableas an imaging tool. The techniquesinvolved use flying spot scanning (to bediscussed) in combination with broad areadetectors. The primary advantage ofresonance fluorescence lies in the largeamount of backscatter obtained at highenergies where the compton process
diographic Testing
ompton scattering intensity (divided by breitor) is plotted versus energy loss parameter where λ is wavelength in units of 10–10 m.
Titanium + ion
Vanadium+2 ion
0.2 0.4 0.6 0.8 1 1.2
Energy loss parameter, sinθ·λ–1 (0.1 nm–1)
would allow only forward scatter. Thesecond advantage is that the backscatteredphotons have energies characteristic ofthe atoms from which they originated.This allows chemical analysis to beperformed — even of light elements — ofmaterials within heavy absorptiveenclosures.
Single and Multiple ScatteringThere are basically two scattering modelsuseful for backscatter imaging. They willbe discussed only for compton scatter butin the single scattering case, the sameremarks apply qualitatively to elasticscatter as well. In the first, singlescattering model, an incident photontravels with some probability ofabsorption to a region within thematerial. It is there scattered and returnsalong a straight path with someprobability of absorption to a detector.The simplicity of this model allows closedform calculations and has provenextremely useful in the service ofnondestructive testing. Computations arebased on geometry and are relativelysimple compared with the correspondingcomputations for visible light because thewave nature of X-rays can generally beignored because of their smallwavelengths.
The second model is multiplescattering. Two entirely differentapproaches may be used but both involvesolving the boltzmann transport equation.Historically, the first approach was tosolve the boltzmann transport equationdirectly. Except in a very few special cases,this approach was fraught with errors anddisappointments due to the simplifyingassumptions that were needed.
What emerged as the most successfulapproach is solution by monte carlosimulation. The overall energy transfer isestimated from averaging over many suchpaths generated by random numbers. Thiscomputationally intensive approach isgreatly facilitated by digital computers.Unlike early attempts at solving theboltzmann transport equation directly,monte carlo methods usually showexcellent agreement with experiment. Ineither single or multiple scattering, thetheoretical treatment depends somewhaton the detector model. Detectors maycount photons or respond to photonenergy. The following discussion ofbackscatter presumes photon counting.The energy of the counted photons ismeasured separately in modern detectorsand provides supplementary information.
The single scattering model isapplicable, at least as an initial estimate,to almost all backscatter imagingapplications to date. The reason for this isthat most imaging is done with photons

3RT14_Layout(379_402) 10/2/02 3:06 PM Page 385
in the 30 to 100 keV energy range. Inmost materials, for example, transitionmetals, there is significant absorption inthis energy range. Consequently,multiple-scattered photons have lost moreenergy because of the compton processand are therefore better targets forphotoelectric absorption. In addition,they are laterally displaced. In systemswith both collimated sources andcollimated detectors, multiple-scatteredphotons must follow very specific pathsthat undo the lateral displacement effectto reach the detector. Because these pathsare specific, their associated probabilitiesare low.
Consider an X-ray pencil beamentering a uniform material (Fig. 6). Aparticular set of photons passes throughthe upper layer of material, is scattered insome volume element and returns backthrough the material to the detector.There is a round trip path that contributesto the attenuation of photons. This is thefirst element of the process. In the secondelement, the scattering itself, thereciprocal of the linear dimension of theinterrogated area (scattering zone) definesthe resolution. This dimension is relatedto the solid angle subtended by the pencilbeam. The throughput or fraction ofavailable photons participating isproportional to this solid angle. Ifuncollimated detectors are used, then bythis reasoning, the throughput is inverselyproportional to the square of theresolution. Under such circumstances theresolution is in two dimensions only; thebeam interrogates more or less the entiredepth of the specimen at once and theresulting signal is an integral over thedepth.
As an example consider a configurationwhere a narrow pencil enters a uniform
FIGURE 6. Scattering model.
Source Singly scattered photon
Multiply scattered photon
Workpiece
Incident radiation pencil
material (see Fig. 7). Presume that thedetector is configured to collect allphotons on paths for which the cosine ofthe angle between them and the incidentpencil is unity (implied is that the solidangle of the detector is not a factor); thiswould be about 180 degree scatter. Theprobability of scattering in a volumeelement of thickness t is σt, where σ is thelinear scattering coefficient. If z is thedistance from the scattering element tothe surface, the amount of scattering inthat element is I0σt·exp(–µz), taking intoaccount attenuation on the way in.Including attenuation on the way outgives:
(6)
Taking the limit as t becomesinfinitesimal and integrating over theentire specimen give:
(7)
where now z is the thickness of thespecimen, as proportional to the strengthof the signal at the detector. For aninfinitely thick specimen, the signal issimply proportional to the ratio of thescattering coefficient and the linearattenuation coefficient.
A frequent type of measurement is toestimate the density of a material from itsbackscatter signal. But, given thisexpression, backscatter can be expected toreveal very little about the density ofabsorptive materials, because both thelinear scattering coefficient σ and thelinear attenuation coefficient µ areproportional to density. A way aroundthis limitation is to use multiple detectorsto provide different path lengths for thescattered photon. This allows µ to bedecoupled from σ. More commonly indensity measurements a differentapproach separates the source anddetector; its application to concrete isdiscussed below. If the material is a weakabsorber, then expanding in a seriesmakes the signal instead proportional:
(8)
where x is the material’s thickness.When a collimated detector is used, its
solid angle relative to the point ofscattering becomes important. Thethroughput is then proportional to thesolid angles of both the source pencil andthat of the detector. This proportionalitysuggests that geometry could result in thesignal’s being inversely proportional tothe fourth power of the resolution.Practical volume imaging systems make
Scattering == ++ (( ))I x O x02σ µ
Scattering = − −( )[ ]Iz0
21 2
σµ
µexp
Scattering = −( )I t z0 2σ µexp
385Backscatter Imaging

386 R
FIGURE 7.diameter detector.
Source
3RT14_Layout(379_402) 10/2/02 3:06 PM Page 386
one of the imaging elements a slit so thatthe throughput is inversely proportionalto the cube of the resolution. This is still asevere limitation. In some systems, theresolution requirement is relaxed in lessimportant dimensions to overcome thisrestriction. For example, in acommercially developed backscattertomography system,2,3 resolution in thedirection perpendicular to the plane ofthe tomograms has been somewhatreduced. In depth profiling backscatterschemes, the resolution in directionsperpendicular to depth is considerablyreduced.
This resolution problem is shown inFig. 7. The scattering volume is assumedto be roughly spherical. Referring to thescattered rays approaching the detector, itshould be apparent that the resolveddimension can be no smaller than thediameter of the aperture shown betweenthe scattering volume and the detector;imagine the aperture at first located at thescattering volume itself and then whileadjusting the size of the detectorwithdraw it in steps toward the detectorto visualize. The solid angle Ω issubtended by the detector aperture:
(9)
where d is both the aperture diameter andproportional to (if not identical to) theresolved dimension and r is the distancefrom the scattering volume to thedetector. If the source is large in diametercompared to the resolved dimension, thenthe same construction can be applied tothe source resulting in the fourth powerrelationship mentioned. If the source issmaller than the resolved dimension, thepower of aperture diameter d in the
Ω = πd
r
2
216
adiographic Testing
Resolved dimension can be no smaller thanof aperture shown between scattering volume and
Geometricbright zone
Detector
Resolved dimension
Scattering volume
throughput may diminish but the overallefficiency would be improved by makingthe source larger. Were it possible toreplace the detector aperture by anannular slit, the power would then bereduced to three. The single scattergeometry has been extensively modeledin the literature.
The multiple scattering model is ofprimary importance only in thosetechniques that use detectors collimatedto exclude singly scattered photons,because single scattering usuallydominates even when uncollimateddetectors are used. The multiple scatteringmodel can be described through thetransport equation. This equation statesthat in any element or particular region inspace, the rate of change in the number ofphotons within the region equals thefluxes integrated over that element’sboundary.
These surface fluxes come from twosources. First are those arising fromphotons passing through the elementunscattered (the convection term). Secondare those arising from photons beingscattered into the element. A third flux isproportional to the volume of theelement and comes from photons createdor absorbed in the element. Generally, thecreation of photons within the elementcan be neglected. A monte carlo solutionof the transport equation might dividethe space into discrete elements and trackhypothetical photons, scattered or notdepending on generated random numbersas they pass from element to element.Summing over many trial incidentphotons allows calculation of theexpected fraction of them in any volumeelement at any time going in anyparticular direction with any particularenergy.
Apart from monte carlo and othernumerical methods, many approacheshave been tried to obtain solutions inclosed form. The most common of thesehas been to assume that the scatteringangles are small. These have resulted in anumber of so called straight aheadapproximations, useful when the energiesof the incident photons are very high. Anexample is Yang’s method, which allowscalculation of the average lateraldisplacement because of scattering of aphoton passing through a thin layer.4
These methods are of little use underimaging conditions. If the convectionterm is made very small, absorptionnegligible, scattering isotropic, sourceterm zero and the number of photons inany volume element independent of time,then it is possible to convert the transportequation into a form of Laplace’sequation. This give the diffusionalapproximation. Diffusional approximationscould yield closed form estimates to some

3RT14_Layout(379_402) 10/2/02 3:06 PM Page 387
flying spot scanning problems that mightbe useful under fortuitous conditions. Butgenerally diffusional assumptions wouldseldom be realistic. Retaining thediffusional assumptions and reintroducingthe convection term would give rise to afokker-planck equation for which there isan extensive literature of solutions.However, the consistently good accuracyreported for monte carlo methods haslargely obviated closed formapproximations.
Multiple scattering may be significantin the detection of low density regions orregions of low atomic number inmaterials. In the case of low densityregions, initially scattered photons maytravel the length of the region beforebeing rescattered out of the material. Inthe case of low Z materials, the relativeabsence of photoelectric absorption mayallow a single photon to exist throughmany scattering events. It has beenreported that when nearlymonochromatic cobalt-60 radiation isbackscattered from steel containing an airgap, a detectable energy peak varies inenergy as a function of the size of the airgap. This effect is enhanced at smallscattering angles and probably resultsfrom multiple scatter within the air gap.5
Cracks can be detected through acombination of multiple scattering andfluorescence. By placing a film in contactwith a metal surface and illuminating thepart obliquely, Hasenkamp was able tovisualize small cracks.6 Just as a deepnotch in a red hot part will usually appearbrighter than its surrounding surface, acrack will appear brighter than itssurroundings when the part is illuminatedwith X-rays in a direction such that onlyscattered X-rays can reach the detector.
387Backscatter Imaging

388
PART 2. Backscatter Imaging Techniques
3RT14_Layout(379_402) 10/2/02 3:06 PM Page 388
PinholeOne of the earliest examples of industrialscatter imaging was performed using apinhole camera. Pinhole cameras havebeen used to image sources such as X-raytube anode spots or isotopes. The pinholecamera technique gives a two-dimensionalimage on film. Its simplicity is offset bythe very small throughput obtainablebecause of the small solid angle subtendedby a pinhole. Illumination of the object tobe examined by a fan beam confined to aplane parallel to the film plane can beused as a form of laminography.7
Closely related to the pinhole camera isthe multiple aperture collimator. This isessentially a plurality of pinholes andmasks designed to image a selectedvolume element repeatedly onto adetector. For that particular volumeelement, the efficiency improves by thenumber of times that there are apertures.Because typically only one volumeelement is imaged at a time, no actualimage is formed unless the apertureassembly is scanned. This technique wasfirst developed for radioisotope scans innuclear medicine and later adapted to thechecking of ordnance detonators where
Radiographic Testing
FIGURE 8. Multiaperture collimator. In onetype of multiaperture collimator, conicalholes are drilled radially in shielding materialsuch as lead. Specimen is illuminated fromside and only photons scattered atgeometric center of collimator are detected.
Detectors
X-ray illumination
only one volume element needed to bechecked. Figure 8 illustrates one form ofmultiaperture detector. Conical holes aredrilled radially in a shielding materialsuch as lead. The specimen, shown ingray, is illuminated from the side. Onlythose photons scattered at the geometriccenter of the collimator are detected.
Moving SlitsBy elongating a pinhole into a slit, itssolid angle may be significantly increasedwithout sacrificing resolution in onedirection. Imaging slits have long beenused for X-ray diffraction to create one oreven two-dimensional images inreciprocal space. Reciprocal space, thefourier transform of ordinary space, is ofgreat interest to crystallographers becauseit defines the periodicities of crystals. Byselecting a certain region of reciprocalspace with slits, two- and eventhree-dimensional images of a selectedcrystal periodicity can be obtained inordinary space by scanning the part to beexamined relative to the configuration offixed source to slit detector. A majorapplication is the mapping of residualstresses in machined parts.
When applied to compton scattering,slit imaging has been used in severaldepth profiling schemes. In these, the slitsare configured to give high resolution in adirection defined as the depth at thesacrifice of resolution in other directions.This configuration allows a maximizationof throughput. In one case the source slitdetector assembly is a rigid assembly andis physically moved relative to the surfaceof the object under study. This makespositional accuracy independent of X-rayparameters or construction accuracy. In asecond configuration, the source and oneslit are stationary while the detector andan imaging slit are moved across thesurface to collect scatter fromprogressively deeper layers (Fig. 9). Bothsystems have their advantages. The formeris easily calibrated for depth because it isinherently a 1:1 system. It is usuallyconfigured so that the angles of both theincident and scattered photon paths areabout or less than 45 degrees with respectto the surface normal. The latter is usuallyconfigured so that the scattered photonmakes an angle much larger than

FIGURE 9.configuradetector scatter fro
Sourc
3RT14_Layout(379_402) 10/2/02 3:06 PM Page 389
45 degrees with respect to the surfacenormal.
In principle, three-dimensional imagescan be obtained through a combinationof depth scanning and lateraldisplacement of the imaging apparatus tocreate three-dimensional scanning.However, when high resolution isrequired in the depth direction, scanningin other directions as well is likely to beimpracticable from the standpoint of thetime required. Such methods have beenused in the laboratory to examine organiccomposites.
Flying SpotFlying spot scanning is by far the mostpopular backscatter modality because ofthe large throughput obtainable. Thedetector solid angle can reach nearly 2πsteradians. Flying spot scanning was usedin the very earliest forms of television,which antedated broadcast television. Itwas rediscovered as a means of reducingunwanted scatter in transmission X-raysin the early 1970s and soon thereafter wasapplied to backscatter imaging.8
The most common technique involvesplacing a chopper wheel in front of a longand often semicircular slot (Fig. 10).8 Thecombination of the slot in the chopperwheel and the fixed slot together form amoving mask that limits the incidentX-ray beam to whatever will pass throughthe mask. Usually a raster is scanned. Thetest object moves on a conveyor or inextreme cases the entire scanningapparatus moves. Because noreciprocating motion is needed, the speedof scanning can be correspondingly rapidand free of vibration.
ddebibid
ttobaaa
uebdromfhi3aacXmotmasdm
sw
Moving detector depth scanning. In slit imagingtion, source and one slit are stationary whileand imaging slit are moved across surface to collectm progressively deeper layers.
Collimated detector
Direction ofscanning
Workpiece
Interrogated zone
e
The backscattered photons are usuallyetected with broad area uncollimatedetectors. This technique is usedxtensively in luggage scanners to test forombs. As previously discussed, resolutions limited by the size of the hole formedy the moving mask while throughputncreases with the square of its linearimension.
Using a detector in conjunction withhe beam catcher (safety shield),ransmission and backscatter images areften collected simultaneously. These cane processed to enhance featuresssociated with dense materials of lowtomic number such as heterocyclic drugsnd explosives.
Flying spot scanners have been scaledp to sizes that allow the inspection ofntire trucks and freight cars. They haveeen adapted to mine detection byirecting the beam into the ground. Aecent adaptation has been the additionf collimated detectors to detect onlyultiple scattered photons as a means of
urther highlighting low Z materialsaving high densities. By making the hole
n the mask quite large, for example,0 mm (1.2 in.), and by using very largerea detectors, the technique has beendapted for scanning humans foroncealed drugs and explosives at a low-ray dosage. Collecting data at two orore different energies allows estimation
f the ratio of the scattering cross sectiono the linear absorption coefficient. This
ay be used to estimate the effectivetomic number of the material beingcanned to partially identify explosives,rugs or water in metal and otheraterials.A significant variation on the flying
pot scanner has been its combinationith an imaging slit and segmented
detectors. In one such configuration,2 areciprocating aperture formed by arotating slotted cylinder placed very close
389Backscatter Imaging
FIGURE 10. Flying spot X-ray backscatter system.8
Flying spotX-ray beam
Rotatingcollimation
disk
Slitcollimator
Backscatterdetectors
Object
Translation

390 Ra
FIGURE 11.cold bond
Back
scat
ter
coun
ts (
103 )
tim
es d
imen
sion
less
fact
or e
qual
to
unity
at
surf
ace
10
8
6
4
2
000
3RT14_Layout(379_402) 10/14/02 10:40 AM Page 390
to the anode of an X-ray tube scans thebeam in one direction. Calling thatdirection X, the raster is completed by adrive that moves the detectors, tube andX direction scanner in the Y direction. Along imaging slit (actually two, one oneach side of the scanner) parallel to the Xdirection images the Z direction ontosegmented detectors. Thus a truethree-dimensional imaging system isformed. To increase speed, three scanningslits and sets of detectors can be workedsimultaneously off one tube. This system’sresolution is best in the X and Ydirections, about 2 line pairs per 1 mm(0.04 in.). The Z direction is divided intoabout 1 mm (0.04 in.) thick slices. Thescanned area is about 50 × 100 mm(2 × 4 in.). It has been found useful foraircraft bulkhead inspections and is one ofthe many backscatter techniques used fortesting aircraft honeycomb.
A different approach to flying spotscanning has been to use magnetic coilsto move the electron beam back and forthalong the anode in an X-ray tube. Thistechnique has been tried with a fixedaperture to move the X-ray beam backand forth or with a film anode tube toscan a raster in low energy X-rays formicro examination of thin objects.Scanning the beam would allow a higherspot intensity than would otherwise bepossible in a fixed anode tube. Difficultieswith this technique as a means of beamsteering include the problem of keepingthe electron beam in focus over asignificant angular deflection, providing atube, anode and window wide enough forsignificant deflection.
diographic Testing
Depth profile of boron fiber composite patch oned aluminum aircraft skin.
Simulated disbond
Skin (two layers plus bond)
Patch
0.5 1.0 1.5 2.0 2.5 3.0(0.02) (0.04) (0.06) (0.08) (0.10) (0.12)
Depth, mm (in.)
The scanning beam, reversed geometrytechnique is discussed elsewhere in thisvolume.
Depth ProfilingDepth profiling has already beendiscussed under moving slit techniqueswhere the moving detector technique wasdiscussed. Here the fixed detectortechnique will be treated. In either case, amajor issue in depth profiling is thesimultaneous optimization of flux andresolution in the depth direction.9 Theexact solution depends on the sourcecollimation, the linear absorptioncoefficient and the depth being scanned.For materials having small absorptioncoefficients, the angle between the sourceand the detector should exceed90 degrees, permitting for a very highthroughput at a given resolution. Forabsorptive materials, a symmetricalconfiguration having about a 90 degreeseparation between source and detector isa good choice although others includingasymmetrical configurations may performas well with compensating advantages.
The fixed detector technique has thedetector in a fixed position relative to thesource and both combined into a singleassembly. Slits are used to control thedegree of collimation and the source anddetector angles. Lead screws move theassembly perpendicular to the surface ofthe material being probed. An array ofoptical gages measures the true location ofthe surface. Because the interrogatedregion is at a fixed depth with respect tothe assembly, the gages return the exactdepth being scanned. Depth accuracy of13 µm (0.0005 in.) has been achievedunder field conditions. Actual accuracy inmeasuring the thickness of a layerdepends on the size of the interrogatedzone, the roughness of the surfacesinvolved and the amount of noise. Typicalaccuracies are in the range of ±0.04 mm(±0.0015 in.).
Figure 11 shows a depth profile of aboron fiber composite patch applied to analuminum aircraft skin. The scan wasmade on an aircraft in the field. The chartshows a parameter roughly proportionalto the electron density times a factor thatdecreases with increasing photoelectricabsorption. As expected, the organicmaterial containing the low Z element,boron, gives a higher signal than thealuminum substrate. Each flat toppedpeak corresponds to a layer of material.When needed, layer thicknesses aremeasured at half the height of the peakusing a least squares fit to the data. Thesimulated disbond is a thin layer offluorocarbon polymer introduced to testultrasonics. Commonly noise increases

3RT14_Layout(379_402) 10/2/02 3:06 PM Page 391
with depth because the actual number ofphotons is less for a scan at a constantspeed. Measuring the time required toachieve a constant count would reducenoise but is impracticable where voidsmay be encountered. Increasing thecounting time with depth is the usualpractice to reduce noise.
391Backscatter Imaging

392 R
PART 3. Reconstruction and Image ProcessingTechniques
3RT14_Layout(379_402) 10/2/02 3:06 PM Page 392
Reconstruction is the term for extracting animage from data that do not themselvesform a proper image. Reconstruction hasbeen used in backscatter ultrasonographyand has been important in computedtomography. Except for the crude formused in depth profiling, however,reconstruction has seen little applicationin X-ray backscatter imaging.
Classically, reconstruction recovers atwo-dimensional cross sectional slice inthe plane of a fan beam from manyone-dimensional projections of an objecttaken at regular angles. Central to fouriertechniques of reconstruction is the centralsection theorem that permits calculationof the fourier transform of the crosssectional slice from the fourier transformsof the projections. But access to all sidesof the object in question is usuallyrequired to reconstruct the slice. Backprojection techniques regard thereconstruction problem as one of linearalgebra in which the image to be found isa matrix and the projections areanalogous to row, column or diagonalsums. Such schemes are in principle moreflexible and could be adapted to a varietyof new problems.
Backscatter imaging has been mostlyused when access is highly restricted orthe specimen can be treated astwo-dimensional. In luggage scanningthere is no particular restriction to accessand hence no reason why a backprojection scheme could not develop athree-dimensional image from combinedtransmission and backscatter dataacquired in different planes at the sametime. Inspection of aircraft imposes morerestrictions. Besides reconstruction, thereare techniques of deconvolution toremove the blurring caused by finiteapertures and similar techniques commonto all image processing. These find wideuse in all digital radiography.
Backscatter tomography as describedabove generates basically athree-dimensional data set. The onlylimitation to these data is that featuresnearer the surface cast shadows on thoseunderneath them. These shadows mayresult from either enhanced absorption orenhanced scatter. However, even with theproblem of beam hardening (changes inthe incident photon energy distributionresulting from passing throughintervening material), elimination of most
adiographic Testing
shadows would be relativelystraightforward by using back projection.In principle a similar approach might beapplied to flying spot scanning, especiallywhere multiple detectors may be disposedabout the periphery of the object beingscanned.
In certain configurations the integratedscatter from a single pencil of X-rays orgamma rays may contain useful,quantitative chemical information. Asimple example is the case whenscattering is weak and the energiesinvolved are high so that absorption canbe neglected as in the common bonedensity measurement used in medicine.The constituents of bone — calcium,carbon, hydrogen and oxygen — havesmall atomic numbers and hence absorblittle in proportion to their comptonscattering. The photon count can beaccurately related to the amount of bonepresent.
Applying this principle are backscatterthickness gages for sheet stock. In mostcases the photon count is not preciselylinear with the thickness of the metal.Because the metal is uniform in itsconstitution, however, the onlycontribution would be from changes inthickness. Dual energy techniques dependon the atomic number of the materialexamined because photoelectricabsorption changes much more quicklywith photon energy than does comptonscattering. In depth profiling the sametype of information is obtained using asingle energy or band of energies. This isbecause it allows a comparison of theattenuation of the incident X-rays withthe amount of backscatter given off.
Another reason computed tomographyhas not been extensively applied tobackscatter tomography is that it does notsignificantly improve the image in mostcases. A test was performed with acommercial backscatter tomographysystem2,3 on a phantom composed ofaluminum sheets, rivets and a pellet ofaluminum corrosion product (Fig. 12).Figures 12b and 12c show respectively asection through the pellet area andanother section through the upper surfaceof the bottom plate. The bottom plateitself was inherently featureless becausethe rivets filled the rivet holes. However,the rivet heads, the corrosion pellet andsides of the bulged region of the top plate

3RT14_Layout(379_402) 10/2/02 3:06 PM Page 393
appear as shadows. These shadows couldhave been removed throughreconstruction but have weak contrast incomparison with the strong contrast ofthe backscatter itself. The added noisefrom the reconstruction could possiblyhave been more detrimental than theshadows.
Reconstruction has been applied indepth profiling because it leads to a morereadable chart. The one-dimensionalnature of the problem simplifies thereconstruction problem significantly. Italso provides a simple way of explainingwhat is needed in backscatterreconstruction. As the X-radiation passesinto the material it is both scattered andabsorbed. Thus as the probe penetratesdeeper, there is less of it. Also, as itpenetrates deeper, the lower energyphotons are absorbed or scatteredpreferentially over those with higherenergies. Thus the average energy of thephotons in the probe tends to increasewith depth. This is why these changes arecalled beam hardening. Similarly, after theprobe has been scattered at some point
FIGURE 12. Backscatter tomography ofphantom composed of aluminum sheets,rivets and pellet of aluminum corrosionproduct: (a) schematic of side view,showing pellet and dome; (b) slice throughpellet and dome; (c) slice through bottomplate.
(a)
(b)
(c)
Corrosion product
under study, the same effects also act onthe photons as they return to thedetector.
Essentially the reconstruction problemis how to boost the signal to compensatefor increasing depth. A first orderapproach is to boost it in proportion tothe amount of signal collected includingany previous boost. If photoelectricabsorption were not a factor, such atechnique could easily guarantee that theresulting scan would be a chart of electrondensity versus depth. But absorption issignificant and varies from material tomaterial. In addition to boosting thesignal in proportion to the integratedbackscatter, an empirical power law hasbeen used to compensate for beamhardening. When the composition of thestructure being studied is known, thecorrection constants are known a priori. Inother cases, it may be assumed that theappropriate material constants will resultin essentially level, flat topped peaks asshown in Fig. 11. Different constants maybe applied to different layers.
Besides reconstructions there are alsoother techniques of image processing thatcan be applied to backscatter signals. Oneof these is deconvolution to remove theaperture function. These techniques areextensively discussed in their ownliterature.
Salient to backscatter imaging is theproblem of quantum noise. Becausedeconvolution is essentially high passfiltering, it tends to exaggerate quantumnoise. Experimentally, fourier techniqueshave met with only limited success.Iterative techniques in the spatial domainwork better because unrealistic excursionscan be trimmed along the way. VonCitert’s technique10 is the starting pointfor a variety of iterative techniques.
SensitivityIn transmission shadowgraphicradiography, sensitivity is generallydefined as being the smallest change inmaterial thickness that can be detected onfilm. This type of sensitivity is measuredwith an image quality indicator. Involume imaging or depth profiling, thevoxel size is a measure of resolution androughly corresponds to sensitivity intransmission shadowgraphic radiography.By analogy, sensitivity for integratedbackscatter techniques may be defined asthe minimum detectable change inthickness.
Other possible sensitivities can bedefined, too. Minimum detectable changein density is one. In backscatterradiography, quantum noise is the usuallimiting factor in any densitymeasurement. For a given material, test
393Backscatter Imaging

394
3RT14_Layout(379_402) 10/2/02 3:06 PM Page 394
configuration and source intensity, thenumber of counts will not be constant butwill be poisson distributed. The poissondistribution has the convenient propertythat its mean is also its variance. Thus theexpected deviation in the number ofcounts is the square root of that numberof counts.
If a plot or image is examined and astep or dip or contrasting region is seen,the null hypothesis that the perceivedchange is only the result of noise mustfirst be tested. The subject of statistics is along one but one well treated in texts. If arule of thumb is needed, the nullhypothesis may be rejected if the changeis more than two standard deviations ofthe noise level. The contribution ofbackground radiation to noise is low ifequipment is well designed. For example,consider a volume element thatcontributes 8100 counts. The square rootof that number is 90, the expectedstandard deviation. Thus if an adjacentelement has more than 8100 – 180 = 7920counts, it would be presumed to representno fluctuation in density. Thus thesensitivity to changes in density would beon the order of 180/8100 = 0.02 or2 percent.
Sensitivity in terms of dimensions haspreviously been mentioned. Wheredimensional measurements are based onedge location, the size of the interrogatedvolume (Fig. 7), is important indetermining dimensional sensitivity.However, the dimensional accuracy isbetter than the resolved dimension shownbecause edges can be located by numericalfitting. The problem again reverts to oneof quantum noise and its effect on the fit.In the case of very small gaps, theseappear in the image or chart convolvedwith the aperture function, that is, thetransmission of the aperture. In fact theylook like an image of the aperture.Measurement of such small features isbased on the size of the dip they producein the intensity of the surrounding image.For example, if an aperture function wererectangular, a gap one tenth the width ofthe aperture function (essentially theresolved dimension of Fig. 7) wouldproduce ideally a 10 percent dip in thesignal. Whether a 10 percent dip isdetectable depends on the number ofphotons counted.
Radiographic Testing

PART 4. Applications of Backscatter Imaging
3RT14_Layout(379_402) 10/2/02 3:06 PM Page 395
The principles and techniques describedabove have evolved in different ways tomeet the needs of numerous applications.It is not possible to describe them all here.What follows is a sampling of applicationsselected to bring out major points ofinterest.
OrdnanceX-ray backscatter has proven itself usefulin two areas related to ordnance. Themost direct is the checking of fuses anddetonators in artillery shells and similardevices. There is a need to routinely checkthese to see whether they have been fusedat the beginning of a mission and defusedafterward. For obvious reasons of safety, anoncontact technique of checkingordnance fuses is preferred. Transmissionradiography has been used to check thecontents of food cans and otherapplications similar to the checking ofordnance fuses. However, artillery shellsare typically made of thick steel and otherrelatively heavy metals. The fuses aremade of organic materials and show littlecontrast in transmission radiography. But,being relatively dense organic materials,the composition of the fuses does scatterradiation well and absorbs little. This hasallowed the construction of automaticfuse checking equipment.
The second area of use for X-raybackscatter in relation to ordnance ismine detection. The problem andtechnology of mine detection are, notsurprisingly, similar to baggage scanning.Early mine detectors often relied on themetallic nature of the housing of a mineto detect it. As with most of the apparatusof contemporary life, the need for ametallic housing has been obviated inantipersonnel mines — contributing littleto the mine besides weight anddetectability. As with the ordnance fuses,the high density of low atomic numberelements needed to make an explosivefacilitates detection of mines by X-raybackscatter. It is perhaps fortunate tothose faced with cleaning upnonoperative mine fields that anabsolutely undetectable mine is of littleuse to any military force.
For checking ordnance fuses a narrowlycollimated incident beam has beenconfigured with a multiaperture
collimator similar to that shown in Fig. 8.One example was configured to identifycracks voids and anomalies in the filler onthe order of 1.6 mm (0.063 in.) through a13 mm (0.5 in.) thick steel case.11 Anisotope source of cobalt-60 yieldinggamma rays of 1.17 and 1.33 MeV wasused to penetrate the steel case. Thedetector collimator was oriented roughly90 degrees to the incident beam. Thesame configuration was also evaluated tocheck for the presence of explosives indemilitarized practice bombs.
Mine detectors using comptonbackscatter have evolved along much thesame lines as luggage scanners. Some mayuse isotope sources (anecdotal) forportability. Others use small X-raymachines.12 These use the principle offlying spot scanners although thescanning of the spot may be semimanualvia a gantry. The spot size is usually onthe order of 10 to 20 mm (0.4 to 0.8 in.).Usually uncollimated detectors are used tomaximize throughput. Mines arerecognized primarily by their shape andscattering characteristics. Antipersonnelmines are usually made of plastic whileheavier antitank mines are made of metalto provide more tamping. In the eventthat a mine uses lead azide or mercuryfulminate as a detonator, fluorescenceradiation in the 80 keV range may bedetected. These high energy fluorescencephotons can escape through earth, plasticand thinner metal housings. This is thesubject of a United States Patent.13
Recently the concept of lateralmigration radiography has been appliedto land mine detection.14 Lateralmigration radiography is imaging ofspecifically multiple-scattered photons. Asmentioned previously, explosive materialsand plastics are expected to favor multiplescatter. To accomplish multiple scatterimaging, detectors collimated to excludesingly scattered photons are used. Inpractice the multiple scatter detectors areaugmented with noncollimated detectorsto provide an image conventional formine detectors. It is reported that the airvolumes in the land mines give themunique signatures apart from their multiplescatter characteristics. The air volume isnecessary to the functioning of the minebecause it gives something to compress totranslate applied pressure into mechanicaldisplacement that activates the mine. The
395Backscatter Imaging

396
TABLE 1. Aircraft corrosion products.
Material Density (g·cm–3)
Aluminum 2.71Commercial aircraft corrosion product 2.0Military aircraft corrosion product 2.1Crystalline gibbsite (Al2O3·3H2O) 2.42
3RT14_Layout(379_402) 10/2/02 3:06 PM Page 396
air volume also gives free flight to thephotons that appear through rescatteringat some distance from their point ofentry. This double scattering is therationale behind lateral migrationradiography.
Corrosion, AircraftSecond only to the interdiction of drugsand bombs in suitcases, no otherapplication has stimulated theimaginations of inventors more thanaircraft inspections. The need fortechniques of corrosion detection andevaluation that require access only to theoutside of an aircraft has drawn attentionto X-ray backscatter as a desirable choice.That X-ray backscatter can be especiallygood at detecting voids is an additionalbonus.
Transmission shadowgraphicradiography remains the techniquecommonly used for corrosion evaluationaround windows and door frames. Whileadequate to the task, removing a plane’sinterior furnishings is usually required.Lap splices are often checked byultrasonic, eddy current or visual testing.Again, these techniques have been provenadequate to the task of detectingcorrosion but evaluation of the damage interms of metal loss still requiresdismantling the joint. Also, ultrasound isonly useful for inspecting the first layer incommercial aircraft because theirconstruction often involves faying stripsthat create benign air gaps in older planes.Air gaps block ultrasound. Military aircraftare usually constructed without fayingstrips; the air gap problem is less acutewith military planes. The ability of X-raybackscatter depth scans to gage thethickness of subsurface layers hassuggested its use to measure metal loss.
Commuter aircraft designed to becommissioned on the safe life basis wereexpected to fly only so many cycles.Because they were not expected to requireairframe inspections, they often haveuninspectable areas — especially in the tail.Recommissioning them to extend theirlife requires a means of inspecting theseareas. What makes them uninspectable islimited access. Adding ports forborescopes has helped solve theinspectability problem. However, X-rayvisualization requiring only single sideaccess would also be helpful.
X-ray backscatter tomography has beenintroduced for the purpose of generalinspection. Two systems that have beentried are a commercial system2,3 andanother system developed by an aviationmanufacturer.15 The former has graduallygained some acceptance and is used forthe inspections of aft pressure bulkheads
Radiographic Testing
in aircraft for corrosion and largecracks.3,16 X-ray backscatter tomography,while unable to resolve fine cracks thatmay result from fatigue corrosionprocesses, is able to visualize themechanical distortions that take place incorroding aircraft as a result ofaccumulated corrosion product.
Commercial aircraft alloys, generallyaluminum copper, are susceptible tocorrosion but fortunately most structuralmembers are made of alloys notparticularly susceptible to stress corrosionor fatigue corrosion (environmentalfatigue). This means that theenhancement of fatigue by corrosionresults almost entirely from metal loss.High strength alloys in landing gear arelikely to experience fatigue cracking inadvance of discernible corrosion damagebut these parts are easily accessed forinspection. Military aircraft are morelikely to use higher strength and thereforeless forgiving alloys. Aluminum alloyscontaining magnesium are among thosesusceptible to exfoliative corrosion, a typeof intergranular corrosion that can bevery damaging before it is noticed. Hencethe inspection requirements differ for thetwo classes of aircraft.
The corrosion products of aluminumare hydrated aluminum oxides. They arerarely crystalline and have comparativelylow densities, being roughly half water byweight.17 Electron density correlates withdensity. Furthermore, aircraft corrosionproducts in situ appear to contain manyvoids and are surprisingly difficult toisolate when parts are dismantled. Indepth profiling, artificially growncorrosion products scatter less than theparent aluminum. A similar relation issuggested by Fig. 12b when the brightnessof the dome is compared with that of thepellet. Table 1 compares some sampledensities.18 The aircraft skin corrosionproducts listed were measured in a dryand essentially void free condition.Gibbsite is not a primary aircraft corrosionproduct and is included for reference.
A characteristic of aircraft corrosion isswelling caused by the formation ofcorrosion products. Corrosion within lapsplice joints causes swelling between therivets leading to a phenomenon calledpillowing. Exfoliative corrosion causes the

MOVIE.Backscatterscan ofundamagedarea.
MOVIE.Movingsource andsensor intoplace.
MOVIE.Pillowingandcorrosion.
3RT14_Layout(379_402) 10/2/02 3:06 PM Page 397
metal itself to swell and in extreme casesburst in pocklike eruptions.
Apart from three-dimensionalbackscatter tomography, a number oftwo-dimensional techniques are in use.These have their origins in thicknessgaging and flying spot scanningtechniques. One example is the compactbackscatter gage developed by an aviationmanufacturer.19 This hand held deviceincorporates a collimated americium-241isotope source of 60 keV low level gammaradiation. Surrounding the source is ascintillator. The device also includes aposition sensor. As it is manually sweptover the surface to be examined, thelocation of the source is recorded allowingthe accumulation of a two-dimensionalimage in a manner similar to thatmentioned for mine detectors. It may beoperated in any of several modes: as athickness gage, as a two-dimensionalimager, as a profile scanner and as an edgelocator. For automated edge location, agantry is used.
To detect corrosion, the techniquedetects gaps. In forming, corrosionproducts separate metal members. Oftenthe corrosion product is leached out ordries leaving behind gaps. The presence ofsubsurface gaps reduces the count rate.When the position encoder is engaged,subsurface gaps can be mapped. Thismapping has facilitated the use of thegage to detect blistering and pitting ofaircraft skins because of corrosion. Arelated application is the detection ofwater in honeycomb. Should water invadehoneycomb, it corrodes rapidly losingstrength. The additional material in theform of trapped water has been visualizedin detail using backscatter tomographybut is more easily detected with the handheld backscatter probe. Hand heldnonimaging backscatter probes have alsobeen used for the detection ofcontraband. A gantry mounted version ofthis configuration, more directlyresembling a mine detector, has beenreported.20
One-dimensional scanning techniqueshave also been applied in the form ofdepth profiling to measuring metal lossdue to corrosion. One-dimensionalscanning has the advantage that thethickness measurement depends onthickness only and is unrelated to thematerial’s X-ray constants.21 Theintegrated backscatter techniques ofthickness measurement depend stronglyon the properties of what is beingmeasured and must be specificallycalibrated for the material. They are oflittle value when layers of differentmaterials are present simultaneously.One-dimensional scanning is best whenmaximum resolution in the thicknessdirection is needed, as discussed above.
Corrosion, PipelinePipelines for carrying petroleum aresubject to corrosion and need inspection.These pipes often have metal cladinsulating jackets. If the jackets can beremoved and the pipes can be drained forinspection, there is little problem withusing ultrasonic techniques or filmradiography using a radioisotope.However, when the pipes are full of oil,there is very little backwall reflection inultrasonic inspection and no way ofintroducing an isotope. The reflectionproblem is further aggravated whencorrosion product adheres to the interiorof the pipe.
Fortunately, corrosion much morefrequently takes place on the outside ofthe pipe. This creates a rough surfaceproblem for ultrasound. Integratedbackscatter thickness gaging is usefulwhen pipes are dry and corrosionproducts are not present. It is of littlevalue when pipes are filled with oil.Attempts to use tomographic backscatterimaging have met with only limitedsuccess because the limited photon energyavailable did not allow good imaging ofsteel. Depth profiling using the movingdetector technique discussed above alsomet with little success when pipes werefilled with oil. Similar problems are alsomet in offshore oil lines.22
An innovative approach is to usemultiple scattering within the oil toilluminate the pipe from the inside.23
Thickness may then be gaged by acalibration process or thin areas visualizedwith film or detector arrays placed on theoutside of the pipe. It should beemphasized that when iron corrosionproducts adhere to the pipe, thicknessmeasurements of any sort are unreliable.It is conceivable that the amount ofcorrosion product could be determinedthrough the 6.92 MeV resonancefluorescence of oxygen.
CompositesComposite materials formed of resins andfibers are highly dispersive to ultrasoundtransmission. Thick sections are extremelydifficult to inspect with ultrasound. Thereis also a masking effect: surface layerdisbonds prevent penetration of theultrasound and hide the extent ofdamage. Organic fiber composites areusually dielectric and so unsuitable foreddy current testing. Because mostdamage involves little change in volume,transmission radiography has difficultyfinding it. Because compton scattering isrelatively strong in low Z materials andbecause backscatter techniques are more
397Backscatter Imaging

398 Ra
3RT14_Layout(379_402) 10/2/02 3:06 PM Page 398
sensitive to small changes in density thanare transmission techniques, X-raybackscatter imaging shows considerablepromise for detecting damage incomposite structures too thick forultrasonic testing.
Commercially available backscattertomography has been evaluated incomparison with ultrasonic techniques fortesting of joints in composite materials.24
In any test technique using opticalradiation, the resolution of an incoherentor energy technique can be no better thanthe wavelength. While coherent phasebased techniques can improve on this,they are not practicable for ultrasonictesting of composites — to a large extentbecause they are composites. Reducing theultrasonic wavelength substantiallyreduces the penetration depth in thesematerials. In contrast, X-ray techniquesare not limited by their wavelengthsbecause these are extremely short. Theresolution tradeoff appears to favorbackscatter tomography for depths greaterthan several millimeters in many cases.
Besides the issue of resolution there isthe problem of shadows created by surfacedamage that hide damage underneath.This is especially important when imagingdelaminations, internal cracks in theplane of the material caused by impactdamage or faulty layup. A backscatterdepth profiler with an X,Y translationstage has shown that very tinydelaminations can be studied andcompared with ultrasonic microscopy.25
The special advantage of backscatter isthat it can resolve delaminationsunderneath other delaminations.Ultrasonic microscopy in common withother ultrasonic techniques can onlyresolve those delaminations in a directline of sight from the surface.
ConcreteCompton backscatter has proven itselfuseful as a means of measuring density.For this reason there is considerableinterest in using gamma backscatter tomeasure the density of concrete. Becausethe actual density of concrete depends onits flow during pouring, poured concretemay be nonuniform in strength. Theresults obtained from testing samples ofthe mix poured into containers may notbe representative — especially ofconsolidation in the vicinity ofreinforcement. This has motivated thedevelopment of backscatter techniques forthe purpose for which it seems wellsuited.
Another area of interest, the testing ofconcrete structures for rebar corrosion, isstill difficult by any means. In thelaboratory, X-ray measurements of
diographic Testing
concrete specimens for segregation haslong been practiced. Recently computedtomography has obviated the sectioningof samples. Where surface measurementssuffice, many of these same techniquesseem applicable in the field using X-raybackscatter techniques with the flyingspot or other2,3 configuration. Formeasuring metal loss in rebar corrosion,where the corrosion product remains inplace, experience suggests that this isoutside the reach of the present resolutionversus depth tradeoff because the scale ofmeasurement is in tens of micrometers ata depth of tenths of meters (thousandthsof an inch at a depth of inches). On theother hand, sampling the average densityof concrete may actually benefit from lowresolution because this means a largersample of the aggregate. Similar remarksalso apply to asphalt pavings.
A major factor in the strength ofconcrete is the fraction of air thatbecomes entrapped in the mix. Nucleargaging of several types is used to testconcrete largely with this problem inmind. One technique is gammabackscatter imaging. The AmericanSociety for Testing and Materials providesa standard for the testing of concrete bygamma backscatter.26 This techniquemeasures only an average density andrepresents the state of the art at the turnof the millennium. The backscattertechnique has been criticized for givingtoo much weight to top layers, for beingtoo sensitive to chemical effects and forbeing susceptible to interference fromrebars. The American Society for Testingand Materials standard attempts toaddress these issues. Similar standardshave been issued by several stategovernments. Location of rebars and voidsthrough flying spot techniques has beenproposed and is under investigation.
The evaluation of concrete is a goodplace to examine the principles ofbackscatter density measurement. Theessential idea is deceptively simple. Acesium-137 (662 keV) source is used toemit gamma photons into the concrete. Aphoton detector is placed at some smalldistance from the source. The response ofthe detector is a function of the density ofthe concrete. The function is not a simpleone, however — the geometry is simplebut the integrals involved are not. To geta qualitative picture of the processsimplifying assumptions are needed. Thesource and the detector are separated by adistance d, called the sonde length. If thepenetration is shallow relative to thesonde length, the total round trip path zfrom the source to depth to the detector isabout z + d. If the change in the solidangle of the detector with depth isneglected, an expression similar to thatgiven before is obtained:

3RT14_Layout(379_402) 10/2/02 3:06 PM Page 399
(10)
for an infinitely thick section. Let σ = c1ρ,where ρ is density and µ = c2ρ. Thenexpanding the exponential gives thefollowing result:
(11)
which is a power series in the density. Ofcourse the assumptions made are toosimple. A typical calibration formula takesthe form of Eq. 12:
(12)
When this equation is plotted it gives zerofor zero density, then reaches a peak atsome intermediate density and, followingthat, tails off to give zero for infinitedensity. Thus for any reading obtained,there are two possible densities. Thedensitometer is designed to make one ofthese unrealistic for the expectedconditions of use.
ClosingBackscatter imaging is a powerfultechnique with a growing list ofapplications. Additional publicationsdocument its capabilities.27-30
Scattering = −( )+ −( ) +
A B
A B
1 1
22
2
ρ ρ
ρ ρ
exp
exp ...
I
d
cc
c d c c d02
1
21 1 2
22
2−− ++ −−
ρ ρ
...
Scattering == −−I
dd0
2σµ
µexp( )
399Backscatter Imaging

1. International Union ofCrystallography. International Tables forX-Ray Crystallography, Vol. C:Mathematical, Physical and ChemicalTables. Dordrecht, Netherlands: KluwerAcademic Publishers (1999).
2. Kosanetzky, J.M., G. Harding,K.H. Fischer and A. Meyer. ComptonBackscatter Tomography of Low AtomicNumber Materials with the ComScanSystem. Philips Technical InformationBulletin. Hamburg, Germany: PhilipsGmbH (1988).
3. Kosanetzky, J.M. Inspection of thePressure Bulkhead of an Aircraft.ComScan Application Note. Hamburg,Germany: Philips GmbH (undated,ca. 1990).
4. Yang, C.N. “Actual Path Length ofElectrons in Foils.” Physical Review.Vol. 84. Melville, NY: AmericanPhysical Society (1951): p 599-600.
5. Archipov, G.A., E.G. Golukov,B.L. Dvinyaninov, P.P. Zol’nikov,Y.A. Kovyazin and K.A. Sukhanova.“Using Scattered Gamma Radiation forDetecting Subsurface Defects in Metal”[translation]. Defektoskopiya – TheSoviet Journal of Nondestructive Testing.No. 3. New York, NY: ConsultantsBureau (1976): p 55-60.
6. Hasenkamp, F.A. “Radiography UsingScattered Radiation.” Presented atASNT’s Conference on Innovative andAdvanced NDT Radiography[Wilmington, DE] (August 1977).
7. Strecker, H. “Scatter Imaging ofAluminum Castings Using an X-RayFan Beam and a Pinhole Camera.”Materials Evaluation. Vol. 40, No. 10.Columbus, OH: American Society forNondestructive Testing (September1982): p 1050-1056.
8. R.H. Bossi, K.D. Friddell and J.M.Nelson. “Backscatter X-Ray Imaging.”Materials Evaluation. Vol. 46, No. 11.Columbus, OH: American Society forNondestructive Testing (October1988): p 1462-1467.
9. Lawson, L. “Flux MaximizationTechniques for Compton BackscatterDepth Profilometry.” Journal of X-RayScience and Technology. Vol. 4.Amsterdam, Netherlands: IOS Press(1993): p 18-36.
10. Qiu, F., W.L. Anderson and P.S. Ong.“Deconvolution of X-Ray BackscatterDiffraction Data for NDE ofCorrosion.” Progress in QuantitativeNondestructive Evaluation. Vol. 12. NewYork, NY: Plenum (1993): p 1979-1985.
11. Stokes, J.A., K.R. Alvar, R.L. Corey,D.G. Costello, J. John, S. Kocimski,N.A. Lurie, D.D. Thayer, A.P. Trippeand J.C. Young. “Some NewApplications of Collimated PhotonScattering for NondestructiveExamination.” Nuclear Instruments andMethods. Vol. 193. Amsterdam,Netherlands: North HollandPublishing Company (1982):p 261-267.
12. Lockwood, G., S.L. Shope, J.C.Wehlberg, M.M. Selph, J.M. Jojola,B.N. Turman and J.A. Jacobs. “FieldTests of Xray Backscatter MineDetection.” Proceedings of the 2ndInternational Conference on the Detectionof Abandoned Land Mines [Edinburgh,United Kingdom, 1998]. IEEConference Publication No. 458.Stevenage, United Kingdom: Instituteof Electrical Engineers (1998):p 160-163.
13. Annis, M. and P. Bjorkholm.Shadowgraph Imaging Using Scatter andFluorescence. United States Patent4 839 913 (1989).
14. Su, Z., A. Jacobs, E.T. Dugan, J. Howleyand J. Jacobs. “Lateral MigrationRadiography, Application to LandMine Detection and Classification.”Optical Engineering. Vol. 39.Bellingham, WA: International Societyfor Optical Engineering (2000):p 2472-2479.
15. Black, G.L. Advanced Development ofBackscatter Imaging Tomography. FinalReport, WL-TR-93-4015. WrightPatterson Air Force Base, OH: Air ForceWright Laboratory (November 1995).
16. “Midcoast Purchases ComScan 160 IIX-Ray System to Complete Gulfstream580 Bulkhead Inspections.” Pressrelease. Saint Louis, MO: MidcoastAviation (May 1999).
17. “The Analysis and Composition ofAluminum Corrosion Products.” NACEPublication 60-5. Annual Conference:Corrosion. Vol. 16. Houston, TX: NACEInternational (1960): p 181t-187t.
400 Radiographic Testing
References
3RT14_Layout(379_402) 10/2/02 3:06 PM Page 400

18. Lawson, L. X-Ray Backscattering. FinalReport, National Aging AircraftResearch Program (NAARP), NDI 4,Subtask D, Radiographic Methods forCorrosion Inspection. Washington,DC: Federal Aviation Administration(2001).
19. Schulte, R.L. Two-Dimensional ImagingBackscatter Probe. United States Patent5 763 886 (1998).
20. Dunn, W.L. and A.M. Yacout.“Corrosion Detection in Aircraft byX-Ray Backscatter Methods.” AppliedRadiation and Isotopes. Vol. 53. NewYork, NY: Pergamon Press (2000):p 625-632.
21. Lawson, L. “Compton X-RayBackscatter Depth Profilometry forAircraft Corrosion Inspection.”Materials Evaluation. Vol. 53, No. 8.Columbus, OH: American Society forNondestructive Testing (August 1995):p 936-941.
22. Bridge, B. “A Theoretical FeasibilityStudy of the Use of ComptonBackscatter Gamma-Ray Tomographyfor Underwater Offshore NDT.” BritishJournal of Non-Destructive Testing.Vol. 27. Northampton, UnitedKingdom: British Institute ofNon-Destructive Testing (1985):p 357-363.
23. Ong, P.S., W.L. Anderson, B.D. Cookand R. Subramanyan. “TranscatterX-Ray Technique for the Inspection ofInsulated, Oil-Carrying Pipelines.”Review of Progress in QuantitativeNondestructive Evaluation. Vol. 12. NewYork, NY: Plenum (1993): p 295-301.
24. Roye, W. “The Reliability ofNondestructive Techniques within theField of Modern Composite Materials.”British Journal of Non-DestructiveTesting. Vol. 33, No. 11. Northampton,United Kingdom: British Institute ofNon-Destructive Testing (November1991): p 549-550.
25. Kim, N. and J. Achenbach.“Quantitative Characterization ofMultiple Delaminations in LaminatedComposites Using the ComptonBackscatter Technique.” Journal ofNondestructive Evaluation. Vol. 17. NewYork, NY: Plenum (1998): p 53-65.
26. C 1040-93 (2000), Standard TestMethods for Density of Unhardened andHardened Concrete in Place by NuclearMethods. West Conshohocken, PA:ASTM International (2001).
27. Evans, R. The Atomic Nucleus. NewYork, NY: McGraw-Hill (1955).
28. Huddleston, A. and J. Sackler.“Determination of Electron Density bythe Dual-Energy Compton ScatterMethod.” Medical Physics. Vol. 12. NewYork, NY: American Institute ofPhysics, for the American Associationof Physicists in Medicine (1985):p 13-19.
29. MacKenzie, I.K. Method and Apparatusfor Measuring Thickness of Paint Layerson Substrates Using BackscatteredX-Rays. United States Patent 5 862 199(1999).
30. Williams, B.G. Compton Scattering. NewYork, NY: McGraw Hill (1977).
401Backscatter Imaging
3RT14_Layout(379_402) 10/2/02 3:06 PM Page 401

Richard D. Albert, Digiray Corporation, Danville,California (Part 3)
Richard C. Barry, Lockheed Martin Missiles and Space,Palo Alto, California (Part 4)
Francis M. Charbonnier, McMinnville, Oregon (Part 2)
Edward H. Ruescher, Coeur d’Alene, Idaho (Part 4)
William P. Winfree, National Aeronautics and SpaceAdministration, Hampton, Virginia (Part 3)
Special RadiographicTechniques1
15C H A P T E R
3RT15_Layout(403_436) 10/14/02 3:18 PM Page 403

404 Radi
PART 1. Microfocus Radiographic Testing2
FIGURE 1. Microfocus X-ray video system.
160 kV microfocus X-ray tube head
Television camera
Imageintensifier
ZoomMagnified X-ray image
Control unit Manipulatorcontrols
Monitor
3RT15_Layout(403_436) 10/14/02 3:18 PM Page 404
Projection radiography can beaccomplished with a true microfocusX-ray source — that is, an X-ray tube orother source with an electron focal spotsmaller than 0.1 mm (0.004 in.). Inpractice, focal spots from 0.002 to0.025 mm (0.0001 to 0.001 in.) haveproven to be the most useful forradioscopic systems3 whereas spots from0.025 to 0.075 mm (0.001 to 0.003 in.)have proven satisfactory for filmtechniques using moderate magnificationlevels. Film techniques have beendocumented previously in theliterature.3-5 Successful radioscopicprojection using microfocal equipmentwas limited before the mid-1980s by acombination of low X-ray output,marginal X-ray system reliability and atotal lack of real time performancespecifications other than the qualityindicators generally required for filmradiography.5 Since then the techniquehas continued to develop in variousapplications.6-13 New imagingtechnologies using screens of amorphoussilicon, amorphous selenium and othermaterials offer a variety of solutions forindustrial real time imagery. Engineersand researchers will continue to introducedesigns and integrate new materials toadapt the technology for field use.
Projection MicrofocusRadioscopyA typical system for testing of smallerobjects contains digital radioscopiccomponents. One type of system that hasshown versatility in many applicationshas been remote video viewing systemslike those in Fig. 1. The X-ray source is a160 kV constant potential microfocus unitcapable of 300 W operation at a focal spotsize of 0.25 mm (0.01 in.). It can alsooperate continuously at 80 W with a focalspot of 0.012 mm (0.0005 in.). This meansthat the X-ray unit can operatecontinuously at 160 kV and 0.5 mA witha 12 µm (5 × 10⁻⁴ in.) focal spot size and,in this configuration, can resolve detailsas small as 25 µm (0.001 in.) at a1:1 geometric relationship withoutmagnification.
Low light level imaging camerascombined with high resolution fluors orX-ray image intensifiers and camera
ographic Testing
combinations are capable of resolving tento two line pairs per millimeter (250 to50 line pairs per inch), respectively, asmeasured by resolution test pattern, withgood contrast (better than 50 percentmodulation of the composite videosignal). Accordingly, these video systemscannot resolve the fine details (0.1 mm[0.004 in.] or less) available in the X-rayimage at 1:1 magnification. However, ifprojection magnification techniques of10× or greater are used, even the two linepair per millimeter system can resolve a20 line pair per millimeter (500 line pairper inch) test pattern as shown in Fig. 2(these images are radiographic positives).
The geometry used for the test data wasa distance from source to detector of1.50 m (60 in.) and a distance from sourceto object of 0.15 m (6.0 in.), producingthe 10× projection magnification. Theradioscopic imaging system used a 0.23 m(9.0 in.) X-ray image intensifier opticallycoupled with a 15 MHz closed circuittelevision fitted with a 25 mm (1.0 in.)vidicon image tube. With low absorbingmaterials, projection magnifications of50× or more can be obtained; 100×projections have been achieved. Thearrangement shown, or others, can alsouse deposited rare earth screens or crystalfluors if the camera is equipped with asufficiently sensitive image tube such as asilicon intensified target or an intensified
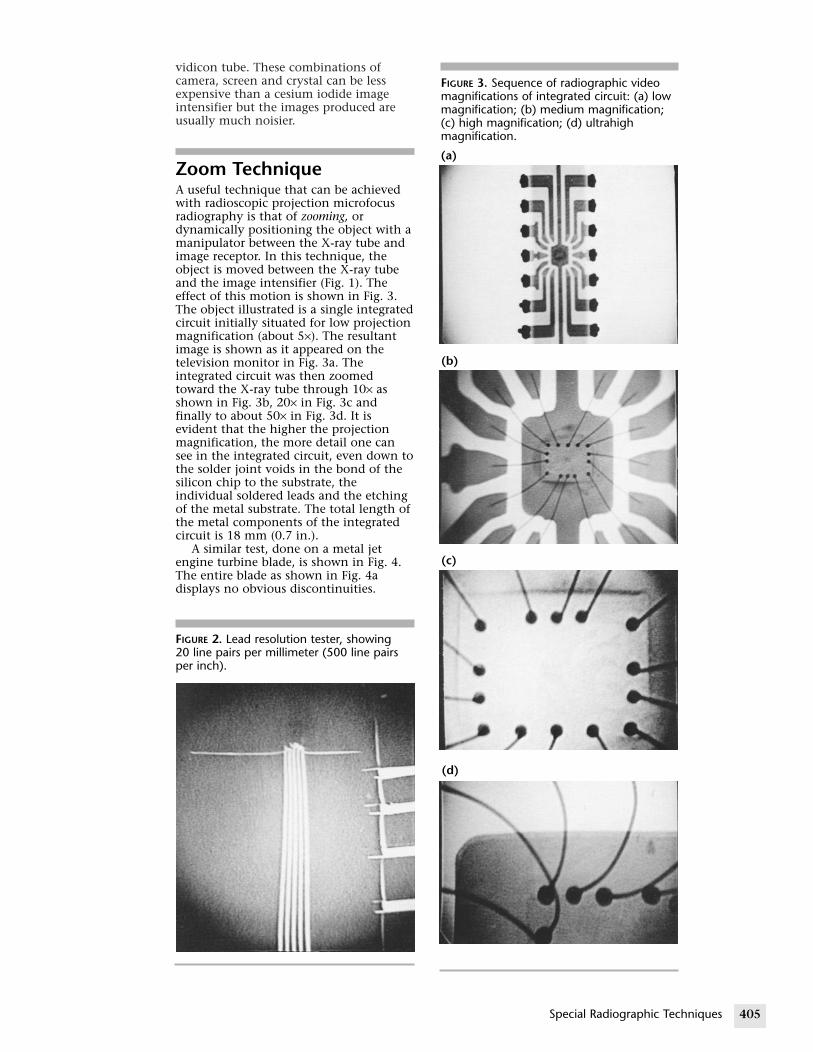
FIGURE 3. Sequence of radiographic videomagnifications of integrated circuit: (a) lowmagnification; (b) medium magnification;(c) high magnification; (d) ultrahighmagnification.
(a)
(b)
(c)
3RT15_Layout(403_436) 10/14/02 3:18 PM Page 405
vidicon tube. These combinations ofcamera, screen and crystal can be lessexpensive than a cesium iodide imageintensifier but the images produced areusually much noisier.
Zoom TechniqueA useful technique that can be achievedwith radioscopic projection microfocusradiography is that of zooming, ordynamically positioning the object with amanipulator between the X-ray tube andimage receptor. In this technique, theobject is moved between the X-ray tubeand the image intensifier (Fig. 1). Theeffect of this motion is shown in Fig. 3.The object illustrated is a single integratedcircuit initially situated for low projectionmagnification (about 5×). The resultantimage is shown as it appeared on thetelevision monitor in Fig. 3a. Theintegrated circuit was then zoomedtoward the X-ray tube through 10× asshown in Fig. 3b, 20× in Fig. 3c andfinally to about 50× in Fig. 3d. It isevident that the higher the projectionmagnification, the more detail one cansee in the integrated circuit, even down tothe solder joint voids in the bond of thesilicon chip to the substrate, theindividual soldered leads and the etchingof the metal substrate. The total length ofthe metal components of the integratedcircuit is 18 mm (0.7 in.).
A similar test, done on a metal jetengine turbine blade, is shown in Fig. 4.The entire blade as shown in Fig. 4adisplays no obvious discontinuities.
405Special Radiographic Techniques
FIGURE 2. Lead resolution tester, showing20 line pairs per millimeter (500 line pairsper inch).
(d)

406 Radiographic Testing
FIGURE 4.Sequence of radiographicmagnifications of turbine blade: (a) lowmagnification view; (b) high magnificationview of cracked metal in turbine blade;(c) high magnification view of drilling faultsin blade; (d) high magnification view of0.3 mm (0.01 in.) steel shot.
(a)
(b)
(c)
(d)
Crack
3RT15_Layout(403_436) 10/14/02 3:18 PM Page 406
However, on close inspection at about 12×magnification (Fig. 4b), a small crack atthe trailing edge of the blade is visible.Note that drilling undercuts are present atthe blade tip in Fig. 4c and that the bodyof the blade (Fig. 4d) also contains smallsteel shot sized about 0.25 mm (0.01 in.).
Another important benefit ofprojection techniques is the greatlyimproved image contrast level that resultsby eliminating all but very low anglescatter at the image plane.
Automatic DefectRecognition ApplicationsAutomatic defect recognition (ADR) isapplied to parts that must be tested forthe presence or absence of certaincomponents or for the presence orabsence of bonding agents such as solderand brazing. Automatic defect recognitionmay also be used at very high speed forobjects that can be scanned andinterrogated by intensity statistics, pixelstatistics or similar window techniques forvoids, inclusions or other anomalies withgood contrast against the surroundingmaterial. The picture in Fig. 5 shows theease of achieving a test for the presence,absence or correct location of componentsin a small armaments arming device. Thediameter of the device is about 25 mm(1.0 in.) and, when imaged at 10×
FIGURE 5. Munitions safety and armingdevice details visible with microfocusradiography.

3RT15_Layout(403_436) 10/14/02 3:18 PM Page 407
magnification, it can be tested by a seriesof window scans that give the computer asignature for the correct location andpresence of components. The speed of astandard 525 line television systemequipped with a flash analog-to-digitalconverter allows the window scans to bedone in 0.016 s, giving an automatic testcapability up to 60 parts per second.
A second example of a specimen thatlends itself to automatic defectrecognition is the small tantalumcapacitor shown in Fig. 6. This capacitor,manufactured in batches of ten thousandor more, can be tested at about 20×magnification to reveal centering of theelectrode, solder filling and voids in thehermetic seals around the top of the canand around the lead wire. Here, a videowindow is positioned in the appropriatearea and an automatic intensitycomparison (accept/reject) is made.
The third example, also manufacturedin very large quantities, is the resistorspark plug shown in Fig. 7. The spark plugis typical of parts that can be testedautomatically for homogeneity of corematerial. In this case, area measurementand intensity measurement can be used todetect voids in the resistive sealingcompound inside the ceramic insulatingshell. The magnification required foradequate resolution of voids as small as0.05 mm (0.002 in.) is about 25×.
Microfocus benefits automatic defectrecognition by greatly increasing theimage quality and reducing the bandwidth, stability and repeatability
FIGURE 6. Medium magnification of solderfaults in miniature tantalum capacitor, lessthan 6.3 mm (0.25 in.) in diameter.
tolerances required of automatic defectrecognition positioning and imagingequipment.
New systems boast geometricalmagnification up to 2400× and totalmagnification up to 7200×, offeringnanofocus technology with <900 nm(4.5 × 10⁻⁵ in.) resolution and 500 nm(2.5 × 10⁻⁵ in.) feature recognition.
High Power ApplicationsThe usefulness of a microfocus X-raysystem is greatly enhanced if the systemcan be used to penetrate dense, thickobjects as well as small, highly detailedobjects. The need for systems to penetratefairly thick specimens with enough X-rayflux to produce a useful image in thevideo system requires high outputmicrofocus equipment. Systems based onmicrofocus and nanofocus technologyhave been produced in a variety ofconfigurations using interchangeabletargets and sophisticated handlingsystems.
Limited Field of ViewVarious image intensifiers and directdigital detector technology are availableto achieve the radiographic sensitivityrequired for some applications.Amorphous silicon screen sensitivity is atleast 5× greater than conventional imageintensifier X-ray converters.
A major concern with projectionradiography is the limited field of view.For small objects this is rarely an issue. Asobjective size increases, however, thelimited field of view requires multipleexposures to obtain coverage. The numberof exposures required to cover an object
407Special Radiographic Techniques
FIGURE 7. Medium magnification view ofelectrode seal in resistor spark plug.

408
FIGURE 9. View of dental work withmicrofocus rod anode.
3RT15_Layout(403_436) 10/14/02 3:18 PM Page 408
that would just fill the detector field ofview is increased by the magnificationsquared. For example, if 3× is used thennine exposures are required to cover all ofthe original test object. Thus,optimization of the level of magnetizationto bring out detail yet limit the number ofexposure positions is an importantchallenge in projection radiographictesting.
Penetrameter CompatibilityThe limited field of view in highmagnification images also presents aproblem for penetrameters or imagequality indicators. A requirement tosimultaneously display an appropriateimage quality indicator may tax thesystem when combined with arequirement to produce an acceptablevideo and hard copy image or digitalrecord for archival purposes. Oftenstandard penetrameters are too large,covering a large fraction of the imagearea.
Special ApplicationsSome objects that do not fit in a volumeconvenient to a system’s fixed enclosurecan also be tested by using highmagnification microfocus with remotedisplays or automated video systems.
Systems have been constructed forobjects as varied as honeycomb coreaircraft parts as shown in Fig. 8 and fordental X-rays as shown in Fig. 9. Aircraftsections naturally require a very largemanipulator to properly align themicrofocus source, imager and parts toshow subtle discontinuities such ascrushed core cells. This application placessevere demands on the microfocus unit’smechanical and electrical design.
Radiographic Testing
FIGURE 8. Crushed core cells in aluminumhoneycomb.
Likewise, the dental application requires aspecial rod anode to permit interorallocation for panoramic radiography of theteeth. The results of these twoapplications show the capability ofmicrofocus to detect minute detail:cracked enamel in the teeth and thecrushed honeycomb cell ends in theaircraft structure. Also, it shows theflexibility of the equipment to adapt tospecialized requirements.
Projection Microfocus RadioscopyThe literature describes previousdevelopments in film projectionradiography and contains many highquality photographs showing resultsachieved with microfocal radiography.1-14
ClosingProjection microfocal radiography usingboth digital and film sensors is verypractical for detecting minute details inobjects ranging from tiny integratedcircuits to large steel structures having13 mm (0.5 in.) thick walls. The majorimpedance to wide acceptance ofprojection microfocus radioscopy in the1980s was the tardiness of industry inaccepting a slightly modifiedpenetrameter that can be fitted into thesmall field of view of a highly magnifiedprojection X-ray image.

PART 2. Flash Radiography15
3RT15_Layout(403_436) 10/14/02 3:18 PM Page 409
Development of FlashRadiographyFlash radiography is a special type ofradiography used to produce a single stopmotion image or a series of sequentialimages of high speed dynamicphenomena. In conventional radiography,the subject is motionless during exposure.The exposure time can therefore belengthened as necessary to obtain properdetector exposure once thetube-to-detector distance, the focal spotsize and the tube voltage have beenadjusted for optimum sharpness (lateralresolution) and contrast (depthresolution). In flash radiography, a stopmotion requirement places an upper limiton the exposure time, that is, on theduration of the X-ray pulse or theduration of X-ray detector activation. Thistime limit in turn depends on the velocityof the object being radiographed. Forinstance, millisecond exposures may beadequate to stop motion in vibrationstudies whereas submicrosecondexposures are generally required forballistic or shock wave studies andsubnanosecond exposures may berequired for extremely high speed orextremely short duration events such asnuclear fuel pellet implosion.
Real time radiography, using X-rayimage intensifiers and cameras ortelevision display systems, representsanother type of radiography that producesan essentially continuous display of adynamic event. In real time, however, theevent’s rate of motion or change must besufficiently slow to allow millisecondexposures at a video tape frame rate of60 frames per second.
Flash radiography provides timeresolution or stop motion, which is notpresent in conventional radiography. Thisadded capability, however, carries somelimitations.
1. The exposure time and radiationintensity must generally be preset andthere is no opportunity to changethem while the exposure is inprogress.
2. Relatively high voltages are required toachieve useful X-ray intensities duringa very short pulse. Hence, imagecontrast is more limited than inconventional radiography.
3. Even at high voltages, the totalradiation intensity per pulse isrelatively low, typically an incidentdose of 2.58 × 10⁻⁷ to 1.29 ×10⁻⁵ C·kg–1 (1 to 50 mrem) at 3 m(10 ft) from the X-ray source; theintensity is much less after penetrationof a thick object. Consequently veryfast combinations of sensor and screenmust be used, resulting in a loss ofsharpness and an increase in quantumnoise.
4. Because the target cannot be cooledeffectively during the submicrosecondpulse, the X-ray target must bephysically large (1 to 5 mm (0.04 to0.20 in.) to absorb the electron beamenergy. The large focal spot places anadditional limitation on the sharpnessof the radiographic image.
5. During the observation of very violentevents, such as large explosivedetonations or impact phenomena,suitable shields and a substantialphysical distance from the event mustbe used to protect the sensor fromdamage. This further degrades thecontrast and sharpness of the image.
The ability to control and optimizetechnique factors is much more limited inflash radiography than it is inconventional static radiography and thesame image quality cannot generally beattained. However, in many situationsinvolving high speed events, flashradiography represents the only availabletechnique for imaging or observation andits limitations are tolerated because of itsunique ability to freeze motion andprovide time resolved information. It ispossible to gate an X-ray detector systemto get the equivalent of a fast shutter forstop motion image acquisition. Chargecoupled device systems are available ingated configurations.
History and General PrinciplesThe general principles that govern theproduction and the imagingcharacteristics of X-rays are identical forconventional static radiography and flashradiography. Subjects have been widelydiscussed in the literature, such as theenergy and intensity of X-raybrehmsstrahlung and characteristicradiation (as a function of tube voltageand target material); X-ray penetration
409Special Radiographic Techniques

410
3RT15_Layout(403_436) 10/14/02 3:18 PM Page 410
and image contrast (as a function of tubevoltage); or the relation of imagesharpness to geometry and focal spot size.
Extensive references to flashradiography may be found in otherpublications16-19 and in the NondestructiveTesting Handbook, second edition: Vol. 3,Radiography and Radiation Testing.15
Several general observations maysuggest the range of future developmentsin and applications for flash radiography.
1. Flash radiography has been used forballistic studies to track the detonationof explosives and especially theprojection of shells and rockets.(Incidentally, because the test objectswere removed from service upondetonation, these tests were strictlyspeaking not nondestructive testing.)
2. Increases in the memory and speed ofmicroprocessors have made it possiblefor digital radiography to be used incircumstances where flash radiographywas formerly used, that is, successiveexposures at frame rates faster thanvideo. Digital radiography obviates themechanical systems of switches thatwere necessary for film flashradiography.
3. Some flash radiography research hasnot been released for publicationbecause of its military sponsorship.
4. The quantity of published researchstudies on flash radiography hassharply diminished since 1990.
Means of X-Ray GenerationIn X-ray tubes for conventionalradiography, a thermionic cathode is usedto produce an electron beam that isaccelerated and focused to strike a smallspot on a metal plane target. This basicmechanism of generating X-rays byimpact of high energy electrons on ametal target is also used in flashradiography. However, because thermioniccathodes cannot produce the very highpeak current densities and total currentsrequired for flash radiography, differentelectron sources must be used. Thesesources do not allow effective focusing ofthe electron beam, so different X-ray tubeand target geometries must be designedfor achieving the necessary confined focalspot.Gas Discharge Tubes. In early designs, gasdischarges were used to accelerate electronsinto the target and produce X-rays. Gasdischarges can produce very large electroncurrents. However, electrons lose energyby collision or ionization and the averageenergy of the electrons striking the targetis considerably less than the voltageapplied to the tube; a severe loss in X-raygenerating efficiency and X-ray hardnessis the result. For these reasons gas
Radiographic Testing
discharge tubes are no longer used in flashX-ray systems.Field Emission. Field emission is a processin which electrons are emitted into highvacuum by applying an extremely highelectric field (30 to 100 MV·cm–1) at thesurface of a cold metal cathode, generallymade of tungsten. The cathode iselectrolytically etched into a very sharpneedle so that the high electric fieldnecessary for emission can beconcentrated at the tip of the needle andcan be produced at a reasonable appliedvoltage. The electric field applied at thecathode surface thins and lowers thepotential energy barrier at the surface and,when the applied electric field issufficiently high, electrons at or slightlybelow fermi energy can tunnel throughthe surface energy barrier with aprobability (described by quantummechanical theory) that increasesexponentially with field strengthVacuum Discharges. Vacuum dischargesoccur in a residual gas pressure lowenough so that the electron mean freepath is many times larger than the gapspacing between the electrodes; underthese conditions, the avalanchebreakdown and collisions of electronswith gas molecules are essentiallyeliminated. In a vacuum discharge tube, afinite time is required for the discharge todevelop even though the dischargeinitiation time can be short at highvoltages and can be affected by properchoice of voltage, pulse duration and gapspacing. Once initiated, a vacuumdischarge is terminated only by removingthe voltage applied to the tube and thereis then a finite recovery time required forthe plasma to recombine and the metalvapor in the gap to condense anddisappear. This recovery time, whichdepends on prior discharge current andenergy as well as gap spacing andelectrode material, set the minimum timeinterval between successive X-ray pulsesfrom a given discharge tube; it is typicallyon the order of microseconds.
Flash X-Ray TubesFlash X-ray tube designs are based onbasic mechanisms and principles.Figure 10 illustrates a typical design for ahigh vacuum sealed field emission flashX-ray tube, operating at relatively highvoltages (100 to 2000 kV).
The simple sealed tube of Fig. 10 uses amultiple needle field emission cathodeconsisting of six linear arrays surroundinga conical target made of tungsten. Thefocal spot and resolution characteristics ofthis flash X-ray source have beendiscussed.20 The sharpness of the X-rayimage is determined by the base diameterof the cone, the effective focal spot

FIGURE 1tube.
An
High voltareentr
cav
3RT15_Layout(403_436) 10/14/02 3:18 PM Page 411
diameter being about two thirds of thecone base diameter. The pulsed heatabsorption capability of the target isproportional to the lateral area of thecone (and also to the electron range intothe target).
For a given resolution, the X-rayintensity can be increased by using a conewith a small half angle θ. If θ becomes toosmall, X-rays are reabsorbed more heavilyin the target and the effective X-ray beamcoverage is reduced. In practice, anominal θ value of seven degrees is foundto be about optimum for flashradiography. The maximum X-rayintensity increases very rapidly withincreasing voltage, both because theelectron range increases rapidly withvoltage and because the efficiency ofX-ray generation also increases withvoltage; hence it is difficult to achievelarge X-ray intensities at low voltageswithout excessive evaporation and rapiddestruction of the target.
Pulsed High Voltage Sources forFlash RadiographyA number of techniques have been usedto generate the pulsed high voltage and toaccommodate the high current, lowimpedance characteristics of flash X-raytubes.
The oldest and simplest technique is tocharge a capacitor to a high voltage, thendischarge the capacitor through a lowimpedance pressurized gas triggered sparkgap. This technique is limited to 100 to150 kV, in practice.
Capacitive energy storage at relativelylow voltage (15 to 100 kV) followed byvoltage multiplication is routinely used togenerate high voltages. The voltagemultiplication is achieved by means of apulse transformer of a marx-surgegenerator. Pulse transformers are suitablefor output voltages up to 400 kV.Marx-surge generators can be used over abroad range of voltages, up to severalmegavolts, and have been commonlyused in flash X-ray systems.Marx-Surge Generators. In the simplestform of a marx-surge generator, a bank ofN capacitors (of individual capacitance C)is charged in parallel to a direct current
0. High voltage, sealed, field emission, flash X-ray
ode target contactField emissioncathode
geantity
X-raywindow
X-ray target
voltage V0 (typically 15 to 100 kV) thendischarged in series by means of crossconnected spark gaps. The open circuitoutput voltage is then NV0. The outputvoltage waveform into a resistive load R isan exponential:
(1)
where T is trigger voltage.For flash radiography applications, the
capacitor in each stage of the marx-surgegenerator is replaced by a pulse formingnetwork to produce a more effective,more nearly rectangular outputwaveform.15
Blumlein Line Generators. The rise time ofthe voltage pulses delivered by amarx-surge generator is not easily reducedbelow 5 ns. The difficulty in designing adevice with sufficiently low inductanceputs a lower limit of about 15 ns on theX-ray pulse length. The design also limitsthe maximum current intensity and theminimum characteristic impedance of thepulser, particularly for high voltagesystems that contain a large number ofstages. For these reasons, more complexhigh voltage generating circuits are usedfor applications that require output pulsesof very short duration, very high currentor very low impedance. The blumlein linegenerator is pulse charged by a marx-surgegenerator. A blumlein generator generallyconsists of three coaxial cylinders thatbehave as two transmission linesconnected through a resistive load (theflash X-ray tube). The blumlein and thetube are designed to have approximatelyequal impedance, about 60 Ω, yielding a600 kV, 10000 A, 3 ns electron or X-raypulse.Electron Accelerators. Linear acceleratorsare sometimes used to produce very highelectron energies for flash radiographicapplications requiring moderately short(about 0.1 to 10 µs) repetitive pulses ofvery high energy X-rays. A unique designfor high energy flash radiography system,built in 1965, used three large cylindricalcavities, resonant at 50 MHz, arranged inseries and excited by input radiofrequencyenergy at 50 MHz. Standing wavesdeveloped and increased in amplitudeduring the excitation period. When thestanding wave amplitude reaches itsmaximum (about 5 MV·cm–1 axial field),a high current pulsed electron gunproduced an intense, relatively low energy(500 keV) electron beam. The beam wasinjected into the radio frequency cavitiesand accelerated to 27 MV. The emergingelectron beam was focused onto atransmission X-ray target, producing avery high energy X-ray source only 1 mm(0.04 in.) in diameter. The system was
V NVNTRC
= −
o exp
411Special Radiographic Techniques

412
3RT15_Layout(403_436) 10/14/02 3:19 PM Page 412
suited for flash radiographic applicationsdemanding very high penetration andhigh image quality.Commercial Flash X-Ray Systems. Thedifferent available outputs provideadditional flexibility and imagingcapability. Soft X-ray output, achievedwith special flash X-ray tubes using a thinberyllium or polyester film window,allows much higher X-ray dose andcontrast. Soft X-rays are useful in theobservation of low density media or inflash X-ray diffraction studies.Others. A number of other flash X-raysystems have also been designed, builtand used, particularly for very highpenetration studies, for a variety ofballistic and diffraction applications,16
and for soft X-ray and characteristic X-ray
gest
InInwanfi60inop
wraAcaTh
Radiographic Testing
FIGURE 11. Application of high voltage slow vprocess. Sequential radiographs of filling of m(c) third; (d) fourth, cavities filled.
(a)
(b)
neration for flash X-ray diffractionudies.
dustrial Applicationsdustrial applications are not yet asidespread as applications to ballisticsd detonics. A dynamic study of liquid
lled high voltage power switches (10 kV,0 A) was made to investigate arcitiation and quenching during switchening.Arc welding and electron beam
elding21 have also been studied by flashdiography and flash cineradiography.nother application is to the metalsting process, as illustrated in Fig. 11.is sequence of four radiographs was
ideo flash radiography system to study castingulticavity shell mold: (a) first image; (b) second;
(c)
(d)

3RT15_Layout(403_436) 10/14/02 3:19 PM Page 413
obtained with a 600 kV slowcineradiographic system. The fourradiographs illustrate successful phasesduring a test pour of a multiple cavityshell mold for steel fittings and shows thegating characteristics as well as castingdiscontinuities due to premature partialfilling of the upper cavities.
High voltage cine flash radiography hasalso been used successfully to studydynamic conditions inside gas turbinesand jet engines.18 The main purpose ofsuch studies is to obtain accurateengineering data on clearances betweenthe rotating and static parts of gasturbines, at all steady state or transientrunning conditions, between cold staticand maximum power. A 2 MV flash X-raysystem capable of delivering five pulses in15 s was used in early experiments onlarge jet engines. Better results weresubsequently obtained using a linearaccelerator as the pulsed X-ray source foran X-ray image intensifier coupled to a16 mm rotating prism camera for imagerecording.
Nuclear TechnologyHigh speed radiography has been appliedto nuclear technology, particularly to theimaging of stainless steel clad fuelelements. Another important applicationis the investigation of interactions of fuelwith coolant in safety studies of liquidsodium cooled fast breeder reactors. Botha flash X-ray system (250 to 350 kV peak,1000 pulses per second) and a directcurrent X-ray source (420 kV, 15 mA) havebeen used in these studies. The imagingsystem consists of an X-ray imageintensifier (gated when used with thedirect current X-ray source) and a 16 mmpin registered framing camera or rotatingprism camera. Both systems haveproduced useful cineradiographs ofsimulated safety failures (fuel coolantinteractions) in steel pipe test sections.
X-Ray Backlighting for PelletImplosion StudiesOne of the elements of controlled nuclearfusion research involves the study ofpellet implosion to produce high density,high temperature plasmas. The pellets aresmall hollow glass, plastic or metalspheres filled with a deuterium tritium gasmixture under pressure. Bombardment byintense, short pulse ion beams or, morecommonly, laser beams causes the pelletto implode, generating the very highdensities, temperatures and pressuresrequired to initiate thermonuclear fusionreactions. Flash radiography of implodingpellets, using an external X-ray source(backlighting), is exceptionally difficultbecause it requires extremely short pulses,very precise timing and very high
resolution. A three-channel high voltagesystem meets these requirements and hasbeen used successfully for flashradiography of high density metal pellets.
Very low energy X-rays are required forglass and plastic pellets and it is possibleto produce the necessary flash X-raysource characteristics by bombarding ametal target with a very short duration,very high power, sharply focused laserbeam; this evaporates the target andproduces a plasma that radiates X-rays.The X-rays emitted are predominantlyL shell characteristic radiation from thetarget and the X-ray energy is therebycontrolled through choice of the targetmaterial. By this means a 0.1 mm(0.004 in.), 1.5 keV, 50 ps duration plasmasource has been produced18 bybombarding a brass target with a 50 ps,1 J glass laser pulsed beam. The techniquewas improved by using two separate laserbombarded targets (copper andmolybdenum) to produce two X-raymicrosources 250 ps apart. By using asmall copper wire instead of a planetarget, a point X-ray source only 6 µm(2.4 × 10⁻⁴ in.) in diameter was produced.
Flash X-Ray DiffractionX-rays are used to record diffractionpatterns that yield detailed informationabout the crystal structure, texture,residual stresses and discontinuitydistribution of various materials. X-raydiffraction studies normally use finebeams of low energy, continuous ormonochromatic X-rays and require thelong exposure times that restrict suchstudies to static situations. However, it isof great interest to obtain informationabout the crystal structure of materialsunder very high dynamic stresses or otherrapidly changing conditions that couldproduce significant changes in thecrystalline state. Intensive efforts havebeen made to produce the very highintensity, short pulse, low energy X-raybeams required for flash X-ray diffractionwith very short exposure times.
ClosingIn can be said, in summary, thatsuccessful flash radiography demands thegood practices of conventionalradiography as well as its own specializedpractices (triggering and protection frompotentially violent test environments, forexample).
Flash X-ray equipment and techniquesare available for obtaining single orsequential images. A variety of flash X-raygenerators have been built to providedifferent degrees of penetration, intensity,portability and pulse duration.
413Special Radiographic Techniques

414
PART 3. Reversed Geometry Radiography withScanning Source22,23
FIGURE 1(a) convradiogra
(a)
PoiX-r
sour
(b)
Largescanning
X-raysource
3RT15_Layout(403_436) 10/14/02 3:19 PM Page 414
Reversed GeometrySystemA simplified schematic in Fig. 12compares the reversed geometry system toa conventional radiographic setup. Thereversed geometry, scanning sourceradiographic system uses a large,electronically raster scanning X-ray sourcepositioned near the object to be testedand a discrete detector for videoradiographic imaging of a structure. Alarge portion of X-ray scatter (noise)bypasses the small, distant point sensors,thus improving the signal-to-noise ratio.A computer controls both the X-ray tubeand the pixel-by-pixel imageconstruction.24,25
The following description is given bythe patent for the technique:“Radiographic images of high definitionand clarity are produced quickly and with
Radiographic Testing
2. Comparison of radiographic test setups:entional radiography; (b) scanning sourcephy with reversed geometry.
Sample
Scattered radiation
ntayce
Pointdetector
X-ray film orimage intensifier
Sample
Scattered radiation
Scatteredradiation
reduced radiation exposure of the subjectby using a scanning X-ray source in whicha moving point source of X-rays is createdby sweeping an electron beam in a rasterpattern on a broad anode. A radiationdetector having a very small radiationsensitive area is situated on the oppositeside of the subject from the source. Theoutput of the detector controls electronbeam intensity within a cathode ray typedisplay tube wherein the raster pattern issynchronized with that of the X-raysource to produce an image of internalstructure of the subject. In someembodiments of the invention, the smallradiation detector is mounted on a probesuitable for insertion into internal regionsof a living body or into recesses inmechanical structure to be examined.Stereo images may be produced by usingtwo spaced apart detectors controlling twoseparate images directed to separate eyesof the observer or by using a singledetector alternately controlling each ofthe two images while the raster pattern atthe source is alternately shifted betweentwo at least partially separate areas of theanode. As the detector output is anelectronic signal, the image data may bestored on magnetic tape or the like andmay also be readily processed byelectronic techniques for such purposes asimage enhancement and addition,subtraction or superimposition of images.Automatic brightness control may also beprovided to produce uniform contrast indifferent areas of the image where thecorresponding different regions of thesubject have different average densities.26
Reversed geometry has several possibleadvantages compared to conventionalradiography. First, the X-ray detector canbe miniaturized and easily positionedinside a complex structure (such as anaircraft wing) enabling images of eachsurface of the structure to be obtainedseparately. Second, multiple detectorsenable the simultaneous acquisition ofdata from several different perspectiveswithout moving the structure or themeasurement system. Data from severaldifferent perspectives provide a means forlocating the position of discontinuitiesand enhance separation of features at thesurface from features inside the structure.Finally, the amount of secondary scatteredradiation contributing to the noise in theradiograph is reduced compared to

TABLE 1. Features of reversed geometry, scanning sourcesystem.
Feature Specification
SystemOperating current 0 to 0.5 mA, selectablePower 120 V, 60 Hz, 20 ASpeed ≤ 4 s (512 to 2048 bits, selectable)
DetectorType sodium iodide (> 99 percent efficient)Diameter 25 mm (1 in.)Length 100 mm (4 in.)Extender diameter 3.2 mm (0.125 in.) diameter
ImageArea magnification ×1 to ×100Focal spot size < 25 µm (0.001 in.)Linear imaging 256 to 2000 linesOverall field of view 75 to 250 mm (3 to 10 in.)Off-axis alignment ± 0.7854 rad (± 45 degrees)Penetrameter power 2-2T for aluminum
ResolutionContrast resolution 0.5 percent for plastics and composites;
0.3 percent for 4.19 mm (0.165 in.) thick aluminum
Contrast control ×1 to ×1000 signal gainImage resolution 1 to 80 pixels per millimeter
(25 to 2000 pixels per inch)Spatial resolution 4.5 to 10 line pairs per millimeter
3RT15_Layout(403_436) 10/14/02 3:19 PM Page 415
conventional radiography. This simplifiesthe conversion of the radiographs toquantitative images of the integratedmaterial density along the ray pathsbetween the source and the detector.
The intensity of the X-ray flux isrecorded with a relatively small thalliumactivated sodium iodide scintillationdetector coupled to a photomultipliertube. The photomultiplier tube output isamplified and offset before being digitizedby a data acquisition computer. Thisenables optimizing the dynamic range ofthe digitizer to the dynamic range of theacquired signal. A detector is placed0.81 m (32 in.) above the center of thetube. Seven other detectors are placed atpositions around the tube at distancesvarying from 290 to 380 mm (11 to15 in.) from the center and at a height of360 mm (14 in.) above the surface of thetube. The detectors enable the acquisitionof three dimensional data about aspecimen. The data acquisition computeris connected to all eight detectors througha multiplexer enabling electronicswitching between detectors.
The specimen of interest is placed ontop of the X-ray source. This is theopposite of conventional radiographywhere the object is placed near animaging detector and the source isapproximately a point source. The dataacquisition computer also controls therastering of the electron beam. Byacquiring the output of the detector as afunction of electron beam position, thecomputer is able to generate an electronicimage of the specimen of interest.
Technique SetupSee Table 1 lists features of the reversedgeometry, scanning source system. Themost unique feature of the system is thelarge scanning X-ray source with a targetdiameter of about 250 mm (10 in.). TheX-ray source operates in a manner similarto a video monitor. An electron beam iselectronically rastered over the innersurface of the front of the X-ray source.Where the electrons collide with the innersurface of the tube, X-rays are generated.By electronically scanning the electronbeam, the instantaneous position of theX-ray source scans an area of the frontsurface of the tube. The size and locationof the scanned region is user definableand varies from the whole front surface toan area of about 50 × 50 mm(2.0 × 2.0 in.). The repetition rate of thescan is user definable, variable from0.25 to 16 s. The acceleration voltage isalso user definable from 55 to 160 kVwith an electron beam current up toabout 0.5 mA. The diameter of theelectron beam spot at the inner surface ofthe tube is about 25 µm (0.001 in.).
Applications
Crack Detection23
An aircraft manufacturer conducted aseries of experiments, ranging fromimaging crack simulations with thelaboratory system to imaging real fatiguecracks under fastener heads with theportable system in the maintenancehangar. In May 1998, this systemexamined airliner aircraft wings in ahangar. The array of eight detectors weresuspended about 0.61 m (24 in.) abovethe aircraft wing and the 250 mm (10 in.)diameter scanning X-ray tube rested on amobile arm adjacent to the lower surfaceof the wing.
Another reversed geometry systemcapability is the use of eight simultaneousdetectors in conjunction withtomographic software. This enables theresolution of discrete layers within thestructure with a single exposure and nomechanical motion. The X-ray system ison a rolling platform with variable height.The platform supports the X-ray sourceand the articulating arm supports theX-ray detectors. Each X-ray detectorconsists of eight scintillators mounted ona photomultiplier tube. Primary X-rays
415Special Radiographic Techniques
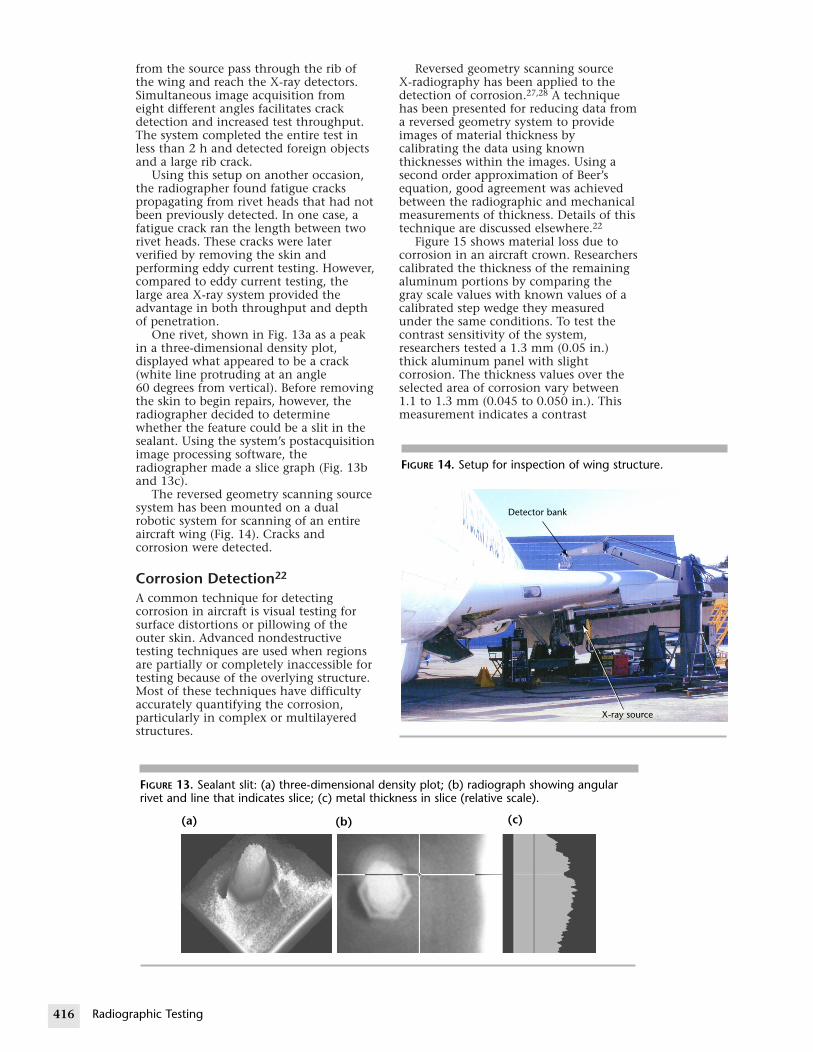
416
FIGURE 14. Setup for inspection of wing structure.
Detector bank
X-ray source
3RT15_Layout(403_436) 10/14/02 3:19 PM Page 416
from the source pass through the rib ofthe wing and reach the X-ray detectors.Simultaneous image acquisition fromeight different angles facilitates crackdetection and increased test throughput.The system completed the entire test inless than 2 h and detected foreign objectsand a large rib crack.
Using this setup on another occasion,the radiographer found fatigue crackspropagating from rivet heads that had notbeen previously detected. In one case, afatigue crack ran the length between tworivet heads. These cracks were laterverified by removing the skin andperforming eddy current testing. However,compared to eddy current testing, thelarge area X-ray system provided theadvantage in both throughput and depthof penetration.
One rivet, shown in Fig. 13a as a peakin a three-dimensional density plot,displayed what appeared to be a crack(white line protruding at an angle60 degrees from vertical). Before removingthe skin to begin repairs, however, theradiographer decided to determinewhether the feature could be a slit in thesealant. Using the system’s postacquisitionimage processing software, theradiographer made a slice graph (Fig. 13band 13c).
The reversed geometry scanning sourcesystem has been mounted on a dualrobotic system for scanning of an entireaircraft wing (Fig. 14). Cracks andcorrosion were detected.
Corrosion Detection22
A common technique for detectingcorrosion in aircraft is visual testing forsurface distortions or pillowing of theouter skin. Advanced nondestructivetesting techniques are used when regionsare partially or completely inaccessible fortesting because of the overlying structure.Most of these techniques have difficultyaccurately quantifying the corrosion,particularly in complex or multilayeredstructures.
Radiographic Testing
FIGURE 13. Sealant slit: (a) three-dimensionrivet and line that indicates slice; (c) meta
(a) (b)
Reversed geometry scanning sourceX-radiography has been applied to thedetection of corrosion.27,28 A techniquehas been presented for reducing data froma reversed geometry system to provideimages of material thickness bycalibrating the data using knownthicknesses within the images. Using asecond order approximation of Beer’sequation, good agreement was achievedbetween the radiographic and mechanicalmeasurements of thickness. Details of thistechnique are discussed elsewhere.22
Figure 15 shows material loss due tocorrosion in an aircraft crown. Researcherscalibrated the thickness of the remainingaluminum portions by comparing thegray scale values with known values of acalibrated step wedge they measuredunder the same conditions. To test thecontrast sensitivity of the system,researchers tested a 1.3 mm (0.05 in.)thick aluminum panel with slightcorrosion. The thickness values over theselected area of corrosion vary between1.1 to 1.3 mm (0.045 to 0.050 in.). Thismeasurement indicates a contrast
al density plot; (b) radiograph showing angularl thickness in slice (relative scale).
(c)

3RT15_Layout(403_436) 10/14/02 3:19 PM Page 417
sensitivity of about two percent formaterial loss resulting from corrosion.
Detection and quantification ofcorrosion in real aircraft specimens isconsiderably more difficult thanquantifying variations in thickness in afabricated specimen. The image of atypical lap joint specimen in Fig 15aillustrates this difficulty. The specimen,obtained from an aircraft fuselage, hasseveral different thicknesses. Linearscaling of the image contrast to enable thevisualization of the variable thicknesses inthe specimen masks the slight variationresulting from the corrosion in thesample. Improved visualization of thecorrosion is obtained by performing alinear stretch of the contrast, which scalesthe image to enable visualization of thecorrosion for a single thickness of thespecimen.
An alternate technique that enables therapid visualization of corrosion in aspecimen with multiple thicknesses ishistogram equalization. Histogram
eqprhqu
illcoaraprainFothcothstvofithmspthviinar
FIGURE 15. Enhancement of corrosion data:(a) scaled radiographic image;(b) three-dimensional rendering fromdetector of reversed geometry, scanningsource system.
(a)
(b)
ualization gives the best gray scaleesentation of the corrosion. Because
istogram equalization is nonlinear, theantitative nature of the data is lost.Examination of the images in Fig. 15
ustrates a difficulty in quantification ofrrosion in real specimens. The corrodedeas of the specimen have thepearance of having more materialther than less. This can be readily seen an alternate representation of the data.llowing calibration of the data, aree-dimensional volume can benstructed by assuming a flat bottom fore sample and a voidless, homogeneousructure. The vertical voxels of thelume representation are filled with
xed values until the projection throughe volume representation is equal to theeasured projection through theecimen. This reconstructed volume isen displayed with a volumesualization algorithm. For the specimen Fig. 15a, the results of this proceduree shown in Fig. 15b. The region of
corrosion appears as an increase in theapparent thickness of the material.
The apparent increase in materialthickness is a result of the radiographicintensities being a function of the totalmass along the ray path between thesource and the detector. As the materialcorrodes, the aluminum of the structurecombines with other elements to producecorrosion byproducts. These byproductsare sometimes trapped within thestructure. The net mass along the ray pathis the mass of the residual material plusthe mass of the byproducts. This increasein net mass results in an increase ratherthan a decrease in the attenuation of theX-rays, which gives the appearance of anincrease in material thickness rather thana decrease. The profile of thickness can beplotted in menu generated charts alonguser selectable lines.
X-ray tomographic images help toprovide insight into the nature ofcorrosion and the difficulty of quantifyingit with radiographic techniques. X-raytomography enables viewing crosssections of the material, withoutdisturbing either the delicate structure ofthe residual material or the location of thebyproducts. The nature of corrosion, asillustrated in these cross sections, makes itdifficult to quantify with any technique.However, the increase in apparentthickness is a good indicator as to thepresence of corrosion.
The detectability of the corrosion withradiography can be further improved withdigital laminography. Laminography isperformed by imaging the specimen fromseveral different angles. These images areall back projected and summed to yield animage that highlights the information at aselected depth in the measurement
417Special Radiographic Techniques

418
3RT15_Layout(403_436) 10/14/02 3:19 PM Page 418
volume. This is advantageous forincreasing the detectability of corrosionthat exists at a known location — forexample, at the interface between twolayers. The reversed geometry system isideally suited to digital laminography asthe source position is electronically madeto scan a selected area. Several detectorscollect data at different locations aroundthe specimen to provide the differentangles required for laminography.
ClosingA reversed geometry portable system hasthe capability to detect fatigue cracks inaircraft structure. The system also candistinguish between cracks, which reducethe base level thickness, and irregularitiesin sealant, which do not.
The reversed geometry technique canpresent images of the effects of corrosionon a real aircraft specimen. Because of thenature of the corrosion, the radiographgives the appearance of increasedthickness in the corroded area, makingquantification of the extent of corrosiondifficult. Using data from the eightdetectors laminographic imagereconstruction of planes of interest withinthe lap joint can increase the detectabilityof the corrosion effects. Digital removal ofsurface features from images of interiorplanes of interest can improve corrosionboundary definition.
Radiographic Testing

PART 4. Stereo Radiography1
3RT15_Layout(403_436) 10/14/02 3:19 PM Page 419
BackgroundRadiographic discontinuity depthdetermination is important becausefracture mechanics helps determineproduct serviceability. Fracture mechanicsuses information on the character, size,shape and location of discontinuities. Thepresent discussion deals with (1) parallaxtechniques for determining discontinuitydepth in a part or weldment1,29 and(2) stereo imaging, which takes advantageof human binocular vision.30
Stereo radiography is a radiographictechnique using two separate radiographicimages with a source shift exactly parallelto the imaging plane; the movement ofthe source between exposures is about thesame as the distance between pupils ofhuman eyes. When the processed imagesare viewed, the right eye sees one imageand the left eye sees the other. The braincombines the images, giving theimpression of a three-dimensionalradiograph. The possibilities of stereoradiographs has intrigued investigators formany years.30-32 Advances inmicroprocessor technology andconcurrent software development in the1990s have widened the range ofapplications for which three-dimensionalimaging is practical.33-36
Purpose of Stereo RadiographicTesting30
The main purposes of stereo radiographictesting are (1) to provide depthinformation and (2) to aid in theinterpretation of complex radiographicimages.
1. As with binocular vision, a pair ofradiographic images permits theviewer to estimate the relativedistances from a reference point tovarious objects of interest in the fieldof view. Triangulation provides precisedepth measurements.
2. Radiographs of complex objects areoften difficult to interpret when theimages of many features aresuperimposed. Stereo radiographictesting lets the viewer separateoverlapping features according to theirdepths, greatly improving theprobability that each item will beproperly identified and evaluated.
mobindysttediititca
PPaprwthcoth
soprbapothm
ofprtoraco
SAforaheqthdire
thredi(2anfotrdise
th
Innovations in radioscopy andicroprocessing have made it possible totain images instantly and to store themdefinitely. These innovations have madenamic imaging practical. Dynamicereo imaging entails movement of thest piece or sensors, making it easier tostinguish overlapping items and making possible to see around or behind someems. The detection of contraband inrgo containers is one application.
arallax Principlerallax techniques are based on theinciple that from two exposures madeith different positions of the X-ray tube,e depth of the discontinuity ismputed from the shift of the shadow ofe discontinuity.30
The shadows of objects closest to theurce will have the largest shadowojection. An object close to theckground does not appear to changesition whereas an object farther frome background appears to shift aoderate amount.The amount of left or right movement
the projected shadows is directlyoportional to the closeness of the object the light source. Visual anddiographic parallax principles arempared in Fig. 16.
imilar Triangle Relationship similar triangle relationship is the basisr most of the calculations used in thediographic parallax techniques: theeight D divided by the height T – D isual to base B divided by base A. All ofe radiographic parallax techniquesscussed here maintain this fundamentallationship.Radiographic parallax techniques use
ree variations of the similar trianglelationship. These three techniques arescussed next: (1) the rigid formula,) the single marker approximate formulad (2) the double marker approximate
rmula (Fig. 17). The data for the similariangle relationship are derived from thesplacement of the image from thensor plane.The sensor plane is used rather than
e depth below the surface, for it is not
419Special Radiographic Techniques

420
3RT15_Layout(403_436) 10/14/02 3:19 PM Page 420
always possible to have the sensor incontact with the surface of the part.
In addition to problems encountered incalculating the object’s height above thesensor surface, certain orientation ordiscontinuity geometries can causemeasurement errors; these errors are notdue to failure of the technique but tofailure of the radiographer to recognizeand compensate for variations in objectdisplacement.
Rigid FormulaFigure 17a shows the rigid formulaparallax technique, which is also definedin Eqs. 2 to 4.
(2)
(3)
(4)
and where A is the source’s shift betweenexposures; B is the parallax or image shiftof the discontinuity; D is the distance ofthe discontinuity above the image plane;K is the distance from the test object tothe sensor plane (assuming those surfacesare parallel); and T is the distance fromsource to sensor.30,31
By measuring or knowing the firstthree parameters, the fourth parametercan be calculated based on the similar
H D KBT
A BKs = − =
+−
DBT
A B=
+
DT D
BA−
=
Radiographic Testing
FIGURE 16. Comparison of visual and radiogra
Visualposition 1
Visualposition 2
Dis
Marker backgro
Object close tobackground does n
appear to change po
Object farther frobackground appear
shift moderately
Object farthest frobackground appea
to shift most
triangle relationship. With the rigidparallax technique, no markers arenecessary. However, the part thickness,the distance from source to sensor and thesource shift must be accurately known. Inaddition to knowing these measurements,the image of the discontinuity must bepresent on a twice exposed radiograph.
Normally, this radiograph is made by(1) calculating the necessary exposuretime; (2) making one part of theradiograph with half of this exposuretime; (3) moving the source parallel to(and a specified distance along) the sensorplane; and then (4) making the secondhalf of the exposure. The rigid parallaxtechnique can be used when the sensorsurface is placed in contact with the partbottom and when there are no limitationson the height of the source above thesensor plane. It is important to have asignificantly large ratio of (1) the distancefrom source to sensor over (2) the distancefrom sensor side of object to sensor whenusing the rigid parallax technique.
Three other important points shouldbe remembered when using rigid formulaparallax radiography.
1. The fundamental relationship betweendiscontinuity height and image shift isnonlinear.
2. As the discontinuity heightapproaches the distance from sourceto sensor, the image shift increaseswithout limit.
3. When the discontinuity height issmall compared to the distance fromsource to sensor, the curve of accuracyapproaches linearity.
phic parallax.
Sourceposition 1
Sourceposition 2
Markercontinuity
undSensorplane
otsition
ms to
mrs

FIGURE(c) dou
(a)
T –
(b)
So
D
3RT15_Layout(403_436) 10/14/02 3:19 PM Page 421
Single MarkerApproximate FormulaWhen the part thickness anddiscontinuity height are small relative tothe distance from source to sensor, therelationship between B and D approacheslinearity and the height of thediscontinuity above the sensor planebecomes approximately proportional to itsparallax. A proportional relationshipoffers certain advantages in that anartificial discontinuity or marker can beplaced on the source side of an object asshown in Fig. 17b.
The height of the discontinuity can beestimated or calculated by comparing the
17. Stereo technique diagrams: (a) rigid formula parallable marker approximate technique.
Source 1
A
Source 2
D
T
DHs
K
B
H
Sensor plane
urce 1
A
Source 2
iscontinuityMarker
HHs
K
B1 Sensor planeB2
shift of its radiographic image with that ofthe marker. For example, if the singlemarker shift is twice the shift of thediscontinuity, this indicates that thediscontinuity is about in the middle ofthe wall. This parallax techniqueeliminates the need for detailedmeasurement of the part thickness, of thedistance from source to sensor and of thesource shift as required by the rigidtechnique.
With distances from source to sensor atleast ten times greater than the partthicknesses, maximum errors on the orderof three percent (of the part thicknesses)can be expected. These errors are based onthe premise that the sensor is in intimatecontact with the part being radiographed.
421Special Radiographic Techniques
x technique; (b) single marker approximate technique;
LegendA = source shiftB = indication shift in imageD = distance from discontinuity to sensor planeK = distance from test object to sensor planeH = thickness of test objectHs = height of discontinuity above marker on sensor sideT = distance from source to sensor
(c)
Source 1
A
Source 2
Discontinuity
Sensor sidemarker
HsH
B2 Sensorplane
K
Sourcesidemarker
B3 B1
T

422
TABL
Ri
Ap
Ap
3RT15_Layout(403_436) 10/14/02 3:19 PM Page 422
If the sensor is not in intimate contactwith the part, the error will be increasedbecause the proportional ratio is based onthe discontinuity height above the sensorplane.
Double MarkerApproximate FormulaWhen the sensor cannot be placed inintimate contact with the object or whenthe image of the discontinuity is notpresent on a double exposed radiograph,the double marker approximate techniqueshould be used (see Fig. 17c).
If both markers are thin, neglect theirthickness and assume that they representthe top and bottom of the test piece. Bymeasuring the parallax or image shift ofeach marker, as well as that of thediscontinuity, the relative position of thediscontinuity between the two surfaces ofthe test object can be obtained by linearinterpolation, using Eqs. 5 to 9.
(5)
(6)
(7)
(8)
(9) H HBBs s
d
s≅ × ∆
∆
HH
BB
s d
s≅ ∆
∆
∆∆
BB
B BB B
d
s≅ −
−1 3
2 3
B B B2 3− ≅ ∆ s
B B B1 3− ≅ ∆ d
Radiographic Testing
E 2. Triangulation measurement requirements.
Flaw and DistanceMarker from Source SourceShifts to Sensor Shift
Formula (B) (T) (A)
gid formula yes yes yes
proximate formula: yes no nosource side marker
proximate formula: yes no nosource side andsensor side markers
where Hs is the height of the discontinuityabove the sensor side marker and H is thedistance between the source side markerand the sensor side marker.
Listed in Table 2 are the variousparallax formulas, the triangulationmeasurement requirements and thegeneral areas of application for thedouble-marker, single-marker and rigidformula parallax techniques.
Effects of DiscontinuityGeometry on ParallaxAccuracyThe effect of discontinuity geometry onthe accuracy of parallax calculations iscommon to all three of these techniques.Calculations typically indicate the centerline dimension of the discontinuity abovethe sensor plane. However, in those caseswhere the geometry of the discontinuityis not cylindrical or rectilinear, its shapecan influence the accuracy anddetectability of discontinuities. If thegeneral shape of the discontinuity can bedetermined by viewing a standardradiograph, proper allowances can bemade.
Figure 18 shows three cases where theapproximate, average displacement of thediscontinuity on the sensor plane can becalculated by using Eq. 10.
(10)
where R and L are indication widthscaused by sources 1 and 2 respectively.
If the discontinuity geometry is similarto one of those in Fig. 19, averaging the
Parallax shift = ×L R2
SensorSeparation
(K) Application Notes
yes for relatively short distances from source to sensor orwhere marker placement is difficult
where part thickness is unknown or difficult tomeasure
yes also requires that part thickness D2 plus sensorseparation K be known
for relatively long distancesfor situations where sensor side marker placement is
difficultno also requires that part thickness H be known
most accurate approximate formulabest for long distances from source to sensorsimplifies data retrieval

3RT15_Layout(403_436) 10/14/02 3:19 PM Page 423
discontinuity shift does not show the truediscontinuity dimension location.
Source MovementThe correct movement is parallel to thesensor plane. This principle is furtherillustrated in Fig. 20, which showsincorrect source movements and changesin distance from source to sensor for a flatobject or a tapered surface.
When the source position is notperpendicular to the sensor plane, theapproximate angle of the sensor plane (tothe source) must be known andcompensated for in the calculations, evenwith correct source movement.
Care must also be exercised when usingthe parallax technique of discontinuitydepth determination on cylindrical parts.It is important to maintain the angle ofsource to sensor or plane as closely aspossible to 90 degrees, particularly inthose cases where flexible film cassettes(or sensors embedded in fabric thatconforms to test object surfaces) are used.This is also true when radiography of
FIGURE 18. Flaw geometries that permit calcudifficult orientation; (b) oblique discontinuity(c) indication from long discontinuity resemb
(a)
Source 1 Source 2
L
R
LegendL = width of indication created by source 2 on sensor plaR = width of indication created by source 1 on sensor pla
(b
cylindrical parts is made using a rigidcassette. The radiographer must be awareof and maintain to the maximum extentpossible, a normal relationship of thesensor plane to the source. Additionally,when rigid sensor planes (including filmcassettes) are used, the standoff orseparation distance between the rigidsensor planes and the inside or outside ofthe cylindrical object must be known andcompensated for in the calculations.
Flickered Image Technique forDepth Measurement30
Quantitative depth information can beextracted from a pair of stereo imagesthrough parallax calculations or by meansof the radioscopic flickered imagetechnique. The flickered image techniqueuses a pair of radioscopic images stored ina computer, a single video monitor andsoftware.
1. Identifying markers are placed on thefront and back surfaces of the testobject.
423Special Radiographic Techniques
lation of average flaw displacement: (a) discontinuity with no creates larger indication for source 1 than source 2;les indication in Fig. 18a.
Sensorplane
nene
)
Source 1 Source 2
L
R
(c)
Source 1 Source 2
L
R

424
FIGURE 19. Examples of flaw geometries where center line ofdiscontinuity is not determined by shift averaging:(a) discontinuity with tail; (b) discontinuity shaped likecylindrical or conic section.
(a)
Source 1 Source 2
Tail sectionnot shown in
radiograph
Actual verticalmidpoint ofdiscontinuity
Midpointdetermined bytriangulation
(b)
Source 1 Source 2
A
Measuring thisshift gives A
Measuringthis shiftgives averageof B and C
B
C
D
3RT15_Layout(403_436) 10/14/02 3:19 PM Page 424
2. A pair of stereo radioscopic imageswith adequate separation are acquiredand stored in the digital imageprocessor.
3. The computer recalls the two imagesand alternately displays first the rightimage and the left image at a rate ofabout two images per second. Using akeyboard or other input device theoperator shifts one of the flickeringimages until the front surface markersare superimposed. A keystroke recordsthe magnitude of the lateral shift ofthe image of the moved marker.
4. Similarly, the images of the backsurface markers are superimposed andthe magnitude of lateral shift isrecorded.
5. The projected distance between thefront and back surface markers isusually the test object thickness and isentered in the computer.
6. The images of a feature of interest (adiscontinuity, foreign object orsurface) within the test object aresuperimposed and this position isentered in the computer.
7. The computer calculates and displaysthe distance or depth from the frontsurface to the feature of interest.
This technique is fast, simple andaccurate. Repeatability within ±3 percenthas been demonstrated.
Radiographic Testing
FIGURE 20. Incorrect source shifts: (a) oblique sensor plane; (b) oblique source shift; (c) source shift oblique tosensor plane.
(a)
Shift
Sensor plane
(b)
Shift
Sensor plane
(c)
Shift
Sensor plane

3RT15_Layout(403_436) 10/14/02 3:19 PM Page 425
Approaches for StereoViewing30
Various arrangements have been used toachieve stereoscopic vision ofradiographic tests (Fig. 21). Before the
1amrv
t
FIGURE 21. Designs for stereo radiographic dstereoscope; (b) signals from moving test omonitors, partially silvered mirror and polarcovering entire monitor screen, producing
(a)
(b)
Monitor
Left Input
Optics
DelayB
DelayA
Signal B
Electronic input signal
Stereoscdisplay
990s, stereo radiographs have used films both the recording and viewingedium. A video hard copy printer
eproduced pairs of images that could beiewed with an optical stereoscope.
An extension of this technique displayswo images, left and right, on a matched
425Special Radiographic Techniques
isplays: (a) two video monitors and prismatic specularbject assigned to separate monitors for stereo image; (c) two videoized filters; (d) liquid crystal synchronous polarizing screendifferent polarizations for right and left images.
(c)
(d)
MonitorMonitor
Monitor
Delayed right input
Fixed mirror
Signal A
opicsystem
Polarizingglasses
Polarizingscreen
Polarizingscreen
Polarizingglasses
Polarizingglasses
Synchronouspolarizingscreen
Displaysynchronizer
SignalB
input
SignalA
input
Monitor
SignalB
SignalA

426
3RT15_Layout(403_436) 10/14/02 3:19 PM Page 426
pair of video monitors, placed side by sideso that their screens could be viewedthrough a prismatic stereo scope(Fig. 21a).
One dynamic stereo system, notillustrated here, used an X-ray tube with adouble filament with double control gridsand a rotating anode. The tube producedtwo focal spots separated by about 20 mm(0.8 in.). The grids controlled the flow ofelectrons from the two filaments toactivate the left focal spot and then theright one, creating a series of left andright images in the intensifier tube.
The setup shown in Fig. 21b permitsviewing by several people at once. Twocathode ray tube monitors are orientedperpendicularly to each other; a partiallysilvered, 45 degree mirror beam splitter isplaced between the monitors; and a linearpolarizing filter is placed over the face ofeach monitor. When the filters areproperly adjusted, observers wearingpolarized glasses can observe the image inthe right monitor with the right eye andthe image in the left monitor with the lefteye.
The viewing system in Fig. 21c uses asingle display monitor with a liquidcrystal modulator. The right and leftimage are input to an external modulatorframe synchronizer and then to thedisplay monitor. A screen sized liquidcrystal modulator mounted on the screenprovides a different polarization for theleft image than for the right. Theobserver’s polarized eyewear decodes thecircularly polarized images in such a waythat the left eye sees only the left imageand the right eye sees only the rightimage. Head orientation does not affectthe stereo effect and many people canwatch simultaneously.
In another configuration (Fig. 21d), theradiation source and imaging systemremain stationary while the test object istranslated or rotated at a constantvelocity. A continuous series of images isacquired and stored. Selected images aredisplayed to produce the same spatialseparation as achieved when a stationaryobject is viewed from two positions.
Radiographic Testing

PART 5. X-Ray Diffraction and X-RayFluorescence1
3RT15_Layout(403_436) 10/14/02 3:19 PM Page 427
Principles of AnalyticTechniquesX-rays are a form of electromagneticradiation produced in an atom wheninner orbital electrons are ejected and theouter electrons move to fill the positionsnear the nucleus. This transition takes theouter electrons from states of high to lowenergy, energy that is released in the formof X-rays.
When a beam of this X-ray energy fallsonto a specimen, three basic phenomenamay result: absorption, scatter orfluorescence. These phenomena form thebasis of several important X-ray analyticaltechniques.
Absorption AnalysisThe absorption of X-rays increases withthe atomic number of the absorbingmatter. This property of X-rays wasquickly established and applied to medicaldiagnosis. At one time, it was also used forthe analysis of materials but thesetechniques have now been superceded byX-ray fluorescence. Today, absorptiontechniques are only found in morespecialized fields, such as X-ray absorptionedge fine structure analysis. Theabsorption effect is still important inestablishing a relationship between X-rayintensity and element composition orphase. In X-ray diffraction andfluorescence, phase is any chemicallyhomogenous, physically distinctconstituent of a substance.
X-Ray Fluorescence SpectrometryFluorescence occurs when an intense X-raybeam irradiates a specimen andcharacteristic X-ray spectra are emitted.Spectrometry may be defined as therecording of these emission spectra and itsseparation into its component parts, eachpart being characteristic of an element.
X-ray fluorescence spectrometryconsists of two techniques. The first ofthese is wavelength dispersive spectrometry,which uses the diffracting power of acrystal to isolate narrow wavelengthbands from the polychromaticcharacteristic radiation excited in thesample. The second, energy dispersivespectrometry, uses a proportional detectorto isolate the energy bands.
Because of the known relationshipbetween emission wavelength and atomicnumber, identification of an element canbe made by isolating individualcharacteristic lines and elementalconcentrations can be estimated fromcharacteristic line intensities. Thus, thesetwo techniques are means of materialscharacterization in terms of chemicalcomposition.
X-Ray DiffractionThe discovery of X-ray diffraction wasmade by Max von Laue in 191339 andmay be defined as changes in thescattering characteristics of X-rays due tocollision with some object in their path.Diffraction is a special case of X-rayscattering that can be used for theidentification of elemental phases.
Scattering occurs when an X-rayphoton interacts with the loosely boundouter electrons of an element. When thiscollision is elastic (no energy is lost in thecollision process), the scatter is said to becoherent (or rayleigh) scatter. Coherentlyscattered photons may undergosubsequent interactions with otherscattered photons, causing reinforcementor interference.
Under certain geometric conditions,scattered wavelengths may reinforce oneanother if exactly in phase or may cancelone another if exactly out of phase. Thecoherently scattered photons thatconstructively interfere with each othergive diffraction maxima (peaks in theX-ray diffraction diagram). Phase heredenotes a uniform motion varyingaccording to simple harmonic laws.
A crystal lattice, for example, consistsof a regular arrangement of atoms and,when a monochromatic beam of radiationfalls onto these atomic layers, scatteringwill occur. To satisfy the requirements forinterference, it is necessary that thescattered waves originating from theindividual atoms (the scattering points) bein phase with one another.
The geometric conditions necessary forthe waves to be in phase are illustrated inFig. 22. Two parallel rays strike a set ofcrystal planes at an angle θ and arescattered. (Diffraction angles are labeled θfor the angle of specimen to source and2θ for the angle of source to specimen todetector.)
427Special Radiographic Techniques

428
FIGURE 2
Ray a
Ray b
d
LegendA = poinB = poinC = poinD = poind = inteX = variθ = ang
3RT15_Layout(403_436) 10/14/02 3:19 PM Page 428
Reinforcement will occur when thedifference in the path lengths of the twowaves is equal to a whole number ofwavelengths. This path length differenceis equal to
__BC +
__BD (Fig. 22). For
reinforcement to occur, __BC must equal
__BD;
and if__BC =
__BD = X, then 2X must equal
nλ, where n is an integer and λ is thewavelength.
It will also be seen that X = d × sinθ,where d is the interplanar atomic spacing.Hence, the overall condition forreinforcement is a statement of Bragg’slaw:40
(11)
Role of Crystal Structure inX-Ray Scattering andDiffractionAll substances are made of individualatoms and nearly all substances havesome degree of order, or periodicity, in thearrangement of these atoms.
A crystal is a highly ordered substancethat can be defined as a homogeneous,anisotropic body (exhibiting propertieswith values that vary when measured ondifferent axes), having the natural shapeof polyhedron.
In practical terms, determining thehomogeneity of a substance depends onthe means available for measuring thecrystallinity. In general, the shorter thediffracted wavelength, the smaller therecognizable crystalline region.
Even noncrystalline materials have adegree of order and each will give some
sggoXeBoadapdirs
PITisis
ggagcohetd
td
n dλ θ= ×2 sin
Radiographic Testing
2. Geometric conditions for diffraction of X-rays.
θ A
X XC D
t where ray a is diffractedt where ray b is diffractedt in incident ray bt in diffracted ray b’
rplanar atomic spacingable denoting distance from point B to point C or Dle of incidence
Ray a
Ray b
θ
2θ
B
ort of a diffraction pattern. For example,lassy materials and liquids will generallyive diffraction patterns in the form ofne or more broad diffuse peaks or halos.-ray powder diffractometry usually dealsxclusively with crystalline materials.ecause every ordered material is made upf a unique arrangement and number oftoms, every ordered material will give aiffraction pattern that is, to all intentsnd purposes, also unique. The diffractionattern can, moreover, be used toetermine the degree of crystallinity; that
s, the dimensions of the crystallineegions in otherwise amorphousubstances.41
ositioning of Analyticalnstrumentationhere are many similarities between the
nstrumentation used for diffraction andpectrographic measurements, particularlyn the case of the wavelength dispersivepectrometer.
As examples, the high voltageenerator used to power the X-ray tube isenerally of the same type; the digital andnalog counting electronics andoniometer (angle measurement orontrol) circuitry are almost identical. It isften found that in a given laboratory, theigh voltage generator and countinglectronics are actually shared betweenhe diffractometer and wavelengthispersive spectrometer.
Shown in Fig. 23 are layout diagrams ofhe instrumentation used in the threeifferent analytical techniques.
X-Ray Diffraction forMeasurement of StressOne of the important metallurgicalapplications of X-ray diffraction is in thedetermination of residual stress.42 When apolycrystalline piece of metal is deformed,the lattice plane spacings will changetheir values, the new valuescorresponding to the applied stress. If thestress is uniform, this value change willmanifest itself as a shift in the observed2θ angle of the appropriate diffractionline. If the stress is nonuniform, the effectwill appear as a broadening of theappropriate diffracted line profile.
As far as uniform strain is concerned, itis a rather simple procedure to correlatethe line shift with the stress in the system,by using measured elastic constants or bycalibration with materials of known stress.It should be realized, however, that ineither instance the diffraction techniqueis actually measuring strain, not stress; itis thus an indirect technique of
’
’

3RT15_Layout(403_436) 10/14/02 3:19 PM Page 429
measurement. When an applied stress isremoved and the deformation persists, thematerial is said to have residual stress.Determination of residual stress in metalsis one of the most common applicationsof X-ray stress measurement. AutomatedX-ray machines are available for the rapidmeasurement of stress, both on laboratoryspecimens as well as on large samples,such as weldments in pipe lines, aircraftwings and so on.
Elemental Analysis byX-Ray Fluorescence
Principles of X-Ray FluorescenceThe basis of the X-ray fluorescencetechnique lies in the relationship betweenthe atomic number Z and the wavelengthλ (or energy E) of the X-ray photonsemitted by the sample element:
(12)
whtheque
Mhav(0.6me(Z =L seura
OandanaalmusefromreaeffiX-rBecareradX-r
Cspecateinstinstsystandana
EK Z s
12 41 2
.= = −( )λ
FIGURE 23. X-ray analytical instrumentation:(a) X-ray powder diffractometry;(b) wavelength dispersive X-rayspectrometry; (c) energy dispersive X-rayspectrometry.
(a)
Source
Detector
Specimen
(b)
Source
DetectorSpecimen
(c)
Source
Detector
Specimen
Crystal spectrometer
ere K and s are constants dependent on spectral series of the emission line instion.40
ost commercial X-ray spectrometerse a range of about 0.02 to 2.01 nm to 60 keV), which will allow
asurement of the K series from fluorine 9) to lutetium (Z = 71) and for theries from manganese (Z = 25) tonium (Z = 92).
ther line series can occur from the M N levels but these have little use inlytical X-ray spectrometry. Althoughost any high energy particle can bed to excite characteristic radiation
a specimen, an X-ray source offers asonable compromise betweenciency, stability and cost. Commercialay spectrometers use an X-ray source.ause primary (source) X-ray photons used to excite secondary (specimen)iation, the technique is referred to asay fluorescence spectrometry.
ommercially available X-rayctrometers fall roughly into twogories: wavelength dispersiveruments and energy dispersiveruments. The wavelength dispersiveem was introduced in the early 1950s has developed into a widely acceptedlytical tool; energy dispersive
spectrometers became commerciallyavailable in the early 1970s. By thetwenty-first century thousands of units ofboth types have been in use.
Qualitative Analysis with X-RaySpectrometerThe output from a wavelength dispersivespectrometer may be either analog ordigital. For qualitative work, an analogoutput is traditionally used and in thisinstance a rate meter integrates the pulsesover short time intervals, typically on theorder of a second or so. The output fromthe rate meter is fed to a strip chartrecorder that scans at a speedconveniently coupled with thegoniometer scan speed. The recorderdisplays a diagram of intensity versustime, which becomes a diagram of 2θversus intensity. Tables are used tointerpret the resulting wavelengths.
For quantitative work, it is moreconvenient to use digital counting. Acombination of timer and scaler isprovided that allows pulses to beintegrated over a period of several tens ofseconds and then displayed as count orcount rate.
Most modern wavelength dispersivespectrometers are controlled in some wayby a minicomputer or microprocessor.Specimen changers make them capable ofvery high specimen throughput. Oncethey are set up, the spectrometers can rununattended for several hours.
429Special Radiographic Techniques

430
RE 24. Lower limits of detection obtainable withelength dispersive spectrometer.
Det
ectio
n lim
it (µ
g·g-
1)
1000
100
10
1
Atomic number
0 10 20 30 40 50 60 70 80 90 100
3RT15_Layout(403_436) 10/14/02 3:19 PM Page 430
Quantitative TechniquesThe great flexibility and range of thevarious X-ray fluorescence spectrometers,coupled with their high sensitivity andgood inherent precision, makes themideal for quantitative analysis. As with allinstrumental analysis techniques, highprecision can be translated into highaccuracy only by compensating for thevarious systematic errors in the analysisprocess.
The precision of a well designed X-rayspectrometer is typically on the order ofone tenth of a percent, the majorcontributor to the random error being theX-ray source (the high voltage generatorplus the source element). In addition,there is an error arising from the statisticsof the actual counting process.
Systematic errors in quantitative X-rayspectrometry arise mainly fromabsorption and specimen relatedphenomena (matrix effects). This is alsothe case in X-ray powder diffraction,except that in spectrometry, thesystematic errors are much morecomplicated.
Diffraction deals with a singlewavelength — for example, the diffracted,monochromatic line scattered from theprimary source. In spectrometry, manywavelengths are involved. Although thesematrix effects are somewhat complicated,many excellent techniques have beendeveloped for handling them. The adventof the minicomputercontrolledspectrometer has done much to enhancethe application of correction procedures.In most cases, the presence of elements ofatomic number Z = 9 and greater can bequantified to an accuracy of a few tenthsof a percent. The areas of application forthe X-ray fluorescence technique nowcover almost all areas of inorganicanalysis.
Trace AnalysisThe wavelength dispersive X-rayfluorescence technique is a reasonablysensitive technique with detection limits(for most elements) in the low parts permillion range. Figure 24 shows a curve forthe lower limit of detection as a functionof atomic number, for a typical system.The curve is a smooth U shape, which isrepeated above atomic number Z = 50(tin) and displaced upward by about oneorder of magnitude. Below atomicnumber Z = 13 (aluminum), thesensitivity drops quite sharply until at theconventional low atomic number limit ofthe technique (fluorine, Z = 9) theachievable detection limit is only about500 µg·g–1. With energy dispersivespectrometers, detection limits aretypically five to ten times worse than thewavelength dispersive instruments. The
lowconcdevipradete
(13
wheconthethebacana
Fphoabopercper 100dete
Gcansamtenbe helemas asign10 µinsttraccirc10 µ
FIGUwav
Radiographic Testing
er limit of detection is defined as thatentration equivalent to two standardations of the background count rate. Inctical terms, the lower limit ofction (LLD) is given by Eq. 13:
)
re m is the counting rate per unitcentration of the analyte element; Rb background counting rate; and tb is analysis time spent counting thekground (effectively one half the totallysis time).or example, in steel, the elementsphorus would give a sensitivity ofut 2000 counts per second for eachent, over a background of 35 countssecond. For a total analysis time of s, tb would equal 50 s, giving action limit of about 12 µg·g–1.enerally, the ultimate detection limits
only be obtained where a largeple is available, typically several
ths of a gram. Very small samples canandled, though with much poorerent detection limits. Samples as small
few milligram will give measurableals for concentration levels ofg·g–1 or greater. Special
rumentation has been used for ultrae analysis. Under favorableumstances, detection limits down tog·g–1 can be obtained.
LLD b
b=
314
mRt

3RT15_Layout(403_436) 10/14/02 3:19 PM Page 431
Instrumentation for X-RayFluorescence AnalysisWavelength Dispersive Spectrometry. Allconventional X-ray spectrometerscomprise three basic parts: the primarysource unit; the spectrometer itself; andthe measuring electronics. The primarysource unit consists of a sealed X-ray tube,plus a very stable high voltage generator,capable of providing up to 3 kW of powerat a typical potential of 60 to 80 W. Thesealed X-ray tube has an anode ofchromium, rhodium, tungsten, silver,gold or molybdenum and delivers anintense source of continuous radiationthat impinges on the specimen,producing characteristic radiation.
In the wavelength dispersivespectrometer, a single crystal of knownspacing is used to disperse thepolychromatic beam of characteristicwavelengths coming from the sample,such that each wavelength will diffract ata discrete angle. A portion of thecharacteristic fluorescence radiation isthen collected by the actual spectrometer,where the beam is passed, via a collimatoror slit, onto the surface of an analyzingcrystal. Individual wavelengths are thendiffracted in accordance with Bragg’s law.
A photon detector, typically a gas flowproportional counter or a scintillationcounter, is used to convert the diffractedcharacteristic photons into voltage pulsesthat are integrated and displayed as ameasure of the characteristic lineintensity. To maintain the requiredgeometric conditions, a goniometer isused to ensure that the angle of source tocrystal and the angle of crystal to detectorare kept the same.Energy Dispersive Spectrometry. Like thewavelength dispersive spectrometer, theenergy dispersive spectrometer alsoconsists of the three basic units:excitation source; spectrometer; anddetection system. In this case, however,the detector itself acts as the dispersionagent. The detector is typically a lithiumactivated silicon detector, a proportionaldetector of high intrinsic resolution. Thelithium activated silicon detector diodeserves as a solid state version of the gasflow detector in the wavelength dispersivesystem.
When an X-ray photon is stopped bythe detector a cloud of ionization isgenerated in the form of electron holepairs. The number of electron/hole pairscreated (or the total electric chargereleased) is proportional to the energy ofthe incident X-ray photon. The charge isswept from the diode by a high voltageapplied across it. A preamplifier isresponsible for collecting this charge on afeedback capacitor to produce a voltagepulse proportional to the original X-ray
photon energy. Thus when a range ofphoton energies is incident on thedetector, an equivalent range of voltagepulses is produced as detector output. Amultichannel analyzer is used to sort thearriving pulses to produce a histogramrepresentation of the X-ray energyspectrum.
The output from an energy dispersivespectrometer is generally given on a visualdisplay unit. The operator is able todisplay the contents of the variouschannels as an energy spectrum.Provisions are often made to allowzooming, to overlay spectra, to subtractbackground and so on in a ratherinteractive manner. As is the case withmodern wavelength dispersive systems,nearly all energy dispersive spectrometerswill incorporate some form ofminicomputer for spectral stripping, peakidentification, quantitative analysis and ahost of other useful functions.
Materials CertificationThe energy dispersive spectrometer playsan important role in the area of materialscertification, covering the range fromscrap metal sorting to alloy identificationand certification.
In the identification of specific producttypes, it may be necessary only to identifya few key elements and use these tofingerprint the product.
Sometimes this is done by deliberatelyadding tracer elements at lowconcentration. The technique has beenused successfully in the sorting of finishedpolymer pieces by tagging them with theelements chlorine and chromium, atconcentration levels of about 0.1 percent.A very short counting time, perhaps a fewseconds, is all that the energy dispersivespectrometer requires to establish thesource of the polymer product.
Another example of the spectrometer’suse is in the analysis of plating on sheetsteel, where it is necessary to control thethickness of a coated layer.44–45 Acalibration curve of X-ray line intensity, asa function of coating thickness, can beeasily established from a few standardsamples. This curve is then used forquality control purposes by comparisonwith online count data from the energydispersive system.
ClosingSince the 1950s, X-ray analyticaltechniques have been widely used inmaterials research, quality control andcertification. Although there arealternatives to the X-ray fluorescencetechnique for elemental analysis, theability of the technique to give fast,
431Special Radiographic Techniques

432
3RT15_Layout(403_436) 10/14/02 3:19 PM Page 432
accurate analyses over wide concentrationranges, coupled with its excellentqualitative capability, makes thetechnique very attractive. As far as phaseanalysis is concerned, the X-raydiffraction technique’s capacity foridentification of multiphase mixtures isunique and is enhanced by its ability togive data on stress, strain, texture,topography and so on.
The minicomputer has played animportant role in the development ofinstrumentation, both for X-raydiffraction and X-ray fluorescence.Modern diffractometer and spectrometersystems are highly automated and most ofthe tedium and complexity of datainterpretation are being reduced by thecomputer. Fast and efficient programs areavailable for peak hunting, profiledeconvolution, data plotting and otherfunctions. The rapid growth in computertechnology will undoubtedly continue togive impetus to the X-ray analytical field.
In the realm of instrumentation, afruitful area has been high power sources.Rotating anode X-ray tubes, operating at15 to 20 kW, are available for diffractionmeasurements and give higher X-rayintensities (by an order of magnitude)than do sealed tubes of the 1970s.Two-dimensional position sensitivedetectors have been applied in stress andlow angle scatter measurements. TheX-ray analytical field has traditionallybeen quick to implement technologies,making the role of X-ray techniques inmaterials characterization secure for yearsto come.
Radiographic Testing

1 Nondestructive Testing Handbook,second edition: Vol. 3, Radiography andRadiation Testing. Columbus, OH:American Society for NondestructiveTesting (1985).
2. “Projection Microfocus Radiography.”Nondestructive Testing Handbook,second edition: Vol. 3, Radiography andRadiation Testing. Sec. 19, “SpecializedRadiographic Methods.” Columbus,OH: American Society forNondestructive Testing (1985):p 801-807.
3. McDaniel, G.A. “Recent Developmentsin High Output Microfocus X-RaySystems.” Automated NondestructiveTesting: Proceedings of a Topical Seminar[Idaho Falls, ID, June 1983]. New York,NY: Gordon and Breach SciencePublishers (1986): p 209-212.
4. Spaulding, W.H. and J.J. Schuldies.“Microfocus Radiography andComputer Image EnhancementApplied to Non-Metallics.” PaperSummaries: ASNT National FallConference [Denver, CO, October1978]. Columbus, OH: AmericanSociety for Nondestructive Testing(1978): p 127-130.
5. Peugeot, R.S. “Theoretical andPractical Considerations of MicrofocusRadiography.” Materials Evaluation.Vol. 40, No. 2. Columbus, OH:American Society for NondestructiveTesting (February 1982): p 150, 152.
6. Bagnell, M.J. and B. Kotzian.“Microfocus Radiography of JetEngines.” Materials Evaluation. Vol. 44,No. 13. Columbus, OH: AmericanSociety for Nondestructive Testing(December 1986): p 1466-1467.
7. Marchese, M. and K.A. Glodowski.“Real-Time Microfocus Radiographyfor Electronic Failure Analysis.”Materials Evaluation. Vol. 49, No. 12.Columbus, OH: American Society forNondestructive Testing (December1991): p 1481-1485.
8. Silver, M.D. and N.R. Schreiber.“Microfocus Volume CT of AluminumCastings.” 1992 ASNT Spring Conference[Orlando, FL]. Columbus, OH:American Society for NondestructiveTesting (March-April 1992): p 124.
9. Ellingson, W.A., E.A. Sivers,D.A. Holloway, J.R. Ling, J.P. Pollingerand H.C. Yeh. “Application of 3-DMicrofocus X-Ray ComputedTomography for Mapping DensityVariations in Pressure Slip Cast Si3N4Ceramics.” ASNT 1993 SpringConference. Columbus, OH: AmericanSociety for Nondestructive Testing(March-April 1993): p 129.
10. Isaacson, B. “MicrofocusRadiography.” Proceedings of theRadiologic NDT III: Advancements,Automation and Imaging [Atlantic City,NJ]. Columbus, OH: American Societyfor Nondestructive Testing (August1993): p 88.
11. Renwick, S. and H. Hansen.“High-Energy Microfocus X-RaySource.” ASNT 1994 Fall Conference andQuality Testing Show [Atlanta, GA].Columbus, OH: American Society forNondestructive Testing (September1994): p 47.
12. Biagi, E., A. Forti, L. Masotti andC. Cappabianca. “Ultrasonic HighResolution Images and X-RayMicrofocus Testing for DefectDetection in Ceramic Materials.” ASNT1996 Spring Conference/Fifth AnnualResearch Symposium [Norfolk, MD].Columbus, OH: American Society forNondestructive Testing (March 1996):p 171.
13. Silva, F. “Automated X-Ray InspectionStrategies.” Real-Time Radioscopy andDigital Imaging [Mashantucket, CT].Columbus, OH: American Society forNondestructive Testing (August 1998):Appendix, p 1-15.
14. Ely, R.V. Microfocal Radiography. NewYork, NY: Academic Press (1980).
15. Charbonnier, F. “Flash Radiography.”Nondestructive Testing Handbook,second edition: Vol. 3, Radiography andRadiation Testing. Columbus, OH:American Society for NondestructiveTesting (1985): p 491-531.
16. Jamet, F. and G. Thomer. FlashRadiography. Elsevier PublishingCompany (1976).
17. Bryant, L.E., ed. Proceedings of the FlashRadiography Symposium [Houston, TX].Columbus, OH: American Society forNondestructive Testing (1976).
433Special Radiographic Techniques
References
3RT15_Layout(403_436) 10/14/02 3:19 PM Page 433

18. Marilleau, J., ed. Proceedings of the FirstEuropean Conference on Cineradiographywith Photons or Particles [Paris, 1981].Bellingham, WA: International Societyfor Optical Engineering (1983).
19. Webster, E.A., Jr. and A.M. Kennedy.Proceedings of the 1986 FlashRadiography Topical [Portland, OR, July1986]. Columbus, OH: AmericanSociety for Nondestructive Testing(1986).
20. Charbonnier, F.M. et al. Radiology.Vol. 117. Easton, PA: RadiologicalSociety of North America (1975):p 165-172.
21. Bryant, L.E. “Flash Radiography ofElectron Beam Welding.” MaterialsEvaluation. Vol. 29, No. 10. Columbus,OH: American Society forNondestructive Testing (October1971): p 237-240.
22. Winfree, W.P., N.A. Cmar-Mascis andF.R. Parker. “Enhanced Imaging ofCorrosion in Aircraft Structures withReverse Geometry X-Ray ®.” Paper7C2. Third Joint Conference on AgingAircraft [Albuquerque, NM]. Arlington,VA: Galaxy Scientific for the FederalAviation Administration,Airworthiness AssuranceNondestructive Inspection ValidationCenter, Sandia National Laboratories,Albuquerque, NM (September 1999).
23. Albert, R., W. Pember, J. Garrison andD. Reyna. “Aircraft Inspection with aPortable, Filmless X-Ray System UsingReverse Geometry.” MaterialsEvaluation. Vol. 58, No. 5. Columbus,OH: American Society forNondestructive Testing (May 2000):p 634-638.
24. Albert, T.M. “X-Ray SystemApplications Using Reverse Geometryfor High Sensitivity.” MaterialsEvaluation. Vol. 51, No. 12. Columbus,OH: American Society forNondestructive Testing (September1993): p 1020-1027.
25. Albert, R.D. and T.M. Albert.“Aerospace Applications of X-RaySystem Using Reverse Geometry.”Materials Evaluation. Vol. 51, No. 12.Columbus, OH: American Society forNondestructive Testing (December1993): p 1350-1352.
26. Albert, R.D. X-Ray Scanning Method andApparatus. United States Patent3 949 229 (April 1976).
27. Albert, T.M. “Reverse Geometry X-RayImaging: An Emerging QNDETechnology.” Review of Progress inQuantitative Nondestructive Evaluation.Vol. 13. Plenum, NY: Plenum (1994):p 587.
28. Birt, E.A., F.R. Parker and W.P. Winfree.“Quantification of Corrosion Damagein Aircraft Skin Using a Novel X-RayRadiography System.” Review ofProgress in Quantitative NondestructiveEvaluation. Vol. 13. Plenum, NY:Plenum (1994): p 1963.
29. Landolt, J.F., W.D. Stump andJ.L. Summers. “A Visual ComparativeMethod for RadiographicDetermination of Defect Thickness.”Materials Evaluation. Vol. 36, No. 11.Columbus, OH: American Society forNondestructive Testing (October1978): p 33.
30. Barry, R.C., M.D. Barker andL.M. Klynn. “Real-Time StereoRadiography.” Materials Evaluation.Vol. 50, No. 2. Columbus, OH:American Society for NondestructiveTesting (February 1992): p 247-252.
31. Burbank, B.B. “Improved StereoscopicRadiography.” Industrial Radiography.Vol. 2, No. 2. Columbus, OH:American Society for NondestructiveTesting (Fall 1943): p 20-23, 31-32.
32. Dudley, L.P. “StereoscopicRadiography.” Industrial Radiographyand Nondestructive Testing. Vol. 5,No. 1. Columbus, OH: AmericanSociety for Nondestructive Testing(Summer 1946): p 23-25, 39.
33. Lipton, L. “Stereo-Vision Formats forVideo and Computer Graphics.” Whitepaper. San Rafael, CA: StereoGraphicsCorporation (1997).
34. Lipton, L. StereoGraphics Developers’Handbook. San Rafael, CA:StereoGraphics Corporation (1997).
35. Lipton, L. “A Little History; and HP’sLink to Stereoscopic Visualization.”The HP Chronicle. Austin, TX:Publications and Communications(March 2000).
36. Lipton, L. and M. Feldman. “A NewAutostereoscopic Display Technology:The SynthaGram™.” White paper. SanRafael, CA: StereoGraphics (2001).
37. Radiography in Modern Industry, fourthedition. Rochester, NY: Eastman KodakCompany (1980): p 114-116.
38. McMaster, R.C., ed. NondestructiveTesting Handbook, first edition. Vol. 1,Sec. 20. Columbus, OH: AmericanSociety for Nondestructive Testing(1959): p 49.
39. Henry, N.F.M. and K. Lonsdale, eds.International Tables for X-RayCrystallography, third edition: Vol. 1,Symmetry Groups. Birmingham, AL:Kynoch Press (1969).
40. Moseley, H.G.J. “The High FrequencySpectra of the Elements.” PhilosophicalMagazine, sixth series. Vol. 26.London, United Kingdom: Taylor andFrancis, Limited (1913): p 1024.
434 Radiographic Testing
3RT15_Layout(403_436) 10/14/02 3:19 PM Page 434

41. Hentschel, M.P., A. Lange, J. Schors,O. Wald and K.W. Harbich. “WideAngle X-Ray Diffraction Topographyof Polycrystalline Materials.”Nondestructive Characterization ofMaterials IX. AIP Proceedings 497.Melville, NY: American Institute ofPhysics (1999): p 655-660.
42. Ruud, C.O., M.E. Jacobs, J.A. Josef,D.J. Snoha and A.L. Moran. “X-RayDiffraction Techniques for theAssessment of Residual Stress andMicrostrain in Carbon GraphiteMaterials.” Materials Evaluation.Vol. 48, No. 7. Columbus, OH:American Society for NondestructiveTesting (July 1990): p 894-897.
43. Nondestructive Thickness GagingMethod for Thin Layers Using X-RayFluorescence, Chesney, H.L.,E.P. Papadakis and J.M. Brinkerhoff.Materials Evaluation. Vol. 39, No. 8.Columbus, OH: American Society forNondestructive Testing (July 1981):p 726-738.
44. Light, G.M., G.P. Singh andF.D. McDaniel. “Ultrasonic and X-RayFluorescence Measurement of theThickness of Metal Foils.” MaterialsEvaluation. Vol. 47, No. 3. Columbus,OH: American Society forNondestructive Testing (March 1989):p 322-324, 326-328, 330.
45. Adams, L. “X-Ray FluorescenceMeasures Coating Thickness.” Quality.Vol. 40, No. 11. Bensenville, IL:Business News Publishing (November2001): p 30-33.
435Special Radiographic Techniques
3RT15_Layout(403_436) 10/14/02 3:19 PM Page 435

John P. Barton, Consultant, San Diego, California
16C H A P T E R
Neutron Radiography
3RT16_Layout(437_452) 10/2/02 3:09 PM Page 437

438 Radio
PART 1. Applications of Neutron Radiography
3RT16_Layout(437_452) 10/2/02 3:09 PM Page 438
Neutron radiation is similar toX-radiation. The radiation can originatefrom an effective point source or can becollimated to shine through an object in acoherent beam. The pattern ofpenetrating radiation can then be studiedto reveal clues about the internals of theobject. The information conveyed can bevery different from that obtainable withX-rays. Whereas X-rays are attenuated bydense metals more than by hydrocarbons,neutrons are attenuated more byhydrocarbons than by most metals. Thedifference can mean much more than thereversal of a positive image to a negative
graphic Testing
FIGURE 1. Electric bridge wire squid: (a) drawinterpretation; (c) helium-3 gaseous penetrapplied to dysfunctional unit.
Electrode postPlatinbridg
Nick
Braze
Metaceramgapp
Braze
Steelnicke
Aluminaceramic insert
10 mm (0.4 in.)
Connector pin
Annular spacefilled with dry
nitrogen, 0.23 mm(0.01 in.) wide
Annular spark gap
(a)
(b)
Braze regions
image. Neutrons, for example, can revealdetails within high density surroundingsthat cannot be revealed by othermeans.1-13
A typical application for neutronradiography is shown in the images of apyrotechnic device (Fig. 1), where thesmall explosive charge is encased inmetal. Other applications includeinspection of explosive cords used in pilotejector mechanisms; inspection of gaskets,seals and O-rings inside metallic valves;confirmation that coolant channels in jetengine turbine blades are free of blockage;studies of coking in jet engine fuel
ing and (b) neutron radiograph of part as aid toant applied to serviceable unit; (d) penetrant
um radiale wire
el cup
seal
llizedic
ed pin
seal
body,l plated
(c)
(d)
No gas inannular space
helium-3 gas
Gas inannularspace
helium-3 gas

3RT16_Layout(437_452) 10/2/02 3:09 PM Page 439
nozzles; and screening of aircraft panels todetect low level moisture or early stagecorrosion in aluminum honeycomb(Fig. 2).
User’s GuideUnlike many other forms ofnondestructive testing, neutronradiography is not a do-it-yourselftechnique. There have been neutronradiography service centers in the UnitedStates since 1968. To try out neutronradiography on an object of interest, it issimply necessary to locate the servicescurrently available and, if agreed, mailyour item to them. Typically, the neutronradiograph and your item will be mailedback within a day or two. The cost couldbe less than 1 or 2 h of an engineer’stime. If assistance is required to interpretthe findings, this too may be requested ona service basis, as may referrals to morespecialized neutron radiographictechniques.
The providers of neutron radiographyservices use equipment and expertise thatis highly specialized. Even though one ormore neutron radiography service centershave been operating successfully for over30 years, there has been no in-houseneutron radiography available at anygeneral service, commercial
FIGURE 2. Comparison of neutronradiographs of moisture globules inaluminum honeycomb panel, later dried:(a) before processing; (b) after processing.
(a)
(b)
nondestructive testing center. Theinterested user is therefore advised to seeka supplier of neutron radiographic servicesusing leads such as society directories orthe published literature.
Because neutrons are fundamentallydifferent from X-rays, any object that is acandidate for inspection by X-radiographycould also be a candidate for neutronradiography. If X-rays cannot givesufficient information, then trials withneutron techniques may be prudent. Themost frequently successful complement toX-radiography is static radiography withthermal neutrons. This approach isreviewed next.
Then more specialized neutronradiology techniques are reviewed, such asneutron computed tomography, dynamicneutron imaging, high frame rate neutronimaging, neutron inducedautoradiography and neutron gaging. Foreach of the neutron radiology techniquesdifferent neutron energies may beselected. The user should be aware thatmany of the specialized services are onlyavailable at one or two centers worldwide.It is therefore important to shop in theglobal market and to take advantage ofthe excellent communications existingbetween neutron radiography centers invarious countries.
439Neutron Radiography

440 R
PART 2. Static Radiography with ThermalNeutrons
TABLE 1. Cattenuati
Element
Leada
CadmiuIronAluminuWaterb
a. Other masilver, plat
b. Other maoils, plasti
FIGURE 3. Radiographs of full sizemotorcycle: (a) neutron radiograph;(b) x-radiograph.
(a)
3RT16_Layout(437_452) 10/2/02 3:09 PM Page 440
Neutron EnergyThermal energy neutrons are those thathave collided repeatedly with a moderatormaterial, typically graphite or water, suchthat they reach an equilibrium energywith the thermal energy of the moderatornuclei.
The attenuation coefficients forthermal neutrons differ from material tomaterial in a way that is different fromX-rays as shown in Table 1. As aconsequence, a high degree of contrastbetween the elements in an object ispossible. In addition, thermal neutronsare relatively easy to obtain and easy todetect.11-15
Neutron CollimationBecause the source of thermal neutrons isa dispersed moderator volume, ratherthan a point source, it is necessary to usea collimator between the source and theobject. In preference to a single tubeparallel sided collimator or a multiple slitcollimator, the most frequently useddesign uses divergent beam geometry.16
The collimator may be used to extract abeam in any one of a variety of differentgeometries including horizontal orvertical, radial or tangential to the source.A collimator that is tangential to thesource can provide a thermal neutronbeam relatively free of fast neutron andgamma ray contamination. An incidentalconsequence of the divergent collimator
adiographic Testing
omparison of X-ray and thermal neutronon.
Relative RelativeDensity X-Ray Thermal Neutron(g·cm–3) Attenuation Attenuation
11.3 High Lowm 7.9 Medium Very high
7.8 Medium Mediumm 2.7 Low Low
1 Low High
terials relatively transparent to thermal neutrons include gold,inum, titanium, silicon, tin and zinc.terials relatively opaque to thermal neutrons include hydrogenouscs, rubbers, explosives and light elements boron and lithium.
principal is that even very large objectscan be radiographed using an array ofside-by-side films (Fig. 3).
Neutron Imaging
Collimation RatioThe collimation ratio is the ratio L·D–1 ofthe collimator length L to aperturediameter D. This ratio helps to predictimage sharpness.
Imaging ProcessesFor static thermal neutron radiography ofnonradioactive objects, two importantimaging processes are (1) the gadoliniumconverter with single emulsion X-ray filmand (2) the neutron sensitive storagephosphor (neutron imaging plate). Forstatic neutron radiography of radioactiveobjects, additional imaging processes are(1) dysprosium foil activation transfer tofilm, (2) indium foil activation transfer to
(b)

FIGURE 4. Neutron radiographs of nuclearfuel: (a) longitudinal cracks in pellets;(b) missing chips in compacted fuels;(c) inclusions of plutonium in pellets;(d) accumulation of plutonium in centralvoid; (e) deformed cladding; (f) hydrides incladding.(a)
(b)
(c)
d)
e)
(f)
3RT16_Layout(437_452) 10/2/02 3:10 PM Page 441
film and (3) track etch imaging using aboron converter and cellulose nitrate film.
The established direct imagingtechnique uses thin gadolinium layervapor deposited on a solid converterscreen, which is held flat against a singleemulsion film inside a vacuum cassette ofthin aluminum construction. An exposureof 109 neutrons per square centimeter cangive a high resolution, high contrastradiograph if careful dust free filmdarkroom procedures are used.
Neutron sensitive imaging platesconsist of a thin phosphor layercontaining a mixture of storage phosphor,neutron converter and organic binder.Following the neutron exposure stage isthe information readout phase, in whichthe plate is scanned by a thin laser beamstimulating the emission of a pattern oflight. Merits of this neutron imagingtechnique include five decades oflinearity, wide dynamic range, directavailability of digital data for processingconverter efficiencies of 30 to 40 percent,and spatial resolution acceptable for someapplications.17,18
For neutron radiography of highlyradioactive objects, dysprosium andindium foil activation transfer to film andtrack etch imaging each offer completediscrimination against gamma rayfogging.19 Examples of nuclear fuelneutron radiography are shown in Fig. 4.Dysprosium transfer can be combinedwith a cadmium indium foil sandwich fordual energy radiography. Alternative tracketch techniques have been developed toyield more precise dimensionalmeasurements.20
Image Quality IndicatorsFor any nondestructive system, the bestmeasure of quality is to compare theimage of the test object with an image ofa similar object that contains a knownartificial discontinuity, a defect standard, orreference standard. However, neutronradiography has the same problems asother nondestructive testing methods: thequantity of reference standards required istoo large to obtain and maintain. In lieuof a reference standard, neutronradiographers have chosen to fabricate aresolution indicator that emulates theworst case scenario with gaps placedbetween and holes placed beneathdifferent plastic thicknesses.12 Fordefining the neutron beam characteristicsa beam purity indicator has been devisedto accompany the sensitivity indicator.
The image quality indicator system ofASTM International has become theprimary or alternate system for mostmanufacturing specifications on aninternational basis. The no umbra device, adevice to measure resolution, is described
idt
NA3niua
(
(
n ASTM E 803-91 and can be used toetermine the collimation ratio L·D–1 ofhe neutron radiography facility.13
uclear Reactor Systems nuclear reactor system operated for over0 years solely to provide a commercialeutron radiographic service is illustrated
n Fig. 5. The reactor core, positionednderground in a tank of water, is onlybout 0.38 m (15 in.) in diameter and
441Neutron Radiography
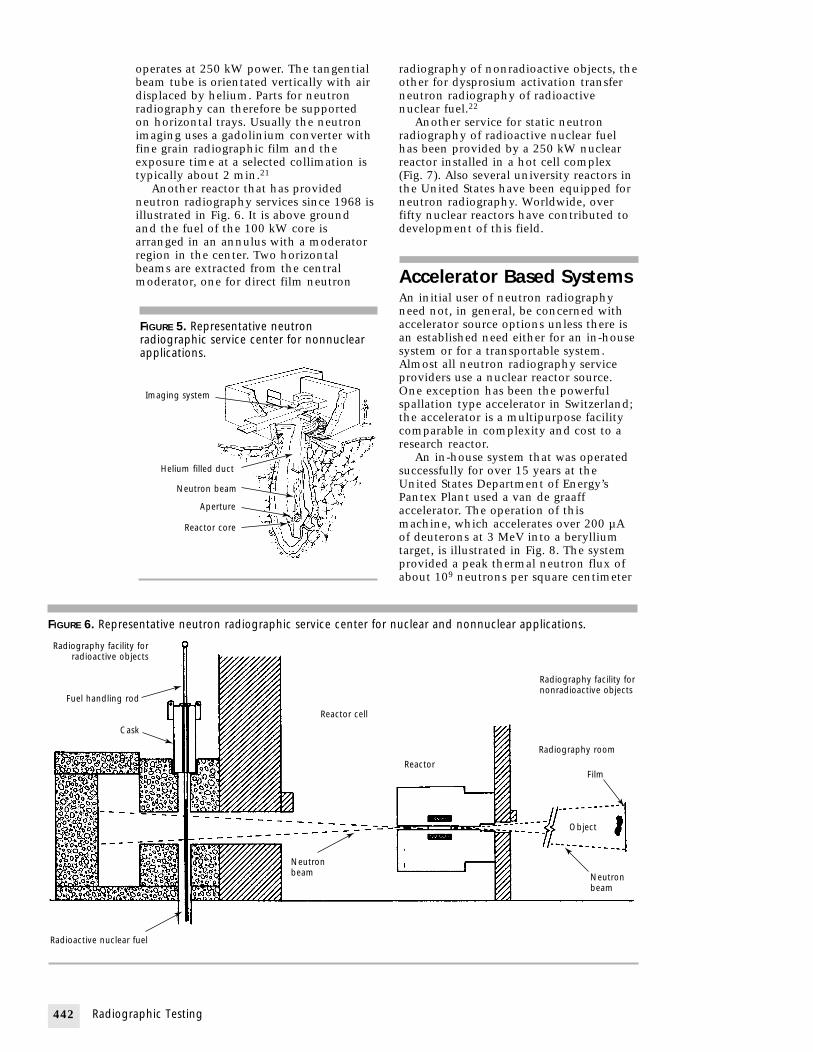
442
FIGURE 6
Radiograradi
Fuel h
Radioacti
3RT16_Layout(437_452) 10/2/02 3:10 PM Page 442
operates at 250 kW power. The tangentialbeam tube is orientated vertically with airdisplaced by helium. Parts for neutronradiography can therefore be supportedon horizontal trays. Usually the neutronimaging uses a gadolinium converter withfine grain radiographic film and theexposure time at a selected collimation istypically about 2 min.21
Another reactor that has providedneutron radiography services since 1968 isillustrated in Fig. 6. It is above groundand the fuel of the 100 kW core isarranged in an annulus with a moderatorregion in the center. Two horizontalbeams are extracted from the centralmoderator, one for direct film neutron
Radiographic Testing
FIGURE 5. Representative neutronradiographic service center for nonnuclearapplications.
Imaging system
Helium filled duct
Neutron beam
Aperture
Reactor core
. Representative neutron radiographic service center fo
phy facility foroactive objects
andling rod
Cask
ve nuclear fuel
Neutronbeam
Reactor cell
radiography of nonradioactive objects, theother for dysprosium activation transferneutron radiography of radioactivenuclear fuel.22
Another service for static neutronradiography of radioactive nuclear fuelhas been provided by a 250 kW nuclearreactor installed in a hot cell complex(Fig. 7). Also several university reactors inthe United States have been equipped forneutron radiography. Worldwide, overfifty nuclear reactors have contributed todevelopment of this field.
Accelerator Based SystemsAn initial user of neutron radiographyneed not, in general, be concerned withaccelerator source options unless there isan established need either for an in-housesystem or for a transportable system.Almost all neutron radiography serviceproviders use a nuclear reactor source.One exception has been the powerfulspallation type accelerator in Switzerland;the accelerator is a multipurpose facilitycomparable in complexity and cost to aresearch reactor.
An in-house system that was operatedsuccessfully for over 15 years at theUnited States Department of Energy’sPantex Plant used a van de graaffaccelerator. The operation of thismachine, which accelerates over 200 µAof deuterons at 3 MeV into a berylliumtarget, is illustrated in Fig. 8. The systemprovided a peak thermal neutron flux ofabout 109 neutrons per square centimeter
r nuclear and nonnuclear applications.
Reactor
Radiography room
Film
Object
Neutronbeam
Radiography facility fornonradioactive objects

3RT16_Layout(437_452) 10/2/02 3:10 PM Page 443
second, two orders of magnitude less thanthe reactor systems described above butsufficient for low throughput work using2 h exposure times and a relatively lowbeam collimation ratio.
Cyclotrons and radio frequencyquadrupole accelerators are othercandidates for a potential customdesigned in-house neutron radiographicsystem. Neutron radiographicperformance data have been reported fordesigns with a variety of sizes, neutronyields and costs.23
For transportable systems much of thedevelopment work has used sealed tubeacceleration of deuterium tritiummixtures. This can consist of a sourcehead that is maneuverable with long hightension cable linking it to the highvoltage power supply and control unit asillustrated (Fig. 9). The particular typeshown yields a peak thermal neutron fluxof about 108 neutrons per square
cenhal
HiCaOf sucamdomradtranbypthecensouDepneuof 2mil
FIGURE 7. Hot cell fuel inspection system.
Main cell
Rad
Apert
Control rod d
Reactor room
Removablebeam filter
Core Collimator
FIGURE 8. Cross section showing van de graaff
Ion beamchannel Accelerating tube
Chargingsupply (30 kV)
MotorVacuum pump
Target
Belt
timeter second with a tube operationf life of about 200 h.24-25
gh Intensitylifornium-252 Systems
the many radioactive neutron sources,h as polonium-210 beryllium andericium-244 beryllium, one has
inated interest for neutroniography: californium-252. Thissplutonic isotope is produced as aroduct of basic research programs. In United States, some governmentters have been able to obtain therce on a low cost loan basis from theartment of Energy. The isotope yieldstrons by spontaneous fission at a rate × 109 neutrons per second perligram and has a half life of 2.5 years.
443Neutron Radiography
Elevator driveSpecimen tube
Lead shield
Foil transporter
Beam stop
Beam scraperGamma shield
Neutronshutter
iography room
ure changer
rives
principle.
Corona rings
Ionsource
High voltage electrode
Pressure tank

444
FIGUREhead, t
(a)
3RT16_Layout(437_452) 10/2/02 3:10 PM Page 444
A high yield source of up to 50 mg can besmaller than a tube of lipstick (Fig. 10).
An in-house stationary system hasoperated at the United States Departmentof Energy’s installation at Pantex with atotal source strength of 150 mgcalifornium-252. It provided sets of ninefilms, each 350 × 425 mm (14 × 17 in.),approaching reactor quality by usinggadolinium with a very fine grain X-rayfilm; a collimator ratio of 65; andexposure time of under 24 h.
A maneuverable source system hasoperated at McClellan Air Force Base witha total source strength of 50 mgcalifornium-252. It provided singleneutron radiographs using a fastscintillator screen; high speed, lightsensitive film; a collimator ratio of 30;and an exposure time of 12 min. Thissystem was designed for the specificapplication of scanning intact aircraft to
detsucalu
calsubcenproneuwh
LoThintcouin-100radim105
exp
Radiographic Testing
9. Components of mobile deuterium tritium neutron raypically on 6 m (20 ft) cables; (b) cooling unit (left) an
(b)
FIGURE 10. Californium-252 sourcescompared in size to postage stamp.
ect hidden problems at an early stage,h as moisture or corrosion inminum honeycomb.26
Another example of a high yieldifornium-252 system design uses acritical multiplier to amplify thetral neutron flux. This design (Fig. 11)duces a peak central flux of 7 × 10⁸
trons per square centimeter seconden loaded with 40 mg californium-252.
w Cost In-House Systemere is evidence that an extremely lowensity californium-252 neutron sourceld provide a convenient, low cost
house system. A source size of onlyµg can provide useful quality neutron
iographs by using highly efficientaging systems that need only
neutrons per square centimeterosure. This is 10 000 times less than
diographic system: (a) deuterium tritium sourced power supply; (c) control unit.
(c)
FIGURE 11. Elevation of subcritical multiplier system.
Concretebiological
shield
Californium-252source
Coretank
Uranium-235 fuel andcadmium safety plates
Shutter
Radiographyport
Collimator withenriched lithium
plates
Leadshielding
Fluxtraparea
Water moderatorand reflector

3RT16_Layout(437_452) 10/2/02 3:10 PM Page 445
the exposure used typically withgadolinium and single emulsion film. Thesmall source size would mean aninexpensive source and also inexpensiveshielding, handling and interlockrequirements.26 Therefore, anondestructive testing center with avariety of X-ray, ultrasonic and otherinspection capabilities could easilyincorporate a small californium-252 basedneutron radiographic capability using anunderground storage geometry in anexisting radiographic bay. Becauseneutron radiography yields uniqueinformation, such an inexpensivein-house capability could be an importantcomplement to an otherwise full servicenondestructive testing center.
445Neutron Radiography

446 R
PART 3. Special Techniques of NeutronRadiography
FIGURE 12engine: (
(a)
3RT16_Layout(437_452) 10/2/02 3:10 PM Page 446
Dynamic NeutronRadioscopyServices that provide different types ofdynamic neutron radioscopy have beendeveloped at numerous nuclear reactorcenters worldwide. They cover frame ratesthat range from 30 frames per second (realtime motion display similar to television)to 1000 frames per second range (a highframe rate) or to 10 000 frames per second(a very high frame rate).27–28
An example of a real time dynamicneutron radioscopic application isillustrated in Figure 12. A beam from a28 MW reactor was used to study the flowcharacteristics of lubricant inside anoperating jet engine. Other applicationshave included studies of absorption andcompression refrigerator designs, studiesof automotive parts in motion and a largerange of two-phase flow studies.
For high throughput dynamic neutronimaging one reactor center has beenequipped with three separate beams, eachwith its neutron imaging system anddigital image interpretation system.29
Other reactor centers have developedtechniques for simultaneous neutron andgamma ray dynamic imaging using a pairof scintillator screens in conjunction witha low light level television camera andvideo processing.30
Tradiof 1on tstea108
secocamsensframper reacneumillsuchevenpuls
SuRaThepartsignchachaanoenequitpen
Ndevsubttechpoly
adiographic Testing
. Frames from real time studies of operating aircrafta) first view; (b) second view.
(b)
he development of dynamic neutronoscopic services with a high frame rate000 frames per second has capitalizedhe availability of very high intensitydy state neutron beams (with a flux ofneutrons per square centimeternd) and very high frame rate videoeras used with rapid response neutronitive scintillator screens. A very highe rate capability, up to 10 000 frames
second, uses the ability of certaintors to be pulsed, giving a hightron yield for a time duration of a fewiseconds. The event to be studied, as the burn cycle of a pyrotechnict, is synchronized to the neutrone time.31
bthermal Neutrondiology neutron attenuation coefficient of aicular material can changeificantly as the neutron energy isnged. The pattern of this variation alsonges abruptly from one element tother. Therefore, selection of differentrgy neutrons provides possibilities fore different neutron radiologyetration and contrast.eutron radiology service reactors have
eloped neutron beams of selectedhermal or cold neutrons using threeniques: (1) beam filtration bycrystal beryllium, which passes only
long wavelength, low energy neutronsbelow 0.005 eV, (2) a refrigeratedmoderator volume and (3) selection oflonger wavelength, low energy neutronsby multiple internal reflection in a gentlycurved guide tube.32,33
The effect of this energy selection istypically to increase the transparency ofcertain materials while simultaneouslyincreasing the contrast or detectability ofhydrogenous materials (see Table 2 andFig. 13). Just as thermal neutronradiography gives different information toX-radiography, so subthermal or coldneutron radiography gives informationdifferent from that of regular thermalneutron techniques. An example is givenin Fig. 14. It is possible, using a guidetube, to select only very cold neutrons(that is, energies below 0.001 eV) and thiscan provide high sensitivity for very thinhydrogenous specimens.

oldeutrons.
Neu
tron
att
enua
tion
High
LowFastThermal
Hydrogen and mostnoncrystal materials
Certain metals(Table 2)
Cold
IGURE 14. Neutron radiographs of explosiveridge wire igniter: (a) thermal neutronage; (b) cold neutron image.
a) (b)
3RT16_Layout(437_452) 10/2/02 3:10 PM Page 447
Epithermal and FastNeutron RadiologyA reactor beam, although consistingprimarily of thermal neutrons, willcontain a proportion of both subthermaland epithermal (high energy) neutrons.With a filter such as cadmium, thethermal and subthermal neutrons can beremoved and only the epithermal part ofthe neutron energy spectrum will betransmitted.33
For the inspection of enriched nuclearfuel the higher penetration of epithermalneutrons provides a valuable differencefrom thermal or subthermal neutronradiography. Indium has a high resonancecapture cross section at about 1.4 eVepithermal energy. Cadmium wrappedindium foil activation transfer imagingtechniques have been used for thisapplication.
Another epithermal neutron techniqueuses an indium foil filter in the incidentbeam to remove neutrons close to thespecific resonance energy. This beam ispassed through the object and an indiumdetector is used on the far side. Thetechnique can provide high sensitivity tosmall quantities of hydrogen in the objectbecause hydrogen can change the energyof an incident neutron more than heavierelements.
The term fast neutron radiographyrefers normally to those neutron energiesyielded by an unmoderated acceleratorsource or radioactive source. Fast neutronradiography provides high penetrationbut little contrast between elements. Theaccelerator can provide a point source.Tantalum is one of several detectormaterials for direct exposure andscintillator screens can be used.Alternatively, foil activation transfer withholmium has been demonstrated.34
NTCdcopcct
Fn
Fbim
(
TABLE 2. Relative neutron attenuationcoefficients.
Thermal ColdElement Neutrons Neutrons
Beryllium 0.861 0.055Silicon 0.092 0.050Iron 1.160 0.568Nickel 1.980 1.350Zirconium 0.340 0.047Lead 0.370 0.049Bismuth 0.250 0.126
eutron Computedomographyomputed axial tomography has beeneveloped for neutron radiography andan provide detailed cross sectional slicesf the object to be analyzed. Although therinciple is similar to that of X-rayomputed tomography, the informationonveyed by neutrons can be unique. In aypical facility the object is rotated in the
IGURE 13. Attenuation of materials for thermal and c
447Neutron Radiography
Explosive charge

448
3RT16_Layout(437_452) 10/2/02 3:10 PM Page 448
neutron beam and data are stored forupward of 200 angles. Detectors used haveincluded a scintillator screen 6LiF-ZnS(Ag), viewed by a cooled charge coupleddevice camera and alternatively a storagephosphor image plate loaded with Gd2O3combined with an automatic laser beamscanner. Using a high intensity neutronradiography beam of over 108 neutronsper square centimeter second, computedtomography of two-phase flow volumeshas been processed as a time averagedthree-dimensional analysis.35-37
Neutron Gaging andNeutron Probe TechniquesNeutron gaging is the measurement ofattenuation of a collimated small diameterbeam of radiation as it is transmitted by aspecimen. A neutron radiology servicecenter equipped with a nuclear reactorhas demonstrated that the imagingtechniques can be complemented by themore quantitative techniques ofgaging.38,39 The gaging technique caninspect items of greater thickness thancan be inspected with neutronradiography. It has been used for staticgaging of discrete assemblies and forcontinuous scanning of long objects foracceptable uniformity.
There are also a variety of neutronprobe techniques in which radiation,typically gamma, is observed as a result ofneutron radiation incident on the object.For example the associated particle sealedtube neutron generator enables the flighttime of the incident neutron to be used inconjunction with gamma rayspectroscopy to indicate the chemicalcomposition within an object. Thistechnique has been developed foridentification of hidden explosives, drugsor nuclear materials.40
Another example of a neutron probe isneutron interferometry to detect phaseshifts of the neutron wave properties. Thisneutron phase topography has beenproposed for very high sensitivity materialtesting.41
Neutron Induced AutoradiographyBy exposing a painting to thermal or coldneutrons and later imaging theradioactivity induced in the various paintcomponents, a technique has beendeveloped sensitive to many elementsincluding manganese, potassium, copper,sodium, arsenic, phosphorus, gold, iron,mercury, antimony and cobalt. Theneutron exposures were originallyperformed in a moderator block (thermalcolumn), close to a reactor core. However,beams similar to those used fortransmission neutron radiography have
beenautoa sera randiffeThis,scintcan psucce
CloInduon n
Radiographic Testing
used for this neutron inducedradiography of paintings.42 Typically,ies of autoradiographs is taken usingge of neutron exposure times andrent decay times before imaging. combined with a range ofillator screen and film sensitivities,rovide extensive information aboutssive layers of each painting.
singstry standards have been publishedeutron radiographic testing.11-13,43-45

1. Barton, J.P. et al., eds. NeutronRadiography: Proceedings of the FirstWorld Conference. Dordrecht,Netherlands: D. Reidel Publishers(1982).
2. Barton, J.P. et al., eds. NeutronRadiography: Proceedings of the SecondWorld Conference. Dordrecht,Netherlands: Kluwer AcademicPublishers (1987).
3. Fujine, S. et al., eds. NeutronRadiography: Proceedings of the ThirdWorld Conference. Dordrecht,Netherlands: D. Reidel Publishers(1990).
4. Barton, J.P. et al., eds. NeutronRadiography: Proceedings of the FourthWorld Conference. Yverdon,Switzerland: Gordon and BreachScience Publishers (1994).
5. Fischer C.O. et al., eds. NeutronRadiography: Proceedings of the FifthWorld Conference. Berlin, Germany:Deutsche Gesellschaft fürZerstörungsfreie Prüfung (1997).
6. Fujine, S. et al., eds. NeutronRadiography: Proceedings of the SixthWorld Conference. Yverdon,Switzerland: Gordon and BreachScience Publishers (2001).
7. Kobayashi, H. et al., eds. NeutronRadiography System Design andCharacterization: Proceedings of SecondInternational Topical Meeting. Reprintedin Nuclear Instruments and Methods inPhysics Research, Section A.Amsterdam, Netherlands:Elsevier/North Holland (1996).
8. Lehmann, E. et al., eds. NeutronDetectors, Imaging Techniques andApplications: Proceedings of the ThirdInternational Topical Meeting on NeutronRadiography. Reprinted in NuclearInstruments and Methods in PhysicsResearch, Section A. Amsterdam,Netherlands: Elsevier/North Holland(1999).
9. Berger, H., ed. Practical Applications ofNeutron Radiography and Gaging. WestConshohocken, PA: ASTMInternational (1975).
10. Domanus, J.C., ed. Practical NeutronRadiography. Dordrecht, Netherlands:Kluwer Academic Publishers (1992).
11. ASTM E 748, Standard Practices forThermal Neutron Radiography ofMaterials. West Conshohocken, PA:ASTM International (1995).
12. ASTM E 545, Standard Method forDetermining Image Quality in DirectThermal Neutron RadiographicExamination. West Conshohocken, PA:ASTM International (1999).
13. ASTM E 803-91, Standard Method forDetermining the L/D Ratio of NeutronRadiography Beams. WestConshohocken, PA: ASTMInternational (1996).
14. Hawkesworth, M.R. et al. “Basics ofThermal Neutron Radiography.”Neutron Radiography: Proceedings of theFirst World Conference. Dordrecht,Netherlands: D. Reidel Publishers(1982): p 5-21.
15. Whittemore, W.L. “Neutron Sourcesand Facilities.” Neutron Radiography:Proceedings of the Sixth WorldConference. Yverdon, Switzerland:Gordon and Breach Science Publishers(2001): p 3-10.
16. Domanus, J.C., ed. Collimators forThermal Neutron Radiography.Dordrecht, Netherlands: D. ReidelPublishers (1987).
17. Rant, J.J. “Imaging Techniques.”Neutron Radiography: Proceedings of theSixth World Conference. Yverdon,Switzerland: Gordon and BreachScience Publishers (2001): p 23-34.
18. Kobayashi, H. et al. “BasicPerformance of a Neutron SensitivePhoto-Stimulated LuminescenceDevice for Neutron Radiography.”Neutron Detectors, Imaging Techniquesand Applications: Proceedings of theThird International Topical Meeting onNeutron Radiography. Reprinted inNuclear Instruments and Methods inPhysics Research, Section A.Amsterdam, Netherlands:Elsevier/North Holland (1999): p 1-8.
19. McClellan, G.C. et al. “NeutronRadiography Applications andTechniques at the Hot CellExamination Facility.” NeutronRadiography: Proceedings of the FirstWorld Conference. Dordrecht,Netherlands: D. Reidel Publishers(1982): p 437-443.
20. Markgraf, J.F.W. “The PracticalUtilization of Nitrocellulose Film inNeutron Radiography.” NeutronRadiography: Proceedings of the ThirdWorld Conference. Dordrecht,Netherlands: D. Reidel Publishers(1990): p 353-364.
449Neutron Radiography
References
3RT16_Layout(437_452) 10/2/02 3:10 PM Page 449

21. Newacheck, R.L. “Applications andTrends of Industrial NeutronRadiography.” Neutron Radiography:Proceedings of the First World Conference.Dordrecht, Netherlands: D. ReidelPublishers (1982): p 77-84.
22. Leighty, C.E. “Neutron Radiography atthe General Electric Nuclear TestReactor.” Neutron Radiography:Proceedings of the First World Conference.Dordrecht, Netherlands: D. ReidelPublishers (1982): p 153-162.
23. Hamm, R.S. “Status of the LansarNeutron Generators.” NeutronRadiography: Proceedings of the FifthWorld Conference. Berlin, Germany:Deutsche Gesellschaft fürZerstörungsfreie Prüfung (1997):p 540-567.
24. Cluzeau, S. “Thermal Neutron SourceUsing a Sealed Neutron Tube.” NeutronRadiography: Proceedings of the FourthWorld Conference. Yverdon,Switzerland: Gordon and BreachScience Publishers (1994): p 453-460.
25. Barton, J.P. et al. “Experience withAircraft Inspected in MNRS Using Filmand Electronic Imaging.” NeutronRadiography: Proceedings of the FourthWorld Conference. Yverdon,Switzerland: Gordon and Breach(1994): p 133-142.
26. Barton, J.P. et al. “Lessons from PantexCf-252 Wide Angle BeamCharacterization.” NeutronRadiography: Proceedings of the SixthWorld Conference. Yverdon,Switzerland: Gordon and BreachScience Publishers (2001): p 124-136.
27. Lindsay, J.T. et al. “Fifteen Years ofNeutron Radioscopy Applications inTransmission Lubrication Studies forthe Automotive Industry.” NeutronRadiography: Proceedings of the SixthWorld Conference. Yverdon,Switzerland: Gordon and BreachScience Publishers (2001): p 67-76.
28. Takenaka, N. et al. “Application ofNeutron Radiology to ThermalHydraulic Phenomena.” NeutronRadiography: Proceedings of the SixthWorld Conference. Yverdon,Switzerland: Gordon and BreachScience Publishers (2001): p 503-506.
29. Polichar, R. et al. “A QuantitativeNeutron Radioscopic ImageAcquisition and Processing System forSNRS.” Neutron Radiography: Proceedingsof the Fourth World Conference.Yverdon, Switzerland: Gordon andBreach Science Publishers (1994):p 195-206.
30. Balasko, M. “Dynamic NeutronRadiography Instrumentation andApplication in Central Europe.”Neutron Radiography System Design andCharacterization: Proceedings of SecondInternational Topical Meeting. Reprintedin Nuclear Instruments and Methods inPhysics Research, Section A.Amsterdam, Netherlands:Elsevier/North Holland (1996):p 140-143.
31. Mishima, K. “Multiphase FlowMeasurements.” Neutron Radiography:Proceedings of the Sixth WorldConference. Yverdon, Switzerland:Gordon and Breach Science Publishers(2001): p 35-50.
32. Bayon, G. “Review on Use of NeutronRadiography at Saclay NuclearResearch Centre.” Neutron Radiography:Proceedings of the Fifth WorldConference. Berlin, Germany: DeutscheGesellschaft für ZerstörungsfreiePrüfung (1997): p 25-31.
33. Whittemore, W.L. et al. Physics ofNeutron Radiography Using SelectedEnergy Neutrons.” NeutronRadiography: Proceedings of the FirstWorld Conference. Dordrecht,Netherlands: D. Reidel Publishers(1982): p 23-33.
34. Klahn, R.T. et al. “Fast NeutronRadiography Research at ANL-W.”Neutron Radiography: Proceedings of theFifth World Conference. Berlin,Germany: Deutsche Gesellschaft fürZerstörungsfreie Prüfung (1997):p 382-390.
35. Schillenger, G. “Improved NeutronRadiography and 3D Tomography Dueto Better Beam Geometry.” NeutronRadiography: Proceedings of the SixthWorld Conference. Yverdon,Switzerland: Gordon and BreachScience Publishers (2001): p 601-606.
36. McFarland, E. et al. “QuantitativeEvaluation of a Neutron Radiographyand Tomography System.” NeutronRadiography: Proceedings of the FourthWorld Conference. Yverdon,Switzerland: Gordon and BreachScience Publishers (1994): p 561-574.
37. Kobayashi, H. “Recent Development ofCooled CCD Camera for NeutronRadiography Imaging — Tomography.”Neutron Radiography: Proceedings of theFourth World Conference. Yverdon,Switzerland: Gordon and BreachScience Publishers (1994): p 553-560.
38. Reynolds, G.M. “Neutron GagingSystems.” Practical Applications ofNeutron Radiography and Gaging. WestConshohocken, PA: ASTMInternational (1975): p 58-73.
450 Radiographic Testing
3RT16_Layout(437_452) 10/2/02 3:10 PM Page 450
39. Newacheck, R.L. et al. “ComputerizedNeutron Gaging Adds a NewDimension to Neutron Radiography.”Neutron Radiography: Proceedings of theSecond World Conference. Dordrecht,Netherlands: D. Reidel Publishers(1987): p 821-828.
40. Rhodes, E. et al. “NeutronInterrogation for Detection of NuclearMaterials, Explosives and Drugs.”Neutron Radiography: Proceedings of theFourth World Conference. Yverdon,Switzerland: Gordon and BreachScience Publishers (1994): p 827-836.
41. Rauch, H. “Neutron Phase Topographyfor High Sensitive Material Testing.”Neutron Radiography: Proceedings of theFifth World Conference. Berlin,Germany: Deutsche Gesellschaft fürZerstörungsfreie Prüfung (1997):p 61-68.
42. Fischer, C.O. et al. “Autoradiographyof Large Scale Paintings.” NeutronRadiography: Proceedings of the SixthWorld Conference. Yverdon,Switzerland: Gordon and BreachScience Publishers (2001): p 563-571.
43. E 2023-99, Standard Practice forFabrication of Neutron RadiographicSensitivity Indicators. WestConshohocken, PA: ASTMInternational (1999).
44. E 1496-97, Standard Test Method forNeutron Radiographic DimensionalMeasurements. West Conshohocken,PA: ASTM International (1997).
45. E 2003-98e1, Standard Practice forFabrication of the Neutron RadiographicBeam Purity Indicators. WestConshohocken, PA: ASTMInternational (1998).
451Neutron Radiography
3RT16_Layout(437_452) 10/2/02 3:10 PM Page 451

George R. Strabel, Howmet Research Corporation,Whitehall, Michigan
Radiographic Testing ofMetal Castings1
17C H A P T E R
3RT17_Layout(453_472) 10/2/02 3:11 PM Page 453

454 Rad
PART 1. Introduction to Radiographic Testing ofMetal Castings
3RT17_Layout(453_472) 10/2/02 3:11 PM Page 454
Casting is a metals fabrication methodchosen primarily because it producescomplex shapes with a minimum offinished weight. In addition, castingpermits the manufacture of a desiredproduct with fewer components, thusminimizing the amount of joining (byfasteners or welds). Possible castingproblems are often associated with themold, the molten metal or patterns in thecast object; these must be properlyconsidered to avoid difficulties and toensure required quality levels. Theseproblems can be addressed byradiographic testing.
Casting DiscontinuitiesPouring of castings is simplified when themelt fluidity is high. This is achieved bysuperheating the material above itsmelting range to a point where associatedgas absorption is kept to a reasonableminimum; this is especially important formolten practices with ordinary air. Failureto superheat creates the possibility of gaspocket formation in some portions of thecasting. Gas pockets tend to occur in theheavier cast sections while gas porosityoccurs under an initial layer of solidifiedmetal near the mold or core walls. Largepockets of gas are obviously detrimentalto the strength of the casting unless it isdesigned to allow pocket formation onlyin portions discarded during finishing.
Subsurface gas may be unacceptablebecause finish machining may producesurface openings that act as locations ofstress concentration. Subsurface porosityoccurs because the gas takes some time tomove toward the mold and core wallsand, in that time, heat loss causes metalskins to form, preventing the gas fromescaping. The extent of subsurfaceporosity varies with mold type. Sandmolds, depending on their degree ofdryness, have a greater tendency toproduce solid metal skins near mold walls,when compared to shell and plastic(precision casting) molds. Possible sourcesof such discontinuities should beeliminated during the casting process.
iographic Testing
Reasons for RadiographicTestingThe major goal of radiographic testing ofcastings is to help control the productionprocess and product quality. The latter isespecially true when the number ofcastings is high and the production ofpilot castings is possible and practical.
Film radiography has been one of themost effective nondestructive testingtechniques for quality control of castings.Film radiography uses penetratingionizing radiation and providespermanent reference data. The image, inprinciple, is a record of variation in thetotal thickness of radiation absorbingmaterial displayed in a single plane; or aplanar projection of conditions prevailingin the three-dimensional space of theitem tested.
Other common nondestructive testingmethods are affected by themetallographic structure and degree ofworking to which the metal has beensubjected; generally these considerationshave no effect on the radiationtransmission or subsequent legibility ofthe radiographic indications. The onlyexceptions are grain and the conditioncalled mottling, as described in some detailbelow. Hence radiography is the mosteffective nondestructive testing methodfor castings, which generally are studiedfor presence of volumetric defect types. Asis true of any important engineeringfabrication where stress concentrationsmay cause trouble, surface methods suchas magnetic particle or liquid penetranttesting should supplement radiographybecause discontinuities such as surfacecracks are difficult to detectradiographically.
To be effective, the radiographicmethod requires proper interpretation ofresulting images. Interpretation, in turn,demands a familiarity with the types ofdiscontinuities generated. Importantthings to consider include the method ofcasting; mold and core materials anddesign; melting and pouringtemperatures; cooling rates and time; andpossible interaction of the particularmetallographic structure with the testradiation.

PART 2. General Radiographic Techniques forMetal Castings
3RT17_Layout(453_472) 10/2/02 3:11 PM Page 455
Radiation Sources UsedGamma ray sources, especially as used incasting radiography, have the followingadvantages over X-rays: (1) simpleapparatus; (2) compactness;(3) independence from external power;(4) ability to provide simultaneous testingof many objects and completecircumferences of large cylindrical objects;(5) practicality when access to the interiorof the object is difficult; and (6) usabilitywhen testing must occur in confinedspaces. Radium, a naturally occurringgamma ray source, came into use in thelate 1930s; it has since been replaced byartificial isotopes (see Table 1).
X-rays, however, are essential for someapplications. Low (kilovolt) X-ray energiesare needed for obtaining requiredradiographic sensitivities in light metals(such as aluminum) and in thin materialthicknesses of steel. High energy(megavolt) X-rays are necessary forpenetration of steel thicknesses in excessof 200 mm (8.0 in.). As with allnondestructive testing, casting inspectionis best done with the method thatproduces the desired results for thespecific application.
Gamma ray sources, unlike X-raymachines, emit penetrating radiationhaving only one or a few discretewavelengths. Sources are commonlyspecified by the energy of the individualquantum (using units of electronvolts)rather than by wavelength. Thus a gammaray with an energy of 1.25 MeV is
epe1ttee
btvX
ca((itdspbcssg
bbuads
mor
TABLE 1. Gamma ray sources used in indust
Radioactive EnergyElement (MeV) Half Life
Cesium-137 0.66a 33 yrCobalt-60 1.17 and 1.33 5.3 yrIridium-192 0.137 to 0.651b 75 dyThulium-170 0.048 and 0.054c 127 dy
a. Usual form used is cesium chloride, soluble powder cawelded stainless steel.
b. Has at least 12 gamma rays, principal ones at 0.310, 0c. Produced in limited intensities for desired energies, so
sensitivity down to 13 mm (0.5 in.) aluminum and for
quivalent in wavelength and penetratingower to the most penetrating radiationmitted by an X-ray tube operating at.2 MeV. The total penetrating power ofhe gamma radiation source is about equalo that of a 3 MeV X-ray machine thatmits a spectrum or wide range ofnergies.
The wavelengths (or energies) emittedy a gamma ray source depend only onhe nature of the emitter and are notariable at the will of the operator, as-rays are.
Important gamma sourceharacteristics include: (1) the curie valuend specific activity, (2) half life,3) energy of quanta, (4) dosage rate and5) application thickness limit. Thentensity of gamma radiation depends onhe number of radioactive atoms thatisintegrate per second in the source. Formall or moderate sources, this intensity isroportional to the source activity inecquerel (1 disintegration per second) orurie (3.7 × 10¹⁰ disintegrations perecond). The proportionality fails for largeources or for those emitting low energyamma rays because of self-absorption.
The specific activity, expressed inecquerel (or curie) per gram, is importantecause it influences geometricalnsharpness of the images. Higher specificctivity allows shorter source-to-sensoristances without a loss of imageharpness.
Gamma ray dosage is expressed inicrosievert per gigabecquerel hour at
ne meter (µSv·GBq–1·h–1 at 1 m), oroentgen per curie hour at one meter
455Radiographic Testing of Metal Castings
rial radiography.
Dosage Rate Metallurgical Application and__________________________mSv·GBq–1·h–1 (R·Ci–1·h–1 Thickness of Steel or Equivalent_______________________________
at 1 m at 1 m) mm (in.)
0.1053 (0.39) 12 to 88 (0.5 to 3.5)0.3645 (1.35) 25 to 200 (1.0 to 8.0)0.1485 (0.55) 12 to 75 (0.5 to 3.0)0.0081 (0.003) 0.75 to 13 (0.03 to 0.5)
lling for special precautions to prevent leakage, such as double encapsulation in
.470 and 0.600 keV. use is not widespread. Has excellent portability and may be used at two percent light nonmetals.

456 Ra
3RT17_Layout(453_472) 10/2/02 3:11 PM Page 456
(R·Ci–1·h–1 at 1 m). Gamma ray sourceslose activity with time, the rate dependingon the material half life shown in Table 1.Knowing the half life of the isotope allowspreparation of decay curves as illustratedfor iridium-192 in Fig. 1. This graph ofactivity versus time permits revisedcalculation of exposure time as theactivity of the gamma ray sourcediminishes.
X-rays are made by using electricalenergy to produce electrons accelerated tovery high velocities. X-rays are emitted bydeceleration of the electrons when theystrike a target, which for industrialradiography is usually made of tungsten.
diographic Testing
FIGURE 1. Decay curves for iridium-192:(a) linear plot; (b) logarithmic plot.
Rem
aini
ng a
ctiv
ity (
perc
ent)
(a)
(b)
0 50 100 150 200
100
90
80
70
60
50
40
30
20
10
0
Time (days)
Rem
aini
ng a
ctiv
ity (
perc
ent)
0 50 100 150 200
1009080
7060
50
40
30
20
10
Time (days)
The higher the voltage of the appliedenergy, the greater the speed of theelectrons striking the focal spot. The resultis a decrease in wavelength of the X-raysemitted, with a simultaneous increase inpenetrating power and intensity. Thus,unlike gamma ray sources, X-ray machineradiations may be varied at the will of theoperator within the range of theequipment used.
The various X-ray machinescommercially available may be veryroughly classified according to theirmaximum voltage. Table 2 is a generalizedguide for typical X-ray machines byvoltage ranges and applications.2 Thetable must be used with theunderstanding that particular machinesdiffer in their specifications from modelto model.
Although most commonly used X-raymachines are less mobile thanradioisotopes and depend on electriccurrent, they are available in portabledesigns. In addition, those with rod anodetubes (in which the target is perpendicularto the electron stream) can be used toproduce radiographs with circumferentialcoverage of appropriate items. The majoradvantages of X-rays are their ability togenerate higher intensities of penetratingradiation and their variability in radiationintensity (quantity) and energy (quality)as determined by the operator and theapplication.
TABLE 2. Representative energies of X-ray machines andtheir applicable thickness limits.
Maximum ApproximateVoltage (kV) Screens Thickness Limitsa
50 none thin sections of most metalsb
none or lead foil 125 mm (5.0 in.) aluminumc
150 none or lead foil 25 mm (1.0 in.) steel c
fluorescent 38 mm (1.5 in.) steel c
250 lead foil 50 mm (2.0 in.) steel c
fluorescent 75 mm (3.0 in.) steel c
400 lead foil 75 mm (3.0 in.) steel c
fluorescent 100 mm (4.0 in.) steel c
1000 lead foil 125 mm (5.0 in.) steel c
fluorescent 200 mm (8.0 in.) steel c
2000 lead foil 200 mm (8.0 in.) steel c
8000 to 25 000 lead foil 400 mm (16.0 in.) steel c
a. Also used for important nonmetallics such as moderate thicknesses ofgraphite and small electronic components, wood and plastics.
b. Lower limit depends on particular machine and how secondary voltagemay be adjusted.
c. Or equivalent.

FIGURE 2. Sample of radiographic shooting sketch (RSS),showing film placement and Identification.1,3,5
3RT17_Layout(453_472) 10/14/02 10:43 AM Page 457
Specification RequirementsRadiographic testing of castings providesinformation about the quality of theproduct within the limits of the testmethod. Hence, the contract betweenproducer and consumer should, for theirmutual benefit, refer to time provenspecifications. Among the most widelyused specifications are those of ASTMInternational with emphasis on techniqueand interpretation of radiographicindications3 and those of the AmericanSociety of Mechanical Engineers (ASME)with emphasis on product quality andin-process weld repairs.4
During the preparation of radiographictest requirements, it is essential torecognize that radiographic coverage hasits limitations, especially when inspectingcastings with complex geometries or partconfigurations. Geometry or partconfigurations that do not allow completecoverage with normal radiographictechniques should be acknowledged bysupplier and user before the start of work.Supplementary nondestructive testingmethods should be clearly agreed on fromthe outset.
It should be noted that theradiographic method is particularlyeffective for discontinuities that displace avolume of cast material. Cracks andplanar discontinuities that do not displacean appreciable volume of material maynot be detected by radiography unless theradiation is favorably oriented. Additionalnondestructive test methods and criteriafor acceptability must be agreed on bysupplier and user.
Radiographic SetupRadiographic coverage is determined bythe casting geometry, especially thoseportions to which gates and risers areconnected during casting; cylindricalportions; flanges; bosses; and portionsinaccessible to radiation and to film orsensing apparatus. The inaccessibleportions always call for specialconsiderations in nondestructive testingcontract dealings. All radiographic testing(especially of portions critical to use orloading) requires the making ofradiographic shooting sketches (RSS) and thecompilation of associated data.Recommended radiographic shootingsketch types (for example, Fig. 2) arecovered by ASTM International.1,3,5
Shooting sketches may take intoconsideration such aspects assimultaneous coverage of cylindricalportions, completely or by sectors; andsingle or double wall shots when insidediameters are relatively small, 100 mm
(4 in.) or less). With isotope radiography,it is often convenient to examine anumber of castings simultaneously. In allcases, special consideration must be givento proper identification of the images.This is usually done using lead lettersattached to the object under test. Becausesources are never actually ideal pointsources, the source-to-sensor distanceshould be such that it limits geometricunsharpness Ug with reasonablyeconomical exposure times. Thisunsharpness is given by:
(1)
where D is the source-to-object distance,F is the effective focal spot size and t isthe object-to-sensor distance.
The equipment parameters for digitalacquisition, processing and display of testresults must be applicable to theinspection goals. This technology isdiscussed elsewhere.
UF tDg = ⋅
457Radiographic Testing of Metal Castings

458
3RT17_Layout(453_472) 10/2/02 3:11 PM Page 458
Penetrameters
Plaque Penetrameters5
A relatively simple way to determinewhether the radiographic testingprocedure has met the required qualitylevel (even without detailed considerationof the many factors involved) is by theproper choice and use of penetrameters.The penetrameter (also referred to as theimage quality indicator, or IQI) is simply ametal plaque with holes. Its material ischosen to have radiation absorptioncharacteristics close to those of thematerial under test. Its thickness and holesizes are predetermined percentages of thesection thickness to be radiographed. Theplaque, as most commonly used in castingradiography, is 2 percent of the sectionthickness and its three holes havediameters of 1, 2 and 4 percent of theplaque thickness. Where casting thicknessand/or exposures vary appreciably, morethan one penetrameter must be used toindicate image sensitivity.
Penetrameters are usually placed on theportion radiographed. If this is notpossible, because of curvature of the partor possible interference with radiographiclegibility, the penetrameters are placed asclose as possible to the portionradiographed, on blocks of the samematerial and a similar thickness and asclose to the casting as possible. Inaddition, penetrameters are usually placed
Radiographic Testing
FIGURE 3. Wire penetrameter, shown inpositive image radiograph of 19 mm(0.75 in.) thick casting.
on the source side of the casting. Whenthey are placed on the sensor side, itshould be indicated on the radiographwith a lead marker and the comparabilityof penetrameter size to the one requiredfor the source side must be suitablydemonstrated.
Wire Penetrameters6
Wire penetrameters, originally introducedin Germany and known as DeutscheInstitut für Normung (DIN) types, havebeen used in the United States as analternative means of radiographic qualitycontrol. Such a device is illustrated inFig. 3. When a wire penetrameter is used,the size must be equivalent to thecustomarily specified plaque type. Table 3shows equivalence data that compare wirepenetrameters to plaque types for the 2-2Tlevel. This designation signifies thatradiographs must show, as a minimum, aplaque thickness within two percent (thatis, the first 2 in 2-2T ) and a hole diameterwithin twice the plaque thickness, or 2T .
Discontinuity Detectionand RadiographicSensitivityFor optimum radiographic sensitivity theimage must meet contrast requirements.Film density requirements and image
TABLE 3. Wire penetrameter sizes equivalent to 2-2T holelevels.6
Minimum Specimen Thickness Wire Diameter_____________________________ _______________________mm (in.) mm (in.)
6.35 (0.250) 0.08a (0.0032)a
7.95 (0.313) 0.10a (0.0040)a
9.50 (0.375) 0.13a (0.0050)a
12.7 (0.500) 0.16 (0.0063)15.9 (0.625) 0.20 (0.008)19.1 (0.750) 0.25 (0.010)22.2 (0.875) 0.33 (0.013)25.4 (1.00) 0.40 (0.016)31.8 (1.25) 0.51 (0.020)38.1 (1.50) 0.64 (0.025)44.4 (1.75) 0.81 (0.032)50.8 (2.00) 1.02 (0.040)63.5 (2.50) 1.27 (0.050)76.2 (3.00) 1.60 (0.063)88.9 (3.50) 2.03 (0.080)
102.0 (4.00) 2.50 (0.100)114.0 (4.50) 3.20 (0.126)127.0 (5.00) 4.06 (0.160)
a. Wire diameters for use with specimens less than 12.7 mm (0.5 in.) inthickness do not represent true 2-2T level. They follow the samerelationship as hole type.

459Radiographic Testing of Metal Castings
3RT17_Layout(453_472) 10/2/02 3:11 PM Page 459
signal levels are used to quantify thisparameter. It must be remembered that apenetrameter is used to indicate thequality level of the radiographictechnique and not necessarily to providea measurement of the size of minimumdiscontinuity that can be shown in theobject. Thus, if required penetrameterdetails are visible in the radiograph, thereis no certainty that an equivalent flaw inthe casting will be revealed. This isbecause the penetrameter holes havesharp boundaries while natural castingholes of the same size may haveboundaries that are more or less rounded,with sides gradually merging intosurrounding casting portions. Hence, thehole of the penetrameter may be readilydiscerned, even though its density differsonly slightly from that of the surroundingcasting area.
Similar considerations apply to linearor crack like indications. If the plane ofthe linear discontinuity is inclined awayfrom the beam (by at least 7 degrees), thecrack may not be visible on theradiograph because of the relativelygradual transition of densities in theimage. Similarly, the visibility of a wirepenetrameter does not guarantee that acasting discontinuity of the same crosssection will actually be visible. Thehuman eye discerns a long boundarymore readily than it does a short one,even if the density increase and imagesharpness are the same. Nevertheless, it istrue that the probability of flaw detectionin the object radiographed (to ensure therequired quality) is related to thediscernibility of penetrameter features,when all other factors are the same.6-9
Considerations Specific toCastings
Mold TypeAs castings progress from sand moldcastings to shell mold, permanent mold,investment, precision, plastic mold anddie castings, the radiographic proceduremust be changed to accommodate morecastings with more complex shapes andthinner sections. All these factors providejustification for using one or more pilotruns designed to improve yields andminimize or eliminate systematic flaws.
Mold type also determines the amountand frequency of radiographic testing. Forsand castings, sections are relativelythicker with rougher skins; there is moreallowance for machining, especially forsurfaces joined to other systemcomponents. Difficulties in radiographicinterpretation are increased by surfaceroughness and by sections with
dw
tbcurfasretoSuesaf
rpfccrtfswjoddco
AWawnkwTaaIfnm(zbloT
uaahvcr
imensions substantially thicker thanhen finished.Exposures must be made in such a way
hat penetrameter sensitivity, as dictatedy finished section thicknesses, is notompromised. This is usually done bysing penetrameters based on finishedather than rough wall thicknesses. Asoundry techniques improve, precisionnd die cast sections become thinner andmoother; the interpretation ofadiographs is improved and radiationnergies must be reduced. Of course, inhe more precise casting techniques, costf all production steps must be watched.ystematic flaws must be determinedsing pilot runs of sufficient number tonsure the required quality levels. Ithould be noted that smoother surfaceslso tend to considerably reduce randomlaws.
Individual sand castings generallyequire more radiography because theossibility of nonsystematic (random)laws is larger than for the more preciseasting techniques. Important sandastings, however, require individualadiography, especially of critical portions,o locate both systematic and randomlaws. It may be pointed out thatystematic flaws are generally associatedith the casting details (gates, risers,
unctions of heavy to thin portions andther locations). Random flaws may beue to accidental conditions (local gasue to mold moisture; local stressesausing incidence of linear flaws andther anomalies).
lloy Castingshen testing alloys, the major factor
ffecting the radiography is alloy density,hich determines the energy levelseeded in the radiation sources. It is wellnown that alloys are prone to reactionith the atmosphere or mold material.he general solidification peculiarities oflloys may affect the indication types thatre discernible in their radiographs.ndustrial casting alloys fall into theollowing major types according to atomicumber: (1) light metals (includingagnesium, aluminum and tin);
2) intermediate alloy types (includinginc, cast iron, steels, brasses andronzes); and (3) heavy metals (includingead and tantalum). The densities of somef the most common alloys are shown inable 4.
Of the heavy alloys, tantalum may besed as an example for a typical castingspplication. Tantalum castings are used incid resistant chemical equipment such aseat exchangers, centrifugal pumps andalves. Tantalum has a combination ofharacteristics not found in manyefractory metals. These characteristics

460 R
TABLE 4.Testing a
Eleme
MagneAluminTitaniumCast iroZincCarbonStainlesAluminMangaSilicon Tin broNavy bNickel sTantalu
a. Up to ab. Dependc. Use ava
3RT17_Layout(453_472) 10/2/02 3:11 PM Page 460
include ease of fabrication, lowductile-to-brittle transition temperatureand high melting point.
Tantalum oxidizes in air above 299 °C(570 °F). Because of its high density, itrequires longer exposures or a differentchoice of radiation energy than neededfor less dense materials. Thus a section7.5 mm (0.30 in.) thick requires anexposure of about half an hour with amedium size cesium-137 source when fastindustrial films or sensitive sensors areused with intensifying screens.
SuperalloysSuperalloys have requirements unique totheir physical characteristics. Testpersonnel must consult applicablestandards and specifications whenconducting radiographic tests of thesematerials.
Radiographic StandardsStandards for radiographic testing ofcastings have been written (with the helpof producers, consumers, government andeducational institutions) for radiographicpractices and image quality control.3-27
Following the standards ensures theproduction of reference radiographicimages that can be meaningfully read byrepresentatives of both producer andconsumer interests.
Of course, the reading leads to aninterpretation of the casting’s soundness
adiographic Testing
Common alloy casting densities versus radiograpnd Materials (ASTM) reference radiograph docu
Density Range Radiographic Sount or Alloy (g·cm–3) Commonly Use
sium 1.79 to 1.86 X-raysa
um 2.57 to 2.95 X-raysa
4.43 to 4.65 X-rays and iridium-192n 5.54 to 7.48 X-rays, iridium-192, cob
6.60 to 6.70 X-rays, iridium-192, cob steels 7.81 to 7.84 X-rays, iridium-192, cobs steels 7.53 to 7.75 X-rays, iridium-192, cobum bronze 7.50 to 7.80 X-rays, iridium-192, cobnese bronze 7.70 to 8.30 X-rays, iridium-192, cobbronze 8.30 X-rays, iridium-192, cobnze 8.70 to 8.80 X-rays, iridium-192, cobronze 8.70 X-rays, iridium-192, cobilver 8.85 to 8.95 X-rays, iridium-192, cobm 16.60 cesium-137
bout 300 kV peak.ing on thickness involved, use applicable documents for aluminuilable documents closest in density.
and interpretation requires some sort ofstandardized guideline. ASTMInternational’s work on referenceradiograph documents (beginning in 1950and continuing to the present) has led tothe development of standards thatencourage relatively unbiaseddetermination of casting quality for use inmeeting contractually required acceptancecriteria.14 Reference radiographdocuments published by ASTMInternational include information onfabrication material of the hardware used;section thickness ranges; discontinuitytypes represented; and numbers ofdiscontinuities shown in graded types.15-27
Reference radiographs for steel castingswere first issued by the United States NavyBureau of Engineering in 1938 as GammaRay Radiographic Standards for SteamPressure Service.15 These were reissued in1942 by the Bureau of Ships as ReferenceRadiographic Standards for Steel Castingsand adopted in 1952 by ASTMInternational.16
ASTM International has also developedimproved techniques for mass productionand monitoring of document illustrations,either in the form of actual radiographs orphotographic copies of originally selectedradiographs. Its recent work involvesreference radiographs for titanium alloys.
Documents for ductile and gray ironcastings13,25 have been produced. Anotherdocument discusses how images change ascertain radiographic parameters vary.8
hic sources used and American Society forments.
rces Available ASTMd Reference Radiographs
E 15517 and E 50524
E 15517 and E 50524
see noteb
alt-60 E 80225 plus applicable steel documentsalt-60 nonec
alt-60 E 192,19 E 446,16 E 18618 and E 28021
alt-60 E 192,19 E 446,16 E 18618 and E 28021
alt-60 E 27220
alt-60 E 27220
alt-60 E 27220
alt-60 E 31022
alt-60 E 27220
alt-60 E 27220
none
m or steel including source type.

PART 3. Radiographic Indications for MetalCastings
FIGURE 4. Radiographs of 6.4 mm (0.25 in.) aluminumcasting: (a) gas voids; (b) elongated gas porosity.
(a)
(b)
3RT17_Layout(453_472) 10/14/02 10:45 AM Page 461
The major objective of radiographictesting of castings is the disclosure ofdiscontinuities (with emphasis onvolumetric types) that adversely affect thestrength of the product. Thesediscontinuities, of course, are related tocasting process deficiencies which, ifproperly understood, can lead to accurateaccept/reject decisions as well as tosuitable corrective measures. Following isa brief description of the most commondiscontinuity types included in existingreference radiograph documents (ingraded types or as single illustrations).The discontinuities in Figs. 4 to 10 areoffered for illustrative purposes only andmay exhibit appearances different fromthose of other cast materials.
More information on discontinuitytypes may be found in this volume’schapter on radiographic interpretation.
Radiographic Indicationsfrom Casting ProcessGas porosity is a form of more or lessspherical voids within the cast metal.These voids are usually due to occludedgas in the melt, gas that had no chance torise and escape through the casting top orits risers. Gas porosity often comes fromthe atmosphere or from interactionsbetween mold and metal. Overheating ofmelt and excessive moisture in moldsand/or cores tends to promote this flawtype (Figs. 4 and 5).
Sand inclusions and dross arenonmetallic oxides, appearing on theradiograph as irregular, dark blotches.These come from disintegrated portions ofmold or core walls and/or from oxides(formed in the melt) that have not beenskimmed off before metal is introducedinto the mold gates. Careful control of themelt, proper holding time in the ladle andskimming of the melt during pouring willminimize or obviate this source oftrouble.
Shrinkage is a form of discontinuitythat appears as dark regions on theradiograph. Individual shrinks assumevarious forms but in all cases shrinkageoccurs because molten metal shrinks as itsolidifies in all portions of the finalcasting. Shrinkage is avoided by makingsure that the volume of the casting is
adequately fed by risers that sacrificiallyretain the shrinkage.
Shrinkage can be recognized in anumber of characteristic but varyingappearances on radiographs. There are atleast five types: (1) cavity, (2) dendritic,(3) filamentary, (4) sponge types and(5) microshrinkage. Some documentsdesignate these types by numbers,without actual names, to avoid possiblemisunderstanding.
Cavity shrinkage appears as areas withdistinct jagged boundaries. It may beproduced when metal solidifies betweentwo original streams of melt, coming fromopposite directions to join a common
461Radiographic Testing of Metal Castings

462
FIGURE 5castingsaluminu
(a)
(b)
IGURE 6. Sponge shrinkage in 13 mm (0.5 in.) aluminumasting.
FIGURE 7. Microshrinkage in 6.3 mm (0.25 in.) thick
3RT17_Layout(453_472) 10/2/02 3:11 PM Page 462
front; cavity shrinkage usually occurs at atime when the melt has almost reachedsolidification temperature and there is nosource of supplementary liquid to feedpossible cavities.
Dendritic shrinkage is a treelikedistribution of very fine lines or smallelongated cavities that may vary indensity and are usually unconnected.
Filamentary shrinkage usually occurs as acontinuous structure of connected lines orbranches of variable length, width anddensity or occasionally as a network.
Sponge shrinkage shows itself as areas oflacy texture with diffuse outlines,generally toward the mid thickness ofheavier casting sections. Sponge shrinkagemay be dendritic or filamentaryshrinkage; filamentary sponge shrinkageappears more blurred because it isprojected through the relatively thickcoating between the discontinuities andthe sensor surface (Fig. 6).
Groups of tiny shrinks are referred toas microshrinkage (Fig. 7).28
Fc
Radiographic Testing
. Gas discontinuities in 6.4 mm (0.25 in.) thick: (a) gas voids in steel; (b) round gas porosity inm.28
magnesium base alloy castings: (a) sponge microshrink;(b) feathery microshrink.28
(a)
(b)

FIGURE
FIGURE 9. Inclusion less dense thansurrounding material in 3.2 mm (0.125 in.)aluminum casting.
FIGURE 10. Inclusion more dense thansurrounding material in 6.4 mm (0.25 in.)aluminum casting.
3RT17_Layout(453_472) 10/2/02 3:11 PM Page 463
Cracks are thin (straight or jagged)linearly disposed discontinuities thatoccur after the melt has solidified. Theygenerally appear singly and originate atcasting surfaces.
Cold shuts generally appear on or neara surface of cast metal as a result of twostreams of liquid meeting and failing tounite (Fig. 8).
Inclusions are other materials in asupposedly uniform metallic matrix. Theymay be less or more dense than thematrix alloy and will appear on theradiograph, respectively, as darker orlighter indications. The latter type is morecommon in light metal castings (Figs. 9and 10).
Chills, chaplets and other inserts usedto support cores or cool casting metalappear as discontinuities when they arenot united with the poured metal. Theyappear as broken lines or concentriccircles in the image.
Core shift shows itself as a variation insection thickness, usually on radiographicviews representing diametrically oppositeportions of cylindrical casting portions.
Hot tears are linearly disposedindications that represent fracturesformed in a metal during solidificationbecause of hindered contraction. Thelatter may occur because of overly hard(completely unyielding) mold or corewalls. The effect of hot tears, as a stressconcentration, is similar to that of anordinary crack; hot tears are usuallysystematic flaws. If flaws are identified ashot tears in larger runs of a casting type,they may call for explicit improvementsin technique.
Misruns occur as a result of moltenmetal’s failure to fill a mold cavity:
8. Cold shut in 3.2 mm (0.125 in.) aluminum casting.
misruns appear on the radiograph asprominent dense areas of variabledimensions with a definite smoothoutline. They are mostly random inoccurrence and not readily eliminated byspecific remedial actions in the process.
Mottling is a radiographic indicationthat appears as an indistinct area of moreor less dense images. The condition is adiffraction effect that occurs on relativelyvague, thin section radiographs, mostoften with austenitic stainless steel.Mottling is caused by interaction of the
463Radiographic Testing of Metal Castings

464
3RT17_Layout(453_472) 10/14/02 10:50 AM Page 464
object’s grain boundary material with lowenergy X-rays (300 kV or lower).Inexperienced interpreters may incorrectlyconsider mottling as indications ofunacceptable casting flaws. Evenexperienced interpreters often have tocheck the condition by reradiographyfrom slightly different source-to-sensorangles. Shifts in mottling are then verypronounced, while true castingdiscontinuities change only slightly inappearance.
Radiographic Indications inCasting Repair WeldsMost common alloy castings requirewelding either in their upgrading fromanomalous conditions or in joining themto other system parts. It is mainly forreasons of casting repair that thesedescriptions of the more common welddiscontinuities are given. The termsappear as indication types inASTM E 390.23 For additional information,see the chapter on welds in this volume.
Slag is nonmetallic solid materialentrapped in weld metal or between weldmaterial and base metal.
Porosity shows gas pockets or voids inthe weld metal.
Undercut is a groove melted in the basemetal at the edge of a weld and leftunfilled by weld metal. It represents astress concentration that often must becorrected.
Incomplete penetration, as the nameimplies, is a lack of weld penetrationthrough the thickness of the joint (orpenetration less than specified).
Incomplete fusion is lack of completefusion of some portions of the metal in aweld joint with adjacent metal; eitherbase or previously deposited weld metal.
Arc strike is an indication from alocalized heat affected zone or a change insurface contour of a finished weld oradjacent base metal. Arc strikes are causedby the heat generated when electricalenergy passes between surfaces of thefinished weld or base metal and thecurrent source.
Weld spatter occurs in arc or gaswelding as metal particles that areexpelled during welding and do not formpart of the actual weld.
Tungsten inclusion is usually more densethan base metal particles.
Oxidation is the condition of a surfacethat is heated during welding, resulting inoxide formation on the surface, because ofpartial or complete lack of purge of theweld atmosphere.
Radiographic Testing

PART 4. Radiographic Testing and ProcessScheduling
3RT17_Layout(453_472) 10/2/02 3:11 PM Page 465
It is important to determine whenradiographic testing should be done, withrespect to required heat treatment,necessary repair welding and rough orfinish machining. The timing of such testsis usually determined by mutualagreement between producer and user,with due consideration to the costs.
If a casting could possibly be rejected,further steps in its manufacture andtesting should be minimized oreliminated. In addition, it is also knownthat heat treatment, especially drastictemperature changes, may causeaggravation of some discontinuity types.
On the other hand, the closer thecasting surfaces are to their finishedcondition, the easier it is to readradiographic images and disclose linearsurface flaws; these tend to act as stressconcentrations and could be the mostdamaging discontinuities in service. Allother things being equal, however,radiographic testing is performed as early
TABLE 5. Statistical correlation data betwrepresentative types of radiographic indmanganese-nickel-aluminum bronze plat
Tens__________Discontinuity Slope To
Class B Steel (MIL-S-15083)
Gas porosity –3.28Inclusions –0.03Linear shrinks –8.11Dendritic shrinkage –8.11Worm hole shrinkage –7.60Hot tears –8.06Chill inserts –2.58Chaplet inserts –4.93
Manganese-Nickel-Aluminum Bronze (MIL-B-
Gas porosity –4.07Sand inclusions –0.06Dross inclusions –3.85Linear shrinkage –3.62Spongy shrinkage –3.58 ±
a. At 6.9 MPa (1000 lbf·in.–2).b. At 100 mm (4.0 in.) gage length.c. 95 percent tolerance limit.d. No significant relationship indicated.e. Data not taken.
in the process as possible, to permitnecessary weld repairs. Consequently,radiographic interpreters must have theactual casting available for theirinspection to make allowance for surfaceirregularities.
In addition, experience has shown thatcastings should be examined in their finalform with surface nondestructive testingmethods, usually magnetic particle orliquid penetrant testing. The coverage andtest frequency (if many castings of asingle type are involved) is subject tomutual agreement between producer anduser, with a logical statistical basis for thenumber and exact locations to be tested.
Factors Influencing Choiceof Acceptance CriteriaThe advent of reference radiographs hasdone much to improve the measurementof casting quality, especially as applied to
465Radiographic Testing of Metal Castings
een tensile properties and severity ofications in 75 mm (3.0 in.) thick steel ande castings.14
ile Yield Percent Elongationb________ __________________ ___________________lerancec Slope Tolerancec Slope Tolerancec
±5.2 –0.43 ——d –3.65 +5.0——d –0.03 ——d –1.36 ——d
±6.2 1.76 ±2.3 –3.38 ±4.8±9.2 –0.69 ±3.0 –1.22 ±3.8±5.4 –1.43 ±2.2 –3.46 ±5.6±6.8 –1.23 ±2.0 –4.40 ±5.8±5.2 –0.08 ——d –2.59 ±4.3±5.4 –0.061 ±1.9 –3.26 ±3.8
21250A, Alloy #2)
±6.4 ——e ——e ——d ——d
±7.2 ——e ——e ——d ——d
±9.0 ——e ——e –1.20 ±3.9±8.4 ——e ——e –1.10 ±2.610.1 ——e ——e –0.93 ±3.0

466 R
3RT17_Layout(453_472) 10/2/02 3:11 PM Page 466
important technological applications. Itmust be remembered that referenceradiographs are sets of illustrations(especially of the graded severitydiscontinuity types), which cover a widerange of attainable casting quality levels.There is no recommendation ofacceptability criteria for particularapplications.
The ASME Boiler and Pressure VesselCode 4 does point out accept/reject criteriafor various graded steel castingdiscontinuity types. Briefly, accept/rejectcriteria for castings should be based onthe following considerations: (1) alloytype; (2) section thickness; (3) pressure(including temperature and superheatwhen steam is involved); (4) service stress;(5) presence of impact and vibration;(6) fatigue; (7) exposure to penetratingradiation; (8) accessibility formaintenance and replacement duringexpected life; and (9) alloy solidificationpeculiarities, if any. At best, however, theacceptance criteria are largely qualitative.
Table 5 presents data to illustrate theadvantages of correlating radiographicdiscontinuity indications with destructivetest results. The term slope in Table 5 isthe deterioration Y per grade of severityand is expressed by Eq. 2:
(2)
where a is average value for substantiallysound plates and X is indication severity.
The radiographer has little say indetermining criteria for acceptance orrejection. Establishing such criteria is theresponsibility of the customers. Criteriaare frequently specified by using astandardized grading system — forexample, AMS-STD-2175,29 radiographicgrades A, B, C and D.
Y a bX= –
adiographic Testing

PART 5. Problems in Radiographic Testing ofMetal Castings
3RT17_Layout(453_472) 10/2/02 3:11 PM Page 467
The important decisions in castingradiography involve setup, actualradiographic procedures andinterpretation. Each of these may at timesbecome problems in actual practice. Theintent of the present discussion is toconsolidate the discussion of castingcontrol problems and to indicate varioussolutions.
Radiographic SourceThe choice of radiographic source is basedon many considerations. Often the sourceis determined by availability. If this is thecase, care must be taken to ensure thatthe penetrameter sensitivity required bycontractual agreement can be met. Theusual limits for most commonly usedradiation sources, as far as metal sectionthickness is concerned, are cited inTables 1 and 2. When deviation fromthese limits is considered for availablesources, trial shots with carefully chosencompensating parameters should be madeto determine whether the requiredsensitivity can be achieved. Theseparameters include higher resolutionimage settings (or finer grained film),larger source-to-sensor distance forimproved sharpness and proper basedensity.
When a choice of source can be made,the preferred one is determined by acombination of factors, including: sectionthickness; the ability to producesimultaneous, complete coverage of acylindrical casting portion; and thedesirability for simultaneous radiographyof several castings at one time. Areasonably small gamma ray source isoften the best choice for the heaviermetals, especially when portability isdesired and the radiography is scheduledfor raw castings — that is, before surfacepreparations, necessary machining andrepair or assembly welding.
Radiographic CoverageContrary to a common misconception,there is no such thing as 100 percentradiographic coverage for all castings. Tomake sure that no coverage problems arisebetween producer and purchaser, it isessential to follow proper and early
plthcaquskex
cowancoinreesregethFiPlththsoimthin
RScimbyprcorewthadexbeantrofcafora(wthfireofra
cafuncope
anning of the radiography. Decisions one radiographic techniques, especially forstings produced in considerableantities, can best be made by shootingetches and associated tabular data (forample, see Fig. 2).In the control of castings, radiographicverage is recognized to be a problemith certain configurations of the moldd core; these include portionsnnecting flanges with bodies andclude transition portions betweenlatively thin bodies and heavy bosses,pecially when source location (withspect to sensor) is limited by castingometry and details. Thus, for example,e blackened portion in the casting ofg. 2 cannot be radiographed properly.acement of the source on the inside ofe cylinder is prohibited by the size ofe inside diameter; placement of theurce on the outside is made practicallypossible by the limited space betweene other flange and the portion ofterest.
adiographic Schedulingheduling of radiography is also anportant aspect that should be agreed on all concerned parties before actualoduction. Scheduling requires suchordination especially if the castingquires considerable machining andelding. Radiography performed early ine manufacturing process has thevantage of saving further productionpenses on castings that may ultimately rejected or may require extensive repaird associated, unplanned heat
eatments. Where an appreciable number a particular casting is produced, pilotstings may yield valuable informationr corrective action, even if they arediographed in the as-cast conditionith gates and risers attached and sectionicknesses considerably greater than
nished dimensions). Note, however, thatquired penetrameter sensitivities areten based on the finished thicknessther than on the as-cast thickness.Once major problems in the pilot
stings(s) have been suitably solved,ture castings can be radiographed in the
early finished and weld repairedndition, thereby obtaining the bestnetrameter sensitivity and optimized
467Radiographic Testing of Metal Castings

468 R
3RT17_Layout(453_472) 10/2/02 3:11 PM Page 468
sensor or film sensitivity. Theinterpretation of a pilot radiograph oftenincludes consideration of how the castingprocess might have caused a given flaw.Thus, radiographic interpretation is notsimply a search for casting discontinuities;it also allows the discovery and eventualrepair of major systematic flaws.
RadiographicInterpretationThe interpretation of radiographic imagesmust be performed by trained andcertified personnel. Proper reading ofimages demands that the casting beavailable for reference purposes.Regardless of when the radiography isperformed, visual testing of the part mayhelp decide whether indications on theradiograph are true internal flaws orindications caused by surface finish orother conditions.
Knowledge of gate and riser locations,if the casting is radiographed after theirremoval, can also help imageinterpretation. Shrinkage is more likely tooccur near risers, if they are of smallvolume or if the melt solidifies quickly.Gas inclusions are more likely to be foundnear gates because of the influx of meltwhen other portions have partiallysolidified. Interior casting surfaces may attimes cause false indications onradiographs because of surface or nearsurface conditions of the wall; moisture inthe core may introduce gas into the meltbefore it has time to move upward andout through the risers. At other times,brittle components of the core surfacemay be carried by the melt stream intothe casting wall and may then result innear surface density differences; these alsocould be incorrectly interpreted asdiscontinuities.
The hot tear is another discontinuitywhose positive recognition is sometimesdifficult but nonetheless important. Thisdefect is linear in nature and has all theadverse effects of a crack. It occurs whenthe melt is nearly solidified and is theresult of an applied force in excess ofwhat the just solidified metal couldwithstand at considerably highertemperatures. This is the clue fordetermining the accuracy of a hot tearinterpretation.
There must exist in the casting, asconfined by mold and core, a source ofsuitably directed stress to make this typeof defect possible. In a cylindrical casting,for example, a relatively unyielding coremay cause an outward force as the metalshrinks and thus produce a hot tear.When interpreting a linear discontinuityas a hot tear, it must be verified that the
gecastso
CRTretyala ucodbnsolireti
CSpcoencatekeraaspan
adiographic Testing
ometry and mold configuration arepable of providing correspondingresses during the last stages oflidification.
hoice of Referenceadiographs
here is at present a wide range ofference documents for various alloypes and section thicknesses, though notl alloys are represented. Because of this,decision must be made by producer andser on the document mutuallynsidered appropriate for judging
iscontinuities. For example, ASTM E 310,ased on leaded bronze hardware, shouldot be used for bronzes that tend tolidify more rapidly (those containing
ttle or no lead).22 A separate set ofference radiographs are available fortanium alloy castings.27
onclusionecific problems in the radiographicntrol of castings are difficult toumerate because of the wide variety ofsting materials, configurations andchniques. To ensure that problems arept to an absolute minimum, thediographic testing of castings in all itspects should be specified in contracts,
urchase orders, product specificationsd drawings.

1. Goldspiel, S. “Radiographic Control ofCastings.” Nondestructive TestingHandbook, second edition: Vol. 3,Radiography and Radiation Testing.Columbus, OH: American Society forNondestructive Testing (1985):p 458-490.
2. Quinn, R.A. and C.C. Sigl, eds.Radiography in Modern Industry, fourthedition. Rochester, NY: Eastman KodakCompany (1980).
3. ASTM E 1030-00, Standard Test Methodfor Radiographic Examination of MetallicCastings. West Conshohocken, PA:ASTM International (2000).
4. ASME Boiler and Pressure Vessel Code:Section VIII, Pressure Vessels.Division 1, “Examination of SteelCastings,” Appendix VII. New York:American Society of MechanicalEngineers.
5. ASTM E 94-00, Standard Guide forRadiographic Examination. WestConshohocken, PA: ASTMInternational (2000).
6. ASTM E 747-97, Standard Practice forDesign, Manufacture and MaterialGrouping Classification of Wire ImageQuality Indicators (IQI) Used forRadiology. West Conshohocken, PA:ASTM International (1997).
7. ANSI PH2.8-1975, Sensitometry ofIndustrial X-Ray Films for Energies Up to3 Million Electron Volts. New York, NY:American National Standards Institute(1997).
8. ASTM E 592-99, Standard Guide toObtainable ASTM EquivalentPenetrameter Sensitivity for Radiographyof Steel Plates 1/4 to 2 in. (6 to 51 mm)Thick with X Rays and 1 to 6 in. (25 to152 mm) Thick with Cobalt-60. WestConshohocken, PA: ASTMInternational (1999).
9. ASTM E 746-93 (1998), Standard TestMethod for Determining Relative ImageQuality Response of IndustrialRadiographic Film. WestConshohocken, PA: ASTMInternational (1998).
10. ASTM E 1734-98, Standard Practice forRadioscopic Examination of Castings.West Conshohocken, PA: ASTMInternational (1998).
11. ASTM E 1814-96, Standard Practice forComputed Tomographic (CT)Examination of Castings. WestConshohocken, PA: ASTMInternational (1996).
12. ASTM F 629-97, Standard Practice forRadiography of Cast Metallic SurgicalImplants. West Conshohocken, PA:ASTM International (1997).
13. Goldspiel, S. “Development ofRadiographic Standards for Castings.”Third International Conference onNondestructive Testing [Osaka, Japan].Tokyo, Japan: Japanese Society forNondestructive Testing, for theInternational Committee forNondestructive Testing (1960).
14. Goldspiel, S. “Development ofRadiographic Standards for Castings.”Materials Research and Standards(July 1969).
15. Goldspiel, S. and W.N. Roy. “ReferenceRadiographs.” Standardization News.Vol. 10, No. 11. West Conshohocken,PA: ASTM International (November1982).
16. ASTM E 446-98, Standard ReferenceRadiographs for Steel Castings Up to 2 in.(51 mm) in Thickness. [SupersedesE 71.] West Conshohocken, PA: ASTMInternational (1998).
17. ASTM E 155-00, Standard ReferenceRadiographs for Inspection of Aluminumand Magnesium Castings. WestConshohocken, PA: ASTMInternational (2000).
18. ASTM E 186-98, Standard ReferenceRadiographs for Heavy-Walled (2 to4 1/2-in. [51 to 114-mm]) Steel Castings.West Conshohocken, PA: ASTMInternational (1998).
19. ASTM E 192-95 (1999), StandardReference Radiographs for InvestmentSteel Castings of Aerospace Applications.West Conshohocken, PA: ASTMInternational (1999).
20. ASTM E 272-99, Standard ReferenceRadiographs for High-StrengthCopper-Base and Nickel-Copper AlloyCastings. West Conshohocken, PA:ASTM International (1999).
21. ASTM E 280-98, Standard ReferenceRadiographs for Heavy-Walled (4 1/2 to12-in. [(114 to 305-mm]) Steel Castings.West Conshohocken, PA: ASTMInternational (1998).
469Radiographic Testing of Metal Castings
References
3RT17_Layout(453_472) 10/2/02 3:11 PM Page 469

22. ASTM E 310-99, Standard ReferenceRadiographs for Tin Bronze Castings.West Conshohocken, PA: ASTMInternational (1999).
23. ASTM E 390-01, Standard ReferenceRadiographs for Steel Fusion Welds. WestConshohocken, PA: ASTMInternational (2001).
24. ASTM E 505-96, Standard ReferenceRadiographs for Inspection of Aluminumand Magnesium Die Castings. WestConshohocken, PA: ASTMInternational (1996).
25. ASTM E 689-95, Standard ReferenceRadiographs for Ductile Iron Castings.West Conshohocken, PA: ASTMInternational (1999).
26. ASTM E 802-95 (1999), StandardReference Radiographs for Gray IronCastings Up to 4 1/2 in. [114 mm]) inThickness. West Conshohocken, PA:ASTM International (1999).
27. ASTM E 1320-00, Standard ReferenceRadiographs for Titanium Castings. WestConshohocken, PA: ASTMInternational (2000).
28. Casting Inspection Handbook. Arlington,TX: GAF Corporation (1968).
29. SAE AMS-STD-2175, Castings,Classification and Inspection of.Warrendale, PA: SAE International(1998).
BibliographyApplegate, R.L. “The Use of X-Ray
Inspection to Identify AlloyMaterials.” Nondestructive Testing.Vol. 21, No. 5. Columbus, OH:American Society for NondestructiveTesting (September-October 1963):p 311-312.
Baer, W.H. “Radiographic Tests of GunMetal Castings.” Nondestructive Testing.Vol. 6, No. 4. Columbus, OH:American Society for NondestructiveTesting (Spring 1948): p 33-39.
Balakrishnan, B.R. andV. Balasubramanian. “Analysis of theHeavy Element in Alloys and Ores byBeta Ray Backscattering.” MaterialsEvaluation. Vol. 25, No. 7. Columbus,OH: American Society forNondestructive Testing (July 1967):p 173-176.
Ball, L.W. “X-Ray Micrography As a Toolfor Foundry Control.” IndustrialRadiography. Vol. 4, No. 1. Columbus,OH: American Society forNondestructive Testing (Summer1945): p 29-36.
Bland, J. and S. Goldspiel. “X-RayDetermination of the CladdingThickness of Clad Metals.” IndustrialRadiography. Vol. 1, No. 4. Columbus,OH: American Society forNondestructive Testing (April 1943):p 25-28.
Burrill, E.A. “Radiography of SmallCastings with High Cobalt or NickelContent.” Nondestructive Testing.Vol. 13, No. 3. Columbus, OH:American Society for NondestructiveTesting (May-June 1955): p 19-21.
Busk, R.S. “A Correlation of theMechanical Properties andRadiographic Appearance ofMagnesium Alloy Castings.” IndustrialRadiography. Vol. 2, No. 3. Columbus,OH: American Society forNondestructive Testing (Winter1943-1944): p 33-37.
Clark, G.L. and R.W. Eyler. “Developmentof a Monochromatic RadiographicMethod for Locating Small Defects inAluminum Alloy Castings.” IndustrialRadiography. Vol. 3, No. 1. Columbus,OH: American Society forNondestructive Testing (Summer1944): p 13-18.
Clarke, E.T. “Gamma Radiography ofLight Metals.” Nondestructive Testing.Vol. 16, No. 3. Columbus, OH:American Society for NondestructiveTesting (May-June 1958): p 265-268.
Cohen, J., E. Hall, L. Leonard andR. Ogilvie. “Investigation ofSegregation in Cast Irons byRadiographic Techniques.”Nondestructive Testing. Vol. 13, No. 2.Columbus, OH: American Society forNondestructive Testing (March-April1955): p 33-34.
Dively, R.W. “Radiography in the DieCasting Industry.” IndustrialRadiography and Nondestructive Testing.Vol. 6, No. 1. Columbus, OH:American Society for NondestructiveTesting (Summer 1947): p 20-21, 39.
Droegkamp, R.E. “Van de GraaffRadiography of High Density Alloys.”Nondestructive Testing. Vol. 13, No. 5.Columbus, OH: American Society forNondestructive Testing(September-October 1955): p 27-30.
Field, N.M. “Foundry X-Ray Service.”Industrial Radiography. Vol. 3, No. 4.Columbus, OH: American Society forNondestructive Testing (Spring 1945):p 23-25, 28.
Foster, B.E. and R.W. McClung. “A Studyof X-Ray and Isotopic Techniques forBoreside Radiography ofTube-to-Tubesheet Welds.” MaterialsEvaluation. Vol. 35, No. 7. Columbus,OH: American Society forNondestructive Testing (July 1977):p 43-46, 51.
470 Radiographic Testing
3RT17_Layout(453_472) 10/2/02 3:11 PM Page 470
Isaacson, B.G. and B. Krohn. “DigitalRadiography Pinpoints Casting DefectsAutomatically.” Materials Evaluation.Vol. 45, No. 8. Columbus, OH:American Society for NondestructiveTesting (August 1987): p 884-885.
Klein, F.D. “Comments and Observationson Experimental X-Ray DiffractionStress Methods and Technique forSand Cast Magnesium AlloyStructures.” Industrial Radiography.Vol. 4, No. 4. Columbus, OH:American Society for NondestructiveTesting (Spring 1946): p 41-46, 49.
Kuttemperoor, V.Z. “Photon Activation ofAlloys and Elements Used in IndustrialParts Requiring High-Energy X-RayRadiography.” Materials Evaluation.Vol. 33, No. 5. Columbus, OH:American Society for NondestructiveTesting (May 1975): p 113-119.
Lueckerath, W., K. Fink and R. Flossmann.“A Nondestructive Method to DetectPipes and Cavities in Hot Steel Bloomsduring the Rolling-Process by Meansof Betatron, X-Ray-Image-Intensifierand Television-Setup.” NondestructiveTesting. Vol. 18, No. 1. Columbus, OH:American Society for NondestructiveTesting (January-February 1960):p 27-34.
Lutts, C.G. “An X-Ray Method forStudying Skin Thickness of BronzeCastings.” Nondestructive Testing.Vol. 6, No. 4. Columbus, OH:American Society for NondestructiveTesting (Spring 1948): p 13-14, 21.
Munro, J.J. “Calculation of ScatteredRadiation Intensities of 192 IridiumGamma Rays from a Steel Slab.”Materials Evaluation. Vol. 35, No. 2.Columbus, OH: American Society forNondestructive Testing (February1977): p 51-53.
Strecker, H. “Scatter Imaging ofAluminum Castings Using an X-RayFan Beam and a Pinhole Camera.”Materials Evaluation. Vol. 40, No. 10.Columbus, OH: American Society forNondestructive Testing (September1982): p 1050-1056.
Struk, D. NDT in the Foundry. Columbus,OH: American Society forNondestructive Testing (1995).
Trout, E.D., J.P. Kelley and V.L. Larson.“Transmitted and Scattered X Rays forAluminum and Steel 50 to 300 kVp.”Materials Evaluation. Vol. 32, No. 8.Columbus, OH: American Society forNondestructive Testing (August 1974):p 163-168.
Wilsey, R.B., D.H. Strangways andG.M. Corney. “The PhotographicMonitoring of Stray X-Rays in theRadiography of Metals.” NondestructiveTesting. Vol. 14, No. 2. Columbus, OH:American Society for NondestructiveTesting (March-April 1956): p 18-23.
471Radiographic Testing of Metal Castings
3RT17_Layout(453_472) 10/2/02 3:11 PM Page 471

Stanislav I. Rokhlin, Ohio State University, Columbus,Ohio
George L. Becker, Newark, Delaware (Part 6)
Roy L. Buckrop, United States Army OperationsSupport Command, Rock Island Arsenal, Rock Island,Illinois (Part 6)
Herbert Chapman, Scarborough, Ontario, Canada(Parts 2 to 6)
Tosiyasu Fukui, Kobe, Japan (Part 8)
Eiichi Hirosawa, Nagoya, Japan (Part 8)
Masahisa Naoe, Nagoya, Nagoya, Japan (Part 8)
Radiographic Testing ofWelds
18C H A P T E R
3RT18_Layout(473_512) 10/2/02 3:15 PM Page 473

474 Radio
PART 1. Introduction to Radiographic Testing ofWelds1
3RT18_Layout(473_512) 10/2/02 3:15 PM Page 474
Radiographic testing is applied to a newproduct to provide assurance that theproduct will be free of discontinuitiessignificant enough to be considereddefects and justify rejection of theproduct. Wherever people work onproducts, it is normal for things to gowrong. This is the case for all industrialprocesses, from the historically establishedtrades to modern production systems.
The quality of welds may be partlydetermined visually; there are generalrequirements of workmanship that aremost easily met by having the weldsappear correct. The main reason forconcern with welds, however, is that theymust be as sound throughout as theirintended use demands. In determiningthe requirements for intended use, whensome minor discontinuities might bepresent, radiographic testing has veryspecial advantages. The radiographicprocess provides good information on theprecise nature of a discontinuity. Somediscontinuities are not inherentlyhazardous, so this ability to identify themwith some assurance becomes veryimportant. For example, cases of isolatedspherical porosity are seldom consideredserious in themselves because they do notconstitute stress risers within thecomponent. Linear and clustered porosity,however, can be serious failure anomalies.It is important that porosity be evaluatedbecause its presence could indicate thatthe welding process has gone awry andpresage other serious difficulties.
In the hierarchy of quality functions,radiography comes at the functional peak.A welding procedure would usually beregarded as a proven routine althoughcertain unexpected events may occur. Forinstance, a welding process couldgradually change, such as drift in aninstrument. There might be no externalindication that the process had beenaltered. Radiographic testing cancontribute very meaningfully here becauseof the detailed record it provides of theinternal condition of a weld.
Radiographic testing is useful inwelding technique development. Inaddition, many standards requireradiographic testing in the finalinspection.2-9 In some cases, when weldsbecome hidden in complex assemblies,this final inspection can occur fairly earlyin the component’s manufacturing cycle.
graphic Testing

PART 2. Weld Design1
FIGURE 1. Butt joints with groove welds:(a) square groove single weld; (b) squaregroove double weld; (c) single bevel groove;(d) double bevel groove; (e) singleV groove; (f) double V groove.
(a)
(b)
(c)
(d)
(e)
(f)
Toe
Toe
Toe
3RT18_Layout(473_512) 10/2/02 3:15 PM Page 475
Most weldments consist of two pieces ofmetal joined in a way that satisfies aspecification, a drawing or some othermeans of stating a requirement. Inindustry, welded joints are most oftensecured by fusion welding.
Butt JointsThe basic type of welded assembly is thesquare butt joint in which the originalsquare cut faces are butted or prespaced.When there is some space left betweenthe faces, which is the common form ofassembly, this space is referred to as agroove. In the case of butt joints, thegroove is square; its shape involves onlyright angles. It is possible to make a weldin a square cut joint with the joint facesfitted tightly together (with no groove).Such a tight joint can lead to theentrapment of nonweld materials in theweld metal because the joint is not opento let these materials float away.
A square groove joint made withoutthe addition of filler metal can containdiscontinuities typical of the materialbeing welded, joint configuration and thewelding process. In a radiograph, thesediscontinuities usually appear as straightlines when gross quantities of entrappedsolids are present as linear slag. Inasmuchas they usually will have lower mass thanthe metal involved, they will appear asdarker zones in the radiographic image.
Another type of butt joint has aprepared groove. Figure 1 shows sixwelded assemblies made up of a singletype of joint, the butt joint, and a singletype of weld, the groove weld. The shapeof the groove serves to classify the set stillfurther. In Figs. 1a, 1c and 1e, the grooveis limited to one side of the joint, the topside as drawn. These make up the singlegroove set, with groove shapes as follows:(1) square, because of 90 degreerectangular shape (Fig. 1a); (2) bevel, withone angled face (Fig. 1c); (3) V, a pair ofangled surfaces facing one another(Fig. 1e). Figures 1b, 1d and 1f repeat theprevious three but are doubled throughthe thickness. The double joint is usedmainly for thick material but can bespecified for thinner members when it isdesired to have a better balance ofmaterial on the two sides, to minimizedistortion.
These grooves can be symmetrical orasymmetrical. The groove form is anecessity for joints in thicker materialswhere there must be access formaintaining an arc and allowing metal tobe deposited under controlled conditions.Usually, economic choice will determinewhether the V groove or the bevel grooveis used. Note that the smaller bevel grooverequires less electrode material to makethe joint. Less weld metal means lessdistortion. In these simple joints, metal isadded from one side only; whendistortion occurs, the assembly bends inthe direction shown in Fig. 2.
In order of increasing complexity, thenext form of joint is the double V ordouble bevel preparation shown inFigs. 1d and 1f. These include mirrorimages of the single bevel joints and areused when the material is too thick to be
475Radiographic Testing of Welds

476 Ra
3RT18_Layout(473_512) 10/2/02 3:15 PM Page 476
welded from one side without seriousdistortion. A root pass is again performedbut this time in the midsection of theweld. This midsection is a small, squaregroove butt joint and requires checking,as above, for the similar geometry.
When fitness-for-purpose criteria areapplied, fairly large discontinuities mightbe tolerated in the midsection. In the caseof the bevel weld preparation, there is avertical face involved, when the weld is tobe made in the flat position (Figs. 1cand 1d). This configuration can lead tosome difficulties in welding. When thesquare face is oriented vertically and weldmetal is being deposited, there could beproblems in developing a uniform fusionlayer on this face. The resultingdiscontinuity is referred to as incompletefusion. When it is feasible to position thejoint so that the square face is horizontalduring welding, this sort of difficulty maybe avoided.
Other Joints and WeldsThere are some further joints of morecomplex geometry not as well suited toradiographic testing as the butt joint.
The T joint, for example, may beassembled with one or two fillet welds(Fig. 3). This is the weld most commonlyused with the T joint. It would providethe most economic assembly because nospecial preparation (machining) isrequired. The T joint with fillet welds isnot an easy assembly to inspect because it
diographic Testing
FIGURE 2. Potential distortion with weldingdone from one side only.
FIGURE 3. T joint with fillet welds.
is not easy to set up for reliableradiography. In its most rudimentaryform, a single fillet weld, confined to oneside, would be a candidate forradiography. While this weld may beradiographed by shooting from above(with respect to the orientation of Fig. 3),such welds should be subjected to refinedtechniques of testing with cautionbecause an unfused zone exists in theoriginal joint interface and this thin gaplooks very much like an internal crack.
More refined models of the T joint areshown in Figs. 4a and 4b, where preparedwelds are illustrated. Some optionsavailable to the weld designer are shownin this figure. Other forms of preparation(shown in Fig. 1) might also be used. Thewelds shown would be amenable toradiography by positioning the sensorunder the base plate. Joints such as thismay be expected to carry dynamic loadsin service, as in bridges.
Another fundamental joint, the cornerjoint, may be bonded by several kinds ofweld. A corner totally welded with aprepared weld is shown in Fig. 5. Thisweld is one of several for joining at thecorner. The simplest method is a filletweld on the inside corner, such as thosefillets shown in Fig. 3. Any of the othersingle groove shapes in Fig. 1 could beused here as well. For static service(buildings not subject to variable windloads, for example) the simpler fillet weldcould be used on the inside corner; thiscase parallels the T joint illustrated inFig. 3.
Another complex joint is the lap joint,usually assembled with a pair of filletwelds as shown in Fig. 6. This unbalancedlooking joint is a natural for the fillet
FIGURE 4. T joints with groove welds:(a) single bevel groove; (b) double bevelgroove.
(a)
(b)

FIGURE 6. Lap joint with double fillet welds.
FIGURE 7. Edge joints: (a) normal fusededge; (b) thin sheet before welding; (c) thinsheet after welding with flange consumed.
(a)
3RT18_Layout(473_512) 10/2/02 3:15 PM Page 477
weld. There would be no point in cuttingany groove shapes as a preparation. Asimilar joint can be used to join twoextended plates by butting them andadding a pad bonded by fillet welds; theplate junction is made by including oneof the groove welds associated with thebutt joint.
A final edge joint requires the simplestform of weld. As shown in Figs. 7, thisjoint is ordinarily secured by meltingexisting flanges. Note that theconfiguration in Fig. 7a could be weldedon the reverse side, using the naturalgroove there; it would then be classedamong the groove welds.
Weldment Material andThicknessThe material involved in a weldmentinfluences radiography mainly through itsdensity and, more importantly, its atomicnumber.
Welded materials ordinarily range indensity from 1.78 g·cm–3 for magnesiumto 8.57 g·cm–3 for niobium. Comparisonsof density alone are not sufficient whencomparing materials; the absorption ofionizing radiation by a specimen is alsoaffected by the atomic structure of thematerial.
The thickness of the material underexamination has an influence that acts inparallel with the specimen density. As thethickness increases, the energy level of theradiation source and exposure time mustbe increased.
Another effect related to the thicknessof the material has to do with how closethe zone of interest is to the plane of thedetector. This distance has a directinfluence on the sharpness of the image.
The geometrical unsharpness is alsocontrolled by the size of the radiationsource and its distance from the object. InX-ray devices it is the size of the X-ray
FIGURE 5. Corner joint with single bevelgroove.
tube target interrupting the electron flow;in a gamma ray source, it is the physicalsize of the isotope. Increases in distancefrom source to object can compensate forlarge source sizes.
When butt joints are examined, oneside of the weld could be of more interestthan another. In this case, to reduce theunsharpness, the detector is positioned sothat the potential discontinuities arecloser to the sensor. This applies to thesingle-V or bevel groove, when the root ofthe joint, or toe of the weld, is virtually atthe back surface of the weld. This portionof any groove weld is the most susceptibleto discontinuities.
477Radiographic Testing of Welds
(b)
(c)

478 R
PART 3. Discontinuities in Welds1
3RT18_Layout(473_512) 10/2/02 3:15 PM Page 478
Although many of the followingdiscontinuities occur in several types ofwelded joints, the differences in jointgeometry produce differences in thelocation and orientation of thediscontinuities. Thus, the radiographicprocedure for imaging one discontinuitymight not be useful for another.
Weld discontinuities that can be foundby radiography are mainly porosity,inclusions, inadequate penetration,incomplete fusion, cracks, underfill,undercut and arc strikes.
Some weld discontinuities notcommonly found by radiography includeunderbead cracks, lamellar tearing,lamination and delamination.
PorosityPorosity is a condition in which the metalhas voids containing gases; most weldscontain a certain percentage of porosity.These gases are dissolved in the metalwhile it is hot and then separate as itcools. The solubility of gases in metals canbe very high at high temperatures.
The gases result from chemical andphysical reactions during welding. Acertain amount of gas is always generatedin standard welding but is usually notdetectable radiographically. At times,however, excessive gas is produced andleads to the discontinuity called porosity.
Most porosity is spherical but can takeon other shapes, depending on weldingconditions. It can also be distributed inways that are again related to weldingcondition.
Porosity may be found anywherethroughout the weld metal. It will not befound in the unmelted heat affected zoneof the material.
The restrictions on porosity in somewelds may be rather lenient. Thiscondition does not seriously weaken awelded joint. There are two aspectscontributing to this apparent lenience.
First, spherical porosity does not act asa stress riser, meaning that it does notbehave like a sharp notch that wouldindeed weaken a joint. Secondly, thestrength of weld metal is customarilygreater than the nominal strength of thematerial being joined. Welding electrodes,with their special coatings, are designed todeposit a relatively high strength material,
adiographic Testing
one with a very fine cast structure as aresult of an extremely rapid cooling rate.Most weldments then can accommodate afair amount of porosity, especially whenthe service conditions are predictable. Anexception to this lenience is for severelinear and clustered porosity in highlystressed and fatigued sensitive joints.
Common Types of PorosityUniformly distributed, spherical porosityindicates that the cause of the difficultyhas been averaged over the entire weld.
Clustered spherical porosity occurs inzones where there has been a perturbationin the welding process, especially whenwelding has been stopped and started upagain. In such cases the pores would bespherical.
Linear spherical porosity is confined tothe earlier portions of the weld, oftenfollowing a joint edge. Linear sphericalporosity usually indicates contaminatedmaterial.
Damaging porosity is usually easy toidentify in a radiographic image and,although inclusions can be similarlyshaped, will usually be less symmetricaland more contrasting.
PipingPiping is a term applied to porosity of ateardrop shape; it usually has a lineardistribution. The condition is easilyrecognized in a properly orientedradiograph because of its streamlinedshape and customary grouping.
Herring Bone PorosityHerring bone porosity is a special case,occurring in automatic arc weldingprocesses. It has a tear drop shape, similarto piping porosity, and is distributed inlinear fashion with a high degree ofregularity. Herring bone porosity is causedby contamination, generally the presenceof air. In the gas metal arc process, aspecial atmosphere provided by theequipment helps avoid this discontinuity.
InclusionsInclusions are pieces of slag or other solidmaterials that have been trapped by weldmetal. This form of discontinuity, like

3RT18_Layout(473_512) 10/2/02 3:15 PM Page 479
porosity, is consistently found by theradiographic process. It can occur innearly spherical, isolated cases but thetendency is for inclusions to accumulatelinearly. Most inclusions consist ofresidual slag from the electrode coatingsor fluxes in welding. The trapped materialtends to occur in the welding directionand therefore normally appears in a line.
In building up a weld, a channel effectoccurs on both sides of the bead. Ifthrough a fault in the process some slag istrapped, there could be two affectedzones, corresponding to the weld beadwidth. When such parallel slag lines occurthey are called wagon tracks.
In multipass welding, the slag coveringwill remain on the as welded work piece,just as it does on properly completedwelds, and measures must be taken toensure its removal.
If this interbead slag is not completelyremoved before the next pass, inclusionswill result. In a radiograph, this type ofslag is not distinguishable from slagmaterial trapped during single-pass welds.
All the welding processes involvingflux can exhibit slag inclusions. Just as forporosity, the automatic processes, whenthey go awry, tend to exhibit long, regulardiscontinuities.
The spherical type of slag inclusionmay often be distinguished from porositybecause there is a major density differencebetween the solid slag and the open void.When both appear in the same image,confirmation is easier. A major slaginclusion may also have a structure thatcan be resolved in a radiograph and willnot be smooth.
The limits on slag are more stringentthan for porosity because the linear formof the inclusion can act as a stress riser.The interpreter is usually directed by theapplicable code in determining theallowable length and width of suchinclusions.
An intermittent slag line is actually asingle slag deposit with gaps. Theaccumulated length of the broken runplus the gap space may be used todetermine the total discontinuity length,in some specifications.
Inadequate PenetrationThe discontinuity called inadequatepenetration may or may not constitute adefect. One definition states inadequatepenetration of the joint constitutespenetration less than that specified. Thus itis possible to have an incompletelybonded (or incompletely filled) joint thatwould still be allowed by specification.This is especially true for partialpenetration weld joints, discussed below.Should such a weld be radiographed, clear
gzruapm
ucttijwuo(pt
wsfwwcao
IIcwnppfota(simmdabbzdodwriab
tiepga
eometric indications of the unweldedone would be obtained. However, if theadiation source is angularly adjusted, thenwelded joint may not show and thenomalies can be evaluated. Inadequateenetration must be monitored andeasured to determine limits.On a radiograph, this indication is
sually a straight sided, dark zone. In thease of joints welded from one side only,he image will be well defined, assuminghe detector is on the root side. Whennadequate penetration occurs in thickeroints welded from both sides or pipingelds, the outlines will not be sharp. Thisnsharpness occurs because (1) the zonef interest is further from the detector or2) the discontinuity is a smallerercentage of the total specimenhickness.
The effect of this condition on theeldment can be very serious: a pair of
harp notches may be present, extendingor a considerable distance. The jointould be weak in bending across theeld, especially for repeating loads or
ycles. In these cases, specifications suchs those in AWS D1.13 impose strict limitsn the length permitted.
ncomplete Fusionncomplete fusion is a discontinuityharacterized by unbonded zones in aeld where weld metal is cast in place butot bonded to a prepared surface or to arevious bead. The shape may then berecisely or roughly linear. In its usualorm, the discontinuity exhibits a gapver some of its width, gradually closingo zero. The typical radiographicppearance shows evidence of taperingthe image would be longitudinal andhaded across its width). Note that whenncomplete fusion comprises only weld
etal in complete contact with anotheraterial, the thickness of the
iscontinuity could be near zero. In thisrrangement, the discontinuity might note detectable radiographically unless theeam were directed along the unfusedone. Radiographic techniques might notetect this type of discontinuity. Inrdinary weld sampling, with the beamirected at the weld bead, the resultould be negative. If the radiographic
equirements are designed to detectncomplete fusion, a requirement for theppropriate beam direction (Fig. 8) woulde included.
Incomplete fusion can occur in allypes of fusion welds. The limits forncomplete fusion are generallyquivalent to those for incompleteenetration and specifications mightroup the two conditions together, classeds fusion discontinuities.
479Radiographic Testing of Welds

480
3RT18_Layout(473_512) 10/2/02 3:15 PM Page 480
CracksA crack may be defined as a split,exhibiting a sharp tip and typically a verysmall opening. Its detectability byradiography is a function of theorientation of the beam to the crack. Asin the case of incomplete fusion, cracksare ordinarily detectable only by ensuringthat the beam direction is in line with thecrack. Typically, when cracking issuspected but cannot be confirmed, moreradiography will be required to confirmthe indication. When clearly detected in aradiograph, the typical crack will appearas a narrow, irregular line.
Cracks exposed by radiography arealways considered discontinuities andrejection follows, with repair being anoption. They are the most serious form ofdiscontinuity because their sharp tip actsas a severe stress riser. For cyclic loading,cracks are always dangerous. Note that ininterpreting radiographs, the verypresence of a crack is sufficient evidencefor rejection; there is no guarantee thatthe actual limits of a crack will match thevisible length of its radiographic image.Further portions of cracks can be closedvery tightly because of weld shrinkagestresses and no tightly closed crack wouldbe detectable.
Radiographic Testing
FIGURE 8. Radiography of weld joint basedon double U groove; both source positionsin line with prepared faces.
Source position 1 Source position 2
Sensor
Hot CracksA form of cracking, referred to as hotcracking or hot tearing, is radiographicallydetectable. This discontinuity originatesduring or just after the hardening of themetal when shrinkage is excessive. Whennarrow, deep welds are made, the weldmetal does not stay molten long enoughto fill the normal shrinkage spaces.
Hot cracks have some visible width andare therefore more easily detected withradiography.
Crater CrackA variation on the hot crack is the cratercrack. These occur if the electrode isremoved too soon at the point where aweld is terminated. Crater cracks usuallyconsist of sets of radial cracks and arerecognizable in a radiograph by thistypical pattern.
Other SeparationsOther cracks may develop adjacent to theweld metal, in the heat affected zone.Such cracks may be associated withhydrogen in the metal and may appear upto several hours after the completion ofthe weld. Hydrogen cracking is almostalways associated with high strengthmaterials because of their susceptibility toalloy modifications during welding andinherent ductility. They may not be openand will generally not be oriented in apredictable direction. The radiographicmethod should not be used for theirdetection.
Other serious forms of separation notordinarily detectable with radiographyinclude (1) the underbead crack (a coldcrack sloped away from the plate surface),(2) lamellar tearing (separation within theplane of the plate) and (3) delamination(opening of an in-plate separation).
Tungsten InclusionTungsten inclusions are particles from thetungsten electrodes that become depositedin weld metal through faulty procedures.The particles may be spherical and appearmuch denser than the material beingwelded, typically aluminum alloys andstainless steels. The very high densityserves as positive identification.
Tungsten inclusions are not consideredespecially harmful in stainless steel andare usually counted with porosity. Thecondition does indicate some processingor procedural problem and should thus bemonitored. However, in titanium alloys,such inclusions require removal andrework.

3RT18_Layout(473_512) 10/14/02 10:52 AM Page 481
UndercutUndercut refers to a groove melted intobase metal directly adjacent to a weldbead. External undercut is ordinarilyevident visually. Internal undercut occursin pipe welds. When undercut occurs inassemblies, the original surface may notbe accessible and the need forradiographic interpretation may arise.Undercut is a processing fault and may berepaired by adding an extra, narrow weldbead.
The condition is generally recognizablebecause the plate thickness will exhibit adefinite tone on a radiograph, whereasadjacent to the weld there will be a darkerarea where the plate thickness hasactually been reduced.
In some standards, a certain amount ofundercut is permitted. As an example,AWS Standard D1.1-833 permits undercutto a depth of 1.6 mm (0.063 in.) formaterial thicker than 15.9 mm (0.625 in.).In more critical cases, no undercut ispermitted and a radiographicdetermination leads to rejection.
Arc StrikesArc strikes are discontinuities that resultfrom establishing the welding arc in zonesother than a weld. They consist ofremelted metal or portions of electrodemetal in unscheduled places. Theirpotential danger arises from steep changesin metal properties that develop when amaterial such as steel has been subjectedto very rapid heating and cooling.Excessive hardness can result, leading topossible fracture during welding orservice.
The condition is identified by itsposition (away from the weld metal) andby a small patch of extra thickness that isoften intermittent but linear.
Arc strikes are usually cause forrejection on critical weldments because ofthe possible effect on service life. Repairsare possible and would generally involvegrinding through the thin affected layer,with fine grinding as a finishingoperation; no further welding would bescheduled.
A collection of radiographs showingspecial conditions for weldments ispresented elsewhere.
481Radiographic Testing of Welds

482 Ra
PART 4. Technique Development1
3RT18_Layout(473_512) 10/2/02 3:15 PM Page 482
Radiation SourcesEquipment that could be used for theradiography of weldments is usually oneof three types: (1) standard, low voltageX-ray generators, (2) gamma ray sourcesand (3) high energy X-ray generators.
Standard X-Ray GeneratorsAll X-ray units are high voltage devices.The standard equipment recommendedfor weldments ranges from 25 kV peak to420 kV constant potential. This rangecovers weldment materials with densitiesof 1.8 to 8.6 g·cm–3. Because of theattenuation coefficients and thicknesses,there are limitations in thicknesses thatcan be adequately covered. Figure 9presents some thickness limits for X-raymachines both in the regular voltageranges and for high energy X-raygenerators. High energy X-ray generatorsare primarily electron accelerators that donot use standard X-ray tube heads. Theirenergies range from 1 to 25 MeV.
Gamma Ray SourcesThe exposure time with radioactiveisotopes depends on the available activityand on the amount of material in the
diographic Testing
FIGURE 9. X-ray potential and general thicknes
Pote
ntia
l (M
eV)
25.0
15.0
10.0
5.0
2.0
1.00
0.500.400.300.200.150.100.080.06
50 100(2) (4)
0 100 200(4) (8)
Th
capsule. This activity level is presented inbecquerel (Bq) or curie (Ci).
The shape of the isotopic pellet alsoaffects its usefulness in radiography. Onlythe atoms near the outside of the pelletcontribute fully to the exposure. Foratoms in the interior, the radiationemitted first penetrates part of the pelletitself. Because the materials are dense,with a medium to high atomic number,intensity diminishes significantly.
FilmAn important factor influencing thechoice of film is the total cost of theoperation. Slow, fine grained film costsroughly the same as other film but canend up costing much more because of thelonger exposures it demands. The timecost can be twofold: (1) radiographicpersonnel are required for a longer timeand (2) the working areas of fabricatingshops may have to be shut down forsafety reasons. With isotopic radiationsources it is customary to operatehazardous equipment on off shifts. Thisprocedure can be very safe but it can addmaterially to the interval between theactual exposure and the repair of thecomponent.
s limits for steel.
300 400 500 600(12) (16) (20) (24)
ickness, mm (in.)

3RT18_Layout(473_512) 10/14/02 10:55 AM Page 483
With film, there is also a choice to bemade for the type of radiation being used(high or low energy) and for the weldmaterial density. The informationavailable from film is contained in itsoptical density variations. If this variationis reduced by the quality of the radiation,whether the film is light or dark, theinformation content also decreases. Tooptimize contrast, film selection andexposure parameters are determined byusing film characteristic curves andexposure charts as discussed elsewhere.
Setup for Exposure ofVarious Weld TypesThe choice of a radiographic technique isusually based on sensitivity. It is usuallygiven in terms of percentages of theradiation, with two percent or lessapplying to fairly critical projects and fourpercent to less critical work. As anexample of scaling, in a steel section 100mm (4 in.) thick, a 2 percent sensitivitywould correspond to 2.0 mm (0.08 in.).
Following are examples showing howthe radiography of specific weldmentscould be handled.
Butt JointConsider a butt joint in 76 mm (3.0 in.)steel, as might occur in the wall of apressure vessel. The welding techniqueshould be in accordance with the ASMEBoiler and Pressure Vessel Code,Section VIII.2
To ensure weld quality, the designermight have the joint prepared for weldingfrom two sides, with the initial weldingpass made at the midsection, whichbecomes the root of the joint. This weldpreparation is called U groove preparation,similar to the double-V groove weld(Fig. 1f). Such a configuration permitsaccess to the root for welding and requiresmuch less material to fill than a V shapedopening. Good practice requires that thebackside of the root pass be ground orgouged, leaving a groove for the first passon the second side. Such a weld usuallyrequires at least five passes on each side.The passes would be sequenced tominimize stress and distortion but thesequence of passes does not influence theradiographic method.
If the initial root pass and the first passon the second side have been performedproperly (and confirmed by visualobservation at the time) then thereshould be no radiographic indicationsassociated with the root of the joint. Themost likely areas for difficulty are on thesteeply sloping sides of the groove — it isfor these zones that the radiographic testis designed. The radiography can require
two exposures, with the beam directed inline with the preparation angle of thegroove. The symmetry of the joint willensure that one shot on either side of theweld can be used to sample the two flanks(Fig. 8). The image will be evaluatedaccording to the code requirements.2 Theactual length of the weld being sampledaffects the exposure geometry.
The beam direction has a further effecton the test because as it shifts from the90 degree orientation, a discontinuity’sprojected shape and position change. Thevisibility of a plaque image qualityindicator will serve to show whether thedistortion significantly affects the image.The specified film density is broad enoughto accommodate the variation arisingfrom this projection effect. In some cases,the finished weld bead must be ground tomake the weld region flush. In the casechosen here, grinding is not required;instead, a maximum bead height isindicated. If this were not taken intoaccount, the extra bead metal could leadto some underexposure of the image;exposure parameters must be based on thetotal thickness.
Joint with Varying ThicknessesAnother common variation occurs whentwo members of differing thicknesses arefastened by a butt joint. For such a case,the weld area is a tapered zone. Althoughthere are limits set for the angle of such ataper, the difference between the twothicknesses has a critical effect on theradiographic process. Accommodatingsuch a difference may require a specialarrangement, such as using films withdifferent speeds for a single exposure. Bythis means, the thinner steel section willbe captured on slower film and thethicker section on faster film. To evaluatesuch a radiograph, the two films can beviewed together.
Joining Different MaterialsOnly one type of material is involved inthe previous example but another variablecan arise in a welded joint when morethan one type of material is involved. Atypical case of this sort involves jointsthat will be exposed to significantmagnetic fields, such as in large electricalequipment. These configurations ofteninclude two parts fabricated from steeljoined by a nonmagnetic weld of stainlesssteel. The weld serves to break thecontinuity of the magnetic field thatoccurs when the component is in service.To the radiographer, there will be anoticeable change in radiographic densitybetween the steel and the stainless steel. Itis important that the form of the joint beknown so that the change in density will
483Radiographic Testing of Welds
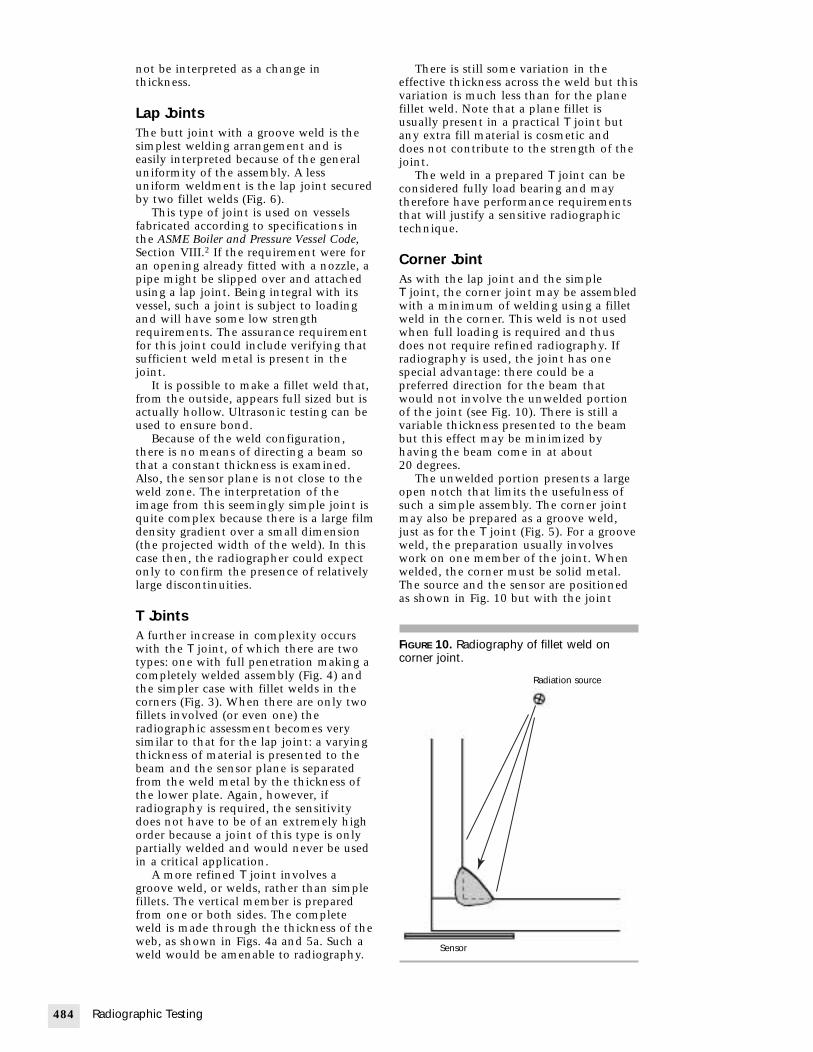
484 R
FIGURE 10. Radiography of fillet weld oncorner joint.
Radiation source
Sensor
3RT18_Layout(473_512) 10/2/02 3:16 PM Page 484
not be interpreted as a change inthickness.
Lap JointsThe butt joint with a groove weld is thesimplest welding arrangement and iseasily interpreted because of the generaluniformity of the assembly. A lessuniform weldment is the lap joint securedby two fillet welds (Fig. 6).
This type of joint is used on vesselsfabricated according to specifications inthe ASME Boiler and Pressure Vessel Code,Section VIII.2 If the requirement were foran opening already fitted with a nozzle, apipe might be slipped over and attachedusing a lap joint. Being integral with itsvessel, such a joint is subject to loadingand will have some low strengthrequirements. The assurance requirementfor this joint could include verifying thatsufficient weld metal is present in thejoint.
It is possible to make a fillet weld that,from the outside, appears full sized but isactually hollow. Ultrasonic testing can beused to ensure bond.
Because of the weld configuration,there is no means of directing a beam sothat a constant thickness is examined.Also, the sensor plane is not close to theweld zone. The interpretation of theimage from this seemingly simple joint isquite complex because there is a large filmdensity gradient over a small dimension(the projected width of the weld). In thiscase then, the radiographer could expectonly to confirm the presence of relativelylarge discontinuities.
T JointsA further increase in complexity occurswith the T joint, of which there are twotypes: one with full penetration making acompletely welded assembly (Fig. 4) andthe simpler case with fillet welds in thecorners (Fig. 3). When there are only twofillets involved (or even one) theradiographic assessment becomes verysimilar to that for the lap joint: a varyingthickness of material is presented to thebeam and the sensor plane is separatedfrom the weld metal by the thickness ofthe lower plate. Again, however, ifradiography is required, the sensitivitydoes not have to be of an extremely highorder because a joint of this type is onlypartially welded and would never be usedin a critical application.
A more refined T joint involves agroove weld, or welds, rather than simplefillets. The vertical member is preparedfrom one or both sides. The completeweld is made through the thickness of theweb, as shown in Figs. 4a and 5a. Such aweld would be amenable to radiography.
adiographic Testing
There is still some variation in theeffective thickness across the weld but thisvariation is much less than for the planefillet weld. Note that a plane fillet isusually present in a practical T joint butany extra fill material is cosmetic anddoes not contribute to the strength of thejoint.
The weld in a prepared T joint can beconsidered fully load bearing and maytherefore have performance requirementsthat will justify a sensitive radiographictechnique.
Corner JointAs with the lap joint and the simpleT joint, the corner joint may be assembledwith a minimum of welding using a filletweld in the corner. This weld is not usedwhen full loading is required and thusdoes not require refined radiography. Ifradiography is used, the joint has onespecial advantage: there could be apreferred direction for the beam thatwould not involve the unwelded portionof the joint (see Fig. 10). There is still avariable thickness presented to the beambut this effect may be minimized byhaving the beam come in at about20 degrees.
The unwelded portion presents a largeopen notch that limits the usefulness ofsuch a simple assembly. The corner jointmay also be prepared as a groove weld,just as for the T joint (Fig. 5). For a grooveweld, the preparation usually involveswork on one member of the joint. Whenwelded, the corner must be solid metal.The source and the sensor are positionedas shown in Fig. 10 but with the joint

3RT18_Layout(473_512) 10/2/02 3:16 PM Page 485
oriented as shown in Fig. 5, so the sensorplane and weld metal are virtually incontact.
Fillet WeldsThe fillet weld is commonly used with thelap joint, the corner joint and the T joint;the fillet weld may be used in conjunctionwith a groove weld in a corner or T joint.
For a 90 degree T joint with asymmetrical fillet weld, the shortest paththrough the weld is that bisecting the90 degree angle, giving a radiation beamangle of 45 degrees. If the sensor plane(film holder or detector assembly) ispositioned in contact with the flange ofthe T joint (the top of the T), then theradiation beam must pass through arelatively large thickness of metal.
Another approach to the radiographyof fillet welds is to position the sensor onthe weld side of the joint. In this case, thethickness of the sensor plane will havesome considerable influence on theradiographic resolution. This limitationonly applies when the sensor is flat.Flexible film holders and detector arraysare available that can be bent to conformto the weldment and thereby bring thesensor closer to the weld bead. The extrametal in the radiation path does not fallbetween the weld zone and the sensorand resolution will usually be improved.In this setup, the beam is at right anglesto the weld surface. This arrangement isthe best for detecting centerline cracking.A similar arrangement is useful for Tjoints in which the web (the stem of theT) is prepared for welding.
Other arrangements may be used tocompensate for the uneven geometry ofthe fillet weld. One example is theintroduction of metal wedges, preparedwith shapes complementary to the filletshape and fitted between the sensor andthe radiation source. The wedges may bein contact with the weld surface or on theopposite side, where they should be incontact with the sensor plane. This setupcan be used with any of the three jointtypes using the fillet weld.
Edge JointThe edge joint is illustrated in Fig. 7. Thisform of joint is usually intended forsealing and is not considered structural.When the weld is completed, there is asevere notch on one side that reaches tothe root of the weld and precludes anysignificant bending or tensile loading. Theedge joint has an evident deficiency inload bearing capacity but may beradiographically tested when sealing is acrucial factor. The total geometry of thejoint discourages radiography: althoughthe weld is fairly thin, it is mounted on
legs that act as a thick section whenviewed from directly above. When sealinga cylindrical object with an edge weld,tangential radiography is frequently used.
A form of the edge joint made withflanges could be readily checkedradiographically (Figs. 7a and 7c). If madefrom thin material, when fairly sharpbending might be assumed in the weldpreparation, a careful weld could bedesigned to use up all the projectedmaterial and melt through to the back,rather like the consumable insert. Theresulting weld is somewhat thicker thanthe sheet and is suited to the radiographicexamination process. Such welds are usedon articles made of precious metal, wherethe amount of material is always a greatpart of the total cost.
Image Quality IndicatorsThere are two basic image qualityindicators for indicating the quality of aradiograph: the plaque image qualityindicator (a flat rectangular plate) and thewire image quality indicator. In NorthAmerica, quality is judged by checking forthe discernibility of (1) the outline of theplaque itself and either (2) wires or(3) certain small holes in the thin plaque.At one end of the plaque there are leadcharacters that identify the material of theplaque and its thickness (see Figs. 11aand 12).
The plaque image quality indicator firstfunctions in a thickness mode, thethickness being a percentage of theweldment thickness. A second aspect ofthis sensitivity indicator is related to theactual hole diameter. Customarily, becausemany codes so require, the plaquethickness will be 2 percent of the weldthickness and a hole whose diameter istwo times the plaque thickness (2T) willbe required.
ASTM E 1025, Standard Practice forDesign, Manufacture, and Material GroupingClassification of Hole-Type Image QualityIndicators (IQI) Used for Radiology,10 is astandard for plaque image qualityindicators. Image quality indicators thatare made to ASTM E 142, Standard Methodfor Controlling Quality of RadiographicTesting,11 will incorporate the 2T hole andtwo other holes, one with diameter equalto the plaque thickness (1T) and one witha diameter four times the plaque thickness(4T). For more critical applications, acontract could require that the smallesthole be used. Alternatively, plaques couldbe prepared with other versions of thehole diameters. The 2 percent level,however, has the advantage ofinternational recognition because of itspresence in the ASTM standards and
485Radiographic Testing of Welds

486
3RT18_Layout(473_512) 10/2/02 3:16 PM Page 486
because many codes refer to the 2 percentlevel.
The next most common form of imagequality indicator is the wire type (Fig.11b). The wires are arranged by diameterand are all of the same length. The wirematerial is chosen to match the materialin the weldment. In use, a specificationwill state the smallest diameter thatshould be visible on a finishedradiograph. The wire package is of astandard design and information aboutthe wire set is presented in leadcharacters. Customarily it would be statedthat at least two thirds of the significantwire length should be resolved on theimage. See Table 1 for some details on thedesign of the wire set.12
An image quality indicator portrays thematerial thicknesses and identity on eachdevice, with the 1T, 2T and 4T holes(Fig. 12).13
Radiographic Testing
FIGURE 11. Image quality indicators:(a) plaque; (b) wire.
(a)
(b)
Purpose of Image QualityIndicatorsAll forms of the image quality indicatorhave one basic purpose: displaying ameasure of the radiographic quality andthereby some measure of the quality ofthe radiographic process.
Some of the most critical radiographictest objects are pressure containing zonesin nuclear reactors. These zones comprisethe main pressure vessels, heatexchangers, pipe fittings, valves andpiping and are linked with one anotherby welds. Because of the extremes inpressure and temperature thesecomponents must withstand, they arebuilt from very thick metal. They are,however, not much thicker than theyneed to be and no large safety factors are
TABLE 1. Comparison of plaque and wireimage quality indicator sensitivity.
Plaque Thickness Wire Diameter_________________ _______________mm (in.) mm (in.)
0.13 (0.005) 0.13 (0.005)0.16 (0.006) 0.16 (0.006)0.20 (0.008) 0.20 (0.008)0.23 (0.009) 0.25 (0.010)0.25 (0.010) 0.33 (0.013)0.28 (0.011) 0.40 (0.016)0.31 (0.012) 0.51 (0.020)0.51 (0.020) 0.64 (0.025)2.54 (0.100) 0.81 (0.032)3.81 (0.150) 1.02 (0.040)
1. Plaque thicknesses are arbitrary in this example.2. Wire diameters are in geometric series, each
multiplied by tenth root of 10 (1.2589).
FIGURE 12. Image quality indicator of typedescribed in ASTM E 1742, ASTM E 2104and MIL-STD-453.13,20,21

3RT18_Layout(473_512) 10/2/02 3:16 PM Page 487
involved. Exceeding minimum standardscould make these components so thickand heavy that the material andfabrication costs would be prohibitive.The aim is to ensure that the assembly isof high enough quality that it canfunction in complete safety. The weldsinvolved are expected to be as sound asthe materials being joined. The materialsare subjected to quality assurance systemsthroughout their manufacture and thewelded joints become equally important.When radiography is used to determinethe quality of the welds, the test systemitself logically becomes subject toquestion and to similar control.
Area CoverageThe area to be covered by the sensor(either film or detector array) is a majorconcern. For one thing, the sensor sizemust be adequate for the size of the weldzone involved. The sensor must also belarge enough to gather information onradiographic quality (the image qualityindicator and any shims must be visible).Larger sensor sizes may be required whencomplex sensor identification systems areinvolved.
The area to be covered is directlyaffected by the geometry of thearrangement. The radiation source imagesprecisely only when the object and thesensor plane are normal to the beam.With flat work pieces, this becomes adefinite limitation on the length of a weldthat can be covered in a single exposure.Often a specification will incorporate alimit here — for example, a maximum of27 degrees half angle in such a case.
Such exposure angles have twoimportant effects and both tend todegrade the image. First, the true shape ofan indication will not be presentedbecause the beam will generate a shadowthat is elongated in the plane common tothe weld metal and the axis of theradiation beam. The second effect has todo with the position of an imagecompared with the actual position of thediscontinuity that generates the image.An indication in the image will always beprojected away from the true position ofthe discontinuity causing the image. Likethe distortion effect above, this canbecome quite severe if limits are notimposed.
Specifications usually incorporateclauses covering exposure geometry andmay even go a step further in demandingthat the image quality indicators beplaced at the outboard end of the joint,where the effect is intensified. Presumingthat the image quality indicator issufficiently visible, the radiograph isjudged accordingly.
ScreensFor weldments of steel and other densemetals, a lead foil screen between thesensor and the radiation source is usuallyrequired. The screen improves the imagequality by filtering out longer wavelengthradiation, which causes general fogging,by filtering out scatter and by intensifyingthe image. A companion screen, fitted onthe back side of the sensor, also actspositively to reinforce the image formingprocess and minimize backscatteredradiation.
The lead screen is not used for lightalloy weldments because, with aluminumand other light metals, the softerradiation must reach the sensorunimpeded to yield an adequate contrastrange through the material. A screen onthe back side of the sensor, however, actspositively and is often used. In thisposition, it contributes to latent imageexposure (1) by electron intensificationand (2) by blocking secondary radiation(backscatter). Such radiation is alwayslower in energy when compared to theprimary beam; if not stopped, it couldcause general image fogging. Thespecifications in ASME Boiler and PressureVessel Code2 require that a lead character Bbe present on the back of the cassette asevidence that a screen was used. If asignificant amount of backscatteredradiation impinges on the wrong side ofthe cassette, the B is imaged.
Section ThicknessThe quality of any radiography is verymuch dependent on the object’s effectivesection thickness. A simple geometricconcept governs here; the farther the zoneof interest is from the film or otherdetector, the less distinct the shadow willbe. This is a very real effect. The result is amoderate loss of resolution when a thickweld is considered and the effect can bevery pronounced when complex shapesare involved, such as some forms ofcorner and T joints. The image qualityindicator image becomes very importantas a monitor and the radiographicprocedure must make it clear that theimage quality indicator should not bepositioned where it would yieldmisinformation. It is often required toposition the image quality indicator onthe top surface of the part, creating thelargest unsharpness in the image qualityindicator image.
The ultimate sensitivity is not expectedto be constant over a wide range ofweldment thicknesses. The sensitivityparameter is presented as a percentage ofthe object thickness. See Table 1 for a
487Radiographic Testing of Welds

488 R
3RT18_Layout(473_512) 10/2/02 3:16 PM Page 488
comparison of plaque and wire imagequality indicator sizes.1 Specifications thatpresent acceptance limits for radiographyalso present the scaling of the acceptableindication sizes.
Identifying Welds andImagesBecause a radiograph is a permanentreference of a weldment’s condition, it isusually required that the finished imagebe traceable to the specific joint. Thisneed is generally met with a markingsystem consisting of lead characters thatappear clearly on the image through thethickness range involved. As evidence thatcoverage is complete, records made at thetime of the radiography must adequatelyshow how to match the image (1) to theweld, (2) to the location on the weld and(3) to the position of the sensor plane andthe beam direction of the originalexposure. Careful marking and recordkeeping are necessary, especially if checksare made later to determine whether somecondition is developing into a significantdiscontinuity.
Devices that mark by imprinting animage from the radiation must beconsiderably more dense than thematerial under study. Lead is commonlyused for overprinting on steel and suchnumbers, letters and symbols are availablein many sizes and thicknesses. On verythick welds, even quite thick lead markerscan virtually disappear on the image; theycan be mounted on a block of steel orsheet of lead. A similar case exists when aweld specimen is smaller in area than thesensor plane. If the numbers are thin,they could disappear in the image andshould be positioned on a separate leadshim or on a shim of thickness similar tothat of the weld material.
In ASTM E 94, Recommended Practice forRadiographic Testing, there are suggestionsfor the type of information that should beretrievable from image marking systems.14
In large radiographic projects, a fewsimple identifying numbers are notsufficient for permanent reference; onoccasion the image identity scheme couldrequire as much storage medium (eitherin bytes or as part of the film mass) as theweld zone itself. There are refined codingsystems that print information on theimage using visible light as the exposuremedium. These systems have thedisadvantage of being indirect comparedto the identity scheme using leadcharacters exposed simultaneously on theradiograph.
For some welds, the area of interest isnot limited to the weld metal. Forexample, a form of cracking can occur
adiographic Testing
adjacent to a weld, rather than directly inthe weld. The identifying symbols mustbe positioned so as not to obscure apossible discontinuity.
With light materials, identifying theimage with lead characters is quite easybecause of the difference in densitybetween low density materials (such asaluminum) and lead.
Film HandlingAll of the standard precautions for filmhandling apply when radiographingwelds. Extreme care should be taken inloading, unloading and handling the filmcassette. Cleanliness is essential forscreens and during the processing phase.
During exposure, the film seems safe inits cassette, yet there can be mishandlingat this stage too. A special case for weldsoccurs when a high weld bead, coupledwith a heavy load, imposes on the film apattern (pressure mark) that will be visibleafter processing.

PART 5. Standards and Specifications forRadiographic Testing of Welds1
3RT18_Layout(473_512) 10/14/02 10:56 AM Page 489
There is much published material onradiographic testing, its controls andlimits of acceptance. Publications areavailable with specific information onradiographic testing as it applies toweldments. The welds in question aremeans of joining metal products,including (1) pressure vessels, boilers andheat exchangers, (2) buildings, industrialstructures and bridges, (3) ships andmarine structures, (4) transmissionpipelines, (5) industrial pipe, (6) storagetanks, (7) rail vehicles, (8) machinery,(9) aircraft and spacecraft and (10) roadvehicles. See elsewhere in this volume formore about standards for radiographictesting.
A specification is a document thatstates in some detail the requirements ofthe test method and techniques. Thesource of such a specification is usuallythe buyer of the product. Instead ofcomposing a complex technicaldocument, such a buyer could choose aparticular standard document thatadequately covers the particular method.
A standard is a published specification,test technique, classification or practicethat has been prepared by an issuingbody. To satisfy the needs of a contract, astandard or parts of a standard canfunction as a specification.
A code is a collection of relatedstandards and specifications given theforce of law by government regulation. Anexample is the ASME Boiler and PressureVessel Code,2 which consists of manyspecifications covering pressure vessels,their manufacture and inspection, theirlicensing and their inservice inspection; itincorporates scores of ASTM standards.15
Another example is the National BuildingCode of Canada, incorporating CanadianStandards Association design standards,Canadian Standards Association weldedconstruction requirements andconstruction safety measures to ensurepublic safety in buildings.16
The ASTM standards do not presume toset acceptance standards for radiographybecause these vary according to theproduct. The ASME Boiler and PressureVessel Code2 contains such limits, as doesthe American Welding Society’s StructuralWelding Code3 and the American Bureau ofShipping’s Rules for Building and ClassingSteel Vessels.4 Piping and pipelines arecovered by the American Society of
MsWsWSAOrmiArSC
sARacSNADhssIRs
RRSTpSEtscacrPACTupas
e
echanical Engineerings’ pipingtandards8,17 and by API 1104, Standard for
elding Pipelines and Related Facilities.6 Fortorage tanks refer to Americanaterworks Association’s D100, Welded
teel Tanks for Water Storage,18 andPI 650, Standard for Welded Steel Tanks foril Storage.9 Requirements for rail vehicles
efer to the AWS Standard D1.1 alreadyentioned.3 Machinery is typically
ncorporated into existing standards.typical standard that could apply to
oad vehicles is AWS D14.3/D14.3M,pecification for Welding Earthmoving andonstruction Equipment.19
For aircraft and aerospace,pecifications are more specialized.STM E 2104, Standard Practice foradiographic Examination of Advanced Aerond Turbine Materials and Components,20
overs some important test situations.tandards have been issued by theational Aeronautics and Spacedministration and by the United Statesepartment of Defense. Since the 1990s,owever, many United States militarytandards have been superseded bytandards of SAE International and ASTMnternational. MIL-STD-453C, Inspection,adiographic,21 for example, has beenuperseded by ASTM E 1742.13
adiographicequirements for Welds inelected Standardshe radiographic testing of welds inarticular is covered by ASTM E 1032,tandard Test Method for Radiographicxamination of Weldments.22 Althoughhere is some commonality in thetandards cited for the radiographicontrol of welds, there is variation in thecceptance limits. For the method andontrol, respectively, it is normal to see aeference to ASTM E 94, Recommendedractice for Radiograph Testing,14 andSTM E 142, Standard Method forontrolling Quality of Radiographicesting.11 The acceptance limits are, notnnaturally, associated with the type ofroduct involved, so those products thatre deemed more critical will carry moretringent requirements.
The acceptance criteria are usuallyxpressed in graded words and numbers,
489Radiographic Testing of Welds

490
3RT18_Layout(473_512) 10/2/02 3:16 PM Page 490
occasionally with a graphical presentationas a backup for estimating the extent ofporosity. Where porosity charts areincluded, there is also an absolute limitbased on total area and individualdiameters.
Radiographic Testing

PART 6. Radiography of WeldDiscontinuities1,23,24
3RT18_Layout(473_512) 10/2/02 3:16 PM Page 491
Crack Detectability in SteelWeld Specimens23
BackgroundWhenever penetrating radiation is used tosearch for discontinuities in solids, anappropriate exposure technique must beestablished. Variables governing theexposure, such as kilovoltage,milliamperage, time and distance, must bejudiciously selected to exceed minimumtest sensitivity requirements. The effectthat each variable has on overallsensitivity is generally understood andappreciated. However, overall testsensitivity is often judged on the visibilityof holes in image quality indicators(penetrameters) and such judgment canbe misleading. For example, how closelydoes the flat, pancake shaped hole of theindicator simulate a thin canyon shapedcrack? Was it ever intended to do this?Perhaps not, yet the indicator isunderstood to communicate a 2 percentdiscontinuity detectability level, regardlessof the shape of the discontinuity itself, toall who can see the 2T hole.
It was known from earlier work25 thatthe recording of an image of a crack or acracklike discontinuity on a radiographwas a more exacting task than wasgenerally acknowledged. It was alsosuspected that the image of a crack onany given medium might not necessarilybe observable when the image of the 2Thole in the image quality indicator wasvisible.25 These observations motivatedthe review of exposure variables tounderstand better how crack detectabilitysensitivity related to overall testsensitivity.
Kilovoltage and radiation sourcepositioning were chosen as the exposurevariables that earlier studies25–27 hadindicated as having the greatest effect oncrack detectability. Since cobalt-60 andiridium-192 were the two isotopes mostcommonly used for radiographicpurposes, each was selected to supplementthe energy range of the X-ray generatingequipment, producing high energy testdata.
The effects of energy level andradiation source position changes oncrack detectability were evaluated on an
actual crack in a steel weld. The weld wasmachined in steps to present various crackdepths on the radiographs. Steel plateswere added progressively beneath thiscracked wedge until the crack image wasno longer discernible on the image. BothX-radiation and gamma radiation wereused and standard image qualityindicators were added to correlate crackdetectability with indicator sensitivity.Detectability parameters were establishedfor the various energies and positionsused.
Test ObjectA cracked steel weld, supplied by theSubcommittee for Nondestructive Testingof Unfired Pressure Vessels of theAmerican Society of Mechanical Engineers(ASME), was used for these tests. It hadbeen fabricated as part of a proposal tohave this specimen used in aninvestigation of the effectiveness ofradiographic techniques.
Originally, two double beveled platesmeasuring 152 × 483 mm (6.0 × 19.0 in.)by 38 mm (1.5 in.) thick were butt weldedand purposely cracked during welding.The bottom of the welded assembly wasmachined to expose the crack along thefull length of the weld. It was thenmachined to the configuration observedin Fig. 13. Widths of the crack weremeasured at the bottom surface of thecrack using a visual measuring comparatorwith 6× magnification. The followingvalues represent an average of the widthsfound at each of the four machined steps:(1) 1.59 mm (0.063 in.) deep, 0.08 mm(0.003 in.) wide; (2) 3.18 mm (0.125 in.)deep, 0.08 mm (0.003 in.) wide;(3) 4.76 mm (0.188 in.) deep, 0.09 mm(0.0035 in.) wide; (4) 6.35 mm (0.25 in.)deep, 0.127 mm (0.005 in.) wide.
An approximation of the crosssectional shape of the crack was obtainedby photographing the end view of thecrack at the end of the weld closest to the1.59 mm (0.063 in.) thick portion of thetest object. Figure 14 is a tracing of thisphotograph. Note this crack closelyresembles two parallel 0.79 mm(0.031 in.) deep cracks, radiographically,because of the severe bend it exhibits. Thecrack presents a mere 75 µm (0.003 in.)reduction in radiation path lengththrough the test plate along thehorizontal portion of the bend. This is
491Radiographic Testing of Welds

492
FIGURE 14. End view of crack in test object.23
1.59 mm(0.063 in.)
Lower surface of test object
3RT18_Layout(473_512) 10/2/02 3:16 PM Page 492
much less than two percent of theradiation path and would not be expectedto show.
Different thicknesses of smaller steelplates were used as filler plates and placedon top of each of the four sections ofcracked weld so that the four steps wouldbe equal in total crack-plus-fillerthickness.
A series of eight ASTM image qualityindicators was placed on top of the fillerplates, facing the radiation. Slitsmeasuring 0.25 mm (0.010 in.) by6.35 mm (0.250 in.) were cut into eachimage quality indicator in an attempt torelate slit visibility, in addition to holevisibility, with crack detectability. Oneimage quality indicator in each series wasthe correct thickness for the totalthickness of steel under test. The sevenadditional image quality indicators wereused to determine the precise level of holeand slit sensitivity existing whenever acrack detectability limit was reached.
Exposure and Film ProcessingControlsThe following parameters remainedconstant throughout the testing.Isotope Source Collimation. The cobaltand iridium sources were used directly,without collimation, to duplicate extremefield conditions when collimation was notfeasible.Screens. A combination of 0.13 mm(0.005 in.) thick front and 0.25 mm(0.010 in.) back lead screens was used toconform to the standard practice of theindustry.
Radiographic Testing
FIGURE 13. Radiographic test object. Crackeddeterminations.23
Filler plates
150 mm(6.0 in.)
Alignment key Cr
Film Type. An industrial X-ray film wasused that had both very fine grain sizecharacteristics and relatively fast exposurespeed.Film Density. The exposures werecalculated to produce a resultant filmdensity of 2.0. This figure is usuallyaccepted as a suitable level for filminterpretation.Film Processing. A 240 s (4 min) dryingcycle was established to expedite testingresults. A conventional industrial X-rayfilm processor was modified to obtain thisfaster processing.Solutions. To ensure consistent anduniform film and solution compatibility,the same developer and fixer were usedand temperature was held constant at31 °C (88 °F) throughout the tests.
Testing ProcedureThe cracked weld, with the filler platesinstalled, was radiographed at fiveseparate energy levels. At each level, steelplates were added in 1.59 mm (0.063 in.)thick increments beneath the full length
weld used for natural crack threshold
0.48 m
(19.0 in.)
ack depth 6.35 mm (0.250 in.)
Crack depth 4.76 mm (0.188 in.)
Crack depth 3.18 mm (0.125 in.)
Crack depth 1.59 mm (0.063 in.)

ABLE 2. Limits of detectability obtainedor 1.6 mm (0.063 in.) deep crack in steelre expressed as thicknesses of steel thatan be placed with cracked plate inadiation path without losing crackmage, where t = crack depth.
Radiation Source AngleEnergy (degrees inclination)____________________________Level 0 8 17 30
250 kV 31 t 31 t 28 t 27 t275 kV 29 t 26 t 25 t 24 t300 kV 28 t 25 t 24 t 19 tIridium-192 14 t 12 t 11 t 11 tCobalt-60 8 t 8 t 7 t 5 t
3RT18_Layout(473_512) 10/2/02 3:16 PM Page 493
of the weld. Exposures were made at eachnew thickness and this process continueduntil the image of a 1.59 mm (0.063 in.)deep crack was no longer distinguishableon the radiograph. The 1.59 mm(0.063 in.), or shallowest, crack waschosen as the standard for these tests sothat the penetration of the totalthicknesses of steel required for crackobliteration would fall within thepractical working range of the X-rayequipment.
In addition, many different sourceangles were used at each energy level todetermine effect of angle on the detectionof the shallowest crack. Plates were againadded, at each angle, until the crackbecame undetectable to the radiographer.The angles were measured as degrees ofinclination from the vertical or centralportion of the beam, which wasconsidered to be zero degrees. Theradiation source-to-sensor distanceincreased slightly as the angle ofinclination increased. All sources wereshifted laterally at a constant 914 mm(36.0 in.) level; however, the X-ray tubewas also angled toward the crack. Earlierwork25 indicated that such relativelyminor changes in source-to-film distancehad no appreciable effect on crackdetectability. This lateral approachprovides a more precise way to duplicatecritical source angles using conventionalindustrial equipment.
The resultant film radiographs werereviewed by experienced radiographers todetermine limits of crack detectability foreach energy level and source position.This limit was expressed as the maximumnumber of thicknesses t of steel (eachthickness was equal to the depth of thecrack) that could be placed in the path ofradiation, along with the cracked plate,without losing the image of the crack.
To relate these t values to the familiarconcept of image quality indicatordetectability, it would require 50 t toproduce a crack depth-to-thickness addedratio of 1:50, the detectability level ofstandard, 2 percent, hole type imagequality indicators.
The t values were used to calculatecrack detectability sensitivity as follows:
(1)
The image quality indicator (IQI) holeand slit sensitivities at each t value arecalculated as follows:
(2)
(
TTvTc
a2smtd1(lsirdblo
bcrrbut(pwr
bddeot1
Holesensitivity
Thinnest IQI thicknesswith visible 2T hole
Thickness underpenetrameter
=
Crackdetectibilitysensitivity
c
c=
+d
t d
Tfacri
3)
est Resultsable 2 lists the t values found at thearious energy levels and source angles.able 3 shows the results of the sensitivityalculations.
None of the t values reported in Table 2pproached the 50 t limit, indicative ofpercent image quality indicator hole
ensitivity, but the values themselvesight be used as crack detection
hresholds for exposure techniqueeterminations. For example, to detect a.59 mm (0.063 in.) crack in 51 mm2.0 in.) of steel (32 t total), an energyevel at or close to 250 kV and a near zeroource angle must be used. If onlyridium-192 was available as a source ofadiation, this same crack could beetected whenever the total thickness toe penetrated was 23.8 mm (0.88 in.) oress and the source was positioned directlyver the crack.
All of the sensitivity calculations wereased on a 1.59 mm (0.063 in.) deeprack, although the crack more closelyesembled a 0.79 mm (0.0313 in.) crackadiographically because of the severeend it exhibited at nearly this distancep from the lower surface (Fig. 14). Theest crack was considered to be a 1.59 mm0.063) in.) deep crack because it wasrobably the cross sectional shape thatould be most difficult to detect
adiographically.If the sensitivity calculations had been
ased on a 0.79 mm (0.031 in.) crackepth, all but three of the cracketectability sensitivity levels in the X-raynergy range would have been 2 percentr less and these three exceptions were athe extreme source position angles of7 and 30 degrees. If the percent
Slitsensitivity
Thickness of thinnestIQI with visible slitThickness under IQI
=
493Radiographic Testing of Welds

494 R
TABLE 3. C
EnergyLevel
250 kV
275 kV
300 kV
Iridium-
Cobalt-6
3RT18_Layout(473_512) 10/2/02 3:16 PM Page 494
sensitivity of an X-ray passing through a0.08 mm (0.003 in.) wide slit werecalculated at these extreme angles as aratio of the distance traveled through theair gap of the slit to the travel distancethrough sound metal, then these threesensitivity levels would have been2 percent or less, as well.
Although none of the crackdetectability sensitivity values approachedthe 2 percent level, a generally acceptedlevel of overall test sensitivity,28 there isno inexplicable loss of sensitivity.Radiation travels in straight lines andpenetrates significant amounts of metalby passing in and out of the side walls ofthe crack before it reaches the sensor.Accordingly, there is less of a difference inthe intensity of radiation reaching thesensor between the cracked anduncracked areas than there would havebeen if the crack had been a smooth,straight walled slit or image qualityindicator hole. It is these differences inintensities that are recorded as images ofthe crack and slit or hole; therefore, it isonly a less than expected change in theintensity of the emerging radiation in thecracked area that occurs and not a loss oftest sensitivity.
An examination of the image qualityindicator thickness listed in Table 3 showsthat all but two of the thicknesses listedfor hole type image quality indicatorswithin the X-ray energy range areidentical at 0.38 mm (0.015 in.) thickness.
adiographic Testing
rack detectability and image quality indicator se
Source t TotalPosition Value Thickness_______________ _______________(degree) mm (in.) mm (in.)
0 49.19 (1.938) 50.76 (2.000)8 49.19 (1.938) 50.76 (2.000)
17 44.42 (1.750) 46.02 (1.813)30 42.84 (1.688) 44.42 (1.750)
0 46.02 (1.813) 47.59 (1.875)8 41.24 (1.625) 42.84 (1.688)
17 39.67 (1.563) 41.24 (1.625)30 38.07 (1.500) 39.67 (1.563)
0 44.42 (1.750) 46.02 (1.813)8 39.67 (1.563) 41.24 (1.625)
17 38.07 (1.500) 39.67 (1.563)30 30.15 (1.188) 31.73 (1.250)
192 0 22.21 (0.875) 23.81 (0.938)8 19.04 (0.750) 20.63 (0.813)
17 17.46 (0.688) 19.04 (0.750)30 17.46 (0.688) 19.04 (0.750)
0 0 12.69 (0.500) 14.29 (0.563)8 12.69 (0.500) 14.29 (0.563)
17 11.12 (0.438) 12.69 (0.500)30 7.94 (0.313) 9.52 (0.375)
Similarly, with iridium-192, the 2T hole ina 0.45 mm (0.0175 in.) thick imagequality indicator is always visible alongwith the test crack. With cobalt-60, the0.51 mm (0.020 in.) thick image qualityindicator is visible. From these data therudiments of a positive correlation can beseen forming between the visibility of a2T hole in a thinner (than 2 percent ofthe metal it is placed on) image qualityindicator and crack detectability.
ConclusionsThe image of the 2T hole in the imagequality indicator whose thickness wascorrect for the thickness of steel beingradiographed would always be discernibleon the image on which the crack was nolonger visible. This meant the 2T hole inthe correct 2 percent thick image qualityindicator could not be considered as areliable indicator of a 2 percent crackdepth detectability level.
The slit also could be readily shown onthe correct 2 percent thick image qualityindicator after an image of the crack haddisappeared. The slit, in fact, reacted morelike a line of fine, aligned porosity toradiation and became easier to detect thanthe 2T hole. It too was not a reliableindicator of 2 percent crack depthdetectability sensitivity.
Crack detectability did increase as theenergy level decreased, as was evidencedby the increasing t values in Table 2.
nsitivity.
Image Quality Indicator Sensitivity_________________________________ ______________________________Hole Slit Crack Hole Slit_______________ _______________
mm (in.) mm (in.) (percent) (percent) (percent)
0.38 (0.0150) 0.32 (0.0125) 3.23 0.750 0.6250.38 (0.0150) 0.38 (0.0150) 3.23 0.750 0.7500.38 (0.0150) 0.38 (0.0150) 3.57 0.827 0.8270.38 (0.0150) 0.32 (0.0125) 3.71 0.857 0.7151.97 (0.0775) 0.38 (0.0150) 3.45 0.932 0.8000.38 (0.0150) 0.32 (0.0125) 3.85 0.885 0.7400.38 (0.0150) 0.32 (0.0125) 4.00 0.923 0.7680.38 (0.0150) 0.32 (0.0125) 4.18 0.960 0.8000.44 (0.0175) 0.44 (0.0175) 3.57 0.963 0.9630.38 (0.0150) 0.38 (0.0150) 4.00 0.922 0.9220.38 (0.0150) 0.38 (0.0150) 4.18 0.958 0.9580.38 (0.0150) 0.32 (0.0125) 5.27 1.200 1.0000.44 (0.0175) 0.38 (0.0150) 7.15 1.865 1.6000.44 (0.0175) 0.38 (0.0150) 8.32 2.150 1.8450.44 (0.0175) 0.44 (0.0175) 9.10 2.330 2.3300.44 (0.0175) 0.38 (0.0150) 9.10 2.330 2.0000.51 (0.020) 0.51 (0.020) 12.5 4.000 4.0000.51 (0.020) 0.51 (0.020) 12.5 4.000 4.0000.51 (0.020) 0.51 (0.020) 14.3 4.560 4.5600.51 (0.020) 0.51 (0.020) 20.0 6.380 6.380

FIGURE 15. Recommended radiographic procedures forpartial penetration joint designs: (a) double V groove;(b) offset double V groove; (c) corner; (d) corner; (e) corner;(f) corner; (g) corner; (h) corner; (i) 135 degree corner;(j) 135 degree corner; (k) T joint with groove; (l) T joint.24
70 degrees
10 degrees
(b)
(a)
75 degrees90 degrees
(c) 25 degrees
45 degrees
75 degrees
(d) 25 degrees
70 degrees
(e) 25 degrees
70 degrees
Rebated
(f)35 degrees
(g) 35 degrees
Rebated
(i)
45 degrees
90 degrees
(l) 25 degrees25 degrees
60 degrees
(h) 35 degrees
(j)10 degrees
(k) 30 degrees30 degrees
3RT18_Layout(473_512) 10/2/02 3:16 PM Page 495
A decrease in the source position anglealso increased crack detectability, again asevidenced by increasing t values inTable 2.
The cross sectional shape, ordirectional changing, of the crack in aplane parallel to the direction of radiationaffects crack detectability.
Standard hole type image qualityindicators may be used to measure thetechnique’s ability to provide cracklikeindications. Within the 250 to 300 kVX-ray energy range, the 1.59 mm(0.063 in.) crack was visible whenever the2T hole in a standard image qualityindicator 0.38 mm (0.015 in.) thick wasvisible. At iridium and cobalt energies, the2T holes in the 0.45 mm (0.018) and0.51 mm (0.020 in.) thick image qualityindicators, respectively, were reliableindicators of the detectability of a1.59 mm (0.063 in.) crack.
Typical Weld JointDiscontinuities21
To conduct an effective test, it is necessaryfor the inspector to understand thecircumstances of manufacturing andservice and to know what to look for.
For any test process, realistic standardsof acceptability must be established. Thesestandards will depend on many aspects ofthe welded component, such as itsapplication to the base material and itscost. Because the perfect weld has neverexisted and only degrees of weldperfection are obtainable, the followingexamples of weld discontinuities arepresented.
Figure 15 shows the recommendedradiographic procedures for partialpenetration weld joint designs. Partialpenetration welds differ from fullpenetration welds and require more carewhen being radiographed to ensurecomplete or maximum weld coveragewith minimum interference from thenormal unfused weld joint land.Figures 16 and 17 illustrate radiationangles for two typical weld joint designs.
The joint may be incomplete forvarious reasons. Figure 18 shows gascavities in an aluminum weld. Figures 19and 20 show incomplete penetration inaluminum and steel welds, respectively.Figures 21 and 22 show lack of fusion inaluminum and steel welds, respectively.
Figure 23 shows ungraded conditions(discontinuities that are not due towelding process but do affect weldquality) in aluminum welds — poor platefitup and cleaning brush bristleinclusions.
Porosity is frequently visible in weldradiographs. Figure 24 shows fine
495Radiographic Testing of Welds

496 Radiographic Testing
FIGURE 16. Correct and incorrect radiographic procedure forjoint design in Fig. 15c: (a) correct procedure, incompletepenetration at both roots separated from land image;(b) incorrect procedure, incomplete penetration in line withland image and cannot be evaluated.24
(a)30 degrees
Land
(b)
Land
45 degrees
FIGURE 17. Correct and incorrect radiographic procedure forjoint design in Fig. 15a: (a) correct procedure, incompletepenetration at both roots separated from land image;(b) incorrect procedure, incomplete penetration in line withland image cannot be evaluated.24
(a)10 degrees
Land
(b)
Land
90 degrees
FIGURE 18. Reference standards for gas cavities in aluminumwelds: (a) cross section of joint in Fig. 15a, showing gascavity; (b) 2-1T sensitivity; (c) standard 1; (d) standard 2.24
(a)10 degrees
(b)
(c)
(d)
FIGURE 19. Examples of incomplete penetration correlatedwith weld cross sections in aluminum welds: (a) joint inFig. 15c, incomplete penetration due to welding gunmisalignment, and lack of fusion also present; (b) joint inFig. 15b, 60 degrees, incomplete penetration resulting fromlow current setting.24
(a)25 degrees
(b)
90 degrees
3RT18_Layout(473_512) 10/2/02 3:16 PM Page 496

497Radiographic Testing of Welds
FIGURE 20. Varying degrees of incomplete penetration in steelwelds correlated with weld cross sections: (a) slight conditionnormal for joint in Fig. 15b made with stick electrode;(b) moderate condition in joint in Fig. 15c resulting from toolarge electrode on root pass; (c) gross condition in joint ofFig. 15a, resulting from low heat and too large electrode.24
(a)
90 degrees
(b)
(c)
30 degrees
90 degrees
FIGURE 21. Examples of lack of fusion correlated with crosssections of aluminum welds: (a) lack of fusion, resulting fromwelding gun misalignment; (b) lack of fusion, resulting fromlow current setting.24
(a)25 degrees
(b)30 degrees
FIGURE 22. Examples of lack of fusion in steel welds,correlated with weld cross sections: (a) lack of fusion causedby trapped slag in joint of Fig. 15a; (b) slag trapped in sharpnotches made by high crown bead in joint of Fig. 15b;(c) severe condition due to poor gun angle and sharp notchin joint of Fig. 15a.24
(a)10 degrees
(b)
(c) 10 degrees
90 degrees
FIGURE 23. Examples of ungraded conditions correlated withweld cross sections in aluminum welds: (a) plate separation,appearing similar to incomplete penetration; (b) wireinclusion trapped during cleaning operation.24
(a)
90 degrees
(b)
90 degrees
3RT18_Layout(473_512) 10/2/02 3:16 PM Page 497

498 Radiographic Testing
FIGURE 24. Reference standards for fine scattered porosity insteel welds: (a) cross section of fine scattered porosity injoint of Fig. 15b; (b) 2-1T radiographic sensitivity;(c) standard 1, about 1 pore per 1 cm2 (6 pores per 1 in.2);(d) standard 2, about 2 pores per 1 cm2 (12 pores per1 in.2).24
(b)
(c)
(d)
(a)90 degrees
FIGURE 25. Reference standards for coarse scattered porosityin steel welds: (a) cross section of coarse, scattered porosityin joint of Fig. 15b; (b) 2-1T sensitivity; (c) standard 1, about0.3 pore per 1 cm2 (2 pores per 1 in.2); (d) standard 2,about 0.7 pore per 1 cm2 (4 pores per 1 in.2).24
(b)
(c)
(d)
(a)
90 degrees
FIGURE 27. Reference standards for clustered porosity in steelwelds: (a) cross section; (b) 2-1T sensitivity; (c) standard 1;(d) standard 2; (e) standard 3.24
(b)
(c)
(d)
(a)
(e)
FIGURE 26. Reference standards for linear porosity in steelwelds: (a) cross section of linear porosity in joint of Fig. 15a;(b) sensitivity 2-1T; (c) standard 1; (d) standard 2.24
(b)
(c)
(d)
(a) 10 degrees
3RT18_Layout(473_512) 10/2/02 3:16 PM Page 498
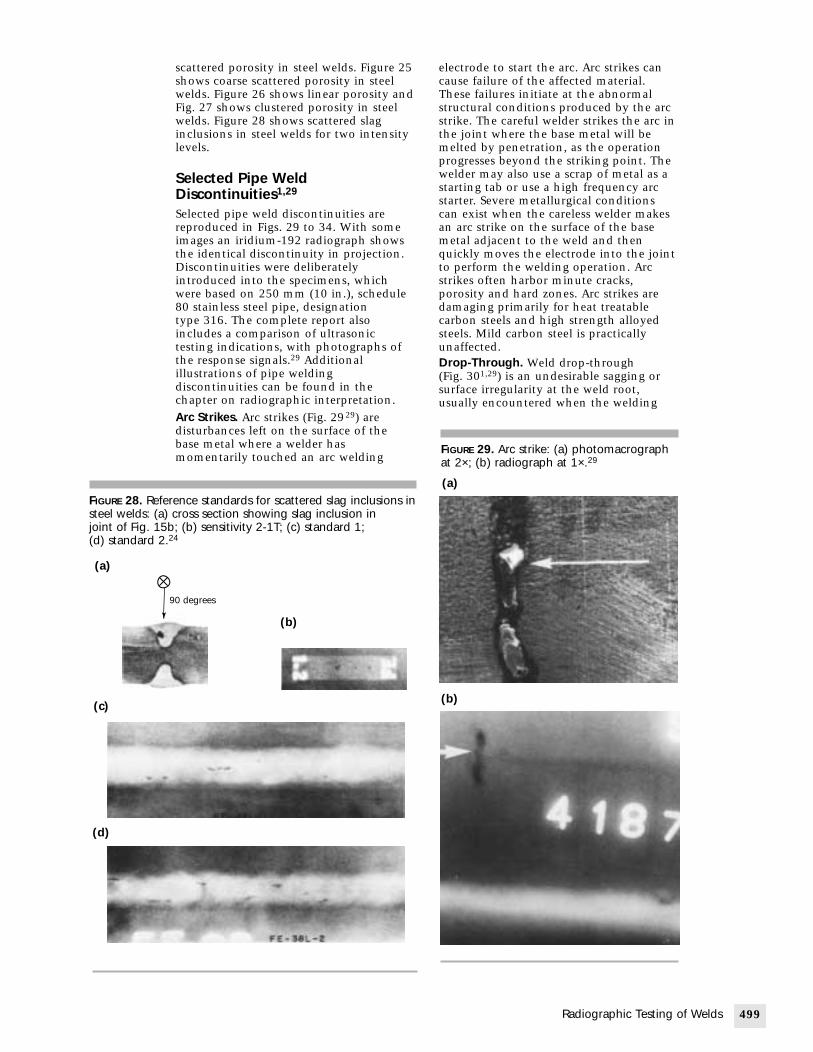
FIGURE 2steel weljoint of F(d) stand
(c)
(d)
(a)
FIGURE 29. Arc strike: (a) photomacrographat 2×; (b) radiograph at 1×.29
3RT18_Layout(473_512) 10/2/02 3:16 PM Page 499
scattered porosity in steel welds. Figure 25shows coarse scattered porosity in steelwelds. Figure 26 shows linear porosity andFig. 27 shows clustered porosity in steelwelds. Figure 28 shows scattered slaginclusions in steel welds for two intensitylevels.
Selected Pipe WeldDiscontinuities1,29
Selected pipe weld discontinuities arereproduced in Figs. 29 to 34. With someimages an iridium-192 radiograph showsthe identical discontinuity in projection.Discontinuities were deliberatelyintroduced into the specimens, whichwere based on 250 mm (10 in.), schedule80 stainless steel pipe, designationtype 316. The complete report alsoincludes a comparison of ultrasonictesting indications, with photographs ofthe response signals.29 Additionalillustrations of pipe weldingdiscontinuities can be found in thechapter on radiographic interpretation.Arc Strikes. Arc strikes (Fig. 2929) aredisturbances left on the surface of thebase metal where a welder hasmomentarily touched an arc welding
8. Reference standards for scattered slag inclusions inds: (a) cross section showing slag inclusion inig. 15b; (b) sensitivity 2-1T; (c) standard 1;ard 2.24
(b)
90 degrees
electrode to start the arc. Arc strikes cancause failure of the affected material.These failures initiate at the abnormalstructural conditions produced by the arcstrike. The careful welder strikes the arc inthe joint where the base metal will bemelted by penetration, as the operationprogresses beyond the striking point. Thewelder may also use a scrap of metal as astarting tab or use a high frequency arcstarter. Severe metallurgical conditionscan exist when the careless welder makesan arc strike on the surface of the basemetal adjacent to the weld and thenquickly moves the electrode into the jointto perform the welding operation. Arcstrikes often harbor minute cracks,porosity and hard zones. Arc strikes aredamaging primarily for heat treatablecarbon steels and high strength alloyedsteels. Mild carbon steel is practicallyunaffected.Drop-Through. Weld drop-through(Fig. 301,29) is an undesirable sagging orsurface irregularity at the weld root,usually encountered when the welding
499Radiographic Testing of Welds
(a)
(b)

500 Radiographic Testing
FIGURE 30. Drop-through:(a) photomacrograph at 4×; (b) radiographat 1×.29
(a)
(b)
FIGURE 31. Radiograph of severe case ofdrop-through.
3RT18_Layout(473_512) 10/2/02 3:16 PM Page 500
amperage is too high for the rate of travel,causing overheating of the weld joint andbead deposit. Drop-through ischaracterized by excessive root bead widthand a slumping of weld metal on the backside of the weld. The condition in Fig. 31is much more severe, as evidenced by theweld material hanging inside the pipewall. The droplet shape is easily identified,together with the cavity remaining afterthe material was dislodged. Figure 31shows a pipe with diameter of 150 mm(6.0 in.) and wall thickness of 11 mm(0.43 in.).Unconsumed Insert. An unconsumedinsert (Fig. 3229) results from preplacedfiller metal that is not completely meltedand fused in the root joint. This condition
FIGURE 32. Unconsumed Insert:(a) photomacrograph at 4×; (b) radiographat 1×.29
(a)
(b)

FIGURE 3incomp
3RT18_Layout(473_512) 10/2/02 3:16 PM Page 501
is caused by low welding current,improper electrode manipulation,improper joint design and improperwelding speed. Considerable weldertechnique and skill must be developed toensure high quality root beads whenusing inserts with the gas tungsten arcwelding process. Proper weldingparameters and sufficient skill of thewelder will produce melting and fusion ofthe insert and the side walls of the jointpreparation. This results in a satisfactoryroot bead profile. Incomplete Penetration. Figure 33illustrates a major blowhole withassociated incomplete penetration in alarge stainless steel pipe. The bead shape,which changes from a smooth to a rippledform, further shows that there was a
3. Radiograph showing blowhole and associatedlete penetration.
FIGURE 34. Radiograph showing indication ofcontinuous incomplete penetration.
perturbation in the welding process, suchas a change in heat input or speed. Theimage is a contact shot of an objectmeasuring 400 mm (16.0 in.) in diameterand 10 mm (0.37 in.) in wall thickness.Figure 34 portrays what is probably a caseof 100 percent incomplete penetrationaround a butt joint in a pipe. The imageshows about 80 percent of the pipediameter. A very uniform indicationextends along the weld centerline. Itseems to disappear toward the edges ofthe image but this is the section in whichpoor projection geometry prevails, so thatthe effective wall thickness, as seen by thebeam, increases very rapidly. The imagedemonstrates the loss in image definitionas the optical conditions degrade. Thepipe measures 150 mm (6.0 in.) indiameter and 11 mm (0.43 in.) in wallthickness.
ClosingWeldments are often subjected to highpressure, high temperature and cyclicloading. These stresses are usuallystrongest in structures that can leasttolerate the possibility of failure (nuclearreactors, for example). Because of thevariety of welding techniques and thevariety of joined materials, nondestructivetesting of welds is difficult but vitallyimportant.
501Radiographic Testing of Welds

502
PART 7. In-Process Radioscopy of ArcWelding30–32
FIGURE 35. Horizontal setup for radioscopic observation ofmetal and flux transfer and solidification in welding process.
X-ray tube
X-Y leadshutters
Plate
Torch
X-rayimageintensifier
X-Y leadshutters
3RT18_Layout(473_512) 10/2/02 3:16 PM Page 502
Introduction30,31
Two different approaches may be appliedto the nondestructive testing of welds.The conventional one consists in theapplication of nondestructive testing afterwelding without relation to the processitself. The second, new, approach isin-process nondestructive inspection, inwhich the production and testingoperations are integrated into a singleprocedure. In this combined approach,information received from nondestructivetesting may be used in feedback withother process parameters for processcontrol. Such a concept gives significantcost savings.33 Because the nondestructivetesting system is included as a part of thesensing system in the feedback loop of theprocess control, the quality control isintegrated with the process itself.
The ultimate goal of welding processcontrol is to achieve good weld qualityand high weld productivity. Differentcontrol techniques for automated weldinghave been used to reach this goal34,35 butlack of direct information on weld qualityhas been a weak point in thesetechniques. A different approach to solvethis problem is in-process nondestructiveinspection, which aims to integrateradioscopic nondestructive testingtechniques with welding process controltechniques. Such an approach mayimprove weld quality and providesignificant cost reduction.33
The dynamic nature of the arc weldingprocess and the different types of welddiscontinuities produced during arcwelding create difficulties for radioscopicquality control. For real time applicationof radiography to weld process control,the acquisition and processing ofinformation must be fast enough toextract useful features before any majorchange occurs in the welding process.This prohibits some sophisticated butslow image processing algorithms.
One approach is to use radioscopy as avision system in remote arc weldingprocess monitoring.30 Direct informationon weld penetration extracted from realtime radiographic images of the solidifiedweld has been used in feedback to adjustthe welding conditions to maintain weldquality.36 The disadvantage of thistechnique is the time (and space) delay inextracting information on weld
Radiographic Testing
penetration. The delay leads to theappearance of small weld areas with lackof penetration.
In another technique, weld penetrationis controlled by radiographic informationon weld pool depression to eliminate thetime delay — thus providing feedbackbefore weld solidification.31 Integration ofweld quality control with welding processcontrol is achieved by in-processradiographic information on thedepression of the butt joint welding pooland the weld properties in the solidifiedareas. During the welding process, thewelding conditions are automaticallycontrolled to maintain the required pooldepression and, hence, weld penetration.Butt joint weld penetration in thesolidified weld is simultaneously tested byextracting information from real timeradiographic images in the area of thewelding path behind the liquid pool. Thisinformation is also used in feedback forweld process control. Butt joint weldquality maintenance and penetrationcontrol have been demonstrated.
Experimental Concept30
Two system setups for radioscopicobservation of the welding process areone horizontal (Fig. 35) and one vertical(Fig. 36). In the horizontal setup, theX-ray beam is oriented parallel to thewelded piece and the image intensifierreceiver is positioned on the side. Thissetup is appropriate for studying metaland flux transfer and solidification of the

FIGURE 36.welding p(cracks, caand weld
X-Y lead
FIGURE 37. Example showing one frame ofradioscopic image of submerged arc
3RT18_Layout(473_512) 10/2/02 3:16 PM Page 503
weld pool. Testing in this position usuallyrequires soft X-rays (about 30 to 50 kVpeak) and therefore a miniature X-ray unitmay be used.
In the second, vertical, setup, the X-raybeam is perpendicular to the weld surfaceor at small angles to the welding torch.This configuration is appropriate forstudying discontinuity formation in theweld (cracks, cavities and porosities) andfor monitoring lack of fusion and weldpenetration. Weld pool dynamics andweld penetration may also be studied andmonitored in this configuration of thesystem. The energy of the X-ray requiredin this case is determined by thepenetration requirement and is usuallyhigher than in the horizontal case. In thissetup, the X-ray unit was mounted abovethe welding piece and the imageintensifier was mounted below it.
The radioscopic unit may be used notonly for online quality control but as avision system in feedback control of thewelding power supply or used for manualremote control.
The radiographic monitoring method isdistinguished from optical monitoring intwo ways: (1) there is no effect of thewelding arc on visibility and, moreimportant, (2) internal discontinuities ofthe weld and weld penetration are visibleand therefore complete information onweld quality is available for weld control.Also, welding processes such as submergedarc welding are accessible by thistechnique.
Automatic weld quality and processcontrol is also possible in the frameworkof the radiographic method. In thisapproach, the radioscopic image isdigitized and analyzed by computer. Thewelding electrode position can beobserved in the image together with the
Vertical setup for radioscopic observation ofrocess monitors formation of discontinuitiesvities and porosity) and monitors lack of fusionpenetration.
X-ray tube
shutters
Plate
TorchX-Y lead shutters
X-ray imageintensifier
depressed welding pool and the weldinggap. Therefore, one branch of control mayinclude tracking and torch positioningalgorithms that will control the weldingmanipulator.
A second branch of control is weldquality control. Here the digitized imageis analyzed by different patternrecognition algorithms for identificationof weld quality and type of welddiscontinuities (if they exist). Next,information on weld characteristics is fedto the decision algorithm. Informationfrom other sensors is also accumulated inthis unit for analyzing weld current,voltage and other parameters. Here theappropriate schedule for changing thewelding parameters should be established:for example, appropriate current and weldspeed.
Radioscopic Control of ArcWeld Penetration31
Change of welding conditions such ascurrent, voltage and speed of welding canaffect the thickness and width of the weldreinforcement and penetration. They alsodetermine the existence and depth ofincomplete weld penetration. The lack ofweld penetration lowers the weld bearingcapacity and hence is a discontinuity thatmay be considered a weld defect.
An example of a frozen image (oneframe) from sequences of radioscopicimages taken during submerged arcwelding is shown in Fig. 37. As usual inradioscopy the image is represented in
503Radiographic Testing of Welds
welding. Lack of weld penetration is due toincorrect position of welding electroderelative to joint gap.
Complete weldpenetration
Lack of penetration
Weldingelectrode
Welding torch Joint gap
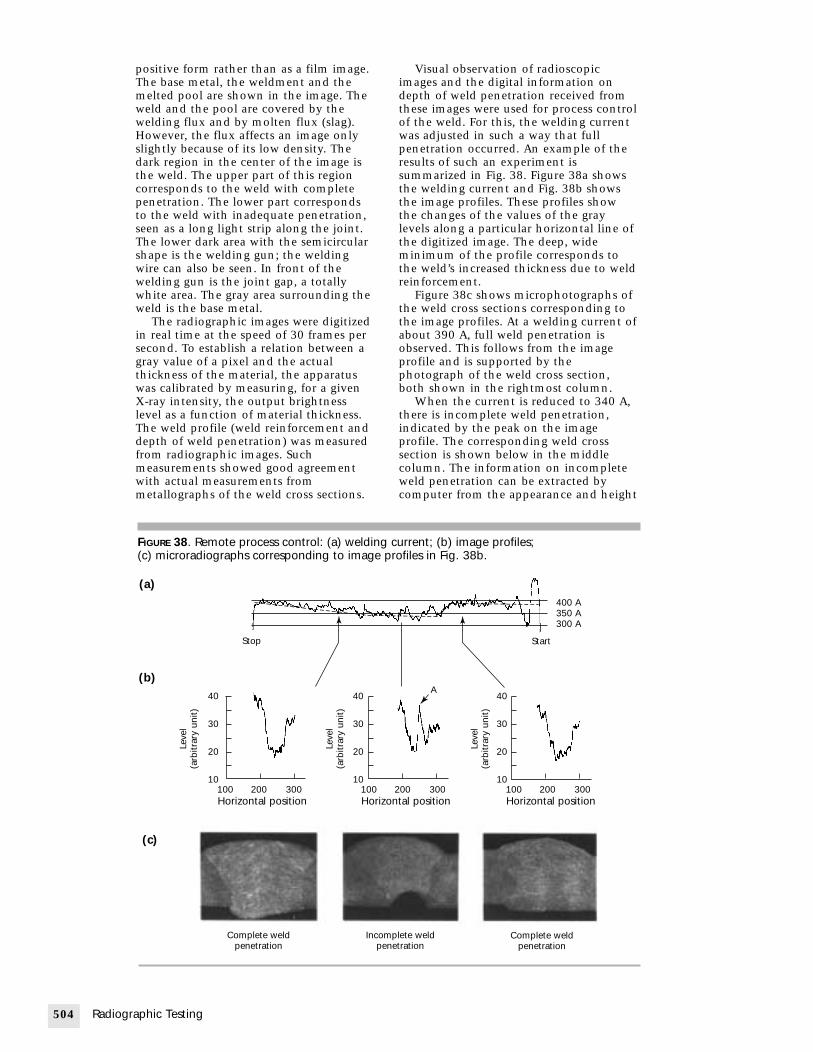
504 R
3RT18_Layout(473_512) 10/2/02 3:16 PM Page 504
positive form rather than as a film image.The base metal, the weldment and themelted pool are shown in the image. Theweld and the pool are covered by thewelding flux and by molten flux (slag).However, the flux affects an image onlyslightly because of its low density. Thedark region in the center of the image isthe weld. The upper part of this regioncorresponds to the weld with completepenetration. The lower part correspondsto the weld with inadequate penetration,seen as a long light strip along the joint.The lower dark area with the semicircularshape is the welding gun; the weldingwire can also be seen. In front of thewelding gun is the joint gap, a totallywhite area. The gray area surrounding theweld is the base metal.
The radiographic images were digitizedin real time at the speed of 30 frames persecond. To establish a relation between agray value of a pixel and the actualthickness of the material, the apparatuswas calibrated by measuring, for a givenX-ray intensity, the output brightnesslevel as a function of material thickness.The weld profile (weld reinforcement anddepth of weld penetration) was measuredfrom radiographic images. Suchmeasurements showed good agreementwith actual measurements frommetallographs of the weld cross sections.
adiographic Testing
FIGURE 38. Remote process control: (a) weldi(c) microradiographs corresponding to imag
Stop
100 200 300Horizontal position
100Ho
Complete weldpenetration
In
40
30
20
10
40
30
20
10
(a)
(b)
(c)
Leve
l(a
rbitr
ary
unit)
Leve
l(a
rbitr
ary
unit)
Visual observation of radioscopicimages and the digital information ondepth of weld penetration received fromthese images were used for process controlof the weld. For this, the welding currentwas adjusted in such a way that fullpenetration occurred. An example of theresults of such an experiment issummarized in Fig. 38. Figure 38a showsthe welding current and Fig. 38b showsthe image profiles. These profiles showthe changes of the values of the graylevels along a particular horizontal line ofthe digitized image. The deep, wideminimum of the profile corresponds tothe weld’s increased thickness due to weldreinforcement.
Figure 38c shows microphotographs ofthe weld cross sections corresponding tothe image profiles. At a welding current ofabout 390 A, full weld penetration isobserved. This follows from the imageprofile and is supported by thephotograph of the weld cross section,both shown in the rightmost column.
When the current is reduced to 340 A,there is incomplete weld penetration,indicated by the peak on the imageprofile. The corresponding weld crosssection is shown below in the middlecolumn. The information on incompleteweld penetration can be extracted bycomputer from the appearance and height
ng current; (b) image profiles;e profiles in Fig. 38b.
Start
200 300rizontal position
100 200 300Horizontal position
complete weldpenetration
Complete weldpenetration
400 A350 A300 A
40
30
20
10
Leve
l(a
rbitr
ary
unit)
A

Weldin
FIGURE 39depressecurrent 1welding
Welding ele
FIGURE 40. Cross section showing welding electrode,depressed pool surface and liquid-to-solid interface.
3RT18_Layout(473_512) 10/2/02 3:16 PM Page 505
of the profile peak. The depth of the weldpenetration was calculated from theheight of this peak. If the incompletepenetration occurs, the welding currentmust be increased. When the current isincreased above 360 A, the peakdisappears, indicating full penetration, asshown on the microphotograph of thecorresponding weld cross section.
Radioscopic WeldPenetration Control withFeedback on Weld PoolDepression32
Above was described the technique ofautomatic control of weld penetration. Inthat technique the weld was monitored atsome distance behind the welding pool.36
The time (and space) delay in extractionof information on weld penetration leadsto the appearance of small areas of weldwith lack of penetration. The techniquediscussed next is free from thisdisadvantage. In this technique thecontrol of weld penetration isaccomplished by radiographicinformation on pool depression in systemfeedback for bead-on-plate and butt welds.
Figure 39 shows one frame from asequence of radiographic images of amolten pool of a bead-on-plate (no weldjoint) weld taken during submerged arcwelding. The image is positive, therefore athinner section of the depressed weldpool is represented as a lighter area. Thewelding torch and welding electrode areseen in the bottom of the image. Thecircular white area in front of the weldingtorch is the welding pool. The solidifiedweld and the molten pool are covered bythe welding flux and by the molten flux(slag). However, the flux affects an image
g torch
Bead-on-plate weld
Depressed welding pool
. One frame of radioscopic image of bead-on-plated molten pool. X-ray tube voltage 150 kV, tube0 mA, welding arc current 410 A, arc voltage 30 V,speed 11.0 mm·s–1 (0.43 in.·s–1).
ctrode
only slightly because of its low densityand thickness. The gray area surroundingthe weld is the base metal.
Figure 40 is the schematic showing theconsumable welding electrode, electricarc, metal transfer, depressed pool surface,liquid pool, weld penetration and basemetal. H is the plate thickness and d is thethickness of liquid and solid metaltogether at the bottom of the weldingpool. Because of the heat of the arc,which melts the plate, and the arcpressure on the molten pool, the weldingpool is depressed during welding and thematerial thickness is reduced from H to d.The depressed pool surface becomesdeeper and wider when a higher weldingcurrent is used because of the expansionof the welding arc at a higher current.
In Fig. 40, because of the thinnermaterial under the welding arc, theattenuation of X-rays is less in thewelding pool area than in thesurrounding base metal. Hence, it is seenas a lighter area on a positive radiographicimage (Fig. 39). The material thicknesscan be reconstructed from the image byknowing the brightness level and theX-ray attenuation coefficient. The relationbetween the brightness level and thematerial thickness in this work is obtainedexperimentally. This three-dimensionalinformation on the welding pool helpscharacterize weld penetration.
Depression and Weld Geometry32
Knowledge of the relation between weldpenetration and pool dimensions isnecessary to control weld penetrationusing the method described. Weldpenetration could be changed by
505Radiographic Testing of Welds
Depressed pool surface
Liquid-to-solidinterface
Welding electrode
Arc plasma
Metal transfer
H
d
Legendd = thickness of solid and liquid metal at bottom of welding poolH = plate thickness

506 Ra
FIGURE 41. depressed butt weld;
(a)
(b)
Weld pool
Electrode
Weld pool
Electrode
3RT18_Layout(473_512) 10/2/02 3:16 PM Page 506
changing the welding current. A greaterwelding current resulted in a larger pooldiameter and deeper weld penetration. Asan example, three-dimensionalradiographic images of a welding pool areshown in Fig. 41. Light areas correspondto reduced thickness of the material;peaks are images of the depressed pool.The brightness of the welding pool areameans that molten metal was pushed byplasma pressure away from the electrode,which also is visible in these images.When the welding current is insufficient,melting of the base metal is less intenseand the light area becomes narrower. InFig. 41a, lack of weld penetration can beseen in the solidified area behind the poolas a white stripe (indicated by an arrow inthe figure). A butt weld with lack of weldpenetration shows the pool diameter to beabout the width of the butt weld gap.
The relation between weld pooldepression and weld current and arc forceare described elsewhere.37,38 The examplesof implementation and computerizedweld process control by these means aredescribed elsewhere.31,36
diographic Testing
Three-dimensional radioscopic image ofpool for butt weld: (a) incompletely penetrated(b) completely penetrated butt weld.
Basematerial
Incompletepenetration
Basematerial
Completepenetration

PART 8. False Indications in Radiographs ofAluminum Alloy Welds39
3RT18_Layout(473_512) 10/2/02 3:16 PM Page 507
IntroductionAn indication is valid if it corresponds toa real discontinuity. False indications(sometimes called ghost defects) inaluminum alloy welds may lead to errorsin radiographic interpretation.Investigations have been reported on falseindications observed in radiographs ofaluminum alloy welds. W.D. Rummel andB.E. Gregory40 and M.S. Tucker andP.A. Larssen41 report linear dark markingssimilar to lack of fusion in radiographs of2014 aluminum alloy welds and indicatethat these linear markings are caused bythe X-ray diffraction effect from particulardendritic grain structures in the weldmetals. Rabkin42 also reports dark bandsin radiographs of aluminum magnesiumalloy welds, which correspond to theregions with increased magnesiumcontent. Issiki43 discusses the occurrenceof macrostructure in a radiograph ofaluminum alloy castings and itsmechanism in detail. Furthermore, Irie44
has shown the false indications due tograin structure in stainless steel welds.
These false indications are caused byeither macro grain structure or bysegregation of alloying elements. Inradiographs of aluminum zinc magnesiumalloy plates welded with aluminummagnesium filler metals. Another type offalse indication is discussed; thesediscontinuities are associated with neitherparticular grain structures nor segregationof constituents. They appear inradiographs as linear dark markings quitesimilar to lack of fusion but have noinfluence on mechanical properties of thewelds.
StudyFalse indications observed in radiographsof aluminum zinc magnesium alloy plateswelded with aluminum magnesium fillermetals appear to be linear discontinuitiessuch as lack of fusion or undercuts. Thecause is neither a particular grain structurenor segregation of alloying elements butrather the interaction of two factors inX-ray absorption. One cause is thecompositional difference between weldmetal (magnesium rich) and parent metal(zinc rich); the other cause is thegeometrical form and size ofreinforcement of the weld beads.
False indications are observed in bothends of lapped penetrations only under acritical condition wherein thecompositional effect exceeds the sizeeffect of reinforcement. The condition istheoretically formulated as follows:
(4)
where the term at the left side is the ratioof the X-ray attenuation coefficient ofparent metal µP to that of weld metal µwand where the second term on the rightside is the ratio of gradient ofreinforcement θ to that of penetration ofthe fused zone θP at the position x1 of thefalse indication.
Chemical and GeometricalFactors of Fused ZoneFrom observation of a number ofradiographs of aluminum zinc magnesiumalloy welds, it was found that aluminumzinc magnesium alloy plates welded withaluminum magnesium filler metalexhibited the clear false indications butwelds made with parent metal filler didnot. When an aluminum magnesiumplate and an aluminum zinc magnesiumalloy plate are welded with aluminummagnesium filler metal, only one lineardark line appears in the side of thealuminum zinc magnesium alloy plate. Inaddition, welds with relatively highreinforcement do not always exhibit falseindications.
It was also found that the falseindications disappeared when thereinforcement of the weld bead wasremoved, as shown in Fig. 42. These factssuggest that both chemical compositionsof the filler metal and geometry of theweld metal are concerned with theoccurrence of the false indications.
Analysis of False IndicationThere are two factors affecting thetransmitted X-ray intensity in welds. Oneis the constitutional factor FC, resultingfrom the compositional differencebetween weld and parent metals, and theother is the shape or size factor FS,
µµ
= +
=
P
w P1
1
tantan
θθ
x x
507Radiographic Testing of Welds

508
FIGURE 4section oFig. 43a
(a)
(b)
h
0
hP
Legendh = heigX = widtθ = Incli
3RT18_Layout(473_512) 10/2/02 3:16 PM Page 508
resulting from the geometry ofreinforcement and penetration of welds.
Figure 43 shows a cross section of theweld. The shaded area in Fig. 44 showsthe range where false indications areformed. The left end of the range(tan θ = 0) corresponds to the flat welds(without reinforcement), whereas the
Radiographic Testing
FIGURE 42. Effect of reinforcement on ghostdiscontinuities in radiographs of welds madwith filler metal (aluminum with five percenmagnesium by weight) joining aluminumzinc magnesium (above) to aluminummagnesium (below): (a) bead on; (b) beadoff.39
(a)
(b)
3. Coordinates of cross section in welds: (a) crossf weld; (b) enlarged view of quadrant shown in
.39
Weld metal
Basemetal
XX1 X2
θ
θP
ht of weld metalh lapped in penetrationnation of reinforcement (degrees)
boundary on the right (FC = FS gives thecritical angles of inclination ofreinforcement and penetrationcorresponding to the visible limit of thefalse indication. Therefore, in the middleof the two boundary lines, there shouldexist the optimum condition under whichthe false indication will be observed mostclearly.
Formation of False Indication Dueto Block Model of WeldsTo confirm the above hypothesis, theformation of false indications wasinvestigated by radiography of blockmodels. These models were composed oftwo kinds of wedge pieces representingthe weld metal and parent metal close tothe fusion zone.
Compositions of the wedge piecesrepresenting the weld metal and parentmetal were aluminum (4 percentmagnesium and 2 percent zinc by weight)and aluminum (6 percent zinc and1 percent magnesium by weight),respectively. The angle of inclination ofpenetration was 45 degrees and those ofreinforcement were 45, 30, 15 and0 degrees. One of the radiographs of these
et
FIGURE 44. Conditions for appearance ofghost discontinuities in radiographs ofwelds.39
Abs
orpt
ion
ratio
(µ P
·µw–1
)
Inclination of reinforcement andpenetration (tanθ·tanθP
–1)
2.0
1.5
1.0
0.50 0.5 1.0
FC > FS
FC = FS
FC < FS
LegendFC = constitutional factor resulting from compositional
difference between weld metal and parent metalsFS = size factor resulting from geometry of
reinforcement and penetration of weldsµP = absorption coefficient of parent metalµw = absorption coefficient of weld metal
θ = angle

FIGURE 4aluminuangles θ(b) pene(d) θ = 1
(a)
(b)
(c)
(d)
(e)
Film
den
sity
(ra
tio)
Film
den
sity
(ra
tio)
Film
den
sity
(ra
tio)
Film
den
sity
(ra
tio)
3RT18_Layout(473_512) 10/2/02 3:16 PM Page 509
block models showed dark lines similar tofalse indications in radiographs of welds.The false indications were clearly observedas two parallel dark lines forθ = 15 degrees but were not observed forlarger angles of inclination. The results ofmeasurements of film density are shownin Fig. 45.
It is apparent from these results thatthe formation of false indications dependson the interaction of geometrical andconstitutional factors in welds.
5. Film density in radiographs of block models withm zinc magnesium alloy quasi welds with variousof penetration: (a) schematic diagram;tration angle θ = 45 degrees; (c) θ = 30 degrees;5 degrees; (e) θ = 0 degree.39
Cross section(relative unit)
1.5
1.0
0.5
1.0
0.5
1.5
1.0
1.5
1.0
45 degrees
θ
Discrimination of Falsefrom Valid IndicationsFrom the cause of the formation of thefalse indications, it is clear that thepresence of the false indications does notreduce the mechanical properties of thewelded joints. The aluminum zincmagnesium alloy welds with falseindications are nearly as strong as thesame alloy welds without false indicationsand do not show large changes inmechanical properties. The slightdifference of mechanical propertiesdepends on the compositions of weldmetal and not on the false indications.
As mentioned above, the falseindications themselves are not harmful;nevertheless, it is quite important to judgewhether the linear markings observed inradiographs are the false indicationsthemselves or whether they contain realwelding discontinuities as well as falseindications. If the condition of formationof the false indication expressed is notsatisfied, the linear markings are realdiscontinuities. If the condition issatisfied, it is very difficult to determinewhether they contain real discontinuitiesor not. In this case, it is necessary toobserve in detail the location and form oflinear dark markings in X-radiographs,because false indications appear about inthe middle between the bead center andthe bead edge whereas welddiscontinuities such as cracking, lack offusion, undercut and others appear ascomparatively sharp lines and in manycases tend to show their specific forms inradiographs.
To further discriminate between falseindications and valid indications, theultrasonic test method can be used. Noultrasonic echo should be obtained fromfalse indications.
509Radiographic Testing of Welds

1. Chapman, H. “Radiographic Controlof Welds.” Nondestructive TestingHandbook, second edition: Vol. 3,Radiography and Radiation Testing.Columbus, OH: American Society forNondestructive Testing (1985):p 418-457.
2. ASME Boiler and Pressure Vessel Code.New York, NY: American Society ofMechanical Engineers (2000).
3. AWS D1.1/D1.1M, Structural WeldingCode — Steel. Miami, FL: AmericanWelding Society (2002).
4. ABS 2, Rules for Building and ClassingSteel Vessels. New York, NY: AmericanBureau of Shipping (2001).
5. ABS 14, Nondestructive Inspection of HullWelds. New York, NY: American Bureauof Shipping (1986).
6. API STD 1104, Welding Pipelines andRelated Facilities. Washington, DC:American Petroleum Institute (1999).
7. CSA W59-M1989 (R2001), Welded SteelConstruction (Metal Arc Welding), metricversion. Toronto, Ontario: CanadianStandards Association (2001).
8. ASME B31.1, Power Piping. New York,NY: American National StandardsInstitute (2001).
9. API 650, Standard for Welded Steel Tanksfor Oil Storage. Washington, DC:American Petroleum Institute (1998).
10. ASTM E 1025, Standard Practice forDesign, Manufacture, and MaterialGrouping Classification of Hole-TypeImage Quality Indicators (IQI) Used forRadiology. West Conshohocken, PA:ASTM International (1998).
11. ASTM E 142, Standard Method forControlling Quality of RadiographicTesting. West Conshohocken, PA:ASTM International (1992).
12. ASTM E 747, Design, Manufacture andMaterial Grouping Classification of WireImage Quality Indicators (IQI) Used forRadiology. West Conshohocken, PA:ASTM International (1997).
13. ASTM E 1742, Standard Practice forRadiographic Examination. WestConshohocken, PA: ASTMInternational (2000).
14. ASTM E 94, Recommended Practice forRadiographic Testing. WestConshohocken, PA: ASTMInternational (1977).
15. Annual Book of ASTM Standards. WestConshohocken, PA: ASTMInternational (2002).
16. NRC-BLDG CODE-95, NationalBuilding Code of Canada 1995. Ottawa,Ontario, Canada: National ResearchCouncil Canada, Institute for Researchin Construction (1995).
17. ASME B31.3, Process Piping. New York,NY: American National StandardsInstitute (2001).
18. D100, Welded Steel Tanks for WaterStorage. Denver, CO: AmericanWaterworks Association (1996).
19. AWS D14.3/D14.3M, Specification forWelding Earthmoving and ConstructionEquipment. Miami, FL: AmericanWelding Society (2000).
20. E 2104, Standard Practice forRadiographic Examination of AdvancedAero and Turbine Materials andComponents. West Conshohocken, PA:ASTM International (2001).
21. MIL-STD-453C, Inspection,Radiographic. Washington, DC:Department of Defense (1996).Superseded by ASTM E 1742.13
22. E 1032, Standard Test Method forRadiographic Examination of Weldments.West Conshohocken, PA: ASTMInternational (2001).
23. Becker, G.L. “Factors GoverningRadiographic Crack Detectability inSteel Weld Specimens.” MaterialsEvaluation. Vol. 30, No. 7. Columbus,OH: American Society forNondestructive Testing (July 1972):p 149-152.
24. Buckrop, R.L. “What Makes a GoodWeld … and Radiography Can ProveIt.” Materials Evaluation. Vol. 30, No. 5.Columbus, OH: American Society forNondestructive Testing (May 1972):p 25A–31A.
25. Becker, G.L. and W.T. Granett. “TheUse of Crack Simulators to AssureX-Ray Inspection TechniqueReliability.” Proceedings of the SixthSymposium on Nondestructive Evaluationof Aerospace and Weapons SystemComponents and Materials. NorthHollywood, CA: Western PeriodicalsCompany (1967): p 533-559.
26. Criscuolo, E.L. “Slit Detection byRadiography.” Materials Evaluation.Vol. 24, No. 4. Columbus, OH:American Society for NondestructiveTesting (April 1966): p 201-205.
510 Radiographic Testing
References
3RT18_Layout(473_512) 10/2/02 3:16 PM Page 510

27. Dutili, J.W. and G.H. Tenney. “APreliminary Investigation of theRadiographic Visualization of Cracks.”Nondestructive Testing. Vol. 12, No. 2.Columbus, OH: American Society forNondestructive Testing (March-April1954): p 13-15.
28. McMaster, R.C. “RadiographicSensitivity.” Nondestructive TestingHandbook, first edition. Vol. 1,Section 15. Columbus, OH: AmericanSociety for Nondestructive Testing(1959): p 31-37.
29. NDE Characteristics of Pipe WeldDefects. Special Report NP-1590-SR.Palo Alto, CA: Electric Power ResearchInstitute (1980).
30. Rokhlin, S.I. “In-Process RadiographicEvaluation of Arc Welding.” MaterialsEvaluation. Vol. 47, No. 2. Columbus,OH: American Society forNondestructive Testing (February1989): p 219-224. Erratum, MaterialsEvaluation, Vol. 47, No. 12 (December1989): p 1424.
31. Guu, A.C. and S.I. Rokhlin. “Arc WeldProcess Control Using RadiographicSensing.” Materials Evaluation. Vol. 50,No. 11. Columbus, OH: AmericanSociety for Nondestructive Testing(November 1992): p 1344-1348, 1356.
32. Guu, A.C. and S.I. Rokhlin.“Computerized Radiographic WeldPenetration Control with Feedback onWeld Pool Depression.” MaterialsEvaluation. Vol. 47, No. 10. Columbus,OH: American Society forNondestructive Testing (October1989): p 1204-1210.
33. Watkins, A.D., J.A. Johnson andH.B. Smart. “Economic Evaluation ofConcurrent Welding andNondestructive Testing.” WeldingJournal. Vol. 65, No. 6. Miami, FL:American Welding Society (June 1986):p 17-21.
34. Richardson, R.W. “Robotic Weld JointTracking Systems — Theory andImplementation Methods.” WeldingJournal. Vol. 21, No. 11. Miami, FL:American Welding Society(November 1986): p 43-51.
35. Chen, W.H., P. Banerjee andB.A. Chin. “Study of PenetrationVariation in Automated Gas TungstenArc Welding.” Recent Trends in WeldingScience and Technology [Gatlinburg,TN]. Materials Park, OH: ASMInternational (1989): p 517-522.
36. Rokhlin, S.I., K. Cho and A.C. Guu.“Closed-Loop Process Control of WeldPenetration Using Real-TimeRadiography.” Materials Evaluation.Vol. 47, No. 3. Columbus, OH:American Society for NondestructiveTesting (March 1989): p 363-369.
37. Guu, A.C. and S.I. Rokhlin.“Technique for SimultaneousReal-Time Measurements of Weld PoolSurface Geometry and Arc Force.”Welding Journal. Vol. 71, No. 12.Miami, FL: American Welding Society(December 1992): p 473-482.
38. Guu, A.C. and S.I. Rokhlin. “A Studyof Arc Force, Weld Pool Depression,and Penetration during Gas TungstenArc Welding.” Welding Journal. Vol. 72,No. 8. Miami, FL: American WeldingSociety (August 1993): p 381-390.
39. Hirosawa, E., M. Naoe and T. Fukui.“‘Ghost Defects’ in Radiographs ofAluminum Alloy Welds.” MaterialsEvaluation. Vol. 29, No. 5. Columbus,OH: American Society forNondestructive Testing (May 1971):p 99-104.
40. Rummel, W.D. and B.E. Gregory.“Ghost Lack of Fusion in AluminumAlloy Butt Fusion Welds.” MaterialsEvaluation. Vol. 23, No. 12. Columbus,OH: American Society forNondestructive Testing (December1965): p 586-588.
41. Tucker, M.S. and P.A. Larssen.“Markings in Radiographs of 2014Aluminum Alloy Gas Tungsten-ArcWelds.” Welding Journal. Vol. 47, No. 5.Miami, FL: American Welding Society(May 1968): p 223-225.
42. Rabkin, D.M., L.A. Bukalo,V.T. Korzbova and A.S. Deniyanchuck.“Weld Heterogeneity in AluminumMagnesium Alloys.” AvtomaticheskaiaSvarka [Automatic Welding]. InRussian. No. 5. Kiev, Ukraine: InstytutElektrozvariuvannia of Akademiianauk Ukraïnś koï RSR (1966): p 74-75.
43. Issiki, S., J. Ko, K. Kataoka andT. Yamazawa. “The Abnormal Patternin Radiographs of Aluminum AlloyCastings.” In Japanese. Hihakai-Kensa[Journal of NDI]. Vol. 15. Tokyo, Japan:Japanese Society for Non-DestructiveInspection (July 1966): p 257-265.
44. Irie, M., M. Fujii and S. Yamashita.“The Influence of Structure on theX-ray Radiograph of Stainless SteelWelds.” In Japanese. Hihakai-Kensa[Journal of NDI]. Vol. 12. Tokyo, Japan:Japanese Society for Non-DestructiveInspection (June 1963): p 263.
511Radiographic Testing of Welds
3RT18_Layout(473_512) 10/2/02 3:16 PM Page 511

Frank J. Sattler, Sattler Consultants, Incorporated,Akron, Ohio
19Radiographic Testing in
Utility, Petroleum andChemical Industries
C H A P T E R
3RT19_Layout(513_542) 10/2/02 3:18 PM Page 513

514 Ra
PART 1. Overview
3RT19_Layout(513_542) 10/2/02 3:18 PM Page 514
In the utility, nuclear, chemical andpetroleum industries there are a variety ofapplications of penetrating radiation andradiographic testing. Many of theseapplications will not be covered herebecause they are in common practice ordetailed in other parts of this book.Radiography is required in many of theseapplications because it is specified bycodes and standards in federal, state andlocal governing regulations. Most of theradiographic requirements come aboutduring fabrication and construction ofchemical and petroleum plants and powergeneration facilities such as boilers,pressure vessels, nuclear power plantcomponents and gas and oil transmissionpipelines. However, some of these samerequirements come into effect whenrepairs, replacements or additions aremade to the facilities. Radiography alsohas become a valuable tool for accessingdeterioration caused by corrosion anderosion in many pipes, vessels and othercomponents that are part of today’scomplex plants. Penetrating radiation hasseen many applications in detecting andmeasuring fluids and their movement,leak detection gages, liquid level gagesand other important monitoringinstrumentation.
In addition to the radiography fornuclear power plant components, severalapplications exist where radiographictesting is performed on nuclear fuel orfuel rods during manufacture, after serviceor to gather additional test information.Some of these examinations involveautoradiography where the componentitself provides radiation to expose theradiographic film or other media.
Other uses of radiography include amove to eliminate film though imagingwhere the radiographic image is formedradioscopically and recorded on magneticor optical media. Digital enhancementbrings additional benefits to imagequality. Tomography adds a thirddimension to radiographic imaging andexpands the uses of penetrating radiationtests.
diographic Testing

PART 2. Pipe and Tubing Applications
FIGURE 1. Internal pipeline X-ray generator and crawlerdevice.1
3RT19_Layout(513_542) 10/2/02 3:18 PM Page 515
Pipelines
HistoryBefore 1946 it was common practice ingas and oil pipeline construction to cutout a certain number of pipe welds madeeach day. Test specimens were cut fromthese welds and mechanical tests weremade. If the weld failed these tests, thecontractor was required to replace thewelds at no cost to the owner and, if theypassed, the owner paid the cost ofreplacement. It was apparent to manypipeline engineers that a nondestructivemethod of testing pipeline welds wouldbe more economical and dependable.
During World War II radiography wasused extensively as a means of measuringweld quality in various industries. Thesame principles were used in applyingradiography to pipeline welding problems.The first recorded use of radiography forthe examination of pipeline weldingoccurred in 1945.1 At that time radiumwas used as a radiographic source becauseX-ray equipment available was notadaptable for the job. With radium, theradiographic quality was poor but theportability presented many advantagesover other pipeline weld inspectionmethods then available.
In 1946 a 621 km (385 mi), 457 mm(18 in.) diameter petroleum line wasconstructed in California. Radiographictesting of the circumferential pipe weldswas accomplished by drilling a 19 mm(0.75 in.) hole about 76 mm (3 in.) fromthe weld. An 11 GBq (300 mCi) capsule ofradium, mounted on a device that wouldsupport it at the center of the pipe in linewith the weld, was then placed throughthis hole. In this manner a completecircumferential weld radiograph was madein one exposure. The method had thefurther advantage of having to penetrateonly one wall thickness of pipe as theradium sources available were usually lessthan 37 GBq (1 Ci) in strength.
The disadvantages of the radiumtechnique were the cost and time requiredto cut the hole and patch weld theopening. The quality of the plug weld wasan unknown factor. Another disadvantageof the gamma rays produced by radiumand its radon gas was the lowradiographic contrast obtained, resulting
Radiograp
in radiographic sensitivities of four to fivepercent. Yet, in comparison with thedestructive testing previously used, it haddefinite advantages in monitoring weldquality.
With the advent of iridium-192production, an even better radioisotopesource for pipeline radiography wasavailable. It had the same advantages ofportability without an external powersource but was available in higher sourcesizes and smaller physical sizes to improveits specific activity. Because of its energyspectrum and strength, it could be usedboth internally and externally, throughsingle or double walls to exposeradiographic film.
With the availability of portable X-raygenerators capable of generating X-rays360 degrees around a pipe, it was nowpossible to radiograph an entirecircumferential line weld. It was alsofeasible to select the energy best suited toprovide the sensitivity required. Crawlerswere developed that could carry the X-raytube or isotope source hundreds of meters(thousands of feet) back into weldedsections of a pipeline fed by portablegenerators carried onto the right of way. Atypical X-ray crawler device is shown inFig. 1.1 The unit has a sensing system toidentify the weld and stop at the rightdistance to make an exposure or adetector senses a low level gamma isotope
515hic Testing in Utility, Petroleum and Chemical Industries

516 R
FIGURE 2. Iof pipe oras specifie1104 and
Imag
e qu
ality
indi
cato
r th
ickn
ess,
mm
(10
–3in
.) 1.02
0.89
0.76
0.63
0.51
0.38
0.25
0.13
0
Legend==
3RT19_Layout(513_542) 10/14/02 10:59 AM Page 516
on the outside of the pipe and stops thecrawler. A technician identifies the weldwith lead numbers and letters on theexternal pipe surface beneath a filmcassette that is wrapped around the weld.Depending on the number of welds toexamine, either hand processing orautomatic processors may be used toprocess the film.
Most of the welding and inspectionson pipelines are governed byANSI/API Recommended Practice 1104.2However, many companies supplementthis standard with additional orsupplemental requirements. Requirementsrange from finer grain film to higher filmdensity requirements, to specificationsthat detail that only X-ray generators canbe used in single wall exposures exceptwhere tie in welds or repair welds are tobe radiographed. ANSI/API RecommendedPractice 1104 requires that one of threetypes of image quality indicators be usedto confirm the quality of the radiograph.Two of these are plaque type imagequality indicators, ASTM E 1025 andAPI,2,3 whereas the third type referencesASTM E 747 wire image qualityindicators.4 In most cases, because theinside of the pipe wall is inaccessible,image quality indicators are placed on theoutside surface of the pipe adjacent to theweld. The plaque image quality indicatorsas well as the wire image qualityindicators used represent a range ofsensitivities depending on thickness.Figure 2 is a plot of pipe or weld thickness
aimpthsinth5qcinthinis2qaresthd
AInlissales(Tththtysbw
adiographic Testing
mage quality indicator (IQI) thickness as function weld thickness for plaque image quality indicatorsd per American Petroleum Institute for both API ASTM E 1025 image quality indicators.2,3
(40)
(35)
(30)
(25)
(20)
(15)
(10)
(5)
0 13 25 38 50(0.5) (1.0) (1.5) (2.0)
Pipe or weld thickness, mm (in.)
ASTM International image quality indicatorsAmerican Petroleum Institute image quality indicators
nd the maximum thickness of the plaqueage quality indicators allowed for the
ipe or wall thickness.2,3 Figure 3 showse maximum allowable source and
ensor side equivalent image qualitydicator sensitivity for wall or weldicknesses from 1.27 mm (0.050 in.) to
1 mm (2.0 in.) for the plaque imageuality indicators. For most of theommon weld or wall thicknesses found pipeline work, below 19 mm (0.75 in.),e maximum equivalent image qualitydicator sensitivity allowed by API 11042
about 3 percent or greater, all less than-4T sensitivity. Investigations of weldinguality on lines subjected to seismicctivity have suggested that additionaladiographic sensitivity, smaller values ofquivalent image quality indicatorensitivity, may be warranted because of
e better images provided in revealingiscontinuities.5
ssessing Pipe Weld Quality most codes and standards, the rejection
mits are based on workmanshiptandards. As a result, the radiographictandards of API 11042 and other codesnd standards require the measurement ofngth or width or both to access the
everity of a discontinuity indication.he interpretation and identification ofese indications is discussed elsewhere inis volume and the evaluation of thepe of indication is detailed in the
pecifications.) These requirements areased on judgments about the levels ofeld and examination quality that can be
attained and maintained in field or shop
FIGURE 3. Maximum allowed source and sensor sideequivalent image quality indicator sensitivity as function ofpipe or weld thickness per API 1104.2
Equi
vale
nt im
age
qual
ity in
dica
tor
sens
itivi
ty (
perc
ent)
25
20
15
10
5
00 13 25 38 50
(0.5) (1.0) (1.5) (2.0)
Pipe or weld thickness, mm (in.)
3RT19_Layout(513_542) 10/2/02 3:18 PM Page 517
applications. The quality achieved mustnot compromise the pipe or othercomponent integrity.
Steels with improved strength andfracture toughness have been used in newpipeline construction. With theseimprovements, it may be possible toreplace the workmanship standards with afracture mechanics based approach todetermine weld quality on a fitness forpurpose criterion.6 Such an approachplaces increased demands on thenondestructive tests performed becauseadditional discontinuity information isneeded. At most, radiographic testing hastraditionally required onlytwo-dimensional determination of adiscontinuity’s extent, that is, the lengthand width dimensions of an indication.For fracture mechanics evaluations, athird dimension is necessary, indicationdepth (through-wall thickness), toproperly evaluate a discontinuity’s effecton serviceability.
Studies by the United StatesDepartment of Transportation6 wereconducted to determine if it is possible tomeasure a discontinuity’s dimensions(through-wall thickness as revealed byfilm density differences) in productionpipeline radiographs. These studies revealthat tighter controls are needed onvarious radiographic variables such askilovoltage, film processing, film typesand intensifying screens andsource-to-sensor geometry beforesufficient information is obtained fromproduction radiographic film. Studieshave been conducted to look at controlsto be placed on these variables and atother supplementary testing methods thatcan be used to obtain the requiredinformation.
Video Technique for SizingDiscontinuitiesIn other work to determine discontinuitydimension radiographically, a radioscopicsystem image intensifier system with avidicon camera has been used toradiograph pipe segments containingartificial and welding discontinuities.7 Theradiographic images produced wererecorded on a video recorder and then thevoltage of one of the horizontal rasterlines was measured with an oscilloscopeat various locations in and adjacent toseveral types of discontinuities in theimage. This study had several conclusions.Radioscopy is an alternative to filmradiography for the inspection of pipelinegirth welds fabricated to API 1104.2Permanent records can be made on videotape with identification informationsuperimposed by an alphanumeric videowriter. Immediate hard copies of rejectablediscontinuities can be generated for repair
Radiogra
operations. Existing technology forremote mechanized inspection can bereadily used for moving the real timedetector module around the pipe andproviding X and Y motion. All equipmentexcept the detector head can be housed ina truck with 30.5 m (100 ft) of cabling tothe detector. Electric power is providedfrom a brushless motor generator set.Volumetric discontinuities can beaccurately sized electronically.
Power and Process Piping
ASME CodesElectric power plants today can bepowered by coal, oil, gas or nuclear fuel.Many of the large coal and oil boilershave been supplemented with combinedcycle systems or newer natural gas standalone turbine generators. Chemical andpetroleum plants have extensive pipingand vessels, some built to ASME or APIstandards. Nuclear power plants built inearlier years have extensive pipingsystems to support various functions toturn turbine generators. Most piping inthese systems is built to requirements ofthe ASME Boiler and Pressure Vessel Code ofthe American Society of MechanicalEngineers (ASME).8,9 Among theserequirements are those for B31.1, PowerPiping;10 B31.3, Process Piping;11 andseveral sections of the ASME Boiler andPressure Vessel Code (Section I, Rules for theConstruction of Power Boilers; Section VIII,Rules for the Construction of Pressure Vessels;and Section III, Nuclear Components).8,9
These standards invoke the ASME Boilerand Pressure Vessel Code, Section V,Article 2, for radiography; some havesupplemental requirements forradiography; and each containsacceptance standards for evaluating anyindications found in radiographs. InB31.3,11 acceptance standards are basedon several design service categories withtighter acceptance requirements for moresevere service.
Section V, Article 2,8 contains themethodology for producing theradiographic images of welds and basemetal for piping, vessels and othercomponents. An essential part of anyradiographic requirement is the resolutionof specific features of a penetrameter’simage, or image quality indicator features,that must be resolved in the radiographicimage.
Article 2 provides a table, like theprevious API 1104,2 which details whatimage quality indicator is to be used for agiven thickness range and what essentialhole (2T) or wire size must be resolved.Table T-276 has both source side and
517phic Testing in Utility, Petroleum and Chemical Industries

518 Ra
FIGURE 4. Mequivalentwall thicknand Pressumm (1.0 i
Legend= So= Se
Equi
vale
nt im
age
qual
ity in
dica
tor
sens
itivi
ty (
perc
ent)
30
25
20
15
10
5
00
3RT19_Layout(513_542) 10/2/02 3:18 PM Page 518
sensor side image quality indicatorrequirements. The source side imagequality indicator requirements forthickness of 51 mm (2.0 in.) and less givevery similar equivalent image qualityindicator sensitivities as for the APIrequirements shown in Fig. 3.2 The sensorside image quality indicators may be usedonly where inaccessibility prevents handplacement of the image quality indicatorson the source side. When sensor sideimage quality indicators are used a leadletter F shall be placed next to or on theimage quality indicator.
The maximum values of equivalentimage quality indicator sensitivity for theASME Boiler and Pressure Vessel Code,Article 2,8 for source side image qualityindicators are very similar to those ofAPI 1104.2 The maximum values ofequivalent image quality indicatorsensitivity for the ASME Boiler and PressureVessel Code, Article 2,8 for sensor sideimage quality indicators are 10 to20 percent below those of the source sideimage quality indicators. (Smallerequivalent image quality indicator percentvalues indicate greater sensitivity.)Maximum equivalent image qualityindicator sensitivity for source and sensorside plaque type image quality indicatorsfor 0 to 25 mm (0 to 1.0 in.) thick areshown in Fig. 4.8 Piping thicknesses inASME work can run as high as 75 to100 mm (3.0 to 4.0 in.) so these rules
diographic Testing
aximum allowed source and sensor side image quality indicator sensitivity as function ofess plus allowable reinforcement for ASME Boilerre Vessel Code, Article 2, for total thickness of 25n.) and less.8
urce side image quality indicatorsnsor side image quality indicators
5 10 15 20 25(0.2) (0.4) (0.6) (0.8) (1.0)
Metal plus allowable reinforcement, mm (in.)
apply, in many cases, to piping muchthicker than normal in pipeline work.
Figure 5 illustrates maximumequivalent image quality indicatorsensitivity allowed for thicknesses over25 mm (1.0 in.) in pipe or vessel wall plusapplicable reinforcement for both sourceside and sensor side image qualityindicators. At total thicknesses (base metalplus allowable reinforcement) of 51 mm(2.0 in.) or more, the maximumequivalent image quality indicatorsensitivity for either sensor side or sourceside image quality indicators is 2 percentor less. At 102 mm (4.0 in.) and above,the maximum equivalent image qualityindicator sensitivity is below 1.5 percentfor both source side and sensor side imagequality indicators and drops to below1 percent for sensor side image qualityindicators at 152 mm (6 in.) and greaterthicknesses.8
Article 2, Table T-276, serves all of theASME Boiler and Pressure Vessel Code workfor weld radiography image qualityindicator selection except for Section III,Division 1, nuclear work in Classes NBand NC, Class 1 and Class 2, componentsrespectively.9 Class 1 and 2 componentimage quality indicator requirements aredetailed in Tables NB and NC 5111-1.9Requirements are included for ASTMplaque image quality indicators(ASTM E 1025) as well as ASTM wireimage quality indicators (E 747).3,4 Whenplaque image quality indicators are usedon the source side of the object, little
Legend= Source side image quality indicators= Sensor side image quality indicators
FIGURE 5. Maximum allowed source and sensor sideequivalent image quality indicator sensitivity as function ofwall thickness plus allowable reinforcement for ASME Boilerand Pressure Vessel Code, Article 2, for thicknesses of 25 to500 mm (1.0 to 20 in.).7
Equi
vale
nt im
age
qual
ity in
dica
tor
sens
itivi
ty (
perc
ent)
3.0
2.5
2.0
1.5
1.0
0.50 50 100 150 200 250 300 350 400 450 500
(2) (4) (6) (8) (10) (12) (14) (16) (18 (20)
Metal plus allowable reinforcement, mm (in.)

FIGURE 6. Cequivalent wall thicknand Pressur
Legend= A= S
Equi
vale
nt im
age
qual
ity in
dica
tor
sens
itivi
ty (
perc
ent)
6
5
4
3
2
1
00
3RT19_Layout(513_542) 10/2/02 3:18 PM Page 519
difference in sensitivity is noted exceptfor some deviations at lower thicknesses.A plot of both the nuclear Class 1 andClass 2 maximum equivalent imagequality indicator sensitivity allowable aswell as those of Article 2 are shown inFig. 6 for source side image qualityindicators. The dashed lines are Article 2requirements and coincide with NB andNC requirements for most of thethickness range. However, the sensor sideimage quality indicator requirements arevery different in the nuclear workcompared to those in Article 2 for16.0 mm (0.63 in.) thickness and above.The equivalent image quality indicatorsensitivity maximum averages about25 percent lower than their counterpartallowables in Article 2 at the largethicknesses and approaches equal valuesat the 16.0 mm (0.63 in.) thickness. Acomparison of maximum sensor sideequivalent image quality indicatorsensitivities for Article 2 and Nuclear Class1 and Class 2 are shown in Fig. 7. Sensorside maximum equivalent image qualityindicator sensitivities allowable are allbelow 2 for thicknesses greater than about22 mm (0.88 in.) and below 1 for totalthicknesses greater than about 110 mm(4.5 in.).8
Detection of Corrosion andErosionThere are many applications ofradiographic testing that require thoughtand ingenuity to apply code rules to
Radiogra
omparison of maximum allowed source sideimage quality indicator sensitivity as function ofess plus allowable reinforcement for ASME Boilere Vessel Code.8
rticle 2 image quality indicators, Table T-276ection III, NB and NC Table 5111-1
50 100 150 200 250 300 350 400 450 500(2) (4) (6) (8) (10) (12 (14) (16) (18 (20)
Metal plus allowable reinforcement, mm (in.)
comply with sensitivity requirements. Thecode rules for piping assume that access toboth the inside or outside of the pipe ispossible and are generally made to doweld testing during construction or forrepair or replacement. However,radiography has been found very useful indoing piping wall thickness surveys inboth power plants and chemical andpetrochemical facilities during shutdownoutages and even during operation. Theseuses range from identifying areas thathave had thickness reductions to actuallydetermining remaining wall thicknesses.
One of the popular techniques fordetection of erosion or corrosion istangential radiography12,13 illustrated forexternal corrosion in Fig. 8.12 Normallyerosion and corrosion are hidden fromviewing by either being on the pipe’sinside surface or by external corrosionbeing covered by insulation. In tangentialradiography, a view of the pipe’s crosssection, including a view of the pipe wall,is projected on the sensor, enabling directmeasurement of the remaining pipe wallthickness. The extremities of the pipe wallcross section projected onto the sensormay be defined by a line drawn from thesource to the sensor through a tangentpoint on the pipe’s outside diameter andfrom the source to the sensor through atangent point on the pipe’s insidediameter. The thickest portion of the pipethrough which the radiation passes istherefore a cord bisected by the insidediameter tangent point. The cross section
519phic Testing in Utility, Petroleum and Chemical Industries
FIGURE 7. Comparison of maximum allowed sensor sideequivalent image quality indicator sensitivity as function ofwall thickness plus allowable reinforcement for ASME Boilerand Pressure Vessel Code.8
Legend= Article 2 image quality indicators, Table T-276= Section III, NB and NC Table 5111-1
Equi
vale
nt im
age
qual
ity in
dica
tor
sens
itivi
ty (
perc
ent)
5
4
3
2
1
00 50 100 150 200 250 300 350 400 450 500
(2) (4) (6) (8) (10) (12 (14) (16) (18 (20)
Metal plus allowable reinforcement, mm (in.)

520 Rad
FIGURE 8. Tawall thickne
Radiograph o
FIGURE 9. Enpenumbra.1
D
3RT19_Layout(513_542) 10/2/02 3:18 PM Page 520
of the pipe wall that appears in the imageis approximately that which occursperpendicular to the center of the cord.
As the image of the cross section isprojected onto the sensor, the image isenlarged somewhat as shown in Fig. 9.13
This enlargement is proportional to thesource-to-sensor distance andsource-to-object distance.(Source-to-sensor distance is the same assource-to-film distance in other contexts,film being a kind of analog sensor.) Theenlargement may be calculated and takeninto consideration in the direct wallmeasurement as follows:
(1) II d
ca SSD
SSD=
−( )0 5.
iographic Testing
ngential radiographic technique to determiness.12
Gamma rays
Corroded area
Pipe
Sensor planef pipe
largement of pipe wall and resulting3
istance from source to sensor
Chord
Penumbra
Enlargement
Penumbra
Sensor plane
in which Ic = corrected image dimension,Ia = apparent image dimension,SSD = source-to-sensor distance andd = pipe outside diameter.
Because the radiation does not actuallyemanate from a point source, a penumbra(shadow image of the edges of the crosssection) will also appear on the image.The extent of the penumbra may becalculated as follows, and a furthercorrection may be made to the direct wallreading:
(2)
in which Ug is the width of totalpenumbra and F is the radiation sourcefocal spot size.
The source-to-sensor distance, film typeand exposure density all significantlyinfluence the accuracy of tangentialradiography. The locations of the tangentpoints will vary with the source-to-sensordistance (Fig. 10) as follows:
(3)
in which K is the angle of rotation oftangent point as shown in Fig. 10.13
One of the problems encountered isthat of undercut or burnoff where thethinner or outer thickness of the pipe isdarkened considerably over the thickerinner portion of the wall and may be toodark at higher film densities or imagecontrast settings. For optimized results,the source-to-sensor distance should be aslarge as practical. Ratios of source-to-sensor distance to outside diameter of sixor more produce low unsharpness values.High contrast image settings and fine
Kd
d=
−−cos
..
1 0 50 5SSD
UF d
dg SSD=
×( )−
2 0 5
0 5
.
.
Proj
ecte
d im
age
FIGURE 10. Variation of tangent point on pipe outsidediameter with different source-to-sensor distances and pipeoutside diameters. Sharpness varies with interrogationangle K.13
KK
Sensorplane

3RT19_Layout(513_542) 10/2/02 3:18 PM Page 521
grained films produce more accurateresults when developed to medium rangefilm densities around 2.0.
A comparator block can also reduce thecalculations needed to provide correctionsto the measurement. In one study,13 acomparator block was developed that hadseveral artificially drilled holes of varioussizes to simulated metal loss. With thesimulator block, the calculations of metal
Radiogr
FIGURE 11. Comparator block having three d
(a)
LegendA. 3.17 mm (0.125 in.).B. 6.35 mm (0.250 in.).C. 9.52 mm (0.375 in.).D. 12.69 mm (0.500 in.).E. 19.04 mm (0.750 in.).
D D D
C B
(b)
FIGURE 12. Placement of comparator block ocross section; (b) side view; (c) side view witFig. 12b. Tangent point may be determinedholder to pipe. K = interogation angle.13
(a)
K
0
(b)
loss are simplified by direct comparison toknown losses in the comparator blocksample. The comparator block used isshown in Fig. 11 and its placement at thetangent point can be determined with astraight edge or string stretched from thesource to the pipe.13 The placement of thecomparator at the tangent point is shownin Fig. 12.13 Another problem with thesemeasurements is that the maximum wall
521aphic Testing in Utility, Petroleum and Chemical Industries
ifferently sized drilled holes and slot.13
AB
CD
(c)
D
AD E
n pipe at tangent point from source: (a) axialh pipe rotated about 90 degrees from position in with straight edge or taught string from source
0
(c)
K

522 Ra
FIGURE 13.tangential(b) rectanhigh dens
(a)
B
A
A
A
A
B
B
B
D
LegendA. 1.27 mB. 2.54 mC. 3.81 mD. 5.08 mE. 5.84 mF. 6.22 mG. 6.85 mH. 12.56
Protectivespaces
(b)
Protectivespaces
3RT19_Layout(513_542) 10/2/02 3:18 PM Page 522
thickness loss must be perpendicular tothe radiation beam. If it is not, significanterrors can be made in determining wallloss that may be either greater than theactual loss or much less than the actualloss.
Other types of calibrated referenceblocks14 have been used in performingtangential radiographic thicknessmeasurements. A dense metal calibrationblock with milled slots separated atknown distances is machined and placed
oaswipwmwarsdi
diographic Testing
Another concept for calibrated reference block for radiography of pipe wall: (a) square block;gular block. Material is lead based alloy or otherity metal.14
D
Protectivspaces
AA
A
BB
B
C
EF
G
m (0.050 in.).m (0.100 in.).m (0.150 in.).m (0.200 in.).m (0.230 in.).m (0.245 in.).m (0.270 in.).
mm (0.495 in.).
Protectivespaces
AAB
B
H
n each exposure. Typical reference blocksre shown in Fig. 13.14 The slots areeparated by known dimensions of theall thickness to be measured and are
maged at the tangent locations where theipe wall is measured. Calculations of theall thickness are based on theeasurement of the thickness of the pipeall as seen in the radiographic imagend picking a dimension off theadiographic image of the reference blockimilar or closest to the pipe thicknessimension measured. The actual thickness
s determined by multiplying themeasured wall thickness in the radiographby the actual physical separation of thelines chosen from the reference blockdivided by the separation of the referencelines on the reference block as seen in theradiograph.
A third approach15 to measuring wallthickness by the tangential technique andusing computed radiography uses a stepblock or tapered thickness block tomeasure thickness in other areas of thewall. The burnout or undercut that occursbecause scatter and the primary beamfrom the source darken the outer wallthickness can be reduced by a 1.6 mm(0.06 in.) lead screen on the source side ofthe cassette. Other scatter reducingtechniques may also help. A round ball ofhigh density metal is used to determinethe source location in the radiograph andthe enlargements that occur in differentparts of the images. With this technique,the tangential thicknesses are measuredbut the additional density information inthe radiograph is used to determinethickness in other areas.
Another approach to radiography forwall thickness measurements16 involves anonfilm technique and computerprocessing of image data using aniridium-192 source. The cassette containsa linear array of X-ray detectors and alinear motion system to drive the arraythe length of the frame. The cassettesystem detector is optimized for use withthe energies of the iridium-192. source.The detector scintillators are a photodiodebased solid state line array with aseparation between the array elements. Anexcellent photon capture efficiency ismaintained because of the thickness ofeach scintillator. The array provides forthe measurement of the radiographicintensities emerging from the pipe with16-bit accuracy as it moves, sending thedata to a portable computer for storageand processing. The radiation profileprovides pipe wall measurements and aradiographic image display as shown inFig. 14.16 The intensity measurementsrepresent the thickness of the pipe andcan be calibrated for double-wallmeasurements. The detectors can also beused to take profile or tangent wall shots
e

FIGURE 1radiogra(lower).1
URE 15. Pipe wall scan through both pipe walls:radiographic image; (b) wall profiles and thicknesssentation across one pipe scan line.16
)
URE 16. Distillation column: (a) schematic cross section; trace from scan with gamma radiation.17
Clear vapor
Mist eliminator
Normal tray
Jetentrainment
Normal tray
Foaming
Normal tray
Weeping
(b)
3RT19_Layout(513_542) 10/2/02 3:18 PM Page 523
to provide single-wall measurements.Figure 15 is a single-wall and double-wallpipe scan where both profile anddouble-wall thickness data arepresented.16
Monitoring Methods andTechniquesThere are many other uses of penetratingradiation to perform functions that arenot related to finding discontinuities,thickness changes and thicknessmeasurements. Radiation is attenuated tovarying degrees depending on the energyof the source and the thickness anddensity of matter through which it passes.It has many other uses in monitoringprocesses, leak detection, flowmeasurement and detecting andmeasuring fluids in containment systems.These methods have found uses in powerplants and chemical and petroleumplants.
One of these applications17 uses sealedradioactive sources of cobalt-60 andcesium-137 to perform a series of leveland density measurements. Sources usedtypically have strengths from 0.37 to3.7 GBq (10 to 100 mCi) whereas theradiation intensity measurements aremade with scintillation detectors. Thesource holder has a collimator thoughwhich the beam emerges and is guided toa detector on the opposite side of theobject. The beam is placed so that it istransmitted through a column or reactorto take a series of density measurementsby measuring the transmitted radiation.The beam of radiation is made to scanthrough the diameter of the column asdepicted in Figure 16.17 When a column isoperating properly, it has the right mix ofliquid and gases at various elevationsalong with its internals at their proper
FIG(a)pre
(a)
(b
FIG(b)
(a)
523Radiographic Testing in Utility, Petroleum and Chemical Industries
4. Pipe wall scan through both pipe walls showingphic image (upper) and thickness presentation6
Tray damage
Flooding
Chimney tray
Gooddistribution
Vaporbypassing
Damagedvapor
distributor

524 Ra
GURE 17. Flow rate measurements at two pipe locations:) downstream from injection point; (b) resulting intensityeasurements from both detectors as function of timeration ∆T.17
Known distance
)
Detector 1 Detector 2
)
Radi
atio
n in
tens
ity (
rela
tive
scal
e)
Time (selectable scale)
∆T
3RT19_Layout(513_542) 10/2/02 3:18 PM Page 524
locations. The radiation transmitted ateach elevation is a function of the densityand thickness of the materials in its path.Higher transmissions of radiation areindicative of higher amounts of gaswhereas lower transmissions are caused byhigher densities and thicknesses of liquidand metal. A drawing of a representativeradiation intensity pattern for a column isshown in Fig. 16b,17 with a description ofthe internal conditions that caused thelevels in transmitted radiation intensity.The scan can detect existing problemsthat result in density differences. Theseproblems may include anomalies thatresult from the column’s hydraulicperformance, fouling and coking depositsand damaged or missing trays andpacking. A scan of the column when thecolumn is operating properly can formthe base signature against which problemscan be identified when the column is notfunctioning properly.
Another application in monitoringoperations17 involves unsealed sources ortracers to perform invasive measurements.In the sealed source technique, themeasurement remains external to theprocess and is affected by transmission inand out of the vessel. In the processworld, it is often meaningful to determinevolumes, speeds and frequency inreactions. This can be accomplished byintroducing a radioactive tracer gas intothe process while measuring where thematerial goes and how fast it moves.Radioactive tracers are used to locate andsize leaks in heat exchangers; discovermean residence time, velocity and plugflow attributes of a process; determineleakage past relief and block valves; andlearn mass/flow relationships throughflare lines or piping systems.
Radioactive isotopes that are normallypossible for these types of tests areiodine-131, sodium-24, bromine-82 andkrypton-85. Which isotope is right for thejob depends on the physical character ofthe system. Figure 17 illustrates a pipingsystem with two scintillation detectors atleast 10 pipe diameters downstream fromthe injection point of the isotope.17 Thefirst detector’s measurements provide astarting point for the timing sequence.The transport of the tracer material isbeing measured at two locations a fixeddistance apart. The flow rate isdetermined by the time differencebetween the peaks of intensity curve forthe two sensors as shown in the lowerhalf of Fig. 17.17
Neutron radiography18 has been usedto detect fluids in process pipes thatnormally carry gases. This studydetermined that it was possible to detectfluids in small diameter pipe, 6.0 to14.3 mm (0.25 to 0.563 in.) outsidediameter with a ratio of outside diameter
tofrinthrefewcaobanththat
trapanapina soanra
FI(amdu
(a
(b
diographic Testing
inside diameter of 3. Fluid thicknessesom 0.08 to 0.89 mm (0.003 to 0.035 in.) thickness were detectable. Althoughese studies were conducted with aactor using transfer techniques, it waslt that in-plant tests could be performedith the neutron isotope sourcelifornium-252. Better detectability wastained by angling the beam (in the testsgling the pipe) at a sufficient angle toe neutron beam to effectively increasee thickness of liquid to make it moretenuating to the radiation.Liquid level gages19 using radiation
ansmission principles have severalplications in determining liquid heightsd fluid density values. In simpleplications, a radiation gage can bestalled to determine when the liquid intank has reached a certain level. When aurce is installed on one side of a tankd the detector on the other, thediation in air is much larger than when

3RT19_Layout(513_542) 10/2/02 3:18 PM Page 525
that radiation is attenuated by a liquid.The gage can provide a feedback signal toturn off the flow of liquid as the radiationlevel drops. This gage is called apredetermined liquid level gage. Anothertype of liquid level gage uses changes indistance to constantly monitor the liquidlevel in tanks or other containers. In thistype of gage, the radioactive source isenclosed in a float guided by suitableguides inside a tank or other storagedevice while the detector is some distanceaway at a higher elevation. As the liquidmoves up or down, the source moves upor down, changing the distance betweenit and the detector. Because radiationintensity changes as a function of thesquare of the distance, the change inradiation intensity provides a measure ofthe liquid height. This type of float gagehas several advantages over otherapproaches. Some of the advantages arethat the level can be accurately detectedin totally enclosed containers, the changein level can be continuously monitoredand high accuracies can be obtained overselected portions of the range.
525Radiographic Testing in Utility, Petroleum and Chemical Industries

526 Ra
PART 3. Vessel and Component Applications
FIGURE 18. Placing film and aligning 13 MeV linearaccelerator beam for examination of boiling water reactornozzle weld.20
3RT19_Layout(513_542) 10/2/02 3:18 PM Page 526
Pressure Vessels
ASME Boiler and Pressure VesselCodeThe radiography requirements of variousASME code items was detailed above, inthe power and process piping section ofthis chapter. Requirements for vessels orpiping concerning radiography are thesame, except that because of thethicknesses involved and the manner inwhich the examinations can beconducted, they result in greatersensitivity for thicker components. Thisincreased sensitivity results in a higherquality, as smaller thicknesses anddensities are now resolved in theseradiographic images. Vessels in boilerconstruction such as the mud and steamdrums fabricated to the ASME Boiler andPressure Vessel Code, Section I, as well asother pressure vessels constructed to theASME Boiler and Pressure Vessel Code,Section VIII, requirements areradiographed to ASME Section V,Article 2,8 requirements — otherrequirements being provided by thereferencing code sections along withacceptance standards for any resultingindications. Nuclear codes and the ASMEBoiler and Pressure Vessel Code, Section III,9use the ASME Boiler and Pressure VesselCode, Article 2,8 for most of theirrequirements except that they have aseparate image quality indicator table thatapplies for Class 1 and 2 components.Acceptance standards are in relativelyclose agreement for these three codesections.
Nuclear Vessels and ComponentsNuclear construction requires othermethods of nondestructive testing butplaces responsibility for volumetricexaminations on radiography. Because ofthe thicknesses involved, high energyisotopes and linear accelerators must beused to penetrate the carbon steel wallthicknesses that may exceed 406 mm(16.0 in.) in the nozzle belts of pressurizedwater reactor vessels. Cobalt-60 has anupper limit of about 200 mm (8.0 in.) ofequivalent carbon steel thickness and issuitable for most applications in boilingwater reactors (BWRs). However, to reduce
diographic Testing
exposure times and to radiographthicknesses exceeding 200 mm (8.0 in.) inpressurized water reactor (PWR) vessels,linear accelerators are used. (Isotopesources require long exposure times forthick materials.) Betatrons were popular inthe 1950s and early 1960s but werereplaced by liner accelerators, with at first10×, then 20× and even greater increasesin radiation intensity. A 13 MeV linearaccelerator20 is shown in Fig. 18, wherefilm placement and beam alignment arebeing performed to set up an exposure ona nozzle weld in a boiling water reactorvessel.20 These linear accelerators reducedthe time required for radiography andtherefore its cost while maintaining thesensitivity required. A 7.5 MeV linearaccelerator is shown with its smaller sizehead being set up for the examination ofa pressure vessel weld in Fig. 19.20
Inservice Inspection ofComponentsIn general, radiography does not workvery well in inservice examinations innuclear and other plants because of theneed to have access to both sides of acomponent. In a nuclear power plant, thecomponent is likely to contain water orcontaminated water of some type on the

3RT19_Layout(513_542) 10/2/02 3:18 PM Page 527
internal side of the component or pipe.Ultrasonic angle beam examinations aremore suitable, in most instances becausethey require access to only one side.However, nuclear plants have materialsand fabrications that contain austeniticcast and wrought components, that offerlimited physical access, that limit thesensitivity of the test or that prevent aneffective examination of the material.Several applications of radiography havebeen made and unique equipment ortechniques developed where ultrasonicapplications are limited.
The main coolant pipe in somepressurized water reactors (PWRs) is someform of austenitic stainless steel that isusually cast conventionally orcentrifugally or that may be wroughtpipe. This pipe is joined to the carbonsteel reactor, steam generators andpressurizer vessels by some form of safeend weld. The weld has either hightemperature nickel chromium alloy oraustenitic stainless buttering on thecarbon steel nozzle and then is joined bywelding with austenitic filler metal. Arcwelding produces a cast structure in theweld that, along with the austeniticstainless pipe, make for a difficult if notimpossible ultrasonic examination. Aunique radiographic examination of this
wpopioawaec
sicdrttpepVo
Tlipvi11o
Radi
FIGURE 19. Radiographic examination ofpressure vessel welds is conducted with7.5 MeV linear accelerator.20
eld is performed in French nuclear unitressurized water reactor vessels by meansf a special manipulator. This manipulatorrovides for placing under water an
sotope source internally within the centerf the pipe-to-nozzle weld surrounded byn inflatable diaphragm that replacesater with air. Film is manually placedround the pipe-to-nozzle weld and thexposure is made of the weldircumference.
To determine if radiography has theensitivity to detect planar discontinuitiesn austenitic materials, a study wasonducted to see if the minimum sizeiscontinuity was detectable byadiography.21 One of the conclusions ofhe study was that minimumhrough-wall thickness detectable using aortable miniature linear accelerator isssentially equal to or less than the valuesermitted by the ASME Boiler and Pressureessel Code, Section XI, Inservice Inspectionf Nuclear Plants.
In a nuclear power plant inennessee,22 radiography with a miniatureinear accelerator provided thenformation needed to confirm theosition of valve disks in two separatealves. Each valve was 965 mm (38.0 in.)n diameter with a wall thickness of02 mm (4.0 in.) and an additional02 mm (4.0 in.) of insulation on theutside surfaces. This meant that the
radiation beam would have to travelthrough 204 mm (8 in.) of carbon steelbefore producing an image on the sensingplane at a minimum source-to-sensor of1.17 m (46.0 in.). Additional material wasexpected internally as the disk was about0.76 m (30 in.) in diameter and 76 mm(3.0 in.) thick. The valves were in themain steam piping system with full steamflow operating at temperatures above200 °F (93 °C). With these thicknesses,radiography with conventional X-raysources or even the most powerful ofisotope sources would be impractical.Even with the miniature linearaccelerator, exposure times were 45 minlong. The radiographs showed that onedisk had become detached and was lodgedin the valve body whereas the second diskwas detached and eventually found some152 m (500 ft) downstream where itlodged in a reducer section.
In another nuclear power plant,23
access was the determining factor indeveloping a radiographic technique toperform examinations of main steampiping. The main steam piping thattransports steam from four steamgenerators to the turbine is enclosedwithin a guard pipe (Fig. 20).23 The guardpipe is designed to prevent damage tosurrounding components in the event of arupture of a main steam pipe. Some of thecircumferential welds in this piping are
527ographic Testing in Utility, Petroleum and Chemical Industries

528
FIGURE 2
Ste
(a)
FIGURE 21. Isotope source tube: (a) guidetube; (b) access hole plug.23
Unspecified distance
3RT19_Layout(513_542) 10/2/02 3:19 PM Page 528
required to be examined during the tenyear inservice inspection interval. Becauseof the access limitations, ultrasonicexamination of only part of the weld ispossible. Radiographic techniques weredeveloped to perform the examinations.The welds are both vertical andhorizontal. Access to the pipe welds isrestricted to two hand holes located180 degrees apart on each weld to beradiographed as shown in Fig. 20.23 Thehand holes are 305 mm (12 in.) indiameter and are covered with a flangeplate when the power plant is inoperation. Each of the welds has twogamma holes, one hole underneath eachof the flange plates. An iridium-192source is positioned in the center of thepipe with a special guide tube and plugshown in Fig. 21.23 The identificationmarkers and number belt to marklocations around the pipe were placed ona steel banding strap and fed around thepipe. Because of problems with the sourcehaving to pass close to the sensing planeif a panoramic film belt was used, twoexposures were made on each weld fromeach side of the pipe. Figure 22 illustrateshow the exposures were made23 exceptthat film cassettes were placed only on
Radiographic Testing
0. Steam generator and piping within guard pipe.23
am generator
Vertical welds
Horizontal welds
Hand holes
Guard pipe
Main steam pipe
180 degrees of the pipe circumferencefarthest from the hand hole being used. Alead backing of the cassettes was used tohold the film in place and limitbackscatter from the guard pipe.
TanksNondestructive testing of welded steeltanks for oil storage is specified forfabrication in API 650, Welded Steel Tanksfor Oil Storage.24 For butt welded tankshells with thicknesses less or equal to25 mm (1.0 in.) in thickness, only spotradiographs are required. Spots atjunctions of vertical and horizontal seams
(b)
See Fig. 21b
Threads sameas gammaaccess hole
FIGURE 22. Panoramic technique using J tube guide tube andgamma access hole holder.23
Sensor Source
J tubeprovidingaccess to
gammasource

3RT19_Layout(513_542) 10/2/02 3:19 PM Page 529
required are to include 51 mm (2 in.) ofthe horizontal seams. Vertical joints inwalls that exceed 25 mm (1 in.) inthickness shall be completelyradiographed as well as butt welds aroundthe periphery of a manhole or nozzle inany wall thickness. Radiographs are to bemade in accordance with therequirements of the ASME Boiler andPressure Vessel Code, Section V, Article 2,8except for unsharpness requirements.Acceptance of radiographs is to be basedon resolving the prescribed image qualityindicator. Acceptance of radiographs isbased on the acceptance standards of theASME Boiler and Pressure Vessel Code,Section VIII, Division 1, ParagraphUW-51(b). API Standard 653, TankInspection, Repair, Alteration, andReconstruction25 also defers to the sameASME Boiler and Pressure Vessel Codesections for radiographic requirementsand acceptance standards.
Some types of tanks present uniqueproblems for detecting corrosioninternally. Double-walled insulated tanksare used in petrochemical plants in severalprocesses. When these vessels are operatedat fill levels below their maximumcapability, the volume above the liquid isoccupied by entrained air or vapors.Exposure of the inner wall to the resultingboundary between gas and fluid hascaused erosion in some processes. Becausethe exterior of the inner shell is notavailable for ultrasonic testing, the onlyeffective method of examination is toenter the tank when it is shut down andexamine the surfaces visually. Evenconventional radiography is not effectivebecause of the great image unsharpnessthat would be present in any image.Access into the tank requires venting anddraining, removing it from service. Downtime for these actions can take the tankout of service for up to two days.
To determine an acceptable techniqueto detect and measure erosion damage, afeasibility study26 was conducted onlaminography to image and providemeasurement of any wall thickness losses.A 19 mm (0.75 in.) plate specimencontaining several different types of wallloss was fabricated for the inner wall.Polystyrene foam was used to simulate theheating fluid occupying the layer betweenthe inner and outer vessels and then a6.0 mm (0.25 in.) thick plate for the outershell and another layer of polystyrenefoam to simulate the outer insulation.Several iridium-192 exposures were madeat a source-to-sensor distance of 1.8 m(72 in.) and at 0, 305 and 610 mm (0, 12and 24 in.) offsets from the center of thespecimen. The resulting radiographs werescanned and digitized. The digitalinformation was analyzed using alaminography algorithm along with a
Radiogra
conventional computer graphics program.Comparison of the actual sharp edgedfabrications versus the image processeddata showed a greater than 98 percentcorrelation. Examination of the largeerosion gouge showed a +6.7 percent,–5.3 percent variance from the actualdepths. These techniques may provide anonevasive means of measuring innererosion with acceptable accuracy.
529phic Testing in Utility, Petroleum and Chemical Industries

530 Ra
PART 4. Nuclear Fuel Applications
FIGURE 23. Pictorial diagram of thickness measuring systemfor coated nuclear fuel microspheres.27
Promethium-147source
MicrospheresCollimator
High voltage
Readoutinstrumentation
Photomultiplier tubeSourceshield
Containmentcell
Thalliumactivatedsodiumiodidecrystal
3RT19_Layout(513_542) 10/2/02 3:19 PM Page 530
One of the critical areas in a nuclearreactor is the fuel and its containment.Poor containment of the fuel in the fuelrods will cause erosion and dispersion ofthe uranium throughout the reactorsystem and cause higher radiation levelswherever it is trapped. Many items gointo maintaining the quality of the fuelfrom the individual microspheres tocompaction of the fuel in the fuelelement to producing a good seal weld onthe fuel element. Examinations of fuelafter use can reveal characteristics thatcaused problems and that must beaddressed in future fabrications.Radiography has also been used tocharacterize nuclear waste materialswithout having to open the waste drums.
Microradiographic techniques havebeen used for many years to measurecoating thicknesses of nuclear fuelmicrospheres. This measurement typicallyinvolves using very low energies with aberyllium window tube. At low energies itmay use an inert gas instead of air toreduce attenuation while placing thespheres on bare single-emulsion film orphotographic plates. The resultant imagecan be enlarged many times to accuratelydetermine the coating thickness. It wasdesirable, however, to have a technique27
that could have faster feedback in order tochange processing parameters if necessary.It was required to measure pyrolyticcarbon thickness on approximately0.25 mm (0.010 in.) diameter thoriummicrospheres on small samples during thecoating operation to prevent overcoating.
Experiments were set on a series ofthorium dioxide particles with 0.23 mm(0.009 in.) diameters having coatingthicknesses in the range of 0.013 to0.173 mm (0.0005 to 0.0068 in.) todetermine the optimum X-ray energywith microradiographic techniques. Twosizes of acrylic containment cells wereconstructed to hold the particles duringradiography with each coating thicknesshaving its own containment cells. Thebest sensitivity was obtained with 50 kVconstant potential radiation and a thinner1.588 mm (0.0625 in.) acryliccontainment cell. The 50 kV constantpotential polychromatic X-ray beam hasan effective energy of about 38 keV.Effective energy is defined as the energyof monochromatic (single-wavelength)radiation that would produce the same
diographic Testing
absorption measurement as obtained frompolychromatic X-rays emitted at a givenX-ray tube voltage. Because themeasurements were to be made on aproduction line, an isotopic radiationsource was desirable. Promethium-147 wasinvestigated and chosen as the radiationsource because it produces a characteristicX-ray of 38 keV when bombarded by itsown 0.223 MeV beta radiation. Thisradioactive isotope is a more stableradiation source than an X-ray generatorand is quite portable while being availablein 3.7 GBq (100 Ci) source sizes. Figure 23represents a pictorial diagram of thethickness measuring system developed tomeasure the coating thickness.27 Byscanning the particles and averaging thevoltages, a thickness measurement wasdetermined from a calibration curve witha total measurement time of 2 min. At thelatter stages of the program, a directreading thickness instrument wasdeveloped, as shown in Fig. 24,27 whichprovided a measurement accuracy on thecoatings within 2.0 µm (8 × 10⁻⁵ in.) overa range of carbon coating thicknessesfrom 0.016 mm (0.0006 in.) to 0.168 mm(0.0066 in.).
Acceptance standards often call forlimits of acceptability of an item such asno cracks or no tungsten inclusions. Whatthis limit implies is that no detectablecracks or tungsten inclusions areacceptable in the radiographs. However,the sensitivity in a radiograph willdetermine what is detectable so thatpersonnel performing examinations to

(a)
Opt
ical
den
sity
0.1
dens
ity u
nits
per
10 m
m)
10 mm(0.4 in.)
FIGURE 25. Microdensitometric scans over 0.1 mm (0.004 in.)diameter tungsten wire on 15.5 mm (0.61 in.) thickzirconium alloy block: (a) extra fine grain film with averagespeed and high contrast; (b) high speed, medium grainfilm.28 In film radiography, film density is expressed as ratioin base 10 logarithm of I0·Ix–1, where I0 is radiation reachingthe densitometric detector without intervening film andwhere Ix is radiation through film. These measurementscorrespond to contrast or relative brightness differences inradioscopy, which in some cases can be adjusted by usingdifferent amounts of gain.
3RT19_Layout(513_542) 10/2/02 3:19 PM Page 531
different criteria can get different results.Such a problem28 was faced in theexamination of thin, stainless steel clad,5 to 7 mm (0.20 to 0.28 in.) diameter, fuelpin tube–to–end plug, tungsten insert gaswelds. A similar problem existed in 14 to15 mm (0.55 to 0.59 in.) diameterzirconium alloy clad fuel pins welded inthe same manner. Tungsten wires andpowders were used to simulate tungsteninclusions found in the radiographs. Wiresizes chosen were 0.05 and 0.1 mm(0.002 and 0.004 in.) and particles whoselarger dimensions were 0.05, 0.1, 0.15 and0.2 mm (0.002, 0.004, 0.006 and0.008 in.) were chosen for the study. Theend cap welds are examined with shapecorrected blocks to reduce the scatter thatwould come from the cylindricalconfiguration. It was possible to detectboth the 0.05 mm (0.002 in.) and 0.1 mm(0.004 in.) diameter wires in the 5.5 mm(0.22 in.) thick stainless steel radiographsmade on very fine grain, fine grain andmedium grain films. The limit ofdetection in the steel zirconium alloywelds was determined to be 0.1 mm(0.004 in.) as shown on fine and mediumgrain films. Microdensitometer scans ofthe latter films are shown in Fig. 25.28
Densitometric measurements in filmare analogous to contrast measurementsin electronic images, which measurementsprovide monochromatic data for thedescription of density in the test object.Work in the 1990s was conducted tocontrol and quantify gray levels fordensitometry. An unprocessed image maybe compared with a reference image tohelp identify vignetting and otherdistortions caused by incident radiationpatterns and by gain in the imageintensifier and elsewhere in thesystem.29,30
Radiation gaging applications canmeasure densities of materials with afairly high accuracy. This techniqueassumes that all other conditions thatmight affect the amount of radiation
Radiogra
FIGURE 24. Gaging system for direct readoutprocess monitor for carbon coatingthickness on nuclear fuel microspheres.27
being transmitted through the materialare under control and that the onlyvariable affecting the radiation intensity isdensity. In the production of fuelelements,31 there are different means ofplacing the nuclear fuel particles withinthe metal tubes, usually zirconium alloyor stainless steel tubes. One of thesefilling techniques uses vibratory energy tocompact the fuel particles. Anothertechnique is to insert cold pressed andsintered oxide pellets into similar tubing.The fuel particle density and distributionplay an important roll in the performanceof the fuel element. Developmentengineers studied the effects of variousmanufacturing parameters on fuelhomogeneity and density. These variablesincluded fuel particle size distribution,vibratory energy, rod loading techniquesas well as pressing pressure and sinteringtemperatures. Seamless tubing can haverelatively large wall thickness variationsthat can be more pronounced in smallerdiameters. As a billet is pierced to start thetube process, the mandrel that pierces thetube can float providing thick and thinareas on opposite sides of the tube. If thediameter is unaffected, the wall will be
531phic Testing in Utility, Petroleum and Chemical Industries
(
Length of tungsten wire in image(proportional scale)
(b)
Opt
ical
den
sity
(0.1
den
sity
uni
tspe
r 10
mm
)
Length of tungsten wire in image(proportional scale)
1 mm(0.04 in.)

532 Ra
IGURE 26. Radiation attenuation technique for evaluation ofel concentration in metal clad nuclear fuel rod: (a) setup;) strip chart recorder trace showing attenuation with
.2 × 12.7 mm (0.13 × 0.5 in.) collimator; (c) same, showingduced resolution with 3.2 × 3.2 mm (0.13 × 0.13 in.)
ollimator. Outside diameter of compacted rod = 12.7 mm.5 in.). Thickness of stainless steel wall = 0.89 mm.035 in.). Diameter of compacted thorium uranium dioxide percent thorium) fuel = 10.92 mm (0.430 in.).31
a)
DetectorCollimator
Data readoutRadiation source
Sample
Source container
b)
Att
enua
tion
(cha
rt r
eadi
ng) 80
70
60
50
40
0 25 50 75 100 125 150(1) (2) (3) (4) (5) (6)
Distance, mm (in.)
c)
Att
enua
tion
(cha
rt r
eadi
ng) 80
70
60
50
40
0 25 50 75 100 125 150(1) (2) (3) (4) (5) (6)
Distance, mm (in.)
3RT19_Layout(513_542) 10/2/02 3:19 PM Page 532
heavy on one side and light on the otheror vice versa but contain the sameamount of metal. If the diameter changes,the total wall thickness across two walls180 degrees apart will not be the same.These wall thickness variations anddiameter variations can affect radiationtransmission measurements and interferewith the density determination.Commercial tubing 13 mm (0.5 in.)outside diameter by 0.89 mm (0.035 in.)wall may have a wall thickness toleranceof ±10 percent and an inside diametertolerance of 0.27 mm (±0.005 in.).
Figure 26a is a diagram of thetechnique with the radiation sources onthe bottom and the detector on top.31 Theradiation energies used were those fromcobalt-60 (1.17 and 1.33 MeV) andcesium-137 (0.662 MeV) obtained from74 GBq (2 Ci) of cobalt-60 and 185 GBq(5 Ci) of cesium-137. The two sourceswere housed in a two-compartmenturanium pig. The detection system formeasuring the radiation intensity is asodium iodide (thallium activated) crystaloptically coupled to a photomultipliertube. The collimation of the beam occursin the pig where the radiation beams are5 mm (0.2 in.) wide by 16 mm (0.63 in.)long and then in lead cylinders measuring64 mm (2.5 in.) diameter by 152 mm(6.0 in.) long. The long dimension of thecollimators is lined up in the axialdirection of the fuel rod. The output ofthe detector is fed to a strip chart recorder.
Two collimator dimensions,3.0 × 3.0 mm (0.13 × 0.13 in.) and3 × 13 mm (0.125 × 0.5 in.), wereevaluated as well as various scanningspeeds. A larger collimator reduces theresolution as shown in Figs. 26b and26c.31 With the larger collimator, thesignals are higher but show less resolutionto changes evident in the smallercollimator scan.
Figure 27 shows the difference inattenuation between the cobalt-60 andcesium-137 radiation sources. Theattenuations are close at lowerconcentrations and deviate at higherconcentrations. This difference in sourceattenuation is expected because of thesource energies.
From calculations using massabsorption coefficients of the variousmaterials at the effective energy ofcobalt-60, it was determined that0.025 mm (0.001 in.) of stainless steel wasequivalent in attenuation to 0.018 mm(0.0007 in.) of thorium uranium dioxide(3 percent thorium) fuel. Stainless steelshims 0.025 mm to 0.25 mm (0.001 to0.010 in.) thick were placed on the tubescontaining 13 and 19 mm (0.5 and0.75 in.) diameter pellets during scanning.Figure 28 shows the attenuation curves asa function of fuel density with no shims
asthh10
Ffu(b3rec(0(0(3
(
(
(
diographic Testing
nd with the 0.25 mm (0.010 in.) thickhim in the beam.31 As the plots show,
e additional thickness of stainless steelas an equivalence in attenuation to a.66 percent change in fuel content, a.178 mm (0.007 in.) wall thickness

3RT19_Layout(513_542) 10/2/02 3:19 PM Page 533
change on the 13 mm (0.5 in.) diameterrod.
The gamma ray attenuation techniquedeveloped in this study had areproducibility better than 1 percent forevaluating fuel heterogeneities invibratory compacted and sintered pelletfuel rods with metal cladding.Heterogeneities appearing as fuelconcentration changes result from particleand compaction density variations as wellas variations in tube wall and diameter. Ifbetter precision is required, tubing withspecial tolerances must be used.
Computed tomography (CT) was firstdeveloped and used in the medical field.The technique is starting to becomepopular in industrial radiography butseveral differences between medical andindustrial radiography have restricted itsuse. In industrial radiography, a higherrange of film densities or contrast settingsare used for a large range of objects, manyof which are not suitable for computedtomography or would greatly multiply thecost of performing computed tomography.In general, industrial radiography isperformed with requirements for smallerdetail in the radiographs, detail that canbe hard to achieve in each of the multipleradiographs required.
Normally in a radiograph, the details ofa three dimensional object are displayedin two dimensions. The cross sectionaldetails are piled on each other, the film
dlatpadpt
imtbtooudcr
tstMa0dubna
nd
Radiogr
FIGURE 27. Comparison of attenuation ofradiation from cobalt-60 and cesium-137versus changes in fuel concentration, using3.2 × 3.2 mm (0.13 × 0.13 in.) collimator.31
170
160
150
140
130
120
110
100
90
80
70
60
50
40
Att
enua
tion
(cha
rt r
eadi
ng)
0.9 1.0 1.1 1.2 1.3 1.4 1.5 1.6 1.7 1
Ratio of fuel mass (g) to volume (relative unit) of collimated beam
Cobalt-60
Cesium-137
ensity or contrast setting at any givenocation being a function of the thicknessnd density seen as the radiation traverseshe object. Computed tomographyresents the radiographic exposure data in cross section of the object, revealingetails as if the object were slicederpendicularly to the axis about whichhe multiple radiographs were made.
To produce the computed tomographicmage, multiple exposures are made at
ultiple angles around a selected axis ofhe specimen. Processed film images cane digitized by scanning and recordinghe film densities within the imagedbject for each angled exposure. Variousther digital imaging techniques can besed to produce digital image data. Theigitized data are then imported to aomputed tomographic imageeconstruction process in a computer.
With suitable calibration, computedomography can have higher sensitivity tomaller changes in density or thicknesshan in conventional radiography.
edical systems routinely claim thebility to achieve sensitivities within.5 percent of thickness or materialensity. Computed tomography has beensed with X-ray, gamma ray and neutroneams in examining fuel and otheruclear materials. A few of thepplications are discussed next.
Experiments32 were performed onuclear fuel rod assemblies to determineebris formation and relocation (DFR) in
simulated accidents to study the effects of
533aphic Testing in Utility, Petroleum and Chemical Industries
.8
FIGURE 28. Radiation attenuation curves obtained withcobalt-60, showing influence of variations in metal claddingthickness on apparent fuel concentration, with 3.2 × 3.2 mm(0.13 × 0.13 in.) collimator. Scan speed = 3.4 mm·s–1
(8 in.·min–1). Outside diameter of pellet rod = 12.7 mm(0.5 in.). Thickness of stainless steel wall = 0.89 mm(0.035 in.). Diameter of thorium uranium dioxide (3 percentthorium) pellet = 10.82 mm (0.426 in.).31
Att
enua
tion
(cha
rt r
eadi
ng) Pellet rod with 0.25 mm (0.010 in.)
of 347 stainless steel shim
Pellet rod withoutstainless steel shim
0.90 0.95 1.00 1.05 1.10 1.15 1.20 1.25
Ratio of fuel mass (g) to volume (relative unit) ofcollimated beam
90
80
70
60
50
40

534 R
FIGURE 29. Typical slice images from last fuel assemblytested: (a) array of 16 images of rod cross sections atresolution of 128 × 128 pixels; (b) magnification byinterpolation of one cross section image to128 × 128 pixels.32 Interpolation does not improve genuineresolution but avoids pixelization of image.
(a)
(b)
3RT19_Layout(513_542) 10/2/02 3:19 PM Page 534
overheated conditions on the assemblies.Light water reactor (LWR) fuel rodassemblies are placed in the core of aresearch reactor and where the fuel isfission heated. The assembly is thenexposed to superheated steam to createconditions that might exist in a coredamage accident. After the assemblieshave been exposed to the hightemperatures, a low density pottingmaterial is poured into the assembly tostabilize the debris in its conditionimmediately after testing. The assemblywas contained in a steel can about180 mm (7.1 in.) in diameter and 1.00 m(39 in.) long. The part of the fuelassembly in the can that contained thefuel and where molten fuel might haveflowed was about 100 mm (3.9 in.) by650 mm (25 in.) long. Because of thethickness and density of the fuel, a highenergy source, 7.5 MeV linear acceleratorwas selected to perform the radiography.At the time of this work, no electronic ordigital screens could record this radiationso a fine grain film was used. Because thefuel in the can was giving off someradiation, the film had to be separatedfrom the can about 1.00 m (39 in.) andthat required that a long source-to-objectdistance of 12 m (39 ft) also be used toreduce unsharpness. The film cassette had0.5 mm (0.020 in.) front and back leadscreens contacting the film while 6 mm(0.25 in.) lead sheets protected thecassette from forward scatter andbackscatter. The exposures were each0.5 Gy (50 rad) at the film and requiredabout 8 min to accomplish each exposurewith a minimum film density ofabout 1.5.
Four assemblies were radiographed. Thefirst can was radiographed every10 degrees whereas succeeding cans wereradiographed every 5 degrees. Only180 degrees was covered, as the180 degree exposure contained the sameinformation as at 0 degrees. The filmswere digitized using a mircodensitometerwith a resolution of 0.4 mm (0.016 in.) inboth directions. The digitizing produced512 points per scan and 1400 to1630 scans per area of interest in the foursets of either 19 or 37 radiographs.
Figure 29 shows some typicaltomographic images of the last fuelelement assembly.32 Theses images wereproduced on a display device having512 × 512 pixel resolution. The array of16 separate images (Fig. 29a) is displayedat the reconstructed resolution of128 × 128 pixels per image. In particular,note that the shapes and locations of theeroded rods, as well as cracks such as thatin the rod nearest the plane 66 markers inFig. 29b, are visible in these images. Eachtomographic image of each can consists of1400 to 1600 slices like those in Fig. 29a.
adiographic Testing

FIGURE 3tomogra
Reactor
Eastbeamtube
3RT19_Layout(513_542) 10/2/02 3:19 PM Page 535
Computed radiography has provenuseful in the posttest analysis of thedebris formation and relocation nuclearfuel experiment packages. The film basedtechnique provides relatively highresolution images but is expensive becauseof the time required to handle anddigitize the radiographs.
Similar tomographic work was done onirradiated fuel elements at anotherfacility.33 However, these fuel elementshave up to 2.78 Sv·s–1 (106 R·h–1) gammaactivity so that isotope or X-ray exposuresare out of the question as the largegamma intensity would expose the film orsaturate any other detector. This workcalled for neutron radiographictomography with transfer foils. Inneutron radiography, transfer foils areused in high intensity gamma beams.Neutrons are absorbed in the transfer foil,in this case 0.13 mm (0.024 in.) thickindium. Neutron radiography of largenuclear fuel bundles requires neutronbeam energies of sufficient energy topenetrate the full array of fuel pins in thebundle. In most neutron radiography, theimages are formed by the capture ofthermal or lower energy neutrons.However, in this case, the reactor neededto produce epithermal neutrons. Theseneutrons provide sufficient penetration ofthe fuel bundles and are imaged by the1.46 eV resonance of indium. Becauseindium has a large thermal neutron crosssection, the indium must be shielded witha thermal neutron filter such as cadmiumor gadolinium. Because the gammaradiation from the fuel bundles is quitelarge, positioning adjustments to thespecimen and rotation for the variousradiographs must be accomplished
Radiogra
0. Neutron radiographic facility used for neutronphy of hot fuel assemblies.33
Gammaneutronshutter
Cask
Specimentube
Foil transporter
North beam tube
remotely. Also the indium foils must beplaced remotely for each exposure. Adrawing (Fig. 30) shows one port of thereactor for neutron radiography and otherfeatures.33
Exposures of the indium foil in thereactor required 18 min with a collimatorlength-to-diameter ratio of 125. Theactivated transfer screens were placedagainst a medium grain radiographic filmin a vacuum cassette (so intimate contactresults) immediately following exposure.The transfer screen must be left in contactwith the film for at least four half lives(indium half life = 54 min) but normallythese exposures were left overnight. Theresultant beta particle emission from theindium screen exposes the film, which inturn is processed in an automaticprocessor. Thirty-six films were exposedfor each fuel bundle. Figure 31 shows areconstruction of the neutrontomographic image of one cross section ina 91-pin fuel bundle using the 36 neutronradiographs to form the image.33
Neutron tomography of irradiated fuelbundles is an expensive form ofnondestructive testing and it wouldprobably not find general application forexamination of routine fuel bundles.However, there are safety tests beingconducted on fuel bundles in which thereis a very large capital investment andwhere the expected results have warrantedthe cost of tomography. In theseinstances, the irradiation effects on thefuel under the deliberately induced severeoperating conditions have caused verygross displacement of the internalcomponents. These features wouldobviously be lost or disturbed duringdisassembly of the bundle. Neutrontomography thus becomes a valuable andeffective way to study the relationship of
535phic Testing in Utility, Petroleum and Chemical Industries
FIGURE 31. Tomographic reconstruction of91-pin fuel bundle using 36 neutronradiographs.33
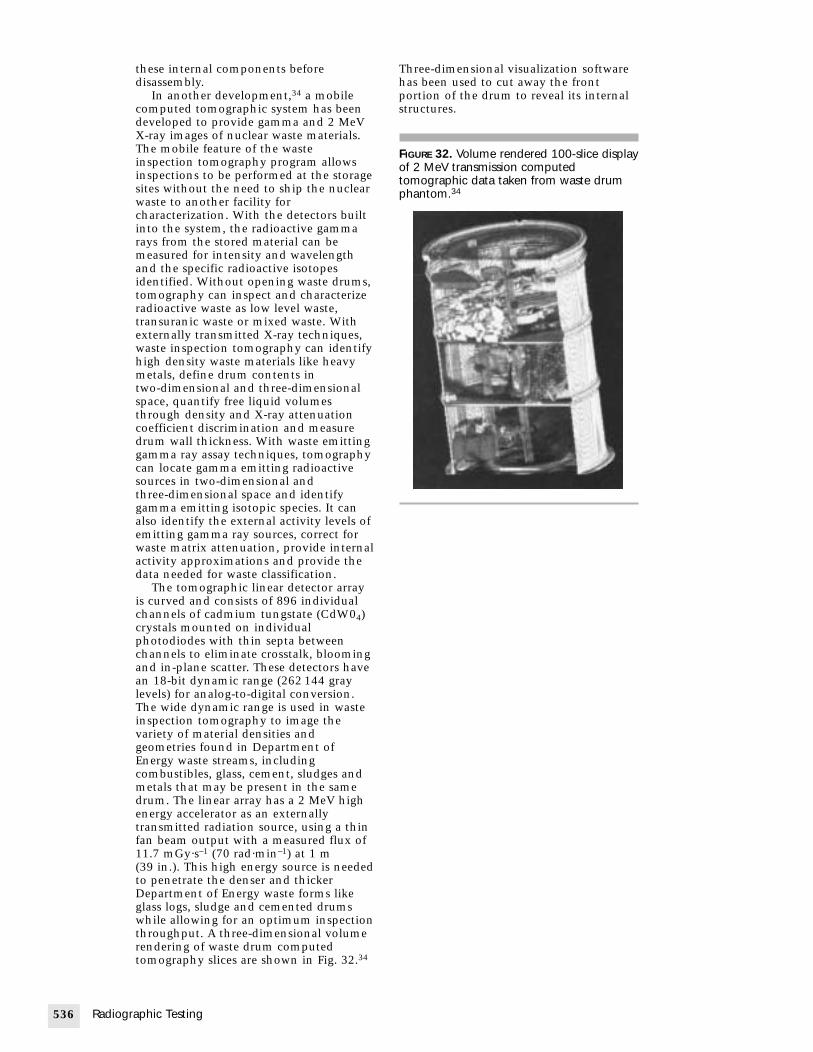
Three-dimensional visualization softwarehas been used to cut away the frontportion of the drum to reveal its internalstructures.
536
FIGURE 32. Volume rendered 100-slice displayof 2 MeV transmission computedtomographic data taken from waste drumphantom.34
3RT19_Layout(513_542) 10/2/02 3:19 PM Page 536
these internal components beforedisassembly.
In another development,34 a mobilecomputed tomographic system has beendeveloped to provide gamma and 2 MeVX-ray images of nuclear waste materials.The mobile feature of the wasteinspection tomography program allowsinspections to be performed at the storagesites without the need to ship the nuclearwaste to another facility forcharacterization. With the detectors builtinto the system, the radioactive gammarays from the stored material can bemeasured for intensity and wavelengthand the specific radioactive isotopesidentified. Without opening waste drums,tomography can inspect and characterizeradioactive waste as low level waste,transuranic waste or mixed waste. Withexternally transmitted X-ray techniques,waste inspection tomography can identifyhigh density waste materials like heavymetals, define drum contents intwo-dimensional and three-dimensionalspace, quantify free liquid volumesthrough density and X-ray attenuationcoefficient discrimination and measuredrum wall thickness. With waste emittinggamma ray assay techniques, tomographycan locate gamma emitting radioactivesources in two-dimensional andthree-dimensional space and identifygamma emitting isotopic species. It canalso identify the external activity levels ofemitting gamma ray sources, correct forwaste matrix attenuation, provide internalactivity approximations and provide thedata needed for waste classification.
The tomographic linear detector arrayis curved and consists of 896 individualchannels of cadmium tungstate (CdW04)crystals mounted on individualphotodiodes with thin septa betweenchannels to eliminate crosstalk, bloomingand in-plane scatter. These detectors havean 18-bit dynamic range (262 144 graylevels) for analog-to-digital conversion.The wide dynamic range is used in wasteinspection tomography to image thevariety of material densities andgeometries found in Department ofEnergy waste streams, includingcombustibles, glass, cement, sludges andmetals that may be present in the samedrum. The linear array has a 2 MeV highenergy accelerator as an externallytransmitted radiation source, using a thinfan beam output with a measured flux of11.7 mGy·s–1 (70 rad·min–1) at 1 m(39 in.). This high energy source is neededto penetrate the denser and thickerDepartment of Energy waste forms likeglass logs, sludge and cemented drumswhile allowing for an optimum inspectionthroughput. A three-dimensional volumerendering of waste drum computedtomography slices are shown in Fig. 32.34
Radiographic Testing
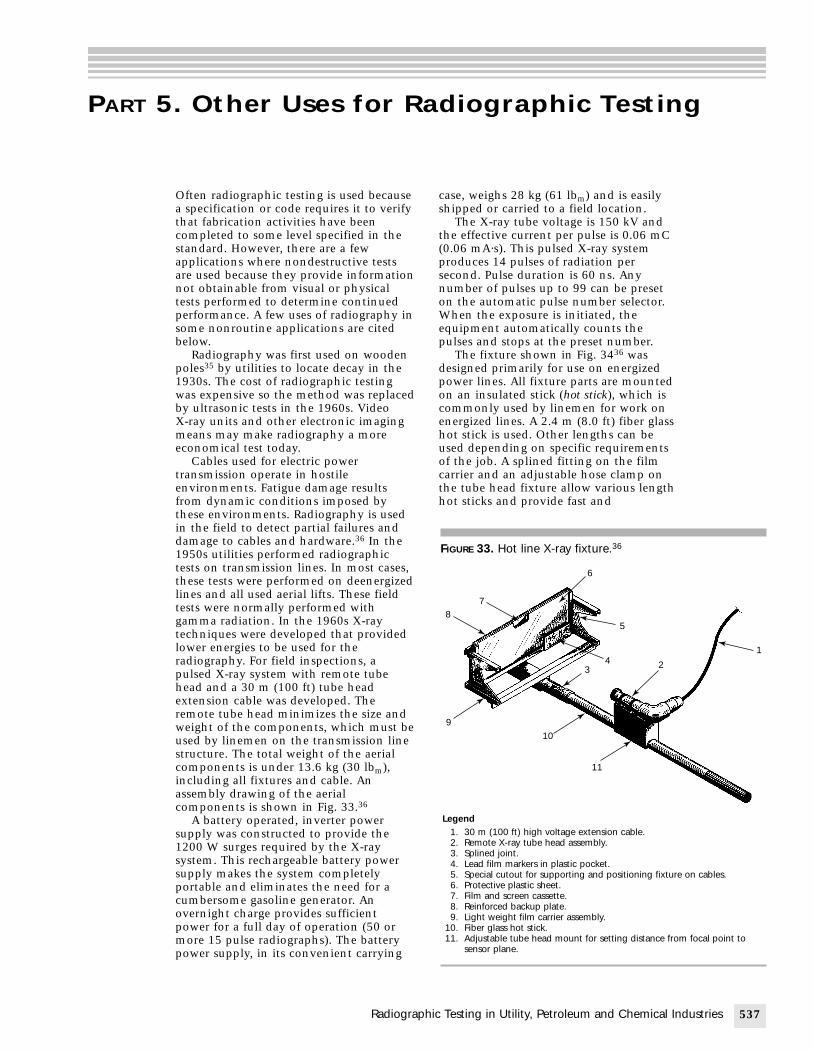
PART 5. Other Uses for Radiographic Testing
Legend1. 30 m (100 ft) high voltage extension cable.2. Remote X-ray tube head assembly.3. Splined joint.4. Lead film markers in plastic pocket.5. Special cutout for supporting and positioning fixture on cables.6. Protective plastic sheet.7. Film and screen cassette.8. Reinforced backup plate.9. Light weight film carrier assembly.
10. Fiber glass hot stick.11. Adjustable tube head mount for setting distance from focal point to
sensor plane.
FIGURE 33. Hot line X-ray fixture.36
1
11
109
4
5
6
78
23
3RT19_Layout(513_542) 10/2/02 3:19 PM Page 537
Often radiographic testing is used becausea specification or code requires it to verifythat fabrication activities have beencompleted to some level specified in thestandard. However, there are a fewapplications where nondestructive testsare used because they provide informationnot obtainable from visual or physicaltests performed to determine continuedperformance. A few uses of radiography insome nonroutine applications are citedbelow.
Radiography was first used on woodenpoles35 by utilities to locate decay in the1930s. The cost of radiographic testingwas expensive so the method was replacedby ultrasonic tests in the 1960s. VideoX-ray units and other electronic imagingmeans may make radiography a moreeconomical test today.
Cables used for electric powertransmission operate in hostileenvironments. Fatigue damage resultsfrom dynamic conditions imposed bythese environments. Radiography is usedin the field to detect partial failures anddamage to cables and hardware.36 In the1950s utilities performed radiographictests on transmission lines. In most cases,these tests were performed on deenergizedlines and all used aerial lifts. These fieldtests were normally performed withgamma radiation. In the 1960s X-raytechniques were developed that providedlower energies to be used for theradiography. For field inspections, apulsed X-ray system with remote tubehead and a 30 m (100 ft) tube headextension cable was developed. Theremote tube head minimizes the size andweight of the components, which must beused by linemen on the transmission linestructure. The total weight of the aerialcomponents is under 13.6 kg (30 lbm),including all fixtures and cable. Anassembly drawing of the aerialcomponents is shown in Fig. 33.36
A battery operated, inverter powersupply was constructed to provide the1200 W surges required by the X-raysystem. This rechargeable battery powersupply makes the system completelyportable and eliminates the need for acumbersome gasoline generator. Anovernight charge provides sufficientpower for a full day of operation (50 ormore 15 pulse radiographs). The batterypower supply, in its convenient carrying
cs
t(psnoWep
dpocehuocth
Radiogra
ase, weighs 28 kg (61 lbm) and is easilyhipped or carried to a field location.
The X-ray tube voltage is 150 kV andhe effective current per pulse is 0.06 mC0.06 mA·s). This pulsed X-ray systemroduces 14 pulses of radiation perecond. Pulse duration is 60 ns. Anyumber of pulses up to 99 can be presetn the automatic pulse number selector.hen the exposure is initiated, the
quipment automatically counts theulses and stops at the preset number.
The fixture shown in Fig. 3436 wasesigned primarily for use on energizedower lines. All fixture parts are mountedn an insulated stick (hot stick), which isommonly used by linemen for work onnergized lines. A 2.4 m (8.0 ft) fiber glassot stick is used. Other lengths can besed depending on specific requirementsf the job. A splined fitting on the filmarrier and an adjustable hose clamp onhe tube head fixture allow various lengthot sticks and provide fast and
537phic Testing in Utility, Petroleum and Chemical Industries

538 R
IGURE 35. Radiograph of splice made on energized lineeveals splice applied incorrectly. Outer aluminum sleevearrow 1) should be centered over steel core splicearrow 2).36
12
IGURE 36. Radiograph showing multiple breaks underuspension clamp in field X-ray.36
Break Break
3RT19_Layout(513_542) 10/2/02 3:19 PM Page 538
convenient assembly. The tube head canbe positioned easily anywhere along thelength of the hot stick.
Industrial radiographic film is not usedin this application, because of the higherdoses of radiation required. Instead,medical screens and film provide adequatesensitivity for the application. Typicalexposures using focus film distances of760 mm (30 in.) are 15 to 20 pulses (1 to1.5 s). After 30 pulse exposures, adosimeter located 0.3 m (1 ft) behind thetube head did not show any doseaccumulation. A second dosimeter 0.3 m(1 ft) to the side of the tube head alsoshowed no dose accumulation. Anotherdosimeter placed 4 m (13 ft) directly infront of the tube head had a reading of1.3 µC·kg–1 (5 mR). During fieldinspections, lineman using pocketdosimeters have had no more than0.5 µC·kg–1 (2 mR) recorded for a fullday’s work. Examples of radiographs madeon hot lines in the field are shown inFigs. 35 and 36.36
ClosingRadiographic testing has a long history ofsignificant applications in the electricpower and related industries.37–43
Innovations in detector technology,digital processing and signal transmissionand storage hold the promise of furtherdevelopment and more applications inthe twenty-first century.
Fr((
Fs
adiographic Testing
FIGURE 34. Lineman using hot line X-rayequipment.36

1. McMaster, R.C. Nondestructive TestingHandbook, first edition. Vol. 1, Sec. 25.Columbus, OH: American Society forNondestructive Testing (1959):p 16-27.
2. API Recommended Practice 1104,Welding of Pipelines and RelatedFacilities, eighteenth edition.Washington, DC: American PetroleumInstitute (1994).
3. ASTM E 1025, Standard Practice forDesign, Manufacture, and MaterialGrouping Classification of Hole-TypeImage Quality Indicators (IQI) Used forRadiology. West Conshohocken, PA:ASTM International (1998).
4. ASTM E 747, Standard Practice forDesign, Manufacture and MaterialGrouping Classification of Wire ImageQuality Indicators (IQI) Used forRadiology. West Conshohocken, PA:ASTM International (1997).
5. Bagarry, A. and A. Sambranov.“Seismic Activity Calls for ModifiedRadiographic Technique in PipingSystem Inspection.” MaterialsEvaluation. Vol. 55, No. 4. Columbus,OH: American Society forNondestructive Testing (April 1997):p 452-453.
6. Placious, R.C., D.A. Garrett,M.B. Kasen and H. Berger.“Dimensioning Flaws in Pipeline GirthWelds by Radiographic Methods.”Materials Evaluation. Vol. 39, No. 8.Columbus, OH: American Society forNondestructive Testing (July 1981):p 755-760.
7. Wenk, S.A. “Radiographic VideoTechnique for Sizing Defects in PipeWelds.” Materials Evaluation. Vol. 39,No. 8. Columbus, OH: AmericanSociety for Nondestructive Testing(July 1981): p 748-751. Errata,Materials Evaluation, Vol. 39, No. 10(September 1981): p 938.
8. ASME Boiler and Pressure Vessel Code:Section V, Nondestructive Examination.Article 2, “Radiographic Examination.”New York, NY: American Society ofMechanical Engineers (2001): p 16-59.
9. ASME Boiler and Pressure Vessel Code:Section III, Rules for Construction ofNuclear Facility Components. Div. 1,Subsections NB and NC, Class 1 andClass 2 Components. New York, NY:American Society of MechanicalEngineers (2001).
10. ANSI/ASME B 31.1, Power Piping. NewYork, NY: American Society ofMechanical Engineers (1998).
11. ANSI/ASME B 31.3, Process Piping. NewYork, NY: American Society ofMechanical Engineers (1999).
12. Marks, P.T. “The Generation of Error inInterpretation.” 1993 InternationalChemical and Petroleum IndustryInspection Technology III TopicalConference [Houston, TX]. Columbus,OH: American Society forNondestructive Testing (June 1993):p 90-91.
13. Burkle, W.S. “Application of TangentialRadiographic Technique for EvaluatingPipe System Erosion/Corrosion.”Materials Evaluation. Vol. 47, No. 10.Columbus, OH: America Society forNondestructive Testing (October1989): p 1184, 1186-1188.
14. Krolicki, R.P. “Internal CorrosionExamination and Wall ThicknessMeasurement of Pipe by RadiographicMethod.” Materials Evaluation. Vol. 35,No. 2. Columbus, OH: AmericanSociety for Nondestructive Testing(February 1977): p 32-33, 44.
15. Loftus, T. “Integrating Profile andComputed Radiography for Internaland External Corrosion Detection,Evaluation and Monitoring.” ASNT’sInternational Chemical and PetroleumIndustry Inspection Technology (ICPIIT)VI Topical Conference: The Challenges toNDT in the New Millennium [Houston,TX]. Columbus, OH: American Societyfor Nondestructive Testing (June1999): p 77-86.
16. Gupta, N. and B. Isaacson. “Near RealTime In-Service Pipe ComponentInspection without RemovingInsulation.” The 9th Asia-PacificConference on Nondestructive Testing inConjunction with ASNT’s 1998 SpringConference and 7th Annual ResearchSymposium [Anaheim, CA]. Columbus,OH: American Society forNondestructive Testing (March 1998):p 217-220.
539Radiographic Testing in Utility, Petroleum and Chemical Industries
References
3RT19_Layout(513_542) 10/2/02 3:19 PM Page 539
17. Winfield, C. and J.D. Bowman.“Radiotracer Methods for FlowMeasurement and Online LeakDetection.” 1993 InternationalChemical and Petroleum IndustryInspection Technology III TopicalConference [Houston, TX]. Columbus,OH: American Society forNondestructive Testing (June 1993):p 86-89.
18. Winn, W.G. “Neutron RadiographicDetection Limits of Fluids in MetalPipes.” Materials Evaluation. Vol. 34,No. 9. Columbus, OH: AmericanSociety for Nondestructive Testing(September 1976): p 207-212.
19. Regas, S. “Industrial Applications ofRadioisotopes, Nuclear Liquid LevelGauges.” Nondestructive Testing.Vol. 16, No. 6. Columbus, OH:American Society for NondestructiveTesting (November-December 1958):p 493-494.
20. Forrer, G.R. and F. J. Sattler.“State-of-the-Art Review ofNondestructive Testing as Applied toNuclear Pressure Vessels andComponents.” Materials Evaluation.Vol. 33, No. 10. Columbus, OH:American Society for NondestructiveTesting (October 1975): p 20A-23A,25A-27A.
21. Lapides, M.E. “Radiographic In-ServiceInspection of Cast Austenitic NuclearPlant Components.” MaterialsEvaluation. Vol. 44, No. 1. Columbus,OH: American Society forNondestructive Testing (January 1986):p 108-113.
22. Freeman, W.E. and M.L. Turnbow.“Miniature Linear Accelerator forRadiography of Nuclear PlantComponents.” Materials Evaluation.Vol. 49, No. 10. Columbus, OH:American Society for NondestructiveTesting (October 1991): p 1341-1342.
23. Cabe, D. “Radiography of Main SteamPiping Welds Enclosed within GuardPipe.” Materials Evaluation. Vol. 47,No. 10. Columbus, OH: AmericanSociety for Nondestructive Testing(October 1989): p 1126-1128.
24. API Standard 650, Welded Steel Tanksfor Oil Storage, tenth edition.Washington, DC: American PetroleumInstitute (1998).
25. API Standard 653, Tank Inspection,Repair, Alteration, and Reconstruction,third edition. Washington, DC:American Petroleum Institute (2001).
26. Knight, R.B., Jr., C. Maucher andT.S. Jones. “A Method to DetermineErosion in Sealed Double WalledVessels Using Gamma Ray Sources andLaminographic Tomosynthesis.” The9th Asia-Pacific Conference onNondestructive Testing in Conjunctionwith ASNT’s 1998 Spring Conference and7th Annual Research Symposium[Anaheim, CA]. Columbus, OH:American Society for NondestructiveTesting (March 1998): p 217-220.
27. Foster, B.E. and S.D. Snyder.“Measurement of Carbon CoatingThickness on Microspheres of NuclearFuels.” Materials Evaluation. Vol. 28,No. 1. Columbus, OH: AmericanSociety for Nondestructive Testing(January 1970): p 13-16.
28. Panakkal, J.P., K.N. Chandresekharanand J.K. Ghosh. “RadiographicDetection of Tungsten in Nuclear FuelPin End-Plug Welds.” MaterialsEvaluation. Vol. 43, No. 8. Columbus,OH: American Society forNondestructive Testing (July 1985):p 1005-1007.
29. Stupin, D.M. “Filmless RadiographicDetection of Microscopic Wires andVery Small Areal Density Variations.”Materials Evaluation. Vol. 45, No. 12.Columbus, OH: American Society forNondestructive Testing (November1987): p 1315-1319.
30. Scott, D.M. “Density Measurementsfrom Radioscopic Images.” MaterialsEvaluation. Vol. 47, No. 10. Columbus,OH: American Society forNondestructive Testing (October1989): p 1113-114, 1116-1119.
31. Foster, B.E. and S.D. Snyder.“Evaluation of Variables in theMeasurement of Fuel Concentration.”Materials Evaluation. Vol. 26, No. 2.Columbus, OH: American Society forNondestructive Testing (February1968): p 27-32.
32. Hansche, B.D. “Film-Based ComputedTomography of Nuclear-Fuel-DamagedExperiments.” Materials Evaluation.Vol. 47, No. 6. Columbus, OH:American Society for NondestructiveTesting (June 1989): p 741-745.
33. Richards, W.J., G.C. McClellan andD.M. Tow. “Neutron Tomography ofNuclear Fuel Bundles.” MaterialsEvaluation. Vol. 40, No. 12. Columbus,OH: American Society forNondestructive Testing (November1982): p 1263-1267.
34. Bernardi, R.T. and H. Martz, Jr.“Nuclear Waste Drum Characterizationwith 2 MeV X-Ray and Gamma-RayTomography.” Materials Evaluation.Vol. 53, No. 10. Columbus, OH:American Society for NondestructiveTesting (October 1995): p 1121-1122,1124-1126.
540 Radiographic Testing
3RT19_Layout(513_542) 10/2/02 3:19 PM Page 540

35. Collins, R.V. “The Role of NDT in anElectric Utility.” Materials Evaluation.Vol. 30, No. 5. Columbus, OH:American Society for NondestructiveTesting (August 1972): p 174-180.
36. Strange, W.F., G.H. Ault andE.A. Capadona. “Radiographic Testingof Cables and Hardware for PowerTransmission and Oceanography.”Materials Evaluation. Vol. 27, No. 1.Columbus, OH: American Society forNondestructive Testing (January 1969):p 16-22.
37. Carpenter, O.R. “Some Results ofAdvances in Welding and Radiographyon the Welding of Pressure Vessels”[1945 Lester Honor Lecture]. IndustrialRadiography and Nondestructive Testing.Vol. 5, No. 1. Columbus, OH:American Society for NondestructiveTesting (Summer 1946): p 9-17.
38. Moriarty, C.D. “Progress inNondestructive Testing of SteamTurbine-Generator Components”[1960 Mehl Honor Lecture].Nondestructive Testing. Vol. 19, No. 1.Columbus, OH: American Society forNondestructive Testing(January-February 1961): p 29-38.
39. Hovland, H. “Developments in FieldX-Radiography, 1931–62.” MaterialsEvaluation. Vol. 43, No. 11. Columbus,OH: American Society forNondestructive Testing (October1985): p 1386-1390.
40. Moore, P.O. “A Gamma-Radiographerof Pipeline Welds.” MaterialsEvaluation. Vol. 43, No. 9. Columbus,OH: American Society forNondestructive Testing (August 1985):p 1084-1086, 1088-1089.
41. Neutron Radiography: Proceedings of theFirst World Conference (San Diego, CA,December 1981]. Dordrecht,Netherlands: D. Reidel PublishingCompany (1983).
42. Neutron Radiography: Proceedings of theSecond World Conference (Paris, France,June 1986]. Dordrecht, Netherlands:D. Reidel Publishing Company (1987).
43. Ross, A.M. “Neutron RadiographicInspection of Nuclear Fuels.” AtomicEnergy Review. Vol. 15, No. 2. Vienna,Austria: International Atomic EnergyAgency (1977): p 221-247.
541Radiographic Testing in Utility, Petroleum and Chemical Industries
3RT19_Layout(513_542) 10/2/02 3:19 PM Page 541

Lisa Brasche, Iowa State University, Ames, Iowa
Donald J. Hagemaier, Huntington Beach, California
20Aerospace Applications of
Radiographic Testing1
C H A P T E R
3RT20_Layout(543_568) 10/14/02 3:29 PM Page 543

544 Ra
PART 1. Film Radiography of AviationComponents
FIGURE 1. R
Skin cra
FIGURE 2. Radiograph showing corrosion in bondedhoneycomb.
Water filled honeycomb cellsCorrosion in honeycomb
FIGURE 3. Mobile X-ray system.
3RT20_Layout(543_568) 10/14/02 3:29 PM Page 544
Radiography inspection plays a criticalrole in the life cycle management ofaviation components with applicationsduring production and service. Initialapplications of radiography to aerospaceinspections occurred over 50 years ago.During the years from 1955 to 1965, theaircraft industry produced the firstcommercial jet transports with expansionin the aerospace field to ballistic missiles,research rocket aircraft and the beginningof manned space flight. The rapid growthin engineered systems placed newdemands on nondestructive testing.2,3
Initial routine applications usedradiographic testing to check castings andweldments for discontinuities as part offabrication quality control.4,5 Many small,lightweight aluminum castings wereinspected semiautomatically byfluoroscopy. Nationally, commercialaircraft and military aircraft wereperiodically X-rayed to detect fatiguecracks (Fig. 1) and corrosion (Fig. 2).Lightweight portable X-ray machines werenot available at this time, which requiredspecialized designs like the boommounted, mobile X-ray unit (Fig. 3) thatallowed placement of the X-ray source inthe proper position for each exposure. Itwas especially useful for radiography ofwings and empennage structures. In the1970s, the aerospace industry wasengaged in the moon projects, wide bodycommercial transports, research andmilitary satellites, advanced ballistic
diographic Testing
adiograph showing cracks at door corner.
Frame crack
End of titanium crack
ck
Jamb crack
missiles and the beginning of the spaceshuttle program. These advances placednew demands on radiographic testing.
Automated Inspection5,6
Computers are used in all aspects ofinspection, for data gathering, processing,transmission and storage. Automation ofradiographic testing can take any ofseveral forms.6

FIGURE 4. In-motion radiography of welded steel tanks:(a) schematic; (b) photograph.
Aft X-ray tube withrestricted aperture
Weld
Direction of carriage travel
Forward X-ray tubewith restricted
aperture
70 mm (2.8 in.) stripfilm outside shell
70 mm (2.8 in.) filmoutside three welds
Weld
(a)
(b)
3RT20_Layout(543_568) 10/14/02 3:29 PM Page 545
1. Radioscopic inspection may take placein assembly lines for mass productionof components, such as printedcircuits, that are later integrated intoaircraft.
2. Robotic inspection calls forprogrammed control of test objectposition, including loading into,orientation with and offloading fromtest system.
3. Automatic inspection involvesprogrammed manipulation andindexing of source or sensor systemcomponents relative to a test objectin situ.
In-Motion Radiography5
Applications of radiography have involvedinspection in support of the manufactureof intermediate range ballistic missiles. Amajor problem is to provide techniquesfor the X-ray inspection of large tankweldments — imperative to meet schedulerequirements for reliability, to maketimely delivery of missile components andto keep costs commensurate with those ofan average product development.
In-motion radiography of weldmentsin one case has required that an X-rayfacility be built and special equipmentdesigned or purchased. In the absence ofpackaged strip film, engineers havedesigned and built a machine to cassette70 mm roll film. The technique consistsof placing two rod anode X-ray tubes on aboom and porting the X-rays through anaperture that projects a narrow beam tothe longitudinal welds of the tank. Thewelded tank was placed on a carriage thatrode a track anchored on the floor of theexposure room (Fig. 4). An electricalvariable speed drive propelled the carriageand tank along the track at a speed of0.15 m·min–1 (0.5 ft·min–1).Simultaneously, the three longitudinalweldments were exposed to the X-raybeams.
Two 150 kV X-ray units were used toreduce the exposure time by half. Onetube was located at the end of the boomand a second was located half the tanklength behind it. With this arrangement,it was necessary to propel the tank onlyhalf its length to obtain completeexposure of the three longitudinal welds.The aft X-ray tube was positioned insidethe boom to compensate for the twodifferent tank lengths. The carriage drivemechanism and X-ray machines weresynchronized to operate simultaneouslywhen the start button was pushed in thecontrol room. Three lead ports were usedto restrict the X-ray beams to the threelongitudinal welds. The slits in the portends were 3.2 mm (0.13 in.) long and25.4 mm (1.00 in.) wide, producing abeam 25.4 mm (1.00 in.) long and
2(c
ur
FIAtfintjsadiapt
03 mm (8.0 in.) wide, at a 1.22 m48 in.) source-to-film distance. Table 1ompares the techniques used.
In-motion radiography has also beensed for liquid hydrogen tanks in solidocket motors (Fig. 5).
light Test Aircraftnspection7
pplications also include a nondestructiveesting unit to perform inspections oflight test passenger jet aircraft. To addressssues that arise with performingondestructive testing in the field, such as
he transportation of equipment to theob, a mobile laboratory was designedpecifically to house portable equipmentnd to serve as an X-ray film processingarkroom. The system was used for
nspection of jetliners and militaryircraft. An elaborate, accelerated testrogram was undertaken during the flightest phase of the passenger jet in 1957.
545Aerospace Applications of Radiographic Testing

546 R
TABLE 1. Comparison of techniques used for in-motion radiography of longitudinal welds.
Distance from FocalThickness Length Voltage Amperage Point to Sensor Travel______________ ____________ ___________________ __________________
Material mm (in.) m (ft) (kV) (mA) m (in.) mm·s–1 (in.·min–1)
2014 aluminum 9.53 (0.375) 6.1 (20.0) 90 15.0 1.22 (48) 2.5 (6.0)2014 aluminum 9.53 (0.375) 4.6 (15.1) 90 15.0 1.22 (48) 2.5 (6.0)4340 steel 2.29 (0.090) 3.7 (12.1) 150 3.5 0.46 (18) 1.7 (4.0)4340 steel 1.65 (0.065) 2.0 (6.6) 140 3.5 0.46 (18) 1.9 (4.5)4340 steel 3.81 (0.150) 4.3 (14.1) 160 4.0 0.51 (20) 1.5 (3.5)
FIGURE 5. In-motion radiography of liquidhydrogen tanks: (a) X-ray tube, collimatingslit and drive mechanism; (b) film transportmechanism for stop frame radiographicsystem used on forward dome.
(b)
(a)
3RT20_Layout(543_568) 10/14/02 3:29 PM Page 546
The equivalent of 40 to 120 years ofendurance (depending on the type ofoperation) under simulated service loadswas imposed on the test specimens. Inthis way, damage propagation rates andfailsafe characteristics of the structurewere studied under deliberately prolongedexposures to fatigue beyond thatpermissible in actual service. From thisinformation, the company decided whatareas to survey with nondestructivetesting.
The passenger jet was X-rayed toascertain that all extraneous material(debris) had been removed from allcontrol surfaces — ailerons, flaps,elevators, rudder and vertical orhorizontal stabilizers. It required 480 filmsof 360 by 430 mm (15 × 17 in.) each tocover the necessary areas. The airplaneswere then turned over to a testingdivision for evaluation and certification.In flight tests aircraft were subjected tostress levels above those normallyencountered in regular service. Hence, allcritical areas were periodically surveyed100 percent. The technician placed thefilm on one side of the vertical stabilizerand then moved the bucket to theopposite side to make the exposure(Fig. 6).
The closed areas and control surfaces ofjet aircraft are also radiographed for debrisor discontinuities as part of final assemblyinspection. Figure 7a shows the placementof 360 by 430 mm film over the structureto be inspected. The X-ray source ispositioned to expose a large area of theassembly, as shown in Fig. 8. The film isread and discrepancies are reported. Thearea is opened up and the debris isremoved and compared with the objectindicated by the film images. Typicaldebris includes tools, springs, wire clips,flashlights, nuts, bolts and paint brushes.
Routine inspection for fabricationerrors or discontinuities in closed areas isaccomplished simultaneously with thedebris survey. Defective areas are reportedand corrective action is implemented.Film evaluation and corrective action areperformed in the shortest possible time.The radiographs may show both debris
adiographic Testing
and workmanship errors consisting ofinadequate rivet shank-to-hole fit andshort hole-to-edge distances. Radiographsof aircraft structure contain a wide rangeof densities and complicated geometricalimages.
Aircraft X-ray inspection can readilylocate the following discrepancies: cracks,corrosion, double drilled holes, oversizedholes, short hole-to-edge distances, loose

FIGURE 7and stru
3RT20_Layout(543_568) 10/14/02 3:29 PM Page 547
rivets and loose hardware. It is also usedto check for missing assemblies and usedfor general inspection of closed areas.
CompositesRadiographic testing has found variousapplications in the inspection ofengineered materials such as compositelaminates.4,8-10
Brazed Honeycomb StructuresIn the 1960s in-motion radiographicinspection of brazed honeycombstructures was developed for militaryaircraft. A radiation collimator wasdesigned and fabricated with an
FIGURE 6. Radiographic inspection of aircraftstabilizer.
. X-ray film placement on vertical stabilizer for debrctural inspection.
adjustable aperture for controlling theradiation pattern and hence theunsharpness gradient necessary forblurring of all preselected details nearestto the radiation source without causingunsharpness of the image surface adjacentto the film. The focal-to-film distance wasestablished at 910 mm (36 in.). Theoptima in definition, area coverage,radiation potential and speed of travelwere considered in determining thefocal-to-film distance for brazedhoneycomb. The X-ray exposure wasaccomplished by controlled linearmovement of the brazed assembly acrossthe area of radiation emitted by thestationary collimated X-ray source (seeFig. 9).
547Aerospace Applications of Radiographic Testing
is
FIGURE 8. Position of X-ray source to expose maximum areaof structure being radiographed.
FIGURE 9. In-motion radiography facility for brazedhoneycomb structure.

548
3RT20_Layout(543_568) 10/14/02 3:29 PM Page 548
The fine grained, high contrast filmwas cut in widths of 300 mm (1 ft) andvaried in length. Cassettes toaccommodate the various lengths of X-rayfilm were designed and fabricated from aspecial plastic material suitable forradiographic work. The plastic cassetteswere secured in intimate contact with thehoneycomb panel by precut lengths ofmagnetic rubber strips placed on thecassette and magnetically attached to thehoneycomb panel.
In all phases of the operation,in-motion radiography was less timeconsuming than conventionalX-radiography. The ease of operationwas particularly noted in theinterpretation of the radiographs.Figure 10a is a conventional (still)radiograph showing brazed fillets on thesource and film side (double surface) ofthe panel. Figure 10b is an in-motion
Radiographic Testing
FIGURE 10. Brazed honeycomb structure:(a) conventional (not moving) radiograph oftwo surfaces; (b) in-motion radiograph ofone surface.
(a)
(b)
radiograph showing only the brazed filletson the film side (single surface) of thepanel. It is much easier to detect lack ofbraze and to measure the fillet width onthe latter radiograph.
Helicopter CompositeRotor/Propeller Blades11
Significant performance improvements inrotor/propeller blades were realized byproper use of composite materials. From1954 to 1962, intensive research intomaterials and fabrication techniques wereperformed and backed up by componentand sample fatigue testing. The successfuluse of fiber reinforced composite materialsin helicopter rotor blades leads naturallyto an improved capability for a successfulV/STOL propeller design.
To fully appreciate the enormity andimportance of the nondestructiveinspection to be done, one must be awareof the types of loads that rotor blades bearand the general construction of the blade.Rotor blades in service are subjected to avariety of static and cyclic loads. Theseloads include beam, centrifugal, torsionaland flatwise and cordwise bending.
One of the most important tasks in theuse of composites is the development ofthe nondestructive testing capability toensure that the hardware to be tested is ofknown quality. Some of the mostchallenging efforts come not in theselection of nondestructive test techniqueto use but in the mechanism necessary forpractical application of that technique tothe complex structure of a rotor/propellerblade. Figure 11 shows a concept of theautomated penetrating radiationinspection equipment provided for anX-ray sensitive vidicon and imageintensifier presentation. The system wasbasically a mobile X-ray unit in which theblade is fixed within two tracks and the
FIGURE 11. X-ray structure sensitive vidiconand image intensifier system concept.
Camera
Blade
Televisionmonitor
Control console
Handling equipment

FIGURE 12of honey(c) cell st
(a)
(b)
3RT20_Layout(543_568) 10/14/02 3:29 PM Page 549
enclosed generator-and-detector systemtraverses the length of the rotor blade.
The X-ray vidicon image was presentedon a remote 430 mm (17 in.) video screenat about 30×. The image amplificationsystem also presented a view on the samescreen at 1:1. The viewing area using thevidicon tube was about 13 by 13 mm(0.5 × 0.5 in.) with 1 to 2 percent imagequality indicator sensitivity whereas theviewing area of the image amplifier isabout 200 × 200 mm (8 × 8 in.) with 3 to4 percent image quality indicatorsensitivity.
Both the X-ray generator and pickuptubes had free 90 degree movement toallow for selection of the viewing anglethat proved to be most desirable. Viewingspeed was variable, the maximum speedbeing limited by interpreter perception.All controls and viewing apparatus wereremote. Figure 12 shows somephotographs taken of the video screenshowing various conditions anddiscontinuities.
549Aerospace Applications of Radiographic Testing
. Typical vidicon monitor presentations: (a) imagecomb structure; (b) cell wall fracture and separation;ructure deformation; (d) cell wall separation.
(c)
(d)

550
PART 2. Radiographic Testing of Space FlightComponents
3RT20_Layout(543_568) 10/14/02 3:29 PM Page 550
Solid Propellant RocketMotors
Saturn Fuel and Oxidizer TankWeldmentsDuring the early 1960s, many engineeringtalents were applied to the NationalAeronautics and Space Administration’sefforts for manned space flight. Thisincluded fabrication of 6.7 m (22 ft)diameter tanks for the Saturn moonrocket (Fig. 13). The weld jointconfiguration for the SIV-B is illustrated inFig. 14. Initially, the in-motion techniqueusing the welding fixture was used on thedome welds but was discontinued becausesmooth movement of the fixture was notachieved. The conventional techniqueslocated a 100 kV beryllium window X-raytube on a fixture inside the dome.12 About1.2 m (4 ft) of extra fine grain film wascovered in each exposure. Circular domemovement was used between exposures toalign each of nine segment welds with theX-ray beam. In Fig. 15, the operator isplacing 70 mm (2.8 in.) strip film overeach weld. After the nine films areexposed, the operation was repeated three
twt
LDtrUssuraDppt
(mwdcwctmntae
Radiographic Testing
Boosterstage
Secondstage
Third stage
FIGURE 13. Liquid propellant rocket enginesused to launch Apollo Saturn moon rocket.
imes to cover the full length of eacheld. The cylindrical section welds, or
ank welds, were similarly radiographed.
arge Rocket Motorsuring a time of international tension in
he 1950s and 1960s, solid propellantockets became an important part of thenited States arsenal. These missile
ystems consisted of ground, air andubmarine launched vehicles. They weresed in intercontinental and intermediateange missiles, where high performancend immediate readiness were required.iscontinuities in the propellant andropellant-to-liner joint affect theerformance, reliability and safety ofhese motors.
Radiography of large, 0.75 to 1.5 m2.5 to 5 ft) diameter, solid propellant
otors can be accomplished in severalays. If the central perforation is of aesign that permits the insertion of aassette, radiography can be accomplishedith a 2000 kV X-ray source or a
obalt-60 gamma ray source located onhe exterior and the film placed inside the
otor (Fig. 16a). If the motor design doesot permit the insertion of a cassette,
hen radiography can only beccomplished by radiation penetrating thentire unit (Fig. 16b). For thicknesses
greater than 760 mm (30 in.), X-rayenergies above 2 MeV are required.Therefore, most of the earlier work wasdone with 10, 22 and 31 MeV betatrons.13
In the 0.5 to 6 MeV range, the van degraff and resonant transformer types ofX-ray equipment were capable ofproviding the intensity and penetratingpower necessary for high qualityradiography in propellant thickness rangeup to 760 mm (30 in.). Above about5 MeV, however, and for heavierpropellant sections, these two directacceleration techniques becameimpractical. In their stead, the betatronand microwave linear electron accelerator(linac) were required. The radiationoutput from betatrons is in the 25 to50 mC·kg–1 (100 to 200 R) per minuterange, whereas the linear acceleratorradiation output ranges from 130 mC·kg–1
to 2.5 C·kg–1 (0.5 to 10.0 kR) per minuteand can thus rapidly radiograph thickpropellant sections as illustrated inFig. 17. High energy equipment wasdeveloped in the 1950s.14

551Aerospace Applications of Radiographic Testing
FIGURE 14. Weld joint configuration for Saturn SIV-B rocket.
Fittings Flange and center plates
Meridian seams on forwardand aft dome and commonbulkhead face assembly
Cylindrical tanklongitudinal seams
Seal weld
Common bulkhead andliquid oxygen tank
assembly
Tank assembly andaft cylindrical tank rings
Tank assembly andforward cylindrical
tank rings
FIGURE 15. X-ray technician placing film ondome segment welds before radiographicinspection.
FIGURE 16. Radiography of solid propellantrocket motors: (a) single-wall radiography;(b) double-wall radiography.
(a) Film
Source
Film
Propellant
Liner
(b) Film
Film
Film
Source
Film
FIGURE 17. Exposure thickness data forpropellant at various X-ray energies.
Exp
osur
e tim
e (m
in)
1000
100
10
1.0
0.1
A
B
C
D
0 0.5 1.0 1.5 2.0(20) (40) (60) (80)
Propellant thickness, m (in.)
LegendA. 2000 kV peak at 1.5 mAB. 10 MeV betatron at 7.0 Sv·min–1 (700 R·min–1)C. 22 MeV betatron at 1.4 Sv·min–1 (140 R·min–1)D. 10 MeV linear accelerator at 10 Sv·min–1
(1000 R·min–1)
MOVIE.Automatedinspection ofrocket motor.
3RT20_Layout(543_568) 10/14/02 3:29 PM Page 551

552
3RT20_Layout(543_568) 10/14/02 3:29 PM Page 552
Jet Engine Inspection14,15
On-aircraft, periodic gamma rayinspection of jet engines is used fordetection of compressor and turbine bladedamage, including hot gas damage ofburner cans. Possibly one of the greatestassets of the inspection is the ability tojudge turbine blade alignment. Theflexible isotope guide is inside a rigidaluminum tube and inserted through theaxial engine drive shaft to apredetermined distance. The iridium-192source is stopped at the selectedlongitudinal locations along the engineaxis, as illustrated in Fig. 18. The film isplaced on the outside of the area to beinspected. The film (as shown in Fig. 19a)is evaluated for evidence of excessivewear, misalignment or otherunsatisfactory conditions. Figure 19b,photographed after engine disassembly,shows that a stator blade had worn its slotexcessively and the resulting vibrationhad caused a crack in the retainer ring. Ifnot detected, the resulting internaldamage to the engine can cause completefailure.
Small Ablative ThrustChambers16
Silica phenolic materials have been usedextensively in the manufacture of exhaustnozzles for solid propellant rocket motors.In this particular application, the materialmust withstand high intensity, short timeablation and erosion. In spacecraftengines for Gemini or Apollo, however,the motor is pulse fired at intervalsthroughout the mission to a totalaccumulated time of 10 to 20 min. Thehypergolic engines are designed toproduce from 111 to 445 kN (25 to100 lbm) of thrust in environments found
Radiographic Testing
FIGURE 18. Iridium-192 gamma ray inspection
Sixteenth stage exit guide vanes
Film around engine circumference
at over 160 km (100 mi) above sea level. Itis apparent that the quality reliability ofthese small engines must be ensured forthe intended mission of the spacecraft. Anillustration of the type and number ofmotors in the Gemini vehicle is shown inFig. 20.
The radiographic testing of ablativematerials has revealed variousdiscontinuities, such as delaminations,porosity, cracks and resin rich or resinstarved bands. Detail parts inspectionrevealed discontinuities similar to thosefound in the billets. These discontinuitieswere undetected because the originalbillets were not radiographed or wereimproperly radiographed. Tangentialradiographs also revealed case-to-ablativeadhesive voids and porosity.
Tangential radiographic inspection ofthe case-to-ablative bondline is illustratedin Fig. 21. Measurement of the filmdensity at an interface is not possibleunless a separation of 0.75 mm (0.030 in.)or greater exists, because the minimumaperture on a standard densitometer is0.75 mm (0.030 in.). Measurements ofgaps less than this require an automaticscanning microdensitometer.
It was found generally that the X-rayabsorption of most adhesives was verylow, causing interpretation problems ofcase-to-ablative and other bond jointinterfaces. Thick or thin bond jointsyielded different radiographic results thatwere difficult to interpret. To compensatefor the problem, a small percentage ofantimony trioxide was added to theadhesives. This material did not affect thecohesive bond strength but made thejoint more opaque to X-ray and bondlinediscontinuities became more apparent byrevealing the presence of adhesives asillustrated in Fig. 22.
The verification of delaminations andlocation of leakage paths was proved byradiographing various specimens and
of jet engine.
Film around engine circumferenceSpherical gamma ray emission
Isotope iridium-192
Sixteenth stage exit guide vanes

553Aerospace Applications of Radiographic Testing
FIGURE 19. Gamma radiography of vanesegments in jet engine: (a) gammaradiographs; (b) visual crack indicationpreviously revealed by gamma rayinspection of vane guide.
(a)
(b)
FIGURE 20. Gemini vehicle space engines.
Two 45 kg(100 lbm)engines
Sixteen 11 kg (25 lbm) engines
Eight 11 kg (25 lbm) engines
Four 45 kg (100 lbm) engines
Two 39 kg (85 lbm) engines
FIGURE 21. Tangential radiographic technique for case bondusing a microphotometer: (a) setup; (b) recording.
X-ray focal point
X-ray
FilmMotortangentimage
Brush pen recorder
Microphotometerresponse fromtangent radiograph
Film motionLight
source
Lightmeter
(a) (b)
FIGURE 22. Case-to-ablative bonddiscontinuities are revealed by radiopaqueadditive in adhesive: (a) first image;(b) closer image.(a)
(b)
3RT20_Layout(543_568) 10/14/02 3:29 PM Page 553

554
3RT20_Layout(543_568) 10/14/02 3:29 PM Page 554
motors before and after soaking in X-rayopaque solutions. Different solutions weretried but the one yielding the best resultswas a concentrated water solution of leadacetate and lead nitrate. All delaminationsand leakage paths were detected after a1 h soak period and rinse (Fig. 23). Motorsshowing delaminations and leakage pathswere rinsed thoroughly with deionizedwater to remove most of the lead solutionand were then dried and pressureimpregnated with resin. Reradiographingafter resin impregnation usually indicatedthat the void was filled, thereby makingthe part acceptable for use. Motorsrepaired in this way were hot firedsuccessfully, indicating the adequacy ofthe repair procedure.
Video Radioscopy and X-RayImage Intensifier Tests17
The normal technique of inspecting smallablative thrust chambers requires thateach chamber be radiographed before hotfiring and also at subsequent intervalsduring the test program. This plan entailsdisassembly of the chamber and shippingit to the X-ray laboratory for radiographic
Radiographic Testing
FIGURE 23. Soaking in saturated solution oflead acetate and lead nitrate: (a) beforesoaking; (b) after soaking.
(a)
(b)
testing. After inspection, the chamber isreturned to the cell for further testing.The prime factor of discoveringdiscontinuities when they occur andbefore they can lead to failure is missedby this technique of using X-ray imageequipment in conjunction with motionpicture film. Sequencing of the thrustchamber image during hot firing willensure that complete failure analysis dataare obtained.
Cinefluorography has been usedsuccessfully to establish the mode offailure in small solid propellant rocketengines during hot firing.18 A similarstudy on solid propellant rocket engineswas reported.13 Cinefluorography of solidpropellant engines reveals the flame frontpattern and burning rate as a function ofcontrast differential in the test object. Thefailure analysis of liquid hypergolicablative engines by cinefluorography ismore concerned with the detail resolutionof discontinuities as they develop in thetest object.
The equipment consisted of afractional focus X-ray tube, full waverectified voltage transformer, X-raycontrol panel, high gain, image intensifiertube and an optical system for viewing.Additional accessory equipment can beused for special purpose applications.Such equipment consists of a 16, 35 or70 mm motion picture camera capable of7.5, 16, 30 or 60 frames per second(Fig. 24a). In this way, cinefluorographictime lapse studies may be made ofsystems while functioning. Such studiesmay include the analysis of small solid orliquid propellant engines during hotfiring. Other techniques include the use ofa television camera (kinefluorography) inplace of the positive print and
FIGURE 24. Comparison of cinefluorographyand kinefluorography: (a) cinefluorography,direct photography of output phosphor ofimage intensifier tube; (b) kinefluorography,photography of picture tube image ofoutput phosphor.
(a)Image intensifier tube
Optics Film
(b)
Image intensifier tube
OpticsFilm
Televisioncamera
tube
Display tube

(a)
FIGURE 25(b) after
3RT20_Layout(543_568) 10/14/02 3:29 PM Page 555
transmitting the image to a televisionmonitor (Fig. 24b).
An X-ray image intensifier system hasproved successful in determining themode and sequence of failure of ablativethrust chamber during actual firing.Delaminations, bond joint separationsand cracks were readily detected in testmaterials and assemblies. A high gainX-ray image system was installed at theRocketdyne test facility for hot firestudies. Excellent results were obtainedusing a 150 kV, 4 mA, 0.3 mm (0.012 in.)fractional focus X-ray tube in conjunctionwith a 230 mm (9.1 in.) diameter, highgain image intensifier.
Radiographic results of a chamber firedto failure are shown in Fig. 25. Test resultsof the failure mode were recorded on16 mm motion picture film at 32 framesper second.
Used as a process and quality controldevice during manufacturing operations,the X-ray image intensifier has manyapplications involving direct viewing ofthe image tube. Thus, the cost of film andthe time involved for film processing areavoided. Unusual phenomena might bephotographed with a positive print orregular camera when required. Cylindricalobjects can be rotated through360 degrees during viewing; in filmradiography, they would likely have to beX-rayed in two exposures at 90 degrees.Confidence in the detection ofdiscontinuities is greatly improved by the360 degree scan.
Parts to be inspected are placed on a130 mm (5 in.) turntable capable ofsupporting and rotating a 23 kg (50 lbm)assembly in either direction at 1 rotation
. Ablative thrust chamber: (a) before firing;firing.
Case separation
(b)
Delaminationseparations
Bond joint separatio
per minute. The turntable can be elevatedand depressed over a 250 mm (10 in.)travel. It can be positioned within about100 mm (4 in.) of the input phosphor forbest detail resolution of as far as 760 mm(30 in.) away for direct geometricmagnification. A horizontal travel of250 mm (10 in.) transverse to the X-raybeam also is provided. The X-ray tubehead itself can be traveled horizontally toprovide a range of 150 to 760 mm (6 to30 in.) from the input phosphor. Thisrange permits the use of very highradiation intensities at short focal lengthsor improved image sharpness at greaterfocal length, as different test problemsdictate.
In selecting parameters for a specifictest, the technician first positions the itemon the turntable and adjusts theelectrically driven lead shutters to confineradiation to the area of interest. Then,while observing the image tube, thetechnician selects the geometricrelationship best suited for the testobjectives. Next, the energy level (kV) isadjusted for the desired contrast and thetube current (mA) is adjusted forbrightness. The component then isscanned on either axis or is rotated, orcombinations might be used. When asignificant anomaly is observed, it can berecorded in a variety of ways for laterobservation.
A functional multienvironmentalfluoroscopic facility has been used for theevaluation of valves, switches, actuatorsand other components. The system canreveal the operation of internalcomponents under various dynamic andenvironmental conditions expected to beencountered during flight. Thetemperature and pressure of theinspection chamber can be varied to meetenvironmental requirements. A generalview of the test room and inspectioncabinet is shown in Fig. 26a and thecontrol console and X-ray image monitorare shown in Fig. 26b. Radioscopic resultscan be seen on the monitor and imagesare recorded on video media that provideplayback capability for the systemengineers responsible for analysis of eachcomponent tested.
Large Liquid PropellantRocket Engines19-21
Throughout the modern era of rocketry,liquid propellant rocket engines havedemonstrated their ability to provide highperformance, high reliability andoperational flexibility. It is mandatory tohave highly reliable launch vehicles.
The engine reliability program beginswith design and manufacture to ensure
n
555Aerospace Applications of Radiographic Testing

556
FIGURsystem
(b)
(a)
FIGURE 27. Apollo space vehicle booster engine, 6.67 MN(1.5 × 10⁶ lbf).
3RT20_Layout(543_568) 10/14/02 3:29 PM Page 556
accurate, high strength, failure freehardware. Extensive inspection proceduresfurther assist this phase. Enginecomponent testing follows inspection andfinally the liquid propellant rocket enginecan be subjected to extensive testing inthe development phase to uncover anypotential weakness. This extensive testeffort provides a high degree ofconfidence in the engine reliability.Liquid propellant rocket engines alsoprovide the capability of testing the articlethat will be used during the actual launch.Also, each engine is tested before it isdelivered to the customer and later eachstage and engine is tested as a unit andcompletely checked out before thelaunch. Fig. 27 shows a completed engine.Five of these 6.67 MN (1 500 000 lbf)thrust engines were used on the mannedSaturn moon rocket booster stage.19
Radiography is used to detect internaldiscontinuities in weldments and highstrength castings, to determine braze alloydistribution in brazed thrust chambers(Fig. 28) or components and to internallyinspect electrical assemblies for missing orbroken components. Special radiographic
puf
NSCTn
Radiographic Testing
E 26. Functional multienvironmental fluoroscopic: (a) installation; (b) control console.
rocedures have been developed fornique problems as indicated in theollowing paragraphs.
eutron Radiography ofpecial Aerospaceomponents
ypical aerospace items that have beeneutron radiographed include jet engine
FIGURE 28. Radiographic testing of thrustchamber tube-to-tube braze joints:(a) technique setup; (b) positive prints ofradiographs, arrows marking indications.
(b)
(a)
Braze joints

FIGURE 29. Attenuation in adhesive bonded, aluminumhoneycomb core, fiber matrix facing sheet, compositespecimens: (a) low kilovoltage X-rays; (b) thermal neutrons.
(b)
1
2
375 mm3.0 in.)
125 mm (5.0 in.)
Legend1. graphite2. boron
(a)
1
2
3
3RT20_Layout(543_568) 10/14/02 3:29 PM Page 557
turbine blades, adhesively bondedhoneycomb and laminates, ordnance orpyrotechnic devices, flight controls andmetal assemblies containing nonmetalO rings or seals.22-24 Inspection of suchparts is possible because neutronradiographic testing can detect certain lowdensity materials through heavy metalsections.
Attenuation of X-radiation isdetermined largely by the electron densityof the material being examined, so thatthicker and/or denser materials appearmore opaque. Neutrons undergo twomain types of reactions with atomicnuclei: absorption (capture) andscattering. The mass attenuationcoefficient for thermal neutrons is thus afunction of both the scattering andcapture probabilities for each element; thedensity of a particular material orcomponent is a poor predictor whether itwill be relatively transparent or opaque tothe passage of neutrons.25
High attenuation coefficients forthermal neutrons are exhibited byhydrogen and boron. Hydrogen has thehighest scattering coefficient whereasboron, cadmium, samarium andgadolinium have unusually high neutroncapture probabilities. For this reason,hydrogenous or boron containingmaterials being inspected by neutronradiography can be seen or delineatedfrom other elements in many cases whereX-radiography is inadequate. It is thuspossible to expose a specimen (forexample, a hydrogenous or boratedexplosive or a fuel sealed in a metalliccontainer) to a beam of thermal neutronsand to project an image having excellentresolution and contrast, therebydistinguishing between the chargematerial and its container while revealingany imperfections in the specimen.Similarly, neutron radiography permitsdetection of hydrides,26 which can causehydrogen embrittlement in welds and canbe used for nondestructive testing ofordnance (explosive) devices to determinethe relative density of the charge materialand/or the presence of voids or cracks.
Explosive and Pyrotechnic DevicesOne of the important applications ofneutron radiography is the quality controlof certain critical explosive devices, suchas pilot seat ejection cartridges,detonating cords and pressure cartridgesfor aerospace applications. These devicesnormally contain explosives orpropellants of low atomic numbers. Inmost instances, they also have metalhousings. Therefore, it is nearlyimpossible to inspect them effectivelywith postassembly X-ray examination.
(
However, because hydrogenous materials
have a high neutron scatter rate, aneutron radiograph will image gaps,cracks, low density areas or otherdiscontinuities that could prevent normaloperation.
A neutron radiograph will imagecertain materials of low atomic numberwhereas the X-radiograph does not. Thepowder train inside an explosive device iswell defined in the neutron radiograph,for example, but is not shown in theX-radiograph. Hence, neutronradiography has played a major role inyielding a no failure reliability forordnance devices in aerospace programs.
Adhesive Bonded CompositeStructures27
Thermal neutrons are highly attenuatedby boron and hydrogen atoms. Therefore,when an adhesive bonded laminate orhoneycomb specimen is neutronradiographed, the hydrocarbon adhesivebecomes very apparent because of its highneutron scatter. This condition is reversedfor X-radiography where metalcomponents are high attenuators. A highdensity boron fiber composite would becompletely opaque to a thermal neutronbeam, as shown in Fig. 29.
In Fig. 29, specimens have aluminumhoneycomb cores with adhesive bondedskins of graphite epoxy, boron epoxy andfiberglass.
557Aerospace Applications of Radiographic Testing
3. fiber glass

558
3RT20_Layout(543_568) 10/14/02 3:29 PM Page 558
Investment CastingsInvestment casting, also known as the lostwax process, is a manufacturing methodused to produce near net shape metalarticles. A wax pattern is produced byinjection molding into a die cavitytypically machined into aluminum. Thedie cavity replicates the desired castingshape. After molding, the wax pattern isdipped into a series of slurries thatcontain ceramic particles. Multiplecoatings of ceramic slurries are applied tobuild a sufficiently thick mold layer. Thedip layers are allowed to dry and hardenbetween applications.
The first layer of the mold is referred toas the face coat, important because it is incontact with the molten metal anddetermines the quality of the casting.Subsequent layers are referred to as backuplayers. After sufficient layers have beenapplied, the wax is melted from the shell,leaving a cavity whose shape is an exactreplica of the desired metal article.
The ceramic mold is sintered to make itdenser and stronger. Metal is then meltedand poured into the mold. Aftersolidification and cooling, the ceramicshell is removed leaving a metallic castingof the same geometry as the wax pattern.After shell removal, the casting isnondestructively tested to revealinclusions of mold material. Thesediscontinuities are removed by grindingand subsequently repaired by welding.
Investment casting has been used toproduce precise, high quality aerospaceengine components that range from 0.1to 1.2 m (a few inches to several feet) andare cast in a variety of alloys includingsteel, nickel, cobalt and titanium.
Titanium Castings for AerospaceStructuresAirframe manufacturers have beenexploring the use of titanium investmentcastings to replace componentstraditionally produced from forgings.Titanium investment castings in theseapplications reduce weight, costs and leadtime. The fatigue driven, fracture criticalenvironment of these aerospace structuresrequires a quality level higher thannecessary for titanium castings inaerospace engines. The design of thesefracture critical titanium castings is drivenby the ability to detect mold face coatinclusions in the components. Therequired thicknesses have challenged thelimits of radiographic testing.
Investment Casting of TitaniumThe investment casting of titanium posesseveral challenges due to the high
Radiographic Testing
reactivity of molten titanium. Ceramicmaterials used to produce face coats forthe investment casting of titanium mustbe stable and have low reactivity withmolten titanium. If the ceramic face coatmaterials are reduced by the molten andsolidifying titanium a type of brittle,oxygen enriched titanium called alphacase is generated. The amount of alphacase produced on a casting must belimited as mechanical properties arenegatively affected. This in turn restrictsthe candidate ceramic face coat materialsthat can be used.

PART 3. Techniques for Advanced Materials
FIGURE 30. In-motion radiography of composite wing skin.
3RT20_Layout(543_568) 10/14/02 3:29 PM Page 559
In the decade from 1975 to 1985, theaerospace industry was busy launchingthe space shuttle,28 producing highperformance jet fighters, attackhelicopters, missiles and satellites.Considerable work was accomplished indeveloping fiber reinforced plasticcomposite aircraft structures. In the 1980sand 1990s, radiography, particularly X-raybased imaging techniques andapplications, saw tremendous growth.29
As with many technologies, advances inspeed of data acquisition/analysis wereenabled by the improvements made incomputers and semiconductors. Advancesin digital radiography continue to affectthe aerospace industry, with manybenefits leveraged from medicalapplications. The Air Force ResearchLaboratory has served as a major fundingsource30-32 driving the development of allthree of the main components of apenetrating radiation system: a source ofradiation, a manipulation system for thetest object and a detector system. AirForce Research Laboratory investmentshave focused on improvements insensitivity with emphasis on cost effectiveapplications. Simulation tools have been afocus of work at several researchlaboratories.33,34 Recent aerospaceapplications are provided in theremaining section.
Advanced Materials
Adhesively Bonded HoneycombStructuresIn-motion fluoroscopic inspection ofmetallic bonded honeycomb structureshas been done for years by severalprominent manufacturers.35,36 In-motionradiographic techniques have been usedto inspect a variety of bonded honeycombstructures. These structures are composedof aluminum core bonded to eitheraluminum, boron epoxy or carbon epoxyskins. The inspections are performed todetect crushed core, core node separation,foreign objects, core splice discontinuitiesand core tie-ins at closures.
A collimator is used to limit the X-raybeam in the direction of motion. Rollfilms of required lengths and 70, 120, 254and 355 mm wide are used. The films are
processed in automatic film processingequipment and special film reading boxeshave been fabricated, some of whichprovide for viewing up to 1.5 m (5 ft) offilm at one time. The assemblies areoriented with the honeycomb cellsparallel with the X-ray beam and thedirection of motion is parallel to theribbon direction.
CompositesFigure 30 shows in-motion radiographybeing performed on carbon to epoxycomposite upper wing skin. Thecomposite skin is about 8 m (26 ft) tip totip and 1.8 m (71 in.) forward to aft at thecenterline. The stainless steel tool isdesigned to manipulate the assembly infive axes to permit orientation of thecontoured surface perpendicular to theX-ray beam. The X-ray tube head has alead shielded cone attached to the port tolimit radiation onto a narrow line about13 mm (0.5 in.) wide in the direction oftube motion. The tube support ismounted on the ceiling and has anextension up to 12 m (40 ft).
A more detailed view of the goosenecktube support and in-motion cone isshown in Fig. 31a. This figure shows abonded honeycomb assembly with boronepoxy skins on 360 mm wide roll filmthat is on 3 mm (0.12 in.) vinyl leadbackup material. The pendant control
559Aerospace Applications of Radiographic Testing

560
3RT20_Layout(543_568) 10/14/02 3:30 PM Page 560
permits movement of the tube support inthree directions.
The control console for a representativein-motion radiography system has thestandard X-ray control panel modified toprovide kilovoltage slope control duringthe in-motion exposure (see Fig. 31b). Asmany aircraft structures taper in thicknessfrom inboard to outboard, it is impossibleto maintain constant film density withoutadjusting X-ray parameters during thein-motion exposure. Kilovoltage waschosen as the variable because it can bechanged to match energy level with thethickness of the part. Anotherimprovement in the in-motion control isconstant speed control, whichautomatically compensates for varyingloads and maintains a constant speedreadout on a digital tachometer. Thetelevision monitor (Fig. 31b) displays thearea of the assembly being subjected toradiation. It does not provide an X-rayimage but is used to aid in alignment ofthe assembly.
Microfocus RadiographyNormal radiography is accomplishedusing 1 to 3 mm (0.04 to 0.12 in.) focalspots. Projection radiography can beaccomplished with a true microfocusX-ray source; that is, an X-ray tube with
a0f0r0ht
1Xoo(c(s(ctvmo
amzoXtwiFc
Radiographic Testing
FIGURE 31. In-motion radiography: (a) goosenpanel.
(a)
n electron focal spot smaller than.1 mm (0.004 in.). In practice, focal spotsrom 0.002 to 0.25 mm (8 × 10⁻⁵ in. to.01 in.) have proven to be useful foradioscopic systems37 and spots from.025 to 0.075 mm (0.001 to 0.003 in.)ave proven satisfactory for film
echniques using magnification.A typical system might contain a
60 kV constant potential microfocus-ray tube capable of continuousperation at 0.5 mA with a focal spot sizef 12 µm (5 × 10⁻⁴ in.). Using a 12 µm5 × 10–4 in.) focal spot size, the systeman resolve details as small as 25 µm0.001 in.) without magnification. Theystem may also contain a 230 mm9.0 in.) X-ray image intensifier opticallyoupled to a 15 MHz closed circuitelevision fitted with a 25 mm (1.0 in.)idicon image tube. With low absorbingaterials, projection magnification of 50×
r more may be obtained.A useful technique that can be
chieved with radioscopic projectionicrofocus radiography is that of
ooming or dynamically positioning thebject with a manipulation between the-ray tube and image receptor.38 In this
echnique, magnification is achievedhen the object is moved away from
mage receptor and toward the X-ray tube.igure 32 illustrates a single integratedircuit that was initially situated for low
eck tube support and cone assembly; (b) control
(b)

FIGURE 33. Microfocus radioscopic images:(a) jet engine blade; (b) enlargement.
(a)
(b)
3RT20_Layout(543_568) 10/14/02 3:30 PM Page 561
projection magnification of 2×. Theintegrated circuit was then zoomedtoward the X-ray tube through 10×, 50×and 250× magnification. It is evident thatthe higher the magnification, the moredetail one can see on the video monitor.
A similar test, done on a metal jetengine turbine blade is shown in Fig. 33aand at 10× magnification in Fig. 33b. Jetengine turbine blade inspection usingradioscopic microfocus radiography hasbeen performed for jet enginemanufacturers. The blades are inspectedfor cracks, voids, inclusions and pluggedcooling passages.
Computed TomographyComputed tomography (CT) combinesthe capabilities of the computer with anX-ray source for the inspection andanalysis of the internal structure ofobjects. Very minor changes in densitycan be accurately detected by a computedtomography system. Ordinary filmradiography inspection systems havesome major weaknesses. One is that theycreate only superimposed images ofartifacts. The superpositioning of images— lying one on top of another — distortsthe inspection results. Computedtomography eliminates superposition byexamining an object in a series of crosssectional slices from different views alongthe length of the object.
A computer calculates an image basedon the information in all the slices andreconstructs a two-dimensional picture ofa slice through the object. This precise,highly accurate, two-directional datapackage can be viewed on a cathode raytube screen, printed out in hard copy andstored on optical or magnetic media.39
In the 1980s computed tomographywas developed for industrial applications.Solid rocket motor components were
FIGURE 32. Microfocus radioscopic images ofintegrated circuit.
inspected, including cases, propellants,liners and igniters (Fig. 34).
The inspection system features a420 kV X-ray source to inspect objects upto 1 m (40 in.) diameter (Fig. 35). Therange of measurable signal levelsproduced is about 106 to 1, superior tothat offered by alternative techniques atthe time of testing. The information ismore complete, detailed and accurate andthe computer sorted images can bemanipulated and analyzed by design,manufacturing and quality engineers orstored for future reference.
Work has been completed for theUnited States Air Force to develop andimplement an automated device to X-rayinspect turbine blades and vanes.40 Thisradiographic inspection module uses a gasionization X-ray detector as the imagemedium. A computer processes thedetector output signal to generate digitalX-ray images. Advanced image processing
561Aerospace Applications of Radiographic Testing

562
FIGURE 34for aeros
pro
X-rayenergysource
FIGURE 35. Computed tomography system.
3RT20_Layout(543_568) 10/14/02 3:30 PM Page 562
software, operates on these digital imagesto make automated accept/rejectdecisions. The handling of the part duringX-ray exposure is carried out roboticallyunder computer control.
To detect internal material andmanufacturing discontinuities and tomake inspection decisions, the computeroperates on two data representations,depending on the application. The first isdigital fluoroscopy, or digital radiography,and results in a filmlike image (Fig. 36a).Digital fluoroscopy allows quickidentification of internal anomalies andother features of interest. The second iscomputed tomography (CT) and results ina cross sectional image (Fig. 36b). Thislatter data format, although requiringmore time to generate, yields significantlyhigher material discontinuity sensitivityand a better ability to resolve internalanomalies such as thin walldiscontinuities. Computed tomographyprovides additional geometric detail notavailable with conventional filmradiography. Computer based X-rayinspection is expected to yield significantimprovements in productivity, reliabilityand sensitivity for airfoils. In addition, thenew industrial computed tomographycapability provides new inspectioncapability and offers new freedom todesign engineers, allowing them to bemore innovative. Advancednondestructive testing techniques, likecomputed X-ray tomography, will be akey to the practical realization ofoptimum designs.
Neutron TomographyNeutron radiography has already provenitself as a reliable method for the
Radiographic Testing
. Simplified illustration of computed tomographypace structures.
Solidpellantmotor
Detectorarray
Dataacquisition
andprocessing
Reconstructionand
imaging
Tomographimage
Density foreach matrixelement inpixel
M pixels N pixels
detection of hydrogenous substances,such as moisture and corrosion in aircraftcomponents. The advantage of neutronsis that low atomic number nuclei, inparticular hydrogen, have higherinteraction cross sections than thesurrounding material. Figure 37 shows aneutron radiograph of an aerospace valve,in which the O rings are clearly visible aslight horizontal bands.
A neutron tomography systemgenerally consists of an intense neutronsource, object turntable, a scintillatorscreen, a mirror, a cooled charge coupleddevice camera, and computer imaging andprocessing support. With such anarrangement, the actual distribution ofmaterials across a given path can bedetermined.
FIGURE 36. Digital images of turbine blade: (a) fluoroscopic;(b) tomographic.
(a)
Scarfs
(b)
Scarfs

3RT20_Layout(543_568) 10/14/02 3:30 PM Page 563
As aerospace and nondestructive testengineers have become more familiarwith the capabilities of neutronradiography and tomography, thetechniques have been used more. Neutrontomography systems have been used todetermine the hydrogen content inaircraft compressor blades41 and the exactplacement and shape of O rings in criticalcomponents of spacecraft (Fig. 38).
An Air Force Research Laboratoryprogram42 was initiated to develop andevaluate advanced radiographic andradioscopic systems. To ensure broadapplicability to many aerospaceinspection needs, a diverse team wasassembled consisting of commercialcompanies and government contractors.The program evaluates detectors that areproven in other industries and that arefast and easy to use. To reduce reliance onmore costly film techniques and enhanceinspection productivity, these detectorsinclude large area, flat panel, X-raydetectors modified from medicalapplications, recently available dentalsensors and photographic industry digitalcharge coupled devices modified forradiography.
Reversed Geometry,Scanning Beam TechniqueThe National Aeronautics and SpaceAdministration has explored a technique,reversed geometry scanning beam
raai
adp(ooaedwmmdoiocrrtqmb
asRihpfiwa
FIGURE 37. Neutron radiograph of aerospacevalve. O rings are visible as light bands.
adiographic testing.43 The technique usesn electronically scanning X-ray sourcend a discrete detector for radioscopicmaging of a structure.
The scanning source system has severaldvantages. Miniaturization of theiscrete X-ray detector enables easyositioning inside a complex structuresuch as an aircraft wing) allowing imagesf each surface of the structure to bebtained separately. Additionaldvantages include multiple detectors thatnable the simultaneous acquisition ofata from several different perspectivesithout moving the structure or theeasurement system. This provides aeans for locating the position of
iscontinuities and enhances separationf features at the surface from featuresnside the structure. Finally, the amountf secondary scattered radiationontributing to the noise in the image iseduced compared to conventionaladiography. Noise reduction facilitateshe acquisition and analysis ofuantitative data about the integratedaterial density along the ray path
etween the source and the detector.Details of the techniques and
pplication to crack detection in aircrafttructures have been published.43,44
esults are shown for different crack sizesn a range of thicknesses. Application tooneycomb structures is also beingresented. A honeycomb specimen with aatigue crack in one of the face sheets wasmaged with the scanned X-ray system. Itas shown that the variation in contrasts a function of incident angle can be
used to remove some of the image clutterdue to the effects from the underlyinghoneycomb structure, thereby improvingthe detectability of the crack. A
563Aerospace Applications of Radiographic Testing
FIGURE 38. Neutron tomographic image ofaerospace valve, showing bend in O ring.
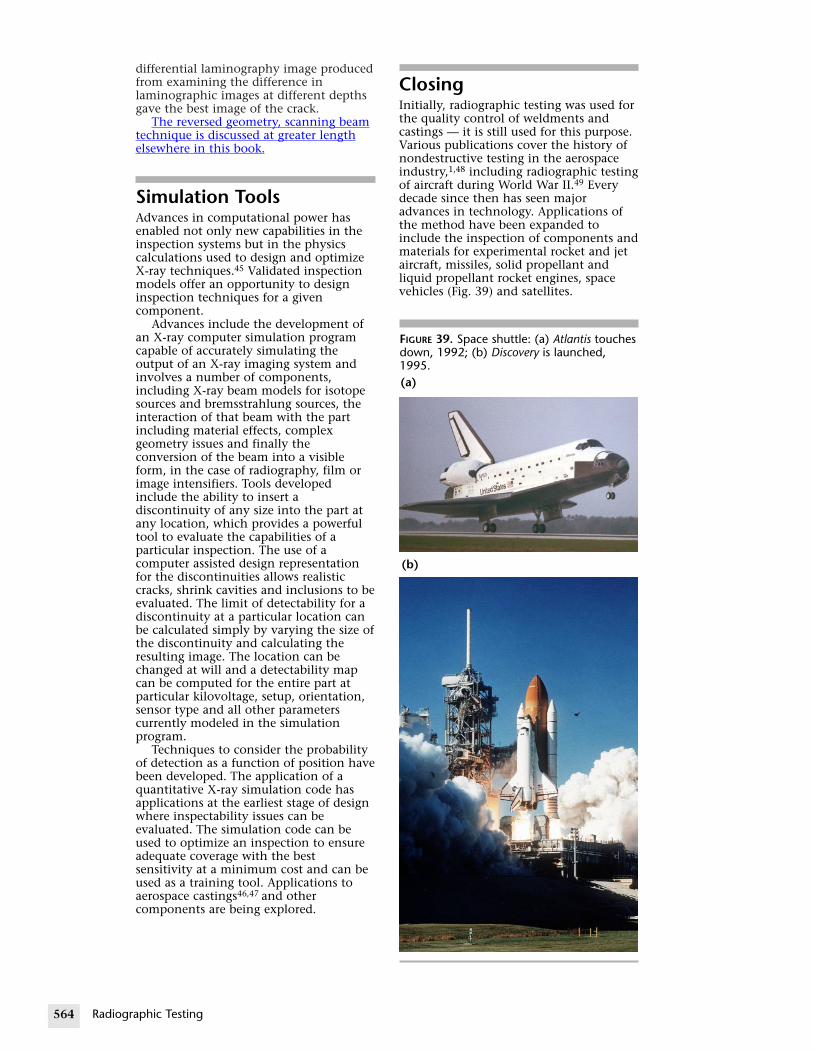
564
FIGURE 39. Space shuttle: (a) Atlantis touchesdown, 1992; (b) Discovery is launched,1995.
(b)
(a)
3RT20_Layout(543_568) 10/14/02 3:30 PM Page 564
differential laminography image producedfrom examining the difference inlaminographic images at different depthsgave the best image of the crack.
The reversed geometry, scanning beamtechnique is discussed at greater lengthelsewhere in this book.
Simulation ToolsAdvances in computational power hasenabled not only new capabilities in theinspection systems but in the physicscalculations used to design and optimizeX-ray techniques.45 Validated inspectionmodels offer an opportunity to designinspection techniques for a givencomponent.
Advances include the development ofan X-ray computer simulation programcapable of accurately simulating theoutput of an X-ray imaging system andinvolves a number of components,including X-ray beam models for isotopesources and bremsstrahlung sources, theinteraction of that beam with the partincluding material effects, complexgeometry issues and finally theconversion of the beam into a visibleform, in the case of radiography, film orimage intensifiers. Tools developedinclude the ability to insert adiscontinuity of any size into the part atany location, which provides a powerfultool to evaluate the capabilities of aparticular inspection. The use of acomputer assisted design representationfor the discontinuities allows realisticcracks, shrink cavities and inclusions to beevaluated. The limit of detectability for adiscontinuity at a particular location canbe calculated simply by varying the size ofthe discontinuity and calculating theresulting image. The location can bechanged at will and a detectability mapcan be computed for the entire part atparticular kilovoltage, setup, orientation,sensor type and all other parameterscurrently modeled in the simulationprogram.
Techniques to consider the probabilityof detection as a function of position havebeen developed. The application of aquantitative X-ray simulation code hasapplications at the earliest stage of designwhere inspectability issues can beevaluated. The simulation code can beused to optimize an inspection to ensureadequate coverage with the bestsensitivity at a minimum cost and can beused as a training tool. Applications toaerospace castings46,47 and othercomponents are being explored.
Radiographic Testing
ClosingInitially, radiographic testing was used forthe quality control of weldments andcastings — it is still used for this purpose.Various publications cover the history ofnondestructive testing in the aerospaceindustry,1,48 including radiographic testingof aircraft during World War II.49 Everydecade since then has seen majoradvances in technology. Applications ofthe method have been expanded toinclude the inspection of components andmaterials for experimental rocket and jetaircraft, missiles, solid propellant andliquid propellant rocket engines, spacevehicles (Fig. 39) and satellites.

3RT20_Layout(543_568) 10/14/02 3:30 PM Page 565
The high reliability of these vehiclesand systems can be directly attributed toproper application of nondestructivetesting as a whole and industrialradiography in particular. This reliabilityhas been made possible through thededication of scientists, engineers andtechnicians of the aerospacenondestructive testing community.Radiographic testing continues to beimportant for aerospace quality and safetyin the twenty-first century.
565Aerospace Applications of Radiographic Testing

1. Hagemaier, D.J. “AerospaceRadiography — The Last ThreeDecades” [1984 Lester Honor Lecture].Materials Evaluation. Vol. 43, No. 10.Columbus, OH: American Society forNondestructive Testing (September1985): p 1262-1264+.
2. Hagemaier, D.J. “NondestructiveTesting Developments in the AircraftIndustry.” Materials Evaluation. Vol. 49,No. 12. Columbus, OH: AmericanSociety for Nondestructive Testing(December 1991): p 1470-1472,1474-1476, 1478.
3. Dodge, D.O. “A Time of Opportunity”[1980 Lester Honor Lecture]. MaterialsEvaluation. Vol. 39, No. 1. Columbus,OH: American Society forNondestructive Testing (January 1981):p 32-35.
4. Chitty, F. “Radiography as a Control inAluminum Alloy Spotwelding and theFabrication of Plastic HoneycombPanels for Aircraft.” NondestructiveTesting. Vol. 6, No. 4. Columbus, OH:American Society for NondestructiveTesting (Spring 1948): p 11-12.
5. Hitt, W.C. and D.J. Hagemaier.“Radiography of WeldmentsIn-Motion.” Symposium onNondestructive Testing in the MissileIndustry [San Francisco, October 1959].Special Technical Publication 278.West Conshohocken, PA: ASTMInternational (1960).
6. Gallar, J.J. “Modular RoboticManipulation in RadiographicInspection.” Materials Evaluation.Vol. 46, No. 11. Columbus, OH:American Society for NondestructiveTesting (October 1988): p 1397-1399.
7. Hagemaier, D.J. and A. Barath.“Mobile Field Testing of Missiles andAircraft.” Symposium on NondestructiveTesting in the Missile Industry [SanFrancisco, October 1959]. SpecialTechnical Publication 278. WestConshohocken, PA: ASTMInternational (1960).
8. Hastings, C.H. and M.V. Grund.“Radiographic Inspection ofReinforced Plastics and Resin-CeramicComposites.” Nondestructive Testing.Vol. 19, No. 5. Columbus, OH:American Society for NondestructiveTesting (September-October 1961):p 347-351.
9. Hasenkamp, F.A. “RadiographicLaminography.” Materials Evaluation.Vol. 32, No. 8. Columbus, OH:American Society for NondestructiveTesting (August 1974): p 169-174, 180.
10. Becker, G.L. “A Brief Look at theLow-Energy Radiography ofComposite Materials.” MaterialsEvaluation. Vol. 43, No. 6. Columbus,OH: American Society forNondestructive Testing (May 1985):p 596, 598.
11. Whealy, R.D. “NDT of an AdvancedGeometry Composite Blade.”Proceedings, Aerospace — AFMLConference on NDT of Plastic/CompositeStructures [Dayton, OH]. WrightPatterson Air Force Base, OH: Air ForceMaterials Laboratory (March 1969).
12. McFaul, H.J. “Automated RadiographicFilm Interpretations.” Presented atVoordrachten: 5th InternationalSymposium on Industrial Radiography[Antwerp, Belgium]. Mortsel, Belgium:Gevaert-Agfa (1969).
13. Criscuolo, E. et al. “Radiography ofLarge Solid Propellant Rocket Motors.”Symposium on Nondestructive Testing inthe Missile Industry [San Francisco,October 1959]. Special TechnicalPublication 278. West Conshohocken,PA: ASTM International (1960): p 3-11.
14. Burrill, E.A. “High-Energy NuclearRadiations — Their Implications forIndustry” [1961 Lester Honor Lecture].Nondestructive Testing. Vol. 19, No. 3.Columbus, OH: American Society forNondestructive Testing (May-June1961): p 167-176.
15. Failor, J.A. “Life Beyond the Limits:Radiography and Aircraft TurbineRepair.” Materials Evaluation. Vol. 54,No. 6. Columbus, OH: AmericanSociety for Nondestructive Testing(June 1996): p 659-660, 662.
16. Hagemaier, D.J. Nondestructive Testingof Silica-Phenolic Materials for SmallAblative Thrust Chambers.AFML-TR-66-274. Wright-Patterson AirForce Base, OH: Air Force MaterialsLaboratory (1966).
17. Hagemaier, D.J. and R. Kleint.“Cinefluorography of Small AblativeThrust Chambers during Hot Firing.”Materials Evaluation. Vol. 24, No. 4.Columbus, OH: American Society forNondestructive Testing (April 1966):p 186-191.
566 Radiographic Testing
References
3RT20_Layout(543_568) 10/14/02 3:30 PM Page 566

18. Weiley, R.G. “Photo RecordingInternal Ballistics and Flame Fronts ofSolid Propellant Engines by Cine-XData Process.” Presented atSymposium for the Society ofPhoto-Optical InstrumentationEngineers [Miami Beach, FL].Bellingham, WA: International Societyfor Optical Engineering (August 1964).
19. Hagemaier, D.J. “Testing RocketEngine Materials.” Metal Progress,Vol. 94, No. 2. Materials Park, OH:ASM International (August 1968):p 87-90.
20. Barclay, J.L. “X-Ray and BallisticMissiles” [1958 Lester Honor Lecture].Nondestructive Testing. Vol. 17, No. 2.Columbus, OH: American Society forNondestructive Testing (March-April1959): p 73-79.
21. Viswanathan, K., K.V. Rao, C. Subbiahand M.C. Uttam. “PerformanceCharacteristics of Conventional X-RayGenerator, Isotope Source, andHigh-Energy Accelerator in RocketMotor Evaluation.” MaterialsEvaluation. Vol. 44, No. 1. Columbus,OH: American Society forNondestructive Testing(January-February 1987): p 86-90.
22. Tomlinson, R.L. and P.E. Underhill.“Production Neutron RadiographyFacility for the Routine NDTInspection of Special AerospaceComponents.” AGNTP-29. San Ramon,CA: Aerojet-General Corporation,Nuclear Division (March 1969).
23. Lewis, W.J. and L.G.I. Bennett. “TheUse of Neutron Radiography in theInspection of Aircraft CompositeFlight Control Surfaces.” The FirstPan-American Conference onNondestructive Testing: Alliance of theAmericas [Toronto, Canada, September1998]. Columbus, OH: AmericanSociety for Nondestructive Testing(1998): p 51-55.
24. DeVolpi, A. and E.A. Rhodes. “Neutronand Gamma-Ray TomographicImaging of LMFBR SAREF-ProgramSafety-Test Fuel Assemblies.” MaterialsEvaluation. Vol. 40, No. 12. Columbus,OH: American Society forNondestructive Testing (November1982): p 1273-1279.
25. Berger, H. Neutron Radiography. NewYork, NY: Elsevier Publishing (1965).
26. Hagemaier, D.J., J. Halchak andG. Basl. “Detection of TitaniumHydride by Neutron Radiography.”Materials Evaluation. Vol. 27, No. 9.Columbus, OH: American Society forNondestructive Testing (September1969): p 193-198.
27. Hagemaier, D.J., H.J. McFaul andJ.T. Parks. “Nondestructive TestingTechniques for the Fiberglass, GraphiteFiber and Boron Fiber CompositeAircraft Structures.” MaterialsEvaluation. Vol. 28, No. 9. Columbus,OH: American Society forNondestructive Testing(September 1970): p 194-204.
28. Buetzow, G.C. “AutomatedRadiography of Space Shuttle Motor.”Materials Evaluation. Vol. 47, No. 6.Columbus, OH: American Society forNondestructive Testing (June 1989):p 686-687, 690-691.
29. Gray, J.N. and G.R. Tillack. “X-RayImaging Methods over the Last25 Years — New Advances andCapabilities.” Review of Progress inQuantitative NDE. New York, NY:Plenum Press (2000).
30. Kropas-Hughes, C.V. and S. Trent Neel.“Basics of Computed Tomography.”Materials Evaluation. Vol. 58, No. 5.Columbus, OH: American Society forNondestructive Testing (May 2000):p 630-633.
31. Maranville, C. “Requirements forRadioscopy of Aerospace Structures.”Real-Time Radioscopy and DigitalImaging [Mashantucket, CT, August1998]. Columbus, OH: AmericanSociety for Nondestructive Testing(1998): p 37-43.
32. Jones, T. “Evaluation of Digital X-RayImaging Systems for US Air ForceApplications.” ASNT Fall Conferenceand Quality Testing Show PaperSummaries [Phoenix, AZ, October1999]. Columbus, OH: AmericanSociety for Nondestructive Testing(1999): p 137-139.
33. Gray, J. “Three Dimensional Modelingof Projection X-Ray Radiography.”Review of Progress in QuantitativeNondestructive Evaluation. Vol. 7A. NewYork, NY: Plenum (1988): p 343-348.
34. Inanc, F. and J.N. Gray. “NewDevelopments in the ComputerSimulation of X-Ray NDE Process.”Review of Progress in QuantitativeNondestructive Evaluation. Vol. 10A.New York, NY: Plenum (1991):p 355-362.
35. Hoppins, W.K. “In-MotionRadiography.” Precision Metal.Cleveland, OH: Industrial PublishingCompany (August 1968).
36. Bulban, E.J. “Fluoroscopic InspectionAssures Quality.” Aviation Week andSpace Technology. New York, NY:McGraw-Hill (August 1979).
567Aerospace Applications of Radiographic Testing
3RT20_Layout(543_568) 10/14/02 3:30 PM Page 567

37. McDaniel, G.A. “Recent Developmentsin High Output Microfocus X-RaySystems.” Automated NondestructiveTesting: Proceedings of a Topical Seminar[Idaho Falls, ID, June 1983]. Sponsoredby American Society forNondestructive Testing South IdahoSection. Amsterdam, Netherlands:Gordon and Breach Science Publishers(1986): p 209-212.
38. Chapter 19, “Specialized RadiographicMethods.” Nondestructive TestingHandbook, second edition: Vol. 3,Radiography and Radiation Testing.Columbus, OH: American Society forNondestructive Testing (1985):p 759-835.
39. London, B., R.N. Yancey andJ.A. Smith. “High-Resolution X-RayComputed Tomography of CompositeMaterials.” Materials Evaluation.Vol. 48, No. 5. Columbus, OH:American Society for NondestructiveTesting (May 1990): p 604-608, 629.
40. Wojciechowski, C. “Automated X-RayInspection of Air Foils.” Presented atQual-Test®-3 [Cincinnati, OH, October1984]. Program, Materials Evaluation,Vol. 42, No. 10 (September 1984):p 19.
41. Richards, W.J., M.R. Gibbons andK.C. Shields. “Neutron Tomography ofAerospace Structures.” Fifth WorldConference on Neutron Radiography[Berlin, Germany, June 1996]. Berlin,Germany: Deutsche Gesellschaft fürZerstörungsfreie Prüfung (1997):p 644-649.
42. Bueno, C., M.D. Barker, R.A. Betz,R.C. Barry and R.A. Buchanan.“Nondestructive Evaluation of AircraftStructures using High Resolution RealTime Radiography.” NondestructiveEvaluation of Aging Aircraft, Airports,Aerospace Hardware and Materials. SPIEProceedings 2455. Bellingham, WA:International Society for OpticalEngineering (1995): p 114-124.
43. Winfree, W., R. Parker and P. Howell.“Detection of Cracks in AircraftStructures with Reverse GeometryX-Ray®.” Proceedings of the 5th JointDOD/FAA/NASA Aging AircraftConference (September 2001).
44. Albert, R., W. Pember, J. Garrison andD. Reyna. “Aircraft Inspection with aPortable, Filmless X-Ray System UsingReverse Geometry.” MaterialsEvaluation. Vol. 58, No. 5. Columbus,OH: American Society forNondestructive Testing (May 2000):p 634-638.
45. Xu, J., R. Wallingford, T. Jensen andJ. Gray. “Recent Developments in theX-Ray Radiography Simulation Code:XRSIM.” Review of Progress inQuantitative Nondestructive Evaluation.Vol. 13A. New York, NY: Plenum(1994): p 557-562.
46. Conley, J., B. Moran and J. Gray.“A New Paradigm for the Design ofSafety Critical Castings.” Aluminum inAutomotive Applications. SP 1350.Warrendale, PA: SAE International(1998) p 25-38.
47. Gray, J. “Recent Developments of anX-Ray NDE Simulation Tool.” Modelingof Casting, Welding and AdvancedSolidification Processes. Vol. 9. Aachen,Germany: Shaker-Verlag (2000):p xxxvi-xliii.
48. Straw, R. “Voices in the Air — TheEarly Days of Aircraft NDT.” MaterialsEvaluation. Vol. 42, No. 2. Columbus,OH: American Society forNondestructive Testing (February1984): p 152-160.
49. Ito, G. “A Review of the History ofNondestructive Testing in Japan.”Materials Evaluation. Vol. 40, No. 11.Columbus, OH: American Society forNondestructive Testing (October1982): p 1138, 1140-1141.
568 Radiographic Testing
3RT20_Layout(543_568) 10/14/02 3:30 PM Page 568

Bruce E. Bolliger, Agilent Technologies, Singapore, Republicof Singapore (Part 2)
Gary G. Korkala, Security Defense Systems, Nutley, NewJersey (Parts 3 and 4)
Andreas F. Kotowski, Rapiscan Security Products, Hawthorne,California (Part 4)
Stig Oresjo, Agilent Technologies, Loveland, Colorado(Part 2)
Samuel G. Snow, Oak Ridge, Tennessee (Part 1)
Other Applications ofRadiographic Testing
21C H A P T E R

570 R
PART 1. Radiation Gaging of Density orThickness1
TABLE 1.
AbsorpAttenuAttenuBeta bCompCompNeutroX-ray
Radiation gaging does not use shadowimage formation yet is a nondestructivetesting technique by which density,thickness and composition can bedetermined using the interaction ofionizing radiation with a test material.Applications of radiation gaging rangefrom high accuracy measurements ofcoating thickness to detection of termitedamage. Radiation gaging may be usedonline to enable real time control ofprocessing equipment or may involveextensive scanning and analysis toconstruct three-dimensional images ofinternal density variations in materials.
Gaging TechniquesRadiation gaging includes a wide varietyof measurement types. Gamma rays,X-rays, beta particles, neutrons andpositive ions can all be used for radiationgaging. These radiations interact with thetest material in a number of useful ways.
Despite the wide diversity oftechniques that can be used, onetechnique, gamma or X-ray attenuationgaging, has found the widest applicationbecause of its general applicability to allmaterials and many componentconfigurations. Gamma and X-rayattenuation techniques are particularlywell suited for process monitoringapplications such as control of thicknessin a rolling mill or monitoring density ofa solution in process piping. As aninspection tool for fabricatedcomponents, attenuation gaging can beused to ensure that density, compositionand thickness of a wide variety ofmaterials have been kept under control.
Ahor
tTmccro(p
nnofmretn
A
Ggtttnucotmeoi
adiographic Testing
Applications of radiation measurement for gagin
Technique
tion edge densitometry coating thickness; compositeation gaging of density paper and wood pulp; cigareation gaging of thickness metal sheet, foil, pipes and tuackscatter coating thickess (for exampleton scattering density or thickness of nondeuted tomography multidirectional location of inn gaging objects or discontinuities wit
fluorescence coating thickness
ttenuation gaging can achieve extremelyigh accuracies for some applications; orperational parameters can be adjusted forapid testing on an assembly line basis.
Interactions of radiation with matterhat are useful for gaging are listed inable 1, along with an indication ofeasurement applications. For
onvenience, these may be classed in twoategories: (1) those involving gammaays and X-rays and (2) radiations basedn interactions of nuclear particlesneutrons, positive ions and betaarticles).
Gaging with particles from the atomicucleus gives the name nucleonic toucleonic gaging, widely used for thenline gaging of low density and thinilm materials, such as paper and other
aterials manufactured in sheets andolls. Nucleonic gaging is a wellstablished family of quality controlechniques with a long history inondestructive testing.2-6
ttenuation Gaging
aging by measuring the attenuation ofamma and X-ray photon beams is usedo determine the product of density Dimes thickness T. In many applications,he density may be assumed to beonvarying and this gaging technique issed for thickness measurements, often inontinuous automatic systems for controlf production equipment. Conversely, ifhickness is held constant, density can be
easured. Use of more than one radiationnergy makes possible the measurementf the density thickness product ofndividual elemental components in a
g of density or thickness.
Application
s of two materialsttesbes; plastic film, sheet and tubing, vinyl on wood)nse materials; high and low density discontinuities; testing from one sideternal discontinuities
h high hydrogen content (for example, damp regions)

FIGthic
So
Soand
multicomponent material such as alayered structure or a composite.
The basic gamma or X-ray attenuationgage, in its simplest form, consists of anX-ray or gamma source, source shieldingand collimation, an air gap where samplescan be introduced and a collimateddetector as shown in Fig. 1. The principleof operation is simple and is described bya single basic equation. If the intensity ofthe radiation measured by the detectorwith no sample in place is I0, then when asample of thickness T is introduced intothe air gap so as to intercept the radiationbeam, the intensity I measured by thedetector is given by the exponentialattenuation law:
(1)
where ρ is the density of the sample andµM is the mass attenuation coefficient ofthe sample material for gamma or X-raysof the energy used.
Measurements of radiation intensity Ican be used to determine samplecharacteristics that depend on the productµρT. Most commonly, radiationattenuation gaging is used to measurethickness when coefficient µ anddensity ρ are controlled or known.
Other applications include monitoringdensity when thickness is held constantand monitoring composition variationthrough its effect on µ, ρ or both.Although the basic principles of thesemeasurements are simple, they must bethoroughly understood in order to selectthe proper approach to a givenmeasurement problem.
The technique of gaging density andthickness by attenuation measurement isthe basis for most of the applicationsdiscussed below (Figs. 2 and 3).
I I T= −µ( )0 exp M ρ
URE 1. Basic gamma attenuation gage for sample ofkness T.1
urce
urce shield collimator
Sourcecollimation
Sample
T
Radiationbeam
Penumbra
Detector collimation
Detector shieldand collimator
Detector
X-Ray Fluorescence
X-ray fluorescence (XRF) gaging is basedon excitation and detection ofcharacteristic X-ray emission (K or LX-rays). Because the energy of theradiation emitted is unique to theemitting element, X-ray fluorescence iscommonly used for elemental analysis.X-ray fluorescence as an analytical tool isdescribed elsewhere in this volume.
When used for gaging, X-rayfluorescence generally uses an isotopicgamma source and a semiconductor(energy dispersive) detector.Cadmium-109, americium-241,gadolinium-153 and cobalt-57 are suitableexcitation sources, the choice dependingon the elements to be excited. Thesemiconductor detector is usually lithiumdrifted silicon [Si(Li)].
An X-ray fluorescence gage can be usedto measure the thickness of coatings for avariety of material combinations ofcoating and substrate. Coating thicknesscan be measured by measuring (1) theincrease in X-ray intensity from thecoating material with increasing coatingthickness, (2) the attenuation of substrateX-rays by the coating or (3) acombination of both.7
Compton Scattering
Compton scattering is used to measurematerial density, including detection ofhigh and low density discontinuities, andcan also be used for one-sided thicknessgaging. The equipment used for comptonscatter gaging is very similar to that usedfor X-ray fluorescence gaging. In factX-ray fluorescence and comptonscattering measurements can be combinedin a single gage.
Compton scattering can be used tomeasure density or thickness of lowatomic number materials. Theconfigurations of source and detector andsample are similar to those used for X-rayfluorescence. Source energy must be highenough to ensure that (1) comptonscattering is the predominant interactionwith the material and (2) the radiationpenetrates adequately to the desiredgaging depth. Best sensitivity is obtainedfor the lowest energy that satisfies theserequirements.
The energy E´ of the scattered radiationis related to the energy E of the incidentradiation and the scattering angle θaccording to the relationship:19
(2)
where µe is the electron rest mass and C isthe speed of light (µeC2 = 0.51 MeV).
1 1 11
2′− = −( )
E E Cµθ
e
cos
571Other Applications of Radiographic Testing

572 Ra
FIGURE 2. A(b) measurof packagi
(a)
(b)
Thus, the energy of the scatteredradiation is selected by choice ofscattering angle and source energy. Thiscan be important for separating comptonscattered radiation from interfering X-rayfluorescence radiation.
The intensity of the scattered radiationis usually so low that a spectrometricdetector can be used. A scintillation
detector has adequate energy resolutionfor many applications.
Examples of the application ofcompton scattering gages includemeasuring the thickness of compositestructures with a low energy system8
(40 and 100 keV from gadolinium-153)and detection of termite damage torailway ties with a system using 662 keVgamma rays from cesium-137.9
diographic Testing
utomated applications of X-ray density gaging: (a) measurement of thickness of coiled stainless steel;ement of thickness of hot strip steel; (c) measurement of moisture content of paper at paper mill; (d) measurementng tape after application of adhesive coating.14
(c)
(d)

3RT21_Layout(569_608) 10/28/02 2:46 PM Page 573
Other Radiation GagingTechniquesTomography. Tomography is a specializedform of attenuation gaging by whichmultidirection attenuation measurementsare computer analyzed to reconstructimages of the internal distribution of massin the test object. This technique isextremely valuable when internaldiscontinuities need to be located as wellas detected or when the shape of the testobject is irregular enough to obscureinternal density variations inconventional radiography or radiationattenuation gaging.Absorption Edge Densitometry. The verygood energy resolution of semiconductordetectors makes possible absorption edgespectrometry in a practical gage.10 Thiscan be used for coating thicknessmeasurements or composition of atwo-element composite material. Thebasis for this measurement is the abruptchange in X-ray attenuation that occurs atthe photoelectric absorption edge of oneof the two elements. By gaging with twoenergies, one above and one below theabsorption edge, it is possible todetermine the mass per area of bothelements.Beta Backscatter. Beta backscatter is a wellestablished technique for measuringcoating thicknesses. Its applicability isbased on the increased backscattering ofbeta particles as a function of increasingatomic number. As coating thicknessincreases from zero, the backscatterresponse varies smoothly from theresponse characteristic of the substrateatomic number to the responsecharacteristic of the coating atomicnumber. Intermediate values ofbackscatter response can be calibrated
dstni
gBiNsmtcnbmbmamoamonspgRscueaaTscHgpam
FIGURE 3. Scanner searches for holes,discolorations and protrusions in cigaretterod. After passing though scanner, cigaretterod is divided into cigarettes.14
irectly in terms of coating thickness. Theensitivity of this technique improves ashe difference between the atomicumbers of the coating and the substrate
ncreases.Details of beta backscatter for thickness
aging are discussed elsewhere.1ackscatter imaging is discussed elsewhere
n this book.eutron Gaging. Neutron gaging is a very
pecialized technique most often used foreasuring hydrogen content (usually in
he form of water), or less often, theontent of other isotopes with higheutron cross sections. Neutron gages cane simple, inexpensive systems foreasuring moisture in food, soil or other
ulk materials. The basis of theeasurement technique can be
ttenuation of thermal or fast neutrons,oderation of fast neutrons, or scattering
f thermal neutrons. For somepplications, such as moistureeasurements, neutron gaging is the best
r only available technique. However,eutron gages are of limited andpecialized use. A published reviewrovides an excellent summary of neutronaging.11
utherford Scattering. Rutherfordcattering, elastic scattering of positivelyharged particles from atomic nuclei, is aseful surface analysis technique. Thenergy loss upon scattering at a specificngle is an easily calculable function oftomic weight of the scattering material.his technique can be used to identifyurface contaminants and determineomposition of materials at the surface.owever, applicability of this technique isenerally limited to samples becauseositive ions are readily absorbed in airnd measurements must therefore beade in vacuum.
Detector TypesThe operation of all gamma and X-raydetectors is based on the effect of energydeposited in the detector. Photons deposittheir energy primarily by three types ofinteraction with the detector material:photoelectric absorption, scattering fromatomic electrons and pair production.
In all three mechanisms, some or all ofthe photon energy is transferred to kineticenergy of electrons and some of theenergy may escape from the detector. It isin the means by which different types ofdetectors transfer the kinetic energy ofthese electrons into measurable voltage orcurrent signals that detectors differ. Thedifferent types of detection include gasfilled detectors, scintillation phototubesystems and semiconductor detectors.12
573Other Applications of Radiographic Testing

574 R
Gas Filled DetectorsA gas filled detector consists of a chambercontaining gas in which an electric field ismaintained. Geometry may be planar orcoaxial. The primary electrons from theinteraction of photons with the detectorlose their energy by ionizing gasmolecules along their paths, leaving tracksof electron positive ion pairs. Theelectrons are quickly swept out of the gasto the anode. The relationship betweenthe negative charge collected at the anodeand the energy deposited in the detectorby the radiation is dependent on theelectric field strength in the chamber. Atvery low voltages the field strength isinsufficient to separate all of the electronsfrom the positive ions beforerecombination occurs. In thisrecombination region, the relationshipbetween energy deposited and chargecollected is complicated and difficult topredict.
Gas filled chambers are relativelyinefficient because of the low density ofgas. For radiation attenuation gaging, onlythe ionization chamber has an offsettingadvantage for specific applications. Anionization chamber can be an extremelystable detector for measuring very intenseradiation fields that would damage othertypes of detectors. For highest efficiency, ahigh atomic number gas such as xenonshould be used.
Ionization ChambersFor voltages sufficiently high to preventrecombination of electrons and positiveions, the charge collected is independentof the voltage and proportional to theenergy deposited. This is the ionizationchamber region of operation. Ionizationchambers are used in the current mode.That is, rather than trying to detect theextremely small charge collected from asingle photon interaction, the integratedcurrent of many interactions is measured.This current is proportional to the energydeposited in the detector per unit timeand hence, for constant photon energy, tothe radiation flux.
Proportional CountersAs the electric field in a gas filled chamberis increased further, secondary electronsare accelerated to energies that ionizeother molecules in the gas, producingadditional electron-and-ion pairs. In thisproportional region, the charge collected isproportional to the energy deposited andincreases with increasing voltage. Bymeasuring the collected charge from asingle interaction, proportional countersare used for energy spectrometry. That is,individual photons are detected andsorted according to charge. Because charge
ir
GAmecpiitipi
SAiimgestcr
wptappipeciteCpmdc1cbaBmcsduSaippdeTse
adiographic Testing
s proportional to energy, this sortingesults in an energy spectrum.
eiger Counterss voltage is further increased, the gasultiplication continues to increase until
ach photon interaction produces aomplete electrical breakdown of the gas,roviding a large pulse of charge
ndependent of the deposited energy. Thiss the geiger region of a gas filled tube. Inhis region, individual photonnteractions are detected as withroportional counters but energy
nformation is lost.
cintillator Phototubess the primary electrons from a photon
nteraction pass through a material, theyonize atoms and excite atomic or
olecular energy levels. Some materialsive up a portion of their excitationnergy as light, a process calledcintillation. Scintillation materialsransparent to their own light can beoupled to a photodetector and used as aadiation detector.
The phototube has a glass frontindow through which light passes to ahotoemissive surface on the inside of theube. Because the photoemissive surface ist negative potential relative to otherarts of the tube, it is called thehotocathode. In the presence of thempressed electric field, light striking thehotocathode causes electrons to bejected and accelerated to the anode. Theharge transferred from cathode to anodes proportional to the light intensity onhe photocathode and hence to thenergy deposited in the scintillator.urrent Mode. When the scintillatorhototube detector is used in the currentode, the anode current is measured to
etermine the average radiation flux. Theurrents generated are on the order of0–10 to 10–7 A. To measure these smallurrents accurately, the dark current (theackground current measured in thebsence of radiation) must be small.ecause tubes not designed for low leveleasurements may have large dark
urrents, care should be exercised inelecting a phototube. Phototubes withark currents less than 10–11 A should besed.pectrometry Mode. A scintillator canlso use a photomultiplier tube to operaten a spectrometric mode. In ahotomultiplier tube, the charge from thehotocathode is accelerated to the firstynode of a dynode chain, ejecting morelectrons from the surface of the dynode.hese electrons are accelerated to theecond dynode, ejecting additionallectrons. The process continues down the

dynode chain, multiplying the charge ateach dynode, so that the charge reachingthe anode is many times that ejected fromthe cathode. The collected charge due to asingle pulse of light in the scintillator canbe measured and related to the energydeposited by the initial photoninteraction. Thus, a scintillatorphotomultiplier can be used for energyspectrometry.
Semiconductor DetectorsUnlike gas filled detectors andscintillation detectors that can either beoperated in a current mode orspectrometry mode, semiconductordetectors are always used in thespectrometry mode. The advantage ofsemiconductor detectors is the superiorresolution for energy spectrometry.Semiconductor detectors have theadditional advantage of being more stablethan scintillation photomultiplierdetectors.
A semiconductor radiation detector canbe described as the solid state analogy to agas filled detector. Charge carriers in asemiconductor are electron hole pairscreated by ionizing radiation, much aselectron positive ion pairs are created inthe gas detector. In semiconductors,electrons exist in energy bands separatedby band gaps. In the absence of anyexcitation, the valence band is completelyfilled with electrons and the conductionband is empty. The band gap is an energyrange in which electrons cannot exist.Electrons can be excited, either bythermal energy or by an interaction withradiation, leaving a positive hole in thevalence band and an electron in theconduction band. In the presence of anapplied field, the mobile electrons andholes migrate through the semiconductor,creating a current.
Silicon and germanium detectors canbe made to incorporate large volumes inwhich electron hole pairs are formed andcan readily migrate to electrical contacts.By collecting the charge generated by adetected photon, the photon’s energy canbe measured with precision. To minimizethermally generated noise, detectors arecooled to liquid nitrogen temperature. Inaddition to cooling the detector, theliquid nitrogen operates a pump thatmaintains an insulating vacuum aroundthe detector. An integral preamplifiercollects the small charge generated byindividual photons and outputs acorresponding voltage pulse to theexternal electronics.
Selection of Detector TypeRadiation detection can be grouped intwo categories: current mode types andspectrometers. Depending on the specificdetector and detector electronics, theupper limit of count rates that can behandled by a spectrometer system isbetween 104 and 105 counts per second.As a general rule, a radiation gagingapplication that requires intensitiesgreater than 104 counts per second (toachieve the required accuracy inacceptable measurement time) should notbe attempted with a spectrometer system.For most of these applications, ascintillator phototube system, operated inthe current mode, is best.
Current Mode DetectorsA typical scintillator used for gammadetection is thallium activated sodiumiodide. Thallium activated sodium iodidehas two characteristics that make itunsuitable for attenuation gagingapplications requiring current modeoperation.
1. A long decay contributes to slowdetector response.13
2. Thallium activated sodium iodidedarkens under intense gammaexposure, reducing the amount oflight reaching the photocathode. Thisslow recovery makes response evenslower.
Europium activated calcium fluoride,CaF2(Eu), is one scintillator that has beenfound to exhibit neither of these effects.The only drawback of europium activatedcalcium fluoride over thallium activatedsodium iodide is a lower efficiencybecause of its lower atomic number, lowerdensity and somewhat less light outputfor the same energy deposition. Currentmode measurements should use either aeuropium activated calcium fluoridescintillator or an alternative also free ofslow response effects.
Spectrometer Mode DetectorsSpectrometer detectors can be used whenhigh intensity is not required. Theirenergy selection capability makes itpossible to choose the desired gagingenergy. For example, a spectrometricsource makes it possible to gage with43 keV X-rays from gadolinium-153 whilediscriminating against the 100 keVgammas. Energy spectrometry also allowsdiscrimination against lower energyscattered radiation that can be a source ofmeasurement error.
Germanium and silicon detectors offergood energy resolution. For energies up toabout 100 keV, lithium activated silicon
575Other Applications of Radiographic Testing

576
detectors are satisfactory. Germaniumdetectors are preferred for higher energiesbecause of their higher efficiency.Germanium detectors may be eitherplanar or coaxial. Coaxial detectors arepreferred for higher energies because, withtheir greater detector volume, they aremore efficient at high energies. Forapplications where 15 to 20 percentenergy resolution is adequate, ascintillator photomultiplier detectorprovides a less expensive alternative thatdoes not require liquid nitrogen cooling.For spectrometry, thallium activatedsodium iodide is an acceptable scintillator.
Application CaseHistories14
Nucleonic measurement gages have beenused since the 1950s for nondestructivetesting in the manufacture of diverseproducts, including paper, metals, plastics,tires and cigarettes. These gages have beenintegrated into programs for qualitycontrol and statistical process control.
Radiation density gaging andradioscopy taken together are applicableto online testing for various anomalies invarious consumer goods (Table 1).
SteelSteel gaging can use X-ray sources orisotopes. Radiation particles are beamedinto the steel as it passes through theproduction line and sensors are used tocalculate the radiation absorbed by thesteel and the radiation passing through it.Calculating mathematical differencebetween the two provides a rapid,accurate thickness measurement. In the1950s, X-ray thickness gages were usedalmost exclusively to measure productthickness. Since then, computer basedelectronics have modernized themanufacturing process so that thicknessmeasurement data are fed directly into amill’s control systems, resulting inautomated statistical process control. Thesame technology is used for qualitymonitoring and for final testing of steelproducts.Thickness. Gamma ray gages andnucleonic measurement devices are usedby steel manufacturers to monitorthickness in castings, coiled steel (Fig. 2a),steel plate, sheet, hot strip steel (Fig. 2b),cold strip steel and walls of pipe products.These gages provide feedback to millcontrol. Their accuracy depends on thecalibration and application of the gagingsystem being used, as well as on thematerial’s temperature. A multiple-pointarea of measurement can be documented
Radiographic Testing
at high speed to monitor the full widththickness profile of steel.
For strip steel, data are used to makemanual adjustments along the productionlines. X-ray gages are integrated intoautomated process control to help thecompany make steel thinner thannormally specified. With an automatedsystem, rapid adjustments can be made tothe production lines to eliminate waste.Liquid Metal Level. The technology isused also to measure liquid level incontinuously cast bolts as dross is beingpoured into the slab. Radiation is used bycasters to measure levels of molten metalin moldsCoating Thickness. Radiation devices areused to measure coating thickness oncoated steel.Moisture. Moisture affects the density ofmaterials used in steel making. Radiationis gaged to measure the amount ofmoisture content in coke.Furnace Monitoring. Isotopes areembedded in blast furnace walls tomeasure the thickness of refractory wallsand radiation sensors are used to track thepositions of slab.
AluminumNucleonic measurement gages are used ona wide range of aluminum products,including foil, house coverings, armor,automotive bodies and aircraft bodies.Many aluminum products are actually acombination of aluminum and plastic.Because both materials are expensive,thickness variation is critical. Aluminummanufacturers have incentive to producethinner materials to save material costsand to achieve weight objectives. X-raythickness gaging is very important forthese objectives.
A major manufacturer of aluminumcans has used beta ray gages to guaranteethat products meet the industry’sspecifications for thickness. Themanufacturer has used these thicknessgages on all aluminum sheet made andadditional gages are used for final qualitytesting.
Paper and PulpIn the paper and pulp industries,radiation gages and sensors are usedmainly to measure density or basisweight, moisture content (Fig. 2c),thickness and ash content. Nonionizingfrequencies of radiation (such as infraredand visible radiation) are used to evaluatethe glossiness, smoothness, opacity andbrightness of paper.
A manufacturer of fine papers,including bond, carbonless and coatedpapers for use in stationery and printedmatter, has used beta ray gages to measure

paper weight. Another papermanufacturer uses a krypton-80 beta gageto measure the mass (organic, inorganicand water content) of its paper products.In some of the company’s productionareas, the gages are used to automate themanufacturing process. The companymakes printing paper for use inadvertisements and brochures anduncoated papers for use in making tradebooks.
Nucleonic measurement gages havebeen used for the evaluation of paperproducts. The technology is used tomeasure basis weight and moisturecontent. Measurement data areautomatically transmitted into acomputer, which adjusts the productionline.
The gaging systems help cut down onenergy in the final stage of drying thepaper. A scanner, placed near the end ofthe production line, identifies wet spotson the paper so that automaticadjustments can be made to the dryingprocess. Without the gages, there was noaccurate way to predict efficiently theamount of energy necessary to dry thepaper and in many cases the paper couldbe overdried.
In the manufacture of wood particleboard, an isotope device withpromethium and americium sources hasbeen used to measure the density(thickness and weight) of the mat (layersof resin and wax) before it is pressed intoboard. Mounted on a frame, the scannermoves horizontally over the product asthe wood passes through the productionline.
PlasticsHot melt plastic is used to makepackaging tape. In one factory, the tapewas processed on two webs, in whichunwound base paper is run through acoating section. Two scanners were usedon each roll of tape as it passed throughthe production line: one scanned theproduct before adhesive coating wasapplied; the other scanned the tape afterthe coating was applied (Fig. 2d). Thestatistical difference between bothmeasurements indicates the thickness ofthe adhesive coating.
Measurement data are fedautomatically into production control andimmediate, automatic adjustments aremade to the production line. The samedata appear on a control screen, alertingplant operators of these changes (Fig. 3).In addition, all measurement data are fedinto a personal computer and archived foranalysis. The system provides actual dataon the products. Accurate measurement isimportant because adhesive coating isvery expensive and because customers
want a consistent product. The gages havereduced waste and downtime.
Beta ray thickness measurement gageshave been used to measure extruded vinylused to cover wooden window frames.Even with variations in the process, thetechnique is 99.9 percent accurate, animprovement over production withoutthe gages.
Chemical companies have usednucleonic gages to measure the thicknessof extruded plastic sheets formed byforcing melted plastic through dies.
Other IndustriesRadiation measurement gages are alsoused in the production of fiber glass,textiles, fabrics and pharmaceuticals. Inthe tire industry, the gages are used onsteel radial tires to measure the top andbottom coats of rubber on the tire and tomeasure the number of cords across thetire’s surface.
The technology is also used in theproduction of cigarettes to measureweight, as well as to measure filter sizeand weight. Similar infrared gagesmeasure circumference to verify that thecigarette is not too thin or too thick. Anoptical rod scanner (Fig. 3) searches forvisible discontinuities, including holes,discolorations and protrusions.
ClosingRadiation thickness gages have helpedmanufacturers of many products to reducecosts and to guarantee their products withconfidence. The need for precision andproduct uniformity have made radiationgaging devices a vital part of theproduction process, especially withinautomated or statistical process controlsystems.
577Other Applications of Radiographic Testing
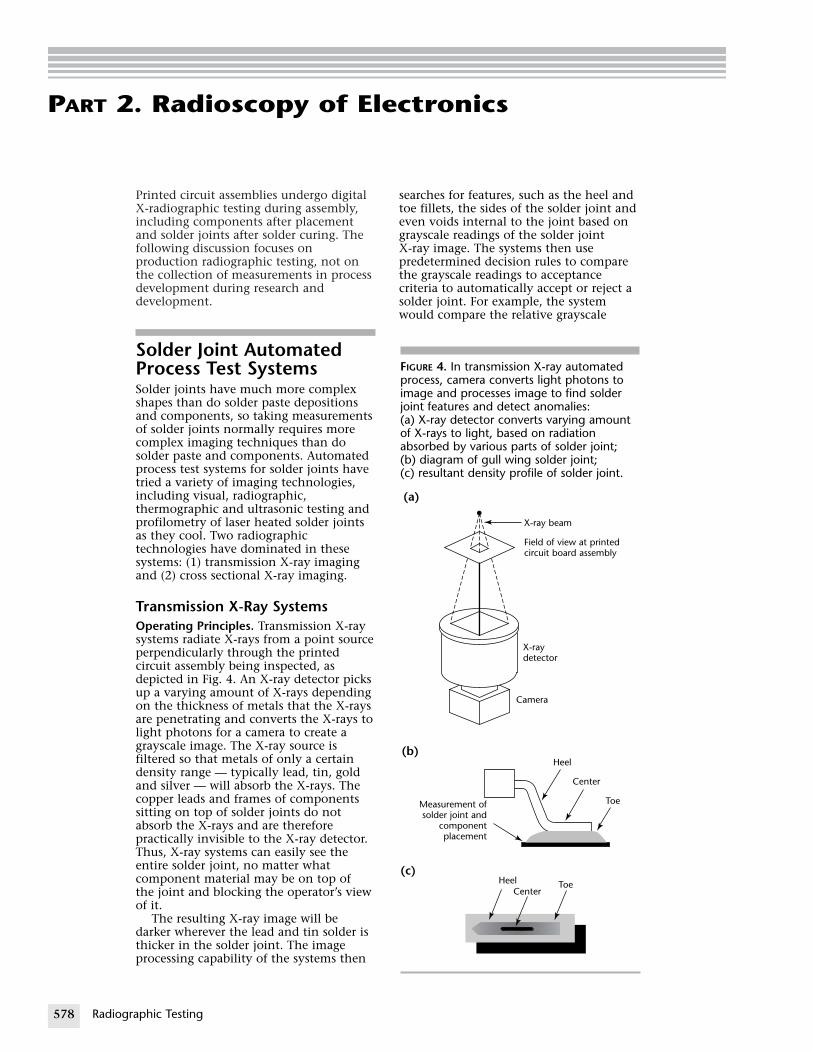
578 R
PART 2. Radioscopy of Electronics
FIGURE 4. In transmission X-ray automatedprocess, camera converts light photons toimage and processes image to find solderjoint features and detect anomalies: (a) X-ray detector converts varying amountof X-rays to light, based on radiationabsorbed by various parts of solder joint;(b) diagram of gull wing solder joint;(c) resultant density profile of solder joint.
X-ray beam
Field of view at printedcircuit board assembly
(a)
(b)
(c)
X-raydetector
Camera
Measurement ofsolder joint and
componentplacement
Heel
Center
Toe
HeelCenter
Toe
Printed circuit assemblies undergo digitalX-radiographic testing during assembly,including components after placementand solder joints after solder curing. Thefollowing discussion focuses onproduction radiographic testing, not onthe collection of measurements in processdevelopment during research anddevelopment.
Solder Joint AutomatedProcess Test SystemsSolder joints have much more complexshapes than do solder paste depositionsand components, so taking measurementsof solder joints normally requires morecomplex imaging techniques than dosolder paste and components. Automatedprocess test systems for solder joints havetried a variety of imaging technologies,including visual, radiographic,thermographic and ultrasonic testing andprofilometry of laser heated solder jointsas they cool. Two radiographictechnologies have dominated in thesesystems: (1) transmission X-ray imagingand (2) cross sectional X-ray imaging.
Transmission X-Ray SystemsOperating Principles. Transmission X-raysystems radiate X-rays from a point sourceperpendicularly through the printedcircuit assembly being inspected, asdepicted in Fig. 4. An X-ray detector picksup a varying amount of X-rays dependingon the thickness of metals that the X-raysare penetrating and converts the X-rays tolight photons for a camera to create agrayscale image. The X-ray source isfiltered so that metals of only a certaindensity range — typically lead, tin, goldand silver — will absorb the X-rays. Thecopper leads and frames of componentssitting on top of solder joints do notabsorb the X-rays and are thereforepractically invisible to the X-ray detector.Thus, X-ray systems can easily see theentire solder joint, no matter whatcomponent material may be on top ofthe joint and blocking the operator’s viewof it.
The resulting X-ray image will bedarker wherever the lead and tin solder isthicker in the solder joint. The imageprocessing capability of the systems then
adiographic Testing
searches for features, such as the heel andtoe fillets, the sides of the solder joint andeven voids internal to the joint based ongrayscale readings of the solder jointX-ray image. The systems then usepredetermined decision rules to comparethe grayscale readings to acceptancecriteria to automatically accept or reject asolder joint. For example, the systemwould compare the relative grayscale

FIGURE 5. Schematic of cross sectional X-ray automatedprocess test system for solder joint measurement: (a) addingimages around circle from rotating X-ray beam and detectorcreates focal plane that captures only solder joints of interest,minimizing what is below or above; (b) diagram of solderjoint; (c) density profile with feature extraction and rulesbased anomaly detection, separately for top and bottom ofassembly; (d) resultant density profile with dimensionalmeasurements. Image processing software then finds solderjoint features and detect anomalies.
(a)
Rotating X-ray beam
Focal plane
Rotating X-ray detector
Top of boardassembly
Bottom ofboard
assembly
(c)
(d)
A
BA
BA
AA
B
Heel
Separate image for top andbottom of board assembly
Center
Toe
Heel ToeCenter
Feature extractionand rules based
anomaly detection
(b)
Quantitativedimensionalmeasurements
Heel
CenterToe
reading for the heel fillet region, thecenter of the solder joint and the toe filletregion. The acceptance criteria might statethat the heel fillet reading should be twicethat of the center and that the toe filletreading should be 50 percent higher thanthat of the center. If the actual readingsdo not meet these criteria, then the solderjoint is reported as being anomalous.
Figure 4c shows an X-ray image of agull wing solder joint that shows thecenter of the joint as much darker thanthe heel fillet region. This solder joint isclearly anomalous as the heel fillet regionshould always be darker and with a highergrayscale reading than the center of thejoint, where the solder is thinnest formechanically good solder joints. (Thesystem’s image processing capability candetect much more subtle changes ingrayscales than can the human eye,allowing very accurate relative readingsfrom one solder joint to the next.)Application. Transmission X-raytechnology works well for single-sidedsurface mount assemblies. Theseautomated process test systems willaccurately detect solder jointdiscontinuities such as open joints,insufficient solder, excess solder, bridges,misalignment between pin and pad andvoids for most surface mount solder jointtypes, including J leads, gull wings,passive chips and small outlinetransistors. These systems also detectmissing components and reversedtantalum capacitors. Based on trends ingrayscale reading, these systems also canaccurately detect process drifts throughprocess control charting.
For double-sided assemblies, however,the transmission X-ray images of solderjoints on the topside will overlap with theimages of solder joints on the bottomside. The X-rays are absorbed by anysolder in their path through the printedcircuit assembly from the source to thedetector. These overlapping images makeaccurate solder joint measurementimpossible. Transmission X-ray imagingalso cannot easily distinguish between thetop, bottom and barrel of platedthrough-hole (PTH) solder joints, nor thebottom and ball of ball grid array (BGA)solder joints. So transmission X-raysystems cannot be used for accuratemeasurement and discontinuity detectionof solder joints on double-sidedassemblies nor for plated through-holeand ball grid array solder joints.
Cross Sectional X-Ray SystemsOperating Principles. Cross sectionalX-ray systems radiate X-rays at an acuteangle from vertical through the printedcircuit assembly being inspected. As Fig. 5indicates, images from all around the
579Other Applications of Radiographic Testing
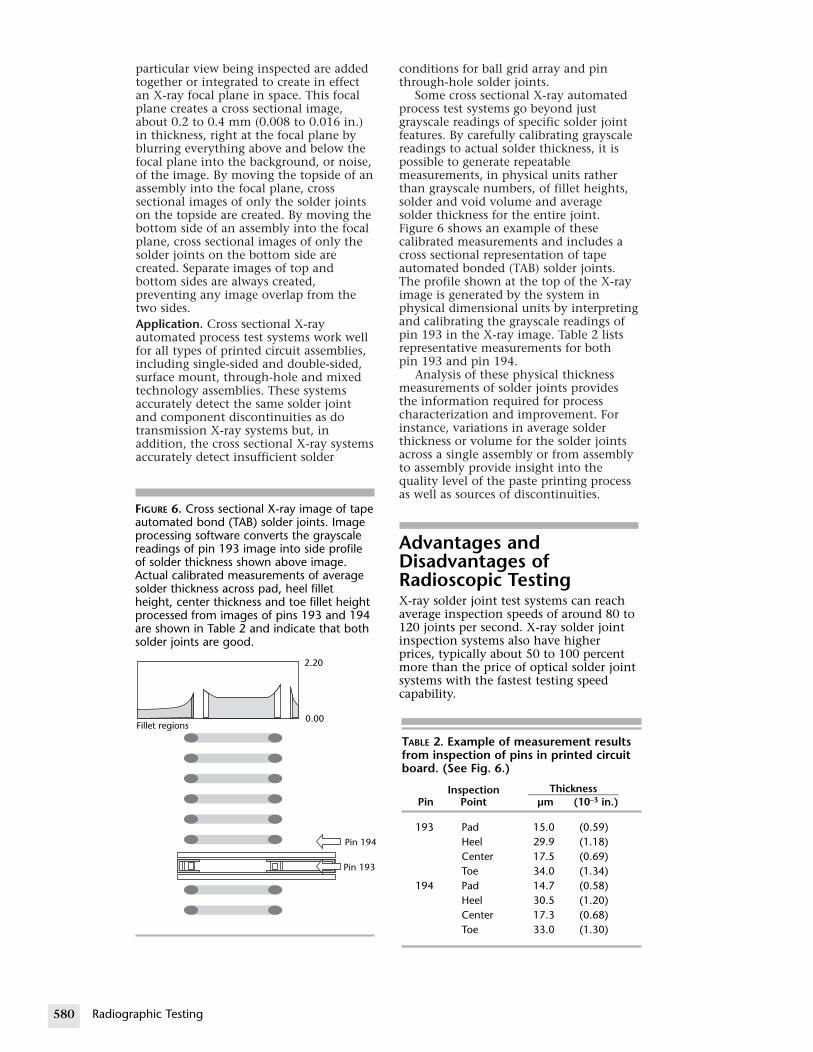
580
particular view being inspected are addedtogether or integrated to create in effectan X-ray focal plane in space. This focalplane creates a cross sectional image,about 0.2 to 0.4 mm (0.008 to 0.016 in.)in thickness, right at the focal plane byblurring everything above and below thefocal plane into the background, or noise,of the image. By moving the topside of anassembly into the focal plane, crosssectional images of only the solder jointson the topside are created. By moving thebottom side of an assembly into the focalplane, cross sectional images of only thesolder joints on the bottom side arecreated. Separate images of top andbottom sides are always created,preventing any image overlap from thetwo sides.Application. Cross sectional X-rayautomated process test systems work wellfor all types of printed circuit assemblies,including single-sided and double-sided,surface mount, through-hole and mixedtechnology assemblies. These systemsaccurately detect the same solder jointand component discontinuities as dotransmission X-ray systems but, inaddition, the cross sectional X-ray systemsaccurately detect insufficient solder
Radiographic Testing
FIGURE 6. Cross sectional X-ray image of tapautomated bond (TAB) solder joints. Imageprocessing software converts the grayscalereadings of pin 193 image into side profileof solder thickness shown above image.Actual calibrated measurements of averagesolder thickness across pad, heel filletheight, center thickness and toe fillet heightprocessed from images of pins 193 and 194are shown in Table 2 and indicate that bothsolder joints are good.
Fillet regions
2.20
Pin 19
Pin 19
0.00
conditions for ball grid array and pinthrough-hole solder joints.
Some cross sectional X-ray automatedprocess test systems go beyond justgrayscale readings of specific solder jointfeatures. By carefully calibrating grayscalereadings to actual solder thickness, it ispossible to generate repeatablemeasurements, in physical units ratherthan grayscale numbers, of fillet heights,solder and void volume and averagesolder thickness for the entire joint.Figure 6 shows an example of thesecalibrated measurements and includes across sectional representation of tapeautomated bonded (TAB) solder joints.The profile shown at the top of the X-rayimage is generated by the system inphysical dimensional units by interpretingand calibrating the grayscale readings ofpin 193 in the X-ray image. Table 2 listsrepresentative measurements for bothpin 193 and pin 194.
Analysis of these physical thicknessmeasurements of solder joints providesthe information required for processcharacterization and improvement. Forinstance, variations in average solderthickness or volume for the solder jointsacross a single assembly or from assemblyto assembly provide insight into thequality level of the paste printing processas well as sources of discontinuities.
Advantages andDisadvantages ofRadioscopic TestingX-ray solder joint test systems can reachaverage inspection speeds of around 80 to120 joints per second. X-ray solder jointinspection systems also have higherprices, typically about 50 to 100 percentmore than the price of optical solder jointsystems with the fastest testing speedcapability.
e
4
3
TABLE 2. Example of measurement resultsfrom inspection of pins in printed circuitboard. (See Fig. 6.)
ThicknessInspection _________________Pin Point µm (10–3 in.)
193 Pad 15.0 (0.59)Heel 29.9 (1.18)Center 17.5 (0.69)Toe 34.0 (1.34)
194 Pad 14.7 (0.58)Heel 30.5 (1.20)Center 17.3 (0.68)Toe 33.0 (1.30)

Automated X-ray testing of solderjoints has the following major advantages:(1) extremely high discontinuity detectioncapability; (2) obviation of visual testingby automating solder joint discontinuitydetection, thereby also reducingunnecessary rework due to false rejectcalls; (3) reduction of rework analysis timeby pinpointing discontinuities to theexact solder joint; (4) real time processcontrol of all three process steps (pasteprinting, component placement andsolder cure) to lower discontinuity ratesand rework costs; (5) quantitativemeasurements to help permanentlyeliminate the causes of discontinuitiesfrom all three process steps; (6) reductionof failures at final assembly and in thefield, failures due to anomalous hiddensolder joints and marginal solder jointsdue to insufficient solder, misalignmentor excessive voids; and (7) applicability tolead free solder systems.
Automated radioscopy of solder jointshas some limitations. Test throughput isnot always fast enough to inspect allsolder joints within the manufacturingcycle time for the printed circuit assembly.Also, automated radioscopy requires asignificant learning curve to becomeexpert at developing solder joint testswith low rates both of false calls (incorrectrejections) and of missed calls (incorrectacceptances).
Implementation ofAutomated Process TestSystemsSuccessful implementation of automatedprocess test systems into printed circuitassembly production lines requires asignificant investment in training, processanalysis and system integration. Theimplementation can be a lengthy processthat requires concerted effort by engineersor skilled technicians. Listed here arehighlights of what several manufacturershave learned are key aspects ofsuccessfully implementation of automatedtest systems such as X-radiographingtesting.
1. Assess requirements carefully. Start bycarefully assessing the requirementsfor automated process test in theparticular production environmentinto which the system will beintegrated. Determine exactly whatkind of discontinuities are mostimportant for the test system todetect, what measurements will mosthelp with process improvement andwhat benefits will generate thequickest financial return oninvestment.15 This assessment mustconsider the test and measurement
capability that already has beenimplemented as well as newrequirements arising from futureprinted circuit assembly designs.
2. Select a small number of automatedprocess test systems to evaluatethoroughly and compare against thesystem requirements. The evaluationshould include a benchmark usingprinted circuit assemblies fromproduction to determine the system’scapabilities to accurately detect theimportant discontinuity types withinthe required false reject rate,repeatedly making the requiredmeasurements and not exceeding therequired test time. Elements of cost ofownership should be well understood,including test development time,maintenance skills and cost, expectedsystem downtime and suppliermaintenance services and prices.
3. Consider and plan carefully forinterfaces to other factory systems.These systems include board handlingequipment, barcode reading systems,computer aided design systems forautomatic download of board layoutand component package informationand quality data management systemsfor statistical process control andhistorical quality tracking.
4. Start with a focus on statistical processcontrol measurements instead ofdiscontinuity detection. Until theprocess variation is reduced, mostmanufacturers will encounter a ratehigher than desired — either a falserejection rate or a false acceptancerate. Allowing one or the other rate tobe too high while focusing onreducing the process variation first willavoid time consuming, unproductivetweaking of acceptance thresholds.Reducing process variation requirescorrelating measurements to theprocess parameters causing thevariation and discontinuities and thenproperly adjusting these processparameters.16
5. With an understanding of the selectedsystem’s capability, carefully define thedefects that must be detected forproduct quality and reliability. Manyof the visual testing criteria used inthe past are not appropriate forautomated test systems because thesystem takes objective and differentmeasurements.
6. Do not underestimate the initialresource investment required to obtainoptimum benefit from an automatedprocess test system. Theimplementation plan should includededicated technical support for thefirst six months of operation and testdevelopment. Developing a thoroughunderstanding of the measurement
581Other Applications of Radiographic Testing

582 R
results and correlating the data withprocess parameters is key to successfuluse of the system. Implementationshould also address the fact thatproduction personnel will have to beconvinced of the accuracy of thesystem’s test results before full benefitcan be obtained from the system.
Image Processing forQualitative Assessment ofElectronicsRadioscopic systems incorporating imageprocessing software and images may beenhanced by color coding of density data,displaying the test object with colors
adiographic Testing
FIGURE 7. Contrast enhancement in microfocus radioscopic images of printed circuit board:(a) automatic contrast enhancement revealing bonding pattern and voids in quasi pack;(b) manual contrast enhancement of quasi pack; (c) measurements line between two voidson quad flat pack; (d) gray range highlighted in red; (e) colors selected by trackball toenhance contrast; (f) contour enhancement of density differences.
(a)
(b)
(c)
(d)
(e)
(f)

FIGURE 8. Color enhancement of images on computer screen: (a) poor bonding on surfacemounted component; (b) colorized highlight of misregistered areas of printed circuit board;(c) solder voids and registration placement on surface mounted component; (d) heatdelamination, registration and placement of surface mounted component; (e) connections,component placement, registration accuracy and solder voids in surface mounted printedcircuit board; (f) accurate registration of printed circuit board.
(a)
(b)
(c)
(d)
(e)
(f)
OVIE.nspectionf printedircuitoards.
assigned according to thresholds selectedby the user. Figure 7 shows six images ofthe same printed circuit to illustrateseveral options for contrastenhancement.17 Image enhancement canalso be used to detect anomalies thatoccur during assembly (Fig. 8).17 Colorversions of the images in Figs. 7 and 8may be seen in a journal article17 or in theCD-ROM version of this book.
The application of radiographic testing toelectronics testing is documented in thetechnical literature.15-21
MIocb
583Other Applications of Radiographic Testing

584
PART 3. Radiographic Testing of ConsumerGoods
BLE 3. Applications of radiographic testing to onlinespection of consumer products.
Category Problem
Foreign objects stonesmetalsplasticsbone fragmentsglass
Anomalous products deformed productsclod formationssize errorswater logged productsdefrosted frozen products
Missing items missing constituentsmissing packagesproduct missing from cartonbag or box missing from case
Demand for pharmaceutical and foodsafety has prompted industry to lookbeyond electromagnetic metal detectors toother nondestructive means of detectingcontaminants in consumer product.Conventional radiography has been usedin industry since the first half of thetwentieth century. In the 1990s,radioscopy has also been used, especiallyin the electronics industry, where a fewmanufacturers are offering fullycomputerized systems.
Radioscopic testing has been primarilywith image intensifiers and chargecoupled device cameras. Images aredisplayed on a closed circuit televisionmonitor; often an image processor withframe averaging removes noise and usesadditional image enhancement features.This operation has generally been manual:the operator views the images and makesan accept/reject decision. In systems ofthis type the component or product beinginspected is usually stopped in order forthe image processing to be effective. Incertain food inspection applications aconveyor is used at a continuous speedwhere the product flow is slow enough togive the operator time to view thedisplayed image.
Since 1990 X-ray sensitive linear arrayshave seen increasing applications fortesting and screening of commercial andconsumer products. The advent of thelinear diode array (LDA) and verysophisticated image analysis softwareproducts permit tests at production lineflow capacities. Systems are available withenough resolution to detect wire down to0.28 mm (0.011 in.) diameter withoperating speeds greater than 1.5 m·s–1
(300 ft·min–1).These systems use a low energy
constant potential X-ray source, lineararray detector, computer, conveyor and aradiation safe enclosure. The X-ray energylevels vary from 50 to 140 kV peak. Theimage processing software provides asystem less dependent on operators’qualitative assessments and capable ofdetecting a wide variety of contaminants.In addition these systems may be used forchecking tamper evident seals, fill level,missing product, improper packaging andmore. Product size generally ranges fromsmall processed cartons and bottles toactual full cases. The detectors areavailable in almost any size and many
veacWprpr
mwapgo
LThslocoapinle(3anth0.(0arde
sysowpoitedith
TAin
Radiographic Testing
ndors offer standard enclosures that willcommodate many different products.ashdown enclosures are used forocessed meat, poultry and dairyoducts.Radioscopy and radiation density
easurement together are applicable to aide variety of quality controlplications for many types of consumerods (Table 3).
inear Arrayse commercial use of linear arrays haswly emerged in industrial andnsumer food and pharmaceuticalplications. These systems are available various conveyor widths, X-ray energyvels and speeds in excess of 1.5 m·s–1
00 ft·min–1) are attainable. Resolutiond sensitivity is based on the selection ofe array’s pixel size, ranging from225 mm (0.01 in.) up to 2.5 mm.1 in.) with little limitation in theray’s length, especially in the largertector size.A typical linear array based X-ray
stem consists of a variable energy X-rayurce with collimator, detector moduleith image processor, personal computer,wer supply, conveyor to transport thems to be inspected and an imagesplay monitor. Software ranges fromat required to produce an image to

GURE 9. Radiographic images ofgetables: (a) radioscopic image of onion;) microfocus radioscopic image of tomatoed.
)
)
advanced detection programs to fullyautomate the test process. Thecomponents are usually housed in ashielded cabinet or in some casesenclosures are manufactured thatincorporate an existing production typeconveyor used in the firms manufacturingprocess.
The operation is based on an array oflight sensitive silicon photo diodes coatedwith a scintillator along with the signalprocessing electronics. The detectorsprovide a standard digital data output to aframe storage card and personal computer.Energy levels of the X-ray source aretypically in the 20 to 160 kV peak withcurrent values from 0.20 to 20 mA,depending on the pixel pitch of the arrayand the speed of the conveyor.
Resolution is determined by the pixelpitch of the detector but processing speedis also important in selecting the properdetector. As an example, a 2.5 mm(0.1 in.) pixel detector has a maximumscanning speed of 1.1 m·s–1 (210 ft·min–1)and a 0.8 mm (0.03 in.) pixel detector hasa maximum speed of only 0.3 m·s–1
(57 ft·min–1). Currently detectors areavailable with a pixel pitch of 0.225 mm(8.9 × 10⁻³ in.), 0.4 mm (0.016 in.),0.8 mm (0.03 in.), 1.5 mm (0.06 in.) and2.5 mm (0.10 in.). The standard detectorlength varies between manufactures withthe higher resolution detectors (lowerpixel pitch) generally not exceeding0.40 m (16 in.) in length.
ApplicationsRadiography is widely used for the studyof biological specimens. Theinstrumentation and techniques arefamiliar from medical applications.Medical radiology and industrialradiography were closely alliedtechnologies in the middle of thetwentieth century but drifted apart, inpart because industrial test objectsrequired ionizing radiation with greaterpenetrating power than do thin biologicaltissues. Each field developed its ownhardware, technical literature andprocedures.
FoodComputerized systems have beenmanufactured to inspect variousconsumer food products, including candy,tobacco, fresh baked goods, cheese, butter,canned meats, snack foods and numerousother packaged or cased products.22 Thelayers of an onion are clearly visible inFig. 9a.23
Online systems incorporate objectrecognition software for swift, automatedaccept/reject decision making.
RereunascopiX-thanas
SeAsrastuex
FIve(bse
(b
(a
presentative of such systems is oneported that can test marmalade jars foriform fill and for foreign objects, such
glass splinters. The system can alsount the slices of pepperoni on frozenzza. As soon as a grocery item passes theray sensor, the program can interprete resulting image and cause anomalous item to be ejected from thesembly line.24
ed with all sorts of biological specimens,diographic testing can be applied to thedy of seeds.25,26 The image can be
amined to determine the following.
585Other Applications of Radiographic Testing

586
IGURE 11. Radiographic testing of toothpaste: (a) five
1. Radiography can show that theembryo has germinated to produce aseedling (see Fig. 9b).
2. Radiography can show whether a seedor shell is full or empty (Fig. 10). Someseeds are empty because of geneticdeficiency.
3. Full seeds may not germinate becauseof rough handling or other traumathat causes cracking in the seed coat.Such cracking can be seen withradiography.
4. Stereo radiography makes it possible toview internal features of seedmorphology. A stereo image can beproduced by taking one image, thenmoving either the image plane or thetest object and then taking the otherimage. Depth is seen when the twoimages are viewed simultaneously witha stereoscope or prism.
5. Tomography can be used to provideimages of selected planes in the seed.
6. A radiopaque dye can be added toselectively enhance the visibility ofstructures according to their ability toabsorb the dye’s vehicle.
Figure 10 shows radiographs of walnutseeds.
CWteshth
oateco
PPpdScoecoha
vqhra
F
Radiographic Testing
FIGURE 10. Black walnut seeds: (a) nut 1, dphotostatic negative radiograph; (b) nut 1dry photostatic positive radiograph; (c) nu1, conventional film radiograph, negative;(d) nut 2, dry photostatic negativeradiograph; (e) nut 2, dry photostaticpositive radiograph; (f) nut 2, conventionafilm radiograph, negative.26
(a)
(b)
(c)
(d)
(e)
(f)
elluloseood products can be radiographicallysted for discontinuities in variousapes.27 as well as for consistentickness as paper.14
Cigarettes are inspected for uniformityf fill and packing by online density gagess described above.14 Radioscopicchniques have been applied inmbustion studies.28
harmaceuticalsharmaceutical applications includeackaged catheter kits, saline solutionispensers, metal film drug packaging.ystems are used for inspecting engine
mponents, aluminum castings,lectronic assemblies, computers,
nsumer electronic packaging, wirearness assemblies and numerousdditional packaged products.
Radiographic testing can providearious sorts of information useful touality control of pharmaceutical andygiene products. Figure 11a showsdiographic images used to measure the
ry,t
l
exposures show ball bearing sinks to bottom in centersample;23 (b) radioscopic image reveals metal particles intoothpaste tube.
(a)
(b)
Metal particles

GURE 13. Radioscopic image of light bulbveals connections.
MOVIE.Radiographicinspection oflight bulb.(Press escape toclose.)
3RT21_Layout(569_608) 10/28/02 2:51 PM Page 587
density of toothpaste by tracking a metalball falling through the paste.23 Figure 11bshows metal shavings discovered inside atube of toothpaste.
PackagingThe increased usage of decorative metalfilm packaging in consumer foodmanufacturing has mandated an increaseduse of X-ray testing because metaldetectors will no longer function becauseof the metal film. Linear arrays arecapable of detecting metal contaminantsdown to 0.5 mm (0.02 in.) as well asidentifying plastic, stones, rubber andrelated possible contaminants.
In addition, linear X-ray testing makesit possible to inspect products by the caserather than by the individual box,something metal detectors usually cannotdo. Another advantage of the automaticcomputer processing is that several testsmay be conducted simultaneously.Although the original intent may havebeen to detect a metal contaminant, thecomputer program can also look fornumerous packaging anomalies, missingproduct, duplicate product, anomalouspackage integrity and even product countverification.
Figure 12 shows how radioscopy canreveal that a battery is missing in ahandheld device. In essence each imagemay be subject to highly advancedprocessing, if required, while obviating anoperator.
The image in Fig. 13 shows thefilaments in a light bulb.
SpRaeqsporRaillFifil
FIre
FIGURE 12. Radioscopic image of metaldetector wands reveals assembly error.
Battery missing
orts Equipmentdiography can be used to test sportsuipment for departures fromecification, because of either tampering manufacturing discontinuities.diography can detect corking or otheregal cores in baseball bats, for example.gure 14 shows images of golf balls in am radiograph made circa 1930.23
587Other Applications of Radiographic Testing
FIGURE 14. Radiograph of golf balls.23

588
PART 4. Radiographic Testing in SecuritySystems
X-Ray Screening forAirport SecurityX-ray screening systems became widelyused in the early 1970s followingincidents of hijacking. The airline
insc
syfluouwi
Radiographic Testing
FIGURE 15. Radioscopic scanner typicallyused for airport security.
FIGURE 16. Schematic diagram of conveyor be
Lead shieldeddiode array box
Diode array boards
X-ray beam
X-ray collimator
X-ray generator
X-ray control board
Conveyor belt
dustry was required to conduct X-rayreening of passenger carryon baggage.29
Twentieth century X-ray screeningstems were radioscopes, eitheroroscopes with cathode ray tubetputs or closed circuit television screensth video compatible outputs.30,31
By the year 2000, virtually all X-raysystems had become based on lineardetector arrays. Thousands are in usethroughout the world. In the twenty-firstcentury, airport baggage X-ray scannersprovide high resolution digital imaging,with sophisticated image analysis andenhancement software that can detectand identify explosive materials, weaponsand other contraband seconds after theluggage enters the X-ray machine.
A variety of techniques offerpossibilities for imaging and visualizationfor aircraft security. Planar transmissionimaging techniques using X-rays andnuclear radiation have been investigated.Means for distinguishing materials byusing multiple radiation sources areavailable, along with techniques forsimulating materials with mixtures ofother materials. Tomographic
lt radioscopic scanner.
Drive roller
Computer rack (at rear)
Main control board

OVIE.argo
canning.
reconstruction techniques have beenderived and estimates have been made oftheir performance. X-ray diffractiontechniques offer an alternative totransmission imaging.32
The enclosure of a representativeinstallation (Figs. 15 and 16) contains aconveyor and a 140 to 160 kV peak, 0.2 to2.0 mA X-ray generator. A folded linear
dioscrecomenhmotheranpenovesysfor excdosSys
FIGURE 17. Radioscopic image of suitcasecontents: (a) detailed image; (b) imagethresholded to view items of greatest
density.(a)
(b)
FIGURE 18. Radioscopic security inspection o
OVIE.age
cquisitionndvaluation.
OVIE.ages atMV andMV.
OVIE.ontraband water
ank.
de array is used to ensure 100 percentening of anything in the tunnel and aputer with image analysis andancement software with image displaynitor enables the operator to observe flow of luggage. The high dynamicge of the systems provides foretration in steel from 25 mm (1 in.) tor 400 mm (16 in.) in the larger cargotems. Linear array technology provideslow scatter, high dynamic range andellent quantum efficiency and lowe, typically 1 µSv (0.1 mR) per test.tems are available from familiar
luggage screening systems (Fig. 17) tothose capable of inspecting a fully loadedsea freight container or a semi tractortrailer (Fig. 18). The larger systems usehigh energy X-ray generators from 320 kVpeak to 9 MeV.33
The use of compton backscatterimaging for mine detection and baggagescanning is discussed elsewhere in thisvolume.
Small wand shaped metal detectors andlow intensity radiation detectors of otherdesigns are available for frisking and otherlow intensity searches of individuals.34
Threat Recognition SoftwareSoftware can identify and separate objectswith specific material characteristics,including explosives, narcotics, gold,other metals, currency and evenagricultural products.
An operator training program isdesigned to daily test the operator withknown X-ray images of contraband.Threat assessment software provides realtime operator training and performancemonitoring. The threat projectionsoftware inserts numerous types of threatobjects at predefined settings andintervals into otherwise clean bags,allowing supervisors to monitor theoperator’s recognition response. Thistraining may also be networked to several
MCs
MImaae
MIm36
MCint
589Other Applications of Radiographic Testing
f vehicle.

590
machines for testing and downloading ofdata.
Images may be saved or transmitted todistant security stations for furtheranalysis without allowing the suspect bagto exit the system. These systems may alsobe networked so that an entire airportterminal could have all X-ray units alsosending images to a central location forobservation, backup or additional analysisof suspect bags.
Radiological Detection andIdentification of MaterialThrough compton scatter andphotoelectric absorption, dual energyX-ray technology makes it possible toseparate organic from inorganic materials.The photoelectric effect is very energydependent; compton scattering is onlymildly energy dependent. The ratio ofphotoelectric effect to compton scatteringdepends on atomic number (Z number).Using two X-ray energies permits thedetermination of this ratio and soprovides the average (or mean) effective Znumber along the line of sight. Comptonscattering is effective in imaging of water,hydrocarbons and other organic materials— generally composed of hydrogen,carbon, oxygen and nitrogen andtypically displayed as orange. Metals, steeland copper are displayed as blue.Aluminum is on the boundary of themetals, typically identified as a material ofmixed high and low atomic number anddisplayed as green. Explosives and drugstend to be low atomic number whereasweapons have a high atomic number. Theeffective Z number aids in identificationof these materials by the system operator.
A prototype system used at UnitedStates southern point of entries for cargotruck and railroad freight car inspectionshas prompted development of othervehicle inspection systems that are costeffective, transportable, fast and reliableand that use low level radiationexposures. A high resolution 13 mm(0.5 in.) system that scans an entire cargotruck, including the van, can conductnormal as well as oblique scans in 90 s.A system that scans railroad cars at8 km·h–1 (5 mi·h–1) has been underdevelopment. It has the option of using acobalt-60 source for inspecting heaviercargoes. In addition, a system has beenplanned that will be mounted on a smallvehicle with an extendable detector towerand deployable gamma ray source to scana suspect vehicle, either a passenger car orcargo truck, for contraband.33
PuSefoinrathmcoco
adinanchextefawstthidanarascoof
teceteim
Radiographic Testing
lsed Fast Neutron Analysisveral techniques have been advancedr detection of explosive devices by usingteractions of specific nuclei with gammays or fast neutrons. Techniques usingese interactions identify the device byeasuring the densities or relativencentrations of the elementalnstituents of explosives.35,36
Pulsed fast neutron analysis37 has beenvanced as a technology that canterrogate large (truck sized) containersd conveyances for user specifiedemicals or materials such as drugs,plosives and hazardous materials. Thest object is subjected to short pulses ofst neutrons that pass through containeralls and produce gamma rays as theyrike the cargo. Gamma sensors measuree radiation, which permitsentification of elements (carbon, oxygend nitrogen) present in small, specificeas of the test object. The system thensembles the small images into amposite image that shows the contents the container.Studies have reported that the
chnique can work. As of the turn of thentury, however, the cost of thechnology has limited itsplementation.38

PART 5. Infrastructure Applications ofRadiographic Testing
URE 19. Radiograph of 13 mm (0.5 in.) reinforcement barsd 16 mm (0.6 in.) steel conduit in 0.46 m (18 in.) thickncrete slab.44
In their broadest sense, infrastructureinstallations include transportationsystems such as railroads, tunnels, streets,highways and bridges; civil engineeringstructures such as dams, walkways, arenasand other public buildings; utilitiessystems for the conveyance of liquid andgas materials, such as petroleum, naturalgas, water and sewage; energy systemssuch as towers, high tension lines,underground cables and piping. Mostinfrastructures either, like architecture, arehyperengineered to avoid failure or, likestructural steel and electric power, haveevolved specialized and codifiedtechnologies apart from other parts ofinfrastructure. As a result, discussions ofinfrastructure nondestructive testingtypically concentrate on highways andbridges.
SoilRadiation techniques have been appliedto the testing of soil.39,40 These techniquesare valuable for comparative research onaggregates such as concrete and forimaging of objects irradiated in situ insoil.
ConcreteBecause concrete is an aggregate thatseverely scatters acoustic waves, theapplicability of nonacoustic test methods,such as radiographic and microwavetesting, has long been of interest.23,41-43
The ability of gamma rays to provideimages of steel rebars inside concrete(Fig. 19) has been demonstrated44-47
although access problems preventwidespread implementation of thetechnique in highway maintenanceprograms. Obstacles include (1) thedesirability of testing from two sides,often difficult, (2) safety considerationsassociated with high energy radiation inpublic places and (3) expense.
Research by the United StatesDepartment of Transportation hasincluded the evaluation of the followingtechniques for inspecting concrete, steeland asphalt: (1) X-ray computedtomography for determination of crackpropagation, void percentage anddistribution in concrete;48 (2) validation
ofin(3sptocesc(5cocoac
ChChcopoacdecoanmpoge70cammwi
we
FIGanco
X-ray radiography techniques forspection of bridge cables;) development of codes, standards andecifications for radiography andmography of concrete; (4) measuringment hydration using a neutronattering technique;49 and) determination of chloridencentration and depth profiles inncrete using prompt gamma neutrontivation analysis.50-52
loride Contaminationloride contamination is a major
ntributor to road deterioration. Artable prompt gamma neutrontivation spectroscopy system has beenveloped to analyze the elementalmposition (calcium, silicon, aluminumd others) of reinforced concrete and toeasure chloride contamination. Thertable system consists of a high purityrmanium gamma detector with apercent relative efficiency, a
lifornium-252 neutron source andoderator subsystem and a portableultichannel analyzer system integratedth a laptop computer.Two types of activation experimentsre performed to evaluate the device:
591Other Applications of Radiographic Testing

592
FIGURE 20. Setup for radiographic test of bridge splice.53
FIGURE 21. Inspector positions X-ray filmholder for radiographic test of section oflongitudinal seam in penstock.56
(1) a detector calibration and (2) anevaluation of the actual performance ofthe complete system with thecalifornium-252 source using full scale testslabs containing known amounts ofchloride. Both techniques indicate that itis feasible to use this technique tomeasure the chloride content ofreinforced concrete in the field. Thechloride level for the corrosion thresholdcan be measured with a precision of10 percent for a counting time of roughly6 min. The prompt gamma neutronactivation technique is competitive withthe conventional destructive method.51
BridgesThe approach of design engineers forbridges — as for elevators, skyscrapers andamusement park rides — is tohyperengineer, that is, to specify secondarysupports and materials stronger thanrequired by the worst scenarios of the civilarchitect’s imagination so that materialfailures remain noncritical. However,despite hyperengineering, the passage ofdecades has made bridges a matter ofurgent and ongoing concern.Radiographic testing plays several criticalroles in the inspection of thousands ofbridges in the United States.53
1. Structural steel needs to be inspectedduring forging.
2. Welds during fabrication need to beinspected using applicable codesstandards.
3. In maintenance testing during thelifetime of the bridge, radiographictesting may be used selectively toanalyze corrosion rates and monitorother material conditions. Inparticular, radiographic testing hasbeen used to test welds, cables andcable caps.54 Special applications mayarise for particular bridges, such as adrainage pump inspected with a linearaccelerator.55
4. More generally, laboratory studiescontribute to an understanding ofmaterial behavior.
The greatest obstacle for radiographictesting occurs when the structuralmembers requiring attention are buriedunder concrete (Fig. 20). There has beenan economic incentive to develop othermethods — such as visual testing,microwave testing or acoustic methods —for maintenance tests after initialfabrication.
Radiographic Testing
Other Civil StructuresRadiographic testing finds application inthe testing of a great variety of civilstructures. Any sort of structural steel, forexample, may be inspected duringfabrication or years later duringmaintenance.
PenstocksIn dams, valves control the flow of waterin penstocks, large conduits that conveywater to hydroelectric generators.Radiographic testing has been used to testpenstocks installed in water projects inColorado and Washington (Fig. 21).56

Light Poles57
Radiographic testing has been used to testlight poles for discontinuities that mightlead to material failure and expensive ordangerous accidents. In one case in Texas,lamps had been mounted on poles 24 m(80 ft) high (Fig. 22). Each pole wasconstructed by butt welding together foursections of 6 m (20 ft) each. After oneweld failed in service, all welds wereinspected.
Ultrasonic testing was unhelpfulbecause waves passed through the weldsand reflected from the inside surface ofthe hollow poles. Many of the weldsfailed to comply with requirements ofAWS D1.1, Structural Welding Code.58
Radiographic testing revealed severaldiscontinuities: porosity, slag, incompletepenetration and lack of penetration.
BuildingsThe nondestructive testing of buildings isa concern of both infrastructure andconservation. The radiographic testing ofsome historic buildings is discussed below.
593Other Applications of Radiographic Testing
FIGURE 22. Inspector in aerial personnel liftradiographically tests welded part of lamppost.57

594
PART 6. Radiographic Testing in Conservation ofHistoric Buildings and Museum Objects
URE 23. Statue of Liberty: (a) seen from above, statuelosed in scaffolding, May 1984; (b) radiographer preparesxpose film to 3.7 TBq (100 Ci) iridium-192 source.92
ArchaeologyRadiographic testing has found a widevariety of applications in the investigationof artifacts for their preservation and forresearch in the fields of anthropology,archaeology and history.59-62 Studies havefocused on particular materials such asglass,63 wood64 and metals65-67 and onparticular techniques such as computedtomography,68 compton scattering69 andX-ray fluorescence.70
Bones and FossilsIn anthropology radiographic testing isapplied to the examination of funeraryremains, particularly mummies.71-74 Thistest object is not unlike those in the morefamiliar applications of medical andforensic investigations.
Radiographic testing has also been usedto examine fossils and coral.75-76
StructuresGamma radiography has been popular forthe testing of buildings and outdoorstructures because isotopes are portableand do not require electric power.
Statue of Liberty77,78
The Statue of Liberty stands 46 m (151 ft)tall and weighs 254 000 kg (560 000 lbm).A special design was necessary to supporta statue of this size. Its external envelopeof 300 copper plates, joined by300 000 rivets, is secured by 1500 coppersaddles to an armature of 600 vertical ironribs, each 50 mm (2 in.) thick. Thisflexible design permits the structure tobreathe, that is, to expand and contractwith temperature and other weatherconditions. The monument was renovatedin 1986 because years of corrosion andstrain had caused 600 saddles to fail(Fig. 23).
Gamma radiography was performed aspart of the diagnostic work. A gamma rayprojector with a 3.7 TBq (100 Ci)iridium-192 isotope and radiographic filmof three speeds were selected for the job.Most exposures were made in 5 min. Atungsten collimator was used to controlradiation scatter. Attention was paid to tierods, rivets, bolts, welds and pylons,
parbascenconloc
BuRadins
FIGencto e
(b)
(a)
Radiographic Testing
ticularly the tie rod assembly at thee, where the statue is anchored to atral pylon. The radiographic testingfirmed discontinuity severity and
ations needing repair.
ildingsiographic testing has been used to
pect ancient buildings, looking

IGURE 24. Cape Hatteras Lighthouse:) aerial view; (b) portion of ornamental
upport system, with isotope head visible atottom of structure’s circular aperture.83
b)
a)
diagnostically for hidden structures anddiscontinuities to guide renovation,conservation and restoration.79 Oneexample is the gamma radiographyperformed on the Acropolis, in Athens,Greece.80
Capitol. The Capitol building inWashington, District of Columbia, neededrenovation in 1983. Before drilling holesin two walls the architects needed toknow where utility lines and ventilationducts and flues were located. The walls,like much of the building, were rebuiltafter being destroyed in the War of 1812;lines for electricity, water and telephonewere installed years later and no drawingsremained to show where.
The walls were X-radiographed with asmall, mobile linear accelerator. The firstwall was 0.6 m (24 in.) thick and theX-ray head was positioned 1 m (39 in.)from the wall for a source-to-film distanceof 1.6 m (63 in.). The linear acceleratorwas operated for 1.5 h at 50 percentpower: 0.5 Gy·min–1 at 1 m (50 rad·min–1
at 39 in.); total dose to the film was18 mGy (1.8 rad). To shorten the exposuretime, the equipment was operated at100 percent power for the second wall,0.46 m (18 in.) thick. The radiographictesting showed that utility lines could beinstalled in the walls.81
Roofs and Hidden Apertures. In the fieldof building conservation, radiographictesting shares at least two applicationswith another method, infraredthermography: one is looking for hiddenapertures in walls, as in the case of theCapitol described above; another issurveying rooftops for moisture ingressand retention. A neutron moisture gage isfeasible because of the opacity of watermolecules to neutron radiation.82
Lighthouse. The Cape HatterasLighthouse, Cape Hatteras, NorthCarolina, was built around 1867 andsuffered damage in an 1886 earthquake.In 1976 a painting contractor noticedcracks in the brackets supporting the castiron gallery. In 1979 a platform wasconstructed beneath the gallery for testingand repairs. In radiographic testing, theinspector used a 9.37 TBq (252 Ci)cobalt-60 source and a 1.8 m (6 ft)source-to-film distance to obtain imagesthrough 0.6 m (2 ft) of masonry and50 mm (2 in.) of iron (see Fig. 24). Thefilm radiographs revealed severe cracks inseven brackets behind the masonry.Subsequent repairs compensated for thesediscontinuities and made the gallery safeto walk on.83,84
Cosmic RadiographyCosmic radiography is distinguished fromother types of radiography by its radiationsource. Cosmic rays are emitted by stars in
odc7o
F(asb
(
(
uter space and can be recorded withetector arrays on Earth. Cosmic raysomprise electrons of about00 pC·kg–1·h–1 (2.7 µR·h–1) and photonsf about 200 pC·kg–1·h–1 (0.8 µR·h–1).
595Other Applications of Radiographic Testing

5
IGURE 25. Higashi Honganji Temple: (a) photograph ofmple; (b) planar view of cosmic ray pattern.85
b)
a)
Intensities on Earth vary with altitude,latitude and sun spot activity. Becausecosmic radiation is emitted from alldirections in the Universe, the Earth itselfserves as a radiation shield, partly limitingthe source to the sky overhead. Theatmosphere also helps to reduce radiationfrom directions other than directlyoverhead.Limitations. Limitations include thefollowing:
1. The inspectors cannot control thewavelength and intensity of the rays.Material data are quantified onlyapproximately. Cosmic radiographycould not be used to gage thethickness of piping, for example.
2. The inspectors cannot select sourcelocation and so cannot control theangle of incidence of rays.Consequently, the radiation is difficultto collimate and scatter is difficult tocontrol. The resulting images lackresolution; they are fuzzy becauseradiation comes from different parts ofthe sky.
These considerations limit cosmicradiography to preliminary, qualitativeassessment of massive objects.Advantages. The advantages of cosmicrays are (1) their extremely greatpenetrating power, (2) low cost, (3) greatersafety than with other forms of ionizingradiation and (4) availability in remotelocations.Applications. The main gate of a templein Nagoya, Japan, was examined toinvestigate the practicality of applyingcosmic rays to structural analysis of largeobjects (Fig. 25). Cosmic ray intensity datawere collected at a number of positionsaround and under the gate with athallium activated sodium iodidescintillation counter. A threshold of3 MeV was used to distinguish cosmic rayspectra from terrestrial radiation fromelements such as uranium and potassiumin the environment. The resulting cosmicradiographic image corresponded to theknown structure.85
Cosmic radiography was used in 1968to look for hidden rooms in the Pyramidof Khafre, the second largest pyramid atGiza, Egypt. Cosmic ray particles reachingthe sensor were counted from differentdirections and made it possible toestimate the amount of materialthroughout the pyramid. No hiddenrooms were found.86,87
Cosmic radiography could be used forqualitative surveys of dams, some bridgesand other massive structures.87
Historic ShipsHistoric ships present a particularchallenge to conservationists because of
thwpilteJoCCuG(4tourrwBsrec
Fte
(
(
96 Radiographic Testing
eir age and because exposure to seaater and weather is destructive to metalarts. The following case historieslustrate the benefits of radiographicsting for these vessels.seph Conrad. The fully rigged Josephonrad, moored in Mystic Seaport,onnecticut, was built in 1882 andnderwent inspection and repairs in 1978.amma radiography with a 1.5 TBq0 Ci) iridium-192 source was conducted inspect the riveted hull, which had
ndergone repairs in 1962. After furtherepairs in 1978, the hull was replated,adiographically tested and then coatedith tar.88
elle. Underwater archeology can presentpecial problems. Ships can sink andemain on the ocean floor for decades,ven centuries. Wood rots and metalorrodes. The Belle, a ship in French

597Other Applications of Radiographic Testing
URE 26. Radiography of submarine Hunley: (a) positioningadioscopic image plate on hull exterior; (b) computediograph of hull’s rivets (the vessel was riveted from theide and sanded to improve its hydrodynamics); (c) setting exposure of iridium-192.91
)
explorer La Salle’s final expedition, sankin 1886 along the coast of Texas and wasdiscovered in 1995. Conservators haveused radiographic testing to examinethousands of corroded objects, to identifythem and decide how they can berestored. For a variety of speeds bothmedical and industrial film was used.Each artifact was radiographed three timesto provide images from differentangles.89,90
Hunley. The submarine H.L. Hunley servedthe Confederacy in the American CivilWar, sinking the Union warshipHoustatonic in Charleston Harbor, SouthCarolina, in 1964. The Hunley sank whilereturning from that mission. Its wreck wasdiscovered in 1995 and salvaged with thehelp of radiographic testing (Fig. 26).When new, the submarine weighed6800 kg (15000 lbm) and was 12 m (39 ft)long.
The salvaged vessel was full ofsediment. A primary goal of theradiographic testing was to measure thewidth of the submarine’s plates and findthe seam line to help decide the bestpoint of entry. Confronted with the needto create an image through 1.2 m (46 in.)of sand and silt, the radiographers used2.5 h exposures with a cobalt-60 source.Digital images were manipulated to makeparticular features more visible. Using thisinformation, conservators removed severalof the hull’s plates and excavated thesediment inside the hull carefully, muchas an archeologist excavates a site on dryland.
As with the Belle, corroded objects thatwere discovered were then radiographedto identify them and determine how bestto restore them. Recovered objects, inaddition to human bones, includedcanteens, buttons, a thimble and alantern.91
Liberty Bell78,92,93
The Liberty Bell in Philadelphia rang tocelebrate the United States’ independencein 1776. Gamma radiography wasperformed with film in 1975 to assess thebell’s integrity before a planned movefrom Independence Hall to a differentbuilding across the street (Fig. 27). Theradiographic testing used took place intwo phases: (1) a series of small sectionsand (2) one large image of the entire bell.
The small radiographs were made withstandard 0.36 × 0.43 m (14 × 17 in.) filmexposed to a 1.9 TBq (52 Ci) iridium-192source. Because of thickness variations inthe bell, exposure times ranged from1.75 min at 1.9 TBq (52 Ci) to 17 min at3.7 TBq (100 Ci).
The full size radiograph was made witha vinyl covered package containing
FIGa rradinsup
(b
(a)
(c)

598
14 sheets of 1.3 × 2.1 m (52 × 84 in.) film.The sheets were made by slicing 2.1 m(7 ft) sections from rolls of film in a widthof 1.3 m (52 in.), the width in which theyare manufactured before being cut tonormal size. A 25 TBq (670 Ci) gamma rayprojector containing cobalt-60 in a 900 kg(2000 lbm), 0.6 m (24 in.) diameter lead
ball(50
Twithav197oth
Radiographic Testing
FIGURE 27. Gamma radiography of LibertyBell in 1976: (a) setup showing lead ballcontaining cobalt-60; (b) film image.92
(b)
(a)
was positioned at a distance of 15 m ft) from the film.he bell was radiographically tested
h film again in 2001 and the imagese been compared with those from5 to check for crack propagation ander changes.94
Marble Statues
Caligula95
In the 1980s, the Virginia Museum of FineArts, Richmond, acquired a statue of theRoman Emperor Caligula dating from thefirst century of the Christian Era. Afracture had separated the head from theshoulders of the statue and a conservatorin 1970 had reconnected them using ametal pin and glue. Radiography wasundertaken to determine the extent of the1970 conservation efforts and, byexamination of the marble grain, to verifythat the head was originally part of therest of the statue. One of only twocomplete statues of that emperor, thestatue is worth more if the head isoriginal. The radiographic tests helpedfurther studies to verify the head’sauthenticity (Fig. 28).
An iridium-192 source of 3.3 to 37 TBq(90 to 1000 Ci) was placed 1.2 m (48 in.)from the film cassettes taped to the head.It required a series of 4 h exposures to getimages through 0.20 m (8 in.) of marble.
Pietà96
At the New York World’s Fair, in 1964, theVatican exhibited MichelangeloBuonarroti’s Pietà. Before moving thestatue to the United States, the Vaticancommissioned a radiographer from theUnited States to document its condition.(Fig. 29a) The technician practiced byradiographing stacks of marble windowsills but the Carera marble chosen byMichelangelo proved harder and moreabsorbing than the samples.
Radiographic work in the Basilica wastimed to avoid interference with Lentenservices. Film radiographs were made inthe day with a portable X-ray machineoperating up to 200 kV peak and exposuretimes ranging from 30 s to 10 min.Additional exposures were madeovernight with gamma equipment, usinga cobalt-60 source for the thickest parts ofthe statue.
Fragile parts were of concern. Thestatue had been moved in the past butthere was no record about the moves or ofdamage to the statue. Radiographs of theoutstretched left hand of Mary revealedthat the fingers had been broken andrepaired using interior pins (Fig. 29b).

FIGURE 28. Statue of Caligula: (a) placemof film casette; (b) digitized film image
(b)
(a)
Shipping experts used this information forpacking the statue.
Paintings97
The scientific examination of art can bedivided into two basic categories:destructive and nondestructive. Amongthe destructive methods are those thatinvolve sampling, taking a small slice orscraping for closer scrutiny, perhaps bymicroscopy or spectroscopy. Aconservator’s goal, however, is carefully tomaintain valuable works of art and toslow the inevitable deterioration.Nondestructive testing is an invaluabletool to this end. The art historian alsofinds nondestructive testing an importantasset in the pursuit of information ofhistorical value — for example, aboutcreative techniques of a particular artist ora certain period of art.
ent.95
599Other Applications of Radiographic Testing
FIGURE 29. Michelangelo Buonarroti’s Pietà,Saint Peter’s Basilica, Vatican: (a) film casetteplacement; (b) image of hand, showing pinsused to repair broken fingers.96
(b)
(a)

600
As part of the creative evolution of apainting, an artist will often reconsiderduring composition and paint over theoriginal idea. The artist may even paintover an earlier works simply because theartist considers the earlier painting lessimportant than the need for anothercanvas. A change can also be made bysomeone other than the original artist.From the art historian’s point of view,these underpaintings can afford insightinto artistic development or thetechniques used to achieve a particulareffect. They can also help determine theartist or the authenticity of a painting.
Three nondestructive methods derivedfrom the electromagnetic spectrum areused in the testing of two-dimensionalart: (1) ultraviolet fluorescentphotography, for study of chemistry onthe surface; (2) infrared reflectographyand thermography, sensitive to relativelyemissive hues near the surface; and(3) X-radiography, suited for revealingsubsurface layers. X-radiography recordsthe distribution of pigments that have ahigh absorption coefficient for X-rays. TheX-rays used in X-radiography willcompletely penetrate a canvas. However,if pigments such as white lead orvermillion with high absorptioncoefficients are present,98 theirdistribution will be indicated on aphotographic plate placed behind thecanvas.
X-radiography has been used toexamine paintings since early in thetwentieth century.23 By revealing hiddenlayers of a painting, the method canprovide valuable information aboutartistic techniques and materials. Thisinformation can help conservatorspreserve or restore paintings.99-103
Flemish Art104,105
Film radiography has been used for theexamination and restoration of severalmasterpieces of Flemish art.
1. Van Eyck’s Altarpiece of the Mystic Lamb(1432), Saint Bavo’s Cathedral, Ghent,consists of seven paintings on threeoaken boards. Radiographic testing hasshown where apertures in the woodgrain had been filled with pigmentand mounting glue and revealedseveral layers in the painting process.
2. Peter Paul Rubens’ Portrait of GaspardGevartius (1628), Royal Museum ofFine Arts, Antwerp, was painted on apanel consisting of five boards joinedby dowel pins. Radiographic testinghas revealed various details of Rubens’technique. For example, a thick layerof paint confirmed a technique called“wet in wet” (alla prima).
3
4
VeInfhatecFledisknwais amiUscochpoanchrea
Vecocomois, sizpaauto ori
BaSoin AstheBaBushoimapsamunbowoFiga toldsligind
Radiographic Testing
. The original canvas of Rubens’ TheVirgin and Child Enthroned with Saints(1628), Royal Museum of Fine Arts,Antwerp, had deteriorated and beenmounted on a second canvas, soradiography is the only way toexamine the original canvas.Radiographic testing has revealed fewcorrections to the original, suggestinga high level of mastery.
. The Oyster Eater (1882), Royal Museumof Fine Arts, Antwerp, is a work fromJames Ensor’s youth. It uses lessopaque commercial oils from tubes.Radiographic testing has revealed thatEnsor mixed paints on the canvasmore than on the palette.
rmeer97
rared reflectography and X-radiographyve been applied in relating the paintinghniques of seventeenth centurymish artist Jan Vermeer to histinctive style.106,107 View of Delft,own for the realistic impression it gives,s examined by Wheelock. The painting cityscape of the seventeenth centuryrrored in the still waters of a harbor.ing infrared and X-radiography,nservators were able to determine theanges made in the length andsitioning of the reflections in the waterd in the outlining of the city’s profile:anges that Vermeer made to achieve hislistic effect.In addition to learning more aboutrmeer’s working techniques,nservators attempted to determinempositional changes and also to learnre of actual physical condition — thatabrasion, restorations or any sort ofe alteration. Some changes to ainting can result in questions ofthenticity, especially when they appearbe done by someone other than theginal artist.106,107
um97
me of the examination procedures usedthe Intermuseum Conservationsociation laboratory are illustrated by infrared photographs of Charles
um’s Boy with Still Life, owned by thetler Institute of American Art. Fig. 30aws the portrait using normal light. No
ages other than that of the title areparent. An infrared photograph of the
e painting shows the sketch, orderdrawing, for the face of the youngy and the faint image of a youngman slightly above and to the right.ure 30b, the result of X-radiography, ishird image and appears to be that of aner man. In addition, darker areashtly below center and lower lefticate some restoration.

Higgens97
The painting Randall’s Mill (1922-23), byAmerican artist Victor Higgens, wasexamined by the IntermuseumConservation Association laboratory(Fig. 31a).107 The painting was still on theoriginal canvas stretcher and in a framewith a brass label, which reads: “VICTORHIGGENS NA [sic] / 1884-1949 /RANDALL’S MILL.”
In light from a window, the raisedsurface of another painting appeared onthe canvas. After examining Randall’s Millunder a raking light, the laboratoryconservators assayed the oil painting withvarious methods including X-radiography
and appewherefleappefigurof a Photreflefromcamcanvof thFig.
AHiggStar subsin 19
FIGURE 30. Charles Baum’s Boy with Still Lifpreviously attributed to Severin Roesen:(a) visible light photograph;(b) X-radiograph of entire canvas showingimage apparently of older man.97
(b)
(a)
infrared reflectography. The paintingars as a depopulated landscape but,n it is viewed with infraredctography, the structure of a millars, along with carriages filled withes, horsedrawn wagons and the figuresaddled donkey being led by a man.ographic images of the infraredctography examination were made the black and white monitor as the
era scanned various portions of theas. With X-radiography, the structuree mill is the dominant element of
31b. painting of this description byens was detailed in the Indianapolisin 1924 but the paintingequently disappeared. In an interview75, Helen Spiess Ferris, daughter of
Benjamin G. Randall, related the taleexplaining the painting beneath a
e,
601Other Applications of Radiographic Testing
FIGURE 31. Victor Higgens’ Randall’s Mill: (a) visible lightphotograph; (b) X-radiograph showing mill of title.97
(b)
(a)

6
painting. Randall had built the mill of thetitle. In the vicinity of the mill, he owneda cabin that he made available to theartist Higgens. Higgens painted thepicture of Randall’s Mill from that cabin.On seeing the picture, Randallpronounced it “the worst picture Higgensever painted.” The statement must havebothered Higgens for some time, for theoverpainting is in a style that Higgensused much later during the 1940s.
ClosingThe applications in this chapter illustratethe versatility of radiographic testing.
02 Radiographic Testing

1. Snow, S.G. and R.A. Morris.“Radiation Gaging.” NondestructiveTesting Handbook, second edition:Vol. 3, Radiography and RadiationTesting. Chapter 16. Columbus, OH:American Society for NondestructiveTesting (1985): p 674-704.
2. Davis, R.S. “Early Development ofProcess Automation with NucleonicMeasurement Gages.” MaterialsEvaluation. Vol. 47, No. 10.Columbus, OH: American Societyfor Nondestructive Testing(October 1989): p 1190-1191.
3. Trout, E.D., R.M. Gager andA.L. Pace. “Possible IndustrialApplications of Soft X-Radiation15 to 100 Kilovolts.” NondestructiveTesting. Vol. 7, No. 3. Columbus,OH: American Society forNondestructive Testing(Winter 1948-1949): p 20-24.
4. Reider, J.E. “Industrial NucleonicGaging.” Nondestructive Testing.Vol. 15, No. 6. Columbus, OH:American Society for NondestructiveTesting (November-December 1957):p 360-365.
5. Clayton, J.D. “Thickness Gaging byGamma Ray Attenuation.” MaterialsEvaluation. Vol. 31, No. 2.Columbus, OH: American Societyfor Nondestructive Testing(February 1973): p 27-32.
6. Ball, E. “A Method for Non-ContactThickness and ConductivityGaging.” Materials Evaluation.Vol. 33, No. 9. Columbus, OH:American Society for NondestructiveTesting (September 1975): p 54A,57A.
7. Coulter, J.E. X-Ray FluorescenceTechnique for Measuring CoatingThickness. Y-1927. Oak Ridge, TN:Oak Ridge Y-12 Plant (1974).
8. White, J.D. Compton ScatteringTechnique for Measuring the AreaDensity of Glass-Reinforced Structures.Y-1714. Oak Ridge, TN: Oak RidgeY-12 Plant (1970).
9. Foukes, R.A., J.S. Watt,B.W. Seatonberry, A. Davison,R.A. Greig, H.W.G. Lowe andA.C. Abbott. International Journal ofApplied Radiation and Isotopes.Vol. 29, No. 12 (1978): p 721.
10. Whittaker, J.W. and S.G. Snow.“A Radiation Attenuation Techniquefor Simultaneous Determination ofLayer Thickness in a Bi-LayeredStructure.” Materials Evaluation.Vol. 34, No. 10. Columbus, OH:American Society for NondestructiveTesting (October 1976): p 224-229.
11. Reynolds, G.M. “Neutron GagingSystems.” Practical Applications ofNeutron Radiography and Gauging.Special Technical Publication 586.ASTM International (1976): p 58.
12. Knoll, G.F. Radiation Detection andMeasurement, third edition. NewYork: John Wiley and Sons (2000).
13. Koicki, S., A. Koicki and V. Aydacic.Nuclear Instrumentation and Methods(1973): p 297.
14. Davis, R.S. “Nondestructive Gagingwith Radiation Sources.” MaterialsEvaluation. Vol. 47, No. 9.Columbus, OH: American Societyfor Nondestructive Testing(September 1989): p 1054, 1056,1058, 1060.
15. Baird, D.L. “Using 3D X-RayInspection for ProcessImprovements.” Proceedings ofNEPCON West Conference. DesPlaines, IL: Cahners Publishing(1993).
16. Sack, T. “Implementation Strategyfor an Automated X-Ray InspectionMachine.” Proceedings of Nepcon WestConference. Des Plaines, IL: CahnersPublishing (1991).
17. Olsen, R. “More Than Just a PrettyPicture: Real-Time X-Ray ImageEnhancement in the ElectronicsIndustry.” Materials Evaluation.Vol. 46, No. 11. Columbus, OH:American Society for NondestructiveTesting (October 1988):p 1403-1408.
18. Silva, F. “Automated X-RayInspection Strategies.” Real-TimeRadioscopy and Digital Imaging[Mashantucket, CT, August 1998].Columbus, OH: American Societyfor Nondestructive Testing (1998):appendix.
603Other Applications of Radiographic Testing
References

19. Buechler, D.W. “Real-TimeRadiography for ElectronicsReliability Assessment.” MaterialsEvaluation. Vol. 45, No. 11.Columbus, OH: American Societyfor Nondestructive Testing(November 1987): p 1326-1329.
20. Marchese, M. and K.A. Glodowski.“Real-Time Microfocus Radiographyfor Electronic Failure Analysis.”Materials Evaluation. Vol. 49, No. 12.Columbus, OH: American Societyfor Nondestructive Testing(December 1991): p 1481-1485.
21. “X-Ray Technology Digital DetectorBased Systems.” Technical note.Bohemia, NY: V.J. Technologies(2000).
22. Tollner, E. and M. Shahin. “X-RayImaging for Classifying FoodProducts Based on Internal Defects.”ASNT Spring Conference and 9thAnnual Research Symposium Abstracts[Birmingham, AL]. Columbus, OH:American Society for NondestructiveTesting (March 2000): p 89-90.
23. St. John, A. and H.R. Isenburger.Industrial Radiography. New York, NY:John Wiley and Sons (1934).
24. Schmitt, P. “Lebensmittelscanner.”Arbeitskreis IndustrielleRöntgenprüfverfahren. Ausgabe 1[ZfP-Zeitung, Ausgabe 79]. Berlin,Germany: Deutsche Gesellschaft fürZerstörungsfreie Prüfung(April 2002): p 4.
25. Katz, R., M.R. Lee and M. Milner.“X-Ray Inspection of Wheat.”Nondestructive Testing. Vol. 9, No. 2.Columbus, OH: American Societyfor Nondestructive Testing(Fall 1950): p 16-18.
26. Vozzo, J.A. “Seed Radiography.”Materials Evaluation. Vol. 46, No. 11.Columbus, OH: American Societyfor Nondestructive Testing(October 1988): p 1450, 1452-1455.
27. Beaton, J.A., W.B. White andF.H. Berry. “Radiography of Treesand Wood Products.” MaterialsEvaluation. Vol. 30, No. 10.Columbus, OH: American Societyfor Nondestructive Testing(October 1972): p 14A-17A.
28. Brenizer, J.S., K.W. Tobin,J.M. Hylko, D.D. McRae andR.W. Jenkins, Jr. “QuantitativeMeasurement of Equivalent WaterDensity in a Burning Cigarette.”Materials Evaluation. Vol. 45, No. 11.Columbus, OH: American Societyfor Nondestructive Testing(November 1987): p 1310-1314.
29. “Mobile X-Ray Unit (on a Trailer)‘Eyes’ Airport Luggage, Packages.”Materials Evaluation. Vol. 30, No. 5.Columbus, OH: American Societyfor Nondestructive Testing(May 1972): p 54A.
30. Battema, J.P. “NondestructiveTesting Fights Terrorism.” MaterialsEvaluation. Vol. 44, No. 11.Columbus, OH: American Societyfor Nondestructive Testing (October1986): p 1304, 1310, 1314, 1316.
31. Tsacoumis, T.P., ed. Access SecurityScreening: Challenges and Solutions.Special Technical Publication 1127.West Conshohocken, PA: ASTMInternational (1992).
32. Lanza, R.C. “Visualization andImaging.” Aviation Security Problemsand Related Technologies. SPIEProceedings, Vol. CR42. Bellingham,WA: International Society forOptical Engineering (1992):p 104-125.
33. Verbinski, V.V., J. Payne andM. Snell. “Recent Developments inthe VACIS Gamma RadiographySystems.” Enforcement and SecurityTechnologies. SPIE Proceedings,Vol. 3575. Bellingham, WA:International Society for OpticalEngineering (1998): p 368-374.
34. De Moulpied, D.S., P.J. Rothschildand G.J. Smith. “X-Ray BodySearchEliminates Strip Search in MontanaPrison.” Enforcement and SecurityTechnologies. SPIE Proceedings,Vol. 3575. Bellingham, WA:International Society for OpticalEngineering (1998): p p 175-181.
35. Bell, C.J. “Nuclear Technologies forExplosives Detection.” AviationSecurity Problem and RelatedTechnologies. SPIE Proceedings,Vol. CR42. Bellingham, WA:International Society for OpticalEngineering (1992): p 137-166.
36. Hussein, E.M. “Detection ofExplosive Materials Using NuclearRadiation: A Critical Review.”Aviation Security Problem and RelatedTechnologies. SPIE Proceedings,Vol. CR42. Bellingham, WA:International Society for OpticalEngineering (1992): p 126-136.
37. Fishbein, R.H. “Pulsed Fast NeutronAnalysis May Help QuenchTerrorism.” Materials Evaluation.Vol. 55, No. 12. Columbus, OH:American Society for NondestructiveTesting (December 1997): p 1330,1332, 1334.
604 Radiographic Testing

38. Baltzer, K.R. “Is There a Role forNondestructive Testing inPreventing Terrorism and IncreasingHomeland Security?” MaterialsEvaluation. Vol. 60, No. 4.Columbus, OH: American Societyfor Nondestructive Testing(April 2002): p 513-517.
39. Marr, W.A. and C. Fairhurst, eds.Nondestructive and Automated Testingfor Soil and Rock. Special TechnicalPublication 1350. WestConshohocken, PA: ASTMInternational (1999).
40. Bernhard, R.K. and M. Chasek. “SoilDensity Determination by Means ofRadioactive Isotopes.” NondestructiveTesting. Vol. 11, No. 8. Columbus,OH: American Society forNondestructive Testing(November-December 1953):p 17-23. Errata, Vol. 12, No. 1(January-February 1954): p 40.
41. Ritz, V.H. “Broad and Narrow BeamAttenuation of Ir-192 Gamma Raysin Concrete, Steel, and Lead.”Nondestructive Testing. Vol. 16, No. 3.Columbus, OH: American Societyfor Nondestructive Testing(May-June 1958): p 269-272.
42. Runkiewicz, L. “Application theRadiographical Testing for Controlof Building Constructions ofConcrete in Poland.” 3rd EuropeanConference on Nondestructive Testing[Florence, Italy]. Vol. 1. Brescia,Italy: Italian Society forNon-Destructive Testing, for theEuropean Societies forNondestructive Testing(October 1984): p 142-153.
43. Mitchell, T.M. “Radioactive/NuclearMethods.” CRC Handbook onNondestructive Testing of Concrete.Boca Raton, LA: CRC Press (1990):p 227-252.
44. Clarke, E.T. “Cobalt-60 Radiographyof Concrete.” Materials Evaluation.Vol. 47, No. 10. Columbus, OH:American Society for NondestructiveTesting (October 1989):p 1200-1203.
45. Niehous, F., G. Coen, R. Kretschmerand M. Biercher. “RadiographicInspection of Prestressed Concreteup to 1600 mm Wall ThicknessUsing a 9 MeV Linear Accelerator.”11th World Conference onNondestructive Testing [Las Vegas,Nevada]. Vol. 1. Columbus, OH:American Society for NondestructiveTesting (November 1985):p 528-534.
46. Sakine, I. and M. Fujinawa.“Exploratory Tests of Corrosion ofReinforcing Steel in Concrete byX-Radiography.” MaterialsEvaluation. Vol. 42, No. 1.Columbus, OH: American Societyfor Nondestructive Testing(January 1984): p 121-126.
47. Forbis, J.E. “Radiography forBuilding Renovation.” MaterialsEvaluation. Vol. 59, No. 6.Columbus, OH: American Societyfor Nondestructive Testing(June 2002): p 685-686, 688,690, 692-694.
48. Saleh, H.H., G. Washer andM. Moore. “The Use of X-RayComputed Tomography forHighway Applications.” ASNT FallConference and Quality Testing Show2000 Paper Summaries Book[Indianapolis, IN]. Columbus, OH:American Society for NondestructiveTesting (November 2000): p 126.
49. Livingston, A. and H. Saleh.“Development of an EpithermalNeutron Detector forNondestructive Measurement ofConcrete Hydration.” NondestructiveCharacterization of Materials VIII:Proceedings of the Eighth InternationalSymposium held in Boulder, Colorado,June 15-20, 1997. New York, NY:Plenum Press (1998): p 535-540.
50. Livingston, R.A. and H.H. Saleh.“Specification and Design of aPortable Prompt Gamma/NeutronActivation System forNondestructive Determination ofChloride in Reinforced Concrete.”Topics on Nondestructive Evaluation:Vol. 2, Nondestructive Testing andEvaluation of Infrastructure.Columbus, OH: American Societyfor Nondestructive Testing (1998):p 83-96.
51. Saleh, H.H. and R.A. Livingston.“Experimental Evaluation of aPortable Neutron-BasedGamma-Spectroscopy System forChloride Measurements inReinforced Concrete.” Journal ofRadioanalytical and NuclearChemistry. Vol. 244, No. 2.Lausanne, Switzerland: ElsevierSequoia (May 2000): p 367-371.
52. Livingston, R.A., H.H. Saleh,R.C. Block and P.J. Brand. “Time ofFlight Calibration of Li-6 GlassEpithermal Neutron Detectors.”Applied Radiation and Isotopes.Vol. 53, No. 4-5. Oxford, UnitedKingdom: Pergamon Press(May-June 2000): p 773-777.
605Other Applications of Radiographic Testing

53. Hellier, C. “Who Will Inspect OurBridges?” Materials Evaluation.Vol. 41, No. 12. Columbus, OH:American Society for NondestructiveTesting (November 1983):p 1352-1355.
54. Thomas, G., S. Benson, P. Durbin,N. Del Grande, J.J. Haskins,A. Brown and D.J. Schneberk.“Nondestructive EvaluationTechniques for Enhanced BridgeInspection.” Review of Progress inNondestructive Evaluation. Vol. 13B.New York, NY: Plenum Press (1994):p 2083-2090.
55. Newell, R.S. and P.J. Stolarski. “Useof a Portable Linear Accelerator toRadiograph a Bridge DrainagePump.” Materials Evaluation. Vol. 50,No. 9. Columbus, OH: AmericanSociety for Nondestructive Testing(September 1992): p 1084,1086-1087.
56. Bell, R.D. “Field Radiography —Images from the Past.” MaterialsEvaluation. Vol. 42, No. 7.Columbus, OH: American Societyfor Nondestructive Testing(June 1984): p 849-851.
57. “Radiography Saves BaseballSeason.” Materials Evaluation.Vol. 47, No. 10. Columbus, OH:American Society for NondestructiveTesting (October 1989): p 1162. Seealso Vol. 48, No. 4 (April 1990):p 504.
58. AWS D1.12, Structural Welding Code— Steel. Section 8, “Buildings.”Miami, FL: American WeldingSociety (1986).
59. Reimers, P. and J. Riederer.“Zerstörungsfreie PrüfungKulturgeschichtlicher Objekte durchComputertomographie (CT).” 3rdEuropean Conference on NondestructiveTesting [Florence, Italy]. Vol. 1.Brescia, Italy: Italian Society forNon-Destructive Testing, for theEuropean Societies forNondestructive Testing(October 1984): p 305-313.
60. Boutaine, J.L. “Radiography Appliedto Non Destructive Examination ofCultural Objects.” 7th EuropeanConference on Non-Destructive Testing[Copenhagen, Denmark]. Vol. 1.Copenhagen, Denmark: 7th ECNDT(May 1998): p 391.
61. Lavayssiére, B. and N. Lacoudre.“Application of Radiography for theConservation and Restoration ofArchaeological Objects.” 7thEuropean Conference onNon-Destructive Testing [Copenhagen,Denmark]. Vol. 1. Copenhagen,Denmark: 7th ECNDT (May 1998):p 416-419.
62. Yang, J. “X-Ray Radiography Appliedto the Study of the AncientManufacturing Technique and theState of Conservation of CulturalRelics.” 15th World Conference onNon-Destructive Testing [Rome, Italy].Brescia, Italy: Italian Society forNon-Destructive Testing MonitoringDiagnostics (October 2000): p 170.
63. Schiekel, M., G. Haase, A. Meisterand M. Seibitz. “Investigation ofHistorical Glasses Using NaturalBorn Radioactivity.” 15th WorldConference on Non-Destructive Testing[Rome, Italy]. Brescia, Italy: ItalianSociety for Non-Destructive TestingMonitoring Diagnostics(October 2000): p 174.
64. Alonso, M.A. M Arroyo, V. Gil,E.M. de Salinas and G. Delojo.“A Radiographic Study of InsectAttacks in Woods.” 7th EuropeanConference on Non-Destructive Testing[Copenhagen, Denmark]. Vol. 1.Copenhagen, Denmark: 7th ECNDT(May 1998): p 400-408.
65. Míšek, B. and L. Ptáček. “Some DataObtained on X-Ray andNeutronographic Examination ofHeat Resistant Ni-Base Alloys.” 3rdEuropean Conference on NondestructiveTesting [Florence, Italy]. Vol. 1.Brescia, Italy: Italian Society forNon-Destructive Testing, for theEuropean Societies forNondestructive Testing(October 1984): p 246-251.
66. Ptáčková, M. and L. Ptáček.“Complex Examination ofCorrosion Damage in ArchaeologicalFinds of Etruscan Bronze Jewels.”3rd European Conference onNondestructive Testing [Florence,Italy]. Vol. 1. Brescia, Italy: ItalianSociety for Non-Destructive Testing,for the European Societies forNondestructive Testing(October 1984): p 252-261.
67. Gottlieb, B. “NDT Examination ofBronze Lurs.” 7th EuropeanConference on Non-Destructive Testing[Copenhagen, Denmark]. Vol. 1.Copenhagen, Denmark: 7th ECNDT(May 1998): p 436-443.
68. Rossi, M. “High Resolution3D Computed Tomography of SmallArchaeological Sculptures.”7th European Conference onNon-Destructive Testing [Copenhagen,Denmark]. Vol. 1. Copenhagen,Denmark: 7th ECNDT (May 1998):p 409-415.
606 Radiographic Testing

69. Tartari, A. “Compton ScatteringElemental Imaging of a Deep LayerPerformed with the PrincipalComponent Analysis.” 15th WorldConference on Non-Destructive Testing[Rome, Italy]. Brescia, Italy: ItalianSociety for Non-Destructive TestingMonitoring Diagnostics(October 2000): p 158.
70. Caneva, C. “XRF Spectrometers forNon-Destructive Investigations inArt and Archaeology.” 15th WorldConference on Non-Destructive Testing[Rome, Italy]. Brescia, Italy: ItalianSociety for Non-Destructive TestingMonitoring Diagnostics(October 2000): p 171.
71. Rossi, M., D. Romani and D. Picchi.“Investigation of Small EgyptianMummies by 3D ComputedTomography.” 15th World Conferenceon Non-Destructive Testing [Rome,Italy]. Brescia, Italy: Italian Societyfor Non-Destructive TestingMonitoring Diagnostics(October 2000): p 159.
72. “NSWC X-Rays Mummified Bull.”Materials Evaluation. Vol. 36, No. 5.Columbus, OH: American Societyfor Nondestructive Testing(April 1978): p 58.
73. Lombardo, B., G. Conlogue andR. Colten. “The Use of ComputedRadiography to Survey MummifiedRemains.” ASNT Fall Conference andQuality Testing Show 2000: PaperSummaries Book [Indianapolis, IN].Columbus, OH: American Societyfor Nondestructive Testing(November 2000): p 127.
74. Paderni, L. and M. Micheli. “X-RayStudy of Peruvian Funeral ‘Fardos’ ofthe Museo Preistorico Etnografico‘Luigi Pignorini.’“ 3rd EuropeanConference on Nondestructive Testing[Florence, Italy]. Vol. 1. Brescia,Italy: Italian Society, forNon-Destructive Testing, for theEuropean Societies forNondestructive Testing(October 1984): p 263-275.
75. Zangerl, R. “The Use of X-Rays inthe Study of Fossils.” NondestructiveTesting. Vol. 7, No. 1. Columbus,OH: American Society forNondestructive Testing(Summer 1948): p 29-31.
76. “X Rays Provide Researcher withViews of Coral Growth Patterns.”Materials Evaluation. Vol. 37, No. 9.Columbus, OH: American Societyfor Nondestructive Testing(August 1979): p 26-27.
77. “The Statue of Liberty: TheRestoration in Retrospect.” MaterialsEvaluation. Vol. 44, No. 8.Columbus, OH: American Societyfor Nondestructive Testing(July 1986): p 891-895.
78. Berntson, C.M. “NondestructiveTesting Sheds Light on PreservingAmerica’s Past.” Materials Evaluation.Vol. 43, No. 10. Columbus, OH:American Society for NondestructiveTesting (September 1985):p 1180-1182, 1184-1186.
79. Hatziandreau, L. and G. Ladopoulos.“Use of Radiography for Solution ofDiagnostic Problems Existing inMarble Monuments.”Materialprüfung. Vol. 22. Berlin,Germany: Bundesanstalt fürMaterialforschung und Prüfung(July 1980): p 298-300.
80. Clarke, E.T. “Radiography of AncientStructures on the Acropolis ofAthens.” Technology andConservation. Vol. 8, No. 3. Boston,MA: Technology Organization(Fall 1983): p 18-22.
81. “Radiography Aids Renovation ofCapitol.” Materials Evaluation.Vol. 43, No. 10. Columbus, OH:American Society for NondestructiveTesting (September 1985): p 1148,1150-1151.
82. Bonin, H.W. and C.J. Thorp.“Neutron Moisture Gage for RoofingSurveys: Experiment andSimulation.” 3rd European Conferenceon Nondestructive Testing [Florence,Italy]. Vol. 1. Brescia, Italy: Brescia,Italy: Italian Society forNon-Destructive Testing, for theEuropean Societies forNondestructive Testing(October 1984): p 224-229.
83. Blancato, R.J. “Radiography Finds‘Broken Bones’ in Cape HatterasLighthouse.” Materials Evaluation.Vol. 38, No. 3. Columbus, OH:American Society for NondestructiveTesting (March 1980): p 13-15.
84. Clarke, E.T. “Radiography of theCape Hatteras Lighthouse.”Technology and Conservation. Vol. 5,No. 1. Boston, MA: TechnologyOrganization (Spring 1980): p 20-24.
85. Minato, S. “Feasibility ofCosmic-Ray Radiography: A CaseStudy of a Temple Gate as aTestpiece.” Materials Evaluation.Vol. 46, No. 11. Columbus, OH:American Society for NondestructiveTesting (October 1988):p 1468-1470.
607Other Applications of Radiographic Testing

86. Livingston, R.A. “TransferringTechnology from ConservationScience to Infrastructure Renewal.”Public Roads. Vol. 58, No. 1. McLean,VA: Federal Highway Administration(Summer 1994).
87. Alvarez, L.W. “Search for HiddenChambers in the Pyramids.” Science.Vol. 167. Washington, DC:American Association for theAdvancement of Science (1970):p 832-839.
88. “Hellier Examines Historic Vesselwith Modern NDT Tests.” MaterialsEvaluation. Vol. 36, No. 7.Columbus, OH: American Societyfor Nondestructive Testing(June 1978): p 70-71.
89. Kleven, S. “Use of ComputedRadiology during the ArchaeologicalConservation of LaSalle’s Ship —The Belle.” 15th World Conference onNon-Destructive Testing [Rome, Italy].Brescia, Italy: Italian Society forNon-Destructive Testing MonitoringDiagnostics (October 2000): p 157.
90. “Uncovering Historical TreasuresUsing NDT.” Materials Evaluation.Vol. 57, No. 7. Columbus, OH:American Society for NondestructiveTesting (July 1999): p 736.
91. Fanning, D.F. “The ConfederateSubmarine H.L. Hunley andNondestructive Testing. MaterialsEvaluation. Columbus, OH:American Society for NondestructiveTesting (March 2002): p 409-413,416-419.
92. “How They Did It — Radiographingthe Liberty Bell.” MaterialsEvaluation. Vol. 34, No. 2.Columbus, OH: American Societyfor Nondestructive Testing(February 1976): p 14A-16A,18A, 26A.
93. Clarke, E.T. “Radiographing theLiberty Bell.” Foundry Trade Journal.Vol. 141. London, United Kingdom:Institute of British Foundrymen(August 1976): p 223-228.
94. “Examining the Liberty Bell.” TheNDT Technician. Vol. 1, No. 3.Columbus, OH: American Societyfor Nondestructive Testing (July2002): p 1-5.
95. “Radiography Aids Art Conservationof Caligula Statue.” MaterialsEvaluation. Vol. 47, No. 10.Columbus, OH: American Societyfor Nondestructive Testing(October 1989): p 1129-1131.
96. “George Corney’s Radiographs HelpMove Vatican’s Pieta.” MaterialsEvaluation. Vol. 22, No. 6.Columbus, OH: American Societyfor Nondestructive Testing(June 1964): p 279.
97. Humphries, H. “Infrared Testing inArt Conservation.” MaterialsEvaluation. Vol. 45, No. 4.Columbus, OH: American Societyfor Nondestructive Testing(April 1987): p 426-428, 430.
98. Van Asperen de Boer, J.R.J. “InfraredReflectography: A Contribution tothe Examination of Earlier EuropeanPaintings.” Dissertation. Amsterdam,Netherlands: University ofAmsterdam (July 1970): p 11-15.
99. Graham, D. and T. Eddie. X-RayTechniques in Art Galleries andMuseums. Boston: Adam HilgerLimited (1985).
100. Rossi, M., F. Casali, A. Bacchilegaand D. Romani. “An ExperimentalX-Ray Digital Detector forInvestigation of Paintings.”15th World Conference on Non-Destructive Testing [Rome, Italy].Brescia, Italy: Italian Society forNon-Destructive Testing MonitoringDiagnostics (October 2000): p 160.
101. Pancyzk, E., M. Ligeza, K. Pytel,A. Kalicki, L. Ro~winska, B. Sartowskaand L. Walis. “Neutron-InducedAutoradiography in the Study of OilPaintings by Tintoretto, Marieschiand Bellotto.” 15th World Conferenceon Non-Destructive Testing [Rome,Italy]. Brescia, Italy: Italian Societyfor Non-Destructive TestingMonitoring Diagnostics (October2000): p 179.
102. “The Mysterious Paintings of FrancisPicabia.” Worldwide. Vol. 7. Mortsel,Belgium: Agfa-Gavaert NV [n.d.].
103. “The Hermitage MuseumConservation Project: Titian’s TheFlight into Egypt.” Worldwide.Vol. 8/9. Mortsel, Belgium:Agfa-Gavaert NV [n.d.].
104. Flemish Masterpieces X-Rayed withStructurix Industrial X-Ray Film. Pressrelease. Mortsel, Belgium:Agfa-Gavaert NV [n.d.].
105. The Ingenuity of Flemish Art and NDTTechnology Combined. Brochure.Mortsel, Belgium: Agfa-Gavaert NV[1988].
106. Wheelock, Arthur K., Jr. “NEAFellows’ Diary: Vermeer’s PaintingTechnique.” Art Journal. Vol. 41,No. 2. New York, NY: HearstCorporation (Summer 1981):p 162-164.
106. Wheelock, A.K., Jr. Vermeer and theArt of Painting. New Haven, CT: YaleUniversity Press (1995).
107. Porter, D. Correspondence(January 1987).
608 Radiographic Testing

Frank A. Iddings, San Antonio, Texas
22C H A P T E R
Attenuation Coefficients
3RT22 LAYOUT(609_652) 10/3/02 1:43 PM Page 609

610
PART 1. Introduction to Attenuation Coefficients
3RT22 LAYOUT(609_652) 10/3/02 1:43 PM Page 610
The attenuation of an X-ray or gamma raybeam passing through matter (and thebeam’s resulting attenuation) is theconsequence of a series of single events.During each event a photon is removedfrom the beam after interaction with anucleus or an orbital electron in theattenuating material. The total probability(per atom) for scattering or absorption ofa photon of the original energy is givenby a proportionality constant σ. This isoften referred to as the cross sectionbecause it has the dimensions of an area.Such cross sections are measured in a unitof 10–28 m2. In physics, this unit has beencalled barn (b), where 1 b = 100 fm2 =10–28 m2 = 10–24 cm2.
The total attenuation coefficient is thesum of the attenuation coefficients due tocompton scattering, the photoelectriceffect and pair production. Thephotoelectric effect is that process in whicha photon transfers its total energy to anelectron in some shell of an atom. It ismost significant at lower photon energies.As photon energy increases, comptonscattering becomes the main processcontributing to attenuation. Very highenergy photons are absorbed by pairproduction, in which a photon is convertedinto an electron and a positron. Thisprocess occurs in the electrical field of anucleus and requires a minimum photonenergy of 1.02 MeV.
The total attenuation coefficient can beexpressed in three different forms:
1. The atomic attenuation coefficientmeasures the probability ofabsorption, per atom of absorbingmaterial, in barn (10–28 m2).
2. The mass attenuation coefficientmeasures the probability of absorptionper gram of absorbing material in asquare centimeter of the beam(cm2·g–1).
3. The linear attenuation coefficientmeasures the probability of absorptionper centimeter of the absorbingmaterial’s thickness (cm–1).
Linear Attenuation CoefficientThe linear attenuation coefficient µL canbe expressed as:
(1)
whcotheattof
wa
whcenpreatt
for
whgramaCacobe
MThcomacopro
(2)
for
whattoxis fArox
µ µ ρL M== ××
Radiographic Testing
ere µM is the mass attenuationefficient and where ρ is the density of absorbing material. The linearenuation coefficient has a dimensioncm–1.The linear attenuation coefficient µL ofter at 1 MeV, for example, is:
ere 1 is the density ρ in gram per cubictimeter at standard temperature andssure and where 0.0705 is the massenuation coefficient µM for water.The linear attenuation coefficient µL air at 0.020 MeV is:
ere 0.0012 is the density ρ of air inm per cubic centimeter and 0.761 is itsss attenuation coefficient µM.lculation of the mass attenuationefficients for air and water is shownlow).
ass Attenuation Coefficiente mass attenuation coefficient µM of ampound or mixture is the sum of thess attenuation coefficients of the
nstituent elements, weighted inportion to their relative abundance R.
The total mass attenuation coefficient a compound, water, at 1 MeV, is:
ere 0.126 and 0.0636 are the massenuation coefficients of hydrogen andygen at 1 MeV. The relative abundanceigured using the relative atomic mass= 1 for hydrogen and Ar = 16 forygen. Relative atomic mass (formerly
µM water
2 –1
0.1262
18
0.06361618
cm g
( ) =
+
= ⋅0 0705.
µ µ
µ
M total M a a
M b b
(( )) == (( ))++ (( )) ++ ……
R
R
0 761 0 0012 0 9 0. = . 1 1 cm–3 –1 ×× ××.
0 0705
1 0 0705
. cm g
g cm = . cm
2 –1
–3 –1
⋅
× ⋅

611Attenuation Coefficients
3RT22 LAYOUT(609_652) 10/3/02 1:43 PM Page 611
called atomic weight) is the ratio of theaverage mass per atom of an element toone twelfth of the mass of the atom of thenuclide carbon 12.
The same method can be used tocalculate the mass attenuation coefficientat 0.02 MeV for air (a mixture), whichconsists in percentages by weightprimarily of N2 (75.6 percent), O2(23.1 percent) and Ar (1.3 percent). Themass attenuation coefficients are asfollows: nitrogen, 0.598 cm2·g–1; oxygen,0.840 cm2·g–1; and argon, 8.87 cm2·g–1.Therefore the total mass attenuationcoefficient for air at 0.02 MeV is:
Linear Coefficient TablesTables 1 to 40 are based on a narrow beamabsorption. The calculated atomic, massand linear attenuation coefficients forvarious elements are given in the energyrange of 0.01 to 30 MeV.
The tables were prepared for a previousedition by the Radiation PhysicsCommittee of the American Society forNondestructive Testing, under thedirection of C. Robert Emigh of LosAlamos National Laboratory, New Mexico.The tabulations provide data for thephotoelectric component; data for thepair production component, whichincludes both nuclear and orbital electroncontributions; data for the scatteringcomponent; and a correction forelectronic binding energies. Values wereobtained from G.R. White’s calculatedvalues in the Handbook of Radiology1 andother sources.2-4 Corrections to thesevalues and values for other elements wereobtained by graphical interpolation. Forconvenience, the values are presented tono more than three significant figures,although the estimated probable error isno larger than one-half unit in the lastplace, or three percent, whichever isgreater. The linear attenuation coefficientsare calculated with the density mostcommonly used for the given element.
K Absorption EdgeTables 21 to 40 include information onthe element’s K absorption edge. Whenthe transmitted photon energy reachesthe binding energy of a particular shell ofelectrons, there is an abrupt increase inthe absorption. The energy at which this
shacalideenFucauinv
µM air
2 –1
0.598
0.840
8
cm g
( ) = ×( )+ ×( )+ ×( )= ⋅
0 756
0 231
87 0 013
0 761
.
.
. .
.
rp change occurs for K electrons isled the K absorption edge and is used tontify the situation where kineticergy of the ejected K electron is zero.rther increase of the photon energyses the absorption to decrease almostersely with the cube of the energy.

612 Radiographic Testing
PART 2. Attenuation Coefficient Tables
TABLE 1. Attenuation coefficients for hydrogen (atomic number Z = 1).
Attenuation Coefficient µ_____________________________________Energy Cross Section (10–28 m2) Atomic Massa Linearb
_________________________________(MeV) Scattering Photoelectric Pair (10–28 m2) (cm2·g–1) (cm–1)
0.01 0.637 0.005 — 0.642 0.384 32.1 × 10⁻⁶
0.015 0.627 0.001 — 0.628 0.375 31.4 × 10⁻⁶
0.02 0.616 — — 0.616 0.368 30.8 × 10⁻⁶
0.03 0.596 — — 0.596 0.356 29.8 × 10⁻⁶
0.04 0.578 — — 0.578 0.345 28.9 × 10⁻⁶
0.05 0.561 — — 0.561 0.335 28.1 × 10⁻⁶
0.06 0.546 — — 6.546 0.326 27.3 × 10⁻⁶
0.08 0.517 — — 0.517 0.309 25.9 × 10⁻⁶
0.10 0.493 — — 0.493 0.295 24.7 × 10⁻⁶
0.15 0.444 — — 0.444 0.265 22.2 × 10⁻⁶
0.20 0.407 — — 0.407 0.243 20.4 × 10⁻⁶
0.30 0.354 — — 0.354 0.212 17.8 × 10⁻⁶
0.40 0.317 — — 0.317 0.189 15.8 × 10⁻⁶
0.50 0.289 — — 0.289 0.173 14.5 × 10⁻⁶
0.60 0.268 — — 0.268 0.160 13.4 × 10⁻⁶
0.80 0.235 — — 0.235 0.140 11.7 × 10⁻⁶
1.0 0.211 — — 0.211 0.126 10.6 × 10⁻⁶
1.5 0.172 — — 0.172 0.103 8.63 × 10⁻⁶
2.0 0.146 — — 0.146 0.0873 7.31 × 10⁻⁶
3.0 0.115 — 0.001 0.116 0.0693 5.80 × 10⁻⁶
4.0 0.0960 — 0.0010 0.0970 0.0580 4.86 × 10⁻⁶
5.0 0.0828 — 0.0014 0.0842 0.0503 4.21 × 10⁻⁶
6.0 0.0732 — 0.0019 0.0751 0.0449 3.76 × 10⁻⁶
8.0 0.0599 — 0.0027 0.0626 0.0374 3.13 × 10⁻⁶
10.0 0.0510 — 0.0033 0.0543 0.0325 2.72 × 10⁻⁶
15.0 0.0377 — 0.0046 0.0423 0.0253 2.12 × 10⁻⁶
20.0 0.0302 — 0.0056 0.0358 0.0214 1.79 × 10⁻⁶
30.0 0.0220 — 0.0071 0.0291 0.0174 1.46 × 10⁻⁶
a. Mass attenuation coefficient is calculated by using relative atomic mass Ar = 1.008.b. Linear attenuation coefficient is calculated by using density ρ = 8.38 × 10⁻⁵ g·cm–3.
3RT22 LAYOUT(609_652) 10/3/02 1:43 PM Page 612

613Attenuation Coefficients
TABLE 2. Attenuation coefficients for beryllium (atomic number Z = 4).
Attenuation Coefficient µ_____________________________________Energy Cross Section (10–28 m2) Atomic Massa Linearb
_________________________________(MeV) Scattering Photoelectric Pair (10–28 m2) (cm2·g–1) (cm–1)
0.01 3.54 5.42 — 8.96 0.599 1.090.015 3.01 1.39 — 4.40 0.294 0.5350.02 2.77 0.52 — 3.29 0.220 0.4000.03 2.53 0.13 — 2.66 0.178 0.3240.04 2.38 0.05 — 2.43 0.162 0.2950.05 2.28 0.02 — 2.30 0.154 0.2800.06 2.21 0.01 — 2.22 0.148 0.2690.08 2.09 — — 2.09 0.140 0.2550.10 1.99 — — 1.99 0.133 0.2420.15 1.78 — — 1.78 0.119 0.2170.20 1.63 — — 1.63 0.109 0.1980.30 1.41 — — 1.41 0.0943 0.1720.40 1.27 — — 1.27 0.0849 0.1550.50 1.16 — — 1.16 0.0775 0.1410.60 1.07 — — 1.07 0.0715 0.1300.80 0.940 — — 0.940 0.0628 0.1141.0 0.845 — — 0.845 0.0565 0.1031.5 0.686 — 0.001 0.687 0.459 0.08352.0 0.586 — 0.003 0.589 0.0394 0.07173.0 0.460 — 0.008 0.468 0.0313 0.05704.0 0.384 — 0.014 0.398 0.0266 0.04845.0 0.331 — 0.019 0.350 0.0234 0.04266.0 0.293 — 0.024 0.317 0.0212 0.03868.0 0.240 — 0.031 0.271 0.0181 0.0329
10 0.204 — 0.039 0.243 0.0162 0.029515 0.151 — 0.051 0.202 0.0135 0.024620 0.121 — 0.061 0.182 0.0122 0.022230 0.0880 — 0.075 0.163 0.0109 0.0198
a. Mass attenuation coefficient is calculated by using relative atomic mass Ar = 9.013.b. Linear attenuation coefficient is calculated by using density ρ = 1.82 g·cm–3.
3RT22 LAYOUT(609_652) 10/3/02 1:43 PM Page 613

614 Radiographic Testing
TABLE 3. Attenuation coefficients for carbon (atomic number Z = 6).
Attenuation Coefficient µ_____________________________________Energy Cross Section (10–28 m2) Atomic Massa Linearb
_________________________________(MeV) Scattering Photoelectric Pair (10–28 m2) (cm2·g–1) (cm–1)
0.01 6.90 38.6 — 45.5 2.28 5.060.015 5.30 10.2 — 15.5 0.778 1.730.02 4.64 3.91 — 8.55 0.429 0.9520.03 4.04 0.99 — 5.03 0.252 0.5590.04 3.71 0.38 — 4.09 0.205 0.4550.05 3.53 0.18 — 3.71 0.186 0.4130.06 3.38 0.10 — 3.48 0.175 0.3890.08 3.18 0.04 — 3.22 0.162 0.3600.10 3.02 0.02 — 3.04 0.153 0.3400.15 2.69 — — 2.69 0.135 0.3000.20 2.46 — — 2.46 0.123 0.2730.30 2.13 — — 2.13 0.107 0.2380.40 1.90 — — 1.90 0.0953 0.2120.50 1.74 — — 1.74 0.0873 0.1940.60 1.61 — — 1.61 0.0808 0.1790.80 1.41 — — 1.41 0.0707 0.1571.0 1.27 — — 1.27 0.0637 0.1411.5 1.03 — — 1.03 0.0517 0.1152.0 0.878 — 0.006 0.884 0.0444 0.09863.0 0.691 — 0.018 0.709 0.0356 0.07904.0 0.576 — 0.031 0.607 0.0305 0.06775.0 0.497 — 0.042 0.539 0.0270 0.05996.0 0.439 — 0.052 0.491 0.0246 0.05468.0 0.359 — 0.068 0.427 0.0214 0.0475
10 0.306 — 0.083 0.389 0.0195 0.043315 0.226 — 0.110 0.336 0.0169 0.037520 0.181 — 0.130 0.311 0.0156 0.034630 0.132 — 0.160 0.292 0.0146 0.0324
a. Mass attenuation coefficient is calculated by using relative atomic mass Ar = 12.010.b. Linear attenuation coefficient for graphite form of carbon is calculated by using density ρ = 2.22 g·cm–3.
3RT22 LAYOUT(609_652) 10/3/02 1:43 PM Page 614

TABLE 4. Attenuation coefficients for nitrogen (atomic number Z = 7).
Attenuation Coefficient µ_____________________________________Energy Cross Section (10–28 m2) Atomic Massa Linearb
_________________________________(MeV) Scattering Photoelectric Pair (10–28 m2) (cm2·g–1) (cm–1)
0.01 9.0 79.4 — 88.4 3.80 44.3 × 10⁻⁴
0.015 6.7 21.2 — 27.9 1.20 14.0 × 10⁻⁴
0.02 5.73 8.21 — 13.9 0.598 6.97 × 10⁻⁴
0.03 4.84 2.15 — 6.99 0.301 3.51 × 10⁻⁴
0.04 4.45 0.81 — 5.26 0.226 2.63 × 10⁻⁴
0.05 4.14 0.38 — 4.52 0.194 2.26 × 10⁻⁴
0.06 3.98 0.21 — 4.19 0.180 2.10 × 10⁻⁴
0.08 3.73 0.08 — 3.81 0.164 1.91 × 10⁻⁴
0.10 3.54 0.04 — 3.58 0.154 1.79 × 10⁻⁴
0.15 3.15 0.01 — 3.16 0.136 1.58 × 10⁻⁴
0.20 2.87 — — 2.87 0.123 1.43 × 10⁻⁴
0.30 2.48 — — 2.48 0.107 1.25 × 10⁻⁴
0.40 2.22 — — 2.22 0.0955 1.11 × 10⁻⁴
0.50 2.02 — — 2.02 0.0869 1.01 × 10⁻⁴
0.60 1.87 — — 1.87 0.0804 0.937 × 10⁻⁴
0.80 1.65 — — 1.65 0.0710 0.827 × 10⁻⁴
1.0 1.48 — — 1.48 0.0637 0.742 × 10⁻⁴
1.5 1.20 — — 1.20 0.0516 0.601 × 10⁻⁴
2.0 1.03 — 0.01 1.04 0.0447 0.521 × 10⁻⁴
3.0 0.806 — 0.025 0.831 0.0357 0.416 × 10⁻⁴
4.0 0.672 — 0.042 0.714 0.0307 0.358 × 10⁻⁴
5.0 0.580 — 0.057 0.637 0.0274 0.319 × 10⁻⁴
6.0 0.512 — 0.071 0.583 0.0251 0.292 × 10⁻⁴
8.0 0.419 — 0.092 0.511 0.0220 0.256 × 10⁻⁴
10 0.357 — 0.111 0.468 0.0201 0.234 × 10⁻⁴
15 0.264 — 0.148 0.412 0.0177 0.206 × 10⁻⁴
20 0.212 — 0.174 0.386 0.0166 0.193 × 10⁻⁴
30 0.154 — 0.213 0.367 0.0158 0.184 × 10⁻⁴
a. Mass attenuation coefficient is calculated by using relative atomic mass Ar = 14.088.b. Linear attenuation coefficient is calculated by using density ρ = 1.165 × 10⁻³ g·cm–3.
615Attenuation Coefficients
3RT22 LAYOUT(609_652) 10/3/02 1:43 PM Page 615

616 Radiographic Testing
TABLE 5. Attenuation coefficients for oxygen (atomic number Z = 8).
Attenuation Coefficient µ_____________________________________Energy Cross Section (10–28 m2) Atomic Massa Linearb
_________________________________(MeV) Scattering Photoelectric Pair (10–28 m2) (cm2·g–1) (cm–1)
0.01 11.3 146 — 157 5.91 78.7 × 10⁻⁴
0.015 8.3 39.6 — 47.9 1.80 24.0 × 10⁻⁴
0.02 6.9 15.4 — 22.3 0.840 11.2 × 10⁻⁴
0.03 5.77 4.09 — 9.86 0.371 4.94 × 10⁻⁴
0.04 5.18 1.55 — 6.73 0.253 3.37 × 10⁻⁴
0.05 4.86 0.73 — 5.59 0.211 2.81 × 10⁻⁴
0.06 4.62 0.40 — 5.02 0.189 2.52 × 10⁻⁴
0.08 4.31 0.15 — 4.46 0.168 2.24 × 10⁻⁴
0.10 4.06 0.07 — 4.13 0.156 2.08 × 10⁻⁴
0.15 3.61 0.02 — 3.63 0.137 1.82 × 10⁻⁴
0.20 3.29 0.01 — 3.30 0.124 1.65 × 10⁻⁴
0.30 2.84 — — 2.84 0.107 1.43 × 10⁻⁴
0.40 2.54 — — 2.54 0.0957 1.27 ×10⁻⁴
0.50 2.31 — — 2.31 0.0870 1.16 × 10⁻⁴
0.60 2.14 — — 2.14 0.0806 1.07 × 10⁻⁴
0.80 1.88 — — 1.88 0.0708 0.943 × 10⁻⁴
1.0 1.69 — — 1.69 0.0636 0.847 × 10⁻⁴
1.5 1.37 — — 1.37 0.0516 0.687 × 10⁻⁴
2.0 1.17 — 0.01 1.18 0.0444 0.591 × 10⁻⁴
3.0 0.921 — 0.033 0.954 0.0359 0.478 × 10⁻⁴
4.0 0.768 — 0.054 0.822 0.0310 0.413 × 10⁻⁴
5.0 0.663 — 0.074 0.737 0.0278 0.370 × 10⁻⁴
6.0 0.586 — 0.091 0.677 0.0255 0.340 × 10⁻⁴
8.0 0.479 — 0.119 0.598 0.0225 0.300 × 10⁻⁴
10 0.408 — 0.143 0.551 0.0208 0.277 × 10⁻⁴
15 0.302 — 0.190 0.492 0.0185 0.246 × 10⁻⁴
20 0.242 — 0.224 0.466 0.0175 0.233 × 10⁻⁴
30 0.176 — 0.273 0.449 0.0169 0.225 × 10⁻⁴
a. Mass attenuation coefficient is calculated by using relative atomic mass Ar = 16.000.b. Linear attenuation coefficient is calculated by using density ρ = 1.332 × 10⁻³ g·cm–3.
3RT22 LAYOUT(609_652) 10/3/02 1:43 PM Page 616

TABLE 6. Attenuation coefficients for sodium (atomic number Z = 11).
Attenuation Coefficient µ_____________________________________Energy Cross Section (10–28 m2) Atomic Massa Linearb
_________________________________(MeV) Scattering Photoelectric Pair (10–28 m2) (cm2·g–1) (cm–1)
0.01 20.6 588 — 609 16.0 15.50.015 14.0 169 — 183 4.79 4.650.02 11.3 67.5 — 78.8 2.06 2.000.03 8.91 18.1 — 27.0 0.707 0.6860.04 7.71 7.0 — 14.7 0.385 0.3740.05 7.07 3.3 — 10.4 0.272 0.2640.06 6.67 1.90 — 8.57 0.225 0.2180.08 6.08 0.74 — 6.82 0.179 0.1740.10 5.66 0.32 — 5.98 0.157 0.1520.15 5.01 0.09 — 5.10 0.134 0.1300.20 4.54 0.04 — 4.58 0.120 0.1170.30 3.92 0.01 — 3.93 0.103 0.1000.40 3.50 — — 3.50 0.0917 0.08900.50 3.19 — — 3.19 0.0836 0.08120.60 2.94 — — 2.94 0.0770 0.07480.80 2.59 — — 2.59 0.0679 0.06591.0 2.32 — — 2.32 0.0608 0.05901.5 1.89 — — 1.89 0.0495 0.04812.0 1.61 — 0.02 1.63 0.0427 0.04153.0 1.27 — 0.06 1.33 0.0348 0.03384.0 1.06 — 0.10 1.16 0.0304 0.02955.0 0.911 — 0.139 1.05 0.0275 0.02676.0 0.805 — 0.170 0.975 0.0255 0.02488.0 0.659 — 0.221 0.880 0.0231 0.0224
10 0.561 — 0.266 0.827 0.0217 0.021115 0.415 — 0.351 0.766 0.0201 0.019520 0.333 — 0.413 0.746 0.0195 0.018930 0.242 — 0.500 0.742 0.0194 0.0188
a. Mass attenuation coefficient is calculated by using relative atomic mass Ar = 22.997.b. Linear attenuation coefficient is calculated by using density ρ = 0.971 g·cm–3.
617Attenuation Coefficients
3RT22 LAYOUT(609_652) 10/3/02 1:43 PM Page 617

618 Radiographic Testing
TABLE 7. Attenuation coefficients for magnesium (atomic number Z = 12).
Attenuation Coefficient µ_____________________________________Energy Cross Section (10–28 m2) Atomic Massa Linearb
_________________________________(MeV) Scattering Photoelectric Pair (10–28 m2) (cm2·g–1) (cm–1)
0.01 24.3 851 — 875 21.7 37.80.015 16.4 244 — 260 6.44 11.20.02 13.0 99.0 — 112 2.77 4.820.03 10.1 27.4 — 37.5 0.929 1.620.04 8.71 10.5 — 19.2 0.476 0.8290.05 7.88 5.13 — 13.0 0.322 0.5610.06 7.37 2.84 — 10.2 0.253 0.4400.08 6.70 1.10 — 7.80 0.193 0.3360.10 6.25 0.53 — 6.78 0.168 0.2920.15 5.48 0.14 — 5.62 0.139 0.2420.20 4.96 0.06 — 5.02 0.124 0.2160.30 4.28 0.02 — 4.30 0.107 0.1860.40 3.82 0.01 — 3.83 0.0949 0.1650.50 3.48 — — 3.48 0.0862 0.1500.60 3.22 — — 3.22 0.0798 0.1390.80 2.82 — — 2.82 0.0699 0.1221.0 2.53 — — 2.53 0.0627 0.1091.5 2.06 — 0.01 2.07 0.0513 0.08932.0 1.76 — 0.02 1.78 0.0441 0.07683.0 1.38 — 0.08 1.46 0.0362 0.06304.0 1.15 — 0.12 1.27 0.0315 0.05485.0 0.994 — 0.165 1.16 0.0287 0.05006.0 0.878 — 0.201 1.08 0.0268 0.04678.0 0.719 — 0.261 0.980 0.0243 0.0423
10 0.612 — 0.314 0.926 0.0229 0.039915 0.452 — 0.415 0.867 0.0215 0.037420 0.362 — 0.490 0.852 0.0211 0.036730 0.264 — 0.593 0.857 0.0212 0.0369
a. Mass attenuation coefficient is calculated by using relative atomic mass Ar = 24.32.b. Linear attenuation coefficient is calculated by using density ρ = 1.741 g·cm–3.
3RT22 LAYOUT(609_652) 10/3/02 1:43 PM Page 618
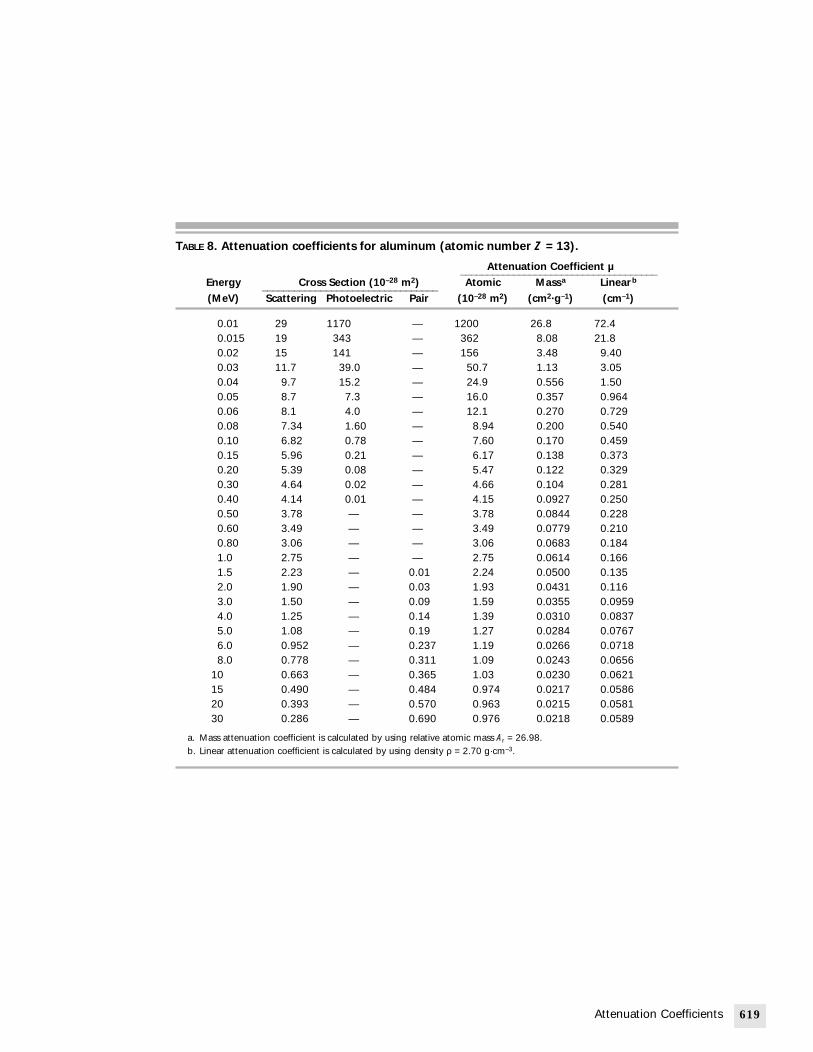
TABLE 8. Attenuation coefficients for aluminum (atomic number Z = 13).
Attenuation Coefficient µ_____________________________________Energy Cross Section (10–28 m2) Atomic Massa Linearb
_________________________________(MeV) Scattering Photoelectric Pair (10–28 m2) (cm2·g–1) (cm–1)
0.01 29 1170 — 1200 26.8 72.40.015 19 343 — 362 8.08 21.80.02 15 141 — 156 3.48 9.400.03 11.7 39.0 — 50.7 1.13 3.050.04 9.7 15.2 — 24.9 0.556 1.500.05 8.7 7.3 — 16.0 0.357 0.9640.06 8.1 4.0 — 12.1 0.270 0.7290.08 7.34 1.60 — 8.94 0.200 0.5400.10 6.82 0.78 — 7.60 0.170 0.4590.15 5.96 0.21 — 6.17 0.138 0.3730.20 5.39 0.08 — 5.47 0.122 0.3290.30 4.64 0.02 — 4.66 0.104 0.2810.40 4.14 0.01 — 4.15 0.0927 0.2500.50 3.78 — — 3.78 0.0844 0.2280.60 3.49 — — 3.49 0.0779 0.2100.80 3.06 — — 3.06 0.0683 0.1841.0 2.75 — — 2.75 0.0614 0.1661.5 2.23 — 0.01 2.24 0.0500 0.1352.0 1.90 — 0.03 1.93 0.0431 0.1163.0 1.50 — 0.09 1.59 0.0355 0.09594.0 1.25 — 0.14 1.39 0.0310 0.08375.0 1.08 — 0.19 1.27 0.0284 0.07676.0 0.952 — 0.237 1.19 0.0266 0.07188.0 0.778 — 0.311 1.09 0.0243 0.0656
10 0.663 — 0.365 1.03 0.0230 0.062115 0.490 — 0.484 0.974 0.0217 0.058620 0.393 — 0.570 0.963 0.0215 0.058130 0.286 — 0.690 0.976 0.0218 0.0589
a. Mass attenuation coefficient is calculated by using relative atomic mass Ar = 26.98.b. Linear attenuation coefficient is calculated by using density ρ = 2.70 g·cm–3.
619Attenuation Coefficients
3RT22 LAYOUT(609_652) 10/3/02 1:43 PM Page 619

620 Radiographic Testing
TABLE 9. Attenuation coefficients for silicon (atomic number Z = 14).
Attenuation Coefficient µ_____________________________________Energy Cross Section (10–28 m2) Atomic Massa Linearb
_________________________________(MeV) Scattering Photoelectric Pair (10–28 m2) (cm2·g–1) (cm–1)
0.01 33 1580 — 1610 34.5 81.10.015 22 470 — 492 10.6 24.90.02 17 194 — 211 4.53 10.60.03 12.8 54.4 — 67.2 1.44 3.380.04 10.8 21.4 — 32.2 0.691 1.620.05 9.6 10.3 — 19.9 0.427 1.000.06 8.9 5.8 — 14.7 0.315 0.7400.08 8.0 2.3 — 10.3 0.221 0.5190.10 7.38 1.10 — 8.48 0.182 0.4280.15 6.44 0.29 — 6.73 0.144 0.3380.20 5.82 0.12 — 5.94 0.127 0.2980.30 5.01 0.04 — 5.05 0.108 0.2540.40 4.46 0.02 — 4.48 0.0961 0.2260.50 4.07 — — 4.07 0.0873 0.2050.60 3.75 — — 3.75 0.0804 0.1890.80 3.30 — — 3.30 0.0708 0.1661.0 2.96 — — 2.96 0.0635 0.1491.5 2.40 — 0.01 2.41 0.0517 0.1212.0 2.05 — 0.04 2.09 0.0448 0.1053.0 1.61 — 0.10 1.71 0.0367 0.08624.0 1.34 — 0.16 1.50 0.0322 0.07575.0 1.16 — 0.23 1.39 0.0298 0.07006.0 1.03 — 0.28 1.31 0.0281 0.06608.0 0.84 — 0.35 1.19 0.0255 0.0599
10 0.714 — 0.426 1.14 0.0245 0.057615 0.528 — 0.565 1.09 0.0234 0.055020 0.423 — 0.663 1.09 0.0234 0.055030 0.308 — 0.793 1.10 0.0236 0.0555
a. Mass attenuation coefficient is calculated by using relative atomic mass Ar = 28.09.b. Linear attenuation coefficient is calculated by using density ρ = 2.35 g·cm–3.
3RT22 LAYOUT(609_652) 10/3/02 1:43 PM Page 620

TABLE 10. Attenuation coefficients for argon (atomic number Z = 18).
Attenuation Coefficient µ_____________________________________Energy Cross Section (10–28 m2) Atomic Massa Linearb
_________________________________(MeV) Scattering Photoelectric Pair (10–28 m2) (cm2·g–1) (cm–1)
0.01 56 4280 — 4340 65.4 10.9 × 10⁻²
0.015 36 1320 — 1360 20.5 3.41 × 10⁻²
0.02 27 561 — 588 8.87 1.48 × 10⁻²
0.03 19 164 — 183 2.76 0.459 × 10⁻²
0.04 15.6 64.5 — 80.1 1.21 0.201 × 10⁻²
0.05 13.6 31.6 — 45.2 0.682 0.113 × 10⁻²
0.06 12.4 18.0 — 30.4 0.458 0.0762 × 10⁻²
0.08 10.8 7.2 — 18.0 0.271 0.0451 × 10⁻²
0.10 9.85 3.60 — 13.5 0.204 0.0339 × 10⁻²
0.15 8.43 0.98 — 9.41 0.142 0.0236 × 10⁻²
0.20 7.57 0.41 — 7.98 0.120 0.0200 × 10⁻²
0.30 6.48 0.12 — 6.60 0.0995 0.0165 × 10⁻²
0.40 5.76 0.05 — 5.81 0.0876 0.0146 × 10⁻²
0.50 5.24 0.03 — 5.27 0.0795 0.0132 × 10⁻²
0.60 4.84 0.02 — 4.86 0.0733 0.0122 × 10⁻²
0.80 4.24 — — 4.24 0.0639 0.0106 × 10⁻²
1.0 3.81 — — 3.81 0.0575 0.009 56 × 10-2
1.5 3.09 — 0.02 3.11 0.0469 0.007 80 × 10-2
2.0 2.64 — 0.06 2.70 0.0407 0.006 77 × 10-2
3.0 2.07 — 0.17 2.24 0.0338 0.005 62 × 10-2
4.0 1.73 — 0.27 2.00 0.0302 0.005 02 × 10-2
5.0 1.49 — 0.37 1.86 0.0280 0.004 66 × 10-2
6.0 1.32 — 0.45 1.77 0.0267 0.004 44 × 10-2
8.0 1.08 — 0.59 1.67 0.0252 0.004 19 × 10-2
10 0.918 — 0.691 1.61 0.0243 0.004 04 × 10-2
15 0.679 — 0.913 1.59 0.0240 0.003 99 × 10-2
20 0.544 — 1.06 1.60 0.0241 0.004 01 × 10-2
30 0.396 — 1.29 1.69 0.0255 0.004 24 × 10-2
a. Mass attenuation coefficient is calculated by using relative atomic mass Ar = 39.944.b. Linear attenuation coefficient is calculated by using density ρ = 1.663 × 10⁻³ g·cm–3.
621Attenuation Coefficients
3RT22 LAYOUT(609_652) 10/3/02 1:43 PM Page 621

622 Radiographic Testing
TABLE 11. Attenuation coefficients for calcium (atomic number Z = 20).
Attenuation Coefficient µ_____________________________________Energy Cross Section (10–28 m2) Atomic Massa Linearb
_________________________________(MeV) Scattering Photoelectric Pair (10–28 m2) (cm2·g–1) (cm–1)
0.01 69 6380 — 6450 96.9 1490.015 44 2010 — 2050 30.8 47.40.02 33 859 — 892 13.4 20.60.03 24 254 — 278 4.18 6.440.04 19 102 — 121 1.82 2.800.05 15.8 50.6 — 66.4 0.098 1.540.06 14.3 28.8 — 43.1 0.648 0.9980.08 12.3 11.6 — 23.9 0.359 0.5530.10 11.2 6.0 — 17.2 0.259 0.3990.15 9.48 1.60 — 11.1 0.167 0.2570.20 8.47 0.67 — 9.14 0.137 0.2110.30 7.23 0.20 — 7.43 0.112 0.1720.40 6.42 0.09 — 6.51 0.0978 0.1510.50 5.84 0.05 — 5.89 0.0885 0.1360.60 5.38 0.03 — 5.41 0.0813 0.1250.80 4.72 0.01 — 4.73 0.0711 0.1091.0 4.24 — — 4.24 0.0637 0.09811.5 3.43 — 0.02 3.45 0.0518 0.07982.0 2.93 — 0.07 3.00 0.0451 0.06953.0 2.30 — 0.21 2.51 0.0377 0.05814.0 1.92 — 0.33 2.25 0.0338 0.05215.0 1.66 — 0.45 2.11 0.0317 0.04886.0 1.46 — 0.55 2.01 0.0302 0.04658.0 1.20 — 0.72 1.92 0.0289 0.0445
10 1.02 — 0.84 1.86 0.0280 0.043115 0.755 — 1.12 1.88 0.0283 0.043620 0.605 — 1.31 1.92 0.0289 0.044530 0.440 — 1.57 2.01 0.0302 0.0465
a. Mass attenuation coefficient is calculated by using relative atomic mass Ar = 40.08.b. Linear attenuation coefficient is calculated by using density ρ = 1.54 g·cm–3.
3RT22 LAYOUT(609_652) 10/3/02 1:43 PM Page 622

TABLE 12. Attenuation coefficients for titanium (atomic number Z = 22).
Attenuation Coefficient µ_____________________________________Energy Cross Section (10–28 m2) Atomic Massa Linearb
_________________________________(MeV) Scattering Photoelectric Pair (10–28 m2) (cm2·g–1) (cm–1)
0.01 84 9150 — 9230 116 5270.015 53 2900 — 2950 37.1 1680.02 39 1250 — 1290 16.2 73.50.03 27 374 — 401 5.04 22.90.04 22 154 — 176 2.21 10.00.05 18.3 76.3 — 94.6 1.19 5.400.06 16.3 43.9 — 60.2 0.757 3.440.08 14.0 17.9 — 31.9 0.401 1.820.10 12.5 9.2 — 21.7 0.273 1.240.15 10.6 2.5 — 13.1 0.165 0.7490.20 9.40 1.04 — 10.4 0.131 0.5950.30 7.99 0.31 — 8.30 0.104 0.4720.40 7.09 0.13 — 7.22 0.0908 0.4120.50 6.43 0.07 — 6.50 0.0818 0.3710.60 5.94 0.05 — 5.99 0.0754 0.3420.80 5.19 0.02 — 5.21 0.0655 0.2971.0 4.66 0.01 — 4.67 0.0587 0.2661.5 3.78 0.01 0.02 3.81 0.0479 0.2172.0 3.22 — 0.09 3.31 0.0416 0.1893.0 2.53 — 0.25 2.78 0.0350 0.1594.0 2.11 — 0.41 2.52 0.0317 0.1445.0 1.82 — 0.54 2.36 0.0297 0.1356.0 1.61 — 0.67 2.28 0.0287 0.1308.0 1.32 — 0.86 2.18 0.0274 0.124
10 1.12 — 1.02 2.14 0.0269 0.12215 0.829 — 1.34 2.17 0.0273 0.12420 0.664 — 1.58 2.24 0.0282 0.12830 0.484 — 1.90 2.38 0.0299 0.136
a. Mass attenuation coefficient is calculated by using relative atomic mass Ar = 47.9.b. Linear attenuation coefficient is calculated by using density ρ = 4.54 g·cm–3.
623Attenuation Coefficients
3RT22 LAYOUT(609_652) 10/3/02 1:43 PM Page 623
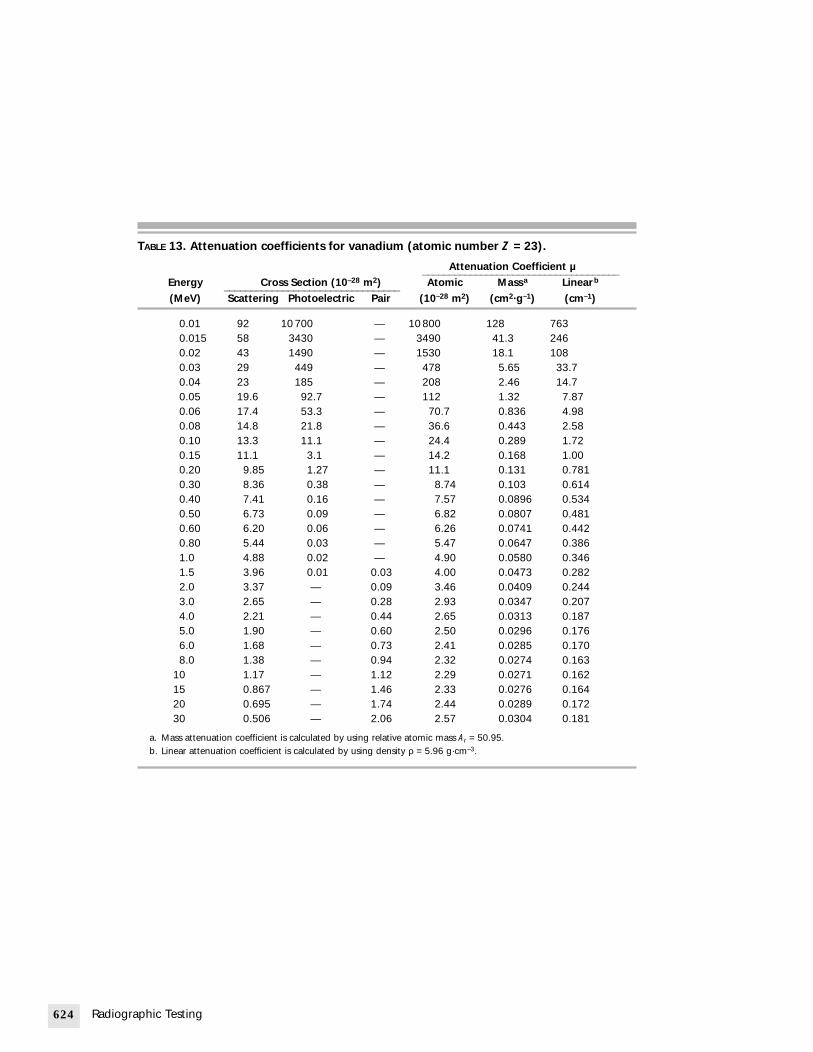
624 Radiographic Testing
TABLE 13. Attenuation coefficients for vanadium (atomic number Z = 23).
Attenuation Coefficient µ_____________________________________Energy Cross Section (10–28 m2) Atomic Massa Linearb
_________________________________(MeV) Scattering Photoelectric Pair (10–28 m2) (cm2·g–1) (cm–1)
0.01 92 10 700 — 10 800 128 7630.015 58 3430 — 3490 41.3 2460.02 43 1490 — 1530 18.1 1080.03 29 449 — 478 5.65 33.70.04 23 185 — 208 2.46 14.70.05 19.6 92.7 — 112 1.32 7.870.06 17.4 53.3 — 70.7 0.836 4.980.08 14.8 21.8 — 36.6 0.443 2.580.10 13.3 11.1 — 24.4 0.289 1.720.15 11.1 3.1 — 14.2 0.168 1.000.20 9.85 1.27 — 11.1 0.131 0.7810.30 8.36 0.38 — 8.74 0.103 0.6140.40 7.41 0.16 — 7.57 0.0896 0.5340.50 6.73 0.09 — 6.82 0.0807 0.4810.60 6.20 0.06 — 6.26 0.0741 0.4420.80 5.44 0.03 — 5.47 0.0647 0.3861.0 4.88 0.02 — 4.90 0.0580 0.3461.5 3.96 0.01 0.03 4.00 0.0473 0.2822.0 3.37 — 0.09 3.46 0.0409 0.2443.0 2.65 — 0.28 2.93 0.0347 0.2074.0 2.21 — 0.44 2.65 0.0313 0.1875.0 1.90 — 0.60 2.50 0.0296 0.1766.0 1.68 — 0.73 2.41 0.0285 0.1708.0 1.38 — 0.94 2.32 0.0274 0.163
10 1.17 — 1.12 2.29 0.0271 0.16215 0.867 — 1.46 2.33 0.0276 0.16420 0.695 — 1.74 2.44 0.0289 0.17230 0.506 — 2.06 2.57 0.0304 0.181
a. Mass attenuation coefficient is calculated by using relative atomic mass Ar = 50.95.b. Linear attenuation coefficient is calculated by using density ρ = 5.96 g·cm–3.
3RT22 LAYOUT(609_652) 10/3/02 1:43 PM Page 624

TABLE 14. Attenuation coefficients for chromium (atomic number Z = 24).
Attenuation Coefficient µ_____________________________________Energy Cross Section (10–28 m2) Atomic Massa Linearb
_________________________________(MeV) Scattering Photoelectric Pair (10–28 m2) (cm2·g–1) (cm–1)
0.01 101 12 500 — 12 600 146 10500.015 64 4040 — 4100 47.5 3420.02 47 1760 — 1810 21.0 1510.03 32 533 — 565 6.54 47.00.04 25 221 — 246 2.85 20.50.05 21 111 — 132 1.53 11.00.06 18.5 63.9 — 82.4 0.954 6.860.08 15.7 26.3 — 42.0 0.486 3.490.10 14.0 13.5 — 27.5 0.318 2.290.15 11.7 3.75 — 15.5 0.179 1.290.20 10.3 1.55 — 11.9 0.138 0.9920.30 8.74 0.46 — 9.20 0.107 0.7690.40 7.75 0.20 — 7.95 0.0921 0.6620.50 7.03 0.11 — 7.14 0.0827 0.5950.60 6.48 0.07 — 6.55 0.0758 0.5450.80 5.67 0.03 — 5.70 0.0660 0.4751.0 5.09 0.02 — 5.11 0.0592 0.4261.5 4.13 0.01 0.03 4.17 0.0483 0.3472.0 3.51 0.01 0.11 3.63 0.0420 0.3023.0 2.76 — 0.30 3.06 0.0354 0.2554.0 2.30 — 0.48 2.78 0.0322 0.2325.0 1.99 — 0.65 2.64 0.0306 0.2206.0 1.76 — 0.79 2.55 0.0295 0.2128.0 1.44 — 1.02 2.46 0.0285 0.205
10 1.22 — 1.21 2.43 0.0281 0.20215 0.905 — 1.59 2.50 0.0290 0.20920 0.725 — 1.87 2.60 0.0301 0.21630 0.528 — 2.24 2.77 0.0321 0.231
a. Mass attenuation coefficient is calculated by using relative atomic mass Ar = 52.01.b. Linear attenuation coefficient is calculated by using density ρ = 7.19 g·cm–3.
625Attenuation Coefficients
3RT22 LAYOUT(609_652) 10/3/02 1:43 PM Page 625

626 Radiographic Testing
TABLE 15. Attenuation coefficients for manganese (atomic number Z = 25).
Attenuation Coefficient µ_____________________________________Energy Cross Section (10–28 m2) Atomic Massa Linearb
_________________________________(MeV) Scattering Photoelectric Pair (10–28 m2) (cm2·g–1) (cm–1)
0.01 110 14 400 — 14 500 159 11800.015 70 4690 — 4760 52.2 3880.02 51 2051 — 2100 23.0 1710.03 34 626 — 660 7.24 53.80.04 27 263 — 290 3.18 23.60.05 22 132 — 154 1.69 12.60.06 19.7 76.2 — 95.9 1.05 7.800.08 16.6 31.4 — 48.0 0.527 3.920.10 14.7 16.2 — 30.9 0.339 2.520.15 12.2 4.51 — 16.7 0.183 1.360.20 10.8 1.88 — 12.7 0.139 1.030.30 9.13 0.56 — 9.69 0.106 0.7880.40 8.09 0.24 — 8.33 0.0914 0.6790.50 7.33 0.13 — 7.46 0.0818 0.6080.60 6.76 0.08 — 6.84 0.0750 0.557’0.80 5.91 0.04 — 5.95 0.0653 0.4851.0 5.30 0.03 — 5.33 0.0585 0.4351.5 4.30 0.01 0.03 4.34 0.0476 0.3542.0 3.66 0.01 0.12 3.79 0.0416 0.3093.0 2.88 — 0.33 3.21 0.0352 0.2624.0 2.40 — 0.52 2.92 0.0320 0.2385.0 2.07 — 0.70 2.77 0.0304 0.2266.0 1.83 — 0.86 2.69 0.0295 0.2198.0 1.50 — 1.11 2.61 0.0286 0.212
10 1.28 — 1.31 2.59 0.0284 0.21115 0.943 — 1.72 2.66 0.0292 0.21720 0.755 — 2.02 2.78 0.0305 0.22730 0.55 — 2.43 2.98 0.0327 0.243
a. Mass attenuation coefficient is calculated by using relative atomic mass Ar = 54.93.b. Linear attenuation coefficient is calculated by using density ρ = 7.43 g·cm–3.
3RT22 LAYOUT(609_652) 10/3/02 1:43 PM Page 626

TABLE 16. Attenuation coefficients for iron (atomic number Z = 26).
Attenuation Coefficient µ_____________________________________Energy Cross Section (10–28 m2) Atomic Massa Linearb
_________________________________(MeV) Scattering Photoelectric Pair (10–28 m2) (cm2·g–1) (cm–1)
0.01 120 16 500 — 16 600 179 14100.015 75 5380 — 5460 58.9 4640.02 55 2380 — 2440 26.3 2070.03 37 729 — 766 8.27 65.10.04 29 308 — 337 3.64 28.60.05 24 155 — 179 1.93 15.20.06 20.9 90.7 — 112 1.21 9.520.08 17.5 38.0 — 55.5 0.599 4.710.10 15.4 19.1 — 34.5 0.372 2.930.15 12.8 5.4 — 18.2 0.196 1.540.20 11.3 2.2 — 13.5 0.146 1.150.30 9.50 0.66 — 10.2 0.110 0.8660.40 8.42 0.29 — 8.71 0.0940 0.7400.50 7.63 0.16 — 7.79 0.0841 0.6620.60 7.03 0.10 — 7.13 0.0769 0.6050.80 6.15 0.05 — 6.20 0.0669 0.5271.0 5.52 0.03 — 5.55 0.0599 0.4711.5 4.46 0.02 0.03 4.51 0.0487 0.3832.0 3.81 0.01 0.12 3.94 0.0425 0.3343.0 2.99 — 0.35 3.34 0.0360 0.2834.0 2.50 — 0.57 3.07 0.0331 0.2605.0 2.15 — 0.76 2.91 0.0314 0.2476.0 1.90 — 0.92 2.82 0.0304 0.2398.0 1.56 — 1.20 2.76 0.0298 0.235
10 1.33 — 1.41 2.74 0.0296 0.23315 0.981 — 1.86 2.84 0.0306 0.24120 0.786 — 2.17 2.96 0.0319 0.25130 0.572 — 2.61 3.18 0.0343 0.270
a. Mass attenuation coefficient is calculated by using relative atomic mass Ar = 55.85.b. Linear attenuation coefficient is calculated by using density ρ = 7.87 g·cm–3.
627Attenuation Coefficients
3RT22 LAYOUT(609_652) 10/3/02 1:43 PM Page 627

628 Radiographic Testing
TABLE 17. Attenuation coefficients for cobalt (atomic number Z = 27).
Attenuation Coefficient µ_____________________________________Energy Cross Section (10–28 m2) Atomic Massa Linearb
_________________________________(MeV) Scattering Photoelectric Pair (10–28 m2) (cm2·g–1) (cm–1)
0.01 130 18 800 — 18 900 193 17200.015 82 6170 — 6250 63.9 5690.02 60 2760 — 2820 28.8 2560.03 40 848 — 888 9.08 80.80.04 31 360 — 391 4.00 35.60.05 25 181 — 206 2.11 18.80.06 22 106 — 128 1.31 11.70.08 18.5 43.8 — 62.3 0.637 5.670.10 16.3 22.5 — 38.8 0.397 3.530.15 13.4 6.40 — 19.8 0.202 1.800.20 11.8 2.65 — 14.5 0.148 1.320.30 9.91 0.80 — 10.7 0.109 0.9700.40 8.75 0.34 — 9.09 0.0929 0.8270.50 7.94 0.19 — 8.13 0.0831 0.7400.60 7.30 0.12 — 7.42 0.0758 0.6750.80 6.39 0.06 — 6.45 0.0659 0.5871.0 5.73 0.04 — 5.77 0.0590 0.5251.5 4.64 0.02 0.03 4.69 0.0479 0.4262.0 3.96 0.01 0.14 4.11 0.0420 0.3743.0 3.11 0.01 0.38 3.50 0.0358 0.3194.0 2.59 — 0.61 3.20 0.0327 0.2915.0 2.24 — 0.82 3.06 0.0313 0.2796.0 1.98 — 1.00 2.98 0.0305 0.2718.0 1.62 — 1.29 2.91 0.0297 0.264
10 1.38 — 1.53 2.91 0.0297 0.26415 1.02 — 2.00 3.02 0.0309 0.27520 0.815 — 2.35 3.17 0.0324 0.28830 0.594 — 2.82 3.41 0.0349 0.311
a. Mass attenuation coefficient is calculated by using relative atomic mass Ar = 58.94.b. Linear attenuation coefficient is calculated by using density ρ = 8.90 g·cm–3.
3RT22 LAYOUT(609_652) 10/3/02 1:43 PM Page 628

TABLE 18. Attenuation coefficients for nickel (atomic number Z = 28).
Attenuation Coefficient µ_____________________________________Energy Cross Section (10–28 m2) Atomic Massa Linearb
_________________________________(MeV) Scattering Photoelectric Pair (10–28 m2) (cm2·g–1) (cm–1)
0.01 141 21 300 — 21 400 220 19500.015 89 7020 — 7110 73.0 6460.02 65 3160 — 3230 33.2 2940.03 43 984 — 1030 10.6 93.80.04 33 418 — 451 4.63 41.00.05 27 210 — 237 2.43 21.50.06 23 123 — 146 1.50 13.30.08 19.4 51.1 — 70.5 0.724 6.410.10 17.1 26.4 — 43.5 0.447 3.960.15 14.0 7.52 — 21.5 0.221 1.960.20 12.3 3.12 — 15.4 0.158 1.400.30 10.3 0.95 — 11.3 0.116 1.030.40 9.10 0.41 — 9.51 0.0977 0.8650.50 8.24 0.22 — 8.46 0.0869 0.7690.60 7.58 0.14 — 7.72 0.0793 0.7020.80 6.63 0.07 — 6.70 0.0688 0.6091.0 5.94 0.04 — 5.98 0.0614 0.5431.5 4.81 0.02 0.04 4.87 0.0500 0.4432.0 4.11 0.01 0.15 4.27 0.0439 0.3893.0 3.22 0.01 0.41 3.64 0.0374 0.3314.0 2.69 0.01 0.65 3.35 0.0344 0.3045.0 2.32 — 0.88 3.20 0.0329 0.2916.0 2.05 — 1.07 3.12 0.0320 0.2838.0 1.68 — 1.39 3.07 0.0315 0.279
10 1.43 — 1.64 3.07 0.0315 0.27915 1.06 — 2.14 3.20 0.0329 0.29120 0.846 — 2.52 3.37 0.0346 0.30630 0.616 — 3.02 3.64 0.0374 0.331
a. Mass attenuation coefficient is calculated by using relative atomic mass Ar = 58.69.b. Linear attenuation coefficient is calculated by using density ρ = 8.85 g·cm–3.
629Attenuation Coefficients
3RT22 LAYOUT(609_652) 10/3/02 1:43 PM Page 629

630 Radiographic Testing
TABLE 19. Attenuation coefficients for copper (atomic number Z = 29).
Attenuation Coefficient µ_____________________________________Energy Cross Section (10–28 m2) Atomic Massa Linearb
_________________________________(MeV) Scattering Photoelectric Pair (10–28 m2) (cm2·g–1) (cm–1)
0.01 150 23 600 — 23 800 226 20100.015 96 8000 — 8100 76.8 6840.02 70 3580 — 3650 34.6 3080.03 46 1120 — 1170 11.1 98.80.04 35 474 — 509 4.83 43.00.05 29 242 — 271 2.57 22.90.06 24 143 — 167 1.58 14.10.08 20.5 60.2 — 80.7 0.765 6.810.10 17.9 30.7 — 48.6 0.461 4.100.15 14.5 8.9 — 23.4 0.222 1.980.20 12.8 3.7 — 16.5 0.156 1.390.30 10.7 1.1 — 11.8 0.112 0.9970.40 9.43 0.48 — 9.91 0.0940 0.8370.50 8.54 0.26 — 8.80 0.0834 0.7420.60 7.86 0.16 — 8.02 0.0760 0.6760.80 6.87 0.08 — 6.95 0.0659 0.5871.0 6.16 0.05 — 6.21 0.0589 0.5241.5 4.98 0.02 0.04 5.04 0.0478 0.4252.0 4.25 0.02 0.16 4.43 0.0420 0.3743.0 3.34 0.01 0.44 3.79 0.0359 0.3204.0 2.78 0.01 0.71 3.50 0.0332 0.2955.0 2.40 0.01 0.95 3.36 0.0319 0.2846.0 2.12 — 1.16 3.28 0.0311 0.2778.0 1.74 — 1.48 3.22 0.0305 0.271
10 1.48 — 1.75 3.23 0.0306 0.27215 1.09 — 2.29 3.38 0.0320 0.28520 0.877 — 2.69 3.57 0.0339 0.30230 0.638 — 3.23 3.87 0.0367 0.327
a. Mass attenuation coefficient is calculated by using relative atomic mass Ar = 63.54.b. Linear attenuation coefficient is calculated by using density ρ = 8.90 g·cm–3.
3RT22 LAYOUT(609_652) 10/3/02 1:43 PM Page 630

TABLE 20. Attenuation coefficients for zinc (atomic number Z = 30).
Attenuation Coefficient µ_____________________________________Energy Cross Section (10–28 m2) Atomic Massa Linearb
_________________________________(MeV) Scattering Photoelectric Pair (10–28 m2) (cm2·g–1) (cm–1)
0.01 164 26 400 — 26 600 245 17500.015 103 8920 — 9020 83.1 5930.02 75 4060 — 4140 38.2 2720.03 49 1280 — 1330 12.3 87.70.04 37 549 — 586 5.40 38.50.05 29 276 — 305 2.81 20.00.06 26 163 — 189 1.74 12.40.08 21.5 68.5 — 90.0 0.829 5.910.10 18.7 35.5 — 54.2 0.499 3.560.15 15.2 10.2 — 25.4 0.234 1.670.20 13.2 4.28 — 17.5 0.161 1.150.30 11.1 1.29 — 12.4 0.114 0.830.40 9.77 0.56 — 10.3 0.0949 0.6770.50 8.85 0.30 — 9.15 0.0843 0.6010.60 8.14 0.19 — 8.33 0.0768 0.5480.80 7.11 0.09 — 7.20 0.0663 0.4731.0 6.38 0.06 — 6.44 0.0593 0.4231.5 5.16 0.03 0.04 5.23 0.0482 0.3442.0 4.40 0.02 0.17 4.59 0.0423 0.3023.0 3.45 0.01 0.47 3.92 0.0361 0.2584.0 2.88 0.01 0.74 3.63 0.0335 0.2395.0 2.48 0.01 1.01 3.50 0.0323 0.2306.0 2.20 0.01 1.22 3.43 0.0316 0.2258.0 1.80 — 1.59 3.39 0.0312 0.223
10 1.53 — 1.87 3.40 0.0313 0.22315 1.13 — 2.45 3.58 0.0330 0.23520 0.906 — 2.87 3.78 0.0348 0.24830 0.660 — 3.45 4.11 0.0379 0.270
a. Mass attenuation coefficient is calculated by using relative atomic mass Ar = 65.38.b. Linear attenuation coefficient is calculated by using density ρ = 7.133 g·cm–3.
631Attenuation Coefficients
3RT22 LAYOUT(609_652) 10/3/02 1:43 PM Page 631

632 Radiographic Testing
TABLE 21. Attenuation coefficients for germanium (atomic number Z = 32).
Attenuation Coefficient µ_____________________________________Energy Cross Section (10–28 m2) Atomic Massa Linearb
_________________________________(MeV) Scattering Photoelectric Pair (10–28 m2) (cm2·g–1) (cm–1)
0.01 189.0 3690 — 3880 32.2 1730.01112 170.0 3000 — 3170 26.3 141
K 0.01112c 170.0 27 500 — 27 700 230 12300.015 119.0 11 100 — 11 200 93.0 4980.02 86.0 5130 — 5220 43.3 2320.03 56.0 1640 — 1700 14.1 75.60.04 42.0 708 — 750 6.23 33.40.05 34.0 356 — 390 3.24 17.40.06 29.0 212 — 241 2.00 10.70.08 23.7 89.9 — 114 0.946 5.070.10 20.5 46.6 — 67.1 0.557 2.990.15 16.4 13.5 — 29.9 0.248 1.330.20 14.3 5.70 — 20.0 0.166 0.8900.30 11.9 1.74 — 13.6 0.113 0.6060.40 10.5 0.76 — 11.3 0.0938 0.5030.50 9.45 0.41 — 9.86 0.0818 0.4380.60 8.70 0.26 — 8.96 0.0744 0.3990.80 7.59 0.13 — 7.72 0.0641 0.3441.0 6.80 0.08 — 6.88 0.0571 0.3061.5 5.51 0.04 0.05 5.60 0.0465 0.2492.0 4.69 0.03 0.19 4.91 0.0408 0.2193.0 3.69 0.01 0.54 4.24 0.0352 0.1894.0 3.07 0.01 0.86 3.94 0.0327 0.1755.0 2.65 0.01 1.15 3.81 0.0316 0.1696.0 2.34 0.01 1.39 3.74 0.0310 0.1668.0 1.92 0.01 1.81 3.74 0.0310 0.166
10 1.63 — 2.13 3.76 0.0312 0.16715 1.21 — 2.78 3.99 0.0331 0.17720 0.966 — 3.25 4.22 0.0350 0.18830 0.704 — 3.91 4.61 0.0383 0.205
a. Mass attenuation coefficient is calculated by using relative atomic mass Ar = 72.60.b. Linear attenuation coefficient is calculated by using density ρ = 5.36 g·cm–3.c. K = K absorption edge.
3RT22 LAYOUT(609_652) 10/3/02 1:43 PM Page 632

TABLE 22. Attenuation coefficients for selenium (atomic number Z = 34).
Attenuation Coefficient µ_____________________________________Energy Cross Section (10–28 m2) Atomic Massa Linearb
_________________________________(MeV) Scattering Photoelectric Pair (10–28 m2) (cm2·g–1) (cm–1)
0.01 215 4410 — 4630 35.3 170.00.01268 172 2530 — 2700 20.6 99.1
K 0.01268c 172 22 300 — 22 500 172 8270.015 137 13 600 — 13 700 105 5050.02 98 6360 — 6460 49.3 2370.03 63 2050 — 2110 16.1 77.40.04 47 895 — 942 7.19 34.60.05 38 454 — 492 3.75 18.00.06 32 270 — 302 2.30 11.10.08 26 116 — 142 1.08 5.190.10 22.3 60.2 — 82.5 0.629 3.030.15 17.7 17.7 — 35.4 0.270 1.300.20 15.1 7.45 — 22.6 0.172 0.8270.30 12.7 2.28 — 15.0 0.114 0.5480.40 11.2 1.00 — 12.2 0.0931 0.4480.50 10.1 0.54 — 10.6 0.0809 0.3890.60 9.26 0.34 — 9.60 0.0732 0.3520.80 8.07 0.17 — 8.24 0.0629 0.3031.0 7.23 0.11 — 7.34 0.0560 0.2691.5 5.85 0.05 0.06 5.96 0.0455 0.2192.0 4.99 0.03 0.22 5.24 0.0400 0.1923.0 3.92 0.02 0.61 4.55 0.0347 0.1674.0 3.26 0.01 0.96 4.23 0.0323 0.1555.0 2.82 0.01 1.30 4.13 0.0315 0.1526.0 2.49 0.01 1.57 4.07 0.0311 0.1508.0 2.04 0.01 2.04 4.09 0.0312 0.150
10.0 1.73 0.01 2.39 4.13 0.0315 0.15215.0 1.28 — 3.12 4.40 0.0336 0.16220 1.03 — 3.66 4.69 0.0358 0.17230 0.748 — 4.39 5.14 0.0392 0.189
a. Mass attenuation coefficient is calculated by using relative atomic mass Ar = 78.96.b. Linear attenuation coefficient is calculated by using density ρ = 4.81 g·cm–3.c. K = K absorption edge.
633Attenuation Coefficients
3RT22 LAYOUT(609_652) 10/3/02 1:43 PM Page 633

634 Radiographic Testing
TABLE 23. Attenuation coefficients for zirconium (atomic number Z = 40).
Attenuation Coefficient µ_____________________________________Energy Cross Section (10–28 m2) Atomic Massa Linearb
_________________________________(MeV) Scattering Photoelectric Pair (10–28 m2) (cm2·g–1) (cm–1)
0.01 309 9220 — 9530 62.9 4110.015 196 2820 — 3020 19.9 1300.01760 171 1790 — 1960 12.9 84.2
K 0.01760c 171 15 800 — 16 000 106 6920.02 140 11 000 — 11 100 73.3 4790.03 88 3710 — 3800 25.1 1640.04 65 1650 — 1720 11.4 74.40.05 51 850 — 901 5.95 38.90.06 43 512 — 555 3.67 24.00.08 33 226 — 259 1.71 11.20.10 28 117 — 145 0.958 6.260.15 21.8 35.3 — 57.1 0.377 2.460.20 18.5 15.2 — 33.7 0.223 1.460.30 15.2 4.68 — 19.9 0.131 0.8550.40 13.3 2.08 — 15.4 0.102 0.6660.50 11.9 1.13 — 13.0 0.0859 0.5610.60 11.0 0.71 — 11.7 0.0773 0.5050.80 9.53 0.36 — 9.89 0.0653 0.4261.0 8.53 0.23 — 8.76 0.0579 0.3781.5 6.89 0.11 0.08 7.08 0.0468 0.3062.0 5.88 0.07 0.32 6.27 0.0414 0.2703.0 4.61 0.04 0.85 5.50 0.0363 0.2374.0 3.84 0.03 1.35 5.22 0.0345 0.2255.0 3.31 0.02 1.80 5.13 0.0339 0.2216.0 2.93 0.02 2.17 5.12 0.0338 0.2218.0 2.40 0.01 2.79 5.20 0.0343 0.224
10 2.04 0.01 3.28 5.33 0.0352 0.23015 1.51 0.01 4.26 5.78 0.0382 0.24920 1.21 — 5.00 6.21 0.0410 0.26830 0.88 — 6.00 6.88 0.0454 0.296
a. Mass attenuation coefficient is calculated by using relative atomic mass Ar = 91.22.b. Linear attenuation coefficient is calculated by using density ρ = 6.53 g·cm–3.c. K = K absorption edge.
3RT22 LAYOUT(609_652) 10/3/02 1:43 PM Page 634

TABLE 24. Attenuation coefficients for niobium (atomic number Z = 41).
Attenuation Coefficient µ_____________________________________Energy Cross Section (10–28 m2) Atomic Massa Linearb
_________________________________(MeV) Scattering Photoelectric Pair (10–28 m2) (cm2·g–1) (cm–1)
0.01 326 10 300 — 10 600 68.7 5890.015 208 3140 — 3350 21.7 1860.01902 152 1490 — 1640 10.6 90.8
K 0.01902c 152 13 000 — 13 200 85.6 7340.02 148 11 900 — 12 000 77.8 6670.03 93 4070 — 4160 27.0 2310.04 69 1810 — 1880 12.2 1050.05 54 936 — 990 6.42 55.00.06 45 563 — 608 3.94 33.80.08 35 251 — 286 1.85 15.90.10 29 130 — 159 1.03 8.830.15 22.5 39.3 — 61.8 0.401 3.440.20 19.1 16.9 — 36.0 0.233 2.000.30 15.6 5.23 — 20.8 0.135 1.160.40 13.6 2.32 — 15.9 0.103 0.8830.50 12.3 1.25 — 13.6 0.0882 0.7560.60 11.2 0.79 — 12.0 0.0778 0.6670.80 9.78 0.40 — 10.2 0.0661 0.5661.0 8.75 0.26 — 9.01 0.0584 0.5001.5 7.08 0.13 0.09 7.30 0.0473 0.4052.0 6.02 0.08 0.33 6.43 0.0417 0.3573.0 4.73 0.05 0.90 5.68 0.0368 0.3154.0 3.95 0.03 1.41 5.39 0.0350 0.3005.0 3.40 0.03 1.89 5.32 0.0345 0.2966.0 3.00 0.02 2.27 5.29 0.0343 0.2948.0 2.46 0.02 2.93 5.41 0.0351 0.301
10 2.09 0.01 3.43 5.53 0.0359 0.30815 1.55 0.01 4.48 6.04 0.0392 0.33620 1.24 0.01 5.24 6.49 0.0421 0.36130 0.90 — 6.27 7.17 0.0465 0.398
a. Mass attenuation coefficient is calculated by using relative atomic mass Ar = 92.91.b. Linear attenuation coefficient is calculated by using density ρ = 8.57 g·cm–3.c. K = K absorption edge.
635Attenuation Coefficients
3RT22 LAYOUT(609_652) 10/3/02 1:43 PM Page 635

636 Radiographic Testing
TABLE 25. Attenuation coefficients for molybdenum (atomic number Z = 42).
Attenuation Coefficient µ_____________________________________Energy Cross Section (10–28 m2) Atomic Massa Linearb
_________________________________(MeV) Scattering Photoelectric Pair (10–28 m2) (cm2·g–1) (cm–1)
0.01 340 11 400 — 11 700 73.5 7500.015 220 3480 — 3700 23.2 2400.02004 160 1510 — 1670 10.5 107
K 0.02004c 160 13 000 — 13 200 82.9 8460.03 98 4390 — 4490 28.2 2880.04 71 1960 — 2030 12.7 1300.05 56 1030 — 1090 6.85 69.90.06 47 620 — 667 4.19 42.70.08 36 274 — 310 1.95 19.90.10 30 144 — 174 1.09 11.10.15 23.2 43.4 — 66.6 0.418 4.260.20 19.8 18.7 — 38.5 0.242 2.470.30 16.1 5.8 — 21.9 0.138 1.410.40 14.0 2.6 — 16.6 0.104 1.060.50 12.6 1.4 — 14.0 0.0879 0.8970.60 11.5 0.88 — 12.4 0.0779 0.7950.80 10.0 0.45 — 10.5 0.0659 0.6721.0 8.96 0.29 — 9.25 0.0581 0.5931.5 7.25 0.14 0.09 7.48 0.0470 0.4792.0 6.15 0.09 0.35 6.59 0.0414 0.4223.0 4.83 0.05 0.94 5.82 0.0365 0.3724.0 4.03 0.04 1.50 5.57 0.0350 0.3575.0 3.48 0.03 1.98 5.49 0.0345 0.3526.0 3.08 0.01 2.38 5.47 0.0344 0.3518.0 2.52 0.01 3.06 5.59 0.0351 0.358
10 2.14 0.01 3.59 5.74 0.0360 0.36715 1.59 0.01 4.68 6.28 0.0394 0.40220 1.27 0.01 5.47 6.75 0.0424 0.43230 0.92 — 6.57 7.49 0.0470 0.479
a. Mass attenuation coefficient is calculated by using relative atomic mass Ar = 95.95.b. Linear attenuation coefficient is calculated by using density ρ = 10.2 g·cm–3.c. K = K absorption edge.
3RT22 LAYOUT(609_652) 10/3/02 1:43 PM Page 636

TABLE 26. Attenuation coefficients for silver (atomic number Z = 47).
Attenuation Coefficient µ_____________________________________Energy Cross Section (10–28 m2) Atomic Massa Linearb
_________________________________(MeV) Scattering Photoelectric Pair (10–28 m2) (cm2·g–1) (cm–1)
0.01 443 18 500 — 18 900 106 11100.015 285 5670 — 5960 33.3 3490.02 202 2460 — 2660 14.9 1560.02559 156 1180 — 1340 7.48 78.5
K 0.02559c 156 10 000 — 10 200 57.0 5980.03 125 6590 — 6720 37.5 3930.04 91 2960 — 3050 17.0 1780.05 70 1580 — 1650 9.22 96.70.06 57 952 — 1010 5.64 59.20.08 44 427 — 471 2.63 27.60.10 36 225 — 261 1.46 15.30.15 27.1 68.6 — 95.7 0.534 5.600.20 22.6 30.4 — 53.0 0.296 3.110.30 18.3 9.49 — 27.8 0.155 1.630.40 15.8 4.27 — 20.1 0.112 1.170.50 14.2 2.32 — 16.5 0.0922 0.9670.60 13.0 1.46 — 14.5 0.0810 0.8500.80 11.3 0.75 — 12.1 0.0676 0.7091.0 10.1 0.48 — 10.6 0.0592 0.6211.5 8.13 0.24 0.12 8.49 0.0474 0.4972.0 6.91 0.15 0.45 7.51 0.0419 0.4403.0 5.43 0.09 1.20 6.72 0.0375 0.3934.0 4.52 0.06 1.87 6.45 0.0360 0.3785.0 3.90 0.05 2.50 6.45 0.0360 0.3786.0 3.44 0.04 2.99 6.47 0.0361 0.3798.0 2.82 0.03 3.81 6.66 0.0372 0.390
10.0 2.40 0.02 4.47 6.89 0.0385 0.40415.0 1.77 0.01 5.81 7.59 0.0424 0.44520.0 1.42 0.01 6.79 8.22 0.0459 0.48130.0 1.03 0.01 8.14 9.18 0.0513 0.538
a. Mass attenuation coefficient is calculated by using relative atomic mass Ar = 107.88.b. Linear attenuation coefficient is calculated by using density ρ = 10.49 g·cm–3.c. K = K absorption edge.
637Attenuation Coefficients
3RT22 LAYOUT(609_652) 10/3/02 1:43 PM Page 637

638 Radiographic Testing
TABLE 27. Attenuation coefficients for cadmium (atomic number Z = 48).
Attenuation Coefficient µ_____________________________________Energy Cross Section (10–28 m2) Atomic Massa Linearb
_________________________________(MeV) Scattering Photoelectric Pair (10–28 m2) (cm2·g–1) (cm–1)
0.01 466 20 200 — 20 700 111 9600.015 322 6220 — 6540 35.1 3040.02 212 2700 — 2910 15.6 1350.02676 159 1170 — 1330 7.13 61.7
K 0.02676c 159 9700 — 9860 52.8 4570.03 131 7080 — 7210 38.6 3340.04 95 3210 — 3310 17.7 1530.05 73 1710 — 1780 9.54 82.50.06 60 1030 — 1090 5.84 50.50.08 46 461 — 507 2.72 23.50.10 38 245 — 283 1.52 13.10.15 27.9 74.9 — 103 0.552 4.770.20 23.3 33.4 — 56.7 0.304 2.630.30 18.7 10.4 — 29.1 0.156 1.350.40 16.2 4.66 — 20.9 0.112 0.9690.50 14.5 2.55 — 17.1 0.0917 0.7930.60 13.3 1.60 — 14.9 0.0799 0.6910.80 11.5 0.83 — 12.3 0.0659 0.5701.0 10.3 0.53 — 10.8 0.0579 0.5011.5 8.30 0.26 0.13 8.69 0.0466 0.4032.0 7.06 0.17 0.47 7.70 0.0413 0.3573.0 5.54 0.10 1.25 6.89 0.0369 0.3194.0 4.62 0.07 1.95 6.64 0.0356 0.3085.0 3.98 0.05 2.61 6.64 0.0356 0.3086.0 3.51 0.05 3.12 6.68 0.0358 0.3108.0 2.88 0.03 3.98 6.89 0.0369 0.319
10 2.45 0.03 4.66 7.14 0.0383 0.33115 1.81 0.02 6.05 7.88 0.0422 0.36520 1.45 0.01 7.08 8.54 0.0458 0.39630 1.06 0.01 8.47 9.54 0.0511 0.442
a. Mass attenuation coefficient is calculated by using relative atomic mass Ar = 112.41.b. Linear attenuation coefficient is calculated by using density ρ = 8.65 g·cm–3.c. K = K absorption edge.
3RT22 LAYOUT(609_652) 10/3/02 1:43 PM Page 638

TABLE 28. Attenuation coefficients for tin (atomic number Z = 50).
Attenuation Coefficient µ_____________________________________Energy Cross Section (10–28 m2) Atomic Massa Linearb
_________________________________(MeV) Scattering Photoelectric Pair (10–28 m2) (cm2·g–1) (cm–1)
0.01 510 24 000 — 24 500 124 9050.015 330 7410 — 7740 39.3 2870.02 240 3220 — 3460 17.6 1280.02925 150 1050 — 1200 6.09 44.5
K 0.02925c 150 8580 — 8730 44.3 3230.03 143 8150 — 8290 42.1 3070.04 103 3700 — 3800 19.3 1410.05 79 1990 — 2070 10.5 76.70.06 65 1210 — 1280 6.50 47.50.08 49 539 — 588 2.98 21.80.10 40 286 — 326 1.65 12.00.15 29.6 88.8 — 118 0.599 4.370.20 24.6 39.3 — 63.9 0.324 2.370.30 19.7 12.4 — 32.1 0.163 1.190.40 17.0 5.6 — 22.6 0.115 0.8400.50 15.2 3.0 — 18.2 0.0924 0.6750.60 13.8 1.9 — 15.7 0.0797 0.5820.80 12.0 1.0 — 13.0 0.0660 0.4821.0 10.7 0.64 — 11.3 0.0574 0.4191.5 8.65 0.32 0.14 9.11 0.0462 0.3372.0 7.36 0.20 0.51 8.07 0.0410 0.2993.0 5.76 0.12 1.35 7.23 0.0367 0.2684.0 4.80 0.08 2.14 7.02 0.0356 0.2605.0 4.14 0.06 2.82 7.02 0.0356 0.2606.0 3.66 0.05 3.37 7.08 0.0359 0.2628.0 2.99 0.04 4.29 7.32 0.0372 0.272
10 2.55 0.03 5.04 7.62 0.0387 0.28315 1.89 0.02 6.54 8.45 0.0429 0.31320 1.51 0.01 7.63 9.15 0.0464 0.33930 1.10 0.01 9.15 10.3 0.0523 0.382
a. Mass attenuation coefficient is calculated by using relative atomic mass Ar = 118.70.b. Linear attenuation coefficient is calculated by using density ρ = 7.30 g·cm–3.c. K = K absorption edge.
639Attenuation Coefficients
3RT22 LAYOUT(609_652) 10/3/02 1:43 PM Page 639

640 Radiographic Testing
TABLE 29. Attenuation coefficients for antimony (atomic number Z = 51).
Attenuation Coefficient µ_____________________________________Energy Cross Section (10–28 m2) Atomic Massa Linearb
_________________________________(MeV) Scattering Photoelectric Pair (10–28 m2) (cm2·g–1) (cm–1)
0.01 535 25 900 — 26 400 131 8670.015 344 8010 — 8350 41.3 2730.02 244 3490 — 3730 18.5 1220.03050 148 1000 — 1150 5.69 37.7
K 0.03050c 148 8140 — 8290 41.0 2710.04 108 3970 — 4080 20.2 1340.05 82 2140 — 2220 11.0 72.80.06 67 1300 — 1370 6.78 44.90.08 51 580 — 631 3.12 20.70.10 42 311 — 353 1.75 11.60.15 30.4 93.5 — 124 0.614 4.060.20 25.1 42.8 — 67.9 0.336 2.220.30 20.1 13.5 — 33.6 0.166 1.100.40 17.3 6.11 — 23.4 0.116 0.7680.50 15.5 3.34 — 18.8 0.0930 0.6160.60 14.1 2.09 — 16.2 0.0802 0.5310.80 12.3 1.09 — 13.4 0.0663 0.4391.0 10.9 0.71 — 11.6 0.0574 0.3801.5 8.82 0.34 0.15 9.31 0.0461 0.3052.0 7.51 0.22 0.54 8.27 0.0409 0.2713.0 5.89 0.13 1.42 7.44 0.0368 0.2444.0 4.91 0.09 2.21 7.21 0.0357 0.2365.0 4.23 0.07 2.95 7.25 0.0359 0.2386.0 3.73 0.06 3.51 7.30 0.0361 0.2398.0 3.06 0.04 4.47 7.57 0.0375 0.248
10 2.60 0.03 5.22 7.85 0.0388 0.25715 1.92 0.02 6.79 8.73 0.0432 0.28620 1.54 0.01 7.90 9.45 0.0468 0.31030 1.12 0.01 9.49 10.6 0.0524 0.347
a. Mass attenuation coefficient is calculated by using relative atomic mass Ar = 121.76.b. Linear attenuation coefficient is calculated by using density ρ = 6.62 g·cm–3.c. K = K absorption edge.
3RT22 LAYOUT(609_652) 10/3/02 1:43 PM Page 640

TABLE 30. Attenuation coefficients for iodine (atomic number Z = 53).
Attenuation Coefficient µ_____________________________________Energy Cross Section (10–28 m2) Atomic Massa Linearb
_________________________________(MeV) Scattering Photoelectric Pair (10–28 m2) (cm2·g–1) (cm–1)
0.01 590 29 800 — 30 400 144 7100.015 380 9360 — 9740 46.2 2280.02 270 4130 — 4400 20.9 1030.03 164 1260 — 1420 6.74 33.20.03323 150 933 — 1080 5.13 2S.3
K 0.03323c 150 7510 — 7660 36.4 1790.04 117 4490 — 4610 21.9 1080.05 89 2470 — 2560 12.2 60.10.06 72 1500 — 1570 7.45 36.70.08 54 677 — 731 3.47 17.10.10 44 360 — 404 1.92 9.470.15 32 113 — 145 0.688 3.390.20 26.5 50.0 — 76.5 0.363 1.790.30 21.0 16.0 — 37.0 0.176 0.8680.40 18.1 7.2 — 25.3 0.120 0.5920.50 16.2 3.9 — 20.1 0.0954 0.4700.60 14.8 2.5 — 17.3 0.0821 0.4050.80 12.8 1.3 — 14.1 0.0669 0.3301.0 11.4 0.84 — 12.2 0.0579 0.2851.5 9.18 0.41 0.17 9.76 0.0463 0.2282.0 7.81 0.26 0.59 8.66 0.0411 0.2033.0 6.10 0.16 1.53 7.79 0.0370 0.1824.0 5.09 0.11 2.41 7.61 0.0361 0.1785.0 4.39 0.08 3.17 7.64 0.0363 0.1796.0 3.88 0.07 3.78 7.73 0.0367 0.1818.0 3.17 0.05 4.81 8.03 0.0381 0.188
10 2.70 0.04 5.63 8.37 0.0397 0.19615 2.00 0.02 7.30 9.32 0.0442 0.21820 1.60 0.01 8.51 10.1 0.0479 0.23630 1.17 0.01 10.2 11.4 0.0541 0.267
a. Mass attenuation coefficient is calculated by using relative atomic mass Ar = 126.92.b. Linear attenuation coefficient is calculated by using density ρ = 4.93 g·cm–3.c. K = K absorption edge.
641Attenuation Coefficients
3RT22 LAYOUT(609_652) 10/3/02 1:43 PM Page 641

642 Radiographic Testing
TABLE 31. Attenuation coefficients for cesium (atomic number Z = 55).
Attenuation Coefficient µ_____________________________________Energy Cross Section (10–28 m2) Atomic Massa Linearb
_________________________________(MeV) Scattering Photoelectric Pair (10–28 m2) (cm2·g–1) (cm–1)
0.01 633 34 700 — 35 300 160 2990.015 411 11 000 — 11 400 51.7 96.70.02 290 4830 — 5120 23.2 43.40.03 177 1480 — 1660 7.52 14.10.03603 146 881 — 1030 4.67 8.73
K 0.03603c 146 7100 — 7250 32.9 61.50.04 127 5160 — 5290 24.0 44.90.05 96 2840 — 2940 13.3 24.90.06 78 1720 — 1800 8.16 15.30.08 58 765 — 823 3.73 6.980.10 47 414 — 461 2.09 3.910.15 34 129 — 163 0.739 1.380.20 27.8 58.4 — 86.2 0.391 0.7310.30 21.9 18.6 — 40.5 0.184 0.3440.40 18.8 8.46 — 27.3 0.124 0.2320.50 16.8 4.64 — 21.4 0.0970 0.1810.60 15.3 2.93 — 18.2 0.0825 0.1540.80 13.3 1.54 — 14.8 0.0671 0.1251.0 11.8 1.00 — 12.8 0.0580 0.1081.5 9.53 0.49 0.18 10.2 0.0462 0.08642.0 8.10 0.31 0.64 9.05 0.0410 0.07673.0 6.36 0.18 1.66 8.20 0.0372 0.06964.0 5.29 0.13 2.59 8.01 0.0363 0.06795.0 4.56 0.10 3.42 8.08 0.0366 0.06846.0 4.04 0.08 4.07 8.19 0.0371 0.06948.0 3.30 0.06 5.17 8.53 0.0387 0.0724
10 2.81 0.05 6.04 8.90 0.0403 0.075415 2.07 0.03 7.82 9.92 0.0450 0.084220 1.66 0.02 9.12 10.8 0.0490 0.091630 1.21 0.01 10.9 12.1 0.0548 0.102
a. Mass attenuation coefficient is calculated by using relative atomic mass Ar = 132.91.b. Linear attenuation coefficient is calculated by using density ρ = 1.87 g·cm–3.c. K = K absorption edge.
3RT22 LAYOUT(609_652) 10/3/02 1:43 PM Page 642

TABLE 32. Attenuation coefficients for barium (atomic number Z = 56).
Attenuation Coefficient µ_____________________________________Energy Cross Section (10–28 m2) Atomic Massa Linearb
_________________________________(MeV) Scattering Photoelectric Pair (10–28 m2) (cm2·g–1) (cm–1)
0.01 662 37 000 — 37 700 165 6240.015 371 11 900 — 12 300 53.9 2040.02 303 5190 — 5490 24.1 91.10.03 185 1590 — 1780 7.81 29.50.03748 145 837 — 982 4.31 16.3
K 0.03748c 145 6720 — 6870 30.1 1140.04 132 5510 — 5640 24.7 93.40.05 100 3030 — 3130 13.7 51.80.06 81 1834 — 1920 8.42 31.80.08 60 815 — 875 3.84 14.50.10 49 444 — 493 2.16 8.160.15 35 138 — 173 0.759 2.870.20 28.4 62.8 — 91.2 0.400 1.510.30 22.4 20.0 — 42.4 0.186 0.7030.40 19.2 9.14 — 28.3 0.124 0.4690.50 17.1 5.02 — 22.1 0.0969 0.3660.60 15.6 3.18 — 18.8 0.0825 0.3120.80 13.5 1.67 — 15.2 0.0667 0.2521.0 12.1 1.09 — 13.2 0.0579 0.2191.5 9.70 0.53 0.19 10.4 0.0456 0.1722.0 8.25 0.34 0.67 9.26 0.0406 0.1533.0 6.47 0.20 1.73 8.40 0.0368 0.1394.0 5.39 0.14 2.68 8.21 0.0360 0.1365.0 4.65 0.11 3.59 8.35 0.0366 0.1386.0 4.11 0.09 4.21 8.41 0.0369 0.1398.0 3.35 0.07 5.35 8.77 0.0385 0.146
10 2.86 0.05 6.26 9.17 0.0402 0.15215 2.11 0.03 8.09 10.2 0.0447 0.16920 1.69 0.02 9.45 11.2 0.0491 0.18630 1.23 0.02 11.3 12.6 0.0553 0.209
a. Mass attenuation coefficient is calculated by using relative atomic mass Ar = 137.36.b. Linear attenuation coefficient is calculated by using density ρ = 3.78 g·cm–3.c. K = K absorption edge.
643Attenuation Coefficients
3RT22 LAYOUT(609_652) 10/3/02 1:43 PM Page 643
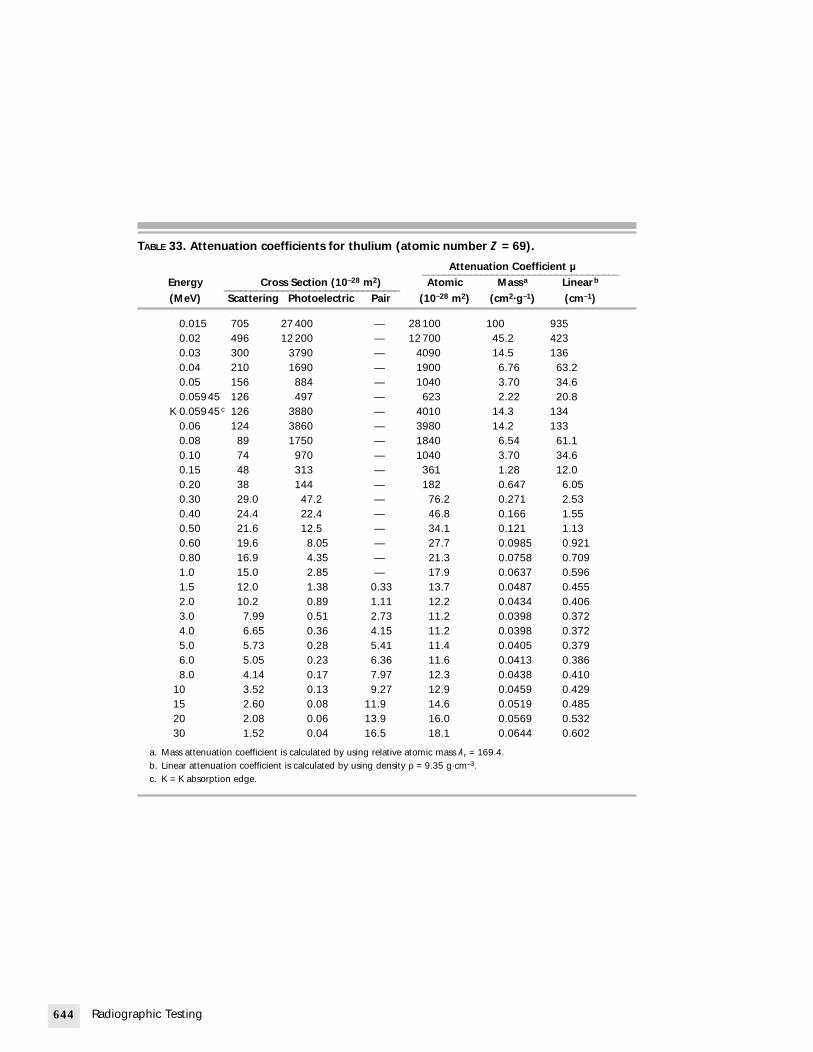
644 Radiographic Testing
TABLE 33. Attenuation coefficients for thulium (atomic number Z = 69).
Attenuation Coefficient µ_____________________________________Energy Cross Section (10–28 m2) Atomic Massa Linearb
_________________________________(MeV) Scattering Photoelectric Pair (10–28 m2) (cm2·g–1) (cm–1)
0.015 705 27 400 — 28 100 100 9350.02 496 12 200 — 12 700 45.2 4230.03 300 3790 — 4090 14.5 1360.04 210 1690 — 1900 6.76 63.20.05 156 884 — 1040 3.70 34.60.05945 126 497 — 623 2.22 20.8
K 0.05945c 126 3880 — 4010 14.3 1340.06 124 3860 — 3980 14.2 1330.08 89 1750 — 1840 6.54 61.10.10 74 970 — 1040 3.70 34.60.15 48 313 — 361 1.28 12.00.20 38 144 — 182 0.647 6.050.30 29.0 47.2 — 76.2 0.271 2.530.40 24.4 22.4 — 46.8 0.166 1.550.50 21.6 12.5 — 34.1 0.121 1.130.60 19.6 8.05 — 27.7 0.0985 0.9210.80 16.9 4.35 — 21.3 0.0758 0.7091.0 15.0 2.85 — 17.9 0.0637 0.5961.5 12.0 1.38 0.33 13.7 0.0487 0.4552.0 10.2 0.89 1.11 12.2 0.0434 0.4063.0 7.99 0.51 2.73 11.2 0.0398 0.3724.0 6.65 0.36 4.15 11.2 0.0398 0.3725.0 5.73 0.28 5.41 11.4 0.0405 0.3796.0 5.05 0.23 6.36 11.6 0.0413 0.3868.0 4.14 0.17 7.97 12.3 0.0438 0.410
10 3.52 0.13 9.27 12.9 0.0459 0.42915 2.60 0.08 11.9 14.6 0.0519 0.48520 2.08 0.06 13.9 16.0 0.0569 0.53230 1.52 0.04 16.5 18.1 0.0644 0.602
a. Mass attenuation coefficient is calculated by using relative atomic mass Ar = 169.4.b. Linear attenuation coefficient is calculated by using density ρ = 9.35 g·cm–3.c. K = K absorption edge.
3RT22 LAYOUT(609_652) 10/3/02 1:43 PM Page 644

TABLE 34. Attenuation coefficients for tantalum (atomic number Z = 73).
Attenuation Coefficient µ_____________________________________Energy Cross Section (10–28 m2) Atomic Massa Linearb
_________________________________(MeV) Scattering Photoelectric Pair (10–28 m2) (cm2·g–1) (cm–1)
0.015 808 34 000 — 34 800 116 19300.02 569 15 200 — 15 800 52.6 8730.03 342 4750 — 5090 17.0 2820.04 238 2120 — 2360 7.86 1300.05 176 1110 — 1290 4.30 71.40.06 140 638 — 778 2.59 43.00.067 51 124 440 — 564 1.88 31.2
K 0.067 51c 124 3360 — 3480 11.6 1930.08 101 2140 — 2240 7.46 1240.10 79 1180 — 1260 4.20 69.70.15 53 387 — 440 1.47 24.40.20 41 179 — 220 0.733 12.20.30 31.1 59.3 — 90.6 0.302 5.010.40 26.1 28.4 — 54.5 0.182 3.020.50 23.0 15.9 — 38.9 0.130 2.160.60 20.9 10.3 — 31.2 0.104 1.730.80 17.9 5.60 — 23.5 0.0783 1.301.0 15.9 3.69 — 19.6 0.0653 1.081.5 12.7 1.78 0.39 14.9 0.0496 0.8232.0 10.8 1.15 1.28 13.2 0.0440 0.7303.0 8.45 0.66 3.08 12.2 0.0406 0.6744.0 7.04 0.47 4.67 12.2 0.0406 0.6745.0 6.06 0.36 6.06 12.5 0.0416 0.6916.0 5.35 0.29 7.08 12.7 0.0423 0.7028.0 4.37 0.21 8.86 13.4 0.0446 0.740
10 3.72 0.17 10.3 14.2 0.0473 0.78515 2.75 0.11 13.2 16.1 0.0536 0.89020 2.20 0.08 15.4 17.7 0.0590 0.97930 1.61 0.05 18.4 20.1 0.0670 1.11
a. Mass attenuation coefficient is calculated by using relative atomic mass Ar = 180.88.b. Linear attenuation coefficient is calculated by using density ρ = 16.6 g·cm–3.c. K = K absorption edge.
645Attenuation Coefficients
3RT22 LAYOUT(609_652) 10/3/02 1:43 PM Page 645

646 Radiographic Testing
TABLE 35. Attenuation coefficients for tungsten (atomic number Z = 74).
Attenuation Coefficient µ_____________________________________Energy Cross Section (10–28 m2) Atomic Massa Linearb
_________________________________(MeV) Scattering Photoelectric Pair (10–28 m2) (cm2·g–1) (cm–1)
0.015 840 36 000 — 36 800 121 22600.02 590 16 000 — 16 600 54.4 10200.03 350 5040 — 5390 17.7 3310.04 245 2220 — 2470 8.09 1510.05 180 1160 — 1340 4.39 82.10.06 145 674 — 819 2.68 50.10.06964 122 437 — 559 1.83 34.2
K 0.06964c 122 3230 — 3350 11.0 2060.08 104 2250 — 2350 7.70 1440.10 80 1250 — 1330 4.36 81.50.15 54 408 — 462 1.51 28.20.20 42 186 — 228 0.747 14.00.30 31.5 63.1 — 94.6 0.310 5.800.40 26.5 29.8 — 56.3 0.184 3.440.50 23.4 16.7 — 40.1 0.131 2.450.60 21.2 11.0 — 32.2 0.105 1.960.80 18.2 5.9 — 24.1 0.0790 1.481.0 16.1 3.9 — 20.0 0.0655 1.221.5 12.9 1.9 0.40 15.2 0.0498 0.9312.0 10.9 1.2 1.32 13.4 0.0439 0.8213.0 8.57 0.71 3.20 12.5 0.0410 0.7674.0 7.10 0.50 4.81 12.4 0.0406 0.7595.0 6.13 0.38 6.23 12.7 0.0416 0.7786.0 5.42 0.31 7.34 13.0 0.0426 0.7978.0 4.43 0.23 9.06 13.7 0.0449 0.840
10 3.77 0.18 10.6 14.6 0.0478 0.89415 2.79 0.11 13.5 16.4 0.0537 1.0020 2.24 0.08 15.7 18.0 0.0590 1.1030 1.63 0.06 18.8 20.5 0.0672 1.26
a. Mass attenuation coefficient is calculated by using relative atomic mass Ar = 183.92.b. Linear attenuation coefficient is calculated by using density ρ = 18.7 g·cm–3.c. K = K absorption edge.
3RT22 LAYOUT(609_652) 10/3/02 1:43 PM Page 646

TABLE 36. Attenuation coefficients for platinum (atomic number Z = 78).
Attenuation Coefficient µ_____________________________________Energy Cross Section (10–28 m2) Atomic Massa Linearb
_________________________________(MeV) Scattering Photoelectric Pair (10–28 m2) (cm2·g–1) (cm–1)
0.015 940 43 800 — 44 700 138 29500.02 670 19 700 — 20 400 63.0 13500.03 400 6240 — 6640 20.5 4390.04 280 2720 — 3000 9.26 1980.05 188 1440 — 1630 5.03 1080.06 163 836 — 999 3.08 65.90.07858 117 381 — 498 1.54 33.0
K 0.07858c 117 2830 — 2950 9.10 1950.08 115 2680 — 2800 8.64 1850.10 88 1500 — 1590 4.91 1050.15 59 498 — 557 1.72 36.80.20 45 226 — 271 0.836 17.90.30 34 77.3 — 111 0.343 7.340.40 28.3 37.1 — 65.4 0.202 4.320.50 24.8 21.1 — 46.0 0.142 3.040.60 22.5 13.9 — 36.4 0.112 2.400.80 19.2 7.6 — 26.8 0.0827 1.771.0 17.0 4.9 — 21.9 0.0676 1.451.5 13.6 2.4 0.47 16.5 0.0509 1.092.0 11.6 1.5 1.51 14.6 0.0451 0.9653.0 9.04 0.90 3.55 13.5 0.0417 0.8924.0 7.52 0.63 5.37 13.5 0.0417 0.8925.0 6.46 0.48 6.92 13.9 0.0429 0.9186.0 5.71 0.39 8.07 14.2 0.0438 0.9378.0 4.67 0.29 9.98 14.9 0.0460 0.984
10 3.98 0.22 11.7 15.9 0.0491 1.0515 2.94 0.14 14.9 18.0 0.0555 1.1920 2.36 0.10 17.3 19.8 0.0611 1.3130 1.72 0.07 20.6 22.4 0.0691 1.48
a. Mass attenuation coefficient is calculated by using relative atomic mass Ar = 195.23.b. Linear attenuation coefficient is calculated by using density ρ = 21.4 g·cm–3.c. K = K absorption edge.
647Attenuation Coefficients
3RT22 LAYOUT(609_652) 10/3/02 1:43 PM Page 647

648 Radiographic Testing
TABLE 37. Attenuation coefficients for gold (atomic number Z = 79).
Attenuation Coefficient µ_____________________________________Energy Cross Section (10–28 m2) Atomic Massa Linearb
_________________________________(MeV) Scattering Photoelectric Pair (10–28 m2) (cm2·g–1) (cm–1)
0.015 977 45 500 — 46 500 142 27400.02 681 20 700 — 21 400 65.4 12600.03 412 6550 — 6960 21.3 4120.04 285 2890 — 3180 9.71 1880.05 210 1510 — 1720 5.25 1010.06 165 880 — 1050 3.21 62.00.08 118 382 — 500 1.53 29.60.08091 117 368 — 485 1.48 28.6
K 0.08091c 117 2740 — 2860 8.74 1690.10 92 1570 — 1600 5.07 98.00.15 60 520 — 580 1.77 34.20.20 46 241 — 287 0.877 16.90.30 34.5 80.9 — 115 0.351 6.780.40 28.7 39.4 — 68.1 0.208 4.020.50 25.2 22.5 — 47.7 0.146 2.820.60 22.8 14.7 — 37.5 0.115 2.220.80 19.5 8.03 — 27.5 0.0840 1.621.0 17.3 5.29 — 22.6 0.0690 1.331.5 13.8 2.56 0.48 16.8 0.0513 0.9912.0 11.7 1.65 1.56 14.9 0.0455 0.8793.0 9.17 0.95 3.65 13.8 0.0422 0.8154.0 7.62 0.67 5.50 13.8 0.0422 0.8155.0 6.56 0.50 7.10 14.2 0.0434 0.8386.0 5.80 0.41 8.22 14.4 0.0440 0.8508.0 4.74 0.30 10.2 15.2 0.0464 0.896
10 4.04 0.24 11.9 16.2 0.0495 0.95615 2.98 0.15 15.2 18.3 0.0559 1.0820 2.39 0.11 17.7 20.2 0.0617 1.1930 1.74 0.08 21.2 23.0 0.0703 1.36
a. Mass attenuation coefficient is calculated by using atomic weight Z = 197.2.b. Linear attenuation coefficient is calculated by using density ρ = 19.32 g·cm–3.c. K = K absorption edge.
3RT22 LAYOUT(609_652) 10/3/02 1:43 PM Page 648

TABLE 38. Attenuation coefficients for lead (atomic number Z = 82).
Attenuation Coefficient µ_____________________________________Energy Cross Section (10–28 m2) Atomic Massa Linearb
_________________________________(MeV) Scattering Photoelectric Pair (10–28 m2) (cm2·g–1) (cm–1)
0.02 750 24 000 — 24 800 72.1 8180.03 450 7620 — 8070 23.5 2660.04 310 3310 — 3620 10.5 1190.05 230 1740 — 1970 5.73 65.00.06 180 1040 — 1220 3.55 40.30.08 127 444 — 571 1.66 18.80.08823 113 334 — 447 1.30 14.7
K 0.08823c 113 2510 — 2620 7.62 86.40.10 100 1780 — 1880 5.47 62.00.15 64 596 — 660 1.92 21.80.20 49 275 — 324 0.942 10.70.30 36.2 93.4 — 130 0.378 4.290.40 30.1 45.7 — 75.8 0.220 2.490.50 26.3 26.1 — 52.4 0.152 1.720.60 23.8 17.3 — 41.1 0.120 1.360.80 20.3 9.5 — 29.8 0.0867 0.9831.0 18.0 6.2 — 24.2 0.0704 0.7981.5 14.4 3.0 0.5 17.9 0.0521 0.5912.0 12.2 2.0 1.7 15.9 0.0462 0.5243.0 9.51 1.1 4.0 14.6 0.0425 0.4824.0 7.91 0.80 6.02 14.7 0.0427 0.4845.0 6.79 0.60 7.63 15.0 0.0436 0.4946.0 6.00 0.49 8.84 15.3 0.0445 0.5058.0 4.91 0.35 11.0 16.3 0.0474 0.538
10 4.18 0.28 12.8 17.3 0.0503 0.57015 3.09 0.18 16.3 19.5 0.0567 0.64320 2.48 0.13 18.9 21.5 0.0625 0.70930 1.80 0.09 22.6 24.5 0.0712 0.807
a. Mass attenuation coefficient is calculated by using atomic weight Z = 207.21.b. Linear attenuation coefficient is calculated by using density ρ = 11.34 g·cm–3.c. K = K absorption edge.
649Attenuation Coefficients
3RT22 LAYOUT(609_652) 10/3/02 1:43 PM Page 649

650 Radiographic Testing
TABLE 39. Attenuation coefficients for uranium (atomic number Z = 92).
Attenuation Coefficient µ_____________________________________Energy Cross Section (10–28 m2) Atomic Massa Linearb
_________________________________(MeV) Scattering Photoelectric Pair (10–28 m2) (cm2·g–1) (cm–1)
0.03 590 12 000 — 12 600 31.9 5970.04 400 5250 — 5650 14.3 2670.05 300 2780 — 3080 7.79 1460.06 230 1640 — 1870 4.73 88.50.08 163 716 — 879 2.22 41.50.10 123 374 — 497 1.26 23.60.1163 103 239 — 342 0.866 16.2
K 0.1163c 103 1790 — 1890 4.78 89.40.15 78 905 — 983 2.49 46.60.20 59 417 — 476 1.20 22.40.30 42 146 — 188 0.0476 8.900.40 34.7 73.2 — 108 0.273 5.110.50 30.2 43.1 — 73.3 0.186 3.480.60 27.1 29.2 — 56.3 0.142 2.660.80 23.0 16.0 — 39.0 0.0987 1.851.0 20.3 10.5 — 30.8 0.0779 1.461.5 16.2 5.1 0.8 22.1 0.0559 1.052.0 13.7 3.3 2.3 19.3 0.0488 0.9133.0 10.7 1.9 5.21 17.8 0.0450 0.8424.0 8.88 1.3 7.62 17.8 0.0450 0.8425.0 7.62 1.0 9.73 18.4 0.0466 0.8716.0 6.74 0.81 11.1 18.6 0.0471 0.8818.0 5.51 0.59 13.5 19.6 0.0496 0.928
10 4.69 0.46 15.7 20.9 0.0529 0.98915 3.47 0.30 20.0 23.8 0.0602 1.1320 2.78 0.22 23.1 26.1 0.0661 1.2430 2.02 0.15 27.6 29.8 0.0754 1.41
a. Mass attenuation coefficient is calculated by using atomic weight Z = 238.07.b. Linear attenuation coefficient is calculated by using density ρ = 18.7 g·cm–3.c. K = K absorption edge.
3RT22 LAYOUT(609_652) 10/3/02 1:43 PM Page 650

TABLE 40. Attenuation coefficients for plutonium (atomic number Z = 94).
Attenuation Coefficient µ_____________________________________Energy Cross Section (10–28 m2) Atomic Massa Linearb
_________________________________(MeV) Scattering Photoelectric Pair (10–28 m2) (cm2·g–1) (cm–1)
0.03 627 13 200 — 13 800 34.8 6790.04 426 5700 — 6130 15.5 3020.05 312 3020 — 3330 8.39 1640.06 243 1780 — 2020 5.09 99.30.08 171 778 — 949 2.39 46.60.10 130 409 — 539 1.36 26.50.12256 101 222 — 323 0.814 15.9
K 0.12256c 101 1660 — 1760 4.44 86.60.15 81 976 — 1060 2.67 52.10.20 61 455 — 516 1.30 25.40.30 44 159 — 203 0.512 9.980.40 35.7 80.0 — 116 0.292 5.690.50 31.0 47.0 — 78.0 0.197 3.840.60 27.9 31.9 — 59.8 0.151 2.940.80 23.6 17.5 — 41.1 0.104 2.031.0 20.8 11.6 — 32.4 0.0817 1.591.5 20.6 5.60 0.81 27.0 0.0681 1.332.0 14.0 3.63 2.46 20.1 0.0507 0.9893.0 10.9 2.08 5.45 18.4 0.0464 0.9054.0 9.09 1.46 8.04 18.6 0.0469 0.9155.0 7.82 1.09 10.1 19.0 0.0479 0.9346.0 6.91 0.90 11.5 19.3 0.0487 0.9508.0 5.65 0.65 14.0 20.3 0.0512 0.998
10 4.80 0.50 16.3 21.6 0.0545 1.0615 3.54 0.33 20.7 24.6 0.0620 1.2120 2.84 0.24 23.9 27.0 0.0681 1.3330 2.07 0.17 27.8 30.0 0.0756 1.47
a. Mass attenuation coefficient is calculated by using atomic weight Ar = 239.b. Linear attenuation coefficient is calculated by using density ρ = 19.5 g·cm–3.c. K = K absorption edge.
651Attenuation Coefficients
3RT22 LAYOUT(609_652) 10/3/02 1:43 PM Page 651

1. White, G.R. “Absorptive Componentsof the Mass Absorption Coefficients.”National Bureau of Standards ReportNo. 1003. Gaithersburg, MD: NationalInstitute of Standards and Technology(n.d.).
2. Victoreen, J.A. “The Absorption ofIncident Quanta by Atoms As Definedby the Mass Photoelectric AbsorptionCoefficient and the Mass ScatteringCoefficient.” Journal of Applied Physics.Vol. 19. Melville, NY: AmericanInstitute of Physics (1948): p 855.
3. Victoreen, J.A. “The Calculation ofX-Ray Mass Absorption Coefficients.”Journal of Applied Physics. Vol. 20.Melville, NY: American Institute ofPhysics (1949): p 1141.
4. Zemany, P.D. and H.A. Liebhafsky.“Plating Thickness by the Attenuationof Characteristic X-Rays.” Journal of theElectrochemical Society. Vol. 103. NewYork, NY: Electrochemical Society(1956).
652 Radiographic Testing
References
3RT22 LAYOUT(609_652) 10/3/02 1:43 PM Page 652

Ringo Beaumont, Tempe, Arizona
Richard H. Bossi, The Boeing Company, Seattle,Washington
Lawrence R. Lawson, Bradford, Pennsylvania
William E.J. McKinney, Naples, Florida
George Wheeler, Materials and Processes Consultants,Schenectady, New York
23C H A P T E R
Radiographic TestingGlossary
3RT23 LAYOUT(653_674) 10/3/02 1:42 PM Page 653

654
3RT23 LAYOUT(653_674) 10/3/02 1:42 PM Page 654
IntroductionThis glossary is based on volumes of theNondestructive Testing Handbook,1-10
published by the American Society forNondestructive Testing.
The definitions in this glossary havebeen modified to satisfy peer review andeditorial style. For this reason, referencesgiven in this glossary should beconsidered not attributions but ratheracknowledgments and suggestions forfurther reading.
The definitions in this NondestructiveTesting Handbook volume should not bereferenced for inspections performedaccording to standards or specifications orin fulfillment of contracts. Standardswriting bodies take great pains to ensurethat their documents are definitive inwording and technical accuracy. Peopleworking to written contracts orprocedures should consult definitionsreferenced in those standards whenappropriate.
This glossary is provided forinstructional purposes. No other use isintended.
Terms
A
Å: Angstrom.absorbed dose: Amount of energy
imparted to matter by an ionizingevent per unit mass of irradiatedmaterial at the place of interest.Absorbed dose is expressed in gray (Gy)or rad.11
absorption: Event where photons in abeam of radiation interact with atomsof a material the photons pass throughand are reduced in energy by thisinteraction.7,12
absorption coefficient, linear (µL):Fractional decrease in transmittedintensity per unit of absorberthickness. Expressed in unitsof cm–1.7,12
accelerator: (1) Device that acceleratescharged particles to high energies.Examples are X-ray tubes, linearaccelerators and betatrons. (2) Linearaccelerator.
acceptable quality level (AQL):Maximum percentage of defectiveunits of the total units tested in anacceptable lot.
acceptance criteria: Standard againstwhich test results are to be comparedfor purposes of establishing thefunctional acceptability of a part orsystem being examined.
accelor
accetadtps
accoocomAo
accupo
actibr
actipapb
actuacuiadap
vg
agenato
algormn
alphimnia
altetr
altemcf
ampana
wfi
angten1
Radiographic Testing
ptance level: Average or standard testevel above or below which testbjects are acceptable, in contrast toejection level.4,13
ptance standard: Specimen similar tohe test object containing natural orrtificial discontinuities that are wellefined and similar in size or extent tohe maximum acceptable in theroduct. See reference standard andtandard.4,6,7
mmodation: Of the eye, adjustmentf the lens’ focusing power byhanging the thickness and curvaturef the lens by the action of tinyuscles attached to the lens.8ccommodation facilitates the viewingf objects near and far.racy: Degree of conformity of aarticular measurement to a standardr true value.
vation: Process by which neutronsombard stable atoms and make themadioactive.vity: Degree of radioactivity of aarticular isotope. Activity is expresseds the number of atoms disintegratinger unit of time. Measured inecquerel.al throat: See throat, actual.ty: See neural acuity; vision acuity.tive thresholding: Threshold valuearying with inconstant backgroundray level.8cy: Organization selected by anuthority to perform nondestructiveesting, as required by a specificationr purchase order.2rithm: Prescribed set of well definedules or processes for the solution of aathematical problem in a finite
umber of steps.4,14
a particle: Positively charged heliumon emitted by certain radioactive
aterials. It is made up of twoeutrons and two protons; hence it is
dentical with the nucleus of a heliumtom.11
rnating current: Electrical currenthat reverses its direction of flow ategular intervals.6rnating current field: Varying
agnetic field produced around aonductor by an alternating currentlowing in the conductor.6ere (A): Unit of electric current.6
log-to-digital converter: Circuithose input is information in analog
orm and whose output is the samenformation in digital form.4,14
strom (Å): Unit of distance once usedo express wavelengths oflectromagnetic radiation. The SI unitanometer (nm) is now preferred;nm = 10 Å.2,8

3RT23 LAYOUT(653_674) 10/3/02 1:42 PM Page 655
anode: (1) In radiography, the positiveelectrode of a cathode ray tube thatgenerates ionizing radiation.(2) Positively charged terminal, whichmay corrode electrochemically duringproduction of an electric current.Compare cathode.8
anomaly: Variation from normal materialor product quality.4
AOQ: Average outgoing quality.AOQL: Average outgoing quality limit.AQL: See acceptable quality level.arc welding: See electric arc welding.artifact: In nondestructive testing, an
indication that may be interpretedincorrectly as a discontinuity.2
artificial discontinuity standard: Seeacceptance standard.
artificial discontinuity: Reference point,such as a hole, groove or notch, that isintroduced into a reference standardto provide accurately reproduciblesensitivity levels for nondestructivetest equipment.4,13 A manufacturedmaterial anomaly. See acceptancestandard and reference standard.6
artificial flaw standard: See acceptancestandard.
ASNT: American Society forNondestructive Testing.
ASNT Recommended Practice No.SNT-TC-1A: Set of guidelines foremployers to establish and conduct anondestructive testing personnelqualification and certificationprogram. SNT-TC-1A was first issued in1968 by the Society for NondestructiveTesting (SNT, now ASNT) and has beenrevised every few years since.8
attenuation: (1) Decrease in energy orsignal magnitude in transmission fromone point to another. Can beexpressed in decibels or as a scalarratio of the input magnitude to theoutput magnitude.4,14 (2) Change insignal strength caused by an electronicdevice such as an attenuator.7 (3) Inradiography, the decrease in radiationintensity caused by distance, bypassage through material or by both.11
austenite: Face centered cubic phase ofiron, which phase is stable between906 °C (1663 °F) and 1390 °C (2535 °F)and which often acts as a solvent forcarbon. Also called gamma iron.
austenite, retained: Face centered cubicsolid solution in iron or iron-nickel,stable at room temperature.
automated system: Acting mechanismthat performs required tasks at adetermined time and in a fixedsequence in response to certainconditions.8 Robotic system.
B
ba
baba
ba
ba
ba
ba
ba
be
be
be
be
be
be
655
ck reflection: Signal received from thefar boundary or back surface of a testobject.7,10
ck scatter: See backscatter.ckground noise: Signals that originatefrom the test object, the testinstrument and their surroundingsand that interfere with test signals ofinterest. The higher the level ofbackground noise, the more difficult itis to distinguish a discontinuity.Sometimes called grass or hash.5,7,8,10
ckground signal: Steady or fluctuatingoutput signal of a test instrumentcaused by the presence of acoustic,chemical, electrical or radiationconditions to which the sensingelement responds.1
ckscatter: (1) Interaction of radiationwith matter such that the direction oftravel after scattering is over90 degrees and often close to180 degrees to the original direction oftravel. (2) In transmission radiography,interaction of radiation with matterbehind the image plane such thatscattered radiation returns to theimage plane, often adding fog andnoise that interfere with production ofan image of the specimen. (3) Ofscatter imaging, interaction ofincident radiation with a specimenthat scatters the radiation throughlarge angles frequently greater than90 degrees to the original direction oftravel. Such radiation is used to forman image or to measure a parameter ofthe specimen, usually through digitaltechniques.
ckscatter imaging: In radiographictesting, a family of radioscopictechniques that use backscatter.
rium clay: Molding clay containingbarium, used to eliminate or reducethe amount of scattered or secondaryradiation reaching the film.3
seline: Standard, average, priormeasurements or other criteria used inquality control for comparison andevaluation.
am: Defined stream of radiationparticles in which stream all particlesare traveling in parallel paths.
am quality: Penetrating energy of aradiation beam.
am spread: Divergence from a beam ofradiation in which all particles aretraveling in parallel paths.
cquerel (Bq): SI unit for measurementof radioactivity, equivalent to onedisintegration per second. Replacescurie.
ta particle: Electron or positronemitted from a nucleus during decay.11
ta ray: Radiation stream consisting ofbeta particles.
Radiographic Testing Glossary

656
3RT23 LAYOUT(653_674) 10/3/02 1:42 PM Page 656
betatron: Circular electron acceleratorthat is a source of either high energyelectrons or X-rays. The electrons areinjected by periodic bursts into aregion of an alternating magneticfield.11 Sometimes the electrons areused directly as the radiation.
billet: Solid semifinished round or squareproduct that has been hot worked forforging, rolling or extrusion.2
bleed: Refers to molten metal oozing outof a casting. Stripped or removed fromthe mold before completesolidification.3
blind riser: Internal riser that does notreach to the exterior of the mold.3
blister: Discontinuity in metal, on or nearthe surface, resulting from theexpansion of gas in a subsurface zone.Very small blisters are called pinheadsor pepper blisters.2
blowhole: Hole in a casting caused by gasexpanding in molten metal.
Bq: Becquerel.brazing: Joining of metals and alloys by
fusion of nonferrous alloys that havemelting points above 430 °C (806 °F),but below melting points of materialsbeing joined.2
brehmsstrahlung: Electromagneticradiation produced when electrons’path and kinetic energy brings themclose to the positive fields of atomicnuclei — as when, for example,electrons strike a target provided forthis purpose. The electrons slow down,giving up kinetic energy asX-radiation.
bridging: Premature solidification ofmetal across a mold section before themetal below or beyond solidifies.3
brinelling: Stripe indentations made by aspherical object. False brinelling refersto a type of surface wear.8
brittle crack propagation: Very suddenpropagation of a crack with theabsorption of no energy except thatstored elastically in the body.Microscopic examination may revealsome deformation even though it isnot visible to the unaided eye.2
brittleness: Quality of a material that maylead to crack formation andpropagation without appreciableplastic deformation.2
burning: Extreme overheating. Makesmetal grains excessively large andcauses the more fusible constituents ofsteel to melt and run into the grainboundaries or it may leave voidsbetween the grains. Steel may beoxidized to the extent that it is nolonger useful and cannot be correctedby heat treating but it can beremelted.2
burnt-in sand: Discontinuity consistingof a mixture of sand and metalcohering to the surface of a casting.3
burr:ocu
burstruSe
butt m
C
C: Cocalci
covio
calibcame
rashsorasa
case frfaoalmca
casintod
casinohpce
casseisinexflscn
cast sooo
cast ww
castiso
castiin(1voth(2chbaninro
castibca
Radiographic Testing
Raised or turned over edge occurringn a machined part and resulting fromtting, punching or grinding.8,15
: In metal, external or internalpture caused by improper forming.8e also crack, forging.weld or butt joint: Weld joining twoetal pieces in the same plane.8
ulomb.um tungstate: Fluorescent chemicalmpound that emits visible blueolet light when irradiated by X-raysr gamma rays.ration reflector: See reference reflector.ra: Device that contains a sealeddiation source, where the source orielding can be moved so that theurce becomes unshielded (to make adiographic exposure) or shielded (forfe storage).crushing: Mechanism producingacture of the case, like subcasetigue but attributable to staticverloading rather than to fatigueone. In many instances theovement of the subcase causes these to crack or spall.8g: Many strings of pipe that are used line the hole during and after
rilling of a gas or oil well.8g string: Tubular structure on theuter perimeter of a gas or oil wellole. The casing string is a permanentart of the well and many aremented into the formation.8tte, film: Lightproof container that used for holding radiographic film position during the radiographicposure. The cassette may be rigid or
exible and may contain intensifyingreens, filter screens, both oreither.11
tructure: Internal physical structuref a casting evidenced by shape,rientation of grains and segregationf impurities.2,3
eld assembly: Assembly formed byelding one casting to another.3ng: Object of shape obtained bylidification of a substance in a mold.
ng shrinkage: Total shrinkagecludes the sum of three types:) liquid shrinkage (the reduction inlume of liquid metal as it coolsrough the liquidus to the solidus);) solidification shrinkage (theange in volume of metal from the
eginning to ending of solidification);d (3) solid shrinkage (the reduction volume of metal from the solidus toom temperature).2,3
ng strains: Strains in a casting causedy casting stresses that develop as thesting cools.3

3RT23 LAYOUT(653_674) 10/3/02 1:42 PM Page 657
casting stresses: Stresses set up in acasting because of geometry andcasting shrinkage.3
cathode: (1) Negatively charged terminalin an arrangement that producescurrent by chemical reactions.Compare anode.8 (2) In radiography,the negative electrode of an X-raytube, the electrode from whichelectrons are emitted.
cathode ray: Stream of electrons emittedby a heated filament and projected ina more or less confined beam underthe influence of a magnetic or electricfield.7,12
cathode ray tube: Vacuum tube in whichan electron beam of cathode rays areprojected on a fluorescent screen toproduce an image or spot.
cavitation fatigue: Form of pitting causedby erosion from vibration andmovement in liquid environments.8
cementite: Iron carbide (Fe3C), present insteels.8
centrifugal casting: Casting made in amold (sand, plaster or permanent) thatrotates while the metal solidifies underthe pressure developed by centrifugalforce.3
certification: Process of providing writtentestimony that an individual (or testtechnique, process or equipment) isqualified. See also certified.8
certified: Having written testimony ofqualification. See also certification.8
cesium-137: Radioactive isotope ofelement cesium, having a half life of30 years and photon energy of about660 keV.
chaplet: Metal support used to hold acore in place on a mold.3
characteristic curve: Curve that expressesfilm density as function of log relativeexposure. These curves are useful indetermining exposure correctionfactors and to define the gammacharacteristics of the film.
chill: (1) Metal insert embedded in thesurface of a sand mold or core orplaced in a mold cavity to increase thecooling rate at that point. (2) Whiteiron occurring on a gray iron casting,such as the chill in the wedge test.3
chipping: (1) Removing seams and othersurface discontinuities in metalsmanually with chisel or gouge or bycontinuous machining, before furtherprocessing. (2) Removing excessivemetal.2,3
Ci: Curie.cire perdue process: Lost wax process.3clean: Free from interfering solid or liquid
contamination on the test surface andwithin voids or discontinuities.2
cleavagpolyof thresuis onCon
closingfolloclossepaopen
closurecognshapperc
cobalt-6cobaand1.33
code: Stlaw.
coefficimasform
coherensam
coherenno e
cold cameathe 0.13torr)discioniin aphili
cold chmacplun
cold crastraithroexissurfor st
cold shcausmetbut somlatteincodiscsurfstreato ucausof mprodfoldto thsepamaiportis sebod
e fracture: Fracture, usually of acrystalline metal, in which moste grains have failed by cleavage,
lting in bright reflecting facets. Ite type of crystalline fracture.
trast with shear fracture.2: In image processing, dilationwed by erosion. A single pixel
ing connects a broken featurerated by one pixel. See alsoing.8: Process by which a personitively completes patterns ores that are incompletelyeived.80: Radioactive isotope of elementlt, having half life of 5.3 years
photon energies of 1.17 andMeV.andard enacted or enforced as a
8
ents of the filter: Values in ak that serves as a filter in imageation and processing.8t radiation: Radiation at the
e energy and phase.t scatter: Form of scatter wherenergy is lost.thode ionization gage: Pressuresuring gage for low pressures, inrange of 13.3 mPa to belownPa (10–4 torr to below 10–12
, that works by measuring aharge current associated with thezation of gas by electrons confined magnetic field. Also called aps discharge gage or penning gage.amber machine: Die castinghine where the metal chamber orger are not heated.3cks: Discontinuities appearing as
ght lines usually continuousughout their length and generallyting singly. Cold cracks start at theace and result from cold workingressing of metallic materials.2ut: (1) Casting discontinuityed by two streams of semimoltenal coming together inside a moldfailing to fuse. Cold shuts areetimes called misruns but ther term correctly describesmplete filling of the mold.3 (2) Aontinuity that appears on theace of metal as a result of twoms of liquid meeting and failingnite. A cracklike discontinuityed by forging, where two surfacesetal fold against each other touce a discontinuity at the point of
ing. This is usually at some anglee surface. It may also be a
rate piece of metal forged into then component. See lap. (3) Aion of the surface of a forging thatparated in part from the mainy of metal by oxide.2,3
657Radiographic Testing Glossary

658
3RT23 LAYOUT(653_674) 10/3/02 1:42 PM Page 658
cold work: Permanent deformationproduced by an external force in ametal at temperature below itsrecrystallization temperature.2
collimator: Device for restricting the size,shape and direction of the irradiatingbeam, thereby limiting beam spreadand its consequences.
color discrimination: Perception ofdifferences between two or morehues.8
compensator: Electrical matchingnetwork to compensate for electricalimpedance differences.7,12
compensator blocks: Material added toregions of a test object to flatten itsradiographic image.
complete testing: Testing of an entireproduction lot in a prescribed manner.Sometimes complete testing entailsthe inspection of only the criticalregions of a part. One hundredpercent testing requires the inspectionof the entire part by prescribedmethods. Compare sampling, partial.8
compton scatter: Reduction of energy ofincident photon by its interactionwith an electron. Part of the photonenergy is transferred to the electron,giving it kinetic energy, and theremaining photon is redirected withreduced energy.
computed tomography: Technique bywhich radiation passing through anobject is displayed as one slice or layerof that object at a time. Image data areprocessed in three dimensions.
contrast: (1) In film radiography, themeasure of differences in the filmblackening or density resulting fromvarious radiation intensitiestransmitted by the object and recordedas density differences in the image.Thus, difference in film blackeningfrom one area to another.11 (2) Thedifference in visibility between anindication and the surrounding area.
contrast, subject: Ratio of radiationintensities transmitted by selectedportions of object being radiographed.
control: See in control, process control andquality control.
control cable: Cable connected toisotopic radiographic source and usedto move the source in and out of theexposure device.
core: (1) Specially formed materialinserted in a mold to shape theinterior of another part of a castingthat cannot be shaped as easily by thepattern. (2) In a ferrous alloy, theinner portion that is softer than theouter portion or case.3
corrcwmtc
corrcpooi
corrdca
corrco
corrbpc
corro
courwgc
coutp
cracVdrdcd(bgb(a
cracmwm
cracoaf
cractcTln
cracwcc
cracdbo
Radiographic Testing
osion: Deterioration of a metal byhemical or electrochemical reactionith its environment. Removal ofaterial by chemical attack, such as
he rusting of automobileomponents.2osion, crevice: Type of galvanicorrosion caused by a difference inartial pressure of oxygen between theccluded interior and exposed exteriorf a notchlike geometry. Active metalons are usually present.osion embrittlement: Severe loss ofuctility of a metal, resulting fromorrosive attack, usually intergranularnd often not visually apparent.2osion fatigue: Fatigue crackingaused by repeated load applicationsn metal in a corrosive environment.2osion, fretting: Corrosion facilitatedy fretting, particularly where arotective surface has been chafed in aorrosive environment.8osion-erosion: Simultaneousccurrence of erosion and corrosion.8
lomb (C): SI unit for electric charge,eplacing faraday and ampere hour,here 1 A·h = 3600 C. X-ray oramma ray intensity is measured inoulomb per kilogram (C·kg–1).
pon: Piece of material from which aest object is prepared, often an extraiece, as on a casting or forging.3k: (1) Break, fissure or rupture, usually shaped and relatively narrow andeep. A discontinuity that has aelatively large cross section in oneirection and a small or negligibleross section when viewed in airection perpendicular to the first.22) Propagating discontinuities causedy stresses such as heat treating orrinding. Difficult to detect unaidedecause of fineness of line and patternmay have a radial or latticedppearance).6k, base metal: Cracks existing in base
etal before a manufacturing orelding operation or occurring in baseetal during the operation.2
k, cold: Cracks that occur in a castingr weld after solidification and thatre caused by excessive stress generallyrom nonuniform cooling.2k, cooling: Cracks in bars of alloy orool steels resulting from unevenooling after heating or hot rolling.hey are usually deep and lie in a
ongitudinal direction, but are usuallyot straight.2
k, crater: Multisegment crack in aeld crater. Segments radiate from a
ommon point, often called starracks.k, fatigue: Progressive cracks thatevelop in the surface and are causedy the repeated loading and unloadingf the object.2

3RT23 LAYOUT(653_674) 10/3/02 1:42 PM Page 659
crack, forging: Crack developed in theforging operation due to forging at toolow a temperature, resulting inrupturing of the metal.2 Also calledforging burst.
crack, hot: Crack that develops before thecasting has completely cooled, ascontrasted with cold cracks, thatdevelop after solidification.2
crack, longitudinal: Crack parallel to thelength of the test object.2
crack, machining: Crack caused by tooheavy a cut, a dull tool or chatter.Typically called machining tears.2
crack, quenching: Ruptures producedduring quenching of hot metal due tomore rapid cooling and contraction ofone portion of a test object thanoccurs in adjacent portions.2
crack, transverse: Cracks at right anglesto the length of the test object.2
crack, weld: Cracks in weld fusion zonesor adjacent base metal. Usually a resultof thermal expansion or contractionstresses related to temperature changesduring welding.2
crater: In arc or gas fusion welding, acavity in the weld bead surface,typically occurring when the heatsource is removed and insufficientfiller metal is available to fill thecavity.2
crevice corrosion: See corrosion, crevice.CRT: See cathode ray tube.crush: Casting discontinuity caused by a
partial destruction of the mold beforethe metal was poured.3
curie (Ci): Unit for measurement of thequantity of radioactivity,corresponding originally to radiationfrom atomic disintegrations from 1 gof radium; replaced by becquerel (Bq)in SI, where 1 Ci = 3.7 × 10¹⁰ Bq.
D
decay curve: Graph showing radioactivestrength as a function of time for anisotope. Decay curves are used indetermining exposure times inradiographic testing.
defect: Discontinuity whose size, shape,orientation or location make itdetrimental to the useful service of itshost object or which exceeds theaccept/reject criteria of an applicablespecification.6,10,17 Note that somediscontinuities may not affectserviceability and are therefore notdefects.2 All defects arediscontinuities.2 Compare discontinuityand indication.8,15
definitiondemarcsharpnradiogrscreen radiatiofilm or
deformatiload. S
delaminatgeneramateri
depth of fwhich satisfacin the distanc
depth of fmovedproduc
depth of fmetal h
detail: In sharpnthe clediscondefiniti
detector, Xdeveloper
solutiohalide
dewaxingpatternheat or
die castin(2) Casmetal iinto th
diffractioncohereinterferesultinscatterdiffract
dilation: Iconditpixel inof its ethe inperosion
discontinuunintephysicpart.6,8
uninteinterprobject Compaindicati
discontinudisconindentnotchereferenaccuratdeterm
: Description of linearation sensitivity, or the detailess of object outline in aaphic image. It is a function oftype, exposure geometry,n energy and characteristics of
sensor.on: Change of shape underee also creep.8ion: Laminar discontinuity,
lly an area of unbondedals.7ield: Range of distance overan imaging system givestory definition when its lens isbest focus for a specifice.8ocus: Distance a sensor may be from a lens system and stille a sharp image.usion: Depth to which baseas melted during welding.2
radiography, the degree ofess of outline of an image, orar definition of an object ortinuity in the object. See alsoon.
-ray: Sensor, X-ray.: In radiography, a chemicaln that reduces exposed silvercrystals to metallic silver.11
: Removing the expendable wax from an investment mold by solvent.3g: (1) Casting made in a die.ting process where moltens forced under high pressuree cavity of a metal mold.3: Special case of scatter, where
ntly scattered photons undergorence or reinforcement,g in patterns indicative of the
ing medium. See also X-rayion.n image processing, theion of a binary image where the the output image is a 1 if any
ight closest neighbors is a 1 inut image. See also closing,and opening.8ity: Intentional or
ntional interruption in theal structure or configuration of a,16 After nondestructive testing,ntional discontinuitieseted as detrimental in the hostmay be called flaws or defects.6re defect, dislocation andon.ity, artificial: Reference
tinuities such as holes,ations, cracks, grooves ors that are introduced into ace standard to provideely reproducible indications forining sensitivity levels.2
659Radiographic Testing Glossary

660
3RT23 LAYOUT(653_674) 10/3/02 1:42 PM Page 660
discontinuity, inherent: Materialanomaly originating fromsolidification of cast metal. Pipe andnonmetallic inclusions are the mostcommon and can lead to other typesof discontinuities in fabrication.8,15
discontinuity, primary processing:Material anomaly produced from thehot or cold working of an ingot intoforgings, rod and bar.8,15
discontinuity, secondary processing:Material anomaly produced duringmachining, grinding, heat treating,plating or other finishingoperations.8,15
discontinuity, service induced: Materialanomaly caused by the intended useof the part.8
dose: See absorbed dose.dose rate: Radiation dose delivered per a
specified unit of time and measured,for instance, in sievert per minute (orin rem per hour). See also absorbeddose.11
dosimeter: Device that measures radiationdose, such as a film badge orionization chamber.11
drop: Discontinuity in a casting due to aportion of the sand dropping from thecope or overhanging section of themold.3
drop out: Falling away of green sand fromthe walls of a mold cavity when themold is closed.3
dross: Scum that forms on the surface ofmolten metals largely because ofoxidation but sometimes because ofthe rising of impurities to the surface.3
E
effective focal spot: Size and geometry offocal spot after target interaction.Viewed from along the primary beamcentral axis at the target the effectivefocal spot would appear nearly squareand smaller than the actual focal spotarea covered by the electron stream.
effective throat: In welding, the weldthroat including the amount of weldpenetration but ignoring excess metalbetween the theoretical face and theactual face.8
electric arc welding: Joining of metals byheating with electric arc. Also calledarc welding.8
electrochemical corrosion: Corrosionthat occurs when current flowsbetween cathodic and anodic areas onmetallic surfaces.2
electronvolt (eV): Kinetic energy acquiredby an electron in passing through apotential difference of 1 V in vacuum;1 eV = ~1.60 J. The electronvolt iscommonly used to express the energyof X-rays.
ele
ero
ero
eVev
ex
ex
F
fal
fal
fat
fea
Radiographic Testing
ment: Chemical substance that cannotbe divided into simpler substances bychemical means. Examples arehydrogen, lead and uranium.2sion: (1) Loss of material ordegradation of surface quality throughfriction or abrasion by moving fluids,made worse by solid particles in thosefluids or by cavitation in the movingfluid. (2) In image processing,condition of a binary image where thepixel in the output image is a 1 if eachof its eight neighbors is a 1 in theinput image. See also closing, dilationand opening.8sion-corrosion: Simultaneousoccurrence of erosion and corrosion.8
: Electronvolt.aluation: Process of determining themagnitude and significance of adiscontinuity after the indication hasbeen interpreted as relevant.Evaluation determines if the testobject should be rejected, repaired oraccepted. See indication andinterpretation.2,6,7
foliation: Corrosion that progressesapproximately parallel to the outersurface of the metal, causing layers ofthe metal to be elevated by theformation of corrosion product.2
posure factor: In X-radiography, thequantity that combines sourcestrength (milliampere), time (usuallyminute) and distance. It is the productof milliamperage and time divided bydistance squared and determines thedegree of film density.
se brinelling: Fretting wearindentations. Compare brinelling.8
se indication: Indication that could beinterpreted as originating from adiscontinuity but which actuallyoriginates where no discontinuityexists.7 Distinct from nonrelevantindication.2 Compare defect.8
igue fracture: Progressive fracture of amaterial that begins at a discontinuityand increases under repeated cycles ofstress. The phenomenon leading tofracture under repeated or fluctuatingstresses having a maximum value lessthan the tensile strength of thematerial.2ture extraction: From an enhancedimage, derivation of some featurevalues, usually parameters fordistinguishing objects in the image.8

3RT23 LAYOUT(653_674) 10/3/02 1:42 PM Page 661
ferromagnetic material: Material such asiron, nickel or cobalt whose relativepermeability is considerably greaterthan unity and depends on themagnetizing force.4,14 Materials thatare most strongly affected bymagnetism are called ferromagnetic.2
field: In video technology, one of twovideo picture components thattogether make a frame. Each picture isdivided into two parts called fieldsbecause a frame at the rate of thirtyframes per second in a standard videooutput would otherwise produce aflicker discernible to the eye. Eachfield contains one half of the totalpicture elements. Two fields arerequired to produce one completepicture or frame so the field frequencyis sixty fields per second and the framefrequency is thirty frames per second.8
field of view: Range or area that can beseen through an imaging system, lensor aperture.8
fillet weld: Weld at vertex or cornerformed by two metal pieces.8
film badge: Package of photographic filmworn as a badge by radiographicpersonnel (and by workers in thenuclear industry) to measure exposureto ionizing radiation. Absorbed dosecan be calculated by degree of filmdarkening caused by irradiation.11
film holder: See cassette, film.film speed: Relative exposure required to
attain a specified film density.11
film undercut: See undercut, film.filter: (1) Network that passes
electromagnetic wave energy over adescribed range of frequencies andattenuates energy at all otherfrequencies.4,13 (2) Processing device orfunction that excludes a selected kindof signal or part of a signal.8 (3) Inradiography, the thickness ofabsorbing material placed in a primaryradiation beam to selectively removelonger wavelength radiation, therebyadjusting the quality of theradiographic image.
fine crack: Discontinuity in a solidmaterial with a very fine opening tothe surface, but possessing length anddepth greater than the width of thisopening. Usually the depth is manytimes the width.2
finite element analysis: Numericaltechnique for the analysis of acontinuous system whereby thatsystem is decomposed into acollection of finite sized elements.4
fit up: To secure one or more jointmembers with special externalfixturing to prevent movement duringwelding.8,15
fixingthain thebla
flakes:fissstretransolusufracbrisurdissha
flaw: Rdisdisc
focal sbomeffe
focus:lenoffseeacc
focus, actsce
fog: Insouprihumradfilm
foil: M0.1
foreignsandisbeiforisovarcorthi
forgincra
forginSee
foundme
fracturenopar
frame:a vperA ffielfram
: Procedure used in film processingt removes undeveloped silver saltsthe emulsion from the surface of film, leaving only the developedck silver of the image on the film.Short discontinuous internal
ures in ferrous metals attributed tosses produced by localizedsformation and/or decreased
ubility of hydrogen during coolingally after hot working. On atured surface, flakes appear as
ght silvery areas; on an etchedface they appear as short,continuous cracks.8,15 Also calledtter cracks and snowflakes.2ejectable anomaly or unintentional
continuity. See also defect andontinuity.2pot: Area on target that receives
bardment of electrons. See alsoctive focal spot.Position of a viewed object and as system relative to one another toer a distinct image of the object asn through the lens system. Seeommodation and depth of field.8principal plane of: Single planeually in focus in a photographicne.8crease of film density caused byrces other than from the intended
mary beam exposure. Heat,idity, pressure and scatter
iation can all cause fogging of the.
etal in sheet form less than5 mm (6 × 10⁻³ in.) thick.2 materials: Inclusions that may be
d, slag, oxide or dross metal or anysimilar material in the materialng examined. In radiographic film,eign materials may appear aslated, irregular or elongatediations of film density notresponding to variations inckness of material or to cavities.3g burst: Also called forging crack. Seeck, forging.g crack: Also called forging burst. crack, forging.ry: Establishment or building wheretal castings are produced.3e: Break, rupture or crack largeugh to cause a full or partialtition of a casting.2,3
Complete raster scan projected onideo screen. There are thirty frames second in a standard video output.rame may be comprised of twods, each displaying part of the total
e. See also field.8
661Radiographic Testing Glossary

66
3RT23 LAYOUT(653_674) 10/3/02 1:42 PM Page 662
fretting: Action that results in surfacedamage, especially in a corrosiveenvironment, when there is lowamplitude motion between solidsurfaces in contact under pressure.Also called fretting corrosion.2
fretting corrosion: See corrosion, fretting.
G
galling: Type of adhesive wear more grossthan fretting.8
gamma iron: Austenite.gamma rays: High energy, short
wavelength electromagnetic radiationemitted by the nucleus of a radioactiveisotope. Energies of gamma rays areusually between 0.01 and 10 MeV.X-rays also occur in this energy rangebut are of nonnuclear origin.11
gas holes: Holes created by a gas evolvingfrom molten metal.2 Appear as darkspots occurring individually, inclusters or distributed throughout acasting.3
gas porosity: Gas pockets or voids inmetal. Refers to porous sections inmetal that appear as round orelongated dark spots corresponding tominute voids usually distributedthrough the entire casting.3 Sphericalor elongated internal cavities causedby evolution of dissolved gases frommolten metal or slag trapped duringcooling and solidification of castingsor fusion welds.2
gas tungsten arc welding (GTAW): Inertgas shielded arc welding using atungsten electrode. Also called tungsteninert gas (TIG) welding.8
gated pattern: Pattern designed toinclude gating in the mold.3
general examination: Test orexamination of a person’s knowledge,typically (in the case of nondestructivetesting personnel qualification) awritten test on the basic principles of anondestructive testing method andgeneral knowledge of basic equipmentused in the method. (According toASNT’s guidelines, the generalexamination should not addressknowledge of specific equipment,codes, standards and procedurespertaining to a particular application.)Compare practical examination andspecific examination.8
geometric unsharpness: See unsharpness,geometric.
gouge: Surface indentation caused byforceful abrasion or impact or flamecutting. Also called nick. Compare toolmark.8
gradient: Slope of characteristic curve forspecified film density.
graininfromthaclusilvnakma
grains:megraform(2)the
gray (Gdosmatheabs1 G
gray letheor, com
gross pcasvoinumpra
guide radthedev
Gy: Gr
H
halatiobrigor d
hardnestifdef(2)scra
heat afmewelandthe
heat chwhandfrombelprother
holes:as aprocav
2 Radiographic Testing
ess: Film characteristic that results improper film processing and
t consists of the grouping ormping together of many smaller grains into masses visible to theed eye or with slightgnification.11
(1) Solid particle or crystal oftal. As molten metal solidifiesins grow and lattices intersect,
ing irregular grain boundaries.8Individual crystals that make up crystalline structure of metal.2y): SI unit for measurement of the
e of radiation absorbed per unitss at a specified location. Replaces rad where rad denotes radiationorbed dose, not radian.y = 1 J·kg–1 = 100 rad.vel: Integer number representing brightness or darkness of a pixelas a composite value, of an imageprised of pixels.8orosity: In weld metal or in a
ting, pores, gas holes or globulards that are larger and in greater
ber than obtained in goodctice.2,3
tube: Cable connected to isotopiciographic source and used to move source in and out of the exposureice.ay.
n: Spreading of light around aht image on a fluorescent screeneveloped film.ss: (1) Of metals, temper or
fness or resistance to plasticormation, usually by indentation.Of metals, temper or resistance totching, abrasion or cutting.2fected zone (HAZ): Base metal not
lted during brazing, cutting ording, but whose microstructure physical properties were altered by heat.2ecking: Surface cracking caused
en metal rapidly heated (or cooled heated repeatedly) is prevented expanding freely by colder metal
ow the surface. Friction mayduce the heat. Sometimes calledmal fatigue.8Any voids remaining in an object result of improper manufacturingcessing. Often called gas holes,ities or air locks.2

663Radiographic Testing Glossary
3RT23 LAYOUT(653_674) 10/3/02 1:42 PM Page 663
hot cracks: Ragged dark lines of variablewidth and numerous branches. Theyhave no definite line of continuityand may exist in groups. They mayoriginate internally or at the surface.3Cracks occurring in hot solid metals,caused by stresses of thermalexpansion or contraction andoriginating either internally or at thesurface.2
hot tears: Fractures formed in a metalduring solidification because ofhindered contraction. Surface crackson castings produced by contractionof the metal during cooling.2,3 Hottears often occur where areas ofdifferent thickness adjoin.8
hundred percent testing: See one hundredpercent testing.
I
icicles: Coalescence of metal protrudingbeyond the root of the weld.Sometimes called burn through.2
image: Visual representation of a testobject or scene.8
image enhancement: Any of a variety ofimage processing steps, used singly orin combination to improve thedetectability of objects in an image.8
image orthicon: Television tube that usesthe photoemission method. Comparevidicon tube.8
image processing: Actions applied singlyor in combination to an image, inparticular the measurement andalteration of image features bycomputer. Also called pictureprocessing.8
image quality indicator: Strip of materialthe same composition as that of thematerial being tested, representing apercentage of object thickness andprovided with a combination of steps,holes or slot or alternatively made as aseries of wires. When placed in thepath of the rays, its image provides acheck on the radiographic techniqueemployed.3–11
image segmentation: Process in whichthe image is partitioned into regions,each homogeneous.8
impregnation: (1) Treatment of porouscastings with a sealing medium to stoppressure leaks. (2) The process offilling the pores of a sintered compact,usually with a liquid such as alubricant. (3) The process of mixingparticles of a nonmetallic substance ina matrix of metal powder, as indiamond impregnated tools.3
impurities: Elements or compoundswhose presence in a material isunintentional.2,3
in control: Within prescribed limits ofprocess control.8
in-mwrarae
incidst
incluusuothre
incothtoth
incopopc
indeliin
indicdinrea
indiceStoin
indicbdm
indiccac
indicdnetyad
inheththdst
interob
interAcmea
otion radiography: Technique inhich either the object beingdiographed or the source ofdiation is in motion during the
xposure.3,11
ent radiation: Primary radiationriking an object at closest point.sion: Foreign particles or impurities,sually oxides, sulfides, silicates andch, that are retained in metal (welds
r castings) during solidification orat are formed by subsequentaction of the solid metal.2,3
mplete fusion: Fusion that is lessan complete. Failure of weld metal fuse completely with and bond toe base metal or preceding bead.2
mplete penetration: In welding, rootenetration that is less than completer failure of a root pass and a backingass to fuse with each other.2 Alsoalled lack of fusion.2x of refraction: Ratio of velocity ofght in a vacuum to velocity of light a material.ation: Nondestructive testingiscontinuity response that requiresterpretation to determine itslevance. Compare defect, discontinuity
nd false indication.8ation, discontinuity: Visible
vidence of a material discontinuity.ubsequent interpretation is required determine the significance of andication.2ation, false: (1) Indication producedy something other than aiscontinuity.6 (2) Indication due toisapplied or improper testing.2ation, nonrelevant: Indication
aused by a condition that does notffect the usability of the object (ahange of section, for instance).2ation, relevant: Indication from aiscontinuity (as opposed to aonrelevant indication) requiringvaluation by a qualified inspector,pically with reference to an
cceptance standard, by virtue of theiscontinuity’s size or location.8,16
rent discontinuities: Discontinuitiesat are produced in the material ate time it is formed (for example,
uring solidification from the moltenate).2granular corrosion: Corrosionccurring preferentially at grainoundaries.2granular stress corrosion cracking:nomaly caused by intergranularorrosion as a result of sensitizedaterial, stress and corrosive
nvironment (typical in the heatffected zone of stainless steel welds).

664
3RT23 LAYOUT(653_674) 10/3/02 1:42 PM Page 664
interlaced scanning: Process whereby thepicture appearing on a video screen isdivided into two parts. Interlacedscanning reduces flicker by increasingthe electron beam’s downward rate oftravel so that every other line is sent.When the bottom is reached, thebeam is returned to the top and thealternate lines are sent. The odd andeven line scans are each transmitted at1/60 s, totaling 1/30 s per frame andretaining the standard rate of 30frames per second. The eye’spersistence of vision allows the oddand even lines to appear as a singleimage without flicker.8
interpretation: Determination of thesignificance of test indications fromthe standpoint of their relevance orirrelevance. The determination of thecause of an indication or theevaluation of the significance ofdiscontinuities from the standpoint ofwhether they are detrimental orinconsequential.2
inverse square law: From a point sourceof radiation, the intensity of energydecreases as the inverse square ofdistance from source.3,11
investment casting: (1) Casting metalinto a mold produced by surrounding(investing) an expendable pattern witha refractory slurry that sets at roomtemperature after which the wax,plastic or frozen mercury pattern isremoved. Also called precision castingor lost wax process. (2) A casting madeby the process.3
ion chambers: Device for measuringradiation due to ionization of a gas ina chamber.
ionizing radiation: Form of radiationthat can displace orbital electronsfrom atoms. Types include X-rays,gamma rays and particles such asneutrons, electrons and alphaparticles.11
IQI: Image quality indicator.irradiance: Power of electromagnetic
radiant energy incident on the surfaceof a given unit area. Compareradiance.8
J
joint: (1) Part of the mold where the copeand cheek, cope and drag or cheekand drag come together.3 (2) Part ofweld where two welded parts meet.
joint efficiency: Strength of a weldedjoint expressed as a percentage of thestrength of the unwelded base metal.2
joint penetration: Distance weld metaland fusion extend into a joint.2
L
lack ofof uparwelpen
laminaor sblorollandLampipsegdirediscmein tincsurlamobjstre
lap: Suto ttanandmeplathecold
level, alevedepobj
level, rindbelparothremacc
light maluber
limitedcertareIII)certquaactileve
linac:linear
atothr
line pausespemin
lost-waprouse
Radiographic Testing
fusion: Discontinuity due to lacknion between weld metal and
ent metal or between successived beads.2 Also called incompleteetration.tion: Discontinuity in plate, sheettrip caused by pipe, inclusions orwholes in the original ingot. Aftering, laminations are usually flat parallel to the outside surface.inations may also result from
e, blisters, seams, inclusions orregation elongated and are madectional by working. Laminationontinuities may also occur in
tal powder compacts.2 May appearhe form of rectangles or plates aslusion stringers between rolledfaces. Short, intermittentinations may be detrimental if theect is subjected to high bendingsses in service.6rface discontinuity, usually parallelhe surface, appearing as a fold orgential seam in a wrought product caused by folding over of a hot
tal fin or sharp corner in a thinte, then rolling or forging it into surface but not welding it. See also shut.2,6
cceptance: In contrast to rejectionl, test level above or below which,ending on the test parameter, testects are acceptable.2ejection: Value established forication or test signal above orow which, depending on the testameter, test objects are rejectable orerwise distinguished from theaining objects.2 See level,
eptance.etal: Low density metal such as
minum, magnesium, titanium,yllium or one of their alloys.2 certification: Individuals who areified only for specific operations
usually called limited Level (I, II or or are designated as having limitedification because they are notlified to perform the full range ofvities expected of personnel at thatl of qualification.8
Linear accelerator.accelerator: Device that acceleratesmic particles in a straight lineough a series of magnetic fields.ir: Pair of adjacent, parallel linesd to evaluate the resolution of acific imaging system. See alsoimum line pair.8x process: Investment castingcess in which a wax pattern isd.3

3RT23 LAYOUT(653_674) 10/3/02 1:42 PM Page 665
lot tolerance percent defective: Inquality control, the percent defectiveat which there is a 10 percentprobability of acceptance in aproduction run.8
low pass filtering: Linear combination ofpixel values to smoothen abrupttransitions in a digital image. Alsocalled smoothing.8
M
machine vision: Automated systemfunction of acquiring, processing andanalyzing images to evaluate a testobject or to provide information forhuman interpretation. A typicalsystem consists of a light source, avideo camera, a video digitizer, acomputer and an image display.8
macroshrinkage: Casting discontinuityconsisting of voids in the form ofstringers shorter than shrinkage cracks.This discontinuity results fromcontraction during solidificationwhere there is not an adequateopportunity to supply filler material tocompensate for the shrinkage. It isusually associated with abrupt changesin section size.2,3 See shrink.
mask: (1) Square matrix of n × n withdifferent values that serves as a filterin image processing.8 (2) Inradiography, a cover with an apertureto view a specific area; mask plate.(3) In radiographic testing, a selectiveradiation filter.
match plate: Device used in a highintensity illuminator to limit the lightto a specific area, typically less thanthe size of the film radiograph. Seemask.
material noise: Random signals caused bythe material structure of the testobject.10 A component of backgroundnoise.7
mathematical morphology: Imageprocessing technique of expandingand shrinking. The basic operators inmathematical morphology are dilation(expanding), erosion (shrinking),opening and closing.8
measurement system: Entire system fromsensor to display inclusive.1
mechanical properties: Properties of amaterial that reveal its elastic andinelastic behavior where force isapplied, thereby indicating itssuitability for mechanical applications(for example, modulus of elasticity,tensile strength, elongation, hardnessand fatigue limit).2
metallicontMaya craobjeincl
metalloconsandeye magelecdiffr
metallumet
micro:mea
microc(0.0dim
microfiprop
micropthe
microscthatin aapprsmaordinot Micmea
microsea grcallecracthe wrotheiensufromlong
microshnot thanintediscdurinot filleshrisolidpart
minimua spbetwlinesyste
misrunresubefo
MKSA:elecunitampSI sy
c discontinuity: Break in theinuity of the metal of an object. be located on the surface (such asck) or deep in the interior of thect (such as a gas pocket orusion).2graphy: Science dealing with thetitution and structure of metals
alloys as revealed by the unaidedor by such tools as low powerednifications, optical microscope,tron microscope and X-rayaction.2rgy: Science and technology of
als.2Prefix that divides a basic unit ofsure by one million.2rack: Crack less than about 50 µm02 in.) in largest surfaceension. See also microfissure.ssure: Crack of microscopicortions. See also microcrack.
orosity: Porosity visible only withaid of a microscope.2opic stresses: Residual stresses vary from tension to compression distance (presumablyoximating the grain size) that isll compared to the gage length innary strain measurement. Hence,detectable by dissection method.roscopic stresses can sometimes besured by X-ray shift.2gregations: (1) Segregation within
ain, crystal or small particle. Alsod coring.2 (2) Extremely narrowks, usually long and straight, onsurfaces of highly finishedught metals. Often very shallow,r identity must be established tore that the indications are not detrimental cracks, deep laps or inclusion stringers.6rinkage: Casting discontinuity,
detectable at magnifications lower ten diameters, consisting of
rdendritic voids. Thisontinuity results from contractionng solidification where there isan adequate opportunity to supplyr material to compensate fornkage. Alloys with a wideification temperature range are
icularly susceptible.2,3
m line pair: Closest distance thatecific imaging system can resolveeen a pair of adjacent, parallel
s (line pair) used to evaluatem resolution.8
: Casting not fully formed,lting from the metal solidifyingre the mold is filled.3System of units for mechanics andtromagnetics in which the basics are meter, kilogram, second andere. It is a constituent part of thestem of units.4,14
665Radiographic Testing Glossary

6
3RT23 LAYOUT(653_674) 10/3/02 1:42 PM Page 666
model, analytical: Representation of aprocess or phenomenon by a set ofsolvable equations.4,14
mottle: In radiographic testing,nonuniform density where it shouldbe uniform, resulting from scatteredradiation, secondary radiation,forward scatter and film irregularities.Often confused with graininess.
N
NDC: Nondestructive characterization.NDE: (1) Nondestructive evaluation.
(2) Nondestructive examination.8NDI: Nondestructive inspection.8NDT: Nondestructive testing.8near ultraviolet radiation: Ultraviolet
radiation with wavelengths rangingfrom about 320 to about 400 nm.Sometimes called black light.8
necking down: Localized reduction inarea of a specimen or structuralmember during welding oroverloading.8,15
neural acuity: Ability of the eye andbrain together to discriminate patternsfrom background. Discrimination isinfluenced by knowledge of the targetpattern, by the scanning techniqueand by the figure/ground relationshipof a discontinuity.8
neutron: Uncharged elementary particlewith mass nearly equal to that of theproton.11
neutron fluence: Integrated exposure(product of current and time) ofneutrons per unit area.
neutron flux: Neutron current; quantityof neutrons passing through a unitarea per unit time.
neutron radiography: Radiographic testingusing a neutron beam.
neutron radioscopy: Radioscopy using aneutron beam.
nick: Surface indentation caused byforceful abrasion or impact. Also calledgouge. Compare tool mark.8
noise: Any undesired signals that tend tointerfere with normal detection orprocessing of a desired signal. Seegraininess and mottle.
nondestructive characterization (NDC):Branch of nondestructive testingconcerned with the description andprediction of material properties andbehaviors of components and systems.
nondestructive evaluation (NDE):Another term for nondestructive testing.In research and academiccommunities, the word evaluation isoften preferred because it connotesquantitative interpretation ofnondestructive test data based onunderstanding of nondestructive testprocess.
nondestAnotIn thexambecatrialspow
nondestAnotIn sothe wmainhas b
nondestDetecondaffecits intestiprobmateprese(surfalso nondnond
nonrelenonr
normalsuitatransin aibelo
numericgenemathsysteanaldigit
O
oil counHollto coprod
one hunall pa precomponlyCom
openingerosiopenpixe
organolorga
orientatsurfaa ref
orthicon
66 Radiographic Testing
ructive examination (NDE):her term for nondestructive testing.e utilities and nuclear industry,ination is sometimes preferreduse testing can imply performance of pressure containment or
er generation systems.8ructive inspection (NDI):her term for nondestructive testing.me industries (utilities, aviation),ord inspection often impliestenance for a component thateen in service.8ructive testing (NDT):rmination of the physicalition of an object withoutting that object’s ability to fulfilltended function. Nondestructive
ng techniques typically use aing energy form to determinerial properties or to indicate thence of material discontinuities
ace, internal or concealed). Seenondestructive evaluation,estructive examination andestructive inspection.8vant indication: See indication,elevant.izing: Heating a ferrous alloy to able temperature above theformation range and then coolingr to a temperature substantiallyw the transformation range.3al analysis: Technique torate numbers as the solution to aematical model of a physicalm. Used in place of a closed formytic expression. Usually requiresal computation.4
try tubular goods (OCTG):ow cylindrical components usednvey petroleum and relateducts.8dred percent testing: Testing of
arts of an entire production lot inscribed manner. Sometimes,lete testing entails the testing of the critical portions of the part.pare sampling, partial.8: Image processing operation ofon followed by dilation. A singleing eliminates isolated single
ls. See also closing.8eptic: Relying on or using sensens, such as the human eye.8ion: Angular relationship of ace, plane, discontinuity or axis toerence plane or surface.7,10
: See image orthicon.8

3RT23 LAYOUT(653_674) 10/3/02 1:42 PM Page 667
P
parallax: Apparent difference in positionof an imaged point according to twodifferently positioned sensors.8
parting line: Mark left on the castingwhere the die halves meet. Also, thesurface between the cover and ejectorportions of the die.3
pass: In welding, a single bead along theentire weld length or the process oflaying down that bead.8
pearlite: Platelet mixture of cementiteand ferrite in steels or in alpha andbeta phases in nonferrous alloys.8
peeling: (1) Dropping away of sand fromthe casting during shakeout. (2) Thedetaching of one layer of a coatingfrom another or from the basic metal,because of poor adherence.3
penetrameter: See image quality indicator.penning gage: Cold cathode ionization
gage.period: Absolute value of the minimum
interval after which the samecharacteristics of a periodic waveformor a periodic feature return.4,14
peripheral vision: Seeing of objectsdisplaced from the primary line ofsight and outside the central visualfield.8,17
phase shift: Change in the phaserelationship between two alternatingquantities of the same frequency.4,13
philips discharge gage: Cold cathodeionization gage.
photoconduction: Method by which avidicon television camera tubeproduces an electrical image, in whichconductivity of the photosensitivesurface changes in relation to intensityof the light reflected from the scenefocused onto the surface. Comparephotoemission.8
photoelectric effect: Emission of freeelectrons from a surface bombarded bysufficiently energetic photons. Suchemissions may be used in anilluminance meter, calibrated inlux.8,17 Interaction of photons withatoms in which the full energy of thephoton is absorbed by an orbitalelectron, removing the electron fromthe atom.
photoemission: Method by which animage orthicon television camera tubeproduces an electrical image, in whicha photosensitive surface emitselectrons when light reflected from aviewed object is focused on thatsurface. Compare photoconduction.8
photometry: Science and practice of themeasurement of light or photon-emitting electromagnetic radiation.8
photon: Particle of electromagneticradiation.
photoreincluelem
physicapropcondtherm
picture picture pigtail:
cablecapsumovcont
pill: In gcontradia
pinholecastinelectnumthrou
pipe: (1)solidingo(2) Dprod(3) Eoxiditowabackmeta
pitting:surfafatigu
pitting fof sufatigusurfaloadipittin
pixel: OEachthe seleme
plane ofplane
pores: (1(2) Mintencompelect
porosityfromgas. Vpinh
positivemeshdirecthe s
pouringreceienter
pouringa fur
ceptor: Photon sensor. Examplesde film and electronic detectorents.8l properties: Nonmechanicalerties such as density, electricaluctivity, heat conductivity andal expansion.2
element: See pixel.processing: See image processing.In gamma radiography, flexible to which an isotope bearingle may be attached for
ement in and out of a shieldingainer.amma radiography, capsule
aining isotopic source oftion. porosity: Porosity, in either
gs or metal formed byrodeposition, resulting fromerous small holes distributedghout the metal.3 Central cavity formed duringification of metal, especiallyts, by thermal contraction.iscontinuity in wrought or castucts resulting from such a cavity.xtrusion discontinuity due to thezed surface of the billet flowingrd the center of the rod at the end. (4) Cast, wrought or weldedl tube.2Discontinuity consisting ofce cavities. See also cavitatione and pitting fatigue.8atigue: Discontinuity consistingrface cavities typically due toe and abrasion of contacting
ces undergoing compressiveng. See also cavitation fatigue andg.8ne element of a digital picture. pixel represents a finite area incene being imaged. See picturent. focus: See focus, principalof.) Small voids within a metal.inute cavities, sometimestional, in a powder metallurgyact. (3) Minute perforations in an
roplated coating.2: Discontinuity in metal resulting the creation or coalescence ofery small pores are called
oles.8,15
sliding: Rolling and sliding ofing gears or rollers whentions of rolling and sliding areame.8 basin: Basin on top of a mold tove the molten metal before its the sprue or downgate.3: Transferring molten metal fromnace or a ladle to a mold.3
667Radiographic Testing Glossary

66
3RT23 LAYOUT(653_674) 10/3/02 1:42 PM Page 668
practical examination: In certification ofnondestructive testing personnel, ahands-on examination using testequipment and sample test objects.Compare general examination andspecific examination.8
primary radiation: Radiation emittingdirectly from the target of an X-raytube or from a radioactive source.11
principal plane of focus: See focus,principal plane of.
process: Repeatable sequence of actions tobring about a desired result.8
process control: Application of qualitycontrol principles to the managementof a repeated process.8
process testing: Initial product testing toestablish correct manufacturingprocedures and then by periodic teststo ensure that the process continues tooperate correctly.2
proof test: Structural integrity test.
Q
qualification: Process of demonstratingthat an individual (or test technique,process or instrument) has therequired amount and the requiredtype of training, experience,knowledge and abilities. See alsoqualified.8
qualified: Having demonstrated therequired amount and the requiredtype of training, experience,knowledge and abilities. See alsoqualification.8
quality: Ability of a process or product tomeet specifications or expectations ofits users in terms of efficiency,appearance, longevity andergonomics.8
quality assurance: Administrative actionsthat specify, enforce and verify aquality control program.8
quality control: Physical andadministrative actions required toensure compliance with the qualityassurance program. May includenondestructive testing in themanufacturing cycle.8
R
R: Roentgen.rad: Radiation absorbed dose. Unit of
absorbed dose of ionizing radiation.One rad is equal to the absorption of10–5 J (100 erg) of radiation energy pergram of matter.11 Replaced by the gray(Gy).
radiance: Radiant flux per unit solidangle and per unit projected area ofthe source. Measured in watts persquare meter steradian. Compareirradiance.8
radiaer
radiaf
radiaea
radiae
radiasrrlir
radiosino
radioDsdr
radioinffleat
radioponpin
radioradio
wdeio
radiorDd
radiomv
radiotXaaTmm
8 Radiographic Testing
nt energy: Energy emitting aslectromagnetic waves. Also known asadiation.8nt flux: Radiant energy’s rate of
low, measured in watts.8nt intensity: Electromagnetic energy
mitted per unit time per unit solidngle.nt power: Total radiant energy
mitted per unit time.8tion safety officer: Individual
upervising program to provideadiation protection. Theepresentative appointed by thecensee for liaison with the applicableegulatory agency.11
grapher: Person that performs,upervises and is responsible fordustrial radiographic testing
perations.graphic interpretation:etermination of the cause and
ignificance of subsurfaceiscontinuities indicated on aadiograph.graphic screens: Thin sheets used totensify the effect of radiation on
ilms.11 The screens can be made of aluorescent material or a metal such asad. Metallic screens absorb secondary
nd scattered radiation, which helpso improve image quality.graphic testing (RT): Use of
enetrating radiant energy in the formf X-rays, gamma rays or neutrons forondestructive testing of objects torovide images of the objects’teriors. Also called radiography.graphy: Radiographic testing.logy: (1) That branch of medicinehich uses ionizing radiation foriagnosis and therapy. (2) Science oflectromagnetic radiation, particularlynizing radiation.meter: Instrument for measuring
adiant power of specified frequencies.ifferent radiometers exist forifferent frequencies.8metric photometer: Radiometer foreasuring radiant power over a
ariety of wavelengths.8scopy: Radiographic testing
echnique in which gamma rays,-rays or neutrons are used to producen image on a video or screen displays opposed to a latent image on a film.he test object or interrogating opticsay move in real time to present aoving radiographic image.

669Radiographic Testing Glossary
3RT23 LAYOUT(653_674) 10/3/02 1:42 PM Page 669
raster: Repetitive pattern whereby adirected element (a robotic arm or aflying dot on a video screen) followsthe path of a series of adjacent parallellines, taking them successively in turn,always in the same direction (from topto bottom or from left to right),stopping at the end of one line andbeginning again at the start of thenext line. Following a raster patternmakes it possible for electron beams toform video pictures or frames and fora sensor bearing armature to cover apredetermined part of the surface of atest object.8
real time: Playback of video or audiostreams at frame rate replicating theevent originally recorded.
real time radiography: Radioscopy. Seealso real time.
recommended practice: Set of guidelinesor recommendations.8
Recommended Practice SNT-TC-1A: SeeASNT Recommended PracticeNo. SNT-TC-1A.
reference reflector: Reflector with knowndimensioned surface established toprovide an accurately reproduciblereference level.7
reference standard: Typical test objectwith known artificial or naturaldiscontinuities of various specific sizes,used as a basis for test comparisons,equipment calibration or determiningthe efficiency of the discontinuitydetection process. Also called referenceor test panel, reference or test block andreference or test piece.2 See alsoacceptance standard.
reinforcement of weld: (1) In a buttjoint, weld metal on the face of theweld that extends out beyond asurface plane common to themembers being welded. (2) In a filletweld, weld metal that contributes toconvexity. (3) In a flash, upset or gaspressure weld, weld metal exceedingbase metal diameter or thickness.2
rejection level: See level, rejection.relevant indication: See indication,
relevant.rem: Roentgen equivalent man. Unit of
absorbed radiation dose in biologicalmatter. It is equal to the absorbed dosein rads multiplied by the quality factorof the radiation.11
remote viewing: Viewing of a test objectnot in the viewer’s immediatepresence. The word remote previouslyimplied either closed circuit televisionor fiber optic systems remote enoughso that, for example, the eyepiece andthe objective lens could be in differentrooms. High resolution video anddigital signals can now be transmittedaround the world with little loss ofimage quality. Compare direct viewing.8
repeatabildetectaprocesssource.
reserve viindividunder visual acuity conditvision individacuity.
residual ealloy inadded
resolutionpertainreprodresolviparallepair an
resolutiontest sysof indilocatedother i
resolutionor seriedetectesystem
resolutionbetweelines was two,of arc. the recexpress
resolving systemor distaon thedistancsurfacesystemparalle
robotic syprogramovemautoma
roentgen radiatioradiatioelectrostandarroentgSI comkilogra
root crackheat afweld.2
root penemetal e
RT: Radiog
ity: Ability to reproduce able indication in separateings and tests from a constant1,2
sion acuity: Ability of anual to maintain vision acuitypoor viewing conditions. Asystem with 20/20 near visionunder degraded viewingions has considerable reserveacuity compared to that of anual with 20/70 near vision
8
lements: Elements present in an small quantities, but not
intentionally.2: Aspect of image qualitying to a system’s ability touce objects, often measured byng a pair of adjacent objects orl lines. See also minimum lined resolving power.8, discontinuity: Property of atem that enables the separationcations due to discontinuities in close proximity to eachn a test object.2 test: Procedure wherein a lines of lines or line pairs ared to verify or evaluate a’s sensitivity.8 threshold: Minimum distancen a pair of points or parallelhen they can be distinguished not one, expressed in minutesVision acuity in such a case isiprocal of one half of the perioded in minutes.8,17
power: Ability of detections to separate two points in timence. Resolving power depends
angle of vision and thee of the sensor from the test. Resolving power in visions is often measured usingl lines. Compare resolution.8stem: Automated systemmmed to perform purposefulents in variable sequences.8 Seeted system.(R): Unit for measurement ofn intensity; amount ofn that will generate one
static unit in 1 cm–3 of air atd atmospheric conditions. Theen (R) has been replaced by anpound unit, coulomb perm (C·kg–1).: Crack in either the weld orfected zone at the root of a
tration: Depth to which weldxtends into the root of a joint.2
raphic testing.

6
3RT23 LAYOUT(653_674) 10/3/02 1:42 PM Page 670
S
salvage tests: Testing after salvageoperations or testing objects that canbe repaired.2
sampling, partial: Testing of less thanone hundred percent of a productionlot. See also one hundred percenttesting.8
sampling, random partial: Partialsampling that is fully random.8
sampling, specified partial: Partialsampling in which a particularfrequency or sequence of sampleselection is prescribed. An example ofspecified partial sampling is the testingof every fifth unit.8
scattering: Random reflection andrefraction of radiation caused byinteraction with material it strikes orpenetrates.
scintillation: Emission of light of specificfrequencies after the absorption ofelectromagnetic radiation, such asX-rays or gamma rays.
scintillation detector: Radiationmeasuring device based on use of ascintillating material.
scrap: (1) Manufactured materials notsuitable for intended use.(2) Discarded metallic material thatmay be reclaimed through meltingand refining.3
seam: (1) On the surface of metal, anunwelded fold or lap that appears as acrack, usually resulting from adiscontinuity obtained in casting orworking. (2) Mechanical or weldedjoints.3 (3) Longitudinal surfacediscontinuity on metal originatingfrom a surface crack or blowhole nearthe surface of the ingot, that is drawnout during rolling and follows therolling direction. Also due to overfillwhile rolling. After forging, seamsgenerally follow the direction of flowlines.2
seeability: Characteristic of an indicationthat enables an observer to see itagainst the adverse conditions ofbackground, outside light and others.2
segregation: Nonuniform distribution ofalloying elements, impurities ormicrophases.2,3
selectivity: Characteristic of a test systemthat is a measure of the extent towhich an instrument can distinguishthe desired signal from disturbances ofother frequencies or phases.4,13
sensitivity: Measure of a sensor’s abilityto detect small signals. Limited by thesignal-to-noise ratio.7
sensitization: Condition of exposed silverhalide emulsion in radiographic filmbefore development.
sensor, Xdeviceand prionizinX-ray and eldetect
shallow dopen tthat ppropoopeninshallo
shieldingreducepenetr
shrink: Incastingcoolinin soliInclud(stringpatternapplie
shrink mcastinga thickthan a
shrinkagecausedmetal
shrinkagewith s
shrinkagemetal cracksmoltenlocalizpenetr
SI: Internmeasuof meameterkelvinand m
sievert (Sexposureplac1 Sv =
signal: Reinform
signal elefilm ofaceplalayer d
signal proanalysdigital
signal-to-valuesinform(respoinform
slag: Nonthe mnonmrefinin
70 Radiographic Testing
-ray: In radiographic testing, or material that changes withovides evidence of contact withg radiation. Examples include
film, X-ray sensitive phosphorsectronic devices such as linearor arrays. See detector, X-ray.iscontinuity: Discontinuityo the surface of a solid objectossesses little depth inrtion to the width of thisg. Scratch or nick may be a
w discontinuity in this sense.2: Material or object used to intensity of or exposure toating radiation.ternal rupture occurring ins due to contraction during
g, usually caused by variationsdification rates in the mold.es shrinkage sponge, small voidsers or bunches) or a fingerprint of semifused seams. Also
d to surface shrinkage cracks.2,6
ark: Surface depression on a that sometimes occurs next to section that cools more slowlydjacent sections.3 cavities: Cavities in castings by lack of sufficient moltenas the casting cools.2,3
cracks: Hot tears associatedhrinkage cavities.2,3
porosity or sponge: Porousoften with a network of fine formed during solidification of metal. At surface, may form a
ed, lacy or honeycombedant indication.2ational System of units ofrement. An international systemsurement based on seven units:(m), kilogram (kg), second (s),(K), ampere (A), candela (cd)ole (mol). See also MKSA.4,14
v): SI unit for measurement ofre to ionizing radiation,
ing rem.1 J·kg–1 = 100 rem.sponse containing relevantation.4,13
ctrode: Transparent conductingn the inner surface of a vidicon’ste and a thin photoconductiveeposited on the film.8cessing: Acquisition, storage,
is, alteration and output of data through a computer.8noise ratio: Ratio of signal (responses that contain relevantation) to baseline noise values
nses that contain nonrelevantation). See noise.4,7,13
metallic product resulting fromutual dissolution of flux andetallic impurities in smelting,g and welding operations.3

3RT23 LAYOUT(653_674) 10/3/02 1:42 PM Page 671
slag inclusions: Nonmetallic solidmaterial entrapped in weld metal orbetween weld metal and base metal.2,3
slag lines: Elongated cavities containingslag or other foreign matter in fusionwelds.2,3
SNT-TC-1A: See ASNT RecommendedPractice No. SNT-TC-1A.
source: Machine or material from whichionizing radiation emanates.
spalling: Cracking or flaking of smallparticles of metal, usually in thinlayers, from the surface of an object.2
spatial resolution: Width of smallestregion from which reliable data can beextracted.9
specific examination: In certification ofnondestructive testing personnel, awritten examination that addresses thespecifications and products pertinentto the application. Compare generalexamination and practical examination.8
specification: Set of instructions orstandards to govern the results orperformance of a specific set of tasksor products.8
spectral power distribution: Radiantpower per unit wavelength as afunction of wavelength. Also knownas spectral energy distribution, spectraldensity and spectral distribution.8
spectral reflectance: Radiant fluxreflected from a material divided bythe incident radiant flux.8
spectral transmittance: Radiant fluxpassing through a medium divided bythe incident radiant flux.8
spectrophotometer: Instrument used forspectrophotometry.8
spectrophotometry: Measurement of theluminance or illuminance producedby electromagnetic radiation as afunction of wavelength.
spectroradiometer: Instrument used forspectroradiometry.8
spectroradiometry: Measurement ofelectromagnetic radiant power andspectral emittance, used particularly toexamine colors and to measure thespectral emittance of light sources.8
spectroscope: Instrument used forspectroscopy.8
spectroscopy: Spectrophotometry orspectroradiometry in which thespectrum, rather than being analyzedonly by a processing unit, is presentedin a visible form to the operator fororganoleptic examination.8
spectrum: (1) Amplitude distribution offrequencies in a signal.7(2) Representation of radiant energy inadjacent bands of hues in sequenceaccording to the energy’s wavelengthsor frequencies. A rainbow is a wellknown example of a visible spectrum.8
spectrum response: Amplification (gain)of a receiver over a range offrequencies.7
speed of ligenergy, i108 m·s–1
186 000 materialswith thewhich its
speed of visdurationfor some
spot check tobjects frlot’s quachosen apercent. accurate
spot examinwelds or
standard: (1material for compcalibratioauthorityserve as ameasuremestablishprocedurand goveapplicatiinternatiproducedacceptancand refer
standard atStandardAtmosph(14.695920 °C (29The denscondition(0.07517
steel: Iron atwo perc
Stefan-Boltzgoverninindependradiant erelates ththe fourttemperatmaterial intensityblock at (95 BTUconstant1.52041
step wedge:stepped wed
steps of vrange of the radiohaving thcomplexwedge mradiograpradiograpinclude pcalibrate
ht: Speed of all radiantncluding light, is 2.997925 ×
in vacuum (approximatelymi·s–1). In all transparent the speed is less and varies material’s index of refraction,elf varies with wavelength.8,17
ion: Reciprocal of the of the exposure time requiredthing to be seen.8,17
ests: Testing a number ofom a lot to determine the
lity, the sample size beingrbitrarily, such as five or tenThis does not provideassurance of the lot’s quality.2ation: Local examination ofcastings.2) Physical object with knowncharacteristics used as a basisarison, specification orn. (2) Concept established by, custom or agreement to model or rule in theent of quantity or the
ment of a practice ore.7,12 (3) Document to controlrn practices in an industry oron, applied on a national oronal basis and usually by consensus. See alsoe standard, working standardence standard.4,8,13
mospheric conditions: temperature and pressure.eric pressure of 101.325 kPalbf·in.–2). Temperature of3.15 K, 68 °F or 527.67 °R).ity of dry air at theses is 1.2041 kg·m–3
lbm·ft–3).1lloy, usually with less thanent carbon.8mann law: Relationshipg the wavelengthent rate of emission ofnergy per unit area. The lawe total radiation intensity toh power of absoluteure and emissivity of thesurface. For example, (heat flow) from a copper100 °C (212 °F) is 300 W·m–2
·ft–2·h–1). (Stefan-Boltzmann for photon emission =× 1015 photon·s–1·m–2·K–2.)9
Stepped wedge.ge: Reference object, witharious thicknesses in thetested parts’ thicknesses, forgraphic testing of partsickness variations or
geometries. The steppedust be made of materialhically similar to that of thehic test object and mayenetrametric features (such as
d holes) in any or all steps.
671Radiographic Testing Glossary

6
3RT23 LAYOUT(653_674) 10/3/02 1:42 PM Page 672
stereo imaging: Imaging techniqueinvolving the capture and display oftwo images of the same object fromdifferent angles. Binocular viewingsimultaneously of the two imagessimulates a three-dimensional viewing.
stereo radiography: Radiographic testingusing stereo imaging.
strain: Alteration of the shape of amaterial by external forces.
stress: (1) In physics, the force in amaterial that resists external forcessuch as tension and compression.(2) Force per unit area.8
stress corrosion cracking: Failure bycracking under combined action ofcorrosion and stress, either applied orresidual. Cracking may be eitherintergranular or transgranular,depending on the metal and corrosivemedium.2
stress raiser: Contour or property changethat causes local concentration ofstress.8
stress riser: See stress raiser.stringer: In wrought materials, an
elongated configuration ofmicroconstituents or foreign materialaligned in the direction of working.Commonly, the term is associatedwith elongated oxide or sulfideinclusions in steel.2
strobe: Of or pertaining to irradiation orlighting that flashes intermittently at arate that may be adjusted, that is oftenperceived as a flicker and that is usedto image moving objects or stillobjects with potential movement.8
structural integrity test (SIT): Test thatdemonstrates the capability of a vesselto withstand specified internalpressure loads. Proof test.
subcase fatigue: Fatigue originating belowthe case depth. Compare case crushing.Also called spalling fatigue.8
subcase origin fatigue: See subcasefatigue.
substrate: Layer of metal underlying acoating, regardless of whether thelayer is base metal.2
subsurface discontinuity: Anydiscontinuity that does not extendthrough the surface of the object inwhich it exists.2 See near surfacediscontinuity.
subsurface fatigue: Fatigue cracking thatoriginates below the surface. Usuallyassociated with hard surfaced or shotpeened parts but may occur anytimesubsurface stresses exceed surfacestresses.8suppression: See reject.
survey meter: Portable instrument thatmeasures rate of exposure dose orionizing radiation intensity.11
Sv: Sievert.
T
test piece: Ptest qualitytest surface
object.2,
thermolummeasurinmaterialirradiatimeasurematerial
threshold: Sresolution
threshold lthat cauchangesthan a s
thresholdintechniquimage in(2) Filterselected
throat, acturoot of aopposedsize.8
throat, theobeginninperpendthe largeinscribedthe fillet
throat, welfillet wesize and
toe crack: Bweld.2
tolerance: Pvariationstandard
tool mark:made bymanufacCompar
trace: Line scanningscreen to
tungsten inresultingparticleswelding
tungsten intungsten
U
underbead base mezone.2
undercut: Ugroove lcreated blocated iweld.2,8
72 Radiographic Testing
art subjected to testing. level: See level, rejection.: Exposed surface of a test7
inescent dosimetry: Means ofg radiation dose by using a
that stores energy due toon, which energy can bed as light emission when the is heated.ee adaptive thresholding, threshold and threshold level.
evel: Setting of an instrumentses it to register only those in response greater or lesspecified magnitude.4,13
g: (1) Digital data processinge that reduces a gray levelto a binary image.8ing out signals below aenergy or amplitude.al: Shortest distance from the fillet weld to its face, as to theoretical throat or weld
retical: Distance from theg of the root of the weld
icular to the hypotenuse ofst right triangle that can be within the cross section of weld. Compare weld size.8d: Distance from the root of ald to its face. Compare weld throat, actual.8ase metal crack at the toe of a
ermissible deviation or from exact dimensions ors.2Shallow indentation or groove the movement ofturing tools over a surface.e gouge or nick.8formed by an electron beam from left to right on a video generate a picture.8clusions: Inclusions in welds from solidified droplets, or splinters of tungsten from electrodes.2ert gas (TIG) welding: See gasarc welding.
crack: Subsurface crack in thetal adjacent to the weld fusion
ndesirable depression oreft unfilled by weld metal,y melting during welding andn base material at the toe of a

673Radiographic Testing Glossary
3RT23 LAYOUT(653_674) 10/3/02 1:42 PM Page 673
undercut, film: Scattering phenomenonin X-ray film where the edges of ahigh contrast feature are blurred.
unit die: Die block that contains severalcavity inserts for making differentkinds of die castings.3
unsharpness, geometric: Fuzziness orlack of definition in a radiographicimage resulting from the source size,object-to-film distance and the source-to-object distance.11
upper confidence limit: Calculated valueconstructed from sample data with theintention of placing a statistical upperboundary on a true leakage rate.1
V
video: Pertaining to the transmission anddisplay of images in an electronicformat that can be displayed on ascreen.8
video presentation: Electronic screenpresentation in which radiofrequencysignals have been rectified and usuallyfiltered.7,12
vidicon tube: Television tube that usesthe photoconduction method. Compareimage orthicon.8
visible light: Radiant energy in the 400 to700 nm wavelength range.6
vision acuity: Ability to distinguish finedetails visually. Quantitatively, it is thereciprocal of the minimum angularseparation in minutes of two lines ofwidth subtending one minute of arcwhen the lines are just resolvable asseparate.8
voids: Hollow volumes, depressions orcavities. See also discontinuity anddislocation.8
W
weld bead: Deposit of filler metal from asingle welding pass.2
weld crack: Crack in weld metal.2weld line: Junction of the weld metal and
the base metal or the junction of basemetal parts when filler metal is notused.2
weld metal: That portion of a weld thathas been melted during welding.2
weld nugget: Weld metal in spot, seam orprojection welding.2
weld size: Thickness of weld metal — in afillet weld the distance from the rootto the toe of the largest isosceles righttriangle that can be inscribed in across section of the weld.8
weld throat: See throat, weld.working standard: Work piece or energy
source calibrated and used in place ofexpensive reference standards. In thecalibrating of photometers, thestandard would be a light source.8
worm holesdue to enpipes.2
X
X-ray: Peneradiationorbital eexcited anonisotoby bombhigh speelectrons
X-ray diffratesting tcharactescatterininteractidiffractio
X-ray fluoretesting tcharactewavelengmaterial
XRD: X-ray XRF: X-ray f
Z
zircon sandused as afor drilleirregularscatterin
: Elongated or tubular cavitiestrapped gas. Also called
trating electromagnetic emitted when the inner
lectrons of an atom arend release energy. Radiation ispic in origin and is generatedarding a metallic target withed charged particles, usually.ction (XRD): Radiographicechnique used for materialrization, based on change ing of X-radiation as a result ofon with test material. See alson.scence (XRF): Radiographic
echnique used for materialrization, based onths of fluorescence from
irradiated by X-rays.diffraction.luorescence.
: Highly absorptive material blocking or masking mediumd holes, slots and highly geometries to reduceg during radiography.3

1. Nondestructive Testing Handbook, thirdedition: Vol. 1, Leak Testing.Columbus, OH: American Society forNondestructive Testing (1998).
2. Nondestructive Testing Handbook, thirdedition: Vol. 2, Liquid Penetrant Testing.Columbus, OH: American Society forNondestructive Testing (1999).
3. Nondestructive Testing Handbook,second edition: Vol. 3, Radiography andRadiation Testing. Columbus, OH:American Society for NondestructiveTesting (1985).
4. Nondestructive Testing Handbook,second edition: Vol. 4, ElectromagneticTesting. Columbus, OH: AmericanSociety for Nondestructive Testing(1986).
5. Nondestructive Testing Handbook,second edition: Vol. 5, AcousticEmission Testing. Columbus, OH:American Society for NondestructiveTesting (1987).
6. Nondestructive Testing Handbook,second edition: Vol. 6, Magnetic ParticleTesting. Columbus, OH: AmericanSociety for Nondestructive Testing(1989).
7. Nondestructive Testing Handbook,second edition: Vol. 7, UltrasonicTesting. Columbus, OH: AmericanSociety for Nondestructive Testing(1991).
8. Nondestructive Testing Handbook,second edition: Vol. 8, Visual andOptical Testing. Columbus, OH:American Society for NondestructiveTesting (1993).
9. Nondestructive Testing Handbook,second edition: Vol. 9, SpecialNondestructive Testing Methods.Columbus, OH: American Society forNondestructive Testing (1995).
10. Nondestructive Testing Handbook,second edition: Vol. 10, NondestructiveTesting Overview. Columbus, OH:American Society for NondestructiveTesting (1996).
11. NDT Terminology. Wilmington, DE: E.I.du Pont de Nemours & Company,Photo Products Department (n.d.).
12. Nondestructive Testing Methods.TO33B-1-1 (NAVAIR 01-1A-16)TM43-0103. Washington, DC:Department of Defense, United StatesAir Force (June 1984): p 1.25.
13. E 268-81, Definitions Approved for Useby Agencies of the Department of Defenseas Part of Federal Test Method StandardNo. 151b and for Listing in the DoDIndex of Specifications and Standards.Philadelphia, PA: American Society forTesting and Materials (1981).
14. IEEE Standard Dictionary of Electricaland Electronic Terms. New York, NY:Institute of Electrical and ElectronicsEngineers, distributed byWiley-Interscience, a division of JohnWiley and Sons (1984).
15. EPRI Learning Modules. Charlotte, NC:Electric Power Research Institute(various years).
16. 1992 Annual Book of ASTM Standards.Section 3, Metals Test Methods andAnalytical Procedures: Vol. 03.03,Nondestructive Testing. Philadelphia,PA: ASTM International (1992).
17. IES Lighting Handbook: ReferenceVolume. New York, NY: IlluminatingEngineering Society of North America(1984).
674 Radiographic Testing
References
3RT23 LAYOUT(653_674) 10/3/02 1:42 PM Page 674

Users of the CD-ROM version of this book are urged to read its instructionsand take advantage of its search function, a powerful indexing tool that can,with a single command, provide access to all occurrences of a given wordthroughout the entire book. The following printed index is necessarily moreselective.
Page references in italic type indicate illustrations. Page references followedby table indicate material in tables.
Readers are encouraged to consult this volume’s glossary: glossary entriesare not entered in the index.
AA 4907. See Korean Standards AssociationA 4921. See Korean Standards Associationablative thrust chamber radiography, 552-555absorbed dose, 119absorbers, 49, 131absorption
alpha particles, 45beta particles, 45and film radiography, 152-153neutrons, 45-47and photoelectric effect, 48-49X-rays, 57-58
absorption analysis, 427absorption edge densitometry, 573absorption edges, 49, 611
selected elements, 612-651tableaccelerator neutron sources, 53, 442-443
safety aspects, 134See also linear accelerators
acceptance criteria, 14castings, 465-466nuclear fuel rods, 530power and process piping, 516welds, 489-490See also reference standards
acid stop bath, 234acoustic emission testing, 10, 10-11acoustic methods, 11Acropolis, gamma radiography, 595acrylic, hounsfield value, 314tableactinium series, 52activation foils, 104-105activator, in film development, 234adhesive bonded composite structures, 557, 559, 559-560
adhesives, X-ray absorption, 552, 553aerospace applications, 543-544
advanced material techniques, 559-565aviation component radiography, 544-549inspection with thulium-170, 78simulation tools, 564space flight component radiography, 550-558
Aerospace Material Specification (AMS). See SAE Internationalafterglow, 293agreement states, 114, 117-118air
hounsfield value, 314tablemass attenuation coefficient, 611
air bells, 205
aircraftbackscatter imaging of aluminum skin, 390backscatter imaging of corrosion, 396-397brazed honeycomb structures, 547, 547-548, 549corrosion detection using reversed beam scanning, 416-418, 417dynamic neutron radioscopy of engines, 446fatigue cracking of fuselage, 3flight test inspection, 545-547, 547helicopter composite rotor/propeller blades, 548-549panel neutron radiography, 439radioscopic imaging, 254residual stress measurement, 429wing crack detection using reversed beam scanning, 415-416, 416See also jet engine turbine blades
air image, 293airport security screening, 588, 588-590, 589ALARA (As Low As Reasonably Achievable) dose, 120, 133alarming rate meters, 98-99alarm signals, 127alloy castings, 459. See also castingsalloy identification, 590
by energy dispersive spectrometry, 431alpha case, 558alpha particles
absorption by matter, 45discovery, 38emission, 43
Altarpiece of the Mystic Lamb (Van Eyck), radiographic evaluation, 600aluminum
adhesive bonded composite structures, 557attenuation coefficients, 383, 619tableaviation component radiography, 544backscatter imaging of aircraft skin, 390backscatter tomography of sheets, rivets and pellets, 392-393, 393casting density versus radiographic sources, 460tablecold shuts in castings, 463contrast sensitivity phantom, 333digital radiography of tube welds, 297dimensional measurement phantoms, 338exfoliate corrosion, 396false radiographic indications in welds, 507-509, 508gas cavities in welds, 496honeycomb panel neutron radiography, 439hounsfield value, 314tableimage analysis of casting, 358inclusions in castings, 463incomplete penetration in welds, 496inspection with thulium-170, 78lack of fusion in welds, 497lead foil screens for, 159maximum filter thickness, 157microfocus radioscopy of aircraft honeycomb, 408porosity in castings, 461, 462radiation gaging, 576radiographic equivalence factors, 153tableradiological detection and identification, 590scattered radiation, 153shrinkage in castings, 462step wedge image analysis, 364-365tungsten inclusions in welds, 480X-ray and thermal neutron attenuation, 440table
Index
3RT_Index(675_692) 10/3/02 1:38 PM Page 675

aluminum bronze, casting density versus radiographic sources, 460tableambient dose equivalent, 32, 119American National Standards Institute (ANSI)
ANSI/API Recommended Practice 1104, 516ANSI/ASME B31.1, 17tableANSI/ASME B31.3, 17tableANSI/ASNT CP-189, 15, 17tableANSI N43.9-1991, 17tableANSI PH2.8-1975, 17tableANSI film standards bibliography, 251ANSI Type I exposure devices, 79, 80, 80-83ANSI Type II exposure devices, 83, 83-84, 84
American Petroleum Institute (API)API 510, 17tableAPI 570, 17tableAPI 650, 17table, 489, 528API 653, 529API 1104, 17table, 489, 516, 516
American Society for Nondestructive Testing (ASNT)ASNT Central Certification Program (ACCP), 15ASNT Recommended Practice No. SNT-TC-1A, 15, 17table, 18history of, 26-27Industrial Radiography Radiation Safety Personnel (IRRSP)
program, 117-118American Society for Testing and Materials (ASTM). See ASTM InternationalAmerican Society of Mechanical Engineers. See ASME Boiler and Pressure
Vessel CodeAmerican Welding Society (AWS)
AWS D1.1, 17table, 479, 481, 489AWS D14.3/D14.3M, 489
amorphous selenium detectorsfor digital radiography, 284, 287, 290-291, 298, 298discontinuity centers, 293for microfocus radiography, 404properties, 286table
amorphous silicon detectorscalibration, 356for digital radiography, 284, 287, 290, 294, 296, 296-298, 297for microfocus radiography, 404, 407properties, 286tablefor radioscopy, 279
AMS (Aerospace Material Specification). See SAE Internationalannihilation, 45
and pair production, 50anode grounded circuit, 65anodes, 57
X-ray tubes, 61, 61-62, 63, 63ANSI. See American National Standards Instituteantimony, attenuation coefficients, 640tableantiparticles, 39API. See American Petroleum InstituteApollo booster engine, 556archaeology applications, 596archival storage of film, 178, 243arc strikes
castings, 464welds, 481, 499, 499
arc weldingflash radiography, 412-413radioscopy, 502, 502-506, 503, 504
area detectors, image digitization, 350area monitoring, 123, 125, 127area viewers, 191argon, attenuation coefficients, 621tableartifacts. See radiographic artifactsartillery shells, 21
backscatter imaging, 380, 395scanning microdensitometry of fuses, 197
art radiography, 598-601ASME Boiler and Pressure Vessel Code, 17table
butt joints, 483castings acceptance criteria, 466and image quality indicators (penetrameters), 174lap joints, 484lead foil screens, 487nuclear pressure vessels, 527power and process piping, 517, 518pressure vessels, 526tanks, 529weld acceptance criteria, 489
ASNT. See American Society for Nondestructive Testing
asphalt radiography, 591ASTM International (formerly American Society for Testing and Materials).
ASTM C 638, 16tableASTM E 94, 16table, 488, 589ASTM E 142, 485, 589ASTM E 155, 16tableASTM E 170, 16tableASTM E 186, 16tableASTM E 192, 16tableASTM E 242, 16tableASTM E 272, 16tableASTM E 280, 16tableASTM E 310, 16table, 468ASTM E 390, 16table, 464ASTM E 431, 16tableASTM E 446, 16tableASTM E 505, 16tableASTM E 592, 16tableASTM E 666, 16tableASTM E 689, 16tableASTM E 746, 16tableASTM E 747, 16table, 174, 175, 516, 518ASTM E 748, 16tableASTM E 802, 16tableASTM E 803, 16table, 441ASTM E 975, 16tableASTM E 999, 16tableASTM E 1000, 16tableASTM E 1025, 16table, 173, 175, 485, 516, 516, 517, 518ASTM E 1030, 16tableASTM E 1032, 16table, 589ASTM E 1114, 16tableASTM E 1161, 16tableASTM E 1165, 16tableASTM E 1254, 16table, 178ASTM E 1255, 16tableASTM E 1320, 16tableASTM E 1390, 16tableASTM E 1411, 16tableASTM E 1441, 16tableASTM E 1453, 16tableASTM E 1475, 16tableASTM E 1496, 16tableASTM E 1570, 16tableASTM E 1647, 16tableASTM E 1648, 16tableASTM E 1672, 16tableASTM E 1734, 16tableASTM E 1735, 16tableASTM E 1742, 16table, 486, 489ASTM E 1814, 16tableASTM E 1815, 16table, 228ASTM E 1894, 16tableASTM E 1931, 16tableASTM E 1936, 16tableASTM E 1955, 16tableASTM E 2002, 16tableASTM E 2033, 16tableASTM E 2104, 486, 489ASTM E 2116, 16tableASTM F 629, 16tableASTM F 947, 16tableASTM F 1035, 16tableCommittee E-7 on Nondestructive Testing, 27image quality indicators (penetrameters). See image quality indicatorsinternational standards, 15, 16tableISO versus ASTM film classifications, 228tablestandards for metal castings, 460test standards, 15, 16table
atomic attenuation coefficientdefined, 50, 610selected elements, 612-651table
atomic mass unit, 31atomic number, 39atomic structure, 38-41, 57atomic weight (relative atomic mass), 610-611attenuation, 44-45, 48-51
gaging, 570-571and image analysis, 347See also absorption; scattering
676 Radiographic Testing
3RT_Index(675_692) 10/3/02 1:38 PM Page 676

attenuation coefficientsdefined, 50-51, 610-611gamma attenuation with and without scatter, 51neutrons, 440table, 447tableselected elements, 612-651table
audit, of radiation safety procedures, 115-117automatic defect recognition, 406-407
image analysis, 371-374automotive applications
assembly line radioscopy, 278digital radiography, 300radioscopic security inspection of truck, 589, 590spark plug microfocus radioscopy, 407tire radiation gaging, 577wheel radioscopy, 279
aviation component radiography, 544-549. See also aircraftAWS. See American Welding Society
Bbackground scatter, 348backscattered radiation, 154, 154backscatter imaging, 28
applications, 395-399multiaperture collimator, 388principles, 379-387for radiation gaging, 392, 573reconstruction and image processing techniques, 392-394sensitivity, 393-394techniques, 388-391
backscatter tomography, 392badge plants, 133badges
body, 103film, 108, 121-122
bad pixels, 357baggage scanners, 588-590ball grid arrays
image analysis, 356-357, 357, 361, 362solder joints, 579
barium, attenuation coefficients, 643tablebarium clay diaphragms, 155barium fluorobromide, europium activated, 287, 294barrels, digital radiography of contents, 300barriers, 127baseball bat radiography, 587battery flashlight computed tomography, 327battery powered densitometer, 194
beam focusing, X-ray tubes, 60-61beam hardening
and computed tomography, 336and image analysis, 349, 360, 365, 392-393
becquerel (Bq), 31, 42, 119Belle (ship), radiography of artifacts, 596-597beryllium
attenuation coefficients, 613tablegrid diaphragms for radiography of, 157neutron attenuation coefficients, 447table
beta disintegration, 46beta particles
absorption by matter, 45discovery, 38emission, 43-44maximum range versus energy, 131See also electrons
betatron generator, 69betatrons, 68, 68-69
for nuclear vessel radiography, 526bismuth germanate, 100table, 260tablebitmapped graphics, 276tableblob analysis, 362, 372blowholes
interpretation in castings, 214, 214interpretation in welds, 501
body badges, 103body scan tomography. See laminographybohr atom, 38, 39-41, 40Boiler and Pressure Vessel Code. See ASME Boiler and Pressure Vessel Codeboilers, 514
effect of discontinuities, 3boiling water reactor radiography, 526, 526-527
bonehounsfield value, 314tableradiography, 596
boronattenuation coefficients, 557capture cross section, 47table
boron fiber compositesattenuation in adhesive bonded, 557backscatter imaging, 390
boron trifluoride neutron detector tubes, 104, 122, 123bouwers-schmidt lenses, 271Boy with Still Life (Baum), radiographic evaluation, 600, 601, 601branching, 43brass
inspection with cobalt-60, 75radiographic equivalence factors, 152, 153table
brass filters, 156brazed honeycomb structures, 547, 547-548, 549brazing, automatic defect recognition, 406bremsstrahlung, 44, 56-57bridge radiography, 591, 592, 596bridge wire igniter, 447bridge wire squid, 438broad beam shielding, 133bronze
casting density versus radiographic sources, 460tabletensile property relation to radiographic indications, 465table
brumlein line generators, 411building materials, density of selected commercial, 133tablebuilding radiography, 593
historic buildings, 594-596burnthrough, interpretation in welds, 211, 211butt joints, 475, 475-476
exposure setup, 483-484in-process radioscopy of arc-welded, 502, 506
Ccable radiography, 537cadmium
attenuation coefficients, 638tablecapture cross section, 47tableneutron absorption by, 47X-ray and thermal neutron attenuation, 440table
cadmium tungstate, properties, 260tablecalcium, attenuation coefficients, 622tablecalcium fluoride, europium-activated
properties, 260tablefor radiation gaging, 575
calcium tungstateproperties, 257tablerelative light yield, 257tablespectral emission, 258
calibrationdensitometers, 194-195low level transforms, 356-359radiation detection instruments, 126
californium-252, 104for neutron radiography, 443-445, 444spontaneous fission, 44
californium-252 exposure devices, 134Caligula statue radiography, 598, 599, 599Canadian General Standards Board
CAN/CGSB-48.3-92, 17tableCAN/CGSB-48.5-95, 17tableCAN/CGSB-48.9712-95, 17tableCAN/CGSB-48-GP-2M, 17table
capacitor microfocus radiography, 407Cape Hatteras Lighthouse, radiographic testing of gallery, 595, 595Capitol building, radiographic testing of walls, 595capping, 319carbon
attenuation coefficients, 614tablehounsfield value, 314table
carbon-to-carbon composites, computed tomography, 335cargo transport, digital radiography application, 300
677Index
3RT_Index(675_692) 10/3/02 1:38 PM Page 677

castings, 453-454aerospace components, 556, 558computed tomography of turbine blades, 326flash radiography, 412, 412-413image analysis of aluminum, 358interpretation of discontinuities, 213-217interpretation report, 201radiographic indications, 461-464radiographic techniques for, 455-460radiographic testing and process scheduling, 465-466, 467-468radiographic testing problems, 467-468repair welds, 464, 465
cast iron, 459Cape Hatteras Lighthouse, 595casting density versus radiographic sources, 460table
cathode grounded circuit, 65cathode rays, 21cathodes, 57
X-ray tubes, 60cavity shrinkage, 461-462cellulose radiography, 586CEN 584, 17tablecenter grounded circuit, 65centimeter-gram-second (CGS) units, 29certification. See personnel qualification and certificationcesium, attenuation coefficients, 642tablecesium-137, 53, 74table, 75-76
attenuation by fuel rods, 533bibliography, 86disintegration, 76gamma ray source, 128tablegamma ray transmission through lead and concrete, 131gamma spectra, 75half value thickness, 51tablesource for castings, 455table
cesium iodide scintillators, 266in digital radiography, 289, 297discontinuity centers, 293properties, 257table, 260tablespectral emission, 258
channel electron multipliers, 266-267characteristic curve, 167, 167-169, 222, 224, 223-227, 242-243
gamma, 232, 233, 243intensifying salt screen exposed, 243of films exposed with lead foil screens, 169typical industrial film, 224, 225characteristic X-rays, 44, 57
charge coupled devices, 269for digital radiography, 294, 298, 298-300for film digitization systems, 180-181intensified, 271, 279properties, 286tablefor radioscopy, 269-271sensitivity compared to vidicons, 270
chemical industry applications. See utility, petroleum and chemical industryapplications
chemical spot testing, 11chemical streaks, 204, 204chill inserts, 463chloride contamination detection, in roads, 591-592chlorine, capture cross section, 47tablechromium, attenuation coefficients, 625tablechromium-51, gamma ray source, 128tablecigarette radiation gaging, 573, 577, 586cinefluorography, rocket engines, 554, 554-555civil structure radiography, 591, 592-593clustered porosity
interpretation in welds, 498welds, 478
coarse scattered porosity, in steel welds, 498coatings
backscatter imaging, 381thickness gaging, 571, 573, 576
cobaltattenuation coefficients, 628tablecapture cross section, 47table
cobalt-60, 52, 74table, 74-75attenuation with fuel rods, 533bibliography, 86-87disintegration, 75exposure devices, 82, 82-83gamma ray source, 128tablegamma ray transmission through lead and concrete, 131gamma spectra, 75half value thickness, 51tablefor nuclear vessel radiography, 526source for castings, 455tabletemporary field site versus permanent facility, 116
codes, 187-188, 489. See also ASME Boiler and Pressure Vessel Code; referencestandards
coherent scattering. See elastic scatteringcold cracks, interpretation in welds, 212cold neutrons, attenuation by selected elements, 447cold shuts, 463, 463
interpretation in castings, 216-217collimation
in computed tomography, 305and image analysis, 351in megavolt radiography, 158neutrons, 440in radioscopy, 262, 271
color conditioning, 240color lookup tables, 354, 354-356, 355, 359coloumb per kilogram (C*kg-1; replaces roentgen), 31-32, 119compact disk (CD) data storage, 275comparator, with etched glass reticle, 192comparator block, 521, 521-522composites
adhesive bonded, 557aviation component radiography, 547, 547-548backscatter imaging, 390, 397-398computed tomography, 335inspection with thulium-170, 78See also honeycomb structures
compound units, 32, 120compton scattering, 49, 347
attenuation coefficient, 610defined, 49, 380-382, 382for radiation gaging, 571-572for radiological material detection, 590
computed tomography, 28, 303-305aerospace components, 561-562, 562applications, 323-327back projection filtering, 314body scan method, 304capabilities, 323tablewith collimated fan beam and linear detector array, 305contrast, 316-317, 332-334contrast discrimination curves, 334data acquisition and reconstruction, 312effective aperture, 308fuel rods, 533-536imaging process, 346, 347, 349and material density, 334-335mechanical handling, 320principles of, 310-315probability distribution for feature detection, 332for radiation gaging, 573reference standards, 328-338resolution, 316-317shape inspectability versus conventional radiography, 325tablesource-object-detector configurations and effective beam widths, 316system design, 318-322, 321, 321tablesystem generations, 319system size versus cost, 322system size versus sensitivity to detail, 322tradeoffs in detectors, 351See also laminography; phantoms
concavity, in welds, 211, 212, 212concrete
backscatter imaging, 398-399gamma ray transmission through, 131and infrastructure radiography, 591, 591-592shielding equivalents, 132tableX-ray transmission under broad beam conditions, 133
concrete shooting booth, 130cone beam computed tomography, 320
678 Radiographic Testing
3RT_Index(675_692) 10/3/02 1:38 PM Page 678

Conference for Radiation Control Program Directors, 118confined space, 19consultants, 13consumer goods radiography, 584-587contrast detail dose curves, 328contrast discrimination curves, 329contrast sensitivity, 346, 348
computed tomography, 317, 332-334control strips, 242convexity (excessive penetration), in welds, 210-211convolution function, in computed tomography, 313-314Coolidge Award, 27copper
attenuation coefficients, 630tabledimensional analysis of pipe, 367-370, 367-370inspection with cobalt-60, 75radiographic equivalence factors, 153tableradiological detection and identification, 590segregation in castings, 217
copper diaphragms, 155copper filters, 156core shift, 463
interpretation in castings, 217, 217corner joints, 476, 477
exposure setup, 484, 484-485radiographic procedure, 495
corrosionbackscatter imaging of aircraft, 396-397backscatter imaging of pipelines, 397in power and process piping, 519-523reversed geometry scanning beam radiography of aircraft, 416-418, 417
cosmic radiography, 595-596cosmic rays, 39, 52cost benefit analysis, 13crack detection, 2, 5table, 6table
aircraft wings, using reversed beam scanning, 415-416, 416aviation components, 544backscatter imaging, 387first uses of radiography, 26interpretation in castings, 216, 216interpretation in welds, 212nuclear fuel rods, 530, 534steel welds, 491-495, 492visibility and image quality indicators (penetrameters), 175-176See also castings; discontinuities; welds
crackstypes in castings, 463types in welds, 480
crater cracks, 480interpretation in welds, 212
crimp marks, 177, 202, 202crookes tube, 21, 23cross sections, 46-47, 50
selected elements, 47table, 612-651tableSee also individual elements
crown (static mark), 240, 240cruise missile computed tomography, 326, 327crystals
latent image site, 221residual stresses, 428-429X-ray diffraction, 427-428, 428
cupping, 319curie (Ci), 31, 42, 119current mode detectors, 574, 575cyclotrons, 53, 443
Ddam radiography, 593, 596darkroom technique, 237debris formation and relocation, in nuclear fuel rods, 533-535decay constant, 42deexcitation, 100defects. See discontinuitiesdefect standard, 441definition, 170, 171
delaminationablative thrust chambers, 555surface mounted components, 582welds, 478, 480
delayed cracks, interpretation in welds, 212delay streaks, 205dendritic shrinkage, 461, 462dense inclusions, 208, 215, 215densitometers, 165, 194-198density
backscatter based estimation, 385, 398castings, versus radiographic sources, 460tableand computed tomography, 334-335limitations of radiographic testing, 12optical, of film, 141, 164-165, 190-198selected building materials, 133tableSee also radiation gaging
density phantoms, 335, 336dental work, microfocus radioscopy, 408Department of Transportation (United States)
concrete radiography research, 591pipeline radiography research, 517radioactive material transportation regulations, 118
depleted uranium shields, 132for ANSI Type I exposure devices, 81for ANSI Type II exposure devices, 83
depth profiling, 390-391, 392computed tomography, 311
detectors. See radiation detectorsdeuterium, 42Deutsche Industrie Norm (DIN) standards, 17table
for castings radiography, 458DIN 6814, 17tableDIN 6832-2, 17tableDIN 25430, 17tableDIN 54109, EN 462 P1 (DIN) and ASTM E 747, 174, 175, 183DIN 54115, 17tableDIN EN 444, 17tableDIN EN 12681, 17tableDIN EN 14096, 17tableimage quality indicators (penetrameters), 174, 175, 458for radioscopy, 277See also image quality indicators, wire type
Deutsche Institut für Normung. See Deutsche Industrie Norm (DIN) standardsdeveloper, 163, 241-242
faults from, 233tableMQ and PQ, 232and spotting artifacts, 204, 205
development. See film developmentdiaphragms, for reduction of scattering, 155
grid type, 157-158diffused p-n junction detector, 106-107, 107digital audio tape (DAT) data storage, 275digital fluoroscopy, aerospace structures, 562digital images, 349-351
colorizing, 354practical considerations, 351-352transform techniques, 356-366, 357tablevisual enhancement, 353-356See also computed tomography
digital laminography. See laminographydigital radiographic imaging, 283-284
detectors for, 284-288, 296-300, 351image contrast and signal statistics, 289-295imaging process, 346, 347, 349substitute for flash radiography, 410
digital transmission densitometer, 194digital video disk (DVD) data storage, 275, 276dimensional measurements
image analysis, 366-370phantoms for, 336-338, 337
DIN standards. See Deutsche Industrie Normdirectional dose equivalent, 32, 119direct reading dosimeters, 94dirt, radiographic artifacts caused by, 203, 205discontinuities
heat treatment effects, 465types in castings, 461-464types in welds, 478-481
679Index
3RT_Index(675_692) 10/3/02 1:38 PM Page 679

discontinuity detection, 2, 26, 5table, 6tabledepth detection using stereo radiography, 419-426and imaging method selection, 14interpretation for castings, 213-217interpretation for welds, 207-212limiting factors in detection, 12in pipelines, 517and radiographic sensitivity, 458-459reliability, 19-20visibility and image quality indicators (penetrameters), 175-176See also automatic defect recognition; castings; crack detection; welds
disintegration, 42disintegration rate, 119disposal, radioactive materials, 118distillation column radiography, 523dose. See radiation dosedosimeters, 121-122, 123
direct reading, 94energy dependence of response, 94performance specifications, 95table
DOT. See Department of Transportation (United States)double beam microdensitometry, 196dross, 461
interpretation in castings, 214-215drugs. See pharmaceuticalsdrying, of film, 230, 244dual energy techniques, 28dynamic neutron radioscopy, 446dynodes, 101dysprosium, capture cross section, 47table
Eeddy current testing, 8, 8-9edge joints, 477, 477
exposure setup, 485edge spread function
computed tomography, 329, 331, 332and image quality indicators (penetrameters), 277
effective apertures, 308elastic scattering
defined, 380neutrons, 46
electromagnetic radiation, 48-51electromagnetic spectrum, 48electron beam welding, flash radiography, 412-413electron capture, 44electronic components
image analysis, 359, 360laminography, 306radioscopy, 578-583, 584surface mounted, 582tantalum capacitor microfocus radiography, 407
electronic dosimeters, 122electronic quenching, in geiger-müller counters, 97electronic radiation sources, 55-58
generator construction, 59-66for high voltage radiography, 63, 63-66, 66for megavolt radiography, 67-70standards, 14
electronic radioscopy, 28electron linear accelerators, 69, 69-70, 70electrons
atomic structure, 38capture, 44and latent image formation, 108production from incident photon, 50radiation detection instruments, 123radiation protection measurement, 121-122See also beta particles
electronvolt, 31electrostatic generators, 67, 67-68, 68
elemental analysis, by X-ray fluorescence spectrometry, 429-431elementary particles, 38-41EN 12679, 17tableencapsulated isotope sources, 79, 79-80enclosed installations, 127-128energy conservation, 56energy dispersive spectrometry, 427, 429, 429
instrumentation for, 431energy levels, 40-41
epithermal neutron radiography, 447epithermal neutrons, 104tableequivalent dose, 32equivalent sensitivity of image quality indicator (penetrameter), 174-175erosion, of power and process piping, 519-523European wire image quality indicators (penetrameters), 174, 175europium, capture cross section, 47tableexaminations, for certification, 18excessive penetration (convexity), in welds, 210-211, 211excitation, 45exfoliate corrosion, 396explosives
aerospace, 557backscatter imaging, 381flash radiography, 410neutron radiography, 438, 447
exposure, 119, 243for castings, 459in film radiography, 139-151, 221-222, 231
exposure charts, 165-167exposure control, 127-129exposure devices
with crankout and tube guide, 81guide tube collimators for, 82isotope radiation sources, 77, 80, 80-84safety considerations, 116-117with source exchanger, 83
exposure factor, 149-150, 166
Ffabric radiation gaging, 577false indications, 202
aluminum alloy welds, 507-509, 508See also radiographic artifacts
faraday (unit of charge), 38fast neutron radiography, 447fast neutrons, 46, 104table
shielding, 134fatigue corrosion, 396feature space, 356females, radiation exposure, 120fermi distribution, 43fiber glass
attenuation in adhesive bonded composites, 557radiation gaging, 577
fiber optic scintillators, 290, 291, 298, 299fiber optic tapers, 299field emission, 410FIFO (first-in, first out) system, of film storage, 240filamentary shrinkage, 461, 462fillet welds, 476
on corner joints, 484exposure setup, 485
film badges, 121-122, 122film, radiographic
artifacts, 202base, 231contrast, 170, 171emulsion, 231graininess, 171-172, 227handling, 177
film developmentartifacts associated with, 204-205chemistry, 230-236, 231-234darkroom technique, 237equipment and practice, 238-240latent image, 108-109, 219-229, 230processing technique, 241-246silver recovery, 247-249
film digitization systemscharge coupled device, 180-181laser, 181
680 Radiographic Testing
3RT_Index(675_692) 10/3/02 1:38 PM Page 680

film radiographyabsorption and scattering, 152-158automatic processing, 233-234, 236, 245-246characteristic curve, 167, 167-169, 169, 222, 224-226equivalent exposure ratios, 168tableexposure, 139-151, 221-222, 222, 231exposure charts, 165, 165-167, 166film choice for castings, 458-459film choice for welds, 482-483film classification, 228tablefilm digitization, 180-182film handling and storage, 177-179, 240, 488image quality and detail visibility, 170-176industrial X-ray films, 163-169screens for, 154-155, 159-162sensitivity, 151source strength, distance and time relations, 147-149transmittance, opacity and density relationships, 162tableX-ray spectral sensitivity curve, 228
film scratchesafter processing, 206before processing, 202
film shipping, 177film speed, 226, 243-244
relative values, 226tableshifts in curve position with salt screens, 243
filmless radiography. See radioscopyfilters, 155-157
effect on X-ray intensity, 156final edge joints, 477fine scattered porosity, in steel welds, 498finger marks, 177, 204fingerprints, 204fire-on-position data acquisition, 320fission fragments, 53fission track counting systems, 122fixation, 230, 235fixer, 234-235, 244flashlight computed tomography, 327flash radiography, 28, 409-413
flash X-ray diffraction, 413flash X-ray tubes, 410-411, 411
flaws. See discontinuitiesFlemish art, radiographic evaluation, 600flickered imaged technique, 423-424, 424flight test aircraft inspection, 545-547fluid flow radiography, 524, 524-525fluorescence scattering, 381, 384fluorescent screens, 161-162, 162, 164
artifacts associated with dirt, 203, 205and graininess, 227for radioscopic imaging, 254, 256-259, 279
fluoroscopy, 254-255fluoroscope, 23, 24See also radioscopy
flying spot scanning, 389, 389-390focus cup, X-ray tubes, 60
fog, 203, 225and darkroom technique, 237, 238and development, 233
food radiography, 585, 585digital, 300
fossil radiography, 596fourier transforms
in backscatter imaging, 388, 392in computed tomography, 310, 314, 329, 332and image analysis, 348and modulation transfer function, 292
frame averaging, in imaging systems, 352freeman chain code algorithms, 356, 356, 363fuel injector image analysis, 355fuel rods/elements. See nuclear fuelfuture usefulness, and nondestructive testing, 2gadolinium, capture cross section, 47tablegadolinium oxysulfide, 266, 290
relative light yield, 257tablespectral emission, 258
gaging. See radiation gaginggain decrease, 293-294gamma (of characteristic curve), 232, 243
gamma versus temperature curve, 233
gamma ray attenuation gaging, 570, 570-571gamma radiography
audit procedures, 116-117backscatter imaging, 398bibliography, 85-88of buildings and structures, 594, 595, 597exposure charts, 167infrastructure applications, 591jet engine inspection, 552, 553and pulsed fast neutron analysis, 590See also isotope radiation sources
gamma rays, 38attenuation, 48-51attenuation with and without scatter, 51dissipation in matter, 152dosage, 455-456as electromagnetic radiation, 48emission, 44, 142exposure control installations, 127-128exposure factor, 150and ionization, 91radiation damage from, 293-294radiation detection instruments, 123, 124, 125radiation protection measurement, 121-122radiographic equivalence factors, 153tabletransmission through concrete, 131transmission through lead, 131
gamma ray sourcesbibliography, 86-88for castings, 455-456output, 128table, 129shielding equivalents, 132tableskyshine from, 131for welds, 482
gas discharge tubes, 410gas filled detectors, for radiation gaging, 574gas ionization detectors, 91-99gaskets, neutron radiography, 438gas void porosity
castings, 454, 461, 462interpretation in castings, 214, 214, 468interpretation in welds, 496welds, 478
geiger-müller counters, 97, 125described, 96-99energy response curves, 98quenching in, 97for radiation gaging, 574resolving time, 96
Gemini space vehicle, 552, 553geometric enlargement, 146, 147geometric unsharpness, 60, 145-146, 146
welds, 477germanium, attenuation coefficients, 632tablegermanium detectors
gamma ray efficiency, 107for radiation gaging, 575-576sodium iodide (thalium-activated) compared, 101surface barrier, 106
ghost defects, 507, 508glass, high density, 290
properties, 260tableglass dosimeters, 122
glass X-ray tube, 59gold
attenuation coefficients, 648tablecapture cross section, 47table
gold-198gamma ray source, 128tablegamma ray transmission through lead and concrete, 131
golf ball radiography, 587go/no-go gage, 175. See also image quality indicatorsgovernment licensing, 114, 118government regulations, 117-118, 514graetz circuit, 64, 64graphite composites
attenuation in adhesive bonded, 557epoxy woven stiffener computed tomography, 326
gray (Gy; replaces rad), 32, 119gray wedge, 195-196greinacker circuit, 64, 64-65
681Index
3RT_Index(675_692) 10/3/02 1:38 PM Page 681

grid diaphragms, 157-158groove welds, 475, 475-476, 477
radiographic procedure, 495
HH and D (Hurter and Driffield) curve. See characteristic curvehalf life, 42-43half value layer (thickness), 131, 132table, 264table
common materials, 51tabledefined, 51
hard disk data storage, 275hardener, in film development, 234Hatteras Lighthouse, radiographic testing of gallery, 595, 595helicopter composite rotor/propeller blades, 548-549herring bone porosity, 478Higashi Honganji Temple, cosmic radiography, 596, 596high intensity illuminators, 190-192, 191high low defect, 211, 212, 212high voltage radiography, 67
pulsed sources for flash radiography, 411radiation sources for, 63, 63-66, 66See also megavolt radiography
highway radiography, 591histogram equalization, 417historic building radiography, 594-596historic ship radiography, 596-597hole image quality indicators (penetrameters), 172-174hollow bead porosity, 207, 208holmium, capture cross section, 47tableholography, 11honeycomb structures
aerospace components, 557, 559, 559-560aviation components, 544, 547, 547-548, 549backscatter imaging, 390microfocus radioscopy, 408neutron radiography of aluminum, 439
hot cells, 79, 84, 442, 443hot cracks, 480
interpretation in welds, 212hot line X-ray fixture, 537
hot stick, 537-538, 538hot tears, 216, 216, 463, 468, 480hounsfield values, 314tableHunley (Civil War submarine), radiography of artifacts, 597, 597Hurter and Driffield (H and D) curve. See characteristic curvehydride detection, 557hydrogen, attenuation coefficients, 557, 612tablehydrogen cracking, 480hyperons, 39hypo retention, 234, 235-236
Iicicles, 211illuminators, 190-192, 191image analysis, 345-346
automated testing techniques, 371-374digital images and processing schemes, 346-352techniques and radiographic tests, 353-370
image intensifier tubes, 254, 265, 265-266, 271-273for aviation component radiography, 548spectral matching, 267-268
image isocons, 272-273, 273, 274table, 279image processing
backscatter imaging, 392-394qualitative assessment of electronics, 582-583
image quality indicators and penetrameters, 486-487ASTM E 747, 516, 518for castings, 458film radiography, 172-176and image analysis, 353for microfocus radioscopy, 408for neutron radiography, 441for computed tomography, 328-338, 329table, 330, 333, 335, 337plaque type, 172, 174, 458, 485, 486for power and process piping, 516, 517, 518, 518, 519for radioscopy, 277sensitivity and discontinuity visibility, 175, 486tablefor weld radiography, 485-487, 486wire type, 173-175, 174, 277, 458, 458table, 486, 486,
image transform techniques, 356-366inadequate penetration. See incomplete penetrationinclusions
castings, 463, 463, 468interpretation in castings, 214-215interpretation in welds, 207-208, 219welds, 478-479
incomplete fusioncastings, 464welds, 479-480
incomplete penetrationcastings, 464interpretation in welds, 208-209, 209, 496, 497, 501welds, 479
indium, capture cross section, 47tableindustrial radiography. See specific applications, materials and techniquesinelastic scattering, 46infrared testing, 11, 11infrastructure radiography, 591-593inherent geometry, 338in-house programs, 13in-motion radiography, 28
aerospace components, 559, 559-560, 560aviation components, 545, 545-549
in-process nondestructive inspection, 502integrated circuits. See printed circuitsintegrating instruments, 93, 123intensified charge coupled device cameras, 271, 279intensified silicon intensifier targets, 272interactive image enhancement, 353-354, 359Inter-Governmental Maritime Consultative Organization (IMCO), radioactive
material transportation requirements, 118interlacing, 275intermediate neutrons, 104tableInternational Air Transport Association, radioactive material transportation
requirements, 118International Atomic Energy Agency, radioactive material transportation
requirements, 118International Committee for Weights and Measures, 31International Organization for Standardization (ISO), 18-19
ISO 2504, 17tableISO 3999, 17tableISO 7004, 17tableISO 9712, 17table, 19ISO 9915, 17tableISO 11699, 17table, 228ISO versus ASTM film classifications, 228tableTechnical Committee 135, 19
interpretation. See radiographic interpretationinverse square law, for radiation attenuation, 23, 44-45
and radiographic exposure, 146-147, 147investment castings, 558iodine, attenuation coefficients, 641tableionization, 91, 91
by alpha particles, 45by electromagnetic radiation, 49
ionization chambers, 91, 121, 125current amplifier for, 93described, 91-93energy and directional response, 92externally located on survey instruments, 93for radiation gaging, 574
ionizing radiation, 56, 90effect on scintillators, 100effect on semiconductors, 106
ion pair, 91iridium, capture cross section, 47tableiridium-192, 41table, 74, 76-77
bibliography, 87decay curves, 456disintegration, 76exposure devices, 80, 81gamma ray exposure chart, 166gamma ray source, 128table, 455tablegamma ray transmission through lead and concrete, 131gamma spectra, 75, 77half value thickness, 51tablefor pipeline radiography, 515production, 52
682 Radiographic Testing
3RT_Index(675_692) 10/3/02 1:38 PM Page 682

ironattenuation coefficients, 383, 627tablecasting density versus radiographic sources, 460tablehounsfield value, 314tableinspection with cobalt-60, 75X-ray and thermal neutron attenuation, 440tableSee also stainless steel; steel
ISO. See International Organization for Standardizationisocon cameras, 272-273, 273, 274table, 279isotope radiation sources, 73-74
encapsulation, 79-80exposure devices, 77, 80, 80-84leak testing of sealed, 126selection of isotopes, 74-78semiannual audits, 116-117source handling equipment, 79-84source tube for pipe radiography, 528standards, 14temporary field site versus permanent facilities, 116
JJapanese Standards Association (JSA)
JSA K 7091, 17tableJSA K 7521, 17tableJSA Z 4560
jet enginesflash radiography, 413inspection, 552, 552, 553
jet engine turbine bladescomputed tomography, 305, 323, 326, 561-562, 562flash radiography, 413microfocus radiography, 406, 560-561, 561neutron radiography, 438, 556-557
joints, 475-477Joseph Conrad, radiographic testing of hull, 596JSA. See Japanese Standards Association
KK 7091. See Japanese Standards AssociationK 7521. See Japanese Standards AssociationK absorption edge, 49, 611
fluorescent screens, 259selected elements, 612-651table
K capture, 44kinefluorography, 554, 554-555kissing, 205knowledge-of-position systems, 320Korean Standards Association (KSA)
KSA A 4907, 17tableKSA A 4921, 17tableKSA M 3910, 17table
KSA. See Korean Standards Association
LL absorption edge, 49lack of fusion, 496, 497, 503
aluminum alloy welds, 507, 509interpretation in welds, 209, 210
lag, 293lamellar tearing, 478, 480laminography, 28, 305
corrosion detection in aircraft with reversed geometry scanning, 417-418described, 304, 306-309effective aperture, 308generalized mathematical solution, 307scanned beam system, 306for tank radiography, 529See also digital radiographic imaging
lanthanum bromide, relative light yield, 257tablelanthanum hypobromite, spectral emission, 258lap joints, 476-477, 477
exposure setup, 484laser film digitization systems, 181lateral migration radiography, 395-396
leadattenuation coefficients, 383, 649tablefilters, 156, 158gamma ray transmission through, 131masks and diaphragms, 155for overprinting to identify radiographs, 488radiographic equivalence factors, 152, 153tableradiographic quality, 155shielding equivalents, 132tableX-ray and thermal neutron attenuation, 440table
lead foil screens, 154-155, 159-161artifacts associated with dirt, 203characteristic curves of films exposed with, 167, 169and film graininess, 172, 227kilovoltage effect on intensification properties, 160for radioscopy, 259-260uniformity of electrons emitted, 161for weld radiography, 487
lead resolution tester, 405leak testing, 10
of isotope sealed sources, 126lenard tube, 23Lester Honor Lecture, 27Liberty Bell, radiographic testing prior to moving, 597, 598licensing, 114, 118light bulb radiography, 587lighthouse radiography, 595, 595light leaks, 203, 203-204light pole radiography, 593, 593lightroom, 237limited angle tomography, 320linacs, 69linatrons, 53linear accelerators
for flash radiography, 411-412for megavolt radiography, 69-70for nuclear vessel radiography, 70, 526, 526-528for radioscopy, 264
linear attenuation coefficientdefined, 50, 610selected elements, 612-651table
linear detector arraysfor computed tomography, 305for digital radiography, 286table, 288, 290, 294, 300image digitization, 349for nuclear fuel tomography, 536
linear diode arraysfor airport bagging screening, 589for consumer goods radiography, 584
linear porosityinterpretation in welds, 207, 498welds, 478line focusing, X-ray tubes, 60, 60
line pair gages, 329line pair resolution phantom, 330, 330line spread function
computed tomography, 328, 329-332, 331and image analysis, 368
liquid level gages, 524-525liquid penetrant testing, 8, 8, 27
castings, 465liquid propellant rocket motors, 555-556lithium, capture cross section, 47tablelithium drifted detectors, 107, 107lithium-6 fluoride dosimeters, 122
properties, 102-103lithium iodide scintillators, 100table
for neutron detection, 104locks, 127longitudinal cracks, in welds, 212, 213, 213lookup tables, 354, 354-356, 355, 359low level transforms, 356luminescent dosimetry, 102-103, 122
683Index
3RT_Index(675_692) 10/3/02 1:38 PM Page 683

MM 3910. See Korean Standards Associationmagnesium
attenuation coefficients, 618tablecasting density versus radiographic sources, 460tableradiographic equivalence factors, 153tableshrinkage in castings, 462
magnetic particle testing, 8, 27castings, 465
magnifiers, 192, 193manganese, attenuation coefficients, 626tablemanganese bronze, casting density versus radiographic sources, 460tablemanganese-nickel-aluminum bronze, tensile property relation to radiographic
indications, 465tablemarble statue radiography, 598, 599marx-surge generators, 411masks and diaphragms, 155
and interpretation, 192mass attenuation coefficient
defined, 50, 610-611selected elements, 612-651table
matrix effects, in spectrometry, 430measure, units of, 29-32medical radiography
computed tomography, 305first use of radiography, 21, 24interpretation reproducibility, 186market size, 28
megavolt radiographyelectronic radiation sources, 67-70film storage, 178microfocus radioscopy, 406scattering in, 158See also high voltage radiography
Mehl Honor Lecture, 26, 27mercury, capture cross section, 47tablemesons, 39
metal ceramic X-ray tube, 59metal detector wands, 587microchannel plates, 266-267, 267
in intensified charge coupled devices, 271microfilm, 178-179microfocus radiography, 28, 404, 404-408
aerospace components, 560-561, 561of electronics, 578-583microfocus X-ray tubes, 62
microshrinkage. See shrinkagemicroshrinks. See shrinkageMIL-STD. See military specificationsmilitary specifications
MIL-B-21250A, 465tableMIL-S-15083, 465tableMIL-STD-453, 486, 489
mine detection, backscatter imaging for, 395-396mine rock anchor bolts, scanning microdensitometry, 198mismatch, interpretation in welds, 211, 212misruns, 463
interpretation in castings, 217, 217mobile neutron radiography system, 444mobile radiation sources, 14moderators, 46modular radiation enclosure, 130modulation transfer function
computed tomography, 328, 329-332, 331, 332tableand imaging, 277, 277-279, 290, 292, 292-293, 348-349and laser film digitization systems, 181
moiré imaging, 11moisture measurement, 572, 573molybdenum, attenuation coefficients, 636tablemonitors, 354
for radioscopy, 275morphological transforms, 356, 360-363motion blur, in radioscopy, 262motorcycle neutron radiography, 440mottling, 454, 463-464
and film radiography, 158quantum, 227, 262, 289screen mottle, 162, 171-172
moving detector depth scanning, 388-389, 389MQ developers, 232
multiscale, multiresolution transforms, 356, 363-364, 364mummy radiography, 594munitions. See explosives; ordnance
Nnarrow beam shielding, 133National Building Code of Canada, 489National Institute of Standards and Technology, 125natural radioactivity, 52navy bronze, casting density versus radiographic sources, 460tableNCRP 61, 17tableneutrinos, 39neutron absorbers, 47neutron activation, 52neutron capture, 46, 52neutron detectors, 104-105neutron gaging, 448, 573neutron induced autoradiography, 448neutron interferometry, 448neutron radiography
aerospace components, 556-557applications, 437-439dynamic radioscopy, 446epithermal, 447fast, 447for fluid flow measurements, 524for high and low density materials, 12imaging, 264, 440-441radiation safety, 134-135special techniques, 446-448static radiography with thermal neutrons, 440-445subthermal, 446training and experience recommended, 18table
neutronsatomic structure, 39capture, 46, 52classification, 104tableinteractions, 45-47radiation detection instruments, 126radiation protection measurement, 122
neutron sensitive screens, 259neutron sources, 53, 441-443
radiographic isotope creation, 74-78safety aspects, 134
neutron tomography, 447-448, 530, 534-536, 535aerospace components, 562-563
newvicon, 272, 273characteristics, 274table
nickelattenuation coefficients, 629tabledigital radiography of bucket blades, 300radiographic equivalence factors, 153table
nickel silver, casting density versus radiographic sources, 460tableniobium, attenuation coefficients, 635tablenitrogen, attenuation coefficients, 615tablenondestructive testing
applications, 4defined, 2methods classification, 4-6methods overview, 7-12objectives, 5table, 6tablepurposes, 2-4specifying tests, 186-187test objects, 5-6value of, 7
Nondestructive Testing Handbook series, 27nonmetallics, 207nonrelevant indications, 202no umbra device, 441NRC. See Nuclear Regulatory Commissionnuclear cross sections. See cross sectionsnuclear fission, 46nuclear fuel, 530-536
cesium-137 recovery from, 76digital radiography, 300flash radiography, 413neutron radiography, 441scanning microdensitometry, 197thickness measuring system for microspheres, 530, 531
nuclear magnetic resonance imaging (MRI), 311
684 Radiographic Testing
3RT_Index(675_692) 10/3/02 1:38 PM Page 684

nuclear neutron absorption, 46nuclear power plants
inservice inspection with linear accelerator, 70, 526-528piping radiography, 517, 518pressure vessel radiography, 526
nuclear radiographic service centers, 442nuclear reactor neutron sources, 441-442
radiographic isotope creation, 74-78safety aspects, 134
Nuclear Regulatory Commission (NRC), 114permissible doses, 120reporting of leaking isotope sources, 126safety personnel certification, 117-118waste disposal licensing, 118
nuclear transmutation, 46nuclear waste
computed tomography, 536disposal licensing, 118
nucleonic gaging, 570, 576-577
Oobject scatter, 348observed contrast, in radioscopy, 261-262Occupational Safety and Health Standards, 17table, 19onion radiography, 585open installation, 128optical coupling
digital radiography, 299radioscopy, 269, 271
optical density, 141, 164-165, 190-198optically stimulated luminescence dosimetry, 103optical testing methods, 11optotype, 189ordnance
aerospace, 557backscatter imaging, 388, 395-396microfocus radioscopy, 406
O-ringsneutron radiography, 438, 557neutron tomography of aerospace, 562, 563
overlap, interpretation in welds, 210oxidation, repair welds in castings, 464oxtail, 63oxygen, attenuation coefficients, 616tableThe Oyster Eater (Ensor), radiographic evaluation, 600
Ppackaging radiography, 587packaging tape, attenuation gaging, 572paintings, radiographic testing, 598-601pair production, 347
attenuation coefficient, 610defined, 49, 50
papermoisture content gaging, 572radiation gaging, 576-577
paper radiographsdensity, 195viewing, 192-193
parallax, and stereo radiography, 419-423, 420partial volume effect, 317particle physics
electromagnetic radiation, 48-51elementary particles, 38-41radioactive material production, 52-63radioactive material properties, 42-47
passenger jet flight test radiography, 545-546, 547pellet implosion studies, flash radiography application, 413penetrameters. See image quality indicatorspenetrating radiation, 22, 23, 48penstock radiography, 592, 592perception, 189-190periodic table, 40, 41permissible doses, 120persistence curves, 257-258personal dose equivalent, 32personnel dosimetry, 121-122
clip-on devices, 122personnel monitoring, 127
personnel monitoring instrumentsdose rate versus effective energy, 98geiger-müller counters, 98-99ionization chambers, 93-94
personnel qualification and certification, 13, 15, 18-19, 186ANSI/ASNT CP-189, 17tableASNT Recommended Practice No. SNT-TC-1A, 17table, 18tableISO 9712, 17tablefor radiation safety, 19, 117-118See also training
petroleum industry applications. See utility, petroleum and chemical industryapplications
phantoms, 310, 335-338categories and measurement technique, 329tablefor contrast sensitivity, 333for dimensional measurement, 336-338, 337and image analysis, 351line pair resolution, 330for material density, 335, 336for medical computed tomography, 328nuclear waste drum, 536
pharmaceuticalsbackscatter imaging, 381radiation gaging, 577radiographic testing, 586-587
phosphors, 256, 257tablefor digital radiography, 284, 286, 290-291, 291in neutron detection, 104for personnel dosimetry, 122spectral emission, 267typical glow curve, 102
photocathodes, 101, 574response spectrum in image intensifiers, 267
photocurrent signal, 270photoelectric effect, 347
attenuation coefficient, 610defined, 48-49
photographic density, 141, 164-165density versus exposure, 226and exposure, 226paper radiographs, 195quality control, 242-243
photoluminescent glass dosimeters, 122photomultiplier tubes, 100-101, 101
with laser film digitization systems, 181in thermoluminescent dosimeters, 103
photon attenuation coefficients. See attenuation coefficientsphotons, 48-50, 56-57
characteristics, 48tablepair production from incident, 50photoelectric interaction of incident with orbital electron, 49
Pietà statue radiography, 598, 599, 599pigtail, 79, 79, 80, 81, 83pillowing, 396-397pi marks, 205, 205pinhole cameras, for backscatter imaging, 388pipeline radiography, 515-517
backscatter imaging of corrosion, 397radioscopic imaging, 254residual stress measurement, 429
pipe radiographyautomated defect recognition in welds, 372, 372-374, 373dimensional analysis of copper, 367-370, 367-371nuclear power plants, 527-528, 528power and process piping, 517-525
piping (weld porosity type), 478interpretation, 478
pixel pitch, 292plaque penetrameters. See image quality indicatorsplastics, radiation gaging, 577plastic scintillators, 100
for neutron detection, 104plated through-hole (PTH) solder joints, 579platinum, attenuation coefficients, 647tableplumbicon, 272, 273plutonium, attenuation coefficients, 651tablepocket ionization chambers, 93-94, 94pocket knife, digital laminography, 308, 309point clouds, 363, 369point spread function, 348-349
computed tomography, 328, 329
685Index
3RT_Index(675_692) 10/3/02 1:38 PM Page 685

polonium, 38porosity, 2
castings, 454, 461, 464interpretation in castings, 213-214, 214interpretation in welds, 207, 207-208, 495, 496, 498, 499repair welds in castings, 464welds, 478
Portrait of Gaspard Gevartius (Rubens), radiographic evaluation, 600positron emission tomography (PET), 311positrons, 39
production from incident photon, 50potassium-40, 52power line radiography, 537-538power piping radiography, 517-525PQ developers, 232predetermined liquid level gage, 525pressure marks, 203, 203, 205, 205pressure vessel radiography, 526-528, 527pressurized water reactor radiography, 526-527
primary X-ray photons, 347printed circuits
laminography, 306microfocus radiography, 405radioscopy, 578-583
process piping radiography, 517-525projection microfocus radioscopy, 264, 404-408proportional counters, 94-95
for neutron detection, 104for radiation gaging, 574
proportional region, 574protective enclosures, 130-131protective installation, 127protons, 38-39pulsed fast neutron analysis, 590pulsed high voltage sources, for flash radiography, 411Pyramid of Khafre, cosmic radiography, 596pyrotechnic devices
aerospace, 557neutron radiography, 438, 446, 447
Qqualification. See personnel qualification and certificationquality control, 188
of film processing, 242-244quality factor, 119-120quantum mottle, 227, 262, 289quantum noise, 360quantum theory, 48quartz fiber pocket dosimeter, 94
Rrad (radiation absorbed dose), 32, 119radiation absorption. See absorptionradiation attenuation. See attenuationradiation conversion material, 287radiation damage, 293-294
thresholds, 265tableradiation detectors, 122-123
calibration, 126choice, 123-125, 350tableSee also radiation gaging; radiation measurement; radiation safety; and
specific detectorsradiation dose
definitions, 32, 119-120dosage rate, 32, 74-75, 120, 128-129, 455-456dose equivalent, 32, 119See also personnel certification; radiation safety
radiation gaging, 28, 570-573application case histories, 576-577backscatter imaging application, 392, 573detector types, 573-576. See also radiation detectors;See also radiation detectors; radiation measurement; radiation safety
radiation measurement, 89-90, 122-126. See also radiation detectors; radiationgaging; radiation safety
radiation safety, 19doses, 119-120exposure control, 127-129exposure levels, 119-120management, 114-118neutron radiography, 134-135protection measurements, 121-126shielding, 130-133standards and practices, 17tableSee also dosimeters; personnel certification; radiation dose
radiation safety officer, 114-117and changes to protective enclosures, 130
radiation sources, 14, 55-88for flash radiography, 411for metal castings, 455-456, 467output, 129for radioscopy, 263-264for welds, 482See also electronic radiation sources; isotope radiation sources
radiation surveys, 123, 125, 127and shielding wall thickness, 123, 125, 127survey meter, 121
radiation, units of measure for, 29-32, 42, 119-120radiation weighting factors, 119tableradioactive decay, 43, 43-44radioactive materials
production, 52-63properties, 42-47transportation and disposal, 118
radioactive neutron sources, safety aspects, 134radio frequency quadrupole accelerators, 443radiographer certification, 15, 18-19, 117-118radiographic artifacts
aluminum alloy welds, 507-509, 508computed tomography, 336in digital radiography, 295radioscopic, 206types of, 202-206viewing accessories for interpreting, 192
radiographic contrastdefined, 170, 243and film development, 223-225, 226-227and film exposure, 150-151and kilovoltage, 151
radiographic equivalence factors, 152-153, 153tableradiographic interpretation, 14, 185-188
castings, 213-217, 468densitometers for, 194-198reporting, 198-201reproducibility, 186viewing equipment, 190-193vision acuity and perception, 189-193welds, 207-212See also radiographic artifacts
radiographic parallax, 420radiographic sensitivity
defined, 170and discontinuity detection, 458-459and film exposure, 151
radiographic shadows, 143, 143-144, 144radiographic shooting sketches, 199
castings, 457radiographic testing
advances in, 28advantages and disadvantages, 12, 454audit procedures, 115-117essential steps of, 186history, 21-28imaging and viewing, 14, 189-193management, 12-20personnel qualification and certification, 15, 18-19, 18tablereliability, 19-20representative setup, 7test procedures, 13-15, 16-17table
radiographsidentification, 177setup for making with X-rays, 140subtleties, 364-366
radioscopic artifacts, 206radioscopic imaging system, 255radioscopic weld penetration control, 505, 505-506
686 Radiographic Testing
3RT_Index(675_692) 10/3/02 1:38 PM Page 686

radioscopy, 14, 253-255arc welding, in-process, 502, 502-506, 503, 504cameras for, 269-274consumer goods, 584-587of electronics, 578-583, 584image quality, 261-264image systems, 265-268light conversion, 254, 256, 256-260optical coupling, 269, 271of pipeline weld quality, 517projection microfocus, 404-408recording equipment, 275-276sources for, 263-264systems, 277-279viewing and recording, 275-276See also digital radiographic imaging; fluoroscopy
radium, 38bibliography, 88gamma ray source, 128tablegamma ray transmission through lead and concrete, 131radium-226, 52, 74
radon, publications on 88railroad car security inspection, 590Randall’s Mill (Higgens), radiographic evaluation, 600-601, 601rate instruments, 123rayleigh scattering. See elastic scatteringreader’s sheet, 199real time radiography. See radioscopyrebar, gamma radiography of steel, 591recertification, 18reciprocity law, 148, 149
failure of, 228-229, 229recombination region, 574reconstruction
in backscatter imaging, 392-394in computed tomography, 312, 312-314
reference standards, 187-188for automated defect recognition, 374for casting radiography, 460, 468for computed tomography, 328-338for radiographic testing, 14-15, 16-17tablefor weld radiography, 489-490See also image quality indicators; phantoms; specific standards
regulations, 12, 514relative atomic mass (atomic weight), 610-611relative biological effect, 119relative film speed, 244relativistic neutrons, 104tablereliability, of radiographic testing results, 19-20rem (roentgen equivalent man), 32, 119replenishers, 233, 242residual hypo, 234
residual stress, X-ray diffraction measurement, 428-429resistor spark plugs, microfocus radioscopy, 407resonance fluorescence scattering, 381resonance peaks, 47
resonant transformer X-ray machines (resotrons), 67, 67restricted areas, 120reticulation, 244reversed geometry scanning beam technique, 288, 414, 414-418
aerospace components, 563-564aircraft wing crack detection, 415-416, 416for digital radiography, 286table, 294
reverse engineering, by computed tomography, 324rhenium, capture cross section, 47tablerhodium, capture cross section, 47tablerobotics
assembly line radioscopy of automotive parts, 278, 279use in radioscopic imaging, 254, 255, 264
rocket engines and motorscomputed tomography, 323liquid propellant, 555-556small ablative thrust chambers, 552-555solid propellant, 550-552rod anode, X-ray tubes, 63, 63
roentgen (R), 31-32, 119, 120roentgen rays, 22root cracks, interpretation in welds, 212, 214, 214
rotating anode X-ray tubes, 61, 432rutherford scattering, for radiation gaging, 573
SSAE International (formerly Society of Automotive Engineers) standards, 489
SAE AMS-STD-2175, 466, 470SAE AMS 2635C, 17tableSAE ARP 1611A, 17tableSAE AS 7114/4, 17tableSAE AS 1613A, 17table
safetyfilm development, 244-245increased public demand for, and nondestructive testing, 4See also radiation safety
safety factor, 3salting, 353, 374samarium, capture cross section, 47tablesand castings, 459sand inclusions, 461
interpretation in castings, 214Saturn rocket motor radiography, 550scanned beam laminography system, 306scanning microdensitometry, 195-198
example graphs, 197scattering
and film radiography, 153-158, 154and image analysis, 347-349material, scattering as function of, 382-384and megavolt radiography, 158and radioscopic imaging, 262reduction, 154-158, 155and resolved diameter, 386single and multiple, 382, 384-387, 385types of, 45-47, 49, 380-382See also backscatter imaging; compton scattering; elastic scattering
scatter-to-primary ratios, 348scintillation, 100, 100, 574scintillation detectors, 125
described, 100-101image digitization, 349-351for neutron detection, 104for radiation gaging, 574-575
scintillator plates, 260scintillators, 100table
and beam hardening, 349degradation, 366properties, 260table
scramming, 127scrap film, 248scratches, 202, 206
screen effect, X-ray tubes, 60-61, 61screen gamma, 259screen marks, 203screen mottle, 162SDRAM (synchronous dynamic random access memory) chips, 355seals
neutron radiography, 557radiography of tamper evident, 584
security applications, 28digital radiography, 300radioscopic detection of contraband (circa 1910), 23X-ray screening for airport security, 588, 588-590, 589
seeds, radiographic testing, 585-586segregation, interpretation in castings, 217selenium
attenuation coefficients, 633tableselenium-75, properties, 78selenium-75, publications on, 87-88
self-quenching gas, in geiger-müller counters, 97semiconductor detectors
described, 106-107for radiation gaging, 575See also amorphous selenium detectors; amorphous silicon detectors;
germanium detectors; silicon detectorssensitometric curve, 167sensitometric density, 141, 164-165sensitometry, 230, 242-243service companies, 12-13, 439shearography, 11shielding, 130-133
neutron radiography, 134-135shields, 127
687Index
3RT_Index(675_692) 10/3/02 1:38 PM Page 687

shifts, 463interpretation in castings, 217
ship radiography, 596-597shooting sketches, 199, 457shrinkage
castings, 461-462interpretation in castings, 215-216, 468microshrinkage, 215, 461, 462, 462
shrinks. See shrinkageshrinkwrap codes, 356, 356, 363sievert (Sv; replaces rem), 32, 119, 120sight developing, 245signal-to-noise ratio
computed tomography, 333-334for digital radiography, 294and image analysis, 346
silicon, attenuation coefficients, 620tablesilicon bronze, casting density versus radiographic sources, 460tablesilicon detectors
gamma ray efficiency, 107for radiation gaging, 575-576surface barrier, 106See also amorphous silicon detectors
silicon intensifier targets, 272, 273characteristics, 274table
silverattenuation coefficients, 637tablecapture cross section, 47tablerecovery in film development, 247-249sludge, 249
silver bromide, 163, 221, 221, 227, 231developed grain, 223
silver flake, 249silver halide film, 231
industrial X-ray films, 163latent image formation, 108-109, 220, 220-222See also film development
silver sulfide, 220, 234, 244simulation, aerospace applications, 564single-pixel noise, 360SI units, 29-32skyshine, 130, 130-131slag inclusions
castings, 464interpretation in castings, 214, 215interpretation in welds, 207-208, 208, 499welds, 478-479
slit collimated linear detector arrays, 350slit imaging, for backscatter imaging, 388-389slow neutrons, 46, 104tablesmudge (static mark), 240, 240SNARK, 311Society of Automotive Engineers. See SAE Internationalsodium, attenuation coefficients, 617tablesodium iodide scintillators, 100table
for digital radiography, 288germanium detectors compared, 101properties, 260tablefor radiation gaging, 575, 576
soil, and infrastructure radiography, 591solder joints
automated process test systems, 578-580, 579automatic defect recognition, 406
solid propellant rocket motors, 550-552, 551solid state detectors. See semiconductor detectorssonde length, 398source. See radiation sourcessource shutdown mechanisms, 127space charge, 57space flight component radiography, 550-558spallation, 46spark plugs, microfocus radioscopy, 407spark testing, 11spatially invariant transforms, 356, 359, 359-360spatial resolution, 346, 348-349
digital radiography, 292-293specific activity, 455specifications, 14-15, 187-188
castings, 457welds, 489-490See also reference standards
specific ionization, 91spectrometer mode detectors, 574, 575-576spectroscopy, 11speed of light, 31sponge shrinkage, 216, 461, 462, 462spontaneous fission, 44spontaneous fission neutron sources, safety aspects, 134sports equipment radiography, 587spotting, 204, 204-205spot viewers, 191stainless steel
casting density versus radiographic sources, 460tabledensity gaging, 572fuel rod radiography, 531mottling, 463nuclear vessel radiography, 527pipe weld discontinuities, 499-501tungsten inclusions in welds, 480See also steel
standards. See reference standardsstarter solution, 233state licensing, 114state regulations, 117-118, 514static marks, 161, 203, 239, 240, 240statistics
digital radiographic imaging, 289, 289-295radioscopy, 268
Statue of Liberty, gamma radiography, 594steam generator radiography, 528steel
aviation component radiography, 544backscatter imaging, 387, 395casting density versus radiographic sources, 460tablecrack detectability in welds, 491-495energy dispersive spectrometry of sheet, 431exposure of part containing two thicknesses, 171fluorescent screens for, 161-162fuel injector image analysis, 355gamma radiography of rebar in concrete, 591incomplete penetration in welds, 497in-motion radiography of aviation components, 545inspection with cobalt-60, 75inspection with iridium-192, 76-77inspection with thulium-170, 78lack of fusion in welds, 497lead foil screens for, 159line resolution phantom, 330maximum filter thickness, 157nuclear fuel rods in steel can, 534-535optical density obtained through 13 to 16 mm, 225tablepipe weld radiography, 517porosity in castings, 462porosity in welds, 498radiation gaging, 576, 577radiographic equivalence factors, 152, 153tableradiological detection and identification, 590scattered radiation, 153slag inclusions in welds, 499tensile property relation to radiographic indications, 465tabletungsten inclusions in welds, 480X-ray exposure chart, 165X-ray potential and general thickness limit, 482See also stainless steel
steel diaphragms, 155step wedge, 364-365, 365, 366stereo radiography, 419-426, 421
display designs, 425flaw geometries permitting calculation of average flaw displacement, 423flickered imaged technique, 423-424, 424
storage phosphors, 287-288, 294properties, 286table
strain gaging, 11streak artifacts, 348stress corrosion, 396stress riser, 209, 210, 478, 479, 480strip film viewers, 191subject contrast, 170-171
in radioscopy, 261subthermal neutron radiography, 446superalloys, 460surface barrier detectors, 106-107, 107
688 Radiographic Testing
3RT_Index(675_692) 10/3/02 1:38 PM Page 688

Ttamper evident seal radiography, 584tangential radiography, 519-523, 520, 522
ablative thrust chambers, 552, 553tank radiography, 528-529tantalum
attenuation coefficients, 645tablecapacitor microfocus radiography, 407casting density versus radiographic sources, 460tableinspection with cobalt-60, 75
tantalum-182, gamma ray source, 128tabletantalum screens, 259tape automated boned (TAB) solder joints, 580tapping, 11television cameras, 254, 255, 269
common adjustments for, 274tableoutput versus light input, 273
television monitors, 275, 354tenth value layer, 131, 132tabletextile radiation gaging, 577thermal neutrons, 46, 104table
attenuation by selected elements, 440table, 447shielding, 134-135static radiography with, 440-445
thermal testing, 11thermionic emission, 57thermoluminescence, 102thermoluminescent dosimeters, 122
described, 102-103thermoluminescent dosimetry, 102thermometers, in film development, 241thin film transistors, 287thiosulfate, 234thorium series, 52threat recognition software, in airport security, 589-590thresholding transforms, 356, 358, 359
for automated defect recognition, 372thulium-170, 77-78
attenuation coefficients, 644tablebibliography, 88disintegration, 77source for castings, 455table
tin, attenuation coefficients, 639tabletin bronze, casting density versus radiographic sources, 460tabletitanium
aerospace castings, 558attenuation coefficients, 623tablecasting density versus radiographic sources, 460tablecompton scattering intensity, 383, 384in image intensifier tubes, 266radiographic equivalence factors, 153tabletungsten inclusions in welds, 480
T joints, 476exposure setup, 484, 485radiographic procedure, 495
toe cracks, interpretation in welds, 212tomato radiography, 585tomograms, 305tomography. See computed tomography; laminography; neutron tomographytomosynthesis, 304, 306-309. See also laminographytoothpaste radiography, 586trace analysis, by wavelength dispersive spectrometry, 430track etch neutron detectors, 105training, 18-19
security theat recognition, 589See also personnel qualification and certification
transmission imagescomponents, 346-349digitizing, 349-351subtleties, 364-366transmission X-ray system, 578
transportation, radioactive materials, 118transverse cracks, interpretation in welds, 212, 213, 213tree (static mark), 240, 240trend removal, 371, 372tritium, 42tube gamma, 273tubes welds, 372, 372-374, 373tungsten, attenuation coefficients, 646tabletungsten inclusions
castings, 464interpretation in welds, 208, 209, 209nuclear fuel rods, 530-531welds, 480
tungsten screens, 259turbine blades. See jet engine turbine bladestwo-gain coefficient technique, 367
Uultrasonic testing, 9, 9-10unattended installation, 128unconsumed insert, 500, 500-501underbead cracks, 478, 480
interpretation in welds, 212undercut
castings, 464interpretation in welds, 210piping welds, 520welds, 481, 507
undercut (scattered radiation effect), 153-154underfill, interpretation in welds, 209, 210unfused chaplets, 463
interpretation in castings, 216-217, 217unfused inserts, 463
interpretation in castings, 216unified atomic mass unit, 31units of measure, 29-32, 42, 119-120unsharp mask transforms, 360unsharpness
effect on discontinuity detection, 258geometric, 145-146and object-film-source orientation, 145radioscopy, 258-259welds, 477
uranium, 38absorption and scattering curves, 49attenuation coefficients, 650tableinspection with cobalt-60, 75radiographic equivalence factors, 153table
uranium-235, 52uranium-238, 52
resonance peaks, 47spontaneous fission, 44
uranium series, 52utility, petroleum and chemical industry applications, 513-514
nuclear fuel radiography, 530-536pipeline radiography, 515-517power and process piping radiography, 517-525power line radiography, 537-538pressure vessel radiography, 526-528tank radiography, 528-529
Vvacuum discharges, 410valves
neutron radiography, 438neutron radiography of aerospace, 563
vanadiumattenuation coefficients, 624tablecompton scattering intensity, 383, 384
van de graaff generators, 53, 67, 67-68, 442-443, 443veiling glare, 356vessel radiography, 526-528vibrating reed electrometers, 93, 93vibration analysis, 11video cameras, 254, 255video capture card, 276video cassette recorder (VCR) data storage, 275vidicons, 272, 272, 273
for aviation component radiography, 548characteristics, 274tablesensitivity compared to charge coupled devices, 270
viewing conditions, 190-192viewing room, 237View of Delft (Vermeer), radiographic evaluation, 600vignetting, 271villard circuit, 64, 64The Virgin and Child Enthroned with Saints (Rubens), radiographic evaluation,
600
689Index
3RT_Index(675_692) 10/3/02 1:38 PM Page 689

vision acuity, 189-190vision acuity tests, 189visual parallax, 420visual testing, 7, 7-8volume computed tomography, 320, 327V/STOL propeller blade radiography, 548
Wwagon tracks, 479walnut seed radiography, 586washing, film, 230, 244water
in film development, 232, 235-236, 241hounsfield value, 314tableand spotting artifacts, 204, 205, 205X-ray and thermal neutron attenuation, 440table
wavelength dispersive spectrometry, 427, 429, 429detection lower limits, 430instrumentation for, 431
weld drop-through, 499-500, 500welds, 473-474
arc weld in-process radioscopy, 502, 502-506, 503, 504automated defect recognition, 372, 372-374, 373crack detectability in steel, 491-495design, 475-477digital laminography, 308, 309digital radiography of aluminum tubes, 297discontinuities in, 478-481discontinuity depth detection using stereo radiography, 419discontinuity radiography, 491-501exposure setup for various types, 483-485false indications in aluminum alloys, 507-509, 508flash radiography, 412-413image analysis, 362in-motion radiography of aviation tanks, 545, 546, 546tableinspection of bridge, 592interpretation of discontinuities, 207-212interpretation report, 200light poles, 593liquid propellant rockets, 556material and thickness, 477image quality indicators (penetrameters), 485-487penetration control by in-process radioscopy, 505, 505-506in pipelines, 515-517in pipes, 499-502radiographic techniques, 482-488repair welds in castings, 464, 465residual stress measurement, 429Saturn rocket motor, 550, 551scanning microdensitometry, 197
weld spatter, 464whole body irradiation, 120wire mesh, 277wire image quality indicators (penetrameters), 172-174
for castings radiography, 458sensitivity, 486tablefor weld radiography, 485, 486See also image quality indicators (penetrameters)
working distance, 129working time, 129wormhole porosity
interpretation in castings, 214interpretation in welds, 207
XX-ray crawler device, 515X-ray diffraction, 25, 28, 384
and crystal structure, 427-428, 428flash, 413mottling caused by, 158for residual stress measurement, 428-429
X-ray exposure charts, 165, 165-167, 166X-ray fluorescence gaging, 571X-ray fluorescence spectrometry, 427
elemental analysis by, 429-431X-ray lithography, 28X-ray photon, 57X-ray powder diffractometry, 429X-ray radiography. See radiographic testing
X-raysabsorption, 57-58attenuation, 48-51, 440tablediscovery, 22-23dissipation in matter, 152effect of metal filters on intensity, 156, 156table, 157as electromagnetic radiation, 48and electron capture, 44emission, 141-142exposure control installations, 127-128exposure factor, 150forward intensity from optimum target, 129and ionization, 91radiation damage from, 293-294radiation detection instruments, 12, 124, 125radiation protection measurement, 121-122radiographic equivalence factors, 153tableRoentgen demonstrates, 23spectral sensitivity, 227-228wavelength versus intensity, 141, 142
X-ray sensitive cameras, 273X-ray sources
advances in, 28for castings, 456, 457tableoutput, 129tableshielding equivalents, 132tablefor welds, 482See also electronic radiation sources; isotope radiation sources
X-ray spectrum, 56X-ray tomography. See computed tomographyX-ray tubes
construction, 59, 59-63electron beam distribution, 62flash, 410-411, 411high voltage, 63-66invention, 24-25, 25projected focal spot, 187, 188rotating anode, 61, 432
X-ray distribution , 62
ZZ 4560. See Japanese Standards Associationzinc
attenuation coefficients, 631tablecasting density versus radiographic sources, 460tableradiographic equivalence factors, 153table
zinc cadmium sulfide, 265properties, 257tablerelative light yield, 257tablespectral emission, 258
zinc sulfide, silver-activated, 100tablezirconium
attenuation coefficients, 634tableradiographic equivalence factors, 153table
zooming (in microfocus radiography), 405-406aerospace structures, 560
690 Radiographic Testing
3RT_Index(675_692) 10/3/02 1:38 PM Page 690

Chapter 1. Introduction to Radiographic TestingFigure 11 — Warner-Lambert Company, Morris Plains, NJ.
Chapter 3. Electronic Radiation SourcesFigure 22 — Varian Associates, Palo Alo, CA.
Chapter 4. Isotopes for Gamma RadiographyFigures 7c, 9a, 11, 13b, 14, 16 — Source Production and Equipment
Company, Saint Rose, LA.Figures 10, 12, 13a — AEA Technology PLC, Arlington Heights, IL.
Chapter 5. Radiation MeasurementFigure 4 — Victoreen, Solon, OH.
Chapter 6. Radiation SafetyFigures 1, 3, 5 — Thermo Eberline, Santa Fe, NM.Figure 2 — Landauer, Incorporated, Glenwood, IL.Figures 4a, 4e — Industrial Nuclear Company, San Leandro, CA.Figures 4b, 4c, 4d — NDS Products, Pasadena, TX.Figure 6b — InnospeXion APS, Hvalsoe, Denmark.
Chapter 7. Principles of Film RadiographyFigures 1-24 — Eastman Kodak, Rochester, NY.
Chapter 8. Radiographic InterpretationFigure 3 — National Institute of Standards and Technology, Gaithersburg, MD.Figure 6 — Edmund Scientific, Tonawanda, NY.Figure 7 — Macbeth Division of Kollmorgen Company, Newburgh, NY.Figure 8 — X-Rite, Incorporated, Grandville, MI.Figure 14-23 — Eastman Kodak Company, Rochester, NY.Figure 24, 25, 28, 32, 36, 37 — Southwest Research Institute, San
Antonio, TX.Figure 26, 27, 29-31, 33-35 — Electric Power Research Institute,
Charlotte, NC.
Chapter 10. RadioscopyFigures 1, 16 — Agfa Pantak Seifert GmbH, Ahrensburg, Germany.Figure 14 — From R. Halmshaw. Reprinted with permission.Figure 15 — Yxlon International, Hamburg, Germany.
Chapter 11. Digital Radiographic ImagingFigures 2 — Eastman Kodak, Rochestern NY.Figure 14, 15 — V.J. Technologies, Bohemia, NY.
Chapter 12. Computed TomographyFigure 5 — C.V. Mosby Company, Saint Louis, MO.Figures 6, 7 — R. Schulte.
Chapter 14. Backscatter ImagingFigure 10 — American Science and Engineering, Billerica, MA.
Chapter 16. Neutron Radiographic TestingFigure 4 — Risø National Laboratory, Roskilde, Denmark.Figure 5 — Aerotest Operations, San Ramon, CA.Figure 6 — General Electric Company, Schenectady, NY.Figure 9 — Kaman Sciences, Utica, NY.Figure 11 — IRT Corporation, San Diego, CA.Figure 12 — Rolls Royce Limited.
Chapter 17. Radiographic Testing of Metal CastingsFigure 2 — American Society for Testing and Materials, West
Conshohocken, PA.
Chapter 18. Welding Applications of RadiographicTestingFigures 29, 30b, 32 — Electric Power Research Institute, Palo Alto, CA.
Chapter 19. Applications of Radiographic Testing inUtility, Petroleum and Chemical IndustriesFigures 2-3 — After the American Petroleum Institute, Washington, DC.Figures 4-7 — After the American Society of Mechanical Engineers, New
York, NY.Figure 16 — After Tru-Tec Services, La Porte, TX.
Chapter 20. Aerospace Applications of RadiographicTestingFigures 1-4, 6-8, 14-18, 20 — Boeing Company, Long Beach, CA.Figure 5 — Martin Marietta, Denver, CO.Figures 9-10, 13, 20-23, 25, 27-28, 39-40 — Rocketdyne, Canoga Park, CA.Figures 11-12 — Boeing Company, Philadelphia, PA.Figure 19 — Eastern Airlines, Miami, FL.Figure 24 — Picker International, Cleveland, OH.Figure 26 — Northrop Grumman, Los Angeles, CA.Figure 29-31 — Boeing Company, Saint Louis, MO.Figure 32 — FeinFocus USA, Stamford, CT.Figure 33, 36 — General Electric, Cincinnati, OH.Figures 34-35 — United States Air Force; Aerojet Strategic Propulsion,
Sacramento, CA. Figure 37 — White Sands Testing Station, NM.Figure 38 — University of California Davis, McClellan Nuclear Radiation
Center, CA.Figure 39 — National Aeronautics and Space Administration, Washington, DC.
Chapter 21. Other Applications of RadiographicTestingFigures 9a, 11b, 13 — Rad-Icon, Santa Clara, CA.Figures 9b — V.J. Technologies, Bohemia, NY.Figure 19 — Intermountain Testing Company (Carl E. Fox), Englewood, CO.Figures 20 — Virginia Department of Transportation, Richmond, VA.Figure 23a — Prints and Photographs Division, Library of Congress,
Washington, DC.
691Radiographic Testing
Figure Sources
3RT_Index(675_692) 10/3/02 1:38 PM Page 691

Radiographic Testing
Chapter 4Movie. Isotopic source — United States Nuclear Regulatory Commission,
Washington, DCMovie. Collimators — United States Nuclear Regulatory Commission,
Washington, DC
Chapter 6Movie. Radiation injury — United States Nuclear Regulatory Commission,
Washington, DCMovie. Survey meters — United States Nuclear Regulatory Commission,
Washington, DCMovie. Check equipment — United States Nuclear Regulatory Commission,
Washington, DCMovie. Personnel monitoring devices — United States Nuclear Regulatory
Commission, Washington, DCMovie. Warning tape and signs — United States Nuclear Regulatory
Commission, Washington, DC
Chapter 7Movie. Conventional radiography gives shadow image — The Boeing
Company, Seattle, WA
Chapter 10Movie. Automated wheel inspection — Agfa, Mortsel, Belgium
Chapter 12Movie. Second generation (rotate and translate) — The Boeing Company,
Seattle, WAMovie. Third generation (rotate only) — The Boeing Company, Seattle, WAMovie. Electronic device on turntable — Lockheed Missiles and Space
Company, Sunnyvale, CAMovie. Images of electronic device — Lockheed Missiles and Space Company,
Sunnyvale, CAMovie. Tomographic data image of electronic device — Lockheed Missiles and
Space Company, Sunnyvale, CAMovie. Image slices of electronic device, top to bottom — Lockheed Missiles
and Space Company, Sunnyvale, CAMovie. Slices show delaminations in composite fastener hole — The Boeing
Company, Seattle, WAMovie. Transverse image of delaminations in fastener hole — The Boeing
Company, Seattle, WA
Chapter 13Movie. Exfoliation corrosion, thin to thick — Lockheed Missiles and Space
Company, Sunnyvale, CAMovie. General corrosion, thin to thick — Lockheed Missiles and Space
Company, Sunnyvale, CAMovie. Cracks around fasteners — Lockheed Missiles and Space Company,
Sunnyvale, CAMovie. Cracks around fasteners, in layers from top — Lockheed Missiles and
Space Company, Sunnyvale, CA
Chapter 14Movie. Backscatter scan of undamaged area — Lawrence R. Lawson,
Bradford, PAMovie. Moving source and sensor into place — Lawrence R. Lawson,
Bradford, PAMovie. Pillowing and corrosion — Lawrence R. Lawson, Bradford, PA
Chapter 20Movie. Automated inspection of rocket motor — Agfa, Mortsel, Belgium
Chapter 21Movie. Inspection of printed circuit boards — Agilent Technologies,
Loveland, COMovie. Radiographic inspection of light bulb — Rad-Icon Imaging
Corporation, Santa Clara, CAMovie. Cargo scanning — ARACOR, Sunnyvale, CAMovie. Image acquisition and evaluation — ARACOR, Sunnyvale, CAMovie. Images at 3 MV and 6 MV — ARACOR, Sunnyvale, CAMovie. Contraband in water tank — ARACOR, Sunnyvale, CA
Movie Sources
3RT_Index(675_692) 10/28/02 1:44 PM Page 692