toward improved drug discovery against flexible protein targets
249
TOWARD IMPROVED DRUG DISCOVERY AGAINST FLEXIBLE PROTEIN TARGETS: AN EXHAUSTIVE STUDY OF GLUTAMATE RACEMASE CONFORMATIONAL DYNAMICS, LIGAND BINDING, AND CATALYSIS BY KATIE L. WHALEN DISSERTATION Submitted in partial fulfillment of the requirements for the degree of Doctor of Philosophy in Biochemistry in the Graduate College of the University of Illinois at Urbana-Champaign, 2013 Urbana, Illinois Doctoral Committee: Professor Susan A. Martinis, Chair Assistant Professor M. Ashley Spies, Director of Research, Univ. of Iowa Professor Robert B. Gennis Assistant Professor Rutilio A. Fratti
-
Upload
khangminh22 -
Category
Documents
-
view
3 -
download
0
Transcript of toward improved drug discovery against flexible protein targets

TOWARD IMPROVED DRUG DISCOVERY AGAINST FLEXIBLE PROTEIN TARGETS: AN EXHAUSTIVE STUDY OF GLUTAMATE RACEMASE CONFORMATIONAL
DYNAMICS, LIGAND BINDING, AND CATALYSIS
BY
KATIE L. WHALEN
DISSERTATION
Submitted in partial fulfillment of the requirements for the degree of Doctor of Philosophy in Biochemistry
in the Graduate College of the University of Illinois at Urbana-Champaign, 2013
Urbana, Illinois
Doctoral Committee:
Professor Susan A. Martinis, Chair Assistant Professor M. Ashley Spies, Director of Research, Univ. of Iowa Professor Robert B. Gennis Assistant Professor Rutilio A. Fratti

ii
ABSTRACT
It is generally agreed that many proteins are structurally dynamic; sampling many
conformations while in solution and also adopting new conformations upon
complexation with a ligand. Many of these flexible enzymes are of biological interest,
and hindering their function via binding of competitive inhibitors would open up valuable
therapeutic avenues. Unfortunately due to the conformation-dependent nature of ligand
binding, the act of discovering a new small molecule that will bind these particular
proteins is analogous to aiming at a moving target. The following work focuses on one
particular enzyme, glutamate racemase. Glutamate racemase is an essential and non-
redundant enzyme in all species of bacteria, and inhibition of this enzyme results in cell
wall degradation, followed by imminent cell death. Inhibitors of glutamate racemase
could act as novel antibiotics against a target to which there are no current antibiotics,
and thus no known resistance. My studies focus on three interdependent phenomenon
related to enzymes: protein dynamics, ligand binding, and catalysis. Three main thrusts
of my research lay at the intersection of these physical phenomenon. First and
foremost, the Spies lab is interested in structure-based computer-aided drug discovery,
and the discovery of glutamate racemase inhibitors is a project located at the
intersection of ligand binding and catalysis, where small molecules inhibit the catalytic
process. My second project builds on this by adding a deeper understanding of
noncompetitive GR inhibitors and allostery in general. This entails exploring the
relationship between protein dynamics and catalysis. Finally, my third project involves
more fundamental biochemistry in that we closely examine facets of molecular
recognition such as conformational changes induced by ligand binding, and the role of
interstitial water. The results of the second two projects then feed back into our in silico
methods in order to improve our capacity to predict small molecule binders of glutamate
racemase. Much of the knowledge detailed here can be applied to similar proteins of
alternate classes, thus improving structure-based computer-aided drug discovery
against many flexible proteins.

iii

iv
ACKNOWLEDGEMENTS
Previous research advisors: Dr. Paul Hergenrother, Dr. Manfredo Seufferheld, Dr. Stephen Farrand, Dr. Steven Blanke (all of UIUC) and Dr. Ashok Kumar (of USACE ERDC-CERL). Graduate mentors: Dr. Mirth Hoyt, Dr. Faezeh Koohestani, and Dr. Robert Pugh. Dr. Maria Spies and members of the M. Spies lab: Dr. Masayoshi Honda, Dr. Colin Wu, Shyamal Subramanyan, Mohamed Ghoneim, and Will Jones. Members of the A. Spies lab: Wesley Lay, Kenneth Tussey, Nicholas Vance, and Quinn Li. Previous mentor: Dr. Kevin Hector of the University of Chicago, previously of Downers Grove South High School, an enthusiastic and sincere source of encouragement at an opportune time. Colleagues and friends: Kyle Powers, Jean Vendiola, Sheena Smith (Justin Smith), Ian Gut, Prashant Jain, and Vandana Chakravartty. My entire "adopted" science family at the University of Iowa, especially Medicinal Chemistry Division Head, Dr. Robert Kerns, and Biochemistry Department Head, Dr. Charles Brenner. My PhD research advisor, Dr. Ashley Spies, a wonderful mentor as well as a lifelong friend. My closest ally and companion, Daniel Wichelecki.

v
TABLE OF CONTENTS
GENERAL INTRODUCTION ...........................................................................................1 CHAPTER 1: EXPLOITING ENZYME PLASTICITY AND REACTIVITY IN VIRTUAL SCREENING: THE DISCOVERY OF GLUTAMATE RACEMASE INHIBITORS WITH HIGH LIGAND EFFICIENCY VALUES.....................................................................................17 CHAPTER 2: HYBRID STEERED MOLECULAR DYNAMICS- DOCKING: AN EFFICIENT SOLUTION TO THE PROBLEM OF RANKING INHIBITOR AFFINITIES AGAINST A FLEXIBLE DRUG TARGET.........................................................................................................................32 CHAPTER 3: IN SILICO OPTIMIZATION OF A FRAGMENT- BASED HIT YIELDS BIOLOGICALLY ACTIVE, HIGH EFFICIENCY INHIBITORS FOR GLUTAMATE RACEMASE...............................................................67 CHAPTER 4: FLOODING ENZYMES: QUANTIFYING THE CONTRIBUTIONS OF INTERSTITIAL WATER AND CAVITY SHAPE TO LIGAND BINDING USING EXTENDED LINEAR RESPONSE FREE ENERGY CALCULATIONS............................................................94 CHAPTER 5: THE NATURE OF ALLOSTERIC INHIBITION IN GLUTAMATE RACEMASE: DISCOVERY AND CHARACTERIZATION OF A CRYPTIC INHIBITORY POCKET USING ATOMISTIC MD SIMULATIONS AND PKA CALCULATIONS.........................................................130 GENERAL CONCLUSIONS ........................................................................................162 APPENDIX A: SUPPORTING INFORMATION FOR CHAPTER 1.........................................................................................................172 APPENDIX B: SUPPORTING INFORMATION FOR CHAPTER 2.........................................................................................................187 APPENDIX C: SUPPORTING INFORMATION FOR CHAPTER 3.........................................................................................................207 APPENDIX D: SUPPORTING INFORMATION FOR CHAPTER 4.........................................................................................................218 APPENDIX E: SUPPORTING INFORMATION FOR CHAPTER 5.........................................................................................................227

1
GENERAL INTRODUCTION
I. Enzyme Dynamics and Ligand Binding
Our capacity to determine high-resolution structures of biological
macromolecules (protein, DNA, lipid membranes) has expanded rapidly with the
advancement of techniques such as solid-state nuclear magnetic resonance
(NMR), x-ray crystallography, neutron crystallography, and electron microscopy.
Unfortunately, our ability to analyze the dynamics of these macromolecules is
lagging. Early experiments confirmed that all proteins are undergoing a dynamic
process referred to as "breathing". Exchange of deuterons with protons on the
protein backbone, even within the most buried regions of the protein, provided
evidence that conformational flexibility must allow temporary access of solvent to
these residues1. Proteins in solution are all subject to these constant random
thermal motions. Breathing motions are challenging to distinguish with current
biophysical techniques, but proteins are also flexible on a larger scale. Individual
residue side-chains and the carbon back-bone itself are subject to large motions,
as evidenced by the techniques described above. These motions cannot be
ignored in the functional processes of ligand binding and enzyme catalysis, and
should thus be included in any quantitative structural modeling of proteins and
ligands.
Two schools of thought have dominated current explanations of the role of
conformational flexibility in ligand-binding. First is the idea of a conformational
energy landscape, which is at equilibrium in the presence of constant external
factors (binding partners, temperature, pH, etc.). This energy landscape is pre-
populated with protein conformations of varying energy, where low energy
conformations are highly populated and high energy conformations are sparsely

2
populated. The introduction of a binding partner, such as a small molecule ligand,
into the system, shifts this equilibrium by binding with preference to the most
compatible protein conformation (aka. the protein conformation that results in the
lowest energy complex)2. The alternate and popular school of thought, referred to
as "induced-fit", dictates that a protein exists in solution at its most energetically
favorable unliganded conformation, and the presence of a binding partner results
in physical interactions, which lead to the subsequent induction of the protein
conformation that produces the lowest energy complex3. The "correct"
mechanism, or the possibility that both are equally important, is still hotly debated
due to a lack of experimental evidence in ruling out one or the other.
Another important role of protein flexibility is that involved in allostery.
Allostery is the phenomenon where a binding partner binds an enzyme at a site
distinct from the active site (where chemistry occurs) and results in apparent
changes (positive or negative) to either substrate binding or catalysis. Allostery
was first well-defined during the investigation of oxygen-binding by hemoglobin in
the 1960s by two groups: Monod, Wyman and Changeux2a (Institut Pasteur), and
Koshland, Nemethy, and Filmer3 (Brookhaven National Laboratory). Despite
being a phenomenon of great importance and constant scrutiny, the molecular
mechanism of most allosteric interactions in enzymes is still not well understood
at the atomistic level. In an attempt to mimic the abundance of natural allosteric
regulators, drug therapies are increasingly exploiting allostery as an effective
route for enzyme inhibition or activation. In order to discover and develop novel
allosteric regulators, a greater understanding of the link between protein
conformational dynamics and catalysis is required. The studies and results
contained within this thesis contribute to the general knowledge regarding the
trifecta of protein conformational dynamics, ligand binding, and catalysis, with a
focused application toward computer-aided and structure-based drug discovery.

3
II. State of the Art in Accounting for Protein Flexibility/Solvation in
Computer-Aided Drug Discovery
Virtual screening is becoming increasingly more popular in pharmaceutical
settings for discovery of small-molecules against a particular protein target. The
method is generally faster and substantially more cost-effective than traditional
high-throughput screening campaigns. Additionally, one is not limited to the
chemical entities contained within a particular physical library. With virtual
screening, any compound which can be dreamt up can be modeled and included
in the screening. The key modeling component of virtual screening is the docking
of a small-molecule into a designated pocket on a protein receptor. The protein
receptor structure must be known, either from high-resolution experimental data
(often acquired via NMR or x-ray crystallography) or rigorous homology-modeling
in the case of no experimental data. The pocket where ligand binding occurs
must also be known, generally an easy decision in the case of competitive
inhibitors (binding to the active site), but exponentially more difficult a designation
in the case of novel allosteric regulators a process (aided by pocket analysis
algorithms). Current molecular docking employs search algorithms, which vary
from being of genetic, stochastic, or simulation-based, are in fact quite successful
at generating a docked-pose that matches experimentally-derived structural
data4. A study by Warren and coworkers showed that for 90% of the included
systems, docking produced a result that matched the crystallographically-
determined pose within 2 Å4.
Typical docking algorithms allow for flexibility in the small-molecule around
rotational bonds and within cyclic moieties. For a fragment library, where the
average molecular weight is 150-280 Da, this means simulating flexibility for 10-

4
20 heavy atoms on average. The incorporation of receptor flexibility into
simulation, where a 30 kDa protein is approximately 4,000 atoms, would
obviously and quickly become too computationally expensive to screen large
compound libraries. To circumvent this limitation, some algorithms have been
developed that allow flexibility just in residue side-chains within the binding
pocket. While this is, in principle, an improvement, side-chain movements
represent only a fraction of the conformational picture for the protein receptor.
One particular study within this thesis shows that virtual screening can be made
much more efficacious (as quantified by the "hit-rate", number of binding
compounds per total compounds tested) if a particular conformation of the
receptor is chosen, here the conformation corresponding to that theorized as the
"transition-state" or reactive state conformation.
An alternative to docking to a single receptor is ensemble docking, where
a small molecule is docked to multiple conformations of the protein receptor.
These conformations can be generated from experimental data, eg. multiple co-
crystal structures, or they can be generated with molecular dynamics simulations.
This leads us to a discussion of current molecular dynamics simulation
techniques. Current techniques allow simulation of every atom within the target
protein as well as explicit waters and salts. Thus, the same 30 kDa protein above
would require ~24,000 atoms in its simulation with a 70x70x70 Å3 simulation cell.
With current computational power, simulations of this protein could reach
timescales in the 10s of nanoseconds within one week on 32 processors.
Microsecond-length simulations are less common, but certainly plausible using
super-computing and parallel-computing setups. Long simulations are hampered
by the physical realism of physics-based force field. Common force fields can be
categorized as being either knowledge- or physics-based, where knowledge-
based force fields are based on large datasets derived from multiple systems
while physical-based force fields are based on a biophysically-determined set of
"rules" for bond lengths, angles, strain, etc. Either type of force field has

5
strengths and weaknesses and are often employed in a system-dependent, ad
hoc manner. Over the course of long simulations, current force fields have a
tendency to drift toward the allowance of unnatural phenomenon. These issues
are currently being addressed by labs that specialize in force field generation.
Regardless, nanosecond-length simulations do provide valuable information
regarding the dynamic motions that are considerably larger and more complex
than local thermal fluctuations. A unique adaptation of classical MD simulation,
referred to as "steered" MD simulation, allows the user to manipulate the system
in order to force a physical phenomenon. In one of the studies described here
within, a force is applied to a bound substrate along a fixed vector, in order to
simulate the unbinding in a matter of picoseconds, instead of waiting indefinitely
for the substrate to become unbound in a classical MD simulation. This unbinding
process generates unique protein conformations, which are relevant to the
catalytic cycle of this particular enzyme. Not surprisingly, the marriage of various
types of MD simulations and docking is proving to be extremely fruitful in the
discovery and development of inhibitors for flexible proteins.
Lastly, and perhaps most importantly, is the need for computational
predictions of accurate and precise binding energy between a theoretical ligand
and its protein receptor. This is key to the ranking of docked poses in virtual
screening, as well as the optimization of a lead compounds via analysis of
subsequent derivative compounds. This area of computer-aided drug discovery
is quite immature, compared to ligand placement and MD simulation. Current
methods for free energy calculation range from the short and inexpensive (such
as a docking program's scoring function4) to the long and expensive (such as
simulation-based free-energy perturbation [FEP]5). The key to a successful free
energy calculation in computer-aided drug discovery is the balance of
computational expense (ie. time) and accuracy. The accuracy of a free energy
calculation should, in principle, be dependent on the ability to appropriately
account for every physical component of a protein-ligand interaction: protein

6
desolvation, ligand desolvation, van der Waals interactions, entropic restriction of
the ligand, electrostatic interactions, dipole-dipole interactions, etc. The studies
within this thesis will focus on three classes of free energy prediction: scoring
functions (London dG6 and Autodock7), end-point free energy calculation (MM-
PBSA8 and its sister, MM-BEMSA9) and the Extended Linear Response (ELR10).
Proper energy evaluations lead to proper comparisons of multiple ligands for a
given receptor, and will form the foundation for expeditious and efficacious hit
identification and lead optimization in a computer-aided drug discovery
campaign.
III. Glutamate Racemase, an untapped source for future antibiotics
The peptidoglycan cell wall is an organic polymer specific to bacteria.
Composed of crosslinked sugars and pentapeptides, the peptidoglycan layer
forms a rigid mesh that protects bacterial cells from osmotic stress11. The
inclusion of highly conserved D-amino acids into the pentapeptide portion of this
mesh is believed to be a mechanism of preventing degradation by common
proteases11. D-glutamate is a major constituent of the peptidoglycan cell wall11.
Additionally, specific bacteria such as B. anthracis also require substantial
amounts of D-glutamate for synthesis of the poly-γ-D-glutamic-acid (PDGA)
capsule, a key component for virulence12. The bacterial enzyme, glutamate
racemase (GR), is responsible for the reversible stereoinversion of L-glutamate
to D-glutamate. Key to the selection of GR as the target of a drug discovery
campaign is its necessity and non-redundancy in bacteria. Several knockout
studies have shown that in the absence of GR, bacteria are D-glutamate-
auxotrophic13, confirming the singular method of D-glutamate acquisition as
being through GR. Also important is that there is no human homologue of GR,

7
since there is no requirement for this particular D-amino acid in any processes
endogenous to humans. Adding to its attractiveness as a drug target is the fact
that GR plays a role in phase I of peptidoglycan biosynthesis, while all active
drugs that also target the peptidoglycan cell wall act on enzymes categorized as
being in phase III (extracellular)11. Where resistance may potentially arise (or
already exists) in phase III due to exposure to existing drugs, there is less of a
threat of resistance for a completely novel strategy.
Glutamate racemase (GR) belongs to the cofactor-independent family of
amino acid racemases. GR acts via a general acid/base mechanism utilizing two
active site cysteine residues to abstract the Cα proton and donate a proton to the
opposite face14. This chemistry is quite impressive considering the high pKa
(~29)15 of the Cα proton of glutamate coupled with the lack of pyridoxal-5-
phosphate or metal cofactor. The active site is saturated with hydrogen-bond
donating and accepting residues. An over-representation of threonine residues in
the active site has led to some researchers to refer to it as a “threonine pocket”16.
The catalytic cysteine residues are C74 and C185 (B. subtilis numbering). These
residues were located by predictions based on homology models and confirmed
by site-directed mutagenesis17. The reaction forms a planar anionic intermediate
as a result of the initial cleavage of the α-carbon-hydrogen bond14. Kinetic
isotope effect measurements show that cleavage and reformation of a carbon-
hydrogen bond on the opposite face occur in step-wise manner and are partially
rate-determining steps18. Several conserved residues within the active site
(Asp10, Asp36, Glu152, and His186) have been implicated as aiding in the
reaction by stabilizing the anionic intermediate17b.
The x-ray crystal structure has been determined for glutamate racemases
isolated from a variety of bacterial species (see Chapter 4 for a complete list with
references/PDB codes). The majority of the co-crystal structures show GR bound
to glutamate, glutamate-analogs, or oxygen-rich salts. The protein possesses a

8
general α/β fold, which composes two domains that enclose a relatively small
active site. NMR studies have shown that GR is a highly flexible enzyme capable
of sampling many conformations19. It has been proposed that this flexibility allows
substrate binding and product release from the buried active site. Work within
this thesis will show that GR can bind a wide variety of chemical moieties,
another testament to its flexibility. Also, this thesis will explore whether such
flexibility also plays a role in the immense catalytic power of GR (Chapter 5).
It is also important to discuss the tertiary and quaternary structure of
glutamate racemase, as well as conformational changes that accompany
substrate binding. From here on, I will discuss details regarding the enzyme as
they apply to RacE, the GR isozyme of Bacillus subtilis (the isozyme with which
the majority of the following inhibitor studies were conducted). RacE of B. subtilis
and RacE1/2 of B. anthracis have many structural similarities, and the active site
is highly conserved over all studied species, thus inhibitors discovered against
RacE can be assumed to be candidates for inhibition against the GR isozymes
from B. anthracis, F. tularensis, and H. pylori as well. RacE is found at
equilibrium in solution between a monomer and homodimer state20. The active
site is located at the interface of two domains within each monomer, the amino-
terminal domain (domain A) and the carboxy-terminal domain (domain B). Amino
acid residues from either domain are involved in the catalytic mechanism. Upon
binding of substrate, a hinge movement occurs between domain A and domain B
bringing active site residues closer together and forming the “closed” form of the
enzyme20. This conformational change is required for catalysis. It is believed that
since domain B is more involved in interactions between the two dimers and thus
experiences more restricted mobility, domain A is more likely responsible for
separation that forms the “open” form, allowing the product to leave and new
substrate to bind19b.

9
The majority of the following studies focus on GR isozymes isolated from
B. subtilis (non-pathogenic), H. pylori (pathogenic), F. tularensis (pathogenic),
and B. anthracis (pathogenic). Unlike the vast majority of bacteria, B. anthracis
possesses two genes that encode glutamate racemases: racE1 and racE2.
Recent studies show that both proteins encoded by these genes (RacE1 and
RacE2) are functional and share 67% amino acid sequence homology, although
some structural and enzymatic differences exist between the two16. A RacE1
knockout mutant and RacE2 knockout mutant show significant differences in
phenotype13a. When RacE1 is knocked out, only a moderate decrease in growth
with full recovery after addition of D-glutamate is observed. In contrast, when
RacE2 is knocked out, bacterial growth decreases more significantly and addition
of D-glutamate only achieves partial recovery13a. These studies show a disparity
in the degree of necessity of each RacE isozyme. GR was also knocked out in
Francisella tularensis and resulted in bacteria displaying complete auxotrophy for
D-glutamate13b.
Antibiotics against each of the highlighted pathogenic bacteria are in high
demand. Bacillus anthracis is the causative agent of inhalational anthrax, and
has been catergorized as a Class A bioterrorism agent by the US government21.
Additionally, Francisella tularensis causes tularemia, an illness that causes
widespread death in small mammals such as rodents, rabbits, and beavers; and
also has the capacity to infect humans with flu-like symptoms, which are
potentially lethal if left untreated. The US government has also added F.
tularensis to the list of Class A bioterrorism agents21. Helicobacter pylori was
proven to be linked to both ulceritis and gastic carcinoma in the 1990s22, thus
potential antibiotics could serve as a novel anti-cancer therapeutic. Finally,
Bacillus subtilis is a non-pathogenic soil microbe. The GR isozyme isolated from
this bacteria has been well characterized functionally and structurally. It was the
first liganded crystal structure, providing the first model for computation, and has
thus served as a quality model system in many of the following studies.

10
Currents methods of treatment for B. anthracis infections include
vaccination and heavy doses of oral antibiotics. Vaccination is only effective
when given well in advance of exposure. Today, the two most commonly used
antibiotics against anthrax are ciprofloxacin and doxycycline, which are two types
of fluoroquinolones23. Ciprofloxacin acts by binding DNA gyrase and preventing
the unwinding of chromosomal DNA, thus interfering with bacterial DNA
replication. Doxycycline works by binding ribosomes and preventing the binding
of amino-acyl tRNAs, thus inhibiting protein translation. In the case of tularemia,
the current first-line treatment is a combination of streptomycin (an
aminoglycoside) and tetracycline (a polyketide antibiotic)24. Both of these
antbiotics work by inhibiting protein biosynthesis, and given in combination, are
believed to reduce the occurrence of bacterial resistance. Similarly, H. pylori
infections are currently treated with a combination of antibiotics (clarithromycin
and amoxicillin) as well as a proton pump inhibitor to alter the stomach pH and
reduce the favorability of growth conditions25. Clarithromycin is a macrolide that
interferes with protein biosynthesis, while amoxicillin is a beta-lactam antibiotic
that inhibits bacterial cell wall production at the cross-linking step (Phase III).
None of the current first-line treatments for the mentioned bacterial species have
mechanisms of action that target enzymes in Phase I of peptidoglycan
biosynthesis, and only one treatment targets peptidoglycan at all. Thus, this
combination of enzyme target and bacterial species is an unsaturated area of
research, where any discoveries made herein would contribute greatly to the
universal arsenal of antibacterial therapies.
Studies have been conducted to investigate potential inhibitors of
glutamate racemase in a variety of species. The first potent glutamate racemase
inhibitors with strong antibacterial capacities were developed in 2002 by
researchers at Eli Lilly and Co.26. These competitive inhibitors are highly-
substituted D-glutamate analogues that exhibit maximal inhibition concentrations
(MICs) as low as 10 ng/mL26. Unfortunately, their activity is currently limited to

11
Streptococcus pneumoniae. In 2007, a group from AstraZeneca Global Structural
Chemistry discovered a potent glutamate racemase inhibitor (Compound A) of
Helicobacter pylori that acts through a novel uncompetitive mechanism19b. This
particular compound takes advantage of the hinge-like conformational change
that accompanies substrate binding. By binding to an allosteric site and
displacing a key tryptophan residue, Compound A locks the enzyme in the
“closed” conformation, thus preventing the release of substrate and lowering the
Vmax considerably. In H. pylori, Compound A has an IC50 value of 1.4 μM and an
MIC of 4 μg/mL19b. Substituent variation was used to produce a library of
Compound A analogs, thus uncovering inhibitors with IC50 values as low as 16
nM27. Unfortunately and somewhat unsurprising, this series of compounds
suffered first from poor solubility and membrane permeability (unsuitable for oral
administration), and then a lack of efficacy in the mouse model.
The same group from AstraZeneca went on to discover 9-benzyl purine
variants that inhibit glutamate racemase potently in Enterococcus faecium and
Enterococcus faecalis28. Using high-throughput screening, the 9-benzyl purine
scaffold was selected and again, substituent variation was used to improve
potency. Inhibitors with IC50 values as low as 1.0 μM28 were found. Using the
same 9-benzyl purine scaffold, substructure searches within the AstraZeneca
corporate collection were performed to “scaffold-hop” to an 8-benzyl pteridine
structure which extended inhibitory specificity to include Staphylococcus aureus,
as well as E. faecium and E. faecalis27. This series of inhibitors also suffers from
poor physico-chemical properties, specifically solubility. The importance of
discovering GR inhibitors with quality lipophilicity scores before optimization of
binding potency is highlighted in Chapter 3.
This thesis contains studies that detail the discovery and characterization
of 15 novel millimolar inhibitors and 12 novel micromolar inhibitors of glutamate
racemase. Of the 27 new inhibitors, 9 were confirmed to inhibit via a competitive

12
mechanism and 1 was confirmed to inhibit via a noncompetitive mechanism. The
potency of the remaining inhibitors was accomplished via determination of their
IC50, which cannot distinguish between inhibitory mechanisms. The strongest
inhibitor has an inhibition constant (Ki) of 2.5 micromolar and, unlike previous
high-potency GR inhibitors, an impressive lipophilicity profile. Several of the most
potent compounds were also assayed for antibacterial activity and demonstrated
high micromolar inhibition of bacterial growth for Gram-positive species. Many of
these inhibitors represent exciting new scaffolds for future development of
antibacterial therapeutics. One particular series of inhibitors (Chapter 3) was
composed entirely of novel chemical entities and prompted the successful
application for a method patent covering their use in antibacterial formulations, as
well as three composition of matter patents (US Provisional Application No.
61/779,727).
IV. Overlying Themes in the Following Thesis
The following five chapters of this thesis are verbatim replications of a
publication reproduced with permission from the publishers. Each study herein is
a combination of experimental and computational work with an overarching goal
of improving our understanding of the biophysical workings that lay at the nexus
of protein flexibility, ligand binding, and catalytic power. There are three themes
that transcend the entirety of this thesis: (1) improved modeling of receptor
flexibility in virtual screening (Chapter 1, Chapter 2) and lead optimization
(Chapter 3); (2) inclusion of solvation (Chapter 2) and explicit water molecules
(Chapter 4) in binding energy evaluations; (3) investigation into receptor flexibility
as a determinant of catalytic rate via pKa perturbation (Chapter 5). The contents
of this thesis form a comprehensive depiction of ligand binding and catalysis as

13
they apply to the antibacterial drug target, glutamate racemase. It is my hope that
these case studies may add to the general knowledge of the physical
phenomenon that drive protein-ligand complexation as well as the mechanism by
which allosteric inhibitors negatively affect catalytic rates. The results of such
studies are of paramount importance to computer-aided drug discovery.
Improvement in the efficacy and timeliness of the hit identification and lead
optimization stages of drug discovery will have positive downstream effects on
the overall cost and time required for a drug to move from conception to
regulatory approval.
References
1. Norvell, J. C.; Nunes, A. C.; Schoenborn, B. P., Neutron diffraction analysis of myoglobin: structure of the carbon monoxide derivative. Science 1975, 190 (4214), 568-70.
2. (a) Monod, J.; Wyman, J.; Changeux, J. P., On the Nature of Allosteric Transitions: A Plausible Model. J Mol Biol 1965, 12, 88-118; (b) Tsai, C. J.; Kumar, S.; Ma, B.; Nussinov, R., Folding funnels, binding funnels, and protein function. Protein Sci 1999, 8 (6), 1181-90.
3. Koshland, D. E., Jr.; Nemethy, G.; Filmer, D., Comparison of experimental binding data and theoretical models in proteins containing subunits. Biochemistry 1966, 5 (1), 365-85.
4. Warren, G. L.; Andrews, C. W.; Capelli, A. M.; Clarke, B.; LaLonde, J.; Lambert, M. H.; Lindvall, M.; Nevins, N.; Semus, S. F.; Senger, S.; Tedesco, G.; Wall, I. D.; Woolven, J. M.; Peishoff, C. E.; Head, M. S., A critical assessment of docking programs and scoring functions. Journal of Medicinal Chemistry 2006, 49 (20), 5912-31.
5. Bash, P. A.; Singh, U. C.; Brown, F. K.; Langridge, R.; Kollman, P. A., Calculation of the relative change in binding free energy of a protein-inhibitor complex. Science 1987, 235 (4788), 574-6.
6. Molecular Operating Environment (MOE), 2011.10; Chemical Computing Group Inc.: 1010 Sherbooke St. West, Suite #910, Montreal, QC, Canada, H3A 2R7, 2011.

14
7. Morris, G. M.; Huey, R.; Lindstrom, W.; Sanner, M. F.; Belew, R. K.; Goodsell, D. S.; Olson, A. J., AutoDock4 and AutoDockTools4: Automated Docking with Selective Receptor Flexibility. J. Comp. Chem. 2009, 30, 2785-2791.
8. Brown, S. P.; Muchmore, S. W., High-throughput calculation of protein-ligand binding affinities: modification and adaptation of the MM-PBSA protocol to enterprise grid computing. J Chem Inf Model 2006, 46 (3), 999-1005.
9. Purisima, E. O., Fast Summation Boundary Element Method for Calculating Solvation Free Energies of Macromolecules. Journal of Computational Chemistry 1998, 19 (13), 1494-1504.
10. Tominaga, Y.; Jorgensen, W. L., General model for estimation of the inhibition of protein kinases using monte carlo simulations. J. Med. Chem. 2004, 47, 2534-2549.
11. Bugg, T. D.; Walsh, C. T., Intracellular steps of bacterial cell wall peptidoglycan biosynthesis: enzymology, antibiotics, and antibiotic resistance. Nat. Prod. Rep. 1992, 9 (3), 199-215.
12. Hanby, W. E.; Rydon, H. N., The capsular substance of Bacillus anthracis. The Biochemical journal 1946, 40 (2), xxi.
13. (a) Shatalin, K. Y.; Neyfakh, A. A., Efficient gene inactivation of Bacillus anthracis. FEMS Microbiol. Lett. 2005, 245, 315-319; (b) LoVullo, E. D.; Molins-Schneekloth, C. R.; Schweizer, H. P.; Pavelka, M. S., Jr., Single-copy chromosomal integration systems for Francisella tularensis. Microbiology 2009, 155, 1152-1163.
14. Gallo, K. A.; Tanner, M. E.; Knowles, J. R., Mechanism of the reaction catalyzed by glutamate racemase. Biochemistry 1993, 32 (15), 3991-7.
15. Spies, M. A.; Reese, J. G.; Dodd, D.; Pankow, K. L.; Blanke, S. R.; Baudry, J., Determinants of catalytic power and ligand binding in glutamate racemase. J. Am. Chem. Soc. 2009, 131 (14), 5274-5284.
16. May, M.; Mehboob, S.; Mulhearn, D. C.; Wang, Z.; Yu, H.; Thatcher, G. R.; Santarsiero, B. D.; Johnson, M. E.; Mesecar, A. D., Structural and functional analysis of two glutamate racemase isozymes from Bacillus anthracis and implications for inhibitor design. J. Mol. Biol. 2007, 371 (5), 1219-37.
17. (a) Dodd, D.; Reese, J. G.; Louer, C. R.; Ballard, J. D.; Spies, M. A.; Blanke, S. R., Functional comparison of the two Bacillus anthracis glutamate
15
racemases. J. Bacteriol. 2007, 189 (14), 5265-75; (b) Glavas, S.; Tanner, M. E., Active site residues of glutamate racemase. Biochemistry 2001, 40, 6199-6204.
18. Tanner, M. E.; Gallo, K. A.; Knowles, J. R., Isotope effects and the identification of catalytic residues in the reaction catalyzed by glutamate racemase. Biochemistry 1993, 32 (15), 3998-4006.
19. (a) Mehboob, S.; Guo, L.; Fu, W.; Mittal, A.; Yau, T.; Truong, K.; Johlfs, M.; Long, F.; Fung, L. W.-M.; Johnson, M. E., Glutamate racemase dimerization inhibits dynamic conformational flexibility and reduces catalytic rates. Biochemistry 2009, 48, 7045-7055; (b) Lundqvist, T.; Fisher, S. L.; Kern, G.; Folmer, R. H.; Xue, Y.; Newton, D. T.; Keating, T. A.; Alm, R. A.; de Jonge, B. L., Exploitation of structural and regulatory diversity in glutamate racemases. Nature 2007, 447 (7146), 817-22.
20. Ruzheinikov, S. N.; Taal, M. A.; Sedelnikova, S. E.; Baker, P. J.; Rice, D. W., Substrate-induced conformational changes in Bacillus subtilis glutamate racemase and their implications for drug discovery. Structure 2005, 13 (11), 1707-13.
21. Broussard, L. A., Biological agents: weapons of warfare and bioterrorism. Molecular diagnosis : a journal devoted to the understanding of human disease through the clinical application of molecular biology 2001, 6 (4), 323-33.
22. Armstrong, C. P.; Burton, P. A.; Thompson, M. H., Helicobacter pylori and gastric carcinoma. Histopathology 1991, 19 (4), 389-90.
23. Anthrax prevention and treatment. FDA consumer 2001, 35 (6), 9.
24. Enderlin, G.; Morales, L.; Jacobs, R. F.; Cross, J. T., Streptomycin and alternative agents for the treatment of tularemia: review of the literature. Clinical infectious diseases : an official publication of the Infectious Diseases Society of America 1994, 19 (1), 42-7.
25. den Hollander, W. J.; Kuipers, E. J., Current pharmacotherapy options for gastritis. Expert opinion on pharmacotherapy 2012, 13 (18), 2625-36.
26. de Dios, A.; Prieto, L.; Martin, J. A.; Rubio, A.; Ezquerra, J.; Tebbe, M.; Lopez de Uralde, B.; Martin, J.; Sanchez, A.; LeTourneau, D. L.; McGee, J. E.; Boylan, C.; Parr, T. R., Jr.; Smith, M. C., 4-Substituted D-glutamic acid analogues: the first potent inhibitors of glutamate racemase (MurI) enzyme with antibacterial activity. J. Med. Chem. 2002, 45 (20), 4559-70.
27. Geng, B.; Basarab, G.; Comita-Prevoir, J.; Gowravaram, M.; Hill, P.; Kiely, A.; Loch, J.; MacPherson, L.; Morningstar, M.; Mullen, G.; Osimboni, E.; Satz, A.;

16
Eyermann, C.; Lundqvist, T., Potent and selective inhibitors of Helicobacter pylori glutamate racemase (MurI): pyridodiazepine amines. Bioorg. Medicinal Chem. Lett. 2009, 19 (3), 930-6.
28. Geng, B.; Breault, G.; Comita-Prevoir, J.; Petrichko, R.; Eyermann, C.; Lundqvist, T.; Doig, P.; Gorseth, E.; Noonan, B., Exploring 9-benzyl purines as inhibitors of glutamate racemase (MurI) in Gram-positive bacteria. Bioorg. Medicinal Chem. Lett. 2008, 18 (15), 4368-72.

Reprinted (adapted) with permission from Whalen, K. L.; Pankow, K. L.; Blanke, S. R.; Spies, M. A.
ACS Med. Chem. Lett. 2010, 8, 9-13. Copyright 2011 American Chemical Society. K. L. Pankow
contributed experimental data for 2 inhibitors. S. R. Blanke contributed intellectually to the
discussion section and experimental planning. M. A. Spies performed the in silico modeling and
execution of the virtual screening, as well as experimental planning and discussion.
17
CHAPTER 1: EXPLOITING ENZYME PLASTICITY AND REACTIVITY IN
VIRTUAL SCREENING: THE DISCOVERY OF GLUTAMATE RACEMASE
INHIBITORS WITH HIGH LIGAND EFFICIENCY VALUES.
ABSTRACT Glutamate racemase is an attractive anti-microbial drug target.
Virtual screening using a transition-state conformation of the enzyme resulted in
the discovery of several μM competitive inhibitors, dissimilar from current amino
acid-like inhibitors, providing novel scaffolds for drug discovery. The most
effective of these competitive inhibitors possesses a very high ligand efficiency
value of -0.6 kcal/mol/heavy atom, and is effective against three distinct
glutamate racemases representing two species of Bacillus. The benefits of
employing the transition-state conformation of the receptor in virtual screening
are discussed.
Glutamate racemase (GR) catalyzes stereoinversion at the Cα of
glutamate1, and is a source of D-glutamate in bacteria. D-glutamate is an
essential component of the peptidoglycan layer of bacterial cell walls, and is a
target for antibacterial drug development2. GR possesses an exquisite substrate
specificity, catalyzing stereoinversion of Cα via a 1,1 proton transfer, utilizing a
“two-base” mechanism consisting of two cysteine residues that flank the Cα3.
GR-catalyzed racemization proceeds without the assistance of a cofactor, which
has generated intense interest in its mechanism, as well as the related enzymes
such as diaminopimelate (DAP) epimerase4. GR-ligand co-crystal structures do

18
not provide a reasonable explanation, a posteriori, for how the Cα proton is
abstracted by the catalytic cysteine base, without invoking a reorganization of the
active site5. However, recent MD-QM/MM studies on the B. subtilis GR have
yielded a “reactive” conformation resulting from a repositioning of active site
moieties such that the carbanionic transition state is saturated with hydrogen
bond donors5b.
The plasticity of GR poses immense challenges for classic structure-based
drug design6. The current study seeks to surmount these obstacles by employing
a virtual screening regime, in which the receptor is the “reactive” form of B.
subtilis GR, as described in Spies et al.5b. This methodology is summarized in the
flowchart in Figure 1. The reactive conformation of glutamate racemase,
characterized in Spies et al.5b, was employed in the present study as a receptor
for virtual screening of a large lead-like library of compounds. This approach is
appealing in the sense that the reactive form of the enzyme is characterized by a
compressed active site that exhibits dramatically enhanced protein-ligand
interaction energy5b. After virtual screening and scoring approximately one million
compounds, the docked enzyme-ligand complexes that yielded the greatest
computationally determined pKi values (where Ki is the dissociation constant) or
the most negative interaction energies were slated for experimental investigation
(Table 1). The various types of outcomes are also listed in Figure 1.

19
Figure 1. Flowchart for Inhibitor Discovery Using a Conformationally Active Form of Glutamate Racemase (GR).

20
Table 1. Highest-ranking Hits Emerging from Virtual Screening of a
†Lead-like Library of ~1 Million Compounds to the
‡Reactive (i.e.
Transition State) Form of GR Versus the Outcome of Experimental GR Assays.
Compound
Predicted Interaction Energy
(kcal/mol) from docked poses
§Predicte
d pKi from
docked poses
*Experimental
Results
1
-21.996 10.1 Colloidal Aggregate
ℓ
2
-25.897 10.1 IC50= 3.0 mM
3
£
-13.530 9.9 Ki =42 ± 10 μM
4
-20.511 9.5 IC50= > 2.4 mM
¥
5
-12.156 9.1 Ki =59 ± 13 μM
6
₩
-23.950 8.3 Ki = 1.9 mM
7
₩
-25.015 7.2 IC50= 3.5 mM
8
-14.367 6.6 IC50= 4.0 mM

21
Table 1 Footnote. †The Chemical Computing Group Conformational Database Version 2007, where lead-likeness is based on Oprea’s parametersx7; see Computational Procedures in S.I. ‡The reactive form of GR, as characterized by Spies et al.9
§As determined by the London dG scoring function, implemented within the LigX utility of MOE (v2008.10) 8; values above pKi=9.0 were considered for experimental investigation. *All Ki or IC50 values determined by the circular dichroism assay described in SI, except for 1 and 4. ℓ1 appeared to display non-competitive inhibition with an apparent Ki = 90 ± 7 μM, but was found to inhibit GR through colloidal aggregation. ¥Inhibition by 4 was measured using the coupled-enzyme assay and the actual IC50 is expected to be higher due to partial inhibition of the coupled-enzyme, L-GDH (see SI for details). £Synthesis and derivatization of 3 are described by Fatiadi and Bou et al.9
₩6 and 7 were chosen for their high interaction energies, while 8 was a readily available fragment of 2, 4, 5, and 6.
Two lead compounds were identified (where lead compound refers to a bona
fide competitive inhibitor with μM-range Ki). Table 1 provides a full account of all
of the tested compounds with the greatest predicted pKi values and their
experimental Ki values. Compounds 1-5 have dG scores in the top 1% of the
originally retained 500 compounds from the virtual screen. All of these
compounds were found to be inhibitors (two in the μM range, and two in the mM
range), while 1 was a colloidal aggregator (vide infra). Scoring with dG was
notably superior to simply using ligand interaction energies, as performed in
Spies et al.9 which generated only a few mM inhibitors. Furthermore, in the
current study, interaction energies for the two best inhibitors, 3 and 5, were very
low, underscoring the poor utility of this metric.

22
Figure 2 shows the initial rate kinetic data for GR-inhibition by 3 and 5
(obtained by a circular dichroism assay5b, described in the Supporting
Information section), which was globally fitted to a competitive inhibition model
(fitted parameters located in Table 2), respectively. To our knowledge these are
the first μM competitive inhibitors for GR that are not amino acids. Importantly,
the more effective of these, 3, also inhibits GR isozymes from B. anthracis with
and without the so-called “valine bridge”, which has been shown to confer
species specificity against the only other class of effective competitive inhibitors
for GR2b, 10 (Figure A.2), suggesting that 3 may be developed as a broad anti-
microbial chemotherapeutic.
Surprisingly, 1 was found to exhibit apparent non-competitive inhibition against
GR (Figure 3A). Shoichet and coworkers have thoroughly documented the pitfalls
of hits, from virtual (and high throughput) screening, that show apparent non-
competitive inhibition11. It is often the case that such inhibitors form colloidal
aggregates, which lead to local protein denaturation of the target enzyme, and
thus apparent non-competitive inhibition. Colloidal aggregators can easily be
identified by performing inhibition assays in the presence of increasing
concentrations of mild detergents12. This procedure was performed on 1, which
B A KI = 59 ± 13 µMKI= 42 ± 10 µM
Figure 2. Experimental results for competitive inhibition of GR by compounds 3 (A) and 5 (B). Michaelis-Menten curves are globally fit to competitive inhibition models. See SI for experimental methods described in full.

23
showed almost total alleviation of inhibition in the presence of detergent, clearly
identifying it as a colloidal aggregator, and thus a false positive lead (Figure 3B).
It is instructive to examine the docked poses of 3 into GR using a more
thorough approach than was used in the high throughput docking that was
employed in the initial screen. Docking into both the reactive form of GR and the
crystal structure (PDB 1ZUW) were performed to compare the benefit of
employing the reactive form in the original virtual screening. In these additional
docking studies 3 is
minimized for each docked pose, followed by rescoring with the London dG
scoring function (the computational details are described in the Supporting
Information section). Two salient features emerge from this docking study: 1) the
shape of the active site pocket for the reactive form of GR enforces a very tight
distribution of possible complex structures with 3 (Figures 4A and C), while the
B
0.0 0.5 1.0 1.5 2.0 2.50
10
20
30
400 uM
30 uM
60 uM
100 uM
KI(app) = 91 7 M
D-Glu (mM)
V0 (
nm
ol/
min
)
0
5
10
15
20
25
30
35
40
% I
nh
ibit
ion
Detergent Absent
Detergent Present
A
Figure 3. 1 yields apparent non-competitive inhibition using global kinetic analysis (A), but is shown to actually be a colloidal aggregator using the detergent assay of Shoichet and co-workers
13 (B); the presence of 0.01% Triton X-100 in the assay mixture almost fully alleviates
the enzyme inhibition (see Supporting Information section for a full description of this method).

24
crystal structure (Figures 4B and D) has a wide range of distributions (the
differential in tightness of placement is quantified below) 2) calculated binding
affinities between 3 and the reactive form of GR are uniformly stronger than that
of 3 and the crystal structure, (∆G = -13.0 ± 0.80 kcal/mol for the reactive
complex versus -11.1 ± 0.80 kcal/mol for the crystal complex). Free energy
values obtained from the dG scoring function are not meant to provide a rigorous
estimate of the actual free energy of binding, but rather to provide a metric for
ranking the affinity of a ligand for its receptor in an aqueous environment (see
Supporting Information for a full discussion of the dG scoring function). The
averaged calculated dG value for the transition state complex and the crystal
structure complex with 3, together with the ligand maps in Figure 4A and C,
indicate a more favorable binding to the transition state receptor.
One may quantify the tightness in the distribution of the docked poses in the
reactive complex with 3 versus the crystal structure by calculating the overlap in
molecular volume between the docked poses, such that a high degree of overlap
(i.e., a perfect overlap in which a compound is always docked to the exact

25
volume) has a value of 1, while no overlap at all between docked poses yields a
value of 0. Calculation of the Tanimoto volume (Tvol), which is described in the
Supporting Information section, has been shown to be a superior descriptor of
similarity between docked complexes versus the more often used root mean
square value13. Here we calculated a Tvol of 0.79 ± 0.03 for 3 docked into the
reactive form of GR, versus a value of 0.64 ± 0.17 for 3 docked into the crystal
structure. This disparity is graphically illustrated in the overlap of docked poses
for both complexes in Figures 4C and D, respectively.
The reactive form of GR tightly places docked poses of 3 into highly similar
positions, as supported by the high Tvol value. However, the crystal structure
receptor yields a wide range of positions for 3 with consistently lower calculated
pKi values. Taken together, these volume overlap and calculated binding studies
establish that the selection of the reactive form of GR for virtual screening is an
attractive alternative approach for finding high affinity lead compounds, as
described in the current study.
Although 3 is not, a priori, a substrate analog, it is, in many ways, a
conformational analog to the cyclic glutamate carbanion, the reactive
intermediate described in Spies et al.5b, which is evidenced by calculating the Tvol
of the glutamate carbanion vs. the docked poses of 3 (Tvol = 0.55), as illustrated
in Figure A.3. However, as Figure A.3 indicates, the overlap between the cyclic
glutamate carbanion and 3, while reasonable in terms of molecular volume, is not
electrostatically optimal, due primarily to the region around the Cα and Cα
positions of the glutamate carbanion. One may contrast the binding of 3 versus
glutamine, a substrate analog, which has a Ki of 50 mM. It is interesting to note
that glutamine lacks the ionic and hydrogen bonding complementarity for forming
intramolecular cyclized species as observed with glutamate. It may be that GR’s

26
affinity for substrate and transition state is partially derived from these cyclized
forms.
The active site configuration of the complex between GR and 3 is structurally
reminiscent of proline racemase (a structurally related family of cofactor
independent-racemases) with the transition state analog pyrrole-2-carboxylic acid
(PYC)14, which exhibits two binding states with Ki1 = 4.6 μM and K i2 = 30 μM.
The crystal structure of proline racemase reveals that PYC is compressed
between two Cys residues, and the carboxylate is receiving five hydrogen bonds
from the active site residues. Transition to the active form of proline racemase
involves a conformation change that accommodates the planarity of the proline
ring carbanionic intermediate, which is highly analogous to the case of the cyclic
glutamate carbanion described in Spies et al.9, as well as the nature of the lead
compounds identified in the current study. In all of these systems, the plane of
the ring is perpendicular to the axis connecting the two flanking Cys sulfur atoms.
A superpose of reactive and crystal structure forms of the docked GR-complexes
illustrates that this perpendicularity between the plane of the ring and the sulfur
atoms is only present in the reactive form, while the docked crystal structure
complex is tilted and possesses significant ring strain. A characteristic feature of
all of the docked crystal structure complexes with 3 is ring strain, with O-C-C-O
carbonyl-carbonyl dihedral angles of approximately ~25˚, versus ~5˚ for
complexes with the reactive form as receptor. The differential hydrogen bonding
pattern in the docked crystal structure complex, relative to the reactive
conformation, is responsible for the sub-optimal ligation with 3. Additionally, there
is a significant reduction in the volume of the active site pocket in the reactive
form versus the crystal structure (from 188 Å3 in the crystal structure to 159 Å3 in
the reactive form).

27
The most significant property of 3 is its very large ligand efficiency (LE) value
of -0.6 kcal/mol/heavy atom. LE values are of paramount importance in
fragment-based drug discovery (FBDD), which has been a highly successful and
emerging approach for identifying promising drug candidates15, 16. The FBDD
approach aims to grow small, weak-binding (yet possessing high LE value)
inhibitors into nM inhibitors, which retain Lipinski-like rule-of-five compliance
throughout the process. LE values of -0.3 kcal/mol/heavy atom or greater are
considered to be good, since careful optimization from MW ~ 150 to > 400 should
yield a compound in the ~ tens of nM range16. However, 3 possesses an LE
value far surpassing that of a standard fragment, such that the addition of a
modest four heavy atoms places it in the nM range. Thus, 3 is an excellent point
from which to begin an optimization campaign, particularly in light of the fact that
it is effective against three glutamate racemases, each unique in their oligomeric
equilibrium as well as the presence or absence of the valine bridge (Val149 in
RacE2; Figure A.2 in the Supporting Information section).
C74
C185
Figure 5. Superpose of docked complex of GR with 3 from the reactive form (elemental color/ball and stick rendering) and GR with 3 from the crystal structure (cobalt blue/stick rendering). Each complex is from the top scoring docked configuration (see Supporting Information for further details). Only the residues of the reactive form are shown for clarity. The Connolly (solvent-excluded) surface of the pocket of the reactive form of GR is rendered in colored mesh (purple is hydrogen bonding, green is hydrophobic and blue is polar).

28
Table 2. Optimized Parameters from Global Nonlinear Regression (Competitive Inhibition Model)
Inhibitor 3 5
KM (mM) 0.34 ± 0.08 0.30 ± 0.05 Vmax (nmol/sec) 0.20 ± 0.01 0.19 ± 0.01 KI (μM) 42 ± 10 59 ± 13
R2 0.97 0.98
There are two widely accepted models that account for protein flexibility in
small molecule binding, which may be of use when considering the preferential
docking of lead compounds into the reactive form of an enzyme versus the
corresponding crystal structure. The Monod-Wyman-Changeux (MWC) model
describes an unliganded form of the enzyme, which may be in equilibrium with
numerous conformations17. The ligand may preferentially bind to one of these
sampled receptor conformations. Alternatively, the Koshland-Nemethy-Filmer
(KNF) model describes an “induced-fit” sequence, in which the ligand promotes a
series of conformational changes in the receptor18. The virtual screening
methodology presented in the current work is appropriate for systems that exhibit
behavior similar to the MWC model, since receptor conformational sampling may
be determined a priori (i.e. the reactive conformation is simply an additional,
albeit rare, form that may be elucidated by any number of methods, such as
those described in Spies et al.5b). However, systems exhibiting KNF behavior
assume conformational states that may be unique for a particular protein-ligand
complex, suggesting ambiguity in the receptor target.
Acknowledgement. This work was supported by NIH AI076830 (M.A.S.) and
NIH AI057156 (S.R.B.).

29
Supporting Information Available: Experimental and computational methods,
detailed results, controls. This material is available free of charge via the Internet
at http://pubs.acs.org.
REFERENCES.
1. Gallo, K. A.; Tanner, M. E.; Knowles, J. R., Mechanism of the reaction
catalyzed by glutamate racemase. Biochemistry 1993, 32 (15), 3991-7.
2. (a) Bugg, T. D.; Walsh, C. T., Intracellular steps of bacterial cell wall
peptidoglycan biosynthesis: enzymology, antibiotics, and antibiotic resistance.
Nat Prod Rep 1992, 9 (3), 199-215; (b) de Dios, A.; Prieto, L.; Martin, J. A.;
Rubio, A.; Ezquerra, J.; Tebbe, M.; Lopez de Uralde, B.; Martin, J.; Sanchez, A.;
LeTourneau, D. L.; McGee, J. E.; Boylan, C.; Parr, T. R., Jr.; Smith, M. C., 4-
Substituted D-glutamic acid analogues: the first potent inhibitors of glutamate
racemase (MurI) enzyme with antibacterial activity. J Med Chem 2002, 45 (20),
4559-70; (c) Lundqvist, T.; Fisher, S. L.; Kern, G.; Folmer, R. H.; Xue, Y.;
Newton, D. T.; Keating, T. A.; Alm, R. A.; de Jonge, B. L., Exploitation of
structural and regulatory diversity in glutamate racemases. Nature 2007, 447
(7146), 817-22.
3. Tanner, M. E.; Gallo, K. A.; Knowles, J. R., Isotope effects and the
identification of catalytic residues in the reaction catalyzed by glutamate
racemase. Biochemistry 1993, 32 (15), 3998-4006.
4. (a) Koo, C. W.; Blanchard, J. S., Chemical mechanism of Haemophilus
influenzae diaminopimelate epimerase. Biochemistry 1999, 38 (14), 4416-22; (b)
Pillai, B.; Cherney, M. M.; Diaper, C. M.; Sutherland, A.; Blanchard, J. S.;
Vederas, J. C.; James, M. N., Structural insights into stereochemical inversion by
diaminopimelate epimerase: an antibacterial drug target. Proc Natl Acad Sci U S
A 2006, 103 (23), 8668-73.

30
5. (a) Ruzheinikov, S. N.; Taal, M. A.; Sedelnikova, S. E.; Baker, P. J.; Rice,
D. W., Substrate-induced conformational changes in Bacillus subtilis glutamate
racemase and their implications for drug discovery. Structure 2005, 13 (11),
1707-13; (b) Spies, M. A.; Reese, J. G.; Dodd, D.; Pankow, K. L.; Blanke, S. R.;
Baudry, J., Determinants of catalytic power and ligand binding in glutamate
racemase. J. Am. Chem. Soc. 2009, 131 (14), 5274-5284.
6. Alvarez, J.; Shoichet, B., Virtual screening in drug discovery. Taylor &
Francis: Boca Raton, 2005; p 470 p.
7. Oprea, T. I., Property distribution of drug-related chemical databases.
Journal of Computer-Aided Molecular Design 2000, 14 (3), 251-264.
8. Molecular Operating Environment (MOE), 2011.10; Chemical Computing
Group Inc.: 1010 Sherbooke St. West, Suite #910, Montreal, QC, Canada, H3A
2R7, 2011.
9. (a) Bou, A.; Pericas, M. A.; Serratosa, F., Synthetic applications of di-tert-
butoxyethyne, II: new syntheses of squaric, semisquaric, and croconic acids.
Tetrahedron Letters 1982, 23 (3), 361-364; (b) Fatiadi, A. J., Pseudooxocarbons.
Synthesis of 1,2,3-Tris(dicyanomethylene)croconate salts. A new bond-
delocalized dianion, croconate blue. Journal of Organic Chemistry 1980, 45,
1338-1339.
10. Dodd, D.; Reese, J. G.; Louer, C. R.; Ballard, J. D.; Spies, M. A.; Blanke,
S. R., Functional comparison of the two Bacillus anthracis glutamate racemases.
J Bacteriol 2007, 189 (14), 5265-75.
11. Shoichet, B. K., Screening in a spirit haunted world. Drug Discovery Today
2006, 11 (13-14), 607-615.
12. Feng, B. Y.; Shoichet, B. K., A detergent-based assay for the detection of
promiscuous inhibitors. National Protocols 2006, 1 (2), 550-553.
13. Warren, G. L.; Andrews, C. W.; Capelli, A. M.; Clarke, B.; LaLonde, J.;
Lambert, M. H.; Lindvall, M.; Nevins, N.; Semus, S. F.; Senger, S.; Tedesco, G.;

31
Wall, I. D.; Woolven, J. M.; Peishoff, C. E.; Head, M. S., A critical assessment of
docking programs and scoring functions. J Med Chem 2006, 49 (20), 5912-31.
14. Buschiazzo, A.; Goytia, M.; Schaeffer, F.; Degrave, W.; Shepard, W.;
Gregoire, C.; Chamond, N.; Cosson, A.; Berneman, A.; Coatnoan, N.; Alzari, P.
M.; Minoprio, P., Crystal structure, catalytic mechanism, and mitogenic properties
of Trypanosoma cruzi proline racemase. Proc. Natl. Acad. Sci. U. S. A. 2005,
103 (6), 1705-1710.
15. Howard, S.; Berdini, V.; Boulstridge, J. A.; Carr, M. G.; Cross, D. M.;
Curry, J.; Devine, L. A.; Early, T. R.; Fazal, L.; Gill, A. L.; Heathcote, M.; Maman,
S.; Matthews, J. E.; McMenamin, R. L.; Navarro, E. F.; O'Brien, M. A.; O'Reilly,
M.; Rees, D. C.; Reule, M.; Tisi, D.; Williams, G.; Vinkovic, M.; Wyatt, P. G.,
Fragment-based discovery of the pyrazol-4-yl urea (AT9283), a multitargeted
kinase inhibitor with potent aurora kinase acitivty. Journal of Medicinal Chemistry
2009, 52, 379-388.
16. Murray, C. W.; Rees, D. C., The rise of fragment-based drug discovery.
Nature Chemistry 2009, 1, 187-192.
17. (a) Monod, J.; Wyman, J.; Changeux, J. P., On the Nature of Allosteric
Transitions: A Plausible Model. J Mol Biol 1965, 12, 88-118; (b) Tsai, C. J.;
Kumar, S.; Ma, B.; Nussinov, R., Folding funnels, binding funnels, and protein
function. Protein Sci 1999, 8 (6), 1181-90; (c) Weber, G., Ligand binding and
internal equilibria in proteins. Biochemistry 1972, 11 (5), 864-78; (d) Lee, G. M.;
Craik, C. S., Trapping moving targets with small molecules. Science 2009, 324
(5924), 213-5.
18. Koshland, D. E., Jr.; Nemethy, G.; Filmer, D., Comparison of experimental
binding data and theoretical models in proteins containing subunits. Biochemistry
1966, 5 (1), 365-85.

Reprinted (adapted) with permission from Whalen, K. L.; Chang, K. M.; Spies, M. A. Mol. Inf. 2011, 30, 459-471. Copyright 2011 John Wiley and Sons. K. M. Chang contributed inhibitory assays for several compounds. M. A. Spies contributed intellectual direction and discussions.
32
CHAPTER 2: HYBRID STEERED MOLECULAR DYNAMICS-DOCKING: AN
EFFICIENT SOLUTION TO THE PROBLEM OF RANKING INHIBITOR
AFFINITIES AGAINST A FLEXIBLE DRUG TARGET.
Abstract
Existing techniques which attempt to predict the affinity of protein-ligand
interactions have demonstrated a direct relationship between computational cost
and prediction accuracy. We present here the first application of a hybrid
ensemble docking and steered molecular dynamics scheme (with a minimized
computational cost), which achieves a binding affinity rank-ordering of ligands
with a Spearman correlation coefficient of 0.79 and an RMS error of 0.7 kcal/mol.
The scheme, termed Flexible Enzyme Receptor Method by Steered Molecular
Dynamics (FERM-SMD), is applied to an in-house collection of 17 validated
ligands of glutamate racemase. The resulting improved accuracy in affinity
prediction allows elucidation of the key structural components of a heretofore
unreported glutamate racemase inhibitor (Ki = 9 μM), a promising new lead in the
development of antibacterial therapeutics.
Introduction
The grand challenge of computer-aided drug discovery and design is the
ability to rank-order the binding affinity of known ligands/inhibitors at a
reasonable level of both accuracy and precision. This allows one to predict
potential chemical modifications of an inhibitory scaffold class with high
confidence, which offers a potentially transformative tool for medicinal chemists.
However, current methods have not displayed substantial progress.
Docking and scoring methods used on single crystal structures (or
accurate homology models) have been shown to perform well at both ligand

33
placement and distinguishing binders from non-binders (i.e., enrichment studies).
Furthermore, docking and scoring has worked well in the realm of virtual
screening (VS), where the goal is to enrich test sets with novel binding scaffolds
with approximately micromolar equilibrium dissociation constants[1]. However,
problems persist here as well, as recently reviewed by Martha Head[1].
Nevertheless, all current docking and scoring schemes completely lack the ability
to rank-order drug leads at the level of resolution necessary for efficient drug
optimization. There are a plethora of docking packages and approaches that
account for receptor flexibility[2-7], by employing various versions of ensemble
docking, and show improvements in ligand placement versus single crystal
structure cross-docking. However, it should be emphasized that none of these
approaches has demonstrated any improvements in rank-ordering relative ligand
binding affinities. The current consensus is that affinity rank-ordering is beyond
the means of any simple scoring function, even when flexibility is taken into
account[1, 8-10].
Late-phase drug discovery depends critically on the ability to predict how
affinity to a 3D pharmacophore changes with the structure of the lead compound.
The particular role that relative free energy calculations play in the drug lead
optimization process has been recently reviewed[9, 11]. More sophisticated
treatments to directly calculate the free energy of binding of a ligand to a target
have made noteworthy progress in the last decade, and have recently been
reviewed by Shirts et al. [9] On the other hand, direct free energy calculation
methods based on molecular dynamics (MD) simulations such as thermodynamic
integration (TI)[12] and weighted histogram analysis method (WHAM)[13, 14] are
both technically challenging to implement and usually very computationally
expensive. Furthermore, there is not yet a wide consensus that such methods
meaningfully improve rank-ordering, relative to well designed endpoint methods
that utilize implicit solvation models (MD/MM/PBSA/GBSA)[9, 15]. Additionally,

34
even the most inexpensive TI and WHAM-based calculations of binding free
energies are certainly not applicable to large numbers of compounds.
Hybrid MD/Docking studies have recently shown progress at improving
affinity rank-ordering relative to docking against a single crystal structure[16], but
rely on multiple docking simulations for every ligand tested. Here we present a
novel hybrid method for accurate and precise affinity rank-ordering of ligands
against a challenging enzyme drug target, which employs a combination of
steered molecular dynamics (SMD) simulations, ensemble docking and solvation
free energy calculations of the enzyme. The method has been termed Flexible
Enzyme Receptor Method by Steered Molecular Dynamics (FERM-SMD), and
gives outstanding correlations with experimental values at a fraction of the
simulation costs of methods that rely on extensive MD-based sampling (vide
infra). SMD yields information beyond the normal MD timescale (10s to 100s of
ns) by applying a harmonic force potential along a defined path. Although the
magnitude of the forces and timescales employed may not be compared to the
experimental (i.e., in vitro) studies, it has been shown that SMD simulations have
accurately predicted macromolecular behavior, often with short simulation times.
SMD simulations have been used to determine a variety of macromolecular
phenomena, including binding/unbinding of small molecule-protein complexes,
protein-protein adhesion and stretching of muscle proteins[17-20].
The receptor employed to test this hybrid SMD/Docking approach to ligand
affinity rank ordering is the enzyme glutamate racemase (GR), which catalyzes
the reversible isomerization of L- to D-glutamate[21], a key step in synthesis of the
peptidoglycan cell wall of Gram-positive and -negative bacteria[22], and is
accordingly a recognized drug target for development of antibiotics. GR is a
member of the pyridoxal phosphate-independent family of racemases and
epimerases, which have been the subject of recent mechanistic and structural
advances[23-30]. Knockout studies have shown that the absence of an active form
of GR is lethal for the target cells[31]. Despite attempts from several academic and

35
pharmaceutical labs, progress in lead discovery and therapeutic development
based on GR inhibition has been limited. Successful leads (IC50’s in the low μM-
and high nM-range) are limited to a competitive class of 4-substituted glutamate
analogs[32], an uncompetitive class of pyrazolopyrimidinediones[33], and two
competitive inhibitors located via virtual screening against GR transition state
structures[29]. GR is a challenging system to study in silico due to its inherent
flexibility. This is not an uncommon problem with enzyme targets, and
undermines the core assumption of the majority of tools used in CADD (i.e., drug
design targeting a unique receptor structure). The ligand set employed here, a
total of 17 compounds, is composed entirely of validated, competitive GR
inhibitors (with the exception of D-glutamate, the native substrate) discovered in-
house from previous virtual screening campaigns against GR as described by
Spies and coworkers[26].
Contrary to the technique successfully employed by Spies and coworkers[26]
as well as Whalen and coworkers[29], which focuses on targeting an enzyme
conformation related to the chemical step of the catalytic cycle (i.e., the catalytic
transition state), this study attempts to represent receptor flexibility with
conformations sampled in the process of substrate unbinding. In this study, we
present the utilization of FERM-SMD in the elucidation of the structure-affinity
relationship of a novel competitive GR inhibitor (heretofore unreported), which
displays a Ki of 9 μM (the lowest Ki yet reported for a GR inhibitor). Importantly,
the rank-ordering results presented here meet or exceed a number of critical
accuracy and precision thresholds often cited as performance standards in
CADD.
Results
Discovery of Glutamate Racemase Inhibitors of Varying Scaffolds and
Potencies.

36
All ligands referred to in this study fall into two categories based on their
method of selection for use: 1) those identified from a previous in silico screening
study and 2) glutamate analogs (See SI Data for a full account of the source of
active compounds). The group of ligands identified from virtual screening can be
further categorized into: 1) hits originally ranked in the virtual screening study and
2) hits derived from ranked compounds but not present in the original library of
compounds. Co-crystal structures exist only for compounds 4 (D-glutamate, PDB
1ZUW), 16 (citrate, PDB 2JFV), and 17 (tartrate, PDB 2JFW). Despite being co-
crystallized with GR previously, inhibition by compounds 16 and 17 had not been
characterized until now. All compounds derived from virtual screening underwent
full structural characterization as well as controls for non-specific inhibition, which
can be found in the Supplemental Information (Fig. B.6 and B.7).
All compounds were assayed for inhibition against glutamate racemase
from Bacillus subtilis (RacE, abbreviated in this study as GR) in-house.
Compounds 2, 3, and 9 were presented previously as being competitive
inhibitors of BsGR by our group[26, 29]. Compounds 1, 5-8, and 10-17 are
presented here for the first time as being inhibitors of GR. Compound 4 is the D-
enantiomer of the native substrate, glutamate. Inhibitors discovered here range in
potency from low-µM (Ki = 9 µM) to high-mM (IC50 = 50+ mM), a range of 5 log-
units (Fig. B.4). Additionally, this set of 17 ligands is unique in its wide diversity of
structures (see Table B.1 for all structures), a testament to the flexibility of GR in
that the active site can accommodate inhibitors with solvent accessible volumes
ranging from 307 Å3 to 482 Å3. Worth highlighting is a promising new class of GR
inhibitors represented by 1 and 6. Compound 1 is particularly impressive in that it
possesses a ligand efficiency of 0.53 kcal/mol/heavy atom and is a verified
competitive inhibitor (Fig. B.4, as verified by global fitting to varying inhibition
models). This high ligand efficiency may facilitate the development of a nM
inhibitor that maintains a low molecular weight[34]. The scaffolds of these
sulfonate-containing aromatic compounds offer an assortment of possible

37
modifications that have the potential of increasing the potency into the nM-range.
Additionally, this scaffold lies in a similar chemical space as known therapeutics
(particularly, the recently reviewed class of sulfa drugs[35]), indicating an
increased likelihood of bioactivity[36-40].
1
Ki = 9 M
6
IC50 = 600 M
Docking to the GR Crystal Structure Gives Little-to-No Information About
Rank Order of the Ligand Set.
Docking of inhibitors to a single crystal structure of glutamate racemase
from B. subtilis (PDB 1ZUW) results in a poor Spearman correlation coefficient
(denoted, R) between predicted and actual binding energy (Fig. 6, R = 0.53).
Specifically, this method of docking and scoring more often errs on the side of
overestimating the potency of inhibitors (Table B.1 for affinity predictions). A
handful of inhibitors displayed inhibition in the low mM range (IC50 = 1-10 mM)
but were predicted by docking to possess binding constants in the hundreds and
in some cases even tens of µM. This trend of overestimation of affinity would
indicate that an unfavorable component of complex formation is not being
accounted for in this method. An important corollary of the above is that the RMS
error (1.2 kcal/mol) from the linear regression is beyond the limit for what is
considered “practical accuracy” (1 kcal/mol)[9, 41], which reduces the usefulness of
this correlation in structure-based drug design.

38
Figure 6. Correlation of binding energy for 17 inhibitor-GR complexes as
predicted by docking to the crystal structure and experimental-derived binding
affinities (as Ki or IC50 values), many of which are presented here for the first
time. Experimental results were determined using circular dichroism or a pre-
established colorimetric coupled-enzyme assay, depending on the optical activity
of inhibitor compounds. Docking studies were conducted using a single monomer
of GR from the previously solved co-crystallization of GR from B. subtilis, RacE,
with D-glutamate (1ZUW). Ligands were allowed to explore space limited to the
GR active site. Only the predicted binding energy of the top-ranked binding pose
for each inhibitor is represented on the graph. Data is fit to a semi-log regression
and the Spearman correlation coefficient, R, is noted. The ± 1 kcal/mol threshold
is marked (dotted lines).
Classical MD Simulations of GR-Ligand Complexes Show Receptor
Heterogeneity at the Equilibrated Active Site.
Half-nanosecond MD simulations were conducted on the top-docked
poses of all GR-inhibitor complexes, following simulated annealing energy
minimization, in an attempt to better represent the true complex and improve
0.01 0.1 1 10 100
-10
-8
-6
-4
-2R=0.53
Experimental Kd (mM)
G
bin
d (
kcal/
mo
l)

39
binding energy predictions. Time series data for all of the MD trajectories of GR-
inhibitor complexes are located in Figure B.5 of the SI. We observed that the final
equilibrated complexes varied widely in their degree of opening at the active site
(i.e., the area of the active site entrance). The area is defined by the γ-carbons of
four proline residues that form a plane at the mouth of the active site (residues
41, 44, 146 and 150). The spectrum of areas induced by the presence of inhibitor
ranged from 47.4 Å2 (for 1) to 63.6 Å2 (for 7).This metric for opening is also used
in the SMD studies (vide infra). Figure 7 illustrates the opening metric.
Figure 7. Image of GR (white surface area) with 3 (stick, blue/red/green) bound in
active site. The γ-carbon atom of four proline residues (red; Pro41, Pro44,
Pro146, Pro150) designate the perimeter of the active site entrance. Five
distances (yellow) composing two irregular triangles are calculated to
approximate the area of the active site entrance of varying inhibitor-GR
complexes after energy minimization and 500 psec of molecular dynamics
simulation.

40
It is reasonable that large changes in the degree of opening of the active
site, and generally large changes in the structure of GR (which seem to be
captured or represented in the distribution of equilibrated GR-ligand complexes)
will alter physical parameters that determine the ligand affinity. For instance, one
would expect large changes in the protein solvation energy of a very open GR
complex versus a closed complex, due to its very polar and H-bond donating
interior. This question is best addressed by the use of steered MD simulations
(vide infra), since high energy transitions on the ligand binding trajectory can be
obtained without prohibitively long simulation time.
Steered MD Unbinding Simulation of the Native Substrate (Glutamate)
Shows a Correlated Pattern between Protein Solvation Energy and Area of
Active Site Opening.
In order to investigate if there is a relationship between the degree of
opening and the protein solvation energy we employ SMD to capture a
reasonable ensemble for the entire unbinding process for the substrate, D-glu.
By plotting the area of the active site entrance and the protein solvation energy
as a function of the distance between glutamate and GR (obtained from our SMD
simulations), a pattern between protein conformation and solvation (Fig. 8)
becomes apparent. The active site entrance area opens incrementally as
glutamate is being pulled out of the active site, suggesting that the active site is
closed tightly in the Michaelis-Menten complex and conformational changes must
occur to accommodate the passage of glutamate back through the entrance
during product release. The entrance area reaches a maximum when the
glutamate center of mass is 46.7 Å from the center of mass of GR and this
maximum is immediately followed by a decrease in entrance area indicating the
relaxation of GR upon complete substrate release into bulk solvent. This SMD
simulation agrees with the previous notion that GR undergoes conformational
changes during its catalytic cycle, and now shows that these conformational

41
changes correspond to significant changes in the protein solvation energy, which
will directly affect complex affinity (i.e., more negative protein solvation energies
will contribute to weaker ligand binding; vide infra).
Figure 8. a) Area of active site entrance and corresponding protein solvation
energy at varying time points along the trajectory of a Steered Molecular
Dynamics simulation. The x-axis corresponds to the distance between the center
of the mass of D-glutamate and the center of mass of GR as D-glutamate is
being pulled out of the active site. The area of the active site was calculated as
explained above. Protein solvation energy was calculated for each time-point
using the Poisson-Boltzmann method with an internal dielectric of 25, a solvent
dielectric of 78, and a salt concentration of 0.1 M. The region shaded in yellow
represents entrance areas observed for inhibitor-GR complexes after standard
MD simulation. Twelve structures were selected arbitrarily for analysis. Arrows
indicate structures selected for use in ensemble docking. b) The user-defined exit
vector for D-glutamate (shown in stick rendering) from the active site of B. subtilis
GR employed for SMD unbinding simulations is shown as a red arrow leaving the
active site entrance. The external force was applied only along the pulling vector.
The glutamate was not constrained in the plane orthogonal to the pulling vector
(see Computational Methods section for a detailed description of the SMD
unbinding).

42
The data from the SMD simulation in Figure 8 covers a relatively large
range of openings, relative to the areas of opening seen in equilibrated GR-
ligand complexes obtained from classical MD simulations (Fig. B.5). The range of
openings seen in GR-ligand complexes from classical MD is depicted by the
yellow shaded area in Figure 8 (i.e., opened GR structures captured by ligands
may be a subset of structures in the SMD D-glu-unbinding trajectory). If the
distribution of conformations of GR is relatively independent of the nature of any
particular active site ligand, then a single SMD unbinding simulation with the
natural substrate (which is also the ligand in the original co-crystal structure)
would be a sufficient approximation of the liganded ensemble of GR, and obviate
the need for unbinding simulations for any particular ligand of interest. In other
words, this simple, single SMD with D-glu is used to construct a new target, in
lieu of the crystal structure. It is important to stress that the SMD simulation is
only ever performed one time (i.e., on the native substrate), which is used to
prepare the new target ensemble, which will be docked against the library of
ligands used in this study.
The Flexible Enzyme Receptor Method for Steered-MD Docking (FERM-
SMD).
The following docking and scoring method incorporates the structural data
obtained from the SMD procedure described above for the binding trajectory of
the native substrate with GR in order to improve ligand rank ordering relative to
classical docking (where only a single structure is used as a receptor). The
dominant trend in the erroneous rank-ordering of classical docking with GR is
both the assignment of high affinities to weak inhibitors and the large scatter in
the correlation between predicted and experimental binding energies. The
incorporation of an ensemble of structures taken from the GR-substrate

43
unbinding trajectory allows one to largely correct for these problems with
classical docking, as described below.
Figure 8 clearly shows the trend in solvation energy of GR with opening.
When calculating ligand binding free energy values with endpoint methods
(reviewed recently[42]), ΔGbind is composed of constituent parts of a
thermodynamic box that involves solvation of the individual components. The
binding energy expression is:
Equation 1 shows that the more negative the value of ΔGbind,solv then the more
positive will be the overall ΔGsolv,receptor for a given ligand, assuming all other
parameters are constant. Thus, structural changes in the receptor that lead to
more favorable solvation energies will result in more unfavorable (i.e., weaker)
binding of a given ligand, assuming that the solvation energy of the GR-ligand
complex is relatively unchanged.
Our hypothesis is that this is the major feature that is causing over
estimation of ligand affinity for GR using classical docking. For the case of GR,
this means that the larger openings of GR-ligand complexes and their more
favorable solvation energies of their corresponding protein component would
lower binding affinities of ligands that populate those states (assuming that the
GR-ligand complex solvation energy is not greatly different than the fully closed
state). This concept is illustrated in Figure 9, which depicts a central manifold that
represents the native substrate (dark grey structure) unbinding trajectory, which
has been elucidated with SMD (Fig. 8a). A substrate analog (black structure,
upper manifold of Fig. 9) has a high affinity for the closed state (which closely
matches the crystal structure), and little affinity for more opened states; this
represents a situation where binding affinity would be well predicted using
classical docking methods, and approximates a true positive. On the other hand,

44
some compounds (light grey structure, lower manifold of Fig. 9) will have an
affinity for multiple structures along the ligand unbinding trajectory. To the extent
that open forms are highly complementary to a given ligand, the classical docking
assumptions fail, for numerous reasons, as outlined above. Therefore,
compounds that "capture" or form complexes with more open GR structures
should be identified and have a weighted docking score that accurately reflects
the reduced affinity. A weighting scheme based on a statistical
thermodynamically-determined ensemble from SMD is one approach to construct
a corrected binding energy calculation. However, energies obtained via SMD are
notoriously not reflective of experimental conditions[18,19]. In the FERM-SMD
scheme presented below, the inhibitor-enzyme distribution is determined by a
weighting factor based on the relative binding affinity of a given ligand within the
SMD ensemble, while the ΔΔGprotein,solv (i.e., the change that occurs in the open
state relative to the closed state) is used to correct the predicted binding affinity
of each inhibitor-enzyme complex, as described below.

45
Figure 9. Scheme for Hybrid Steered Molecular Dynamics-Docking and how it
might elucidate rank-order decoys (RODs) amongst a set containing true
positives. In the boxed region is a simplified representation of steered molecular
dynamics (SMD) including the removal of substrate (yellow) along the indicated
vector (arrow), and resulting in the subsequent opening of GR. Structure
ascertained from SMD are then used as receptors in docking of inhibitor 1 (blue)
and inhibitor 2 (red). A true positive (as is the case for inhibitor 1) will result in
high affinity binding to the closed for (Kd = X) and low affinity binding to the open
form (Kd > X). A rank-order decoy (as is the case for inhibitor 2) will result in high
affinity binding to the closed form (Kd = Y) but also high affinity binding to the
open form due its ability to also bind an alternate binding mode only present in
the open form (Kd < Y).
The FERM-SMD/Docking weighting and correction method is summarized as
follows:

46
Eq. 2
Eq. 3
Eq. 4
where, is the predicted binding metric (more negative value
corresponds to tighter binding); is the correction factor for docking to the nth
structure of an ensemble of target structures obtained by steered MD unbinding
of the natural substrate (i.e., a single SMD simulation used for all docking
studies); is the predicted change in free energy for binding of a given
ligand to the nth structure of an ensemble of target structures obtained from SMD,
as described above; is the change in solvation energy of the nth structure
of the SMD ensemble, going from a low dielectric constant to that of aqueous
solvent, by numerically solving the Poisson-Boltzmann (PB) equation; is
the change in solvation energy of a reference structure of the SMD ensemble
(here the most closed or starting structure), going from a low dielectric constant
to that of aqueous solvent, using PB approaches (as above); is the weighting
factor for docking a given compound to the nth structure of the SMD ensemble;
is the equilibrium dissociation constant obtained for docking a given ligand to
the nth structure of the SMD ensemble using AutoDock. represents a
summation of all of the calculated equilibrium constants determined via docking
to the SMD ensemble for ligand .
The FERM-SMD/Docking approach is to simply dock any given ligand to
representative structures from a single SMD simulation from Figure 8
(performed on D-glu), which are indicated by the black arrows (in Fig. 8A), and
span the range from essentially fully closed to the most open (for overlay of

47
structures, see Fig. B.1). When applied to the 17-ligand set of GR, the correlation
between predicted and experimental binding energies increases to R = 0.79 with
an RMS error of 0.70 kcal/mol. This is a significant improvement relative to
orthodox docking, in both of the critical areas of R value and the RMS error (i.e.,
scatter). Importantly, these large improvements were obtained with little
additional simulation time (vide infra). This is a noteworthy improvement in the
field of predicting ligand affinities and performs well against both expensive free
energy approaches (TI and WHAM[13, 43, 44]) and significantly surpasses most end
point methods (MD/MM/PBSA/GBSA type[15, 43, 45, 46]) as well as other ensemble
MD/Docking methods[16]; when one considers the improvement in rank-ordering
(relative to standard docking) of a set of ligands per simulation time, relative to
more expensive techniques, the FERM-SMD/Docking approach is exceedingly
attractive. This will be fully discussed below.
Figure 10. Correlation of binding free energies as predicted by FERM-
SMD/Docking and experimental binding affinities from various inhibitor-GR
complexes. FERMScore values are predicted using the FERM-SMD/Docking
scheme described above. Experimental binding constants are approximates
0.01 0.
1 1 10 100
-3
-2
-1
0
1
R=0.79
Experimental Kd (mM)
FE
RM
Sco
re

48
based on experimentally-derived KM, Ki and IC50 values. Data is fit to a semi-log
regression and the Spearman correlation coefficient is noted. The ± 1 kcal/mol
threshold is marked (dotted lines).
In order to explore whether significant improvement in the correlation
could be attributed simply to ensemble docking regardless of where receptor
structures were acquired, the FERM-SMD/docking method was performed where
SMD-derived structures were replaced with three structures acquired from a 16-
nanosecond classical MD simulation of an apo-RacE monomer. QR analysis was
conducted on snapshots from the classical MD simulation to provide the three
most structurally-distinct snapshots and best represent the sampled structural
space. QR analysis has been shown previously to successfully distill MD results
structurally without losing representation energetically[47,48]. With all other aspects
of the scheme remaining the same, this modified method did not improve upon
the correlation achieved by orthodox docking (Fig. B.3). This finding reaffirms the
ability of SMD to sample a greater structural space and this supports the idea
that relatively large global fluctuations are a key parameter in correcting rank
ordering with a flexible target. Also worth noting, individual docking to any one of
the three structures acquired from SMD does not result in an improvement in the
correlation over orthodox docking to the crystal structure (Fig. B.2), pointing to
the importance of ensemble docking and ruling out the possibility of FERM-
SMD’s success being simply the result of a single structure providing a more
optimal receptor.
A particularly difficult challenge for any computational method is to rank
order congeneric sets. All of the compounds in our 17 ligand set have a low
molecular weight (124-260) and negative charges, consisting of carboxylates
and/or sulfonates (except 2, which has an oxyanion), with some variation in the
number of rotatable bonds. If one examines, for instance the subset of
compounds that have single sulfates, and compares the rank-order performance

49
of orthodox docking versus FERM-SMD/Docking (Table 3, see Table B.1 for a
complete table of predicted and experimental affinities), it is apparent that the
former results in a narrowing and incorrect ordering, while the latter results in a
spreading out of the affinities that mirrors the experimental trend. It is instructive
to examine how the SMD ensemble is used to dock and score compounds into a
more realistic rank-ordering. Figure 11 compares the "well-behaved" 1 which
possesses a relatively enhanced binding affinity for the closed form of GR (Fig.
11a and 11b) to 10, which tends to partition into more open forms of GR, relative
to 1. This differential partitioning would pose serious problems for accurate rank-
ordering using classical docking, but is corrected using FERM-SMD scoring.
Table 3. Predicted and experimental binding constants of select sulfonate-
containing ligands to exemplify the superior rank-ordering of the FERM-SMD
method.
Compound Predicted Binding Constant (mM) Actual Binding Constant (mM)
Crystal Only FERM-SMD
1 0.29
0.002 0.009
6 0.76 0.44 0.6
10 0.23 0.91 1.9
15 62.0 8.9 63
*Relative binding constants are predicted by docking to the crystal structure
(“Crystal Only”) or by docking to the SMD-derived ensemble (“FERM-SMD”) and
calculated using the logarithmic regression shown in the correlations in Figure 6
(y= -0.334ln(x)+5.883 ) or Figure 10 (y= -0.163ln(x)+1.194), respectively.

50
Figure 11. Example of partitioning of false positive (rank-order) decoys into open
forms of GR from the SMD ensemble used in the FERM-SMD/Docking
procedure. Panels a and b illustrate the case of a "well behaved" ligand, in that it
does not partition into opened structures; Panel a is the ligand map for the top
docked pose of 1 to the closed form, which is strongly favored in this case; panel
b is the top docked conformation into an opened structure from the GR SMD
ensemble, which has a strongly diminished affinity for the target, showing a
change in the hydrogen bond donors to sulfate and more solvent exposure of the
ligand relative to the closed complex. Panel c and d summarize the binding
pattern of the rank-order decoy, 10, which partitions into the more opened forms
of GR (relative to compound 1); the FERM-SMD/Docking approach identifies and
corrects the scores of these rank-order decoys, as described in the text.

51
Discussion
Presented here for the first time is a set of bona fide inhibitors of
glutamate racemase (13 of the 17 ligands analyzed by FERM-SMD/Docking)
spanning a large range of potencies and scaffolds. Especially interesting is the
discovery of a unique family of sulfonate-containing aromatic compounds
characterized best by 1, which has the lowest Ki (9 µM) of any GR inhibitor yet
characterized. It is noteworthy that several studies have identified antibacterial
and antifungal activity as well as the low toxicity of 1 (and derivatives thereof)[38,
39], however the target and nature of the bioactivity were not determined.
Compound 1 is one of our most promising leads for optimization, and thus it is
essential that the structural moieties responsible for its relatively high affinity and
ligand efficiency be clarified. Not surprisingly, Figure 11 indicates that rank-
ordering, and thus logical structure based design is problematic without
increased accuracy and precision in the prediction of binding free energies.
Surmounting this barrier will facilitate the development of sorely-needed
antibacterial therapeutics.
It has become clear that the main failure of docking for a flexible target,
such as GR, is the gross assumption of a single representative structure for the
receptor. Previous studies have reported the successful implementation of
ensemble docking in virtual screening as a means of addressing receptor
flexibility and improving enrichment and the accuracy of ligand placement[2, 7, 49].
This study aims at extending the reach of classical docking into the realm of
affinity rank-ordering by enhancing target information (i.e., steered ensemble
docking). The wide variety of programs and approaches for representing local
receptor flexibility by using thermal sampling techniques mixed with classical
scoring functions are not appropriate for solving the affinity rank-order problem.
The authors are not aware of any published study in which such approaches are
tested for the ability to rank-order validated sets of inhibitors.

52
The FERM-SMD/Docking approach represents receptor flexibility in an
inexpensive manner by utilizing ensemble docking of SMD-derived structures,
which when combined with solvation free energy calculations, corrects for
previously inaccurate rank-ordering of ligands. This relatively inexpensive SMD
simulation provides a much improved target (ensemble) than the single crystal
structure used in orthodox docking and virtual screening. The improvement in
Spearman correlation coefficient (R = 0.79) and precision (RMSE = 0.7 kcal/mol)
due to the FERM-SMD/Docking, places this approach amongst the highest
accuracy (as measured by rank-order correlation) methods that have been
published. The best methods for achieving high accuracy and precision are
mostly alchemical approaches (e.g., TI)[9, 11, 44, 50, 51], reaching R values in the
range of 0.72 to 0.85 and RMSE values in the range of 0.4 kcal/mol to 0.7
kcal/mol. However, several studies achieved high accuracy (R > 0.7) using
endpoint approaches (e.g., MM/GBSA[15]), but these often had much lower
precision than alchemical methods[9, 15, 43, 45, 46]. Several authors have cited a 1
kcal/mol threshold value as having real benefits in the workflow of lead
optimization[9, 41]. However, the benefits of precise prediction of relative ligand
affinities extend beyond simple synthetic convenience. This is especially true in
the rapidly changing landscape of natural products synthesis, as recently
reviewed by Li and Vederas[52]. Currently, the intersection of drug discovery and
natural products is characterized by great compound diversity and even greater
synthetic expense, thus the importance of accurate rank-ordering goes beyond
improvement of workflow and will most likely mean the difference between
pursuit and abandonment of a candidate compound. Consequently, accuracy
and precision is best achieved with either alchemical approaches or an efficient
ensemble docking and scoring method, such as FERM-SMD or the
Docking/MD/LIE of Stjernschantz and Oostenbrink (2010)[16].
One recent and noteworthy study by Stjernschantz and Oostenbrink
outlined the successful implementation of a hybrid docking and MD scheme that

53
employs end-point Linear Interaction Energy (LIE) calculations for cytochrome
P450 2C9[16]. Under the assumption that a multitude of binding poses not only
exist but each contribute to the overall binding affinity of a ligand to P450 C29,
classical docking to a crystal structure was carried out and 4 pre-determined
poses (of varying ligand orientation within the active site) were selected from the
docking results. These select four complexes were then subjected to 2 nsec of
MD simulation and binding energy calculations via LIE. The correlation of
predicted and experimental binding energies of a set of 12 ligands was improved
significantly (R=0.83, RMSE=0.7 kcal/mol) over ChemScore alone (R=0.55; the
scoring function utilized by GOLD)[16]. This method is comparable in accuracy
and precision to the scheme presented here but differs greatly in its
computational requirement. Contrary to the FERM-SMD method, the method
discussed above requires four individual MD simulations for each ligand. The
FERM-SMD method uses approximately 50 psec production simulation time for
the actual SMD, while alchemical methods often employ about 20 nsec per
ligand, depending on the number of λ values used per transformation, often
resulting in hundreds of nsec per entire ligand set[42].
Another study, by Colizzi et al.[53], recognizes that orthodox docking fails to
represent the true binding energy of a congeneric set of β-hydroxyacyl-ACP
dehydratase inhibitors. By exploiting the power of SMD to capture conformational
states that are otherwise not sampled by classical MD, the method developed in
this study correctly partitions inhibitors into “active” (IC50 values in the low μM-
range) and “inactive” compounds by comparing the force profiles produced from
individual inhibitor-unbinding SMD simulations. Like the study conducted by
Stjernschantz and Oostenbrink, this method requires individual MD simulations
for each inhibitor, a more costly undertaking than the single SMD simulation
required by FERM-SMD. Additionally, the method developed by Colizzi et al. has
not yet demonstrated whether the generated force profiles have the resolution to
allow for accurate rank-ordering of a set of ligands, only general partitioning of

54
inhibitors that vary in potency by a factor of at least two orders of magnitude (ie.
an enrichment study).
Currently, the FERM-SMD method is not without limitations. Primarily, the
applicability of the method is limited by the ability to correctly represent unbinding
in a steered molecular dynamics simulation. Specifically, correct sampling is
essential to the accuracy of the subsequent docking and scoring. For this
system, the pulling vector used in SMD was easily estimated (as should also be
the case for other enzymes with buried active sites and a single substrate
entrance/exit). However, in the case of enzymes with large, poorly-defined active
sites, determining the correct pulling vector for an unbinding SMD is far less
trivial. If the unbinding (or binding) trajectory is non-obvious, elucidation may be
achieved by multiple exit vector SMD simulations, which may significantly reduce
the efficiency of the improvement in accuracy. However, even this may be
preferable to performing alchemical calculations on a large set of ligands.
Additionally, at this time, FERM-SMD is not an accurate means of calculating
absolute binding free energies. It should be noted that a variety of MD sampling
approaches have been used to determine precise absolute free energies of
binding for one or a few compounds[50, 54, 55], with errors of only 1 or 2 kcal/mol,
but here we only consider comparisons of methods for accurate and precise
determination of relative binding free energy from validated sets of inhibitors.
Mobley et al. suggested that it may be necessary to account for not only
protein conformational changes alone, but also to determine the free energy
differences associated with the conformational transitions in the receptor, in order
to achieve free energy calculations with high accuracy[50]. Indeed, FERM-
SMD/Docking takes into account a correction based on estimated changes in the
ΔGSolv,Receptor between different structures of the ensemble, which are used to
correct the docking score, where it is assumed that ΔGSolv,Receptor is the dominant
factor in free energy changes between structures in the ensemble. Thus, this
parallels the predictions made by Mobley et al. that not only would one have to

55
account for structural changes that occur in the target, but also to consider
energetic changes that occur between such structures. However, it is surprising
that a correction simply based on endpoint ΔGSolv,Receptor using PB approaches
would be sufficient to achieve the large enhancement seen in this study. This
may be due to the accuracy of the AutoDock scoring function to predict ligand
affinities (for binding to a single receptor structure, i.e., with no receptor
flexibility), which includes empirically parameterized terms for ligand desolvation
and entropy. Furthermore, the version of AutoDock used in this study (a module
of the YASARA Structure package, YASARA Biosciences[56]) employs a more
sophisticated charge acquisition scheme than standard AutoDock packages,
based on a semi-empirical quantum chemical RESP-like autoSMILES method[57,
58].
In the future, it would be desirable to apply this method to other flexible
enzyme targets in order to test the applicability of FERM-SMD/Docking across a
range of enzyme classes as well as reveal any additional inadequacies or biases
inherent to the system. As pointed out by Shirts et al., obtaining high-accuracy
ligand binding data has been surprisingly problematic[9]. However, the recently
NIH-funded initiative, Community Structure-Activity Resource (CSAR)[59], has
begun to address this problem by curating high quality binding and structural
data from previously proprietary pharmaceutical databases.
A hybrid Steered-MD-Docking procedure has been described, which
corrects the rank ordering of a set of 17 inhibitors of the highly flexible,
antimicrobial drug target, glutamate racemase. The current study employs this
technique in the elucidation of binding determinants for a new class of sulfonate
GR-inhibitors, best exemplified by 1, which was shown in this study to be a
competitive inhibitor with a Ki of 9 µM. This hybrid SMD-Docking approach is
shown to have high accuracy, precision and efficiency (i.e., improvement in R
value per total simulation time), when compared to the many other methods that
attempt to predict binding affinities for protein-ligand complexation.

56
Materials and Methods
Materials. Inhibitor compounds were acquired from a variety of
vendors. Chemical or common names are listed and catalog numbers as well as
numeration utilized in the current study is noted in parenthesis. Croconic acid (2,
LT00453399) was purchased from Labotest (Bremen, Germany). 4-Hydroxy-1,3-
benzenedisulfonic acid (3, BAS 00124393) was purchased from Asinex
(Moscow, Russia). From Sigma Aldrich (St. Louis, MO) we obtained the
following: α-ketoglutarate (5, K1875), tartrate (16, 228729), D-glutamate (4,
G1001), D-glucuronic acid (8, G5269), citrate (17, C8532), 4-pyridazine
carboxylic acid (12, 297763), (R)-(+)-2-pyrrolidone-5-carboxylic acid (13,
422614), 2-hydroxy-5-nitrobenzenesulfonic acid (11, S364169), chloroaniline-4-
sulfonic acid (6, S438774), and benzimidazole-2-sulfonic acid (1, 530646). Both
dipicolinic acid (9, 02321) and L-pyroglutamic acid (14, 83160) were supplied by
Fluka, while formylbenzenesulfonic acid (10, S0122) and methyl-propene-
sulfonic acid (15, M1408) were purchased from TCI America (Portland,
OR). Compound 13a (7) was generously provided by Igor Komarov (Kyiv Taras
Shevchenko University, Kyiv, Ukraine)[60]. The %-purity and method of purity
analysis for each active compound is listed in Table B.1. Concerning the
coupled-enzyme assay, all reagents were purchased from Sigma Aldrich:
iodonitrotetrazolium (I8377), diaphorase (D5540), ATP (A7699), NAD+ (N7004),
and L-glutamate dehydrogenase (G2501). All reagents related to buffer
preparation for protein purification and circular dichroism were purchased from
Sigma-Aldrich. Amicon centrifugal filtration devices were purchased from
Millipore (Billerica, MA). Finally, HIS-Select Cobalt Affinity Gel (H8162) was
purchased from Sigma-Aldrich.
Protein Expression and Purification. A 10 mL starter culture of LB medium with
100 μg/mL ampicillin was prepared from the stock E. coli BL21 (DE3) cells
containing pET-15b plasmid (cells and plasmid acquired from Novagen/EMD

57
Biosciences [San Diego, CA]) with the gene encoding RacE from B. subtilis and
grown overnight at 37 °C with rotation. The 10 mL starter culture was back-
diluted into 1 L fresh LB medium with 100 μg/mL ampicillin. Cells were grown at
37 °C with shaking until the optical density at 600 nm reached 0.5-0.8. Protein
expression was induced upon addition of a final concentration of 0.1 mM IPTG.
Following induction, cells were grown for an additional 16-20 h at 37 °C with
shaking (16 °C for mutant proteins). Cells were harvested by centrifugation at
5,000 x g for 15 min. Cell lysis was achieved through sonication (3x 20 sec
cycles, 23 kHz and 20 W), using a 100 Sonic Dimembrator (Fisher Scientific).
Insoluble materials were pelleted by centrifugation at 30,000 x g for 30 min and
clarified lysate was applied to batch-style affinity chromatography using His-
Select Cobalt Affinity Gel. Concentrated eluant was incubated at 37 °C for 15 min
with 1 mM ATP and 1 mM MgCl2 to remove high molecular weight contaminants
suspected to be chaperones. Eluant was then diluted 10-fold with H2O and
submitted to ion exchange chromatography using a BioRad Uno Q1 column on a
BioRad BioLogic DuoFlow HPLC. Pooled fractions were then exchanged into
protein storage buffer (50 mM Tris, 100 mM NaCl, 0.2 mM DTT, pH 8.0) and
concentrated utilizing a 10,000 MWCO Amicon centrifugal filter device. Finally,
protein stocks were stored at a final concentration of 7-10 mg/mL with 20%
glycerol at -20 °C.
Enzyme Kinetics via Circular Dichroism. Racemization of D-glutamate to L-
glutamate by glutamate racemase (GR) was assayed by measuring molar
ellipticity at 225nm continuously for 15 min using a JASCO J-720
spectropolarimeter (JASCO Inc., Easton, MD). IC50 curves were acquired in the
presence of 0.5 μM GR and 1 mM D-glutamate with varying concentrations of the
inhibitor compound. Data was analyzed using the accompanying software,
JASCO Spectra Manager v1.54A. Ki values were acquired through global fitting
of three Michaelis-Menten curves conducted in the presence of three distinct
concentrations of inhibitor and 0.5 μM GR. Global fitting to varying inhibition

58
models was completed using GraphPad Prism v5. All assays were performed at
25 °C.
Enzyme Kinetics via the Coupled-Enzyme Assay. For compounds whose
contribution to the spectropolarimeter noise was too great to acquire accurate
kinetic curves (i.e., compounds required in excess or compounds with substantial
optical activity), the previously established coupled-enzyme assay for
measurement of D-glutamate to L-glutamate racemization was utilized[61]. IC50
curves and Ki values were acquired in the same manner in the presence of 0.38
μM GR. Absorbance at 500 nm (production of reduced INT) was measured using
a Varian Cary-300 UV-VIS spectrometer (Agilent Technologies). Data was
acquired using the accompanying Cary Kinetics software. All assays were
performed at 25 °C.
Classical MD Simulations. The molecular dynamics simulations were performed
with the YASARA Structure package version 9.11.9 (YASARA Biosciences)[56]. A
periodic simulation cell with dimensions of 54.99 Å, 64.39 Å, and 57.77 Å was
employed with explicit solvent , using the monomer (C chain) of PDB 1ZUW (B.
subtilis RacE GR with ligand D-glu). The AMBER03 force field was used with
long-range electrostatic potentials calculated with the Particle Mesh Ewald (PME)
method, with a cutoff of 7.864 Å[62-64]. The substrate force field parameters were
generated with the AutoSMILES utility[57], which employs semi-empirical
AM1geometry optimization and assignment of charges, followed by assignment
of AM1BCC atom and bond types with refinement using RESP charges, and
finally the assignments of general AMBER force field atom types. The hydrogen
bond network of GR is optimized using the method of Hooft and coworkers[65], in
order to address ambiguities from multiple side chain conformations and
protonation states that are not resolved by the electron density. YASARA’s pKa
utility was used to assign pKa values at pH 7.0[66]. The box was filled with water,
with a maximum sum of all bumps per water of 1.0 Å, and a density of 0.997
g/ml. The simulation cell was neutralized with NaCl (0.9% final concentration; %

59
by mass). Waters were deleted to readjust the solvent density to 0.997 g/ml. A
short MD was run on the solvent only. The entire system was then energy
minimized using first a steepest descent minimization to remove conformational
stress, followed by a simulated annealing minimization until convergence (<0.05
kJ/mol/200 steps). The MD simulation was then initiated, using the NVT
ensemble at 298 K, and integration time steps for intramolecular and
intermolecular forces every 1.25 fs and 2.5 fs, respectively.
Steered Molecular Dynamics Simulation. The singular steered MD simulation
was carried out using the YASARA Structure package v9.11.9. Before applying
the steering potentials in the production phase, the classical MD procedure,
described above, was executed. The production phase consisted of external
steering forces applied to the center of mass of the GR enzyme and the
glutamate ligand. A vector leading out of the constricted entrance to the active
site of GR was selected (Shown in Fig. 8B, depicted as a red arrow) for constant
velocity pulling of the glutamate ligand into bulk solvent. The velocity of the ligand
in the pulling vector was set in a window of 0.2 to 0.5 Å/ps using a scaled pulling
force of 5000 pN. The large magnitude of the applied steering force constant
allows one to make a stiff spring approximation, which has been shown to
significantly minimize fluctuations of the pulling coordinate[67] from one trajectory
to another. The external force was applied only along the pulling vector. The
glutamate ligand was not constrained in the plane orthogonal to the pulling
vector. The forces and the velocity in the pulling direction were calculated at
every time step. The entire production simulation consisted of ~ 50 ps, which
resulted in a translocation of the glutamate ligand a distance of ~ 30 Å from the
active site of GR.
Preparation of Docking Receptors. Twelve structures were selected from the
SMD simulation at regular time intervals and active site entrance area was
approximated by calculating the area of a plane defined by four points (the ɣ-
carbons of Pro41, Pro44, Pro146, and Pro150). Three structures were selected

60
from that subset to reflect three points, approximately equidistant, along the
continuum of active site entrance areas. The structures correspond to the
following distances between the centers of mass of the glutamate molecule and
GR: 28.8, 43.7, and 46.7 Å, respectively. Structures were prepared for virtual
docking by first deleting all water molecules, salt ions and the substrate, D-
glutamate. A simulation cell was centered on the catalytic cysteine residues,
Cys74 and Cys185, and dimensions of the cell were adjusted for individual
structures to encompass the entirety of the active site. The same preparation
was used for docking to the crystal structure of RacE from B. subtilis (1ZUW,
chain C).
Virtual Docking of Known GR Ligands. Ligands were constructed and minimized
in MOE v2009.10[68] and imported into YASARA for virtual docking. YASARA
v9.11.9[56] employs AutoDock 4[58] in its docking functionality. AutoDock uses a
Lamarckian genetic algorithm to sample ligand conformations and binding
modes. The following general docking parameters were used: 25 independent
docking runs, each with a total of 2.5 x 10⁶ energy evaluations, a torsional
degrees of freedom value of 8, grid point spacing was left at the default of 0.375
Å, and the force field selected was AMBER03. Specific to the genetic algorithm,
the following parameters were used: a population size of 150, 2.7 x 10⁴
generations, an elitism value of 1, a mutation rate of 0.02, and a crossover rate of
0.8. Final poses were considered distinct if they varied by > 5 Å RMSD.
AutoDock uses a semi-empirical free energy force field to predict free energies of
binding which accounts for intermolecular and intramolecular energies, as well as
charge-based desolvation. Calculated binding energies and corresponding
binding constants, acquired from the docking output file, were applied to the
FERM-SMD correction equation (see Results). All correlation datasets are fit to a
semi-log equation and indicated R values represent the Spearman’s coefficient of
rank correlation as calculated by GraphPad Prism v5.0.

61
Protein Solvation Energy Calculations. The protein solvation energy was
calculated for each structure attained from the SMD simulation using the
Poisson-Boltzmann method. In the Poisson-Boltzmann method, the calculated
solvation energy is based on numerical solution of the differential Poisson
equation (also called the finite difference method) and the solvent is represented
as a continuum having a relatively high dielectric constant, while the protein and
ligand may be viewed as point charges projected onto a grid in a low dielectric
continuum. Structures were prepared by deleting all water molecules, salt ions
and substrates. The internal dielectric was set to 25, which resulted in more
consistent energy predictions between structures and was thus determined to be
most representative for the highly-hydrophilic glutamate racemase active site.
The overall trend in solvation energies over the span of the SMD was the same
with an internal dielectric of 2 (Fig. B.8). The external dielectric was set to 78 and
the salt concentration was set to 0.1 M. Solvation energies were reported in
kcal/mol.
Acknowledgements
This work was supported by NIH AI076830 (M. A. S.). Special thanks to Dr. Keith
Westcott for his contribution to the Keith R. Westcott Graduate Student Education Fund
(K. L. W.).
References
[1] M. S. Head in Drug Design: Structure- and Ligand-based Approaches, Vol.
(Eds.: K. M. Merz, Jr., D. Ringe and C. H. Reynolds), New York, NY, Cambridge
University Press, 2010, pp. 98-119.
[2] G. Bottegoni, I. Kufareva, M. Totrov and R. Abagyan, J. Med. Chem. 2009,
52, 397-406.
[3] H. Claussen, C. Buning, M. Rarey and T. Lengauer, J. Mol. Bio. 2001, 308,
377-395.

62
[4] C. R. Corbeil, P. Englebienne and N. Moitessier, J. Chem. Inf. Model. 2007,
47, 435-449.
[5] I. W. Davis, K. Raha, M. S. Head and D. Baker, Protein Sci. 2009, 18, 1998-
2002.
[6] R. M. Knegtel, I. D. Kuntz and C. M. Oshiro, J. Mol. Bio. 1997, 266, 424-440.
[7] M. Mori, F. Manetti and M. Botta, J. Chem. Inf. Model. 2010, Articles ASAP,
[8] G. L. Warren, C. W. Andrews, A. M. Capelli, B. Clarke, J. LaLonde, M. H.
Lambert, M. Lindvall, N. Nevins, S. F. Semus, S. Senger, G. Tedesco, I. D. Wall,
J. M. Woolven, C. E. Peishoff and M. S. Head, J. Med. Chem. 2006, 49, 5912-31.
[9] M. R. Shirts, D. L. Mobley and S. P. Brown in Drug design : structure- and
ligand-based approaches, Vol. 1 (Eds.: K. M. Merz, D. Ringe and C. H.
Reynolds), Cambridge [U.K.] ; New York, Cambridge University Press, 2010, pp.
61.
[10] G. L. Warren, C. E. Peishoff and M. S. Head in Computational and structural
approaches to drug discovery : ligand-protein interactions, Vol. 1 (Eds: R. Stroud
and J. Finer-Moore), Cambridge, RSC Publishing, 2008, pp. 137-153.
[11] W. L. Jorgensen, Acc. Chem. Res. 2009, 42, 724-733.
[12] M. Clark, F. Guarnieri, I. Shkurko and J. Wiseman, J. Chem. Inf. Model.
2006, 46, 231-242.
[13] B. Roux, Comput. Phys. Commun. 1995, 91, 275-282.
[14] S. Kumar, J. M. Rosenberg, D. Bouzida, R. H. Swendswn and P. A. Kollman,
J. Comp. Chem. 1992, 13, 1011-1021.
[15] C. R. W. Guimaraes and A. M. Mathiowetz, J. Chem. Inf. Model. 2010, 50,
547-559.
[16] E. Stjernschantz and C. Oostenbrink, Biophys. J. 2010, 98, 2682-2691.
[17] B. Isralewitz, M. Gao and K. Schulten, Curr. Opin. Struct. Bio. 2001, 11, 224-
230.
[18] H. Lu, B. Isralewitz, A. Krammar, V. Vogel and K. Schulten, Biophys. J.
1998, 75, 662-671.

63
[19] P. E. Marszalek, H. Lu, H. Li, M. Carrion-Vazquez, A. F. Oberhauser, K.
Schulten and J. M. Fernandez, Nature 1999, 402, 100-103.
[20] E. Evans and K. Ritchie, Biophys. J. 1997, 72, 1541-1555.
[21] M. E. Tanner, K. A. Gallo and J. R. Knowles, Biochemistry 1993, 32, 3998-
4006.
[22] C. T. Walsh, J. Biol. Chem. 1989, 264, 2393-2396.
[23] S. N. Ruzheinikov, M. A. Taal, S. E. Sedelnikova, P. J. Baker and D. W.
Rice, Structure 2005, 13, 1707-13.
[24] C. W. Koo and J. S. Blanchard, Biochemistry 1999, 38, 4416-22.
[25] B. Pillai, M. M. Cherney, C. M. Diaper, A. Sutherland, J. S. Blanchard, J. C.
Vederas and M. N. James, Proc. Natl. Acad. Sci. U. S. A. 2006, 103, 8668-73.
[26] M. A. Spies, J. G. Reese, D. Dodd, K. L. Pankow, S. R. Blanke and J.
Baudry, J. Am. Chem. Soc. 2009, 131, 5274-5284.
[27] A. Buschiazzo, M. Goytia, F. Schaeffer, W. Degrave, W. Shepard, C.
Gregoire, N. Chamond, A. Cosson, A. Berneman, N. Coatnoan, P. M. Alzari and
P. Minoprio, Proc. Natl. Acad. Sci. U. S. A. 2005, 103, 1705-1710.
[28] T. Lundqvist, S. L. Fisher, G. Kern, R. H. Folmer, Y. Xue, D. T. Newton, T. A.
Keating, R. A. Alm and B. L. de Jonge, Nature 2007, 447, 817-22.
[29] K. L. Whalen, K. L. Pankow, S. R. Blanke and M. A. Spies, Med. Chem. Lett.
2010, 8, 9-13.
[30] B. Pillai, M. Cherney, C. M. Diaper, A. Sutherland, J. S. Blanchard, J. C.
Vederas and M. N. G. James, Biochem. Biophys. Res. Commun. 2007, 363, 547-
553.
[31] K. Y. Shatalin and A. A. Neyfakh, FEMS Microbiol. Lett. 2005, 245, 315-319.
[32] A. de Dios, L. Prieto, J. A. Martin, A. Rubio, J. Ezquerra, M. Tebbe, B. Lopez
de Uralde, J. Martin, A. Sanchez, D. L. LeTourneau, J. E. McGee, C. Boylan, T.
R. Parr, Jr. and M. C. Smith, J. Med. Chem. 2002, 45, 4559-70.
[33] G. S. Basarab, P. J. Hill, A. Rastagar and P. J. H. Webborn, Bioorg.
Medicinal Chem. Lett. 2008, 18, 4716-4722.

64
[34] A. L. Hopkins, C. R. Groom and A. Alex, Drug Discovery Today 2004, 9,
430-431.
[35] R. O'Shea and H. E. Moser, J. Med. Chem. 2008, 51, 2891-2878.
[36] G. Dannhardt and B. K. Kohl, Arch. Pharm. Pharm. Med. Chem. 2000, 333,
123-129.
[37] M. Mor, F. Bordi, C. Silva, S. Rivara, V. Zuliani, F. Vacondio, M. Rivara, E.
Barocelli, S. Bertoni, V. Ballabeni, F. Magnanini, M. Impicciatore and P. V. Plazzi,
Bioorg. Medicinal Chem. Lett. 2004, 12, 663-674.
[38] M. Willson, J. J. Perie, F. Malecaze, F. Opperdoes and M. Callens, Eur. J.
Med. Chem. 1992, 27, 799-808.
[39] Z. Parashchin, Russ. J. Org. Chem. 1998, 34, 253.
[40] P. Krogsgaard-Larsen, E. Falch, A. Schousboe, D. R. Curtis and D. Lodge,
J. Neurochem. 1980, 34, 756-759.
[41] A. R. Leach, B. K. Shoichet and C. E. Peishoff, J. Med. Chem. 2006, 49,
5851-5855.
[42] T. Steinbrecher and A. Labahn, Curr. Med. Chem. 2010, 17, 767-785.
[43] D. A. Pearlman, J. Med. Chem. 2005, 48, 7796-7807.
[44] H. Fujitani, Y. Tanida, M. Ito, M. R. Shirts, G. Jayachandran, C. D. Snow, E.
J. Sorin and V. S. Pande, J. Chem. Phys. 2005, 123, 84-108.
[45] C. F. Wong and J. A. McCammon, J. Am. Chem. Soc. 1986, 108, 3830-
3832.
[46] B. Kuhn, P. Gerber, T. Schulz-Gasch and M. Stahl, J. Med. Chem. 2005, 48,
4040-4048.
[47] R. E. Amaro, R. Baron and J. A. McCammon, J. Comput. Aided Mol. Des.
2008, 22, 693-705.
[48] P. O'Donoghue and Z. Luthey-Schulten, J. Mol. Biol. 2005, 346, 875-894.
[49] M. Totrov and R. Abagyan, Curr. Opin. Struct. Biol. 2008, 18, 178-184.
[50] D. L. Mobley, A. P. Graves, J. D. Chodera, A. C. McReynolds, B. K. Shoichet
and K. A. Dill, 2007, 371, 1118-1134.

65
[51] D. A. Pearlman in Free Energy Calculations in Rational Drug Design, Vol.
(Eds.: M. Rami Reddy and M. D. Erion), New York, NY, Eds. Academic/Plenum,
2001, pp. 9-33.
[52] J. W.-H. Li and J. C. Vederas, Science 2009, 325, 161-165.
[53] F. Colizzi, R. Perozzo, L. Scapozza, M. Recanatini and A. Cavalli, J. Am.
Chem. Soc. 2010, 132, 7361-7371.
[54] Y. Deng and B. Roux, J. Phys. Chem. B 2008, 113, 2234-2246.
[55] J. Wang, Y. Deng and B. Roux, Biophys. J. 2006, 91, 2798-2814.
[56] (2010). YASARA (9.11.9 9.11.9). Vienna, Austria, YASARA Biosciences
GmbH.
[57] A. Jakalian, D. B. Jack and C. I. Bayly, J. Comp. Chem. 2002, 23, 1623-
1641.
[58] G. M. Morris, R. Huey, W. Lindstrom, M. F. Sanner, R. K. Belew, D. S.
Goodsell and A. J. Olson, J. Comp. Chem. 2009, 30, 2785-2791.
[59] CSAR: Community Structure-Activity Resource (2010),
http://www.csardock.org/.
[60] D. S. Radchenko, O. O. Grygorenko and I. V. Komarov, Tetrahedron:
Asymmetry 2008, 19, 2924-2930.
[61] R. Rej, Anal. Biochem. 1982, 119, 205-210.
[62] W. D. Cornell, P. Cieplak, C. I. Bayly, I. R. Gould, K. M. Merz, Jr., D. M.
Ferguson, D. C. Spellmeyer, T. Fox, J. Caldwell and P. A. Kollman, J. Am.
Chem. Soc. 1995, 117, 5179-5197.
[63] Y. Duan, C. Wu, S. Chowdhury, M. C. Lee, G. Xiong, W. Zhang, R. Yang, P.
Cieplak, R. Luo, T. Lee, J. Caldwell, J. Wang and P. Kollman, J. Comput. Chem.
2003, 24, 1999-2012.
[64] U. Essmann, L. Perera, M. L. Berkowitz, T. Darden, H. Lee and L. G.
Pedersen, J. Chem. Phys. 1995, 103, 8577-8593.
[65] R. W. W. Hooft, G. Vriend, C. Sander and E. E. Abola, 1996, 381, 272.

66
[66] E. Krieger, J. E. Nielsen, C. A. E. M. Spronk and G. Vriend, J. Mol. Graph.
Model. 2006, 25, 481-486.
[67] S. Park and K. Schulten, J. Chem. Phys. 2004, 120, 5946-5961.
[68] Molecular Operating Environment (2008.10 2008.10). Montreal, Quebec,
Canada, Chemical Computing Group.

Reprinted (adapted) with permission from Whalen, K. L.; Chau, A. C.; Spies, M. A.
ChemMedChem, published online August 8th, 2013; DOI: 10.1002/cmdc.201300271.
Copyright 2013 John Wiley and Sons. A. C. Chau contributed in silico docking. M. A. Spies
contributed intellectual direction.
67
CHAPTER 3: IN SILICO OPTIMIZATION OF A FRAGMENT-BASED HIT
YIELDS BIOLOGICALLY ACTIVE, HIGH EFFICIENCY INHIBITORS FOR
GLUTAMATE RACEMASE.
Abstract
A novel lead compound for inhibition of the antibacterial drug target,
glutamate racemase, is optimized for both ligand efficiency and lipophilic
efficiency. A previously developed hybrid MD-docking and scoring scheme,
FERM-SMD, is utilized to predict relative potencies of potential derivatives
prior to chemical synthesis. This scheme was successful in distinguishing
between high and low affinity binders with minimal experimental structural
information, saving time and resources in the process. In vitro potency is
increased approximately 4-fold against glutamate racemase from the model
organism, B. subtilis. Lead derivatives show 2- to 4-fold increased
antimicrobial potency over the parent scaffold. In addition, specificity toward B.
subtilis, over E. coli and S. aureus, show dependency on the chemical
substituent added to the parent scaffold. Finally, insight is gained into the
capacity for these compounds to reach the target enzyme in vivo using a
bacterial cell wall lysis assay. The result of this study is a novel small
molecule inhibitor of GR with the following characteristics: Ki = 2.5 μM, LE =
0.45 kcal/mol/atom, LiPE = 6.0, MIC50 = 260 μg/mL against B. subtilis,
EC50,lysis = 520 μg/mL against B. subtilis
Introduction
In an era of increasingly prolific multi- and total-drug resistant species of
bacteria such as E. coli, M. tuberculosis and S. aureus, the need for rapid
discovery of novel antibiotic classes is greater than any previous time in

68
history. Compounding this problem is the pronounced dearth of both
antimicrobial lead compounds as well as FDA-approved drugs emerging from
the drug discovery enterprise, including both academia and industry[1]. An
illuminating review by O'Shea and coworkers[2] reveals that no novel class of
antibacterials was developed and approved between 1960 and 2001 despite
exhaustive efforts and the parallel development of key techniques. Since the
introduction of streptogramins and quinolones in the early 1960s, the growing
need for antimicrobials has outpaced the rate of approval of novel drugs.
Passage down the pipeline of drug discovery is complicated by the
requirement that any antimicrobial target must be essential within a class of
bacteria as well as non-essential or absent in humans; or possess significant
structural distinction from any human homologues. Additionally, inhibitors
must satisfy stringent physico-chemical requirements that ensure
bioavailability, minimal toxicity, and efficacy. Recent reviews of the current
state of affairs in drug discovery have revealed that lack of chemical diversity
in HTS- and genomics-based drug discovery campaigns has been a
significant culprit in the failure to obtain novel antimicrobial lead compounds[1,
3].
Bacteria require a number of D-amino acids for the biosynthesis of the
peptidoglycan cell wall. It has been well established that improper
peptidoglycan cross-linking is the basis for a number of known antimicrobial
drugs, including the β-lactam class and vancomycins, which act to promote
osmotic lysis[4]. In addition to preventing cross-linking itself, inhibiting
enzymes that catalyze the formation of D-amino acids also leads to lysis due
to high internal osmotic pressure. The two ubiquitous D-amino acids in
bacterial cell walls are D-alanine and D-glutamate, which are biosynthesized
by alanine and glutamate racemases, respectively. The natural product D-
cycloserine is a mechanism based inhibitor of alanine racemase, a PLP-
containing enzyme, and has been shown to kill bacteria by making them
osmotically sensitive[5]. Similar studies have also been carried out on
glutamate racemase (abbrev. GR; EC 5.1.1.3) inhibitors, establishing a mode

69
of action involving damage to the maturation of the peptidoglycan cell wall[6].
Unlike AR, GR is a cofactor-independent racemase, which catalyzes a step-
wise proton abstraction/donation via two cysteines acting in a general
acid/base mechanism[7]. The general α/β-fold forms two domains, which
enclose a relatively small buried active site that is saturated with polar
residues. Not surprisingly, GR knockout studies on several pathogenic
organisms resulted in D-glutamate auxotrophs[8]. Thus, the strategy of
attenuating the pool of D-amino acids is an attractive option for the
development of novel antimicrobial agents. However, the only compound in
this class that is approved for clinical use is the natural product D-cycloserine,
and only in combination with other antibiotics, due to its undesirable side
effects.
To date, only a handful of potent inhibitors have been discovered for
bacterial glutamate racemases. A SAR approach produced a 4S-substituted
D-glutamate analog, which had low-micromolar potency against glutamate
racemase from S. pneumoniae, but suffered from species specificity due to
steric clashing with a species-variable valine bridge to a hydrophobic pocket
proximal to the binding cleft[9]. Later, a high-throughput screening campaign of
nearly 400,000 compounds resulted in the serendipitous discovery of an
uncompetitive inhibitor, which binds to a species-specific allosteric site[6].
More recently, a virtual screening campaign targeting a transition-state-like
model of the target enzyme produced several low-micromolar, competitive
inhibitors[10]. A trend in the molecular makeup of these inhibitors was clear:
aromatic or cyclic compounds containing sulfonic acid moieties. This isn't
surprising considering previous work that supports the presence of a cyclic
carbanion/aci-dienolate transition in the glutamate racemase reaction, which
places significant negative charge density in the back of the active site[11]. The
superiority of these sulfonic acids over carboxylates (such as that in the
natural substrate) could be due to the more dispersed partial negative charge
in the sulfonate, compared to the SP2 hybridization of a carboxylate. Most
recently, a unique ensemble docking scheme was applied to GR from B.

70
subtilis to successfully rank several sulfonate-containing aromatic compounds
with potencies ranging from low micromolar to high millimolar[12]. The best of
these compounds, 1H-benzimidazole-2-sulfonic acid (Ki = 9 μM) is the subject
of this study.
We present here a fragment-based approach to optimization of the
previously mentioned lead compound using entirely in silico methods for
derivative ranking prior to synthesis and experimental testing. Fragment-
based methods offer a number of distinct advantages in drug discovery,
particularly the optimization of ligand efficiency (LE) and lipophilic efficiency
(LiPE) while maintaining potency[13]. Placement and subsequent scoring of
potential derivative compounds was achieved via ensemble docking with a
unique scoring scheme described in Whalen and coworkers.[12] In the current
study, thirty-three derivatives of the lead compound were docked to an
ensemble of conformations generated using steered molecular dynamics and
ranked using a modified binding energy score. Six derivatives were
synthesized and assayed experimentally, resulting in the discovery of two
competitive inhibitors with increased inhibitory potency, as well as excellent
ligand and lipophilic efficiencies. Additionally, compounds were assayed for
bacterial growth inhibition as well as induction of cell wall lysis, ultimately
establishing that this class of GR inhibitors targets bacterial cell wall synthesis
in vivo.
Results and Discussion
BISA, a Scaffold for Optimization
Compound 1 (Figure 15, 4-hydroxy-1,3-benzenedisulfonic acid) was
discovered in a virtual screening campaign against GR using the Chemical
Computing Group Lead-like library (~1 million compounds)[10]. The inhibitory
constant against GR from B. subtilis was 58 ± 13 µM. Scaffold hopping to
compound 2 (Figure 15, 1H-benzimidazole-2-sulfonic acid) increases affinity
against this target to 9 ± 2 µM. Compound 2 also shows equal potency
against two isozymes of GR from B. anthracis (RacE1 and RacE2) as well as

71
GR from F. tularensis (MurI), two bacterial species currently considered as
Tier 1 Biological Select Agents by the US government (Figure 12). The high
ligand efficiency of this fragment, coupled with its cross-species activity made
compound 2 an ideal candidate for optimization.
In order to generate a basis for rational lead optimization, a basic
understanding of the physicochemical components of binding between ligand
and receptor is required. As an alternative to x-ray crystallography or NMR,
virtual docking was used to generate structural information regarding the
interaction of GR and compound 2. Compound 2 was docked in silico to GR
using a previously solved crystal structure (PDB: 1ZUW) as the receptor. The
result of docking shows compound 2 with its sulfonic acid situated in the most
buried region of the active site, between the catalytic cysteines (Figure 13).
The sulfonate moiety is seen participating in several hydrogen bonding
interactions with Asn75, Thr186, and Cys185. Additionally, the benzene
moiety is interacting with Ser11 via an O-H--pi interaction. These moieties
both appear to contribute to recognition of compound 2, and thus the
optimization strategy focused on the addition of substituents that would
produce additional interactions while preserving the original contacts. As seen
by their solvent exposure and protein proximity (symbolized with light blue
shading or a grey dotted line, respectively, in Figure 13), carbons 4, 5, and 6
within the benzene ring could serve as starting points to build on additional
chemical groups without encountering steric clash from active site residues.
Depending on their size, substituents added at these positions have the
capacity to reach additional binding pockets proximal to the main substrate
binding cleft.

72
Figure 12. IC50 curves for the parent compound 2 against a range of GR isozymes isolated from the indicated bacterial species. Indicated IC50 values (in micromolar) acquired via fitting to a dose-response curve.

73
Figure 13. Top-ranked binding pose for compound 2 bound to GR from B. subtilis, as predicted by docking (a). Also, binging pose for compound 2 after 4 nsec of MD simulation with explicit water (b).
Derivative Selection and Synthesis
An in silico library containing compounds 3 through 35 (Figure 15) was
developed based on a previously established two-step synthetic process
(Scheme 1) and the commercially-available 1,2-phenylenediamine derivatives.
This synthetic scheme was chosen for its relative ease, while additional
chemistry may be attempted in the future to further grow fragments out of the
substrate-binding cleft. Before any compound was synthesized, the library
was subjected to a hybrid ensemble docking scheme, referred to as the
a)
b)
45
6
45
6

74
Flexible Enzyme Receptor Method by Steered Molecular Dynamics (aka.
FERM-SMD), previously described by Whalen and coworkers[12]. Figure 14
details how unique conformations of the protein target were generated using
steered molecular dynamics simulations to emulate the substrate unbinding
trajectory. Starting with a crystal structure of D-glutamate bound to glutamate
racemase, D-glutamate is pulled from the active site over the course of the
simulation. In the process, the enzyme alters its structural conformation to
allow substrate passage from the buried binding cleft. Three snapshots were
chosen to represent three distinct structural states, distinguished by the
entrance to the binding cleft: closed, partially open, and fully open (Figure 14).
Compounds are docked to all three structures and their predicted binding
affinities are adjusted according to the respective protein solvation energy
(these varied greatly, and affected the accuracy of the binding affinity
calculation) and weighted to indicate relative binding specificity to one of the
three receptors. Previous studies have shown that the final score produced by
FERM-SMD, deemed FERMscore, shares a high correlation with
experimental binding affinities, particularly for congeneric ligands of GR. On a
set of 17 ligands, FERM-SMD has a predictive accuracy of ± 1 kcal/mol[12].

75
Figure 14. A steered molecular dynamics simulation was conducted on the glutamate-bound crystal structure of glutamate racemase from B. subtilis. A force was applied on the bound substrate along the vector indicated in the top picture (red arrow). Structures were obtained along the unbinding trajectory that correspond approximately to the following states: closed, partially open, and fully open. With substrate removed, these structures then provide the receptors for ensemble docking of the derivative library. Previous results indicate that the highest-affinity inhibitors will bind preferably to the closed conformation, over the partially and fully open conformations.
FERMscores for the library of interest, spanning from 0.4 to 13.7, are
indicated in Table 4. The parent compound, 2, scored the third highest
FERMscore. The two compounds giving higher calculated FERMscores
(compounds 18, and 29) in addition to a third compound, 4, that possessed a
FERMscore in the top 15% of all derivatives were synthesized under contract
by Enamine Ltd. (see Materials and Methods) and all compounds were
heretofore synthetically novel. In addition to the compounds predicted to have
improved binding affinity, three immediately available compounds (15, 24, and
26) were acquired to test the predictive capacity of the employed scoring
method. Compound 7 had an intermediate FERMscore, but distinct
chemotype, which had not been heretofore tested on any GR and was thusly

76
chosen for testing. Unfortunately, several attempts to synthesize compound 7
were unsuccessful, and it was eventually abandoned. The experimental
results are detailed below.
Scheme 1. Scheme for synthesis of 1H-benzimidazole-2-sulfonic acid derivatives using differing phenylenediamine starting points.
In vitro Testing of Derivatives
Inhibition constants (Ki) were acquired for all derivatives against purified
GR from B. subtilis (Figure 16, Table 5). Compounds 15, 24 and 26, all
possessing predicted FERMscores lower than the parent compound, gave Ki
values greater than or within error of that of the parent compound. Compound
24 suffered from a nearly 100-fold loss in binding affinity, which was well
predicted by FERM-SMD, as it possessed the lowest FERMscore of the
compounds tested. Of the compounds predicted to be higher affinity binders
by FERMscore, compound 18 and 29 have Ki values within error of the parent
compound, although the Ki of 29 is improved, 6.4 μM versus 9 μM. This result
was not surprising considering the FERMscores only vary by 5.4 units
between the parent scaffold and the highest scoring derivative. Compound 4
is also predicted to be high affinity, and shows 4-fold improved affinity over
the parent compound, with a Ki of 2.5 μM. This is the most potent non-
glutamate-based, competitive inhibitor of glutamate racemase to date. Overall,
FERM-SMD was successful in distinguishing between tight binding derivatives
(Ki between 2.5 to 12 μM) and weaker binding derivatives (Ki between 13 and
830 μM).

77
1
2
3
4
5
6
7
8
9
10
11
12
13
14
15
16
17
18
19
20
21
22
23
24
25
26
27
28
29
30
31
32
33
34
35
Figure 15. Parent scaffolds and lead derivatives considered in this study. Compounds of interest are highlighted accordingly: lavender = original virtual screening hit; cyan = parent scaffold; green = compounds tested with high predicted affinity; red = compounds tested with low predicted affinity; yellow = compound synthesis attempted, yet unsuccessful.

78
Table 4. FERMscore assignments as predicted by FERM-SMD, ranked from highest to lowest score, corresponding to highest to lowest predicted binding affinity.
Compound [a]
FERMscore Compound FERMscore
29 13.7 26 1.20 18 9.25 7 1.15 2 8.28 6 1.10 5 4.92 23 1.03 4 4.45 15 0.969 34 3.75 20 0.902 14 3.23 33 0.792 13 2.99 16 0.781 12 2.98 32 0.756 9 2.97 28 0.756 8 2.33 35 0.751 22 1.76 25 0.750 17 1.64 3 0.732 21 1.44 10 0.723 11 1.31 24 0.643 19 1.29 31 0.534 30 1.28 27 0.406
[a] Compounds of interest are highlighted accordingly: green = compounds tested with high predicted affinity; cyan = parent scaffold; red = compounds tested with low predicted affinity; yellow = compound synthesis attempted, yet unsuccessful.

79
Figure 16. In vitro inhibition data used to acquire Ki values for each derivative.
Ligand efficiency and lipophilic efficiency were calculated for each
derivative (Table 5). Ligand efficiency is a method of normalizing binding
affinities for compounds of differing molecular weights[14]. Additionally, several
studies have shown that fragment-based drug discovery is more successful if
high ligand-efficiency is maintained through lead optimization[14]. This practice
lowers the occurrence of so-called "molecular obesity" as compounds are
modified to achieve higher potency and favorable
pharmacokinetic/pharmacodynamic profiles[14b]. With the exception of
compound 15, each assayed derivative maintained high ligand efficiency ( >
0.3 kcal/mol/atom). Of the compounds predicted to be high affinity by the
FERM-SMD method, compound 4 and 29 exhibited higher efficiency than
compound 18 (0.45, 0.34 and 0.30, respectively). Lipophilic efficiency is

80
another measure that is indicative of successful passage down the drug
development pipeline, where affinity values are normalized for the partition
coefficient (logP) of the inhibitor[15]. Compound 4 and 29 benefit from an
improved lipophilic efficiency (6.0 and 6.6, respectively) over the parent
scaffold (5.3). Ligand efficiency and lipophilicity efficiency values equal to or
greater than 0.3 kcal/mol/atom and 6.0, respectively, are in the desirable
range for further study and optimization[14a, 15].
Additionally, novel compounds were tested for formation of colloidal
aggregates, a common cause of false positive results. Previous studies have
revealed that glutamate racemase is susceptible to inhibition by colloidal
aggregates in a non-drug-like fashion. In order to distinguish between
inhibition via colloidal aggregation and true binding, enzyme activity is
measured in the presence of the inhibitor in question, as well as a sub-
micellular concentration of detergent, 0.01% Triton X-100. In the case that a
compound is inhibiting an enzyme via a colloidal aggregation, the apparent
inhibition will be completely relieved in the presence of detergent. Colloidal
aggregates must be abandoned due to their non-drug-like mechanism. All
novel compounds tested in this study proved not to operate via the colloidal
aggregate mechanism (Figure C.10).

81
In vivo Testing of Biological Activity
In order to assess the capacity of these compounds to reach the enzyme
target in vivo, inhibition of bacterial growth as well as capacity to induce cell
lysis was assayed with several species of bacteria. B. subtilis was
investigated, as the isozyme of GR from this species was the model for all in
silico predictions. Additionally, E. coli and S. aureus were investigated as
each provides a unique challenge for inhibitor compounds: an additional
physical barrier to entry in the case of Gram-negative E. coli and an
abundance of efflux pumps in the case of S. aureus[16]. All tested derivatives
of compound 2 show increased potency with regards to growth inhibition for B.
subtilis (Figure 17). MIC50 values are increased 2- to 3-fold over the parent
scaffold (Table 6). Surprisingly, the least potent compound in vitro, 24, shows
the greatest potency in vivo. This result suggests that factors other than
Table 5. In vitro results for derivatives of the parent scaffold, 2.
Compound Ki (uM) LE[a] LiPE[b]
2 9.0 ± 2.0 0.53 5.3
4 2.5 ± 0.4 0.45 6.0
15 21 ± 5.0 0.46 4.4
18 12 ± 3.6 0.30 5.0
24 830 ± 75 0.20 1.9
26 13 ± 2.4 0.48 4.5
29 6.4 ± 3.5 0.34 6.6
[a] Ligand efficiencies (LE) determined by converting Ki values to binding
energies and dividing by the number of non-hydrogen atoms. Units =
kcal/mol/atom. [b] Lipophilic efficiences (LiPE) determined by subtracting
logP values from the log(Ki) for each compound.

82
enzyme binding affinity may complicate the overall efficacy of this chemotype
of antimicrobial compounds.
Compounds 4, 18, and 29 were also tested against E. coli and S. aureus
(Figure 18). Compounds 18 and 29 were both highly specific for B. subtilis,
showing no significant growth inhibition at concentrations below 3 mg/mL for
E. coli and S. aureus (Table 6). On the contrary, compound 4 shows growth
inhibition of both E. coli and S. aureus at concentrations approximately 2-fold
higher than the MIC50 against B. subtilis (Table 6). Examination of their
respective chemical structures yields one possible rationale for this distinction
(see Figure 15 for structures). Compound 4 possesses a more compact
chemical shape, most likely making contacts specific to the most buried, and
most highly conserved, region of the GR active site. Whereas compounds 18
and 29 contain larger chemical additions to the benzene ring, which may
clash with the outer region of the GR active site, which is more structurally
diverse region. These in vitro (and in silico) results support the fragment-
based strategy of growing the scaffold out of the highly buried active site
without sacrificing the original contacts.
In order to hone in on the mechanism of action for the derivatives assayed in
this study, a commercially-available cytotoxicity assay, CytoTox-GloTM
(Promega), marketed for use with mammalian cells, was adapted for use with
the examined bacterial species. The relationship between cytotoxicity,
specifically cell lysis, and the readout (luminescence) is outlined in Figure 19.
If the compounds here reach the glutamate racemase target and inhibit the
production of D-glutamate, the lack of this key component will result in an
overall break-down in peptidoglycan synthesis, and subsequent cell lysis
caused by osmotic stress. Lysed cells will leak intracellular proteases into the
surrounding media. The CytoTox-GloTM reagent is composed of a pro-luciferin
substrate, that once cleaved by proteases, can be acted upon by a supplied
luciferase to produce the luminescent readout. Controls using FDA-approved
antibiotics with known mechanisms of action were conducted to optimize the
provided reagents (Figure 20a). S. aureus was exposed to varying

83
concentrations of ampicillin (a transpeptidase inhibitor) or tetracycline (a
microbial ribosome inhibitor) for 24 hours, and then incubated with the
CytoTox-GloTM reagent. As expected, ampicillin yields a dose-dependent
increase in luminescence , while tetracycline elicits no increase in
luminescence at concentrations up to 100-times the published MIC50 (Figure
20a). This optimized assay was then applied to cells treated with our inhibitor
derivatives.
Figure 17. MIC50 curves for the parent scaffold and the two most potent
derivatives against Bacillus subtilis.
Table 6. MIC50[a] values for tested derivatives.
Compound B. subtilis E. coli S. aureus
2 0.72 ± 0.06 - - 4 0.26 ± 0.11 1.6 ± 0.20 1.0 ± 0.25
15 > 3 - - 18 0.36 ± 0.02 > 3 > 3 24 0.14 ± 0.02 - - 26 > 3 - - 29 0.32 ± 0.01 > 3 > 3
[a] in mg/mL

84
Figure 18. MIC50 curves for highest-ranked derivatives, by FERMscore,
comparing species specificity between E. coli, B. subtilis, and S. aureus.

85
The modified CytoTox-GloTM assay confirmed 4 as acting via an
inhibitory mechanism that effects the peptidoglycan with both S. aureus and B.
subtilis (Figure 20b). Luminescence increases concurrently with increased
dosing of compound 4 for S. aureus. While the assayed concentrations do not
span the entire MIC50, due to solubility limitations, an approximately 40%
increase in luminescence was observed in the millimolar range of inhibitor.
For B. subtilis, the species for which compound 4 elicits greater growth
inhibition, we observe a dose-dependent increase of 400% in luminescence in
the low-millimolar range. The observed EC50 for lysis occurs at 520 μg/mL, a
concentration only slightly above that of the MIC50 for growth inhibition (260
μg/mL). The proximity of these two values is supportive of cell lysis as being
the main cause of cell death. Considering the many barriers an antibacterial
compound must overcome, both physical (peptidoglycan and efflux) and
chemical (metabolism), in order to reach the desired target protein, the ability
of compound 4 to cause cell lysis is excellent support for its further
development as an antibacterial therapeutic.
Figure 19. Schematic of treatment of bacterial cells with CytoTox-GloTM assay.
The CytoTox-GloTM reagent contains both the protease substrate, AAF-
luciferin, as well as luciferase. Bacterial cells contain intracellular enzymes
capable of cleaving AAF-luciferin, releasing luciferin, the substrate of
luciferase.

86
Figure 20. Controls for a commercially-available cytotoxicity assay that
monitors cell wall lysis with a luminescent readout (a). Bacteria treated with
two antibiotics, only one utilizing a mechanism of action that interferes with
peptidoglycan synthesis, shows distinct luminescent dose responses. Cell
lysis data for S aureus and B. subtilis cultures treated for 24 hours with
compound 4 (b). Luminescence is measured in arbitrary units, corrected for
the cell density of the sample (variable depending on growth inhibition), and
presented as a percentage of untreated cell luminescence.
Conclusion
This study summarizes the successful utilization of a novel in silico docking
and scoring scheme for selection of derivatives of a lead scaffold via rank-
ordering of binding affinity. The model system used here employs the
antibacterial target, glutamate racemase, and a low-micromolar competitive

87
inhibitor, 1H-benzimidazole-2-sulfonic acid (compound 2), as the lead
compound. This platform can potentially be used for optimization of lead
compounds for other flexible drug targets. In current lead optimization
campaigns, the rate-limiting step is often acquisition of high-resolution
structural data, particularly for flexible enzymes, on the enzyme-drug complex.
Binding pose predictions made by docking software have been largely
validated as correct in many cases via comparison with experimental data,
specifically several programs place ligands within 2 Å RMSD of the
crystallographically determined pose for over 90% of the assessed ligands[17].
The perennial problem lies in the ability of the scoring functions to accurately
rank-order docked ligands across a variety of targets[17]. By developing an in
silico method of derivative ranking based on the docked complex of the parent
scaffold with a predictive error of only ± 1 kcal/mol for binding energy, we can
remove the need for time- and resource-consuming NMR or x-ray
crystallography experiments. Additionally, the ability to predict the binding
potency of potential derivatives, renders the chemical synthesis of weak
binders unnecessary. Here we show that the described scheme guides
optimization of a lead compound, with a minimized resource and time
investment.
The goal of this exercise was to modify the existing chemical scaffold in
order to increase binding affinity to the target enzyme, while also maintaining
favorable physicochemical properties (here, ligand efficiency and lipophilic
efficiency) and biological activity. A docked complex of compound 2 and
glutamate racemase was used to assess the most optimal locations for
substituent addition. Based on that analysis, a library of 33 derivatives of
compound 2 were subjected to a hybrid ensemble docking scheme, FERM-
SMD, in order to rank their potential binding potencies. Of the 33 derivatives,
6 compounds were tested experimentally producing the final selection of
compound 4. Compound 4 has increased binding affinity for the purified
enzyme: 2.5 μM versus 9 μM, high ligand efficiency: 0.45 kcal/mol/atom, high
lipohilic efficiency: 6.0, increased growth inhibition of B. subtilis: MIC50 = 260

88
μg/mL versus 720 μg/mL, and finally, effective bacterial cell lysis: EC50,lysis =
520 μg/mL. The FERM-SMD methodology has afforded a facile optimization
from a high-LE hit with relatively low synthetic cost by precisely identify
binding rank-ordering. Future studies will focus these techniques on
increasingly more complex derivative libraries, in order to achieve even
greater in vitro and biological activity.
Experimental Section
Docking and FERM-SMD: Virtual Screening
The original FERM-SMD method is described in great detail by Whalen
and coworkers[12] BISA derivatives were prepared in silico using MOE
v2011.10[18] (Chemical Computing Group). An ensemble of GR structures was
generated using steered molecular dynamics simulation. Three structures
were chosen at approximately the most closed (corresponding to 0 ps of
simulation time), partially open (13.9 ps, simulation time), and fully open (20
ps, simulation time). Docking to the ensemble of GR structures was achieved
using YASARA v9.11.9[19], which utilizes an optimized version of AutoDock
4[20]. Simulation cells were centered around the active site and expanded to
include the residues surrounding the cleft entrance. Simulations cells had the
following dimensions (in Å): "0 ps" receptor = 18.75 x 20.19 x 19.29; "13.9 ps"
receptor = 19.08 x 21.56 x 18.07; and "20 ps" receptor = 18.94 x 21.31 x
18.93. Receptor-ligand docking combinations that resulted in more than one
high-ranking pose were visually assessed by the author, and the pose that
placed the core scaffold in a position most similar to the parent scaffold
position was chosen as the "true" pose. Resulting binding energies and
affinities for docking to all three receptors were then imported into Excel
(Microsoft Office) and adjusted for receptor-protein solvation, producing a final
FERMscore[12].
Compound Synthesis and Acquisition

89
Compound 1 (catalog #BAS 00124393, >98% purity) was acquired from
Asinex, Ltd. (Moscow, Russia). Compounds 2 (catalog # 530646, 98% purity)
was acquired from Sigma-Aldrich (St. Louis, MO, USA). Compound 15
(catalog # 5648649, 100% purity) was acquired from ChemBridge Corp. (San
Diego, CA, USA). Compound 24 (catalog # STK695918, 98% purity) was
acquired from Vitas-M Laboratories, Ltd. (Moscow, Russia). Compound 26
(catalog # Z57080960, 95% purity) was acquired from Enamine Ltd. (Kiev,
Ukraine). Compounds 4, 18, and 29 were synthesized for the first time in
published literature by collaborators at Enamine Ltd. (Kiev, Ukraine) following
the synthetic process outlined in Scheme 1. 1H NMR spectra for each
synthesized compound is provided in the Supplemental Information (Figures
C.3-C.5). HPLC data showing purity analysis is available in the Supplemental
Information for each newly synthesized compound (Figures C.6-C.8)
Protein Expression and Purification
Genes of glutamate racemase were isolated from B. subtilis, B.
anthracis (two isozymes), and F. tularensis, and expressed in E. coli and
purified using a protocol previously described by Whalen and coworkers[12]
Briefly, hexa-histidine-tagged recombinant proteins were purified via a two-
step process composed of cobalt-affinity (His-Select Affinity Resin, Sigma-
Aldrich) and anion exchange (UNO Q Continuous Bed column, BioRad).
Proteins were stored in buffer containing 100 mM NaCl, 50 mM Tris, 0.2 mM
DTT, pH 8.0 at a concentration of 7-10 mg/mL. Molecular weight was
confirmed via SDS-PAGE analysis (Figure C.1), and protein foldedness was
assessed using circular dichroism (Figure C.2).
In Vitro Inhibition of Enzyme Activity
Steady-state kinetics for D to L racemization was measured using circular

90
dicroism on a JASCO J-715 Spectropolarimeter. All compound stocks were
made up in 50 mM potassium borate buffer pH 8.0, at concentrations varying
from 25-100 mM, depending on compound solubility. Reactions were carried
out at 25°C in 50 mM potassium borate buffer pH 8.0 with 1 μM purified
enzyme. CD signal (mdeg) was measured continuously at 220nm for 10 min.
Plots of CD versus time were fit linearly to obtain initial velocity. Substrate was
varied from 0.25 to 5 mM. For Ki determination, three Michaelis-Menten
curves were obtained for each inhibitor: one in the presence of no inhibitor,
and two in varying concentrations of the inhibitor. A single data set, composed
of three curves, was fit to a competitive inhibition model using GraphPad
Prizm v.5.0[21], and the Ki is obtained as a best-fit value. For IC50
determination, reactions are supplemented with varying concentrations of the
inhibitor, and the observed V0 in nmol/sec is normalized to a %-activity value
based on an uninhibited reation. %-Activity values are plot versus the log of
the inhibitor concentration. The data set is then fit to a log[inhibitor] versus
response model (with variable slope) to calculate the IC50, using GraphPad
Prizm v.5.0[21]. For LiPE calculations, compound logP values for the ionic
species were calculated using MarvinSketch (ChemAxon).
In Vivo Inhibition of Bacterial Growth
A 5 mL culture of bacteria (B. subtilis DB104, E. coli Acella, or S. aureus
ATCC 12600) was incubated overnight at 37 ºC in Tryptic Soy Broth one day
prior to the assay. 96-well plates were prepared with 2X media, phosphate-
buffered saline, the compound of interest and a 20 uL inoculum of bacteria,
totally 200 uL per well. Compound stocks were prepared in phosphate-
buffered saline at a concentration of 10, 12.5 or 25 mM, depending on
compound solubility. A serial dilution ranging from 0.1 to 3000 micromolar for
the compound of interest was assayed. The overnight culture, at an optical
density of approximately 2.0, was diluted 20-fold in water prior to inoculation,
such that initial optical densities were approximately 0.01. A table of reagent
volumes and diagram of plate layout can be found in Figure C.9 of the

91
Supplemental Information. Plates were mixed and incubated at 37 ºC for 24 hr.
Absorbance at 600 nm was measured on a GloMax-Mutli Detection System.
MIC50 values were determined by fitting data to a log[inhibitor] versus
response model using GraphPad Prism v.5.0[21]. The bottom and top values
are constrained to 20% and 100%, respectively.
Cell Wall Lysis Assay
Bacterial cell wall lysis was assayed using a modification of the CytoTox-
Glo assay[22] (Promega Corp.). 100 µL of the contents of a 96-well plate
treated as described above were moved to a white, round-bottom, 96-well
plate. 25 µL of the CytoTox-Glo reagent buffer was added to each well, mixed
and incubated at room temperature in the dark for 15 min. Luminescence was
measured on a GloMax-Multi Detection System. Luminescent values were
normalized based on the absorbance value at 600 nm for each respective well.
Data was then fit to a log[agonist] versus response model, with no upper or
lower constraints, using GraphPad Prism v5.0[21].
Acknowledgements
This work was supported by the NIH in the form of grant numbers R01
GM097373-01A1 (M. A. S.) and AI076830 (M. A. S.), and the Chemical
Biology Training Grant at UIUC (K. L. W.). A special thanks to Irina Yavnyuk
and Tatiana Galushka for facilitating our fruitful collaboration with Enamine Ltd.
References
[1] D. J. Payne, M. N. Gwynn, D. J. Holmes, D. L. Pompliano, Nat. Rev.
Drug Discovery 2007, 6, 29-40.
[2] R. O'Shea, H. E. Moser, J. Med. Chem. 2008, 51, 2891-2878.

92
[3] J. W.-H. Li, J. C. Vederas, Science 2009, 325, 161-165.
[4] T. D. Bugg, C. T. Walsh, Nat. Prod. Rep. 1992, 9, 199-215.
[5] a) A. E. Belanger, J. C. Porter, G. F. Hatfull, J. Bacteriol. 2000, 182,
6854-6856; b) M. R. de Roubin, D. Mengin-Lecreulx, J. van Heijenoort,
J. Gen. Microbiol. 1992, 138 Pt 8, 1751-1757; c) B. H. Hebeler, F. E.
Young, J. Bacteriol. 1975, 122, 385-392.
[6] T. Lundqvist, S. L. Fisher, G. Kern, R. H. Folmer, Y. Xue, D. T. Newton,
T. A. Keating, R. A. Alm, B. L. de Jonge, Nature 2007, 447, 817-822.
[7] P. Conti, L. Tamborini, A. Pinto, A. Blondel, P. Minoprio, A. Mozzarelli,
C. De Micheli, Chem. Rev. 2011, 111, 6919-6946.
[8] a) E. D. LoVullo, C. R. Molins-Schneekloth, H. P. Schweizer, M. S.
Pavelka, Jr., Microbiology 2009, 155, 1152-1163; b) K. Y. Shatalin, A.
A. Neyfakh, FEMS Microbiol. Lett. 2005, 245, 315-319.
[9] a) A. de Dios, L. Prieto, J. A. Martin, A. Rubio, J. Ezquerra, M. Tebbe,
B. Lopez de Uralde, J. Martin, A. Sanchez, D. L. LeTourneau, J. E.
McGee, C. Boylan, T. R. Parr, Jr., M. C. Smith, J. Med. Chem. 2002,
45, 4559-4570; b) M. May, S. Mehboob, D. C. Mulhearn, Z. Wang, H.
Yu, G. R. Thatcher, B. D. Santarsiero, M. E. Johnson, A. D. Mesecar, J.
Mol. Biol. 2007, 371, 1219-1237.
[10] K. L. Whalen, K. L. Pankow, S. R. Blanke, M. A. Spies, ACS Med.
Chem. Lett. 2010, 8, 9-13.
[11] M. A. Spies, J. G. Reese, D. Dodd, K. L. Pankow, S. R. Blanke, J.
Baudry, J. Am. Chem. Soc. 2009, 131, 5274-5284.
[12] K. L. Whalen, K. M. Chang, M. A. Spies, Mol. Inf. 2011, 30, 459-471.
[13] C. W. Murray, D. C. Rees, Nat. Chem. 2009, 1, 187-192.

93
[14] a) A. L. Hopkins, C. R. Groom, A. Alex, Drug Discovery Today 2004, 9,
430-431; b) M. Hann, Med. Chem. Commun. 2011, 2, 349-355.
[15] P. D. Leeson, B. Springthorpe, Nat. Rev. Drug Discovery 2007, 6, 881-
890.
[16] M. Kuroda, T. Ohta, I. Uchiyama, T. Baba, H. Yuzawa, I. Kobayashi, L.
Cui, A. Oguchi, K. Aoki, Y. Nagai, J. Lian, T. Ito, M. Kanamori, H.
Matsumaru, A. Maruyama, H. Murakami, A. Hosoyama, Y. Mizutani-Ui,
N. K. Takahashi, T. Sawano, R. Inoue, C. Kaito, K. Sekimizu, H.
Hirakawa, S. Kuhara, S. Goto, J. Yabuzaki, M. Kanehisa, A. Yamashita,
K. Oshima, K. Furuya, C. Yoshino, T. Shiba, M. Hattori, N. Ogasawara,
H. Hayashi, K. Hiramatsu, Lancet 2001, 357, 1225-1240.
[17] G. L. Warren, C. E. Peishoff, M. S. Head, Computational and structural
approaches to drug discovery : ligand-protein interactions, Vol. 1, 1 ed.,
RSC Publishing, Cambridge, 2008.
[18] 2011.10 ed., Chemical Computing Group Inc., 1010 Sherbooke St.
West, Suite #910, Montreal, QC, Canada, H3A 2R7, 2011.
[19] a) E. Krieger, 12.4.1 ed., YASARA Biosciences GmbH, Vienna, Austria,
2011; b) E. Krieger, G. Koraimann, G. Vriend, Proteins 2002, 47, 393-
402.
[20] G. M. Morris, R. Huey, W. Lindstrom, M. F. Sanner, R. K. Belew, D. S.
Goodsell, A. J. Olson, J. Comput. Chem. 2009, 30, 2785-2791.
[21] GraphPadPrizm, 5 ed. (Ed.: G. Software), San Diego, California, USA,
2007.
[22] A. L. Niles, R. A. Moravec, P. Eric Hesselberth, M. A. Scurria, W. J.
Daily, T. L. Riss, Anal. Biochem. 2007, 366, 197-206.

Reprinted (adapted) with permission from Whalen, K. L.; Spies, M. A. J. Chem. Inf. Mod.,
published online August 21, 2013; DOI: 10.1021/ci400244x. Copyright 2013 American Chemical
Society. M. A. Spies contributed MD simulations and calculations related to ELR binding energy
evaluations.
94
CHAPTER 4: FLOODING ENZYMES: QUANTIFYING THE CONTRIBUTIONS
OF INTERSTITIAL WATER AND CAVITY SHAPE TO LIGAND BINDING
USING EXTENDED LINEAR RESPONSE FREE ENERGY CALCULATIONS*
ABSTRACT: Glutamate racemase (GR) is a cofactor independent amino acid
racemase that has recently garnered increasing attention as an antimicrobial
drug target. There are numerous high resolution crystal structures of GR, yet
these are invariably bound to either D-glutamate or very weakly bound oxygen-
based salts. Recent in silico screens have identified a number of new competitive
inhibitor scaffolds, which are not based on D-Glu, but exploit many of the same
hydrogen bond donor positions. In silico studies on 1-H-benzimidazole-2-sulfonic
acid (BISA) show that the sulfonic acid points to the back of the GR active site, in
the most buried region, analogous to the C2-carboxylate binding position in the
GR-D-glutamate complex. Furthermore, BISA has been shown to be the
strongest non-amino acid competitive inhibitor. Previously published
computational studies have suggested that a portion of this binding strength
derives from complexation with a more closed active site, relative to weaker
ligands, and in which the internal water network is more isolated from bulk
solvent. In order to validate key contacts between the buried sulfonate moiety of
BISA and moieties in back of the enzyme active site, as well as to probe the
energetic importance of the potentially large number of interstitial waters
contacted by the BISA scaffold, we have designed several mutants of Asn75.
GR-N75A removes a key hydrogen bond donor to the sulfonate of BISA, but also
serves to introduce an additional interstitial water, due to the newly created
space of the mutation. GR- N75L should also show the loss of a hydrogen bond
donor to the sulfonate of BISA, but does not (a priori) seem to permit an

95
additional interstitial water contact. In order to investigate the dynamics,
structure and energies of this water-mediated complexation, we have employed
the Extended Linear Response (ELR) approach for the calculation of binding free
energies to GR, using the YASARA2 knowledge based force field on a set of ten
GR complexes, and yielding an R-squared value of 0.85 and a RMSE of 2.0
kJ/mol. Surprisingly, the inhibitor set produces a uniformly large interstitial water
contribution to the electrostatic interaction energy ( ), ranging from 30 to >
50%, except for the natural substrate (D-glutamate), which has only a 7%
contribution of from water. The broader implications for predicting and
exploiting significant interstitial water contacts in ligand-enzyme complexation are
discussed.
1. INTRODUCTION
Numerous studies have established the bacterial cell wall and the
enzymes responsible for its construction as valid targets for broad-spectrum
antibiotics.1, 2 An essential enzyme in this class, which has not been targeted by
antibiotics, is glutamate racemase (GR), which produces D-glutamate, an
essential molecule for a number of pathogenic bacterial species. GR is a
member of a family of co-factor-independent racemases and epimerases, which
employs 1:1-proton transfer using juxtaposed thiol/thiolate general acid-bases
and hydrogen-bonding to the Cα-carboxylate. Previously, GR knockouts have
resulted in D-glutamate auxotrophs, validating the essentiality of GR.3, 4
Structure-based,5 HTS,6 and QSAR7 approaches to obtaining active site
competitive inhibitors have been problematic for disparate reasons, including
flexibility of the enzyme and the inconsistent presence of a hydrophobic pocket
proximal to the active site from species to species. Thus, it is highly desirable to
obtain effective inhibitory scaffolds against GR, which have favorable drug-like
physico-chemical properties. A greater understanding of the physical
determinants of molecular recognition is the key to directing future efforts.

96
The essential and conserved active site residues of GR-ligand recognition
have been well established, especially for D-glutamate, by a number of methods,
including: sequence conservation,8 mutagenesis studies,8-10 co-crystal
structures,5, 6, 11-16 and computational studies.9, 17 These residues include (using
B. subtilis numbering): Asp10, Ser11, Cys74, Asn75, Thr76, Cys185, His187 and
Thr186; where Cys74 and Cys185 act as the general acid/base for racemization.
Asn75 is in a unique position, forming the back “wall” of the active site directly
between the catalytic cysteines - a central location for forming strong hydrogen
bonds with the Cα-carboxylate of D-glutamate, as well as contributing to active
site volume. Previous computational studies have indicated that its amide
functional group is a major source of electrostatic interaction energy with the
glutamate carbanionic transition state.9 MD simulations in the current study also
implicate the amide functional group of Asn75 as being a hydrogen bond donor
to the Cα-carboxylate of D-glutamate. However, computational studies with a
number of other active site ligands indicate that Asn75 is part of a network of
interstitial waters, which are associated with charged and polar inhibitors in the
active site of GR. This network also involves the conserved residues Thr76 and
Thr118. Thus, based on its total sequence conservation, and its role in ligand
recognition, Asn75 is the most important residue of GR that has, heretofore, not
been subjected to a mutagenesis investigation. In the current study we create the
N75A and N75L mutants, both in vitro and in silico, in order to understand the
importance of the amide functional group in both recognizing the native
substrate, as well as several of the most efficient competitive inhibitors.
In addition to the Asn75, another major contributor to ligand-binding
energy in GR is interstitial water, which was also identified as a major source of
transition state stabilization.9 It is not surprising that the water-mediated contacts
in GR are highly ligand dependent. A number of recent studies in other enzymes
have indicated that water networks and interstitial water structure greatly depend
on the particular nature of the enzyme-ligand contacts.18-21

97
An examination of GR crystal structures deposited in the RCSB Protein
Data Bank reveals a heterogeneity in the location and number of the crystal-
water oxygen atoms, which, in part, correlates to the type of ligand in the
complex (Table 7). The scope of crystallographic data for GR-ligand complexes
is limited to essentially D-Glu (and D-Glu analogs) and negatively charged
oxygen-based buffers (acetate, citrate, phosphate, succinate, sulfate, and
tartrate). A histogram comparing the numbers of interstitial waters between the
former and the latter is illustrated in Figure 21. It is clear from the juxtaposition of
these histograms that a variety of water-mediated GR-ligand contacts are
possible. Unfortunately, although a number of recent competitive inhibitors for
GR have been discovered, there remains a dearth of structural data, especially
regarding tight binding complexes in the buried active site.
Previously, two attractive micromolar competitive inhibitors of GR from B.
subtilis were identified. These compounds are1H-benzimidazole-2-sulfonic acid
(1, Ki = 9 μM)22 and croconic acid (2, Ki = 42 μM).23 Both compounds possess
high ligand-efficiency, making them potentially attractive scaffolds for lead
optimization. However, the source of the strength of their binding energy (as well
as the lack of binding energy in many other negatively charged competitive
inhibitors) remains elusive. The current work integrates experimental studies on
wild-type GR and the Asn75 mutants with computational studies, in order to
parse the contributions to binding free energies for a number of different classes
of competitive GR inhibitors, using the Extended Linear Response (ELR) method.
The findings from these studies point to a stark difference in the use of water-
mediated ligand contacts between the natural substrate (D-Glu) and the set of
non-congeneric inhibitors. The extent of these differences and the implications
for future drug design against GR are discussed below.

98
Table 7. Analysis of all deposited GR co-crystal structures from the RCSB PDB. Number of interstitial waters indicated per monomer for each structure.
PDB Species Ligand Monomer
A Monomer
B Monomer
C Monomer
D
1B74 A. pyrophilus D-glutamine 1 - - - 1ZUW B. subtilis D-glutamate 1 1 1 - 2DWU B. anthracis 1 D-glutamate 1 2 2 - 2GZM B. anthracis 2 D-glutamate 0 1 0 1 2JFN E. coli D-glutamate 1 - - - 2JFO E. faecalis D-glutamate 0 1 - - 2JFP E. faecalis D-glutamate 1 1 - - 2JFQ S. aureus D-glutamate 1 2 - - 2JFU E. faecium phosphate ions 2 - - - 2JFV E. faecium citrate 2 - - - 2JFW E. faecium tartaric acid 4 - - - 2JFX H. pylori D-glutamate 1 1 - - 2JFY H. pylori D-glutamate 1 2 - -
2JFZ H. pylori D-glutamate 2 1 - -
2OHO S. pyogenes sulfate ion 0 3 - -
2OHV S. pyogenes naphthylmethyl-
D-glu 1 - - -
2VVT E. faecalis D-glutamate 1 1 - -
2W4I H. pylori D-glutamate 2 1 2 1
3IST L. monocyto. succinic acid 2 2 - -
3ISV L. monocyto. acetate ion 0 - - -
3OUT F. tularensis D-glutamate 2 2 2 -
3UHF C. jejuni D-glutamate 1 1 - -
3UHO C. jejuni D-glutamate 1 1 - -
4B1F H. pylori D-glutamate 2 2 - -
*Structures were downloaded directly from the RCSB PDB and hydrogen atoms were added using the "Clean All" function of YASARA v9.11.9. All non-hydrogen atoms were fixed, and an energy minimization was performed to relax hydrogen atoms. Interstitial waters are defined as a single water molecule forming at least two hydrogen bonds: one with the bound ligand and one with the enzyme. Monomer labeling is arbitrary and does not correspond to PDB labeling. δSeveral deposited structures are unliganded and have been excluded from this analysis. Their PDB ID numbers correspond to 1B73, 3HFR, and 3UHP.

99
Figure 21. Frequency of interstitial waters in GR co-crystal structures. Results
are separated by the indicated nature of the bound ligand. Each monomer in a
particular crystal structure (where some contain dimers or trimers) is considered
a single datum.
2. MATERIALS AND METHODS
2.1. Materials
Croconic acid (LT00453399) was purchased from Labotest (Bremen,
Germany). From Sigma Aldrich (St. Louis, MO) we obtained the following: 1H-
benzimidazole-2-sulfonic acid (530646), D-glutamate (G1001),
iodonitrotetrazolium (I8377), diaphorase (D5540), ATP (A7699), NAD+ (N7004),
and L-glutamate dehydrogenase (G2501). All reagents related to buffer
preparation for protein purification and circular dichroism were purchased from
Sigma-Aldrich. Amicon centrifugal filtration devices were purchased from
Millipore (Billerica, MA). Finally, HIS-Select Cobalt Affinity Gel (H8162) was
0 1 2 3 40
20
40
60
80Dglu-ligands
non-Dglu-ligands*
*non-Dglu-ligands include:acetate, citrate, phosphate,succinate, sulfate, andtartrate.
# of interstitial waters
% o
f all c
rysta
l str
uctu
re
mo
no
me
rs

100
purchased from Sigma-Aldrich.
2.2. Experimental Methods
2.2.1. Protein Expression and Purification
Recombinant protein was expressed in E. coli BL21 (DE3) cells containing
a pET-15b plasmid with the N-terminal 6X-His-tagged gene of choice. Protein
purification was achieved via cobalt-affinity chromatography followed by anion
exchange chromatography. Details of both the expression and purification
scheme were previously described by Whalen et al.24
2.2.2. Mutant Construction
Mutant racE_N75A and racE_N75L were prepared using a QuickChange
II XL Site-Directed Mutagenesis Kit (Stratagene, Santa Clara, CA) and primers
obtained from Eurofins MWG Operon (Huntsville, AL). See Supplementary
Information Table D.1 for primer sequences. Previously prepared and recently
isolated pET15b containing the gene of interest was used as the template DNA.
A BioRad MJ Mini Personal Thermal Cycler (BioRad, Hercules, CA) was used for
all PCR reactions. Mutagenesis was confirmed via in-house DNA sequencing
using an ABI 3730XL capillary sequencer.
2.2.3. Protein Secondary Structure Determination
Circular dichroism was employed in structure determination. A 10 μM
solution of the enzyme of interest in an optically clear borate buffer (50 mM boric
acid, 100 mM KCl, 0.7 mM DTT; pH 8.0) was measured from 190-260 nm, with 5
replicates. The averaged spectra was deconvoluted into respective secondary

101
structure motifs (α-helix, β-sheet, and disordered) using the DichroWeb online
server. The CDSSTR method was utilized with database 4 as a reference.
2.2.4. Enzyme Kinetics
Stereoisomerization of D-glutamate by glutamate racemase was assayed
using a J-720 CD spectropolarimeter from JASCO (Easton, MD). A jacketed
cylindrical cuvette with a volume of 750 μL and a path length of 10 mm was used
for each assay. Readings were measured at 220nm continuously. All
measurements were conducted at 25 ˚C. Concentrations of D-glutamate were
varied from 0.25–5 mM in an optically clear borate buffer (50 mM boric acid, 100
mM KCl, 0.7 mM DTT; pH 8.0). Reactions were initiated upon addition of enzyme
(approx. 0.5 μM). Data acquisition was performed using JASCO Spectra
Manager v1.54A software, and fitting was performed using GraphPad Prism v5.0
from GraphPad Software (San Diego, CA). Inhibitor IC50 curves were obtained
using a coupled-enzyme assay25 with iodonitrotetrazolium absorbance at 500 nm
as the readout, as both inhibitors studied were optically active at 220nm. Assays
were again conducted at 25 ˚C in the presence of 3-6 μM GR. For comparison
with calculated binding energy values, experimental IC50 values were converted
to Ki values via the Cheng-Prussoff equation, and then binding free energies via
the standard Gibbs free energy relation.
2.3. Computational Methods
2.3.1. Virtual Docking
The co-crystal structure of GR from B. subtilis bound to D-glutamate
(1ZUW, chain C) was prepared for virtual docking by first deleting all water
molecules, salt ions, peptide chains A and B, and the substrate, D-glutamate. A
simulation cell was centered on the catalytic cysteine residues, Cys74 and
Cys185, and dimensions of the cell were adjusted to encompass the entirety of

102
the active site resulting in the following cell dimensions (x-y-z): 19.9-15.2-17.2 Å.
Residue 75 was left unaltered in the case of docking to the wild-type model, but
for docking to the N75A and N75L models, Asn75 was replaced with an alanine
or leucine residue in silico, respectively. All ligands, including D-glutamate, were
constructed and minimized in MOE v2011.10 (Chemical Computing Group)26 and
imported into YASARA for virtual docking. YASARA v12.4.127 employs AutoDock
428 in its docking functionality. Specific details regarding pose generation and
scoring can be found in Whalen et al.24 The top-ranking complexes were then
used as starting structures for molecular dynamics simulations.
2.3.2. Molecular Dynamics Simulation
The molecular dynamics simulations of the docked complexes (based on
the PDB 1ZUW, as described above) were performed with the YASARA
Structure package version 12.4.1 (YASARA Biosciences).27, 29, 30 A periodic
simulation cell with boundaries extending 10 Å from the surface of the complex
was employed with explicit solvent, and the cell was neutralized with NaCl (0.9%
by mass). The YASARA2 force field was used with long-range electrostatic
potentials calculated with the Particle Mesh Ewald (PME) method, with a cutoff of
7.86 Å.31-33 The ligand force field parameters were generated with the
AutoSMILES utility, which employs semi-empirical AM1 geometry optimization
and assignment of charges, followed by assignment of AM1BCC atom and bond
types with refinement using the RESP charges, and finally the assignments of
general AMBER force field atom types. Optimization of the hydrogen bond
network of the various GR-ligand complexes was obtained using the method
established by Hooft et al., in order to address ambiguities arising from multiple
side chain conformations and protonation states that are not well resolved in the
electron density.34 Following neutralization, a final density of 0.997 g/mL was
employed. A previously described simulation annealing protocol22 was followed
before initiation of simulations using the NVT ensemble at 298 K, and integration

103
time steps of 1.25 and 2.5 fsec for intra- and intermolecular forces, respectively.
MD simulations of individual ligand in solvent and salt were performed as above,
within a simulation cell having x-y-z dimensions of approximately 70-70-70 Å,
and a total volume of ~340,000 Å3. Snapshots were saved for all cases at
intervals of 25 psec, and the electrostatic interaction energy ( ) and the van
der Waals interaction energy ( ) were calculated at each of the time points,
and averaged to yield the values in Table 11. Solvent accessible surface areas
were constructed with a solvent probe radius of 1.4 Å and the following radii for
the solute elements: polar hydrogens 0.32 Å, other hydrogens 1.0717 Å, carbon
1.8 Å, oxygen 1.344 Å, nitrogen 1.14 Å, sulfur 2.0 Å. All surface area calculations
were performed with the YASARA Structure package.
2.3.3. Ligand Interaction Maps and Reports
Ligand interaction maps were generated from the final snapshots of the 4-
ns MD simulation using MOE v2011.10 (Chemical Computing Group).35 Pocket
analysis was conducted on the same structures using the Site Finder utility of
MOE, using the default alpha sphere radius.
2.3.4. Multiple Regression Analysis Applied to Linear Response
Multiple regression analysis using the R statistical package, version
2.13.1,36 was used to optimize the α, β, γ, and δ coefficients in Eq. 5. A linear
model equating experimental binding free energies, listed in Table 11 and the
computationally-derived values from Table 11 (i.e. , , and )
was employed to obtain optimized values for α-γ, and no restraints were used in
the parameter optimization.
3. RESULTS AND DISCUSSION
3.1. Steady-state kinetics shows racemization activity in mutants, with mild

104
KM alterations.
As discussed above, we predict Asn75 to be key to pocket volume and
polarity, and thus, water accommodation. Two variations of Asn75 mutants were
constructed, where asparagine was swapped for alanine or leucine. Wildtype and
mutant variants of GR from B. subtilis were purified recombinantly from E. coli
(see Figure D.2 for SDS-PAGE). Circular dichroism shows that neither mutation
causes significant changes to the secondary structure of GR (Figure 22, Table
8). Mutant and wild-type enzymes were assayed to determine steady-state
kinetic constants, KM and kcat, in the D- to L- direction of racemization (Table 9).
The apparent KM values increased by a factor of 2-fold and 6-fold relative to wild-
type for GR-N75L and GR-N75A, respectively. It is difficult to explain what
causes the variation in Michaelis constants between GR variants from these
studies due to the complicated nature of this constant, which includes
association, dissociation, and catalytic steps. More striking is the 28-fold increase
in kcat caused by the N75A mutation. This phenomenon is currently the subject of
a separate study.
Figure 22. Comparison of the secondary structure of wild-type and mutant GRs
confirms no unfolding or dramatic structural alteration induced by mutation to
residue 75. Circular dichroism measurements made in triplicate using a Jasco J-
715 spectropolarimeter.

105
Table 8. Deconvolution of circular dichroism spectra into respective secondary
structural motifs.
*Deconvolution performed using the online server, DichroWeb. NRMSD given is
for the comparison of experimental and calculated spectral data.
Table 9. Steady-state kinetic parameters (D- to L- racemization) of wild-type and
mutant GR.
Protein KM (mM) kcat (s-1) kcat/KM (s-1 mM-1)
GR-WT 0.13 ± 0.01 1.64 ± 0.03 12.6 ± 0.08
GR-N75A 0.73 ± 0.09 45.6 ± 1.9 62.5 ± 0.13
GR-N75L 0.49 ± 0.10 0.15 ± 0.01 0.31 ± 0.10
*Steady-state kinetics measured by monitoring ellipticity at 220nm over time
using a Jasco J-715 spectropolarimeter. D-glutamate concentrations varied from
0.25-5.0mM, and data fit to the Michaelis-Menten equation (with errors from
nonlinear regression fitting).
Protein %-α-helix %-β-sheet %-disordered NRMSD
GR-WT 60 14 24 0.001 GR-N75L 65 12 22 0.003 GR-N75A 59 16 25 0.001

106
3.2. Active Site Mutation Causes Ligand-Dependent and Residue-
Dependent Binding Effects
1H-benzimidazole-2-sulfonic acid (1) and croconic acid (2) are both
competitive inhibitors with low-micromolar inhibitory constants that were
previously discovered in virtual screening studies.22, 23 These compounds vary
substantially in electrostatics and shape. The potency of each inhibitor was
determined experimentally against either GR mutant. Compound 1 showed a
50% increase in IC50 for the N75L mutation, and a striking 600% increase in IC50
for the N75A mutation, compared to the IC50 for wildtype GR (Table 10). As
suspected, the leucine and alanine substitutions cause binding energy changes
of unequal magnitude, but surprisingly 1 suffers a greater binding energy loss in
GR-N75A where we hypothesized additional water would be introduced to the
active site. When comparing free energy binding values calculated from these
IC50 values, the same trend holds true. In the case of compound 2, only modest
IC50 decreases of 20% and 40% were observed for the N75L and N75A
mutations, respectively, relative to the wildtype IC50 value (Table 10). Although
there is a statistically significant decrease in the value of the IC50 for GR-N75A-2
compared to WT, the significance of this change does not hold with respect to
their Ki values. Nevertheless, complexation of both of these compounds, to both
wildtype and mutant GR, were subjected to more in-depth structural and
computational analyses.

107
Table 10. GR inhibitors and substrate examined in this study.
# Ligand Name Ligand Structure IC50 Curve
1 1H-benzimidazole-
2-sulfonic acid (BISA)
0 1 2 3 40
25
50
75
100 GR-WT
GR-N75A
IC50 = 128 40 M
IC50 = 890 140 M
GR-N75L
IC50 = 198 36 M
log [inhibitor] (M)
Activi
ty (
%)
Ki (WT) = 9 ± 2 μM22
2 croconate
0 1 2 3 40
25
50
75
100
IC50 = 94 15 M
GR-WT
GR-N75A
IC50 = 58 4 M
GR-N75L
IC50 = 74 12 M
log [inhibitor] (M)
Activi
ty (
%)
Ki (WT) = 42 ± 10 μM23
3 D-glutamate
KM (WT) = 130 ± 10 μM Kd = 110 ± 14 μM (Fig. S5)
4 α-ketoglutarate
IC50 (WT) = 430 μM22
5 chloroaniline sulfonic acid
IC50 (WT) = 720 μM22

108
6 dipicolinic acid
Ki (WT) = 2000 μM9
*Ligand structures shown with molecular surface (van der Waals) rendering.
Hydrophobic regions are colored green, mildly polar regions are colored blue,
and hydrogen bonding regions are colored purple. IC50 curves were
experimentally acquired via methods described in the Materials and Methods
section.
3.3. Molecular Dynamics Simulations Indicate Morphological and Ligand-
binding Changes Resulting from N75A and N75L Mutations
In order to elucidate the nature and strength of the GR-ligand binding
energies for a range of competitive inhibitors, we used a combination of docking,
classical MD simulations and extended linear response (ELR) free energy
calculations. Firstly, we describe the morphological characteristics of the GR-
ligand complexes, followed by an analysis of the sources of binding free energy,
including the role of interstitial water.
3.3.1. Placement of Ligands in GR Active Sites.
A docking protocol, based on AutoDock 4.2, was used to place all of the
ligands employed in the MD simulations (see Computational Methods section).
Subsequently, these complexes were all subjected to the same protocols for
simulated annealing energy minimization, followed by 4 ns of classical MD
simulations, using the YASARA2 knowledge-based force field, using an explicit
solvent model and periodic boundaries (see Computational Methods for details).
These MD simulations were later used in ELR free energy calculations as
described below. This type of hierarchical approach has proven successful in

109
numerous LIE/ELR studies.37-39
3.3.2. Molecular Dynamics Simulations of GR-Ligand Complexes.
MD simulations were employed to obtain structural information for each
inhibitor-GR complex. All ten complexes achieved RMSD equilibrium between 1
and 1.5 ns (Figure D.1). Structures from the end of a 4 ns simulation were used
to parse the GR-ligand interactions. GR-1 and -2 complexes were of particular
interest, due to reasons outlined above. A distinct characteristic of the GR-
N75A-1 complex is that the ligand is less solvent exposed (than the GR-WT- and
GR-N75L-1 complexes). The morphological characteristics of these various GR-
ligand complexes may be described in a number of ways. A ligand pocket
analysis of the three 1-bound complexes shows that the volume of the active site
is markedly reduced for the GR-N75A-1 (Table D.2), relative to GR-N75L- and
GR-WT-1 complexes. Furthermore, in addition to the reduction in the size of the
active site of GR-N75A, the openness of its cleft is significantly reduced, relative
to wild-type and GR-N75L complexes, as described in Figure 23 and Figure D.3.
A cross-section of the three complexes of GR-1 from equilibrated MD snapshots
at 4 ns are compared in Figure D.4. The wild-type complex contains a water
channel that leads out of the back of the active site (away from the entrance),
while the GR-N75A and GR-N75L active sites are not contiguous with this water
channel (Figure D.4). The presence of this connected water channel in the wild-
type GR (and its absence in the mutants) is a stable characteristic seen
throughout the MD simulations. Additionally, while there are only two, or one,
interstitial waters present in the wild-type and GR-N75A complexes, respectively,
there are four interstitial waters in the GR-N75L complex (Figure 23). Lastly, the
key hydrogen-bond contacts between 1 and GR are more optimal in the wild-type
complex than in either Asn75 mutant, and this will be fully discussed below.

110
Given the gross morphological differences between the three GR species,
it naturally follows that inhibitor 1 should be less solvent exposed in the N75A
mutant, which is borne out in the ligand-interaction maps shown in Figure 23.
Both the benzyl ring and sulfonate oxygens are somewhat less solvent exposed
in GR-N75A, than in wild-type and GR-N75L complexes.
Although these MD simulations do provide some insight into the nature of
GR-1 complexation, and more particularly the role of a key residue, Asn75, what
is desired is a quantitative description of the free energy contributions of the GR
pharmacophore. It is apparent from the relatively large plasticity exhibited by GR,
from the MD analysis above, that diverse ligands may yield quite different GR-
liganded complexes, particularly with regard to active site volume and interstitial
water. In fact, a number of recent reports have also highlighted the idiosyncratic
nature of interstitial water structure in enzyme active sites, where the presence of
interstitial water can act as a favorable21, 40 or unfavorable component of the total
binding energy.18-20 In one particular study, Barandun and coworkers observed
striking differences in binding energies between tRNA-guanine transglycosylase
and sets of lin-benzoquanine and lin-benzohypoxanthine inhibitors.20 Barandun
et al. used X-ray crystallography to expose ligand-dependent conformational
changes in key active site residues, which results in the import of interstitial
water.20 Without high-resolution structural information such as that obtained by
Barandun and coworkers, enzyme-plasticity and numerous water-mediated
contacts make the determination of meaningful enzyme-ligand binding energies a
non-trivial task. It would be extraordinarily useful to be able to predict the gross
morphological changes as well as the specific active site alterations due to
complexation with particular GR inhibitors, and more importantly their binding
free energies. To that end we applied the Extended Linear Response (ELR)
method for calculating binding free energies, to a set of 10 different GR-ligand
complexes (vide infra).

111
Figure 23. Ligand interaction maps for the inhibitors, 1 (top) and 2 (bottom),
bound to wild-type (A and D) GR-N75L (B and E), and GR-N75A (C and F)
active sites support the energetic evaluations conducted via ELR. Maps
generated from structures from the final snapshot of a 4-nsec MD simulation.
Residues are indicated with labeled circles. Direct hydrogen bonding interactions
are indicated with blue (backbone) or green (side-chain) dashed lines. Interstitial
water-hydrogen bonding interactions are indicated with gold dashed lines.
Solvent exposure is indicated with light blue shading and the active site surface
proximal to the ligand is indicated with a grey line.

112
3.4. Binding Energy Calculations Using ELR
A permutation of the ELR methodology first described by Jorgensen has
been applied to 10 different GR-ligand complexes.41 A number of ELR
approaches41-44 have been described, and are based on the Linear Interaction
Energy (LIE) method, first described by Aqvist et al.45 The seminal studies for
utilizing the linear response approximation employ expressions for the hydration
energy of ions, and it can be shown that the electrostatic portion of this free
energy ( ) is defined by Equation 1.46, 47 This expression was then
extrapolated by Aqvist and co-workers to the problem of considering ligand-
protein binding, where they showed that the electrostatic contribution to the
binding free energy was expressed by Equation 2, where the term now refers
to the difference between protein and water systems.45
Eq. 1
Eq. 2
In the LIE approach, one obtains interaction energy components from molecular
dynamics or Monte Carlo simulations, then parses the binding energy
contributions into an electrostatic component (based on linear response) and a
van der Waals component based on an empirically scalable parameter:
Eq. 3
indicates differences in the average electrostatic interaction energies
between the two states (i.e. solvated and enzyme-bound systems). Statistical

113
analysis of multiple systems by Aqvist and coworkers lead to an optimal set α
value of 0.161.45 Later studies employed a coefficient, called β, that is variable
and ligand-dependent (ranging from 0.33 to 0.5) in place of the fixed
coefficient of 0.5, thus deviating from linear response.48 These α and β parameter
optimizations worked well for a number of systems,45, 48 but in the case of a
thrombin target, it was necessary to add an additional offset term, γ, in order to
reproduce the experimental binding free energies (Eq. 4).49 In this case the γ
term was a relatively large offset at -2.9 kcal/mol. These, and other studies, led
Aqvist and coworkers to speculate that this constant offset value was highly
dependent on the type of receptor site.50
Eq. 4
An augmented approach to the above model (Eq. 5), in which changes in ligand
solvent accessible surface area (∆SASA) are also empirically scaled was applied
by Jorgensen and coworkers, using the OPLS force field, and investigating the
binding of a set of sulfonamide inhibitors to human thrombin, arrived at solutions
with significantly lower β values than the linear response approximation.42 Later
studies, with various force fields, also found solutions with β values significantly
different from linear response approximation.44, 51
Eq. 5
While the meaning of the β parameter is based on the linear response
approximation, which derives from the potential of mean force from changing
electric fields in polar solvents, the physical meaning of the α value is much more
ambiguous. The α term has been empirically derived, and lacks any clear a priori
physical meaning. Kollman and coworkers determined that the α value is highly

114
correlated to a weighted change in nonpolar SAS upon ligand binding,52 which
they show to be dependent on the nature of the protein binding site (the more
nonpolar the buried moiety, the more positive the weighting). Furthermore,
optimization of the α parameter is expected to also implicitly include terms such
as desolvation and entropy loss. Orthodox linear response-based methods are,
however, not expected to explicitly account for long-range solvent-solute
interactions, although more accurate methods for capturing such effects have
been developed.53 It is not surprising then that significant variation in the values
of α and β (as well as γ and δ) exist across systems and methodological
approaches.
In the current study, we are applying the above ELR approach, using
∆SASA and a constant offset value (δ) in order to reproduce the absolute binding
free energies for the given set of ligands to GR. Furthermore, we are using the
YASARA2 knowledge-based force field (KBFF) in 4 ns simulations for each GR-
ligand complex (see Computational Methods for details). Ten different GR
complexes, employing compounds indicated in Table 10 were used in ELR
calculations; Table 11 lists the average and interaction energies for
both solvated and enzyme-bound systems. In all cases, these highly polar
ligands had negative values for in both the enzyme-bound form and the
solvated system. However, all of the ligands had more negative values in
the solvated system than in the enzyme-bound form, leading to all positive values
for . As expected, the converse of this was true for the , having all
negative values. The change in solvent accessible surface area, as well as the
experimentally-determined binding values are indicated in Table 11.
The adjustable parameters were then optimized using multiple regression
analysis, and the results of this are indicated in Table 12. The residual standard
error yielded a value of 2.0 kJ/mol, with an R value of 0.92. It is remarkable that
the β value here (0.07 ± 0.01) is within error of the lowest RMS model of studies

115
on sulfonamide inhibitors of thrombin (β = 0.071 ± 0.0242), as well as a composite
of ELR performed on 3 different protein kinases (β = 0.084854); and laying in
between β values determined for CYP1A2 (= 0.014 to 0.03451) and HIV-1
reverse transcriptase (0.14443). Taken together these ELR studies using three
different force fields and six different enzymes converge on solutions of β values
that are definitively lower than the original linear approximation, but in toto are
relatively precise.
The optimized α value in the current study is 0.04 ± 0.05. Previous LIE and
ELR studies have shown that the α value has been arguably the most difficult
parameter to estimate. Aqvist and coworkers obtained an optimized α value of
0.18 on a system composed of four different targets,55 while other studies found
diverse optimized values that ranged from being within error of zero43 to being
quite large (> 0.5).51 A relatively large standard regression error on the α value
was obtained for three different protein kinases by Tominaga and Jorgensen (α =
0.077154). The optimized γ value in this study indicates that larger buried solvent
accessible surface area correlates with more unfavorable binding energy, which
means that there is something other than simple cavitation being reported. One
possibility is the ejection of stabilized, interstitial waters in the apo-GR structure.
Ejection of such waters has been estimated to be ~1.8 kcal/mol/water.56 Previous
steered MD studies on GR indicated that severe alterations in the global shape of
the enzyme occur in a ligand-dependent manner.22 GR structures that exhibited
greater degrees of active site cavity opening (induced by steered MD removal of
ligands) also exhibited significantly greater free energies of protein solvation,
suggesting that the ligand-induced changes in complex structure may have a
number of non-obvious energetic implications.

116
Table 11. Data used in the Extended Linear Response calculations.*
Complex
(kJ/mol)
(kJ/mol)
(kJ/mol)
(kJ/mol)
∆Gbind
Experiment (kJ/mol)
Calculated
(Å2)
1-WT -617 -199 +9 -137 -28.8 277 1-N75A -581 -224 +45 -162 -19.5 307 1-N75L -590 -220 +36 -158 -23.9 294 1-wb -626 -62 - - - - 2-WT -1643 -134 +60 -119 -25.0 232 2-N75A -1671 -141 +32 -126 -26.4 231 2-N75L -1684 -119 +19 -104 -26.4 230 2-wb -1703 -15 - - - - 3-WT -1071 -150 +53 -149 -22.2 270 3-wb -1124 -1.4 - - - - 4-WT -1717 -160 +167 -159 -19.4 247 4-wb -1884 +0.6 - - - - 5-WT -532 -166 +73 -125 -18.4 311 5-wb -605 -41 - - - - 6-WT -1753 -172 +140 -147 -15.4 274 6-wb -1893 -25 - - - -
*Carrots ( ) indicate the average of an ensemble, where the ensemble of
structures is obtained from molecular dynamics simulations. Abbreviations: el,
electrostatic; vdw, van der Waals; SASA, solvent accessible surface area; wb,
water box.
Table 12. Multiple regression coefficients from fitting to the Extended Linear
Response model.*
Multiple Regression Estimate
Regression Standard Error
α (van der Waals) 0.04 0.05 β (electrostatic) 0.07 0.01 γ (SAS) (kJ/Å2) 0.08 0.03 δ Intercept (kJ/mol) -43 6
*The residual standard error from the multiple regression fit was 2.0 kJ/mol. The
Multiple R-squared value was 0.85.

117
Figure 24. Plot of experimental versus computationally-derived binding energies.
Data is fit to a linear regression here (solid, black) and the ± 4.2 kJ/mol (1
kcal/mol; red) and ± 2.0 kJ/mol (mult. regression error; blue) boundaries are
shown. The calculated slope is 0.85 ± 0.13, Y-intercept is -3.3 ± 2.9 kJ/mol, and
the R-squared value is 0.85.
3.5. Water contributions to total binding energy are strongly ligand-
dependent.
Another trend in the ELR data is that the relatively closed state of GR-
N75A yields, not surprisingly, more favorable (relative to wild-type and
GR-N75L), for both inhibitors 1 and 2. This corresponds to the smaller active site
volumes seen for the N75A mutant, its greater degree of cleft closure around the
ligands as well as the solvent exposure, as presented in Figure 23. These
enhanced van der Waals contacts do not necessarily track with greater binding
affinities, as the quality of electrostatic interactions with the protein as well as the
water network would need to be maintained in this reduced volume cavity. In
order to parse the electrostatic contributions in terms of protein- and water-

118
mediated contacts, for all of the GR-ligand complexes in this study, we
determined the in the absence of water (vide infra).
The striking conclusion from analyzing the ligand-protein and ligand-water-
mediated contributions to is that for most ligands there is a very large
percentage of the interaction energy achieved through water contacts (Table 13).
These values range from 7% for D-glutamate (3) to 54% for 4. However, the
range for all ligands except for D-glutamate is 24-54%, indicating that all of the
inhibitors here depend significantly more on water-mediated contacts for
enzyme-binding than the natural substrate. In order to make the most stark
comparison of these varying modes of water utilization, we juxtapose the ligand
maps from the end of the MD simulation for D-glutamate- and 4-bound
complexes (Figure 25). The ligand map of D-glutamate in Figure 25 illustrates the
high efficiency of the natural substrate in making productive electrostatic protein
contacts, which is highlighted by the presence of a singular water-mediated
contact. Interestingly, this single water contact occurs at the γ-carboxylate,
remote from the high-quality α-carboxylate-protein contacts in the rear of the
cavity. This is not true of the inhibitors examined in this study. Compound 4
typifies this flooding of the active site of GR, in which there is extensive use of
water-mediated contacts that contribute to the binding energy.
Another GR-ligand complex that exhibits this flooding phenomenon is GR-
N75L-1, whose ligand map was presented earlier in Figure 23, and in which
numerous water-mediated contacts could be seen. Table 13 shows that 1 bound
to GR-WT has a 32% due to water-mediated contacts, while 1 bound to
GR-N75L exhibits a value of 47%, which is clearly reflected in the ligand
interaction maps (Figure 23). Not surprisingly, 1 bound to GR-N75A has
approximately the same dependence on water-mediated contacts as in the GR-
WT complex. This reveals that the very poor quality of ligand-protein interaction
energy, particularly in the hydrogen-bonding between the sulfonate of compound

119
1 and the back of the active site pocket (proximal to the mutated Asn75 position)
is present in GR-N75L. In other words, the damage due to the pharmacophore by
swapping the amide of Asn75 for the isopropyl of leucine could be rescued by
simply flooding this polar active site, and increasing the number of water-
mediated contacts. An astute observation made by Barandun and coworkers is
that despite favorable interactions between imported water and the protein, these
interactions are rarely sufficient to compensate for losses of direct ligand-protein
interactions.20 The difference in compound 1 binding energy between GR-WT
and GR-N75A is most likely the result of an altered binding pose that produces
suboptimal bond distances and angles for direct contacts between ligand and
protein. This reduction in pose quality is quantified in Table 13 where
electrostatic interaction energy is calculated in the absence of water (-419 kJ/mol
vs -391 kJ/mol for WT vs N75A). Additionally, distances and angles were
calculated and averaged for all protein-ligand hydrogen bonding interactions in
the final three snapshots of either complex's MD simulation (Figure D.6). The
results show an increase in overall bond distance and a reduction in bond angle
in the case of N75A, consistent with its smaller electrostatic protein-ligand
interaction energy (Table 13). In addition, there is one less bridging water
molecule in the N75A-complex compared to the wildtype complex.
Table 13. Parsing the contributions of interstitial waters to ligand binding set.*
Electrostatic interaction energies in the absence of
water ( protein [kJ/mol])
% of due to interstitial water-ligand interaction
1-WT -419 32 1-N75A -391 33 1-N75L -314 47 2-WT -777 53 3-WT -993 7 4-WT -798 54 5-WT -377 29 6-WT -1314 25

120
Figure 25. Ligand interaction maps for D-glutamate (A) and 4 (B) bound to wild-
type GR. Residues are indicated with labeled circles. Direct hydrogen bonding
interactions are indicated with blue (backbone) or green (side-chain) dashed
lines. Interstitial water-hydrogen bonding interactions are indicated with gold
dashed lines. Solvent exposure is indicated with light blue shading and the active
site surface proximal to the ligand is indicated with a grey line.

121
4. CONCLUSIONS
The optimized ELR model resulted in an α = 0.04 and β = 0.07, both
values within error of a number of published values on various enzymatic
systems. This solution required an offset (δ value) or -43 ± 6 kJ/mol and yielded
an R-squared value of 0.85 and an RMS error of 2.0 kJ/mol. The MD simulations
indicated that GR-N75A had a reduced active site volume, less open active site
cleft, and decreased solvent exposure with 1H-benzimidazole-2-sulfonic acid (1),
a recently identified high-efficiency competitive inhibitor. Results of the ELR study
indicated that for GR-N75A with 1 and another attractive competitive
inhibitor, croconate (2), are more favorable relative to their wild-type and GR-
N75L counterparts.
Analysis of the contributions of water-mediated contacts to the GR-ligand
electrostatic interaction energies reveals a surprisingly large role in all ligands
(24-54%), except the natural substrate (7%). In the case of inhibitor 1, the N75A
mutation results in non-optimal sulfonate-protein hydrogen bonds in the rear of
the active site, and reduction in active site volume (relative to wild-type). While in
the case of the N75L mutant, the sulfonate-protein hydrogen-bonding is even
poorer, yet the larger active site volume and degree of cleft openness, led to
water-mediated rescue of GR-ligand binding energy. These findings yield deep
insight into potential antibacterial mutagenesis mechanisms. Despite the
attractiveness of 1 as a scaffold, optimization should be pursued cautiously since
it is possible to make a mutant that damages the pharmacophore, and still
produces a perfectly functional glutamate racemase.
ASSOCIATED CONTENT
Supporting Information. Additional figures including: SDS-PAGE analysis of
purified recombinant proteins, MOE computational pocket analysis, mutagenesis

122
primers, D-glu titration to GR, and MD simulation RMSD plots. This material is
available free of charge via the Internet at http://pubs.acs.org.
AUTHOR INFORMATION
Corresponding Author
*Dr. Ashley Spies, email: [email protected]; mailing address: PHAR
S313, 115 S. Grand Avenue, Iowa City, IA 52242
Author Contributions
The manuscript was written through contributions of all authors. All authors have
given approval to the final version of the manuscript.
ACKNOWLEDGMENT
This work was supported by the NIH in the forms of Grants AI076830 and
GM097373, as well as the Chemical Biology Interface Training Grant (UIUC).
ABBREVIATIONS
GR, glutamate racemase; ELR, extended linear response; el, electrostatic; vdw,
van der Waals; BISA, 1H-benzimidazole-2-sulfonic acid; SASA, solvent
accessible surface area; wb, water box.
REFERENCES
1. Bugg, T. D.; Walsh, C. T., Intracellular Steps of Bacterial Cell Wall
Peptidoglycan Biosynthesis: Enzymology, Antibiotics, and Antibiotic Resistance.
Nat. Prod. Rep. 1992, 9, 199-215.
2. Walsh, C. T., Enzymes in the D-alanine Branch of Bacterial Cell Wall

123
Peptidoglycan Assembly. J. Biol. Chem. 1989, 264, 2393-2396.
3. LoVullo, E. D.; Molins-Schneekloth, C. R.; Schweizer, H. P.; Pavelka, M.
S., Jr., Single-Copy Chromosomal Integration Systems for Francisella tularensis.
Microbiology 2009, 155, 1152-1163.
4. Shatalin, K. Y.; Neyfakh, A. A., Efficient Gene Inactivation of Bacillus
anthracis. FEMS Microbiol. Lett. 2005, 245, 315-319.
5. Ruzheinikov, S. N.; Taal, M. A.; Sedelnikova, S. E.; Baker, P. J.; Rice, D.
W., Substrate-Induced Conformational Changes in Bacillus subtilis Glutamate
Racemase and Their Implications for Drug Discovery. Structure 2005, 13, 1707-
1713.
6. Lundqvist, T.; Fisher, S. L.; Kern, G.; Folmer, R. H.; Xue, Y.; Newton, D.
T.; Keating, T. A.; Alm, R. A.; de Jonge, B. L., Exploitation of Structural and
Regulatory Diversity in Glutamate Racemases. Nature 2007, 447, 817-822.
7. de Dios, A.; Prieto, L.; Martin, J. A.; Rubio, A.; Ezquerra, J.; Tebbe, M.;
Lopez de Uralde, B.; Martin, J.; Sanchez, A.; LeTourneau, D. L.; McGee, J. E.;
Boylan, C.; Parr, T. R., Jr.; Smith, M. C., 4-Substituted D-Glutamic Acid
Analogues: the First Potent Inhibitors of Glutamate Racemase (MurI) Enzyme
with Antibacterial Activity. J. Med. Chem. 2002, 45, 4559-4570.
8. Glavas, S.; Tanner, M. E., Active Site Residues of Glutamate Racemase.
Biochemistry 2001, 40, 6199-6204.
9. Spies, M. A.; Reese, J. G.; Dodd, D.; Pankow, K. L.; Blanke, S. R.;
Baudry, J., Determinants of Catalytic Power and Ligand Binding in Glutamate
Racemase. J. Am. Chem. Soc. 2009, 131, 5274-5284.
10. Dodd, D.; Reese, J. G.; Louer, C. R.; Ballard, J. D.; Spies, M. A.; Blanke,
S. R., Functional Comparison of the Two Bacillus anthracis Glutamate
Racemases. J. Bacteriol. 2007, 189, 5265-5275.

124
11. Basarab, G. S.; Hill, P. J.; Rastagar, A.; Webborn, P. J. H., Design of
Helicobacter pylori Glutamate Racemase Inhibitors as Selective Antibacterial
Agents: A Novel Pro-drug Approach to Increase Exposure. Bioorg. Med. Chem.
Lett. 2008, 18, 4716-4722.
12. Geng, B.; Basarab, G.; Comita-Prevoir, J.; Gowravaram, M.; Hill, P.; Kiely,
A.; Loch, J.; MacPherson, L.; Morningstar, M.; Mullen, G.; Osimboni, E.; Satz, A.;
Eyermann, C.; Lundqvist, T., Potent and Selective Inhibitors of Helicobacter
pylori Glutamate Racemase (MurI): Pyridodiazepine Amines. Bioorg. Med.
Chem. Lett. 2009, 19, 930-936.
13. Geng, B.; Breault, G.; Comita-Prevoir, J.; Petrichko, R.; Eyermann, C.;
Lundqvist, T.; Doig, P.; Gorseth, E.; Noonan, B., Exploring 9-Benzyl Purines as
Inhibitors of Glutamate Racemase (MurI) in Gram-Positive Bacteria. Bioorg. Med.
Chem. Lett. 2008, 18, 4368-4372.
14. Kim, K. H.; Bong, Y. J.; Park, J. K.; Shin, K. J.; Hwang, K. Y.; Kim, E. E.,
Structural Basis for Glutamate Racemase Inhibition. J. Mol. Biol. 2007, 372, 434-
443.
15. May, M.; Mehboob, S.; Mulhearn, D. C.; Wang, Z.; Yu, H.; Thatcher, G. R.;
Santarsiero, B. D.; Johnson, M. E.; Mesecar, A. D., Structural and Functional
Analysis of Two Glutamate Racemase Isozymes from Bacillus anthracis and
Implications for Inhibitor Design. J. Mol. Biol. 2007, 371, 1219-1237.
16. Hwang, K. Y.; Cho, C. S.; Kim, S. S.; Sung, H. C.; Yu, Y. G.; Cho, Y.,
Structure and Mechanism of Glutamate Racemase from Aquifex pyrophilus. Nat.
Struct. Biol. 1999, 6, 422-426.
17. Puig, E.; Garcia-Viloca, M.; Gonzalez-Lafont, A.; Lluch, J. M.; Field, M. J.,
New Insights into the Reaction Mechanism Catalyzed by the Glutamate
Racemase Enzyme: pH Titration Curves and Classical Molecular Dynamics
Simulations. J. Phys. Chem. B 2007, 111, 2385-2397.

125
18. Jia, R.; Yang, L.-J.; Yang, S.-Y., Binding Energy Contribution of the
Conserved Bridging Water Molecules in CDK2-inhibitor Complexes: A Combined
QM/MM Study. Chem. Phys. Lett. 2008, 460, 300-305.
19. Biela, A.; Sielaff, F.; Terwesten, F.; Heine, A.; Steinmetzer, T.; Klebe, G.,
Ligand Binding Stepwise Disrupts Water Network in Thrombin: Enthalpic and
Entropic Changes Reveal Classical Hydrophobic Effect. J. Med. Chem. 2012, 55,
6094-6110.
20. Barandun, L. J.; Immekus, F.; Kohler, P. C.; Tonazzi, S.; Wagner, B.;
Wendelspiess, S.; Ritschel, T.; Heine, A.; Kansy, M.; Klebe, G.; Diederich, F.,
From lin-Benzoguanines to lin-Benzohypoxanthines as Ligands for Zymomonas
mobilis tRNA-Guanine Transglycosylase: Replacement of Protein-Ligand
Hydrogen Bonding by Importing Water Clusters. Chemistry 2012, 18, 9246-9257.
21. Palencia, A.; Camara-Artigas, A.; Pisabarro, M. T.; Martinez, J. C.; Luque,
I., Role of Interfacial Water Molecules in Proline-Rich Ligand Recognition by the
Src Homology 3 Domain of Abl. J. Biol. Chem. 2010, 285, 2823-2833.
22. Whalen, K. L.; Chang, K. M.; Spies, M. A., Hybrid Steered Molecular
Dynamics-Docking: An Efficient Solution to the Problem of Ranking Inhibitor
Affinities Against a Flexible Drug Target. Mol. Inf. 2011, 30, 459-471.
23. Whalen, K. L.; Pankow, K. L.; Blanke, S. R.; Spies, M. A., Exploiting
Enzyme Plasticity in Virtual Screening: High Efficiency Inhibitors of Glutamate
Racemase. Med. Chem. Lett. 2010, 8, 9-13.
24. Whalen, K. L.; Tussey, K. B.; Blanke, S. R.; Spies, M. A., Nature of
Allosteric Inhibition in Glutamate Racemase: Discovery and Characterization of a
Cryptic Inhibitory Pocket Using Atomistic MD Simulations and pKa Calculations.
J. Phys. Chem. B 2011, 115, 3416-3424.
25. Rej, R., A Convenient Continuous-Rate Spectrophotometric Method for

126
Determination of Amino Acid Substrate Specificity of Aminotransferases:
Application to Isoenzymes of Aspartate Aminotransferase. Anal. Biochem. 1982,
119, 205-210.
26. Molecular Operating Environment (MOE), 2011.10; Chemical Computing
Group Inc.: 1010 Sherbooke St. West, Suite #910, Montreal, QC, Canada, H3A
2R7, 2011.
27. Krieger, E. YASARA 12.4.1; YASARA Biosciences GmbH: Vienna,
Austria, 2011.
28. Morris, G. M.; Huey, R.; Lindstrom, W.; Sanner, M. F.; Belew, R. K.;
Goodsell, D. S.; Olson, A. J., AutoDock4 and AutoDockTools4: Automated
Docking with Selective Receptor Flexibility. J. Comput. Chem. 2009, 30, 2785-
2791.
29. Krieger, E.; Darden, T.; Nabuurs, S. B.; Finkelstein, A.; Vriend, G., Making
Optimal Use of Empirical Energy Functions: Force-Field Parameterization in
Crystal Space. Proteins 2004, 57, 678-683.
30. Krieger, E.; Joo, K.; Lee, J.; Lee, J.; Raman, S.; Thompson, J.; Tyka, M.;
Baker, D.; Karplus, K., Improving Physical Realism, Stereochemistry, and Side-
Chain Accuracy in Homology Modeling: Four Approaches that Performed Well in
CASP8. Proteins 2009, 77 Suppl 9, 114-122.
31. Cornell, W. D.; Cieplak, P.; Bayly, C. I.; Gould, I. R.; Merz, K. M., Jr.;
Ferguson, D. M.; Spellmeyer, D. C.; Fox, T.; Caldwell, J.; Kollman, P. A., A
Second Generation Force Field for the Simulation of Proteins, Nucleic Acids, and
Organic Molecules. J. Am. Chem. Soc. 1995, 117, 5179-5197.
32. Duan, Y.; Wu, C.; Chowdhury, S.; Lee, M. C.; Xiong, G.; Zhang, W.; Yang,
R.; Cieplak, P.; Luo, R.; Lee, T.; Caldwell, J.; Wang, J.; Kollman, P., A Point-
Charge Force Field for Molecular Mechanics Simulations of Proteins Based on

127
Condensed-Phase Quantum Mechanical Calculations. J. Comput. Chem. 2003,
24, 1999-2012.
33. Essmann, U.; Perera, L.; Berkowitz, M. L.; Darden, T.; Lee, H.; Pedersen,
L. G., A Smooth Particle Mesh Ewald Method. J. Chem. Phys. 1995, 103, 8577-
8593.
34. Hooft, R. W. W.; Vriend, G.; Sander, C.; Abola, E. E., Errors in Protein
Structures. Nature 1996, 381, 272.
35. May, M.; Mehboob, S.; Mulhearn, D. C.; Wang, Z.; Yu, H.; Thatcher, G. R.;
Santarsiero, B. D.; Johnson, M. E.; Mesecar, A. D., Structural and Functional
Analysis of Two Glutamate Racemase Isozymes from Bacillus anthracis and
Implications for Inhibitor Design. J. Mol. Biol. 2007, 371, 1219-1237.
36. R Development Core Team R: A language and environment for statistical
computing, R Foundation for Statistical Computing: Vienna, Austria, 2010.
37. Graffner-Nordberg, M.; Kolmodin, K.; Aqvist, J.; Queener, S. F.; Hallberg,
A., Design, Synthesis, Computational Prediction, and Biological Evaluation of
Ester Soft Drugs as Inhibitors of Dihydrofolate Reductase from Pneumocystis
carinii. J. Med. Chem. 2001, 44, 2391-2402.
38. Luzhkov, V. B.; Aqvist, J., K(+)/Na(+) Selectivity of the KcsA Potassium
Channel from Microscopic Free Energy Perturbation Calculations. Biochim.
Biophys. Acta 2001, 1548, 194-202.
39. Khandelwal, A.; Lukacova, V.; Comez, D.; Kroll, D. M.; Raha, S.; Balaz,
S., A Combination of Docking, QM/MM Methods, and MD Simulation for Binding
Affinity Estimation of Metalloprotein Ligands. J. Med. Chem. 2005, 48, 5437-
5447.
40. Ellermann, M.; Jakob-Roetne, R.; Lerner, C.; Borroni, E.; Schlatter, D.;
Roth, D.; Ehler, A.; Rudolph, M. G.; Diederich, F., Molecular Recognition at the

128
Active Site of Catechol-O-Methyltransferase: Energetically Favorable
Replacement of a Water Molecule Imported by a Bisubstrate Inhibitor. Angew.
Chem. Int. Edit. 2009, 48, 9092-9096.
41. Carlson, H. A.; Jorgensen, W. J., An Extended Linear Response Method
for Determining Free Energies of Hydration. J. Phys. Chem. B 1995, 99, 10667-
10673.
42. Jones-Hertzog, D. K.; Jorgensen, W. L., Binding Affinities for Sulfonamide
Inhibitors with Human Thrombin Using Monte Carlo Simulations with a Linear
Response Method. J. Med. Chem. 1997, 40, 1539-1549.
43. Smith, R. H., Jr.; Jorgensen, W. L.; Tirado-Rives, J.; Lamb, M. L.;
Janssen, P. A.; Michejda, C. J.; Kroeger Smith, M. B., Prediction of Binding
Affinities for TIBO Inhibitors of HIV-1 Reverse Transcriptase Using Monte Carlo
Simulations in a Linear Response Method. J. Med. Chem. 1998, 41, 5272-5286.
44. Tominaga, Y.; Jorgensen, W. L., General Model for Estimation of the
Inhibition of Protein Kinases Using Monte Carlo Simulations. J. Med. Chem.
2004, 47, 2534-2549.
45. Aqvist, J.; Medina, C.; Samuelsson, J. E., A New Method for Predicting
Binding Affinity in Computer-Aided Drug Design. Protein Eng. 1994, 7, 385-391.
46. Roux, B.; Yu, H.-A.; Karplus, M., Molecular Basis for the Born Model of Ion
Solvation. J. Phys. Chem. 1990, 94, 4683-4688.
47. Warshel, A.; Russell, S. T., Calculations of Electrostatic Interactions in
Biological Systems and in Solutions. Q. Rev. Biophys. 1984, 17, 283-422.
48. Hansson, T.; Marelius, J.; Aqvist, J., Ligand binding affinity prediction by
linear interaction energy methods. J. Comput.-Aided Mol. Des. 1998, 12, 27-35.
49. Ljungberg, K. B.; Marelius, J.; Musil, D.; Svensson, P.; Norden, B.; Aqvist,

129
J., Computational Modelling of Inhibitor Binding to Human Thrombin. Eur. J.
Pharm. Sci. 2001, 12, 441-446.
50. Brandsdal, B. O.; Osterberg, F.; Almlof, M.; Feierberg, I.; Luzhkov, V. B.;
Aqvist, J., Free Energy Calculations and Ligand Binding. Adv. Protein Chem.
2003, 66, 123-158.
51. Vasanthanathan, P.; Olsen, L.; Jorgensen, F. S.; Vermeulen, N. P. E.;
Oostenbrink, C., Computational Prediction of Binding Affinity for CYP1A2-Ligand
Complexes Using Empirical Free Energy Calculations. Drug Metab. Dispos.
2010, 38, 1347-1354.
52. Wang, W.; Wang, J.; Kollman, P. A., What Determines the van der Waals
Coefficient Beta in the LIE (Linear Interaction Energy) Method to Estimate
Binding Free Energies Using Molecular Dynamics Simulations? Proteins 1999,
34, 395-402.
53. Shah, J. K.; Asthagiri, D.; Pratt, L. R.; Paulaitis, M. E., Balancing Local
Order and Long-Ranged Interactions in the Molecular Theory of Liquid Water. J.
Chem. Phys. 2007, 127, 144508.
54. Tominaga, Y.; Jorgensen, W. L., General Model for Estimation of the
Inhibition of Protein Kinases Using Monte Carlo Simulations. J. Med. Chem.
2004, 47, 2534-2549.
55. Hansson, T.; Marelius, J.; Aqvist, J., Ligand Binding Affinity Prediction by
Linear Interaction Energy Methods. J Comput.-Aided Mol Des 1998, 12, 27-35.
56. Helms, V.; Wade, R. C., Thermodynamics of Water Mediating Protein-
Ligand Interactions in Cytochrome P450cam: A Molecular Dynamics Study.
Biophys. J. 1995, 69, 810-824.

Reprinted (adapted) with permission from Whalen, K. L.; Tussey, K. B.; Blanke, S. R.; Spies, M.
A. J. Phys. Chem. B, 2011, 115, 3416-3424. Copyright 2011 American Chemical Society. K. B.
Tussey contributed molecular docking with FRED and GOLD. S. R. Blanke contributed helpful
insights into biological implications. M. A. Spies contributed intellectual direction and assistance in
manuscript composition.
130
CHAPTER 5: THE NATURE OF ALLOSTERIC INHIBITION IN GLUTAMATE
RACEMASE: DISCOVERY AND CHARACTERIZATION OF A CRYPTIC
INHIBITORY POCKET USING ATOMISTIC MD SIMULATIONS AND PKA
CALCULATIONS*
Abstract
Enzyme inhibition via allostery, in which the ligand binds remotely from the
active site, is a poorly understood phenomenon, and represents a significant
challenge to structure-based drug design. Dipicolinic acid (DPA), a major
component of Bacillus spores, is shown to inhibit glutamate racemase from
Bacillus anthracis, a monosubstrate/monoproduct enzyme, in a novel allosteric
fashion. Glutamate racemase has long been considered an important drug target
for its integral role in bacterial cell wall synthesis. The DPA binding mode was
predicted via multiple docking studies and validated via site-directed
mutagenesis at the binding locus, while the mechanism of inhibition was
elucidated with a combination of Blue Native PAGE, molecular dynamics
simulations, free energy and pKa calculations. Inhibition by DPA not only reveals
a novel cryptic binding site, but also represents a form of allosteric regulation that
exploits the interplay between enzyme conformational changes, fluctuations in
the pKa values of buried residues and catalysis. The potential for future drug
development is discussed.

131
1. Introduction
D-glutamate (D-glu) has been shown to be an essential feature of the
peptidoglycan layer of bacterial cell walls in a number of pathogenic organisms,
strongly suggesting that blocking its biosynthesis would be an attractive mode of
action for antimicrobial drug discovery1. The enzyme glutamate racemase (GR) is
responsible for the biosynthesis of D-glu in bacteria, employing a cofactor
independent 1,1 proton transfer to invert the stereochemistry of the L-glutamate
substrate. GR is a highly pursued antimicrobial drug target, and has been the
subject of numerous ligand discovery studies2-9.
Extensive inhibitor development against GR has been directed toward the
CDC’s Category A agents 5,10-12. B. anthracis, the causative agent of inhalational
anthrax and a Category A agent, is unique in possessing two functional GR
isozymes (RacE1 and RacE2)5. These particular enzymes have been the subject
of extensive structural and kinetic characterization5,11. Active site differences
between the two isozymes, specifically a key valine residue that bridges the
active site and an adjacent hydrophobic pocket at the entrance of RacE2 (but not
RacE1), have hampered efforts to develop a common and potent inhibitor for
both B. anthracis GR isozymes5.
Accurately modeling enzyme (or receptor) flexibility has long been
recognized as one of the grand challenges in structure-based drug discovery. A
diverse set of crystallographic, computational and screening studies have pointed
to the extensive flexibility of the GR enzyme6-8,11,13, thus creating challenges in
elucidating both its catalytic mechanism, as well as the functional
pharmacophore for effective structure-based drug discovery campaigns. An
important corollary to receptor flexibility is the possibility for allosteric regulation
by an effector molecule, with previous successes seen across several classes of

132
enzymes14. According to the Monod-Wyman-Changeus (MWC) model15, a
flexible (unliganded) enzyme samples a range of conformational states, which
may be captured or recognized by a ligand or set of ligands. If significant
distortion of a target enzyme is populated in these pre-binding equilibria, then
capture of an inactive conformation represents a reasonable strategy for
structure-based drug design. Accordingly, an alternative approach to finding
inhibitors for GRs would be to identify noncompetitive (or uncompetitive)
inhibitors, which act remotely from the active site. This strategy was utilized by
Lundqvist and coworkers in the discovery of a pyrazolopyrimidinedione analogue
(“Compound A”) inhibitor against H. pylori GR4. Compound A was identified in
HTS against AstraZeneca’s compound library as an inhibitor of racemization in
the D→L direction. Lundqvist et al. elegantly demonstrated that Compound A
was an extremely rare uncompetitive inhibitor of a monosubstrate-monoproduct
enzyme in the D→L direction4. Interestingly, this inhibitory approach exploits the
fact that reduction of the kcat/KM of a racemase in one direction must equal its
reduction in the reverse direction (vide infra), which results in a net decrease in
the production of D-glu in vivo as indicated by the accumulation of peptidoglycan
precursors in the cytoplasmic extract of H. pylori cells treated with Compound A4.
This inability to produce peptidoglycan is lethal for H. pylori cells, as
demonstrated by a minimal inhibitor concentration (MIC) of 8 μg/mL for
Compound A4. However, the natural effector molecule acting at the Compound A
binding pocket remains unknown.
In the current study we have discovered a novel inhibitory property for a
natural product, dipicolinic acid (DPA), which is acting as an allosteric inhibitor of
both B. anthracis GR isozymes, and has a distinct binding pocket from
Compound A of Lundqvist et al.4. Furthermore, we employ experimental and
computational studies to elucidate this remote binding locus as well as propose
an atomistic rationale for DPA inhibition supported by MD simulations, free

133
energy and pKa calculations of the dynamic GR ensemble. Interestingly, DPA is
a natural product occurring at high concentrations within the B. anthracis spore
and has been implicated to play a key role in that organism's life cycle. The
implications for B. anthracis sporulation and drug discovery are discussed.
2. Computational and Experimental Details
2.1. Site-Directed Mutagenesis
Mutants racE2_K106A and racE2_S207A were prepared using a
QuikChange II XL Site-Directed Mutagenesis Kit (Stratagene, Santa Clara, CA)
and primers obtained from Eurofins MWG Operon (Huntsville, AL). Previously
prepared and recently isolated pET15b (Novagen, San Diego, CA) containing the
gene of interest was used as the template DNA. A BioRad MJ Mini Personal
Thermal Cycler (BioRad, Hercules, CA) was used for all PCR reactions.
Mutagenesis was confirmed via in-house DNA sequencing using an ABI 3730XL
capillary sequencer. Primer sequences are detailed in Supplementary Table 4.
2.2. Protein Expression and Purification
Proteins were expressed using the BL21 strain (Novagen, San Diego, CA)
of E. coli and pET15b expression vector (Novagen, San Diego, CA). Purification
was composed of three key components: Cobalt-affinity chromatography, ATP
incubation to remove chaperone contaminants, and anion-exchange
chromatography. Expression and purification are described in full detail in
Supplementary Information.
2.3. Enzyme Kinetics – Circular Dichroism

134
Stereoisomerization of D-glutamate by GR was assayed by measuring
angle of rotation (mdeg) at 220-225nm using a J-720 CD spectropolarimeter
(JASCO, Oklahoma City, OK). Data was fit to Michaelis-Menten equations as
well as nonlinear regression curves for noncompetitive inhibition using GraphPad
Prism v5.0 (GraphPad Software Inc., La Jolla, CA). Complete details of kinetic
assay conditions can be found in Supplementary Information.
2.4. Colloidal Aggregation Control
Inhibitors were analyzed for the possibility of colloidal aggregation using a
detergent-based assay previously established by Feng and Shoichet and
successfully applied to this particular system in Whalen et al.7,16. Further details
can be found in Supplementary Information.
2.5. Blue Native – Polyacrylamide Gel Electrophoresis
Protein samples were incubated in loading buffer (100 mM Tris-Cl, 40%
glycerol, 0.01% Coomassie Brilliant Blue G, pH 8.0) and the compound of
interest (1 mM or 45 mM) at room temperature for 15 minutes. Blue-native (BN)
polyacrylamide gels were prepared at a resolving concentration of 10% (30:0.8
total acrylamide:bis ratio) with a 5% stacking gel. The compound of interest was
incorporated into both the gel and running buffer (100 mM Tris-Histidine, pH 8.0)
at the desired concentration. Gels were run at constant voltage (100 V) and
constant amperage (15 mA) for approximately 3.5 h at 4 °C. Gels were stained
using Imperial Protein Stain and destained in water. Respective intensities of
protein bands were analyzed by pixel quantification of a gel scan using Adobe
Photoshop CS4 Extended v11.0 (Adobe Systems Inc., San Jose, CA).
2.6. Docking of DPA to GR

135
Protein Receptor Preparation: The PDB file 2GZM was downloaded from
RCSB for use as the protein receptor. One dimer was deleted from the crystal
cell as only one dimer would be utilized in docking. The remaining dimer was
submitted to steepest descent minimization and 50 picoseconds of molecular
dynamics simulation with YASARA v9.11.9 (further details below)17. All water
molecules and ligands were removed from the finals structure as the last step of
preparation. DPA in its deprotonated state was used as the ligand for docking.
AutoDock (through YASARA): A simulation cell was created 5 Å from all
atoms with dimensions: 102 Å x 72.8 Å x 71.3 Å. The following general docking
parameters were used: 25 independent docking runs, each with a total of 2.5 x
106 energy evaluations, a torsional degrees of freedom value of 8, grid point
spacing was left at the default of 0.375 Å, and the force field selected was
AMBER03. Specific to the genetic algorithm, the following parameters were
used: a population size of 150, 2.7 x 10⁴ generations, an elitism value of 1, a
mutation rate of 0.02, and a crossover rate of 0.8. Final poses were considered
distinct if they varied by > 5 Å RMSD.
GOLD: The genetic algorithm parameters were defined as such: number
of islands set to 5, population size of 100, selection pressure value of 1.1,
maximum number of operations set to 125,000, and a niche size of 2.
Additionally, both crossover and mutation frequency were set to 95, while the
migration frequency was set to 10. GoldScore was used as the sole scoring
function (without the optional fifth component, internal hydrogen bond energy).
DPA was docked a total of 30 times and all solutions were retained.
FRED: A box ~200,000 Ų was drawn around the entire structure, and a
high quality shape potential was created. In enumerating all possible ligand
poses, a translational step size of 1 Å and a rotational step size of 1.5 Å were

136
used. Inner and outer contour filtering was enabled and no additional user-
defined constraint filters were used. Ensemble poses resulting from exhaustive
docking are scored using Chemgauss3 and the top 100 poses are retained. DPA
was docked a total of 32 times.
2.7. Molecular Dynamics Simulations
The procedures and parameters for molecular dynamics simulations of
GR as well as free energy calculations are described in full in the Supplementary
Information.
2.8. Selection of Non-Redundant Structures from MD Simulation
Structure snapshots taken every 150 picoseconds of the molecular
dynamics simulations were converted to PDB format with all water molecules
removed. The collection of structures (133 structures per complex) were then
imported to the Multiseq extension of Visual Molecular Dynamics v1.8.6 for
Windows (VMD, Univ. of Illinois – Urbana-Champaign) and submitted to STAMP
alignment (npass =1, scanscore =1, and scanslide =2). Multiseq was further used
to create a phylogenetic tree based on RMSD of the Cα atoms. Finally, non-
redundant structures were extracted from the phylogenetic tree using a QH cutoff
value of 0.90.
2.9. H++ pKa Calculations
Structures were submitted in pdb format to the H++ server. All water,
ligand and inhibitor molecules were deleted prior to pKa calculation. Structure
“clean-up” is described in full by Gordon et al. 18 and the method of electrostatic

137
calculation of pKa values for all titratable groups is described in Bashford and
Gerwert19. pKa values presented in the text were taken from the pK1/2 output of
H++.
3. Results
3.1. Inhibition of RacE1 and RacE2 by DPA
DPA was originally found in a virtual screening campaign for B. subtilis
RacE but exhibited only low mM inhibition6. When tested on the two glutamate
racemase isozymes from B. anthracis, RacE1 and RacE2, DPA exhibited low μM
inhibition (Ki = 75 ± 16 μM and 92 ± 12 μM, respectively) with clear
noncompetitive behavior, as confirmed via the F test when data is fit to varying
models of inhibition (Fig. 26a and E.1, Table E.1 and E.2). To our knowledge,
this is the first noncompetitive inhibitor against a glutamate racemase. In general,
it is quite rare to find noncompetitive or uncompetitive inhibitors for any
monosubstrate-monoproduct (i.e. Uni-Uni) enzymes20,21. The immediate
tendency is to be wary of noncompetitive inhibitors discovered from screening
campaigns, as they are often revealed to be colloidal aggregators that inhibit
enzymes in a non-drug-like manner22. Colloidal aggregators can be exposed
using a simple detergent-based kinetic assay16. Inhibition by DPA does not
exhibit the characteristic alleviation in the presence of detergent, thus eliminating
the possibility of colloidal-aggregation-based inhibition (Fig. E.2). Previously, our
group successfully employed this detergent-based assay to identify a colloidal
aggregator in a screening campaign against GR from B. subtilis that exhibited
apparent noncompetitive inhibition in the low-μM range7. RacE2 was the main
isozyme studied in the following work since B. anthracis genetic knockout studies

138
identified the absence of RacE2 as resulting in the more severe growth defect,
relative to the RacE1 isozyme10. Furthermore, the inhibitor studies described
here focus on the D→L direction, as in the studies of Lundqvist et al., on GR
inhibition by Compound A4. However, it should be noted that the Haldane
relationship dictates that any reduction of kcat/KM for a racemase in one direction
will result in an equivalent reduction in kcat/KM in the opposite direction20,23,24. This
is because the equilibrium constant for a racemase is unity, and leads to the
following constraint:
Eq. 1

139
Figure 26. Experimental results for noncompetitive inhibition of RacE2_WT (a),
RacE2_S207A (b) and RacE2_K106A (c) by DPA. Kinetic data was attained via circular
dichroism and three independent Michaelis-Menten curves were globally fit to a
noncompetitive inhibition model to produce the presented Ki values (further details in
Supporting Information).

140
3.2. Identification of a Novel Allosteric Pocket by Docking; Location of the
DPA Binding Site
A blind docking campaign targeting the RacE2 dimer was carried out in
order to identify the binding site of DPA. GOLD v4.1, FRED v2.2.5 and AutoDock
4 (via Yasara v9.11.9) were each utilized in this campaign and represent three
different types of docking and scoring methods17,25,26. Despite using very different
methods of docking and scoring (these differences are expounded upon in the
Computational Procedures section of the Supplementary Information), all three
programs came to the same conclusion with regards to the location of the DPA
binding site (Fig. 27a). Given a RacE2 dimer from the original crystal structure
(2GZM) and no user-defined specifications for the binding location, DPA was
consistently positioned with highest rank in all three docking programs in a small
pocket at the dimer interface, making direct contacts with Lys106 and Ser207 of
one monomer and the Lys106 of the second monomer. Specifically, the Ser207
backbone amide acts as a H-bond donor to one carboxyl substituent of DPA
while the Lys106 side chain of the same monomer is a donor for the second
carboxyl substituent of DPA (Fig. 27b). The Lys106 side chain of the second
monomer coordinates both carboxylates as well as the pyridine nitrogen of DPA.
Interestingly, energy minimization results in the formation of an H-bond between
the carboxylate of DPA and the beta-hydroxyl of Ser207 while the Lys contacts
remain unchanged relative to the original docking pose (Fig. 27c). An MD
simulation using S207A RacE2 with DPA bound was conducted to further
elucidate the role of Ser207 in DPA binding. MD simulation shows that the
mutagenesis of Ser207 to alanine results in a complete loss of contact with the
backbone in that region, resulting in a highly solvent-exposed, and presumably
unfavorable, binding position for DPA (Fig. 27d). These results point to the
presence of Ser207 as being essential for organization in this region of the
enzyme and accordingly, formation of the DPA binding pocket. With all three

141
docking programs in agreement, the predicted site was probed via site-directed
mutagenesis (vide infra). Importantly, these models predicting that DPA binds at
a site distal to the active site are consistent with the steady state kinetic data
suggesting non-competitive inhibition.
a b c d S207A RacE2WT RacE2WT RacE2
Figure 27. Superpose of top-docked positions of DPA (space-filling) to the RacE2 dimer
(ribbon, 2GZM) as determined by GOLD v4.1 (magenta), Autodock v4 (blue) and FRED
v2.2.5 (green) (a). The binding pocket is located at the dimer interface and is composed
of residues from both monomers, as detailed by the interaction map (b). After
minimization, the backbone contact of Ser207 is swapped for a contact with the beta-
hydroxyl group (c). After MD simulation of the top docked complex with Ser207 replaced
by Ala, the binding site lacks any contact with the region previously containing Ser207
(d). Letters immediately preceding the residue numbers indicate the monomer, A or B.
Ligand interaction maps were constructed using the LigX function of MOE v2009.10.
3.3. Validation of DPA Binding Site via Mutagenesis
In order to experimentally confirm the predicted DPA binding mode, the
two residues predicted to interact directly with the inhibitor, Lys106 and Ser207,
were mutated to alanine independently and the purified mutant enzyme was

142
assayed for inhibition via DPA. Enzyme activity was unaltered for both mutants
relative to wild-type protein, as indicated by their kcat/KM values (Table E.3). First,
RacE2_S207A was constructed and predicted to abolish a single H-bond
between enzyme and ligand. The observed Ki (Ki = 1236 ± 950 μM) increased
13x compared to wildtype RacE2, which is consistent with the loss of a single H-
bond (loss of 0.68-1.88 kcal/mol, strength of a normal hydrogen bond within a
protein ranges from 1 to 3 kcal/mol27, Fig. 26b). Second, RacE2_K106A was
constructed, abolishing four hydrogen bonds (according to the docking model).
The observed Ki (Ki = 2342 ± 1300 μM) increased 24x compared to wildtype (loss
of 1.43-2.17 kcal/mol, slightly less than predicted; Fig. 26c). The attenuation of
DPA inhibition in both the mutant constructs agrees well with the predicted site
being the true DPA binding site. This is a testament to the precision of GOLD,
FRED and AutoDock at correctly positioning a small molecule in a blind docking
situation.
Cryptic binding sites are not entirely unprecedented for glutamate
racemases. In 1994, Doublet and coworkers characterized the activation of GR
from E. coli by UDP-MurNAc-L-Ala binding to a cryptic back pocket on the
monomer (later co-crystallized by Lundqvist et al.)4,28. As previously mentioned, a
team at AstraZeneca discovered Compound A, a novel uncompetitive inhibitor in
a high-throughput screening against GR from H. pylori and determined this
compound to bind to a pocket located on the opposite face from the active site4 .
Thus far, these two examples have been the only homologues of GR with
established allosteric regulation. Crystal structures of the activator bound to E.
coli GR (2JFN) and Compound A bound to H. pylori GR (2JFZ) were superposed
with the top-docked conformation of DPA into RacE2 in order to see whether
DPA was exploiting either of these pre-established binding sites (Fig. 28). When
the dimer interface is revealed by hiding one monomer, one can clearly see that
the DPA binding site is distinct from those of the activator and Compound A. With

143
this perspective, one can envision D-glutamate bound in the active site and DPA
bound to the back side as being on a shared horizontal plane. The uncompetitive
inhibitor from Lundqvist et al. is bound above this plane and UDP-MurNAc-L-Ala
is bound below4. Thus, the DPA binding site is unlike any established cryptic
sites of GR. With the addition of DPA, three distinct cryptic sites exist within the
GR receptor class, each exhibiting a different mode of regulation.
Figure 28. Superpose of a variety of GR structures in order to highlight the diversity of
known allosteric positions. Superpose of DPA bound to B. a. RacE2, UDP-MurNAc-L-
Ala bound to E. c. GR (2JFN), and pyrazolopyrimidinedione analogue (aka Compound
A) bound to H. p. GR (2JFZ). Only the trace of one monomer is shown for clarity and the
perspective is looking at the enzyme face directly opposite of the entrance to the active
site. D-glutamate (yellow) is seen in the background bound to the active site, while DPA
(green), UDP-MurNAc-L-Ala (magenta), and Compound A (red) are seen in the
foreground. All three cryptic binding sites are distinct. Indicated are center of mass
distances between molecules. There is no evidence that any one GR structure
possesses all of these allosteric pockets. Rather, the figure is meant to illustrate the
distinctive positions and identities of these three different effectors relative to the
glutamate binding pocket.

144
3.4. Quaternary Organization and Inhibition by DPA
One possible mechanism of GR inhibition is a DPA-induced shift in the
oligomeric equilibrium. For instance, Johnson and coworkers have hypothesized
that the RacE2 monomer experiences increased conformational flexibility and
thus higher rates of catalysis29. In order to investigate any DPA-induced changes
of the oligomeric equilibrium of GR, RacE2 dimerization was analyzed using Blue
Native PAGE (BN-PAGE) gels supplemented with DPA. Gels supplemented with
the DPA-analogue, 3,4-pyridinedicarboxylic acid, were used as a control. This
analogue shows no inhibition against RacE2 nor RacE1, and thus is predicted
not to bind the enzyme; but its presence provides a control for nonspecific
interactions that may affect the BN-PAGE results. Both compounds were present
in the gel, running buffer and loading buffer (respectively) at a concentration well
above the Ki calculated for DPA. DPA does not induce any significant change in
the monomer-dimer equilibrium of RacE2 relative to the control (Fig. E.4).
Although BN-PAGE rules out the occurrence of a DPA-induced shift in the
oligomeric equilibrium, the possibility remains that allostery is the source of
inhibition by DPA.
As recently reported by Johnson and coworkers, certain mutations in
residues located at the dimer interface result in an altered RacE2 monomer-
dimer equilibrium29. Thus, both mutant constructs were analyzed via Blue Native
PAGE to assess the monomer-dimer equilibrium and rule out this phenomenon
as having any affect on DPA binding or overall RacE2 catalysis. Both
RacE2_S207A (Fig. 29a) and RacE2_K106A (Fig. 29b) showed no significant
difference in monomer-dimer equilibrium compared to wild type protein. For
RacE2_K106A, these results are contrary to what was reported by Johnson and
coworkers, as they observed only the monomer state for this mutant. Differences
could be attributed to the method (Blue Native PAGE versus size-exclusion

145
chromatography) or protein concentration (45 μg/mL versus 5 mg/mL);
particularly since we observed that the monomer-dimer equilibrium exhibited a
dependence on protein concentration in all gels. Specifically, as protein
concentration increased, the ratio of monomer to dimer decreased (Fig. 29 and
E.4). We chose to examine a protein concentration in the range of those used for
kinetic assays. Furthermore, these GR concentrations may be more
physiologically relevant than the much higher concentrations used in the study by
Johnson and coworkers29.
Figure 29. BN-PAGE to determine the oligomerization of wild-type and mutant RacE2.
Wildtype RacE2 and RacE2_S207A (a) or RacE2_K106A (b) were run side-by-side at
concentrations varying from 45 to 180 μg/mL. Albumin and carbonic anhydrase were
included as running controls. Arrowheads indicate bands representing the dimer and
monomer. Band intensity was quantified via pixel counting and the ratio of monomer to
dimer was plotted against protein concentration for RacE2_S207A (solid line = WT,
dotted line = mutant; c) and RacE2_K106A (d). Data represents an average of three or
more independent trials with standard error shown. Data was additionally fitted to the
expression for M/C ratio as a function of total protein concentration and the
monomer:dimer equilibrium constant (see Supplementary Methods for derivation of this
expression and model fitting parameters).The results indicate that the two mutants do
not have any significant effect on the oligomeric equilibrium. Additionally, see Figure E.3
for BN-PAGE of RacE2 and running controls with NativeMark ladder.

146
3.5. Effect of DPA on Free Energy of Binding of D-Glu to RacE2
Molecular dynamics simulations were performed for both RacE2 dimer
with D-glu bound to both active sites (abbreviated as E2·D-glu2), as well as the
top-docked complex of RacE2 and DPA with glutamate bound to both active sites
(abbreviated as E2·D-glu2·DPA). Both simulations were carried out for 20
nanoseconds (see Materials and Methods for a complete description of the
simulation parameters). Separately, a collection of snapshots taken every 150
picoseconds (totally 133 structures) from each simulation were submitted to
STAMP structural alignment30 and used to compose a structural phylogenetic
tree based on RMSD differences between α-carbon atoms. A structural
phylogenetic tree provides a graphical representation of the structure-based
relationship between different simulation snapshots. Non-redundant structures
were then selected from the collection to represent the most unique
conformations using the widely-accepted technique of QR factorization, thus
more efficiently examining phase space31,32 . A structural homology (QH) value of
0.90 was used as the cutoff for structural redundancy (where QH represents the
fraction of Cα atoms that superimpose, total overlap = 1 and no overlap = 0)33,
resulting in 14 unique structures from E2·D-glu2 and 2 unique structures from
E2·D-glu2·DPA. The QR factorization results immediately indicate that the
presence of bound-DPA results in limited conformational diversity for RacE2
within the respective equilibrated time series. An estimate of the binding free
energy was calculated for glutamate bound to either monomer using an
“endpoint” approach (recently reviewed by Steinbrecher and Labahn)34. The
method employed here, MM-BEMSA, is a variation on the popular MM-PBSA
method, with electrostatic potentials calculated with the Boundary Element
Method (BEM), instead of numerically solving the Poison-Boltzmann (PB)
equation. The details of this approach are described in the Computational
Methods section of the Supplementary Information. Briefly, the BEM technique

147
for calculating electrostatic potentials has some advantages in dealing with highly
curved surfaces of macromolecules, such as clefts and buried pockets, which
made it ideal for the GR receptor35,36.
Instead of doing an endpoint free energy calculation of D-glu binding at
every time point of an MD simulation, we sought a more efficient use of
computational resources. The predicted binding energy was averaged for all non-
redundant structures from each respective trajectory. In the past, McCammon
and coworkers applied this technique to an MD simulation of Kinetoplastid RNA
editing ligase 1 (KREL1), where non-redundant representatives were shown to
possess as much binding energy information as the entire set of structures
resulting from the simulation31. Thus, the non-redundant set of MD structures,
obtained from QR factorization was used in the end point free energy
calculations of D-glu to the RacE2 dimer, with and without DPA bound (i.e. E2·D-
glu2 and E2·D-glu2·DPA). For glutamate bound to monomer B, no significant
difference in free energy of binding exists between E2·D-glu2·DPA and E2·D-glu2
(-17 ± 5.0 kcal/mol versus -22 ± 2.0 kcal/mol, respectively). On the contrary, for
glutamate bound to the A monomer, a less negative free energy of binding (i.e.
weaker complexation) is seen in E2·D-glu2·DPA compared to E2·D-glu2 (-15 ± 1.0
kcal/mol versus -21 ± 2.0 kcal/mol, respectively, Fig. 30d). End point free energy
calculations (such as MM-PBSA) do not yield accurate absolute free energies37,
but have been shown to be highly accurate in terms of relative free energy
values38, and may be used as powerful predictor of trends in relative binding
affinities.

148
Figure 30. Ligand interaction maps for glutamate bound to monomer A of the DPA-
lacking RacE2 complex (a) and DPA-bound RacE2 complex (b), as well as DPA bound
to the cryptic binding site located at the RacE2 dimer interface (c). Maps were generated
from the final structures of 20-nanosecond MD simulations using the LigX function of
MOE v2009.10. Predicted binding energy of glutamate was averaged over the set of
representative structures extracted from MD simulations of the binary (red, n=15) and
ternary complex (blue, n=4, d), error bars = SEM. The details of the binding energy
calculations are outlined in the Computational Procedures section of Material and
Methods.

149
Ligand interaction mapping of equilibrated E2·D-glu2·DPA after the 20
nanosecond simulation show two water bridges formed between DPA and
Asp210 and Glu211 of the A monomer of RacE2 (Fig. 30c). Asp 210 goes on to
form a hydrogen bond with the side-chain hydroxyl of Ser207 (previously
implicated in DPA binding by initial ligand interaction mapping of the top-docked
complex prior to MD). Ser207 also forms a water bridge with Glu211. This
complex network of direct hydrogen bonds and water bridges between DPA and
the A monomer occurs twenty residues downstream of the catalytic residues,
separated by a short α-helix and β-sheet. The interaction maps of glutamate
bound to the active site of the A monomer of equilibrated complexes were
compared. Binding of DPA corresponds with altered hydrogen-bonding within the
active site as compared to E2·D-glu2. Briefly, in E2·D-glu2·DPA, glutamate forms
seven hydrogen bonds with active site residues as opposed to five hydrogen
bonds in E2·D-glu2 (Fig. 30a-b). Also, glutamate of E2·D-glu2·DPA is involved in
five water bridge contacts while glutamate of E2·D-glu2 involves only three. These
variations in enzyme-ligand interactions point to a global conformational change
translated from the dimer interface to the active site. Specific details regarding
hydrogen bonding and enzyme-ligand distances for the two complexes are
described in the Supplementary Information.
3.6. Effect of DPA Binding on pKa of Catalytic Cysteine 74
While differences in free energy of binding of D-glu may contribute
partially to inhibition by DPA, they cannot explain if and why the enzyme-
substrate-inhibitor (ESI) complex is enzymatically unproductive, particularly since

150
the binding pose of D-glu does not vary widely between E2·D-glu2 and E2·D-
glu2·DPA. Considering the importance of the basicity of the general acid/base for
glutamate proton abstraction9,39 and the clear active site rearrangements that
accompany DPA binding8, we chose to examine changes in pKa of the key
catalytic residue, Cys74, for D→L racemization. Each structure selected from QR
factorization of the MD simulations of both ensembles was used to calculate pKa
values with the widely employed MEAD algorithm (implemented in the H++
utility18,40). The distribution of pKa values shows a significant downward shift for
Cys74 of E2·D-glu2·DPA compared to Cys74 of E2·D-glu2 (Fig. 31). Overall, the
E2·D-glu2·DPA structures possessed pKa values in a much more limited range
and with reduced values (less basic) compared to E2·D-glu2 structures, which
possess pKa values ranging from as low as 8 to as high as 20 (Fig. 31). The
possibility that the loss of extreme basicity of Cys74 is responsible for a
dysfunctional ESI complex is discussed below.
Figure 31. Distribution of pKa values calculated for Cys74 (the catalytic base of D L
racemization) for E2·D-glu2 and E2·D-glu2·DPA. Each structure, selected via QR
factorization of a collection of simulation snapshots, was each used in pKa calculation
using the MEAD algorithm from the H++ program18. Details of parameters employed in
these pKa calculations are located in the Computational Procedures section of the
Materials and Methods.

151
4. Discussion
Here we have identified a natural compound, DPA (linked to the B.
anthracis life cycle), which exhibits noncompetitive inhibition of GR from B.
anthracis via binding to a remote and heretofore undiscovered allosteric pocket.
A blind docking study, using three leading algorithms has determined the
consensus pharmacophore for DPA, which lies at the dimer interface. This
consensus pocket was experimentally validated via a multiple site-directed
mutagenesis study. The loss of racemization activity due to DPA has no affect on
the oligomeric equilibrium of GR, suggesting that inhibitor action is allosteric in
nature.
A parallel computational study to understand the source of the DPA-
induced allostery was undertaken. DPA-induced changes in the phase space of
B. anthracis RacE2 showed a significant dampening of the conformational
flexibility of GR. Interestingly, the large conformational fluctuations of E2·D-glu2
manifest large changes in the magnitude of the calculated pKa of the catalytic
base, Cys74. The large pKa perturbations in the E2·D-glu2 are due to a variety of
interactions between active site residues, particularly the interaction between the
catalytic base and Asp11. Unsurprisingly, Asp11 was previously identified as
being located in an area of high homology and subsequently probed via
mutagenesis, resulting in a 1000-fold reduction in the observed kcat of GR39.
Remarkably, the very high basicity of some enzyme catalytic bases has been
shown to be critical to catalytic efficiency even when the protonation state of this
species (the so called "reverse protonation" state41) is not the dominant form at a
given pH. The concept of the role of the reverse protonation state has been fully
developed in the case of enolase and alanine racemase42,43. Thus, what is seen
here in the case of GR is a manifestation of the phenomenon exhibited in
enolase and alanine racemase, in which the reverse protonation state may be

152
the primary driver of catalytic power (i.e. a very high pKa thiolate). However, in
GR there is the additional complexity of a quite flexible ensemble of protein
conformations, with large fluctuations in the values of the pKa of the catalytic
base. It is fascinating that the ensemble with the allosteric inhibitor (DPA) results
in a conformational "freezing out" of the high pKa (i.e. catalytically reactive) forms
of GR. We hypothesize that this is the source of allosteric inhibition by DPA, and
refer to this mode of inhibition as Inhibition by pKa Trapping (IPKAT). We
propose that this is a general phenomenon in GR that can be exploited in the
DPA pocket by other small molecules, and that in principle it is possible to
construct an IPKAT pharmacophore, in which GR inhibition can be predicted by
the distribution of calculated pKa values of the catalytic Cys residues.
The presence of DPA in Bacillus spores has been well-established as
DPA constitutes approximately 10% of the dry weight of dormant spores, but its
exact role in sporulation and germination is only loosely understood44. DPA within
spores is found primarily in its calcium-chelated form, Ca2+-DPA. In the
developing endospore, DPA concentrations remain low until after cortex
formation, which requires peptidoglycan synthesis. In the dormant spore phase of
B. anthracis, Ca2+-DPA concentrations are very high and there is no detectable
metabolic activity. Upon activation of spores by external factors, channel
formation occurs allowing a large efflux of cations and Ca2+-DPA out of the spore
core45. This event occurs concomitantly with an adjustment of the pH from 6.5 to
7.7 and increased hydration45. All of these events are required to restart
metabolism. Accordingly, both the reduced DPA concentration and elevated pH
are conducive with increased GR activity (pH optimum of RacE1 and RacE2 is
~8.011). As the spore core grows nearly 4-5x its original size, the demand for
peptidoglycan synthesis increases and thusly the demand for D-glutamate.
Additionally, D-glutamate is required for the poly-D-glutamic acid capsule
surrounding the mature vegetative cell. Taking all of this into consideration, one

153
may postulate that the fluctuation of DPA concentration over the lifetime of a
differentiating B. anthracis cell coincides with the varying necessity of D-
glutamate (Fig. 32). Thus, it is appealing to imagine the inhibition of GR by DPA
as more than serendipitous. Of course, future in vivo studies are required to
further investigate the interactions of GR and DPA in spores and vegetative cells.
One point to investigate is whether the efflux of DPA actually results in a cellular
DPA concentration less than the Kd, approximately 90 μM, capable of entirely
alleviating GR inhibition. Compartmental distributions of DPA may allow such a
concentration to be reached even if the net cellular concentration of DPA is still
high.
Figure 32. Schematic of life cycle of differentiating B. anthracis cell, with Ca2+-DPA levels
and consequent GR activity indicated.

154
Importantly, the ligand efficiency (free energy of binding divided by the
number of non-hydrogen atoms in the ligand) of DPA is quite high (-0.458 kcal
mol-1 per non-H atom) compared to other known allosteric ligands such as
Compound A (-0.242 kcal mol-1 per non-H atom) and the activator of GR from E.
coli, UPD-MurNAc-L-Ala (-0.150 kcal mol-1 per non-H atom). Despite binding
with higher affinity, the large MW of Compound A from Lundqvist et al.
significantly lowers its ligand efficiency4. Ligand efficiency is one of the principal
factors of lead optimization46. The high ligand efficiency of DPA means that
during ligand optimization, a binding affinity in the low nM can be achieved with
far fewer heavy atom additions and thus a lower MW compared to compounds of
lesser efficiency. Additionally, the possible chemical modifications of DPA are
manifold, providing a large potential library of small molecules to screen.
Allosteric modulators represent an emerging drug class with which some
pharmaceutical companies are having notable successes such as the HIV
inhibitor maraviroc (Pfizer) and the hyperparathyroidism drug cinacalcet
(Amgen)47,48. There are several advantages to using allosteric binding sites as
drug targets over the native substrate binding site. Primarily, the allosteric sites of
GR can accommodate a chemically diverse set of compounds compared to the
active site, i.e. the final drug need not be a substrate analogue. A non-amino-
acid-like inhibitor will increase the selectivity for GR, while lowering the chance of
undesirable interactions with enzymes containing analogous binding site motifs,
such as enzymes involved in amino acid synthesis or the glutamate receptors
that play an important role in neural chemistry. Also, any mutations that could
circumvent inhibition at this particular allosteric site would occur within the
sensitive dimer interface and are thus more likely to affect dimerization and
monomer cross-talk, potentially very key components of GR catalysis. The major
obstacle to virtual screening campaigns targeting allostery is pharmacophore
elucidation. Once this hurdle has been overcome (i.e. a defined structure activity

155
relationship and/or an atomistic understanding of the binding modes that lead to
enzymatic inhibition), then reasonable metrics may be applied to assess binding
modes and predict novel allosteric inhibitors. Such is the case now for B.
anthracis RacE2, particularly in light of the IPKAT hypothesis outlined above,
which permits a physical metric for inhibitory allostery. It is now possible to begin
rational allostery-based virtual screening campaigns against the GR target class,
potentially leading to new inhibitory small molecule anti-anthrax therapeutics.
Associated Content
Supporting Information Available: Additional results (including
aggregation controls, statistical analysis of global fitting, BN-PAGE controls, and
RMSD plots from MD simulations) as well as extensive experimental methods
and computational methods may be found in the Supporting Information. This
material is available free of charge via the Internet at http://pubs.acs.org.
Acknowledgements
This work was supported by NIH AI076830 (M. A. S.) and NIH AI057156
(S. R. B.). Special thanks to Dr. Keith Westcott for his contribution to the Keith R.
Westcott Graduate Student Education Fund (K. L. W.). Additionally, thank you to
Dr. Dylan Dodd for helpful discussions.

156
References
(1) Rogers, H. J.; Perkins, H. R.; Ward, J. B. Microbial cell walls and
membranes; Chapman and Hall: London, United Kingdom, 1980.
(2) de Dios, A.; Prieto, L.; Martin, J. A.; Rubio, A.; Ezquerra, J.; Tebbe,
M.; Lopez de Uralde, B.; Martin, J.; Sanchez, A.; LeTourneau, D. L.; McGee, J.
E.; Boylan, C.; Parr, T. R., Jr.; Smith, M. C. J Med Chem 2002, 45, 4559.
(3) Glavas, S.; Tanner, M. E. Bioorganic and Medicinal Chemistry
Letters 1997, 7, 2265.
(4) Lundqvist, T.; Fisher, S. L.; Kern, G.; Folmer, R. H.; Xue, Y.;
Newton, D. T.; Keating, T. A.; Alm, R. A.; de Jonge, B. L. Nature 2007, 447, 817.
(5) May, M.; Mehboob, S.; Mulhearn, D. C.; Wang, Z.; Yu, H.;
Thatcher, G. R. J.; Santarsiero, B. D.; Johnson, M. E.; Mesecar, A. D. Journal of
Molecular Biology 2007, 371, 1219.
(6) Spies, M. A.; Reese, J. G.; Dodd, D.; Pankow, K. L.; Blanke, S. R.;
Baudry, J. J Am Chem Soc 2009, 131, 5274.
(7) Whalen, K. L.; Pankow, K. L.; Blanke, S. R.; Spies, M. A. ACS
Medicinal Chemistry Letters 2010, 8, 9.
(8) Ruzheinikov, S. N.; Taal, M. A.; Sedelnikova, S. E.; Baker, P. J.;
Rice, D. W. Structure 2005, 13, 1707.

157
(9) Puig, E.; Garcia-Viloca, M.; Gonzalez-Lafont, A.; Lluch, J. M.; Field,
M. J. Journal of Physical Chemistry B 2007, 111, 2385.
(10) Shatalin, K. Y.; Neyfakh, A. A. FEMS Microbiology Letters 2005,
245, 315.
(11) Dodd, D.; Reese, J. G.; Louer, C. R.; Ballard, J. D.; Spies, M. A.;
Blanke, S. R. J Bacteriol 2007, 189, 5265.
(12) LoVullo, E. D.; Molins-Schneekloth, C. R.; Schweizer, H. P.;
Pavelka, M. S., Jr. Microbiology 2009, 155, 1152.
(13) Gallo, K. A.; Tanner, M. E.; Knowles, J. R. Biochemistry 1993, 32,
3991.
(14) Hardy, J. A.; Lam, J.; Nguyen, J. T.; O'Brien, T.; Wells, J. A. Proc
Natl Acad Sci U S A 2004, 101, 12461.
(15) Monod, J.; Wyman, J.; Changeux, J. P. J Mol Biol 1965, 12, 88.
(16) Feng, B. Y.; Shoichet, B. K. National Protocols 2006, 1, 550.
(17) YASARA 9.11.9 ed.; YASARA Biosciences GmbH: Vienna, Austria,
2010.
(18) Gordon, J. C.; Myers, J. B.; Folta, T.; Shoja, V.; Heath, L. S.;
Onufriev, A. Nucleic Acids Res. 2005, 33, W368.

158
(19) Bashford, D.; Gerwert, K. Journal of Molecular Biology 1991, 224,
473.
(20) Cook, P. F.; Cleland, W. W. Enzyme kinetics and mechanism;
Garland Science: New York City, New York, 2007.
(21) Cornish-Bowden, A. Fundamentals of Enzyme Kinetics; Portland
Press, 2004; Vol. 3.
(22) Coan, K. E. D.; Maltby, D. A.; Burlingame, A. L.; Shoichet, B. K.
Journal of Medicinal Chemistry 2009, 52, 2067.
(23) Spies, M. A.; Toney, M. D.; Hynes, J. R.; Klinman, J. P.; Limbach,
H. H.; Schown, R. L. In Hydrogen-Transfer Reactions; Wiley-VCH: Weinheim,
2007; Vol. 3; pp 1139.
(24) Cleland, W. W. An analysis of haldane relationships. In Methods in
Enzymology; Elsevier Inc., 1982; Vol. 87; pp 366.
(25) FRED; 2.2.5 ed.; OpenEye Scientific Software, Inc. : Sante Fe, NM,
USA, 2010.
(26) GOLD; 4.1 ed.; The Cambridge Crystallographic Data Centre:
Cambridge, CB2 1EZ, UK, 2010.
(27) Frey, P. A.; Hegeman, A. D. Enzymatic reaction mechanisms;
Oxford University Press: New York, New York 10016, 2007.

159
(28) Doublet, P.; van Heijenoort, J.; Mengin-Lecreulx, D. Biochemistry
1994, 33, 5285.
(29) Mehboob, S.; Guo, L.; Fu, W.; Mittal, A.; Yau, T.; Truong, K.; Johlfs,
M.; Long, F.; Fung, L. W.-M.; Johnson, M. E. Biochemistry 2009, 48, 7045.
(30) Russell, R. B.; Barton, G. J. Proteins: Structure, Function, and
Genetics 1992, 14, 309.
(31) Amaro, R. E.; Baron, R.; McCammon, J. A. J Comput Aided Mol
Des 2008, 22, 693.
(32) O'Donoghue, P.; Luthey-Schulten, Z. J Mol Biol 2005, 346, 875.
(33) Eastwood, M. P.; Hardin, C.; Luthey-Schulten, Z.; Wolynes, P. G.
IBM Journal of Research and Development 2001, 45, 475.
(34) Steinbrecher, T.; Andreas, L. current Medicinal Chemistry 2010, 17,
767.
(35) Shaw, P. B. Phys. Rev. A 1985, 32, 2476.
(36) Warwicker, J.; Watson, H. C. Journal of Molecular Biology 1982,
157, 671.
(37) Merz, K. R. Drug Design: Structure and Ligand-Based Approaches;
Cambridge University Press: Cambridge, UK, 2010.

160
(38) Brown, S. P.; Muchmore, S. W. J Chem Inf Model 2006, 46, 999.
(39) Glavas, S.; Tanner, M. E. Biochemistry 2001, 40, 6199.
(40) Anandakrishnan, R.; Onufriev, A. Journal of Computational Biology
2008, 15, 165.
(41) Mock, W. L. Bioorganic Chemistry 1992, 20, 377.
(42) Spies, M. A.; Toney, M. D. Journal of the American Chemical
Society 2007, 129, 10678.
(43) Sims, P. A.; Larsen, T. M.; Poyner, R. R.; Cleland, W. W.; Reed, G.
H. Biochemistry 2003, 42, 8298.
(44) Slieman, T. A.; Nicholson, W. L. Applied and Environmental
Microbiology 2001, 67, 1274.
(45) Setlow, P. Current Opinion in Microbiology 2003, 6, 550.
(46) Hopkins, A. L.; Groom, C. R.; Alex, A. Drug Discovery Today 2004,
9, 430.
(47) Dorr, P.; Westby, M.; Dobbs, S.; Griffin, P.; Irvine, B.; Macartney,
M.; Mori, J.; Rickett, G.; Smith-Burchnell, C.; Napier, C.; Webster, R.; Armour, D.;
Price, D.; Stammen, B.; Wood, A.; Perros, M. Antimicrob Agents Chemother
2005, 49, 4721.

161
(48) Iqbal, J.; Zaidi, M.; Schneider, A. E. IDrugs 2003, 6, 587.

162
GENERAL CONCLUSIONS
I. Research Objective and Main Arguments
This thesis describes the deep investigation into the nature of a flexible
protein, with the ultimate goal of improving structure-based drug discovery. The
previously described studies focus on protein conformational dynamics, ligand
binding, and catalysis, with an emphasis on the role of water. The
interdependence of these three processes has been recognized and studied
individually, or in combination, in other systems. Here we focus on glutamate
racemase, a validated drug target that remains a potential untapped source of
novel antibiotic compounds. Below is a list of the main arguments put forth in this
thesis.
1. Protein flexibility can be modeled accurately and cheaply, from a structure-
based drug discovery viewpoint, by using unconventional MD simulation and
ensemble docking, coupled with proper treatment of protein solvation. This can
be used in hit discovery as well as lead optimization.
2. Transition-state-like inhibitors can be found faster and more efficiently by
creating and targeting a "reactive" form of the protein receptor in virtual screening.
3. Interstitial water molecules play a dynamic and idiosyncratic role in the active
site of a flexible enzyme, and their enthalpic contributions represent large
portions of a particular ligand's binding energy. Furthermore, their contributions
can be properly accounted for with the Extended Linear Response method of
binding free energy calculations.

163
4. Small-molecules can regulate enzymes by exploiting protein conformational
dynamics, specifically binding to conformations that dampen catalytic power.
II. General Research Methodology
The common modus operandi in the previous chapters is the discovery of
physical phenomenon via experimental analysis and the subsequent
rationalization via computational modeling. The physical phenomenon range from
highly plastic inhibitor binding (Chapter 1-3); to surprising, mutation-dependent
alteration of enzyme kinetics and ligand binding (Chapter 4); to allosteric
regulation (Chapter 5). Computational techniques are employed to model the
protein system and propose a molecular rationale for experimental observations.
There is also a feedback mechanism that allows us to incorporate what we learn
experimentally into how we model these systems in the future, in order to
improve the accuracy and speed of such techniques. Often, experimental studies
are driven by original computational insights.
Questions were explored using a combination of computational and
experimental techniques. Foremost was the use of traditional biochemistry in the
form of recombinant protein expression , chromatography-based purification, and
enzyme kinetics. Second most prominent is the use of computational modeling of
physical and chemical phenomena, such as small molecule docking, molecular
dynamics simulations of proteins, and binding free energy calculations. Finally, I
employ a mix of biophysical assays, such as bulk fluorescence studies and
circular dichroism; and since the end goal of this work is the development of
antibiotic compounds, in vivo assays for determination of bacterial cell growth
inhibition and measurement of cell wall integrity via cytotoxic leakage assays.

164
III. Discoveries and Challenges to Pre-existing Views
In a systematic manner, the indications of each chapter are presented
below.
In chapter 1, the findings indicate that an enzymatically reactive structure
(derived from simulation) could produce a receptor that would more reliably
discover high-efficiency hits in virtual screening than a high resolution structure of
the receptor bound to the native substrate, the previous standard for virtual
screening.
In chapter 2, the findings indicate that steered MD simulation offers unique
benefits over classical MD simulation at producing diverse and physiologically-
relevant conformations of glutamate racemase. Additionally, the utilization of
these distinct conformations in an ensemble-docking campaign is capable of
accurately modeling large-scale motions in a more efficient way than simulation-
intensive techniques such as docking followed by individual MD simulations,
Thermal Integration, or Free Energy Perturbation.
In chapter 3, the findings indicate that a lead optimization campaign can
rely heavily on computational predictions in order to lower production costs and
optimization time, if said computational techniques accurately rank the lead
derivatives based on a binding-energy-related score.
In chapter 4, the findings indicate the role of a conserved residue in
maintaining pocket structure and subsequent water organization, causing
dramatic alterations to both enzyme kinetics (2200% increase in kcat) and
inhibitor binding (600% increase in IC50 for a competitive lead compound). These
changes seem to be dictated by bridging water molecules, a key component of

165
the pharmacophore otherwise ignored by previous in silico drug discovery
campaigns.
In chapter 5, the findings indicate the presence of subtle chemical
changes being the source of allosteric inhibition in glutamate racemase,
specifically the trapping of enzyme conformations whose lack of flexibility prevent
the spike in catalytic base pKa required for proton abstraction on the Cα carbon
of glutamate.
IV. Significance of these Findings to the Field
Proteins vary in what is referred to as their "druggability", a combination of
physical and chemical characteristics often related to small molecule or peptide
binding. With the saturation of drugs for "easy" targets, the pharmaceutical
industry and academia must turn toward targeting less attractive proteins in order
to find completely new treatments in the case of diseases that have yet to be
tackled, or improved therapies for diseases where treatments exist, but are
suboptimal. Targets are often considered difficult if they are proteins that have
proven harder to characterize structurally or functionally due to a large degree of
inherent flexibility, or if the potential pockets have poor physical characteristics. A
quantitative understanding of the link between protein flexibility and ligand
binding would reduce the discovery barrier to developing drugs for a large swath
of enzymes.
More specifically, the world currently finds itself in the middle of an era of
ever increasing antibiotic resistance, including the unnerving rise of bacterial
populations exhibiting multi- and total-drug resistance1. The need for novel
antibiotic therapies has become a mission of paramount importance. Our
research attacks this mission with a two-prong approach: 1) drug discovery

166
campaigns themselves and 2) the development of techniques that will expedite
and reduce the costs of such campaigns in the future. Either approach will
benefit the field by 1) introducing novel lead compounds into the universal drug
pipeline and, assuming the adoption of our techniques by other pharmaceutical
and academic teams, 2) reduce the large fiscal and time barrier of other
discovery campaigns.
Finally, the discoveries made in the highlighted studies, specifically
Chapter 5, have important implications for general protein biochemistry. In
addition to being and important drug target, as a cofactor-independent amino
acid racemase, glutamate racemase performs powerful and elegantly simple
chemistry. The proton on the alpha-carbon of glutamate has a pKa of
approximately 18, while cysteine (the residue responsible for abstraction) has a
thiol pKa of approximately 8.3 (measured for the single amino acid in solution).
The key to GR catalysis is the perturbation of the thiol pKa to a value that is high
enough to abstract the substrate proton. Also important is the stabilization of the
carbanionic intermediate, which is most likely achieved by a large and highly
optimized network of hydrogen-bonding interactions in the active site. Without the
aid of a cofactor, such as a metal or pyridoxal-5-phosphate, GR manages to
perturb active site pKa's via modifications to the local chemical environment. This
thesis implicates the conformational plasticity of GR as being the driving force
behind these modifications. Such a hypothesis also opens the door to explaining
allosteric modification of enzyme chemistry in other cases where no obvious
changes in the active site structure are observed with the allosteric regulator
bound.
V. Limitations Encountered in This Research
The nature of both this enzyme system and the employed methodologies

167
leads to certain limitations that must be overcome for further advancement. First,
the highest-potency inhibitor produced from lead optimization has an affinity of
2.5 micromolar. Further optimization or combination treatments with either the
allosteric inhibitors of GR or known antibiotics that also target peptidoglycan
biosynthesis will be required to produce reasonable antibiotic therapies.
Additionally, in vivo assays for antibiotic potency are limited by the
potency/solubility of the existing in-house GR inhibitors. Thus, higher potency
inhibitors are additionally required to more confidently establish bacterial growth
inhibition as well as breakdown of peptidoglycan. I believe we have maximized
the potency of an inhibitor which binds specifically to the buried active site (as
quantified by extremely high ligand efficiency, in other words, reaching the upper
limit of binding-energy per heavy atom). Development of inhibitors with
nanomolar affinity will require extension of molecules out of the active site, but
this will require modifications to our current prediction mechanisms. As is, the
FERM-SMD method breaks down when ligands are large enough to extend out
of the buried active site and make contacts with residues in adjacent pockets.
This is possibly due to the dramatically different degrees of solvent exposure
between the buried active site interior and the more exposed region surrounding
the active site cleft. The FERM-SMD method will most likely need to be
supplemented with additional simulation in order to overcome this obstacle. For
instance, if FERM-SMD and the Extended Linear Response (ELR) method could
be combined, together they may be able to properly account for protein-ligand
interactions occurring at both the "mostly" solvent-excluded interior as well as the
solvent-exposed exterior of the binding pocket. Currently, ELR is computationally
expensive (requiring two individual 4-nanosecond simulations per inhibitor of
interest) and thus scripts will need to be written that can utilize the parallel
computing resources available at the University of Iowa High-Performance
Computing center.

168
Second, high-resolution co-crystal structures with the studied inhibitors are
in dire need. GR consistently proves difficult to crystallize (possibly a result of its
flexibility). The lack of experimental data regarding the binding mode of our
small-molecule inhibitors leaves us relying on models created by molecular
docking. Although using a model has proven to be accurate enough for lead
optimization on the 1H-benzimidazole-2-sulfonic acid scaffold (Chapter 3), this
was a pretty clear cut case, considering the compound's asymmetry and the
presence of only one negative charge (negative charges are consistently
positioned between the catalytic cysteines in previously reported GR co-crystals).
There are many GR inhibitors for which molecular docking predicts several
variable binding modes. For example, croconic acid was an interesting scaffold
discovered in virtual screening (Chapter 1), but possesses symmetry and two
negative charges. In this case, it would be ill-advised to conduct a lead
optimization campaign relying on the modeled complex. In our efforts to address
this dearth of structural information, and in addition to on-going crystallization
efforts, the author has contructed a mutagenized form of GR, which once
expressed with 15N-labelled histidine, is purified and sent to collaborators with
expertise in the extremely high-resolution solid-state NMR technique, REDOR
(Rotational Echo Double Resonance). This will be the largest protein construct to
be subjected to REDOR measurements to date. With fluorine- or 13C-labeled
inhibitors, this system could prove much more robust at reporting structural
information. Additionally, this technique has the capacity to reach resolutions
high enough to assign individual protonation states, a thrilling prospect for
determining exact pKa values within the GR active site.
VI. Areas for Further Development and Research

169
The discoveries described here lay the groundwork for intriguing further
studies with glutamate racemase. There are several opportunities now to
advance drug discovery for allosteric inhibitors of glutamate racemase. The
creation of a glutamate racemase model that accurately represents the transition-
state conformation and its subsequent employment as the receptor for virtual
screening has proven successful in discovering new competitive inhibitors
(Chapter 1). If one was also able to model the conformation of glutamate
racemase under the effects of an allosteric inhibitor, it may be possible to
effectively target an allosteric pocket in a similar manner. There has been a
general upswing of the development of allosteric regulators as viable
therapeutics by the pharmaceutical industry, eg. FDA-approved, antiretroviral
drug, Maraviroc (Pfizer)2 and an antiparathyroidism drug, Cinacalcet (Amgen)3.
Allosteric regulators provide unique opportunities for combination therapy against
a single protein target. Along the same lines, the FERM-SMD method was
proven effective at ranking congeneric derivatives of a lead scaffold using a
steered molecular dynamics simulation to generate distinct and functionally
relevant protein conformations for ensemble docking. Similar simulations can be
performed with known allosteric inhibitors (eg. dipicolinic acid bound to GR from
B. anthracis, or AstraZeneca's pyrazolo-pyrimidinedione analogue bound to GR
from H. pylori) from their respective pockets in order to apply the same method to
lead optimization of current allosteric scaffolds. A high-resolution x-ray crystal
structure exists in the case of the AstraZeneca compound, but one would need to
be acquired in the case of dipicolinic acid to provide a confident starting structure
for such simulations.
Taking a more fundamental path, the key hypothesis proposed in Chapter
5, Inhibition by pKa Trapping (IPKAT) can be tested directly via the exact
determination of the catalytic cysteines' pKa's. Previous work by the lab of Dr.

170
Leslie Poole (Wake Forest University) established a method that accomplishes
just that by using a cysteine-specific label, iodoacetanilide, to covalently modify
the target protein at varying pH4. The extent of labeling can be measured with
MALDI-TOF mass spectroscopy and the rate of labeling at varying pH can be
plotted to determine the pKa of specific cysteines. One could perform such
experiments with GR in the presence and absence of an allosteric inhibitor to
determine any shifts in the pKa of the catalytic base incurred by inhibitor binding.
Preliminary work on this project has already been completed by the author, but
was not included in this thesis. Mass spectroscopy has confirmed the ability of
the pH-sensitive label to reach and covalently modify both catalytic cysteines
within the buried active site. Depending on the results obtained with allosteric
inhibitors, it may also be interesting to similarly investigate the GR from E. coli,
which is the only known GR to be regulated by an endogenous activator, UDP-
MurNAc-L-Ala. If enzyme inhibition is achieved via a environmental perturbation
that lowers the pKa of the catalytic base, one would expect a change in the
opposite direction in order to achieve activation.
An important aspect of this work was the development of methods that
improve the drug discovery and development processes. In order for these
methods to be universally applicable, they must be tested with other enzyme
systems. The "reactive conformation" approach to virtual screening and the
FERM-SMD method of lead optimization should be applied to the other in-house
systems: glucokinase, a drug target related to type II diabetes; and caspase-7, a
drug target implicated in both cancer and inflammation. The distinct nature of
each of these proteins will present new issues to troubleshoot and result in more
robust and universal methodologies.
Finally, an additional line of work that was completed by this author, but

171
was not near enough to publication to be included as a thesis chapter, has
entailed the incorporation of a local, highly fluorescent probe into GR as a means
of monitoring the conformational changes induced by small-molecule binding.
The results revealed surprising structural alterations incurred by ligand binding
that were confirmed via Small-Angle X-Ray Scattering. These results corroborate
the assumptions made during the development of the FERM-SMD method
(Chapter 2 and 3), specifically that different small-molecules binding to the same
buried active site have the ability to induce distinct conformational changes.
References
1. Zumla, A.; Raviglione, M.; Hafner, R.; von Reyn, C. F., Tuberculosis. The New England journal of medicine 2013, 368 (8), 745-755.
2. Dorr, P.; Westby, M.; Dobbs, S.; Griffin, P.; Irvine, B.; Macartney, M.; Mori, J.; Rickett, G.; Smith-Burchnell, C.; Napier, C.; Webster, R.; Armour, D.; Price, D.; Stammen, B.; Wood, A.; Perros, M., Maraviroc (UK-427,857), a potent, orally bioavailable, and selective small-molecule inhibitor of chemokine receptor CCR5 with broad-spectrum anti-Human Immodeficiency Virus Type 1 activity. Antimicrob. Agents Chemother. 2005, 49 (11), 4721-4732.
3. Iqbal, J.; Zaidi, M.; Schneider, A. E., Cinacalcet hydrochloride (Amgen). IDrugs 2003, 6 (6), 587-592.
4. Nelson, K. J.; Day, A. E.; Zeng, B. B.; King, S. B.; Poole, L. B., Isotope-coded, iodoacetamide-based reagent to determine individual cysteine pKa values by MALDI-TOF mass spectrometry. Analytical Biochemistry 2008, 375 (2), 187-195.

Reprinted (adapted) with permission from Whalen, K. L.; Pankow, K. L.; Blanke, S. R.; Spies, M. A.
ACS Med. Chem. Lett. 2010, 8, 9-13. Copyright 2011 American Chemical Society. K. L. Pankow
contributed experimental data for 2 inhibitors. S. R. Blanke contributed intellectually to the
discussion section and experimental planning. M. A. Spies performed the in silico modeling and
execution of the virtual screening, as well as experimental planning and discussion.
172
APPENDIX A
SUPPORTING INFORMATION FOR CHAPTER 1
Exploiting Enzyme Plasticity and Reactivity in Virtual Screening and Ligand
Discovery: the discovery of glutamate racemase inhibitors with high ligand
efficiency values.
Katie L. Whalen§, Katherine L. Pankow§, Steven R. Blanke† and M. Ashley
Spies‡§*
§Department of Biochemistry, ‡Institute for Genomic Biology, and †Department of
Microbiology, University of Illinois, Urbana, Illinois 61801
Computational Methods
High-throughput database virtual screening. The docking of the Chemical
Computing Group’s Conformational Data Base, version 2007, (lead-like
compounds, based on the parameters set forth by Oprea1, and consisting of ~ 1
million compounds from public catalogs of 45 chemical suppliers) into the active
site of the reactive conformation of B. subtilis glutamate racemase was
performed as described in Spies et al.,2 However, the method is briefly outlined
as follows: Docking was performed using the program LigandFit3 within the
Cerius2 suite (Accelrys, Inc.) The receptor was an energy minimized snap shot
for MD simulations with the glutamate carbanion, which was later validated to

173
lead to ab initio upon geometry
optimization, as described in Spies et al.2 All compounds in the database were
protonated, energy minimized, and docked in the binding site, performing in-situ
ligand conformational search and rigid-body minimization of the docked poses in
the receptor’s binding site. All docked compounds were scored using the
LigScore scoring function available in LigandFit. The resulting docked poses
were analyzed for biological and computational consistency by i) verifying that
the known carbanion ligand was ranked among the best compounds, and ii)
verifying that the carbanion was docked in a geometry that reproduces the initial
pose.
Scoring and Ranking of Docked Poses. In the initial virtual screen,
detailed above, LigScore was used in ranking docked poses, and the top 500
compounds were selected for further analysis. A more rigorous and
computationally expensive ranking was employed hereafter to re-rank these
compounds in order to determine compounds for actual experimental
examination for GR inhibition activity. The LigX utility within the Molecular
Operating Environment (MOE)4, Version 2008.10, was used to predict the
binding free energy for the docked complex (i.e. the pKi value). The scoring
procedure involved first a local energy minimization, in which only the ligand and
all atoms (including protein receptor and water) in a sphere of 8 Ǻ from the ligand
are allowed to move in the geometry optimization. The force field used in the
energy minimization was MMFF94x, using a nonbonded cutoff of 10 Ǻ. After
energy minimization, the complex is scored using the MOE’s London dG scoring
function4 (vide infra), which is similar to the often cited scoring function used in
AutoDock5. Briefly, the functional form of the London dG scoring function is as
follows:

174
∆𝐺 = 𝑐 + 𝐸𝑓𝑙𝑒𝑥 + 𝑐𝐻𝐵 ∗ 𝑓𝐻𝐵ℎ−𝑏𝑜𝑛𝑑𝑠
+ ∆𝐷𝑖𝑎𝑡𝑜𝑚𝑠 𝑖
where c is the average gain/loss of translational and rotational entropy; Eflex
equals the energy from loss of flexibility of the ligand; fHB is a measure of the
degree of imperfections of hydrogen bonds (ranging from zero to 1); Di is the
desolvation energy of atom i.
∆𝐷𝑖 = 𝑐𝑖𝑅3{ 𝑢 −6𝑑𝑢
𝑢∈𝐴∪𝐵
− 𝑢 −6𝑑𝑢
𝑢∈𝐵
}
where A and B are the protein and ligand volumes, respectively, with atom i
belonging to B; R is the solvation radius of atom i; ci is the desolvation coefficient
of atom i. The values of c, cHB and ci were fitted from ~ 400 x-ray crystal
structures of protein-ligand complexes and their corresponding experimentally
determined pKi values. The triple integrals were approximated using the
Generalized Born integral. For additional information the reader is referred to the
MOE (2008.10) manual (Chemical Computing Group, Inc.)4.
The London dG scoring function was a far superior ranking system than
sampling using MMFF94 protein-ligand interaction energies from globally energy
minimized complexes, as had been employed on GR studies in the past, which
led to only weak competitive inhibitors with low mM binding dissociation
constants, as described in Spies et al.,2 The MMFF94 interaction energy
approach, as employed previously, was computationally more expensive, and did
not locate any M lead compounds. In the current approach, using the ranking
based on the London dG scoring led to the discovery of two M competitive
inhibitors, one weak inhibitor and one compound which was shown to be a

175
colloidal aggregator (by employing the well-established detergent tests of
Shoichet and coworkers6, 7).
Detailed Docking of 3 into the Reactive Conformation of GR versus
Docking into GR Crystal Structure Using Docking-Energy Minimization. The goal
was to look at all reasonable poses of 3 docked into the reactive form of GR and
the crystal structure of GR (PDB 1ZUW), retaining all docked poses and allowing
each pose to undergo minimization and rescoring with London dG, as above.
The Dock utility of MOE (Version 2008.10) was employed. Briefly, the Alpha
Triangle method4 was employed for the placement stage, followed by scoring
using the London dG scoring function. The next step was a refinement stage,
consisting of a full force field (MMFF94) energy minimization of each pose into
the rigid receptor, followed by a rescoring using the London dG scoring function.
This procedure was followed for both the reactive form of GR as receptor and the
crystal structure of GR as receptor, respectively. All explicit solvent was included
in the receptor, and the energy minimization convergence is defined as an RMSD
gradient of 0.01 kcal/mol/Ǻ2, with an upper limit of 500 iterations. The MMFF94
force field is used in the energy minimization; receptor residues over 6 Ǻ away
from ligand poses are not included in the energy calculation. The final energy
was calculated using the Generalized Born solvation model4.
Calculation of Tanimoto Volumes for 3 Docked into Reactive
Conformation of GR and the Crystal Structure of GR. Tanimoto volumes (Tvol) is
a measure of the goodness of overlap between docked poses (or between a
docked pose and an experimentally determined receptor-ligand complex), which
has the following form8-10:

176
𝑇𝑣𝑜𝑙 =𝑂𝑥𝑦
𝐼𝑥 + 𝐼𝑦 − 𝑂𝑥𝑦
where, Oxy is the overlap in molecular volume between two docked
poses; Ix and Iy are the molecular volumes of docked poses x and y, respectively.
For the case of perfect overlap between pose x and y, Oxy is equal to the
molecular volume overlap between compounds x and y, which reduces Tvol to a
value of unity. When there is no overlap at all between poses, then Oxy
approaches zero, and Tvol approaches zero. Tvol is considered a superior method
for the similarity of placement between complexes, because it accounts for cases
where a ligand may be rotated ~ 180˚ (i.e. flipped), but which accurately
describes the available and occupied active site space8-10.
Calculations of Molecular Volumes Using Yasara. The solvent excluded
(ie Connolly) surface of 3, from docked poses, was calculated using the program
YASARA11 (Version 9.5.10), using the ‘Numeric’ algorithm option, with the default
grid resolution.
Experimental Methods
Materials. Materials for Luria-Bertani (LB) medium were purchased from BD
Diagnostics (Franklin Lakes, NJ). Isopropyl-β-D-thiogalactoside (IPTG) was
purchased from Fisher Scientific (Fair Lawn, NJ). Ampicillin, dithiothreitol (DTT),
and β-mercaptoethanol were obtained from Sigma Aldrich (St. Louis, MO).
Amicon centrifugal filter devices with a molecular weigh cutoff of 10,000 were
purchased from Millipore (Billerica, MA). Ni-NTA His-Bind Resin was obtained
from Invitrogen. Materials for preparing the Ni-NTA bind, wash, and elute buffers
were obtained from Sigma Aldrich. Iodonitrotetrazolium chloride, Nicotinamide
adenine dinucleotide hydrate (NAD+), Diaphorase from Clostridium kluyveri and

177
L-Glutamate Dehydrogenase from bovine liver (obtained as an ammonium
sulfate suspension) was purchased from Sigma Aldrich. Adenosine-5’-
Diphosphate, Disodium Salt, Dihydrate was obtained from USB Corporation
(Cleveland, OH). Compound 4 (ID# S364169) was obtained from Sigma-Aldrich.
Compound 5 (ID# BAS 00124393) was obtained from Asinex (Salem, NC).
Compound 1 (ID# MMSA-1076) was obtained from Scientific Exchange (Center
Ossipee, NH). Compound 3 (ID# LT00453399) was obtained from Labotest OHG
(Niederschöna, Germany). Compound 7 was obtained from InterBioschreen (ID#
BB_NC_0417). Compound 8 was obtained from Sigma (ID# 297763). Compound
2 was obtained from Sigma’s Rare Chemical Library (ID# S819670).
GR Expression and Purification. The expression and purification of RacE (B.
subtilis GR)2, RacE1 and RacE2 (isozymes of B. anthracis GR)12 were as
described previously. A 10 mL starter culture of LB medium with 100 μg/mL
ampicillin was prepared from the stock E. coli BL21 (DE3) cells containing a pET-
15b-racE plasmid and grown overnight at 37 degrees Celsius with rotation. The
10 mL starter culture was back-diluted into 1 L fresh LB medium with 100 μg/mL
ampicillin. Cells were grown at 37 degrees Celsius with shaking until the optical
density at 600 nm reached ~ 0.5. RacE expression was induced upon addition of
a final concentration of 0.1 mM IPTG. Following induction, cells were grown for
an additional 16 h at 37 degrees Celsius with shaking. Cells were harvested by
centrifugation at 5,000 x g for 15 min. Supernatant was discarded and cell
pellets were resuspended in Ni-NTA bind buffer (50 mM phosphate, 300 mM
NaCl, 20 mM imidazole, 0.5 mM Tris carboxyethyl phosphine, pH 8.0). Cell lysis
was achieved through sonication (3x 20 sec cycles, 23 kHz and 20 W), using a
100 Sonic Dimembrator from Fisher Scientific. Insoluble materials were pelleted
by centrifugation at 30,000 x g for 30 min and clarified lysate was applied to 4 mL
bed volume of Ni-NTA His-Bind resin. Bound protein was washed with 2X 16 mL
of wash buffer (50 mM phosphate, 300 mM NaCl, 40mM imidazole, 0.5 mM Tris

178
carboxyethyl phosphine, pH 8.0). Bound protein was eluted twice with 4 mL
elution buffer (50 mM phosphate, 300 mM NaCl, 250 mM imidazole, 0.5 mM Tris
carboxyethyl phosphine, pH 8.0) and the collected eluant was exchanged into
protein storage buffer (50 mM Tris, 100 mM NaCl, 0.2 mM DTT, pH 8.0) utilizing
a 10,000 MWCO Amicon centrifugal filter device from Millipore. Concentration by
centrifugation and resuspension in protein storage buffer was repeated twice
more for a total of 3 buffer exchanges.
Protein concentration was quantified by absorbance spectroscopy based
on previously employed methods13. Based on the primary amino acid sequence,
the extinction coefficient for RacE was calculated to be 24,401 M-1 cm-1 at
280nm. Absorbance readings were acquired using a Cary 300 Bio UV-Visible
Spectrophotometer from Varian Incorporated (Palo Alto, CA). Finally, protein
stocks (final concentration = 0.420 mM) were stored in protein storage buffer with
20% glycerol at -20 degrees Celsius.
Enzyme Kinetics – Circular Dichroism. Stereoisomerization of D-glutamate by
glutamate racemase was assayed using a J-720 CD spectropolarimeter from
JASCO (Easton, MD). A jacketed cylindrical cuvette with a volume of 750 μL and
a path length of 10 mm was used for each assay. Readings were measured at
220nm or 225nm depending on contributions to the signal by the inhibitor. All
measurements were conducted at 25 ˚C. Concentrations of D-glutamate were
varied from 0.25–5 mM in an optically clear borate buffer (50 mM boric acid, 100
mM KCl, 0.7 mM DTT; pH 8.0). Reactions were initiated upon addition of RacE
(0.84 μM), RacE2 (0.47 μM) or RacE1 (0.49 μM) . Data acquisition was
performed using a JASCO Spectra Manager v1.54A software and Excel, and
fitting was performed using GraphPad Prism v5.0 software from GraphPad
Software (San Diego, CA). For weaker inhibitors with high absorbance, where
higher concentrations were employed, a 1 mm path length cuvette was used in

179
order to avoid saturating the instrument. Data was also presented as
Lineweaver-Burke plots, using KaleidaGraph v4.03 by Synergy Software
(Reading, PA).
No Observed Time-Based Inhibition of GR by 5. Inhibitors were analyzed for
time-dependent inhibition by mixing RacE (0.56 μM) and inhibitor (50 μM) in
optically clear borate buffer (50 mM boric acid, 100 mM KCl, 0.7 mM DTT; pH
8.0) and incubating on ice for various amounts of time (0 min, 2.5 min, 5 min, and
10 min). Reactions were initiated upon addition of D-glutamate (1 mM) and initial
velocity was measured using circular dichroism as described above. Differences
in initial velocity are negligible (less than 10%) for both compounds (Figure S1).
Testing for Colloidal Aggregation. It has been well established that the
identification of non-competitive inhibition, which has often arisen in high
throughput screenings (both virtual and non-virtual), may be the result of colloidal
aggregation of the ligand of interest. This phenomenon occurs exclusively with
(apparent) non-competitive, not competitive inhibitors, and has been extensively
characterized and reviewed by Shoichet and co-workers6, 7. In the current study,
a single non-competitive inhibitor was identified (1; Table 1). Thus, 1 was
analyzed for the possibility of colloidal aggregation using a previously established
detergent-based assay6. First, we describe the coupled enzyme assay used in
this study14, followed by the details of the detergent assay for colloidal
aggregation.
Enzyme Kinetics – Coupled-Enzyme Assay. The D- to L-glutamate
racemization activities of RacE, RacE1 and RacE2 were assayed through a
previously established coupled method14, utilizing L-glutamate dehydrogenase
and diaphorase. Absorption data was collected on a Cary 300 UV-VIS

180
Spectrophotometer from Varian Incorporated (Palo Alto, CA). In this coupled-
enzyme assay, the stereoinversion of D-glutamate by glutamate racemase
provided the L-glutamate required by L-glutamate dehydrogenase. The NADH
by-product of dehydrogenation is then oxidized by diaphorase to produce the
reduced form of iodonitrotetrazolium (INT). Reduced iodonitrotetrazolium can be
quantified by measuring the absorption at 500 nm.
Coupled-Enzyme Assay Calibration. The stoichiometric relationship
between absorption at 500 nm and the concentration of L-glutamate produced
was calculated to be approximately 0.00103 AU/nmol, with some variance
depending on the absorptivity of each new batch of iodonitrotetrazolium (INT).
Absorptivity of INT was determined by titrating 10 nmol-aliquots of L-glutamate
into a cuvette containing diaphorase, INT, L-glutamate dehydrogenase, ADP and
NAD+. Absorption at 500 nm is plotted as a function of L-glutamate added. The
slope of this plot is the conversion factor used in the coupled-enzyme assay to
convert AU/min to nmol/min.
Coupled-Enzyme Assay: test for inhibition of glutamate dehydrogenase
coupling enzyme. The coupled-enzyme assay was utilized in order to determine
any possible incidence of L-glutamate dehydrogenase inhibition by the added
inhibitor. Michaelis-Menten curves were composed under three sets of
conditions: without inhibitor, with a concentration of inhibitor that causes
significant inhibition (of the full coupled system), and with the same concentration
of inhibitor and twice the concentration of glutamate racemase. All other reagent
concentrations remain the same. If L-glutamate dehydrogenase is not being
inhibited, one would expect to see an exactly two-fold increase in activity in the
presence of two-fold more glutamate racemase15. In other words, the ratio of
initial velocity in the presence of 1X enzyme to the initial velocity in the presence
of 2X enzyme should be 1:2. For 1, the ratio is 1: 1.91 ± 0.07, which is within
error due to factors of the coupled-enzyme system. Thus, 1 would not appear to
be inhibiting the coupled enzyme and any inhibition witnessed is that of

181
glutamate racemase alone. For 4, the ratio is 1: 1.75 ± 0.01 indicating that some,
but not the majority, of the total inhibition is contributed by inhibition of L-
glutamate dehydrogenase. It should be noted that neither compounds 1 nor 4
could be studied using circular dichroism due to their high absorbance in the UV
range.
Detergent Assay for Colloidal Aggregation (false positive for non-
competitive inhibition)-Activity of RacE was measured in the presence and
absence of inhibitor in buffer containing 0.01% Triton X-100 (vol/vol). The percent
inhibition was compared to that acquired when conducting the same
measurements in buffer without Triton-X 100. If the inhibitor is indeed
aggregating, one would expect to see a decrease in the percent inhibition in the
presence of detergent. A greater than two-fold decrease in inhibition confirms
colloidal aggregation6. These tests were all performed using the coupled enzyme
assay14 (vide supra), together with controls and calibration. Figure 3 shows that 1
is, indeed, a colloidal aggregator (1 was the only non-competitive inhibitor found
in the current study). As a further control for this study, we also performed said
detergent test on the competitive inhibitors 3 and 5, which did not have any effect
on rate as a function of increasing concentrations of detergent, as expected.

182
Figures
Figure 1
Figure A.1. Initial velocity of stereoinversion of D-glutamate catalyzed by RacE
in the presence of inhibitor (3 or 5) as a function of increasing incubation time.
Differences in initial velocity are negligible (less than 10%) for both compounds.

183
Figure A.2 A.
Figure A.2 B.
Figure A.2. IC50 curves for compound 3 against Bacillus anthracis glutamate racemase isozymes, RacE1 (a) and RacE2 (b). The Log[Inhibitor] vs. Response equation (constraints: TOP = 0.22, BOTTOM = 0.04, and SLOPE = -1.0) was fit using GraphPad Prism v5.0 software.

184
Figure A.3. Superpose of GR complex with 3 onto GR complex with Cyclic
Glutamate Carbanion. The top scoring complex from docked compound 3 into
the reactive form of GR (as outlined in Figure 1) is shown with its molecular
volume, while the cyclic glutamate carbanion is rendered in stick form. The
overlap image derives from a full superpose of the two complexes, and only the
ligands are shown for clarity. The Tvol value (see Computational Methods section,
above, for a full description of this metric) for this overlap was calculated to be
0.55. This indicates a reasonable volume overlap between the two complexes;
however, there is clearly a far from ideal electrostatic mapping between the two
complexes, especially around the C and C carbons of the carbanion. The
docking procedure is described above in the Computational Methods section.

185
References
1. Oprea, T. I. Property distribution of drug-related chemical databases. J
Comput Aided Mol Des 2000, 14, 251-64.
2. Spies, M. A.; Reese, J. G.; Dodd, D.; Pankow, K. L.; Blanke, S. R.;
Baudry, J. Determinants of Catalytic Power and Ligand Binding in Glutamate
Racemase. J Am Chem Soc 2009.
3. Venkatachalam, C. M.; Jiang, X.; Oldfield, T.; Waldman, M. LigandFit: a
novel method for the shape-directed rapid docking of ligands to protein active
sites. J Mol Graph Model 2003, 21, 289-307.
4. Molecular Operating Environment, Version 2008.10; Chemical
Computing Group: Montreal, Quebec, Canada.
5. Morris, G. M.; Goodsell, D. S.; Halliday, R. S.; Huey, R.; Hart, W. E.; K., B.
R.; Olson, A. J. Automated Docking Using a Lamarckian Genetic Algorithm and
an Empirical Binding Free Energy Function. J. Comput. Chem. 1998, 19, 1639-
1662.
6. Feng, B. Y.; Shoichet, B. K. A detergent-based assay for the detection of
promiscuous inhibitors. Nat Protoc 2006, 1, 550-3.
7. Shoichet, B. K. Screening in a spirit haunted world. Drug Discov Today
2006, 11, 607-15.
8. Willett, P.; Javidi, B.; Lops, M. Analysis of image detection based on
fourier plane nonlinear filtering in a joint transform correlator. Appl Opt 1998, 37,
1329-41.
9. Warren, G. L.; Andrews, C. W.; Capelli, A. M.; Clarke, B.; LaLonde, J.;
Lambert, M. H.; Lindvall, M.; Nevins, N.; Semus, S. F.; Senger, S.; Tedesco, G.;
Wall, I. D.; Woolven, J. M.; Peishoff, C. E.; Head, M. S. A critical assessment of
docking programs and scoring functions. J Med Chem 2006, 49, 5912-31.
10. Muchmore, S. W.; Souers, A. J.; Akritopoulou-Zanze, I. The use of three-
dimensional shape and electrostatic similarity searching in the identification of a

186
melanin-concentrating hormone receptor 1 antagonist. Chem Biol Drug Des
2006, 67, 174-6.
11. Krieger, E.; Koraimann, G.; Vriend, G. Increasing the precision of
comparative models with YASARA NOVA--a self-parameterizing force field.
Proteins 2002, 47, 393-402.
12. Dodd, D.; Reese, J. G.; Louer, C. R.; Ballard, J. D.; Spies, M. A.; Blanke,
S. R. Functional comparison of the two Bacillus anthracis glutamate racemases.
J Bacteriol 2007, 189, 5265-75.
13. Gill, S. C.; von Hippel, P. H. Calculation of protein extinction coefficients
from amino acid sequence data. Anal Biochem 1989, 182, 319-26.
14. Rej, R. A convenient continuous-rate spectrophotometric method for
determination of amino acid substrate specificity of aminotransferases:
application to isoenzymes of aspartate aminotransferase. Anal Biochem 1982,
119, 205-10.
15. Cook, P. F.; Cleland, W. W. Enzyme kinetics and mechanism. Garland
Science: London ; New York, 2007; p xxii, 404 p.

Reprinted (adapted) with permission from Whalen, K. L.; Chang, K. M.; Spies, M. A. Mol. Inf. 2011, 30, 459-471. Copyright 2011 John Wiley and Sons. K. M. Chang contributed inhibitory
assays for several compounds. M. A. Spies contributed intellectual direction and discussions.
187
APPENDIX B
SUPPORTING INFORMATION FOR CHAPTER 2
Hybrid Steered Molecular Dynamics-Docking: an efficient solution to the problem
of ranking inhibitor affinities against a flexible target.
Katie L. Whalen1, Kevin M. Chang1 and M. Ashley Spies1,2*
Department of Biochemistry1 and Institute of Genomic Biology2, University of Illinois, Urbana, Illinois 61801
Table of Contents
Supplemental Tables ………………………………………………… 188
Supplemental Figures ………………………………………………... 190
Supplemental Data (1H-NMR peaks & Ligand Sources)…........…. 204

188
Table B.1. Complete set of bona fide GR inhibitors discovered in-house (in addition to the native substrate) with predicted binding constants (Kd), acquired from docking to the crystal structure alone or FERM-SMD structures and the actual binding constant as approximated by experimentally-derived Ki, Km, and IC50 values. Purity and method of analysis noted for each ligand.
Compound Predicted Kd (mM) Actual Kd (mM) Purity, Method
Crystal Only FERM-SMD
1 0.29 0.002 0.009 99.9%, HPLC
2 0.61 9.1 0.042 > 95%, HPLC
3 0.002 0.001 0.059 > 99%, NMR
4
0.96 0.24 0.1 > 99%, TLC
5 276 0.05 0.43 99.8%, HPLC
6 0.76 0.44 0.6 > 99%, TLC
7 0.15 1.7 1.3
See Komarov et
al. 2008
8
1.9*10-5 1.9 1.5 100%, PAT
9 4.4 0.41 1.9 99.8%, GC
10
0.23 0.91 1.9 96.1%, OxForm
11 0.005 6.0 1.9 > 99%, TLC
12
3.0 34 2.7 99.6%, GLC
13 1.6 59 14 96.8%, GLC
14 16 28 16 100%, SHT

189
15 62 8.9 63 99.1%, IET
16 1.4*10
4 112 70 99.9%, GC
17 1.9*103 89 110 99.7%, PAT
Abbreviations: HPLC, high performance liquid chromatography; NMR, nuclear magnetic resonance; TLC, thin layer chromatography; PAT, perchloric acid titration; GC, gas chromatography; OxForm, oxime formation; GLC, gas liquid chromatography; SHT, sodium hydroxide titration; IET, ion exchange titration

190
Figure B.1. Front (A) and side (B) view of active site entrance of superposed GR
structures (ribbon) with Prolines shown (stick) and direction of expansion
indicated (white arrows). Structures were superposed so that the RMSD of all
atoms is minimal. The three structures of GR selected for ensemble docking
correspond to the following distances between glutamate and GR (centers of
mass): 41.9 Å (red), 43.7 Å (green), and 46.7 Å (blue). Prolines shown are the
following: Pro150 (top, foreground), Pro146 (bottom, foreground), Pro44 (bottom,
background) and Pro41 (top, background). Length and direction of white arrows
are arbitrarily assigned and meant only as a visual aid.
A B

191
Figure B.2. Correlations of binding energies as predicted by docking to a single
structure from the FERM-SMD ensemble and experimentally-determined binding
affinities. Structure numbers are arbitrarily assigned and the corresponding
simulation time is listed in parentheses. Data is fit to a logarithmic equation and
the Spearman correlation coefficient, denoted R, is indicated.

192
Figure B.3. Correlation of predicted FERMScore values and experimental binding
affinities where the described FERM-SMD method is performed on structures
acquired from a 16-nanosecond classical MD simulation of apo-RacE, in place of
structures acquired from SMD. Three structures were selected from the classical
MD by composing a structure-based phylogenetic tree of snapshots taken every
150 picoseconds and performing QR analysis to select for non-redundant
structures, using a QH cutoff of 0.89. All other steps of the FERM-SMD method
remaining the same.

193
Figure B.4. Global fitting to a competitive inhibition model and non-linear fitting to
a dose-response curve for derivation of Ki and IC50 values, respectively. Enzyme
kinetics were measured via circular dichroism and colorimetric coupled-enzyme
assays (See Methods for details) in the presence of saturating D-glutamate.
16 (Tartrate)
0 1 2 30
10
20
30
40
50
IC50 = 70 mM
log[inhibitor] (mM)
V0 (
nm
ol/m
in)
17 (Citrate)
0 1 2 30
10
20
30
40
IC50 = 110 mM
log[inhibitor] (mM)
V0 (
nm
ol/m
in)
5 (-Ketoglutarate)
0 1 2 3 40
20
40
60
IC50 = 0.43 mM
log[inhibitor] (mM)
V0 (
nm
ol/m
in)
8 (D-glucuronic acid)
0 2 4 60.0
0.1
0.2
0.3
0.4
0.50
1200
1800
Ki = 1.45 0.32 mM
D-Glu (mM)
V0 (
nm
ol/
sec)
6 (Chloroaniline sulfonic acid)
-2.0 -1.5 -1.0 -0.5 0.0 0.5
5
10
15
20
IC50 = 0.60 mM
log[inhibitor] (mM)
7 (Radchenko et al. 13a)
0 1 2 3 40
10
20
30
IC50 = 1.3 mM
log[inhibitor] (mM)
V0 (
nm
ol/m
in)
10 (Formylbenzenesulfonic acid)
-1.5 -1.0 -0.5 0.0 0.5 1.0 1.5
10
20
30
40
IC50 = 1.9 mM
log[inhibitor] (mM)
15 (Methylpropenesulfonic acid)
-0.5 0.0 0.5 1.0 1.5 2.0
5
10
15
20
IC50 = 63 mM
log[inhibitor] (mM)
V0 (
nm
ol/
min
)
11 (hydroxyl-Nitrobenzenesulfonic acid)
-1.5 -1.0 -0.5 0.0 0.5 1.0 1.5
10
20
30
40
50
IC50 = 1.9 mM
log[inhibitor] (mM)
V0 (
nm
ol/m
in)
14 (L-Pyroglutamate)
-1.5 -1.0 -0.5 0.0 0.5 1.0 1.5
10
20
30
40
IC50 = 16 mM
log[inhibitor] (mM)
V0 (
nm
ol/
min
)
1 (Benzimidazole-2-sulfonic acid)
0 5 10 15 20 250.0
0.5
1.0
1.5
2.00 M
40 M
120 M
Ki = 9.6 1.5 M
D-Glu (mM)
V0 (
nm
ol/
sec)
12 (4-pyridazine carboxylic acid)
-1.0 -0.5 0.0 0.5 1.0
50
100
IC50 = 2.7 mM
log[inhibitor] (mM)
ba c
d e f
g h i
j k l
m13 (D-pyroglutamate)
-1.0 -0.5 0.0 0.5 1.0
50
100
IC50 = 14 mM
log[inhibitor] (mM)

194
Figure B.5. Equilibration achieved over 500 picoseconds of molecular dynamics
simulations. Differences between the backbone carbons of each subsequent
simulation snapshot structure (interval = 25 psec) and the original structure,
expressed as RMSD (Å), plotted against simulation time for each GR-ligand
complex (a-q).
4 (D-Glutamate)
0 200 400 6000.0
0.5
1.0
1.5
Simulation Time (psec)
RM
SD
(Å
)
13 (D-pyroglutamate)
0 200 400 6000.0
0.5
1.0
1.5
Simulation Time (psec)
RM
SD
(Å
)
2 (Whalen et al. 3)
0 200 400 6000.0
0.5
1.0
1.5
Simulation Time (psec)
RM
SD
(Å
)
3 (Whalen et al. 5)
0 200 400 6000.0
0.5
1.0
1.5
Simulation Time (psec)
RM
SD
(Å
)
7 (Radchenko et al. 13a)
0 200 400 6000.0
0.5
1.0
1.5
Simulation Time (psec)
RM
SD
(Å
)
9 (Dipicolinic acid)
0 200 400 6000.0
0.5
1.0
1.5
Simulation Time (psec)
RM
SD
(Å
)
11 (hydroxyl-Nitrobenzenesulfonic acid)
0 200 400 6000.0
0.5
1.0
1.5
Simulation Time (psec)
RM
SD
(Å
)
8 (Glucuronic acid)
0 200 400 6000.0
0.5
1.0
1.5
Simulation Time (psec)
RM
SD
(Å
)
5 ( -Ketoglutarate)
0 200 400 6000.0
0.5
1.0
1.5
Simulation Time (psec)
RM
SD
(Å
)
16 (Tartrate)
0 200 400 6000.0
0.5
1.0
1.5
2.0
Simulation Time (psec)
RM
SD
(Å
)
14 (L-Pyroglutamate)
0 200 400 6000.0
0.5
1.0
1.5
2.0
Simulation Time (psec)
RM
SD
(Å
)
17 (Citrate)
0 200 400 6000.0
0.5
1.0
1.5
Simulation Time (psec)
RM
SD
(Å
)
6 (Chloroaniline sulfonic acid)
0 200 400 6000.0
0.5
1.0
1.5
Simulation Time (psec)
RM
SD
(Å
)
12 (4-pyridazine carboxylic acid)
0 200 400 6000.0
0.5
1.0
1.5
Simulation Time (psec)
RM
SD
(Å
)
1 (Benzimidazole-2-sulfonic acid)
0 200 400 6000.0
0.5
1.0
1.5
Simulation Time (psec)
RM
SD
(Å
)
10 (Formylbenzenesulfonic acid)
0 200 400 6000.0
0.5
1.0
1.5
2.0
Simulation Time (psec)
RM
SD
(Å
)
15 (Methylpropenesulfonic acid)
0 200 400 6000.0
0.5
1.0
1.5
Simulation Time (psec)
RM
SD
(Å
)
a b c d
e f g h
i j k l
m n o p
q

195
Figure B.6. Detergent assay for elimination of false positives due to non-specific
inhibition by aggregation. Percent inhibition was analyzed for each inhibitor at a
concentration near the IC50 with saturating D-glutamate (1 mM) and in the
presence or absence of 0.01% Triton X-100. Detergent assays were not
performed for substrate analogs nor known active site binders.
11 (hydroxyl-Nitrobenzenesulfonic acid)
0.00 0.010
20
40
60
80
100
% Triton X-100
% I
nh
ibit
ion
10 (Formylbenzenesulfonic acid)
0.00
0.01
0
20
40
60
80
100
% Triton X-100
% I
nh
ibit
ion
15 (Methylpropenesulfonic acid)
0.00
0.01
0
20
40
60
80
100
13 (D-pyroglutamate)
0.00 0.010
20
40
60
80
100
% Triton X-100
% I
nh
ibit
ion
1 (Benzimidazole sulfonic acid)
0.00 0.010
20
40
60
80
100
% Triton X-100
% I
nh
ibit
ion
14 (L-Pyroglutamate)
0.00 0.010
20
40
60
80
100
% Triton X-100
% I
nh
ibit
ion
3 (Whalen et al. 5)
0.00 0.010
20
40
60
80
100
% Triton X-100
% I
nh
ibit
ion
2 (Whalen et al. 3)
0.00 0.010
20
40
60
80
100
% Triton X-100
% I
nh
ibit
ion
0.00 0.010
20
40
60
80
100
6 (Chloroanilinesulfonic acid)
% Triton X-100
% I
nh
ibit
ion
12 (4-pyridazinecarboxylic acid)
0.00 0.010
20
40
60
80
100
% Triton X-100
% I
nh
ibit
ion
a b c
d e f
g h i
k

196
Figure B.7. Electrospray ionization mass spectrometry for confirmation of ligand
structure of compounds presented here for the first time as being active against
GR.
a. 12 (4-pyridazine carboxylic acid)
b. 5 (alpha-ketoglutarate)

197
c. 1 (1H-benzimidzole-2-sulfonic acid
d. 6 (2-chloroaniline-4-sulfonic acid)

198
d. 8 (D-glucuronic acid)
e. 13 (D-pyroglutamate)

199
f. 10 (2-formylbenzene-sulfonic acid)
g. 4 (D-glutamate)

200
h. 14 (L-pyroglutamate)
i. 15 (2-methyl-2-propene-1-sulfonic acid)

201
j. 11 (2-hydroxy-5-nitrobenzenesulfonic acid)
k. 16 (citrate)

202
l. 9 (dipicolinic acid, DPA)
m. 17 (L-tartrate)
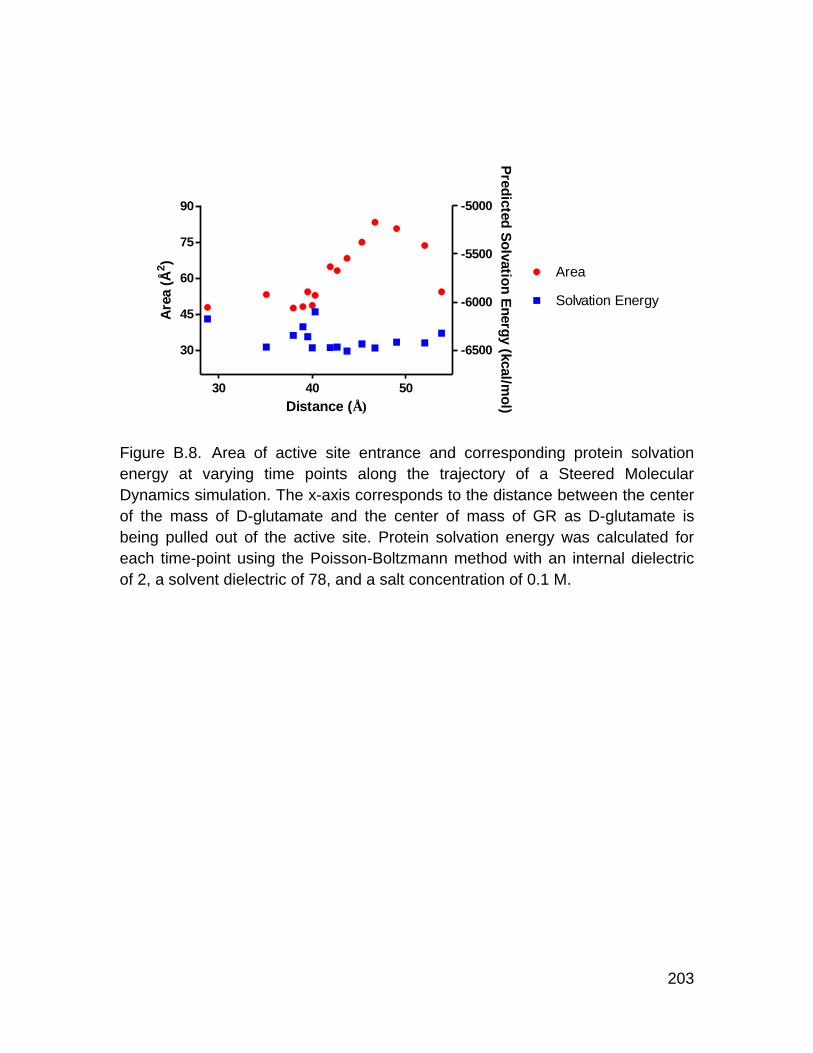
203
Figure B.8. Area of active site entrance and corresponding protein solvation
energy at varying time points along the trajectory of a Steered Molecular
Dynamics simulation. The x-axis corresponds to the distance between the center
of the mass of D-glutamate and the center of mass of GR as D-glutamate is
being pulled out of the active site. Protein solvation energy was calculated for
each time-point using the Poisson-Boltzmann method with an internal dielectric
of 2, a solvent dielectric of 78, and a salt concentration of 0.1 M.
30 40 50
30
45
60
75
90
-6500
-6000
-5500
-5000
Area
Solvation Energy
Distance (Å)
Are
a (
Å2)
Pre
dic
ted
So
lvatio
n E
nerg
y (k
cal/m
ol)

204
Supplemental Data
1H-NMR Peaks
The following compounds were selected from a previous virtual screening
study or were analogues based on hits from the same virtual screening study[1].
Nuclear magnetic resonance (NMR) was used to confirm the structure of each hit
and all experimentally-attained spectra agree strongly with chemical shifts
predicted by ChemDraw Ultra v12.0 (CambridgeSoft Corp., Cambridge, MA). All 1H-NMR spectra were acquired in-house on a Varian Unity 400 MHz with a 5mm
Nalorac QUAD probe, unless indicated otherwise. All samples analyzed in-house
were suspended in D2O.
1 (1-benzimidazole-2-sulfonic acid). δ (ppm) 7.05 (d, 2H), 7.45 (d, 2H).
2 (Croconic acid). δ (ppm) 16.78 (s, 1H).
3 (4-Hydroxy-1,3-benzenedisulfonic acid). (1H-NMR performed by Asinex,
Moscow, Russia) δ (ppm) 7.03 (d, 1H,), 7.81 (d, 1H), 8.14 (s, 1H).
6 (2-Chloroaniline-4-sulfonic acid). δ (ppm) 4.54 (s, 2H), 6.78 (d, 1H), 7.35 (d,
1H), 7.55 (s, 1H).
9 (2,6-Pyridinedicarboxylic acid [dipicolinic acid]). (1H-NMR performed by
Sigma-Aldrich, St. Louis, MO) δ (ppm) 8.1-8.3 (m, 3H).
10 (2-Formylbenzenesulfonic acid). δ (ppm) 7.55-7.60 (dt, 2H), 7.80 (t, 2H),
10.55 (s, 1H).
11 (2-Hydroxy-5-nitrobenzensulfonic acid). δ (ppm) 3.22 (s, 1H), 6.35 (d, 1H),
7.90 (d, 1H), 8.38 (s, 1H).
12 (4-pyridazinecarboxylic acid). δ (ppm) 7.82 (d, 1H), 9.15 (d, 1H), 9.20 (s,
1H).
13* (D-pyroglutamic acid). δ (ppm) 1.68 (m, 2H), 2.40 (t, 1H), 2.60 (m, 1H),
3.95 (t, 1H).
14* (L-pyroglutamic acid). δ (ppm) 1.68 (m, 2H), 2.40 (t, 1H), 2.60 (m, 1H), 3.95
(t, 1H).

205
15 (2-Methyl-2-propene-1-sulfonic acid). δ (ppm) 1.69 (s, 3H), 3.42 (s, 2H),
4.85 (d, J = 2.1, 2H).
*Compounds 13 and 14 were not derived from virtual screening, but rather
were substrate analogs.

206
Description of Sources of Active Compounds
The following compounds were direct hits from a virtual screening of ~ 1
million compounds (Chemical Computing Group Conformational Database
Version 2007, Chemical Computing Group, Montreal, Canada) conducted
previously by Spies et al.[1]: compounds 2 (croconic acid, ranking = #75), 3 (4-
hydroxy-1,3-benzenedisulfonic acid, ranking = #57), 9 (dipicolinic acid, ranking =
#62) and 11 (2-hydroxy-5-nitrobenzenesulfonic acid, ranking = #59). The
following compounds were analogs derived from virtual screening hits: 1 (1-
benzimidazole-2-sulfonic acid), 6 (2-chloroaniline-4-sulfonic acid), 10 (2-
formylbenzenesulfonic acid), 12 (4-pyridazinecarboxylic acid) and 15 (2-methyl-
2-propene-1-sulfonic acid). Glutamate analogs include the following compounds:
4 (α-ketoglutarate), 7 (a restricted glutamate derivative), 8 (D-glucuronic acid), 13
(D-pyroglutamate), 14 (L-pyroglutamate), 16 (citrate), and 17 (tartrate). D-
glutamate itself was also included in this study (compound 5).
[1] M. A. Spies, J. G. Reese, D. Dodd, K. L. Pankow, S. R. Blanke and J. Baudry, J Am Chem Soc 2009, 131, 5274-5284.

Reprinted (adapted) with permission from Whalen, K. L.; Chau, A. C.; Spies, M. A.
ChemMedChem, published online August 8th, 2013; DOI: 10.1002/cmdc.201300271. Copyright
2013 John Wiley and Sons. A. C. Chau contributed in silico docking. M. A. Spies contributed
intellectual direction.
207
APPENDIX C
SUPPORTING INFORMATION FOR CHAPTER 3
IN SILICO OPTIMIZATION OF A FRAGMENT-BASED HIT YIELDS
BIOLOGICALLY ACTIVE, HIGH EFFICIENCY INHIBITORS FOR GLUTAMATE
RACEMASE.
Katie L. Whalen[a,b], Anthony C. Chau[b], and M. Ashley Spies *[a]
Figure C.1. SDS-PAGE analysis of purified glutamate racemases from B. subtilis
(*), B. anthracis (*), and F. tularensis (**). Two isozymes exist in the case of B.
La
dd
er
B.s
ubtilis
B. an
thra
cis
1
B.
an
thra
cis
2
F. tu
lare
nsis
37 kD
25 kD * **

208
anthracis. Molecular weight of glutamate racemases from B. subtilis and B.
anthracis is ~31,500 and F. tularensis is ~29,300.
200 220 240 260
-20
-10
0
10
20Bs RacE
Wavelength (nm)
CD
(m
deg
)
200 220 240 260
-20
-10
0
10
20Ba RacE1
Wavelength (nm)
CD
(m
deg
)
200 220 240 260
-40
-20
0
20
40
60Ba RaceE2
Wavelength (nm)
CD
(m
deg
)
200 220 240 260
-20
-10
0
10
20Ft MurI
Wavelength (nm)
CD
(m
deg
)
Figure C.2. Circular dichroism of purified proteins to assess protein foldedness.

209
Figure C.3. 1H NMR spectra for compound 4. Experiment conducted at ambient
temperature. Peak at 2.50 corresponds to the employed solvent, DMSO.

210
Figure C.4. 1H NMR spectra for compounds 18. Experiment conducted at
ambient temperature. Peak at 2.50 corresponds to the employed solvent, DMSO.

211
Figure C.5. 1H NMR spectra for compounds 29. Experiment conducted at
ambient temperature. Peak at 2.50 corresponds to the employed solvent, DMSO.

212
Figure C.6. HPLC analysis of compound 4, showing 98.1% purity.

213
Figure C.7. HPLC analysis of compound 18, showing 99.0% purity.

214
Figure C.8. HPLC analysis of compound 29, showing 100.0% purity.

215
Figure C.9. Example of MIC50 reagent volumes for a single replicate of one
inhibitor. Inhibitor concentration varies along the X-axis of the plate. Two
compounds could be assayed in triplicate per 96-well plate of bacteria. Blank
wells contain 100 μL of phosphate-buffered saline (PBS) and 100 μL of 2X
media.

216
4
No Triton with 0.01% Triton0
20
40
60
80
100
99% 99%
%-I
nh
ibit
ion
18
No Triton with 0.01% Triton0
20
40
60
80
100
15% 17%
%-I
nh
ibit
ion
29
no Triton with 0.01% Triton0
20
40
60
80
100
50% 46%%-I
nh
ibit
ion
Figure C.10. Colloidal aggregate testing for newly synthesized derivatives of 1H-
benzimidazole-2-sulfonic acid. Racemase activity tested in the presence of a
fixed concentration of inhibitor (200 μM), 1 mM D-glutamate, and with or without
0.01% Triton X-100 included in the working buffer. %-Inhibition determined in
triplicate with standard deviation shown (error bars).

217
BISA Derivative MIC50 vs Lactococcus lactis
-2 0 2 40.0
0.2
0.4
0.6
0.8
1.04
18
29
26
log[inhibitor] (mM)
OD
at
600n
m
Figure C.11. MIC50 analysis of select derivatives of 1H-benzimidazole-2-sulfonic
acid against Lactococcus lactis. Compounds 18 and 26 show no growth inhibition
within the tested range of inhibitor concentrations. Compound 29 starts to show
growth inhibition at the highest tested concentration. Surprisingly, compound 4 (a
potent growth inhibitor against B. subtilis) causes noticeable growth activation
compared to untreated cells. This is an unexpected phenomenon, which may be
the result of productive metabolism of the inhibitor compound.

Reprinted (adapted) with permission from Whalen, K. L.; Spies, M. A. J. Chem. Inf. Mod.,
published online August 21, 2013; DOI: 10.1021/ci400244x. Copyright 2013 American Chemical
Society. M. A. Spies contributed MD simulations and calculations related to ELR binding energy
evaluations.
218
APPENDIX D
SUPPORTING INFORMATION FOR CHAPTER 4
Flooding Enzymes: quantifying the contributions of interstitial water and cavity
shape to ligand binding using Extended Linear Response free energy
calculations
Katie L. Whalen1,2,3 and M. Ashley Spies1,2
1College of Pharmacy, Division of Medicinal and Natural Products Chemistry, and 2 Carver College of Medicine, Department of Biochemistry, the University of Iowa,
Iowa City, Iowa; 3Department of Biochemistry, University of Illinois at Urbana-
Champaign, Urbana, Illinois

219
Table D.1. Primers used in site-directed mutagenesis to create desired GR mutations.
Desired
Mutation Template
DNA Primer Primer Sequence (5' to 3')
N75A pET15b-
racE_WT RacEN75Afor gctcgtgatcgcctgtgctacagcaacagcgatcg RacEN75Arev cgatcgctgttgctgtcgaacaggcgatcacgagc
N75L* pET15b-
racE_C74A RacEN75AC74Afor caaaatgctcgtgatcgccgctaatacagcaacagcgatc
RacEN75AC74Arev gatcgctgttgctgtattagcggcgatcacgagcattttg *The production of GR-N75L was a serendipitous result of mis-priming in PCR during parallel attempts to construct racE-C74A-N75A with the listed primers and pET15b-racE-C75A as template. Sequencing confirms racE-N75L is the only resulting mutation. This result was highly repeatable.

220
Table D.2. Active site analysis of inhibitor-bound GR complexes via MOE Site Finder. * Enzyme Inhibitor Size PLB Hyd Side Residues
GR-WT
BISA 189 2.49 18 140
D10 S11 G12 V13 G14 G15 T37 C40 P41 Y42
G43 A73 C74 N75 T76 A77 V96 T118 N120
T121 V149 E153 G184 C185 T186 H187 F246
I249
CA 192 2.43 21 147 D10 S11 G12 V13 G14 G 15 T37 C40 P41
Y42 G43 A73 C74 N75 T76 A77 T118 N120
T121 V149 E153 C815 T186 H187 Q245 I249
GR-
N75L
BISA 187 2.94 16 141
D10 S11 G12 V13 G14 G15 T37 C40 P41 Y42
G43 A73 C74 L75 T76 A77 V96 G117 T118
N120 T121 V149 E153 G184 C185 T186 H187
Q245 I249
CA 156 3.02 11 117 D10 S11 G12 V13 G14 G15 C40 P41 Y42 G43
P44 C74 A75 T76 A77 V96 G117 T118 N120
T121 V149 E153 G184 C185 T185 H187 Y188
GR-
N75A
BISA 131 2.98 10 93 D10 S11 G12 G14 G15 P41 Y42 G43 A73 C74
A75 T76 A77 G117 T118 N120 T121 V149
G184 C185 T186 H187
CA 127 2.86 8 93 D10 S11 G12 V13 G14 G15 C40 P41 Y42 G43
P44 C74 A75 T76 G117 T118 N120 T121
V149 P150 E153 G184 C185 T186 H187 * Final snapshots from MD simulation were imported to MOE v2011.10. "Size" indicates the number of contact atoms in the receptor. "PLB" corresponds to the Propensity for Ligand Binding [Soga 2007] score. "Hyd" indicates the number of hydrophobic contact atoms in the receptor. "Side" indicates the number of sidechain contact atoms in the receptor. Finally, "Residues" indicates the residues that make up the calculated site.

221
Figure D.1. Cα-atom RMSD plots for GR inhibitors (A) and substrate (B) over the course of each complex's 4-ns MD simulation.

222
Figure D.2. SDS-PAGE analysis of purified recombinant RacE (B. subtilis). Molecular weight is approximately 31,000 Da with the 6X-His-tag.

223
Figure D.3. Quantification of the active site cleft for BISA (1) and CA (2) in complex with GR-WT, GR-N75L, or GR-N75A. Cleft measurements made by calculating the area between four points which form a circumference about the active site entrance (A). Measurements made for the final three snapshots of each complex simulation with standard deviations shown (B).

224
Figure D.4. Molecular surface representations of GR-BISA complexes. Structures were obtained from the final snapshot of each 4-ns MD simulation. Solvent accessible surface area is rendered in white using the YASARA Structure package. Surfaces are cut away to show the ligand binding pocket shape. Key residues interacting with the ligand (directly or via interstitial bonds) are shown (stick, magenta). BISA is shown bound to the active site (stick, elemental coloring). Hydrogen bonds are shown (yellow, dotted line), and all interstitial waters are shown (stick, elemental coloring). Each structure is oriented with the entrance to the active site positioned at the left of the image.

225
0.0 0.5 1.0 1.5
0.90
0.95
1.00Best-fit values
Bmax
Kd
NS
Background
Std. Error
Bmax
Kd
NS
Background
-0.1552
0.1059
0.05516
0.9994
0.008410
0.01396
0.008205
0.002893
[D-glutamate] (mM)
No
rmalize
d
Flu
ore
sce
nce
In
ten
sit
y (A
U)
Figure D.5. Titration of D-glutamate to RacE-C74A for determination of dissociation constant. RacE-C74A is a functionally-inactive form of glutamate racemase that can bind D-glutamate, but cannot abstract the Cα proton. Intrinsic tryptophan/tyrosine fluorescence (excitation at 280 nm, emission at 343 nm) was measured continuously at 25°C using a Cary Eclipse Fluorescence Spectrophotometer (Agilent). A 90 μM solution of purified RacE-C74A in 50 mM Tris-HCl, 100 mM NaCl, pH 8.0, 2 mM DTT was incubated in a quartz cuvette (pathlength = 10 mm) for 10 min at 25°C prior to the first injection. A 50 mM solution of D-glutamate in the same buffer was used for substrate injections. The titration was repeated three times. Data was fit to a "Total binding - one site" model with GraphPad Prism v5.0. The dissociation constant is within error of the reported KM value.

226
1-WT 1-N75A 1-N75L150
152
154
156
158
160
162
3.00
3.02
3.04
3.06
3.08
3.10
Bond Angle
Bond Distance
An
gle
()
Dis
tan
ce (Å
)
Figure D.6. Average angle and distance measurements for ligand-protein hydrogen bonds observed in the final 3 snapshots of MD simulation. Measurements made for 3 individual snapshots per simulation. Each complex contained between 3-4 hydrogen bonding interactions between ligand and protein. The 1-WT complex possessed the most optimal overall bonding distances and angles, where both 1-N75A and 1-N75L complexes suffer from increased bond distances and decreased bond angles.

Reprinted (adapted) with permission from Whalen, K. L.; Tussey, K. B.; Blanke, S. R.; Spies, M.
A. J. Phys. Chem. B, 2011, 115, 3416-3424. Copyright 2011 American Chemical Society. K. B.
Tussey contributed molecular docking with FRED and GOLD. S. R. Blanke contributed helpful
insights into biological implications. M. A. Spies contributed intellectual direction and assistance in
manuscript composition.
227
APPENDIX E
SUPPORTING INFORMATION FOR CHAPTER 5
Inhibition of B. anthracis Glutamate Racemase by DPA: Discovery of an
Allosteric Cryptic Binding Site
Katie L. Whalen1, Kenneth B. Tussey2, Steven R. Blanke3,4, and M. Ashley
Spies1,4*
Department of Biochemistry1, Program for Biophysics and Computational
Biology2, Department of Microbiology3, and Institute of Genomic Biology4,
University of Illinois, Urbana, Illinois 61801
Table of Contents
Supplemental
Methods………………………………………………………………………….….. 228
Supplemental Computational Methods..…………….......……………….….…... 230
Supplemental Results….………………………………………………………...... 232
Supplemental Tables and Figures……………………………..……………..….. 234
Supplemental References………………..……………………………………..… 243

228
Supplemental Methods
Protein Expression and Purification
A 10 mL starter culture of LB medium with 100 μg/mL ampicillin was prepared from the stock E. coli BL21 (DE3) cells containing pET-15b plasmid with the gene of choice and grown overnight at 37 °C with rotation. The 10 mL starter culture was back-diluted into 1 L fresh LB medium with 100 μg/mL ampicillin. Cells were grown at 37 °C with shaking until the optical density at 600 nm reached 0.5-0.8. Protein expression was induced upon addition of a final concentration of 0.1 mM IPTG. Following induction, cells were grown for an additional 16-20 h at 37 °C with shaking (16 °C for mutant proteins). Cells were harvested by centrifugation at 5,000 x g for 15 min. Supernatant was discarded and cell pellets were resuspended in bind buffer (50 mM phosphate, 300 mM NaCl, 20 mM imidazole, 0.5 mM Tris carboxyethyl phosphine, pH 8.0). Cell lysis was achieved through sonication (3x 20 sec cycles, 23 kHz and 20 W), using a 100 Sonic Dimembrator from Fisher Scientific. Insoluble materials were pelleted by centrifugation at 30,000 x g for 30 min and clarified lysate was applied to 4 mL bed volume of His-Select Cobalt Affinity Gel. Bound protein was washed with 2X 16 mL of wash buffer (50 mM phosphate, 300 mM NaCl, 40mM imidazole, 0.5 mM Tris carboxyethyl phosphine, pH 8.0). Bound protein was eluted twice with 4 mL elution buffer (50 mM phosphate, 300 mM NaCl, 250 mM imidazole, 0.5 mM Tris carboxyethyl phosphine, pH 8.0) and the collected eluant was concentrated via centrifugal filtration. Eluant was incubated at 37 °C for 15 min in the presence of 1 mM ATP and 1 mM MgCl2 to remove molecular weight contaminants suspected to be chaperones. Eluant was then diluted 10X with H2O and submitted to ion exchange chromatography using a BioRad Uno Q1 column on a BioRad BioLogic DuoFlow HPLC. Pooled fractions were then exchanged into protein storage buffer (50 mM Tris, 100 mM NaCl, 0.2 mM DTT, pH 8.0) and concentrated utilizing a 10,000 MWCO Amicon centrifugal filter device. Finally, protein stocks were stored at a final concentration of 7-10 mg/mL with 20% glycerol at -20 °C.
Colloidal Aggregation Control
Inhibitors were analyzed for the possibility of colloidal aggregation using a previously established detergent-based assay1 (successfully applied this system to expose colloidal aggregators in Whalen et al.2). Activity of RacE was

229
measured in the presence and absence of inhibitor in buffer containing 0.01% Triton-X 100 (vol/vol). The percent inhibition was compared to that acquired when conducting the same measurements in buffer without Triton-X 100. If the inhibitor is indeed aggregating, one would expect to see a decrease in the percent inhibition in the presence of detergent (as seen in Whalen et al.2). Feng and Shoichet stated that a greater than two-fold decrease in inhibition confirms colloidal aggregation1.
Enzyme Kinetics – Circular Dichroism
Stereoisomerization of D-glutamate by GR was assayed by using a J-720 CD spectropolarimeter from JASCO, Inc. (Easton, MD). A jacketed cylindrical cuvette with a volume of 750 μL and a path length of 10 mm was used for each assay. Readings were measured at 220nm or 225nm depending on contributions to the signal by the inhibitor. All measurements were conducted at 25 ˚C. Concentrations of D-glutamate were varied from 0.25–5 mM in an optically clear borate buffer (50 mM boric acid, 100 mM KCl, 0.7 mM DTT; pH 8.0). Reactions were initiated upon addition of enzyme (approx. 0.5 μM). Data acquisition was performed using a JASCO Spectra Manager v1.54A software and Excel, and fitting and statistical analysis was performed using GraphPad Prism v5.0 (GraphPad Software, Inc., La Jolla, CA).
Monomer:Dimer Equilibrium Model and BN-PAGE Data Fitting
A monomer:dimer equilibrium model was formulated using the following relationships:
Eq. 1
Eq. 2
, where M is the monomer concentration, C is the complex, or dimer, concentration and PT is the total protein concentration.
Eq. 3
Substitution via Eq. 1 and solving for C gives:
Eq. 4
where . A similar procedure for monomer concentration leads to:
Eq. 5
230
The M/C ratio was measured via pixel quantification of BN-PAGE gels and the total protein concentration is known. The initial value of Kd was set arbitrarily to 0.01 μg/mL and solved by fitting the data. All data fitting was executed using GraphPad Prism v5.0. Additionally, combining equations 3 and 4 leads to the simpler expression in Eq. 6.
Eq. 6
Supplemental Computational Methods
Molecular Dynamic Simulations
The molecular dynamics simulations were performed with the YASARA Structure package version 9.11.9 (YASARA Biosciences)3. A periodic simulation cell with boundaries of 99.64 Å, 70.54 Å, and 68.98 Å was employed with explicit solvent , using the dimer (A and B chains) of PDB 2GZM (B. anthracis RacE2 GR with ligand D-glu). The AMBER03 force field was used with long-range electrostatic potentials calculated with the Particle Mesh Ewald (PME) method, with a cutoff of 7.864 Å4-6. The substrate force field parameters were generated with the AutoSMILES utility7, which employs semi-empirical AM1 geometry optimization and assignment of charges, followed by assignment of AM1BCC atom and bond types with refinement using RESP charges, and finally the assignments of general AMBER force field atom types. The hydrogen bond network of GR is optimized using the method of Hooft and coworkers8, in order to address ambiguities from multiple side chain conformations and protonation states that are not resolved by the electron density. YASARA’s pKa utility was used to assign pKa values at pH 7.09. The box was filled with water, with a maximum sum of all bumps per water of 1.0 Å, and a density of 0.997 g/ml. The simulation cell was neutralized with NaCl (0.9% final concentration; % by mass). Waters were deleted to readjust the solvent density to 0.997 g/ml. A short MD was run on the solvent only. The entire system was then energy minimized using first a steepest descent minimization to remove conformational stress, followed by a simulated annealing minimization until convergence (<0.05 kJ/mol/200 steps). The MD simulation was then initiated, using the NVT ensemble at 298 K, and integration time steps for intramolecular and intermolecular forces every 1.25 fs and 2.5 fs, respectively.
Docking Program Specifications
GOLD employs a traditional genetic algorithm for exploring ligand conformations and binding modes within a partially flexible active site 10. The

231
GOLD scoring function for ranking binding modes is composed of terms that account for three conditions: hydrogen bonding between ligand and enzyme, the hydrophobic contribution of the energy of binding, and the internal energy of the ligand10. Quite contrary, FRED employs a non-stochastic sampling of ligand conformations by systematically rotating and translating conformers within the binding site in a stepwise fashion. Docked complexes are filtered by several default and user-defined constraints, such as the requirement that ligand conformers fit within the active site volume, and then ranked by the scoring function Chemgauss 3. The Chemgauss 3 scoring function is comprised of terms for: steric interactions, ligand hydrogen-bond donors and acceptors, interactions with active site metal atoms, and desolvation11. Lastly, AutoDock uses a Lamarckian genetic algorithm to sample ligand conformations and binding modes, which varies slightly from the traditional genetic algorithm employed by GOLD in that conformers are also allowed to search local conformational space to find local minima12. AutoDock uses a semiempirical free energy force field to predict free energies of binding which accounts for intermolecular and intramolecular energies, as well as charge-based desolvation.
D-Glu Free Energy Binding Calculations with the Fast Boundary Element Method (BEM)
The method employed here falls under the class of free energy calculations known as Endpoint Methods, which includes the popular MM-PBSA approach. These methods were recently reviewed by Steinbrecher and Labahn13, and involve calculating ΔGbind from constituent parts of a thermodynamic box that involves solvation of the individual components. The binding energy expression is:
In the MM-PBSA method the procedure is based on numerical solution of the differential Poisson equation (also called the finite difference method) and the solvent is represented as a continuum having a relatively high dielectric constant, while the protein and ligand may be viewed as point charges projected onto a grid in a low dielectric continuum. The molecular surface of the protein and ligand is the important interface between these two dielectrics. However, we employ an alternative approach to the finite-difference method called the Boundary Element Method (BEM) 14,15. In this method much of the focus is placed on accurately representing the boundary between the two dielectrics, in which a very accurate boundary charge distribution is used to represent a uniform dielectric at the interface between the low and the high dielectric continuum. From this boundary region of uniform dielectric strength, Coulomb's Law is used to calculate the

232
electrostatic potentials. Each method has distinct strengths and weaknesses, yet the latter has not been as widely employed in the literature even though there have been significant advances in the speed and accuracy of this appraoch16-18. The BEM method was designed to perform optimally for such curved protein surfaces, by accurately representing the geometry of the protein boundaries. The work of Zauhar and Morgan19 have shown that the geometry of the boundary region is of central importance to representing the electrostatic potential of proteins15, and may avoid some of the difficulties inherent in assignment of the protein dielectric in the finite difference approach of MM-PBSA (recently reviewed by Warshel and co-workers20). A major difficulty in Endpoint methods is assigning an internal dielectric. Here we used a wide range of values for εp, which did not affect the relative binding energies or the trends seen in Fig. 5d, but only the absolute free energies of binding. It is important to note that ΔGbinding values obtained from Endpoint methods, such as MM-PBSA or BEM, should be viewed as accurate scoring functions, which have enhanced rank-ordering value, rather than as metrics of accurate absolute binding free energy21. For the current study, BEM, the boundary between solvent (dielectric constant 78) and solute (dielectric constant ranged from 2 to 28) was formed by the latter's molecular surface, constructed with a solvent probe radius of 1.4 Å and the following radii for the solute elements: polar hydrogens 0.32 Å, other hydrogens 1.017 Å, carbon 1.8 Å, oxygen 1.344 Å, nitrogen 1.14 Å, sulfur 2.0 Å. The solute charges were assigned based on the AMBER03 force field22, using GAFF/AM1BCC23 for the ligands. The term for the hydrophobic component of ligand binding, ΔGnp was calculated by using the empirical treatment of Tan et al.24 (SAV probe = 1.80 Å, surface tension (ɣ) = 0.0480 kcal/mol-Å3, and constant offset (c) = -3.2655 kcal/mol.).
Supplemental Results
Monomer versus Dimer Docking
DPA was docked to the same site with only a single monomer present using AutoDock and showed severely attenuated binding affinity (Interaction Energy = -27.45 kcal/mol (dimer) versus -14.81 kcal/mol (monomer), calculated by LigX25).
Hydrogen-Bond Network of Active Site
In E2·D-glu2, the distance between the side chain of Thr186 and His187 and the amine of glutamate was 4.34 Å and 5.32 Å, respectively. For E2·D-glu2·DPA, the distance between Thr186 and His187 and the amine was 2.99 Å and 3.77 Å, respectively. Thus, only in E2·D-glu2·DPA is Thr186 within hydrogen-bonding distance of the substrate. In addition to increased contact with

233
glutamate, the movement of Thr186 brings the side chain hydroxyl within hydrogen-bonding distance of Ala73 of an adjacent loop. This hydrogen bond may be responsible for bringing both the side chain and backbone amines of Asn75 close enough to glutamate to form hydrogen bonds with either oxygen of its α carboxylate (3.59 Å and 2.92 Å, respectively), interactions that are completely absent in the E2·D-glu2 (6.50 Å and 4.99 Å, respectively).
Structures were critically analyzed to find the source of the weaker free energy of binding of monomer A of E2·D-glu2·DPA. It was previously reported that a main conformational change related to glutamate binding occurs in a loop containing His187 and Thr186 which have both been indicated in binding and catalysis26. Thus, we began by examining the effect of DPA binding on this loop. Ligand interaction mapping of equilibrated E2·D-glu2·DPA after the 20 nanosecond simulation show two water bridges formed between DPA and Asp210 and Glu211 of the A monomer of RacE2 (Fig. 5c). Asp 210 goes on to form a hydrogen bond with the side-chain hydroxyl of Ser207 (previously implicated in DPA binding by initial ligand interaction mapping of the top-docked complex prior to MD). Ser207 also forms a water bridge with Glu211. This complex network of direct hydrogen bonds and water bridges between DPA and the A monomer occurs twenty residues downstream of the catalytic residues, separated by a short α-helix and β-sheet. It is possible then that interactions between DPA and Ser207, Asp210 and Glu211 result in a rearrangement in the enzyme conformation that is translated down the backbone to the catalytic residues, His187 and Thr186.
Solvation and DPA Inhibition
An additional water molecule interacting with glutamate of the E2·D-glu2·DPA further indicates an active site rearrangement coincident with binding of DPA. The active site solvent accessible volume for the E2·D-glu2 monomer A is 1214.35 Å3 which decreases to 1171.15 Å3 for the E2·D-glu2·DPA monomer A, a difference of 43.2 Å3. Thus, the additional water bridge seen in E2·D-glu2·DPA is not due to more water molecules in the active site but instead more optimal positioning of present water molecules. Thus, greater protein solvation energy of E2·D-glu2·DPA appears to contribute at least partially to the source of the weaker D-glu binding free energy.
Monomer-Monomer Interactions
According to the equilibrated structure resulting from MD simulation, binding of DPA to the RacE2 dimer interface disrupts two inter-monomer hydrogen bonds occurring between Lys106a and Asp210b (and vice versa, Lys106b to Asp210a), forcing either Lys106 to instead hydrogen bond to Glu211. There is no net loss of direct contact between the monomers with DPA bound, which agrees well with the results of Blue Native PAGE.

234
Supplementary Tables and Figures
Supplementary Table E.1. Fitting parameters of RacE2_WT activity versus DPA
data to varying inhibition models via GraphPad Prism v5.0.
Inhibition Model Degrees of
Freedom
Abs. Sum of
Squares
Competitive 13 0.001858
Noncompetitive 13 0.0009267
Uncompetitive 13 0.001597
Mixed Model 12 0.0009108
Supplementary Table E.2. Comparison of global fitting via F test of RacE2_WT
activity versus DPA data to varying inhibition models.
Parameter Comparison 1 Comparison 2 Comparison 3
Null Hypothesis Competitive Inhibition Uncompetitive Inhibition Noncompetitive Inhibtion
Alternative Hypothesis Mixed Model Inhibition Mixed Model Inhibition Mixed Model Inhibition
P Value 0.0041 0.0109 0.6548
Conclusion (alpha = 0.05) Reject Null Reject Null Do Not Reject Null
Preferred Model Mixed Model Inhibition Mixed Model Inhibition Noncompetitive Inhibition
F (DFn, DFd) 12.48 (1,12) 9.037 (1,12) 0.2102 (1,12)
Supplementary Table E.3. Steady-state kinetic parameters of WT and mutant
RacE2 enzymes as determined by circular dichroism. Fit to the Michaelis-Menten
equation via GraphPad Prism v5.0.
Protein
D L Racemization
kcat (s-1) Km (mM) kcat/ Km (103 M-1 s-1)
RacE2 WT 2.13 ± 0.1 1.27 ± 0.3 1.68 ± 0.2
RacE2 K106A 5.68 ± 0.8 2.27 ± 0.7 2.50 ± 0.3
RacE2 S207A 0.73 ± 0.1 0.29 ± 0.1 2.52 ± 0.4

235
Supplementary Table E.4. Description of primers used for site-directed
mutagenesis of racE2.
Gene Desired Mutation Primer Primer Sequence (5’3’)
racE2 Lys106Ala K106Afor 5’-agttattcacccaggatcacgtacagctttagcagtgacaaacacatac-3’
K106Arev 5’-gtatgtgtttgtcactgctaaagctgtacgtgatcctgggtgaataact-3’
racE2 Ser207Ala S207Afor 5’-ggagataaagtacaactcattgcttcaggtgatgaaacagcgc-3’
S207Arev 5’-gcgctgtttcatcacctgaagcaatgagttgtactttatctcc-3’
Supplementary Table E.5. Comparison of global fitting via F test of RacE1_WT
activity versus DPA data to varying inhibition models.
Parameter Comparison 1 Comparison 2 Comparison 3
Null Hypothesis Competitive Inhibition Uncompetitive Inhibition Noncompetitive Inhibtion
Alternative Hypothesis Mixed Model Inhibition Mixed Model Inhibition Mixed Model Inhibition
P Value 0.0221 0.0484 0.6915
Conclusion (alpha = 0.05) Reject Null Reject Null Do Not Reject Null
Preferred Model Mixed Model Inhibition Mixed Model Inhibition Noncompetitive Inhibition
F (DFn, DFd) 6.156 (1,20) 4.418 (1,20) 0.1621 (1,20)

236
Supplementary Figure E.1. Inhibition of RacE1 by DPA assayed via circular
dichroism and globally fit to a noncompetitive inhibition model, resulting in a Ki
value of 78 ± 12 μM.
0 2 4 60
2
4
6
0 M
50 M
100 M
D-Glu (mM)
V0 (
nm
ol/
sec)
Ki = 78 12 M
-2
0
2
4
6
8
10
-2 0 2 4 6 8 10 12
0 uM50 uM100 uM
1 / V
0 (
nm
ol/sec)-1
1/D-Glu (mM)-1

237
Supplementary Figure E.2. Colloidal aggregate test for false positives. Inhibition
of RacE2 by 50 μM DPA was assayed in the presence and absence of 0.01%
Triton-X 100 detergent. The percent inhibitions of either set of conditions were
within error (< 10%) proving DPA not to act through aggregate formation. Data
represents the average of three separate trials with standard deviation shown.

238
Supplementary Figure E.3. Blue Native PAGE of WT RacE2 and running controls
with NativeMark ladder (10% resolving gel, 4% stacking gel). Monomer band
appears to migrate slightly slower than the 20 kDa marker, as expected (RacE2
monomer MW = 30 kDa). Dimer band appears to migrate slightly slower than the
66 kDa marker (RacE2 dimer MW = 60 kDa) which is most likely due to the fact
that the RacE2 homodimer has a more elongated oval shape (see diagram
adjacent to arrow head) than the globular marker protein, and thus migrates
slower. Higher order oligomers are also present on the gel in negligible
quantities.
kDa
480
242
146
66
20
Ladder
RacE
2_
WT
Carb
.A
nhydra
se
Alb
um
in

239
Supplementary Figure E.4. BN-PAGE to determine the effect of DPA on RacE2
dimerization. Loading buffer, running buffer and PAGE gel contained 1 mM DPA
(a) , 1mM 3,4-pyridinedicarboxylic acid (b), or buffer (c). Albumin and carbonic
anhydrase were included as running controls. Arrowheads indicate bands
representing the dimer and monomer. Band intensity was quantified via pixel
counting and the ratio of monomer to dimer was fitted to an expression for
monomer:dimer equilibrium (derivation of expression detailed above in
Supplementary Methods). Data represents an average of two or more
independent trials with standard error shown. Fitting of data resulted in the
following Kd values for RacE2 in the presence of DPA, analogue, or buffer: 48 ±
13, 39 ± 5, and 30 ± 7 μg/mL, respectively. Thus, BN-PAGE would confirm that
there is no significant change in the Kd of dimerization due to the presence of
DPA.

240
Supplementary Figure E.5. Ligand interaction maps for glutamate bound to the
active site of monomer B when DPA is absent (a) and bound (b). Maps were
constructed from the equilibrated structures of the 20 nanosecond MD
simulations.
a b

241
Supplementary Figure E.6. Equilibration achieved over 20 nanoseconds of
molecular dynamics simulations. Differences between the backbone carbons of
each subsequent simulation snapshot structure and the original structure,
expressed as RMSD (Å), plotted against time for the E2·D-glu2 (a) and E2·D-
glu2·DPA complex (b).
a
b
E2·D-glu2
E2·D-glu2·DPA

242
Supplementary Figure E.7. Purification of recombinant 6x-His-tagged
RacE2_S207A, RacE2_K106A, and WT RacE2 via Co2+-affinity chromatography
followed by UNO-Q anion-exchange chromatography.
MW (kD) Cell
pelle
t
Cla
rifie
dly
sate
Co-F
low
-thro
ugh
Co-w
ash1
Co-w
ash2
Co-e
lute
IonE
xch
ange-e
lute
1Io
nE
xch
ange-e
lute
2
75
50
37
25
25
37
50
75
25
37
50
75
RacE2_S207A
RacE2_K106A
RacE2_WT

243
Supplementary References
(1) Feng, B. Y.; Shoichet, B. K. National Protocols 2006, 1, 550.
(2) Whalen, K. L.; Pankow, K. L.; Blanke, S. R.; Spies, M. A. ACS Medicinal
Chemistry Letters 2010, 8, 9.
(3) Krieger, E.; Koraimann, G.; Vriend, G. Proteins: Structure, Function, and
Genetics 2002, 47, 393.
(4) Cornell, W. D.; Cieplak, P.; Bayly, C. I.; Gould, I. R.; Merz, K. M., Jr.;
Ferguson, D. M.; Spellmeyer, D. C.; Fox, T.; Caldwell, J.; Kollman, P. A. Journal of the
American Chemical Society 1995, 117, 5179.
(5) Duan, Y.; Wu, C.; Chowdhury, S.; Lee, M. C.; Xiong, G.; Zhang, W.;
Yang, R.; Cieplak, P.; Luo, R.; Lee, T.; Caldwell, J.; Wang, J.; Kollman, P. Journal of
Computational Chemistry 2003, 24, 1999.
(6) Essmann, U.; Perera, L.; Berkowitz, M. L.; Darden, T.; Lee, H.; Pedersen,
L. G. Journal of Chemical Physics 1995, 103, 8577.
(7) Jakalian, A.; Jack, D. B.; Bayly, C. I. Journal of Computational Chemistry
2002, 23.
(8) Hooft, R. W. W.; Vriend, G.; Sander, C.; Abola, E. E. Nature 1996, 381,
272.
(9) Krieger, E.; Nielsen, J. E.; Spronk, C. A. E. M.; Vriend, G. Journal of
Molecular Graphics and Modeling 2006, 25, 481.
(10) Jones, G.; Willett, P.; Glen, R. C.; Leach, A. R.; Taylor, R. Journal of
Molecular Biology 1997, 267, 727.
(11) McGann, M. R.; Almond, H. R.; Nicholls, A.; Grant, J. A.; Brown, F. K.
Biopolymers 2003, 68, 76.
(12) Morris, G. M.; Goodsell, D. S.; Halliday, R. S.; Huey, R.; Hart, W. E.;
Belew, R. K.; Olson, A. J. Journal of Computational Chemistry 1998, 19, 1639.
(13) Steinbrecher, T.; Andreas, L. current Medicinal Chemistry 2010, 17, 767.
(14) Juffer, A. H.; Botta, E. F. F.; Vankeulen, B. A. M.; Vanderploeg, A.;
Berendsen, H. J. C. Journal of Computational Physics 1991, 97, 144.
(15) Zauhar, R. J.; Morgan, R. S.; Shaw, P. B. Biophysical Journal 1985, 47,
A21.

244
(16) Chan, S. L.; Purisima, E. O. Computers & Graphics 1998, 22, 83.
(17) Purisima, E. O. Journal of Computational Chemistry 1998, 19, 1494.
(18) Totrov, M.; Abagyan, R. Biopolymers 2001, 60, 124.
(19) Zauhar, R. J.; Morgan, R. S. Journal of Molecular Biology 1985, 186, 815.
(20) Kato, M.; Braun-Sand, S.; Warshel, A.; Stroud, R.; Finer-Moore, J.
Challenges and progresses in calculations of binding free energies - what does it take to
quantify electrostatic contributions to protein-ligand interactions. In Computational and
structural approaches to drug discovery : ligand-protein interactions; RSC Publishing:
Cambridge, 2008; pp 268.
(21) Shirts, M. R.; Mobley, D. L.; Brown, S. P.; Merz, K. M.; Ringe, D.;
Reynolds, C. H. Free-energy calculations in structure-based drug design. In Drug design
: structure- and ligand-based approaches; Cambridge University Press: Cambridge
[U.K.] ; New York, 2010; pp 61.
(22) Duan, Y.; Wu, C.; Chowdhury, S.; Lee, M. C.; Xiong, G. M.; Zhang, W.;
Yang, R.; Cieplak, P.; Luo, R.; Lee, T.; Caldwell, J.; Wang, J. M.; Kollman, P. Journal of
Computational Chemistry 2003, 24, 1999.
(23) Wang, J. M.; Wolf, R. M.; Caldwell, J. W.; Kollman, P. A.; Case, D. A.
Journal of Computational Chemistry 2004, 25, 1157.
(24) Tan, C.; Tan, Y.-H.; Luo, R. Journal of Physical Chemistry B 2007, 111,
12263.
(25) Molecular Operating Environment; 2008.10 ed.; Chemical Computing
Group: Montreal, Quebec, Canada.
(26) Ruzheinikov, S. N.; Taal, M. A.; Sedelnikova, S. E.; Baker, P. J.; Rice, D.
W. Structure 2005, 13, 1707.