Spatial interference among moving targets
14
Spatial interference among moving targets Peter J. Bex * , Steven C. Dakin Institute of Ophthalmology, University College London, 11-43 Bath Street, London EC1V 9EL, UK Received 5 August 2004; received in revised form 18 November 2004 Abstract Peripheral vision for static form is limited both by reduced spatial acuity and by interference among adjacent features (Ôcrowd- ingÕ). However, the visibility of acuity-corrected image motion is relatively constant across the visual field. We measured whether spatial interference among nearby moving elements is similarly invariant of retinal eccentricity and assessed if motion integration could account for any observed sensitivity loss. We report that sensitivity to the direction of motion of a central target—highly vis- ible in isolation—was strongly impaired by four drifting flanking elements. The extent of spatial interference increased with eccen- tricity. Random-direction flanks and flanks whose directions formed global patterns of rotation or expansion were more disruptive than flanks forming global patterns of translation, regardless of the relative direction of the target element. Spatial interference was low-pass tuned for spatial frequency and broadly tuned for temporal frequency. We show that these results challenge the generality of models of spatial interference that are based on retinal image quality, masking, confusions between target and flanks, attentional resolution limits or (simple) ‘‘averaging’’ of element parameters. Instead, the results suggest that spatial interference is a consequence of the integration of meaningful image structure within large receptive fields. The underlying connectivity of this integration favours low spatial frequency structure but is broadly tuned for speed. Ó 2005 Elsevier Ltd. All rights reserved. Keywords: Spatial interference; Crowding; Acuity; Motion; Optic flow 1. Introduction Convergent electrophysiological (Hubel & Wiesel, 1968; Schiller, Finlay, & Volman, 1976; Wurtz, 1969) and behavioural (Anderson & Burr, 1987) studies have established that the classical receptive fields of early vi- sual mechanisms are relatively small and selective for stimulus attributes such as spatial frequency, orientation and direction of motion. In order to derive functional information about large objects and their movements, such local representations must be integrated across the visual field. While pooling is therefore necessary for the perception of global structure, many studies of spatial form discrimination have shown that informa- tion about component structure can be degraded in the process of image integration. For example, alphanu- meric characters that are reliably identified in isolation can no longer be identified when they are closely sur- rounded by other optotypes (Bouma, 1970; Townsend, Taylor, & Brown, 1971) or contours (Flom, Weymouth, & Kahneman, 1963). This effect is known as spatial interference, crowding, or local contour interaction. Sim- ilarly, discrimination thresholds for the contrast, spatial frequency and orientation of a target grating are ele- vated by nearby flanking gratings (He, Cavanagh, & Intriligator, 1996; Parkes, Lund, Angelucci, Solomon, & Morgan, 2001; Wilkinson, Wilson, & Ellemberg, 1997). However, crowded elements that cannot be indi- vidually identified can nevertheless contribute to the estimate of the mean orientation of the ensemble (Parkes et al., 2001; Wilkinson et al., 1997) and can still gener- ate local, orientation-specific after-effects (He et al., 1996). 0042-6989/$ - see front matter Ó 2005 Elsevier Ltd. All rights reserved. doi:10.1016/j.visres.2004.12.001 * Corresponding author. E-mail address: [email protected] (P.J. Bex). www.elsevier.com/locate/visres Vision Research 45 (2005) 1385–1398
Transcript of Spatial interference among moving targets
www.elsevier.com/locate/visres
Vision Research 45 (2005) 1385–1398
Spatial interference among moving targets
Peter J. Bex *, Steven C. Dakin
Institute of Ophthalmology, University College London, 11-43 Bath Street, London EC1V 9EL, UK
Received 5 August 2004; received in revised form 18 November 2004
Abstract
Peripheral vision for static form is limited both by reduced spatial acuity and by interference among adjacent features (�crowd-ing�). However, the visibility of acuity-corrected image motion is relatively constant across the visual field. We measured whether
spatial interference among nearby moving elements is similarly invariant of retinal eccentricity and assessed if motion integration
could account for any observed sensitivity loss. We report that sensitivity to the direction of motion of a central target—highly vis-
ible in isolation—was strongly impaired by four drifting flanking elements. The extent of spatial interference increased with eccen-
tricity. Random-direction flanks and flanks whose directions formed global patterns of rotation or expansion were more disruptive
than flanks forming global patterns of translation, regardless of the relative direction of the target element. Spatial interference was
low-pass tuned for spatial frequency and broadly tuned for temporal frequency. We show that these results challenge the generality
of models of spatial interference that are based on retinal image quality, masking, confusions between target and flanks, attentional
resolution limits or (simple) ‘‘averaging’’ of element parameters. Instead, the results suggest that spatial interference is a consequence
of the integration of meaningful image structure within large receptive fields. The underlying connectivity of this integration favours
low spatial frequency structure but is broadly tuned for speed.
� 2005 Elsevier Ltd. All rights reserved.
Keywords: Spatial interference; Crowding; Acuity; Motion; Optic flow
1. Introduction
Convergent electrophysiological (Hubel & Wiesel,
1968; Schiller, Finlay, & Volman, 1976; Wurtz, 1969)
and behavioural (Anderson & Burr, 1987) studies have
established that the classical receptive fields of early vi-sual mechanisms are relatively small and selective for
stimulus attributes such as spatial frequency, orientation
and direction of motion. In order to derive functional
information about large objects and their movements,
such local representations must be integrated across
the visual field. While pooling is therefore necessary
for the perception of global structure, many studies of
spatial form discrimination have shown that informa-tion about component structure can be degraded in
0042-6989/$ - see front matter � 2005 Elsevier Ltd. All rights reserved.
doi:10.1016/j.visres.2004.12.001
* Corresponding author.
E-mail address: [email protected] (P.J. Bex).
the process of image integration. For example, alphanu-
meric characters that are reliably identified in isolation
can no longer be identified when they are closely sur-
rounded by other optotypes (Bouma, 1970; Townsend,
Taylor, & Brown, 1971) or contours (Flom, Weymouth,
& Kahneman, 1963). This effect is known as spatialinterference, crowding, or local contour interaction. Sim-
ilarly, discrimination thresholds for the contrast, spatial
frequency and orientation of a target grating are ele-
vated by nearby flanking gratings (He, Cavanagh, &
Intriligator, 1996; Parkes, Lund, Angelucci, Solomon,
& Morgan, 2001; Wilkinson, Wilson, & Ellemberg,
1997). However, crowded elements that cannot be indi-
vidually identified can nevertheless contribute to theestimate of the mean orientation of the ensemble (Parkes
et al., 2001; Wilkinson et al., 1997) and can still gener-
ate local, orientation-specific after-effects (He et al.,
1996).

1386 P.J. Bex, S.C. Dakin / Vision Research 45 (2005) 1385–1398
Explanations of crowding have been based on factors
that limit resolution at several stages of visual process-
ing. Visual acuity can be reduced under crowded condi-
tions by interactions in the physics of the target and
flanking stimuli in the retinal image, such as the point
spread function (Liu & Arditi, 2000) or masking bythe spatial frequency components they share (Hess,
Dakin,&Kapoor,2000a).However, crowdingalsooccurs
between target and flank stimuli that are presented to
opposite eyes (Flom et al., 1963; Tripathy & Levi,
1999), implicating a cortical locus for at least some part
of spatial interference. Crowding effects are maximal
when the spatial (Kooi, Toet, Tripathy, & Levi, 1994;
Nazir, 1992), spatial frequency (Andreissen & Bouma,1976; Chung, Levi, & Legge, 2001; Hess et al., 2000a;
Kooi et al., 1994) or orientation (Levi, Klein, & Harih-
aran, 2002) structure of the target and flanking stimuli
are similar. Thus spatial interference is greater among
channels that are similarly-tuned for contrast polarity,
spatial frequency or orientation than across differently-
tuned channels. Tuning properties for foveal crowding
are similar to those reported for masking (Polat & Sagi,1993; Wilson, McFarlane, & Phillips, 1983; Zenger &
Sagi, 1996) and consequently some authors have argued
that crowding in central vision can be considered a
masking phenomenon (Chung et al., 2001; Levi, Harih-
aran, & Klein, 2002).
While masking might account for crowding in foveal
vision, crowding effects in peripheral visual field are not
consistent with this explanation and require a differentmodel. In the periphery, crowding effects can be roughly
equal for targets and flankers that are of either the same
or opposite contrast polarity (Hess, Dakin, Kapoor, &
Tewfik, 2000b) although this can depend on eccentricity
and location in the visual field (Kooi et al., 1994). The
extent of spatial interference does not scale with the spa-
tial frequency of the target as it does on fovea (Chung
et al., 2001; Levi, Hariharan, et al., 2002) or with targetsize (Tripathy & Cavanagh, 2002). These findings rule
out masking effects, which scale with spatial frequency
in both fovea and periphery (Polat & Sagi, 1993). In-
stead, the results of peripheral crowding studies impli-
cate a non-selective spatial pooling region of relatively
fixed size that may correspond to the spatial resolution
of visual attention (He et al., 1996; Intriligator & Cava-
nagh, 2001; Tripathy & Cavanagh, 2002), the integra-tion stage of later visual processes (Chung et al., 2001)
or the region over which grouping and segmentation
processes combine texture (Parkes et al., 2001; Wilkin-
son et al., 1997).
We have recently shown that while acuity falls for
moving alphanumeric targets, the spatial extent over
which moving elements crowd one another spatial inter-
ference is not significantly affected by motion of speedsup to 84 deg/s (Bex, Dakin, & Simmers, 2003). Although
resolution for static spatial form rapidly declines in
peripheral visual field (Millidot, 1966), sensitivity to
temporal modulation (motion and flicker) is relatively
invariant across the visual field for detection (McKee
& Nakayama, 1984; Wright & Johnston, 1983) and dis-
crimination (McKee & Nakayama, 1984; Waugh &
Hess, 1994) tasks, as long as the size and/or contrastof the stimuli is adjusted to compensate for spatial acu-
ity changes. In the case of flicker fusion (the lowest flick-
er rate that appears steady), sensitivity increases
somewhat with eccentricity (Kelly, 1971a, 1971b) and
recent evidence suggests that information processing
may even be faster in the periphery (Carrasco, McElree,
Denisova, & Giordano, 2003). We sought to test
whether these differences in the sensitivity to spatialand temporal modulation as a function of eccentricity
might also affect spatial interference among moving ele-
ments. We therefore measured how an observer�s abilityto detect the direction of motion of a textured element
was affected by the presence of nearby moving elements.
It is now widely agreed that the perception of motion
over large areas of visual space is based on a hierarchical
process of integration over successively increasing size.Unidirectional motion signals at a limited spatial scale
are first encoded by motion detectors with small recep-
tive fields, such as those observed in area V1 of the pri-
mate cortex (Hubel & Wiesel, 1968). Behavioural studies
of motion summation in human observers confirm that
the motion of single drifting Gabor patches is integrated
by detectors with small receptive fields that scale with
the target wavelength (c 2 0 to 7 deg, Anderson & Burr,1987). Numerous behavioural (Bex & Makous, 1997;
Bex, Metha, & Makous, 1998; Bex, Metha, & Makous,
1999; Burr, Morrone, & Vaina, 1998; Dakin & Bex, in
press; Freeman & Harris, 1992; Gurney & Wright,
1996; Lappe, Bremmer, & van den Berg, 1999; Lappe
& Rauschecker, 1995; Meese, 2000; Meese & Harris,
2001; Morrone, Burr, & Di Pietro, 1999; Morrone, Burr,
& Vaina, 1995; Regan & Beverly, 1978; Snowden& Milne, 1996, 1997; Verghese & Stone, 1995, 1996;
Wilkinson et al., 2000; Wilson & Wilkinson, 1998; Wil-
son, Wilkinson, & Asaad, 1997) and electrophysiologi-
cal (Duffy & Wurtz, 1991, 1993; Graziano, Andersen,
& Snowden, 1994; Kim, Mulligan, & Sherk, 1997; Or-
ban, Lagae, Raiguel, Xiao, & Maes, 1995; Saito, Tana-
ka, Isono, Yasuda, & Mikami, 1989; Tanaka & Saito,
1989) studies have shown that later stages of visual pro-cessing involve detectors with receptive fields of increas-
ing size that specialise in the detection of complex global
patterns that form the primitives of optic flow (Koend-
erink, 1986). This suggests that the visual system differ-
entially integrates different motion configurations and
led us to speculate that the global pattern of motion
may also affect the magnitude or the spatial extent over
which spatial interference might be observed. To testthis conjecture, we manipulated the directions of motion
of groups of crowding elements so that their combined

P.J. Bex, S.C. Dakin / Vision Research 45 (2005) 1385–1398 1387
motions formed different global patterns of translation,
rotation, expansion/contraction or random motion.
2. Experiment 1: Acuity and spatial interference with
drifting Gabor stimuli
2.1. Methods
2.1.1. Apparatus
Stimuli were generated on a Macintosh G4 computer
with software adapted from the VideoToolbox routines
(Pelli, 1997) and were displayed on a LaCie Electron-
Blue 22 0 monitor at a frame rate of 75 Hz and a meanluminance of 50 cd/m2. The display measured 36 cm
(1152 pixels) horizontally, 27.2 cm (870 pixels) vertically
and was 230, 115 cm or 57 cm from the observer, in an
otherwise dark room. The luminance of the display was
linearized with pseudo-12-bit resolution (Pelli & Zhang,
1991) in monochrome and calibrated with a Minolta
photometer. Images were presented in greyscale by
amplifying and sending the same 12-bit monochromesignal to all RGB guns of the display.
2.1.2. Stimuli
The target stimulus was a horizontal or vertical Ga-
bor patch that was the product of a circular Gaussian
envelope and an oriented sinusoid:
Gðx; yÞ ¼ exp �ðx2 þ y2Þ2r2
� �
� cos 2pðcos hxþ sin hyÞ
qþ /
� �ð1Þ
where h determines the orientation, q the spatial fre-
quency and / the phase of the sinusoid. Unless other-
wise stated, the Michelson contrast of the targets was
50%. The standard deviation of the Gaussian window
(r) was fixed at half the wavelength of the carrier. The
starting phase (/) of the sinusoidal carrier was randomon any trial and was changed by 9.6 deg on successive
video frames to produce animation at 2 Hz. The orienta-
tion of the carrier grating was varied to produce up,
down, left or right motion within the stationary Gauss-
ian window. Illustrations of single animation frames of
the stimuli are shown in Fig. 1 and are drawn to scale
so that 1.5–2 cycles of the carrier grating were visible
within the Gaussian window. The target was presentedin the centre of the display (at the locus of luminance
calibration) and a black (<1 cd/m2) fixation cross was
presented 256 pixels to its right. The observer�s viewingdistance was varied from 230, 115 to 57 cm so that the
eccentricity of the target was 2, 4 or 8 deg, respectively
in the nasal visual field (to avoid the blind spot).
The observers were the authors (PB and SD) who are
both experienced psychophysical observers with visual
acuity of 6/6 or better and both practised the task exten-
sively before formal data collection. Observers viewed
the display monocularly with an eye-patch covering
their non-dominant eye. Their task in all experiments
was to fixate the cross and to identify the direction of
motion of the target (up down, left or right) by pressingone of four buttons on a response box. Auditory feed-
back was provided following incorrect responses.
Stimuli were presented for 160 ms within a raised co-
sine temporal envelope lasting 26 ms. This brief duration
prevented observers from making an involuntary eye
movement to the target as these take 150–200 ms to ini-
tialise and execute to a known location (Carpenter, 1988).
2.1.3. Procedure
2.1.3.1. Acuity. Direction acuity thresholds were first
measured by varying the spatial frequency of the target
Gabor in a four alternative direction identification task.
The target spatial frequency was under the control of a
QUEST staircase (Watson & Pelli, 1983) that concen-
trated stimuli at a spatial frequency producing 75% cor-
rect responses. Note that as the standard deviation ofthe Gaussian envelope was in fixed proportion to carrier
wavelength, target size decreased as spatial frequency in-
creased. Direction acuity thresholds were measured at
eccentricities of 2, 4 and 8 deg, in random order, by
changing the viewing distance between runs. The raw
data from at least four runs of 32 trials were combined
and fitted with a cumulative normal function by least
v2 fit, from which direction acuity thresholds were deter-mined at the 75% correct level together with 95% confi-
dence intervals on this point by standard methods
(Press, Teukolsky, Vetterling, & Flannery, 1992).
2.1.3.2. Spatial interference. Spatial interference was
measured in a four alternative direction identification
task in which observers identified the direction of mo-
tion (up, down, left, right) of a target Gabor that wassurrounded by four flanking Gabors that were either
drifting or counter-phase flickering. We originally
planned to set the spatial frequency of the target Gabor
close to a value that just supported its unflanked direc-
tion identification in analogy to the standard procedure
of crowding studies with static stimuli. However, we
found that the direction identification task was impossi-
ble with flanking elements present at almost any separa-tion, so we instead set the target spatial frequency at
twice the direction acuity threshold. It was therefore
very easy to detect the direction of this target in isola-
tion, but with four flanking elements present the task
was difficult.
The spatial frequency of the target and flanking Ga-
bors was the same and was fixed at twice the direction
acuity threshold estimated in the acuity tasks at eacheccentricity. We have shown elsewhere that contrast
detection thresholds are the same for expanding,

Fig. 1. Illustrations of the stimuli. Observers were required to identify the direction of motion (up, down, left right) of a Gabor element (a horizontal
or vertical grating drifting within a stationary Gaussian envelope). (a) Single targets were presented in acuity conditions. Direction acuity threshold
was the highest spatial frequency, that supported the 75% correct identification of the direction of an isolated Gabor element. (b)–(i) Four drifting
flanking elements were positioned around the target on crowding tasks. The resultant Spatial Interference Zone was the centre–centre spacing
between each flanking element and the central target element that restored direction identification of the target element to 75% correct. The
directions/orientations of the four flanking elements were arranged to form global patterns of (b) parallel translation; (c) orthogonal translation; (d)
rotation; (e) radial or (f) random motion. (g) Isotropic band-pass filtered noise targets were used in Experiment 2 to remove orientation cues. Spatial
frequency tuning was measured with (h) high and (i) low spatial frequency flanking elements. See text for details.
1388 P.J. Bex, S.C. Dakin / Vision Research 45 (2005) 1385–1398
contracting, rotating and translating patterns composed
of similar elements to those employed in the present
manuscript (Bex et al., 1998) and so no additional con-trast scaling was required to equate the visibility of the
flanking elements. The temporal frequency of target
and flanking elements was fixed at 2 Hz. The extent of
spatial interference was measured by measuring sensitiv-
ity to the direction of motion of the target element as a
function of the centre–centre separation between target
and flanking Gabors. The directions of motion of the
four flanking elements were set to form the followingglobal patterns:
A. Translation: all four flankers moved in the same
direction (up, down, left or right). This direction
was determined randomly from trial to trial. In sep-
arate conditions the relative directions of the target
and flanking elements were either the same (condi-tion 1, Fig. 1b), orthogonal (condition 2, Fig. 1c)
or opposite (condition 3, Fig. 1b).
B. Complex motion: each flanker moved in a different
direction. In separate conditions flankers formed a
global pattern of rotation (condition 4, either clock-wise or counter-clockwise, at random across trials,
Fig. 1e) expansion (condition 5, Fig. 1d) contraction
(condition 6, Fig. 1d) or random motion (condition
7, any random combination of up, down, left and
right flankers that was not rotational or radial,
Fig. 1f). The absolute direction of the target was
randomised across trials.
C. Flicker: the contrast of each flanker was sinusoidallyreversed at 2 Hz to produce counter phase flicker. In
separate conditions the orientations of the flanks
were: all the same orientation with a parallel target
(condition 8, Fig. 1b), all the same orientation with
an orthogonal target (condition 9, Fig. 1c), in a
radial configuration with randomised target direc-
tion (condition 10, Fig. 1d), or in a circular config-
uration with randomised target direction(condition 11, Fig. 1e).

P.J. Bex, S.C. Dakin / Vision Research 45 (2005) 1385–1398 1389
Illustrations of single animation frames of the stimuli
are shown in Fig. 1. Note that single animation frames
are the same for more than one condition and condi-
tions differ only with the directions of element motion,direction arrows have been drawn on the illustrative
captions below the results to help differentiate
conditions.
To minimise adaptation effects and to prevent the ob-
server from anticipating the direction of target motion,
the eleven conditions were randomly interleaved in a sin-
gle run. The separation between target and flanking ele-
ments was under the control of a QUEST staircase(Watson & Pelli, 1983) that concentrated observations
at a separation producing 75% correct responses for
detecting the direction of motion of the central target
Gabor. The raw data from at least four runs of 32 trials
were combined and we confirmed by inspection that per-
formance ranged from chance to 100% correct in all
cases. As in the acuity condition, combined data were
fit with a cumulative normal function from which the ex-tent of spatial interference was determined at the spac-
ing that produced 75% correct identification of the
target direction. 95% confidence intervals on this point
were estimated by standard methods (Press et al.,
1992) and are indicated by error bars.
2.2. Results
2.2.1. Acuity
Fig. 2 shows direction acuity in c/deg for two observ-
ers (see legend) at three eccentricities, indicated on the x
axis. Direction acuity is defined as the highest spatial
frequency grating drifting at 2 Hz whose direction (up,
down, left, or right) observers were able to identify on
0
2
4
6
8
10
12
14
16
0 1 2 3 4 5 6 7 8 9eccentricity (deg)
dire
ctio
n ac
uity
(c/
deg)
PB GaborsSD GaborsPB NoiseSD Noise
Fig. 2. Direction acuity for two observers. Direction acuity threshold
was defined as the highest spatial frequency that supported element
direction discrimination on 75% trials. Stimuli were isolated Gabors
(open symbols) or Gaussian-windowed patches of band-pass filtered
noise (filled symbols). Error bars show 95% confidence intervals.
75% trials. Error bars show ±95% confidence intervals.
Results indicate a conventional decline in spatial fre-
quency acuity with eccentricity. These thresholds were
used to scale the spatial frequency of target and flank
stimuli in the crowding experiments to ensure equal vis-
ibility of elements under all conditions.
2.2.2. Spatial interference
Figs. 3–5 show the extent of spatial interference, in
degrees of visual angle, for two observers at three eccen-
tricities (2, 4 and 8 deg; see legend). Error bars show
95% confidence intervals. In this section, we treat the
eleven conditions of flanker motion separately, but the
data were collected in a single run. Across all conditions,spatial interference increased with eccentricity, in line
with many previous studies (Bex et al., 2003; Bouma,
1970; Chung et al., 2001; Hess et al., 2000b; Jacobs,
Fig. 3. The spatial extent of crowding induced by translating flanks.
Interference zones are defined as the centre–centre spacing between the
target and each flanking element that produced 75% correct direction
identification. Error bars show 95% confidence intervals.
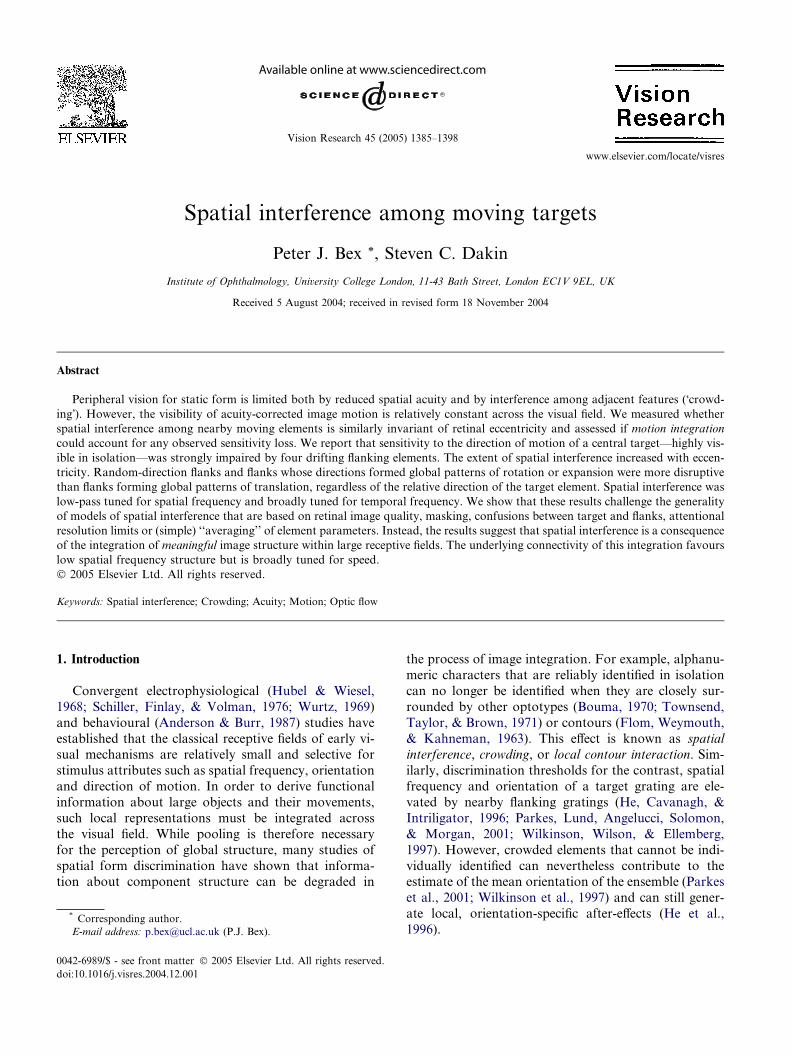
Fig. 4. The spatial extent of crowding induced by flanks undergoing
complex motion. As Fig. 3, except flanking elements could either form
a global pattern of rotation, expansion, contraction or random
motion.
Fig. 5. The spatial extent of crowding induced by counter-phase
flickering flanks. As Fig. 3, except flanking elements were counter-
phase flickering and were arranged in a parallel, orthogonal, circular
or radial configuration around the target.
1390 P.J. Bex, S.C. Dakin / Vision Research 45 (2005) 1385–1398
1979; Latham & Whitaker, 1996; Loomis, 1978; Stras-
burger, Harvey, & Rentschler, 1991; Toet & Levi,1992; Wolford & Chambers, 1984).
As we used Gabor stimuli, the tails of the elements
were allowed to overlap. Based on a conservative esti-
mate of 2 visible cycles (see Fig. 1) and ignoring contrast
attenuation in the tails of the Gaussian window, the radii
of the elements were 9.2 0 at 2 deg eccentricity, 13.3 0 at
4 deg eccentricity and 17.14 0 at 8 deg eccentricity. For
all except parallel translating conditions (in which we re-port no crowding in Experiment 1) the element radii are
much smaller than the extent of spatial interference and
indicate that crowding occurred even when there was a
clear gap between the target and flankers.
Fig. 3 shows that there was effectively no spatial
interference for conditions in which all flanks moved
in the same direction to form a global pattern of trans-
lation. We return to this point below. Spatial interfer-
ence was present when the target and flanking
elements moved in orthogonal directions and was even
greater when the target and flanking elements movedin opposite directions.
Fig. 4 shows the extent of spatial interference for con-
ditions in which the flanks all moved in a different direc-
tion, forming global patterns of rotational, radial or
random complex motion. As there were no systematic
differences between results derived with the two direc-
tions of optic flow patterns (clockwise and anti-clock-
wise rotation, expanding and contracting radialmotion) these data were combined across directions.
At all eccentricities, spatial interference was greater with
complex motion flanking stimuli than with translational
flanks, but no systematic differences among the complex
patterns was evident.
Fig. 5 shows the extent of spatial interference for con-
ditions in which the flanks counter-phase flickered.
Their orientations were manipulated to form global

P.J. Bex, S.C. Dakin / Vision Research 45 (2005) 1385–1398 1391
arrangements of parallel, radial, circular or random
structure. Counter-phase flickering flanks produce less
spatial interference than drifting flanks (except for same
direction conditions) and there was no systematic effect
of their orientation configuration. This observation
could be attributed, at least in part, to the lower contrastof each of the drifting components forming the counter-
phase flickering patch.
3. Experiment 2: Acuity and spatial interference with
noise stimuli
Limitations arise from the use of the Gabor stimuliused in Experiment 1 that restrict the conclusions that
can be drawn from the results. We randomly interleaved
all conditions in a single run to minimise the observer�sability to use the structure or direction of the flanking
elements to influence their responses. However, it is pos-
sible that observers reported the direction of one of the
flanking elements when they could not detect the direc-
tion of the target (Chastain, 1982; Ortiz, 2001).Although this problem is avoided with the complex mo-
tion stimuli in which the flanks contain all four direc-
tions, it could explain why we found little or no
spatial interference when target and flanking elements
moved in the same direction (Fig. 3, left data), because
reporting the direction of any element, target or flank,
produces a correct response. To avoid this problem,
we adopted a true 4AFC task in which the observeridentified the interval containing specified target direc-
tion (e.g., �left�) among four intervals that contained
each possible target direction (up/down/left/right).
It is also possible that the static orientation cues pre-
sented by Gabor micro-patterns in the orthogonal con-
dition could have affected the results. Our fitting
procedure assumed a guess rate of 25% (up/down/left/
right), but if observers could detect the orthogonal tar-get orientation (for example by pop-out; Beck, 1982; Ju-
lesz, 1984; Treisman, 1987, chapter 35), but not its
direction, the guess rate would increase to 50% (up or
down if horizontal; left or right if vertical). It is possible
that this contributed to the difference between orthogo-
nal and same orientation conditions. In practice this is
unlikely because this potential cue is present in flickering
surround gratings yet we observed no systematic differ-ence for flickering gratings of any orientation combina-
tion. Furthermore, the guess rate on psychometric
functions was around 25% instead of 50%. However,
in order to avoid these potential confounds between
the direction and orientation of target and flanks, we re-
peated Experiment 1 with isotropic band-pass filtered
noise drifting within the static Gaussian envelopes.
Uniform noise was digitally filtered (Press et al.,1992) with logarithmic exponential filters. These filters
have the advantage of sharper spatial frequency tuning
than other candidates such as Laplacian of Gaussian fil-
ters and are defined in the Fourier domain by
Aðf Þ ¼ expj lnðf =F peakÞj3 ln 2
ðb0:5 ln 2Þ3
!ð2Þ
where Fpeak specifies the peak frequency and b0.5 the half
bandwidth of the filter in octaves, which was fixed a 0.5
octaves (full bandwidth was one octave).
Direction acuity was measured as in Experiment 1 by
varying the peak spatial frequency of the target in a sin-gle interval 4 alternative direction identification task,
under the control of a QUEST staircase (Watson &
Pelli, 1983). Thresholds at three eccentricities (2, 4 or
8 deg) were measured in random order by changing the
viewing distance between runs. The drift speed of the
noise carrier was fixed at 1 pixel/frame, with the conse-
quence that the peak temporal frequency varied with
the peak spatial frequency of the noise and speed in-creased with eccentricity (0.6, 1.2 or 2.3 deg/s at 2, 4 or
8 deg eccentricity, respectively) as the viewing distance
was changed. However, the target and flanking elements
were always the same spatial and temporal frequency as
each other so comparisons at a given eccentricity are at a
fixed speed. Furthermore, we show in Experiment 3 that
spatial interference is broadly tuned for temporal fre-
quency, so that it is not likely that this difference affectedour results. However, this limitation does prevent direct
comparison of crowding magnitude across eccentricity.
We adopted a 4AFC procedure to measure spatial
interference. In this task, there were four temporal inter-
vals, one for each of the target directions (up/down/left/
right), in random order and separated by 250 ms. The
motion of the four flanking elements was similar across
the four intervals, following the same directional condi-tions of translation and complex motion as in Experi-
ment 1, with the exception that counter-phase flicker
was not included. The observer�s task was to identify
which of the four intervals contained a target drifting
in a specified direction. The specified target direction
was randomly selected and then fixed within each run.
Adaptation at the target location should be minimal
since all four target directions were presented in randomorder each trial. Adaptation effects on both target and
flanks were avoided by randomly interleaving all flank
conditions within a single run. All other parameters
were similar to those employed in Experiment 1.
3.1. Results
Direction acuity performance with noise carriers areincluded in Fig. 2 (filled symbols), along with equivalent
data for grating carriers (open symbols). These data
show the fall-off in acuity with eccentricity and were used
to scale the stimuli in the crowding experiments to twice
threshold carrier-wavelength (as in Experiment 1).

1392 P.J. Bex, S.C. Dakin / Vision Research 45 (2005) 1385–1398
Figs. 6 and 7 show the extent of spatial interference
(in degrees of visual angle) for two observers at eccen-
tricities of 2, 4 and 8 deg. We treat the six conditions
of flanker motion separately, but recall that the data
were collected in a single run. Across all conditions, spa-
tial interference increased with eccentricity. In thisExperiment, 4AFC and noise carriers prevented observ-
ers from achieving a correct response by reporting the
direction of any flanking element and isotropic noise
carriers eliminated orientation interactions between tar-
get and flanking stimuli. Under these conditions, spatial
interference for translating flanks were present for all
surrounds configurations and there were no systematic
differences between same, orthogonal or opposite targetand flank directions. However, note that even with our
PB Translation
0
0.5
1
1.5
2
2.5
3
3.5
Inte
rfer
ence
Zon
e (d
eg)
2 deg
4 deg
8 deg
SD Translation
0
0.5
1
1.5
2
2.5
3
3.5
0
Inte
rfer
ence
Zon
e (d
eg)
2 deg
8 deg
OrthogonalParallel Opposite
Fig. 6. Crowding among drifting noise elements forming a global
pattern of translation. The direction of motion is indicated on the x
axis. Details as Fig. 3.
4AFC task it is still possible that observers identified
the interval containing same direction flanks not by
detecting the motion of the target element. For example
if observers could reliably determine the interval con-
taining orthogonal and opposite direction flanks, the
same direction condition is necessarily the remaininginterval. It is therefore possible that we may still have
underestimated the extent of spatial interference for
translating flanks moving in the same direction as the
target. With noise carriers, spatial interference was still
greater for complex moving flank configurations than
for translating flank configurations (with the possible
exception of same-direction translation). Random direc-
tion flanks were still as effective as rotating or expand-ing/contracting flanks.
PB Complex Motion
0
0.5
1
1.5
2
2.5
3
3.5
Inte
rfer
ence
Zon
e (d
eg)
2 deg
4 deg
8 deg
SD Complex Motion
0
0.5
1
1.5
2
2.5
3
3.5
0
Inte
rfer
ence
Zon
e (d
eg)
2 deg
8 deg
RandomRotationRadial
Fig. 7. Crowding among drifting noise elements forming a global
pattern of complex motion. The direction of motion is indicated on the
x axis. Details as Fig. 3.

Temporal Frequency Tuning
0
0.2
0.4
0.6
0.8
1
1.2
1.4
1 10Temporal Frequency of 5 c/deg Flanks (Hz)
Spat
ial I
nter
efer
ence
Zon
e (d
eg)
PBSD
Fig. 9. Temporal frequency tuning of motion crowding. Details as Fig.
3, except that a 5 c/deg central target was surrounded by four flanking
elements forming a random global pattern of motion (all four
directions in random order) of the temporal frequency shown on the
x axis.
P.J. Bex, S.C. Dakin / Vision Research 45 (2005) 1385–1398 1393
4. Experiment 3: Spatial and temporal frequency tuning of
spatial interference
In order to examine the underlying connectivity of
the interactions among nearby motion detectors, we esti-
mated the spatial and temporal frequency tuning of mo-tion spatial interference. The extent of spatial
interference was measured, at 4 deg eccentricity, for a
target of fixed spatial and temporal frequency as a func-
tion of the spatial or temporal frequency of the flanking
stimuli. We used a single interval direction identification
task with random direction flanking Gabor elements,
(condition 4 in Section 2.1). The flanking elements in
this stimulus contain all target directions and orienta-tions and therefore avoid some potential confounds be-
tween the target and flank orientations and directions
discussed above, except the possibility of that knowledge
of the target orientation would restrict the directions to
2 instead of 4. This single interval task was faster than
the 4AFC task which assisted in maintaining observer
concentration over the run. The spatial (5 c/deg) and
temporal (2 Hz) frequency of the target element wasthe same as in Experiment 1 for this eccentricity.
4.1. Results
Fig. 8 shows extent of spatial interference as a func-
tion of the spatial frequency of Gabors drifting at
2 Hz flanking a 5 c/deg centre target drifting at 2 Hz.
Open symbols plot data from conditions in which theMichelson contrast of the target and flanks was 50%.
Filled symbols plot data from conditions in which the
Michelson contrasts of target and flank elements were
equated for visibility (2 · threshold detection contrast).
Contrast direction identification threshold was mea-
sured as for the direction acuity task in Experiment 1,
Spatial Frequency Tuning
0
0.5
1
1.5
2
2.5
1 10 100Spatial Frequency of 2Hz Flanks (c/deg)
Spat
ial I
nter
efer
ence
Zon
e (d
eg) PB
SDPBSD
Fig. 8. Spatial frequency tuning of motion crowding. Details as Fig. 3,
except that a 5 c/deg central target was surrounded by four flanking
elements forming a random global pattern of motion (all four
directions in random order) of the spatial frequency shown on the x
axis.
except that the spatial frequency of the target was fixed
and its contrast was adjusted to determine the contrastrequired for observers to identify the target direction
correctly on 75% trials. In both cases, spatial interfer-
ence was greatest for flanking elements that were lower
in spatial frequency than the target, i.e., motion crowd-
ing was low-pass tuned for spatial frequency.
Fig. 9 plots spatial interference as a function of the
temporal frequency of 5 c/deg drifting Gabors flanking
a centre target of 5 c/deg, drifting at 2 Hz. There was lit-tle difference in contrast direction identification thresh-
old as a function of target temporal frequency so we
did not need to equate the visibility of target and flank
elements. Spatial interference was approximately the
same for all flanking temporal frequencies, i.e., motion
crowding is broadly tuned for temporal frequency.
5. General discussion
5.1. Acuity, crowding and motion
We first measured the resolution limit for drifting tar-
gets so that crowding targets could be placed near their
resolution threshold. In line with many previous studies,
we found that resolution decreased with eccentricity(Aubert & Forster, 1857). It is standard practice in stud-
ies of crowding to place the resolution target near
threshold (Bouma, 1970; Flom et al., 1963; Townsend
et al., 1971). We had originally planned to present the
target at a size producing 90% correct direction discrim-
ination, but found that observers were unable to identify
the direction of motion when such a target was

1394 P.J. Bex, S.C. Dakin / Vision Research 45 (2005) 1385–1398
surrounded by four drifting flanking Gabors, even when
there was a considerable separation between them. We
therefore elected to present the target at a wavelength
that was twice resolution threshold. Several studies have
shown that while the extent of spatial interference scales
with spatial frequency in foveal vision (Chung et al.,2001; Levi, Hariharan, et al., 2002) it is approximately
invariant of target size or spatial frequency (Chung
et al., 2001; Levi, Hariharan, et al., 2002; Tripathy &
Cavanagh, 2002) in peripheral visual field. As our data
were collected in the peripheral visual field, the results
are therefore not likely to have been affected by the par-
ticular target spatial frequency we selected.
In line with many previous studies we also found thatcrowding effects increased with eccentricity (Bouma,
1970; Chung et al., 2001; Hess et al., 2000b; Jacobs,
1979; Latham & Whitaker, 1996; Loomis, 1978; Stras-
burger et al., 1991; Toet & Levi, 1992; Wolford &
Chambers, 1984). Unlike previous studies (including
studies that used drifting targets (Aubert & Forster,
1857; Bex et al., 2003), the present task did not require
observers to make a spatial discrimination (i.e., letteridentity or orientation). It is well known that while spa-
tial resolution for static images decreases with eccentric-
ity (Aubert, 1857), sensitivity to motion or flicker is
relatively invariant of eccentricity (McKee & Nakay-
ama, 1984; Waugh & Hess, 1994; Wright & Johnston,
1983)—and in the case of critical flicker fusion thresh-
old, sensitivity can be higher in the peripheral than fo-
veal visual field (Kelly, 1971a, 1971b). It was thereforeunclear if crowding of a direction discrimination task
(that did not require identification of spatial form)
would increase with eccentricity. We report that it does.
5.2. Tuning of crowding
Previous studies of static band-pass filtered letters
(Chung et al., 2001) or letters composed of multipleGabor elements (Levi, Hariharan, et al., 2002) have
shown that crowding (like masking) is band-pass tuned
for spatial frequency in fovea and broadly tuned for spa-
tial frequency in peripheral visual field. Our data suggest
that directional crowding is low-pass tuned for spatial
frequency. In other motion-based tasks, low-pass spatial
frequency tuning and broad temporal frequency tuning
has been observed (Bex & Dakin, 2002).The data presented above are consistent with these
results. We found low pass tuning of similar magnitude
when either the physical or the effective (fixed multiple
of detection threshold) contrast of the target and flank-
ing elements were equated. As contrast threshold in-
creased with spatial frequency, the relative physical
contrast of the flanks increased with their spatial fre-
quency. When there is a contrast difference between sta-tic target and flank elements of the same spatial
structure, there can be a release from crowding that
has been attributed to segmentation (Kooi et al.,
1994), although others have reported that crowding
effects increase monotonically with the contrast of the
flanks (Kothe & Regan, 1990). Our target and flanks dif-
fer in spatial frequency content; under these conditions
we also found no evidence of a release from crowdingwith a difference in either the physical or effective con-
trast of the flanks.
5.3. Motion contrast and motion capture
Electrophysiological and psychophysical studies of
motion contrast have shown that surround patterns that
move in the same direction tends to reduce neural re-sponses (Allman, Miezin, & McGuinness, 1985; Chiao
& Masland, 2003; Frost & Nakayama, 1983; Kastner,
Nothdurft, & Pigarev, 1999; Raiguel, Vanhulle, Xiao,
Marcar, & Orban, 1995) or reduce behavioural mea-
sures of sensitivity (Nakayama & Tyler, 1981; Sachtler
& Zaidi, 1995; Shioiri, Ito, Sakurai, & Yaguchi, 2002;
van Doorn & Koenderink, 1982; Watson & Eckert,
1994) or adaptation (Bell, Lehmkuhle, & Westendorf,1976; Day & Strelow, 1971; Strelow & Day, 1971) to
motion. Collectively, these results have been modeled
by directionally antagonistic centre–surround motion
contrast detectors (Murakami & Shimojo, 1993; Nakay-
ama & Loomis, 1974; Nawrot & Sekuler, 1990; Regan &
Beverley, 1984; Royden, 1997; Royden, 2002; Sachtler &
Zaidi, 1993; Watson & Eckert, 1994) in which responses
from adjacent motion detectors tuned to the same direc-tion of motion inhibit one another and/or motion detec-
tors selective for opposite directions facilitate one
another. The present results show that the visibility of
the direction of motion of a supra-threshold target is im-
paired most by dissimilar surround directions and this
effect is in the opposite direction to that predicted by
motion contrast. It is possible that motion of the flank-
ing elements masked the direction of the target by mo-tion capture (Murakami & Shimojo, 1993). The extent
of spatial interference increases with eccentricity, like
motion capture (Murakami & Shimojo, 1993), however,
random motion flanking conditions produced large
crowding effects that would not be expected from cap-
ture. These factors suggest that the phenomenon
observed in the present study is distinct from conven-
tional motion contrast and is therefore best consideredspatial interference or crowding.
5.4. Implications for low-level models of crowding
Many models of crowding have been proposed. At the
earliest stages of perception, it has been suggested that
crowding arises from blurring of adjacent features in
the retinal image by the eye�s optical point spread func-tion (Liu & Arditi, 2000). It is already known that this
cannot account for all crowding effects (e.g., because

P.J. Bex, S.C. Dakin / Vision Research 45 (2005) 1385–1398 1395
images presented to different eyes crowd one another;
Flom et al., 1963; Tripathy & Levi, 1999), and it cannot
explain the present data because similar flanking condi-
tions produce different crowding effects. Another low le-
vel model is based on spatial frequency masking by
common structure in target and flanking images (Hesset al., 2000a). Once again, it has already been shown that
this model cannot account for masking effects in periph-
eral visual field (for example the observation that target
and flanking stimuli of opposite contrast polarity are po-
tent crowders (Hess et al., 2000b) and we note here that
this model cannot explain the present data either.
At the next level of visual processing, several authors
have noted that crowding effects are greatest among ele-ments of similar spatial (Kooi et al., 1994; Nazir, 1992),
spatial frequency (Andreissen & Bouma, 1976; Chung
et al., 2001; Hess et al., 2000a; Kooi et al., 1994) or ori-
entation (Levi, Klein, et al., 2002) structure. These re-
sults are consistent with masking effects within
selective visual channels. If we attempt generalise this
approach to account for direction crowding, one would
expect greater crowding effects between target and flank-ing elements that move in the same direction. However,
we observe crowding effects of approximately the same
magnitude for all translating flank conditions, including
same-, orthogonal-, and opposite-direction configura-
tions (Fig. 6), with the caveat that a 4AFC paradigm
does not exclude the possibility that same direction is de-
tected by default. Furthermore, we also report that
flanks of lower spatial frequency than the targets arethe most effective (Fig. 7). Neither of these findings is
consistent with masking.
5.5. Implications for higher-level models of crowding
5.5.1. Positional confusions of target and flank elements
An analysis of the apparent identity of letters pre-
sented under crowded conditions shows that observers�responses are not random. Observers are more likely
to report the identity of one of the flanking letters than
other letters of equal probability (Chastain, 1982; Ortiz,
2001). This suggests that instead of the target identity
being lost, masked or averaged, its position (and there-
fore its identity) is confused with that of one of the
flanking elements. However, our data are not consistent
with this explanation. If this effect were to account fordirection crowding, we would expect no crowding for
same direction translating flanks in our 4AFC tasks.
This is because the observer could discriminate the inter-
val containing five elements of the same direction from
the other three intervals that contain four same and
one different direction.
5.5.2. Compulsory form integration
It has recently been shown that an observer�s abilityto discriminate the orientation of a tilted Gabor can
be impaired by nearby Gabors of differing orientation,
an effect similar to crowding of letter identity (He
et al., 1996; Parkes et al., 2001; Wilkinson et al., 1997).
While the orientation of the crowded target grating is
not detectable, it can generate local, orientation-specific
after-effects (He et al., 1996) and it contributes to the ori-entation, contrast or spatial frequency of the group by a
quantity equivalent to simple averaging (Parkes et al.,
2001; Wilkinson et al., 1997). Based on these data, Wil-
kinson et al. (1997) and Parkes et al. (2001) propose that
this and possibly other forms of crowding are caused by
‘‘compulsory averaging’’ of stimulus information within
the smallest receptive fields available at a given eccentric-
ity. Although these models were developed to accountfor orientation discrimination, if it represents a general
model of crowding then we should be able to apply it
to our motion task. At the most general level, averaging
predicts that the higher the directional variability of the
flanks the worse the performance, and this is consistent
with our observation that radial, rotational and random
flanks crowd more than translating flanks. However,
note that flanks undergoing complex global motion al-ways contain four orthogonal directions of motion. Four
orthogonal directions cancel within an average, so that
the mean of the quintet is always that of the target ele-
ment. According to a simple compulsory averaging
model, we should observe little or no crowding for our
complex motion conditions, but we actually observe
the greatest crowding effects for these stimuli.
We propose that in order to accommodate our find-ings, the averaging model must to modified to allow
for the presence of a random-direction/zero-mean ‘‘ped-
estal’’. Alternatively, averaging might be restricted to
occur within a narrow range of directions (for example,
only within channel). In this case, a similar pedestal or
orientation effect would also be expected for orientation
crowding; this has yet to be examined.
5.5.3. Crowding from meaningful global configurations
It has recently been suggested that while crowding
inevitably involves masking effects that have been mod-
elled with linear filters at a first stage of visual process-
ing, it also involves a subsequent stage in which the
visual system pools information over a region that in-
creases with eccentricity (Chung et al., 2001). Our results
are consistent with this suggestion. Our observation thatthe spatial extent of crowding is larger for complex mo-
tion configurations is consistent with the large receptive
fields (up to 60 deg) that have been reported for optic
flow detectors (Burr et al., 1998). Under this view,
though, it is less clear why random surround flank com-
binations should crowd as much as radial and rotational
surrounds. The random configurations contained direc-
tion contrast and motion shearing among the crowdingelements could also promote integration across large
areas. We therefore speculate that crowding arises from

1396 P.J. Bex, S.C. Dakin / Vision Research 45 (2005) 1385–1398
second stage integration processes in the visual system
and that the spatial extent of such pooling increases with
eccentricity and also depends on the configurations of
the components of the retinal image.
Acknowledgments
We are grateful to Professor Mark Georgeson for
suggesting the 4AFC task employed in Experiment 2.
The research was supported by the Wellcome Trust
and by the Biotechnical and Biological Sciences Re-
search Council.
References
Allman, J., Miezin, F., & McGuinness, E. (1985). Stimulus specific
responses from beyond the classical receptive field: Neurophysio-
logical mechanisms for local–global comparisons in visual neurons.
Annual Review of Neuroscience, 8, 407–430.
Anderson, S. J., & Burr, D. C. (1987). Receptive field size of human
motion detection units. Vision Research, 27(4), 621–635.
Andreissen, J. J., & Bouma, H. (1976). Eccentric vision: Adverse
interactions between line segments. Vision Research, 16, 71–78.
Aubert, H., & Forster, B. (1857). Beitrage zur kenntniss des indirekte
sehens (I) untersuchungen uber den raumsinn der retina (Contri-
butions to the knowledge of indirect seeing (I) investigating the
spatial localisation of the retina). Archive fur Ophthalmologie, 3,
1–37.
Beck, J. (1982). Textural segmentation. In J. Beck (Ed.), Organisation
and representation in perception. Hillsdale, NJ: Erlbaum.
Bell, H., Lehmkuhle, S. W., & Westendorf, D. H. (1976). On the
relation between visual surround and motion aftereffect velocity.
Perception and Psychophysics, 20, 13–16.
Bex, P. J., & Dakin, S. C. (2002). Comparison of the spatial-frequency
selectivity of local and global motion detectors. Journal of the
Optical Society of America a—Optics Image Science and Vision,
19(4), 670–677.
Bex, P. J., Dakin, S. C., & Simmers, A. J. (2003). The shape and size of
crowding for moving targets. Vision Research, 43(27), 2895–2904.
Bex, P. J., & Makous, W. (1997). Radial motion looks faster. Vision
Research, 37(23), 3399–3405.
Bex, P. J., Metha, A. B., & Makous, W. (1998). Psychophysical
evidence for a functional hierarchy of motion processing mecha-
nisms. Journal of the Optical Society of America A, 15(4), 769–776.
Bex, P. J., Metha, A. B., & Makous, W. (1999). Enhanced motion
aftereffect for complex motions. Vision Research, 39(13),
2229–2238.
Bouma, H. (1970). Interaction effects in parafoveal letter recognition.
Nature, 226, 177–178.
Burr, D. C., Morrone, M. C., & Vaina, L. M. (1998). Large receptive
fields for optic flow detection in humans. Vision Research, 38(12),
1731–1743.
Carpenter, R. H. S. (1988). Movements of the eyes. Lodon: Pion.
Carrasco, M., McElree, B., Denisova, K., & Giordano, A. M. (2003).
Speed of visual processing increases with eccentricity. Nature
Neuroscience, 6(7), 699–700.
Chastain, G. (1982). Confusability and interference between members
of parafoveal letter pairs. Perception Psychophysics, 32(6), 576–580.
Chiao, C. C., & Masland, R. H. (2003). Contextual tuning of direction-
selective retinal ganglion cells. Nature Neuroscience, 6(12),
1251–1252.
Chung, S. T. L., Levi, D. M., & Legge, G. E. (2001). Spatial-frequency
and contrast properties of crowding. Vision Research, 41(14),
1833–1850.
Dakin, S. C., & Bex, P. J. (in press). Summation of concentric
orientation structure: Seeing the glass or the window? Vision
Research.
Day, R. H., & Strelow, E. R. (1971). Reduction or disappearance of
visual aftereffect of movement in the absence of patterned
surround. Nature, 230, 55–56.
Duffy, C. J., & Wurtz, R. H. (1991). Sensitivity of MST neurons to
optic flow stimuli. I. A continuum of response selectivity to large-
field stimuli. Journal of Neurophysiology, 65(6), 1329–1345.
Duffy, C. J., & Wurtz, R. H. (1993). An illusory transformation of
optic flow fields. Vision Research, 33(11), 1481–1490.
Flom, M. C., Weymouth, F. W., & Kahneman, D. (1963). Visual
resolution and spatial interaction. Journal of the optical Society of
America, 53, 1026–1032.
Freeman, T. C. A., & Harris, M. G. (1992). Human sensitivity to
expanding and rotating motion: Effects of complementary masking
and directional structure. Vision Research, 32(1), 81–87.
Frost, B. J., & Nakayama, K. (1983). Single visual neurons code
opposing motion independent of direction. Science, 2, 744–745.
Graziano, M. S., Andersen, R. A., & Snowden, R. J. (1994). Tuning of
MST neurons to spiral motions. Journal of Neuroscience, 14(1),
54–67.
Gurney, K., & Wright, M. J. (1996). Rotation and radial motion
thresholds support a two-stage model of differential-motion anal-
ysis. Perception, 25(1), 5–26.
He, S., Cavanagh, P., & Intriligator, J. (1996). Attentional resolution
and the locus of visual awareness. Nature, 383(6598), 334–337.
Hess, R. F., Dakin, S. C., & Kapoor, N. (2000a). The foveal �crowding�effect: Physics or physiology? Vision Research, 40(4), 365–
370.
Hess, R. F., Dakin, S. C., Kapoor, N., & Tewfik, M. (2000b). Contour
interaction in fovea and periphery. Journal of the Optical Society of
America a—Optics Image Science and Vision, 17(9), 1516–1524.
Hubel, D. H., & Wiesel, T. N. (1968). Receptive fields and functional
architecture of monkey striate cortex. Journal of Physiology, 195,
215–243.
Intriligator, J., & Cavanagh, P. (2001). The spatial resolution of visual
attention. Cognitive Psychology, 43(3), 171–216.
Jacobs, R. J. (1979). Visual resolution and contour interaction in the
fovea and periphery. Vision Research, 19, 1187–1195.
Julesz, B. (1984). A brief outline of the texton theory of human vision.
Trends in Neuroscience, 7, 41–45.
Kastner, S., Nothdurft, H. C., & Pigarev, I. N. (1999). Neuronal
responses to orientation and motion contrast in cat striate cortex.
Visual Neuroscience, 16(3), 587–600.
Kelly, D. H. (1971a). Theory of flicker and transient responses. I.
Uniform fields. Journal of Optical Society of America, 61(4),
537–546.
Kelly, D. H. (1971b). Theory of flicker and transient responses. II.
Counterphase gratings. Journal of Optical Society of America,
61(5), 632–640.
Kim, J., Mulligan, K., & Sherk, H. (1997). Simulated optic flow and
extrastriate cortex I: Optic flow versus texture. Journal of Neuro-
physiology, 77, 554–561.
Koenderink, J. J. (1986). Optic flow. Vision Research, 26(1), 161–179.
Kooi, F. L., Toet, A., Tripathy, S. P., & Levi, D. M. (1994). The effect
of similarity and duration on spatial interaction in peripheral-
vision. Spatial Vision, 8(2), 255–279.
Kothe, A. C., & Regan, D. (1990). Crowding depends on contrast.
Optometry and Vision Science, 67(4), 283–286.
Lappe, M., Bremmer, F., & van den Berg, A. V. (1999). Perception of
self-motion from visual flow. Trends in Cognitive Sciences, 3(9),
329–336.

P.J. Bex, S.C. Dakin / Vision Research 45 (2005) 1385–1398 1397
Lappe, M., & Rauschecker, J. P. (1995). An illusory transformation in
a model of optic flow processing. Vision Research, 35(11),
1619–1631.
Latham, K., & Whitaker, D. (1996). Relative roles of resolution and
spatial interference in foveal and peripheral vision. Ophthalmic and
Physiological Optics, 16(1), 49–57.
Levi, D. M., Hariharan, S., & Klein, S. A. (2002). Suppressive and
facilitatory spatial interactions in peripheral vision: Peripheral
crowding is neither size invariant nor simple contrast masking.
Journal of Vision, 2(2), 167–177.
Levi, D. M., Klein, S. A., & Hariharan, S. (2002). Suppressive and
facilitatory spatial interactions in foveal vision: Foveal crowding is
simple contrast masking. Journal of Vision, 2(2), 140–166.
Liu, L., & Arditi, A. (2000). Apparent string shortening concomitant
with letter crowding. Vision Research, 40(9), 1059–1067.
Loomis, J. M. (1978). Lateral masking in foveal and eccentric vision.
Vision Research, 18, 335–338.
McKee, S. P., & Nakayama, K. (1984). The detection of motion in the
peripheral visual field. Vision Research, 24(1), 25–32.
Meese, T. S. (2000). Complex motion detection in human vision.
Spatial Vision, 14(1), 91–92.
Meese, T. S., & Harris, M. G. (2001). Broad direction tuning for
complex motion mechanisms. Vision Research, 41(15), 1901–1914.
Millidot, M. (1966). Foveal and extra-foveal acuity with and without
stabilized retinal images. British Journal of Physiological Optics, 23,
75–106.
Morrone, M. C., Burr, D. C., & Di Pietro, S. (1999). Cardinal
directions for visual optic flow. Current Biology, 9(14), 763–766.
Morrone, M. C., Burr, D. C., & Vaina, L. M. (1995). 2 Stages of visual
processing for radial and circular motion. Nature, 376(6540),
507–509.
Murakami, I., & Shimojo, S. (1993). Motion capture changes to
induced motion at higher luminance contrasts, smaller eccentric-
ities, and larger inducer sizes. Vision Research, 33, 2091–2107.
Nakayama, K., & Loomis, J. M. (1974). Optical velocity patterns,
velocity-sensitive neurons, and space perception: A hypothesis.
Perception, 3, 63–80.
Nakayama, K., & Tyler, C. W. (1981). Psychophysical isolation of
movement sensitivity by removal of familiar position cues. Vision
Research, 21(4), 427–433.
Nawrot, M., & Sekuler, R. (1990). Assimilation and contrast in motion
perception—explorations in cooperativity. Vision Research, 30(10),
1439–1451.
Nazir, T. A. (1992). Effects of lateral masking and spatial precuing on
gap- resolution in central and peripheral-vision. Vision Research,
32(4), 771–777.
Orban, G. A., Lagae, L., Raiguel, S., Xiao, D., & Maes, H. (1995). The
speed tuning of medial superior temporal (MST) cell responses to
optic-flow components. Perception, 24(3), 269–285.
Ortiz, A. (2001). Can letter-position uncertainty account for lateral
masking? Investigative Ophthalmology Visual Science, 42(4),
S4557.
Parkes, L., Lund, J., Angelucci, A., Solomon, J. A., & Morgan, M.
(2001). Compulsory averaging of crowded orientation signals in
human vision. Nature Neuroscience, 4(7), 739–744.
Pelli, D. G. (1997). The VideoToolbox software for visual psycho-
physics: Transforming numbers into movies. Spatial Vision, 10,
437–442.
Pelli, D. G., & Zhang, L. (1991). Accurate control of contrast on
microcomputer displays. Vision Research, 31(7–8), 1337–1350.
Polat, U., & Sagi, D. (1993). Lateral interactions between spatial
channels—suppression and facilitation revealed by lateral masking
experiments. Vision Research, 33(7), 993–999.
Press, W. H., Teukolsky, A. A., Vetterling, W. T., & Flannery, B. P.
(1992). Numerical recipes in C. Cambridge: Cambridge University
Press.
Raiguel, S., Vanhulle, M. M., Xiao, D. K., Marcar, V. L., & Orban, G.
A. (1995). Shape and spatial-distribution of receptive-fields and
antagonistic motion surrounds in the middle temporal area (V5) of
the macaque. European Journal of Neuroscience, 7(10), 2064–2082.
Regan, D., & Beverly, K. I. (1978). Looming detectors in the human
visual pathway. Vision Research, 18, 415–421.
Regan, D., & Beverley, K. I. (1984). Figure-ground segregation by
motion contrast and by luminance contrast. Journal of Optical
Society of America, 1, 433–442.
Royden, C. S. (1997). Mathematical analysis of motion-opponent
mechanisms used in the determination of heading and depth.
Journal of the Optical Society of America a—Optics Image Science
and Vision, 14(9), 2128–2143.
Royden, C. S. (2002). Computing heading in the presence of moving
objects: A model that uses motion-opponent operators. Vision
Research, 42(28), 3043–3058.
Sachtler, W. L., & Zaidi, Q. (1993). Effect of spatial configuration on
motion aftereffects. Journal of the Optical Society of America a—
Optics Image Science and Vision, 10(7), 1433–1449.
Sachtler, W. L., & Zaidi, Q. (1995). Visual processing of motion
boundaries. Vision Research, 35(6), 807–826.
Saito, H., Tanaka, K., Isono, H., Yasuda, M., & Mikami, A. (1989).
Directionally selective responses of cells in the middle temporal
area (MT) of the macaque monkey to the movement of equilumi-
nous opponent colour stimuli. Experimental Brain Research, 75,
1–14.
Schiller, P. H., Finlay, B. L., & Volman, S. F. (1976). Quantitative
studies of single-cell properties in monkey striate cortex. I.
Spatiotemporal organization of receptive fields. Journal of Neuro-
physiology, 39, 1288–1399.
Shioiri, S., Ito, S., Sakurai, K., & Yaguchi, H. (2002). Detection of
relative and uniform motion. Journal of the Optical Society of
America a—Optics Image Science and Vision, 19(11), 2169–2179.
Snowden, R. J., & Milne, A. B. (1996). The effects of adapting to
complex motions: Position invariance and tuning to spiral motions.
Journal of Cognitive Neuroscience, 8(5), 435–452.
Snowden, R. J., & Milne, A. B. (1997). Phantom motion aftereffects—
evidence of detectors for the analysis of optic flow. Current Biology,
7, 717–722.
Strasburger, H., Harvey, L. O., & Rentschler, I. (1991). Contrast
thresholds for identification of numeric characters in direct and
eccentric view. Perception and Psychophysics, 49(6), 495–508.
Strelow, E. R., & Day, R. H. (1971). Aftereffect of visual movement:
Storage in the absence of a patterned surround. Perception and
Psychophysics, 9, 485–486.
Tanaka, K., & Saito, H. (1989). Analysis of motion of the visual field
by direction, expansion/contraction, and rotation cells clustered in
the dorsal part of the medial superior temporal area of the
macaque monkey. Journal of Neurophysiology, 62, 626–641.
Toet, A., & Levi, D. M. (1992). The 2-dimensional shape of spatial
interaction zones in the parafovea. Vision Research, 32(7),
1349–1357.
Townsend, J. T., Taylor, S. G., & Brown, D. R. (1971). Lateral
masking for letters with unlimited viewing time. Perception and
Psychophysics, 10, 375–378.
Treisman, A. (1987). Properties, parts and objects. In K. R. Boff, L.
Kaufman, & F. P. Thomas (Eds.), Handbook of perception and
human performance. New York: Wiley.
Tripathy, S. P., & Cavanagh, P. (2002). The extent of crowding in
peripheral vision does not scale with target size. Vision Research,
42(20), 2357–2369.
Tripathy, S. P., & Levi, D. M. (1999). Looking behind a pathological
blind spot in human retinal. Vision Research, 39(11), 1917–1925.
van Doorn, A. J., & Koenderink, J. J. (1982). Spatial properties of the
visual detectability of moving spatial white noise. Experimental
Brain Research, 45(1–2), 189–195.
1398 P.J. Bex, S.C. Dakin / Vision Research 45 (2005) 1385–1398
Verghese, P., & Stone, L. S. (1995). Combining speed information
across space. Vision Research, 35(20), 2811–2823.
Verghese, P., & Stone, L. S. (1996). Perceived visual speed constrained
by image segmentation. Nature, 381(9/5/96), 161–163.
Watson, A. B., & Eckert, M. P. (1994). Motion-contrast sensitivity:
Visibility of motion gradients of various spatial frequencies.
Journal of the Optical Society of America A, 11, 496–505.
Watson, A. B., & Pelli, D. G. (1983). QUEST: A Bayesian adaptive
psychometric method. Perception and Psychophysics, 33, 113–120.
Waugh, S. J., & Hess, R. F. (1994). Suprathreshold temporal-
frequency discrimination in the fovea and the periphery. Journal
of Optical Society of America A, 11, 1199–1212.
Wilkinson, F., James, T. W., Wilson, H. R., Gati, J. S., Menon, R. S.,
& Goodale, M. A. (2000). An fMRI study of the selective
activation of human extrastriate form vision areas by radial and
concentric gratings. Current Biology, 10(22), 1455–1458.
Wilkinson, F., Wilson, H. R., & Ellemberg, D. (1997). Lateral
interactions in peripherally viewed texture arrays. Journal of the
Optical Society of America a—Optics Image Science and Vision,
14(9), 2057–2068.
Wilson, H. R., McFarlane, D. K., & Phillips, G. C. (1983). Spatial
frequency tuning of orientation selective units estimated by oblique
masking. Vision Research, 23(9), 873–882.
Wilson, H. R., & Wilkinson, F. (1998). Detection of global structure in
Glass patterns: Implications for form vision. Vision Research,
38(19), 2933–2947.
Wilson, H. R., Wilkinson, F., & Asaad, W. (1997). Concentric
orientation summation in human form vision. Vision Research,
37(17), 2325–2330.
Wolford, G., & Chambers, L. (1984). Contour interaction as a
function of eccentricity. Perception and Psychophysics, 36, 457–
460.
Wright, M. J., & Johnston, A. (1983). Spatiotemporal contrast
sensitivity and visual field locus. Vision Research, 23(10), 983–989.
Wurtz, R. H. (1969). Visual receptive fields of striate cortex neurons in
awake monkeys. Journal of Neurophysiology, 32, 727–742.
Zenger, B., & Sagi, D. (1996). Isolating excitatory and inhibitory
nonlinear spatial interactions involved in contrast detection. Vision
Research, 36(16), 2497–2513.