Rapid detection of bacterial cells by light scattering method
10
Rapid detection of bacterial cells by light scattering method Oleksandr I. Bilyy a ,Vasyl’ B. Getman a , Rostyslav O. Bilyy b , Igor M. Kushnir c , Igor Ya. Kotsiumbas c . a The Ivan Franko National University of Lviv; b Inst. of Cell Biology of Nat. Academ. Sciences of Ukraine, Lviv; c State Scientific-Research Control Institute of Veterinary Preparations and Fodder Additives Ukraine, Lviv. ABSTRACT Method of rapid detection of bacterial cells by light scattering is described. Determination of quantitative changes of bacteria is the given method based on the changes of their size distributing in the process of cultivation. Liquid medial are diluted and analyzed by the proposed technology to determine presence of bacteria. A method includes sounding of flow suspended bacterial cells by monochromatic coherent light, registration of signals of co-operation of sounding radiation with the explored microbiological objects by detects amplitudes and durations of scattered light impulses. Distribution of particles by sizes is determined from the measured functional dependence of number of registered particles from amplitude and duration of the proper electric impulses on the output photoreceiver. Detection is done for a range of particle size from 0.1 to 10 mkm, and thus particle’s size distribution is determined. The results of studying of rapid detection of Escherichia coli by light scattering are described. Keywords: bacteria, rapid detection, light scattering, particles size distribution, Escherichia coli. 1. INTRODUCTION. On the given time the problem of search of new methods of rapid detection of a bacteria is actual from many reasons. In particular, it is development of biotehnologiy, bacterial control of food products and drinking-water, bacterial diagnostics. Detection assays must be sensitive and specific, capable of detecting low concentrations of target agents without interference from background materials.The most wide development was acquired by the immunological methods of rapid detection the bacteria. In this case the antibodies or antibody fragments are used as molecular recognition element for specific analytes (antigens) to form a stable complex. The device embodying this concept was called immunosensor. Depending on the method of signal transduction, immunosensors may be divided into second in importance basic groups: electrochemical, optical, immunomagnetic methods with the used microfluidic devices, and their combination [1-7]. Among the optical detection methods of rapid assay the bacteria it follows to select the light scattering method [8] and fluorescent detection using a specific labelling as dye, nanoparticles, antibody [6,9-11]. On the given time most sensible method of rapid detection of bacteria are based on the measured of change the intensity of fluorescent molecules-markers with the fragments of molecular structure of bacterial cells.It is known, that for measuring of fluorescence the optimum number of molecules-markers on one cell over a range of 10 3 -10 5 cell -1 . Therefore fluorescent methods at definite conditions and option of molecules-markers allow to register the bacteria at cell limit of 10 cells/mL. Combination of fluorescence methods with the light scattering method is traditionally used in the method of flow cytometry.The given method gets information about bacterial cells after two informative channels: by measuring of changes of fluorescence intensity and 90 degrees light scatterin intensity. Thus in the process of reproduction of bacteria there is correlation between the changes of the given parameters and quantity of bacterial cells [12]. Therefore the given method also allows to identify bacteria after their type. In literature there is the described method of rapid detection bacterial cells Escherichia coli O1576:Н7 in apple juice, milk and ground beef by flow cytometry by with limit concentration 10 3 cells/mL [13]. The method susceptibility of rapid detection the bacteria as a rule is determined the next parameters: limit concentration of bacterial cells, which it is possible reliably to register; duration of analysis for which it is possible reliably to register given value limit concentration of cells.The detection limits of other immunobiosensing metods reported previously for E. coli O157:H7 are 10 3 cells/mL [14]. Estimation of quantity of bacterial cells during cultivation process is based on so the curves of growth, which express the functional sentinel dependence of change of quantity of cages in the process of Biomedical Applications of Light Scattering II, edited by Adam Wax, Vadim Backman Proc. of SPIE Vol. 6864, 686411, (2008) · 1605-7422/08/$18 · doi: 10.1117/12.762744 Proc. of SPIE Vol. 6864 686411-1 Downloaded From: http://proceedings.spiedigitallibrary.org/ on 08/04/2013 Terms of Use: http://spiedl.org/terms
-
Upload
independent -
Category
Documents
-
view
0 -
download
0
Transcript of Rapid detection of bacterial cells by light scattering method

Rapid detection of bacterial cells by light scattering method
Oleksandr I. Bilyy a ,Vasyl’ B. Getman a , Rostyslav O. Bilyy b, Igor M. Kushnir c, Igor Ya. Kotsiumbas c.
aThe Ivan Franko National University of Lviv; bInst. of Cell Biology of Nat. Academ. Sciences of Ukraine, Lviv; cState Scientific-Research Control Institute of Veterinary Preparations and Fodder
Additives Ukraine, Lviv.
ABSTRACT Method of rapid detection of bacterial cells by light scattering is described. Determination of quantitative changes of bacteria is the given method based on the changes of their size distributing in the process of cultivation. Liquid medial are diluted and analyzed by the proposed technology to determine presence of bacteria. A method includes sounding of flow suspended bacterial cells by monochromatic coherent light, registration of signals of co-operation of sounding radiation with the explored microbiological objects by detects amplitudes and durations of scattered light impulses. Distribution of particles by sizes is determined from the measured functional dependence of number of registered particles from amplitude and duration of the proper electric impulses on the output photoreceiver. Detection is done for a range of particle size from 0.1 to 10 mkm, and thus particle’s size distribution is determined. The results of studying of rapid detection of Escherichia coli by light scattering are described. Keywords: bacteria, rapid detection, light scattering, particles size distribution, Escherichia coli.
1. INTRODUCTION.
On the given time the problem of search of new methods of rapid detection of a bacteria is actual from many reasons. In particular, it is development of biotehnologiy, bacterial control of food products and drinking-water, bacterial diagnostics. Detection assays must be sensitive and specific, capable of detecting low concentrations of target agents without interference from background materials.The most wide development was acquired by the immunological methods of rapid detection the bacteria. In this case the antibodies or antibody fragments are used as molecular recognition element for specific analytes (antigens) to form a stable complex. The device embodying this concept was called immunosensor. Depending on the method of signal transduction, immunosensors may be divided into second in importance basic groups: electrochemical, optical, immunomagnetic methods with the used microfluidic devices, and their combination [1-7]. Among the optical detection methods of rapid assay the bacteria it follows to select the light scattering method [8] and fluorescent detection using a specific labelling as dye, nanoparticles, antibody [6,9-11]. On the given time most sensible method of rapid detection of bacteria are based on the measured of change the intensity of fluorescent molecules-markers with the fragments of molecular structure of bacterial cells.It is known, that for measuring of fluorescence the optimum number of molecules-markers on one cell over a range of 103-105 cell-1 . Therefore fluorescent methods at definite conditions and option of molecules-markers allow to register the bacteria at cell limit of 10 cells/mL. Combination of fluorescence methods with the light scattering method is traditionally used in the method of flow cytometry.The given method gets information about bacterial cells after two informative channels: by measuring of changes of fluorescence intensity and 90 degrees light scatterin intensity. Thus in the process of reproduction of bacteria there is correlation between the changes of the given parameters and quantity of bacterial cells [12]. Therefore the given method also allows to identify bacteria after their type. In literature there is the described method of rapid detection bacterial cells Escherichia coli O1576:Н7 in apple juice, milk and ground beef by flow cytometry by with limit concentration 103 cells/mL [13]. The method susceptibility of rapid detection the bacteria as a rule is determined the next parameters: limit concentration of bacterial cells, which it is possible reliably to register; duration of analysis for which it is possible reliably to register given value limit concentration of cells.The detection limits of other immunobiosensing metods reported previously for E. coli O157:H7 are 103 cells/mL [14]. Estimation of quantity of bacterial cells during cultivation process is based on so the curves of growth, which express the functional sentinel dependence of change of quantity of cages in the process of
Biomedical Applications of Light Scattering II, edited by Adam Wax, Vadim BackmanProc. of SPIE Vol. 6864, 686411, (2008) · 1605-7422/08/$18 · doi: 10.1117/12.762744
Proc. of SPIE Vol. 6864 686411-1
Downloaded From: http://proceedings.spiedigitallibrary.org/ on 08/04/2013 Terms of Use: http://spiedl.org/terms

their growth. Microbiologists traditionally divide bacterial growth curves into lag, exponential (logarithmic), stationary phases, and death phase. Four characteristic phases of the growth cycle are recognized [15]. Quantity estimation of change of bacterial cells in the process of their cultivation is carried outin a exponential phase. In this phase the rate of exponential growth of a bacterial culture is expressed as generation time, also the doubling time of the bacterial population. Generation time (G) is defined as the time (t) per generation (n = number of generations). Hence, G=t/n is the equation from which calculations of generation time (below) derive. Generation times for bacteria vary from about 12 minutes to 24 hours or more. The generation time for of Escherichia coli in the laboratory is 15-20 minutes, but in the intestinal tract, the coli form’s generation time is estimated to be 12-24 hours. For most known bacteria that can be cultured, generation times range from about 15 minutes to 1 hour. Many lithotrophs, such as the nitrifying bacteria, also have long generation times. Some bacteria that are pathogens, such as Mycobacterium tuberculosis and Treponema pallidum, have especially long generation times, and this is thought to be an advantage in their virulence.
2. BACTERIAL CELLS MONITORING BY LIGHT SCATTERING METHOD.
In literature the description of light scattering properties of bacteria meets within the framework of Rayleight theory [16], Mi scattering theory [17] and Rayleigh-Gans theory [18,19]. The refractive index and cell dimensions have been correlated with of angular distribution of scattered light intensity from bacteria in model of Rayleigh-Gans. It is common knowledge that index of refraction is a physical parameter, which determine light scattering properties of examined particles. Systematic refractometric analysis of bacterial suspension showed [20,21] that it is incorrect to speak about absolute refraction index value of bacteria from given species, as there is data spread of this values within given bacterial population. The cell of any nature consists of the following component: – nucleus, cytoplasm and plasma cell membrane, with different refraction indexes. The refraction indexes’ values for cell components are described; their values are 1.38 - 1.41 for nucleus, and 1.36-1.375 for cytoplasm. Cytoplasm refraction index also depends on water osmoliarity, glucose concentration in the cell, and can change in wide range. For liver cells this range is from 1.330 to 1.344. Studied microbiological objects, placed in physiological solution with refraction index 1.334 scatter light with intensity described by Rayleigh-Gans theory. Criteria which determine possibility of application of Rayleigh-Gans theory for processes’ description of quasielastic scattering by particles of incident light wave with a wave vector q the following parameters , and β :
04 sin2
nq π θλ
= , (1)
0
| 1| 1,nn
α = − << (2)
0
| 1| 1nqan
β = − << , (3)
where n – complex refraction index of a particle, n0 – refraction index of particle’s environment, θ - angle of scattering, λ – wavelength of incident radiation, a – particle’s radius. Parameter a specify that refraction index of a particle must be similar to that of environment. Parameter β indicate that phase displacement between incident and dissipated field is insignificant, so incident field inwards and outwards the particle are approximately identical. The angular distribution of scattered light intensity IRG measured at a distance d for particles in the Rayleigh-Gans theory is given by : Intensity of light scattering by the spherical micropaticles with radius a is defined as:
2 220
4 2 30 0
1 cos sin cos ,RGI n n u u uI d n u
θλ
⎡ ⎤−+ −⎡ ⎤= ⎢ ⎥ ⎢ ⎥⎣ ⎦⎣ ⎦ (4)
u qa= , (5)
Proc. of SPIE Vol. 6864 686411-2
Downloaded From: http://proceedings.spiedigitallibrary.org/ on 08/04/2013 Terms of Use: http://spiedl.org/terms
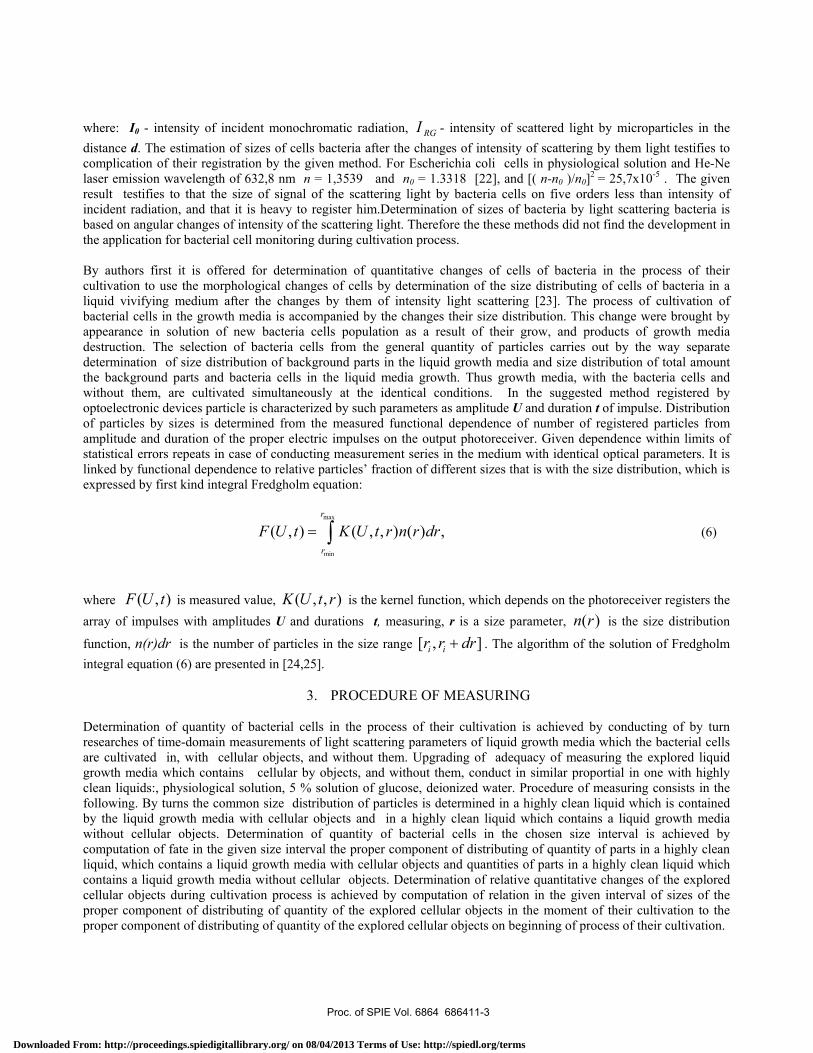
where: I0 - intensity of incident monochromatic radiation, RGI - intensity of scattered light by microparticles in the distance d. The estimation of sizes of cells bacteria after the changes of intensity of scattering by them light testifies to complication of their registration by the given method. For Escherichia coli cells in physiological solution and He-Ne laser emission wavelength of 632,8 nm n = 1,3539 and n0 = 1.3318 [22], and [( n-n0 )/n0]2 = 25,7x10⁻⁵ . The given result testifies to that the size of signal of the scattering light by bacteria cells on five orders less than intensity of incident radiation, and that it is heavy to register him.Determination of sizes of bacteria by light scattering bacteria is based on angular changes of intensity of the scattering light. Therefore the these methods did not find the development in the application for bacterial cell monitoring during cultivation process. By authors first it is offered for determination of quantitative changes of cells of bacteria in the process of their cultivation to use the morphological changes of cells by determination of the size distributing of cells of bacteria in a liquid vivifying medium after the changes by them of intensity light scattering [23]. The process of cultivation of bacterial cells in the growth media is accompanied by the changes their size distribution. This change were brought by appearance in solution of new bacteria cells population as a result of their grow, and products of growth media destruction. The selection of bacteria cells from the general quantity of particles carries out by the way separate determination of size distribution of background parts in the liquid growth media and size distribution of total amount the background parts and bacteria cells in the liquid media growth. Thus growth media, with the bacteria cells and without them, are cultivated simultaneously at the identical conditions. In the suggested method registered by optoelectronic devices particle is characterized by such parameters as amplitude U and duration t of impulse. Distribution of particles by sizes is determined from the measured functional dependence of number of registered particles from amplitude and duration of the proper electric impulses on the output photoreceiver. Given dependence within limits of statistical errors repeats in case of conducting measurement series in the medium with identical optical parameters. It is linked by functional dependence to relative particles’ fraction of different sizes that is with the size distribution, which is expressed by first kind integral Fredgholm equation:
max
min
( , ) ( , , ) ( ) ,r
r
F U t K U t r n r dr= ∫ (6)
where ( , )F U t is measured value, ( , , )K U t r is the kernel function, which depends on the photoreceiver registers the array of impulses with amplitudes U and durations t, measuring, r is a size parameter, ( )n r is the size distribution
function, n(r)dr is the number of particles in the size range [ , ]i ir r dr+ . The algorithm of the solution of Fredgholm integral equation (6) are presented in [24,25].
3. PROCEDURE OF MEASURING
Determination of quantity of bacterial cells in the process of their cultivation is achieved by conducting of by turn researches of time-domain measurements of light scattering parameters of liquid growth media which the bacterial cells are cultivated in, with cellular objects, and without them. Upgrading of adequacy of measuring the explored liquid growth media which contains cellular by objects, and without them, conduct in similar proportial in one with highly clean liquids:, physiological solution, 5 % solution of glucose, deionized water. Procedure of measuring consists in the following. By turns the common size distribution of particles is determined in a highly clean liquid which is contained by the liquid growth media with cellular objects and in a highly clean liquid which contains a liquid growth media without cellular objects. Determination of quantity of bacterial cells in the chosen size interval is achieved by computation of fate in the given size interval the proper component of distributing of quantity of parts in a highly clean liquid, which contains a liquid growth media with cellular objects and quantities of parts in a highly clean liquid which contains a liquid growth media without cellular objects. Determination of relative quantitative changes of the explored cellular objects during cultivation process is achieved by computation of relation in the given interval of sizes of the proper component of distributing of quantity of the explored cellular objects in the moment of their cultivation to the proper component of distributing of quantity of the explored cellular objects on beginning of process of their cultivation.
Proc. of SPIE Vol. 6864 686411-3
Downloaded From: http://proceedings.spiedigitallibrary.org/ on 08/04/2013 Terms of Use: http://spiedl.org/terms

u as i 15 2 2.S 3 asT ilu e hit erval (Ii our
4 4-S 5
Measuring are given for determination of particles sizes distributing a statistic character is had. Therefore for the receipt of reliable data in the process of measuring to performed their statistical treatment. Measuring for every test of liquid growth media which contains the explored particles is conducted not less than 5 times. Statistical treatment the results of the experiments is conducted by determination of mean value of result of measuring, standard deviation of mean value of result of measuring σ , computation the value of error of measuring, which determines the scopes of confidence interval ∆ relatively mean value of result:
( , ) ,t m p σ∆ = (7)
where: t – the Student’s coefficient for the number of measuring of m and confiding probability p. In future, at computations, is accepted p=0,95. It means that in an interval k k k−∆ < < + ∆ gets not less than 95% results of measuring.
4. ESCHERICHIA COLI CELL MONITORING DURING CULTIVATION PROCESS. We prepare for researches the solution with the bacterial cells of Escherichia coli in a liquid growth media № 1 by the makers of Ukraine State Pharmacopeia. Growth media filtered through membrane filter with the pore diameter 0.22 mkm and sterilize in steam sterilizer for the temperatures of 121°C during 15 minutes. Sterile growth media pour out in even parts in the sterilized glass old tub. In one of old tubs bacterial cells E.coli from computation, that initial concentration of cells in growth media was 10 cells/mL. Prepared thus solutions of liquid growth media №1 and solution Escherichia coli in a liquid growth media pour out in sterile test tubes, close up their by bolster cork and cultivated in a thermostat for temperatures 37°C. Fig.1. The results of measuring the temporal chages of particles of products the disintegration of liquid growth media
Proc. of SPIE Vol. 6864 686411-4
Downloaded From: http://proceedings.spiedigitallibrary.org/ on 08/04/2013 Terms of Use: http://spiedl.org/terms

1i •
/JI
Im0- -
7mg- -
00 1 2 3 6 6
Time interval (hour)
400
15 2 25 3 3.5 4 45 5
T ilu e hit erval (Ii our
as
Fig.2. The results of measuring the temporal changes of particles of bacterial cells Escherichia coli and products the disintegration of liquid Fig.3. The results of measuring the temporal changes of bacterial cells Escherichia coli during cultivation
Proc. of SPIE Vol. 6864 686411-5
Downloaded From: http://proceedings.spiedigitallibrary.org/ on 08/04/2013 Terms of Use: http://spiedl.org/terms

ar,el
CLrde8
0.12H . •
02 0,4 C6 08 tO 12 14 1,6 LB
Di an,eter of microp article. nikni
The research of changes of light scattering by particles in prepared solutions of liquid growth media and solution Escherichia coli in a liquid growth media during 6 hours with an interval of 1 hour. Determination of light scattering by cellular suspensions was performed on laser microparticle analyzer PRM-6 [26]. Preliminary preparation of test which consisted in the following was conducted. The contents of each of test tubes which contained a liquid growth media or a liquid growth media with bacterial cells Escherichia coli suspension using sterile physiological (isotonic) 0.9% NaC1 solution (LvivDialik, Lviv, Ukraine). In the got tests of particles suspensions the temporal changes of particles were explored. On fig.1-3 observed temporal changes of particles’ by measurement light scattering spectra of particles suspensions are shown. Fig.1 shows the results of measuring the temporal chages of particles of products the disintegration of liquid growth media in isotonic 0.9% NaC1 solution. Fig.2 shows the results of measuring the temporal changes of particles of bacterial cells Escherichia coli and products the disintegration of liquid growth media in isotonic 0.9% NaC1 solution. Fig. 3 shows the results of size relative changes of bacterial cells Escherichia coli during cultivation process in relation to data on beginning of process cultivation in growth media. In this study it has been demonstrated that the suggested method of bacteria assay allow to take information about the relative change of bacterial cells E.coli in the process of their cultivation on the interval of time 4 hours cultivation. On fig.4-6 observed time changes of particles’ size distribution determination by measurement light scattering spectra of particles suspensions are shown. Fig.4 shows the results of measuring the percentage of particles of products the
Fig.4. The results of measuring the percentage of particles of the disintegration of liquid growth media. disintegration of liquid growth media in the interval of sizes 0,2-2,0 mkm in isotonic 0.9% NaC1 solution. Fig.5 shows the results of measuring the percentage of particles of bacterial cells Escherichia coli and products the disintegration of liquid growth media in the interval of sizes 0,2-2,0 mkm in isotonic 0.9% NaC1 solution. Curves 1-4 on this figures is the particles suspensions on beginning of process of cultivation and after incubation in a thermostat during 4 hours, 5 hours and 6 hours correspondingly. Particular monitoring during cultivation process the growth media indicates (fig.4) that in the size interval of 0,2 – 0,6 um observed the particles to be considered as the products of disintegration of liquid
Proc. of SPIE Vol. 6864 686411-6
Downloaded From: http://proceedings.spiedigitallibrary.org/ on 08/04/2013 Terms of Use: http://spiedl.org/terms

—Curvel—Gurvo2
•Qj3
1:...1:,'. _:
N'.
.
V 4 0$ as to 12 1.4 1,6 1.8
Diameter of lrndroparU die, inkin
growth media. In fig.5 we see essential variations with time the particles size distribution. With the increase of time cultivation simultaneously reduces the percentage of particles in the interval of sizes 0,2-0,3 mkm and grows reduces the percentage of particles products in the interval of sizes 0,3-1,3 mkm and is observed maximum on a distribution curve at 0,68 mkm. Fig. 6 shows the results of size relative changes of bacterial cells Escherichia coli in the interval of sizes 0,2-2,0 mkm during cultivation process in relation to data on beginning of in relation to data on beginning of process cultivation in growth media. On this figure curve 1-4 is the normalize initial distributing of bacterial cells Escherichia coli on beginning of process of their cultivation and after incubation in a thermostat during 4 hours, 5 hours and 6 hours correspondingly. The got results allow to take information about the relative change of bacterial ctlls E.coli
Fig.5 The results of measuring the percentage of particles of bacterial cells Escherichia coli and products the disintegration of liquid growth media
Proc. of SPIE Vol. 6864 686411-7
Downloaded From: http://proceedings.spiedigitallibrary.org/ on 08/04/2013 Terms of Use: http://spiedl.org/terms

i2 I I I I I I
—Curve2•Curvo3. Curvu4
81:'
7 4 . .,.., .... I
6 :.L4 — — 4
5 — — —1 .4
4bA,
hit — hft
Dia'itetcr of IIIICIo1)ortlc le. IIIkIII
Fig.6. The results of size relative changes of bacterial cells Escherichia coli during cultivation process in relation to data on beginning of process cultivation in growth media. in the process of their cultivation. On the interval of time 6 hours cultivation the quantity of bacterial cells by sizes 0,5mkm increase in 3, by sizes 0,6um increase in 7 and by sizes 0,5mkm increase in 11,2. On fig.7 observed time changes of particles’ size distribution the bacterial cells of Escherichia coli in with initial con-tsentration 10 cells/mL determination by measurement light scattering spectra of particles suspensions are shown.The measurements of particles’ size distribution carried out on beginning of process of cultivation in a thermostat during Ec2 =3.5, Ec3 =4.0, Ec4 =4.5, Ec5 =5.0, Ec6 =5.5, Ec7 = 6.0, Ec8 = 7.0 and Ec9 =22 hours. On fig.4 we see eight expressly selected distribution curves. Curves Ec2, Ec3 and Ec4 on this figures has wide distribution in the interval of sizes 0, 34-1, 8 mkm with a peak maximum at 0,7 mkm.Curves Ec5, Ec6, Ec7 and Ec8 on this figures has narrow distribution in the interval of sizes 0, 02-7, 0 mkm with a peak maximum at 0, 32 mkm. Curves Es5-Es8 is had distribution tail area in long the size region, at that intensity of them with growth of time of incubation falls off. Curve distribution Es=9 has the maximum at 0, 29 does not contain tail area and terminates at 0, 4 mkm. The received results was due to as follows. The fresly ready solution of cells suspensions the bacteria Escherichia coli has wide distribution as which cells is represented by direct sticks 1, 1-1, 5 * 2, 0-6, 0 microns [27]. With increase of time monitoring during cultivation process the vivifying property of growth media decreases. It leads to the increase of quantity the bacterial cells, which have less sizes. In the size interval of 0, 2 – 0, 6 um observed the particles to be considered as the products of disintegration of liquid growth media and concentraion theirsincreasing (fig.4). As result is the characteristic size redistribution of particles throughout the sizes which is accompanied by the shifted of peak maximum distributing in shortly the size region and growth of maximum at 0, 32 mkm which caused by the products of disintegration of liquid growth media. In conclusion, method of bacterial cell monitoring during cultivation process based on particles’ size distribution reliable registration the bacteria cells of Escherichia coli with initial concentration 10 cells/mL in times of 3,5 hours, what respectively equal the detection limits ~103 cells/mL of Escherichia coli.
Proc. of SPIE Vol. 6864 686411-8
Downloaded From: http://proceedings.spiedigitallibrary.org/ on 08/04/2013 Terms of Use: http://spiedl.org/terms

0,18- ____ Ec2- Ec30,16 -
Ec40,14 - / - Ec5
Ec60,12 - Ec7
EcSt 0,10 - . EcO
V N-
:: LI0,2 0:4 0,6 0,8 1,0 1,2 1,4 1,6 1,8 2,0
Diameter of micropaiticle. 111km
Fig.7. The results of measuring the temporal changes of particles’ size distribution the bacterial cells of Escherichia coli
during cultivation on the interval of time: Ec2 =3.5, Ec3 =4.0, Ec4 =4.5, Ec5 =5.0, Ec6 =5.5,Ec7 = 6.0,Ec8 = 7.0 and Ec9 =22 hours.
5. CONCLUSIONS
Conducted experiments demonstrates the method of bacterial cell monitoring during cultivation process based on particles’ size distribution is useful for rapid and quantitative detection of Escherichia coli. The result showed that this biosensing method could detect Escherichia coli down to 1000 cell/mL in approximately 3,5 h without any enrichment. Method uses optoelectronic device in which the particle’s size is determined by two parameters: amplitude and duration of registered impulse of scattered light by a particle. Method gives information about percentage of bacterial cells in definite interval size and interval time during cultivation process.
REFERENCES
1. F. Ricci, G. Volpe, L. Micheli, G. Pallesch, ”A review on novel developments and applications of immunosensors in food analysis”, Analytica Chimica Acta, 605, pp. 111–129, 2007. 2. O. Lazcka, F. Campob, F. Munoz , “Pathogen detection: A perspective of traditional methods and biosensors”, Biosensor and Bioelectronics, 22, pp.1205-1217, 2007.
Proc. of SPIE Vol. 6864 686411-9
Downloaded From: http://proceedings.spiedigitallibrary.org/ on 08/04/2013 Terms of Use: http://spiedl.org/terms

3. K. Rijal, A. Leung , P. Mohana Shankar, R. Mutharasan, ”Detection of pathogen Escherichia coli O157:H7 AT 70 cells/mL using antibody-immobilized biconical tapered fiber sensors”, Biosensor and Bioelectronics, 21, pp.871 - 880, 2005. 4. J. Brewster, R.Mazenko, “Filtration capture and immunoelectrochemical detection for rapid assay of Escherichia coli O157:H7”, J. Immunolog. Methods, 211, pp.1-8, 1998. 5. A.Gehring, D. Albin, P. Irwin, S.Reed, S.Tu, “Comparison of enzyme-linked immunomagnetic chemiluminescence with U.S. Food and Drug Administration's Bacteriological Analytical Manual method for the detection of Escherichia coli O157:H7”, J. Microbiolog. Methods, 67, pp. 527-533,2006. 6. C. Sakamoto, N.Yamaguchi, M.Yamada,H. Nagase, M.Seki, M. Nasu, “Rapid quantification of bacterial cells in potable water using a simplified microfluidic device”, J. Microbiolog. Methods, 68, pp.643-647, 2007. 7. Yanbin Li, Xiao-Li Su, “Microfluidics-based optical biosensing method for rapid detection of Escherichia coli O157:H7”, J. Rapid Methods and Automation in Microbiology, 14, pp. 96-109, 2006. 8. R. Wang, E. Liow, P. Keay, “Detection of Escherichia coli O157 in raw beef using a ccd based light scattering instrument”, J. Rapid Methods and Automation in Microbiology, 10, pp. 245-254, 2002. 9, L. Goodridge, J. Chen, M. Griffiths, “Development and characterization of a fluorescent-bacteriophage assay for detection of Escherichia coli O157:H7”, Apl. Environmen. Microbiol., 65, pp.1397-1404, 1999. 10. L.Wang, W. Zhao, M. O’Donoghue, W. Tan, “Fluorescent nanoparticles for multiplexed bacteria monitoring”, Bioconjugate Chem., 18, pp. 297-301, 2007. 11. F. Su, Y. Endo, H. Saiki, Xin-Hui Xing, N. Ohmura, “Simple and sensitive bacterial quantification by a flow-based kinetic exclusion fluorescence immunoassay”, Biosensors and Bioelectronics, 22, pp 2500–2507, 2007. 12. T. Åkerlund, K. Nordstrom, R. Bernander, “Analysis of cell size and dna content in exponentially growing and stationary-phase batch cultures of Escherichia coli”, J. Bacteriology, 177 , pp. 6791–6797 , 1995. 13. N. Yamaguchi, M. Sasada, M.Yamanaka, M. Nasu, “Rapid detection of respiring Escherichia coli O157:H7 in apple juice, milk, and ground beef by flow cytometry”, Cytometry Part A , 54A, pp.27–35, 2003. 14. Ja-an Annie Ho, Hsiu-Wen Hsu,”Procedures for preparing Escherichia coli O157:H7 immunoliposome and its application in liposome immunoassay”, Analytical Chemistry,75, pp. 4330-4334, 2003. 15. Albert G.Moat, John W.Foster, Michael P. Spector, Microbial Physiology, 4th ed., 714 pp., Copyright by Wiley-Liss, Inc.. New York, 2002. 16. J. Yguerabide, E. E. Yguerabide, “Light-scattering submicroscopic particles as highly fluorescent analogs and their use as tracer labels in clinical and biological applications”, Analytical Biochemistry, 262, pp.137–156, 1998. 17. J. Murray, D. W. Hukins, and P. Evans, “Application of Mie theory and cubic splines to the representation of light scattering patterns from bacteria in the logarithmic growth phase,” Phys. Med. Biol., 24, pp. 408–415, 1979. 18. L. Koch, “Theory of the angular dependence of light scattered by bacteria and similar-sized biological objects,” J. Theor. Biol., 18, pp. 133–156, 1968. 19. A. Katz, A. Alimova, M. Xu, E. Rudolph, M. K. Shah, H. E. Savage, R. B. Rosen, S. A. McCormick, R. R. Alfano, ”Bacteria size determination by elastic light scattering ”, IEEE Journal of Selected Topics in Quantum Electronics, 9, pp. 277-287, 2003. 20. B. Fikhman, Microbiological refractometriya, 280 pp., Medicine, Мoskow, 1967. 21. O. Bilyi, “The examinations of microorganisms by correlation optics method”, Pros. SPIE, 5477, pp. 538-544, 2004. 22. A.Balaev, V.Doubrovski, K.Dvoretski, “Laser beam scattering by bacterial cell: application of the discrete dipole approximation”, Pros. SPIE, 4001, pp.312-316, 2000. 23. I.Kotsyumbas, I. Kushnir , R. Bilyy, I.Yarynovska, V. Getman, A.Bilyi, “ Light scattering application for bacterial cell monitoring during cultivation process”, Proc. SPIE, 6631, pp. 1I–8I-8, 2007. 24. O. Bilyi, R. Bilyy, V. Getman, “A new method of quantitative determination of apoptotic parameters in cellular suspensions”, Pros. SPIE., 5477, pp. 530-537, 2004. 25. O. Bilyi, R. Bilyy , V. Getman, “Method of determination of aerosol microparticles` size distribution by iteration process”, 6303, pp. os1-os10-10, 2006. 26. О. Bilyi, V. Getman., Y. Matvijchuk., “Method of determination of microparticle's distribution by sizes in disperse medium,” Measuring and Computing Devices in Technological Processes (UA), № 2, pp. 28- 32, 2001. 27. Bergey's Manual of Determinative Bacteriology, Ninth Edition, Ed. by John G.Holt, Noel R.Krieg, Peter H.A.Sneath, James T.Staley, Stanley T.Williams, Williams & Wilkins, Baltimore, 1994.
Proc. of SPIE Vol. 6864 686411-10
Downloaded From: http://proceedings.spiedigitallibrary.org/ on 08/04/2013 Terms of Use: http://spiedl.org/terms