
Title (Use “Title” style here) - JRC Publications Repository
456
EUR 24139 EN/1 - 2010 ENERGY EFFICIENCY IN DOMESTIC APPLIANCES AND LIGHTING Proceedings of the 5th International Conference EEDAL'09 16-18 June, Berlin, Germany VOLUME 1 Editors: Paolo BERTOLDI, Rita WERLE
-
Upload
khangminh22 -
Category
Documents
-
view
1 -
download
0
Transcript of Title (Use “Title” style here) - JRC Publications Repository
EUR 24139 EN/1 - 2010
ENERGY EFFICIENCY IN DOMESTIC APPLIANCES AND LIGHTING
Proceedings of the 5th International Conference EEDAL'09 16-18 June, Berlin, Germany
VOLUME 1
Editors: Paolo BERTOLDI, Rita WERLE

The mission of the JRC-IE is to provide support to Community policies related to both nuclear and non-nuclear energy in order to ensure sustainable, secure and efficient energy production, distribution and use. European Commission Joint Research Centre Institute for Energy Contact information Address: Via E. Fermi, 2749, I-21027 Ispra (VA), ITALY E-mail: [email protected] Tel.: +39 (0)332 78 9299 Fax: +39 (0)332 78 9992 http://ie.jrc.ec.europa.eu/ http://www.jrc.ec.europa.eu/ http://re.jrc.ec.europa.eu/energyefficiency/
Legal Notice Neither the European Commission nor any person acting on behalf of the Commission is responsible for the use which might be made of this publication.
Europe Direct is a service to help you find answers to your questions about the European Union
Freephone number (*):
00 800 6 7 8 9 10 11
(*) Certain mobile telephone operators do not allow access to 00 800 numbers or these calls may be billed.
A great deal of additional information on the European Union is available on the Internet. It can be accessed through the Europa server http://europa.eu/ JRC 56066 EUR 24139 EN/1 ISBN 978-92-79-14836-1 ISSN 1018-5593 DOI 10.2788/54535 Luxembourg: Office for Official Publications of the European Communities © European Communities, 2010 Reproduction is authorised provided the source is acknowledged Printed in Italy


ENERGY EFFICIENCY IN DOMESTIC APPLIANCES AND LIGHTING
Proceedings of the 5th International Conference EEDAL'09
16-18 June, Berlin, Germany
VOLUME 1
Editors: Paolo BERTOLDI, Rita WERLE
ii
EEDAL‘09 ProceedingsContents
VOLUME 1
Metering and Smart Appliances 1
Smart Metering – a means to promote sustainable energy consumption? Socio-technical research and development on feedback systemsSebastian Gölz, Fraunhofer-Institut für Solare Energiesysteme ISE, GermanyKonrad Götz, Jutta Deffner, Institute for social-ecological Research ISOE, Frankfurt/Main, Germany
3
‘Nice to Know’ - metering and informative feedbackEllen Christiansen, University of Southern Denmark & Aalborg University, Denmark
14
Extreme-user approach and the design of energy feedback systemsLassi A. Liikkanen, Helsinki Institute for Information Technology HIIT, Finland
23
A Residential Electric Load Simulator to Support Demand Management Strategies in Competitive Electricity MarketsAlberto Prudenzi, University of L’Aquila, Italy & 2nd University of Rome “Tor Vergata”, Italy
36
PowerCentsDC Program – Demand and Conservation Effect of Pricing and Advanced FeedbackChris King, eMeter Strategic Consulting, USA
46
Encouraging public support for smart metering via appealing and enabling in-home energy feedback devicesHenk van Elburg, European Smart Metering Alliance (ESMA), United Kingdom
57
My Home – the interactive and “intelligent” way to save energyGöran Wilke, The Danish Electricity Saving Trust, DenmarkAnders Hjort Jensen, The Danish Electricity Saving Trust, Denmark
65
E-mail and SMS as a tool for electricity savings in households, report from a field experimentAnders Larsen, Institute for Society and Globalisation, Roskilde University, Denmark
78
Metering and Smart Grid 90
Smart use of domestic appliances in renewable energy systemsRainer Stamminger, University of Bonn, Germany
92
Simulation of high-resolution domestic electricity demand based on a building occupancy model and its applicability to the study of demand side managementMurray Thomson, Graeme Hodgson, Ian Richardson, Centre for Renewable Energy Systems Technology at Loughborough University, United Kingdom
97
Microgrid with Agents: the DSM Mechanism of a Promising Model for Future Electricity InfrastructureRui Duan, Katholieke Universiteit Leuven, Belgium
106
How Smart Domestic Appliances Can Support the Integration of Renewable Energy in Local and National Energy SystemsChristof Timpe, Öko-Institut e.V. - Institute for Applied Ecology, GermanyChristian Möllering, enervision GmbH, Germany
117
Evaluation 129
Best Practices and Issues for Attributing Effects to Energy Efficiency and Behavioural Programs – Discussion of Net-to-Gross (NTG) and Non-Energy Benefits (NEBs)Lisa Skumatz, Skumatz Economic Research Associates, Inc. (SERA Inc.), USA
131
Domestic information, communication and entertainment (ICE) appliance monitoring: A practical perspective and implications for inter-disciplinary researchMichael Coleman, The Institute of Energy and Sustainable Development (IESD), De Montfort University, United Kingdom
142
A “Bottom Up” Model For Estimating Australian Residential Energy UseLloyd Harrington, Energy Efficient Strategies, Australia
154
How Long Do Program Savings Last? Issues in Measure Lifetimes and Retention of 166
iii
Savings and BehavioursLisa Skumatz, Skumatz Economic Research Associates, Inc. (SERA Inc.), USAMeasuring Market Transformation in U.S. Appliance and Lighting MarketsKenneth Tiedemann, BC Hydro, Canada
176
Analysis of the electricity end-use in EU-27 householdsBogdan Atanasiu, Joint Research Centre, Directorate-General of the European Commission
189
Energy consumption of whitegoods - what is improving and what is not: analysis of 15 years of data in AustraliaLloyd Harrington, Energy Efficient Strategies, Australia
202
Monitoring and evaluation of energy savings from domestic appliances for the EU’s Energy Service DirectiveStefan Thomas, Wuppertal Institut für Klima, Umwelt, Energie GmbH, Germany
211
Tracking Market Progress – Alternatives to Market Share Methods to Better Identify “Market Effects” and Program Exit InformationLisa A. Skumatz, Skumatz Economic Research Associates, Inc. (SERA Inc.), USA
223
Policies and Programmes 232
An analysis of the global carbon impacts of energy-using productsChris Evans, Bilyana Chobanova, Market Transformation Programme, UK, Klinckenberg Consultants
234
Assessment of Supplier Obligations and White Certificate Schemes in Improving Residential Energy EfficiencyPaolo Bertoldi, Joint Research Centre, Directorate-General of the European Commission
245
The Costs of Increasing Electricity Savings through Utility Efficiency Programs: Evidence from US ExperienceKenji Takahashi, Synapse Energy Economics, Inc., USA
262
Making demand response standard for household air conditioners: the Australian experienceGeorge Wilkenfeld, George Wilkenfeld and Associates, Australia
274
Standardization of Power Related Energy ConsultingMonika Löber, Deutsche Energie-Agentur GmbH (dena) – German Energy Agency, Germany
284
Working with retailers to push beyond EuP compliance: Some different approaches used, and options for international strengtheningJeremy Tait, Tait Consulting Limited, United Kingdom
290
IEA Mapping and Benchmarking Annex: Informing Sustainable Product Policy Decision MakingDavide Minotti, Defra & Market Transformation Programme UK, United Kingdom
302
Raising energy efficiency through the Intelligent Energy Europe programme: first results from ten projects on domestic appliancesChristophe Coudun, Executive Agency for Competitiveness and Innovation (EACI), EU
310
Residential Electricity Demand in China – Can Efficiency Reverse the Growth?Virginie E. Letschert, Ernest Orlando Lawrence Berkeley National Laboratory, USA
318
Demonstration of the new promotion scheme for high-efficiency home appliances and evaluation of its energy saving effectShinichi Kishida, Jyukankyo Research Institute, Japan
329
Indicator-Benchmark-System: A cost-effective and market-based method for quantitative verification of energy efficiency improvementsDr. Jan Witt, Jörg Zöllner, HEA – Fachgemeinschaft für Energieeffizienz e.V. – Berlin, Germany
337
National campaigns transforming the marketGunnar Pautzke, CECED (European Committee of Domestic Equipment Manufacturers), Belgium
343
iv
Replacing outdated household appliances saves energy and improves performance –A national initiativeClaudia Oberascher, HEA – Fachgemeinschaft für effiziente Energieanwendung e.V., Germany
350
Effective presentation of energy cost information in conjunction with EU-energy labels: An experimental study with refrigerating appliances in GermanyCorinne Faure, Goethe-Universität Frankfurt, Germany
357
Refrigerator Replacement Programs in BrazilGilberto De Martino Jannuzzi, University of Campinas – UNICAMP, and International Energy Initiative – IEI, Latin American Office, Brazil
364
Household Energy Efficiency – always the bridesmaid?Jo Grugeon, Rachel Ollivier, Lara Olsen, Cool nrg International, Australia
373
How Can We Rank Energy-Saving Activities? -Development of an Energy-Saving Activity Selection Tool Considering Residents Preferences-Tsuyoshi Ueno and Yukio Nakano, Central Research Institute of Electric Power Industry, Japan
381
Policies and Behaviour 391
What's driving sustainable energy consumption - a survey of the empirical literatureKlaus Rennings, Centre for European Economic Research (ZEW GmbH), Germany
393
Analysis of the Hungarian residential energy consumption and influence of the end-user behaviour on energy consumption patternsViktoryia Novikava, Center for Climate Change and Sustainable Energy Policy (3CSEP), Central European University, Hungary
410
The Impact of Price on the Residential Demand for Electricity, Natural Gas and WaterLarry Dale, Lawrence Berkeley National Laboratory, USA
422
VOLUME 2
Monitoring 436
Decomposing Electricity Use of Finnish Households to Appliance CategoriesRouhiainen Virve, Adato Energia Oy, Finland
438
Characterization of the Household Electricity Consumption in the EU, Potential Energy Savings and Specific Policy RecommendationsAníbal De Almeida, ISR - University of Coimbra, PortugalNicolai Feilberg, SINTEF Energy Research, NorwayHervé Lefebvre, ADEME, French Energy Agency, France
456
Energy demand for white goods, what influences? – Answer from in-depth metering of electricity demand in 400 Swedish householdsPeter Bennich, Egil Öfverholm, Zinaida Kadic, The Swedish Energy Agency, Switzerland
477
Residential End-Use Electricity Consumption Pattern in Chennai CityB. P. Chandramohan, Presidency College, Chennai, India
492
Potential 512
Potential for CO2 mitigation in the Hungarian residential buildingsAleksandra Novikova, Central European University, Hungary
514
Predictions for the contribution of residential lighting to the carbon emissions of the UK to 2050Daniel Curtis, Environmental Change Institute, University of Oxford, United Kingdom
529
Energy savings potential in the use of residential lightingMats Bladh, Linköping University, Sweden
538
EcoTopTen scenarios for sustainable consumption – reduction potentials due to the use of energy efficient productsDietlinde Quack, Öko-Institut e.V. Institute for Applied Ecology, Germany
547
Developing Countries 558
Positive impacts of energy efficiency on the electricity services to the urban and peri-urban poor
560

v
John R. Mollet, International Copper Association (ICA), USASolar Water Heating in South AfricaNico Beute, Cape Peninsula University of Technology, South Africa
572
On-line use rate meters for solar cookers and “Hot Box” heat retention cookers in Developing Countries: Concept, tests, verification of output data and field test methodologyMichael Grupp, Synopsis, France & Institute for Energy and Environment, GermanyMarlett Balmer, ProBEC, South Africa
581
Promotions of Compact Fluorescent Lamps (CFLs) by Utility-Bill-Payback Scheme in VietnamYoshiaki Shibata, Jyukankyo Research Institute, Japan
592
A Breath of Fresh air: protos the plant-oil stoveSamuel N. Shiroff, BSH Bosch und Siemens Hausgeräte GmbH, Germany
602
Lighting 610
Do new types of Energy Saving Lamps change the markets?Michael Bross, GfK Retail and Technology GmbH, Germany
612
The EuP preparatory study for the eco-design of domestic lightingPaul Van Tichelen, VITO & BIO IS & Energy piano & Kreios, Belgium
622
CFLs in the USA – Market and Technical Status ReportChristopher Granda, Vermont Energy Investment Corporation, USAStephen Bickel, D&R International, USA
636
Really bright- the lighting campaignChristiane Egger, O.Oe. Energiesparverband, Austria
649
ENBW Lighting Expert - Showing the difference in lighting installationsHans Lang, EnBW Vertriebs- und Servicegesellschaft mbH, GermanySimon Wössner, Jan de Boer, Fraunhofer-Institute of Building Physics, Germany
655
Energy-Saving Experiment in Moscow Residential SectorJulian Aizenberg, GC «Topservice» & Light House, Moscow, Russia
664
Lighting efficiency in dwellings: a case studyBenoit Roisin, Université Catholique de Louvain (UCL), BelgiumMagali Bodart, Belgian Building Research Institute (BBRI), Belgium
666
The development trend of China's Green LightingZhao Yuejin, CNIS, China
678
Off-Grid-Lighting solutions for least developed countriesReinhard Weitzel, OSRAM GmbH, Germany
686
Transforming the Market for Efficient Lighting, RussiaJulian Aizenberg, Russian Lighting Research Institute (VNISI), Russia
692
Be aware of CFLs: our experience in the implementation of the energy saving lamps’ usePatrizia Pistochini, ENEA, Italian National Agency for New technology, Energy and the Environment, ItalyGeorges Zissis, Université de Toulouse; UPS, INPT; LAPLACE (Laboratoire Plasma et Conversion d'Energie), France
699
Tubular daylight guidance systems - Energy Saving Potential in Residential Buildings in RomaniaC•lin CIUGUDEANU, Florin POP, Lighting Engineering Center UTC-N, Technical University of Cluj-Napoca, Romania
713
Labelling & Standards 725
Progress towards Managing Residential Electricity Demand: Impacts of Standards and Labeling for Refrigerators and Air Conditioners in IndiaMichael A. McNeil, Ernest Orlando Lawrence Berkeley National Laboratory, USA
727
CECED encourages fair competition among all appliance manufacturersGerhard Fuchs, CECED (European Committee of Domestic Equipment Manufacturers),Belgium
739
UK Government Standards Process for Energy-using productsFrank Klinckenberg, Klinckenberg consultants & AEA Energy & Environment, the Netherlands
743
vi
Energy labeling in White Goods WorldwideAnton Eckl, GfK Retail and Technology GmbH, Germany
749
Opportunities for Energy Standards and Labels in CIS countriesFrank Klinckenberg, Klinckenberg Consultants, the Netherlands
767
Review on Chinese Energy Efficiency Standards and Energy Label SystemGeng Wang, China National Institute of Standardization, China
777
Standards and labels for promoting energy efficiency in RussiaNataly Olofinskaya, United Nations Development Programme (UNDP), RussiaGennady Smaga, United Nations Development Programme (UNDP)/Global Environment Facility (GEF) project, Russia
784
New developments in enforcing compliance with Standards and Labels in the UKDaniel Kapadia, Defra, United KingdomChris Evans, Market Transformation Programme, United Kingdom
794
Label It and They Will Buy? The Case of Energy Efficient Class-A AppliancesJoachim Schleich, Fraunhofer Institute for Systems and Innovation Research (ISI), Karlsruhe, Germany & Virginia Polytechnic Institute and State University, Blacksburg, USA
802
Design of an Endorsement Labeling Program for Economies in Transition - a case from IndiaAmit Khare, ICF International, USA
812
Results of a recent survey of compliance with Directive 92/75/EEC (Energy Labelling) in all EU Member StatesBarbara Schlomann, Fraunhofer Institute for Systems and Innovation Research (Fraunhofer ISI), Germany
825
The impact of Ecodesign measures on household electricity consumption in the Netherlands: even more savings are possibleHans-Paul Siderius, SenterNovem, the Netherlands
837
Pro-poor Standard and Labelling programmes? Results of a survey on S&L for domestic appliances in Southern Mediterranean countries Sylvaine Herold, European Institute for Energy Research (EIFER), Germany
848
Beyond A: the future of the energy labelPaolo Falcioni, CECED (European Committee of Domestic Equipment Manufacturers), Belgium
861
The Evaluation Methods of China Monitor Energy Efficiency StandardGuanglei Du, 3M China Limited, ChinaXin Zhang, Haihong Chen, China National Institute of Standardization, China
865
Heating 870
Reducing the Carbon Footprint of Existing Domestic Heating: A Non-Disruptive ApproachMartin O’Hara, Danfoss Randall Limited, United Kingdom
872
Raising the Efficiency of Boiler Installations (BOILeff)Guenter R. Simader, Austrian Energy Agency, AustriaNúria Quince, CREVER - Group of Applied Thermal Engineering, Universitat Rovira i Virgili, Spain
881
Policies for reducing environmental impacts and improving energy efficiency: the case of solid fuel small combustion installationsShailendra Mudgal, BIO Intelligence Service S.A.S., France
890
VOLUME 3
Heating/Water Heating and CHP 897
Energy Services for Domestic Heating – Special Aspects of the Domestic Heating Oil MarketChristian Küchen, Institut für wirtschaftliche Ölheizung e.V. (IWO), Germany
899
The use of heat pumps in the renovation of buildingsKai Schiefelbein, Norbet Markus, Stiebel Eltron GmbH & Co. KG, Germany
909
Policy Instruments to Support Uptake and Appropriate Application of Micro-CHPAdam Hawkes, Centre for Energy Policy and Technology (ICEPT), Imperial College
919

vii
London, United KingdomCalifornia’s Solar Water Heating Program: Scaling Up to Install 200,000 Systems by 2020Robert Mowris, Verified, Inc. USA
932
Heating, Ventilating and Air Conditioning (HVAC) 942
Dynamics of the AC Markets WorldwideTanja Heidingsfelder, Tobias Kupczyk, GfK Retail and Technology GmbH, Germany
944
Energy consumption of European residential comfort fansJerome Adnot, Center for Energy and Processes, Mines Paristech, France
951
Energy Efficiency Standards for Residential Air Conditioning and Heating Equipment –The U.S. ExperienceKarim Amrane, Air-Conditioning, Heating, and Refrigeration Institute, USA
961
Energy Efficiency Labelling of Ceiling Fans in India: Challenges and the Way ForwardAlvin Jose, Bureau of Energy Efficiency, Ministry of Power, Government of India, India
970
Analyses of the energy consumption of complex HVAC systems in residential buildings taking into account the thermal comfortJoachim Seifert, Technical University of Dresden & Viessmann Werke & Institute of Building energy systems, Dresden, Germany
978
Sustainable Building 989
Sustainable Building Operation – Experiences from Danish Housing EstatesJesper Ole Jensen, Danish Building Research Institute, Denmark
991
Dynamic Analysis Methodologies Applied to Energy Management in Residential BuildingsHans Bloem, Joint Research Centre, Directorate-General of the European Commission
1003
Beyond Solar Decathlon – Germany’s contribution to the international competition in energy efficient residential building design and residential appliancesHannes Guddat, TU Darmstadt, FB15, Energy Efficient Building Design GroupMichael Keller, TU Darmstadt, FB15, Energy Efficient Building Design GroupChristoph Thim, BSH Bosch und Siemens Hausgeräte GmbH
1012
Set Top Boxes 1032
Energy efficiency trends in STBsRobert Turner, Pace plc, United Kingdom
1034
Policies for reducing environmental impacts and improving energy efficiency: the case of complex set-top boxesSanaée Iyama, BIO Intelligence Service S.A.S., France
1040
The international effort to develop a new IEC measuring method for Set Top Boxes (STBs)Keith Jones, Digital CEnergy Australia, Australia
1052
Information and Communications Technology (ICT) 1065
Energy Consumption for Information and Communication Technologies in German households – present state and future trendsBarbara Schlomann, Fraunhofer Institute for Systems and Innovation Research (Fraunhofer ISI), Germany
1067
Energy and environmental efficiency for broadband deployment and multi-services implementationDominique Roche, FT/NSM/TECHNOLOGIES, FranceLuca Giacomello, Telecom Italia, Italy
1079
Network connectivity and low-power mode energy consumptionBruce Nordman, Lawrence Berkeley National Laboratory, USA
1091
Graphics and Microprocessor Technology for More Sustainable Media-Rich ComputingDonna Sadowy, AMD - Advanced Micro Devices, Inc., USA
1102

viii
Consumer Electronics 1110
Gadgets and GigawattsMark Ellis, Mark Ellis and Associates, Australia
1112
How compatible are Consumer Electronics and sustainability?Heribert Tippenhauer, GfK Retail and Technology GmbH, Germany
1123
Difficulties in the Energy Efficiency Standards Program for Consumer Electronics, by the Case of Set-Top BoxesLi Pengcheng, China National Institute of Standardization, China
1132
Domestic Appliances Standby Power Losses: The Case of Eleven Suburbs in the Greater JohannesburgMercy V. Shuma-Iwisi, University Of Witwatersrand, South Africa
1139
Televisions and Consumer Electronics 1151
The IEC 62087 TV Testing Methodology Review – A Template for International Stakeholder Cooperation in Developing Harmonised Testing StandardsRobert Harrison, UK Government Market Transformation Programme, United KingdomKeith Jones, Department of Environment, Water, Heritage and the Arts (DEWHA) Australian Government, Australia
1153
Standby Labeling and Procel Seal on TVs – The Brazilian ExperienceHamilton Pollis, PROCEL – Brazilian National Program of Electric Energy Conservation, ELETROBRAS – Centrais Elétricas BrasileirasAlexandre Novgorodcev, PBE – Brazilian Labeling Program - INMETRO – National Institute of Metrology, Standardization and Industrial Quality, Brazil
1159
Potential energy savings for televisions due to the application of labelling and MEPS in Australia Keith Jones, Digital CEnergy Australia, Australia
1172
The Research of China FPD TV Energy Efficiency Standard MethodologyZhang Xin, China National Institute of Standardization, China
1184
Washing and Drying 1192
Ecodesign requirements on spinning speed for washing machines? An analysis of the trade-off with the penetration and use of tumble dryers in EuropeMilena Presutto, Italian National Agency for New Technologies, Energy and the Environment (ENEA), Italy
1194
Energy Efficiency of washing machines – A harmonized standard for a diversified marketGundula Czyzewski, BSH Bosch und Siemens Hausgeräte GmbH, GermanyTom Hilgers, wfk Institutes and Test Materials, Germany
1206
Promotion of energy-efficient heat pump driersJürg Nipkow, Swiss Agency for Efficient Energy Use (S.A.F.E.), Switzerland
1215
Large Energy Savings by Sorption-assisted DishwasherHeinz Heißler, BSH Bosch und Siemens Hausgeräte GmbH, Germany
1226
Cold Appliances 1229
Relevance of consumer real life behaviour in cold storage on energy consumptionJasmin Geppert, University of Bonn, Germany
1231
Cool Carbon - BSH Refrigerator Exchange Program with the Carbon CertificatesSamuel N. Shiroff, BSH Bosch und Siemens Hausgeräte GmbH, GermanyDr. Thomas Grammig, Proklima, Germany
1242
A New Global Test Procedure for Household RefrigeratorsLloyd Harrington, Energy Efficient Strategies, Australia
1251
Highest energy efficiency in household refrigerating appliancesThomas Ertel, Liebherr-Hausgeräte Ochsenhausen GmbH, Germany
1265
Advances in Environmentally Sustainable Refrigerants and Blowing AgentsJ. M. Bowman, Honeywell International, USA
1271
Preliminary measurement of energy consumption for residential refrigerators and refrigerator-freezersBudihardjo, Refrigeration and Air Conditioning Laboratory, University of Indonesia,
1279

ix
IndonesiaImproving Energy Efficiency of Product Use: An Exploration of Environmental Impacts of Household Cold Appliance Usage PatternsTang Tang, Loughborough University, United Kingdom
1286
Other Appliances 1298
Strategies to Enhance Energy Efficiency of Coffee MachinesEric Bush, Topten International Group, Switzerland
1300
Energy Implications of Appliances in CarsAlan Meier, Lawrence Berkeley National Laboratory, USA
1308
Energy savings potentials in domestic ventilation products and the necessary technologiesR. Volkmar Uebele, BSH Bosch und Siemens Hausgeräte GmbH, Germany Energy
1315
Labelling and Standards for Domestic Gas Cooking Appliances in Brazil – Improving Energy Efficiency and SafetyClaudio Guimarães Alzuguir, CONPET – Programa Nacional da Racionalização do Uso dos Derivados do Petróleo e do Gás Natural & PETROBRAS – Petróleo Brasileiro S.A., Brazil
1327
Topten.info: Market Pull for High Efficiency ProductsEric Bush, Topten International Group, Switzerland
1339
x
Introduction
The residential sector is responsible for a large and increasing share of energy and electricity consumption and the related emissions into the atmosphere. Residential energy demand is also rapidly increasing putting a strain on the available finances and infrastructures of several developed and developing countries. Although recent progress in energy efficiency of major domestic appliances and lighting equipment, new and larger appliances are continuouslyadded to the existing stock. Recently the rapid introduction and expansion of ICT and consumer electronics has contributed to the additional power request from the domestic sector, together with the request for more comfort and large dwellings. This has resulted not only in additional CO2 emissions, but also in a larger strain on the electricity network, contributing to electricity blackouts and other electricity supply problems mainly in developing countries.
By improving energy efficiency of domestic appliances and lighting countries can afford to maintain the present level of comfort, and at the same time avoid large investments in the energy and electricity infrastructure, and even more important avoid an irreversible impact on the environment. Domestic appliances and lighting offers a large untapped energy efficiency potential, which in most cases is cost-effective for the users, as well for the society as a whole.
Energy efficiency improvements in residential appliances and lighting can play a key role in assuring a sustainable energy future and socio-economic development, and at the same time mitigate climate change. Energy efficiency measures related to residential appliances and lighting are among the most cost-effective CO2 emission reduction actions, and offer the best opportunity to increase the security and reliability of energy supply. In developing countries efficient residential appliances and lighting are vital to improve living conditions and reduce local pollution.
However market, policy, trade and information barriers impede the further penetration of energy efficient residential appliances and lighting, resulting in a missed opportunity for climate change mitigation and socio-economic development.
The International Energy Efficiency in Domestic Appliances and Lighting (EEDAL) conference started in 1997 in Florence, filling a gap: there was no energy efficiency conference was dedicated entirely to residential appliances and lighting. The EEDAL conference has established itself as an influential and recognised international event where participants can discuss the latest developments and build international partnerships among stakeholders.
The fifth EEDAL conference was organised in Berlin on 16 to 18 June 2006. EEDAL’09 was of the most successful conference in the series with over 300 participants coming from all continents, representing 26 countries.
The EEDAL’09 conference have been very successful in attracting an international audience, representing a wide variety of stakeholders involved in policy implementation and development, research and programme implementation, manufacturing and promotion of energy efficient residential appliances and lighting.
EEDAL'09 has provided a unique forum to discuss and debate the latest developments in energy and environmental impact of residential appliances and installed equipment, and lighting. The presentations were made by the leading experts coming from all continents. The presentations covered the policies and programmes adopted and planned in several geographical areas and countries, as well as the technical and commercial advances in the dissemination and penetration of energy efficient residential appliances and lighting.
The three-day conference included plenary sessions where key representatives of governments and international organisations and manufacturers presented their views and programmes to advance energy efficiency in residential appliances and lighting. Concurrent

xi
sessions on specific themes, dealing both with technologies, socio-economic issues and policies, allowed in-depth discussions among participants.
The conference presentations highlighted the available technologies to improve efficiency, as well the numerous programmes and policies adopted by developed and developing countries. Among them it emerged that standards and labels are essential component of any country policy set, and these two instruments have delivered remarkable results in a very cost-effective manner. Other market transformation programmes such as procurements, increased information, and smart meters are as well important and more efforts in this area have started. The often forgotten components of the energy demand, the consumer behaviours and the usage patterns, is still a topic of research, and it demands more attention both from policy makers as well as programme design and managers. Energy efficiency in the residential sector is an important component of climate change and sustainable development policies and as such it should be further supported, including financing support and an adequate legislative and organisational framework, by national and international organisation.
This year’s conference focussed on how to improve the energy efficiency of appliances and lighting products traded around the world, through improved technology, better information for consumers, and effective product standards and policies, posing two basic questions:
In all parallel sessions a combination of technologies, programmes and policies were presented.
From the presentations emerged that:• In most countries residential energy consumption, and in particular electricity, is still
growing;• There is still a large, cost-effective saving potential in developed and developing
countries, despite the several policies and programmes implemented (a lot of work in front of us). This saving potential is among the most cost-effective option to reduce CO2.
• Lighting is of particular importance, and it offers a fast solution (CFLs), many countries have started the process if phasing out incandescent lighting, and LED are now a new available technology. Standby is still increasing and needs more attention (could become the largest electricity use, including on-mode of CE and ITC). Coldappliances are still predominant in residential electricity consumption. HVAC and water heating still need attention. Cooking is important for developing countries.
• The need for more data collection on the installed equipment, user, real technical options to better quantify the large saving achieved through programme evaluation, and the remaining.
Among the policy options there is been in many sessions a call for:
• more aggressive and progressive efficiency standards, more use of labels on more equipment, and a stronger enforcement;
• Market based policies to support energy services in the residential sector and rebalancing investments between supply and demand (including distributed generation). This may include white certificates and ‘personal’ carbon allowances.
• More attention to metering, demand response, billing, and consumer feedback.• International Collaborations and partnerships on test methods, efficiency levels and
quality levels, labels • The need to build a strong case for energy efficiency (including carbon and financial
benefits), to assure policy makers on the real saving potential, and bring private investors money.
The book contains the papers presented in the concurrent sessions.
It is hoped that the availability of this book will enable a large audience to benefit from the presentations made at the conference. Potential readers who may benefit from this book

xii
include energy and environment researchers, engineers and equipment manufacturers, policy makers, energy agencies and energy efficiency programme managers, energy supply companies, energy regulatory authorities.
The EEDAL'09 conference was organised by DENA, the German Energy Agency and the European Commission Directorate General Joint Research Centre.

Metering and Smart Appliances
1

2
Smart Metering – a means to promote sustainable energy consumption? Socio-technical research and development on feedback systems
Sebastian Gölz 1; Konrad Götz, Jutta Deffner 2
1 Fraunhofer-Institut für Solare Energiesysteme ISE,
2 Institute for social-ecological Research ISOE, Frankfurt/Main
Abstract
Technical innovation with metering technologies and the possibility of continuous consumption feedback and demand response programs for private homes provide optimism that so-called Smart Metering could contribute significantly to sustainable energy consumption.
The project consortium of Intelliekon funded by the German Ministry for Education and Research focuses on the hypothesis that not only the operation of the technology but also the associated interaction within the socio-technical system contributes to energy conservation in the exemplary field of electricity. Knowledge – provided and specifically displayed by the feedback-system –leads to action by households only if the information can socially and cognitively be integrated into the everyday routines of the recipients.
The ambitious goal of Intelliekon is overcoming obstacles and integrating everyday routines of household members with the perspectives of nine participating utilities and a system provider of smart metering. Transdisciplinarity starts with developing feedback systems by integrating perspectives of social sciences and with those of utilities.
The conclusion from an exploratory study is that it does not make sense to bombard people with real-time data, because it is barely possible to interpret the data. Means of relating and comparing data at manageable intervals are more attractive and helpful as a kind of benchmarking. Visualisation in graphs and the information in general must help consumers to make practical changes in their household habits. It makes sense to give a few but carefully selected and well-designed data views. Along with the conclusions derived from the study, two feedback instruments have been defined and developed and will be operated in a field test at numerous sites.
Introduction: The project “Intelliekon”
Is it reasonable to believe that feedback based on Smart Metering technology stimulates the dissemination of knowledge and motivates more efficient use of household and electronic appliances? Is the use of such feedback instruments so much fun that people will integrate them as an additional feature in their daily routines? Or, do we have to acknowledge the limitation of this innovation due to its current lack of standardisation and have to face a - technically and social scientifically spoken – flash in the pan. These are some of the major questions the project consortium of Intelliekon1 focuses on. The three-year cooperative project is the largest in the German-speaking region area in terms of scope and partners. Its orientation toward practical results renders it specifically promising. Three research institutes (Fraunhofer ISE, ISOE and Fraunhofer ISI), a smart metering system provider (EVB Energie AG), nine German utilities (Energieversorgung Oelde, Stadtwerke Hassfurt, Stadtwerke Muenster, Stadtwerke Schwerte, Stadtwerke Ulm, SVO Energie, Celle, swb, Bremen, SWK SETEC, Krefeld, Technische Werke Kaiserslautern) and an Austrian utility (Linz AG) are working together to test and evaluate jointly developed feedback instruments in a one-year field test with several thousand households. 1 funded by the German Ministry for Education and Research under the Contract 01 UV0804A
3

The project has three phases: 1. Development phase (year 1): for the socio-technical definition and development of feedback
instruments that match household needs and preferences in regard to energy consumption and saving.
2. Field test phase (year 2): using the same feedback instruments in all sites, measuring and documenting energy consumption and use of feedback data, with three scientific surveys of all participating households.
3. Analyze and dissemination phase (year 3): final assessment of the C02 impact of the achieved consumption effects and development of conclusions on the effect of feedback features.
Detailed research questions are presented below, with further information available at www.intelliekon.de.
Smart Metering and sustainable energy consumption
“Smart Metering“ is the advanced intelligent metering of energy consumption with electronic recording of the consumption in small temporal intervals and having bidirectional communication that also allows automated or indirect management of loads according to economic or other criteria. Additionally following functions for energy services can be provided as well [1].
Smart Metering permits [2]:
1. Automated and remote metering reading
2. Information (feedback) for the consumer (also possible for different energy sources, e.g. multi-utility metering) on consumption, costs, CO2 emissions, historical, and current data, including comparisons
3. Remote connection and disconnection
4. Energy management of automated loads and appliances
5. Quality assurance by ongoing power quality monitoring, with identification of voltage sages and power outages
6. Services for local energy feed-in
Technical innovation in metering technologies and the possibility of continuous consumption feedback and demand response programs for private homes provide optimism that Smart Metering could contribute significantly to sustainable energy consumption.
By using digital meters – which will serve customers all over Europe in the future – to monitor the energy consumption of private households at all times, new possibilities will arise to obtain detailed and up-to-date data. This will not only simplify billing for the utilities, but also provide consumers precise data feedback on their energy consumption patterns through visualisation and reporting. Many stakeholders share the expectation that, based on this information feedback, it will be possible for households and small and medium businesses to learn how to save energy in the future.
The technical innovations
At present various technical concepts for Smart Metering are being tested and investigated all over Germany. Here we can only give a very short description on components and possible systems [3]: A digital meter collects energy consumption data and replaces the mechanical Ferraris meter. A data concentrator can be placed in the household to collect data from different energy sources or can be situated near a local transformer to collect the data from several hundred households. Data processing is normally offered by the service provider, i.e. the utility or a metering company.
To be marketable, smart meter communications systems must offer reliable bidirectional communications along all positions of the distribution line. The communication infrastructure often
4
must be adapted to local conditions and turned out to be the most failure prone element in the system. Additionally communication between components of different suppliers often is not possible as standards are not (yet) defined, and many suppliers use proprietary protocols.
The most common communications medium between meters, data concentrator and the data processing center is power line carrier (PLC). In these cases, the data concentrator is usually in the nearest substation; from there the information is – due to the technical limitations of PLC – transferred via mobile phone lines / radio (GSM/GPRS) or a wire-based medium (i.e. DSL) to the data processing center [4].
The political frameworks
The target of the EU directive on energy end-use efficiency and energy services 2006/32/EG [5] is energy savings of 9% in each EU-member state by the year 2015. This directive and the German federal laws concerning the liberalisation of the energy market and the metering service companies promote the dissemination of the technology.
In German Federal legislation, the amendment of the Energy Economy Law (EnWG) [6] has established the rapid liberalisation of meter reading services. According to the law, beginning in 2010, it is obligatory for metering service companies to install meters which collect actual consumption and time of use. This will stimulate the wide-spread installation of Smart Meters in households.
State of the art
The importance of sustainable energy consumption is increasing because of both environmental concerns and also rising electricity costs. Though households report an interest in saving energy [7], use of new appliances and the continued operation of old appliances in parallel lead to the so called rebound effect [8] - meaning the saving effects of the new appliances are neutralized. Psychological studies show that feedback promotes a decrease in energy consumption. The effects of feedback on electricity consumption are summarized in three review papers.
Fischer [9] screened 26 studies on feedback from 11 countries in the years 1987 until 2007. She concentrated on studies which focused directly on feedback. According to her findings feedback led to energy savings between 5% and 12%.
Darby [10] reports energy savings between 5% and 15% for direct feedback, i.e. display of actual consumption on the meter or a screen. Between 0% und 10% savings have been attained with indirect feedback, which is processed information, mostly the electricity bill.
Abrahamse und Steg [8] reviewed 38 papers from 1977 through 2004 with several interventions promoting energy saving in households. In the case of feedback they confirm its effectiveness, which is stronger if it is provided frequently. The effects differ between households with low and high consumption. No difference is reported for the feedback of costs or environmental impacts, as well as for individual feedback or social comparisons.
Most studies deal with effects of feedback and some with factors which influence the scale of effects [8]. Virtually none of the studies describes the mechanisms which lead to the effectiveness of feedback. Wilhite und Ling [11] support compatibility in the way feedback is displayed and the way consumers analyze their consumption and make decisions about alternative consumption patterns. More insight into these psychological processes could help to optimize the technical part of the feedback system and develop it adequately to meet consumers’ needs – eventually including specific differences for different target groups.
The project Intelliekon is investigating the way that households use the feedback implemented via smart metering. Both the preferences for information provided as well as the reasons that motivate behaviour that comes into play from the feedback will be analyzed, and their role in causing changes in the use of electrical appliances (and household consumption) will be assessed.
5
Methods of the research
On the one hand, the empirical project is be based on the concept of household functions meaning that the use of feedback systems has to be compatible with everyday life routines like washing, cleaning, cooking, raising children, information management, household organization, entertainment, etc. On the other hand, it is assumed that societal mores as well as personal goals, attitudes and orientation will influence energy consumption and the acceptance of feedback information.
Within a qualitative and quantitative empirical approach two problems are addressed: the societal problem of unsustainable energy use at the household level and the everyday problem of the fact that households do not yet have direct access to data about their energy consumption which could have an effect on energy use. So the questions arising from this focus on the following:
- Do consumers use information feedback information provided in the field test? Is the use of feedback systems compatible with everyday life routines of the users and their household members?
- How are socio-demographic aspects (like household size, gender, income, and age) related to power consumption on the one hand and the use of feedback systems on the other? Is there a relationship between individual preferences and motivations and the use of feedback instruments?
- How does use of feedback instruments correlate with electricity consumption? And what is the result if the effects are projected for the whole country’s population?
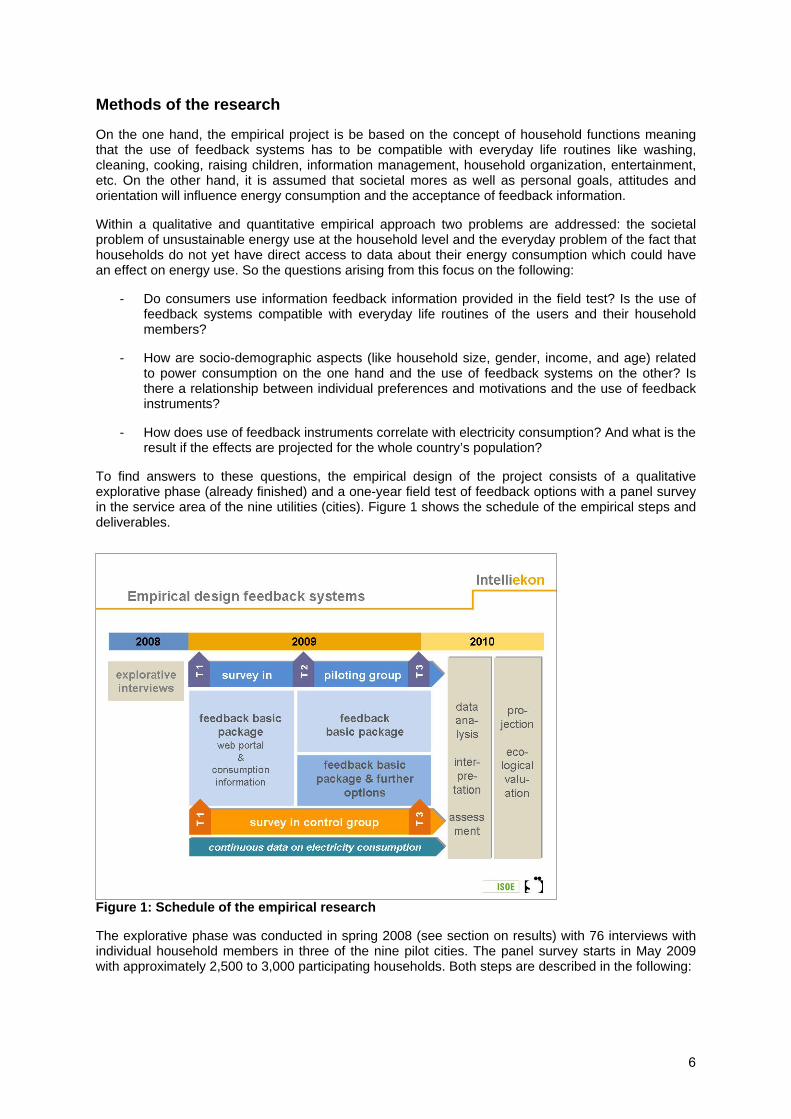
To find answers to these questions, the empirical design of the project consists of a qualitative explorative phase (already finished) and a one-year field test of feedback options with a panel survey in the service area of the nine utilities (cities). Figure 1 shows the schedule of the empirical steps and deliverables.
Figure 1: Schedule of the empirical research
The explorative phase was conducted in spring 2008 (see section on results) with 76 interviews with individual household members in three of the nine pilot cities. The panel survey starts in May 2009 with approximately 2,500 to 3,000 participating households. Both steps are described in the following:
6
Explorative pilot study
The function of the qualitative empirical step was to gather initial evidence on different feedback options in different social groups, especially on the valuation of the subjects’ electricity and their motives for saving energy. A second aim was to gather initial reactions on continuous feedback of electricity use in households. Thirdly it was to explore the needs of the users/consumers regarding the feedback instruments. The whole design should contribute to developing research hypotheses and good phrasing for the standardised questionnaire design.
A qualitative study was the optimal design, as it enabled interviewees to express themselves in everyday language. This is important for understanding the subjects’ contexts and daily routines and for being able to interpret motivations [12]. In four of the pilot cities (Bremen, Kaiserslautern, Muenster, Schwerte) a total of 76 in-depth interviews were conducted [13] in spring 2008. The sample was socio-demographically distributed by age, gender, social status, household size, and households with and without children. The aim of this sample scheme was to form a sample which represents as much as possible relevant and typical combinations of attributes and attitudes. The interviews lasted between 60 and 90 minutes and were digitally recorded. The analysis was done after transcription by computer assisted qualitative data analysis (caqda) and coding referring to content analysis [14]. The analysis allows vertical (analyzing one case) and horizontal (analyzing one topic over all cases) interpretation. The topics of the prepared interview guideline were the basis of the data analysis. Among the topics of the interview guidelines were:
- socio-structural, and cultural background: household description, internet usage, and appliance holdings of the household
- Feedback visualisation and functionality: discussion of six feedback visualisations
- Handling feedback systems in three concrete options: informative overview of paper via mail, an energy display, and a web-based energy portal
Panel survey
During a one-year pilot phase, households will be surveyed in the partner utilities’ service areas regarding different feedback instruments. The objectives of the panel study are to specify the relationships between electricity consumption, household size and formation, appliance holding of households, social structure, attitudes on energy consumption and saving, and attitudes toward , as well as to evaluate the feedback options. With this data in combination with the continuous data on energy consumption, a projection will be developed on the saving potential of feedback systems in the context of Germany via computational modelling.
To achieve this, a treatment and control group design was chosen. The basic concept is that all treatment participants will be testing two basic feedback instruments (informative electricity mail and web portal) over a six-month time span. After this time period, the participants will be able to chose an additional (basic package is ongoing) option for a time span of another six months. The expected options will be personal energy consultations, energy displays, and tariff options offered by the utilities.
To monitor the use and effects of the feedback instruments, a panel survey with three interview periods will be conducted. The first will be in May 2009, the second at the end of testing the basic feedback option, and the third during testing of the additional options (beginning of 2010). To be able to compare the behaviour and opinions of feedback users and non feedback users, the study design includes a control group. The control group guarantees that external effects that may influence behaviour concerning energy consumption (increasing energy prices, framing by media etc.) are accounted for. The control group will also have digital electricity counters but no access to the feedback instruments. The relationship in sample size between the treatment and control groups will be 2/3 to 1/3. The approximate sample size in total will be between 2,500 and 3,000 participants (households) from the service areas of the nine utilities. The survey will be conducted as CATI (computer assisted telephone interview): The control group will be surveyed at the beginning and during the final questionnaire period. The selection of households which are equipped with new smart metering technology by the utilities is not representative of the total population. Thus it is necessary to describe and evaluate the sub samples concerning representative distribution in the different cities by
7
Fun / hands-on approach to technology
Fun / hands-on approach to technology
Economy and control
Economy and control
Challenge, efficiency
orientation
Challenge, efficiency
orientation Socialisation Upbringing
Socialisation Upbringing
No benefit / no point
Disinterest / inability
No benefit / no point
No benefit / no point
Disinterest / inability
Disinterest / inability
Existential economy
Economy mentality
Existential economy
Existential economy
Economy mentality Economy mentality
Environmental protection /
reducing CO2
Environmental protection /
reducing CO2
Problem of data privacyProblem of
data privacy
inte
rest
in a
nd a
ccep
tanc
eof
feed
back
info
rmat
ion
high
low
comparing it with data from the micro census2.Data analysis will be done using social science statistical software. The dependent variables in the statistical analyses will be the current electricity usage and the use of the feedback instruments. Beside univariate analysis of data and descriptive results on the acceptance of feedback and energy consumption, there will be testing of hypotheses via correlation analysis and inter correlation analysis (e.g. multivariate analyses, multiple regressions); factor analyses and cluster analyses will be conducted to develop target group models.
Results from the explorative study
As the project will start its core phase, the field testing of feedback instruments, only in May 2009, the main results so far are from the qualitative study and the development of the feedback instruments. These results are described in the following sections
The objective was to provide initial pointers on options for feedback systems desired by different social groups. As already mentioned, the initial question was to find out about the relevance of electricity and electricity-saving issue in different social groups. Secondly we looked for initial reactions to the idea of regular feedback to inform people of their own electricity consumption. Thirdly we did an analysis of desired configurations based on the example of three feedback options and seven forms of presenting the data.
The results focus on general reactions towards the feedback and on selected reactions towards the three specific feedback instruments (informative overview, display, web portal).
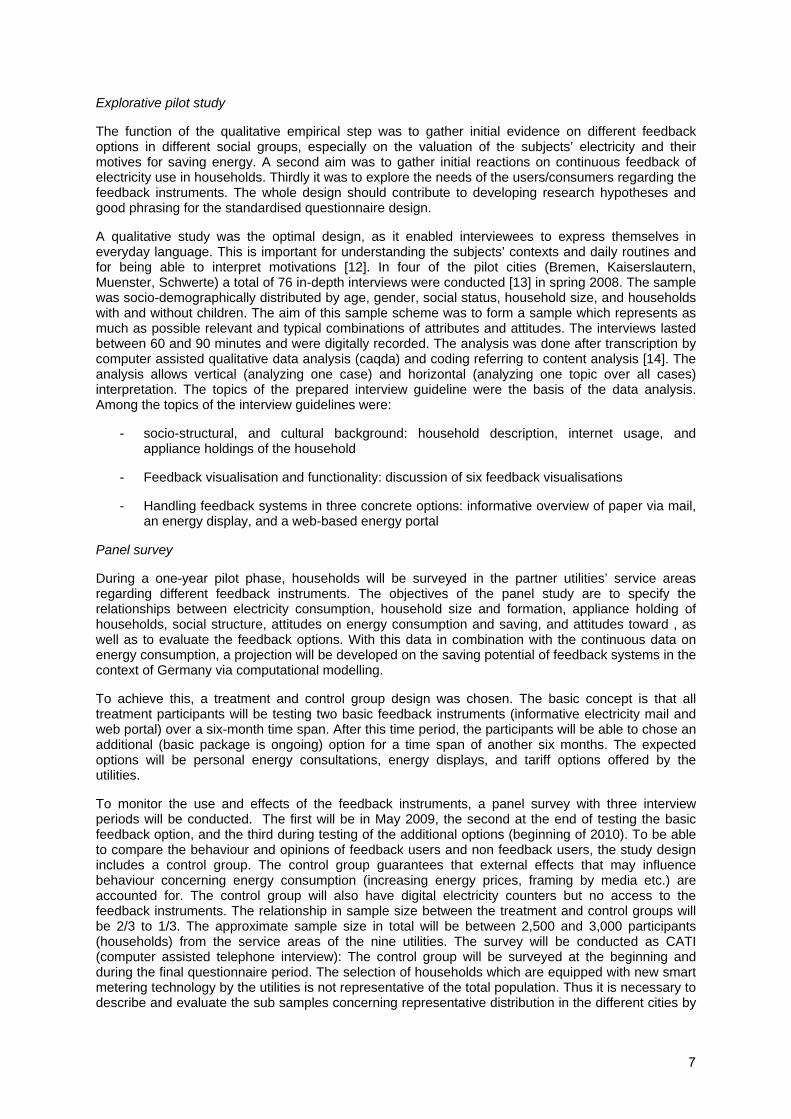
General opinions on feedback information
In the majority of cases, people show interest and take a positive view of receiving feedback and draw practical conclusions from this. But also there are three reluctant or negative sub-groups. One large sub-group is open-minded to the idea of saving energy, but sees no way of cutting down consumption any further. A second, small sub-group wholly rejects the idea of feedback or is indifferent to it. This was expressed by a feeling that one’s behaviour is under surveillance or that the feeling was one of scepticism or pointlessness. A third sub-group is physically, cognitively or socially incapable of adequately processing the information and drawing conclusions from it.
2 The micro census is a statistical census by the Federal Statistical Office, in which selected – along specific criteria - households participate. The number of households is set to secure representativness of results. The micro census is used to control data from population census in repeated(shorter) periods of time and correct it if necessary.
8

An overview of the different reactions towards the feedback given is shown in fig. 2.Figure 2: Overview of reactions towards feedback – overlapping boxes indicate a possible connection between motivations (motivational-alliances)
Key motivations in favour of feedback
The first and most important positive motivation is economy and control. In the first instance, this is a practical, economic orientation based on traditional values. From this perspective energy saving must not, however, restrict living standards and lifestyle. It is more to the contrary: it should be a chance to save money to be spent on something else. In the second instance, control means survival amongst households in precarious circumstances, a must for surviving on the financial means available.
A second motivation to vote for feedback is competitiveness and a modern efficiency orientation. Energy savings is seen as a sporting challenge for an efficient and intelligent approach to energy as part of the rational everyday operation of a modern household. The third motivator we found is social responsibility and upbringing. It is seen in family households as a chance for communication within the family, as an instrument to educate children to save, and as a basis for discussion of energy-saving behaviour. Last but not least, there is the motive of environmental protection/CO2 reduction. It is an intrinsic motivator for those of an ecological persuasion. For others the climate change phenomenon is seen as a rational motive for assessing one's own electricity consumption.
Occasionally a motive is visible on a different level: a fun and hands-on approach to technology. Some interviewees found interesting the offer of technical feedback which sparks curiosity and interest in trying it out in a hands-on way. Technical features of this kind can have a symbolic meaning as a prestigious gadget.
Key attitudes against feedback
Some of the respondents are against feedback instruments because of the problem of data privacy. They expressed concerns about lack of data privacy or protection of personality rights. They realise that a large amount of household-related data will be generated, which could end up in the wrong hands and so they see the risk of a too-transparent customer.
There is also an important group which shows strong indifference: these interviewees do not see any benefit and no point because of disinterest in or rejection of the technology. In this group there is a general dislike of the topic, being uninformed about it. They are questioning the benefit, being convinced that they are already using very little electricity.
There is a third subgroup that is totally disinterested or shows an inability to use a feedback system. On the one hand, for elderly people, there is an age-related focus on just coping from day to day. The second inability is due to social disintegration like language barriers or a lack of cognitive logic.
Reactions towards proposed three feedback options
Feedback option “Informative consumption overview in writing with graphs”
The rejection of this feedback information results mainly from modern internet users, which have become the majority. Information in writing via mail seems to be an anachronistic way of getting information. Besides that, it is presumed that additional costs are produced to make the overview available for the consumers (mailing costs). This lessens the acceptance.
Support for this option is expressed by a minor group for whom feedback on paper is a conventional and familiar medium. From this perspective this option seems to be convenient information without having to become active. The information in writing is welcomed above all by elderly people and those without internet access or any affinity for the internet. Because of this clear segment it seems to be meaningful for selected target groups as basic information in appropriate intervals, e.g. on a monthly basis.
9

Feedback option of a in-home display, so called “Energy Box”
The Energy Box is small display which is able to show current (15 min interval) power consumption in the household in numbers. The display can be used in any room of the house, either cordlessly or plugged into a power socket.
There is limited interest in this option. For potential users it seems to have not much direct benefit and there are doubts about its effectiveness. There arise questions like this: Is there any graphic information? Is there any possibility of memory-based comparison of weeks, days, months? If not, the box gets even more unattractive. Besides this, the Energy Box creates a feeling of surveillance and potential for conflicts. One participant of the study noted, “If I have to monitor consumption every day, it will take away somewhat from my quality of life.” Additional there is fear of additional costs (for the box) and an expectation for being interested only for a limited period: “A nice toy for a week, then you lose interest.” Some foresee even practical restrictions, like the limited number of available power sockets at an easily viewable visual height.
The option of the Energy Box sparks spontaneous curiosity in some: “fascinating, interesting”. The real-time representation of current electricity consumption enhances a direct learning process and seems to motivate some of the respondents to investigate unnecessary sources of consumption, to avoid peak loads, and to identify the base load. Also it is apparent that the box could develop symbolic qualities like an ‘on-board computer’ in a car and can become a topic of discussion in the family and among friends.
Feedback option “Web Portal”
There is broad approval of the web portal as a contemporary feedback medium offering lots of interesting options: it seems possible to individualize representation of data, allows fast and flexible access to information, and invites hands-on, creative use. There are attractive additional functions (e.g. energy-saving tips), and it is perceived to be free of charge. This option seems to be a general source of feedback which is viable for the future.
Those rejecting this option either have an aversion towards the internet (too alien, too virtual) – most of them have no internet access at home – or they shy away from the effort of logging in (the problem of increasingly difficult to remember login data arose often). From the perspective of some respondents, the internet solution is considered to be time consuming and impossible to integrate naturally into daily routines, particularly for busy women with multiple responsibilities (job/mother/household).
Conclusion from the exploratory study
Useful feedback instruments have to take several items into consideration. It does not make sense to bombard people with just-in-time data, because it is barely possible to interpret them. Means of relating and comparing data at manageable intervals are attractive and helpful as a kind of benchmarking. The visualisation in graphs and the information in general must help consumers to make practical changes in their household situation. It makes sense to give a few but carefully selected and well-designed and informative displays.
From our point of view it is recommended that the web portal be introduced as a general feedback instrument, with the possibility of interactive features. Within this, internet users can chose their favourite charts on for a year (comparison of the months), half a year (comparison of the weeks), a month (comparison of the days), a week (days), or a day (hours). It should be possible to choose between graphs (bar charts), tables and a combination of tables and charts.
As an additional option it makes sense to offer a printed informative consumption overview with one or two graphs/bar diagrams for customers without internet access as mandatory for the disinterested. Concerning the Energy Box, it should be possible to lease displays at the utility’s customer care centre for a low fee or to purchase it by those interested. Further it is an indispensable precondition for efficacy to have the option of a personal electricity consultation and assistance in interpreting the feedback, along with pointers for possible action and energy-saving tips (energy-related advisory service).
10
Development of the feedback systems
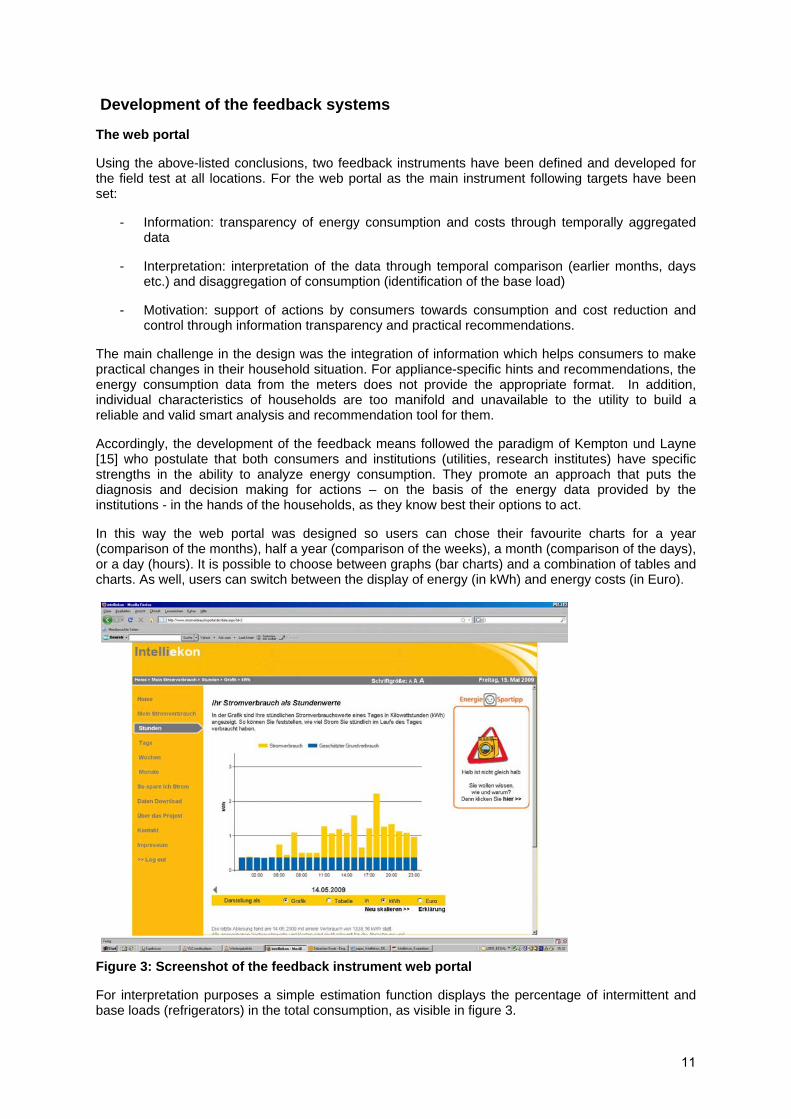
The web portal
Using the above-listed conclusions, two feedback instruments have been defined and developed for the field test at all locations. For the web portal as the main instrument following targets have been set:
- Information: transparency of energy consumption and costs through temporally aggregated data
- Interpretation: interpretation of the data through temporal comparison (earlier months, days etc.) and disaggregation of consumption (identification of the base load)
- Motivation: support of actions by consumers towards consumption and cost reduction and control through information transparency and practical recommendations.
The main challenge in the design was the integration of information which helps consumers to make practical changes in their household situation. For appliance-specific hints and recommendations, the energy consumption data from the meters does not provide the appropriate format. In addition, individual characteristics of households are too manifold and unavailable to the utility to build a reliable and valid smart analysis and recommendation tool for them.
Accordingly, the development of the feedback means followed the paradigm of Kempton und Layne [15] who postulate that both consumers and institutions (utilities, research institutes) have specific strengths in the ability to analyze energy consumption. They promote an approach that puts the diagnosis and decision making for actions – on the basis of the energy data provided by the institutions - in the hands of the households, as they know best their options to act.
In this way the web portal was designed so users can chose their favourite charts for a year (comparison of the months), half a year (comparison of the weeks), a month (comparison of the days), or a day (hours). It is possible to choose between graphs (bar charts) and a combination of tables and charts. As well, users can switch between the display of energy (in kWh) and energy costs (in Euro).
Figure 3: Screenshot of the feedback instrument web portal
For interpretation purposes a simple estimation function displays the percentage of intermittent and base loads (refrigerators) in the total consumption, as visible in figure 3.
11

Several components have been introduced to increase the motivation to undertake and practical knowledge of energy saving measures. The screen in the web portal was divided into several areas to serve for navigation, consumption data presentation and to provide a link to the energy saving recommendations – which was done via a graphical teaser to attract the user’s attention to practical knowledge quickly. For the teasers, adapted traffic signs are expected to provoke surprise and curiosity. In addition a systematic approach through the navigation permits a game to increase motivation for energy saving and to finalise the game as “energy saving king / queen”. For a more analytic approach, energy saving hints are structured along the different rooms and according to the appliances of German households. Last but not least, more curious individuals can browse additional information on energy saving under the category “Do you know …?”. A data download function and contact possibilities for inquiries are also included.
Monthly consumption information
The monthly printed consumption information will use graphs, tables and energy saving recommendations from the web portal and adopt the graphical design. It will comprise not more than two pages, will be printed in colour and sent via paper mail. This feedback instrument will fulfill the legal obligation of utilities from 2010 onwards to provide on request a monthly bill.
Discussion and way forward
The development of the feedback instruments has to acknowledge technical and also legal limitations. These concerns range from the collection and transmission of more frequent metering readings to providing more detailed analysis tools. Here the main concern is the disturbance of the privacy and data security. The planned use of hourly consumption data seems a practical compromise between consumers’ expectation and reasonable systems design and operation costs of the communication technologies.
Nevertheless it can be stated, based upon the previous results, that a rather broad interest exists in different household segments in feedback based on smart metering, , as well as different motives for its use. This confirms the overall research strategy to undertake a socially-differentiated analysis. Here the size of the final sample is the crucial issue and can vary due to the voluntary participation of households. With a population about 6,000 households a large sample can still be achieved that will allow the scientifically-ambitious comparison study with the control group.
The empirical design was approved by all of the industrial partners, so it can be run effectively. Regarding the achievement of the intended project goals, the current status has to be assessed highly positively. The expectation is to be able to report the results of the panel study a year after this publication in the same or similar publications.
12
References
[1] DRAM (2008): Definitions. Demand Response and Advanced Metering Coalition (DRAM). Can be downloaded at: http://www.dramcoalition.org/id19.htm
[2] IEA (2007): DSM Spotlight - DSM on the Rise. IEA Demand-Side Management Executive Commitee. Can be downloaded at: http://www.ieadsm.org/Files/Exco%20File%20Library/Annual%20Reports/IEA%20DSM%20Annual%20Report%202007.pdf
[3] Fraunhofer ISE (2007): AP 2.1 Internationale Feldstudien und AP2.2 Potentialstudien. Internal unpubished research report in the project „E-Box“. Fraunhofer Institut für Solare Energiesysteme (ISE), Freiburg.
[4] Noeren, D. (2008). Entwurf zur soziotechnischen Begleitforschung im Feldversuch eines Smart-Metering-Systems. Unpublished Master thesis, Fraunhofer Institut für Solare Energiesysteme (ISE), Freiburg.
[5] EU (2006): Directive 2006/32/EG of the European Parlament and of the Council. European Union. Can be downloaded at: http://eur-lex.europa.eu/LexUriServ/LexUriServ.do?uri=OJ:L:2006:114:0064:0085:EN:PDF
[6] German Bundestag (28.02.2008): Entwurf eines Gesetzes zur Öffnung des Messwesens bei Strom und Gas für Wettbewerb. Drucksache 16/8306.
[7] Mansouri, I., Newborough, M., Probert, D. (1996). Energy Consumption in UK Households: Impact of Domestic Electrical Appliances. Applied Energy, 54 (3), 211- 285.
[8] Abrahamse, W., Steg, L. (2005). A review of intervention studies aimed at household energy conservation. Journal of Environmental Psychology, 25, 273–291.
[9] Fischer, C. (2007). Influencing Electricity Consumption via Consumer Feedback. A Review of Experience, TIPS Discussion Paper 8. Verfügbar unter: http://www.tips-project.de [7.11.2008]
[10] Darby, S. (2006). The effectiveness of feedback on energy consumption. A review for DEFRA of the literature on metering, billing and direct displays. Can be downloaded at: http://www.defra.gov.uk/environment/energy/research/pdf/energyconsump-feedback.pdf
[11] Wilhite, H., Ling, R. (1995). Measured energy savings from a more informative energy bill. Energy and Buildings, 22, 145-155.
[12] Giddens, Anthony (1984): Interpretative Soziologie. Frankfurt a. M. (in German)
[13] Witzel, Andreas (2000). Das problemzentrierte Interview [26 Absätze]. Forum Qualitative Sozialforschung / Forum: Qualitative Social Research [On-line Journal], 1(1). Can be downloaded at: http://www.qualitativeresearch.net/fqs-texte/1-00/1-00witzel-d.htm (in German)
[14] Mayring (1995): Qualitative Inhaltsanalyse. In: Flick, Uwe; Ernst von Kardorff; Heiner Keupp; Lutz von Rosenstiel; Stephan Wolff (1995): Handbuch qualitative Sozialforschung. Weinheim (in German)
[15] Kempton, W., Layne, L. (1994). The consumer’s energy analysis environment. Energy Policy, 22 (10), 857-866
13

“Nice to Know” - metering and informative feedback
Ellen Christiansen* & Anne Marie Kanstrup**
*University of Southern Denmark, **Aalborg University
Abstract
The appropriate information to the customer at the appropriate time is a recipe for influencing consumers to conserve electricity. The Feedback project, from which this paper reports, is a case in point. The idea is to exploit the information possibilities afforded by online metering. This information can be fed back to the consumer, thereby raising awareness of electricity consumption, which may lead to conservation behavior. In connection with a larger experiment with new forms of feedback, we conducted qualitative interviews with 22 families about their one-year experience with receiving feedback via SMS and/or e-mail, to understand how they experienced the feedback. Here we present an analysis of narratives derived from these interviews. We identify three levels of sense-making in which a relationship is established between stimulation and interpretation: (a) the recall of the potential action space, (b) a sense of identity of being an acting electricity consumer, which may or may not spill over to (c) choices when buying appliances, educating children etc. The paper puts this insight into a design perspective, suggesting that design of feedback about metering and billing should consider the practices in which this information plays a role, such as careful housekeeping, storytelling to friends and family, and education of children. Taking customer practice as point of departure could lead to development of a new type of services, which in turn can support conservation behavior. Introduction
Electricity consumption in private households makes up a significant part of the total consumption of electricity both in industrial and developing countries [1]. In Denmark, where this research was conducted, households stand for 1/3 of the total electricity consumption [2]. Initiatives toward electricity savings in private households include technological development of online feedback and automatic controls, and behavior change through feedback and information service, as well as the development of low energy appliances for households, control management and automation. In Denmark it is estimated that use and innovation of present and future control systems can reduce electricity consumption with up to 30% (www.danskenergi.dk). Effort is put into developing intelligent houses and equally effort is put into campaigns for motivating households to change to electricity-conscious behavior. It is estimated that households can make a 26-33% savings on their electricity consumption by behavioral change only [3], provided households’ difficulty in seeing the effect of their contribution to electricity saving is overcome. Initiatives such as Google’s 2009 launch of a ‘power-meter’ http://www.google.org/powermeter/howitworks.html indicates that there are more savings to be harvested by involving web 2.0 activities.
Studies of household electricity consumption point to households being units of varying stability, values and habits. Background variables such as family type, income, education, and the size of the house explain 40% or more of variations in electricity consumption in private households [5]. However, studies also show that feedback for motivating electricity conservation is a quite complex task where personal values, attitudes and social norms regarding environmental behavior play only a minor role compared to structural conditions, such as home size and family size. In other words: green attitudes and electricity consumption are not closely related. One of the reasons for this is the invisible nature of electricity consumption. Additionally, a pronounced reduction in electricity consumption may compromise comfort in the everyday life and may have a disturbing effect on daily routines [4]. As elaborated by Kuehn [5], electricity consumption is a direct or indirect consequence of other fields of consumption. This, and the invisible nature of electricity, means that its consumption is often an un-reflected part of everyday life.
Naturally, making electricity consumption visible has significant influence, and experiences with electronic feedback have measurable effects. There are experiments with electricity meters, monitors and PC-applications [1, 6]. On the basis of a review on metering, billing, and direct displays Darby concludes that “Monitors would be most useful if they showed instantaneous usage, expenditure and
14
historic feedback as a minimum, with the potential for displaying information in microgeneration, tariffs and carbon emissions” [6, p. 17]. However, consumer behavior research related to motivation psychology stresses that making electricity consumption visible is not enough, hence a call for empowerment of consumers. It is pointed out, that “limited abilities and restricted opportunities ... make it difficult even for highly motivated individual to do anything radical to improve the sustainability of their lifestyle” [7, p. 167]. Empowerment involves competence, relatedness, and autonomy [7]. Similar results are found in recent design experiments like ‘222b Lee High Road’ where RED (http://www.reduk.net/) worked on how to strengthen policy towards domestic energy use starting from a householder centered design approach. Design leads from this work are: the importance of making energy visible, design for control, appealing to multiple motivations and collaboration [8].
Generally, the literature can be read as a warning of underestimating the complexity of human behavior in design of feedback. As stressed by Costanzo et al. [9] often used and too simple theories on conservation behavior are ‘the attitude model’ and ‘the rational-economic model’, which, however, turn out to have limited explanatory power when confronted with empirical data.
In this paper we present an analysis of 22 qualitative interviews with households about their experience of receiving feedback about electricity consumption via SMS or e-mail for a year. After accounting for method and data we report our findings and their bearings on design of feedback.
Method and Data
This qualitative study of customer demand for online feedback on electricity consumption in private households in Denmark is a follow-up on an experimental study where SMS and e-mail notification were tested as media for giving feedback to private households (the Feedback Project: ‘Dansk Energi, Project nr. 338-020’, http://feedback.noe.dk1). In this experiment 1,432 households were randomly allocated to three experimental groups and two control groups. The acceptance rate for participation was 31 %. The treatment in experiment group 1 (105 households) was frequency based feedback, in group 2 (94 households) it was deviation based, and in group 3 (108 households) it was limit based. ‘Frequency based’ implies that feedback is sent out every day, week or month. ‘Deviation based’ means that the feedback is sent out if the electricity consumption during this period (day, week or month) deviates with a certain percentage compared to the consumption in the previous period. ‘Limit based’ means that the feedback is sent out, if the current electricity consumption is very low or very high compared to the consumption in previous periods. In all treatment-groups most households chose e-mail as their medium of feedback, fewer SMS, and only 12-13% chose SMS and e-mail. This experiment has been thoroughly reported elsewhere, including the selection of participants and their allocation to various experimental and control groups and the effects of the feedback interventions on the household’s electricity consumption. In the experiment the median participating household in experiment group 2 and 3 reduced consumption by 3% corresponding to 135 kWh. [10, 11]. In the follow-up study reported here, we interviewed 22 households, about the experience of receiving feedback about their electricity consumption, for details see [12] 24 households were selected for interviews, eight from each experiment group. In order to get a reasonably covering picture the participants were recruited by means of a screening questionnaire, designed to identify the main types of electricity consumers [13]. All 307 participants in the experiment were approached for participation either pr. e-mail or ordinary mail. At deadline, 67 persons had returned a partly or fully filled out questionnaire, which gives a response rate of 22%. Respondents are 67/33% men/women, age range 36 - 76 (average 54.6), average household size was 2.5 persons, the sample distribution of monthly household income in DKK was: 1.5% less than 8000, 13.6% between 8000 and 14999, 27.3% between 15000 and 29999, 22.7% between 30000 and 49999, 27.3% between 50000 and 69999 and 7.6% over 70000 DKK.
1 The aim of the Feedback project is to develop and test new concepts for the utillities’ communication with households about their electricity consumption at the end-use level (feedback), and to give a scientifically based answer to the question: Does online feedback about electricity consumption generate electricity savings, and will the savings increase if the feedback is given at the final consumption level (i.e. electricity consumption of the specific appliance) compared to a situation in which it is given as the summary electricity consumption at household level? The project is running from 2006 – funded by the Danish Energy Association.
15

The six questions of the questionnaire were designed to classify respondents regarding electricity consumption as economic, environmentalist, busy, or indifferent, respectively. Principal component analysis and correlation analysis were used to establish whether the six questions could be assumed to reflect a number of latent dimensions or variables. Cluster analysis was applied to test if the questions identified clear, distinct, and large enough groups to be practically interesting. As a result we ended up having two clusters: cluster 1 ‘the indifferent regarding electricity consumption’, who scores neutral on all questions, and cluster 2, in numbers the double of cluster 1, ‘the engaged regarding electricity consumption’, who emphasize saving of money as well as care for the environment. The 24 households were drawn conditionally random, so that three from each experiment group were drawn randomly from each of the two clusters, which implies that cluster 1, the indifferent’ were overrepresented compared to their share of the 67, but not necessarily of all 307. The foundation for a valid outcome of qualitative interviews is a certain amount of trust between informant and interviewer [14]. Hence we put a lot of care in making the appointments with the households, explaining the purpose, our way of working etc. We called up by phone, in many cases more than once for explaining and (re)scheduling. Many households suggested doing the interview over the phone, but we argued that sitting down in the home environment would allow them to remember many more details, and allow us to get many more ideas for asking additional questions. The interviews were for the most part conducted at the dinner table, and none had objection to us using a tape recorder. Two households canceled on the day of the visit. Each of us conducted 11 interviews in a three-day period in May 2008. We were ready to discuss the problems with data delivery that occurred during the experiment, but only few informants mentioned the instabilities, and that without much emphasis. The conversations lasted from half an hour to one hour, where we tried to map out the participants experience and interpretation of the received information, what they remembered having received, and their motivation. We asked if the household had saved electricity in the period, what they had done in order to save electricity, if they had changed daily routines, what their overall experience of the feedback was, when, how and by whom the feedback was received, whether the feedback encouraged conservation behavior, and which types of cut downs they favored. In addition, they were invited to build their own preferred electricity saving aid from a toolbox we had designed in order to be able to include their hopes and dreams about support for electricity conserving behavior. In another study within the FEEDBACK project these authors worked with eight families on designing interfaces for on-line feedback on electricity consumption [13]. In order to also include a design perspective, we presented the interviewees with a box of 9 possibilities for electricity saving support: Regarding automation they could choose automatic turn off the light if no movements within the last ten minutes. Regarding behavioral change they could choose to do laundry at night, and regarding social competition they could choose to engage in on-line communities combating on electricity savings. They could also focus on change of devices, see photo 1. The interviewees were also offered the possibility of labeling boxes themselves. When analyzing their choices in relation to adherence to ‘the indifferent’ or ‘the engaged’ no significant pattern of preferences emerged. All interviews were transcribed and analyzed. In the analysis we looked for
• expressions regarding the key purpose of the experiment, the effect given certain forms (frequency, deviation, limit based) of feedback in certain media (SMS/e-mail/SMS+e-mail). The interviewee’s did not seem to recall form of feedback beyond notification, but they remembered correctly the media in which they received the message.
• expressions indicating how much, where, and how often the families wanted feedback about electricity consumption.
The interview guide was built on issues related to the experiment as well as to related work mentioned in the introduction to this paper, and these authors’ prior research within the FEEDBACK project [13]. At this stage of the analysis we applied
16
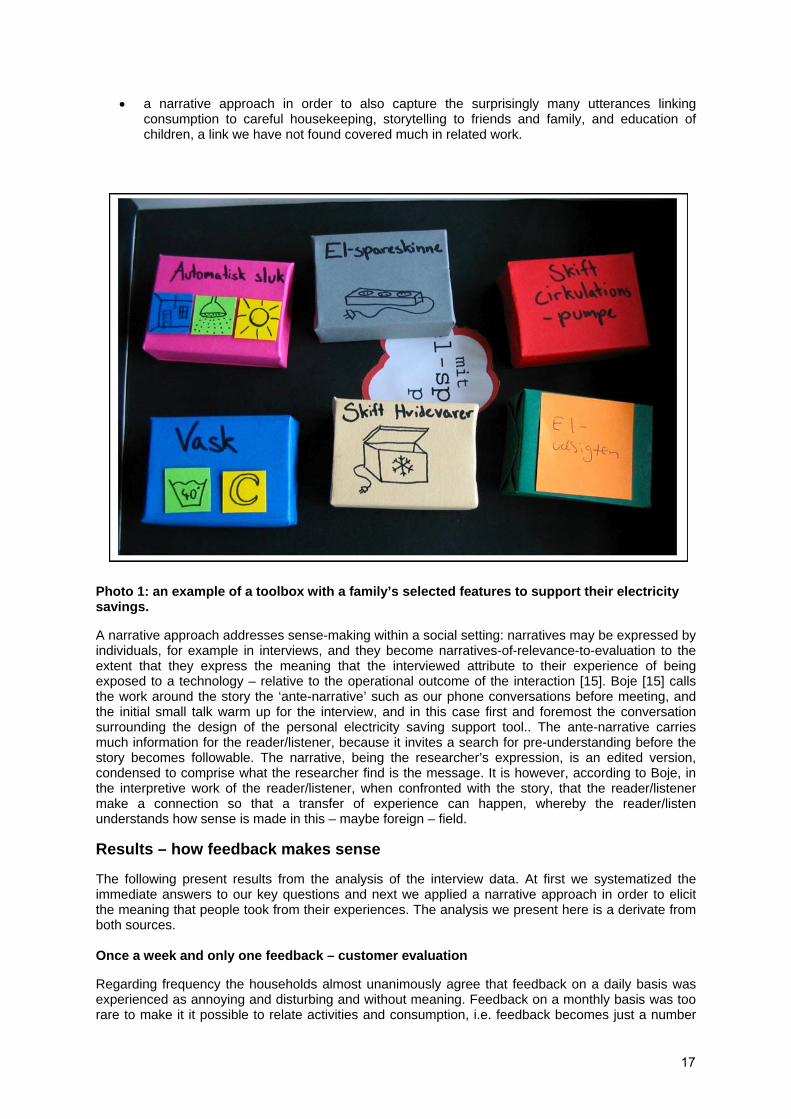
• a narrative approach in order to also capture the surprisingly many utterances linking consumption to careful housekeeping, storytelling to friends and family, and education of children, a link we have not found covered much in related work.
Photo 1: an example of a toolbox with a family’s selected features to support their electricity savings.
A narrative approach addresses sense-making within a social setting: narratives may be expressed by individuals, for example in interviews, and they become narratives-of-relevance-to-evaluation to the extent that they express the meaning that the interviewed attribute to their experience of being exposed to a technology – relative to the operational outcome of the interaction [15]. Boje [15] calls the work around the story the ‘ante-narrative’ such as our phone conversations before meeting, and the initial small talk warm up for the interview, and in this case first and foremost the conversation surrounding the design of the personal electricity saving support tool.. The ante-narrative carries much information for the reader/listener, because it invites a search for pre-understanding before the story becomes followable. The narrative, being the researcher’s expression, is an edited version, condensed to comprise what the researcher find is the message. It is however, according to Boje, in the interpretive work of the reader/listener, when confronted with the story, that the reader/listener make a connection so that a transfer of experience can happen, whereby the reader/listen understands how sense is made in this – maybe foreign – field.
Results – how feedback makes sense
The following present results from the analysis of the interview data. At first we systematized the immediate answers to our key questions and next we applied a narrative approach in order to elicit the meaning that people took from their experiences. The analysis we present here is a derivate from both sources. Once a week and only one feedback – customer evaluation
Regarding frequency the households almost unanimously agree that feedback on a daily basis was experienced as annoying and disturbing and without meaning. Feedback on a monthly basis was too rare to make it it possible to relate activities and consumption, i.e. feedback becomes just a number
17

with no relation to household activities, and consequently, difficult to act upon. Weekly feedback was found to be the right frequency; an opportunity to look back over the past week’s events, recall and take stock. Many of the household embraced this as a service they hoped would continue, and said they used it for poking each other about overspending, and for storytelling in the family or to relatives and neighbors. Feedback via both SMS and e-mail was experienced as redundant. However, the opportunity to choose between SMS and e-mail notification was experienced as a service. There was a clear division between households preferring SMS (arguing that SMS is easy to look up and it was seen as an advantage that they did not have to start up the computer) and households preferring e-mail (arguing that SMS comes when you don’t need them and it was seen as an advantage that they could check their e-mail in their own tempi). Regarding the design-your own toolkit, only a few showed real interest. All except one family did however accept the challenge and made their choices. Among the options offered 16 wanted automatic switch, 15 wanted to change appliances, 12 wanted el-saving plug in, 12 wanted to regulate washing towards cheap hours, 6 wanted to change the circulation pump, 4 wanted to change their vendor. In addition some families suggested things others could do such as campaigns in schools, saving in public buildings, tighter laws and tax increase, solar heating. Nice to know – the immediate experience
The interviewees focused on three modes of enjoying feedback, which, we present under the headlines ‘nice to know’, ‘a sense of agency’, and ‘our family history’, referring to the immediate, emotionally loaded experience of getting to know more, to the sensed action space, and the more long-term sense of identity through a lived history respectively. Feedback about electricity consumption is experienced as a positive service regardless of whether there has been a gain in relation to conservation. Feedback becomes an integrated part of the lived life in the household. Accessibility is central and a desire expressed by the families. Electricity is invisible. Providing accessibility to this invisible consumption is regarded as a service. Bringing this basic resource to the fore is reassuring, like it used to be, when having to collect wood for the fireplace, pump for water, transforming tallow to candles – but without the physical hassle. Also the feedback gives a sense of rhythm – how fast is the consumption running? Several of the families, both adults and teenagers, recalled their joy of watching old meters spin fast or slow according to the consumption now replaced with digital numbers: ”it has been exciting to be able to follow the consumption”. ”you had a nice feeling with having knowledge about the consumption all the time”. ‘The SMS came around 6 PM, and then the phone said ‘beep’ and I knew it is 6 PM, and then I go out and read my meter, and write it down in my book’ The sensed action space
Feedback about electricity consumption opens a space of agency in the form of feeling in control and feeling able to forecast the outcome of certain events, and eventually take action. It enables the ongoing caring for the house, sustaining the family, raising kids, and the economy – in short the housekeeping. Overview of the current consumption is used for understanding and triggering interest in rhythm and developments in consumption. Being able to compare with last week, last month, and last year is central, and forms the basis for the families’ acceptance or fight against the consumption of electricity in the household. National guidelines and saving objectives were actually by some seen as a mean to understanding whether a household consumption is high or low. Several households were keeping a book on their consumption, reading the meter once a week or once a month, prior to participating in the experiment. Keeping a book, seeing curves, being able to follow the development of the consumption is expressed as exciting and safe, and feedback on a weekly basis is optimal for making sense of the consumption. Also, with respect to educating the younger generation weekly information with the possibility of comparing household consumption to norms can provide a basis for
18

continuous learning about consumption and with this conservation behavior. The relation between rhythm, reminders, and comparisons of consumption creates a pattern, which supports attention. ‘I grew up in poverty, and it was necessary to keep the light switched off. Today, I never have my out-door lamp turned on, because there is a lamppost right outside my house. And I only use the quick-wash programs. Unfortunately the noise rules of this apartment house prevent me from washing during night when the electricity prize is low.’ “when our kids were home the consumption rose and it was actually fun to see how obvious it was that the consumption went up by 65%, I liked that I could follow this.’ ‘I have the principle that I do not allow myself to spend more than 4000 kWh pr year.’ Our family history – building identity
Feedback about electricity consumption confirms members of the household in their sense of being a family who has a history. Feedback about electricity contributes to the family identity:
“when the feedback said that there had been a 2% reduction last week or 5 % increase then I started thinking, well it must be right because in this week I have sawed a lot of firewood” “every-time I got an SMS I started reconstructing what I did yesterday” “it is easy for me to see that Friday is my day off and on that day I am doing the laundry and baking and so on” The distinctive formats of feedback chosen by the experimenters: frequency, deviation and limit are logical in relation to consumption. The households we interviewed, however, distinguished between here-and-now interruptions, which at best create a form of rhythm in their awareness of electricity consumption, and more long term effects of being reminded such as feeling safe because of knowing not to be overspending or being economic because of knowing what have been saved, and then in the real long run, knowing about what kind of electricity consumer the family is. This seemed to be a welcome contribution to the family identity picture. In short the households, regardless of being engaged or indifferent, welcomed knowledge about their electricity consumption as a sense of ‘pulse’ in the family life, as part of the house-hold action space, and as part of the family identity. In the following section we discuss the potential design-implications of this insight in the 22 households’ sense making around electricity consumption. Perspectives for future design of feedback about electricity consumption
Design of utility feedback can be motivated by public/governmental interest in frugal spending of resources. Other, possible motivating factors are the providers’ desire to build customer loyalty by providing consumption data as a service at their customers’ convenience, or third parties’ business of creating home information services. In any case, the key to success is customer satisfaction. Various stakeholders have various perspectives, and often limited insight into each others’ constraints and agendas. However, the design of feedback services depends on the quality of the input as well as on the fit between output format and context of reception. Today utility providers can meter at a detailed level and the technology for this is rapidly growing. Humans – and human practices – are however pretty stable, but complex to model. For designers of feedback about electricity consumption in private households this has a bearing in the direction of keeping it simple and allowing consumers their own interpretation, which they, as far as our material goes, will use in situated ways depending on their attitude and practices of keeping the house a home. Designers might feel tempted to fulfill the demands of as many identities and situational constraints as possible: people of all varieties should be able to operate the interface as ‘users’, they should be able to use the information as a tool in educating the family about frugal ways of living, they should have access to product information that would help them make informed purchase choices, etc. However,
19

the vivid storytelling prompted by a simple weekly SMS or e-mail suggests that designers’ main concern should be to keep it simple! Rather than hoping that their design can motivate consumers, designers should realize that their design can only stimulate consumers. The motivation is in the consumer, but the artifact can stimulate and prime that motivation. This may require design research to look deep into the relationship between stimulation and interpretation, where we normally tend to focus on the relationship between stimulation and perception. Apart from the situational sense-making of the received information, we accounted for in [12], the families in various ways expressed positions regarding habits and attitudes, which fell outside the scope of our initial frame of information motivating electricity conservation. In order to make sense of these expressions we replaced quantitative measures related to the socio-economic notion ‘household’ with the socio-culturally symbolic notion of ‘home’. Since ancient times the notion of home has been related to the fireplace. The process of maintaining the fireplace was a basic human skill, and both ancient Greek and Roman goddesses Hestia and Vestas were dedicated to watch over not only the home fire place or ‘heart fire’, but the whole of the right ordering of domesticity and the family. In modern times the heart fire has been substituted by power plugs and switches, pervading the domestic space in intangible ways. The maintenance of electricity supply is no longer in the hands of goddesses, but delegated to the electricity provider, and to electricians in case something fails to function. Most people pay their electricity bill via a banking system. Consequently, people do not have to pay attention to the financial basis for their power supply. Much to our surprise several of our informants, however, told us how they themselves kept track of the meter, and compared their own notes to the figures on the bill from the provider. They also reported small habitual traits, which demonstrated their care for the electricity consumption: as a ‘natural’ part of educating the children, of housekeeping, and as a way of ‘controlling’ the life of the house, an aspect of electricity consumption, which we find so far has been neglected, and which we find may have potential to stimulate electricity saving through a more frugal attitude to electricity consumption. Prior to these interviews we had no idea, neither from personal experience nor from the research literature, that some people actually was doing so much to keep track of electricity consumption. Hence, our findings in this qualitative study invites a new research agenda and a new research approach to design of feedback about metering and billing should focus on the practices in which this information plays a role, such as storytelling to friends and family, family identity building, and education of children. Such reframing from product focus to customer focus may lead to development of new services, which in turn can support conservation behavior. Conclusion
In this paper we have – by applying a narrative method – gone beyond the immediate answers to a number of open evaluating questions, which we posed to 22 households in half to one hour interview settings in the home, preferably at the dinner table, and which were transcribed, analyzed and reported in [12]. The narrative approach, being the researcher’s expression, is an edited version, condensed to comprise what the researcher finds is the message. This approach has allowed us to identify three strands of sense-making, in which a relationship is established between stimulation and interpretation. The three strands are hierarchical in the sense that the immediate feedback generates a meaning, which prompts the recall of the potential action space, which again creates a sense of identity of being an acting electricity consumer. At the first level of stimulation-interpretation the immediate response is that it is nice to know, when given on a weekly basis in the preferred medium be it e-mail or SMS. At the second level of stimulation-interpretation nice knowing translates into an invitation to act as a responsible consumer, which at the third level of stimulus-interpretation translates into an identity as responsible consumer – an identity which may or may not spill over and influence choices when buying appliances, educating children etc.
20
A household is a socio-economic unit, and in studies of electricity savings in the private sector, a household is the most common unit of analysis. Based on statistical analysis we started our work by dividing households into two types: concerned and indifferent. However, in the actual interviews we found no correlation between this initial attitude grouping and the viewpoints expressed regarding the experience of having information about electricity consumption. Our findings suggest that in order to invoke the innovative energy of the households regarding electricity saving, we need to target the home setting and the self-efficacy energy of its’ inhabitants as home-keepers. For this to happen, electricity consumption must move from the background, literally hidden in the walls, to the foreground and become part of peoples’ public social identity of consumption. Our empirical findings suggest that this is far from impossible, due to the status of electricity as heart fire, a constituent of the home at a symbolic level. References
[1] Wood, G. and Newborough, M. Dynamic energy-consumption indicators for domestic appliances: environment, behavior and design. Energy and Buildings 35 (2003), 821-841
[2] Gram-Hanssen, K. Husholdningernes el-forbrug – hvem bruger hvor meget, til hvad og hvorfor? (The electricity consumption of private households – who is using how much, on what, and why?). Danish Building Research Institute, SBI 2005:12, 2005.
[3] van Houwelingen, J.H. and van Raaij, W.F. The Effect of Goal-Setting and Daily Electronic Feedback on In-Home Energy Use. Journal of Consumer Research 16, 1 (1989), 98-105.
[4] Pedersen, L.H. and Broegaard, E. Husholdningernes elforbrug – en analyse af attituder og adfærd på energi- og miljøområdet (The electricity consumption of private households – an analysis of attitudes and behaviour related to energy and environment). AKF Forlager, 1997.
[5] Kuehn, S. Livsstil og energiforbrug – analyseret med bourdieusk optik (Lifestyle and energyconsumption – analyses with a Bourdieuan lens). Dansk Sociologi 2 (1999), 19-34.
[6] Darby, S. The Effectiveness of Feedback on Energy Consumption: A review on the literature on metering, billing and direct displays. Environmental Change Institute, University of Oxford, 2006
[7] Thøgersen, J. How May Consumer Policy Empower Consumers for Sustainable Lifestyles? Journal of Consumer Policy 28 (2005), 143-178
[8] Lockwood, M. and Murray, R. RED Future Currents: Designing for a changing climate. RED and Design Council, London, 2005
[9] Costanzo, M., Archer, D., Aronson, E., and Pettigrew, T. Energy Conservation Behavior: The Difficult Path From Information to Action. American Psychologist 4, 5 (1986), 521-528
[10] Kibsgaard, K., A. Larsen, S. Leth-Petersen, K. Stiesmark, M. Togeby (2008). Electricity savings in households with everyday IT, report from a field experiment. Can be downloaded at: feedback.noe.dk.
[11] Junge, M. (2008): Electricity Consumption and the Effect of Online Feedback, Results from an experiment. CEBR – Centre For Economic and Business Research Report # 32008 Copenhagen Business School, Frederiksberg.
[12] Christiansen, E., A.M. Kanstrup, A. Grønhøj & A. Larsen (2009). Elforbrug på e-mail & sms: Rapport om 22 husholdningers erfaringer efter et års feedback. (Electricity consumption on e-mail & sms: report on 22 households’ experiences after one year with feedback). Feedback opfølgningsprojekt no. 340-051. Aalborg Universitet. E-learning Lab Publication series no. 17: http://www.ell.aau.dk/fileadmin/user_upload/documents/publications/ell_publication_series/eLL_Publication_Series_-_No_17.pdf
[13] Kanstrup, A. M. & E. Christiansen (2006). Selecting and engaging innovators: combining democracy and creativity. Paper presented at the Nordichi 2006 ‘Changing roles’, Oslo, Norway, October 14-18.
21

[14] Kvale, S. (1996). InterViews: An Introduction to Qualitative Research Interviewing. Sage
[15] Boje, D.E. Narrative methods for organizational and communication research. Sage 2001.
22
Extreme-user approach and the design of energy feedback systems
Lassi A. Liikkanen
Helsinki Institute for Information Technology HIIT Helsinki University of Technology TKK, Finland
Abstract
New automatic meter reading and smart home devices can provide increasingly detailed information about electricity consumption in households. This information can be considered as feedback about electricity use, which implies that in can be useful in raising energy awareness and promoting electricity conservation practices. For three decades, feedback methods have been studied a considerable literature exists about effective feedback. However, applying the principles of successful feedback to in the design of electricity feedback products is never straight forward, because the feedback must coupled with some product or service that the user finds useful or entertaining.
In this paper the extreme-user design method is introduced as a way of discovering what requirements users have for feedback systems. Through a case study of 20 electric power meter users, I illustrate the potential of this method in providing ideas for design. Through a semi-structured interview I examined how the power meters are used, user satisfaction with the meters, and motivations underlying the loan. Three categories of users were discovered and labeled wisdom seekers, detectives, and judges. They had different attitudes towards electric devices, being interested in learning, revealing, or evaluating energy consumption facts. These differences in user attitudes indicate that different users likely require dissimilar functionalities from the feedback application. It was also discovered that loaning the meter changed the attribution of consumption from devices to habits. Initially the participants were looking for a faulty device that could explain their electricity bill. However, after the measurements, their attribution changed and they understood that their own habits would need to change in order to reduce consumption.
Introduction
The introduction of new electricity metering technology and new smart home networks is about to completely change the accessibility of electricity consumption information. This has the potential to significantly raise the level of awareness in household electricity consumption assuming that inhabitants receive the right kind of information or feedback. However, designing new information and communication technologies (ICT), such as those centered on energy awareness, is always a huge challenge. Instead of helping and supporting, poorly designed ICT can be useless or mislead users, for instance, relying blindly on GPS navigation has caused several car accidents [1]. This is also true in the context of energy feedback. Poorly designed system may not only be ineffective, but may increase electricity consumption if it signals that you can safely consume more than you do now.
This paper proposes a method to inform the design of energy feedback systems. This method is called extreme-user approach. We propose that one segment of extreme users in the context of technology-mediated energy feedback (North-Europe, 2009) are people who use electric power meters. In this paper, we introduce this method along with its justifications, and an example study of extreme users. Finally, we discuss the possible benefits of this approach and how it may help in the design of electricity feedback systems.
Electricity Equation and Feedback
Understanding and making a change for household electricity consumption requires understanding what components make up the total consumption. The model of energy consumption presented here is composed of three main components, illustrated in Figure 1 on the next page. The equation starts from the needs of a user, asking what does an individual want to do achieve (Item A). On next level, there are parallel items of how this goal is fulfilled by using what ever equipment available (B1 and B2). Decisions on these two levels contribute to how the total consumption builds up (item C). Take the example of preparing a cup of coffee. Say that the person has three devices that can be used; a stove, water boiler, and a coffee maker. However, the total electricity consumption is not only
23
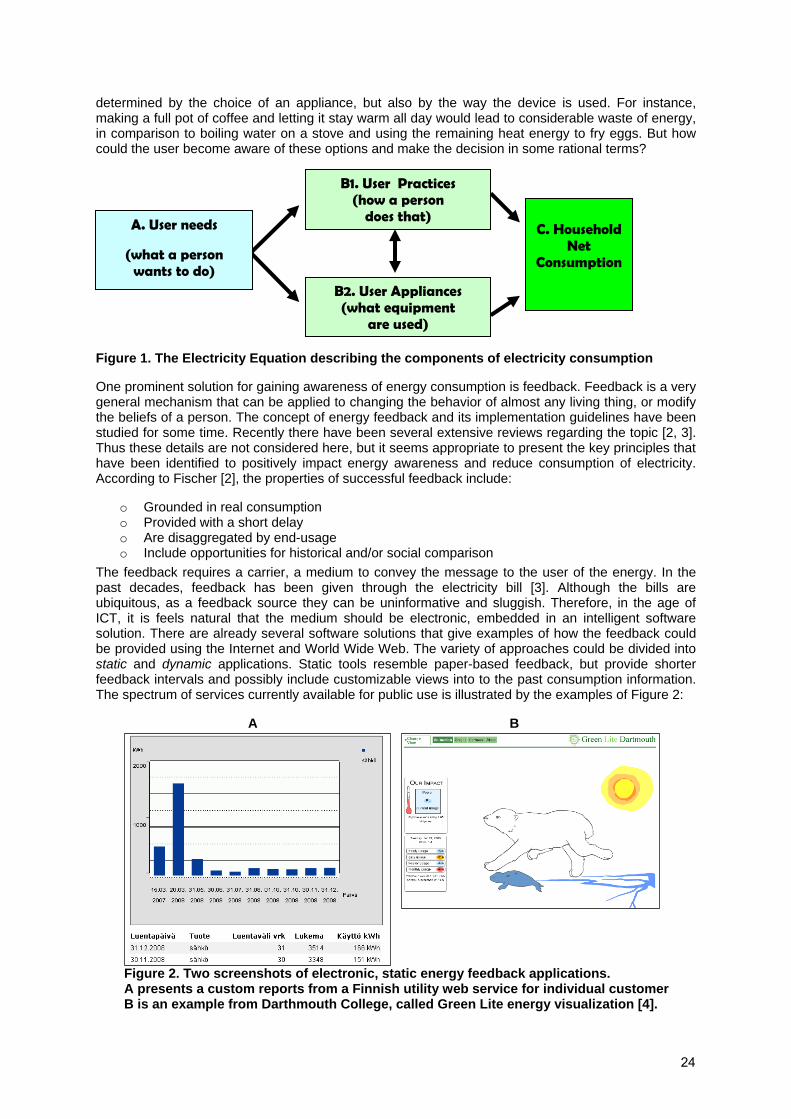
determined by the choice of an appliance, but also by the way the device is used. For instance, making a full pot of coffee and letting it stay warm all day would lead to considerable waste of energy, in comparison to boiling water on a stove and using the remaining heat energy to fry eggs. But how could the user become aware of these options and make the decision in some rational terms?
Figure 1. The Electricity Equation describing the components of electricity consumption
One prominent solution for gaining awareness of energy consumption is feedback. Feedback is a very general mechanism that can be applied to changing the behavior of almost any living thing, or modify the beliefs of a person. The concept of energy feedback and its implementation guidelines have been studied for some time. Recently there have been several extensive reviews regarding the topic [2, 3]. Thus these details are not considered here, but it seems appropriate to present the key principles that have been identified to positively impact energy awareness and reduce consumption of electricity. According to Fischer [2], the properties of successful feedback include:
o Grounded in real consumption o Provided with a short delay o Are disaggregated by end-usage o Include opportunities for historical and/or social comparison
The feedback requires a carrier, a medium to convey the message to the user of the energy. In the past decades, feedback has been given through the electricity bill [3]. Although the bills are ubiquitous, as a feedback source they can be uninformative and sluggish. Therefore, in the age of ICT, it is feels natural that the medium should be electronic, embedded in an intelligent software solution. There are already several software solutions that give examples of how the feedback could be provided using the Internet and World Wide Web. The variety of approaches could be divided into static and dynamic applications. Static tools resemble paper-based feedback, but provide shorter feedback intervals and possibly include customizable views into to the past consumption information. The spectrum of services currently available for public use is illustrated by the examples of Figure 2:
Figure 2. Two screenshots of electronic, static energy feedback applications. A presents a custom reports from a Finnish utility web service for individual customer B is an example from Darthmouth College, called Green Lite energy visualization [4].
A. User needs
(what a person wants to do)
B1. User Practices (how a person
does that)
B2. User Appliances (what equipment
are used)
C. Household
Net Consumption
A B
24
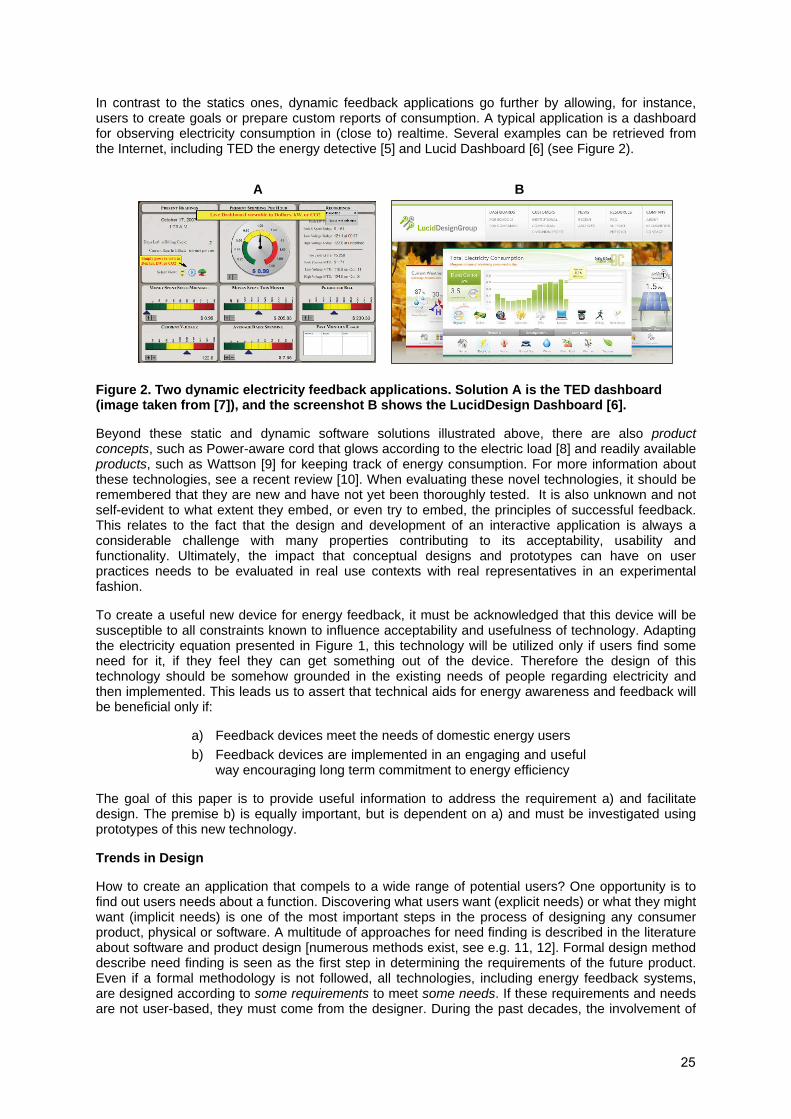
In contrast to the statics ones, dynamic feedback applications go further by allowing, for instance, users to create goals or prepare custom reports of consumption. A typical application is a dashboard for observing electricity consumption in (close to) realtime. Several examples can be retrieved from the Internet, including TED the energy detective [5] and Lucid Dashboard [6] (see Figure 2).
Figure 2. Two dynamic electricity feedback applications. Solution A is the TED dashboard (image taken from [7]), and the screenshot B shows the LucidDesign Dashboard [6].
Beyond these static and dynamic software solutions illustrated above, there are also product concepts, such as Power-aware cord that glows according to the electric load [8] and readily available products, such as Wattson [9] for keeping track of energy consumption. For more information about these technologies, see a recent review [10]. When evaluating these novel technologies, it should be remembered that they are new and have not yet been thoroughly tested. It is also unknown and not self-evident to what extent they embed, or even try to embed, the principles of successful feedback. This relates to the fact that the design and development of an interactive application is always a considerable challenge with many properties contributing to its acceptability, usability and functionality. Ultimately, the impact that conceptual designs and prototypes can have on user practices needs to be evaluated in real use contexts with real representatives in an experimental fashion.
To create a useful new device for energy feedback, it must be acknowledged that this device will be susceptible to all constraints known to influence acceptability and usefulness of technology. Adapting the electricity equation presented in Figure 1, this technology will be utilized only if users find some need for it, if they feel they can get something out of the device. Therefore the design of this technology should be somehow grounded in the existing needs of people regarding electricity and then implemented. This leads us to assert that technical aids for energy awareness and feedback will be beneficial only if:
a) Feedback devices meet the needs of domestic energy users b) Feedback devices are implemented in an engaging and useful
way encouraging long term commitment to energy efficiency
The goal of this paper is to provide useful information to address the requirement a) and facilitate design. The premise b) is equally important, but is dependent on a) and must be investigated using prototypes of this new technology.
Trends in Design
How to create an application that compels to a wide range of potential users? One opportunity is to find out users needs about a function. Discovering what users want (explicit needs) or what they might want (implicit needs) is one of the most important steps in the process of designing any consumer product, physical or software. A multitude of approaches for need finding is described in the literature about software and product design [numerous methods exist, see e.g. 11, 12]. Formal design method describe need finding is seen as the first step in determining the requirements of the future product. Even if a formal methodology is not followed, all technologies, including energy feedback systems, are designed according to some requirements to meet some needs. If these requirements and needs are not user-based, they must come from the designer. During the past decades, the involvement of
A B
25
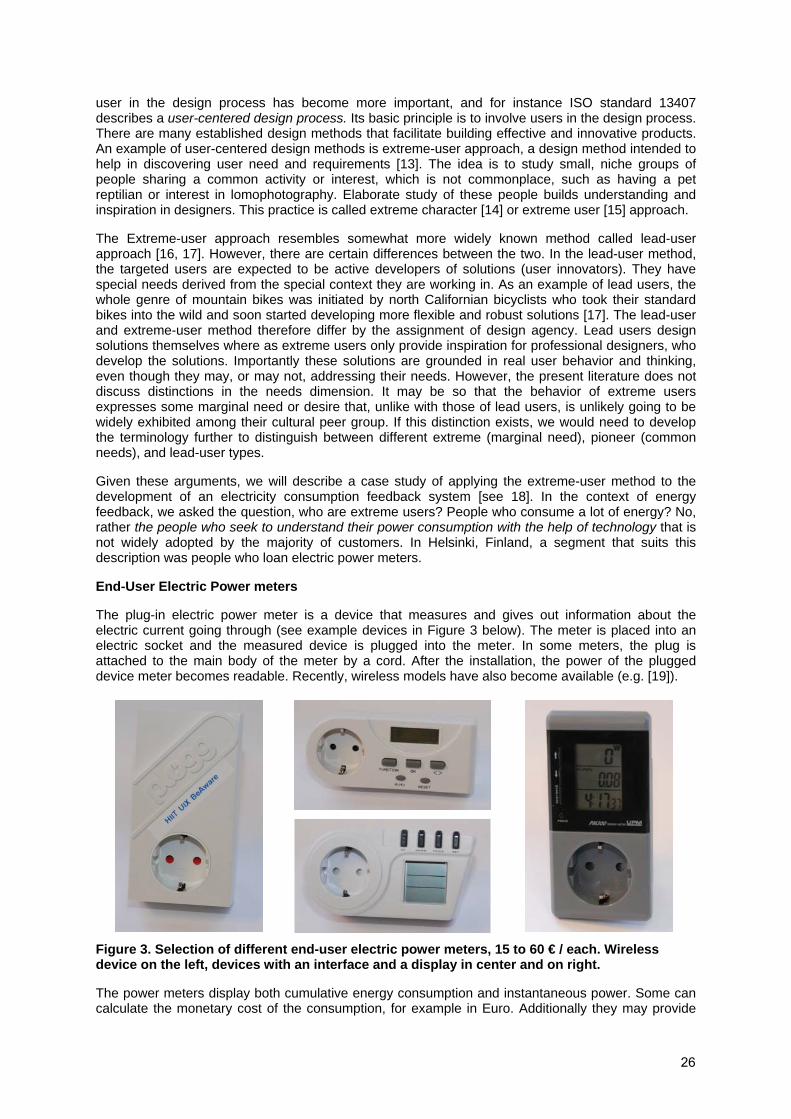
user in the design process has become more important, and for instance ISO standard 13407 describes a user-centered design process. Its basic principle is to involve users in the design process. There are many established design methods that facilitate building effective and innovative products. An example of user-centered design methods is extreme-user approach, a design method intended to help in discovering user need and requirements [13]. The idea is to study small, niche groups of people sharing a common activity or interest, which is not commonplace, such as having a pet reptilian or interest in lomophotography. Elaborate study of these people builds understanding and inspiration in designers. This practice is called extreme character [14] or extreme user [15] approach.
The Extreme-user approach resembles somewhat more widely known method called lead-user approach [16, 17]. However, there are certain differences between the two. In the lead-user method, the targeted users are expected to be active developers of solutions (user innovators). They have special needs derived from the special context they are working in. As an example of lead users, the whole genre of mountain bikes was initiated by north Californian bicyclists who took their standard bikes into the wild and soon started developing more flexible and robust solutions [17]. The lead-user and extreme-user method therefore differ by the assignment of design agency. Lead users design solutions themselves where as extreme users only provide inspiration for professional designers, who develop the solutions. Importantly these solutions are grounded in real user behavior and thinking, even though they may, or may not, addressing their needs. However, the present literature does not discuss distinctions in the needs dimension. It may be so that the behavior of extreme users expresses some marginal need or desire that, unlike with those of lead users, is unlikely going to be widely exhibited among their cultural peer group. If this distinction exists, we would need to develop the terminology further to distinguish between different extreme (marginal need), pioneer (common needs), and lead-user types.
Given these arguments, we will describe a case study of applying the extreme-user method to the development of an electricity consumption feedback system [see 18]. In the context of energy feedback, we asked the question, who are extreme users? People who consume a lot of energy? No, rather the people who seek to understand their power consumption with the help of technology that is not widely adopted by the majority of customers. In Helsinki, Finland, a segment that suits this description was people who loan electric power meters.
End-User Electric Power meters
The plug-in electric power meter is a device that measures and gives out information about the electric current going through (see example devices in Figure 3 below). The meter is placed into an electric socket and the measured device is plugged into the meter. In some meters, the plug is attached to the main body of the meter by a cord. After the installation, the power of the plugged device meter becomes readable. Recently, wireless models have also become available (e.g. [19]).
Figure 3. Selection of different end-user electric power meters, 15 to 60 € / each. Wireless device on the left, devices with an interface and a display in center and on right.
The power meters display both cumulative energy consumption and instantaneous power. Some can calculate the monetary cost of the consumption, for example in Euro. Additionally they may provide
26
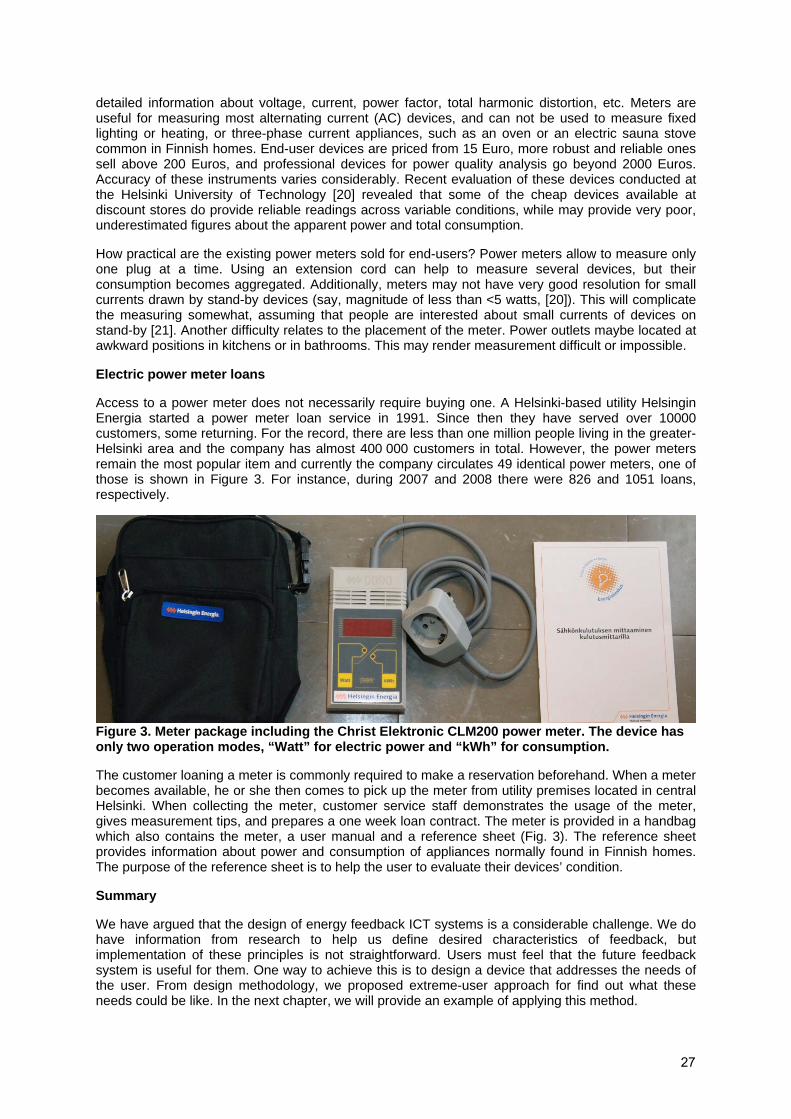
detailed information about voltage, current, power factor, total harmonic distortion, etc. Meters are useful for measuring most alternating current (AC) devices, and can not be used to measure fixed lighting or heating, or three-phase current appliances, such as an oven or an electric sauna stove common in Finnish homes. End-user devices are priced from 15 Euro, more robust and reliable ones sell above 200 Euros, and professional devices for power quality analysis go beyond 2000 Euros. Accuracy of these instruments varies considerably. Recent evaluation of these devices conducted at the Helsinki University of Technology [20] revealed that some of the cheap devices available at discount stores do provide reliable readings across variable conditions, while may provide very poor, underestimated figures about the apparent power and total consumption.
How practical are the existing power meters sold for end-users? Power meters allow to measure only one plug at a time. Using an extension cord can help to measure several devices, but their consumption becomes aggregated. Additionally, meters may not have very good resolution for small currents drawn by stand-by devices (say, magnitude of less than <5 watts, [20]). This will complicate the measuring somewhat, assuming that people are interested about small currents of devices on stand-by [21]. Another difficulty relates to the placement of the meter. Power outlets maybe located at awkward positions in kitchens or in bathrooms. This may render measurement difficult or impossible.
Electric power meter loans
Access to a power meter does not necessarily require buying one. A Helsinki-based utility Helsingin Energia started a power meter loan service in 1991. Since then they have served over 10000 customers, some returning. For the record, there are less than one million people living in the greater-Helsinki area and the company has almost 400 000 customers in total. However, the power meters remain the most popular item and currently the company circulates 49 identical power meters, one of those is shown in Figure 3. For instance, during 2007 and 2008 there were 826 and 1051 loans, respectively.
Figure 3. Meter package including the Christ Elektronic CLM200 power meter. The device has only two operation modes, “Watt” for electric power and “kWh” for consumption.
The customer loaning a meter is commonly required to make a reservation beforehand. When a meter becomes available, he or she then comes to pick up the meter from utility premises located in central Helsinki. When collecting the meter, customer service staff demonstrates the usage of the meter, gives measurement tips, and prepares a one week loan contract. The meter is provided in a handbag which also contains the meter, a user manual and a reference sheet (Fig. 3). The reference sheet provides information about power and consumption of appliances normally found in Finnish homes. The purpose of the reference sheet is to help the user to evaluate their devices’ condition.
Summary
We have argued that the design of energy feedback ICT systems is a considerable challenge. We do have information from research to help us define desired characteristics of feedback, but implementation of these principles is not straightforward. Users must feel that the future feedback system is useful for them. One way to achieve this is to design a device that addresses the needs of the user. From design methodology, we proposed extreme-user approach for find out what these needs could be like. In the next chapter, we will provide an example of applying this method.
27
Research Method
Recruiting respondents
For this study, we recruited customers who had just returned the power meter. There was no intentional selection of respondents based on background characteristics. The interview format was a semi-structured interview. Semi-structured referred to two things: if the person spontaneously provided answers for a question coming up later, then the question was not repeated. Secondly, even though many questions were presented as open-ended, most of them were scored immediately during the interview according to pre-defined scales. If the chosen scale and set of response items did not match the answer, a separate note was made. If there was a need to present any focusing follow-up questions, these questions were presented just for this particular subject.
The first interview was carried out in the utility premises (customer service center), where all the participants were recruited. However, the rest 19 interviews were conducted over the telephone with a short delay after the customer had returned the meter, because recruiting subjects on site turned out too time consuming. The interval between the return and the interview was recorded. No particular incentive was proposed for the participants. All interviews were conducted by the author LL.
Ethics
Subjects participated voluntarily. All informants were adults and provided their consent to be interviewed. The data was recorded anonymously and the purpose of the study was introduced.
Instrument
The procedure of the interview followed the structure of the instrument. The target time for one interview was 12 minutes. The subjects were not informed about the pre-defined response items, unless they could not otherwise explicate their opinion. Responses were transcribed instantly to the printed answer sheet by the interviewer.
The interview questions were prepared beforehand and fell under four categories. The preparation of the instrument started from interviewing the customer service staff of the utility and some other experts in the area of consumer energy advice. The resulting question/answer sheet was printed on a single one-sided A4 sheet (the Finnish original available from the author by request). The sections were labeled as 1) use experiences, 2) motives, 3) satisfaction, and 4) background information. The sections 1 and 2 were considered the most important for discovering the user needs.
The section use experiences included details about the measurements carried out by the subject. The goal was to learn about what people really do with the devices, what they try and what they achieve. To help people in responding and remembering, and to be systematic, we tried to exhaust the list of 11 typical measured appliances. For each these appliances, informants were asked if they owned the device and whether they had measured it. If a device had been measured, the user was also asked that in which kind of operational state it had been measured. We were also interested in social dimensions of using the meter. Who made the measurements, how did other family members think about the meter? Informants were also asked to evaluate the impact of loaning the meter, what difference did it make for their consumption. Finally, the participants evaluated whether one week was adequately long loan time or not.
Motives underlying the loan were also prompted. These covered expectations about the benefit of the meter and the primary inspiration why the person had borrowed the meter in the first place. Satisfaction questions probed the contentment and acceptance of the meter. Customers were asked whether they felt having completed their goals and whether they would borrow it again. Customers also evaluated how easy it was to conduct the measurements. This measure of usability was complemented with control question whether they had read the supplied manual or not. The attitudes about upcoming Internet feedback services were probed by asking: “In future, smart home systems or automatic remote meters may allow your utility to provide you with close to realtime feedback about your electricity consumption, possibly revealing the consumption of individual appliances. Do you have interest in this kind of Internet-based service?” In the final section of the interview, we recorded background information from the subjects anonymously.
28
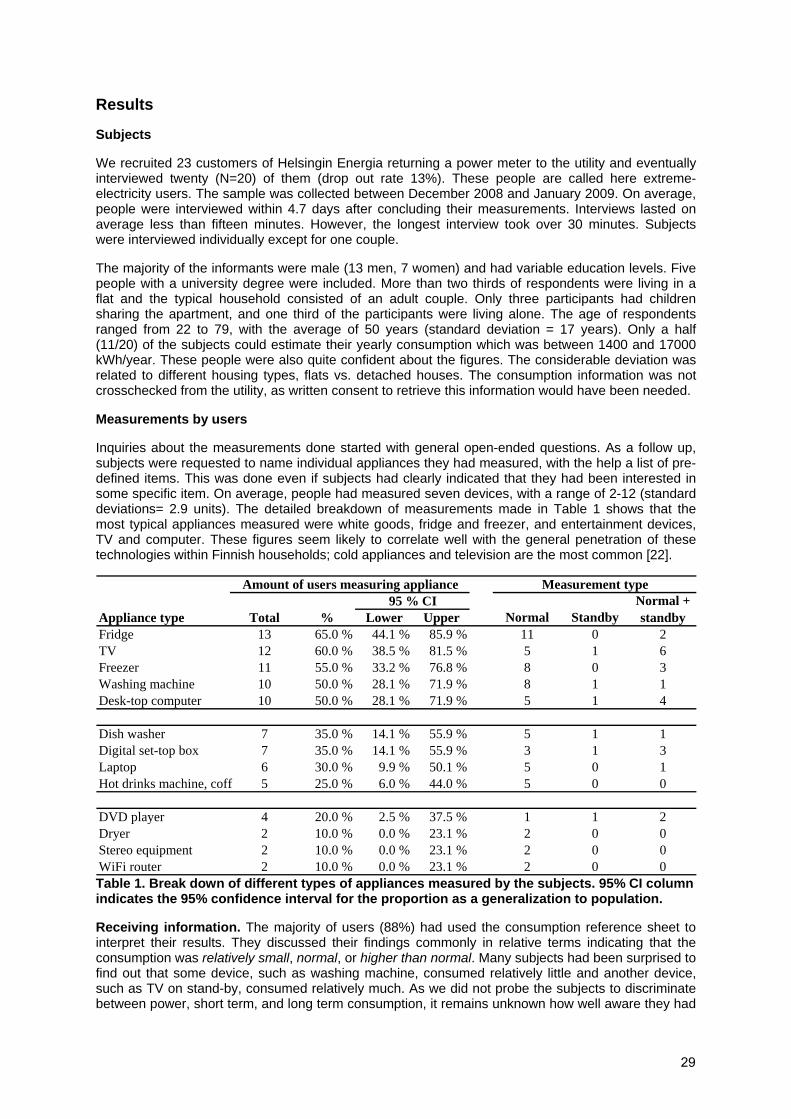
Results
Subjects
We recruited 23 customers of Helsingin Energia returning a power meter to the utility and eventually interviewed twenty (N=20) of them (drop out rate 13%). These people are called here extreme-electricity users. The sample was collected between December 2008 and January 2009. On average, people were interviewed within 4.7 days after concluding their measurements. Interviews lasted on average less than fifteen minutes. However, the longest interview took over 30 minutes. Subjects were interviewed individually except for one couple.
The majority of the informants were male (13 men, 7 women) and had variable education levels. Five people with a university degree were included. More than two thirds of respondents were living in a flat and the typical household consisted of an adult couple. Only three participants had children sharing the apartment, and one third of the participants were living alone. The age of respondents ranged from 22 to 79, with the average of 50 years (standard deviation = 17 years). Only a half (11/20) of the subjects could estimate their yearly consumption which was between 1400 and 17000 kWh/year. These people were also quite confident about the figures. The considerable deviation was related to different housing types, flats vs. detached houses. The consumption information was not crosschecked from the utility, as written consent to retrieve this information would have been needed.
Measurements by users
Inquiries about the measurements done started with general open-ended questions. As a follow up, subjects were requested to name individual appliances they had measured, with the help a list of pre-defined items. This was done even if subjects had clearly indicated that they had been interested in some specific item. On average, people had measured seven devices, with a range of 2-12 (standard deviations= 2.9 units). The detailed breakdown of measurements made in Table 1 shows that the most typical appliances measured were white goods, fridge and freezer, and entertainment devices, TV and computer. These figures seem likely to correlate well with the general penetration of these technologies within Finnish households; cold appliances and television are the most common [22].
Appliance type Total % Lower Upper Normal StandbyFridge 13 65.0 % 44.1 % 85.9 % 11 0 2TV 12 60.0 % 38.5 % 81.5 % 5 1 6Freezer 11 55.0 % 33.2 % 76.8 % 8 0 3Washing machine 10 50.0 % 28.1 % 71.9 % 8 1 1Desk-top computer 10 50.0 % 28.1 % 71.9 % 5 1 4
Dish washer 7 35.0 % 14.1 % 55.9 % 5 1 1Digital set-top box 7 35.0 % 14.1 % 55.9 % 3 1 3Laptop 6 30.0 % 9.9 % 50.1 % 5 0 1Hot drinks machine, coff 5 25.0 % 6.0 % 44.0 % 5 0 0
DVD player 4 20.0 % 2.5 % 37.5 % 1 1 2Dryer 2 10.0 % 0.0 % 23.1 % 2 0 0Stereo equipment 2 10.0 % 0.0 % 23.1 % 2 0 0WiFi router 2 10.0 % 0.0 % 23.1 % 2 0 0
Normal + standby
Measurement typeAmount of users measuring appliance95 % CI
Table 1. Break down of different types of appliances measured by the subjects. 95% CI column indicates the 95% confidence interval for the proportion as a generalization to population.
Receiving information. The majority of users (88%) had used the consumption reference sheet to interpret their results. They discussed their findings commonly in relative terms indicating that the consumption was relatively small, normal, or higher than normal. Many subjects had been surprised to find out that some device, such as washing machine, consumed relatively little and another device, such as TV on stand-by, consumed relatively much. As we did not probe the subjects to discriminate between power, short term, and long term consumption, it remains unknown how well aware they had
29
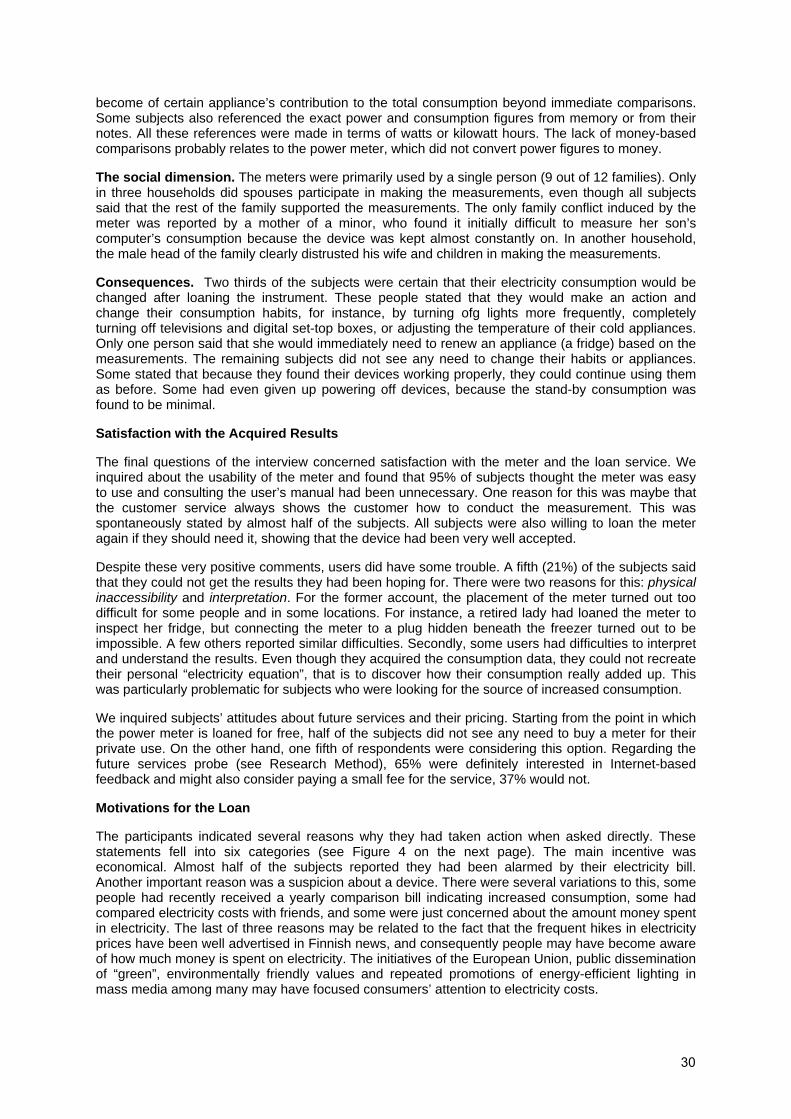
become of certain appliance’s contribution to the total consumption beyond immediate comparisons. Some subjects also referenced the exact power and consumption figures from memory or from their notes. All these references were made in terms of watts or kilowatt hours. The lack of money-based comparisons probably relates to the power meter, which did not convert power figures to money.
The social dimension. The meters were primarily used by a single person (9 out of 12 families). Only in three households did spouses participate in making the measurements, even though all subjects said that the rest of the family supported the measurements. The only family conflict induced by the meter was reported by a mother of a minor, who found it initially difficult to measure her son’s computer’s consumption because the device was kept almost constantly on. In another household, the male head of the family clearly distrusted his wife and children in making the measurements.
Consequences. Two thirds of the subjects were certain that their electricity consumption would be changed after loaning the instrument. These people stated that they would make an action and change their consumption habits, for instance, by turning ofg lights more frequently, completely turning off televisions and digital set-top boxes, or adjusting the temperature of their cold appliances. Only one person said that she would immediately need to renew an appliance (a fridge) based on the measurements. The remaining subjects did not see any need to change their habits or appliances. Some stated that because they found their devices working properly, they could continue using them as before. Some had even given up powering off devices, because the stand-by consumption was found to be minimal.
Satisfaction with the Acquired Results
The final questions of the interview concerned satisfaction with the meter and the loan service. We inquired about the usability of the meter and found that 95% of subjects thought the meter was easy to use and consulting the user’s manual had been unnecessary. One reason for this was maybe that the customer service always shows the customer how to conduct the measurement. This was spontaneously stated by almost half of the subjects. All subjects were also willing to loan the meter again if they should need it, showing that the device had been very well accepted.
Despite these very positive comments, users did have some trouble. A fifth (21%) of the subjects said that they could not get the results they had been hoping for. There were two reasons for this: physical inaccessibility and interpretation. For the former account, the placement of the meter turned out too difficult for some people and in some locations. For instance, a retired lady had loaned the meter to inspect her fridge, but connecting the meter to a plug hidden beneath the freezer turned out to be impossible. A few others reported similar difficulties. Secondly, some users had difficulties to interpret and understand the results. Even though they acquired the consumption data, they could not recreate their personal “electricity equation”, that is to discover how their consumption really added up. This was particularly problematic for subjects who were looking for the source of increased consumption.
We inquired subjects’ attitudes about future services and their pricing. Starting from the point in which the power meter is loaned for free, half of the subjects did not see any need to buy a meter for their private use. On the other hand, one fifth of respondents were considering this option. Regarding the future services probe (see Research Method), 65% were definitely interested in Internet-based feedback and might also consider paying a small fee for the service, 37% would not.
Motivations for the Loan
The participants indicated several reasons why they had taken action when asked directly. These statements fell into six categories (see Figure 4 on the next page). The main incentive was economical. Almost half of the subjects reported they had been alarmed by their electricity bill. Another important reason was a suspicion about a device. There were several variations to this, some people had recently received a yearly comparison bill indicating increased consumption, some had compared electricity costs with friends, and some were just concerned about the amount money spent in electricity. The last of three reasons may be related to the fact that the frequent hikes in electricity prices have been well advertised in Finnish news, and consequently people may have become aware of how much money is spent on electricity. The initiatives of the European Union, public dissemination of “green”, environmentally friendly values and repeated promotions of energy-efficient lighting in mass media among many may have focused consumers’ attention to electricity costs.
30
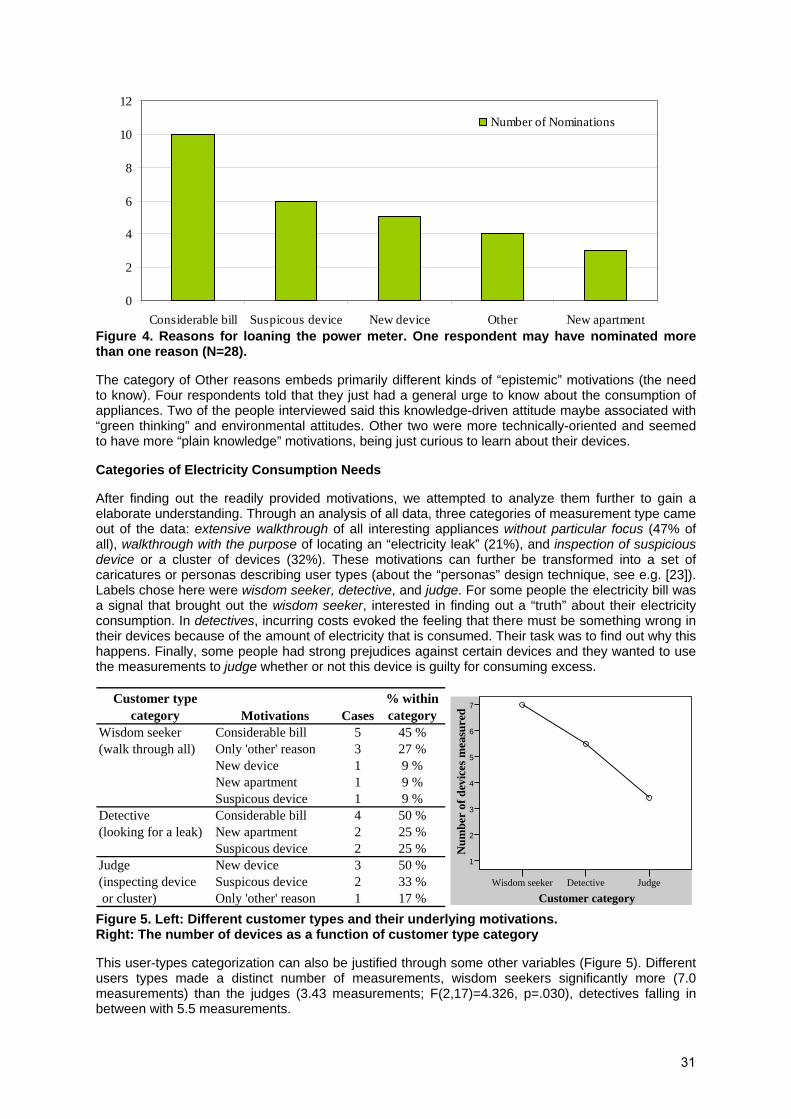
0
2
4
6
8
10
12
Considerable bill Suspicous device New device Other New apartment
Number of Nominations
Figure 4. Reasons for loaning the power meter. One respondent may have nominated more than one reason (N=28).
The category of Other reasons embeds primarily different kinds of “epistemic” motivations (the need to know). Four respondents told that they just had a general urge to know about the consumption of appliances. Two of the people interviewed said this knowledge-driven attitude maybe associated with “green thinking” and environmental attitudes. Other two were more technically-oriented and seemed to have more “plain knowledge” motivations, being just curious to learn about their devices.
Categories of Electricity Consumption Needs
After finding out the readily provided motivations, we attempted to analyze them further to gain a elaborate understanding. Through an analysis of all data, three categories of measurement type came out of the data: extensive walkthrough of all interesting appliances without particular focus (47% of all), walkthrough with the purpose of locating an “electricity leak” (21%), and inspection of suspicious device or a cluster of devices (32%). These motivations can further be transformed into a set of caricatures or personas describing user types (about the “personas” design technique, see e.g. [23]). Labels chose here were wisdom seeker, detective, and judge. For some people the electricity bill was a signal that brought out the wisdom seeker, interested in finding out a “truth” about their electricity consumption. In detectives, incurring costs evoked the feeling that there must be something wrong in their devices because of the amount of electricity that is consumed. Their task was to find out why this happens. Finally, some people had strong prejudices against certain devices and they wanted to use the measurements to judge whether or not this device is guilty for consuming excess.
Customer type category Motivations Cases
% within category
Wisdom seeker Considerable bill 5 45 %(walk through all) Only 'other' reason 3 27 %
New device 1 9 %New apartment 1 9 %Suspicous device 1 9 %
Detective Considerable bill 4 50 %(looking for a leak) New apartment 2 25 %
Suspicous device 2 25 %Judge New device 3 50 %(inspecting device Suspicous device 2 33 % or cluster) Only 'other' reason 1 17 % Figure 5. Left: Different customer types and their underlying motivations. Right: The number of devices as a function of customer type category
This user-types categorization can also be justified through some other variables (Figure 5). Different users types made a distinct number of measurements, wisdom seekers significantly more (7.0 measurements) than the judges (3.43 measurements; F(2,17)=4.326, p=.030), detectives falling in between with 5.5 measurements.
Customer categoryJudgeDetectiveWisdom seeker
Num
ber
of d
evic
es m
easu
red 7
6
5
4
3
2
1
31

Attribution of electricity consumption.
An interesting theme that emerges from the data concerns the attribution of electricity consumption. Many informants named the electricity bill as a motivator to loan the meter, but reacted to it differently. In particular, detectives made the inference that they must possess a defective appliance which is wasting energy. This attribution suggests that they had excluded their own part from the electricity equation. They were not guilty of consuming energy, their appliances were. However, if we consider the responses to the question of “how did the measurements affect your life?”, the changes the subjects listed were dominantly habitual. This means that in contrast to their expectations, they learned that in fact the devices were operating properly, but their own habits were lavish. However, the attribution change was noticed for only half of the people initially suspecting a device, the rest become content with their bill after confirming the function of their devices.
Discussion and Conclusions
In 2009, countries all over the world have to consider ways to tackle climate change. European countries have a special role in this puzzle as they are acting under the new EU climate package intended to show an example for the rest of the world. There are many levels to this battle. Consumers are considered as one important resource if they just can be motivated to participate in the quest for a more sustainable future. One solution for empowering people comes from different energy feedback solutions. With new generation of smart meters and smart home utilities, the technological barriers for realtime, disaggregated feedback are cracking. However, to fully utilize the potential of these technologies, they must be designed carefully in order to achieve desired impact.
In this paper, we have proposed an extreme-user approach to help to developing energy feedback systems. In the context of electricity feedback, we defined extreme users as people who voluntarily make the effort of loaning an electricity power meter for a short period of time to learn more about their electric devices. In twenty interviews, we asked these people about their motives and actions regarding the loaned power meter. Three categories of use cases were discovered: extensive walkthrough without focus, walk through with a purpose, and inspecting a suspicious device. These categories were further labeled as three characters describing the different attitudes of users. The results show that the average awareness of electricity even among the quite selected set of users was very variable. Only half were aware of their own yearly consumption and many did not seem to grasp energy concepts very well. In spite of this, most people did perform several measurements and generally satisfied with the results. It appears that the users clearly seek to utilize these devices as one-shot ailments. This also matches their motives, but contradicts the principle b of successful feedback, i.e. long-term support for sustainable consumption.
Implications for Design
The results acquired here can find several uses for the designing future electricity feedback tools. By first confirming user types by additional studies and then developing further into personas [23], designers can proceed to produce functionalities that best support the needs of wisdom seeker, detective, or judge. Also the fact that the participants had wide interests in individual appliances strengthens the existing principle of disaggregated feedback – information must be available about independent devices and also about their different kind of uses. Although the informants were generally satisfied, there were problems associated with the “power meter as feedback” approach. In addition to the brief exposure to consumption data, the measurements were commonly made by one person only. This further begs the question how well power meters empower the whole family? The limitations and problems with this approach might be overcome with the help of future solutions. We could identify a number of issues that should be considered:
I. The agency in learning about consumption was typically embodied in a single user
II. Physical installation of the sensor could be too difficult
III. Interpretation of the results was non-systematic and superficial
IV. Storing and sharing the results of the measurements was non-systematic
Each of these factors could be addressed in upcoming applications. For the first point, allocating the agency of measurements to the whole family would be the preferable way to engage them further in
32

the process of becoming energy aware. The devices used for measurements could, for instance, be accessible over the Internet, so that all family members would have an equal opportunity to perform experiments and access the results. This would be facilitated if there were multiple measurement devices. The second issue is related to development of the measurement devices. We should expect that the manufacturers, once aware of the problem, will in future invest efforts to produce smaller and more easily installable units, for instance using a radio protocol (such as Zigbee) to get rid of the wires, or conducting the measurements at the fuse box level.
The third and fourth issues could both be resolved by a novel feedback application. The application should not only provide direct electric power or consumption figures, but contextualize and present them in a way that the user can directly see how the device contributes to the total consumption of the household. This inevitably includes user evaluations about how much, or how often, they use certain appliance. An application that can store consumption and power data comes already very close to the possibility of sharing this information. An Internet-based interface could allow the user to give their friends and relatives access to their measurement data. This would greatly facilitate social comparisons, and lead personal evaluations of electricity efficiency or wastefulness. This data might also be anonymously contributed for creating a comprehensive database of electricity consumption, which could be a valuable resource for other people without this feedback system or researchers interested in typical consumption figures (but see the discussion about privacy issues in [24]).
Future Work
In this paper we have proposed a method to help designing energy feedback systems. This work is just a start and in future we need to gather more experiences and experiment with prototypes to see where we are headed. We believe this approach can be beneficial and we have presented examples how we could leverage present findings to guide the development of future energy feedback and ICT awareness applications. There are many difficult design questions remaining. For instance, what should the energy feedback system at large help people to achieve? We have already revealed some needs of electricity consumers, but we also need to see the big picture. Especially the motivations beyond immediate needs and signals should be acknowledged.
There are also many basic level research questions open for study. We bypassed the level of energy awareness and how the measurements affected it. There could be two distinct types of energy awareness: general awareness of the concepts of electricity and technology (the difference of power and consumption, stand-by mode, computer power savings modes, etc.), and specific awareness of the energy consumed by particular devices (television, fridge, etc.). If the energy awareness is to be taken seriously in feedback application development, then it needs to be evaluated as well. Also the phenomenon of attribution change, what happens after discovering your consumption, might be an interesting topic for future studies.
Many users believed that the acquired information would make a change in their consumption habit or future appliance investments, but did these change really occur? This could be investigated by a follow-up study, which could confirm whether the levels awareness and consumption changes. The practices of present power meter loaners could also be studied in more detail. For instance, we do not know for how long do people remember the results, or how do they keep track of them? How does awareness relate to consumption habits? In the present data, we already have evidence that increased awareness can actually increase the consumption, if the user for instance perceives stand-by consumption negligible by his or her own account.
Based on the current study, it is uncertain whether device specific consumption information alone can help to consumption practices for the better. The present results suggests that the power meter as it is currently applied, best suits the needs of a judge who is inspecting individual devices suspected “faulty” (what is the criterion anyway) or to be replaced. The needs of a wisdom seeker or detective are not supported so well because their goal is completely different. Instead of pronouncing a verdict to a single device, they are interested in understanding the big picture. Using the meter they do receive some consumption figures, but they could typically use some help in putting them together.
Acknowledgements
This work was supported by BeAware, a research project funded by the Seventh Framework programme of European Community (STREP Project INFSO-ICT-224557). I am grateful for the help
33
of customer service staff working for Helsingin Energia for the aid in recruiting the participants and for Giulio Jacucci and Tatu Nieminen for commenting this manuscript.
References
[1] http://www.engadget.com/tag/gps%20accident/
[2] Fischer, C. Feedback on household electricity consumption: a tool for saving energy? Energy Efficiency. 1 2008, pp. 79-104.
[3] Darby, S. The Effectiveness of Feedback on Energy Consumption. A Review for DEFRA of the Literature on Metering, Billing and direct Displays. University of Oxford, Oxford (2006).
[4] http://greenlite.dartmouth.edu/portal/dartmouth#gotoDemo
[5] http://www.theenergydetective.com/ted-footprints-main.html
[6] http://luciddesigngroup.com/
[7] http://theenergydetective.com/media/FootprintsScreenShots-SF.pdf
[8] Gustafsson, A. and Gyllenswärd, M. The power-aware cord: energy awareness through ambient information display. Proc. of the CHI 2005. ACM Press, New York, USA.
[9] http://www.diykyoto.com/uk/wattson/about
[10] Pierce, J., Odom, W. and Blevis, E. Energy Aware Dwelling: A Critical Survey of Interaction Design for Eco-Visualization. Proc. of the OZCHI 2008 (Cairns, Australia, 8 -12 Dec 2008 2008). Can be ordered from ACM Press, New York, USA.
[11] Kujala, S., Kauppinen, M. and Rekola, S. Bridging the Gap between User Needs and User Requirements. Proc. of the Advances in Human-Computer Interaction I (2001). Can be ordered from Typorama Publications.
[12] Lindgaard, G., Dillon, R., Trbovich, P., White, R., Fernandes, G., Lundahl, S. and Pinnamaneni, A. User Needs Analysis and requirements engineering: Theory and practice. Interacting with Computers. 1 2006, pp. 47-70.
[13] Holmquist, L.E. User-driven innovation in the future applications lab. Proc. of the CHI 2004 (Vienna, Austria, 2004). Can be ordered from ACM Press, New York, USA.
[14] Djajadiningrat, J.P., Gaver, W.W. and Fres, J.W. Interaction relabelling and extreme characters: methods for exploring aesthetic interactions. Proc. of the Designing Interative Systems DIS'00, 2000. Can be ordered from ACM Press, New York, USA.
[15] Holmquist, L.E. Inventing the future. Interactions. 2 2006, pp. 44-ff.
[16] Urban, G.L. and von Hippel, E. Lead user analyses for the development of new industrial products. Management Science. 5 1988, pp. 569-582.
[17] Luthje, C. and Herstatt, C. The Lead User method: an outline of empirical findings and issues for future research. R&D Management. 5 2004, pp. 553-568.
[18] http://www.energyawareness.eu/beaware/
[19] http://www.plogginternational.com/ploggproducts.html
[20] Liikkanen, L.A. and Nieminen, T. Comparing end-user electric power meters for accuracy. HIIT Technical Reports 2009-1. Helsinki Institute for Information Technology HIIT, Helsinki, Finland (2009). https://www.hiit.fi/files/admin/publications/Technical_Reports/hiit-tr-2009-1.pdf
[21] Gudbjerg, E. and Gram-Hanssen, K. Standby consumption in private homes socio-economic studies, mapping and measuring reduction? What works: campaigns or hardware solutions.
34

Proc. of the The International Conference on Energy Efficiency in Domestic Appliances and Lighting (EEDAL’06) (London, UK, 2006).
[22] Rouhiainen, V. Decomposing Electricity Use of Finnish Households to Appliance Categories. Proc. of EEDAL 2009 (this volume)
[23] Pruitt, J. and Grudin, J. Personas: practice and theory. Proc. of the 2003 conference on Designing for User Experiences (DUX2003) (San Francisco, California, 2003). Can be ordered from ACM Press, NY.
[24] Lisovich, M. and Wicker, S. Privacy Concerns in Upcoming Residential and Commercial Demand-Response Systems. Proc. of the Clemson University Power Systems Conference (Clemson, SC, March, 2008 2008). http://www.truststc.org/pubs/332/lisovich2007pci_v3.pdf.
35

A Residential Electric Load Simulator to Support Demand Management Strategies in Competitive Electricity Markets
A. Prudenzi, A. Silvestri
Dept. of Electrical Engineering, University of L'Aquila, Italy
M. Regoli
Dept. of Economics, 2nd University of Rome
Abstract
The present paper is aimed at illustrating a residential load simulator that implements a psychological model of the domestic customer’s electric energy usage. The model aims at reproducing the daily electric load shape of a residential area by aggregating contributions of individual households. The individual household’s daily load shape, on its turn, is the result of the elemental contributions of electric appliances demand being part of its typical mix. Thus the model provides a constructive approach to the load shaping problem by following a bottom-up mechanism based upon interaction between the two elemental units of the demand: household’s member and individual appliance. In the paper, some main figures of the simulation model and possible applications are reported in due detail.
Introduction
Recent energy crises have focused attention on issues of demand management and of its influence on system reliability. From many parts, power system planners have re-affirmed the concept that among the best resources for a utility to solve its operational problems, when critical situations occur may be its own customers. Indeed, they can help a utility for instance by means of voluntary demand management programs if they are offered the right incentives. So, many transmission and distribution congestion problems could be addressed through effective demand management programs. However, effective demand management programs should involve adequate load research activities aimed at identifying: a) real demand patterns of customers’ classes; b) susceptibility of customers to demand management strategies and incentives [1]. In the residential segment of electricity the demand management involves the knowledge of the household typical patterns-of-use that are strictly linked to lifestyle concepts and rules [2]. In this latter segment, therefore, the availability of residential load simulators able to reproduce psychological aspects of household’s daily load demand should give a useful support to load research [3]. The development of models for ascertaining the load shape in residential end-use areas is a cost-effective option for electric companies as it allows reduction of load investigations to the ones only required for model tuning and validation, thus allowing ex-ante evaluations of energy and demand management programs. A model of the residential customer's demand has been proposed in the recent past that can be defined psychological since adopts the probabilistic functions such as "availability" and "proclivity" of household's member for accounting for lifestyle factors affecting energy usage in houses [4]. The model, following a "bottom-up" approach, allows the reproduction of the load diagram of a residential end-use area through a process of synthesis that allows differentiation between the and engineering components of demand. The synthesis involves aggregation of the load diagrams of each individual household by taking into account the macroscopic socioeconomic and demographic characteristics of the area concerned. The model has been opportunely improved and implemented in a program called DELOS (Domestic Electrical LOad Simulator) that acts as a residential customer’s load simulator. Thus, both data obtained from load research activities and data concerning people lifestyle, household's typical appliance mix and pattern-of-use, as well as energy and demand typical figures, must be input in the model for simulating daily load shapes of domestic end-users. A preliminary calibration activity is then assessed by comparing electrical daily load diagrams made
36
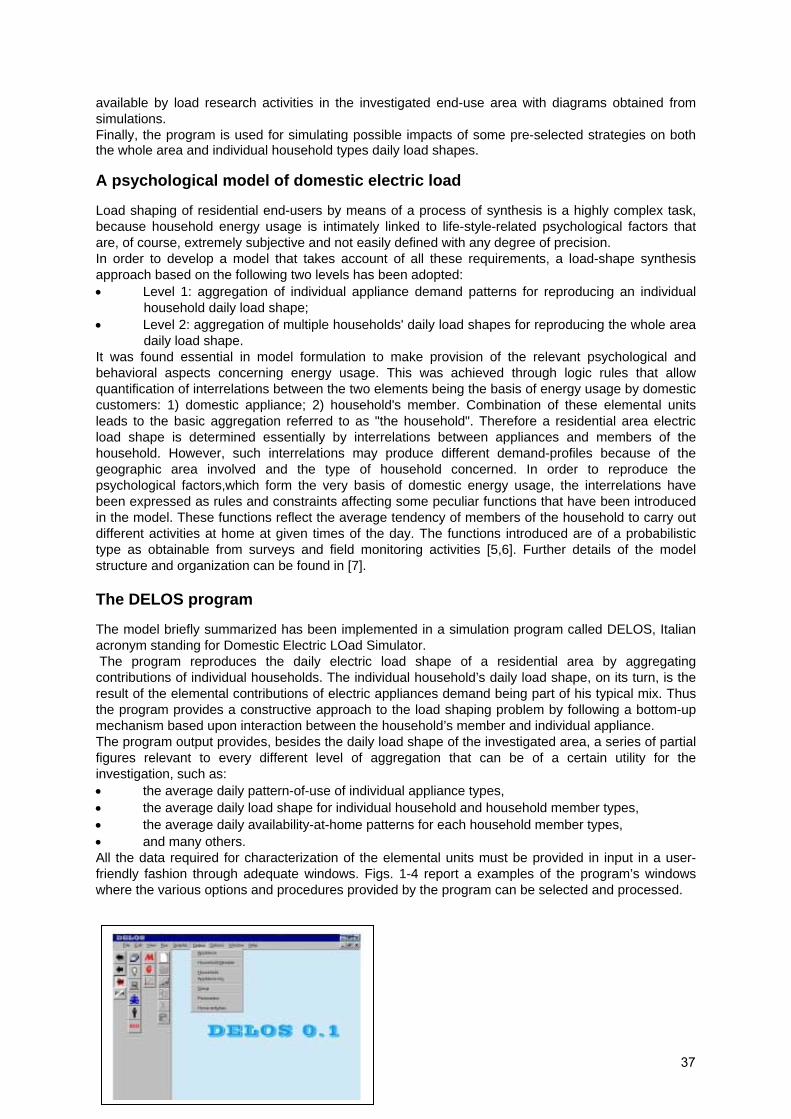
available by load research activities in the investigated end-use area with diagrams obtained from simulations. Finally, the program is used for simulating possible impacts of some pre-selected strategies on both the whole area and individual household types daily load shapes.
A psychological model of domestic electric load
Load shaping of residential end-users by means of a process of synthesis is a highly complex task, because household energy usage is intimately linked to life-style-related psychological factors that are, of course, extremely subjective and not easily defined with any degree of precision. In order to develop a model that takes account of all these requirements, a load-shape synthesis approach based on the following two levels has been adopted: • Level 1: aggregation of individual appliance demand patterns for reproducing an individual
household daily load shape; • Level 2: aggregation of multiple households' daily load shapes for reproducing the whole area
daily load shape. It was found essential in model formulation to make provision of the relevant psychological and behavioral aspects concerning energy usage. This was achieved through logic rules that allow quantification of interrelations between the two elements being the basis of energy usage by domestic customers: 1) domestic appliance; 2) household's member. Combination of these elemental units leads to the basic aggregation referred to as "the household". Therefore a residential area electric load shape is determined essentially by interrelations between appliances and members of the household. However, such interrelations may produce different demand-profiles because of the geographic area involved and the type of household concerned. In order to reproduce the psychological factors,which form the very basis of domestic energy usage, the interrelations have been expressed as rules and constraints affecting some peculiar functions that have been introduced in the model. These functions reflect the average tendency of members of the household to carry out different activities at home at given times of the day. The functions introduced are of a probabilistic type as obtainable from surveys and field monitoring activities [5,6]. Further details of the model structure and organization can be found in [7]. The DELOS program
The model briefly summarized has been implemented in a simulation program called DELOS, Italian acronym standing for Domestic Electric LOad Simulator. The program reproduces the daily electric load shape of a residential area by aggregating contributions of individual households. The individual household’s daily load shape, on its turn, is the result of the elemental contributions of electric appliances demand being part of his typical mix. Thus the program provides a constructive approach to the load shaping problem by following a bottom-up mechanism based upon interaction between the household’s member and individual appliance. The program output provides, besides the daily load shape of the investigated area, a series of partial figures relevant to every different level of aggregation that can be of a certain utility for the investigation, such as: • the average daily pattern-of-use of individual appliance types, • the average daily load shape for individual household and household member types, • the average daily availability-at-home patterns for each household member types, • and many others. All the data required for characterization of the elemental units must be provided in input in a user-friendly fashion through adequate windows. Figs. 1-4 report a examples of the program’s windows where the various options and procedures provided by the program can be selected and processed.
37
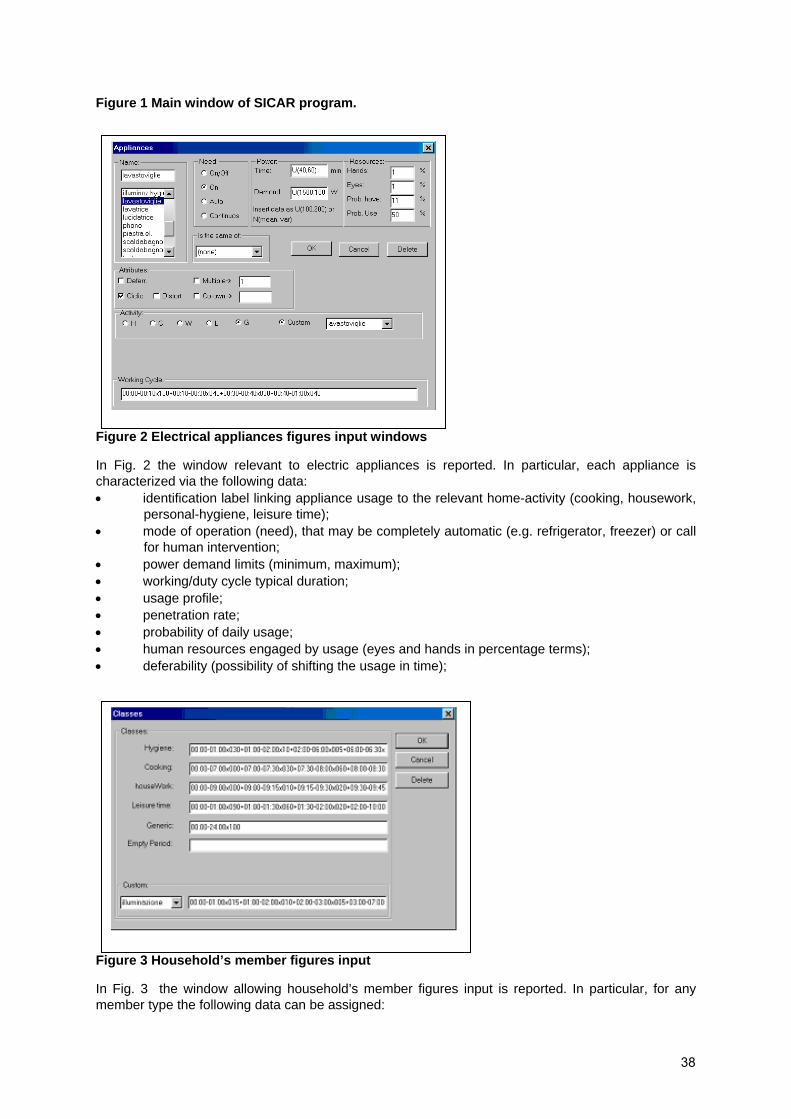
Figure 1 Main window of SICAR program.
Figure 2 Electrical appliances figures input windows
In Fig. 2 the window relevant to electric appliances is reported. In particular, each appliance is characterized via the following data: • identification label linking appliance usage to the relevant home-activity (cooking, housework,
personal-hygiene, leisure time); • mode of operation (need), that may be completely automatic (e.g. refrigerator, freezer) or call
for human intervention; • power demand limits (minimum, maximum); • working/duty cycle typical duration; • usage profile; • penetration rate; • probability of daily usage; • human resources engaged by usage (eyes and hands in percentage terms); • deferability (possibility of shifting the usage in time);
Figure 3 Household’s member figures input
In Fig. 3 the window allowing household’s member figures input is reported. In particular, for any member type the following data can be assigned:
38
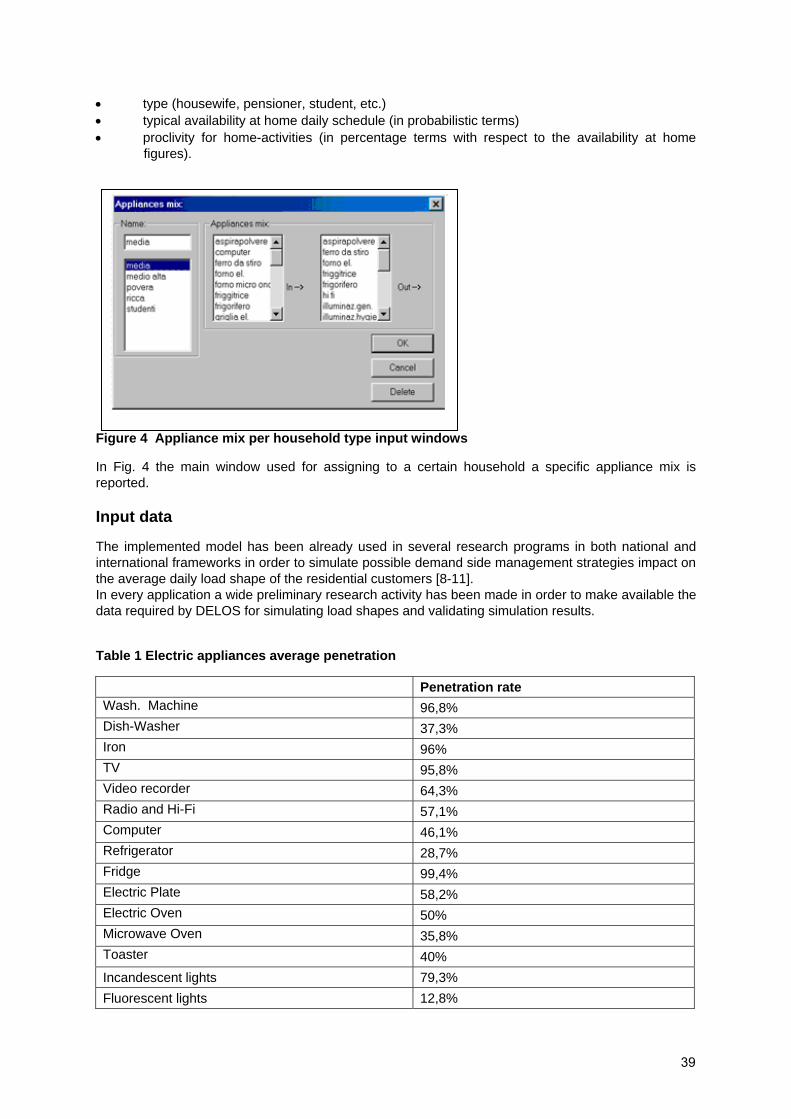
• type (housewife, pensioner, student, etc.) • typical availability at home daily schedule (in probabilistic terms) • proclivity for home-activities (in percentage terms with respect to the availability at home
figures).
Figure 4 Appliance mix per household type input windows
In Fig. 4 the main window used for assigning to a certain household a specific appliance mix is reported. Input data
The implemented model has been already used in several research programs in both national and international frameworks in order to simulate possible demand side management strategies impact on the average daily load shape of the residential customers [8-11]. In every application a wide preliminary research activity has been made in order to make available the data required by DELOS for simulating load shapes and validating simulation results.
Table 1 Electric appliances average penetration
Penetration rate Wash. Machine 96,8% Dish-Washer 37,3% Iron 96% TV 95,8% Video recorder 64,3% Radio and Hi-Fi 57,1% Computer 46,1% Refrigerator 28,7% Fridge 99,4% Electric Plate 58,2% Electric Oven 50% Microwave Oven 35,8% Toaster 40% Incandescent lights 79,3% Fluorescent lights 12,8%
39
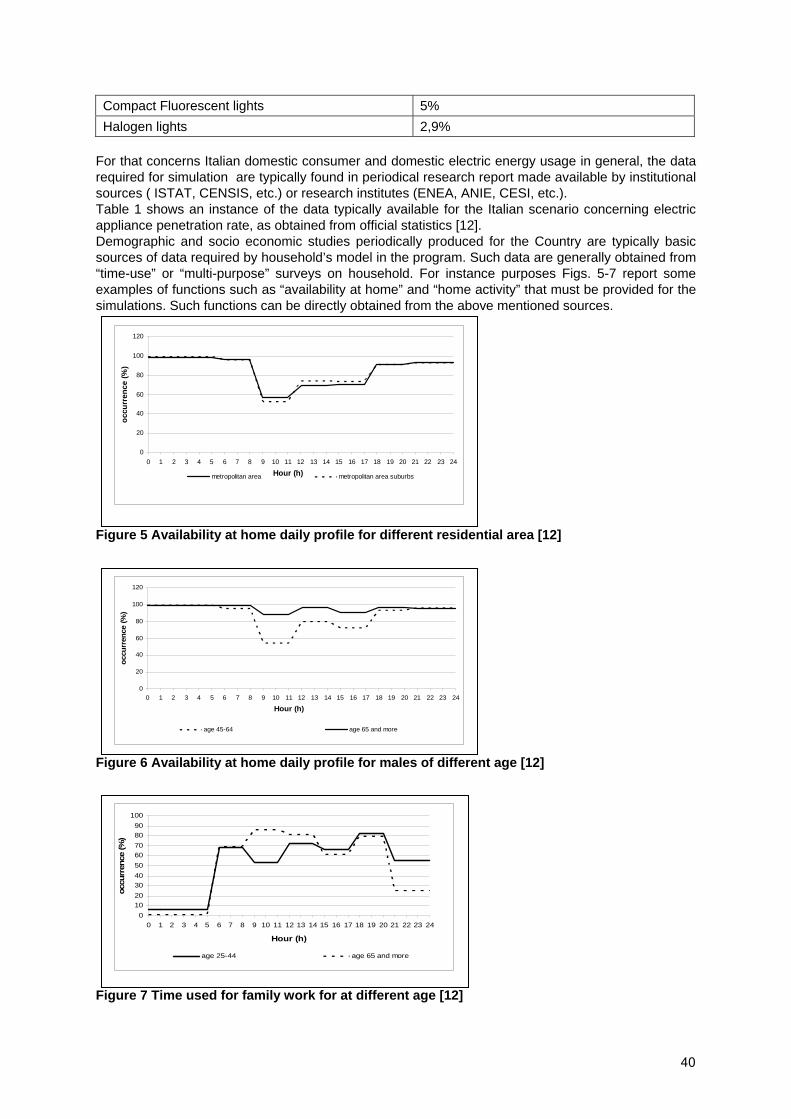
Compact Fluorescent lights 5% Halogen lights 2,9%
For that concerns Italian domestic consumer and domestic electric energy usage in general, the data required for simulation are typically found in periodical research report made available by institutional sources ( ISTAT, CENSIS, etc.) or research institutes (ENEA, ANIE, CESI, etc.). Table 1 shows an instance of the data typically available for the Italian scenario concerning electric appliance penetration rate, as obtained from official statistics [12]. Demographic and socio economic studies periodically produced for the Country are typically basic sources of data required by household’s model in the program. Such data are generally obtained from “time-use” or “multi-purpose” surveys on household. For instance purposes Figs. 5-7 report some examples of functions such as “availability at home” and “home activity” that must be provided for the simulations. Such functions can be directly obtained from the above mentioned sources.
Figure 5 Availability at home daily profile for different residential area [12]
Figure 6 Availability at home daily profile for males of different age [12]
Figure 7 Time used for family work for at different age [12]
0
20
40
60
80
100
120
0 1 2 3 4 5 6 7 8 9 10 11 12 13 14 15 16 17 18 19 20 21 22 23 24
Hour (h)
occu
rren
ce (%
)
metropolitan area metropolitan area suburbs
0
20
40
60
80
100
120
0 1 2 3 4 5 6 7 8 9 10 11 12 13 14 15 16 17 18 19 20 21 22 23 24
Hour (h)
occu
rren
ce (%
)
age 45-64 age 65 and more
0102030405060708090
100
0 1 2 3 4 5 6 7 8 9 10 11 12 13 14 15 16 17 18 19 20 21 22 23 24
Hour (h)
occu
rren
ce (%
)
age 25-44 age 65 and more
40

The data concerning type and usage of electric appliances at household consists of the typical demand, the typical working cycle and the daily usage probability. Most of the data required can be obtained from statistics or market research reports. Furthermore, load research performed directly at lab or household’s is particularly important for providing more specific practical information concerning both individual appliance typical working cycle and household’s typical daily load shape. Fig. 8 shows an example of the demand recording for a washing machine.
Figure 8 Power demand recording for a class A washing machine during a working cycle at 60°C
The data above mentioned are used for simulating both the individual household and the whole investigated area daily electric load shapes. The result thus obtained from every simulation can be compared with results made available from electric load monitoring activity in the area. The comparison typically allows a detailed calibration and verification activity of the psychological model of domestic demand as implemented in the program. For instance purposes Figs. 9 and 10 report both monitored average per customer daily load shape and the simulated one from a case study concerning a European research program.[8]
Figure 9 Whole area average daily load shape as obtained from load monitoring activity
0
200
400
600
800
1000
1200
1400
1600
1800
2000
0 30 60 90 120 150 180 210
Time [min]
Ele
ctri
cal d
eman
d [W
]
0,0
100,0
200,0
300,0
400,0
500,0
600,0
700,0
800,0
900,0
0:00
1:05
2:10
3:15
4:20
5:25
6:30
7:35
8:40
9:4510
:5011
:5513
:0014
:0515
:1016
:1517
:2018
:2519
:3020
:3521
:4022
:4523
:50
Wat
t
41

Figure 10 Whole area average daily load shape as obtained from DELOS simulations
Figure 11 Contribution of various appliance classes to whole daily electric load shape resulted from simulations
The simulation activity performed with DELOS allowed identify electric appliance classes typical load patterns thus giving possibility to assess cost-effective demand-side activities in the load area. Prediction of demand and energy management strategies impact
1. After having successfully performed the above mentioned in-depth calibration activity of the model on the real data collected for the customers’ sample, the simulator can be considered as a valid model for effectively reproducing the customer’s electric energy pattern-of-use in the investigated area. The program can thus be applied for predicting possible impact on household’s daily load shape of some more common energy and load management strategies, such as:
• penetration of higher energy efficiency appliances (washing-machine, dish-washer, water heater, small appliances, lighting retrofitting)
• energy source substitution (electricity with gas for water heating ) 2. Load shifting strategy involving off-peak period penetration of more efficient water heaters
operated during night-time. 3. Simulation of customer's response to binominal tariff experiments. Different scenarios of penetration of appliances with high energy efficiency characteristics can be easily simulated through DELOS with various penetration rates and various technological improvement thus obtaining customer’s demand response and its impact an daily load shape. In fig. 11, for instance, a results of simulations for the area of the above mentioned case study are reported in comparison.
0
100
200
300
400
500
600
700
800
900
1000
0.00
1.15
2.30
3.45
5.00
6.15
7.30
8.4510
.0011
.1512
.3013
.4515
.0016
.1517
.3018
.4520
.0021
.1522
.3023
.45
time
dem
and
(W)
0
100
200
300
400
500
600
700
800
900
1000
0.00
1.30
3.00
4.30
6.00
7.30
9.0010
.3012
.0013
.3015
.0016
.3018
.0019
.3021
.0022
.30
time
dem
and
(W)
El. Water HeaterSmall Appl.LightingTv,Video,HifiComputerRefrigeratorDish WasherWashing Machine
42
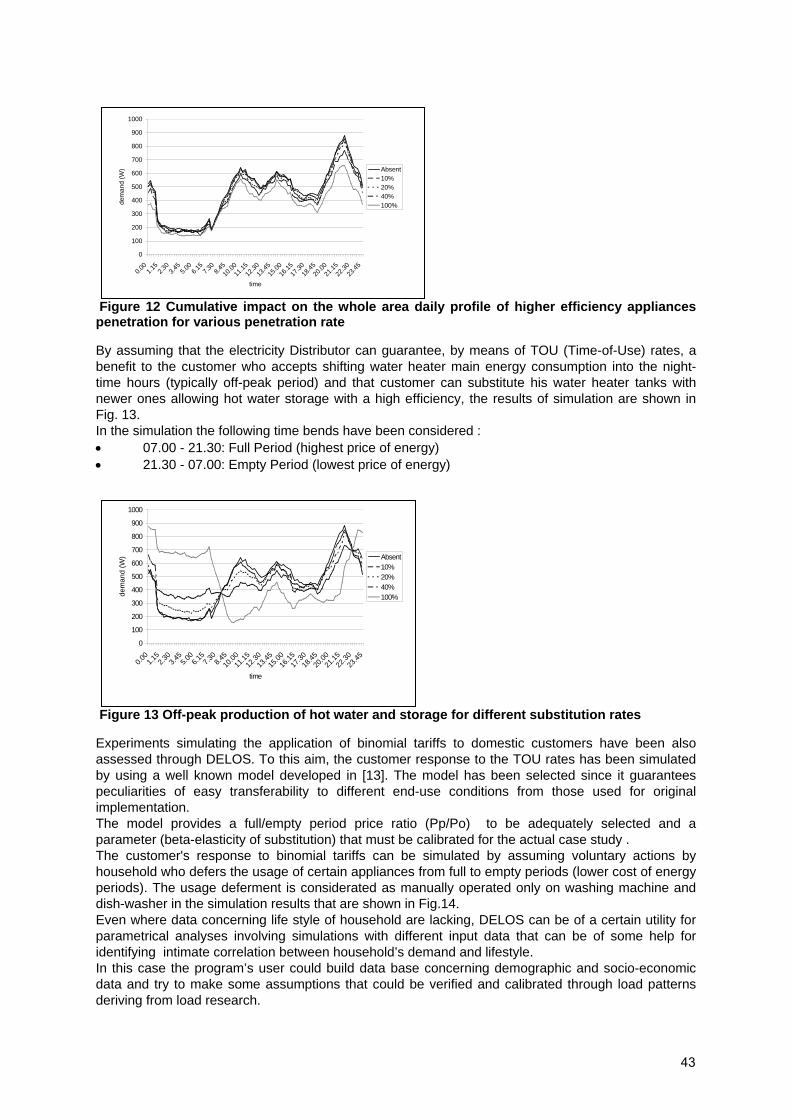
Figure 12 Cumulative impact on the whole area daily profile of higher efficiency appliances penetration for various penetration rate
By assuming that the electricity Distributor can guarantee, by means of TOU (Time-of-Use) rates, a benefit to the customer who accepts shifting water heater main energy consumption into the night-time hours (typically off-peak period) and that customer can substitute his water heater tanks with newer ones allowing hot water storage with a high efficiency, the results of simulation are shown in Fig. 13. In the simulation the following time bends have been considered : • 07.00 - 21.30: Full Period (highest price of energy) • 21.30 - 07.00: Empty Period (lowest price of energy)
Figure 13 Off-peak production of hot water and storage for different substitution rates
Experiments simulating the application of binomial tariffs to domestic customers have been also assessed through DELOS. To this aim, the customer response to the TOU rates has been simulated by using a well known model developed in [13]. The model has been selected since it guarantees peculiarities of easy transferability to different end-use conditions from those used for original implementation. The model provides a full/empty period price ratio (Pp/Po) to be adequately selected and a parameter (beta-elasticity of substitution) that must be calibrated for the actual case study . The customer's response to binomial tariffs can be simulated by assuming voluntary actions by household who defers the usage of certain appliances from full to empty periods (lower cost of energy periods). The usage deferment is considerated as manually operated only on washing machine and dish-washer in the simulation results that are shown in Fig.14. Even where data concerning life style of household are lacking, DELOS can be of a certain utility for parametrical analyses involving simulations with different input data that can be of some help for identifying intimate correlation between household’s demand and lifestyle. In this case the program’s user could build data base concerning demographic and socio-economic data and try to make some assumptions that could be verified and calibrated through load patterns deriving from load research.
0
100
200
300
400
500
600
700
800
900
1000
0.00
1.15
2.30
3.45
5.00
6.15
7.30
8.4510
.0011
.1512
.3013
.4515
.0016
.1517
.3018
.4520
.0021
.1522
.3023
.45
time
dem
and
(W) Absent
10%20%40%100%
0
100
200
300
400
500
600
700
800
900
1000
0.00
1.15
2.30
3.45
5.00
6.15
7.30
8.4510
.0011
.1512
.3013
.4515
.0016
.1517
.3018
.4520
.0021
.1522
.3023
.45
time
dem
and
(W) Absent
10%20%40%100%
43
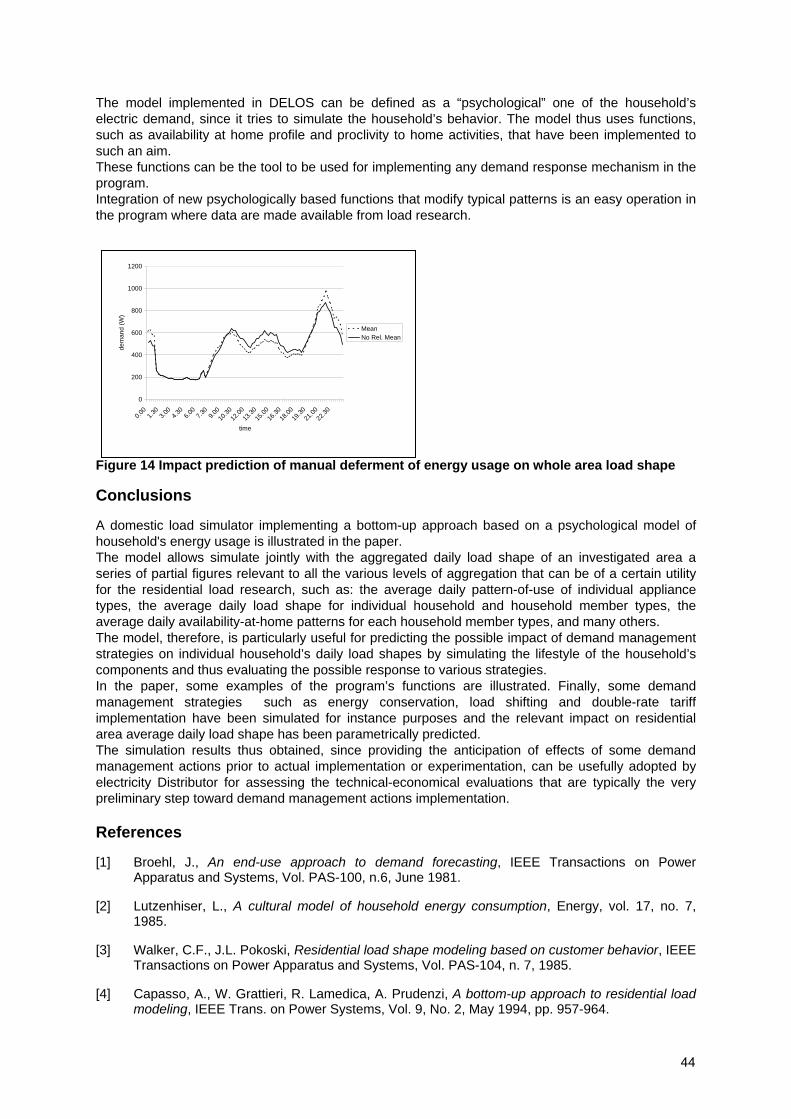
The model implemented in DELOS can be defined as a “psychological” one of the household’s electric demand, since it tries to simulate the household’s behavior. The model thus uses functions, such as availability at home profile and proclivity to home activities, that have been implemented to such an aim. These functions can be the tool to be used for implementing any demand response mechanism in the program. Integration of new psychologically based functions that modify typical patterns is an easy operation in the program where data are made available from load research.
Figure 14 Impact prediction of manual deferment of energy usage on whole area load shape
Conclusions
A domestic load simulator implementing a bottom-up approach based on a psychological model of household's energy usage is illustrated in the paper. The model allows simulate jointly with the aggregated daily load shape of an investigated area a series of partial figures relevant to all the various levels of aggregation that can be of a certain utility for the residential load research, such as: the average daily pattern-of-use of individual appliance types, the average daily load shape for individual household and household member types, the average daily availability-at-home patterns for each household member types, and many others. The model, therefore, is particularly useful for predicting the possible impact of demand management strategies on individual household’s daily load shapes by simulating the lifestyle of the household’s components and thus evaluating the possible response to various strategies. In the paper, some examples of the program’s functions are illustrated. Finally, some demand management strategies such as energy conservation, load shifting and double-rate tariff implementation have been simulated for instance purposes and the relevant impact on residential area average daily load shape has been parametrically predicted. The simulation results thus obtained, since providing the anticipation of effects of some demand management actions prior to actual implementation or experimentation, can be usefully adopted by electricity Distributor for assessing the technical-economical evaluations that are typically the very preliminary step toward demand management actions implementation. References
[1] Broehl, J., An end-use approach to demand forecasting, IEEE Transactions on Power Apparatus and Systems, Vol. PAS-100, n.6, June 1981.
[2] Lutzenhiser, L., A cultural model of household energy consumption, Energy, vol. 17, no. 7, 1985.
[3] Walker, C.F., J.L. Pokoski, Residential load shape modeling based on customer behavior, IEEE Transactions on Power Apparatus and Systems, Vol. PAS-104, n. 7, 1985.
[4] Capasso, A., W. Grattieri, R. Lamedica, A. Prudenzi, A bottom-up approach to residential load modeling, IEEE Trans. on Power Systems, Vol. 9, No. 2, May 1994, pp. 957-964.
0
200
400
600
800
1000
1200
0.00
1.30
3.00
4.30
6.00
7.30
9.0010
.3012
.0013
.3015
.0016
.3018
.0019
.3021
.0022
.30
time
dem
and
(W)
MeanNo Rel. Mean
44
[5] Capasso, A., W. Grattieri, A. Invernizzi, F. Insinga, R. Lamedica, A. Prudenzi, Validation tests and applications of a model for Demand-Side Management studies in residential load areas, Proc. of CIRED 1993, 12-th International Conference on Electricity Distribution, Birmingham (UK), May 17-21, 1993 (b).
[6] De Almeyda, A.T., et al., Energy Efficiency in Household Appliances, Conference Proceedings, November 10-12, 1997, Florence, Italy.
[7] Capasso, A., A. Invernizzi, R. Lamedica, A. Prudenzi, Probabilistic processing of survey collected data in a residential load area for hourly demand profile estimation, Proceedings of IEEE APT'93 Technical Conference, September 3-8, 1993, Athens.
[8] Gomes Martins, A., C.A. Bel, A: Gabaldon, M. Klingner, F. Pinto de Carvalho, A. Prudenzi, Rational use of energy resources in cities through DSM, Final Report, European Contract number XVII/4.1031/Z/97/112, Coimbra, Portugal, January 2000.
[9] CESI - Rapporto di Ricerca di Sistema (Progetto GENDIS) – A. Borghetti, S. Spelta Definizione del modello di carico elettrico e termico di tipiche utenze civili, prot. A0/038094, dicembre 2000. http://www.ricercadisistema.it
[10] CESI – G. L. Fracassi Applicazioni elettriche per la casa: simulazione delle curve di carico delle diverse applicazioni elettriche, prot. A0/041132, dicembre 2000
[11] CESI – G. L. Fracassi Valutazione delle modifiche delle curve di carico della clientela domestica a seguito dell’introduzione di nuove tariffe: Parte I – Taratura del modello di simulazione, prot. A0/020356, giugno 2000.
[12] Maria Clelia Romano Time use in daily livfe, A multidisciplinary approach to the Time use’s analysis n 35, 2008.
[13] EPRI, Residential response to Time-of-Use rates, Vol. 1: Development and Demonstration of a transferability model, Report EA-3560, Palo Alto, California, June 1984 b.
45

PowerCentsDC™ Program
Effect of Pricing and Advanced Feedback
Chris King
eMeter Strategic Consulting
Abstract
In the past several years, utilities globally have conducted numerous pilot programs related to smart meters. These include dynamic pricing programs and others assessing the conservation effect of feedback to consumers regarding their energy usage. With few exceptions, analysis of pricing programs has focused on peak demand reductions and analysis of feedback programs has focused on total usage reductions, the “conservation effect.” Pepco and the District of Columbia, United States, have collaborated on a residential pilot that combines pricing and feedback and will analyze both effects. It is called PowerCentsDC. The program went live in July 2008 and will run through February 2010. It includes three pricing options: critical peak pricing, peak time rebate (critical peak rebate), and day-ahead hourly pricing. It includes three feedback options: smart thermostats, monthly detailed energy usage reports, and consumer engagement software. The thermostats provide prices currently in effect, month-to-date bill, and notification of critical peak or high price events. The energy reports show daily energy use by price period. The consumer engagement software includes a website with detailed usage and cost data, as well as subscription services for “pushing” data to consumers. Preliminary results suggest the pilot will provide significant insight regarding both peak demand reduction and conservation associated with the combination of dynamic pricing and advanced feedback.
The Literature Policymakers are looking to smart meters to meet a number of policy goals. For example, Ofgem, the electricity regulator in the U.K., expresses high expectations for the potential of Smart Meters to support electricity conservation and, as a result, to reduce carbon emissions. [1] Regulators are looking for smart meters to support three of the most important life goals of society today – and one related specifically to electricity: • Convenience • Fight global warming • Control household costs • Reliable power Pilot programs indicate that smart meters can support these goals. For example, one recent pilot found that AMI-provided information reduced total consumption by six percent [2] – roughly the equivalent of replacing every incandescent light bulb in America with a compact fluorescent, or removing the greenhouse gas emissions of over than 8 million cars. By educating consumers on the link between their power use and global emissions – a relationship that changes by the hour – smart meter data can help consumers manage their carbon emissions in addition to their costs.
46
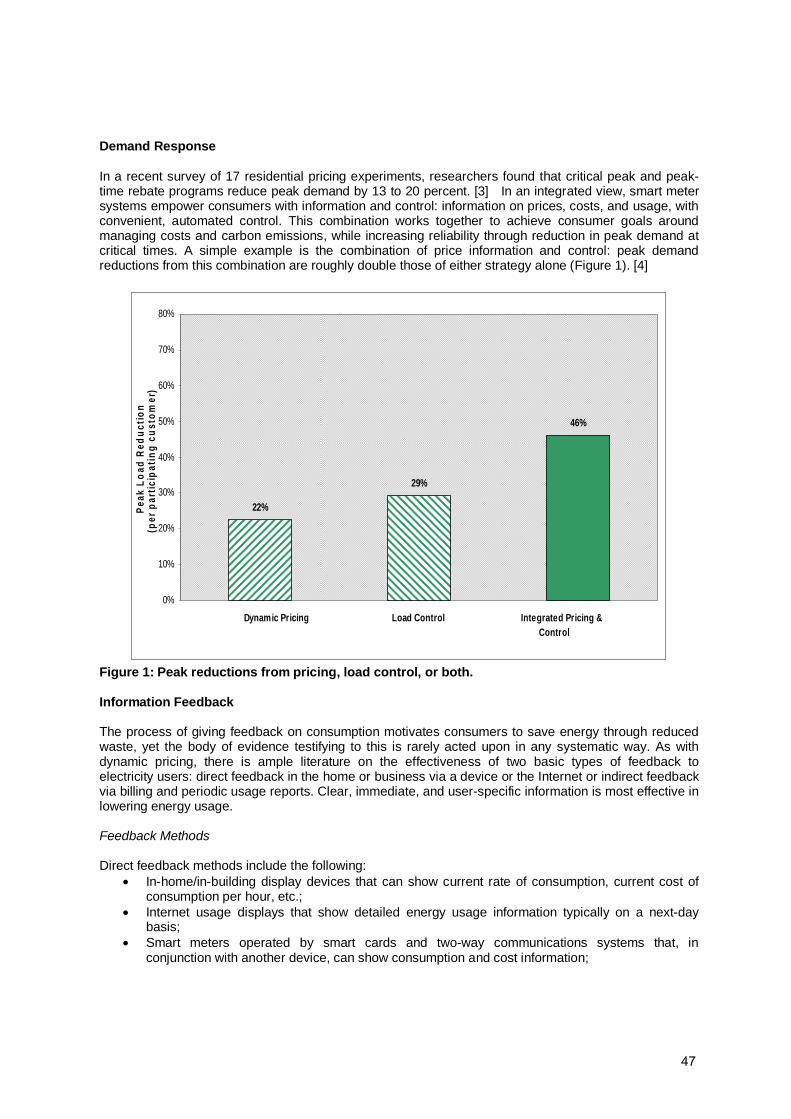
Demand Response In a recent survey of 17 residential pricing experiments, researchers found that critical peak and peak-time rebate programs reduce peak demand by 13 to 20 percent. [3] In an integrated view, smart meter systems empower consumers with information and control: information on prices, costs, and usage, with convenient, automated control. This combination works together to achieve consumer goals around managing costs and carbon emissions, while increasing reliability through reduction in peak demand at critical times. A simple example is the combination of price information and control: peak demand reductions from this combination are roughly double those of either strategy alone (Figure 1). [4]
46%
29%
22%
0%
10%
20%
30%
40%
50%
60%
70%
80%
Dynamic Pricing Load Control Integrated Pricing & Control
Pea
k L
oad
Red
uct
ion
(per
par
tici
pat
ing
cu
sto
mer
)
Figure 1: Peak reductions from pricing, load control, or both. Information Feedback The process of giving feedback on consumption motivates consumers to save energy through reduced waste, yet the body of evidence testifying to this is rarely acted upon in any systematic way. As with dynamic pricing, there is ample literature on the effectiveness of two basic types of feedback to electricity users: direct feedback in the home or business via a device or the Internet or indirect feedback via billing and periodic usage reports. Clear, immediate, and user-specific information is most effective in lowering energy usage. Feedback Methods Direct feedback methods include the following:
• In-home/in-building display devices that can show current rate of consumption, current cost of consumption per hour, etc.;
• Internet usage displays that show detailed energy usage information typically on a next-day basis;
• Smart meters operated by smart cards and two-way communications systems that, in conjunction with another device, can show consumption and cost information;
47

• Prepayment meters that provide direct feedback to use in electricity bill management; and • Device monitors that are inserted between the plug and wall socket on appliances and show
information such as current rate of consumption and current cost of consumption per hour.
Indirect feedback consists of data processed by the utility, then sent to customers. Such feedback includes the following:
• Actual bills based on metered usage rather than estimates, and possibly measured in intervals; • More frequent bills, e.g., monthly rather than quarterly basis; • Comparison data on a year-to-year basis or normalized for weather; and • Usage disaggregation, where use is estimated at the appliance level based on analysis of meter
reads in association with customer-provided data such as appliance and housing stock. Conservation Effect of Feedback Programs Monthly feedback on electric usage is generally insufficient to enable customers to manage usage effectively. In 14 utility and government programs carried out in the United States, residential customers provided with daily feedback on electricity usage reduced total consumption by an average of 11 percent.9 A survey of 26 feedback experiments concluded, “One result, at least, seems clear: Feedback stimulates energy (and specifically, electricity) savings.” [5] The level of savings ranges from 0 to 15 percent with a “norm” of 5 to 15 percent. [6]
Many utilities now offer customers energy usage information via the Internet. The data vary from simple monthly data to estimated usage by appliance for residential customers to detailed quarter-hourly usage data provided on a next-day basis. Customers are slowly but steadily taking advantage of their ability to access such data, typically beginning with a few percent of customers in the first year and growing by a few percent per year. In some cases, such as Ameren-UE, more than 20 percent of customers are actively using the utility Web site to obtain data and carry out customer service inquiries. Initial results from analysis of the effects of these programs on total consumption indicate that access to, and use of, the data cause electricity consumers to become more efficient and use less energy. Many utilities have gone beyond just providing monthly consumption, both current and historical, and provide online energy analyses or even more detailed consumption information. For example, over 120 U.S. utilities offer their residential customers an online bill disaggregation tool that evaluates energy use to show how much each appliance or end use is consuming, and also makes recommendations on where to cut energy use, and by how much.
For commercial customers, the largest and most comprehensive program in place today is in California. During California's 2001 energy crisis, the state legislature approved funding to provide smart meters to all customers with peak demands above 200 kW. Through contracts with California's electric utilities, the program provided approximately 23,300 real-time meters and associated electronic communications equipment, enabling customers to view their hourly load profile and energy use either over the Internet or on a real-time basis.10 The program included all of California's major utilities and was designed to motivate at least 500 MW of peak-demand reduction during its first year of operation.
The utilities provide customer access to usage information via the Internet using an integrated software package, including supporting hardware and software and professional services. Meter data from the previous day is sent to these systems for display to the customer the next morning. Customers have a variety of preformatted reports from which to choose and may also develop custom reports. These reports can be generated for specific time frames, such as the last 24 hours, the last month, and the last year. Customers can view charts comparing two different time frames for a single facility (such as July 2002 vs. July 2003) or two different facilities in the same time frame.
Southern California Edison (SCE) reported on customer usage of the system in October 2003.11 At SCE, the system is known to customers as SCE Energy Manager. Following the meter installation and confirmation that the Web site is reliably receiving data, the customer is sent a user ID and password
48
along with sign-on instructions and fact sheets of the various energy rates and load-management programs available from the utility. One of the main objectives of the implementation was to make it easy for the customer to use the system with little or no training. However, for customers to maximize the use of the system, SCE conducted hands-on training sessions throughout its service territory. In addition, SCE staffs a program management office during business hours to assist customers with the Web site.
Surveys determined customer use of Energy Manager. The California Energy Commission reports that 39 percent of Energy Manager users reduced total consumption as a result of using the system.12 The survey also found that 48 percent of users were able to reduce their energy costs, and 39 percent reduced peak load. With respect to accessing the data, 44 percent reported access at least once a week, with 54 percent reporting monthly or as needed access. SCE asked customers why they used the system, and they received the responses shown in Table 4. SCE reports that customers who use the system are satisfied with it, with three-fourths of users saying the software is easy to understand and use. Program Overview PowerCentsDCTM is an advanced or “smart” meter project through which selected District of Columbia residential customers in all eight wards will be provided the opportunity to control their electric bills and potentially save money. It is sponsored by Smart Meter Pilot Program, Inc. (“SMPPI”), a non-profit corporation created through a Merger Settlement Agreement and approved by the District of Columbia Public Service Commission on May 1, 2002. Under the terms of the Settlement Agreement, Pepco agreed to contribute $2 million to fund a smart meter project program. The participating organizations formed a non-profit corporation, Smart Meter Pilot Program, Inc. (“SMPPI”), to implement the agreement and administer the PowerCentsDC project. The SMPPI Board is comprised of representatives from the District of Columbia Office of the People’s Counsel (“OPC”), the District of Columbia Public Service Commission ("PSC"), the District of Columbia Consumer Utility Board ("CUB"), the International Brotherhood of Electrical Workers Local 1900 ("IBEW"), and the Potomac Electric Power Company ("Pepco").
The PowerCentsDC project is the first program in the electric utility industry to test the response of residential customers to three different innovative pricing options under one program: Hourly Pricing, Critical Peak Pricing, and Critical Peak Rebate (Peak-Time Rebate). Through these pricing options, customers may save on their bills by reducing electricity use when their prices are high. These times are known as “critical peak hours” (under the project, approximately 60 hours each year) and “critical peak days” (under the project, approximately 15 per year). Customer changes in electricity demand during these times are known as “demand response.”
While customer participation is voluntary, the project design has been carefully developed to ensure that the evaluated results are representative. To facilitate a statistically valid analysis and for rate design purposes, participation is limited to customers receiving Standard Offer Service (SOS) from Pepco.
Participating customers receive a free special “smart meter” installation for their home, which measures the customer’s electricity use at hourly intervals and sends the data wirelessly to Pepco. A third party billing vendor uses these data to calculate customers’ bills based on the PowerCentsDC tariff and to provide participants with a report, mailed with their bill each month, depicting their electricity consumption during the month. About a third of the project participants received a free “smart thermostat” that reduces central air conditioner compressor use in response to receipt of a radio-controlled signal; provides customer messages; and when programmed, automatically reduces electricity use of air conditioners or central heating systems during high priced hours. The meter selected by SMPPI also has the capability of providing other system benefits such as remote meter reading, load research data, outage detection and voltage monitoring information. Project Background
49

In the PJM Region of the United States, wholesale electricity prices vary each hour as electricity supply and demand conditions change. When temperatures are very high or very low, power use increases as electricity consumption for cooling and heating increases. During these times, power supplies may be limited, thereby increasing wholesale market electric prices.
PowerCentsDC provides consumers with electricity pricing options based on these changing wholesale costs that enable consumers to save money by altering their consumption of electricity. Conventional electric meters do not provide customers with all the information needed to effectively manage their consumption as they record only total consumption, much like a car’s odometer records total miles and does not record the time at which electricity is used, so the price of electricity to consumers does not reflect the variations in wholesale prices. If the electric rates paid by consumers tracked wholesale electricity market prices then they could choose to reduce consumption during the highest cost hours and potentially lessen their electricity bills accordingly. The PowerCentsDC Project will install smart meters that enable the provision of such pricing options.
While strongly emphasizing innovation, PowerCentsDC is also designed to provide pragmatic, actionable results. Specifically, the project is designed to provide statistically valid results that can be extrapolated to the entire District of Columbia residential population. The project will measure five primary items: 1) customer reduction in electricity consumption during peak times, 2) customer changes in overall consumption, 3) customer satisfaction with different pricing options and technologies, 4) usefulness of the selected technologies, and 5) value of presenting additional pricing information to customers. Following the project’s completion, policymakers will have the necessary information to begin assessing the cost-effectiveness of these residential pricing and technology options as well.
Program Pricing Options Participants in PowerCentsDC are billed under one of three pricing options: Hourly Pricing (“HP”), Critical Peak Pricing (“CPP”), or Critical Peak Rebate (“CPR”). All pricing options are designed to be revenue neutral, assuming no customer changes to consumption in response to price. Under all three options, the generation charge on the customer’s bill is calculated using time-varying prices. All other components of the bill, including the transmission and distribution charges, are calculated using existing rates for those components.
Under HP, electricity prices vary hourly. The prices are set the day ahead, based on the prices in the “day-ahead” wholesale market, which is our regional power market operated by the PJM Interconnection. Prices will be posted on the project website, www.PowerCentsDC.org, for access by HP participants and will also be available by calling a toll-free number. Prices will be displayed in real-time on smart thermostats for those customers electing to use them. Based on recent wholesale market trends, HP prices are expected to exceed conventional “SOS” prices only about one-third of the time within a year, with lower prices the rest of the time.
Under CPP, customers face two prices: 1) critical peak prices, and 2) prices for all other hours. Critical peak prices will be in effect for four hours on critical peak days, of which there are 15 each year. During the summer (June 1 to October 31), there will be 12 critical peak days, and during the winter (November 1 to May 31) there will be 3 critical peak days. The critical peak hours will occur between 2 p.m. to 6 p.m. in the summer and between 6 a.m. to 8 a.m. and between 6 p.m. to 8 p.m. during the winter. Critical peak “events” are called by the project implementation contractor when wholesale prices in the day-ahead market exceed a threshold approved by the SMPPI Board of Directors. Customers are notified of these events the day before, by 5 p.m., via their choice of an automated phone call, email, text page, or smart thermostat notification. Prices during the 60 critical peak hours each year are substantially higher than conventional SOS rates but are offset by lower prices during the remaining 8,700 hours of the year.
Under CPR, customers continue to pay the same generation charges as Standard Offer Service. During critical peak events, CPR customers can earn rebates by reducing their consumption below what they would normally have used during those times. The rebate is calculated by multiplying the reduced
50
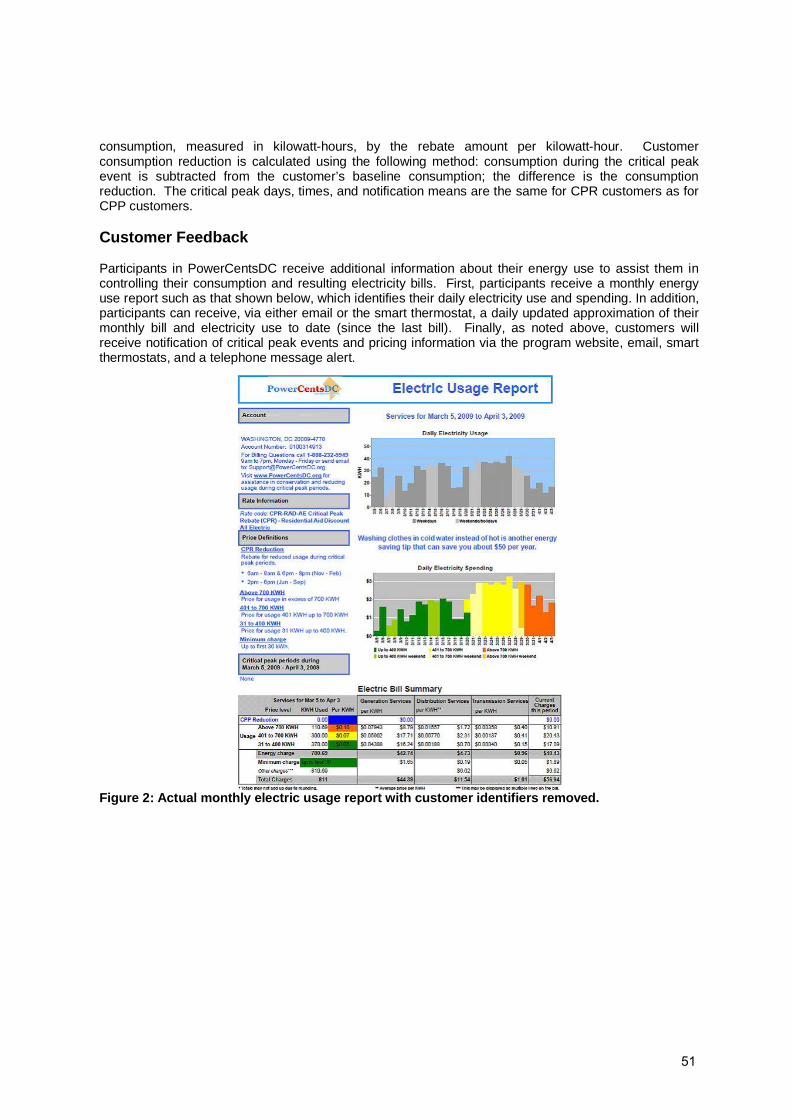
consumption, measured in kilowatt-hours, by the rebate amount per kilowatt-hour. Customer consumption reduction is calculated using the following method: consumption during the critical peak event is subtracted from the customer’s baseline consumption; the difference is the consumption reduction. The critical peak days, times, and notification means are the same for CPR customers as for CPP customers.
Customer Feedback Participants in PowerCentsDC receive additional information about their energy use to assist them in controlling their consumption and resulting electricity bills. First, participants receive a monthly energy use report such as that shown below, which identifies their daily electricity use and spending. In addition, participants can receive, via either email or the smart thermostat, a daily updated approximation of their monthly bill and electricity use to date (since the last bill). Finally, as noted above, customers will receive notification of critical peak events and pricing information via the program website, email, smart thermostats, and a telephone message alert.
Figure 2: Actual monthly electric usage report with customer identifiers removed.
51
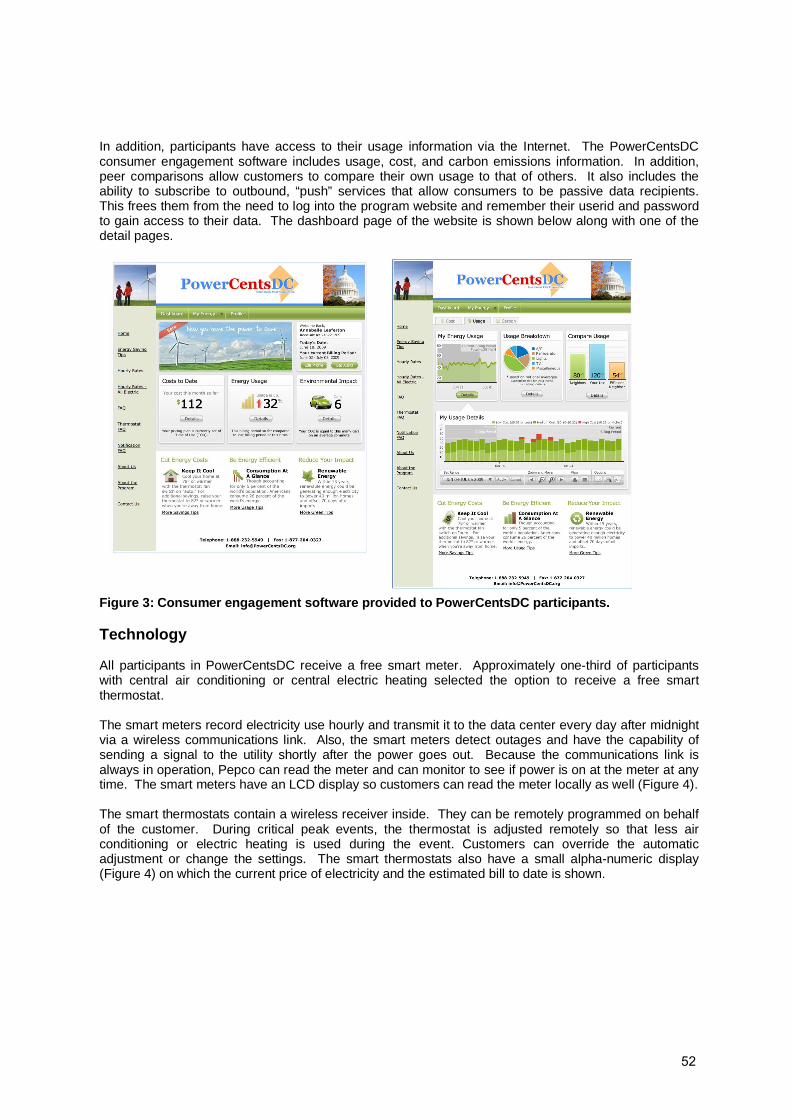
In addition, participants have access to their usage information via the Internet. The PowerCentsDC consumer engagement software includes usage, cost, and carbon emissions information. In addition, peer comparisons allow customers to compare their own usage to that of others. It also includes the ability to subscribe to outbound, “push” services that allow consumers to be passive data recipients. This frees them from the need to log into the program website and remember their userid and password to gain access to their data. The dashboard page of the website is shown below along with one of the detail pages.
Figure 3: Consumer engagement software provided to PowerCentsDC participants. Technology All participants in PowerCentsDC receive a free smart meter. Approximately one-third of participants with central air conditioning or central electric heating selected the option to receive a free smart thermostat. The smart meters record electricity use hourly and transmit it to the data center every day after midnight via a wireless communications link. Also, the smart meters detect outages and have the capability of sending a signal to the utility shortly after the power goes out. Because the communications link is always in operation, Pepco can read the meter and can monitor to see if power is on at the meter at any time. The smart meters have an LCD display so customers can read the meter locally as well (Figure 4). The smart thermostats contain a wireless receiver inside. They can be remotely programmed on behalf of the customer. During critical peak events, the thermostat is adjusted remotely so that less air conditioning or electric heating is used during the event. Customers can override the automatic adjustment or change the settings. The smart thermostats also have a small alpha-numeric display (Figure 4) on which the current price of electricity and the estimated bill to date is shown.
52

Figure 4: Sample meter and smart thermostat. Experimental Design
The basic concept of the pilot is to have two groups of customers: participants and control customers. Invited voluntary participants were placed on a pre-assigned tariff, received a smart meter, and received a smart thermostat if they have central air conditioning if they wanted one. Control customers received a smart meter and are treated in the same way that Pepco customers generally are treated; these customers remained on their current tariff and are expected to continue using electricity as they would normally. Electricity consumption for the two groups is being compared using standard statistical techniques, by an independent outside expert, to determine the effects of the tariffs and equipment on electricity consumption of participants.
PowerCentsDC invited participants were selected via a stratified random sample. Separate residential groups were established for each of the three pricing options: HP, CPP, and CPR. Within those groups, there are groups for standard customers and all-electric customers. Low income customers served under Pepco’s Residential Aid Discount rate (“RAD”) are participating only under the CPR option. A statistically valid control group provides consumption data for comparison with each of the participant groups. The sample design is shown below, with estimated number of participants for each rate type. Table 1: PowerCentsDC sample design.
TARIFF Customer Group HPO CPP CPR Control Standard Customers 175 175 175 63 All-Electric Customers 75 75 75 63 Standard RAD Customers - - 75 63 All-Electric RAD Customers - - 50 63 Total Meters 250 250 375 252
Participants were recruited using direct mail. The direct mail included an introductory letter and a brochure with sufficient detail to enable consumers to make informed participation decisions. Customers were able to enroll by returning an enrollment form, sending an email, or calling the PowerCentsDC toll-free telephone number. The recruitment process was conducted in a manner to minimize the introduction of any self-selection bias on the part of participants. A survey of participants will be conducted to determine knowledge and satisfaction levels with the program. A survey of participants and control customers will be conducted to determine major appliance saturation (e.g., type of air conditioner). This end-use data will be included in the econometric analysis to control for differences in response and to separate out the effect of pricing. SMPPI has selected Stanford University in California to perform this analysis.
53
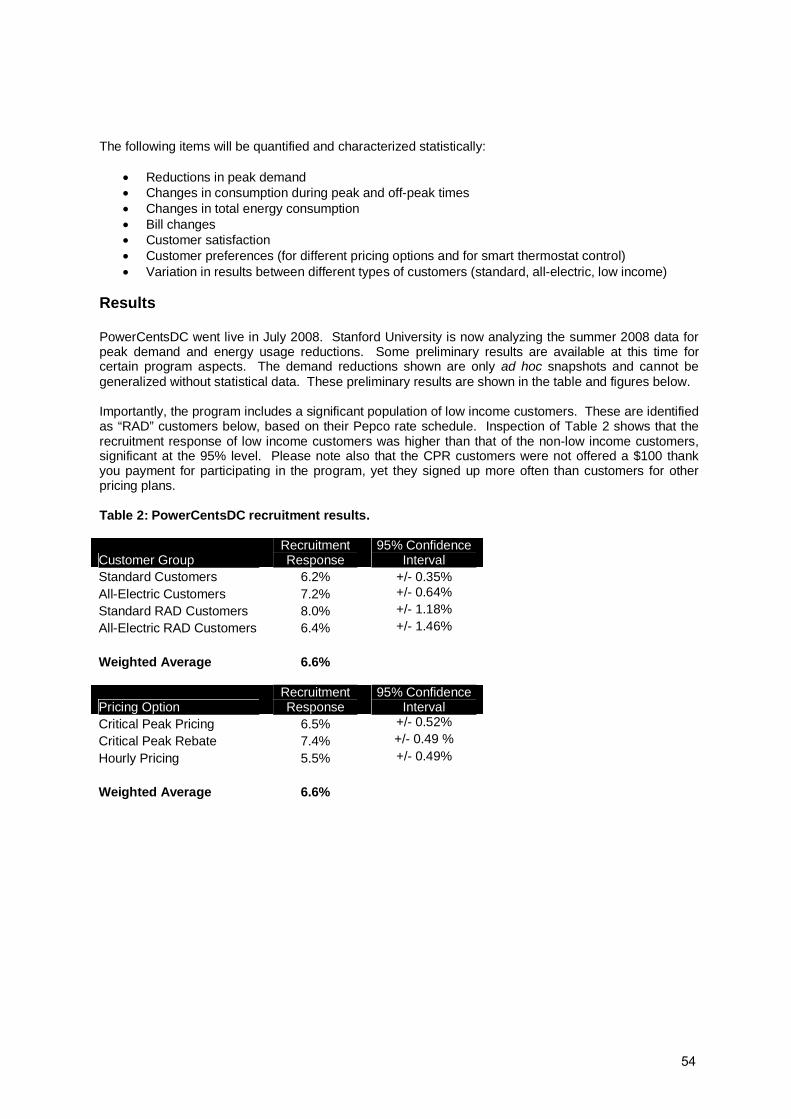
The following items will be quantified and characterized statistically:
• Reductions in peak demand • Changes in consumption during peak and off-peak times • Changes in total energy consumption • Bill changes • Customer satisfaction • Customer preferences (for different pricing options and for smart thermostat control) • Variation in results between different types of customers (standard, all-electric, low income)
Results PowerCentsDC went live in July 2008. Stanford University is now analyzing the summer 2008 data for peak demand and energy usage reductions. Some preliminary results are available at this time for certain program aspects. The demand reductions shown are only ad hoc snapshots and cannot be generalized without statistical data. These preliminary results are shown in the table and figures below. Importantly, the program includes a significant population of low income customers. These are identified as “RAD” customers below, based on their Pepco rate schedule. Inspection of Table 2 shows that the recruitment response of low income customers was higher than that of the non-low income customers, significant at the 95% level. Please note also that the CPR customers were not offered a $100 thank you payment for participating in the program, yet they signed up more often than customers for other pricing plans. Table 2: PowerCentsDC recruitment results.
Customer Group Recruitment Response
95% Confidence Interval
Standard Customers 6.2% +/- 0.35% All-Electric Customers 7.2% +/- 0.64%
Standard RAD Customers 8.0% +/- 1.18%
All-Electric RAD Customers 6.4% +/- 1.46%
Weighted Average 6.6%
Pricing Option Recruitment Response
95% Confidence Interval
Critical Peak Pricing 6.5% +/- 0.52%
Critical Peak Rebate 7.4% +/- 0.49 %
Hourly Pricing 5.5% +/- 0.49%
Weighted Average 6.6%
54
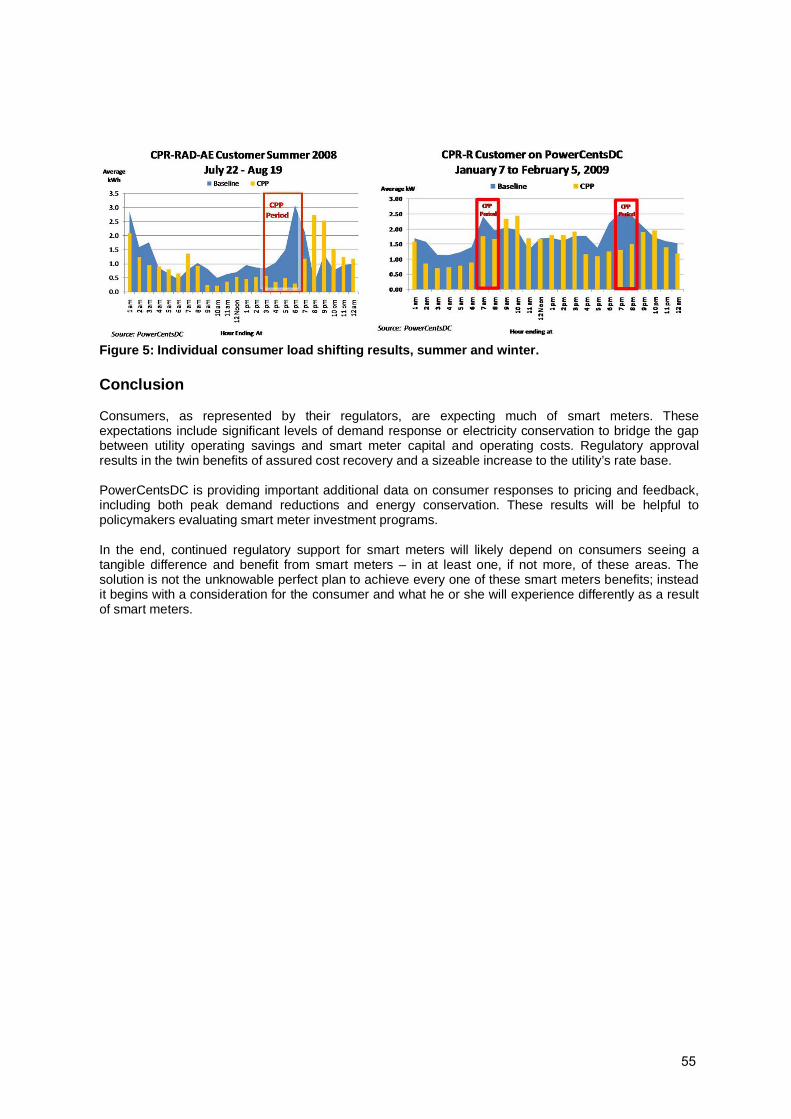
Figure 5: Individual consumer load shifting results, summer and winter. Conclusion Consumers, as represented by their regulators, are expecting much of smart meters. These expectations include significant levels of demand response or electricity conservation to bridge the gap between utility operating savings and smart meter capital and operating costs. Regulatory approval results in the twin benefits of assured cost recovery and a sizeable increase to the utility’s rate base. PowerCentsDC is providing important additional data on consumer responses to pricing and feedback, including both peak demand reductions and energy conservation. These results will be helpful to policymakers evaluating smart meter investment programs. In the end, continued regulatory support for smart meters will likely depend on consumers seeing a tangible difference and benefit from smart meters – in at least one, if not more, of these areas. The solution is not the unknowable perfect plan to achieve every one of these smart meters benefits; instead it begins with a consideration for the consumer and what he or she will experience differently as a result of smart meters.
55
References
[1] Ofgem. Press Release. First Trials of Smart Energy Meters in Britain Are To Begin. July 12, 2007.
[2] IBM. Ontario Energy Board Smart Price Pilot Final Report. July 2007. Can be downloaded at
http://www.oeb.gov.on.ca/documents/cases/EB-2004-0205/smartpricepilot/OSPP%20Final%20Report%20-%20Final070726.pdf
[3] Faruqui, A. and Sergici, S. Household Response of Dynamic Pricing to Electricity – A Survey of
the Experimental Evidence. January 2009. Can be downloaded at www.hks.harvard.edu/hepg/recent_postings.html
[4] King, C. Integrating Residential Dynamic Pricing and Load Control: the Literature. EnergyPulse,
December 14, 2004. [5] Fischer, C. Consumer Feedback: a Helpful Tool for Stimulating Electricity Conservation? Proc:
SCP Cases in the Field of Food, Mobility, and Housing. Workshop of the Sustainable Consumption Research Exchange Network (Paris, France, June 4-5, 2007), pp. 503-522. June 2007.
[6] Darby, S. The Effectiveness of Feedback on Energy Consumption. A Review for DEFRA of the
Literature on Metering, Billing, and Direct Displays. April 2006. Can be downloaded at http://www.eci.ox.ac.uk/people/darbysarah.php
56
Encouraging public support for smart metering via appealing and enabling in-home energy feedback devices
Henk van Elburg
SenterNovem Netherlands
Abstract
Backed by rising energy demands, volatile oil prices and the threat of climate change, the use of automated meter management (AMM), often referred to as „smart metering‟, is rapidly gaining momentum across the world. Europe can become a world leading centre of this development, thanks to the European Services Directive (ESD) of the European Commission. This Directive requires energy suppliers to provide consumers with competitively priced, accurate individual (smart) meters with information on time-of-use and accurate billing. Policies for large-scale deployments of smart meters have already been adopted in Italy, Sweden the Netherlands, Ireland, and the U.K. Serious considerations of implementing full smart metering deployment are taking place in countries like France, Denmark and Finland.
Oddly enough from an energy efficiency point of view, residential smart metering installation alone does not automatically result in successful consumer involvement and a lower carbon lifestyle. These benefits require additional automation technologies, such as intuitive, aesthetic and affordable in-house displays or customized data presentment applications on web pages, cell phones or TVs.
To accelerate the deployment of contemporary „add-on‟ information systems to keep pace with the deployment of smart meters, it is of great importance to timely track technical and commercial in-home and web-based feedback innovations in pioneering countries on a worldwide scale. At EEDAL 2009, the latest pioneering insights regarding attractive in-home communication to facilitate a modern energy efficient lifestyle will be revealed from an energy marketing point of view, illustrated by several appealing and enabling add-on in-home information feedback devices.
Introduction
Successful innovation of the consumer information aspects of smart metering is a promising way of developing a sustainable energy market. Backed by the European Services Directive (ESD), innovation in domestic metering and in information feedback is expected to increase soon everywhere in the EU.
However, the development of a more sustainable energy market through smart metering will be seriously handicapped if the introduction of smart meters is not accompanied by the right information feedback mechanisms to stimulate public awareness and positive participation at the household level. In other words, without easy accessible and convenient in-home energy feedback or other applications such as smart (dynamic) pricing, smart metering will not really involve consumers and will not really encourage mass market energy conservation. Despite this relevance, the development of enhancing energy feedback solutions in most European countries is only recently becoming a subject of broad interest and commercial development among stakeholders in energy sector.
The aim of this paper therefore is to stress the need for careful consideration of effective feedback techniques as a critical precondition for actually achieving a more sustainable society through smart metering. This paper informs stakeholders about feedback options and corresponding benefits that support the implementation of smart metering. Before doing that, the paper first outlines the possible advantages for consumers that come along with the introduction of smart metering. Next, different consumer feedback options will be presented, followed by insights regarding the most valuable device-based feedback methods in facilitating energy saving behavior. This paper ends with relevant conclusions regarding the most promising device-based feedback mechanisms to stimulate public awareness and positive participation at the household level.
57

Smart Metering and consumer feedback
Traditional utility meter readings are not informative for most consumers. Most meters are not easily accessible, almost always being installed where the electricity or gas supplies come into the building. Another inconvenience is the type of information; readings are displayed in kWh, often shown as a cumulative total, and offers no ability for the consumer to access historical or even instantaneous information. The result is that most consumers have difficulty in locating their meters as well as understanding the information when found. The introduction of smart metering in combination with feedback devices is generally expected to change all this. In his comprehensive Survey of Regulatory and Technological Developments Concerning Smart Metering in the European Union Electricity Market, Jorge Vasconcelos (2008) mentions the following potential improvements for consumers:
1. Customer awareness and energy savings through better information. Smart meters can record how much electricity is used during different periods of the day and eventually show usage instantaneously on a display to visualize the impact of individual appliances.
2. More accurate meter reading and frequent billing. With smart meters, bills are based on real rather than estimated consumption to improve the possibilities for energy management by consumers.
3. Greater tariff variety and flexibility. Smart meters when combined with time-of-use tariffs allow customers to better manage their electricity consumption and thus offer customers savings on their electricity bills.
4. Improved conditions for “vulnerable” (e.g. low-income) customers. Smart meters allow suppliers to better communicate with vulnerable customers, e.g. sending timely warning messages to avoid abrupt disconnection and instead allow phased actions.
5. Easier comparability of offers. Being better aware of what their consumption has been during the past, customers are better informed when comparing tariffs of competing suppliers.
6. Easier to change supplier. Customers will be able to switch suppliers more easily as meters can be read any time on request, thus shortening delays for the switching to take effect.
7. Increased competition among suppliers. Prices should become more competitive as suppliers are able to offer customized contracts and added-value services.
8. Ability to manage consumption of individual devices. If individual devices are able to communicate with the smart meter or an energy management application, the customer or the supplier is able to remotely control these devices. For instance, freezers and air conditioners can be remotely cycled or disconnected for a certain period of time during peak hours.
9. Able to manage micro-generation such as a combined heat and power facility or photovoltaic equipment.
10. Potential for additional devices such as connecting gas and/or water meters and being a gateway for innovative feedback and other domestic applications.
In considering the benefits of smart metering, potential disadvantages should not be forgotten. One disadvantage is that smart metering leads to more automation, so there are privacy concerns and there is a theoretical potential for misuse of systems and/ or data by criminals, vandals and hackers. These concerns should be solved by good security. Another concern is that the careless introduction of smart metering and related options (e.g. smart, dynamic pricing tariffs) may lead to higher costs for some consumers or decreased consumer satisfaction if such options are not voluntary. But overwhelmingly it seems that these disadvantages can be overcome and will not outweigh the advantages. Careful piloting of both meters and feedback solutions is essential to minimize and avoid these disadvantages.
Types of feedback for consumers
The international experience on smart metering-related consumer feedback covers a wide range of practices. These practices can best be understood in context by looking at them in terms of their
58

contribution to the technique and type of information and presentation as part of the awareness and learning process about the use of energy. Feedback can be divided into four basic types, based on a mix of various degrees of instantaneous and continuous information dissemination, the type, quality and quantity of data presentation, and finally the interaction and control by the energy user.
Real-time feedback
Every household should continuously be able to see what is happening to consumption and directly respond to it, ideally without having to switch on/ log on to an optional feedback service first. The main characteristic of real-time feedback is that consumers have an easily-accessible in-home display or web based monitor1, associated with the smart meter. Real-time or (near) real-time energy feedback is not defined as logging on to a website and personal webpage, because this requires an extra effort for consumers to locate information, often based on consumption the day before.
The readable, easy to comprehend energy use information displayed on an in-home display can either be in kWh, in Euros or CO2 as presented at a total level or a more disaggregated level (depending on sub-meters or on signal recognition capability). Taking data directly from the meter also means that the information can be (near) real time, much increasing its value and effectiveness. Recent developments in domestic communications provide paths for further innovation in bringing data convenient to the consumer.
Householders can look at the displays for instantaneous information and in some cases they can also set an alarm which is triggered when the load rises above a user-specified level. Once the consumers can see the changes in their energy use instantaneously on a display, they are much more likely to act to reduce that consumption. Parker, Hoak, Meir and Brown (2006) suggest a parallel with hybrid automobiles, where accumulating evidence suggests that feedback from dashboard-mounted displays allows drivers (e.g. of Toyota‟s Prius) to improve their mileage as they learn from experience. The important reason for this is that drivers suddenly have an immediate feedback about how various aspects of their driving habits shape mileage.
Research-literature indicates savings from real-time energy feedback devices to range from 5% to 15% (Darby, 2006). Savings are typically of the order of 10% for relatively simple displays. There is also indication that high energy users may respond more than low users to real-time feedback, because real-time displays show up the significance of moment-to-moment behavior best (Darby, 2006).
Near real-time feedback can eventually also tell the consumer about the relative importance of different end-uses. For instance, an instantaneous, easily accessible display may show the surge in consumption when the electric kettle is switched on, or the relative significance of a radio, vacuum-cleaner or toaster. Presumably for this to be effective, the display must react within a given time – less than the duration of the activity. At present, fully disaggregated feedback using signal recognition of different appliances is relatively expensive and complicated to supply, though this may change within the next few years.
Non-real-time feedback
Important characteristics for non-real-time feedback are that consumers have no real-time access to consumption data, respond to previous consumption behavior (which may have a lower information value), and needs regular switching on/ logging on to another feedback device which requires commitment regarding regular use and interaction. Finally in the case of non-real-time feedback, consumers have to rely on information being processed in some way before reaching the energy
1 Recent developments show that web based options can be both "next-day" as well as real-time. GreenBox, for example, makes software that can accept real-time input from a meter and display it on a webpage in real-time. Both webpage options have the extra effort of logging on. In contrast, Tendril is developing the ability to send data, including real-time data, to a Blackberry or iPhone, so there is no need to log on.
59

user. Examples of non-real-time feedback are frequent (e.g. day-to-day) feedback through a personalized webpage on a home PC, per e-mail, SMS or frequent (on line) billing.
The interactive feedback service is based on smart meter readings with a combination of:
1. historical feedback;
2. comparative feedback/ normative feedback;
3. disaggregated feedback (e.g. the heating load at different times of year);
4. Detailed annual and/or bi-monthly energy reports.
Research-literature indicates that savings from non-real-time feedback range from 0% to 10% (Darby, 2006), but can vary according to context and the quality of information given. There are also indications (Darby, 2006) that non-real-time feedback is more suitable than real-time feedback for demonstrating effects on consumption of changes in space heating, household composition and the impact of investments in efficiency measures or high-consuming appliances. In other words: non-real-time feedback can show up longer term effects best, such as investments in insulation, use of new appliances, replacement of heating systems and appliances, home additions, and adding new members to the household.
Feedback accompanying prepayment systems
Traditional prepayment meters tend to be „semi-smart‟, because they lack a two way communication module within the meter to communicate with the utility or other central database. Other relevant characteristics of traditional prepayment are the focus on budget management of costs and the transfer of information such as tariff-changes and meter reading data to and from the key code at the payment point/-shop.
Nevertheless, from an energy saving point of view, modern pre-pay systems have the potential to be much more than just a traditional option to low-income consumers in general. Research-literature indicates that savings to date for all pre-pay consumers are estimated to range broadly from 3% to approx. 15%. Savings of 10-20% are quoted for North American systems (Darby, 2006).
Feedback accompanying time sensitive pricing
This section considers the use of domestic smart metering for managing loads via voluntary reactions by final customers to price signals (e.g. delaying electricity demand by hour or two to avoid a price peak). Because this demand response is strongly related to smart metering and reducing carbon emissions, it is worth mentioning time sensitive pricing. Although its focus is more on the reduction of peak usage instead of end use energy savings, the total energy consumption in the whole system could be reduced by responding to market prices.
Electricity tariff structures, such as time of use pricing, critical peak pricing and real-time pricing are already important in those parts of the world with summer and winter peaks in demand allied with (imminent) supply constraints (California, Ontario, the northeastern states of the USA, the Nordic countries, France and parts of Australia) or with fluctuating market prices due to high penetration of intermittent generation such as wind power in Denmark.
There is evidence of reductions of up to 30% of peak demand through a variety of reduction programmes involving time-sensitive pricing, with or without direct load control by the supplier (Darby 2006). Automatic Meter Management (AMM) allows for time-sensitive tariffs to be used and communicated remotely to the consumer. In general, three broad types of tariff structures can be distinguished:
1. Time-of-use/day tariffs reflect daily and seasonal variations in electricity costs. These are fixed in advance based on estimated costs. These tariffs reflect expected costs faced during peak, shoulder and off-peak periods of the day. Consumers are informed of the different time periods and prices on their bills and on their meter display.
60

2. Actual cost tariffs/ real time pricing require consumers to pay, in each half hour period, the actual cost of electricity in the wholesale market. The price is usually known shortly before the time of use. Consumers are alerted to these prices through the meter display.
3. Critical peak pricing/Peak time rebate. Critical peak pricing/peak time rebate is the application of different prices for specific hours of the year, when the system is stressed and/or hourly energy market prices are high. In this case, consumers pay a flat or time of day price most of the time and a high or critical peak price at times when it is important to reduce demand (or earn a high or critical peak rebate by reducing below their baseline load for critical peak days). This type of pricing is used in France (called the „Tempo‟ tariff) and consumers see a red light on their meter a day before the critical peak period begins. In California, the major utilities will be providing peak time rebates to all residential customers following deployment of smart meters.
The main advantage of time-of-use/day pricing is that consumers know the price well in advance of consuming electricity. However, this might also be the main disadvantage, when price variations in the market do not follow such regular patterns. In order to provide consumers with predictable prices, such tariffs are unlikely to reflect the actual cost of producing electricity at any point in time (as the prices are set in advance and based on forecasts of costs). Real time pricing on the other hand trades predictability for price accuracy, while critical peak pricing/peak time rebates falls somewhere in between real time and time-of-use/day pricing in terms of predictability and accuracy.
Lessons learned: insights of feedback
There is a growing interest in the potential benefits of introducing feedback mechanisms that accompany smart metering roll outs and how this should be organized. It is becoming a „hot‟ topic in countries such as UK, USA, Canada, Netherlands, Italy, Australia and the countries of Scandinavia.
Despite this interest, there is still limited evidence from recent use of smart metering feedback to quantify energy savings in households. Most evidence so far is based on small-scale trials and only very few have been longitudinal to judge whether the response is likely to last or can be built upon. Another problem is the difficulty of comparing these field trials. All contain a different mix of elements such as sample size, housing type, additional interventions, financial influences, household composition, feedback frequency and duration. Recorded feedback savings can also dramatically differ according to the technology under consideration, the institutional and cultural background (lifestyles, interest of consumers), climatic conditions against which the study takes place, the quality of feedback information, and the way in which studies are conducted. And last but not least: feedback techniques are likely to evolve over time. Home-ICT is evolving very fast. In a landscape where appliances and multimedia applications will be linked together, innovative techniques, like „pop-up‟ messaging on the TV set when on, could be more effective than a separate screen displaying the same messages all the time.
As mentioned before, the search for smart metering consumer practices is a continuing process. Most present feedback insights are evolving and will need regular updates. Nonetheless, studying current smart metering experiences from both relevant literature as well as completed field trials describes some general observations („rules of thumb‟) regarding effective consumer feedback that are worth mentioning here:
1. Real-time feedback seems to be the best facilitator for household energy conservation through smart metering. According to Sarah Darby (2006), a well published authority in the field of energy feedback, the „norm‟ for real-time feedback is to range from 5% to 15%. Saving from non-real-time feedback range from 0% to 10%. Prepayment with some form of display feedback promises consumers more of a change in electricity use; savings of 10 – 20% are quoted for North American systems.
2. Accuracy (e.g. resolution of 10 watts) and frequency (updates every second) of near real time feedback is crucial. “Breaking energy habits down into Euros (dollars) and cents” and “see the surge in consumption (e.g. clothes dryer)” are essential slogans for raising awareness.
3. Feedback will be more useful when accompanied by a specific goal and/or historic benchmark;
61
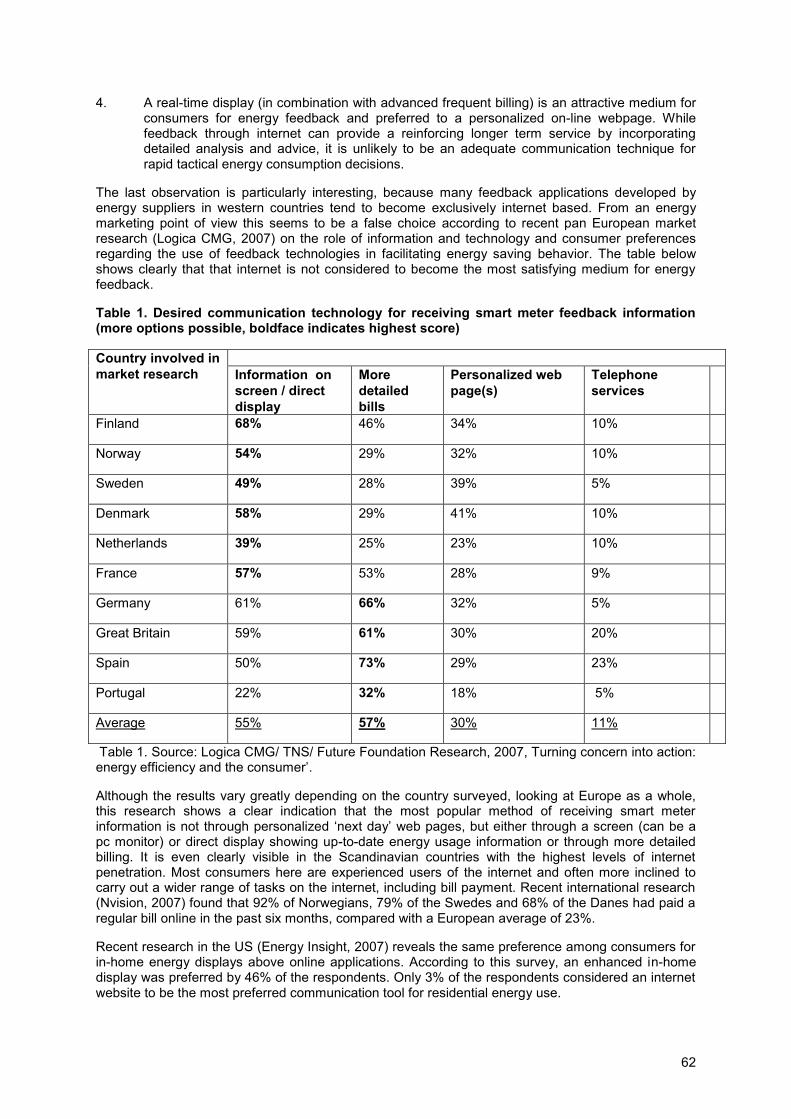
4. A real-time display (in combination with advanced frequent billing) is an attractive medium for consumers for energy feedback and preferred to a personalized on-line webpage. While feedback through internet can provide a reinforcing longer term service by incorporating detailed analysis and advice, it is unlikely to be an adequate communication technique for rapid tactical energy consumption decisions.
The last observation is particularly interesting, because many feedback applications developed by energy suppliers in western countries tend to become exclusively internet based. From an energy marketing point of view this seems to be a false choice according to recent pan European market research (Logica CMG, 2007) on the role of information and technology and consumer preferences regarding the use of feedback technologies in facilitating energy saving behavior. The table below shows clearly that that internet is not considered to become the most satisfying medium for energy feedback.
Table 1. Desired communication technology for receiving smart meter feedback information (more options possible, boldface indicates highest score)
Country involved in
market research
Information on
screen / direct
display
More
detailed
bills
Personalized web
page(s)
Telephone
services
Finland 68% 46% 34% 10%
Norway 54% 29% 32% 10%
Sweden 49% 28% 39% 5%
Denmark 58% 29% 41% 10%
Netherlands 39% 25% 23% 10%
France 57% 53% 28% 9%
Germany 61% 66% 32% 5%
Great Britain 59% 61% 30% 20%
Spain 50% 73% 29% 23%
Portugal 22% 32% 18% 5%
Average 55% 57% 30% 11%
Table 1. Source: Logica CMG/ TNS/ Future Foundation Research, 2007, Turning concern into action: energy efficiency and the consumer‟.
Although the results vary greatly depending on the country surveyed, looking at Europe as a whole, this research shows a clear indication that the most popular method of receiving smart meter information is not through personalized „next day‟ web pages, but either through a screen (can be a pc monitor) or direct display showing up-to-date energy usage information or through more detailed billing. It is even clearly visible in the Scandinavian countries with the highest levels of internet penetration. Most consumers here are experienced users of the internet and often more inclined to carry out a wider range of tasks on the internet, including bill payment. Recent international research (Nvision, 2007) found that 92% of Norwegians, 79% of the Swedes and 68% of the Danes had paid a regular bill online in the past six months, compared with a European average of 23%.
Recent research in the US (Energy Insight, 2007) reveals the same preference among consumers for in-home energy displays above online applications. According to this survey, an enhanced in-home display was preferred by 46% of the respondents. Only 3% of the respondents considered an internet website to be the most preferred communication tool for residential energy use.
62
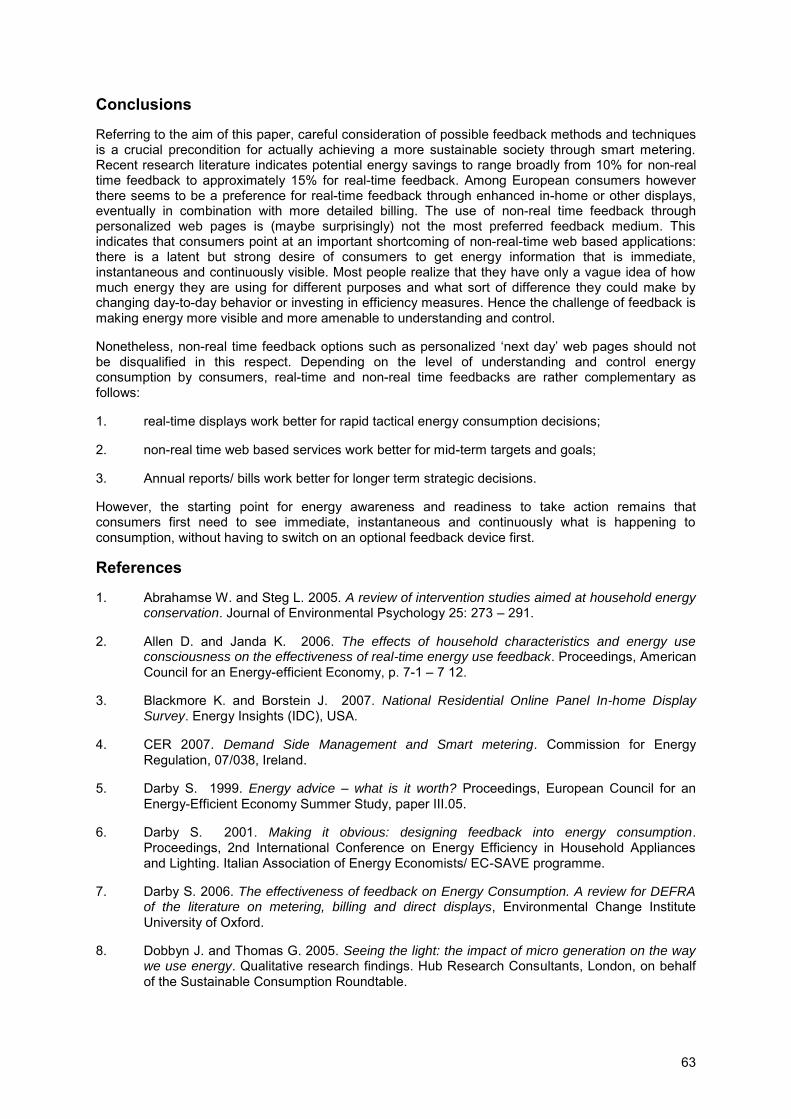
Conclusions
Referring to the aim of this paper, careful consideration of possible feedback methods and techniques is a crucial precondition for actually achieving a more sustainable society through smart metering. Recent research literature indicates potential energy savings to range broadly from 10% for non-real time feedback to approximately 15% for real-time feedback. Among European consumers however there seems to be a preference for real-time feedback through enhanced in-home or other displays, eventually in combination with more detailed billing. The use of non-real time feedback through personalized web pages is (maybe surprisingly) not the most preferred feedback medium. This indicates that consumers point at an important shortcoming of non-real-time web based applications: there is a latent but strong desire of consumers to get energy information that is immediate, instantaneous and continuously visible. Most people realize that they have only a vague idea of how much energy they are using for different purposes and what sort of difference they could make by changing day-to-day behavior or investing in efficiency measures. Hence the challenge of feedback is making energy more visible and more amenable to understanding and control.
Nonetheless, non-real time feedback options such as personalized „next day‟ web pages should not be disqualified in this respect. Depending on the level of understanding and control energy consumption by consumers, real-time and non-real time feedbacks are rather complementary as follows:
1. real-time displays work better for rapid tactical energy consumption decisions;
2. non-real time web based services work better for mid-term targets and goals;
3. Annual reports/ bills work better for longer term strategic decisions.
However, the starting point for energy awareness and readiness to take action remains that consumers first need to see immediate, instantaneous and continuously what is happening to consumption, without having to switch on an optional feedback device first.
References
1. Abrahamse W. and Steg L. 2005. A review of intervention studies aimed at household energy conservation. Journal of Environmental Psychology 25: 273 – 291.
2. Allen D. and Janda K. 2006. The effects of household characteristics and energy use consciousness on the effectiveness of real-time energy use feedback. Proceedings, American Council for an Energy-efficient Economy, p. 7-1 – 7 12.
3. Blackmore K. and Borstein J. 2007. National Residential Online Panel In-home Display Survey. Energy Insights (IDC), USA.
4. CER 2007. Demand Side Management and Smart metering. Commission for Energy Regulation, 07/038, Ireland.
5. Darby S. 1999. Energy advice – what is it worth? Proceedings, European Council for an Energy-Efficient Economy Summer Study, paper III.05.
6. Darby S. 2001. Making it obvious: designing feedback into energy consumption. Proceedings, 2nd International Conference on Energy Efficiency in Household Appliances and Lighting. Italian Association of Energy Economists/ EC-SAVE programme.
7. Darby S. 2006. The effectiveness of feedback on Energy Consumption. A review for DEFRA of the literature on metering, billing and direct displays, Environmental Change Institute University of Oxford.
8. Dobbyn J. and Thomas G. 2005. Seeing the light: the impact of micro generation on the way we use energy. Qualitative research findings. Hub Research Consultants, London, on behalf of the Sustainable Consumption Roundtable.
63
9. IEA-DSM 2005. Smaller consumer energy saving by end-use monitoring and feedback. Chester, International Energy Agency Demand-side Management Programme Task XI-1.
10. IEA-DSM 2005. Time of use pricing for demand management delivery. Chester, International Energy Agency Demand-side Management Programme Task XI, part 2.
11. Janssen E. Jonkers R. and Gelissen R. 2007. Effectiviteit van feedback bij huishoudelijk energieverbruik. Study for optimizing feedback on smart metering, ResCon Research and Consultancy Haarlem.
12. King C. and Delurey D. 2005. Twins, siblings or cousins? Analyzing the conservation effects of demand response programs. Public Utilities Fortnightly.
13. Lees E. 2007. Smart Meters – Costs and Consumer Benefits. Report to Energy Watch.
14. Logica CMG 2007. Turning concern into Action: Energy Efficiency and the European consumer. An international pan-European survey among 10.000 consumers to examine consumer attitudes towards climate change, their personal action to reduce consumption, blockers to this behavior and the potential role of information and technology as enablers of increased energy efficiency action. London.
15. Mountain D. 2006. The impact of real-time feedback on residential electricity consumption: the Hydro One pilot. Mountain Economic Consulting and Associates Inc., Ontario.
16. Ofgem 2006. Domestic metering innovation. Consultation document. Ofgem.
17. Owen G. and Ward J. 2006. Smart meters: commercial, policy and regulatory drivers. Sustainability First, London.
18. Parker D. and Hoak D. Meir A. and Brown R. 2006. How much energy are we using? Potential of residential energy demand feedback devices. Florida Solar Energy Center and Lawrence Berkeley National Laboratory, USA, 2006 ACEEE Summer study on Energy Efficiency in buildings, p. 1-211 – 1.222.
19. Ueno T. Inada R. Saeki O. and Tsuji K. 2005. Effectiveness of displaying energy consumption data in residential houses. Analysis on how the residents respond. Proceedings, European Council for an Energy-efficient Economy, paper 6.100.
20. Vasconcelos J. 2008. Survey of Regulatory and Technological Developments Concerning Smart metering in the European Union Electricity Market, Robert Schuman Centre for Advanced Studies, Florence, Italy.
21. Völlink T. 2004. Go for less. Dutch research-dissertation on the effects of feedback in relation to goal setting on household energy and water consumption in The Netherlands, University of Maastricht, The Netherlands.
64
My Home – the interactive and “intelligent” way to save energy
Göran Wilke
Danish Electricity Saving Trust
Abstract
The concept of the “intelligent” home is not new, but translating theory into reality presents many challenges. Launched in Denmark in October 2008 by the Danish Electricity Saving Trust (Elsparefonden), My Home is an interactive web portal which offers consumers the opportunity to calculate their household energy consumption, receive advice on possible savings, and ultimately control and monitor their indoor environments using wireless devices in a simulation of their homes.
This paper describes the software functionality of My Home and how the concept encourages consumers to adopt sensible habits by using equipment and appliances in the “greenest” possible way. The paper further examines the theme that despite the vast amount of IT in homes, there is little linkage to home control and monitoring systems: how measures such as a common standard for communication and the use of energy labelling can address this issue; and how major commercial players are responding to the challenge.
Lastly, the paper describes user response to My Home to identify whether the platform corresponds to requirements in terms of usability. One important aspect of this research revealed that although consumers liked the ability to be able to monitor their electricity consumption, the feature that really appealed to them was the possibility to control and monitor their home environment, thereby making life easier, fun, and “green”.
The paper concludes by summing up the main aspects of the My Home concept with a description of the Trust’s goals, and information on recent international exposure.
Introduction
European consumers can save billions of Euros – simply by making sure that appliances in their homes only consume electricity when actually in use. The secret is to eliminate unnecessary standby consumption and ensure that lighting, ventilation, heating systems and air conditioners only operate as and when required. One way of achieving this is for consumers to use correctly programmed home control and monitoring systems.
Launched in Denmark in October 2008, My Home is an interactive web portal offering consumers the opportunity to calculate their household energy consumption, receive advice on possible savings, and control and monitor their indoor environments using wireless devices in a simulation of their homes [5].
This initiative by the Trust establishes a common platform for developing the green IT market, one which puts customers in a strong position, and also allows for accumulated data on homes to be collected under a single roof in the form of a unitary digital and standardised description covering buildings, plant and equipment, and consumer trends. Simultaneously, wireless and Internet connectivity will provide a launching pad for future new business concepts where home owners entrust tasks like surveillance, operation and control to external players.
My Home currently allows users to draw a floorplan of their home and equip it with electrical appliances and furniture. Options for controlling and monitoring appliances in the different rooms can then be added to the floorplan via a simple Internet browser, which consumers can access wherever they are. One aspect of the My Home initiative is that The Trust wishes to encourage Danish consumers to purchase energy saving devices covered by the Trust’s Energy Saving Label.
This paper describes the software functionality of My Home and examines the energy saving features and benefits available to consumers who use this system to control and monitor their indoor environment. The paper identifies the requirement to adopt a common infrastructure and standard communication protocol for use by all producers and suppliers in order to ensure a mass market for
65
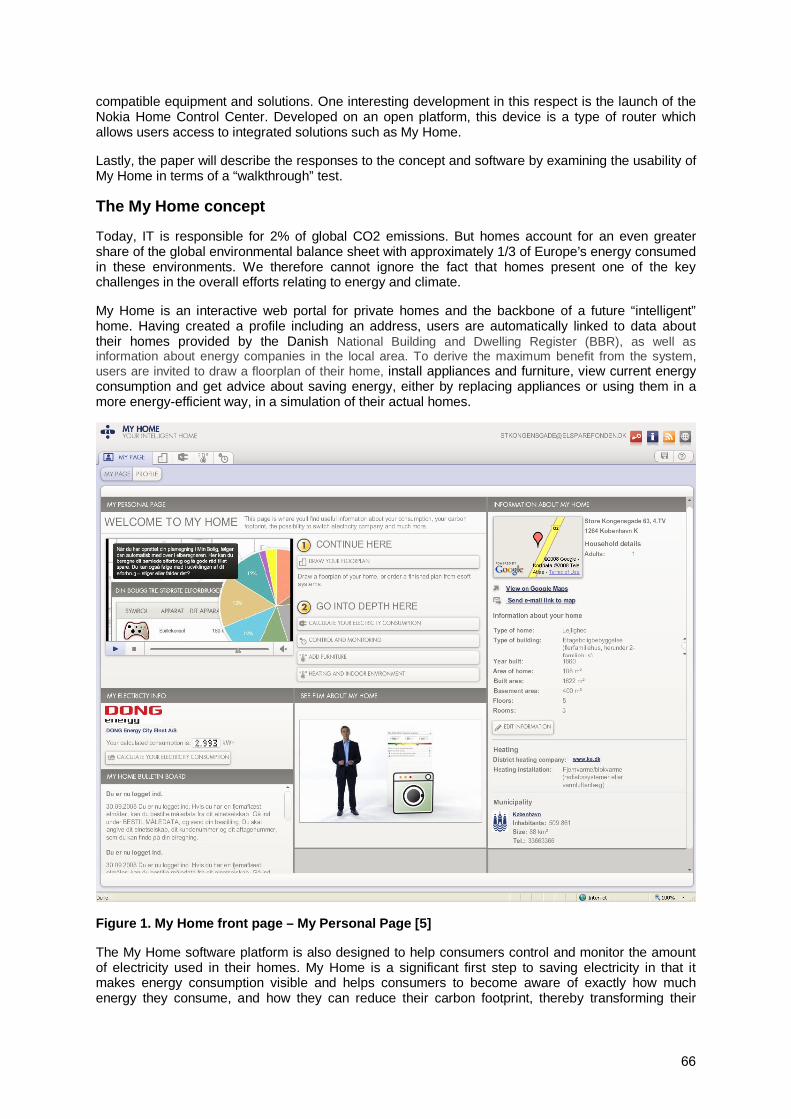
compatible equipment and solutions. One interesting development in this respect is the launch of the Nokia Home Control Center. Developed on an open platform, this device is a type of router which allows users access to integrated solutions such as My Home.
Lastly, the paper will describe the responses to the concept and software by examining the usability of My Home in terms of a “walkthrough” test.
The My Home concept
Today, IT is responsible for 2% of global CO2 emissions. But homes account for an even greater share of the global environmental balance sheet with approximately 1/3 of Europe’s energy consumed in these environments. We therefore cannot ignore the fact that homes present one of the key challenges in the overall efforts relating to energy and climate.
My Home is an interactive web portal for private homes and the backbone of a future “intelligent” home. Having created a profile including an address, users are automatically linked to data about their homes provided by the Danish National Building and Dwelling Register (BBR), as well as information about energy companies in the local area. To derive the maximum benefit from the system, users are invited to draw a floorplan of their home, install appliances and furniture, view current energy consumption and get advice about saving energy, either by replacing appliances or using them in a more energy-efficient way, in a simulation of their actual homes.
Figure 1. My Home front page – My Personal Page [5]
The My Home software platform is also designed to help consumers control and monitor the amount of electricity used in their homes. My Home is a significant first step to saving electricity in that it makes energy consumption visible and helps consumers to become aware of exactly how much energy they consume, and how they can reduce their carbon footprint, thereby transforming their
66

behaviour. The My Home concept encourages consumers to adopt sensible habits by using equipment and appliances in the “greenest” possible way.
Ultimately, My Home also allows users to control and monitor their home appliances and devices even when they are somewhere else. They will also be able to program automatic systems to control all their appliances and equipment for which logical rules can be defined. For example, this could involve controlling the indoor environment based on whether anyone is in the house or not, switching on the heating in a second or holiday home, or switching on the patio lights from a mobile phone. Central control and monitoring allows users to optimise their home’s energy consumption while monitoring the building and receiving reports as required. Users also have access to invaluable statistics about their home’s energy consumption, and thus have a good basis for determining how “green” a life they are living.
Leading edge software functionality
To begin the process of creating a simulated home, users create a floorplan which is linked to their profile and can be saved on a dedicated website. My Home offers several options for doing this. Users can use the drawing tool supplied to draw a floorplan of their home. Alternatively, they can scan in an existing floorplan, or choose one of several demo layouts of various standard homes such as homes for a family with children, a retired couple or a single person. If users choose one of the demo homes, My Home will automatically suggest a range of electrical appliances for the home. Naturally, users can change the standard selection to suit their individual circumstances.
My Home offers a home control and monitoring suite that provides users with an overview of their home and allows them to access equipment in different rooms. In order to use this function consumers require a Master Controller, which is a small home computer which manages their homes. Installing the Master both physically in a home and virtually in the programme allows a user to control and monitor various devices around the home. For example, a user can dim the lights, switch them on and off, or adjust the temperature in a room via a wireless radiator thermostat. All products recommended by the Trust use the Z-Wave standard and are compatible with My Home.
67
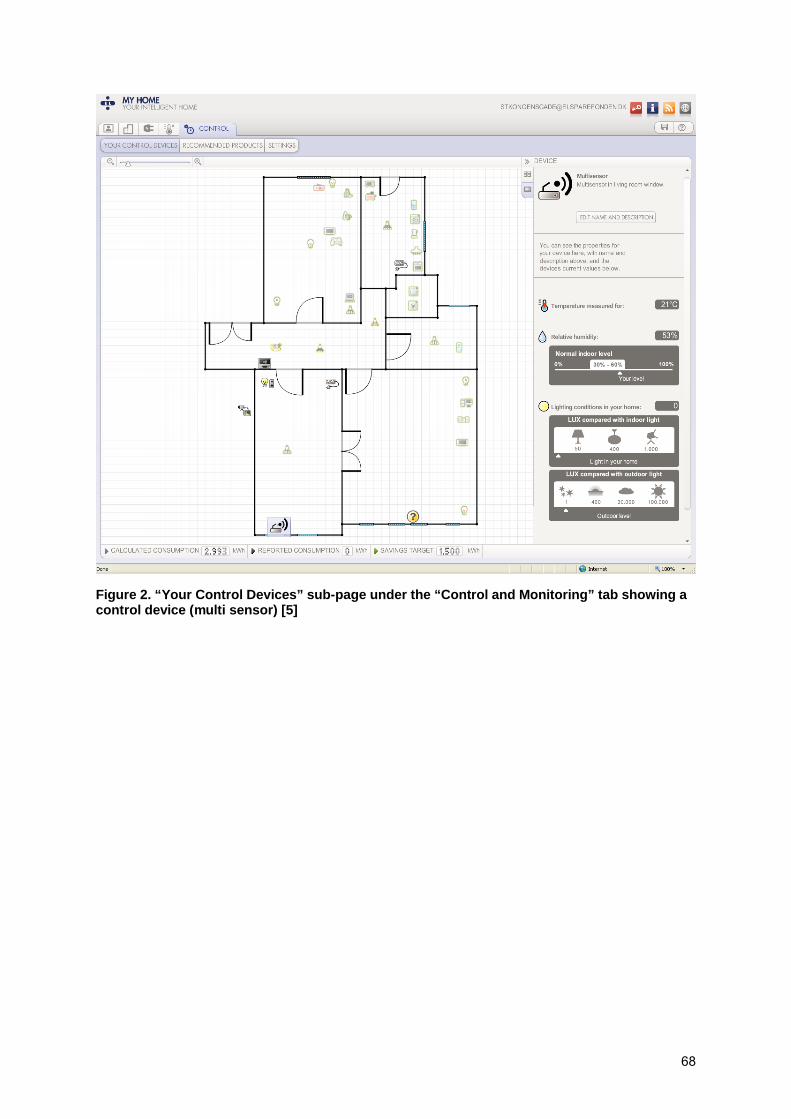
Figure 2. “Your Control Devices” sub-page under the “Control and Monitoring” tab showing a control device (multi sensor) [5]
68

Figure 3. Sub-page under the “Control and Monitoring” tab showing a light dimmer switch, and webcam view of the room where the lamp is located [5]
Calculating consumption
My Home includes tools for calculating consumption based on manual or remote meter readings, and calculating electricity consumption of appliances. In terms of the latter, the more users tell My Home about their electrical appliances, the more detailed the overview and the better advice they receive. Users can select relevant appliances and drag them into the rooms on the floorplan corresponding to approximately the same locations occupied by the appliances in real life. The system’s built-in calculator keeps track of the standard consumption for all appliances. As information about consumption patterns and the use of various products is entered, the system provides an increasingly precise estimate of annual consumption. My Home identifies energy wasteful equipment and advises on alternative solutions that offer the same performance but use less energy.
69
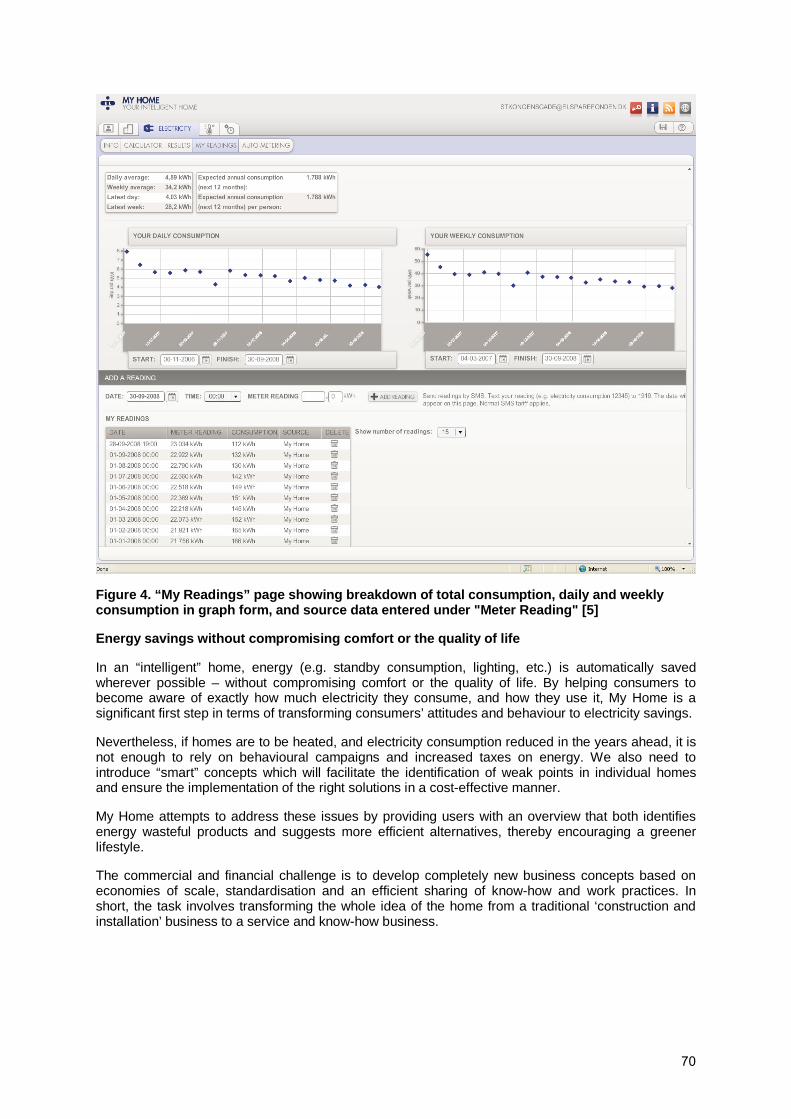
Figure 4. “My Readings” page showing breakdown of total consumption, daily and weekly consumption in graph form, and source data entered under "Meter Reading" [5]
Energy savings without compromising comfort or the quality of life
In an “intelligent” home, energy (e.g. standby consumption, lighting, etc.) is automatically saved wherever possible – without compromising comfort or the quality of life. By helping consumers to become aware of exactly how much electricity they consume, and how they use it, My Home is a significant first step in terms of transforming consumers’ attitudes and behaviour to electricity savings.
Nevertheless, if homes are to be heated, and electricity consumption reduced in the years ahead, it is not enough to rely on behavioural campaigns and increased taxes on energy. We also need to introduce “smart” concepts which will facilitate the identification of weak points in individual homes and ensure the implementation of the right solutions in a cost-effective manner.
My Home attempts to address these issues by providing users with an overview that both identifies energy wasteful products and suggests more efficient alternatives, thereby encouraging a greener lifestyle.
The commercial and financial challenge is to develop completely new business concepts based on economies of scale, standardisation and an efficient sharing of know-how and work practices. In short, the task involves transforming the whole idea of the home from a traditional ‘construction and installation’ business to a service and know-how business.
70

Vast amount of IT in homes – but little linkage to home control and monitoring systems
Enabling different devices to communicate together presupposes one thing and that is that we have a standardised way of describing our homes: One ‘digital’ culture which allows us to share know-how, conduct research and design solutions based on a common set of principles.
The My Home initiative by the Trust establishes a common platform for developing the green IT market, one which puts customers in a strong position, and also allows for accumulated data on homes to be collected under a single roof. In the future, and subject to permission being granted by users, a unitary digital and standardised description of buildings, equipment and machinery, and consumer trends could enable service providers to offer expert advice on a very cost-effective basis. Simultaneously, wireless and Internet connectivity will be a launch pad for new business concepts in situations where home owners could entrust tasks like surveillance, operation and control to external players.
Although there is a vast amount of literature describing the physical structure and the energy use of all building types and appliances, using standard terminology, at present, there are no standard concepts for “intelligent” homes which address the multiple issues of comfort, indoor environment, energy and security.
As a first step, and because the market for “intelligent” wireless devices is growing rapidly, the Trust wishes to ensure that the different technologies can communicate together in a cost effective way from a consumer’s point of view.
Common standard for easy access
Cost and user-friendliness are major obstacles to installing efficient private home control and monitoring systems. However, the market is currently in a transition phase with many manufacturers now supplying devices to private consumers. Many of these devices support the Z-Wave standard, and they can communicate with each other using this standard, irrespective of manufacturer [7, 11].
Nothing is more frustrating than buying electronic products that cannot interface with other products that you own. When you invest in technology for your home, you want to be sure that it will work seamlessly with what you already have, and can communicate with any other components you might want to add in the future. The Trust has chosen Z-Wave as its wireless control protocol because it is a widely accepted technical standard that ensures complete interoperability between all Z-Wave devices, no matter what the brand.
The main features of Z-Wave are the use of open communication protocols and low power consumption. Z-Wave is marketed worldwide and is a strong player on the American market.
The Trust hopes that its support of the Z-Wave standard will help eliminate obstacles by offering consumers a common standard for controlling devices without tying them to one manufacturer. The Trust’s main reasons for recommending Z-Wave are:
• Hardware comprises an inexpensive chip for integration into devices.
• Low power consumption makes battery-powered sensors and switches a reality, even for extended operating periods.
• 30-metre operating distance can be considerably extended thanks to the built-in repeat function that allows signals to be relayed from any other Z-Wave chip.
• Rapidly growing market share with increasing numbers of manufacturers adopting the technology.
• Alliance of companies using Z-Wave (Z-Wave Alliance Group) cooperates on protocol development, thereby ensuring connectivity between Z-Wave-equipped devices via open standards [12].
71
• Z-Wave Alliance and communication protocol are available to everyone at low cost.
• Well-defined communication protocols and an open approach create opportunities for a wide variety of third-party products, thereby ensuring competition in the market and ultimately lower prices for consumers.
Offering consumers a common standard for controlling devices, without tying them to one manufacturer, is one side of the equation. The other side involves ensuring that consumers have access to high-quality products.
In order to achieve this, the Trust requires that devices comply with the terms of its Energy Saving Label, which not only ensures both uniformity and compatibility, but also guarantees energy efficient solutions for consumers that are both user-friendly and easy to set up and configure. To date the Trust has approved the use of its Energy Saving Label on a small number of these control devices, and there are more on the way [6, 8].
The Energy Saving Label
The Danish Electricity Saving Trust launched its Energy Saving Label in autumn 2006. The label helps consumers to choose energy efficient products.
The Label can be used on products which conform to current EU or agreed labelling schemes on energy requirements, including any supplementary quality requirements. The criteria have been laid down on the basis of international labelling schemes and are based on objective standards. Where no international criteria exist, the Trust has developed these in partnership with the relevant Danish trade organisations.
The requirements have been established so that the Energy Saving Label will be used on the top 20% most energy efficient products within a given product category on the market. The Trust’s labelling scheme is a dynamic programme, and the Trust regularly amends the requirements for the individual product categories in line with market developments.
In order to draw attention and strengthen voluntary agreements with trade organisations the Trust has produced a variation of the Energy Saving Label which clearly displays the product category relating to the recommended products exclusively stocked by the producer or retailer in question. Consumers thus have the opportunity to see that these are precisely the companies who are going out of their way to promote energy savings in Denmark.
By 2008 the Trust’s labelling scheme covered the following product categories: A-rated energy saving light bulbs, fridges and freezers, washing machines, computers and monitors, circulator pumps. Apart from wireless devices, other product categories will be added to the scheme in due course, including TV equipment, digital decoder (set-top boxes), consumer electronics, etc.
In general, products need to:
• Save energy in a straightforward way.
• Be relevant to the general public.
• Be safe and comply with regulatory requirements.
To ensure the credibility of the Energy Saving Label the Trust carries out ongoing random testing both at a product level and in the stores where the label is displayed [6].
The use of the label is administrated by an Energy Saving Label Secretariat.
Recommended products can be found on the Trust’s website and in printed material [8].
The Energy Saving Label for wireless devices
The My Home concept involves offering consumers a common standard for controlling devices without tying them to one manufacturer or too narrow a base. In order to achieve this, the Trust
72

requires that wireless devices comply with the terms of its recommended Energy Saving Label, which generally ensures that products save energy and conform to the quality requirements laid down.
The use of the Energy Saving Label for wireless devices ensures that recommended devices interface seamlessly with My Home, and offers consumers the security that the recommended wireless products they have purchased are amongst the most energy efficient on the market.
Consumers therefore also have the opportunity to see that the products are produced by companies who are going out of their way to promote energy savings in Denmark.
Manufacturers can use the recommended Energy Saving Label on their products. However, this endorsement is subject to the fact that the products covered satisfy a number of conditions laid down by the Trust.
Figure 5. Example of Energy Saving Label for a wireless device
Specific requirements for wireless equipment:
• Residential gateways, sensors, actuators and remote controls must be approved by the Z-Wave Alliance and be labelled with the Z-Wave logo, thereby ensuring that products from different manufacturers can communicate.
• The recommended residential gateways should be able to control other sensors, actuators and remote controls recommended by the Trust.
• The recommended gateways should be able to upload measurements (e.g. meter data) to the Trust’s server, and receive data and information from the server using the data format laid down by the Trust.
• The recommended residential gateways should be capable of receiving automatic firmware upgrades to enable control of new types of products and the use of the latest software developed by the Trust.
• The Trust will promote the above components on its website at www.savingtrust.dk [8].
• The Trust will develop freeware applications for residential gateways, sensors, actuators and remote controls and data tools for analysing meter data.
Current developments
The launch of the Nokia Home Control Center is a major step in the direction of “intelligent” home control and the necessity of a common standard. Developed on an open platform, this device is a type of router which allows users access to integrated solutions such as My Home. In future, the Nokia Home Control Center will be able to act as the physical link which allows consumers to control and monitor their energy consumption via My Home. The Trust expects that Nokia’s new initiative will pave
73

the way for even greater growth in the market for wireless equipment and devices which can control and monitor the home, thereby allowing consumers to save considerable amounts of electricity [9].
My Home and Usability
The Trust’s vision for My Home involves the creation of a useful free software tool which appeals to the general public. By collecting home-related topics together under one roof, My Home offers the best starting point for home control and monitoring – as opposed to a toy for energy buffs. The Trust wants to listen to users, and to grow with them and with the technology, because The Trust knows that more “intelligent” homes are also greener homes. Currently, My Home has ca 60,000 registered users. Currently, My Home is mainly used as a home energy use calculator/simulator and a source of advice. The Trust has set itself a target of 100,000 registered users by end of 2009 [13].
One way to find what users want, and whether they can navigate round the system appropriately, is to investigate responses to the My Home platform to see if it is meeting their requirements, and examine the usability of the system in terms of a ‘walkthrough’ usability test. A ‘walkthrough’ or ‘key task’ test is a cognitive method which involves asking the user to do something and then watching what they do, and how well they perform the task [2, 10].
The walkthrough test
Testing for usability is a way of looking at values associated with My Home from a user perspective. Using this type of ethnographic field work in Danish homes1, the Trust has discovered four different types of motivation and needs associated with the use of My Home2 for the following types:
• Green users
• Convenience users
• Financially-motivated users
• Technical users
Responses from the four different types of users:
Statements made by green users:
• “My Home should help me get an overview of how I can reduce my energy consumption. It would be brilliant if it can help me to see the total CO2 emissions as a result of my actions – and also ambitious.”
• “If My Home helped me to become greener I wouldn’t even think about the reason for using the tool. I would just think: Goodness, how cool!”
Statements made by convenience users:
• “If I am going to use My Home, then I have to get some benefits from it. Not financially, but to make my everyday life easier. Otherwise I wouldn’t have time for it. Never.”
Statements made by financially-motivated users:
1 The field work was based on a combination of a home interview and usability test, followed by a second usability test at a later date. The first test involved 8 persons and combined an individual home interview and a usability test of the application. The interviewer guided the interviewee through a walkthrough test, which included tasks such as walking around the interviewee’s home to identify the potential for installing home control devices. The second usability test conducted at a later date involved 8 new persons testing a newer version of the system. This paper only focuses on the results of the first test session.
2 The usability test was based on a beta, not the latest, version of My Home. The test was one element in the development process for making My Home user-friendly.
74

• “It’s very ingenious, especially if I can use it for more than simply calculating how much electricity I use. It has to be easy and it’s very important that others do the work for me. They have to provide me with all the information.”
• “My Home needs to provide me with concrete advice on how I can save money as quickly as possible. Preferably in actual figures. It should be like a calculator – it represents facts and quick and correct answers.”
Statements made by technical users:
• “It’s not enough for me to get some advice on how to save electricity. I like new tech stuff and My Home should tell me all about the latest home control devices. It would be great if the Trust demonstrated new gadgets that I can use.”
• “The most important reason for persuading me to use it would be that I can play with it.”
[3]
In general, it is important that the different needs of all the above types of users are fulfilled in terms of ease of access. It is of paramount importance to users that My Home is extremely user-friendly and offers very specific benefits and results – otherwise they won’t use it. The users also find it extremely valuable that My Home provides as much information as possible (rather than the other way round).
Users like the home control and monitoring functionality
Users are favourably disposed towards the different control and monitoring scenarios which have been introduced. Home control and monitoring is popular for different reasons:
• It makes your everyday life easier (comfort)
• It is nice to use (gadget)
• It helps you to act greener
The value of home control and monitoring is that it helps individual consumers to act greener in terms of energy consumption, without using a lot of time and personal energy on learning what is required to act appropriately: “All three scenarios are very appealing, especially direct control. I need that immediately. Controlling your heating by remote control is very ingenious. I just hate to come home to a cold house. I would definitely like that and would use it every weekend.” [3]
Conclusion, goals, and international exposure
An integrated Internet portal for private households, My Home acts as the backbone of the “intelligent” home, one which puts customers in a strong position, and also allows for accumulated data on homes to be collected under a single roof.
In this respect, the platform is a significant first step to saving electricity in that it makes electricity consumption visible and helps consumers to become aware of exactly how much electricity they consume, and the ways in which they use it, thereby transforming their behaviour. The My Home concept encourages consumers to adopt sensible habits by using equipment and appliances in the greenest possible way.
The Trust is also in the forefront of developing a common set of principles or ‘language’ for describing homes in order to address the multiple issues of comfort, indoor environment, energy and security.
By adopting Z-Wave as its wireless control protocol the Trust is ensuring that the different technologies can communicate together in a cost effective way from a consumer’s point of view. This will enable easy configuration of home control and monitoring systems, which is normally very difficult to perform. Consequently the target groups can be defined as broadly-based.
My Home is a dynamic concept and additional functionality such as the recently added heating calculator section will be added based on suggestions identified users and consumers.
75
One important aspect of the research showed that although consumers liked the ability to be able to monitor their electricity consumption, the feature that really appealed to them was the possibility to control and monitor their homes, thereby making life easier, fun, and green.
The Trust’s is working hard to ensure that My Home fulfils these win-win-win aspirations.
The Trust’s goals
Collectively, Danes have the possibility to save up to 3 million KWh by managing their homes intelligently, which is equivalent to 1.5 million tons of CO2 – or nearly half a ton of CO2 per household. The combination of My Home and “intelligent” control and monitoring can therefore help Denmark to take a big step on the way to a leading position in “intelligent” home control and energy savings in the months up to the United Nations Climate Change Conference, COP15 Copenhagen.
Although the Trust’s mission is to help consumers and the public sector save electricity, it is equally important to encourage producers, wholesalers and the retail trade to develop and offer energy efficient products. This is why the Trust is pleased to discover that the business world is becoming increasingly aware of demands by consumers for wireless equipment in their homes. The Trust can already observe a considerable interest in the market for the opportunities provided by My Home for companies to develop products for the “intelligent” home.
As a not-for-profit organisation with no commercial affiliations, the Trust hopes that it will be possible to establish collaborations with not only the key players in the field of home control, but also many smaller and innovative companies. The aim of these collaborations will be the creation and sharing of common standard for communication, not only between My Home and home control systems but also with external communications platforms.
International exposure
My Home wins Adobe award
Adobe MAX Awards is a global awards program that recognises the most engaging user experiences on the Internet created with the help of Adobe technologies. Every year Adobe hosts a series of conferences with the purpose of bringing together, developers and decision makers over 4 days of inspiring workshops, networking and previews into technologies of the future. The events are also an opportunity to applaud individuals and organisations that have created unique experiences for end-users.
With over 700 entries, competing projects were divided into 3 categories: Develop Design and Envision. My Home was the winner of the Envision category [1].
References
[1] AbobeMAX (2008): Welcome to MAX 2008 Europe.
http://max.adobe.com/eu/experience/#?s=0&p=0 (first accessed 11.01.2009).
[2] Krug, Stephen (2006): Don’t make me think. A common sense approach to web usability. New Riders
[3] Schlesinger, Katja Øder (2008): The values of My Home from a user perspective. Findings from fieldwork explorations in Danish homes. Home control and energy savings conference 01.10.2008
[5] Danish Electricity Saving Trust, (2008): My Home. http://minbolig.elsparefonden.dk/ (first accessed 26.12.2008).
[6] Danish Electricity Saving Trust, (2008/2): The Energy Saving Label defines requirements for energy efficiency.
http://www.savingtrust.dk/consumer/products/energy-saving-equipment/wireless-equipment/energy-saving-equipment (first accessed 07.01.2009).
76
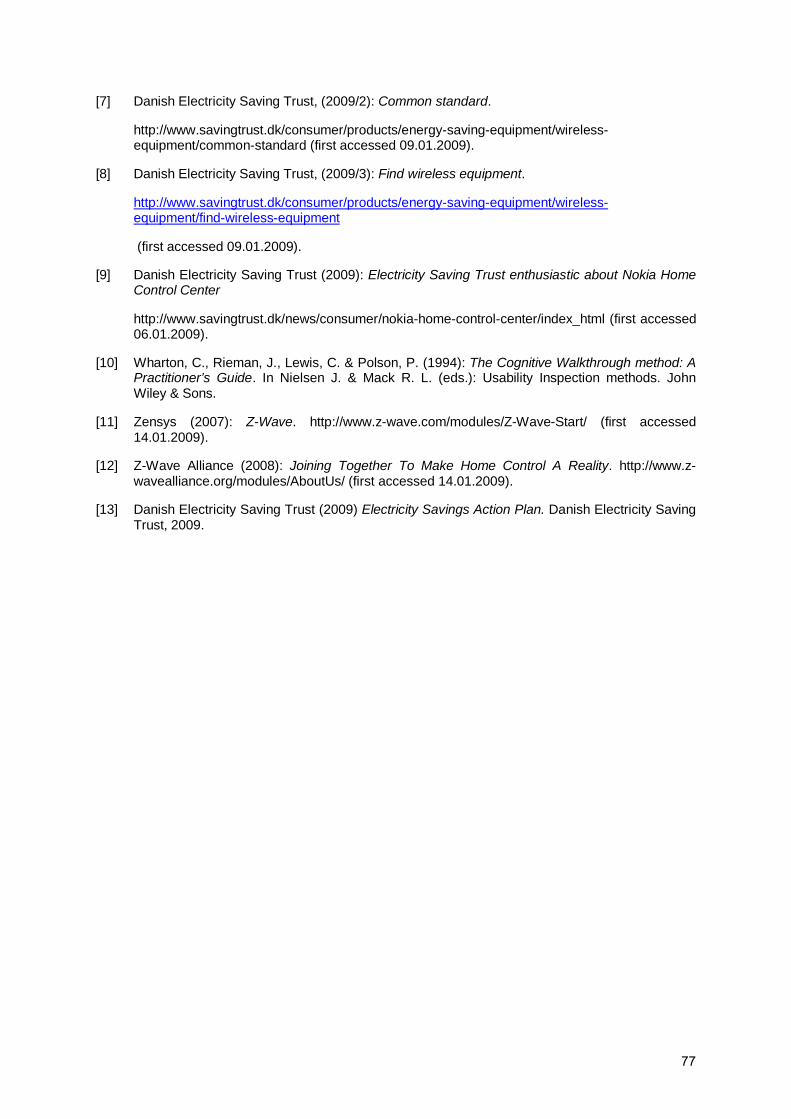
[7] Danish Electricity Saving Trust, (2009/2): Common standard.
http://www.savingtrust.dk/consumer/products/energy-saving-equipment/wireless-equipment/common-standard (first accessed 09.01.2009).
[8] Danish Electricity Saving Trust, (2009/3): Find wireless equipment.
http://www.savingtrust.dk/consumer/products/energy-saving-equipment/wireless-equipment/find-wireless-equipment
(first accessed 09.01.2009).
[9] Danish Electricity Saving Trust (2009): Electricity Saving Trust enthusiastic about Nokia Home Control Center
http://www.savingtrust.dk/news/consumer/nokia-home-control-center/index_html (first accessed 06.01.2009).
[10] Wharton, C., Rieman, J., Lewis, C. & Polson, P. (1994): The Cognitive Walkthrough method: A Practitioner’s Guide. In Nielsen J. & Mack R. L. (eds.): Usability Inspection methods. John Wiley & Sons.
[11] Zensys (2007): Z-Wave. http://www.z-wave.com/modules/Z-Wave-Start/ (first accessed 14.01.2009).
[12] Z-Wave Alliance (2008): Joining Together To Make Home Control A Reality. http://www.z-wavealliance.org/modules/AboutUs/ (first accessed 14.01.2009).
[13] Danish Electricity Saving Trust (2009) Electricity Savings Action Plan. Danish Electricity Saving Trust, 2009.
77
E-mail and SMS as a tool for electricity savings in households, report from a field experiment
Vibeke Hansen Kjærbye
AKF and Roskilde University
Anders Larsen
Roskilde University and Ea Energy Analyses
Søren Leth – Petersen
University of Copenhagen
Mikael Togeby
Ea Energy Analyses
Abstract
This paper analyzes the effect of supplying online feedback by SMS-text messages and email about electricity consumption on the level of total household electricity consumption.
An experiment was conducted where 1,452 households were randomly allocated to three experimental groups and two control groups. Feedback was supplied throughout 2007 to members of the experiment groups who accepted the invitation, and data on consumption of electricity for 2006 and 2007 collected for all participants and control group members. 30% of the households invited to receive feedback accepted the invitation. The estimated effects of the feedback on consumption of electricity are estimated to be in the range of 2-3%. The feedback technology is cheap to implement and therefore likely to be cost-effective. The experiment was designed very carefully from an econometric perspective. That is one of the reasons why the experiment is incremental in an innovation perspective.
The quantitative (econometric) analysis was however followed by a qualitative analysis based on interviews with 22 households. The main finding here is that customers demand knowledge about their electricity consumption independent of their attitude towards electricity conservation. We find that the received and perceived feedback is valued, that it increases awareness of electricity consumption, and give the families an increased sense of control over their energy consumption.
1. Introduction
There is a long tradition for providing consumers with feedback information about their energy consumption, for example by printing last period’s consumption level of the energy bill [9]. The purpose of feedback information is to increase the awareness among consumers of their energy consumption. Consumption of electricity is characterized by being indirect in nature, i.e. consumers consume services derived from electricity, for example by using a dishwasher. Understanding the exact marginal costs of using a dishwasher requires reading of the meter before and after the use of the dishwasher while holding constant the use of other appliances, calculating the use of electricity and transforming it in to money terms. This is usually much too complicated compared to the potential gain from understanding the exact marginal costs of consuming a service derived from electricity. Consumers can handle this by applying routine based decision making. Such behavior is sometimes labelled inattentiveness [7]. Feedback provides consumers with more information, so that consumption decisions can be made at smaller costs. Supplying feedback information about electricity consumption at an increased frequency should enable consumers to make more precise consumption decisions by relying less on routine based decision making. In this sense supplying feedback at an
78
increased frequency could in principle affect the level of consumption both upwards and downwards, since a costumer may realize upon having received more information that her level of consumption was actually lower than what is optimal. Policy makers, however, tend to focus on the ability of such measures to reduce consumption.
Advanced meters with automated meter reading are being distributed in many countries. In Denmark 45% of all Danish costumers will be equipped with an advanced meter within few years. This development takes place without special regulation from the authorities. In Sweden advanced meters are required by authorities, and in other countries like Norway, and the Netherlands a similar development is under way. The distribution of advanced meters together with the rapid development and proliferation of new information technologies provide new possibilities for giving feedback information.
The objective of this paper is to investigate the effect of supplying feedback by text messages and /or email on the level of total household electricity consumption. Feedback by text messages and /or email is being used already in other sectors. In the banking and portable telephone sector, for example, account statements are being supplied to consumers by SMS-text messages and email. For the present purpose this technology is adapted to generate feedback on household electricity consumption, and a randomized field experiment is performed where a group of costumers of a Danish electricity supplier are randomly allocated to two control groups and three experimental groups that are invited to receive feedback. For all the households who accept the invitation and all control households electricity consumption is recorded from 1 January 2006 to 31 December 2007. The experimental groups receive feedback via SMS-text messages or emails from 1 January 2007 to 31 December 2007.
The choice of feedback technology is made based on a tradeoff between the type of feedback that is known to have the largest impact and the costs of implementing the technology that supplies it. It is know that feedback information works best if it is given frequently, over a long period and at an appliance specific level, see [2]. The effect of online feedback by SMS-text message and email has never previously been explored. As applied in this experiment it meets the first two requirements. It is sent out at e.g. a daily frequency, and the experiment runs for an entire year. There is thus plenty of opportunity for participants to adjust and get used to the type of feedback given. The third requirement is not met in our setup. Appliance specific feedback is usually relatively costly as it requires meters to be installed at all the appliances targeted. Unless the savings are very large the benefits are unlikely to be large enough to finance the technology required. Our feedback technology, on the other hand, operates on total household electricity consumption. The majority of the population have access to receiving either email or text messages. This implies that the type of feedback information tested here is cheap to implement, and therefore likely to be cost-effective even if the impact is small. This is important since effects of feedback are likely to be small. For example [6] finds that 113 Japanese households, who had feedback provided by a continuous display installed in the residence and giving information about consumption, were observed with a level of electricity consumption that was 1.5 % lower than that of a control group.
Behind the “conservative” design of the experiment is also a prioritizing of the econometric analysis. We did not provide the household with other information about e.g. efficient appliances or the global warming as this would raise the question if the effect we found was due to the feedback.
The results of the present experiment indicate moderate interest in the type of feedback tested. 30% of the households invited to participate in the experimental groups accepted the invitation. The majority of the participating households preferred to receive feedback by email. The results based on a differences-in-differences analysis, where the growth rate of consumption from 2006 to 2007 is compared for participants and control group members, suggest that among the households that received feedback electricity consumption was reduced by 2-3%. Results are, however, not significant across all econometric specifications investigated, and this is likely due to the fact that the experiment includes a limited number of households, compared to the natural variation in demand.
The paper is organized as follows. In the next section the feedback technology is described. After that, the experimental design is outlined and the data described. Then results are presented and finally the analysis is summarized and conclusions are made. Section 4.1 and the first half of section 4.2 and the footnotes linked to these pages are explaining the econometric analyses. Thus this section can be skipped by readers not interested in the technique. The final results (the savings in the
79

treatment groups) are in table 6 in section 4.2. A short conclusion from a qualitative study of customer perception of the feedback is en section 4.3
2. Experimental design
The experiment is conducted by randomly allocating a group of costumers of a Danish electricity supplier, SYD ENERGI, on two control groups and three experimental groups that will have different degrees of choice between various types of feedback via SMS text messages or emails. For all the households involved in the experiment electricity consumption is recorded from 1 January 2006 to 31 December 2007.
2.1 Types of feedback
Three types of feedback are given to the experimental groups. Frequency, deviation, and limit based feedback. Frequency based feedback provides the consumer with information about the development of her consumption level at a regular frequency. Deviation based feedback provides the consumer with feedback when current consumption deviates significantly from the consumption level of the previous period. Limit based feedback provides feedback when current consumption is extreme relative to the distribution of consumption levels in several earlier periods. The types of feedback are summarized in table 1 below.
Table 1: Types of feedback
Types of feedback
Description
Frequency based The feedback is sent out every day, week or month Deviation based The feedback is sent out, if the electricity consumption during this period
(day, week or month) deviates with a certain percentage compared to the consumption in the previous period
Limit based The feedback is sent out, if the current electricity consumption is very low or very high compared to the consumption in previous periods
For the experiment we select 1,452 households that we include/invite to participate in the experiment. They are allocated randomly on two control groups and three experimental groups. One of the control groups is blind, but the members of the second control group are informed that they are part of an experiment testing the effect of feedback information. This second control group is introduced as an attempt to frame any experimental effect that may be present.
The three experimental groups are given different degrees of choice with respect to the type of feedback that they will receive. Group 1 is given no choice of feedback and receive only frequency based feedback at a weekly frequency. Group 2 has more choice. Group 2 members can choose frequency and/or deviation based feedback at three different frequencies, daily, weekly, or monthly. Experimental group 3 is not restricted in their choice.
This allocation of choices between the three experimental groups reflects a weighting of a design, where the effect of information on consumption can be measured without complications, group 1, and a design that reflects the available technological possibilities, but where the isolated effect of information on consumption is more difficult to measure, because the participating households must make choices concerning both consumption and type of information they wish to receive, group 2 and 3. The types of feedback available to members of the three experimental groups are summarised in table 2.
In connection with the experiment a home page is established where all households in control group 2 and all three experimental groups can get access to graphical presentations of historical consumption data1. All households in the experimental group have to choose whether to receive feedback via SMS-text messages and/or email. SMS-text messages contain only text whereas emails also contain a graphical presentation of the consumption data. Participants in group 2 and 3 also have to choose the
1 In this sense control group 2 did get feedback, but it required logging on the home page of SYD ENERGI.
80
type of feedback they wish to receive. For these households a default feedback setup was established, but households in group 2 and 3 could adjust the setup, i.e. the type and frequency of the feedback, at the homepage at any point during the experimental period.
Table 2: The types of feedback available to the three experiment groups. Participants in group 2 and 3 can choose two types of feedback.
Types of feedback Experiment group 1
Experiment group 2
Experiment group 3
Monthly frequency based
X X
Weekly frequency based X X X Daily frequency based X Monthly deviation based X Weekly deviation based X X Daily deviation based X X Monthly limit based X Weekly limit based X Daily limit based X
As for the choice of rule in experiment group 2 and 3 most households did choose two rules, as well frequency as either a limit or a deviation based rule. If only one rule was chosen it was mainly the frequency based rule2. 2.2 Implementation
The experiment was conducted among a set of costumers of SYD ENERGI. This supplier was targeted because it is the first company in Denmark to install advanced meters enabling automated meter reading at a massive scale to their customers. The pool of participants for the experiment was selected among the costumers who had an on-line meter installed and in operation by 1 January 2006. 15,847 households satisfied this criterion. For these costumers we obtained information about dwelling characteristics from the official building registers that enabled us to deselect costumers that are not likely to benefit from this type of feedback or would not be relevant to the experiment. From the pool of costumers we selected households living in a detached, terrace or town house that did not use electricity as the main energy source for heating the house. Denmark is a relatively cold country, and energy consumption for heating purposes is the dominating part of total household energy consumption. We exclude households using electricity as the main source for heating since their consumption co-varies strongly with outdoor temperature, and electricity consumption is therefore very volatile for this group. We also deselect costumers that use the house for commercial purposes or use the house as non-permanent residence. Finally, we required the costumer to have been living in the house at least since 1 January 2006. Imposing these restrictions left us with 1,452 costumers. These households were then randomly allocated to the two control groups and the three experiment groups, approximately 200 to each of the control groups and approximately 350 to each of the experiment groups. More households were assigned to the experiment groups than to the control groups. This is because households in the experiment groups can choose not to accept the invitation to participate in the experiment, and drop-outs are expected. The control groups, on the other hand, will only suffer from attrition to the extent that some households move during the experiment period.
Invitations were sent out to the experimental groups and information about the experiment sent out to control group 2 in mid-November 2006. Members of control group 1 were not informed that they were part of the experiment. Members of experimental group 1-3 were asked to sign up via the homepage or by returning a reply-form included in the letters. Members of the experimental groups who had not answered by the beginning of December received a second letter reminding to sign up to the experiment.
2 Details about the choices of rules and the use of the web-site can be found in http://feedback.noe.dk/Publicering/PDF/samlet%204.%20version2.pdf page 25
81
For implementing the experiment a technical platform has been developed3. The purpose of the platform is to facilitate communication between the electronic on-line meters located at the costumers, the billing server located at energy supplier, and a feedback server that for the purposes of this experiment is placed at a third location. As mentioned previously the feedback technology applied in this experiment is based on an idea known from other sectors. For example, some banks offer feedback to their customers about movements in their account. In that case the bank already has all the necessary information available in their data base. In the present context the consumption data, from which the feedback is to be calculated, is initially collected at the costumers. Therefore, consumption data needs to be transferred from the costumers to the billing server of the electricity supplier and then to the feedback server before feedback is generated and sent back to the costumers4. Consumption data are transferred from the customers to the billing server by Power Line Communication and from the billing server to the feedback server by an internet connection.
The technical platform also facilitates communication between the feedback server and the costumers through a web interface, where customers can get access to a graphical presentation of their consumption data. The web interface enable customers to update their own profile with e-mail addresses, GSM phone numbers (experimental group 1-3), and choice of feedback (experimental group 2 and 3). Each household can enter more phone numbers and more email addresses. The webpage is secured so that access requires user name and password. The website offers a possibility for the participating households who have forgotten their password to type their address and then via text message or e-mail receive their password. The web-site is not used a lot by the households. Many households only use the web-site once to join the experiment. There is however also a group of households that do login ten month after the atart of the experiment, i.e. October 2007, or later5.
3. Data and Summary Statistics
The data used in the analysis come from different sources. Consumption was recorded for all participants and all control group members for the period 1 January 2006 to 31 December 2007. The number, the timing and type of messages were also recorded. As mentioned earlier we also had access to data from the public building register with information about the type of house, the size and the main heating source. These data are publicly available and were used to select the households entering the sample that we invited to participate or included in the control groups. Next, historical data on annual consumption was obtained from the electricity supplier, SYD ENERGI, for 2004, and 2005. These data were collected for billing purposes by SYD ENERGI before electronic on-line metres were installed. Finally, using the address code of the house we merged background characteristics of the individuals living at the addresses where electricity was supplied and measured during the experiment. These background characteristics are measured in 2006 and include information about income, education, age, marital/cohabitation status of the adult members, and household size. The background characteristics are obtained from administrative registers. These registers are not publicly available and can only be used by researchers under strict confidentiality conditions. Because of the confidentiality restrictions this information could only be obtained after the experiment had finished.
Next, we describe the participation rate and summary statistics characterising the participants in the experiment. Also a description of the amount of feedback sent out and the level of electricity consumption across the different groups in the experiment is presented.
In table 3 an overview of the participation rate is given. The first column gives the number of households invited to participate in the experiment. The second column gives the number of households who accepted the invitation, and the third column the number of households who
3 The technical platform is designed and developed by ZONITH A/S (http://www.zonith.com/). A detailed description of the platform (in Danish) can be downloaded at http://feedback.noe.dk/Publicering/PDF/FeedbackTeknologiPlatformAfslutningsRapport%20(v12).pdf 4 The type of online-meters installed at the costumers do not allow for feedback to be generated directly at the costumer. This would require “intelligent” meters that can store and make calculations on location. 5 Details about the lock-in to the website can be found in table 4.3 at http://feedback.noe.dk/Publicering/PDF/samlet%204.%20version2.pdf
82
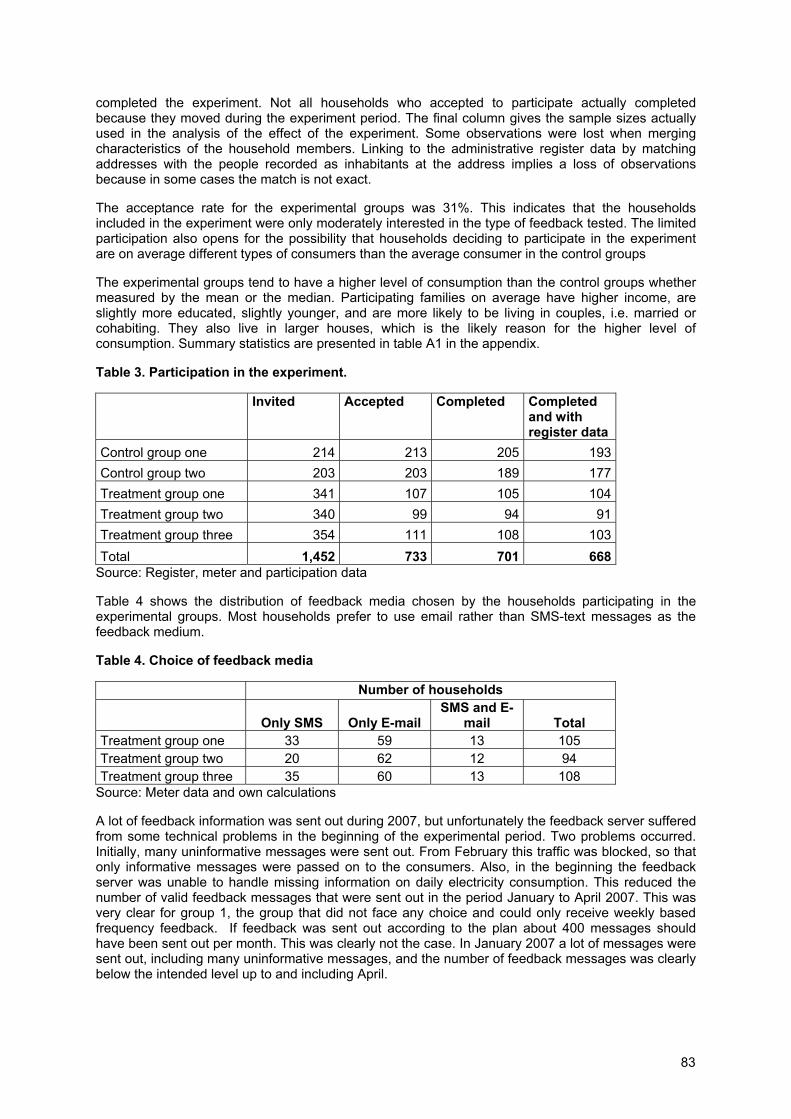
completed the experiment. Not all households who accepted to participate actually completed because they moved during the experiment period. The final column gives the sample sizes actually used in the analysis of the effect of the experiment. Some observations were lost when merging characteristics of the household members. Linking to the administrative register data by matching addresses with the people recorded as inhabitants at the address implies a loss of observations because in some cases the match is not exact.
The acceptance rate for the experimental groups was 31%. This indicates that the households included in the experiment were only moderately interested in the type of feedback tested. The limited participation also opens for the possibility that households deciding to participate in the experiment are on average different types of consumers than the average consumer in the control groups
The experimental groups tend to have a higher level of consumption than the control groups whether measured by the mean or the median. Participating families on average have higher income, are slightly more educated, slightly younger, and are more likely to be living in couples, i.e. married or cohabiting. They also live in larger houses, which is the likely reason for the higher level of consumption. Summary statistics are presented in table A1 in the appendix.
Table 3. Participation in the experiment.
Invited Accepted Completed Completed and with register data
Control group one 214 213 205 193 Control group two 203 203 189 177 Treatment group one 341 107 105 104 Treatment group two 340 99 94 91 Treatment group three 354 111 108 103 Total 1,452 733 701 668
Source: Register, meter and participation data
Table 4 shows the distribution of feedback media chosen by the households participating in the experimental groups. Most households prefer to use email rather than SMS-text messages as the feedback medium.
Table 4. Choice of feedback media
Number of households
Only SMS Only E-mail SMS and E-
mail Total Treatment group one 33 59 13 105 Treatment group two 20 62 12 94 Treatment group three 35 60 13 108
Source: Meter data and own calculations A lot of feedback information was sent out during 2007, but unfortunately the feedback server suffered from some technical problems in the beginning of the experimental period. Two problems occurred. Initially, many uninformative messages were sent out. From February this traffic was blocked, so that only informative messages were passed on to the consumers. Also, in the beginning the feedback server was unable to handle missing information on daily electricity consumption. This reduced the number of valid feedback messages that were sent out in the period January to April 2007. This was very clear for group 1, the group that did not face any choice and could only receive weekly based frequency feedback. If feedback was sent out according to the plan about 400 messages should have been sent out per month. This was clearly not the case. In January 2007 a lot of messages were sent out, including many uninformative messages, and the number of feedback messages was clearly below the intended level up to and including April.
83
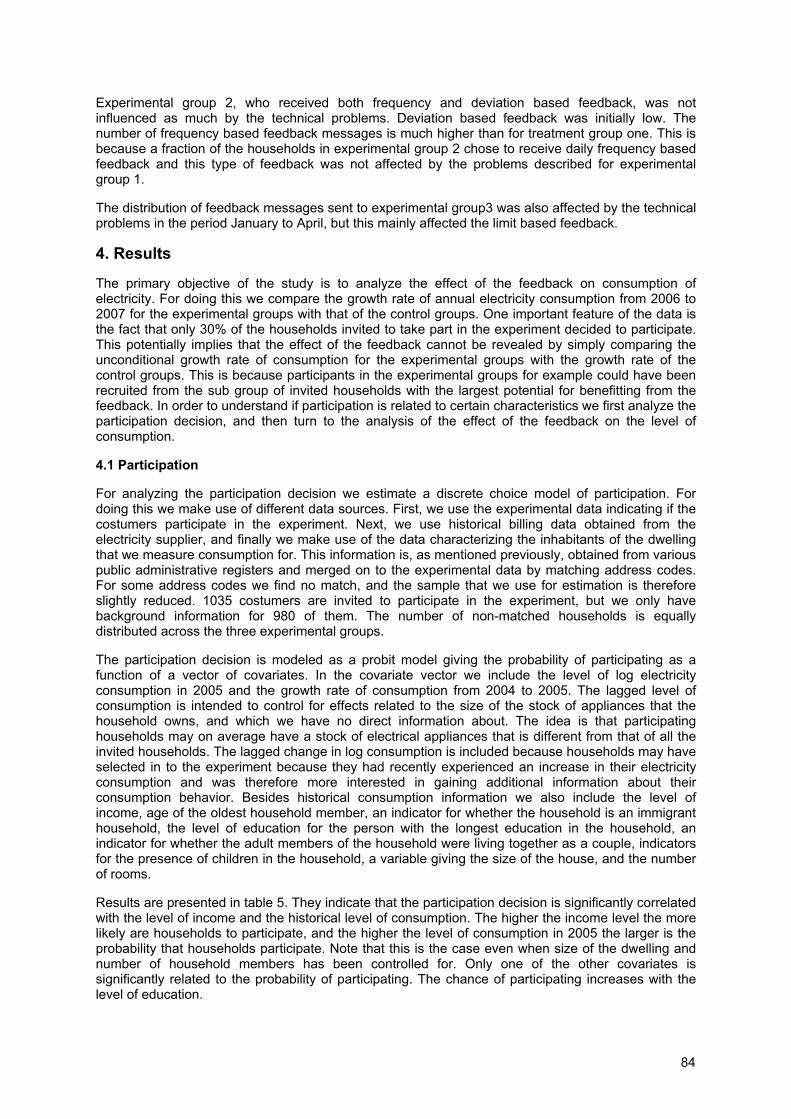
Experimental group 2, who received both frequency and deviation based feedback, was not influenced as much by the technical problems. Deviation based feedback was initially low. The number of frequency based feedback messages is much higher than for treatment group one. This is because a fraction of the households in experimental group 2 chose to receive daily frequency based feedback and this type of feedback was not affected by the problems described for experimental group 1.
The distribution of feedback messages sent to experimental group3 was also affected by the technical problems in the period January to April, but this mainly affected the limit based feedback.
4. Results
The primary objective of the study is to analyze the effect of the feedback on consumption of electricity. For doing this we compare the growth rate of annual electricity consumption from 2006 to 2007 for the experimental groups with that of the control groups. One important feature of the data is the fact that only 30% of the households invited to take part in the experiment decided to participate. This potentially implies that the effect of the feedback cannot be revealed by simply comparing the unconditional growth rate of consumption for the experimental groups with the growth rate of the control groups. This is because participants in the experimental groups for example could have been recruited from the sub group of invited households with the largest potential for benefitting from the feedback. In order to understand if participation is related to certain characteristics we first analyze the participation decision, and then turn to the analysis of the effect of the feedback on the level of consumption.
4.1 Participation
For analyzing the participation decision we estimate a discrete choice model of participation. For doing this we make use of different data sources. First, we use the experimental data indicating if the costumers participate in the experiment. Next, we use historical billing data obtained from the electricity supplier, and finally we make use of the data characterizing the inhabitants of the dwelling that we measure consumption for. This information is, as mentioned previously, obtained from various public administrative registers and merged on to the experimental data by matching address codes. For some address codes we find no match, and the sample that we use for estimation is therefore slightly reduced. 1035 costumers are invited to participate in the experiment, but we only have background information for 980 of them. The number of non-matched households is equally distributed across the three experimental groups.
The participation decision is modeled as a probit model giving the probability of participating as a function of a vector of covariates. In the covariate vector we include the level of log electricity consumption in 2005 and the growth rate of consumption from 2004 to 2005. The lagged level of consumption is intended to control for effects related to the size of the stock of appliances that the household owns, and which we have no direct information about. The idea is that participating households may on average have a stock of electrical appliances that is different from that of all the invited households. The lagged change in log consumption is included because households may have selected in to the experiment because they had recently experienced an increase in their electricity consumption and was therefore more interested in gaining additional information about their consumption behavior. Besides historical consumption information we also include the level of income, age of the oldest household member, an indicator for whether the household is an immigrant household, the level of education for the person with the longest education in the household, an indicator for whether the adult members of the household were living together as a couple, indicators for the presence of children in the household, a variable giving the size of the house, and the number of rooms.
Results are presented in table 5. They indicate that the participation decision is significantly correlated with the level of income and the historical level of consumption. The higher the income level the more likely are households to participate, and the higher the level of consumption in 2005 the larger is the probability that households participate. Note that this is the case even when size of the dwelling and number of household members has been controlled for. Only one of the other covariates is significantly related to the probability of participating. The chance of participating increases with the level of education.
84
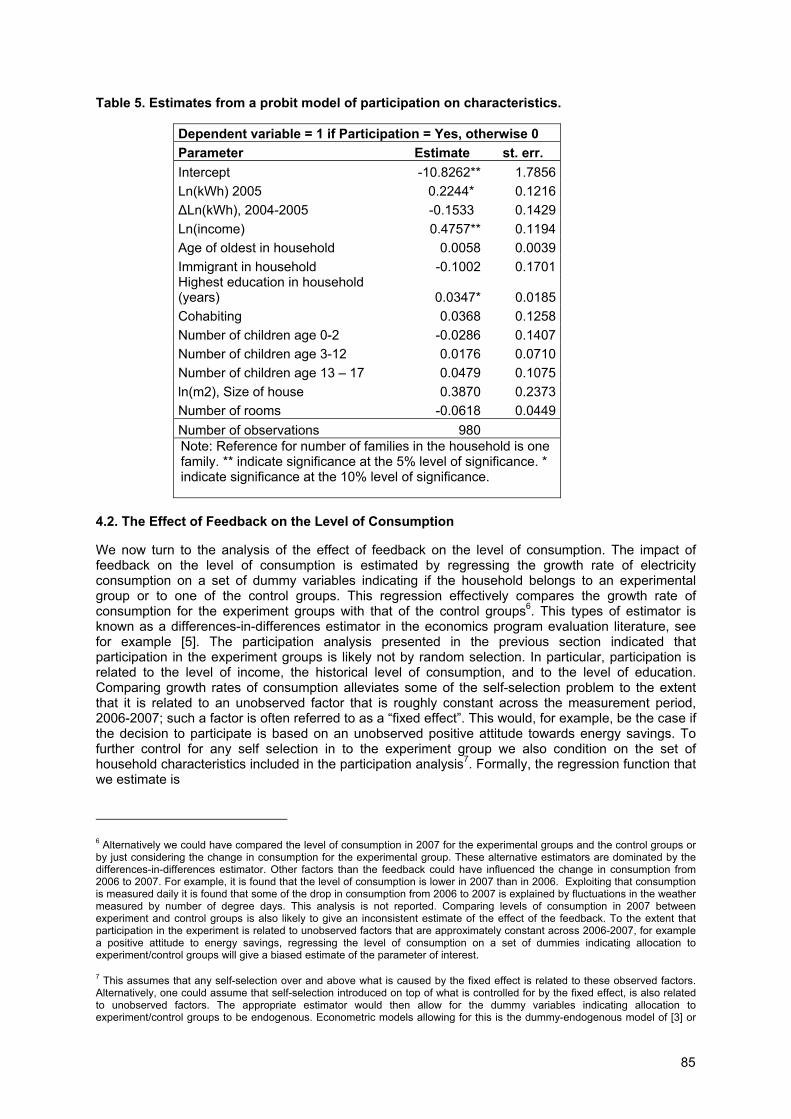
Table 5. Estimates from a probit model of participation on characteristics.
Dependent variable = 1 if Participation = Yes, otherwise 0 Parameter Estimate st. err. Intercept -10.8262** 1.7856Ln(kWh) 2005 0.2244* 0.1216ΔLn(kWh), 2004-2005 -0.1533 0.1429Ln(income) 0.4757** 0.1194Age of oldest in household 0.0058 0.0039Immigrant in household -0.1002 0.1701Highest education in household (years) 0.0347* 0.0185Cohabiting 0.0368 0.1258Number of children age 0-2 -0.0286 0.1407Number of children age 3-12 0.0176 0.0710Number of children age 13 – 17 0.0479 0.1075ln(m2), Size of house 0.3870 0.2373Number of rooms -0.0618 0.0449Number of observations 980Note: Reference for number of families in the household is one family. ** indicate significance at the 5% level of significance. * indicate significance at the 10% level of significance.
4.2. The Effect of Feedback on the Level of Consumption
We now turn to the analysis of the effect of feedback on the level of consumption. The impact of feedback on the level of consumption is estimated by regressing the growth rate of electricity consumption on a set of dummy variables indicating if the household belongs to an experimental group or to one of the control groups. This regression effectively compares the growth rate of consumption for the experiment groups with that of the control groups6. This types of estimator is known as a differences-in-differences estimator in the economics program evaluation literature, see for example [5]. The participation analysis presented in the previous section indicated that participation in the experiment groups is likely not by random selection. In particular, participation is related to the level of income, the historical level of consumption, and to the level of education. Comparing growth rates of consumption alleviates some of the self-selection problem to the extent that it is related to an unobserved factor that is roughly constant across the measurement period, 2006-2007; such a factor is often referred to as a “fixed effect”. This would, for example, be the case if the decision to participate is based on an unobserved positive attitude towards energy savings. To further control for any self selection in to the experiment group we also condition on the set of household characteristics included in the participation analysis7. Formally, the regression function that we estimate is
6 Alternatively we could have compared the level of consumption in 2007 for the experimental groups and the control groups or by just considering the change in consumption for the experimental group. These alternative estimators are dominated by the differences-in-differences estimator. Other factors than the feedback could have influenced the change in consumption from 2006 to 2007. For example, it is found that the level of consumption is lower in 2007 than in 2006. Exploiting that consumption is measured daily it is found that some of the drop in consumption from 2006 to 2007 is explained by fluctuations in the weather measured by number of degree days. This analysis is not reported. Comparing levels of consumption in 2007 between experiment and control groups is also likely to give an inconsistent estimate of the effect of the feedback. To the extent that participation in the experiment is related to unobserved factors that are approximately constant across 2006-2007, for example a positive attitude to energy savings, regressing the level of consumption on a set of dummies indicating allocation to experiment/control groups will give a biased estimate of the parameter of interest.
7 This assumes that any self-selection over and above what is caused by the fixed effect is related to these observed factors. Alternatively, one could assume that self-selection introduced on top of what is controlled for by the fixed effect, is also related to unobserved factors. The appropriate estimator would then allow for the dummy variables indicating allocation to experiment/control groups to be endogenous. Econometric models allowing for this is the dummy-endogenous model of [3] or
85
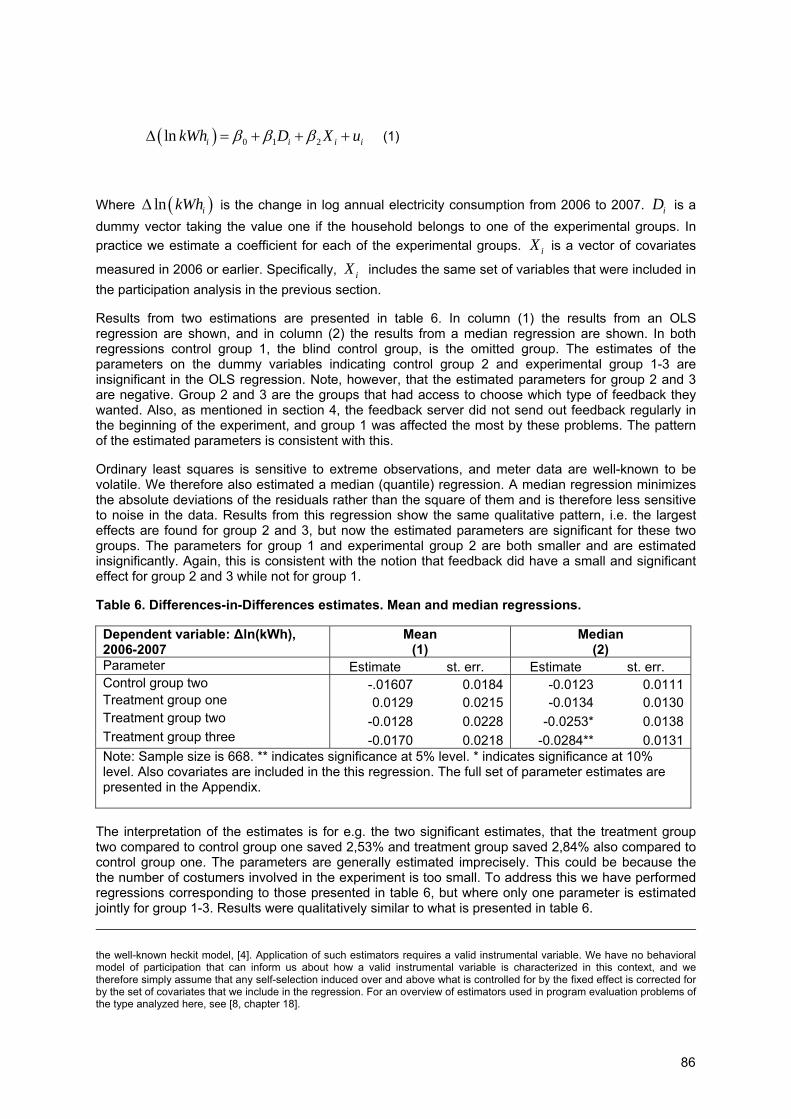
( ) 0 1 2ln i i i ikWh D X uβ β βΔ = + + + (1)
Where ( )ln ikWhΔ is the change in log annual electricity consumption from 2006 to 2007. iD is a dummy vector taking the value one if the household belongs to one of the experimental groups. In practice we estimate a coefficient for each of the experimental groups. iX is a vector of covariates
measured in 2006 or earlier. Specifically, iX includes the same set of variables that were included in the participation analysis in the previous section.
Results from two estimations are presented in table 6. In column (1) the results from an OLS regression are shown, and in column (2) the results from a median regression are shown. In both regressions control group 1, the blind control group, is the omitted group. The estimates of the parameters on the dummy variables indicating control group 2 and experimental group 1-3 are insignificant in the OLS regression. Note, however, that the estimated parameters for group 2 and 3 are negative. Group 2 and 3 are the groups that had access to choose which type of feedback they wanted. Also, as mentioned in section 4, the feedback server did not send out feedback regularly in the beginning of the experiment, and group 1 was affected the most by these problems. The pattern of the estimated parameters is consistent with this.
Ordinary least squares is sensitive to extreme observations, and meter data are well-known to be volatile. We therefore also estimated a median (quantile) regression. A median regression minimizes the absolute deviations of the residuals rather than the square of them and is therefore less sensitive to noise in the data. Results from this regression show the same qualitative pattern, i.e. the largest effects are found for group 2 and 3, but now the estimated parameters are significant for these two groups. The parameters for group 1 and experimental group 2 are both smaller and are estimated insignificantly. Again, this is consistent with the notion that feedback did have a small and significant effect for group 2 and 3 while not for group 1.
Table 6. Differences-in-Differences estimates. Mean and median regressions.
Dependent variable: Δln(kWh), 2006-2007
Mean (1)
Median (2)
Parameter Estimate st. err. Estimate st. err. Control group two -.01607 0.0184 -0.0123 0.0111Treatment group one 0.0129 0.0215 -0.0134 0.0130Treatment group two -0.0128 0.0228 -0.0253* 0.0138Treatment group three -0.0170 0.0218 -0.0284** 0.0131Note: Sample size is 668. ** indicates significance at 5% level. * indicates significance at 10% level. Also covariates are included in the this regression. The full set of parameter estimates are presented in the Appendix.
The interpretation of the estimates is for e.g. the two significant estimates, that the treatment group two compared to control group one saved 2,53% and treatment group saved 2,84% also compared to control group one. The parameters are generally estimated imprecisely. This could be because the the number of costumers involved in the experiment is too small. To address this we have performed regressions corresponding to those presented in table 6, but where only one parameter is estimated jointly for group 1-3. Results were qualitatively similar to what is presented in table 6.
the well-known heckit model, [4]. Application of such estimators requires a valid instrumental variable. We have no behavioral model of participation that can inform us about how a valid instrumental variable is characterized in this context, and we therefore simply assume that any self-selection induced over and above what is controlled for by the fixed effect is corrected for by the set of covariates that we include in the regression. For an overview of estimators used in program evaluation problems of the type analyzed here, see [8, chapter 18].
86

This modest saving based on a very modest intervention in the life of the households can easily be explained theoretically. Many factors play a role in the individual households energy use. Energy consumers are often identified as rational economic actors making rational choices regarding the adoption of more or less efficient technologies and behaviours. But in the literature about energy efficient economy there is a growing interest for understanding human behaviour and the recognition that people are motivated to action as a result of both economic and non-economic factors. Non-economic factors include a set of social, cultural, political and ethical factors that shape individual and household energy demand. Among the non-economic factors of interest are measures of social status, social norms, social institutions and social behaviour.
4.3. Qualitative study of customer perception of the feedback
A total of 22 households were interviewed about their reaction to continuous feedback on electricity consumption, which they had received for a year by email and/or SMS. The 22 households have been selected to give a as representative picture as possible [1]. The main finding in this follow-up study is that customers demand knowledge about their electricity consumption independent of their attitude towards electricity conservation. We find that the received and perceived feedback is valued, that it increases awareness of electricity consumption, and that it gives the families an increased sense of control over their energy resources. The interviewed households prefer weekly feedback on consumption, which they view as an opportunity to recall the past week’s events, something which is much appreciated. Customers expressed a keen interest in having information about electricity consumption just for the sake of knowing, monitoring, comparing and competing. Interest in this information seemed unrelated to the actual electricity savings accomplished during the year of feedback, attitude to saving, and priority given to conservation behavior.
This finding suggests that electricity suppliers should focus on feedback about metering and billing as a service, which in the first place supports households’ wish to sustain themselves. In the second place, this feedback also brings energy consumption issues more to the foreground, improves general energy literacy, and plays a role in storytelling to friends and family. Thereby it also becomes part of the social norm landscape and contributes to the fostering of both family identity and the education of children. Such a reframing of feedback information from a saving focus to a service focus may lead to the development of new services, which in turn may increase awareness among those less aware, and support and ease the awareness of those already aware, in this way supporting conservation behaviour
5. Summary and Conclusions
The paper present an analysis of an experiment designed to test the effect of on-line feedback supplied by SMS-text messages and email on total household electricity consumption. 1,452 households were randomly allocated to two control groups and three experiment groups. Households allocated to the experiment group were invited to receive feedback. 30% of the invited households accepted the invitation. The analysis suggests that among the participating households online feedback had an effect in the range of 2-3% on total household electricity consumption. Considering the type of policy instrument (information about the aggregate electricity consumption in the household) we find the savings reasonable. We would not have been very surprised if there were no savings at all.
The main finding in a qualitative study is that customers demand knowledge about their electricity consumption. And this demand is perhaps not very instrumental related to saving electricity; but to know and to be in control. The demand seems independent of the households’ attitude towards electricity conservation.
Lessons from previous studies of feedback have shown that feedback is most likely to have an effect if it is given frequently, over a long period and at an appliance specific level. The type of feedback investigated here satisfies the first two requirements, but compromise the third. This is because appliance specific feedback is likely to be costly to implement and effects are likely to be small but larger than here estimated. Our feedback technology operates on total household electricity consumption. It is cheap to implement, and even small reductions in consumption are likely to make the feedback cost effective.
87

The company who has supplied the technology for this experiment estimates that the costs of the scheme per consumer are 6 USD (4.4 EUR). In the experiment the median participating household in group 2 and 3 reduced consumption by 3% corresponding to 135 kWh.
References
[1] Christiansen, Ellen Anne Marie Kanstrup, Alice Grønhøj, Anders Larsen (2008): E-mail og/eller SMS? Strategiske perspektiver i 22 husholdningers erfaringer på baggrund af et års feedback om elforbruget. Syddansk Universitet. (Strategic perspectives in 22 households experiences based on one years experiences of feedback about their electricity consumption.) A summary of this is presented in the paper: “Nice to Know - metering and informative feedback presented” by Ellen Christiansen at the EEDAL 2009 - conference
[2] Fischer, C. (2008); Feedback on household electricity consumption: a tool for saving energy?; Energy Efficiency, 1, pp. 79-104.
[3] Heckman, J. (1978); Dummy Endogenous Variables in a Simultaneous Equation System; Econometrica, vol. 46, no. 4, July 1978, pp. 931-59.
[4] Heckman (1979); Sample-selection Bias as a Specification Error; Econometrica, vol. 47, no. 1, January 1979, pp. 153-61.
[5] Heckman, J.; Lalonde, R.; Smith, J. (1999): The Economics and Econometrics of Active Labor Market Programs. In Ashenfelter and Card: Handbook of Labor Economics, Volume 3A.
[6] Matsukawa, I. (2004); The Effects of Information on Residential Demand for Electricity; The Energy journal; Volume 25; Number 1.
[7] Reis, R. (2006); Inattentive Consumers; Journal of Monetary Economics; Volume 53, 8, pp. 1761-1800.
[8] Wooldridge, J. (2002); Econometric Analysis of Cross Section and Panel Data; MIT Press, Cambridge Massachusetts.
[9] Wilhite, H.; Høivik, A. ; Olsen, J.-G. (2002); Advances in the use of consumption feedback information in energy billing: the experiences of a Norwegian energy utility; Proceedings of the 1999 ECEEE Summer Study, 1999.
88
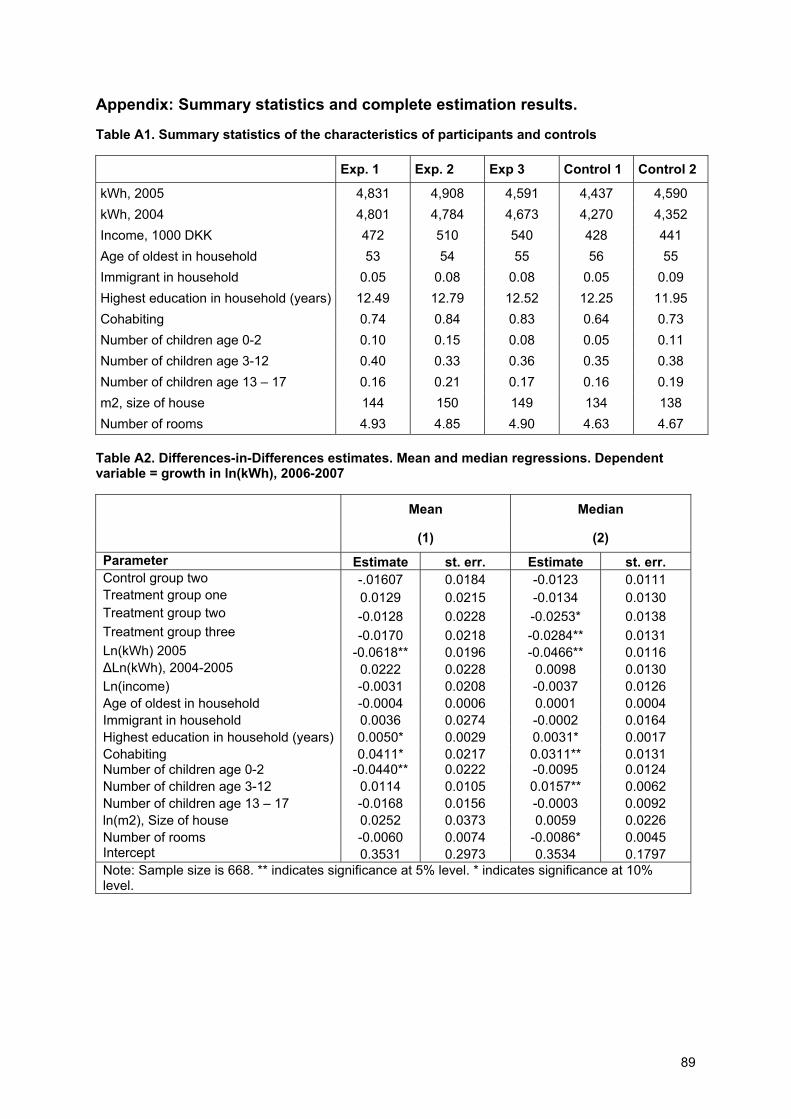
Appendix: Summary statistics and complete estimation results.
Table A1. Summary statistics of the characteristics of participants and controls
Exp. 1 Exp. 2 Exp 3 Control 1 Control 2
kWh, 2005 4,831 4,908 4,591 4,437 4,590 kWh, 2004 4,801 4,784 4,673 4,270 4,352 Income, 1000 DKK 472 510 540 428 441 Age of oldest in household 53 54 55 56 55 Immigrant in household 0.05 0.08 0.08 0.05 0.09 Highest education in household (years) 12.49 12.79 12.52 12.25 11.95 Cohabiting 0.74 0.84 0.83 0.64 0.73 Number of children age 0-2 0.10 0.15 0.08 0.05 0.11 Number of children age 3-12 0.40 0.33 0.36 0.35 0.38 Number of children age 13 – 17 0.16 0.21 0.17 0.16 0.19 m2, size of house 144 150 149 134 138 Number of rooms 4.93 4.85 4.90 4.63 4.67
Table A2. Differences-in-Differences estimates. Mean and median regressions. Dependent variable = growth in ln(kWh), 2006-2007
Mean Median (1) (2) Parameter Estimate st. err. Estimate st. err. Control group two -.01607 0.0184 -0.0123 0.0111 Treatment group one 0.0129 0.0215 -0.0134 0.0130 Treatment group two -0.0128 0.0228 -0.0253* 0.0138 Treatment group three -0.0170 0.0218 -0.0284** 0.0131 Ln(kWh) 2005 -0.0618** 0.0196 -0.0466** 0.0116 ΔLn(kWh), 2004-2005 0.0222 0.0228 0.0098 0.0130 Ln(income) -0.0031 0.0208 -0.0037 0.0126 Age of oldest in household -0.0004 0.0006 0.0001 0.0004 Immigrant in household 0.0036 0.0274 -0.0002 0.0164 Highest education in household (years) 0.0050* 0.0029 0.0031* 0.0017 Cohabiting 0.0411* 0.0217 0.0311** 0.0131 Number of children age 0-2 -0.0440** 0.0222 -0.0095 0.0124 Number of children age 3-12 0.0114 0.0105 0.0157** 0.0062 Number of children age 13 – 17 -0.0168 0.0156 -0.0003 0.0092 ln(m2), Size of house 0.0252 0.0373 0.0059 0.0226 Number of rooms -0.0060 0.0074 -0.0086* 0.0045 Intercept 0.3531 0.2973 0.3534 0.1797 Note: Sample size is 668. ** indicates significance at 5% level. * indicates significance at 10% level.
89

Metering and Smart Grid
90

91
Smart use of domestic appliances in renewable energy systems
Rainer Stamminger, Heiko Jungbecker
University of Bonn, Section Household and Appliance Technology
Abstract
The challenges on load management with an increasing share of fluctuating energy generation by renewable energies – i.e. mainly by solar and wind power – will grow steadily in the future. As a main part of the electricity demand of the residential sector in Europe is consumed by domestic appliances [1] the smart integration of these devices will play a bigger role in fluctuating energy systems. Within the European project SMART-A (“Smart Domestic Appliances in Sustainable Energy Systems”) [2] an analysis of the synergy potential of ten domestic appliances was carried out with respect to
possibilities for the use of power and heat supplied by renewable energies,
the ability to adapt their operation to the requirements set by the energy supply,
technical possibilities for a more flexible use,
additional costs of such smart appliances as compared to conventional appliances and
the additional energy consumption due to a smart operation.
In addition to the investigation of synergistic potentials for a smarter use of each appliance, possible constraints for a smart operation of appliances were identified. An overview of the range of opportunities of how smart appliances can contribute to a load management in future energy systems will be presented in the following.
Synergy potential
The possibilities of adapting the operation of domestic appliances to the requirements set by renewable energy supply and to other load management requirements in electricity networks have been investigated in a study carried out by the University of Bonn [3]. Appliances considered in the analysis are washing machines, dishwashers, tumble dryers, air conditioners, ovens and stoves, refrigerators, freezers, electric water heaters, heating circulation pumps and storage units of electric heating systems. Scenarios have been developed to show the potential for “smarter” modes of operation. Four levels of synergy scenarios have been drawn up, dependent on the complexity of the technical adjustments required.
The simplest level gives the consumer full control: after receiving a tariff signal or information about the availability of renewable energy during that day it is up to him to act. The use of a timer function would make this solution more convenient for the consumer.
The second level appliances have some kind of internal energy management device which controls the operation based on incoming signals. After choosing the operation mode (program, water temperature etc.) of his device the consumer sets it in a remote mode e.g. by pressing a “smart” button in which the device then reacts depending on the signal received. The consumer certainly has the opportunity to switch off the remote mode at any time and operate the machine in a conventional way.
The third level is characterised by the presence of external control over the appliance, thanks to bidirectional flows of information. The device still has to be programmed and set in a remote mode by the consumer. After that the device communicates with an external energy manager by exchanging information about the programming on the one hand and the availability of renewable energy or other requirements for demand side load management on the other. The operation is then being triggered from outside.
92

In level 4, additional options for storing energy e.g. by lowering the temperature in a freezer or using other technologies to intensify the use of renewable energy and CHP and therefore to increase the share of electricity or heat from renewable sources consumed by the appliance are taken into account.
In level 4 the possibilities of the device for a more intense use of renewable energy and CHP in connection to other technologies and storage capacities are investigated.
The potentials for a “smarter” operation of the appliances are quite different in the various scenarios. However, apart from ovens and stoves whose synergy potential is very low, most of the other devices show good possibilities to contribute to an increased use of renewable energy by smart operations.
Load curves in Europe
The effects of a simultaneous operation of all appliances during one day in an average European household have also been investigated in the study [3]. For this analysis, the average energy consumption and the synergy potential of each type of appliance was identified. Furthermore a differentiation between five European regions was investigated for the years 2010 and 2025. The following regions were defined as representative for the different parts of Europe and were therefore included in the analysis:
• Region A: South Europe
• Region B: Scandinavia
• Region C: New Member States
• Region D: Germany/Austria
• Region E: United Kingdom
The flexibility of smart appliances operation is driven by the penetration, technologies and usage patterns of appliances and the acceptance of consumers to use smart appliance operations. Assumptions were made about the consumer acceptance and have been verified by a comprehensive consumer research in various countries. The load curve of a synthetic European household has been estimated, which is based on an average usage of the ten most common appliances. The load curve reflects the energy consumption of one average European household over 24 hours for which the penetration rates for all appliances were assumed to be 100%, meaning each appliance is present and used in this home. In order to fit to a common scale, electric heating has been omitted here. The figure depicts the average usage pattern of appliances across Europe without distinction between summer and winter. It shows the great variance in the power demand of appliances over a typical day, with a clear peak demand of over 800 W during the evening, followed by a drastic reduction down to 200 W during night hours. Additional power demand in the households is required by other goods and services, like lights, entertainment and infotainment activities which also show a high level of variance during a day, but not being considered in this investigation.
93
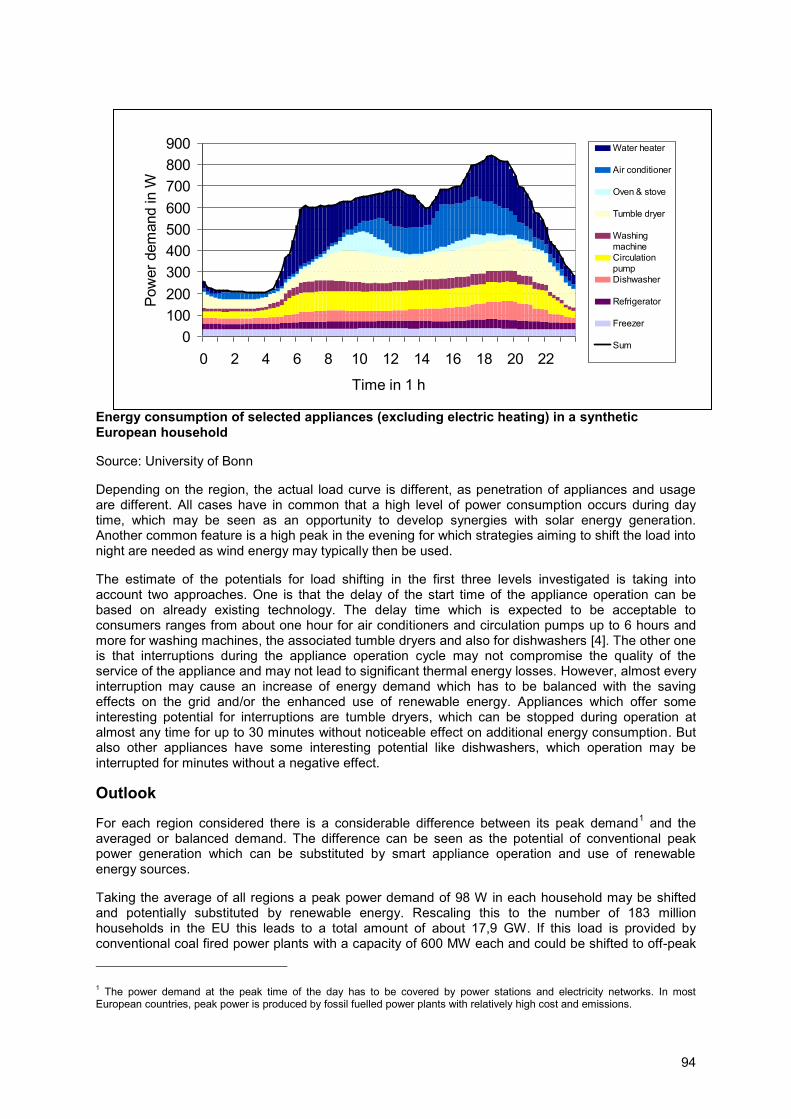
Energy consumption of selected appliances (excluding electric heating) in a synthetic European household
Source: University of Bonn
Depending on the region, the actual load curve is different, as penetration of appliances and usage are different. All cases have in common that a high level of power consumption occurs during day time, which may be seen as an opportunity to develop synergies with solar energy generation. Another common feature is a high peak in the evening for which strategies aiming to shift the load into night are needed as wind energy may typically then be used.
The estimate of the potentials for load shifting in the first three levels investigated is taking into account two approaches. One is that the delay of the start time of the appliance operation can be based on already existing technology. The delay time which is expected to be acceptable to consumers ranges from about one hour for air conditioners and circulation pumps up to 6 hours and more for washing machines, the associated tumble dryers and also for dishwashers [4]. The other one is that interruptions during the appliance operation cycle may not compromise the quality of the service of the appliance and may not lead to significant thermal energy losses. However, almost every interruption may cause an increase of energy demand which has to be balanced with the saving effects on the grid and/or the enhanced use of renewable energy. Appliances which offer some interesting potential for interruptions are tumble dryers, which can be stopped during operation at almost any time for up to 30 minutes without noticeable effect on additional energy consumption. But also other appliances have some interesting potential like dishwashers, which operation may be interrupted for minutes without a negative effect.
Outlook
For each region considered there is a considerable difference between its peak demand1 and the averaged or balanced demand. The difference can be seen as the potential of conventional peak power generation which can be substituted by smart appliance operation and use of renewable energy sources.
Taking the average of all regions a peak power demand of 98 W in each household may be shifted and potentially substituted by renewable energy. Rescaling this to the number of 183 million households in the EU this leads to a total amount of about 17,9 GW. If this load is provided by conventional coal fired power plants with a capacity of 600 MW each and could be shifted to off-peak 1 The power demand at the peak time of the day has to be covered by power stations and electricity networks. In most European countries, peak power is produced by fossil fuelled power plants with relatively high cost and emissions.
0100200300400500600700800900
0 2 4 6 8 10 12 14 16 18 20 22
Time in 1 h
Pow
er d
eman
d in
WWater heater
Air conditioner
Oven & stove
Tumble dryer
WashingmachineCirculationpumpDishwasher
Refrigerator
Freezer
Sum
94

periods, up to 30 of these plants would no longer be needed and their production might be substituted by renewable energy.
Using the same assumptions for region D (Germany/Austria) this would lead to a peak load reduction of about 3,5 GW. Taking the 37,7 million households of Germany the peak capacity of up to 6 coal fired power plants might be substituted.
Domestic appliances offer a wide range of opportunities to contribute to load management in energy systems with an increasing part of fluctuating energy generation when being adjusted with latest technologies and smart control options. The market penetration of such smart appliances will mainly depend on the acceptance of the consumers and therefore mainly on the costs and benefits of smart devices in comparison to conventional ones.
For more detailed information about the analysis and its results please refer to the book “Synergy Potential of Smart Domestic Appliances in Renewable Energy Systems” published at Shaker Verlag, Germany [5].
95

References
[1] Bertoldi, P.; Atanasiu, B. 2007: Electricity Consumption and Efficiency Trends in the Enlarged European Union, Status Report 2006, EUR 22753 EN.
[2] Further information about the Smart-A project and detailed reports are available at http://www.smart-a.org.
[3] Stamminger, R. et al. Synergy potential of smart domestic appliances. D2.3 of the WP2 report of the Smart-A project (University of Bonn, November 2008). Can be downloaded at: http://www.smart-a.org.
[4] Mert W., Suschek-Berger J. and Tritthart W., Consumer acceptance of smart appliances. D5.5 of the WP5 report of the Smart-A project. 2008. Can be downloaded at: http://www.smart-a.org.
[5] Stamminger, R. (ed.) Synergy potential of smart domestic appliances in renewable energy systems. (Bonn, Germany, 2009). ISBN 978-3-8322-8082-6. Can be ordered from http://www.shaker.de/online-Gesamtkatalog/booklist.asp?ID=1375027&CC=661&Reihe=423
96
Simulation of high-resolution domestic electricity demand based on a building occupancy model and its applicability to the study of demand side management
Ian Richardson, Graeme Hodgson, Murray Thomson
CREST (Centre for Renewable Energy Systems Technology), Loughborough University, UK
David Infield
Department of Electronic and Electrical Engineering, University of Strathclyde, UK
Alice Delahunty
E.ON Engineering Limited, UK
Abstract
Alongside the well understood need to reduce overall electricity consumption, there is an increasing need to provide demand response: the ability to time shift electrical demand in accordance with available low-carbon generation including wind, marine and solar power. Many domestic loads can readily be employed to provide time shifting demand response in the range of minutes to hours and this concept is already the subject of numerous demonstrations worldwide. The modelling presented in this paper provides a basis for the quantification of the availability and impact of demand response in the domestic sector. In particular, this paper describes the development of a domestic electricity demand model capable of providing data with a one-minute time resolution and with which the operation of demand response may be assessed. The electricity demand model is constructed at the level of individual household appliances and their usage is based on surveyed time-use data. This provides for appropriate temporal diversity of energy use between simulated dwellings. Occupancy data allows the correlated usage of appliances to be represented within an actively occupied dwelling, as well as representing the sharing of appliances, such as lighting, in dwellings with multiple occupants. This paper summarises previously developed occupancy and lighting models and explains how the lighting model can be extended to create an integrated appliance model.
Introduction
Demand response is considered to provide benefits to both electricity market operation and technical system efficiency [1],[2]. It is of particular interest in electricity generation systems that comprise time variable generation sources such as renewable technologies because demand can be scheduled to coincide with generation availability.
The time of operation of many domestic loads may be shifted without undue inconvenience to the dwelling’s occupants. An example is in the cold appliances category, where thermal storage provides scope to advance or delay a cooling cycle of a fridge [3]. A further example, in the wet appliance category, is a washing machine, where the delay of operation by several hours may have minimal impact on the household. When aggregated to include many thousands of dwellings (and hence appliance units), there is clearly significant potential for demand rescheduling in response to market or technical balancing considerations.
This work is concerned with the development of a model of domestic demand at sufficient time resolution (initially one-minute) to support studies of demand response. Because effective demand response is dependent on having sufficient quantities of appliances to time shift, it is essential that any such modelling takes properly into account demand diversity between dwellings, as well as, appropriate correlation of appliance use within a dwelling that is actively occupied. It is acknowledged
97
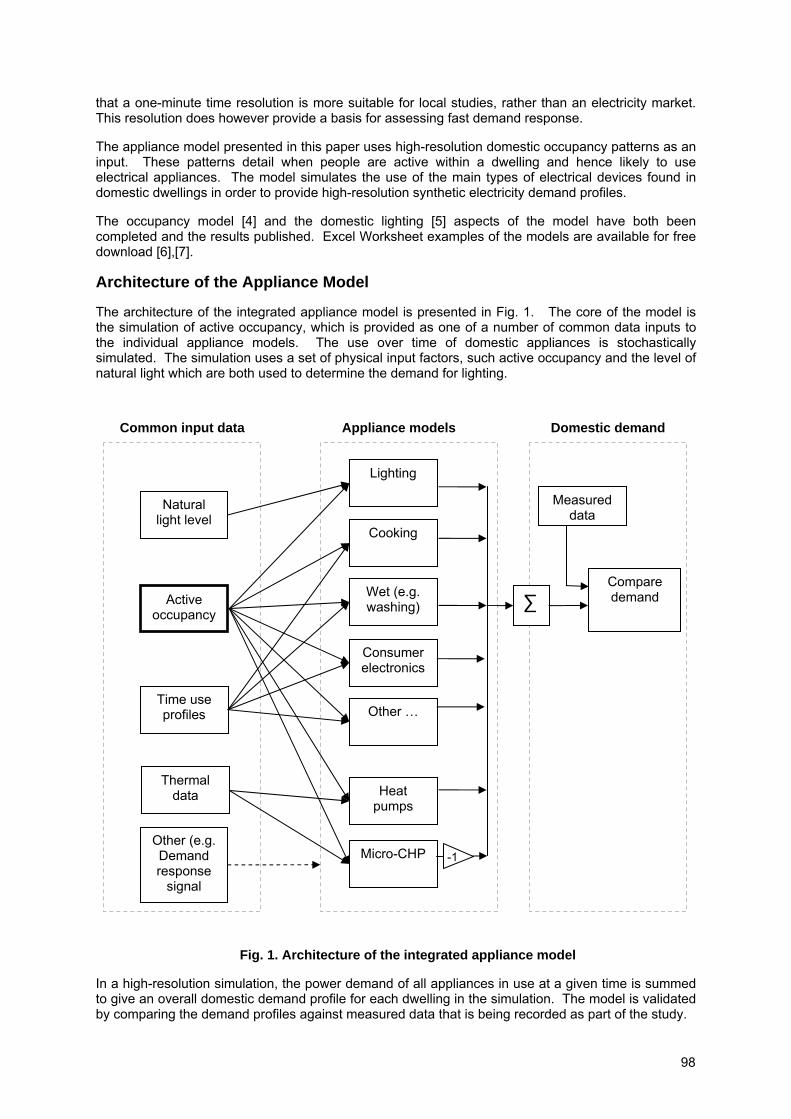
that a one-minute time resolution is more suitable for local studies, rather than an electricity market. This resolution does however provide a basis for assessing fast demand response.
The appliance model presented in this paper uses high-resolution domestic occupancy patterns as an input. These patterns detail when people are active within a dwelling and hence likely to use electrical appliances. The model simulates the use of the main types of electrical devices found in domestic dwellings in order to provide high-resolution synthetic electricity demand profiles.
The occupancy model [4] and the domestic lighting [5] aspects of the model have both been completed and the results published. Excel Worksheet examples of the models are available for free download [6],[7].
Architecture of the Appliance Model
The architecture of the integrated appliance model is presented in Fig. 1. The core of the model is the simulation of active occupancy, which is provided as one of a number of common data inputs to the individual appliance models. The use over time of domestic appliances is stochastically simulated. The simulation uses a set of physical input factors, such active occupancy and the level of natural light which are both used to determine the demand for lighting.
Fig. 1. Architecture of the integrated appliance model
In a high-resolution simulation, the power demand of all appliances in use at a given time is summed to give an overall domestic demand profile for each dwelling in the simulation. The model is validated by comparing the demand profiles against measured data that is being recorded as part of the study.
Active occupancy
Natural light level
Lighting
Cooking
Wet (e.g. washing)
Consumer electronics
Time use profiles
∑ Compare demand
Measured data
Other …
Thermal data Heat
pumps
Micro-CHP
Common input data Appliance models Domestic demand
Other (e.g. Demand response
signal
-1
98

In the context of demand response, the model is capable of taking into account other data, such as pricing or electricity generation supply margin, in the form of a demand response signal as can be seen in Fig. 1. Furthermore, the fast demand response capability of heat pump or micro-CHP units will depend upon thermal constraints. For example, the internal temperature of the dwelling and the heating thermostat set-point will constrain the delay or advance of heating cycles. A simple building heat demand model will therefore be integrated to provide thermal data to the appliance model.
The core aspects of domestic occupancy pattern simulation and the approach to the modelling of individual appliance categories are presented in the following sections.
The Modelling of Domestic Occupancy
Why use occupancy as a basis for energy modelling?
The nature of appliance usage within domestic dwellings varies significantly throughout the day as a result of the behaviour of the occupants. The number of residents who live in a dwelling, together with the pattern of their active occupancy are key determinants of the energy demand profile of a dwelling [4],[8]. Active occupancy refers to occupants that are within a dwelling and are not asleep.
The modelling of domestic occupancy as a basis for energy demand simulations has three benefits:
Firstly, it is possible to take account of the sharing of appliance use. For example, a second occupant arriving home on a winter evening is likely to only incrementally increase, rather than say double, the lighting demand upon their arrival. An occupancy model can address this by providing a numerical sequence of the number of active occupancy over a number of time periods.
Secondly, active occupancy enables multiple different appliance models to use the same input data. For example, an actively occupied house on a winter evening is likely to have both lighting and television appliance loads. This correlation of appliance use is a particular issue for stochastic appliance models, as independently representing appliances will not provide the required realistic diversity in usage.
Thirdly, being able to apply stochastically generated occupancy patterns to a large number of dwellings allows for appropriate diversity in energy demand between dwellings over time.
Model Implementation
The occupancy model uses the data captured in diaries from the United Kingdom 2000 Time Use Survey (TUS) [9] as a basis for a stochastic simulation of occupancy. This data in the survey contains information on the location and activities the occupants were undertaking during the survey at a ten-minute resolution. This data is used to determine when occupants were active and not asleep. The model uses a Markov Chain method to generate statistically comparable data sets using a set of transition probability matrices to represent the likelihood of changes in the number of active occupants within a dwelling over time.
Using the Model
The model is run to generate stochastic active occupancy profiles. Two example occupancy profiles are shown in Fig. 2, both for dwellings with two occupants. The first example is representative of a dwelling lived in by a couple that both work. There is no active occupancy during the night, a short period of activity at breakfast, followed by absence through the day with further activity in the evening. The second example is perhaps more representative of a retired couple. In this case, both occupants are active within a dwelling for the majority of the day with a three hour gap in the morning. Note that the transition from two to zero active occupants occurs simultaneously at 09:00 AM. The state transition approach allows for correlated changes in dwelling occupancy.
99
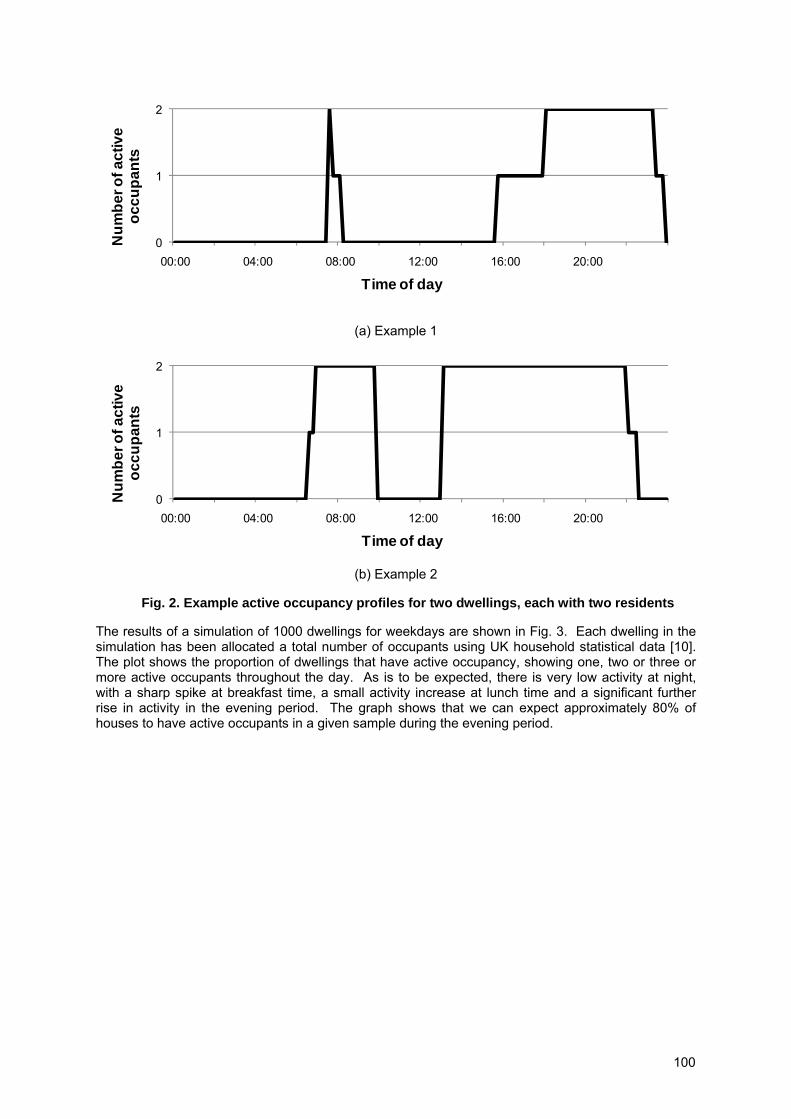
0
1
2
00:00 04:00 08:00 12:00 16:00 20:00
Num
ber o
f act
ive
occu
pant
s
Time of day
(a) Example 1
0
1
2
00:00 04:00 08:00 12:00 16:00 20:00
Num
ber o
f act
ive
occu
pant
s
Time of day
(b) Example 2
Fig. 2. Example active occupancy profiles for two dwellings, each with two residents
The results of a simulation of 1000 dwellings for weekdays are shown in Fig. 3. Each dwelling in the simulation has been allocated a total number of occupants using UK household statistical data [10]. The plot shows the proportion of dwellings that have active occupancy, showing one, two or three or more active occupants throughout the day. As is to be expected, there is very low activity at night, with a sharp spike at breakfast time, a small activity increase at lunch time and a significant further rise in activity in the evening period. The graph shows that we can expect approximately 80% of houses to have active occupants in a given sample during the evening period.
100
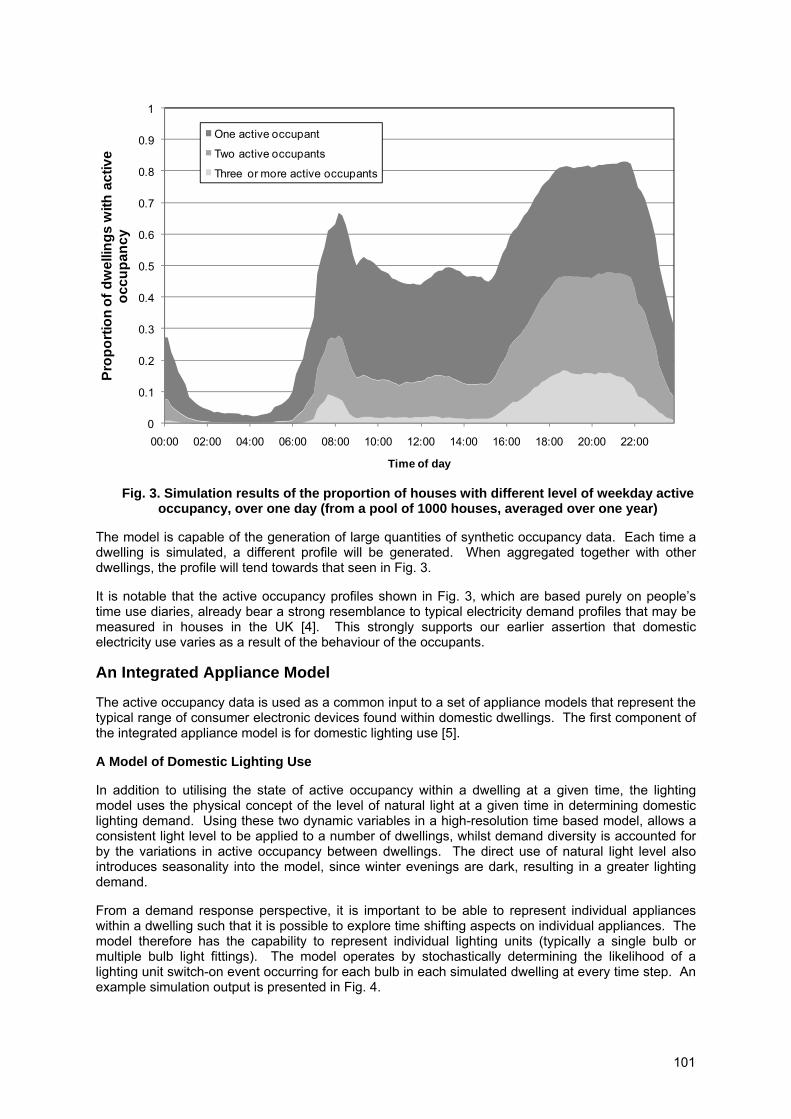
0
0.1
0.2
0.3
0.4
0.5
0.6
0.7
0.8
0.9
1
00:00 02:00 04:00 06:00 08:00 10:00 12:00 14:00 16:00 18:00 20:00 22:00
Prop
ortio
n of
dw
ellin
gs w
ith a
ctiv
e oc
cupa
ncy
Time of day
One active occupant
Two active occupants
Three or more active occupants
Fig. 3. Simulation results of the proportion of houses with different level of weekday active occupancy, over one day (from a pool of 1000 houses, averaged over one year)
The model is capable of the generation of large quantities of synthetic occupancy data. Each time a dwelling is simulated, a different profile will be generated. When aggregated together with other dwellings, the profile will tend towards that seen in Fig. 3.
It is notable that the active occupancy profiles shown in Fig. 3, which are based purely on people’s time use diaries, already bear a strong resemblance to typical electricity demand profiles that may be measured in houses in the UK [4]. This strongly supports our earlier assertion that domestic electricity use varies as a result of the behaviour of the occupants.
An Integrated Appliance Model
The active occupancy data is used as a common input to a set of appliance models that represent the typical range of consumer electronic devices found within domestic dwellings. The first component of the integrated appliance model is for domestic lighting use [5].
A Model of Domestic Lighting Use
In addition to utilising the state of active occupancy within a dwelling at a given time, the lighting model uses the physical concept of the level of natural light at a given time in determining domestic lighting demand. Using these two dynamic variables in a high-resolution time based model, allows a consistent light level to be applied to a number of dwellings, whilst demand diversity is accounted for by the variations in active occupancy between dwellings. The direct use of natural light level also introduces seasonality into the model, since winter evenings are dark, resulting in a greater lighting demand.
From a demand response perspective, it is important to be able to represent individual appliances within a dwelling such that it is possible to explore time shifting aspects on individual appliances. The model therefore has the capability to represent individual lighting units (typically a single bulb or multiple bulb light fittings). The model operates by stochastically determining the likelihood of a lighting unit switch-on event occurring for each bulb in each simulated dwelling at every time step. An example simulation output is presented in Fig. 4.
101
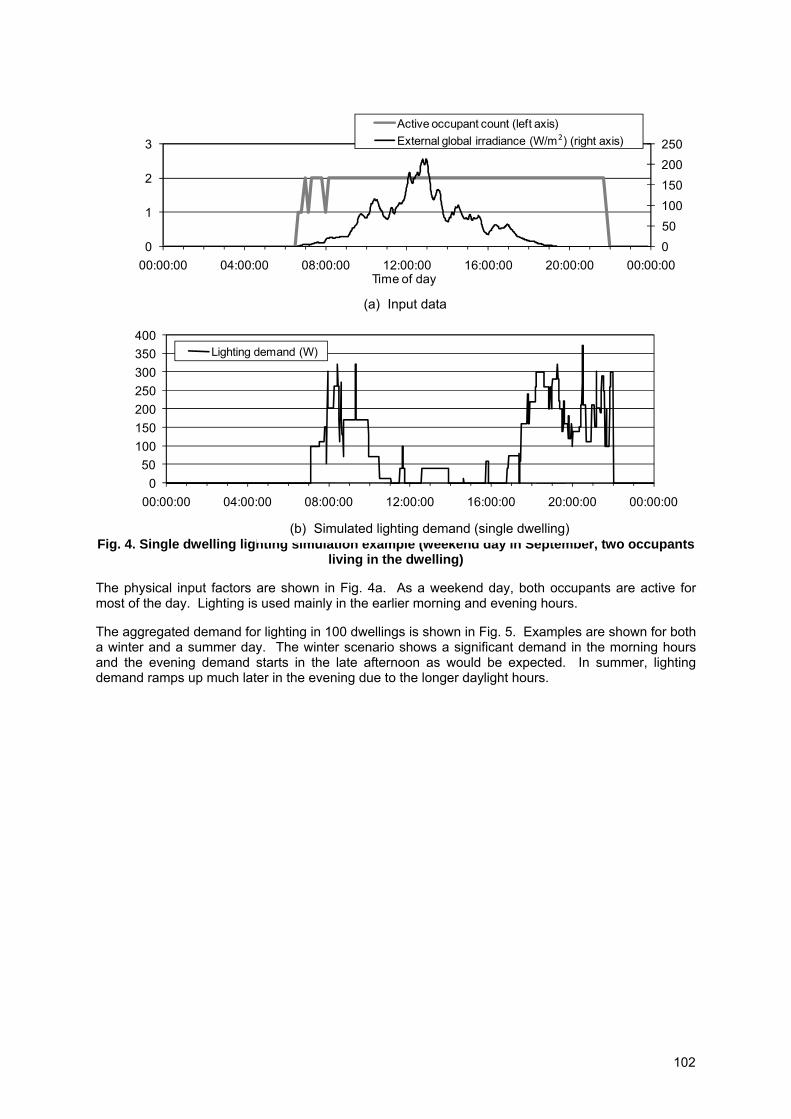
050100150200250
0
1
2
3
00:00:00 04:00:00 08:00:00 12:00:00 16:00:00 20:00:00 00:00:00Time of day
Active occupant count (left axis)External global irradiance (W/m ) (right axis)2
050
100150200250300350400
00:00:00 04:00:00 08:00:00 12:00:00 16:00:00 20:00:00 00:00:00
Lighting demand (W)
Fig. 4. Single dwelling lighting simulation example (weekend day in September, two occupants living in the dwelling)
The physical input factors are shown in Fig. 4a. As a weekend day, both occupants are active for most of the day. Lighting is used mainly in the earlier morning and evening hours.
The aggregated demand for lighting in 100 dwellings is shown in Fig. 5. Examples are shown for both a winter and a summer day. The winter scenario shows a significant demand in the morning hours and the evening demand starts in the late afternoon as would be expected. In summer, lighting demand ramps up much later in the evening due to the longer daylight hours.
(b) Simulated lighting demand (single dwelling)
(a) Input data
102
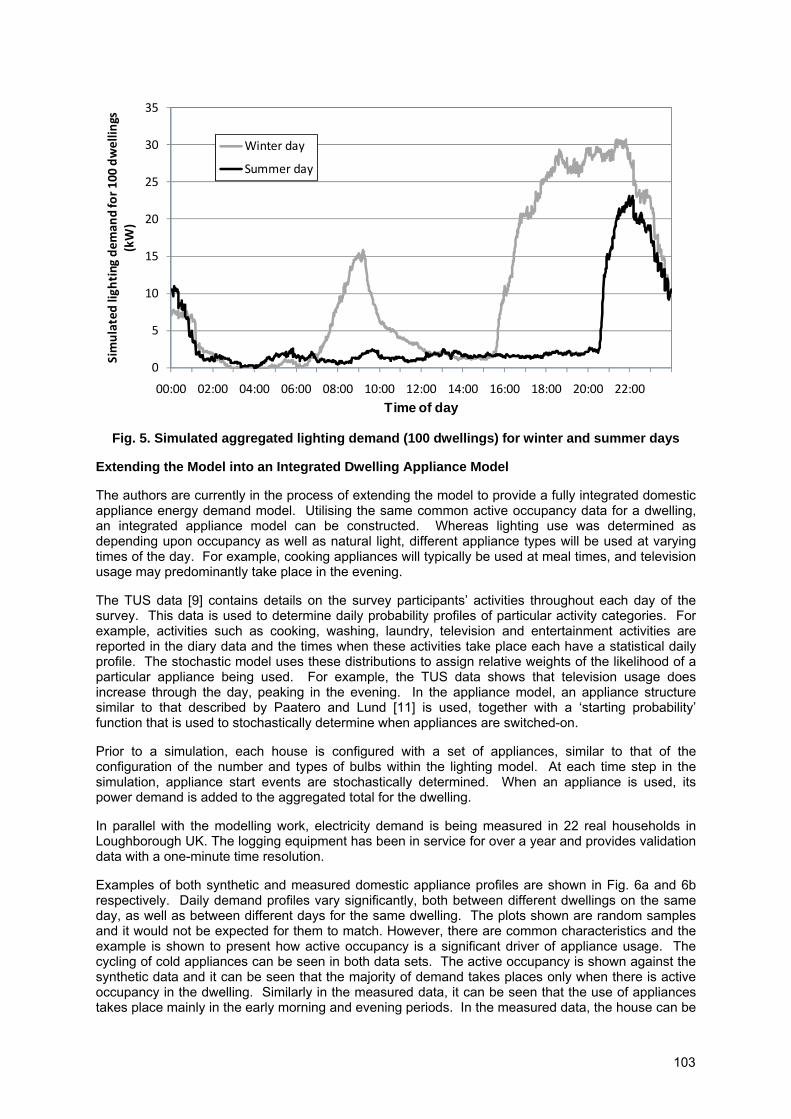
0
5
10
15
20
25
30
35
00:00 02:00 04:00 06:00 08:00 10:00 12:00 14:00 16:00 18:00 20:00 22:00
Simulated
ligh
ting
dem
and for 1
00 dwellin
gs
(kW)
Time of day
Winter day
Summer day
Fig. 5. Simulated aggregated lighting demand (100 dwellings) for winter and summer days
Extending the Model into an Integrated Dwelling Appliance Model
The authors are currently in the process of extending the model to provide a fully integrated domestic appliance energy demand model. Utilising the same common active occupancy data for a dwelling, an integrated appliance model can be constructed. Whereas lighting use was determined as depending upon occupancy as well as natural light, different appliance types will be used at varying times of the day. For example, cooking appliances will typically be used at meal times, and television usage may predominantly take place in the evening.
The TUS data [9] contains details on the survey participants’ activities throughout each day of the survey. This data is used to determine daily probability profiles of particular activity categories. For example, activities such as cooking, washing, laundry, television and entertainment activities are reported in the diary data and the times when these activities take place each have a statistical daily profile. The stochastic model uses these distributions to assign relative weights of the likelihood of a particular appliance being used. For example, the TUS data shows that television usage does increase through the day, peaking in the evening. In the appliance model, an appliance structure similar to that described by Paatero and Lund [11] is used, together with a ‘starting probability’ function that is used to stochastically determine when appliances are switched-on.
Prior to a simulation, each house is configured with a set of appliances, similar to that of the configuration of the number and types of bulbs within the lighting model. At each time step in the simulation, appliance start events are stochastically determined. When an appliance is used, its power demand is added to the aggregated total for the dwelling.
In parallel with the modelling work, electricity demand is being measured in 22 real households in Loughborough UK. The logging equipment has been in service for over a year and provides validation data with a one-minute time resolution.
Examples of both synthetic and measured domestic appliance profiles are shown in Fig. 6a and 6b respectively. Daily demand profiles vary significantly, both between different dwellings on the same day, as well as between different days for the same dwelling. The plots shown are random samples and it would not be expected for them to match. However, there are common characteristics and the example is shown to present how active occupancy is a significant driver of appliance usage. The cycling of cold appliances can be seen in both data sets. The active occupancy is shown against the synthetic data and it can be seen that the majority of demand takes places only when there is active occupancy in the dwelling. Similarly in the measured data, it can be seen that the use of appliances takes place mainly in the early morning and evening periods. In the measured data, the house can be
103
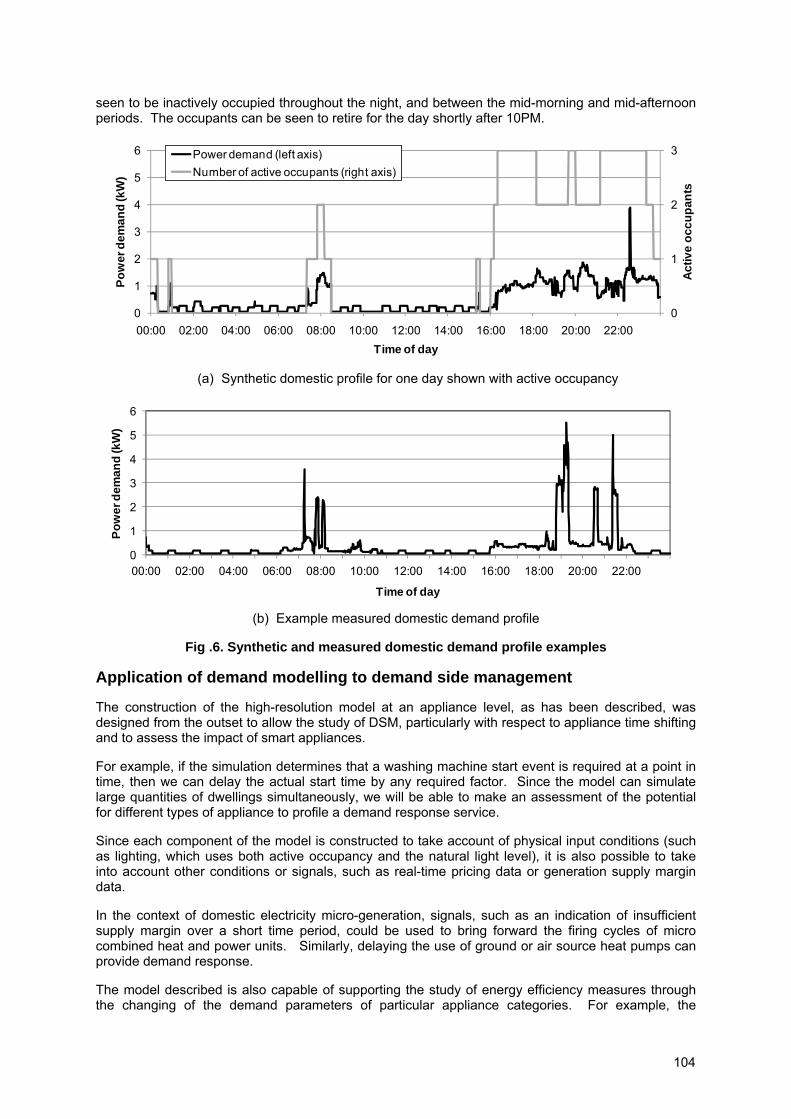
seen to be inactively occupied throughout the night, and between the mid-morning and mid-afternoon periods. The occupants can be seen to retire for the day shortly after 10PM.
0
1
2
3
0
1
2
3
4
5
6
00:00 02:00 04:00 06:00 08:00 10:00 12:00 14:00 16:00 18:00 20:00 22:00
Activ
e oc
cupa
nts
Pow
er d
eman
d (k
W)
Time of day
Power demand (left axis)Number of active occupants (right axis)
(a) Synthetic domestic profile for one day shown with active occupancy
0
1
2
3
4
5
6
00:00 02:00 04:00 06:00 08:00 10:00 12:00 14:00 16:00 18:00 20:00 22:00
Pow
er d
eman
d (k
W)
Time of day
(b) Example measured domestic demand profile
Fig .6. Synthetic and measured domestic demand profile examples
Application of demand modelling to demand side management
The construction of the high-resolution model at an appliance level, as has been described, was designed from the outset to allow the study of DSM, particularly with respect to appliance time shifting and to assess the impact of smart appliances.
For example, if the simulation determines that a washing machine start event is required at a point in time, then we can delay the actual start time by any required factor. Since the model can simulate large quantities of dwellings simultaneously, we will be able to make an assessment of the potential for different types of appliance to profile a demand response service.
Since each component of the model is constructed to take account of physical input conditions (such as lighting, which uses both active occupancy and the natural light level), it is also possible to take into account other conditions or signals, such as real-time pricing data or generation supply margin data.
In the context of domestic electricity micro-generation, signals, such as an indication of insufficient supply margin over a short time period, could be used to bring forward the firing cycles of micro combined heat and power units. Similarly, delaying the use of ground or air source heat pumps can provide demand response.
The model described is also capable of supporting the study of energy efficiency measures through the changing of the demand parameters of particular appliance categories. For example, the
104
increased use of compact fluorescent light can be explored by changing the statistical distribution of lighting technologies within a particular group of dwellings.
Conclusions
This paper has outlined work to develop a high-resolution domestic electricity demand model. The model is based upon dwelling occupancy patterns, which are a key contributor to the patterns of energy use in the home. This approach provides significant advantages in terms of providing the appropriate levels of diversity in energy use between simulated dwellings and also allows appliance usage to be shared within the home, with appropriate usage correlation in time.
It is important that the model represents individual appliances, in order that the demand response potential of different appliance groups can be properly simulated. It would not be possible to perform such analysis solely with an aggregated demand profile.
The active occupancy and lighting elements of the model have already been published and example implementations of the models are freely available for use and integration in other energy demand studies. The detail of the full integrated appliance model is intended as the subject of a forthcoming publication.
References
[1] Anjali Sheffrin, Henry Yoshimura, David LaPlante, Bernard Neenan, Harnessing the Power of Demand, The Electricity Journal, Volume 21, Issue 2, March 2008, Pages 39-50.
[2] M.H. Albadi, E.F. El-Saadany, A summary of demand response in electricity markets, Electric Power Systems Research, Volume 78, Issue 11, November 2008, Pages 1989-1996.
[3] Michael Stadler, Wolfram Krause, Michael Sonnenschein, Ute Vogel, Modelling and evaluation of control schemes for enhancing load shift of electricity demand for cooling devices, Environmental Modelling & Software, Volume 24, Issue 2, February 2009, Pages 285-295.
[4] Ian Richardson, Murray Thomson, David Infield, A high-resolution domestic building occupancy model for energy demand simulations, Energy and Buildings, Volume 40, Issue 8, 2008, Pages 1560-1566. doi:10.1016/j.enbuild.2008.02.006
[5] Ian Richardson, Murray Thomson, David Infield, Alice Delahunty, Domestic lighting: A high-resolution energy demand model, Energy and Buildings, In Press, Corrected Proof, Available online 6 March 2009. doi:10.1016/j.enbuild.2009.02.010
[6] Ian Richardson, Murray Thomson, Domestic Active Occupancy Model—Simulation Example, Loughborough University Institutional Repository (2008) http://hdl.handle.net/2134/3112.
[7] Ian Richardson, Murray Thomson, Domestic Lighting Demand Model—Simulation Example, Loughborough University Institutional Repository (2008) http://hdl.handle.net/2134/4065.
[8] S. Abu-Sharkh, R. Li, T. Markvart, N. Ross, P. Wilson, R. Yao, K. Steemers, J. Kohler, R. Arnold, Microgrids: distributed on-site generation, Technical Report 22, Tyndall Centre for Climate Change Research, 2005.
[9] Ipsos-RSL and Office for National Statistics, United Kingdom Time Use Survey, 2000 (Computer File), third ed., UK Data Archive (distributor), Colchester, Essex, September 2003, SN: 4504.
[10] Office for National Statistics, Social Trends No. 36, 2006 Edition, HMSO, Crown Copyright 2006.
[11] J. V. Paatero, P.D. Lund, A model for generating household electricity load profiles, International Journal of Energy Research 30 (5) (2005) 273-290.
105

Microgrid with Agents: the DSM Mechanism of a Promising Model for Future Electricity Infrastructure Rui Duan, Geert Deconinck
Dept. Electrical Engineering (ESAT), Div. ELECTA, Katholieke Universiteit Leuven
Abstract
Although the financial crisis shrinks oil price, human as an entire race still face the future of a hot, flat and crowded world [1]. Therefore, a critical transformation from our traditional energy consumption manner of fossil fuel combustion must be made. After years of endeavor in research and experiment, a number of Renewable Energy Sources (RES) has already become technically available as alternatives. A pivotal task still needed to be carried out is adapting the existing electricity infrastructure, which is still a very efficient energy delivery facility, to incorporate emerging RES openly and equally. For the purpose of wide adoption of RES, which results in the evolution to next generation infrastructure for electricity, impellers should contain economic and political measures, rather than only technology. In this paper, we introduced the architecture of future electricity infrastructure based on microgrids for high RES penetration. Moreover, we brief the mechanisms of a prevailing electricity market, for economical incentives of RES accommodation. Most important of all, the multi-agent model of the proposed system and its coordination mechanism within the market environment is elaborated.
I. Introduction
In the near future, a substantial amount of electricity will be fed into the power grid at low voltage level. The lower parts of power grid are expected to evolve from a hierarchical top-down structure into a network of microgrids [2], where vast number of components influence each other. A combination of technologies, such as RES, demand response, real-time pricing and intelligent control, opens the possibility of optimization regarding economics, dependability and sustainability. In this case, the traditional paradigm of centralized control used in current electricity infrastructure will reach the limits of scalability and complexity.
On the other hand, the electricity supply will no longer be in the hands of a small group of big market players, but be spread out over a vast number of small ones. This will give rise to new business models in electricity production and consumption. In regions with highly deregulated energy system, market mechanisms should be used for planning of large-scale production via day-ahead power exchange trading, and for real-time balancing via auctions held by the Transport System Operators (TSO). The coordination mechanisms for the low-end of the grid hierarchy must be based on economic principles as well.
106
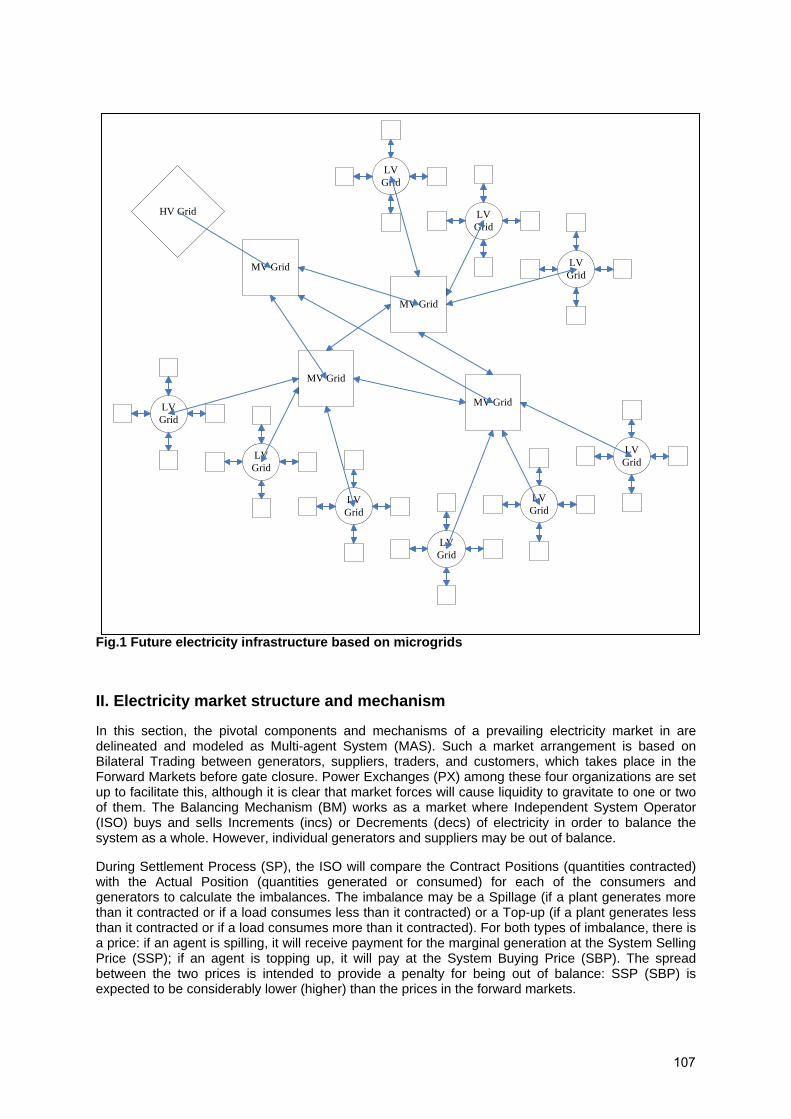
Fig.1 Future electricity infrastructure based on microgrids
II. Electricity market structure and mechanism
In this section, the pivotal components and mechanisms of a prevailing electricity market in are delineated and modeled as Multi-agent System (MAS). Such a market arrangement is based on Bilateral Trading between generators, suppliers, traders, and customers, which takes place in the Forward Markets before gate closure. Power Exchanges (PX) among these four organizations are set up to facilitate this, although it is clear that market forces will cause liquidity to gravitate to one or two of them. The Balancing Mechanism (BM) works as a market where Independent System Operator (ISO) buys and sells Increments (incs) or Decrements (decs) of electricity in order to balance the system as a whole. However, individual generators and suppliers may be out of balance.
During Settlement Process (SP), the ISO will compare the Contract Positions (quantities contracted) with the Actual Position (quantities generated or consumed) for each of the consumers and generators to calculate the imbalances. The imbalance may be a Spillage (if a plant generates more than it contracted or if a load consumes less than it contracted) or a Top-up (if a plant generates less than it contracted or if a load consumes more than it contracted). For both types of imbalance, there is a price: if an agent is spilling, it will receive payment for the marginal generation at the System Selling Price (SSP); if an agent is topping up, it will pay at the System Buying Price (SBP). The spread between the two prices is intended to provide a penalty for being out of balance: SSP (SBP) is expected to be considerably lower (higher) than the prices in the forward markets.
LV Grid
LV Grid
LV Grid
MV GridLV Grid
LV Grid
LV Grid
MV Grid
LV Grid
LV Grid
LV Grid
MV Grid
MV Grid
HV Grid
107
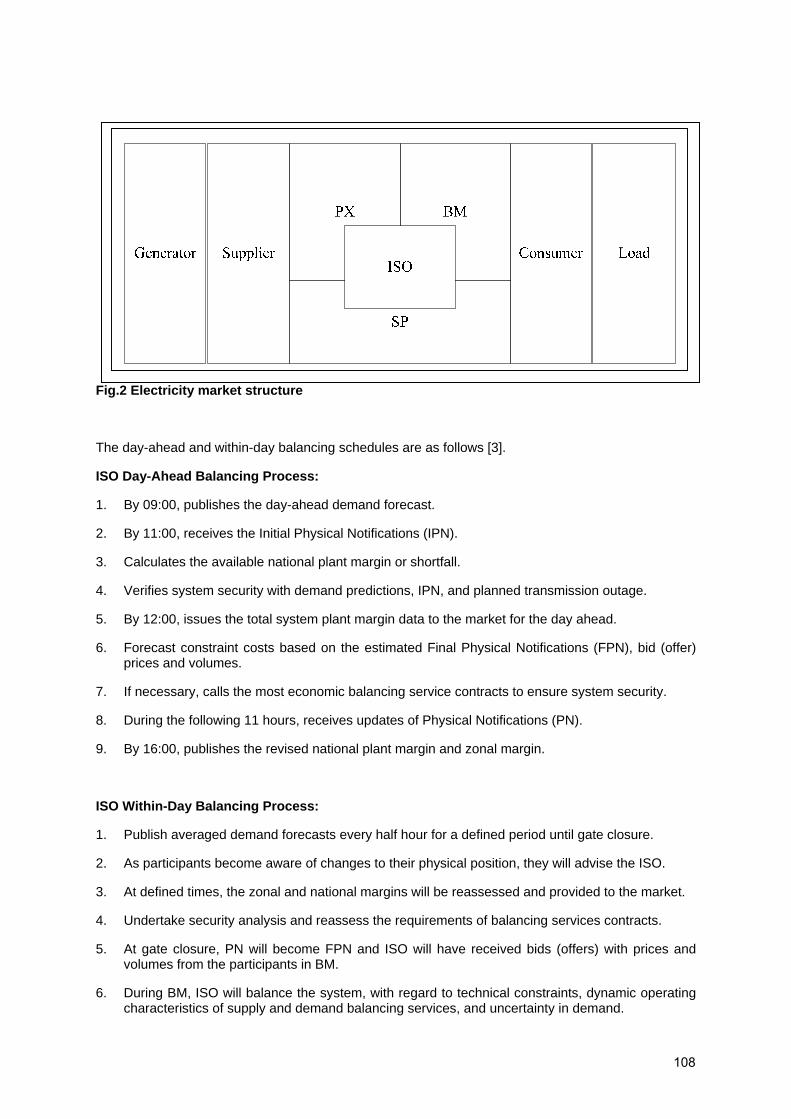
Fig.2 Electricity market structure
The day-ahead and within-day balancing schedules are as follows [3].
ISO Day-Ahead Balancing Process:
1. By 09:00, publishes the day-ahead demand forecast.
2. By 11:00, receives the Initial Physical Notifications (IPN).
3. Calculates the available national plant margin or shortfall.
4. Verifies system security with demand predictions, IPN, and planned transmission outage.
5. By 12:00, issues the total system plant margin data to the market for the day ahead.
6. Forecast constraint costs based on the estimated Final Physical Notifications (FPN), bid (offer) prices and volumes.
7. If necessary, calls the most economic balancing service contracts to ensure system security.
8. During the following 11 hours, receives updates of Physical Notifications (PN).
9. By 16:00, publishes the revised national plant margin and zonal margin.
ISO Within-Day Balancing Process:
1. Publish averaged demand forecasts every half hour for a defined period until gate closure.
2. As participants become aware of changes to their physical position, they will advise the ISO.
3. At defined times, the zonal and national margins will be reassessed and provided to the market.
4. Undertake security analysis and reassess the requirements of balancing services contracts.
5. At gate closure, PN will become FPN and ISO will have received bids (offers) with prices and volumes from the participants in BM.
6. During BM, ISO will balance the system, with regard to technical constraints, dynamic operating characteristics of supply and demand balancing services, and uncertainty in demand.
108
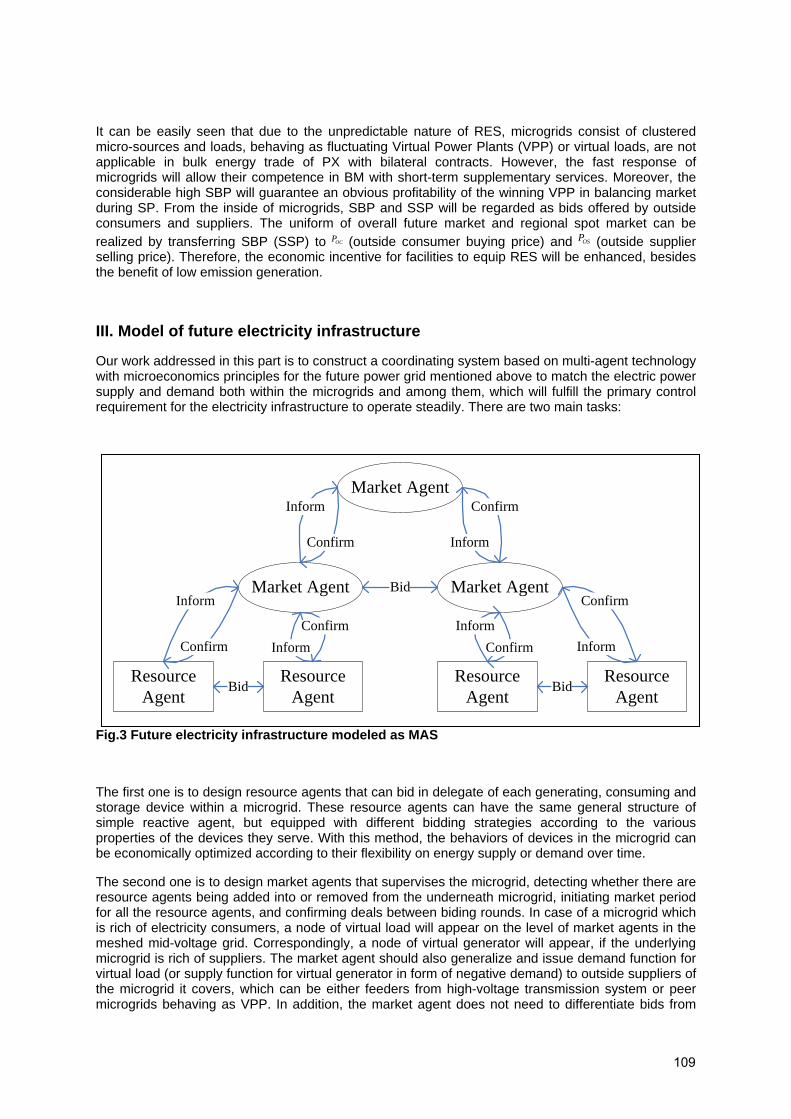
It can be easily seen that due to the unpredictable nature of RES, microgrids consist of clustered micro-sources and loads, behaving as fluctuating Virtual Power Plants (VPP) or virtual loads, are not applicable in bulk energy trade of PX with bilateral contracts. However, the fast response of microgrids will allow their competence in BM with short-term supplementary services. Moreover, the considerable high SBP will guarantee an obvious profitability of the winning VPP in balancing market during SP. From the inside of microgrids, SBP and SSP will be regarded as bids offered by outside consumers and suppliers. The uniform of overall future market and regional spot market can be realized by transferring SBP (SSP) to OCP (outside consumer buying price) and OSP (outside supplier selling price). Therefore, the economic incentive for facilities to equip RES will be enhanced, besides the benefit of low emission generation.
III. Model of future electricity infrastructure
Our work addressed in this part is to construct a coordinating system based on multi-agent technology with microeconomics principles for the future power grid mentioned above to match the electric power supply and demand both within the microgrids and among them, which will fulfill the primary control requirement for the electricity infrastructure to operate steadily. There are two main tasks:
Fig.3 Future electricity infrastructure modeled as MAS
The first one is to design resource agents that can bid in delegate of each generating, consuming and storage device within a microgrid. These resource agents can have the same general structure of simple reactive agent, but equipped with different bidding strategies according to the various properties of the devices they serve. With this method, the behaviors of devices in the microgrid can be economically optimized according to their flexibility on energy supply or demand over time.
The second one is to design market agents that supervises the microgrid, detecting whether there are resource agents being added into or removed from the underneath microgrid, initiating market period for all the resource agents, and confirming deals between biding rounds. In case of a microgrid which is rich of electricity consumers, a node of virtual load will appear on the level of market agents in the meshed mid-voltage grid. Correspondingly, a node of virtual generator will appear, if the underlying microgrid is rich of suppliers. The market agent should also generalize and issue demand function for virtual load (or supply function for virtual generator in form of negative demand) to outside suppliers of the microgrid it covers, which can be either feeders from high-voltage transmission system or peer microgrids behaving as VPP. In addition, the market agent does not need to differentiate bids from
ResourceAgent
ResourceAgent
Market Agent
Bid
Confirm
Inform
ConfirmInform
ResourceAgent
ResourceAgent
Market Agent
Bid
ConfirmInform
Confirm
Inform
Market Agent
Bid
Confirm
Inform Confirm
Inform
109

underlying market agents or resource agents, which will allow more flexibility for the MAS to be deployed on real-life complex grid architectures.
Fig.4 Simplified circuit model of a microgrid
In such a hierarchically distributed environment, for each resource (load or generator), agents should be introduced, which are responsible for managing their functions respectively. On one hand, Generator Agent (GA) controls the output of its associated DER to ensure that the demand of Load Agents (LA) is satisfied. On the other hand, LA determines the maximum unit price it is willing to pay for a quantity of power required during a specific period of time, based on internal prediction algorithms that incorporate real-time and historical data. At the same time, the GA interacts with its affiliated DER to determine unit production cost, preferred markup, and the quantity of power available for supply. Production costs are calculated based on operation, fuel, and maintenance overheads. During some certain time period, GA and LA coordinate with each other to achieve their objectives. Primarily, both LA and GA wish to maximize their utility. LA wants to minimize their cost by purchasing energy below their unit price, whereas GA wants to maximize their profits by selling energy above the unit cost and maximizing markup. For the problem of energy allocation, auction-based mechanism has been shown to work well, which implement bilateral contracts between GA and LA.
Let’s consider a simplified model of microgrid, which is composed of two distributed generators 1G , 2G and two loads 1L , 2L (as shown in Figure. 5). Here we do not take storage devices in to account, because they behave either as load or as generator at any certain moment. Each of the above actors participating in the market competition of electric energy within the microgrid has its own capacity Q (either demand quantity or supply quantity) and initial price P (either price to buy or price to sell).
110

Fig.5 Market model of a microgrid
As such a simple model, the environment within a microgrid can be partially accessible, which means load agents can acquire all the information from generator agents, e.g. 1GP , 2GP , OSP (price of outside
supplier) and 1GQ , 2GQ , OSQ (quantity of outside supplier), while generator agents can acquire all the
information from load agents e.g. 1LP , 2LP , OCP (price of outside consumer) and 1LQ , 2LQ , OCQ (quantity of outside consumer); same kind of device agents (either loads or generators) should be unperceivable to each other, due to their private ownership and rivalry relationship for resources (either consumers or producers) within the microgrid. Moreover, although all the above variables alter during each market period, they will not change during each single biding round, which results in a static environment [4]. These facts are the fundamental basis for the coordination system based on MAS to be built.
Fig.6 Market procedure of a microgrid
… …
Phase 1 Phase
2 Phase 3
Phase 1 Phase
2 Phase 3
t t+1 T (min)
Market Period
Conclusion(Demand Function)
Negotiation(Bid & Adjust)
Activation(Initial Pricing)
111
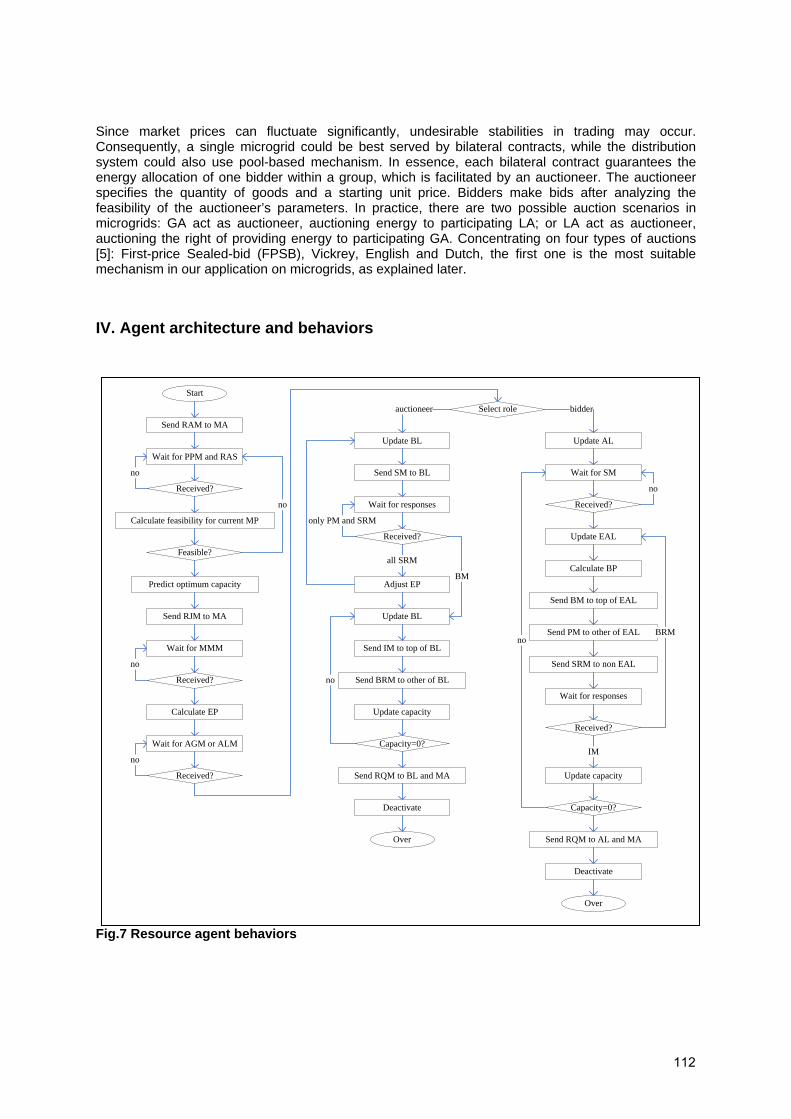
Since market prices can fluctuate significantly, undesirable stabilities in trading may occur. Consequently, a single microgrid could be best served by bilateral contracts, while the distribution system could also use pool-based mechanism. In essence, each bilateral contract guarantees the energy allocation of one bidder within a group, which is facilitated by an auctioneer. The auctioneer specifies the quantity of goods and a starting unit price. Bidders make bids after analyzing the feasibility of the auctioneer’s parameters. In practice, there are two possible auction scenarios in microgrids: GA act as auctioneer, auctioning energy to participating LA; or LA act as auctioneer, auctioning the right of providing energy to participating GA. Concentrating on four types of auctions [5]: First-price Sealed-bid (FPSB), Vickrey, English and Dutch, the first one is the most suitable mechanism in our application on microgrids, as explained later.
IV. Agent architecture and behaviors
Fig.7 Resource agent behaviors
Start
Send RAM to MA
Received?
Wait for PPM and RAS
Feasible?
Calculate feasibility for current MP
no
no
Predict optimum capacity
Send RJM to MA
Wait for MMM
Received?
Select role
no
Calculate EP
Wait for AGM or ALM
Received?
Update BL Update AL
auctioneer bidder
no
Send SM to BL Wait for SM
Received?
Update EAL
Calculate BP
Send BM to top of EAL
Send PM to other of EAL
Send SRM to non EAL
Wait for responses
Received?
Update BL
Send IM to top of BL
Update capacity
Capacity=0?
Wait for responses
Received?
Send RQM to BL and MA
Over
Deactivate
no
only PM and SRM
Adjust EP
all SRM
BM
Update capacity
Capacity=0?
Send RQM to AL and MA
Over
Deactivate
no
Send BRM to other of BL
IM
BRM
no
112
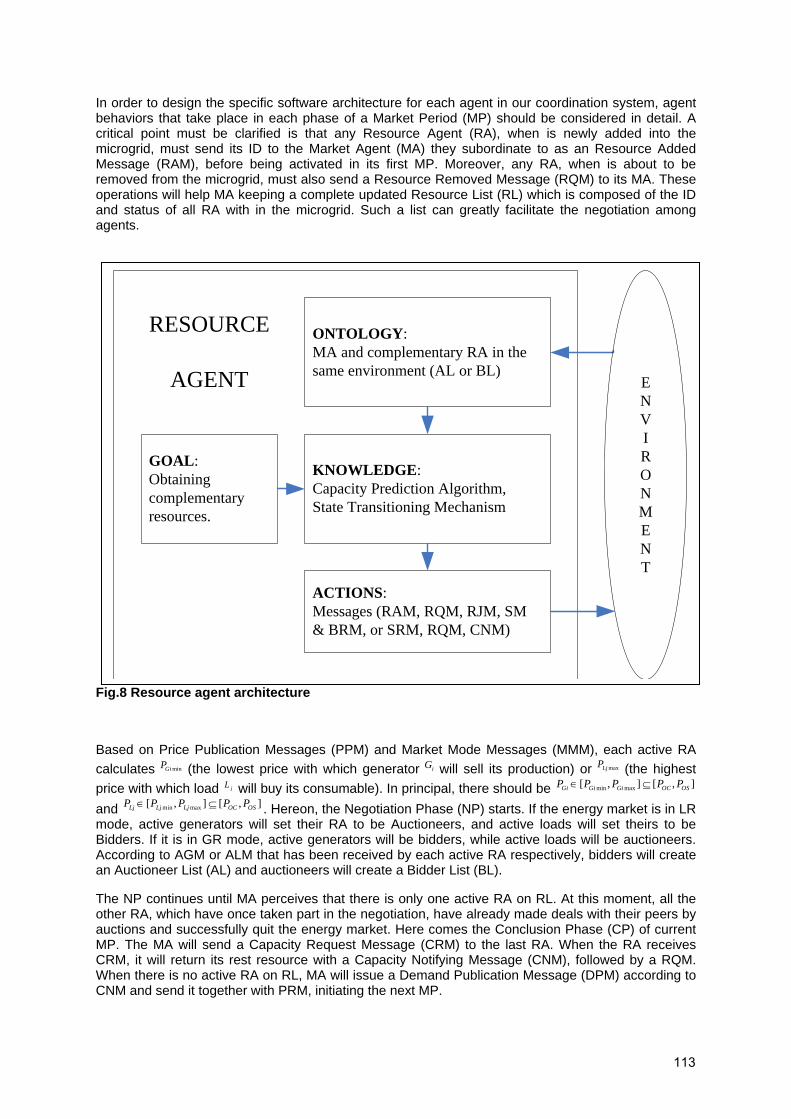
In order to design the specific software architecture for each agent in our coordination system, agent behaviors that take place in each phase of a Market Period (MP) should be considered in detail. A critical point must be clarified is that any Resource Agent (RA), when is newly added into the microgrid, must send its ID to the Market Agent (MA) they subordinate to as an Resource Added Message (RAM), before being activated in its first MP. Moreover, any RA, when is about to be removed from the microgrid, must also send a Resource Removed Message (RQM) to its MA. These operations will help MA keeping a complete updated Resource List (RL) which is composed of the ID and status of all RA with in the microgrid. Such a list can greatly facilitate the negotiation among agents.
Fig.8 Resource agent architecture
Based on Price Publication Messages (PPM) and Market Mode Messages (MMM), each active RA calculates minGiP (the lowest price with which generator iG will sell its production) or maxLjP (the highest price with which load jL will buy its consumable). In principal, there should be min max[ , ] [ , ]Gi Gi Gi OC OSP P P P P∈ ⊆ and min max[ , ] [ , ]Lj Lj Lj OC OSP P P P P∈ ⊆ . Hereon, the Negotiation Phase (NP) starts. If the energy market is in LR mode, active generators will set their RA to be Auctioneers, and active loads will set theirs to be Bidders. If it is in GR mode, active generators will be bidders, while active loads will be auctioneers. According to AGM or ALM that has been received by each active RA respectively, bidders will create an Auctioneer List (AL) and auctioneers will create a Bidder List (BL).
The NP continues until MA perceives that there is only one active RA on RL. At this moment, all the other RA, which have once taken part in the negotiation, have already made deals with their peers by auctions and successfully quit the energy market. Here comes the Conclusion Phase (CP) of current MP. The MA will send a Capacity Request Message (CRM) to the last RA. When the RA receives CRM, it will return its rest resource with a Capacity Notifying Message (CNM), followed by a RQM. When there is no active RA on RL, MA will issue a Demand Publication Message (DPM) according to CNM and send it together with PRM, initiating the next MP.
GOAL: Obtaining complementary resources.
ONTOLOGY: MA and complementary RA in the same environment (AL or BL)
KNOWLEDGE: Capacity Prediction Algorithm, State Transitioning Mechanism
ACTIONS: Messages (RAM, RQM, RJM, SM & BRM, or SRM, RQM, CNM)
RESOURCE
AGENT ENVIRONMENT
113
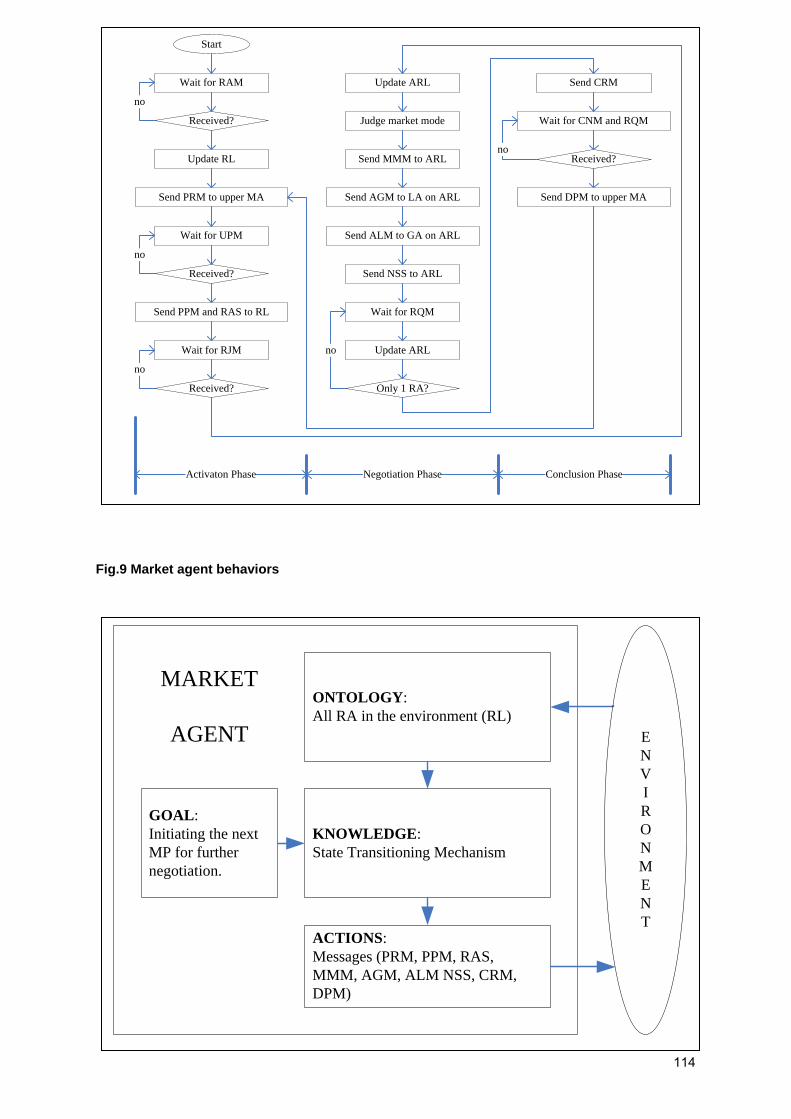
9
Fig.9 Market agent behaviors
Start
Wait for RAM
Received?
Send PRM to upper MA
Wait for UPM
Received?
no
Update RL
Send PPM and RAS to RL
Wait for RJM
Received?
Update ARL
Judge market mode
Send MMM to ARL
Send AGM to LA on ARL
Send ALM to GA on ARL
Send NSS to ARL
Wait for RQM
Update ARL
Only 1 RA?
no
Send CRM
Wait for CNM and RQM
Received?no
Send DPM to upper MA
no
no
Activaton Phase Negotiation Phase Conclusion Phase
GOAL: Initiating the next MP for further negotiation.
ONTOLOGY: All RA in the environment (RL)
KNOWLEDGE: State Transitioning Mechanism
ACTIONS: Messages (PRM, PPM, RAS, MMM, AGM, ALM NSS, CRM, DPM)
MARKET
AGENT ENVIRONMENT
114
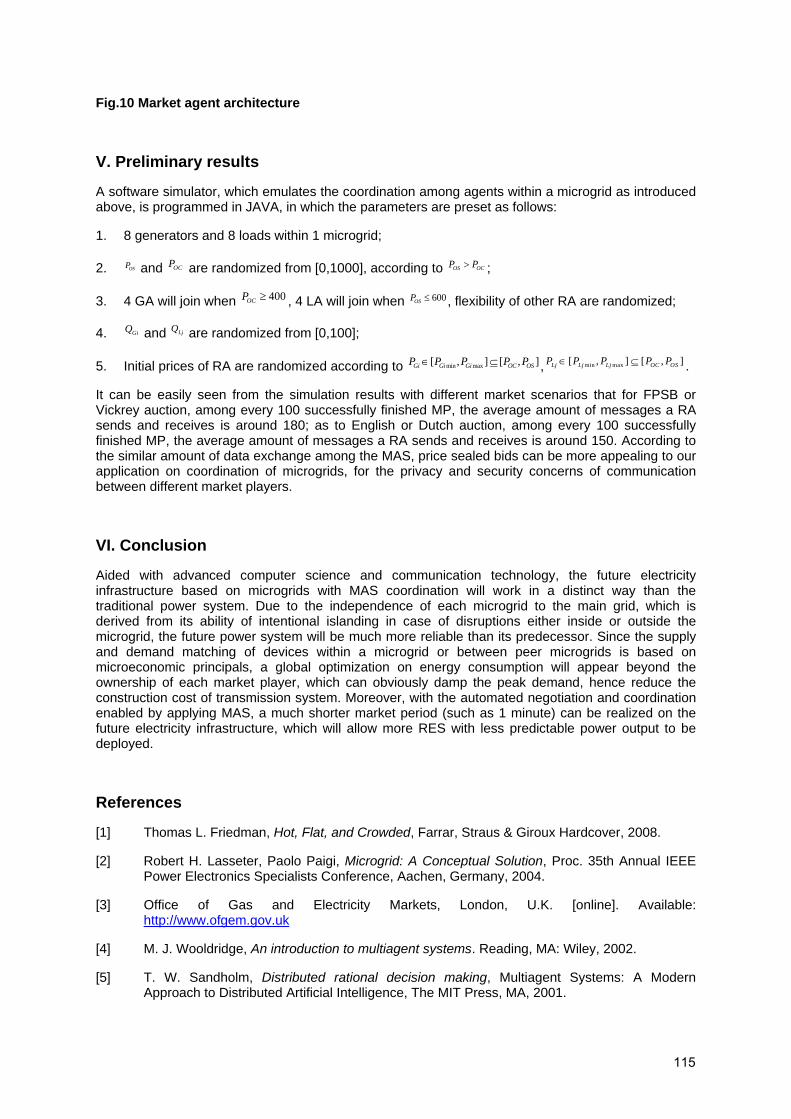
Fig.10 Market agent architecture
V. Preliminary results
A software simulator, which emulates the coordination among agents within a microgrid as introduced above, is programmed in JAVA, in which the parameters are preset as follows:
1. 8 generators and 8 loads within 1 microgrid;
2. OSP and OCP are randomized from [0,1000], according to OS OCP P> ;
3. 4 GA will join when 400OCP ≥ , 4 LA will join when 600OSP ≤ , flexibility of other RA are randomized;
4. GiQ and LjQ are randomized from [0,100];
5. Initial prices of RA are randomized according to min max[ , ] [ , ]Gi Gi Gi OC OSP P P P P∈ ⊆ , min max[ , ] [ , ]Lj Lj Lj OC OSP P P P P∈ ⊆ .
It can be easily seen from the simulation results with different market scenarios that for FPSB or Vickrey auction, among every 100 successfully finished MP, the average amount of messages a RA sends and receives is around 180; as to English or Dutch auction, among every 100 successfully finished MP, the average amount of messages a RA sends and receives is around 150. According to the similar amount of data exchange among the MAS, price sealed bids can be more appealing to our application on coordination of microgrids, for the privacy and security concerns of communication between different market players.
VI. Conclusion
Aided with advanced computer science and communication technology, the future electricity infrastructure based on microgrids with MAS coordination will work in a distinct way than the traditional power system. Due to the independence of each microgrid to the main grid, which is derived from its ability of intentional islanding in case of disruptions either inside or outside the microgrid, the future power system will be much more reliable than its predecessor. Since the supply and demand matching of devices within a microgrid or between peer microgrids is based on microeconomic principals, a global optimization on energy consumption will appear beyond the ownership of each market player, which can obviously damp the peak demand, hence reduce the construction cost of transmission system. Moreover, with the automated negotiation and coordination enabled by applying MAS, a much shorter market period (such as 1 minute) can be realized on the future electricity infrastructure, which will allow more RES with less predictable power output to be deployed.
References
[1] Thomas L. Friedman, Hot, Flat, and Crowded, Farrar, Straus & Giroux Hardcover, 2008.
[2] Robert H. Lasseter, Paolo Paigi, Microgrid: A Conceptual Solution, Proc. 35th Annual IEEE Power Electronics Specialists Conference, Aachen, Germany, 2004.
[3] Office of Gas and Electricity Markets, London, U.K. [online]. Available: http://www.ofgem.gov.uk
[4] M. J. Wooldridge, An introduction to multiagent systems. Reading, MA: Wiley, 2002.
[5] T. W. Sandholm, Distributed rational decision making, Multiagent Systems: A Modern Approach to Distributed Artificial Intelligence, The MIT Press, MA, 2001.
115

[6] J. K. Kok, C. J. Warmer, I. G. Kamphuis, PowerMatcher: Multiagent Control in the Electricity Infrastructure, Proc. 4th International Joint Conference on Autonomous Agents and Multiagent Systems, Netherlands, 2005.
[7] N. D. Hatziargyriou, A. Dimeas, A. G. Tsikalakis, J. A. Pecas Lopes, G. Kariniotakis, J. Oyarzabal, Management of Microgrids in Market Environment, Proc. International Conference on Future Power Systems, 2005.
116

How Smart Domestic Appliances Can Support the Integration of Renewable Energy in Local and National Energy Systems
Christof Timpe; Christian Möllering1
Öko-Institut e.V.; enervision GmbH
Abstract
Demand Response is one of the important measures supporting the integration of large shares of fluctuating renewable electricity into European networks. Millions of domestic appliances can help to achieve this objective, if a coordinated intelligent operation of these devices is enabled. Simulations undertaken in the Smart-A project show that domestic appliances such as refrigerators and freezers, washing machines, tumble driers and dishwashers can provide a significant number of Demand Response options without reducing the quality of the service provided. Consumer research showed that consumers are in principle ready to accept smart operations of appliances. However most consumers would neither accept major changes to their daily routines nor significant additional cost.
A key benefit of Smart Appliances for the integration of renewable energy is their ability to contribute to the compensation of imbalances which occur due to the variability of wind power generation. This benefit results from reduced fuel costs and CO2 emissions related to conventional plants required for the provision of balancing power and also from reduced needs to curtail wind production due to low demand levels or network constraints. In local energy systems, Smart Appliances and Micro-CHP can both help to increase the utilisation of locally produced energy and thus can reduce loads in the medium and high voltage systems. Smart-A simulations demonstrate that many European countries can benefit significantly from Smart Appliances operation. The benefits are highest in countries with high shares of wind power and low flexibility of the conventional generation.
Background
European electricity systems are facing significant challenges. In December 2008 European policymakers have passed a Directive on the promotion of renewable energy [1], which legally implements an earlier political agreement to raise the share of renewable energy in total energy consumption from 8,5% in 2005 to 20% by 2020. This ambitious increase will cover all three energy sectors, electricity, heating & cooling and transport, and will most likely mean that the share of renewable energy in Europe’s electricity production will reach or even exceed 35% within the next ten years. The largest part of this increase will come from wind power, which is by nature a fluctuating energy resource. European electricity systems must become able to deal with the new generation mix and its variability.
One of the key measures for dealing with generation variability is demand-side load management. Under this concept, the demand for electricity is not static any more, it rather responds to price signals or to other indicators reflecting the current stress on the electricity system [2]. Together with distributed generation, energy storage technologies and more flexible operation of centralized power plants, Demand Response can help to cope with the challenges of future energy systems.
So far, the work on Demand Response options has mostly focused on large consumers in the industrial and commercial sector. In case that the domestic sector is included, this is usually based on pricing signals such as time-of use tariffs and real time pricing, which are supplemented by communication systems for the price signals like websites or in-house displays. What is still largely
1 This paper is based on selected results from the European project “Smart Domestic Appliances in Sustainable Energy Systems (Smart-A)”. The results reported in this paper have been achieved jointly by the project consortium: Öko-Institut (coordinator), University of Bonn, Enervision GmbH, Miele & Cie. KG and EnBW Energie Baden-Württemberg AG from Germany, Imperial College and University of Manchester from the United Kingdom, the Inter-University Research Centre from Austria and the European Association for the Promotion of Cogeneration (COGEN Europe) from Belgium. Further information about the Smart-A project and detailed reports are available at http://www.smart-a.org.
117
lacking is the conceptual and technological integration of domestic energy-using appliances into the Demand Response concept.
State-of-the-art domestic appliances are not only becoming more and more energy efficient, they can also offer a range of options for load-shifting. This can include delaying the start of washing or dishwashing cycles, interruptions of the operation of appliances, or the use of refrigerators and freezers for temporarily storing energy in order to avoid operation of the compressor during peak times. Although the energy consumption and load of a single appliance is negligible compared to the challenge of managing distribution networks and national electricity systems, the impact of a coordinated smart operation of millions of domestic appliances can be significant. First projects in this field have been undertaken for example in the Dynamic Demand Control project in the UK, where the variations of the system frequency are used as an indicator for the stress on the system, which triggers Demand Response actions of appliances [3].
This paper summarizes selected results from the European project “Smart Domestic Appliances in Sustainable Energy Systems (Smart-A)”, which assesses the potential synergies from coordinating the energy demand of domestic appliances with the generation of electricity and heat from renewable energies or cogeneration and with other load management requirements in electricity networks. The project is supported by the European Commission through the IEE program. Part of the project is further supported by the German Federal Ministry for the Environment, Nature Conservation and Nuclear Safety (BMU). The results reported in this paper have been achieved jointly by the partners in the Smart-A project, to which the authors express their thanks.
Demand Response Options provided by Domestic Appliances
The possibilities of Demand Response which can be offered by the major electric appliances in a typical household are the subject of a separate paper for this conference [4], which is based on the Smart-A project report on Appliances [5, 6]. Following on from this in-depth analysis, the most relevant options for Demand Response can be summarized as shown in Table 1.
Table 1: Typical options for Demand Response provided by Smart Appliances
Smart Timing of Appliances Cycles Interruptions of Appliances Cycles
Expected typical time shifts of the cycle: • Washing machine / Dryer: 3 – 6 hrs • Dishwasher: 3 – 8 hrs • Refrigerator / freezer: 15 – 30 mins • Other appliances: 15 – 30 mins … 1 hr
Expected typical duration of interruption: • Washing machine: ~ 15 mins • Dryer: ~ 30 mins • Dishwasher: ~ 15 mins • Refrigerator / freezer: ~ 15 mins • Other appliances: ~ 15 mins
Source: Own compilation of results from [5, 6].
In this classification, the smart timing of appliance cycles means to schedule the start of the cycle in reflection of both the consumer’s demand for services and the conditions in the energy system. For example, the consumer might set the appliance in “ready” mode when he leaves for work and defines the time by when the appliance should have finished its cycle. The appliance can then optimize its operation in the given timeframe: It could start the cycle just in time to finish until the given time or it could start earlier than this, based on signals given from the energy system. It is essential that the quality of the service provided is not reduced due to the smart operation of an appliance.
The load shape of a Demand Response measure by a Smart Appliance usually consists of a load reduction period and an energy recovery period. Obviously, a delay in the operation of an appliance or an interruption of a cycle results in a load reduction for a certain period. At the time when the delayed cycle is started or the interruption is ended (or shortly after) energy demand will increase compared to the base case [3, 5]. It is also possible that the start of the cycle is preponed instead of being delayed. In this case a load increase is followed by a load reduction. It must be noted that the interruption of the cycle of an appliance with thermal loads usually means a certain increase in the total energy demand for this cycle. This effect has been taken into account in the limitations shown in Table 1.
118

Whereas the influence of shifting the operation of a single appliance on the load of a local or national energy system is negligible, the impact of coordinated Demand Response action of millions of appliances can be significant.
Consumer Acceptance of Smart Domestic Appliances
The smart operation of appliances can be based on different levels of consumer interaction:
1. Fully automatic smart operation: Here, the appliance is designed in such a way that the consumer can not modify or switch off the smart operation mode. This could apply to the control of compressors in refrigerators and freezers, which could try to avoid their operation during short peak load periods, based on a signal broadcasted by the electricity supplier or the distribution system operator.
2. “Set and forget” smart operation: In this case, the consumer is asked to select the smart operation of the appliance once, e.g. during a setup procedure after installing it. After this, the consumer will usually not think about the smart operation any more. However, it would be possible for him to modify the setting back to “unsmart” operation, if desired. For example, the appliance could be equipped with a timer, and if the consumer sets the timer to a certain time until when the cycle should be completed, the appliance is by default enabled to operate at any time between the point in time when the timer is set and the latest point in time in which it must start operation in order to finish the cycle at the given time.
3. Case by case consideration about smart operation: In this case, the consumer is asked to take a decision about the smart operation every time he starts a cycle. For example, the consumer would have to press a separate “smart” button when starting the cycle of an appliance in order to enable it to operate at any time within a defined time interval (e.g. between when the consumer leaves for work and when he comes back). In more complex arrangements, the consumer might receive a signal indicating the current situation in the energy system, which might be reflected in a real-time electricity price. Based on this signal he could then take appropriate decisions, e.g. to start the appliance later during the day or maybe even on another day.
Obviously, all technical potentials for using domestic appliances as smart consumer loads will be irrelevant if the owners and operators of the appliances are not supporting this concept. It is therefore a key success factor for the further development of the Smart Appliances concept to understand how consumers react to the idea of using their appliances as a tool for load management and to find out how the participation rate of a Demand Response program for Smart Appliances can be increased.
For these reasons, the Smart-A project has undertaken extensive consumer research. This comprised a comprehensive literature research, a consumer survey based on returned questionnaires from some 2.900 households in four different European countries plus qualitative research using phone interviews and focus groups. The results of this work are documented in a Smart-A project report on consumer acceptance [7].
In a nutshell, the consumers involved in our research showed a surprisingly high general acceptance of the concept of Smart Appliances. Nevertheless in practice several restrictions will limit the actual uptake of Smart Appliances. It became clear that consumers expect a perceptible economic benefit if they are contributing to load management in energy systems. If they have to bear higher investment cost for a Smart Appliance, then they usually expect a very short payback period of not more than three years. The refinancing of such higher investment should preferably be done through a cycle-based incentive scheme, which compensates the consumer for each smart operation of an appliance.
The research undertaken also showed that as a principle, consumers are not willing to change their daily routines in order to adapt to a smart operation of appliances. This obviously limits the Smart Appliances potential, e.g. the maximum duration over which the cycle of an appliance can be shifted. Whereas it is clear that hardly anybody is willing to take clothes out of a washing machine during the night, it must also be taken into account that only few consumers might agree to change e.g. the time of loading and starting the operation of their dishwasher to a different time of the day than they are used to. However, the wider use of timer functions might be accepted by many consumers. Clearly, if
119
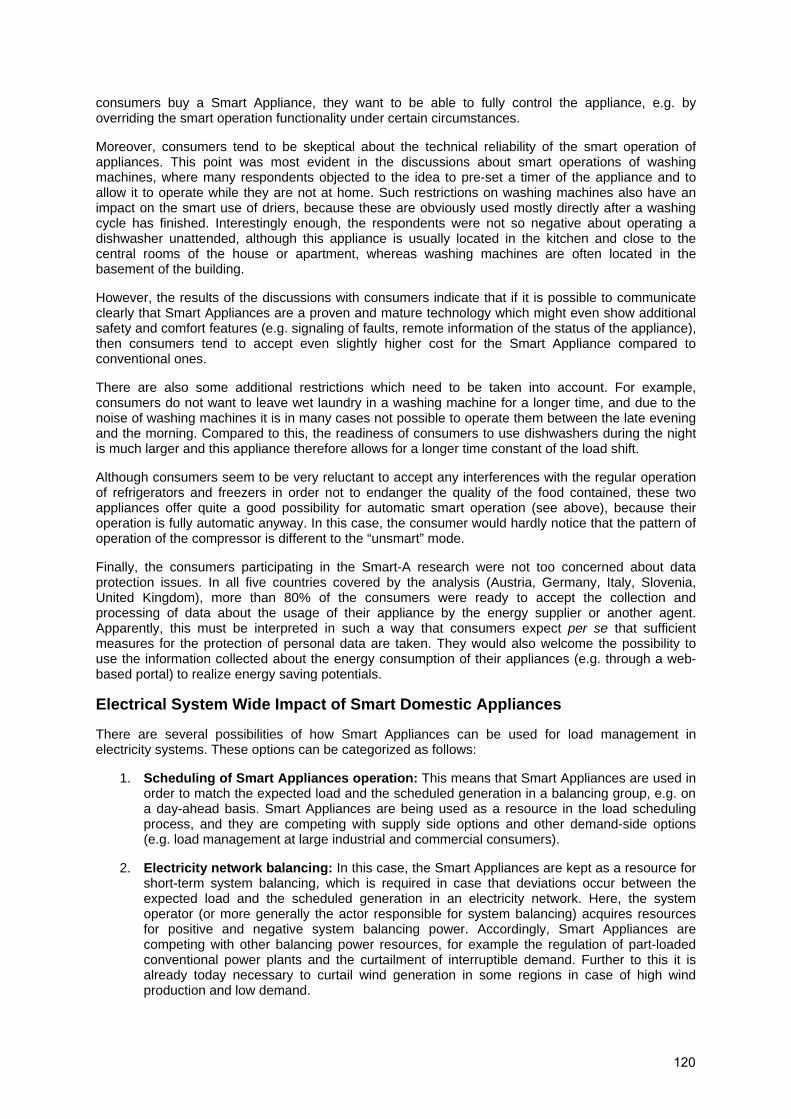
consumers buy a Smart Appliance, they want to be able to fully control the appliance, e.g. by overriding the smart operation functionality under certain circumstances.
Moreover, consumers tend to be skeptical about the technical reliability of the smart operation of appliances. This point was most evident in the discussions about smart operations of washing machines, where many respondents objected to the idea to pre-set a timer of the appliance and to allow it to operate while they are not at home. Such restrictions on washing machines also have an impact on the smart use of driers, because these are obviously used mostly directly after a washing cycle has finished. Interestingly enough, the respondents were not so negative about operating a dishwasher unattended, although this appliance is usually located in the kitchen and close to the central rooms of the house or apartment, whereas washing machines are often located in the basement of the building.
However, the results of the discussions with consumers indicate that if it is possible to communicate clearly that Smart Appliances are a proven and mature technology which might even show additional safety and comfort features (e.g. signaling of faults, remote information of the status of the appliance), then consumers tend to accept even slightly higher cost for the Smart Appliance compared to conventional ones.
There are also some additional restrictions which need to be taken into account. For example, consumers do not want to leave wet laundry in a washing machine for a longer time, and due to the noise of washing machines it is in many cases not possible to operate them between the late evening and the morning. Compared to this, the readiness of consumers to use dishwashers during the night is much larger and this appliance therefore allows for a longer time constant of the load shift.
Although consumers seem to be very reluctant to accept any interferences with the regular operation of refrigerators and freezers in order not to endanger the quality of the food contained, these two appliances offer quite a good possibility for automatic smart operation (see above), because their operation is fully automatic anyway. In this case, the consumer would hardly notice that the pattern of operation of the compressor is different to the “unsmart” mode.
Finally, the consumers participating in the Smart-A research were not too concerned about data protection issues. In all five countries covered by the analysis (Austria, Germany, Italy, Slovenia, United Kingdom), more than 80% of the consumers were ready to accept the collection and processing of data about the usage of their appliance by the energy supplier or another agent. Apparently, this must be interpreted in such a way that consumers expect per se that sufficient measures for the protection of personal data are taken. They would also welcome the possibility to use the information collected about the energy consumption of their appliances (e.g. through a web-based portal) to realize energy saving potentials.
Electrical System Wide Impact of Smart Domestic Appliances
There are several possibilities of how Smart Appliances can be used for load management in electricity systems. These options can be categorized as follows:
1. Scheduling of Smart Appliances operation: This means that Smart Appliances are used in order to match the expected load and the scheduled generation in a balancing group, e.g. on a day-ahead basis. Smart Appliances are being used as a resource in the load scheduling process, and they are competing with supply side options and other demand-side options (e.g. load management at large industrial and commercial consumers).
2. Electricity network balancing: In this case, the Smart Appliances are kept as a resource for short-term system balancing, which is required in case that deviations occur between the expected load and the scheduled generation in an electricity network. Here, the system operator (or more generally the actor responsible for system balancing) acquires resources for positive and negative system balancing power. Accordingly, Smart Appliances are competing with other balancing power resources, for example the regulation of part-loaded conventional power plants and the curtailment of interruptible demand. Further to this it is already today necessary to curtail wind generation in some regions in case of high wind production and low demand.
120

3. Electricity network congestion management: Here, the Smart Appliances are used in order to manage the operation of electricity networks (usually at the distribution system level), which are facing congestion. For example, if there is an area which is supplied by weak lines, then Smart Appliances can be used to reduce peak demand in this area. Smart Appliances are competing in this case with all other resources which an “active distribution system operator” can use, including distributed generation and other Demand Response options [8].
4. Other ancillary services for system operation: These can include voltage regulation and reactive power correction, which are not treated in further detail here.
Obviously, the flexibility of a Smart Appliance can only be used for one strategy at a time. However, as part of a smart strategy of operating demand side resources, it would be possible to use the same Smart Appliance for different purposes at different times, depending on the framework conditions in the electricity system.
For the purposes of the Smart-A project, a framework was analyzed in which the share of electricity from renewable energy sources is significantly increased compared to current levels. This is in line with the renewable energy targets on which European policy makers have recently agreed [1]. Much of the expected increase of renewable energy in Europe will come from wind energy, and some from solar power, which means that the share of fluctuating generation will significantly increase across Europe and will grow even stronger in certain regions with favorable conditions for the use of these renewable energy sources. It is known that the fluctuations in the total generation of a larger number of wind parks which are all connected to a transmission system are much smaller than for a single wind converter. Also the predictability of wind power generation has been improved remarkably. Nevertheless, the ambitious renewable energy targets will imply a significant additional burden on electricity systems, both in terms of congestion management and balancing (see for example the extensive study undertaken for Germany [9]). Therefore the analysis in the Smart-A study has focused on the usage of Smart Appliances for electricity network balancing and congestion management [10, 11].
In order to assess the overall benefits which Smart Appliances may be able to bring about in electricity network balancing, dynamic model calculations have been performed with a linear optimization model. The model assesses the benefits which Smart Appliances can add to the system in the case that significant shares of wind power create certain imbalances. This benefit results from reduced fuel costs and CO2 emissions related to conventional plants required for the provision of balancing power and also from reduced needs to curtail wind production due to low demand levels.
The model is based on a generic set of power plants with different generation flexibilities. The generation flexibility describes the ability of the power generation system in a country or region to deal with imbalances between power generation and demand. This is driven by the share of “must run”-plants and the shares of power plants with different levels of minimum stable generation. Additional factors like ramping times of power plants have not been reflected in this rough analysis.
The variations in the framework conditions for Smart Appliances operation across Europe are addressed by an analysis of five regional cases, which are characterized by their typical electricity generation mix, generic load curves and a penetration rate of Smart Appliances which reflects the specific value per kW of controllable load and also the expected uptake of Smart Appliances by consumers in each region:
121
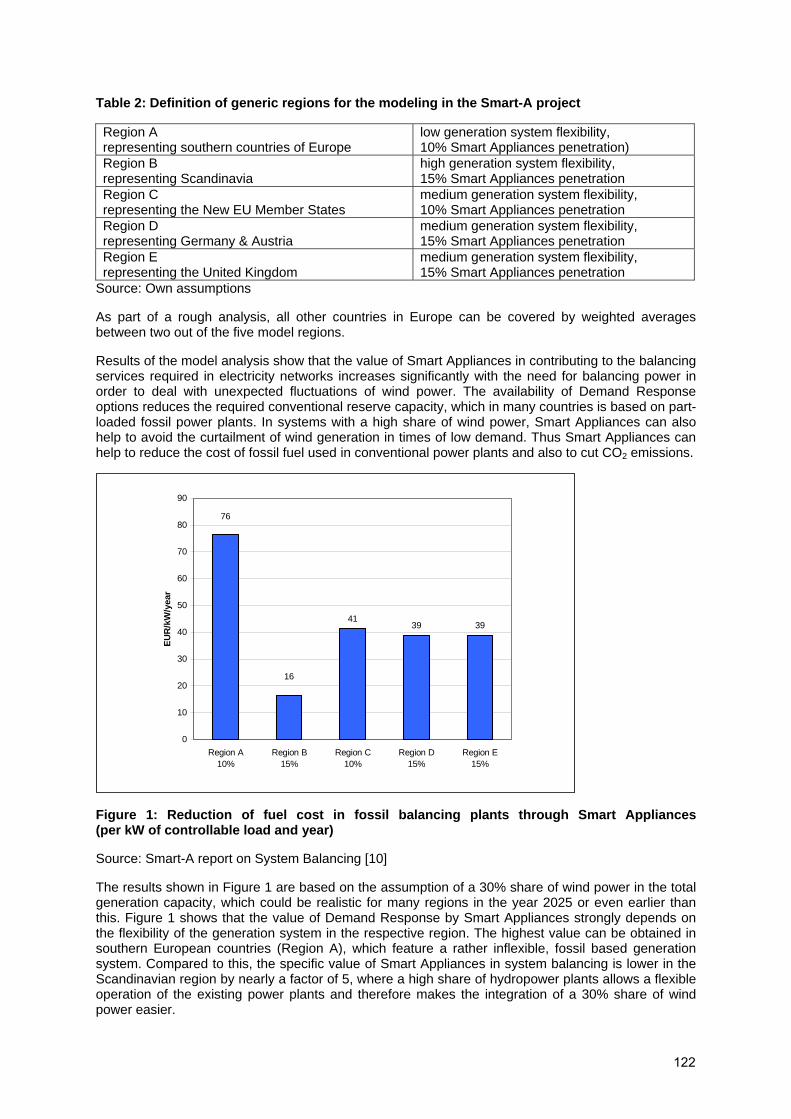
Table 2: Definition of generic regions for the modeling in the Smart-A project
Region A representing southern countries of Europe
low generation system flexibility, 10% Smart Appliances penetration)
Region B representing Scandinavia
high generation system flexibility, 15% Smart Appliances penetration
Region C representing the New EU Member States
medium generation system flexibility, 10% Smart Appliances penetration
Region D representing Germany & Austria
medium generation system flexibility, 15% Smart Appliances penetration
Region E representing the United Kingdom
medium generation system flexibility, 15% Smart Appliances penetration
Source: Own assumptions
As part of a rough analysis, all other countries in Europe can be covered by weighted averages between two out of the five model regions.
Results of the model analysis show that the value of Smart Appliances in contributing to the balancing services required in electricity networks increases significantly with the need for balancing power in order to deal with unexpected fluctuations of wind power. The availability of Demand Response options reduces the required conventional reserve capacity, which in many countries is based on part-loaded fossil power plants. In systems with a high share of wind power, Smart Appliances can also help to avoid the curtailment of wind generation in times of low demand. Thus Smart Appliances can help to reduce the cost of fossil fuel used in conventional power plants and also to cut CO2 emissions.
4139 39
76
16
0
10
20
30
40
50
60
70
80
90
Region A10%
Region B15%
Region C10%
Region D15%
Region E15%
EUR
/kW
/yea
r
Figure 1: Reduction of fuel cost in fossil balancing plants through Smart Appliances (per kW of controllable load and year)
Source: Smart-A report on System Balancing [10]
The results shown in Figure 1 are based on the assumption of a 30% share of wind power in the total generation capacity, which could be realistic for many regions in the year 2025 or even earlier than this. Figure 1 shows that the value of Demand Response by Smart Appliances strongly depends on the flexibility of the generation system in the respective region. The highest value can be obtained in southern European countries (Region A), which feature a rather inflexible, fossil based generation system. Compared to this, the specific value of Smart Appliances in system balancing is lower in the Scandinavian region by nearly a factor of 5, where a high share of hydropower plants allows a flexible operation of the existing power plants and therefore makes the integration of a 30% share of wind power easier.
122
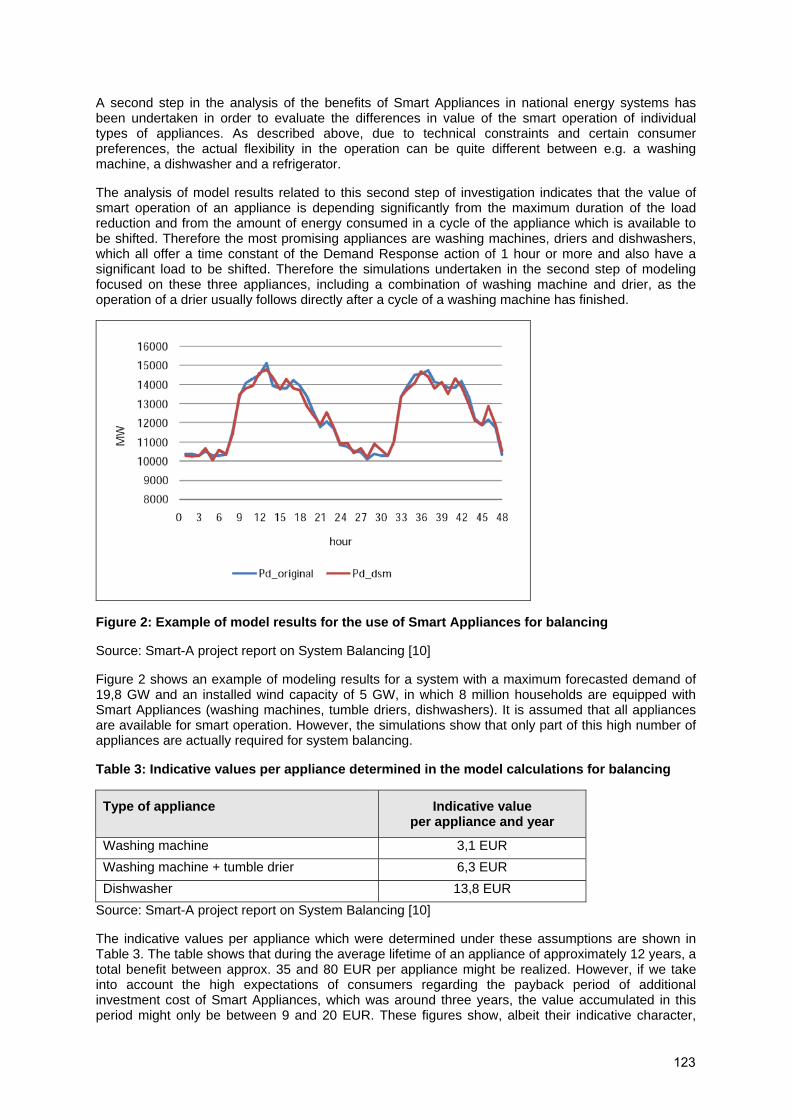
A second step in the analysis of the benefits of Smart Appliances in national energy systems has been undertaken in order to evaluate the differences in value of the smart operation of individual types of appliances. As described above, due to technical constraints and certain consumer preferences, the actual flexibility in the operation can be quite different between e.g. a washing machine, a dishwasher and a refrigerator.
The analysis of model results related to this second step of investigation indicates that the value of smart operation of an appliance is depending significantly from the maximum duration of the load reduction and from the amount of energy consumed in a cycle of the appliance which is available to be shifted. Therefore the most promising appliances are washing machines, driers and dishwashers, which all offer a time constant of the Demand Response action of 1 hour or more and also have a significant load to be shifted. Therefore the simulations undertaken in the second step of modeling focused on these three appliances, including a combination of washing machine and drier, as the operation of a drier usually follows directly after a cycle of a washing machine has finished.
Figure 2: Example of model results for the use of Smart Appliances for balancing
Source: Smart-A project report on System Balancing [10]
Figure 2 shows an example of modeling results for a system with a maximum forecasted demand of 19,8 GW and an installed wind capacity of 5 GW, in which 8 million households are equipped with Smart Appliances (washing machines, tumble driers, dishwashers). It is assumed that all appliances are available for smart operation. However, the simulations show that only part of this high number of appliances are actually required for system balancing.
Table 3: Indicative values per appliance determined in the model calculations for balancing
Type of appliance Indicative value per appliance and year
Washing machine 3,1 EUR Washing machine + tumble drier 6,3 EUR Dishwasher 13,8 EUR
Source: Smart-A project report on System Balancing [10]
The indicative values per appliance which were determined under these assumptions are shown in Table 3. The table shows that during the average lifetime of an appliance of approximately 12 years, a total benefit between approx. 35 and 80 EUR per appliance might be realized. However, if we take into account the high expectations of consumers regarding the payback period of additional investment cost of Smart Appliances, which was around three years, the value accumulated in this period might only be between 9 and 20 EUR. These figures show, albeit their indicative character,
123
that under certain conditions Smart Appliances can realize a relevant value when used in system balancing. However, as the value obtained must pay for all extra cost of the smart functionalities and incentivize their actual use, the figures also indicate a potentially quite narrow business case for Smart Appliances if they are used only for system balancing.
A third step in the analysis of the benefits of Smart Appliances in national energy systems addressed the potential benefits of Smart Appliances in case of significant distribution network congestion. For this purpose, a model representing an IEEE 30 Bus Network with 41 branches and a peak load of 186 MW was established as a test system. The framework conditions were set in a way that due to system congestion, load shed occurred during peak times in the winter season and to a low extent also during autumn and spring.
Under the specific assumptions made for this example, the use of Smart Appliances made it possible to reduce the volume of load shed during autumn and spring to zero and to cut down the load shed during peak times in winter by one third. Due to the high value which avoided load shed has for the distribution system operator, which was assumed here to be 3.750 EUR/MW, the following values could be determined for the different types of appliances used in the analysis.
Table 4: Indicative values per appliance determined in the model calculations for a specific case of network congestion
Type of appliance Indicative value per appliance and year
Washing machine 40 EUR Washing machine + tumble drier 107 EUR Dishwasher 215 EUR
Source: Smart-A project report on System Balancing [10]
It must be noted that the results shown in Table 4 strongly depend on the assumptions made for the model analysis, and that the real world framework conditions of network congestions are always case-specific. However, the assumptions made for these calculations were not unrealistic. Thus, the results show that under certain conditions of severe network congestions, the value of Smart Appliances as a resource for Demand Response can be significantly higher than for the participation in balancing of a national electricity system. Under such conditions, Smart Appliances can be a highly beneficial demand side resource.
Impact of Smart Domestic Appliances on Local Energy Systems
Definition of a local energy system
A local energy system (LES) is defined as an agglomeration of households and small enterprises within an area, where meteorological circumstances are constant and the distribution of heat is sensible considering nowadays technologies. Regarding electricity systems, only low and medium voltage levels are used at this scale. A LES can therefore be a city quarter or a small town, where the main connections across the system border would be electricity from the supra-local grid and gas import for heating and micro-CHP (see Figure 3).
Solar energy produced by thermal collectors and photovoltaics is assessed as locally generated renewable energy, while fuel for heating and CHP as well as electricity from the grid, which may contain electricity generated by large wind turbines, comes from outside the local energy system.
124
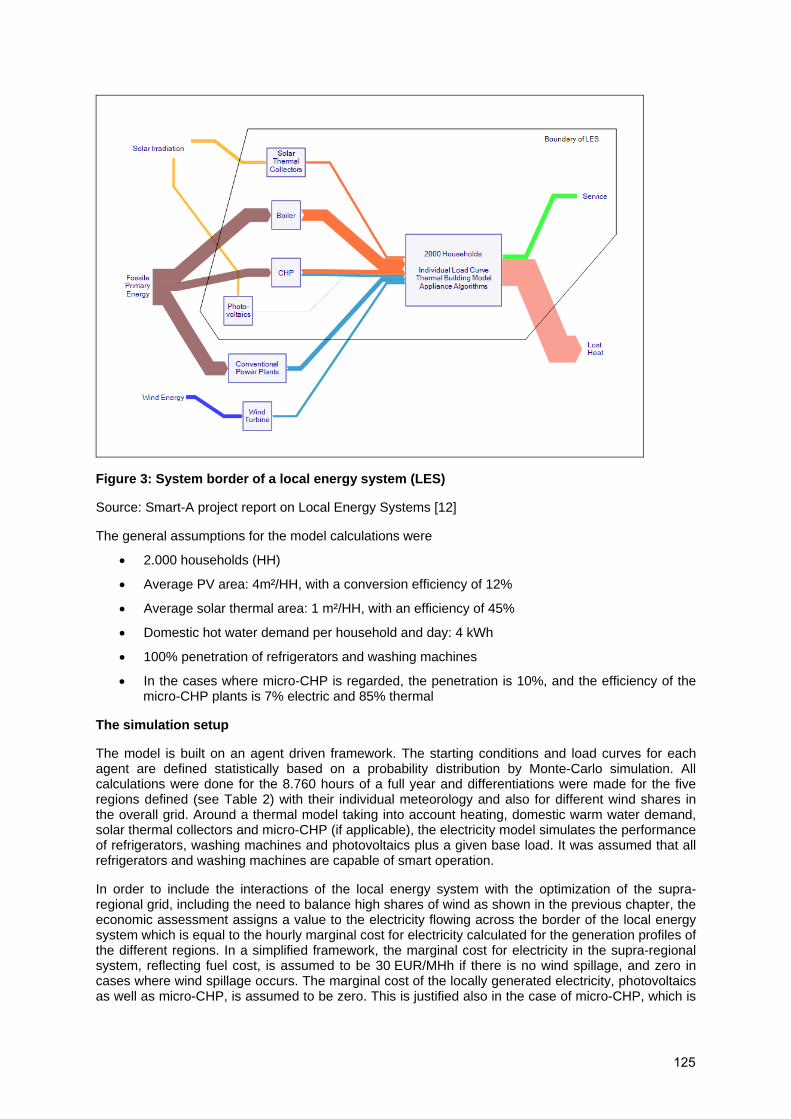
Figure 3: System border of a local energy system (LES)
Source: Smart-A project report on Local Energy Systems [12]
The general assumptions for the model calculations were
• 2.000 households (HH)
• Average PV area: 4m²/HH, with a conversion efficiency of 12%
• Average solar thermal area: 1 m²/HH, with an efficiency of 45%
• Domestic hot water demand per household and day: 4 kWh
• 100% penetration of refrigerators and washing machines
• In the cases where micro-CHP is regarded, the penetration is 10%, and the efficiency of the micro-CHP plants is 7% electric and 85% thermal
The simulation setup
The model is built on an agent driven framework. The starting conditions and load curves for each agent are defined statistically based on a probability distribution by Monte-Carlo simulation. All calculations were done for the 8.760 hours of a full year and differentiations were made for the five regions defined (see Table 2) with their individual meteorology and also for different wind shares in the overall grid. Around a thermal model taking into account heating, domestic warm water demand, solar thermal collectors and micro-CHP (if applicable), the electricity model simulates the performance of refrigerators, washing machines and photovoltaics plus a given base load. It was assumed that all refrigerators and washing machines are capable of smart operation.
In order to include the interactions of the local energy system with the optimization of the supra-regional grid, including the need to balance high shares of wind as shown in the previous chapter, the economic assessment assigns a value to the electricity flowing across the border of the local energy system which is equal to the hourly marginal cost for electricity calculated for the generation profiles of the different regions. In a simplified framework, the marginal cost for electricity in the supra-regional system, reflecting fuel cost, is assumed to be 30 EUR/MHh if there is no wind spillage, and zero in cases where wind spillage occurs. The marginal cost of the locally generated electricity, photovoltaics as well as micro-CHP, is assumed to be zero. This is justified also in the case of micro-CHP, which is
125
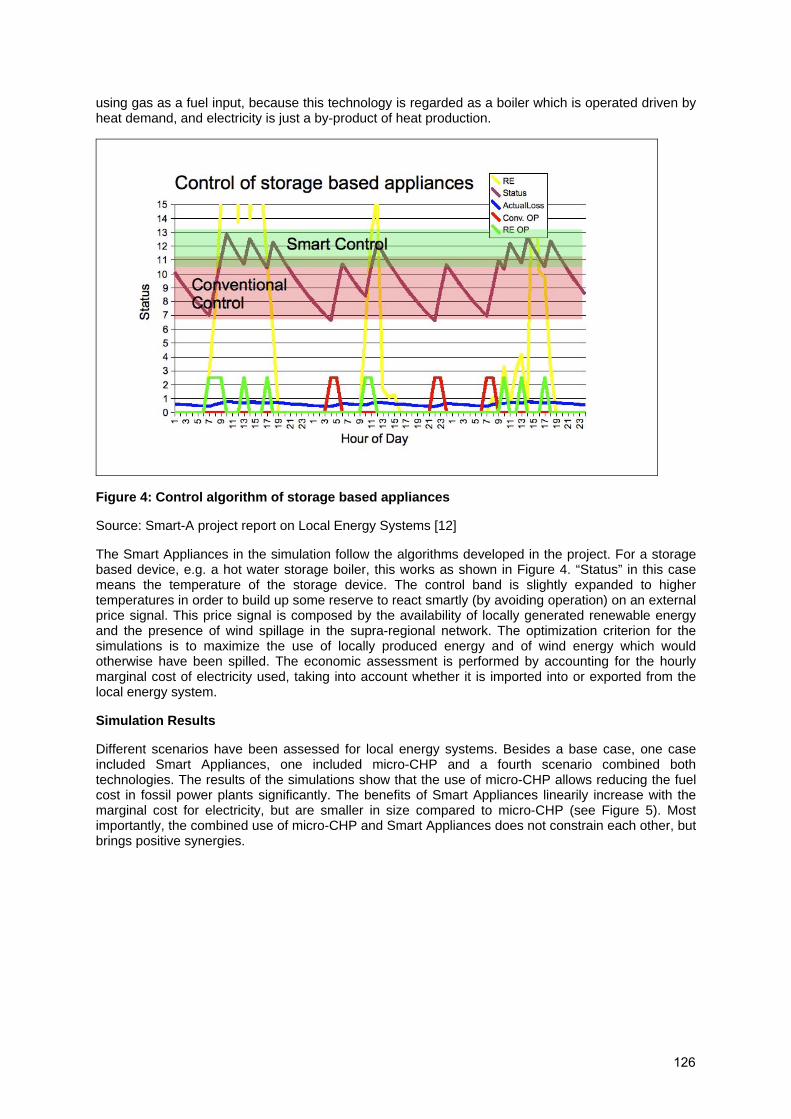
using gas as a fuel input, because this technology is regarded as a boiler which is operated driven by heat demand, and electricity is just a by-product of heat production.
Figure 4: Control algorithm of storage based appliances
Source: Smart-A project report on Local Energy Systems [12]
The Smart Appliances in the simulation follow the algorithms developed in the project. For a storage based device, e.g. a hot water storage boiler, this works as shown in Figure 4. “Status” in this case means the temperature of the storage device. The control band is slightly expanded to higher temperatures in order to build up some reserve to react smartly (by avoiding operation) on an external price signal. This price signal is composed by the availability of locally generated renewable energy and the presence of wind spillage in the supra-regional network. The optimization criterion for the simulations is to maximize the use of locally produced energy and of wind energy which would otherwise have been spilled. The economic assessment is performed by accounting for the hourly marginal cost of electricity used, taking into account whether it is imported into or exported from the local energy system.
Simulation Results
Different scenarios have been assessed for local energy systems. Besides a base case, one case included Smart Appliances, one included micro-CHP and a fourth scenario combined both technologies. The results of the simulations show that the use of micro-CHP allows reducing the fuel cost in fossil power plants significantly. The benefits of Smart Appliances linearily increase with the marginal cost for electricity, but are smaller in size compared to micro-CHP (see Figure 5). Most importantly, the combined use of micro-CHP and Smart Appliances does not constrain each other, but brings positive synergies.
126
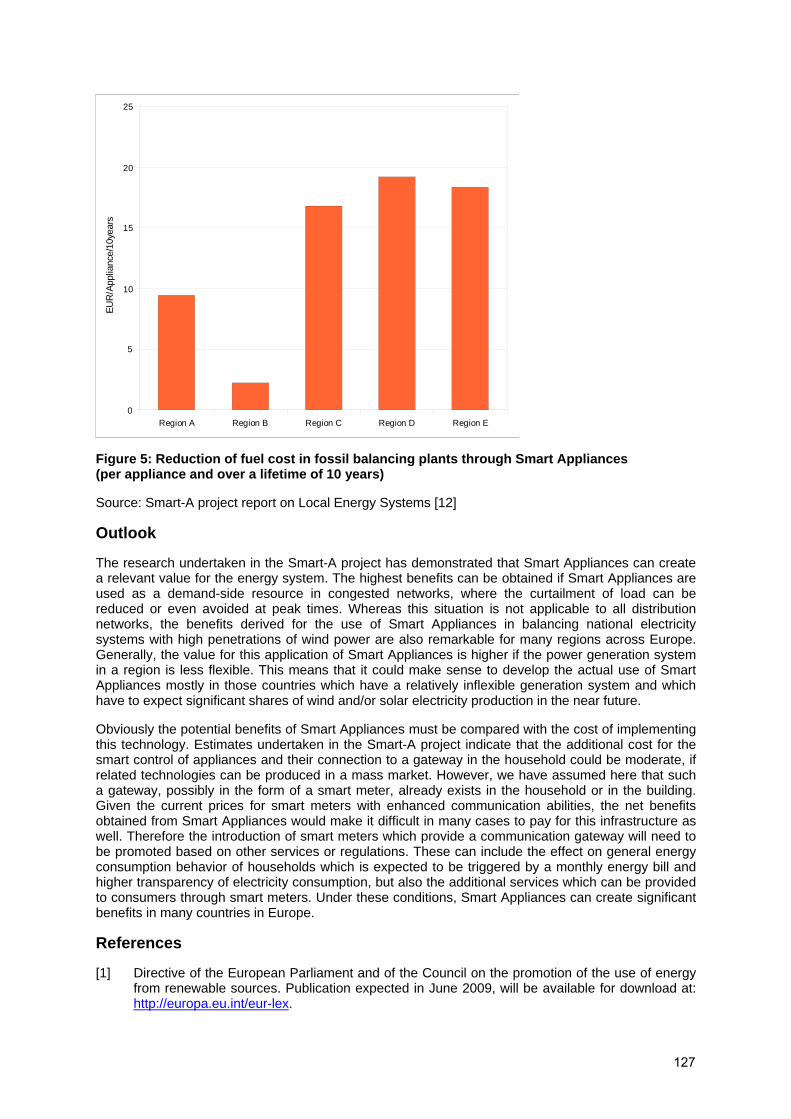
Region A Region B Region C Region D Region E0
5
10
15
20
25EU
R/A
pplia
nce/
10ye
ars
Figure 5: Reduction of fuel cost in fossil balancing plants through Smart Appliances (per appliance and over a lifetime of 10 years)
Source: Smart-A project report on Local Energy Systems [12]
Outlook
The research undertaken in the Smart-A project has demonstrated that Smart Appliances can create a relevant value for the energy system. The highest benefits can be obtained if Smart Appliances are used as a demand-side resource in congested networks, where the curtailment of load can be reduced or even avoided at peak times. Whereas this situation is not applicable to all distribution networks, the benefits derived for the use of Smart Appliances in balancing national electricity systems with high penetrations of wind power are also remarkable for many regions across Europe. Generally, the value for this application of Smart Appliances is higher if the power generation system in a region is less flexible. This means that it could make sense to develop the actual use of Smart Appliances mostly in those countries which have a relatively inflexible generation system and which have to expect significant shares of wind and/or solar electricity production in the near future.
Obviously the potential benefits of Smart Appliances must be compared with the cost of implementing this technology. Estimates undertaken in the Smart-A project indicate that the additional cost for the smart control of appliances and their connection to a gateway in the household could be moderate, if related technologies can be produced in a mass market. However, we have assumed here that such a gateway, possibly in the form of a smart meter, already exists in the household or in the building. Given the current prices for smart meters with enhanced communication abilities, the net benefits obtained from Smart Appliances would make it difficult in many cases to pay for this infrastructure as well. Therefore the introduction of smart meters which provide a communication gateway will need to be promoted based on other services or regulations. These can include the effect on general energy consumption behavior of households which is expected to be triggered by a monthly energy bill and higher transparency of electricity consumption, but also the additional services which can be provided to consumers through smart meters. Under these conditions, Smart Appliances can create significant benefits in many countries in Europe.
References
[1] Directive of the European Parliament and of the Council on the promotion of the use of energy from renewable sources. Publication expected in June 2009, will be available for download at: http://europa.eu.int/eur-lex.
127

[2] Albadi M.H. and El-Saadany E.F. A summary of demand response in electricity markets. Electric Power Systems Research 78 (2008), pp. 1989–1996.
[3] Short J. and Leach S. Using smart appliances to provide peak-load management and increase the efficiency of the electricity network. Proceedings of the International Conference on Energy Efficiency in Domestic Appliances and Lighting 2006. Can be downloaded at: http://mail.mtprog.com/eedal.html.
[4] Jungbecker H. and Stamminger R. Smart use of domestic appliances in renewable energy systems. Paper submitted for the International Conference on Energy Efficiency in Domestic Appliances and Lighting EEDAL 2009.
[5] Stamminger R. et al. Synergy Potential of Smart Appliances. Deliverable D2.3 of the Smart-A project (2009). Can be downloaded at: http://www.smart-a.org.
[6] Stamminger R. (ed.), Synergy Potential of Smart Domestic Appliances in Renewable Energy Systems (2009). Can be ordered at: (http://www.shaker.de/online-Gesamtkatalog/booklist.asp?ID=1375027&CC=661&Reihe=423)
[7] Mert W., Suschek-Berger J. and Tritthart W., Consumer acceptance of smart appliances. Deliverable D5.5 of the Smart-A project (2008). Can be downloaded at: http://www.smart-a.org.
[8] Bauknecht D. and Brunekreeft G. Distributed Generation and the Regulation of Electricity Networks. In: Sioshansi F. P. (ed.): Competitive Electricity Markets: Design, implementation & performance (2008).
[9] Deutsche Energie-Agentur GmbH. Planning of the Grid Integration of Wind Energy in Germany Onshore and Offshore up to the Year 2020 (dena Grid study) (2005). Can be downloaded at: http://www.offshore-wind.de/page/index.php?id=2605&L=1.
[10] Silva V. et al. Value of Smart Appliances in System Balancing. Deliverable D4.4 of the Smart-A project (Part I). Forthcoming, will be available for download at: http://www.smart-a.org.
[11] Silva V. et al. Role of Demand Side Management to Reduce System Constraints and Investment. Deliverable D4.4 of the Smart-A project (Part II). Forthcoming, will be available for download at: http://www.smart-a.org.
[12] Möllering C. Local Energy & Smart Appliances – Strategies for increasing the use of local renewable energies by Smart Appliances. D3.3 of the Smart-A project. Forthcoming, will be available for download at: http://www.smart-a.org.
128

Evaluation
129

130

Best Practices and Issues for Attributing Effects to Energy Efficiency and Behavioral Programs – Discussion of Net-to-Gross (NTG) and Non-Energy Benefits (NEBs)
Lisa A. Skumatz, Ph.D.
Skumatz Economic Research Associates, Inc. (SERA), Superior, CO, USA
Abstract Evaluation and attribution methods have reached a point that they must evolve in order to provide credible results for the next generation of programs. Two primary factors have complicated the methodologies that have been applied to energy efficiency programs:
• Transition to more behavioral, outreach and other non-measure-based programs (education, advertising), making it especially hard to “count” impacts, and
• Increased chatter in the marketplace, in which consumers may be influenced by any number of utility programs by the host/territorial utility (the “portfolio”) as well as influences from outside the territorial utility (national, neighboring programs, movies/media).
The authors1 reviewed hundreds of conference papers and interviewed scores of professionals to identify improved techniques (and associated policy issues) for quantifying the share of direct and indirect effects that can be attributed to the influence of program interventions above and beyond what would have occurred without the intervention – either naturally or due to the sway of other market influences or trends. The project involved a review of methods from around the US and Canada. The authors analyzed: issues/ problems from current approaches; alternatives proposed or considered (including from other fields); applications and what “needs” to be measured; and the next steps that need to be taken. We present results for two key issues and how they relate to behavioral programs and the new marketplace: • Net-to-gross, including free ridership and spillover (direct program effects); • Non-energy benefits (representing indirect effects).
Near- and long-term implications for program design, evaluation, outreach, and benefit-cost for programs across the US, practices in different states, information for market “exit” timing, and “new” approaches / best practices are also presented. Introduction As part of a recent research project,2 the authors examined methods and associated policy issues related to:
• Gross Effects: Measuring the broad array of impacts caused, or potentially caused, by program interventions – either measure-based, market-based, education or other interventions. This includes undertaking the measurement of gross, or potential, energy savings and non-energy benefits.
• Net Effects Attribution: Identifying the share of those effects – direct and indirect – that can be attributed to the influence of the interventions undertaken – above and beyond what would have occurred without the intervention – either naturally or due to the sway of other market influences or trends.
Using the current terminology in the energy efficiency (EE) field, this boils down to examining four key topics in evaluation: impact evaluation; attribution / free ridership / net-to-gross; non-energy benefits; and persistence. This paper discusses preliminary findings associated with the first three topics.
1 Thanks to literature review and other assistance from Carol Mulholland and Jane Colby (Cadmus Group), D. Juri Freeman, Dana D’Souza, and Dawn Bement (Skumatz Economic Research Associates), and Gregg Eisenberg (Iron Mountain Consulting). 2 This paper represents the results of preliminary research conducted for CIEE, but errors remain the responsibility of the author; the CIEE Project manager is Ed Vine. More detailed / complete research is forthcoming.
131

The data and outputs from these evaluation topics are used for an array of applications, including: • Measuring progress in the market – most often using share of sales / installation of energy
efficiency (EE) equipment compared to standard equipment; • Benefit-cost analysis for programs – generally using standardized regulatory tests; • Attributing savings, and shareholder benefits, to entities investing in (specific) programs –
applying gross impact evaluation values modified by net-to-gross attribution ratios consisting of free ridership, and some share of spillover;
• Comparing savings from EE to market needs and supply sources to assure energy demand needs are met – reviewing the cost per unit for EE vs. new supply, and the size and reliability of the kWh or therms;
• Program decision-making, marketing, and program design – using results of process, impact, free ridership, and other program evaluation elements to improve and optimize the program offering; and other applications.
In each case, there can be significant investment dollars at risk or associated; hence the need to revisit methods and approaches. Further, as programs have evolved, evaluation has become more complex. Some programs have moved away from “widget” based programs toward education, advertising, and up-stream programs that make it harder to “count” impacts. In addition, there is an increasing number of actors delivering these programs – leading to market chatter and increasing difficulty in identifying which among all the deliverers of the EE message are responsible for the change in energy efficiency behaviors, actions, or purchases. The increased chatter in the marketplace allows a situation in which consumers may be influenced by any number of utility programs by the host / territorial utility (the “portfolio”) as well as influences from outside the territorial utility (national, neighboring programs, movies / media, etc.). Attributing or assigning responsibility for changed behaviors, adoption of EE measures or similar effects is muddied. There is considerable debate over the precision – or (presumed) lack thereof – in association with a number of specific aspects of evaluation research. For example, many criticize the accuracy of free ridership or net-to-gross ratios, or deride the estimates of non-energy benefits. The 2003 Nobel-award winning economist, W.J. Granger, summarized the overall purpose of evaluation as ‘…research designed to help avoid making wrong decisions (about programs)’.3 As this relates to energy efficiency programs, perhaps the three most important potential “wrong decisions” might relate to:
1) Assuring public dollars are being responsibly spent; 2) Apportioning dollars and efforts between alternative strategies; and 3) Helping identify the appropriate time for exit strategies (or program revisions).
Perhaps this overriding principle is worth keeping in mind as we consider our standards for evaluation in energy efficiency. If adopted (at least for some applications), then it becomes clear that the level of accuracy applied to evaluation research can be flexible, based on the value (cost) of the possibility of a wrong decision coming out of the particular advisory research.4 Identifying the cost of a “yes/no” decision about going ahead with a program or intervention may allow a much less accurate estimate for input information than a decision about the precise level of shareholder dollars that should be allowed for a particular agency, should that be a desired outcome to be supported by the evaluation exercise. This paper represents the preliminary results of research that involved outreach to more than 100 researchers in the energy evaluation and related fields, and review of more than 100 papers and reports representing research in the key topics covered by this paper. Our ability to follow-up on some of the research was limited by budget constraints. The work does, however, attempt to identify the state of the art and its strengths / weaknesses, potential improvements and how they relate to behavioral issues, as well as recommendations on next steps and next research directions.
3 Luncheon speech, Western Economics Association Meetings, Denver, CO, 2003. Parenthetical clarification added by author. 4 It may also suggest that the accuracy on one “tail” of the research may be different than the other tail.
132

Energy Savings Measurement The first step in attribution of program effects from an energy efficiency intervention is generally developing an estimate of energy savings. Impact evaluations apply at least one of the following five general methods: • Measurement and Verification (M&V), which involves metering or estimating key parameters
from a sample of participants and applying it to all participants.
• Deemed Savings, which involve applying “deemed” or agreed-upon savings obtained from other evaluations or manufacturers data to all program participants.
• Statistical Analyses, which involve applying statistical regression models to utility billing or
metering data of all program participants • Market Progress / Market Share,5 which uses information from sales, shipments or other similar
data to develop estimates of changes in sales (and implied usage) of program-recognized energy efficient equipment relative to non-program equipment. Estimates of the associated energy (and/or demand) savings are then calculated.6
• Surveys and Self-Reporting, which are often needed to estimate the savings-related changes
from behavioral / educational / social marketing programs, perhaps in concert with market progress methods described above. While there can be difficulties linking back to direct savings (and some simply don’t try to count or evaluate these programs), good experimental design with random assignment to test and control groups of adequate size can provide estimates.
These approaches have generally served to provide gross estimates of programs, even if a few issues have arisen in respect to the application to more market and behavioral programs. Interviews with leaders in the field and review of the literature indicate a number of key issues associated with the application of these methods to the evolving generation of programs: • An up-front understanding of program goals against which progress is being measured is not
always available and complicates evaluation. • The field needs to pay more attention to market assessments – up front – so it becomes clearer
what actions are needed in the market and when a program should exit the market – and to provide baseline information.
• Market and appliance / equipment saturation surveys need to be re-introduced to allow better understanding of the market, identify needs, and provide a baseline for program evaluations.
• Logger studies are needed for some types of measures (e.g. lighting) and programs. • There is a significant problem in using program records for establishing a baseline; information
is collected to support rebates and not evaluation, or useful baseline data are not collected up-front against which to compare.
• Modeling and other approaches for assessing behavioral programs could be improved. • Education and behavioral program evaluations have been evaluated, but tend to require
tailored, rather than prescribed, evaluation methods. Impacts may be indirect in some cases, but direct and indirect impacts can be measured for many programs with good up-front experimental design methods and sufficient sample sizes.
• Estimating the impacts from one program is difficult – many suggest it may only be possible to estimates market effects from entire portfolios of programs.
Net Effects – Free Riders and Net to Gross (NTG) Whichever of these techniques is used, estimation of gross effects is only one step in the attribution of “net” effects to specific programs. The “net” effects are a significant element of the assessment of
5 For example, Dimetrosky and Titus 2007, and Skumatz, 2007. 6 One innovative approach indirectly measures market share by estimating the effect on a decomposed price differential and tracking the size of the coefficient for the efficiency features of the measure(s). See Skumatz 2007; Skumatz 2009.
133

benefits and costs for a program, computations that in some states can determine the start, continuation, or dissolution of a program’s funding. Estimating the effects of the program above and beyond what would have happened without the program involves another step – identifying the share of energy efficient measures installed / purchased that would have been installed / purchased without the program’s efforts. Some purchasers would have purchased the measure without the program’s incentive or intervention. They are called “free riders” – they received the incentive but didn’t need it. Others may hear about the benefits of the energy efficient equipment and may install it even thought they do not directly receive the program’s incentives for those installations. These are called “spillover”7 – implementers that were not recorded directly in the program’s “count” of installations. The combination of the “negative” of free ridership and the “positive” of spillover are computed as a “net to gross” (NTG) ratio, and are applied to the “gross” savings to provide an estimate of attributable “net” savings for the program.8 The NTG, or its components, have been addressed in four main ways: • “Deemed” Net to gross, where some net ratio is assumed (1, 0.8, 0.7, etc.) that is applied to all
programs or all programs of specific types. This is generally negotiated between utilities and regulators or assigned by regulators.
• Models with dynamic baseline: in this case, a baseline of growth of adoption of efficient measures is developed, and the gross computation of savings is adjusted by the estimate from the baseline for the period.
• Paired comparisons: Saturations (or changes in saturations) of equipment can be compared for the program (or “test”) group, vs. a control group. The control group is similar to the test area in all possible ways, but does not offer the program being studied – or those particular customers do not receive the program. Ideal is pre- and post- measurement in both test and control groups to allow strong “net” comparisons.
• Survey-based: In this approach, a sophisticated battery of questions is asked about whether the participant would have purchased the measures / adopted the behavior without the influence of the program. Those participating despite the program are the free ridership percentage.9 These are then netted out of the gross savings. Spillover batteries can also be administered to samples of potential spillover groups (participants, non-participants).
Spillover is more complicated than free ridership to measure. Free ridership emanates from the pool of identified program participants; the effects from spillover are not realized from the participating measures or projects and in many cases, not even all from the entities that participated. Identifying who to contact to explore the issue of spillover and associated indirect effects can be daunting. Our interviews suggest that a number of utilities consider free ridership, but do not include spillover (also called free drivers) in their analyses of program effects. As an example, one major California study addressing net to gross explicitly limits its analysis content to free ridership. There is considerable – and growing - controversy regarding the use of net to gross, particularly in regulatory proceedings. NTG ratios can be used to reduce (incorporating free ridership) or potentially expand (if extensive free ridership is associated with the program) the amount of savings attributable to a program. This has huge potential financial implications in some states in which utilities may receive financial awards for running programs and running them well. The controversy seems to arise from the following main issues: • The potential for error and uncertainty associated with these measurements, because of
difficulties in 1) identifying an accurate baseline; 2) identifying / implementing a control group;
7 For those interested, there are commonly three types of spillover. Inside project spillover, in which refrigerators are rebated and the person receives / installs that equipment, but they start thinking about conservation and also install an energy efficient dishwasher. Outside spillover is when a builder gets rebates on one project, but then starts to install similar efficient measures in other projects (e.g. homes) even without rebates. Non-participants spillover applies to builders that hear about energy efficiency and never participated or got any rebates, but started to hear about energy conservation and decided to install efficient equipment to serve his customers or to keep up with other builders, etc. No incentives were provided for these measures. 8 The literature shows computations of this NTG ratio from adding the factors (1-FR+SO) or multiplicative computations are sometimes used ((1-FR)*(1+SO)). Both are used in practice. 9 Using enhanced batteries of questions allowing for partial spillover, and asking corroborating questions can help improve the reliability of this approach. Skumatz, Violette, and Woods, 2004.
134

or 3) relying on self responses to a survey depending on the free ridership / spillover methods employed.
• The expense of high quality analysis – with arguments the money could be better spent on program design, implementation, incentives, etc.
• Baselines and effects are harder and harder to identify and analyze as programs move up stream, involve different levels of vendors and other actors, and lead to changes in baselines up the chain. In addition, program spillover complicates control group assessment.
• Difficult to separate out the effects and influences of different programs within a marketplace (own utility / agency and outside utility / agency).
• Concerns that using measured NTG or free ridership ratios introduces a great deal (to some, an unacceptable level) of risk into the potential financial performance metrics for the program, which will lead to “same old / same old” programs and reduce innovation in program offerings.
However, despite these concerns, to quote one prominent researcher in the field, “not measuring is not the answer”.10 Rather, it may be important to consider the uses to which the free ridership, spillover, or net to gross ratios are put. Based on our analyses, however, elements of the NTG measurement are important for the following reasons: • Free ridership is important to identify superior program designs or exit timing. Programs with
higher free ridership might benefit (in at least cost-effectiveness terms) from tweaking of outreach, targeting, rebate / intervention levels, or refinements in which (efficiencies of) measures are included in the program. If programs have high free ridership, or if free ridership has been increasing significantly, it may be time for the program to be phased out, delete or upgrade measures, or undergo a significant redesign.11
• Spillover is a very important metric in assessing the performance of education / outreach /
behavioral programs. In fact, spillover is one of the key desired impacts from these types of programs. Ignoring these effects may significantly understate the program’s performance.
Examining performance (free ridership, spillover, net to gross) makes it possible to distinguish and control for poorly designed / implemented programs, and cookie cutter designs that may have declining performance over time. Some interviewees said ‘deemed savings are ridiculous’ for this reason. The “rub” for objectors to NTG seems to arise from several sources: 1) cost of the NTG research and estimation work; 2) reliance on self-report surveys, and 3) the gravity of the uses to which NTG has been put. The third derives from the fact that NTG elements have become part of computations of financial reward, and the research is exploring a number of options including, but not limited to, the following: • Deemed savings with periodic checks of NTG ratios for the program to balance risk with
innovation incentives; • Developing “deemed” values for common program types; • Allow flexibility for innovative programs, or for complex programs. Reliable measurement methods are available that suit many program types. • Basic experimental design work that requires random assignment into treatment and control
groups. Although politically difficult, it is particularly important for outreach and behavioral programs.12
10 Mike Rufo presentation at 2009 ACEEE- Market Transformation Conference, Washington DC. 11 On a related note, free ridership is affected by NEBs and affects program participation. High free ridership may occur because measures have a host of attractive features. Computing rebates or incentives based on economic payback only may lead to higher rebates than needed to induce adoption of efficient measures or behaviors. High free ridership indicates the presence of this potential problem. 12 Many advertisers measure the impacts as far as message or adversiting retention, but this should proably not be suffcient for energy efficiency measrues becuase there are so many setps to achieving the ultiamte goal of energy savings. They must not only purchse the meaure (probably the end of the concern for product adveritseres), but must install it, use it properly, and hopefully retain usage. Energy efficiency evalautors may need a higher standard to assure programs are well designed and public dollars are being effectively spent.
135

• Consider survey designs that introduce a real-time data collection element to gather early (and potentially more reliable) feedback on program influence near the point of actual decision-making.13 This may be suited to education programs as well as “widget” programs.14
• Another approach that may work for some programs is to use discrete choice modeling approaches introducing explanatory variables that help address issues of imperfect control groups, unobserved factors, etc. to allow improved estimates of attributable impacts.
This issue is important and bears further research. There is likely a compromise approach that encourages good design and performance, doesn’t stifle innovation, and isn’t too burdensome. It may be worth further testing some of the approaches described in this section. Non-Energy Benefits (NEBs) Non-energy benefits (NEBs)15 represent the positive and negative effects beyond energy savings and energy bill savings that are attributable to energy efficiency programs. Strictly speaking, NEBs are “omitted program effects” – impacts attributable to the program, but often ignored in program evaluation work. After years of research, more and more utilities and regulators are considering these effects in program design, benefit / cost analysis, marketing, and other applications. Over the last 20 years, a wide range of NEBs have been identified in studies.16 Starting with work in the mid-1990s, the literature began to explore more consistent measurement methods, and sort these benefits into three “perspectives” based on the beneficiary of the effect – utility / agency; societal; and participant.17 While there are certainly measurement issues associated with estimating “hard to measure” (HTM) effects like NEBs, credibility also suggests that some basic methodological considerations also be considered in assessing and attributing NEB effects to energy efficiency (EE) interventions. Best practices require addressing each of the following in NEB research. • Issue of Redundancy: Note that similarly-named benefits can arise in multiple perspectives
without being redundant. For instance a reduction in bill-related calls to the utility company benefits both the utility / ratepayers and the participating households making or receiving those calls. This is not double-counting benefits – rather, it recognizes that some effects have multiple beneficiaries and each is valued at an appropriate tailored valuation method.
• Net Positive and Negative: Non-energy benefits or non-energy effects may be positive or
negative, and the “net” effects may also be positive or negative. Negative benefits can be interpreted as barriers in some applications.
• Net of standard equipment choices: When NEBs are applied to energy efficiency programs,
it is critical that the impact be measured above and beyond the base of what would happen without the program – specifically, the equipment that would be selected without the program. That is generally taken to mean equipment that is standard efficiency at the point of the purchase of the equipment. For estimation work based on survey responses, it is important to ask about NEBs not between a household or businesses’ OLD equipment (which they may be replacing), but between the standard efficiency NEW equipment they would otherwise purchase vs. the higher efficiency new equipment that the program addresses.
• Net of free riders: To the extent that the interest is in NEBs that are attributable to the
program above and beyond what would have happened without the program, the NEBs would have a free ridership factor applied (and potentially spillover, but that is another discussion).
13 Gordon and Skumatz, 2007. 14 This could be through forms filled out after program delivery, through web surveys, or other approaches with appropriate follow-up to monitor adoption and retention of desired behavioral changes. 15 The term Non-Energy Benefits (NEBs) has been the standard term in the literature since the late 1980s. Although more lately some authors have attempted to rebrand the term as non-energy effects or impacts, we give naming rights to the originators of the concept. 16 A detailed literature review covering more than 300 studies is included Skumatz 1997, Skumatz and Dickerson1998, Weitzel and Skumatz 2001, and other subsequent studies). 17 Initiated in Skumatz 1997 and described in detail in subsequent research by the author,and reviewed in Amann, 2006.
136

• Minimizing Overlap / Double Counting: As discussed above, early work on NEBs focused
on developing laundry lists of possible impacts / sources. Care is needed in defining the specific NEBs measured within these categories to minimize overlap and double-counting. For instance, owners may have difficulty separating out labor changes from maintenance benefits and might assign value to each and possibly double-count at least a portion of the value. However, pulling back and focusing on non-overlapping ”drivers” (as listed in the table above) as sources may help alleviate some of this issue. In addition, asking about total values can be used to “normalize” individual categories of impact, reducing the potential overestimate of impacts from a pure “bottom up” valuation approach.18
A discussion of each of the main three perspectives for NEBs follows. Utility-Perspective NEBs: These are NEBs realized as indirect costs or savings to the utility – and its ratepayers (like bill payment improvements, infrastructure savings, etc.). The vast majority of initial work on NEBs in the 1990s focused on utility perspective NEBs, particularly addressing topics related to arrearage changes from low income programs. Significant impacts were attributed to the programs (an average of about 20-25% reduction in arrearages); however, when valued for the utility at carrying charges, these arrearage effects were small for each participant. Further, when compared to the values associated with other benefit categories from the societal and participant perspective19, the arrearage and debt / financial benefits from programs represented a small fraction of overall NEBs. Limited work may still be proceeding on these impacts on a program-by-program basis20, but they are not making it into the literature. However, there is a fair number of utility-perspective NEBs that are not being much addressed in the literature – probably because they can be difficult to estimate – and some of these may have weight. These include: line loss reductions lower generation, transfer, and use of kWh by (participating) customers; time of day / capacity impacts / avoided infrastructure,21 and insurance impacts, among others Societal-Perspective Impacts: These impacts represent indirect program effects beyond those realized by ratepayers / utility or participants, but accrue to society at large. A great deal of attention has been paid to two main types of societal NEBs – specifically: • Emissions: Early literature estimating values for these impacts – and the effort required to
measure them - varied dramatically, depending on whether deemed values were used (at one simple extreme), or whether the effects were measured for a particular air shed (very complex modeling). As time goes on, studies are moving toward the middle, assigning factors for avoided emissions per kWh saved based on generating fuel mix. The literature addresses three main options for the complexity of emissions-per-kWh factors the used to develop program estimates: using “grid or system average” values (average fuel mix for the entire year across the territory); margin operations (varying the emissions per kWh by type of fuel mix for peak / off peak and similar variations depending on the program and measures) or hourly dispatch, involving more complex modeling of time and location of savings. Greater complexity supports more differentiation by type of program, but also increase time and cost. However, the GHG impacts are large, and as utilities begin eyeing cap and trade scenarios, the potential value of these NEB estimates and the emphasis on estimating these NEBs is increasing. However, three issues need to be addressed before the NEB values for emission can be used beyond fairly simple applications – particularly before they can be used for cap and trade, etc. These include: additionality (parallel to net-to-gross, assigning savings to a particular program or portfolio without overlap from other programs or efforts to avoid double-claiming); program vs. project attribution; and error / risk / uncertainty issues. While each issue has been raised by many papers, none of the papers forwarded solutions and the debate continues on the international stage.
18 Skumatz and Gardner 2006. 19 for instance, as pointed out in the LIPPT work, among other comprehensive studies 20 For instance, arrearage reductions may be a goal of a low income program; if these impacts are being measured for goal-related reasons, the computation of the associated utility-perspective NEB merely needs a carrying charge interest rate. 21 This is very important. However, it may be that the estimates associated with demand response programs may currently be considered direct impacts, rather than NEBs. There are effects associated with a wide array of programs, and these indirect benefits are valuable, however, it can be debated whether they fall into NEB or energy effect categories.
137

• Job creation / economic development: Energy efficiency programs are generally more labor intensive than electricity generation.22 The literature shows significant impacts associated with efficiency programs, and that these impacts vary dramatically depending on the type of program (weatherization and education programs are more labor intensive than appliance replacement programs) and by the scope of the territory being considered and the local industry mix.23 Most researchers are relying on third party macroeconomic input/output models to develop these estimates, with considerable reliability and reliability.
• Other: The health and safety impacts have been very sparsely studied, even though the impacts on the health care system – including incidence of chronic illnesses, etc. - may in fact be quite large. Infrastructure (water and power) and national security impacts are gaining some attention. Few other societal impacts have been seriously measured.
Participant-Perspective NEBs: The most controversial types of NEBs are those that accrue to the program participants. This is where factors like operations and maintenance, comfort, productivity, “doing good for the environment” and others arise. Some lists include more than a score individual benefit categories. The literature has tested more than eight main methods of measuring these NEBs, in three main categories: • Direct computation: Examples include engineering computations, estimates from business
records, water savings per fixture multiplied by rates, etc. • Survey methods: willingness to pay / accept, contingent valuation, verbal / percentage /
labeled scaling; and others. • Other specialized techniques: regression-based methods (for example used to estimate
productivity or student score impacts from daylighting). Each method has pros and cons, and a few studies have compared performance of different measurement methods. The main purpose of each is to develop monetized estimates of the indirect impacts that can be assigned to the program. A review of scores of studies of participant NEBs for residential, commercial, renewables, and other programs repeatedly showed relatively large estimated participant NEBs. The computed values often exceeded the value of the energy savings from the program measures. And although the papers varied in their estimation methods, all argued that the impacts were real, and were significant and merited continued analysis. The most common positive, highly valued NEBs related varied somewhat by programs and measures. However, for residential measures, comfort, operations and maintenance, ability to do good for the environment, and other features or performance-related elements were often among the most valued benefits. If water savings were associated with the measure, that factor often rated highly, and property value improvements were also valued for weatherization and similar programs.24 On the commercial side, again, the NEBs varied considerably based on program, with varied benefits for design-related programs, and more limited specific values or programs focusing on individual measures.25 Highly valued positive effects tended to include comfort, operations / maintenance / lifetime, "doing good" for the environment, and performance issues. Productivity benefits were demonstrated, particularly in several studies that focused on that metric (analyses of daylighting in schools and retail26). A percentage of the commercial studies found significant net negative NEB values – and significant concerns – related to maintenance of new, cutting edge energy efficient equipment.27 This issue was explored in terms of its implications for representing a significant program barrier, and the information the NEB values provided for possible remedies.28 Specialized
22 See studies of “net” job creation and economic multiplier studies including Imbieriwicz and Skumatz 2004; Imbierowicz, Skumatz, and Gardner 2006; Skumatz and Freeman, 2009, among others. 23 Imbierowicz, and Skumatz, 2004 24 Negative effects were relatively uncommon for residential measures, with occasional exceptions for aesthetics, noise, or sometimes maintenance. Low income programs also valued the improved ability to pay bills and the improved understanding of energy using equipment. 25 For example, in a boiler evaluation by the author, the smaller footprint was very highly valued. 26 Aumann et.al. 2004 27 In research by the author, this usually expressed in concerns that support staff wouldn’t be albe to maintain it, or parts would be hard to obtain in less urban areas, etc. 28 It was suggested that the value of the negative NEB could be one indication of the dollar value that would be needed to increase adoption of the meaure (and progarm participation). In one program, suggestions were made that the program might
138

analyses of commissioning, renewables, and real time pricing programs also showed strong NEB values. NEBs have been applied liberally to behavioral and education program – and it has been suggested these represent some of the key values of the programs. These include a variety of Energy Star programs, weatherization and education programs, commercial training, schools programs, and others. The literature has also explored NEB values toward a more robust understanding of program participation and decision-making. This may have particular application in understanding program decision-making and in addressing behavior and information programs. Studies have examined differences in NEBs for participants vs. non-participants, and for various actors in the chain of delivering a program (vendors vs. businesses, builders vs. owners, etc.) to explore differences and disconnects in perceptions of NEB values for energy efficient equipment as an indicator of where additional information, incentives, or other interventions may be needed to continue strong adoption of efficiency measures. Studies point out that, internally, in program design and evaluation,29 NEBs can be used for several key purposes: • Marketing and targeting to maximize the bang for the budget dollar; • Crafting the marketing message to “sell” the program or measures based on the features that
most appeal to potential participants. • Identifying “negative” NEBs and differences in NEB values by supply chain actors, which
describe important program barriers that can be addressed; • Selecting among measures to include in the program, examining tradeoffs in terms of
measures with higher NEBs to provide maximum value for participants. • Estimating appropriate program incentives, including the value of non-economic factors
accompanying the measures, rather than setting incentives based only on economic payback computations to optimize incentives and encourage better (and more efficiently-funded) participation.
• Benefit cost assessment. While most utilities and regulators are not treating NEBs formally, some are examining them for marketing purposes. A few include “easily computed” NEBs in formal analyses (e.g. soap and water savings for washing machine programs). One utility considers “readily measured” as maintenance, greenhouse gas, lifetime, product loss / waste, equipment productivity, and floor space indicators.30 Another considers “readily measured” as carbon value in societal tests, present value of deferred plant extension, and water / sewer savings.31 Another utility includes percentages of NEBs in various scenarios they present to the regulators. Although NEBs have a wide array of potential applications, they have been used only sparingly by utilities and regulators around the country because of concerns about measurement uncertainty. They have been suggested to potentially have roles in: • Portfolio development (utility, societal, and participant NEBs) • Program refinement (utility, societal, and participant NEBs) • Marketing (participant and potentially societal) • Benefit cost / customer decision-making (participant and possibly societal) • Benefit cost / regulatory applications (potential utility, potentially participant, probably societal).
Considerable debate has arisen over the use – or lack of use – of NEBs in regulatory tests. In particular, many believe that some NEBs (environmental and elements of participant benefits) should appropriately be introduced into the TRC or societal test. 32 This would support better selection
consider augmenting the warranty toward the value of the concern, or increase the rebate to offset the perceived negative value. (Skumatz and Bement, 2007.) 29 And related, in many ways, to process evaluation. 30 BC Hydro 2008 31 Author inteview with Fred Gordon, Energy Trust of Oregon, 2009. 32 To get past the barrier of prescribed tests in the California environment, Knight et. al. (2006) has suggested that rather than adding NEBs as a benefit, it might be considered the inverse - a reduction in the costs - achieving the same objective. This is receiving some important traction at the CPUC. Knight has pursued this issue the farthest. Examining template scenarios, Knight computes that if a program starts at a TRC test of 1, adding environmental effects would increase the TRC; if economic effects of 50% of the energy savings were added, the TRC would increase to 3; if NEBs reflected that participant costs are 50% and residents would be essentially willing to pay 50%, the TRC would be 4, and so on. He suggests for one program with conservative assumptions, NEBs would push the participant test value to 2, depending on the program. He suggests the program screening process is too conservative and strong, beneficial programs are being rejected.
139

between programs, and support variations for programs that are peak / off peak, or vary based on fuel choice, etc. A review of current treatment of NEBs in regulatory tests (BCHydro 2008) finds evidence of utilities using NEBs in program marketing; in scenario analysis, as a project screening device, as a program screen, but none currently using it formally as a program screen in regulatory applications. Non-energy benefits (NEBs) may reflect some of the most important effects from energy efficiency measures and programs, and may especially represent some of the main outcomes of educational and behavioral programs. Current regulatory tests, by omitting these impacts, may serve to discourage adoption of these programs. However, the literature argues that NEBs are real and to some degree measurable, and have a variety of applications. They represent important factors influencing program and measure adoption, but it is unclear how quickly regulators or others may begin to incorporate NEBs into the program review process. Perhaps an important near-term step may be the approach used in New York, in which program / portfolio metrics are reported with various proportions of NEBs incorporated. This provides an indication of the overall value of the programs, and if provided at a program and portfolio level, might better reflect some of the differential values associated with education and behavioral – and other – programs. If these indicators can be allowed to influence some program choice, this may achieve the objectives suggested by Granger, helping avoid making wrong (or less good) program choices. Conclusions New program generations have complicated evaluation. Education, outreach, training, and market-based approaches make it harder to count “widgets” and assign savings for energy efficiency programs. New and multiple actors providing programs and outreach within utility territories increases the influence “chatter” and make it harder to isolate the impacts associated with one agency’s program, or even the influence of one vs. another program from one utility or entity. These important evaluation complexities have become harder to ignore. Some have argued that traditional evaluation approaches are failing and not worth conducting. Others have proposed modifications and patches. It may be the case that varying and evolving programs may not be suited to “one size fits all evaluation protocols” and need tailored evaluations, but, to paraphrase, not measuring is not the best answer. The best programs will not be identified – or valued and taken seriously by system planners and regulators – unless they are measured and verified (and frankly, nor should they be). A review of the state of evaluation in these areas – gross and attributable net savings, and non-energy benefits – suggests some lessons are old lessons (up-front evaluation design and random assignment may seem difficult, but there is no reliable “after the fact” substitute). Some are new possibilities (for example, reflecting market share through price decomposition, revisions to the regulatory tests to incorporate NEBs). Some concessions to chatter and overlaps may be needed (portfolio-level decision-making, or scenarios may be an appropriate evolution). There needs to be more up-front market assessment and baseline attention (saturation studies, perhaps augmented with behavioral aspects) to support evaluation of effects at least at the portfolio level. In some cases, deemed estimates associated with template program types may be appropriate if they are updated based on periodic measurement. Other ideas have also been discussed, but most importantly, evaluations need to continue and to loop back to program design to assure the public dollars are being well-spent and “wrong” program decisions are avoided. References 1. Amann, Jennifer Thorne,Valuation of Non-Energy Benefits to Determine Cost-Effectiveness of
Whole House Retrofits Programs: A Literature Review, American Council for an Energy Efficient Economy, Washington DC, 2006.
2. Aumann, Don, Lisa Heschong, Roger Wright, Ramona Peet, Windows and Classrooms Student
Performance and the Indoor Environment, Proceedings of the 2004 American Council for an Energy Efficient Economy, Summer Study, Asilomar, CA, 2004.
3. BC Hydro, Discussion Paper on Counting Participant Non-Energy Benefits in the Total Resource
Cost Test, 4/15/08.
140
4. Dimetrosky, Scott, and Elizabeth Titus, Filling Gaps in the Story of Energy Efficiency Program
Success: Evaluating the Availability of Market Penetration Tracking Data for the Residential Sector, AESP White Paper Series, 2007.
5. Gordon, Susie, and Lisa A. Skumatz, Integrated Real Time (IRT), On-Going Data Collection for
Evaluation – Benefits and Comparative Results, Proceedings for the European Council for an Energy Efficient Economy (ECEEE), Cote D’Azur, France, 2007.
6. Imbierowicz, Karen and Lisa Skumatz, The Most Volatile Non-Energy Benefits (NEBs): New
Research Results Homing in on Environmental and Economic Impacts, Proceedings of the 2004 American Council for an Energy Efficient Economy, Summer Study, Asilomar, CA, 2004.
7. Imbierowicz, Karen Lisa A. Skumatz and John Gardner, Net NEB Multipliers for Economic
Impacts – Do Multipliers Vary Significantly by State and Program Type? Proceedings of the 2006 American Council for an Energy Efficient Economy, Summer Study, Asilomar, CA, 2006.
8. Knight , Robert, Loren Lutzenhiser, and Susan Lutzenhiser, Why Comprehensive Residential
Energy Efficiency Retrofits are Undervalued, Proceedings of the 2006 American Council for an Energy Efficient Economy, Summer Study, Asilomar, CA, 2006.
9. Skumatz, Lisa A., Recognizing All Program Benefits: Estimating the Non-Energy Benefits of
PG&E’s Venture Partners Pilot Program (VPP), 1997 Energy Evaluation Conference, Chicago, IEPEC, 1997.
10. Skumatz, Lisa A., Ph.D., Tracking Market Progress: Addressing Traditional Market-Share
Measurement Issues with an Innovative Proxy - the NEEPP Tracking Approach, AESP White Paper Series, 2007.
11. Skumatz, Lisa A., Ph.D., Tracking in a New Way – Augmenting Traditional Market Share Methods
to Better Identify “Market Effects” and Program Exit Information, Proceedings of the EEDAL Conference, Berlin, Germany, 2009.
12. Skumatz, Lisa A. and Dawn Bement, New Non-Energy Benefits (NEBs) Results in the
Commercial / Industrial Sectors: Findings from Incentive, Retrofit, and Technical Assistance / new Construction Programs, Proceedings from the 2007 European Council for an Energy Efficiency Economy (ECEEE), Cote D’Azur, France, 2007.
13. Skumatz, Lisa A., and Chris Ann Dickerson, Extra! Extra! Non-Energy Benefits of Residential
Programs Swamp Load Impacts!, Proceedings of the 1998 ACEEE Conference, Asilomar, California, 1998.
14. Skumatz, Lisa A., and David Juri Freeman, Do Energy Efficiency Strategies Outperform Recycling
in GHG Mitigation and Job Creation?, Proceedings of the 2009 IEPEC Conference, Portland, OR, 2009.
15. Skumatz, Lisa A. and John Gardner, Differences in the Valuation of Non-Energy Benefits
According to Measurement Methodology: Causes and Consequences, Proceedings of the Association for Energy Service Professionals NESP Conference San Diego, CA, AESP, Clearwater FL, January 2006.
16. Skumatz, Lisa A., Daniel Violette, and Rose Woods, Successful Techniques for Identifying,
Measuring, and Attributing Causality in Residential Programs, Proceedings of the 2004 American Council for an Energy Efficient Economy, Summer Study, Asilomar, CA, 2004.
17. Weitzel, David, and Lisa A. Skumatz, Making the Most of Your Data – Reliable Techniques for
Estimating Baseline and Projected Market Shares from Market Transformation Interventions with Limited Observations, Proceedings from the 2001 Association of Energy Service Professionals (AESP) Conference, Ponte Vedra, Florida, 2001.
141
Domestic information, communication and entertainment (ICE) appliance monitoring: A practical perspective and implications for inter-disciplinary research
Michael Coleman1, Andrew Wright1, Neil Brown1, Steven Firth2 1The Institute of Energy and Sustainable Development, De Montfort University 2Loughborough University
Abstract
Inter-disciplinary research is being undertaken to improve the understanding of domestic electricity consumption by information, communication and entertainment (ICE) equipment use in UK homes. ICE appliances are consumer electronics, and information and communication technologies (ICT). The research methodology involves the collection of both appliance electricity consumption measurements and household interview data from a sample of 20 households. Initial results from 5 households suggest that the use of video appliances dominates ICE electricity consumption and that this has been influenced by the changeover to digital services. Household behaviour appears to be influenced by lifestyle factors, the formation of habits, social influences and physical constraints. Data also suggest an emotional aspect to the use of ICE appliances. Knowledge appears to be a significant factor for both the formation of behavioural patterns and the adoption of new technologies. Individuals with the role of ICE purchasing, and the transfer of user information, may be important for energy efficiency initiatives. Better product design and clearer information at the point of sale could have an influence on user behaviour. The limitations of the appliance monitoring system used are considered, and some suggestions to overcome these issues are presented.
Introduction
At present, UK domestic and non-domestic buildings are responsible for approximately 50% of national energy consumption and around 45% of the nation’s CO2 emissions [1, 2]. UK households are responsible for “about 30 per cent of total UK energy use and about 27 per cent of carbon dioxide emissions on an end user basis” [3, p74]. In 2006, space heating contributed the highest amount of energy consumption in UK homes (around 57.7%), followed by water heating (around 24.8%), lighting and appliances (around 14.7%) and cooking (around 2.8%) [4]. Space and water heating have traditionally been seen as the end uses with the most potential to make significant reductions in CO2 emissions and the “promotion of energy efficient measures in this sector have therefore been high profile” [5, p12]. However, there is growing concern for the increase in use of domestic appliances within households [5-8]. The estimated consumption of electricity from the lighting and appliances end use has more than doubled from around 44TWh to 89TWh between 1970 and 2004 [9]. It is now widely anticipated that this trend will continue as a result of further increases in appliance ownership, new services and the further diversification of products [6, 7, 10]. Figure 1 shows the electricity consumption of the main appliance types and indicates that over the past 10 years consumer electronics and information and communications technology (ICT) appliances have been the most rapidly growing electricity end use.
Defra [11] has forecast that, with no action, the electricity consumption from consumer electronics alone could rise 64%, to over 34TWh by 2020, from the 2008 baseline of around 20.7TWh. Similarly, with no action, it is estimated that household information and communication technology (ICT) electricity consumption could increase from 10.9TWh in 2006 to 15TWh by 2020, which is an increase of 34% [12]. When the consumer electronics and ICT categories are combined, into the single category of Information, Communication and Entertainment (ICE) appliances, the BERR [4] data show that in 2006 the ICE category accounted for around 31.7% of UK domestic appliance electricity consumption, significantly overtaking the traditionally highest appliance categories [4]. In contrast to other appliances, until relatively recently, there have been only limited UK policy measures to address this rising ICE electricity consumption, with initiatives such as compulsory energy labelling concentrating on white goods [8]. Efforts to raise the profile of energy efficient ICE appliances have largely been limited to voluntary initiatives. More recent European policy, such as the Eco-design of Energy-using Products (EuP) Directive, has provided a level of impetus to deal with ICE appliance
142
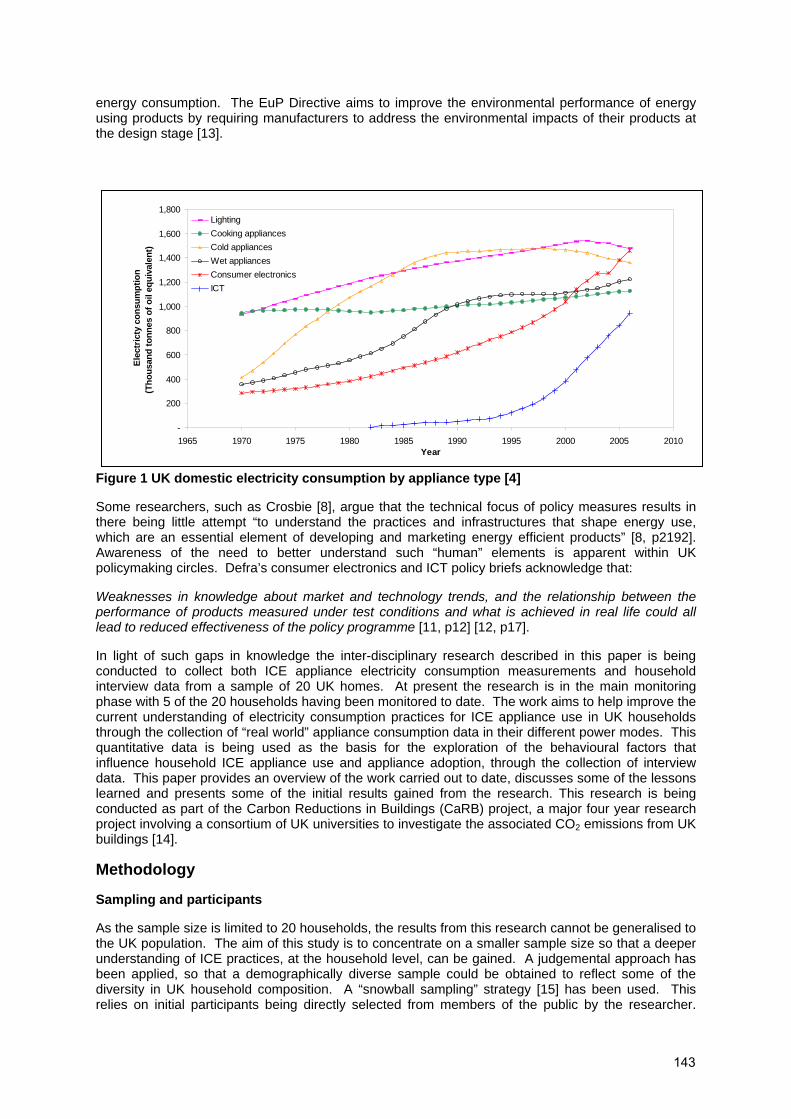
energy consumption. The EuP Directive aims to improve the environmental performance of energy using products by requiring manufacturers to address the environmental impacts of their products at the design stage [13].
Figure 1 UK domestic electricity consumption by appliance type [4]
Some researchers, such as Crosbie [8], argue that the technical focus of policy measures results in there being little attempt “to understand the practices and infrastructures that shape energy use, which are an essential element of developing and marketing energy efficient products” [8, p2192]. Awareness of the need to better understand such “human” elements is apparent within UK policymaking circles. Defra’s consumer electronics and ICT policy briefs acknowledge that:
Weaknesses in knowledge about market and technology trends, and the relationship between the performance of products measured under test conditions and what is achieved in real life could all lead to reduced effectiveness of the policy programme [11, p12] [12, p17].
In light of such gaps in knowledge the inter-disciplinary research described in this paper is being conducted to collect both ICE appliance electricity consumption measurements and household interview data from a sample of 20 UK homes. At present the research is in the main monitoring phase with 5 of the 20 households having been monitored to date. The work aims to help improve the current understanding of electricity consumption practices for ICE appliance use in UK households through the collection of “real world” appliance consumption data in their different power modes. This quantitative data is being used as the basis for the exploration of the behavioural factors that influence household ICE appliance use and appliance adoption, through the collection of interview data. This paper provides an overview of the work carried out to date, discusses some of the lessons learned and presents some of the initial results gained from the research. This research is being conducted as part of the Carbon Reductions in Buildings (CaRB) project, a major four year research project involving a consortium of UK universities to investigate the associated CO2 emissions from UK buildings [14].
Methodology
Sampling and participants
As the sample size is limited to 20 households, the results from this research cannot be generalised to the UK population. The aim of this study is to concentrate on a smaller sample size so that a deeper understanding of ICE practices, at the household level, can be gained. A judgemental approach has been applied, so that a demographically diverse sample could be obtained to reflect some of the diversity in UK household composition. A “snowball sampling” strategy [15] has been used. This relies on initial participants being directly selected from members of the public by the researcher.
-
200
400
600
800
1,000
1,200
1,400
1,600
1,800
1965 1970 1975 1980 1985 1990 1995 2000 2005 2010Year
Elec
tric
ty c
onsu
mpt
ion
(Tho
usan
d to
nnes
of o
il eq
uiva
lent
)
LightingCooking appliancesCold appliancesWet appliancesConsumer electronicsICT
143

Following their involvement, the participants are used to identify other potential households for inclusion in the study. At the initial stages of this research it was identified that, due to the novel use of the monitoring equipment, there was the potential for the monitoring equipment to require adjustment in the field. Snowball sampling meant that potential dwelling access problems were minimised and, as highlighted by Wall and Crosbie, for “exploratory research with a qualitative component, snowball sampling offers practical advantages, not least the ability to quickly recruit participants at a low cost” [16, p2]. It could be argued that this approach introduces a bias into the research due to the exclusion of random participant selection. However, the random selection of 20 participants could also introduce bias (e.g. towards households with an interest in energy issues).
Monitoring of ICE appliances
Individual ICE appliances and whole house electricity consumption in each dwelling are being monitored at 5 minutely intervals for a period of two weeks. Appliance measurements are being recorded through the adaptation of a smart metering system developed for small businesses and domestic dwellings. This residential monitoring system (RMS) is designed to collect incremental energy consumption data and was purchased by the CaRB project due to its unique characteristics, such as the provision of a straightforward data management system allowing rapid data transfer via the Internet. The RMS consists of a central data collection point, called a JACE gateway, which is connected to 20 White Goods Monitors (WGM) [17]. The WGMs are plug-in loggers that enable incremental electricity consumption data to be collected. The WGMs transfer this interval data via a Power Line Carrier connection (i.e. through the dwellings ring mains) to a LON Converter, which boosts the LONWORKS communication protocol signal and thus improves system communication. Data is transferred from the gateway to a central server on a daily basis and is managed in an SQL database. The system is easily accessible via the Internet allowing analysis to be undertaken more readily [17]. Whole house electricity consumption is being measured through the installation of a current clamp logger, which is attached to the mains supply. The quantitative data has been analysed through Microsoft Excel, which has allowed rapid graphical and statistical analysis of the electricity and power consumption of the appliances.
Householder interviews
Following the analysis of each dwelling’s appliance data, householders were interviewed about their ICE practices. Interviews have been semi-structured, so that predetermined areas of interest are investigated, whilst allowing for issues unique to each household to be pursued. Wherever practicable, interviews have been conducted with all the householders above the age of 10. Interview questions have concentrated on two key themes: (i) reasons for the main behaviours identified in the data; (ii) the reasons for the adoption of the ICE appliances. The first set of questions is facilitated through the use of graphs and charts, which summarise the patterns of appliance use recorded. The appliance electricity load profiles presented to householders were simplified, so that only the power mode and duration of use were shown. The development of behavioural questions was informed by Triandis’ [18] theory of interpersonal behavior (TIB). TIB was used, because unlike other behavioural theories, it incorporates a number of discrete constructs that were deemed of particular importance to ICE practices, such as habit, facilitating-conditions and emotions. The second set of questions was developed to explore the reasons for the adoption of the appliances within the home. Rogers’ [19] Diffusion of Innovations Theory (DIT) provided a framework to guide questions concerning the adoption of ICE appliances and technologies, such as: (i) the characteristics of the innovation (i.e. ICE appliance/technology); (ii) communication channels (i.e. the way in which householders learn about and make sense of the innovation); (iii) time (which includes the innovativeness of individuals); and (iv) the social system (e.g. social norms etc) [19]. The social and psychological theories were used to help focus the qualitative part of this study on factors found to be significant in previous empirical behavioural research. However, theory was used to guide the research, rather than constrain it, and questions were developed to allow data to come freely from participants. The interviews have been recorded and data are being analysed thematically through template analysis. Both TIB and DIT have provided useful frameworks to make sense of the data, and have helped to allow other themes to emerge. Socio-demographic data was also collected through a householder questionnaire.
Initial results
The results presented below are based on measurements recorded at 5 of the households monitored and interviews from 4 of the 5 households (household 3 postponed due to the ill health of a
144
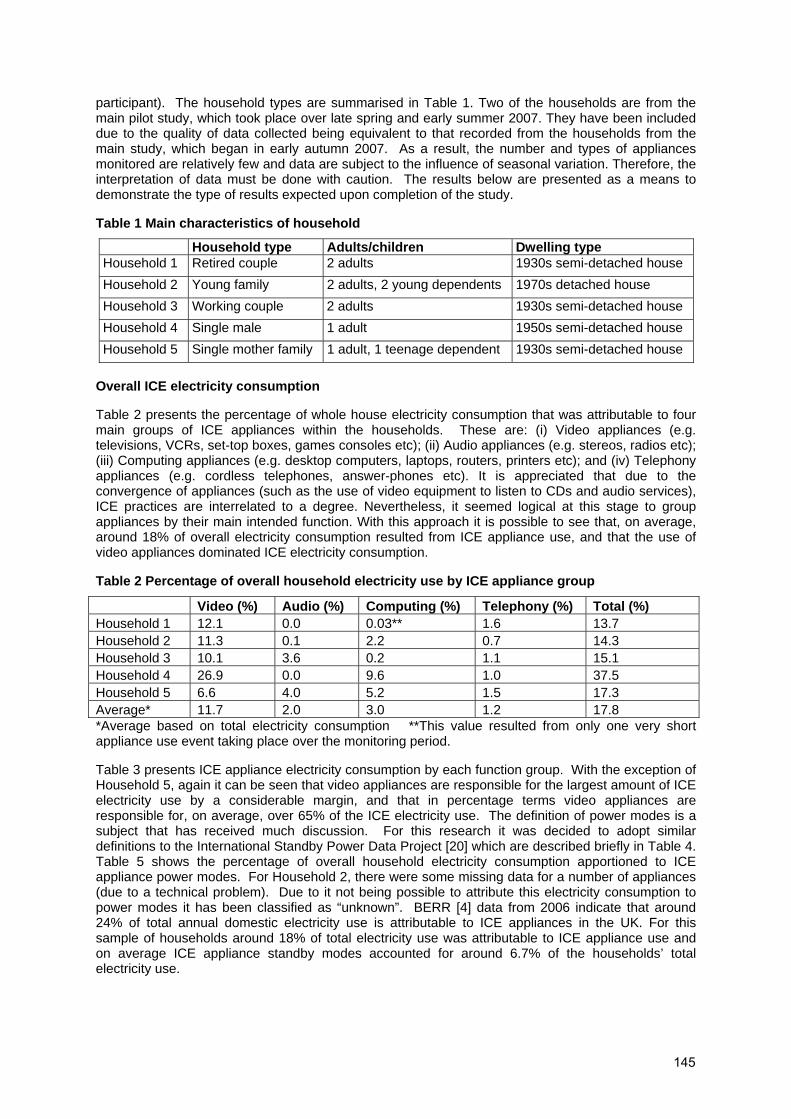
participant). The household types are summarised in Table 1. Two of the households are from the main pilot study, which took place over late spring and early summer 2007. They have been included due to the quality of data collected being equivalent to that recorded from the households from the main study, which began in early autumn 2007. As a result, the number and types of appliances monitored are relatively few and data are subject to the influence of seasonal variation. Therefore, the interpretation of data must be done with caution. The results below are presented as a means to demonstrate the type of results expected upon completion of the study.
Table 1 Main characteristics of household
Household type Adults/children Dwelling type Household 1 Retired couple 2 adults 1930s semi-detached house Household 2 Young family 2 adults, 2 young dependents 1970s detached house Household 3 Working couple 2 adults 1930s semi-detached house Household 4 Single male 1 adult 1950s semi-detached house Household 5 Single mother family 1 adult, 1 teenage dependent 1930s semi-detached house
Overall ICE electricity consumption
Table 2 presents the percentage of whole house electricity consumption that was attributable to four main groups of ICE appliances within the households. These are: (i) Video appliances (e.g. televisions, VCRs, set-top boxes, games consoles etc); (ii) Audio appliances (e.g. stereos, radios etc); (iii) Computing appliances (e.g. desktop computers, laptops, routers, printers etc); and (iv) Telephony appliances (e.g. cordless telephones, answer-phones etc). It is appreciated that due to the convergence of appliances (such as the use of video equipment to listen to CDs and audio services), ICE practices are interrelated to a degree. Nevertheless, it seemed logical at this stage to group appliances by their main intended function. With this approach it is possible to see that, on average, around 18% of overall electricity consumption resulted from ICE appliance use, and that the use of video appliances dominated ICE electricity consumption.
Table 2 Percentage of overall household electricity use by ICE appliance group
Video (%) Audio (%) Computing (%) Telephony (%) Total (%) Household 1 12.1 0.0 0.03** 1.6 13.7 Household 2 11.3 0.1 2.2 0.7 14.3 Household 3 10.1 3.6 0.2 1.1 15.1 Household 4 26.9 0.0 9.6 1.0 37.5 Household 5 6.6 4.0 5.2 1.5 17.3 Average* 11.7 2.0 3.0 1.2 17.8 *Average based on total electricity consumption **This value resulted from only one very short appliance use event taking place over the monitoring period.
Table 3 presents ICE appliance electricity consumption by each function group. With the exception of Household 5, again it can be seen that video appliances are responsible for the largest amount of ICE electricity use by a considerable margin, and that in percentage terms video appliances are responsible for, on average, over 65% of the ICE electricity use. The definition of power modes is a subject that has received much discussion. For this research it was decided to adopt similar definitions to the International Standby Power Data Project [20] which are described briefly in Table 4. Table 5 shows the percentage of overall household electricity consumption apportioned to ICE appliance power modes. For Household 2, there were some missing data for a number of appliances (due to a technical problem). Due to it not being possible to attribute this electricity consumption to power modes it has been classified as “unknown”. BERR [4] data from 2006 indicate that around 24% of total annual domestic electricity use is attributable to ICE appliances in the UK. For this sample of households around 18% of total electricity use was attributable to ICE appliance use and on average ICE appliance standby modes accounted for around 6.7% of the households’ total electricity use.
145
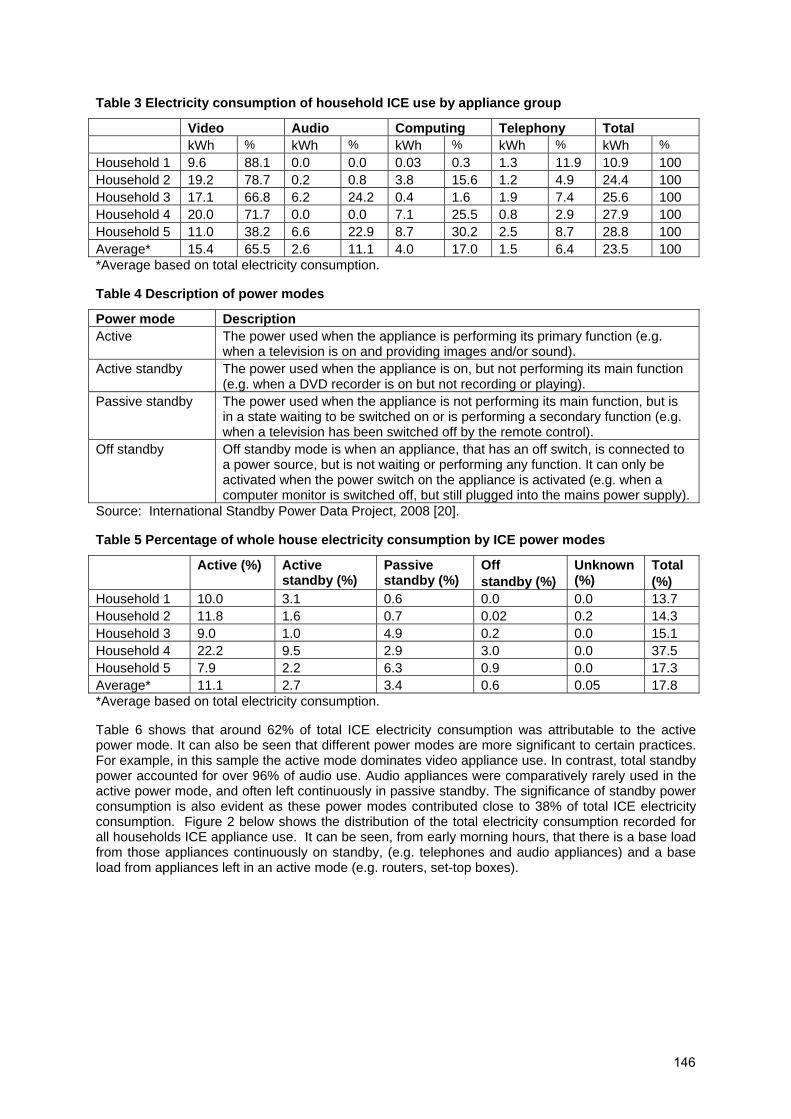
Table 3 Electricity consumption of household ICE use by appliance group
Video Audio Computing Telephony Total kWh % kWh % kWh % kWh % kWh % Household 1 9.6 88.1 0.0 0.0 0.03 0.3 1.3 11.9 10.9 100 Household 2 19.2 78.7 0.2 0.8 3.8 15.6 1.2 4.9 24.4 100 Household 3 17.1 66.8 6.2 24.2 0.4 1.6 1.9 7.4 25.6 100 Household 4 20.0 71.7 0.0 0.0 7.1 25.5 0.8 2.9 27.9 100 Household 5 11.0 38.2 6.6 22.9 8.7 30.2 2.5 8.7 28.8 100 Average* 15.4 65.5 2.6 11.1 4.0 17.0 1.5 6.4 23.5 100 *Average based on total electricity consumption.
Table 4 Description of power modes
Power mode Description Active The power used when the appliance is performing its primary function (e.g.
when a television is on and providing images and/or sound). Active standby The power used when the appliance is on, but not performing its main function
(e.g. when a DVD recorder is on but not recording or playing). Passive standby The power used when the appliance is not performing its main function, but is
in a state waiting to be switched on or is performing a secondary function (e.g. when a television has been switched off by the remote control).
Off standby Off standby mode is when an appliance, that has an off switch, is connected to a power source, but is not waiting or performing any function. It can only be activated when the power switch on the appliance is activated (e.g. when a computer monitor is switched off, but still plugged into the mains power supply).
Source: International Standby Power Data Project, 2008 [20].
Table 5 Percentage of whole house electricity consumption by ICE power modes
Active (%) Active standby (%)
Passive standby (%)
Off standby (%)
Unknown (%)
Total (%)
Household 1 10.0 3.1 0.6 0.0 0.0 13.7 Household 2 11.8 1.6 0.7 0.02 0.2 14.3 Household 3 9.0 1.0 4.9 0.2 0.0 15.1 Household 4 22.2 9.5 2.9 3.0 0.0 37.5 Household 5 7.9 2.2 6.3 0.9 0.0 17.3 Average* 11.1 2.7 3.4 0.6 0.05 17.8 *Average based on total electricity consumption.
Table 6 shows that around 62% of total ICE electricity consumption was attributable to the active power mode. It can also be seen that different power modes are more significant to certain practices. For example, in this sample the active mode dominates video appliance use. In contrast, total standby power accounted for over 96% of audio use. Audio appliances were comparatively rarely used in the active power mode, and often left continuously in passive standby. The significance of standby power consumption is also evident as these power modes contributed close to 38% of total ICE electricity consumption. Figure 2 below shows the distribution of the total electricity consumption recorded for all households ICE appliance use. It can be seen, from early morning hours, that there is a base load from those appliances continuously on standby, (e.g. telephones and audio appliances) and a base load from appliances left in an active mode (e.g. routers, set-top boxes).
146
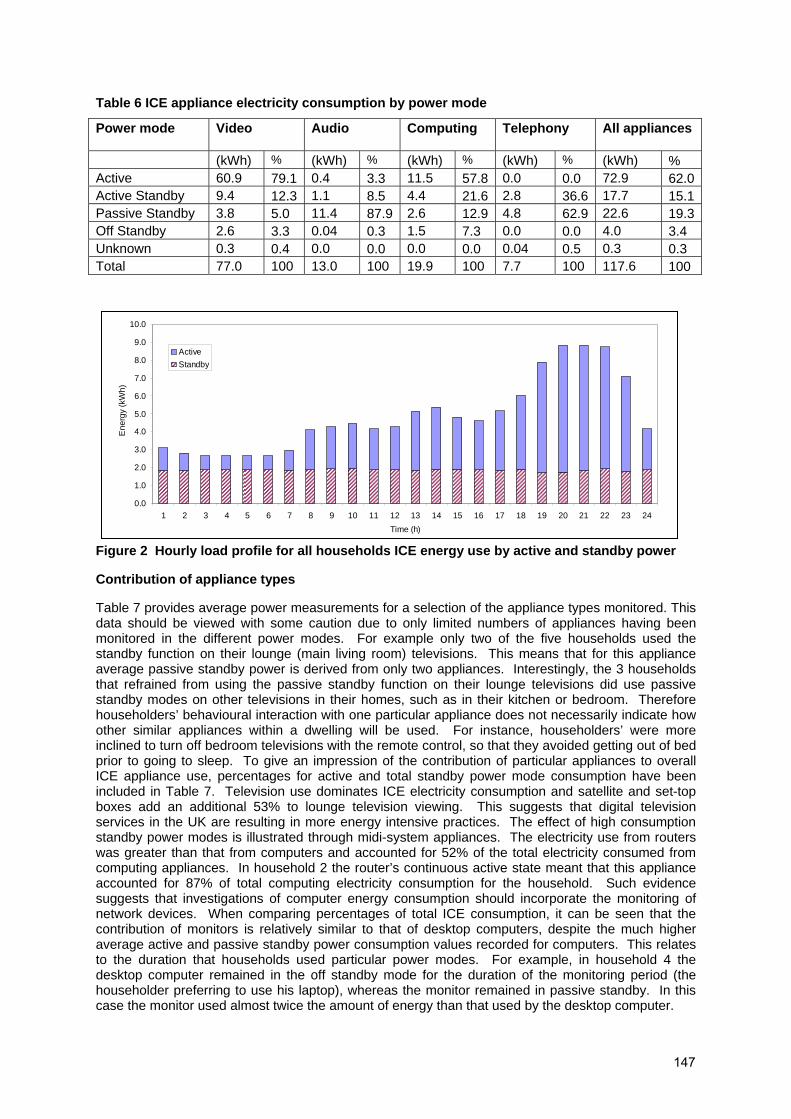
Table 6 ICE appliance electricity consumption by power mode
Power mode Video
Audio
Computing
Telephony
All appliances
(kWh) % (kWh) % (kWh) % (kWh) % (kWh) % Active 60.9 79.1 0.4 3.3 11.5 57.8 0.0 0.0 72.9 62.0Active Standby 9.4 12.3 1.1 8.5 4.4 21.6 2.8 36.6 17.7 15.1Passive Standby 3.8 5.0 11.4 87.9 2.6 12.9 4.8 62.9 22.6 19.3Off Standby 2.6 3.3 0.04 0.3 1.5 7.3 0.0 0.0 4.0 3.4 Unknown 0.3 0.4 0.0 0.0 0.0 0.0 0.04 0.5 0.3 0.3 Total 77.0 100 13.0 100 19.9 100 7.7 100 117.6 100
Figure 2 Hourly load profile for all households ICE energy use by active and standby power
Contribution of appliance types
Table 7 provides average power measurements for a selection of the appliance types monitored. This data should be viewed with some caution due to only limited numbers of appliances having been monitored in the different power modes. For example only two of the five households used the standby function on their lounge (main living room) televisions. This means that for this appliance average passive standby power is derived from only two appliances. Interestingly, the 3 households that refrained from using the passive standby function on their lounge televisions did use passive standby modes on other televisions in their homes, such as in their kitchen or bedroom. Therefore householders’ behavioural interaction with one particular appliance does not necessarily indicate how other similar appliances within a dwelling will be used. For instance, householders’ were more inclined to turn off bedroom televisions with the remote control, so that they avoided getting out of bed prior to going to sleep. To give an impression of the contribution of particular appliances to overall ICE appliance use, percentages for active and total standby power mode consumption have been included in Table 7. Television use dominates ICE electricity consumption and satellite and set-top boxes add an additional 53% to lounge television viewing. This suggests that digital television services in the UK are resulting in more energy intensive practices. The effect of high consumption standby power modes is illustrated through midi-system appliances. The electricity use from routers was greater than that from computers and accounted for 52% of the total electricity consumed from computing appliances. In household 2 the router’s continuous active state meant that this appliance accounted for 87% of total computing electricity consumption for the household. Such evidence suggests that investigations of computer energy consumption should incorporate the monitoring of network devices. When comparing percentages of total ICE consumption, it can be seen that the contribution of monitors is relatively similar to that of desktop computers, despite the much higher average active and passive standby power consumption values recorded for computers. This relates to the duration that households used particular power modes. For example, in household 4 the desktop computer remained in the off standby mode for the duration of the monitoring period (the householder preferring to use his laptop), whereas the monitor remained in passive standby. In this case the monitor used almost twice the amount of energy than that used by the desktop computer.
0.0
1.0
2.0
3.0
4.0
5.0
6.0
7.0
8.0
9.0
10.0
1 2 3 4 5 6 7 8 9 10 11 12 13 14 15 16 17 18 19 20 21 22 23 24Time (h)
Ene
rgy
(kW
h)
ActiveStandby
147
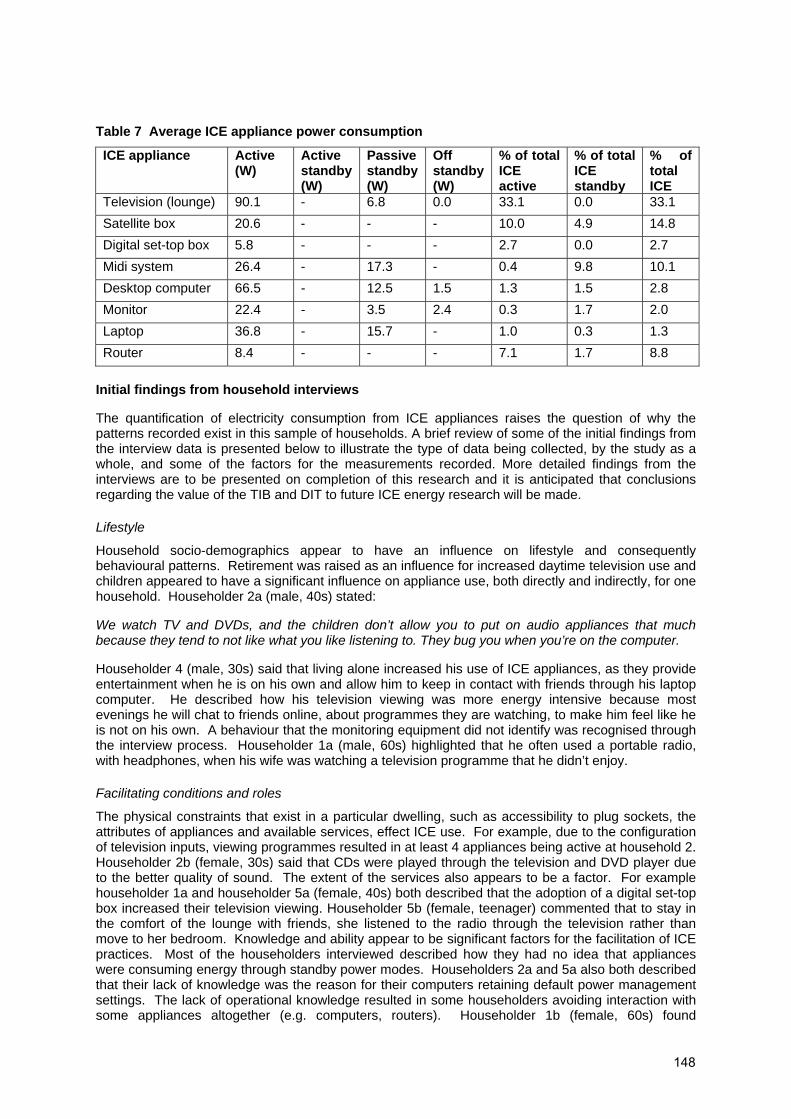
Table 7 Average ICE appliance power consumption
ICE appliance Active (W)
Active standby (W)
Passive standby (W)
Off standby (W)
% of total ICE active
% of total ICE standby
% of total ICE
Television (lounge) 90.1 - 6.8 0.0 33.1 0.0 33.1 Satellite box 20.6 - - - 10.0 4.9 14.8 Digital set-top box 5.8 - - - 2.7 0.0 2.7 Midi system 26.4 - 17.3 - 0.4 9.8 10.1 Desktop computer 66.5 - 12.5 1.5 1.3 1.5 2.8 Monitor 22.4 - 3.5 2.4 0.3 1.7 2.0 Laptop 36.8 - 15.7 - 1.0 0.3 1.3 Router 8.4 - - - 7.1 1.7 8.8
Initial findings from household interviews
The quantification of electricity consumption from ICE appliances raises the question of why the patterns recorded exist in this sample of households. A brief review of some of the initial findings from the interview data is presented below to illustrate the type of data being collected, by the study as a whole, and some of the factors for the measurements recorded. More detailed findings from the interviews are to be presented on completion of this research and it is anticipated that conclusions regarding the value of the TIB and DIT to future ICE energy research will be made.
Lifestyle
Household socio-demographics appear to have an influence on lifestyle and consequently behavioural patterns. Retirement was raised as an influence for increased daytime television use and children appeared to have a significant influence on appliance use, both directly and indirectly, for one household. Householder 2a (male, 40s) stated:
We watch TV and DVDs, and the children don’t allow you to put on audio appliances that much because they tend to not like what you like listening to. They bug you when you’re on the computer.
Householder 4 (male, 30s) said that living alone increased his use of ICE appliances, as they provide entertainment when he is on his own and allow him to keep in contact with friends through his laptop computer. He described how his television viewing was more energy intensive because most evenings he will chat to friends online, about programmes they are watching, to make him feel like he is not on his own. A behaviour that the monitoring equipment did not identify was recognised through the interview process. Householder 1a (male, 60s) highlighted that he often used a portable radio, with headphones, when his wife was watching a television programme that he didn’t enjoy.
Facilitating conditions and roles
The physical constraints that exist in a particular dwelling, such as accessibility to plug sockets, the attributes of appliances and available services, effect ICE use. For example, due to the configuration of television inputs, viewing programmes resulted in at least 4 appliances being active at household 2. Householder 2b (female, 30s) said that CDs were played through the television and DVD player due to the better quality of sound. The extent of the services also appears to be a factor. For example householder 1a and householder 5a (female, 40s) both described that the adoption of a digital set-top box increased their television viewing. Householder 5b (female, teenager) commented that to stay in the comfort of the lounge with friends, she listened to the radio through the television rather than move to her bedroom. Knowledge and ability appear to be significant factors for the facilitation of ICE practices. Most of the householders interviewed described how they had no idea that appliances were consuming energy through standby power modes. Householders 2a and 5a also both described that their lack of knowledge was the reason for their computers retaining default power management settings. The lack of operational knowledge resulted in some householders avoiding interaction with some appliances altogether (e.g. computers, routers). Householder 1b (female, 60s) found
148

manufacturers’ manuals “mind boggling” and left it to her husband to explain how to use appliances. Conversely, householder 2b explained that the transfer of knowledge from her husband had resulted in a recent increase in the use of computer appliances.
The transfer of knowledge within the household appears to relate to the formation of roles within a household. The households with more than one occupant had a household member who assumed the role of managing the ICE equipment and this incorporated the transfer of operational knowledge. The emergence of roles within households can be categorised as a form of social influence at the household level. Other social influences suggested by TIB were also evident in the data. For example behaviours, such as always turning appliances off or leaving appliances on standby, appear to have manifested themselves into household norms through responses such as “this is just what we do”. There was also evidence that wider social norms have an effect on appliance use. Householder 4 believed that the impact of friends’ values and beliefs had influenced some of the ways he used ICE appliances. Householder 4 also stated that he tried to be energy efficient in his home, in respect to other electricity end uses (e.g. turning off lights, buying energy efficient cold and wet appliances etc), but had little knowledge of ICE electricity consumption or standby power modes. This helps to explain this households’ higher ICE contribution to whole house electricity consumption shown previously in Table 2.
Habitual behaviour
Habitual behaviour appeared to be a strong influence on routines formed around video appliances. For two households it was clear that video appliances were switched off overnight at the mains (by the switch on UK mains sockets/outlets) and standby power modes were rarely used. This could have been construed as an energy saving behaviour, but it became clear that safety was the motivation. Householder 2b explained:
Its just habit I suppose, I think from a long time ago, when we were in a different property, we had things going through extensions [plug socket extension cables] and I know they weren’t the ideal or safe option to do, so I used to turn them off then. So it’s just stayed as a habit really.
Householder 2b also described habits that resulted in wasted energy. For example she said “we might just leave the TV on and be upstairs doing something, we’ll not just turn it off. The majority of the time it’s on whether anybody is watching it or not”. Householder 4 also stated that television use was a “force of habit” and “the sort of thing where sometimes you have it on even when you’re not watching it”.
Emotions
An emotional aspect to ICE appliance use was evident in the interview data. Householders’ often described how the use of ICE appliances was a means of relaxing and pleasure. Householder 4 explained that turning his television off provided him with a strong emotional response when the environmental consequences of ICE use were raised. He said “it makes you feel better… if you’re turning things off. It does make you feel like you care”. Householder 4 also explained how the television was used to make him feel more comfortable in his home by providing background noise. Householder 2b descried a similar sentiment, saying:
Yeah, it’s like a background. And even if we have people round, you have the TV on and the volume down, because you know it’s like a background thing just a focus, to look at. [laughs] Which when you think about it is a bit daft!
This participant went on to explain that her television is “like a focus in the room, like a gas fire is to some people, we’ve got the TV, as a main centre point”. This quotation illustrates how embedded ICE appliances, and particularly televisions, have become in households infrastructure and helps explain why video practices dominated this sample of households.
An important aspect of the interview data presented above is the suggestion that the formation of some energy wasteful behaviours is connected to the operational attributes of appliances and householders’ knowledge. It follows that the design of products, and services, is fundamentally important to ICE practices, because the operational features and user-friendliness of appliances help to determine how an appliance can be used, how efficiently it operates (independently and with other devices), and the level of knowledge householders need to acquire, in order to operate it in an energy
149

efficient way. Product designers may therefore be able to assist energy savings by not only addressing power mode electricity consumption, but also by improving the ease of use of devices. This is an issue raised by Meier and Nordman [21] who identified that the standardisation of power control user interfaces could have a significant energy saving potential for office equipment, and other devices, by improving the clarity and ease of use of appliances energy management controls.
The adoption of ICE appliances
Perceived attributes
The perceived attributes of an appliance or technology was a common reason given by householders for the adoption of particular ICE technologies. For example householder 2a stated that “I’m influenced by what the product can do rather than any other factors”, and householders 2a and 4 both described the benefit of improved services as the main reason for the adoption of satellite television. Other perceived attributes were also evident such as complexity, compatibility with other equipment and compatibility with existing household practices. All the householders described that the decision to purchase a new ICE appliance was very much determined by the financial cost and that this was balanced against potential benefits. The adoption of appliances and technologies did not necessarily correlate to socio-demographic data. For example householder 4 stated, “I’m happy to buy 5 year old technology if it costs me a lot less rather than buying brand new” despite receiving an annual income above the national average. Household 2 also had an annual income well above the national average, but replacement of appliances was “by necessity rather than want”. In contrast, householder 5a, whose income was below the national average, possessed four televisions, the most in the sample. This higher ownership was partly due to receiving older televisions as free gifts from friends.
Social influences
A general observation concerning the sample of households was that they generally appear to be what DIT would consider majority adopters (i.e. they were not at the forefront of the adoption of new ICE technologies). As a result, there was evidence that decisions to adopt new technologies were, to a degree, the result of maintaining existing practices and the influence of social factors. For example householder 2b said:
I think if this TV broke, we’d probably be going looking for one, you’d be pressured to sort of get the new high-tech model that’s available at the moment… we’d feel pressured if we didn’t have a TV, because the majority of households have a TV in this day and age don’t they, and computers as well.
Householder 1a explained that he felt resigned to the effects of commercialism saying, “you are forced to buy a digital item, because the powers at be, aren’t supplying an analogue supply… you’ve no choice!” As highlighted previously, the result of the adoption of digital television services for this household was increased viewing and the creation of a more energy intensive activity. This example highlights the direct effect of authority policy decisions on household electricity consumption. Other social influences included the workplace, friends and household acquaintances. One interesting quote comes from householder 2b who stated:
I’ve seen flat screen TVs in other people’s houses, I’m quite envious because it’s much better than ours. But we wouldn’t spend the money until this one’s on its way out.
Householder 5b also commented that she sometimes felt jealous of friends who had laptops and that this made her want to own one. The idea that envy of other individuals could influence ICE appliance adoption is an issue not clearly represented in DIT. However, previous DIT research by Kirwan [22] found that envy occurred in a community where only a number of tenants adopted household renewable technology. It can be envisaged that envy of the status symbolism, often associated with ICE appliances, could be a factor in their adoption. However, this will require further investigation.
150
Communication
All the households explained that advice from work colleagues, friends or family members, who have a better understanding of ICE technologies, was an important factor for the adoption decision. Consumer advice publications and retailers also appear to have a role in the transfer of information. The process of information gathering appears to be a means to guide purchase decisions and reduce uncertainty and risk. Two householders commented that the energy efficiency of an appliance would influence their decision. However, both householders also stated that the inclusion of energy efficiency into their decision process was very limited, due to no clear energy labelling system currently existing for ICE appliances in the UK. The interviews suggest that household members who are responsible for managing the ICE appliances within the home also possess the responsibility for the information gathering and decision-making. If this is representative of UK households, such householders may be more important for energy efficiency initiatives focused on ICE appliance use.
Problems encountered – practical implications
When reflecting on the methodology and the application of the monitoring equipment used for this study there are a number of practical implications that can be discerned from the work. The limitation of just twenty plug-in units meant that only the key ICE appliances, which generally remain in a fixed location, could be monitored. Portable appliances, such as mobile telephones, were also omitted from this research due to the uncertainty regarding whether householders would remember to charge their telephones from a fixed point and the potential interference with routines. Larger mobile technologies, such as laptops, were included in this research based on the supposition that householders would generally operate and charge them from a single socket point. Initial results suggest that this assumption was justified, but there is the inherent uncertainty that laptop use, with the external power supply, did occur away from the predetermined location and that their electricity consumption could be underrepresented. The use of spot power measurements could be a potential means to add some detail regarding the electricity consumption of appliances not included in this research. However, this method would not identify consumption patterns and may only be suitable for appliances known to operate in a continuous power mode.
During preliminary testing, it became evident that the use of the Power Line Carrier connection could result in an unsatisfactory maintenance of 5 minutely polling intervals due to the poor quality of some dwellings’ ring mains. Further development of the system considerably reduced this problem allowing this research to proceed. The effects of other unforeseen external phenomenon, such as mains-borne interference, could still disrupt logging intervals. Future development of the RMS will consider the potential of wireless communication for the transfer of interval data. The plug-in meters were limited to a 1Wh resolution for logging, which resulted in additional processing steps when determining the contribution of low power loads. Standby power loads of just a few Watts would result in zero energy consumption measurements for a number of 5 minutely intervals prior to a 1Wh measurement. It was found that manual processing was the most effective method to deal with this problem, due to familiarisation with data allowing errors to be avoided. Despite the use of Microsoft Excel allowing a relatively quick means to produce a range of graphical and statistical information for the interviews, the need to manually process some data highlights limitations in the software’s capability to deal with more complex data from some appliance types. The 1Wh resolution also made it difficult to determine the different standby power modes of some appliances, particularly VCRs. Averaging techniques allowed these power modes to be discerned well enough for the requirements of this research and it is believed that the results gained provide a valid assessment. However, it would be advised that future energy research investigating low power modes should use sub 1Wh resolution logging equipment to avoid such problems.
The 5 minutely interval, used by the monitoring equipment, was appropriate for this research, as it allowed patterns of appliance use to be discerned relatively easily. Although a shorter interval, such as 1 minute, would provide greater detail, it would also result in the need to manage considerably more data, especially if longer monitoring periods were used. Households in this research have been monitored over only a short time period and therefore seasonal variation will have an effect on the results gained. The two week monitoring period appears to have been sufficient for the exploratory nature of this research, as key behavioural patterns could be discerned from the data recorded. It is believed that a shorter time period would not provide the level of detail required, due to some behavioural patterns being subject to longer term influences, such as householders’ biweekly activities (e.g. visits to family or friends, attending sports events). It is hoped that future research in
151
this area will incorporate a more expansive longitudinal element, of at least a month, so that deeper insights into behavioural patterns can be gained. The inter-disciplinary approach applied to this research has found that the qualitative and quantitative data often complement each other. Interview data provided an understanding of why the patterns of consumption recorded varied between households. The use of graphs and charts improved the quality of the interview data collected, and allowed householders’ incorrect perceptions of their electricity consumption to be removed from the interview process.
Conclusions
The initial results of this research suggest that ICE electricity consumption is dominated by the use of video appliances. Although much of the electricity consumption by video appliances was in the active mode, interview data suggests that these appliances are not always being watched by householders. The significance of set-top boxes and network devices, such as routers, has been highlighted. In some households these devices can be more significant, in energy consumption terms, than the main device they are supporting. ICE practices appear to have become more energy intensive due to the changeover to digital television services and the formation of new behavioural patterns. The reasons for current ICE practices are complex and appear to involve factors such as habits, physical constraints, emotions, social influences, and householders’ knowledge. Standby power modes contributed to around 38% of total ICE appliance use in this sample, which suggests current policy efforts to address this source of wasted energy are necessary. However, it also appears necessary to address behavioural factors for energy consumption. For example ICE appliance consumption could be reduced by simple householder interventions (e.g. turning off rarely used appliances that are continuously left in standby power modes). Householders’ knowledge of ICE appliance energy consumption, and standby power modes, was often very limited. The initial results of this study suggest that better product design and clearer information at the point of sale could have an influence on user behaviour and some householders’ purchasing decisions. Individuals, who assume the role of managing, purchasing and transferring knowledge of ICE technologies, may have particular importance to energy efficiency initiatives. The use of an inter-disciplinary methodology, for this research, provided a more holistic understanding of the factors involved in ICE appliance use. However the challenge of monitoring increasing numbers of mobile technologies is an issue that will require significant consideration for future household energy studies.
References
[1] Department of Trade and Industry. Energy Consumption in the United Kingdom. 2002. Can be downloaded at: http://www.dti.gov.uk/files/file11250.pdf.
[2] Department for the Environment, Food and Rural Affairs. UK Energy Efficiency Action Plan 2007. Can be downloaded at: http://www.defra.gov.uk/environment/climatechange/uk/energy/ pdf/action-plan-2007.pdf.
[3] Department for the Environment, Food and Rural Affairs. Climate Change: The UK Programme 2006. Stationary Office (UK). 2006. ISBN 0-10-167642-5.
[4] Department for Business, Enterprise and Regulatory Reform. Energy consumption in the United Kingdom: domestic data tables. 2008 update. 2008. Can be downloaded at: http://www.berr.gov.uk/files/file47214.xls.
[5] Owen, P. The Rise of the Machines, Energy Saving Trust (UK). 2006.
[6] Market Transformation Programme. Sustainable Products 2005 Policy Analysis and Projections (updated 2006). 2006. Can be downloaded at: http://www.mtprog.com/ReferenceLibrary/MTP_ Sustainable_Products_2005_ updated_26_1_06.pdf.
[7] Owen, P. The ampere strikes back. Energy Saving Trust (UK). 2007.
[8] Crosbie, T. Household energy consumption and consumer electronics: The case of the television. Energy Policy, 36, pp2191-2199. 2008.
152
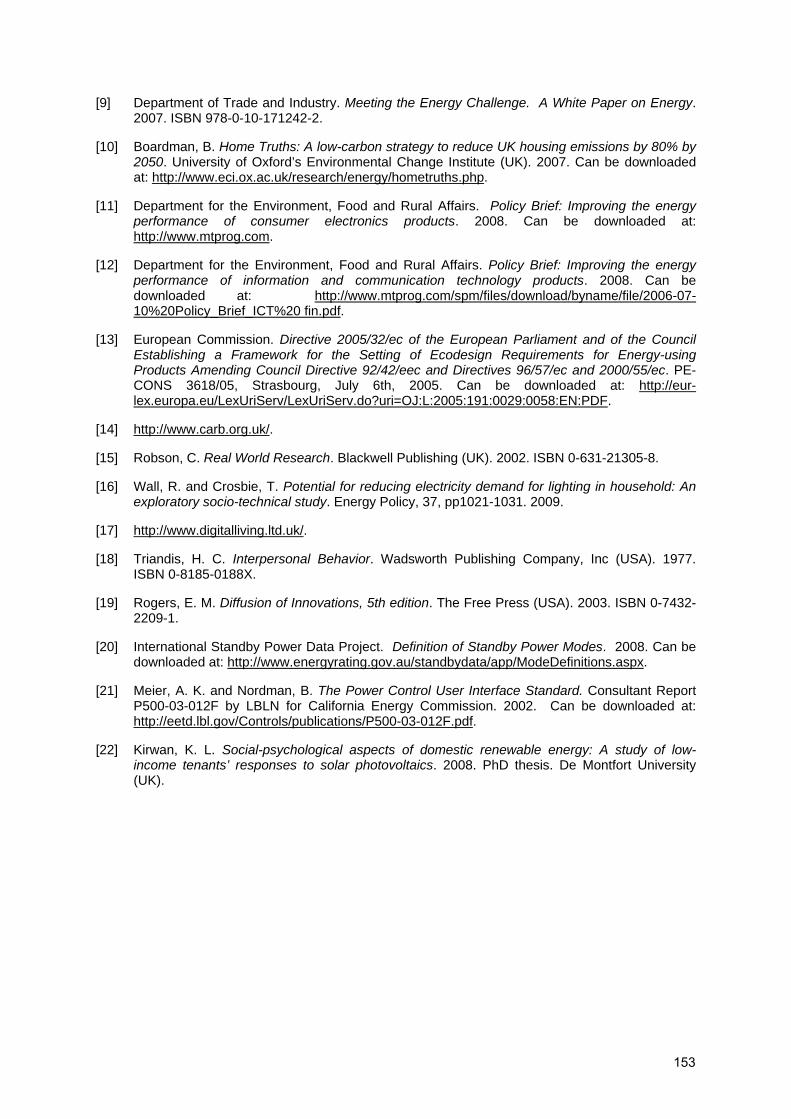
[9] Department of Trade and Industry. Meeting the Energy Challenge. A White Paper on Energy. 2007. ISBN 978-0-10-171242-2.
[10] Boardman, B. Home Truths: A low-carbon strategy to reduce UK housing emissions by 80% by 2050. University of Oxford’s Environmental Change Institute (UK). 2007. Can be downloaded at: http://www.eci.ox.ac.uk/research/energy/hometruths.php.
[11] Department for the Environment, Food and Rural Affairs. Policy Brief: Improving the energy performance of consumer electronics products. 2008. Can be downloaded at: http://www.mtprog.com.
[12] Department for the Environment, Food and Rural Affairs. Policy Brief: Improving the energy performance of information and communication technology products. 2008. Can be downloaded at: http://www.mtprog.com/spm/files/download/byname/file/2006-07-10%20Policy_Brief_ICT%20 fin.pdf.
[13] European Commission. Directive 2005/32/ec of the European Parliament and of the Council Establishing a Framework for the Setting of Ecodesign Requirements for Energy-using Products Amending Council Directive 92/42/eec and Directives 96/57/ec and 2000/55/ec. PE-CONS 3618/05, Strasbourg, July 6th, 2005. Can be downloaded at: http://eur-lex.europa.eu/LexUriServ/LexUriServ.do?uri=OJ:L:2005:191:0029:0058:EN:PDF.
[14] http://www.carb.org.uk/.
[15] Robson, C. Real World Research. Blackwell Publishing (UK). 2002. ISBN 0-631-21305-8.
[16] Wall, R. and Crosbie, T. Potential for reducing electricity demand for lighting in household: An exploratory socio-technical study. Energy Policy, 37, pp1021-1031. 2009.
[17] http://www.digitalliving.ltd.uk/.
[18] Triandis, H. C. Interpersonal Behavior. Wadsworth Publishing Company, Inc (USA). 1977. ISBN 0-8185-0188X.
[19] Rogers, E. M. Diffusion of Innovations, 5th edition. The Free Press (USA). 2003. ISBN 0-7432-2209-1.
[20] International Standby Power Data Project. Definition of Standby Power Modes. 2008. Can be downloaded at: http://www.energyrating.gov.au/standbydata/app/ModeDefinitions.aspx.
[21] Meier, A. K. and Nordman, B. The Power Control User Interface Standard. Consultant Report P500-03-012F by LBLN for California Energy Commission. 2002. Can be downloaded at: http://eetd.lbl.gov/Controls/publications/P500-03-012F.pdf.
[22] Kirwan, K. L. Social-psychological aspects of domestic renewable energy: A study of low-income tenants’ responses to solar photovoltaics. 2008. PhD thesis. De Montfort University (UK).
153
A “Bottom Up” Model For Estimating Australian Residential Energy Use
Lloyd Harrington, Robert Foster & Jack Brown
Energy Efficient Strategies, Australia
Tim Farrell
Department of the Environment, Water, Heritage and the Arts, Australia
Topic Topics related to Policies and Programs: - 10. Program Monitoring & Evaluation Keywords Bottom up, top down, end use energy, forecasting. Abstract In 2006, the Australian government commissioned a study to develop end–use energy consumption estimates in the residential sector in Australia. The study, completed in early 2008, provides a firm, quantitative basis for the development of specific greenhouse reduction programs by government and industry in the residential sector. A “bottom up” model was developed that tracks, for each of the 8 states and territories, energy consumption from 1986 to 2006, with projections to 2020. The model separately tracks four main categories of end use; space conditioning (11 types), water heaters (9 types), cooking products (6 types) and electrical appliances (major and minor – 32 types). Four main fuel types (electricity, mains (natural) gas, wood and LPG) are also covered, thereby allowing estimates of greenhouse gas emissions to be made from total energy consumption. The model includes a comprehensive “stock model” for each individual end use appliance within each state. Key input data includes ownership (appliance stock), technical attributes (size and energy efficiency) and usage patterns (hours of use, cycles, duration of various standby modes). A housing stock model generates primary heating and cooling demand which is based on a simulation of representative building shells with 20 years of historical hourly weather data across 10 representative Australian climate zones. The model allows assessment of energy impacts at a state or national level of a wide range of policy options from MEPS for TVs to retrofitting of ceiling insulation to existing dwellings. Key findings are the decline in total refrigeration energy (despite larger sizes and increased ownership), a massive increase in energy consumption from the rapid transition towards large flat screen televisions and an overall decline in hot water energy consumption due to an increase in solar systems and system efficiency. Background The report titled Australian Residential Sector Baseline Energy Estimates 1986-2020 [1] published in June 2008 was commissioned by the Department of the Environment, Water, Heritage and the Arts (DEHWA) to determine end use energy consumption estimates in the residential sector and to provide a quantitative foundation for the development of greenhouse response measures by industry and government. The study is an update of the first baseline
154
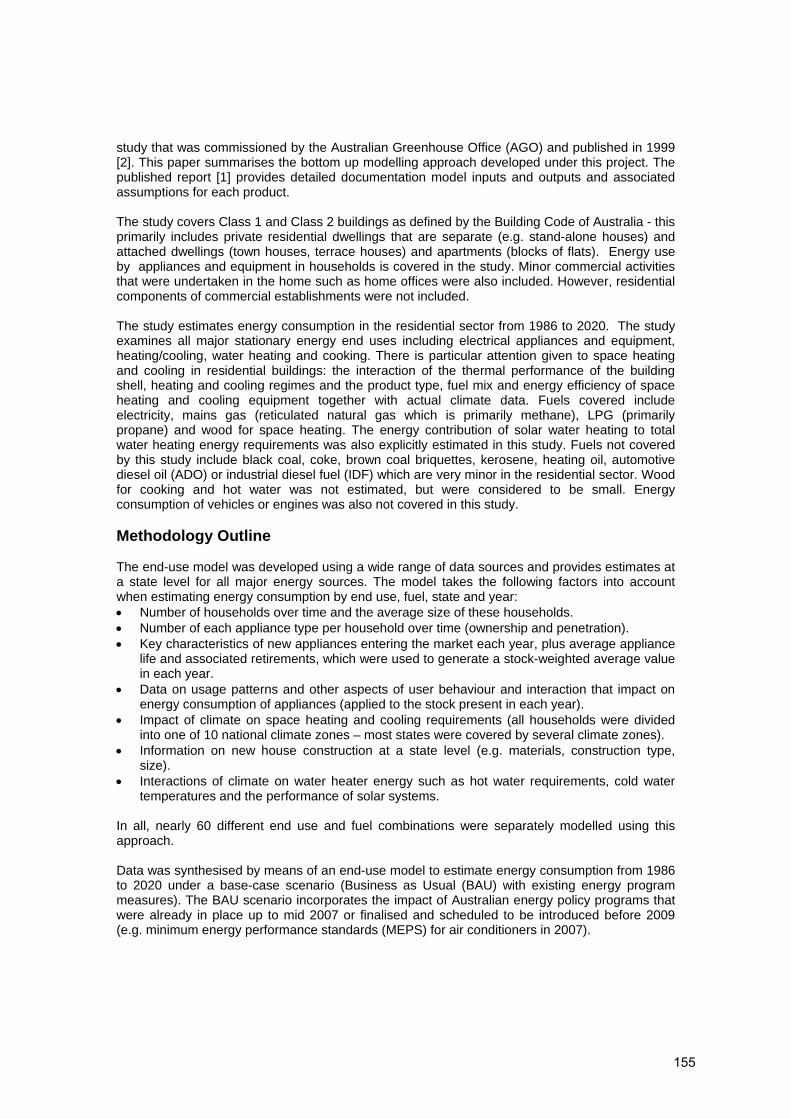
study that was commissioned by the Australian Greenhouse Office (AGO) and published in 1999 [2]. This paper summarises the bottom up modelling approach developed under this project. The published report [1] provides detailed documentation model inputs and outputs and associated assumptions for each product. The study covers Class 1 and Class 2 buildings as defined by the Building Code of Australia - this primarily includes private residential dwellings that are separate (e.g. stand-alone houses) and attached dwellings (town houses, terrace houses) and apartments (blocks of flats). Energy use by appliances and equipment in households is covered in the study. Minor commercial activities that were undertaken in the home such as home offices were also included. However, residential components of commercial establishments were not included. The study estimates energy consumption in the residential sector from 1986 to 2020. The study examines all major stationary energy end uses including electrical appliances and equipment, heating/cooling, water heating and cooking. There is particular attention given to space heating and cooling in residential buildings: the interaction of the thermal performance of the building shell, heating and cooling regimes and the product type, fuel mix and energy efficiency of space heating and cooling equipment together with actual climate data. Fuels covered include electricity, mains gas (reticulated natural gas which is primarily methane), LPG (primarily propane) and wood for space heating. The energy contribution of solar water heating to total water heating energy requirements was also explicitly estimated in this study. Fuels not covered by this study include black coal, coke, brown coal briquettes, kerosene, heating oil, automotive diesel oil (ADO) or industrial diesel fuel (IDF) which are very minor in the residential sector. Wood for cooking and hot water was not estimated, but were considered to be small. Energy consumption of vehicles or engines was also not covered in this study. Methodology Outline The end-use model was developed using a wide range of data sources and provides estimates at a state level for all major energy sources. The model takes the following factors into account when estimating energy consumption by end use, fuel, state and year: • Number of households over time and the average size of these households. • Number of each appliance type per household over time (ownership and penetration). • Key characteristics of new appliances entering the market each year, plus average appliance
life and associated retirements, which were used to generate a stock-weighted average value in each year.
• Data on usage patterns and other aspects of user behaviour and interaction that impact on energy consumption of appliances (applied to the stock present in each year).
• Impact of climate on space heating and cooling requirements (all households were divided into one of 10 national climate zones – most states were covered by several climate zones).
• Information on new house construction at a state level (e.g. materials, construction type, size).
• Interactions of climate on water heater energy such as hot water requirements, cold water temperatures and the performance of solar systems.
In all, nearly 60 different end use and fuel combinations were separately modelled using this approach. Data was synthesised by means of an end-use model to estimate energy consumption from 1986 to 2020 under a base-case scenario (Business as Usual (BAU) with existing energy program measures). The BAU scenario incorporates the impact of Australian energy policy programs that were already in place up to mid 2007 or finalised and scheduled to be introduced before 2009 (e.g. minimum energy performance standards (MEPS) for air conditioners in 2007).
155

The end use model is based on a series of stock models which accounts for the average technical characteristics of both new appliances and buildings entering the stock and old ones leaving the stock to provide a stock-weighted average from 1986 to 2020. The main inputs into the appliance end-use model are: • Appliance attributes – these are typically capacity or other attributes that affect energy
consumption, including energy efficiency. • Ownership – this is data on the presence of the total number of products that consume
energy in households. • Determination of appliance usage parameters (e.g. frequency and duration of use, climate
impacts, temperature settings for washers etc). The housing stock model was complex as it accounted for the key attributes of the building shell stock in each state as well as taking into account climatic data. Dwellings in each state were allocated into one of 10 national climate zones, which were selected to cover the major climate zones/population centres in Australia. Dwellings in each state were apportioned to the relevant climate zone on the basis of the number of households in each postcode area as reported by Australia Post. Appliance ownership data and occupancy information together with estimated zoning within the residential stock was applied to the Building Shell simulation software (a modified version of AccuRate© (www.nathers.gov.au) to generate heating and cooling demand. One of the limitations of the study related to the fragmented nature of regional data on appliance ownership and fuel availability, which meant that it was considered to be uniform across each state. Having completed the setup and operation of all the end use modules, a calibration check was undertaken. This check involved the collation of all of the energy consumption estimates for each year, fuel type and each state and territory. This was followed by a comparison against actual top down data for the same period. In all cases Australian Bureau of Agricultural and Resource Economics (ABARE) data has been used as the primary top down source. Where possible published data from the Energy Supply Association of Australia (ESAA, formerly Electricity Supply Association of Australia) and the Australian Gas Association (AGA) was also used for some state-level comparisons. In some cases, state utility data was made available as part of the review process. Some small adjustments to some stock model parameters were required to calibrate the model estimates with actual top down energy consumption data. Main Findings Overall Trends The study estimated that the residential sector energy consumption in 1990 was about 299 PJ (electricity, gas, LPG and wood) and that by 2008 this had grown to about 402 PJ and is projected to increase to 467 PJ by 2020 (Figure 1). The residential energy consumption is estimated to increase during the Kyoto commitment period (2008-12) by between 135% and 141% compared to 1990 levels. This increase coincides with a continuing trend towards an increased proportion of the total residential energy demand being met by electricity (high greenhouse gas intensity) and a decrease in the use of wood (low greenhouse gas intensity). It is likely that this predicted growth in energy use in the residential sector will be at least matched by the growth in greenhouse gas emissions (ie at least 135% above 1990 levels by 2008). On the basis of these estimates it could be argued that the residential sector will fail to make an equitable contribution to the Kyoto emissions target of 108% above 1990 emissions levels.
156

Figure 1 - Trends in Energy Consumption in Australia’s Residential Sector from 1990 to 2020. The Kyoto commitment period of 2008-12 is shaded grey [1] A B Year Year Figure 2 - Trends in Australia’s Residential Energy Use a) per household and b) per person– from 1990 to 2020 [1] Dividing the total residential energy consumption by the estimated number of households in the corresponding year, enabled the energy consumption per household to be estimated. Since 1990 the average energy consumption per Australian household has remained relatively constant apart from the influence of year-to-year climatic variations that impact significantly on space conditioning energy demand (Figure 2a). Projecting forward to 2020 there is expected to be about a 6% decline in energy consumption per household compared to 1990 levels. This decline is achieved despite expected increases in service deliveries to households, particularly in space conditioning and in a diverse range of appliance types such as larger more power-intensive televisions and an increase in standby
157
energy consumption, lighting, computers and other home entertainment. The decline in energy consumption per household is primarily being driven by existing and planned energy programs designed to improve energy efficiency of appliances and the building shell. By dividing the total residential energy consumption by the population in the corresponding year, the trend in per person residential energy consumption shows a steady but modest increase from 17 GJ/person in 1990 to 20 GJ/person in 2020, or a 20% increase over the study period (Figure 2b). This increase in energy consumption per person is partly being driven by a decline in persons per household, as there are some forms of fixed energy consumption that are associated with each household. Trends By Fuel Type The contribution of electricity to residential energy consumption is predicted to increase from 46% in 1990 to 53% in 2020 (Figure 3). Gas consumption is also expected to increase from 30% of total energy consumption in 1990 to 37% in 2020 while wood is predicted to decease from 21% to only 8% over the same period. LPG use will remain relatively unchanged and is expected to contribute to 2% of energy use in 2020.
158

Figure 3 - Trends in Residential Energy Consumption by Fuel Type – Australia 1990 to 2020 [1] Trends By End Use The national trends in energy consumption by each major end use from 1990 to 2020 are presented in Figure 4. Growth in electrical appliance energy consumption was the largest among major end-uses and was estimated to increase from 70.5 PJ in 1990 to 169.4 PJ in 2020, which represents an increase of 4.7% per annum. By 2020 energy use by electrical appliance is forecast to almost match space heating as the largest single energy use in the average Australian household. Energy demand for space heating is forecast to continue to rise but not at the same rate as for appliances (1.3% average growth per annum, 1990 to 2020). Water heating was the other major energy use and after plateauing in 2004 is expected to decline slowly to 2020. Water heating is the only major energy use predicted to decline over the study period, principally as a result of various energy programs undertaken by Commonwealth and State/Territory Governments. The key drivers for changes in water heating energy are an increase in gas and solar technologies with a corresponding decrease in electric storage hot water. The declining demand for hot water has also resulted from an increase in water efficient appliances such as front loading washing machines and low-flow shower heads combined with a decline in the number of people per household. Cooking energy is forecast to undergo slow but steady growth of approximately 1.8% per annum over the study period, roughly in line with the growth in the number of households. There is a trend towards gas cook tops and electric ovens, which is driven by consumer preference and overall performance. Cooking energy consumption remains a modest share of total energy consumption. Of all the major end uses, space cooling is forecast to show the most rapid growth over the study period with an average growth of 16.1% per annum. This growth comes off a very low energy base of 3.0 PJ in 1990, so even with this high rate of growth in total energy terms by 2020 energy consumption for space cooling is only 17.7 PJ or 4% of total residential energy consumption in that year. However, despite its low contribution to total energy consumption, space cooling is an end use that attracts considerable political and policy attention due to its very poor load factor and the potential to create major problems for the electricity generation, transmission and distribution systems on peak summer days. This issue has been the subject of several major studies in
159
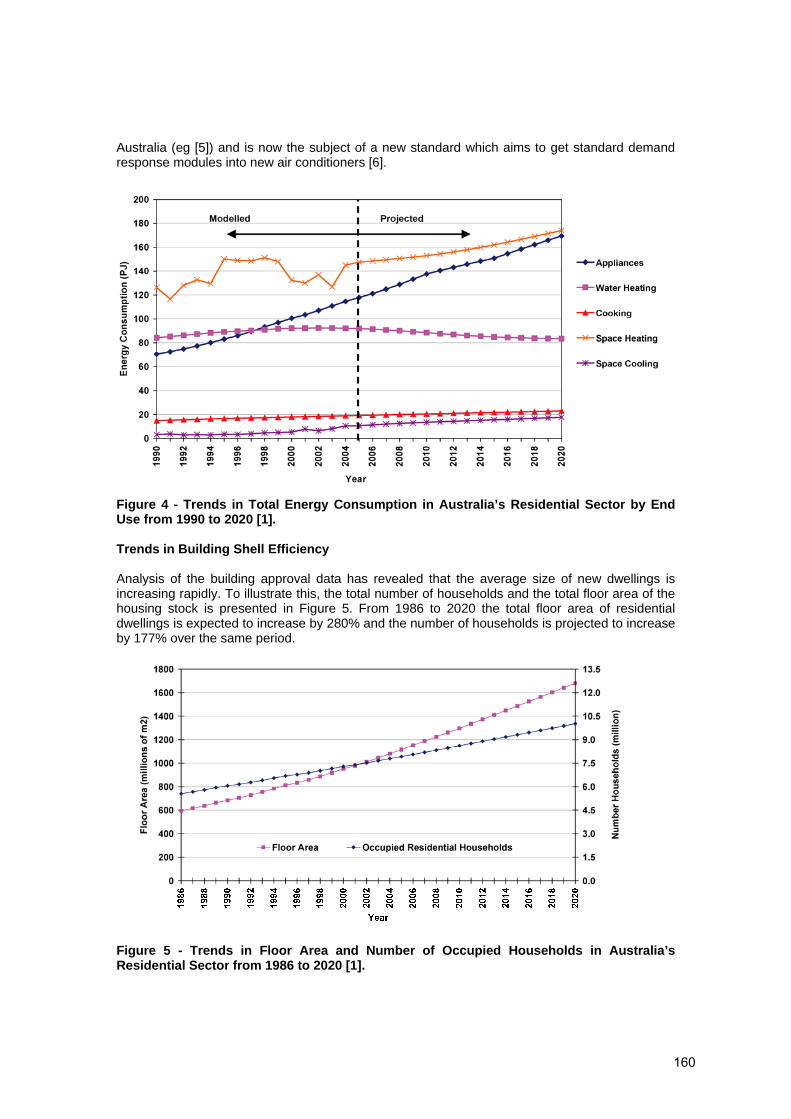
Australia (eg [5]) and is now the subject of a new standard which aims to get standard demand response modules into new air conditioners [6]. Figure 4 - Trends in Total Energy Consumption in Australia’s Residential Sector by End Use from 1990 to 2020 [1]. Trends in Building Shell Efficiency Analysis of the building approval data has revealed that the average size of new dwellings is increasing rapidly. To illustrate this, the total number of households and the total floor area of the housing stock is presented in Figure 5. From 1986 to 2020 the total floor area of residential dwellings is expected to increase by 280% and the number of households is projected to increase by 177% over the same period. Figure 5 - Trends in Floor Area and Number of Occupied Households in Australia’s Residential Sector from 1986 to 2020 [1].
160

The national trend for building shell efficiency (i.e. total potential space conditioning load per square metre of floor area), shows a modest but steady improvement over the study period, down from 280 MJ/m2 to approximately 200 MJ/m2 (Figure 6). This improvement is being driven by policy initiatives that commenced in Victoria and the ACT in 1990 and by 2005 had expanded to include all states through the Building Code of Australia (BCA). Unfortunately the improvement in building shell efficiency over the study period has been outpaced by the rate of increase in average floor area. This has occurred to the extent that on a per household basis the potential space conditioning load (i.e. whole house heating and cooling in accordance with the default schedules of operation in the Nationwide House Energy Rating software - AccuRate) is projected to increase from about 30 GJ to 35 GJ per household per annum from 1986 to 2005 (Figure 6 - secondary “y” axis, blue line). Post 2005, where a standardised climate has been assumed the trend is reasonably steady suggesting that efficiency improvements are offsetting increases in average floor areas. Figure 6 - Trends in building shell efficiency in Australia’s Residential Sector from 1986 to 2020 [1] Emerging Trends Space Conditioning Energy demand for heating and cooling is projected to increase despite the introduction of minimum building shell performance standards in all jurisdictions. The main factors driving this trend are: • The floor area of the average new dwelling continues to significantly exceed that of the stock
average, thereby driving up the average floor area of the stock of dwellings as a whole over time. In addition householders continue to undertake renovations that increase the floor areas of their existing dwellings, particularly the older detached dwellings.
• The share of dwellings with whole house heating systems, particularly gas heating, is projected to rise significantly over the remainder of the study period, especially in the colder states.
• The share of dwellings with space cooling installed is projected to continue to rise significantly over the remainder of the study period – penetration of air conditioners has more than doubled in the past 10 years to around 65%. While the energy consumption for cooling
161

is still relatively modest, this will have increased by a factor of five from 1990 to 2020 under current trends.
• The relatively recently introduced building shell performance standards only affect approximately 2% of the total stock per annum and in reality provide only a modest level of improvement compared to the BAU case in terms of total energy consumption projections to 2020. Nonetheless, stringent standards for new dwellings will have significant long-term energy impacts, which will continue to accrue beyond 2020. New housing built now with poor building shell efficiency will be a large long-term liability for future generations.
Additional analysis was undertaken for space conditioning loads using actual weather data over the past 20 years. The objective was to simulate energy demand in a set of dwellings where the housing stock characteristics were constant so that the only variable influencing space conditioning was the weather conditions. This type of analysis was designed to reveal the trends in potential space conditioning demand driven by climate variability independently from trends in housing stock type and numbers. Interestingly in all parts of Australia except the tropical north, the trend in predicted potential heating load over the study period was downward and the trend in cooling load was upwards as shown for South Australia (Figure 7). This trend is broadly consistent with predictions for climate impacts associated with global warming. Figure 7 - Space Conditioning Loads for Total, Heating and Cooling for Fixed Stock in the Residential Sector in South Australia from 1986 to 2020 [1]. Water Heating In 1990 water heater usage accounted for approximately 84 PJ, this is estimated to have peaked at approximately 92 PJ in 2002 but is projected to slowly decline to 84 PJ by 2020, despite an increase in household numbers. The most significant trend over the study period for water heater energy use is the shift away from resistive electric heating (primarily storage systems) towards natural gas or combinations of solar with gas or electric boosting. Increased natural gas use has coincided with the expansion of the natural gas network, which is growing steadily, but still only covers 46% of Australian households. Instantaneous gas units have also gained favour because of their compact size and their capacity to provide a continuous flow of hot water. Solar boosted water heating has also gained popularity over recent years (although the installed base was relatively small up to 2003 with a national average of about 4%). This increasing trend is being driven largely by initiatives at the state level, particularly the provision of rebate schemes and requirements for new homes to exclude or discourage electric
162

storage water heaters. Some of these schemes are also boosting the stock of heat pump “solar” water heaters, which may become more significant over time as the capital costs are likely to fall. The application of minimum energy performance standards (MEPS) (1999 and 2005 for electric and 2009 for gas), existing and emerging state and BCA requirements mandating the use of lower greenhouse intensive technologies [3] and the various incentive schemes designed to encourage greater use of solar and heat pump technologies all combine to result in an overall downward trend in total energy consumption for water heaters from 2002 to 2020. Refrigerators/Freezers Refrigerator and freezer energy use grew slowly at start of the study period but has been in decline since 2004. In 1986 refrigerators and freezers usage combined accounted for approximately 26 PJ and by 2020 this is projected to have decreased to approximately 24 PJ. This decrease is predicted to occur despite an increase in total stock (refrigerators and freezers) from approximately 10 million units in 1986 to an estimated 17 million units by 2020 (70% increase). Since the early 1990s the average energy consumption of new refrigerators and freezers has improved significantly, with a 40% reduction from 1993 to 2006 [4]. These improvements have been driven by both the energy labelling program and by the introduction of MEPS requirements in 1999 followed by more stringent levels in 2005. The 2005 MEPS levels will continue to place downward pressure on energy growth for these products over the study period. IT Equipment Energy use of personal computers, laptops, monitors and miscellaneous Information Technology (IT) equipment has been growing rapidly since the start of the study period. In 1986 energy use of IT equipment was negligible, this was estimated to have increased to nearly 7.9 PJ by 2005 and is projected to continue to rise to almost 15 PJ by 2020. The main drivers for the increase in energy consumption have been: • An increase in the total number of households. • A rapid increase in ownership of personal computer laptops and related equipment over the
study period. Since 1986 ownership of personal computers has risen from virtually zero to 0.87 by 2005. Ownership is projected to rise to nominally 1.25 for personal computers and 0.65 for laptops by 2020.
• For personal computers, on-mode power consumption has virtually doubled from approximately 50W to more than 100W at present.
• Hours of use have almost doubled since the early 1990s from approximately 500 hours per annum to more than 900 hours per annum. This is projected to continue to rise to approximately 1200 hours per annum by 2020. There is a large potential for energy management of these products to reduce energy consumption.
Entertainment (Games, STB and TVs) Games consoles, set top boxes and television energy use has been growing significantly in recent years. In particular, television energy use has been growing steadily since the start of the study period but is now projected to grow more rapidly over the remainder of the study period. In 1986 TV usage accounted for approximately 3 PJ and in 2005 was estimated to have increased to approximately 12 PJ and is projected to exceed 45 PJ by 2020 (without the introduction of MEPS and energy labelling which is being finalised). The main drivers for the projected rapid increase in energy consumption are as follows:
163
• The average number of televisions per household is projected to increase from approximately 1.5 in 1986 to a projected 2.1 by 2020. One in 4 households now buy a new television each year.
• Hours of viewing have been rising steadily over the study period from approximately 1500 per annum in 1986 to a projected 2800 hours by 2020 per TV.
• Newer technologies such as Plasma and LCD have been driving a trend towards a very rapid increase in average screen size. This trend has resulted in a rapid rise in energy consumption from an average on-mode consumption of approximately 65W in 1986 to 100W in 2005 and continuing to grow to an estimated 230W by 2020.
Lighting Lighting energy use had shown steady and relatively strong growth since the start of the study period but is expected to decline from 2010 to 2015 then begin to rise again for the remainder of the study period. In 1986 lighting energy usage was approximately 13 PJ and by 2005 this is estimated to have increased to nearly 25 PJ with a peak of just over 27 PJ in 2010. Following a dip in energy consumption post 2010, consumption is projected to rise again to approximately 25 PJ by 2020. Apart from the growth in the number of households and the increase in floor areas of those households the main drivers influencing the general upward trend in lighting energy consumption are: • Since the early 1990’s there has been a strong growth in the use of quartz halogen (QH) low
voltage lighting. This change in technology is doubling the power density of these types through increased illumination levels.
• Compact fluorescent lamps have been slowly gaining market share since their introduction in the late 1980’s. The penetration of this relatively efficient technology (approximately 50-65 lumens per watt) is expected to increase rapidly with the announced phase out of incandescent lamps in 2009. This is expected to drive lighting energy consumption downwards for the following 5 years.
• By 2015 it is expected that practically all standard incandescent lamps will have been removed from the stock (largely replaced by CFLs). Beyond 2015, increases in household numbers and the expected continuing popularity of QH lamps is projected to drive energy consumption upwards again. However, future regulatory proposals may ameliorate these trends.
Conclusions The titled Australian Residential Sector Baseline Energy Estimates 1986-2020 [1] provides one of the most detailed assessments of residential end use energy consumption ever undertaken in Australia. The “bottom up” end use modelling approach, while by no means unique or radical, has been applied in a comprehensive and systematic fashion to the residential sector to cover nearly all significant end uses. The bottom up estimates have been reconciled with state level top down data and there is generally good agreement, although the data suggests that there may be some questions regarding the reliability of national energy data share by sector which has been compiled since 2000. Due to concerted efforts over many years, many areas now have rich data sets for modelling and therefore good modelling inputs can be developed. Areas such as ownership and attributes for new appliances and equipment are generally well documented. Despite the detailed modelling undertaken, the study revealed that there is a paucity of data in some areas. In particular, there is little individual product end use metering data which is critical to quantify the impacts of human interactions (frequency and duration of use) and climate and weather related impacts. This is one area where data collection efforts need to be expanded. Another area with poor data is average age and the distribution of age – very little documentation on retirements for either appliances or
164
buildings exists. Lighting is another area where there is poor data on the stock and energy consumption. Expanded end use data collection efforts (both in the form of expanded ownership studies and end use metering studies) would also help to capture any new product types or emerging trends, which will increase the integrity of any future analysis. The study was commissioned in order to obtain a better understanding of end use energy consumption so that government can develop better energy policies to reduce energy consumption and their associated greenhouse gas emissions (as well as fine tune existing policies). The results have already been used to refine policy measures in a number of areas including household refrigeration, air conditioners and hot water systems. The study has also lead to a refinement of an impact assessment methodology which can now be used to evaluate many energy programs such as those that reduce energy consumption, improve equipment efficiency and assess the impact of end use fuel switching. The model provides a basis for longer term projections of energy consumptions and greenhouse gas emissions in the residential sector. References [1] EES 2008, Australian Residential Sector Baseline Energy Estimates 1986-2020.
Department of the Environment, Water, Heritage and the Arts, 2008, available from www.energyrating.gov.au in the electronic library.
[2] EES 1999, Australian Residential Building Sector Greenhouse Gas Emissions 1990-
2010, Australian Greenhouse Office 1999 (available from www.energyrating.gov.au in the electronic library)
[3] GWA 2007, Specifying the Performance of Water for New Houses in the Building Code of
Australia, report prepared for the Australian Building Codes Board, prepared by George Wilkenfeld & Associates (with EES and Thermal Design), December 2007.
[4] EES 2006, Greening Whitegoods: A report into the energy efficiency trends of Major
Household Appliances in Australia From 1993 to 2005, Prepared by Energy Efficient Strategies, E3 Report 2006/06, available from www.energyrating.gov.au in the electronic library.
[5] EES 2004, Electrical Peak Load Analysis Victoria 1999 – 2003. Prepared by EES, for the
Victorian Energy Networks Corporation (VENCORP) and the Australian Greenhouse Office. Available from www.energyrating.gov.au in the electronic library.
[6] AS 4755-2007 Framework for demand response capabilities and supporting technologies
for electrical products. AS 4755.3.1-2008 Demand response capabilities and supporting technologies for electrical products - Interaction of demand response enabling devices and electrical products - Operational instructions and connections for airconditioners. Available from Standards Australia at www.saiglobal.com
165
How Long Do Program Savings Last? Issues in Measure Lifetimes and Retention of Savings and Behaviors Lisa A. Skumatz
Skumatz Economic Research Associates, Inc. (SERA), Superior, CO, USA
Abstract The authors examined best practices in estimation methods for measure lifetimes, reviewed primary and secondary research results, and compared estimated useful lifetimes (EULs) for residential, commercial, and industrial measures used around the U.S.. We found convergence in lifetimes for many measures, but variations in policies for a variety of residential and non-residential energy efficiency equipment and measures. Available research on technical degradation was also reviewed. The project examined the issue of “remaining useful lifetimes” (RULs), related to programs focused on achieving early removal of equipment. The theory is that perhaps greater savings should be assigned for the period between “early” program replacement and when the equipment would otherwise have been replaced, and a lower “incremental” savings figure for the period after equipment would have been replaced in the absence of the program. This suggestion has been considered or used in several states. Research on the topic is not extensive, but information on available primary research, policies, and application around the US is summarized. Beyond the “status quo” review, the project’s focus was to examine the impacts of two key complicating factors: 1) transition to more non-measure-based programs (education, advertising), making it hard to “count” and measure retention, and 2) increased “chatter” in the marketplace, in which consumers may be influenced by any number of local programs as well as outside influences. The project went beyond reviewing lifetimes for traditional measures to also examine research and policies related to persistence assumptions for behavior, education/outreach, and training-based programs, and issues related to complications from market “chatter”. Finally, the project examined gaps in existing research, promising techniques for non-measure-based programs, and recommended next steps. Introduction Retention studies, also known as measure life studies, are a critical and highly useful component of energy efficiency research.1 Despite the various data collection and treatment methodologies employed, the fundamental purpose of measure retention studies is to estimate the amount of time that a measure will be in place, presumably delivering energy efficiency benefits. The measure life provides a limit for the number of years a program’s annual savings will last. Early programs used figures related to laboratory lifetimes. Studies in the early 1990s demonstrated that a combination of factors affect the years over which a measure delivers savings and it is not well estimated using laboratory lifetimes. In the commercial sector, business turnover has a strong effect,2 as well as changes in styles, perceived functionality, and the ability of maintenance staff to keep advanced equipment functioning. We find similar types of factors affect in-situ retention of equipment in households. The overall approach taken by most measure retention studies in the energy efficiency (EE) field is to estimate the median effective useful life (EUL) of the measure in question. The EUL is usually defined as the median number of years3 that a measure is likely to remain in-place and operable.4 This
1 This paper represents the results of preliminary research conducted for CIEE, but errors remain the responsibility of the author; the CIEE Project manager is Ed Vine. More detailed / complete research is forthcoming. 2 This is a factor that varies dramatically across the non-residential sector. Restaurants may turn over in 6 months or lighting styles / décor change every couple of years; schools tend to stay schools and keep measures in place until well past their optimal functioning lifetime! 3 Or other time interval, as appropriate. 4 “In-place and operable” is at least the most common definition of measure survival. Depending on the specific measure under inquiry, alternative formulations of the definition may be more appropriate.
166

amount of time is often calculated by estimating the amount of time until half of the units are no longer in-place and operable. The key data needed to derive these estimates is straightforward: installation location, measure(s) installed, date installed, date measure became inoperable or was removed. From these data, a basic measure life study can be conducted.5 While this task may seem straightforward at first glance, there are often considerable complications involved with obtaining EUL estimates. Measures often last for a long time, making it impractical to simply wait until half of the units fail in order to determine the median survival time. Measure lives are also frequently interrupted prematurely by the owners or employees of the residence or business in which the measure was installed. Obtaining unbiased EUL estimates, therefore, can require delicate statistical analysis to control for exogenous factors that might affect measure lifetime and to predict measure lifetimes based on empirical data. Furthermore, applications for this work require projected results fairly early into the lifetime of much of the equipment installed as part of various programs, when a set of measures is young and only a relatively small portion of the installations may have failed. For example, protocols that were in place for many years in California required periodic verification of EULs when measures had been installed for fewer than five years. While important, this poses a particular challenge, as EUL estimates are driven off failures and few measures projected to last 20 years or more would be expected to fail under that schedule. Developing unbiased estimates of EULs under circumstances of limited data early in measure lifetimes is particularly challenging. Best Practices Summary The authors evaluated more than 120 reports and studies addressing EUL methods, research, and primary studies estimating EULs covering a diverse collection of energy efficiency measures. We compared the different data collection, treatment, and analysis techniques used by various studies on the basis of their effectiveness in obtaining meaningful results, their ability to produce reasonable EUL estimates, the degree to which they produced statistical models that fit the data and the defensibility of the conclusions drawn from them. The review of a large number of studies provided an opportunity to view the range of practices used for small and large, and simple and complex measures and programs over a period of nearly ten years. We found that there were a few problems that arose repeatedly.
• Sampling-Based Issues: We found that many studies had difficulties with the initial data set,
which often is not designed with evaluation in mind. Depending on the types of program and its delivery method, datasets might not contain complete information on all of the three key pieces of information needed for retention studies (participant, measure(s) installed, installation date), or lack full (or updated) contact information. This was more problematic for programs delivered indirectly through commercial channels than programs installed by utilities and their directly-hired contractors. As time goes on (before or between retention studies), the problems in conducting a high quality retention study are exacerbated. In addition, some datasets were based on warranty or registration cards, which may represent a biased population. Finally, if multiple measures are under investigation, or if measures are distributed as part of a multi-measure program that disburses measures based on perceived recipient needs or usage, a measure-based population list may be preferable to a location-based sample because sampling might lead to bias from measure clustering. Problems with the initial database were not uncommon, and with poor starting records, the measure life study is probably fatally flawed.
• Data Collection Issues: The most important factor has to do with the data collection method.
The cost of on-site visits / interviews is high, but for phone surveys to be practical, the measures must be unique and memorable. Phone surveys work for household furnaces, refrigerators, or water heaters; they don’t work for CFLs that may have been installed at different times and are not unique, clearly identified measures. Potential removals need to be memorable and the measures need to be clearly identifiable. Trained staff are needed to recognize the equipment as the model or type installed, and to probe for the best estimate of failure dates where respondents may not recall exact dates. Failure dates are the most critical data needed to support the estimation work.
5 Enhanced data can improve the estimates; these issues are discussed later in the paper.
167
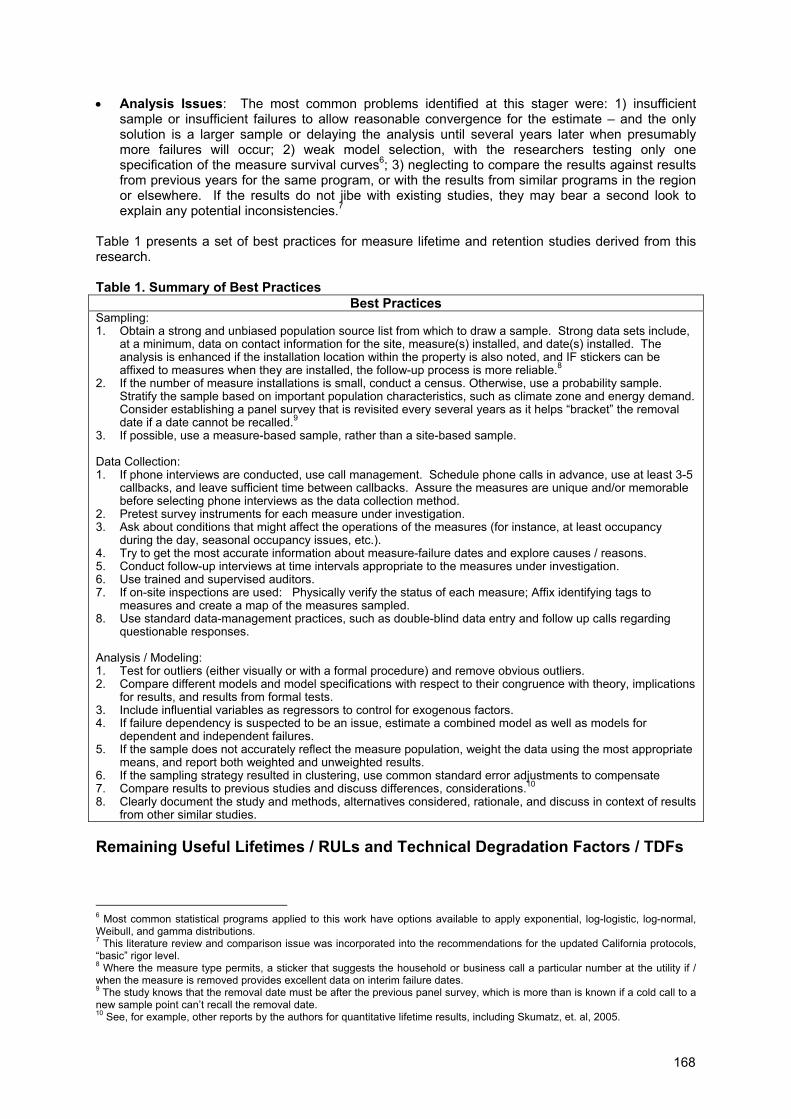
• Analysis Issues: The most common problems identified at this stager were: 1) insufficient sample or insufficient failures to allow reasonable convergence for the estimate – and the only solution is a larger sample or delaying the analysis until several years later when presumably more failures will occur; 2) weak model selection, with the researchers testing only one specification of the measure survival curves6; 3) neglecting to compare the results against results from previous years for the same program, or with the results from similar programs in the region or elsewhere. If the results do not jibe with existing studies, they may bear a second look to explain any potential inconsistencies.7
Table 1 presents a set of best practices for measure lifetime and retention studies derived from this research. Table 1. Summary of Best Practices
Best Practices Sampling: 1. Obtain a strong and unbiased population source list from which to draw a sample. Strong data sets include,
at a minimum, data on contact information for the site, measure(s) installed, and date(s) installed. The analysis is enhanced if the installation location within the property is also noted, and IF stickers can be affixed to measures when they are installed, the follow-up process is more reliable.8
2. If the number of measure installations is small, conduct a census. Otherwise, use a probability sample. Stratify the sample based on important population characteristics, such as climate zone and energy demand. Consider establishing a panel survey that is revisited every several years as it helps “bracket” the removal date if a date cannot be recalled.9
3. If possible, use a measure-based sample, rather than a site-based sample. Data Collection: 1. If phone interviews are conducted, use call management. Schedule phone calls in advance, use at least 3-5
callbacks, and leave sufficient time between callbacks. Assure the measures are unique and/or memorable before selecting phone interviews as the data collection method.
2. Pretest survey instruments for each measure under investigation. 3. Ask about conditions that might affect the operations of the measures (for instance, at least occupancy
during the day, seasonal occupancy issues, etc.). 4. Try to get the most accurate information about measure-failure dates and explore causes / reasons. 5. Conduct follow-up interviews at time intervals appropriate to the measures under investigation. 6. Use trained and supervised auditors. 7. If on-site inspections are used: Physically verify the status of each measure; Affix identifying tags to
measures and create a map of the measures sampled. 8. Use standard data-management practices, such as double-blind data entry and follow up calls regarding
questionable responses. Analysis / Modeling: 1. Test for outliers (either visually or with a formal procedure) and remove obvious outliers. 2. Compare different models and model specifications with respect to their congruence with theory, implications
for results, and results from formal tests. 3. Include influential variables as regressors to control for exogenous factors. 4. If failure dependency is suspected to be an issue, estimate a combined model as well as models for
dependent and independent failures. 5. If the sample does not accurately reflect the measure population, weight the data using the most appropriate
means, and report both weighted and unweighted results. 6. If the sampling strategy resulted in clustering, use common standard error adjustments to compensate 7. Compare results to previous studies and discuss differences, considerations.10 8. Clearly document the study and methods, alternatives considered, rationale, and discuss in context of results
from other similar studies. Remaining Useful Lifetimes / RULs and Technical Degradation Factors / TDFs
6 Most common statistical programs applied to this work have options available to apply exponential, log-logistic, log-normal, Weibull, and gamma distributions. 7 This literature review and comparison issue was incorporated into the recommendations for the updated California protocols, “basic” rigor level. 8 Where the measure type permits, a sticker that suggests the household or business call a particular number at the utility if / when the measure is removed provides excellent data on interim failure dates. 9 The study knows that the removal date must be after the previous panel survey, which is more than is known if a cold call to a new sample point can’t recall the removal date. 10 See, for example, other reports by the authors for quantitative lifetime results, including Skumatz, et. al, 2005.
168

Some programs are designed to intervene at the time measures are being replaced, and the years and savings values to be assigned for the lifetime of the savings are fairly unambiguous.11 However, some programs may be geared toward replacing existing (lower efficiency) equipment with energy efficient equipment before the old equipment ceases to function or before it would otherwise be replaced.12 These issues arise most often in early-replacement programs, relating to the assumption of whether the savings should be calculated as:
- the difference between energy use for the old measure replaced and the new EE measure (we’ll call this “enhanced delta”)
- the difference between the new standard measures available on the market compared to the EE measure induced by the program (we’ll call this “standard delta”).
The question arises, then, whether programs that lead to early replacement should be able to take credit for extra savings – “enhanced delta” during early replacement period– its “remaining useful lifetime” (RUL) before its EUL, and “standard delta” for the period after the normal measure lifetime for the old equipment.13 That is, assuming data on age of the existing equipment can be gathered, should the program be able to count higher savings for the RUL period? We conducted interviews with utilities and professionals across the nation on practices regarding RULs. Comments ranged from “we don’t use these at all” to “they’re used constantly”, depending on the region / utility called. Many of the interviewees agreed that RULs were a concept that had some potential application in the situation of early removal of equipment - that different savings estimates should be used for the two periods of time – enhanced delta during the period of “early replacement” followed by standard delta for the period when the equipment would otherwise have been replaced However, every respondent noted the difficulty of measuring the period in time for the early replacement – and noted it was 1) do-able, but 2) required separate questions on the program research. None believed it was appropriate to ONLY assign to the program the enhanced delta for the period in which the decision was moved forward, a possibility that had come up in some discussions.14 There were only a few primary studies of RULs. One was a Wisconsin study that examined a program that accelerated residential CAC replacement. They gathered the age of the equipment that was being pulled out (using model numbers) and used the lifetimes associated with that equipment to calculate a mortality table (which properly takes into account the fact that if you’ve lived to 90 you stand a better chance of living to 100). These data were used to document the savings stream. A utility in the Northeast states is undertaking a survey approach to examine this issue for a few programs.15 A study in New York (Gowans, 2005) and a study in California (Peterson 2005)16 also developed approaches to associated RULs with specific programs and estimate impacts on program-associated energy savings. Theoretically, it seems that using mortality computations on verified equipment age (or survey information where model information is not available, like some lighting), is a valid approach to the
11 Assigned measure lifetime (EUL), and difference in energy use between standard efficiency available at the time of purchase to the efficiency purchased 12 Leading to early replacement intentionally / by design, or perhaps unintentionally. The logic works in either case. 13 The total lifetime would still be the EUL. Presumably the RUL period would be assigned based on the difference between the age of the existing equipment and the EUL for the equipment. This would seem more consistent with EUL and savings computation practice, rather than conducting interviews asking when the equipment might have otherwise been replaced for each individual installation. Certainly, there will be those early replacements that are installations that tend to hang onto equipment longer than others, but on average, this may be the most computationally elegant approach, should it be used. 14 The issue of RULs may also apply to behavioral programs, so if the issue is solved for measure-based programs, the same policy may apply. Consider the following hypothetical. If codes and standards were going to be implemented in a future year that would mandate some behavior (e.g. you may no longer leave outdoor lights on all night – they must be on a timer), and if a program moved that behavior-related impact forward, it is possible that a parallel situation with the measure-based program arises. 15 Three other interviewees told about related issues. One belatedly found enhanced deltas were recorded for all participants for a program that needed later adjustment; another stated they had issues with first year savings being used throughout the life of the measures (they believed decay functions should be used) and another found out that the auditors were assigning all remaining years of early replacement to the first year – leading to a much over-estimated value for savings. These remain cautionary tales in looking at savings, early replacement, and savings computations and recording. 16 The California study (on the residential program AC Energy Hog) based its analysis on assembled grouped data from RASS 2002, linking stock counts and estimated hazards by age-of-appliance ranges, and Weibull specifications for the resulting survival function. The memo does not suggest the differences in estimated energy savings. The New York memo discusses the topic of RULs from a policy point of view.
169
issue of RULs. Ad hoc assumptions are not appropriate, especially given the much extended replacement intervals in schools (for example) compared to other business types. The two-part savings calculation is likely theoretically appropriate (it is shortchanging a measure if ONLY the early adoption portion is counted). However, the issue is not only one of when equipment would have died – it also involves a subjective decision by the business or homeowner. The years until they “would have replaced” the measure may be even less certain than the self-report information that some are having with responses used in free ridership and net to gross computations. However, given that early replacement programs can have an impact on getting inefficient equipment out of the marketplace, it probably bears a few years of study to see whether reliable techniques can be used to generate responses – especially as the research will only require gathering a few more pieces of information at the point of program implementation / installation / replacement.17 18 19 We also explored the topic of Technical Degradation Factors (TDF), another factor affecting how much savings is being delivered from program-related installations of energy efficiency equipment. This factor relates to the question of whether the measures perform at the new efficiencies consistently over time, or whether their efficiency performance degrades over time (or potentially in given installations). Unexpected decay in performance could be an important issue, particularly for measures for which savings are assumed to accrue for upwards of 15 years. Unfortunately, in our work with the CPUC reviewing more than 100 EUL and TDF studies, we were unable to find TDF papers within the last decade that had been based on primary data.20 Primary research could be justified, particularly for measures with technical or engineering changes that may affect the degradation of specific equipment types relative to the degradation that would be expected with older technology. Of course, it is worth noting that the performance degradation is the combination of two effects – technical degradation and behavioral / operational related degradation defined by quality of use and quality of upkeep of the equipment. Studies that look at degradation in situ need to account for the influence of both these factors. Engineering studies that examine potential technical / mechanical reasons for differences in the relative performance decay over time may miss changes in the effects on the behavioral components. Therefore, setting priorities for future TDF studies will need to examine both technical and behavioral elements. Retention Results for Measure-Based Programs The authors conducted a review of half a dozen recent studies of EUL summaries, as well as examining more than 100 EUL studies conducted on a host of programs in California, and examined measure lifetime assignments for hundreds of measures. We found that deemed measure lifetimes or EUL values used by many different areas of the country seemed to have similar values, as illustrated in Table 2.
17 Specifically, equipment model and age; survey questions on when they would have replaced, and age of equipment that can’t be traced through models. 18 One utility interviewed uses the entire savings – old measure to new measure (enhanced delta)– throughout the lifetime of the measures, and they assume that a (majority) share of those installing the new measures (e.g. CFLs) will replace with CFLs again, so their savings go out beyond the initial lifetime. The utility notes that if something like this is not assumed, you should probably be readjusting your demand forecasts back up after programs. 19 The case of the very effective “cash for clunkers” early automobile replacement programs may be worth examining. Whether the early replacement period was assigned higher emissions savings than the later periods may suggest a precedent for the policy issue in energy. 20 The only studies at all were a series by Proctor Engineering (1997) on different equipment types. The studies generally concluded that more many of the measures, an engineering assessment would conclude that relative degradation – above the degradation pattern that would be realized in standard efficiency equipment – was very unlikely for the majority of equipment types. In some cases (examples included residential air conditioners and refrigerators, among others), the analysis suggested that the degradation associated with new efficient equipment might be less than standard / traditional equipment, leading to “negative” degradation or higher / increasing savings relative to traditional equipment. In the case of a lighting measure (HID) small quantifiable technical degradation was suggested. The study noted that for several measures (commercial package air conditioners and oversized evaporative cooled condensers), the engineering analysis suggested that potentially significant relative technical degradation could occur – and primary research may be needed to further explore the issue. Many measures were likely to experience absolute technical degradation, but that it leads to stable or increasing savings over time to the parallel standard measure.
170

Table 2. Range of EUL Values Used in the US Residential Measures Commercial Measures • Lighting – CFL Bulbs about 6-8 years21, with some
recent work starting to incorporate variations based on assumptions about hours per day the bulb operates
• Hardwired fixtures – about 15-20 years for interior and exterior fixtures
• Lamps (table or torchiere) – about 5-10 years for most studies22, depending on type
• Occupancy sensors – varies from 10-15 years • HVAC replacement – varies from 15-25 years • HVAC and water heating in Energy Star –varies from 15-
25 years • Room A/C – 11-15 years • Programmable thermostat – 10-12 years • Whole house fans – 25 years • Attic ventilation fans with thermostat controls – 19 years • Duct sealing and air sealing – each about 15-20 years • Insulation – 20-25 years • Duct insulation – 20 years • Windows – 20-35 years • Pipe wrap – 10-20 years • Tank temperature turn down – 4-7 years23 • Weatherization (combination measures) – 20-25 years24
• Lighting – CFL Bulbs – 3.4-6 years, with some recent work starting to incorporate variations based on assumption on hours per day bulb operates in business locations
• Fluorescent fixture – 11-16 years • Hardwired CFL – 10-15 years • HID (interior and exterior) 13-15 years • Occupancy sensors – 8-15 years • Daylighting dimming – 9-10 years25 • Packaged AC/Heat Pump – 12-15 years • Chillers 19023 years • Economizers – 7-15 years • Programmable thermostat – 5-10 years • EMS – 10-15 years • Motors – 13-20 years.
Our review of EULs identified several issues:26 • Process equipment lacks EUL studies in many cases, largely because each specific measure
has a small sample size. Some utilities or agencies “assign” a 10 year lifetime, assuming that progress in the industry leads to reconfiguring of equipment on that kind of schedule. This issue may bear additional research, especially since lifetimes are likely dependent on situation, or on the pace of innovations in the particular industry.27
• Some equipment may require changes in assumptions based on operating assumptions. For example, CFLs and other lighting equipment in commercial establishments, VSDs when applied to agricultural milking when they endure harsh outside conditions, etc.28 Lighting logger studies are particularly important given that huge shares of utility programs and savings are based on these measures.
• Reliable EUL estimates are missing in many key end uses: cooking, air compressor equipment, chillers, ASDs/VSDs, refrigeration equipment and freezers in some sectors; and others. In addition, there is only limited information available on the increasingly important – and targeted – plug loads sector (including copiers and office equipment) and unless very short lifetimes are assigned, these measures may need to have EUL studies conducted to provide justifiable savings estimates.
• There are few retention studies on building shell measures. They are not generally assumed to be subject to widespread failure / removal, but this assumption should be verified by several studies, potentially in different parts of the country.
• There has been a trend in the field to move toward simplified EUL tables, but this is a problem. Even some of the earliest research29 found significant variations in business turnover by business type, and this turnover has a direct effect on retention of measures (particularly
21 Logger studies are leading to improved estimates based on hours per day equipment is generally “on”. 22 but longer for DEER (9-16) 23 The GDS 2007 study suggested this measure needed additional study. 24 DEER cited values closer to 13 years 25 DEER assumed 16 years. 26 In addition to specific suggestions on changing DEER draft values, based on our review of national and CA EUL studies (Skumatz 2008). 27 Think of the difference between high-tech computer chip manufacture vs. traditional steel or paper manufacture, as hypothetical extremes. 28 In addition, some lifetimes may specifically need to be adjusted based on the influence of behavioral programs. For instance, if a program suggests relying on daylighting and leaving lights off until really needed, the operating hours for CFLs may need to be adjusted in accordance with the success of such a hypothetical program. 29 Skumatz and Hickman 1991
171

lighting). These variations are important factors in program savings computations and program design.30
The urgency of the need for additional EUL research in specific measures should be weighted by the expected future savings to be derived from the measures. For those that are rare and have low savings, the priority may be low. Similarly, for measures unaffected by operating hours and climate (e.g. exit signs, etc.), priority for investment of additional research budget should probably also be low. Measures subject to climate and operating hours assumptions may be higher priority (HVAC, others).31 Retention for Non-Widget-Based Programs - Education / Training / Behavioral Probably the single biggest gap in lifetime studies is the virtual non-existence of studies examining the retention of education, training, and behavior-focused “measures”.32 Reviewing more than 100 studies in education / training (Freeman and Skumatz 2009), we found only a couple that even mentioned the topic of the retention of savings.33 Almost all studies examined savings for at most the first year of the program, which makes it hard for potentially important and dynamic education programs to receive high benefit/cost ratios, reducing likelihood of funding. Other than an early study by Harrigan and Gregory (1994), which found 85%-90% of the savings from the education portion of a weatherization program was retained after three years, few studies have conducted primary data analysis of the topic. Even well-funded multi-year statewide outreach programs have not examined the persistence of behavior change. This oversight, along with the omission of cost information from most social marketing and outreach / behavior studies (Freeman and Skumatz 2009) represent significant issues associated with behavioral programs.34 Unfortunately, even if first year annual savings estimates are available, it is not possible to develop reliable estimates of the benefit-cost ratio, nor is it possible to rely on long-term savings from programs that are not continually refreshed. For this reason, many utilities assign retention values no higher than three years in most cases.35 Also of concern is that the savings and potentially the persistence may be highly variable depending on the specific program, specific media, quality of the campaign, and many other factors. It may be that every program will require its own persistence study for at least a while, until there is time to develop reliable best practices and “template” programs. The behavioral persistence topic is gaining interest,36 and should be among the highest priorities for new research.37 The research is exploring several options for approaches for behavioral programs. An option is identifying cases for which it is suitable to apply the measure-based “Best Practices” methods to the development of measure life estimates for behavioral programs. This may work in general, with revisions to questions to ask about persistence / presence of behaviors.38 There are nuances related to “partial retention” (e.g. some household members, etc.), but conceptually, this approach can apply to some programs.39 More complex issues of bias40 will also arise because behaviors may not be as observable as measures. In addition, costs may be even higher than traditional EUL work for behavioral programs that are not easily associated with specific businesses or
30 Without consideration of variations by business type, programs could keep “churning” the same business types, and fixed or deemed EULs that don’t vary by business type would miss this effect and keep counting streams of savings that never materialize over time. 31 The question arises whether lifetimes for air conditioners or HVAC should be similar between two very different areas of the country; say, the Northwest vs. Florida. Behavioral considerations should be expected to matter. 32 And this has not changed substantially since the author’s last review of the topic. (Skumatz and Green 2000) 33 In both this study and Skumatz and Green 2000, we also found that although savings are often mentioned, retention is virtually never mentioned, and costs are also rarely discussed. Both are significant weaknesses in this evaluation literature. 34 There is not a great deal of information on this point in other fields beyond energy efficiency either (Freeman and Skumatz, 2009). 35 Although it is unclear if a median EUL of 3 years can be justified given there is minimal research for this figure. 36 It is gaining mention in more and more policy documents, and, for example, CAE has established a working committee on the topic. 37 The associated issue of technical degradation (TDF) is probably best represented in behavioral programs as “retention”, and there are certainly no extant studies of this topic separately. 38 For behavioral or market-based outreach / education programs that influence a home or business to purchase a measure (e.g. Energy Star programs advocating purchase of CFLs or Energy Star refrigerators, etc.) the traditional approach seems completely appropriate. 39 From a data analysis point of view, it may provide more failure data, which can assist model-fitting! 40 Depending on who in the house / business is interviewed, and the usual bias sources like trying to please the interviewer, etc.
172
homes (no “tracking” or warranty cards, etc., like CFL purchases), because large scale survey approaches may be one of the few data collection options available.41 The traditional EUL approach is well suited to longer-lived measures, but may also suit behavioral measures because behaviors may become “unadopted” or “fail” sooner, simplifying data collection and reducing the lag until high quality estimates can be derived.42). The expensive data collection might also have to be frequent, given that the lifetimes may be short. Models might be based on months of lifetimes rather than years. Simplified approaches – perhaps as straightforward as the kind of retention study conducted by Harrigan 1994, may suit for lower-budget programs. Random assignment, follow-up of test and control groups, and similar methods to estimate retained shares of savings and behaviors are the least that is needed. Large scale surveys of household or business populations may be needed until reasonable estimates can be derived and some kind of convergence in results by type of program potentially emerge. Summary This paper reviewed the literature and status of work on measure lifetimes and provided information on a number of key topics in persistence. The research found: • Problems and best practice suggestions for EUL studies: The paper addressed some of
the key issues that have hampered EUL studies in the past. Of particular note are assuring that implementation databases are better structured to support evaluation research; using appropriate sampling approaches when bundled programs are implemented, using phone data collection only when measures are unique or memorable and using panel surveys if possible, testing multiple model specifications, and most importantly, benchmarking the results against the findings for earlier years of the program and for similar programs around the nation.
• Results and Gaps in EULs: A review of results from measure-based EUL studies around
North America shows measure lifetimes exist and are fairly consistent for many measure-based programs in commercial, residential, and commercial sectors.43 Relatively similar EUL values are being assigned by utilities across the country – perhaps with not enough recognition of the operational hours that vary by climate zone. The review also shows a lack of depth in studies in process equipment, some shell measures, and specific end-uses like cooking, refrigeration, air compressors and other equipment.
• Technical Degradation: The issue of technical degradation was discussed, and there is a
shortage of primary research on this topic. Certainly engineering-type studies can help identify research priorities to some extent, noting which technologies have had engineering, mechanical, or process change that will more likely significantly change their performance relative to standard equipment. However, equipment with significant changes in behavioral (operational or upkeep) elements may also see changes in performance. Priority-setting for new research on this topic should take both factors into account (mechanical and behavioral) and resulting figures should be verified periodically.
• RUL Issues: Regarding the topic of Remaining Useful Lifetimes (RULs) in early replacement
programs, some utilities argue RULs are critical to certain programs; others don’t feel the estimation complexity is a worthwhile expenditure. The jury is still out on the policies to be applied broadly, but if a program is designed as early replacement, a credible case could be made that its savings pattern is significantly altered from end-of-lifetime programs. Perhaps in the short run, presenting benefit cost figures including and excluding the enhanced savings could be presented to identify whether the programs are moving decisions forward enough to
41 RASS surveys may need to be expanded to include behaviors, or large scale surveys incorporating interviews on behaviors from several programs may be needed. Surveys of rolling segments of the population maybe appropriate. 42 This seems sensible because 1) people move from the home about every 5 years and potentially the service territory and take their program-influenced behaviors with them, stopping the savings in that dwelling. Most measure-based programs are permanent to the home (except maybe refrigerators and CFLs) and stay after the occupant moves. 43 Although some regions may have used values from other areas (a reviewer suggests this may lead to “groupwise mistakes”), many others have conducted primary research that has, for a number of measures, led to similar EUL estimates.
173
make a difference. There are potentially cases in which this analysis would also be applied to behavioral programs.
• Retention of Behavioral Changes Results and Needs: Of particular note is the virtual
absence of studies addressing retention or persistence of education / outreach / behavioral programs. This is an important gap as behavioral and market-based programs become a larger and larger share of utility / agency portfolios. Further research in best practices for the array of behavioral programs or “types” would be a useful addition to the literature, and agencies should consider requiring new behavioral programs to conduct retention assessments every year or two for a period reaching on the order of three or more years out. This may be the only way to gain enough literature to develop credible estimates of the persistence of savings from behavioral programs, and allow more serious consideration of them as reliable resource substitutes. Finally, EUL measurement approaches will need to be tested and applied to a variety of behavioral programs. Some may parallel traditional EUL estimation best practices, but the application of statistical approaches to some programs may be challenging. This research should be a priority for the near term.
References 1. BC Hydro. QA Standard Technology: Effective Measure Life, 2006. 2. Bender, Sylvia L., Mithra Moezzi, Maria Hill Gossard, and Loren Lutzenhiser. Using Mass Media
to Influence Energy Consumption Behavior: California’s 2001 Flex Your Power Campaign as a Case Study, Proceedings from the ACEEE Summer Study: Asilomar, CA: 2002.
3. Bensch, Ingo, Scott Pigg, and Marge Anderson. How Much is that Training Worth? Quantifying
the Value of Training and Other ‘Fuzzy’ Education Events, Proceedings of the ACEEE Summer Study, Asilomar, CA. 2006.
4. Blasnik, Michael. Persistence of Savings: An Assessment of Technical Degradation, Proceedings
from the IEPEC Conference, Chicago, IL. 1997. 5. GDS Associates, Measure Life Report – Residential and Commercial / Industrial Lighting and
HVAC Measures, new England State Program Working Group. 2007. 6. Gowans, Dakers. Memo: Evaluating long term impacts of the Commercial / Industrial
Performance and Technical Assistance early replacement projects, memo to Cherie Gregoire, NYSERDA, Albany, NY, December 5, 2005.
7. Freeman, D. Juri and Lisa A. Skumatz, Ph.D. Literature Review of Social Marketing and
Education Programs in Multiple Fields, prepared for State of Colorado Advanced Technology Grant Program, Superior, CO. 2009.
8. Harrigan, Merilee S., and Judith M. Gregory. Do Savings from Energy Education Persist?
Proceedings of the ACEEE Summer Study, Asilomar, CA. 1994. 9. Peterson, John. Appendix: AC Energy Hog Roundup Program Remaining Useful Life Analysis,
Memo to Shahana Samiullah, Southern California Edison International, January 20, 2007. 10. Skumatz, Lisa A., 2008. Research on Priority EULs, prepared for Southern California Edison,
Rosemead, CA, by Skumatz Economic Research Associates, Inc., Superior, CO. 11. Skumatz, Lisa A. and John Gardner, 2005. Revised / Updated EULs Based on Retention and
Persistence Studies Results, prepared for Southern California Edison, Rosemead, CA, by Skumatz Economic Research Associates, Inc., Superior, CO.
12. Skumatz, Lisa A., and John Green, 2000, Evaluating the Impacts of Education / Outreach
Programs – Lessons on Impacts, Methods, and Optimal Education, Proceedings of the ACEEE Summer Study, Asilomar, CA.
174

13. Skumatz, Lisa A., and Curtis Hickman. Bonneville Power Administration Measure Life Project, prepared for Bonneville Power Administration (BPA), Portland, OR. 2001.
14. Skumatz, Lisa A., Rose A. Woods, and Scott Dimetrosky, Review of Retention and Persistence
Studies for the CPUC, prepared for California Public Utilities Commission, San Francisco, CA. 2004.
175

Measuring Market Transformation in U.S. Appliance and Lighting Markets
K. H. Tiedemann and I.M. Sulyma
BC Hydro, Vancouver, BC
Abstract
Market transformation programs create new challenges and opportunities for program evaluators. On the one hand, traditional evaluation techniques such as use of pre/post comparisons with treatment and control groups may not be possible if the treatment group is potentially the whole population. On the other hand, econometric techniques can potentially deal with confounding market effects in a comprehensive and credible manner. This study develops and applies the interrupted time-series model to measure market transformation in the U.S. markets for residential appliances and lighting. This study has three main conclusions. First, an increase in GDP increases the sales of both more efficient and less efficient refrigerators, clothes washers, dishwashers, room air conditioners, and screw -type lamps. Second, an increase in electricity price increases sales of Energy Star® refrigerators, clothes washers, dishwashers, room air conditioners as well as compact fluorescent lamps. Third, additional energy conservation activities launched following the 2001 California and Pacific Northwest energy crisis increased the sales of Energy Star refrigerators, clothes washers, dishwashers, room air conditioners and compact fluorescent lamps, thus further helping to transform these markets.
Introduction
Market transformation programs create new challenges and opportunities for program evaluators. On the one hand, traditional evaluation techniques such as use of pre/post comparisons with treatment and control/comparison groups may not be possible if the treatment group is potentially the whole population. This means that new methods of measuring the impacts of DSM programs may need to be developed. On the other hand, econometric techniques can potentially deal with confounding market effects including free riders and spill-over in a comprehensive and credible manner. This means that it may be possible to avoid subjective, and potentially unreliable, survey based approaches to measuring market transformation.
Three main types of econometric studies provide quantitative information on market transformation: (a) learning or experience curve studies; (b) discrete choice theory studies; and (c) demand and supply studies. We briefly discuss each concept and mention studies that apply an econometric approach using market data on prices or quantities for efficient products.
Learning or experience curves model the fact that for many products, unit product costs decrease with increased experience. The original concept was that production experience leads to increases in worker skills and lower production costs in a smooth and regular manner. The Boston Consulting Group broadened the concept from worker related learning to efficiency improvements accruing to all factors of production [1]. In an influential paper, Bass [2] integrates the concepts of experience curves and diffusion rates and develops key elements of a market transformation approach. Several studies have estimated learning curves for energy using technologies, where the learning rate is the reduction in cost for a doubling of output. Akisawa [3] estimated learning curves for air conditioner heat pumps using Japanese data, and he found a learning rate of some 10%, in other words, for the period examined a doubling of production of air conditioner heat pumps reduces unit costs by 10%. Iwafune [4] applied learning curve modeling to compact fluorescent lamps, and he found a learning rate of 16%. Taken together these studies have significant implications for market transformation programs, because they suggest that efforts to increase market sales and encourage early adoption of efficient technologies can have big payoffs in terms of cost reductions and consumer welfare improvements.
Discrete choice theory studies focus on the determinants of consumer behaviour, with a view to determining the net impact of program activities. They are thus an appropriate means of estimating program attribution rates, if detailed suitable data is available or can be collected. Hassett and Metcalf [5] investigated the impact of a US Federal Government tax credit program on energy efficiency
176
investments. They concluded that a ten-percentage point reduction in tax price for energy investments increased the probability of investment by 24 percent. Nanduri et al [6] discrete choice modeling to examine Canadian markets for refrigerators, freezers, clothes washers, clothes dryers, dishwashers, and electric ranges and to estimate gross energy savings by appliance type and year. They found significant producer and consumer impacts caused by energy efficiency labeling.
Several previous studies have used econometric methods to analyze the impact of market transformation programs. Duke and Kammen [7] found that accounting for interaction between the demand response and production response for electronic ballasts increases the consumer benefit cost ratio. Horowitz [8] found that coordinated national electronic ballast programs were more cost effective than local efforts. Horowitz and Haeri [9] found that the cost of energy efficiency investments was fully capitalized in housing prices and that purchasing an energy efficient house was cost effective. Jaffe and Stavins [10] found that insulation levels in new residential housing appropriately reflect energy prices. Tiedemann [11] applied an econometric approach similar to that used here to an analysis of the China Green Lights program, and he found that the program had statistically significant positive impacts on sales of more efficient, and negative impacts on sales of less efficient lighting products. A similar analysis approach applied by Tiedemann et al [12] to two energy efficient lighting products in Thailand found that the Thai programs also had statistically significant positive impacts on the sales and prices of compact fluorescent lamps and efficient (T8) linear fluorescent lamps, and negative impacts on the sales of less efficient incandescent and linear fluorescent lamps (T10, T12).
A number of papers have examined the impact of the Energy Star® program using engineering methods. Webber et al [13] provide a comprehensive set of both historical energy savings and forecast savings due to Energy Star®. They explore the magnitude and allocation of Energy Star® savings in detail, but they don’t examine the determinants of sales of Energy Star® products, which is the focus of this paper. Wenzel et al [14] provide a detailed sourcebook on energy use in the residential sector, and they include detailed estimates of energy consumption by end use. Meyers et al [15] estimate historical and forecast impacts of Energy Star® sales on energy use and carbon emissions, and they estimate that Energy Star® products saved 740 petajoules of energy and 13 million metric tons of carbon emissions through 1999.
Nadel et al [16] provide a comprehensive overview of market transformation activities in the United States, and a summary of Energy Star® is available at www.energystar.gov/index [17].
Market Transformation Model
Demand and Supply Model
To understand the effects of a market transformation program, a clear and well-defined conceptual model of the market is needed. Figure 1 represents the usual demand and supply model for an appliance in a single country, where the quantity of the appliance is measured from the origin on the horizontal axis and the per unit price is measured from the origin on the vertical axis. In this model, the quantity demanded as a function of price is given by the demand curve D for every possible price, and the quantity supplied as a function of price is given by the supply curve S.
The demand curve D is assumed to slope downward from the left in the usual manner. This means that at lower prices, higher quantities of the appliance are demanded. Since the majority of energy efficient appliances sold in most countries are imported, the supply curve S is assumed to be horizontal (perfectly elastic) at the price P. P is the import price at the port of entry plus tariffs plus domestic distribution costs including profit margins minus subsidies. Changes in stocks are ignored in this simple framework, so that in equilibrium the quantity demanded equals the quantity supplied at the price P. The intersection of the demand and supply curves determines the quantity bought and sold Q at the unit price P.
177

Figure1 Demand and Supply Model
Note that shifts in the demand and supply curves can be interpreted in terms of the domestic market transformation programs. The shift from D1 to D2 in Figure 2 represents the demand-pull aspects of the domestic program. This includes all activities that operate primarily by increasing the demand for energy efficient appliances such as advertising, promotions, mall displays and school training programs. The shift from S1 to S2 represents the technology push aspects of the domestic program. This includes all activities that operate primarily by increasing the supply of energy efficient products such as labeling and product testing and retail subsidies.
Figure2 Shift in the Demand and Supply Model
Approach
For convenience we refer to any energy using end-use as an appliance. It is convenient to view an appliance market (such as the market for more energy efficient refrigerators and less energy efficient refrigerators) in isolation and abstract from linkages to other markets or general equilibrium effects. Consider the following simple two-equation model where 1. is the demand curve for a standard appliance and 2. is the demand curve for an energy efficient appliance that meets the same energy service need. For example, if we consider the market for refrigerators, 1. could be the demand curve for standard efficiency refrigerators while 2. could be the demand curve for energy efficient refrigerators, such as Energy Star® qualifying refrigerators.
1. quantity1t = α1 + β1 pricet + γ1 incomet + δ1 dummyt + ε1t
178
2. quantity2t = α2 + β2 pricet + γ2 incomet + δ2 dummy2 + ε2t In these equations, quantityit is residential and small commercial market demand for the appliance (i) at time (t), pricet is the unit price of electricity for residential and small commercial customers at time (t), incomet is total domestic income or GDP at time (t), dummyt is a shift variable that takes the value “0” in the pre-Change program period and the value “1” in the post-Change program period, and ε1t is the error term for equation (i) at time (t).
Equation 1. represents the demand curve for product 1. and says that demand in year (t) is a linear function of electricity price, total domestic income and a preference variable, which represents a shift in consumer demand as a result of marketing activity. It would be desirable to include the price of product 1. and the price of competing product 2. in this equation, but these prices are not available. Similarly, equation 2. represents the demand curve for product 2. and says that demand in year (t) is a linear function of electricity price, total domestic income and a preference variable, which represents a shift in consumer demand as a result of marketing activity. It would be desirable to include the price of product 2. and the price of competing product 1. in this equation, but these prices are not available. If produce 1 and product 2 are normal goods, then consumption of product 1 and consumption of product 2 increases with an increase in the activity variable. Since the surveys attempt to capture sales of lighting products to residential and small commercial customers, the appropriate activity variable would be the sum of consumer disposable income and small business. Because household disposable income and small business sales are highly correlated with GDP, we use GDP as the activity variable. This then gives Hypothesis 1.
Hypothesis 1: An increase in GDP increases sales of standard efficiency and Energy Star® refrigerators, clothes washers, dishwashers, room air conditioners and screw-type lamps.
We assume that consumers base purchase decisions, at least in part, through the assessment of some financial criteria such as pay-back period or life cycle costs. Because comprehensive information on customer costs and benefits is not available, we apply a modified analysis in which consumers consider the cost of electricity in making purchase decisions on energy using products. An increase in the price of electricity shifts purchases towards more energy efficient products, while a decrease in the price of electricity shifts purchases towards less energy efficient products. This then gives us Hypothesis 2.
Hypothesis 2: An increase in electricity price increases sales of more energy-efficient Energy Star® refrigerators, clothes washers, dishwashers and air conditioners and decreases sales of less energy-efficient non-Energy Star® refrigerators, clothes washers, dishwashers and room air conditioners.
Barriers to increased sales of energy efficient products include inadequate consumer and trade ally awareness and knowledge of the features, benefits and cost effectiveness of energy efficient products. DSM marketing efforts are aimed, in part, at overcoming these barriers and thereby increasing demand for more energy efficient products (that is, shifting the demand curve upwards and to the right) and reducing demand for less energy efficient products (that is, shifting the demand curve downwards and to the left). This then gives us Hypothesis 3.
Hypothesis 3: An increase in DSM marketing increases sales of more energy-efficient Energy Star® refrigerators, clothes washers, dishwashers and room air conditioners and decreases sales of less energy-efficient non-Energy Star® refrigerators, clothes washers, dishwashers and air conditioners.
Some evidence suggests that price effects work relatively slowly compared to DSM marketing effects in changing sales levels for energy using products. In other words, in the short term it may be easier to shift the demand curve than to change prices enough to move significantly along the demand curve. This then gives us Hypothesis 4.
Hypothesis 4: The impact of an increase in DSM marketing has relatively large short-term impacts compared to electricity price increases.
Data
The study approach includes the following data sources. First, information from the Department of Energy and the Energy Information Administration was used to build a database of sales of
179
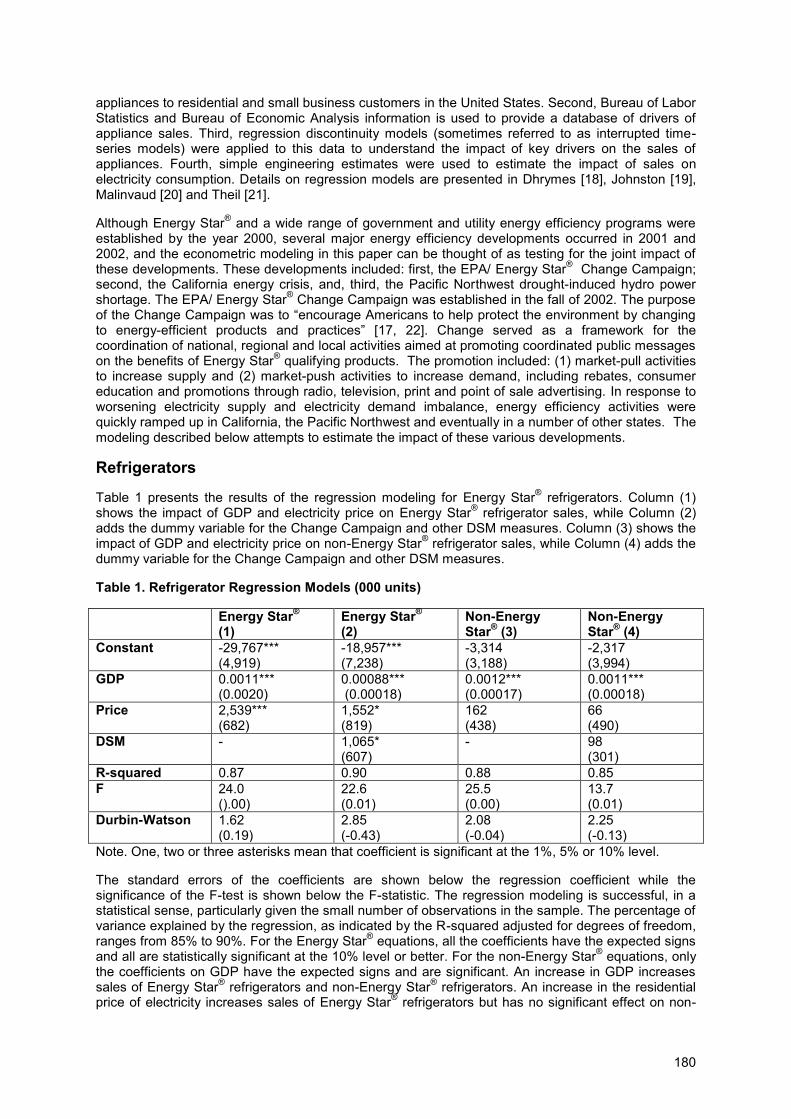
appliances to residential and small business customers in the United States. Second, Bureau of Labor Statistics and Bureau of Economic Analysis information is used to provide a database of drivers of appliance sales. Third, regression discontinuity models (sometimes referred to as interrupted time-series models) were applied to this data to understand the impact of key drivers on the sales of appliances. Fourth, simple engineering estimates were used to estimate the impact of sales on electricity consumption. Details on regression models are presented in Dhrymes [18], Johnston [19], Malinvaud [20] and Theil [21].
Although Energy Star® and a wide range of government and utility energy efficiency programs were established by the year 2000, several major energy efficiency developments occurred in 2001 and 2002, and the econometric modeling in this paper can be thought of as testing for the joint impact of these developments. These developments included: first, the EPA/ Energy Star® Change Campaign; second, the California energy crisis, and, third, the Pacific Northwest drought-induced hydro power shortage. The EPA/ Energy Star® Change Campaign was established in the fall of 2002. The purpose of the Change Campaign was to “encourage Americans to help protect the environment by changing to energy-efficient products and practices” [17, 22]. Change served as a framework for the coordination of national, regional and local activities aimed at promoting coordinated public messages on the benefits of Energy Star® qualifying products. The promotion included: (1) market-pull activities to increase supply and (2) market-push activities to increase demand, including rebates, consumer education and promotions through radio, television, print and point of sale advertising. In response to worsening electricity supply and electricity demand imbalance, energy efficiency activities were quickly ramped up in California, the Pacific Northwest and eventually in a number of other states. The modeling described below attempts to estimate the impact of these various developments.
Refrigerators
Table 1 presents the results of the regression modeling for Energy Star® refrigerators. Column (1) shows the impact of GDP and electricity price on Energy Star® refrigerator sales, while Column (2) adds the dummy variable for the Change Campaign and other DSM measures. Column (3) shows the impact of GDP and electricity price on non-Energy Star® refrigerator sales, while Column (4) adds the dummy variable for the Change Campaign and other DSM measures.
Table 1. Refrigerator Regression Models (000 units)
Energy Star®
(1) Energy Star
®
(2) Non-Energy Star
® (3)
Non-Energy Star
® (4)
Constant -29,767*** (4,919)
-18,957*** (7,238)
-3,314 (3,188)
-2,317 (3,994)
GDP 0.0011*** (0.0020)
0.00088*** (0.00018)
0.0012*** (0.00017)
0.0011*** (0.00018)
Price 2,539*** (682)
1,552* (819)
162 (438)
66 (490)
DSM - 1,065* (607)
- 98 (301)
R-squared 0.87 0.90 0.88 0.85 F 24.0
().00) 22.6 (0.01)
25.5 (0.00)
13.7 (0.01)
Durbin-Watson 1.62 (0.19)
2.85 (-0.43)
2.08 (-0.04)
2.25 (-0.13)
Note. One, two or three asterisks mean that coefficient is significant at the 1%, 5% or 10% level.
The standard errors of the coefficients are shown below the regression coefficient while the significance of the F-test is shown below the F-statistic. The regression modeling is successful, in a statistical sense, particularly given the small number of observations in the sample. The percentage of variance explained by the regression, as indicated by the R-squared adjusted for degrees of freedom, ranges from 85% to 90%. For the Energy Star® equations, all the coefficients have the expected signs and all are statistically significant at the 10% level or better. For the non-Energy Star® equations, only the coefficients on GDP have the expected signs and are significant. An increase in GDP increases sales of Energy Star® refrigerators and non-Energy Star® refrigerators. An increase in the residential price of electricity increases sales of Energy Star® refrigerators but has no significant effect on non-
180
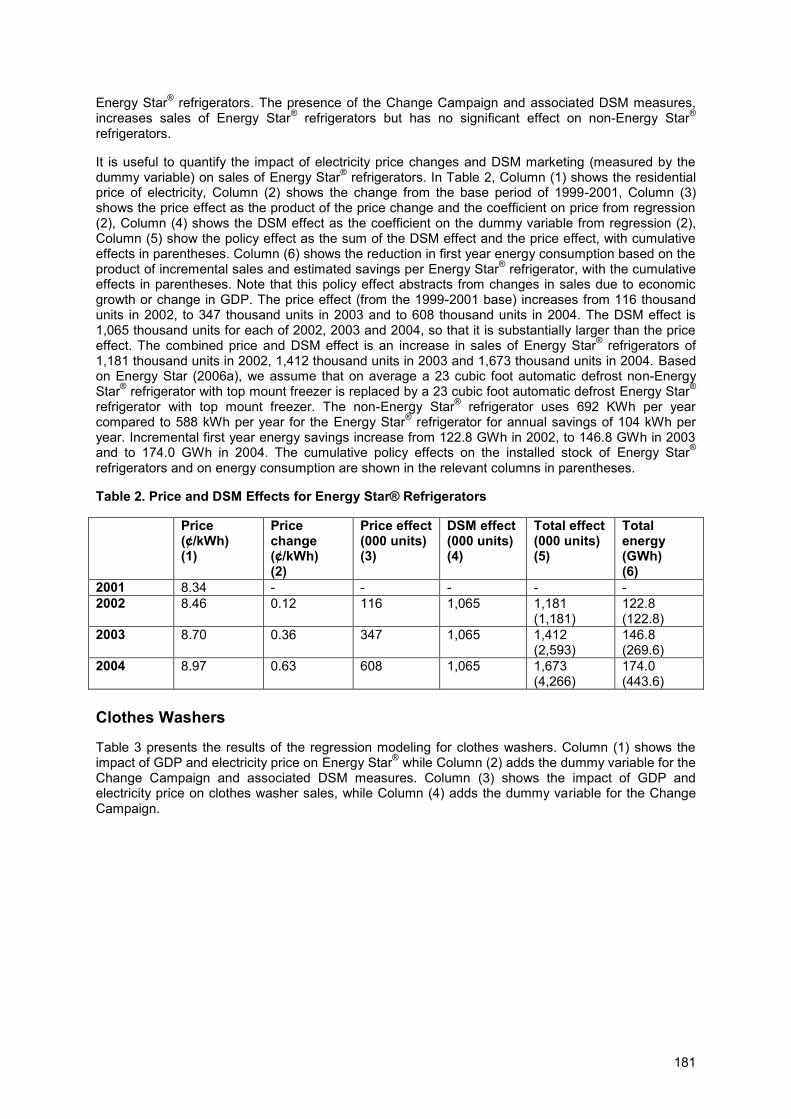
Energy Star® refrigerators. The presence of the Change Campaign and associated DSM measures, increases sales of Energy Star® refrigerators but has no significant effect on non-Energy Star® refrigerators.
It is useful to quantify the impact of electricity price changes and DSM marketing (measured by the dummy variable) on sales of Energy Star® refrigerators. In Table 2, Column (1) shows the residential price of electricity, Column (2) shows the change from the base period of 1999-2001, Column (3) shows the price effect as the product of the price change and the coefficient on price from regression (2), Column (4) shows the DSM effect as the coefficient on the dummy variable from regression (2), Column (5) show the policy effect as the sum of the DSM effect and the price effect, with cumulative effects in parentheses. Column (6) shows the reduction in first year energy consumption based on the product of incremental sales and estimated savings per Energy Star® refrigerator, with the cumulative effects in parentheses. Note that this policy effect abstracts from changes in sales due to economic growth or change in GDP. The price effect (from the 1999-2001 base) increases from 116 thousand units in 2002, to 347 thousand units in 2003 and to 608 thousand units in 2004. The DSM effect is 1,065 thousand units for each of 2002, 2003 and 2004, so that it is substantially larger than the price effect. The combined price and DSM effect is an increase in sales of Energy Star® refrigerators of 1,181 thousand units in 2002, 1,412 thousand units in 2003 and 1,673 thousand units in 2004. Based on Energy Star (2006a), we assume that on average a 23 cubic foot automatic defrost non-Energy Star® refrigerator with top mount freezer is replaced by a 23 cubic foot automatic defrost Energy Star® refrigerator with top mount freezer. The non-Energy Star® refrigerator uses 692 KWh per year compared to 588 kWh per year for the Energy Star® refrigerator for annual savings of 104 kWh per year. Incremental first year energy savings increase from 122.8 GWh in 2002, to 146.8 GWh in 2003 and to 174.0 GWh in 2004. The cumulative policy effects on the installed stock of Energy Star® refrigerators and on energy consumption are shown in the relevant columns in parentheses.
Table 2. Price and DSM Effects for Energy Star® Refrigerators
Price (¢/kWh) (1)
Price change (¢/kWh) (2)
Price effect (000 units) (3)
DSM effect (000 units) (4)
Total effect (000 units) (5)
Total energy (GWh) (6)
2001 8.34 - - - - - 2002 8.46 0.12 116 1,065 1,181
(1,181) 122.8 (122.8)
2003 8.70 0.36 347 1,065 1,412 (2,593)
146.8 (269.6)
2004 8.97 0.63 608 1,065 1,673 (4,266)
174.0 (443.6)
Clothes Washers
Table 3 presents the results of the regression modeling for clothes washers. Column (1) shows the impact of GDP and electricity price on Energy Star® while Column (2) adds the dummy variable for the Change Campaign and associated DSM measures. Column (3) shows the impact of GDP and electricity price on clothes washer sales, while Column (4) adds the dummy variable for the Change Campaign.
181
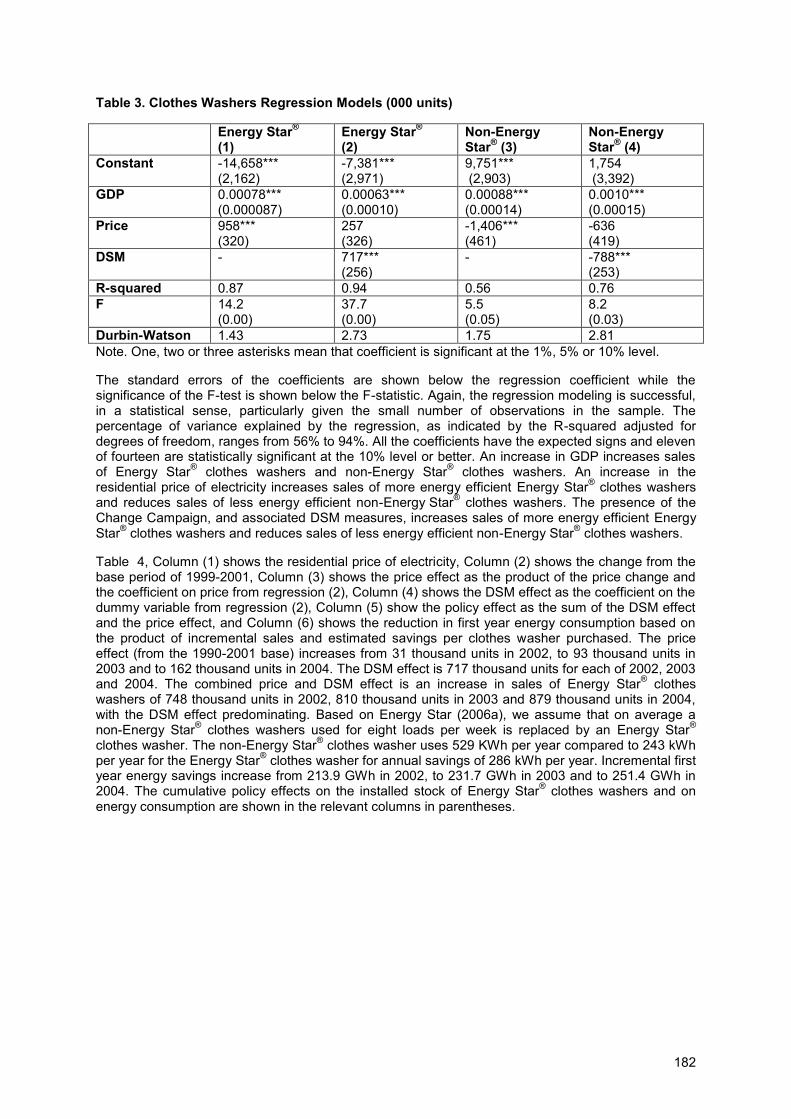
Table 3. Clothes Washers Regression Models (000 units)
Energy Star®
(1) Energy Star
®
(2) Non-Energy Star
® (3)
Non-Energy Star
® (4)
Constant -14,658*** (2,162)
-7,381*** (2,971)
9,751*** (2,903)
1,754 (3,392)
GDP 0.00078*** (0.000087)
0.00063*** (0.00010)
0.00088*** (0.00014)
0.0010*** (0.00015)
Price 958*** (320)
257 (326)
-1,406*** (461)
-636 (419)
DSM - 717*** (256)
- -788*** (253)
R-squared 0.87 0.94 0.56 0.76 F 14.2
(0.00) 37.7 (0.00)
5.5 (0.05)
8.2 (0.03)
Durbin-Watson 1.43 2.73 1.75 2.81 Note. One, two or three asterisks mean that coefficient is significant at the 1%, 5% or 10% level.
The standard errors of the coefficients are shown below the regression coefficient while the significance of the F-test is shown below the F-statistic. Again, the regression modeling is successful, in a statistical sense, particularly given the small number of observations in the sample. The percentage of variance explained by the regression, as indicated by the R-squared adjusted for degrees of freedom, ranges from 56% to 94%. All the coefficients have the expected signs and eleven of fourteen are statistically significant at the 10% level or better. An increase in GDP increases sales of Energy Star® clothes washers and non-Energy Star® clothes washers. An increase in the residential price of electricity increases sales of more energy efficient Energy Star® clothes washers and reduces sales of less energy efficient non-Energy Star® clothes washers. The presence of the Change Campaign, and associated DSM measures, increases sales of more energy efficient Energy Star® clothes washers and reduces sales of less energy efficient non-Energy Star® clothes washers.
Table 4, Column (1) shows the residential price of electricity, Column (2) shows the change from the base period of 1999-2001, Column (3) shows the price effect as the product of the price change and the coefficient on price from regression (2), Column (4) shows the DSM effect as the coefficient on the dummy variable from regression (2), Column (5) show the policy effect as the sum of the DSM effect and the price effect, and Column (6) shows the reduction in first year energy consumption based on the product of incremental sales and estimated savings per clothes washer purchased. The price effect (from the 1990-2001 base) increases from 31 thousand units in 2002, to 93 thousand units in 2003 and to 162 thousand units in 2004. The DSM effect is 717 thousand units for each of 2002, 2003 and 2004. The combined price and DSM effect is an increase in sales of Energy Star® clothes washers of 748 thousand units in 2002, 810 thousand units in 2003 and 879 thousand units in 2004, with the DSM effect predominating. Based on Energy Star (2006a), we assume that on average a non-Energy Star® clothes washers used for eight loads per week is replaced by an Energy Star® clothes washer. The non-Energy Star® clothes washer uses 529 KWh per year compared to 243 kWh per year for the Energy Star® clothes washer for annual savings of 286 kWh per year. Incremental first year energy savings increase from 213.9 GWh in 2002, to 231.7 GWh in 2003 and to 251.4 GWh in 2004. The cumulative policy effects on the installed stock of Energy Star® clothes washers and on energy consumption are shown in the relevant columns in parentheses.
182
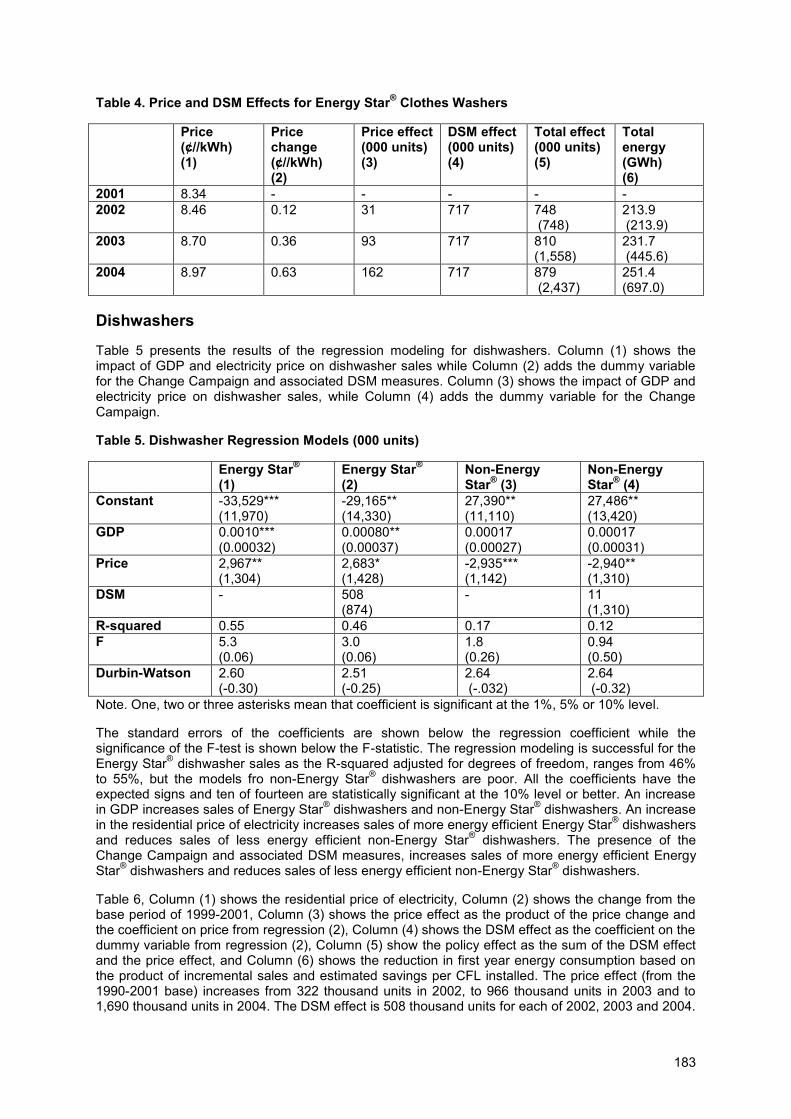
Table 4. Price and DSM Effects for Energy Star® Clothes Washers
Price (¢//kWh) (1)
Price change (¢//kWh) (2)
Price effect (000 units) (3)
DSM effect (000 units) (4)
Total effect (000 units) (5)
Total energy (GWh) (6)
2001 8.34 - - - - - 2002 8.46 0.12 31 717 748
(748) 213.9 (213.9)
2003 8.70 0.36 93 717 810 (1,558)
231.7 (445.6)
2004 8.97 0.63 162 717 879 (2,437)
251.4 (697.0)
Dishwashers
Table 5 presents the results of the regression modeling for dishwashers. Column (1) shows the impact of GDP and electricity price on dishwasher sales while Column (2) adds the dummy variable for the Change Campaign and associated DSM measures. Column (3) shows the impact of GDP and electricity price on dishwasher sales, while Column (4) adds the dummy variable for the Change Campaign.
Table 5. Dishwasher Regression Models (000 units)
Energy Star®
(1) Energy Star
®
(2) Non-Energy Star
® (3)
Non-Energy Star
® (4)
Constant -33,529*** (11,970)
-29,165** (14,330)
27,390** (11,110)
27,486** (13,420)
GDP 0.0010*** (0.00032)
0.00080** (0.00037)
0.00017 (0.00027)
0.00017 (0.00031)
Price 2,967** (1,304)
2,683* (1,428)
-2,935*** (1,142)
-2,940** (1,310)
DSM - 508 (874)
- 11 (1,310)
R-squared 0.55 0.46 0.17 0.12 F 5.3
(0.06) 3.0 (0.06)
1.8 (0.26)
0.94 (0.50)
Durbin-Watson 2.60 (-0.30)
2.51 (-0.25)
2.64 (-.032)
2.64 (-0.32)
Note. One, two or three asterisks mean that coefficient is significant at the 1%, 5% or 10% level.
The standard errors of the coefficients are shown below the regression coefficient while the significance of the F-test is shown below the F-statistic. The regression modeling is successful for the Energy Star® dishwasher sales as the R-squared adjusted for degrees of freedom, ranges from 46% to 55%, but the models fro non-Energy Star® dishwashers are poor. All the coefficients have the expected signs and ten of fourteen are statistically significant at the 10% level or better. An increase in GDP increases sales of Energy Star® dishwashers and non-Energy Star® dishwashers. An increase in the residential price of electricity increases sales of more energy efficient Energy Star® dishwashers and reduces sales of less energy efficient non-Energy Star® dishwashers. The presence of the Change Campaign and associated DSM measures, increases sales of more energy efficient Energy Star® dishwashers and reduces sales of less energy efficient non-Energy Star® dishwashers.
Table 6, Column (1) shows the residential price of electricity, Column (2) shows the change from the base period of 1999-2001, Column (3) shows the price effect as the product of the price change and the coefficient on price from regression (2), Column (4) shows the DSM effect as the coefficient on the dummy variable from regression (2), Column (5) show the policy effect as the sum of the DSM effect and the price effect, and Column (6) shows the reduction in first year energy consumption based on the product of incremental sales and estimated savings per CFL installed. The price effect (from the 1990-2001 base) increases from 322 thousand units in 2002, to 966 thousand units in 2003 and to 1,690 thousand units in 2004. The DSM effect is 508 thousand units for each of 2002, 2003 and 2004.
183
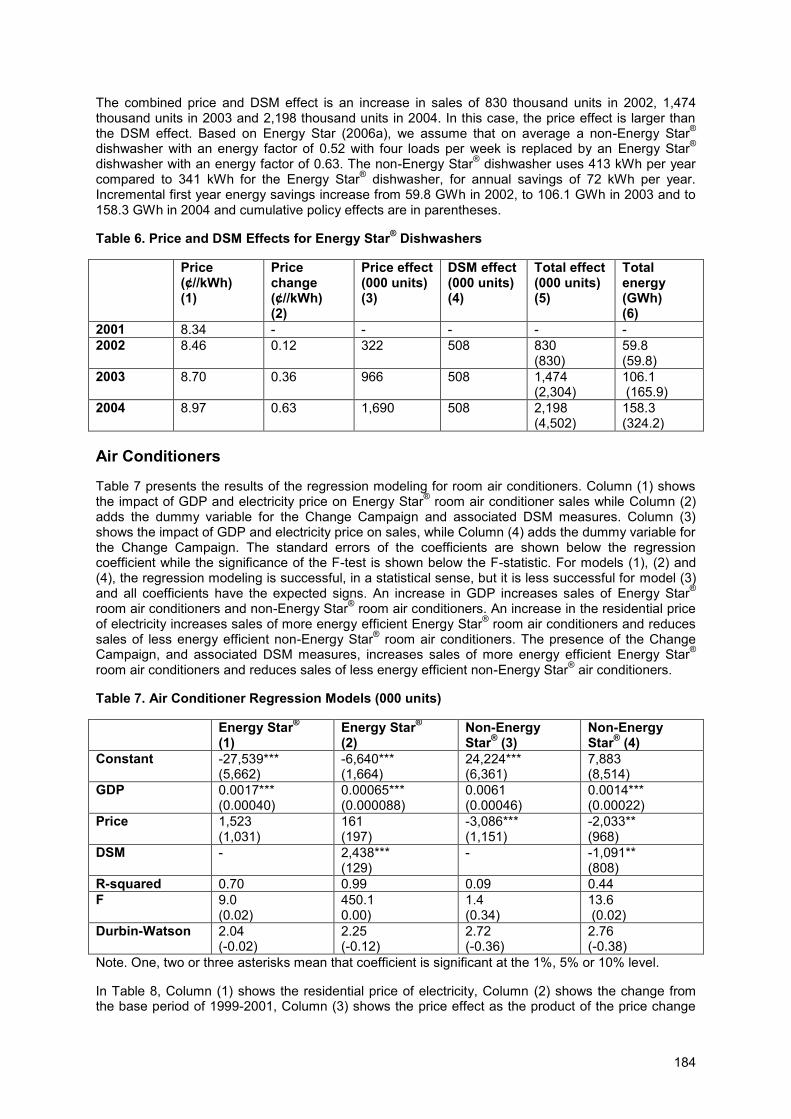
The combined price and DSM effect is an increase in sales of 830 thousand units in 2002, 1,474 thousand units in 2003 and 2,198 thousand units in 2004. In this case, the price effect is larger than the DSM effect. Based on Energy Star (2006a), we assume that on average a non-Energy Star® dishwasher with an energy factor of 0.52 with four loads per week is replaced by an Energy Star® dishwasher with an energy factor of 0.63. The non-Energy Star® dishwasher uses 413 kWh per year compared to 341 kWh for the Energy Star® dishwasher, for annual savings of 72 kWh per year. Incremental first year energy savings increase from 59.8 GWh in 2002, to 106.1 GWh in 2003 and to 158.3 GWh in 2004 and cumulative policy effects are in parentheses.
Table 6. Price and DSM Effects for Energy Star® Dishwashers
Price (¢//kWh) (1)
Price change (¢//kWh) (2)
Price effect (000 units) (3)
DSM effect (000 units) (4)
Total effect (000 units) (5)
Total energy (GWh) (6)
2001 8.34 - - - - - 2002 8.46 0.12 322 508 830
(830) 59.8 (59.8)
2003 8.70 0.36 966 508 1,474 (2,304)
106.1 (165.9)
2004 8.97 0.63 1,690 508 2,198 (4,502)
158.3 (324.2)
Air Conditioners
Table 7 presents the results of the regression modeling for room air conditioners. Column (1) shows the impact of GDP and electricity price on Energy Star® room air conditioner sales while Column (2) adds the dummy variable for the Change Campaign and associated DSM measures. Column (3) shows the impact of GDP and electricity price on sales, while Column (4) adds the dummy variable for the Change Campaign. The standard errors of the coefficients are shown below the regression coefficient while the significance of the F-test is shown below the F-statistic. For models (1), (2) and (4), the regression modeling is successful, in a statistical sense, but it is less successful for model (3) and all coefficients have the expected signs. An increase in GDP increases sales of Energy Star® room air conditioners and non-Energy Star® room air conditioners. An increase in the residential price of electricity increases sales of more energy efficient Energy Star® room air conditioners and reduces sales of less energy efficient non-Energy Star® room air conditioners. The presence of the Change Campaign, and associated DSM measures, increases sales of more energy efficient Energy Star® room air conditioners and reduces sales of less energy efficient non-Energy Star® air conditioners.
Table 7. Air Conditioner Regression Models (000 units)
Energy Star®
(1) Energy Star
®
(2) Non-Energy Star
® (3)
Non-Energy Star
® (4)
Constant -27,539*** (5,662)
-6,640*** (1,664)
24,224*** (6,361)
7,883 (8,514)
GDP 0.0017*** (0.00040)
0.00065*** (0.000088)
0.0061 (0.00046)
0.0014*** (0.00022)
Price 1,523 (1,031)
161 (197)
-3,086*** (1,151)
-2,033** (968)
DSM - 2,438*** (129)
- -1,091** (808)
R-squared 0.70 0.99 0.09 0.44 F 9.0
(0.02) 450.1 0.00)
1.4 (0.34)
13.6 (0.02)
Durbin-Watson 2.04 (-0.02)
2.25 (-0.12)
2.72 (-0.36)
2.76 (-0.38)
Note. One, two or three asterisks mean that coefficient is significant at the 1%, 5% or 10% level.
In Table 8, Column (1) shows the residential price of electricity, Column (2) shows the change from the base period of 1999-2001, Column (3) shows the price effect as the product of the price change
184

and the coefficient on price from regression (2), Column (4) shows the DSM effect as the coefficient on the dummy variable from regression (2), Column (5) show the policy effect as the sum of the DSM effect and the price effect, and Column (6) shows the reduction in first year energy consumption based on the product of incremental sales and estimated savings. The price effect (from the 1990-2001 base) increases from 19 thousand units in 2002, to 58 thousand units in 2003 and to 101 thousand units in 2004. The DSM effect is 2,438 thousand units for each of 2002, 2003 and 2004. The combined price and DSM effect is an increase in sales 4,457 thousand units in 2002, 2,496 thousand units in 2003 and 2,539 thousand units in 2004, with the DSM effect dominating. Based on Energy Star (2006a), we assume that on average a 10,000 Btu/h non- Energy Star® room air conditioner with EER of 9.7 is replaced by a 10,000 Btu/h Energy Star® room air conditioner with EER of 10.7, with 700 operating hours per year. The non-Energy Star® room air conditioner uses 718 kWh per year while the Energy Star® room air conditioner uses 648 kWh per year for savings of 70.0 kWh per year. Incremental first year energy savings increase from 172.0 GWh in 2002, to 174.7 GWh in 2003 and to 177.7 GWh in 2004. The cumulative policy effects on the installed stock of CFLs and on energy consumption are shown in the relevant column in parentheses.
Table 8. Price and DSM Effects for Air Conditioners
Price (¢//kWh) (1)
Price change (¢//kWh) (2)
Price effect (000 units) (3)
DSM effect (000 units) (4)
Total effect (000 units) (5)
Total energy (GWh) (6)
2001 8.34 - - - - - 2002 8.46 0.12 19 2,438 2,457
(2,457) 172.0 (172.0)
2003 8.70 0.36 58 2,438 2,496 (4,953)
174.7 (346.7)
2004 8.97 0.63 101 2,438 2,539 (7,492)
177.7 (524.4)
Screw Type Lamps
Table 3 presents the results of the regression modeling for screw-type lamps. Column (1) shows the impact of GDP and electricity price on CFL sales while Column (2) adds the dummy variable for the Change a Light Campaign and associated DSM measures. Column (3) shows the impact of GDP and electricity price on incandescent lamp sales, while Column (4) adds the dummy variable for the Change a Light Campaign. The standard errors of the coefficients are shown below the regression coefficient while the significance of the F-test is shown below the F-statistic.
The regression modeling is successful, in a statistical sense, particularly given the small number of observations in the sample. The percentage of variance explained by the regression, as indicated by the R-squared adjusted for degrees of freedom, ranges from 56% to 85%, which is quite reasonable for a time-series model.
All the coefficients have the expected signs and all are statistically significant at the 10 level or better. An increase in GDP increases sales of CFLs and incandescent lamps. An increase in the residential price of electricity increases sales of more energy efficient CFLs and reduces sales of less energy efficient incandescent lamps. The presence of the Save a Light campaign, and associated DSM measures, increases sales of more energy efficient CFLs and reduces sales of less energy efficient incandescent lamps. The Durbin-Watson statistics for models (1) and (2) are fine, but they are low for models (3) and (4). Fitting a first-order auto-regressive model to the data did not significantly improve the situation.
185
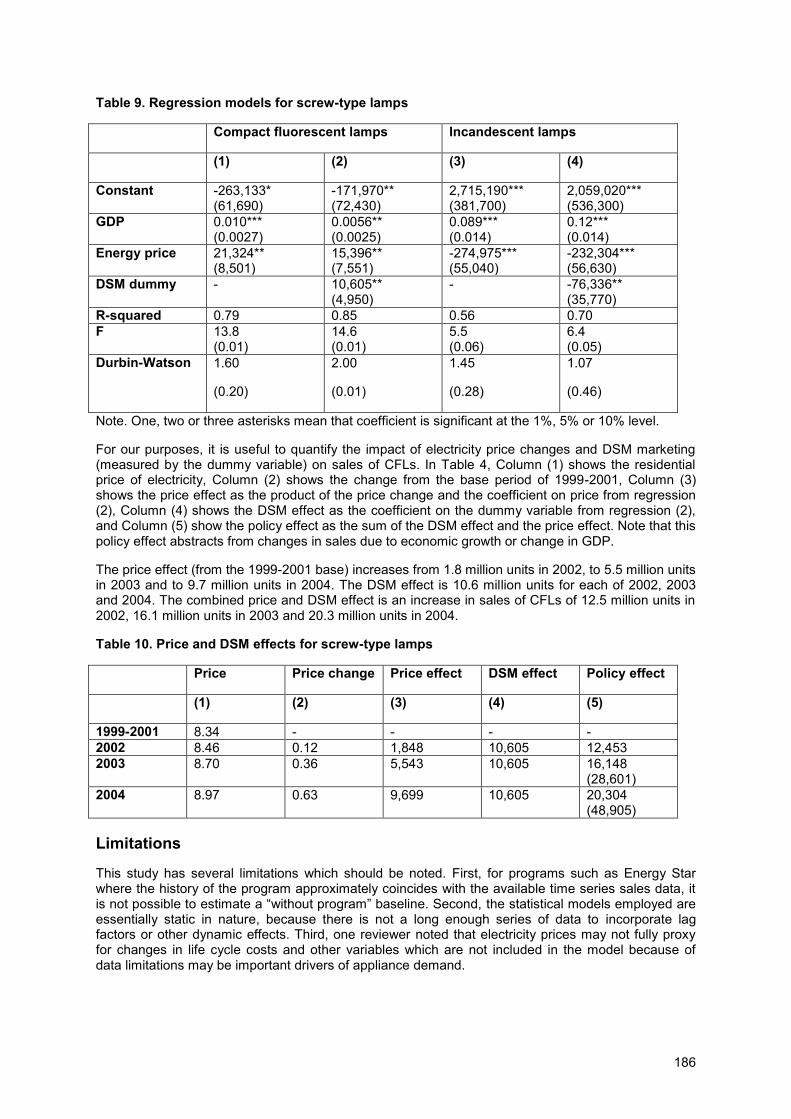
Table 9. Regression models for screw-type lamps
Compact fluorescent lamps Incandescent lamps
(1) (2) (3) (4)
Constant -263,133* (61,690)
-171,970** (72,430)
2,715,190*** (381,700)
2,059,020*** (536,300)
GDP 0.010*** (0.0027)
0.0056** (0.0025)
0.089*** (0.014)
0.12*** (0.014)
Energy price 21,324** (8,501)
15,396** (7,551)
-274,975*** (55,040)
-232,304*** (56,630)
DSM dummy - 10,605** (4,950)
- -76,336** (35,770)
R-squared 0.79 0.85 0.56 0.70 F 13.8
(0.01) 14.6 (0.01)
5.5 (0.06)
6.4 (0.05)
Durbin-Watson 1.60
(0.20)
2.00
(0.01)
1.45
(0.28)
1.07
(0.46)
Note. One, two or three asterisks mean that coefficient is significant at the 1%, 5% or 10% level.
For our purposes, it is useful to quantify the impact of electricity price changes and DSM marketing (measured by the dummy variable) on sales of CFLs. In Table 4, Column (1) shows the residential price of electricity, Column (2) shows the change from the base period of 1999-2001, Column (3) shows the price effect as the product of the price change and the coefficient on price from regression (2), Column (4) shows the DSM effect as the coefficient on the dummy variable from regression (2), and Column (5) show the policy effect as the sum of the DSM effect and the price effect. Note that this policy effect abstracts from changes in sales due to economic growth or change in GDP.
The price effect (from the 1999-2001 base) increases from 1.8 million units in 2002, to 5.5 million units in 2003 and to 9.7 million units in 2004. The DSM effect is 10.6 million units for each of 2002, 2003 and 2004. The combined price and DSM effect is an increase in sales of CFLs of 12.5 million units in 2002, 16.1 million units in 2003 and 20.3 million units in 2004.
Table 10. Price and DSM effects for screw-type lamps
Price Price change Price effect DSM effect Policy effect
(1) (2) (3) (4) (5)
1999-2001 8.34 - - - - 2002 8.46 0.12 1,848 10,605 12,453 2003 8.70 0.36 5,543 10,605 16,148
(28,601) 2004 8.97 0.63 9,699 10,605 20,304
(48,905) Limitations
This study has several limitations which should be noted. First, for programs such as Energy Star where the history of the program approximately coincides with the available time series sales data, it is not possible to estimate a “without program” baseline. Second, the statistical models employed are essentially static in nature, because there is not a long enough series of data to incorporate lag factors or other dynamic effects. Third, one reviewer noted that electricity prices may not fully proxy for changes in life cycle costs and other variables which are not included in the model because of data limitations may be important drivers of appliance demand.
186
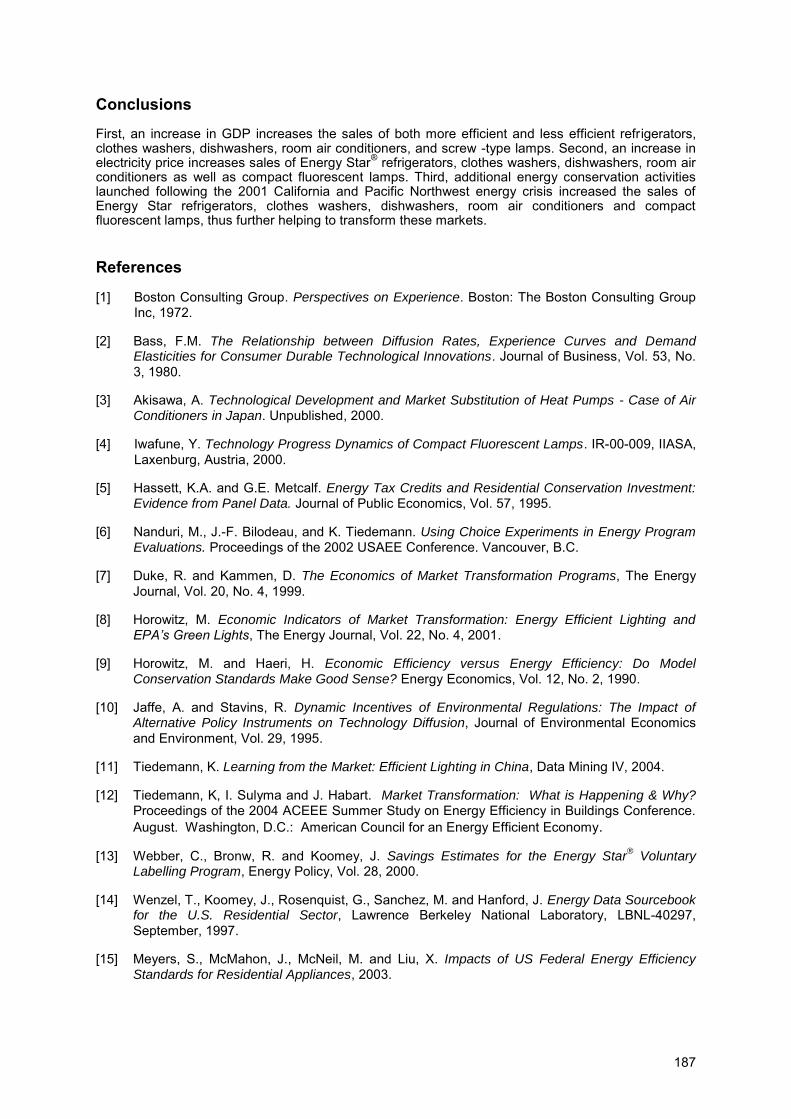
Conclusions
First, an increase in GDP increases the sales of both more efficient and less efficient refrigerators, clothes washers, dishwashers, room air conditioners, and screw -type lamps. Second, an increase in electricity price increases sales of Energy Star® refrigerators, clothes washers, dishwashers, room air conditioners as well as compact fluorescent lamps. Third, additional energy conservation activities launched following the 2001 California and Pacific Northwest energy crisis increased the sales of Energy Star refrigerators, clothes washers, dishwashers, room air conditioners and compact fluorescent lamps, thus further helping to transform these markets.
References
[1] Boston Consulting Group. Perspectives on Experience. Boston: The Boston Consulting Group Inc, 1972.
[2] Bass, F.M. The Relationship between Diffusion Rates, Experience Curves and Demand Elasticities for Consumer Durable Technological Innovations. Journal of Business, Vol. 53, No. 3, 1980.
[3] Akisawa, A. Technological Development and Market Substitution of Heat Pumps - Case of Air Conditioners in Japan. Unpublished, 2000.
[4] Iwafune, Y. Technology Progress Dynamics of Compact Fluorescent Lamps. IR-00-009, IIASA, Laxenburg, Austria, 2000.
[5] Hassett, K.A. and G.E. Metcalf. Energy Tax Credits and Residential Conservation Investment: Evidence from Panel Data. Journal of Public Economics, Vol. 57, 1995.
[6] Nanduri, M., J.-F. Bilodeau, and K. Tiedemann. Using Choice Experiments in Energy Program Evaluations. Proceedings of the 2002 USAEE Conference. Vancouver, B.C.
[7] Duke, R. and Kammen, D. The Economics of Market Transformation Programs, The Energy Journal, Vol. 20, No. 4, 1999.
[8] Horowitz, M. Economic Indicators of Market Transformation: Energy Efficient Lighting and EPA’s Green Lights, The Energy Journal, Vol. 22, No. 4, 2001.
[9] Horowitz, M. and Haeri, H. Economic Efficiency versus Energy Efficiency: Do Model Conservation Standards Make Good Sense? Energy Economics, Vol. 12, No. 2, 1990.
[10] Jaffe, A. and Stavins, R. Dynamic Incentives of Environmental Regulations: The Impact of Alternative Policy Instruments on Technology Diffusion, Journal of Environmental Economics and Environment, Vol. 29, 1995.
[11] Tiedemann, K. Learning from the Market: Efficient Lighting in China, Data Mining IV, 2004.
[12] Tiedemann, K, I. Sulyma and J. Habart. Market Transformation: What is Happening & Why? Proceedings of the 2004 ACEEE Summer Study on Energy Efficiency in Buildings Conference. August. Washington, D.C.: American Council for an Energy Efficient Economy.
[13] Webber, C., Bronw, R. and Koomey, J. Savings Estimates for the Energy Star® Voluntary
Labelling Program, Energy Policy, Vol. 28, 2000.
[14] Wenzel, T., Koomey, J., Rosenquist, G., Sanchez, M. and Hanford, J. Energy Data Sourcebook for the U.S. Residential Sector, Lawrence Berkeley National Laboratory, LBNL-40297, September, 1997.
[15] Meyers, S., McMahon, J., McNeil, M. and Liu, X. Impacts of US Federal Energy Efficiency Standards for Residential Appliances, 2003.
187
[16] Nadel, S., Thorne, J., Sach, H., Prindle, B. and Elliott, R. Market Transformation: Substantial
Progress from a Decade of Work, ACEEE, Washington, D. D., Report No. 036, April 2003.
[17] Energy Star. Energy Star Major Milestones. Accessed at www.energystar.gov/index, August 24, 2006.
[18] Dhrymes, P. J. Econometrics – Statistical Foundations and Applications (1970). Harper and Row, New York, 1970.
[19] Johnston, J. Econometric Methods, Third Edition, McGraw-Hill, New York, 1984.
[20] Malinvaud, E. Statistical Methods of Econometrics, Second Edition, North Holland, Amsterdam, 1970.
[21] Theil, H. Principles of Econometrics, Wiley, New York, 1971.
[22] Midwest Energy Efficiency Alliance. 2004 Change a Light, Change the World Campaign, Summary Report, Midwest Energy Efficiency Alliance.
188
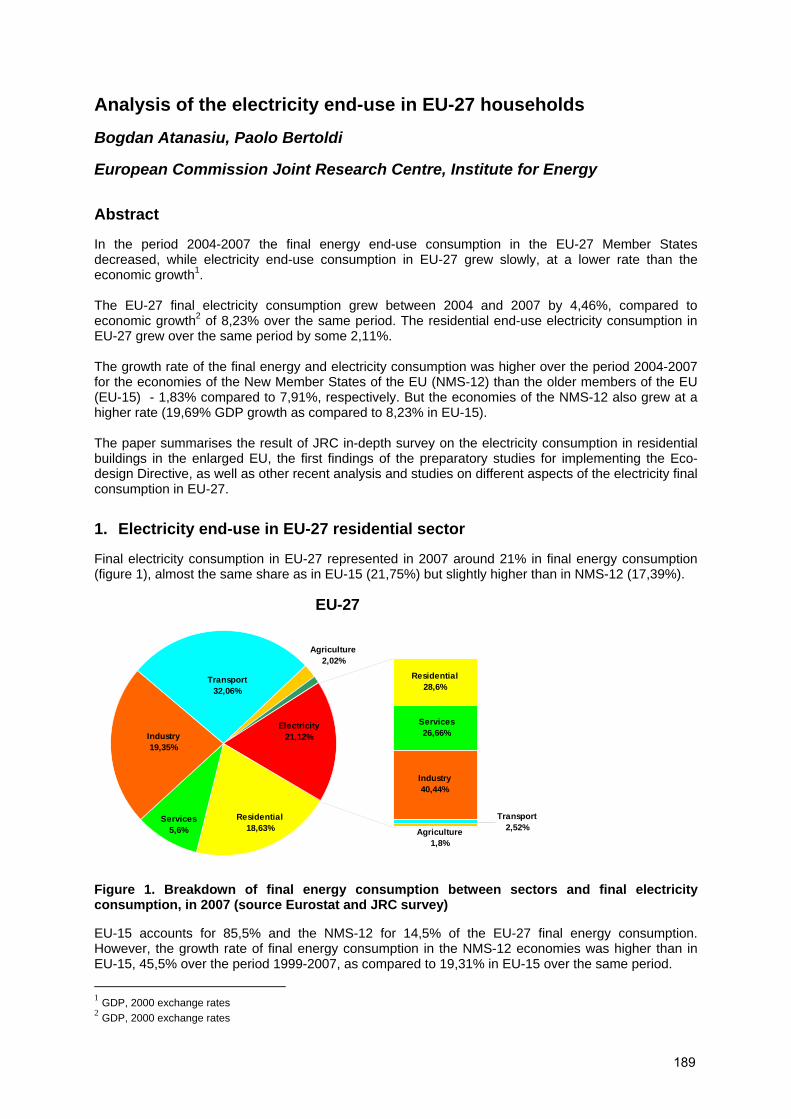
Analysis of the electricity end-use in EU-27 households
Bogdan Atanasiu, Paolo Bertoldi
European Commission Joint Research Centre, Institute for Energy
Abstract
In the period 2004-2007 the final energy end-use consumption in the EU-27 Member States decreased, while electricity end-use consumption in EU-27 grew slowly, at a lower rate than the economic growth1. The EU-27 final electricity consumption grew between 2004 and 2007 by 4,46%, compared to economic growth2 of 8,23% over the same period. The residential end-use electricity consumption in EU-27 grew over the same period by some 2,11%. The growth rate of the final energy and electricity consumption was higher over the period 2004-2007 for the economies of the New Member States of the EU (NMS-12) than the older members of the EU (EU-15) - 1,83% compared to 7,91%, respectively. But the economies of the NMS-12 also grew at a higher rate (19,69% GDP growth as compared to 8,23% in EU-15). The paper summarises the result of JRC in-depth survey on the electricity consumption in residential buildings in the enlarged EU, the first findings of the preparatory studies for implementing the Eco-design Directive, as well as other recent analysis and studies on different aspects of the electricity final consumption in EU-27.
1. Electricity end-use in EU-27 residential sector
Final electricity consumption in EU-27 represented in 2007 around 21% in final energy consumption (figure 1), almost the same share as in EU-15 (21,75%) but slightly higher than in NMS-12 (17,39%).
EU-27
Agriculture1,8%
Transport2,52%
Industry40,44%
Services26,66%
Residential28,6%
Transport32,06%
Industry19,35%
Services5,6%
Residential18,63%
Electricity21,12%
Agriculture2,02%
Figure 1. Breakdown of final energy consumption between sectors and final electricity consumption, in 2007 (source Eurostat and JRC survey)
EU-15 accounts for 85,5% and the NMS-12 for 14,5% of the EU-27 final energy consumption. However, the growth rate of final energy consumption in the NMS-12 economies was higher than in EU-15, 45,5% over the period 1999-2007, as compared to 19,31% in EU-15 over the same period. 1 GDP, 2000 exchange rates 2 GDP, 2000 exchange rates
189

In 2007, the energy consumption of the residential sector in EU-27 dropped down by -1,55% below 1999 (figure 2).
050
100150200250300350400
1990 1999 2000 2001 2002 2003 2004 2005 2006 2007
[Mto
e]
Residential Services Industry Transport Agriculture
Figure 2: Final energy consumption in EU-27
Total electricity consumption in the residential sector for the EU-27 grew by 13,17% on the period 1999-2007, from 707,52 TWh in year 1999 to 800,72 TWh in year 2007. In absolute terms the electricity residential consumption in 2007 registered a slight decrease comparing with 2006 (figure 3). Final electricity consumption growth rate was lower than the economic growth3 rate of 20,57% on the period 1999-2007and 8,23% on the period 2004-2007.
0
200
400
600
800
1990
1991
1992
1993
1994
1995
1996
1997
1998
1999
2000
2001
2002
2003
2004
2005
2006
2007
[TW
h]
EU27 EU15 NMS12
Figure 3: Final electricity consumption in EU-27 residential sector
The largest electricity consumers in EU-27 households are electric heating systems (18,8%), cold appliances (15,3%), lighting (10,8%) and water heating systems (8,6%). The home appliances stand-by consumption accounted for 5,9% or 47,5 TWh/yr, being the eighth main consumer, more than air-conditioning, almost the same as home computers and dishwashers together. (figure 4).
3 GDP, 2000 exchange rates
190
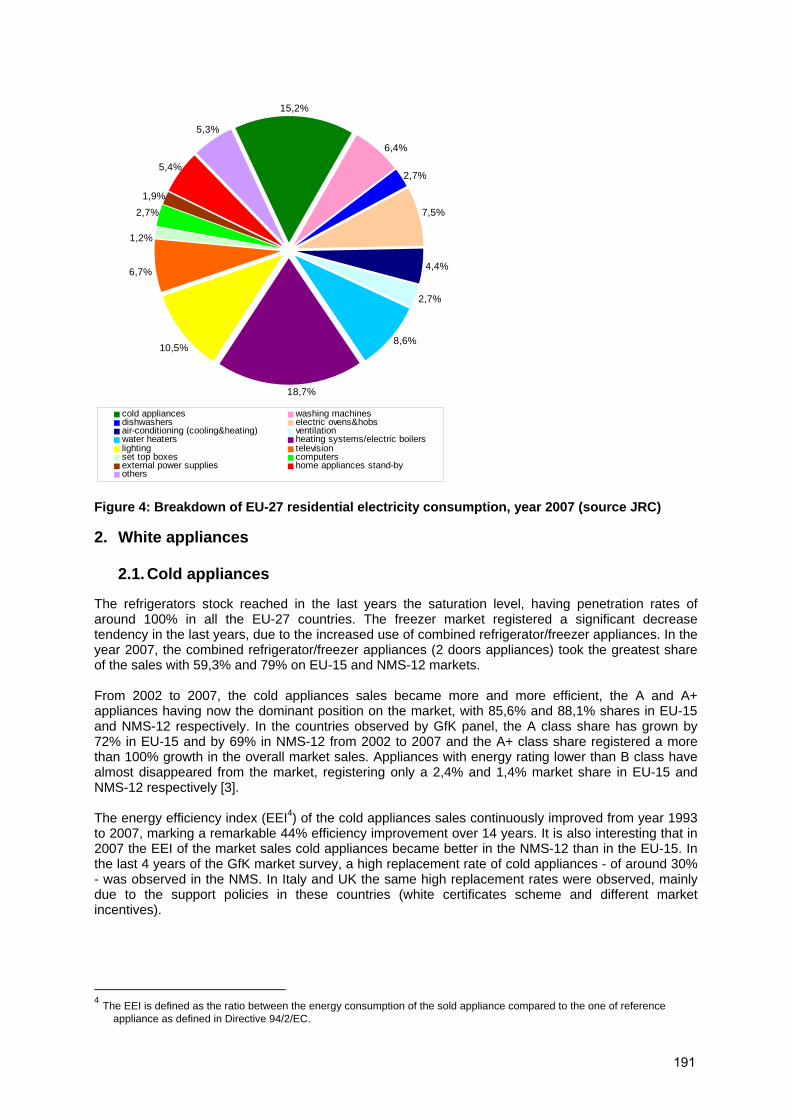
2,7%
5,3%
1,9%
5,4%
1,2%
6,7%
6,4%
15,2%
8,6%
2,7%
4,4%
7,5%
2,7%
18,7%
10,5%
cold appliances washing machinesdishwashers electric ovens&hobsair-conditioning (cooling&heating) ventilationwater heaters heating systems/electric boilerslighting televisionset top boxes computersexternal power supplies home appliances stand-byothers
Figure 4: Breakdown of EU-27 residential electricity consumption, year 2007 (source JRC)
2. White appliances
2.1. Cold appliances
The refrigerators stock reached in the last years the saturation level, having penetration rates of around 100% in all the EU-27 countries. The freezer market registered a significant decrease tendency in the last years, due to the increased use of combined refrigerator/freezer appliances. In the year 2007, the combined refrigerator/freezer appliances (2 doors appliances) took the greatest share of the sales with 59,3% and 79% on EU-15 and NMS-12 markets. From 2002 to 2007, the cold appliances sales became more and more efficient, the A and A+ appliances having now the dominant position on the market, with 85,6% and 88,1% shares in EU-15 and NMS-12 respectively. In the countries observed by GfK panel, the A class share has grown by 72% in EU-15 and by 69% in NMS-12 from 2002 to 2007 and the A+ class share registered a more than 100% growth in the overall market sales. Appliances with energy rating lower than B class have almost disappeared from the market, registering only a 2,4% and 1,4% market share in EU-15 and NMS-12 respectively [3]. The energy efficiency index (EEI4) of the cold appliances sales continuously improved from year 1993 to 2007, marking a remarkable 44% efficiency improvement over 14 years. It is also interesting that in 2007 the EEI of the market sales cold appliances became better in the NMS-12 than in the EU-15. In the last 4 years of the GfK market survey, a high replacement rate of cold appliances - of around 30% - was observed in the NMS. In Italy and UK the same high replacement rates were observed, mainly due to the support policies in these countries (white certificates scheme and different market incentives).
4 The EEI is defined as the ratio between the energy consumption of the sold appliance compared to the one of reference
appliance as defined in Directive 94/2/EC.
191

60,13756,679 56,02
100
96,193,9 91,8
88,482,3
79,372,4 70 67,6 65,6
63,6854,7657,9560,9
64,75
0
20
40
60
80
100
120
1993
1994
1995
1996
1997
1998
1999
2000
2001
2002
2003
2004
2005
2006
2007
%
EEI EU-15 EEI NMS-12 Figure 5: Evolution of the EEI for cold appliances sales
In 2007 the EU-27 refrigerators stock in residential sector was around 190,577 millions units and the freezers stock at around 84,292 millions units [1]. The estimated energy consumption for the cold appliances stock in EU-27 was in 2005 around 82 TWh/yr for refrigerators and 40 TWh/yr for freezers [1], the overall cold appliances consumption remaining the same in 2007 [2]5.
2.2. Washing machines
As in the case of refrigerators, the washing machines stock reached the saturation level, having penetration rates around 100% in all the EU-27 countries. The washing machines sales in 2007 were dominated by A class or better, together taking a share of 96,7% and 95,3% in EU-15 and NMS-12 respectively. In the countries observed by GfK panel, the A+ class share growing rapidly in the last five years, reaching market shares of 39% in EU-15 and 40% in NMS-12. Appliances with energy rating lower than B class almost disappeared from the market, representing in 2007 less than 2% of the EU-27 market. The EU-27 washing machines stock in residential sector was estimated to be around 172,848 millions units (JRC estimation based on [4]). According with the Eco-design preparatory study for wet appliances, the estimate energy consumption for the washing machines stock in 2005 was around 51 TWh/yr, considering a 295 kWh average yearly energy consumption per appliance and 90% penetration rate in the EU-27 households (JRC estimation based on [4]).
The energy efficiency index (EEI6) of the washing machines sales continuously improved over the last 12 years, marking a remarkable 30% efficiency improvement in 2007. In 2007 the EEI of the market sales cold appliances became the same in the NMS-12 than in the EU-15. According to the GfK panel, for washing machines the attention of the consumer to efficient energy consumption appliances is much higher than for refrigerators and the price seem to be an important element in supporting the growth of segments A+.
5 Based on an extrapolation of the stock model elaborated under the [11] taking in consideration the follows: strong market
penetration of more than A class appliances, the stock saturation and the consequent tendency for replacement of old existing appliances with more efficient one rather than to increase the stock, the higher penetration rates of very efficient appliances in NMS where the stock was more aged and inefficient than in EU-15 but also the market trend for replacing refrigerators with combo-cold appliances.
6 For washing machines the EEI is expressed as the energy used per kg of soiled cloths in a 60ºC cotton cycle (kWh/kg)
192
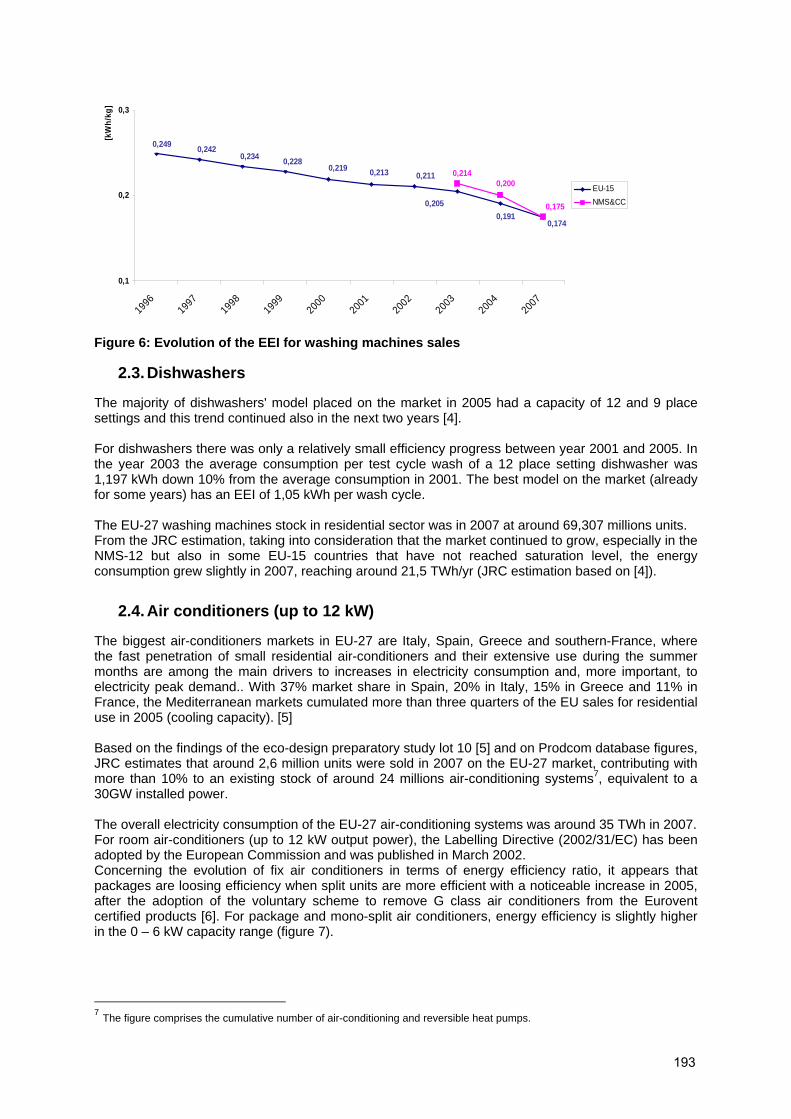
0,1740,191
0,205
0,2110,2130,2190,2280,234
0,2420,249
0,175
0,2000,214
0,1
0,2
0,3
1996
1997
1998
1999
2000
2001
2002
2003
2004
2007
[kW
h/kg
]
EU-15NMS&CC
Figure 6: Evolution of the EEI for washing machines sales
2.3. Dishwashers
The majority of dishwashers' model placed on the market in 2005 had a capacity of 12 and 9 place settings and this trend continued also in the next two years [4]. For dishwashers there was only a relatively small efficiency progress between year 2001 and 2005. In the year 2003 the average consumption per test cycle wash of a 12 place setting dishwasher was 1,197 kWh down 10% from the average consumption in 2001. The best model on the market (already for some years) has an EEI of 1,05 kWh per wash cycle. The EU-27 washing machines stock in residential sector was in 2007 at around 69,307 millions units. From the JRC estimation, taking into consideration that the market continued to grow, especially in the NMS-12 but also in some EU-15 countries that have not reached saturation level, the energy consumption grew slightly in 2007, reaching around 21,5 TWh/yr (JRC estimation based on [4]).
2.4. Air conditioners (up to 12 kW)
The biggest air-conditioners markets in EU-27 are Italy, Spain, Greece and southern-France, where the fast penetration of small residential air-conditioners and their extensive use during the summer months are among the main drivers to increases in electricity consumption and, more important, to electricity peak demand.. With 37% market share in Spain, 20% in Italy, 15% in Greece and 11% in France, the Mediterranean markets cumulated more than three quarters of the EU sales for residential use in 2005 (cooling capacity). [5] Based on the findings of the eco-design preparatory study lot 10 [5] and on Prodcom database figures, JRC estimates that around 2,6 million units were sold in 2007 on the EU-27 market, contributing with more than 10% to an existing stock of around 24 millions air-conditioning systems7, equivalent to a 30GW installed power. The overall electricity consumption of the EU-27 air-conditioning systems was around 35 TWh in 2007. For room air-conditioners (up to 12 kW output power), the Labelling Directive (2002/31/EC) has been adopted by the European Commission and was published in March 2002. Concerning the evolution of fix air conditioners in terms of energy efficiency ratio, it appears that packages are loosing efficiency when split units are more efficient with a noticeable increase in 2005, after the adoption of the voluntary scheme to remove G class air conditioners from the Eurovent certified products [6]. For package and mono-split air conditioners, energy efficiency is slightly higher in the 0 – 6 kW capacity range (figure 7).
7 The figure comprises the cumulative number of air-conditioning and reversible heat pumps.
193

Figure 7: Evolution of the EER (model weighted average) for air-cooled Air conditioners up to 12 kW (source Eurovent, [5])
2.5. Electric Water Heaters
Electric water heaters were responsible for 8,1% of the total residential electricity consumption, which represented in 2007 around 68,7 TWh/year. From JRC estimations, in the year 2007 the installed stock of electric water heaters in EU-27 was around 119 million units (out of 267 million units) of which 29 million units electric instantaneous and 90 million units electric storage water heaters. For the same year, the estimations showed an installed stock of around 2 millions solar water heaters. In 2007, around 31,7% of the EU-27 households owned a secondary water heater, usually a small one for kitchen or bath. Electric storage water heaters with a capacity over 30 litres represent about 27 % of the installed park for primary water heaters, with an additional share of 6,6 % for instantaneous electric water heater (>12kW) as a primary installation and around 7% of instantaneous water heater (<12kW) as a secondary one. In terms of sales about 5,9 million of storage model were sold (or about 34 % of total water heaters sales), with 2,4 million instantaneous models. (JRC estimation based on [7]) The preparatory study on Ecodesign of water heaters estimated a 34% efficiency of the water heaters stock in 2005. [7] For electric water heaters there are no energy efficiency policies for labeling, minimum energy requirements or similar, but measures are expected in the framework of the Eco-design Directive.
2.6. Space heating
The space heating equipment is still the largest electricity residential consumers, with an estimate consumption of around 150 TWh, including electric equipment (electric boilers and radiators) as well as the electricity consumption of the monitoring and control equipment of the other heating equipment fuelled by gas or oil. The EU central heating stock rose in the last years reaching in 2007 an estimated 80% of the installed heating systems (some 163 millions dwellings). Since 1990 the fastest growth – 52-53% - was registered by individual hydronic central heating systems, reaching almost 100 million units. The biggest share of individual central heating sector, almost 80%, is taken by gas-fired systems, ¾ of these being wall-hung ones. The electric central heating boilers represent around 1,2 % (1,11 million units) of the existing stock and 0,5 - 0,6% (39.000 units) of the market sales. Apart from individual hydronic systems, around 10% of the residential stock is connected to the district heating from which 3% is the NMS-12 contribution. Other 15% represent the collective heating and 7% dry electric or local gas heaters. The market trends indicate that the electric boilers will preserve their marginal position also in the future. [8]
194
The overall boilers sales registered some 7 million units sold in 2007 from which 60% represent replacements of old existing boilers, 22% for new houses and only some 14% representing first time installation in a dwelling. The wall hung gas boilers dominate the stock (51,5%) and the sales (80%), but the biggest part is still taken by the non-condensing boilers. In the Netherlands, Germany, the UK and Denmark the more efficient condensing boilers have significant shares on both the existing stock and market sales. Several countries like France, Ireland, Italy, The Netherlands, Austria and Denmark, developed specific national programmes offering subsidies and tax credits for high efficiency condensing boilers.
2.7. Television
The EU-27electricity consumption of TVs in 2007 is estimated to be 60 TWh of which 54 TWh are related to on-mode power consumption and 6 TWh are related to standby/off-mode power consumption. Following the findings of the EuP preparatory study [11], our estimate indicates that the installed stock of TVs in EU-27 residential sector was around 310 million units. The penetration rate of around 150% reflects the market tendency to have two TVs per household. Small screen sizes are still dominating the stock (more than 50%), but the medium screen size segment is steadily growing towards an estimate of 33% in 2010. The large screen sizes are the smallest segment with approximately 12% share. Regarding the penetration rate of different display technologies there are more than 60% CRT-TVs in the households, followed by 30% LCD TVs and up to 10% PDP TVs, but CRT-TVs are sharply reducing the market share in favour of flat TVs8. The estimates show that in 2007, the CRT TVs (35% market share) lost EU market leadership in favour of LCDs (53% market share). [11] On mid-term, some promising “disruptive” display technologies might enter the market, some sources indicating the OLED technology as the most market challenging one following the year 2010. [10]
2.8. Digital TV services
Digital TV, in the form of digital cable, satellite, digital terrestrial (DTT), and IPTV (Internet Protocol Television), is replacing very fast the analogue technologies. The EU Member States are gradually closing analogue transmissions and moving to digital broadcasting. Five Member States (Germany, Finland, Luxembourg, Sweden and the Netherlands) have already completed switch-off at the beginning of 2009 and by 2010 the process should be well advanced in the whole EU-27. [9] According to several studies [20] [21] in June 2008 in EU-27 were some 103 millions digital TV subscriptions, from which 40 millions digital satellite, 17 millions digital cable, 36 millions digital terrestrial and 10 millions IPTV. In the near future the equipment for reception, decoding and interactive processing of digital broadcasting and related services will contribute more and more substantially to the electricity consumption of EU households. Based on penetration levels, the specifications of the equipment and the requirements of the service provider, in 2007 a total European consumption of up to 23 TWh/yr was estimated. To limit the potential growth in energy consumption a voluntary programme was introduced, the European Code of Conduct for Digital TV Services9, developed by a working group including stakeholders. The Code of Conduct sets out the basic principles to be followed by all parties involved in digital TV services, operating in the European Community in respect of energy efficient equipment.
8 LCD= liquid crystal display, PDP= plasma display panel, CRT= cathode-ray tube, RP= rear-projection 9 All the information can be found at http://energyefficiency.jrc.cec.eu.int/html/standby_initiative_digital%20tv%20services.htm
195
With the general principles and actions resulting from the implementation of this Code of Conduct the (maximum) electricity consumption could be limited to 15 TWh per year, equivalent to total saving of about 750 million EURO per year.
2.9. Set-top boxes (STBs) The simple set-top boxes (SSTBs) have the primary function of converting digital input into analogue output signals. During the ongoing transition for analogue to digital broadcasting TV sets not adapted to receive digital signals will need to be accompanied by these devices. Taking into account the fast penetration of the digital TV sets on the EU markets, it is expected that in the coming years the SSTBs will loose importance in favour of the complex SSBs. Starting from the estimation from the Preparatory study for Eco-design Requirements of EuPs on Simple Digital TV Converters (Simple Set Top Boxes), in the year 2007 in EU-27 were around 47,5 millions SSTB and some 3 millions SSTB/PVR, with an overall consumption of 3 TWh/yr10. [12] The preparatory study for eco-design requirements for EuPs, Lot 18 estimates for year 2007 a CSTBs stock of 71,6 million units with an estimate electricity consumption of around 6,31 TWh/yr. For the same year, the CSTBs market sales were estimated at 24,2 million units [13]. In the framework of the eco-design Directive, in February 2009 the EU commission adopted a Regulation with regard to eco-design requirements for simple set-top boxes [22], imposing mandatory requirements for the stand-by and active mode energy consumption, taking effect in 2010.
2.10. Broadband equipment
Broadband penetration in Europe continues to grow, from 18,2% in July 2007 to up to 21,7% in July 2008. As of mid 2008, EU-27 had 107,602 millions fixed broadband lines, with a 7,8% increase in the last six months. Out of these lines, 85,873 millions were DSL (79,8% of total) and 21,729 (20,2%) were provided using other transmission means, predominately cable modem. At EU-27 level, the fixed penetration rate11 was 21,7%, with 3,5% more than one year ago. Regarding speeds, 25,1% of fixed broadband lines are in the range of 144 Kbps - 2 Mbps, 62,0% of reported lines are in the range of 2 - 10 Mbps and 12,8% of the lines are in the range of speeds beyond 10 Mbps. In 2008, the number of the non-DSL lines reached 21,729 million, which represents a 22,7% (4,025 million new lines) growth in the last year. However, DSL growth continues to slow down by 10.9% per year comparing to July 2007, to the benefit of other fixed broadband technologies like cable, fibre to the home (FTTH) and wireless local loops. The penetration rate of broadband fix lines in EU-27 household reached 53,78% as of mid-2008. In 2008, EU-27 had 34,040 millions mobile broadband12 active users (subscribers)13, with an average EU fix penetration level at 6,9%. The number of mobile broadband connections using only dedicated data cards/modems/keys was significantly lower (around 2 to 3%). [23] Depending on the penetration level, the specifications of the equipment and the requirements of the service provider, a total EU-27 consumption of up to 50 TWh per year is estimated for the year 2015. To address the issue of energy efficiency all service providers, network operators, equipment and 10 The annual power consumption per SSTB was estimated at around 54,75kWh/device (4h/day on-mode) and around 108,97
kWh/yr per SSTB/PVR (8h/day on-mode) [HAR2007]
11 Fixed penetration rate means the number of broadband lines per 100 population
12 Mobile broadband active users are users using broadband dedicated data services via data modems/cards/keys and other active 3G equivalent users using mobile terminals in last 90 days.
13 The figure must be significantly bigger, as time as France, the Netherlands and the UK did not report on.
196
component manufacturers helped the European Commission to develop the Code of Conduct for Broadband equipment14. With the general principles and actions resulting from the implementation of this Code of Conduct the (maximum) electricity consumption could be limited to 25 TWh per year, this is equivalent to 5,5 Millions tons of oil equivalent (TOE) and to total saving of about € 7,5 Billions per year.
2.11. External Power Supplies
The preparatory study Lot 7 (Battery chargers and external power supplies) has shown that the significant environmental impact related to external power supplies are due to energy consumption in all life cycle stages. 2009 estimates show that in EU-27 the stock of 2 billion units EPS imply a 17,3 TWh electricity consumption in the use phase15 and sales of around 611 millions units per year. [14] The estimate done under the EPS Code of Conducts indicates an electricity consumption of around 14 TWh in 2006 (BaU)16. Based on these, the JRC estimates for the 2007 an EPS electricity consumption of around 15,5 TWh/yr. In the framework of the eco-design Directive, The Commission has adopted a new Regulation to improve the energy performance of external power supplies to come into force in 2010, which is expected to cut their electricity losses by nearly a third by 2020, resulting in some 9TWh/year savings. Since 2000 the European Code of Conduct on Energy Efficiency of External Power Supplies (EU CoC EPS)17 has been applied for reducing the no-load losses and improving the on-mode efficiency. Due to this voluntary agreement, from 2005 many of the external power supplies in the European market have no-load losses below 1 W. With actions resulting from the Code of Conduct the stand-by consumption of wall packs and chargers 5 TWh/year can be saved by 2010. The operation losses can be also reduced by increasing the power conversion efficiency, resulting in energy savings of the same order of magnitude (1 to 5 TWh).
2.12. Information technologies
In the last decade computers have become omnipresent and their role will continue to be more and more important due to their impacts on education, society, and personal lives. Consequently, the number of computers and information technologies is continuously growing, Europe is becoming more computerised and Internet access is spreading among households across the European Union. According to Euro-barometer, the majority of European households (57%) have a computer and nearly half of the household population now has access to the Internet (49%). The level of overall Internet access (i.e. narrowband, broadband) shows that there has been a significant increase in Internet penetration rates across the EU since 2007 (+7 percentage points). However, the Internet access remains considerably higher in the EU15 (52%) than in the NMS12 (33%). [15] Starting from the above presented data and based on the findings of the EuP preparatory studies for Lot 3, Personal Computers (desktops and laptops) and Computer Monitors [16], we estimate that in 2007 there were around 111 millions computers (49,6 desktops and 61,2 laptops) and almost 56 millions monitors (42,2 millions CRT and 13,7 millions LCD monitors) in EU-27 households. The
14 all the information can be found at
http://energyefficiency.jrc.cec.eu.int/html/standby_initiative_broadband%20communication.htm 15 Here "electricity consumption" means the sum of energy losses due to the conversion of electricity from the mains power source (expressed as "active efficiency"), and of no load energy consumption. The energy consumption of the primary load product is not considered. 16 EPS Code of Conduct http://re.jrc.ec.europa.eu/energyefficiency/pdf/CoC%20PowerSupply%20Version3-28112007.pdf 17 all the information can be found at
http://energyefficiency.jrc.cec.eu.int/html/standby_initiative_External%20Power%20Supplies.htm
197
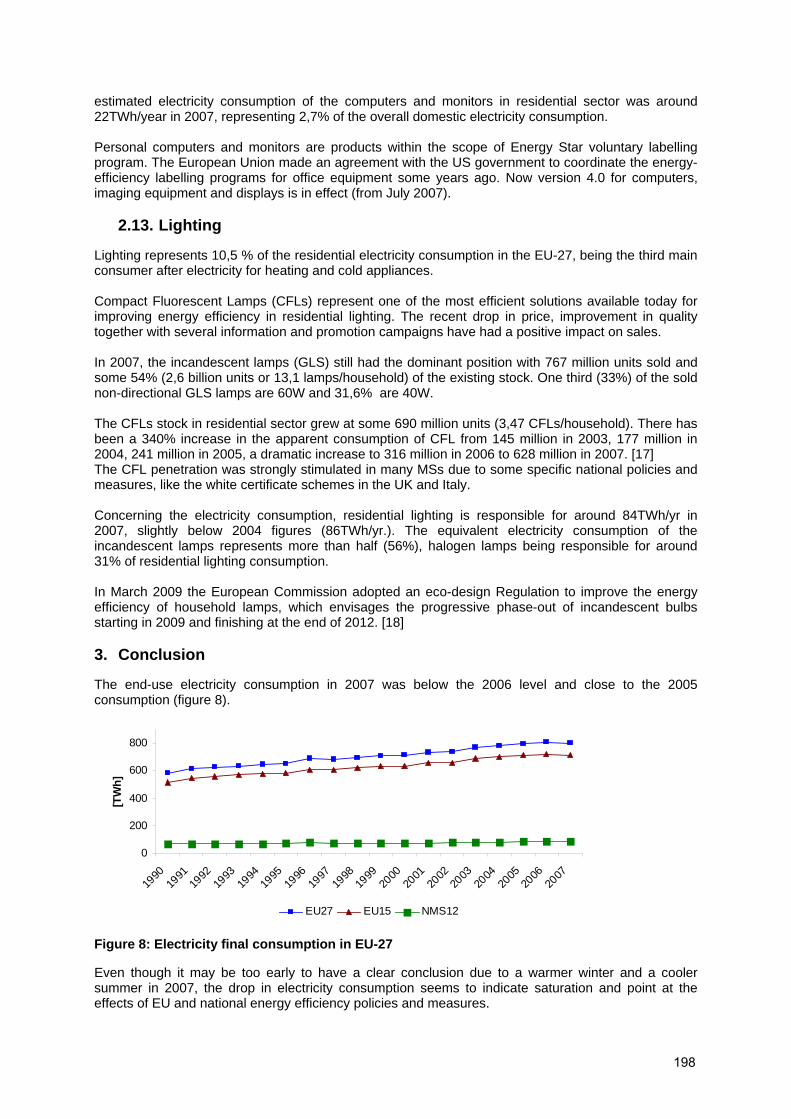
estimated electricity consumption of the computers and monitors in residential sector was around 22TWh/year in 2007, representing 2,7% of the overall domestic electricity consumption. Personal computers and monitors are products within the scope of Energy Star voluntary labelling program. The European Union made an agreement with the US government to coordinate the energy-efficiency labelling programs for office equipment some years ago. Now version 4.0 for computers, imaging equipment and displays is in effect (from July 2007).
2.13. Lighting
Lighting represents 10,5 % of the residential electricity consumption in the EU-27, being the third main consumer after electricity for heating and cold appliances. Compact Fluorescent Lamps (CFLs) represent one of the most efficient solutions available today for improving energy efficiency in residential lighting. The recent drop in price, improvement in quality together with several information and promotion campaigns have had a positive impact on sales. In 2007, the incandescent lamps (GLS) still had the dominant position with 767 million units sold and some 54% (2,6 billion units or 13,1 lamps/household) of the existing stock. One third (33%) of the sold non-directional GLS lamps are 60W and 31,6% are 40W. The CFLs stock in residential sector grew at some 690 million units (3,47 CFLs/household). There has been a 340% increase in the apparent consumption of CFL from 145 million in 2003, 177 million in 2004, 241 million in 2005, a dramatic increase to 316 million in 2006 to 628 million in 2007. [17] The CFL penetration was strongly stimulated in many MSs due to some specific national policies and measures, like the white certificate schemes in the UK and Italy. Concerning the electricity consumption, residential lighting is responsible for around 84TWh/yr in 2007, slightly below 2004 figures (86TWh/yr.). The equivalent electricity consumption of the incandescent lamps represents more than half (56%), halogen lamps being responsible for around 31% of residential lighting consumption. In March 2009 the European Commission adopted an eco-design Regulation to improve the energy efficiency of household lamps, which envisages the progressive phase-out of incandescent bulbs starting in 2009 and finishing at the end of 2012. [18] 3. Conclusion
The end-use electricity consumption in 2007 was below the 2006 level and close to the 2005 consumption (figure 8).
0
200
400
600
800
1990
1991
1992
1993
1994
1995
1996
1997
1998
1999
2000
2001
2002
2003
2004
2005
2006
2007
[TW
h]
EU27 EU15 NMS12
Figure 8: Electricity final consumption in EU-27
Even though it may be too early to have a clear conclusion due to a warmer winter and a cooler summer in 2007, the drop in electricity consumption seems to indicate saturation and point at the effects of EU and national energy efficiency policies and measures.
198

Significant efficiency progresses made in the last years by the main white appliances seems to be compensated by the growing contribution of the ICT and electronics. While in the EU-15 the electricity consumption dropped down with almost 0,9% in 2007 compared to 2006, in the NMS-12 final electricity consumption still shows a slight grow (0,5% in 2007 compared to than in 2006). The NMS-12 trend can be explained by a faster economic growth and improvement of the living standards. For certain main electric appliances such as refrigerators and washing machines stock saturation has been reached in almost all the MSs and the market sales average efficiency class is A but there is still a large efficiency potential, especially for refrigerators. For space heating in the Netherlands, Germany, the UK and Denmark the more efficient condensing boilers have significant shares on both the existing stock and market sales. Several countries like France, Ireland, the Netherlands, Austria and Italy, have developed specific national programmes offering subsidies and tax credits for high efficiency condensing boilers. However, electric space heating and water heating remain a major problem, no policy action been implement for these major energy consumers, but the eco-design Regulations are under preparation. Compact Fluorescent Lamps (CFLs) represent one of the most efficient solutions available today for improving energy efficiency in residential lighting. The CFLs stock in residential sector has been growing and there has been a 340% increase in the apparent consumption of CFL in 2007 as compared to 2003. In December 2008, the Ecodesign Regulatory Committee and EU Member States experts endorsed the European Commission's draft regulation progressively phasing out incandescent bulbs starting in 2009 and finishing at the end of 2012. The labelling Directive was an important policy for promoting the energy efficiency measures, contributing substantially to the market transformation for domestic appliances. However, energy labelling scheme needs a revision of the energy classes (i.e. for refrigerators & washing machines), a recast of the labelling Directive being expected to be adopted soon. The voluntary initiatives of the industry, including the EU Code of Conducts, have also had a very important contribution to the reduction in stand-by energy consumption of certain products, such as external power supplies, set top boxes, broadband equipments. Under the EU Directive for Eco-design of the energy using products mandatory standard for 25 product lots are already under assessment, for 4 products final legislation has been adopted (residential lighting, tertiary sector and street lighting, external power supplies, and simple set top boxes), plus an horizontal regulation to reduce standby and off-mode losses in all electric and electronic products . The estimate savings impact of the first 9 Regulations, 3 of them already in force and the rest expected to be adopted until July 2009, is up to 169TWh/yr by 2020, representing more than 21% of the final electricity consumption in EU-27 residential sector (table 1) [19].
199
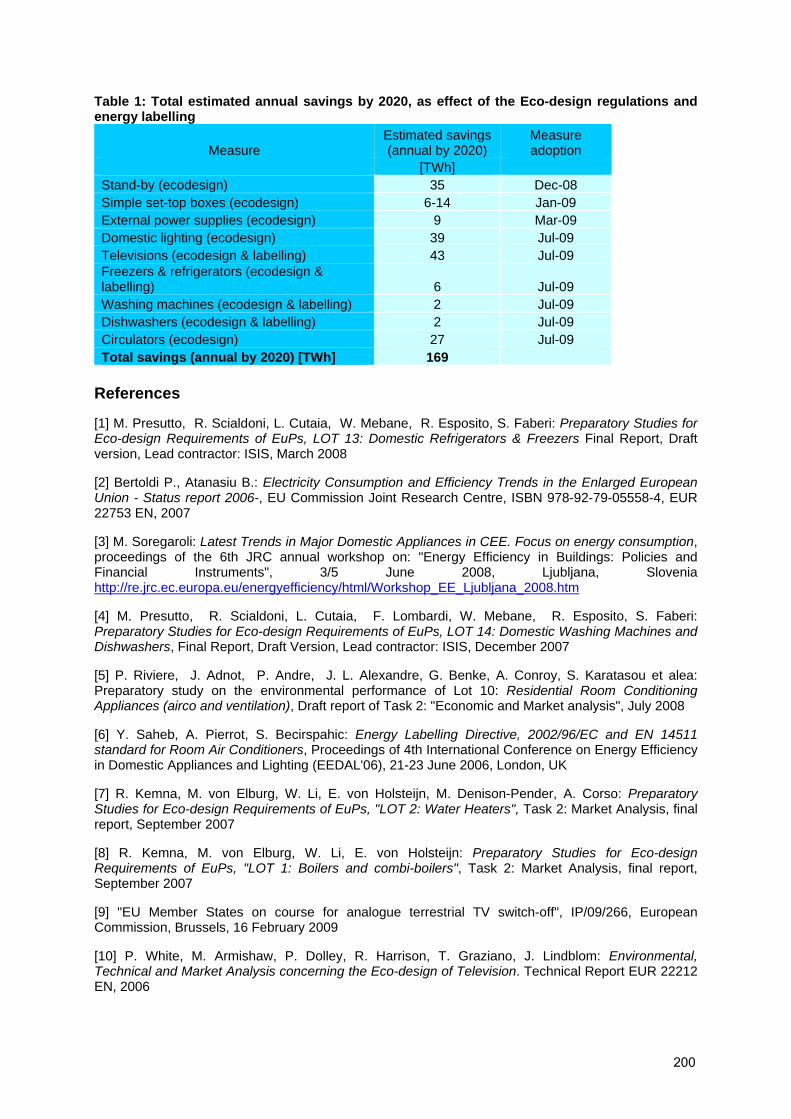
Table 1: Total estimated annual savings by 2020, as effect of the Eco-design regulations and energy labelling
Measure Estimated savings (annual by 2020)
Measure adoption
[TWh] Stand-by (ecodesign) 35 Dec-08 Simple set-top boxes (ecodesign) 6-14 Jan-09 External power supplies (ecodesign) 9 Mar-09 Domestic lighting (ecodesign) 39 Jul-09 Televisions (ecodesign & labelling) 43 Jul-09 Freezers & refrigerators (ecodesign & labelling) 6 Jul-09 Washing machines (ecodesign & labelling) 2 Jul-09 Dishwashers (ecodesign & labelling) 2 Jul-09 Circulators (ecodesign) 27 Jul-09 Total savings (annual by 2020) [TWh] 169
References
[1] M. Presutto, R. Scialdoni, L. Cutaia, W. Mebane, R. Esposito, S. Faberi: Preparatory Studies for Eco-design Requirements of EuPs, LOT 13: Domestic Refrigerators & Freezers Final Report, Draft version, Lead contractor: ISIS, March 2008
[2] Bertoldi P., Atanasiu B.: Electricity Consumption and Efficiency Trends in the Enlarged European Union - Status report 2006-, EU Commission Joint Research Centre, ISBN 978-92-79-05558-4, EUR 22753 EN, 2007
[3] M. Soregaroli: Latest Trends in Major Domestic Appliances in CEE. Focus on energy consumption, proceedings of the 6th JRC annual workshop on: "Energy Efficiency in Buildings: Policies and Financial Instruments", 3/5 June 2008, Ljubljana, Slovenia http://re.jrc.ec.europa.eu/energyefficiency/html/Workshop_EE_Ljubljana_2008.htm
[4] M. Presutto, R. Scialdoni, L. Cutaia, F. Lombardi, W. Mebane, R. Esposito, S. Faberi: Preparatory Studies for Eco-design Requirements of EuPs, LOT 14: Domestic Washing Machines and Dishwashers, Final Report, Draft Version, Lead contractor: ISIS, December 2007
[5] P. Riviere, J. Adnot, P. Andre, J. L. Alexandre, G. Benke, A. Conroy, S. Karatasou et alea: Preparatory study on the environmental performance of Lot 10: Residential Room Conditioning Appliances (airco and ventilation), Draft report of Task 2: "Economic and Market analysis", July 2008
[6] Y. Saheb, A. Pierrot, S. Becirspahic: Energy Labelling Directive, 2002/96/EC and EN 14511 standard for Room Air Conditioners, Proceedings of 4th International Conference on Energy Efficiency in Domestic Appliances and Lighting (EEDAL'06), 21-23 June 2006, London, UK
[7] R. Kemna, M. von Elburg, W. Li, E. von Holsteijn, M. Denison-Pender, A. Corso: Preparatory Studies for Eco-design Requirements of EuPs, "LOT 2: Water Heaters", Task 2: Market Analysis, final report, September 2007
[8] R. Kemna, M. von Elburg, W. Li, E. von Holsteijn: Preparatory Studies for Eco-design Requirements of EuPs, "LOT 1: Boilers and combi-boilers", Task 2: Market Analysis, final report, September 2007
[9] "EU Member States on course for analogue terrestrial TV switch-off", IP/09/266, European Commission, Brussels, 16 February 2009
[10] P. White, M. Armishaw, P. Dolley, R. Harrison, T. Graziano, J. Lindblom: Environmental, Technical and Market Analysis concerning the Eco-design of Television. Technical Report EUR 22212 EN, 2006
200

[11] Fraunhofer Institute for Reliability and Microintegration, IZM and Öko-Institut: EuP Preparatory Studies Lot 5: “Televisions”, Final Report on Task 2: “Economic and Market Analysis”, Berlin, August 2007
[12] R. Harrison C. Jehle: Simple Digital TV Converters (Simple Set Top Boxes), Preparatory studies for Eco-design Requirements of EuPs, Final Report, December 2007
[13] Bio Intelligence Service S.A.S.: Lot18: Complex set-top boxes, final report, Preparatory studies for eco-design requirements of EuPs (II), December 2008
[14] Bio Intelligence Service S.A.S.: Lot 7: Battery chargers and external power supplies, Final Report, European Commission DG TREN Preparatory Study for Eco-design Requirements of EuPs [Contract N°TREN/D1/40-2005/LOT7/S07.56433], January 2007
[15] European Commission, Directorate-General for the Information Society and Media coordinated by Directorate-General for Communication: "E-Communications Household Survey", Special Eurobarometer 293/ Wave 68.2, Fieldwork November – December 2007, Publication June 2008
[16] IVF Industrial Research and Development Corporation: Lot 3 Personal Computers (desktops and laptops) and Computer Monitors Final Report, Preparatory studies for Eco-design Requirements of EuPs [Contract TREN/D1/40-2005/LOT3/S07.56313], September 2007
[17] P. Van Tichelen, A. Vercalsteren, S. Mudgal, B. Tinetti, L. Turunen, C. Kofod, L. Vanhooydonck, J.M. Deswert: (ContractTREN/07/D3/390-2006/S07.72702) Preparatory Studies for Eco-design Requirements of EuPs, Lot 19: Domestic lighting, Part 1 - Non-Directional Light Sources, Draft final task reports, Task 2: Economic and Market Analysis, October 2008
[18] Commission Regulation (EC) No 244/2009 of 18 March 2009 implementing Directive 2005/32/EC of the European Parliament and of the Council with regard to ecodesign requirements for non-directional household lamps
[19] A. Toth: EU legislative instruments for lighting, Conference on energy efficiency in the lighting market, Brussels, February 2009
[20] J. Lee: Western Europe Digital Television Forecast: 1H'09, 2 Mar 2009 http://www.strategyanalytics.com
[21] e-Media Institute, http://www.e-mediainstitute.com/en/default.content
[22] Commission Regulation (EC) No 107/2009 of 4 February 2009 implementing Directive 2005/32/EC of the European Parliament and of the Council with regard to eco-design requirements for simple set-top boxes
[23] DG INFSO/B3, COMMUNICATIONS COMMITTEE, Working Document on Subject: Broadband access in the EU: situation at 1 July 2008, Brussels, 28 November 2008, COCOM08-41 FINAL
201
Energy consumption of whitegoods - what is improving and what is not: analysis of 15 years of data in Australia Lloyd Harrington and Jack Brown
Energy Efficient Strategies, Australia
Abstract Australia has had an energy labelling program for white goods since the mid 1980’s. Since 1993, market data on total sales for refrigerators, freezers, clothes washers, clothes dryers and dishwashers has been purchased. Information on model number and actual price was provided and this has been cross matched with the regulator data which has detailed attribute data. Since 2003, sales data on air conditioners has also been available. The sales data tracks model number, units sold and actual price paid, and covers 95% of the retail market for whitegoods and 70% of the air conditioner market. The paper explores the changes that have occurred over the past 15 years. In this period refrigerator-freezer energy consumption has continued to decline at around 3% per annum despite increases in frost free share (now 80% of all products sold) and slight increases in volume. For clothes washers, there has been a dramatic shift from vertical axis to European style drum machines (horizontal axis) over the past 5 years (from a base of 15% to over 50% in 2007), mainly driven by water efficiency rebates and mandatory water efficiency labelling which were introduced in 2006. However, within each product type, there has been little change in efficiency. For dishwashers, the energy and water consumption has continued to decrease at an amazing 4% per annum over the study period. Air conditioners have also increased in efficiency over the study period, mainly in response to MEPS. However, dryers are a product where there has been little movement in product performance in recent times. Introduction This paper provides an in depth look at appliance performance trends in Australia over the calendar years 1993 to 2007 inclusive. The whitegoods market grew significantly over this period: the analysis covers 2.55 million appliances sold in 2007 with a total retail value of just over EURO 1.0 billion. Generally, there has been a significant improvement in the energy efficiency for all products as a result of mandatory energy labelling except for clothes dryers. In the case of refrigerators and freezers, additional improvements have occurred as a result of Minimum Energy Performance Standards (MEPS) which were initially introduced in 1999 and subsequently upgraded in 2005. Generally, sales of all appliance types have been increasing. This is a result of increasing numbers of households, increasing penetration and ownership of some appliance types (especially dishwashers), and the replacement of products as they are retired. The Base Data In 1995, Energy Efficient Strategies (EES) was first commissioned to undertake an analysis of appliance retail sales data purchased by the Australian Government in order to track energy efficiency trends of major appliances which were regulated for energy efficiency (energy labelling). As additional information has accumulated over time, it has been possible to determine trends in product attributes and energy efficiency to a very high degree of certainty. This paper
202
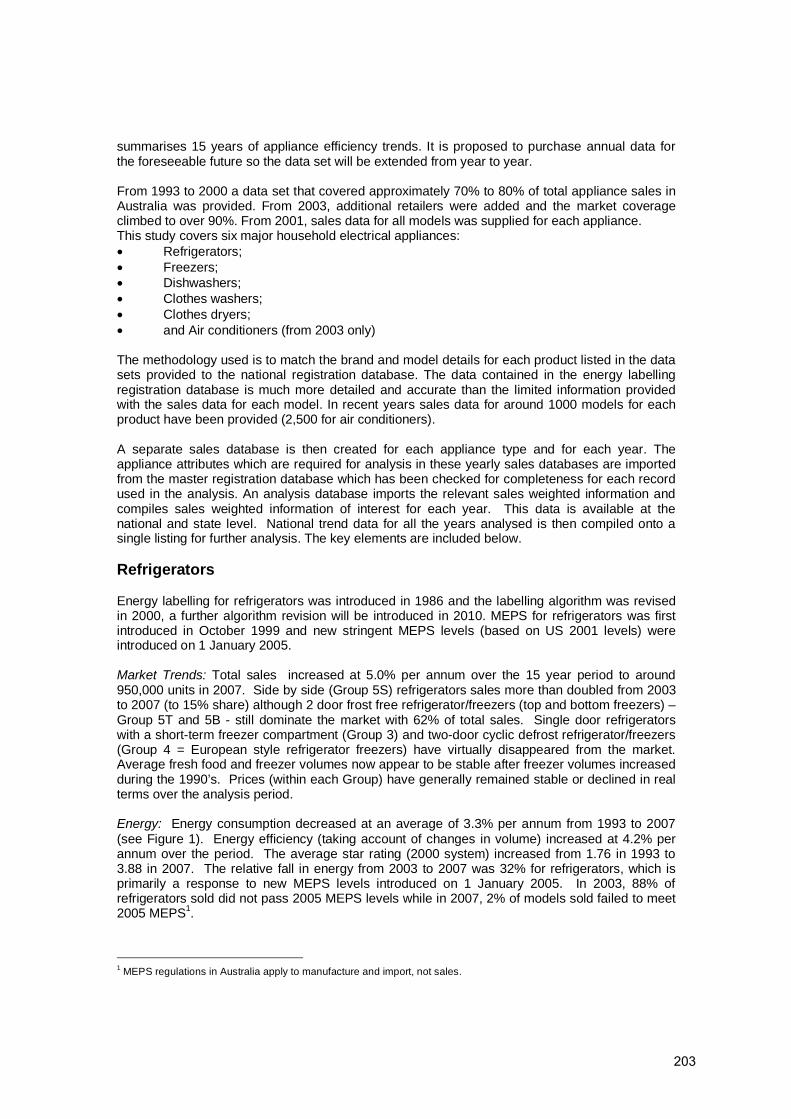
summarises 15 years of appliance efficiency trends. It is proposed to purchase annual data for the foreseeable future so the data set will be extended from year to year. From 1993 to 2000 a data set that covered approximately 70% to 80% of total appliance sales in Australia was provided. From 2003, additional retailers were added and the market coverage climbed to over 90%. From 2001, sales data for all models was supplied for each appliance. This study covers six major household electrical appliances: • Refrigerators; • Freezers; • Dishwashers; • Clothes washers; • Clothes dryers; • and Air conditioners (from 2003 only) The methodology used is to match the brand and model details for each product listed in the data sets provided to the national registration database. The data contained in the energy labelling registration database is much more detailed and accurate than the limited information provided with the sales data for each model. In recent years sales data for around 1000 models for each product have been provided (2,500 for air conditioners). A separate sales database is then created for each appliance type and for each year. The appliance attributes which are required for analysis in these yearly sales databases are imported from the master registration database which has been checked for completeness for each record used in the analysis. An analysis database imports the relevant sales weighted information and compiles sales weighted information of interest for each year. This data is available at the national and state level. National trend data for all the years analysed is then compiled onto a single listing for further analysis. The key elements are included below. Refrigerators Energy labelling for refrigerators was introduced in 1986 and the labelling algorithm was revised in 2000, a further algorithm revision will be introduced in 2010. MEPS for refrigerators was first introduced in October 1999 and new stringent MEPS levels (based on US 2001 levels) were introduced on 1 January 2005. Market Trends: Total sales increased at 5.0% per annum over the 15 year period to around 950,000 units in 2007. Side by side (Group 5S) refrigerators sales more than doubled from 2003 to 2007 (to 15% share) although 2 door frost free refrigerator/freezers (top and bottom freezers) – Group 5T and 5B - still dominate the market with 62% of total sales. Single door refrigerators with a short-term freezer compartment (Group 3) and two-door cyclic defrost refrigerator/freezers (Group 4 = European style refrigerator freezers) have virtually disappeared from the market. Average fresh food and freezer volumes now appear to be stable after freezer volumes increased during the 1990’s. Prices (within each Group) have generally remained stable or declined in real terms over the analysis period. Energy: Energy consumption decreased at an average of 3.3% per annum from 1993 to 2007 (see Figure 1). Energy efficiency (taking account of changes in volume) increased at 4.2% per annum over the period. The average star rating (2000 system) increased from 1.76 in 1993 to 3.88 in 2007. The relative fall in energy from 2003 to 2007 was 32% for refrigerators, which is primarily a response to new MEPS levels introduced on 1 January 2005. In 2003, 88% of refrigerators sold did not pass 2005 MEPS levels while in 2007, 2% of models sold failed to meet 2005 MEPS1.
1 MEPS regulations in Australia apply to manufacture and import, not sales.
203
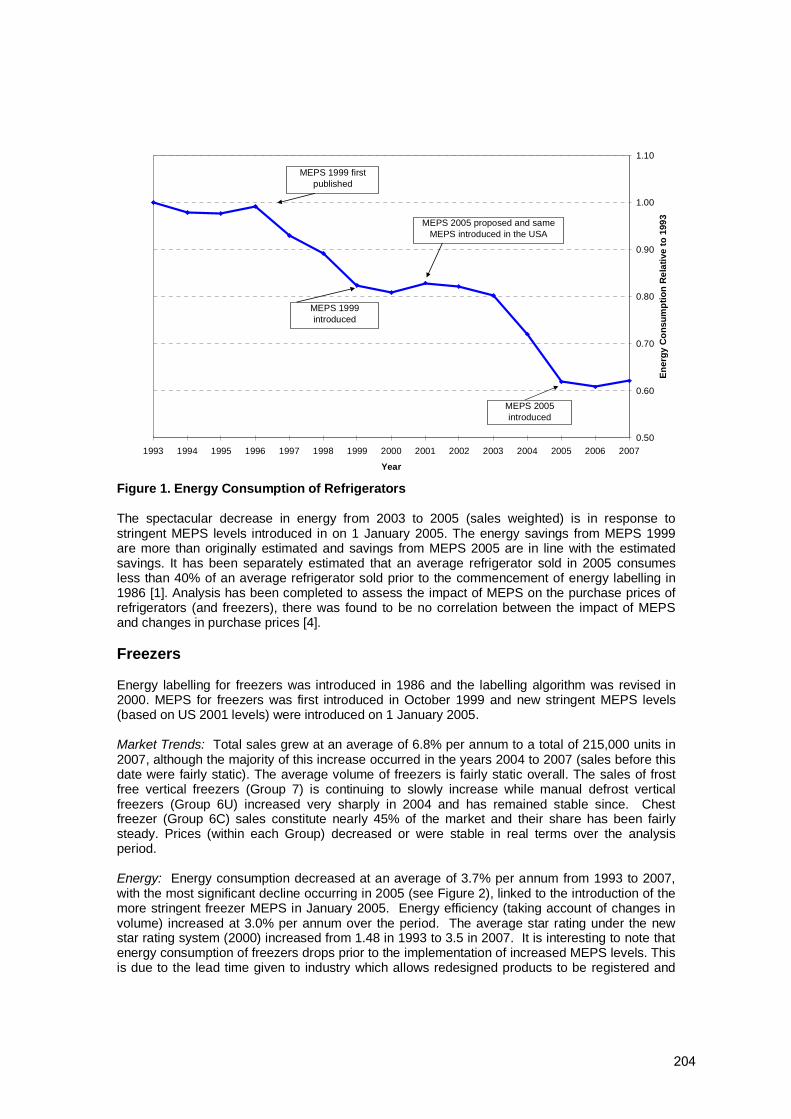
0.50
0.60
0.70
0.80
0.90
1.00
1.10
1993 1994 1995 1996 1997 1998 1999 2000 2001 2002 2003 2004 2005 2006 2007
Year
En
erg
y C
on
sum
pti
on
Rel
ativ
e to
199
3
MEPS 1999 first published
MEPS 1999 introduced
MEPS 2005 proposed and same MEPS introduced in the USA
MEPS 2005 introduced
Figure 1. Energy Consumption of Refrigerators The spectacular decrease in energy from 2003 to 2005 (sales weighted) is in response to stringent MEPS levels introduced in on 1 January 2005. The energy savings from MEPS 1999 are more than originally estimated and savings from MEPS 2005 are in line with the estimated savings. It has been separately estimated that an average refrigerator sold in 2005 consumes less than 40% of an average refrigerator sold prior to the commencement of energy labelling in 1986 [1]. Analysis has been completed to assess the impact of MEPS on the purchase prices of refrigerators (and freezers), there was found to be no correlation between the impact of MEPS and changes in purchase prices [4]. Freezers Energy labelling for freezers was introduced in 1986 and the labelling algorithm was revised in 2000. MEPS for freezers was first introduced in October 1999 and new stringent MEPS levels (based on US 2001 levels) were introduced on 1 January 2005. Market Trends: Total sales grew at an average of 6.8% per annum to a total of 215,000 units in 2007, although the majority of this increase occurred in the years 2004 to 2007 (sales before this date were fairly static). The average volume of freezers is fairly static overall. The sales of frost free vertical freezers (Group 7) is continuing to slowly increase while manual defrost vertical freezers (Group 6U) increased very sharply in 2004 and has remained stable since. Chest freezer (Group 6C) sales constitute nearly 45% of the market and their share has been fairly steady. Prices (within each Group) decreased or were stable in real terms over the analysis period. Energy: Energy consumption decreased at an average of 3.7% per annum from 1993 to 2007, with the most significant decline occurring in 2005 (see Figure 2), linked to the introduction of the more stringent freezer MEPS in January 2005. Energy efficiency (taking account of changes in volume) increased at 3.0% per annum over the period. The average star rating under the new star rating system (2000) increased from 1.48 in 1993 to 3.5 in 2007. It is interesting to note that energy consumption of freezers drops prior to the implementation of increased MEPS levels. This is due to the lead time given to industry which allows redesigned products to be registered and
204
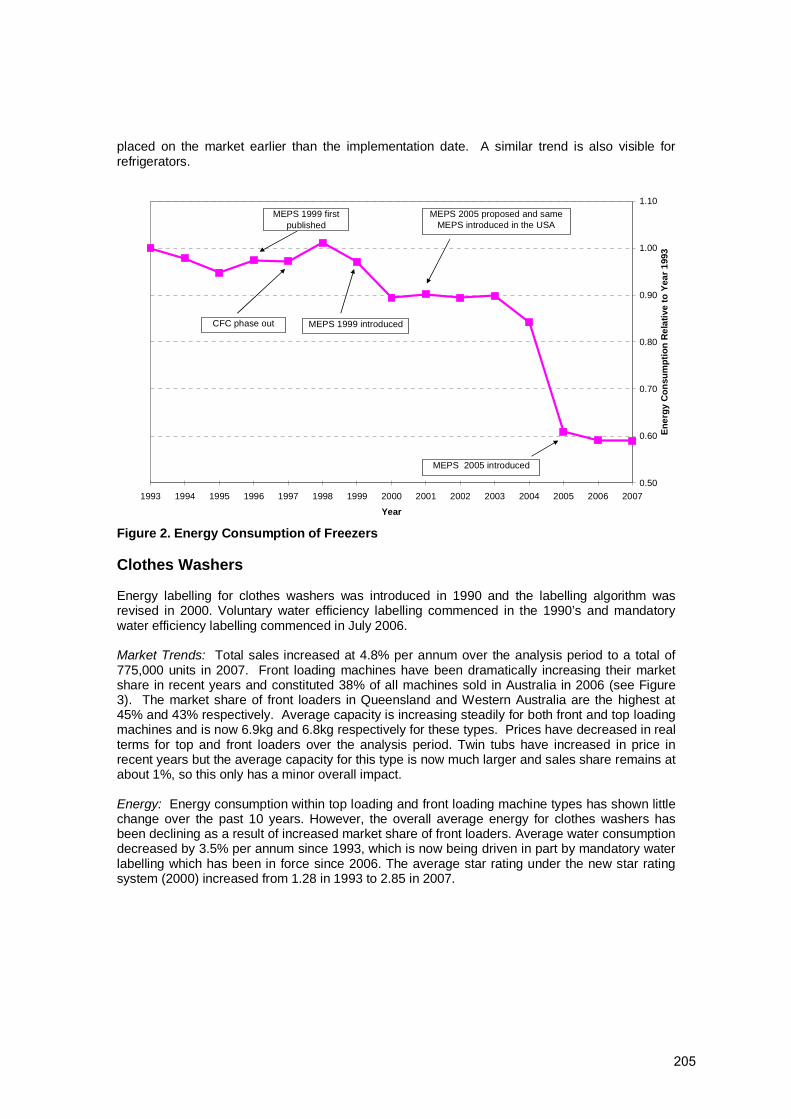
placed on the market earlier than the implementation date. A similar trend is also visible for refrigerators.
0.50
0.60
0.70
0.80
0.90
1.00
1.10
1993 1994 1995 1996 1997 1998 1999 2000 2001 2002 2003 2004 2005 2006 2007
Year
En
erg
y C
on
sum
pti
on
Rel
ativ
e to
Yea
r 19
93
MEPS 1999 first published
MEPS 1999 introduced
MEPS 2005 proposed and same MEPS introduced in the USA
MEPS 2005 introduced
CFC phase out
Figure 2. Energy Consumption of Freezers Clothes Washers Energy labelling for clothes washers was introduced in 1990 and the labelling algorithm was revised in 2000. Voluntary water efficiency labelling commenced in the 1990’s and mandatory water efficiency labelling commenced in July 2006. Market Trends: Total sales increased at 4.8% per annum over the analysis period to a total of 775,000 units in 2007. Front loading machines have been dramatically increasing their market share in recent years and constituted 38% of all machines sold in Australia in 2006 (see Figure 3). The market share of front loaders in Queensland and Western Australia are the highest at 45% and 43% respectively. Average capacity is increasing steadily for both front and top loading machines and is now 6.9kg and 6.8kg respectively for these types. Prices have decreased in real terms for top and front loaders over the analysis period. Twin tubs have increased in price in recent years but the average capacity for this type is now much larger and sales share remains at about 1%, so this only has a minor overall impact. Energy: Energy consumption within top loading and front loading machine types has shown little change over the past 10 years. However, the overall average energy for clothes washers has been declining as a result of increased market share of front loaders. Average water consumption decreased by 3.5% per annum since 1993, which is now being driven in part by mandatory water labelling which has been in force since 2006. The average star rating under the new star rating system (2000) increased from 1.28 in 1993 to 2.85 in 2007.
205
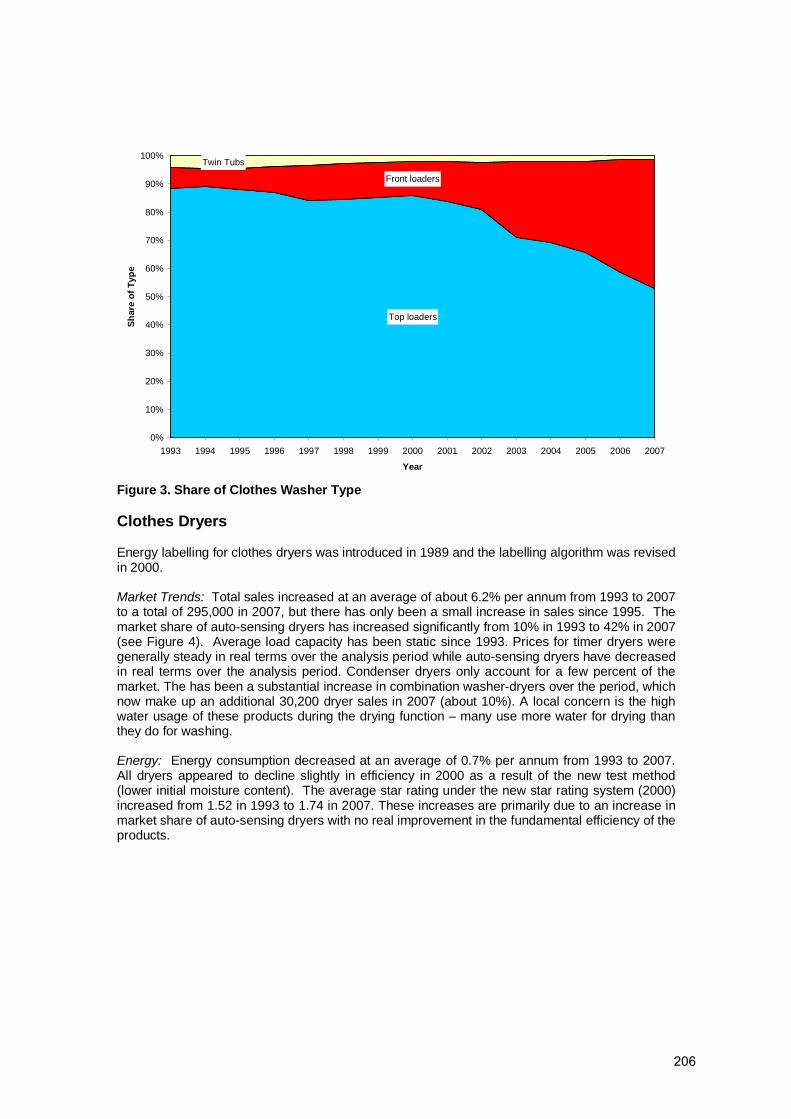
Top loaders
Front loaders
Twin Tubs
0%
10%
20%
30%
40%
50%
60%
70%
80%
90%
100%
1993 1994 1995 1996 1997 1998 1999 2000 2001 2002 2003 2004 2005 2006 2007
Year
Sh
are
of
Typ
e
Figure 3. Share of Clothes Washer Type Clothes Dryers Energy labelling for clothes dryers was introduced in 1989 and the labelling algorithm was revised in 2000. Market Trends: Total sales increased at an average of about 6.2% per annum from 1993 to 2007 to a total of 295,000 in 2007, but there has only been a small increase in sales since 1995. The market share of auto-sensing dryers has increased significantly from 10% in 1993 to 42% in 2007 (see Figure 4). Average load capacity has been static since 1993. Prices for timer dryers were generally steady in real terms over the analysis period while auto-sensing dryers have decreased in real terms over the analysis period. Condenser dryers only account for a few percent of the market. The has been a substantial increase in combination washer-dryers over the period, which now make up an additional 30,200 dryer sales in 2007 (about 10%). A local concern is the high water usage of these products during the drying function – many use more water for drying than they do for washing. Energy: Energy consumption decreased at an average of 0.7% per annum from 1993 to 2007. All dryers appeared to decline slightly in efficiency in 2000 as a result of the new test method (lower initial moisture content). The average star rating under the new star rating system (2000) increased from 1.52 in 1993 to 1.74 in 2007. These increases are primarily due to an increase in market share of auto-sensing dryers with no real improvement in the fundamental efficiency of the products.
206
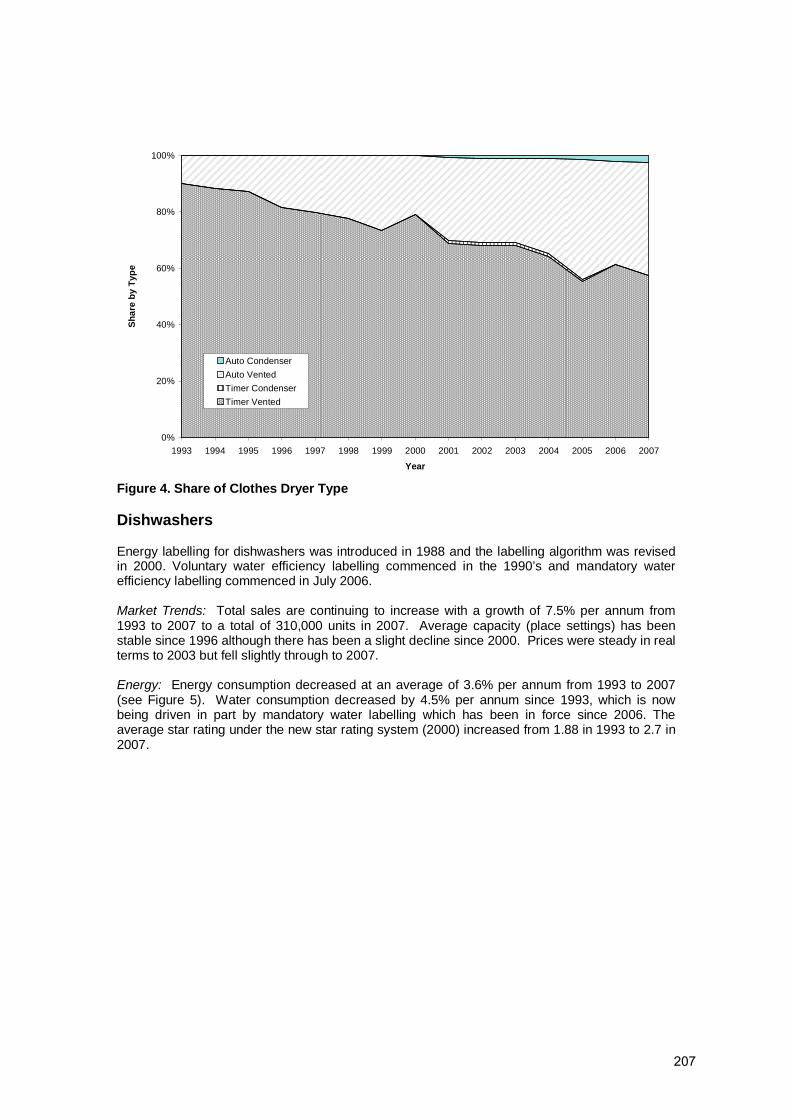
0%
20%
40%
60%
80%
100%
1993 1994 1995 1996 1997 1998 1999 2000 2001 2002 2003 2004 2005 2006 2007
Year
Sh
are
by
Typ
e
Auto Condenser
Auto Vented
Timer Condenser
Timer Vented
Figure 4. Share of Clothes Dryer Type Dishwashers Energy labelling for dishwashers was introduced in 1988 and the labelling algorithm was revised in 2000. Voluntary water efficiency labelling commenced in the 1990’s and mandatory water efficiency labelling commenced in July 2006. Market Trends: Total sales are continuing to increase with a growth of 7.5% per annum from 1993 to 2007 to a total of 310,000 units in 2007. Average capacity (place settings) has been stable since 1996 although there has been a slight decline since 2000. Prices were steady in real terms to 2003 but fell slightly through to 2007. Energy: Energy consumption decreased at an average of 3.6% per annum from 1993 to 2007 (see Figure 5). Water consumption decreased by 4.5% per annum since 1993, which is now being driven in part by mandatory water labelling which has been in force since 2006. The average star rating under the new star rating system (2000) increased from 1.88 in 1993 to 2.7 in 2007.
207
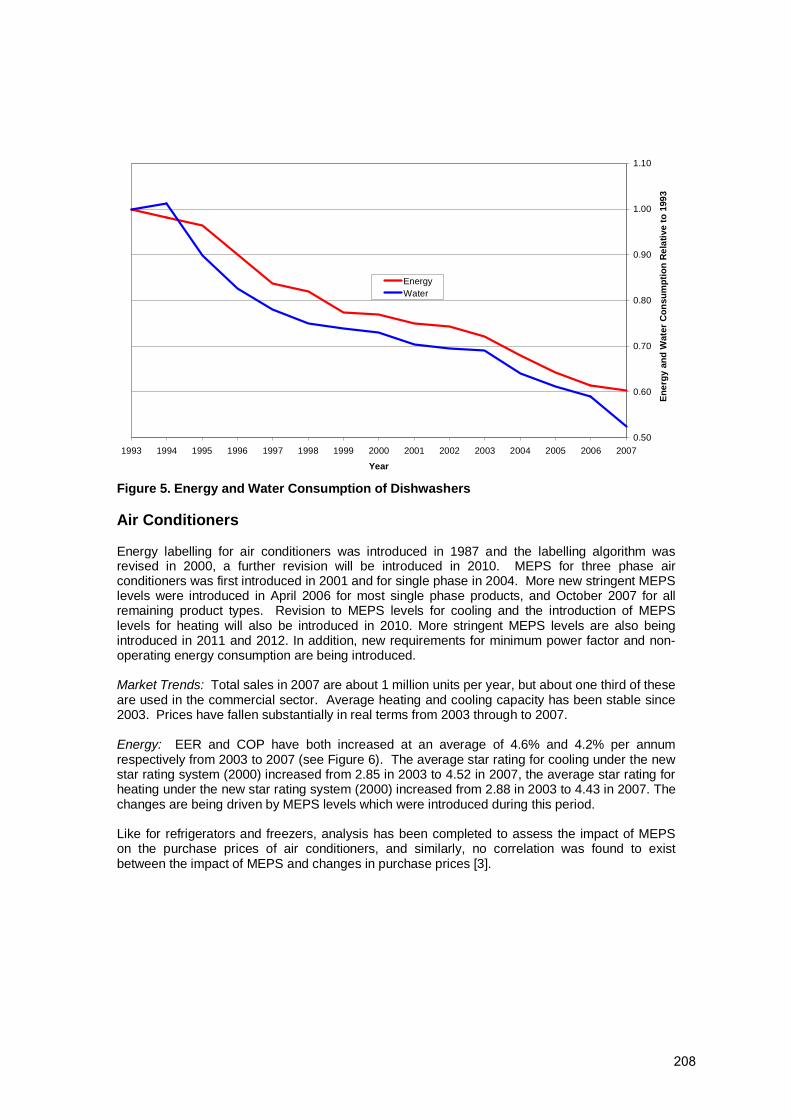
0.50
0.60
0.70
0.80
0.90
1.00
1.10
1993 1994 1995 1996 1997 1998 1999 2000 2001 2002 2003 2004 2005 2006 2007
Year
En
erg
y an
d W
ater
Co
nsu
mp
tio
n R
elat
ive
to 1
993
EnergyWater
Figure 5. Energy and Water Consumption of Dishwashers Air Conditioners Energy labelling for air conditioners was introduced in 1987 and the labelling algorithm was revised in 2000, a further revision will be introduced in 2010. MEPS for three phase air conditioners was first introduced in 2001 and for single phase in 2004. More new stringent MEPS levels were introduced in April 2006 for most single phase products, and October 2007 for all remaining product types. Revision to MEPS levels for cooling and the introduction of MEPS levels for heating will also be introduced in 2010. More stringent MEPS levels are also being introduced in 2011 and 2012. In addition, new requirements for minimum power factor and non-operating energy consumption are being introduced. Market Trends: Total sales in 2007 are about 1 million units per year, but about one third of these are used in the commercial sector. Average heating and cooling capacity has been stable since 2003. Prices have fallen substantially in real terms from 2003 through to 2007. Energy: EER and COP have both increased at an average of 4.6% and 4.2% per annum respectively from 2003 to 2007 (see Figure 6). The average star rating for cooling under the new star rating system (2000) increased from 2.85 in 2003 to 4.52 in 2007, the average star rating for heating under the new star rating system (2000) increased from 2.88 in 2003 to 4.43 in 2007. The changes are being driven by MEPS levels which were introduced during this period. Like for refrigerators and freezers, analysis has been completed to assess the impact of MEPS on the purchase prices of air conditioners, and similarly, no correlation was found to exist between the impact of MEPS and changes in purchase prices [3].
208
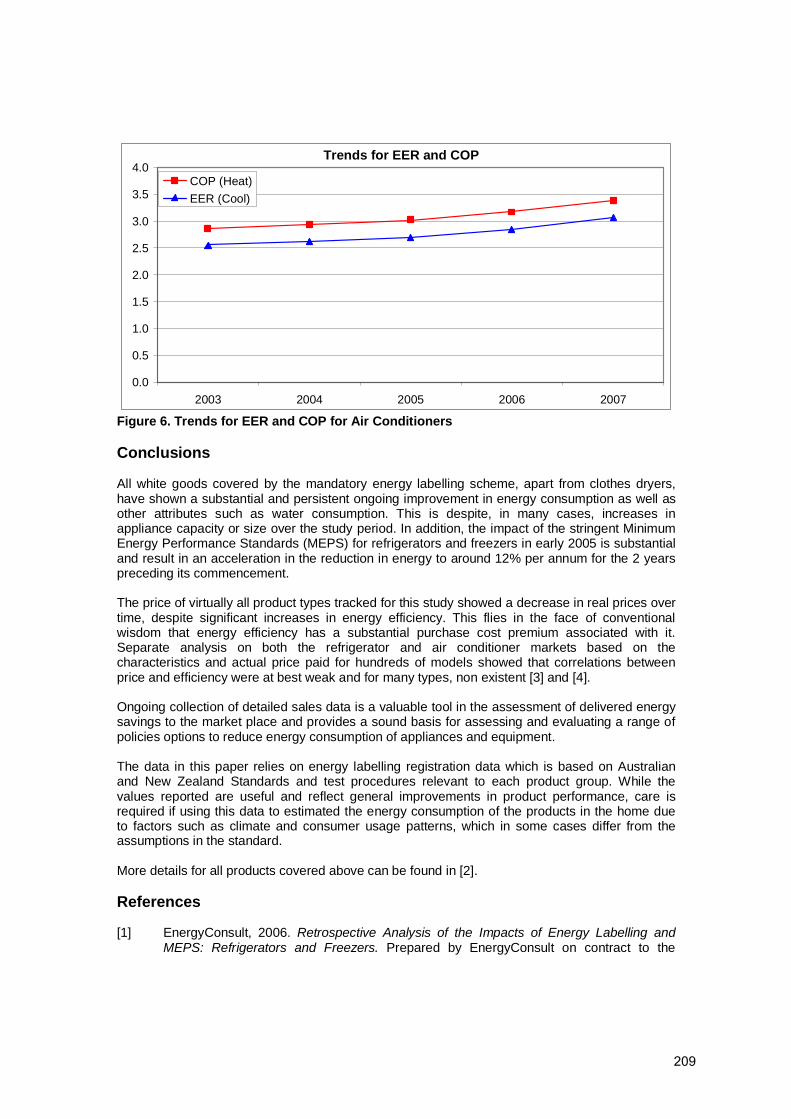
Trends for EER and COP
0.0
0.5
1.0
1.5
2.0
2.5
3.0
3.5
4.0
2003 2004 2005 2006 2007
COP (Heat)
EER (Cool)
Figure 6. Trends for EER and COP for Air Conditioners Conclusions All white goods covered by the mandatory energy labelling scheme, apart from clothes dryers, have shown a substantial and persistent ongoing improvement in energy consumption as well as other attributes such as water consumption. This is despite, in many cases, increases in appliance capacity or size over the study period. In addition, the impact of the stringent Minimum Energy Performance Standards (MEPS) for refrigerators and freezers in early 2005 is substantial and result in an acceleration in the reduction in energy to around 12% per annum for the 2 years preceding its commencement. The price of virtually all product types tracked for this study showed a decrease in real prices over time, despite significant increases in energy efficiency. This flies in the face of conventional wisdom that energy efficiency has a substantial purchase cost premium associated with it. Separate analysis on both the refrigerator and air conditioner markets based on the characteristics and actual price paid for hundreds of models showed that correlations between price and efficiency were at best weak and for many types, non existent [3] and [4]. Ongoing collection of detailed sales data is a valuable tool in the assessment of delivered energy savings to the market place and provides a sound basis for assessing and evaluating a range of policies options to reduce energy consumption of appliances and equipment. The data in this paper relies on energy labelling registration data which is based on Australian and New Zealand Standards and test procedures relevant to each product group. While the values reported are useful and reflect general improvements in product performance, care is required if using this data to estimated the energy consumption of the products in the home due to factors such as climate and consumer usage patterns, which in some cases differ from the assumptions in the standard. More details for all products covered above can be found in [2]. References [1] EnergyConsult, 2006. Retrospective Analysis of the Impacts of Energy Labelling and
MEPS: Refrigerators and Freezers. Prepared by EnergyConsult on contract to the
209
Equipment Energy Efficiency Committee. Copy available from www.energyrating.gov.au in the electronic library.
[2] EES, 2006. Greening Whitegoods - A report into the energy efficiency trends of Major
Household Appliances in Australia From 1993 to 2005. Prepared by Energy Efficient Strategies on contract to the Equipment Energy Efficiency Committee. Copy available from www.energyrating.gov.au in the electronic library.
[3] EES, 2008a. Consultation Regulatory Impact Statement for the Revision to the Energy
Labelling Algorithms and Revised MEPS levels and Other Requirements for Air Conditioners (Report 2008/09). Prepared by Energy Efficient Strategies for Energy Equipment Efficiency Committee, Australia. Copy available from www.energyrating.gov.au in the electronic library.
[4] EES, 2008b. Consultation Regulatory Impact Statement of proposed revisions to the
method of test and energy labelling algorithms for household refrigerators and freezers (Report 2008/04). Prepared by Energy Efficient Strategies for Energy Equipment Efficiency Committee, Australia. Copy available from www.energyrating.gov.au in the electronic library.
210
Monitoring and evaluation of energy savings from domestic appliances for the EU’s Energy Service Directive
Stefan Thomas
Wuppertal Institute for Climate Environment Energy, Wuppertal, Germany
Harry Vreuls
SenterNovem, Sittard, the Netherlands
Jean-Sébastien Broc
École des Mines de Nantes, France
Jerôme Adnot
École des Mines de Paris, France
Adam Gula
AGH University of Science and Technology, Krakow, Poland
Barbara Schlomann
Fraunhofer-ISI, Karlsruhe, Germany
Didier Bosseboeuf
ADEME, Paris, France
Bruno Lapillonne
ENERDATA, Grenoble, France
Nicola Labanca
end-use Efficiency Research Group Politecnico di Milano, Dipartimento di Energia, Milano, Italy
Abstract
A crucial prerequisite for the successful implementation of the Energy Service Directive (ESD) is the availability of harmonised calculation methods for the energy savings achieved. Such methods will enable the Member States to prove that they attain the overall target of 9 % or more energy savings by 2016. Since 2006, the project “Evaluation and Monitoring for the EU Directive on Energy End-Use Efficiency
211
and Energy Services EMEEES”, implemented under the European Commission’s Intelligent Energy Europe programme by 21 partners and co-ordinated by the Wuppertal Institute, has worked on a set of 20 bottom-up and 14 top-down evaluation methods. It developed (1) an integrated system of bottom-up and top-down methods for the evaluation of energy services and other energy efficiency improvement measures; and (2) a set of harmonised default values for the methods.
The paper presents an overview of the final results on EMEEES’ methods for domestic space and water heating, including solar water heating, white goods, and IT equipment. It discusses the importance of measurement for the effectiveness of the ESD, looking at the quantity to be measured – all or additional energy savings – and early action. It compares the main elements of calculation needed to ensure consistent results between bottom-up and top-down methods. It also includes preliminary results from field tests of some of the developed methods. Finally, general conclusions are drawn.
Introduction
The EU Directive on energy end-use efficiency and energy services (2006/32/EC; for the remainder of this paper abbreviated as the ESD) has raised concerns among the Member States about how they could evaluate the energy savings from energy services and other energy efficiency improvement measures implemented in order to achieve the indicative target of 9 % energy savings in 2016. The constitution of an ad-hoc Committee of the Member States (hereafter named ESD Committee) has therefore been included in the Directive to assist the European Commission in the task of elaborating common and harmonised methods for the evaluation of energy savings. Due to the difficulties related to this task, the Commission also needed support from independent experts.
From November 2006 to April 2009, the IEE1 project “Evaluation and Monitoring for the EU Directive on Energy End-Use Efficiency and Energy Services” (EMEEES) worked on a set of calculation methods and case applications, with 21 partners and co-ordinated by the Wuppertal Institute. The project partners were able to bring strong experience in evaluation methodology and practice as well as different perspectives to the consortium. They included energy agencies, a ministry, two energy companies, and several research institutes and consultancies; they are listed in the acknowledgements. The objective of this project was to assist the Commission in the elaboration of evaluation methods through delivering practical advice, support and results. This included the development of concrete methods for the evaluation of single programmes, services and measures (mostly bottom-up), as well as with schemes for monitoring the overall impact of all measures implemented in a Member State (combination of bottom-up and top-down methods2).
The paper presents an overview of the final results on EMEEES’ methods, concentrating on calculation methods that are relevant for domestic appliances. It starts with a short presentation of the results and products of the EMEEES project and how the project has addressed harmonisation issues. It continues with a discussion of the importance of measurement for the effectiveness of the ESD, looking at the quantity to be measured – all or additional energy savings – and early action. It compares the main elements of calculation needed to ensure consistent results between bottom-up and top-down methods both for all or additional energy savings. Then it presents, which methods were developed for domestic appliances. It also includes preliminary results from field tests of some of these methods for measuring the impact of energy efficiency improvement measures and energy services. Finally, general conclusions are drawn.
The project “Evaluation and Monitoring for the EU Directive on Energy End-Use Efficiency and Energy Services (EMEEES)” - Overview of results and products
1 Programme Intelligent Energy Europe of the European Commission : http://ec.europa.eu/energy/intelligent/index_en.html 2 Bottom-up methods start from data at the level of a specific energy efficiency improvement measure (e.g. energy savings per participant and number of participants) and then aggregate results from all the measures. Top-down methods start from global data (e.g. national statistics for energy consumption or equipment sales), then going down to more disaggregated data when necessary (e.g. energy efficiency indicators already corrected for some structural or weather effects).
212
The direct results of EMEEES are (1) a system of bottom-up and top-down methods and their integrated application for the evaluation of around 20 types of energy efficiency technologies and/or energy efficiency improvement measures, harmonised between Member States; (2) a set of harmonised input data and benchmarks for these evaluation methods; (3) a template and a guide for Member States for the Energy Efficiency Action Plans; and (4) a method for the European Commission to assess the plans.
The overall results were presented at a one-day conference in Brussels in October 2008. All reports and case applications produced by the project are available at www.evaluate-energy-savings.eu. With regard to the methods developed by EMEEES, they include:
• Two summary reports on bottom-up methods (Vreuls/Broc/Thomas 2009) and top-down methods (Lapillonne/Bosseboeuf/Thomas 2009)
• Bottom-up methodological report
• 20 bottom-up case applications papers, six of which are dealing with domestic appliances (cf. table 2)
• Compilation of EMEEES formulae for unitary gross annual energy savings, baselines, and default values as well as data to collect for bottom-up case applications
• Compilation report on 14 top-down case studies, with three on domestic appliances (cf. table 2)
• A report on consistency and the integration of the savings from bottom-up and top-down methods (Boonekamp and Thomas 2009)
• EMEEES proposal of a checklist for reporting the results of energy efficiency improvement (EEI) measures
The high share of case applications and studies on domestic appliances in the total of those developed by EMEEES reflects the importance of domestic appliances for achievinf the ESD’s energy savings targets. For instance, while domestic appliances and lighting account for about 13 % of the EU’s overall electricity consumption, their energy savings potential is around 27 % of the total potential for electricity savings (own calculation based on Bertoldi/Atanasiu 2006 and Lechtenböhmer et al. 2008).
In the longer run, the project is expected to make an important contribution to a smooth implementation of the ESD. It will build trust and confidence that the overall target of 9 % energy savings within 9 years can be achieved, and will thus support Member States in attaining their target.
Addressing harmonisation issues
A harmonised model of bottom-up and top-down calculation methods should be developed and used for the ESD reporting (cf. ESD article 15). Harmonisation should give a reasonable freedom for the Member States (following the principle of subsidiarity), while the results reported can be compared. Therefore, the methods and the 20 bottom-up and 14 top-down case applications developed by the EMEEES project are a starting point, but these methods and applications are not intended to exclude the use of own methods and further methods for other sectors, end uses, and kinds of energy services and energy efficiency improvement measures by the Member States. However, harmonisation should be ensured by key elements proposed by EMEEES: a general structure both for the documentation of bottom-up and top-down energy savings and for the calculation itself, with the selection of baseline and baseline parameters as well as correction factors, and a dynamic approach to ensure improvement over time. In bottom-up measurement, EMEEES has proposed a three-level approach to facilitate such improvement over time:
• Level 1 is based on EU default values for energy savings per unit or for other parameters to allow countries that don’t have monitoring and evaluation experiences a quick start. The default values are conservative and yield relatively low energy savings results, in order to encourage level 2 or 3 evaluation with own monitoring, survey, and measurement activities.
• Level 2 is the national level. Evaluation of samples can be used to calculate national average default values that can be used to calculate overall energy savings.
213
• At level 3, measure-specific values can be developed to prove that savings are higher than national averages, or individual energy savings can be calculated for larger final consumers benefiting from an energy efficiency improvement measure.
These EMEEES proposals were based on past experiences and existing literature (e.g. CPUC 2006, SRCI et al. 2001, TecMarket Works et al. 2004, Vreuls et al. 2005), taking account of the ESD specificities. Bottom-up and top-down methods can both be used for calculating ESD energy savings. In order to avoid “adding up apples and pears” the key elements for top-down and bottom-up should also be mutually consistent. EMEEES findings on how to achieve such consistency will be presented below. The development of such a harmonised model is a learning process, and the methods should be improved in the future as more experiences from Member States will become available and lessons can be learned.
The importance of measurement for the effectiveness of the ESD
The primary objective of the ESD is to achieve at least 9 % of annual energy savings3 across the EU by inducing energy efficiency improvement measures and stimulating the energy services markets. Member States need to measure and prove the savings they achieved. But how much energy savings will these 9 % really be? Will they contribute to the “objective of saving 20 % of the EU’s energy consumption compared to projections by 2020” as stated by the European Council on 8/9 March 2007? The ESD does not explicitly mention that the resulting energy savings shall be additional to the so-called autonomous savings4 that energy consumers, investors, or other market actors would have done by themselves anyway. However, the ESD energy savings will need to be additional to autonomous savings, if the EU is to attain the objective of saving 20 % of the EU’s energy consumption compared to projections – hence, additional savings – by 2020. This is the case, although the two targets are not directly comparable: the ESD target is on final energy savings and for each Member State, and the 20 % target is on primary energy savings (hence, includes savings in power and district heat generation and transmission, and oil refineries) and for the EU as a whole. However, final energy savings directly translate into primary energy savings. And the 20 % target is so high that all Member States will at least have to come close to 9 % additional energy savings for the Union to meet the 20 % target5.
Furthermore, the ESD states that ‘early action’ can be counted towards the national energy savings target, albeit subject to guidelines by the European Commission. However, the ESD text can be interpreted in two ways: ‘early action’ could mean energy savings from technical or organisational action taken by market actors between 2008 and 2016 but facilitated by measures created before 2008 by Member States to achieve energy efficiency improvements (e.g., a building code revised in 2005 with tightened requirements) (we shall call this interpretation ‘early measures’), or it could mean energy savings achieved between 1995 and 2008 due to energy efficiency improvement measures (we shall call this ‘early energy savings’). A number of Member States have claimed early energy savings in their first national energy efficiency action plans filed in 2007 to fulfil the ESD’s requirements. Up to 45 % of the 9 % target would be achieved through such early energy savings by these Member States.
What does this mean for a harmonised model of methods to evaluate energy savings for the ESD? If the ESD is to make a significant contribution to achieving the EU’s target of 20 % additional energy savings by 2020, as the 2006 EU Action Plan for Energy Efficiency assumed, the following political conclusions will need to be drawn for the implementation of the ESD:
1 Not all energy savings from all end-use actions to improve energy efficiency should be allowed to count for the ESD energy savings target but only energy savings additional to autonomous changes of energy efficiency. Member States should, under this condition, try with the highest appropriate effort to exclude energy savings due to autonomous changes from the calculation of ESD energy savings. The next section will present how to make bottom-up and top-down calculations of additional energy savings consistent with each other.
3 ESD implementation covers 9 years (2008-2016). The national targets were calculated in 2007, and consist for each Member-State of 9% (or above) of its annual average energy consumption (in absolute terms (GWh)), based on a reference period (the most recent five-year period previous to 2008, for which data were available). The energy consumption taken into account in the ESD does not include that covered by the European Emission Trading Scheme (see Directive 2003/87/EC). 4 ,“brought about by natural replacement, energy price changes, etc.” as stated in the EU Action Plan (EC, 2006) 5 See also the analysis in Boonekamp, 2009
214

2 The best solution regarding ‘early action’ would be not to allow ‘early energy savings’ to count towards the ESD target. This will not put forerunners at a disadvantage, since they already have good experiences and have many – early – measures in place, which will create new energy savings during the 2008 to 2016 period.
However, it is not up to the EMEEES project to decide on the interpretation of the ESD. We therefore decided that our methods and case applications should enable Member States to both calculate all energy savings and the additional energy savings that are an impact of energy efficiency improvement measures. Furthermore, the methods and case applications need to enable Member States to assess whether early energy savings achieved before 2008 still exist in 2016.
Main elements of calculation needed to ensure consistent results between bottom-up and top-down methods
Following the considerations in the preceding section, the EMEEES project has developed methods and case applications that would allow the calculation of both additional or all energy savings.
• Additional energy savings6 are understood as those that are additional to autonomous energy savings (i.e., to savings that would occur without energy efficiency programmes, energy services, and other energy efficiency policies such as building codes or energy efficiency mechanisms). These additional energy savings include additional energy savings due to existing policies, programmes, and services that are ongoing or have a lasting effect.
• By contrast, all energy savings are those resulting from all technical, organisational, or behavioural actions taken at the end-use level to improve energy efficiency, whatever their driving factor (or cause) (energy services, policies, or market forces and autonomous technical progress).
The ESD monitoring system can include bottom-up or top-down methods for monitoring and evaluation, or combinations of both (cf. ESD Annex IV for the definition of bottom-up and top-down methods and footnote 2 above). In order for it to be a harmonised system, the results of either bottom-up or top-down calculation must be consistent and comparable with each other. This requires that the elements of calculation need to be chosen in a consistent manner for both, and for the two evaluation targets introduced above: additional and all energy savings.
Bottom-up methods start from calculating annual energy savings for one final consumer or one piece of equipment. These so-called unitary energy savings can normally not be directly measured but need to be calculated from the difference between the energy-efficient situation after an energy efficiency improvement measure and a hypothetical baseline. For example, the savings for a specific dwelling are the calculated or measured gas use after a thermal insulation measure compared to the calculated or measured gas use before, normalising measured values for fluctuation in heating degree days. In some cases, the choice of the baseline is decisive for whether all or additional savings will be calculated, as table 1 presents. Then these so-called unitary energy savings per consumer or equipment are added together for all consumers or equipment affected by an energy efficiency improvement measure. However, the resulting total gross annual energy savings need to be corrected by some factors. The ESD requires avoidance of double counting but accounting for multiplier effects. It does not explicitly require correction for free-rider effects, i.e., savings by those consumers who would have taken the energy-saving action without energy efficiency programmes, energy services, and other energy efficiency policies. Correcting for free-rider effects or not is, therefore, another element in the calculation of all or additional energy savings (cf. table 1 for details on bottom-up calculations, baselines, and correction factors).
As for top-down methods, the overall energy savings are calculated from the difference in the current value of a particular statistical indicator used in a certain year, and the hypothetical value that is calculated for that year from a reference trend assumed. The simplest form of a reference trend is to take the value of the indicator in a base year as the reference. For instance, if the average amount of gas use per dwelling decreases with respect to a base year, the difference is taken as energy savings. The resulting energy savings have been called ‘total’ savings (‘apparent total’ savings would be a better 6 For general discussions about additionality and baseline, see also (Vine 2008).
215

name), and the assumption is easily made that these are equivalent to ‘all’ energy savings. However, this intuitive calculation is only meaningful for indicators that have the ‘right’ trend over the years, a trend towards higher energy efficiency. But that is only the case for about 60 % of all the 14 indicators and countries analysed in EMEEES. This is because there are structural effects that also lead to changes in the indicator value but have nothing to do with energy efficiency. Therefore, these structural effects need to be corrected before calculating if possible with reasonable effort. Such correction could be done by bottom-up modelling of some of the effects to correct them. With all structural effects removed, ‘total’ energy savings should be equal to ‘all’ energy savings. It may, however, be difficult to judge from the results whether all structural effects have been removed, and it may be costly and sometimes not possible at all to do the correction. An equivalent way, in principle, could therefore be to calculate the reference trend for ‘all’ energy savings from bottom-up modelling of the energy consumption underlying the indicator, with zero energy efficiency changes in the model. However, the feasibility of this approach was not tested in EMEEES.
For calculating additional energy savings, the top-down approach taken in EMEEES is a regression analysis of past trends of an indicator that would reflect the autonomous changes. This was conclusive in some cases but not in others. In those latter cases, again, bottom-up modelling of the energy consumption underlying the indicator and the structural changes may provide a way forward, but EMEEES was not able to test it (cf. table 1 for details on top-down calculations and correction factors).
Table 1 presents the elements that would ensure consistency in principle. It must be noted that only the elements of bottom-up and top-down calculations in either of the two rows of the table: additional energy savings and all energy savings, respectively, are consistent with each other. Using the elements of bottom-up calculation from one and those of top-down from the other row of the table would be highly inconsistent.
Table 1. Elements of calculation for the evaluation of additional or all energy savings that will ensure consistency between bottom-up and top-down methods
Evaluation target
Elements of bottom-up calculation
Elements of top-down calculation
Additional energy savings
Case 1: replacement of existing equipment
Baseline = Without measure situation (market baseline)
Case 2: add-on energy efficiency investment without replacement of existing equipment or building
Baseline = Before action situation
Case 3: new building or appliance: the before situation does not exist and a reference has to be created.
Baseline = A reference situation° (e.g., (2) the existing market)
Apart from avoiding double-counting and taking multiplier effects* into account, also free-rider effects* should be analysed in principle
Case a): for specific energy consumption indicators related to an end-use equipment (e.g., cars, refrigerators): Reference trend = EU default value (based on a regression analysis for all countries with data available, and on the average of the three countries with the slowest trend found in the analysis)
Case b): for other types of indicators (unit energy consumption of sectors, diffusion indicators): b1) if possible, Reference trend for one country = extrapolation of historical trend before measures (from regression analysis for each country) b2) otherwise, the only option that appears consistent, however, feasibility was NOT tested within EMEEES: Reference trend = result of direct (bottom-up) modelling calculation or of correction of the indicator for structural effects, using (bottom-up) modelling
In all cases: correction of reference trend for energy market price increase, using a default value for the short-term price elasticity of 0.1 or 0.2
All Case 1: replacement of existing The option that appears most consistent, however,
216

energy savings
equipment
Baseline = Before action situation (stock baseline if aggregated units are used)
Case 2: add-on energy efficiency investment without replacement of existing equipment or building
Baseline = Before action situation
Case 3: new building or appliance: the before situation does not exist and a reference has to be created.
Baseline = A reference situation° (e.g., (1) the existing stock)
Apart from avoiding double-counting, only multiplier effects* have to be analysed in principle
feasibility was NOT tested within EMEEES:
Reference trend = result of (bottom-up) modelling calculation of the development of the indicator without any technical, organisational, or behavioural actions taken at the end-use level to improve energy efficiency
In particular, zero change of the indicator between years would only be a correct reference trend, if all structural effects influencing the indicator value were removed**. This may be feasible for specific energy consumption indicators related to an end-use equipment (e.g., cars, refrigerators).
In these cases: Reference trend = base year (2007) value of the indicator
This will not be feasible for indicators of sectoral unit energy consumption or diffusion indicators, with the one exception of solar water heaters
* In practice, this is often difficult, and so it is recommended to only assess multiplier and free-rider effects for EEI measures exceeding a threshold of annual energy savings of, e.g., 40 million kWh of electricity or 100 million kWh of other fuels, or a minimum contribution of 5 % to the ESD energy savings target of a country. According to experience, the additional costs for evaluating these effects would still be below 1 % of the overall costs of measures above this threshold.
° Reference situation could be: (1) the existing stock, (2) the existing market; (3) the legal minimum performance; (4) the Best Available Technology (BAT) (situation (4) only appropriate for technology procurement and similar measures that aim to bring technologies better than BAT to the market)
** Despite the efforts of ODYSSEE to remove structural effects, the ‘total apparent’ energy savings calculated by taking zero change of the indicator between years as the reference trend are, for most ODYSSEE indicators, not consistent with calculating all energy savings (see text on top-down before table 1).
Notwithstanding these principles, the actual methods and case applications have looked for a pragmatic solution and often propose to skip some of these effects from the calculation, if there is no way, or it is too expensive to evaluate them.
Concrete methods and case applications developed for domestic appliances
For domestic appliances, the EMEEES project developed six bottom-up and three top-down case applications of the principal methods (cf. Vreuls et al. 2009, Lapillonne et al. 2009). Table 2 presents these case applications.
Table 2. EMEEES case applications for domestic appliances
Subject Bottom-up methods Top-down methods
Space heating Condensing boilers
Biomass boilers
Domestic water heating Solar water heaters
Heat Pumps
Solar water heaters
Domestic appliances Cold appliances and washing machines
Specific white goods (refrigerators)
217
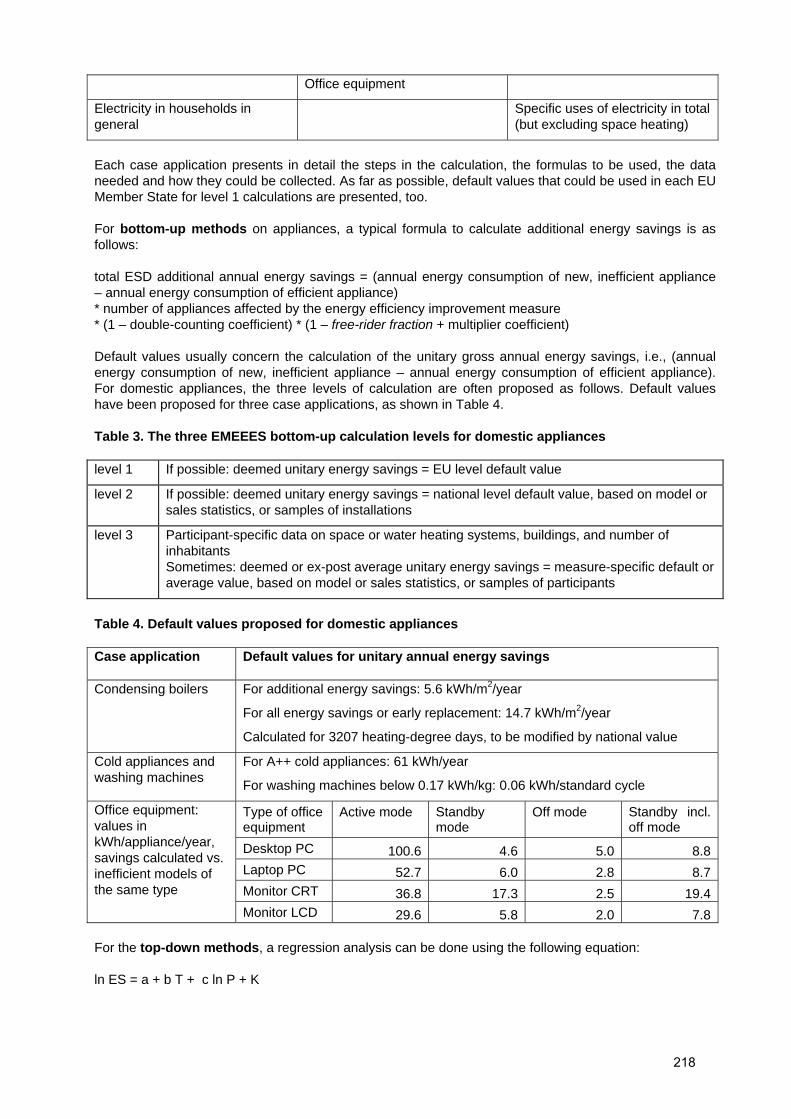
Office equipment
Electricity in households in general
Specific uses of electricity in total (but excluding space heating)
Each case application presents in detail the steps in the calculation, the formulas to be used, the data needed and how they could be collected. As far as possible, default values that could be used in each EU Member State for level 1 calculations are presented, too.
For bottom-up methods on appliances, a typical formula to calculate additional energy savings is as follows:
total ESD additional annual energy savings = (annual energy consumption of new, inefficient appliance – annual energy consumption of efficient appliance) * number of appliances affected by the energy efficiency improvement measure * (1 – double-counting coefficient) * (1 – free-rider fraction + multiplier coefficient)
Default values usually concern the calculation of the unitary gross annual energy savings, i.e., (annual energy consumption of new, inefficient appliance – annual energy consumption of efficient appliance). For domestic appliances, the three levels of calculation are often proposed as follows. Default values have been proposed for three case applications, as shown in Table 4.
Table 3. The three EMEEES bottom-up calculation levels for domestic appliances
level 1 If possible: deemed unitary energy savings = EU level default value
level 2 If possible: deemed unitary energy savings = national level default value, based on model or sales statistics, or samples of installations
level 3 Participant-specific data on space or water heating systems, buildings, and number of inhabitants Sometimes: deemed or ex-post average unitary energy savings = measure-specific default or average value, based on model or sales statistics, or samples of participants
Table 4. Default values proposed for domestic appliances
Case application Default values for unitary annual energy savings
Condensing boilers For additional energy savings: 5.6 kWh/m2/year
For all energy savings or early replacement: 14.7 kWh/m2/year
Calculated for 3207 heating-degree days, to be modified by national value
Cold appliances and washing machines
For A++ cold appliances: 61 kWh/year
For washing machines below 0.17 kWh/kg: 0.06 kWh/standard cycle
Office equipment: values in kWh/appliance/year, savings calculated vs. inefficient models of the same type
Type of office equipment
Active mode Standby mode
Off mode Standby incl. off mode
Desktop PC 100.6 4.6 5.0 8.8Laptop PC 52.7 6.0 2.8 8.7Monitor CRT 36.8 17.3 2.5 19.4Monitor LCD 29.6 5.8 2.0 7.8
For the top-down methods, a regression analysis can be done using the following equation:
ln ES = a + b T + c ln P + K
218

with : ln : logarithm; ES: energy saving indicator; b: trend; T: time; P : energy price; c : price elasticity (may be differentiated between upward and downward price elasticity); K: constant coefficient.
For the specific white goods, EMEEES proposes to do this regression over all EU Member States, but to define the reference trend based on the average of the three countries with the slowest trend found in the analysis (cf. table 1). In this way, the reference trend is assumed to reflect the trend in countries that have had little policy on energy-efficient appliances. For solar water heaters, we assume that all installations were influenced by policy, hence the reference trend is zero m2 of collector area.
The case applications are available at www.evaluate-energy-savings.eu.
First results from the field tests
In co-operation with Member State governments, energy companies, and other organizations offering energy efficiency improvement measures, the EMEEES methods have been tested in six pilot tests. These will each evaluate ex post the energy savings from energy efficiency improvement measures implemented in various countries for a selected sector and end use, by making use of the methods and case applications tested.
The table 5 below reports the list of case applications on appliances being tested, whereas table 6 indicates which energy efficiency improvement measures are being evaluated. All the case applications on domestic appliances tested are bottom-up.
Table 5: List of case applications on appliances being tested
EMEEES case applications Sector Italy France Denmark Sweden
Energy-efficient white goods residential X X
Condensing Boilers residential X X
Table 6: energy efficiency improvement measures on appliances evaluated ex-post
Country Subject
France French White Certificates, VAT reduction on dwellings renovation works, and tax credit for energy efficient equipments and renewable energies.
Italy Schemes under the Italian White Certificates system
Denmark Rebate programme by the Energy Saving Trust
Preliminary results are available from the field tests performed in Italy and France. In general the tests performed so far indicate that it is quite difficult to find a good compromise between accuracy and applicability of the methods being developed. Hereunder it is briefly discussed how this aspect emerged for some of the case applications presently under test.
Concerning the EMEEES bottom-up case application related to the installation of condensing boilers in the domestic sector, the field tests have suggested that this case application should be simplified in some points. In particular, field test outcomes indicated that providing EU default values for energy efficiency improvements related to parts of the heating system like heat emitters, heat control systems and heating distribution systems might not be appropriate. It appears better to provide a single default value to only allow the evaluation of the energy efficiency improvement due to condensing boiler installation and ensuring that the case application is applied in case simple and effective operation standards are fulfilled (e.g. only in case condensing boilers with modulated burners are installed in heating systems where the water temperature does not exceed 60 °C) than attempting to capture effects that are too difficult to estimate. This approach would ensure that real savings are generated and would make the method
219
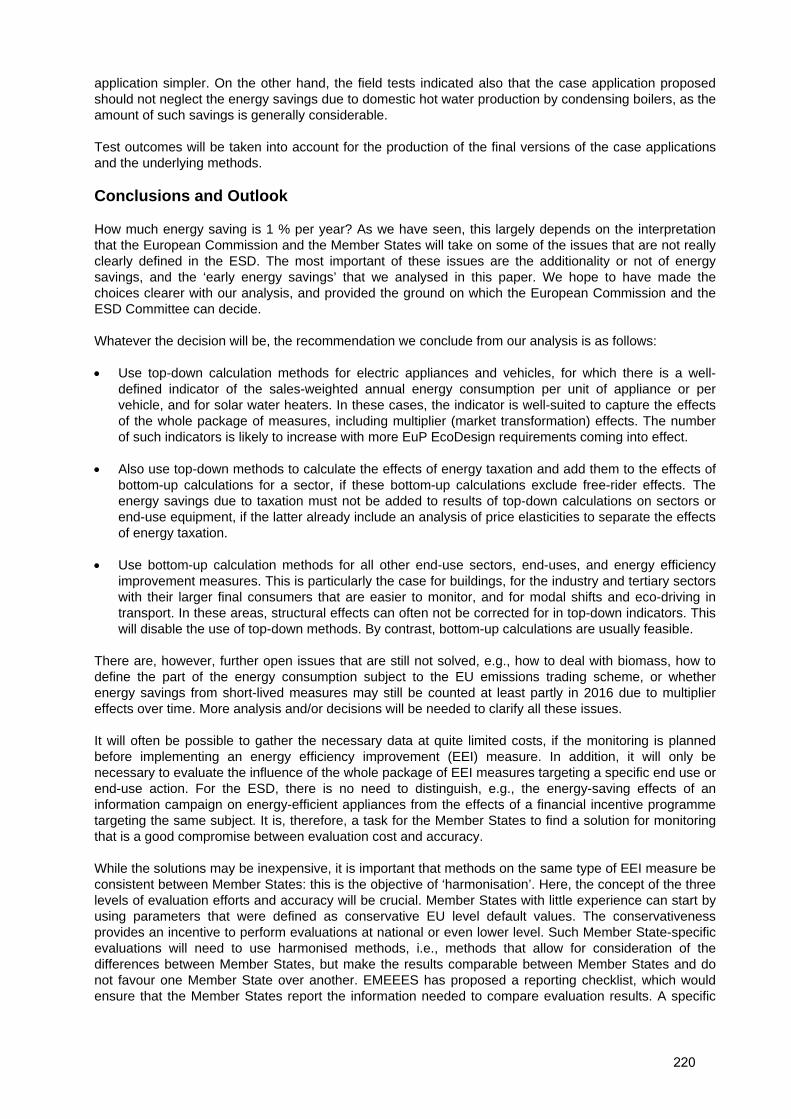
application simpler. On the other hand, the field tests indicated also that the case application proposed should not neglect the energy savings due to domestic hot water production by condensing boilers, as the amount of such savings is generally considerable.
Test outcomes will be taken into account for the production of the final versions of the case applications and the underlying methods.
Conclusions and Outlook
How much energy saving is 1 % per year? As we have seen, this largely depends on the interpretation that the European Commission and the Member States will take on some of the issues that are not really clearly defined in the ESD. The most important of these issues are the additionality or not of energy savings, and the ‘early energy savings’ that we analysed in this paper. We hope to have made the choices clearer with our analysis, and provided the ground on which the European Commission and the ESD Committee can decide.
Whatever the decision will be, the recommendation we conclude from our analysis is as follows:
• Use top-down calculation methods for electric appliances and vehicles, for which there is a well-defined indicator of the sales-weighted annual energy consumption per unit of appliance or per vehicle, and for solar water heaters. In these cases, the indicator is well-suited to capture the effects of the whole package of measures, including multiplier (market transformation) effects. The number of such indicators is likely to increase with more EuP EcoDesign requirements coming into effect.
• Also use top-down methods to calculate the effects of energy taxation and add them to the effects of bottom-up calculations for a sector, if these bottom-up calculations exclude free-rider effects. The energy savings due to taxation must not be added to results of top-down calculations on sectors or end-use equipment, if the latter already include an analysis of price elasticities to separate the effects of energy taxation.
• Use bottom-up calculation methods for all other end-use sectors, end-uses, and energy efficiency improvement measures. This is particularly the case for buildings, for the industry and tertiary sectors with their larger final consumers that are easier to monitor, and for modal shifts and eco-driving in transport. In these areas, structural effects can often not be corrected for in top-down indicators. This will disable the use of top-down methods. By contrast, bottom-up calculations are usually feasible.
There are, however, further open issues that are still not solved, e.g., how to deal with biomass, how to define the part of the energy consumption subject to the EU emissions trading scheme, or whether energy savings from short-lived measures may still be counted at least partly in 2016 due to multiplier effects over time. More analysis and/or decisions will be needed to clarify all these issues.
It will often be possible to gather the necessary data at quite limited costs, if the monitoring is planned before implementing an energy efficiency improvement (EEI) measure. In addition, it will only be necessary to evaluate the influence of the whole package of EEI measures targeting a specific end use or end-use action. For the ESD, there is no need to distinguish, e.g., the energy-saving effects of an information campaign on energy-efficient appliances from the effects of a financial incentive programme targeting the same subject. It is, therefore, a task for the Member States to find a solution for monitoring that is a good compromise between evaluation cost and accuracy.
While the solutions may be inexpensive, it is important that methods on the same type of EEI measure be consistent between Member States: this is the objective of ‘harmonisation’. Here, the concept of the three levels of evaluation efforts and accuracy will be crucial. Member States with little experience can start by using parameters that were defined as conservative EU level default values. The conservativeness provides an incentive to perform evaluations at national or even lower level. Such Member State-specific evaluations will need to use harmonised methods, i.e., methods that allow for consideration of the differences between Member States, but make the results comparable between Member States and do not favour one Member State over another. EMEEES has proposed a reporting checklist, which would ensure that the Member States report the information needed to compare evaluation results. A specific
220
issue for harmonisation is also, how to evaluate the energy savings from ‘early action’ between 1995 and 2007, as far as allowed for the ESD.
The cost that evaluation entails is another reason for EMEEES to propose for bottom-up evaluations a pragmatic three-level approach with increasing accuracy but also increasing cost from level 1 to level 3. However, it should also be noted that particularly bottom-up evaluation will also deliver knowledge on how effective an energy efficiency improvement measure has been in delivering energy savings, and can deliver insights in why it has been effective. It therefore facilitates improvement of measures. And it allows collecting data on implementation costs of all parties involved, which can be compared to the benefits achieved from saving energy.
It is clear that doing research and development of a normally technical issue such as measurement and calculation methods for energy savings under a lack of clarity of the basics is far from easy. It was further complicated by the highly political environment with its diverging interests. These were sometimes also present within the EMEEES consortium. On the other hand, the many open issues and the need to develop a harmonised measurement system for a new purpose also presented an intellectual challenge, and an opportunity to give the implementation of the ESD and its process a clearer shape.
The results of our work were discussed with the Member States and with the expert public in a series of workshops and conferences, and are available at www.evaluate-energy-savings.eu. These various dissemination activities made it possible to get rich feedback from concerned stakeholders. Some of the proposals (e.g. evaluating additional savings) were the subject of lively debates. But most of the comments were constructive, and despite some disagreements, all stakeholders welcome the results from EMEEES as valuable inputs, both for the ESD Committee discussions and for the ESD implementation in each country. The efforts to build a common language were also appreciated, as this is very helpful in avoiding misunderstandings. Finally, the discussions about the EMEEES project were a good starting point in many Member States to put evaluation issues on the agenda and launch a learning process, especially in the new Member States.
References
[1] Bertoldi, P., and B. Atanasiu, 2006. Electricity Consumption and Efficiency Trends in the Enlarged European Union, Status report 2006. JRC, Ispra.
[2] Boonekamp, P.G.M., 2009. How much will the Energy Service Directive contribute to EU energy and emissions goals? (to be published in Energy Efficiency).
[3] Boonekamp, P.G.M., and Thomas, S. 2009. Harmonised and integrated bottom-up and top-down methods to evaluate the ESD energy savings, Report from the EMEEES project. ECN, Petten and Wuppertal Institute, Wuppertal.
[4] California Public Utilities Commission (CPUC), 2006. California Energy Efficiency Evaluation Protocols: Technical, Methodological, and Reporting Requirements for Evaluation Professionals. Report prepared by the TecMarket Works Team, CPUC, San Francisco, CA, April 2006.
[5] European Commission (EC), 2006. Action Plan for Energy Efficiency: Realising the Potential. Communication from the Commission COM(2006)545 final. European Commission, Brussels, 19 October 2006.
[6] Lapillonne, B., Bosseboeuf, D., Thomas, S., 2009. Top-down evaluation methods of energy savings, Summary report. Enerdata, Grenoble, ADEME, Paris, Wuppertal Institute, Wuppertal.
[7] Lechtenböhmer, S. et al., 2008. Updated study on: How to achieve a domestic 30% GHG emission reduction target in the EU by 2020? Wuppertal Institute, Wuppertal.
[8] SRCI, NOVEM, Electricity Association, MOTIVA, Norsk Enok og Energi AS, Centre for Energy Conservation of Portugal, Elkraft system, SEVEn, Energy Saving Trust, Wuppertal Institute, 2001. A European Ex-Post Evaluation Guidebook for DSM and EE Service Programmes. SAVE Project No. XVII/4.1031/P/99-028, April 2001
221

[9] TecMarket Works, Megdal & Associates, Architectural Energy Corporation, RLW Analytics, et al., 2004. The California Evaluation Framework. Report prepared for the Southern California Edison Company as mandated by the California Public Utilities Commission, K2033910, Revised September 2004. Available at: http://www.calmac.org/toolkitevaluator.asp
[10] Thomas, S., Nilsson, L., Eichhammer, W., Vreuls, H., , 2007, Broc, J.-S., Bosseboeuf, D., Lapillonne, B., Leutgöb, K., 2007. How much energy saving is 1 % per year? In: eceee 2007 Summer Study, 4 – 9 June 2007, Proceedings, Saving energy: Just do it!, Vol. 2, p. 571-582
[11] Vine, E., 2008. Breaking down the silos: the integration of energy efficiency, renewable energy, demand response and climate change. Energy Efficiency, 1(1), pp.49-63.
[12] Vreuls, H., De Groote, W., Bach, P., Schalburg, R., Dyhr-Mikkelsen, K., Bosseboeuf, D., Celi, O., Kim, J., Neij, L., Roosenburg, M., 2005. Evaluating energy efficiency policy measures & DSM programmes - volume I : evaluation guidebook. Report for the IEA-DSM task IX, October 2005. Available at: http://dsm.iea.org/Publications.aspx?ID=18
[13] Vreuls, H., Thomas, S., Broc, J.-S., 2009. General bottom-up data collection, monitoring, and calculation methods, Summary report. SenterNovem, Sittard, Wuppertal Institute, Wuppertal, ARMINES, Nantes
Acknowledgements
The authors wish to thank the European Commission for the financial support to the EMEEES project, and all partners of the EMEEES project for their contributions to the results presented here. The partnering organisations are listed in the following table.
Partners in the EMEEES project.
Project partner Country
Wuppertal Institute for Climate, Environment, Energy (WI) DE Agence de l’Environnement et de la Maitrise de l’Energie (ADEME) FR SenterNovem NL Energy research Centre of the Netherlands (ECN) NL Enerdata sas FR Fraunhofer-Institut für System- und Innovationsforschung (FhG-ISI) DE SRC International A/S (SRCI) DK Politecnico di Milano, Dipartimento di Energetica, eERG IT AGH University of Science and Technology (AGH-UST) PL Österreichische Energieagentur – Austrian Energy Agency (A.E.A.) AT Ekodoma LV Istituto di Studi per l’Integrazione dei Sistemi (ISIS) IT Swedish Energy Agency (STEM) SE Association pour la Recherche et le Développement des Méthodes et Processus Industriels (ARMINES)
FR
Electricité de France (EdF) FR Enova SF NO Motiva Oy FI Department for Environment, Food and Rural Affairs (DEFRA) UK ISR – University of Coimbra (ISR-UC) PT DONG Energy DK Centre for Renewable Energy Sources (CRES) GR
222
Tracking Market Progress – Alternatives to Market Share Methods to Better Identify “Market Effects” and Program Exit Information
Lisa A. Skumatz
Skumatz Economic Research Associates, Inc. (SERA), Superior, Colorado, USA
Abstract A key metric for monitoring progress of efficiency and market transformation is market share for energy efficient models. However, sales data are difficult and expensive to obtain, and most rely on five main data sources: • Dealer / manufacturer sales data; • Shipments data; • In-store clipboard surveys of models for sale; • Required reporting by “participating” vendors; or • Household surveys.
This paper reviews pros, cons, and the demonstrated “real-world” performance of each traditional market metric for several household appliances. We noted two main sources of problems with these measurement methods: • Troubling disagreements in computed market share using different data sources; • Sales measures reflect market progress, but do not provide implementable information on
important barriers and the “market exit” point.
To address shortfalls the paper develops a new, cost-effective proxy measurement approach to indirectly indicate market share / market progress and compares results to traditional metrics. This approach uses statistical analysis of price rather than quantity to track progress. This metric is robust, low cost for data collection and computation, and provides several advantages over traditional metrics: • Tracks market progress and supports comparisons over time, between markets, and comparisons
with results • Provides indications of additional rebate levels that might be needed to encourage further
progress in the market • Identifies mature markets ready for exit strategies, which cannot generally be identified from
sales-based methods.
This paper discusses real-world results for this low-cost, price-based metric, and suggests it can be introduced as an in-between period tracking method or approach for suitable programs with smaller budgets.
Introduction
One of the most common and critical market progress indicators for an energy efficiency program is the change in market share for efficient equipment models relative to standard efficiency equipment attributable to the actions of the program. However, setting aside the “attributable to the program” issue (a very complex issue in itself), even the more straightforward issue of tracking market share can be expensive, time-consuming, and yield inconsistent results. Our research for several residential appliance programs shows that computed market share figures can be prone to potentially unacceptable swings in values from alternative measurement methods and available data sources. Further, the data on sales or shipments are, and will likely continue to be – difficult (and therefore, expensive) to obtain from wholesalers and retailers who lack incentives to provide information they consider business sensitive. Skumatz Economic Research Associates (SERA) researchers decided to explore the potential of alternative, parallel, and less expensive methods of indicating market progress that might provide
223

acceptable options for monitoring interim program / market progress. If the metric was successful, it could: • reduce overall tracking expenses; • allow more frequent updates on market progress; • provide a useful indicator for tracking market progress between more traditional sales-based
computations; • provide a feasible tracking alternative for low budget programs.
Statement of the Problem In our work for energy agencies across North America we (and other evaluators) have used seven approaches to measure changes in the market share of efficient equipment. These key approaches, the data sources, and our assessment of their performance and relative costs, are provided in Table 1. Our exploratory research and our research for clients computed product market shares from each of these methods in various combinations. The unpleasant outcome was that the market penetration results were different for each method, and not at all similar in some cases. This left us, as evaluators, in the extremely uncomfortable position of having to “select” the market progress value for our client (with clients naturally leaning toward ones that showed greatest progress). “Checking” the results using multiple methods in some ways raises more questions than it answers, and based on our experience, few projects are in a position to be able to afford results from more than one of these measurement methods. Table 1: Pros & Cons of Traditional Market Share-Related Progress Indicators & SERA’s Proposed “NEEPP” Method (Source: Skumatz Economic Research Associates - SERA, 2006) Method Assessment Cost
Periodic sales data from dealers, manufactures
Suppliers are balky / have little incentive to provide information (considered business sensitive); labor intensive to collect / reliance on “good will”; representativeness issues, data consistency issues when suppliers “drop out” in some time periods.
Very High
Shipments Somewhat inconsistent data source, problems with reselling across state boundaries, available for some commodities.
Medium
In-store models counting / tracking, relative shelf space measures
Inaccurate for quantities, although shelf space provides some proxy indicator of relative sales; not very practical for commercial sector
Medium
Dedicated or saturation surveys, purchases
Lack of knowledge by respondents, lack of incentive to respond (or respond fully), sample size problems for commercial sector.
High
On-site inspections / audits
Inspectors have good knowledge of equipment, but sample sizes are a problem; finding a sample of recent purchases difficult
High
Industry / association sales data
Some sales data are available for limited equipment types, but much equipment is not available
Medium
Warranty cards / rebate
Shows promise for some products, but “Control” sales are missing
Medium
SERA’s NEEPP method (addressed in this paper)
Straightforward/inexpensive data collection, control and test data, analytical results provide extra information to inform market maturity, program design / rebate, and exit timing
Low-Medium
Finally, the expense – and the fact that the expense of collecting these market data will likely continue unabated – led us to investigate whether there wasn’t a more economical method of providing a reliable indicator reflecting the same market progress we were after. Emergency medical technicians have developed proxy indicators that could reflect their performance, specifically heart attack deaths. While the indicator does not reflect the wide array of lifesaving services they perform, it does provide a useful indicator of performance that can be used to portray progress locally, and support comparisons to emergency services in other areas. In the energy field, is there a way to reflect market progress in a meaningful, but less costly way?
224
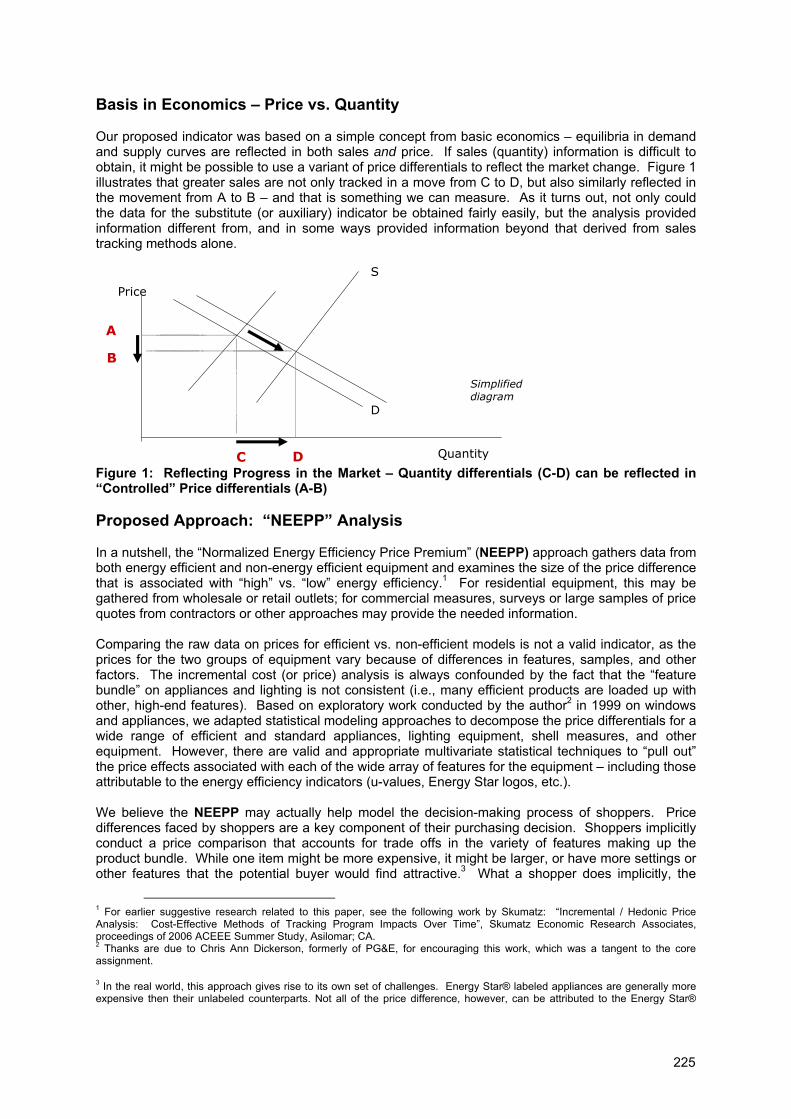
Basis in Economics – Price vs. Quantity Our proposed indicator was based on a simple concept from basic economics – equilibria in demand and supply curves are reflected in both sales and price. If sales (quantity) information is difficult to obtain, it might be possible to use a variant of price differentials to reflect the market change. Figure 1 illustrates that greater sales are not only tracked in a move from C to D, but also similarly reflected in the movement from A to B – and that is something we can measure. As it turns out, not only could the data for the substitute (or auxiliary) indicator be obtained fairly easily, but the analysis provided information different from, and in some ways provided information beyond that derived from sales tracking methods alone. Figure 1: Reflecting Progress in the Market – Quantity differentials (C-D) can be reflected in “Controlled” Price differentials (A-B)
Proposed Approach: “NEEPP” Analysis In a nutshell, the “Normalized Energy Efficiency Price Premium” (NEEPP) approach gathers data from both energy efficient and non-energy efficient equipment and examines the size of the price difference that is associated with “high” vs. “low” energy efficiency.1 For residential equipment, this may be gathered from wholesale or retail outlets; for commercial measures, surveys or large samples of price quotes from contractors or other approaches may provide the needed information. Comparing the raw data on prices for efficient vs. non-efficient models is not a valid indicator, as the prices for the two groups of equipment vary because of differences in features, samples, and other factors. The incremental cost (or price) analysis is always confounded by the fact that the “feature bundle” on appliances and lighting is not consistent (i.e., many efficient products are loaded up with other, high-end features). Based on exploratory work conducted by the author2 in 1999 on windows and appliances, we adapted statistical modeling approaches to decompose the price differentials for a wide range of efficient and standard appliances, lighting equipment, shell measures, and other equipment. However, there are valid and appropriate multivariate statistical techniques to “pull out” the price effects associated with each of the wide array of features for the equipment – including those attributable to the energy efficiency indicators (u-values, Energy Star logos, etc.). We believe the NEEPP may actually help model the decision-making process of shoppers. Price differences faced by shoppers are a key component of their purchasing decision. Shoppers implicitly conduct a price comparison that accounts for trade offs in the variety of features making up the product bundle. While one item might be more expensive, it might be larger, or have more settings or other features that the potential buyer would find attractive.3 What a shopper does implicitly, the
1 For earlier suggestive research related to this paper, see the following work by Skumatz: “Incremental / Hedonic Price Analysis: Cost-Effective Methods of Tracking Program Impacts Over Time”, Skumatz Economic Research Associates, proceedings of 2006 ACEEE Summer Study, Asilomar; CA. 2 Thanks are due to Chris Ann Dickerson, formerly of PG&E, for encouraging this work, which was a tangent to the core assignment.
3 In the real world, this approach gives rise to its own set of challenges. Energy Star® labeled appliances are generally more expensive then their unlabeled counterparts. Not all of the price difference, however, can be attributed to the Energy Star®
Price
Quantity
A
B
C D
D
S
Simplified diagram
225
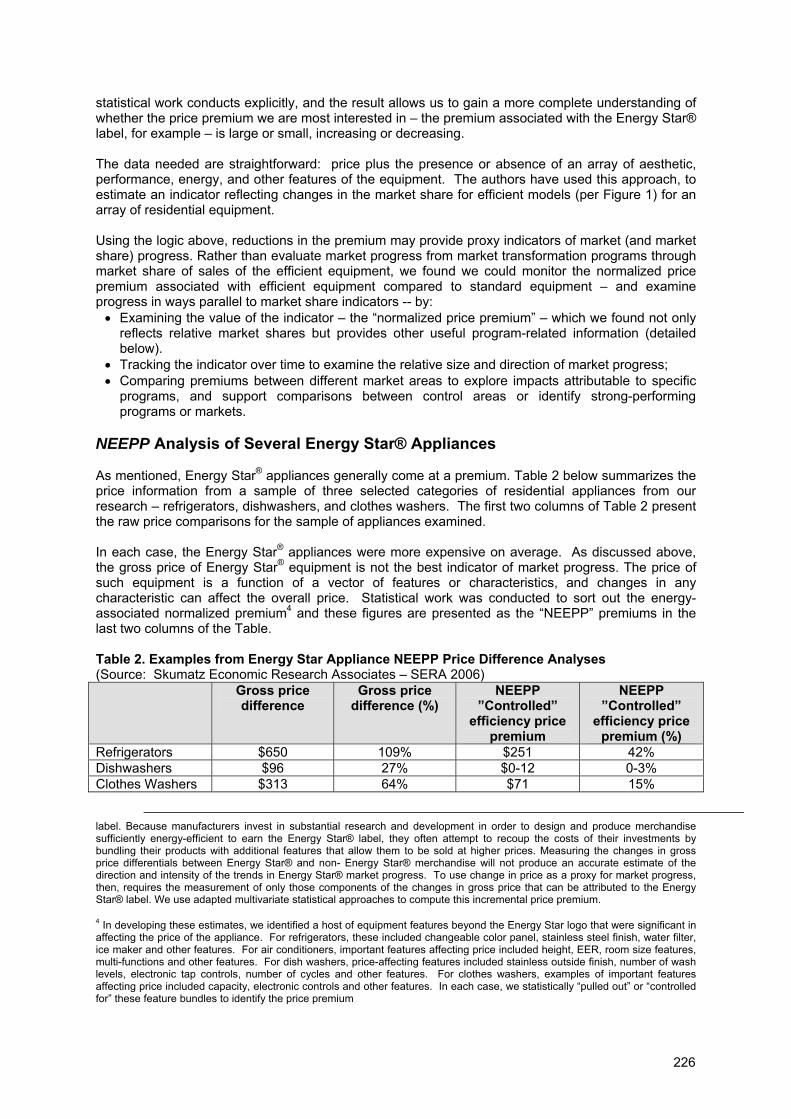
statistical work conducts explicitly, and the result allows us to gain a more complete understanding of whether the price premium we are most interested in – the premium associated with the Energy Star® label, for example – is large or small, increasing or decreasing. The data needed are straightforward: price plus the presence or absence of an array of aesthetic, performance, energy, and other features of the equipment. The authors have used this approach, to estimate an indicator reflecting changes in the market share for efficient models (per Figure 1) for an array of residential equipment. Using the logic above, reductions in the premium may provide proxy indicators of market (and market share) progress. Rather than evaluate market progress from market transformation programs through market share of sales of the efficient equipment, we found we could monitor the normalized price premium associated with efficient equipment compared to standard equipment – and examine progress in ways parallel to market share indicators -- by: • Examining the value of the indicator – the “normalized price premium” – which we found not only
reflects relative market shares but provides other useful program-related information (detailed below).
• Tracking the indicator over time to examine the relative size and direction of market progress; • Comparing premiums between different market areas to explore impacts attributable to specific
programs, and support comparisons between control areas or identify strong-performing programs or markets.
NEEPP Analysis of Several Energy Star® Appliances As mentioned, Energy Star® appliances generally come at a premium. Table 2 below summarizes the price information from a sample of three selected categories of residential appliances from our research – refrigerators, dishwashers, and clothes washers. The first two columns of Table 2 present the raw price comparisons for the sample of appliances examined. In each case, the Energy Star® appliances were more expensive on average. As discussed above, the gross price of Energy Star® equipment is not the best indicator of market progress. The price of such equipment is a function of a vector of features or characteristics, and changes in any characteristic can affect the overall price. Statistical work was conducted to sort out the energy-associated normalized premium4 and these figures are presented as the “NEEPP” premiums in the last two columns of the Table. Table 2. Examples from Energy Star Appliance NEEPP Price Difference Analyses (Source: Skumatz Economic Research Associates – SERA 2006) Gross price
difference Gross price
difference (%) NEEPP
”Controlled” efficiency price
premium
NEEPP ”Controlled”
efficiency price premium (%)
Refrigerators $650 109% $251 42% Dishwashers $96 27% $0-12 0-3% Clothes Washers $313 64% $71 15%
label. Because manufacturers invest in substantial research and development in order to design and produce merchandise sufficiently energy-efficient to earn the Energy Star® label, they often attempt to recoup the costs of their investments by bundling their products with additional features that allow them to be sold at higher prices. Measuring the changes in gross price differentials between Energy Star® and non- Energy Star® merchandise will not produce an accurate estimate of the direction and intensity of the trends in Energy Star® market progress. To use change in price as a proxy for market progress, then, requires the measurement of only those components of the changes in gross price that can be attributed to the Energy Star® label. We use adapted multivariate statistical approaches to compute this incremental price premium.
4 In developing these estimates, we identified a host of equipment features beyond the Energy Star logo that were significant in affecting the price of the appliance. For refrigerators, these included changeable color panel, stainless steel finish, water filter, ice maker and other features. For air conditioners, important features affecting price included height, EER, room size features, multi-functions and other features. For dish washers, price-affecting features included stainless outside finish, number of wash levels, electronic tap controls, number of cycles and other features. For clothes washers, examples of important features affecting price included capacity, electronic controls and other features. In each case, we statistically “pulled out” or “controlled for” these feature bundles to identify the price premium
226
Implications of the Results The results for these appliances were selected as the examples in this paper because they illustrate different market stages and implications. Gross Price Differential: A significant gross price differential exists for each of the set of large appliances we examined. However, as mentioned, simple (gross) comparisons hide the effects of other differences in the equipment – for example, differences in size, features/ options, or other factors, including sample effects. Normalized Price Differential: The results show the simple gross price comparisons and the price premiums that could be associated with the Energy Star® label, controlling for other differences. The normalized differentials for the three pieces of equipment are lower, but differences in their relative sizes suggest different market stages and different implications.
Refrigerators: A simple comparison of the refrigerators included in the sample was almost $600, or 109% more than standard models. However, after controlling for key features, the remaining NEEPP price premium that appears to be attributable to Energy Star® is about $251 or a 42% price premium.
• Implications: Manufacturers appear to be bundling additional features on Energy Star® models, causing their apparent prices to be higher than they would need to be if “comparable” models that were Energy Star® and non-Energy Star® were available (or obvious) to shoppers. However, the results still show a fairly substantial premium for Energy Star®, and program incentives may still be needed in the marketplace to generate or maintain increased sales of the efficient products.5
Washing Machines: The results showed that the Energy Star® variable, after eliminating the effects of other factors, was responsible for a NEEPP price difference of $71, a significant decrease from the gross price differential of $313. The percentage premium for the Energy Star® label decreased from 64% to 15% attributable to the Energy Star® label.
• Implications: This is an important finding, because the apparent price difference for these clothes washers has been a considerable concern to program managers. The NEEPP work shows that a good share of that price difference is due not to the Energy Star® logo per se, but to manufacturers “loading up” other premium features on these machines to help recoup development costs, reap consumer surplus, and maximize profits on these models that currently have cachet. Again, the results show a fairly substantial NEEPP premium for Energy Star®, and program incentives may still be needed in the marketplace to generate or maintain increased sales of the efficient products.
Dishwashers: Table 2 shows that the gross price difference between the dishwashers in our sample that are Energy Star® qualified and those that are not is $96. After accounting for other features, the NEEPP price premium associated with the Energy Star® variable is small and statistically insignificant, and the estimated price premium falls from $96 to $12 (or less), and from 27% to about 3% or less. The price premium associated with the Energy Star® label for dishwashers appears to be nearly zero. • Implications: The results for dishwashers are particularly noteworthy. The research shows
that the NEEPP price premium for the Energy Star® logo has become negligible. This may indicate that the market has become reasonably mature, and that consumers do not need to pay extra for the efficiency feature (and the bill savings associated with that feature).
Indicators Informing Program Exit Timing The “controlled” NEEPP differences show small energy efficiency price premiums associated with dishwashers, and the high premiums associated with efficient refrigerators. We suggest that this provides key information on program exit timing. Interventions may no longer be needed to
5 One anonymous reviewer wondered whether the price premium is justified by production costs, or whether it was simply that manufacturers are trying to capture their part of the net benefit to the consumer through their pricing strategy? No specific information on this question is available to the author; and the question would be an interesting investigation.
227
encourage selection of Energy Star® models of dishwashers as they are currently labeled. This indicator might be adopted as a trigger for: • invoking an “exit strategy” for program interventions in that market, or • identifying the time to “upgrade” the efficiencies needed to receive the Energy Star® logo to
continue to move the market forward. The findings of Table 2 indicate that this same situation is not reflected in refrigerators or clothes washers – there still may be a case for continued intervention because households must be induced to pay more for the energy efficiency feature. The results provide quantitative information that shows: • The incremental price point at which consumers would be indifferent between energy efficient vs.
standard efficiency equipment (if there were no auxiliary effects associated with energy efficiency, like bill savings, possible concerns about maintenance, or other non-energy effects / benefits).
• A maximum potential rebate level that the program might offer.6 • An indicator of market maturity. • An indicator of potentially opportune times to increase the efficiency levels that qualify as “energy
efficient” or receive the Energy Star® designation. In particular, if price differentials are low, it may indicate the need to increase the efficiency levels of the equipment covered by the program.
This analytical method provides insights into current and future program needs beyond that obtained from traditional tracking methods. Sales tracking doesn’t provide insight on the level of rebate that might be effective at increasing purchases of energy efficient equipment (without over-incentivizing the purchase). We have applied these methods to tracking differentials over periods as long as 5 years with interesting results.
Issues and Considerations of the NEEPP Approach Several concerns may arise about the approach.
• Data collection: We find that the cost of the data collection for the author’s “NEEPP” method– even from a relatively large sample – is not very costly at all. Unlike quantity and shelf space information, the data on price and features are completely visible and readily available. Unlike sales and shipment data, there are no confidentiality and retailer “drop-in/drop-out” issues associated. Certainly, there are sales data available on a subset of residential appliances through the Energy Star® National Retailer Partner Sales Data, and these data represent perhaps 50% of sales data (not strictly from a representative sample, but mostly from large sellers). That works fairly well (and conveniently) for those appliances covered, but those data, while “free” to member users, are not free to collect and are available as long as EPA or others fund the data collection work. One problem we identified, however, is that the results from this data source differed from “similar” information from shipments, survey, and other sources when analyzing the same appliances in the same region(s) of the country. Using one data source eliminates inconsistencies, but those inconsistencies are troublesome and may be appropriate to be addressed in a full program assessment.
6 In simple terms, the value of the “normalized energy efficiency price premium” estimates the incentive or rebate that would create a price point at which the consumer sees no difference in initial cost attributable to the energy efficient vs. standard efficiency measure. A higher rebate would make the energy efficient equipment cheaper than standard models, all other factors (read features) equal, which should presumably represent a higher rebate than necessary to induce purchase. If perfect information existed (along with trust in that information and knowledge of the purchaser’s discount rate), the rebate should be placed so the remaining price premium should be just less than the discounted value of the energy savings over the equipment’s lifetime. However, this simplifies the real world somewhat. Besides information imperfections, there is an array of other complicating factors – positive and negative – associated with energy efficiency equipment. This discussion excludes the positive flow of “services” from “comfort”, greater control, and other positive effects, and the negative flow from any risks or uncertainties associated with the equipment’s maintenance, lifetime, performance, etc. For a discussion of the measurement of value from the potentially complicating effects from these factors, see the author’s work on “non-energy benefits”, for example, New Non-Energy Benefits (Nebs) Results In The Commercial / Industrial Sectors: Findings From Incentive, Retrofit, And Technical Assistance / New Construction Programs, Proceedings for the European Council for an Energy Efficient Economy (ECEEE), June 2007, France and Non-Energy Benefits from ENERGY STAR®: Comprehensive Analysis of Appliance, Outreach, and Homes Programs, Proceedings of the 2004 ACEEE Summer Study, Asilomar, CA, August 2004.
228

• Attribution / modeling and the effects of other factors in causing price decreases. There are certainly a number of factors that can affect price differences. These might include technology advances, initiatives by major retailers (separate from programs), and other factors. This is absolutely true and the goal is to specifically account for the range of influences in the analytical modeling work and identify the remaining efficiency differential. However, note that these same factors will also necessarily affect the results from the market share analyses. As price falls due to these other factors, the supply and demand curves will indicate a resulting increase in the purchases of energy efficient models. Thus, these same non-programmatic factors need to be extracted from changes in the market share work as well. This is not something that affects only the price analysis work – both approaches need to consider these factors, and the NEEPP approach is specifically designed “up front” to do so.7
• Existing market share tracking efforts. Based on research over the years, we have found that inconsistencies arise in measuring market share from different data sources (sales, shipments, etc. as listed in Table 1). Certainly there are important reasons for variations based on differences between specific sources; however, in previous work we found differences large enough to draw opposing conclusions about progress for some appliances (for example). The point in this paper is not that all market share / sales tracking is flawed and should be terminated. Rather, we suggest that:
o showing only one result can be misleading – selecting one can derive considerably different results than the selection of another metric and showing more than one may provide more accurate information;
o the data collection for SERA’s “NEEPP” approach is affordable, and the results provide additional information beyond that provided by direct market share work;
o the NEEPP approach can alternate with traditional market share tracking. Replacing some of the periodic tracking with NEEPP analyses, or spending a little extra to gain the additional perspective and context that NEEPP provides, alongside traditional market share tracking, may be another fruitful approach for some program evaluation assignments.
Applications of the NEEPP Approach
The values derived by an on-going series of these price decomposition studies can be compared to future studies of a similar nature to look for market effects measured in terms of decreasing price differentials from Energy Star® programs. The authors are monitoring this effect on an on-going basis (and comparing to other locations) and are collecting data on price and appliance / equipment features, in association with the periodic on-site data collection efforts conducted as part of program evaluation. This work has several applications.
• Tracking market progress toward transformation. Sales and market share data are very
difficult and expensive to obtain (if they can be obtained at all). Using readily available market price data and information on features, a price decomposition analysis can provide an alternate, and less expensive, source for information indicating progress in the market. This price premium indicator shows promise for providing an indirect reflection of the market equilibrium conditions provided by market share tracking, and lower premium values would tend to be associated with a more mature market. Presumably, the lower the premium, the lower the incremental manufacturing costs, and the higher the market share (since consumers do not have to pay much extra for this feature). This may also reflect the point at which the market resembles the long-run equilibrium, and the market has moved forward and become more transformed due to the combination of market forces and any program interventions. The results can possibly address the question of whether additional or
7 In our initial exploratory research, we used standard approaches applied to statistical research. Given that one of our goals was to mimic the shopping decision-making process, we collected data on the myriad features that a shopper could identify from the product materials and packaging. Some factors are reflected as exists / doesn’t exist; others are values like cubic inches, and other factors. We used statistical methods to identify the most important explanatory factors, and these were reported in the analysis. Through repeated studies, data collection has become more directed, but as new features are added, the data collection evolves.
229

continuing interventions are needed in the market, and how quickly the market is progressing toward transformation. In addition to comparisons over time, the work can be used to make comparisons to other states or areas to assess relative market progress between areas and possibly identify more and less successful intervention approaches.
• Assessing need for new or continuing program interventions. A high or continuing price premium may be an indicator that the market is not maturing on its own, or that additional interventions may be needed to assist in achieving market transformation – information that is fairly reliable and inexpensive to obtain through this method, and can augment information from process evaluations or assessments of barriers and logic. The price premium may implicitly reflect this “market state,” though it may not address “why” and additional research may be needed.
• Estimating appropriate incentive or rebate levels. The “controlled” price premiums estimated through this approach provide guidance for identifying appropriate levels for appliance rebates to encourage purchase of efficient models. This is useful to program planners, and may be more reliable than rebate estimates derived form other methods. The information on the premium is useful as a reflection of the amount of a price rebate that might be needed to encourage consumers to purchase Energy Star® labeled appliances (or reflect the maximum threshold at which they would be indifferent). If consumers conduct similar tradeoffs of features vs. price as the statistical work assumes, a dollar amount equal to the premium associated with Energy Star® should reflect the maximum rebate needed to make consumers indifferent between the two models. This estimate makes several simplifying assumptions. First, the consumer assigns zero value to the stream of energy savings that they will receive in the future. If they assign a value to this stream, then the rebate could presumably be lower than the estimated associated price increment. Second, if they associate with the logo higher quality appliances, the rebate may be able to be set lower than the estimate. Third, if they assign differences in maintenance, the rebate may be lower than the price premium indicates.
• Identifying market maturation. A low or zero attributed price premium may prove a useful “trigger point” for helping to identify the point at which markets may have matured, and program exit strategies may be justified.
The authors are applying this approach to additional measures, and are tracking pricing and sales results for a number of appliances to allow comparison of the results to identify whether the method provides a parallel (and less expensive) tracking method. Finally, we are applying the work to commercial measures to explore feasible data collection and analytical approaches for applications in that sector.
Summary
This paper summarizes work using statistical methods to examine the portions of the apparent price differences for a variety of appliances that are attributable to efficiency labels or components of efficient measures. The work stems from research examining progress in market transformation. The goal was to monitor market progress in the premium associated with efficient equipment compared to standard equipment – and potentially track these changes (hopefully, according to logic, declining) over time. However, the incremental cost metric is always confounded by the fact that the “feature bundle” on appliances and lighting is not consistent (i.e., many efficient products are loaded up with other, high-end features). Based on work conducted by the authors some years ago, we adapted statistical models to decompose the price differentials for efficient and standard refrigerators, clothes washers, and dish washers. The authors used site visits and web searches to gather data on appliance prices and features for a set of efficient and standard models. The authors first examined apparent (raw) price differentials between efficient and standard models. Then, using statistical techniques to control for differences attributable to each of the appliance features and options, we estimated the normalized price premium attributable to the energy efficient features and logos (NEEPP premiums).
230

The results showed that while the apparent (gross) price differences for efficient measures are high, the percentage and dollar differences decrease dramatically when the price differences statistically attributable to other features of the measure are accounted for. Results differed by appliance, and the varying results have different implications for the underlying programs and measures. This work has several applications. Tracking price differentials over time is an important application of this work – and this indicator may be used instead of, or in addition to (and more cheaply than), market share. For example, to save funds, it may be cost-effective to decrease the frequency of tracking market shares, and introduce between-period price analysis studies. Results from tracking for one client shows that price premiums associated with both appliances fell between the two years, potentially demonstrating market progress and indicating that the approach shows promise in providing an idea of how mature the market has become. The values may also be compared between states or areas for evidence of relative market progress of maturity. This would be accomplished by conducting empirical price analysis work in states with and without high levels of Energy Star® program activity. In theory, price premiums for high-activity states should be lower than in states where less promotion of the Energy Star® label has taken place. This method provides intriguing implications for program analysis. From our exploratory research and work for clients around the country, we have found NEEPP supports:
• Market progress tracking over time using a less expensive metric (NEEPP normalized efficiency price premiums).
• Information on the need for continued (or ceasing) market interventions by programs. • Demonstrating the need for and level of possible rebates to continue market progress. • Feedback on timing for possible market exit for programs. • Indications of the level of market maturity and timing for increasing the thresholds for Energy
Star® or receiving program incentives. • Tracking market progress within and between states or service territories, using a proxy
variable that is less expensive and complicated to measure than direct indicators of sales or market share.
This NEEPP tracking method uses more readily available data and reduces the need for very expensive sales tracking – tracking that is unlikely to get less expensive over time. This paper suggests this NEEPP approach provides a potentially valuable tool, allowing use of more expensive sales-based market share tracking less often (replaced by periodic tracking with NEEPP). This hybrid evaluation approach will provide new program guidance not provided from traditional sales-based approaches. References 1. Skumatz, Lisa A., Ph.D., 2007. Tracking Market Progress: Addressing Traditional Market Share
Measurement Issues with an Innovative Proxy – the “NEEPP” Tracking Approach. White Paper for Association of Energy Services Professionals (AESP), www.aesp.org. January.
231

Policies and Programmes
232

233

An analysis of the global carbon impacts of energy-using products
Chris Evans
Market Transformation Programme, UK
Bilyana Chobanova, Frank Klinckenberg
Klinckenberg Consultants
Abstract
This paper provides a partial summary of a report commissioned by the UK Government’s Market Transformation Programme to aid the strategic development of its product policy activities for energy using products. The report, which was primarily based upon a review of existing published materials, provided an analysis of global and regional domestic product market sizes, their growth potential and their energy related carbon emissions. Additionally, the analysis identified the emissions mitigation potential of each of the major domestic product sectors and set this in both a global and a regional context.
Introduction
The Department for Environment Food and Rural Affairs (Defra) is the UK Government department with lead responsibilities for the development of policy for energy using products. As such, it needs to understand the global carbon impacts of products to assist the prioritisation of its activities. For this purpose its Market Transformation Programme [1] commissioned an analysis [2] describing these impacts.
This analysis covered:
• the global market size • the growth potential for domestic and commercial1 products • the energy demand • the energy related emissions • the emissions mitigation potential
For the following product sectors:
• Domestic cold
• Domestic wet
• Domestic lighting
• Televisions
• Domestic ICT
• Consumer electronics excluding TVs and domestic ICT (standby only)
• Domestic cooking – electric
• Domestic cooking – gas
• Domestic water boilers (space and water heating) – gas
1 This paper focuses on domestic products as it has been prepared for EEDAL 2009
234

• Domestic water boilers (space and water heating) – oil
• Domestic water boilers (space and water heating) - electricity
• Domestic air-conditioning
• Commercial refrigeration
• Commercial lighting
• Street lighting
• Commercial ICT
• Servers
• Commercial cooking – electric
• Commercial cooking – gas
• Motors- electric all that are not over lapping with other categories in this list
• Commercial water boilers (space and water heating) – gas
• Commercial water boilers (space and water heating) – oil
• Commercial water boilers (space and water heating) – electricity
• Commercial air-conditioning
• Heat pumping (heating and cooling)
The necessary analyses were addressed through a review of available materials. It was known that much of the summary information needed was already available and required only to be collated in an accessible format to support an analysis.
Information was collected about trade volumes and (current and projected) carbon impacts of product and presented in this summary paper as global figures, as well as a regional distribution for the top five impact product groups.
The regions:
• Oceania (PAO) • North America (NAM) • Western Europe (WEU) • Central and Eastern Europe (EEU) • Former Soviet Union (FSU) • Latin America (LAM) • Sub-Saharan Africa (SSA) • North Africa/Middle East (MEA) • Centrally Planned Asia (CPA) • South Asia/Other Pacific Asia (SAS-PAS)
Analytical approach
The determination of the Base Case End Use Energy Demand, Market Size and Carbon Emissions Mitigation has been made through a bottom-up model developed by the Lawrence Berkeley National Laboratory. This model, called the Bottom-Up Energy Analysis System (BUENAS) forecasts the uptake and consumption of individual technologies in the residential and commercial building sub-sectors. The model takes a modular approach, and builds up sub-sector energy one end-use at a time. In the first module, energy service demand (activity) is modelled according to trends in economic growth. In the residential sector, the ownership of each appliance is modelled
235

econometrically according to projections of household income, urbanization, electrification, and heating and cooling degree days in the case of space heating and cooling.
The determination of energy demand, market size and carbon emissions mitigation are as follows:
• Base Case Energy Demand – Penetration of each end use technology in each region over the forecast period, multiplied by baseline energy consumption (electricity or fuel), and multiplied by number of households.
• Energy related emissions result from the energy demand estimates, multiplied by a carbon factor in each year. Electricity carbon factors taken from IEA data are used, which is averaged over countries, yielding a carbon factor for each region. Fuel energy is converted using a single universal multiplier for natural gas.
• Market Size – Turnover rate of each product, as the sum of new installations (due to new floor space, population growth or increase in ownership rate) plus replacements (determined by retirement of equipment installed in previous years)
• Emissions Mitigation – Difference in energy savings in Base Case and Efficiency Case, multiplied by carbon factors (CO2 per unit of electricity or fuel), forecast at a regional level.
Availability of data [3]
The availability of data for the different products groups varies considerably. The table below shows what kind of data has been available for the different product groups, indicates where gaps in the information exist, as well as giving details on what products are covered with the data presented. In general, data has been searched and analysed for 29 product groups (23 reported in this summary). For 17 groups most of the information has been collected, for 19 some gaps exist and for three product groups no information (n.a) is available on a global scale.
Product group Unit Energy
Consumption Market
size Energy
Demand Energy related
emissions Emission mitigation
1 Domestic cold2 yes yes yes yes yes
2 Domestic wet3 yes yes yes yes yes
3 Domestic lighting
yes yes yes yes yes
4 TVs yes yes yes yes yes
5 Domestic ICT4 n.a n.a n.a n.a n.a
6 Consumer electronics5
yes yes yes yes yes
2 Market size, energy demand, related emissions and emission mitigation potential data are only for refrigerators and combined refrigerators/freezers, market share and impact of stand alone freezers not significant on a global scale. 3 Market size, energy demand, related emissions and emission mitigation potential data are only for washing machines. Market share and impact of dishwashers are not significant on a global scale. 4 Market size, energy demand and emission mitigation potential data, based on Stand-by power for domestic ICT are included in Consumer electronic product group. 5 Energy demand, related emissions and carbon impact calculations are available for stand-by power only. The range of products under this category is too wide to be able to estimate actual demand and emission in working mode.
236
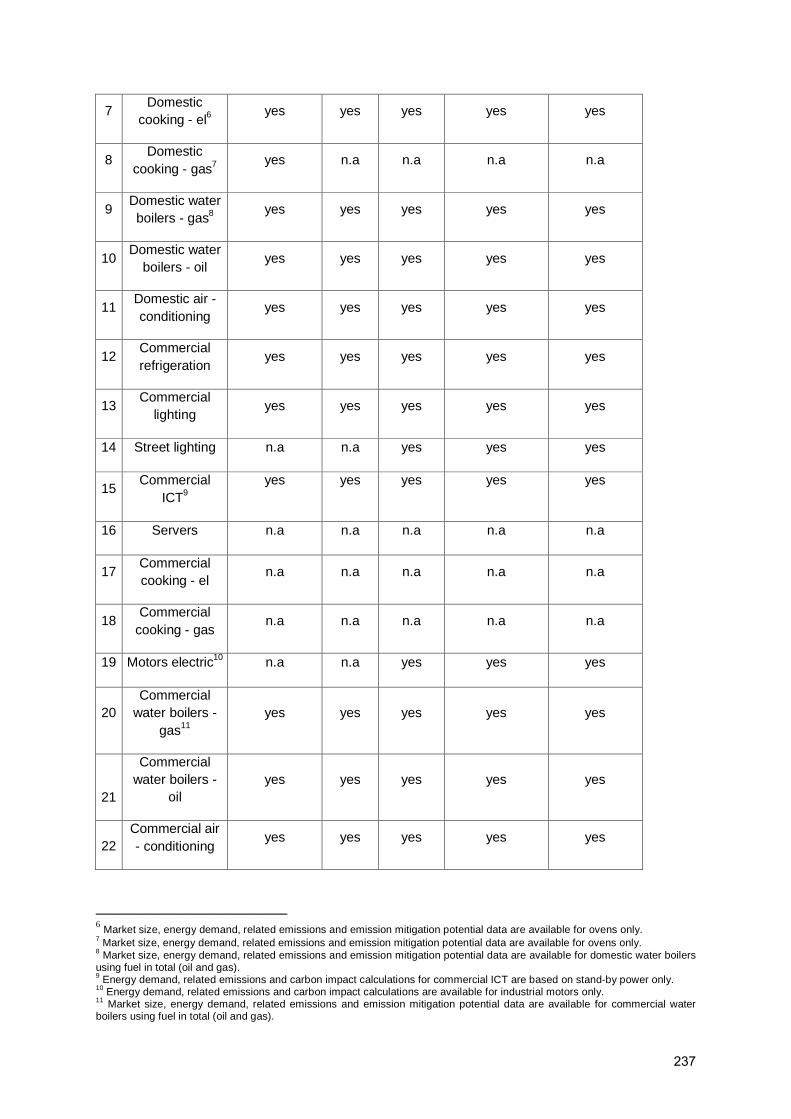
7 Domestic
cooking - el6 yes yes yes yes yes
8 Domestic
cooking - gas7 yes n.a n.a n.a n.a
9 Domestic water boilers - gas8
yes yes yes yes yes
10 Domestic water
boilers - oil yes yes yes yes yes
11 Domestic air - conditioning
yes yes yes yes yes
12 Commercial refrigeration
yes yes yes yes yes
13 Commercial
lighting yes yes yes yes yes
14 Street lighting n.a n.a yes yes yes
15 Commercial
ICT9 yes yes yes yes yes
16 Servers n.a n.a n.a n.a n.a
17 Commercial cooking - el
n.a n.a n.a n.a n.a
18 Commercial
cooking - gas n.a n.a n.a n.a n.a
19 Motors electric10 n.a n.a yes yes yes
20 Commercial
water boilers - gas11
yes yes yes yes yes
21
Commercial water boilers -
oil yes yes yes yes yes
22 Commercial air - conditioning
yes yes yes yes yes
6 Market size, energy demand, related emissions and emission mitigation potential data are available for ovens only. 7 Market size, energy demand, related emissions and emission mitigation potential data are available for ovens only. 8 Market size, energy demand, related emissions and emission mitigation potential data are available for domestic water boilers using fuel in total (oil and gas). 9 Energy demand, related emissions and carbon impact calculations for commercial ICT are based on stand-by power only. 10 Energy demand, related emissions and carbon impact calculations are available for industrial motors only. 11 Market size, energy demand, related emissions and emission mitigation potential data are available for commercial water boilers using fuel in total (oil and gas).
237

23 Heat pumping n.a n.a n.a n.a n.a
Summarised results (1): domestic products market size
Table 1a: Global market estimates (thousand units12)
Product group 2005 2020
Electricity
Domestic cold 97 223 149 743
Domestic wet 79 775 126 883
TVs 150 382 225 294
Domestic lighting 13 239 988 19 286 056
Consumer electronics 405 976 592 130
Domestic cooking el 32 990 42 971
Domestic water boiler electricity 13 386 20 340
Domestic water heating electricity 16 925 23 963
Domestic air-conditioning 17 539 25 581
Fuel
Domestic water boilers, fuel 41 700 62 317
Domestic water heating, fuel 58 626 86 310
Table 1b: Global market estimates for domestic lighting (thousand units)
2005 2020 2005 2020
Incandescent Lamps 12 592 146 18 313 301 95% 95%
Fluorescent 295 383 439 694 2% 2%
CFL 352 459 53 3061 3% 3%
Total 13 239 988 19 286 056 100% 100%
Source: M. McNeil, V. E. Letschert, Lawrence Barkley National laboratory, Feb 2009
12 A breakdown of the domestic lighting figures are given in a separate table
238
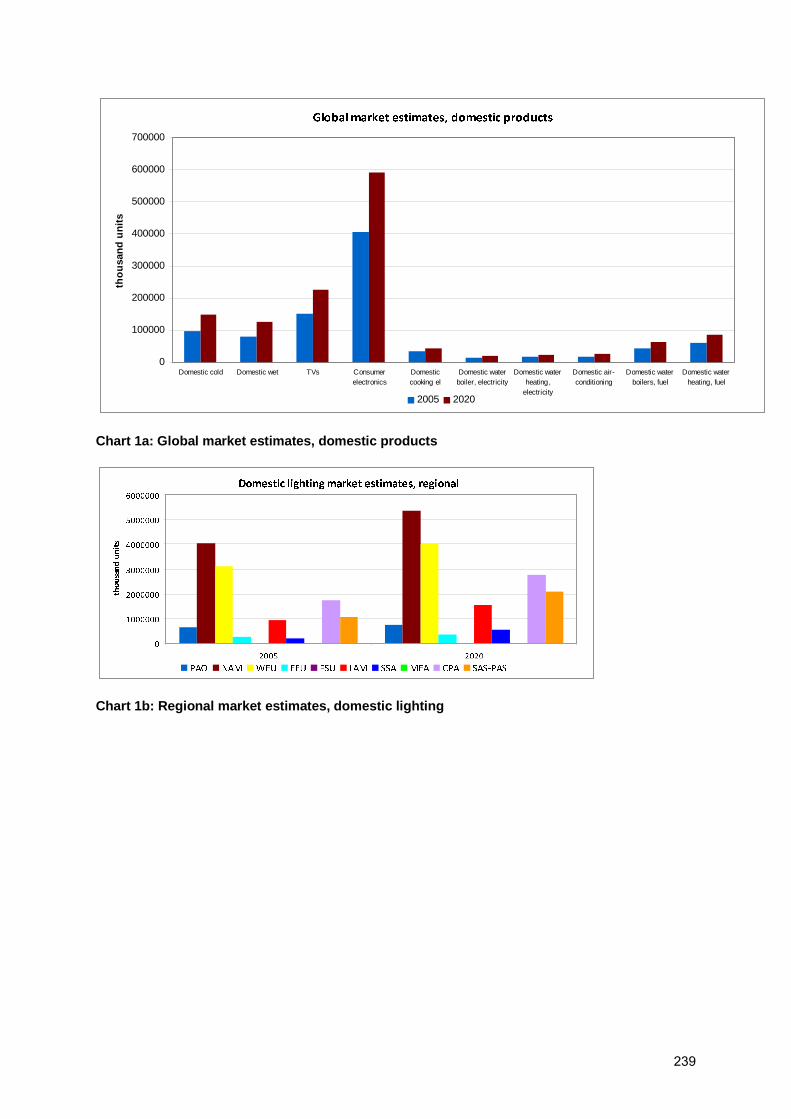
Global market estimates, domestic products
0
100000
200000
300000
400000
500000
600000
700000
Domestic cold Domestic wet TVs Consumerelectronics
Domesticcooking el
Domestic waterboiler, electricity
Domestic waterheating,
electricity
Domestic air-conditioning
Domestic waterboilers, fuel
Domestic waterheating, fuel
tho
usa
nd
un
its
2005 2020
Chart 1a: Global market estimates, domestic products
Domestic lighting market estimates, regional
0
1000000
2000000
3000000
4000000
5000000
6000000
2005 2020
thousand units
PAO NAM WEU EEU FSU LAM SSA MEA CPA SAS-PAS
Chart 1b: Regional market estimates, domestic lighting
239
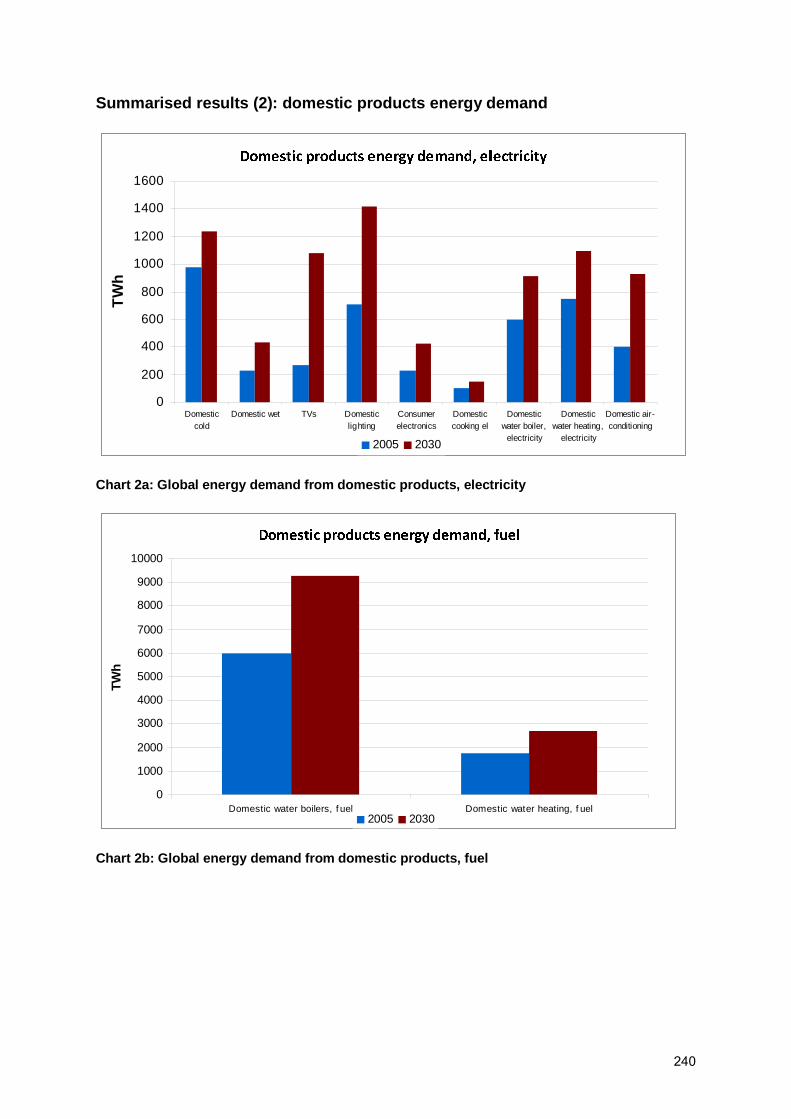
Summarised results (2): domestic products energy demand
Domestic products energy demand, electricity
0
200
400
600
800
1000
1200
1400
1600
Domesticcold
Domestic wet TVs Domesticlighting
Consumerelectronics
Domesticcooking el
Domesticwater boiler,
electricity
Domesticwater heating,
electricity
Domestic air-conditioning
TW
h
2005 2030
Chart 2a: Global energy demand from domestic products, electricity
Domestic products energy demand, fuel
0
1000
2000
3000
4000
5000
6000
7000
8000
9000
10000
Domestic water boilers, f uel Domestic water heating, f uel
TWh
2005 2030
Chart 2b: Global energy demand from domestic products, fuel
240
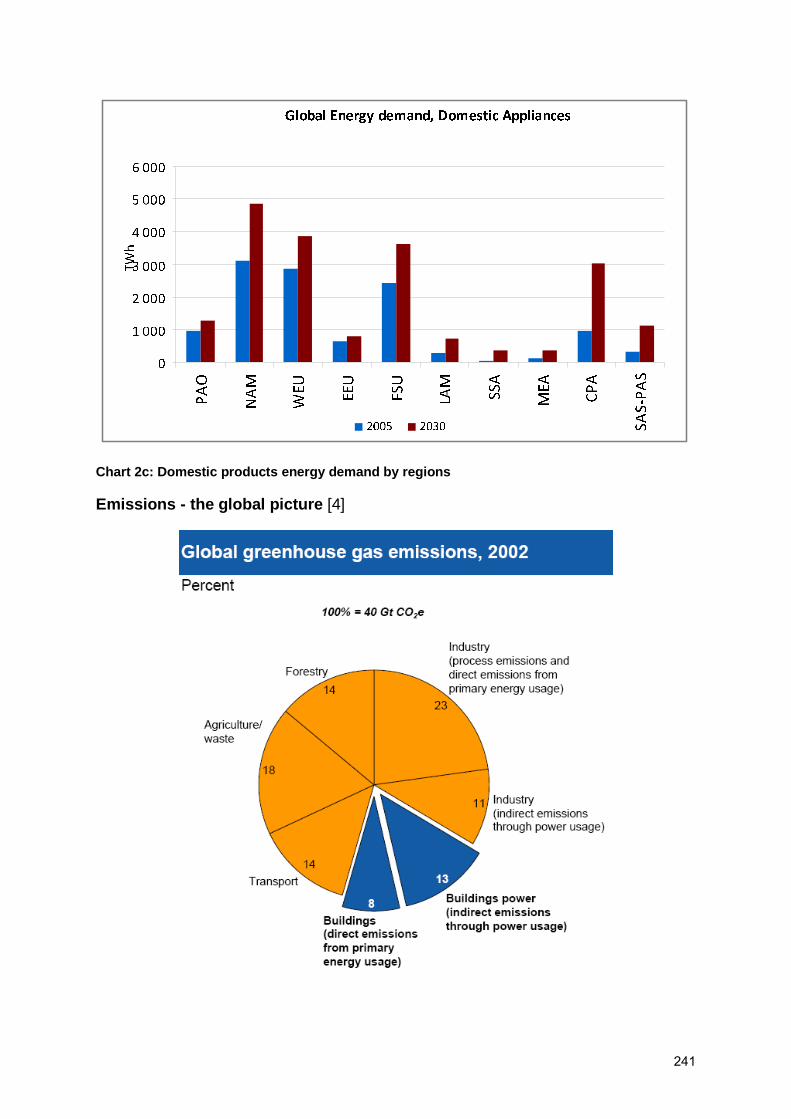
Global Energy demand, Domestic Appliances
0
1 000
2 000
3 000
4 000
5 000
6 000
PAO
NAM
WEU
EEU
FSU
LAM
SSA
MEA
CPA
SAS-PAS
TWh
2005 2030
Chart 2c: Domestic products energy demand by regions
Emissions - the global picture [4]
241
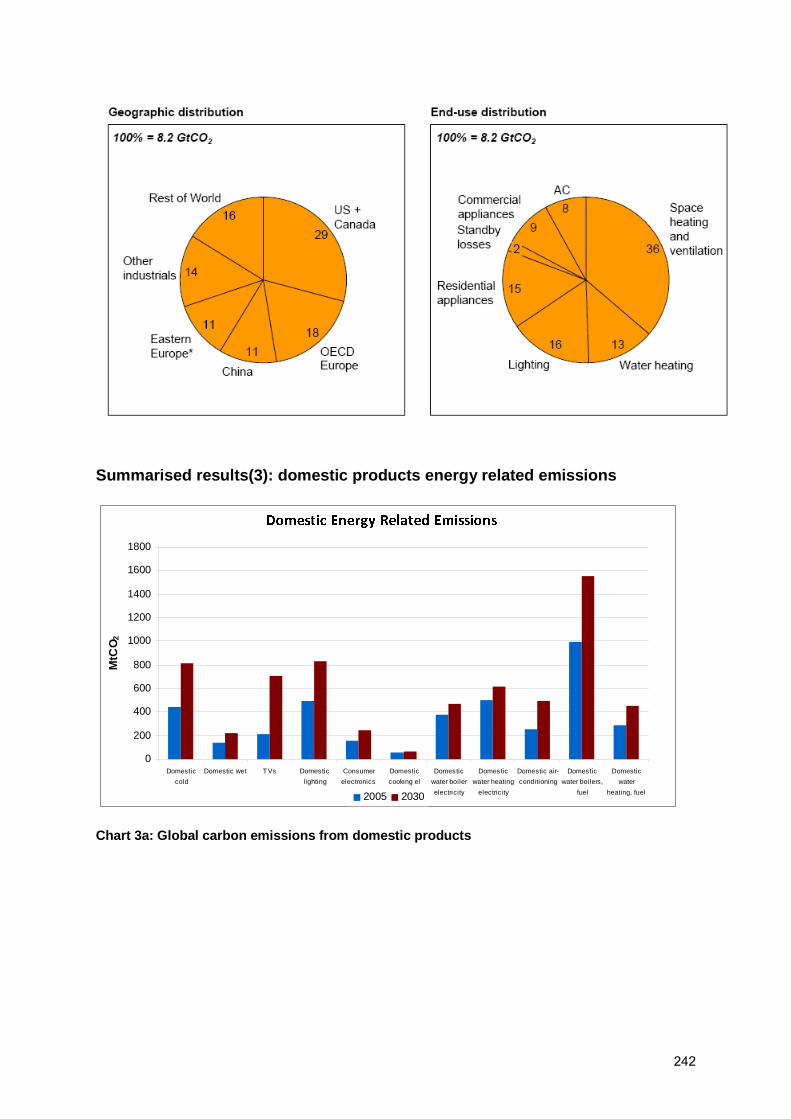
Summarised results(3): domestic products energy related emissions
Domestic Energy Related Emissions
0
200
400
600
800
1000
1200
1400
1600
1800
Domestic
cold
Domestic wet TVs Domestic
lighting
Consumer
electronics
Domestic
cooking el
Domestic
water boiler
electricity
Domestic
water heating
electricity
Domestic air-
conditioning
Domestic
water boilers,
fuel
Domestic
water
heating, fuel
MtC
O2
2005 2030
Chart 3a: Global carbon emissions from domestic products
242
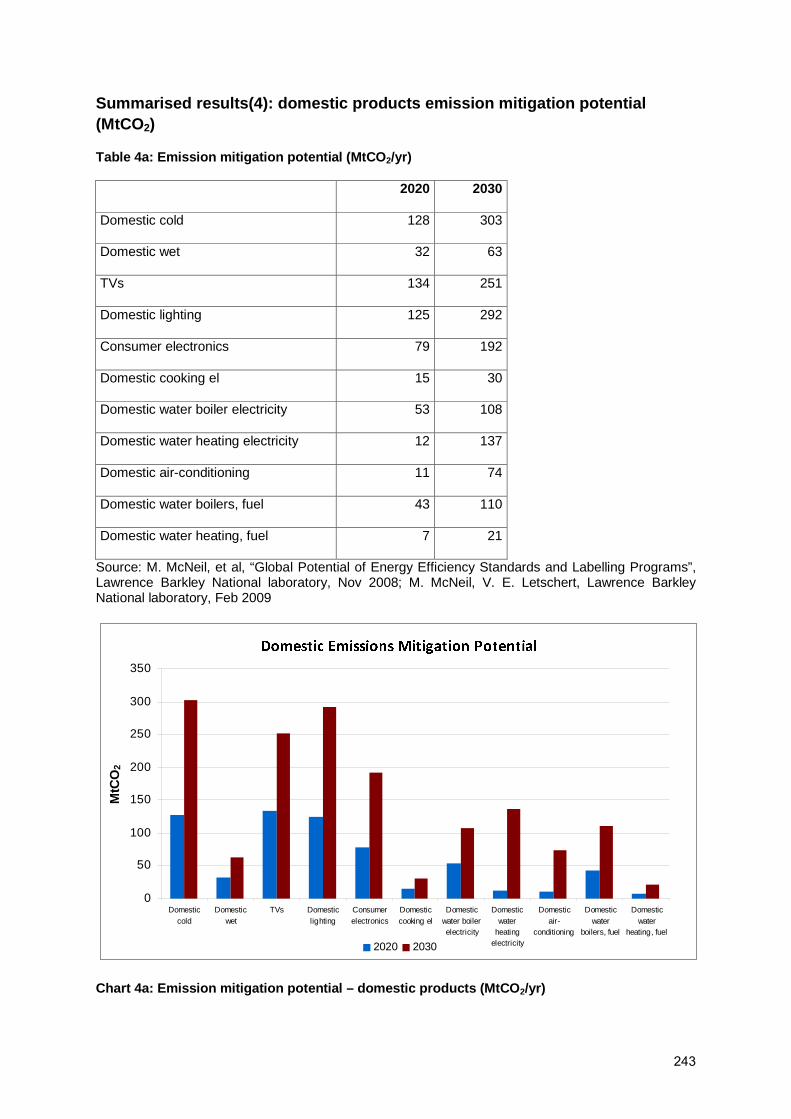
Summarised results(4): domestic products emission mitigation potential (MtCO2)
Table 4a: Emission mitigation potential (MtCO2/yr)
2020 2030
Domestic cold 128 303
Domestic wet 32 63
TVs 134 251
Domestic lighting 125 292
Consumer electronics 79 192
Domestic cooking el 15 30
Domestic water boiler electricity 53 108
Domestic water heating electricity 12 137
Domestic air-conditioning 11 74
Domestic water boilers, fuel 43 110
Domestic water heating, fuel 7 21
Source: M. McNeil, et al, “Global Potential of Energy Efficiency Standards and Labelling Programs”, Lawrence Barkley National laboratory, Nov 2008; M. McNeil, V. E. Letschert, Lawrence Barkley National laboratory, Feb 2009
Domestic Emissions Mitigation Potential
0
50
100
150
200
250
300
350
Domesticcold
Domesticwet
TVs Domesticlighting
Consumerelectronics
Domesticcooking el
Domesticwater boilerelectricity
Domesticwater
heatingelectricity
Domesticair-
conditioning
Domesticwater
boilers, fuel
Domesticwater
heating, fuel
MtC
O2
2020 2030
Chart 4a: Emission mitigation potential – domestic products (MtCO2/yr)
243
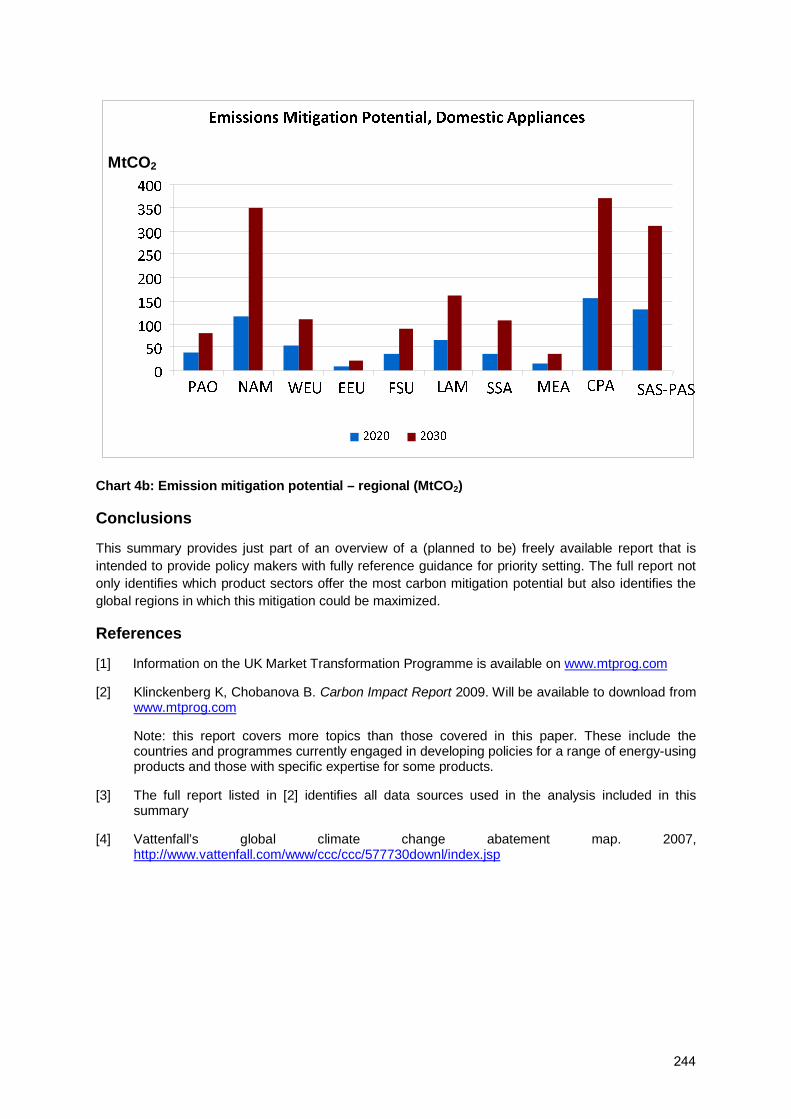
Chart 4b: Emission mitigation potential – regional (MtCO2)
Conclusions
This summary provides just part of an overview of a (planned to be) freely available report that is intended to provide policy makers with fully reference guidance for priority setting. The full report not only identifies which product sectors offer the most carbon mitigation potential but also identifies the global regions in which this mitigation could be maximized.
References
[1] Information on the UK Market Transformation Programme is available on www.mtprog.com
[2] Klinckenberg K, Chobanova B. Carbon Impact Report 2009. Will be available to download from www.mtprog.com
Note: this report covers more topics than those covered in this paper. These include the countries and programmes currently engaged in developing policies for a range of energy-using products and those with specific expertise for some products.
[3] The full report listed in [2] identifies all data sources used in the analysis included in this summary
[4] Vattenfall’s global climate change abatement map. 2007, http://www.vattenfall.com/www/ccc/ccc/577730downl/index.jsp
Emissions Mitigation Potential, Domestic Appliances
0
50
100
150
200
250
300
350
400
PAO NAM WEU EEU FSU
LAM SSA
MEA
CPA SAS-PAS
MtCO2
2020 2030
244
Assessment of Supplier Obligations and White Certificate Schemes in Improving Residential Energy Efficiency
Paolo Bertoldi, Silvia Rezessy
European Commission Joint Research Centre, Institute for Energy
Abstract
A number of European Union Member States have introduced market-based policy portfolios that build on suppliers' obligations to foster energy efficiency improvements. These portfolios are usually based on quantified energy savings obligations imposed on energy distributors or suppliers, eventually coupled with certification of project-based energy savings (via white certificates), and the possibility to trade the certificates or the obligation. The paper provides an up-to-date review of white certificate schemes in the EU, and analysis of the results achieved so far in the residential sector. The paper discusses major design and operational features of existing white certificate portfolios, such as eligible projects, technologies and obliged parties, institutional structure and processes and energy saving evaluation methods. The paper shows that while these schemes are conceptually similar, the implementation shows some marked design differences, which have resulted in the promotion of different technologies. The role of supplier obligations and white certificate schemes in promoting residential energy efficiency is discussed. Based on the results to date in the three major schemes in the EU, supplier obligations seem to deliver larger and cheaper savings than originally expected. Trading of white certificates seem better suited for broader systems with more comprehensive coverage, where energy service companies or other project aggregators can participate on the market. While supplier obligations do deliver results in the residential sector, trading does not appear to be necessary in the case of a narrow scheme that only covers the residential sector.
Introduction
A number of policy and legislative actions aimed at improving end-use energy efficiency have been introduced since the oil crises in the 70s. Among the many policy instruments introduced in the European Union to support energy efficiency, the UK, Italy, France, Denmark and the Flemish region of Belgium have introduced obligations on some categories of energy market operators (in particular electricity and gas distributors or suppliers) to deliver a certain amount of energy savings1. These obligations – referred to as utility or supplier obligations, or energy efficiency resource standards – include an energy saving target, which can be defined in absolute terms based on market shares, for example, or as a percentage of annual sales2. Introducing tradable certificates for energy savings (referred to as white certificates) is an additional policy option related to the implementation of supplier obligations. The savings related to the implementation of energy efficiency projects are verified by an independent party (either ex-ante or ex-post) and certified by means of white certificates In the EU, Italy and France are the only countries where the policy portfolio includes energy savings obligations in combination with tradable white certificates. In the UK and Denmark savings can be traded without formal certification.
1 Other European countries, such as the Netherlands and most recently Poland, Bulgaria and Romania, have expressed interest in introducing white certificates schemes. As of 2009 almost half of the states in the USA have some kind of energy efficiency or energy savings obligations, either as a stand-alone target (referred to as energy efficiency resource standards, EERSs) or as part of renewable energy obligations (referred to as renewable portfolio standards, RPSs). 2 In the US obligations have been expressed as a percentage of demand, peak demand, load growth or retail sales.
245

Five key elements are to be considered in the definition of such a portfolio: (a) Establishing energy saving obligation on some category of market actors; (b) Tradable instrument (certificate) and rules for trading; (c) Technical processes to support the scheme and the market (e.g. measurement and verification); (d) Cost recovery mechanism in some cases, and (e) Enforcement mechanisms and sanctions. The role of trading is debated later in the paper: trading could make the scheme more cost-effective, but not without additional costs for both the administrator and obliged parties. The paper introduces briefly the fundamental design concepts of a white certificate policy portfolio and brings concrete examples about the implementation choices in Europe. The paper is organized as follows. Following the introduction, Section 2 discusses the establishment of energy saving obligations, obligated parties and eligible projects and brings examples from the existing supplier obligations in Europe. Section 3 presents the tradable commodity (white certificates) looking at delineation of certificates and trading rules, and bringing examples from Italy and France. Section 4 introduces an evaluation summary of the existing white certificate scheme. Section 5 concludes with a few general observations about design issues and some country-specific explanations on what has worked in different national contexts, in particular in promoting energy efficiency in the residential sector.
Creating demand: energy saving obligations
There are two options to create demand for tradable certificates for energy savings: by imposing an obligation on some category of energy market operators or by introducing some financial incentive in order to foster voluntary demand (e.g. by fixing a price per kWh saved in similar manner to a feed in tariff for renewable electricity). All existing European schemes rely on mandatory energy saving targets imposed on energy distributors or suppliers.
Size and unit of the obligation
Usually the size of the total energy saving obligation is linked to a national target defined by the government and introduced in legislation. The target can be defined e.g. in relation to the economic savings potential in the sector(s) covered by the scheme or of actual or predicted consumption. The reference point and year for setting the target are crucial. Energy savings may embody different commodities, such as primary energy, final energy or CO2 content of energy saved. Some Member States have expressed the obligations in primary energy (Italy and Flanders region in Belgium) and some have expressed them in final energy (Denmark and France). The target under new phase of supplier obligation in the UK (CERT) is expressed in CO2; previously it was expressed in final energy, fuel standardised to take into consideration the carbon content of fuels saved. The definition of compliance period (temporal content of the target) and possibly rate of increase are important from the point of view of providing security for investors. Some Member States have fixed multi-annual targets and compliance is to be demonstrated at the end of the period (UK and France), while others have annual targets and annual compliance (Denmark, Italy and Flanders). Denmark, Flanders and Italy require annual compliance. To ensure policy stability annual targets are established in the framework of multi-annual period. In the case of multi-annual targets obligations periods last 3 years on average. While ensuring a certain degree of stability, this relatively short period allows adjustments of the targets or the operational modalities of the scheme. In practice the difference between annual and multi-annual targets is not that substantial where annual targets are combined with long validity of certificates (e.g. over the entire period under which the obligation is valid), as in Italy.
246
Obligated parties and energy vectors
Defining who the obligated actors should be and how the overall target should be apportioned to individual actors is an important step in the delineation of the scheme. Some Member States have chosen to impose the obligation on suppliers (retail companies) and some on distributors (grid owners). The former have strong links to the final consumer and motivation to market value-added services and the obligations seek to transform their business model away from pure commodity sales and towards energy service sale. The latter are more stable regulated companies, which are regional monopolies. With proper tariff regulation, distributors do not have the strong push towards 'more kWh', as is in the case of retailers (suppliers). To show compliance with the obligation market actors may choose to implement energy efficiency projects directly or via daughter companies or to purchase certificates from third parties. An important issue is to have a significantly large share of final energy consumption covered by the subjects under obligation, while retaining a manageable number of obligated parties by possibly excluding very small market actors for whom the saving obligation may pose a big burden. Some Member States only cover energy providers of certain size of grid-bound energies (UK, Italy and Flanders: either electricity only or both electricity and gas) or also other energy providers (e.g. heating, cooling, LPG, as in France and Denmark). In principle the individual targets can be expressed as a sales percentage or as an absolute value, i.e. independently of the commercial choices of suppliers (Oikonomou, Rietbergen and Patel 2007). In a comparison of the distributional effects from alternative apportionment rules Quiron finds that setting energy saving targets as a percentage of the energy that distributors or suppliers sell and contingent upon the evolution of market shares is more acceptable than setting absolute targets (Quirion 2005). In the latter case under assumptions of perfect competition and no public intervention in the energy market, energy suppliers’ profit decreases since suppliers cannot pass the cost of certificate generation on to consumers. Target apportionment among obliged parties can be based on market share or number of consumers (linear or increasing for larger obliged parties).
Eligible projects: technologies, actors, customer base
The scope of the scheme is defined as the end-use sectors covered (residential, commercial and industry), the types of projects and/or technologies eligible under the scheme and the modalities under which projects will be allowed (e.g. lifetimes). The regulator can decide to leave the scheme completely open to any technology, form of energy or end-use sector, or to limit it with respect to technologies (e.g. establishing a list of eligible project types), end-use sectors or energies (e.g. only grid-bound ones). The economic textbook argument is to not limit eligibility because this could lead to higher costs of compliance than if the market forces were left to determine the least-cost path to the environmental or social objective. In addition, theoretically the wider the scope in terms of types of projects/investment choices and the fewer limitations in terms of compliance routes, the more diverse marginal costs of compliance become and the greater the benefits of trading in terms of lowering the overall cost of compliance. There are some practical arguments against a comprehensive scheme that is completely open in terms of technologies and sectors. A purely operational consideration against extensive scope is that inclusion of all project types and all sectors may result in difficult and expensive validation and monitoring of savings and a huge amount of work for regulators to design monitoring and verification methodologies. Because cost minimization is an inherent feature of markets, a completely open scheme may focus compliance on large-scale projects, or on projects where savings are easy to monitor. Economies of scale and straightforward monitoring are likely to bring a reduction in transaction costs of certification. Such a trend however may leave out certain hard-to-reach sectors, such as residential buildings, and also create cross subsidies if the cost recovery mechanisms are paid only by the residential clients.
247
Defining the energy saving obligation, the obliged parties, target apportionment and project eligibility: examples from European practice
Defining the obligation. In Italy the energy saving targets are expressed in primary energy (toe) and were previously imposed on electricity and gas grid distribution companies with more than 100,000 customers as of the end of 2001 and set on an annual basis for the period 2005-2009; in 2008 the threshold was reduced to 50,000 customers in year t-2. This resulted in an increase of the number of obliged electricity distributors to 14 in 2008 (up from 10) and of gas distributors to 61 (up from 20). Current targets are just for savings achieved each year (annual savings) and do not include expected savings in the future. The mechanism is planned to deliver energy savings equivalent to 6 Mtoe (251 PJ) in 2012 (Pavan 2009). The Energy Efficiency Commitment (EEC) in the UK runs in 3-year cycles from 2002 to 2011. The EEC-1 program (2002-2005) required that all gas and electricity suppliers with 15,000 or more residential customers deliver a certain quantity of ‘fuel standardized energy benefits’ by assisting residential customers to take energy-efficiency measures in their homes. The overall savings target was 62 fuel standardized TWh3 and the total delivered savings reached 86.8 TWh. In EEC-2 (2005-2008) the threshold for being subject to an energy saving obligation was increased to 50,000 domestic customers and the target was fixed at 130 TWh. Due to carrying over of savings from EEC-1, already in 2005 more than a quarter of this target was achieved. In addition, while there appears to have been a roughly double increase of the target between EEC-1 and EEC-2, due to changes in the way the savings have been calculated (discount factors), it is difficult to put a precise figure on the increase. The total delivered savings in EEC-2 reached 192 TWh (lifetime discounted savings and excluding comfort) (Lees 2008). The third phase of EEC, which runs from April 2008 till March 2011 has been re-named Carbon Emission Reduction Target (CERT) and has a target of 154 MtCO2 lifetime savings in 2011. In the French system saving obligations are set for energy suppliers delivering electricity, gas, domestic fuel (not for transport), cooling and heating for stationary applications for the period 2006-2009. A threshold for the imposition of a savings target is set at 0.4 TWh/year except for LPG where it is 0,1 TWh cumac/year and domestic fuel where there is no threshold. Obliged actors have received targets based on their physical sale quantities in the residential and commercial sectors. Annual adjustments of the individual obligations are made to take into account variations in the market. The system excludes plants under the EU ETS Directive and fuel substitution between fossil fuels. The total target for the first three years is 54 TWh (in final energy, i.e. 197 PJ) cumulated over the life of the energy efficiency actions with a 4 % discount rate. In Denmark electricity and gas distributors (grid companies), as well as heat distributors are subject to annual energy saving targets in the period 2006-2013. The targets are expressed in final energy and only first year savings from projects are taken into consideration. The total annual obligation is 2.95 PJ (as of 2010 the target will be 5.4 PJ/y). Energy efficiency obligations without certificate trading are also in place in the Flemish region of Belgium, whereby regional utility obligations have been imposed on 16 electricity distributors. The annual target is 0.58 TWh and eligible actions refer to residential and non energy intensive industry and service and can involve saving fuel from any sources. Separate targets are set for low voltage and high voltage clients: 10.5% of electricity supplied over the 6 years from 2003 to 2008 in the case of low voltage clients and 1% per annum for high voltage users (Collys 2005). The Flemish obligation has no trading option of any type (certificates or – as is the case of the EEC – obligations).
Target apportionment. In Italy each year national targets are apportioned among electricity and gas distributors on the basis of the quantity of electricity and gas distributed to final customers compared to
3 Energy savings are discounted over the lifetime of the measure and then standardized according to the carbon content of the fuel saved. These coefficients are set as: coal (0.56), electricity (0.80), gas (0.35), LPG (0.43) and oil (0.46)
248
the national total in year t-2, linear to the market share. Prior to the legislative changes in 2008, 22 % of the total obligation in Italy was been distributed, which corresponded to the volume of small suppliers (below 100,000 customers, in accordance with the initial rule in place). In the UK target apportionment is based on number of domestic customers; in EEC-1 the obligation was tighter for companies with increasing size, but this feature of the system was removed in EEC-2. In the French system the distribution of obligations is based on market shares of energy sales turnover in the residential and tertiary sectors; EDF accounts for approximately 55 % of the obligation and GDF SUEZ for 26 %. The apportionment of the total annual target is done on annual basis to take into account new market players.
Eligible projects. Energy efficiency projects in all end-use sectors are eligible for certification in Italy, along with some supply options (such as CHP and solar). Initially at least half of the target had to be achieved by reduction of the supplied energy sector (a.k.a. the “50 % constraint”) (Pavan 2002), but this feature was removed in 2008 to increase competition (Pavan 2009). There is an illustrative list of eligible projects. Energy savings projects contribute to the achievement of targets for up to 5 years (up to 8 years in some cases). In the UK only energy saving activities concerning domestic users are eligible. In EEC-1 and EEC-2 at least 50% of the energy savings must be targeted at customers that receive income related benefits or tax credits (so-called priority group) as this condition contributes to the governmental objective of fuel poverty eradication. This share has been reduced to 40% in CERT. Projects can be related to electricity, gas, coal, oil and LPG. Suppliers can achieve improvements in relation to any domestic consumers in Great Britain. Suppliers can receive 50% uplift on the savings of energy efficiency measures that are promoted through energy service activities. This uplift is limited to 10% of the overall activity. Apart from plants under the EU European Emission Trading Scheme (ETS) Directive and fuel substitution between fossil fuels, no other restrictions on compliance are foreseen in the French scheme. Any economic actor can implement projects and get savings certified, as long as savings are above 3 GWh over the lifetime of a project, although it is possible to pool savings from similar actions to reach the threshold. Actions must be additional relative to their usual activity. All energies (including fuel) and all the sectors (including transportation and excluding installations covered by the ETS) are eligible. Certification of projects implemented by organizations, which do not have a saving obligation is allowed but only after considering the impact of the project on business turnover. If an impact on business turnover is identified, then certification of savings is allowed only for innovative products and services4. In Denmark all end-use sectors apart from transport are allowed, while in Flanders residential, non-energy intensive industry and service sectors are allowed.
White certificates – the tradable commodity
It is important to distinguish between certification of energy savings and trading of white
certificates. Trading is not a precondition for certification: in itself a certificate is an instrument that provides a guarantee that savings have been achieved due to a specific project. A certificate can be used as an accounting tool to verify compliance with energy saving targets or with other obligations, or to qualify for e.g. state support (subsidies) or preferential taxation.
Certificate delineation. A white certificate is an instrument issued by an authority or an authorised body providing a guarantee that a certain amount of energy savings has been achieved under certain conditions. Each certificate is a unique and traceable commodity that carries a property right over a
4 An innovative product in this context means that its efficiency is at least 20 % higher compared to standard equipment and its market share is below 5 %.
249

certain amount of savings and guarantees that the benefit of these savings has not been accounted for elsewhere. The size and validity of a certificate have important implications for the number of parties that can offer certificates for sale (unless other restrictions apply). A long certificate validity and possibility to bank certificates for future use increase the elasticity and flexibility of demand in the long term, but may discourage trade in the ongoing period. Minimum project size may be applied for certification of savings in order to reduce transaction costs and encourage pooling of projects (Pavan 2002); on the other hand only allowing large amounts of savings to be certified may discourage some project developers from having their project results certified, unless it is possible to pool savings from different projects for the sake of certification. Minimum project size thresholds may discourage residential projects, which tend to be of small size, unless there is a straightforward possibility to aggregate project savings. To mitigate the uncertainties about the achievement of the quantified policy target within the pre-specified timeframe, banking of certificates for future use may be allowed once obligated parties achieve their present targets. The validity and any associated inter-temporal flexibility of certificates (rules governing banking and borrowing), the rules for ownership transfer, the length of the compliance period and expectations of market actors about policy stability and continuity will all influence the market for white certificates. In France and the UK compliance is demonstrated at the end of a multi-annual period. In Italy and Denmark the obliged parties have to demonstrate compliance annually, but savings can be banked for future use. In the Flemish region of Belgium distributors have to demonstrate compliance annually. Italian certificates are denominated in primary energy (1 toe) and are valid for the entire period of the mechanism, recently extended to 2012. Depending on the measurement and verification approach adopted (see explanation of approaches later), the following thresholds apply on projects that can be certified: for “default approach” 25 toe/year, independent from the type of project proposer; for “engineering approach” certificates 100 toe/year for obliged actors and 50 toe/year for non-obliged actors; and for energy monitoring plan 200 toe/year for obliged actors and 100 toe/year for non-obliged actors. In France certificates are denominated in final energy, expressed in kWh cumulated over the life time and discounted (so-called kWh cumac). Certification application is allowed above a threshold of 1 GWh of savings over the lifetime of a project (Baudry and Monjon 2005); smaller projects can be grouped together to reach the threshold for applying for certification, i.e. the threshold is per application for certification and not per project. The certificates are delivered after the programs are implemented but before energy savings are realized. The frequency of certification is another important point: savings may be certified at regular intervals – e.g. annually – or for the entire lifetime of the measure. In Italy certification is ex-post and annual on the basis of savings occurring. In Denmark only first year savings count (even though there is no formal certification). All other schemes rely on ex-ante verification of the savings for the entire lifetime of the measures. Another issue related to certification is attribution of initial property right: the initial property right owner of a white certificate could be the party planning and executing the energy efficiency measure (e.g. a supplier or an ESCO), the party financing it (e.g. a bank or an ESCO), or the party on whose premises the energy efficiency measure is implemented (e.g. a building owner). For efficiency projects with long lifetimes (e.g. building refurbishment), the ownership issue can affect the way in which the market will work.
Rules for certificate trading. Rules defining trading parties are important for market liquidity: certificate trading requires infrastructure to minimise transaction costs, consisting of well-functioning market places, registries and low administrative requirements to do trades (waide and Buchner 2008). Provided that administrative and monitoring costs are not disproportionate, as many parties should be allowed to trade in the scheme as possible, since this enhances the prospects of diversity in marginal abatement costs and lowers the risk of excessive market power. A key benefit of allowing many parties in the scheme is
250

that new entrants may have the incentive to innovate and deliver energy efficiency solutions, which have a lower marginal cost. There are different trading options: horizontal trading between obliged parties (possible in Italy and France with certificate trade and in the UK and Denmark with obligation or project trade), vertical trading whereby obliged parties purchase certified savings or projects from third parties (possible in Italy, France, the UK and Denmark), and temporal trading, most notably banking, whereby in case of over-compliance participant carry over part of their savings to the next compliance period (possible in Italy, UK, France, Denmark and Flanders). Apart from these dimensions, trading can occur on a spot market or bilaterally (over-the-counter). To date different systems in the European Union show markedly different degree and patterns of trading. Italy has seen buoyant trading (mostly bilateral, but increasing share of spot market). In Italy banking is possible from the perspective that targets and target compliance are annual, while certificates are valid till 2012. In Italy certificates are issued by the electricity market operator upon request of the regulator AEEG to all distributors and their controlled companies, to energy service providers and ESCOs, and – since 2008 – to large end-users (companies with an energy manager). Certificates are tradable via bilateral contracts or – since March 2006 – on a spot market organized and administered by the electricity market operator. As of 2009 Italy has seen buoyant trading (mostly bilateral, but increasing share of spot market) – more than 75% of the certificates went to non-obliged parties (ESCOs). As of 1 June 2008, approximately 35% of all transactions took place on the spot market. In Italy banking is possible from the perspective that targets and target compliance are annual, while certificates are valid till 2012. In France any economic actor can undertake savings actions and apply for certificates as long as the savings are at least 1 GWh over the lifetime of a measure. There is no formal market organized by the national administration, therefore there are only OTC trades between obligated entities, and between project implementers and obligated entities. There is a registry with information on white certificates (www.emmy.fr). There is limited trading in France as suppliers prefer to implement the projects themselves through agreement with equipment suppliers and installers, this is to position them selves vis-à-vis their clients as suppliers of energy services. In the UK only energy suppliers may have schemes accredited by the regulator and trading is legally limited to transfer of obligations (or the delivery of these obligations) between suppliers, i.e. horizontal trading. It is believed that there have been bilateral trades between suppliers, as well as sales of insulation measures to suppliers from the managing agent for Government funded programmes (Eyre et al 2009). In the UK horizontal trades can only occur once own targets are met and with the agreement of the regulator. This, along with the limited scope of the supplier obligation in the UK and the fact that most suppliers use the same contractors to undertake the work, greatly undermine incentives for horizontal trading. The absence of large cost differences does not justify horizontal trading. Banking (temporal trading) has been common since it was allowed in 2002. Obliged parties banked 28% of EEC-2 target from EEC-1 and 25% of the original CERT target from EEC-25. In France trading is still uncommon and as of January 2009 accounted for only 4% of all certificates attributed. Out of the 147 certificate holders in the official registry, only 37 are eligible parties (without obligations). As in Italy, banking provisions apply in the sense that certificates are valid for three compliance periods, which could amount to 3 compliance periods, or a minimum of 5 years, with possible banking between periods.
5 The carry forward from EEC-1 to EEC-2 was also shaped by the change in discount rate from 6% to 3.5% (see below), which considerably increase the lifetime saving of the longer lived measures such as insulation proportionately more than shorter lifetime products such as appliances. Almost all measures carried forward were insulation measures (Lees 2009).
251
Mitigating certificate price volatility. Pre-defined non-compliance penalties, minimum or maximum buy-out prices and certificate reserves attained by the regulator are tools to mitigate price volatilities. Recycling the revenue collected from penalties to obligated parties that exceed their obligations enforces the effect of a penalty by increasing the opportunity costs of non-compliance. In compliance markets the maximum cost of compliance or price of certificates can be effectively capped by means of a non-compliance penalty. France and Flanders set pre-defined penalties, respectively 2 Eurocents/kWh and 1 Eurocent/kWh. Italy and the UK require case-by-case assessment of non-compliance. In the UK, the stated policy is that any financial penalty should exceed the cost of delivery. In Italy, a one-year grace period exists if at least 60% of the annual target is met; if not, the financial penalty does not cancel the obligation. The choice to not set a penalty has been made to avoid setting of a 'buyout price', which is likely to influence the price of certificates (Eyre et al 2009). In the UK the regulator OFGEM has the power to consider whether it is appropriate to set a penalty for non-compliance. However, there is no specific guidance on how this penalty would be calculated other than the indication that suppliers that do not meet their individual target may face a penalty fee that can be up to 10% of supplier’s turnover.
Processes to support the scheme
Baseline setting to measure the impact of projects and choice of verification system, discounting of savings from measures and cost recovery deserve special attention for their fundamental role in TWC schemes. To determine the energy savings resulting from an energy efficiency activity, the eventual energy consumption has to be compared to a baseline – a counterfactual reference scenario without additional savings efforts. The choice of the reference scenario – in terms of reference consumption and conditions – raises some challenges related to determining the relevant system boundary, minimizing the risk of producing leakage, the practicality and cost-effectiveness of a baseline methodology, and treating no-regret measures in the baseline determination. Additionality refers to certification of genuine and durable increases in the level of energy efficiency beyond what would have occurred in the absence of the energy efficiency intervention, for instance only due to technical and market development trends and policies in place. In the UK, the Department for Environment, Food and Rural Affairs (DEFRA) requires suppliers to demonstrate additionality in each of the schemes they carry out. In Italy savings have to go over and above spontaneous market trends and/or legislative requirements (Pavan 2004; Pavan 2005). For projects that are based on the deemed savings and engineering verification approach (see explanation in the next section) there is a case-by-case additionality check performed by the regulator.
Verification approaches. Energy savings can be determined by estimating energy consumption or by metering consumption before and comparing it to the consumption after the implementation of one or more energy efficiency improvement measures and adjusting for external factors such as occupancy levels, level of production etc. Possible verification approaches are metering or standard savings (also referred to as deemed savings or default savings values). The former implies metering real energy consumption and calculating savings (e.g. with climate or weather corrections) based on consumption before and after the energy-efficiency improvement is carried out. The latter implies standard formulas for energy-efficiency measures (e.g. a given number of CFLs installed in the residential sector is equivalent to a given quantity of kWh saved). There can be various combinations of the above, such as sampling of metering. In principle the metering approach is a more accurate guarantee of energy saved than the deemed savings (which cannot verify details such as location and operating hours of installed CFLs), but in practice it can be difficult to identify the actual saving (e.g. in households there is only one meter for all electricity usage: impact of increase in number of appliances, fluctuations with changing household numbers, lifestyle, weather etc.). It may result in high monitoring costs for projects of smaller size.
252

The Italian TWC scheme uses three verification approaches: a deemed savings approach with default factors for free riding, delivery mechanism and persistence; an engineering approach; and a third approach based on monitoring plans whereby energy savings are quantified via a comparison of measured or calculated consumptions before and after the project, taking into account changed framework conditions (e.g. climatic conditions, occupancy levels, production levels). All monitoring plans must be submitted for pre-approval to the regulatory authority AEEG and must conform with pre-determined criteria (e.g. sample size, criteria to choose the measurement technology, etc. see (Pavan 2004; Pavan 2005). The deemed savings approach does not require in-field measurement – it involves 22 technical sheets developed by the regulator AEEG. Deemed savings apply to technologies for which energy savings are well known and do not exceed 25 toe per year; default factors for free riding, delivery mechanism and persistence have been introduced. Examples of measures that are certified using this approach include CFL, m2 insulated wall, small PV applications and high efficiency boilers. 85% of the certified saving up to May 2008 were based on deemed savings, 5% were based on the engineering approach and only 10% were based on monitoring. There is ex-post verification and certification of actual energy savings achieved on a yearly basis. The engineering approach implies some on-field measurement and applies to measures for which energy savings are known but they may differ depending on a number of restricted factors (e.g. number of working hours). This approach applies to measures that yield up to 50 toe per year (for ESCOs and small distributors) and 100 toe per year for large distributors, respectively. Finally, the metered baseline method applies to measures for which energy savings need to be addressed in a case-by-case basis. It entails direct measurement of energy use, pre-approval of proposed baselines and methodologies. This approach applies to measures that yield up to 100 toe per year (for ESCOs and small distributors) and 200 toe per year for large distributors in savings respectively (Mundaca and Neji 2007). In the UK the savings of a project are calculated and set based on a standardized estimate (deemed savings) taking into consideration the technology used, weighted for fuel type and discounted over the lifetime of the measure. There is limited ex-post verification of the energy savings carried out by the Government in order to inform the design of standardized estimates in future periods. In general the regulator requires that 5% of all measures must be monitored for quality of installation using a standardised questionnaire. 1% of the measures funded by obliged parties must be monitored for customer satisfaction and some do-it-yourself measures must be monitored for customer utilisation using a statistically significant samples of the beneficiaries (Togeby et al. 2007). In France a list of standardized actions with the saving evaluation method has been published in June 2006 and completed a few times since. As of April 2009, the standardized actions introduced include 60 in the residential sector, 83 in the commercial sector, 22 in the industrial sector, and 15 in other systems. In France there is differentiation of energy saving according to geographical region due to large variation of climatic zones (similar development is also seen within the Italian scheme). The French scheme has introduced deemed savings also for four measures in the transport sector: bus driver training, energy efficient tires, vehicles running on cleaner fuels and recuperation on braking (Mundaca and Neji 2007). In Flanders the distribution system operators have to submit to the Flemish Energy Agency a description of all actions to be carried out to meet the target, presenting the method for calculating the primary savings of the action. The actions cannot be started before the agency approves the calculation methods, the amount of the financial contribution and the conditions attached to the grant. In Denmark energy savings can be calculated as a specific engineering calculation or based on standard values. Unlike in the other national schemes, in Denmark most savings come from projects where specific engineering calculations were used.
253

Discount factors. In the case of multiannual targets, it is often debated whether energy savings should be discounted over time. The role of the discount factors can be seen as accounting for the ‘deterioration’ of a measure over its lifetime and actualising annual savings for different measures with different life spans. The key question is whether discounting is done for economic or environmental reasons (Lees 2007). In the EEC-1 and EEC-2 in the UK and in France there were/are discount factors for accounting the annual savings of different measures with different life spans. In France the discount factor is 4 %. In the UK the discount rate was decreased from 6 % in EEC-1 to 3.5 % in EEC-2 and eliminated altogether in the CERT. Changing the discount rate ‘increases’ savings coming from projects thus decreasing the size of the target: the same goal with a lower discount factor is a lower and easier-to-reach goal in practice: for the case of the UK from 62 TWh to 81 TWh fuel standardized lifetime-discounted savings; the reduction of discount rates has favored the measures with longer life cycle. Cost recovery. Cost recovery is a process whereby an energy distributor is able to recover, through rates, the costs of implementing any type of energy saving action beyond the consumers’ meter. Under the assumption of perfect competition all customers will bear the same specific burden of the costs incurred for savings project implementation by energy suppliers. In practice suppliers may shift the burden to less competitive market segments. In Italy cost recovery of 100 Euro/toe is allowed for each certificate delivered by the distributor as long as the distributor total saving target for the year under consideration has not been achieved. Cost recovery is also allowed when the intervention concerns measures on the customer base of another distributor or measures that save energy on an energy carrier different from the one of the distributor. The cost recovery is net of any contribution from other sources and is administered by a fraction of electricity and gas network tariffs going to a fund disbursed by the regulator in such a way that each obliged actor can receive 3 Eurocent/kWh saved. Prior to 2008 cost recovery was only allowed for electricity and gas savings, which largely biased actions towards savings in electricity and gas, undermining primary saving projects. This feature was removed in 2008. The impact of cost recovery in the case of electricity (rate adders) has been estimated at 0.6 Euro/year for an average family (Grattieri 2007). For the first obligation period, the French scheme stipulates rises in prices and tariffs to be estimated to a maximum of 0.5 %. In Flanders the savings obligation is incorporated in the electricity tariffs as a public service obligation. Similarly, distribution companies in Denmark are allowed to recover costs associated with meeting the target.
Results of the current European schemes
Dominant end-use sectors and measures. Experience from EEC-1 in Great Britain shows that a significant share (56 %) of the 86.8 TWh of savings delivered in the period 2002-2005 came from building insulation (wall and loft). CFLs accounted for 24% of the savings achieved, followed by appliances (11 %) and heating measures, mainly condensing boilers (9 %) (Lees 2006). CFLs accounted for the largest number of projects undertaken (almost 40 million measures related to CFL installation in EEC-1), followed by almost 6 million refrigerators, freezers and washing appliances (Lees 2005). All suppliers, but two – who went into administrative receivership – achieved their targets; six suppliers exceeded their targets in EEC-1 and carried over their additional savings to EEC-2. In EEC-2 (2005-2008) over 120 millions measure were installed, although CFLs and appliances dominated in number in term of energy saving 75% were achieved with insulation measures, 8% with heating measures, 5% appliances and 12% with CFL and lighting measures, 75% of the energy savings delivered came from insulation, 12% from lighting measures, 8% from heating and 5% from appliances (Lees 2008). The heavy emphasis on insulation is driven by working with lifetime savings, which incentivises the use of long lifetime measures.
254

Energy savings accredited by the regulator AEEG in the first 3.5 years of operation of the Italian scheme come primarily from electricity savings in buildings (59%), heat demand in buildings (21 %), public lighting (8%), generation and distribution of energy in buildings (6%) and industrial energy consumption (6 %) (AEEG 2008). On the other hand in the period 1 June 2007-1 June 2008, the Italian regulator certified approximately 904 toe of energy savings. However, due to the existence of certificates issued in 2005 and 2006, but not yet redeemed, as of 1 June 2008 there were almost 1.34 million certificates in circulation, equal to 210% of the 2007 target (AEEG 2008). By the end of 2008 – half a year before the end of the compliance period – 67% of the target under the French scheme was met (Bodineau 2009). 88% of the savings achieved are from measures in the residential sector, followed by 6% in industry and 4.4% in commercial buildings. Almost two thirds of the certificates issued concern actions in residential heating. The dominant measures – efficient boilers, heat pumps, insulation and window – are eligible for tax credits too. Energy suppliers have directed their programs to take advantage of this support (Eyre et al 2009) The most typical measures in the Danish scheme are energy audits, information, subsidies and combinations of those. In the period 2006-2008 the largest amount of savings is on electricity. Natural gas savings – in absolute terms less than half the amount of electricity savings in 2006-2008 – exceed the target by almost a third. It has been observed that while oil and district heating companies, as well as natural gas companies mainly deliver savings in their own energy type, electricity companies have delivered more than half of their savings outside of electricity and have focussed on industrial consumers. District heating companies have decided to work with their own customers and their own energy carrier (Togeby et al 2009). In Flanders the most common actions include super-insulated glazing, condensing and high-efficiency boilers, roof insulation in existing buildings, thermostatic valves and solar boilers. In addition to the actions the distribution system operators are free to choose, they are also obliged to carry out two energy scans for every 100 household connections in 2007-2009. During these scans, energy saving light bulbs, water-economy shower heads, pipe insulation and radiator foil will be installed where advisable.
Dominant sectors. Among the schemes that target more than one end-use sectors, the Italian and French schemes have delivered the largest amount of energy savings in the residential sector, while the Danish obligation has focused efforts on trade and industrial sectors. The availability of deemed savings measurement methods associated with various projects implemented in the residential sector has focused the efforts of obligated parties towards these. Summary and conclusions: what has (not) worked?
This paper has described the concept, the main elements and the overarching design issues related to the establishment and practical functioning of a system with tradable certificates for energy savings. It has illustrated the functionalities of the concept by giving examples with key design and operational features of existing schemes in Europe. Even if these national implementations are conceptually similar, the exact design of their major elements brings some marked implementation differences. Table 1 summarizes the key design features of the ongoing phases of the schemes in Italy, France and the UK.
255
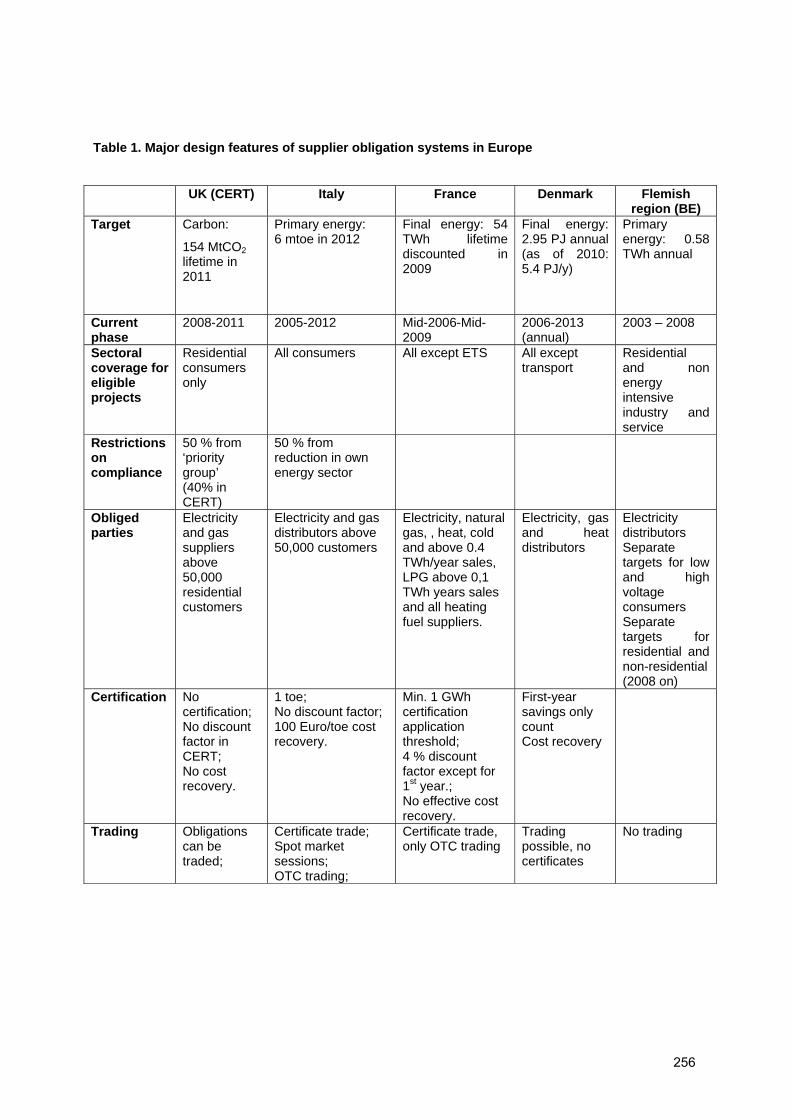
Table 1. Major design features of supplier obligation systems in Europe
UK (CERT) Italy France Denmark Flemish
region (BE) Target Carbon:
154 MtCO2 lifetime in 2011
Primary energy: 6 mtoe in 2012
Final energy: 54 TWh lifetime discounted in 2009
Final energy: 2.95 PJ annual (as of 2010: 5.4 PJ/y)
Primary energy: 0.58 TWh annual
Current phase
2008-2011 2005-2012
Mid-2006-Mid-2009
2006-2013 (annual)
2003 – 2008
Sectoral coverage for eligible projects
Residential consumers only
All consumers All except ETS All except transport
Residential and non energy intensive industry and service
Restrictions on compliance
50 % from ‘priority group’ (40% in CERT)
50 % from reduction in own energy sector
Obliged parties
Electricity and gas suppliers above 50,000 residential customers
Electricity and gas distributors above 50,000 customers
Electricity, natural gas, , heat, cold and above 0.4 TWh/year sales, LPG above 0,1 TWh years sales and all heating fuel suppliers.
Electricity, gas and heat distributors
Electricity distributors Separate targets for low and high voltage consumers Separate targets for residential and non-residential (2008 on)
Certification No certification; No discount factor in CERT; No cost recovery.
1 toe; No discount factor; 100 Euro/toe cost recovery.
Min. 1 GWh certification application threshold; 4 % discount factor except for 1st year.; No effective cost recovery.
First-year savings only count Cost recovery
Trading Obligations can be traded;
Certificate trade; Spot market sessions; OTC trading;
Certificate trade, only OTC trading
Trading possible, no certificates
No trading
256

UK (CERT) Italy France Denmark Flemish region (BE)
Penalty Penalty can be as high as 10 % of the supplier’s turnover.
Fixed by the Regulator taking into account, inter alia, the actual possibility to meet the target, the magnitude of the non-compliance, the state of affairs of the non-compliant party.
0.02 Euro/kWh cumac
Penalty exists, not fixed.
0.01 Euro/kWh
The design of supplier obligations and white certificate schemes across Europe varies considerably and their performance is heavily influenced by initial policy, market and institutional conditions and policy traditions in each national context. The three major supplier obligation and white certificate schemes in the EU – the UK, France and Italy – show that obliged parties have achieved and exceeded their obligations. In the UK and France obliged parties are moving in the direction of positioning themselves as energy efficiency providers vis-à-vis their clients. Obliged companies in the UK and France have formed partnerships with energy efficiency industries, bringing new activities to their portfolios without significantly modifying their core business of selling energy. For example, suppliers in the UK use their brand on the delivery of products via contractors. In Italy obliged companies do not have a direct contact with final energy users and obligations have been mostly delivered by energy service providers. In the medium term this cooperation may expand the scope of commonly implemented projects to the tertiary and industrial sectors once 'low-hanging fruits' are exhausted. Whether certification of energy savings and certificate trading adds value to supplier obligation depends on the design modalities: trading appears essential in a system with a wide scope (sectoral coverage, project types and non-obliged parties allowed to trade in), as in Italy where trading is an important element. On the other hand, in the UK the policy choice has been to limit the scheme to the residential sector. Since most suppliers work with a number of contractors and retailers, the implementation costs are similar, there appears to be little scope for or added value from certificate trading. In France suppliers have chosen to do projects themselves or via partnerships and the conditions for non-obliged parties to certify and trade in savings appear burdensome. The choice of primary or final energy influence the balance between savings on gas and electricity: for example in France, where the obligation is in final energy, most savings have occurred in gas. In Italy, where obligations are in primary energy, most savings have occurred in electricity. Long lifetimes for certain measures and the availability of deemed savings for certain types of projects influence the compliance choices towards such projects. The policy additionality of supplier obligation and white certificate schemes is not always clear. For example, in France obliged parties rely on local contractors and offer incentives, such as zero-interest loans and few months of free subscription, which tend to overlap with and be smaller in size than existing generous tax credits. The latter seem to be more important in financing most of the interventions. Nevertheless, one needs to keep in mind that in France residential tariffs are regulated and there is no cost recovery: hence obliged parties are not passing on the costs in any standard way. In Italy tax credits play an important role too and it is not clear which policy is the driver for a project to be implemented: the rebate given by obliged parties as part of their progress on targets or tax credits available for certain energy efficiency measures. In the UK and Italy obliged parties tend to subsidise the energy efficiency intervention, especially in the case of low-cost measures (e.g. CFLs). In the UK in the case of insulation in social housing, obliged parties sign contract with social housing providers.
257

The heavy reliance on deemed saving evaluation method in most supplier obligation schemes reflects the reduced transaction costs associated with applying these. Nevertheless, especially in the case of the massive give-aways of CFLs in Italy and the UK, installation remains unclear and hence the actual amount of savings achieved in reality. Allowing parties that are not under the savings obligations to get their project savings certified is an important feature of the system. The UK scheme is a closed one with savings accredited only to the obliged parties. In Italy and France, subject to various conditions, other economic actors or public bodies can receive certificates too. In Denmark also daughter companies of obliged parties carry out activities related to meeting the obligations. In the UK the supplier obligation has been introduced with the intention of, among other, changing business models in energy supply. It has been observed that the major household energy suppliers have developed their own program, used to some extent as a marketing tool (Eyre et al 2009). Supplier obligations in the UK and France have contributed to the formation of partnerships between energy companies and energy efficiency industries, bringing new activities in the obliged companies without significantly modifying their core business of selling energy. In Italy obliged parties do not have a direct contact with final energy users and obligations have been mostly delivered by energy service providers. This shows that to a certain extent in the UK and France suppliers appear willing to position themselves as energy efficiency providers vis-à-vis their clients, while in Italy distributors prefer to relay on ESCO. This may point to the possible development in Italy that once low-cost standard residential projects, such as CFL give-aways, are 'over', obligated parties will move to the tertiary and industrial sectors, more in line with ESCO activities. Different is the situation in Italy, where the scheme has boasted the development of a market for energy efficiency services. In Italy the largest share of white certificates – more than three quarters – have been issued to energy service providers, which shows that the major strategy of obliged parties so far is to rely on trading. In France, the majority of obliged parties have developed new services in the household energy market, such as advice, individual audits, financial instruments like low-interest rate loans and upfront subsidies. These build on partnerships with retailers, installers, manufacturers and banks and has also helped to structure and organise installation sector offers in the household sector (Eyre et al 2009). This shows that in the UK and France where the obligated parties implement project themselves or contract projects out, there is not much scope for trading. For trading to be an effective element, it is essential to have a system with open design, allowing other market actors such as ESCO to implement projects and have savings certified. If a scheme is limited in scope (e.g. residential sector only), then implementation costs may tend to be very similar, and there is little scope for trading. Finally, a set of early general observations and some country specific conclusions can be extracted based on the discussion provided in this paper. First of all, similarly to the US-style demand-side management (DSM) systems, the three major European schemes are in reality dominated by subsidy measures, i.e. obliged parties subsidize savings measures partially or entirely. Financial incentives for end-users are especially important in the residential sector. Compared to traditional DSM, whereby utilities are obliged to spend a certain amount of money on energy saving programs and there is no ‘guarantee’ on amounts to be saved, TWC systems in principle work in the direction of both assuring savings are delivered and making incentives for implementing cost-effective projects (see Bertoldi and Rezessy 2006). Second, with the exception of the Danish obligation, European schemes are dominated by measures with standardized saving factors. A scheme limited in terms of scope is more likely to use this valuation method because there is only a limited number of saving options available, which are carried out in large
258

numbers. Thus, supplier obligations and white certificate schemes are well-suited to deliver low-cost and standard energy efficiency measures. Nevertheless, they can be designed to channel efforts towards measures with higher upfront investment needs (e.g. longer lifetimes of certain project types, longer validity of certificates). Third, the schemes all have some supply options included. In some cases options are allowed that are ‘in-between’ supply and end-use options, namely micro cogeneration and solar heaters that replace end-use technologies. In practice the supplier obligations in the UK has been a ‘tendering’ system, whereby suppliers tendered to energy efficiency industry (e.g. manufacturers and installers) projects to deliver them savings. While the EEC has been successful, this is not a real white certificate scheme as there is no market for certificates. Part of its success has possibly also been due to the limited coverage of the scheme (residential sector only), which makes design and operation easier6. Based on the review and analysis of European schemes provided in the previous sections, here a set of lessons are extracted about the design and operation of supplier and utility obligations and tradable certificate schemes.
• Supplier obligations engage energy market actors into energy efficiency without necessarily changing their business models from selling energy into selling energy services at least on the short term. Suppliers have modified their institutional structure accordingly.
• Many design modalities – such as size and unit of the obligation, obliged parties, sectoral and energy coverage – reflect national policy priorities;
• White certificate schemes are well-suited to deliver low-cost and standard energy efficiency measures. Nevertheless, they can be designed to channel efforts towards measures with higher upfront investment needs (e.g. longer lifetimes of certain project types, longer validity of certificates)
• Providing administrative and monitoring costs are not disproportionate, as many parties as possible should be covered by the scheme to ensure diverging marginal costs and to lower risks of market power and speculative behavior.
• Defining standard measurement and verification reduce the transaction costs for obliged parties and project developers and thus may direct the market towards types of projects or sectors, where such standard methodologies (‘deemed savings’) are available. Thus, the co-existence of default values for unitary energy savings and of more detailed measurement and verification methodologies results in a bias towards measures that introduce energy efficiency technologies with default values for unitary energy savings.
• Minimum buy-out prices and penalties may act to establish a ceiling and a floor price.
• Banking of certificates or savings, long validity of certificates and long compliance periods mitigate price risks for obliged and eligible parties, but may discourage trading and thus reduce liquidity in the current compliance period.
• Administrative costs of all policy instruments are a function of the simplicity of the system and the ease of obtaining reliable information necessary for its design and enforcement. The relatively low burden for the British authority include a single eligible sector, rather limited number of obliged parties, ex-ante measurement and verification approach, a limited set of measures, as well as lack of real certificates and trading provisions (either bilateral or spot).
6 According to the National Energy Efficiency Action plan of the UK under the Energy Service Directive, the scheme is to be extended in scope.
259
• An efficiently working tradable certificate market requires that all players know the price of certificates in the market, the possibilities for the purchase and sale of certificates and possess information on the types and costs of renewable electricity generation and energy saving technologies and processes in the market.
References
AEEG, Autorità per l'energia elettrica e il gas (2008). Terzo rapporto annuale sul meccanismo dei titoli di efficienza energetica. Situazione al 31 maggio 2008. Milan, AEEG.
Baudry, P. and S. Monjon (2005). The French Energy Law and white certificates system. Copenhagen, RECS open seminar, 25 September 2005.
Bodineau, L. 2009. The French Energy Savings Certificates Scheme. Presentation at the JRC workshop on "White Certificates, Utility and Supplier Obligations", 31 March-01 April 2009, Centre Borschette, Brussels, Belgium
Bertoldi, P. and S. Rezessy (2006). Tradable certificates for energy efficiency (white certificates): theory and practice. Ispra, IES, Joint Research Centre, European Commission.
Collys, A. (2005). The Flanders (BE) regional utility obligation. In: Bottom–up Measurement and Verification: National and Regional Examples, Brussels.
Grattieri, W. (2007). Market mechanisms for energy efficiency: white certificates in Italy. Ankara.
Eyre, N., Pavan, M. and Bodineau, L. 2009. Energy company obligations to save energy in Italy, the UK and France: what have we learned? Summer study of the European Council for Energy Efficient Economy, La Colle sur Loup, ECEEE.
Lees, E. (2005). How increased activity on energy efficiency lowers the cost of energy efficiency. Copenhagen, RECS seminar.
Lees, E. (2006). Evaluation of the Energy Efficiency Commitment 2002-2005. Wantage, Eoin Lees Energy.
Lees, E. (2007). European experience of white certificates. WEC ADEME project on energy efficiency policies, World Energy Council.
Lees, E. (2008). Evaluation of the Energy Efficiency Commitment 2005-08. Wantage, Eoin Lees Energy.
Mundaca, L. and L. Neji (2007). Policy recommendations for the assessment, operation and implementation of TWC schemes. Report presented to Intelligent Energy Executive Agency by IIIEE at Lund University on behalf of the EWC team. Lund, Lund University.
Oikonomou, V., M. Rietbergen and M. Patel (2007). An ex-ante evaluation of a White Certificates scheme in The Netherlands: A case study for the household sector. Energy policy 35(2).
Pavan, M. (2002). What's up in Italy? Market liberalization, tariff regulation and incentives to promote energy efficiency in end-use sectors. American Council for Energy Efficient Economy (ACEEE) summer study, Asilomar, Ca., ACEEE.
Pavan, M. (2004). The Italian White Certificates System: Measurement and Verification Protocols. EU and ECEEE expert seminar on Measurement and Verification in the European Commission's Proposal for a Directive on Energy Efficiency and Energy Services, Brussels.
260

Pavan, M. (2005). Italian Energy Efficiency Obligation and White Certificates: Measurement and Evaluation. European Parliament Workshop on Case studies of Current European Schemes for the Measurement and Verification of Energy Efficiency Improvements, Brussels.
Pavan, M. (2009). Distributor obligations and White Certificates in Italy. Presentation at the JRC workshop on "White Certificates, Utility and Supplier Obligations", 31 March-01 April 2009, Centre Borschette, Brussels, Belgium.
Togeby, M., Dyhr-Mikkelsen, K. and E. James-Smith (2007). Design of white certificates. Comparing UK, Italy, France and Denmark. Copenhagen, Ea Energy Analyses.
Togeby, M., Dyhr-Mikkelsen, K., Larsen, A., Hansen, M. and Bach, P. 2009. Danish energy efficiency policy: revisited and future improvements. Summer study of the European Council for Energy Efficient Economy, La Colle sur Loup, ECEEE.
Quirion, P. (2005). Distributional impacts of energy-efficiency certificates vs. taxes and standards. Summer study of the European Council for Energy Efficient Economy, Mandelieu, ECEEE.
Waide, P. and B. Buchner (2008). Utility energy efficiency schemes: saving obligations and trading. In: Energy Efficiency 1(4): 297-311.
261
The Costs of Increasing Electricity Savings through Utility
Efficiency Programs: Evidence from US Experience
Kenji Takahashi and David A. Nichols
Synapse Energy Economics, Inc.
Abstract
Interest in increasing the scale of electric energy efficiency programs is growing in the US. Funded through utility surcharges or tariffs, these programs use information and financial incentives to induce adoption of energy efficiency measures in the buildings and industrial sectors.
One question regarding such energy programs is whether or not they can sustain high levels of savings. We define high savings as incremental reductions in annual electricity sales of one percent or more due to one year’s program activities. Data show that some utilities achieved high savings over several years, implying that high levels of savings can be sustained.
Another question is how the unit cost of saved energy (CSE) for programs may change as program scale increases. To address this basic question, we collected data covering program performance from numerous jurisdictions over many years.
Steady-state analysis arranges technologies on a “conservation supply curve” of increasing costs per unit of saved energy. However, CSE for programs may not increase in this way given innovation, economies of scale, and learning curves. To analyze how CSE changed in practice as program scale increased, we investigated program CSE for several programs in different regions. Our statistical analysis finds that program CSE decreased as program scale and impact grew.
This paper updates preliminary results reported at Summer Study of the American Council for an Energy-Efficiency Economy in 2008. In particular, it adds an initial analysis focused on residential programs alone. It also discusses factors which may contribute to decreases in CSE.
Introduction and Background
In the U.S., there are a variety of governmental policies and programs intended to accelerate the acceptance of energy-efficient technologies and practices. Some policies are mandates, while others rely on education and financial incentives to induce voluntary actions. Policies may emanate from the central (Federal) government, state-level government, or jointly. This paper focuses on experience with one particular type of governmental initiative, namely, energy efficiency (EE) programs, also sometimes called energy conservation programs. These EE programs are funded by the ratepayers of electric and gas distribution utilities and are based on state laws and / or regulations. They are often carried out by energy utilities operating under governmental supervision.
EE programs funded by utility ratepayers are intended to increase the productivity with which utility customers use energy. These programs aim to improve the energy efficiency of the stock of buildings and equipment and to improve energy management practices. The programs rely in large part on inducing utility customers to adopt energy efficient equipment, buildings, and practices through financial incentives, as well as research, education, and training. Incentives are directed primarily to customers, but can also be offered to businesses which make, distribute, or install energy-using measures. Financial incentives constitute a major part of the budget of ratepayer-funded EE programs.
262
Electric EE is often a cost-effective strategy for addressing electricity costs, fossil fuel use, and emissions. Many U.S. states and utilities have given increasing consideration to efficiency measures and have stated an interest in achieving higher levels of energy savings and emission reductions (both greenhouse and criteria pollutants). State governors and legislatures have announced plans to achieve substantial savings, such as 15 or 20 percent savings in projected levels of energy use over several years. Prominent among the means that are being set forth to realize these plans is increased ratepayer-funded energy efficiency. [1] Despite the accelerating pace of EE program adoption, there are concerns that unprecedented managerial efforts and financial resources are required to achieve significantly increased energy savings through such programs. The analysis of empirical data on EE programs described in this paper is intended to provide useful information to program administrators and policy makers interested in how much energy savings can be realistically achieved through efficiency measures, and at what cost. Utilities and other EE program administrators typically know the costs of their own programs. However, research considering information across sectors, regions, and utilities is sparse. This research seeks to examine the relationship between the costs of and the scale of EE programs for a large number of utilities or third party program administrators over multiple years. A number of utilities or other administrators have achieved high energy savings over a number of years. The National Action Plan for Energy Efficiency states that well-designed energy programs are now “delivering annual energy savings on the order of 1 percent of electricity and natural gas sales.” [2] Data summarized by K. Takahashi et al. (2008) show that programs in varying U.S. regions during varying time periods have indeed achieved annual incremental energy savings equal to or in excess of one percent of annual electricity sales.[3] Some programs have saved over two percent of annual energy sales per year.[3] These data themselves provide evidence that incremental annual energy savings of at least one percent of annual sales can be achieved and sustained. But at what cost? In particular, does the relative cost or programs increase as their penetration reaches or exceeds one percent of annual sales? These questions are especially relevant in light of the growing interest in several jurisdictions in achieving, sustaining, or even surpassing these high levels of savings.
Analysis of Trends in the Cost of Saved Energy The Conservation Supply Curve
It is useful to step back and consider the theoretical perspective that the unit cost of saved energy (CSE) should increase as more of the energy savings potential is tapped. Steady-state analysis can readily arrange efficiency technologies on a “conservation supply curve” (CSC) of increasing costs per unit of saved energy so that it would appear as if increasing acquired savings would require an increase in the cost per unit savings. (See Figure 1.)
263

Figure 1. Illustrative Energy-Efficiency Supply Curve
Source: XENERGY Inc. 2002. California’s Secret Energy Surplus: the Potential for Energy Efficiency
Many studies develop CSE, also known as “energy-efficiency supply curves”, for use in planning studies and policy analysis.[4] These curves are always presented with "steps" that increase as one moves along the horizontal axis from left to right (increasing energy savings). This notion of an "increasing cost supply curve for saved energy" is intuitive and reflects a logical order of prioritization of opportunities (Figure 1).
CSC analysis is certainly useful for comparing the relative costs of EE measures and for understanding the aggregate potential for EE that is available up to any given CSE level. However, CSCs are based on demonstrated and currently well-understood measures and programs. They may imply increased market share for advanced technologies, but only rarely do they reflect true technological or institutional improvement over time. In contrast, analysts of fossil fuel supply do not limit their analyses to "proven" resources, but routinely include hydrocarbon reserves that are described as "undiscovered," "possible," or "prospective."[5] This appears to be a bias against demand-side resources in long-term energy modeling.
A recent study of CSCs that had been prepared for the same region of the U.S. at intervals between 1983 and 2005 found that the assumptions regarding the incremental cost and the potential market penetration of specific residential efficiency technologies changed significantly over time from one CSC analysis to the next. Certain technologies were becoming more available, economical, and applicable over time, even though each successive CSC analysis had no framework for projecting dynamic change in the technologies used to construct it.[6] While this study did not find this “trend” true for all technology inputs it selected for examination, the study does constitutes a recognition that, even within the conceptual framework of the CSC, the static nature of assumptions about technologies is a limitation.
Additionally, CSC analysis can lead to an assumption that EE programs must mimic the CSC curve, such that the greater their amount of savings, the greater their program cost.1 However, program CSE might be expected to differ from the technology CSE that underlies CSC analysis, for several reasons. Beyond the obvious fact that energy efficiency program costs2 typically cover a substantial fraction, but not all, of efficiency’s incremental costs, the program CSE fluctuates due to many factors such as year, utility, sector, type of program, and size of program.
1 This assumption can be found in studies of the achievable potential for energy efficiency in various regions as conducted by research firms. As one example, the “New Jersey Energy Efficiency and Distributed Generation Market Assessment” prepared by KEMA, Inc., for this U.S. state in 2004 projected that for its higher “Advanced Efficiency” scenario, incentives to EE program participants would have to rise from 40- 50% of incremental measure costs to 80% (page 2-6).” 2 The costs of the utility or other program administrator including the costs for marketing, administration, program rebates, and measurement and verification of energy savings.
264

In fact, we found that the data for actual energy efficiency programs do tell a different story from that which might be inferred from CSCs. These programs generally include a range of measures, ranging from zero (or even negative net cost) per kWh saved up to (and occasionally exceeding) avoided costs. The overall cost per kWh saved for a utility program in a given year turns out to be lower in the more ambitious years. This could be because fixed program costs can be spread over more measures or participants. On the electricity supply side it is generally accepted that there are "economies of scale" in power plant construction costs (i.e., larger equipment costs less on a per MW basis).
Utility efficiency programs are often composed of various programs that target each market sector, including the low-income, residential, and commercial and industrial sectors. The overall CSE for a program is always the weighted average cost of saved energy through a portfolio of various measures.
As noted above, CSC analysis seldom addresses economies of scale. Theoretically, a program administrator can enjoy economies of scale by expanding its operation of EE programs. For example, a large program may allow for bulk purchase of certain efficiency measures at a lower price or for bulk discounts for contracts with energy service companies to deliver energy savings. Further, larger programs may be able to allocate the cost of marketing and administration over a greater amount of energy savings, tending to reduce program cost per kWh saved as program scale increases. Similarly, marketing and customer education will increase customers’ adoption of new technologies, which in turn can accelerate the mass production of such technologies and thus reduce unit price over time. Furthermore, greater scope of programs could reduce marketing expense or provide synergistic savings.3
Analysis of Historical Trends in Program CSE
Data and Methods: We analyzed several comprehensive EE programs in varying regions in order to explore the empirical relationship between program CSE and program scale for all sectors (residential, commercial, and industrial, or “RCI”) combined as well as for the residential sector alone. Data from over 160 cases (years and regions or utilities) were collected on expenditures, costs, and savings associated with efficiency programs. 4 This analysis focused on utilities or other entities with comprehensive electric energy efficiency programs. Data were obtained either from utility efficiency annual reports or directly from program administrators or staff at state energy offices or regulatory commissions. There are important caveats and uncertainties associated with the collected data. In particular, data on achieved energy savings are derived from reports by program administrators and/or regulators, and are inherently less certain than data on costs. Regular impact evaluation activities to verify savings estimates have been conducted by virtually all entities pursuing comprehensive energy efficiency programs on a sustained basis;5 nevertheless, there is still uncertainty when quantifying exact savings. Quality of savings estimation and verification may, in fact, vary between jurisdictions, but this variability is unlikely to impact this analysis. Indeed, our analysis focuses on trends and behavior within utilities and jurisdictions, which are likely to have internally consistent measures and metrics. Trends observed across utilities are of interest, but not explored in this analysis. Utility reports on savings did not consistently report a consistent metric of savings. Reports sometimes contained both first year and lifetime savings, and others reported only first year savings. Where lifetime savings were not available, we estimated lifetime savings based on the average lifetime of efficiency
3 For example, combining a lighting retrofit with a large commercial AC retrofit can reduce the size of the AC unit needed, making the retrofit both cheaper and more cost-effective. 4 All of the references used for this analysis are presented at the end of this paper. 5 For detailed information how M&V has been conducted in Northeast states see Northeast Energy Efficiency Partnerships, Inc. 2006. The Need for and Approaches to Developing Common Protocols to Measure, Verify and Report Energy Efficiency Savings in the Northeast, January 2006. Also for California’s historical practice on M&V, see page 26 of Edward Vine and Jayant Sathaye 1999. Guidelines for the Monitoring, Evaluation, Reporting, Verification, and Certification of Energy-Efficiency Projects for Climate Change Mitigation, March 1999. Lawrence Berkeley National Laboratory.
265
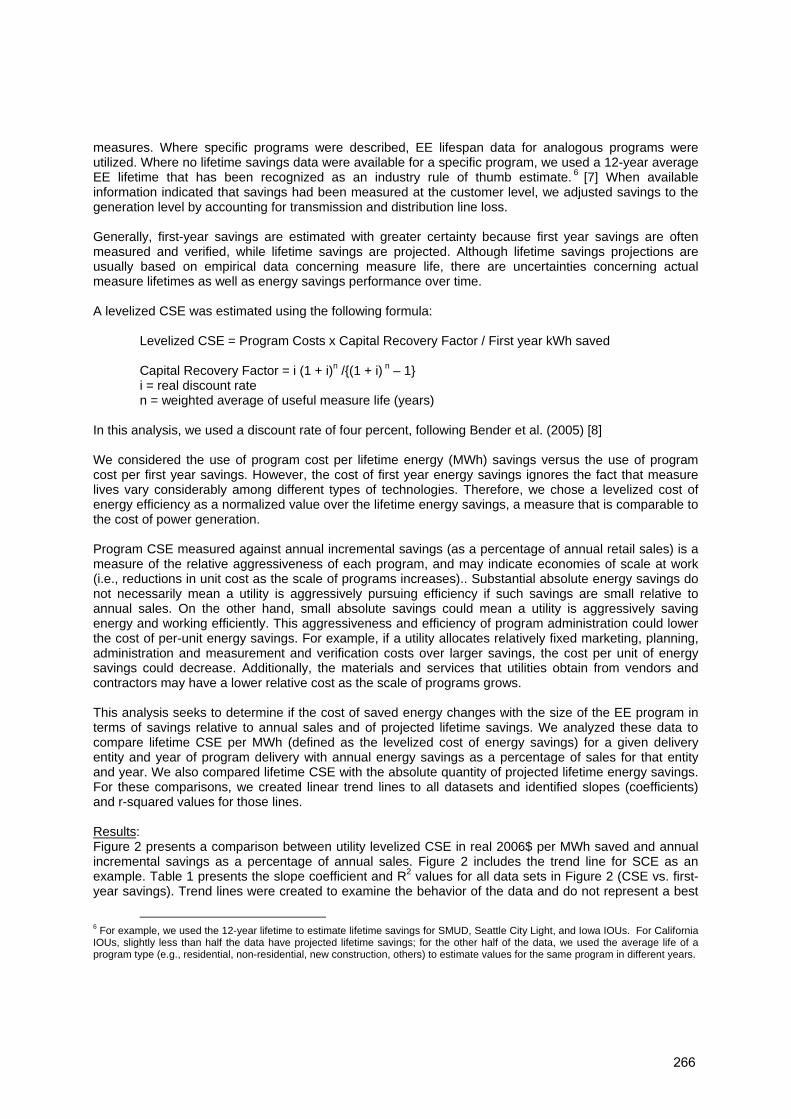
measures. Where specific programs were described, EE lifespan data for analogous programs were utilized. Where no lifetime savings data were available for a specific program, we used a 12-year average EE lifetime that has been recognized as an industry rule of thumb estimate. 6 [7] When available information indicated that savings had been measured at the customer level, we adjusted savings to the generation level by accounting for transmission and distribution line loss. Generally, first-year savings are estimated with greater certainty because first year savings are often measured and verified, while lifetime savings are projected. Although lifetime savings projections are usually based on empirical data concerning measure life, there are uncertainties concerning actual measure lifetimes as well as energy savings performance over time. A levelized CSE was estimated using the following formula:
Levelized CSE = Program Costs x Capital Recovery Factor / First year kWh saved Capital Recovery Factor = i (1 + i)n /{(1 + i) n – 1} i = real discount rate n = weighted average of useful measure life (years)
In this analysis, we used a discount rate of four percent, following Bender et al. (2005) [8]
We considered the use of program cost per lifetime energy (MWh) savings versus the use of program cost per first year savings. However, the cost of first year energy savings ignores the fact that measure lives vary considerably among different types of technologies. Therefore, we chose a levelized cost of energy efficiency as a normalized value over the lifetime energy savings, a measure that is comparable to the cost of power generation.
Program CSE measured against annual incremental savings (as a percentage of annual retail sales) is a measure of the relative aggressiveness of each program, and may indicate economies of scale at work (i.e., reductions in unit cost as the scale of programs increases).. Substantial absolute energy savings do not necessarily mean a utility is aggressively pursuing efficiency if such savings are small relative to annual sales. On the other hand, small absolute savings could mean a utility is aggressively saving energy and working efficiently. This aggressiveness and efficiency of program administration could lower the cost of per-unit energy savings. For example, if a utility allocates relatively fixed marketing, planning, administration and measurement and verification costs over larger savings, the cost per unit of energy savings could decrease. Additionally, the materials and services that utilities obtain from vendors and contractors may have a lower relative cost as the scale of programs grows. This analysis seeks to determine if the cost of saved energy changes with the size of the EE program in terms of savings relative to annual sales and of projected lifetime savings. We analyzed these data to compare lifetime CSE per MWh (defined as the levelized cost of energy savings) for a given delivery entity and year of program delivery with annual energy savings as a percentage of sales for that entity and year. We also compared lifetime CSE with the absolute quantity of projected lifetime energy savings. For these comparisons, we created linear trend lines to all datasets and identified slopes (coefficients) and r-squared values for those lines.
Results: Figure 2 presents a comparison between utility levelized CSE in real 2006$ per MWh saved and annual incremental savings as a percentage of annual sales. Figure 2 includes the trend line for SCE as an example. Table 1 presents the slope coefficient and R2 values for all data sets in Figure 2 (CSE vs. first-year savings). Trend lines were created to examine the behavior of the data and do not represent a best
6 For example, we used the 12-year lifetime to estimate lifetime savings for SMUD, Seattle City Light, and Iowa IOUs. For California IOUs, slightly less than half the data have projected lifetime savings; for the other half of the data, we used the average life of a program type (e.g., residential, non-residential, new construction, others) to estimate values for the same program in different years.
266
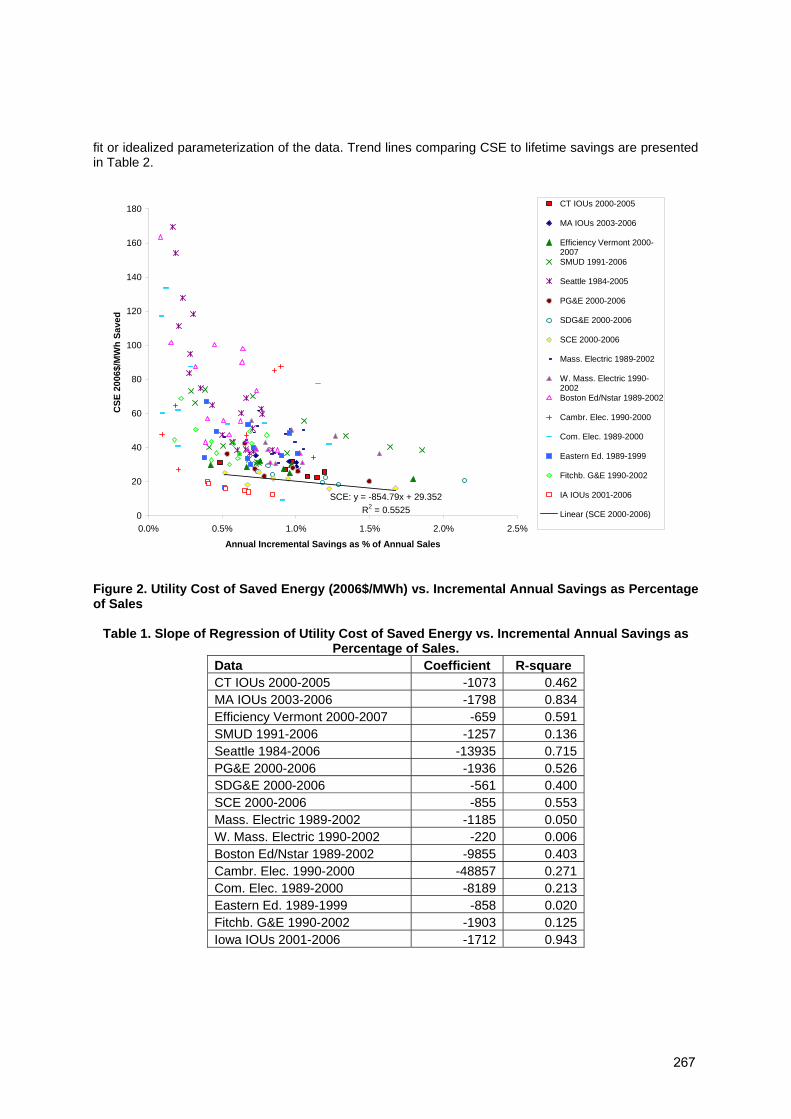
fit or idealized parameterization of the data. Trend lines comparing CSE to lifetime savings are presented in Table 2.
SCE: y = -854.79x + 29.352
R2 = 0.55250
20
40
60
80
100
120
140
160
180
0.0% 0.5% 1.0% 1.5% 2.0% 2.5%
Annual Incremental Savings as % of Annual Sales
CSE
200
6$/M
Wh
Save
d
CT IOUs 2000-2005
MA IOUs 2003-2006
Efficiency Vermont 2000-2007SMUD 1991-2006
Seattle 1984-2005
PG&E 2000-2006
SDG&E 2000-2006
SCE 2000-2006
Mass. Electric 1989-2002
W. Mass. Electric 1990-2002Boston Ed/Nstar 1989-2002
Cambr. Elec. 1990-2000
Com. Elec. 1989-2000
Eastern Ed. 1989-1999
Fitchb. G&E 1990-2002
IA IOUs 2001-2006
Linear (SCE 2000-2006)
Figure 2. Utility Cost of Saved Energy (2006$/MWh) vs. Incremental Annual Savings as Percentage of Sales
Table 1. Slope of Regression of Utility Cost of Saved Energy vs. Incremental Annual Savings as Percentage of Sales.
Data Coefficient R-square CT IOUs 2000-2005 -1073 0.462 MA IOUs 2003-2006 -1798 0.834 Efficiency Vermont 2000-2007 -659 0.591 SMUD 1991-2006 -1257 0.136 Seattle 1984-2006 -13935 0.715 PG&E 2000-2006 -1936 0.526 SDG&E 2000-2006 -561 0.400 SCE 2000-2006 -855 0.553 Mass. Electric 1989-2002 -1185 0.050 W. Mass. Electric 1990-2002 -220 0.006 Boston Ed/Nstar 1989-2002 -9855 0.403 Cambr. Elec. 1990-2000 -48857 0.271 Com. Elec. 1989-2000 -8189 0.213 Eastern Ed. 1989-1999 -858 0.020 Fitchb. G&E 1990-2002 -1903 0.125 Iowa IOUs 2001-2006 -1712 0.943
267

Table 2. Slope of Regression of Utility Cost of Saved Energy vs. Projected Lifetime
Savings Data Coefficient R-square CT IOUs 2000-2005 -2.695E-06 0.457 MA IOUs 2003-2006 -4.950E-06 0.676 Efficiency Vermont 2000-2007 -1.135E-05 0.658 SMUD 1991-2006 -1.590E-05 0.207 Seattle 1984-2006 -1.271E-04 0.731 PG&E 2000-2006 -1.841E-06 0.552 SDG&E 2000-2006 -2.249E-06 0.420 SCE 2000-2006 -6.484E-07 0.591 Mass. Electric 1989-2002 -9.022E-06 0.168 W. Mass. Electric 1990-2002 -8.284E-06 0.026 Boston Ed/Nstar 1989-2002 -4.542E-05 0.454 Cambr. Elec. 1990-2000 -1.747E-03 0.183 Com. Elec. 1989-2000 -1.390E-04 0.186 Eastern Ed. 1989-1999 -2.854E-05 0.034 Fitchb. G&E 1990-2002 -1.760E-04 0.078 Iowa IOUs 2001-2006 -3.927E-06 0.948
Most recently, we conducted similar analysis on residential EE programs alone. Due to limited availability of sector-specific data, at this writing we had collected data on 9 utilities and one pair of utilities.7,8 We disaggregated the data for MA IOUs presented in Figure 2 into five program administrators.9 Figure 3 compares utility levelized CSE in real 2006$ per MWh saved with first year savings as a percentage of sales. We generated linear trend lines to all datasets and identified slopes and R2 values for those lines. Figure 3 includes the trend line for SCE as an example. Table 3 presents the coefficients and R2 values for all data sets in Figure 3. We also drew linear trend lines for to compare CSE with lifetime energy savings. Table 4 presents the coefficient and R2 values for all data sets for this analysis.
7 Note that residential programs for California utilities (i.e., SCE, PG&E, and SDG&E) do not include new construction programs. 8 All of the references used for this analysis are presented at the end of this paper. 9 Due to confidentiality requirements of the MA PARIS database we obtained, Massachusetts programs are not named.
268
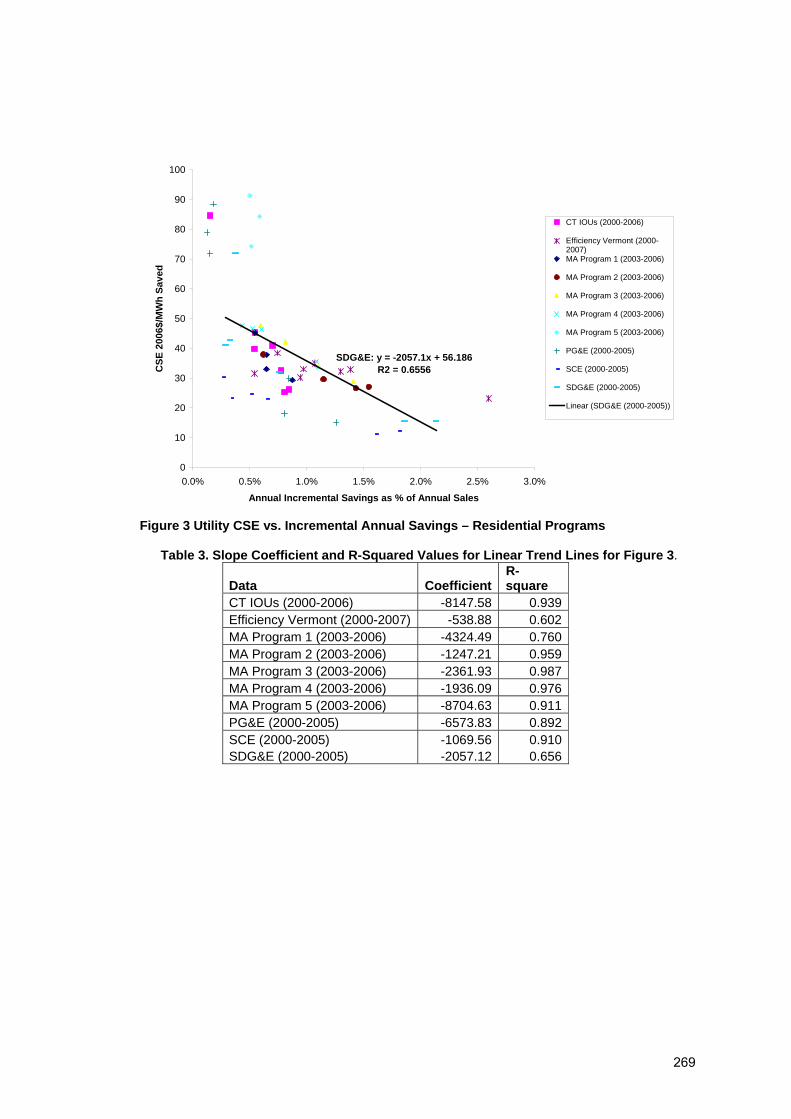
SDG&E: y = -2057.1x + 56.186R2 = 0.6556
0
10
20
30
40
50
60
70
80
90
100
0.0% 0.5% 1.0% 1.5% 2.0% 2.5% 3.0%
Annual Incremental Savings as % of Annual Sales
CSE
200
6$/M
Wh
Save
d
CT IOUs (2000-2006)
Efficiency Vermont (2000-2007)MA Program 1 (2003-2006)
MA Program 2 (2003-2006)
MA Program 3 (2003-2006)
MA Program 4 (2003-2006)
MA Program 5 (2003-2006)
PG&E (2000-2005)
SCE (2000-2005)
SDG&E (2000-2005)
Linear (SDG&E (2000-2005))
Figure 3 Utility CSE vs. Incremental Annual Savings – Residential Programs
Table 3. Slope Coefficient and R-Squared Values for Linear Trend Lines for Figure 3.
Data CoefficientR-square
CT IOUs (2000-2006) -8147.58 0.939 Efficiency Vermont (2000-2007) -538.88 0.602 MA Program 1 (2003-2006) -4324.49 0.760 MA Program 2 (2003-2006) -1247.21 0.959 MA Program 3 (2003-2006) -2361.93 0.987 MA Program 4 (2003-2006) -1936.09 0.976 MA Program 5 (2003-2006) -8704.63 0.911 PG&E (2000-2005) -6573.83 0.892 SCE (2000-2005) -1069.56 0.910 SDG&E (2000-2005) -2057.12 0.656
269

Table 4. Slope Coefficient and R-Squared Values for Linear Trend Lines for Residential Program CSE vs. Projected Lifetime Savings
Data Coefficient R-square CT IOUs (2000-2006) -6.18E-05 0.684 Efficiency Vermont (2000-2007) -4.14E-05 0.577 MA Program 1 (2003-2006) -1.23E-04 0.499 MA Program 2 (2003-2006) -2.73E-05 0.860 MA Program 3 (2003-2006) -6.55E-05 0.939 MA Program 4 (2003-2006) -1.86E-04 0.821 MA Program 5 (2003-2006) -3.88E-03 0.904 PG&E (2000-2005) -2.39E-05 0.884 SCE (2000-2005) -3.76E-06 0.894 SDG&E (2000-2005) -3.17E-05 0.646
A key result of the analysis for both comprehensive RCI programs and residential programs is that, while R2 values are low in some cases, among all datasets that we collected, all slope coefficients of the linear trend lines are negative. The data strongly suggest that per-unit cost of EE decreases as the amount of EE savings increases. We also found the following:
• Variation of per unit cost of energy efficiency for a given utility generally decreases as the amount
of efficiency savings increases. In other words, the data show that the cost of efficiency becomes smaller and less variable for higher savings amounts. For example, there are several cases where costs of efficiency reach over $100 per MWh saved below 0.5% savings penetration.
• Declining trend curves were observed regardless of the size of the utilities or program administrators. Annual retail electricity sales range from about 500 GWh to close to 90,000 GWh. About half of the entities analyzed have less than 10,000 GWh of annual retail sales. Even small utilities experienced decreasing CSE when they expanded their programs.
• Finally, looking at the results of the analysis for the same utilities for the entire sector and the residential sector alone, residential programs generally show higher correlation. This implies that the programs for the other sectors (C&I) are likely to show lower correlation between CSE and savings. In other words, economies of scale may be more effective for residential programs.
We recognize that the data and analysis presented here are preliminary. They do not yet include quantitative analysis of the underlying sources of variation in program CSE across utilities and across years. However, the macro-level trends identified do at least call into question what is a common explicit or implicit assumption concerning the achievability and program costs of large-scale EE. Conclusion
This study find that the relationship between the CSE and energy efficiency savings for ratepayer funded EE programs is broadly negative (i.e. costs decrease as program sizes increase). It is important to emphasize that this finding contradicts the generally accepted theory that costs of EE increase when EE savings amounts increase.10 The fact that the coefficient is negative in every case is particularly striking. While it is possible that unit costs might begin to increase at much higher levels of EE program savings, this evidence suggests that current program savings levels have not yet approached any such point.
10 For example, the data for SCE, PG&E, MA IOUs, and Seattle City Light show that a more than 50% of the variation in CSE can be explained by the amount of energy savings. For others, like Mass. Electric, Cambridge Electric, and Eastern Edison, the amount of energy savings explains a smaller fraction of the variations in CSE.
270

Possible reasons for this finding include (1) economies of scale are at work (e.g., allocating marketing and administration costs over more EE savings, achieving lower unit costs for program inputs); (2) economies of scope are at work (e.g., exploiting synergies among different measures); (3) administrators become smarter and more organized in designing and developing EE programs; or (4) administrators have more credibility or more resources available for quality program design and development, etc. We explored the relationship of program cost for saved energy to the level of electricity savings achieved by numerous utilities over many years. This analysis focused on utilities or other entities with comprehensive electric energy efficiency programs for all sectors (RCI) as well as the residential sector alone. Our overall finding is that the per-unit program cost of achieving energy efficiency seems to decline as program scale and aggressiveness increase, at least based on the experience to date of many utilities with comprehensive programs. This may surprise those who would expect the opposite trend based on theoretical conservation supply analysis.
One aspect of this analysis compared each utility’s program CSE for a given year to the total quantity of lifetime electricity savings projected from that year’s energy efficiency program. For every program analyzed, we found a trend of decreasing utility CSE as the absolute quantity of EE savings increased. This trend was generally even stronger in the analysis of residential programs alone. Another aspect of this analysis compared each utility’s program CSE to annual incremental savings as percent of sales. For every program analyzed regardless of the size of utilities or program administrators, we found a trend of decreasing utility CSE as the relative quantity of EE savings increased. Again, this trend was generally even stronger in the analysis of residential programs alone.
We further found that variation of CSE for a given utility generally decreases as the amount of efficiency savings increases. We also observed that every case.
This is a preliminary analysis that we expect to extend in several directions. Possibilities for further research include:
• Adding data for additional utilities and regions to the analysis. • Further investigation of CSE by type of measure, program or sector (e.g. residential versus non-
residential and the impact of compact fluorescent light). • Review of the data sets to ensure that load management type programs have been fully
excluded. (As this was done where evident, this would be in the nature of double-checking.) • Explicit analysis of the share of administrative and marketing costs to total program costs as a
function of program impact, to test one of the hypotheses about economies of scale. • Investigation of the impact of bulk discounts for products and service contracts on program costs. • Investigation of the impact of synergistic program effects on program costs. • Review of the savings evaluation and verification history associated with each data set. • Comparison of total CSE (i.e., utility plus participant costs) with electricity savings achieved. • Analysis of CSE/savings trends among gas energy efficiency programs.
Works Cited [1] [ACEEE] American Council for Energy Efficient Economy 2008. The 2008 State Energy Efficiency
Scorecard, Washington, DC.: ACEEE [2] [DOE and EPA] U.S. Department of Energy and U.S. Environmental Protection Agency. 2006.
National Action Plan For Energy Efficiency. Washington, DC: U.S. Department of Energy and U.S. Environmental Protection Agency. DOE and EPA 2006, ES-4
271
[3] K. Takahashi and D. Nichols 2008. The Sustainability and Costs of Increasing Efficiency Impacts: Evidence from Experience to Date, proceedings of the 2008 ACEEE Summer Study on Energy Efficiency in Buildings, ACEEE, pp. 8-363 - 8-375.
[4] Bernow, S., M. Lazarus, and D. von Hippel. 2002. Clean Electricity Options for the Pacific Northwest:
An Assessment of Efficiency and Renewable Potentials through the Year 2020. Presentation to the NW Energy Coalition, October. Bernow 2002; Coito & Rufo 2002; Donovan et al. 2003
[5] Biewald, B. 2004. The Shape of Things to Come: Incorporating Unproven Reserves of Efficiency
Savings into Energy Models. Presentation to the East Coast Energy Group, Washington, DC. November 10.
[6] Gordon, F., Garth, L., Eckman, T., and Grist, C. 2008. Beyond Supply Curves, the 2008 Summer
Study on Energy Efficiency in Buildings, ACEEE, pp. 8-98 - 8-109.]) [7] [DOE and EPA] U.S. Department of Energy and U.S. Environmental Protection Agency. 2006.
National Action Plan For Energy Efficiency. Washington, DC: U.S. Department of Energy and U.S. Environmental Protection Agency; Kushler, M., D. York, and P. Witte. 2005. Examining the Potential for Energy Efficiency to Help Address the Natural Gas Crisis in the Midwest: Washington, DC: American Council for an Energy Efficient Economy, 2005..
[8] Bender, S., M. Messenger, and C. Rogers. 2005. Funding and Savings for Energy Efficiency
Programs for Program Years 2000 through 2004. Sacramento, CA: California Energy Commission. References used for Figure 2 and 3 and Table 1 - 4. [9] [CEC] California Energy Commission. 2008. Data File for Energy Savings and Program Expenditures
for Three Investor Owned Utilities for 2000 to 2005. (Unpublished raw data obtained from Cynthia Rogers in February 2008).
[10] [CT ECMB] Connecticut Energy Conservation Management Board. 2007. Report of the Energy
Conservation Management Board Year 2006 Programs and Operations. CT ECMB. 2006. Report of the Energy Conservation Management Board Year 2005 Programs and Operations. CT ECMB. 2005. Report of the Energy Conservation Management Board Year 2004 Programs and Operations. CT ECMB. 2004. Report of the Energy Conservation Management Board Year 2003 Programs and Operations. CT ECMB. 2003. Report of the Energy Conservation Management Board Year 2002 Programs and Operations. CT ECMB. 2002. Report of the Energy Conservation Management Board Year 2000-2001 Programs and Operations. CT ECMB. 2001. Report of the Energy Conservation Management Board Year 2001 Programs and Operations.
[11] [DOE] U.S. Department of Energy. Not dated. Energy Information Administration Form EIA-861.
Final Data Files, available at http://www.eia.doe.gov/cneaf/electricity/page/eia861.html [12] [MECo] Massachusetts Electric Company. 2006. 2005 Energy Efficiency Annual Report Revisions. [13] [PG&E] Pacific Gas & Electric. 2007. Energy Efficiency Program Portfolio Annual Report For 2006
PG&E. 2006. Energy Efficiency Programs Annual Report for 2005 PG&E 2005. Energy Efficiency Programs Annual Report for 2004.
272
[14] [SCE] Southern California Edison. 2007. 2007 Energy Efficiency Annual Report
SCE. 2006. 2006 Energy Efficiency Annual Report. SCE. 2005. 2005 Energy Efficiency Annual Report. SCE. 2004. 2004 Energy Efficiency Annual Report. SCE. 2003. 2003 Energy Efficiency Annual Report. SCE. 2002. 2002 Energy Efficiency Annual Report. SCE. 2001. 2001 Energy Efficiency Annual Report.
[15] [SDG&E] San Diego Gas & Electric. 2007. Energy Efficiency Annual Report 2006 Results.
SDG&E. 2006. Energy Efficiency Programs Annual Summary and Technical Appendix SDG&E. 2005. Energy Efficiency Programs Annual Summary and Technical Appendix
[16] [SMUD] Sacramento Municipal Utility District. 2007. Data files for energy savings and program
expenditures for SMUD. Unpublished raw data obtained from Jim Parks.
[17] Coito, F., and M. Rufo. 2002. California's Secret Energy Surplus: the Potential for Energy Efficiency. Prepared by Xenergy Inc. for the Energy Foundation and Hewlett Foundations. Burlington, Mass.: Xenergy Inc.
[18] Donovan, C., R. N. Elliott, D. Hill, P. Mosenthal, S. Nadel, C. Neme, and J. Plunkett. 2003. Energy
Efficiency and Renewable Energy Resource Development Potential In New York State. Prepared for the New York State Energy Research and Development Authority. Bristol, Vt.: Optimal Energy, Inc.
[19] Efficiency Vermont. 2004. Year 2003 Annual Report and Annual Energy Savings Claim.
Efficiency Vermont. 2005. Year 2004 Annual Report and Annual Energy Savings Claim. Efficiency Vermont. 2006. Year 2005 Annual Report and Annual Energy Savings Claim. Efficiency Vermont. 2007. Year 2006 Annual Report and Annual Energy Savings Claim. Efficiency Vermont 2008. Year 2007 Annual Report. Efficiency Vermont. 2009. Data files for energy savings and program expenditures for Efficiency Vermont. (Unpublished raw data obtained from Huessy, F.)
[20] Garvey, E. 2007. Minnesota’s Demand Efficiency Program. Presentation to the National Action Plan
for Energy Efficiency – Midwest Implementation Meeting, Minneapolis, Minn. June 21. [21] Massachusetts Department of Telecommunications and Energy. 2003. Massachusetts Electric Utility
Energy Efficiency Database. Unpublished raw data obtained from Gene Fry, June 2007. [22] Massachusetts Division of Energy Resources. 2008. Data File for Energy Savings and Program
Expenditures for Massachusetts Utilities for 2003 to 2006 (PARIS database). (Unpublished raw data obtained from Lawrence Masland in February 2008).
[23] Rogers, C. (California Energy Commission). 2008. Personal Communication. February. [24] Seattle City Light. Pearson, D. and D. Tachibana, ed. 2006. Energy Conservation Accomplishments:
1977-2005. Seattle, Wash.: Seattle City Light. [25] Sherman, M. and L. Masland. (Massachusetts Division of Energy Resources). 2008. Personal Communication. February.
273
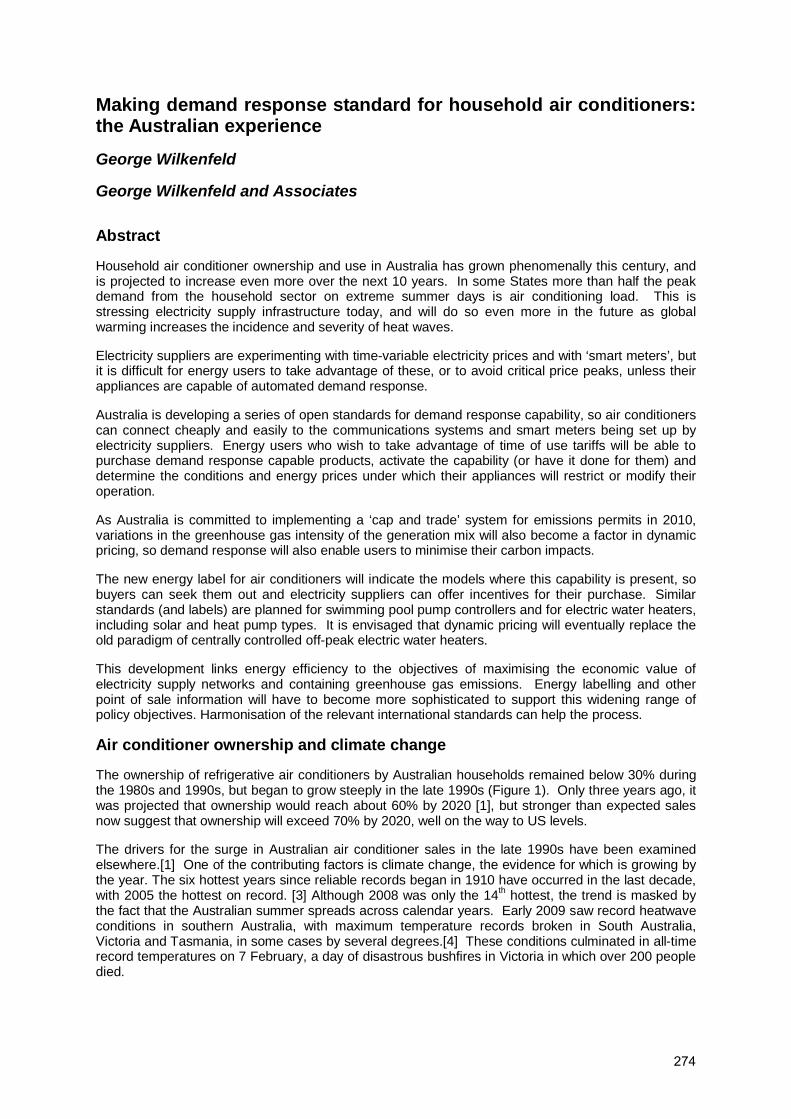
Making demand response standard for household air conditioners: the Australian experience
George Wilkenfeld
George Wilkenfeld and Associates
Abstract
Household air conditioner ownership and use in Australia has grown phenomenally this century, and is projected to increase even more over the next 10 years. In some States more than half the peak demand from the household sector on extreme summer days is air conditioning load. This is stressing electricity supply infrastructure today, and will do so even more in the future as global warming increases the incidence and severity of heat waves.
Electricity suppliers are experimenting with time-variable electricity prices and with ‘smart meters’, but it is difficult for energy users to take advantage of these, or to avoid critical price peaks, unless their appliances are capable of automated demand response.
Australia is developing a series of open standards for demand response capability, so air conditioners can connect cheaply and easily to the communications systems and smart meters being set up by electricity suppliers. Energy users who wish to take advantage of time of use tariffs will be able to purchase demand response capable products, activate the capability (or have it done for them) and determine the conditions and energy prices under which their appliances will restrict or modify their operation.
As Australia is committed to implementing a ‘cap and trade’ system for emissions permits in 2010, variations in the greenhouse gas intensity of the generation mix will also become a factor in dynamic pricing, so demand response will also enable users to minimise their carbon impacts.
The new energy label for air conditioners will indicate the models where this capability is present, so buyers can seek them out and electricity suppliers can offer incentives for their purchase. Similar standards (and labels) are planned for swimming pool pump controllers and for electric water heaters, including solar and heat pump types. It is envisaged that dynamic pricing will eventually replace the old paradigm of centrally controlled off-peak electric water heaters.
This development links energy efficiency to the objectives of maximising the economic value of electricity supply networks and containing greenhouse gas emissions. Energy labelling and other point of sale information will have to become more sophisticated to support this widening range of policy objectives. Harmonisation of the relevant international standards can help the process.
Air conditioner ownership and climate change
The ownership of refrigerative air conditioners by Australian households remained below 30% during the 1980s and 1990s, but began to grow steeply in the late 1990s (Figure 1). Only three years ago, it was projected that ownership would reach about 60% by 2020 [1], but stronger than expected sales now suggest that ownership will exceed 70% by 2020, well on the way to US levels.
The drivers for the surge in Australian air conditioner sales in the late 1990s have been examined elsewhere.[1] One of the contributing factors is climate change, the evidence for which is growing by the year. The six hottest years since reliable records began in 1910 have occurred in the last decade, with 2005 the hottest on record. [3] Although 2008 was only the 14th hottest, the trend is masked by the fact that the Australian summer spreads across calendar years. Early 2009 saw record heatwave conditions in southern Australia, with maximum temperature records broken in South Australia, Victoria and Tasmania, in some cases by several degrees.[4] These conditions culminated in all-time record temperatures on 7 February, a day of disastrous bushfires in Victoria in which over 200 people died.
274
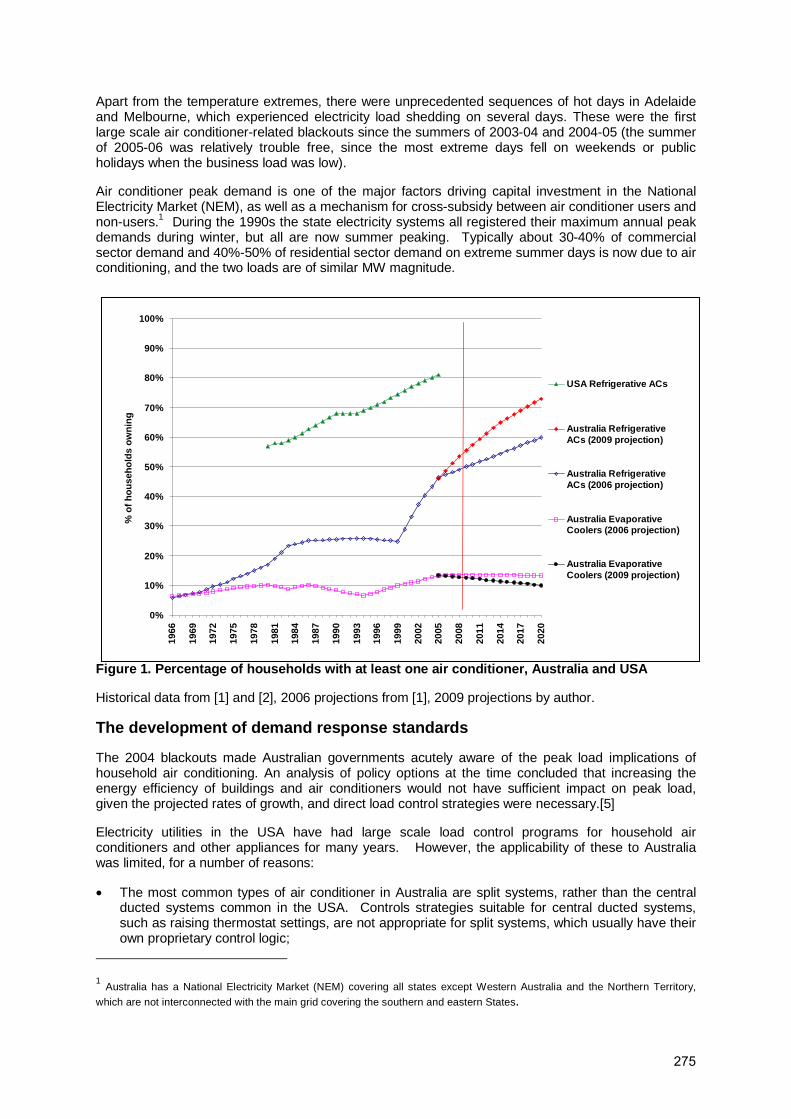
Apart from the temperature extremes, there were unprecedented sequences of hot days in Adelaide and Melbourne, which experienced electricity load shedding on several days. These were the first large scale air conditioner-related blackouts since the summers of 2003-04 and 2004-05 (the summer of 2005-06 was relatively trouble free, since the most extreme days fell on weekends or public holidays when the business load was low).
Air conditioner peak demand is one of the major factors driving capital investment in the National Electricity Market (NEM), as well as a mechanism for cross-subsidy between air conditioner users and non-users.1 During the 1990s the state electricity systems all registered their maximum annual peak demands during winter, but all are now summer peaking. Typically about 30-40% of commercial sector demand and 40%-50% of residential sector demand on extreme summer days is now due to air conditioning, and the two loads are of similar MW magnitude.
Figure 1. Percentage of households with at least one air conditioner, Australia and USA
Historical data from [1] and [2], 2006 projections from [1], 2009 projections by author.
The development of demand response standards
The 2004 blackouts made Australian governments acutely aware of the peak load implications of household air conditioning. An analysis of policy options at the time concluded that increasing the energy efficiency of buildings and air conditioners would not have sufficient impact on peak load, given the projected rates of growth, and direct load control strategies were necessary.[5]
Electricity utilities in the USA have had large scale load control programs for household air conditioners and other appliances for many years. However, the applicability of these to Australia was limited, for a number of reasons:
• The most common types of air conditioner in Australia are split systems, rather than the central ducted systems common in the USA. Controls strategies suitable for central ducted systems, such as raising thermostat settings, are not appropriate for split systems, which usually have their own proprietary control logic;
1 Australia has a National Electricity Market (NEM) covering all states except Western Australia and the Northern Territory,
which are not interconnected with the main grid covering the southern and eastern States.
0%
10%
20%
30%
40%
50%
60%
70%
80%
90%
100%
1966
1969
1972
1975
1978
1981
1984
1987
1990
1993
1996
1999
2002
2005
2008
2011
2014
2017
2020
% o
f h
ou
seh
old
s o
wn
ing
USA Refrigerative ACs
Australia RefrigerativeACs (2009 projection)
Australia RefrigerativeACs (2006 projection)
Australia EvaporativeCoolers (2006 projection)
Australia EvaporativeCoolers (2009 projection)
275

• Most of the air conditioners sold in Australia are imported – although there is some local manufacture – whereas the USA is largely self-sufficient in air conditioners and control equipment;
• The Australian pattern of use tends to be intermittent rather than constant, so air conditioners are usually struggling to cool a hot house on a hot afternoon, whereas in the USA the air conditioner is operating for more of the time, the house is cooler by the time the peak arrives and the incremental demand is less;
• The regulatory environment is different. The Australian electricity sector was reformed in the 1990s, so generation and retailing became contestable, while transmission and distribution remained regulated monopolies. This makes the benefits of demand response programs difficult to aggregate and to justify to regulators, who are focussed on price and rates of return on capital. The electricity regulators in the USA are far more inclined to permit, or even mandate, expenditure on customer-based energy efficiency and demand response programs;
• Very few utilities in Australia are large enough on their own to justify the cost of developing unique ‘end-to end’ systems from the control room to the appliance, unlike the USA, where many utilities are large enough to do this.
Although there was extensive contact with US utilities and vendors of load control systems and equipment, it became apparent that different approaches were needed in Australia.
In early 2005 the then Australian Greenhouse Office (AGO)2 initiated the Australian Household Electricity Load-Management Platform (A-HELP) project. The aim of the project was to build a large scale, reliable and low cost demand response capability in the household appliance stock, by standardising the main elements, starting from the appliance end.
A-HELP became a framework and a point of focus for a range of projects and activities, not all managed by the AGO. During 2005 a large number of organisations became involved, including the principal manufacturers and importers of air conditioners and their industry association, the operators of electricity distribution networks and their industry association, home automation system suppliers, professional organisations, university departments and research organisations.
Many of these stakeholders were already aware of and working on peak load management, but had not previously been able to identify or engage with all the other stakeholders. After a series of informal meetings, the AGO referred the matter to the national standards-setting body, Standards Australia. In January 2006 Standards Australia formed a new committee (designated EL-054, Remote Demand Management of Electrical Products), which in April 2007 published AS 4755-2007, Framework for demand response capabilities and supporting technologies for electrical products.3
The objective of this Standard is ‘to provide a framework to concisely describe the capabilities of electrical products to alter their electricity demand in response to information originating from outside the immediate user environment. The likely application of such a demand response framework is to assist energy policy makers, electricity supply utilities or demand response aggregators to plan and implement demand response programs. A common framework is necessary to allow effective consultation between the parties involved (electricity suppliers, electrical product suppliers, metering and control equipment suppliers, consumers and market regulators) in the course of developing demand response programs.’[6]
The standard adopts a three part framework, covering the ‘Remote Agent’ (which is usually the energy utility, but could be an intermediary such as a demand response aggregator), a ‘Demand Response Enabling Device’ (DRED) and the Electrical Product’ (EP). The DRED is actually a set of
2 Following a change of Government in late 2007 the energy efficiency programs of the AGO were reorganised as part of the Commonwealth Department of the Environment, Water, Heritage and the Arts (DEWHA).
3 Now that this it become a mainstream electricity utility and standards issue the ‘A-HELP’ designation has been dropped in
favour of, simply, ‘demand response’.
276

capabilities and functions, which may be located in a separate physical component, or incorporated into the Electrical Product itself, the electricity meter or some other device.
During the Standards development process it quickly became apparent that there are many possible pathways and protocols for communicating between the Remote Agent and the DRED, including wireless, power line carrier (PLC) and internet-based options. There were (and still are) many views on which of several existing standards to adopt, or indeed whether it is necessary to adopt standards at all, beyond specifying a core set of message requirements. The issue was further complicated when the Australian State and Territory governments agreed on a national rollout of ‘smart’ electricity meters, which among other benefits are intended to facilitate the development of demand response and to serve as portals to home area networks (HANs).
The Standards group decided to disentangle these issues by first developing a standard interface between air conditioners and DREDs, so air conditioner manufacturers could begin to introduce demand response-capable products without waiting for resolution of the ‘upstream’ issues. This interface is defined in AS 4755 Part 3.1: Interaction of demand response devices and electrical products - Operational instructions and connections for air conditioners.[7] Figure 2 illustrates the parts of the demand response standards, both existing (outlined in green) and planned (orangeand red).
Figure 2. Existing and planned parts of the Demand Response standard AS4755.
The AS 4755.3.1. Standard Interface
The interface consists of four terminals located under a secure access panel on the compressor (outdoor) unit of the air conditioner. The terminals could be in the form of four screwed connectors or a standard RJ45 socket (in which 4 of the 8 available connector pins are used). The connections are intended for three low voltage DC relays from the DRED and one common return. The electrical resistances, capacitances, current and voltage limits of the connections are all specified.
Remote agent
DREDAir
Conditioner DRM 1,2,3
Functional
Physical
AS 4755.1
AS 4755.3.1AS 4755.2
ProprietaryControls
ProprietaryControls
ProprietaryControls
??
AS 4755.3.3
AS 4755.3.2 Swimming Pool Pump Controls
Waterheaters
ProprietaryControls
277

• If relay 1 is closed, the air conditioner operates in demand response mode 1(DRM 1), in which the compressor remains off until the relay opens again, although fans can continue to operate. This is intended for simple air conditioners where the DRED controls the cycling;
• If relay 2 is closed (DRM 2), the air conditioner continues to cool (or heat), but the electrical energy used must be no more than 50% of what would be used if it were operating at the full rated cooling or heating capacity. This is intended for inverter drive units with their own control logic, which are free to optimise operation in any way, provided it meets the DRM parameters;
• If relay 3 is closed (DRM 3), the air conditioner operates as in DRM2, except that the energy use limit is 75% rather than 50%.
This arrangement reduces the risks and uncertainties for parties on both sides of the interface. It places the point of initiating, controlling, possibly over-riding and then terminating a ‘demand response event’ outside the air conditioner, and greatly simplifies the technical issues which manufacturers must resolve before their products can participate in utility demand response programs.
From the utility’s viewpoint, the final connection to the appliance is usually the most expensive part of setting up a demand response program, so the introduction of a standard gives an assurance that all new air conditioners with the interface will connect and operate as intended, without the risks of malfunction or non-response that are all too common when existing air conditioners are connected to demand response systems.
As Figure 2 indicates, work is now starting on a standard interface for electric water heaters, so they too can be instructed to switch off or to operate at reduced power during demand response events. Many electric storage water heaters in Australia are already connected to ‘controlled’ tariffs, where the utility provide energy to the heating element for part of the day only – traditionally for about 8 hours overnight on the ‘off-peak’ tariff, or for all but the afternoon peak period on the ‘extended hours’ tariff. As the older timeclock and power line carrier control systems near the end of their useful lives it is envisaged that the peak load management of electric water heaters (including solar-electric and heat pump types) will migrate to the new DRED-demand response platform. In fact, the instruction set may end up being identical to the three demand response modes for air conditioners. A similar interface for swimming pool pump controllers is also planned.
Work has also started on what may be the most technically demanding part of the standard: the functional specifications for the DRED and its communications with the Remote Agent (shown as AS 4755.2 in Figure 2).
The current situation
When air conditioners, peak loads, blackouts and demand response first became public issues in 2004, the press coverage was either skeptical or negative. Some articles had deadlines such as ‘Big Brother will control your air conditioner’. This made energy ministers and officials understandably nervous. Five years on, there seems to be a new maturity in the debate, brought about by several factors.
There have now been several large scale utility trails of air conditioner demand response in Adelaide, Perth, Sydney, Brisbane and Townsville, each involving hundreds and up to thousands of customers. These have shown that customers can be persuaded to join the trials, often through a sense of civic duty rather than financial reward, once they understand the issues. The trials have also shown that demand response events on peak load days do lead to significant reductions in demand, without excessive (or indeed noticeable) impact on the comfort levels of participants.[8] People were often unaware that their air conditioners had been cycled, for up to 15 mins off out of every hour.
Politicians have also seen that the utilities are able to engage their customers and deal with the occasional (but inevitable) problems without negative political consequences.
Another new factor is the gradual move from flat tariffs to time of use (TOU) electricity prices, which vary over the cycle of the day and from workdays to weekends. As utilities roll out time of use meters, more customers are choosing (or being required) to go to these tariffs, although in some areas the TOU meter is still read as if it were an old-style interval meter, and flat rate tariffs still apply. Critical
278

peak prices (CPP), which can be five to ten times as high as the year-round average on, say, 10 days each year, are also being trialled.
Customers on these tariffs only benefit if they are aware when high price periods occur, which needs special advance notification in the case of CPP, and are able to respond by reducing their load. They may not be at home, or may not notice when price changes are indicated by in-home displays. Even if they notice, they may not know what appliances to switch off or turn down, or when faced with the decision may opt to leave settings as they are.
Historically, air conditioner users have not faced the costs of their load on the electricity system. Those on TOU and CPP prices, still a minority, will now at least face a price signal and, if they fail to respond, will return more revenue and make a greater contribution to future investments in infrastructure. However, this alone will not address:
• The desire of customers to be able to respond effectively to the price signals, without needing to be home, to personally monitor the prices and to make on the spot decisions; and
• The need for network system managers to be have another option to manage extreme system-wide peaks or emergencies, short of uncontrolled load shedding.
Automated demand response can address these issues. Utilities and their customers will be free to contract either direct load control (eg where the DRED activates DRM1 whenever the Remote Agent signals) or price-mediated response. The DRED could be pre-configured to activate DRM1, DRM 2 or DRM3 at selected electricity price points, or if it controls more than one electrical product it could be pre-configured with preferences so the load of least value to the customer will be curtailed first. Since participation would be voluntary, customers could opt out of the program and pay higher tariffs if they wished – although whether they were able to opt out of individual demand response events while they were still participants is, again, up the program design. In case of a system emergency, all preferences can be over-ridden.
Future electricity prices will also be influenced by the cost of carbon. The Australian Government is committed to introducing a ‘cap and trade’ Carbon Pollution Reduction Scheme (CPRS) no later than 2010.[9] As electricity generators will have to purchase permits in proportion to the CO2-intensity of their output, this will influence the prices they bid into the wholesale market. The retail price of electricity should therefore vary with the weighted carbon-intensity of generation over the cycle of each day. Customers could choose to respond to price periods caused by high carbon-intensity – if not individually, then by contracting with demand response aggregator who offers control strategies sensitised to carbon intensity (ie energy price) rather than network constraints (ie transmission and distribution price).
While issues such as these were restricted to professional and utility circles just five years ago, public debates about peak demand, the enormous capital expenditure programs which networks are planning (which will flow through to tariffs) and the greenhouse question have greatly raised the awareness and sophistication of many electricity users – household as well as business – so the demand response interface standard has come at exactly the right time.
A consortium of electricity network operators has now been formed to encourage the air conditioning industry to introduce models which have the standard interface. The members of the consortium operate distribution networks in Perth, Adelaide, Sydney, Brisbane, central Queensland and Melbourne, supply several million households and constitute a large potential market for equipment suppliers.
The consortium is trying to motivate air conditioner manufacturers to supply AS4755.3.1-capable products in their areas, to create a critical mass for rolling out DRED-based communications systems.. The manufacturers, for their part, need a commercial incentive to supply these products. As many models are made or designed outside Australia, local suppliers need to convince their head offices to equip models with the interface, which would in many cases simply provide a new physical point of access to capabilities that are already in the control software.
279
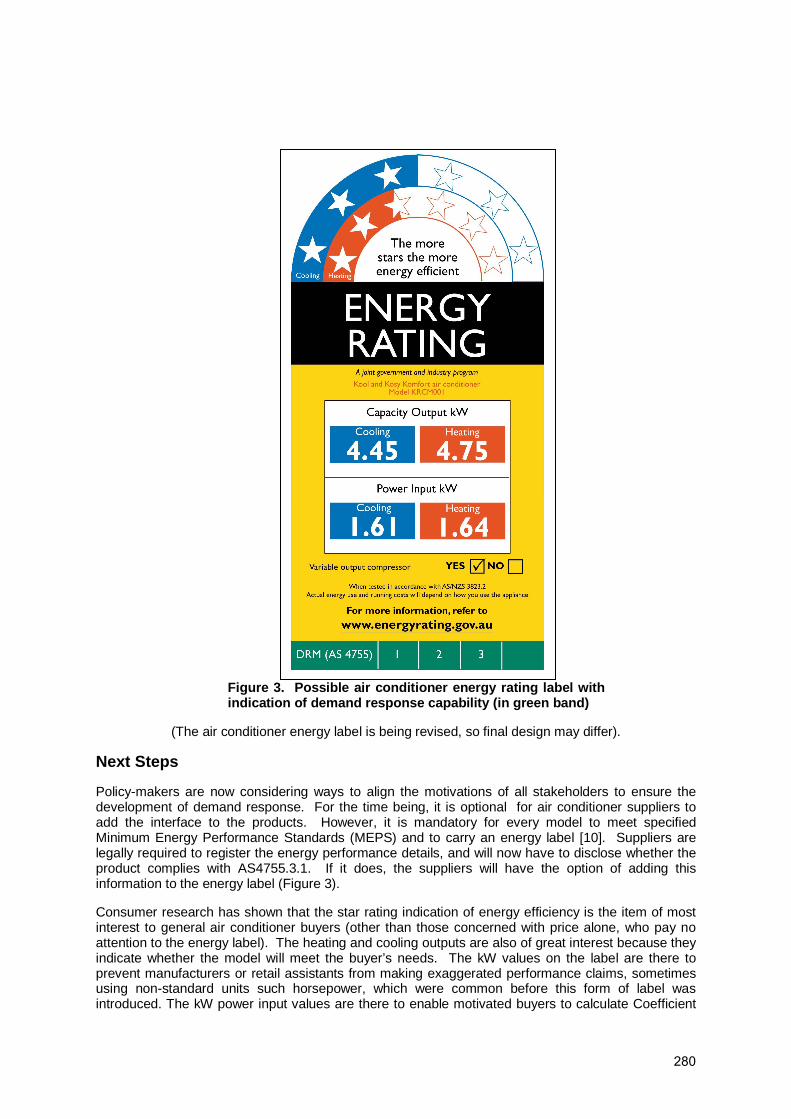
Figure 3. Possible air conditioner energy rating label with indication of demand response capability (in green band)
(The air conditioner energy label is being revised, so final design may differ).
Next Steps
Policy-makers are now considering ways to align the motivations of all stakeholders to ensure the development of demand response. For the time being, it is optional for air conditioner suppliers to add the interface to the products. However, it is mandatory for every model to meet specified Minimum Energy Performance Standards (MEPS) and to carry an energy label [10]. Suppliers are legally required to register the energy performance details, and will now have to disclose whether the product complies with AS4755.3.1. If it does, the suppliers will have the option of adding this information to the energy label (Figure 3).
Consumer research has shown that the star rating indication of energy efficiency is the item of most interest to general air conditioner buyers (other than those concerned with price alone, who pay no attention to the energy label). The heating and cooling outputs are also of great interest because they indicate whether the model will meet the buyer’s needs. The kW values on the label are there to prevent manufacturers or retail assistants from making exaggerated performance claims, sometimes using non-standard units such horsepower, which were common before this form of label was introduced. The kW power input values are there to enable motivated buyers to calculate Coefficient
280
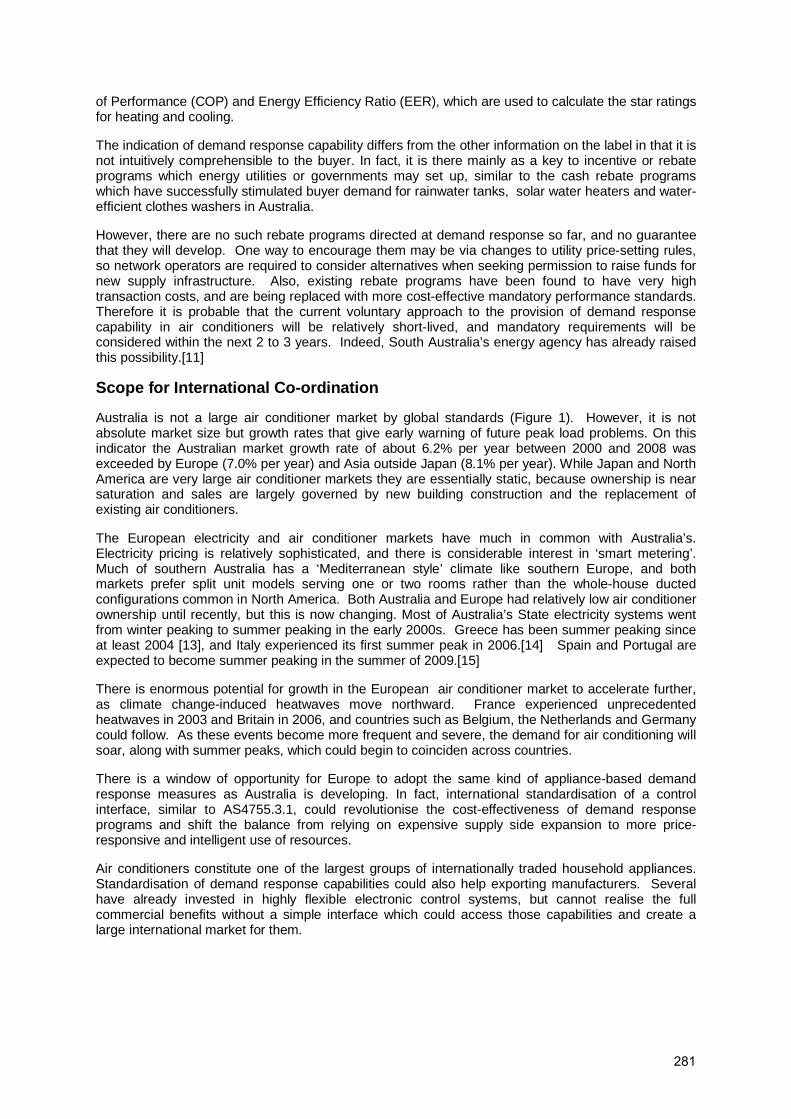
of Performance (COP) and Energy Efficiency Ratio (EER), which are used to calculate the star ratings for heating and cooling.
The indication of demand response capability differs from the other information on the label in that it is not intuitively comprehensible to the buyer. In fact, it is there mainly as a key to incentive or rebate programs which energy utilities or governments may set up, similar to the cash rebate programs which have successfully stimulated buyer demand for rainwater tanks, solar water heaters and water-efficient clothes washers in Australia.
However, there are no such rebate programs directed at demand response so far, and no guarantee that they will develop. One way to encourage them may be via changes to utility price-setting rules, so network operators are required to consider alternatives when seeking permission to raise funds for new supply infrastructure. Also, existing rebate programs have been found to have very high transaction costs, and are being replaced with more cost-effective mandatory performance standards. Therefore it is probable that the current voluntary approach to the provision of demand response capability in air conditioners will be relatively short-lived, and mandatory requirements will be considered within the next 2 to 3 years. Indeed, South Australia’s energy agency has already raised this possibility.[11]
Scope for International Co-ordination
Australia is not a large air conditioner market by global standards (Figure 1). However, it is not absolute market size but growth rates that give early warning of future peak load problems. On this indicator the Australian market growth rate of about 6.2% per year between 2000 and 2008 was exceeded by Europe (7.0% per year) and Asia outside Japan (8.1% per year). While Japan and North America are very large air conditioner markets they are essentially static, because ownership is near saturation and sales are largely governed by new building construction and the replacement of existing air conditioners.
The European electricity and air conditioner markets have much in common with Australia’s. Electricity pricing is relatively sophisticated, and there is considerable interest in ‘smart metering’. Much of southern Australia has a ‘Mediterranean style’ climate like southern Europe, and both markets prefer split unit models serving one or two rooms rather than the whole-house ducted configurations common in North America. Both Australia and Europe had relatively low air conditioner ownership until recently, but this is now changing. Most of Australia’s State electricity systems went from winter peaking to summer peaking in the early 2000s. Greece has been summer peaking since at least 2004 [13], and Italy experienced its first summer peak in 2006.[14] Spain and Portugal are expected to become summer peaking in the summer of 2009.[15]
There is enormous potential for growth in the European air conditioner market to accelerate further, as climate change-induced heatwaves move northward. France experienced unprecedented heatwaves in 2003 and Britain in 2006, and countries such as Belgium, the Netherlands and Germany could follow. As these events become more frequent and severe, the demand for air conditioning will soar, along with summer peaks, which could begin to coinciden across countries.
There is a window of opportunity for Europe to adopt the same kind of appliance-based demand response measures as Australia is developing. In fact, international standardisation of a control interface, similar to AS4755.3.1, could revolutionise the cost-effectiveness of demand response programs and shift the balance from relying on expensive supply side expansion to more price-responsive and intelligent use of resources.
Air conditioners constitute one of the largest groups of internationally traded household appliances. Standardisation of demand response capabilities could also help exporting manufacturers. Several have already invested in highly flexible electronic control systems, but cannot realise the full commercial benefits without a simple interface which could access those capabilities and create a large international market for them.
281
Figure 4. Estimated global air conditioner sales by region, 2000-2008
Historical data to 2003 and projections to 2008 from [12]
Conclusions
Australia started to shift from moderate to high air conditioner ownership in 1999, and this change is now irreversible. It took about five years for air conditioners to come to dominate electricity system peaks on extreme summer days, to the extent of causing load shedding and driving the infrastructure investment planning of the network operators. It has taken another five years to develop a potential alternative way to manage this through demand response, not just for air conditioners but for other large household electricity loads. Whether this can be deployed on a large scale on a voluntary basis will become apparent over the next year to two. If not, mandatory approaches could be considered.
As several European and Asian countries are experiencing conditions which have led and will lead to air conditioners peak load stress on their electricity supply systems, adoption of internationally harmonised demand response standards would be extremely valuable.
References
[1] Wilkenfeld G. Building Demand Response Capability into Appliances: A-HELP in difficult times. Proc. of the International Energy Efficiency in Domestic Appliances & Lighting (EEDAL) Conference ‘06, London, 21-23 June.
[2] Australian Bureau of Statistics. Environmental Issues: Energy use and conservation, Australia, 4602.0.55.001, March 2008.
[3] http://www.bom.gov.au/announcements/media_releases/climate/change/20090105.shtml
[4] Australian Government Bureau of Meteorology, Special Climate Statement 17: The exceptional January-February heatwave in south-eastern Australia, 4 February 2009. Accessible at: http://www.bom.gov.au/climate/current/statements/scs17c.pdf
[5] George Wilkenfeld and Associates. A National Demand Management Strategy for Small Air Conditioners: the Role of the National Appliance and Equipment Energy Efficiency Program (NAEEEP), for the Australian Greenhouse Office, November 2004, available at http://www.energyrating.gov.au/library/details200422-ac-demandmanagement.html
[6] Australian Standard AS 4755-2007, Framework for demand response capabilities and supporting technologies for electrical products, . Available for purchase from Standards Australia at: http://infostore.saiglobal.com/store/. Type ‘AS’ and ‘4755’ into the search bar.
0
5,000
10,000
15,000
20,000
25,000
30,000
35,000
40,000
2000 2001 2002 2003 2004 2005 2006 2007 2008
Th
ou
san
ds
Asia (excl. Japan)
North America
Japan
Europe
Central & South America
Middle East
Africa
Oceania
Actual Projected
282
[7] Australian Standard AS 4755.3.1-2008, Demand response capabilities and supporting technologies for electrical products, Part 3.1: Interaction of demand response enabling devices and electrical products-Operational instructions and connections for air conditioners. Available for purchase from Standards Australia at: http://infostore.saiglobal.com/store/. Type ‘AS’ and ‘4755’ into the search bar.
[8] Western Power. Nedlands Direct Load Control Project: Interim Report, Perth, May 2008.
[9] Carbon Pollution Reduction Scheme: Australia’s low carbon future, December 2008, available at http://www.climatechange.gov.au/whitepaper/index.html
[10] http://www.energyrating.gov.au/
[11] http://www.energyrating.gov.au/pubs/2009-ac-day1-denlay1.pdf
[12] Japan Refrigeration and Air Conditioning Industry Association data, downloaded 31 July 2006
[13] http://vdn-archiv.bdew.de/news_2004_peak_load_2005_07_28.asp
[14] http://www.industrie.gov.tn/fr/projetelmed/images/pdf/10_Italian_market.pdf
[15] Prof. Anibal de Almeida, Personal Communication, February 2009
283
Standardization of Power Related Energy Consulting
Monika Löber
Deutsche Energie-Agentur GmbH (dena) – German Energy Agency
Abstract
The German nationwide campaign “Initiative EnergieEffizienz – energy efficiency in private households” aims at contributing to the energy efficient use of electricity in 39 million households by raising public awareness on this issue. The project by the German Energy-Agency and its partners addresses key topics of domestic power consumption –reduction in energy consumption of consumer electronics and IT-equipment, energy efficient high quality lighting and energy efficiency in white goods sector. The key message: intelligent purchase decisions and energy efficient use of electric appliances help to avoid unnecessary energy consumption.
One of the focal points of Initiative EnergieEffizienz is the qualified power related energy consulting at points of sale (POS). To assure high standard of consultants’ skills, content and results of the personal consultations, German Energy-Agency has recently worked out a set of defined criteria which are constantly monitored. By co-operating with a selected number of professional energy consultants, a steady quality level is being kept throughout Germany. Moreover, the campaign provides specific materials, i.e. brochures, check-lists, guidelines and tools, to support and further standardize the consultations.
At the conference, the scale of activities by Initiative EnergieEffizienz, especially at the point of sale, will be outlined. New quality standards of power related energy consulting and reliable mechanisms to assure them even with significant numbers of consultations will be presented. First experiences with set standards will be described.
Initiative EnergieEffizienz
The nationwide campaign “Initiative EnergieEffizienz – energy efficiency in private households” aims at contributing to an energy efficient use of electricity in 39 million German households. Since 2002 the campaign has been raising public awareness on this issue. The project by the German Energy Agency and its partners, the energy companies EnBW, E.ON, RWE, Vattenfall Europe and Federal Ministry for Economics and Technology (BMWi), addresses key topics of domestic power consumption: reduction in energy consumption of consumer electronics and IT-equipment, energy efficient high quality lighting and energy efficiency in domestic appliances. The key message – intelligent purchase decisions and energy efficient use of household equipment help to avoid unnecessary energy consumption.
One of the campaign’s main pillars is press and public relations. This focus enables to set the topic on Germany’s public agenda and to get basic or detailed information through to consumers. Further activities include an internet site with extensive information and several interactive tools for consumers and stakeholders, exhibitions, contests and promotions. An exhibition on energy efficiency is shown regularly in shopping malls, museums or advice centres. By such activities, people can get involved personally and actively with the “low interest topic” energy efficiency - a necessary step to make them change their habits and attitudes.
As young people are top users of IT-equipment and consumer electronics some activities aim directly at teenagers and students. For example, a jump and run computer game called PowerScout was developed – it combines action, challenge and useful background information on stand-by losses. A design contest for luminaries was organized to enhance students of product and industrial design to develop concepts of attractive lighting with efficient fluorescent lamps. An energy efficiency contest in students’ residential homes contributed to reduce the energy consumption by overall 6% in a specific period compared with the homes’ power consumption the year before.
Focal point of Initiative EnergieEffizienz is engaging the retail of electric and electronic equipment in order to improve its advisory skills concerning energy efficiency. The campaign’s up-to-date information materials are therefore being used by retailers at the point of sale. Promotion activities
284

and power related energy consulting in big department stores, do-it-yourself stores or discounters have been very successful in providing direct information to consumers.
What did the campaign achieve so far? Nationwide approx. 8.500 electric and electronic retailers, department stores, do-it-your-self stores and discounters, and over 1.500 centres and institutions are committed within a German-wide network of the Initiative. The partners of Initiative EnergieEffizienz use the campaign’s material to inform their customers about energy efficient equipment and lamps and how to use power in a clever and efficient way.
Sample of Brochures Distributed by Initiative EnergieEffzienz
Deutsche Energie-Agentur GmbH (dena) More than 1,9 million brochures were distributed by customer advisors at points of sale and during the campaign’s promotion activities in 2008. Around 8 million brochures found their way to consumers since October 2002. The campaign is also taking the challenge to address the low-interest topic by intensive press relations: From the campaign’s beginning to December 2008 around 12.050 articles have been published in newspapers and magazines, TV & radio.
Overall, German Energy Agency was very successful in building up a network of retailers and consumer advice centres co-operating with the Initiative EnergieEffizienz. The campaign achieved a high press coverage despite the fact that power efficiency is still a topic of “low interest”. It also contributed to changes in public awareness and attitudes, according to a survey carried out by forsa and showing developments between 2002 and 2008:
Recognition of the EU Energy Label + 14% Use of switched socket extension leads + 22% Appreciation of cost-saving characteristics of compact fluorescent lamps (CFL) + 11% Knowledge about the variety of CFL + 25% Implementation of energy saving measures + 15% (surveyed since 2005) Qualified Power Related Energy Consulting at the Point of Sale
Since 2002, Initiative EnergieEffizienz has been working on improving the quality of information given at the point of sale. One strategy has been to provide specific information material and training to sales people. Initiative EnergieEffizienz works out helpful lines of reasoning, thus enabling retailers to focus on energy efficiency as a main quality attribute. Another way is to organize power related promotional activities at POS by means of showing positive effects on customer loyalty and turnover by addressing energy efficiency. In the past years, German Energy Agency has organized such activities on a large scale in co-operation with small retailers and big department stores such as Karstadt, IKEA, Saturn and Media Markt. More than 13.000 people took the chance to inform
285

themselves on their individual power saving potential during POS activities of Initiative EnergieEffizienz in 2008.
With rising numbers, standardization of content, duration and results of the energy consultancy carried out at POS became a challenge. To improve the outcome and to keep this unique standard within the German-wide activities of Initiative EnergieEffizienz, German Energy Agency has newly developed crucial criteria to standardize and qualify its consultancy. These criteria include the consultants’ skills, the specific content of the advisory dialogue, requirements regarding its results and the way they are presented to consumers as well as a consistent and more thorough evaluation of the activities. Accompanying materials, such as a printed manual and a software, help to structure the dialogue and support the content’s quality. Providing additional and free information material to the customers, for example check-lists, brochures or small paper calculators which help to estimate saving potentials of clever buying decisions, contribute to the sustainability of the consultation.
Skills
The power related energy consultancy is implemented by a qualified energy consultant. In order to secure the consultant’s technical skills and experience, dena works exclusively with energy consultants who match BAFA-criteria for government funding of energy consulting in private households (“Vor-Ort-Beratung”). The Federal Office of Economics and Export Control (BAFA) is a superior federal authority subordinated to the Federal Ministry of Economics and Technology (BMWi). With its criteria BAFA sets a unique standard for energy consulting, with no comparable official standard so far.
Building on his or her technical skills and experience, German Energy Agency trains its consultants by means of online-based trainings. They focus energy efficient facts around lighting, domestic appliances, IT and consumer electronics, strengthen argumentation and consulting skills by giving examples of typical sales dialogues, and do away with consumers’ provisos and misinformation. The online-training closes with a test.
Content and duration
The campaign’s power related consultation is highly standardized in content, length and scale. Typically it takes around 20 minutes – a length necessary to get and place all crucial information on the consumer’s needs – and works with several modules according to a manual or a software. Both the manual and the software are provided by Initiative EnergieEffizienz and function as guidelines for consulting. They are consistent with the campaign’s other materials, e.g. brochures, calculation tools etc.
286
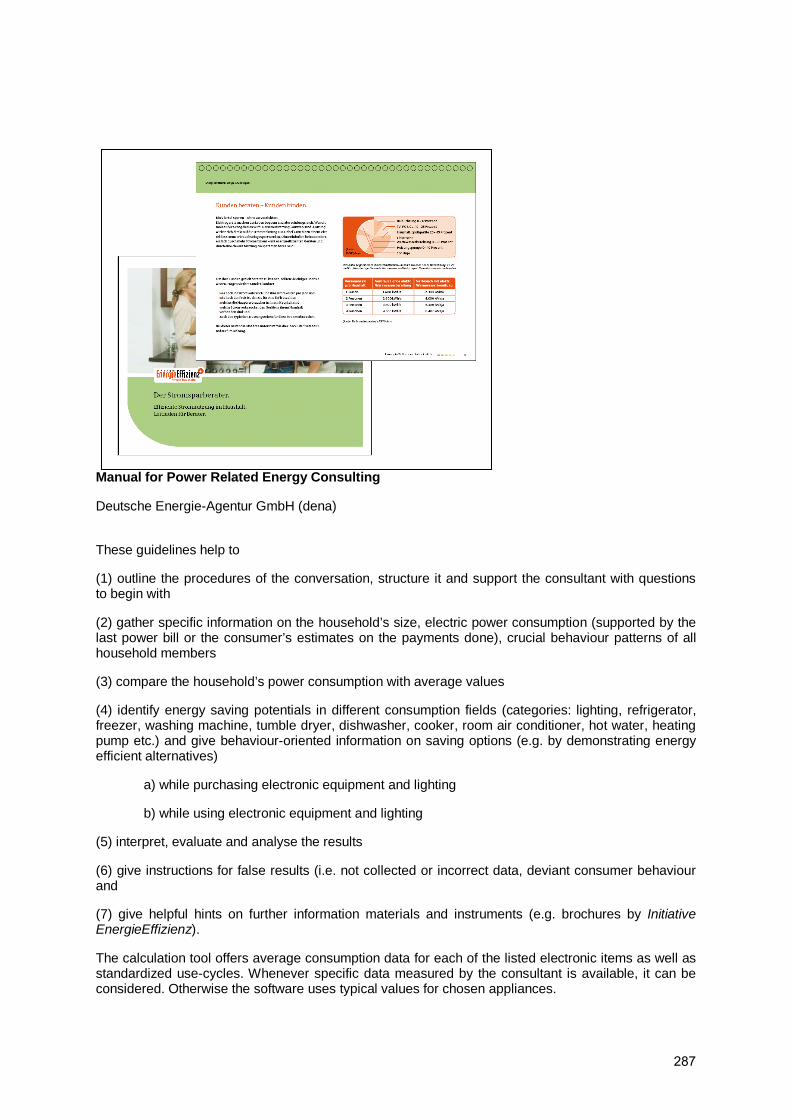
Manual for Power Related Energy Consulting
Deutsche Energie-Agentur GmbH (dena)
These guidelines help to
(1) outline the procedures of the conversation, structure it and support the consultant with questions to begin with
(2) gather specific information on the household’s size, electric power consumption (supported by the last power bill or the consumer’s estimates on the payments done), crucial behaviour patterns of all household members
(3) compare the household’s power consumption with average values
(4) identify energy saving potentials in different consumption fields (categories: lighting, refrigerator, freezer, washing machine, tumble dryer, dishwasher, cooker, room air conditioner, hot water, heating pump etc.) and give behaviour-oriented information on saving options (e.g. by demonstrating energy efficient alternatives)
a) while purchasing electronic equipment and lighting
b) while using electronic equipment and lighting
(5) interpret, evaluate and analyse the results
(6) give instructions for false results (i.e. not collected or incorrect data, deviant consumer behaviour and
(7) give helpful hints on further information materials and instruments (e.g. brochures by Initiative EnergieEffizienz).
The calculation tool offers average consumption data for each of the listed electronic items as well as standardized use-cycles. Whenever specific data measured by the consultant is available, it can be considered. Otherwise the software uses typical values for chosen appliances.
287
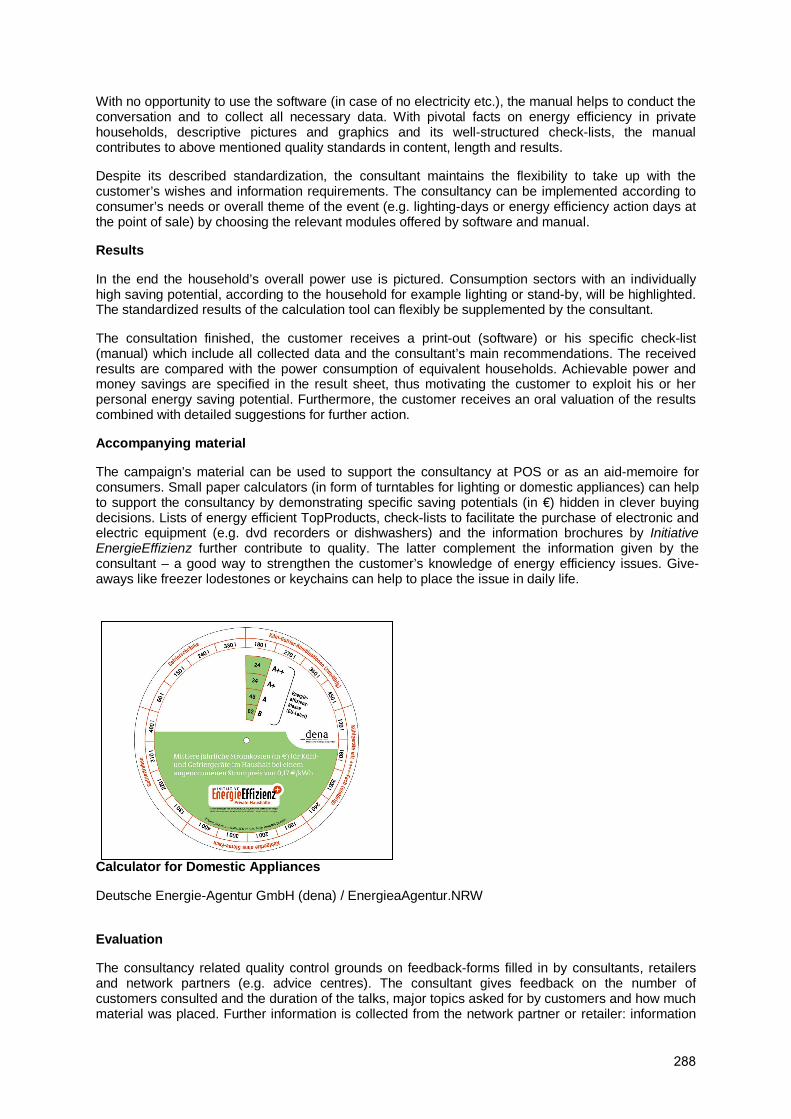
With no opportunity to use the software (in case of no electricity etc.), the manual helps to conduct the conversation and to collect all necessary data. With pivotal facts on energy efficiency in private households, descriptive pictures and graphics and its well-structured check-lists, the manual contributes to above mentioned quality standards in content, length and results.
Despite its described standardization, the consultant maintains the flexibility to take up with the customer’s wishes and information requirements. The consultancy can be implemented according to consumer’s needs or overall theme of the event (e.g. lighting-days or energy efficiency action days at the point of sale) by choosing the relevant modules offered by software and manual.
Results
In the end the household’s overall power use is pictured. Consumption sectors with an individually high saving potential, according to the household for example lighting or stand-by, will be highlighted. The standardized results of the calculation tool can flexibly be supplemented by the consultant.
The consultation finished, the customer receives a print-out (software) or his specific check-list (manual) which include all collected data and the consultant’s main recommendations. The received results are compared with the power consumption of equivalent households. Achievable power and money savings are specified in the result sheet, thus motivating the customer to exploit his or her personal energy saving potential. Furthermore, the customer receives an oral valuation of the results combined with detailed suggestions for further action.
Accompanying material
The campaign’s material can be used to support the consultancy at POS or as an aid-memoire for consumers. Small paper calculators (in form of turntables for lighting or domestic appliances) can help to support the consultancy by demonstrating specific saving potentials (in €) hidden in clever buying decisions. Lists of energy efficient TopProducts, check-lists to facilitate the purchase of electronic and electric equipment (e.g. dvd recorders or dishwashers) and the information brochures by Initiative EnergieEffizienz further contribute to quality. The latter complement the information given by the consultant – a good way to strengthen the customer’s knowledge of energy efficiency issues. Give-aways like freezer lodestones or keychains can help to place the issue in daily life.
Calculator for Domestic Appliances
Deutsche Energie-Agentur GmbH (dena) / EnergieaAgentur.NRW
Evaluation
The consultancy related quality control grounds on feedback-forms filled in by consultants, retailers and network partners (e.g. advice centres). The consultant gives feedback on the number of customers consulted and the duration of the talks, major topics asked for by customers and how much material was placed. Further information is collected from the network partner or retailer: information
288

regarding the consultant and the quality of his or her consultancy, the overall duration of consultancies carried out, an estimate on the satisfaction of customers etc.
Conclusion
Nevertheless Initiative EnergieEffizienz works with a significant number of energy consultants, thanks to described criteria a steady quality level of the campaign’s power related consumer consultancy is being kept throughout Germany. Several thousand power related energy consultations are going to be conducted this year. The dena-developed quality standard makes sure consumers get a thorough and meaningful consultation which eventually will lead to action and contribute to reduction of power consumption in Germany.
289
Working with retailers to push beyond EuP compliance: Some different approaches used, and options for international strengthening
Jeremy Tait
Director, Tait Consulting Limited
Abstract
This paper presents the case for how retailers can use the standards and methodologies developed for the Eco-design (EuP) directive to shift the field of choice for consumers further and faster than regulation alone. For retailers, the proposed approach reduces commercial risks, shows market leadership and reassures their increasingly cost and eco-conscious customers. Retailer action has already proven its power in the market with white goods, and the diverse case studies outlined in the paper. EuP brings a new beginning for free market competition on energy issues: The paper proposes practical ways in which action by governments, energy agencies and others could help retailers to raise the standards of appliances they sell to the benefit of all, including consumers. By working with retailers, their major buying power and consumer influence can be applied, and governments can encourage supply chains along the path to be set at COP 15 in December 2009.
The author has worked with major UK retailers as manager of the UK Market Transformation Programme for five years, and more recently working independently for the Energy Saving Trust. The views expressed in this paper are those of the author and are not endorsed by other organizations mentioned. Comment was sought from the organizations as part of research in many cases.
1. Aims of the paper
This paper has three main aims:
1. To present the case for working with retailers to transform product markets, collating examples of some approaches employed so far.
2. To propose options for practical international collaboration between those working with retailers (or interested in doing so), to consolidate a body of knowledge and improve harmonization and effectiveness.
3. To propose some specific ideas for strengthening the existing European voluntary actions by retailers.
This paper does not assume to provide guidance on designing retailer initiatives, but collates anecdotal and other evidence and options with a view to stimulating debate. Expertise and experience exists across many member states, in the US and elsewhere. This paper concludes with some practical options aiming to get experts from diverse markets working together, so that they can help retailers to more effectively transform product markets.
2. The Challenge
Aspirations for COP 15 in Copenhagen require non-linear change. Whilst EuP provides an excellent basis for minimum standards, the market can deliver more - and in many areas already has (see later). In addition, regulation is slow and struggles to deal with fast-developing goods; market led mechanisms could deliver faster and more ambitious improvement.
3. The external situation
Many initiatives with retailers have been tried over the years with varying success. It is arguable, however, that a number of factors are coinciding now that means rapid progress can be made:
290

Consumers are increasingly aware of climate change and wider issues of sustainability. Retailers and manufacturers are responding by developing product eco-profiles and offering more consumer information.
Energy efficient and sustainable products are high on national, regional and international political agendas. For example, the policies of the UK Sustainable Development Commission, the European Commission, the UN CSD, governments and NGOs around the world all recognize the need to develop and to promote higher standards.
Retail market leaders are making Corporate Responsibility commitments and competing to deliver more sustainable products. There are some great examples of retailers making public commitments on product energy efficiency and sustainability: Marks & Spencer with its Plan A1; Tesco with its Sustainable Consumption Institute2; Quelle with its environmental strategy3; and the WWF Climate Savers4 programme operates in a number of countries and includes retail. The opportunity is to support the market leaders, to widen the scope of these commitments and to encourage fair competition.
Retailers have significant buying power. Concentration of market share within a few major chains means that the buying power of major national and multinational retailers is now a significant force in markets. 60% of the televisions and other main consumer electronics goods are sold into the UK by 15 retail chains. Competitive action by key retailers is already helping to raise efficiency standards and to reduce prices in European markets.
Action by a few individuals can change the whole market. In sectors such as televisions and other consumer electronics, less than twenty retailers control half of the UK market. Thus the individuals who edit the buying choices of over half of UK television shoppers could be gathered around one moderately sized table for a discussion on standards. This should be compared to the cost and effectiveness of trying to directly influence the 6 million consumers every year who buy those televisions.
Retailers are trying to understand the implications of EuP – but it’s hard! Retailers need to know the current and future implications of EuP. Most have own brand products that they specify; and due diligence will require them to check that suppliers are delivering compliant branded goods. But even those who are keen to understand what is happening with EuP are finding it hard - reliable information is scarce even amongst those working with the regulations! Uncertainty of the future of energy labeling due to the split vote on TVs and refrigerators5 is adding to concerns.
Retailers need advice on standards well in advance of EuP regulations. Preparations for launch of a product range start at least 12 months ahead with initial discussions on specifications; then detailed specifications, buying trips, catalogues to prepare. And then the product’s shelf life in store, that may be one year or more – giving a two-year horizon. This means that retailers are starting to specify products now that will be affected by regulations currently in draft form, many of which are not yet officially published. Reliable forward-looking advice would help business planning and reduce the commercial risk for retailers.
A European, business-led umbrella for retailer voluntary initiatives (including sustainable products) now exists. The Retailers’ Environmental Action Programme (REAP6) was launched in
1 http://plana.marksandspencer.com/
2 http://www.sci.manchester.ac.uk/
3 http://www.quelle.com/en/responsibility/for-the-environment.html
4 http://www.worldwildlife.org/climate/climatesavers2.html
5 The European Parliament voted in May to support the A to G, plus A-20% / A-40% etc top labels for refrigerators; but rejected the same labeling system for televisions. See http://www.eceee.org/news/news_2009/2009-05-06/
6 http://www.eurocommerce.be/content.aspx?PageId=41456
291
March 2009 as a showcase and information-sharing platform for retailers’ (unilateral & voluntary) initiatives on sustainability (see later).
4. The opportunity: Retailers ‘choice editing’ for energy efficiency
The factors described above coincide to offer current motivation to act. And the preparatory studies for EuP have established for many products a prerequisite means to do so – metrics and market benchmarks to differentiate products on energy efficiency. These provide clear ‘railroads’ leading to more energy efficient and sustainable products. Retailers have the market clout to permanently shift the field of choice offered to consumers towards more sustainable products.
The ‘railroads’, ie the means to rank products - test methodologies and labelling systems - are prerequisites for progress. The study teams have established metrics for measurement of efficiency that give a direction of travel. They have set benchmarks of performance, as way-markers to measure ambition and progress. In many cases this provides the basis for a competitive market on energy efficiency for products that had no consensus on performance nor direction to improvement. These methodologies provide railroads, and Regulations will be traveling along them, pulling the market behind. But vehicles that move faster and further than regulations can travel these same railroads.
Retailers can already offer to consumers products that go beyond future regulatory minimum standards. In most cases such products are already available, often at competitive prices. There is now an opportunity to make energy efficiency of consumer products a routine competitive issue for retailers.
It has been well argued that labeling alone does not transform markets. The UK Sustainable Development Commission (SDC) examined 19 case studies examining the drivers and barriers to ‘mainstreaming more sustainable products’ in its 2006 paper Looking Back, Looking Forward - Lessons in Choice Editing for Sustainability [1]. One of its key conclusions was that “the evidence suggests that the green consumer has not been the tipping point in driving green innovation. Instead, ‘choice editing for quality and sustainability by government and business has been a critical driver in the majority of cases. Manufacturers, retailers and regulators have made decisions to edit out less sustainable products on behalf of consumers, raising the standard for all.” The SDC thus established the phrase ‘choice editing’ to mean shifting the field of choice for mainstream consumers. They describe it as ‘cutting out unnecessarily damaging products and getting real sustainable choices on the shelves’.
Choice editing for energy efficiency can bring benefits to the retailer:
• Brand differentiation through offering reduced energy bills, and reassurance to customers that sustainability issues are being addressed on their behalf (our customers ‘can’t buy wrong’ on environmental issues by shopping here)
• It’s an easy environmental win (compared to grappling with wider sustainability issues)
• Opportunity to ‘up-sell’ on efficiency (leading interested consumers to premium choices)
• Regulatory risk reduction: Getting ahead of regulations, ensuring compliance
• Building profile as a market leader (ie setting standards), not a follower (trying to keep up with them)
• Incontrovertible and quantifiable evidence of progress for corporate social responsibility reporting. For example in-use carbon footprint of products sold, and range audits for percentage meeting certain standards (see range benchmarking below)
• It fulfils consumer expectations that retailers are addressing environmental issues that they care about
• It provides excellent capacity building experience on sustainable procurement for staff, suppliers and supporters, since metrics and benchmarks for energy are now well established
292

(which has taken over ten years). Good preparation for when they start to tackle much more complex sustainability issues.
And for the consumer, benefits include:
• Energy savings, year on year
• Relief from the stress and complexities of understanding environmental labels and sustainability issues.
• Reassurance that their environmental aspirations are being met
But equally there can be benefits for government & agencies investing focus in this area:
• Working with the market to go beyond regulations (in tandem with other approaches)
• Far less costly than trying to influence consumers directly with ‘point of sale’ or other broadcast information
• Government and agencies can focus on developing the robust technical and policy information, and let the retailers apply their marketing muscle and resources to reach out to their customers, branding and promoting the authoritative information that government has supplied.
Examples of retailer initiatives delivering some of these benefits are given later in the paper.
5. Hurdles to be overcome for retailer initiatives
Initiatives with retailers have been tried in the past, with varying degrees of success. And when considering such initiatives for energy using products now, there are hurdles to be overcome in the market. These include:
Parts of the market seem to think that EuP fixes everything, and have moved focus to trying to tackle wider sustainability issues (a considerably higher leap than tackling energy, especially given doubts raised in May 2009 over the suitability of LCA analysis for the task [5]). And yet soundings from retailers and manufacturers would imply that EuP is very far from widely understood, let alone acted upon. And compliance activity has not yet been planned. Energy efficiency of products sold should remain a focus for action by retailers because: Mitigating climate change requires non-linear improvement; It’s an easy win (compared to overall ‘sustainability’); there is significant scope for further improvement beyond the minimum standards for many products; success in this field is quantifiable and reportable (in terms of easily calculated in-use carbon footprint of products sold and range audits for percentage meeting certain standards-see later); as metrics and benchmarks are now established, it provides excellent capacity building training before staff & suppliers tackle more complex sustainability issues.
The economic downturn is displacing environmental concerns. Retailer and consumer enthusiasm for environmental issues may be displaced for some, but market leaders are sticking to their commitments. A Financial Times article in March 2009 [2] quoted Sir Stuart Rose, Executive Chairman of Marks & Spencer: “We are absolutely as committed as we were and we are not backing off [from Plan A]”. The same article quoted research7 taking in 25,000 consumers in nine countries showing that sustainability remains a driver for consumers - just over a third of consumers still ranked it as a very important issue behind unemployment and economic uncertainty. Environmental responsibility can become a differentiator in tough economic times.
Product markets are different in different countries. Even though manufacturers and some retailers operate across several countries, trading conditions, cultural priorities, consumer receptiveness and impact of messaging do vary. Any initiative would have to be locally tailored.
7 Havas Media Intelligence.
293

Retailers would want exclusive support. Information or support is more attractive if it gives a competitive advantage. So influential early adopters should be targeted, and all opportunities to enhance peer pressure to follow suit thereafter exploited (through publicity, public and/or private performance audits etc).
Retailers are not homogenous. Large and small, sales volume versus price margin, value adding verses cut-price, hypermarkets and Internet. Flexibility of approach would be required to tailor messages and support.
If it affects the price, they won’t play ball. Sustainability may be more economic to build into premium product ranges and value adding services; but anecdotal evidence implies that product sectors that have not previously had environmental differentiation (eg labels) before are likely to yield efficiency improvements with little or no price impact. And discount retailers could be targeted with different/lower objectives in mind such as at least reduction of sink markets for poor products.
Retailers don’t seem to want formal agreements. There are some good examples of formal voluntary retailer agreements, such as the Courtauld Commitment (see later) on reduction of packaging waste in the UK8, and the voluntary agreement with many major UK retailers and manufacturers brokered by the Government for phase out of inefficient tungsten filament lamps to a specific timetable9 which is nine months or so in advance of EuP making this mandatory. But retailers are very wary of initiatives that restrict competitive maneuverability: An overt objective of the Eurocommerce REAP initiative (see later) is to avoid the need for formal voluntary agreements between retailers and government10, citing the “need for free competition within market conditions that vary between member states”. However, there is still much scope for unilateral initiatives, rewarded with publicity that helps induce competitive peer pressure to follow suit.
Risk that competition law could preclude formal agreements with retailers. This has been a particular issue for the UK, following evidence that retailers colluded to fix the price of milk11. A subsequent UK Office of Fair Trading report [3] examined how voluntary agreements, particularly in the context of the EuP Directive, could fall foul of European competition law. The report identified that voluntary agreements on product standards are at risk of being anti-competitive mainly through their encouragement of ‘coordinated effects’, which, if intentionally distorting markets with no mitigating social benefits, could be construed as (illegal) collusion. However, it found that as long as economic benefits offset the harms to competition, direct restrictions brought about by a voluntary agreement may be exempted from the prohibitions in competition law. The report goes on to describe mitigating measures for those designing agreements, as well as practical constraints on the way the business of an agreement is conducted with participants to minimize anticompetitive risks. Retailers are advised in the report to satisfy themselves that they comply with the law before entering such initiatives.
6. Types of intervention, and possible roles of Government and agencies
A short review of current and past retailer initiatives (mainly in the UK, but examples abroad were sought and considered) has yielded the following types of intervention that can be lead by Government and agencies in conjunction with business:
8 The Courtauld Commitment is a voluntary agreement between WRAP and major UK grocery organisations that supports less packaging and food waste ending up in household bins. See http://www.wrap.org.uk/retail/courtauld_commitment/.
9 See Defra NEWS RELEASE Ref: 328/07, 27 September 2007.
10 “Retailers do not attempt to harmonise retail environmental actions either across the sector, or across the European Union”; Retailers’ Environmental Action Programme Terms Of Reference, EuroCommerce / ERRT, 3 March 2009.
11 See for example http://news.bbc.co.uk/ a1/hi/business/7132108.stm.
294

• Retailer product range benchmarking against regulatory and market benchmarks, usually as a confidential process of support. (See Energy Saving Trust and TopTen examples below).
• Independent guidance, or training, for retailer buyers. (See Energy Saving Trust and TopTen examples below).
• Independent and authoritative support on consumer messaging, ie how to convey savings to consumers. (See Energy Saving Trust example below).
• Professional design support and encouragement to product specifiers and developers in the supply chain. (See Courtauld Commitment and paint solvent labeling examples below).
• Publication in advance of annual anticipated product energy performance standards expected of the market12. (See Energy Saving Trust and consumer electronics examples below).
• Providing impartial information on EuP and other policies well in advance. (See Energy Saving Trust example below).
• Product endorsement schemes. (See TopTen and Energy Saving Trust examples below).
• Direct consumer information campaigns to underpin campaigns by retailers. (See Energy Saving Trust example below).
• Raising awareness of risks from particularly inefficient products and/or opportunities for significant savings. (See patio heaters example below).
• Recognizing and rewarding success by retailers and suppliers. (See Energy Saving Trust and Patio Heaters examples below).
• Formal agreements, with top level signatories. (See Courtauld Commitment example below).
• Training of sales staff on energy efficiency and labeling (has been undertaken at least by the Energy Saving Trust in the UK, and by Ademe in France).
• Setting priorities for products and issues to address. (See EuroCommerce example below).
This is not an exhaustive list, and the author would welcome additional suggestions.
7. Retailer initiatives illustrating a range of intervention types
Other reports have collated a wide range of excellent choice editing case histories, notably the Sustainable Development Commission reports Looking Back, Looking Forward [1] and I Will If You Will [4]. Some examples of choice editing in practice and retailer initiatives are outlined below. These examples gave rise to the list of intervention types above. Some observations on each by the author are included, to highlight points of relevance to the objectives of this paper.
12 This has been undertaken by UK government through a formal annual product standards consultation process managed via the Market Transformation Programme. See http://www.mtprog.com/cms/whitepaper/.
295

a) UK Energy Saving Trust retailer initiatives
The Energy Saving Trust13 has set out ‘to persuade and assist retail partners to improve the carbon efficiency of their product ranges’. An important part of their strategy is their Energy Saving Recommended endorsement scheme14 for a wide range of consumer appliances. Retailer and manufacturer partners may use the Energy Saving Recommended label on qualifying products that are listed on the scheme website. Criteria generally aim to endorse the top 20% energy-efficient products, and include a range of other product quality issues. This scheme is promoted directly to consumers along with a wide range of related advice and motivational messaging.
The Energy Saving Trust’s retail initiatives aim to engage with the category managers, buyers and environmental / sustainability managers of major retailers to increase the availability of high-efficiency domestic appliances, and particularly promote the use of the Energy Saving Trust’s Energy Saving Recommended scheme. An additional focus has been coaching on the implications of the EuP directive.
The Energy Saving Trust is helping retailers understand how their current product ranges compare to market average, current and likely future minimum standards. And then arming buyers with the knowledge and confidence to negotiate for higher energy efficiency standards.
There are three practical strands to the approach taken to date:
a) Publication of a suite of 12 short guide booklets for retail buyers, one for each main product area (one for each of televisions, refrigerators, domestic lighting, external power supplies etc). the booklets explaining how energy efficiency is measured for the product, and about the relevant regulations and labeling schemes. They also describe technical trends and performance standards to be expected from current products, and savings possible to the consumer and nationally from better products. They each provide benchmarks for poor (bottom 20%), market average, and best practice (top 20%) performance levels. These are provided free of charge as printed copies and PDF files. The content is reviewed at least quarterly to keep up to date with market and regulatory developments.
b) Running workshops for retail buyers to go through the content of the guide booklets in more detail and discuss questions. These workshops are hosted by the Energy Saving Trust and delivered in conjunction with specialists in each product area.
c) Audit / benchmarking of product ranges. This is being piloted as a free service in which the retailer provides a product list with as much energy efficiency information as they have, and the Energy Saving Trust audits the performance data against market average performance benchmarks, and other regulatory or voluntary standards. Benchmarks used include current and draft EuP regulatory minimum standards, ENERGY STAR standards, other international codes and labels.
The Energy Saving Trust works with over a dozen major retailers of domestic appliances and is building links with the independent retail sector. It is further developing its initiatives with retailers to encourage both early adoption of the forthcoming EuP minimum standards, and to ensure that more products are made available at significantly higher levels of efficiency.
The author’s observations from this example that may be of relevance to future initiatives include:
1. Many major retailers are very keen to better understand EuP to ensure compliance
2. Each retailer has different priorities
3. Information given on efficiency will often be used with suppliers 13 The Energy Saving Trust is a UK independent, non-profit making organisation providing impartial information and advice to help people use energy more efficiently, conserve water, reduce waste and make renewable energy sources more accessible. http://www.energysavingtrust.org.uk/
14 http://www.energysavingtrust.org.uk/esr
296

4. Even highly price-conscious retailers have been surprised and concerned when poor efficiency standards are apparent in their range.
b) UK Voluntary Retailer Initiative on Consumer Electronics
The background to this initiative is that in 2006 the UK Department for Environment Food and Rural Affairs (Defra) and HM Treasury jointly proposed that retailers “adopt a policy that ensures certain standards in the products procured and sold”. This was to be a voluntary initiative to deliver more efficient consumer electronics products (chosen above other products as a significant energy consumption risk with scope for savings). Senior management representatives from 10 major UK retailers attended two summits with government Ministers over a period of months. As part of the initiative, retailers were provided with spreadsheet template tool into which they could enter performance criteria for their products. The tool outputs included red or green flags indicating how each product, and the entire sales weighted range, performed against government benchmarks embedded in the spreadsheet. The Energy Saving Trust also offered technical support to the retailers on product standards and consumer messaging. Whilst some of the retailers took part in some product range benchmarking, and awareness of product efficiency issues was raised at the top management and buyer level, no further commitments were made by the retailers. This was at least partly because of the progress at European level with the EuP Directive for consumer electronics, which will deliver a significant part of the initial savings. Furthermore, the retail industry was at the same time developing its own climate change strategy.
The author’s observations from this example that may be of relevance to future initiatives include:
1. Even the motivated retailers need technical support to fully understand the implications of product standards.
2. The stance taken to such initiatives by retailers varies widely, from participative support to extreme suspicion.
3. One-to-one support is necessary to build retailers understanding of their own product range status before they will share data or make any public commitments.
4. Influencing one-to-one may sometimes work better than joint agreements in a competitive environment. It will also help avoid perceptions of collusion.
5. Assessment of the actual benefits and savings to be realised, by both consumers and retailers, are essential before proceeding to ‘greening’ product ranges
c) Swiss retailer initiatives via TopTen
TopTen is a project that offers an endorsement label for the most energy efficient products in Europe and runs a 30 million hits per year website on which they are listed. The TopTen team have set up collaborative agreements with a few retail chains in Switzerland, in which a license is granted to use the TopTen label at point of sale, and the team are helping retail buyers to identify and stock TopTen endorsed products.
d) Solvents labelling for DIY paints, and transformation of the supply chain
The B&Q DIY retail chain demonstrated how retailers can take the lead and transform markets through their campaign on Volatile Organic Compounds (VOCs, solvents) in paints. B&Q helped their customers to choose less damaging paints by leading the development of a clear labelling scheme introduced in 1995. But they also worked with suppliers to ensure availability of effective but low VOC paints in the UK. This involved significant investment by the paint manufacturers. The campaign has been a major success: In the five years to 2003 there was an estimated 21% reduction in VOC content paint and the EU market share of water-based paints rose to 70% [4].
The author’s observations from this example that may be of relevance to future initiatives include:
297

1. This was a long-term campaign, underpinned by a well researched and delivered product label, developed in conjunction with manufacturers15.
e) Voluntary phase out of an iconic ‘bad’ product: The patio heater
Wyvale, a leading the UK garden centre chain, decided in 2007 to stop selling patio heaters, which are portable gas-burning heaters for outdoor use. This was one of a range of actions in Wyvale’s bid to become carbon neutral by 2010. The patio heater was the subject of a number of questions in Parliament around this time, and an NGO16 branded these products “fundamentally insane” for burning gas to heat outside air. A major UK DIY chain, B&Q, followed suit by withdrawing patio heaters from their product range in 2008.
The author’s observations from this example that may be of relevance to future initiatives include:
1. Sometimes, retailers take the view that they do not always have to simply provide what customers want. That same NGO put it more strongly: “the tired old argument that 'you have to give consumers what they want' is running a bit thin."
2. Selecting an iconic product to work on can generate positive press and help lodge an impression in consumers’ minds.
f) Retailers’ Environmental Action Programme (REAP), EuroCommerce / ERRT
EuroCommerce is an international retail trade Federation, and represents retailers and wholesalers to the EU. Together with the European Commission, the European Retail Round Table and two other retail trade groups, EuroCommerce launched the Retailers Environmental Action Programme (REAP) in March 2009. It provides a Retail Forum to share best practice and to identify barriers and opportunities linked to sustainable consumption and production (SCP). The signatories, over 20 major retailers from around Europe, have committed to reduce the environmental footprint of their operations and their supply chains (‘how we sell’), to promote more sustainable products (‘what we sell’) and to better inform consumers on environmental issues (‘how we communicate’). Notably, there is also a Matrix of Action Points [7] and published in association with the programme which is a public list of the unilateral commitments made by individual members under each of those three categories. This Matrix includes a number of specific commitments relating to energy using products including, for example: ‘To sell only energy-saving TV sets. Target: By 2009, 100% of all offered TV sets with stand-by consumption less than 1 watt’ (Quelle).
However, the products part of the draft workplan (the list of technical topics to be addressed in the quarterly forum meetings) specifically avoids inclusion of activities relating to products covered by the EuP Directive, focusing instead on broader sustainability challenges such as fish and timber.
The author’s observations from this example that may be of relevance to future initiatives include:
1. The draft workplan implies that energy-using products are a lower priority and perhaps “dealt with” by EuP.
2. The Forum could provide direct access to interested retailers, to help build capacity to comply with and/or exceed EuP requirements, with a significant collective buying power.
g) The Courtauld Commitment on reduction of packaging waste
The Courtauld Commitment is a voluntary agreement between the Waste and Resources Action Programme (WRAP) and major UK grocery organisations that supports less packaging and food waste ending up in household bins. Its objectives are: To design out packaging waste growth by 2008 (achieved: zero growth); To deliver absolute reductions in packaging waste by 2010; To help reduce the amount of food the nation's householders throw away by 155,000 tonnes by 2010, against a 2008 15 See for example the British Coatings Federation Ltd, http://www.coatings.org.uk/
16 Craig Bennett, climate campaigner at Friends of the Earth, quoted in an article in the Independent newspaper website http://www.independent.co.uk/news/business/news/wyevale-takes-lead-in-stopping-sale-of-gaspowered-heaters-443456.html.
298

baseline. Ten major retailers and nearly 30 other brands and suppliers have joined this commitment since its launch in July 2005, representing over 90% of the UK grocery supermarkets. The group meet annually to review progress, share information and develop future initiatives. See http://www.wrap.org.uk/retail/courtauld_commitment/.
The author’s observations from this case study that may be of relevance to future initiatives include:
1. The ‘Commitment’ wording itself is broad and high level, leaving flexibility for how each signatory will deliver its commitment.
2. A wide range of support services and design advice is provided through WRAP free of charge to help the signatories deliver.
3. Success is publicised through case studies [6] and press reports.
8. Why collaborate internationally on supporting retailers?
In the same way that retailers themselves are sharing best practice on sustainability and establishing a better knowledge base (through the REAP Retail Forum), the government agencies, NGOs and others who work with retailers on energy using products could usefully do the same thing for themselves. The activities and aims of such collaboration could include:
• To map and characterise retailer initiatives to identify common work elements, challenges and solutions
• To harmonise the product standards that retailers request of suppliers, tracking the constantly developing market average, and identifying class leader products
• To pool market intelligence on EuP, product markets, best/average/poor performance benchmarks, and tailor this for retailers consumption
• Share best practice on motivational tactics
• Share widely applicable basic information, guidance material and analysis tools & approaches
• To provide authoritative and transnational support to the Retailer’s Environmental Action Programme on energy using products
• To support and encourage the actions of REAP signatories within each country
• To influence national product endorsement labels to become better harmonized and so easier for multinational retailers to use.
Altogether, these possible elements of collaboration could save duplicating effort in each country separately, and help improve the overall effectiveness of campaigns through learning from the experience of others.
9. Proposal to strengthen the retailer’s environmental action programme
There is a specific opportunity to build a focus on energy using products into the European Retailers Environmental Action Programme. Clearly, the leaders and signatories to this programme will need convincing that energy using products deserve attention. The rationale described in section 4 (i.e. the arguments for choice editing, particularly on energy efficiency) could help in this regard, in particular using quantifiable progress on energy using products to build momentum for the overall initiative. And then one or more of the initiative types described in section 6 may be useful. These could be delivered collectively if presented to the Retail Forum, or individually to signatories at the national level by governments or their agencies. This national activity could be most effective on overall supply chains if the National efforts are co-ordinated, ensuring harmonization and a concerted approach to priority products.
299

10. Practical next steps
This paper aims to stimulate debate and practical action to address some of the opportunities raised. Options for short-term actions include:
• Consider augmenting or initiating an annex under the IEA Energy Efficiency of End-use Equipment (4E) Implementing Agreement. IEA projects are particularly well suited to mapping policies and market interventions, with analysis of their effectiveness. This could provide a more formal umbrella for the simpler actions that follow.
• Propose research questions to be addressed in future papers (such as prioritising products with significant scope beyond EuP minimum standards, how best to deliver product standard information through supply chains, mapping international efforts to influence product standards through supply chains etc).
• Set up a working party to approach the Retailers Environmental Action Programme leaders and/or signatories, and the European Commission representative responsible, to present the case for addressing EuP products. Furthermore, to develop information as appropriate to be presented to a future meeting of the Retailer Forum.
• Set up an e-mail group/discussion forum for those working with retailers
• Facilitate bilateral discussions with those undertaking similar or related initiatives
• Schedule side meetings for those working with retailers alongside conferences, trade fairs and other initiatives to exchange information and experience
This is not an exhaustive list of options. The author invites input and ideas from readers, and indications of which of the above, or others, could usefully be initiated.
11. Conclusions
The major retailers in Europe have significant buying power in product markets, and many are already showing leadership on raising product standards. A relatively small number of professional people specify the products within their organizations – these people can be targeted and influenced towards more sustainable products far more cost effectively than the millions of consumers who buy the products they specify.
This paper has laid out the rationale for why supporting retailers to specify more energy-efficient products makes sense to retailers, to consumers and to the government agencies who work in that field. A range of specific elements to initiatives with retailers have been identified and illustrated by examples. But importantly, there is an opportunity to coordinate the activity of government agencies around Europe to provide harmonised support to help retailers, and to strengthen the existing European environmental initiative by retailers (the Retailers’ Environmental Action Programme, REAP, under EuroCommerce).
At the very least, initiatives that build capacity in retail organizations to specify for energy efficiency will increase EuP compliance rates, but have the potential to achieve market change months or years in advance of regulation, and in many areas to go well beyond the regulatory minimum.
The practical options to take this forward will be discussed at the EEDAL conference, and the author invites and welcomes any contributions to the debate. An approach will be made to the IEA Implementing Agreement on Energy Efficiency of End-Use Equipment (4E) to explore whether such an initiative, possibly including some of the options described in this paper, might be of interest to its members.
Readers with experience of working with retailers already, or who are considering such an initiative in future are invited to contact the author: By email at [email protected]; telephone +44 1235 884 896; mobile +44 7814 242469; post: Tait Consulting Limited, 39 Foliat Drive, Wantage Oxfordshire OX12 7AL UK. Thank you.
300

References
[1] Sustainable Consumption Round Table for the Sustainable Development Commission and National Consumer Council, Looking back, looking forward - Lessons in Choice Editing for Sustainability - 19 case studies into drivers and barriers to mainstreaming more sustainable products, 2006. Available from http://www.sd-commission.org.uk/publications/downloads/Looking_back_SCR_2.pdf.
[2] Financial Times Business and the Environment Section, Elizabeth Rigby, Ethical and Environment Reputations Are on the Slide, Monday, March 16, 2009, Page 2.
[3] Frontier Economics for the UK Office Of Fair Trading, The competition impact of environmental product standards, October 2008. Reference OFT1030. Available from http://www.oft.gov.uk/advice_and_resources/publications/reports/Economic-research/
[4] Sustainable Development Commission, I Will If You Will - Towards Sustainable Consumption, 2006. ISBN: 1 899581 79 0. Available from http://www.sd-commission.org.uk/publications.php?id=367
[5] Environmental product indicators and benchmarks in the context of environmental labels and declarations, available from http://www.anec.eu/attachments/ANEC-R&T-2008-ENV-005final.pdf
[6] Waste and Resources Action Programme (WRAP), Courtauld Commitment Case Studies (2008). Available from www.wrap.org.uk/courtauld.
[7] EuroCommerce, Retailers Environmental Action Programme, Matrix of Action Points, March 2009. Available from http://www.eurocommerce.be/doc.aspx?doc=Environment/REAPMAP-March2009(Layout)-final.doc
Acknowledgements
The author would like to thank the following people, and others, for input and support during the preparation of this paper:
Sophie Attali of Topten International Group
Eric Bush of Topten International Group
Anna Siefken of ICF International
Jill Vohr of the US Environmental Protection Agency
Stuart Monk of the Energy Saving Trust
Chris Baker
Alan Knight of Single Planet Living
Jane Brownsord.
301
IEA Mapping and Benchmarking Annex: Informing Sustainable Product Policy Decision Making
Davide Minotti
Sustainable Products & Materials Division, Department of the Environment, Food and Rural Affairs, UK Government
Abstract
The coming decade will, for the first time, see the establishment of substantive sustainable product policies affecting all major appliances, and many commercial products in most, if not all, trading zones of the world. Unfortunately, the policy-makers charged with the development and implementation of these sustainable product strategies have difficulty indentifying the potential performance of products already in (or soon to be available in) the global marketplace; the likely impact various policy options may have on these products; and how any resultant outcomes will compare with actions taken, and outcomes achieved, elsewhere. Hence, these policy-makers are often forced to make decisions with major environmental and economic impacts based on fragmented and incomplete data.
The countries participating in the IEA Implementing Agreement for a Co-operative Programme on Efficient Electrical End-use Equipment (4E) have identified this knowledge shortfall and have initiated a new Annex as a first step to developing credible, reliable and timely information for sustainable product policy-making decisions. This collaborative action, the 4E Mapping and Benchmarking Annex, seeks to address not just one, but a wide range of domestic, commercial and industrial products and seeks to provide:
• Mapping of energy efficiency performance of electrical products in specific countries/regions and an indication of the policies that contribute to this change in efficiency. Where possible, the overviews will be presented as complete time series showing evolving product efficiency over time.
• Benchmarking of the product efficiency within individual countries/regions against others and associated projections on potential energy and emissions-saving potentials for improvements in the individual, regional and global market.
This paper examines the aims, objectives, scope, implementation programme and likely outcomes of the Annex. Strategic Background
The coming decade will, for the first time, see the establishment of substantive sustainable product policies affecting all major appliances and many commercial products in most, if not all, trading zones of the world. Activities related to the Energy Using Products Directive in Europe mirror similar initiatives in China, Australia, Asia, the Americas, etc.
The policy-makers charged with the development and implementation of these sustainable product strategies invariably begin by asking similar questions such as, “What is economically feasible for particular product groups?”; “What policy approaches appear likely to yield the most effective outcomes?”; and “How do my current situation and proposed actions/outcomes compare with the situation in, and actions taken by, other economies?”. Unfortunately, seeking the answers to these questions is an extremely resource intensive task requiring the collection of disparate data sources; complex analysis to enable data based on differing voltages and testing methodologies to be made comparable; a mapping of data through time to establish policy impacts, etc. Nevertheless, a number of countries have initiated such studies when considering policy initiatives. To cite just 2 extreme examples, the European Unions’ Eco-Design Directive[1] requires the benchmarking of 15 products within and beyond the EU prior to the development of policy proposals for introduction across the European Union, and an Australian Standby Power project[2] (which includes Hungry and the Czech Republic with more countries expected to contribute) where in-store testing of several hundred
302

products to has been undertaken to establish benchmarking data for stand-by power policy development.
However, as individual policy-makers initiate their actions at different times, exchange of such information is of limited value as both products and markets evolve rapidly, resulting in analysis undertaken just a few years previously (often based on even older data) becoming of limited value. Further, such studies are often viewed as only partial, addressing one locality or specific policy initiative. Hence, policy-makers are often forced to make decisions with major environmental and economic impacts based on fragmented and incomplete data.
The countries participating in the IEA Implementing Agreement for a Co-operative Programme on Efficient Electrical End-use Equipment (4E)1 have identified this knowledge shortfall and have initiated a collaborative action (known as an Annex) as a first step to developing credible, reliable and timely information for sustainable product policy-making decisions. This collaborative action, the 4E Mapping and Benchmarking Annex, began activities immediately following formal creation at the 4E Executive Committee Meeting at the end of April 2009.
Annex Goal and Deliverables Overview
The overall goal of the Mapping & Benchmarking Annex is:
To provide policy-makers with a single source knowledge base on product performance and associated policy tools employed by economies across the world, thus enabling more informed policy-making at the national and regional levels.
Annex Overview
The Annex aims to provide policy makers with information on a wide range of domestic, industrial and commercial products. The questions the Annex seeks to answer are:
• What are the differences in the performance of products sold in the various regions of the world?
• What are the primary causes of these differences (policy, culture, etc.)? • What does this tell us about the potential for national, regional and global improvement in the
performance of products, and the potential mechanisms that policy-makers may engage to realise this potential?
To answer these questions the Mapping and Benchmarking Annex will:
1. Mapping: provide an overview of the energy efficiency performance of certain electrical end-use equipment (or energy using products) in several countries and/or regional areas and a brief summary of the main policy measures regarding energy efficiency of products in those areas;
2. Benchmarking: compare average and best performance of products put on the market in different countries and/or regional areas; analyse variations between different markets; share best practices and lessons learnt by, for example, highlighting potential for further improvement of energy efficiency levels globally.
Whenever possible, product information will be collected and mapped on the energy efficiency of the worst, sales-weighted average and most efficient product available on different regional markets and the average efficiency of products in the installed stock at end-users (households, commercial sites, etc.). Furthermore, this mapping element will explore the room for future improvements in energy efficiency by attempting to identify the best available technology (BAT) and the best not yet available technology (BNAT) normally in the form of advanced prototype products. In addition, summary
1 The countries currently participating in the 4E Annex (and it is anticipated also the Mapping and Benchmarking Annex) are Australia, Austria, Canada, Denmark, France, Korea, The Netherlands, Switzerland, the UK and the USA. More countries, particularly from the major trading nations and greenhouse gas emitters, are expected to join in the near future.
Information on the 4E Implementing Agreement can be found at www.iea-4e.org
303

information will be sought to map the main historic, current, as well as envisaged or planned, policy measures that may have shaped product efficiency at the local level. The mapping exercise will be done per country or region as appropriate and will be dependent upon the availability of secondary information.
The mapping overview enables benchmarking of sales-weighted and most efficient products and provides the opportunity for the evaluation of the potential to bridge the gaps in energy efficiency levels and/or achieve BAT in the relevant countries and/or regional areas. Wherever possible, differentiation will then be made between impact on performance caused by local issues (e.g. culture and practice) and applied policy measures, thus greatly improving the ability of policy-makers to learn from the actions of their peers elsewhere.
Figure 1 summarizes the structure of the aims of the Annex.
Figure 1: Overview of the aims of the Mapping and Benchmarking Annex
Annex Scope
The scope of the Annex can primarily be defined on three axes:
• Product coverage and policy review: What products will be covered, to what degree using what data sources, and what analysis will be undertaken?
• Geographic coverage: What geographic areas are to be addressed and to what degree? • Stakeholder participation: Who are the key stakeholders to engage in data collection,
analysis and dissemination?
Each of these axes is addressed in the following sub-sections, with a scope defined for each. However, it is clear that while a number of issues can be clearly defined at this stage, the precise boundaries of some areas have a number of possible options. Given the need to provide results to inform policy development at the earliest possible opportunity, a pragmatic approach to the definition of the Annex scope has been adopted, based on a combination of the importance of products in terms of global energy consumption and the likely short-term availability of data. Further, to prove the usefulness of the Annex outcomes in policy development before the commitment of extensive resources, a two phase implementation programme is being adopted. Phase 1 will concentrate on a limited product range with clearly accessible data sources and limited geographical and stakeholder
Summary of main policy measures
Products
1. Mapping
Stock/Park (average)
Market
BNAT
Current
Envisaged/planned
Worst
BAT
2. Benchmarking
Sales weighted average
Compare market sales weighted average and BAT
Analyze differences across markets (main policy and other factors)
Share best practice to improve performance globally
304

groupings, followed by an expansion to Phase 2 which will encompass more product groups with potentially wider geographical coverage and stakeholder engagement. It is envisaged that Phase 1 will be completed within six months and provide meaningful results to enable movement to Phase 2 on approval by the Implementing Agreement Executive Committee.
Product and Policy Review
The outcome of the Annex will be overviews of the energy efficiency performance of electrical products in differing markets (ideally presented as time series demonstrating evolution of product efficiency over time), and an indication of the policies that drive markets to adopt the higher efficiency products. However, the potential number of products that could be covered by the Annex is enormous, as are the sub-classifications of these products (e.g. both top loader and front loader washing machines provide a similar service, but their functionality is fundamentally different and must be analysed as such). Further, to effectively compare products, it may be necessary to consider data on other performance criteria (again, using washing machines as an example, it is somewhat meaningless to compare energy performance without consideration of water consumption and effectiveness of laundry cleansing, both of which directly impact energy consumption). Similarly, the understanding of, and the application of correction factors to, the testing standard or other mechanism by which efficiency and other performance criteria are measured is critical to effectively compare product performance. Given these potential complications, the Annex will adopt the following pragmatic approaches to these issues:
• Product definition: A functional product categorisation has been chosen for this Annex (definitions are proposed based on Nordman and Sanchez (2006)[3]). Within this categorisation, participating countries have identified ten prioritised product categories to be addressed during Phase 1 and the early stages of Phase 2 implementation of the Annex2. The further sub-definition of products by functionality and/or technology will be undertaken on a case-by-case basis as the products are addressed.
• Energy and performance criteria and measurement methodologies: In all cases where information exists, time sequenced energy consumption data will be collected for best and worst product performers on the market and, where possible, BNAT. Similarly, in all cases, the testing methodologies employed to evaluate this consumption will be identified, and where available, conversion factors developed to account for differing testing methodologies, voltage variation, etc. Where possible, data will also be gathered on market shares of products to provide a measure of weighted average in the market place and, again where possible, the installed products in the stock (park). Other performance criteria will be collected where available and appropriate to individual products on a case-by-case basis.
• Policy identification: A brief summary of the main policy measures employed, or planned in, each market will be gathered. Efforts will be made to categorise such policy actions by type (regulatory, financial/incentive, voluntary, information/capacity building), areas and percentage of the market targeted, etc.
During the second year of the implementation programme, a pilot ‘in-depth’ investigation of policies applied within a number of countries, regions and/or product groups will be conducted. If successful in identifying useful lessons for policy-makers from analysis of the policies adopted and the outcomes identified in the benchmarking activities, this activity will be expanded in future years.
• Data sources: During Phase 1 and the early stages of Phase 2 of the implementation plan, data collection will be limited to secondary sources (i.e. where data collection, and in some cases, data analysis has already been undertaken and information can be readily be accessed). Following these preliminary Phases, and with the full agreement of participating member countries, some primary data collection activities may be initiated where the
2 It is anticipated that Phase 1 activities will address five products (domestic cold appliances, domestic laundry appliances, domestic air conditioners and lap top computers) and a further five products (integrated home networks, water heaters, domestic lighting, computer displays and AC motors) will be addressed in the early stages of Phase 2 (it is anticipated full mapping of eight of these products and benchmarking of six products will be completed within the first year). This initial listing of ten products has been agreed by consensus among participating countries.
305
importance of the product group is high (in terms of overall energy consumption and/or potential efficiency improvements). However, it is anticipated that such activity will be highly targeted due to the likely high costs.
• Analysis: The secondary sources will be brought together, and through an understanding of the various test methodologies and conversion factors, an overall view of worse, average and best (and ideally a sales-weighted average and current stock of) product solutions within markets and regions will be formulated. Further, based on this technical analysis and the available information on policy measures, efforts will be made to understand the drivers for differences between markets over the time series, taking into account policy measures as well as other relevant factors (to be defined, but could include energy prices, competitive pressures, attention for environmentally sound behaviour, supply chain culture/structure, etc.). Benchmarking of individual countries and/or regions against this base data and BNAT will then enable policy-makers to identify areas where significant potential for improvement exists, and to learn from best practice elsewhere to increase the likelihood of success of actions taken locally.
Depending on importance (i.e. energy consumption and/or saving potential) and/or speed of product innovation, data and analysis on individual products will be reviewed and, where necessary, updated on an annual or two yearly basis.
Geographical Coverage
The aim of the Annex is to cover the products for all main regions in the world. An in-principle classification of regions is presented below:
• Africa (possibly with South Africa treated as a separate entity) • Asia (possibly with China and India treated as separate entities) • Australia and New Zealand • Central and South America (possibly with Brazil treated as a separate entity) • Europe: Switzerland and the EU (with particular focus on the participating countries of the
Austria, Denmark, France, the Netherlands, UK) • Middle East • USA • Canada • Russia
Ideally, information will be collected, mapped and benchmarked for all main countries/markets and then summarised by region. However, again for reasons of practicality, it is recognised that during Phase 1 and early Phase 2 implementation, geographical coverage for an individual product will be limited to areas where secondary data already exists, and/or where participating members or the Operating Agent Team are able to access data rapidly and at low cost (e.g. through direct contacts with manufacturers, through secondary organisations, etc.). An analysis of the likely ability to extend geographical coverage in Phase 2, especially to cover emerging markets and key producing nations, will be undertaken prior to the six month review.
Stakeholder Participation and Communications
Stakeholder participation in the gathering, analysis and effective use of the information and analyses generated by the Annex is essential to both the functioning of the Annex and the impact. However, while it is recognised that the sources of information and potential users of resulting outputs are numerous, again pragmatism is necessary in order to manage the scope for implementation purposes. Hence, for Phase 1 and the early stages of Phase 2, the following stakeholder participation is envisaged:
• Information collection: Information will primarily be sourced via semi-standardised information requests for rapidly available secondary data from participating countries, other 4E Annexes and through regional contacts of the Operating Agent team. These requests will be followed up by individual communications from the Operating Agent team to ensure clarity of requests and rapid collection of available material.
306

• Data analysis: The primary responsibility for the information analysis will be with the
Operating Agent. However, all stages of the information collection and analysis process will be transparently documented (including limitations, assumptions and gaps).
• Information dissemination: Clearly the most important element of the task is the communication of outputs to stakeholders including those non-expert senior policy-makers that are not members of the 4E Implementing Agreement. In particular, the primary target audiences are policy-makers and their supporting staff within participating countries and potentially key producing nations (i.e. China, India and Brazil). As such, information outputs from the project will be targeted to meet their needs, with original data source3 and supporting material easily accessible if required. At this stage it is anticipated that key information dissemination tools will be:
• Product specific analysis reports: Providing overview analysis by country and/or
region for individual products including simple to understand text and graphics on the mapping of product performance within markets, and the policy and other influences driving these regional variations. For each product, a participating country will lead a review of all draft outputs related to that product to ensure comprehensive coverage and transparent reporting. These reports will be housed on the Annex website4 and will be directly disseminated through participating country representatives to the relevant local policy-makers. Further, it is anticipated that participating representatives will combine the Annex outputs with other policy work and present the outcomes to a broader influential audience.
• Quarterly progress newsletters: Primarily targeting participating country representatives and other Annex stakeholders, these newsletters will provide quarterly updates on the overall progress of the Annex, along with more detailed updates on specific product reviews underway or completed, likely outcomes from individual analysis and forward plans.
• Project website: The project website4 will be the central hub for information on the
project. The website will hold copies of the product specific analysis reports and the quarterly newsletters, but will also hold copies of, or links to, all non-confidential reference sources and a comprehensive database on product performance, testing methodologies and policies adopted by individual countries (where this information has been obtained).
It is anticipated that the vast majority of the information on the website will be publically accessible (Note: At this stage it is not anticipated that the Annex will hold full product databases, although this may be reviewed later in the implementation programme).
During the first year of implementation, promotion of Annex outputs and communications will primarily focus on participating countries. However, this situation will be reviewed at the end of the first year’s implementation and consideration will be given to active promotion of Annex outputs to wider stakeholder groups (e.g. developing/supplier countries).
3 In most cases the information sourced will be available as reference material and will be made available to all stakeholders at the time of analysis and summary reporting. However, it is recognised that some information may be confidential (e.g. commercial data sourced from manufacturers or commercially sourced data such as GfK), and such instances will be dealt with on a case-by-case basis. 4 www.iea-4e.org/annexes/mapping-and-benchmarking
307

Organisational Structure and Implementation Programme
The overall implementation processes of the Annex are summarised in Figure 2.
Figure 2: Representation of the dynamic nature of activities within the Mapping and Benchmarking Annex
This Annex differs from many other IEA Implementing Agreement Annexes in that the Operating Agent not only has to undertake the day-to-day management of the Annex and to facilitate others in the implementation, but has also to undertake a very significant proportion of the work. Overall management of the Annex will fall to the Chair of the Mapping and Benchmarking Annex Management Committee (UK representative) with direction from the Annex Management Committee (established with one representative from each participating country) and, ultimately, the Implementing Agreement Executive Committee.
It is anticipated that work within the Annex will run for at least four years. Figure 3 gives an overview of the implementation schedule. Detailed work plans will be developed and implemented annually.
Participating Countries
Regional Operating Agent reps
Non-participating countries/other
data sources
O P E R
A T I N
G A
G E N
T
Advice, Requests,Analysis, Review
Publ
ic d
omai
n/w
ebsi
te
Data collection and consolidation
FurtherData analysis
BENCHMARKING2. Comparativecountry data
1. Region & country mapping outputs
A n
n e
x
O u
t p
u t s
20012004
2007
1. Example: Austria Laundry
Test: IEC XYZLabels:announced 2004compulsory 2006
η2. Example: Laundry 2006
BAT
CanadaUSA
Switzerland
EU
Data analysis
MAPPING
Participating Countries
Regional Operating Agent reps
Non-participating countries/other
data sources
O P E R
A T I N
G A
G E N
T
Advice, Requests,Analysis, Review
Publ
ic d
omai
n/w
ebsi
te
Data collection and consolidation
FurtherData analysis
BENCHMARKING2. Comparativecountry data2. Comparativecountry data
1. Region & country mapping outputs1. Region & country mapping outputs
A n
n e
x
O u
t p
u t s
20012004
2007
1. Example: Austria Laundry
Test: IEC XYZLabels:announced 2004compulsory 2006
η2. Example: Laundry 2006
BAT
CanadaUSA
Switzerland
EU
Data analysis
MAPPING
Data analysis
MAPPING
308
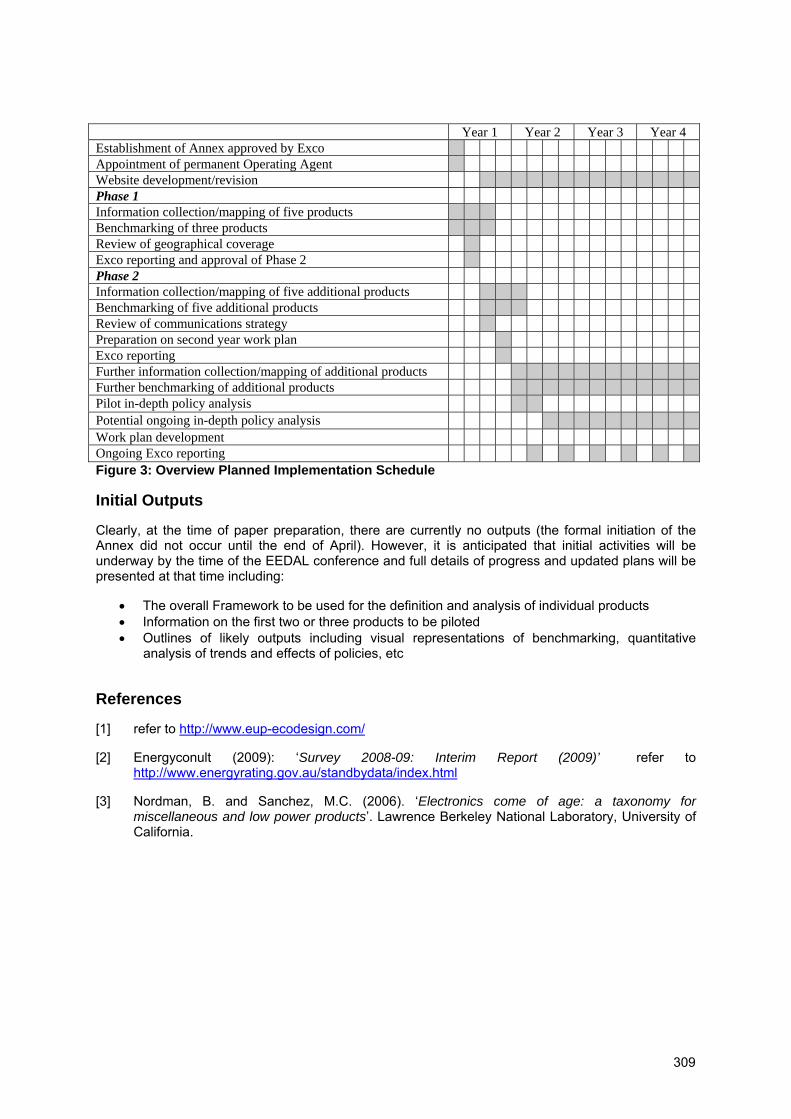
Year 1 Year 2 Year 3 Year 4 Establishment of Annex approved by Exco Appointment of permanent Operating Agent Website development/revision Phase 1 Information collection/mapping of five products Benchmarking of three products Review of geographical coverage Exco reporting and approval of Phase 2 Phase 2 Information collection/mapping of five additional products Benchmarking of five additional products Review of communications strategy Preparation on second year work plan Exco reporting Further information collection/mapping of additional products Further benchmarking of additional products Pilot in-depth policy analysis Potential ongoing in-depth policy analysis Work plan development Ongoing Exco reporting Figure 3: Overview Planned Implementation Schedule
Initial Outputs
Clearly, at the time of paper preparation, there are currently no outputs (the formal initiation of the Annex did not occur until the end of April). However, it is anticipated that initial activities will be underway by the time of the EEDAL conference and full details of progress and updated plans will be presented at that time including:
• The overall Framework to be used for the definition and analysis of individual products • Information on the first two or three products to be piloted • Outlines of likely outputs including visual representations of benchmarking, quantitative
analysis of trends and effects of policies, etc
References
[1] refer to http://www.eup-ecodesign.com/
[2] Energyconult (2009): ‘Survey 2008-09: Interim Report (2009)’ refer to http://www.energyrating.gov.au/standbydata/index.html
[3] Nordman, B. and Sanchez, M.C. (2006). ‘Electronics come of age: a taxonomy for miscellaneous and low power products’. Lawrence Berkeley National Laboratory, University of California.
309
Raising energy efficiency through the Intelligent Energy Europe programme: first results from ten projects on domestic appliances
Christophe Coudun & Vincent Berrutto
Executive Agency for Competitiveness and Innovation (EACI), European Commission, Brussels, Belgium
Abstract
The Intelligent Energy Europe (IEE) programme is the European Union's main instrument to support actions aimed at overcoming the non-technological market barriers to energy efficiency and renewable energy sources, in all sectors of the economy (http://ec.europa.eu/intelligentenergy). More than 400 projects have been supported by this programme, of which 28 have aimed specifically at transforming the market for energy efficient products, through a combination of soft measures: information campaigns, awards, benchmarking, voluntary agreements, exhibitions, training activities, promotion and transfer of best practices, etc. The IEE programme aims to enforce the application and enhance the awareness of EU labels and minimum energy efficiency standards, as well as suggesting life cycle approaches so that products are designed, manufactured, purchased, installed, used and disposed of in the most energy-intelligent way.
This paper presents an overview of 10 completed or on-going projects, covering a wide range of domestic appliances, target groups and markets. This paper is of interest for whoever is looking to learn from the IEE projects and/or is interested to apply to future Calls for Proposals.
Introduction
The objective of the Intelligent Energy – Europe (IEE) programme is to contribute to secure, sustainable and competitively priced energy for Europe, by providing for action: (i) to foster energy efficiency and the rational use of energy resources; (ii) to promote new and renewable energy sources and to support energy diversification; (iii) to promote energy efficiency and the use of new and renewable energy sources in transport. The programme in particular contributes to the Energy Policy for Europe and its '20-20-20' goals: reducing greenhouse gas emissions by 20% compared to 1990 levels, increasing the share of renewables in final energy consumption to 20%, and reducing primary energy use by 20% compared to projections, all by 2020.
This programme has become the main Community instrument to tackle non-technological barriers to the spread of efficient use of energy and greater use of new and renewable energy sources. After a successful first phase from 2003 to 2006, Intelligent Energy – Europe has been continued with an increased budget of EUR 730 million for the period 2007-2013. The IEE programme is managed by the Executive Agency for Competitiveness and Innovation (EACI, formerly known as the Intelligent Energy Executive Agency) under powers delegated by the European Commission.
In operational terms the Intelligent Energy - Europe programme aims to:
• provide the elements necessary for the improvement of sustainability, the development of the potential of cities and regions, as well as for the preparation of the legislative measures needed to attain the related strategic objectives; develop the means and instruments to follow up, monitor and evaluate the impact of the measures adopted by the Community and its Member States in the fields addressed by the programme;
• boost investment across Member States in new and best performing technologies in the fields of energy efficiency, renewable energy sources and energy diversification, including in transport, by bridging the gap between the successful demonstration of innovative technologies and their effective, broad market uptake in order to attain leverage of public and private sector investment, promote key strategic technologies, bring down costs, increase market experience and contribute to reducing the financial risks and other perceived risks and barriers that hinder this type of investment;
310
• remove the non-technological barriers to efficient and intelligent patterns of energy production and consumption by promoting institutional capacity building at, inter alia, local and regional level, by raising awareness, notably through the educational system, by encouraging exchanges of experience and know-how among the main players concerned, business and citizens in general and by stimulating the spread of best practices and best available technologies, notably by means of their promotion at Community level.
Intelligent Energy - Europe covers action in the following fields:
• Energy efficiency and rational use of resources (SAVE component), including improving energy efficiency and the rational use of energy, in particular in the building and industry sectors; or supporting the preparation and application of legislative measures.
• New and renewable energy resources (ALTENER), including promoting new and renewable energy sources for centralised and decentralised production of electricity, heat and cooling, and biofuels, thus supporting the diversification of energy sources; integrating new and renewable energy sources into the local environment and the energy systems; or supporting the preparation and application of legislative measures.
• Energy in transport (STEER) to promote energy efficiency and the use of new and renewable energy sources in transport, including supporting initiatives relating to all energy aspects of transport and the diversification of fuels; promoting renewable fuels and energy efficiency in transport; or supporting the preparation and application of legislative measures.
• Integrated initiatives combining several of the aforementioned fields or relating to certain Community priorities. They may include actions integrating energy efficiency and renewable energy sources in several sectors of the economy and/or combining various instruments, tools and actors within the same action or project.
The above fields and objectives are valid for the whole IEE programme duration, i.e. from 2007 to 2013. However, every year a work programme is elaborated with the EU Member States to set a number of more specific, action-related objectives.
What is an IEE project?
A successful IEE-funded project should have a strong focus on promotion and dissemination activities and help deliver the key EU climate change and energy objectives. Each project should match the priorities of the IEE Work Programme of the running year, involve at least three partners from three different countries (a typical IEE project is carried out by seven-eight organizations), and take two to three (maximum) years to deliver results. It is important to notice that an IEE project is not a “hardware” type investment or research & development project, for which other funding opportunities are available at EU level.
Any public or private organisation established in the EU, Norway, Iceland, Liechtenstein, and Croatia can apply for funding, as well as international organizations, whereas natural persons cannot. The average total costs of IEE projects are around EUR 1 million, supported up to 75% by the programme (grants). It is highly recommended that any potential proposer be familiar with the key documents published each year: the Work Programme providing backgrounds, priorities and budgets, the Call for Proposals presenting the evaluation criteria, priorities and deadlines, and the Application forms & Guide for Proposers that constitute essential forms and guides to draw up and submit proposals. All these documents are available on the programme web site.
IEE-funded projects in the scope of the EEDAL conference
In 2005 European households used 69% of their energy to heat rooms. Fourteen percent was used to heat water, and about 17% went on lighting, cooking and other electrical appliances. While the percentage used for ambient heating has decreased over the last 20 years, the share of energy consumed by electric appliances is projected to grow from 15% in 2000 to 27% in 2030. Across the 27 EU countries, household electricity consumption is around 29% of total electricity consumption [1]. Considerable effort has gone into increasing the energy efficiency of appliances, but changes in lifestyle have offset a large part of this. In the tertiary sector, office equipment is responsible for up to
311
40% of the electricity consumed in every building. This sector, which includes outdoor lighting, is growing as is its demand for energy.
To support the integration of energy efficiency measures into national legislation, the European Commission has proposed several directives which have been adopted and are now in force. These cover broad areas where there is significant energy saving potential for equipment and products, in particular the Directive on Eco-design Requirements for Energy-using Products [2], the Directives on the Energy Labelling of Domestic Appliances and the Regulation on the Energy Efficiency Labelling Programme for Office Equipment.
As far as energy-efficient products are concerned, the IEE projects take in a wide range of products, target groups and markets. They should help prepare the ground for individual energy-efficient products in markets such as residential lighting, office and street lighting, IT servers, boilers, air conditioners, motor systems, pumps, circulators, elevators, escalators, distribution transformers and construction products. While all IEE projects are not yet complete, they have already resulted in concrete action. Many brochures, guidelines, training/communication/press kits, articles and web tools are indeed available to increase awareness.
The following section presents an overview of the projects funded in the field of energy efficient products, with a direct relevance to the EEDAL topics.
Residential appliances/white goods
Reducing energy consumption: making efficient products the normal and best choice for consumers, retailers and manufacturers (EURO-TOPTEN)
http://www.topten.info
January 2006 – October 2008
Topten is a market transformation tool used to bring more energy efficiency on the market of products and equipment. In particular, Topten provides buyers with selections of most efficient products available on the market through user-friendly websites managed at national level; stimulates consumers and large buyers, via communication and support to professional procurers; stimulates manufacturers and retailers, via regular contacts, information and promotion of their most efficient products; and contributes to market transformation and policy design thanks to its analyses [3].
The key results of the project include: 12 national websites presenting continuously updated selections of best appliances, recommendations for users and selection criteria; information available in more than 10 languages; 166 product categories scanned in the 12 countries, broken down into more than 600 market segments to stick to consumers' preferences; more than 9.5 million visitors over the three years of the project, 4.3 million in 2008; a large media coverage, reaching over 150 million readers, viewers and listeners, worth over EUR 2.1 million; "Best of Europe": the only review of the supply of efficient appliances on the European market (BAT, policy analyses); an open Topten platform: new organisations can join at any time; differentiated impact on numerous target groups: tailored information delivered to consumers, procurement officers, policy makers, NGOs and institutions, support to utilities, support and recognition to product manufacturers and retailers investing in energy efficiency.
Pro-Efficient cold & lighting products (PROEFFICIENCY)
http://www.escansa.com/proefficiency
312

January 2006 – December 2008
The aim of PROEFFICIENCY was to promote eco-efficient cold and lighting products in the household and tertiary sectors in six countries using promoter initiatives and consumer projects aimed at residents, tenants and shops. It has involved an analysis of both EU and national projects with similar objectives at conferences and workshops.
More than 320 key actors, including national and local energy agencies, have been brought together in various forums to exchange experiences about efficient cold and lighting products in the residential and tertiary sectors. Twenty promoter initiatives are underway, involving manufacturers of lighting and cold products, retailers, commercial and social building owners, university departments, energy efficiency advice centers, and national energy agencies. Fifteen consumer projects focusing on resident associations, local government, architects, consumer organisations, and owners associations are also underway. Monitoring of results in both the refrigerator and lighting markets have led to estimated energy savings of 2,000 MWh/year, which is more than 3,350 tons of CO2 emissions. Two technical guidebooks have been produced and translated into languages of the participating countries, as well as brochures, posters and stickers. Trials involving the promotion of free efficient lamps have stimulated interest. A need of information was identified with regard to efficient lighting and cold appliances in the households of the involved countries. Also, people responsible of public buildings seem to lack of means and appropriate measures of energy efficiency in general, and of efficient lighting in particular.
Promotion of energy efficient appliances (PROMOTION 3E)
http://www.promotion3e.ips.pt
October 2008 – September 2011
PROMOTION 3E aims at reducing the energy consumption of households’ electric equipments and products by implementing actions to encourage the take-up of energy-efficient appliances as well as measures that increase quality and efficiency of information available to consumers. These measures will also lead to higher market share for the most energy-efficient household appliances and to accelerate their market penetration. In order to achieve these objectives, focus is being placed on training of appliances’ sales personnel, with the conviction that a well informed customer will learn to purchase high energy-efficient appliances. PROMOTION 3E integrates a set of instruments, material and actions for the dissemination and awareness-raising of good practices concerning the differently labelled household appliances, as well as training of sales personnel, in order to guarantee the adequate dissemination and promotion of the energy-efficient appliances’ performance and efficiency.
The expected results include the improvement of the knowledge about appliances’ choice process by consumers, namely which are the barriers and motivations for choosing class A, A+ or class A++ appliances; training activities for supply adequate knowledge to the sales’ staff, for a large number of stores; creation and implementation of a model for efficient store’s certification system, intending to distinguish the stores that, on energy efficiency issues, provide to their customers high-quality information and support services; support material such as handbook, brochure, leaflets, magnetic banners and other information and dissemination materials.
Appliance Testing for Energy Label Evaluation (ATLETE)
June 2009 – May 2011
The main goal of the recently-launched ATLETE project is to increase European-wide implementation and control of energy labelling and eco-design implementing measures for appliances. The developed verification methodology, once validated, will be applicable with very minor adaptations for any
313
Energy-using Products (EuP). ATLETE will demonstrate that market surveillance and testing can be done in a systematic, effective and cost-efficient way, thus helping to transform the market to ensure the highest benefit for consumers, manufacturers and the environment. Key stakeholders to be engaged in the project include the EU institutions, governmental organizations, manufacturers, retailers, associations, consumer groups and NGO’s, the media and general public. Progress and results of the project will be widely disseminated via a website, publishable reports, a conference and the media.
Residential lighting
European Efficient Residential Lighting Initiative (EnERLIn)
http://www.enerlin.enea.it
January 2006 – December 2008
EnERLIn aimed at increasing residential lighting efficiency in 13 Member States by increasing the penetration of Compact Fluorescent Lamps (CFLs) in the residential sector. Energy savings from greater use of CFLs can be as high as 11 TWh a year in EU, the equivalent of 1.2 million tons of greenhouse gases. The main target groups were: national energy agencies; energy utilities; lighting manufacturers; consumer defense associations; consumers; lamp and luminary retailers; policy makers; architects and civil engineers.
More than 700,000 leaflets, posters and booklets promoting compact fluorescent lamps have been printed and distributed by the EnERLIn partners in participating countries. More than 1,000 people have participated to conferences and round table discussions, with proceedings being available on the web page. More than 500 young people at schools and colleges in six countries have been taught about energy-efficient lighting issues and three e-learning modules on energy-efficient lighting are available in English and French.
More than 50,000 questionnaires have been sent to CFL end-users in various countries, with a high return rate. They showed that a first tool for estimating energy consumption due to lighting in the residential sector has been established and used to predict the impact of various scenarios in the horizon of 2030. It has been shown that convincing end-users to use more good quality CFLs instead of incandescent light bulbs may lead to 21% energy gains associated to a 13% increase of available light compared to the 2006 situation.
Residential HVAC
Raising the efficiency of new installed boilers (BOILEFF)
http://www.energyagency.at/projekte/boileff.htm
February 2007 – September 2009
Installed boilers do not operate as efficiently as they could. While test cases demonstrate that boilers could achieve high efficiencies, their real performance is much lower. Starting from the observation that many boiler installations suffer from serious shortcomings, BOILEFF aimed at assessing two
314
market approaches for improving boiler efficiency. The first market approach, called 'quality line', is built on a checklist of quality criteria for boiler installations, which should form part of contracts with final customers. The second approach, 'performance line', focuses on installer guarantees.
Audits of 75 heating systems have revealed major weaknesses in boiler installations (including the generation unit, heat distribution system, heat emitters and the space heating control system). The development of a definition of high quality installations is helping overcome typical installation failures and is expected to result in efficiency improvements of between 5% and 10%. Installers are now introducing performance quality guarantees, helping to raise confidence in boiler replacements and stimulate markets.
Up to 100 pilot projects have been performed during the last heating season to test the impact of both the quality line and performance line approaches. BOILEFF hopes to achieve energy savings of around 155 GWh in the five participating countries.
Changing the heating market mechanisms: Boiler Information System on Efficiency (BISON)
http://www.boilerinfo.org/bison.htm
November 2007 – April 2010
The performance of domestic central heating boilers is to a great extent linked to their installation conditions. They are generally sold via installers. For this reason, consumer information on these boilers cannot be treated in the same way as appliances such as cookers or freezers. BISON aims at setting up an information system based on calculations of annual efficiency gains, taking into account the interaction of the boiler with the installation and the building. It will be made available to consumers, installers, energy consultants, architects and designers. Even under modest projections, potential energy savings are substantial. A database format has been defined, as has been a first version of the user interface. In parallel, interviews have begun with a view to assessing the requirement for market surveys.
Home automation and metering
Eco n' Home or how to reduce energy consumption in households (Eco n' Home)
http://www.econhome.net
January 2006 – December 2008
Eco n’Home explored innovative approaches to reducing the energy consumption of households by identifying possible improvements in their day-to-day energy use. The main result is the 'home energy diagnosis' - a tool to reduce domestic energy consumption. Based on a common methodology, this tool is transferable to users across Europe. It allows analysis of energy consumption in households and, based on the findings, leads to technical and non-technical recommendations for reducing energy use in heating, electricity and transport. This tool has been tested during an 18-month period.
The results reveal household energy savings of around 17% per year on average, which translates into a two tons CO2 saving per household per year. Households seemed less motivated when provided with free services and surveys compared to paid-for services. The predominant motivating factor of those taking part was to save money, for example on heating bills. Environmental awareness was low. Around 20% of the households surveyed consider that participating in such a programme had led to a change in their behaviour towards the environment. Implementing one small measure can help the householder implement subsequent, more complicated measures. In some cases, giving the householder just one low-energy light bulb led to the replacement of most lights with low-energy bulbs.
315
Residential Monitoring to Decrease Energy Use and Carbon Emissions in Europe (REMODECE)
http://www.isr.uc.pt/~remodece
January 2006 – September 2008
REMODECE aimed at understanding how households use different types of electric equipment in 12 countries. It has evaluated how much electricity can be saved by means currently available, such as moving to more efficient appliances or reducing standby consumption. This information will help the development of more energy-efficient equipment in the years to come.
The main results and achievements of REMODECE include an updated European database on residential consumption, including central and eastern European countries; methodologies to combine the use of selective monitoring with wider-scale surveying; a software tool for evaluating energy performance in households; and a set of policy recommendations for different types of equipment.
The consortium found that purchase cost and design are mentioned first as the main decision factors when buying appliances and lighting, while features and design were mentioned as the main decision factors for buying electronic loads.
Standby and Off-Mode Energy Losses In New Appliances Measured in Shops (SELINA)
http://www.selina-project.eu
October 2008 – September 2010
SELINA aims at characterising the EU market in terms of standby and off consumption in new electrical and electronic household and office equipment, being sold in shops, by developing an appliance specific measuring methodology. A large scale monitoring of new equipment will allow characterizing low power modes, of the equipment being sold in a large sample of EU countries. This should allow creating an equipment database with the market trends, which is a major tool for policy makers to define future policies and regulations.
The purpose of these standby measurements on a common set of products is to allow national and international comparison of these alike products across different countries and regions. Such measurement will heighten the awareness of stakeholders of the magnitude of standby power and will provide a focal point to highlight differences across regions. The main objective of this project is to identify effective market transformation policies initiatives targeted at all the key stakeholders involved in the manufacture, distribution, sales and operation of appliances with standby and off-mode losses. As a result huge savings of electricity (80 TWh projected by 2020) and carbon emissions (30 MTons of CO2 by 2020) are expected to be achieved.
Conclusion
The energy we use on electric appliances is increasing. Even when new energy-efficient devices are introduced, savings are often offset by changes in our lifestyle and the never-ending quest for household comfort [4]. Renewed focus on energy efficient appliances is therefore crucial if we are to meet our climate change goals.
316
Projects supported by the Intelligent Energy Europe (IEE) programme complement European legislation and help convert it into action by mobilizing market actors in the Member States. These projects look to overcoming market barriers for energy-efficient products in the residential and tertiary sectors. This means using the best technologies for consuming less energy, while guaranteeing or even improving comfort levels.
Further information on projects supported by the IEE programme is available in the recent projects brochure on energy-efficient products and equipment. Also, much information regarding projects and their most important documents is available for public download, at http://ieea.erba.hu/ieea and http://www.iee-library.eu, respectively.
Additional projects are expected in the years to come. The 2009 IEE call for proposals was published at the end of March 2009. As far as appliances are concerned, the call is looking for proposals addressing: market transformation actions with high impact; energy-efficient heating and cooling appliances; removal of financial barriers; training of sales persons, installers and maintenance staff; eco-design/labelling topics not covered by tenders; soft measures recommended by eco-design preparatory studies; and networking among verification authorities.
To be selected for funding, projects should build on existing actions, involve the right market actors, demonstrate community added-value, be cost effective, and have a high impact. Altogether projects funded under the IEE programme are expected to contribute to secure, sustainable and competitively priced energy for Europe.
References
[1] Bertoldi, P. & Atanasiu, B. (2007) Electricity Consumption and Efficiency Trends in the Enlarged European Union. Status report 2006, European Commission, Directorate-General Joint Research Centre. Institute for Environment and Sustainability. Ispra, Italy.
[2] Directive 2005/32/EC of the European Parliament and of the Council of 6 July 2005 establishing a framework for the setting of ecodesign requirements for energy-using products and amending Council Directive 92/42/EEC and Directives 96/57/EC and 2000/55/EC of the European Parliament and of the Council.
[3] Bush, E., Attali, S., Brunner, C. U. & Niederberger, A. A. (2007) Topten – Best of Europe. How do best products perform and why aren’t they sold across Europe? Proceedings of the eceee 2007 Summer Study, 1331-1341.
[4] Owen, P. (2006) The rise of the machines. A review of energy using products in the home from the 1970s to today. Energy Saving Trust, United Kingdom.
Acknowledgements
The authors wish to thank the IEE project coordinators, as well as their co-beneficiaries for the work performed within the IEE programme. They also would like to thank Dr. Kerstin Lichtenvort, who has been the EACI Project Officer in charge of projects on energy-efficient products between 2005 and 2008.
317
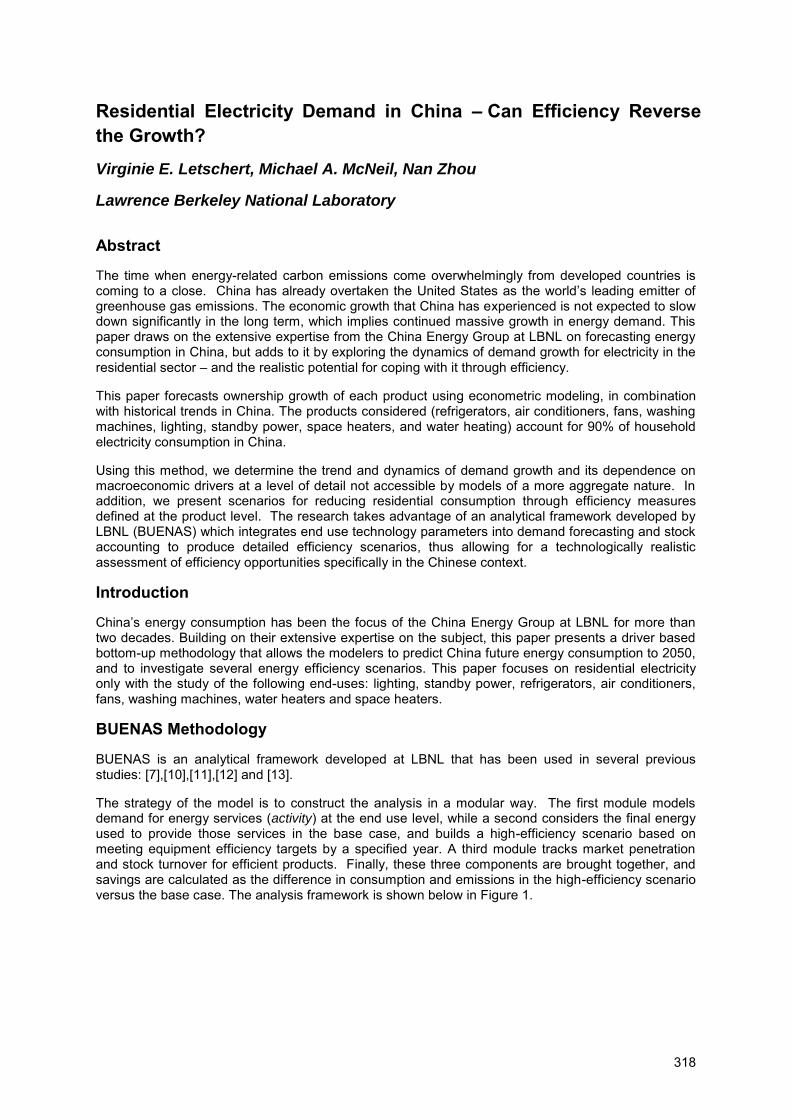
Residential Electricity Demand in China – Can Efficiency Reverse
the Growth?
Virginie E. Letschert, Michael A. McNeil, Nan Zhou
Lawrence Berkeley National Laboratory
Abstract
The time when energy-related carbon emissions come overwhelmingly from developed countries is coming to a close. China has already overtaken the United States as the world’s leading emitter of greenhouse gas emissions. The economic growth that China has experienced is not expected to slow down significantly in the long term, which implies continued massive growth in energy demand. This paper draws on the extensive expertise from the China Energy Group at LBNL on forecasting energy consumption in China, but adds to it by exploring the dynamics of demand growth for electricity in the residential sector – and the realistic potential for coping with it through efficiency.
This paper forecasts ownership growth of each product using econometric modeling, in combination with historical trends in China. The products considered (refrigerators, air conditioners, fans, washing machines, lighting, standby power, space heaters, and water heating) account for 90% of household electricity consumption in China.
Using this method, we determine the trend and dynamics of demand growth and its dependence on macroeconomic drivers at a level of detail not accessible by models of a more aggregate nature. In addition, we present scenarios for reducing residential consumption through efficiency measures defined at the product level. The research takes advantage of an analytical framework developed by LBNL (BUENAS) which integrates end use technology parameters into demand forecasting and stock accounting to produce detailed efficiency scenarios, thus allowing for a technologically realistic assessment of efficiency opportunities specifically in the Chinese context.
Introduction
China’s energy consumption has been the focus of the China Energy Group at LBNL for more than two decades. Building on their extensive expertise on the subject, this paper presents a driver based bottom-up methodology that allows the modelers to predict China future energy consumption to 2050, and to investigate several energy efficiency scenarios. This paper focuses on residential electricity only with the study of the following end-uses: lighting, standby power, refrigerators, air conditioners, fans, washing machines, water heaters and space heaters.
BUENAS Methodology
BUENAS is an analytical framework developed at LBNL that has been used in several previous studies: [7],[10],[11],[12] and [13].
The strategy of the model is to construct the analysis in a modular way. The first module models demand for energy services (activity) at the end use level, while a second considers the final energy used to provide those services in the base case, and builds a high-efficiency scenario based on meeting equipment efficiency targets by a specified year. A third module tracks market penetration and stock turnover for efficient products. Finally, these three components are brought together, and savings are calculated as the difference in consumption and emissions in the high-efficiency scenario versus the base case. The analysis framework is shown below in Figure 1.
318
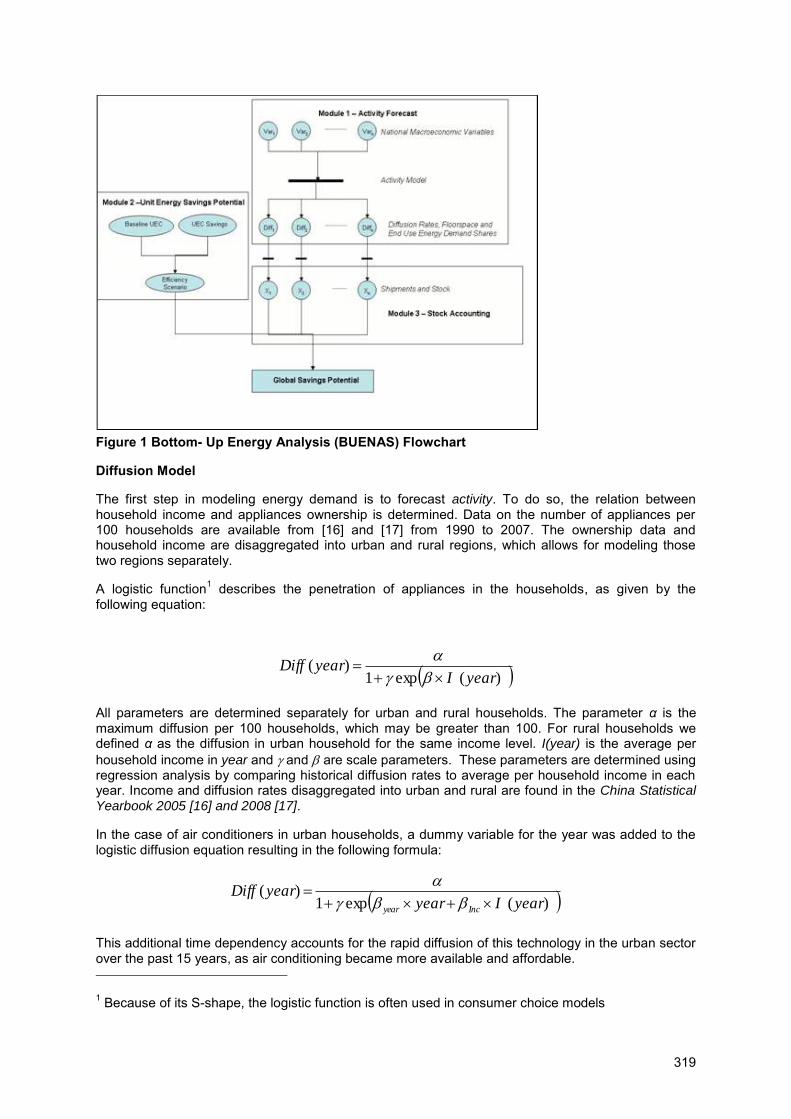
Figure 1 Bottom- Up Energy Analysis (BUENAS) Flowchart
Diffusion Model
The first step in modeling energy demand is to forecast activity. To do so, the relation between household income and appliances ownership is determined. Data on the number of appliances per 100 households are available from [16] and [17] from 1990 to 2007. The ownership data and household income are disaggregated into urban and rural regions, which allows for modeling those two regions separately.
A logistic function1 describes the penetration of appliances in the households, as given by the following equation:
)(exp1)(
yearIyearDiff
All parameters are determined separately for urban and rural households. The parameter α is the maximum diffusion per 100 households, which may be greater than 100. For rural households we defined α as the diffusion in urban household for the same income level. I(year) is the average per household income in year and and are scale parameters. These parameters are determined using regression analysis by comparing historical diffusion rates to average per household income in each year. Income and diffusion rates disaggregated into urban and rural are found in the China Statistical Yearbook 2005 [16] and 2008 [17].
In the case of air conditioners in urban households, a dummy variable for the year was added to the logistic diffusion equation resulting in the following formula:
)(exp1)(
yearIyearyearDiff
Incyear
This additional time dependency accounts for the rapid diffusion of this technology in the urban sector over the past 15 years, as air conditioning became more available and affordable. 1 Because of its S-shape, the logistic function is often used in consumer choice models
319
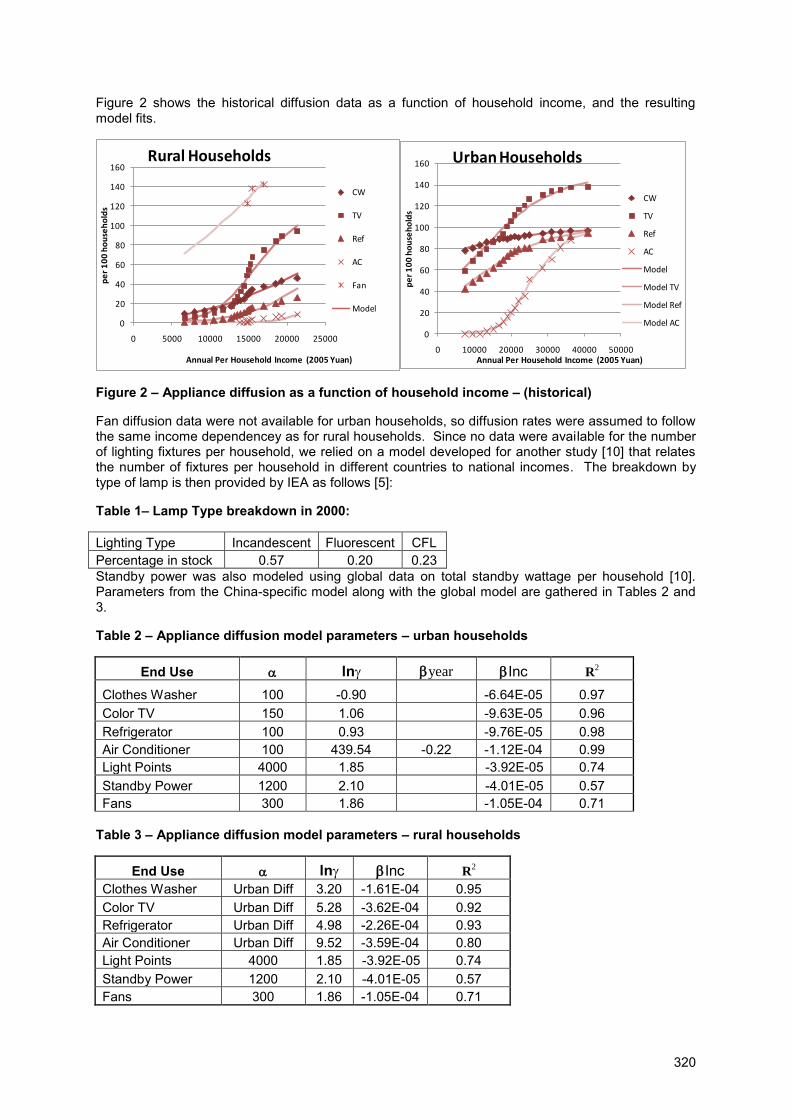
Figure 2 shows the historical diffusion data as a function of household income, and the resulting model fits.
0
20
40
60
80
100
120
140
160
0 10000 20000 30000 40000 50000
pe
r 1
00
ho
use
ho
lds
Annual Per Household Income (2005 Yuan)
Urban Households
CW
TV
Ref
AC
Model
Model TV
Model Ref
Model AC0
20
40
60
80
100
120
140
160
0 5000 10000 15000 20000 25000
pe
r 1
00
ho
use
ho
lds
Annual Per Household Income (2005 Yuan)
Rural Households
CW
TV
Ref
AC
Fan
Model
Figure 2 – Appliance diffusion as a function of household income – (historical)
Fan diffusion data were not available for urban households, so diffusion rates were assumed to follow the same income dependencey as for rural households. Since no data were available for the number of lighting fixtures per household, we relied on a model developed for another study [10] that relates the number of fixtures per household in different countries to national incomes. The breakdown by type of lamp is then provided by IEA as follows [5]:
Table 1– Lamp Type breakdown in 2000:
Lighting Type Incandescent Fluorescent CFL Percentage in stock 0.57 0.20 0.23 Standby power was also modeled using global data on total standby wattage per household [10]. Parameters from the China-specific model along with the global model are gathered in Tables 2 and 3.
Table 2 – Appliance diffusion model parameters – urban households
End Use ln year Inc R2
Clothes Washer 100 -0.90 -6.64E-05 0.97 Color TV 150 1.06 -9.63E-05 0.96 Refrigerator 100 0.93 -9.76E-05 0.98 Air Conditioner 100 439.54 -0.22 -1.12E-04 0.99 Light Points 4000 1.85 -3.92E-05 0.74 Standby Power 1200 2.10 -4.01E-05 0.57 Fans 300 1.86 -1.05E-04 0.71
Table 3 – Appliance diffusion model parameters – rural households
End Use ln Inc R2
Clothes Washer Urban Diff 3.20 -1.61E-04 0.95 Color TV Urban Diff 5.28 -3.62E-04 0.92 Refrigerator Urban Diff 4.98 -2.26E-04 0.93 Air Conditioner Urban Diff 9.52 -3.59E-04 0.80 Light Points 4000 1.85 -3.92E-05 0.74 Standby Power 1200 2.10 -4.01E-05 0.57 Fans 300 1.86 -1.05E-04 0.71
320
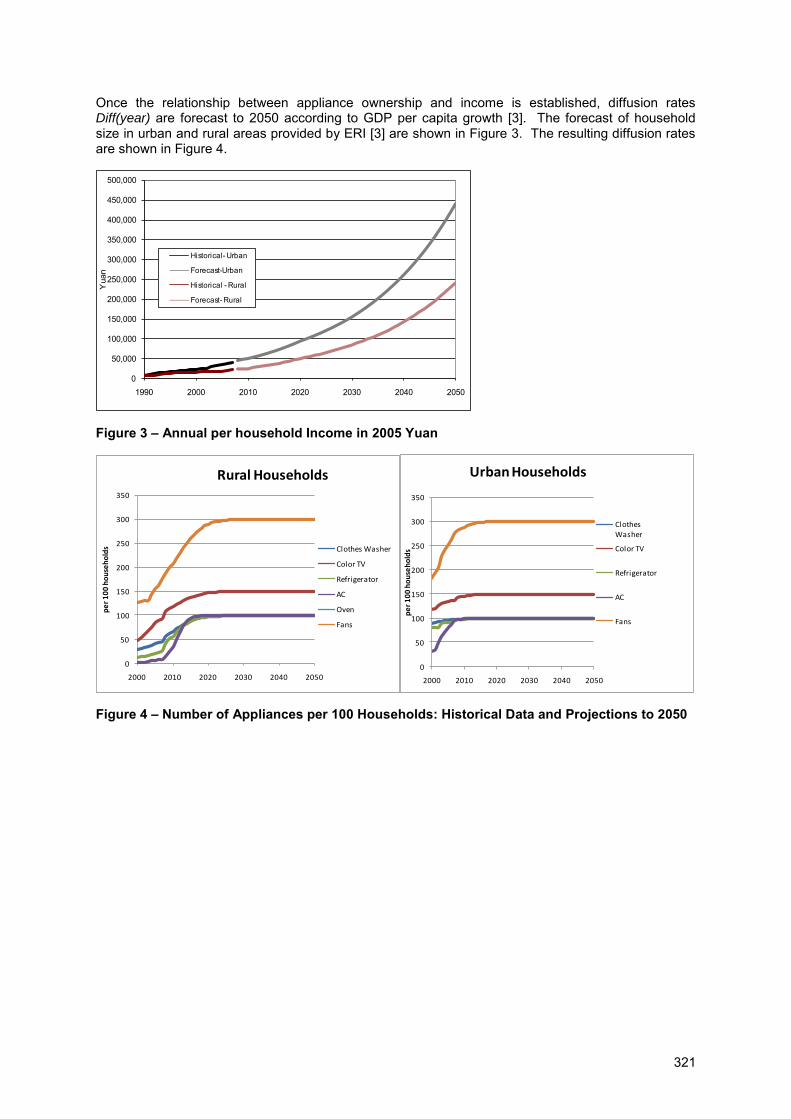
Once the relationship between appliance ownership and income is established, diffusion rates Diff(year) are forecast to 2050 according to GDP per capita growth [3]. The forecast of household size in urban and rural areas provided by ERI [3] are shown in Figure 3. The resulting diffusion rates are shown in Figure 4.
0
50,000
100,000
150,000
200,000
250,000
300,000
350,000
400,000
450,000
500,000
1990 2000 2010 2020 2030 2040 2050
Yua
n
Historical- Urban
Forecast-Urban
Historical - Rural
Forecast- Rural
Figure 3 – Annual per household Income in 2005 Yuan
0
50
100
150
200
250
300
350
2000 2010 2020 2030 2040 2050
pe
r 1
00
ho
use
ho
lds
Urban Households
Clothes Washer
Color TV
Refrigerator
AC
Fans
0
50
100
150
200
250
300
350
2000 2010 2020 2030 2040 2050
pe
r 1
00
ho
use
ho
lds
Rural Households
Clothes Washer
Color TV
Refrigerator
AC
Oven
Fans
Figure 4 – Number of Appliances per 100 Households: Historical Data and Projections to 2050
321
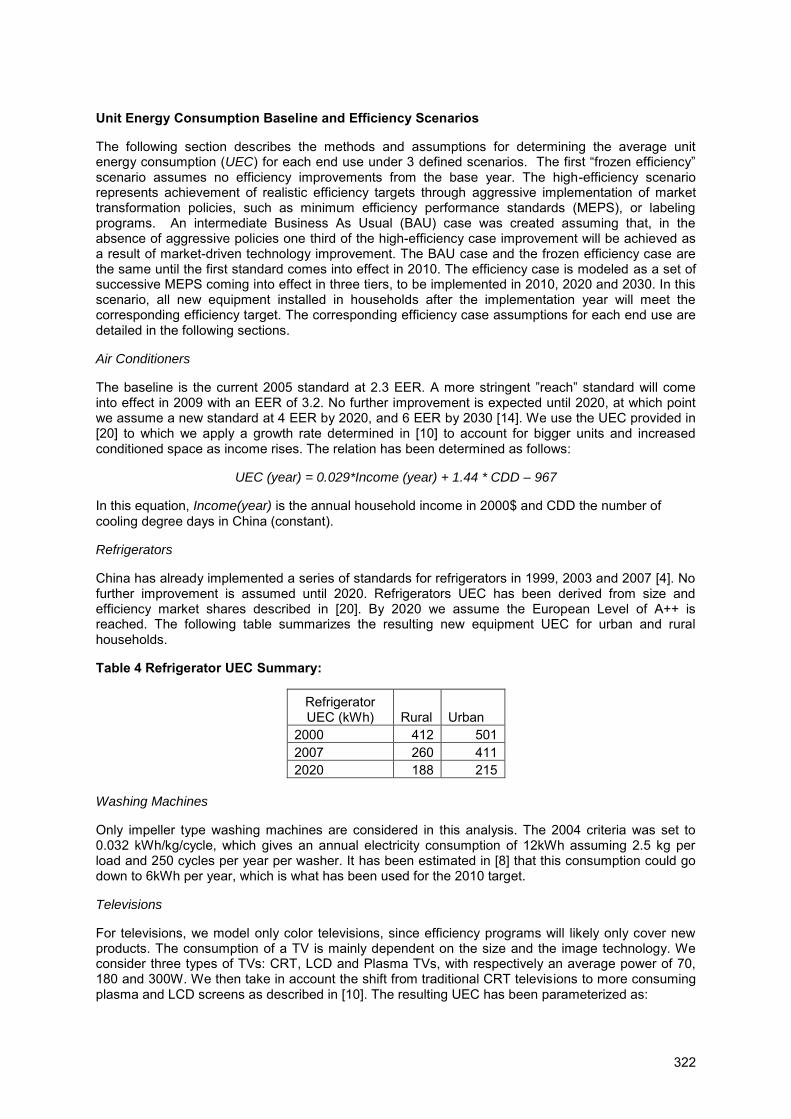
Unit Energy Consumption Baseline and Efficiency Scenarios
The following section describes the methods and assumptions for determining the average unit energy consumption (UEC) for each end use under 3 defined scenarios. The first “frozen efficiency” scenario assumes no efficiency improvements from the base year. The high-efficiency scenario represents achievement of realistic efficiency targets through aggressive implementation of market transformation policies, such as minimum efficiency performance standards (MEPS), or labeling programs. An intermediate Business As Usual (BAU) case was created assuming that, in the absence of aggressive policies one third of the high-efficiency case improvement will be achieved as a result of market-driven technology improvement. The BAU case and the frozen efficiency case are the same until the first standard comes into effect in 2010. The efficiency case is modeled as a set of successive MEPS coming into effect in three tiers, to be implemented in 2010, 2020 and 2030. In this scenario, all new equipment installed in households after the implementation year will meet the corresponding efficiency target. The corresponding efficiency case assumptions for each end use are detailed in the following sections.
Air Conditioners
The baseline is the current 2005 standard at 2.3 EER. A more stringent ”reach” standard will come into effect in 2009 with an EER of 3.2. No further improvement is expected until 2020, at which point we assume a new standard at 4 EER by 2020, and 6 EER by 2030 [14]. We use the UEC provided in [20] to which we apply a growth rate determined in [10] to account for bigger units and increased conditioned space as income rises. The relation has been determined as follows:
UEC (year) = 0.029*Income (year) + 1.44 * CDD – 967
In this equation, Income(year) is the annual household income in 2000$ and CDD the number of cooling degree days in China (constant).
Refrigerators
China has already implemented a series of standards for refrigerators in 1999, 2003 and 2007 [4]. No further improvement is assumed until 2020. Refrigerators UEC has been derived from size and efficiency market shares described in [20]. By 2020 we assume the European Level of A++ is reached. The following table summarizes the resulting new equipment UEC for urban and rural households.
Table 4 Refrigerator UEC Summary:
Refrigerator UEC (kWh) Rural Urban
2000 412 501 2007 260 411 2020 188 215
Washing Machines
Only impeller type washing machines are considered in this analysis. The 2004 criteria was set to 0.032 kWh/kg/cycle, which gives an annual electricity consumption of 12kWh assuming 2.5 kg per load and 250 cycles per year per washer. It has been estimated in [8] that this consumption could go down to 6kWh per year, which is what has been used for the 2010 target.
Televisions
For televisions, we model only color televisions, since efficiency programs will likely only cover new products. The consumption of a TV is mainly dependent on the size and the image technology. We consider three types of TVs: CRT, LCD and Plasma TVs, with respectively an average power of 70, 180 and 300W. We then take in account the shift from traditional CRT televisions to more consuming plasma and LCD screens as described in [10]. The resulting UEC has been parameterized as:
322
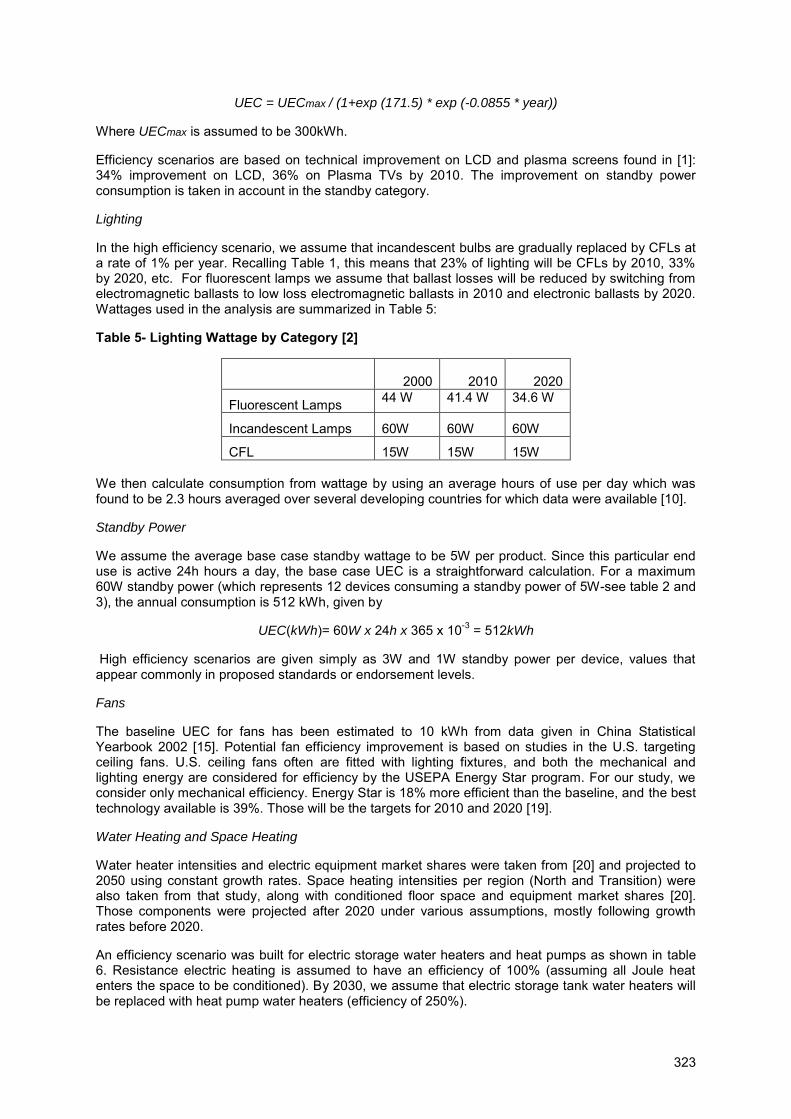
UEC = UECmax / (1+exp (171.5) * exp (-0.0855 * year))
Where UECmax is assumed to be 300kWh.
Efficiency scenarios are based on technical improvement on LCD and plasma screens found in [1]: 34% improvement on LCD, 36% on Plasma TVs by 2010. The improvement on standby power consumption is taken in account in the standby category.
Lighting
In the high efficiency scenario, we assume that incandescent bulbs are gradually replaced by CFLs at a rate of 1% per year. Recalling Table 1, this means that 23% of lighting will be CFLs by 2010, 33% by 2020, etc. For fluorescent lamps we assume that ballast losses will be reduced by switching from electromagnetic ballasts to low loss electromagnetic ballasts in 2010 and electronic ballasts by 2020. Wattages used in the analysis are summarized in Table 5:
Table 5- Lighting Wattage by Category [2]
2000 2010 2020
Fluorescent Lamps 44 W 41.4 W 34.6 W
Incandescent Lamps 60W 60W 60W
CFL 15W 15W 15W We then calculate consumption from wattage by using an average hours of use per day which was found to be 2.3 hours averaged over several developing countries for which data were available [10].
Standby Power
We assume the average base case standby wattage to be 5W per product. Since this particular end use is active 24h hours a day, the base case UEC is a straightforward calculation. For a maximum 60W standby power (which represents 12 devices consuming a standby power of 5W-see table 2 and 3), the annual consumption is 512 kWh, given by
UEC(kWh)= 60W x 24h x 365 x 10-3 = 512kWh
High efficiency scenarios are given simply as 3W and 1W standby power per device, values that appear commonly in proposed standards or endorsement levels.
Fans
The baseline UEC for fans has been estimated to 10 kWh from data given in China Statistical Yearbook 2002 [15]. Potential fan efficiency improvement is based on studies in the U.S. targeting ceiling fans. U.S. ceiling fans often are fitted with lighting fixtures, and both the mechanical and lighting energy are considered for efficiency by the USEPA Energy Star program. For our study, we consider only mechanical efficiency. Energy Star is 18% more efficient than the baseline, and the best technology available is 39%. Those will be the targets for 2010 and 2020 [19].
Water Heating and Space Heating
Water heater intensities and electric equipment market shares were taken from [20] and projected to 2050 using constant growth rates. Space heating intensities per region (North and Transition) were also taken from that study, along with conditioned floor space and equipment market shares [20]. Those components were projected after 2020 under various assumptions, mostly following growth rates before 2020.
An efficiency scenario was built for electric storage water heaters and heat pumps as shown in table 6. Resistance electric heating is assumed to have an efficiency of 100% (assuming all Joule heat enters the space to be conditioned). By 2030, we assume that electric storage tank water heaters will be replaced with heat pump water heaters (efficiency of 250%).
323
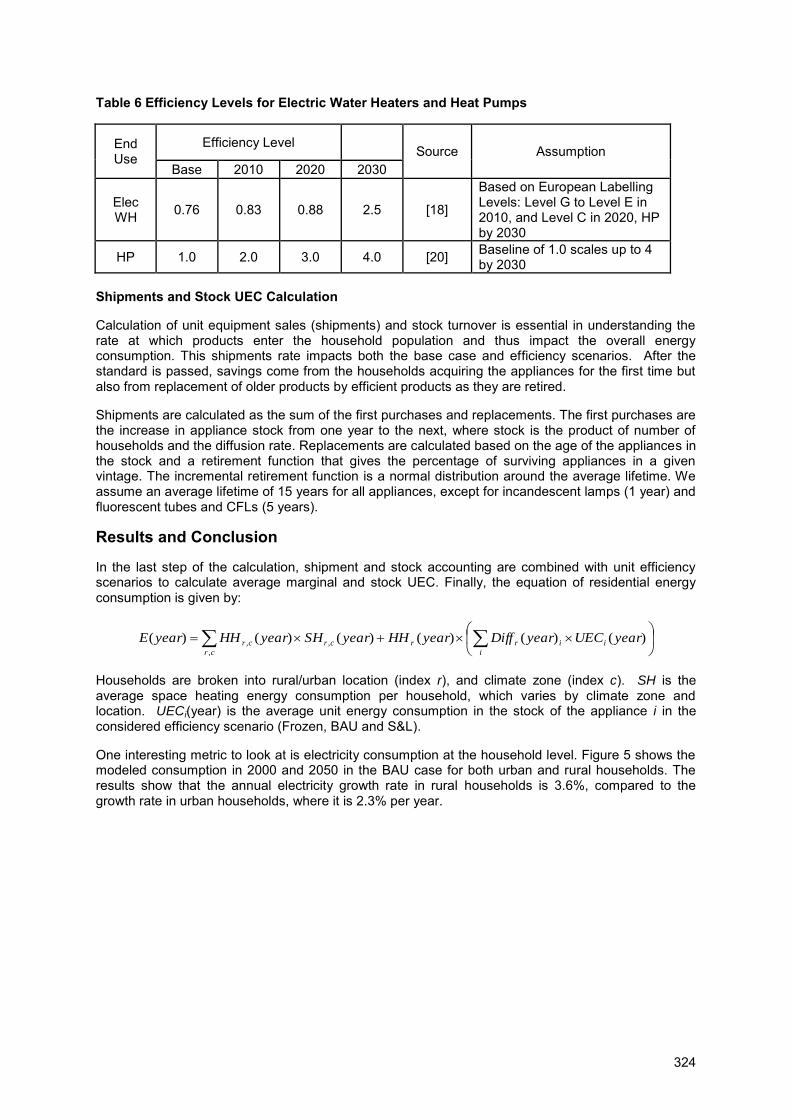
Table 6 Efficiency Levels for Electric Water Heaters and Heat Pumps
End Use
Efficiency Level Source Assumption
Base 2010 2020 2030
Elec WH 0.76 0.83 0.88 2.5 [18]
Based on European Labelling Levels: Level G to Level E in 2010, and Level C in 2020, HP by 2030
HP 1.0 2.0 3.0 4.0 [20] Baseline of 1.0 scales up to 4 by 2030
Shipments and Stock UEC Calculation
Calculation of unit equipment sales (shipments) and stock turnover is essential in understanding the rate at which products enter the household population and thus impact the overall energy consumption. This shipments rate impacts both the base case and efficiency scenarios. After the standard is passed, savings come from the households acquiring the appliances for the first time but also from replacement of older products by efficient products as they are retired.
Shipments are calculated as the sum of the first purchases and replacements. The first purchases are the increase in appliance stock from one year to the next, where stock is the product of number of households and the diffusion rate. Replacements are calculated based on the age of the appliances in the stock and a retirement function that gives the percentage of surviving appliances in a given vintage. The incremental retirement function is a normal distribution around the average lifetime. We assume an average lifetime of 15 years for all appliances, except for incandescent lamps (1 year) and fluorescent tubes and CFLs (5 years).
Results and Conclusion
In the last step of the calculation, shipment and stock accounting are combined with unit efficiency scenarios to calculate average marginal and stock UEC. Finally, the equation of residential energy consumption is given by:
i
iirr
cr
crcr yearUECyearDiffyearHHyearSHyearHHyearE )()()()()()(,
,,
Households are broken into rural/urban location (index r), and climate zone (index c). SH is the average space heating energy consumption per household, which varies by climate zone and location. UECi(year) is the average unit energy consumption in the stock of the appliance i in the considered efficiency scenario (Frozen, BAU and S&L).
One interesting metric to look at is electricity consumption at the household level. Figure 5 shows the modeled consumption in 2000 and 2050 in the BAU case for both urban and rural households. The results show that the annual electricity growth rate in rural households is 3.6%, compared to the growth rate in urban households, where it is 2.3% per year.
324
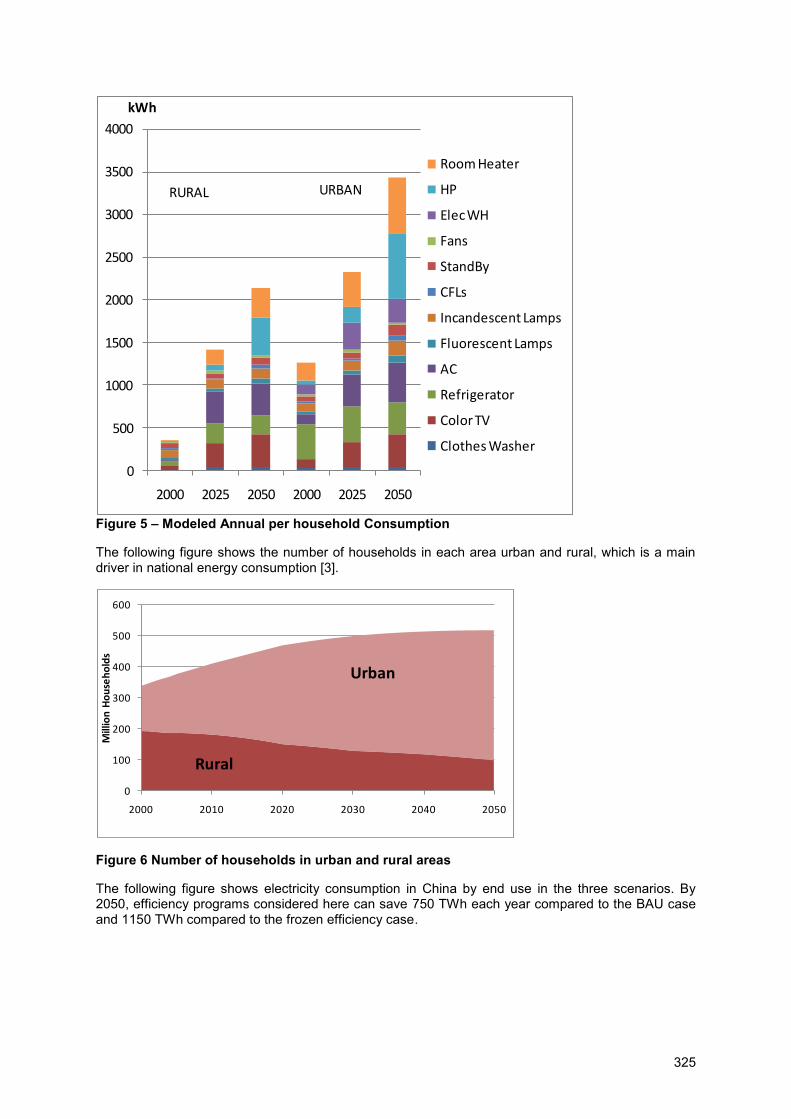
0
500
1000
1500
2000
2500
3000
3500
4000
2000 2025 2050 2000 2025 2050
kWh
Room Heater
HP
Elec WH
Fans
StandBy
CFLs
Incandescent Lamps
Fluorescent Lamps
AC
Refrigerator
Color TV
Clothes Washer
RURAL URBAN
Figure 5 – Modeled Annual per household Consumption
The following figure shows the number of households in each area urban and rural, which is a main driver in national energy consumption [3].
0
100
200
300
400
500
600
2000 2010 2020 2030 2040 2050
Mill
ion
Ho
use
ho
lds
Urban
Rural
Figure 6 Number of households in urban and rural areas
The following figure shows electricity consumption in China by end use in the three scenarios. By 2050, efficiency programs considered here can save 750 TWh each year compared to the BAU case and 1150 TWh compared to the frozen efficiency case.
325

Figure 7 – China Residential Electricity Consumption 2000-2050
The following table shows the electricity consumption annual growth rates for the three scenarios for every decade, since standards levels are applied every 10 years. The growth rate between 2000 and 2010 is by far the largest since it’s when most of the households get access to high intensity end uses for the first time.
Table 7 Annual Consumption Growth Rate in the three scenarios
Annual Growth Rate 2000-2010 2010-2020 2020-2030 2030-2040 2040-2050 2000-2050 Frozen Efficiency 8.6% 5.0% 2.9% 2.3% 2.2% 4.2% BAU 8.5% 4.4% 2.1% 1.2% 1.5% 3.5% S&L 8.4% 3.8% 0.9% 0.1% 0.9% 2.8% Conclusion
This bottom-up analysis of residential electricity scenarios in China provides important insight into the prospects of significantly reducing demand growth in several ways. First, it identifies the particular end uses which will drive demand as households acquire more appliances. It also has an advantage over more macro estimates in that it models saturation effects (households are unlikely to have more than one refrigerator or washing machine, etc.). In addition, savings estimates are based on a realistic set of policy actions, which gradually bring the appliance market up to international best practices. These efficiency targets are in turn based on real-world examples from existing efficiency programs around the world. Implementation of such policies therefore becomes a question of political will and effectiveness of implementation, rather than the development of new technologies or reduction of economic barriers.
Further work is undergoing to determine the effect of building codes on heating and cooling loads, and whether this type of regulation without reform of the district heating system is meaningful, since currently many households do not have control over the amount of heat entering the residence.
Several important conclusions can be drawn from the results. Most obviously, residential electricity consumption in China is currently growing extremely rapidly. This is not a surprise due to the recent history of extremely high economic growth. The analysis confirms that this demand is driven by a rapid uptake in appliances, resulting in near saturation levels for some appliances in the urban sector. In the near future, this trend toward saturation will be nearly complete in urban households, and rural households will also become users of most major appliances. This effect, in combination with continued urbanization mean that demand growth is likely to be strong over the next year. As appliance diffusion reaches saturation, however, growth will slow.
326
In the high-efficiency case, the next ten years will still experience high demand growth, because of the time delay in penetration of the stock by high-efficiency equipment. After that, however, efficiency programs will start to have a significant impact on growth. A system of ratcheted targets will maintain this impact, in spite of the continued trends toward urbanization reaching best-practice levels by 2030, if not already reached by 2020. In this scenario, residential electricity consumption will continue to rise significantly till 2020, after which it will be largely stable for several decades. By 2050 efficiency programs could bring demand by 60% relative to business as usual.
References
[1] Armishaw, M. and B. Harrison (2006). An Approach to the Environmental Analysis of the Eco-design of Television Devices. EEDAL, London.
[2] Brockett, D, D. Fridley, et al. (2002), A Tale of Five Cities: The China Residential Energy Consumption Survey, ACEEE Summer Study on Building Energy Efficiency.
[3] ERI (2008), Energy and Emission Scenario up to 2050 for China, Energy Research Institute, Beijing
[4] Fridley, D., N. Aden, et al. (2007). Impacts of China’s Current Appliance Standards and Labeling Program to 2020. METI
[5] IEA (2006). Light's Labour's Lost: Policies for Energy-Efficient Lighting. Paris, International Energy Agency, OECD.
[6] Letschert, V. and M. McNeil (2007). Coping with Residential Electricity Demand in India's Future - How Much Can Efficiency Achieve? ECEEE Summer Study. Côte d'Azur, France.
[7] Letschert, V. E. and M. A. McNeil (2008). The Boom of Electricity Demand in the residential sector in the developing world and the potential for energy efficiency. ACEEE Buildings Summer Study. Pacific Grove, CA.
[8] Lin, J. and M. Iyer (2007). Cold or hot wash: Technological choices, cultural change, and their
impact on clothes-washing energy use in China. Energy Policy 35: 3046–3052.
[9] Lin J. (2006). Mitigating Carbon Emissions: the Potential of Improving Efficiency of Household Appliances in China.
[10] McNeil, M.A., V. Letschert and S.A. De la Rue du Can (2008) Global Potential of Energy Efficiency Standards and Labeling Programs. Collaborative Labeling and Appliance Standards Program. November 2008.
[11] McNeil, M. and V. Letschert (2007). Future Air Conditioning Energy Consumption in Developing Countries and what can be done about it: The Potential of Efficiency in the Residential Sector. ECEEE Summer Study. Côte d'Azur, France.
[12] McNeil, M. A., V. E. Letschert and S.Wiel (2006). Reducing the Price of Development: The Global Potential of Efficiency Standards in the Residential Electricity Sector. EEDAL, London.
[13] McNeil, M. A. and V. E. Letschert (2005). Forecasting Electricity Demand in Developing Countries: A Study of Household Income and Appliance Ownership. European Council for an Energy Efficient Economy - 2005 Summer Study. Mandelieu, France. LBNL-58283
[14] Murakami, S., M. D. Levine, et al. (2006). Energy Consumption, Efficiency, Conservation, and Greenhouse Gas Mitigation in Japan's Building Sector. Energy and Carbon Emissions: Country Studies, Lawrence Berkeley National Laboratory in collaboration with Japanese Institutions.
[15] NBSC (2002). China Statistical Yearbook, National Bureau of Statistics of China.
[16] NBSC (2005). China Statistical Yearbook, National Bureau of Statistics of China.
327

[17] NBSC (2008). China Statistical Yearbook, National Bureau of Statistics of China.
[18] Sakulin, M. and M. Hoelblinger (2000). Domestic Electric Storage Water Heater (DESWH) Test Methods and Existing Labelling Systems Simulation and Transition Model.
[19] USDOE (2005). FY05 Priority Setting – FY 2005 Preliminary priority setting summary report. Appendix: FY 2005 Technical Support Document. Washington DC.
[20] Zhou N., McNeil M.A., et al. (2007). Energy Use in China: Sectoral Trends and Future Outlook. LBNL
328
Demonstration of the new promotion scheme for high-efficiency home appliances and evaluation of its energy saving effect Shinichi KISHIDA, Takahiro TSURUSAKI
Akio TANAKA, Hidetoshi NAKAGAMI
Jyukankyo Research Institute, Inc., Japan
Abstract
In Japan, the energy conservation regulation called top runner standard was introduced to reduce energy consumption in households. The rated efficiency of home appliances has been improved by this regulation, but the actual energy savings depends on how consumers use appliances. Therefore, in situ energy consumption data needs to be collected to observe the actual efficiency.
In addition, it is necessary to make an effective way to promote the replacement of appliance for the further penetration of high-efficiency appliances. Evaluation of its effectiveness is also important to figure out the effect of replacement.
In this paper, we propose a new promotion scheme for the replacement of appliances and demonstrate its feasibility. Moreover, we evaluate the actual energy saving effect by measurement.
This scheme is composed of three parts to obtain the energy consumption data. The first is an appliance supply part (a Japanese appliance retailer). The second is a measurement part (consumers). The third is an analysis part (our research institute). The demonstration is carried out in winter and appliances to be measured are air conditioner, TV and refrigerator.
The measurement result shows that there are two consumption cases; “energy saved” and “energy increased”. These results are highly affected by the appliance specification like screen size of TV.
The evaluation of this scheme reveals the importance of giving incentives to consumers. Finally, we propose a revised promotion scheme for replacement based on this evaluation.
Introduction
Recently, global warming has become a very important issue in the world and immediate action for this problem is needed to cut the greenhouse gases. In 1997, the Kyoto conference on climate change took place at the Conference of Parties III (COP3) and the Kyoto Protocol was defined as the general framework for this problem. Japan has to reduce greenhouse gases by 6% compared to 1990 level by 2012.
On the other hand, the energy consumption in Japan, especially that of the residential sector, has been increasing by 27% against 1990 level. Therefore, energy savings in the household sector must be promoted to meet the goal set in the Kyoto protocol.
In Japan, the energy conservation regulation called “Top runner” standard was introduced in 1998 to reduce the energy consumption in households. The Top runner program requires that the energy consumption performance of future appliances shown in Table 1 should be more efficient than the best performance of the product currently in the market. According to this program, the apparent efficiency of appliances has been significantly improved. Table 2 shows the rated energy efficiency improvement of appliances. Achieved improvement of each appliance exceeds the initially expected improvement.
329
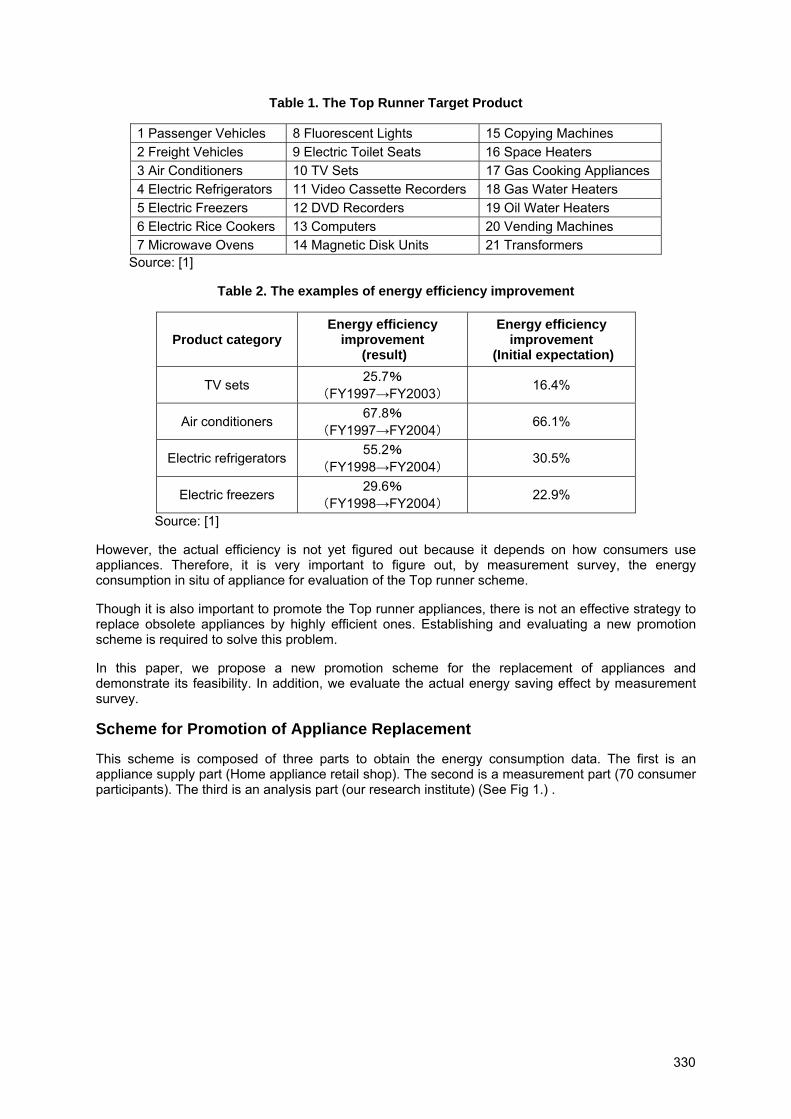
Table 1. The Top Runner Target Product
1 Passenger Vehicles 8 Fluorescent Lights 15 Copying Machines 2 Freight Vehicles 9 Electric Toilet Seats 16 Space Heaters 3 Air Conditioners 10 TV Sets 17 Gas Cooking Appliances 4 Electric Refrigerators 11 Video Cassette Recorders 18 Gas Water Heaters 5 Electric Freezers 12 DVD Recorders 19 Oil Water Heaters 6 Electric Rice Cookers 13 Computers 20 Vending Machines 7 Microwave Ovens 14 Magnetic Disk Units 21 Transformers
Source: [1]
Table 2. The examples of energy efficiency improvement
Product category Energy efficiency
improvement (result)
Energy efficiency improvement
(Initial expectation)
TV sets 25.7% (FY1997→FY2003) 16.4%
Air conditioners 67.8% (FY1997→FY2004) 66.1%
Electric refrigerators 55.2% (FY1998→FY2004) 30.5%
Electric freezers 29.6% (FY1998→FY2004) 22.9%
Source: [1]
However, the actual efficiency is not yet figured out because it depends on how consumers use appliances. Therefore, it is very important to figure out, by measurement survey, the energy consumption in situ of appliance for evaluation of the Top runner scheme.
Though it is also important to promote the Top runner appliances, there is not an effective strategy to replace obsolete appliances by highly efficient ones. Establishing and evaluating a new promotion scheme is required to solve this problem.
In this paper, we propose a new promotion scheme for the replacement of appliances and demonstrate its feasibility. In addition, we evaluate the actual energy saving effect by measurement survey.
Scheme for Promotion of Appliance Replacement
This scheme is composed of three parts to obtain the energy consumption data. The first is an appliance supply part (Home appliance retail shop). The second is a measurement part (70 consumer participants). The third is an analysis part (our research institute) (See Fig 1.) .
330
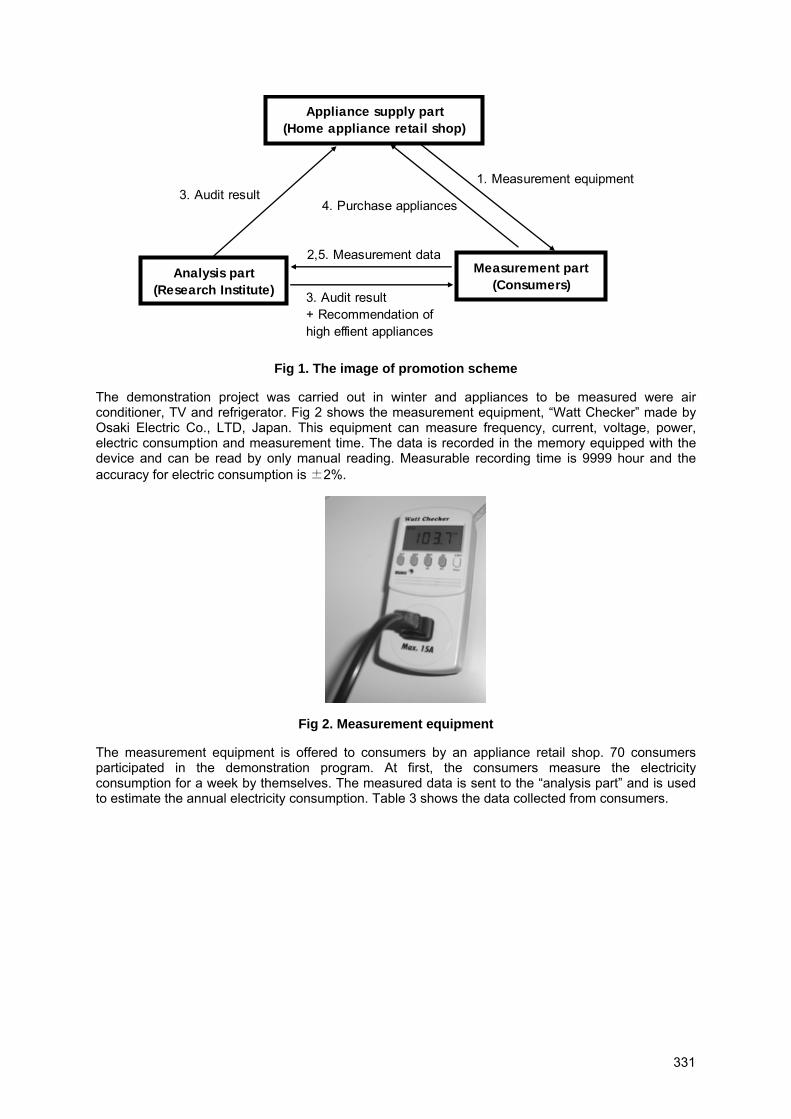
Analysis part(Research Institute)
Measurement part(Consumers)
Appliance supply part(Home appliance retail shop)
2,5. Measurement data
3. Audit result 1. Measurement equipment
3. Audit result+ Recommendation ofhigh effient appliances
4. Purchase appliances
Fig 1. The image of promotion scheme
The demonstration project was carried out in winter and appliances to be measured were air conditioner, TV and refrigerator. Fig 2 shows the measurement equipment, “Watt Checker” made by Osaki Electric Co., LTD, Japan. This equipment can measure frequency, current, voltage, power, electric consumption and measurement time. The data is recorded in the memory equipped with the device and can be read by only manual reading. Measurable recording time is 9999 hour and the accuracy for electric consumption is ±2%.
Fig 2. Measurement equipment
The measurement equipment is offered to consumers by an appliance retail shop. 70 consumers participated in the demonstration program. At first, the consumers measure the electricity consumption for a week by themselves. The measured data is sent to the “analysis part” and is used to estimate the annual electricity consumption. Table 3 shows the data collected from consumers.
331
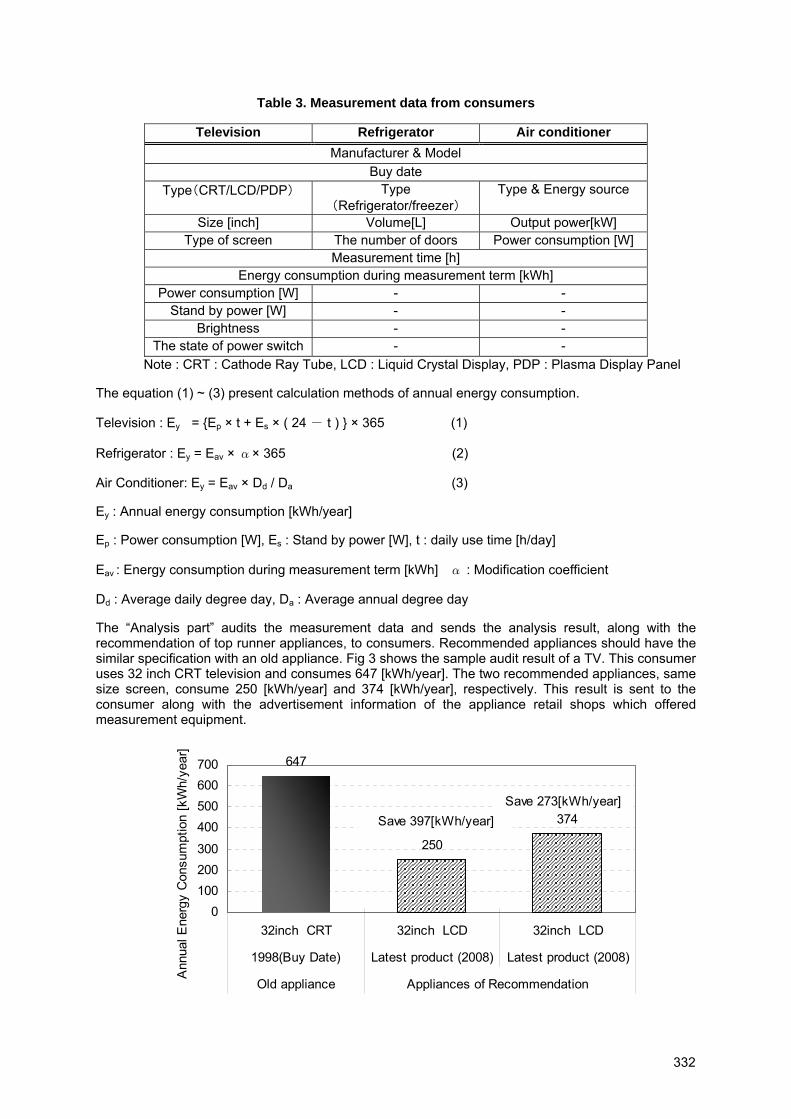
Table 3. Measurement data from consumers
Television Refrigerator Air conditioner Manufacturer & Model
Buy date Type(CRT/LCD/PDP) Type
(Refrigerator/freezer) Type & Energy source
Size [inch] Volume[L] Output power[kW] Type of screen The number of doors Power consumption [W]
Measurement time [h] Energy consumption during measurement term [kWh]
Power consumption [W] - - Stand by power [W] - -
Brightness - - The state of power switch - -
Note : CRT : Cathode Ray Tube, LCD : Liquid Crystal Display, PDP : Plasma Display Panel
The equation (1) ~ (3) present calculation methods of annual energy consumption.
Television : Ey = {Ep × t + Es × ( 24 - t ) } × 365 (1)
Refrigerator : Ey = Eav × α× 365 (2)
Air Conditioner: Ey = Eav × Dd / Da (3)
Ey : Annual energy consumption [kWh/year]
Ep : Power consumption [W], Es : Stand by power [W], t : daily use time [h/day]
Eav : Energy consumption during measurement term [kWh] α : Modification coefficient
Dd : Average daily degree day, Da : Average annual degree day
The “Analysis part” audits the measurement data and sends the analysis result, along with the recommendation of top runner appliances, to consumers. Recommended appliances should have the similar specification with an old appliance. Fig 3 shows the sample audit result of a TV. This consumer uses 32 inch CRT television and consumes 647 [kWh/year]. The two recommended appliances, same size screen, consume 250 [kWh/year] and 374 [kWh/year], respectively. This result is sent to the consumer along with the advertisement information of the appliance retail shops which offered measurement equipment.
647
374
250
0100200300
400500600700
32inch CRT 32inch LCD 32inch LCD
1998(Buy Date) Latest product (2008) Latest product (2008)
Old appliance Appliances of Recommendation
Ann
ual E
nerg
y C
onsu
mpt
ion
[kW
h/ye
ar]
Save 397[kWh/year]Save 273[kWh/year]
332
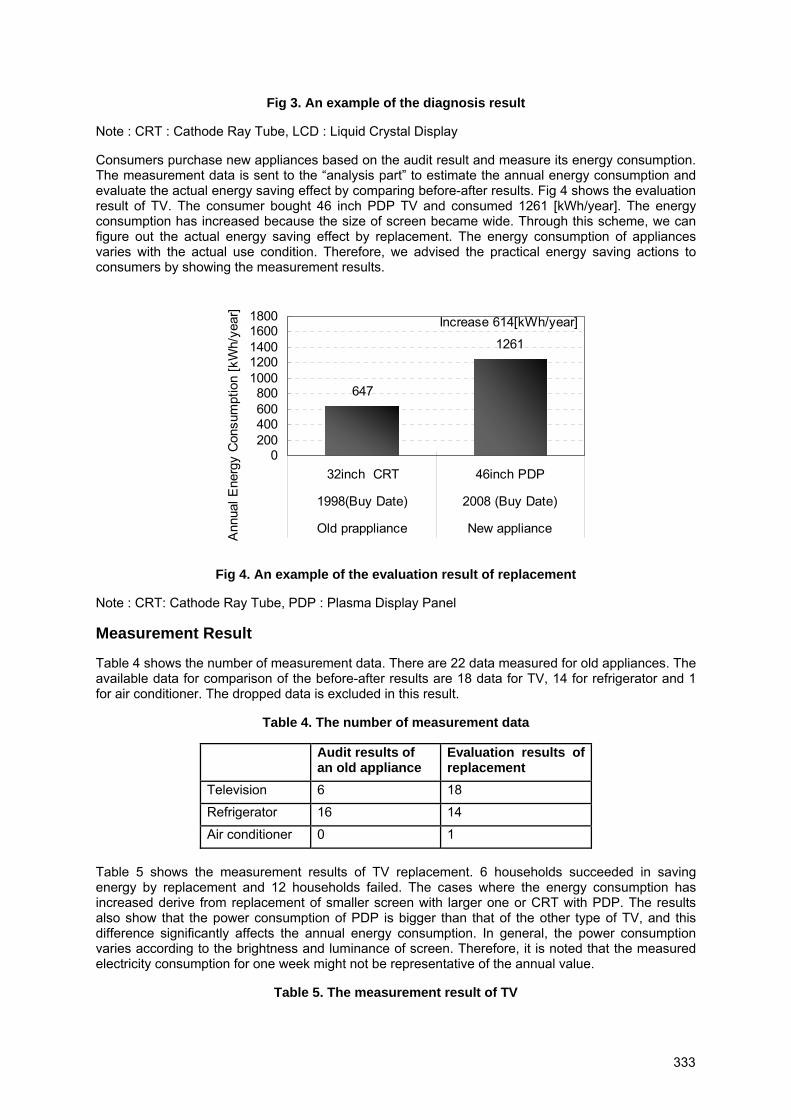
Fig 3. An example of the diagnosis result
Note : CRT : Cathode Ray Tube, LCD : Liquid Crystal Display
Consumers purchase new appliances based on the audit result and measure its energy consumption. The measurement data is sent to the “analysis part” to estimate the annual energy consumption and evaluate the actual energy saving effect by comparing before-after results. Fig 4 shows the evaluation result of TV. The consumer bought 46 inch PDP TV and consumed 1261 [kWh/year]. The energy consumption has increased because the size of screen became wide. Through this scheme, we can figure out the actual energy saving effect by replacement. The energy consumption of appliances varies with the actual use condition. Therefore, we advised the practical energy saving actions to consumers by showing the measurement results.
647
1261
0200400600800
10001200140016001800
32inch CRT 46inch PDP
1998(Buy Date) 2008 (Buy Date)
Old prappliance New applianceAnn
ual E
nerg
y C
onsu
mpt
ion
[kW
h/ye
ar]
Increase 614[kWh/year]
Fig 4. An example of the evaluation result of replacement
Note : CRT: Cathode Ray Tube, PDP : Plasma Display Panel
Measurement Result
Table 4 shows the number of measurement data. There are 22 data measured for old appliances. The available data for comparison of the before-after results are 18 data for TV, 14 for refrigerator and 1 for air conditioner. The dropped data is excluded in this result.
Table 4. The number of measurement data
Audit results of an old appliance
Evaluation results of replacement
Television 6 18
Refrigerator 16 14
Air conditioner 0 1
Table 5 shows the measurement results of TV replacement. 6 households succeeded in saving energy by replacement and 12 households failed. The cases where the energy consumption has increased derive from replacement of smaller screen with larger one or CRT with PDP. The results also show that the power consumption of PDP is bigger than that of the other type of TV, and this difference significantly affects the annual energy consumption. In general, the power consumption varies according to the brightness and luminance of screen. Therefore, it is noted that the measured electricity consumption for one week might not be representative of the annual value.
Table 5. The measurement result of TV
333
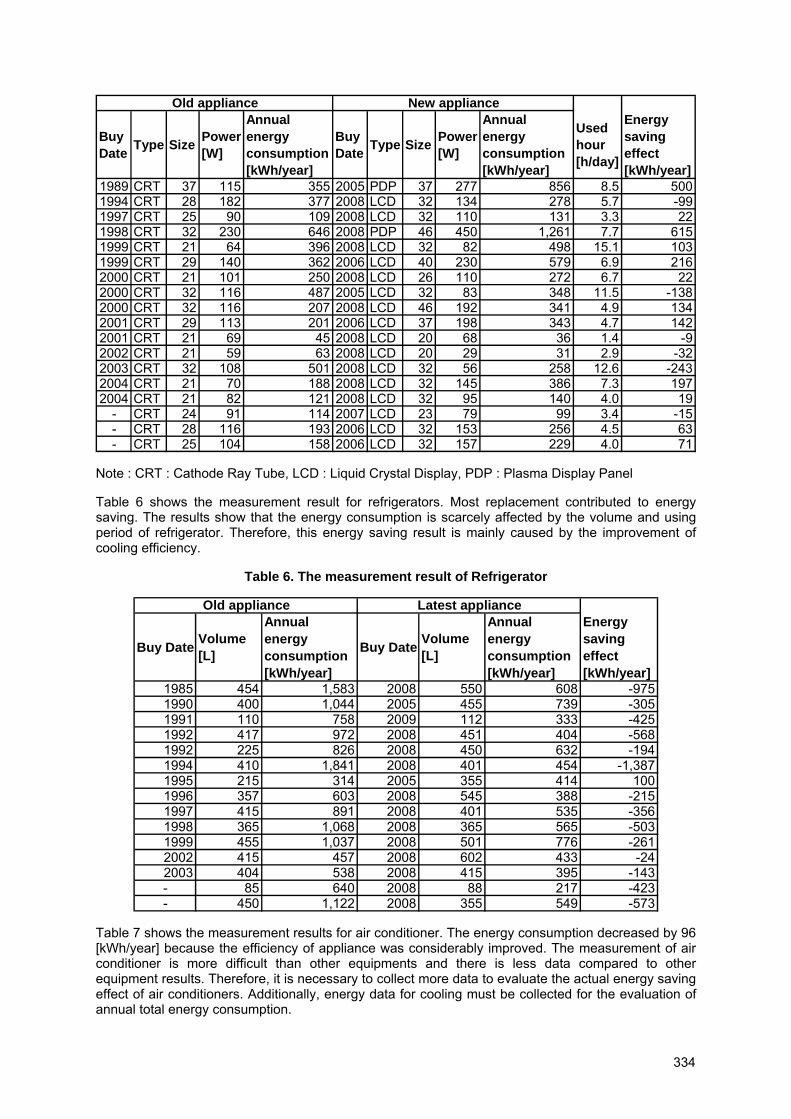
BuyDate Type Size Power
[W]
Annualenergyconsumption[kWh/year]
BuyDate Type Size Power
[W]
Annualenergyconsumption[kWh/year]
Usedhour[h/day]
Energysavingeffect[kWh/year]
1989 CRT 37 115 355 2005 PDP 37 277 856 8.5 5001994 CRT 28 182 377 2008 LCD 32 134 278 5.7 -991997 CRT 25 90 109 2008 LCD 32 110 131 3.3 221998 CRT 32 230 646 2008 PDP 46 450 1,261 7.7 6151999 CRT 21 64 396 2008 LCD 32 82 498 15.1 1031999 CRT 29 140 362 2006 LCD 40 230 579 6.9 2162000 CRT 21 101 250 2008 LCD 26 110 272 6.7 222000 CRT 32 116 487 2005 LCD 32 83 348 11.5 -1382000 CRT 32 116 207 2008 LCD 46 192 341 4.9 1342001 CRT 29 113 201 2006 LCD 37 198 343 4.7 1422001 CRT 21 69 45 2008 LCD 20 68 36 1.4 -92002 CRT 21 59 63 2008 LCD 20 29 31 2.9 -322003 CRT 32 108 501 2008 LCD 32 56 258 12.6 -2432004 CRT 21 70 188 2008 LCD 32 145 386 7.3 1972004 CRT 21 82 121 2008 LCD 32 95 140 4.0 19
- CRT 24 91 114 2007 LCD 23 79 99 3.4 -15- CRT 28 116 193 2006 LCD 32 153 256 4.5 63- CRT 25 104 158 2006 LCD 32 157 229 4.0 71
New applianceOld appliance
Note : CRT : Cathode Ray Tube, LCD : Liquid Crystal Display, PDP : Plasma Display Panel
Table 6 shows the measurement result for refrigerators. Most replacement contributed to energy saving. The results show that the energy consumption is scarcely affected by the volume and using period of refrigerator. Therefore, this energy saving result is mainly caused by the improvement of cooling efficiency.
Table 6. The measurement result of Refrigerator
Buy Date Volume[L]
Annualenergyconsumption[kWh/year]
Buy Date Volume[L]
Annualenergyconsumption[kWh/year]
Energysavingeffect[kWh/year]
1985 454 1,583 2008 550 608 -9751990 400 1,044 2005 455 739 -3051991 110 758 2009 112 333 -4251992 417 972 2008 451 404 -5681992 225 826 2008 450 632 -1941994 410 1,841 2008 401 454 -1,3871995 215 314 2005 355 414 1001996 357 603 2008 545 388 -2151997 415 891 2008 401 535 -3561998 365 1,068 2008 365 565 -5031999 455 1,037 2008 501 776 -2612002 415 457 2008 602 433 -242003 404 538 2008 415 395 -143- 85 640 2008 88 217 -423- 450 1,122 2008 355 549 -573
Old appliance Latest appliance
Table 7 shows the measurement results for air conditioner. The energy consumption decreased by 96 [kWh/year] because the efficiency of appliance was considerably improved. The measurement of air conditioner is more difficult than other equipments and there is less data compared to other equipment results. Therefore, it is necessary to collect more data to evaluate the actual energy saving effect of air conditioners. Additionally, energy data for cooling must be collected for the evaluation of annual total energy consumption.
334
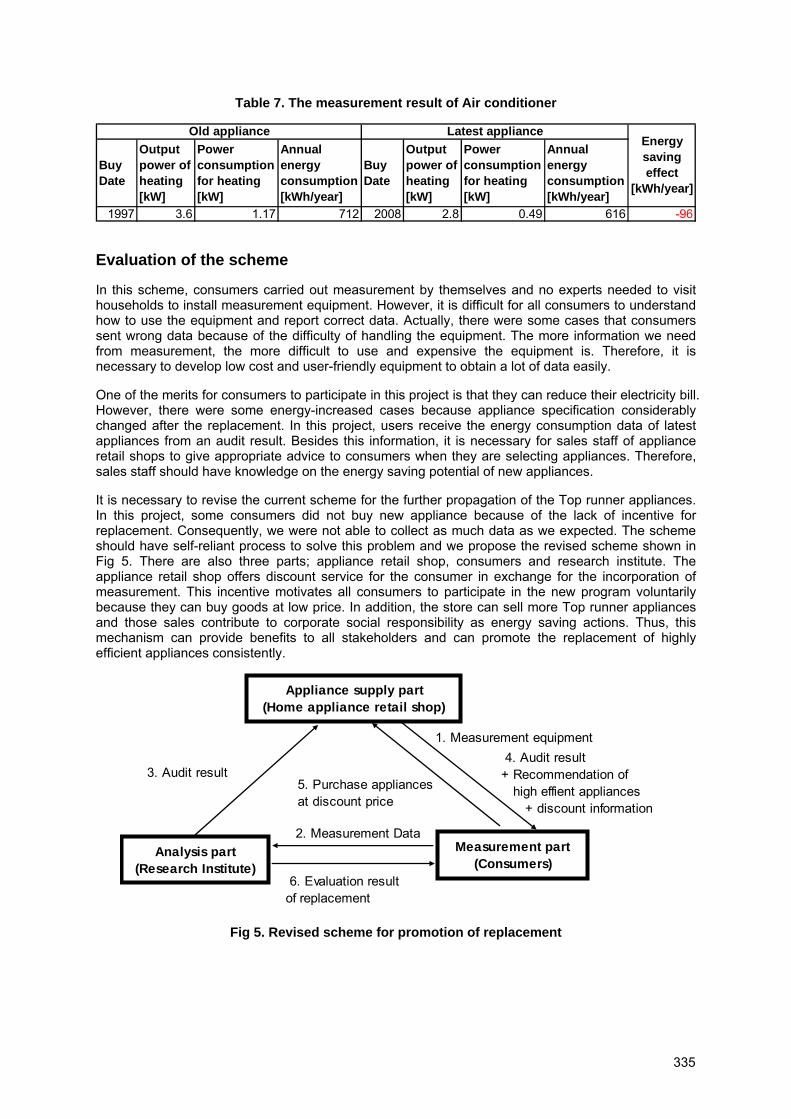
Table 7. The measurement result of Air conditioner
BuyDate
Outputpower ofheating[kW]
Powerconsumptionfor heating[kW]
Annualenergyconsumption[kWh/year]
BuyDate
Outputpower ofheating[kW]
Powerconsumptionfor heating[kW]
Annualenergyconsumption[kWh/year]
1997 3.6 1.17 712 2008 2.8 0.49 616 -96
Old appliance Latest applianceEnergysavingeffect
[kWh/year]
Evaluation of the scheme
In this scheme, consumers carried out measurement by themselves and no experts needed to visit households to install measurement equipment. However, it is difficult for all consumers to understand how to use the equipment and report correct data. Actually, there were some cases that consumers sent wrong data because of the difficulty of handling the equipment. The more information we need from measurement, the more difficult to use and expensive the equipment is. Therefore, it is necessary to develop low cost and user-friendly equipment to obtain a lot of data easily.
One of the merits for consumers to participate in this project is that they can reduce their electricity bill. However, there were some energy-increased cases because appliance specification considerably changed after the replacement. In this project, users receive the energy consumption data of latest appliances from an audit result. Besides this information, it is necessary for sales staff of appliance retail shops to give appropriate advice to consumers when they are selecting appliances. Therefore, sales staff should have knowledge on the energy saving potential of new appliances.
It is necessary to revise the current scheme for the further propagation of the Top runner appliances. In this project, some consumers did not buy new appliance because of the lack of incentive for replacement. Consequently, we were not able to collect as much data as we expected. The scheme should have self-reliant process to solve this problem and we propose the revised scheme shown in Fig 5. There are also three parts; appliance retail shop, consumers and research institute. The appliance retail shop offers discount service for the consumer in exchange for the incorporation of measurement. This incentive motivates all consumers to participate in the new program voluntarily because they can buy goods at low price. In addition, the store can sell more Top runner appliances and those sales contribute to corporate social responsibility as energy saving actions. Thus, this mechanism can provide benefits to all stakeholders and can promote the replacement of highly efficient appliances consistently.
Analysis part(Research Institute)
Measurement part(Consumers)
Appliance supply part(Home appliance retail shop)
2. Measurement Data
3. Audit result
1. Measurement equipment 4. Audit result+ Recommendation of high effient appliances + discount information
5. Purchase appliancesat discount price
6. Evaluation resultof replacement
Fig 5. Revised scheme for promotion of replacement
335

Conclusion
In this paper, we propose a new promotion scheme for the replacement of appliances and demonstrate its feasibility. In addition, we evaluate the actual energy saving effect by measurement survey.
The measurement result of television shows that there are many energy-increasing cases by the replacement. This is caused by a change of screen size or type of television. Meanwhile, most of the replacement of refrigerators contributes to the energy saving, due to improvement of cooling efficiency. There is only one case for the replacement of air conditioner, because of the difficulty of measurement. More data are needed to evaluate the energy saving effect.
In this scheme, there was less replacement than we had expected because consumers did not understand the merit to participate in this project. This reveals that the scheme must have a self-reliant process and some incentive is needed to gather the participant. In conclusion, we proposed a new promotion scheme for replacement. If consumers participate in the measurement, they can buy appliances at low price. This incentive contributes to gather participants and it will be possible to promote further replacement of old appliances by higher efficient ones.
References
[1] The Energy Conservation Center, Japan. Developing the World's Best Energy-Efficient Appliances, 25 Jan 2008. Can be downloaded at: http://www.eccj.or.jp/top_runner/index.html.
336

Indicator-Benchmark-System: A cost-effective and market-based method for quantitative verification of energy efficiency improvements Jan Witt, Jörg Zöllner HEA – Fachgemeinschaft für effiziente Energieanwendung e.V. The European Union’s Energy Efficiency and Energy Services Directive Article 4 of the Directive of the European Parliament and of the Council of 5 April 2006 on energy end-use efficiency and energy services determines an indicative energy end-use savings target of 9 % for each EU Member State to be achieved by the year 2016, at the latest, starting from 2007. The reference point for the required 9 % energy savings target shall be the average energy end-use consumption of the years 2000 to 2005 of each EU Member State. A substantial part of this Directive focuses on the question on how the 9 % energy savings can be verified by the Member States. According to the EU Commission, the quantification of this target must be verifiable by measurement or estimation, and shall be reviewed by a third party or public authority, respectively. However, the Directive has not given a clear-cut answer to the question on how to actually comply with this requirement. It specifies the top-down, bottom-up method and alternatively the energy indicators benchmark approach; the two methods do not mutually exclude, but may complement one another, where applicable. The description of the top-down/bottom-up method covering several pages in Annex 4 to the Directive suggests the complexity of the solution that is to be implemented here. Concerning the bottom-up method, which is to verify energy efficiency improvements, control groups are for instance to be used. That requires a great scientific and time-consuming effort which is however inevitably reflected in the costs. The rules to be applied for the normalisation of measurements according to item 1.2 of Annex 4 with 7 influence factors a) to g) already show that the relevant measurements will be only of a limited conclusiveness, or associated with disproportionately large costs. We consider the method described in Annex 4 to be an interesting intellectual challenge for institutes throughout Europe dealing with issues of energy economics, but we are very doubtful about the validity of the figures thus determined. Besides, we notice that market participants are not consistently included in such a procedure. Their inclusion would enable a higher conclusiveness of results to be achieved in a cost-efficient manner. Already in Article 1, the Directive provides a definition which should be taken into consideration to a larger extent for the assessment of results. Article 1 states that the purpose of the Directive is to effectively enhance „energy end-use efficiency“. This shows the function assigned to energy efficiency in the economic process. Energy conversion (usually referred to as energy consumption) is part of an economic process which contributes to creating goods and services. Energy efficiency characterises the process of energy conversion aiming at making the required goods and services available at the lowest possible energy expenditure. Hence, if energy efficiency is part of the energy application market, the efficiency must always take the conditions of this market as a basis. It can be easily stated that energy efficiency in the large domestic appliances’ sector requires measures different from those in the field of industrial processes. If this definition is endorsed, the quantification method must be specifically determined for each or for essential energy application markets, respectively.
337
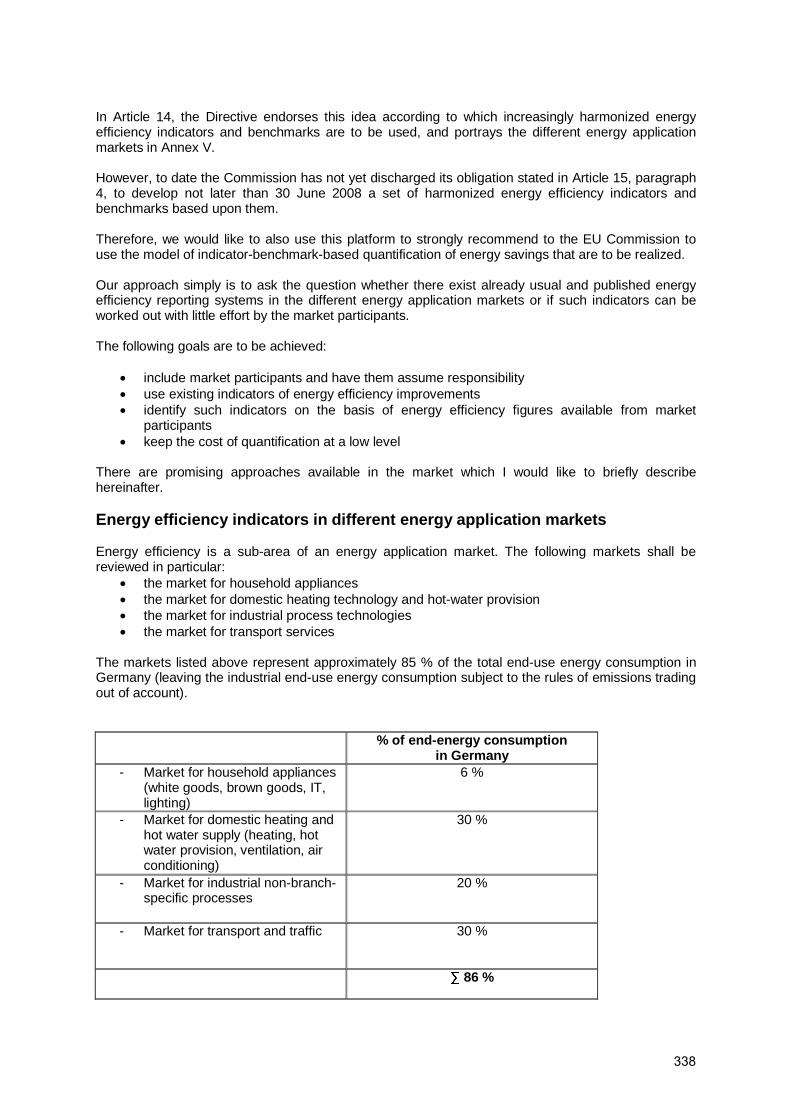
In Article 14, the Directive endorses this idea according to which increasingly harmonized energy efficiency indicators and benchmarks are to be used, and portrays the different energy application markets in Annex V. However, to date the Commission has not yet discharged its obligation stated in Article 15, paragraph 4, to develop not later than 30 June 2008 a set of harmonized energy efficiency indicators and benchmarks based upon them. Therefore, we would like to also use this platform to strongly recommend to the EU Commission to use the model of indicator-benchmark-based quantification of energy savings that are to be realized. Our approach simply is to ask the question whether there exist already usual and published energy efficiency reporting systems in the different energy application markets or if such indicators can be worked out with little effort by the market participants. The following goals are to be achieved:
• include market participants and have them assume responsibility • use existing indicators of energy efficiency improvements • identify such indicators on the basis of energy efficiency figures available from market
participants • keep the cost of quantification at a low level
There are promising approaches available in the market which I would like to briefly describe hereinafter. Energy efficiency indicators in different energy application markets Energy efficiency is a sub-area of an energy application market. The following markets shall be reviewed in particular:
• the market for household appliances • the market for domestic heating technology and hot-water provision • the market for industrial process technologies • the market for transport services
The markets listed above represent approximately 85 % of the total end-use energy consumption in Germany (leaving the industrial end-use energy consumption subject to the rules of emissions trading out of account). % of end-energy consumption
in Germany - Market for household appliances
(white goods, brown goods, IT, lighting)
6 %
- Market for domestic heating and hot water supply (heating, hot water provision, ventilation, air conditioning)
30 %
- Market for industrial non-branch-specific processes
20 %
- Market for transport and traffic 30 %
∑ 86 %
338

Market for household appliances White goods The most striking example of an energy efficiency indicator is the energy label introduced throughout the EU for large household appliances (white goods). This label documents the energy efficiency of every individual large household appliance. Taking the notifications of producers and importers as a basis, the GfK (Gesellschaft für Konsumforschung) market research company annually determines the market shares of each efficiency class for all appliances ranking among „white goods“. The figures thus obtained enable the energy efficiency development as defined by the Directive to be determined. There is a high savings potential: ZVEI calculated that approximately eight billion kWh of electrical energy could be saved per year if all refrigerators and freezers aged ten years or older were replaced by highly efficient appliances (A++). At the present time, the market share of A++ refrigerators and freezers amounts to 5 percent. Two thirds of the refrigerators purchased in 2007 had an A energy label or worse. The market shares of the different energy efficiency classes reported every year enable the reduction in energy consumption within the meaning of the Directive to be determined. The GfK surveys can be considered as having been established by a neutral institution within the meaning of the Directive and could be utilized without any substantial additional costs for the purposes of the Directive. The GFK figures are based on a bottom-up method as defined by Annex 4 of the Directive. The energy consumption of an A++ appliance has been verified through measurement and confirmed by the energy label. Thus, the provision of Annex 4 has been fulfilled. As the introduction of energy labels according to the Directive 92/75/EEC has been implemented in all EU Member States, such an indicator can be raised throughout the EU in a cost-effective manner. Brown goods A progress in energy efficiency improvement for „brown goods“ is generally characterized by the reduction of stand-by energy consumption. In this respect, the EU Commission has made an agreement with the European Information, Communications and Consumer Electronics Industry Technology Association (EICTA). It would thus be possible to use the recordings of EICTA companies about the market share of stand-by-reduced „brown goods“ appliances for developing an indicator of energy efficiency improvements in this sector. A new measurement method would not be required here either; the recordings existing in the market would only have to be condensed and interpreted. Lighting An indicator method will be foregone in the future for the lighting market as the legislator has already introduced very strict regulations concerning the market prohibition of bulbs of conventional technology. It would only be necessary to draw up statistics showing the actual pace of conversion of conventional filament lamps to energy-saving lamps in the market. The indicators described above show whether an energy application market is moving into the right direction. A change of direction may be achieved and quantified for the respective market by means of systematic promotion or restrictions. Energy efficiency indicators in the space heating and hot water provision sectors
339
The quantification of energy savings in the space heating and hot water provision sectors is of particular importance as this sector with a total end-use energy consumption of approximately 30 % plays an essential role in terms of the realization of the Directive’s savings target. An energy efficiency indicator in the space heating market may be the demand-oriented Energy Performance Certificate (EPC). This indicator can be used throughout Europe and enables comparable findings to be obtained in all EU Member States. The documentation of the energy demand of specific classes of buildings in the issued Energy Performance Certificate and the statistical condensation through all EPCs constitute the basis for an indicator. Additional or repeated issuance of EPCs over a specific period of time would clearly show the energy efficiency improvements in the space heating market. Here as well, a bottom-up method as defined in Annex 4 of the Directive would be implemented without additional measurements and estimations, requiring only statistical condensation. The energy efficiency instruments like promotion and advisory services associated with the Energy Performance Certificates have not yet been fully utilized by the national governments. For instance, the validity of 10 years in Germany is too long a period for EPCs to be used as an efficient market instrument. In order to enable energy efficiency improvements to be verified and particularly to accelerate the market development towards increased energy efficiency, shorter periods are required for reviewing the progress made in this respect. Therefore, we put up for discussion the following requirements regarding the Energy Performance Certificate:
• distinct reduction of the periods of validity of the EPC from 10 years to maximally 3 years
• systematic promotion of energy efficiency improvements recorded in the EPC These steps would lead to the creation of an energy efficiency indicator which has been established in the market anyhow, and which only needs to be statistically condensed and evaluated for the purposes of the Energy Efficiency and Energy Services Directive. This would not give rise to additional costs either. As long as the Energy Performance Certificate (EPC) itself constitutes a rather sluggish instrument, it is possible to use already, as a first step, the number of EPCs issued as an indicator. We assume that every EPC issued will incite the building owners concerned to carry out energy efficiency measures (what would otherwise be the aim and object of this certificate?). This average effect would still have to be verified in scientific terms, particularly with regard to the behaviour change of the building owner concerned. Taking our findings as a basis, we estimate this effect at approximately 1,000 kWh/a of heating savings per dwelling and EPC issued. Hence, a conclusive indicator would be available in the short term. Energy efficiency indicators in industry Energy efficiency indicators in industry are particularly reasonable for non-branch-specific processes referred to as „cross-sectional technologies of industrial processes“. Examples of such processes are compressed air generation, steam generation, electrical drives, cold production, pumps, fans and industrial heating and air conditioning. These cross-sectional processes account for 60 % of the industry’s energy end-use demand, leaving the energy end-use demand of industry subject to emissions trading again out of account. The following example of a cross-sectional process, namely compressed air generation, shall illustrate the development of an energy efficiency indicator. The basis for this representation is a campaign carried out from 2002 to 2004 by dena, the Fraunhofer ISI and VDMA with the support of the German Federal Ministry of Economics and Labour.
340

What are the steps required for the development of such an energy efficiency indicator for an industrial process? • A scientific institute analyses the process and defines the framework of the data to be reported. • The process data are reported by the operator to this institute, which will evaluate the process
data and will return recommendations for improvements to the reporting operator. The operator may thus quantify the energy savings realized over a specific period of time.
• The institute carries out a comparison with the process data of other operators and works out relevant benchmarks.
An indicator of the energy efficiency improvement is for instance the energy demand per m3 of compressed air. The energy efficiency improvement can be verified in quantitative terms by anonymising and condensing the data into a national indicator. Within the meaning of Annex 4 of the Directive, the procedure described represents a bottom-up analysis as every single process has been subjected to measurement. The comparison of their own process data with the benchmarks is a strong incentive to the reporting companies to join such a procedure. In this way, a technology transfer takes place within a branch of industry. Thus, the development of such a process indicator system is in the interest of market participants. A quantification of the energy savings realized within the meaning of the Energy Efficiency Directive does not require any additional substantial costs. Government aid should serve to carry out scientific analyses of process cycles, as exemplified in the case of the compressed air process. Transport services The specific energy consumption of the fleet of passenger cars and trucks reported by the respective manufacturers is to be used as an indicator in the field of transport services. The publication of the market share of energy-saving models is already available and needs only to be evaluated for the purposes of the Directive’s statistics. This indicator, too, follows the bottom-up model as defined in Annex 4 of the Directive. The progress in energy efficiency shown in this indicator is scarcely affected by the individual behaviour of users, as in a mass market, bad consumption behaviour of certain users is neutralized by the overcautious behaviour of other users. The examples given above have shown how to use indicators in the market with a view to complying with the requirements of the Energy Efficiency and Energy Services Directive for a quantification of energy efficiency improvements. It is of essential importance that indicators are already available in many markets or can be developed at very short notice in collaboration between industry, economy and the government. It would not be necessary to introduce an additional measurement and estimation system to be newly developed according to Annex 4 of the Directive; this system would be associated with considerable costs and lead to questionable findings. At the same time, there is no national comparison of methodologies for the collection of energy efficiency improvements required. Moreover, the energy efficiency indicators provide an approach for promotional measures, voluntary agreements, legal provisions, etc. Benchmarking The introduction of an indicator system for the determination of energy efficiency improvements in the different national economies would simultaneously open up the possibility to the EU Commission to implement an objective cross comparison between the different Member States in the form of Europe-wide benchmarking. Such benchmarking is feasible because there are equal or very similar structures in the different EU Member States in terms of energy application markets as described above in the context of the development of indicators. For instance in the household appliances’ sector, the same market
341
conditions virtually apply throughout Europe, and equal energy labels have been introduced. The same applies to the space heating and hot water provision market where comparable energy efficiency regulations exist in line with the EU Directive on the energy performance of buildings. A high degree of comparability also exists or will be achieved during the next few years in the different Member States with regard to the structure of industrial processes (that does not mean that industrial processes show everywhere the same energy efficiency). In any case, benchmarking will lead to an approximation of the energy efficiency of the different energy application markets within the EU. This would contribute to a harmonization within the EU; therefore, benchmarking should play a particular role in the political targets set within the EU. Let me state here an additional observation: After we got accustomed to Europe-wide benchmarking in the PISA studies, and we had to establish in Germany that we are not among the best performers which led us to undertake great efforts to catch up with this lag, I am quite confidential that benchmarking in the energy sector will call forth similarly positive efforts to catch up in countries lagging behind. Conclusion The indicator benchmark system allows to integrate all market participants responsible for energy conversion and thus for energy efficiency. This contributes to strengthening market-driven elements. The data of energy efficiency indicators to be collected correspond to a large extent to the data recorded in the market in any case; therefore, they do not require a new system for the registration of energy efficiency improvements, that would be associated with a very high expenditure in terms of costs and methodologies. In Article 15, paragraph 4, the Commission undertakes „to develop energy efficiency indicators and benchmarks based upon them, taking into account available data that can be collected in a cost-effective manner“. I conclude from the above that the Commission is obliged not to develop new methods for energy efficiency improvement, but to use the available bases if they lead to the same result at lower costs.
342

National campaigns transforming the market
Gunnar Pautzke
CECED, European Committee of Domestic Equipment Manufacturers
Abstract
For the last 15 years European manufacturers have invested €15 billion to improve the environmental performance of products, in particular in the area of energy and water consumption. For example today’s average washing machine consumes 48% less energy and 66% less water compared to one made in 1985. Today’s best refrigerator consumes only a quarter of the energy used by a typical model made in 1990. Without doubt the eco-design requirements brought results but in the European households there are still 188 million obsolete and energy inefficient appliances used. If all of them would be replaced with cutting-edge technology ones it would mean a sudden cut of about 22 Mtons CO2. To get from the shop floor to the households, top performing appliances must defeat consumer habit to use the equipment until it dies. Unfortunately in most cases the higher initial purchase price and the long payback time push consumers to buy cheaper but less energy efficient appliances. In this presentation we would like to show successful national campaigns run by the household appliance associations in Hungary and the UK that aim at transforming the market. Both campaigns address consumer awareness offering, amongst others, the possibility to calculate on-line how much money and energy can be saved when exchanging old appliances for new energy efficient ones. Moreover the campaign programmes include different public events, common actions with retailers and competitions to find the oldest working appliances. Apart from presenting awareness raising campaigns, we would also like to focus on national actions that involve market-based instruments. These activities were implemented e.g. in Italy and Spain. Italy applies income tax reduction to consumers who purchase energy efficient appliances. Spain operates a rebate scheme called ‘Plan Renove’. Both actions will be presented in detail including the discussion about results according to sales data and insights from market research. It is clear that market transformation is only possible when the right market instruments are implemented and supported by proper policy measures. The involvement of all stakeholders and a sufficiently long time-frame is needed to ensure successful transformation of the market. Early and better replacement is environmentally and socially justified because it will reward those who achieve above standard results in manufacturing and those who use the top energy efficient products.
343

National campaigns transforming the market
Introduction Household appliances are responsible for 40% of the electricity consumption of residential end-use equipment in the EU 151 and 50.2 % in the new Member States1. The installed stock has an average life cycle of more than 10 years which in extreme cases can be prolonged to up to 20 or 30 years. Market penetration of large appliances like refrigerators or washing machines is close to 100%. For freezers, dishwashers and air-conditioning it is lower but given the long lifespan the number of inefficient and obsolete appliances still used in European household amounts to 188 million2. Climate change is high on the agenda of today’s policy makers. European leaders have set ambitious targets to meet the challenge of global warming. They have committed to improve energy efficiency by 20% by 2020 and reduce greenhouse gas emissions by at least 20% compared to 1990 levels. These targets cannot be achieved with a single magic solution. Win-win-win situations do not occur spontaneously. A joint effort involving as many sectors as possible is necessary. From that standpoint CECED3, the representative organisation for European home appliance manufacturers has been actively promoting the uptake of energy efficient appliances across the European Union because they can seriously contribute to savings in electricity consumption and limit CO2 emissions. Outstanding results For the last 15 years European manufacturers have invested €15 billion in improving energy efficiency and overall performance of appliances. Today’s best refrigerator consumes only a quarter of the energy used by a typical model made in 1990. Today's washing machines use up to 48% less energy and up to 66% less water than an average one produced in 19854. Thanks to this investment that was required by voluntary agreements, about 17 Mtons CO2 are no longer discharged into the atmosphere5. This is equal to the amount of CO2 generated by approximately 5 million cars or 9 thermo-electric generation plants of 500 MW each. Tools for achieving energy efficiency Such outstanding results would not be possible without a coordinated involvement of manufacturers who, in a strongly competitive market, committed themselves to voluntary agreements, energy labelling and other obligations set by the European and national legislation. The introduction of the energy label in 1992 has been a phenomenal success. It is applicable for refrigerators, freezers, washing machines, clothes dryers, dishwashers, electrical ovens and air conditioners. Unfortunately the current structure of the label is insufficient due to the fact that today many products go beyond class A. In case of refrigerators and freezers there are additional classes on top of A, but in case of washing machines and dishwashers for example legislation foresees class A only while the actual energy performance of some models is much higher. Energy efficiency has great potential but requires a proper tool to better promote the state-of-the-art technologies offered by the household appliance industry. According to the industry a solution can be 1 ‘Electricity Consumption and Efficient Trends in the Enlarged European Union. Status report 2006’; Paolo Bertoldi, Bogdan Atanasiu; Institute for Environment and Sustainability 2007, EUR 22753 EN, ISBN 978-92-79-05558-4, ISSN 1018-5593 2 Source: CECED. Publication ’Energy Efficiency. A Shortcut To Kyoto Targets - The Vision of European Home Appliance Manufacturers’ - http://www.ceced.org/IFEDE//easnet.dll/GetDoc?APPL=1&DAT_IM=20429D&DWNLD=White Paper_Energy efficiency_Feb 2006_Final.pdf 3 CECED represents the household appliance industry in Europe. Its member companies employ over 200,000 people, are mainly based in Europe, and have a turnover of about €40 billion. If upstream and downstream business is taken together, the sector employs over 500,000 people. Direct Members are Arçelik, Ariston Thermo Group, BSH Bosch und Siemens Hausgeräte GmbH, Candy Group, De’Longhi, Electrolux AB, Fagor Group, Gorenje, Liebherr Hausgërate, Indesit Company, Miele, Philips D.A.P., Saeco, SEB and Whirlpool Europe. CECED’s member associations cover the following countries: Austria, Belgium, Czech Republic, Denmark, Estonia, France, Germany, Greece, Hungary, Italy, Latvia, Lithuania, Netherlands, Norway, Poland, Portugal, Romania, Slovakia, Spain, Sweden, Switzerland, Turkey and the United Kingdom. 4 Source: CECED 5 Source: CECED. Publication ’Energy Efficiency. A Shortcut To Kyoto Targets - The Vision of European Home Appliance Manufacturers’ - http://www.ceced.org/IFEDE//easnet.dll/GetDoc?APPL=1&DAT_IM=20429D&DWNLD=White Paper_Energy efficiency_Feb 2006_Final.pdf
344
the introduction of a new scheme allowing indication of current energy efficiency achievements and addition of classes in line with technological innovation. Another very effective measure that contributed to transforming the market started in 1997 when the household appliance manufacturers introduced voluntary agreements. At that moment CECED member companies committed to: stop selling their worst performing products, improve average energy performance of the overall product mix and inform consumers how to use appliances in an efficient way. In the following years further products were covered by the agreements:
- washing machines (1997, updated in 2002), - dishwashers, electric storage heaters (1999), - refrigerators, freezers and their combinations (2002, updated in 2004).
Voluntary agreements were widely recognised as progressive and proactive but the industry efforts were not sufficiently supported due to the lack of incentives for further diffusion, poor national enforcement of energy labelling, weak market surveillance and persistent presence of free-riders activities. In addition the uptake of highly efficient products by consumers was not as fast as it could have been. Due this reasons, in March 2007 a decision was made to discontinue renewal of the voluntary agreements. Instead the household appliance sector called on administrations to put stricter legislative measures in place that would be applicable and enforceable to all market players. 188 million obsolete appliances In order to achieve substantial savings in the energy and water consumption, state-of-the-art appliances need to move from the shop floor into households. Unfortunately, despite the financial savings that consumers can make, the uptake of top energy efficient appliances is still very slow. Consumers are not purchasing the most efficient products due to two main reasons.
- Firstly, household appliances are very durable and European consumers follow the culture to ‘use it until it dies’ even if replacement would be justified by economic and environmental choice. Unfortunately the sense of accepting innovation in not the same as in relation to ICT equipment for example.
- Secondly, the higher initial cost of energy efficient appliances (due to necessary R&D investment and more expensive components) and a longer payback time stops consumers from making a larger investment. In most cases lower income pushes them to purchase cheaper but less energy efficient appliances.
Lack of awareness is also a major barrier restricting the diffusion of energy efficient appliances as the environmental benefits are not always clear to consumers. Combined with the ‘use it until it dies’ approach it results in 188 million appliances energy inefficient appliances older than 10 years that are still used in the European households. Market-based instruments in EU-27 The presence of 188 million obsolete appliances creates a huge challenge and it is clear that the situation must be changed. Industry delivered necessary developments but its efforts must be accompanied by support from the authorities at European and national level. There are a wide range of options which can be taken up at national level to speed up diffusion in the market, such as:
- tax incentives, - price rebates schemes, - awareness raising campaigns, - energy efficiency certificates.
The above tools have been introduced in different Member States but in order to achieve good results any scheme should not be limited only to the local communities, must be carefully constructed and in exist for a sufficiently long period of time. Policies that should be avoided are those that distort the consumer’s perception of the product’s value. Such a policy measure would be reduced VAT rates for efficient energy using products. For producers this option would create problems, as it would make high quality products appear cheaper then they actually are. This danger is particularly relevant if the reduced VAT rate is applied only for a short period of time. Most consumers will not be able to understand how much of the total product price is
345
influenced by a VAT reduction. Therefore, lowering VAT will lower the consumer’s perception of the product’s value because the original ‘fair’ price for high efficient products is no longer visible to the consumer. This creates a large problem for producers because once the VAT reduction programme is discontinued consumers would expect to find the same products available at the same price. Therefore producers would be unable to return to the original price level what would harm the return on investments and reduce competitiveness. Whereas reduced VAT rates may have a positive short-term effect on the environment, there are serious objections to this type of policy from a competitive and public budget point-of-view. Other stimulus plans such as rebate schemes or income tax reduction schemes do not have the same drawbacks as VAT and are more than necessary. Italy – tax incentives programme In 2007 Italian budget law included a 20% tax deduction with a ceiling of €200 on the purchase of class A+ or A++ refrigerators/freezers when the consumer decided to replace an obsolete model. According to GfK data the Italian programme boosted the penetration of the most efficient appliances by increasing the sales of A+ cooling products in 2008 by more than 34 percentage points in comparison to 2006 (from 11 to 45 percent). 6 Taking into account that it took four years (from 2003 to 2006) to reach a market share of 11 percent the positive effect of the incentice progamme is inevitable. The tax incentives in Italy are confirmed until 2010. It has been calculated that by that time 100,000 tons CO2 can be avoided which is the equivalent of taking 220,000 cars off the road. Plan Renove de Electrodomesticos (Spain) The Spanish Plan Renove was introduced in 2005. It was divided in two phases: 2005-2007 and 2008-2012. Plan Renove involves industry, agriculture, buildings, transport, public services, energy transformation and dwellings. The global target is to reduce primary energy consumption by 30%. When purchasing a new appliance, consumers must give their old appliance back in order to obtain the subsidy. The subsidy ranges from 50-125€ per appliance and cannot exceed 25% of the purchase price. Depending on the region, the discount can be applied directly or upon completing a specific refund procedure after purchase. The new appliance must have an A energy efficiency class or higher rating. In the first period 2005-2007, up to €213M of public funds were made available for the incentives. Estimated energy savings were in the range of 465 ktoe. In the second period, 2008-2012, up to €532.5M is available and the expected energy saving is 1350 ktoe. All the funds come from the national (contribution 75%) and regional (contribution 25%) budgets. The results of the Spanish Plan are presented in the below table. Table 1: Results of Plan Renove7
Year Number of units sold
Cold appliances (%) Washing machines (%) Dishwashers (%)
2006 650 000 40 45 15 2007 700 000 40 47 13 According to GfK data when comparing January and April 2008 to the same period in 2000, sales of cooling products of class A and higher increased to 89%. Cooling appliances of class C and worse nearly disappeared from the shop floor and sales of class B appliances dropped to 9%.8 As GfK states
6 Source: GfK Retail and Technology, 2009, not published 7 Source: ANFEL (Asociación Nacional de Fabricantes e Importadores de Electrodomésticos de Línea Blanca), not published 8 Source: GfK Retail and Technology 2009, not published
346

in another presentation: ‘Since the start of ‚Plan Renove‘ (June 2006) the sales structure in Spain improved significantly towards better than ’B’ against Portugal.’9 Apart from the initiatives that are based on market-based instruments, communication campaigns are also a powerful tool to transform the market by raising awareness. Considering initiatives taken by CECED members the most successful communication campaigns are currently in progress in Hungary and the United Kingdom. Forgó Morgó campaign (Hungary) The Hungarian campaign run by CECED Magyarország has centred on a character named Forgó Morgó (Spinning Grumbler) who appears as an energy consultant in advertising material. The puppet is a well known character from a Hungarian cartoon who tries to draw consumers’ attention to environmental matters and to emphasise the importance of energy savings. The campaign focused on different product groups and was launched in 3 phases:
- refrigerators: September – December 2006 - washing machines: March – June 2007 - electric cookers: September – November 2007
Refrigerator and washing machine campaigns were accompanied by a €20 reduction sales promotion. The discount was given under the condition of giving back the old appliance and choosing an energy efficient model: refrigerators of class A or above, washing machines of class A. During each phase a competition was held to find the oldest working appliance in each product category:
- fridge: from 1956, - washing machine: from 1951, - electric cooker: from 1930’s.
The owners of the winning oldest appliances received cheques to purchase new state-of-the-art appliances of a brand of their choice. In order to build up awareness among the younger generation, a drawing competition was organised which resulted in more than 800 contestants. Other tools used in the campaign were: TV media coverage, creating an official website with an energy calculator, launching a promotional DVD, opening and closing media events. The efforts of CECED Magyarország were supported by the largest compliance scheme for waste electronic and electric equipment in Hungary, called Electro-Coord. Table 2: Forgó Morgó campaign - summary of activities and results10
Sales promotion
TV spot Oldest appliance game
Children’s drawing competition
Media events
Results (sales & take back, compared to business as usual)
Refrigerators yes no yes no yes higher 7,600 units
Washing machines yes yes yes yes yes lot higher
10,700 units Electric cookers no yes yes no yes no difference
9 Source: GfK presentation given at CECED conference during EUSEW on 29 January 2008 (slide 28) http://www.ceced.be/IFEDE/easnet.dll/GetDoc?APPL=1&DAT_IM=20A042&DWNLD=EUSEW%20CECED%20conf_29%20Jan%202008_GfK%20final3.zip 10 Source: CECED Magyarország Egyesülés, presentation given at CECED conference during EUSEW on 29 January 2008 (slide 21) (http://www.ceced.be/IFEDE/easnet.dll/GetDoc?APPL=1&DAT_IM=20A043&DWNLD=EUSEW%20CECED%20conf_29%20Jan%202008_HUNGARY.ppt)
347

The main conclusion from the campaign was that without financial benefit given to consumers, market transformation is less efficient and that a long term activity involving financial support from the government should be introduced. Time to Change (United Kingdom) The Time to Change programme run by AMDEA (Association of Manufacturers of Domestic Appliances) is an initiative that aims to promote energy efficiency in UK households where 15.4 million outdated domestic appliances are still used11. The campaign’s website was officially launched in October 2007. It offers a wide range of information about major types of energy using appliances. The main feature, however, is a calculator which demonstrates personal savings related to the replacement of aging products with new energy efficient models. In addition, a competition entitled Britain’s Oldest Working Fridge was organised to find the oldest refrigerator still in use. Once again the ‘use it until it dies’ philosophy was proven to be a reality as the winning appliance was 54 years old. The main priorities of the Time to Change campaign is to raise awareness and establish a network of contacts with authorities, officials and other relevant stakeholders who are responsible for the introduction of possible market-based instruments. Conclusions Market transformation, as highlighted in examples above, will not happen quickly enough to contribute to the twenty-twenty target without the right market instruments and proper policy measures in place. The involvement of all stakeholders and a sufficiently long time-frame is needed to ensure successful transformation of the market. Early and better replacement is environmentally and socially justified because it will reward those who achieve above standard results in manufacturing and those who use the top energy efficient products. Innovation requires investment. Conditions should be created for manufacturers to be able to continue developing new efficient technology and to offer it at the best price to consumers. Consumers need to recognise the value of energy efficiency and be willing to pay the right price for it. It is not realistic to expect that only manufacturers invest in both product innovation and educating behavioural change in consumer thinking. Governments have to play a more active role in convincing the consumer to purchase the most efficient appliances e.g. by expanding the scope of public procurement programmes with household appliances. It is not just a question of market transformation but also societal change. References [1] Bogdan Atanasiu, Paolo Bertoldi Electricity Consumption and Efficient Trends in the Enlarged
European Union. Status report 2006. Institute for Environment and Sustainability 2007. ISBN 978-92-79-05558-4, ISSN 1018-5593. Can be downloaded at: http://re.jrc.ec.europa.eu/energyefficiency/pdf/EnEff%20Report%202006.pdf
[2] CECED Energy Efficiency. A Shortcut To Kyoto Targets - The Vision of European Home Appliance
Manufacturers. Can be downloaded at: http://www.ceced.org/IFEDE//easnet.dll/GetDoc?APPL=1&DAT_IM=20429D&DWNLD=White Paper_Energy efficiency_Feb 2006_Final.pdf
[3] GfK, presentation, CECED conference 29 January 2008 (slide 28),
http://www.ceced.be/IFEDE/easnet.dll/GetDoc?APPL=1&DAT_IM=20A042&DWNLD=EUSEW%20CECED%20conf_29%20Jan%202008_GfK%20final3.zip
11 Source: AMDEA, Time to Change campaign (http://www.t2c.org.uk/aboutus.html)
348

[4] CECED Magyarország Egyesülés, presentation, CECED conference 29 January 2008 (slide 21),
(http://www.ceced.be/IFEDE/easnet.dll/GetDoc?APPL=1&DAT_IM=20A043&DWNLD=EUSEW%20CECED%20conf_29%20Jan%202008_HUNGARY.ppt)
349

Replacing outdated household appliances saves energy and improves performance – A national initiative
Author: Claudia Oberascher
Affiliation: HEA - Fachgemeinschaft für effiziente Energieanwendung e.V.
Abstract
German households need a lot of electricity, 1/3 of this amount is spent on large household appliances. As recent surveys show, consumers are aware of the general energy saving potential of efficient household appliances. But on the other hand, they also complain about a lack of information if it comes to the buying decision itself. As a result, the market share of A++ energy-rated refrigerators and freezers in Germany is still very low.
40 per cent of household appliances in Germany are ten years or older. This means that they are technically obsolete and waste energy. 8 billion kWh could be saved per year if all cooling appliances aged ten years or older would be replaced by the most economical appliances.
The initiative HAUSGERÄTE+ was established in 2007 aiming to improve the general knowledge about the possibilities to save energy in the household, encourage end-users to buy the most economical appliances, accelerate the replacement of outdated household appliances and improve efficient use.
The campaign is a co-operation between energy supply companies and manufacturers of household appliances. The initiative (roof campaign) is managed by HEA – a German association for efficient energy use. In addition, regional campaigns are managed by energy supply companies often using their one-to-one relationship to every German household.
HAUSGERÄTE+ focuses on showing that by replacing outdated household appliances, consumers reduce environmental impacts through significantly lower consumption of energy and water, while saving money on the energy bill and enjoying better performances.
1 Energy saving potential in German households
German households need a lot of electricity: 141 billion kWh per year, that is a quarter of the entire electricity used in Germany. 1/3 of this amount is spent on large household appliances [1]:
• 16 % for refrigerators and freezers
• 8 % for cooking
• 9 % for laundry and dishwashing.
40 per cent of the large household appliances in Germany are ten years or older. This means that there are 67 million inefficient old appliances in Germany - every German household owns and uses approximately two outdated appliances - thereof about 29 million refrigerators and freezers. (GfK Electro*Scope, 01/01/2006). This means that they are technically obsolete and waste energy. When disposed, the average age of large appliances ranges from 12 years for dishwashers to 14 years for refrigerators, and freezers even have an average age of 17 years. 8 billion kWh could be saved per year if all cooling appliances aged ten years or older would be replaced by the most economical appliances. [2]
1.1 Market offer and buying behaviour
Efficient household appliances are available in Germany. Appliances with an energy label worse than “B” are almost non-existent in the German market. “B” is becoming marginal. Almost all washing machines and dishwashers are in the highest label class “A”. As for cooling devices, the number of A+ energy-rated appliances is increasing fast. A++ is increasing as well but much more slowly. Several
350
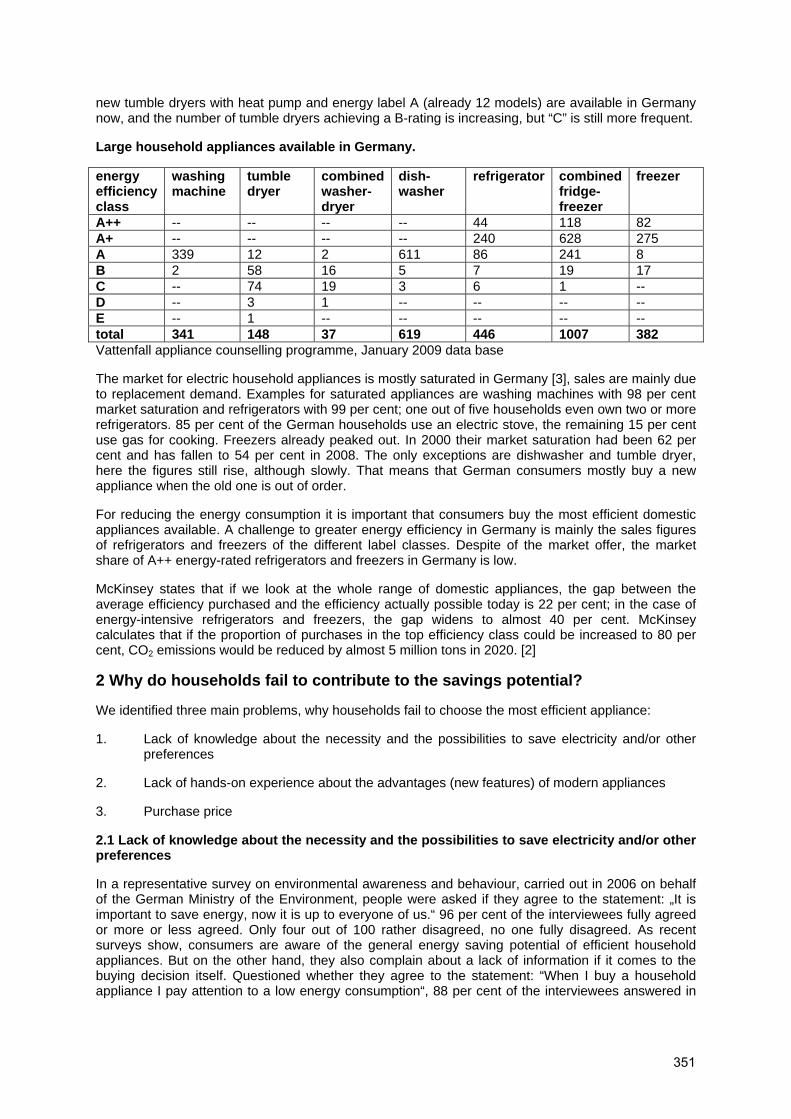
new tumble dryers with heat pump and energy label A (already 12 models) are available in Germany now, and the number of tumble dryers achieving a B-rating is increasing, but “C” is still more frequent.
Large household appliances available in Germany.
energy efficiency class
washing machine
tumble dryer
combined washer-dryer
dish-washer
refrigerator combined fridge-freezer
freezer
A++ -- -- -- -- 44 118 82 A+ -- -- -- -- 240 628 275 A 339 12 2 611 86 241 8 B 2 58 16 5 7 19 17 C -- 74 19 3 6 1 -- D -- 3 1 -- -- -- -- E -- 1 -- -- -- -- -- total 341 148 37 619 446 1007 382 Vattenfall appliance counselling programme, January 2009 data base
The market for electric household appliances is mostly saturated in Germany [3], sales are mainly due to replacement demand. Examples for saturated appliances are washing machines with 98 per cent market saturation and refrigerators with 99 per cent; one out of five households even own two or more refrigerators. 85 per cent of the German households use an electric stove, the remaining 15 per cent use gas for cooking. Freezers already peaked out. In 2000 their market saturation had been 62 per cent and has fallen to 54 per cent in 2008. The only exceptions are dishwasher and tumble dryer, here the figures still rise, although slowly. That means that German consumers mostly buy a new appliance when the old one is out of order.
For reducing the energy consumption it is important that consumers buy the most efficient domestic appliances available. A challenge to greater energy efficiency in Germany is mainly the sales figures of refrigerators and freezers of the different label classes. Despite of the market offer, the market share of A++ energy-rated refrigerators and freezers in Germany is low.
McKinsey states that if we look at the whole range of domestic appliances, the gap between the average efficiency purchased and the efficiency actually possible today is 22 per cent; in the case of energy-intensive refrigerators and freezers, the gap widens to almost 40 per cent. McKinsey calculates that if the proportion of purchases in the top efficiency class could be increased to 80 per cent, CO2 emissions would be reduced by almost 5 million tons in 2020. [2]
2 Why do households fail to contribute to the savings potential?
We identified three main problems, why households fail to choose the most efficient appliance:
1. Lack of knowledge about the necessity and the possibilities to save electricity and/or other preferences
2. Lack of hands-on experience about the advantages (new features) of modern appliances
3. Purchase price
2.1 Lack of knowledge about the necessity and the possibilities to save electricity and/or other preferences
In a representative survey on environmental awareness and behaviour, carried out in 2006 on behalf of the German Ministry of the Environment, people were asked if they agree to the statement: „It is important to save energy, now it is up to everyone of us.“ 96 per cent of the interviewees fully agreed or more or less agreed. Only four out of 100 rather disagreed, no one fully disagreed. As recent surveys show, consumers are aware of the general energy saving potential of efficient household appliances. But on the other hand, they also complain about a lack of information if it comes to the buying decision itself. Questioned whether they agree to the statement: “When I buy a household appliance I pay attention to a low energy consumption“, 88 per cent of the interviewees answered in
351
the affirmative (52 per cent fully agreed, 36 per cent more or less agreed), largely irrespective of their socio-demographic characteristics [4].
In a survey carried out in 2007 (GfK, Nuremberg), German adults were asked what they are sure or probably sure to do in the future because of the climate change. Almost 60 per cent plan to buy new appliances which need less electricity. This answer ranked third after “avoid stand-by losses” and “use energy-saving bulbs”.
On the other hand, only eleven per cent of the interviewed persons know how much they pay for electricity. Age, gender, education and income have no statistical effect on the knowledge of power consumption and price [5]. The authors of the study state that there is a gap between intention and actual doing.
In a recent environmental study consumers were given six buying criteria for electric devices: low price, high quality, good design, high environmental compatibility in general, easy handling and low energy use. The persons were asked to rank these criteria most important, second most important to sixth important. “High quality” turned out to be the most important criteria (most important: 34 per cent, second most important: 21 per cent). Second with only a small gap was “low energy use” (most important: 32 per cent, second most important: 26 per cent). In particular, woman and interviewees with a lower level of education attach a great importance to a low energy use. Third was “low price”: a low price was most important for 16 per cent and second most important for 22 per cent. [6]
The Greendex 2009-survey on consumer behaviour shows, that the attitudes expressed by German consumers suggest they are less concerned about the environment than other consumers surveyed. Germans rank second last out of 17 countries when asked the following questions: “I am very concerned about environmental problems” (43 per cent versus the average of 55 percent) and: “I am currently trying very hard to reduce my own negative impact on the environment” (34 per cent versus the average of 45 percent). Germans are also less likely than others to say they feel guilty about their environmental impacts (last rank out of 17 countries: 14 per cent versus the average of 31 percent) or that global warming will worsen their way of life (30 per cent versus the average of 48 per cent, only British and Swedes are less concerned). In Germany high levels of environmental behaviour seem to correspond with lower environmental concern. [7]
2.2 Lack of hands-on experience about the advantages (new features) of modern appliances
As explained before, the stock of large household appliances in Germany is overaged: 40 per cent are ten years or older. The average age when disposed ranges between 12 years for dishwashers to 17 years for freezers. People therefore lack of hands-on experience about the increased efficiency, performance and security or new features of modern appliances that were introduced into the market during this time. For example, new washing machines show better performance than old ones: „Somewhat surprisingly, the significantly lower usage of water and energy by new machines is not associated with inferior washing performance. On average, to achieve the same performance as a modern machine does by washing at 40 °C, a fifteen year old machine must use a temperature of 60 °C, while a thirty year old one requires 90 °C. A fifteen year old machine uses approximately twice as much energy and water to achieve the same performance as a new one, while a thirty year old requires four times as much.“ [8]
The market for most household appliances is already saturated and therefore new appliances are mainly purchased to replace old ones. Exceptions are dishwashers and tumble dryers, their market is still growing. Concerns exist against these appliances because of ignorance about the energy and water consumption. For approximately 20 years now the dishwasher needs less energy and water than manual dishwashing [9]. Although the chemicals needed are twice as expensive, the dishwasher works 25 per cent cheaper and saves 75 per cent of the time. [10]. A recent study state, that during the heating period the usage of a heat pump tumble dryer is preferable to drying in a heated room [11].
2.3 Purchase price
Most people are aware of the necessity to save energy but when it comes to the buying decision, the purchase price is of greater importance. “Personally, to which extent are you up to paying higher prices for energy saving appliances?” Only 14 per cent answered “definitely to a very large extent”
352

and 46 per cent “to a rather large extent”, whereas 30 per cent answered “rather less” and 9 per cent “not at all”. [4]
At the manufacturer’s side the improvement of energy efficiency is not possible at zero cost. More efficient products need investment in R&D and better components (e.g. compressors, vacuum panels for insulation).
Household appliances, especially cooling appliances have become much more efficient during the last few years. An A++ energy-rated refrigerator needs ca. 60 per cent less energy than a ten-year-old model. As compared to a 15-year-old model, the A++ refrigerator saves 70 per cent energy. For example, a German household could save more than 80 Euros per year when replacing a combined fridge-freezer manufactured in 1990 with a comparable A++ energy-rated appliance. More than 70 Euros per year on the energy bill could be saved by replacing a freezer.
Early replacement of outdated appliances pays off with refrigerators and freezers because of the reduction of costs for electricity, though the payback period takes usually over five years and up to 13 years or longer. [12] The environmental payback period (LCA with regard to primary energy demand and GWP) is much shorter and approximately takes only three years, allowing for the production, distribution, use phase and end-of-life-treatment. However, due to the variability of the purchase price and the rising energy prices, the results of the costs are much more uncertain than those of the environmental impacts. That means that a higher price for energy makes the commercial payback period shorter.
3 Initiative HAUSGERÄTE+
As described before, an appropriate market offer is essential, but if consumers don’t buy these efficient appliances and use them economically there will be no (sufficient) improvement in energy efficiency. That is why HAUSGERÄTE+, an information and marketing campaign, was started by household appliance manufacturers, energy supply companies and their associations.
Aims/goals
The initiative HAUSGERÄTE+ was established in 2007 aiming to
1. improve the general knowledge about the possibilities to save energy in the household
2. encourage end-users to buy the most economical appliances, e.g. cold appliances with energy label A++
3. accelerate the replacement of outdated household appliances
4. improve efficient use in households.
The campaign is a co-operation between energy supply companies (EnBW, E.ON, EWE, Vattenfall Europe, RWE Energy) and manufacturers of household appliances (AEG-Electrolux, Bosch, Bauknecht, Liebherr, Miele, Siemens) and the associations HEA – Fachgemeinschaft für effiziente Energieanwendung e.V. – and ZVEI – Zentralverband der Elektrotechnik- und Elektronikindustrie e.V. The initiative (roof campaign) is managed by HEA – a German association for efficient energy use.
Through this initiative, energy supply companies co-operate with the most important manufacturers of household appliances and their associations. This co-operation guarantees that all material generated under the HAUSGERÄTE+ roof is substantiated.
All information and material is accessible via the HAUSGERÄTE+ website (www.hausgeraete-plus.de). In addition for those not having access to the internet, brochures give the main criteria for a replacement adjusted to the customers’ needs.
HAUSGERÄTE+ focuses on showing that by replacing outdated household appliances, consumers reduce environmental impacts through significantly lower consumption of energy and water, while saving money on the energy bill and enjoying better performances.
There are different target groups for the initiative:
353
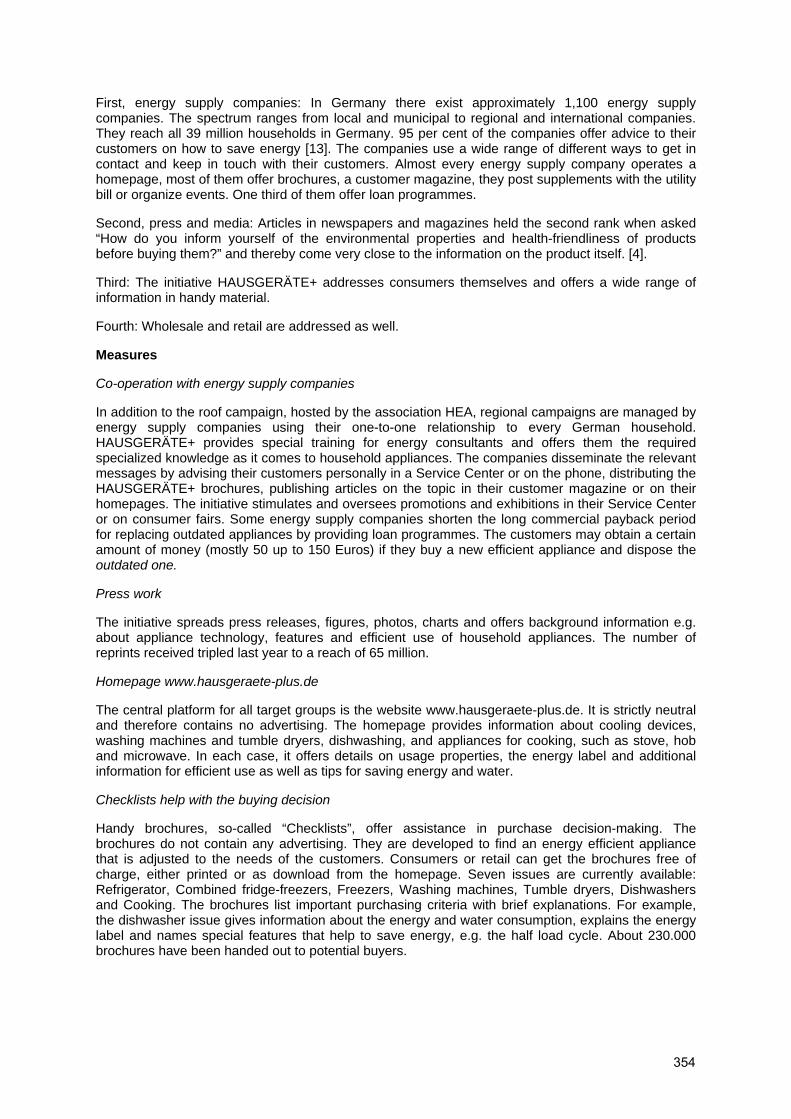
First, energy supply companies: In Germany there exist approximately 1,100 energy supply companies. The spectrum ranges from local and municipal to regional and international companies. They reach all 39 million households in Germany. 95 per cent of the companies offer advice to their customers on how to save energy [13]. The companies use a wide range of different ways to get in contact and keep in touch with their customers. Almost every energy supply company operates a homepage, most of them offer brochures, a customer magazine, they post supplements with the utility bill or organize events. One third of them offer loan programmes.
Second, press and media: Articles in newspapers and magazines held the second rank when asked “How do you inform yourself of the environmental properties and health-friendliness of products before buying them?” and thereby come very close to the information on the product itself. [4].
Third: The initiative HAUSGERÄTE+ addresses consumers themselves and offers a wide range of information in handy material.
Fourth: Wholesale and retail are addressed as well.
Measures
Co-operation with energy supply companies
In addition to the roof campaign, hosted by the association HEA, regional campaigns are managed by energy supply companies using their one-to-one relationship to every German household. HAUSGERÄTE+ provides special training for energy consultants and offers them the required specialized knowledge as it comes to household appliances. The companies disseminate the relevant messages by advising their customers personally in a Service Center or on the phone, distributing the HAUSGERÄTE+ brochures, publishing articles on the topic in their customer magazine or on their homepages. The initiative stimulates and oversees promotions and exhibitions in their Service Center or on consumer fairs. Some energy supply companies shorten the long commercial payback period for replacing outdated appliances by providing loan programmes. The customers may obtain a certain amount of money (mostly 50 up to 150 Euros) if they buy a new efficient appliance and dispose the outdated one.
Press work
The initiative spreads press releases, figures, photos, charts and offers background information e.g. about appliance technology, features and efficient use of household appliances. The number of reprints received tripled last year to a reach of 65 million.
Homepage www.hausgeraete-plus.de
The central platform for all target groups is the website www.hausgeraete-plus.de. It is strictly neutral and therefore contains no advertising. The homepage provides information about cooling devices, washing machines and tumble dryers, dishwashing, and appliances for cooking, such as stove, hob and microwave. In each case, it offers details on usage properties, the energy label and additional information for efficient use as well as tips for saving energy and water.
Checklists help with the buying decision
Handy brochures, so-called “Checklists”, offer assistance in purchase decision-making. The brochures do not contain any advertising. They are developed to find an energy efficient appliance that is adjusted to the needs of the customers. Consumers or retail can get the brochures free of charge, either printed or as download from the homepage. Seven issues are currently available: Refrigerator, Combined fridge-freezers, Freezers, Washing machines, Tumble dryers, Dishwashers and Cooking. The brochures list important purchasing criteria with brief explanations. For example, the dishwasher issue gives information about the energy and water consumption, explains the energy label and names special features that help to save energy, e.g. the half load cycle. About 230.000 brochures have been handed out to potential buyers.
354
Online-appliance counselling
The online-appliance counselling is part of the HAUSGERÄTE+ homepage and contains the current market offer with more than 2,800 models of cooling devices, washing machines, tumble dryers and dishwashers. The search is free of charge. The user-friendly selection is based on only a few purchasing criteria. The results are distinguished into energy usage, with the most efficient model at the top. The list makes clear at a glance that with cooling devices the class A energy label ranks only third, and that there is a wide variety of more efficient models. To stress the savings potential, the operating costs for 14 years (average lifetime of appliances in Germany) are given in addition to the average purchase price.
4 Conclusion and Outlook
Replacement must be adjusted to the needs of the customers: people buy appliances because of their performance, not for saving energy. Performance comes first, efficiency is ranking second. In general, it is essential to increase the awareness of environmental problems, such as global warming and sustainable energy consumption, and the conviction that the actions of every single person are summing up and are therefore important. The different target groups, such as already well informed persons, or persons with no academic background or even illiterates need appropriate information. There is still a long way to go until the huge stock of outdated appliances is replaced.
References
[1] Haushaltsstromverbrauch nach Anwendungsarten 2006. 14 November 2007. VDEW e. V.(ed.)
[2] White Paper on Energy Efficiency – Generating, Distributing and Using Energy Intelligently. September 2008. ZVEI – Zentralverband der Elektrotechnik- und Elektronikindustrie e.V. (ed.). Can be downloaded at: http://www.zvei.org/index.php?id=3693
[3] Zahlenspiegel des deutschen Elektro-Hausgerätemarktes. ZVEI – Zentralverband der Elektrotechnik- und Elektronikindustrie e.V. and GfK Retail and Technology GmbH (ed.). Can be downloaded at: www.zvei.org
[4] Umweltbewusstsein in Deutschland 2008 – Ergebnisse einer repräsentativen Bevölkerungsumfrage. 2008. Bundesministerium für Umwelt, Naturschutz und Reaktorsicherheit (BMU) (ed.). Can be downloaded at: http://www.bmu.de/umweltinformation/downloads/doc/42750.php
[5] Umweltbewusstsein in Deutschland 2006 – Ergebnisse einer repräsentativen Bevölkerungsumfrage. November 2006. Bundesministerium für Umwelt, Naturschutz und Reaktorsicherheit (BMU) (ed.). Can be downloaded at: http://www.bmu.de/umweltinformation/downloads/doc/42750.php
[6] LG Umweltstudie. 2009. F&H Public Relations GmbH (ed.)
[7] Greendex 2009. National Geographic & GlobeScan (ed.). Can be downloaded at: http://www.nationalgeographic.com/greendex/
[8] Stamminger R., Barth A., Dörr S.: Old Washing Machines Wash Less Efficiently and Consume More Resources. Hauswirtschaft und Wissenschaft 3/2005, pp. 124-131.
[9] Stamminger R.: Daten und Fakten zum Geschirrspülen per Hand und in der Maschine. SÖFW-Journal 3-2006.
[10] Stamminger R., Elschenbroich A. Rummler B. Broil G.: Washing-up Behaviour and Techniques in Europe. Hauswirtschaft und Wissenschaft 1/2007, pp. 31-40.
[11] Rüdenauer I, Gensch C.-O., Liu R,: Vergleich der Umweltauswirkungen und Kosten verschiedener Wäschetrocknungssysteme. Studie im Auftrag der B/S/H Hausgeräte GmbH. 17. June 2008. Can be downloaded at: www.oekoinstitut.de
355

[12] Rüdenauer I, Gensch C.-O.: Environmental and economic evaluation of the accelerated replacement of domestic appliances, Case study refrigerators and freezers; Final report. 30 June 2005. Öko-Institut. Can be downloaded at: www.oekoinstitut.de
[13] Ergebnisse der VDEW-Marketing- und Dienstleistungserhebung 2005. VDEW (ed.), Frankfurt, Mai 2006. Can be downloaded at: www.bdew.de
356
Effective presentation of energy cost information in conjunction with EU-energy labels: An experimental study with refrigerating appliances in Germany Corinne Faure and Arhan Nam
Goethe University Frankfurt, Germany
Abstract
Using behavioural decision-making theories, we tested the effects of different energy cost information on willingness to pay for refrigerators of the highest energy classes in an experiment with 303 German consumers. Using a between-subject design, we manipulated the valence of the information (either electricity costs or savings to be realized) and its time frame (1, 5, and 15 years). Our results indicate that information valence significantly influences willingness-to-pay of consumers. Interestingly, we find that the effects are only found for consumers with a low attitude towards energy efficiency. We discuss the implications of these results for policy-making.
Introduction
Major household appliances account for more than a third of total EU 15 residential end-use electricity consumption - refrigerators and freezers (cold appliances) alone for 15% [1]. Although the sales of energy efficient appliances are increasing, the market share of the most efficient appliances remains marginal (for instance, less than 10% of refrigerating appliances sold in Germany in 2007 were of the highest energy class A++ [2]) and is not increasing significantly. It therefore appears that existing energy labels on white appliances in the European Union, which are currently providing consumers with information about energy classes and energy consumption, are not enough to convince many consumers to purchase the most efficient appliances. Recent research on the effects of energy labels indicates that providing information on energy label classes has a greater positive effect on consumer willingness-to-pay than providing information on energy consumption [3]. These results therefore suggest that the EU energy label scheme is fulfilling its purpose and providing consumers with a useful information summary that leads to a higher willingness-to-pay for more efficient appliances. However, these results were based on two markets (washing machines and light bulbs) where a wide range of energy classes are available (that is, products with low and high energy classes coexist in the market). The refrigerating appliance market is facing a different situation: due to technological progress in the late 1990s, the European Union introduced in 2004 two new energy classes for these appliances (A+ and A++ classes). By the year 2007, over 90% of all refrigerating appliances sold on the German market were of at least Class A, with Class A appliances representing about 60% of the overall market [2]. However, while for other appliances a Class A label represents the highest available efficiency class on the market, for refrigerating appliances a Class A label is actually below average. The introduction of the new energy classes has therefore lead to much confusion and might even be counterproductive in convincing consumers to purchase efficient appliances [4].
In light of the diminishing usefulness of the energy label classes for refrigerating appliances, regulators and retailers have been searching for additional information that might help convince consumers to purchase the most efficient appliances. Of particular interest is consumer usage of the energy consumption information that is already provided on the labels. Previous research has so far found little effect of energy consumption information provided on energy labels on consumer choice or willingness-to-pay [3, 5]. This lack of results might be explained by two phenomena: first, the initial energy labels studies were conducted at a time where energy costs were low (average cost of kWh of 2,5 Canadian cents in 1981 for the Anderson & Claxton study), so that potential cost savings were minimal; effects would therefore be more likely to be found with the current energy prices of 20 Euro Cents per kWh. Second, the non-significant results in more recent studies may be due to the fact that consumers are not well informed about energy costs and are therefore not able to translate energy consumption figures into actual costs [3]. Should this second explanation prove to be accurate, providing actual energy cost information about refrigerating appliances should help convince consumers to purchase more efficient appliances. In this context, the focus therefore moves away from the signal value of energy classes to the effects of additional information about energy costs
357
associated with different appliances. As this energy cost information can be framed in different manners, the purpose of this research is to test the extent to which different presentations of energy cost information are influencing consumer willingness-to-pay for more efficient refrigerating appliances. For this purpose, we first briefly review theoretical behavioural decision theories that help predict which information framing might be most effective. We then test these predictions in an experiment about refrigerating appliances and discuss the results and their implications for policy making.
Energy Cost Information
Among the different possibilities to present energy cost information, we identified two key dimensions upon which this information may differ: valence (whether the information is presented to consumers as potential energy savings or as energy costs associated with a particular appliance) and time frame (whether the information is focusing on a relatively short-term time frame (typically a year) or at the other extreme on the average expected life expectancy of an appliance (15 years)).
Behavioural decision theories help provide some predictions for the effectiveness of various presentations of energy cost information. There has been much research in the marketing literature on the effects of information framing. As first shown in Kahneman & Tversky’s [6] original work on prospect theory and as confirmed in many empirical studies since then, consumers are generally exhibiting a higher aversion to losses than attraction for gains. In our context we would therefore expect energy cost information presented as costs (negatively framed) to have a stronger effect than information presented as savings (positively framed).
There is also abundant research on the effects of time frames on consumer decisions. Two sets of theories appear particularly relevant for these effects: time discounting theories and construal level theories. These theories however lead to conflicting predictions about the effects of time frame on the purchase of efficient appliances. On one hand, the situation can be seen as a typical intertemporal situation, with trade-offs between costs and benefits occurring at different points in time (costs linked to price premium for efficient appliance are immediate, costs or savings linked with the appliances are in the near or far future (time frame of information)) [7]. Research on time discounting suggests that consumers generally exhibit positive time preferences for gains, thereby preferring a small gain in the short term to a larger gain in the long term and negative time preferences for losses: consumers have been shown to prefer a large loss in the future rather than a small loss in the short-term (reflection effect, see for instance [8]). In our context, as the time frame increases, consumers should therefore be less likely to purchase efficient appliances in both cases (in the gain (savings) case, because the short-term gains should be perceived as more attractive as the long-term ones; in the loss (costs) case, because the short-term losses should be perceived as more deterrent than the long-term ones). Therefore, time discounting theories suggest that extending the time frame would negatively affect consumer willingness to purchase efficient appliances.
On the other hand, recent research on construal level theory suggests that consumers focus on abstract high level construals and less on low level construals [9] as the perceived distance to the situation increases (here, as the temporal distance increases). Transferring these insights to the context of energy cost information, we would therefore expect that as the time frame increases, consumers are focusing less on the current price premium to pay for a more efficient appliance (low level construal) and more on the abstract implications of energy savings and environmentally friendly behaviour (high level construal). Therefore a longer time frame should lead to a greater propensity to purchase efficient appliances.
Of particular interest from a policy perspective are the characteristics of consumers that may be affected by energy cost information. The growing literature on environmentally conscious or “green” consumers is consistently stressing that 1) more and more consumers are becoming “green” and that 2) nevertheless “green” consumers remain a minority (e.g., [10]). Energy labels, similarly to other types of ecological labels, are geared towards consumers that are already sensitized to ecological issues. These labels would therefore be expected to be sufficient signals for consumers for whom the environment, and especially energy efficiency, is of high personal relevance. On the other hand, consumers who are not particularly concerned about ecological issues should in general be less likely to purchase efficient appliances. It is unclear how additional energy cost information might affect these two groups. To the extent that labels accomplish their signalling purpose, “green” consumers are likely to purchase efficient appliances with or without energy cost information and therefore should
358

not be affected by the additional information. Of particular interest for policy making is how those consumers who are not concerned about the environment are affected by additional energy cost information.
Experimental Study
Experimental design To test the effects of interest, we conducted an experiment with 303 German consumers. The study used a (2 by 3) between-subject experimental design. The first manipulated factor was the valence of the information: the energy cost information was provided in the form of savings (savings in Euros for the more efficient appliances compared to the lowest efficient appliance of Class A) or in the form of absolute costs. The second manipulated factor was the time frame: participants were shown the energy cost information of a 1-year, 5-years, or 15-years time frame. We chose 15 years as the longest time frame because it corresponds to the average expected lifetime of refrigerating appliances on the German market. Therefore the 15-years condition represented the total savings or costs obtained over the lifetime of an appliance.
Table – Experimental design: manipulation of savings and cost levels across experimental conditions
Time frame Energy savings compared to A refrigerator (in Euros)
Energy costs (in Euros)
1 year A++ fridge: 20 Euros
A+ fridge: 10 Euros
A fridge: 0 Euro
A++ fridge: 32 Euros
A+ fridge: 42 Euros
A fridge: 52 Euros
5 years A++ fridge: 100 Euros
A+ fridge: 50 Euros
A fridge: 0 Euro
A++ fridge: 160 Euros
A+ fridge: 210 Euros
A fridge: 260 Euros
15 years A++ fridge: 300 Euros
A+ fridge: 150 Euros
A fridge: 0 Euro
A++ fridge: 480 Euros
A+ fridge: 630 Euros
A fridge: 780 Euros
A total of 303 consumers participated in the experiment. Each participant was exposed to one manipulation (combination of energy cost information and time frame). Participants were randomly assigned to the experimental conditions, so that each group contained ca. 50 participants. In all experimental conditions, participants were firstly asked to choose one of three refrigerators which were A, A+, or A++ classes. Then, they stated their willingness to pay for one of the most efficient appliances (stated willingness-to-pay was measured directly in Euros). Following these initial tasks, respondents completed a number of knowledge checks (knowledge of electricity price, of electricity bill, of energy labels), some attitude questions (especially attitudes towards energy cost), and a few socio-demographic questions. Attitude towards energy cost was measured on a 4-item 5-point scale with satisfactory reliability (Cronbach’s alpha = .72).
The refrigerators were described as one which perfectly fulfils the respondent’s wishes for volume, other functionalities and design. The differences among refrigerators were their energy class and price. To distinguish among the refrigerators, the energy label information was shown to respondents. The appliance prices and their electricity consumption levels were chosen to be realistic and were at the level of standard refrigerators currently on the market in Germany (prices of €399, 599, and 799 for A, A+, and A++ refrigerators respectively, and electricity consumption level of 145, 195, and 245 kWh/year respectively). Applying the current average price of 20 Cents per kWh to the electricity consumption levels, the savings or cost information was then added to the labels. Since the same
359
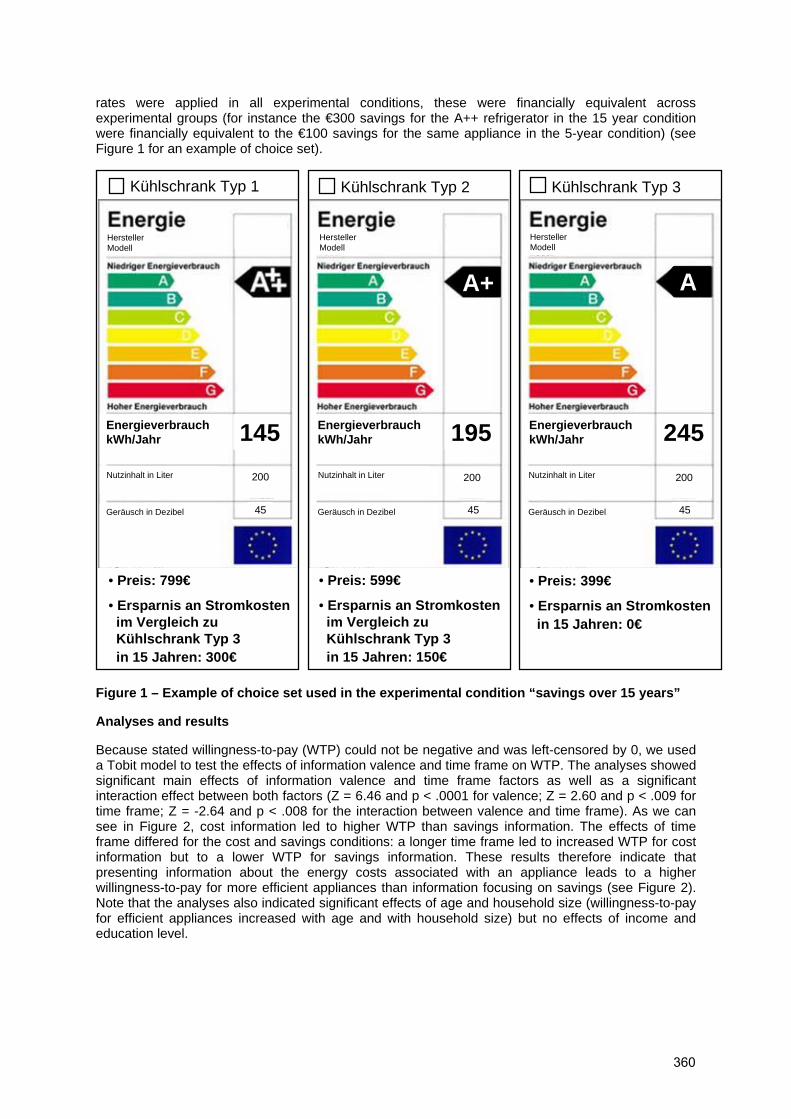
rates were applied in all experimental conditions, these were financially equivalent across experimental groups (for instance the €300 savings for the A++ refrigerator in the 15 year condition were financially equivalent to the €100 savings for the same appliance in the 5-year condition) (see Figure 1 for an example of choice set).
Figure 1 – Example of choice set used in the experimental condition “savings over 15 years”
Analyses and results
Because stated willingness-to-pay (WTP) could not be negative and was left-censored by 0, we used a Tobit model to test the effects of information valence and time frame on WTP. The analyses showed significant main effects of information valence and time frame factors as well as a significant interaction effect between both factors (Z = 6.46 and p < .0001 for valence; Z = 2.60 and p < .009 for time frame; Z = -2.64 and p < .008 for the interaction between valence and time frame). As we can see in Figure 2, cost information led to higher WTP than savings information. The effects of time frame differed for the cost and savings conditions: a longer time frame led to increased WTP for cost information but to a lower WTP for savings information. These results therefore indicate that presenting information about the energy costs associated with an appliance leads to a higher willingness-to-pay for more efficient appliances than information focusing on savings (see Figure 2). Note that the analyses also indicated significant effects of age and household size (willingness-to-pay for efficient appliances increased with age and with household size) but no effects of income and education level.
Kühlschrank Typ 1 Kühlschrank Typ 3
• Preis: 799€
• Ersparnis an Stromkosten im Vergleich zu Kühlschrank Typ 3in 15 Jahren: 300€
Kühlschrank Typ 2
• Preis: 599€
• Ersparnis an Stromkosten im Vergleich zu Kühlschrank Typ 3in 15 Jahren: 150€
• Preis: 399€
• Ersparnis an Stromkosten in 15 Jahren: 0€
Energieverbrauch kWh/Jahr
Nutzinhalt Kühlteil INutzinhalt Gefrierteil I
HerstellerModell
Geräusch
Energieverbrauch kWh/Jahr
Nutzinhalt Kühlteil INutzinhalt Gefrierteil I
Geräusch
Energieverbrauch kWh/Jahr
Nutzinhalt Kühlteil INutzinhalt Gefrierteil I
Geräusch
HerstellerModell
HerstellerModell
A+ A
281 331195 245145Nutzinhalt Kühlteil INutzinhalt Gefrierteil I
Nutzinhalt Kühlteil INutzinhalt Gefrierteil I
Nutzinhalt Kühlteil INutzinhalt Gefrierteil I
200
45
Nutzinhalt in Liter
Geräusch in Dezibel
Nutzinhalt in Liter
Geräusch in Dezibel
Nutzinhalt in Liter
Geräusch in Dezibel
200 200
4545 45
360
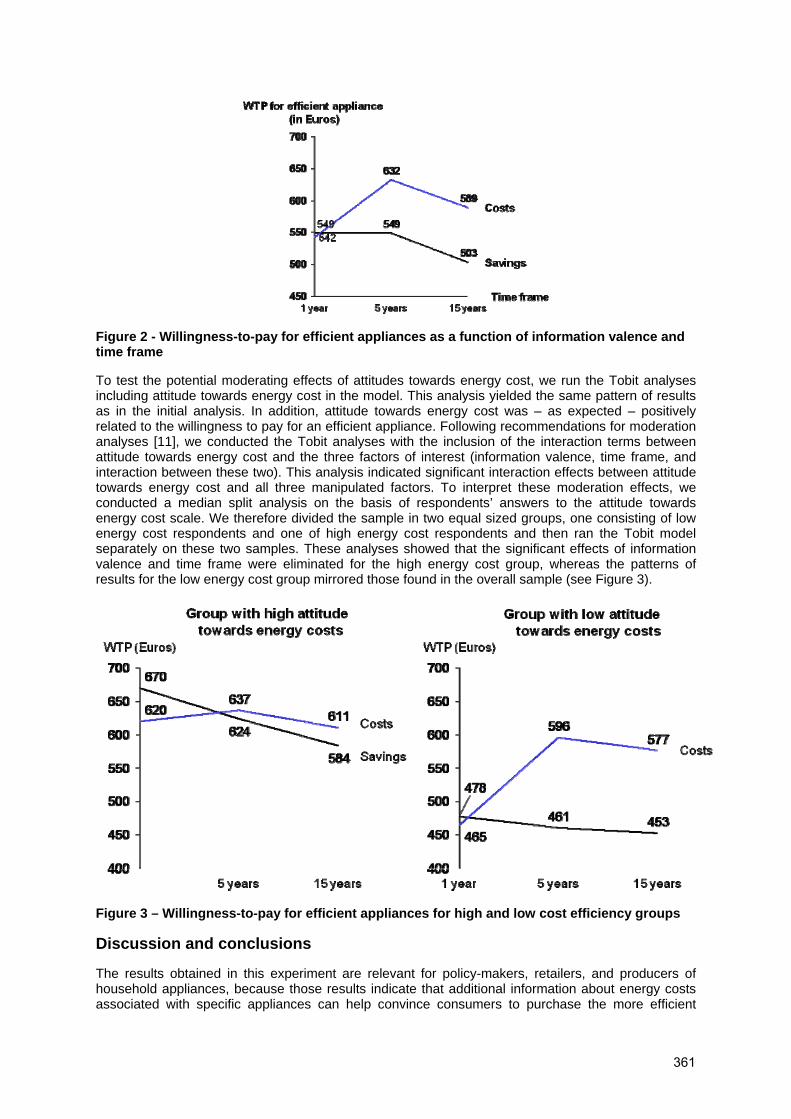
Figure 2 - Willingness-to-pay for efficient appliances as a function of information valence and time frame
To test the potential moderating effects of attitudes towards energy cost, we run the Tobit analyses including attitude towards energy cost in the model. This analysis yielded the same pattern of results as in the initial analysis. In addition, attitude towards energy cost was – as expected – positively related to the willingness to pay for an efficient appliance. Following recommendations for moderation analyses [11], we conducted the Tobit analyses with the inclusion of the interaction terms between attitude towards energy cost and the three factors of interest (information valence, time frame, and interaction between these two). This analysis indicated significant interaction effects between attitude towards energy cost and all three manipulated factors. To interpret these moderation effects, we conducted a median split analysis on the basis of respondents’ answers to the attitude towards energy cost scale. We therefore divided the sample in two equal sized groups, one consisting of low energy cost respondents and one of high energy cost respondents and then ran the Tobit model separately on these two samples. These analyses showed that the significant effects of information valence and time frame were eliminated for the high energy cost group, whereas the patterns of results for the low energy cost group mirrored those found in the overall sample (see Figure 3).
Figure 3 – Willingness-to-pay for efficient appliances for high and low cost efficiency groups
Discussion and conclusions
The results obtained in this experiment are relevant for policy-makers, retailers, and producers of household appliances, because those results indicate that additional information about energy costs associated with specific appliances can help convince consumers to purchase the more efficient
361
appliances. In line with prospect theory expectations, we found that negative information (presented as costs) was the most effective in this respect than information presented as savings. The effects of time frame were more complex, with positive effects of time frame found for cost information (therefore in this case consistent with construal level theory predictions) and negative effects found for savings information (here consistent with time discounting predictions). The study therefore suggests that adding information about the energy costs associated with given appliances may be effective in getting consumers to be willing to pay more for these appliances. Providing such energy cost information may potentially help resolve some of the limitations of the current energy labels.
From a policy perspective, it is particularly interesting that additional energy cost information appeared effective at convincing consumers who are not intrinsically interested in energy cost efficiency. Indeed, the consumers who are concerned with the issue were already choosing the more efficient appliances and additional information did not affect them (possible ceiling effects). This study therefore suggests that external cues such as additional energy cost information may affect behaviour without affecting attitudes. This is a promising result in terms of promoting the diffusion of appliances with the highest energy class as there is much evidence that the green consumer segment, even though growing, is unlikely to grow to encompass the entire market. Affecting the behaviour of the “non green” consumers towards more ethical purchase behaviour should therefore be particularly attractive for policy-makers. Our research suggests that consumers who are not intrinsically interested in energy cost issues may still be convinced by information about costs. Clearly, this study is only a first step and suffers from some limitations. First, the study was only conducted for one product category; second, it only focused on a simple measure of stated willingness-to-pay. Future research should strive at replicating the results in other product categories focusing on more complex dependent measures such as for instance product replacement decisions.
References
[1] Bertoldi, P. & Atanasiu, B. (2007). Electricity consumption and efficiency trends in the enlarged European Union. Status Report 2006. European Commission, Directorate-General Joint Research Center. Institute for Environment and Sustainability. Ispra, Italy.
[2] ZVEI- Zentralverband Elektrotechnik- und Elektronikindustrie e. V. (2007). Energie-Effizienz anpacken! Für eine gemeinsame Energie-Effizienzpolitik. https://www.zvei.org/fileadmin/user_upload/Schwerpunktinitiativen/Energieeffizienz/Energie_Einzel_Rahmen_A4.pdf.
[3] Sammer, K. & Wüstenhagen, R. (2006). The influence of eco-labelling on consumer behaviour – Results of a discrete choice analysis for washing machines. Business Strategy and the Environment, 15(3), 185-199.
[4] CECED (2008). Beyond A: The future of the energy label. Consumer Policy Review, 18(4), 100.103.
[5] Anderson, C.D., Claxton, J.D. (1982). Barriers to consumer choice of energy efficient products. Journal of Consumer Research, 9(3), 163-170.
[6] Kahneman, D. & Tversky, A. (1979). Prospect theory: An analysis of decision under risk. Econometrica, 47(2), 263-291.
[7] Frederick, S., Loewenstein, G., & O'Donoghue, T. (2002). Time discounting and time preference: A critical review. Journal of Economic Literature, 40 (2), 351-401,
[8] Preleck, D., Loewenstein, G. (1991). Decision making over time and under uncertainty: A common approach. Management Science, 37 (7), 770-786
[9] Trope, Y, Liberman, N, & Wakslak, C. (2007). Construal levels and psychological distance: Effects on representation, prediction, evaluation, and behaviour. Journal of Consumer Psychology, 17 (2), 83-96.
[10] Chitra, K. (2007). In search of the green consumers: A perceptual study. Journal of Services Research, 7 (1), 173-191.
362

[11] Baron, R.M., Kenny, D.A. (1986). The moderator-mediator variable distinction in social psychological research: Conceptual, strategic, and statistical considerations. Journal of Personality and Social Psychology, 51 (6), 1173-1182.
363
Refrigerator Replacement Programs in Brazil
Gilberto De Martino Jannuzzi 1,2
Ana Lúcia Rodrigues da Silva 2
Conrado Augustus de Melo 3
José Angelo Paccola 4
Rodolfo Dourado Maia Gomes 5
1University of Campinas (UNICAMP), Brazil
2 International Energy Initiative – IEI, Brazil
Abstract
Brazil’s Electric utilities have invested about 80 million dollars annually in low-income energy efficiency programs, about half of their compulsory investments in end-use programs under current regulation. Since 2007 the regulator has enforced the need to provide evaluation plans for the programs delivered. In this context this paper presents an assessment of refrigerator replacement programs for low-income households that have been introduced in the Brazilian urban and peri-urban slums. Several reasons contribute to make refrigerators attractive appliances for such programs: (a) high share of the residential energy consumption, specially in the Northeast and North regions; (b) high appliance penetration among low-income households; (c) most of low-income households own refrigerators more than 10 years old; d) the energy consumption should be higher in such households due to the precarious electrical installations and consequently inadequate energy quality and voltage provision, then reducing the performance of the appliance. Firstly the paper introduces an overview about refrigerator replacement programs in Brazil. The characteristics of the low income population and refrigerator stock in use are presented. A case study of refrigerator replacement program is presented at the end.
1. Introduction
More recently, following the example of many countries, Brazil has created mechanisms to finance public interest activities during the restructuring of its power sector [1] [2], guaranteeing funds to invest in energy efficiency, energy research and development (CTEnerg). Electricity distribution companies are obliged to invest part of their annual revenues in energy efficiency program under the regulator’s supervision (Table 1). Since 1998 part of these funds have been used by the distribution companies to invest in energy efficiency programs for low-income consumers. During the period 2005/06 almost 61% of the utilities investments in compulsory energy efficiency were dedicated to low-income programs [3].
Table 1 presents the current allocations of Brazilian utilities’ compulsory investments in energy efficiency and R&D programs. The total annual investments in energy efficiency programs is about R$ 300 millions [3]. Only Distribution utilities are required to invest in efficiency programs: amounting to 0.5% of their annual revenues. Public interest energy efficiency programs can be funded by the CTEnerg fund.
364

Table 1: Allocation of the 1% electricity revenues in Energy Efficiency and Energy R&D programs by the type of utility in Brazil (Law 9.991/00)
Notes: CTEnerg is the public interest energy fund; ANEEL is the Brazilian Electricity Regulatory Agency, MME is the Ministry of Mines and Energy.
The present paper is structured as follows: firstly, a brief analysis is made of the Brazilian experience with energy efficiency programs of refrigerator replacement. Secondly the context of low-income population and refrigerator stock characteristics is described. Third results of a case study are presented and finally the findings of the present paper are shown.
1.1. National Experience
The domestic experience in Brazil on implementing energy efficiency programs for low income consumers is not so recent. It has been practiced for some time with different objectives by some utilities, especially through residential lighting programs whose objective is to substitute incandescent bulbs with compact fluorescent lamps. Such experiences have started in the early nineties by the utilities CPFL and CEMIG (Electricity Utilities located in the southeast part of the country), followed by CESP [4] and afterwards by other utilities through the National Electricity Conservation Program (PROCEL). It is worth mentioning the lighting program experiences for low-income households by CEMIG in the Vale do Jequitinhonha in 1995 and by COELCE (Electricity Utility placed in the state of Ceará) in the city of Fortaleza in 1997.
Since then, there is reasonable knowledge on different schemes and strategies to implement energy-efficient lighting programs, ranging from donation-based programs to more sophisticated mechanisms of commercialization, such as through rebates, financing or discount prices.
The experience of COELCE including those focused on the low-income population, of using rebates through the local retail market seem to be a feasible implementing strategy, even though difficulties were faced in that period related to the product novelty and lack of preparedness by the retail market sector for this kind of campaign. One of the advantages of seeking the involvement of the local commerce in energy efficiency programs is the higher assurance of promoting a gradual market transformation for energy-efficient lighting equipment.
Studies carried out by several utilities in Brazil indicate a significant waste of electricity in low income households due to inadequate electricity use, caused by the lack of information about its rational use, precarious electrical installation, use of refrigerators which are in bad condition and buildings without ventilation and natural lighting [5].
Field surveys carried out by COELBA (a utility from State of Bahia in Northeast Brazil) show that refrigerators represent until 70% of total low-income household’s electricity consumption whereas lighting accounts for 20% [6].
Table 2 summarize some results of refrigerator replacement programs for five electricity Brazilian utilities. The energy savings estimated with this programs range from about 43% to 82%.
365

Table 2 Refrigerator replacement programs implemented by utilities in Brazil.
COELBA CELPA CEMAT ELETROPAULO CEB
Number of refrigerators 8023 1300 2522 3150 2400 consumption (MWh/year) – Before replacement
5362 2184 2300 4158 1604
consumption (MWh/year) - After replacement
2301 390 777 907 682
Energy saving (MWh/year) 3061 1794 1522 3250 921 Energy saving (%) 42,9 82,1 66,2 78,2 57,5
2. The Low-income Population
About 37% of the Brazilian residential consumers are considered to be low-income consumers and receive subsidies amounting to around R$ 120 million per month. The proportion of low-income consumers is higher in the Brazilian Northeast and North regions, respectively 66% and 43% of their residential consumers. There are almost 18 million consumers classified as low income in the country, of which 43% are concentrated in the Northeast region, followed by the Southeast (36%). Information on low income consumers by region is provided in Table 3.
Table 3 – Number of low-income electricity consumers by region (2005)
Source: [7]. Note: data from October 2005.
Data from PNAD 2004 (Survey from household sector) also show that the income of more than 30% of the Brazilian households is less than two minimum wages - SM1 (Table 4).
1 Minimum Wages same as Salário Minimo (SM)
366
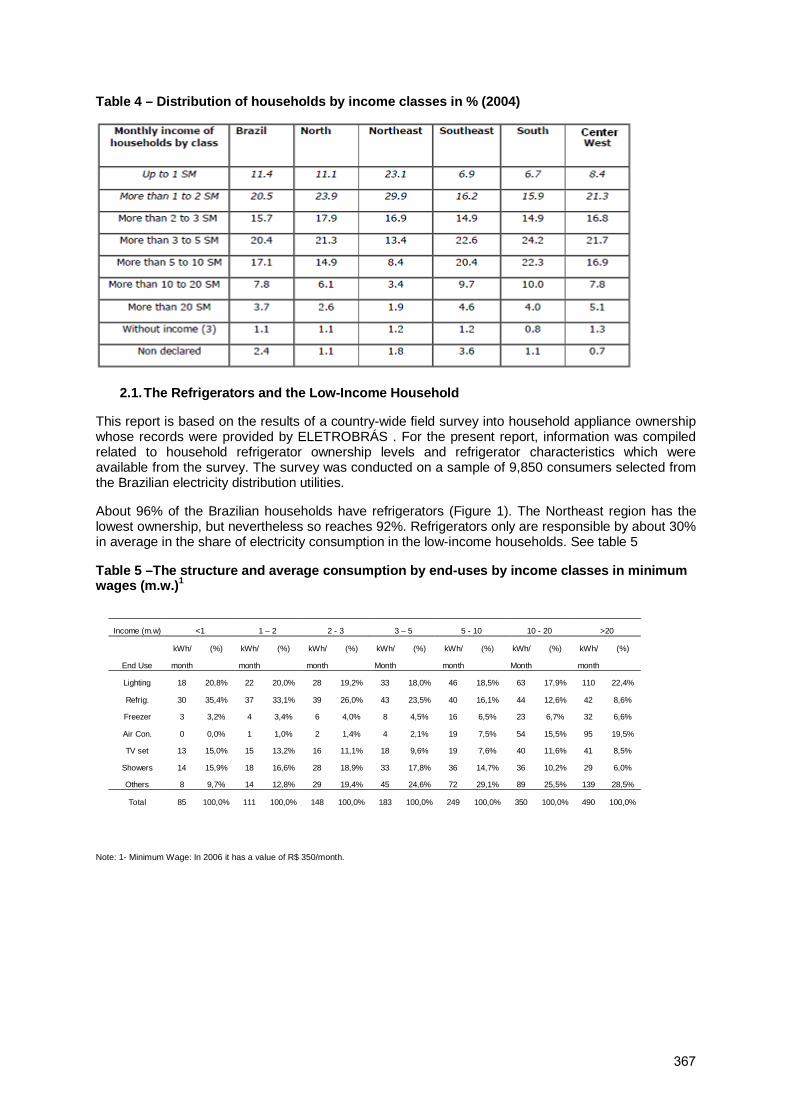
Table 4 – Distribution of households by income classes in % (2004)
2.1. The Refrigerators and the Low-Income Household
This report is based on the results of a country-wide field survey into household appliance ownership whose records were provided by ELETROBRÁS . For the present report, information was compiled related to household refrigerator ownership levels and refrigerator characteristics which were available from the survey. The survey was conducted on a sample of 9,850 consumers selected from the Brazilian electricity distribution utilities.
About 96% of the Brazilian households have refrigerators (Figure 1). The Northeast region has the lowest ownership, but nevertheless so reaches 92%. Refrigerators only are responsible by about 30% in average in the share of electricity consumption in the low-income households. See table 5
Table 5 –The structure and average consumption by end-uses by income classes in minimum wages (m.w.)1
Income (m.w) <1 1 – 2 2 - 3 3 – 5 5 - 10 10 - 20 >20
kWh/ (%) kWh/ (%) kWh/ (%) kWh/ (%) kWh/ (%) kWh/ (%) kWh/ (%)
End Use month
month
month
Month
month
Month
month
Lighting 18 20,8% 22 20,0% 28 19,2% 33 18,0% 46 18,5% 63 17,9% 110 22,4%
Refrig. 30 35,4% 37 33,1% 39 26,0% 43 23,5% 40 16,1% 44 12,6% 42 8,6%
Freezer 3 3,2% 4 3,4% 6 4,0% 8 4,5% 16 6,5% 23 6,7% 32 6,6%
Air Con. 0 0,0% 1 1,0% 2 1,4% 4 2,1% 19 7,5% 54 15,5% 95 19,5%
TV set 13 15,0% 15 13,2% 16 11,1% 18 9,6% 19 7,6% 40 11,6% 41 8,5%
Showers 14 15,9% 18 16,6% 28 18,9% 33 17,8% 36 14,7% 36 10,2% 29 6,0%
Others 8 9,7% 14 12,8% 29 19,4% 45 24,6% 72 29,1% 89 25,5% 139 28,5%
Total 85 100,0% 111 100,0% 148 100,0% 183 100,0% 249 100,0% 350 100,0% 490 100,0%
Note: 1- Minimum Wage: In 2006 it has a value of R$ 350/month.
367
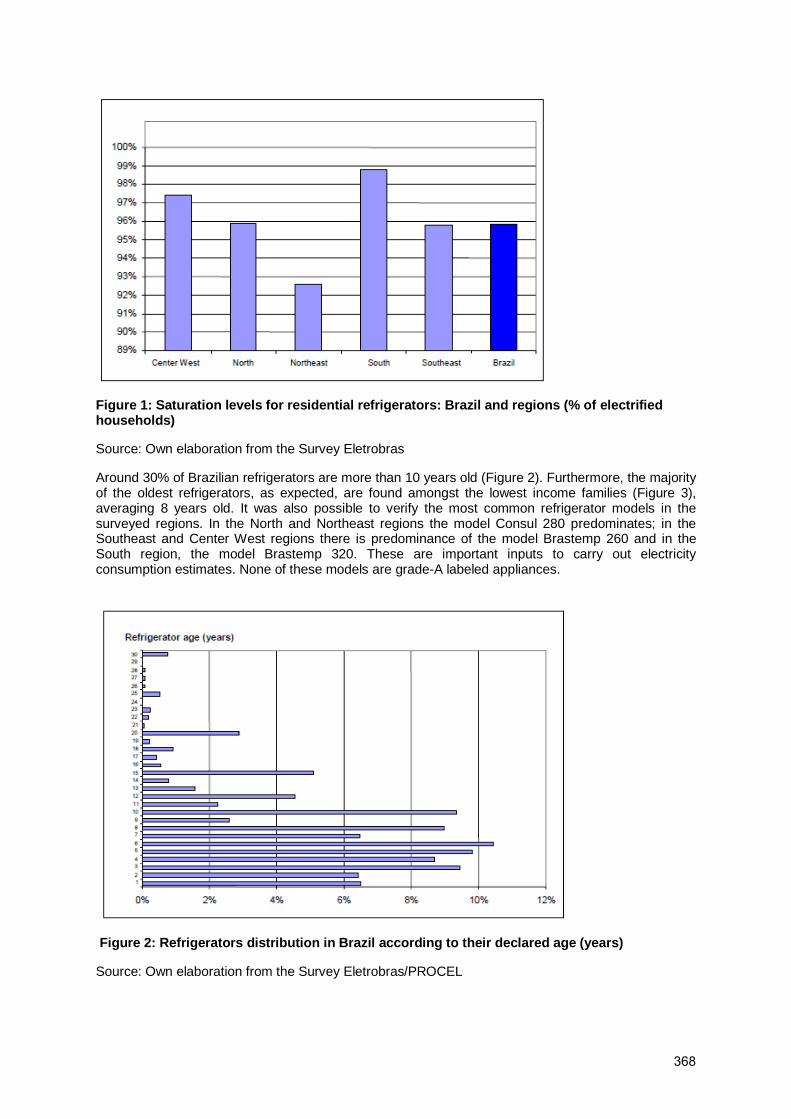
Figure 1: Saturation levels for residential refrigerators: Brazil and regions (% of electrified households)
Source: Own elaboration from the Survey Eletrobras
Around 30% of Brazilian refrigerators are more than 10 years old (Figure 2). Furthermore, the majority of the oldest refrigerators, as expected, are found amongst the lowest income families (Figure 3), averaging 8 years old. It was also possible to verify the most common refrigerator models in the surveyed regions. In the North and Northeast regions the model Consul 280 predominates; in the Southeast and Center West regions there is predominance of the model Brastemp 260 and in the South region, the model Brastemp 320. These are important inputs to carry out electricity consumption estimates. None of these models are grade-A labeled appliances.
Figure 2: Refrigerators distribution in Brazil according to their declared age (years)
Source: Own elaboration from the Survey Eletrobras/PROCEL
368

3. Case Study
This case study was done amongst 141 low income consumers in the State of Bahia, in the metropolitan area of its capital, Salvador. These households have been surveyed in order to better understand their consumption patterns. Individual end-use metering was done in 20 households (refrigerators). Measurements were made continuously during 7 days on the existing refrigerator and ex-post measurements will also be made. A larger program consisting of 13 thousand low-income households is being designed by the same utility.
In this section the data collected on the existing refrigerators is presented along with estimates of the potential electricity savings expected from the replacement program.
About 35% of the existing refrigerators are in poor condition and 66% of the total surveyed are more than 10 years old. Regarding their size, about 50% have volumetric capacity equal or below 300 litres.
3.1 Ex-ante measurements
The end use voltage averaged 126,11 V, which corresponds to the voltage required by the refrigerators in use in Brazil. The power factor measured in the selected households is low, averaging 0.69 (ranging from 0.43 to 1), below what is established by the current national regulation (minimum of 0.92). These lower values indicate the situation of higher distribution losses in this area.
The average energy consumption of the existing refrigerators is about 83 kWh, twice as much the best models currently available in the domestic market. Table 6 shows the results from the measurement of 17 refrigerators.
369
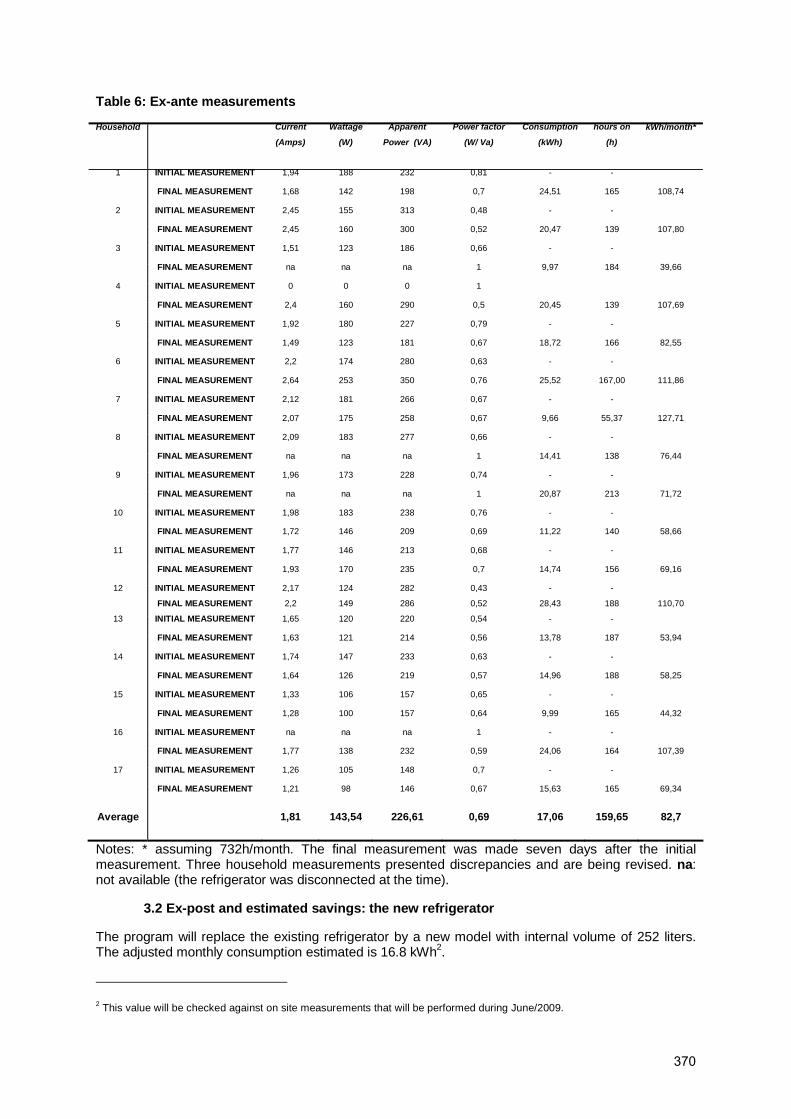
Table 6: Ex-ante measurements
Household Current
(Amps)
Wattage
(W)
Apparent
Power (VA)
Power factor
(W/ Va)
Consumption
(kWh)
hours on
(h)
kWh/month*
INITIAL MEASUREMENT 1,94 188 232 0,81 - - 1
FINAL MEASUREMENT 1,68 142 198 0,7 24,51 165 108,74
INITIAL MEASUREMENT 2,45 155 313 0,48 - - 2
FINAL MEASUREMENT 2,45 160 300 0,52 20,47 139 107,80
INITIAL MEASUREMENT 1,51 123 186 0,66 - - 3
FINAL MEASUREMENT na na na 1 9,97 184 39,66
INITIAL MEASUREMENT 0 0 0 1 4
FINAL MEASUREMENT 2,4 160 290 0,5 20,45 139 107,69
INITIAL MEASUREMENT 1,92 180 227 0,79 - - 5
FINAL MEASUREMENT 1,49 123 181 0,67 18,72 166 82,55
INITIAL MEASUREMENT 2,2 174 280 0,63 - - 6
FINAL MEASUREMENT 2,64 253 350 0,76 25,52 167,00 111,86
INITIAL MEASUREMENT 2,12 181 266 0,67 - - 7
FINAL MEASUREMENT 2,07 175 258 0,67 9,66 55,37 127,71
INITIAL MEASUREMENT 2,09 183 277 0,66 - - 8
FINAL MEASUREMENT na na na 1 14,41 138 76,44
INITIAL MEASUREMENT 1,96 173 228 0,74 - - 9
FINAL MEASUREMENT na na na 1 20,87 213 71,72
INITIAL MEASUREMENT 1,98 183 238 0,76 - - 10
FINAL MEASUREMENT 1,72 146 209 0,69 11,22 140 58,66
INITIAL MEASUREMENT 1,77 146 213 0,68 - - 11
FINAL MEASUREMENT 1,93 170 235 0,7 14,74 156 69,16
INITIAL MEASUREMENT 2,17 124 282 0,43 - - 12
FINAL MEASUREMENT 2,2 149 286 0,52 28,43 188 110,70
INITIAL MEASUREMENT 1,65 120 220 0,54 - - 13
FINAL MEASUREMENT 1,63 121 214 0,56 13,78 187 53,94
INITIAL MEASUREMENT 1,74 147 233 0,63 - - 14
FINAL MEASUREMENT 1,64 126 219 0,57 14,96 188 58,25
INITIAL MEASUREMENT 1,33 106 157 0,65 - - 15
FINAL MEASUREMENT 1,28 100 157 0,64 9,99 165 44,32
INITIAL MEASUREMENT na na na 1 - - 16
FINAL MEASUREMENT 1,77 138 232 0,59 24,06 164 107,39
INITIAL MEASUREMENT 1,26 105 148 0,7 - - 17
FINAL MEASUREMENT 1,21 98 146 0,67 15,63 165 69,34
Average 1,81 143,54 226,61 0,69 17,06 159,65 82,7
Notes: * assuming 732h/month. The final measurement was made seven days after the initial measurement. Three household measurements presented discrepancies and are being revised. na: not available (the refrigerator was disconnected at the time).
3.2 Ex-post and estimated savings: the new refrigerator
The program will replace the existing refrigerator by a new model with internal volume of 252 liters. The adjusted monthly consumption estimated is 16.8 kWh2.
2 This value will be checked against on site measurements that will be performed during June/2009.
370

Comparing the existing measured average refrigerator consumption and the estimated consumption of the new refrigerator, the estimated savings per household is
82.7 – 16.8 = 65.9kWh/month
4. Conclusions
Refrigerators represent an interesting appliance for low income energy-efficiency programs. This is attributed to (a) their high participation in total residential energy consumption; (b) high appliance penetration among low-income households; (c) most of low-income households own refrigerators more than 10 years old; d) the energy consumption should be higher in such households due to the precarious electrical installations and consequently inadequate energy quality and voltage provision, then reducing the performance of the appliance; (e) when compared to newly available models the energy consumption gap is enormous.
These results illustrate the quantitative amount of electricity savings that can be expected from such programs. In the course of the following months further cost-benefit analysis will be made, together with evaluation of household satisfaction and the performance of the new refrigerator in that context.
371
References
[1] Jannuzzi, G. M. (2000). Public Goods and Restructuring of the Brazilian Power Sector: Energy Efficiency, R&D and Low Income Programs. 2000 Summer Study on Energy Efficiency Buildings "Efficiency and Sustainability", Asilomar, California, ACEEE.
[2] Wiser, R., C. Murray, et al. (2003). International Experience with Public Benefits Funds: A Focus on Renewable Energy and Energy Efficiency, Energy Foundation, China Sustainable Energy Program: 100.
[3] Vidinich, R. (2006). Impactos da Mudanças Legais e Estratégicas na Execução de Programas de Eficiência Energética. Apresentação. XVII SENDI, Belo Horizonte, MG.
[4] Jannuzzi, G.M., Dornelas, V. and Bittencourt, M. Evaluation of Residential Lighting Projects in Brazil. In: 4th European Conference on Energy-Efficient Lighting, 1997, Copenhagen. Proceedings: 4th European Conference on Energy-Efficient Lighting. Copenhagen, IAEEL. CD Rom.
[5] Mascarenhas, A. C. R. and D. Nunes (2005). Avaliação do Consumo de energia após melhoria nas instalações elétricas internas e substituição de lâmpadas em habitações populares. VIII Encontro Nacional sobre Conforto no Ambiente Construído - IV Encontro Latino-Americano sobre Conforto no Ambiente Construído, Maceió, Alagoas, Brasil.
[6] Mascarenhas, A. C. R. and A. C. C. Pinhel (2006). Doação de Refrigeradores Eficientes para a População de Baixa Renda na COELBA. SENDI Seminário Nacional de Distribuição de Energia Elétrica, Belo Horizonte, CEMIG.
372
Household Energy Efficiency – always the bridesmaid?
Jo Grugeon, Rachel Ollivier, Lara Olsen
Cool nrg International
Abstract
Domestic energy efficiency is the most cost effective and delivery-ready solution to combat climate change. And yet, while we have been told energy saving is at the heart of European energy policy, the EU’s target of 20% energy efficiency savings by 2020 has not been made binding. This ‘low-hanging fruit’ is being left to rot as governments and markets pursue more expensive and technologically difficult less effective options.
By under-exploiting its energy efficiency potential, Europe is wasting the opportunity to make €100 billion in direct cost savings to householders and reduce CO2 emissions by almost 800 million tonnes a yeari - some 15% of the total EU emission for 2005.ii
At the same time as energy efficiency languishes, the renewable energy industry has finally been given its deserved kick-start with Europe legislating to make a 20% increase in renewable energy by 2020 binding. This is great progress. However, it also highlights the irony that the more cost-effective and ready-to-implement solution is losing out to a less cost-effective solution that will require more time, technological advancement and investment to successfully implement.
This paper explores and contrasts the structure of the renewables and energy efficiency industries to identify for governments and industry what we can learn from renewables to help deliver greater energy efficiency.
Part 1 - Introduction
The World Needs Energy Efficiency Action
The fourth assessment report of the United Nation’s Intergovernmental Panel on Climate Change sets out the stark environmental realities facing the world and makes a convincing case for cutting global CO2 emissions by between 50% and 80% of 1990 levels by 2050iii. Even as the panel outlined the scale of the task, the International Energy Agency issued a warning that made clear the inadequacy of the response so far, suggesting that even with the implementation of all policies on the table, emissions would have risen by a quarter in 2030 iv.
Today, less than two years after the publication of the IPCC Fourth Assessment Report, the world faces those same realities in the context of an economic downturn. This has led to fears that a slowdown in the global economy may lead to a slow down in environmental action.
However, there is a solution that can deliver emission reductions, save consumers money and minimise or at least reduce the need for governments or utilities to invest in power generation or energy subsidy in times of tight credit. This solution is household energy efficiency – which must be part of a three-tiered approach alongside cap and trade schemes and renewable energy.
The case for EE
Energy efficiency is the only action that can deliver up to two thirds of the global CO2 cuts needed in the time we have to act.v It is also the lowest cost solution and can deliver emissions reductions at a negative cost as shown below in the McKinsey study of 2007vi. In fact, McKinsey has shown that even at an oil price of $50 a barrel, a $170bn investment in efficiency would generate more than $900bn in energy savings - or a potential annual rate of return of 17 per centvii
373
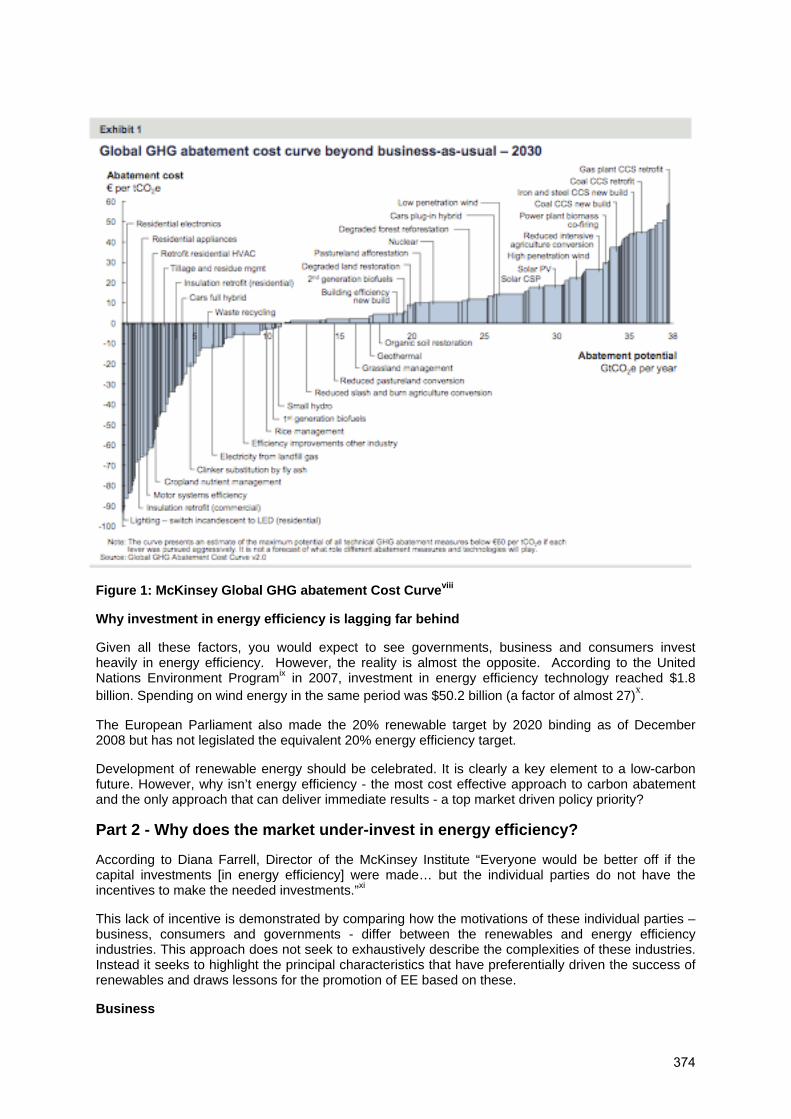
Figure 1: McKinsey Global GHG abatement Cost Curveviii
Why investment in energy efficiency is lagging far behind
Given all these factors, you would expect to see governments, business and consumers invest heavily in energy efficiency. However, the reality is almost the opposite. According to the United Nations Environment Programix in 2007, investment in energy efficiency technology reached $1.8 billion. Spending on wind energy in the same period was $50.2 billion (a factor of almost 27)x.
The European Parliament also made the 20% renewable target by 2020 binding as of December 2008 but has not legislated the equivalent 20% energy efficiency target.
Development of renewable energy should be celebrated. It is clearly a key element to a low-carbon future. However, why isn’t energy efficiency - the most cost effective approach to carbon abatement and the only approach that can deliver immediate results - a top market driven policy priority?
Part 2 - Why does the market under-invest in energy efficiency?
According to Diana Farrell, Director of the McKinsey Institute “Everyone would be better off if the capital investments [in energy efficiency] were made… but the individual parties do not have the incentives to make the needed investments.”xi
This lack of incentive is demonstrated by comparing how the motivations of these individual parties – business, consumers and governments - differ between the renewables and energy efficiency industries. This approach does not seek to exhaustively describe the complexities of these industries. Instead it seeks to highlight the principal characteristics that have preferentially driven the success of renewables and draws lessons for the promotion of EE based on these.
Business
374

The business transaction in energy efficiency is typically a one-off or infrequent product sale (for example a new boiler, insulation or lighting). Once the sale is completed, the consumer uses less energy and reduces their energy spend.
The impact of the consumer being the primary financial beneficiary of energy efficient action is that the considerable aggregate savings generated are fragmented across millions of homes or businesses. Businesses delivering energy efficiency face the resulting barriers to taking their operations to scale:
• High transaction costs
• Highly fragmented customer base (which increases marketing and transaction costs)
• Limited opportunity for repeat business (for example insulation – a one off sale rather than monthly charge)
• Undeveloped supply and/or distribution chains (to reach a large and fragmented customer base)
• Ongoing value created is kWh saved by the customer, which without robust energy trading systems means savings do not convert into value to the business
The comparable transaction and value properties of renewable power are more similar to traditional power supply, being:
• Higher upfront investment cost
• Low transaction costs - service based business with ongoing revenues
• Delivery to the customer via current developed supply chains (e.g. power lines)
• Ongoing value created is kWh that can be sold by the business
The product-based nature of energy efficiency and the fact that ongoing value predominately goes to consumers results in businesses being far less likely (and less able) to stand up a business case based solely on energy efficiency.
Consumers
Consumers benefit from energy efficiency so one would assume that they would be the stakeholder group that is driving its implementation.
However, there are a series of barriers that prevent consumers taking up energy efficiency. The barriers, as noted in many studies, are centred around:
• Limited understanding and hence the low perceived value of energy efficiency
• Compromises on other product attributes (eg. light quality, design)
• Inconvenience and time required to organize and conduct installation
• Real and perceived upfront costs and risks of moving to energy efficient technologies
Addressing one of these several barriers is not enough to change behaviour. The Stern Review identified this issue, stating that “price signals alone may be too muted to have a significant impact” on barriers to energy efficiencyxii.
In contrast, a shift to renewable energy, in the form of an electricity tariff:
• Does not typically involve an upfront cost
• Does not change the product attribute (eg light quality)
375
• Does not inconvenience the consumer during installation
• Allows consumer to easily change away from it if it does not deliver the promised value
The effect of these barriers is that whilst consumers often like the idea of taking energy efficient action they often don’t do it. This was reflected in research undertaken in the UK by Cool nrg, a global leader in domestic energy efficiency action. Research showed that whilst 88% of the population believes that ‘energy saving light bulbs are good to use at home’, only 30% of lights installed are energy saving light bulbsxiii. In contrast, renewable energies account for the highest annual growth rate in energy consumption in Europexiv
Government
If consumers and businesses aren’t demanding energy efficiency, then we might expect governments to do this. However, whilst governments are institutions that seek to increase the health and prosperity of their constituents (businesses and consumers), they also aim to get re-elected.
From a government’s perspective, energy efficiency has the following qualities:
• Measures taken are fragmented (as occur across multiple households) so are not highly visible
• Minimal lobbying by business (as businesses find it hard to commercialise a pure EE business), therefore no ‘national champions’, lowering the perception of jobs and money created through energy efficiency
• Minimal lobbying by consumers
In contrast, renewable industry has:
• Measures that are visible (eg opening new wind farm);
• Businesses that can be created solely around renewables, creating national champions, an industry and jobs
• Consumers demanding and supporting renewable energy
The power that a successful business lobby can have on government actions is evidenced in the experience of Germany, Denmark and Spain who saw how businesses could gain from renewables and implemented strong policies. They also were the countries that lobbied hard for the renewable target to be made binding across Europe.
The table below presents these differences across the stakeholders.
376
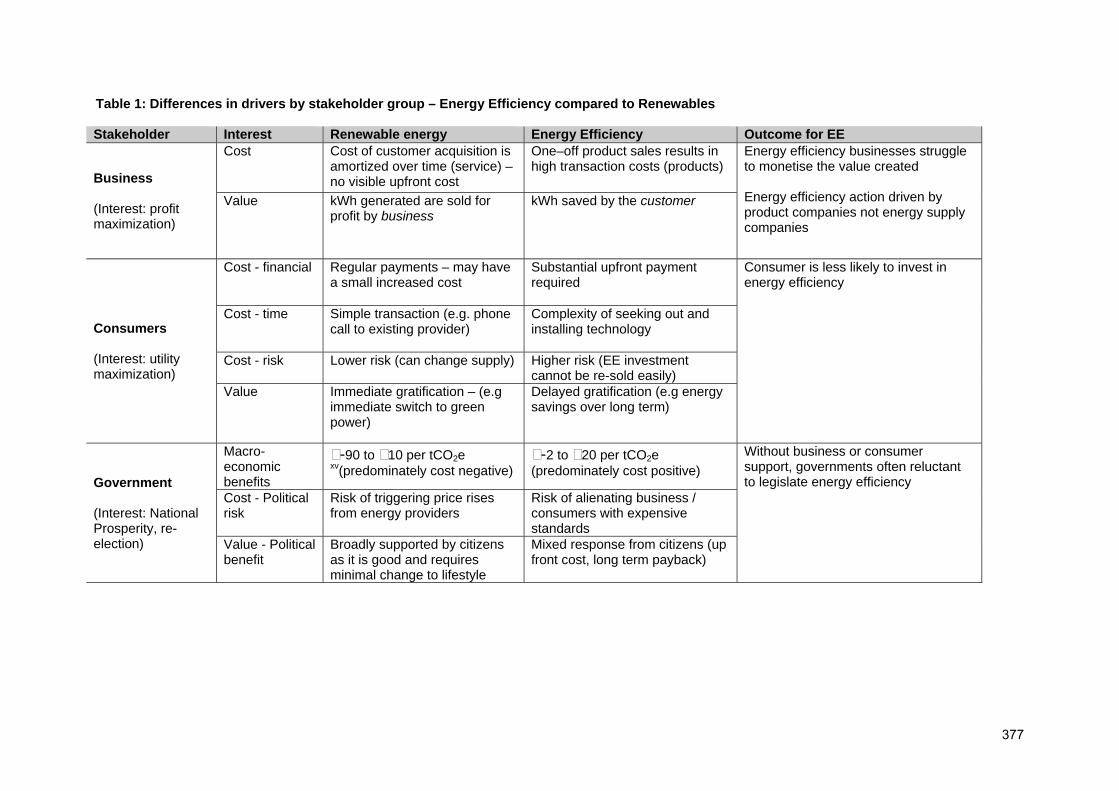
Table 1: Differences in drivers by stakeholder group – Energy Efficiency compared to Renewables Stakeholder Interest Renewable energy Energy Efficiency Outcome for EE
Business (Interest: profit maximization)
Cost Cost of customer acquisition is amortized over time (service) – no visible upfront cost
One–off product sales results in high transaction costs (products)
Energy efficiency businesses struggle to monetise the value created Energy efficiency action driven by product companies not energy supply companies
Value kWh generated are sold for profit by business
kWh saved by the customer
Consumers
(Interest: utility maximization)
Cost - financial Regular payments – may have a small increased cost
Substantial upfront payment required
Consumer is less likely to invest in energy efficiency
Cost - time Simple transaction (e.g. phone call to existing provider)
Complexity of seeking out and installing technology
Cost - risk Lower risk (can change supply) Higher risk (EE investment cannot be re-sold easily)
Value Immediate gratification – (e.g immediate switch to green power)
Delayed gratification (e.g energy savings over long term)
Government
(Interest: National Prosperity, re-election)
Macro-economic benefits
-90 to 10 per tCO2e xv(predominately cost negative)
-2 to 20 per tCO2e (predominately cost positive)
Without business or consumer support, governments often reluctant to legislate energy efficiency
Cost - Political risk
Risk of triggering price rises from energy providers
Risk of alienating business / consumers with expensive standards
Value - Political benefit
Broadly supported by citizens as it is good and requires minimal change to lifestyle
Mixed response from citizens (up front cost, long term payback)
377
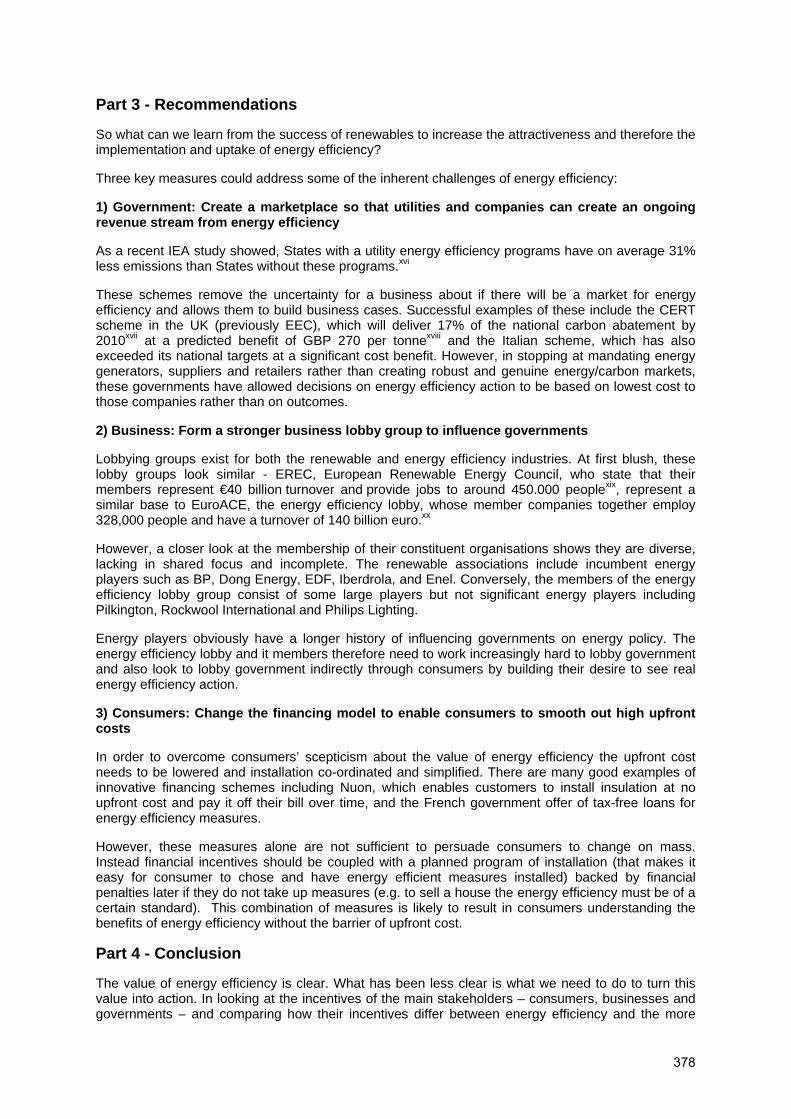
Part 3 - Recommendations
So what can we learn from the success of renewables to increase the attractiveness and therefore the implementation and uptake of energy efficiency?
Three key measures could address some of the inherent challenges of energy efficiency:
1) Government: Create a marketplace so that utilities and companies can create an ongoing revenue stream from energy efficiency
As a recent IEA study showed, States with a utility energy efficiency programs have on average 31% less emissions than States without these programs.xvi
These schemes remove the uncertainty for a business about if there will be a market for energy efficiency and allows them to build business cases. Successful examples of these include the CERT scheme in the UK (previously EEC), which will deliver 17% of the national carbon abatement by 2010xvii at a predicted benefit of GBP 270 per tonnexviii and the Italian scheme, which has also exceeded its national targets at a significant cost benefit. However, in stopping at mandating energy generators, suppliers and retailers rather than creating robust and genuine energy/carbon markets, these governments have allowed decisions on energy efficiency action to be based on lowest cost to those companies rather than on outcomes.
2) Business: Form a stronger business lobby group to influence governments
Lobbying groups exist for both the renewable and energy efficiency industries. At first blush, these lobby groups look similar - EREC, European Renewable Energy Council, who state that their members represent €40 billion turnover and provide jobs to around 450.000 peoplexix, represent a similar base to EuroACE, the energy efficiency lobby, whose member companies together employ 328,000 people and have a turnover of 140 billion euro.xx
However, a closer look at the membership of their constituent organisations shows they are diverse, lacking in shared focus and incomplete. The renewable associations include incumbent energy players such as BP, Dong Energy, EDF, Iberdrola, and Enel. Conversely, the members of the energy efficiency lobby group consist of some large players but not significant energy players including Pilkington, Rockwool International and Philips Lighting.
Energy players obviously have a longer history of influencing governments on energy policy. The energy efficiency lobby and it members therefore need to work increasingly hard to lobby government and also look to lobby government indirectly through consumers by building their desire to see real energy efficiency action.
3) Consumers: Change the financing model to enable consumers to smooth out high upfront costs
In order to overcome consumers’ scepticism about the value of energy efficiency the upfront cost needs to be lowered and installation co-ordinated and simplified. There are many good examples of innovative financing schemes including Nuon, which enables customers to install insulation at no upfront cost and pay it off their bill over time, and the French government offer of tax-free loans for energy efficiency measures.
However, these measures alone are not sufficient to persuade consumers to change on mass. Instead financial incentives should be coupled with a planned program of installation (that makes it easy for consumer to chose and have energy efficient measures installed) backed by financial penalties later if they do not take up measures (e.g. to sell a house the energy efficiency must be of a certain standard). This combination of measures is likely to result in consumers understanding the benefits of energy efficiency without the barrier of upfront cost.
Part 4 - Conclusion
The value of energy efficiency is clear. What has been less clear is what we need to do to turn this value into action. In looking at the incentives of the main stakeholders – consumers, businesses and governments – and comparing how their incentives differ between energy efficiency and the more
378

successful renewables sector we can see that additional measures from all stakeholders are needed if we want energy efficiency to deliver on its promise. The paper identifies these measures as 1) Creating obligations on power companies to provide a market; 2) Forming stronger lobbying groups and; 3) Offering alternate financing options to lower householders’ upfront costs. By implementing these measures, we should see the take up of energy efficiency that the world needs.
379
References
i European Commission. Commission Directive COM(2008) 30 final of 23rd January 2008 with regard to 20 20 by 2020 Europe's climate change opportunity. Can be downloaded at http://www.energy.eu/#saving ii http://themes.eea.europa.eu/IMS/ISpecs/ISpecification20040909113419/IAssessment1195226181050/view_content iii An assessment of the Intergovernmental Panel on Climate Change, Climate change 2007: Synthesis Report, November 2007 ivIEA, World Energy Outlook 2007, p.41 v IEA, World Energy Outlook 2007, p.41 viThe McKinsey Quarterly, A cost curve for greenhouse gas reductions, No. 1, 2007 vii Fiona Harvey If you want to use less power, think 'negawatts', Financial Times, 3 November 2008 viii The McKinsey Quarterly, Pathways to a Low-Carbon Economy Version 2 of the Global Greenhouse Gas Abatement Cost Curve, p7 ix United Nations Environment Program, Press Release “Clean Energy Investments Charge Forward Despite Financial Market Turmoil” according to an analysis issued Tuesday July 1 2008. x United Nations Environment Program, Press Release “Clean Energy Investments Charge Forward Despite Financial Market Turmoil” according to an analysis issued Tuesday July 1 2008 xi The McKinsey Quarterly, Pathways to a Low-Carbon Economy Version 2 of the Global Greenhouse Gas Abatement Cost Curve xii Nicolas Stern, The Economics of Climate Change: The Stern Review, October 2006 xiii Dynamic Markets, Independent Market Research Report commissioned by Cool nrg International, London, February 2009, p.1 and p.4. xiv “European energy sector 'continuous environmental threat', warns EEA”, Euroactive website, www.euractiv.com, November 20 2008 xv The McKinsey Quarterly, Pathways to a Low-Carbon Economy Version 2 of the Global Greenhouse Gas Abatement Cost Curve, p7 xvi “Energy Efficiency Utility Schemes and the Role of Trading”, presentation by Barbara Buchner & Paul Waide, 8th IETA-IEA-EPRI Annual Workshop on Greenhouse Gas Emission Trading, 22 –23 September 2008, Paris xvii “Energy Efficiency Utility Schemes and the Role of Trading”, presentation by Barbara Buchner & Paul Waide, 8th IETA-IEA-EPRI Annual Workshop on Greenhouse Gas Emission Trading, 22 –23 September 2008, Paris xviii “Assessment of EEC 2002–05 Carbon, Energy and Cost Savings”, April 2006, DEFRA
xix EREC website, www.erec-renewables.org, accessed in April 2009 xx EuroACE website, www.euroace.org, accessed in April 2009
380
How Can We Rank Energy-Saving Activities?
-Development of an Energy-Saving Activity
Selection Tool Considering Residents Preferences-
Tsuyoshi UENO and Yukio NAKANO
Central Research Institute of Electric Power Industry
Abstract
In Japan, the household energy consumption is steadily increasing, and drastic energy-saving measures are required. Many energy-saving measures that can be carried out in the home are being proposed by the national government and other institutions; however, the effectiveness of each activity related to energy saving and CO2 emissions reduction and the effects of these activities on residents’ comfort greatly depend on the type of activity. It is important to consider the residents’ preferences and the effect of each energy-saving measure while maintaining as much as possible the convenience and comfort of residents.
We have developed an “Energy-Saving Activity Selection Support Model” that enables users to determine the priority of energy-saving activities suitable for themselves simply by providing household attributes, including their preferences concerning energy saving and the number of household members.
In this paper, the details of our model and the questionnaire survey results are described. Also, the results of the calculation using this model, namely, the suitable energy-saving measures proposed for individual users with different household attributes, including residential area and the number of household members, and different preferences, and the expected potential for energy saving and CO2 reduction are shown. The use of our model is expected to contribute to the promotion of reasonable and efficient energy savings in the residential sector.
1. Introduction and Background
In Japan, household energy consumption is steadily increasing, and drastic energy-saving measures are required. Many energy-saving measures that can be carried out in the home are being proposed by the national government and other institutions; however, the effectiveness of each activity related to energy saving and CO2 emissions reduction and the effects of these activities on residents’ comfort greatly depend on the type of activity. It is important to consider the residents’ preferences and the effect of each energy-saving measure while maintaining as much as possible the convenience and comfort of residents.
We have developed an "Energy-Saving Activity Selection Support Model" that enables users to determine the priority of energy-saving activities suitable for themselves simply by providing household attributes, including their preferences concerning energy saving and the number of household members. The users’ preference for each factor (the degree of importance placed on each factor) was determined by an analytic hierarchy process (AHP), a method for decision making process[1]. An online questionnaire survey involving 700 people was conducted, the result of which was cluster-analyzed to classify users’ preferences into 6 groups.
In this paper, the details of our model and the questionnaire survey results are described. Also, the results of the calculation using this model, namely, the suitable energy-saving measures proposed for individual users with different household attributes, including residential area and the number of household members, and different preferences, and the expected potential for energy saving and CO2 reduction are shown.
381

2. Development of Energy-Saving Activity Selection Support Model
Various energy-saving activities that can be carried out by residents have been proposed, for example, the reduced use of electric appliances such as air conditioners and TVs, cleaning the filters of air conditioners to maintain their efficiency, and unplugging unused electric appliances to reduce standby power.
The effects of energy-saving activities depend on the type of target appliance and activity. Moreover, the amount of labor (convenience) and benefits of carrying out these activities also depend on the type of activity. Let us consider the activity of reducing standby power. Each appliance has a different level of standby power and frequency of use; therefore, the energy-saving effect of this activity depends on the type of appliance. Moreover, the benefit obtained and labors required for this energy-saving activity vary because the position of the socket to which each appliance is connected and the functions during the standby period vary among appliances.
These factors, including the amount of energy saved and the loss of convenience, are interpreted in different ways by people, and therefore, the various consequences of energy-saving activities can be considered. However, it may be possible to propose the most suitable energy-saving activities for each person if the degree of importance placed on each factor and the effect of each energy-saving activity on each factor are relatively evaluated. In this study, we developed a model, using AHP, for ranking appliances to be targeted in energy-saving activities considering not only the amount of energy saved but also the loss of convenience/benefits to users.
AHP is the one of the methods for decision making developed by Saaty[1], and it can be applied to solving the problem containing qualitative elements such as a decision- maker's subjectivity or senses. The AHP is a systematic method for comparing a list of targets or criteria. The decision makers perform paired comparison of the criteria/ targets by using the scale value in Table 1. Then they decide the weight of each criterion/ target by calculating the eigen vector of the matrix that consists of the scale values.
Table 1 Scale Value for Comparing One by One in AHP
Scale Value Meaning of Scale value
1 Equal importance of both elements
3 Moderate importance of one element over another
5 Strong importance of one element over another
7 Very strong importance of one element over another
9 Extreme importance of one element over another
Figure 1 shows the outline of the model proposed in this study. The right side of Fig. 1 shows the hierarchical structure of AHP, which is the core of this model. In this model, Level 1 determines which energy-saving activities a resident should first carry out at home. Next, Level 2 consists of four criteria for selecting rational energy-saving activities, namely, convenience, environmental benefit, comfort, and cost. These criteria are further divided as shown in Levels 3 and 4. Level 5 consists of energy-saving activities targeted in the evaluation, some of which are not shown in Fig. 1 on account of space.
There are a total of 15 criteria in Levels 2-4. Among these, the criteria in upper level are used only for the comparison amongst criteria. Therefore, each alternative (energy-saving activity) has a unique evaluation value with respect to 11 criteria that are directly related to each energy-saving activity in Level 5. The priority in selecting each energy-saving activity, which is the overall aim of this model, is calculated on the basis of these evaluation values and the degree of importance attached to each criterion. Table 2 summarizes the calculation method for the evaluation value of each criterion.
382
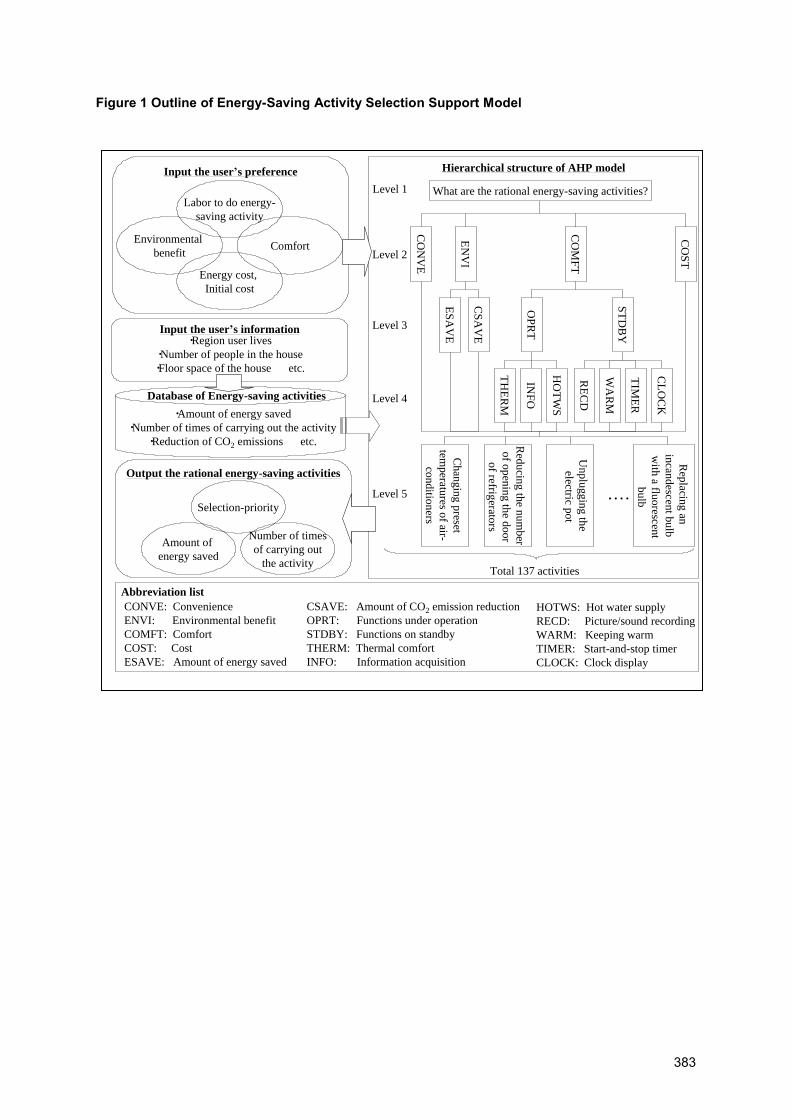
Figure 1 Outline of Energy-Saving Activity Selection Support Model
CO
NV
E
What are the rational energy-saving activities?
CO
ST
EN
VI
ES
AV
E
CS
AV
E
TH
ER
M
HO
TW
S
OP
RT
INF
O
ST
DB
Y
CL
OC
K
RE
CD
TIM
ER
WA
RM
Hierarchical structure of AHP model
Ch
ang
ing
preset
temp
eratures o
f air-
con
ditio
ners
Red
ucin
g th
e nu
mb
er
of o
pen
ing
the d
oo
r
of refrig
erators
Rep
lacing
an
incan
descen
t bu
lb
with
a fluo
rescent
bu
lb・・・・
Un
plu
gg
ing
the
electric po
t
Input the user’s preference
Environmental
benefit
Labor to do energy-
saving activity
Comfort
Energy cost,
Initial cost
Output the rational energy-saving activities
Selection-priority
Amount of
energy saved
Number of times
of carrying out
the activity
Database of Energy-saving activities
・Amount of energy saved
・Number of times of carrying out the activity
・Reduction of CO2 emissions etc.
CO
MF
T
Total 137 activities
CONVE: Convenience
ENVI: Environmental benefit
COMFT: Comfort
COST: Cost
ESAVE: Amount of energy saved
CSAVE: Amount of CO2 emission reduction
OPRT: Functions under operation
STDBY: Functions on standby
THERM: Thermal comfort
INFO: Information acquisition
HOTWS: Hot water supply
RECD: Picture/sound recording
WARM: Keeping warm
TIMER: Start-and-stop timer
CLOCK: Clock display
Abbreviation list
Level 1
Level 2
Level 3
Level 4
Level 5
Input the user’s information・Region user lives
・Number of people in the house
・Floor space of the house etc.
383
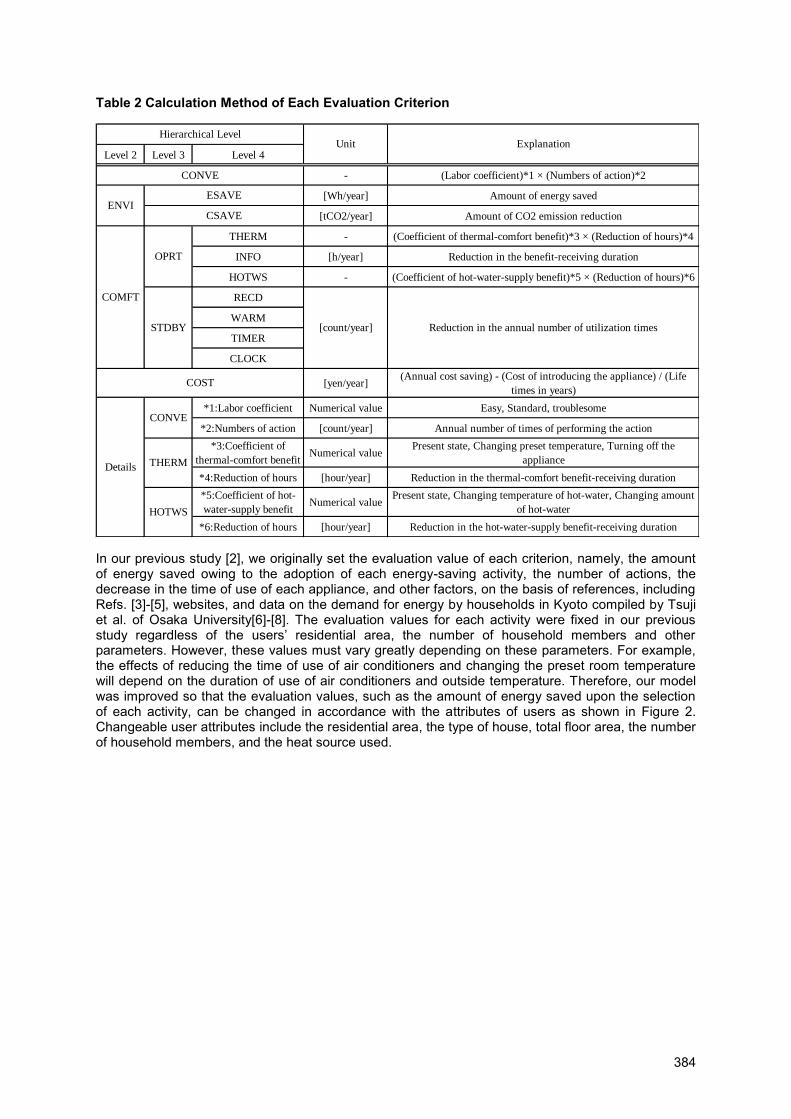
Table 2 Calculation Method of Each Evaluation Criterion
Level 2 Level 3 Level 4
- (Labor coefficient)*1 × (Numbers of action)*2
[Wh/year] Amount of energy saved
[tCO2/year] Amount of CO2 emission reduction
THERM - (Coefficient of thermal-comfort benefit)*3 × (Reduction of hours)*4
INFO [h/year] Reduction in the benefit-receiving duration
HOTWS - (Coefficient of hot-water-supply benefit)*5 × (Reduction of hours)*6
RECD
WARM
TIMER
CLOCK
[yen/year](Annual cost saving) - (Cost of introducing the appliance) / (Life
times in years)
*1:Labor coefficient Numerical value Easy, Standard, troublesome
*2:Numbers of action [count/year] Annual number of times of performing the action
*3:Coefficient of
thermal-comfort benefitNumerical value
Present state, Changing preset temperature, Turning off the
appliance
*4:Reduction of hours [hour/year] Reduction in the thermal-comfort benefit-receiving duration
*5:Coefficient of hot-
water-supply benefitNumerical value
Present state, Changing temperature of hot-water, Changing amount
of hot-water
*6:Reduction of hours [hour/year] Reduction in the hot-water-supply benefit-receiving duration
THERM
Hierarchical Level
[count/year]
HOTWS
CONVE
Details
ENVI
COMFT
COST
CSAVE
Reduction in the annual number of utilization times
Unit Explanation
CONVE
ESAVE
OPRT
STDBY
In our previous study [2], we originally set the evaluation value of each criterion, namely, the amount of energy saved owing to the adoption of each energy-saving activity, the number of actions, the decrease in the time of use of each appliance, and other factors, on the basis of references, including Refs. [3]-[5], websites, and data on the demand for energy by households in Kyoto compiled by Tsuji et al. of Osaka University[6]-[8]. The evaluation values for each activity were fixed in our previous study regardless of the users’ residential area, the number of household members and other parameters. However, these values must vary greatly depending on these parameters. For example, the effects of reducing the time of use of air conditioners and changing the preset room temperature will depend on the duration of use of air conditioners and outside temperature. Therefore, our model was improved so that the evaluation values, such as the amount of energy saved upon the selection of each activity, can be changed in accordance with the attributes of users as shown in Figure 2. Changeable user attributes include the residential area, the type of house, total floor area, the number of household members, and the heat source used.
384
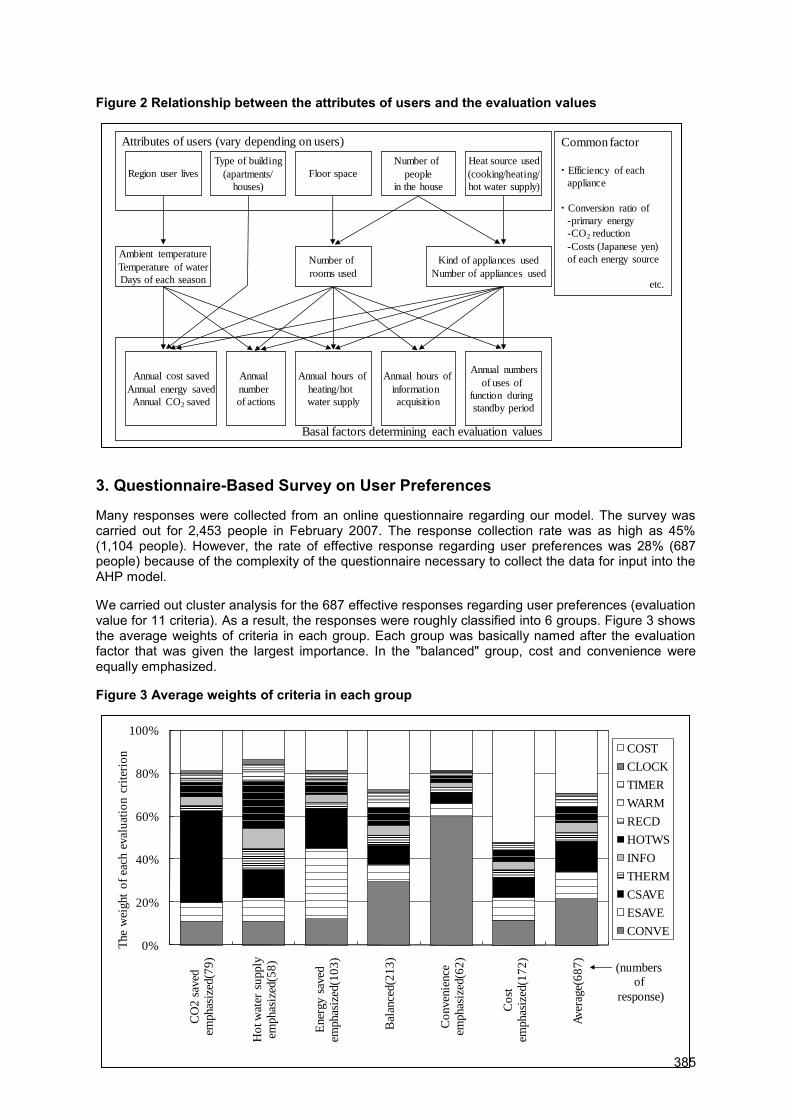
Figure 2 Relationship between the attributes of users and the evaluation values
3. Questionnaire-Based Survey on User Preferences
Many responses were collected from an online questionnaire regarding our model. The survey was carried out for 2,453 people in February 2007. The response collection rate was as high as 45% (1,104 people). However, the rate of effective response regarding user preferences was 28% (687 people) because of the complexity of the questionnaire necessary to collect the data for input into the AHP model.
We carried out cluster analysis for the 687 effective responses regarding user preferences (evaluation value for 11 criteria). As a result, the responses were roughly classified into 6 groups. Figure 3 shows the average weights of criteria in each group. Each group was basically named after the evaluation factor that was given the largest importance. In the "balanced" group, cost and convenience were equally emphasized.
Figure 3 Average weights of criteria in each group
0%
20%
40%
60%
80%
100%
CO
2 s
aved
emphas
ized
(79
)
Ho
t w
ater
su
pply
emphas
ized
(58
)
Ener
gy
saved
emphas
ized
(10
3)
Bal
ance
d(2
13
)
Co
nven
ience
emphas
ized
(62
)
Co
st
emphas
ized
(17
2)
Aver
age(
68
7)
The
wei
ght
of
each
eval
uat
ion c
rite
rio
n COST
CLOCK
TIMER
WARM
RECD
HOTWS
INFO
THERM
CSAVE
ESAVE
CONVE
(numbers
of
response)
Region user lives
Type of building
(apartments/
houses)
Floor space
Number of
people
in the house
Heat source used
(cooking/heating/
hot water supply)
Annual cost saved
Annual energy saved
Annual CO2 saved
Annual
number
of actions
Annual hours of
heating/hot
water supply
Annual hours of
information
acquisition
Annual numbers
of uses of
function during
standby period
Number of
rooms used
Kind of appliances used
Number of appliances used
Attributes of users (vary depending on users)
Basal factors determining each evaluation values
Common factor
・Efficiency of each
appliance
・Conversion ratio of
-primary energy
-CO2 reduction
-Costs (Japanese yen)
of each energy source
etc.
Ambient temperature
Temperature of water
Days of each season
385
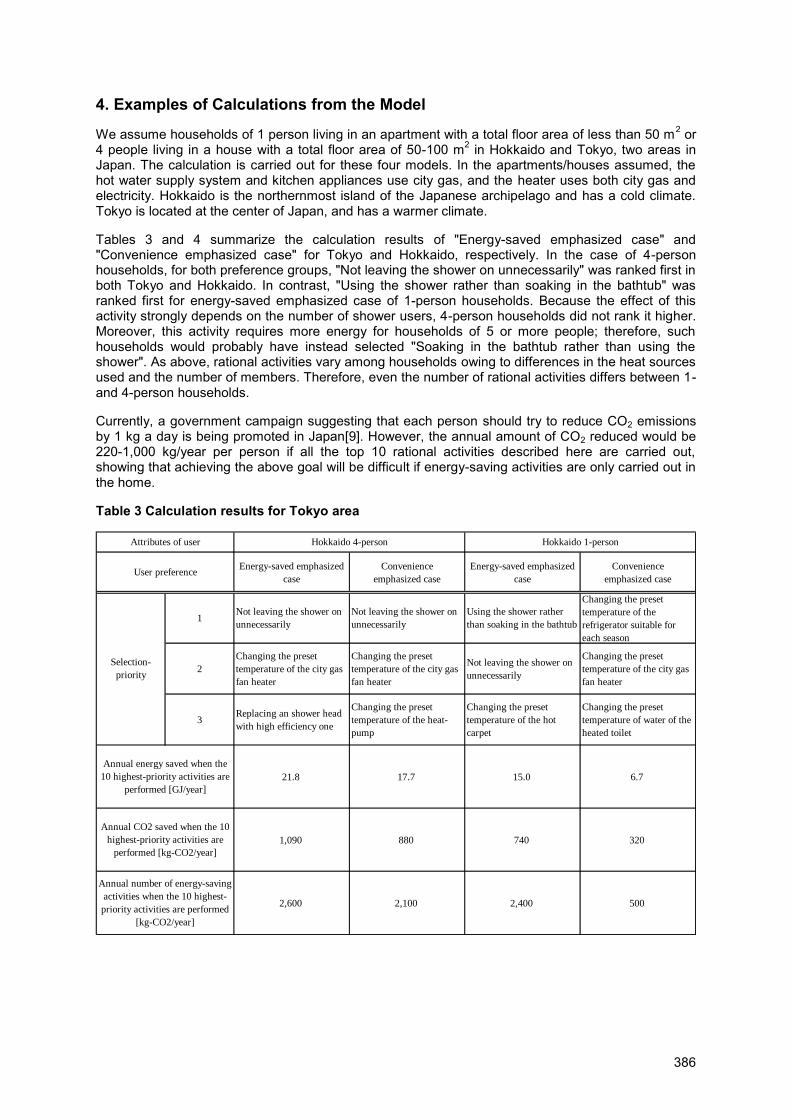
4. Examples of Calculations from the Model
We assume households of 1 person living in an apartment with a total floor area of less than 50 m2 or 4 people living in a house with a total floor area of 50-100 m2 in Hokkaido and Tokyo, two areas in Japan. The calculation is carried out for these four models. In the apartments/houses assumed, the hot water supply system and kitchen appliances use city gas, and the heater uses both city gas and electricity. Hokkaido is the northernmost island of the Japanese archipelago and has a cold climate. Tokyo is located at the center of Japan, and has a warmer climate.
Tables 3 and 4 summarize the calculation results of "Energy-saved emphasized case" and "Convenience emphasized case" for Tokyo and Hokkaido, respectively. In the case of 4-person households, for both preference groups, "Not leaving the shower on unnecessarily" was ranked first in both Tokyo and Hokkaido. In contrast, "Using the shower rather than soaking in the bathtub" was ranked first for energy-saved emphasized case of 1-person households. Because the effect of this activity strongly depends on the number of shower users, 4-person households did not rank it higher. Moreover, this activity requires more energy for households of 5 or more people; therefore, such households would probably have instead selected "Soaking in the bathtub rather than using the shower". As above, rational activities vary among households owing to differences in the heat sources used and the number of members. Therefore, even the number of rational activities differs between 1- and 4-person households.
Currently, a government campaign suggesting that each person should try to reduce CO2 emissions by 1 kg a day is being promoted in Japan[9]. However, the annual amount of CO2 reduced would be 220-1,000 kg/year per person if all the top 10 rational activities described here are carried out, showing that achieving the above goal will be difficult if energy-saving activities are only carried out in the home.
Table 3 Calculation results for Tokyo area
Energy-saved emphasized
case
Convenience
emphasized case
Energy-saved emphasized
case
Convenience
emphasized case
1Not leaving the shower on
unnecessarily
Not leaving the shower on
unnecessarily
Using the shower rather
than soaking in the bathtub
Changing the preset
temperature of the
refrigerator suitable for
each season
2
Changing the preset
temperature of the city gas
fan heater
Changing the preset
temperature of the city gas
fan heater
Not leaving the shower on
unnecessarily
Changing the preset
temperature of the city gas
fan heater
3Replacing an shower head
with high efficiency one
Changing the preset
temperature of the heat-
pump
Changing the preset
temperature of the hot
carpet
Changing the preset
temperature of water of the
heated toilet
21.8 17.7 15.0 6.7
1,090 880 740 320
2,600 2,100 2,400 500
Annual energy saved when the
10 highest-priority activities are
performed [GJ/year]
Annual number of energy-saving
activities when the 10 highest-
priority activities are performed
[kg-CO2/year]
Hokkaido 4-person Hokkaido 1-person
Selection-
priority
Attributes of user
User preference
Annual CO2 saved when the 10
highest-priority activities are
performed [kg-CO2/year]
386
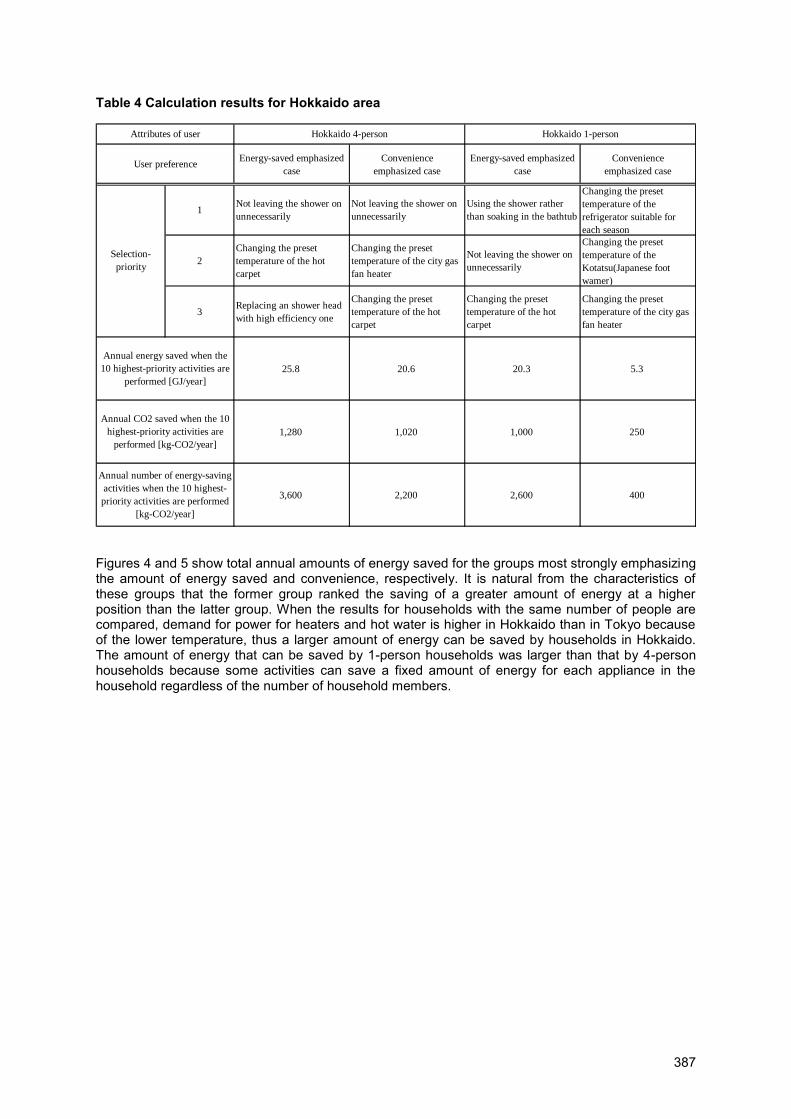
Table 4 Calculation results for Hokkaido area
Energy-saved emphasized
case
Convenience
emphasized case
Energy-saved emphasized
case
Convenience
emphasized case
1Not leaving the shower on
unnecessarily
Not leaving the shower on
unnecessarily
Using the shower rather
than soaking in the bathtub
Changing the preset
temperature of the
refrigerator suitable for
each season
2
Changing the preset
temperature of the hot
carpet
Changing the preset
temperature of the city gas
fan heater
Not leaving the shower on
unnecessarily
Changing the preset
temperature of the
Kotatsu(Japanese foot
wamer)
3Replacing an shower head
with high efficiency one
Changing the preset
temperature of the hot
carpet
Changing the preset
temperature of the hot
carpet
Changing the preset
temperature of the city gas
fan heater
25.8 20.6 20.3 5.3
1,280 1,020 1,000 250
3,600 2,200 2,600 400
Annual energy saved when the
10 highest-priority activities are
performed [GJ/year]
Annual number of energy-saving
activities when the 10 highest-
priority activities are performed
[kg-CO2/year]
Hokkaido 4-person Hokkaido 1-person
Selection-
priority
Attributes of user
User preference
Annual CO2 saved when the 10
highest-priority activities are
performed [kg-CO2/year]
Figures 4 and 5 show total annual amounts of energy saved for the groups most strongly emphasizing the amount of energy saved and convenience, respectively. It is natural from the characteristics of these groups that the former group ranked the saving of a greater amount of energy at a higher position than the latter group. When the results for households with the same number of people are compared, demand for power for heaters and hot water is higher in Hokkaido than in Tokyo because of the lower temperature, thus a larger amount of energy can be saved by households in Hokkaido. The amount of energy that can be saved by 1-person households was larger than that by 4-person households because some activities can save a fixed amount of energy for each appliance in the household regardless of the number of household members.
387

Figure 4 Annual energy reduction of the "Energy-saved emphasized case"
Figure 5 Annual energy reduction of the "Convenience-emphasized case"
5. Development of "Piece Eco"
Based on the model, we developed "Piece Eco", a web-base program easily used on personal computers (Figure 6). The tool selects 10 energy-saving activities appropriate for each user's preference and information among 137 activities, and shows the expected amount of the energy saved and CO2 reduction based on the user’s preference and user’s information such as the region user lives, type of building, number of people in the house, and so on.
Activities selected in many cases seem to contribute energy-saving and CO2 reduction and can be accepted widely. Piece Eco can be used in the website of CRIEPI (http://criepi.denken.or.jp/pieceeco).
0
10
20
30
40
50
60
1 11 21 31 41 51 61 71 81 91
Am
ou
nt
of
En
erg
y S
av
ed
[GJ/
year]
Selection-Priority
Hokkaido 4-person
Tokyo 4-person
Hokkaido 1-person
Tokyo 1-person
0
10
20
30
40
50
60
1 11 21 31 41 51 61 71 81 91
Am
ou
nt
of
En
erg
y S
av
ed
[GJ/
year]
Selection-Priority
Hokkaido 4-person
Tokyo 4-person
Hokkaido 1-person
Tokyo 1-person
388
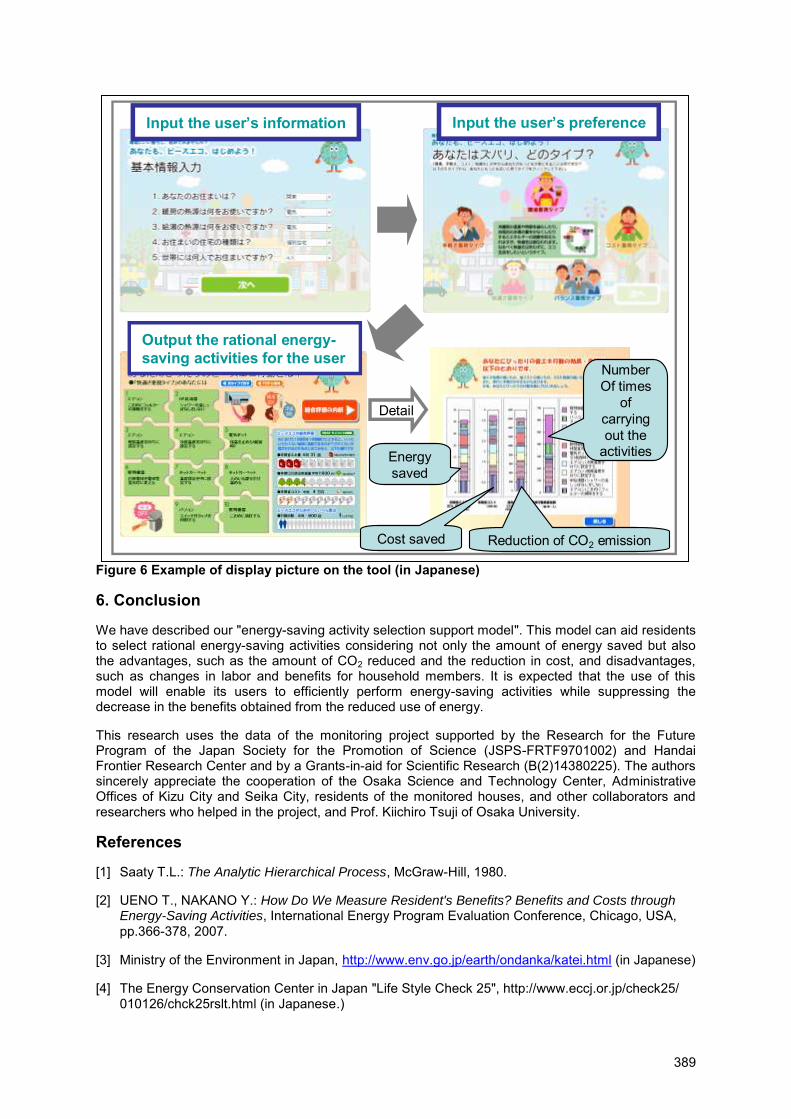
Figure 6 Example of display picture on the tool (in Japanese)
6. Conclusion
We have described our "energy-saving activity selection support model". This model can aid residents to select rational energy-saving activities considering not only the amount of energy saved but also the advantages, such as the amount of CO2 reduced and the reduction in cost, and disadvantages, such as changes in labor and benefits for household members. It is expected that the use of this model will enable its users to efficiently perform energy-saving activities while suppressing the decrease in the benefits obtained from the reduced use of energy.
This research uses the data of the monitoring project supported by the Research for the Future Program of the Japan Society for the Promotion of Science (JSPS-FRTF9701002) and Handai Frontier Research Center and by a Grants-in-aid for Scientific Research (B(2)14380225). The authors sincerely appreciate the cooperation of the Osaka Science and Technology Center, Administrative Offices of Kizu City and Seika City, residents of the monitored houses, and other collaborators and researchers who helped in the project, and Prof. Kiichiro Tsuji of Osaka University.
References
[1] Saaty T.L.: The Analytic Hierarchical Process, McGraw-Hill, 1980.
[2] UENO T., NAKANO Y.: How Do We Measure Resident's Benefits? Benefits and Costs through Energy-Saving Activities, International Energy Program Evaluation Conference, Chicago, USA, pp.366-378, 2007.
[3] Ministry of the Environment in Japan, http://www.env.go.jp/earth/ondanka/katei.html (in Japanese)
[4] The Energy Conservation Center in Japan "Life Style Check 25", http://www.eccj.or.jp/check25/ 010126/chck25rslt.html (in Japanese.)
Input the user’s information
Detail
Energy saved
Cost saved Reduction of CO2 emission
NumberOf times
of carrying out the
activities
Output the rational energy-
saving activities for the user
Input the user’s preference
389

[5] Tokyo Electric Power Company, Reports of Life Style Laboratory. (in Japanese)
[6] Tsuji K., Sano F., Ueno T., Saeki O., Matsuoka T.: Bottom-up Simulation Model for Estimating End-Use Energy Demand Profiles in Residential Houses, ACEEE Summer Study on Energy Efficiency in Buildings, California, USA, 2:342-355, 2004.
[7] Tsuji K., Saeki O., Suzuhigashi A., Sano F. Ueno T.: An End-Use Energy Demand Monitoring Project for Estimating the Potential of Energy Savings in the Residential Sector, ACEEE Summer Study on Energy Efficiency in Buildings, California, USA, 2:311-322, 2000.
[8] Ueno T., Sano F., Saeki O. Tsuji K.: Determination of Standby Power from the Monitored Load Duration Curves for Home Appliances, 2001 Australasian University Power Engineering Conference. 245-250, Perth, Australia, 2001.
[9] Team Minus 6%, http://www.team-6.jp/english/reduction.html
390

Policies and Behaviour
391

392

What's driving sustainable energy consumption
A survey of the empirical literature
Bettina Brohmann
Öko-Institut, Darmstadt
Stefanie Heinzle
University St. Gallen
Klaus Rennings
ZEW Mannheim
Joachim Schleich
Fraunhofer Institut für System- und Innovationsforschung, Karlsruhe
Rolf Wüstenhagen
University St. Gallen
Abstract
The focus of the paper is on the individual decision of energy consumers, and it’s relationship to sustainable consumption. Consumer behaviour is based on individual decisions, but it depends largely on supply-side measures and an appropriate infrastructure (e.g. the availability of energy-efficient household equipment) and on socio-political factors (e.g. if systems of emissions trading or eco-labels exist). It consists of daily “micro-decisions” which construct our self-identity or, in other words, our life-style. We derive some hypotheses on the determinants of sustainable energy consumption in residential buildings from a review of the empirical literature on the diffusion of energy efficient activities. Finally, we specify these hypotheses for three specific technologies of sustainable energy consumption: Domestic appliances, micro-power and green electricity.
393
1. Introduction
Consumption is a key lever to achieving more sustainable development: unsustainable consumption patterns are major causes of global environmental deterioration, including the overexploitation of renewable resources and the use of non-renewable resources with their associated environmental impacts. In environmental terms, the European Environmental Agency report on ‘Household consumption and the environment’ [31] identifies the need areas of food, housing, personal travel/mobility as well as tourism to be the four major areas of household consumption with the highest negative environmental impacts. With regard to development trends, household consumption expenditure per capita in the EU-15 Member States has increased by approximately one third in the last fifteen years [31]. For the period until 2020, consumption growth is expected to continue approximately at the same rate as GDP growth, i.e. 2-3% annually. Technological innovations have reduced the energy and material intensity of most products. However, the increasing volumes of consumed goods have outweighed these gains: Household energy consumption contributes to almost 30% to the total final energy consumption and is, after transport, the second most rapidly growing area of energy use. This paper will focus on the area of residential buildings. It will give an overview of the literature regarding individual consumer decisions on energy demand in the context of sustainable consumption. Although we focus on the economic literature, we will, however, explicitly consider contributions from other socio-economic literature. We will particularly ask for the determinants of sustainable energy consumption regarding the following concrete environmental technologies: Green electricity, domestic appliances and micro-power. We are aware that the individual consumer is embedded in a specific institutional setting that already determines a certain part of his energy consumption. He may be a tenant and his landlord may not be interested in energy saving investments, energy costs may even not be in the focus of his own interest. However, any energy consumption requires an individual decision, may it be aware or unaware. And this is exactly the decision process in the centre of our interests, which we hopefully make more transparent. The paper is structured as follows: We will start with a definition of sustainable consumption. In the next step, we will review the general socio-economic literature regarding individual decisions on energy demand and on general factors influencing sustainable energy use. On this basis, section 3 will derive hypotheses from the existing literature. A review of the literature with regard to three concrete technologies (green electricity, domestic appliances, micro-power) will follow. Finally we will draw some conclusions with hypotheses regarding the three concrete technologies.
2. Sustainable energy consumption
2.1. Definitions of sustainable consumption
“Over the last decade or so, there has been a wealth of social and natural scientific debate about the environmental consequences of contemporary consumption and there is, by now, something of a consensus. It is clear that lifestyles, especially in the developed countries, will have to change if there is to be any chance of averting the long-term consequences of resource depletion, global warming, the loss of biodiversity, the production of waste or the pollution and destruction of valued 'natural' environments” [78, p. 1]. Based on the classic description and definition of the Brundtland Report [94, p. 43], sustainable consumption is now defined as: “[T]he use of goods and services that respond to basic needs and bring a better quality of life, while minimising the use of natural resources, toxic materials and emissions of waste and pollutants over the life cycle, so as not to jeopardise the needs of future generations” [59, p. 16]. Sustainable consumption is seen as a process involving negotiation and the building of consensus – in some areas this process competes with conventional market operations. This means that if new
394

consumption strategies are to be achieved, all actors must be willing to engage in discourse. Hansen/Schrader [41, p. 455] point out that the normative judgement of sustainable development and the corresponding sustainable consumption “has to be given additional legitimacy by a societal discourse” and practice. Sustainable consumption has to be understood as a societal field of action, which could be characterised by three interacting areas of action: the individual area of action (divided in two sub-areas): demand-side area, which includes consumption activities in the context of households as well as of professional procurement activities (of both large-scale private-sector companies and the public sector) and the informal area, in which private consumers undertake informal activities (e.g. unpaid household work), which are not market-oriented and are thus not visible on the level of demand; the supply-side and structural area of action, which includes the activities of companies and also governmental bodies to provide sustainable products, services and information; the socio-political area of action, which includes the activities of governmental bodies but also of organisations and associations to form the general framework for governance in both the individual and supply-side or structural area of action. Furthermore, in this area of action societal factors of consumption behaviour such as visions and moral concepts will be formed. The three areas are interrelated: Consumer behaviour is based on individual decisions, individual behaviour, however, largely depends on supply-side measures, an appropriate infrastructure (e.g. the availability of energy-efficient household equipment) and socio-political factors (e.g. if systems of emissions trading or eco-labels exist). Eberle, Brohmann and Graulich [30] look at sustainable consumption as a more ecological but also socially way of buying and using goods and services. Individual and societal consumption behaviour is embedded in daily routines and influenced by a variety of contextual factors such as specific lifestyles, social environment (neighbourhood, favoured peer groups), systems of infrastructure, habits and routines [79, 32, 78]: with this in mind, sustainable consumption encompasses a range of very diverse fields of action and needs of change. There is consensus among experts that the implementation of more sustainable consumption behaviour requires not only awareness among consumers, but also changed social and economic structures: Consumption is a “socially constructed historically changing process” [14, p. 45]. Several authors [e.g. 34, 86] underline the need and notion of new product policies and the important role of consumers in this regard: “people are not simply end-consumers entirely isolated from the production process” [87, p. 17] but “they participate in the organisation of production-consumption cycles”, [86, p. 53]. On the one hand, every decision of purchase is also a vote for or against certain production conditions (with environmental effects as well as social conditions); on the other hand, “the existence of a suitable supply” [41, p. 463] is crucial for the transition to more sustainable consumption. “The creation of an awareness that an ignorant ’business as usual’ attitude does not only promote inaction but constitutes an active immoral act is hence a necessary prerequisite for a change towards sustainable consumption” [41, p. 459]. Empirical data show that this awareness already exists (in western societies): 75% of German consumers agree with the opinion that users are able to put considerable pressure on producers. In that regard, consumers follow the concept of a “co-producer” [40]. The comprehensive (economic) debate during the first years of the 2000s on the function of consumption as utility production – among other areas in the field of behavioural economics [7, 8, 75] – reveals numerous points of contact which have to be considered in a strategy for change. When taking all these aspects into account it becomes clear and was stated by Jackson [cit. 46, p. 295] that sustainable behaviour is “a function of partly attitudes and intentions, partly of habitual responses, and partly of the situational constraints and conditions under which people operate.” 2.2. Approaches to explain sustainable energy consumption
Three different psychological schools are the main contributors to the field of energy: behavioural psychology, cognitive psychology, and social psychology (especially attitude-behaviour models).
395

While there are many differences among these approaches, they share a focus on individual behaviour. In the case of social psychology, this is modified by the inclusion of ‘social norms’. Psychologists involved in evaluating energy-related behaviour increasingly stress the role of participation, social context and peer-to-peer networks as well as macro-level factors contributing to energy use, such as technology, economy or institutions and culture [1]. There is also an increasing debate about the “social dilemmas” related to energy conservation or/and the use of green electricity: in both cases it is the cumulative impact of the behaviour of all consumers that counts. Meanwhile, psychologists and social psychologists are extending their models beyond the traditional individualistic focus and follow the ideas of a more holistic social-ecological framework [in detail see 48]. As regards the use of energy, sociologists have stated that people do not actively consume energy, but use energy services to raise their family, or run a business, for example [93]. Due to the historically centralised system of supply, users often have little involvement and responsibility. Energy use in the home is mostly invisible, and our energy consuming behaviour is based on habits and routines. In this context, the sociological and socio-technical research is very critical towards existing – single-issue – instruments and measures which only focus on individual behaviour. It is obvious that single-issue interventions have not led to much change in actual energy use in the past. They also argue against the notion of ordinary energy users (and their irrational behaviour) as ‘barriers’ to energy efficiency [39, 78]. Van Vliet [85, p. 11] exemplifies this critique: [Social-psychological models] “lack a proper scheme for analysing the interplay between ‘action’ and ‘structure’ or between ‘micro’ and ‘macro’ levels. Economic models […] do not pay attention to the ‘motives’ or ‘reasons’ of citizen-consumers behind a certain pattern of behaviour. Within the economic theory of ‘revealed preferences’, everything judged an ‘irrational’ factor is excluded from conceptual schemes.” Wilhite et al. [93] point to the drivers of increasing energy use: how new ‘needs’ are constructed and how expectations of comfort and convenience evolve. These expectations are not created by energy users alone: they are also co-constructed by producers of energy-using equipment and systems of provision [78, 80, 86]. Beyond the often discussed rebound effects, Wilhite goes even further in arguing that new technologies themselves serve as change agents: the introduction of these technologies may on the one hand increase efficiency “but at the same time create potentials for new energy intensive practices” [91, p. 23]. In developing his “concept of distributed agency” in consumption, he points to the need of overcoming the separate view on technology on the one hand and the socio-cultural contexts of behaviour on the other hand. With respect to resource consumption in particular (such as energy and water), sociologists of technology argue that effective means to change energy-related social behaviour can only be found by examining the socio-technical networks that build up around new solutions, the way in which tacit knowledge about energy efficiency develops, and the way in which the adoption of new solutions starts to ‘make sense’ in a specific context [39]. In the energy-related context two groups of behaviour were differentiated [see 53]: - Different types of curtailment (saving) behaviour (which include conservation efforts such as turning appliances off – addressing the use phase), and - Different types of efficiency behaviour (which include buying decisions – addressing the investment phase). Talking about the purchasing behaviour we have to consider the (symbolic) meaning of different products and the different purchasing situations as well as lifestyles and life events. In this context Schäfer and Bamberg [74] underline the importance of different events in life as “windows of
396
opportunities” for behavioural change and the chance to intervene successfully towards a more efficient behaviour. Poortinga et al. [64] evaluated the adoption of different energy-saving measures. As a result they discussed the preference of technical instruments1: when consumers get the choice between behavioural measures and technical instruments, technical improvements were preferred to behavioural measures and especially shifts in consumption. While people with a high income found technical measures more acceptable than did people with low or average income, this was explained by the fact that technical measures require initial investment. Furthermore it is mentioned that consumers consider other factors than the effectiveness of practical energy saving. Studies conducted in the early 2000s [37, 4 and 5] have shown that consumers often do not justify their decisions by environmental concerns – even if they decrease negative impacts [7]. On the other hand, Sammer and Wüstenhagen [70, 71] demonstrate that consumers pay more for environmentally sound products. Against the backdrop of the concept of lifestyles, studies indicate that consumer behaviour differentiates between different need areas – due to the symbolic meaning of the given product. Kaenzig and Wüstenhagen [46, p. 297] refer to Pedersen [63] and Bilharz [11], who point out that “purchasing behaviour is not predictable” between different “green” consumption and need areas. Kaenzig and Wüstenhagen [46, p. 297] conclude that different products and systems “have to be considered separately and that findings for one system can not be transferred without careful checking for differences.”
3. Determinants of sustainable energy consumption
Existing studies on the adoption of energy-efficient measures in households are typically based on different, partially over-lapping, concepts from economics (including behavioural economics), psychology (including the marketing-related literature on consumer behaviour) and sociology. For lack of survey-based studies exploring the impact of those factors on the actual diffusion of energy-efficient household appliances the findings for energy-saving measures in households in general serve as proxies. Such analyses on the diffusion of energy-efficient activities typically include factors related to the following categories [e.g. 27, 61, 89, 33, 50, 77, 15, 3, 21 or, in particular, 73]: (1) characteristics of the household (occupants), (2) characteristics of the residence, (3) characteristics of the measure (technology), (4) economic factors, (5) weather and climate factors, (6) information diffusion, (7) attitudes/preferences towards the environment. In light of the interdependencies among factors (and categories), causal impact of individual variables (or concepts) cannot always be clearly identified or distinguished. Among others, Curtis et al. [26] point out that energy-saving measures may be divided in (i) low-cost or no-cost measures which do not involve capital investment but rather behavioural change (e.g. switching off lights, substituting compact fluorescent lamps for incandescent light bulbs) and (ii) measures which require capital investment and involve technical changes in the house (thermal insulation of built environment, windows with double- or triple-glazing). Purchasing a new appliance usually does not require technical changes in the house, but purchasing expenditures may be high. As for the impact of income, results from most studies imply that higher income is positively related with energy-saving activities/expenditures, e.g. Dillman et al. [27] and Long [50] for the US, Walsh [88] and Ferguson [33] for Canada, Sardianou [73] for Greece, and Mills and Schleich [56] for Germany.2 Thus, richer households are less likely to face income or credit constraints for investments in energy efficiency. In additions, empirical findings for Canada by Young [96] suggest that richer households also tend to be associated with a higher turnover rate for household appliances, providing greater chances for energy-efficient appliances to replace older, less energy-efficient appliances. With regard to the impact of education levels on energy-saving activities, empirical evidence is rather mixed. In particular, the econometric analyses by Hirst and Goeltz [42] for the US, by Brechling and Smith [16] for the UK and by Scott [77] for Ireland confirm that higher levels of education are associated with greater energy-saving activities. Reasons include, for example, that a higher education level reduces the costs of information acquisition [76] Likewise, education, as a long term
1 Poortinga et al. distinguish between technical improvements, different use of products and shifts in consumption 2 However, Curtis et al. [24] find no statistically significant correlation of energy saving activities and income in Canada
(Province of Saskatchewan).
397

investment, may be correlated with a low household discount rate and, thus, be positively associated with energy-saving measures. Such measures often require higher up front cost for investment, while savings in energy costs materialise in the future. Attitudes towards the environment as well as social status, lifestyle [51, 52, 89] belonging to a particular social milieu group [66] approving environmentally friendly behaviour tend to be positively related with education. In contrast, the analyses by Ferguson [31] for the take-up of conservation measures in Canadian households and by Mills and Schleich [56] for the diffusion of energy efficient light bulbs in Germany do not imply a statistically significant impact of education levels. As expected from economic theory, most existing studies find that higher energy prices accelerate the diffusion of energy-efficient technologies or are associated with higher expenditure for energy saving measures [e.g. 89, 50, 73, 56]. According to Walsh [89], who finds that older household heads are less likely to carry out energy efficiency improvements, such investments yield a higher expected rate of return for younger investors. For household appliances (and light bulbs) this argument may be less relevant than for measures improving thermal insulation of the built environment, which tend to have a longer lifetime. Further, as suggested by Carlsson-Kanyama et al. [22], younger households tend to prefer up-to-date technology, which is usually also more energy efficient. Lower take-up of energy-efficient technologies by elder households may also interact with older people’s fewer years of formal education, and less information on energy-saving measures. For example, survey results by Linden et al. [49] for Sweden indicate that younger people have better knowledge about energy-efficient measures than older people. Clustering individuals into different types, findings by Barr et al. [3] for the UK, and by Ritchie et al. [68] and Painter et al. [62] for the US suggest that “energy savers” are older. In general, although - depending on the timing of the survey - age may turn out to have varying effects on the take-up of energy-efficient measures, the impact of age may not be linear and depends on the actual measure considered. Household size and the number of children are expected be positively related to the adoption of energy-efficient appliances because more intense use would lead to faster replacement [e.g. 96]. Similarly, the more persons there are in a household, the more profitable it is to acquire information on the energy performance of appliances and to purchase energy-cost saving appliances. For other energy-saving measures such as insulation of walls or roof, household size and composition may be less relevant. In terms of empirics, the literature provides mixed results. For example, results by Curtis [25] imply higher energy-saving activity for households with two to four members than for other household sizes, while the impact of household size on energy-saving expenditures in the study by Long [50] is negative. Renting, rather than owning a residence has been found to inhibit the adoption of energy-saving technologies in a number of previous studies [e.g. 25, 89, 62, 77 or 3], as it is difficult for residence owners to appropriate the savings from investments in energy-saving technologies from tenants [45, 86]. As Black et al. [12] emphasise, this user-investor dilemma holds in particular for energy-saving measures requiring large capital investment such as thermal insulation of the outer walls, roofs, or attics. Since larger residences have, on average, more appliances and higher levels of energy consumption, they are likely to have greater interest in, and knowledge of, household energy consumption and consumption-saving technologies, particularly if the cost of gathering information is relatively fixed. Larger residences may also have greater economic incentives to invest in energy-saving technologies if appliance use is greater. Some studies, among them Walsh [89] or Mills and Schleich [56] find the expected positive relation between housing size and the take-up of energy-efficient measures, while others, such as Sardianou [73] find no statistically significant correlation. Unless recently refurbished, older houses should have higher potentials for (profitable) energy-saving measures. Thus, the age of a dwelling is expected to be positively related to the diffusion of energy-efficient measures. This argument holds in particular for measures improving energy efficiency in the build environment. Because of shorter lifetimes it is presumably less relevant for household appliances, which typically last for around ten years or less [60].
398
Location may also affect the take-up of energy-efficient measures. In particular, urban households may have easier access to information and markets and thus lower transaction costs than rural households. Likewise, larger cities (or utilities in larger cities) tend to be more active in terms of implementing and promoting environmental policies, including policies to raise awareness. The econometric analyses by Scott [77] for the observed diffusion of several energy-efficient technologies in Ireland also suggest a positive relation. However, since citizens in smaller cities and hence more rural areas may have stronger preferences towards the environment, the direction of the relation is likely to be ambiguous. In general, information diffusion relates to the level and quality of knowledge about (i) energy efficiency measures, of (ii) energy consumption (patterns) and costs for existing and new technologies as well as (iii) knowledge about the environmental impact of the particular technology alternatives. From an economic perspective rational household behaviour presumes that households are well informed about the technological alternatives and their costs (including energy costs). For example, information on energy operating costs is typically transmitted via energy bills, where frequency, design and other marketing elements may be relevant. For Norway, Wilhite and Ling [92] report that more frequent and more informative billing led to energy savings of around 10% [cited by 70]. Information on the energy performance of technologies (in particular appliances) is typically transferred via energy-consumption labels. Information about energy-efficient technologies is often transmitted via campaigns by local, regional, national and international administrations or institutions, by energy agencies, consumer associations, technology providers and their associations, or by utilities. Scott [77] finds lack of adequate information on energy saving potential to be a barrier to several energy efficiency technologies in Irish households. From a behavioural and transaction cost perspective, what matters is not only the availability of information but also the credibility of the source [81, p. 43]. For example, Craig and McCann [24] find that the response of New York households to information on energy-saving measures was stronger if the information was provided by the state regulatory agency rather than by the utility. Along similar lines, Curtis et al. [25] find that a greater variety of sources is positively correlated with energy-efficient activities. While information may improve the level and the quality of knowledge, improved information need not necessarily result in sustained energy savings. In particular, energy savings resulting from technology choices tend to have long-term effects, but behaviour-related savings may only be transitory [e.g. 1]. Most studies do not allow for a distinction between the relative contribution of factors related to cost savings and attitudes towards the environment. Brandon and Lewis [15], however, find that environmental attitudes and beliefs are relevant but financial considerations are at least as important.
4. Decisions for concrete environmental technologies
In this section we will focus on empirical evidence regarding three specific technologies of sustainable energy consumption in residential buildings: Domestic appliances, micro-power and green electricity. Stated preference surveys analysing the choice between different product alternatives, such as the choice between different means of transportation [see, e.g. 10], have existed for a relatively long time. Energy-related stated-preference surveys predominantly referred to issues related to transport, in particular to the choice between cars with sustainable or less sustainable energy sources. By empirically analysing Swiss automotive customers, Sammer and Wüstenhagen [73, 74] analysed the effects of the energy label which has been introduced in Switzerland in 2003 on the purchasing decisions for energy-efficient vehicles. Their research based on a conjoint analysis has shown that the energy label does have a measurable influence on the buying decision of Swiss automotive customers [for other energy-related preference surveys related to transportation see 17, 18, 72 and 43].
4.1. Empirical studies in the field of household appliances
Some conjoint analyses have been conducted in the field of energy-related household decisions and are closely connected to the present study. Regarding the energy efficiency of domestic appliances, Sammer and Wüstenhagen [70, 71] examined the impact of the EU energy labels on the choice among different washing machines and light bulbs with different degrees of energy efficiency. Their study investigated the relative importance of eco-labels compared to other product features in consumers' purchasing decisions and showed a significant willingness of customers to pay for A-
399
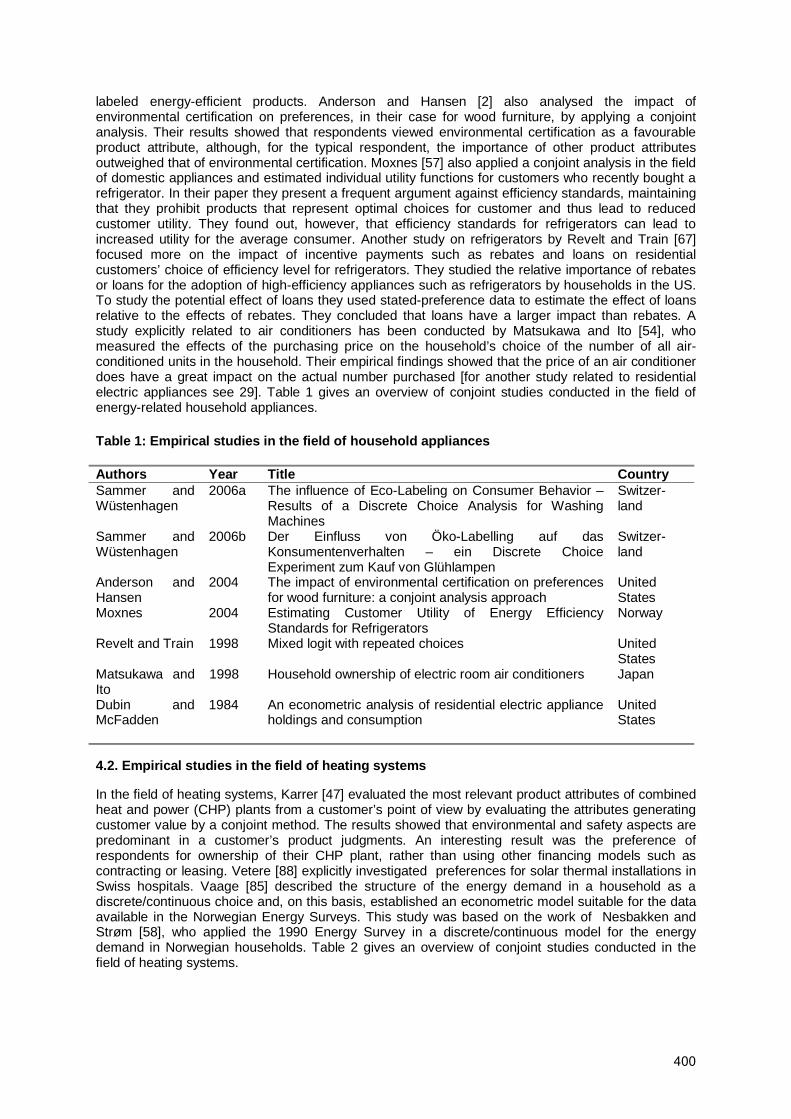
labeled energy-efficient products. Anderson and Hansen [2] also analysed the impact of environmental certification on preferences, in their case for wood furniture, by applying a conjoint analysis. Their results showed that respondents viewed environmental certification as a favourable product attribute, although, for the typical respondent, the importance of other product attributes outweighed that of environmental certification. Moxnes [57] also applied a conjoint analysis in the field of domestic appliances and estimated individual utility functions for customers who recently bought a refrigerator. In their paper they present a frequent argument against efficiency standards, maintaining that they prohibit products that represent optimal choices for customer and thus lead to reduced customer utility. They found out, however, that efficiency standards for refrigerators can lead to increased utility for the average consumer. Another study on refrigerators by Revelt and Train [67] focused more on the impact of incentive payments such as rebates and loans on residential customers’ choice of efficiency level for refrigerators. They studied the relative importance of rebates or loans for the adoption of high-efficiency appliances such as refrigerators by households in the US. To study the potential effect of loans they used stated-preference data to estimate the effect of loans relative to the effects of rebates. They concluded that loans have a larger impact than rebates. A study explicitly related to air conditioners has been conducted by Matsukawa and Ito [54], who measured the effects of the purchasing price on the household’s choice of the number of all air-conditioned units in the household. Their empirical findings showed that the price of an air conditioner does have a great impact on the actual number purchased [for another study related to residential electric appliances see 29]. Table 1 gives an overview of conjoint studies conducted in the field of energy-related household appliances. Table 1: Empirical studies in the field of household appliances
Authors Year Title Country Sammer and Wüstenhagen
2006a The influence of Eco-Labeling on Consumer Behavior – Results of a Discrete Choice Analysis for Washing Machines
Switzer-land
Sammer and Wüstenhagen
2006b Der Einfluss von Öko-Labelling auf das Konsumentenverhalten – ein Discrete Choice Experiment zum Kauf von Glühlampen
Switzer-land
Anderson and Hansen
2004 The impact of environmental certification on preferences for wood furniture: a conjoint analysis approach
United States
Moxnes 2004 Estimating Customer Utility of Energy Efficiency Standards for Refrigerators
Norway
Revelt and Train 1998 Mixed logit with repeated choices United States
Matsukawa and Ito
1998 Household ownership of electric room air conditioners Japan
Dubin and McFadden
1984 An econometric analysis of residential electric appliance holdings and consumption
United States
4.2. Empirical studies in the field of heating systems
In the field of heating systems, Karrer [47] evaluated the most relevant product attributes of combined heat and power (CHP) plants from a customer’s point of view by evaluating the attributes generating customer value by a conjoint method. The results showed that environmental and safety aspects are predominant in a customer’s product judgments. An interesting result was the preference of respondents for ownership of their CHP plant, rather than using other financing models such as contracting or leasing. Vetere [88] explicitly investigated preferences for solar thermal installations in Swiss hospitals. Vaage [85] described the structure of the energy demand in a household as a discrete/continuous choice and, on this basis, established an econometric model suitable for the data available in the Norwegian Energy Surveys. This study was based on the work of Nesbakken and Strøm [58], who applied the 1990 Energy Survey in a discrete/continuous model for the energy demand in Norwegian households. Table 2 gives an overview of conjoint studies conducted in the field of heating systems.
400
Table 2: Empirical studies in the field of heating systems
Authors Year Title Country
Karrer 2006 Customer Value dezentraler Energieversorgung - Relevante Leistungsattribute von BHKW und deren Implikationen fürs Marketing.
Switzerland
Vetere 2008 Conjointanalytische Untersuchung der Kundenpräferenzen im Business-to-Business Marketing für Solarthermie
Switzerland
Jaccard and Dennis
2006 Estimating home energy decision parameters for a hybrid energy-economy policy model
Canada
Vaage, K. 2002 Heating technology and energy use: a discrete / continuous choice approach to Norwegian household energy demand
Norway
Nesbakken and Strom
1993 Energy Use for Heating Purposes in the Household Norway
Research in UK households [53, 30] indicates that micro-power may initiate behavioural change since people who install micro-generating technologies are more likely to be and become more aware of their overall energy use.
4.3. Empirical studies in the field of green electricity
Why does the diffusion of sustainable consumption patterns fail? – This is the research question of Clausen [23]: Within his project two consumer groups of RE (solar thermal and green electricity) and randomly chosen pedestrians were asked about their motivation for buying and using these specific technologies. The results regarding green electricity indicate a broad environmentally sound motivation as the most important reason for buying GE, followed by a great political concern and involvement. Green electricity buyers are less price-sensitive than a comparable group of non-buyers. When asked about the price difference between conventional and green electricity, none of the surveyed groups could estimate it accurately. Clausen [23, p. 28] concludes that the weakest point in the marketing of green electricity may be that the public has still not been successfully provided with information as to what prices can realistically be expected. Whilst green electricity buyers overestimate the price four-fold, non-buyers assume on average a ten-fold higher price for green electricity. Alongside information from newspapers, “friends and acquaintances” are given as the most important source of information, supporting the importance of social components in the dissemination and stabilisation of sustainable consumption (social marketing, see for example 53, 55, 30]. A recent conjoint analysis of the preferences of electricity customers – conducted in Switzerland – backs the findings of Clausen [23]. Burkhalter, Känzig and Wüstenhagen [20] have shown that customers pay special attention to the criteria of energy mix, cost and location of electricity production, whereas other attributes, such as electricity supplier, the pricing model, an eco-certification or the duration of the contract play a subordinate role for the average private client. Goett [36] examined the type of pricing, length of contract and type of supplier. His main findings were that a fixed price was preferred over time-of-day and seasonal rates and that consumers prefer not being locked into a long-term contract. Cai et al. [20] analysed price, outages, integration of renewable sources, support of conservation programmes, and customer services. Their findings showed that the number of outages was by far the most important service attribute. Blass, Lach and Manski [13] also estimated consumer valuation of residential electricity reliability in Israel. They found out that knowledge of consumer willingness to pay for reliability is an important component of a rational planning strategy for capacity investment in the generation and transportation of electricity, as well as a key factor in determining an optimal electricity pricing schedule. Goett, Hudson and Train [35] extended the conjoint-type research of Cai et al based on these previous studies by examining more attributes, including sign-up bonuses, amount and type of renewable, billing options, bundling with
401
other services, reductions in voltage fluctuations, and charitable contributions. Their main result is that customers are vitally concerned about renewable energies offered by suppliers. Their estimates suggest that customers are willing to pay, on average, 2.0 Euro cents per kWh more for a supplier that uses 100% hydro than for a supplier with no renewable sources, and 1.45c more for 100% wind than for no renewables [for other energy-related preference surveys related to electricity see 7, 29, 27]. Table 3 gives an overview of conjoint studies conducted in the field of electricity.
Table 3: Empirical studies in the field of electricity
Authors Year Title Country Burkhalter, Känzig and Wüstenhagen
2007 Kundenpräferenzen für Stromprodukte – Ergebnisse einer Choice-Based Conjoint-Analyse
Switzerland
Goett, A. 1998 Estimating Customer Preferences for New Pricing Products
United States
Cai et al. 1998 Customer retention in a competitive power market: Analysis of a Double-Bounded plus follow-ups Questionnaire
United States
Goett, Hudson and Train
2000 Customer Choice Among Retail Energy Suppliers: The Willingness-to-Pay for Service Attributes
United States
Blass, Lach and Manski
2008 Using Elicited Choice Probabilities to Estimate Random Utility Models: Preferences for Electricity Reliability
Israel
Beenstock et al. 1998 Response bias in a conjoint analysis of power outages Israel Dagsvik et al. 1987 Residential Demand for Natural Gas Netherlands The social dilemma as a debate of (potential) green electricity buyers is mentioned by Truffer, Bruppacher and Behringer [83]. People are willing to pay more for green electricity, but on the condition that everybody is involved and committed. Furthermore the survey shows that in general only few people are familiar with the green power system and infrastructure. So, the importance of labelling and independent verification that Truffer, Markard and Wüstenhagen [84] underlined as one result of a previous focus group research becomes evident.
5. Conclusions
The focus of this paper is on the individual decision of consumers, and its relation to sustainable consumption. Consumer behaviour is based on individual decisions, but it depends largely on economic incentives, supply-side measures and an appropriate infrastructure (e.g. whether the consumer benefits from investments into energy efficient equipment, or the availability of energy-efficient household equipment) and on socio-political factors (e.g. if systems of emissions trading or eco-labels exist). It consists of daily “micro-decisions” which construct our self-identity or, in other words, our lifestyle. Thus behaviour can only be understood in a specific context. The context of beliefs, norms and values has to be analysed to understand sustainable consumption. From a review of the empirical literature on the diffusion of energy-efficient activities we derive the following general hypotheses: (1) Characteristics of the household (occupants): It is confirmed by the literature review that sustainable energy use (including purchase) in residential buildings is significantly influenced by income. However, the evidence on the role of education, age, household size and ownership is mixed. The general message is “it depends”. For example, the causal relation largely depends on a specific regulatory framework (e.g. ownership in Germany has a positive effect on sustainable energy use while it is negative in the US), or on particular circumstances (education may increase awareness of environmental problems but also unsustainable behaviour such as travelling, old people may be less interested in environmental problems but may have more time to spend on purchasing new equipment, for big families energy saving is more profitable but they have less money to invest in energy efficiency equipment). (2) Characteristics of the residence: The relation between housing size and the take-up of energy-efficient measures is expected to be positive. This is confirmed by most studies, although it is not significant in all studies. The age of a
402

residential building is also expected to be positively related to the diffusion of energy-efficient measures since old buildings have a higher potential for improving energy efficiency. An econometric study also confirms that urban households have easier access to information and markets and thus lower transaction costs than rural households. (3) Characteristics of measures (technology): In general, the hypothesis is confirmed in the literature that transparency regarding the costs of energy use is positively correlated with energy-saving behaviour. This has been shown for different measures such as energy bills or energy labels. The effect of information also depends on the credibility of the source: the response of households to information on energy-saving measures is stronger if the information is provided by the state regulatory agency rather than by the utility. (4) Economic factors: Energy prices play an important role and are positively correlated with sustainable energy use. The higher energy prices, the more responsive are households with regard to energy savings. (5) Attitudes/preferences towards the environment: Although sustainable consumption seems not to be possible without changing framework conditions (prices, infrastructure etc.), it is decisive to analyse the individual behaviour assuming a given context in terms of supply factors and regulation. Up to now, however, no clear hypotheses can be derived from the literature. Although there is some agreement that attitudes and lifestyles are relevant, it has not yet been shown that these factors are significant determinants of energy consumption. Finally, we derived some hypotheses from the literature regarding three specific technologies of sustainable energy consumption in residential buildings: Domestic appliances, micro-power and green electricity. Some conjoint analyses have been conducted in the field of household energy-related decisions, which are closely connected to the present study. For example, significant willingness of customers to pay for A-labeled energy efficient products have been shown in studies on the impact of the EU energy labels on the choice among different washing machines and light bulbs with different degreesof energy efficiency. Other results from the literature show that respondents viewed environmental certification as a favourable product attribute, although, for the typical respondent, the importance of other product attributes outweighed that of environmental certification. Another study analysed the impact of incentive payments such as rebates and loans on residential customers’ choice of efficiency level for refrigerators. It concluded that loans have a larger impact than rebates. A study explicitly related to air conditioners showed that the price of an air conditioner has a great impact on the actual number of air conditioners purchased. In the field of heating systems, results from the literature survey showed that environmental and safety aspects are decisive in customer’s product judgments. An interesting result was the preference of respondents for ownership of their CHP plant, rather than using other financing models such as contracting or leasing. Regarding green electricity, a recent study shows that green electricity buyers are less price-sensitive than a comparable group of non-buyers. When asked about the price difference between conventional and green electricity, none of the surveyed groups could estimate it accurately. Alongside information from newspapers, “friends and acquaintances” are given as the most important source of information, supporting the importance of social components in the dissemination and stabilisation of sustainable consumption. A recent conjoint analysis on the preferences of electricity customers backs these findings. It shows that customers pay special attention to the criteria of energy mix, cost and location of electricity production whereas other attributes, such as electricity supplier, the pricing model, an eco-certification or the duration of the contract play a subordinate role for the average private client. Generally, an important role of concern about renewable energies can be derived from the literature. Another study found that a fixed price was preferred over time-of-day and seasonal rates and consumers prefer not being locked into a long-term contract. Further results from the literature survey
403
are: The number of outages may be the most important service attribute. Knowledge of consumer willingness to pay for reliability is an important component of a rational planning strategy for capacity investment in the generation and transportation of electricity, as well as a key factor in determining an optimal electricity pricing schedule. However, the social dilemma as a debate of (potential) green electricity buyers is also mentioned in the literature. People are willing to pay more for green electricity, but only on the condition that everybody is involved and committed. The problem of higher fees for green electricity is that they allow free-riding. The importance of labelling and independent verification is underlined as one result of the literature survey. Regarding policy recommendations, it can be concluded that the heterogeniety of results and behaviour makes it necessary to undertake specific measures for different target groups and for different energy services. Getting prices right ist a necessary element in a policy strategy towards energy efficiency in residential buildings, but it is not sufficient. The determinants of unsustainable energy consumption are multi-dimensional, thus individual and socio-ecological dimensions have to be addressed as well as the economic dimension.
Acknowledgements
The paper has been written as a part of the project “Social, ecologic and economic dimensions of sustainable energy consumption” (Soziale, ökologische und ökonomische Dimensionen eines nachhaltigen Energiekonsums in Wohngebäuden) under the research programme “From words to deeds – new ways of sustainable consumption” (Vom Wissen zum Handeln – neue Wege zum nachhaltigen Konsum) of the German Ministry of Education and Research. Funding for the project is gratefully acknowledged. The paper has been presented at the EEDAL (Energy Efficiency in Domestic Appliances and Lighting in Berlin) in June 2009 and at the ESEE (European Society for Ecological Economics) at Lubljana in June/July 2009. Thanks for helpful comments to anonymous referees that reviewed the paper for these conferences.
References
[1] Abrahamse, W., Steg, L., Vlek, C. and Rothengatter, T. (2005), A review of intervention stud-ies aimed at household energy conservation. Journal of Environmental Psychology. 25, 273–291.
[2] Anderson, R.C., E.N. Hansen (2004): The impact of environmental certification on prefer-
ences for wood furniture: a conjoint analysis approach, Forest Products Journal 54(3), 42-50. [3] Barr, S. Gilg, A.W. and N. Ford (2005), The household energy gap: examining the divide be-
tween habitual- and purchase-related conservation behaviours. Energy Policy 33, 1425–1444. [4] Bartiaux, F. (2002a) Relégation et identité: les déchets domestique at la sphère privée, in:
Magali Pierre (coord.): Les déchets ménagers, entre privé et public. Approches sociologiques, ed. L’Harmattan (Dossiers Sciences Humaines et Sociales), Paris.
[5] Bartiaux, F. (2002b) Vers une économie plus “durable”? Motivations et résistances au chan-
gement des enterprises et des consommateurs en Belgique, in: Actes du colloque “Sociolo-gie, économie et environment“, Cahiers du CRISES (Centre de Recherche sur les Innovations Sociales), Montrèal.
[6] Bartiaux, F. (2003), A socio-anthropological approach to energy related behaviours and inno-
vations at the household level, in: ECEEE (European Council for Energy-Efficient Economy): ECEEE 2003 summer study proceedings – Time to turn down energy demand, 1239-1250.
[7] Beenstock, M., Goldin, E. and Y. Haitovsky (1998), Response bias in a conjoint analysis of power outages, Energy Economics 20 (2), 135-156.
404
[8] Belz, F.-M. (2001), Integratives Öko-Marketing: Erfolgreiche Vermarktung von ökologischen Produkten und Leistungen, Wiesbaden 2001 (zugleich Habilitationsschrift Universität St. Gal-len, St. Gallen 2000).
[9] Belz, F.-M., D. Egger (2001), Nutzen und Kosten von Niedrigenergiehäusern: Empirische
Ergebnisse einer explorativen Untersuchung, in: Der Markt. Zeitschrift für Absatzwirtschaft und Marketing 1, 3-14.
[10] Bhat, C.R., S. Castelar (2002), A unified mixed logit framework for modeling revealed and
stated preferences: Formulation and application to congestion pricing analysis in the San Francisco Bay area, Transportation Research B 36B (7), 593-616.
[11] Bilharz, M. (2005), Strom hat keine Vitamine. Kritische Anmerkungen zur Vermarktung von
Ökostrom, in: Belz, F.-M./Bilharz, M. (Eds.), Nachhaltigkeits-Marketing in Theorie und Praxis, Wiesbaden, 141-160.
[12] Black, J., Sterm, P. and J. Elworth (1985), Personal and contextual influences on household
energy adaptations. Journal of Applied Psychology 70, 3–21. [13] Blass, A. A., Lach, S. and C.F. Manski, Using Elicited Choice Probabilities to Estimate Ran-
dom Utility Models: Preferences for Electricity Reliability, 2008, available online on http://faculty.wcas.northwestern.edu/~cfm754/blm.pdf.
[14] Bocock, R. (1993), Consumption, Routledge, London. [15] Brandon, G., Lewis, A., 1999, Reducing household energy consumption: a qualitative and
quantitative field study. Journal of Environmental Psychology 19 (1), 75–85. [16] Brechling, V., Smith, S. (1994), Household energy efficiency in the UK. Fiscal Studies 15, 44-
56. [17] Brownstone, D., K. Train (1998), Forecasting New Product Penetration with Flexible Substitu-
tion Patterns, Journal of Econometrics 89 (1), 109-129. [18] Brownstone, D., D. S. Bunch and K. Train (2000), Joint Mixed Logit Models of Stated and
Revealed Preferences for Alternative-fuel Vehicles, Transportation Research B 34, 315-338. [19] Burkhalter, A., J. Känzig, and R. Wüstenhagen (2007), Kundenpräferenzen für Stromprodukte
– Ergebnisse einer Choice-Based Conjoint-Analyse. In: Martinuzzi, A., M Tiroch, M. (Eds.), Umweltwirtschaft - International, Interdisziplinär und Innovativ. Beiträge zur Tagung der Kommission Umweltwirtschaft im Verband der Hochschullehrer für Betriebswirtschaft e.V. 3.-5. Oktober 2007 an der Wirtschaftsuniversität Wien.
[20] Cai, Y., I. Deilami, and K. Train (1998,: Customer retention in a competitive power market:
Analysis of a Double-Bounded plus follow-ups Questionnaire, The Energy Journal 19(2): 191 – 215.
[21] Carlsson-Kanyama, A., A.-L. Linden (2007), Energy efficiency in residences-challenges for
women and men in the North. Energy Policy 35, 2163–2172. [22] Carlsson-Kanyama, A., A.-L. Linden and B. Ericsson (2005), Residential energy behaviour:
does generation matter? International Journal of Consumer Studies 29, 239–252. [23] Clausen, J. (2008), Betreiber von Solarwärmeanlagen und Ökostromkunden in der Klima-
schutzregion Hannover, Befragungen im Rahmen des Forschungsprojektes Wenke 2 mit Be-fragung der Nachbarn, Hannover.
[24] Craig, C. S. and J.M. McCann (1978), Assessing communication effects on energy conserva-
tion, Journal of Consumer Research 5, 82-88.
405
[25] Curtis, F., P. Simpson-Housley, and S. Drever (1984). Household energy conservation. En-ergy Policy 12, 452–456.
[26] Dagsvik, J.K., L. Lorentsen,, Ø Olsen and S. Strom (1987), Residential Demand for Natural
Gas, In: R. Golombek, M. Hoel and J. Vislie (Eds.), Natural Gas and Contracts, North-Holland, Amsterdam.
[27] Dillman, D., E. Rosa and J. Dillman (1983) Lifestyle and home energy conservation in the
United States: the poor accept lifestyle cutbacks while the wealthy invest in conservation, Journal of Economic Psychology 3, 299–315.
[28] Dobbyn, J. and Thomas, G. (2005), Seeing the light: the impact of micro-generation on our
use of energy. Sustainable Consumption Roundtable London [29] Dubin, J.A., D.L. McFadden (1984), An econometric analysis of residential electric appliance
holdings and consumption, Econometrica 52, 118-131. [30] Eberle, U., Brohmann, B. and K. Graulich (2004), Sustainable Consumption needs Visions,
Position Paper by the Institute of applied Ecology, Öko-Institut Freiburg/Darmstadt. [31] EEA (European Environment Agency) (2005), Household consumption and the environment,
EEA Report No 11/2005, Copenhagen [32] Empacher, C., D. Hayn, S. Schubert and I. Schultz (2003), Analyse der Folgen des Ge-
schlechterrollewandels für Umweltbewusstsein und Umweltverhalten, Frankfurt am Main. [33] Ferguson M. R. (1993), Energy-saving housing improvements in Canada (1979 - 82): a
nested logit analysis, Environment and Planning A 25, 609 – 625. [34] Fichter, K. (2005), Interpreneurship. Nachhaltigkeitsinnovationen in interaktiven Perspektiven
eines vernetzenden Unternehmertums, Marburg. [35] Goett, A., K. Hudson and K. Train (2000), Customer Choice Among Retail Energy Suppliers:
The Willingness-to-Pay for Service Attributes, The Energy Journal 21, 1-28. [36] Goett, A. (1998), Estimating Customer Preferences for New Pricing Products, Electric Power
Research report TR – 111483, Palo Alto. [37] Gram-Hanssen, K. (2002), Home-building and identity in detached houses– new ways to in-
terpret resource consumption in households. Paper presented at the ENHR 2002 conference, Vienna.
[38] Green, P. E., V. R. Rao (1971), Conjoint Measurement for Quantifying Judgmental Data,
Journal of Marketing Research 8 (3), 355-368. [39] Guy, S., E. Shove (2000), The Sociology of Energy, Buildings and the Environment: Con-
structing Knowledge, Designing Practice. Taylor & Francis Ltd. [40] Hansen, U., T. Hennig (1995), Der Co-Produzenten-Ansatz im Konsumgütermarketing, in: U.
Hansen (Eds.) Verbraucher- und umweltorientiertes Marketing, Schäffer-Poschel, Stuttgart. [41] Hansen, U., U. Schrader (1997), A Modern Model of Consumption for a Sustainable Society,
Journal of Consumer Policy 20, 443-468. [42] Hirst, E., Goeltz, R. (1982), Residential energy conservation actions: analysis of disaggre-
gated data. Energy Systems and Policy 6, 135–150. [43] Horne, M., M. Jaccard and K. Tiedemann (2005), Improving Behavioral Realism in Hybrid
Energy-Economy Models Using Discrete Choice Studies of Personal Transportation Deci-sions, Energy Economics 27, 59-77.
406
[44] Jaccard, M., M. Dennis (2006), Estimating home energy decision parameters for a hybrid
energy-economy policy model, Environmental Modeling & Assessment 11(2), 91-100. [45] Jaffe, A.B. and R.N. Stavins (1994), Energy-efficiency investments and public policy. The
Energy Journal 15, 43-65. [46] Kaenzig, J., R.Wüstenhagen (2006), Understanding strategic choices for sustainable con-
sumption: the case of residential energy supply, Proceedings: Sustainable Consumption and Production: Opportunities and Threats, Wuppertal.
[47] Karrer, B. (2006), Customer Value dezentraler Energieversorgung - Relevante Leistungsat-
tribute von BHKW und deren Implikationen fürs Marketing, IWÖ-Discussion Paper No. 118, University of St. Gallen, Switzerland.
[48] Kurz, T. (2002), The Psychology of Environmentally Sustainable Behaviour: Fitting Together
Pieces of Puzzles, Analysis of Social Issues and Public Policy 2 (1), 257-278. [49] Linden, A-L., A. Carlsson-Kanyama and B. Eriksson (2006), Efficient and inefficient aspects of
residential energy behaviour: what are the policy instruments for change? Energy Policy 34, 1918–1927.
[50] Long, J. (1993), An econometric analysis of residential expenditures on energy conservation
and renewable energy sources. Energy Economics 15, 232-238. [51] Lutzenhiser, L. (1992), A cultural model of the household energy consumption, Energy 17,
47–60. [52] Lutzenhiser, L. (1993), Social and behavioral aspects of energy use, Annual Review of En-
ergy and Environment 18, 247–289. [53] Martiskainen, M. (2007), Affecting consumer behaviour on energy demand, Final report to
EdF Energy, Brighton, East Sussex. [54] Matsukawa, I. and N. Ito (1998), Household ownership of electric room air conditioners, En-
ergy Economics 20 (4), 375-387. [55] Mc Kenzie-Mohr, D. (2000), Fostering Sustainable Behavior Through Community-Based
Social Marketing, American Psychologist 55, 531-537. [56] Mills, B. and J. Schleich (2008), Why don’t households see the light? Explaining the diffusion
of compact fluorescent lamps, paper presented at the 16th Annual Conference of the Euro-pean Association of Environmental and Resource Economists (EAERE), June 25-28, Goth-enburg, Sweden.
[57] Moxnes, E. (2004), Estimating Customer Utility of Energy Efficiency Standards for Refrigera-
tors, Journal of Economic Psychology 25(6), 707-724. [58] Nesbakken, R., S. Strøm (1993), Energy Use for Heating Purposes in the Household, Reports
No. 93 (10), Central Bureau of Statistics, Oslo. [59] OECD (2002), Towards Sustainable Consumption: An Economic Conceptual Framework,
OECD, Paris. [60] OECD (2002), Decision-Making and Environmental Policy Design for Consumer Durabl,.
ENV/EPOC/WPNEP(2002)7/FINAL. OECD, Paris. [61] Olsen, M. (1983), Public acceptance of consumer energy conservation strategies. Journal of
Economic Psychology 4, 183–196.
407
[62] Painter, J., R. Semenik and R. Belk (1983), Is there a generalized conservation ethic? A com-parison of the determinants of gasoline and home heating energy conservation. Journal of Economic Psychology 3, 317–331.
[63] Pedersen, L.H. (2000), The dynamics of green consumption: a matter of visibility?, Journal of
Environmental Policy and Planning 2, 193-210. [64] Poortinga, W., L. Steg, C. Vlek and G. Wiersma (2003), Household preferences for energy-
saving measures: a conjoint analysis, Journal of Economic Psychology 24, 49-64. [65] Poortinga, W., Steg, L., VlekC. and G. Wiesma (2002), Household pereferences for energy-
saving measures: A conjoint analysis, Journal of Economic Psychology 24, 49-64. [66] Reusswig,F., K. Gerlinger and O. Edenhofer (2004), Lebensstile und globaler Energie-
verbrauch - Analysen und Strategieansätze zu einer nachhaltigen Energiestruktur. Potsdam, PIK Report 90.
[67] Revelt, D., K. Train (1998), Mixed logit with repeated choices, Review of Economics and Sta-
tistics 80, 647-657. [68] Ritchie, J.R.B., G.H.G. McGougall and J.D. Claxton (1981), Complexities of household energy
consumption and conservation. Journal of Consumer Research 8, 233–242. [69] Rubik , F., P. Frankl, L. Pietroni and D. Scheer (2006), Eco-labelling and consumers – To-
wards a re-focus and integrated approaches, SCORE! Proceedings 2006 Wuppertal. [70] Sammer, K., R. Wüstenhagen (2006a), The influence of Eco-Labelling on Consumer Behav-
iour – Results of a Discrete Choice Analysis for Washing Machines, Business Strategy and the Environment 15, 185-199.
[71] Sammer, K., R. Wüstenhagen (2006b), Der Einfluss von Öko-Labelling auf das Konsumen-
tenverhalten – ein Discrete Choice Experiment zum Kauf von Glühlampen, in: Pfriem, R. , R. Antes, K. Fichter, M. Müller, N. Paech, S. Seuring, and B. Siebenhüner (Eds.), Innovationen für Nachhaltige Entwicklung, Wiesbaden: Deutscher Universitätsverlag, 469-487.
[72] Sándor, Z., K. Train (2004), Quasi-Random Simulation of Discrete Choice Models, Transpor-
tation Research B 38, 313-327. [73] Sardinanou, E. (2007), Estimating energy conservation patterns of Greek households. Energy
Policy 35, 3778-3791. [74] Schäfer, M. and S. Bamberg (2008), Breaking habits: Linking sustainable campaigns to life
sensitive events, SCORE! Proceedings 10-11 March 2008, Brussels. [75] Scherhorn, G. (1994), Die Unersättlichkeit der Bedürfnisse und der kalte Stern der Knappheit,
in: B. Biervert, M. Held (Eds.) Das Naturverständnis der Ökonomik, Campus, Frankfurt am Main.
[76] Schultz, T.W. (1975), The Value of the Ability to Deal with Disequilibrium. Journal of Eco-
nomic Literature 13(3): 827-46. [77] Scott, S., (1997), Household energy efficiency in Ireland: a replication study of owner of en-
ergy saving items. Energy Economics 19, 187–208. [78] Shove, E. (2003), Converging conventions of comfort, cleanliness and convenience, Journal
of Consumer Policy 26, 395-418. [79] Shove, E., A. Warde (1998), Inconspicuous Consumption: the sociology of consumption, life-
styles and the environment, in Gijswijt, A. et al. (Eds.) Sociological Theory and the environ-ment.
408
[80] Spaargaren, G. F. (2003), Sustainable Consumption: A theoretical and Environmental Policy
Perspective, Society and Natural Resources 16, 687-701. [81] Stern, P. C. (1984), Energy use: the human dimension. W.H. Freeman, New York. [82] Sutherland, R.J. (1996), The economics of energy conservation policy, Energy Policy 24, 361-
370 [83] Truffer, B., S. Bruppacher and J. Behringer (2002), Nachfrage nach Ökostrom, Ergebnisse
einer Fokusgruppenerhebung in den Städten Bern, Zürich und Stuttgart, Ökostrom Publikati-onen, Vol 8.
[84] Truffer, B. ; Markard, R. ; Wüstenhagen, Rolf: Eco-labeling of electricity—strategies and
tradeoffs in the definition of environmental standards. In: Energy Policy 29 (2001), Nr. 11, S. 885-897.
[85] Vaage, K., Heating technology and energy use: a discrete / continuous choice approach to
Norwegian household energy demand. Energy Economics 22, 649-666. [86] Van Vliet, B. (2002), Greening the Grid. The Ecological Modernisation of Network-bound Sys-
tems. PhD-Thesis Wageningen University. [87] Van Vliet, B., H. Chappels and E. Shove (2005), Infrastructures of Consumption. Environ-
mental Innovation in the Utility Industries, Earthscan, London. [88] Vetere, S. (2008), Conjointanalytische Untersuchung der Kundenpräferenzen im Business-to-
Business Marketing für Solarthermie. Master Thesis. University of St. Gallen (forthcoming). [89] Walsh, M. (1989), Energy tax credits and housing improvement. Energy Economics 11, 275–
284. [90] Weber, C., A. Perrels (2000), Modelling lifestyle effects on energy demand and related emis-
sions. Energy Policy 28, 549-566. [91] Wilhite, H. (2007), Will efficient technologies save the world? A call for new thinking on the
ways that enduse technologies affect energy using practises, ECEEE 2007 Summer Study, La Colle sur Loup.
[92] Wilhite, H. R. Ling (1995), Measured energy savings from a more informative energy bill. En-
ergy and Buildings 22, 145–155. [93] Wilhite, H., E. Shove, L. Lutzenhiser and W. Kempton (2000), The Legacy of Twenty Years of
Demand Side Management: We Know More about Individual Behaviour But next to Nothing About Demand, In: E. Jochem, J. Stathaye and D. Bouille (Eds), Society, Behaviour and Cli-mate Change Mitigation, Luwer Academic Press, Dordrect.
[94] WCED - World Commission on Environment and Development (1987), Our Common Future,
Oxford University Press, Oxford. [95] Wüstenhagen, R., K. Sammer (2007), Wirksamkeit umweltpolitischer Anreize zum Kauf ener-
gieeffizienter Fahrzeuge: eine empirische Analyse Schweizer Automobilkunden, erscheint, In: Zeitschrift für angewandte Umweltforschung.
[96] Young, D. (2008), When do energy-efficient appliances generate energy savings? Some evi-
dence from Canada. Energy Policy 36, 34-46.
409
Analysis of the Hungarian residential energy consumption and influence of the end-user behaviour on energy consumption patterns
Benigna Boza-Kiss
Central European University, Center for Climate Change and Sustainable Energy Policy
Aleksandra Novikova
Central European University, Center for Climate Change and Sustainable Energy Policy
Victoria Novikova
Central European University, Center for Climate Change and Sustainable Energy Policy
Maria Sharmina
Central European University, Economics Department
Anne-Claire Loftus
Central European University, Center for Climate Change and Sustainable Energy Policy
Diana Ürge-Vorsatz
Central European University, Center for Climate Change and Sustainable Energy Policy
Abstract
The Hungarian residential sector is the largest energy consumer in the country and is responsible for more than a half of heat and a third of electricity consumption. For this reason, the residential sector could be a significant contributor to energy saving and greenhouse gas mitigation targets in Hungary. According to the authors’ investigation, there has been no in-depth research aimed at obtaining high-quality data on penetration of appliances, their technical characteristics (type, age, efficiency level, etc.) as well as end-use behavioral patterns that altogether determine the residential energy consumption in Hungary. To address this gap in knowledge, a research team at Central European University (CEU) analyzed end-use behavioral patterns of the residential energy consumption in Hungary in the framework of the European project called REMODECE (Residential Monitoring to Decrease Energy Use and Carbon Emissions in Europe). In order to trace the energy consumption habits of the Hungarian population, a survey of 500 households was conducted. The households selected for the survey constitute a representative, highly consistent sample, although a focus on Budapest was placed. The main findings of the study include identification of trends towards increased penetration of new appliances such as dishwashers and tumble dryers, which are still uncommon for a typical Hungarian household, and improvement in the energy efficiency levels of the new appliance stock. In addition,
410
the paper details on user behavior patterns in relation to domestic appliances and lighting as well as on the respondents’ awareness about Energy Star and energy labeling, in general.
Introduction
The Hungarian residential sector is the largest energy consumer in the country. It is responsible for more than a half of district heat and a third of electricity consumption [1]. For this reason, the residential sector could be a significant contributor to energy saving and greenhouse gas abatement targets in Hungary. For evidence-based design of energy conservation policies, it is important to identify the residential energy consumption structure and understand the driving forces behind its dynamics. According to the authors’ investigation, there has been no in-depth research aimed at obtaining high-quality data on penetration of appliances, their technical characteristics such as type, age, energy efficiency level, etc.) as well as behavioral patterns that altogether shape the residential consumption in Hungary.
To address this gap in knowledge, a research team at Central European University (CEU) analyzed end-use behavioral patterns of the residential energy consumption in Hungary in the framework of the REMODECE project (Residential Monitoring to Decrease Energy Use and Carbon Emissions in Europe), which was financially supported by the European Commission’s Intelligent Energy Europe Programme and co-financed by the Central European University Foundation in Hungary. In order to trace the energy consumption habits of the Hungarian population, a survey of 500 households was conducted.
The survey was carried out in three distinct phases, starting in July 2006 and ending in the spring of 2008. First, 100 questionnaires were distributed to the Hungarian households where energy use monitoring was also carried out in the framework of the REMODECE project between July 2006 and April 2008. These questionnaires were subsequently collected, transcribed electronically, and analysed by the project team. Second, the questionnaire was emailed to the entire CEU Hungarian-speaking community, both students and staff, and also emailed to a network of Hungarian energy-related NGOs, “KOTHALO”, who helped to distribute the questionnaire to their employees and clients These efforts resulted in only a very limited number of answers. The third wave of 400 questionnaires was gathered in spring 2008 by a market survey company, in face to face interviews with householders all over Hungary – these questionnaires were also subsequently validated and aggregated by the CEU project team.
The paper presents the main results of the part of the project related to the household survey. The structure of the paper is as follows. Following the introduction, section 1 details on the methodology applied during the survey phase of the project as well as gives a general description of the question-and-answer form used. The next section discusses the issue of representativeness of the household selection and structural criteria pertaining to the sampled households. Section 3 elaborates on the key results of the implemented project and draws some conclusions regarding the Hungarian household energy consumption patterns, appliances’ ownership rates, age and their efficiency levels. The final section provides an overview of the results and a discussion of possible implications for energy consumption.
Methodology
Selection of the participants was random for the 400 questionnaires gathered by the market survey company. For them, quota-based sampling was used, in a way representative of Hungarian averages (the variables are: size of town, sex and age). The sample was selected from a publicly available database for face-to-face interviews. Another 100 questionnaires were given to the existing sample of households whose end-use electricity consumption had been measured within the framework of the REMODECE project. The representativeness of this sample is discussed below. Convenience sampling based on personal contacts and contacts of contacts was used as a first approach to collect the 400 questionnaires apart from the 100 ones coming from the metered households. Contacts from other Hungarian environmental organizations, in particular those participating in the KOTHALO1 were used, in addition to the questionnaire being distributed within the CEU Hungarian community itself
1 http://www.kothalo.hu/
411
and acquaintances of the CEU team. This approach however proved to be rather unsuccessful, with only approximately 5 completed questionnaires received. For the purposes of obtaining the filled-in questionnaires, neither telephone nor web-based methods of survey were used.
The questionnaires comprised nine modules: Household details; Cold appliances; Washing appliances; Cooking appliances; Office appliances; Home entertainment; Air conditioning/Comfort cooling; Lighting; General points – with the level of details being asymmetrical in different modules. The questions were both of quantitative (e.g., “How many laundry loads do you do per week?”) and qualitative nature (e.g., “How do you put the cooked food into your refrigerator/freezer?”) with the former type of questions prevailing.
Representativeness of households’ selection
Regarding a regional representativeness, for the 100 questionnaires gathered from the REMODECE-monitored households, as well as the few questionnaires sent in by some CEU Hungarian students and staff and from the KOTHALO emailing in response to an email request, the data is not regionally representative. The project team was aiming at involving households with high level of appliances. The respondents were from Budapest and its agglomeration area. This fact might raise the question about the regional unbalance that might have skewed the survey results, as the average income and education levels are higher in Budapest than in other regions of Hungary, and both these factors influence energy consumption in households. However, as about 20% of the country’s population live in Budapest, 100 surveyed households from this urban agglomeration represent exactly 20% of the respondents.
The second part of the research (400 households) resulted in a representative sample, as the selection of respondents for the face-to-face questionnaire survey was based on the representative national household list. The survey data were collected from all over the country. In general, the two sets jointly produce a highly consistent sample.
The following structural criteria pertain to the selected households (based on [3] and [4]).
• Household size (m2): The average floor area of a household in the sample was 77 m2, which is insignificantly higher than the national average of 75 m2 (data for 2006). Since the size of the newly built apartments is increasing, a continuous increase in the average floor area of a household is expected, too. The distribution of the size of floor area is even, i.e. there were 68 households with small size (20-45 m2), 198 households with medium size (46-70 m2), and 220 with large size (71-300 m2).
• Level of consumption: 2,240 kWh consumption is close to an average consumption, which is ca. 2,200 kWh/year for a household of two persons, and about 2,400 kWh/year for a family with 2 children (household of four persons).
• Type of household: the ratio of householder respondents between multi-occupancy buildings and single (and twin) houses is about 50-50%, with 264 multi-occupancy and 233 single houses, and with only 8 giving no answer. This is different from the national data, because about 2/3 of the households in Hungary are individual houses (data for 2005).
• Income: No information on income was collected in the Hungarian survey. The information on education level does however give an indication of expected income levels of households:
� No degree or certificate: 53 respondents;
� High school or equivalent: 144 respondents;
� Trade/Vocational certificate (with high-school graduation): 136 respondents;
� University degree or equivalent: 159 respondents.
• Number of household members: The average number of household members in the survey sample was 2.48, compared to the 2.39 according to the Hungarian Statistical Office 2006 data.
412
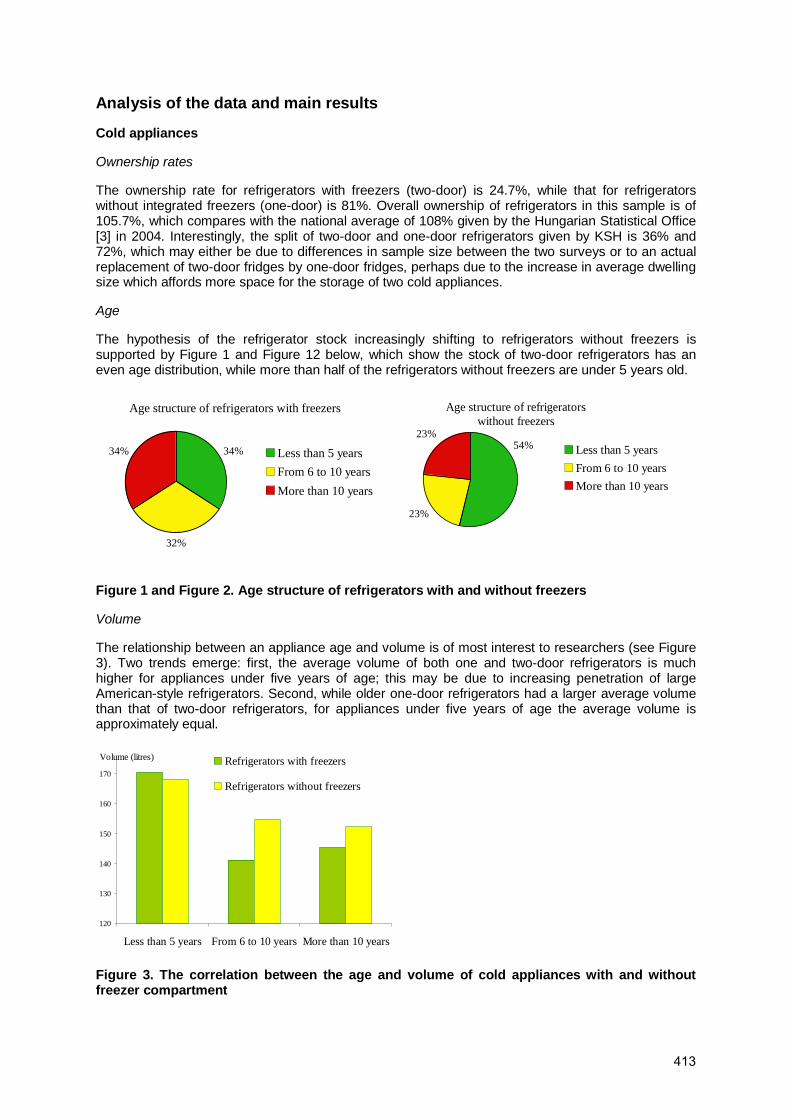
Analysis of the data and main results
Cold appliances
Ownership rates
The ownership rate for refrigerators with freezers (two-door) is 24.7%, while that for refrigerators without integrated freezers (one-door) is 81%. Overall ownership of refrigerators in this sample is of 105.7%, which compares with the national average of 108% given by the Hungarian Statistical Office [3] in 2004. Interestingly, the split of two-door and one-door refrigerators given by KSH is 36% and 72%, which may either be due to differences in sample size between the two surveys or to an actual replacement of two-door fridges by one-door fridges, perhaps due to the increase in average dwelling size which affords more space for the storage of two cold appliances.
Age
The hypothesis of the refrigerator stock increasingly shifting to refrigerators without freezers is supported by Figure 1 and Figure 12 below, which show the stock of two-door refrigerators has an even age distribution, while more than half of the refrigerators without freezers are under 5 years old.
Age structure of refrigerators with freezers
34%
32%
34% Less than 5 years
From 6 to 10 years
More than 10 years
Age structure of refrigerators without freezers
23%
23%54% Less than 5 years
From 6 to 10 years
More than 10 years
Figure 1 and Figure 2. Age structure of refrigerators with and without freezers
Volume
The relationship between an appliance age and volume is of most interest to researchers (see Figure 3). Two trends emerge: first, the average volume of both one and two-door refrigerators is much higher for appliances under five years of age; this may be due to increasing penetration of large American-style refrigerators. Second, while older one-door refrigerators had a larger average volume than that of two-door refrigerators, for appliances under five years of age the average volume is approximately equal.
120
130
140
150
160
170
Less than 5 years From 6 to 10 years More than 10 years
Volume (litres) Refrigerators with freezers
Refrigerators without freezers
Figure 3. The correlation between the age and volume of cold appliances with and without freezer compartment
413
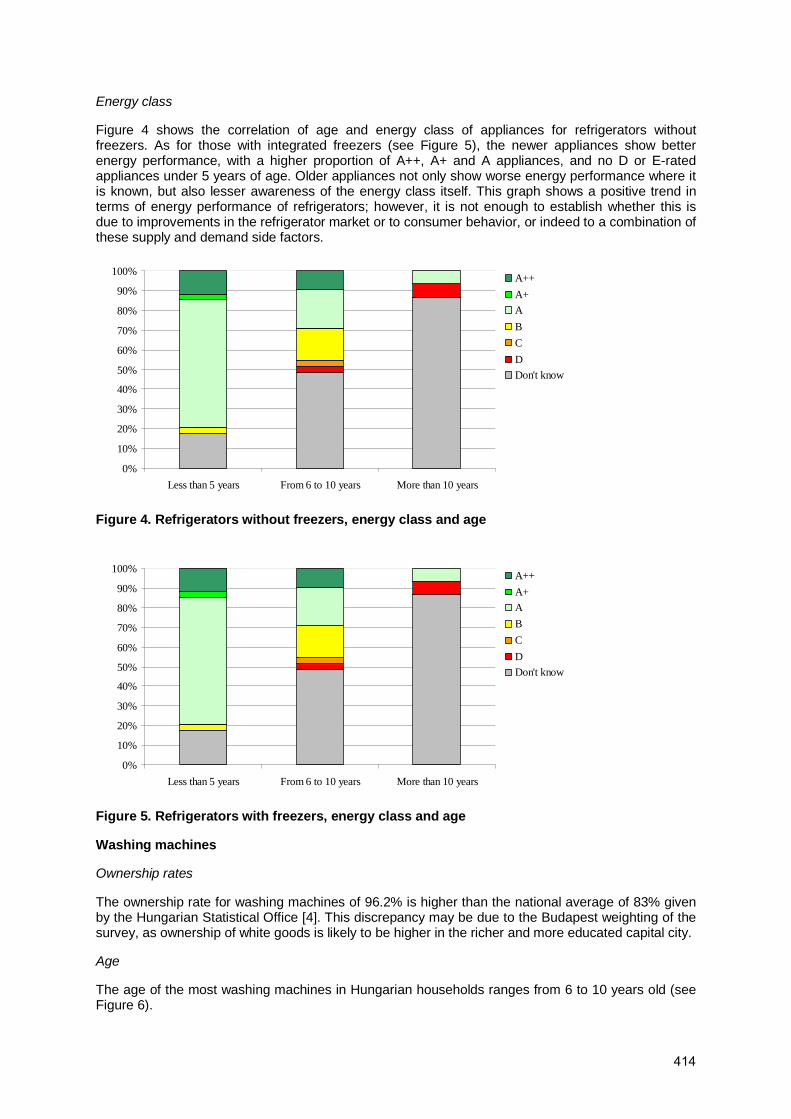
Energy class
Figure 4 shows the correlation of age and energy class of appliances for refrigerators without freezers. As for those with integrated freezers (see Figure 5), the newer appliances show better energy performance, with a higher proportion of A++, A+ and A appliances, and no D or E-rated appliances under 5 years of age. Older appliances not only show worse energy performance where it is known, but also lesser awareness of the energy class itself. This graph shows a positive trend in terms of energy performance of refrigerators; however, it is not enough to establish whether this is due to improvements in the refrigerator market or to consumer behavior, or indeed to a combination of these supply and demand side factors.
0%
10%
20%
30%
40%
50%
60%
70%
80%
90%
100%
Less than 5 years From 6 to 10 years More than 10 years
A++
A+
A
B
C
D
Don't know
Figure 4. Refrigerators without freezers, energy class and age
0%
10%
20%
30%
40%
50%
60%
70%
80%
90%
100%
Less than 5 years From 6 to 10 years More than 10 years
A++
A+
A
B
C
D
Don't know
Figure 5. Refrigerators with freezers, energy class and age
Washing machines
Ownership rates
The ownership rate for washing machines of 96.2% is higher than the national average of 83% given by the Hungarian Statistical Office [4]. This discrepancy may be due to the Budapest weighting of the survey, as ownership of white goods is likely to be higher in the richer and more educated capital city.
Age
The age of the most washing machines in Hungarian households ranges from 6 to 10 years old (see Figure 6).
414

Less than 5 years29%
From 6 to 10 years41%
More than 10 years27%
No answer3%
Figure 6. Age structure of washing machines
The relationship between appliance age and energy class is not as straightforward as for the cold appliances, as can be seen in Figure 7. Indeed, the largest percentage of energy efficient washing machines is in the 6 to 10 year old category, while the largest number of machines for which the energy class is unknown is for washing machines under 5 years of age.
0%
10%
20%
30%
40%
50%
60%
70%
80%
90%
100%
Less than 5 years From 6 to 10 years More than 10 years
A++
A+
A
B
C
D
F
Don't know
Figure 7. Washing machines: age and energy class
Capacity
Smaller washing machines predominate (see Table 1); this may be due to the Budapest weighting of the survey, as smaller apartments dominate in the capital city. Perhaps the split would have been different in a truly representative survey, as 2/3 of the country is composed of single family homes, which may have more room for larger machines.
Table 1. Capacity of washing machines and their share in the total number of washing machines owned by households
Capacity % 5 kg or less 62.5
More than 5 kg 28.0
No answer 9.5
415
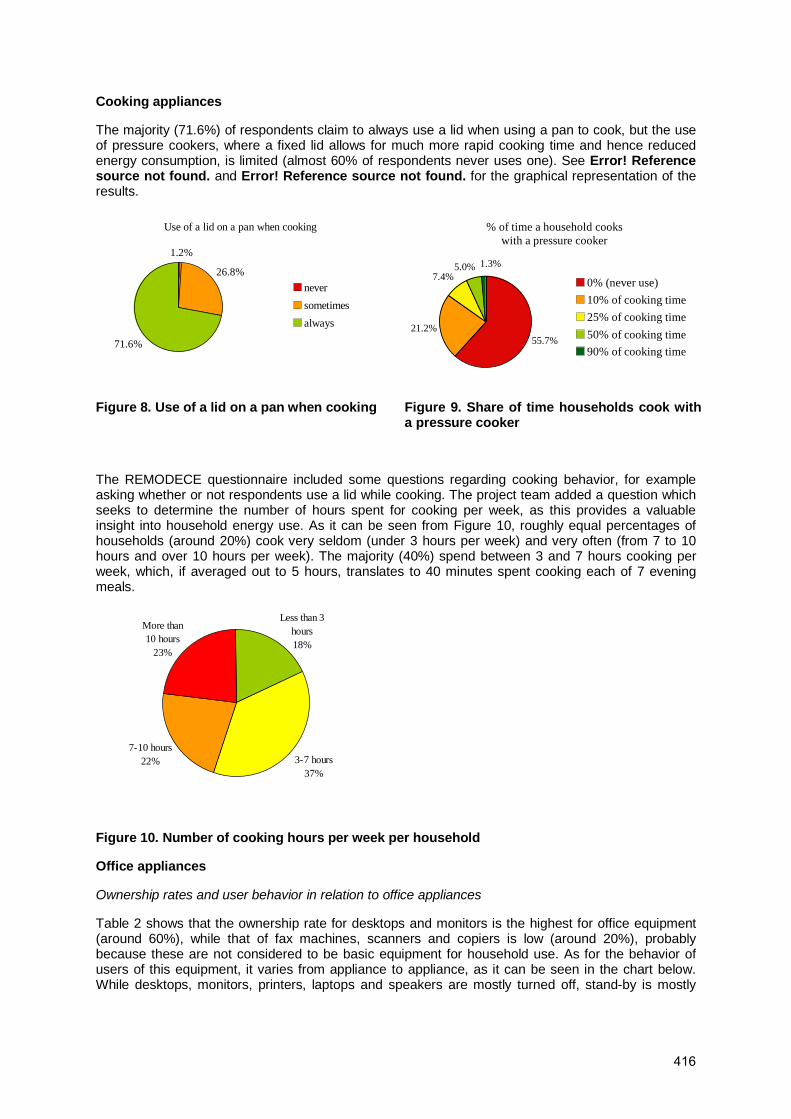
Cooking appliances
The majority (71.6%) of respondents claim to always use a lid when using a pan to cook, but the use of pressure cookers, where a fixed lid allows for much more rapid cooking time and hence reduced energy consumption, is limited (almost 60% of respondents never uses one). See Error! Reference source not found. and Error! Reference source not found. for the graphical representation of the results.
Use of a lid on a pan when cooking
1.2%
26.8%
71.6%
never
sometimes
always
% of time a household cooks with a pressure cooker
55.7%21.2%
7.4%5.0% 1.3%
0% (never use)
10% of cooking time
25% of cooking time
50% of cooking time
90% of cooking time
Figure 8. Use of a lid on a pan when cooking
Figure 9. Share of time households cook with a pressure cooker
The REMODECE questionnaire included some questions regarding cooking behavior, for example asking whether or not respondents use a lid while cooking. The project team added a question which seeks to determine the number of hours spent for cooking per week, as this provides a valuable insight into household energy use. As it can be seen from Figure 10, roughly equal percentages of households (around 20%) cook very seldom (under 3 hours per week) and very often (from 7 to 10 hours and over 10 hours per week). The majority (40%) spend between 3 and 7 hours cooking per week, which, if averaged out to 5 hours, translates to 40 minutes spent cooking each of 7 evening meals.
3-7 hours37%
7-10 hours22%
More than 10 hours
23%
Less than 3 hours18%
Figure 10. Number of cooking hours per week per household
Office appliances
Ownership rates and user behavior in relation to office appliances
Table 2 shows that the ownership rate for desktops and monitors is the highest for office equipment (around 60%), while that of fax machines, scanners and copiers is low (around 20%), probably because these are not considered to be basic equipment for household use. As for the behavior of users of this equipment, it varies from appliance to appliance, as it can be seen in the chart below. While desktops, monitors, printers, laptops and speakers are mostly turned off, stand-by is mostly
416
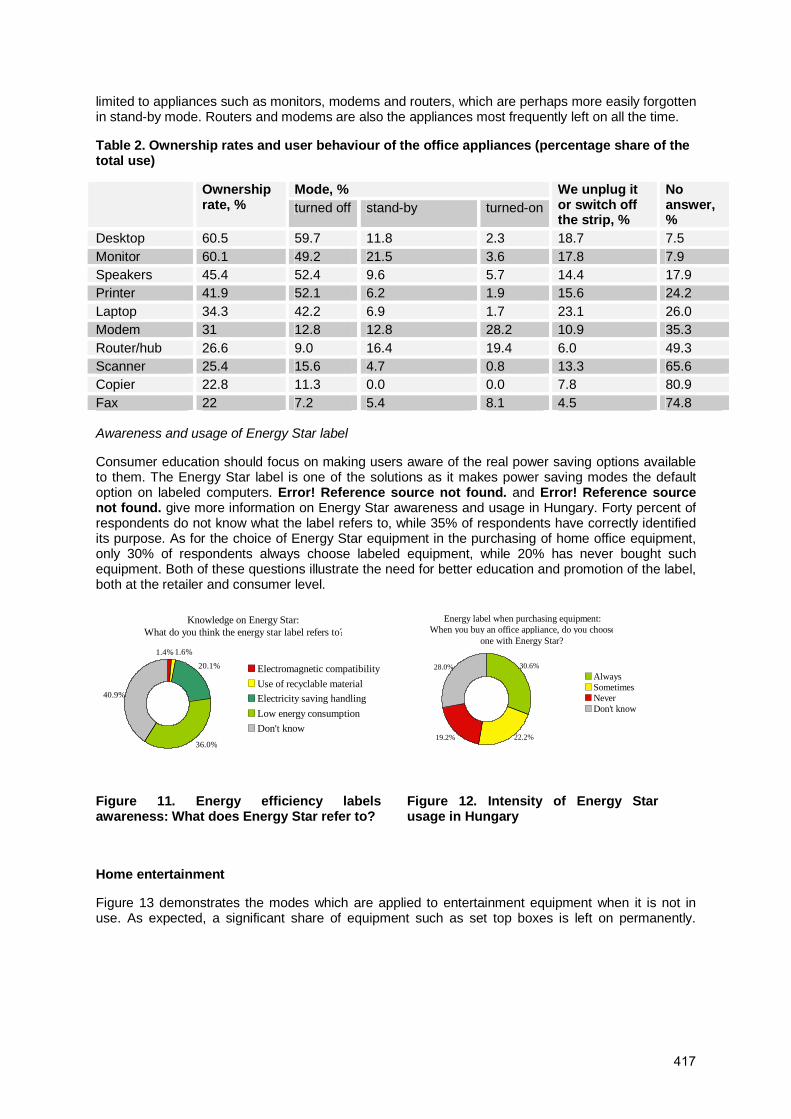
limited to appliances such as monitors, modems and routers, which are perhaps more easily forgotten in stand-by mode. Routers and modems are also the appliances most frequently left on all the time.
Table 2. Ownership rates and user behaviour of the office appliances (percentage share of the total use)
Mode, % Ownership rate, % turned off stand-by turned-on
We unplug it or switch off the strip, %
No answer, %
Desktop 60.5 59.7 11.8 2.3 18.7 7.5 Monitor 60.1 49.2 21.5 3.6 17.8 7.9 Speakers 45.4 52.4 9.6 5.7 14.4 17.9 Printer 41.9 52.1 6.2 1.9 15.6 24.2 Laptop 34.3 42.2 6.9 1.7 23.1 26.0 Modem 31 12.8 12.8 28.2 10.9 35.3 Router/hub 26.6 9.0 16.4 19.4 6.0 49.3 Scanner 25.4 15.6 4.7 0.8 13.3 65.6 Copier 22.8 11.3 0.0 0.0 7.8 80.9 Fax 22 7.2 5.4 8.1 4.5 74.8 Awareness and usage of Energy Star label
Consumer education should focus on making users aware of the real power saving options available to them. The Energy Star label is one of the solutions as it makes power saving modes the default option on labeled computers. Error! Reference source not found. and Error! Reference source not found. give more information on Energy Star awareness and usage in Hungary. Forty percent of respondents do not know what the label refers to, while 35% of respondents have correctly identified its purpose. As for the choice of Energy Star equipment in the purchasing of home office equipment, only 30% of respondents always choose labeled equipment, while 20% has never bought such equipment. Both of these questions illustrate the need for better education and promotion of the label, both at the retailer and consumer level.
Knowledge on Energy Star: What do you think the energy star label refers to?
40.9%
20.1%
36.0%
1.6%1.4%
Electromagnetic compatibility
Use of recyclable material
Electricity saving handling
Low energy consumption
Don't know
Energy label when purchasing equipment: When you buy an office appliance, do you choose
one with Energy Star?
22.2%19.2%
28.0% 30.6%
AlwaysSometimes NeverDon't know
Figure 11. Energy efficiency labels awareness: What does Energy Star refer to?
Figure 12. Intensity of Energy Star usage in Hungary
Home entertainment
Figure 13 demonstrates the modes which are applied to entertainment equipment when it is not in use. As expected, a significant share of equipment such as set top boxes is left on permanently.
417
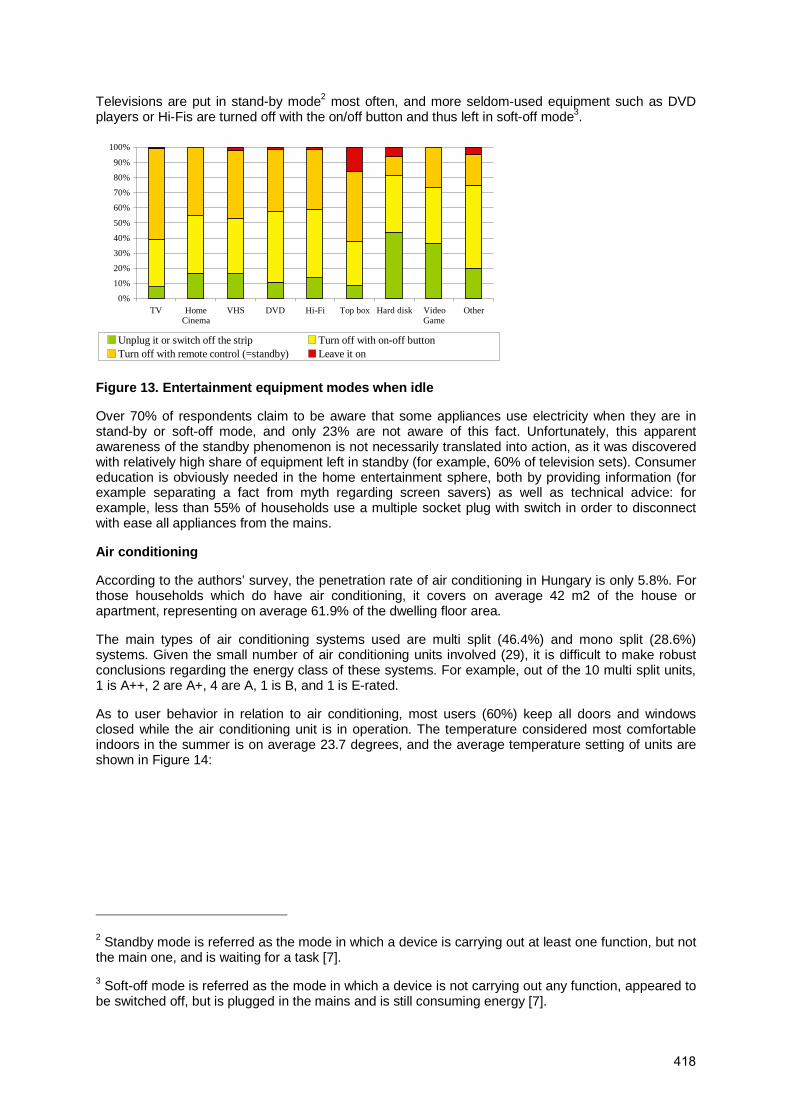
Televisions are put in stand-by mode2 most often, and more seldom-used equipment such as DVD players or Hi-Fis are turned off with the on/off button and thus left in soft-off mode3.
0%
10%
20%
30%
40%
50%
60%
70%
80%
90%
100%
TV HomeCinema
VHS DVD Hi-Fi Top box Hard disk VideoGame
Other
Unplug it or switch off the strip Turn off with on-off buttonTurn off with remote control (=standby) Leave it on
Figure 13. Entertainment equipment modes when idle
Over 70% of respondents claim to be aware that some appliances use electricity when they are in stand-by or soft-off mode, and only 23% are not aware of this fact. Unfortunately, this apparent awareness of the standby phenomenon is not necessarily translated into action, as it was discovered with relatively high share of equipment left in standby (for example, 60% of television sets). Consumer education is obviously needed in the home entertainment sphere, both by providing information (for example separating a fact from myth regarding screen savers) as well as technical advice: for example, less than 55% of households use a multiple socket plug with switch in order to disconnect with ease all appliances from the mains.
Air conditioning
According to the authors’ survey, the penetration rate of air conditioning in Hungary is only 5.8%. For those households which do have air conditioning, it covers on average 42 m2 of the house or apartment, representing on average 61.9% of the dwelling floor area.
The main types of air conditioning systems used are multi split (46.4%) and mono split (28.6%) systems. Given the small number of air conditioning units involved (29), it is difficult to make robust conclusions regarding the energy class of these systems. For example, out of the 10 multi split units, 1 is A++, 2 are A+, 4 are A, 1 is B, and 1 is E-rated.
As to user behavior in relation to air conditioning, most users (60%) keep all doors and windows closed while the air conditioning unit is in operation. The temperature considered most comfortable indoors in the summer is on average 23.7 degrees, and the average temperature setting of units are shown in Figure 14:
2 Standby mode is referred as the mode in which a device is carrying out at least one function, but not the main one, and is waiting for a task [7].
3 Soft-off mode is referred as the mode in which a device is not carrying out any function, appeared to be switched off, but is plugged in the mains and is still consuming energy [7].
418
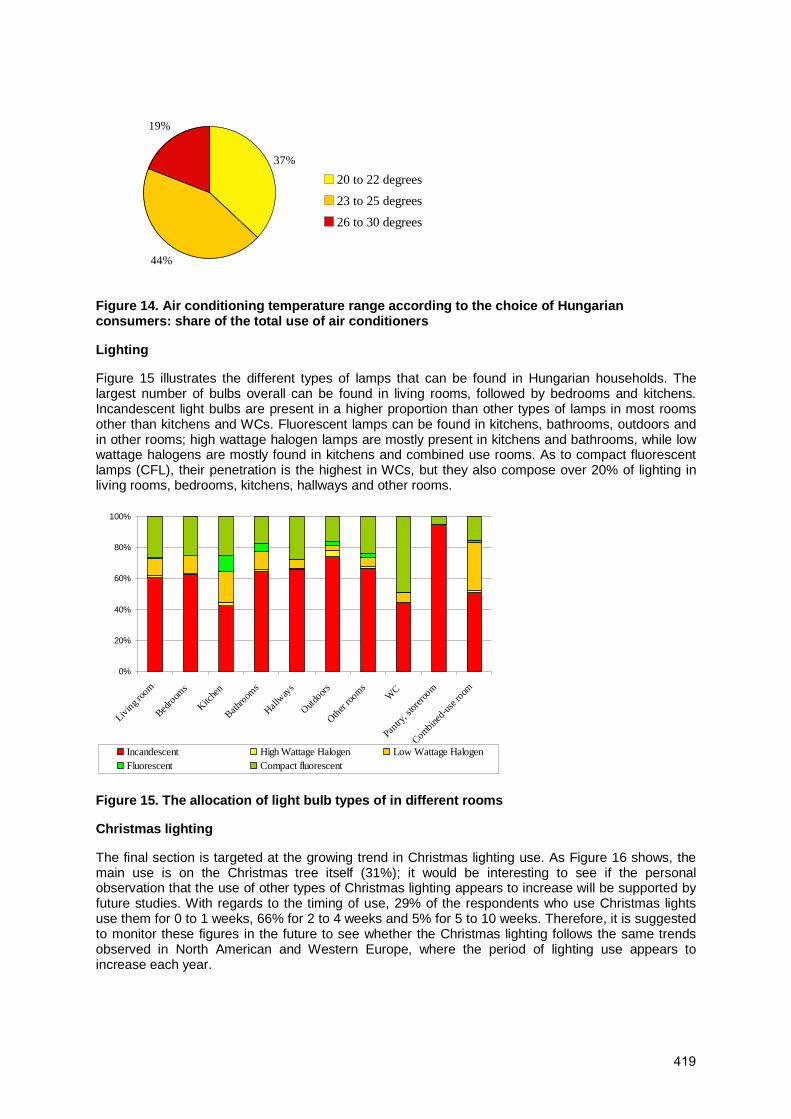
37%
44%
19%
20 to 22 degrees
23 to 25 degrees
26 to 30 degrees
Figure 14. Air conditioning temperature range according to the choice of Hungarian consumers: share of the total use of air conditioners
Lighting
Figure 15 illustrates the different types of lamps that can be found in Hungarian households. The largest number of bulbs overall can be found in living rooms, followed by bedrooms and kitchens. Incandescent light bulbs are present in a higher proportion than other types of lamps in most rooms other than kitchens and WCs. Fluorescent lamps can be found in kitchens, bathrooms, outdoors and in other rooms; high wattage halogen lamps are mostly present in kitchens and bathrooms, while low wattage halogens are mostly found in kitchens and combined use rooms. As to compact fluorescent lamps (CFL), their penetration is the highest in WCs, but they also compose over 20% of lighting in living rooms, bedrooms, kitchens, hallways and other rooms.
0%
20%
40%
60%
80%
100%
Livin
g roo
m
Bedro
oms
Kitche
n
Bathro
oms
Hallway
s
Outdo
ors
Other
room
sW
C
Pantry
, stor
eroo
m
Combine
d-us
e room
Incandescent High Wattage Halogen Low Wattage HalogenFluorescent Compact fluorescent
Figure 15. The allocation of light bulb types of in different rooms
Christmas lighting
The final section is targeted at the growing trend in Christmas lighting use. As Figure 16 shows, the main use is on the Christmas tree itself (31%); it would be interesting to see if the personal observation that the use of other types of Christmas lighting appears to increase will be supported by future studies. With regards to the timing of use, 29% of the respondents who use Christmas lights use them for 0 to 1 weeks, 66% for 2 to 4 weeks and 5% for 5 to 10 weeks. Therefore, it is suggested to monitor these figures in the future to see whether the Christmas lighting follows the same trends observed in North American and Western Europe, where the period of lighting use appears to increase each year.
419
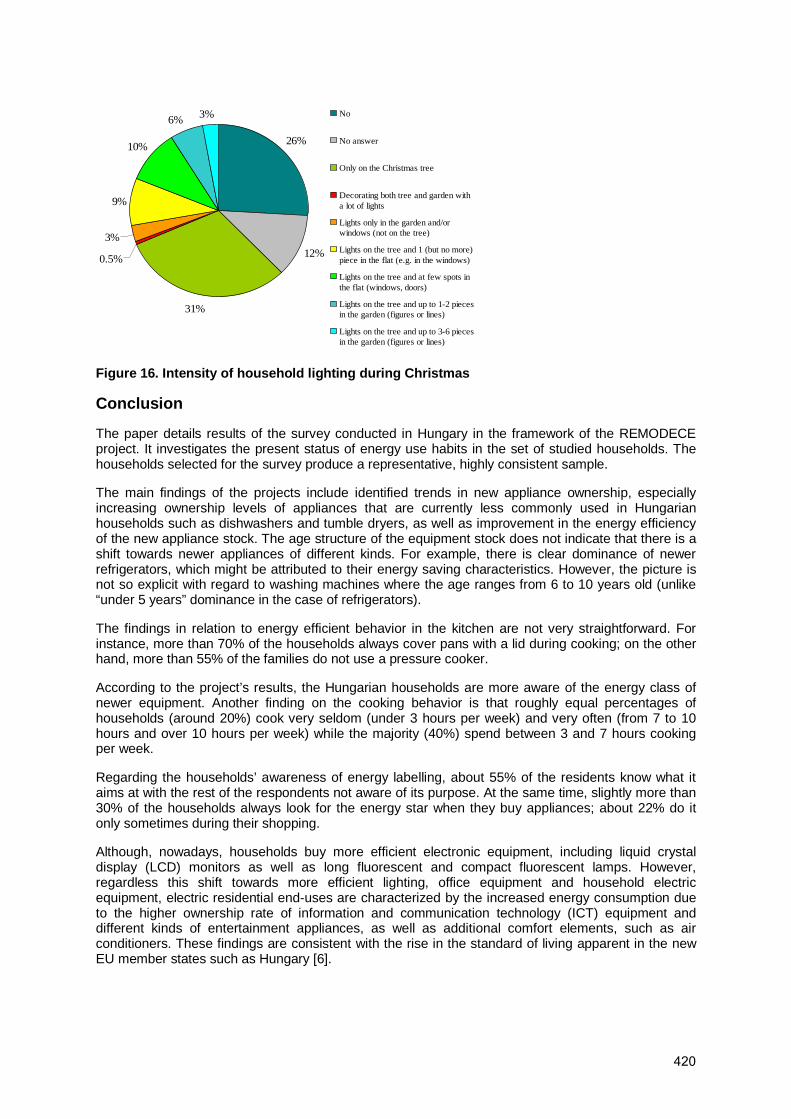
26%
12%
31%
3%
9%
10%
6% 3%
0.5%
No
No answer
Only on the Christmas tree
Decorating both tree and garden witha lot of lights
Lights only in the garden and/orwindows (not on the tree)
Lights on the tree and 1 (but no more)piece in the flat (e.g. in the windows)
Lights on the tree and at few spots inthe flat (windows, doors)
Lights on the tree and up to 1-2 piecesin the garden (figures or lines)
Lights on the tree and up to 3-6 piecesin the garden (figures or lines)
Figure 16. Intensity of household lighting during Christmas
Conclusion
The paper details results of the survey conducted in Hungary in the framework of the REMODECE project. It investigates the present status of energy use habits in the set of studied households. The households selected for the survey produce a representative, highly consistent sample.
The main findings of the projects include identified trends in new appliance ownership, especially increasing ownership levels of appliances that are currently less commonly used in Hungarian households such as dishwashers and tumble dryers, as well as improvement in the energy efficiency of the new appliance stock. The age structure of the equipment stock does not indicate that there is a shift towards newer appliances of different kinds. For example, there is clear dominance of newer refrigerators, which might be attributed to their energy saving characteristics. However, the picture is not so explicit with regard to washing machines where the age ranges from 6 to 10 years old (unlike “under 5 years” dominance in the case of refrigerators).
The findings in relation to energy efficient behavior in the kitchen are not very straightforward. For instance, more than 70% of the households always cover pans with a lid during cooking; on the other hand, more than 55% of the families do not use a pressure cooker.
According to the project’s results, the Hungarian households are more aware of the energy class of newer equipment. Another finding on the cooking behavior is that roughly equal percentages of households (around 20%) cook very seldom (under 3 hours per week) and very often (from 7 to 10 hours and over 10 hours per week) while the majority (40%) spend between 3 and 7 hours cooking per week.
Regarding the households’ awareness of energy labelling, about 55% of the residents know what it aims at with the rest of the respondents not aware of its purpose. At the same time, slightly more than 30% of the households always look for the energy star when they buy appliances; about 22% do it only sometimes during their shopping.
Although, nowadays, households buy more efficient electronic equipment, including liquid crystal display (LCD) monitors as well as long fluorescent and compact fluorescent lamps. However, regardless this shift towards more efficient lighting, office equipment and household electric equipment, electric residential end-uses are characterized by the increased energy consumption due to the higher ownership rate of information and communication technology (ICT) equipment and different kinds of entertainment appliances, as well as additional comfort elements, such as air conditioners. These findings are consistent with the rise in the standard of living apparent in the new EU member states such as Hungary [6].
420
References
[1] International Energy Agency (IEA). World Energy Outlook 2007. Paris: OECD/IEA.
[2] Commission of the European Communities. Green Paper on Energy Efficiency, or Doing More with Less. Brussels, 22.6.2005. [On-line] URL: http://www.isr.uc.pt/~remodece/downloads/Green-paper.pdf
[3] Háztartás-statisztikai Évkönyv (KSH). Household Statistics Yearbook 2005. Budapest: KSH. [On-line] URL: www.ksh.hu.
[4] Háztartás-statisztikai Évkönyv (KSH). Household Statistics Yearbook 2006. Budapest: KSH. [On-line] URL: www.ksh.hu.
[5] National Energy Efficiency Action Plan (NEEAP): Hungary. Approved by the Government on 13 February 2008. [On-line] URL: http://ec.europa.eu/energy/demand/legislation/doc/neeap/hungary_en.pdf
[6] DeAlmeida A. and Fonseca P. 2007. Residential Monitoring to Decrease Energy Use and Carbon Emissions in Europe. [On-line] URL: http://www.isr.uc.pt/~remodece/news/Paper_DeAlmeida.pdf
[7] Schlomann, B., Cremer, C., Friedewald, M., Georgieff, P., Gruber, E., Corradini, R., Kraus, D., Arndt, U., Mauch, W., Schaefer, H., Schulte, M., and Schroder, R. 2005. Technical and legal application possibilities of the compulsory labelling of the standby consumption of electrical household and office appliances. Project No. 53/03. Federal Ministry of Economics and Labour.
421
The Impact of Price on the Residential Demand for Electricity, Natural Gas and Water
Larry Dale
Lawrence Berkeley National Laboratory
Michael Hanemann, Santiago Guerrero
Department of Agricultural and Resource Economics
University of California, Berkeley
Felipe Vasquez,
Department of Economics
University of Conception, Chile
Abstract
Price is an effective tool for controlling household electricity and natural gas demand but its impact is poorly understood. Part of the problem is that demand for these products is confounded by block rate pricing and interrelated consumption of electricity and natural gas, which prevent easy estimation of price impacts. Block rate pricing implies that the purchaser controls the marginal price of the good by the quantity of the good purchased, turning price into an endogenous variable. Interrelated consumption implies that demand for one good is affected by the price of another.
These complications have hitherto prevented accurate estimates of the price elasticity of demand for goods provided by utilities including electricity, natural gas and water. This paper evaluates statistical tools to estimate the joint demand of these goods and suggests initial price elasticity estimates. First, we estimate the household demand for electricity, natural gas and water in California as separate goods, using RECS household survey and utility price data. Following, we evaluate the household demand for natural gas and electricity using a joint estimation procedure. Finally, we indicate the degree to which block rate pricing and interrelated demands affect the price elasticity of demand for these household goods. The paper concludes with a discussion of the use of price to manage the household demand for electricity, natural gas and water in light of our findings.
422

Introduction
This project explores similarities and linkages between electricity and natural gas in California residences via price effects. The paper includes estimates of the price-sensitivity of demand for natural gas and electricity and an initial evaluation of the price sensitivity for these goods in conjunction. The paper also includes initial findings on the price sensitivity of household water consumption, which is closely related to residential electricity and natural gas use. Finally, the paper provides a basic quantitative background on California household water, natural gas and electricity use.
Many issues confound the estimation of demand for electricity and natural gas, including lack of adequately detailed data, the complexity of the demand, and the heterogeneity of household units in general. This paper concentrates on methods for resolving two of these issues—block rate pricing and the linked household demand for household natural gas and electricity, and water.
Following this introduction, in Section 2 we describe block rate pricing and linked demand and their impact on the price elasticity of demand for household utility goods. In Section 3 we summarize estimates of the price elasticity of demand for these goods in the literature and argue that variation in these estimates results in part from the failure to account for block rate pricing and linked demand in a consistent manner. Section 4 presents the statistical technique we propose for estimating demand elasticities. The preliminary results of our work with these techniques are presented in Section 5. The paper concludes in Section 6 with a discussion of the possible policy implications of our results and the direction of our future work. Section 7 offers conclusions.
The Use of Natural Gas, Electricity and Water in California
For reference, we summarize average household expenditures for natural gas, water and electricity in the Western Census Region in 2006 (Table 1). Both average natural gas and water expenditures are nearly equal, while average electricity expenditures are double those levels. Seventy percent of households in the West use some natural gas, with about one third of their natural gas expenditures are used for water heating, and the rest for space heating (EIA 2004).1 Usually, natural gas expenditures for water heating are a fairly small proportion of household utility budget, though due to seasonal variation, it may appear quite important in any given month.
Table 1. Average 2006 household income and expenditures for natural gas, electricity, water and other household goods for the Western Census Region
Category Household Average 2006 US Dollars
After tax income 63574 Average expenditures 57486 Utilities fuels and public services 3101 Electricity 1042 Natural gas 423 Telephone 1081 Water and other public service 485 Gasoline and motor oil 2382
Source: Consumer Expenditures Survey (BLS)
1 A small proportion of houses have natural gas air conditioning.
423

In California, saturation of natural gas is somewhat higher (85%) than most areas, and virtually all households with access to natural gas use it for water heating: 85% of California’s residential water heaters are gas-fired, and only 11% are electric (EIA 2008).2 Among California households with gas water heating, water heating accounts for 41%, on average, of a household’s natural gas use, and for 37% of residential natural gas use overall, the top use after space heating (EIA 2004).
Residential sector natural gas rates in California are mostly structured as a two-tier system, with a baseline price and an excess-of-baseline price. Natural gas utilities buy gas on the national market and are allowed to pass costs onto their customers every month. Thus prices in either of these two tiers vary from month to month, while baseline quantities stay stable within a season. Consumers do not necessarily know in advance the exact natural gas price per unit that they will charged.
Residential water rates are also generally designed to include a range of block rates. The California Urban Water Conservation Council (CUWCC), an organization set up to promote conservation, enjoys the active participation of most of the retail water agencies in the state. The Council mandates that all member agencies have inclining block rates, such that a higher unit price is charged for larger amounts of household consumption.
Block Pricing
As noted above, markets for electricity, natural gas and water are often characterized by block pricing schemes, which complicates the estimation of consumer demand functions for these commodities, and therefore the calculation of both price and income elasticities. These pricing systems introduce a nonlinearity to the budget constraint (a piecewise-linear budget constraint) which, from a calculative standpoint, makes the price that people pay for the marginal unit of consumption an endogenous variable. From a social scientific standpoint, there is debate about what prices consumers actually perceive (Nieswiadomy and Molina 1991).
In the simple uniform price system, people decide the quantity purchased given a constant marginal price for the commodity. However, with a piecewise-linear budget constraint, consumer actions determine not only the quantity purchased, but also the price paid at the margin. This joint decision of price and quantity by the consumer has to be taken into account in the estimation of a demand for these commodities.
Figure 1 presents the simplest case of an increasing block price scheme with two tiers, where the
initial price for the marginal unit is p1 , this price is paid for any unit consumed until the quantity .W After this amount is reached, the marginal price increases up to 2p . A consumer with a demand
function like 1D will consume 1W and pay 1p for each unit. In contrast, a consumer with a demand
function like 2D will consume a quantity equal to 2W and pay 1p for each unit below ,W but 2p for each unit above this threshold. Extension to more tiers is straightforward.
2 These percentages were based on preliminary tables for the 2005 Residential Energy Consumption Survey (EIA 2008). There were an estimated 11.7 million water heaters and 12.1 million residences in California in 2005.
424
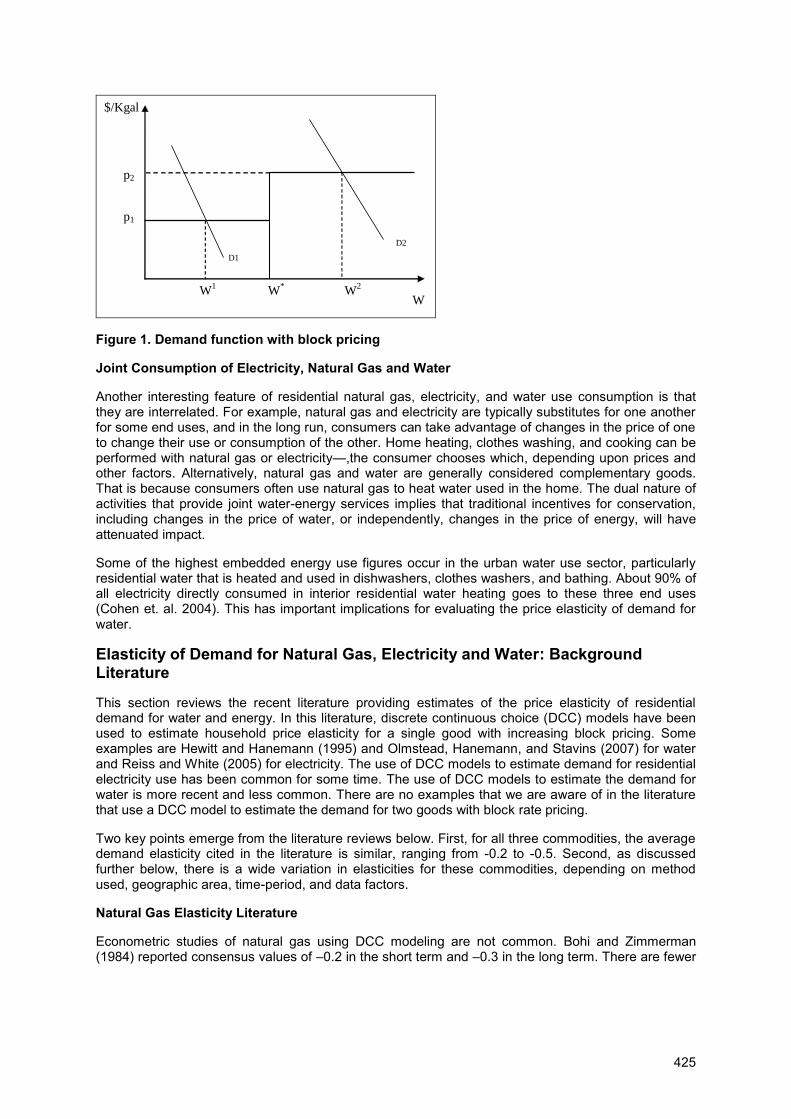
D1
D2
W1
W2
p2
$/Kgal
p1
W*
W
Figure 1. Demand function with block pricing
Joint Consumption of Electricity, Natural Gas and Water
Another interesting feature of residential natural gas, electricity, and water use consumption is that they are interrelated. For example, natural gas and electricity are typically substitutes for one another for some end uses, and in the long run, consumers can take advantage of changes in the price of one to change their use or consumption of the other. Home heating, clothes washing, and cooking can be performed with natural gas or electricity—,the consumer chooses which, depending upon prices and other factors. Alternatively, natural gas and water are generally considered complementary goods. That is because consumers often use natural gas to heat water used in the home. The dual nature of activities that provide joint water-energy services implies that traditional incentives for conservation, including changes in the price of water, or independently, changes in the price of energy, will have attenuated impact.
Some of the highest embedded energy use figures occur in the urban water use sector, particularly residential water that is heated and used in dishwashers, clothes washers, and bathing. About 90% of all electricity directly consumed in interior residential water heating goes to these three end uses (Cohen et. al. 2004). This has important implications for evaluating the price elasticity of demand for water.
Elasticity of Demand for Natural Gas, Electricity and Water: Background Literature
This section reviews the recent literature providing estimates of the price elasticity of residential demand for water and energy. In this literature, discrete continuous choice (DCC) models have been used to estimate household price elasticity for a single good with increasing block pricing. Some examples are Hewitt and Hanemann (1995) and Olmstead, Hanemann, and Stavins (2007) for water and Reiss and White (2005) for electricity. The use of DCC models to estimate demand for residential electricity use has been common for some time. The use of DCC models to estimate the demand for water is more recent and less common. There are no examples that we are aware of in the literature that use a DCC model to estimate the demand for two goods with block rate pricing.
Two key points emerge from the literature reviews below. First, for all three commodities, the average demand elasticity cited in the literature is similar, ranging from -0.2 to -0.5. Second, as discussed further below, there is a wide variation in elasticities for these commodities, depending on method used, geographic area, time-period, and data factors.
Natural Gas Elasticity Literature
Econometric studies of natural gas using DCC modeling are not common. Bohi and Zimmerman (1984) reported consensus values of –0.2 in the short term and –0.3 in the long term. There are fewer
425

and less obvious opportunities for consumers to reduce their demand for natural gas in response to price as compared to electricity, because the use of natural gas in the home (i.e., for air and water heating and cooking) is a necessity, with levels of use rather than dichotomous choice (use/do not use) subject to variation, whereas controlling electricity use cognitively and operationally offers more discrete choices and varied options (e.g., turning off some lights or using fewer electric appliances). Furthermore, consumer-oriented energy efficiency and conservation programs overall focus far more on electricity rather than natural gas—for example, during the California energy crisis 2000–2001, demand response programs, and rate options. On the other hand, natural gas bills may vary more from month to month than do electricity bills, especially where gas provides space heating.
A recent study on natural gas elasticity sponsored by the American Gas Association (Joutz and Trost 2007) found residential price elasticity of -0.18 on average nationwide, considering only post-2000 data. Price-elasticity in the Pacific census division was lower, at -0.12, with California having particularly low levels of residential natural gas demand. The study noted, in addition, a 1% ―natural‖ annual decline in residential consumption of natural gas due to turnover toward more efficient appliances, occurring even in the absence of changes in the price of natural gas.
Electricity Elasticity Literature
Most of the recent studies of electricity demand use DCC modeling. A meta-analysis of residential electricity price-elasticity cites 36 studies providing estimates of long-run or short-run income and price elasticity (Espey and Espey 2004). The study results, based on data from a variety of locations and geographic time periods, encompassed a broad range of elasticities: the mean of short-run price elasticity estimates was -0.35, ranging from -2.01 to -0.004, and the mean of long-run price elasticity estimates was -0.85, ranging from -2.25 to -0.04.
Bohi and Zimmerman (1984) conducted another comprehensive review of studies on energy demand. They found that the consensus estimates for residential electricity price elasticities was –0.2 in the short run and –0.7 in the long run. Garcia-Cerrutti (2000) estimated price elasticities for residential electricity and natural gas demand at the county level in California. For residential electricity, the estimate of the mean was –0.17, with a minimum of –0.79 and a maximum of 0.01. Finally, in a recent study using a similar DCC model and data set, Reiss and White (2005) estimate the residential price elasticity to be -0.39.
Water Elasticity Literature
Most studies suggest that water demand is inelastic. In their meta-analysis of 124 studies, Espey et al. (1997) obtained a mean price elasticity of -0.51 and a short-run median estimate of -0.38. They found the long median estimate to be -0.64.
There have been few studies of household water demand using a DCC model. Recent exceptions include Olmstead et. al (2007) and Hewitt and Hanemann (1993). Estimates of price elasticity appear to be higher for households facing increasing block rate prices (tiered rates) (Espey et al. 1997; Dalhuisen et al. 2003). Olmstead et. al. (2007) obtained an elasticity estimate of -0.33 for households facing uniform marginal prices and an elasticity estimate of -0.064 for households facing tiered rates only. In general, we observe greater price elasticities among block-price samples than among uniform-price samples.
426
Estimation of the Demand for Natural Gas and Electricity—Statistical Techniques
This section presents the problem of estimating household demand for electricity, natural gas and water, given complex rate structures and linked demands. First we discuss the problem of household demand estimation in the case of increasing or decreasing block rates. Following that discussion, we present an approach for estimating the joint demand for two goods with tiered rates.
Statistical Technique Addressing Block Rate Pricing
Estimation of a demand model for a good with block rate pricing has to satisfy two different goals. It has to take into account the endogeneity of price and it must be simple enough to be used by policy makers to promote different policy scenarios. Given sufficient data, we believe the preferred model for dealing with block rate pricing is the Discrete Continuous Choice model (DCC). In this model, there are two decisions involved, a block price decision, where people choose the block they consume in and a quantity decision, where people decide how much to consume in that block. Since there are a discrete number of blocks, the first decision is discrete. The second decision, about consumption within the bock, is continuous.
For a given block pricing scheme, DCC will take into account the probability that an individual chooses any of the blocks and consumes a given quantity within this block. Additionally, it will consider the probability that an individual decides to consume at any of the thresholds defining the different blocks. In this way, the statistical model explains the discrete and continuous decisions underlying people’s behavior.
For a single demand model we use a log-log demand function following Hewitt and Hanemann (1993) of the form
mpZw lnlnln
where w is the observed level of consumption, Z is a vector of individual and weather related characteristics, p is the marginal price and m is the income of the individual and , and are parameters to be estimated. This model has a two error structure, where represents unexplained heterogeneity of preferences among consumers and represents additional unexplained heterogeneity to the econometrician. Let us call w the optimal level of consumption, and assuming that the two error terms are independent and normally distributed with mean zero and variance as
and , the contribution to the likelihood function of an individual in a uniform price system would be
2
lnln
2
1exp
2
1ln
wwli
The likelihood function for the increasing block prices is more complicated. If there are K blocks, then there exist 1K kinks in the budget set, let's call them kw . For each block there exists a
virtual income kk dyy ~ that allows consumer to reach a level of consumption inside of this block.
In order to define ,kd and therefore the virtual income, we need to consider that people pay different
marginal prices for the different units of consumption. Using Figure 1 again, people only pay 1p for
427
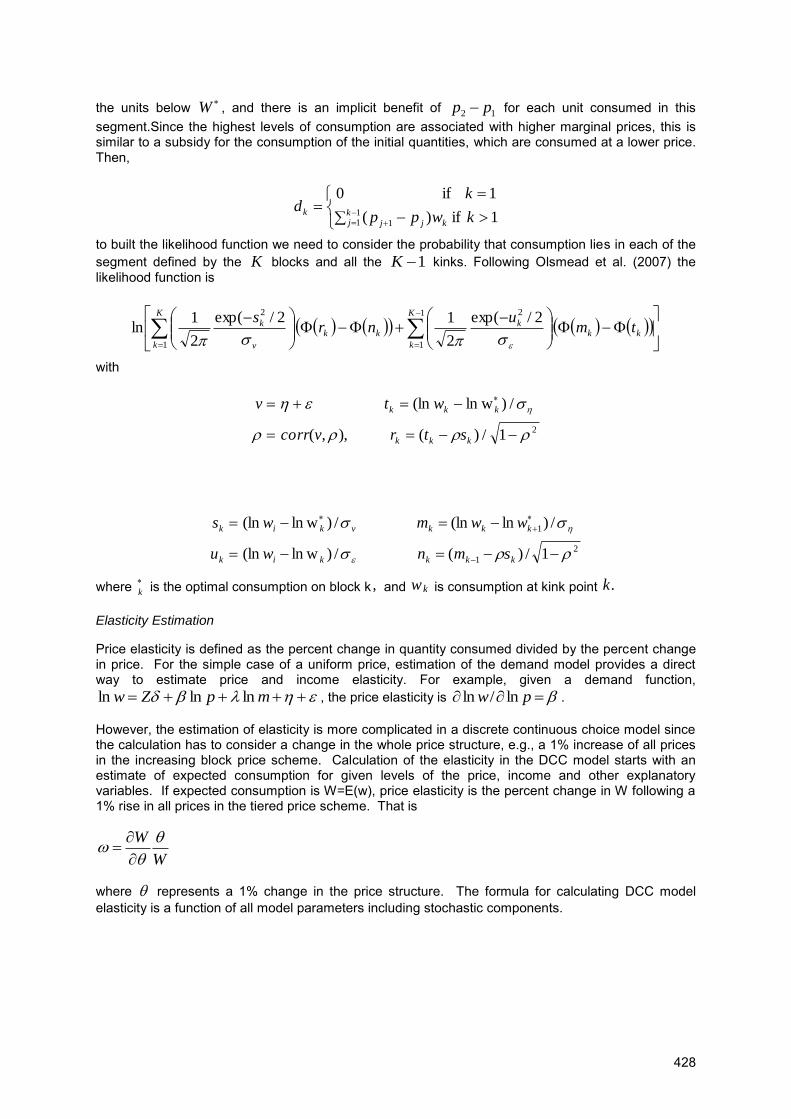
the units below W , and there is an implicit benefit of 12 pp for each unit consumed in this segment.Since the highest levels of consumption are associated with higher marginal prices, this is similar to a subsidy for the consumption of the initial quantities, which are consumed at a lower price. Then,
1 if )(
1 if 0
1
11 kwpp
kd
kjj
kj
k
to built the likelihood function we need to consider the probability that consumption lies in each of the segment defined by the K blocks and all the 1K kinks. Following Olsmead et al. (2007) the likelihood function is
kkk
K
k
kk
v
kK
k
tmu
nrs
2/exp(
2
12/exp(
2
1ln
21
1
2
1
with
21/)( ),,(
/)wln(ln
kkk
kkk
strvcorr
wtv
2
1
1
1/)( /)wln(ln
/)ln(ln /)wln(ln
kkkkik
kkkvkik
smnwu
wwmws
where k is the optimal consumption on block k , and wk is consumption at kink point k.
Elasticity Estimation
Price elasticity is defined as the percent change in quantity consumed divided by the percent change in price. For the simple case of a uniform price, estimation of the demand model provides a direct way to estimate price and income elasticity. For example, given a demand function,
mpZw lnlnln , the price elasticity is pw ln/ln .
However, the estimation of elasticity is more complicated in a discrete continuous choice model since the calculation has to consider a change in the whole price structure, e.g., a 1% increase of all prices in the increasing block price scheme. Calculation of the elasticity in the DCC model starts with an estimate of expected consumption for given levels of the price, income and other explanatory variables. If expected consumption is W=E(w), price elasticity is the percent change in W following a 1% rise in all prices in the tiered price scheme. That is
W
W
where represents a 1% change in the price structure. The formula for calculating DCC model elasticity is a function of all model parameters including stochastic components.
428

Statistical Technique Addressing Linked Consumption
In the case of two or more goods with increasing block pricing, Lee and Pitt (1987) show that the estimation can be done using dual theory and virtual prices. Virtual prices represent the prices that would make people not consume one of the goods under analysis, and they can be determined using the first order conditions of the maximization of a utility function. We represent the situation in Figure
2, where we can see two goods, x 1 and x 2 , each of them with a two-tier scheme.
D1
D2
x11 x
21
p12
$
p11
x11 x1
D1
D2
x12 x
22
p22
$
p21
x22 X2
Figure 2. Linked consumption of two goods with increasing block pricing
Several consumption patterns are possible in this situation (Lee and Pitt 1987). For example, consumption may occur below both price ―kink points,‖ as represented by line D1 (Figure 2). Alternatively, it may occur below the kink point in one market and above the kink point in the other.
Each consumption pattern is represented by a different set of virtual prices, and by a different formulation of the demand curve.
Estimates of Price Elasticity of Demand for Natural Gas, Electricity and Water
Natural Gas and Electricity
Household-level data on gas and electricity consumption for the years 1993 and 1997 were obtained from the Residential Energy Consumption Survey (RECS) microdata files, provided by the Energy Information Administration. The RECS microdata contains data on energy-consuming assets and annual levels of energy consumption for a statistically-representative sample of U.S. households, including a subset sample identified as California households. The RECS microdata does not directly reveal tariffs. In order to recover the prices faced by the consumers, we used the database constructed by Reiss and White (2005), where each individual in the survey was matched to a National Oceanic and Atmospheric Administration (NOAA) weather station. Using geographic information systems (GIS) techniques, each weather station was assigned a ZIP code and a city and it was matched to its corresponding natural gas and electricity provider. Data on the areas supplied by natural gas providers, as well as prices for 1993 and 1997, were obtained from the websites of the providers and by contacting utility personal. Data on electricity prices were obtained from the database provided by Reiss and White. Since natural gas prices were obtained only for single family households, we discarded consumers that reported living in condos and multi-unit houses, as well as those that did not pay utilities. Households without natural gas service were also omitted from the analysis. Some of the socioeconomic variables have different ranges or definitions from survey to survey; these were transformed to make the answers comparable, if possible, and otherwise discarded. Given that RECS reports annual energy consumption, we also calculated average natural gas prices for each household.
Table 2 presents the results of the natural gas and electricity demand analysis. The results are consistent with expectations; the price effects are negative and significant, while income effect is positive, although not significant for natural gas. The family size, race, ownership, and house area are all significant explanatory variables in both models. Using these results and the equations given
429
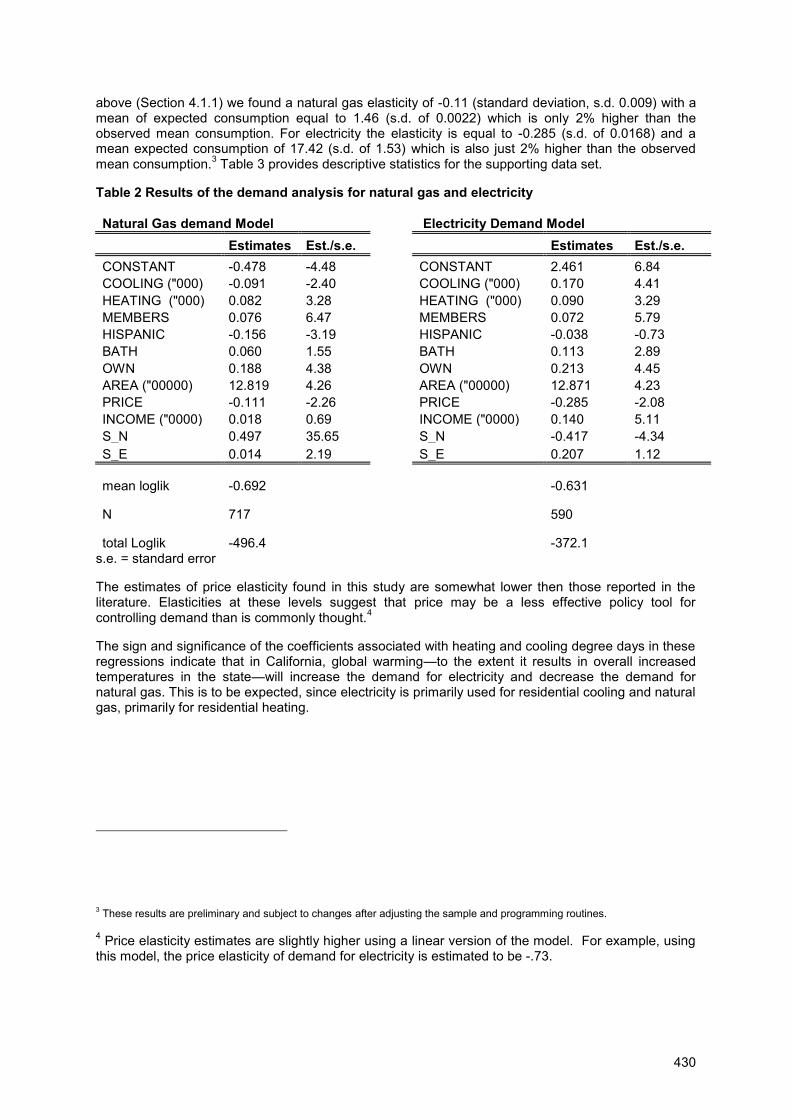
above (Section 4.1.1) we found a natural gas elasticity of -0.11 (standard deviation, s.d. 0.009) with a mean of expected consumption equal to 1.46 (s.d. of 0.0022) which is only 2% higher than the observed mean consumption. For electricity the elasticity is equal to -0.285 (s.d. of 0.0168) and a mean expected consumption of 17.42 (s.d. of 1.53) which is also just 2% higher than the observed mean consumption.3 Table 3 provides descriptive statistics for the supporting data set.
Table 2 Results of the demand analysis for natural gas and electricity
Natural Gas demand Model Electricity Demand Model
Estimates Est./s.e. Estimates Est./s.e.
CONSTANT -0.478 -4.48 CONSTANT 2.461 6.84 COOLING ("000) -0.091 -2.40 COOLING ("000) 0.170 4.41 HEATING ("000) 0.082 3.28 HEATING ("000) 0.090 3.29 MEMBERS 0.076 6.47 MEMBERS 0.072 5.79 HISPANIC -0.156 -3.19 HISPANIC -0.038 -0.73 BATH 0.060 1.55 BATH 0.113 2.89 OWN 0.188 4.38 OWN 0.213 4.45 AREA ("00000) 12.819 4.26 AREA ("00000) 12.871 4.23 PRICE -0.111 -2.26 PRICE -0.285 -2.08 INCOME ("0000) 0.018 0.69 INCOME ("0000) 0.140 5.11 S_N 0.497 35.65 S_N -0.417 -4.34 S_E 0.014 2.19 S_E 0.207 1.12
mean loglik -0.692 -0.631
N 717 590
total Loglik -496.4 -372.1
s.e. = standard error
The estimates of price elasticity found in this study are somewhat lower then those reported in the literature. Elasticities at these levels suggest that price may be a less effective policy tool for controlling demand than is commonly thought.4
The sign and significance of the coefficients associated with heating and cooling degree days in these regressions indicate that in California, global warming—to the extent it results in overall increased temperatures in the state—will increase the demand for electricity and decrease the demand for natural gas. This is to be expected, since electricity is primarily used for residential cooling and natural gas, primarily for residential heating.
3 These results are preliminary and subject to changes after adjusting the sample and programming routines.
4 Price elasticity estimates are slightly higher using a linear version of the model. For example, using this model, the price elasticity of demand for electricity is estimated to be -.73.
430
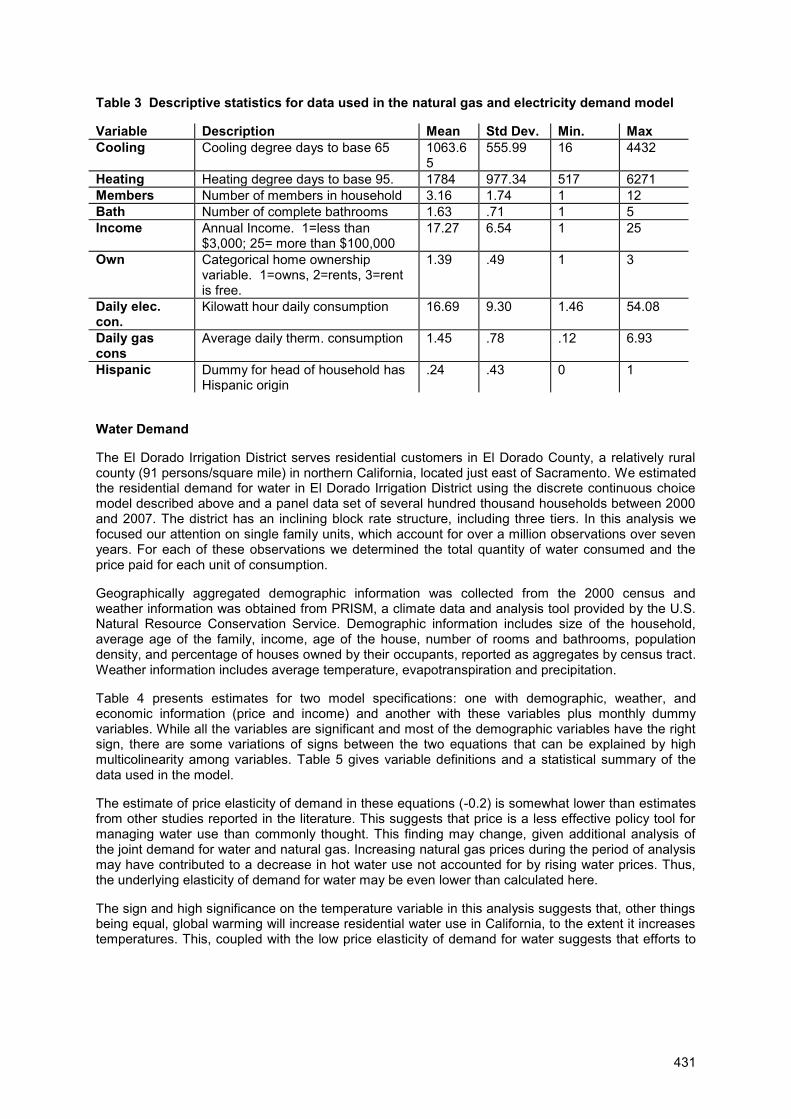
Table 3 Descriptive statistics for data used in the natural gas and electricity demand model
Variable Description Mean Std Dev. Min. Max
Cooling Cooling degree days to base 65 1063.65
555.99 16 4432
Heating Heating degree days to base 95. 1784 977.34 517 6271 Members Number of members in household 3.16 1.74 1 12 Bath Number of complete bathrooms 1.63 .71 1 5 Income Annual Income. 1=less than
$3,000; 25= more than $100,000 17.27 6.54 1 25
Own Categorical home ownership variable. 1=owns, 2=rents, 3=rent is free.
1.39 .49 1 3
Daily elec. con.
Kilowatt hour daily consumption 16.69 9.30 1.46 54.08
Daily gas cons
Average daily therm. consumption 1.45 .78 .12 6.93
Hispanic Dummy for head of household has Hispanic origin
.24 .43 0 1
Water Demand
The El Dorado Irrigation District serves residential customers in El Dorado County, a relatively rural county (91 persons/square mile) in northern California, located just east of Sacramento. We estimated the residential demand for water in El Dorado Irrigation District using the discrete continuous choice model described above and a panel data set of several hundred thousand households between 2000 and 2007. The district has an inclining block rate structure, including three tiers. In this analysis we focused our attention on single family units, which account for over a million observations over seven years. For each of these observations we determined the total quantity of water consumed and the price paid for each unit of consumption.
Geographically aggregated demographic information was collected from the 2000 census and weather information was obtained from PRISM, a climate data and analysis tool provided by the U.S. Natural Resource Conservation Service. Demographic information includes size of the household, average age of the family, income, age of the house, number of rooms and bathrooms, population density, and percentage of houses owned by their occupants, reported as aggregates by census tract. Weather information includes average temperature, evapotranspiration and precipitation.
Table 4 presents estimates for two model specifications: one with demographic, weather, and economic information (price and income) and another with these variables plus monthly dummy variables. While all the variables are significant and most of the demographic variables have the right sign, there are some variations of signs between the two equations that can be explained by high multicolinearity among variables. Table 5 gives variable definitions and a statistical summary of the data used in the model.
The estimate of price elasticity of demand in these equations (-0.2) is somewhat lower than estimates from other studies reported in the literature. This suggests that price is a less effective policy tool for managing water use than commonly thought. This finding may change, given additional analysis of the joint demand for water and natural gas. Increasing natural gas prices during the period of analysis may have contributed to a decrease in hot water use not accounted for by rising water prices. Thus, the underlying elasticity of demand for water may be even lower than calculated here.
The sign and high significance on the temperature variable in this analysis suggests that, other things being equal, global warming will increase residential water use in California, to the extent it increases temperatures. This, coupled with the low price elasticity of demand for water suggests that efforts to
431
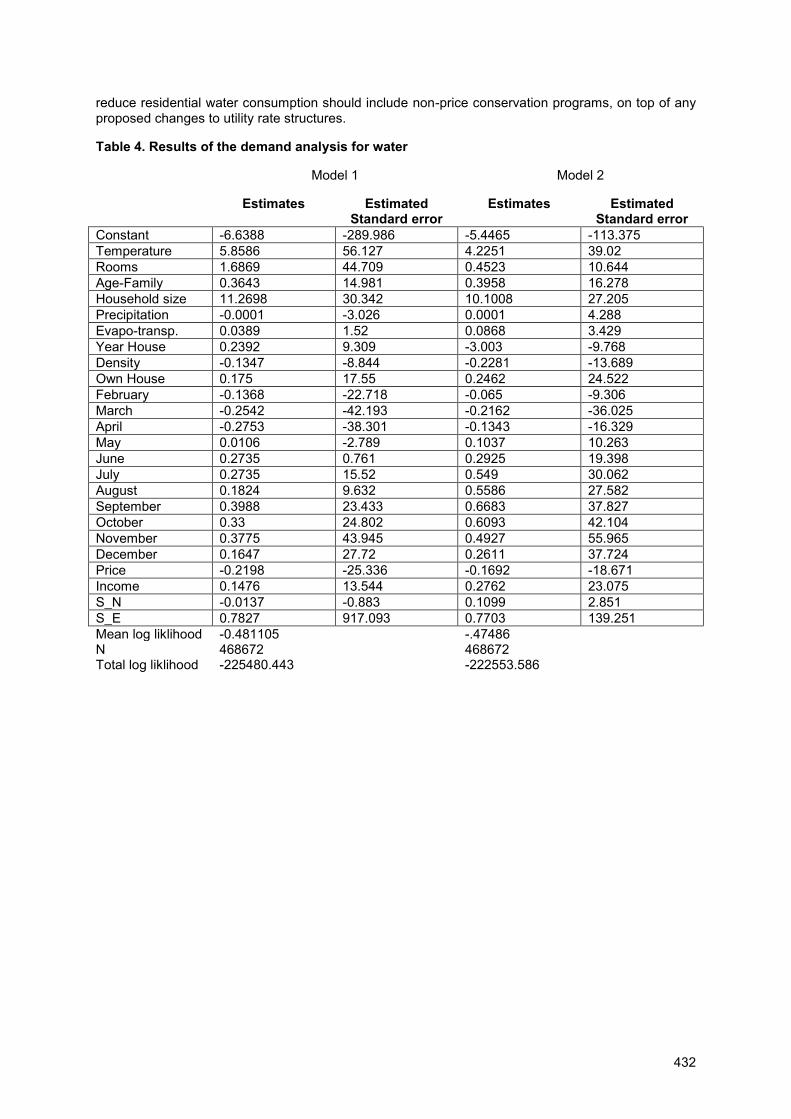
reduce residential water consumption should include non-price conservation programs, on top of any proposed changes to utility rate structures.
Table 4. Results of the demand analysis for water
Model 1 Model 2
Estimates Estimated Standard error
Estimates Estimated Standard error
Constant -6.6388 -289.986 -5.4465 -113.375 Temperature 5.8586 56.127 4.2251 39.02 Rooms 1.6869 44.709 0.4523 10.644 Age-Family 0.3643 14.981 0.3958 16.278 Household size 11.2698 30.342 10.1008 27.205 Precipitation -0.0001 -3.026 0.0001 4.288 Evapo-transp. 0.0389 1.52 0.0868 3.429 Year House 0.2392 9.309 -3.003 -9.768 Density -0.1347 -8.844 -0.2281 -13.689 Own House 0.175 17.55 0.2462 24.522 February -0.1368 -22.718 -0.065 -9.306 March -0.2542 -42.193 -0.2162 -36.025 April -0.2753 -38.301 -0.1343 -16.329 May 0.0106 -2.789 0.1037 10.263 June 0.2735 0.761 0.2925 19.398 July 0.2735 15.52 0.549 30.062 August 0.1824 9.632 0.5586 27.582 September 0.3988 23.433 0.6683 37.827 October 0.33 24.802 0.6093 42.104 November 0.3775 43.945 0.4927 55.965 December 0.1647 27.72 0.2611 37.724 Price -0.2198 -25.336 -0.1692 -18.671 Income 0.1476 13.544 0.2762 23.075 S_N -0.0137 -0.883 0.1099 2.851 S_E 0.7827 917.093 0.7703 139.251 Mean log liklihood -0.481105 -.47486 N 468672 468672 Total log liklihood -225480.443 -222553.586
432
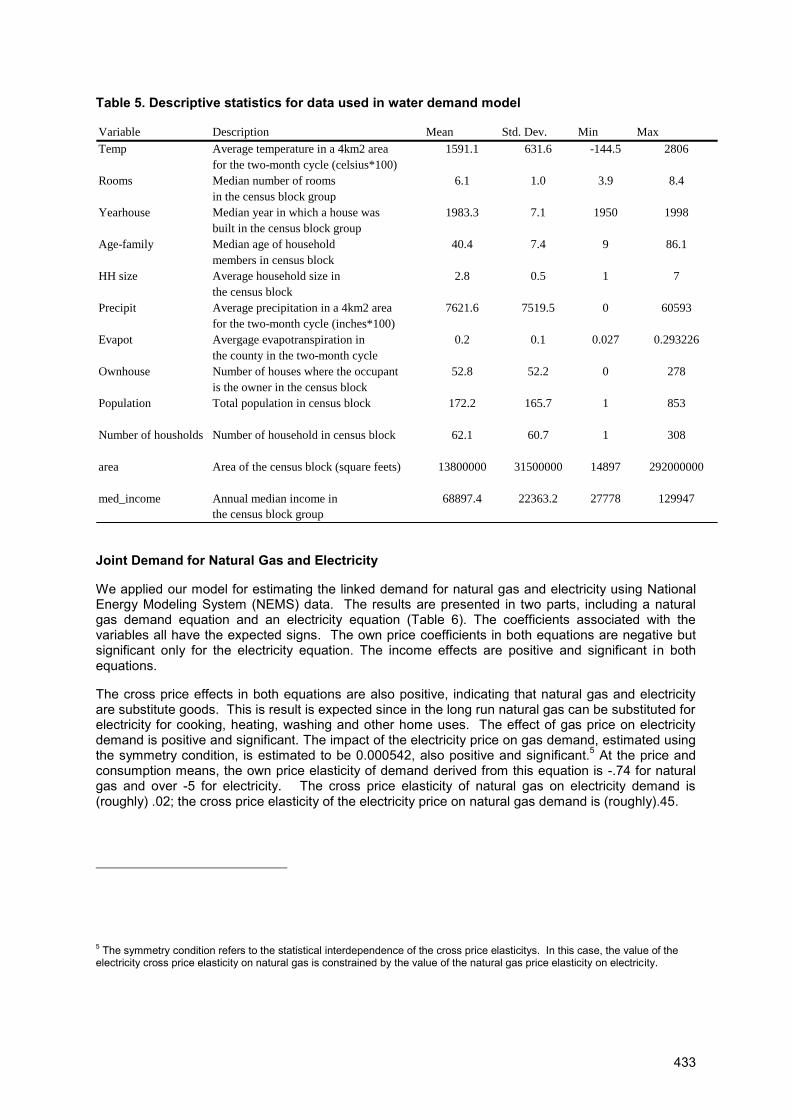
Table 5. Descriptive statistics for data used in water demand model
Variable Description Mean Std. Dev. Min Max
Temp Average temperature in a 4km2 area 1591.1 631.6 -144.5 2806
for the two-month cycle (celsius*100)
Rooms Median number of rooms 6.1 1.0 3.9 8.4
in the census block group
Yearhouse Median year in which a house was 1983.3 7.1 1950 1998
built in the census block group
Age-family Median age of household 40.4 7.4 9 86.1
members in census block
HH size Average household size in 2.8 0.5 1 7
the census block
Precipit Average precipitation in a 4km2 area 7621.6 7519.5 0 60593
for the two-month cycle (inches*100)
Evapot Avergage evapotranspiration in 0.2 0.1 0.027 0.293226
the county in the two-month cycle
Ownhouse Number of houses where the occupant 52.8 52.2 0 278
is the owner in the census block
Population Total population in census block 172.2 165.7 1 853
Number of housholds Number of household in census block 62.1 60.7 1 308
area Area of the census block (square feets) 13800000 31500000 14897 292000000
med_income Annual median income in 68897.4 22363.2 27778 129947
the census block group
Joint Demand for Natural Gas and Electricity
We applied our model for estimating the linked demand for natural gas and electricity using National Energy Modeling System (NEMS) data. The results are presented in two parts, including a natural gas demand equation and an electricity equation (Table 6). The coefficients associated with the variables all have the expected signs. The own price coefficients in both equations are negative but significant only for the electricity equation. The income effects are positive and significant in both equations.
The cross price effects in both equations are also positive, indicating that natural gas and electricity are substitute goods. This is result is expected since in the long run natural gas can be substituted for electricity for cooking, heating, washing and other home uses. The effect of gas price on electricity demand is positive and significant. The impact of the electricity price on gas demand, estimated using the symmetry condition, is estimated to be 0.000542, also positive and significant.5 At the price and consumption means, the own price elasticity of demand derived from this equation is -.74 for natural gas and over -5 for electricity. The cross price elasticity of natural gas on electricity demand is (roughly) .02; the cross price elasticity of the electricity price on natural gas demand is (roughly).45.
5 The symmetry condition refers to the statistical interdependence of the cross price elasticitys. In this case, the value of the electricity cross price elasticity on natural gas is constrained by the value of the natural gas price elasticity on electricity.
433
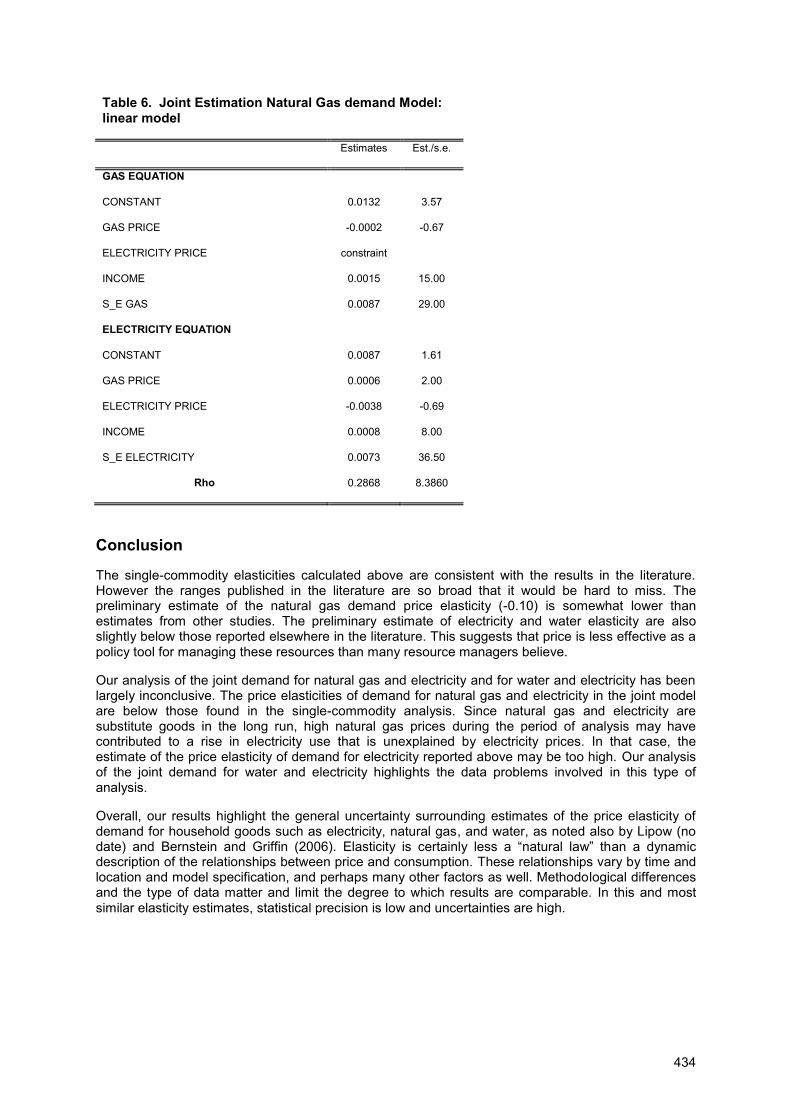
Table 6. Joint Estimation Natural Gas demand Model: linear model
Estimates Est./s.e.
GAS EQUATION
CONSTANT 0.0132 3.57
GAS PRICE -0.0002 -0.67
ELECTRICITY PRICE constraint
INCOME 0.0015 15.00
S_E GAS 0.0087 29.00
ELECTRICITY EQUATION
CONSTANT 0.0087 1.61
GAS PRICE 0.0006 2.00
ELECTRICITY PRICE -0.0038 -0.69
INCOME 0.0008 8.00
S_E ELECTRICITY 0.0073 36.50
Rho 0.2868 8.3860
Conclusion
The single-commodity elasticities calculated above are consistent with the results in the literature. However the ranges published in the literature are so broad that it would be hard to miss. The preliminary estimate of the natural gas demand price elasticity (-0.10) is somewhat lower than estimates from other studies. The preliminary estimate of electricity and water elasticity are also slightly below those reported elsewhere in the literature. This suggests that price is less effective as a policy tool for managing these resources than many resource managers believe.
Our analysis of the joint demand for natural gas and electricity and for water and electricity has been largely inconclusive. The price elasticities of demand for natural gas and electricity in the joint model are below those found in the single-commodity analysis. Since natural gas and electricity are substitute goods in the long run, high natural gas prices during the period of analysis may have contributed to a rise in electricity use that is unexplained by electricity prices. In that case, the estimate of the price elasticity of demand for electricity reported above may be too high. Our analysis of the joint demand for water and electricity highlights the data problems involved in this type of analysis.
Overall, our results highlight the general uncertainty surrounding estimates of the price elasticity of demand for household goods such as electricity, natural gas, and water, as noted also by Lipow (no date) and Bernstein and Griffin (2006). Elasticity is certainly less a ―natural law‖ than a dynamic description of the relationships between price and consumption. These relationships vary by time and location and model specification, and perhaps many other factors as well. Methodological differences and the type of data matter and limit the degree to which results are comparable. In this and most similar elasticity estimates, statistical precision is low and uncertainties are high.
434
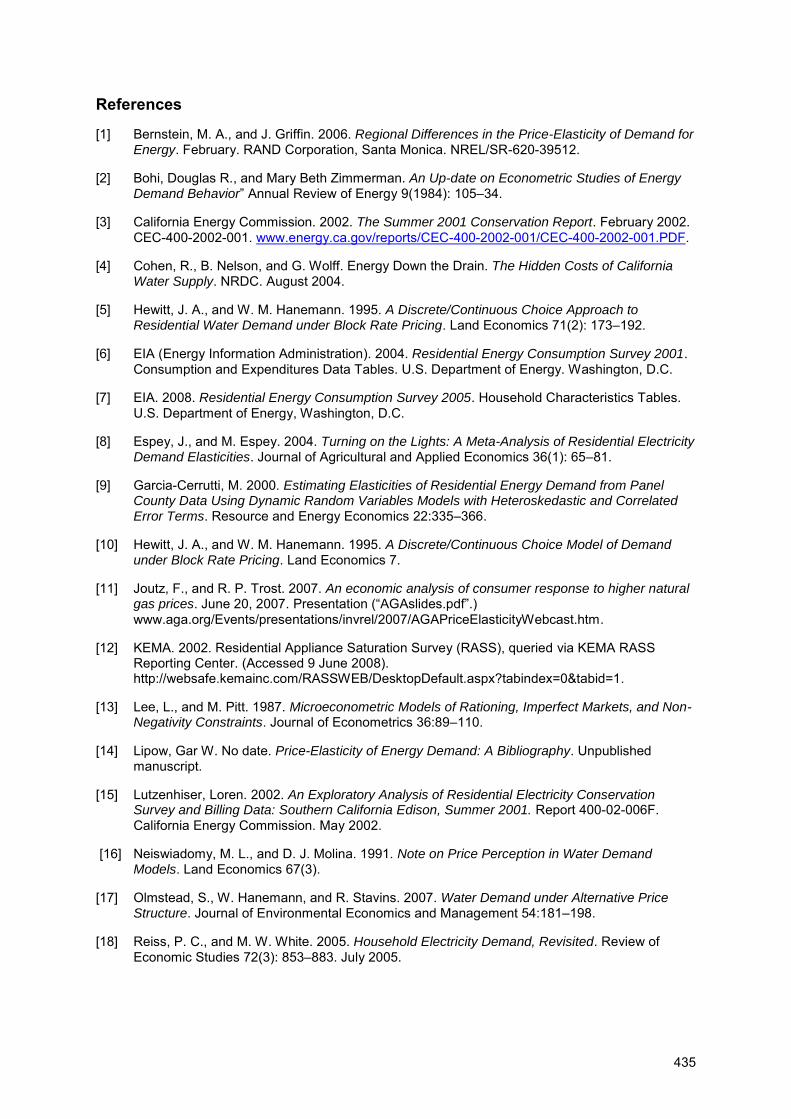
References
[1] Bernstein, M. A., and J. Griffin. 2006. Regional Differences in the Price-Elasticity of Demand for Energy. February. RAND Corporation, Santa Monica. NREL/SR-620-39512.
[2] Bohi, Douglas R., and Mary Beth Zimmerman. An Up-date on Econometric Studies of Energy Demand Behavior‖ Annual Review of Energy 9(1984): 105–34.
[3] California Energy Commission. 2002. The Summer 2001 Conservation Report. February 2002. CEC-400-2002-001. www.energy.ca.gov/reports/CEC-400-2002-001/CEC-400-2002-001.PDF.
[4] Cohen, R., B. Nelson, and G. Wolff. Energy Down the Drain. The Hidden Costs of California Water Supply. NRDC. August 2004.
[5] Hewitt, J. A., and W. M. Hanemann. 1995. A Discrete/Continuous Choice Approach to Residential Water Demand under Block Rate Pricing. Land Economics 71(2): 173–192.
[6] EIA (Energy Information Administration). 2004. Residential Energy Consumption Survey 2001. Consumption and Expenditures Data Tables. U.S. Department of Energy. Washington, D.C.
[7] EIA. 2008. Residential Energy Consumption Survey 2005. Household Characteristics Tables. U.S. Department of Energy, Washington, D.C.
[8] Espey, J., and M. Espey. 2004. Turning on the Lights: A Meta-Analysis of Residential Electricity Demand Elasticities. Journal of Agricultural and Applied Economics 36(1): 65–81.
[9] Garcia-Cerrutti, M. 2000. Estimating Elasticities of Residential Energy Demand from Panel County Data Using Dynamic Random Variables Models with Heteroskedastic and Correlated Error Terms. Resource and Energy Economics 22:335–366.
[10] Hewitt, J. A., and W. M. Hanemann. 1995. A Discrete/Continuous Choice Model of Demand under Block Rate Pricing. Land Economics 7.
[11] Joutz, F., and R. P. Trost. 2007. An economic analysis of consumer response to higher natural gas prices. June 20, 2007. Presentation (―AGAslides.pdf‖.) www.aga.org/Events/presentations/invrel/2007/AGAPriceElasticityWebcast.htm.
[12] KEMA. 2002. Residential Appliance Saturation Survey (RASS), queried via KEMA RASS Reporting Center. (Accessed 9 June 2008). http://websafe.kemainc.com/RASSWEB/DesktopDefault.aspx?tabindex=0&tabid=1.
[13] Lee, L., and M. Pitt. 1987. Microeconometric Models of Rationing, Imperfect Markets, and Non-Negativity Constraints. Journal of Econometrics 36:89–110.
[14] Lipow, Gar W. No date. Price-Elasticity of Energy Demand: A Bibliography. Unpublished manuscript.
[15] Lutzenhiser, Loren. 2002. An Exploratory Analysis of Residential Electricity Conservation Survey and Billing Data: Southern California Edison, Summer 2001. Report 400-02-006F. California Energy Commission. May 2002.
[16] Neiswiadomy, M. L., and D. J. Molina. 1991. Note on Price Perception in Water Demand Models. Land Economics 67(3).
[17] Olmstead, S., W. Hanemann, and R. Stavins. 2007. Water Demand under Alternative Price Structure. Journal of Environmental Economics and Management 54:181–198.
[18] Reiss, P. C., and M. W. White. 2005. Household Electricity Demand, Revisited. Review of Economic Studies 72(3): 853–883. July 2005.
435


European Commission EUR 24139 EN/1 – Joint Research Centre – Institute for Energy Title: Energy Efficiency in Domestic Appliances and Lighting, Proceedings of the 5th International Conference EEDAL'09, 16-18 June, Berlin, Germany, vol. 1 Author(s): Paolo BERTOLDI, Rita WERLE Luxembourg: Office for Official Publications of the European Communities 2010 – 448 pp. – 21 x 29,7 cm EUR – Scientific and Technical Research series – ISSN 1018-5593 ISBN 978-92-79-14836-1 DOI 10.2788/54535 Abstract This book contains the Proceedings of the 5th International Conference on Energy Efficiency in Domestic Appliances and Lighting, Berlin (DE), 16-18 June 2009. The EEDAL’09 conference has been very successful in attracting an international audience, representing a wide variety of stakeholders involved in policy implementation and development, research and programme implementation, manufacturing and promotion of energy efficient residential appliances and lighting. The international community of stakeholders dealing with residential appliances and lighting gathered to discuss the progress achieved in technologies and policies, and the strategies to be implemented to further this progress. EEDAL'09 has provided a unique forum to discuss and debate the latest developments in energy and environmental impact of residential appliances and installed equipment, and lighting. The presentations were made by the leading experts coming from all continents. The presentations covered policies and programmes adopted and planned in several geographical areas and countries, as well as the technical and commercial advances in the dissemination and penetration of energy efficient residential appliances and lighting.


How to obtain EU publications Our priced publications are available from EU Bookshop (http://bookshop.europa.eu), where you can place an order with the sales agent of your choice. The Publications Office has a worldwide network of sales agents. You can obtain their contact details by sending a fax to (352) 29 29-42758.

The mission of the JRC is to provide customer-driven scientific and technical support for the conception, development, implementation and monitoring of EU policies. As a service of the European Commission, the JRC functions as a reference centre of science and technology for the Union. Close to the policy-making process, it serves the common interest of the Member States, while being independent of special interests, whether private or national.
LB
-NA
-24139-EN-C