Land degradation - JRC Publications Repository - European ...
333
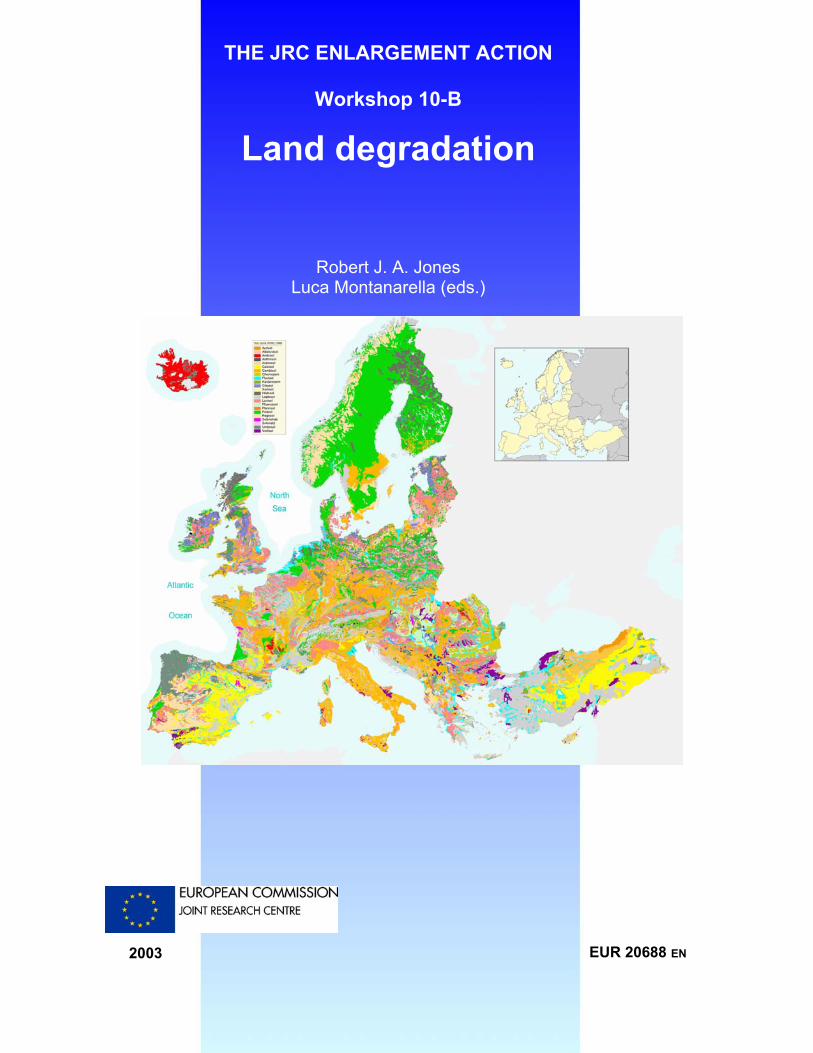
THE JRC ENLARGEMENT ACTION Workshop 10-B Land degradation Robert J. A. Jones Luca Montanarella (eds.) 2003 EUR 20688 EN
-
Upload
khangminh22 -
Category
Documents
-
view
3 -
download
0
Transcript of Land degradation - JRC Publications Repository - European ...
THE JRC ENLARGEMENT ACTION
Workshop 10-B
Land degradation
Robert J. A. Jones Luca Montanarella (eds.)
2003 EUR 20688 EN

THE JRC ENLARGEMENT ACTION
Land degradation
Contributions to the International Workshop “Land degradation”
5-6 December 2002, Ispra, Italy
Edited by
Robert J.A. Jones & Luca Montanarella
Soil and Waste Unit
Institute for Environment & Sustainability Joint Research Centre
European Commission Ispra, 21020 Italy
2003
EUR 20688 EN
MISSION The mission of the Institute of Environment and Sustainability is to provide scientific and technical support to EU strategies for the protection of the environment and sustainable development. Employing an integrated approach to the investigation of air, water and soil contaminants, its goals are sustainable management of water resources, protection and maintenance of drinking waters, good functioning of aquatic ecosystems and good ecological quality of surface waters.
LEGAL NOTICE
Neither the European Commission nor any person acting on behalf of the Commission is responsible for
the use which might be made of the following information.
A great deal of additional information on the European Union is available on the Internet. It can be accessed through the Europa server
(http://europa.eu.int)
EUR 20688 EN European Communities, 2003
Reproduction is authorised provided the source is acknowledged Printed in Italy
The papers printed in the document may be cited as follows:
In: Land Degradation in Central and Eastern Europe R.J.A. Jones and L. Montanarella (eds.). European Soil Bureau Research Report No.10, EUR 20688 EN, (2003), 324 pp. Office for Official Publications of the European Communities, Luxembourg.
COVER MAP THE EUROPEAN SOIL DATABASE VERSION 1.0: DOMINANT SOILS ACCORDING TO WRB (1998)


EUROPEAN SOIL BUREAU RESEARCH REPORT NO. 10
Preface
The Communication from the Commission “Towards a Thematic Strategy for Soil Protection” (COM(2002) 179) clearly identifies major threats to soils in Europe. One of the major threats identified is the increase of flooding and landslides due to soil degradation. The recent events in Central and Eastern Europe have further confirmed the urgent need for action in respect of an effective flood prevention strategy. In the Communication (COM(2002) 179) the current situation in EU Candidate Countries concerning soil degradation is described. This workshop aimed to gather more detailed information on the current situation in Candidate Countries concerning soil degradation. Country presentations focused on the eight major soil threats (erosion, decline in organic matter, contamination, sealing, compaction, salinization, loss of biodiversity and hydogeological risks (floods and landslides)) identified as a priority for Europe and reported on the current extend of soil degradation processes, driving forces, pressures and possible economic impact. Since several Candidate Countries are also parties to the United Nations Convention to Combat Desertification (UNCCD), reference has been made in country presentations to this convention and to the way forward in implementing it at National level. At the regional meeting for the Northern Mediterranean, Central and Eastern European countries, held in Geneva 23-26 July 2002 in preparation of the first session of the Committee for the Review of the Implementation of the Convention (CRIC), there has been an explicit invitation to the European Commission to explore the possibility of organising a meeting on soil protection and land rehabilitation in Europe in the context of UNCCD. This workshop intends to provide a prompt response to this request, providing a scientific input to the ongoing discussions on the implementation of the Convention in Europe.
Luca Montanarella
EDITORS’ NOTE We would like to thank all the contributors for their collaboration in the preparation of this manuscript and their ready acceptance of our editing. Their friendly co-operation was a great help to us.
Robert Jones – Luca Montanarella

EUROPEAN SOIL BUREAU RESEARCH REPORT NO. 10
Table of Contents
Preface
Section 1: Key note papers Land degradation – setting the frame 5 BLUM Winfried E.H. Implementation of UNCCD in Europe 9 DAVID Elysabeth The EU Thematic Strategy on Soil Protection 15MONTANARELLA Luca EU activities in support of the implementation of the UN Convention to Combat Desertification
30
MORETTINI Marco EU Research on Land Degradation 37 SOMMER Stefan Land Degradation Assessment in Drylands : the LADA project 74 NACHTERGAELE Freddy O. Development of decision support tools in LADA: a case study for Ethiopia 89 SONNEVELD Ben and M.A. Keyzer UNCCD / ANNEX IV, BACKGROUND AND A SUMMARY OF ACTIVITIES 130 YASSOGLOU Nicholas Section 2: Country reports Some Aspects of the Present Status of Land Degradation in Bulgaria 149 S. ROUSSEVA, M. BANOV, N. KOLEV LAND DEGRADATION IN CROATIA 165 BASIC Ferdo DEGRADATION OF SOILS IN THE CZECH REPUBLIC 177 Josef Kozák, Luboš Borůvka, Jan Němeček
THE PROBLEMS OF LAND DEGRADATION AND DESERTIFICATION IN SOUTH CAUCASUS
193
T.Urushadze, A.Urushadze LAND DEGRADATION IN HUNGARY 198 Erika MICHÉLI , György VÁRALLYAY, László PÁSZTOR, József SZABÓ LAND DEGRADATION MEASURES IN LITHUANIA 207 BUIVYDAITE Vanda V. and PIVORIUNAS Danielius LAND DEGRADATION IN POLAND 225

Szymon Szewrański, Józef Sasik, Romuald Żmuda SYNTHESIS OF THE NATIONAL STRATEGY TO COMBAT DESERTIFICATION, LANDS DEGRADATION AND DROUGHT IN ROMANIA
240
KLEPS Christian SOILS AND SOIL DEGRADATION IN THE SLOVAK REPUBLIC 255 BIELEK Pavol LAND DEGRADATION IN SLOVENIA 290 F. Lobnik, B. Vrščaj, T. Prus LAND DEGRADATION IN TURKEY 303 S. Kapur, E. Akça, D.M. Özden, N. Sakarya, K.M. Çimrin, U. Alagöz, R. Ulusoy, C. Darıcı, Z. Kaya, S. Düzenli, H. Gülcan
Section 3: Conclusions and recommendations
RECOMMENDATIONS OF THE WORKSHOP PARTICIPANTS 319
Section 4: Participants List of participants 322

Section 1:
Key note papers
4
Section 1: Key note papers Land degradation – setting the frame 5BLUM Winfried E.H. Implementation of UNCCD in Europe 9DAVID Elysabeth The EU Thematic Strategy on Soil Protection 15MONTANARELLA Luca EU activities in support of the implementation of the UN Convention to Combat Desertification
30
MORETTINI Marco EU Research on Land Degradation 37SOMMER Stefan Land Degradation Assessment in Drylands : the LADA project 74NACHTERGAELE Freddy O. Development of decision support tools in LADA: a case study for Ethiopia 89SONNEVELD Ben and M.A. Keyzer UNCCD / ANNEX IV, BACKGROUND AND A SUMMARY OF ACTIVITIES 130YASSOGLOU Nicholas
5
LAND DEGRADATION
Setting the frame
by
Winfried E.H. Blum, Institute of Soil Research,
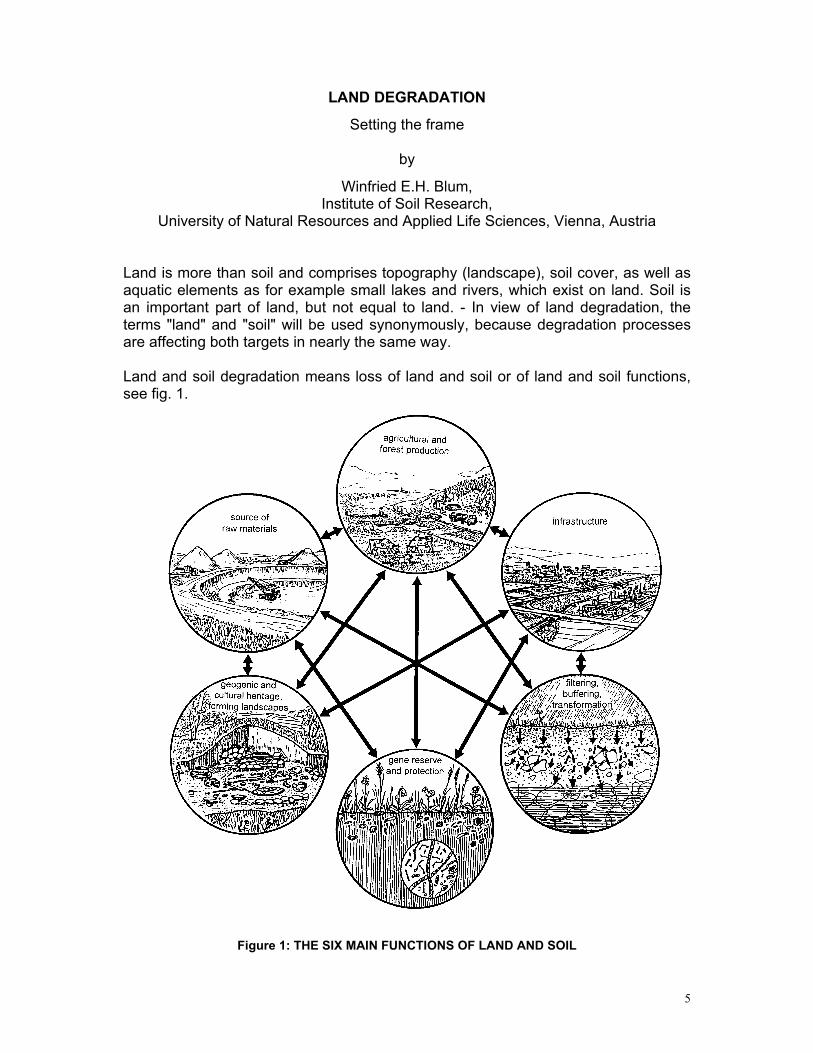
University of Natural Resources and Applied Life Sciences, Vienna, Austria Land is more than soil and comprises topography (landscape), soil cover, as well as aquatic elements as for example small lakes and rivers, which exist on land. Soil is an important part of land, but not equal to land. - In view of land degradation, the terms "land" and "soil" will be used synonymously, because degradation processes are affecting both targets in nearly the same way. Land and soil degradation means loss of land and soil or of land and soil functions, see fig. 1.
Figure 1: THE SIX MAIN FUNCTIONS OF LAND AND SOIL
6
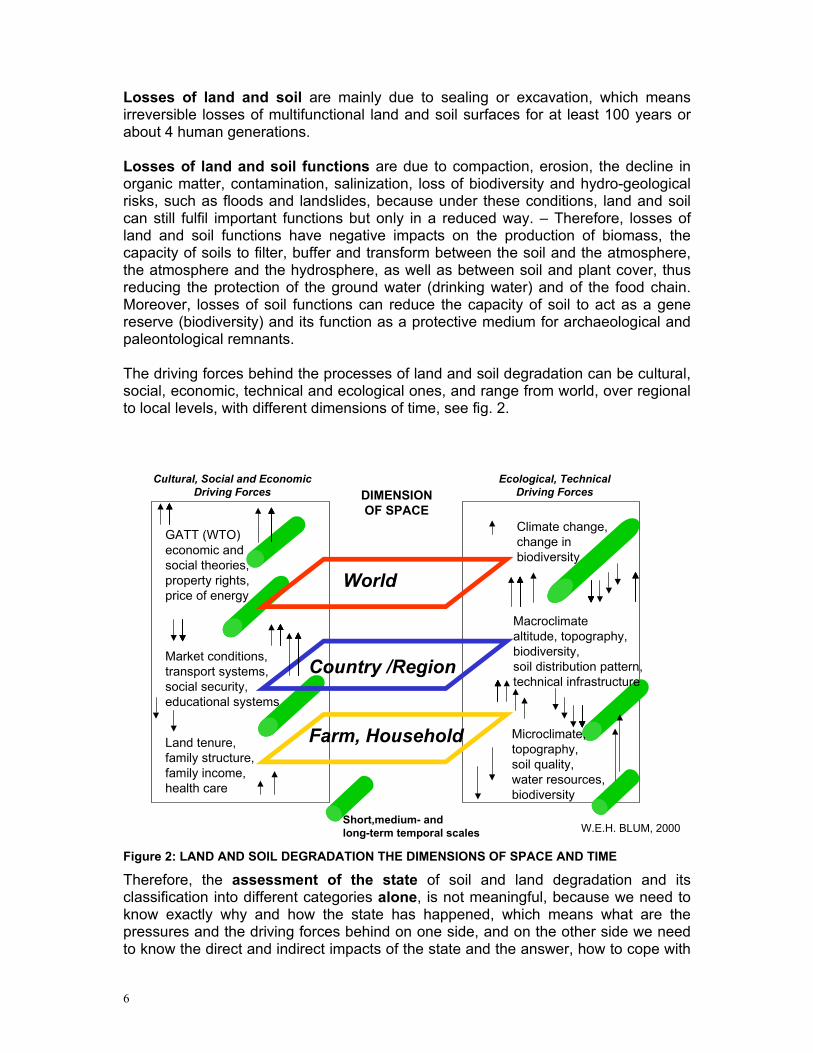
Losses of land and soil are mainly due to sealing or excavation, which means irreversible losses of multifunctional land and soil surfaces for at least 100 years or about 4 human generations. Losses of land and soil functions are due to compaction, erosion, the decline in organic matter, contamination, salinization, loss of biodiversity and hydro-geological risks, such as floods and landslides, because under these conditions, land and soil can still fulfil important functions but only in a reduced way. – Therefore, losses of land and soil functions have negative impacts on the production of biomass, the capacity of soils to filter, buffer and transform between the soil and the atmosphere, the atmosphere and the hydrosphere, as well as between soil and plant cover, thus reducing the protection of the ground water (drinking water) and of the food chain. Moreover, losses of soil functions can reduce the capacity of soil to act as a gene reserve (biodiversity) and its function as a protective medium for archaeological and paleontological remnants. The driving forces behind the processes of land and soil degradation can be cultural, social, economic, technical and ecological ones, and range from world, over regional to local levels, with different dimensions of time, see fig. 2.
World
Country /Region
Farm, Household
Short,medium- andlong-term temporal scales
GATT (WTO)economic andsocial theories,property rights,price of energy
Market conditions,transport systems,social security,educational systems
Land tenure,family structure,family income,health care
Climate change,change inbiodiversity
Macroclimatealtitude, topography,biodiversity,soil distribution pattern,technical infrastructure
Microclimate,topography,soil quality,water resources,biodiversity
Cultural, Social and EconomicDriving Forces
Ecological, TechnicalDriving ForcesDIMENSION
OF SPACE
W.E.H. BLUM, 2000 Figure 2: LAND AND SOIL DEGRADATION THE DIMENSIONS OF SPACE AND TIME
Therefore, the assessment of the state of soil and land degradation and its classification into different categories alone, is not meaningful, because we need to know exactly why and how the state has happened, which means what are the pressures and the driving forces behind on one side, and on the other side we need to know the direct and indirect impacts of the state and the answer, how to cope with
7
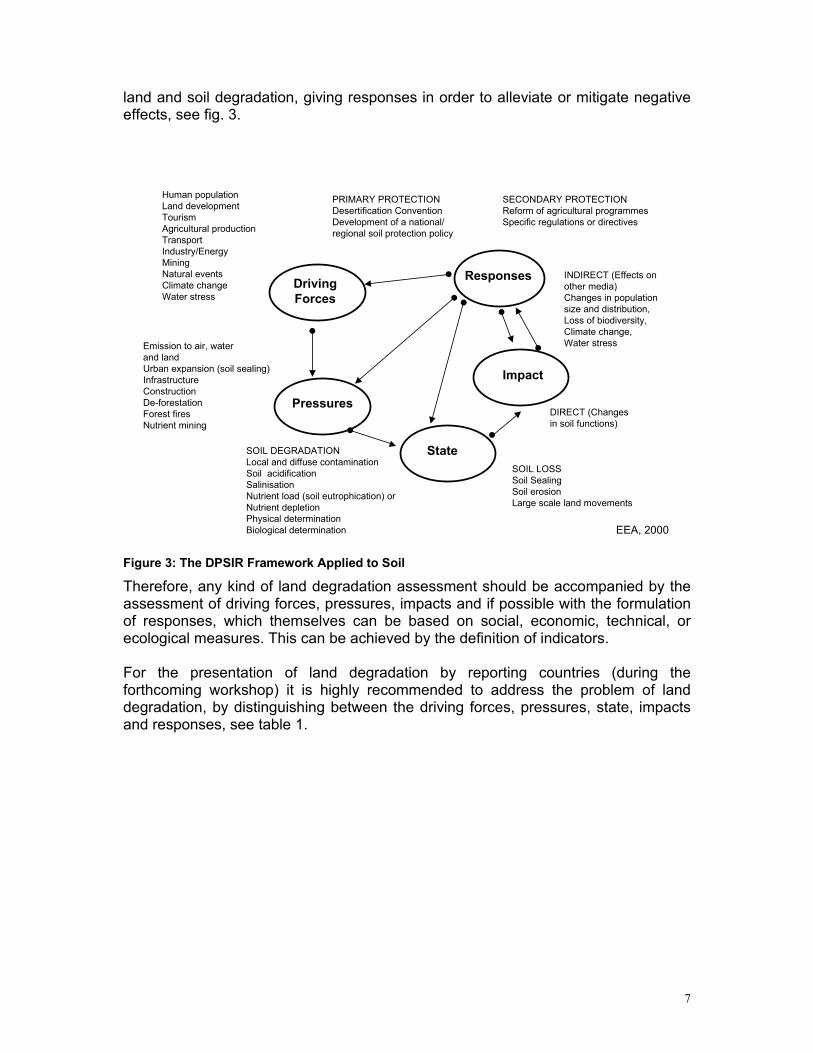
land and soil degradation, giving responses in order to alleviate or mitigate negative effects, see fig. 3.
SOIL LOSSSoil SealingSoil erosionLarge scale land movements
Human populationLand developmentTourismAgricultural productionTransportIndustry/EnergyMiningNatural eventsClimate changeWater stress
PRIMARY PROTECTIONDesertification ConventionDevelopment of a national/regional soil protection policy
SECONDARY PROTECTIONReform of agricultural programmesSpecific regulations or directives
INDIRECT (Effects onother media)Changes in populationsize and distribution,Loss of biodiversity,Climate change,Water stressEmission to air, water
and landUrban expansion (soil sealing)InfrastructureConstructionDe-forestationForest firesNutrient mining
DIRECT (Changesin soil functions)
SOIL DEGRADATIONLocal and diffuse contaminationSoil acidificationSalinisationNutrient load (soil eutrophication) orNutrient depletionPhysical determinationBiological determination
DrivingForces
Pressures
Responses
Impact
State
EEA, 2000
Figure 3: The DPSIR Framework Applied to Soil
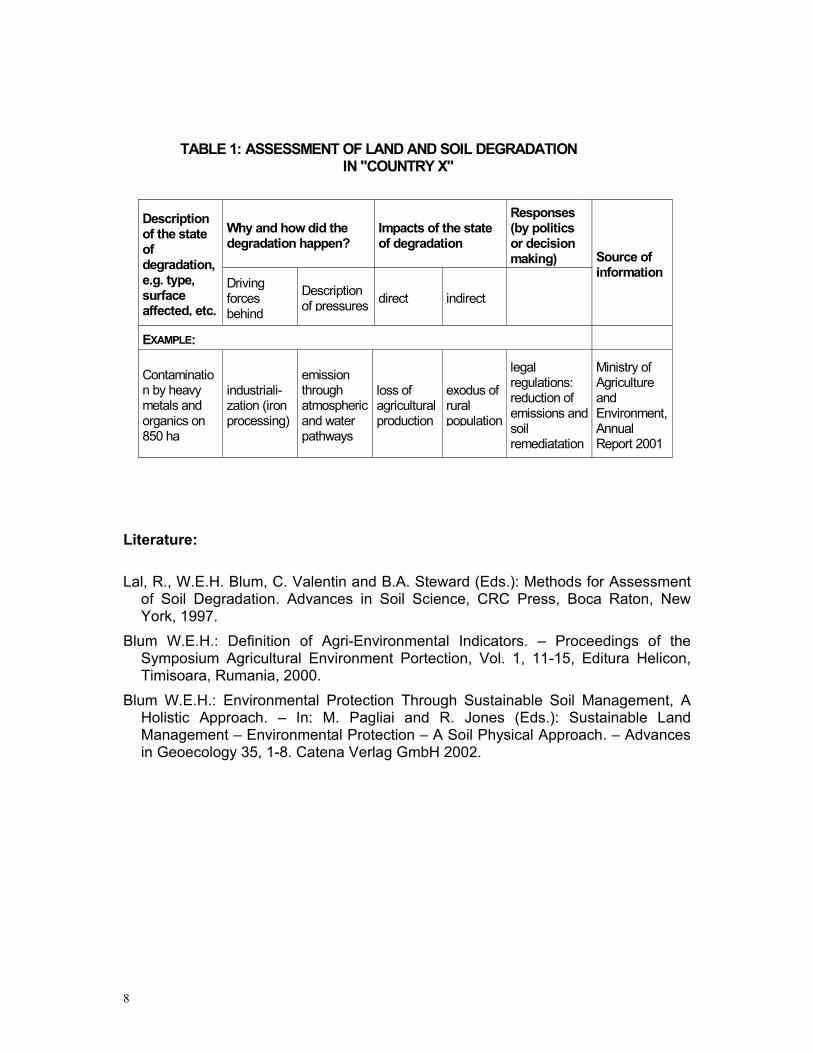
Therefore, any kind of land degradation assessment should be accompanied by the assessment of driving forces, pressures, impacts and if possible with the formulation of responses, which themselves can be based on social, economic, technical, or ecological measures. This can be achieved by the definition of indicators. For the presentation of land degradation by reporting countries (during the forthcoming workshop) it is highly recommended to address the problem of land degradation, by distinguishing between the driving forces, pressures, state, impacts and responses, see table 1.
8
TABLE 1: ASSESSMENT OF LAND AND SOIL DEGRADATION IN "COUNTRY X"
Why and how did thedegradation happen?
Impacts of the stateof degradation
Responses(by politicsor decisionmaking)
Descriptionof the stateofdegradation,e.g. type,surfaceaffected, etc.
Drivingforcesbehind
Descriptionof pressures direct indirect
Source ofinformation
EXAMPLE:
Contamination by heavymetals andorganics on850 ha
industriali-zation (ironprocessing)
emissionthroughatmosphericand waterpathways
loss ofagriculturalproduction
exodus ofruralpopulation
legalregulations:reduction ofemissions andsoilremediatation
Ministry ofAgricultureandEnvironment,AnnualReport 2001
Literature: Lal, R., W.E.H. Blum, C. Valentin and B.A. Steward (Eds.): Methods for Assessment
of Soil Degradation. Advances in Soil Science, CRC Press, Boca Raton, New York, 1997.
Blum W.E.H.: Definition of Agri-Environmental Indicators. – Proceedings of the Symposium Agricultural Environment Portection, Vol. 1, 11-15, Editura Helicon, Timisoara, Rumania, 2000.
Blum W.E.H.: Environmental Protection Through Sustainable Soil Management, A Holistic Approach. – In: M. Pagliai and R. Jones (Eds.): Sustainable Land Management – Environmental Protection – A Soil Physical Approach. – Advances in Geoecology 35, 1-8. Catena Verlag GmbH 2002.
9
Implementation of the United Nation Convention to Combat Desertification in Europe
By Elysabeth David Coordinateur, Europe Unit UNCCD, Bonn Germany Parties in Europe The United Nations Convention to Combat Desertification (UNCCD) is a convention ratified by 184 Parties as of December 2002. From Europe, 38 countries are Parties at UNCCD as follows: Andorra, Albania, Armenia, Austria, Azerbaijan, Belarus, Belgium, Bosnia and Herzegovina, Bulgaria, Croatia, Cyprus, Czech Republic, Denmark, Finland, France, FYR of Macedonia, Georgia, Greece, Hungary, Ireland, Italy, Latvia, Liechtenstein, Luxembourg, Malta, Monaco, Netherlands, Norway, Poland, Portugal, Republic of Moldova, Romania, San Marino, Slovenia, Slovakia, Switzerland, Turkey, Ukraine. The European Community is also a Party to the CCD. Only four Central and Eastern European countries are not yet Parties at CCD. The implementation of the CCD in Europe is a complex process due to the fact that there are developed non-affected countries, developed affected countries, affected countries with an economy in transition, non-affected countries with an economy in transition and in addition, some countries are in accession to the European Union (EU). European affected countries under the CCD are either turned toward the Mediterranean or toward the Central and Eastern Europe framework or for some countries toward both of them. CCD Affected countries under dispositions of the CCD The Article 1 of the CCD gives the definition of the terms (desertification, land degradation, etc), which were negotiated and approved during the negotiation of the dispositions of the CCD. According to article 1 point (f), the definition of land degradation is as follows: “Reduction or loss, in arid, semi-arid and dry sub-humid areas, of the biological or economic productivity and complexity of rain fed cropland, irrigated cropland, or range, pasture, forest and woodlands resulting from land uses or from a process or combination of processes, including processes arising from human activities and habitation patterns, such as: (i) Soil erosion caused by wind and/or water;
(ii) Deterioration of the physical, chemical and biological or economic properties of soil; and
(iii) Long-term loss of natural vegetation;” The same Article 1 also defines affected countries as: “countries whose lands include, in whole or in part, affected areas“. A country officially declares itself as being affected or not under the CCD convention.
10
Obligations of affected country Parties are stated in Article 5 of the CCD as follows: “
• give due priority to combating desertification and mitigating the effects of drought, and allocate adequate resources in accordance with their circumstances and capabilities;
• establish strategies and priorities, within the framework of sustainable development plans and/or policies, to combat desertification and mitigate the effects of drought;
• address the underlying causes of desertification and pay special attention to the socio-economic factors contributing to desertification processes;
• promote awareness and facilitate the participation of local populations, particularly women and youth, with the support of nongovernmental organizations;
• provide an enabling environment by strengthening, relevant existing legislation, enacting new laws and establishing long-term policies and action programmes. “
Following decision of the first session of the Conference of the Parties (COP), affected country Parties are requested to report on their activities to implement the CDD. At the first session of the Committee for the Review of the Implementation of the Convention (CRIC), European countries which submitted report as an affected country were: Albania, Armenia, Azerbaijan, Belarus, Bulgaria, Cyprus, Georgia, Greece, Hungary, Malta, Portugal, Republic of Moldova, Romania, Spain, Turkey. National Action Programmes in Europe The purpose of a national action programme (NAP) is to identify the factors contributing to desertification and practical measures necessary to combat desertification and mitigate the effects of drought. A NAP is prepared by affected country Parties on a bottom-up and participatory approach at local and national levels of non-governmental organizations, end users and their representative organizations, policy makers, technical representatives, local authorities and the scientific community. In order to facilitate the process a National Focal Point (NFP) is officially designated by each country Party. In most cases, an inter-sectorial National Coordinating Body (NCB) has also being established composed of representatives of concerned ministries, NGOs, private sector and scientific community to ensure the coordination and synergies of the process. Affected country Parties which are preparing or finalizing a National action programme are: Albania, Azerbaijan, Belarus, Bosnia and Herzegovina, Bulgaria, Cyprus, FYR of Macedonia, Hungary, Malta, Spain, Turkey, Ukraine. Affected countries, which are in the NAP implementation phase, are: Armenia, Georgia, Greece, Italy, Republic of Moldova, Portugal, and Romania. All above-mentioned National Reports to the CRIC and National Action Programmes may be consulted on the UNCCD website at: www.unccd.int.
11
Regional and Subregional Action Programmes in Europe Affected country Parties shall consult and cooperate to prepare subregional and/or regional action programmes to harmonize, complement and increase the efficiency of national programmes. Neighboring countries may prepare joint programmes for the sustainable management of transboundary natural resources, scientific and technical cooperation, and strengthening of relevant institutions.” Elements for incorporation in action programmes shall be selected and adapted to the socio- economic, geographical and climatic factors applicable to affected country Parties or regions, as well as to their level of development through respective regional annexes.
There are two regional annexes related to Europe under the CCD: Annex IV-Regional Implementation Annex for the Northern Mediterranean and Annex V- Regional Implementation Annex for Central and Eastern Europe. This last annex is a new annex that entered into force in September 2001. The adopted particular conditions of the northern Mediterranean region under the CCD include:
• “semi-arid climatic conditions affecting large areas, seasonal droughts, very high rainfall variability and sudden and high-intensity rainfall;
• poor and highly erodible soils, prone to develop surface crusts; • uneven relief with steep slopes and very diversified landscapes; • extensive forest coverage losses due to frequent wildfires; • crisis conditions in traditional agriculture with associated land
abandonment and deterioration of soil and water conservation structures; • unsustainable exploitation of water resources leading to serious
environmental damage, including chemical pollution, salinization and exhaustion of aquifers;
• concentration of economic activity in coastal areas as a result of urban growth, industrial activities, tourism and irrigated agriculture.”
The adopted particular conditions of the Central and Eastern European Region under the CDD include:
• “specific problems and challenges related to the current process of economic transition, including macroeconomic and financial problems and the need for strengthening the social and political framework for economic and market reforms;
• the variety of forms of land degradation in the different ecosystems of the region, including the effects of drought and the risks of desertification in regions prone to soil erosion caused by water and wind;
• crisis conditions in agriculture due, inter alia, to depletion of arable land, problems related to inappropriate irrigation systems and gradual deterioration of soil and water conservation structures;
• unsustainable exploitation of water resources leading to serious environmental damage, including chemical pollution, salinization and exhaustion of aquifers;
• forest coverage losses due to climatic factors, consequences of air pollution and frequent wildfires;
12
• the use of unsustainable development practices in affected areas as a result of complex interactions among physical, biological, political, social and economic factors;
• the need to review research objectives and the policy and legislative framework for the sustainable management of natural resources; and
• the opening up of the region to wider international cooperation and the pursuit of broad objectives of sustainable development.”
a) Activities at Regional level in Europe
Two regional parallel processes have been recently launched under the CCD in Europe, one for Northern Mediterranean (Annex IV) and one for Central and Eastern Europe (Annex V). Some countries are following both processes as being both Northern Mediterranean and Central and Eastern Countries. The regional process for Northern Mediterranean was launched in Geneva in July 2002 aiming at developing exchange and cooperation between all eleven country Parties of Northern Mediterranean (Albania, Bosnia & Herzegovina, Croatia, Cyprus, Greece, Italy, Malta, Portugal, Slovenia, Spain, Turkey). A bottom up approach has been adopted by analyzing through a questionnaire the expression of the needs and of the offers from each country on various sectors of interest for the CCD. At the occasion of the CRIC1 in November 2002, a second meeting was held in Rome and the Parties considered the issue of water management as a priority. It is planed to have a 3rd meeting in Bonn, in April 2003. After a consultative meeting in Prague (September 2001), the regional process for Central and Eastern Europe was launched at the occasion of the CRIC1, in November 2002. A first meeting of Annex V was held in Rome to discuss a framework of regional cooperation. It includes all current affected country Parties from CEE with the cooperation of non-affected country Parties from the region.
b) Activties at Sub-regional level in Europe In the Northern Mediterranean (Annex IV), a sub-regional process has involved since several years, five developed affected countries: Greece, Italy, Portugal, Spain, and Turkey. There is a rotating presidency (Turkey has the current presidency) and Terms of reference of a SRAP have been adopted in 2000. Focal points are also involved in other scientific projects which results could facilitate their NAP process. A more detailed presentation of the activities of the focal points of Annex IV is also contained in the present document, in the article entitled “UNCCD/Annex IV, backgroud and a summary of activities” by Nicholas Yassoglou. Concerning the Central and Eastern Europe (Annex V), at sub regional level, interest was expressed in establishing a drought mitigation centre in the Balkans.
13
Science and Technical cooperation under the CCD Several general dispositions of the Convention concern the scientific and technical cooperation. Article 16 refers to Information collection, analysis and exchange. Therefore, Parties shall integrate and coordinate the collection, analysis and exchange of relevant data and information to ensure systematic observation of land degradation in affected areas and to understand better and assess the processes and effects of drought and desertification. Article 17 refers to Research and development. The Parties undertake, to promote technical and scientific cooperation in the fields of combating desertification and mitigating the effects of drought through appropriate national, subregional, regional and international institutions. Research priorities for particular regions and subregions, reflecting different local conditions, should be included in action programmes. Article 18 refers to Transfer, acquisition, adaptation and development of technology. The Parties undertake, to promote, finance and/or facilitate the financing of the transfer, acquisition, adaptation and development of environmentally sound, economically viable and socially acceptable technologies relevant to combating desertification and/or mitigating the effects of drought, with a view to contributing to the achievement of sustainable development in affected areas. A Committee on Science and Technology was established under article 24 of the CCD as a subsidiary body of the Conference of the Parties. It provides it with information and advice on scientific and technological matters relating to combating desertification and mitigating the effects of drought. It is composed of government representatives competent in the relevant fields of expertise. The Conference of the Parties establishes and maintains a roster of independent experts with expertise and experience in the relevant fields. The Conference of the Parties may, as necessary, appoint ad hoc panels to provide it, through the Committee, with information and advice on specific issues regarding the state of the art in fields of science and technology relevant to combating desertification and mitigating the effects of drought. These panels shall be composed of experts, whose names are taken from the roster, taking into account the need for a multidisciplinary approach and broad geographical representation. More detailed information on the various activities and functioning of the CST as well as on its new Group of Experts are contained in the present document, in an article entitled ”The role of the Committee on Science and Technology and the Specific role of the Group of experts of the CCD” by Ryszard Debiski. Conclusions The UNCCD Convention is a sustainable development convention and as such represents an action oriented process. More than a convention on desertification and land degradation, it is a convention on “combating” desertification and through it a convention on combating land degradation. It concerns Africa, Asia, Latin America and Caribbean and also Europe through the Northern Mediterranean and Central and

14
Eastern European Annexes. CCD convention provides a legal framework and basis for action to all European country Parties, which declare themselves as affected. Among the various stakeholders, which are participating in the process of implementing the CCD, national scientific communities from affected European country Parties can play an active role. They are encouraged to scientifically contribute to the process by drawing the attention of the decision makers to the status of land degradation with data and facts and also by providing them with adequate tools for monitoring for better sustainable management and rehabilitation of land. There is an important and crucial challenge in European countries with regard to land degradation and soil: it consists in improving the exchange and contacts between the UNCCD national focal point/National Coordinating body working on the preparation and implementation of National Action Programme, and the national scientific community working on the scientific approach to the soil and land degradation issues. Some progresses have been made and the current meeting is one way to go further.
15
The EU Thematic Strategy on Soil Protection
Luca Montanarella
EUROPEAN COMMISSION JOINT RESEARCH CENTRE
Institute for Environment and Sustainability TP 280
I-21020 Ispra (VA), Italy
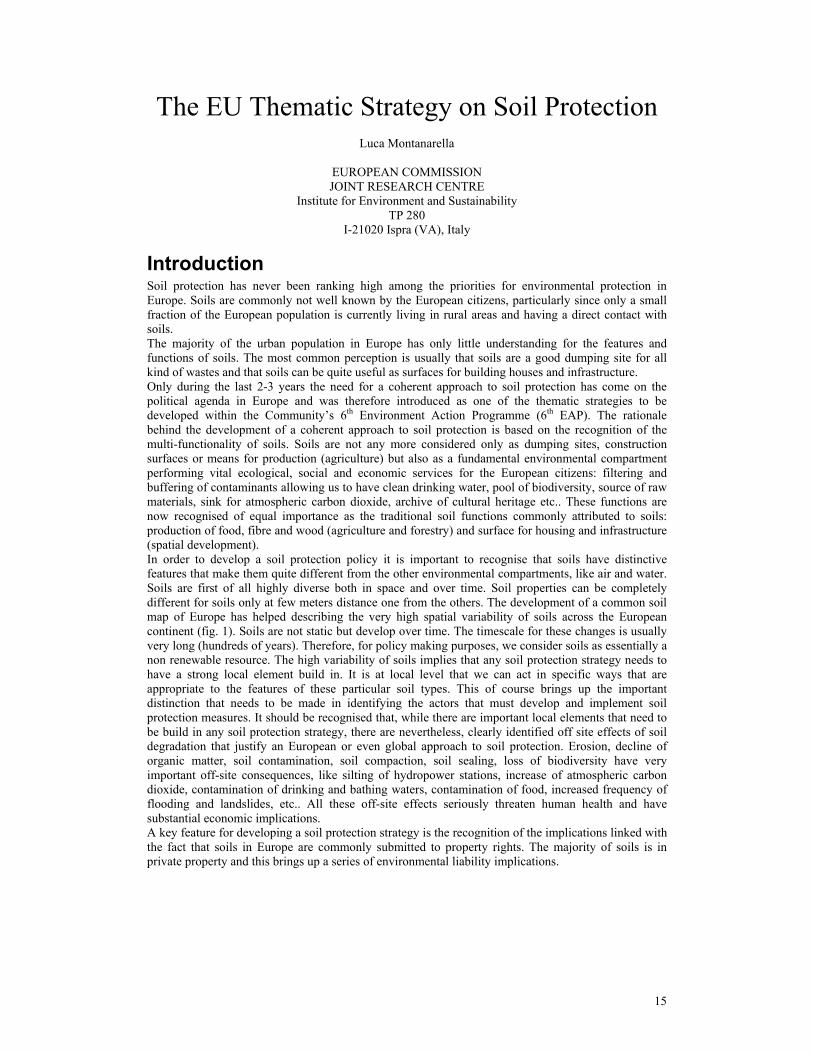
Introduction Soil protection has never been ranking high among the priorities for environmental protection in Europe. Soils are commonly not well known by the European citizens, particularly since only a small fraction of the European population is currently living in rural areas and having a direct contact with soils. The majority of the urban population in Europe has only little understanding for the features and functions of soils. The most common perception is usually that soils are a good dumping site for all kind of wastes and that soils can be quite useful as surfaces for building houses and infrastructure. Only during the last 2-3 years the need for a coherent approach to soil protection has come on the political agenda in Europe and was therefore introduced as one of the thematic strategies to be developed within the Community’s 6th Environment Action Programme (6th EAP). The rationale behind the development of a coherent approach to soil protection is based on the recognition of the multi-functionality of soils. Soils are not any more considered only as dumping sites, construction surfaces or means for production (agriculture) but also as a fundamental environmental compartment performing vital ecological, social and economic services for the European citizens: filtering and buffering of contaminants allowing us to have clean drinking water, pool of biodiversity, source of raw materials, sink for atmospheric carbon dioxide, archive of cultural heritage etc.. These functions are now recognised of equal importance as the traditional soil functions commonly attributed to soils: production of food, fibre and wood (agriculture and forestry) and surface for housing and infrastructure (spatial development). In order to develop a soil protection policy it is important to recognise that soils have distinctive features that make them quite different from the other environmental compartments, like air and water. Soils are first of all highly diverse both in space and over time. Soil properties can be completely different for soils only at few meters distance one from the others. The development of a common soil map of Europe has helped describing the very high spatial variability of soils across the European continent (fig. 1). Soils are not static but develop over time. The timescale for these changes is usually very long (hundreds of years). Therefore, for policy making purposes, we consider soils as essentially a non renewable resource. The high variability of soils implies that any soil protection strategy needs to have a strong local element build in. It is at local level that we can act in specific ways that are appropriate to the features of these particular soil types. This of course brings up the important distinction that needs to be made in identifying the actors that must develop and implement soil protection measures. It should be recognised that, while there are important local elements that need to be build in any soil protection strategy, there are nevertheless, clearly identified off site effects of soil degradation that justify an European or even global approach to soil protection. Erosion, decline of organic matter, soil contamination, soil compaction, soil sealing, loss of biodiversity have very important off-site consequences, like silting of hydropower stations, increase of atmospheric carbon dioxide, contamination of drinking and bathing waters, contamination of food, increased frequency of flooding and landslides, etc.. All these off-site effects seriously threaten human health and have substantial economic implications. A key feature for developing a soil protection strategy is the recognition of the implications linked with the fact that soils in Europe are commonly submitted to property rights. The majority of soils is in private property and this brings up a series of environmental liability implications.
16
Figure 1: Soil map derived from the Soil Geographical Database of Europe at scale 1:1,000,000.
The EU soil protection strategy builds upon the recognition that the important functions of soils are threatened by severe degradation processes. The major threats identified so far are soil erosion, decline in organic matter content, loss of soil biodiversity, soil contamination, salinization, soil compaction, soil sealing and major hydro-geological risks (flood and landslides).
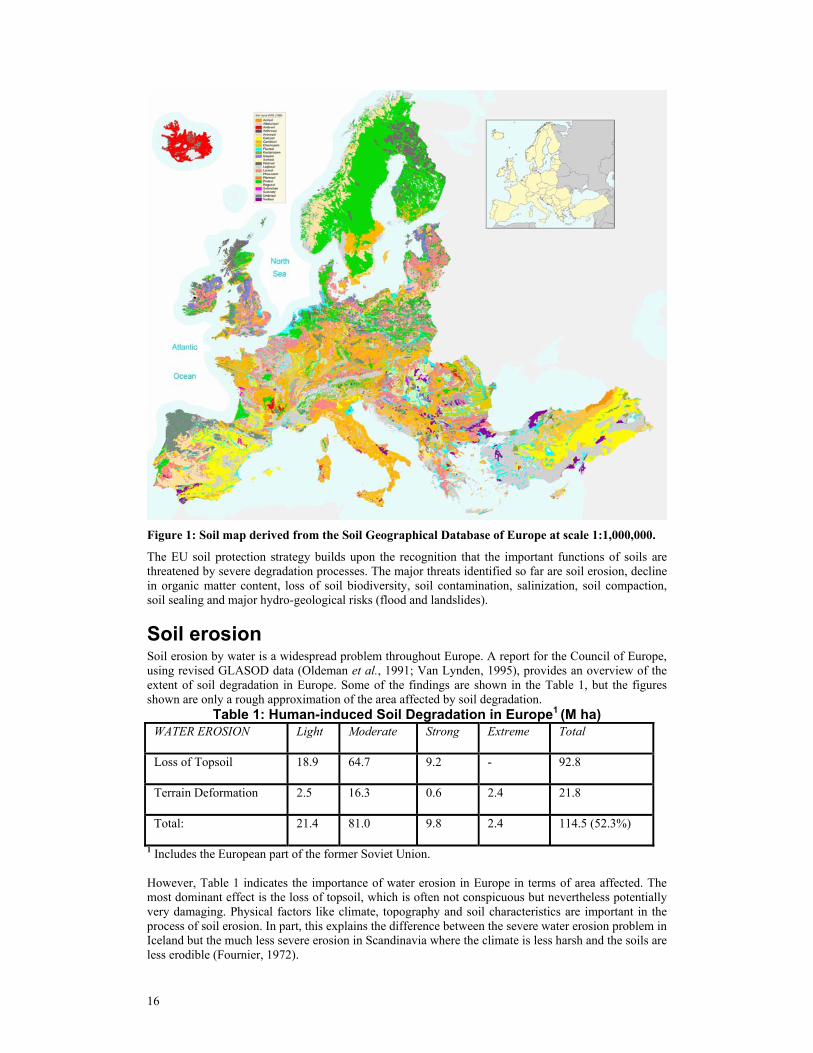
Soil erosion Soil erosion by water is a widespread problem throughout Europe. A report for the Council of Europe, using revised GLASOD data (Oldeman et al., 1991; Van Lynden, 1995), provides an overview of the extent of soil degradation in Europe. Some of the findings are shown in the Table 1, but the figures shown are only a rough approximation of the area affected by soil degradation.
Table 1: Human-induced Soil Degradation in Europe1 (M ha) WATER EROSION Light Moderate Strong Extreme Total
Loss of Topsoil 18.9 64.7 9.2 - 92.8
Terrain Deformation 2.5 16.3 0.6 2.4 21.8
Total: 21.4 81.0 9.8 2.4 114.5 (52.3%)
1 Includes the European part of the former Soviet Union.
However, Table 1 indicates the importance of water erosion in Europe in terms of area affected. The most dominant effect is the loss of topsoil, which is often not conspicuous but nevertheless potentially very damaging. Physical factors like climate, topography and soil characteristics are important in the process of soil erosion. In part, this explains the difference between the severe water erosion problem in Iceland but the much less severe erosion in Scandinavia where the climate is less harsh and the soils are less erodible (Fournier, 1972).
17
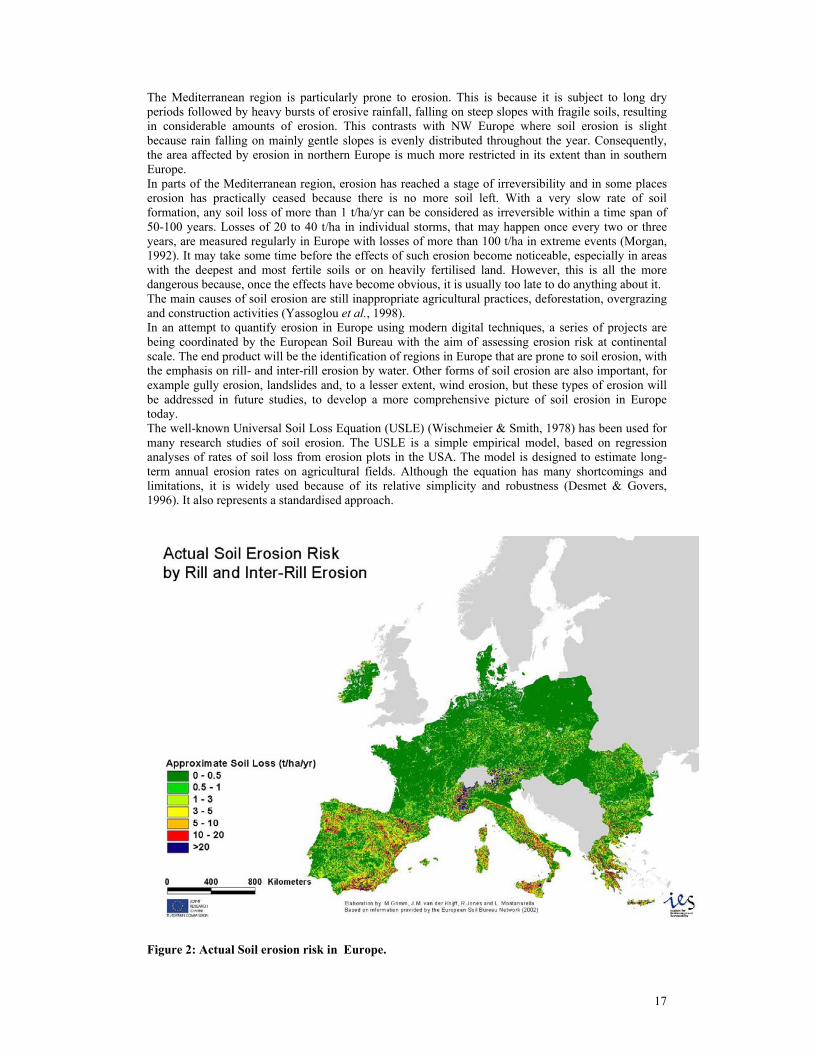
The Mediterranean region is particularly prone to erosion. This is because it is subject to long dry periods followed by heavy bursts of erosive rainfall, falling on steep slopes with fragile soils, resulting in considerable amounts of erosion. This contrasts with NW Europe where soil erosion is slight because rain falling on mainly gentle slopes is evenly distributed throughout the year. Consequently, the area affected by erosion in northern Europe is much more restricted in its extent than in southern Europe. In parts of the Mediterranean region, erosion has reached a stage of irreversibility and in some places erosion has practically ceased because there is no more soil left. With a very slow rate of soil formation, any soil loss of more than 1 t/ha/yr can be considered as irreversible within a time span of 50-100 years. Losses of 20 to 40 t/ha in individual storms, that may happen once every two or three years, are measured regularly in Europe with losses of more than 100 t/ha in extreme events (Morgan, 1992). It may take some time before the effects of such erosion become noticeable, especially in areas with the deepest and most fertile soils or on heavily fertilised land. However, this is all the more dangerous because, once the effects have become obvious, it is usually too late to do anything about it. The main causes of soil erosion are still inappropriate agricultural practices, deforestation, overgrazing and construction activities (Yassoglou et al., 1998). In an attempt to quantify erosion in Europe using modern digital techniques, a series of projects are being coordinated by the European Soil Bureau with the aim of assessing erosion risk at continental scale. The end product will be the identification of regions in Europe that are prone to soil erosion, with the emphasis on rill- and inter-rill erosion by water. Other forms of soil erosion are also important, for example gully erosion, landslides and, to a lesser extent, wind erosion, but these types of erosion will be addressed in future studies, to develop a more comprehensive picture of soil erosion in Europe today. The well-known Universal Soil Loss Equation (USLE) (Wischmeier & Smith, 1978) has been used for many research studies of soil erosion. The USLE is a simple empirical model, based on regression analyses of rates of soil loss from erosion plots in the USA. The model is designed to estimate long-term annual erosion rates on agricultural fields. Although the equation has many shortcomings and limitations, it is widely used because of its relative simplicity and robustness (Desmet & Govers, 1996). It also represents a standardised approach.
Figure 2: Actual Soil erosion risk in Europe.
18
The application of the USLE in Europe (Van der Knijff et al., 2000) is a first attempt to produce a map of quantitative soil erosion by rill and interrill erosion for the whole continent. The estimates of sediment loss are not validated in most cases but relative differences are thought to be real. The map of estimated annual soil erosion risk shown in Figure 2 is based on a 1km x 1km data set for all Europe. Potential erosion risk was also estimated by re-running the USLE assuming a total absence of vegetative cover. One of the main advantages of the Universal Soil Loss Equation (USLE) is that it is well-known and it has been applied widely at different scales. Compared with the methods described above, it probably gives the most detailed information about the Europe-wide distribution of soil erosion risk. Its value lies in the fact that the estimates of erosion are based on standardised, harmonised data sets for the whole of Europe and the model produces quantitative output as actual loss, for example t/ha. However, in this study for Europe, a quantitative assessment was not considered appropriate in view of the quality of the available data. Furthermore, it is not appropriate to use the maps to predict soil losses on any individual agricultural parcel, nor to predict soil loss for any individual year. Only rill- and inter-rill soil erosion by water flow is taken into account and deposition is not included. Thus, the maps should not be used to predict the occurrence of mass movements like landslides. The effect of management practice is nearly impossible to assess at the small scale used here. Compared with other models, the USLE is one of the least data demanding erosion models that has been developed. However, there are still some uncertainties associated with the various data sources such as the estimation of vegetation cover, rainfall erosivity, soil erodibility and the effect of management practice (including contouring, strip cropping, terracing and subsurface drainage (Renard et al., 1997). It should be appreciated that management practice may be one of the most important factors affecting erosion in many cases.
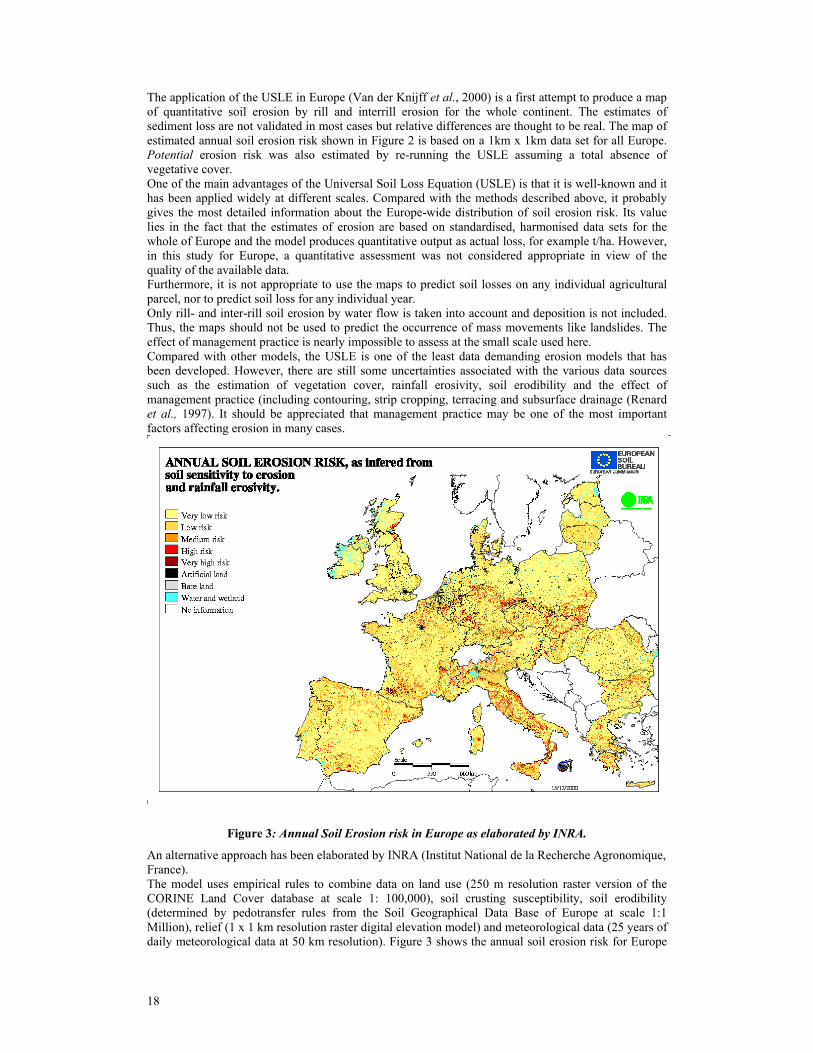
Figure 3: Annual Soil Erosion risk in Europe as elaborated by INRA.
An alternative approach has been elaborated by INRA (Institut National de la Recherche Agronomique, France). The model uses empirical rules to combine data on land use (250 m resolution raster version of the CORINE Land Cover database at scale 1: 100,000), soil crusting susceptibility, soil erodibility (determined by pedotransfer rules from the Soil Geographical Data Base of Europe at scale 1:1 Million), relief (1 x 1 km resolution raster digital elevation model) and meteorological data (25 years of daily meteorological data at 50 km resolution). Figure 3 shows the annual soil erosion risk for Europe
19
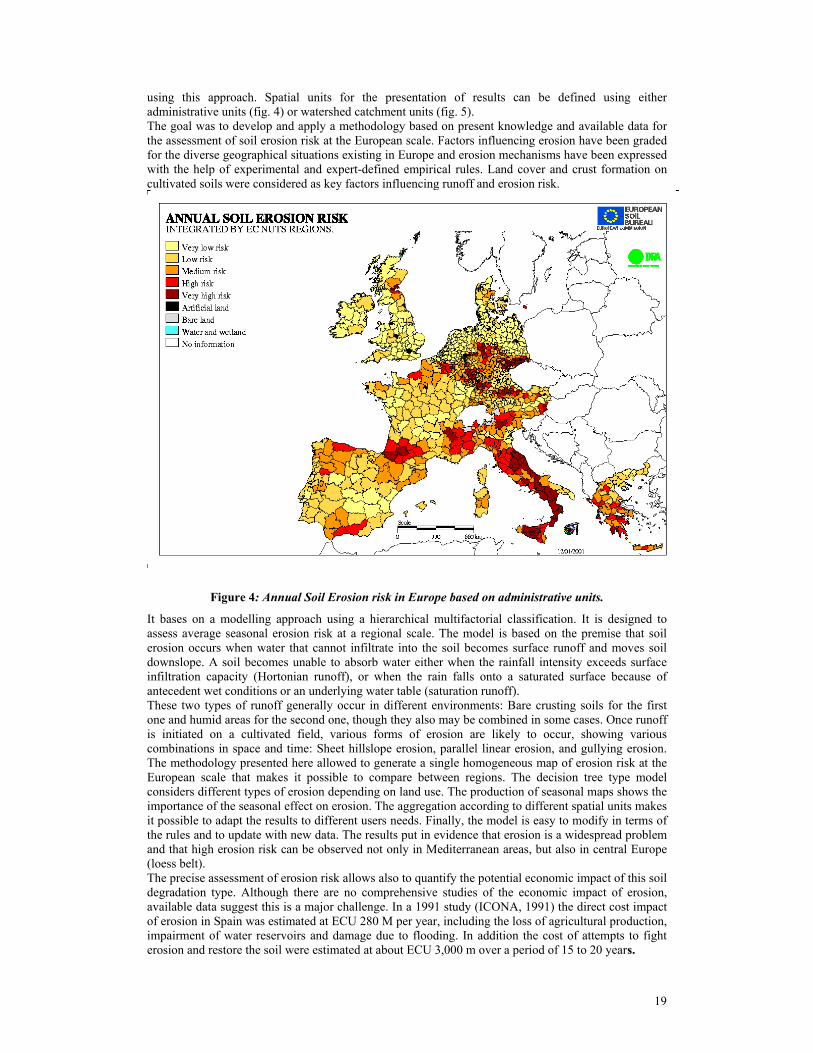
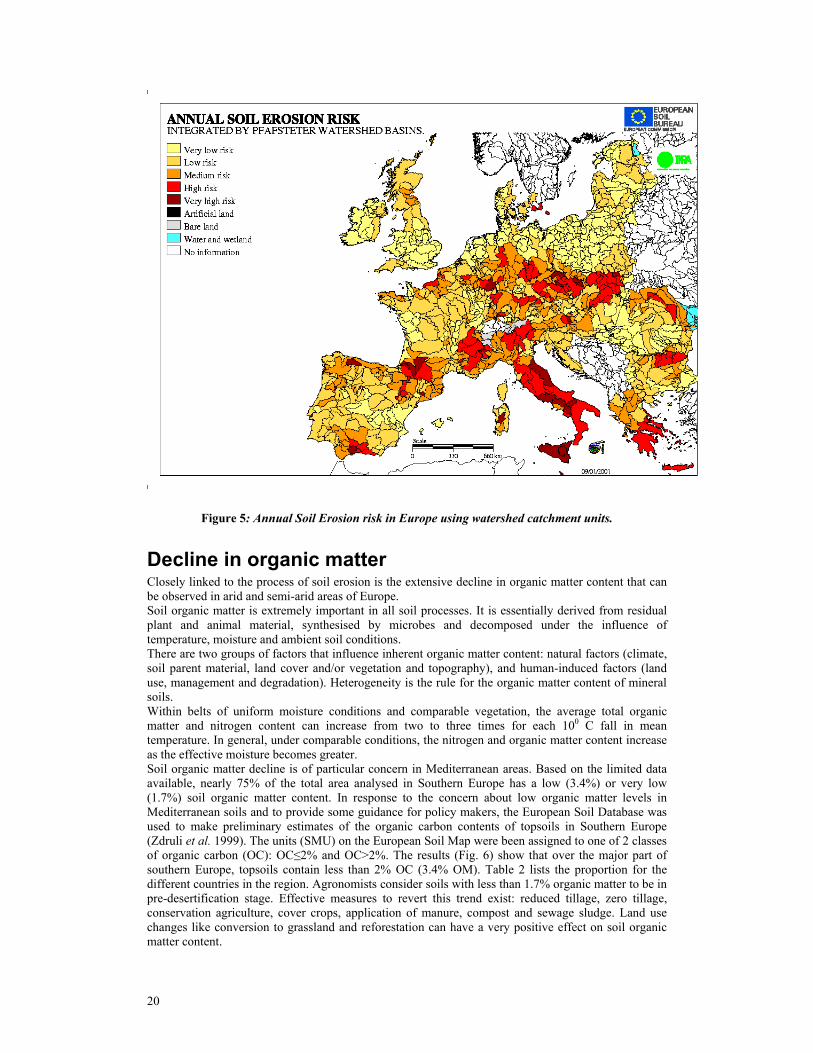
using this approach. Spatial units for the presentation of results can be defined using either administrative units (fig. 4) or watershed catchment units (fig. 5). The goal was to develop and apply a methodology based on present knowledge and available data for the assessment of soil erosion risk at the European scale. Factors influencing erosion have been graded for the diverse geographical situations existing in Europe and erosion mechanisms have been expressed with the help of experimental and expert-defined empirical rules. Land cover and crust formation on cultivated soils were considered as key factors influencing runoff and erosion risk.
Figure 4: Annual Soil Erosion risk in Europe based on administrative units.
It bases on a modelling approach using a hierarchical multifactorial classification. It is designed to assess average seasonal erosion risk at a regional scale. The model is based on the premise that soil erosion occurs when water that cannot infiltrate into the soil becomes surface runoff and moves soil downslope. A soil becomes unable to absorb water either when the rainfall intensity exceeds surface infiltration capacity (Hortonian runoff), or when the rain falls onto a saturated surface because of antecedent wet conditions or an underlying water table (saturation runoff). These two types of runoff generally occur in different environments: Bare crusting soils for the first one and humid areas for the second one, though they also may be combined in some cases. Once runoff is initiated on a cultivated field, various forms of erosion are likely to occur, showing various combinations in space and time: Sheet hillslope erosion, parallel linear erosion, and gullying erosion. The methodology presented here allowed to generate a single homogeneous map of erosion risk at the European scale that makes it possible to compare between regions. The decision tree type model considers different types of erosion depending on land use. The production of seasonal maps shows the importance of the seasonal effect on erosion. The aggregation according to different spatial units makes it possible to adapt the results to different users needs. Finally, the model is easy to modify in terms of the rules and to update with new data. The results put in evidence that erosion is a widespread problem and that high erosion risk can be observed not only in Mediterranean areas, but also in central Europe (loess belt). The precise assessment of erosion risk allows also to quantify the potential economic impact of this soil degradation type. Although there are no comprehensive studies of the economic impact of erosion, available data suggest this is a major challenge. In a 1991 study (ICONA, 1991) the direct cost impact of erosion in Spain was estimated at ECU 280 M per year, including the loss of agricultural production, impairment of water reservoirs and damage due to flooding. In addition the cost of attempts to fight erosion and restore the soil were estimated at about ECU 3,000 m over a period of 15 to 20 years.
20
Figure 5: Annual Soil Erosion risk in Europe using watershed catchment units.
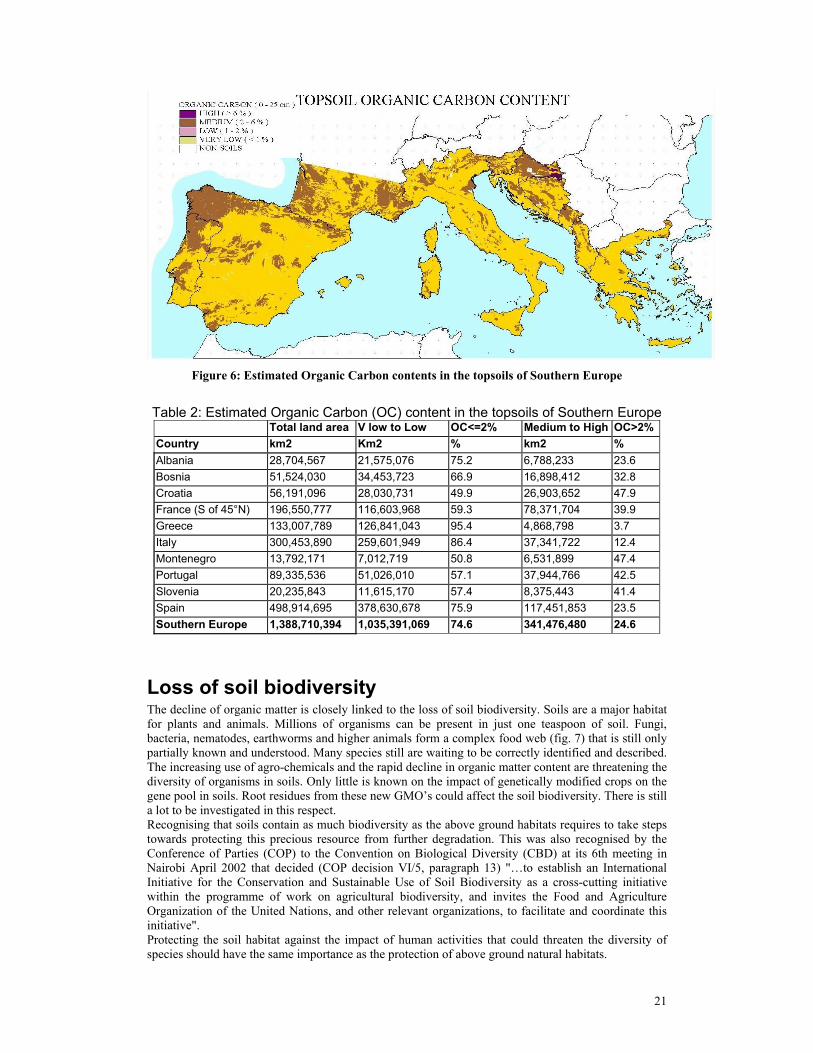
Decline in organic matter Closely linked to the process of soil erosion is the extensive decline in organic matter content that can be observed in arid and semi-arid areas of Europe. Soil organic matter is extremely important in all soil processes. It is essentially derived from residual plant and animal material, synthesised by microbes and decomposed under the influence of temperature, moisture and ambient soil conditions. There are two groups of factors that influence inherent organic matter content: natural factors (climate, soil parent material, land cover and/or vegetation and topography), and human-induced factors (land use, management and degradation). Heterogeneity is the rule for the organic matter content of mineral soils. Within belts of uniform moisture conditions and comparable vegetation, the average total organic matter and nitrogen content can increase from two to three times for each 100 C fall in mean temperature. In general, under comparable conditions, the nitrogen and organic matter content increase as the effective moisture becomes greater. Soil organic matter decline is of particular concern in Mediterranean areas. Based on the limited data available, nearly 75% of the total area analysed in Southern Europe has a low (3.4%) or very low (1.7%) soil organic matter content. In response to the concern about low organic matter levels in Mediterranean soils and to provide some guidance for policy makers, the European Soil Database was used to make preliminary estimates of the organic carbon contents of topsoils in Southern Europe (Zdruli et al. 1999). The units (SMU) on the European Soil Map were been assigned to one of 2 classes of organic carbon (OC): OC≤2% and OC>2%. The results (Fig. 6) show that over the major part of southern Europe, topsoils contain less than 2% OC (3.4% OM). Table 2 lists the proportion for the different countries in the region. Agronomists consider soils with less than 1.7% organic matter to be in pre-desertification stage. Effective measures to revert this trend exist: reduced tillage, zero tillage, conservation agriculture, cover crops, application of manure, compost and sewage sludge. Land use changes like conversion to grassland and reforestation can have a very positive effect on soil organic matter content.
21
Figure 6: Estimated Organic Carbon contents in the topsoils of Southern Europe
Table 2: Estimated Organic Carbon (OC) content in the topsoils of Southern Europe Total land area V low to Low OC<=2% Medium to High OC>2% Country km2 Km2 % km2 % Albania 28,704,567 21,575,076 75.2 6,788,233 23.6 Bosnia 51,524,030 34,453,723 66.9 16,898,412 32.8 Croatia 56,191,096 28,030,731 49.9 26,903,652 47.9 France (S of 45°N) 196,550,777 116,603,968 59.3 78,371,704 39.9 Greece 133,007,789 126,841,043 95.4 4,868,798 3.7 Italy 300,453,890 259,601,949 86.4 37,341,722 12.4 Montenegro 13,792,171 7,012,719 50.8 6,531,899 47.4 Portugal 89,335,536 51,026,010 57.1 37,944,766 42.5 Slovenia 20,235,843 11,615,170 57.4 8,375,443 41.4 Spain 498,914,695 378,630,678 75.9 117,451,853 23.5 Southern Europe 1,388,710,394 1,035,391,069 74.6 341,476,480 24.6
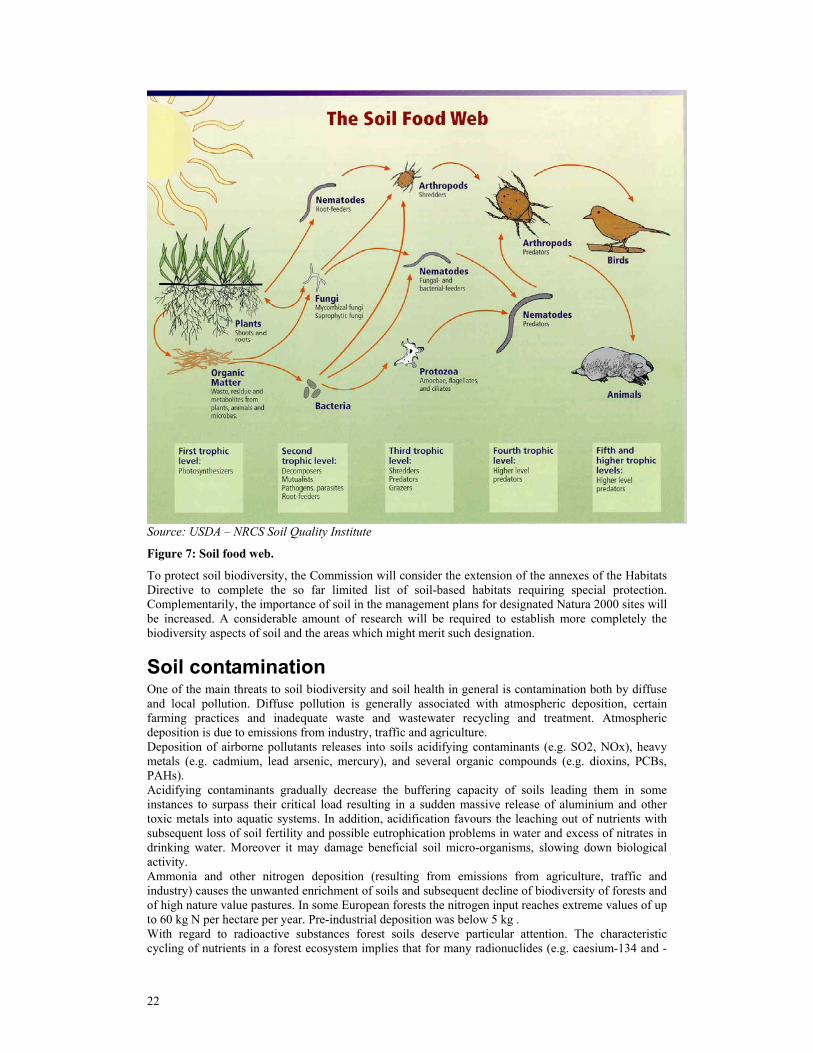
Loss of soil biodiversity The decline of organic matter is closely linked to the loss of soil biodiversity. Soils are a major habitat for plants and animals. Millions of organisms can be present in just one teaspoon of soil. Fungi, bacteria, nematodes, earthworms and higher animals form a complex food web (fig. 7) that is still only partially known and understood. Many species still are waiting to be correctly identified and described. The increasing use of agro-chemicals and the rapid decline in organic matter content are threatening the diversity of organisms in soils. Only little is known on the impact of genetically modified crops on the gene pool in soils. Root residues from these new GMO’s could affect the soil biodiversity. There is still a lot to be investigated in this respect. Recognising that soils contain as much biodiversity as the above ground habitats requires to take steps towards protecting this precious resource from further degradation. This was also recognised by the Conference of Parties (COP) to the Convention on Biological Diversity (CBD) at its 6th meeting in Nairobi April 2002 that decided (COP decision VI/5, paragraph 13) "…to establish an International Initiative for the Conservation and Sustainable Use of Soil Biodiversity as a cross-cutting initiative within the programme of work on agricultural biodiversity, and invites the Food and Agriculture Organization of the United Nations, and other relevant organizations, to facilitate and coordinate this initiative". Protecting the soil habitat against the impact of human activities that could threaten the diversity of species should have the same importance as the protection of above ground natural habitats.
22
Source: USDA – NRCS Soil Quality Institute
Figure 7: Soil food web.
To protect soil biodiversity, the Commission will consider the extension of the annexes of the Habitats Directive to complete the so far limited list of soil-based habitats requiring special protection. Complementarily, the importance of soil in the management plans for designated Natura 2000 sites will be increased. A considerable amount of research will be required to establish more completely the biodiversity aspects of soil and the areas which might merit such designation.
Soil contamination One of the main threats to soil biodiversity and soil health in general is contamination both by diffuse and local pollution. Diffuse pollution is generally associated with atmospheric deposition, certain farming practices and inadequate waste and wastewater recycling and treatment. Atmospheric deposition is due to emissions from industry, traffic and agriculture. Deposition of airborne pollutants releases into soils acidifying contaminants (e.g. SO2, NOx), heavy metals (e.g. cadmium, lead arsenic, mercury), and several organic compounds (e.g. dioxins, PCBs, PAHs). Acidifying contaminants gradually decrease the buffering capacity of soils leading them in some instances to surpass their critical load resulting in a sudden massive release of aluminium and other toxic metals into aquatic systems. In addition, acidification favours the leaching out of nutrients with subsequent loss of soil fertility and possible eutrophication problems in water and excess of nitrates in drinking water. Moreover it may damage beneficial soil micro-organisms, slowing down biological activity. Ammonia and other nitrogen deposition (resulting from emissions from agriculture, traffic and industry) causes the unwanted enrichment of soils and subsequent decline of biodiversity of forests and of high nature value pastures. In some European forests the nitrogen input reaches extreme values of up to 60 kg N per hectare per year. Pre-industrial deposition was below 5 kg . With regard to radioactive substances forest soils deserve particular attention. The characteristic cycling of nutrients in a forest ecosystem implies that for many radionuclides (e.g. caesium-134 and -
23
137 as released by the Chernobyl accident) there is no elimination of radioactive substances (except by radioactive decay). Thus we are today still confronted with levels of radioactivity in forest produce above the maximum permitted levels, especially in wild mushrooms. A number of farming practices can also be considered as a source of diffuse soil contamination, although their effects on water are better known than on soil. Production systems where a balance between farm inputs and outputs is not achieved in relation to soil and land availability, leads to nutrient imbalances in soil, which frequently result in the contamination of ground- and surface water. The extent of nitrate problems in Europe underlines the seriousness of this imbalance. An additional problem relates to heavy metals (e.g. cadmium, copper) in fertilisers and animal feed. Their effects on soil and soil organisms are not clear, although studies have shown the possible uptake of cadmium in the food chain. The effects on soil of antibiotics contained in animal feed are unknown. Pesticides are toxic compounds deliberately released into the environment to fight plant pests and diseases. They can accumulate in the soil, leach to the groundwater and evaporate into the air from which further deposition onto soil can take place. They also may affect soil biodiversity and enter the food chain. The current authorisation process of pesticides assesses inter alia the environmental risks of individual pesticides in the soil, however information on the combined effects remains limited. By this authorisation process pesticides with unacceptable risks are being eliminated. The volume of pesticide active ingredients sold across the 15 EU Member States reached 321,386 tonnes in 1998 . While the use of pesticides is regulated, and they should be only applied following Good Farming Practice, pesticides have been found to leach through the soil into groundwater and to be eroded with soil into surface water. Accumulation in soil occurs, in particular of those compounds now prohibited in the EU. With regard to waste, sewage sludge, the final product of the treatment of wastewater, is also raising concern. It is potentially contaminated by a whole range of pollutants, such as heavy metals and poorly biodegradable trace organic compounds, what can result in an increase of the soil concentrations of these compounds. Some of them can be broken down to harmless molecules by soil micro-organisms whereas others are persistent including heavy metals. This may result in increasing levels in the soil with subsequent risk for soil micro-organisms, plants, fauna and human beings. Potentially pathogenic organisms like viruses and bacteria are also present. However sewage sludge contains organic matter and nutrients such as nitrogen, phosphorus and potassium, of value to the soil and the options for its use include application on agricultural land. Provided that contamination is prevented and monitored at source, the careful and monitored use of sewage sludge on soil should not cause a problem, and, indeed, on the contrary could be beneficial and contribute to an increase of soil organic matter content. 6.5 million tonnes of sludge (dry matter) are produced every year in the EU. It is estimated that by 2005 there will be a 40% increase in the total quantity of sewage sludge available due to the progressive implementation of the Urban Wastewater Directive. A recent implementation report by the Commission on the latter indicates progress but also major delays in the implementation of that Directive in most Member States. A more serious concern for human health is deriving from the large number of highly contaminated sites in Europe. These sites are particularly numerous in many of the EU candidate countries, where contamination associated with the 3000 former military facilities constitutes a major problem which is not yet fully evaluated. Estimates of the number of contaminated sites in the EU range from 300 000 to 1.5 million . This wide range in estimations is due to the lack of a common definition for contaminated sites and relates to different approaches to acceptable risk levels, protection targets and exposure parameters. Soil clean-up is a difficult operation with very high costs. Expenditure for decontamination of contaminated sites greatly varies between Member States. In 2000 the Netherlands invested EUR 550 m in decontamination, Austria 67 and Spain 14. Such disparities reflect different perceptions of the severity of the contamination, different remediation policies and targets, and different ways of estimating expenditure. The European Environment Agency has estimated the total costs for the clean-up of contaminated sites in Europe to be between EUR 59 and 109 billion .
Salinization Salinization is the accumulation in soils of soluble salts of sodium, magnesium, and calcium to the extent that soil fertility is severely reduced.
24
This process is often associated with irrigation as irrigation water always contains variable amounts of salts in particular in regions where low rainfall, high evapotranspiration rates or soil textural characteristics impede the washing out of the salts which subsequently build-up in the soil surface layers. Irrigation with high salt content waters dramatically worsens the problem. In coastal areas salinization can also be associated with groundwater overexploitation (caused by the demands of growing urbanisation, industry and agriculture) leading to a lower water table and triggering the intrusion of marine water. In Nordic countries the winter maintenance of roads with salts can lead to salinization.
In dry land areas of Europe potentially affected by desertification (arid, semiarid and dry sub humid) the most affected zones are located in Hungary, Romania, Spain, Italy, Albania, FYROM and Greece, according to several authors (Szabolcs, 1991); (Misopolinos et Szabolcs, 1996); (EEA, 1998).
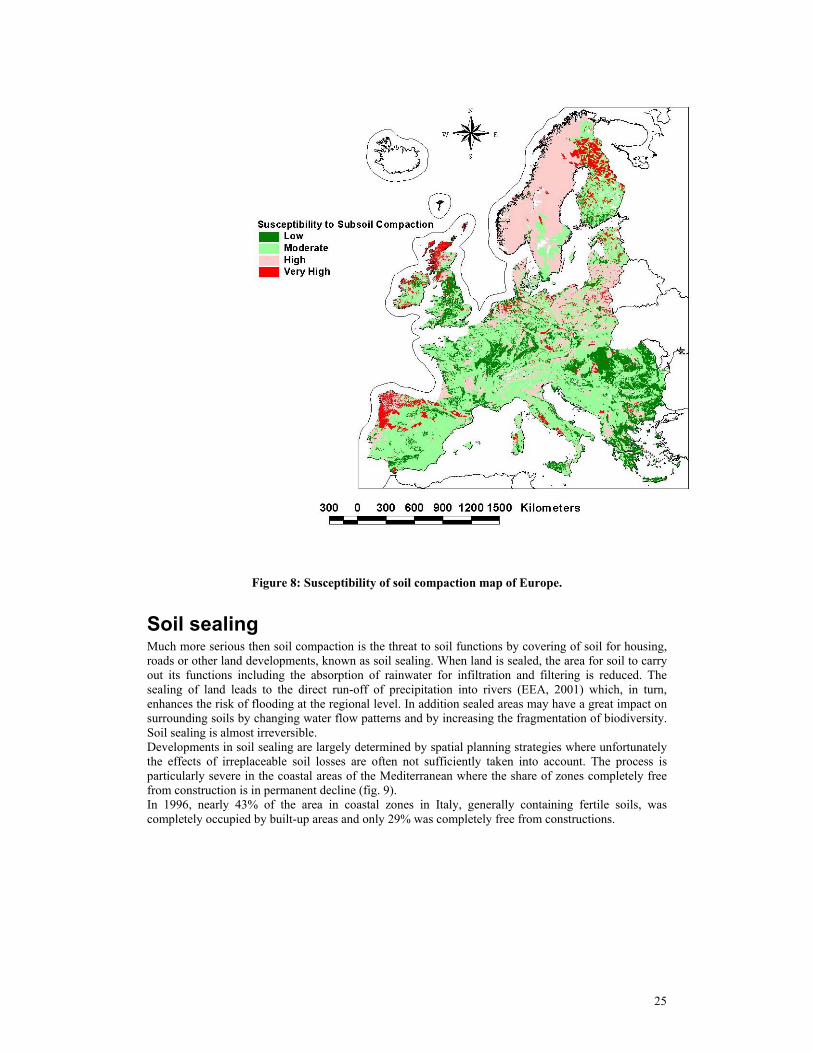
Physical degradation The most common form of soil physical degradation is soil compaction. Soil compaction occurs when soil is subject to mechanical pressure through the use of heavy machinery or overgrazing, especially in wet soil conditions. In sensitive areas, walking tourism and skiing also contribute to the problem. Compaction reduces the pore space between soil particles and the soil partially or fully loses its absorptive capacity. Compaction of deeper soil layers is very difficult to reverse. The overall deterioration in soil structure caused by compaction restricts root growth, water storage capacity, fertility, biological activity and stability. Moreover, when heavy rainfall occurs, the water can no longer easily infiltrate the soil. Resultant large volumes of run-off water increase erosion risks and are considered by some experts to have contributed to some recent flooding events in Europe . It has been estimated that nearly 4% of soil throughout Europe suffers from compaction , but no precise data are available. According to a recent study (Jones et al., 2001, 2003), more than a third of the soils in Europe are highly susceptible to compaction in the subsurface layers or horizons (fig. 8). Compaction of surface soil can, at least temporarily, be alleviated by mechanical loosening but in the subsurface horizons this is often difficult and expensive. Therefore any management system that is likely to increase subsoil compaction is not truly sustainable. There is evidence that soil bulk density increases under zero and minimum tillage systems though the exact effects will depend on the cropping system, the type of machinery employed, the soil type, the soil conditions during the period when the fieldwork is done and a number of other factors. Although reduced tillage results in higher bulk densities, in most cases no reduction or even an improvement of soil qualities will occur, compared to conventional tillage. However, as evident from extensive research in Sweden and other European countries, there are also cases, in which reduced tillage may cause a poorer soil structure, such as reduced rootability and infiltration due to the higher bulk density. Furthermore, even if the structure of already compacted soils may improve under zero or minimum tillage, recuperation of compacted soil is a slow process and the efficiency of the recuperation process decreases strongly with depth and may not sufficiently compensate compaction by heavy wheel loads. Thus, zero tillage, in the same way as conventional tillage, must be accompanied with an adequate protection of the soil by taking care that wheel loads do not exceed the strength of the soil. The detrimental effects of compaction go far beyond agricultural concerns of restricted root penetration, decreasing yields and increasing management costs. The overall deterioration in soil structure that may result from compaction, aggravated at times by a build up of water above the compacted layer, can also:
1. increase lateral seepage of excess water over and through the soil, accelerating the potential pollution of surface waters by organic wastes (slurry and sludge), pesticides, herbicides and other applied agrochemicals;
2. decrease the volume of the soil system available to act as a buffer and a filter for pollutants; 3. increase the risk of soil erosion and associated phosphorus losses on sloping land through the
concentration of excess water above compacted layers; 4. accelerate effective runoff from and within catchments. 5. increase green house gas production and nitrogen losses through denitrification under wetter
conditions.
25
Figure 8: Susceptibility of soil compaction map of Europe.
Soil sealing Much more serious then soil compaction is the threat to soil functions by covering of soil for housing, roads or other land developments, known as soil sealing. When land is sealed, the area for soil to carry out its functions including the absorption of rainwater for infiltration and filtering is reduced. The sealing of land leads to the direct run-off of precipitation into rivers (EEA, 2001) which, in turn, enhances the risk of flooding at the regional level. In addition sealed areas may have a great impact on surrounding soils by changing water flow patterns and by increasing the fragmentation of biodiversity. Soil sealing is almost irreversible. Developments in soil sealing are largely determined by spatial planning strategies where unfortunately the effects of irreplaceable soil losses are often not sufficiently taken into account. The process is particularly severe in the coastal areas of the Mediterranean where the share of zones completely free from construction is in permanent decline (fig. 9). In 1996, nearly 43% of the area in coastal zones in Italy, generally containing fertile soils, was completely occupied by built-up areas and only 29% was completely free from constructions.

26
< 00 - 1 0 1 0 - 2 0 2 0 - 3 0 > 30
I n c r e a s e i n b u i l d - u p a r e a s ( % )
Figure 9: Increase in artificial areas in coastal zones in selected countries in mainland Europe 1975-1990 Source: EEA, Copenhagen, 2000.
Floods and Landslides Floods and landslides are mainly natural hazards intimately related to soil and land management. Floods and mass movements of soil cause erosion, pollution with sediments and loss of soil resources with major impacts for human activities and human lives, damage to buildings and infrastructures, and loss of agricultural land. Floods and landslides are not a threat to soils in the same manner as the threats already listed. However, floods can, in some cases, result in part from soil not performing its role of controlling the water cycle due to compaction or sealing. They may also be favoured by erosion often caused by deforestation or by abandonment of land. Extensive floods have occurred recently in several areas of Europe. Particularly severe events have occurred during summer 2002 in the Elbe river basin and in the Danube basin. There is still not full evidence of an explicit link between soil degradation and flood events in Europe. It is nevertheless well known that soil hydraulic properties play an important role in generating the excessive water runoff generating the flooding. Deterministic models like LISFLOOD (De Roo et al., 2000) can contribute to the understanding of the role of soils in this context. Climate change, changes in land use and other factors play a role in determining the extreme events we have been observing recently. Unstable slopes with sparse vegetation are often prone to mass movements and landslides that can cause serious damages to infrastructure and even threaten human lives. Such unstable sloping conditions are particularly common in the Mediterranean area, where landslides are particularly frequent. In Italy more than 50% of the territory has been classified as having a high or very high hydro-geological risk, affecting 60% of the population or 34 million inhabitants. More than 15% of the territory and 26% of the population are subjected to a very high risk . The impacts on population and the economic damage are relevant. In Italy in the last 20 years floods and landslides had an impact on more than 70 000 people and caused economic damage of at least EUR 11 billion.

27
Conclusions A coherent approach to soil protection in Europe is just at its beginning. The goals set out in the communication “Towards a thematic strategy for soil protection” will take time to be achieved and will need further steps, as outlined in the final conclusions of the Council on this thematic strategy. An efficient soil information system capable to give answers to the questions raised by policy makers is a key requirement before any further action can be effectively be undertaken. Soil information is available in Europe. Unfortunately a lot of this information is scattered in different institutions both at National and at European level. The proposal for a common approach to soil monitoring that the Commission will put forward in 2004 will address this problem and propose solutions that will take into account the existing soil information systems and propose a framework allowing for the interchange of data in an harmonized way across the EU. In the longer term, the availability of policy relevant soil information will allow to efficiently implement the necessary measures in order to achieve soil protection for sustainable development in Europe.
References CEC Soil Map of the European Communities, 1:1,000,000. CEC Luxembourg, 124pp., 7 maps, 1985.
COMMUNICATION FROM THE COMMISSION TO THE COUNCIL, THE EUROPEAN PARLIAMENT, THE ECONOMIC AND SOCIAL COMMITTEE AND THE COMMITTEE OF THE REGIONS “Towards a Thematic Strategy for Soil Protection”, COM(2002) 179 final, Brussels, 16.4.2002.
CORINE Soil Erosion Risk and Important Land Resources in the Southern Regions of the European Community. EUR 13233, Luxembourg, 1992.
De Ploey, J. A Soil Erosion Map for Western Europe. Catena Verlag, 1989.
De Roo A., L. Montanarella, G. Schmuck, “Das Europäische Bodeninformationsystem (EUSIS) und sein Anwendung für Überschwemmungssimulationen mit Hilfe von LISFLOOD”; BfG Mitteilung nr. 21, Koblenz, 2000, pp. 105-115.
Desmet, P.J.J. & Govers, G. A GIS procedure for automatically calculating the USLE LS factor on topographically complex landcape units. Journal of soil and water conservation 51, p. 427-433, 1996.
EEA, Europe's Environment: The Dobris Assessment, Chapter 7. Soil, 27pp. European Environment Agency, 1995.
EEA, Down to Earth: soil degradation and sustainable development in Europe. Environmental Issues Series, Number 16, 32pp. European Environment Agency, 2000.
Fournier, Soil Conservation - Nature and Environment No 5, Council of Europe, Strasbourg, 1972.
Gentile, A.R., Towards the development of a system of policy relevant indicators on soil. European Soil Forum, Berlin, 1999.
Grimm, M., Jones R. & Montanarella L., Soil Erosion Risk in Europe. EUR 19939 EN, 40 pp., Office for Official Publications of the European Communities, Luxembourg, 2002.
ICONA, 1991. Plan national de lutte contre l’érosion. Ministère de l`Agriculture, de la Pêche et de l`Alimentation. Institut National pour la Conservation de la Nature, Madrid.
Jäger, S. Modelling Regional Soil Erosion Susceptibility Using the Universal Soil Loss Equation and GIS. In: Rickson, R.J (ed). Conserving Soil Resources. European Perspectives, pp. 161-177. CAB International, 1994.
Jones, R.J.A., Spoor, G. and Thomasson, A.J. (2000). Assessing the vulnerability of subsoils in Europe to compaction. In: J. Arvidsson, J.J.H. Van den Akker and R.Horn (Eds.), Proceedings of 3rd
28
Workshop of the Concerted Action ‘Experiences with the impact of subsoil compaction on soil, crop growth and environment and ways to prevent subsoil compaction’, 14-16th June 2000, Uppsala, Sweden p.160-172.
Jones, R.J.A., Spoor, G. and Thomasson, A.J. (2003). Assessing the vulnerability of subsoils in Europe to compaction: A preliminary analysis. [Soil & Tillage Research, 0, 000-000. In press].
King, D., Stengel, P. & Jamagne, M. Soil Mapping and Soil Monitoring: State of Progress and Use in France. In: Bullock, P., Jones, R.J.A. & Montanarella, L. (eds): Soil Resources of Europe. EUR 18991 EN, 204 pp. Office for Official Publications of the European Communities, Luxembourg, 1999.
Kirkby, M.J. & King, D Summary report on provisional RDI erosion risk map for France. Report on contract to the European Soil Bureau (unpublished), 1998.
Montier, C., Daroussin, J., King, D. & Le Bissonnais, Y. Cartographie vde l’aléa “Erosion des Sols” en France. INRA, Orléans, 1998.
Morgan, R.P.C. Soil Erosion in the Northern Countries of the European Community. EIW Workshop: Elaboration of a Framework of a Code of Good Agricultural Practices, Brussels, 21-22 May 1992.
Morgan, R.P.C. Soil Erosion and Conservation. Second Edition. Longman, Essex, 1995.
Morgan, R.P.C, Morgan, D.D.V. & Finney, H.J. A predictive model for the assessment of soil erosion risk. Journal of agricultural engineering research 30, p. 245-253, 1984.
Oldeman, L.R., Hakkeling, R.T.A. and Sombroek, W.G., World Map of the Status of Human-Induced Soil Degradation, with Explanatory Note (second revised edition) - ISRIC, Wageningen; UNEP, Nairobi, 1991.
Programa de Acción Nacional Contra la Desertificación (Borrador de Trabajo). Ministerio de Medio Ambiente. Madrid, Marzo, 2001.
Plan national de lutte contre l’érosion. Ministère de l`Agriculture, de la Pêche et de l`Alimentation. Institut National pour la Conservation de la Nature, Madrid, ICONA, 1991.
Renard, K.G., Foster, G.R., Weessies, G.A., McCool, D.K., Yoder, D.C. (eds) Predicting Soil Erosion by Water: A guide to to conservation planning with the Revised Universal Soil Loss Equation (RUSLE). U.S. Department of Agriculture, Agriculture Handbook 703, 1997.
Turner, S., Lyons, H. and D. Favis-Mortlock, Analysis and mapping of soil problem areas (hot spots) in Europe. Joint Final Report to EEA-UNEP, 62pp, 2001.
Van der Knijff, J.M., Jones, R.J.A. & Montanarella, L. Soil erosion risk assessment in Italy. European Soil Bureau, Joint Research Center of the European Commission, 1999.
Van Der Knijff, J.M., Jones, R.J.A. and Montanarella, L. Soil Erosion Risk Assessment in Europe, EUR 19044 EN, 34pp, 2000.
Van Lynden, G W J, The European soil resource: current status of soil degradation in Europe: causes, impacts and need for action. ISRIC, Wageningen. Council of Europe, Strasbourg, 1994.
Van Lynden, G.W.J. European soil resources. Nature and Environment No. 71. Council of Europe, Strasbourg, 1995.
Wischmeier, W.H. & Smith, D.D. Predicting rainfall erosion losses –a guide for conservation planning. U.S. Department of Agriculture, Agriculture Handbook 537, 1978.
World Atlas of Desertification. Edward Arnold, London, United Nations Environment Programme, 1992.
29
Yassoglou, N., Montanarella, L., Govers, G., Van Lynden, G., Jones, R.J.A., Zdruli, P., Kirkby, M., Giordano, A., Le Bissonnais, Y., Daroussin, J. & King, D. Soil Erosion in Europe. European Soil Bureau, 1998.
ZDRULI, P., JONES, R., MONTANARELLA L.. (1999). Organic Matter in the Soils of Southern Europe. DGXI.E3 Brussels.

MARCO MORETTINI, EUROPEAN COMMISSION, DG DEVELOPMENT, UNIT “ENVIRONMENT AND RURAL DEVELOPMENT” "EU ACTIVITIES IN SUPPORT OF THE IMPLEMENTATION OF THE UN CONVENTION TO COMBAT DESERTIFICATION "
30
THE JRC ENLARGEMENT ACTION Workshop on Land Degradation
Ispra 5,6 December 2002
Mr Bidoglio and JRC Colleagues, distinguished delegates, On behalf of the Directorate General for Development of the European
Commission I would like to express our deepest appreciation to the Joint
Research Centre for organising this workshop on Land Degradation, within
the JRC Enlargement Action, at this particular moment in time.
With the Enlargement Action the Joint Research Centre (JRC) is playing a
crucial role in providing scientific and technological support to the 13
candidate countries (which are associated or preparing their association to the
research activities) on their way towards their accession to the European
Union.
But let me say that we welcome this initiative also for five other important
reasons, which I would like to illustrate during this intervention.
First, because it is not limited to Accession Countries but it goes beyond the
enlargement dimension, involving in the scientific debate on land
degradation experts from the other Central and Eastern European countries.
This workshop therefore represents a great opportunity to take stock of the
soil degradation situation in these regions while establishing the appropriate
links with relevant national activities to implement the UN Convention to
Combat Desertification. You may be aware that the DG for Development is
the service chef de file in the Commission and the focal point for the
administrative/political follow-up of the implementation in the Community,
with valuable support and input from several other Commission
MARCO MORETTINI, EUROPEAN COMMISSION, DG DEVELOPMENT, UNIT “ENVIRONMENT AND RURAL DEVELOPMENT” "EU ACTIVITIES IN SUPPORT OF THE IMPLEMENTATION OF THE UN CONVENTION TO COMBAT DESERTIFICATION "
31
departments. In this respect a special word of thanks goes to the Soil & Waste
Unit of the JRC for responding so promptly on behalf of the Commission to
the formal invitation to organise a meeting on soil protection and land
rehabilitation in Europe addressed by the Regional Meeting for the Northern
Mediterranean, Central and Eastern European Countries held in Geneva last
July. This happened in the context of the preparatory work for the first
meeting of the Committee for the Implementation of the Convention (CRIC),
a new subsidiary body of the Convention.
I will come back in more detail on the results of the CRIC-1 meeting later on
during my intervention.
The second reason: this forum is a major occasion to foster dialogue among
countries belonging to:
the UN-CCD regional implementation Annex – Annex IV – for the
Northern Mediterranean – relevant for four Community Member States
and the Annex V for Central and Eastern Europe (relevant for most
candidate countries, but also for many others)
in light of the fact that the elaboration and implementation of Regional and
National Action Programmes within the UN-CCD form valuable policy
instruments to combat desertification and soil degradation phenomena in the
affected areas.
Later on today Professor Yassoglou will present the valuable experience of the
Annex IV countries in the implementation of the UN-CCD, so we will have at
that time an opportunity to have an exchange of views on this aspect and
possibly draw from this experience some operational conclusions, useful also
for other countries.
MARCO MORETTINI, EUROPEAN COMMISSION, DG DEVELOPMENT, UNIT “ENVIRONMENT AND RURAL DEVELOPMENT” "EU ACTIVITIES IN SUPPORT OF THE IMPLEMENTATION OF THE UN CONVENTION TO COMBAT DESERTIFICATION "
32
The third important aspect I would like to mention is the following:
The 6th Framework Programme for Research and Technical Development (6th
FP) officially launched last 11 November places great emphasis on the
creation of a European Research Area, aiming at scientific excellence,
improved competitiveness and innovation through the promotion of
increased co-operation and improved co-ordination among relevant actors at
all levels.
In this respect the new support instruments introduced such as networks of
excellence and integrated projects will give to the EU activities – which by the
way already fully involve Accession countries- a bigger impact on the
international scene promoting partnerships and collaboration.
Within this framework the EUROPEAN SOIL BUREAU (ESB), a specific
project of the JRC has already demonstrated its value in the previous FP as a
network of soil science institutions, carrying out scientific and technical work
programmes in order to collect, harmonise and distribute soil information
from countries all over Europe. In the new programme the ESB will continue
to play a catalytic role in mobilising a network of scientific excellence in
Europe, in the wider continental sense.
The ESB could continue to play a bridging role on one side among countries
in the Annexes IV and V -very soon at the end of 2003 the community will
count members in both Annexes- and on the other among scientists and
policy makers in Europe involved in the fight against land degradation.
This consideration leads me to the fourth aspect I intended to emphasise,
closely linked to the previous.
MARCO MORETTINI, EUROPEAN COMMISSION, DG DEVELOPMENT, UNIT “ENVIRONMENT AND RURAL DEVELOPMENT” "EU ACTIVITIES IN SUPPORT OF THE IMPLEMENTATION OF THE UN CONVENTION TO COMBAT DESERTIFICATION "
33
One of the most important decisions adopted at the last COP of the UN-CCD
concerned the modalities to improve the functioning of the existing
Committee on Science and Technology. COP-5 decided the creation of a
Group of 25 experts, which is now in place and which should be very soon
commencing its work.
We will hear more about this issue from Professor Debicki, one of the eminent
experts belonging to this group.
Let me just recall that the Community in February 2002 while submitting its
recommendations for the programme of work to be undertaken by the Group
of Experts emphasised the following:
1. That the CST work had to be connected to the process of review of
implementation of the Convention and that the review of national
reports had to play a crucial role in identifying main topics for the CST
group of experts.
2. That the work performed by the reformed CST had to be widely
recognised and distributed. Part of its activities should therefore be the
dissemination of its results and update of both ongoing (indicators –
benchmarking – Traditional Knowledge – Early Warning System) and
future activities.
3. That the 25 experts appointed should act as focal points of a wider
network of scientists and other experts, based on the roster of
independent experts, which should be seen as a valuable resource for
the implementation of the convention.
MARCO MORETTINI, EUROPEAN COMMISSION, DG DEVELOPMENT, UNIT “ENVIRONMENT AND RURAL DEVELOPMENT” "EU ACTIVITIES IN SUPPORT OF THE IMPLEMENTATION OF THE UN CONVENTION TO COMBAT DESERTIFICATION "
34
4. That the philosophy of work of the Group of Experts should be the need
to focus on a limited number of themes so to make the best possible use
of limited available resources.
In the Community we continue to believe that these principles should guide
the work of the Group of Experts if we want really to improve the functioning
of the CST. In this respect we are looking forward to a fruitful exchange and
dialogue with all the appointed members of this new group, making the best
possible use of the existing channels and structures.
I believe that it is necessary in this regard to establish the appropriate links
on one side with the activities to be undertaken in 2003 within the context of
the Soil Protection Communication, whose features have been presented in
detail by JRC colleagues
and on the other with the activities of the European Soil Bureau.
Let me conclude by highlighting some of the conclusions/recommendations
formulated at the recent 1st meeting of the CRIC, two weeks ago in Rome as a
result of the fruitful discussions among parties and observers, which seem to
me particularly relevant for this Workshop.
They relate to three of the seven thematic topics tackled at the session,
namely:
Measures for the rehabilitation of degraded land
Drought and desertification monitoring and assessment
Access by affected country parties – particularly developing country
parties – to appropriate technology and know-how
MARCO MORETTINI, EUROPEAN COMMISSION, DG DEVELOPMENT, UNIT “ENVIRONMENT AND RURAL DEVELOPMENT” "EU ACTIVITIES IN SUPPORT OF THE IMPLEMENTATION OF THE UN CONVENTION TO COMBAT DESERTIFICATION "
35
I would like to bring them to your attention.
➨ As to the Measures for the rehabilitation of degraded land:
action should focus on a specific territorial or spatial scale to
address local ecological and socio-economic conditions, and should
promote and implement small and medium size projects and
activities at the local level;
Action should also focus on the analysis of the causes of land
degradation, and on developing measures for prevention in parallel
with measures for rehabilitation.
➨ As to drought and desertification monitoring and assessment:
Key biophysical and socio-economic indicators for monitoring CCD
implementation should be developed, so to cover the establishment
of enabling conditions and the impact of measures taken. These
indicators should be reflected in guidance to Parties;
Monitoring systems should be adjusted to facilitate their application
in concrete measures to combat desertification.
➨ As to Access by affected country parties – particularly developing
country parties – to appropriate technology and know-how
research institutions should be strengthened to develop innovative
approaches and technologies to develop both preventive and
curative measures;
MARCO MORETTINI, EUROPEAN COMMISSION, DG DEVELOPMENT, UNIT “ENVIRONMENT AND RURAL DEVELOPMENT” "EU ACTIVITIES IN SUPPORT OF THE IMPLEMENTATION OF THE UN CONVENTION TO COMBAT DESERTIFICATION "
36
best practices should be promoted through the work of the CST and
its group of experts, National Co-ordinating Bodies and the media;
networking of scientific institutions, exchange of expertise,
technology transfers and training at universities, through the
various Action Programmes under the UNCCD, should be
encouraged;
In my opinion these recommendations indicate in a pragmatic and effective
manner the way forward for a more effective implementation of the
Convention.
Thank you for your attention.
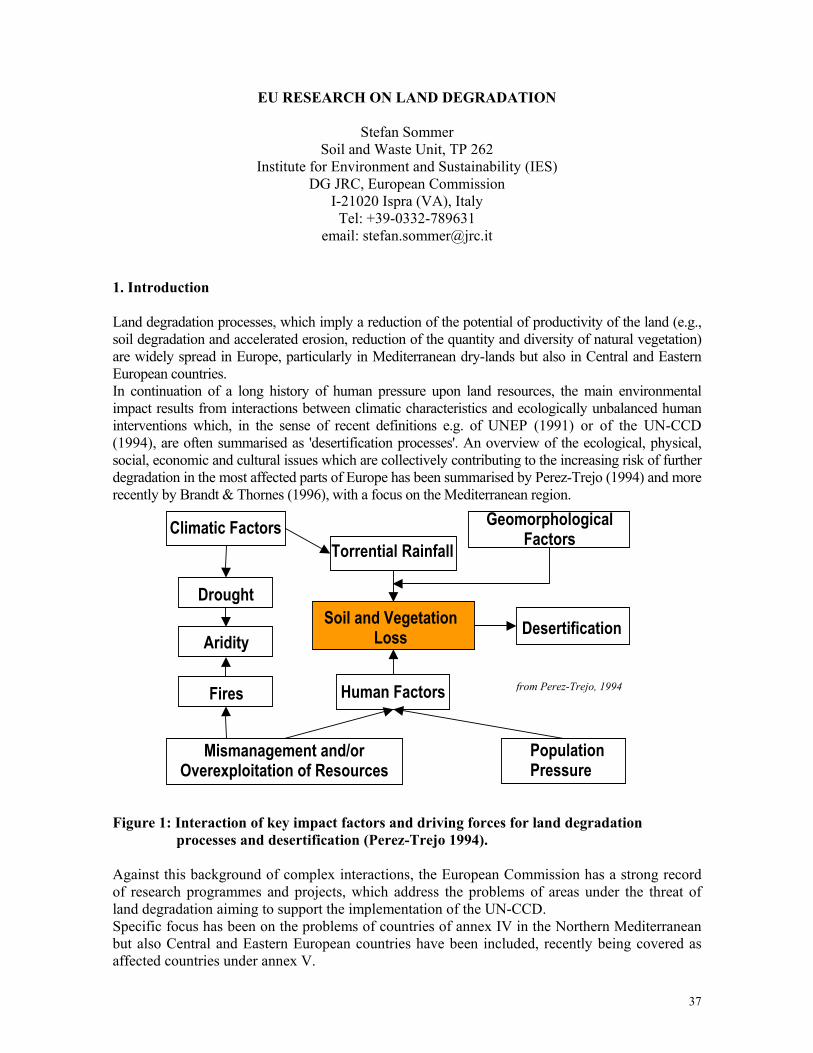
37
EU RESEARCH ON LAND DEGRADATION
Stefan Sommer Soil and Waste Unit, TP 262
Institute for Environment and Sustainability (IES) DG JRC, European Commission
I-21020 Ispra (VA), Italy Tel: +39-0332-789631
email: [email protected] 1. Introduction Land degradation processes, which imply a reduction of the potential of productivity of the land (e.g., soil degradation and accelerated erosion, reduction of the quantity and diversity of natural vegetation) are widely spread in Europe, particularly in Mediterranean dry-lands but also in Central and Eastern European countries. In continuation of a long history of human pressure upon land resources, the main environmental impact results from interactions between climatic characteristics and ecologically unbalanced human interventions which, in the sense of recent definitions e.g. of UNEP (1991) or of the UN-CCD (1994), are often summarised as 'desertification processes'. An overview of the ecological, physical, social, economic and cultural issues which are collectively contributing to the increasing risk of further degradation in the most affected parts of Europe has been summarised by Perez-Trejo (1994) and more recently by Brandt & Thornes (1996), with a focus on the Mediterranean region. Figure 1: Interaction of key impact factors and driving forces for land degradation
processes and desertification (Perez-Trejo 1994). Against this background of complex interactions, the European Commission has a strong record of research programmes and projects, which address the problems of areas under the threat of land degradation aiming to support the implementation of the UN-CCD. Specific focus has been on the problems of countries of annex IV in the Northern Mediterranean but also Central and Eastern European countries have been included, recently being covered as affected countries under annex V.
Climatic Factors
Drought
Aridity
Fires
Torrential Rainfall
Soil and VegetationLoss
Human Factors
Mismanagement and/or Overexploitation of Resources
Desertification
Geomorphological Factors
PopulationPressure
from Perez-Trejo, 1994
38
2. DG RESEARCH Initiatives The Directorate General RESEARCH has addressed land degradation and desertification within the EC research framework programmes over a period of more than 10 years. A comprehensive overview of research results achieved within fp3 and fp4 as well as the policy implications within the European and particularly the Mediterranean context is given in the 2 volumes of the proceedings of the International Conference on Mediterranean Desrtification, held in Crete, Oct. 29 to Nov 1, 1996 (EUR19303). Currently a considerable number of specific research projects are performed under the work programme of the 5th research framework programme (fp5) and relevant issues will be also addressed within the recent fp 6 (2003-2006). 2.1. Environmental Research Programmes within FP 5 and FP 6
In the frame of the Fifth Framework Programme, the Energy, Environment and Sustainable Development (EESD) programme - established a single, integrated platform for stimulating a pan-European approach to the closely related areas of environmental and energy research. Within this framework research possibilities to address land degradation and desertification in Europe were offered to the scientific community in relation to 2 main topics: Vulnerable Ecosystems, and Fighting Land Degradation and Desertification. The following 9 projects were selected for a total budget of about € 7.64 million.
− AID-CCD – Active exchange of experience on indicators and development of Persperctives in the context of the UNCCD EVK2-CT2002-80018
− DESERTLINKS – Combating Desertification in Mediterranean Europe Linking Science with Stakeholders EVK2-CT2001-00109
− CLEMDES – Clearing House Mechanism on Desertification for the Northern Mediterranean Region EVK2-CT2002-80006
− GEORANGE – Geomatics in the Assessment and Sustainable Management of Mediterranean Rangelands EVK2-CT2000-00091
− LADAMER – Land degradation assessment in Mediterranean Europe EVK2-CT2002-00179
− MEDACTION – Policies for land use to combat desertification EVK2-CT2000-00085
− MEDRAP – Concerted Action to support the Northern Mediterranean Regional Action Programme to combat Desertification EVK2-CT2000-20008
− REACTION – Restoration Actions to Combat Desertification in the Northern Mediterranean EVK2-CT2002-80025
− SCAPE – Soil Conservation and Protection Strategies for Europe EVK2-2002-20014
39
As far as the coordination and dissemination of results is concerned the Concerted Action MEDRAP was funded with the aim to establish a link between the scientific community-research results and the policy makers in particular in relation to Annex IV. The programme should also help the relevant groups to contribute toward the elaboration of an Annex IV regional action programme. Details of the above mentioned projects can be found in annex 1 of this paper. The recent 6th Research Framework (FP6) supports land degradation and soil related research in the Sustainable Development, Global Change and Ecosystems Programme. It will focus on large scale integrated assessment of land/soil degradation and desertification in Europe and related prevention and mitigation strategies. Furthermore, it will address soil aspects in relation to the water cycle. Other priorities aim at a better understanding of terrestrial biodiversity and on the role of soil as a carbon sink. In addition under the priority “Specific activities covering a wider field of research”, the 6th framework programme will support research underpinning the formulation and implementation of Community policies (6th Environmental Action Plan), including environmental assessment (soil and water, including the effects of chemical substances). 2.2. INCO - The International Co-operation Programme within FP5 and FP6 Since the early 1980s the Community research programmes have been extended to include scientific co-operation with non-EU countries to strengthen and add value to ongoing research and provide training opportunities in the developing countries (INCO). Between 1994 and 1998 this co-operation focused inter alia on the conservation and sustainable use of natural resources. Practically all regions of the world benefit from these research programmes. The INCO-DEV sub-programme under Fifth Framework Research Programme (1999-2002) seeks to tackle challenges linked directly to the particular conditions of developing countries and to the emergence of a series of far-reaching, interrelated and accelerated changes, like the rapid pace of technological advance, globalisation of knowledge and information, political and economic integration of countries into regional blocks, growing populations increasingly concentrated in urban centres, competition for natural resources and environmental deterioration. For developing countries to keep up with these challenges, research is vital. The problems to be tackled have been defined through appropriate dialogue with developing countries and their sub-regional organisations. Lessons learned through earlier research programmes have stimulated greater emphasis on the policy relevance of research findings.
Within this framework in 2000/2001 the Community continued to provide research opportunities on rational natural resource use in arid and semi-arid ecosystems in most regions (Africa, Asia, Latin America, Russia and the NIS) outside Europe affected by desertification.
In particular 3 projects specifically dedicated to desertification were funded under the EC-INCO Copernicus programme. Details of these projects can be also found in annex 1 of this paper
In the design of the programme a three-level scheme has been followed offering priorities for research based on the principle of partnership building allowing for a true cross-sectoral approach to land degradation and rehabilitation. Due importance has been given to research on individual scientific or technological problems offering tools for development which may be applied in a given system and/or policy context.
Policy research has centred on natural resource use and economic production: adaptation to globalisation and ensuring harmony with the environment. System research has dealt with a practical approach to ecosystem management for sustainability, emphasising the relationship
40
between human activity and the environment and developing strategies for rural productivity. Technology research has been narrowed on technologies suited to small-scale production systems or to production systems under environmental constraint, halting further erosion of the natural resources and preventing over-dependence on inputs arising from the transition from subsistence to commercial patterns of production.
A variety of projects ranging from understanding the dynamics of soil and land cover degradation, over ecological vegetation functions to identifying sustainable agro-ecological strategies with emphasis on appropriate water harvesting, conservation farming and agro-forestry have been funded covering all research costs of the participating third country research entities. In addition to research projects two international workshops meant for targeted dissemination of research results were financed, one on small ruminants in Sahelian Africa, the other on the future of community rangelands in Southern Africa. 2.3. Complementary Research Initiatives Besides research specifically addressing land degradation and desertification in view of the UNCCD, various Community research programmes deal with a number of soil protection problems. In the 5th Research Framework particularly the programmes “Environment and Sustainable Development” and “Quality of Life" are supporting soil-related research. In the key action “Sustainable management and quality of water” a number of research activities are dedicated to assess and minimise pollution originating from industrial activities, from contaminated land, waste disposal sites and sediments or diffuse pollution originating from land-use practices. The interactions between soil and water are also being studied in the context of integrated water management. Ongoing RTD activities are addressing sustainable, risk-based management of contaminated land and groundwater. The Contaminated Land Rehabilitation Network for Environmental Technologies, CLARINET, is a policy-orientated expert network on the management of contaminated land.
Also in the Environmental Applications domain of the “Information Society Technologies Programme” several research projects are carried out which are relevant for improved management of soils.
The key action “Global change, climate and biodiversity” studies vulnerable ecosystems, of which soils are principal components, in relation to climate and global change. Particular attention was given to the driving forces in land degradation and desertification in the fragile ecosystems of Europe. Research effort is also put on assessment of impacts of policies and practices.
In the “Quality of Life programme” research is carried out on new farming systems reducing negative impact on environment and soils. Prevention and control of erosion and salinisation form also part of research activities promoting sustainable use of the soil. For instance, the PESERA research project is assessing soil erosion risk all over Europe. 3. Land Degradation Research in the JRC In addition to the funding of co-ordinated research projects, the Commission directly carries out research activities in the field of land degradation and desertification through its Directorate General Joint Research Centre (JRC). The research activities and the developed methods are considered possible components of regional scale monitoring and early warning systems. Thus the JRC is addressing priority areas for action specified in UNCCD Regional Action Programme documents (RAP), which refer
41
mainly to the creation of a working method to lay the foundation and provide the cognitive elements required to implement the UNCCD at a regional level (ICCD/COP (4)/3/Add.3 (B)). These key priorities are: 1. The areas most at risk of desertification: aiming at a common methodology to identify the
areas most at risk of desertification and territorial degradation. 2. Common indicators for assessing desertification processes; aim is to identify indicators and
methodologies for assessing the extent of ongoing phenomena and relative trends. 3. Collection and analysis of technical and scientific data; 4. Exchange of data and information. 3.1. Specific research within FP 5 and FP 6 Institutional Work Programmes The JRC is co-operating with DG DEV, DG RTD and DG ENV to strengthen the scientific basis of EC support to the UNCCD (United Nations Convention to Combat Desertification) by establishing links with the Thematic Strategy on Soils. Concerning specific actions related to affected countries, the focus of the work is on the Annex IV (Mediterranean) and Annex V countries (Central Eastern Europe). As a deliverable of the activities, the extension of the European Soil Information System has been completed for both areas. The JRC also supports the development of agri-environmental indicators on soil erosion and degradation in collaboration with DG ENV and DG AGRI. In this context, the JRC is working on models and indicators to quantify in a standardised way rates of annual soil erosion at pan-European level and assess long-term trends of land degradation and desertification risk using information coming from the European Soil Information System (EUSIS) and from earth observation data. On-going work at the JRC focuses on the integration of remote sensing data with other data sources and models to provide spatially distributed indicators of land degradation and desertification in relation to soil organic matter, soil erosion and land cover dynamics. Another objective is to provide relevant timely and accurate information, with remote sensing techniques, on changes in the location and condition of vegetation types at the global scale to support EU development and environmental policies, including the implementation of UNCCD. This includes the assessing of ecosystem sustainability, with particular reference to global land cover dynamics, land degradation and disturbance (fire). These activities are implemented in co-operation with a network of partners including local teams and experts. In this context the Global Vegetation Monitoring Unit of the JRC has developed the “World Fire Web”. A software package has been developed to allow the monitoring of active fires using satellite data from the NOAA-AVHRR Instrument. The system has been installed in a number of local receiving stations that cover most areas of the world prone to desertification, and in particular in Italy, Spain, Australia, Brazil, Argentina, Peru, Senegal, Niger, Central African Republic and South Africa. Furthermore it has developed, in cooperation with FAO, a procedure to improve the detection of vegetation growth in desert regions in order to facilitate the fieldwork of plant protection technicians tracking the upsurge of desert locust. In 2000 the Global Land Cover (GLC 2000) project has been initiated, whose objective is to produce a reference land-cover map over the whole globe for the year 2000, using a special set of data collected with the VEGETATION instrument. The end product will permit multi-scale integration, from local/regional to global. This is carried out in partnership with a large number of

42
local institutions, as well as FAO and UNEP. In parallel the Global Burnt Area (GBA 2000) project uses the same data set to deliver a reference map of burned surfaces for the year 2000. Access from affected developing countries to the results of research described is achieved in two different manners. In first place the development of the GLC-GBA network of partners including teams and experts from developing countries ensures their involvement in the research itself. Furthermore results are delivered to institutions that can ensure the sustainable use of the results through their own networks of contacts, such as FAO for desert locust monitoring, UNEP for fire monitoring and Millennium ecosystem Assessment (MA) for land cover mapping. 3.2. Participation in DG RESEARCH funded research projects on land degradation The above described work is underpinned by a strong research component substantially contributing to on-going major research projects on soil erosion, land degradation and desertification launched by DG RTD. The JRC as partner is actively participating in the projects PESERA, GeoRange, DesertLinks, and, in the GMES context LADAMER (see also annex 1). Often in this context, national action plan committees and focal points of UN-CCD Annex IV countries as end-users are directly involved in the projects. DesertLinks for instance has been financed with the aim to contribute to the effort of Annex IV countries to establish, at the Mediterranean level, a framework system for desertification indicators and methods to identify sensitive areas. Projects such as Georange or LADAMER represent an alternative way to address the problem of monitoring desertification to a large extend with information derived from satellite systems. In the INCO context the JRC, jointly with IRD (France), has co-ordinated the project CAMELEO (Changes in Arid Mediterranean Ecosystems on the Long term and Earth Observation), involving 8 institutions from Algeria, Egypt, Morocco and Tunisia as well as OSS/ROSELT (Observatoire du Sahara et Sahel/"Réseau d'Observatoire de Suivi Ecologique à long Terme"). In this framework advanced remote sensing tools have been delivered to North African partners and dedicated training workshops on remote sensing and GIS techniques were organised. 4. References EUR 19303, 1999: Mediterranean Desertification – Research results and policy implications.
Proceedings of the International Conference 19 October to 1 November 1996, Crete, Greece. Eds. Balabanis P., Peter D., Ghazi A., Tsogas M. 2 Vol. Office for Official Publications of the European Communities, Luxemburg, 1999.
EUR 19496, 2001: Desertification Convention – Data and information requirements for
interdisciplinary research. Proceedings of the International Workshop, held in Alghero, Italy, 9 to 11 October 1999. Eds.Enne G., Peter D., Pottier D. Office for Official Publications of the European Communities, Luxemburg, 2001.
Perez-Trejo, F., 1994. Desertification and land degradation in the European Mediterranean, EUR
14850 EN, (Office for Official Publications of the European Communities: Luxembourg). ANNEX 1: Catalogue of Contracts in the area of Land Degradation/Desertification
43
AAANNNNNNEEEXXX III
DDDIIIRRREEECCCTTTOOORRRAAATTTEEE GGGEEENNNEEERRRAAALLL FFFOOORRR RRREEESSSEEEAAARRRCCCHHH
PROGRAMME ENVIRONMENT AND SUSTAINABLE DEVELOPMENT
KEY ACTION GLOBAL CHANGE AND BIODIVERSITY
CATALOGUE OF CONTRACTS
In the area of Land Degradation/Desertification
Updated: January 2003
EC Contact Denis Peter DG Research Environment and Sustainable Development Programme Global Change Unit Rue du Luxembourg 46, 2/97 1040 Brussels Tel: +32.2.295.84.45 Fax: 32.2.299.57.55 Email: [email protected]
45
TABLE OF CONTENTS
− AID-CCD – Active exchange of experience on indicators and development of 3 Persperctives in the context of the UNCCD EVK2-CT2002-80018
− DESERTLINKS – Combating Desertification in Mediterranean Europe Linking 5 Science with Stakeholders EVK2-CT2001-00109
− CLEMDES – Clearing House Mechanism on Desertification for the Northern 8 Mediterranean Region EVK2-CT2002-80006
− GEORANGE – Geomatics in the Assessment and Sustainable Management 10 of Mediterranean Rangelands EVK2-CT2000-00091
− LADAMER – Land degradation assessment in Mediterranean Europe 13 EVK2-CT2002-00179
− MEDACTION – Policies for land use to combat desertification 15 EVK2-CT2000-00085
− MEDRAP – Concerted Action to support the Northern Mediterranean 18 Regional Action Programme to combat Desertification EVK2-CT2000-20008
− REACTION – Restoration Actions to Combat Desertification in the Northern 20 Mediterranean EVK2-CT2002-80025
− SCAPE – Soil Conservation and Protection Strategies for Europe 22 EVK2-2002-20014
− Ongoing EC-INCO Copernicus projects in the field of Desertification 25

46
AID-CCD – Active exchange of experience on indicators and development of perspectives in the context of the UNCCD
EVK2-CT2002-80018
Start date: 01/02/2003 – End date: 31/01/2006 Duration: 36 months
EC contribution: 388,805 Euro EC Contact: Denis Peter
Project Co-ordinator Professor Giuseppe Enne Università degli Studi di Sassari Centro Interdipartimentale di Ateneo – NRD Nucleo Ricerca Desertificazione Via E. de Nicola 9 07100 Sassari Italy Tel: +39.079.229.303/4 Fax: +39.079.229.302 e-mail: [email protected] Project Summary Problems to be solved The project addresses the issue of the UNCCD implementation in a global perspective, by involving all regional Annexes. Among the main issues, indicators, information circulation systems and prevention and mitigation activities have been recognised has the priorities, and much work has been carried out to address these aspects in all Annexes. All these activities have been developed in parallel and have produced a relevant quantity of data and information that has never been organised systematically. In fact, there is a lack of exchange of information among Annexes mainly because there are little opportunities to meet and thoroughly discuss the experiences and the activities carried out. Scientific objectives and approach This project, in the framework of the ENRICH implementation, aims at developing and co-ordinating exchange of experiences across the world between scientific institutions involved in the UNCCD implementation by setting up two thematic seminars each one dealing with a specific issue relevant in all UNCCD Annexes: seminar n. 1 will focus on the "Scientific and technical aspects of desertification indicators and remote sensing"; seminar n. 2 will focus on the "Role of the Information Circulation Systems in the scientific and practical approach to combat desertification". A practical approach will be adopted and the presentation of concrete examples from all Annexes will be favoured in order to avoid too theoretical discussions. The seminars will be preceded by preparatory activities consisting in the elaboration of two preparatory studies and in the realisation of a Think Tank. The first preparatory study will be devoted to the elaboration of a review on the use of indicators in the different Annexes, with particular reference to the response and impact indicators adopted in the different National Action Plans in the UNCCD Annexes.
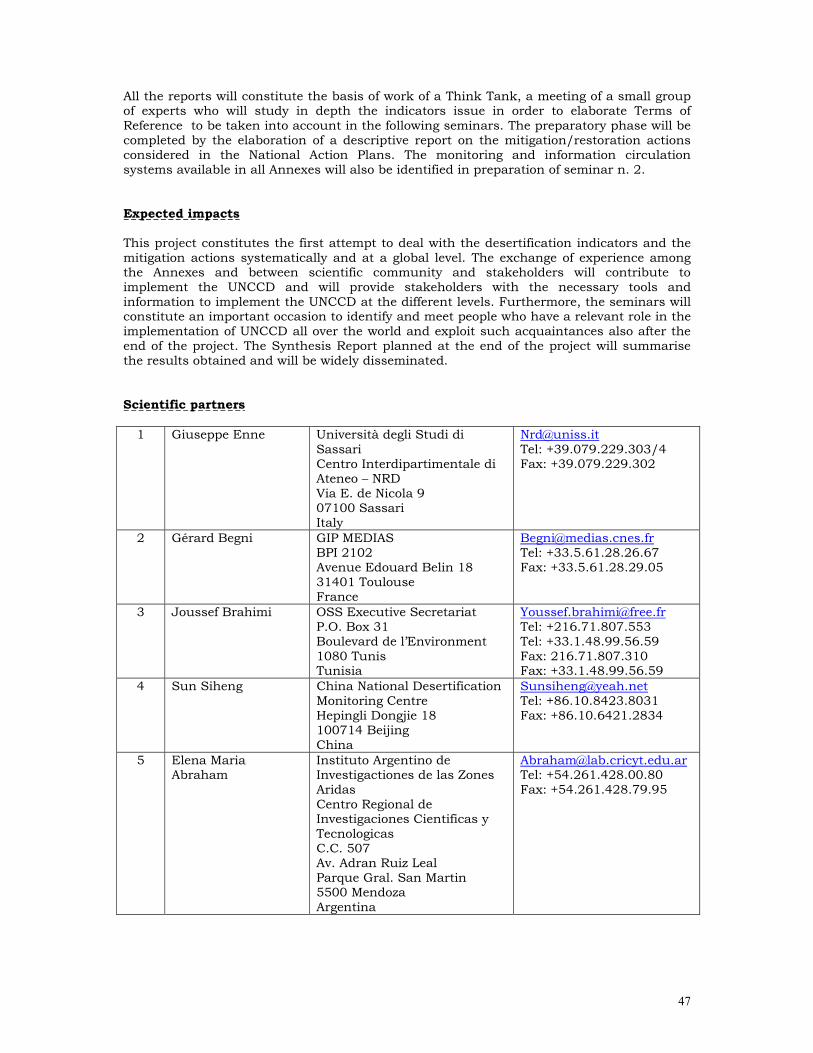
47
All the reports will constitute the basis of work of a Think Tank, a meeting of a small group of experts who will study in depth the indicators issue in order to elaborate Terms of Reference to be taken into account in the following seminars. The preparatory phase will be completed by the elaboration of a descriptive report on the mitigation/restoration actions considered in the National Action Plans. The monitoring and information circulation systems available in all Annexes will also be identified in preparation of seminar n. 2. Expected impacts This project constitutes the first attempt to deal with the desertification indicators and the mitigation actions systematically and at a global level. The exchange of experience among the Annexes and between scientific community and stakeholders will contribute to implement the UNCCD and will provide stakeholders with the necessary tools and information to implement the UNCCD at the different levels. Furthermore, the seminars will constitute an important occasion to identify and meet people who have a relevant role in the implementation of UNCCD all over the world and exploit such acquaintances also after the end of the project. The Synthesis Report planned at the end of the project will summarise the results obtained and will be widely disseminated. Scientific partners
1 Giuseppe Enne Università degli Studi di Sassari Centro Interdipartimentale di Ateneo – NRD Via E. de Nicola 9 07100 Sassari Italy
[email protected] Tel: +39.079.229.303/4 Fax: +39.079.229.302
2 Gérard Begni GIP MEDIAS BPI 2102 Avenue Edouard Belin 18 31401 Toulouse France
[email protected] Tel: +33.5.61.28.26.67 Fax: +33.5.61.28.29.05
3 Joussef Brahimi OSS Executive Secretariat P.O. Box 31 Boulevard de l’Environment 1080 Tunis Tunisia
[email protected] Tel: +216.71.807.553 Tel: +33.1.48.99.56.59 Fax: 216.71.807.310 Fax: +33.1.48.99.56.59
4 Sun Siheng China National Desertification Monitoring Centre Hepingli Dongjie 18 100714 Beijing China
[email protected] Tel: +86.10.8423.8031 Fax: +86.10.6421.2834
5 Elena Maria Abraham
Instituto Argentino de Investigactiones de las Zones Aridas Centro Regional de Investigaciones Cientificas y Tecnologicas C.C. 507 Av. Adran Ruiz Leal Parque Gral. San Martin 5500 Mendoza Argentina
[email protected] Tel: +54.261.428.00.80 Fax: +54.261.428.79.95
48
DESERTLINKS – Combating Desertification in Mediterranean Europe Linking Science with Stakeholders
EVK2-CT2001-00109
Start Date: 01/11/2001 - End Date: 30/10/2004 Duration: 36 months
EC contribution: 1,599,997 Euro EC Contact: Denis Peter
Project Co-ordinator Dr. N. Geeson/Dr J. Brandt Desertlinks Project Office Oaklands House Coggins Mill Lane Mayfield East Sussex TN20 6UL United Kingdom Tel: +44.1435.87.38.59 Fax : +44.1435.87.38.59 Email : [email protected] Web site: www.kcl.ac.uk/desertlinks Project Summary Problems to be solved This project comes at a time when political and scientific initiatives on European desertification are moving in a parallel direction. The UNCCD have developed a strategy for combating desertification that requires affected countries to develop monitoring techniques and national and regional action programmes involving stakeholders. Desertification indicators have been identified as a potentially useful tool for both management and monitoring, and the Northern Mediterranean countries are searching for a common methodology for identifying and using such indicators. Valuable and useful results, knowledge and expertise, including proto-type indicator systems at different scales, have been obtained from previous research into land degradation and desertification in Mediterranean Europe. This will be combined with new kinds of indicators, identified by the local stakeholders in a number of desertification-affected areas. The resulting indicator system will be a significant contribution to the work of the UNCCD, and in particular the Northern Mediterranean countries. Scientific objectives and approach There will be extensive collaboration with local stake holders in desertification affected regions of Alentejo (Portugal), Guadalentín (Spain), Agri (Italy) and Lesvos (Greece) in order to identify: impact indicators relating to perceptions of land function; driving force and pressure indicators relating to decision making; and response indicators relating to land management measures taken to combat desertification. A conceptual and database framework will be developed for these and the other indicators identified in the project. Composite indicators will be developed combining these stakeholder-identified indicators with bio-physical and socio-economic state indicators already developed for Mediterranean Europe. Together they will form an environmentally sensitive area identification system, for use at the sub-national scale. In addition, coarse scale modelling of soil erosion, salinisation and channel processes will provide a regional degradation index at the Mediterranean-wide scale.
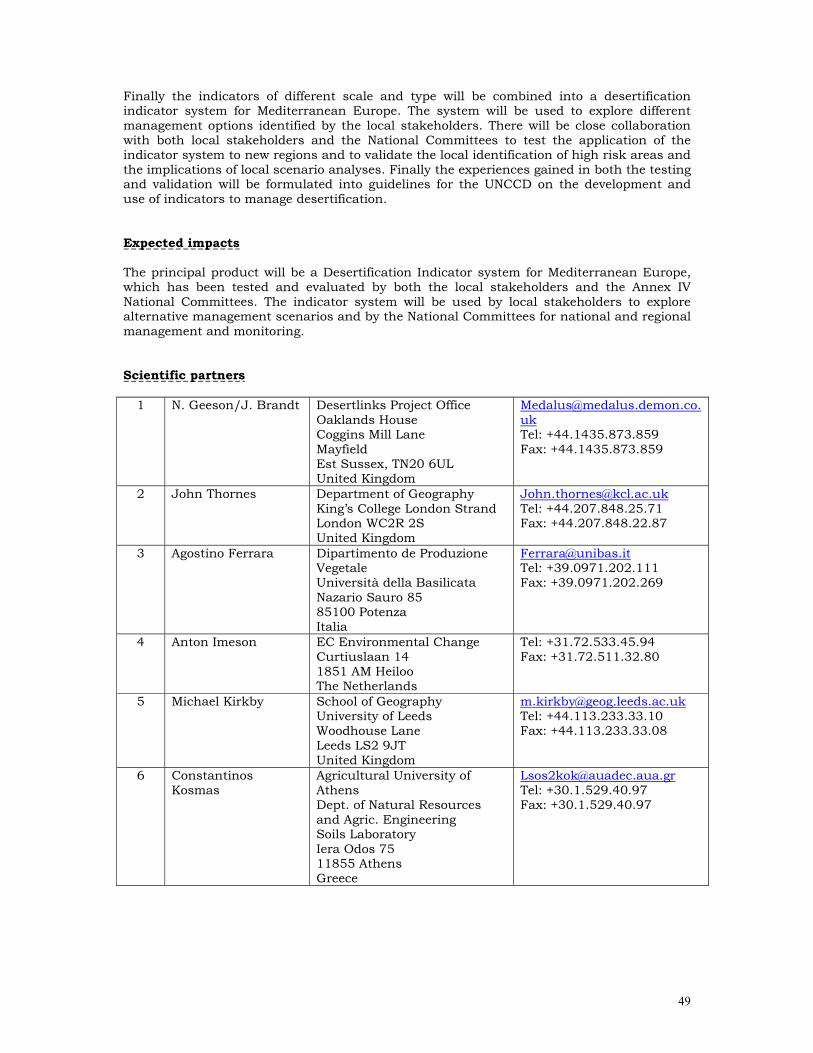
49
Finally the indicators of different scale and type will be combined into a desertification indicator system for Mediterranean Europe. The system will be used to explore different management options identified by the local stakeholders. There will be close collaboration with both local stakeholders and the National Committees to test the application of the indicator system to new regions and to validate the local identification of high risk areas and the implications of local scenario analyses. Finally the experiences gained in both the testing and validation will be formulated into guidelines for the UNCCD on the development and use of indicators to manage desertification. Expected impacts The principal product will be a Desertification Indicator system for Mediterranean Europe, which has been tested and evaluated by both the local stakeholders and the Annex IV National Committees. The indicator system will be used by local stakeholders to explore alternative management scenarios and by the National Committees for national and regional management and monitoring. Scientific partners
1 N. Geeson/J. Brandt Desertlinks Project Office Oaklands House Coggins Mill Lane Mayfield Est Sussex, TN20 6UL United Kingdom
[email protected] Tel: +44.1435.873.859 Fax: +44.1435.873.859
2 John Thornes Department of Geography King’s College London Strand London WC2R 2S United Kingdom
[email protected] Tel: +44.207.848.25.71 Fax: +44.207.848.22.87
3 Agostino Ferrara Dipartimento de Produzione Vegetale Università della Basilicata Nazario Sauro 85 85100 Potenza Italia
[email protected] Tel: +39.0971.202.111 Fax: +39.0971.202.269
4 Anton Imeson EC Environmental Change Curtiuslaan 14 1851 AM Heiloo The Netherlands
Tel: +31.72.533.45.94 Fax: +31.72.511.32.80
5 Michael Kirkby School of Geography University of Leeds Woodhouse Lane Leeds LS2 9JT United Kingdom
[email protected] Tel: +44.113.233.33.10 Fax: +44.113.233.33.08
6 Constantinos Kosmas
Agricultural University of Athens Dept. of Natural Resources and Agric. Engineering Soils Laboratory Iera Odos 75 11855 Athens Greece
[email protected] Tel: +30.1.529.40.97 Fax: +30.1.529.40.97
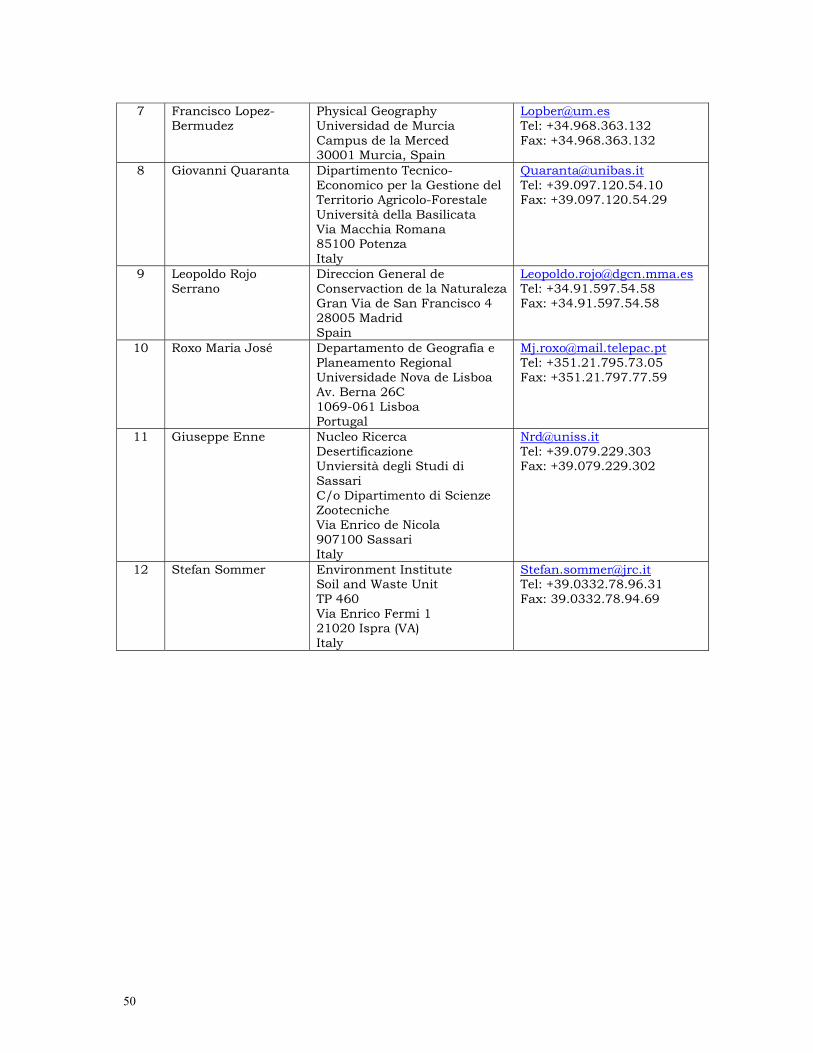
50
7 Francisco Lopez-
Bermudez Physical Geography Universidad de Murcia Campus de la Merced 30001 Murcia, Spain
[email protected] Tel: +34.968.363.132 Fax: +34.968.363.132
8 Giovanni Quaranta Dipartimento Tecnico-Economico per la Gestione del Territorio Agricolo-Forestale Università della Basilicata Via Macchia Romana 85100 Potenza Italy
[email protected] Tel: +39.097.120.54.10 Fax: +39.097.120.54.29
9 Leopoldo Rojo Serrano
Direccion General de Conservaction de la Naturaleza Gran Via de San Francisco 4 28005 Madrid Spain
[email protected] Tel: +34.91.597.54.58 Fax: +34.91.597.54.58
10 Roxo Maria José Departamento de Geografia e Planeamento Regional Universidade Nova de Lisboa Av. Berna 26C 1069-061 Lisboa Portugal
[email protected] Tel: +351.21.795.73.05 Fax: +351.21.797.77.59
11 Giuseppe Enne Nucleo Ricerca Desertificazione Unviersità degli Studi di Sassari C/o Dipartimento di Scienze Zootecniche Via Enrico de Nicola 907100 Sassari Italy
[email protected] Tel: +39.079.229.303 Fax: +39.079.229.302
12 Stefan Sommer Environment Institute Soil and Waste Unit TP 460 Via Enrico Fermi 1 21020 Ispra (VA) Italy
[email protected] Tel: +39.0332.78.96.31 Fax: 39.0332.78.94.69
51
CLEMDES – Clearing House Mechanism on Desertification for the Northern Mediterranean Region
EVK2-2002-80006
Start Date: 01/11/2002 - End Date: 30/10/2004 Duration: 24 months
EC contribution: 244,906 Euro EC Contact: Denis Peter
Project Co-ordinator Dr Guido Bonati Istituto Nazionale di Economia Agraria UO4 Via Barberini 36 00187 Rome Italy Tel: +39.06.4785.65.20 Fax: +39.06.474.19.84 Email: [email protected] PROJECT SUMMARY Problems to be solved The countries of the Northern Mediterranean region are affected by desertification and for this reason they have prepared national and regional action programmes for the application of the UNCCD (United Nations Convention to Combat Drought and Desertification). Desertification affects agricultural production, land use and productivity and, in general, the economic situation and the quality of life of the affected region. A problem faced by stakeholders is the insufficient communication both at national and international level. A Clearing House Mechanism, by allowing the easy and both structured and unstructured communication among partners, is viewed as an effective tool against desertification. Scientific objectives and approach (refer to the scientific and technical gaps and the way to overcome them through research). One of the priorities identified in these programmes is the diffusion of information among the public. The present project aims to set up an Internet based network devoted to the improvement of the diffusion of information. The establishment of an Internet based tool will decentralize existing information using the national language. The project aims to identify a common format and terms of reference for the setup of a Mediterranean portal and of national Internet based information facilities. Three workshops are planned for the identification of priorities and the presentation of results at international level. At national level meetings will be organised to involve the various stake-holders and collect information and data to be diffused through Internet. Expected impacts At the end of the project each focal point will have its own clearing-house mechanism using uniform and standardized tools. This will improve sharing of experiences among stakeholders and will make more effective both at national and international (i.e. regional) level the implementation and adoption of plans to combat desertification.
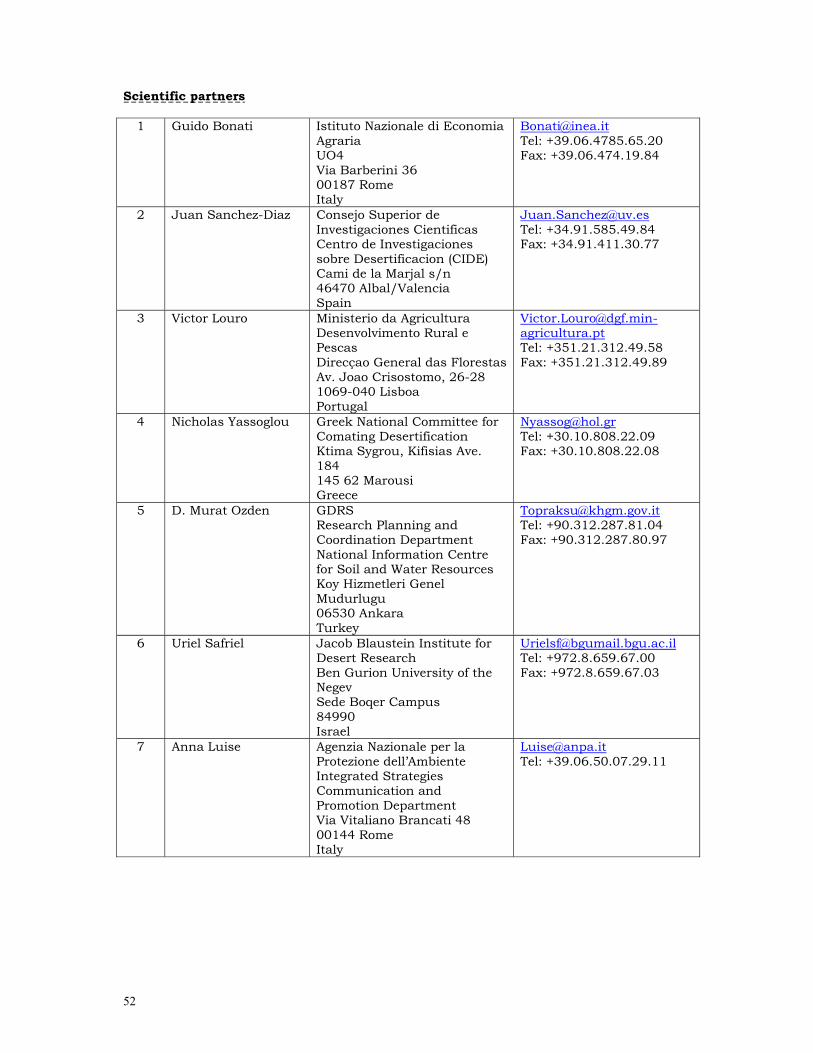
52
Scientific partners
1 Guido Bonati Istituto Nazionale di Economia Agraria UO4 Via Barberini 36 00187 Rome Italy
[email protected] Tel: +39.06.4785.65.20 Fax: +39.06.474.19.84
2 Juan Sanchez-Diaz Consejo Superior de Investigaciones Cientificas Centro de Investigaciones sobre Desertificacion (CIDE) Cami de la Marjal s/n 46470 Albal/Valencia Spain
[email protected] Tel: +34.91.585.49.84 Fax: +34.91.411.30.77
3 Victor Louro Ministerio da Agricultura Desenvolvimento Rural e Pescas Direcçao General das Florestas Av. Joao Crisostomo, 26-28 1069-040 Lisboa Portugal
[email protected] Tel: +351.21.312.49.58 Fax: +351.21.312.49.89
4 Nicholas Yassoglou Greek National Committee for Comating Desertification Ktima Sygrou, Kifisias Ave. 184 145 62 Marousi Greece
[email protected] Tel: +30.10.808.22.09 Fax: +30.10.808.22.08
5 D. Murat Ozden GDRS Research Planning and Coordination Department National Information Centre for Soil and Water Resources Koy Hizmetleri Genel Mudurlugu 06530 Ankara Turkey
[email protected] Tel: +90.312.287.81.04 Fax: +90.312.287.80.97
6 Uriel Safriel Jacob Blaustein Institute for Desert Research Ben Gurion University of the Negev Sede Boqer Campus 84990 Israel
[email protected] Tel: +972.8.659.67.00 Fax: +972.8.659.67.03
7 Anna Luise Agenzia Nazionale per la Protezione dell’Ambiente Integrated Strategies Communication and Promotion Department Via Vitaliano Brancati 48 00144 Rome Italy
[email protected] Tel: +39.06.50.07.29.11
53
GEORANGE - Geomatics in the Assessment and Sustainable Management of Mediterranean Rangelands
EVK2-CT2000-00091
Start Date: 01/01/2001 - End Date: 31/12/2003
Duration: 36 months EC contribution: 1,121,079 Euro
EC Contact: Denis Peter Project Co-ordinator Prof. Joachim Hill University of Trier Remote Sensing Department FB VI Geography/Geosciences Behringstrasse 15 54286 Trier Germany Tel: +49.651.201.45.92 Fax : +49.651.201.38.15 Email : [email protected] Web site: http://www.georange.org.net Project Summary Problems to be solved After a long history of utilisation, large areas of Mediterranean rangelands are today affected from transitional processes that cause conflicts between past and present land uses or economic and ecological priorities. Heavy overgrazing or the accumulation of woody biomass triggered by the abandonment and undergrazing, are causing substantial management problems. Often aggravated by physical factors, the depletion of range resources, or the increasing frequency and severity of wildfires have become a major concern in the environmental policies all over the European Mediterranean countries, as well as in other parts of the world. Scientific objectives and approach The GeoRange approach is explicitly based on an adequate consideration of the multi-functionality of Mediterranean rangelands by integrating specialists from different fields. Based on conceptual research and specific field studies, the project aims at creating an efficient documentation, management and decision support environment, dedicated to the specific needs of rangeland ecologists, managers and conservationists who are also involved in the project. This approach comprises five major objectives: − The assessment of the current range condition and range health by establishing a rule-
base incorporating state variables and related indicators to be derived in the project; − Retrospective analyses of range development to understand how ecosystems have
responded to previous management efforts or changing determinants; − The efficient organisation, integration, visualisation and distribution of spatial and non-
spatial data through a customised GIS-environment and an Internet-based user interface;
− The synthesis of the accumulated expertise on driving factors and past developments resulting in site-specific scenarios for sustainable management of rangelands aiming at a reconciliation between ecological and economical interests;
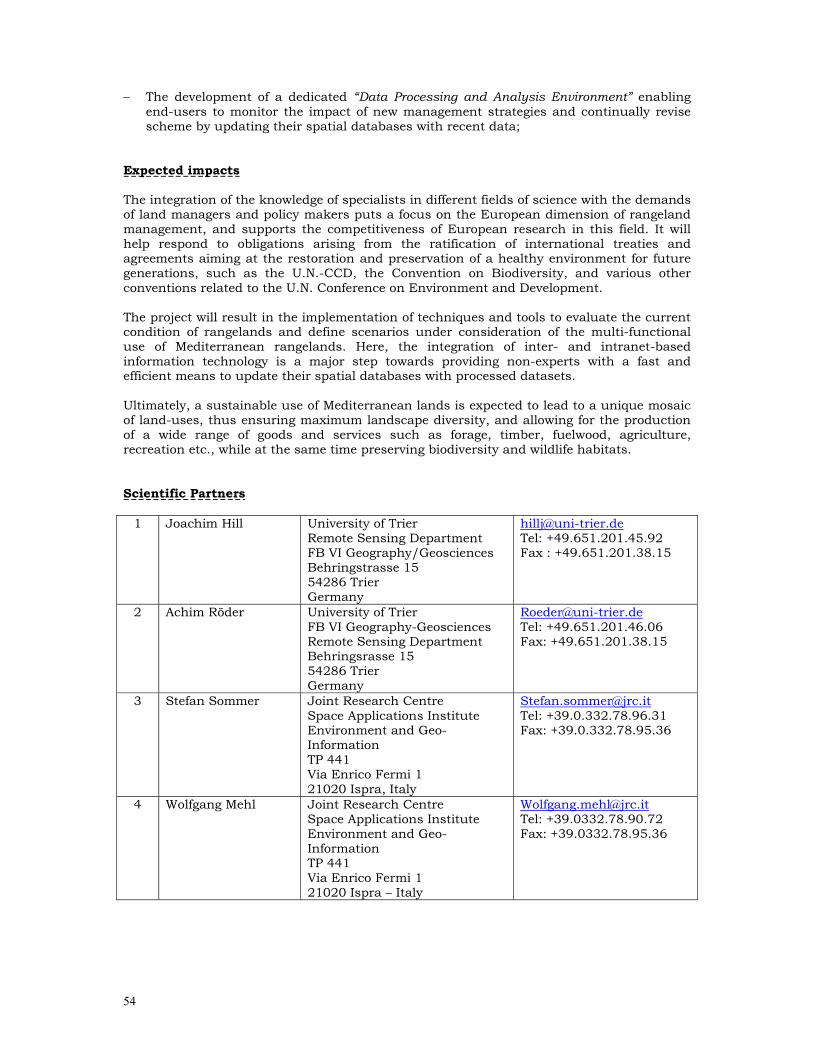
54
− The development of a dedicated “Data Processing and Analysis Environment” enabling end-users to monitor the impact of new management strategies and continually revise scheme by updating their spatial databases with recent data;
Expected impacts The integration of the knowledge of specialists in different fields of science with the demands of land managers and policy makers puts a focus on the European dimension of rangeland management, and supports the competitiveness of European research in this field. It will help respond to obligations arising from the ratification of international treaties and agreements aiming at the restoration and preservation of a healthy environment for future generations, such as the U.N.-CCD, the Convention on Biodiversity, and various other conventions related to the U.N. Conference on Environment and Development. The project will result in the implementation of techniques and tools to evaluate the current condition of rangelands and define scenarios under consideration of the multi-functional use of Mediterranean rangelands. Here, the integration of inter- and intranet-based information technology is a major step towards providing non-experts with a fast and efficient means to update their spatial databases with processed datasets. Ultimately, a sustainable use of Mediterranean lands is expected to lead to a unique mosaic of land-uses, thus ensuring maximum landscape diversity, and allowing for the production of a wide range of goods and services such as forage, timber, fuelwood, agriculture, recreation etc., while at the same time preserving biodiversity and wildlife habitats. Scientific Partners
1 Joachim Hill University of Trier Remote Sensing Department FB VI Geography/Geosciences Behringstrasse 15 54286 Trier Germany
[email protected] Tel: +49.651.201.45.92 Fax : +49.651.201.38.15
2 Achim Röder University of Trier FB VI Geography-Geosciences Remote Sensing Department Behringsrasse 15 54286 Trier Germany
[email protected] Tel: +49.651.201.46.06 Fax: +49.651.201.38.15
3 Stefan Sommer Joint Research Centre Space Applications Institute Environment and Geo-Information TP 441 Via Enrico Fermi 1 21020 Ispra, Italy
[email protected] Tel: +39.0.332.78.96.31 Fax: +39.0.332.78.95.36
4 Wolfgang Mehl Joint Research Centre Space Applications Institute Environment and Geo-Information TP 441 Via Enrico Fermi 1 21020 Ispra – Italy
[email protected] Tel: +39.0332.78.90.72 Fax: +39.0332.78.95.36
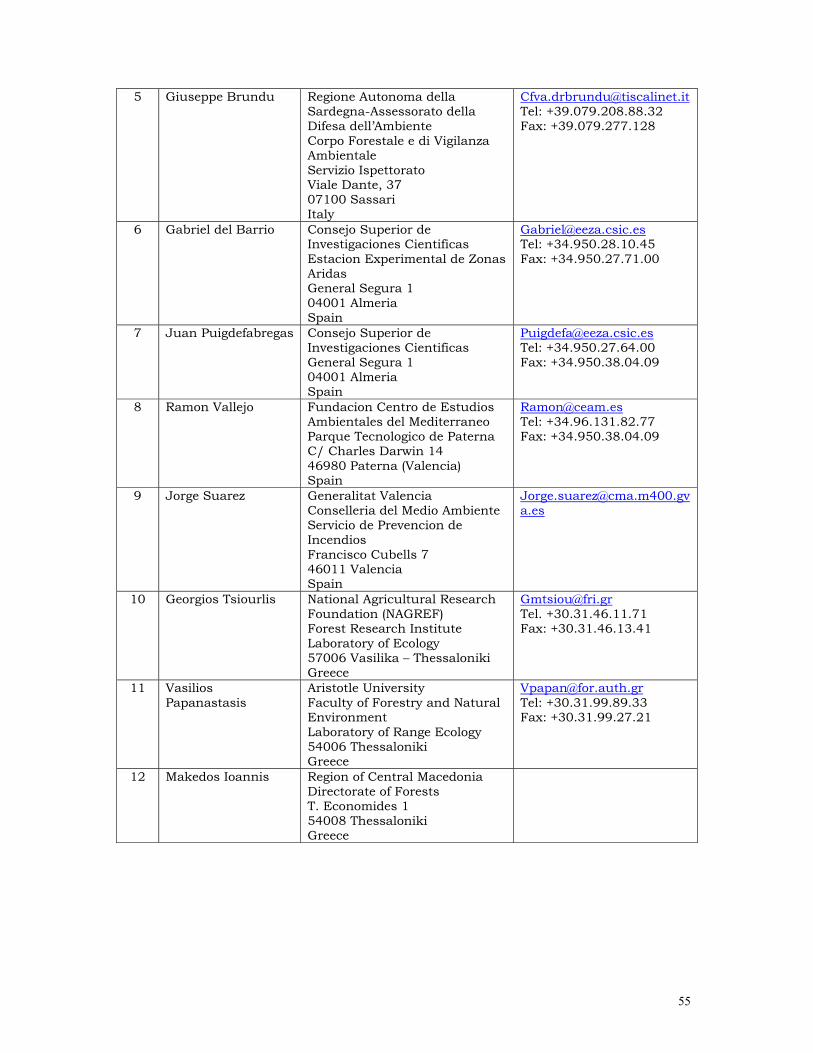
55
5 Giuseppe Brundu Regione Autonoma della Sardegna-Assessorato della Difesa dell’Ambiente Corpo Forestale e di Vigilanza Ambientale Servizio Ispettorato Viale Dante, 37 07100 Sassari Italy
[email protected] Tel: +39.079.208.88.32 Fax: +39.079.277.128
6 Gabriel del Barrio Consejo Superior de Investigaciones Cientificas Estacion Experimental de Zonas Aridas General Segura 1 04001 Almeria Spain
[email protected] Tel: +34.950.28.10.45 Fax: +34.950.27.71.00
7 Juan Puigdefabregas Consejo Superior de Investigaciones Cientificas General Segura 1 04001 Almeria Spain
[email protected] Tel: +34.950.27.64.00 Fax: +34.950.38.04.09
8 Ramon Vallejo Fundacion Centro de Estudios Ambientales del Mediterraneo Parque Tecnologico de Paterna C/ Charles Darwin 14 46980 Paterna (Valencia) Spain
[email protected] Tel: +34.96.131.82.77 Fax: +34.950.38.04.09
9 Jorge Suarez Generalitat Valencia Conselleria del Medio Ambiente Servicio de Prevencion de Incendios Francisco Cubells 7 46011 Valencia Spain
10 Georgios Tsiourlis National Agricultural Research Foundation (NAGREF) Forest Research Institute Laboratory of Ecology 57006 Vasilika – Thessaloniki Greece
[email protected] Tel. +30.31.46.11.71 Fax: +30.31.46.13.41
11 Vasilios Papanastasis
Aristotle University Faculty of Forestry and Natural Environment Laboratory of Range Ecology 54006 Thessaloniki Greece
[email protected] Tel: +30.31.99.89.33 Fax: +30.31.99.27.21
12 Makedos Ioannis Region of Central Macedonia Directorate of Forests T. Economides 1 54008 Thessaloniki Greece
56
LADAMER - Land degradation assessment in Mediterranean Europe EVK2-CT2002-00179
Start Date: 01/12/2002 - End Date: 31/11/2005
Duration: 36 months EC contribution: 831,438 Euro EC Contact: Michel Cornaert
Project Co-ordinator Prof. Joachim Hill University of Trier Remote Sensing Department FB VI Geography/Geosciences Behringstrasse 15 54286 Trier Germany Tel: +49.651.201.45.92 Fax : +49.651.201.38.15 Email : [email protected] PROJECT SUMMARY Problems to be solved In the five EU countries of the Mediterranean Basin natural resources are intensively utilised. While most of the land uses have undergone long evolutions and traditionally were sustainable, changing socio-economical and political frameworks have partly led to deviations from the former equilibrium. In Mediterranean ecosystems, the combination of socio-economic boundary conditions and the specific physical determinants often lead to the degradation of natural resources. These degradation processes may manifest in an accelerated erosion of soil, which is a limited resource of high importance to human welfare in many respects, or vegetation degradation that is directly inter-connected with soil properties and vice versa. The LADAMER project shall contribute to the protection of the natural environment by providing products relevant for planners and political agents. This is in accordance with the European Treaty requiring that "environmental protection must be integrated into the definition and implementation of the other Community policies". It also contributes strongly to the mitigation and prevention of land degradation, which is considered a major threat to Mediterranean ecosystems. Hence, sustainable land management contributes to the National Action Plans that have been established as a consequence of the UN Convention to Combating Desertification. Important to mention is recent COM on soil as well as planned legislation on soil monitoring. Scientific objectives and approach The project encompasses two separate phases. The first phase will start with the procurement and processing of considerable volumes of geoscientific, socio-economic and remotely sensed data covering the Mediterranean basin. The establishment of this unified data base will provide the basis for spatio-temporal analyses and the production of a regional land degradation map for the Mediterranean member states of the European Union. Together with the processed geo-data layers and spatialised socio-economic variables, this information will flow into a concept model to produce a land degradation assessment. Phase II will be devoted to a more in-depth validation, the integration of additional or improved
57
data layers, and the evaluation of advanced methodological options to upgrade the quality and information content of models and products. Expected impacts The required base data for the LADAMER project largely exist but are scattered across various European and international institutions. They need to be assembled in a consistent and well-documented data base. A second result will be a regional assessment of the land degradation status in Mediterranean Europe, based on an existing theoretical framework. In this context, remotely sensed vegetation density is compared to a model-determined reference density. Moreover, regional change maps of vegetation density and land-use classes over time will be derived from remote sensing data analysis and coupled with the before mentioned results to evaluate their performance for early warning and monitoring purposes. The last objective is to couple the existing data, information, knowledge and models into an integrated assessment model, capable to combine different process domains with respect to early warning and environmental surveillance. Finally, the derived products will be validated. The combined output of LADAMER will present a comprehensive as well as spatially explicit image of land degradation effects and associated processes for the relevant European Mediterranean countries. It will hence serve as a kind of integrating project between former research approaches and ongoing monitoring and assessment efforts. The presented information will build a basis for further GMES developments, in particular it will contribute to the establishment of a European monitoring capacity of land and soil resources. Scientific Partners
1 Joachim Hill University of Trier Remote Sensing Department FB VI Geography/Geosciences Behringstrasse 15 54286 Trier, Germany
[email protected] Tel: +49.651.201.45.92 Fax : +49.651.201.38.15
2 Juan Puigdefabregas CSIC EEZA General Segura 1 04001 Almeira, Spain
[email protected] Tel: +34.950.281.045 Fax: +34.950.277.100
3 Guy Engelen Research Institute for Knowledge Systems Papenstraat 8 6200 Al The Netherlands
[email protected] Tel: 31.43.388.33.22 Fax: 31.43.325.31.55
4 Stefan Sommer EC-JRC IES Soil and Waste Unit Via E. Fermi 1 21020 Ispra (VA) Italy
[email protected] Tel: +39.0332.78.96.31 Fax: +39.0332.78.56.01
5 Maria José Roxo Universidade Nova de Lisboa Faculdade de Ciencias Sociais e Humanas Dept. de Geografia e Planeamento Regional Av. Berna 26-C 1069-061 Lisboa/ Portugal
[email protected] Tel: +351.21.795.73.05 Fax: +351.21.797.77.59
58
MEDACTION - Policies for land use to combat desertification EVK2-CT2000-00085
Start Date: 01/01/2001 - End Date: 31/12/2003
Duration: 36 months EC contribution: 1.899.953 Euro
EC Contact: Denis Peter Project Co-ordinator Dr R.S.. De Groot Maastricht University International Centre for Integrative Studies Vrijthof 19 6211 LD Maastricht The Netherlands Tel: +31.433.88.26.62 Fax: +31.433.88.49.16 Email : [email protected] Project Summary Problems to be solved Desertification in the Mediterranean region, as in most other semi-arid regions, is largely a society-driven problem which can only be effectively managed through a thorough understanding of the principal ecological, socio-cultural and economic driving forces associated with land use and climate change, and of their impacts. For this reason, MEDACTION adopts an integrated, multidisciplinary approach, involving social and natural scientists as well as the principal stakeholders in the region to develop land use policies and sustainable management strategies that address and mitigate the specific problems of land degradation, desertification and sustainable development at various scales. Scientific objectives and approach MEDACTION will develop an information and decision-support base on desertification issues in the Northern Mediterranean to assist decision makers at all levels (from the local to the European Union level) in the formal and informal decision and policy making process. More specifically, MEDACTION aims to: − develop land use change scenarios at the Mediterranean, regional and local scales, and
analyse the associated costs and benefits of land degradation mitigation measures; − analyse the effects of past policies in four target areas : Alentejo (Portugal), Guadalentín
(Spain), Agri (Italy) and Lesvos (Greece); − develop and apply Decision Support Systems to examine the effects of various land use
scenarios on land management and policy formulation in these target areas; − develop a web-based tool for (EU, regional and local) planners, decision makers and
citizens, to visualise the consequences of implementing different policies; − develop a desertification policy support framework to assist policy makers to comply
with the requirements of agreed actions to combat desertification (at local, Mediterranean and EU scales)
The MEDACTION output will be the result of a dialogue amongst social actors. That means that the process of designing land use change scenarios, management options and policy tools will be highly participatory, involving the participation of a wide range of stakeholders.
59
Expected impacts MEDACTION will produce a large number of deliverables which have many practical applications to end-users ranging from local stakeholders to EU policy makers: • The project will produce many reports and publications in both scientific and non-
scientific journals addressing the main issues underlying the causes, effects and mitigation options for managing land degradation and desertification in the Northern Mediterranean region;
• Several models, scenarios, and manuals will be developed and made available to local, regional and EU planners and policy makers to improve management and policy strategies related to (mitigation of) land degradation and desertification;
• An interactive Internet-based synoptic prediction system will be developed which will be accessible to end-users and policy makers free of charge to assess land use change and land degradation based on climate change scenarios;
• A Desertification Policy Support Framework Manual will supply guidelines to improve the design and preparation of policies related to desertification in the Northern Mediterranean region;
• A Policy Support System for the Guadalentín and Lesvos target areas will be made available on CD-ROM, with a User manual;
• An alternative Decision Support System for application in the Agri and Alentejo basins will provide output for specified land use, climate and policy scenarios;
• The Internet will be used to build data sets and identify new end-users beyond those already identified in the Target Areas, particularly with regard to land use planning and modeling. This is in addition to the Internet tool for forecasting land use change and land degradation.
Scientific partners
1 Rudolf De Groot
Maastricht University International Centre for Integrative Studies Vrijthof 19 6211 LD Maastricht The Netherlands
[email protected] Tel: +31.433.88.26.62 Fax: +31.433.88.49.16
2 Geoff Wilson Kings College London Department of Geography WC2R 2LS London United Kingdom
[email protected] Tel: +44.20.78.48.24.62 Fax: +44.20.78.48.22.87
3 Miguel Vieira Inst. Para Desenvolv. Rurale e Gestao Ambiental (IDRGA). Rua 1o de Maio, 41-2oA 2700-677 Amadora Portugal
[email protected] Tel : +351.96.909.80.83 Fax : +351.21.494.58.39
4 Andrea Povellato
INEA-Veneto C/o Agripolis, Via Romea , 35020 Legnaro (PD) Italy
[email protected] Tel: +39.498.83.02.48 Fax: +39.498.83.98.64
5 Nikos Beopoulos Agr. University Athens (AUA) Agr. Extension, Rural Systems & Rural Sociology, 75 Iera Odos 11855 Athens Greece
[email protected] Tel : +30.1.529.47.17 Fax : +30.1.529.40.20

60
6 Begonna Peco University Autonoma de Madrid Department de Ecologia Cantoblaco 28049 Madrid Spain
[email protected] Tel: +34.91.397.80.15 Fax: +34.91.397.80.01
7 James Bathurst Univ. of Newcastle Upon Tyne Department of Civil Engineering NE1 7RU, Newcastle Upon Tyne United Kingdom
[email protected] Tel: +44.191.222.63.33 Fax: +44.191.222.66.69
8 Guy Engelen Res. Institute for Knowledge Systems P.O. Box 463, Papenstraat 8 6200 AL Maastricht The Netherlands
[email protected] Tel: +31.433.88.33.22 Fax: +31.433.25.31.55
9 Andy Turner University of Leeds School of Geography Woodhouse Lane LS2 9JT, Leeds United Kingdom
[email protected] Tel: +44.113.233.33.09 Fax:+44.113.233.33.08
10 Helen Briassoulis University of the Aegean Department of Geography 81100 Faonos and Trikoupi Mytilini, Lesvos
[email protected] Tel: +30.2.513.64.11 Fax: +30.2.513.64.99
11 Apostolos Papado-poulos
National Centre for Social Research Institute of Urban and Rural Sociology 14-18 Messoghion Avenue 11527 Athens Greece
[email protected] Tel : +30.1.748.91.31 Fax : +30.1.748.91.43
12 Juan-Jose Onate
Univ. Europea de Madrid (UEM) Dpt. De Medio Ambiente Tajo 2 28670, Villaviciosa de Odon Madrid Spain
[email protected] Tel: +34.916.64.78.00 Fax: +34.916.16.82.65
13 Jose Sumpsi
Univ. Politecnica de Madrid Dept. Econ. y Ciencias Social.Agric. Ciudad Univ. s/n 28049 Madrid Spain
[email protected] Tel: +34.91.397.80.15 Fax: +34.91.397.80.01
61
MEDRAP - Concerted Action to support the Northern Mediterranean Regional Action Programme to combat Desertification
EVK2-CT2000-20008
Start Date: 01/01/2001 - End Date: 31/12/2003 Duration: 36 months
EC contribution: 300,000 Euro EC Contact: Denis Peter
Project Co-ordinator Prof. Giuseppe Enne Nucleo Ricerca Desertificazione Universita de Sassari (NRD) Dipartimento di Scienze Zootecniche 07100 Sassari Italy Tel: 39.079.22.93.04 Fax: 39.079.22.93.02 Email: [email protected] Web site: http://www.uniss.it/nrd/medrap Project Summary Problems to be solved The UNCCD Annex IV Countries (United Nations Convention to Combat Desertification Regional Implementation Annex for the North. Mediterranean) are required to attain the Convention objectives with particular reference to land planning and management both at national and regional (Northern Mediterranean regions) level. In this context, there is a urgent need to harmonise the policies of European Mediterranean Countries. Prevention and mitigation actions must be supported by common strategies for a sustainable development. The implementation of such policies requires a deeper understanding of natural and socio-economic aspects related to land degradation. It is also recognised that the lack of institutional co-ordination at all levels, the weak social participation, the difficult communication between scientists and users are major obstacles to the achievement of these goals. In this context, a participatory multidisciplinary approach is considered essential. Scientific objectives and approach The general objective of this CA is to support the processes of elaboration of the Regional Action Programme (RAP) of the Annex IV Countries. Specific objectives will be to identify, by involving stakeholders in five ad hoc Workshops: − the state of the art on desertification topics, to better evaluate the impacts of human activities
and planning policies on threatened regions; − spatial and temporal priorities and strategies, to implement prevention/mitigation actions and
to improve sustainable land management; − scientific, institutional and political gaps and opportunities, to propose suitable solutions. To achieve these objectives, a wide telematic network for information and knowledge exchange will be set up between scientific community and stakeholders involved in land management at all levels (CCD National Focal Points, Institutional Agencies, NGOs). This will allow a comparison of the different degrees of perception and awareness on relevant themes and will stimulate discussion that will be channelled into five thematic Workshops. The Workshops will focus on the
62
following issues: sustainable management of soil and water resources, political and socio-economic aspects of desertification, identification of sensitive areas, prevention and mitigation, elaboration of regional strategies. Starting from the state of the art, the workshops will focus on finding solutions and providing options to decision makers. The stakeholders involved will be asked to actively contribute both to define problems and to formulate strategies. Before each Workshop their contribution will be collected through questionnaires while setting up discussion. At the end of the meetings, conclusions and summary reports will be sent to them for further feed-back. This process will allow the evaluation of the degree of acceptance of the suggested measures and will help drawing conclusions. The activities will be co-ordinated by a board composed by representatives of CCD National Committees, by a scientific advise panel and by the representative of an NGO network. Expected impacts The final result of the project (guidelines, and strategies for the elaboration of the RAP) will constitute the main direct impact. Its effectiveness is expected to be high, because the National Focal Points are directly involved. The wide exchange of knowledge among the stakeholders will be the other major result. During the Workshops, press interviews and news releases are expected to raise desertification awareness in civil society. Scientific Partners
1 Giuseppe Enne Centro Interdipartimentale di Ateneo NRD (Nucleo Ricerca Desertificazione) Dip. Scienze Zootecniche Università di Sassari Via E. de Nicola, 9 07100 Sassari – Italy
[email protected] Tel: +39.079.22.03.03/4 Fax: +39.079.22.93.02
2 Victor Louro Direccao Geral Florestas Av. Joao Crisostomo, 26 1069-040 Lisboa, Portugal
[email protected] Tel: +351.21.312.49.58 Fax: +351.21.312.24.989
3 Nicholas Yassoglou Greek National Committee for Combatting Desertification Egialias str., 19 15125 Marousi, Greece
[email protected] Tel. +30.1.804.17.93 Fax: +30.1.804.17.93
4 Ramon Vallejo CEAM Parque Tecnologico Ch. Darwin 14 46980 Paterna, Spain
[email protected] Tel: +34.96.131.82.27 Fax: +34.96.131.81.90
5 Antoine Cornet CSFD/IRD B.P. 5045 911, Avenue d'Agropolis 34032 Montpellier, France
[email protected] Tel: +33.4.67.41.61.98 Fax: +33.4.67.41.63.30
6 Mehmet Sakir Ozdemir
Orman Bakanligi - Ministry of Forestry Ataturk Bulvari 153 Bakanliklar 06100 Ankara, Turkey
[email protected] Tel: +90.312.417.729 Fax: +90.312.417.9160

63
REACTION- Restoration Actions to Combat Desertification in the Northern Mediterranean
EVK2-CT-2002-80025
Start Date: 01/01/03 – End Date: 31/12/05 Duration: 36 months
EC contribution: 540.000 Euro EC contact: Dennis Peter
Project Co-ordinator Dr. V. Ramón Vallejo Calzada Fundación Centro de Estudios Ambientales del Mediterráneo (CEAM) Dept. de Restauración C/ Charles Robert Darwin, 14.Parque Tecnológico 46980 (Paterna) Valencia Spain Tel: +34 96 1318227 Fax: +34 96 1318190 Email: [email protected] PROJECT SUMMARY Problems to be solved The Mediterranean Region is recognised among those affected by desertification, requiring action plans at levels that meet the particular conditions of the region established in the UNCCD Annex IV. Mediterranean countries have made a serious effort to combat desertification through a wide array of technical approaches. Reforestation is widely used as effective restoration action to mitigate or reserve land degradation. However, forest plantations in drylands have often low establishment rates and poor productivity.The extermely difficult conditions characterising degraded drylands produce high risk of failure and investment lost. Although there is a sizeable body of experiences and technological capability, the information is under-utilised and inadequately shared due to poor and restricted dissemination, at both national and regional levels. These factors generate economic disadvantage and make difficult the effective mitigation of environmental and socio-economic problems associated to desetification. Scientific objectives and approach The efficiency of restoration iniciatives can be improved through the evaluation and transfer of technologies to flight desertification that are environmentally viable, and socialy acceptable. To approach the evaluation of restoration efforts in the northern Mediterranean from ecological, economic and socio-cultural perspectives, there is a need of incorporating recent advances on indicators and restoration methodologies, and of defining the fundamental information needed. REACTION aims at: 1) establishing a database on land restoration, 2) exploiting the research results produced in projects on restoration, specially those of the EC programmes, for selecting the most appropiate methodology to evaluate the results of restoration projects, 3) providing restoration guidelines in the light of a critical analysis of old and innovate techniques, and 4) facilitating access to high quality information to forest managers, policy-makers, and other stakeholders for the promotion of sustainable mitigation actions. These goals will be achieved through three thematic workshops promoting the exchange of information between stakeholders and experts, by inventorying, compiling, and evaluating well-documented restoration projects in the northern Mediterranean, and through a full dissemination strategy.
64
Expected impacts The final products of REACTION will be a Mediterranean land reforestation database, including successfull and evaluated projects, guidelines for designing and implementing restoration projects, and updating/dissemination procedures adpted to the particularities of the northern Mediterranean countries. The results obtained and conclusions reached can be best utilised by forest managers, scientists, NGOs, and policy-makers enganged in promoting sustainable mitigation actions. Projects included in the database will be available for formation purposes at different technical levels, for any national or international agency interested in land reforestation. REACTION will provide tools for the effective implementation of the National Action Plans (NAPs) and for the design of co-ordinated restoration actions in the framework of the Regional Action Programme (RAP) Scientific Partners
1 Dr. Ramón Vallejo Fundación Centro de Estudios Ambientales del Mediterráneo (CEAM) Dept. Forestal C/Charles R. Darwin, 14. Parque Tecnológico. Paterna 46980 Valencia. Spain
[email protected] Tel: +34 96 1318227 Fax: +34 96 1318190
2 Prof. Giuseppe Enne Centro Interdipartimentale di Ateneo-NRD. Universita degli Studi di Sassari (NRD-UNISS) Via Enrico de Nicola, 9 07100 Sassari Italy
[email protected] Tel: +39 079 229303/4 Fax: +39 079 229302
3 Prof. Athanassios Hatzistathis
Aristotle Univerdity of Thessaloniki (AUTH) University Campus 54124 Thessaloniki Greece
[email protected] Tel: +3091 0998911 Fax: +3091 0998881
4 Prof. Dr. Manuel Madeira
Instituto Superior de Agronomia (ISA.) Tapada de Ajuda 1349-17 Lisboa, Portugal
[email protected] Telf: +351 213653270 Fax: +351 213635031
5 Dr. Dunixi Gabiña International Centre for Advanced Agronomic Mediterranean Studies-Meditarranean Agronomic Institute of Zaragoza. (ICAMAS.IAMZ) Avda. de Montaña, 1005 ES - 50080 Zaragoza
[email protected] Tel: +34 976 716000 Fax: +34 976 716001
6 Dr. James Aronson Centre National de la Recherche Scientifique Centre d’Ecologie Fonctionnelle et Evolutive (CEFE/CNRS) Route de Mende, 1919 FR - 34293 Montpellier
[email protected] Tel: +334 67613311 Fax: +34 67412138
7 Dr. Daniel Vallauri Association Française du WWF (WWFF.C) 188 rue de la Roquette 75011 Paris France
[email protected] Tel: +1 55258488 Fax: +155258485
65
SCAPE – Soil Conservation and Protection Strategies for Europe EVK2-2002-20014
Start Date: 01/11/2002 - End Date: 30/10/2005
Duration: 36 months EC contribution: 713,269 Euro
EC Contact: Denis Peter
Project Co-ordinator Prof Anton Imeson Universiteit van Amsterdam IBED Nieuwe Achtergracht 166 1018 WV Amsterdam The Netherlands Tel: +31.20.525.74.57 Fax: +31.20.525.74.31 Email: [email protected] PROJECT SUMMARY Problems to be solved The need for a European Soil Conservation and Protection policy is expressed in the Commission Communication “Towards a thematic strategy for Soil Protection” (2002). To help realise this goal a platform is needed to analyse existing information and consider the future data and information needed for implementing a sustainable multifunctional soil conservation policy. Problems to be solved include deciding upon future data information and indicator needs, developing a more appropriate integrated multi functional conceptual basis for soil conservation and evaluating and developing guidelines from best practise. The highly contrasted environments of Europe, the limited amount of recently collected soils information and the lack of integration are other problems. Scientific objectives and Approach The overall project aim is to provide scientific supported needed to incorporate soil conservation and protection into the EU policy for sustainable development (“Environment 2010: Our future Our choice”). The CA will enable scientists, responsible organisations, policy-makers and end-users to formulate responses to the dangers to sustainability posed by soil erosion, loss of fertility and soil contamination for example. It will specifically ask a) how can the goal of the sustainable soil conservation be achieved b) what types of data and information are needed by different end-users c) how should this information be measured, monitored and communicated and d) what can be learned from the best soil conservation practises and case studies. Special attention will be given to the need to account for the difference that need to be considered for example with respect to forests, rangelands and farmland and to achieving scientific integration. The platform for the action will be developed by means of four workshops and a conference. Important and interested actors will be invited to prepare information on and discuss how the objectives mentioned in the above paragraph can be achieved. About 20 scientific papers will be commissioned to make targeted reviews of key topics. Case studies that allow innovation and best practise to be demonstrated are to be reviewed. These enable a bottom-up input to be provided that will enable theories and concepts to be evaluated. The CA will identify which different combinations of soil functions should be conserved and the data
66
that is needed for measuring and monitoring them. The key questions that are posed will be developed in work packages that develop during the progression of the action, nevertheless they will also be the subject of dedicated workshops. An open collaborative approach will be adopted so that the action where possible will develop initiatives with partners in order to further the development of the platform and its goals. Expected Impacts Both the “process” of developing the platform and its final results (guidelines, recommendations and strategies) will support the evaluation of different strategies in support of sustainable soil conservation. By involving responsible authorities in the development of the action and adopting an integrated approach, the potential impact of the action for policy should be high. Scientific Partners
1 Anton Imeson Universiteit van Amsterdam IBED Nieuwe Achtergracht 166 1018 WV Amsterdam The Netherlands
[email protected] Tel: +31.20.525.74.57 Fax: +31.20.525.74.31
2 Arnold Arnoldssen Norsk Institutt for Jord-og Skogkartlegging (NIJOS) Section for Soil Information Ravolon 9, P.O. Box 115 1431 Aas Norway
[email protected] Tel: +47.64.94.97.80 Fax: +47.64.94.97.86
Steering Committe
1 Olafur Arnalds RALA – The Agricultural Research Institute Keldnaholt Vesturlandsvegi 112 Reykjavik Iceland
[email protected] Tel: +35.4.577.1010
2 Luca Montanarella European Soil Bureau of the Joint Research Centre T.P. 280 21020 Ispra, Varese Italy
[email protected] Tel: +39.332.785.349
3 Michel Robert Ministère de l’Ecologie et du Dévéloppement Durable 20 avenue de Ségur 75302 Paris 07 SP France
[email protected] Tel: +33.1.42.19.19.15
4 Diego de la Rosa CSIC – Instituto de Recursos Naturales y Agrobiologia de Sevilla Avenida de Reina Mercedes 10 41012 Sevilla Spain
[email protected] Tel: +34.95.462.41.52
5 Mike Jarvis (formerly director of the National Soil Resources Institute)
mike&[email protected]
67
ONGOING EC-INCO COPERNICUS PROJECTS
68
DARCA – Desertification and Regeneration: Modelling the Impact of Market Reforms on Central Asian Rangelands
ICA2-CT2000-10015
Start date: 01/10/2000 – End date: 01/02/2004
EC contribution: 980,620 Euro EC Contact: Denis Peter
Project Co-ordinator Roy Behnke MLURI Craigiebuckler Aberdeen AB15 8QH United Kingdom Tel: +44.1224.498.200 Fax: +44.1224.311.556 Email: [email protected] Web site:http://www.macaulay.ac.uk Introduction As a result of market reforms, private flock owners in Central Asia now decide how many animals to keep, what to feed them and where to move them. New systems of animal husbandry are emerging and these are creating different patterns of rangeland use, degradation and recovery from the Soviet period. Inter-disciplinary field studies at the flock, household and community level will identify the biological, economic and institutuional causes of these shifts. Our goal is to predict the environmental impact of the new forms of rangeland use that are now developing, to examine the effects of alternative policies, and t identify improved husbandry options for newly privatised flock operations. Objectives • Satellite imagery will be used to trace the interactive effects of climate and randge use on
vegetation biomass dynamics; • Ground-based vegetation assessments will provide information of forage availability and
degradation patterns around settlements; • Flock nutrition and performance studies will quantify the response of sheep flocks to
alternative feeding regimes; • Economic analyses of pastoral enterprises will examine the profitability of different
feeding regimes and assess the financial capacity of pastralists to adopt new husbandry practices;
• Land tenure and land use studies will analyse the impact of new property rights sysstems on range use and flock movement;
• Field and remote-sensed data will be integrated in a model that predicts degradation trends in response to changes in policy, market prices and stocking density;
• Study results will be disseminated to policy makers and Central Asian capacity to undertake policy-oriented environmental and development research will be improved.
Forseen results and deliverables • Satellite and ground-based desertification monitoring for rangeland sites in Kazakhstan
and Turkmenistan; • Inter-disciplinary field studies on the causes of grazing-induced desertification;
69
• A model to forecast desertification trends; • Effective dissemination of project results and policy recommendations; • Improved desertification research capacity in Central Asia. Scientific Partners 1 Dr R. Behnke MLURI
Craigiebuckler Aberdeen AB15 8QH United Kingdom
[email protected] Tel: +44.1224.498.200 Fax: +44.1224.311.556
2 Dr G. Gintzburger Centre de Coopération Internationale en Recherche Agronomique pour le Développement (CIRAD) Rue Scheffer 42 75116 Paris France
[email protected] Tel: +33.467.59.37.15 Fax: +33.467.59.37.95
3 Dr E. Mathijs Katholieke Universiteit Leuven Oude Markt 13 3000 Leuven Belgium
[email protected] Tel: +32.16.32.14.50 Fax: +32.16.31.19.96
4 Dr I. Alimaev Kazakstan Scientific Research Institute of Pasture & Fodder Dzandosov Str. 31 480035 Almaty Kazakstan
[email protected] Tel: +7.3272.214.446
5 Dr N. Malmakov Kazak Sheep Breeding Institute Mynbaeva Set 483174 Mynbaeva Almaty Oblast Kazakhstan
[email protected] Tel: +7.8270.220.02 Fax: +7.3272.634.900
6 Mr S. Temirbekov Institute of Botany & Phytointroduction Timiryazeva Str. 44 480090 Almaty Kazakstan
[email protected] Tel: +7.3272.615.097 Fax: +7.3272.617.938
7 Prof. A.G. Babaev National Institue of Deserts, Flora & Fauna Bitarap Turkmenistan 15 744000 Ashgabat Turkmenistan
[email protected] Tel: +9.9312.357.352 Fax: +9.9312.353.716
8 Dr K. Khanchaev Institute of Animal Husbandry and Veterinary Development Gerogly ul. 70 744012 Ashgabad Turkmenistan
Tel: +993.12.360.916 Fax: +993.12.362.591
70
GOBI-DESERTIFICATION – Assessment and Monitoring of Desertification Processes in
Mongolia Using Remote Sensing and Geographic Information System ICA2-2000-10022
Start date: 01/07/2000 – End date: 30/06/2003
EC contribution: 466,400 Euro EC Contact: Denis Peter
Project Co-ordinator Dr Arnon Karnieli Department of Solar Energy and Environmental Physics Jacob Blaustein Institute for Desert Research Ben-Gurion University of the Negev Sede Boker Campus, 84990 Israel Tel: +972.8.659.68.55 Fax: +972.8.659.68.05 Email: [email protected] Introduction Desertification of arid and semi-arid lands has become an increasingly important global ecological problem over the past 20 years. In Mongolia the main type of desertification is degradation of vegetation cover caused by irrational utilisation of pastures (overgrazing, cutting of trees and shrubs for fuel, development of soil biogenic crusts), and increase of deforested and denuded land. This desertification process results in decrease of agricultural productivity, change of plant species composition, livestock fertility, and biodiversity. After collapse of the Mongolia’s socialist system in 1989, the country changed from a centrally planned economic system into a market economy. Presently due to numerous financial constraints there are problems to maintain the existing wells and deliver water to the remote pasture areas. The livestock is concentrated near the settlements and the existing watering points surround settlements. As a result of overgrazing degradation of vegetative cover takes place in these areas. Increasing land pressure potentially threatens the fragile environment of Mongolia, hardly capable of higher productivity, and thus contributes to desertification. The pressure on land is threatening and in some areas already exceeding the conditions for sustainable development. The overall aim of the proposed research is to assess the dynamics of vegetation degradation in the semi-arid and arid regions of the southern Mongolia, and to establish a monitoring system to control desertfication. Specific Objectives • Study of current successional changes of soil-plant communities affected by
anthropogenic activities; • Study the spectral characteristics of successional changes of soil-plant communities
affected by anthropogenic impact; • Monitor small-scale areas that are under progressive state of vegetation degrdation; • Long-term, large-scale estimation of the rate of change of land cover; • Elaborate practical recommendations to combat desertification; • Establish a GIS-based monitoring system to map and model desertification processes at
model polygons.
71
Foreseen results and deliverables • Development of monitoring system as a basis in regional strategy and tactics of nature
resources utilisation aimed towards a stability and ecological safety of the region; • Intensive field studies of successional changes of natural; • Delivering of the hardware and software, training of the local scientists in image
processing and GIS; • Dissemination of the project results and practical recommendations. Scientific Partners 1 Dr Arnon Karnieli Department of Solar Energy and
Environmental Physics Jacob Blaustein Institute for Desert Research Ben-Gurion University of the Negev Sede Boker Campus, 84990 Israel
[email protected] Tel: +972.8.659.68.55 Fax: +972.8.659.68.05
2 Prof. Bernd Meissner
University of Applied Sciences Faculty of Civil Engineering and Geoinformation Georesearch Group Luxemburger Str. 10 133533 TFH Berlin Germany
[email protected] Tel: +49.30.460.42.606 Fax: +49.30.464.21.40
3 Prof. Peter Gunin Moscow State University Department of Biogeography Vorob’evy Gory, 119899 Moscow Russia
[email protected] Tel: +7.095.953.07.13 Fax: +7.095.953.07.13
4 Dr Leonid Ivanov Ural State University Faculty of Biology Department of Plant Pysiology Lenin prospect 51 620083 Ekaterinburg Russia
[email protected] Tel: +7.3432.61.66.85 Fax: +7.3432.55.74.01
5 Dr Chultem Dugarjav
Institute of Botany Mongolian Academy of Sciences Peace Avenue 51 210646 Ulaanbaatar Mongolia
[email protected] Tel: 976.11.45.18.37 Fax: 976.11.32.31.58
6 Dr Mijiddorj Saandar
Monmap Engineering Services Co, LTD Seoul Street 12/16, Sarora Hotel Building r. 502, 5th floor 210646 Ulaanbaatar Mongolia
[email protected] Tel: 976.11.32.78.24 Fax: 976.11.32.78.24
72
PLADAFINIS – Prevention of Land Degrdation in the Aral Sea Region Undergoing Disastrous Desertfication by Increasing Tolerance of Symbiotic Nitrogen Fixation
(SNF) to Salinity ICA2-2000-10001
Start date: 01/10/2000 – End date: 30/09/2003
EC contribution: 600,000 Euro EC Contact: Denis Peter
Project Co-ordinator Marco Bazzicalupo Dipartimento di Biologia Animale e Genetica Via Romana 17 50125 Firenze Italy Tel: +39.055.228.82.42 Fax: +39.055.228.82.50 Email: [email protected] Introduction Salinity of the areas around and neighbouring the Aral Sea is one of the Earth’s greates human-produced environmental disasters. Salinity is a major cause of desertification and soil erosion in irrigated lands and induced people to abandon them. Therefore, large-scale planting of selected vegetables tolerant to salinity is a strategy to be considered for the prevention of land degradation. The root system of rhizobia-legume symbioses has been shown quite effective and could stabilise significatn portion of the dust sources. Rhizobia-legume symbiosis is remarkable due to its capacity to fix N2, which allows host plants to grow without fertilisers on abandoned and marginal lands. Objectives • Survey of aline zones in the Northern Aral Sea region for prospecting soil parameters,
indigenous legume plants and root nodule specific bacteria (rhizobia); • Assessment of the biodiversity of soil microbial communities of Northern Aral Sea
Region; • Physiological testing of the macrosymbionts species Medicago, Melilotus and Galega and
their specific rhizobia for tolerance of SNF to salinity; • Genetic evaluation of SNF tolerance to salinity in the model systems of Sinorhizobium
meliloti/Sinorhizobium medicae – Medicago sativa, M.truncatula and Rhizobium galega – Galega orientalis;
• Field trials with the most efficient and salt tolerant symbiotic associations. Foreseen results and Deliverables • Report about current environmental conditions, • Collection of seeds of the local legumes, • Collection of local rhizobia isolates, • Data set of molecular fingerprinting, • Lists of salinity resistant rhizobia, • Recommendations, methods, report about finding molecular markers for symbioses, • Dissemination/advertising of practical recommendations to local farmers, • Publications in scientific journals.
73
Scientific Partners
1 Prof. Marco Bazzicalupo
University of Florence Dipartimento di Biologia Animale e Genetica 17 50125 Firenze Italy
[email protected] Phone: +39.055.228.82.42 Fax: +39.055.228.82.50
2 Dr. Simarov B. E-M Research Institute for Agricultural Microbiology Podebelsky Shosse 3 189620 Pushkin Russian Federation
[email protected] Phone: +7.812.476.28.02 Fax: +7.812.470.43.62
3 Dr. Dzyubenko Nicolai
N.I. Vavilov Research Institute of Plant Genetic Resources B. Morskaya Street, 42, 190000 St Petersburg Russian Federation
[email protected] Phone: 8.10.812.314.79.45 Fax: +8.10.812.311.87.28
4 Dr. Prof. Lindström Kristina
Department of Applied Chemistry and Microbiology University of Helsinki P.O.Box 56, Biocenter Vikinkaari 9, 00014 Helsinki Finland
Kristina.Linströ[email protected] Phone: +358.9.191.59282 Fax: +358.9.191.59322
5 Prof. Huguet Thierry Lab. Biologie Moleculaire des Relations Plantes-Microorganismes CNRS-INRA, UMR215 BP27, 31326 Castanet-Tolosan Cedex, France
[email protected] Phone: 33.561.285.325 Fax: 33.561.285.061
6 Prof. Priefer Ursula Oekologie des Bodens Worringer weg 1 52062 Aachen Germany
[email protected] Phone: +49 241 8026644 Fax: +49 241 8022637
7 Prof. Toro Nicolas Departemento de Ecologìa Genética Estaciòn Experimental del Zaidìn-CSIC Profesor Albareda 1 18008 Granada Spain
[email protected] Phone: +34-958-129 FAX : +34-958-129600
8 Mr. Khusainov Pri-Aralskaya Research Station of Plant Genetic Resources Tashkentskay Street 27, 464760 AKTJUBENNSK-SHALKAR Kazakstan
[email protected] Phone: 8.107.313.3521139 Fax: 8.107.313.3521139
9 Mr. Rasulov A.S Tashkent State University VUZ-gorodok, 700095 Tashkent Uzbekistan

74
Land Degradation Assessment in Drylands : the LADA project
by
Freddy O. Nachtergaele1 Abstract This paper discusses the background and the initial achievements of the Land Degradation Assessment in drylands (LADA) project. It draws attention to the complexity of the subject, the lack of harmonized definitions and the use of mono-disciplinary techniques and non- participatory approaches that hamper the study of land degradation and its causes. LADA identifies seven steps that combine multidisciplinarity, participatory and integrated approaches in a provisional methodology to be tested in pilot studies. Introduction The Land Degradation Assessment in Drylands (LADA) project, funded by the Global Environmental Fund (GEF) in association with UNEP and the Global Mechanism (GM) and executed by the Food and Agriculture Organization of the United Nations (FAO), responds to the need to strengthen support to combat land degradation as foreseen by the United Nation Convention to Combat Desertification (UN-CCD). During the first (PDF-B) 2 year phase of the project (2002-2004), LADA aims to generate up-to-date ecological, social, and economic and technical information, including a combination of traditional knowledge and modern science, to guide integrated and across-sector management planning in drylands. The principle objective of the LADA project is first and foremost to develop tools and methods to assess and quantify the nature, extent, severity and impacts of land degradation on ecosystems, watersheds and river basins, and carbon storage in drylands at a range of spatial and temporal scales. The project will also build national, regional and global assessment capacities to enable the design and planning of interventions to mitigate land degradation and establish sustainable land use and management practices. The project started with an exploratory workshop in Rome in December 2000, followed by a workshop where operational details, pilot country selection (Argentina, China and Senegal) and general strategy were established in January 2002. Details of these meetings are available on the Internet ( http://www.fao.org/ag/agl/agll/lada/home.stm ). A number of draft papers have been produced on key issues such as the sources of biophysical and socio economic data, the methodologies available to assess land degradation and desertification and a discussion paper on land quality-, socio-economic- and institutional indicators. An electronic mail conference on indicators took place in October (the results of which, including the background documents on indicators can be consulted at: http://www.fao.org/ag/agl/agll/lada/emailconf.stm). The e-mail conference was followed by a technical workshop on methodology development and implementation of the LADA pilot studies, while at the same time expanding the project potentially to Ethiopia, Mexico,
1 Freddy O. Nachtergaele, Technical Officer Land Classification, Land and Water development Division, FAO, Rome , Italy. [email protected]
75
Namibia, South Africa and Thailand was considered. A second phase of the project (2004 – 2008) would apply the approaches globally. LADA is seen by UNEP, GEF and the UN-CCD as in charge of the development of a standard methodology to assess land degradation in drylands and as such have a number of partners combined in a Steering Committee. These include apart from those already mentioned, NGO’s (Landcare Australia), technical agencies such as ISRIC and international bodies such as the European Commission and UNDP. There is a felt need for making this partnership stronger and more efficient. 1. Definitions and Challenges for land degradation assessments in drylands. The LADA project intends to deal with land degradation in a holistic way, the object being land, which is a broader concept than its individual components such as soil and climate. The objective is to go beyond simply observing the status of land degradation and to include changes in space and time and its cause and impacts in the analysis. One of the prime problems encountered is the contradiction in various definitions used for “land”, “degradation” and “desertification”. Reflecting on these definitions reinforces the need for a holistic, multidisciplinary approach. Land is defined as a delineable area of the earth’s terrestrial surface, encompassing all attributes of the biosphere above and below this surface, including those of the near surface climate, the soil, the terrain form, the surface hydrology, the near-surface groundwater reserve, the plant and animal populations and the past and present results of human activity (FAO, 1995). This definition of land conforms to land system units landscape-ecological units or unités de terroir. Degraded land has been defined as land which due to natural processes or human activity is no longer able to sustain properly an economic function and/or the original ecological function (ISO, 1996). More specifically desertification has been defined in the United Nations Convention to Combat Desertification (UN-CCD) as land degradation occurring in arid, semi arid and dry subhumid areas. Land as defined above is a biophysical entity with various components. This definition clashes to some extent with the fact that degraded land is defined according to a terrestrial ecosystem approach based on functions and relationships between components, rather than on the analysis of the components themselves. Land has indeed various functions ( to provide food and fibers, to serve as a buffer between the atmosphere and underground resources, to provide mineral and organic resources, to be a support for infrastructure, to provide memory of archeological knowledge), but all land degradation studies until now have focused mainly on the decline in the components of the land resource itself through soil loss, loss of vegetation and biodiversity, enhanced drought risk etc... It is therefore necessary to study both the components and the functions of the land resource in order to achieve a full picture of its degradation. Obviously “economic” and “original ecosystem functions” may, and do, often clash. For instance, cutting existing forest would according to the definition always result in land degradation from an original ecosystem’s point of view, although the economics for sustainable doing so may be sound. Enhancing land degradation in one part of the landscape may enhance the economic activity in an adjoining one as illustrated in West Africa where the artificial sealing of the most infertile lands allows water harvesting for the more fertile fields.
76
There is the additional problem that it is sometimes difficult to distinguish man-made from natural degradation, and the ISO definition does not make a difference between the two. Liming naturally acidifying soils such as Podzols stops a natural degradation process, but at the same time it endangers the original ecological function of these soils to support long- standing pine forests. Another problem of the degradation definition is linked to the working scale, as well in space as in time. Many climatic phenomena are cyclical and as the drought in the Sahel illustrated, vegetation degradation often is reversible. Land degradation effects have been exaggerated by focusing on soil “loss” and consequent negative soil nutrient balances, while the spatial distribution of these losses and the gains were often ignored, resulting in the highly questionable statements on degradation status and their economic consequences. Moreover, the technical problem of down-scaling the often punctual results observed in plots and farmers field into more general and meaningful statements on a district and country scale requires careful consideration because there phenomena can not be linked by a universal scale-transfer function. The dryland definition from the UN-CCD has been “translated” in the desertification atlas (UNEP, 1992, Darkoh 1995) as areas with an annual P/PET ratio comprised between 0.05 and 0.65. Comparing this aridity index with more traditional definitions of arid, semi arid and dry sub humid zones (Fischer et al, 2002) shows clear differences between the two, particularly in the extent of true deserts, excluded form drylands (Figures 1 and 2). Admittedly these kind of technocratic considerations play a minor role where political decisions are concerned, but it should remain a long term objective to come to sound and workable definitions. Furthermore there is no clear distinction between the terms ‘land degradation’ and ‘desertification’. Many researchers argue that this definition of desertification is too narrow because severe land degradation resulting from anthropic activities can also occur in the temperate humid regions and the humid tropics. The term ‘degradation’ or ‘desertification’ refers to irreversible decline in the ‘biological potential’ of the land. The ‘biological potential’ in turn depends on numerous interacting factors and is difficult to define (Eswaran et al, 2001). Although a holistic view on land degradation is highly necessary to grasp the complexity of the problem, it is obviously not an easy task to capture all the contradictions and pitfall contained in the definitions of land, drylands, and desertification and land degradation. Considering the three most distinct components of land (soil/physiography, land cover/vegetation and climate/water resources) we can define their degradation as follows: Soil degradation is defined as a decline in soil qualities commonly caused through improper use by humans (ISSS, 1996). This includes physical, chemical and/or biological deterioration. Examples are loss of organic matter, decline in soil fertility, decline in structural conditions, erosion, adverse changes in salinity, acidity or alkalinity and the effects of toxic chemicals, pollutants or excessive flooding (Houston and Charman in ISSS, 1996). Vegetation degradation implies reduction in biomass, decrease in species diversity, or decline in quality in terms of the nutritional value for livestock and wildlife. (Eswaran et al, 2000). Clear and detailed criteria for evaluating vegetation degradation are apparently not available yet, although punctual studies show a clear relationship between a floristic change and land degradation (CNEARC, 2002). Land cover changes obtained by remote sensing techniques have been used extensively as a dummy for land degradation changes. It has been debatably successful in monitoring forested areas on a global scale (the Forest Resource Assessment project), but has achieved more modest and less verifiable results at larger scales. Note that only limited information is available on biodiversity, and no obvious indicator has been identified to monitor it.
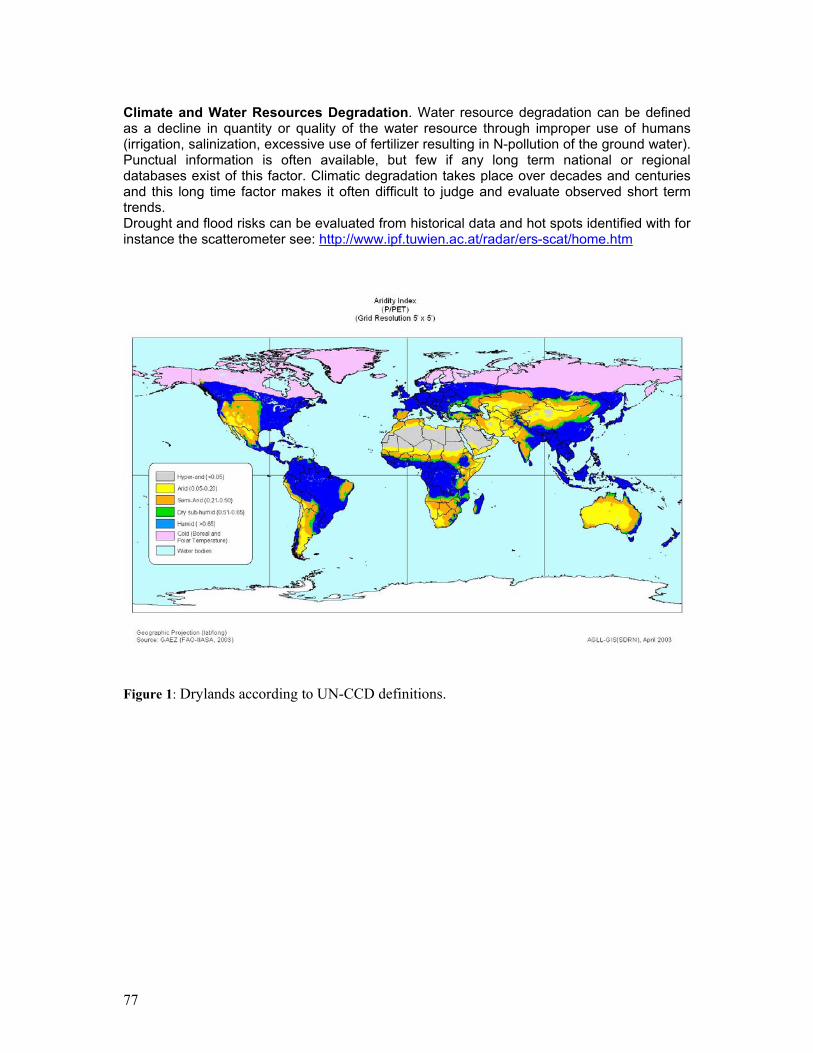
77
Climate and Water Resources Degradation. Water resource degradation can be defined as a decline in quantity or quality of the water resource through improper use of humans (irrigation, salinization, excessive use of fertilizer resulting in N-pollution of the ground water). Punctual information is often available, but few if any long term national or regional databases exist of this factor. Climatic degradation takes place over decades and centuries and this long time factor makes it often difficult to judge and evaluate observed short term trends. Drought and flood risks can be evaluated from historical data and hot spots identified with for instance the scatterometer see: http://www.ipf.tuwien.ac.at/radar/ers-scat/home.htm
Figure 1: Drylands according to UN-CCD definitions.
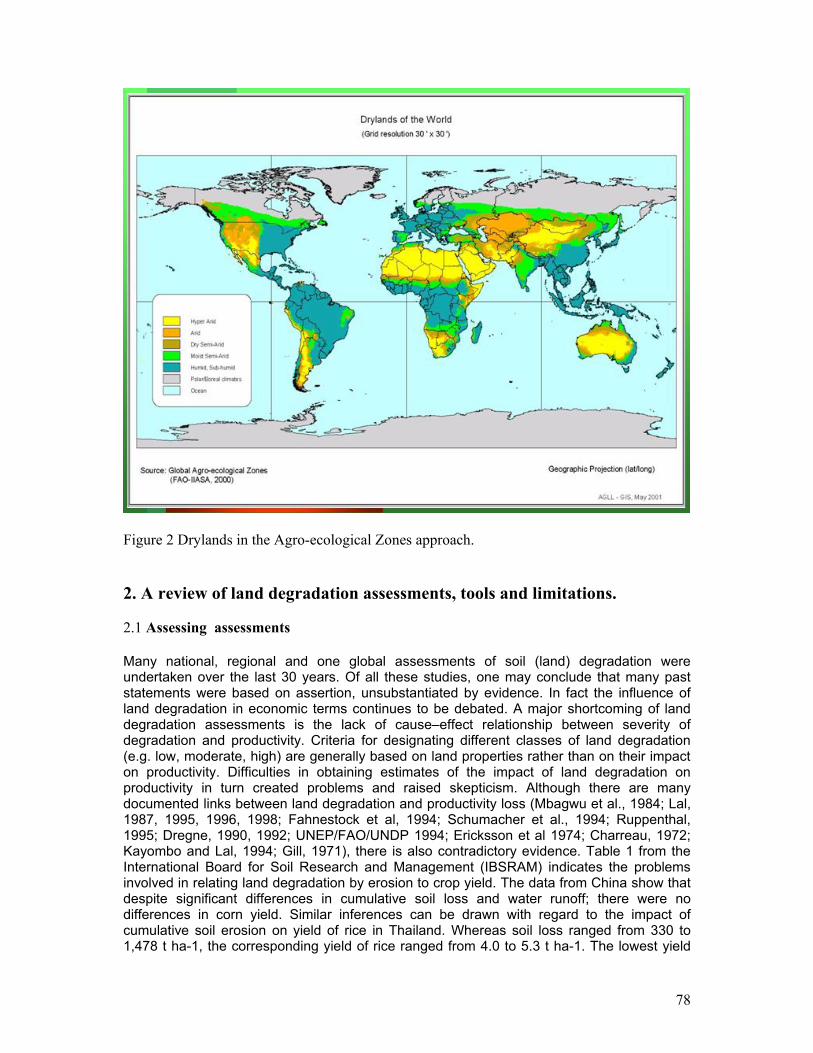
78
Figure 2 Drylands in the Agro-ecological Zones approach. 2. A review of land degradation assessments, tools and limitations. 2.1 Assessing assessments Many national, regional and one global assessments of soil (land) degradation were undertaken over the last 30 years. Of all these studies, one may conclude that many past statements were based on assertion, unsubstantiated by evidence. In fact the influence of land degradation in economic terms continues to be debated. A major shortcoming of land degradation assessments is the lack of cause–effect relationship between severity of degradation and productivity. Criteria for designating different classes of land degradation (e.g. low, moderate, high) are generally based on land properties rather than on their impact on productivity. Difficulties in obtaining estimates of the impact of land degradation on productivity in turn created problems and raised skepticism. Although there are many documented links between land degradation and productivity loss (Mbagwu et al., 1984; Lal, 1987, 1995, 1996, 1998; Fahnestock et al, 1994; Schumacher et al., 1994; Ruppenthal, 1995; Dregne, 1990, 1992; UNEP/FAO/UNDP 1994; Ericksson et al 1974; Charreau, 1972; Kayombo and Lal, 1994; Gill, 1971), there is also contradictory evidence. Table 1 from the International Board for Soil Research and Management (IBSRAM) indicates the problems involved in relating land degradation by erosion to crop yield. The data from China show that despite significant differences in cumulative soil loss and water runoff; there were no differences in corn yield. Similar inferences can be drawn with regard to the impact of cumulative soil erosion on yield of rice in Thailand. Whereas soil loss ranged from 330 to 1,478 t ha-1, the corresponding yield of rice ranged from 4.0 to 5.3 t ha-1. The lowest yield
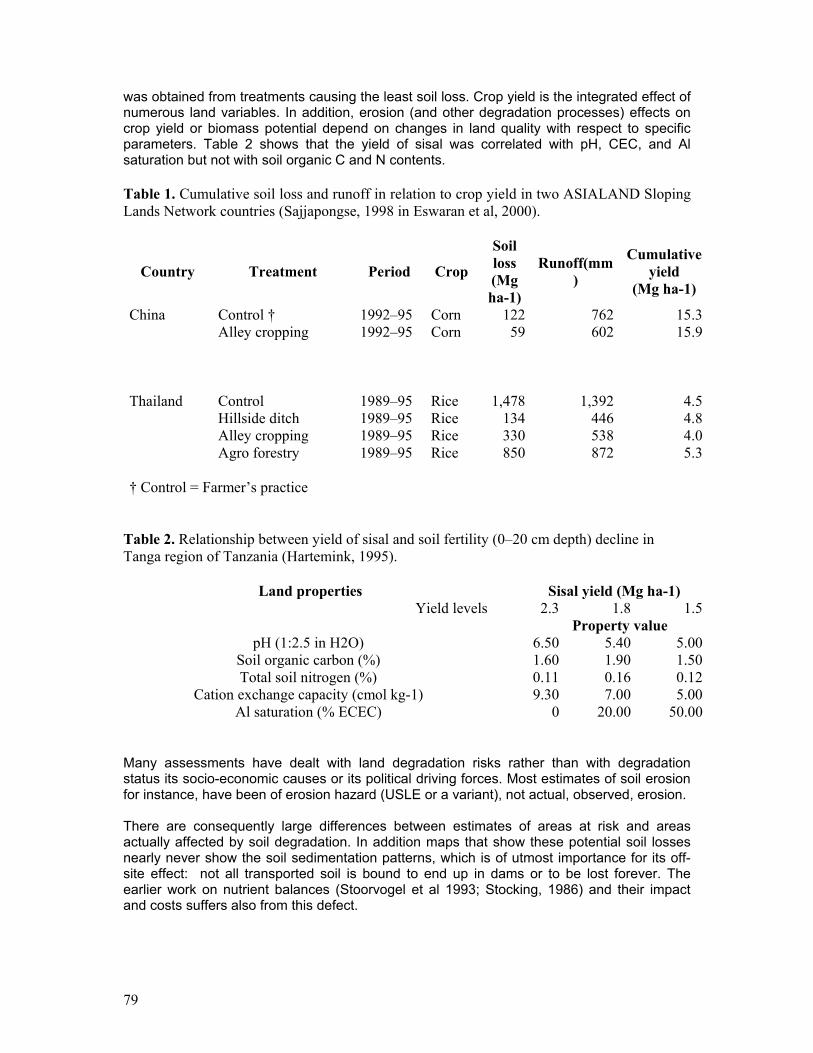
79
was obtained from treatments causing the least soil loss. Crop yield is the integrated effect of numerous land variables. In addition, erosion (and other degradation processes) effects on crop yield or biomass potential depend on changes in land quality with respect to specific parameters. Table 2 shows that the yield of sisal was correlated with pH, CEC, and Al saturation but not with soil organic C and N contents. Table 1. Cumulative soil loss and runoff in relation to crop yield in two ASIALAND Sloping Lands Network countries (Sajjapongse, 1998 in Eswaran et al, 2000).
Country Treatment Period Crop
Soil loss (Mg ha-1)
Runoff(mm)
Cumulative yield
(Mg ha-1)
China Control † 1992–95 Corn 122 762 15.3 Alley cropping 1992–95 Corn 59 602 15.9 Thailand Control 1989–95 Rice 1,478 1,392 4.5 Hillside ditch 1989–95 Rice 134 446 4.8 Alley cropping 1989–95 Rice 330 538 4.0 Agro forestry 1989–95 Rice 850 872 5.3 † Control = Farmer’s practice
Table 2. Relationship between yield of sisal and soil fertility (0–20 cm depth) decline in Tanga region of Tanzania (Hartemink, 1995).
Land properties Sisal yield (Mg ha-1) Yield levels 2.3 1.8 1.5
Property value pH (1:2.5 in H2O) 6.50 5.40 5.00
Soil organic carbon (%) 1.60 1.90 1.50Total soil nitrogen (%) 0.11 0.16 0.12
Cation exchange capacity (cmol kg-1) 9.30 7.00 5.00Al saturation (% ECEC) 0 20.00 50.00
Many assessments have dealt with land degradation risks rather than with degradation status its socio-economic causes or its political driving forces. Most estimates of soil erosion for instance, have been of erosion hazard (USLE or a variant), not actual, observed, erosion. There are consequently large differences between estimates of areas at risk and areas actually affected by soil degradation. In addition maps that show these potential soil losses nearly never show the soil sedimentation patterns, which is of utmost importance for its off-site effect: not all transported soil is bound to end up in dams or to be lost forever. The earlier work on nutrient balances (Stoorvogel et al 1993; Stocking, 1986) and their impact and costs suffers also from this defect.
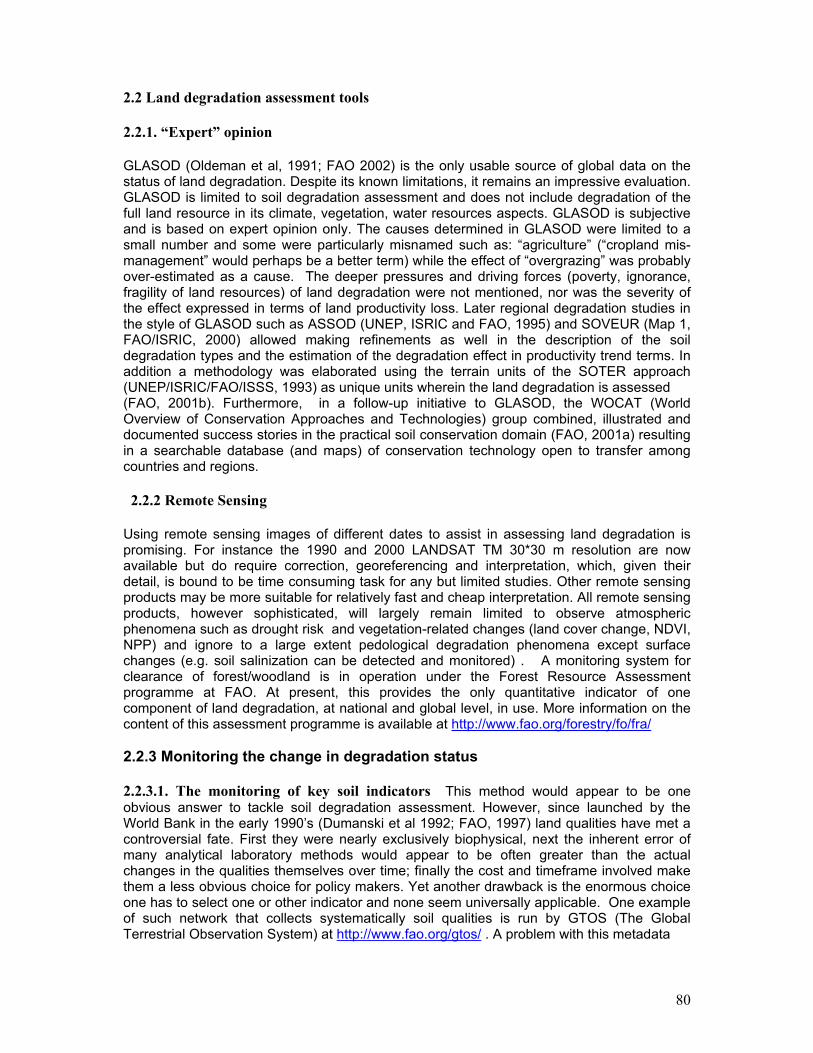
80
2.2 Land degradation assessment tools 2.2.1. “Expert” opinion GLASOD (Oldeman et al, 1991; FAO 2002) is the only usable source of global data on the status of land degradation. Despite its known limitations, it remains an impressive evaluation. GLASOD is limited to soil degradation assessment and does not include degradation of the full land resource in its climate, vegetation, water resources aspects. GLASOD is subjective and is based on expert opinion only. The causes determined in GLASOD were limited to a small number and some were particularly misnamed such as: “agriculture” (“cropland mis-management” would perhaps be a better term) while the effect of “overgrazing” was probably over-estimated as a cause. The deeper pressures and driving forces (poverty, ignorance, fragility of land resources) of land degradation were not mentioned, nor was the severity of the effect expressed in terms of land productivity loss. Later regional degradation studies in the style of GLASOD such as ASSOD (UNEP, ISRIC and FAO, 1995) and SOVEUR (Map 1, FAO/ISRIC, 2000) allowed making refinements as well in the description of the soil degradation types and the estimation of the degradation effect in productivity trend terms. In addition a methodology was elaborated using the terrain units of the SOTER approach (UNEP/ISRIC/FAO/ISSS, 1993) as unique units wherein the land degradation is assessed (FAO, 2001b). Furthermore, in a follow-up initiative to GLASOD, the WOCAT (World Overview of Conservation Approaches and Technologies) group combined, illustrated and documented success stories in the practical soil conservation domain (FAO, 2001a) resulting in a searchable database (and maps) of conservation technology open to transfer among countries and regions. 2.2.2 Remote Sensing Using remote sensing images of different dates to assist in assessing land degradation is promising. For instance the 1990 and 2000 LANDSAT TM 30*30 m resolution are now available but do require correction, georeferencing and interpretation, which, given their detail, is bound to be time consuming task for any but limited studies. Other remote sensing products may be more suitable for relatively fast and cheap interpretation. All remote sensing products, however sophisticated, will largely remain limited to observe atmospheric phenomena such as drought risk and vegetation-related changes (land cover change, NDVI, NPP) and ignore to a large extent pedological degradation phenomena except surface changes (e.g. soil salinization can be detected and monitored) . A monitoring system for clearance of forest/woodland is in operation under the Forest Resource Assessment programme at FAO. At present, this provides the only quantitative indicator of one component of land degradation, at national and global level, in use. More information on the content of this assessment programme is available at http://www.fao.org/forestry/fo/fra/ 2.2.3 Monitoring the change in degradation status 2.2.3.1. The monitoring of key soil indicators This method would appear to be one obvious answer to tackle soil degradation assessment. However, since launched by the World Bank in the early 1990’s (Dumanski et al 1992; FAO, 1997) land qualities have met a controversial fate. First they were nearly exclusively biophysical, next the inherent error of many analytical laboratory methods would appear to be often greater than the actual changes in the qualities themselves over time; finally the cost and timeframe involved make them a less obvious choice for policy makers. Yet another drawback is the enormous choice one has to select one or other indicator and none seem universally applicable. One example of such network that collects systematically soil qualities is run by GTOS (The Global Terrestrial Observation System) at http://www.fao.org/gtos/ . A problem with this metadata
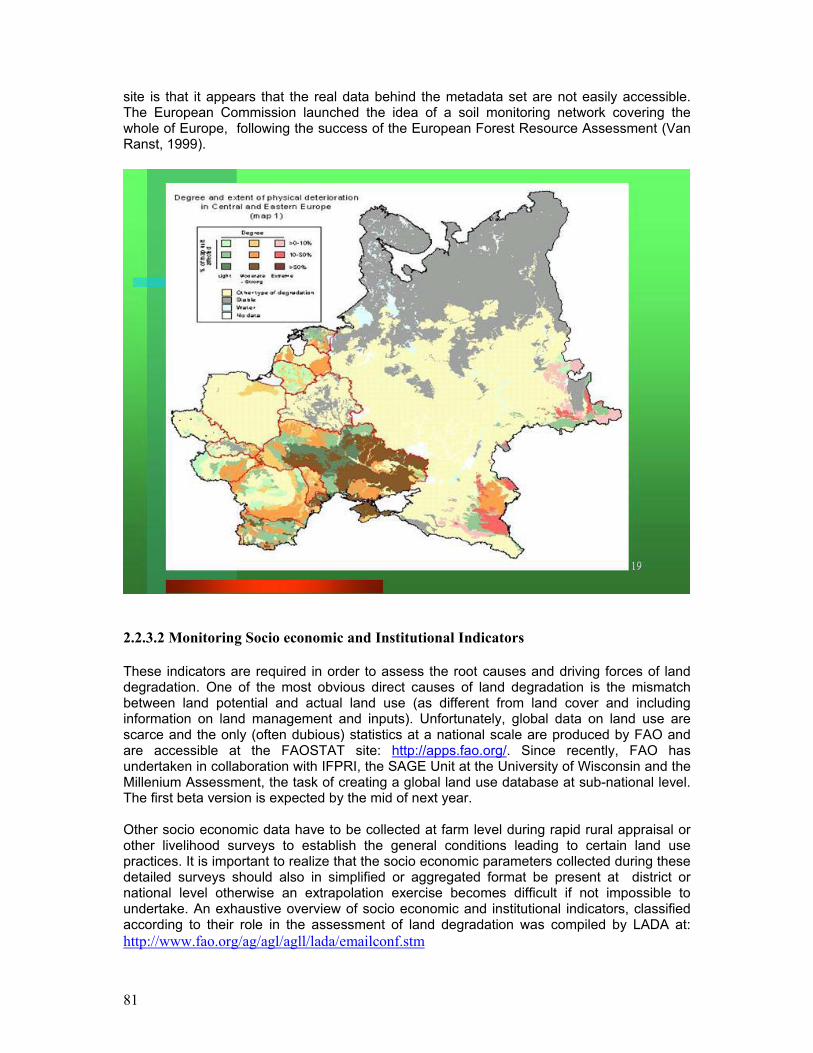
81
site is that it appears that the real data behind the metadata set are not easily accessible. The European Commission launched the idea of a soil monitoring network covering the whole of Europe, following the success of the European Forest Resource Assessment (Van Ranst, 1999).
2.2.3.2 Monitoring Socio economic and Institutional Indicators These indicators are required in order to assess the root causes and driving forces of land degradation. One of the most obvious direct causes of land degradation is the mismatch between land potential and actual land use (as different from land cover and including information on land management and inputs). Unfortunately, global data on land use are scarce and the only (often dubious) statistics at a national scale are produced by FAO and are accessible at the FAOSTAT site: http://apps.fao.org/. Since recently, FAO has undertaken in collaboration with IFPRI, the SAGE Unit at the University of Wisconsin and the Millenium Assessment, the task of creating a global land use database at sub-national level. The first beta version is expected by the mid of next year. Other socio economic data have to be collected at farm level during rapid rural appraisal or other livelihood surveys to establish the general conditions leading to certain land use practices. It is important to realize that the socio economic parameters collected during these detailed surveys should also in simplified or aggregated format be present at district or national level otherwise an extrapolation exercise becomes difficult if not impossible to undertake. An exhaustive overview of socio economic and institutional indicators, classified according to their role in the assessment of land degradation was compiled by LADA at: http://www.fao.org/ag/agl/agll/lada/emailconf.stm
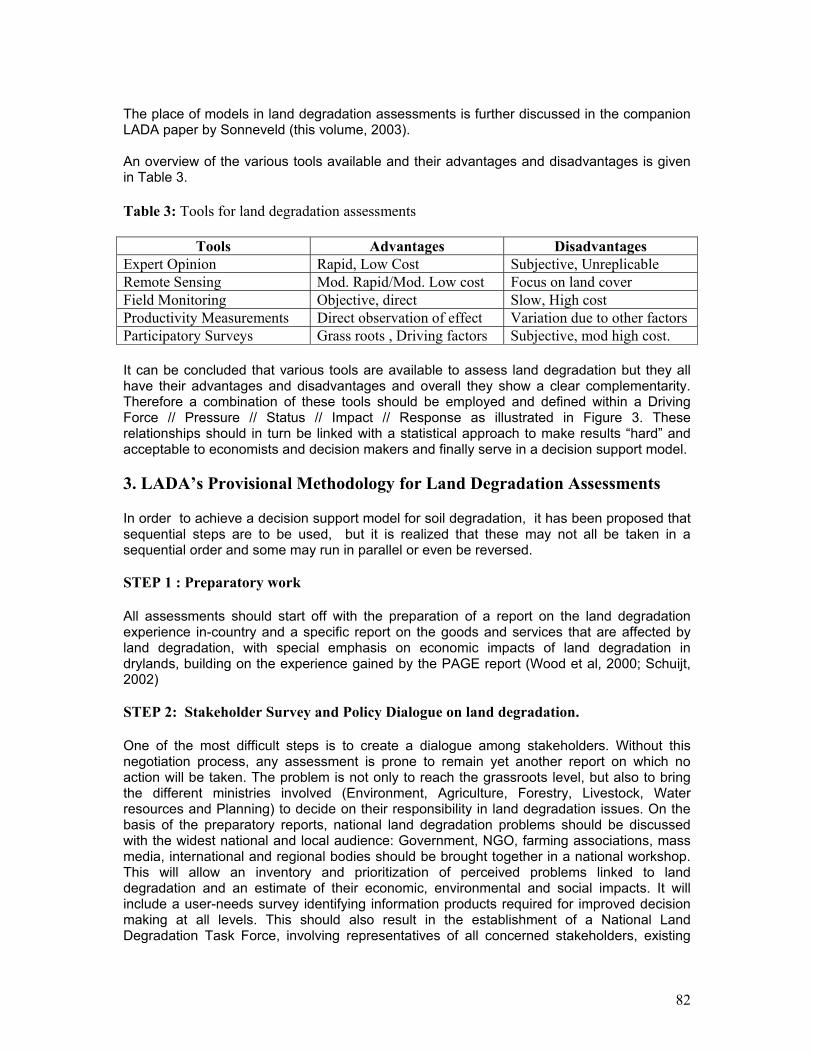
82
The place of models in land degradation assessments is further discussed in the companion LADA paper by Sonneveld (this volume, 2003). An overview of the various tools available and their advantages and disadvantages is given in Table 3. Table 3: Tools for land degradation assessments
Tools Advantages Disadvantages Expert Opinion Rapid, Low Cost Subjective, Unreplicable Remote Sensing Mod. Rapid/Mod. Low cost Focus on land cover Field Monitoring Objective, direct Slow, High cost Productivity Measurements Direct observation of effect Variation due to other factors Participatory Surveys Grass roots , Driving factors Subjective, mod high cost. It can be concluded that various tools are available to assess land degradation but they all have their advantages and disadvantages and overall they show a clear complementarity. Therefore a combination of these tools should be employed and defined within a Driving Force // Pressure // Status // Impact // Response as illustrated in Figure 3. These relationships should in turn be linked with a statistical approach to make results “hard” and acceptable to economists and decision makers and finally serve in a decision support model. 3. LADA’s Provisional Methodology for Land Degradation Assessments In order to achieve a decision support model for soil degradation, it has been proposed that sequential steps are to be used, but it is realized that these may not all be taken in a sequential order and some may run in parallel or even be reversed. STEP 1 : Preparatory work All assessments should start off with the preparation of a report on the land degradation experience in-country and a specific report on the goods and services that are affected by land degradation, with special emphasis on economic impacts of land degradation in drylands, building on the experience gained by the PAGE report (Wood et al, 2000; Schuijt, 2002) STEP 2: Stakeholder Survey and Policy Dialogue on land degradation. One of the most difficult steps is to create a dialogue among stakeholders. Without this negotiation process, any assessment is prone to remain yet another report on which no action will be taken. The problem is not only to reach the grassroots level, but also to bring the different ministries involved (Environment, Agriculture, Forestry, Livestock, Water resources and Planning) to decide on their responsibility in land degradation issues. On the basis of the preparatory reports, national land degradation problems should be discussed with the widest national and local audience: Government, NGO, farming associations, mass media, international and regional bodies should be brought together in a national workshop. This will allow an inventory and prioritization of perceived problems linked to land degradation and an estimate of their economic, environmental and social impacts. It will include a user-needs survey identifying information products required for improved decision making at all levels. This should also result in the establishment of a National Land Degradation Task Force, involving representatives of all concerned stakeholders, existing
83
networks and technicians. This authorative body should have a set of responsibilities defined including a detailed work programme and budget. STEP 3: Land Degradation Stocktaking Exercise and Preliminary Analysis. During this phase all available socio-economic, biophysical data, information and knowledge on land degradation, including remotely sensed data, are collected and evaluated to assess the quality of the available information and identify key data gaps. On the basis of this evaluation a national programme for collecting additional data to fill the crucial gaps should be launched. At the same time a qualitative scheme should be worked out linking the socio-economic and political driving forces (D) resulting in pressures (P) on the land and a certain degradation status (S) and degradation impact (I) on the people, the productivity and the environment. The consequent responses (R) undertaken to combat the degradation should also be evaluated. This quantitative DPRIS scheme (Figure 3) could be turned into a preliminary decision support tool using modeling and statistical techniques. STEP 4: Develop Stratification and Sampling Strategies. Iso-zones in each country will be identified with respect to farming systems, socio-economics and biophysical conditions. This stratification will normally be based on one or a combination of: agro-ecological zoning, administrative units, land use (farming systems), watersheds or SOTER units. • Extensive use will be made of Remote Sensing and related Digital Elevation Models.
Land cover change and NPP/NDVI results will be explored. • Bright spots/Trouble spots based on the Pressure indicators gathered in the two previous
steps will also be identified. • A sampling strategy for iso-zones will be developed for the bright/trouble spot analysis
and for the local field surveys including the rapid rural appraisal and the field measurements (which will form the baseline for a land monitoring scheme), the farmer’s surveys and the pilot site in depth analysis.
• Number of samples to be taken may vary depending on complexity and extent of drylands but is likely to include on average more than 200 individual samples (depends on country size) to be of any statistical use.
STEP 5: Field Surveys and Local Assessments A stake holder’s consultation in local assessment area will be followed by local assessments and include the actual data gathering in communities and households (including data on cause and impacts and perceptions of different socioeconomic groups of land degradation) through rapid rural appraisal (or livelihood) surveys. This socio-economic exercise is supplemented by the: • Actual measurement of limited number of biophysical indicators in the field (Organic
carbon, Electrical Conductivity, biodiversity indicator, pollution) • A nationwide description of biophysical (soil, vegetation, water) degradation status
according to the latest WOCAT guidelines (FAO, 2001a) and an evaluation of techniques and approaches applied by farmers and governments to combat desertification.
This will allow in a first instance to establish a locally adapted Pressure-State-Response scheme based on the results of the community/households appraisal. Local suggestions for action for integration in national implementation will be incorporated. It will also allow identifying constraints and opportunities on policy, legal and institutional issues that need consideration by decision makers as defined by the local stakeholders and function of the specific agro-ecological environment. At the national level various products illustrating risk
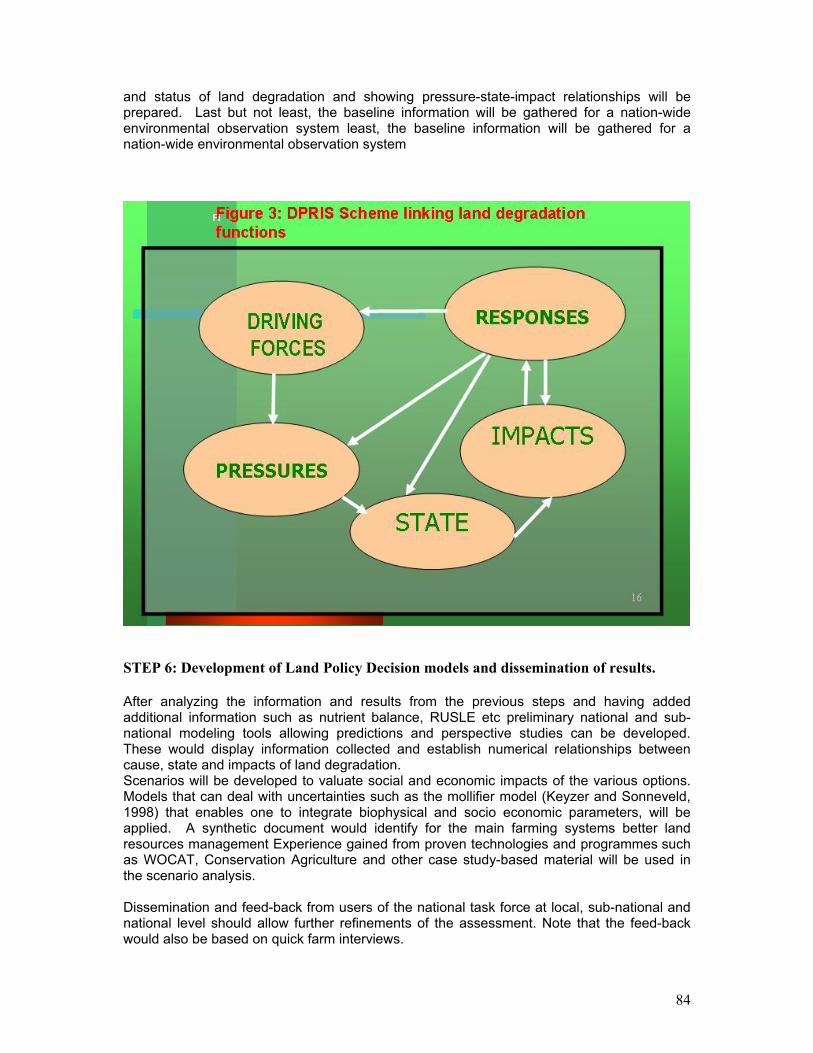
84
and status of land degradation and showing pressure-state-impact relationships will be prepared. Last but not least, the baseline information will be gathered for a nation-wide environmental observation system least, the baseline information will be gathered for a nation-wide environmental observation system
STEP 6: Development of Land Policy Decision models and dissemination of results. After analyzing the information and results from the previous steps and having added additional information such as nutrient balance, RUSLE etc preliminary national and sub-national modeling tools allowing predictions and perspective studies can be developed. These would display information collected and establish numerical relationships between cause, state and impacts of land degradation. Scenarios will be developed to valuate social and economic impacts of the various options. Models that can deal with uncertainties such as the mollifier model (Keyzer and Sonneveld, 1998) that enables one to integrate biophysical and socio economic parameters, will be applied. A synthetic document would identify for the main farming systems better land resources management Experience gained from proven technologies and programmes such as WOCAT, Conservation Agriculture and other case study-based material will be used in the scenario analysis. Dissemination and feed-back from users of the national task force at local, sub-national and national level should allow further refinements of the assessment. Note that the feed-back would also be based on quick farm interviews.
85
STEP 7: Developing a Monitoring Tool The integration of the monitoring process by all concerned stakeholders as part of regular planning and development processes would allow a regular feedback and updating of analysis and responses. 4. Conclusions and Recommendations The land degradation assessment in drylands project (LADA) is the official tool of the UN-CCD and the GEF to develop a standard methodology in the subject matter. Partnerships with various parallel initiatives need to be strengthened. It is important to standardize the terminology related to degradation and drylands in the long run as it often reflect political compromise rather than technical accuracy. There is a need to develop a precise, objective, and unambiguous definitions accepted by all disciplines involved. It is important that land degradation is tackled holistically and in a multidisciplinary way in order to establish links between the driving forces, the causes (pressures) and the state of land degradation and its impact on the people and the environment. Various tools are available to assess land degradation but they all have their advantages and disadvantages and overall they show a clear complimentarity. Therefore a combination of these tools linked with a statistical approach to make results “hard” and acceptable to economists and decision makers is required. It is necessary that the links established integrate biophysical and socio-economic factors into models that can serve to support decisions. The LADA approach blueprint as it stands now involves seven sequential steps involving the (1) the preparation of initial studies, (2) the establishment of a national LADA task force, (3) Stocktaking and Preliminary analysis (4) developing a stratification and sampling strategy (5) develop a sampling strategy and carry out field surveys (6) development of a LADA decision support tool (7) develop a LADA monitoring tool. Bibliography CNEARC, 2002: Dégradation des sols au Sahel. Techniques et méthodes de lutte. Etudes et travaux du CNEARC, Montpellier, France. Charreau, C. 1972 : Problèmes posés par l’utilisation agricole des sols tropicaux par des cultures annuelles. Agronomie tropicale, 27, 905-929. Darkoh, M.K., 1995: The deterioration of the environment in Africa’s drylands and river basins. Desertification Control Bulletin, 24, 35 -41. Dregne, H.E., 1990: Erosion and Soil Productivity in Africa. Journal Soil and Water Conservation, 45, 431 – 436. Drehne, H.E.,(ed) 1992: Degradation and Restoration of arid Lands. Lubbock, Texas Technical University.
86
Dumanski, J., Eswaran, H. and Latham, M.,1992: A proposal for an international framework for evaluating sustainable land management. In: Evaluation for Sustainable land management in the Developing World, eds. J. Dumanski, E. Pushparajah, M. Latham and R. Myers. IBSRAM Proceedings No 12, Vol 2, 25 – 45.Bangkok: IBSRAM. ErcikssonJ., Hakanson, I. and Danfors, B. 1974: The effect of soil compaction on soil structure and crop yields. Bulletin 354. Uppsala: Swedish Institute of Agricultural Engineering. Eswaran, H., Lal, R. and Reich,P.F., 2001: Land degradation, an overview. In: Bridges, E.M., I. Hannam, L.R. Oldeman, F.W.T. Penning de Vries, S.J. Scherr and S. Sompatpanit (eds). Responses to Land Degradation. Proc. 2nd International conference on land degradation and desertification, Khon Kaen, Thailand. Oxford Press, New Dehli, India. Fahnenstock, P., Lal, R. and Hall, G.F., 1995:Land use and erosional effects on two Ohio Alfisols. Crop yields. Journal of Sustainable Agriculture, 7, 85 -100. FAO, 1995: Planning for sustainable use of land resources.Towards a new approach. Land and Water Bulletin 2. FAO, Rome. FAO, 1997: Land quality indicators and Their Use in Sustainable Agriculture and Rural Development. Land and Water Bulletin 5. FAO, Rome. FAO, 2001a: World Overview of Conservation Approaches and Technologies II. FAO’s Land and Water Digital Media Series # 9. FAO, Rome. FAO, 2001b: Guidelines for Qualitative Assessment of Land Resources and Degradation. AGL/Misc33/2001. FAO, Rome. FAO, 2002: TERRASTAT, Global land resources GIS models and databases for poverty and food insecurity mapping. FAO’s Land and Water Digital Media Series # 20. FAO, Rome. FAO/ISRIC, 2000: Soil and Terrain Database, Land Degradation Status and Soil Vulnerability Assessment for Central and Eastern Europe. FAO’s Land and Water Digital Media Series # 10. FAO, Rome. Fischer, G. , van Velthuizen, H.T , Shah, M. and Nachtergaele F.O., 2002: Global agro-ecological Assessment for Agriculture in the 21st Century: Methodology and Results. Gill, W.R., 1971: Economic assessment of soil compaction. St Joseph: ASAE Monograph. Hartemink A.E., 1995 Land fertility decline under sisal cultivation in Tanzania.ISRIC technical paper no 28. wageningen, ISRIC. ISO, 1996: Requirements for characterization of excavated soil and other materials for re-use. CD 15176 ISO/TC 190 SC 7/ Soil and Site Assessment/ WGI/N2 rev.3. ISSS, 1996: Terminology for Soil erosion and Conservation. Bergsma, E., Charman, P.,Gibbons, F., Hurni, H., Moldenhauer, W.C., & Panichapong, S. International Society Soil Science, Vienna. Kayombo B. and Lal, R., 1994: Response of tropical crops to soil compaction. In: Soil Compaction in Crop Production, eds B.D. Sloane and C. van Ouwerkerk, 287-315, Amsterdam, Elsevier.
87
Keyzer, M.A. and Sonneveld, B.G.J.S., 1998: Using the mollifier method to characterize datasets and models: the case of the Universal Soil Loss Equation. ITC Journal 1997-3/4 263-273. Lal, R., 1987: Response of maize and cassava to removal of surface soil from an Alfisol in Nigeria. International Journal of Tropical Agriculture, 5, 77 – 92. Lal, R., 1995: Erosion-Crop productivity relationships for soils of Africa. Soil Science Society of America Journal, 59, 661 – 667. Lal, R., 1996: Axle load and tillage effects on soil degradation and rehabilitation in Western Nigeria. Soil Physical and hydrological properties. Land Degradation Review, 7, 19 - 45. Lal, R., 1998: Soil erosion impact on agronomic productivity and environment quality. Critical reviews in Plant Sciences, 17, 310 – 464. Mbagwu,J.S., Lal, R. and Scott, T.W. 1984: Effects of desurfacing of alfisols and Ultisols in southern Nigeria. Crop Performance. Soil science Society of America Journal, 48, 828-833. Oldeman, L.R., Hakkeling, R.T.A. and Sombroek, W.G., 1992: World Map of the Status of Human-induced land degradation: an explanatory note. Wageningen, ISRIC. Ruppenthal, M. 1995: Soil Conservation in Andean cropping systems: Soil Erosion and Crop Productivity. Traditional and Forage-Legume based Cassava Cropping Systems in the South columbian Andes. Weikersheim, Verlag Josef Margraf. Sajjapongse, A. 1988: Asialand, management of sloping land network: an overview of Phase 3. Network Document No 23, Bangkok, IBSRAM. Schuijt, K., 2002: Land and water use of Wetlands in Africa: Economic values of African Wetlands. IIASA Interim report IR-02-063. Schumacher, T.E., Lindstrom M.J. Mokma, D.L. and Nelson W.W., 1994: Corn yields: erosion relationships of representative loess and till soils in the North Central United States. Journal of Soil and Water conservation, 49, 77 – 81.
Sonneveld, B.G.J.S., 2003: Formalizing the use of expert judgements for land degradation assessment: a case study for Ethiopia. Proceedings of . EU Joint research Centre, Ispra.
Stocking, M. , 1986: The cost of soil erosion in Zimbabwe in terms of losses of three major nutrients. Consultant’s working paperNo 3, Soil Conservation Programme,FAO Land and Water Bulletin Rome, Italy. Stoorvogel, J.J., Smaling, E.M.A. and Jansen, B.J., 1993: Calculating soil nutrient balances in Africa at different scales.I Supra-nationnal scale: Fertilizer Research, 35 227-235. UNEP, 1992: World Atlas of Desertification. London: Edward Arnold. UNEP/ISRIC/FAO, 1995: Soil Degradation in South and Southeast Asia (ASSOD). Wageningen, ISRIC. UNEP/ISRIC/FAO/ISSS, 1993: Global and national soils and terrain databases (SOTER). Rev1. 1995. World Soil Resources Reports # 74. FAO, Rome.
88
UNEP/FAO/UNDP, 1994: Land Degradation in South Asia: Its severity, Causes and effects upon the People. UNEP/FAO/UNDP. FAO World Soil Resources Report 78 FAO,Rome.
Van Ranst, E. 1999: Vulnerability of European forest soils to air pollution. Proceedings of the International Congess on soil vulnerability and sensitivity. EU Joint Research Centre, ISPRA, Italy. Wood, S., K. Sebastian and S.J. Scherr (2000) Pilot Analysis of global ecosystems. World Resource Institute. ISBN: 1-56973-457-7
89
Development of decision support tools in LADA: a case study for Ethiopia
B.G.J.S. Sonneveld* and M.A. Keyzer Centre for World Food Studies of the Vrije Universiteit (SOW-VU).
De Boelelaan 1105 1081 HV, Amsterdam
The Netherlands. Tel: +31 (0)20 444 93 04/21
Fax: +31 (0)20 444 93 25 Email: [email protected]
*Corresponding author.
Acknowledgement. We like to thank the Land and Plant Nutrition Management Service of the Food and Agricultural Organization of the United Nations for sponsoring the participation of the corresponding author in the workshop. The Centre for Development and Environment, University of Berne, kindly allowed the use of the SCRP data base.
Abstract. Land degradation in dryland areas affects the livelihood of millions of
people, especially in development countries where reduced productivity jeopardizes food security while violent conflicts over scarce land become now a perilous possibility. Being a typical externality, land degradation justifies a public intervention and the ratification by national governments of the United Nations Convention to Combat Desertification in the early nineties gave land conservation a high political priority in dryland areas. This together with the implementation of Agenda 21 should have resulted in concerted National Action Plans (NAP), where strategies are developed to preserve the quality of natural resources. However, conservation policies formulated, so far, were mostly unsuccessful and the overall concern is that earlier enthusiasm on environmental issues has lost ground with historical goals agreed. Major reasons for this failure are a poor understanding of underlying mechanisms of the degradation processes and the absence of a quantified impact of degradation on land productivity. The objective of the Land Degradation Assessment in Dry Areas (LADA) project is, therefore, to support developing countries by monitoring and analyzing causes and consequences of degradation processes in relation to the land productivity. LADA focuses thereby on nation-wide assessments, the level where most policy decisions are taken and where the portfolio for environmental projects is coordinated. The implementation of new soil conservation strategies can be underpinned by the development of spatial decision support tools, which inform decision makers about environmental and economic impact of alternative land uses and management techniques while giving due consideration to the needs, aspirations and attitudes of different stakeholders. Key to these spatial decision support tools is a formalized relationship that quantifies the impact of the degradation processes on land productivity in its geographical dependence of biophysical variables and land use.
This paper presents a case study where such a decision support tool is used to analyze the future impact of soil degradation on national food security and land occupation in Ethiopia. The decision support tool uses a spatial optimization model to maximize national agricultural revenues under alternative scenarios of soil conservation, land accessibility and technology. The constraints in the model determine whether people remain on their original
90
site, migrate within their ethnically defined areas or are allowed a trans-regional migration. Key to this model is the combination of a water erosion model with a yield function that relates natural resource characteristics and population distribution to spatially explicit estimates of agricultural yield. A comparison of the simulated land productivity values with historical patterns shows that results are interpretable and yield more accurate outcomes than postulating straightforward reductions in yield or land area for each geographic entity. The results of the optimization model show that in absence of soil erosion control, the future agricultural production stagnates and results in distressing food shortages, while rural incomes drop dramatically below the poverty line. Soil conservation and migration support a slow growth, but yet do not suffice to meet the expected food demand. In a trans-regional migration scenario, the highly degraded areas are exchanged for less affected sites, whereas cultivation on already substantially degraded soils largely continues when resettlement is confined to the original ethnic-administrative entity. A shift to modern technology offers better prospects and moderates the migration, but soil conservation remains indispensable, especially in the long term. Finally, an accelerated growth of non-agricultural sectors further alleviates poverty in the countryside, contributing to higher income levels of the total population and, simultaneously, relieving the pressure on the land through rural-urban migration.
91
‘If private agents and markets would efficiently manage the environment by themselves there would be no need to interfere. However, land degradation in dryland areas, being a typical externality, justifies a public intervention, the policies of which can be underpinned by spatial decision support tools that assist in design of resource conservation strategies while giving due consideration to the aspirations of the different stakeholders’
1 LAND UNDER PRESSURE IN DRYLAND AREAS
The hyperarid, arid, semi-arid and dry sub-humid zones, or drylands1 cover approximately 33% of Earth’s land surface (Adams and Eswaran, 2000) and hosts an estimated 1 billion people in more than a hundred countries. Alarming reports indicate that land degradation and desertification2 are widespread affecting rangelands (73 percent), marginal rainfed crop land (47 percent) and a significant percentage of irrigated lands (UNCED, Agenda 21). These degradation processes have their largest impact in developing countries where current economic conditions do not allow a compensation of lost productivity with expensive inputs. Consequently, farmers are extremely dependent on natural conditions and cannot support a further deterioration of the land. Yet, the current situation is distressing. For example, in the drylands of sub-Saharan Africa, 20-50% of the land is degraded to a certain degree, affecting the livelihood of some 200 million people, but land degradation is also widespread and severe in poor areas of Asia and Latin America. Ongoing land degradation will, undoubtedly, create scarcity, especially in drylands where extensive areas belong to fragile agro-ecological systems which productivity loss might be irreversible for the period of a next generation. The UN Convention to Combat Desertification (UNCCD) indicated in 1994 that 5 to 10 million hectares are lost annually to land degradation. Moreover, natural phenomena such as El Niño Southern Oscillation lead to increased variability and reduce predictability of weather patterns, thereby exacerbating the occurrence of both droughts and flooding. Global warming also may lead to increased rates of desertification and the UN Framework Convention on Climate Change states "…countries with arid and semi-arid areas or areas liable to floods, drought and desertification ... are particularly vulnerable to the adverse effects of climate change". Another recent study (Fischer et al., 2002) provided clear evidence for this statement by simulating Global Climate Change scenarios. The results showed that overall suitability for crop production is reduced in the drylands of East and South Africa, on highly productive lands in Brazil and Paraguay and in densely populated areas in South Asia. An ICRISAT study (Ryan J.G. et al., 2001) shows that water availability and poor soil fertility are the primary constraints throughout the drylands in the coming years. Moreover, the pressure on land is mounting, which is largely due to fast population growth in developing countries, the increasing per capita incomes and
1 Drylands are characterized by a precipitation/potential evapotranspiration ratio of less than 0.65 (Middleton and Thomas 1997) and roughly includes the LGP zones from 0-120 days. 2 The term ‘desertification’, is not about advancing deserts, but refers to a loss of productivity of the land due to farming practices in dryland areas.
92
the associated rise in demand for meat and feedgrains (FAO, 2000; OECD, 2001; USDA, 2001; and FAPRI, 2001).
The question arises how land use systems in the dryland areas will react to these changes in socio-economic and biophysical conditions and if any appropriate measure can be taken. It is, therefore, useful to analyze the interaction between the land use systems and externalities in the dryland areas.
Dryland agriculture and externalities Land use systems in the drylands are characterized by risk-avoiding mechanisms that cope with the prevailing harsh climatic conditions. However, it are also these coping strategies, combined with absence of property rights (Aredo, 1999), that result in externalities3, the negative effects of which are the major cause of land degradation. Moreover, in many developing countries these externalities are exacerbated by day to day survival of the poor (Scherr, 2000) and political instability (Kebbede and Jacob, 1988).
For example, migration patterns of pastoralists, dominating the land use in dryland areas constitute a flexible mechanism to anticipate the seasonal and inter-year rainfall variability that fluctuates the amount of available feed. However, inherent to these migration movements is the occupation of vast areas and trans-national border routes, which make it problematic to formalize land tenure and decentralize decision making power. Consequently, land shared among many, resulted in a tragedy of the commons, which clearly became discernible at the beginning of last century when mounting livestock numbers surpassed lands’ carrying capacity and aggravated a widespread overgrazing of communal land and regular invasions of small scale sedentary farms. Moreover, government policies now discourage transborder movements thereby seriously restricting the access to the required food sources. This also stimulated the sedentarisation of pastoral communities, which no longer found a place in the overpopulated fertile valleys and had to settle in marginal areas bordering the semi-arid and sub-humid zones, mostly around urban centres.
Absence of land tenure and political instable situations also cause the adoption of short time horizons by the land users, inducing a maximum consumption of resource capacity within the time frame that was set. This situation often leads to a 'mining' of the resource with depletion as consequence. This dynamic externality of land degradation is also shown by dissimilar time preferences between governments and land users, leading to the adoption of different discount rates that are used to determine present equivalent of future investments. This is a major reason for the failure of land conservation programs since governments intend to adopt longer time horizons and lower discount rates than private individuals. Rehabilitation projects with long term benefits are, therefore, considered economically unattractive by those directly affected, because, while present costs are included at full value, discounting reduces the long term benefits to small or negligible amounts.
3 The distinguishing characteristic of a negative externality is the lack of accountability; the benefits of resource use all accrue to the individual while payments for additional costs, imposed on others, are born by the entire group or community.
93
Externalities in sedentary agricultural settlements also have a clear spatial dimension which is provoked by the rigid structure of the land parcels. For example, the vocation of one plot can have significant spill over effects on adjacent neighbours (Hanley et al., 1977) alike in watershed areas where heavy use of pesticides on upstream arable lands may profoundly affect the ecosystem functioning of downstream wetlands with nature reserves. Other spatial externalities in dryland areas are the siltation of water reservoirs by eroded soil from higher locations and inefficient use of irrigation water which lead to seepage on lower lying adjacent fields, causing imperfect drainage conditions and salinization (Cacho et al., 2001).
In short, there are many externalities in dryland agriculture which justify a public intervention since there are no efficient markets and price mechanisms that will correct for the deteriorative effects of land degradation. Supporting public intervention
Although this need for government interference to combat land degradation hazard in dryland areas has been widely recognized, implementation of the land conservation policies, so far, have been remarkably unsuccessful (e.g. Johnson, 1999; Haas, 2001) and raises serious concerns for the long term food supply, violent conflicts over scarce productive soils and other vocations of the land like tourism and preservation of biodiversity. One of the reasons that explain this failure is that the underlying mechanisms of the degradation processes are still poorly understood, while the impact of degradation on land productivity was not properly quantified. Policy makers were therefore withdrawn from accurate evaluations of land conservation strategies that could be measured against other investment options. Hence, there is an urgent need for an accurate description of the causes and consequences of degradation processes and their accommodation in decision support tools to underpin the design and evaluation of land conservation strategies. These decision support tools are most useful when they adhere to the national level where most policy decisions are taken that affect the land use and where the portfolio of natural resource projects is coordinated. Since land degradation processes are particularly acute under local conditions these policy tools should contain a spatial component that study land degradation in its geographical dependence of natural resources and land use, while simultaneously informing the policy makers of how and where an intervention is required.
The Land Degradation Assessment in Dry Areas (LADA) project, has the objective to support developing countries by monitoring and analyzing causes and consequences of degradation processes in relation to the land productivity. The implementation of new soil conservation strategies in LADA project countries can be underpinned by the development of spatial decision support tools, which inform decision makers about environmental and economic impact of alternative land uses and management techniques while giving due consideration to the aspirations of the stakeholders.
94
LADA History. The growing awareness of environmental degradation received global recognition as an important threat to the human environment at the first United Nations Conference on Environment and Development (UNCED) in Sweden (1972). The conference created the UN Environment Programme (UNEP) which was established in Nairobi, Kenya in 1973. In 1977 a world plan of action to combat desertification (PACD) was presented motivated by the alarming information that loss of productive land was proceeding at rate of 600.000 hectares per year while, a 300 million hectares extending over 100 countries were considered prone to desertification. The cost of productivity lost every year was estimated at US$ 25 billion, and the resources needed to avert this loss amount to US$ 2.4 billion per year for 20 years. A global inventory of soil degradation (Oldeman et al., 1991) illustrated the severity of the problem and its publication formed one of a series of events orchestrated by the United Nations that culminated in the, second United Nations Conference on Environment and Development (UNCED), held in Rio de Janeiro, June 1992. The fundamental theme of the Rio Earth Summit was the reconciliation of the pursuits of economic development and environmental protection. It emphasized that in developing countries eradicating poverty is essential for the sustainable development of the natural resources.
The AGENDA 21 obliged the participating countries to make a concerted effort in implementing the conference recommendations at national level. The Rio meeting was enthusiastically followed by an array of other such meetings, one of which resulted in the UNCCD. The ratification of the UNCCD obliged the member states to organize concerted National Action Plans (NAP) that should come up with environmental protection programs. However, praise was tempered with concern that the overall implementation of Agenda 21 by governments, the UN, UNCCD and other international organizations, has been disappointing, and the last years has even lost ground in relation to the historic goals agreed. The International Organization of Parliaments of sovereign States concluded in 1997 that, with a very few exceptions, the Rio Declaration has not been submitted for approval to parliaments by their respective governments and a revival of the spirit of Rio is much desired (e.g. Verheij et al. 1997). LADA in operation. The LADA project, initiated in 2001, is an answer to these concerns and has the overall objective to assist policy makers in developing countries in their efforts to combat land degradation. LADA is funded by the Global Environmental Fund (GEF) in association with UNEP and the Global Mechanism (GM) and executed by the Food and Agriculture Organization of the United Nations (FAO). Furthermore a large consortium of UN organizations and research institutes are involved. The Land and Plant Nutrition Management Service of the FAO hosts the LADA secretariat.
LADA aims at a nation-wide assessment, the level where most policy decisions concerning the land use are taken and the portfolio for environmental projects and the National Action Plans (NAPs) are administered. The LADA project provides a unique opportunity to address land degradation problems, because of a conglomerate of public and academic institutions and the rich data sets that are provided by modern technology. The
95
LADA formulates the following objectives to reach this goal: (a) review and synthesis of data and information of relevance to the development of a land degradation assessment in drylands; (b) development, testing and revision of integrated land degradation assessment approaches and methods; (c) capacity and network development for assessment of land degradation; (d) conducting pilot studies to calibrate and test methods for land degradation assessment in selected countries; (e) development of strategies for information communication, executive partnerships and co-financing and; (f) development of a GEF Project Brief. LADA also intends to develop a consensus building process for which the long-term purpose is to identify global environmental benefits accruing from addressing land degradation in drylands in terms of conservation of biodiversity and international waters, and sequestration of carbon.
Of course, land degradation varies largely between the countries in both its physical nature as well as on its impact on land’s performance criteria. Land degradation is than also a clear normative concept that reflects the stakeholders’ interests. LADA, for that reason, takes an active approach to involve national decision makers from the inception of the project to clearly define the relevant agro-ecological capacities of the land and the way these are affected by land degradation4. At a workshop, held in January 2002, three pilot countries (Argentina, Senegal and China) were selected that would review the general situation in drylands and propose national criteria to select specific pilot zones for further study. The findings of these three reports were discussed in a workshop of November, 2002, complemented with the results of a preceding, four-week, e-mail conference on land quality indicators and methodologies for land degradation assessment that were presented during the workshop. In the near future LADA will expand its activities to four or more other countries.
It is now important that, after the stock taking exercises, the collected information on land degradation becomes operational to formulate efficient resource conservation strategies in the national LADA projects.
Objective of this paper
The purpose of this paper is to introduce the use of a decision support model for policy making strategies that will arrest land degradation while giving due consideration to the need of the stakeholders. Rather than a general review of the structure and application of these tools we choose here to discuss a case study for Ethiopia which gives a step-wise explanation of the development and design of a decision support model that addresses the policy questions raised (Sonneveld and Keyzer, 2002). After the introduction to the data sets we formalize the integration of biophysical knowledge in an economic model, thereby embedding an accurate description of land degradation processes in a decision structure that allows evaluation of alternative investment options. Key to the development of this decision support tool is a relationship that quantifies the impact of the degradation process on land
4 Some guidelines for a selection of these performance criteria can be found in a recent study of the World Resource Institute (Woods et al., 2000), which made an inventory of Goods and Services that require specific characteristics of the land.
96
productivity. This relationship is important, on one hand, for cost assessments (Pla Sentis, 1987), and, on the other, for the evaluation of the benefits from land conservation measures (Stocking and Clark, 1999; Graaff, 1996; Pagiola, 1993). Therefore, we pay special attention to infer and validate a reliable relation between land degradation and crop production for Ethiopia at the national level. This paper is innovative compared to earlier publications on this subject, (Sonneveld and Keyzer, 2002; Keyzer and Sonneveld 2001) in that it presents the mathematical details of the model which allows future developers to identify the different information flows within the program.
The target group of this paper is the technical staff involved in the nation-wide land degradation assessment studies and development of decision support tools, normally employed in the framework of the NAP. This multidisciplinary team includes biophysical (agronomy, soil science and hydrology) as well as economic (economists, mathematicians) disciplines. The paper constitutes a logical sequence in the objectives of LADA after its initial phase of nation-wide data inventories in the three pilot countries. The follow-up should be found at the LADA country level where implementation of an appropriate decision support tool should lead to concrete policy recommendations.
The presentation of the decision support model is organized as follows. First, we identify the priorities for soil conservation in Ethiopia, define the related policy questions and discuss the problems that are encountered when we want to quantify the impact of land degradation on food production at the national level (section 2). After introducing the data sets we present the production model with migration (section 3), specify the scenario runs (section 4) and compare the simulated impact of soil loss on agricultural production with the historically developed distribution of productivity and two alternative approaches (section 5). Next (section 6), we assess the economic performance of the sector under the various scenarios, in terms of agricultural productivity, food supply per kaput, value added per kaput and spatial distribution of the population with respect to the population density and occupation of degraded areas. Finally, we summarize the findings and conclude (section 7).
2 THE CASE STUDY: IDENTIFYING PRIORITIES FOR SOIL CONSERVATION IN ETHIOPIA
The natural conditions on the Ethiopian Highlands generally offer a favourable environment for human settlement. The plus factors are mainly attributable to the physiographic abruptness that influences the prevailing winds and results in substantially higher rainfall than in the adjacent arid lowlands in the east, while the moderate temperature prevents the occurrence of tropical diseases that prevail in the low-lying humid pockets in the west. Moreover, the volcanic parent material supplies a rich diversity of nutrients that makes soils more suitable for agriculture than in most other parts of Africa (Voortman et al., 2000).
However, the blessing gradually turned into a curse as population densities and herd sizes kept on augmenting to become the highest in Africa. At present, the Highlands carry 88 per cent out of a total population of 64 million people and 86 per cent of the labour force is
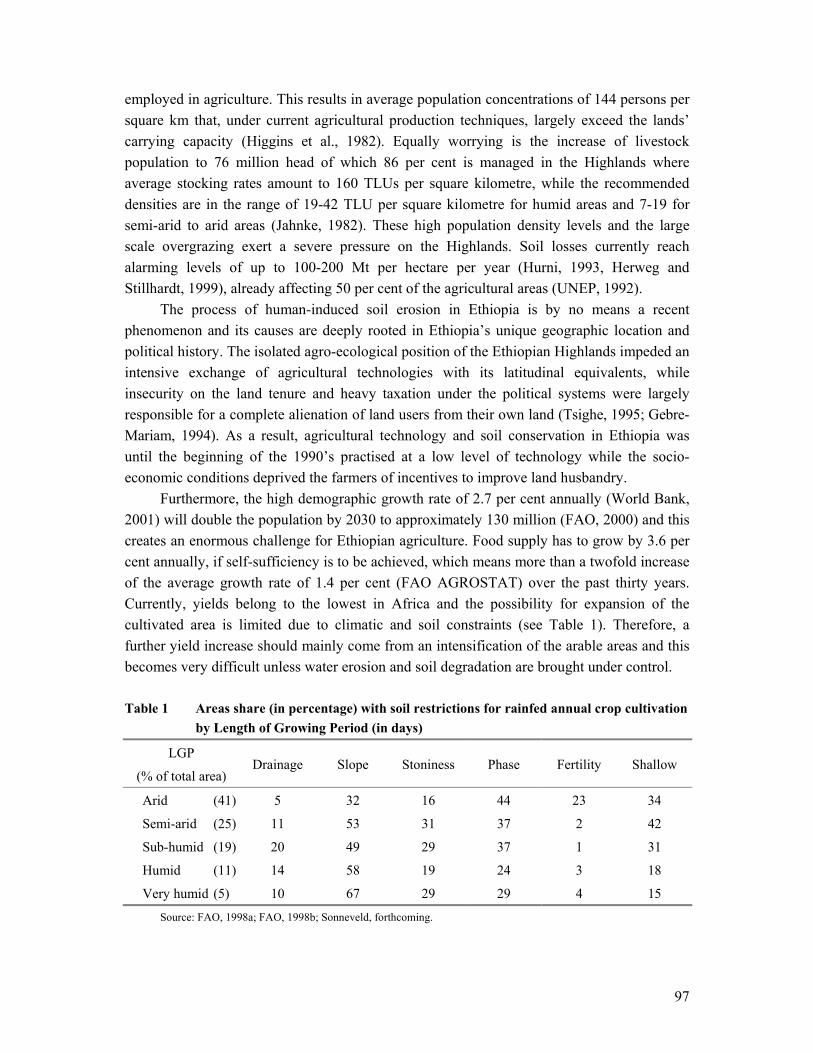
97
employed in agriculture. This results in average population concentrations of 144 persons per square km that, under current agricultural production techniques, largely exceed the lands’ carrying capacity (Higgins et al., 1982). Equally worrying is the increase of livestock population to 76 million head of which 86 per cent is managed in the Highlands where average stocking rates amount to 160 TLUs per square kilometre, while the recommended densities are in the range of 19-42 TLU per square kilometre for humid areas and 7-19 for semi-arid to arid areas (Jahnke, 1982). These high population density levels and the large scale overgrazing exert a severe pressure on the Highlands. Soil losses currently reach alarming levels of up to 100-200 Mt per hectare per year (Hurni, 1993, Herweg and Stillhardt, 1999), already affecting 50 per cent of the agricultural areas (UNEP, 1992).
The process of human-induced soil erosion in Ethiopia is by no means a recent phenomenon and its causes are deeply rooted in Ethiopia’s unique geographic location and political history. The isolated agro-ecological position of the Ethiopian Highlands impeded an intensive exchange of agricultural technologies with its latitudinal equivalents, while insecurity on the land tenure and heavy taxation under the political systems were largely responsible for a complete alienation of land users from their own land (Tsighe, 1995; Gebre-Mariam, 1994). As a result, agricultural technology and soil conservation in Ethiopia was until the beginning of the 1990’s practised at a low level of technology while the socio-economic conditions deprived the farmers of incentives to improve land husbandry.
Furthermore, the high demographic growth rate of 2.7 per cent annually (World Bank, 2001) will double the population by 2030 to approximately 130 million (FAO, 2000) and this creates an enormous challenge for Ethiopian agriculture. Food supply has to grow by 3.6 per cent annually, if self-sufficiency is to be achieved, which means more than a twofold increase of the average growth rate of 1.4 per cent (FAO AGROSTAT) over the past thirty years. Currently, yields belong to the lowest in Africa and the possibility for expansion of the cultivated area is limited due to climatic and soil constraints (see Table 1). Therefore, a further yield increase should mainly come from an intensification of the arable areas and this becomes very difficult unless water erosion and soil degradation are brought under control.
Table 1 Areas share (in percentage) with soil restrictions for rainfed annual crop cultivation by Length of Growing Period (in days)
LGP
(% of total area) Drainage Slope Stoniness Phase Fertility Shallow
Arid (41) 5 32 16 44 23 34
Semi-arid (25) 11 53 31 37 2 42
Sub-humid (19) 20 49 29 37 1 31
Humid (11) 14 58 19 24 3 18
Very humid (5) 10 67 29 29 4 15
Source: FAO, 1998a; FAO, 1998b; Sonneveld, forthcoming.
98
The impact of this unprecedented population concentration on the environment is not clear and hotly debated in literature (e.g. Young, 1998; Sarre and Blunden, 1995; UN, 1987 Choen, 1995). The discussion broadly follows two opposite hypotheses, representing a Malthusian and a Godwin5 perspective. In the Malthusian setting overpopulation will lead to a depletion of natural resources. The current soil degradation problem in Ethiopia would persist causing food insecurity and violent conflicts over scarce land as marginal groups seek to expand their settlements or migrate to other productive areas (Economy, 1997; Homer- Dixon et al., in press and Homer-Dixon, 1999; Barber, 1997). Ethiopia seems especially prone to this kind of conflicts (Zegahegn, 1999; Tuso, 1997), since approximately 60 per cent of the population belongs to a minority group at risk of ethnic conflicts (Easterly and Levine, 1996, Prendergast, 1997)6 and the environmental pressure forces groups to leave their homelands (Coppock, 1990). The regional dissimilarities in population density illustrate these restrictions in land accessibility. Borders of overpopulated and underutilized areas often coincide with the ethnic-administrative boundaries that were formalized in 1992. The alternative perspective of Godwin refuted the idea that man would succumb to imminent natural scarcities and pointed out that technological progress and self-regulation would counter this threat. Population concentration would improve land management as additional inputs of labour reduce production costs and favourably influence the efficiency of markets, communication and transport (Blaikie and Brookfield, 1987). Case studies elsewhere (Tiffen, 1994; Shaxson and Cheatle, 1999; Mortimore, 1994) and in Ethiopia (Grepperud, 1996; Shiferaw et al., 2001) confirmed the positive influence of population pressure on land husbandry, rehabilitation of degraded soils and innovation of new technologies. Tanner and Payne (2001), Tarekegne et al., (1997) and Uloro and Mengel (1994) also show that new technologies can be responsible for spectacular crop production increases in Ethiopia (Howard et al., 1999). The higher value of scarce natural resources could also positively influence land markets and develop the underutilized areas to their full potential by a migration of labour from overpopulated areas. Moreover, population concentrations create favourable conditions for the development of other sectors, as was shown in Asia where the alleviation of rural poverty was to a large extent achieved through migration to urban centers, and employment in the service and industrial sectors.
Which pathway Ethiopia will take in the future remains uncertain especially since the latest developments are equivocal. First, the country witnessed a fast increase of agricultural production in the beginning of the 1990s under the new government, which gave reason to believe that the Malthusian perspective was too pessimistic. However, production stagnated in the second half of the 1990s, when Ethiopia became involved in a war with its neighbour
5 Reverend Thomas Malthus and his contemporary William Godwin started the first documented debate on the impact of population pressure on the environment. Godwin’s ideas are nowadays better known through the recent work of Esther Boserup (1965, 1981). 6 Ethiopia has a long record of ethnic conflicts (e.g. Abbink, 1993; Cohen, 1995). Ethiopia also scores a 3 for racial tension on a scale of 1 (high) to 6 (low) according to Easterly and Levine (1996). This is relatively high compared with neighbouring countries like Yemen (5), Egypt (4) and Somalia (4); only Kenya has a higher score (1).
99
and former province Eritrea. The famine that currently hits the region is also for many a reason to fear that sometime in the future the Malthusian prediction will really come true (Young, 1998; Brown et al., 1999).
Indeed, the current economic conditions do not allow for a large-scale application of purchased inputs that would compensate the loss of nutrients and ameliorate the physical damage that is caused by soil erosion. Consequently, the Ethiopian farmer, who on average cultivates one hectare of food crops while also keeping some livestock, is nowadays extremely dependent on natural conditions and cannot support further deterioration of soil productivity. Furthermore, the scope for raising employment in non-agricultural sectors is also restricted in view of the limited funds available for investment, the low degree of literacy and the instable political situation in the last decade.
In addition, the physical soil loss from water erosion might lead to irreversible changes in soil productivity that directly affect the food security situation in Ethiopia. Even though this loss will often deposit as fresh sediments downstream, the areas that benefit from the transported soil are relatively small compared to those where it was detached. Hence, soil conservation is badly needed in Ethiopia. Where in flat areas low cost measures are presumably adequate to counter the degradation process, this can be recommended without restrictions. However, for the major part of the mountainous Ethiopian Highlands the issue is far more subtle. Erosion control on steep slopes involves high cost programs and even requires complete bans on cultivation of currently occupied soils, with all associated controversies. Therefore, the development of tools that evaluate the impact of policy measures on soil productivity and food security is urgently needed. And this analysis should take place at a national scale, because this is the level where policy decisions affect land use and management most drastically and where soil conservation activities are generally planned.
In this paper, we evaluate the impact of soil conservation on food production in relation to future demographic developments and their impact on soil productivity at a national level. For this, we apply a spatial optimization model that maximizes national agricultural revenues in several prospective scenarios. We pay special attention to the effect of soil conservation, land accessibility, technology and development of non-agricultural sectors. The constraints in the model consists of bounds on land accessibility that determine whether people have to remain on their original sites, can migrate within their ethnically defined areas or are allowed a trans-regional migration. The key relationship in the optimization model is a spatial yield function that estimates the agricultural yield in its geographical dependence of natural resources and population distribution. Using a dynamic recursive simulation, we recursively link this optimization model to a water erosion model by adjusting the area of land suitable for cultivation and the yield potential, both location specific parameters of the spatial yield function. Figure 1 shows the cycle and steps in calculation of land cultivation, soil erosion, soil management and soil productivity. Thus, in principle, the model gives for each year the spatially optimal locations to maximize agricultural revenues at a national level, based on the model outcomes of the previous year. However, calculations on an annual basis are

100
Water holding capacity/soil fertility
Potential yield and area adjustment
Technology (high/low)
Crop/livestock production
t=(t+1)
Water erosion
Soil conservation
Rural/Urban population
Land distribution
Spatial optimization
Land accessibility
Figure 1. Cyclical process of soil degradation, agricultural production, demographicdevelopment and spatial optimization of land use. The dotted linesurrounds the model, outside appear the exogenous variables.
cumbersome both numerically and when it comes to reporting of the results. Therefore, we only solve the spatial optimization for 2000 and 2010, i.e. only allow for migration in those years keeping population at fixed locations in other years. Simulation tests showed that the outcomes do not differ much from those of full annual simulations, essentially because most of the people are able to move to the appropriate locations in 2000 and 2010.
101
Soil degradation and productivity
We consider the linkage between soil degradation and production to be critical both for assessing the damages caused by land degradation, and for evaluating the benefits from soil conservation measures. Indeed, it is remarkable that the literature on the subject seems to focus on soil loss while neglecting the effect of these losses on crop yields. In fact, efforts in quantifying the yield effect have not been very successful (Ruttan, 1999; Kruseman and Van Keulen, 2001). So far, productivity loss from water erosion was mainly established through simulation models, notably the EPIC-model (Erosion Productivity Impact Calculator; Sharpley and Williams, 1990), the PI (Productivity Index: Pierce et al, 1983) and the latest versions of the WEPP (Water Erosion Prediction Project; Nearing et al., 1989). These models were designed for assessments at field level and are not suitable for application at a nationwide scale where data availability is inadequate for a proper validation (Pierce, 1991). Moreover, the soil loss estimates in EPIC and PI are calculated through the Universal Soil Loss Equation (USLE; Wischmeier and Smith, 1978), whose application outside the ecological domain (East of the Rocky Mountains) that served for its calibration is even discouraged by its own designers (Wischmeier, 1976). In WEPP the soil losses are calculated with a process-based water erosion model, which is very data demanding, requires a long-term calibration and validation period and varies in its accuracy to predict soil losses and run-off (e.g. Jetten et al., 2000). Studies that concentrate on smaller study areas used field data to estimate a temporal soil degradation-production function based on a nitrogen balance (Aune and Massawa, 1998) that was later extended with soil depth (Shiferaw et al., 2001). However these models can not be extrapolated at national level.
In short, there is to date no relationship available describing the effect of water erosion on crop yields, which is both empirically robust and theoretically founded. Theoretical restrictions are needed because straightforward statistical estimation techniques are bound to be biased by data limitations (e.g. Openshaw, 1996; King, 1997). For instance, in our exercise the data give a detailed description of environmental conditions at every location but no information is provided on the type of cultivation that is practised on the different soil types, while the severity of soil degradation is known to depend heavily on the combined interaction of these biophysical characteristics and agricultural activities. Indeed, soil degradation appears to be particularly acute under very local, extreme conditions, that are by definition being averaged out in aggregated perspectives of larger landscapes. All this makes it difficult to explain empirically the variability of production levels in relation to soil degradation. In an earlier exercise (Keyzer and Sonneveld, 2001), at national level the data problem was addressed by estimating a nationwide relationship between soil degradation and productivity that concentrated on yield changes of crops which cultivation is known to provoke much erosion in Ethiopia. This exercise accepted the lack of a priori knowledge on the formal structure of this relationship and opted for a highly flexible functional form that closely follows the data, using a kernel density regression. The present paper follows a more comprehensive procedure in that it evaluates the impact of all crop cultivation and livestock
102
activities on the soil productivity. We use an engineering approach, where soil loss is estimated independently from production levels and, subsequently, related to changes in one or more soil productivity characteristics to adjust estimations on yield levels. Smaling (1993) proceeds in a similar way for monitoring of nutrient balances in West Africa. Okumu et al. (1999) for relating soil loss to soil depth, Struif Bontkes (1999) for evaluating changes in organic and macro nutrients, Kruseman (2000) for calculating changes in organic matter and Kassam et al. (1993) for determining soil losses to be used in soil specific production functions. The advantage of this approach is that soil degradation can be simulated for each map unit at a disaggregated level that reflects the detailed level of the biophysical inventory, but there are two major limitations. On one hand, water erosion models are not designed to assess soil loss with the limited available information that prevails at the coarse scale of an exercise at national level. On the other hand, the results of simulated declines in productivity can not be verified against extensive data sets of time series and the simulated data have to be aggregated to correspond to the same geographic entity as the dependent variable, the effect of which on the final results remains unclear. In this paper we attempt to address both problems as follows. First, we apply spatial water erosion models, that were based on previous studies (Sonneveld and Albersen, 1999; Keyzer and Sonneveld, 1998; Sonneveld et al., 2001) and the data set of the Soil Conservation Research Project (Sonneveld et al., forthcoming). The models were especially designed for a nationwide assessment in Ethiopia to calculate the soil losses in its geographical dependence of biophysical variables and land use. Second, we make a modest attempt to validate yield adjustments by comparing historical distributions of potential land productivity characteristics with the simulated values. We also evaluate the accuracy of the yield adjustments with regard to alternative approaches that assess the impact of soil degradation by downgrading the yields for the geographic entity as a whole, rather than calculating its impact at the detailed geographical level.
The paper proceeds as follows. After introducing the production model with migration (section 2), we specify the scenario runs (section 3) and compare the simulated impact of soil loss on agricultural production with the historically developed distribution of productivity and two alternative approaches (section 4). In section 5, we assess the economic performance of the sector under the various scenarios, in terms of agricultural productivity, food supply per kaput, value added per kaput and spatial distribution of the population with respect to the population density and occupation of degraded areas. Section 6 summarizes and concludes.
3 DATA AND THE PRODUCTION MODEL WITH MIGRATION
This section presents the model to be used for simulations. It introduces the agricultural production function that estimates agricultural output at every location as a function of the yield potential and the labour intensity. It also specifies the impact of water erosion on agricultural production as well as the program that is used to maximize agricultural revenues under the alternative scenarios.

103
Production function
The production function relates the agricultural output to labour productivity and potential yield of the area. We apply a cross sectional regression that distinguishes the 460 Cropping Production Systems Zones (CPSZ) of Ethiopia (FAO, 1998b), which correspond to administrative units (Auraja’s), or subdivisions thereof in case a unit has steep ecological gradients.
For each CPSZ, we consider the observed crop yields (FAO, 1998b; CSA, 1997e) and livestock yields (CSA, 1998; Kruska, 1995), weighted according to the areas that are used for their cultivation and grazing, respectively. The potential yield of the CPSZ is not observed directly but calculated according to an Agro-Ecological Zones approach (FAO, 1978-1981; FAO/IIASA, 1993) based on empirical data on prevailing agro-climatic, land and soil constraints. For each CPSZ, an aggregate potential output is calculated in monetary units at constant base year prices, by choosing for every land type the crop or livestock product that is suitable according to the soil and climatic conditions and generates the highest value. Actual output is expressed in the same monetary units.
The data on rural labour availability are derived from a population density map (Deichman, 1994) after correction for the urban population living in the geographical unit. We can safely treat this variable as exogenous, because the ethnic-administrative subdivision determines the population distribution and site occupation in Ethiopia. The yield function does not include agrochemicals because detailed data are lacking and we assume the application to vary with the population density. The production function has been estimated for rainfed areas where sedentary agriculture prevails and a relation between agricultural production, natural endowments, and labour force can be inferred. For the predominantly nomadic agriculture in the arid lowlands a more crude approach is necessary based on aggregated figures of livestock production (CSA, 1997c; FAO AGROSTAT) per labour unit (Deichman, 1994; CSA, 1997a), leading to a fixed production (USD 308 (Purchasing Power parity; PPP)) per person per year. Approximately 9 percent of the rural population lives in such nomadic areas. As this productivity turns out to be very low, the marginal productivity can be taken to be fixed without running the risk of excessive migration to this area under a Free migration scenario. The estimation distinguishes 756 GIS polygons that result from an overlay of the CPSZ areas and the administrative map and is done by cross section over these polygons, with a test about the absence of spatial correlation of residuals.
We opt for a Mitscherlich-Baule function as functional form for the yield relationship on rainfed areas, because of its convenient properties for an assessment of agricultural production (Llewelyn and Weatherstone, 1996). It has the potential yield as upper asymptote and fits well within a convex optimization model (Albersen et al., 2000). Formally, the yield function reads:
104
−−−= βα
jj
jjjj Ay
nexp1y)n(y ,
with ∑= g jg0gjgj ayy π
where jy = annual yield expressed in quantity units per hectare of the land use
types practised in area j jy = potential annual output of area j,
jn = population of area j
α , β = regression parameters jA = surface of area j
jgy = the potential (physical) yield of good g in quantity units per hectare
of area j 0gπ = the price of good g in the base year divided by the price of the
standard land use types practised in area j in that year jga = area share ( jjg A/A ) of good g in area j
The r-square of the regression shows that the function explains 60 per cent of the yields variability. The potential yield ( y ) represents in this function an asymptotic ceiling. The term
jj
j
Ayn
gives the labour input per unit of potential agricultural production in area j; the
exponential term produces smaller values if labour increases so that the estimated yield gets closer to its potential level. The values of the parameters α and β are 1.984192 and 0.079076 respectively and both are highly significant.
Simulations treat a multiplicative error term as fixed effect; hence, the model reproduces base year data.
Quantifying the impact of water erosion on agricultural production
Given the agricultural production function specified above, the impact of soil loss on agricultural production can be expressed via a reduction of potential yield and a reduction of the area under cultivation, in case the potential drops below a threshold value. For this threshold value we adopt the land evaluation criteria of the FAO (e.g. FAO, 1978-81), whereby land with a potential yield level that drops below 20 per cent of the maximum potential yield is considered unsuitable for production, basically because tillage operations become unfeasible due to rill and gully erosion.
To describe the effect of erosion on potential yields, we follow Kassam et al. (1993), who relate soil loss to the two most important soil productivity characteristics: fertility and water holding capacity. Soil fertility depends on soil susceptibility to erosion and

105
regenerative capacity of the topsoil. The soils’ susceptibility to erosion is classified as least, moderately and susceptible, implying productivity reductions of 1, 2 and 7 per cent per cm topsoil loss, respectively. With respect to the regenerative capacity of the soil we follow Hammer (1981), where development of the top soil is related to climatic variables. The water holding capacity of the soil controls the moisture availability for the crop during the growing season and is based on Batjes (1996) where total available water capacity (TAWC) is related to soil type, soil depth, phase and textural class. Effective soil depth (FAO, 1998a) is estimated by taking the mean value of the depth classes of the three most important soils, while missing values are replaced by the depth of the dominant soil except for Leptosols which are shallow by definition (30 cm). Further modifications of soil depth are made if phases occur.
Formally, we denote the combinations of biophysical characteristics and land use that belong to a map unit j by the index k, with K,...,1k = , and the time points by t, T,...,1t = . Hence, every map unit j, is subdivided into areas t,k,jA with yield potentials t,k,jy . The impact
of the soil loss t,k,js , on agricultural production is expressed as a reduction of potential yield
and, if the yield levels drop below a threshold of 20 per cent of the potential yield, the area is taken out of production.
( )1t,k,j1t,k,jt,k,j z1yy −− −= ,
where t,k,jy = potential yield
1t,k,jz − = percentage yield loss,
Furthermore, 1t,k,jz − , the percentage yield loss is modelled as in Kassam et al. (1991),
whereby yield loss due to water erosion is determined by: ( ) ( )( )t,k,jkt,k,jkt,k,j sh,sfmaxz = ,
for ( )t,k,jk sf = yield loss due to reduced soil fertility, under conditions k
( )t,k,jk sh = yield loss due to reduced water holding capacity,
under conditions k. Finally, if 2.0y/y 0,k,jt,k,j ≤ , then area t,k,jA is taken out of production.
Migration
We use the production function and adjusted potential levels to calculate the spatial distribution of the agricultural labour force that would maximize agricultural revenue at national level, given the productivity of land in the geographic entities and subject to migration constraints that reflect different degrees of accessibility.
106
As before, the index j denotes the map unit, and to represent the constraints on migration we also define the index i, referring to the 52 ethnic-administrative areas in Ethiopia. iJ denotes the set of map units in area i.
In the ‘Free’ scenario, allowing nationwide admittance to all geographic entities, the following mathematical program distributes the population so as to maximize the national agricultural revenue:
( ) ( )( )( )∑ −≥j
jjjjj0n AnyCny Pmaxj
,
subject to nn
jj =∑ ,
where ( )jj ny is the production function, P is the price of the reference good, actually a
quality index, whose change reflects the greater processing intensity of output (production of flour, cooking oil, etc.), as well as a shift to higher valued primary products. Furthermore, ( )⋅C is a convex cost function per ha that increases with biophysical yield, and whose
parameters are taken to be equal across areas and includes the production costs for the purchase of agricultural requisites. The ‘Free’ scenario equalizes the marginal productivity of labour across the country, i.e. people migrate until the addition of one unit of labour produces the same amount of agricultural output at every site. To represent the population movement in the ‘Restricted’ scenario, which keeps people within their areas, we replace the constraint by i
Jjj nn
i
=∑∈
and nni
i =∑ . Marginal
productivity is equalized within each of the administrative areas only. Finally, under the ‘Stationary’ scenario people have to stay within in their original map units, and the constraint becomes: jj nn = for given nn
jj =∑ . Marginal productivity of labour will be different across
map units. It is important to remark here that the distribution of labour in this optimization
exercise is compatible with revenue maximization by individual farmers and does not require government-orchestrated intervention, as people can move to places where they can earn higher returns to their labour. Of course, in practice government may have to stimulate the transition. The aim of our calculation is to locate the areas of destination that could accommodate the flow of population, and where specific investments or soil conservation programmes would be required, so as to avoid future conflicts over scarce land.
107
The cost function
The cost function refers to purchased agricultural inputs, and was calibrated as a quadratic function based on national and international statistics of agricultural inputs per hectare: ( ) ( )0,yymaxyC j
2jj γβα ++=
where the parameters α, β and γ had the values of -0.0000008, 0.0035 and -250
respectively. If the sum of the first two terms is smaller than 250 the costs were put on zero.
These values were calibrated to correspond cost elasticity of about 5 and 30 per cent to the
output value for low and high input agriculture, respectively. Cost assessments for Ethiopia
were taken as a representation of low input agriculture while the African countries Zimbabwe
and South Africa were examples for the high input alternative.
We further assume that the implementation and maintenance of soil conservation measures is separate from these inputs and mainly require manual labour combined with educational services and technical assistance.
4 SCENARIO SPECIFICATION
The first, ‘Stationary’ scenario evaluates the situation under the prevailing land occupation and technology levels and with an uncontrolled progressive soil degradation. The second, ‘Control’ scenario assumes a perfect erosion control that relies on soil conservation measures, and can preserve the land’s productivity. The third option, ‘Migration’, appraises different options in land accessibility, with a ‘Free’ alternative allowing trans-regional migration to all productive areas and a ‘Restricted’ alternative where people are confined within their ethnic-administrative areas of origin. This scenario also considers variants with and without tropical disease control that determine whether migration to new settlements in Western Ethiopia is possible. As a fourth alternative, ‘Technology’, we assume gradual adoption of new technologies, less labour intensive technologies in agriculture and accelerated growth of non-agricultural sectors that absorb labour from rural areas.
The scenario specification requires assumptions on exogenous variables concerning (a) the pattern of rural to urban migration, (b) the prospects on technological innovations and (c) the growth in the non-agricultural sector. It is implemented in the model through exogenous adjustment of the productive area (A), the quality index (P), the potential yield ( y ) and the population level ( n ).
Demographic and non agricultural sector development
The growth of the rural labour force will follow two scenarios: the medium UN growth option and an alternative that presents a higher outflow from the agricultural sector to

108
industrial and service activities (AccUrb). Table 2 shows the population development under the two alternatives. The AccUrb assumes that after 30 years the urbanization rate is equal to that of countries with an average medium human development level (UNDP, 1997), whereby urban population growth is adjusted for the expected changing fertility rates (POPIN Ethiopia, 1997). Table 2 Population (x 1000) in the scenarios
Rural Urban Total UN* AccUrb
Year Nomadic Sedentary Nomadic SedentaryUN AccUrb UN AccUrb
2000 4535 46988 4535 46988 11042 11042 62565 62565 2010 5428 56245 5351 55452 18271 15552 79944 76355 2030 7279 75427 6187 64112 45110 51732 127816 122031
* Source: FAO Agrostat.
Technological development
The assumptions on technological development of agricultural production are controlled via two parameters: the potential yield and a quality index expressing the monetary value of a biophysical unit. We consider two technological alternatives: a Medium and High Technology level. Regarding the yield potential, for Medium Technology, the potential yield for crops is taken to reach a maximum of 50 per cent of the attainable yield, while for livestock the current yield levels per TLU under the carrying capacity of the land are taken as a reference. High technology assumes the adoption of agronomic innovations and agricultural requisites like fertilizer and pesticides, thereby increasing the potential yield for crops to 100 per cent of the attainable yield, while the quality index increases due to the greater processing intensity of output (production of flour, cooking oil, etc.) and through a gradual increase in the area share of the cultivation of higher valued crop varieties, occupying up to a maximum of 50 per cent of the arable land. TLU yields, in sedentary and nomadic agriculture, increase under a high technology scenario to levels comparable with more developed countries like South Africa.
With respect to quality, the index tP is expressed as the monetary revenue per unit of biophysical output, and defined as:
∑ ∑
∑ ∑=
j t,k,jk t,k,j0,k
j k t,k,jt,k,jt,k10t ay~
ay~pP
π
π
where 0,1p = price of reference commodity 1k = in the base year 0t =
t,k,jy~ = imputed biophysical yield of good k at time t,
t,k,ja = area share of good k in year t
0,kπ = price of good k in year 0
t,kπ = price of good k in year t
109
and where the imputed yield t.k,jy~ is obtained as ( ) t,k,j0,k,j0,k,j yy/y , which is used as a
proxy for the actual yield, that is only determined at aggregate level within the model and depends on tP itself. The Medium Technology scenario assumes that t,kπ retains the base year value for existing
crop and livestock systems. For the High Technology alternative, tP rises because we assume that t,kπ increases due to the greater processing intensity of output (production of flour,
cooking oil, etc.) and through a gradual shift in t,k,ja over time, towards the cultivation of
higher valued primary commodities up to half of the arable land, assuming that farmers maintain cultivation of traditional crops on the other half, basically for security reasons. The four scenarios are summarised in Table 3.
Table 3 Scenarios for 2000, 2010 and 2030
Scenario Erosion control
Migration Disease control
Accelerated urbanisation
Input
Stationary no no no no low
Control yes no no no low
Migration yes/no yes no no low
Technology yes/no yes yes yes high
5 IMPACT OF WATER EROSION ON LAND PRODUCTIVITY
In this section we validate the soil degradation/yield adjustment procedure and verify the accuracy of the assessment after the aggregation of the results determined for combinations of biophysical characteristics and land use (k) to map unit (j). Since no extensive time series are available for an empirical verification of the results, we only carry out a modest attempt in this context. First, we compare the historical distribution of potential land productivity characteristics with the simulated values. Second, we evaluate the accuracy of the results with regard to alternative approaches that downgrade the yields at the level of map unit j.
Validation by comparison of land productivity patterns.
When comparing the land productivity patterns we assume that the aggregated data on potential yield of our geographic entities (app. 2,000 square km) are representative for the productivity of the landscape, which underwent an age-long process of natural and human induced water erosion. This potential productivity can be considered to be rather stable, not only because the landscape is consolidated in its geomorphologic structure that largely determines the potential possibilities and constraints of the land for cultivation, but also
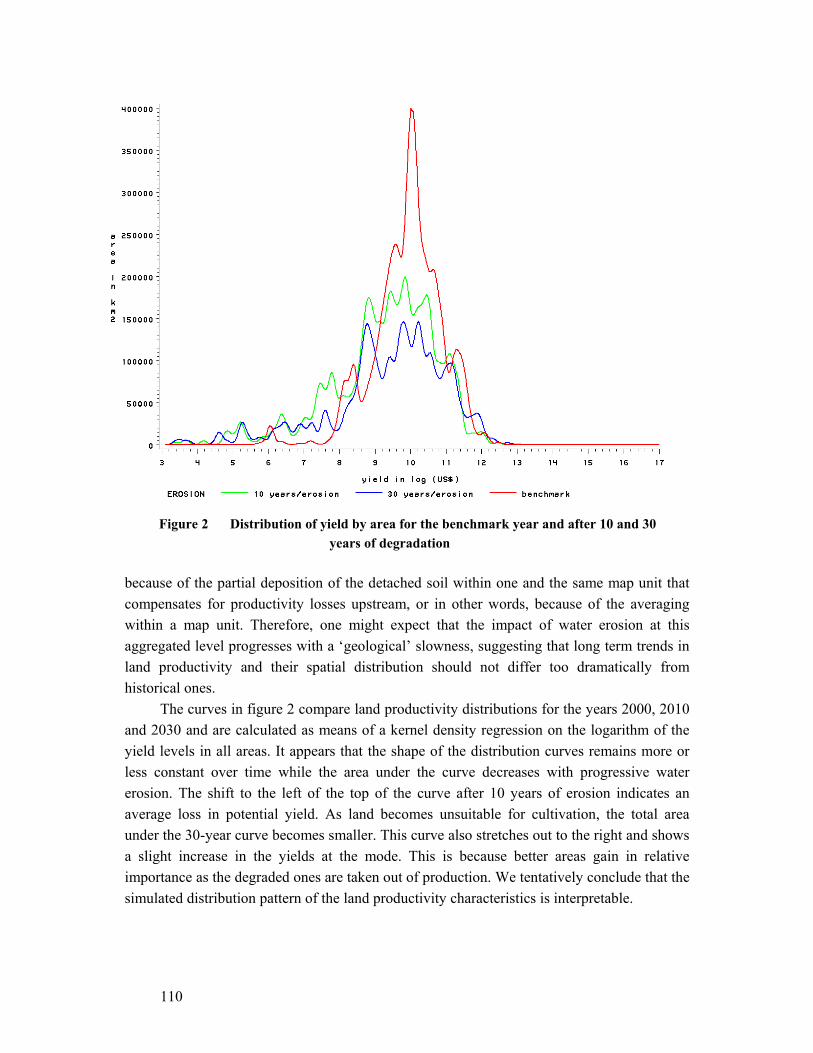
110
because of the partial deposition of the detached soil within one and the same map unit that compensates for productivity losses upstream, or in other words, because of the averaging within a map unit. Therefore, one might expect that the impact of water erosion at this aggregated level progresses with a ‘geological’ slowness, suggesting that long term trends in land productivity and their spatial distribution should not differ too dramatically from historical ones.
The curves in figure 2 compare land productivity distributions for the years 2000, 2010 and 2030 and are calculated as means of a kernel density regression on the logarithm of the yield levels in all areas. It appears that the shape of the distribution curves remains more or less constant over time while the area under the curve decreases with progressive water erosion. The shift to the left of the top of the curve after 10 years of erosion indicates an average loss in potential yield. As land becomes unsuitable for cultivation, the total area under the 30-year curve becomes smaller. This curve also stretches out to the right and shows a slight increase in the yields at the mode. This is because better areas gain in relative importance as the degraded ones are taken out of production. We tentatively conclude that the simulated distribution pattern of the land productivity characteristics is interpretable.
Figure 2 Distribution of yield by area for the benchmark year and after 10 and 30 years of degradation
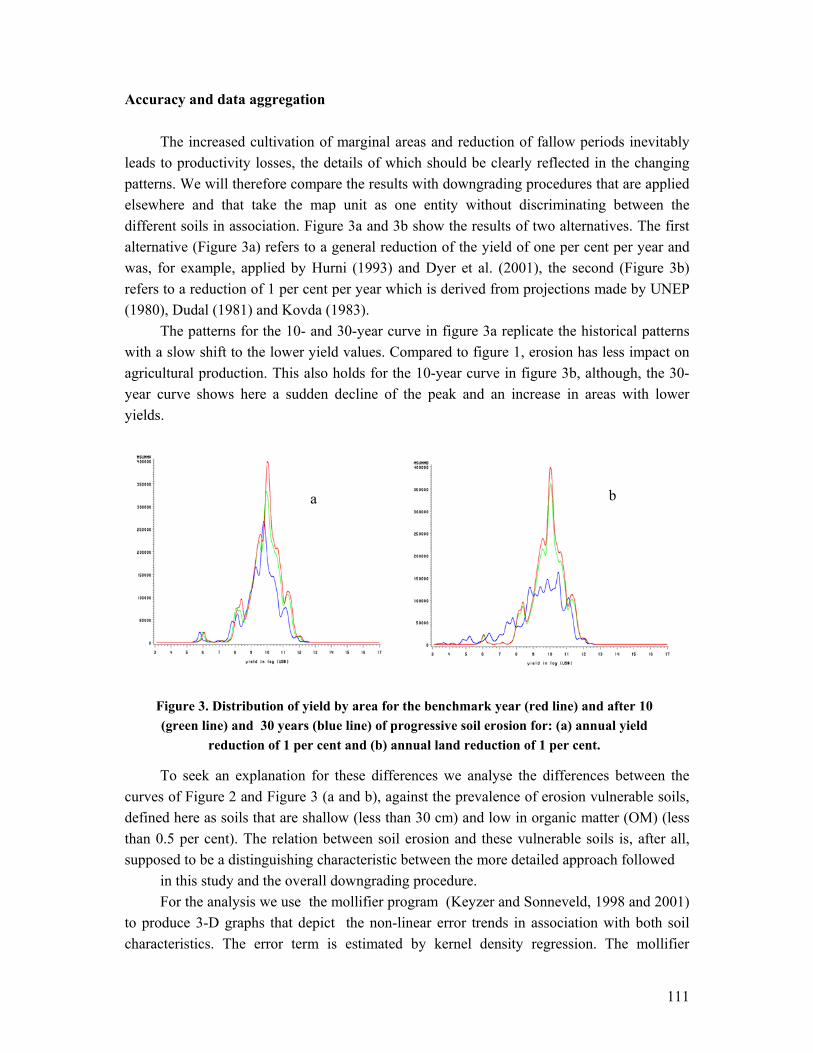
111
Accuracy and data aggregation
The increased cultivation of marginal areas and reduction of fallow periods inevitably leads to productivity losses, the details of which should be clearly reflected in the changing patterns. We will therefore compare the results with downgrading procedures that are applied elsewhere and that take the map unit as one entity without discriminating between the different soils in association. Figure 3a and 3b show the results of two alternatives. The first alternative (Figure 3a) refers to a general reduction of the yield of one per cent per year and was, for example, applied by Hurni (1993) and Dyer et al. (2001), the second (Figure 3b) refers to a reduction of 1 per cent per year which is derived from projections made by UNEP (1980), Dudal (1981) and Kovda (1983).
The patterns for the 10- and 30-year curve in figure 3a replicate the historical patterns with a slow shift to the lower yield values. Compared to figure 1, erosion has less impact on agricultural production. This also holds for the 10-year curve in figure 3b, although, the 30-year curve shows here a sudden decline of the peak and an increase in areas with lower yields.
To seek an explanation for these differences we analyse the differences between the curves of Figure 2 and Figure 3 (a and b), against the prevalence of erosion vulnerable soils, defined here as soils that are shallow (less than 30 cm) and low in organic matter (OM) (less than 0.5 per cent). The relation between soil erosion and these vulnerable soils is, after all, supposed to be a distinguishing characteristic between the more detailed approach followed
in this study and the overall downgrading procedure. For the analysis we use the mollifier program (Keyzer and Sonneveld, 1998 and 2001)
to produce 3-D graphs that depict the non-linear error trends in association with both soil characteristics. The error term is estimated by kernel density regression. The mollifier
Figure 3. Distribution of yield by area for the benchmark year (red line) and after 10 (green line) and 30 years (blue line) of progressive soil erosion for: (a) annual yield
reduction of 1 per cent and (b) annual land reduction of 1 per cent.
a b
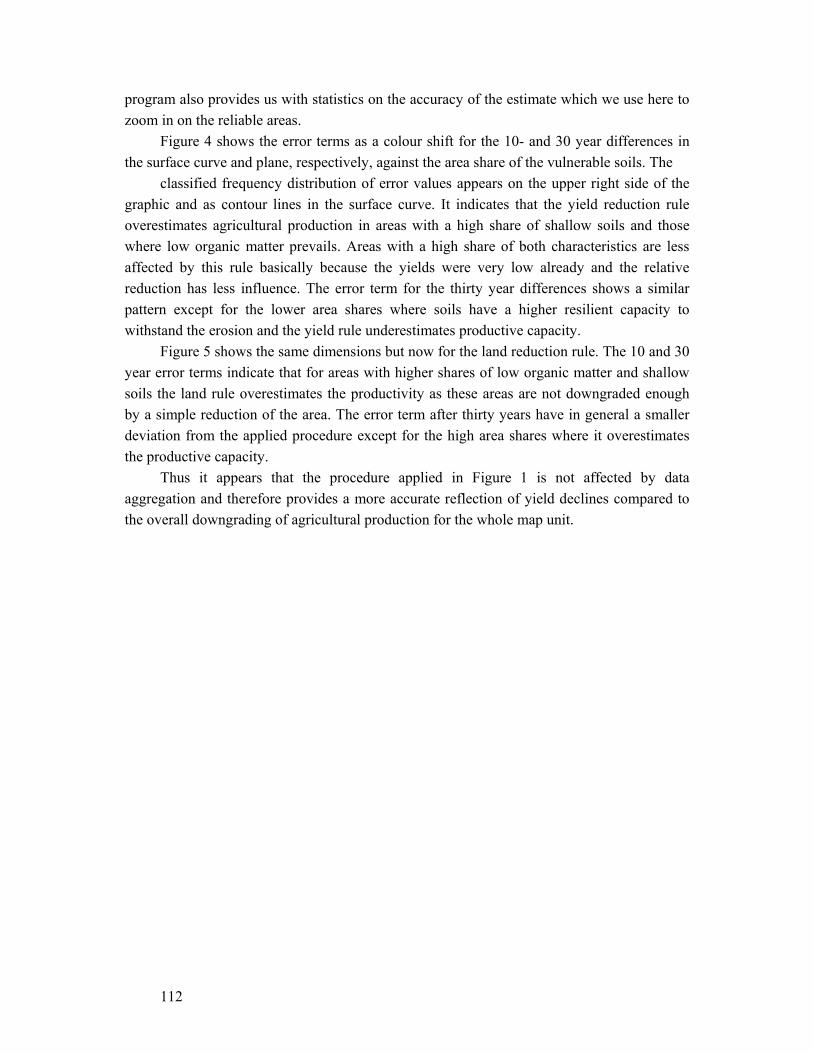
112
program also provides us with statistics on the accuracy of the estimate which we use here to zoom in on the reliable areas.
Figure 4 shows the error terms as a colour shift for the 10- and 30 year differences in the surface curve and plane, respectively, against the area share of the vulnerable soils. The
classified frequency distribution of error values appears on the upper right side of the graphic and as contour lines in the surface curve. It indicates that the yield reduction rule overestimates agricultural production in areas with a high share of shallow soils and those where low organic matter prevails. Areas with a high share of both characteristics are less affected by this rule basically because the yields were very low already and the relative reduction has less influence. The error term for the thirty year differences shows a similar pattern except for the lower area shares where soils have a higher resilient capacity to withstand the erosion and the yield rule underestimates productive capacity.
Figure 5 shows the same dimensions but now for the land reduction rule. The 10 and 30 year error terms indicate that for areas with higher shares of low organic matter and shallow soils the land rule overestimates the productivity as these areas are not downgraded enough by a simple reduction of the area. The error term after thirty years have in general a smaller deviation from the applied procedure except for the high area shares where it overestimates the productive capacity.
Thus it appears that the procedure applied in Figure 1 is not affected by data aggregation and therefore provides a more accurate reflection of yield declines compared to the overall downgrading of agricultural production for the whole map unit.
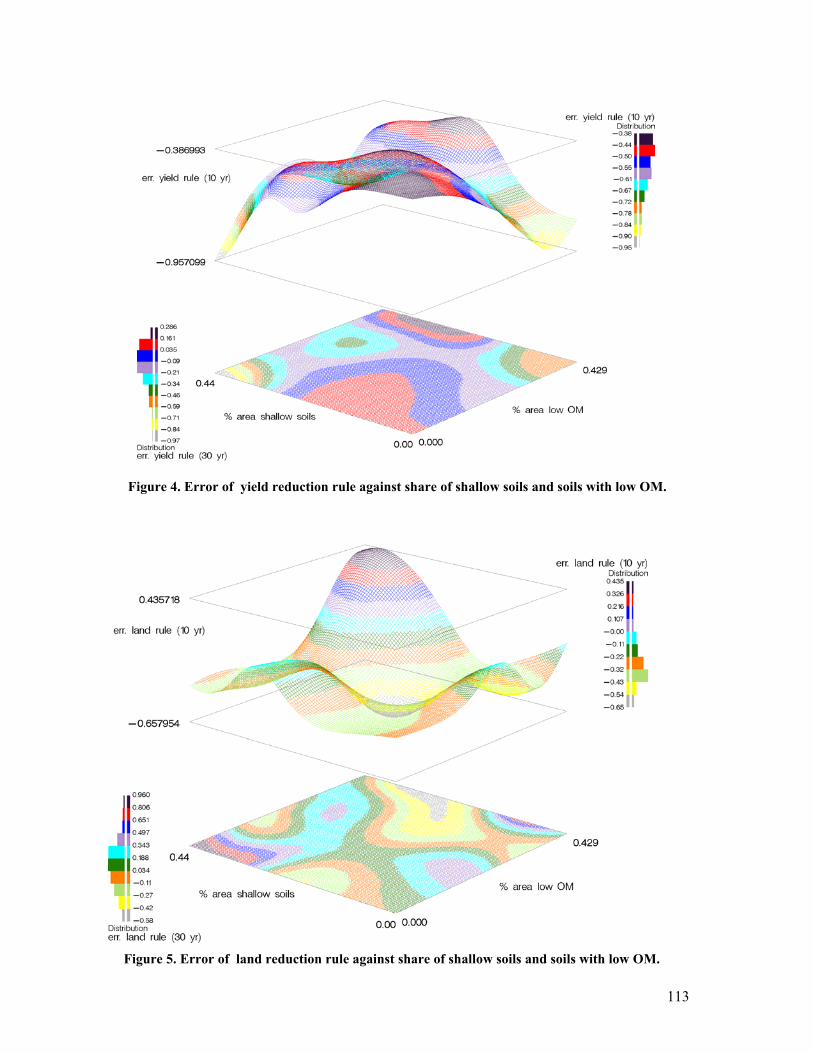
113
Figure 4. Error of yield reduction rule against share of shallow soils and soils with low OM.
Figure 5. Error of land reduction rule against share of shallow soils and soils with low OM.
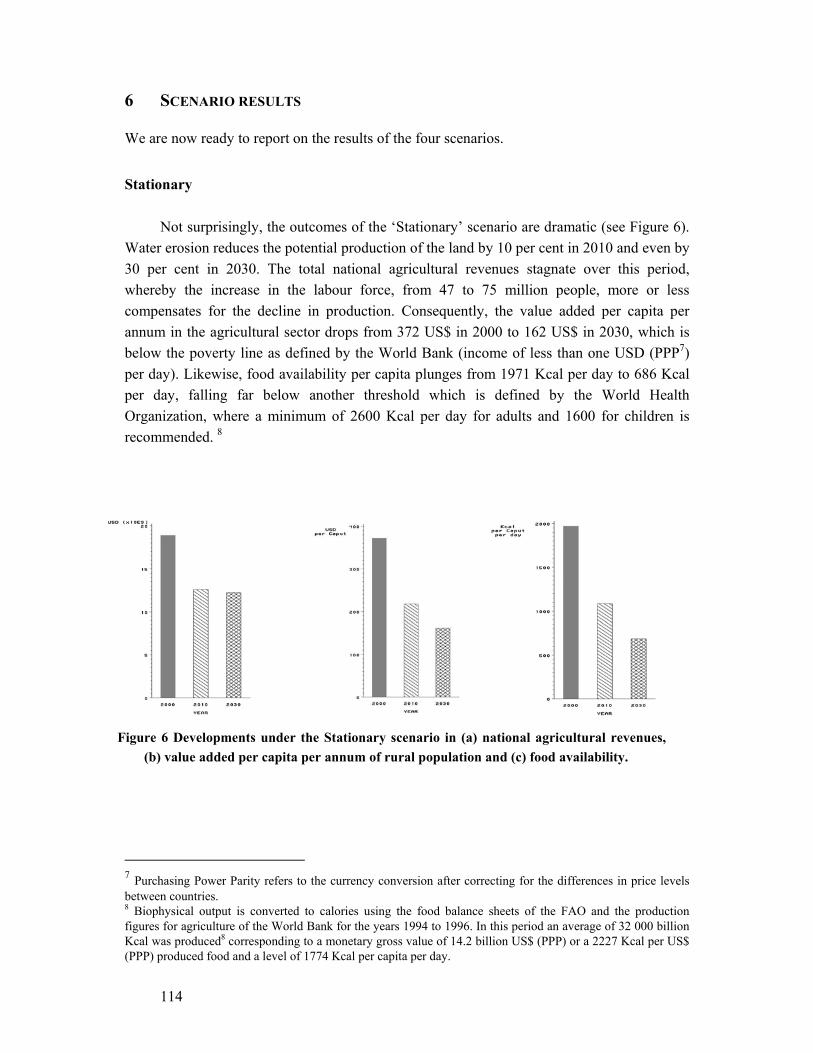
114
6 SCENARIO RESULTS
We are now ready to report on the results of the four scenarios.
Stationary
Not surprisingly, the outcomes of the ‘Stationary’ scenario are dramatic (see Figure 6). Water erosion reduces the potential production of the land by 10 per cent in 2010 and even by 30 per cent in 2030. The total national agricultural revenues stagnate over this period, whereby the increase in the labour force, from 47 to 75 million people, more or less compensates for the decline in production. Consequently, the value added per capita per annum in the agricultural sector drops from 372 US$ in 2000 to 162 US$ in 2030, which is below the poverty line as defined by the World Bank (income of less than one USD (PPP7) per day). Likewise, food availability per capita plunges from 1971 Kcal per day to 686 Kcal per day, falling far below another threshold which is defined by the World Health Organization, where a minimum of 2600 Kcal per day for adults and 1600 for children is recommended. 8
7 Purchasing Power Parity refers to the currency conversion after correcting for the differences in price levels between countries. 8 Biophysical output is converted to calories using the food balance sheets of the FAO and the production figures for agriculture of the World Bank for the years 1994 to 1996. In this period an average of 32 000 billion Kcal was produced8 corresponding to a monetary gross value of 14.2 billion US$ (PPP) or a 2227 Kcal per US$ (PPP) produced food and a level of 1774 Kcal per capita per day.
Figure 6 Developments under the Stationary scenario in (a) national agricultural revenues,(b) value added per capita per annum of rural population and (c) food availability.
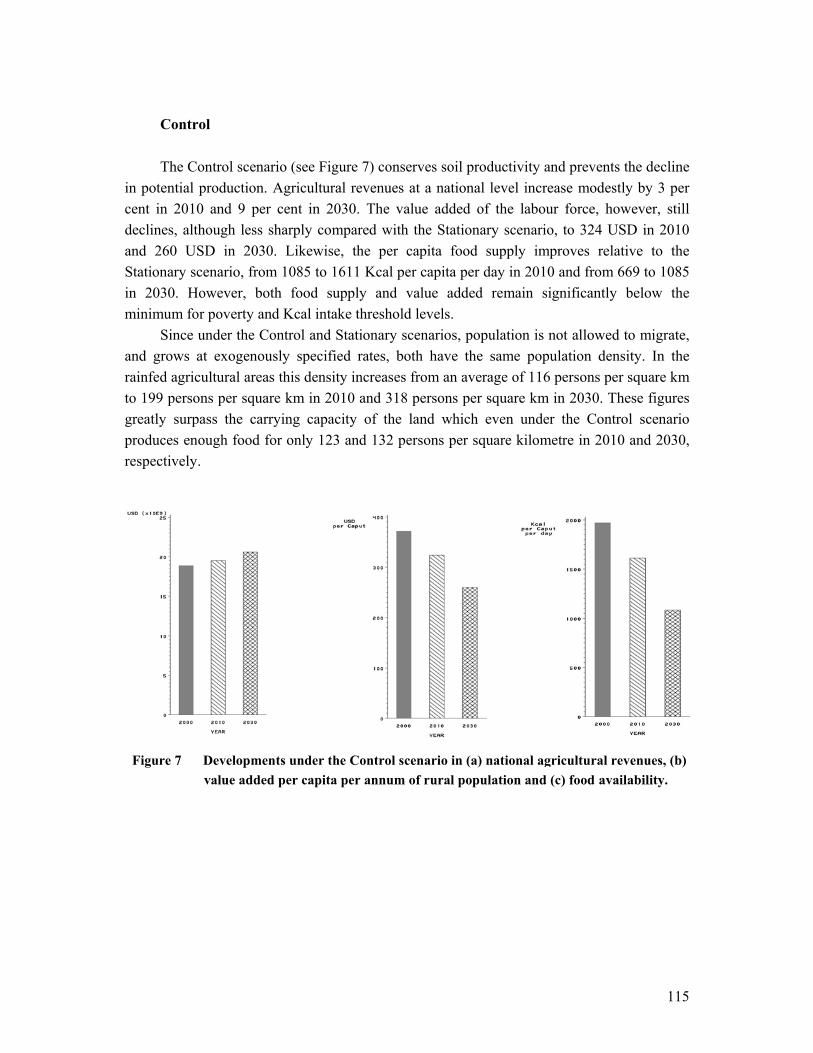
115
Control
The Control scenario (see Figure 7) conserves soil productivity and prevents the decline in potential production. Agricultural revenues at a national level increase modestly by 3 per cent in 2010 and 9 per cent in 2030. The value added of the labour force, however, still declines, although less sharply compared with the Stationary scenario, to 324 USD in 2010 and 260 USD in 2030. Likewise, the per capita food supply improves relative to the Stationary scenario, from 1085 to 1611 Kcal per capita per day in 2010 and from 669 to 1085 in 2030. However, both food supply and value added remain significantly below the minimum for poverty and Kcal intake threshold levels.
Since under the Control and Stationary scenarios, population is not allowed to migrate, and grows at exogenously specified rates, both have the same population density. In the rainfed agricultural areas this density increases from an average of 116 persons per square km to 199 persons per square km in 2010 and 318 persons per square km in 2030. These figures greatly surpass the carrying capacity of the land which even under the Control scenario produces enough food for only 123 and 132 persons per square kilometre in 2010 and 2030, respectively.
Figure 7 Developments under the Control scenario in (a) national agricultural revenues, (b) value added per capita per annum of rural population and (c) food availability.
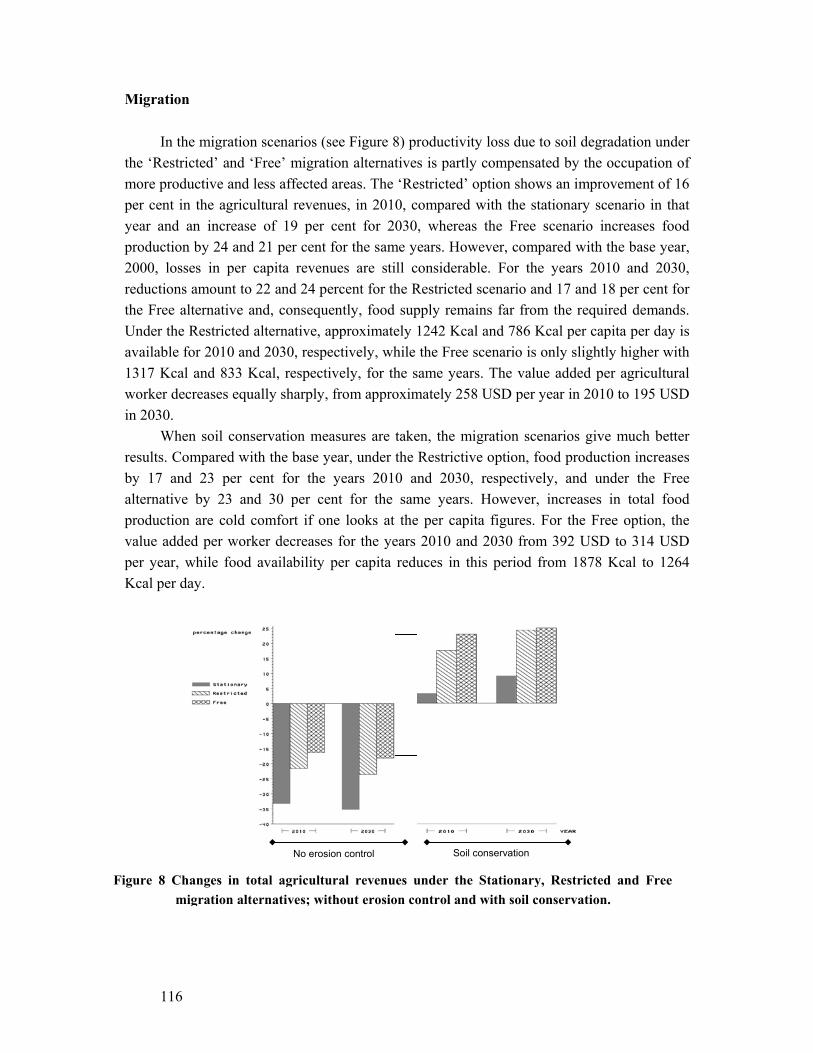
116
Migration
In the migration scenarios (see Figure 8) productivity loss due to soil degradation under the ‘Restricted’ and ‘Free’ migration alternatives is partly compensated by the occupation of more productive and less affected areas. The ‘Restricted’ option shows an improvement of 16 per cent in the agricultural revenues, in 2010, compared with the stationary scenario in that year and an increase of 19 per cent for 2030, whereas the Free scenario increases food production by 24 and 21 per cent for the same years. However, compared with the base year, 2000, losses in per capita revenues are still considerable. For the years 2010 and 2030, reductions amount to 22 and 24 percent for the Restricted scenario and 17 and 18 per cent for the Free alternative and, consequently, food supply remains far from the required demands. Under the Restricted alternative, approximately 1242 Kcal and 786 Kcal per capita per day is available for 2010 and 2030, respectively, while the Free scenario is only slightly higher with 1317 Kcal and 833 Kcal, respectively, for the same years. The value added per agricultural worker decreases equally sharply, from approximately 258 USD per year in 2010 to 195 USD in 2030.
When soil conservation measures are taken, the migration scenarios give much better results. Compared with the base year, under the Restrictive option, food production increases by 17 and 23 per cent for the years 2010 and 2030, respectively, and under the Free alternative by 23 and 30 per cent for the same years. However, increases in total food production are cold comfort if one looks at the per capita figures. For the Free option, the value added per worker decreases for the years 2010 and 2030 from 392 USD to 314 USD per year, while food availability per capita reduces in this period from 1878 Kcal to 1264 Kcal per day.
No erosion control Soil conservation
Figure 8 Changes in total agricultural revenues under the Stationary, Restricted and Freemigration alternatives; without erosion control and with soil conservation.
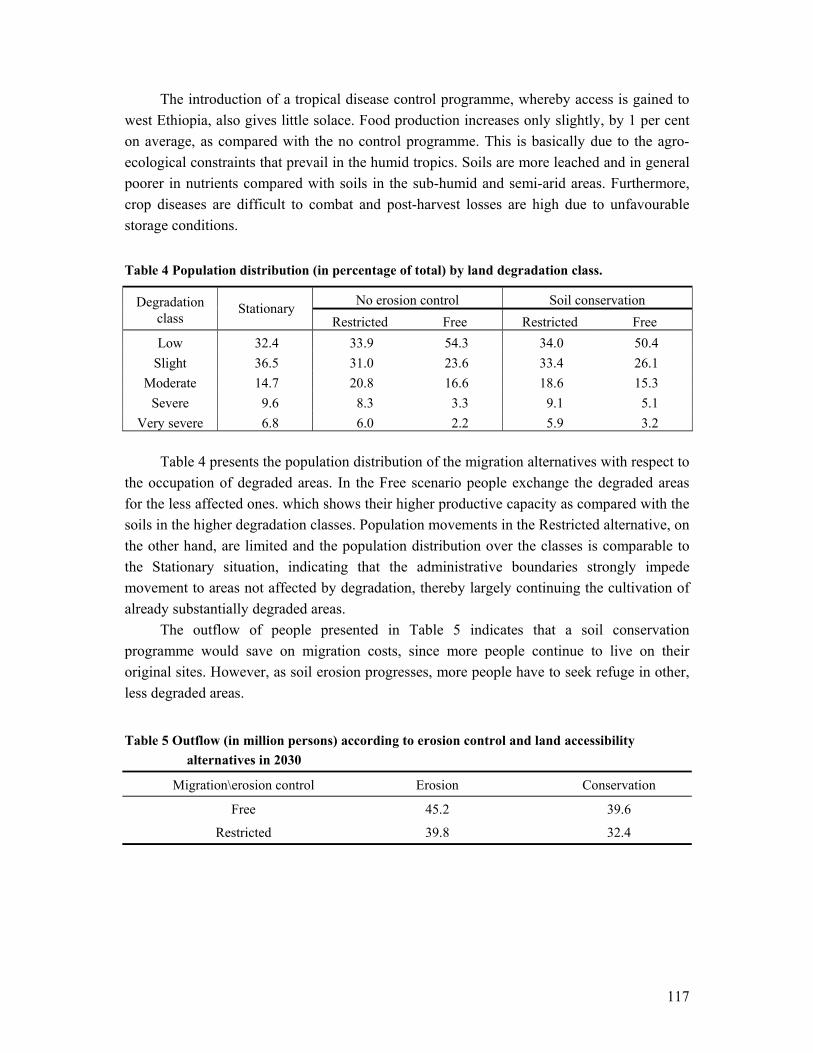
117
The introduction of a tropical disease control programme, whereby access is gained to west Ethiopia, also gives little solace. Food production increases only slightly, by 1 per cent on average, as compared with the no control programme. This is basically due to the agro-ecological constraints that prevail in the humid tropics. Soils are more leached and in general poorer in nutrients compared with soils in the sub-humid and semi-arid areas. Furthermore, crop diseases are difficult to combat and post-harvest losses are high due to unfavourable storage conditions.
Table 4 Population distribution (in percentage of total) by land degradation class.
No erosion control Soil conservation Degradation class
Stationary Restricted Free Restricted Free
Low 32.4 33.9 54.3 34.0 50.4 Slight 36.5 31.0 23.6 33.4 26.1
Moderate 14.7 20.8 16.6 18.6 15.3 Severe 9.6 8.3 3.3 9.1 5.1
Very severe 6.8 6.0 2.2 5.9 3.2
Table 4 presents the population distribution of the migration alternatives with respect to the occupation of degraded areas. In the Free scenario people exchange the degraded areas for the less affected ones. which shows their higher productive capacity as compared with the soils in the higher degradation classes. Population movements in the Restricted alternative, on the other hand, are limited and the population distribution over the classes is comparable to the Stationary situation, indicating that the administrative boundaries strongly impede movement to areas not affected by degradation, thereby largely continuing the cultivation of already substantially degraded areas.
The outflow of people presented in Table 5 indicates that a soil conservation programme would save on migration costs, since more people continue to live on their original sites. However, as soil erosion progresses, more people have to seek refuge in other, less degraded areas.
Table 5 Outflow (in million persons) according to erosion control and land accessibility alternatives in 2030
Migration\erosion control Erosion Conservation
Free 45.2 39.6
Restricted 39.8 32.4
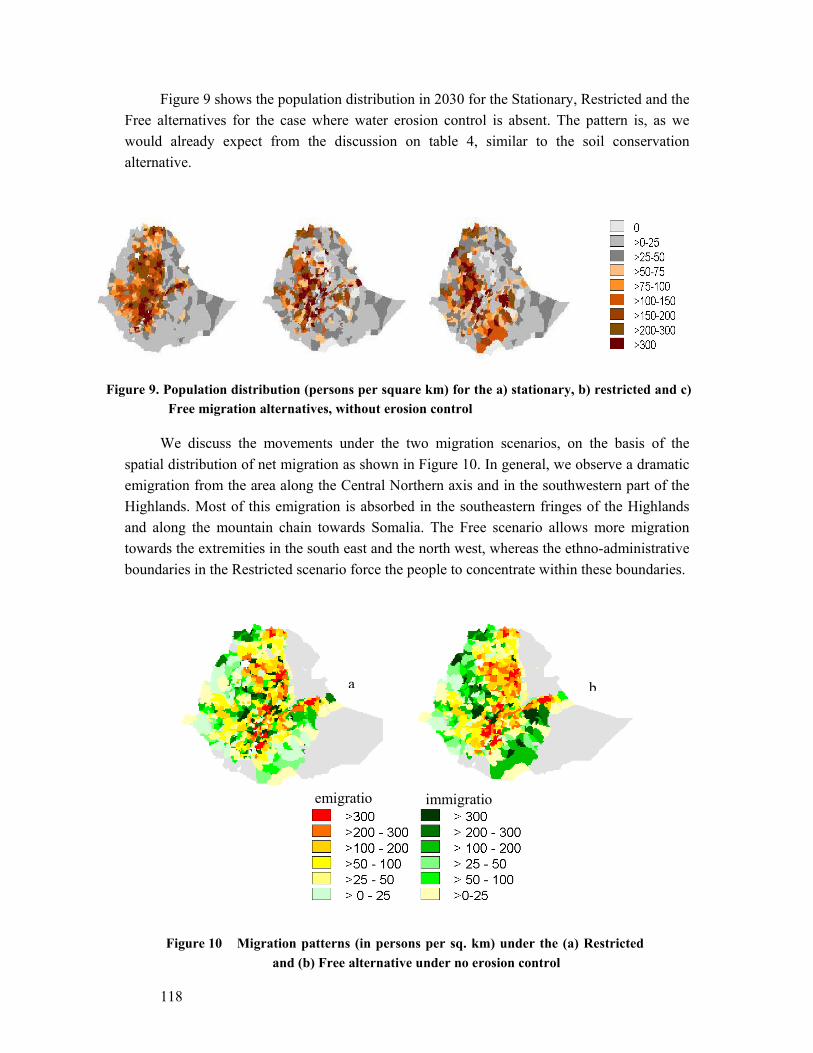
118
Figure 9 shows the population distribution in 2030 for the Stationary, Restricted and the Free alternatives for the case where water erosion control is absent. The pattern is, as we would already expect from the discussion on table 4, similar to the soil conservation alternative.
We discuss the movements under the two migration scenarios, on the basis of the spatial distribution of net migration as shown in Figure 10. In general, we observe a dramatic emigration from the area along the Central Northern axis and in the southwestern part of the Highlands. Most of this emigration is absorbed in the southeastern fringes of the Highlands and along the mountain chain towards Somalia. The Free scenario allows more migration towards the extremities in the south east and the north west, whereas the ethno-administrative boundaries in the Restricted scenario force the people to concentrate within these boundaries.
Figure 9. Population distribution (persons per square km) for the a) stationary, b) restricted and c) Free migration alternatives, without erosion control
emigratio immigratio
a b
Figure 10 Migration patterns (in persons per sq. km) under the (a) Restrictedand (b) Free alternative under no erosion control
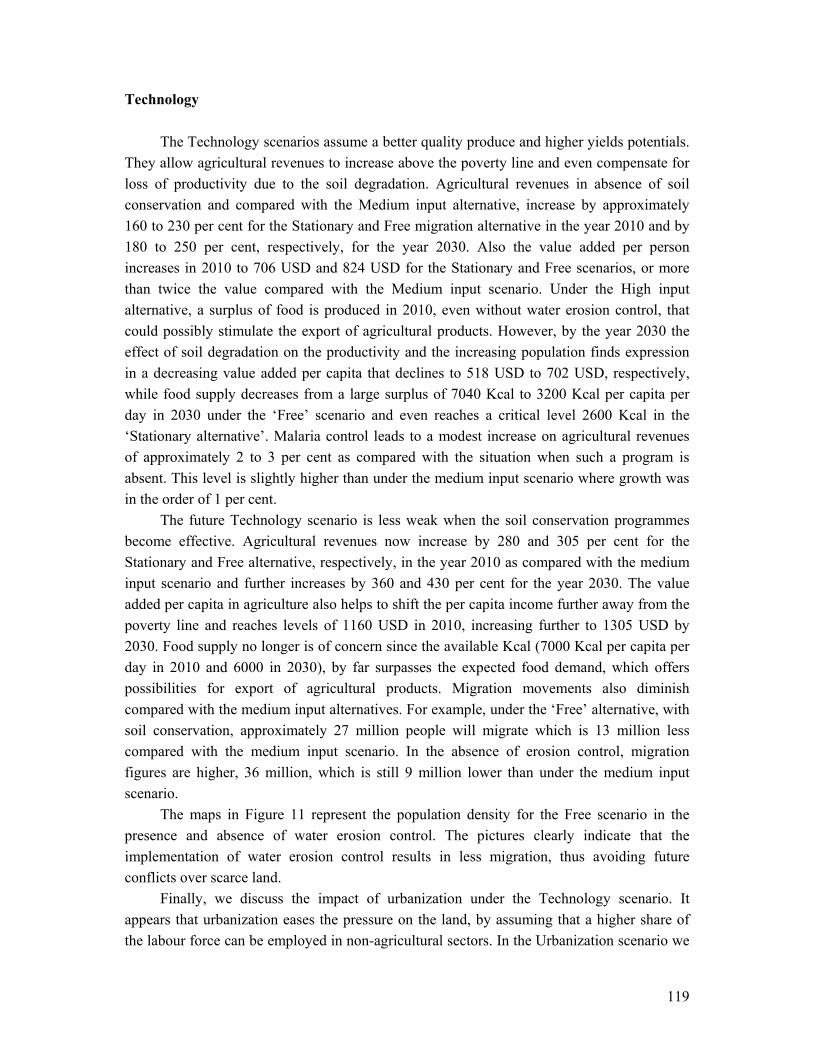
119
Technology
The Technology scenarios assume a better quality produce and higher yields potentials. They allow agricultural revenues to increase above the poverty line and even compensate for loss of productivity due to the soil degradation. Agricultural revenues in absence of soil conservation and compared with the Medium input alternative, increase by approximately 160 to 230 per cent for the Stationary and Free migration alternative in the year 2010 and by 180 to 250 per cent, respectively, for the year 2030. Also the value added per person increases in 2010 to 706 USD and 824 USD for the Stationary and Free scenarios, or more than twice the value compared with the Medium input scenario. Under the High input alternative, a surplus of food is produced in 2010, even without water erosion control, that could possibly stimulate the export of agricultural products. However, by the year 2030 the effect of soil degradation on the productivity and the increasing population finds expression in a decreasing value added per capita that declines to 518 USD to 702 USD, respectively, while food supply decreases from a large surplus of 7040 Kcal to 3200 Kcal per capita per day in 2030 under the ‘Free’ scenario and even reaches a critical level 2600 Kcal in the ‘Stationary alternative’. Malaria control leads to a modest increase on agricultural revenues of approximately 2 to 3 per cent as compared with the situation when such a program is absent. This level is slightly higher than under the medium input scenario where growth was in the order of 1 per cent.
The future Technology scenario is less weak when the soil conservation programmes become effective. Agricultural revenues now increase by 280 and 305 per cent for the Stationary and Free alternative, respectively, in the year 2010 as compared with the medium input scenario and further increases by 360 and 430 per cent for the year 2030. The value added per capita in agriculture also helps to shift the per capita income further away from the poverty line and reaches levels of 1160 USD in 2010, increasing further to 1305 USD by 2030. Food supply no longer is of concern since the available Kcal (7000 Kcal per capita per day in 2010 and 6000 in 2030), by far surpasses the expected food demand, which offers possibilities for export of agricultural products. Migration movements also diminish compared with the medium input alternatives. For example, under the ‘Free’ alternative, with soil conservation, approximately 27 million people will migrate which is 13 million less compared with the medium input scenario. In the absence of erosion control, migration figures are higher, 36 million, which is still 9 million lower than under the medium input scenario.
The maps in Figure 11 represent the population density for the Free scenario in the presence and absence of water erosion control. The pictures clearly indicate that the implementation of water erosion control results in less migration, thus avoiding future conflicts over scarce land.
Finally, we discuss the impact of urbanization under the Technology scenario. It appears that urbanization eases the pressure on the land, by assuming that a higher share of the labour force can be employed in non-agricultural sectors. In the Urbanization scenario we

120
suppose that, during the period 2000-2030, the composition of the Ethiopian labour force gradually changes into one that is comparable for a middle income country (UNDP, 1999)
The differences between the accelerated urbanization (AccUrb) alternative and the population developments under the UN predictions are especially noticeable for the two input levels. Total agricultural revenues under the (AccUrb) are, under the medium input option, about 9 per cent less as compared with the UN population development and drop in 2030 to the lowest levels of this exercise with 599 and 759 Kcal for the Stationary and Free alternative, respectively. However, food supply differences are negligible under the high input option and the values added per capita of the rural population are in general higher under the AccUrb scenario then the UN population development scenario.
Equally important are developments at the national level. The Gross Domestic Product and value added per capita under the AccUrb alternative increase in 2010, by 2 per cent compared with the UN option, but for the year 2030 the difference between these two options is on average 60 per cent. The assumed higher earnings in the non-agricultural sector are the major cause of this large difference, and hence not attributable to erosion control.
Under the AccUrb option the population density in rainfed agricultural areas amounts in 2010 to 114 persons per square km, slightly lower than the UN projections (116). The
a
b
Figure 11 Population density under (a) absence and (b) presence of water erosion, under the Free migration alternative of the Technology scenario.
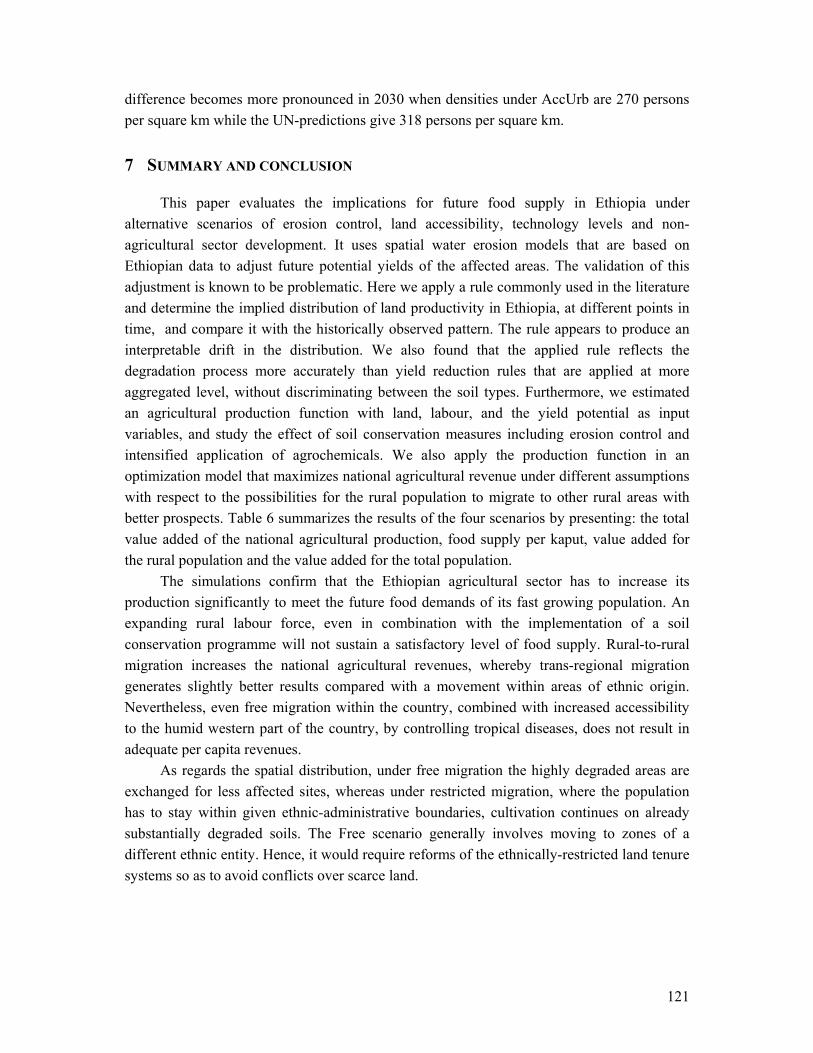
121
difference becomes more pronounced in 2030 when densities under AccUrb are 270 persons per square km while the UN-predictions give 318 persons per square km.
7 SUMMARY AND CONCLUSION
This paper evaluates the implications for future food supply in Ethiopia under alternative scenarios of erosion control, land accessibility, technology levels and non-agricultural sector development. It uses spatial water erosion models that are based on Ethiopian data to adjust future potential yields of the affected areas. The validation of this adjustment is known to be problematic. Here we apply a rule commonly used in the literature and determine the implied distribution of land productivity in Ethiopia, at different points in time, and compare it with the historically observed pattern. The rule appears to produce an interpretable drift in the distribution. We also found that the applied rule reflects the degradation process more accurately than yield reduction rules that are applied at more aggregated level, without discriminating between the soil types. Furthermore, we estimated an agricultural production function with land, labour, and the yield potential as input variables, and study the effect of soil conservation measures including erosion control and intensified application of agrochemicals. We also apply the production function in an optimization model that maximizes national agricultural revenue under different assumptions with respect to the possibilities for the rural population to migrate to other rural areas with better prospects. Table 6 summarizes the results of the four scenarios by presenting: the total value added of the national agricultural production, food supply per kaput, value added for the rural population and the value added for the total population.
The simulations confirm that the Ethiopian agricultural sector has to increase its production significantly to meet the future food demands of its fast growing population. An expanding rural labour force, even in combination with the implementation of a soil conservation programme will not sustain a satisfactory level of food supply. Rural-to-rural migration increases the national agricultural revenues, whereby trans-regional migration generates slightly better results compared with a movement within areas of ethnic origin. Nevertheless, even free migration within the country, combined with increased accessibility to the humid western part of the country, by controlling tropical diseases, does not result in adequate per capita revenues.
As regards the spatial distribution, under free migration the highly degraded areas are exchanged for less affected sites, whereas under restricted migration, where the population has to stay within given ethnic-administrative boundaries, cultivation continues on already substantially degraded soils. The Free scenario generally involves moving to zones of a different ethnic entity. Hence, it would require reforms of the ethnically-restricted land tenure systems so as to avoid conflicts over scarce land.
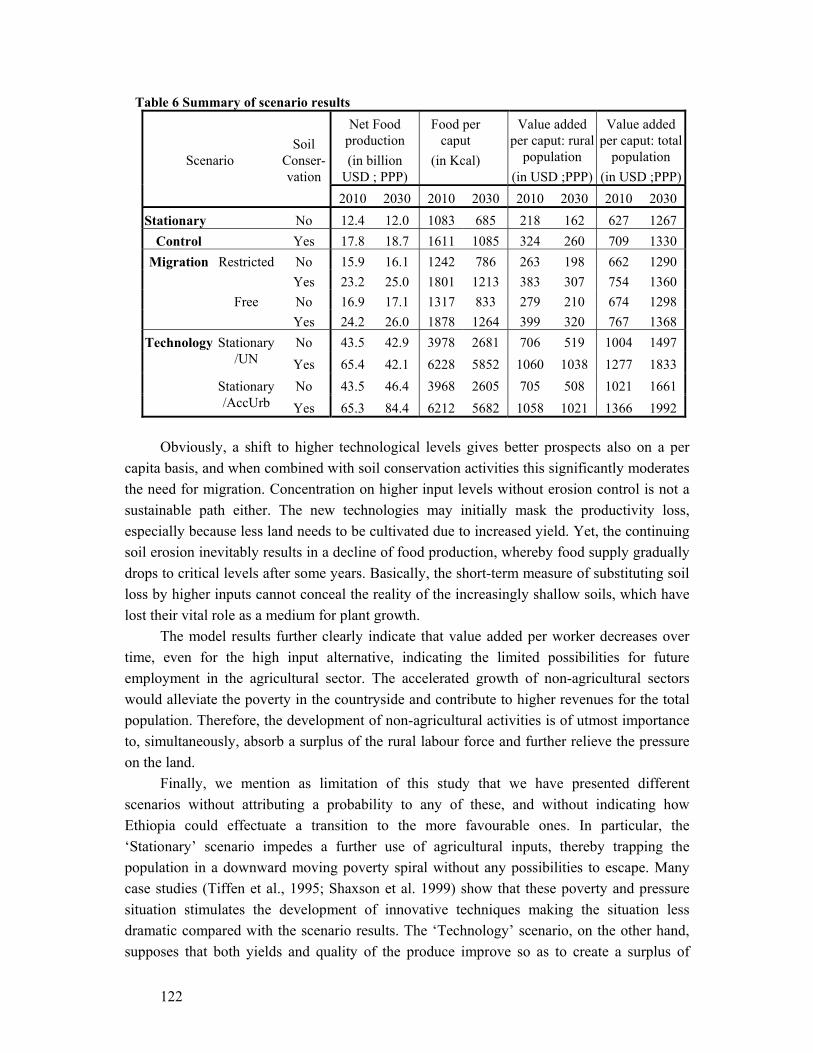
122
Table 6 Summary of scenario results Net Food
production (in billion
USD ; PPP)
Food per caput
(in Kcal)
Value added per caput: rural
population (in USD ;PPP)
Value added per caput: total
population (in USD ;PPP)
Scenario Soil
Conser-vation
2010 2030 2010 2030 2010 2030 2010 2030 Stationary No 12.4 12.0 1083 685 218 162 627 1267
Control Yes 17.8 18.7 1611 1085 324 260 709 1330 Restricted No 15.9 16.1 1242 786 263 198 662 1290
Yes 23.2 25.0 1801 1213 383 307 754 1360 Free No 16.9 17.1 1317 833 279 210 674 1298
Migration
Yes 24.2 26.0 1878 1264 399 320 767 1368 No 43.5 42.9 3978 2681 706 519 1004 1497 Stationary
/UN Yes 65.4 42.1 6228 5852 1060 1038 1277 1833 No 43.5 46.4 3968 2605 705 508 1021 1661
Technology
Stationary/AccUrb Yes 65.3 84.4 6212 5682 1058 1021 1366 1992
Obviously, a shift to higher technological levels gives better prospects also on a per
capita basis, and when combined with soil conservation activities this significantly moderates the need for migration. Concentration on higher input levels without erosion control is not a sustainable path either. The new technologies may initially mask the productivity loss, especially because less land needs to be cultivated due to increased yield. Yet, the continuing soil erosion inevitably results in a decline of food production, whereby food supply gradually drops to critical levels after some years. Basically, the short-term measure of substituting soil loss by higher inputs cannot conceal the reality of the increasingly shallow soils, which have lost their vital role as a medium for plant growth.
The model results further clearly indicate that value added per worker decreases over time, even for the high input alternative, indicating the limited possibilities for future employment in the agricultural sector. The accelerated growth of non-agricultural sectors would alleviate the poverty in the countryside and contribute to higher revenues for the total population. Therefore, the development of non-agricultural activities is of utmost importance to, simultaneously, absorb a surplus of the rural labour force and further relieve the pressure on the land.
Finally, we mention as limitation of this study that we have presented different scenarios without attributing a probability to any of these, and without indicating how Ethiopia could effectuate a transition to the more favourable ones. In particular, the ‘Stationary’ scenario impedes a further use of agricultural inputs, thereby trapping the population in a downward moving poverty spiral without any possibilities to escape. Many case studies (Tiffen et al., 1995; Shaxson et al. 1999) show that these poverty and pressure situation stimulates the development of innovative techniques making the situation less dramatic compared with the scenario results. The ‘Technology’ scenario, on the other hand, supposes that both yields and quality of the produce improve so as to create a surplus of
123
agricultural products. These products will have to be sold, to urban areas, and possibly exported. This requires an infrastructure most of which still has to be developed and the costs of which were not explicitly dealt with. Finally, the assumed increase in output and earnings in the non-agricultural sector, possibly including remittances from Ethiopian workers abroad, is questionable but this scenario serves to illustrate that an escape from poverty cannot build on agriculture alone. References Adams, C.R. and H. Eswaran (2000) Global land resources in the context of food and
environmental security. pp. 35-50. In “Advances in Land Resources Management for the 20th Century”. 655 pp. Eds. S.P. Gawande et al. New Delhi: Soil Conservation Society of India.
Albersen P., G. Fischer, M.A. Keyzer and L. Sun (2000) Estimation of agricultural production relations in the LUC model for China. Interim report IR-2000-027. Centre for World Food Studies and International Institute for Applied Systems Analysis, IIASA, Laxenburg.
Aune, J.B. and A. Massawe (1998) Effects on soil management on economic return and indicators of soil degradation in Tanzania- a modelling approach. Advances in GeoEcology 31, 37-44.
Aredo, D. (1999) Property rights: theory and illustrations with respect to land tenure in Ethiopia. Proceedings of National workshop on Food Security through Sustainable Land Use, January, 1999, Addis Ababa, Ethiopia.
Batjes N. (1996) Development of a world data set of soil water retention properties using pedo-transfer rules. Geoderma. 71, pp 31-52.
Barber, C. V. (1997) Environmental Scarcities, State Capacity and Civil Violence: The Case of Indonesia. Project on Environmental Scarcities, State Capacity, and Civil Violence. Peace & Conflict Studies Program at the University of Toronto.
Blaikie P. and H. Brookfield. (1987) Land degradation and society. Methuen. London. Brown, L.R., G. Gardner and B. Halweil (1999) Beyond Malthus: Nineteen Dimensions of the
Population Challenge. The Worldwatch Environmental Alert Series. Cacho O., Greiner R., Fulloon L. (2001) An economic analysis of farm forestry as a means of
controlling dryland salinity. Australian Journal of Agricultural and Resource Economics. 2001, 45: 2, 233-256.
Choen, J. (1995) How many people can the earth support? Norton. Coppock, L. D. (1990) The Arid and Semi-arid Lowlands of Ethiopia: environments, pastoral
economies and issues in national resources sustainability In IAR, First Natural Resources Conservation Conference. Addis Ababa. 7-8 Feb.
Coppock, L. D. (1993) The Borana Plateau of Southern Ethiopia. Synthesis of pastoral research development and change 1980-91. ILCA Systems Study, International Livestock Centre for Africa. Addis Ababa.
CSA (1998) The 1994 Population and Housing Census of Ethiopia. Volume I: Statistical Report, Office of population and housing census commission, Central Statistical Authority, Addis Ababa.
124
CSA (1997a) Rural Labour force Survey 1987/88. Statistical Bulletin 108, Central Statistical Authority, Addis Ababa.
CSA (1997b) Agricultural Sample Survey 1996/1997. Volume I: Report on area and production for major crops. Statistical Bulletin 171, Central Statistical Authority, Addis Ababa.
CSA (1997c) Agricultural Sample Survey 1996/1997. Volume II: Report on Livestock, poultry and beehives population. Statistical Bulletin 171, Central Statistical Authority, Addis Ababa.
CSA (1997d) Agricultural Sample Survey 1996/1997. Volume III: Report on farm management practices. Statistical Bulletin 171, Central Statistical Authority, Addis Ababa.
CSA (1997e) Agricultural Sample Survey 1996/1997. Volume IV: Report on crop utilization. Statistical Bulletin 171, Central Statistical Authority, Addis Ababa. Daniels, R. B., J. W. Gilliam, D. K. Cassel, and L. A. Nelson (1987) Quantifying the effects of past erosion on present soil productivity. Journal of Soil and Water Conservation 42: 183-187.
CSA (1998) The 1994 Population and Housing Census of Ethiopia. Volume I: Statistical Report, Office of population and housing census commission, Central Statistical Authority, Addis Ababa.
Deichman U. (1994) A medium resolution population database for Africa, Database documentation and digital database, National Center for Geographic Information and Analysis, University of California, Santa Barbara.
Deichman U. African Population Database Documentation. National Center for Geographic Information and Analysis, University of California. Through GRID: http://grid2.cr.usgs.gov/data/
Dyer G., A. Yunez-Naude and J.E. Taylor (2001) Effects of land degradation in a diversified economy with local staple and labour markets: A village town CGE analysis from Mexico. In Economic policy reforms and sustainable land use in LDCs (N. Heerink, H. van Keulen and M.Kuipers eds.). Physica Verlag pp. 185-198.
Dudal, R. (1981) An evaluation of conservation needs. In Morgan R.P.C. (eds.), Soil Conservation, Problems and Prospects. John Wiley & Sons. Chichester, UK pp. 3-12.
Easterly, W. and R. Levine. (1996) Africa's Growth Tragedy. Policies and Ethnic Divisions. Mimeo. The World Bank.
Easterly and Levine. Data Set. Policies and Ethnic Divisions. Economic Growth Research. Worldbank. Through: http://www.worldbank.org/research/growth/ddeale.htm
Economy E. (1997) The Case Study of China - Reforms and Resources: The Implications for State Capacity in the PRC. Occasional Paper of the Project on Environmental Scarcities, State Capacity, and Civil Violence. Cambridge: American Academy of Arts and Sciences and the University of Toronto.
FAO (1978-1981) Agro-ecological Zones Project. Vol. 1, Methodology and results for Africa; Vol.2 Results for Southwest Asia; Vol, 3, Methodology and results for South and Central America; Vol.2 Results for Southeast Asia. World Soil Resources Report, 48/1-4.
125
FAO (1998a) The Soil and Terrain Data Base for north-eastern Africa. Land and Water Digital Media Series 2. FAO, Rome, Italy.
FAO (1998b) Cropping Production Systems Zones of the IGAD. Land and Water Digital Media Series 2. FAO, Rome, Italy.
FAO (2000) The state of food insecurity in the world. Food and Agricultural Organization of the United Nations, Rome.
FAO (2000) ‘Agricultural: towards 2015/30. Technical Interim Report’. Rome: FAO/GPSU. FAPRI (2001) FAPRI Agricultural Outlook 2001, Ames, Iowa: FAPRI. FAO/IIASA (1993) Agro-ecological assessments for national planning: the example of
Kenya. Food and Agriculture Organization and the International Institute for Applied Systems Analysis. Rome.
Fischer, G., H. van Velthuizen, M. Shah, and F. Nachtergaele. (2002) Global Agro-ecological Assessment for Agriculture in the 21st Century: Methodology and Results. RR-02-02. International Institute for Applied Systems Analysis Laxenburg, Austria and the Food and Agriculture Organization of the United Nations, Rome, Italy
Gebre-Mariam (1994) The alienation of land rights among the Afar in Ethiopia. Nomadic peoples. 34/35, pp. 137-146.
Graaff, J. de (1996) The price of soil erosion; an economic evaluation of soil conservation and watershed development. Ph.D. Thesis. Agricultural University Wageningen, The Netherlands.
Grepperud, S. (1996) Population pressure and land degradation: the case of Ethiopia. Journal of Environmental Economics and Management. Vol. 30, No. 1,. 18-33 pp. Orlando, Florida.
Haas, J. 2001. The situation to date. Heinrich Boll Foundation. Berlin, Germany. Through: http://www.worldsummit2002.org/index.htm?http://www.worldsummit2002.org/guide/europe.htm
Hammer W.I. (1981) Soil conservation consultant report. Technical Note. No 7, Centre for Soil Research, Bogor, Indonesia.
Hanley, N., J.F. Shogren and B. White (1997) Environmental economics in theory and practice, London: MacMillan Press.
Herweg, K and B. Stillhardt (1999) The variability of soil erosion in the Highlands of Ethiopian and Eritrea. Research Report 42. Centre for development and Environment. University of Berne.
Higgins, G.M., A.H. Kassam, L. Naiken, G. Fischer and M.M. Shah (1982) Population supporting capacities for land in the developing world. FAO/IIASA. Rome, Italy.
Hurni, H. (1993): Land degradation, famines and resource scenarios in Ethiopia. In World Soil Erosion and Conservation. D. Pimentel (ed.). Cambridge University Press, Cambridge, 27-62
Homer-Dixon, T. and V. Percival. (forthcoming) Environmental Scarcities, State Capacity, and Civil Violence: The Case of Bihar, India.
Homer-Dixon T. F. (1999) Environment, Scarcity, and Violence. Princeton University Press

126
Howard J., V Kelly, M Demeke, M Maredia, and J Stepanek. 1999. Green revolution technology takes root in Africa: the promise and challenge of the ministry of agriculture. Experiment with improved cereals technology in Ethiopia. Policy synthesis. number 42 USAID/Ethiopia.
http://www.aec.msu.edu/agecon/fs2/polsyn/number42.pdf Jahnke, H.E. (1982) Livestock production systems and livestock development in tropical
Africa. Kiel Wissenschaftsverlag. VAUK. Jetten, V., G. Govers, J. Quinton (2000) Distributed soil erosion models prospects for the
future. Paper presented at the International Francqui Chair Workshop. The future of distributed hydrological modelling. Leuven 12-15 April.
Johnson, P.M. (1999) Context, Constraints, Achievements, Innovations, Challenges and Expectations of the Convention to Combat Desertification. In: Drylands, Poverty,and Development. Proceedings of the June 15 and 16, 1999. World Bank Round Table. Washington, USA.
Kassam, A.H., H.T. van Velthuizen, A.J.B. Mitchell, G.W. Fischer and M.M. Shah (1999) Agroecological assessment for agricultural development planning. Main report FAO/IIASA. Rome, Italy.
Kassam, A.H., H.T. van Velthuizen, A.J.B. Mitchell, G.W. Fischer and M.M. Shah (1991) Agroecological assessment for agricultural development planning. A case study of Kenya. Resources data base and land productivity. Technical Annex 2. Soil erosion and productivity. FAO/IIASA. 54p.
Kebbede, G. and M.J. Jacob (1988) Drought, famine and the political economy of environmental degradation in Ethiopia. Geography, vol. 73, pp 65-71.
Keyzer, M.A. and B.G.J.S. Sonneveld (1998) Using the mollifier method to characterize datasets and models: the case of the Universal Soil Loss Equation. ITC Journal 1997-3/4.pp 263-272.
Keyzer M.A. and B.G.J.S. Sonneveld. 2001. The effect of soil degradation on agricultural productivity in Ethiopia: a non-parametric regression analysis. In Economic policy reforms and sustainable land use in LDCs (N. Heerink, H. van Keulen and M.Kuipers eds.). Physica Verlag pp. 269-292.
King G.A (1997) Solution to the Ecological Inference Problem: Reconstructing Individual Behaviour from Aggregate Data. Princeton University Press. 346 pp.
Kovda, V.A. (1983) Loss of productive land due to salinization. Ambio 12: 91-93. Kruseman G. (2000) Bio-economic household modelling for agricultural intensification. PhD.
Thesis. Wageningen Agricultural University. Wageningen. Kruseman G. and H. van Keulen (2001) Soil degradation and agricultural production. In
Economic policy reforms and sustainable land use in LDCs (N. Heerink, H. van Keulen and M.Kuipers eds.). Physica Verlag pp. 21-48.
Kruska, R.L., Perry, B.D. and Reid, R.S. (1995). Recent progress in the development of decision support systems for improved animal health. In: Proceedings of the Africa GIS ‘95 meeting: Integrated Geographic Information Systems Useful for a
127
Sustainable Management of Natural Resources in Africa”, March 6-9, Abidjan, Ivory Coast.
Llewelyn R.V., and A.M. Featherstone (1997) A comparison of crop production functions using simulated data for irrigated corn in Western Kansas. Agricultural Systems. Vol. 54. No4, pp. 521-538.
Middleton, N.T., D.S.G Thomas. (1997) World Atlas of Desertification. Arnold, London. Mortimore, M. (1993) Northern Nigeria: land transformation under agricultural
intensification. In: Population and land use in developing countries (C.L. Jolly and B.B. Torrey, eds.), pp. 42-69. Washington: National Research Council/National Academy Press.
Nearing, M.A., G.R. Foster, L.J. Lane and S.C. Finkner (1989) A process based model for USDA Water Erosion Prediction Project (WEPP) technology. Transactions of the American Society of Agricultural Engineers. 32, 1587-1593.
OECD (2001) OECD Agricultural Outlook 2001-2006, Paris: OECD
Oldeman, L.R., R.T.A. Hakkeling and W.G. Sombroek. (1991) World map of the status of human induced soil degradation. ISRIC/UNEP. Wageningen.
Okumu, B.N, M.A Jabbar, D. Colman and N. Russell (1999) Bio-economic modeling of watershed resources in Ethiopia. Paper presented at the American Agricultural Economics Association meeting Nashville, Tennessee, 1999.
Openshaw, S. (1996) Developing GIS relevant zone based spatial analysis methods. In Longley P, Batty M (eds.) Spatial Analysis: Modelling in a GIS Environment. GeoInformation International, Cambridge.
Pagiola, S. 1993. Cost Benefit Analysis of Soil Conservation. In: Economic and Institutional Analyses of Soil Conservation Projects in Central America and the Caribbean. World Bank. Environment Paper No. 8. World Bank, Washington, D.C.
Pierce F., W.E. Larson, R.H. Dowdy and W.A.P. Graham (1983) Productivity of soils: Assessing long term changes due to erosion. Journal of Soil and Water Conservation. 38: 39-44.
Pierce F. J. (1991) Erosion productivity impact prediction. Pp. 35-52 in Lal, R. and Pierce, F. J. eds. Soil Management for Sustainability. Soil and Water Conservation Society, Ankeny, Iowa.
Pla Sentis, I. (1987) Soil and water conservation problems in agricultural areas of Venezuela. In: I. Pla Sentis (editor) Soil Conservation and Productivity. Volume 1. Universidad Central de Venezuela, Maracay, pp. 180-196.
POPIN (1997) Ethiopia Population Information Resources. http://www.undp.org/popin/regional/africa/ethiopia/index.htm Prendergast J. (1997) Nested Conflict: The Case of Ethiopia. In Building Peace, by John Paul
Lederach, (Washington, D.C.: United States Institute of Peace), pp. 161-169. Ruttan V. W. (1999) The transition to agricultural sustainability. paper presented at "Plants and
Population: Is There Time?" December 5-6 at the National Academy of Sciences in Irvine, California.
128
Ryan J.G., Spencer D.C. and Spencer D.C. (2001) Future challenges and opportunities for agricultural R and D in the semi arid-tropics. International Crops Research Institute for the Semi-Arid Tropics (ICRISAT); Patancheru; India, 79 pp.; many ref.
Sarre, P. and J. Blunden eds. (1995) An overcrowded world? Population, resources and the environment. (The Open University) Oxford University Press.
Scherr, S.J. (2000) A downward spiral? Research evidence on the relationship between poverty and natural resource degradation. Food policy, vol. 25, no.4, pp. 479-498.
Sharpley A.N. and J.R. Williams. Eds (1990) EPIC- Erosion/Productivity Impact Calculator. 1. Model documentation. USDA. Agricultural Bulletin No. 1768. 235 pp.
Shaxson F. and Cheatle (1999) Conservation is for business: Self help groups in Kenya. Paper presented at the ISCO’99 conference in Purdue University, Lafayette. 23-27 May, 1999.
Shiferaw B., S.T. Holden and J. Aune (2001) Population pressure and land degradation in the Ethiopian Highlands: a bio-economic model with endogenous soil degradation. In Economic policy reforms and sustainable land use in LDCs (N. Heerink, H. van Keulen and M.Kuipers eds.). Physica Verlag pp. 73-92.
Smaling E.M.A. (1993) An agro-ecological Framework for integrated nutrient management. PhD. Thesis. Agricultural University Wageningen. Wageningen.
Solomon, A. (2003) The consequences of structural adjustment and debt for desertification and food security in Africa - a literture review and discussion. International Livestock Research Institute. Through: http://spaef.com/IJED_PUB/3_4/3_4_solomon.html
Sonneveld B.G.J.S. and P.A. Albersen (1999) Water erosion assessment based on expert knowledge and limited information using an ordered logit model. Journal of Soil and water Conservation. Vol.54.number 3. pp. 592-597.
Sonneveld, B.G.J.S., M.A. Keyzer and P.A. Albersen (2001). A non-parametric analysis of qualitative and quantitative data for erosion modelling: a case study for Ethiopia. In: D.E. Stott, R.H. Mohtar and G.C. Steinhardt (eds.). Sustaining the Global Farm. Selected papers from the 10th International Soil Conservation Organization Meeting, May 24-29, 1999, West Lafayette, IN, pp. 979-993.
Sonneveld, B.G.J.S. and M.A. Keyzer (2002). Land under pressure: soil conservation concerns and opportunities for Ethiopia. Land degradation and development. Published online in Wiley InterScience (www.interscience.wiley.com). DOI: 10.1002/ldr.503
Sonneveld B.G.J.S. (2002) Land under pressure: the impact of water erosion on soil productivity in Ethiopia. PhD Thesis. Vrije Universiteit Amsterdam. Shaker Publishing, Maastricht.
Stocking, M. and R. Clark (1999) Soil productivity and erosion: Biophysical and farmer perspective assessment for hillslopes. Mountain Research and Development, vol. 19, no.3, pp. 191-202.
Struif-Bontkes T. (1999) Modelling Dynamics of agricultural development: a process approach- the case of Koutiala (Mali). Wageningen Agricultural University. Wageningen.
129
Tanner D.G. and T.S. Payne 2001. CIMMYT Wheat Research and Capacity Building in Eastern, Central, and Southern Africa in: Research Highlights of the CIMMYT Wheat Program 1999-2000. CIMMYT publications, Mexico.
Tarekegne, A., H. Gerbe, and C.A. Francis. 1997. Yield limiting factors to food barley production in Ethiopia. J. Sust. Agric. 10:97-113.
Tiffen M., M. Mortimore and F. Gichuki (1994): Population growth and environmental recovery: policy lessons from Kenya. Gatekeeper Series No 45. London: International Institute for Environment and Development.
Tsighe Z (1995) The political economy of land degradation in Ethiopia. Northeast African Studies. Vol. 2, no. 2, p. 71-98.
Tuso H. (1997) Ethiopia: new political order. Ethnic conflict in the post Cold War era. Africa. Instituto italiano per l'Africa e l'Oriente. Vol. 52, no 3, p. 343-364.
Uloro, Y.; Mengel, K. Response of ensete (Ensete ventricosum W.) to mineral fertilizers in southwest Ethiopia. Fertil-res v.37(2): p.107-113 (1994).
UN (1987) Our Common Future. The Report of the World Commission on Environment and Development Report. United Nations. New York.
UNDP (1997) Human development report. United Nations Development Programme. Oxford University Press.
UNEP (1980) Annual Review, United Nations Environmental Program, Nairobi, Kenya. UNEP (1992): World Atlas of Desertification. Edward Arnold: A division of Hodder and
Stoughton, London, 38-39. USDA (2001) USDA Agricultural Baseline Projections to 2010, Washington DC: USDA, ERS. Verheij, M. S. and W. R. Pace (1997) Renewing the spirit of Rio the csd, Agenda 21 and Earth
Summit. Report produced in preparation for the Special Session of the United Nations General Assembly to Review and Appraise the Implementation of Agenda 21. International NGO Task Group on Legal and Institutional Matters INTGLIM – March.
Voortman R.L., B.G.J.S. Sonneveld and M.A. Keyzer (2000): African Land Ecology: opportunities and constraints for agricultural development. Centre for International Development at Harvard University. Harvard. USA
Wischmeier W.H. (1976) Use and misuse of the universal soil loss equation. Journal of Soil and Water Conservation. Jan-Feb. 1976.
Wischmeier W.H. and D.D. Smith (1978) Predicting rainfall erosion losses, Agricultural Handbook 537, USDA, Washington DC.
World Bank (2001) African development indicators. World Bank. Washington. Wood, S., K. Sebastian and S.J. Scherr (2000) Pilot Analysis of global ecosystems. World
Resource Institute. ISBN: 1-56973-457-7 Young, A. (1998) Land Resources : Now and for the Future. Cambridge University Press. Zegahegn E. (1999) Ethiopia: Economic Policy Analysis. The McKeever Institute of
economic policy. Oakland, CA 94602 USA.
130
UNCCD / ANNEX IV,
BACKGROUND AND A SUMMARY OF ACTIVITIES
N. Yassoglou, Chairman Greek National Committee for Combating Desertification
1. BACKGROUND 1.1. MEMBERSHIP Annex IV of the United Nations Convention for Combating Desertification applies to the North Mediterranean Region. Originally this Annex region consisted of Greece, Italy, Portugal, Spain and Turkey. These were the first countries to ratify the convention. Since 2000, Albania, Bosnia- Herzegovina, Cyprus, Malta and Slovenia ratified the Convention and became de facto members of the Annex IV region. The original five countries decided to maintain their close ties establishing a sub-group and are co-operating as members of the North Mediterranean Subregion. Observant countries France, Monaco, the European Commission and Israel and MEDFORUM have been invited and participated in several subregional activities. 1.2. OBJECTIVES The general objective, which applies to all annexes of the convention, is that countries experiencing drought and/or desertification, ought to combat these phenomena and mitigate their effects. To do this they should prepare and implement their National Action Programmes (N00P) as well as the respective Regional Action Programme (RAP) for their Annex. 1.3. CONDITIONS The particular conditions of the northern Mediterranean region referred in Article 2 to Annex IV of the Convention are briefly listed below: • semiarid climatic conditions affecting large areas, seasonal droughts, very high
rainfall variability and sudden high-intensity rainfall • poor and highly erodible soils, prone to develop surface crusts • uneven relief with step slopes and very diversified landscapes • extensive forest cover losses due to frequent wildfires • crisis in agriculture associated with land abandonment and deterioration of soil
and water conservation structure • unsustainable exploitation of water resources • concentration of economic activity in coastal areas.
131
1.4. OBLIGATIONS Obligations arising from Articles of the Annex IV of the Convention are: • The preparation and implementation of National Action Programmes as integral
parts of the strategic planning for sustainable development. • Consultative and participatory process involving government, local communities
and non-governmental organizations shall be undertaken to provide guidance on a flexible planning strategy.
• Preparation and implementation of Regional and Subregional Action Programmes, in order to complement and increase the efficiency of the National Action Programmes.
• Identification, in co-operation with national institutions, of the national objectives related to desertification.
• Assessment of existing programmes related to desertification and evaluation of operational capacities and activities of relevant institutions.
• Co-ordination in reviewing, harmonizing, making recommendations, implementing action programmes and providing technical cc-operations.
• Co-ordination with other regions and subregions, particularly with those of northern Africa.
1.5. NATIONAL COMMITTEES – FOCAL POINTS Pursuant to Article 5 of Annex IV of the Convention, the member states have established national coordination bodies either in the form of national committees or focal points. The composition of these bodies differs with country, but they all include representatives of various ministries and agencies related to desertification. The responsibilities of these bodies can be summarized as follows: • Preparation and coordination of the implementation of the National Action
Programmes. • Preparation and submission to the related governmental local and non-
governmental agencies of proposals on technological, financial, socio-economic and policy measures for preventing and mitigating desertification.
• Promoting awareness and training to the stake holders and actors involved. • Promoting co-operation with other national committees and focal points and with
UNCCD Secretariat. 2. ACTIONS AND INITIATIVES UNDERTAKEN 2.1. PREPARATION AND IMPLEMENTATION OF NATIONAL ACTION PROGRAMMES 2.1.1. The present status The preparation of National Action Programme for combating desertification is the main mandatory obligation for all the affected signatory countries of the UNCCD.
132
So far Greece, Italy and Portugal have officially reported the preparation and authorization of their NAPs by their respective governments. These countries have already started the implementation of their plans. Spain has progressed significantly in the preparation of its programme and in the mean time is taking actions for combating desertification, in the spirit of the Convention. Turkey is working towards the approval of its programme and has also been implementing projects for combating desertification. 2.1.2. Priorities set in the NAPs Each country of the subregion has set its own priorities for action in combating desertification. These priorities generally fall in the basic scientific, technological and socioeconomic frame of the UNCCD and are the following: • Development of strategies and policies for preventing and mitigating
desertification. As pointed out before, this is a key task, because desertification in the Northern Mediterranean is caused primarily by social and economic changes, which can be addressed by political initiatives.
• Sustainable soil and water management and protection. This is the technological and socio economic frame, which can efficiently phase the problem almost universally.
• Forest protection, particularly against wild fires is a very important task for preventing the advance of desertification, especially on sloping marginal lands.
• Land restoration, in areas not irreversibly desertified, is necessary for the arresting a further deterioration. However, is not always socio-economically feasible.
• Arresting desertification of affected land by the local population is necessary for preventing the advance of desertification in many areas. However in areas, where the human activity is not compatible with the sustainability of the natural resources, a well planned land abandonment may contribute to rehabilitation the ecosystems.
• Socio-economic development in affected areas is the key target of the NAPs. Importance is placed in the development of infrastructure, capacity building and in supporting efforts for creating opportunities for alternative sources of income, especially in marginal lands.
• Legal and institutional adjustments are necessary on several occasions for the implementation of the NAPs. Almost all countries of the Region have developed institutions and legal tools for protecting environment since long time ago. However there is need for enhancement, enactment, updating and harmonization in many occasions.
• Awareness of the entire stakeholder, public and private on the impacts of desertification is not satisfactory in the North Mediterranean Region. Significant effort is needed in this direction. Participatory processes need also to be promoted. The identification and adoption of specific incentives and counter incentives would be necessary for this task.
• Research on desertification has advanced spectacularly in the region especially during the last decade due to the financial support of the EU. However, there are still gaps of knowledge, especially in the socio-economic sector. Education in topics of desertification is circumstacial and inefficient. It needs to be upgraded.
133
2.1.3 Implementation Approaches The specific steps taken by the member counties and the mechanisms adopted in implementing their NAPs vary according to the particular conditions prevailing in each one of them. However, there are certain principles compatible with the UNCCD, which are being generally followed and which are briefly described below. Efforts are being made to integrate the provisions of NAP into the appropriate national and local sustainable development and environmental programmes of the country and not to implement it independently, where is not necessary. Activities and responsibilities are decentralized and specific projects are prepared in detail according to the conditions of each affected province within each country. This task requires effective co-ordination, governance and capacity building. Information, demonstrations and incentives are employed to increase the level of perception and of the consequences of the problem on the part of the stake holders and to secure their active participation. Application of the NAP in pilot areas would contribute to the success of its implementation. International co-operation, linking to research and concerted action projects as well synergies with the other UN conventions improve the scientific basis of the NAPs and contribute to their effective implementation. 3. MEASURES TAKEN 3.1. RISK ASSESSMENT All countries of the Region have been engaged in assessing directly or indirectly desertification. They have focused their efforts in developing suitable risk indicators and preparing risk maps. These tasks have advanced more in some countries and less in others. Greece, Italy and Portugal have applied integrated methodologies to assess the risk of desertification and have prepared respective maps (Figs. 1,2,3), whereas other countries have mapped the severity of specific factors and processes causing land degradation and drought. The indicators used and specific weights placed on them are different and have not been harmonized for the Region. Based on the existing information the high desertification risk in the region of northern Mediterranean ranges from 11 to 30% and the moderate risk from 40 to 70%. These figures show that the problem is quite alarming in this region 3.2. POLICY AND INSTITUTIONS National, regional and international policies for combating desertification are compatible with the UNCCD and prescribed in the NAPs. Environmental and natural resources protection and management policies formulated before the ratification of the convention continue to be applied and contribute to the fight against desertification
134
and drought. The main axes of these policies are: the prevention of degradation and pollutionof the ecosystems, the sustainable management of soil, water, forest and pastoral resources, the prevention of land abandonment, and the support to the affected populations. EU directives concerning water and good agricultural practices are applied by the member states. However, these policies in many cases, need to be further enforced. Institutions established according to the provisions of the convention are the National Co-ordination Bodies and the Focal Points. Their composition, responsibilities, mode of operation, legal status and tasks differ from country to country. Principally they represent, at high levels, relevant governmental and non-governmental sectors. The Focal Points of the northern Mediterranean subregion have been quite active since 1997 in promoting co-operation; exchange of information and participating in E.U. supported projects. Relating institutions and agencies, pre-existing to the convention, are also engaged in various degrees in the implementation of the NAPs and in other parallel activities. Desertification relevant policies, legal frames, institutions and agencies need to be enhanced, modernized, better co-ordinated and promoted in many cases to sufficiently carry out their tasks in preventing and mitigating the phenomenon in the region. 3.3 PARTICIPATORY PROCESSES Even though, participatory processes have been satisfactory applied to some countries of the region, they still remain the issue, which needs highest attention in the fight against desertification. Public perception of the dangers of desertification generally is not at a sufficient level in the North Mediterranean region. Public interest arises temporarily during drought crises and subsides when they pass. Therefore there is a need for better awareness campaigns, demonstrations and effective incentives and counter incentives. Promotion of sustainable management and of codes of good practices by the E.U. Common Agricultural Policy would certainly help stake holders participation in the fight against desertification in the area. Examples of participatory processes applied in the region are: • Preparation of the NAPs • Setting action priorities • Selecting pilot areas • Selecting specific projects for NAP implementation 3.3. TECHNICAL MEASURES Technical measures are and have been taken in the frame of the development and natural resources protection initiatives. They are mostly aim at arresting land and water degradation processes. They usually concern: Soil conservation and erosion control. • Water conservation and fresh water increase. • Application of efficient integrated irrigation systems. • Forest protection, reforestation and sustainable management. • Sustainable agricultural practices.
135
• Research and monitoring on processes of desertification and mitigation methods. The intensity and the efficiency of the above measures vary with country and in some occasions do not match the rates of deterioration. 3.4. SOCIO-ECONOMIC MEASURES Socio-economic measures applied do not always originate exclusively from the obligations arising from the UNCCD. Most frequently they have been designed prior to it and they aim at the general development of specific regions and the protection the environment and the natural resources. Exception is the significant efforts made by some countries, after the ratification of the convention to raise public awareness and to inform the populace on the impacts of desertification. Other socio-economic initiatives, indirectly contributing to the fight against desertification are the following: • Financial support land and water resources development and protection projects. • Education and capacity building in general. • Land use planning. • Financial support to good agricultural practices, biological agriculture and
incentives to land set aside schemes. • General development projects and infrastructure improvements in effected areas. • Incentives for preventing land abandonment and developing opportunities for
alternative employment in marginal lands. • Support for research. • Technical and financial co-operation wit other effected countries. Financial allocations for combating desertification vary with each country and they are difficult to estimate, because as described above they are specific to this effort. The E.U. members cover the expenses from their own resources and from structural and cohesion funds. Other members in addition to their national contributions receive financial assistance from international funds. 4. SUBREGIONAL ACTIVITIES The five members of the North Mediterranean Subregion have co-operatively undertaken activities described below. In some activities, France, Monaco, the European Commission and Israel and the MEDFORUM and other NGOs were invited and participated as observers. South Mediterranean countries have occasionally co-operated in some projects carried out by the subregional members. 4.1. CO-ORDINATION Co-ordination of the activities at the subregional level has been achieved through regular meetings organized by the presiding country. The presiding country was successively Spain, Portugal, Italy, Greece and now Turkey. The meeting were held in various countries of the subregion either at the ministerial or focal point level or both.
136
Ministerial meetings have discussed issues to be presented in the five Conferences of the Partners (COP) of the convention and elaborated common positions to be promoted in these conferences. They also organized common celebrations of the Desertification Day to promote awareness and raise public interest in the problem. Focal point meetings have contributed to the formulation and execution of several relating tasks such as: • Planning the mode and defining the areas of co-operation. • Acquisition of pertinent information and data. • Preparation of the Subregional Action Progamme. • Preparation submission and execution of E.U. supported projects and workshops. • Organization of international conferences on related themes. 4.2. THE SUBREGIONAL ACTION PROGRAMME So far the activities have been at the preparatory stage and particularly the formulation of the terms of reference and their approval by relevant ministers of the subregion. Members of the subregion have undertaken initiatives aiming at the acquisition of data and information needed for the documentation of the action plan. Some of the relevant initiatives have been: • Conferences and workshops: -International conference on Mediterranean desertification (Greece 1996). -International meeting on indicators of desertification (Italy 1998) -IUBILAEUM A. D. 2000. Conference: Religions and civilizations in the Mediterranean Area. Culture, economic and territorial systems (Italy 2000) -Workshop on Desertification, climate changes biodiversity and forest. Synergies for an inter-regional agenda between northern and Southern Mediterranean countries (Italy 2000) -Workshop on social participation and EASW methodology (Italy 2000) -The participation of Mediterranean NGOs in national programmes to combat desertification and drought ( Spain 2000) -The Ancona Initiative. NAPs to combat desertification in the frame of global environmental conventions (Italy 2001) • The preparation and the operation of the E.U. supported projects: MEDRAP, CLEMDES. • The participation int the preparation of the interregional co-operation project
DISMED. • The preparations for the establishment of network of pilot areas in each member
country. • The preparation for the establishment of clearing houses in each country.
4.2.1. The MEDRAP Project The subgroup members have participated in the EU financed Concerted Action Programme (MEDRAP) to support the preparation of the Northern Mediterranean
137
Regional Action Programme for Combating Desertification. The objectives of the project are to: • support processes of the elaboration of the Regional Action Programme of the
Annex IV countries • identify the state of the act on topics of desertification • define spatial and temporal priorities and strategies for prevention and mitigation
of desertification and to improve sustainable management • identify scientific, institutional and political gaps and propose suitable solutions The project consists of a series of workshops, co-ordinated by the Nucleo Ricerca Desertificazione of the University of Sassari. At these workshops scientists, administrators, NGOs and representatives of stake holders exchange views, experience and develop approaches for combating desertification, which could be used as bases for the elaboration of the Regional and National Action Programmes. The first Workshop on “ Sustainable Soil and Water Management” was held in Athens on December 15-17, 2001 organized by the Nucleo Ricerca Desertificazione and the Greek National Committee for Combating Desertification. The second Workshop “Identification of Sensitive Areas in the Northern Mediterranean” was held in Troia, Portugal on June 6-9, 2002. . It was organized by the Nucleo Ricerca Desertificazione and the Portuguese Focal Point. Topics discussed and recommendations of the First Workshop • Effective water erosion control • Control of surface crusting • Soil sealing by structures • Control of soil salinization and nitrate pollution of ground water • Soil water conservation • Increasing fresh water supply • Facing natural and manmade water scarcity arises • Socio-economic aspects of sustainable management Scientists, administrators and stakeholders from all the participating countries attended the workshop. The conclusions of the workshop could provide a valuable basis for the elaboration of RAP and NAP. The main points of the provisional conclusions of the Workshop could be summarized as follows: • The European Environmental Policy should consider the identification and
mapping of the desertification threatened areas, using the models developed for the selection of indicators, assessment of the risks and for the evaluation of factors, processes and impacts involved. The existing experience of the scientific community and the stakeholders should also be used in this task.
• Land use patterns, described in codes of good agricultural practices, should be applied to prevent soil degradation and water pollution and depletion.
• Tillage systems to be applied should be those, which secure erosion and crust control, minimize water loss and increase soil water storage.
138
• Irrigation practices and policies should minimize the threat of soil salinization and secure the sustainability of water resources.
• The state of the art for the sustainable management of the soil and water resources should be codified and put to use.
• Soil resources loss to structures is a serious problem, which could be addressed by applying physical planning to urban expansion, sparing the sealing of productive and environmentally important soils.
• Land use planning should be in harmony with water use and management planning.
• The role of forest management in preservation and mitigation of desertification should be clarified.
• All National Committees should collect all pertinent information, data; experience and conclusions obtained form their individual case studies and research projects in each country. All this information should be evaluated, successes and failures should be assessed and used in the development of an integrated common policy framework. Guidelines and measures towards preventing and combating desertification should be elaborated.
• Non-beneficial consumptive water uses should be controlled. Non–reusable
fraction of the water should be minimized • Crop patterns, practices and management, increasing availability of soil water and
controlling evaporation and transpiration losses should be developed and applied. Demand management in irrigated agriculture should be employed, including water conservation and saving. The users should assume their own responsibility in an autonomous system of water demand and supply. Advisory systems for water should be developed. Incentives and counter incentives aiming at reducing water waste and loss and improving water use efficiency should be adopted.
• Operation and management of reservoirs, conveyance and distribution systems should be improved. There is a need for controlling the distribution and the demand of water. Yield decrease of dams and uncertainties on the estimation of sustainable yield of other hydrologic systems are serious problems, which must be considered. Water recycling and reuse should be encouraged
• Advisory systems for water use should be developed considering efficiency of use, crop response to irrigation and the sustainability of water supply. The use of less demanding indigenous plants should be promoted and traditional practices applied. Respective research and experimentation are needed.
• Adverse environmental impacts versus temporary benefits should be evaluated and the necessary studies should be carried out.
• Monitoring water resources, long-term continuous and accurate estimates of their quantity and quality are needed. Respective databases should be developed and linked to a Mediterranean network. Early warning systems for drought should be developed and operated.
• Desertification should be addressed in a cooperative and a co-development framework. The EU should provide assistance to other no-EU countries in the field of protection and conservation of soil and water resources.
• Policies and management practices should be reconsidered. They should replace those not securing the sustainability of the resources. A strong institutional framework is essential for sustainable development.
139
• Perception of risk and impacts of the soil and water resources decline is inefficient and obscured by short-term perspectives and technological advances. Comprehensive strategy for local and regional sustainable development is crucial to counteracting this kind of myopia
• Promotion of diversity and valorization of opportunities in the affected territories should replace one-way logic of growth in desertification-threatened regions. New opportunities should be created.
• Partnership needs to be promoted, but its contents should be carefully determined to fit their local conditions avoiding non-intelligent interpretation of decisions on a larger scale. Central and local actions and responsibilities should achieve a balance.
• Rural/urban contrast should be avoided. A decentralized system with non-concentrated urban zones and with non-marginalized rural zones should be developed.
• Policy and measure implementation is a difficult task. It requires the cooperation of many actors including NGOs. Specific measures and strategies should be designed and applied by local agencies and stakeholders. Multifunctional approaches should be applied. Policy makers and legislators must be persuaded for the necessity of sustainable management of soil and water resources. The initiatives of France, Italy and Spain should be considered.
• Local populations in desertification sensitive areas should be given, in pursuing their livelihood and income, alternative choices beyond the exploitation of the soil and water resources.
The above conclusion will be further elaborated and published in their final form along with the proceedings of the Workshop by the N.R.D. of the University of Sassari and should be considered in the preparation and implementation of the SAP and NAPs Topics discussed and recommendations of the Second Workshop Each country of the northern Mediterranean region prepared a report on the methodologies they applied in assessing desertification risks. All five national reports were summarized and analyzed during the first session of the workshop “Sensitive areas: experience in the UNCCD Annexes I, III and IV”. In this session, the participants of Latin America and Northern African Countries also presented the state of the art on the identification of sensitive areas in their Countries. The second session “Identification of sensitive areas in the Mediterranean basin” was devoted to the presentation of the knowledge acquired by different EU research projects on the identification of sensitive areas and on the perception of desertification. The discussion that followed at the end of the first day underlined the will of the participants to work together for the identification of a common methodology to assess sensitive areas taking into account both biophysical and socio-economic factors. The actual perception of desertification among the many stakeholders is still insufficient and there is a need to work more to increase awareness at all levels and to establish a long-term interaction.
140
In the third session “Working Groups” the role played by water issues in the sustainable development was highlighted and the implication of man induced water scarcity had been discussed. The policy principles of sustainable development that involve the environment, economics and ethics have also been presented. Four working groups discussed the following topics: Working group 1: Response of science to stakeholders needs. Working group 2: Towards the identification and mapping of sensitive areas: new
scientific perspectives. Working group 3: The role of socio-economic indicators to better characterize
sensitive areas and implement mitigation strategies. Working group 4: Experience on local participation: the use of the EASW
methodology. After the presentation of the conclusions of the four working groups, during the discussion the participants recommended: • Because the perception of desertification in each country is different, it is
necessary to elaborate a common approach that each one of them can accept and apply.
• It is highly recommended that links between MEDRAP and research projects such as DESERTLINKS, PESERA, MEDACTION are established for developing the appropriate methodology on the identification of sensitive areas. The possibility was discussed to establish a working group to elaborate a position paper based on the discussions held during the meeting and on further exchanges between MEDRAP and MEDACTION, DESERTLINKS and DISMED projects.
• The bottom-up approach and the local consultations demonstrate the validity in the identification of mitigation measures that address stakeholders needs;
• There is a need to use both socio-economic and biophysical indicators within a balanced and simplified methodology taking into consideration the existing standards of EU reporting.
• In the field of local participation EASW may provide common methodology, not only for Europe but also for other Countries. In fact, the EASW has been successfully used in other regions.
• The National Focal Points in collaboration with MEDRAP should formulate a request to the EU DESERTLINKS project to collaborate with them to establish socio-economic indicators.
5.2.2. The CLEMDES Project Under the coordination of Italy, the five Focal Points and Israel prepared and submitted to the EU the CLEMDES (Clearing House Mechanism on Desertification for the Northern Mediterranean Region) proposal. The proposal has been approved for financing and began its activities in November 2002. The objectives of the programme are to: • promote and facilitate technical and scientific cooperation within and among
Annex IV and other affected countries • develop mechanisms for the participation of scientific community, stakeholders
and NGOs in the exchange and integration of information on desertification

141
• disseminate available research results • establish a relevant central (portal) website • develop a tool kit to assist national internet data bases • develop synergies with other related initiatives. 4.2.3.The DISMET Initiative The Focal Points of the Annex IV Subgroup are participating in the Desertification Information System to support National Action Programmes in the Mediterranean (DIS/MED), which is an Italian initiative in cooperation with the UNCCD Secretariat and the European Environmental Agency (EEA). The objectives of the initiative are to:
• establish an operational information system for planning needs in the Mediterranean region.
• improve the capacity of national administrations in the Mediterranean
countries to program measures and policies to combat desertification and drought by reinforcing communication.
• facilitate the exchange of information by establishing a common information system to monitor the physical and socio-economic conditions
A technical workshop was held in Florence on 20-22 June 2001, where the following principles were elaborated for the implementation of DIS/MED:
• pursue short-term results taking into account long-terms goals;
• adopt a pragmatic approach in defining activities and products;
• build activities on existing products, methodologies, infrastructure, documents and standards;
• facilitate participation of specialised expertise and a real co-operation among them, with shared responsibilities, in developing products at the national level through DISMED;
• follow a process approach to improve the effectiveness of results;
• promote synergies with other relevant programmes at the national, subregional, regional and international levels;
• strengthen co-operation with specialised operational institutions acting in the Mediterranean area.
The participants agreed that the work program, in the coming six months should focus on the following topics:
• Thematic and sensitivity mapping on desertification and drought to support NAPs and monitoring and produce maps, which will be integrated on both sides of the Mediterranean.
• Establishment of a Meta-database
• Access to existing documentation
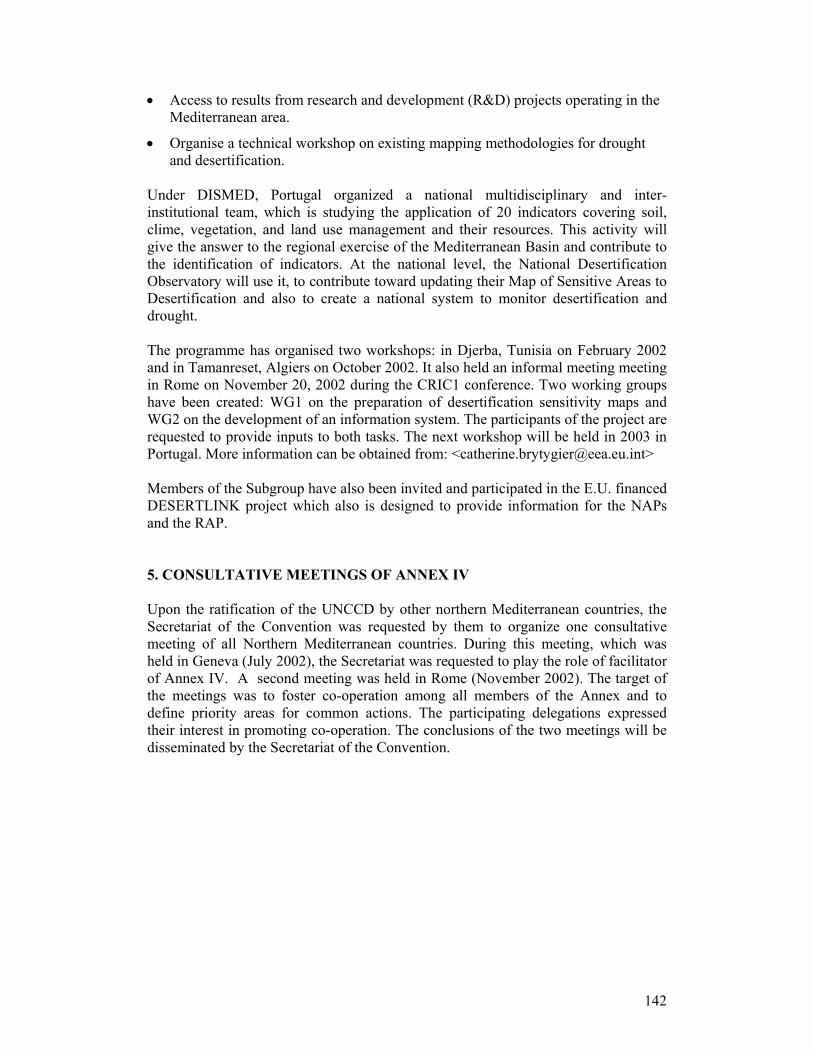
142
• Access to results from research and development (R&D) projects operating in the Mediterranean area.
• Organise a technical workshop on existing mapping methodologies for drought and desertification.
Under DISMED, Portugal organized a national multidisciplinary and inter-institutional team, which is studying the application of 20 indicators covering soil, clime, vegetation, and land use management and their resources. This activity will give the answer to the regional exercise of the Mediterranean Basin and contribute to the identification of indicators. At the national level, the National Desertification Observatory will use it, to contribute toward updating their Map of Sensitive Areas to Desertification and also to create a national system to monitor desertification and drought. The programme has organised two workshops: in Djerba, Tunisia on February 2002 and in Tamanreset, Algiers on October 2002. It also held an informal meeting meeting in Rome on November 20, 2002 during the CRIC1 conference. Two working groups have been created: WG1 on the preparation of desertification sensitivity maps and WG2 on the development of an information system. The participants of the project are requested to provide inputs to both tasks. The next workshop will be held in 2003 in Portugal. More information can be obtained from: <[email protected]> Members of the Subgroup have also been invited and participated in the E.U. financed DESERTLINK project which also is designed to provide information for the NAPs and the RAP. 5. CONSULTATIVE MEETINGS OF ANNEX IV Upon the ratification of the UNCCD by other northern Mediterranean countries, the Secretariat of the Convention was requested by them to organize one consultative meeting of all Northern Mediterranean countries. During this meeting, which was held in Geneva (July 2002), the Secretariat was requested to play the role of facilitator of Annex IV. A second meeting was held in Rome (November 2002). The target of the meetings was to foster co-operation among all members of the Annex and to define priority areas for common actions. The participating delegations expressed their interest in promoting co-operation. The conclusions of the two meetings will be disseminated by the Secretariat of the Convention.
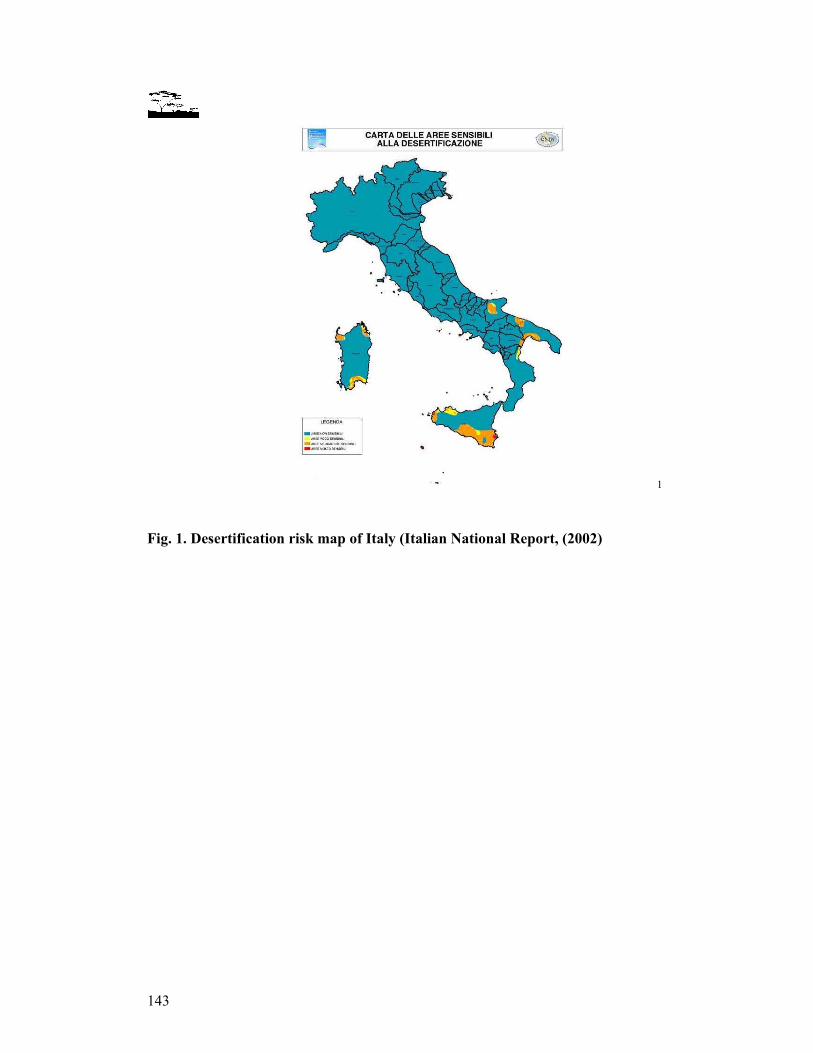
143
1
Fig. 1. Desertification risk map of Italy (Italian National Report, (2002)
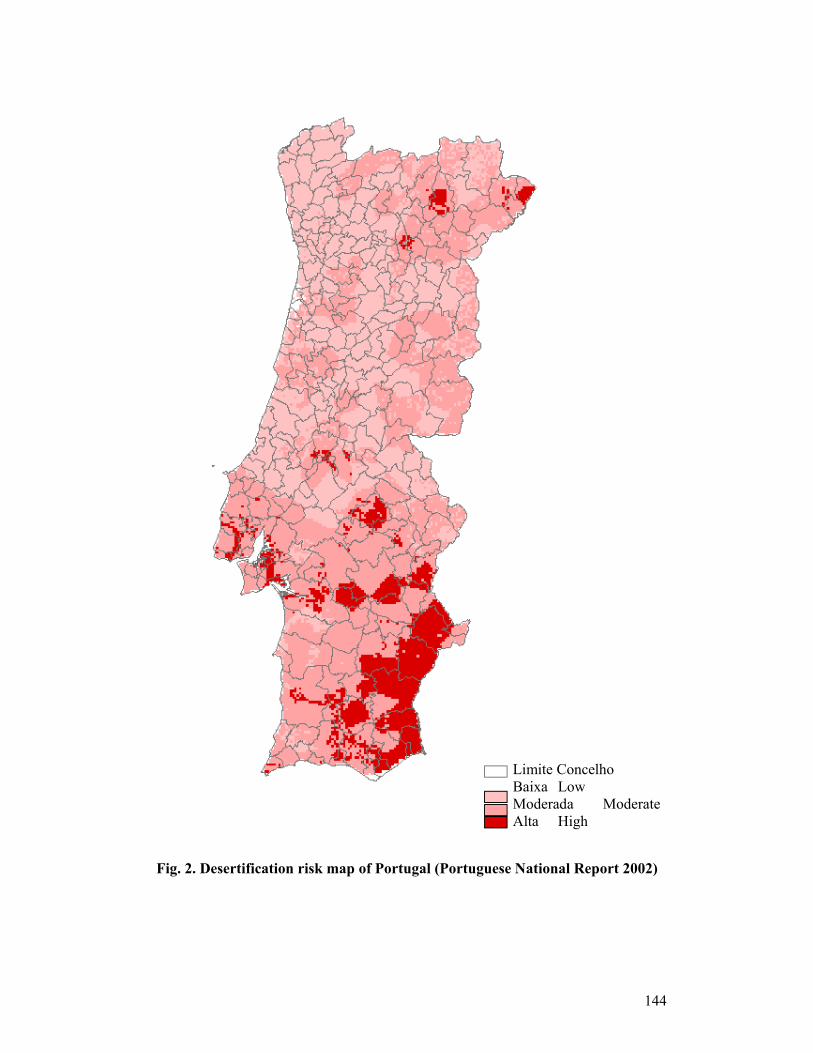
144
4
SicilyRegion: DesertificationRisk
Fig. 2. Desertification risk map of Portugal (Portuguese National Report 2002)
Limite Concelho Baixa Low Moderada ModerateAlta High
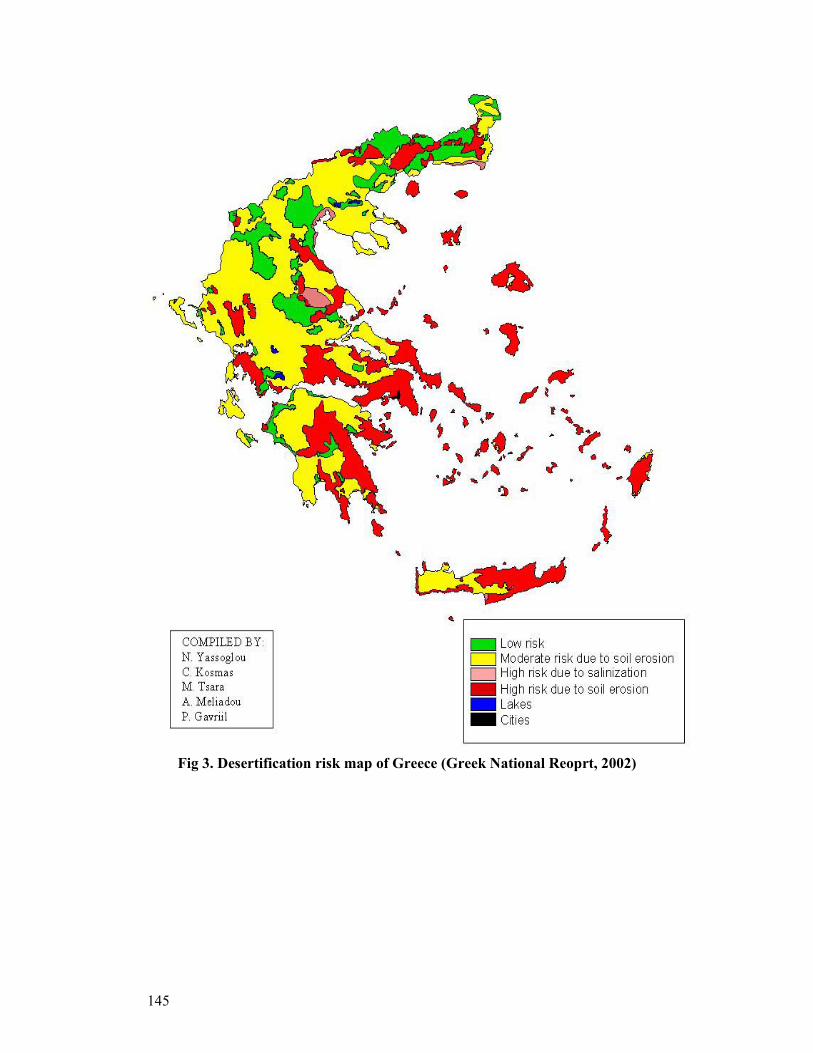
145
Fig 3. Desertification risk map of Greece (Greek National Reoprt, 2002)
146
ACKNOWLEDGEMENTS The author wishes to express his thanks to Dr. M. Sciortino and Mr. V. Louro for providing the maps o Italy and Portugal respectively and reviewing the text. BIBLIOGRAPHIC SOURCES 2002 National Reports for the Implementation of the UNCCD of: Albania Cyprus Greece Italy Malta Portugal Spain Turkey. www.unccd.int/cop/reports/northmed.php MEDRAP project: www.uniss.it/nrd
Section 2:
Country reports
148
Section 2: Country reports
Some Aspects of the Present Status of Land Degradation in Bulgaria 149 S. ROUSSEVA, M. BANOV, N. KOLEV LAND DEGRADATION IN CROATIA 165 BASIC Ferdo DEGRADATION OF SOILS IN THE CZECH REPUBLIC 177 Josef Kozák, Luboš Borůvka, Jan Němeček
THE PROBLEMS OF LAND DEGRADATION AND DESERTIFICATION IN SOUTH CAUCASUS
193
T.Urushadze, A.Urushadze LAND DEGRADATION IN HUNGARY 198 Erika MICHÉLI , György VÁRALLYAY, László PÁSZTOR, József SZABÓ LAND DEGRADATION MEASURES IN LITHUANIA 207 BUIVYDAITE Vanda V. and PIVORIUNAS Danielius LAND DEGRADATION IN POLAND 225 Szymon Szewrański, Józef Sasik, Romuald Żmuda SYNTHESIS OF THE NATIONAL STRATEGY TO COMBAT DESERTIFICATION, LANDS DEGRADATION AND DROUGHT IN ROMANIA
240
KLEPS Christian SOILS AND SOIL DEGRADATION IN THE SLOVAK REPUBLIC 255 BIELEK Pavol LAND DEGRADATION IN SLOVENIA 290 F. Lobnik, B. Vrščaj, T. Prus LAND DEGRADATION IN TURKEY 303 S. Kapur, E. Akça, D.M. Özden, N. Sakarya, K.M. Çimrin, U. Alagöz, R. Ulusoy, C. Darıcı, Z. Kaya, S. Düzenli, H. Gülcan

149
Some Aspects of the Present Status of Land Degradation in Bulgaria
S. ROUSSEVA, M. BANOV, N. KOLEV
N. Poushkarov Institute of Soil Science, 7 Shosse Bankya, Sofia 1080, Bulgaria
Introduction
The United Nations Conference on Environment and Development (UNCED, 1992), better
known as the RIO Earth Summit, considered the fragile ecosystems in chapter 12 of Agenda
21. In this chapter, desertification was defined as ‘land degradation in the arid, semi-arid and
sub-humid areas resulting from various factors, including climatic variations and human
activities’. Consequently, United Nations Convention to Combat Desertification defined land
degradation as ‘reduction or loss in arid, semi-arid and dry sub-humid areas of the biological
or economic productivity and complexity of rainfed cropland, irrigated cropland, or range
pasture forest and woodland resulting from land uses or from a process or combination of
processes, including processes arising from human activities and habitation patterns, such as:
(i) soil erosion caused by wind and/or water; (ii) deterioration of the physical, chemical and
biological or economic properties of soil; and (iii) long-term loss of natural vegetation’.
Concomitant physical phenomena involve reduction in the vegetative cover, increased albedo,
extensive soil erosion and salinization, deterioration of water resources, etc.
The United Nations Convention to Combat Desertification was adopted as a legally
binding document in 1994 (CCD, 1994). The Convention comprises a framework of general
principles and five annexes for Africa, Asia, Latin America, the Northern Mediterranean and
Central and East Europe. The Convention entered into force in 1996 and the number of
country parties to the convention is now reaching 180 including desertification affected and
unaffected developing as well as affected and unaffected developed countries.
In January 2001 the National Assembly of the Republic of Bulgaria ratified the UN
Convention to Combat Desertification and it entered into force for Bulgaria on 22.05.2001.
The Ministry of Environment and Water has undertaken the responsibilities for its
implementation as well as the functions of National co-coordinating institution. National
seminar ‘Land and soil degradation and combating desertification’, which was organized in
Sofia on 13-14 June 2002, aimed at reviewing the current state of the issue in Bulgaria and
designating a body responsible for preparing the National action programme. The aim of this
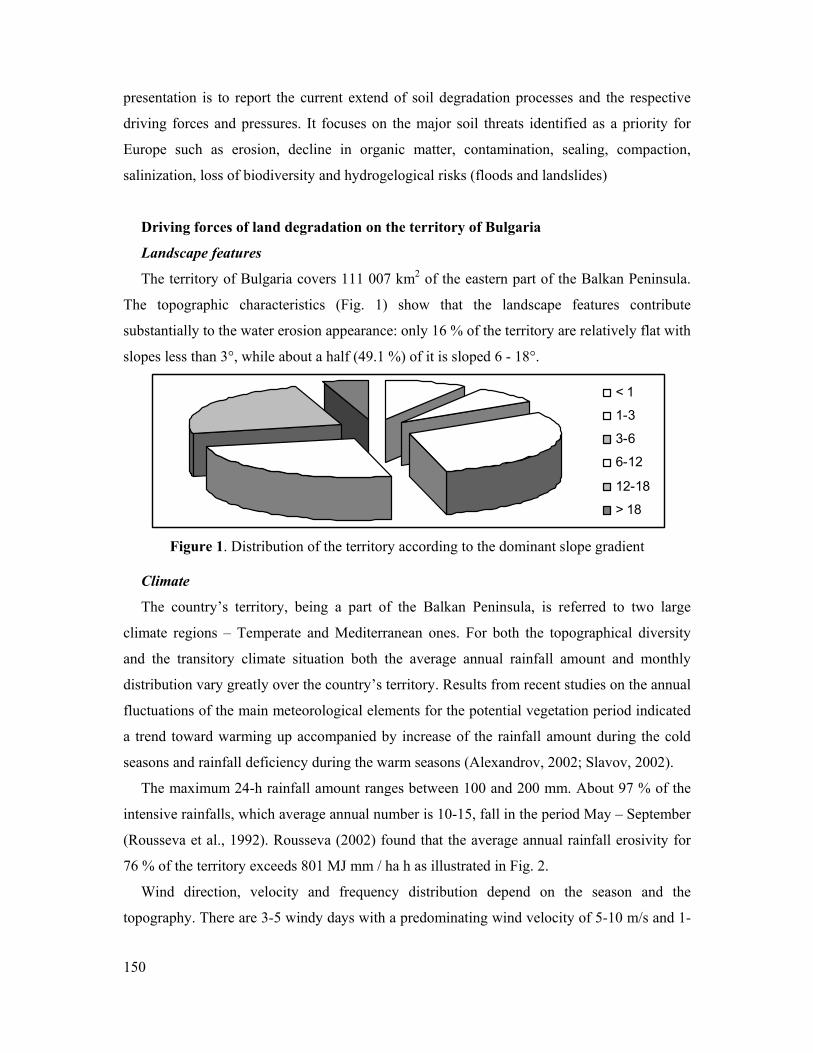
150
presentation is to report the current extend of soil degradation processes and the respective
driving forces and pressures. It focuses on the major soil threats identified as a priority for
Europe such as erosion, decline in organic matter, contamination, sealing, compaction,
salinization, loss of biodiversity and hydrogelogical risks (floods and landslides)
Driving forces of land degradation on the territory of Bulgaria
Landscape features
The territory of Bulgaria covers 111 007 km2 of the eastern part of the Balkan Peninsula.
The topographic characteristics (Fig. 1) show that the landscape features contribute
substantially to the water erosion appearance: only 16 % of the territory are relatively flat with
slopes less than 3°, while about a half (49.1 %) of it is sloped 6 - 18°.
Figure 1. Distribution of the territory according to the dominant slope gradient Climate
The country’s territory, being a part of the Balkan Peninsula, is referred to two large
climate regions – Temperate and Mediterranean ones. For both the topographical diversity
and the transitory climate situation both the average annual rainfall amount and monthly
distribution vary greatly over the country’s territory. Results from recent studies on the annual
fluctuations of the main meteorological elements for the potential vegetation period indicated
a trend toward warming up accompanied by increase of the rainfall amount during the cold
seasons and rainfall deficiency during the warm seasons (Alexandrov, 2002; Slavov, 2002).
The maximum 24-h rainfall amount ranges between 100 and 200 mm. About 97 % of the
intensive rainfalls, which average annual number is 10-15, fall in the period May – September
(Rousseva et al., 1992). Rousseva (2002) found that the average annual rainfall erosivity for
76 % of the territory exceeds 801 MJ mm / ha h as illustrated in Fig. 2.
Wind direction, velocity and frequency distribution depend on the season and the
topography. There are 3-5 windy days with a predominating wind velocity of 5-10 m/s and 1-
< 1
1-3
3-6
6-12
12-18
> 18
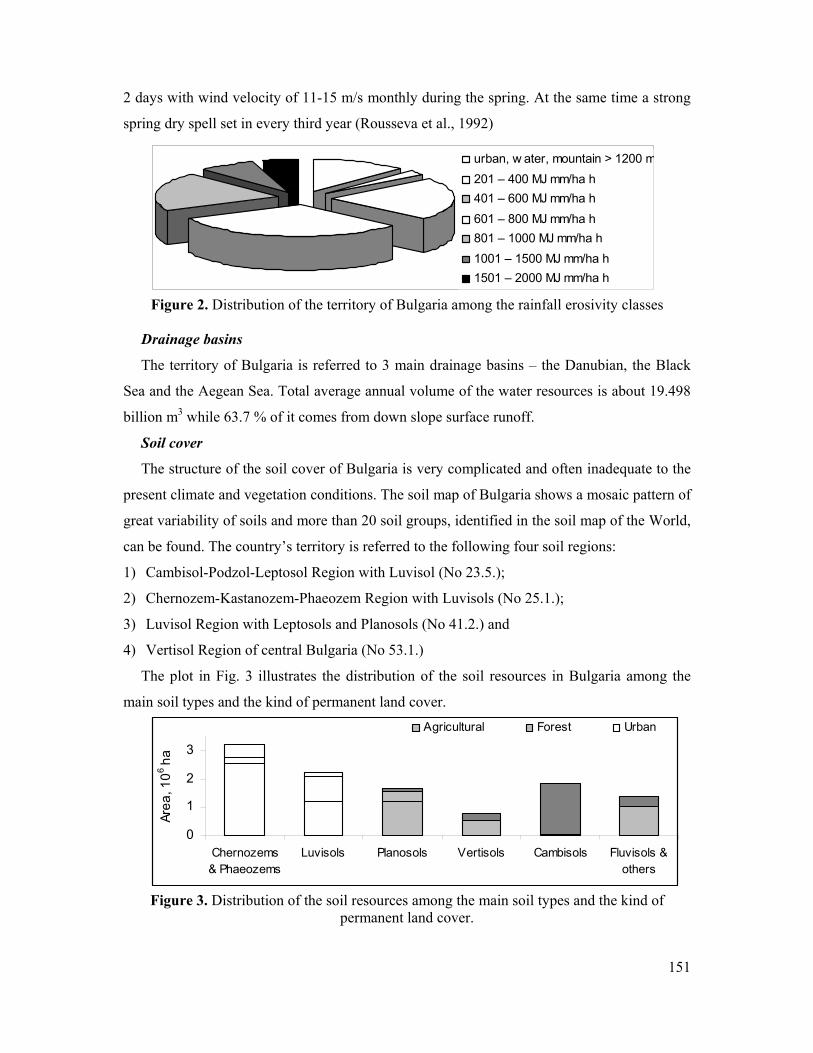
151
2 days with wind velocity of 11-15 m/s monthly during the spring. At the same time a strong
spring dry spell set in every third year (Rousseva et al., 1992)
Figure 2. Distribution of the territory of Bulgaria among the rainfall erosivity classes Drainage basins
The territory of Bulgaria is referred to 3 main drainage basins – the Danubian, the Black
Sea and the Aegean Sea. Total average annual volume of the water resources is about 19.498
billion m3 while 63.7 % of it comes from down slope surface runoff.
Soil cover
The structure of the soil cover of Bulgaria is very complicated and often inadequate to the
present climate and vegetation conditions. The soil map of Bulgaria shows a mosaic pattern of
great variability of soils and more than 20 soil groups, identified in the soil map of the World,
can be found. The country’s territory is referred to the following four soil regions:
1) Cambisol-Podzol-Leptosol Region with Luvisol (No 23.5.);
2) Chernozem-Kastanozem-Phaeozem Region with Luvisols (No 25.1.);
3) Luvisol Region with Leptosols and Planosols (No 41.2.) and
4) Vertisol Region of central Bulgaria (No 53.1.)
The plot in Fig. 3 illustrates the distribution of the soil resources in Bulgaria among the
main soil types and the kind of permanent land cover.
Figure 3. Distribution of the soil resources among the main soil types and the kind of permanent land cover.
0
1
2
3
Chernozems& Phaeozems
Luvisols Planosols Vertisols Cambisols Fluvisols &others
Area
, 106 h
a
Agricultural Forest Urban
urban, w ater, mountain > 1200 m201 – 400 MJ mm/ha h401 – 600 MJ mm/ha h601 – 800 MJ mm/ha h801 – 1000 MJ mm/ha h1001 – 1500 MJ mm/ha h1501 – 2000 MJ mm/ha h
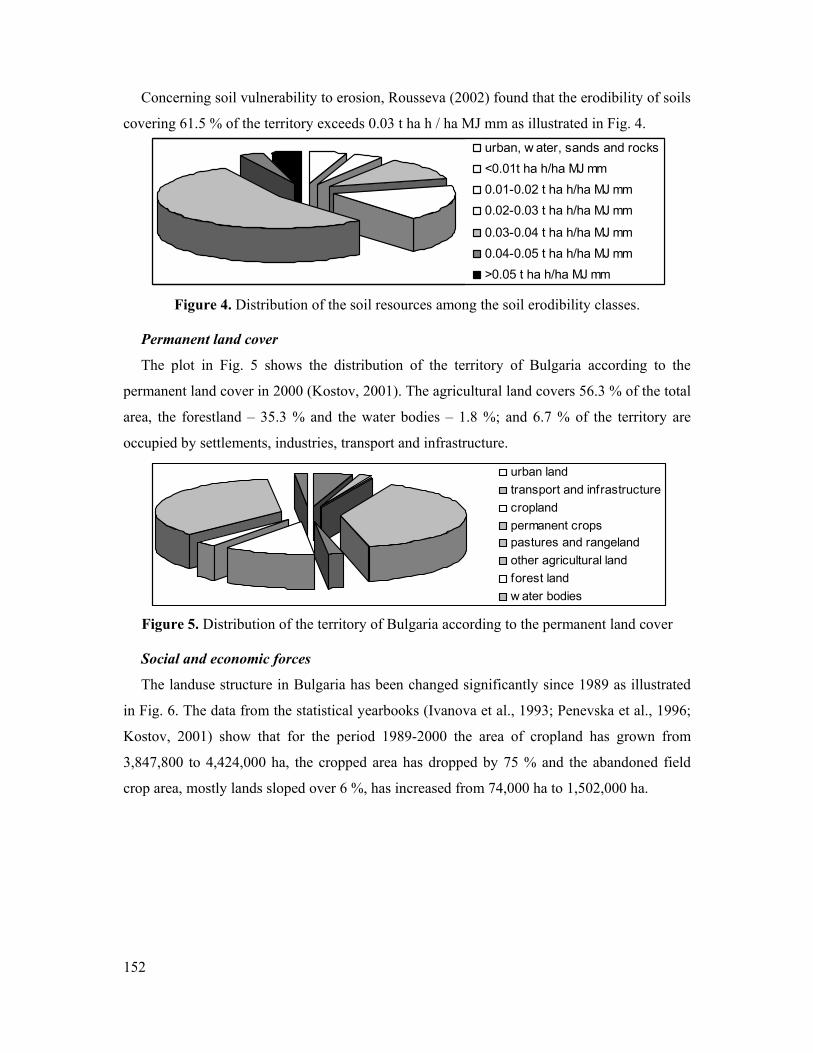
152
Concerning soil vulnerability to erosion, Rousseva (2002) found that the erodibility of soils
covering 61.5 % of the territory exceeds 0.03 t ha h / ha MJ mm as illustrated in Fig. 4.
Figure 4. Distribution of the soil resources among the soil erodibility classes.
Permanent land cover
The plot in Fig. 5 shows the distribution of the territory of Bulgaria according to the
permanent land cover in 2000 (Kostov, 2001). The agricultural land covers 56.3 % of the total
area, the forestland – 35.3 % and the water bodies – 1.8 %; and 6.7 % of the territory are
occupied by settlements, industries, transport and infrastructure.
Figure 5. Distribution of the territory of Bulgaria according to the permanent land cover Social and economic forces
The landuse structure in Bulgaria has been changed significantly since 1989 as illustrated
in Fig. 6. The data from the statistical yearbooks (Ivanova et al., 1993; Penevska et al., 1996;
Kostov, 2001) show that for the period 1989-2000 the area of cropland has grown from
3,847,800 to 4,424,000 ha, the cropped area has dropped by 75 % and the abandoned field
crop area, mostly lands sloped over 6 %, has increased from 74,000 ha to 1,502,000 ha.
urban, w ater, sands and rocks<0.01t ha h/ha MJ mm0.01-0.02 t ha h/ha MJ mm0.02-0.03 t ha h/ha MJ mm
0.03-0.04 t ha h/ha MJ mm0.04-0.05 t ha h/ha MJ mm>0.05 t ha h/ha MJ mm
urban land transport and infrastructurecroplandpermanent cropspastures and rangelandother agricultural landforest landw ater bodies
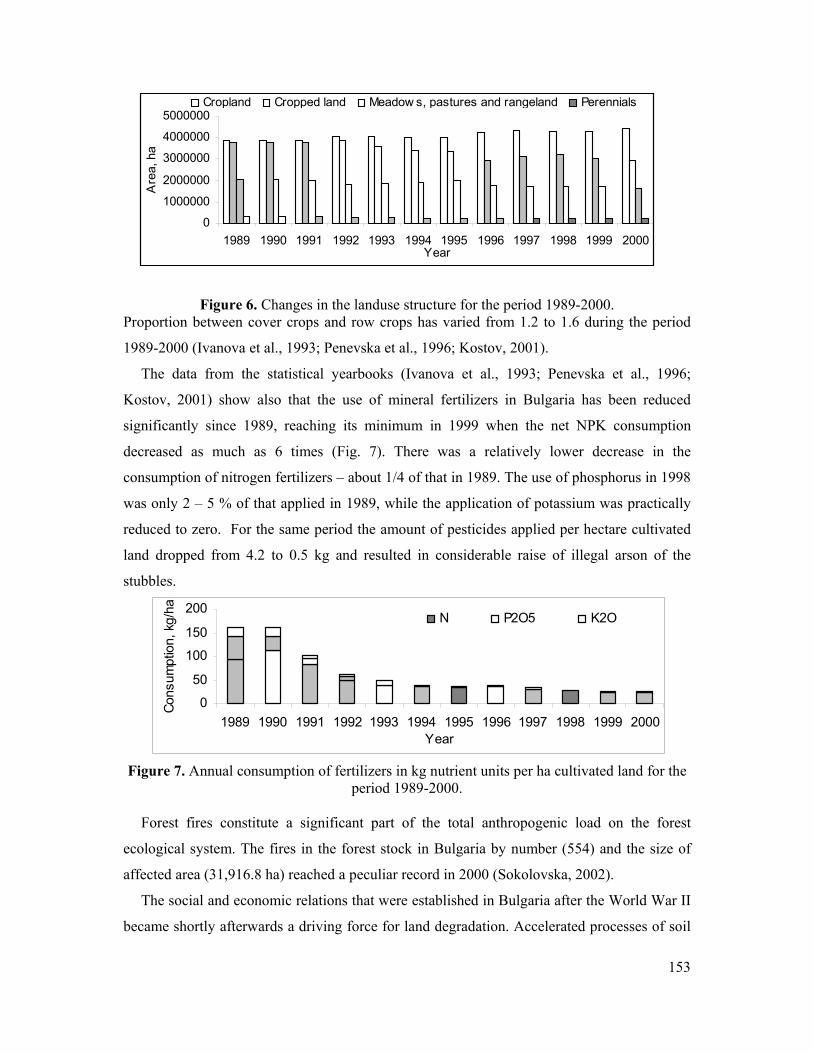
153
Figure 6. Changes in the landuse structure for the period 1989-2000. Proportion between cover crops and row crops has varied from 1.2 to 1.6 during the period
1989-2000 (Ivanova et al., 1993; Penevska et al., 1996; Kostov, 2001).
The data from the statistical yearbooks (Ivanova et al., 1993; Penevska et al., 1996;
Kostov, 2001) show also that the use of mineral fertilizers in Bulgaria has been reduced
significantly since 1989, reaching its minimum in 1999 when the net NPK consumption
decreased as much as 6 times (Fig. 7). There was a relatively lower decrease in the
consumption of nitrogen fertilizers – about 1/4 of that in 1989. The use of phosphorus in 1998
was only 2 – 5 % of that applied in 1989, while the application of potassium was practically
reduced to zero. For the same period the amount of pesticides applied per hectare cultivated
land dropped from 4.2 to 0.5 kg and resulted in considerable raise of illegal arson of the
stubbles.
Figure 7. Annual consumption of fertilizers in kg nutrient units per ha cultivated land for the
period 1989-2000.
Forest fires constitute a significant part of the total anthropogenic load on the forest
ecological system. The fires in the forest stock in Bulgaria by number (554) and the size of
affected area (31,916.8 ha) reached a peculiar record in 2000 (Sokolovska, 2002).
The social and economic relations that were established in Bulgaria after the World War II
became shortly afterwards a driving force for land degradation. Accelerated processes of soil
0
1000000
2000000
3000000
4000000
5000000
1989 1990 1991 1992 1993 1994 1995 1996 1997 1998 1999 2000Year
Are
a, h
a
Cropland Cropped land Meadow s, pastures and rangeland Perennials
0
50
100
150
200
1989 1990 1991 1992 1993 1994 1995 1996 1997 1998 1999 2000Year
Cons
umpt
ion,
kg/
ha N P2O5 K2O
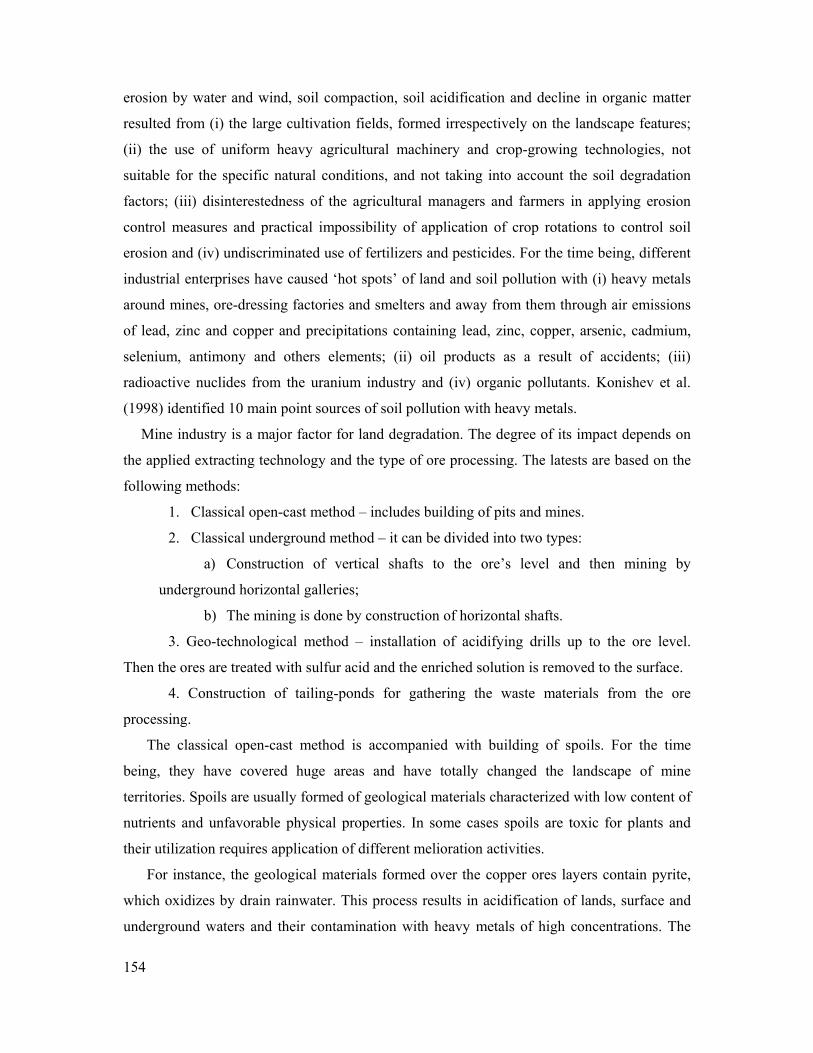
154
erosion by water and wind, soil compaction, soil acidification and decline in organic matter
resulted from (i) the large cultivation fields, formed irrespectively on the landscape features;
(ii) the use of uniform heavy agricultural machinery and crop-growing technologies, not
suitable for the specific natural conditions, and not taking into account the soil degradation
factors; (iii) disinterestedness of the agricultural managers and farmers in applying erosion
control measures and practical impossibility of application of crop rotations to control soil
erosion and (iv) undiscriminated use of fertilizers and pesticides. For the time being, different
industrial enterprises have caused ‘hot spots’ of land and soil pollution with (i) heavy metals
around mines, ore-dressing factories and smelters and away from them through air emissions
of lead, zinc and copper and precipitations containing lead, zinc, copper, arsenic, cadmium,
selenium, antimony and others elements; (ii) oil products as a result of accidents; (iii)
radioactive nuclides from the uranium industry and (iv) organic pollutants. Konishev et al.
(1998) identified 10 main point sources of soil pollution with heavy metals.
Mine industry is a major factor for land degradation. The degree of its impact depends on
the applied extracting technology and the type of ore processing. The latests are based on the
following methods:
1. Classical open-cast method – includes building of pits and mines.
2. Classical underground method – it can be divided into two types:
a) Construction of vertical shafts to the ore’s level and then mining by
underground horizontal galleries;
b) The mining is done by construction of horizontal shafts.
3. Geo-technological method – installation of acidifying drills up to the ore level.
Then the ores are treated with sulfur acid and the enriched solution is removed to the surface.
4. Construction of tailing-ponds for gathering the waste materials from the ore
processing.
The classical open-cast method is accompanied with building of spoils. For the time
being, they have covered huge areas and have totally changed the landscape of mine
territories. Spoils are usually formed of geological materials characterized with low content of
nutrients and unfavorable physical properties. In some cases spoils are toxic for plants and
their utilization requires application of different melioration activities.
For instance, the geological materials formed over the copper ores layers contain pyrite,
which oxidizes by drain rainwater. This process results in acidification of lands, surface and
underground waters and their contamination with heavy metals of high concentrations. The
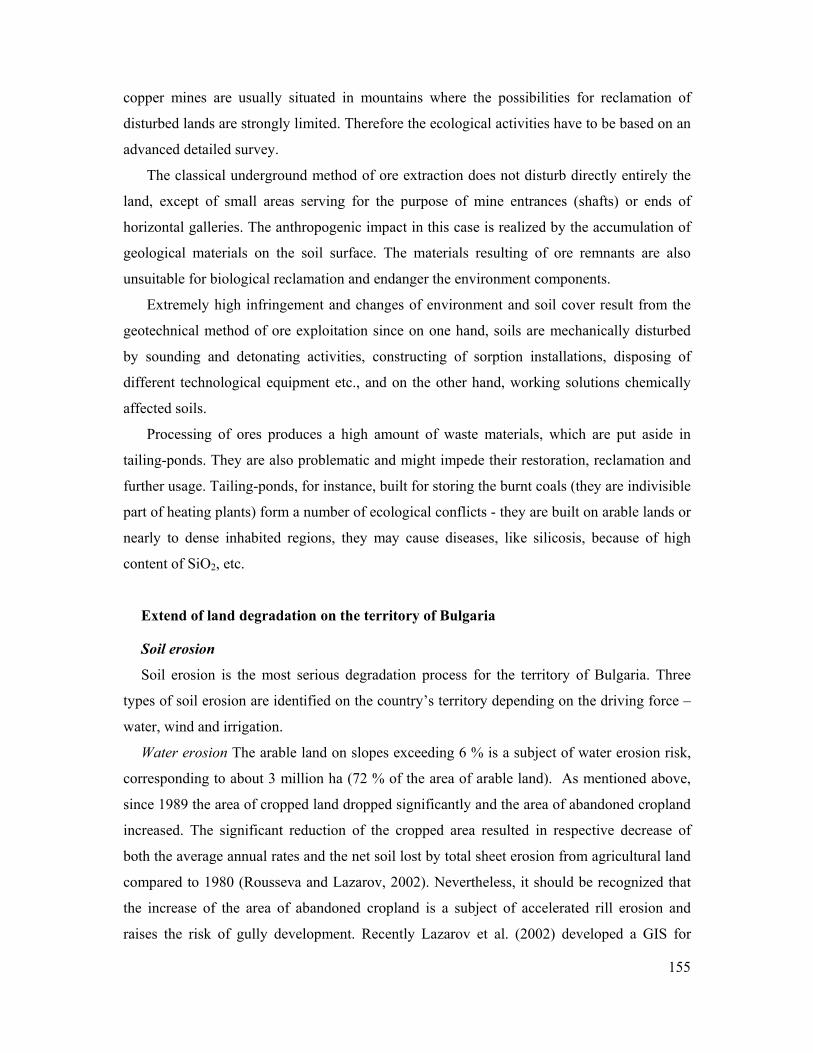
155
copper mines are usually situated in mountains where the possibilities for reclamation of
disturbed lands are strongly limited. Therefore the ecological activities have to be based on an
advanced detailed survey.
The classical underground method of ore extraction does not disturb directly entirely the
land, except of small areas serving for the purpose of mine entrances (shafts) or ends of
horizontal galleries. The anthropogenic impact in this case is realized by the accumulation of
geological materials on the soil surface. The materials resulting of ore remnants are also
unsuitable for biological reclamation and endanger the environment components.
Extremely high infringement and changes of environment and soil cover result from the
geotechnical method of ore exploitation since on one hand, soils are mechanically disturbed
by sounding and detonating activities, constructing of sorption installations, disposing of
different technological equipment etc., and on the other hand, working solutions chemically
affected soils.
Processing of ores produces a high amount of waste materials, which are put aside in
tailing-ponds. They are also problematic and might impede their restoration, reclamation and
further usage. Tailing-ponds, for instance, built for storing the burnt coals (they are indivisible
part of heating plants) form a number of ecological conflicts - they are built on arable lands or
nearly to dense inhabited regions, they may cause diseases, like silicosis, because of high
content of SiO2, etc.
Extend of land degradation on the territory of Bulgaria
Soil erosion
Soil erosion is the most serious degradation process for the territory of Bulgaria. Three
types of soil erosion are identified on the country’s territory depending on the driving force –
water, wind and irrigation.
Water erosion The arable land on slopes exceeding 6 % is a subject of water erosion risk,
corresponding to about 3 million ha (72 % of the area of arable land). As mentioned above,
since 1989 the area of cropped land dropped significantly and the area of abandoned cropland
increased. The significant reduction of the cropped area resulted in respective decrease of
both the average annual rates and the net soil lost by total sheet erosion from agricultural land
compared to 1980 (Rousseva and Lazarov, 2002). Nevertheless, it should be recognized that
the increase of the area of abandoned cropland is a subject of accelerated rill erosion and
raises the risk of gully development. Recently Lazarov et al. (2002) developed a GIS for
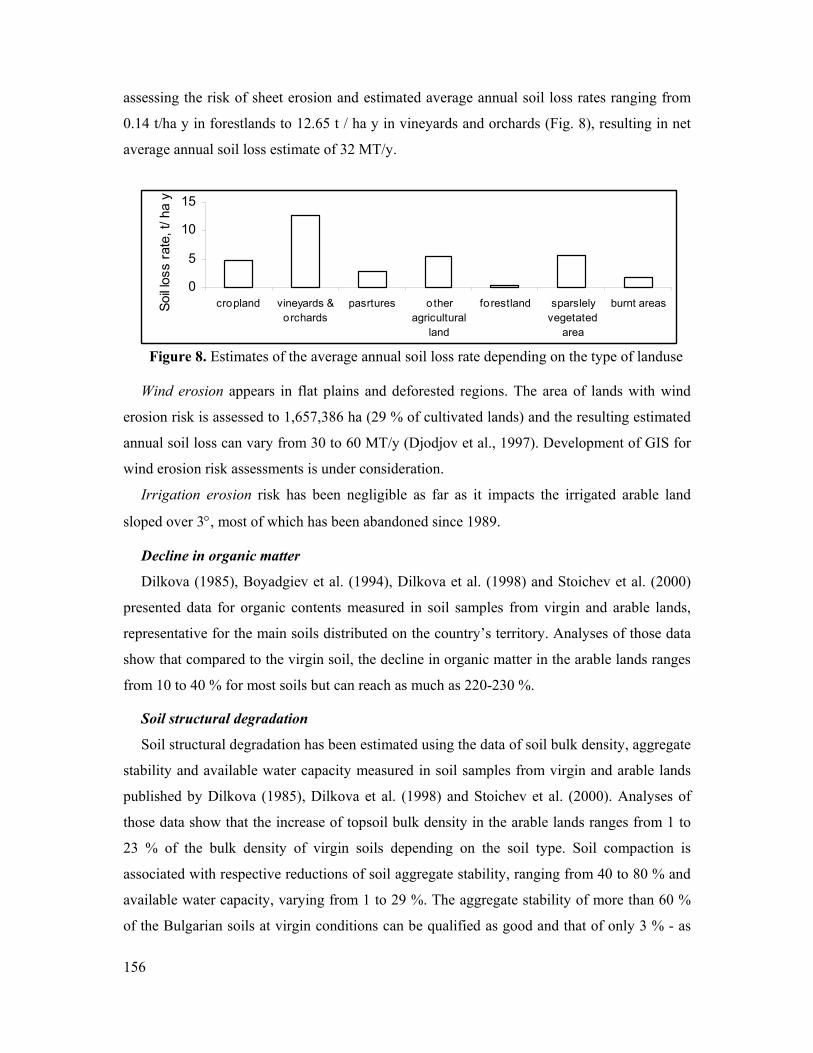
156
assessing the risk of sheet erosion and estimated average annual soil loss rates ranging from
0.14 t/ha y in forestlands to 12.65 t / ha y in vineyards and orchards (Fig. 8), resulting in net
average annual soil loss estimate of 32 MT/y.
Figure 8. Estimates of the average annual soil loss rate depending on the type of landuse Wind erosion appears in flat plains and deforested regions. The area of lands with wind
erosion risk is assessed to 1,657,386 ha (29 % of cultivated lands) and the resulting estimated
annual soil loss can vary from 30 to 60 MT/y (Djodjov et al., 1997). Development of GIS for
wind erosion risk assessments is under consideration.
Irrigation erosion risk has been negligible as far as it impacts the irrigated arable land
sloped over 3°, most of which has been abandoned since 1989.
Decline in organic matter
Dilkova (1985), Boyadgiev et al. (1994), Dilkova et al. (1998) and Stoichev et al. (2000)
presented data for organic contents measured in soil samples from virgin and arable lands,
representative for the main soils distributed on the country’s territory. Analyses of those data
show that compared to the virgin soil, the decline in organic matter in the arable lands ranges
from 10 to 40 % for most soils but can reach as much as 220-230 %.
Soil structural degradation
Soil structural degradation has been estimated using the data of soil bulk density, aggregate
stability and available water capacity measured in soil samples from virgin and arable lands
published by Dilkova (1985), Dilkova et al. (1998) and Stoichev et al. (2000). Analyses of
those data show that the increase of topsoil bulk density in the arable lands ranges from 1 to
23 % of the bulk density of virgin soils depending on the soil type. Soil compaction is
associated with respective reductions of soil aggregate stability, ranging from 40 to 80 % and
available water capacity, varying from 1 to 29 %. The aggregate stability of more than 60 %
of the Bulgarian soils at virgin conditions can be qualified as good and that of only 3 % - as
0
5
10
15
cropland vineyards &orchards
pasrtures otheragricultural
land
forestland sparslelyvegetated
area
burnt areasSoil l
oss
rate
, t/ h
a y
157
poor. The anthropogenic load resulted in deteriorated soil aggregate stability of the
agricultural soils, which is predominantly poor (Dilkova et al., 1998).
Intensive spring and summer rainfalls followed by long dry periods are the most common
cause of crusting of the structurally degraded Bulgarian soils. The surface crust affects the
soil properties directly and indirectly. The direct effects are associated with inhibition of the
seeding emergence, root and plant growth. The indirect effects include decrease of the profile
water permeability, which increases both the soil erosion risk and the soil penetration
resistance. Soil crusting is a widely recognized agronomical problem in the region of the
Distric Planosols, covering 12 % of the arable lands of the country (Stoichev et al., 2000).
Soil acidification
Analyses of soil survey data (Stoichev and Kolchakov, 1992) showed that the area
occupied by soils with pH<7.0 is about 6.5 million ha. Significant part (4.3 million ha) of
those soils is highly vulnerable to acidification (pH<5.0), a half of which is affected by
acidification but only 0.45 million ha belong to the area of arable land (Ganev, 1992 a, b).
There is information showing that long-term application of acid fertilizers has led to a
significant decrease of soil pH (Totev, 1982; Stoichev, 1986, Stoichev and Stoicheva, 1986;
Ganev, 1992a; Stoichev and Kolchakov, 1996). As a result of excessive fertilization with
ammonium nitrate in the period 1965-1985 the area of acid soils in some regions in Bulgaria
had been significantly increased (Ganev, 1992,a). Some assessments show that about 2.7
million ha of acid soils in Bulgaria need liming. About 1.5 million ha of those are arable lands
in plains and semi-mountainous regions and another 1.2 million ha occur in the mountains
(Stoichev and Kolchakov, 1997).
Soil salinization
The total area of land affected by salinization processes in Bulgaria is estimated at 35,000
ha distributed in 8 administrative districts: Pleven, Veliko Tarnovo, Varna, Burgas, Yambol,
Sliven, Stara Zagora and Plovdiv.
Chemical pollution
There are four types of chemical pollution identified and studied on the country’s territory,
namely pollution with heavy metals and metalloids, radioactive nuclides, oil products and
organic pollutants. Land polluted with heavy metals and metalloids is over 43,660 ha, 61.3 %
of which is located in area surrounding industrial enterprises and can be classified as ‘hot
spots’ (Todorova, 2001). Land polluted with radioactive nuclides is 1,049 ha covering more
than 40 ‘hot spots’ (Todorova, 2001). In 1993 the area polluted with radioactive elements
158
resulting from uranium mining was 1,913 ha, of which 1,387 ha – arable land (Anonymous,
1993). The reduction is due to the legislative acts of Bulgarian Government, which stopped
the extraction of uranium in 1992. Pollution with oil products occurs mostly on small spots as
a result of accidents (oil refinery and oil transport pipe lines) (Anonymous, 1993). No land
polluted with organic pollutants (PAH, PCB, pesticides) has been registered lately (Todorova,
2001)
Ore-extraction sites
The total area of lands deteriorated by extraction and primary processing of ores and
minerals by the end of 2000 is 27,778 ha (Kostov, 2001). The rate of reclamation of those
lands is considerably lower than the rate of the land deterioration. The total area of re-
cultivated lands deteriorated by extraction and primary processing of ores and minerals is
8,252.9 ha (Dimitrova, 2002).
The highest Bulgarian tailing-pond is situated at “Maritza-Iztok” mine district. In the ends
of exploitation period it will took an area of 600 ha but the thickness of ashes will be 15 m. It
is necessary to note that the height of tailing-pond might exceed the planned one, which
makes additional complications in an emergency.
In physical aspect, the ash represents a non-structural, strong dusty aggregation, which is
an inexhaustible source of environment contamination. Studying of the ash shows that it has
light mechanical composition, low relative weight, high porosity and low water-fixing
capacity.
It was found that if the speed of wind is 8-10 m/s the content of dust in the air is 690
mg/m3 nearby tailing-ponds and 102-180 mg/m3 in 200 m distance. The high concentration of
dust in the air infringes the normal growth of plants but specially impedes breathing and
assimilation - therefore the untimely drying of plants proceeds. The low content of nutrients,
except potassium was established. PH factor is neutral.
Surface sealing
Analysis of the statistical data (Ivanova et al., 1993; Penevska et al., 1996; Kostov, 2001)
shows that the area affected by surface sealing has increased with an average annual rate of
about 7000 ha/y for the period 1990-2001.
Loss of biodiversity
The loss of biodiversity is associated mostly with (i) the illegal arson of the stubbles, which
has destroyed the entomofauna and flora, and deteriorated the soil microbial equilibrium and
thus caused serious drop in the soil fertility, and (ii) the forest fires, which annihilated
159
thousands of hectares of forest plantations and turned in wilderness large territories
(Dimitrova, 2002).
Landslide and abrasion
Landslides, marine abrasion and riverbank erosion are very common in Bulgaria. The
highest concentration of landslides is encountered along the Black Sea coast, the high
riverbank of Danube, Northern Bulgaria, southwest Bulgaria and the Phodopa Mountain. For
the time being, 960 landslides have been registered in 350 settlements, resorts and residential
areas, covering a total area of 22,000 ha (Petrov, 2002). Another 220 landslides affect the
national road network. From the total length of 394 km of the Bulgarian Black Sea coastal
strip, landslide processes have affected 55 km and an area of 5,500 ha. Further 143 km of the
Black Sea coastal strip are a subject to marine abrasion, which reduces the territory of
Bulgaria by 14.3 ha annually (Petrov, 2002). The entire length of Bulgarian Danube
riverbank is 470 km and 150 km of it, together with the right-side banks of the tributaries
Skomlia, Lom, Tsibritsa, Ogosta, Iskar, Vit and Yantra have been affected by past and
contemporary landslides of a volume measured in billions of cubic meters. The length of the
reinforced banks of Danube is 59 km, the riverbank erosion is active over 48.5 km of the
bank and another 50.2 km of it are with high erosion risk (Petrov, 2002).
Legislative and institutional responses
There is no overall strategy and policy to guarantee efficient protection of the soils as a
natural resource. The legislation for soil protection is incomplete. Separate provisions can be
found in several regulative acts and in the Low on protection of the agricultural lands, but
they are insufficient to assure the land protection from all types of degradation.
The Ministry of Agriculture and Forestry has the responsibility for developing the policy
for use and protection of the agricultural lands and the forestlands. It has developed a system
for limitation of the use of lands polluted by heavy metals. That system is of an advisable
regime and acts in accordance with the degree of pollution and the potential risk of use of
food grown on contaminated lands. Regional projects aiming at limitation and elimination of
pollution, and sustainable management of affected lands have been developed. There are well-
developed procedures for prevention of changes in the type of land use, so uncontrolled use of
agricultural land and forestland for other purposes is not allowed.
The Ministry of Environment and Water is responsible for prevention of pollution and
protection of the land as a natural resource. There are well-developed procedures for
160
preventive protection of soils from pollution and working Executive Environmental Agency
(EEA) responsible for monitoring of the state of lands. The EEA monitoring guarantee control
and protection of lands from (i) pollution with heavy metals and metalloids – 318 monitoring
stations located by source of pollution, such as industry, chemicals, irrigation and road
network; (ii) pollution with persistent organic pollutants – 20 monitoring stations of PAH and
PCB and 48 stations for monitoring of pesticides; (iii) acidification – 70 polygons; (iv)
salinization – 15 polygons; (v) erosion – GIS for soil erosion risk assessments is under
development.
The Ministry of Regional Development and Public Works and Geozashtita – EOOD-
Varna, Pleven and Pernik are the management bodies fulfilling the geological control
activities including the monitoring and control of landslide, marine abrasion and bank erosion.
All mentioned changes and deterioration of the environmental factors caused by mine
industry need right and exact planning of reclamation and restoration activities including the
recommendation for status of land utilization. This is a complex and long-lasting process,
which begins with detailed survey of territories, affected by mine industry. Reclamation is the
most fundamental method for restoration and improvement of land properties aimed to
retrieve disturbed lands to arable landed fund. The principle scheme for reclamation of
disturbed lands in Bulgaria includes two methods: coverage of the reclaimed lands (formed by
geological or waste materials) with a layer of 40 cm depth of soil humus horizon or direct
restoration of lands formed by geological or waste materials.
The first method is more effective than the second one since the fertility of the lands
rapidly restores and ensures a high productivity level. Humus horizon conditions a good
sustainability of yields. This method substantially improves physical, chemical and biological
properties of reclaimed lands. Humus content positively regulates the aeration of substrata and
makes them structural. Thus facilitates their tillage and guarantees a normal growth and
nourishment of plants.
In some specific cases humus layer might be replaced with substance of organic and
inorganic components, which possess definite analytic features and bioproductive capacity.
Method applies mostly in cases of agricultural utilization of lands.
In short supply of humus one should apply the second method of reclamation - that
frequently imposes to do in mine regions of Bulgaria. That is how the estimation of suitability
of various geological materials (which will form reclaimed lands) for reclamation has a prime
mining. The estimation is based on data on morphological composition; particle- and micro-

161
aggregate-size distribution; content of organic matter (humus); contents of total and available
forms of N, P and K; pH; content of carbonates; adsorption capacity and exchangeable cat
ions; chemical composition; content of microelements; particle density; bulk density.
The estimation, in principle, shows the possibilities for selective discovering and
stratification of geological materials in order to achieve fast and stable restoration of lands.
The selective manner of building the reclaimed lands represents a possibility for improving
their features and properties together with to decrease expenses for reclamation.
Biological reclamation of lands includes planting of suitable or special vegetation,
fertilizing with precisely evaluated norms, conventional and unconventional tilling, etc.
Contamination of lands with heavy metals, organic and inorganic matters sometimes exceeds
the limited-admissible concentrations and assumes essential meaning during the biological
stage of reclamation.
Activities, which are applied for improving the fertility of deteriorated lands, might be
classified in the following groups:
I. Technical activities - formation of reclaimed lands
1. Spreading of suitable for reclamation geological substrata.
2. Covering with humus matter.
3. Anti-erosion consolidation of lands.
4. Construction of engineering equipment.
5. Chemical melioration of lands.
II. Biological activities
6. Selection of suitable vegetation species.
7. Planting, afforestation, etc.
8. Maintenance of fertility.
Conclusions
Analysis of the driving forces and the current state of land degradation in Bulgaria shows
that soil erosion is still the major degradation process. Manifestations of landslide, marine
abrasion and riverbank erosion are not negligible either. The rate of re-cultivation of
deteriorated lands due to extraction and primary processing of ores and minerals is still far
behind the rate of land deterioration. Decline in soil organic matter, soil compaction, sealing
and crusting and loss of biodiversity are also processes, which neglect can result in a serious
negative impact on the land productivity potential. Pollution with heavy metals and
162
radioactive nuclides, acidification and salinization has local character, so large territories of
the country are suitable for producing environmentally clean production.
Further improvements of the legislation, the system of land monitoring and the cadastre are
the fundaments for developing the national policy and strategy for land protection from
degradation. Control of further land pollution can be achieved by (i) reduction to non-risk
levels of the harmful substances in the industrial emissions and (ii) waste management and
development of waste products processing industry. Reduction of the consequences of land
deterioration by ore and mineral extracting industry, and land pollution by heavy metals and
radioactive nuclides can be accomplished by development of recovery programs for the
affected regions. Development of national and regional programs for introducing and
stimulating environmentally friendly agricultural systems will result in erosion control,
prevention from further land degradation and recovery of the soil productivity potential.
References
Alexandrov, V. 2002. Climate variability and change on the Balkan Peninsula. Ecology and Future, 1 (2-4), 26-30.
Anonymous. 1993. List of polluted lands by industry. Government decree No 50, March 10, 1993, State Gazette No 24.
Boyadgiev T., Filcheva E., Petrova L. 1994. The organic carbon reserve of Bulgarian soils. In: R. Lal, J.M. Kimble and E. Levine (Eds.) Soil Processes and Greenhouse Effect. Advances in Soil Science, 3: 19-23.
CCD. 1994. United Nations Convention to Combat Desertification. UNCCD Secretariat, www. unccd.int
Dilkova, R. 1985. Structure and Aeration Status of the Main Soil Types in Bulgaria. Monograph. N. Poushkarov Institute of Soil Science, Sofia
Dilkova R., G. Kerchev and M. Kercheva. 1998. Evaluating and grouping of soils according to their susceptibility to anthropogenic degradation. Advances in Geoecology, 31, 125-133.
Dimitrova, T. 2002. Presentation of UN Convention to Combat Desertification. Proc. National seminar “Land and soil degradation and combating desertification”, 13-14 June 2002, Sofia, 4-9.
Djodjov, H., G. Georgiev, I. Georgiev. 1997. Appearance and distribution of wind erosion in Bulgaria. Agricultural Sciences, 4-6.
Ganev, S. 1992a. On the question of the anthropogenic soil acidification in Bulgaria. Soil Science, Agrochemistry and Ecology, 27 (1), 5-11.
Ganev, S. 1992b. Toxic acid soils in Bulgaria. Forest Science, 29 (4), 31-43.
Ivanova A., Petrova H., Istatkova L. 1993. Statistical Yearbook. National Statistical Institute, Statistical Publishing and Printing House of the National Statistical Institute. Sofia.
163
Konishev, P., Koulikov, A. Tchuldjian H. 1998. Soil cover, land use and soil degradation in Bulgaria. In: C. Meine (ed.) Bulgaria’s Biological Diversity: Conservation Status and Needs Assessment, v.2, 631-639.
Kostov J. (Ed.) 2001. Statistical Yearbook. National Statistical Institute, Statprint Ltd. Sofia.
Lazarov A., Rousseva S., Tsvetkova E., Malinov I., Stefanova V. 2002. Geographic Database and Evaluation of Different Soil Erosion Prediction Models for the Purposes of the Soil Information System. (Final report of a Project funded by the Ministry of Environment and Water by Contract No 1108-2556).
Penevska E., Aleksieva M., Dimitrova P., Staevska V., Christova S. 1996. Statistical Yearbook. National Statistical Institute, Statistical Publishing and Printing House of the National Statistical Institute. Sofia.
Petrov, P. 2002. Problems related to landslide, abrasion and erosion processes in the country. Proc. National seminar “Land and soil degradation and combating desertification”, 13-14 June 2002, Sofia, 42-47.
Rousseva S.S. 2002. Information Bases for Developing a Geographic Database forSoil Erosion Risk Assessments. Monograph. N. Poushkarov Institute of Soil Science, Sofia, pp. 198.
Rousseva, S., Koulikov, Al., Lazarov, As. 1992. Soil erosion and conservation in Bulgaria: state and problems. Proc. of Soil Erosion Prevention and Remediation Workshop, U.S. - Central and Eastern European Agro-Environmental Program, Budapest, (Apr.27-May 1, 1992): 39-53
Rousseva, S., Lazarov, A. 2002. Expert estimates of Soil Erosion Rates in the Agricultural Lands since the Beginning of the Land Reform in Bulgaria. Ecology and Industry, 5 (1-3). in print.
Slavov N. 2002. Significance of climate change on the processes of aridity and land degradation in Bulgaria. Proc. National seminar “Land and soil degradation and combating desertification”, 13-14 June 2002, Sofia, 10-17.
Sokolovska, M.G. 2002. Forest ecological systems and the combat against desertification. Proc. National seminar “Land and soil degradation and combating desertification”, 13-14 June 2002, Sofia, 29-35.
Stoichev, D. 1986. Effect of long-term fertilizer application on the pH values and available NPK contents in the soil. Proc. IV National Conference of Soil Science, 404-410.
Stoichev D., Dilkova R. and M. Kercheva. 2000. Soil degradation in Bulgaria. In: R. Lahmar, M. Dosso, A. Ruellan and L. Montanarella (eds) Soils in Central and Eastern European Countries in the New Independent States, in Central Asian Countries and in Mongolia (Present situation and future perspectives), JRC, EC, 111-118.
Stoichev D. and Kolchakov I. 1996. Vulnerability of main Bulgarian soils to acidification. EU Workshop on land information systems – developments for planning the sustainable use of land resources, 20-23 Nov., Hannover. Germany.
Stoichev D.A., Kolchakov, I.H. 1997. Degradation status of Bulgarian soils: overview of available information. In: Batjes, N.H. and E.M.Bridges (eds.) Implementation of a soil degradation and vulnerability database for Central and Eastern Europe. Proceeding of an international workshop (Wageningen, 1-3 October, 1997). ISRIC, Wageningen, 29-33.
164
Stoichev D. and Stoicheva D. 1986. Effect of fertilizer application on soil acidity, Proc. XIII Congress of the ISSS, Hamburg, v. III, 981-982.
Todorova I. 2001. Soil protection in environmental aspect. In: K. Terytze and I. Atanassov (eds.). Assessment of the Quality of Contaminated Soils and Sites in Central and Eastern European Countries (CEEC) and New Independent States (NIS). International Workshop 30 Sept. – 3 Oct. 2001, Sofia, Bulgaria, GorexPress.17-20.
Totev, T. 1982. Acidification of Bulgarian soils under the influence of annual intensive mineral fertilizer application. Proc. III National Conference of Soil Science, Part I, 140-146.
UNCED. 1992. Agenda 21: Programme of Action for Sustainable Development. UN Publication E9.1.I1.
165
LAND DEGRADATION IN CROATIA
F. Bašić UNIVERSITY OF ZAGREB - FACULTY OF AGRICULTURE
Department of General Agronomy
INTRODUCTION Soil investigations have a long tradition in Croatia and they have never lagged behind Europe. They start with the establishment of the Higher Royal Agricultural and Forestry School at Križevci in the middle of past century, in 1891, the first soil analysis laboratory was founded in Zagreb, and the opening of the Faculty of Agriculture and Forestry -1919. (www.agr.hr). The transition of Croatian agriculture will contribute to increases in some kind of food and agricultural production to meet unsatisfied demand, using environmentally friendly technologies usable for 21 century. The mean "pillars" and principles of Sustainable Land Development - SLM (Productivity, Security, Protection, Viability and Acceptability). On the same way, basic principles of multifunctionality (MFCAL) and sustainable land management (productivity, stability of yields, natural resources protection, economic efficiency and social acceptability) are absolutely acceptable and usable for Croatia. Precondition for SLM is coordination of described circumstances in respective agricultural subregion with requirements of the plant, taking into account both, the production and the environmental aspects in short-, mid-, and long-term time scales. The great importance has an optimization of field size according to agroecological conditions resulting more homogeneous fields for the uniform soil management practices-measures. The mean document of soils of Croatia is General Soil Map of Croatia in scale 1:50 000. The very rich GSMC documentation that, in addition to printed material, also contains unique manuscripts, is kept at the Department of Soil Science, Faculty of Agriculture, which is the centre of cartographic activities and the seat of the Project Council for GSMC preparation. The data are awaiting up-to- date digitalisation and/or scanning, as well as advanced computer processing, and there is no doubt that they represent a more than solid and reliable basis for a unique information system of the soils of Croatia. In any case, an imposing number of diverse data and information on the distribution and properties of the soils of Croatia have been collected by modern methods since World War II. They are at least as abundant, if not more numerous, than those collected in some countries that developed under more favourable historical circumstances. Foundation of a unique information system of the soils of Croatia is an urgent task, the implementation of which is delayed by the chronic lack of funds. As geographically extensive branch of economy agriculture has a direct impact on nature and the environment and provides the primary food material that ensures humankind subsistence. Recent trends towards a more intensive and specialized form of agriculture have successfully increased our ability to feed the world, but, in some cases, at the expense of social and/or environmental goals. In such cases agricultural policy should strive to achieve a more optimal balance between social, environmental and economic objectives. It is necessary to stress the need for an intensified cooperation between the regions in the field soil protection – standardisation of methods of monitoring soil properties. Economic recovery and development seem promising for Croatia in the context of the modern concept of sustainable development, based on agriculture and tourism, the two branches of economy that rely on restorable-renewable natural resources.
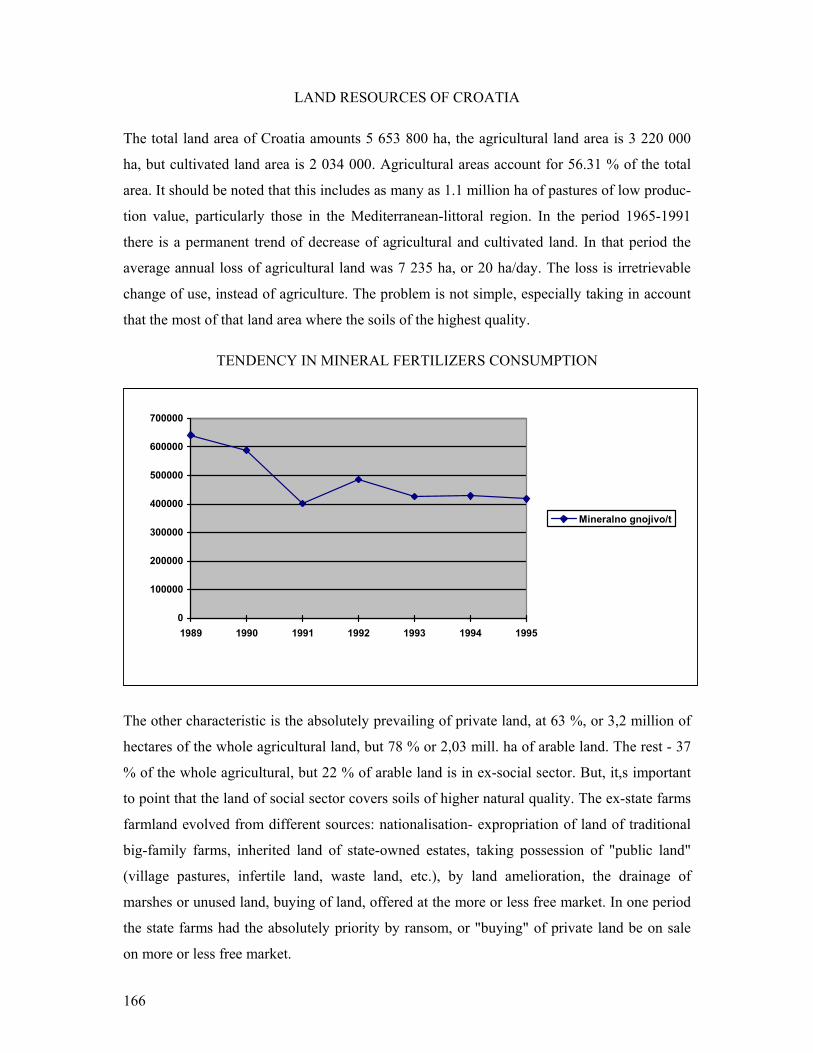
166
0
100000
200000
300000
400000
500000
600000
700000
1989 1990 1991 1992 1993 1994 1995
Mineralno gnojivo/t
LAND RESOURCES OF CROATIA
The total land area of Croatia amounts 5 653 800 ha, the agricultural land area is 3 220 000
ha, but cultivated land area is 2 034 000. Agricultural areas account for 56.31 % of the total
area. It should be noted that this includes as many as 1.1 million ha of pastures of low produc-
tion value, particularly those in the Mediterranean-littoral region. In the period 1965-1991
there is a permanent trend of decrease of agricultural and cultivated land. In that period the
average annual loss of agricultural land was 7 235 ha, or 20 ha/day. The loss is irretrievable
change of use, instead of agriculture. The problem is not simple, especially taking in account
that the most of that land area where the soils of the highest quality.
TENDENCY IN MINERAL FERTILIZERS CONSUMPTION
The other characteristic is the absolutely prevailing of private land, at 63 %, or 3,2 million of
hectares of the whole agricultural land, but 78 % or 2,03 mill. ha of arable land. The rest - 37
% of the whole agricultural, but 22 % of arable land is in ex-social sector. But, it,s important
to point that the land of social sector covers soils of higher natural quality. The ex-state farms
farmland evolved from different sources: nationalisation- expropriation of land of traditional
big-family farms, inherited land of state-owned estates, taking possession of "public land"
(village pastures, infertile land, waste land, etc.), by land amelioration, the drainage of
marshes or unused land, buying of land, offered at the more or less free market. In one period
the state farms had the absolutely priority by ransom, or "buying" of private land be on sale
on more or less free market.
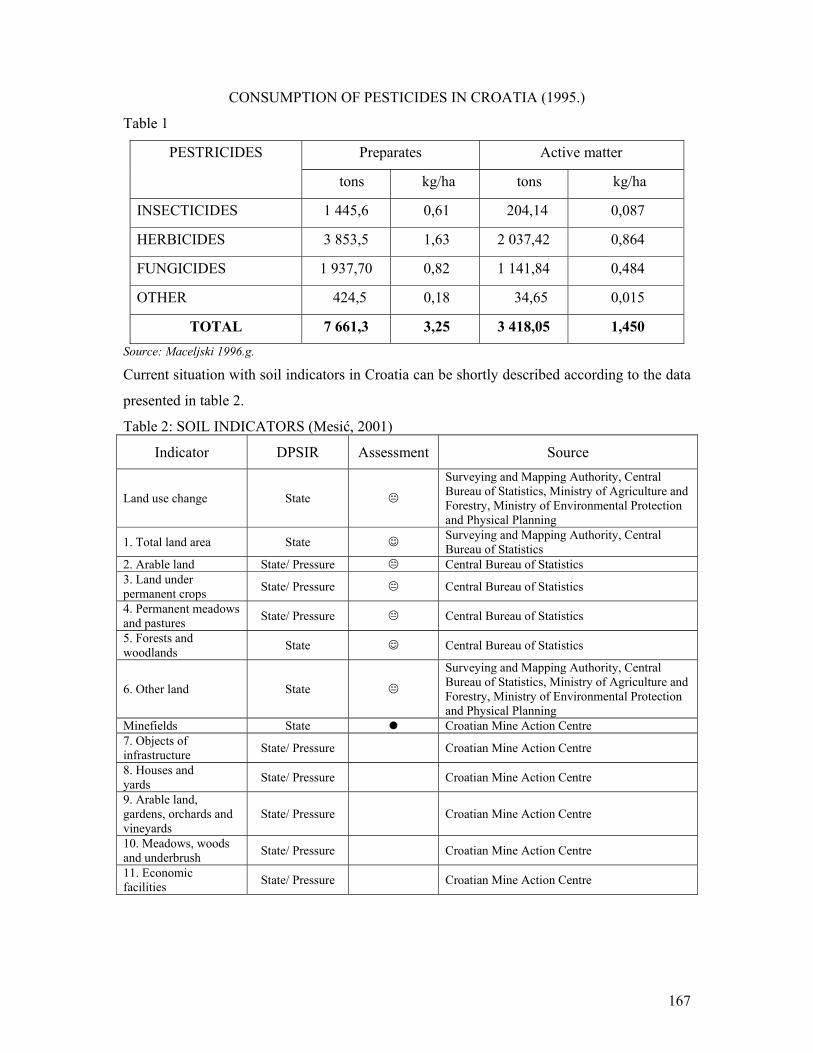
167
CONSUMPTION OF PESTICIDES IN CROATIA (1995.)
Table 1
Preparates Active matter PESTRICIDES
tons kg/ha tons kg/ha
INSECTICIDES 1 445,6 0,61 204,14 0,087
HERBICIDES 3 853,5 1,63 2 037,42 0,864
FUNGICIDES 1 937,70 0,82 1 141,84 0,484
OTHER 424,5 0,18 34,65 0,015
TOTAL 7 661,3 3,25 3 418,05 1,450 Source: Maceljski 1996.g.
Current situation with soil indicators in Croatia can be shortly described according to the data
presented in table 2.
Table 2: SOIL INDICATORS (Mesić, 2001)
Indicator DPSIR Assessment Source
Land use change State
Surveying and Mapping Authority, Central Bureau of Statistics, Ministry of Agriculture and Forestry, Ministry of Environmental Protection and Physical Planning
1. Total land area State ☺ Surveying and Mapping Authority, Central Bureau of Statistics
2. Arable land State/ Pressure Central Bureau of Statistics 3. Land under permanent crops State/ Pressure Central Bureau of Statistics
4. Permanent meadows and pastures State/ Pressure Central Bureau of Statistics
5. Forests and woodlands State ☺ Central Bureau of Statistics
6. Other land State
Surveying and Mapping Authority, Central Bureau of Statistics, Ministry of Agriculture and Forestry, Ministry of Environmental Protection and Physical Planning
Minefields State n Croatian Mine Action Centre 7. Objects of infrastructure State/ Pressure Croatian Mine Action Centre
8. Houses and yards State/ Pressure Croatian Mine Action Centre
9. Arable land, gardens, orchards and vineyards
State/ Pressure Croatian Mine Action Centre
10. Meadows, woods and underbrush State/ Pressure Croatian Mine Action Centre
11. Economic facilities State/ Pressure Croatian Mine Action Centre

168
Soil condition change State\ Pressure
Faculty of Agriculture, Zagreb, Faculty of Agriculture, Osijek, Agricultural Institute Osijek, Agricultural Institute Križevci, Institute of Agriculture and Tourism, Poreč Institute for Adriatic Crops and Karst Reclamation, Split, Faculty of Forestry, Zagreb, Forest Research Institute, Jastrebarsko
12. Changes in soil organic matter content State/ Pressure
13. Soil compaction and structure deterioration
State/ Pressure
14. Soil acidification State/ Pressure
15. Soil eutrophication State/ Pressure
Faculty of Agriculture, Zagreb, Faculty of Agriculture, Osijek, Agricultural Institute Osijek, Agricultural Institute Križevci, Institute of Agriculture and Tourism, Poreč Institute for Adriatic Crops and Karst Reclamation, Split, Faculty of Forestry, Zagreb, Forest Research Institute, Jastrebarsko
Soil degradation State
Faculty of Agriculture, Zagreb, Faculty of Agriculture, Osijek, Agricultural Institute Križevci, Institute of Agriculture and Tourism, Poreč Institute for Adriatic Crops and Karst Reclamation, Split, Faculty of Forestry, Zagreb, Forest Research Institute, Jastrebarsko Faculty of Mining, Geology and Petroleum Engineering, Zagreb
16. Accumulation of heavy metals and potentially toxic elements
Pressure
17. Accumulation of pesticides residues Pressure
18. Petrochemicals in soil Pressure
Faculty of Agriculture, Zagreb, Faculty of Agriculture, Osijek, Agricultural Institute Križevci, Institute of Agriculture and Tourism, Poreč Institute for Adriatic Crops and Karst Reclamation, Split, Faculty of Forestry, Zagreb, Forest Research Institute, Jastrebarsko Faculty of Mining, Geology and Petroleum Engineering, Zagreb
19. Soil erosion State/ Pressure Faculty of Agriculture, Zagreb, Croatian Waters, Central Bureau of Statistics, Faculty of Civil Engineering, Zagreb
Soil information system and legislation
Driving force/ Response
Ministry of Agriculture and Forestry, Ministry of Environmental Protection and Physical Planning, Faculty of Agriculture, Zagreb
20. Soil contamination from industrial activities
State/ Pressure -
21. Soil contamination from municipal waste disposal
State/ Pressure -
22. Soil contamination from industrial waste disposal
State/ Pressure -
23. Soil contamination from localized sources State/ Pressure -
24. Legal instruments Response/ Driving force
Ministry of Environmental Protection and Physical Planning, Ministry of Agriculture and
Forestry
25. Soil information system Response
Ministry of Environmental Protection and Physical Planning, Ministry of Agriculture and
Forestry
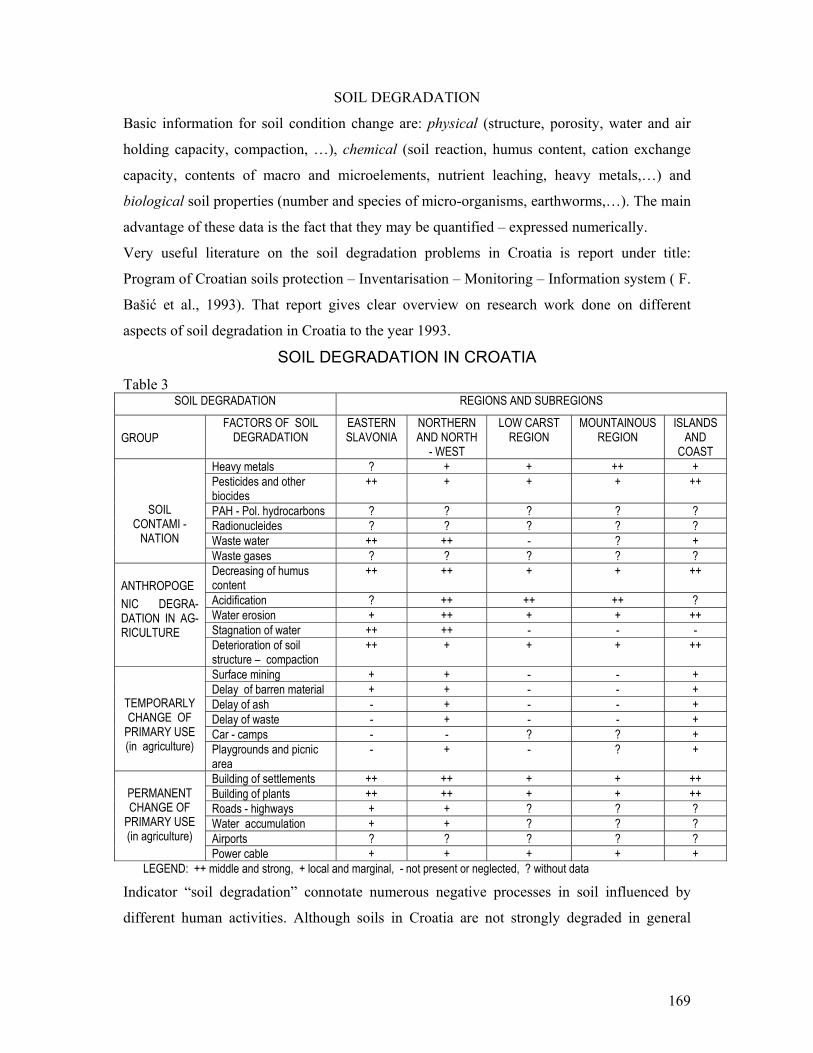
169
SOIL DEGRADATION
Basic information for soil condition change are: physical (structure, porosity, water and air
holding capacity, compaction, …), chemical (soil reaction, humus content, cation exchange
capacity, contents of macro and microelements, nutrient leaching, heavy metals,…) and
biological soil properties (number and species of micro-organisms, earthworms,…). The main
advantage of these data is the fact that they may be quantified – expressed numerically.
Very useful literature on the soil degradation problems in Croatia is report under title:
Program of Croatian soils protection – Inventarisation – Monitoring – Information system ( F.
Bašić et al., 1993). That report gives clear overview on research work done on different
aspects of soil degradation in Croatia to the year 1993.
SOIL DEGRADATION IN CROATIA Table 3
SOIL DEGRADATION REGIONS AND SUBREGIONS
GROUP FACTORS OF SOIL
DEGRADATION EASTERN SLAVONIA
NORTHERN AND NORTH
- WEST
LOW CARST REGION
MOUNTAINOUS REGION
ISLANDS AND
COAST Heavy metals ? + + ++ + Pesticides and other biocides
++ + + + ++
PAH - Pol. hydrocarbons ? ? ? ? ? Radionucleides ? ? ? ? ? Waste water ++ ++ - ? +
SOIL CONTAMI -
NATION Waste gases ? ? ? ? ? Decreasing of humus content
++ ++ + + ++
Acidification ? ++ ++ ++ ? Water erosion + ++ + + ++ Stagnation of water ++ ++ - - -
ANTHROPOGE NIC DEGRA- DATION IN AG-RICULTURE
Deterioration of soil structure – compaction
++ + + + ++
Surface mining + + - - + Delay of barren material + + - - + Delay of ash - + - - + Delay of waste - + - - + Car - camps - - ? ? +
TEMPORARLY CHANGE OF
PRIMARY USE (in agriculture) Playgrounds and picnic
area - + - ? +
Building of settlements ++ ++ + + ++ Building of plants ++ ++ + + ++ Roads - highways + + ? ? ? Water accumulation + + ? ? ? Airports ? ? ? ? ?
PERMANENT CHANGE OF
PRIMARY USE (in agriculture)
Power cable + + + + + LEGEND: ++ middle and strong, + local and marginal, - not present or neglected, ? without data Indicator “soil degradation” connotate numerous negative processes in soil influenced by
different human activities. Although soils in Croatia are not strongly degraded in general

170
(according to the published results of several research projects), there is no systematic
evaluation of soil degradation.
On soil of ex-social sector, all intensive agricultural operations have been applied, involving
usage of big quantities of agrochemicals (mineral fertilizers, pesticides, esp. herbicides,
however that one of atrazin group), and processes of anthropogenic soil and subsurface water
degradation had been registered:
• anthropogenic soil compaction and structural damage • over tillage, using of heavy machinery, • tillage in improper moisture conditions • decrease of humus content and humus quality • unfavourable changes of organic matter regime • improper recycling of organic residues • lack of organic fertilizers • soil acidification (leaching, mineral and liquid fertilizers, acidic depositions, air pollution) • biological degradation • soil and water pollution Regulations on agricultural soil protection from contamination with harmful substances (NN
15/92) regulates the contents of ecologically risky substances allowed, and determines how
many and when the manure can be used.
The requirement, which is increasingly harder to satisfy in Europe, that soils should not be
contaminated with some of the contaminants, primarily heavy metals, seems to give
advantage to Croatia.
Existing results point to the conclusion that there is a strong need for systematic approach to
the question of heavy metal content and heavy metal accumulation in soil.
TOLERANT HEAVY METAL CONTENT Table 4
Sandy and skeletal soils with low humus content
Heavier and heavy soils humus-reach soils
In dry matter of compost and other organic fertilizers
HEAVY METAL Content in mg/kg of soil, extracted in aqua regia
Cadmium (Cd) 1 2 10 Mercury (Hg) 1 2 10 Lead (Pb) 100 150 500 Molybdenum (Mo) 10 15 20 Arsenic (As) 20 30 20 Cobalt (Co) 50 50 100 Nickel (Ni) 50 60 100 Cooper (Cu) 60 100 500 Chromium (Cr) 60 100 500 Zinc (Zn) 200 300 2000 Polic. aromatic hydroc.(PAH) 2 2 -
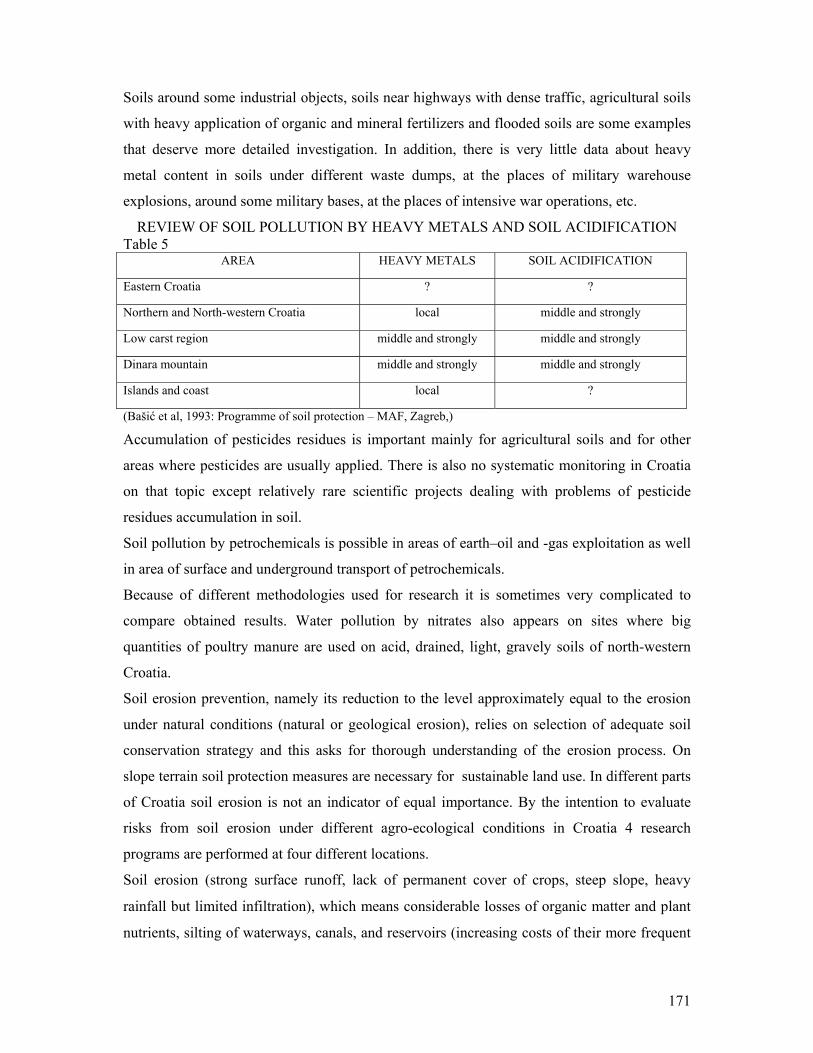
171
Soils around some industrial objects, soils near highways with dense traffic, agricultural soils
with heavy application of organic and mineral fertilizers and flooded soils are some examples
that deserve more detailed investigation. In addition, there is very little data about heavy
metal content in soils under different waste dumps, at the places of military warehouse
explosions, around some military bases, at the places of intensive war operations, etc.
REVIEW OF SOIL POLLUTION BY HEAVY METALS AND SOIL ACIDIFICATION Table 5
AREA HEAVY METALS SOIL ACIDIFICATION
Eastern Croatia ? ?
Northern and North-western Croatia local middle and strongly
Low carst region middle and strongly middle and strongly
Dinara mountain middle and strongly middle and strongly
Islands and coast local ?
(Bašić et al, 1993: Programme of soil protection – MAF, Zagreb,)
Accumulation of pesticides residues is important mainly for agricultural soils and for other
areas where pesticides are usually applied. There is also no systematic monitoring in Croatia
on that topic except relatively rare scientific projects dealing with problems of pesticide
residues accumulation in soil.
Soil pollution by petrochemicals is possible in areas of earth–oil and -gas exploitation as well
in area of surface and underground transport of petrochemicals.
Because of different methodologies used for research it is sometimes very complicated to
compare obtained results. Water pollution by nitrates also appears on sites where big
quantities of poultry manure are used on acid, drained, light, gravely soils of north-western
Croatia.
Soil erosion prevention, namely its reduction to the level approximately equal to the erosion
under natural conditions (natural or geological erosion), relies on selection of adequate soil
conservation strategy and this asks for thorough understanding of the erosion process. On
slope terrain soil protection measures are necessary for sustainable land use. In different parts
of Croatia soil erosion is not an indicator of equal importance. By the intention to evaluate
risks from soil erosion under different agro-ecological conditions in Croatia 4 research
programs are performed at four different locations.
Soil erosion (strong surface runoff, lack of permanent cover of crops, steep slope, heavy
rainfall but limited infiltration), which means considerable losses of organic matter and plant
nutrients, silting of waterways, canals, and reservoirs (increasing costs of their more frequent

172
cleaning) and increasing hazards of water logging and floods in the lower parts of the
watershed.
CATHEGORIES OF WATER EROSION IN CROATIA
Table 6.
I. Excessive erosion 0,48%
II. Strong erosion 1,12%
III. Medium erosion 5,47%
IV. Weak erosion 15,95%
V. Very weak erosion 76,98%
(Petraš et al – Fenomenology of erosion in Croatia, 1998)
According of Racz (1992) the heaviest situation is in central and coastal part of Istria, with
100 – 200 t/ha of eroded soil annually, caused by a extremely erodibility of soil on flysh –
regosols, rendzinas etc.
Private farms practice of integrated, extensive production and great coverage with livestock is
the reason why situation of its soil is much better. On soils of private households, the process
of intensive erosion had been registered, particularly in Pannonian region, as well as in
complete Mediterranean area. Besides all natural factors, the reason for this situation is
unfavorable orientation of plots up-down the slope. Besides, erosion is favored by distortions
in relations of main crops, in favor of maize. From plots sowed with maize, the process
happens exactly after treatment with herbicides, among all with those from group of very
persistent, as atrazin.
Soil pollution is mostly a consequence of:
• penetration of waste drilling fluids from a waste mud pit, which follows oil and gas drilling activities, because of hazardous substances content (PAH, dioxin, mineral oil) in that mud and possible penetration in environment.
• refinement of earth gas (H2S, mercaptanes, Hg, CO2) • flame of waste gas on gas torch (products of burning out of gas) • acidents in transport of petrochemicals (traffic, or breaking of underground pipes)
It can't be forgotten the fact that support to private farmers economically discriminated in the
past period, unconditionally leads to increasing the economic power and possible trends
toward the intensification of agricultural production. Due to certain "hunger in agrochemicals
application" it might come to unfavorable "polarization" tendency in agrochemicals
application (Varallyay, 1994):

173
Case A) Better soil - rich farmer - higher rate of agrochemicals (in spite of the possible lower requirements - better nutrient status of soil) - overdosage Case B) Poor soil - poor farmer - lower rate of agrochemicals (in spite of the higher requirements à lower nutrient supply of soils) - underdosage Certain news and danger presents appearance of new agricultural land users, whose interest
will be just profit as higher as possible, realized in short term. The short-term market-oriented
production of land users may lead to environmental damages because of the lack of necessary
(and sometimes expensive) preventive measures, especially in cases when harmful side-effect
is detectable one-two years later or appears in the surroundings (nitrate pollution,
acidification).
SOIL PROTECTION
In few past decades numerous soil data were collected for the need of project titled “Basic
Soil Map of the Republic of Croatia” at the scale 1:50 000. Because of project needs data on
soil physical and chemical properties were collected by the same methodology. In the period
between 1964. and 1986. approximately 50 000 soil profile were analysed. This data
represents the backbone of the soil information system for Croatian soils. Useful informations
about soils in Croatia can be found at the on-line journal of the Faculty of Agriculture in
Zagreb – ACS (Agriculturae Conspectus Scientificus) with free access to the full text
(http://www.agr.hr/smotra/issues.htm).
In addition to that, significant work on gathering of soil data at more detailed scales was done
for the need of different soil amelioration projects, studies, etc. Unfortunately, that data are
not stored in digital format and many of them will be forgotten.
Although there is a lot of data about soils in Croatia there is no Governmental institution that
will organise and maintain soil information system.
174
Croatia participated in the creation of the approach to organized and integral soil protection
within the Alps and Alps-Adria and Danube river regional associations of its geographical
neighborhood and similar economic aspirations. This approach includes three fields of
activity: I.
INVENTORYING OF SOIL CONDITION
(Collecting of data on kind, degree and intensity of soil
damage)
II. PERMANENT SOIL
MONITORING (Exact quantification and
balance of each soil damage process)
III. SOIL INFORMATION
SYSTEM (The data indispensable for
decision making)
Translocation by mining activities; Brickyard, gravel and sand exploitation, Remove of soil by root and tuber-crops, as beet, carrot, potato, etc., Soil – loan, Soil covering by wastes etc., Soil degradation by forest fire, The heaviest degradation of soil is an irreversible change of use in agriculture. Urban and
industrial agglomeration and technical infrastructure (roads, airports, water accumulation,
canals), are spreading partly on fertile land, what underlines the problem of sealing that
change as an irreversible loss of soil for its most important function – biomass production in
agriculture, and loss the multifunctionality of soil. In a period 1965. - 1987. by that way
Croatia has been loss 166.441 ha of fertile agricultural land.
REFERENCES Basic, F., I. Kisic, A. Butorac, O. Nestroy, M. Mesić 2001. Runoff and soil loss under different tillage methods on Stagnic Luvisols in central Croatia. Soil & Tillage Research, 62, 145-151. Elsevier Science. Basic, F., I. Kisic, M. Mesic. 2001. Statements on problems of soil protection and sustainable land use in Croatia. Co-operation for Soil protection and Sustainable land use in Central and Eastern European (CEE). Countries, str. 14-18. Vienna. Basic, F., Land resources evaluation of Croatia, Agricultural sector re view, FAO, 41, Zagreb, 1993. Basic,F., Bodenerosion in Rahmen des Bodendauerbeobachtungprogramms, Experttagung Bodensch."Bodenerosion und Strukturveränderung", 11, Zagreb, 1992. Basic,F., Hrlec,G., Organische Problemstoffe in den Ackerböden Kroatiens, Expertentagung der gemeinsamen Arbeitsgruppe Bodenschutz ARGE Alpen, Alpen-Adria und Donauländer, Szombathely 17-18 Oktober 1991, Bayerisches Staatsministerium für Landesentwicklung und Umweltfragen, 32-47, München, 1991. Basic,F., Kisic,I. Mesić,M., Butorac,A., Remediation of soil polluted by earth oil in Sava river valey. Znanstveni skup: "Počvite i nivnoto iskoristuvanje" u organizaciji: Makedonskata Akademija na naukite i umetnostite i zemjodelskiot Fakultet, Skopje, 1999. Basic,F., Kisic,I., Butorac,A., Mesić,M., Soil tillage direction as a factor influencing the occurance of erosion drift, Proceedings of International Conference on Soil Condition and Crop Production, pp. 47-50, Gödöllo, 1998. Basic,F., Vidacek, Z., Petrac,J., Racz,Z., Distribution and regional Peculiarities of Soil Erosion in Croatia, "Soil Erosion Prevention and Remediation" Workshop, US-Central and Eastern European Agro Environmental Programme, Budapest, 1992.
175
Blum,W.E.H., Bodenschutz – eine globale Herausforderung, Bodenschutz in einem vereinten Europa, Bodenkundlicher Kongress der Deutschen und der Östereichischen Bodenkundlichen Gesellschaft, p. 25-37, Wien, 2001. Blum,W.E.H., The role of soils in sustaining society and the environment: realities and challenges for the 21st century, 17. World Congress of Soil Science, Keynot lectures, p. 67-86, Bangkok, 2002. Butorac,A., Filipan,T., Basic,F., Mesić,M., Butorac,J., Kisic,I., Response of sugar beet to Agrarvital and waste water fertilizing. II.: Heavy metals, toxic elements and boron content in sugar beet root and leaf, Polj. znan. smotra, Vol. 60, br.1, 81-94, Zagreb, 1995. Chaney,R.L., Ryan J.A., Reeves, Ph.G., Strategies in Soil Protection – Missions and Visions, Bodenschutz in einem vereinten Europa, Bodenkundlicher Kongress der Deutschen und der Östereichischen Bodenkundlichen Gesellschaft, p. 53-65, Wien, 2001. Đumija,Lj., Manitasevic, J., Određivanje teških metala i anorganskih polutanata u vodi odvodnih kanala pokusnog dobra "Ježevo", Agrohemija, No 1-3, Beograd, 69-78, 1989. Kisic, I., F. Basic, M. Mesic, A. Butorac, Soil resistance to penetration in different tillage methods. Proceedings of 15th ISTRO Conference - CD, p. 8. Fort Worth, Dallas, USA, 2000. Kisić,I., Basic,F., Mesic,M., Ekološki uravnotežene mjere gospodarenja u održivoj poljoprivredi. Skup nevladinih organizacija iz Hrvatske i Bosne i Hercegovine, str. 8-9, Sarajevo, 1999. Kisic,I., F.Basic, M.Mesic, A.Butorac, Soil erosion in different tillage systems on stagnosol in Croatia. Proceedings - CD, Scientific registration no: 1351, Symp. No: 20, Montpellier. 1998. Martinovic,J., Vrankovic,A., Zagađenost tla teškim metalima i zaštita izvorišta Klokota, stručno-znanstveni skup o zaštiti rijeke Une, Sane i Korane, 110-113, Cazin, 1986. Mayer,B., Pezdirc,N., Teški metali (Pb,Zn i Cu) u tlima nizinskih šuma sjeverozapadne Hrvatske, "Šumarski list", br.6-8, Zagreb, 251.259, 1990. Mesić M., 2001. «Poljoprivreda» - poglavlje u dokumentu «Nacionalne mogućnosti skupljanja podataka o okolišu, str. 25-35. Izdavač, MZOPU, Zagreb. Mesić M., 2001. «Tlo» - poglavlje u dokumentu «Nacionalne mogućnosti skupljanja podataka o okolišu, str. 118-126. Izdavač, MZOPU, Zagreb. Müller,Ch., Holenstein,J., Herzog,U., Bašić,F., Aichberger,K., Gruber,A. Juritsch,G., Goller,H, Ben-dova,H., Hudnik,V., Hodnik,A., Huber,W., Nemeth,T., Scherer,J., Bodendauerbeobachtungs-flächen, Emphelung der Unterarbeitsgruppe der gemeinsame Arbeitsgruppe "Bodenschutz", Arge Alp, Alpen-Adria und Donauländer, Staatsm. für Landes. und Umwelt. 27, München, 1994. Nestroy,O., Agriculture and Water Protection - a Contradiction ?, Proce- edings of a Syposia Agriculture and Water Management, 13-18, Bizovacke Toplice, 1994. Prpić,B., Martinović,J., Vranković,A., Bašić,F., Waldschäden und Belastung der Waldböden in der SR Kroatien, Kongress Bodenschutz, Arge Alp und Alpen-Adria, München, 73-81, 1987. Racz,Z., Tlo i ekološki problemi današnjice, Poljoprivredna znanstvena smotra, Vol. 55 str. 183 - 195, Zagreb, 1990. Resulović,H., Uticaj tehnološkog progresa na proces oštećenja i potrošnje zemljišta, znanstveo savjetovanje Oštećenje zemljišta i problemi njegove zaštite, izvodi referata, 1-3, Tuzla, 1977. Rojanasoonthon,S., Kheoruenromne,I., Tropical soil science realities and challenges, 17. World Congress of Soil Science, Keynot lectures, p. 89-107, Bangkok, 2002. Romić,D., Klačić,Ž., Romić,M., Petošić,D., Stričević,I., Istraživanje prodora potencijalnih polutanata kroz solum tla do podzemne vode na području Kosnice, pedološki dio, Fond stručne dokumentacije Zavoda za melioracije, 39, Zagreb, 1995. Sanchez,P.,A., Soil science as major player in world development, 17. World Congress of Soil Science: Confronting new realities in the 21st century, Keynot lectures, p. 55-65, Bangkok, 2002. Schulte-Hermann,R., Bursch,W., Knasmüller,S., Parzefall,W., Bodenschutz aus der Sicht der Humantoxikologie, Bodenschutz in einem vereinten Europa, Bodenkundlicher Kongress der Deutschen und der Östereichischen Bodenkundlichen Gesellschaft, p.73-74, Wien, 2001. Seletković,Z., Utjecaj industrijskih polutanata na običnu bukvu u šumskim ekosistemima slavonskog gorja, Glasnik za šumske pokuse, No 27, 83- 196, Zagreb, 1991. Sigbert,H., Bronwyn,S., Freudenschuss, Alexandra, Vibeke,E., Loveland,P., Proposal for a European soil monitoring and assessment framework, European Environment Agency, p.59, Copenhagen, 2001. Smyth,A.J., Dumanski,J., Spendijan,G., Swift,M.J., Thornton, P.K., FESLM: An international framework for evaluating sustainable land management, FAO,74 p. Rome, 1993.
176
Tanic S., Grgic I.: Some ecological aspects of input use in Croatian agriculture, Concerence Pan-Europeenne des Facultes D’agronomie, Louvain-la-Neuve, Belgium 1990 Urushadze,T.,F., Soils in space and time: realities and challenge for the 21st century, 17. World Congress of Soil Science: Confronting new realities in the 21st century, Keynot lectures, p. 3-23, Bangkok, 2002. Varallyay,G., Soil Management and Environmental Relationships in Central and Eastern Europe, 15th
World Congress of Soil Science, Invited Papers for Symposia VIa, Vol.7a, 34-58, Acapulco, 1994. Varallyay,G., Soil Quality in relation to the concepts of multifunctionality and sustainable development, NATO Science Series, 2. Environmental Security, Vol. 69, p. 17-35, Dordrecht, 1997. Vidacek,Z., Racz,Z., Basic,F., The state, current Activities and future Plans for Soil Monitoring Systems in Croatia, International Workshop on Harmonization of Soil Conservation Monitoring Systems, FAO/ECE Working Party, Res. Inst. for Soil Science of Hung. Academy of Sciences, 65-77, Budapest, 1993. Vrankovic,A., Martinovic,J., Pernar,N., Neki pokazatelji ekoloških promjena tla u nacionalnom parku Plitvička jezera, ANUBIH, posebna izdanja, knjiga 15, 133-143, Sarajevo, 1991. Vrbek,B., Gašparac, M., Teški metali u humusnom horizontu tala Nacionalnog parka Risnjak, znanstveno savjetovanje Oštećenje zemljišta i problemi njegove zaštite, Tuzla, 27, 1991. Winpenny J. T.: Values for the Environment, A Guide to Economic Appraisal, HMSO, London, 1991 Zugec,I., Butorac,A, Bićanić,V., Bašić,F., Anwendungsmöglichkeiten alternativer Bodenbearbeitung für landwirtschaftlichen Kulturen in Kroatien, Symposium "Alternative Landwirtschaft", AMA, FKM, ARGE Alpen Adria, Rieder Messe, Ried im Innkreis, 1993. xxx (1992), Pravilnik o zaštiti poljoprivrednog tla (NN br.15/1992.). xxx Bodenschutzkonzept Vorarlberg, Amt der Vorarlberger Landesregierung, 104, Bregenz, 1992. xxx Bodenschutzprogramm Bayern, Bayerische Staatsregierung, 159, M-nchen, 1991.
177
DEGRADATION OF SOILS IN THE CZECH REPUBLIC Josef Kozák, Luboš Borůvka, Jan Němeček Department of Soil Science and Geology, Czech University of Agriculture in Prague, Czech Republic Soil plays an important role in the economy and life of the Czech Republic. Recently, in addition to soil production functions (for both agriculture and forest production), more attention has been paid also to other soil functions, such as ecological (storage and degradation of pollutants, water management, nutrient cycling, landscape component), recreational, cultural etc. Unfortunately, soil is endangered by different types of degradation processes, and, moreover, increasing areas of agricultural and forest land are lost due to construction, mining and other human activities. All these processes require to monitor perpetually all the changes occurring in soils and to reveal the influencing unfavourable factors in order to protect all the soil functions and preserve soil for the future. New technologies and information systems can be helpful in this effort.
Great attention has been focused on soil quality assessment from the viewpoint of sustainable development of agriculture and its environment. The term soil quality is used in soil survey interpretations for a certain functional set of soil properties and characteristics like soil erodibility, soil pollution etc., or in general for satisfying the demand of multifunctionality of soil. Sustainable development in agriculture in the Czech Republic emphasizes especially the following aspects:
- development of agriculture without soil degradation and pollution and without contributing to pollution of waters and biological resources,
- introduction of agricultural systems making possible the production of healthy and reasonably priced products by making use of input regulations, but at the same time maintaining economic effectiveness,
- adaptation of agricultural production to adverse natural and anthropogenic factors along with limitation of the latter where necessary,
- landscape conservation both in regions of intensive use and restricted agricultural production.
SOIL COVER OF THE CZECH REPUBLIC
Land use Total area of the Czech Republic is 78,860 km2. Total agricultural land consists of
42,797 km2, which is 54.3 % of the total area (Ministry of Agriculture, 1999; Table 1). Since 1990, the area of agricultural land dropped down by approximately 121 km2,
mainly due to conversion to forest land and also due to construction. The loss of good, fertile soils in the environs of big cities presents a serious problem. More than 480 km2 of agricultural land has been damaged due to mining of brown coal and other raw materials (Ministry of Agriculture, 1999). However, the decreasing agricultural land area is a long term trend; almost 9,000 km2 has been lost since 1937, the biggest drop occurring in the 1950‘s and 1960‘s. The area of agricultural land per one inhabitant is 0.41 ha in the Czech Republic; the average of the EU is 0.36 ha.
Arable land represents 72.38 % of the agricultural land. It is comparable to Germany (68.21 %), Hungary (77.57), or Poland (76.44), but it is more than is the overall average of the European Union (53.48 %). Higher percentage of arable land can be seen in some North European countries (Sweden – 82.84, Finland – 95.93), where, however, the share of agricultural land from the total area is relatively low. In recent years the area of arable land in the Czech Republic also decreases. Beside the loss due to construction it is
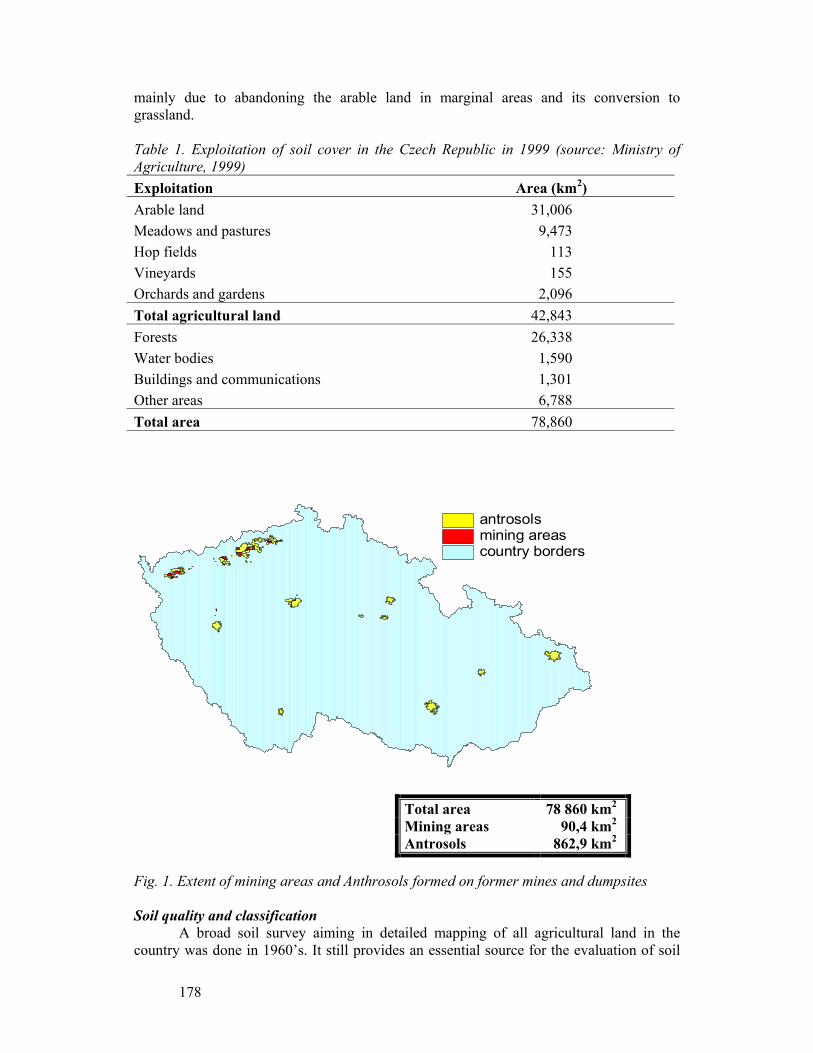
178
country borders
antrosolsmining areas
mainly due to abandoning the arable land in marginal areas and its conversion to grassland.
Table 1. Exploitation of soil cover in the Czech Republic in 1999 (source: Ministry of Agriculture, 1999) Exploitation Area (km2) Arable land 31,006 Meadows and pastures 9,473 Hop fields 113 Vineyards 155 Orchards and gardens 2,096 Total agricultural land 42,843 Forests 26,338 Water bodies 1,590 Buildings and communications 1,301 Other areas 6,788 Total area 78,860
Fig. 1. Extent of mining areas and Anthrosols formed on former mines and dumpsites Soil quality and classification
A broad soil survey aiming in detailed mapping of all agricultural land in the country was done in 1960’s. It still provides an essential source for the evaluation of soil
Total area 78 860 km2 Mining areas 90,4 km2 Antrosols 862,9 km2
179
conditions in the Czech Republic. Recently, soil classification has shifted towards stressing more the exact analytical methods, keeping, however, still in mind the genetic approach (Němeček et al., 2001). This change enables better conversion of the individual soil units to the World Reference Base (WRB). The data were amended with the forest soils so that soil maps of the whole territory of the Czech Republic can be created.
Prevailing soil unit in the Czech Republic is Cambisol, accounting in total for 58.0 % of the total area, approximately 20.6 % being Dystric Cambisol (Kozák et al., 1996; Table 2). These soils are not very fertile and their agricultural productivity is rather low. Fertile soils, like Chernozems (5.8 %), Phaeozems (1.3 %), and Haplic Luvisols (7.6 %) account in total for only 14.7 % of total area, forming less than one third of the agricultural land. These fertile soils are in their distribution limited mainly to the areas with lower elevation in the central parts of Bohemia and in Southern Moravia (Fig. 2). Table 2. Soil classification units in the Czech Republic (Kozák et al., 1996)
WRB soil unit Area (km2) Share (%) Fluvisols 2,288.5 2.90 Gleysols 190.2 0.24 Anthrosols 262.8 0.33 Arenosols 1,507.8 1.91 Rendzic Leptosols 184.2 0.23 Calcic Chernozems 2,252.4 2.86 Calcic Chernozems, Regosols 721.4 0.92 Luvic Chernozems 1,036.1 1.31 Arenic Chernozems 517.0 0.66 Verti-haplic Chernozems, Vertisols 1,184.1 1.50 Verti-stagnic (Pelic) Phaeozems 1,005.3 1.28 Greyzems 217.9 0.28 Calcaro-eutric Cambisols 491.6 0.62 Eutric (Eutrophic) Cambisols 1,255.3 1.59 Eutric (Eutrophic, Pelic) Cambisols 352.3 0.45 Vertic, Stagno-gleyic Cambisols 2,030.5 2.58 Eutric, Dystric Cambisols 23,478.5 29.79 Hyperdystric Cambisols 16,219.3 20.58 Stagno-gleyic Cambisols 1,896.5 2.41 Haplic Luvisols 5,994.6 7.61 Stagnic Luvisols 205.3 0.26 Areni-haplic Luvisols 204.2 0.26 Albic, Glossalbic Luvisols 1,851.9 2.35 Albi-luvic Stagnosols 1,848.7 2.35 Haplic Stagnosols 5,411.6 6.87 Cambic, Haplic Podzols 4,429.3 5.62 Areni-haplic Podzols 1,030.7 1.31 Histosols 79.6 0.10
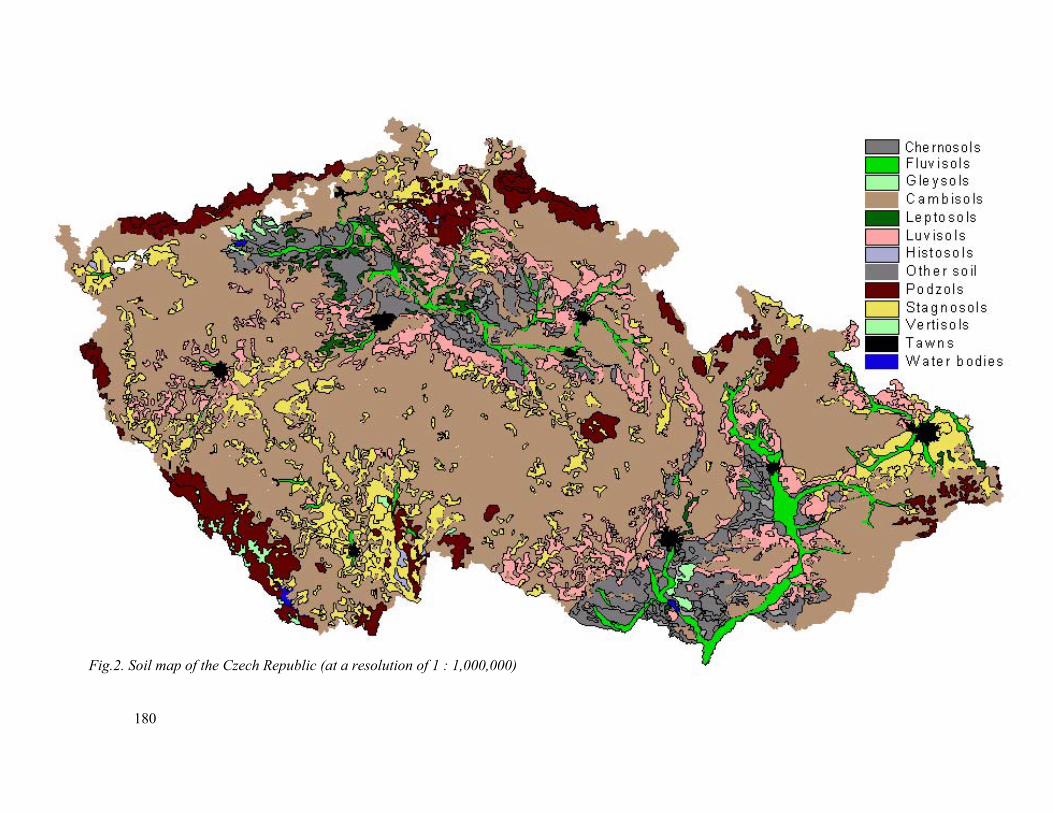
180
Fig.2. Soil map of the Czech Republic (at a resolution of 1 : 1,000,000)
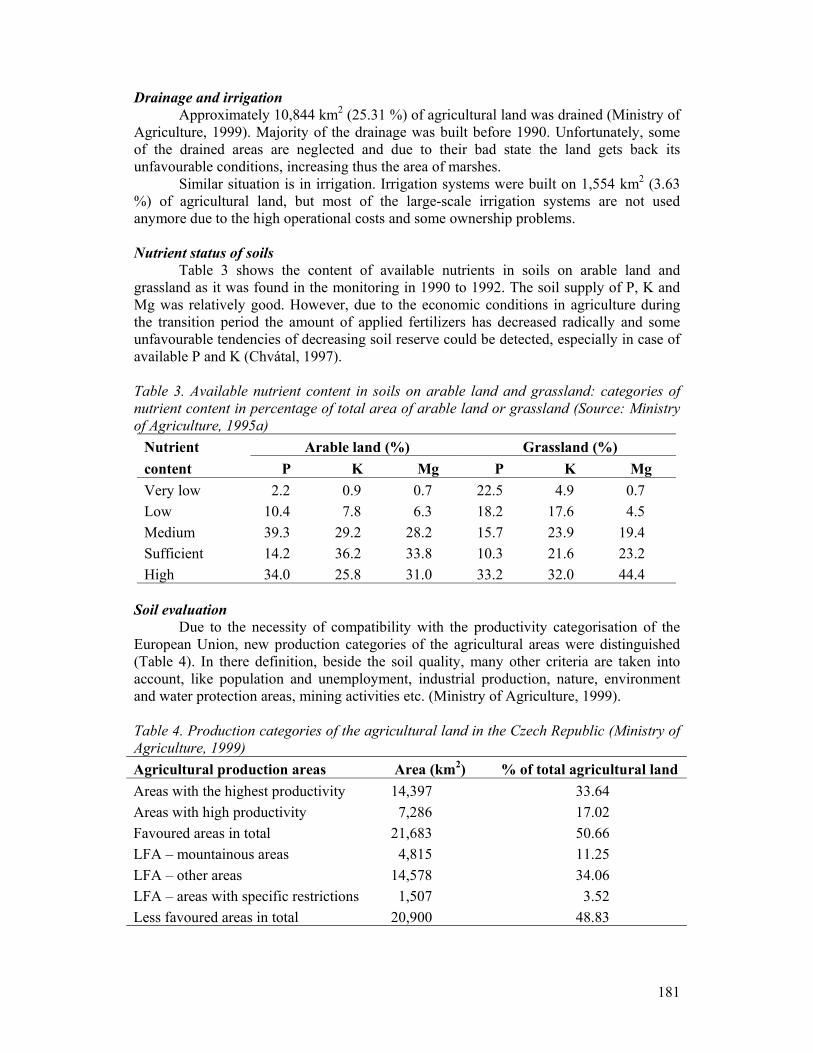
181
Drainage and irrigation Approximately 10,844 km2 (25.31 %) of agricultural land was drained (Ministry of
Agriculture, 1999). Majority of the drainage was built before 1990. Unfortunately, some of the drained areas are neglected and due to their bad state the land gets back its unfavourable conditions, increasing thus the area of marshes.
Similar situation is in irrigation. Irrigation systems were built on 1,554 km2 (3.63 %) of agricultural land, but most of the large-scale irrigation systems are not used anymore due to the high operational costs and some ownership problems. Nutrient status of soils
Table 3 shows the content of available nutrients in soils on arable land and grassland as it was found in the monitoring in 1990 to 1992. The soil supply of P, K and Mg was relatively good. However, due to the economic conditions in agriculture during the transition period the amount of applied fertilizers has decreased radically and some unfavourable tendencies of decreasing soil reserve could be detected, especially in case of available P and K (Chvátal, 1997). Table 3. Available nutrient content in soils on arable land and grassland: categories of nutrient content in percentage of total area of arable land or grassland (Source: Ministry of Agriculture, 1995a)
Nutrient Arable land (%) Grassland (%) content P K Mg P K Mg Very low 2.2 0.9 0.7 22.5 4.9 0.7 Low 10.4 7.8 6.3 18.2 17.6 4.5 Medium 39.3 29.2 28.2 15.7 23.9 19.4 Sufficient 14.2 36.2 33.8 10.3 21.6 23.2 High 34.0 25.8 31.0 33.2 32.0 44.4
Soil evaluation
Due to the necessity of compatibility with the productivity categorisation of the European Union, new production categories of the agricultural areas were distinguished (Table 4). In there definition, beside the soil quality, many other criteria are taken into account, like population and unemployment, industrial production, nature, environment and water protection areas, mining activities etc. (Ministry of Agriculture, 1999).
Table 4. Production categories of the agricultural land in the Czech Republic (Ministry of Agriculture, 1999) Agricultural production areas Area (km2) % of total agricultural land Areas with the highest productivity 14,397 33.64 Areas with high productivity 7,286 17.02 Favoured areas in total 21,683 50.66 LFA – mountainous areas 4,815 11.25 LFA – other areas 14,578 34.06 LFA – areas with specific restrictions 1,507 3.52 Less favoured areas in total 20,900 48.83

182
Less favoured areas (LFA) include mountainous regions, other areas and areas with specific restrictions. The other areas represent regions with decreasing population and land abandoning or areas with soils of low fertility. Specific restrictions can be caused by high industrial production and/or mining (Northern Bohemia and Northern Moravia), or the agricultural production can be limited by specially protected area, types of which will be described further on. The share of the less favoured areas 48.83 % is close to the average of the European Union where it accounts for 51 % of the agricultural land. Protected areas
There are different types of protected territories where particularly agricultural production is limited to different extent, which concerns the application of pesticides, fertilisers, manure etc. Based on Act No. 114/1992 Coll., 6 categories of specially protected territories are recognised:
- National parks - Protected landscape areas - National nature reserves - Nature reserves - National nature monuments - Nature monuments National parks and their mission are declared by an Act, protected landscape areas
are declared by Government Decree, national reserves and national nature monuments are declared by the Ministry of Environment. Other protected areas and territories are declared by municipal councils, national park authorities, or authorities of protected landscape areas by intimation (Matula, 2000). Currently, there are four national parks, namely Krkonoše (362 km2), Šumava (690 km2), Podyjí (63 km2), and České Švýcarsko (79 km2). The list of numbers and areas of specially protected territories is given in Table 5.
Table 5. Specially protected territories of nature in the Czech Republic (modified from Matula, 2000) Category of protected territory Number Area (km2) Percentage of territory National parks 4 1,194 1.51 Protected landscape areas 24 10,416 13.21 National nature reserves 122 264 0.33 National nature monuments 95 27 0.02 Nature reserves 507 257 0.33 Nature monuments 932 276 0.35
In addition to these protected nature territories, there are some areas with surface
and/or ground water protection, where agricultural production and soil management are also limited. Protected areas of natural water accumulation are declared by Decree of Government; the area with the special protection of surface water covers 8,267 km2 and in some cases is identical with the protected landscape areas, the area with special protection of groundwater covers 9,900 km2 (Matula, 2000). Zones of hygienic protection of drinking water resources present another type of area with limited management.
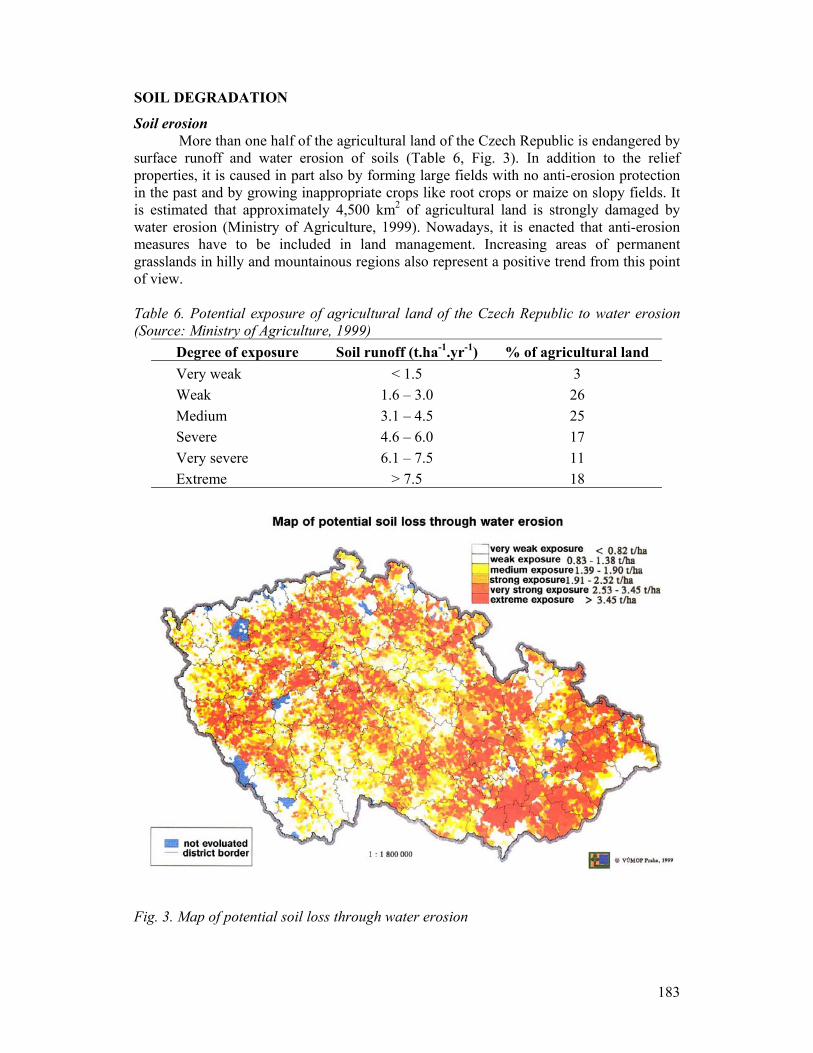
183
SOIL DEGRADATION
Soil erosion More than one half of the agricultural land of the Czech Republic is endangered by
surface runoff and water erosion of soils (Table 6, Fig. 3). In addition to the relief properties, it is caused in part also by forming large fields with no anti-erosion protection in the past and by growing inappropriate crops like root crops or maize on slopy fields. It is estimated that approximately 4,500 km2 of agricultural land is strongly damaged by water erosion (Ministry of Agriculture, 1999). Nowadays, it is enacted that anti-erosion measures have to be included in land management. Increasing areas of permanent grasslands in hilly and mountainous regions also represent a positive trend from this point of view.
Table 6. Potential exposure of agricultural land of the Czech Republic to water erosion (Source: Ministry of Agriculture, 1999)
Degree of exposure Soil runoff (t.ha-1.yr-1) % of agricultural land Very weak < 1.5 3 Weak 1.6 – 3.0 26 Medium 3.1 – 4.5 25 Severe 4.6 – 6.0 17 Very severe 6.1 – 7.5 11 Extreme > 7.5 18
Fig. 3. Map of potential soil loss through water erosion
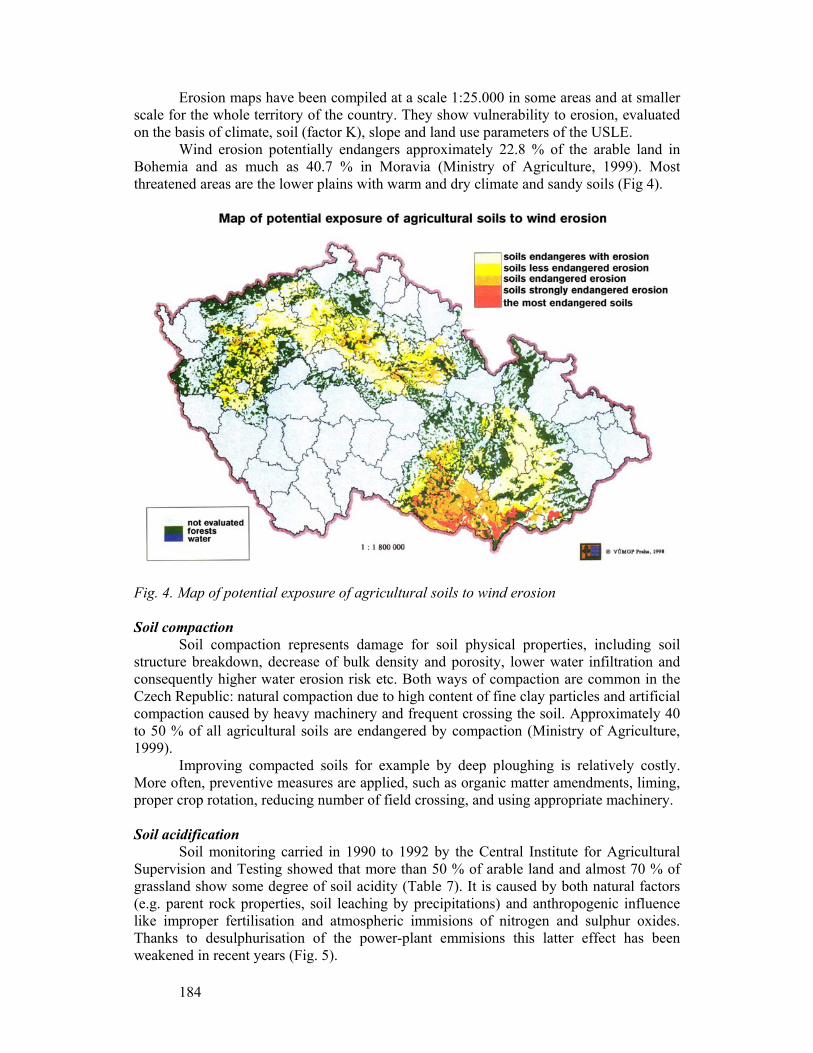
184
Erosion maps have been compiled at a scale 1:25.000 in some areas and at smaller scale for the whole territory of the country. They show vulnerability to erosion, evaluated on the basis of climate, soil (factor K), slope and land use parameters of the USLE.
Wind erosion potentially endangers approximately 22.8 % of the arable land in Bohemia and as much as 40.7 % in Moravia (Ministry of Agriculture, 1999). Most threatened areas are the lower plains with warm and dry climate and sandy soils (Fig 4).
Fig. 4. Map of potential exposure of agricultural soils to wind erosion
Soil compaction
Soil compaction represents damage for soil physical properties, including soil structure breakdown, decrease of bulk density and porosity, lower water infiltration and consequently higher water erosion risk etc. Both ways of compaction are common in the Czech Republic: natural compaction due to high content of fine clay particles and artificial compaction caused by heavy machinery and frequent crossing the soil. Approximately 40 to 50 % of all agricultural soils are endangered by compaction (Ministry of Agriculture, 1999).
Improving compacted soils for example by deep ploughing is relatively costly. More often, preventive measures are applied, such as organic matter amendments, liming, proper crop rotation, reducing number of field crossing, and using appropriate machinery.
Soil acidification
Soil monitoring carried in 1990 to 1992 by the Central Institute for Agricultural Supervision and Testing showed that more than 50 % of arable land and almost 70 % of grassland show some degree of soil acidity (Table 7). It is caused by both natural factors (e.g. parent rock properties, soil leaching by precipitations) and anthropogenic influence like improper fertilisation and atmospheric immisions of nitrogen and sulphur oxides. Thanks to desulphurisation of the power-plant emmisions this latter effect has been weakened in recent years (Fig. 5).
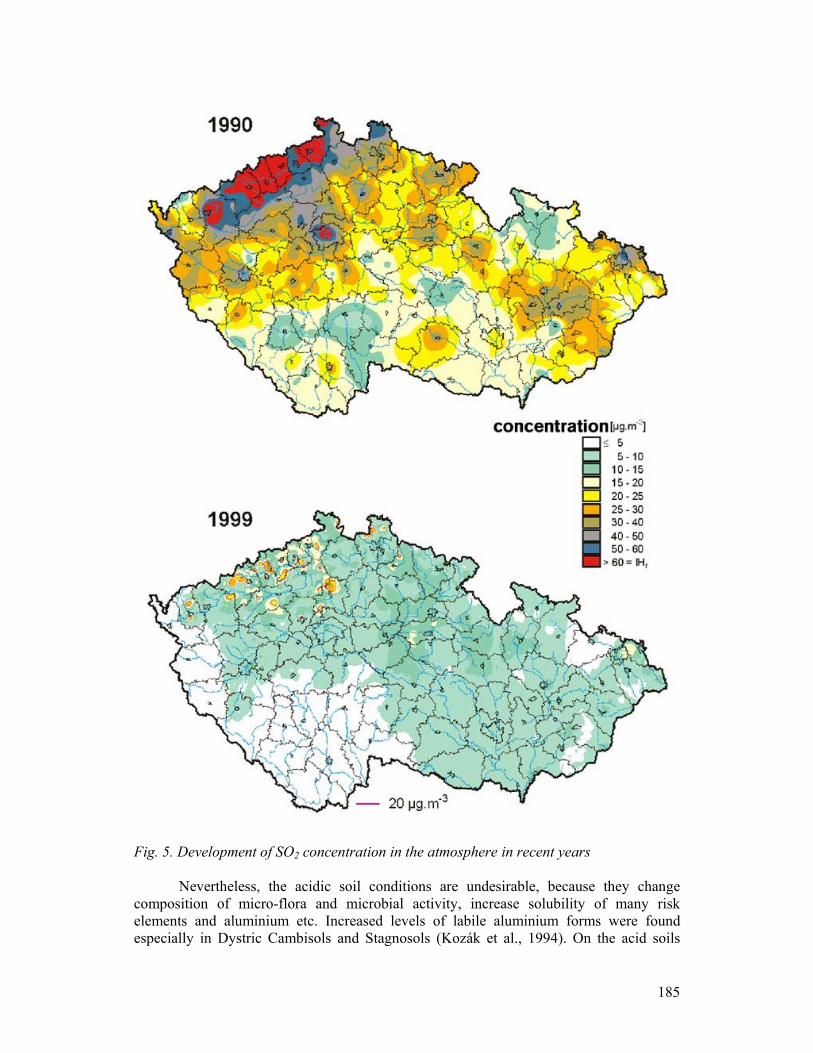
185
Fig. 5. Development of SO2 concentration in the atmosphere in recent years
Nevertheless, the acidic soil conditions are undesirable, because they change
composition of micro-flora and microbial activity, increase solubility of many risk elements and aluminium etc. Increased levels of labile aluminium forms were found especially in Dystric Cambisols and Stagnosols (Kozák et al., 1994). On the acid soils

186
used in agriculture, regular liming is necessary to keep the pH values in an acceptable range.
Even worse situation is in mountain forest soils, where pH values around 3 were found in Dystric Cambisols and Podzols (Kozák and Borůvka, 1998, Borůvka et al., 1999). However, beside the influence of acid deposition, the deciduous forests themselves play an important role in soil acidification in the mountainous regions (Borůvka et al., 1998). Table 7. Soil acidity on arable land and grassland in the Czech Republic (Source: Ministry of Agriculture, 1995a)
Soil category Arable land (%) Grassland (%) Strongly alkalic 0.3 0.0 Alkalic 13.6 2.9 Neutral 34.5 27.2 Slightly acidic 36.6 40.3 Acidic 9.7 14.4 Strongly acidic 4.2 10.5 Extremely acidic 1.2 4.7
pH data from dystric Cambisols and Podzols of forest sites do not show
convincingly that soil acidification has occurred. In arable soils it was found that even strong liming did not change the base saturation in the B horizons, so that this feature was permanent enough to be used in general soil taxonomy.
Loss of organic matter
Soil dehumification trends have been investigated by means of retrospective monitoring (Chvátal, 1997). It has been found that dehumification took place during the last 30-40 years only in regions of dystric Cambisols which were affected by liming, erosion, and deep ploughing and in drained Stagnosols and Gleysols. Soil pollution
Main soil pollutants are risk elements and persistent organic xenobiotics, mainly of anthropogenic origin. However, the pollution is rather limited to certain regions and point contamination prevails. The most endangered areas by both groups of pollutants are Northern Bohemia (thermal power plants, chemical industry), Northern Moravia (heavy industry), Prague and its surroundings (emissions from transportation), and Fluvisols in the alluvia of big rivers (Elbe, Morava) flooded with waters polluted by industrial and municipal wastes. A map of relative background contents of a group of risk elements is shown on Fig. 6 as an example.
Figure 7 shows the relative number of soil samples with risk elements content exceeding maximum tolerable values given in Table 8. Arsenic, Cd, Ni, Pb and Cr are of highest concern, however, only in the case of Cd the limit values are exceeded on more than 1 % of the total agricultural land. The results of soil monitoring carried in 1990 to 1993 showed that the limit value of one or more heavy metals was exceeded on only 2.6 % of the agricultural land (Central Institute for Agricultural Supervision and Testing, 1994). Recently, new system of limit criteria more specified for different soil units and recognising three levels of risk element cotent in soils was proposed (Podlešáková and Němeček, 1996, Podlešáková et al., 1996)
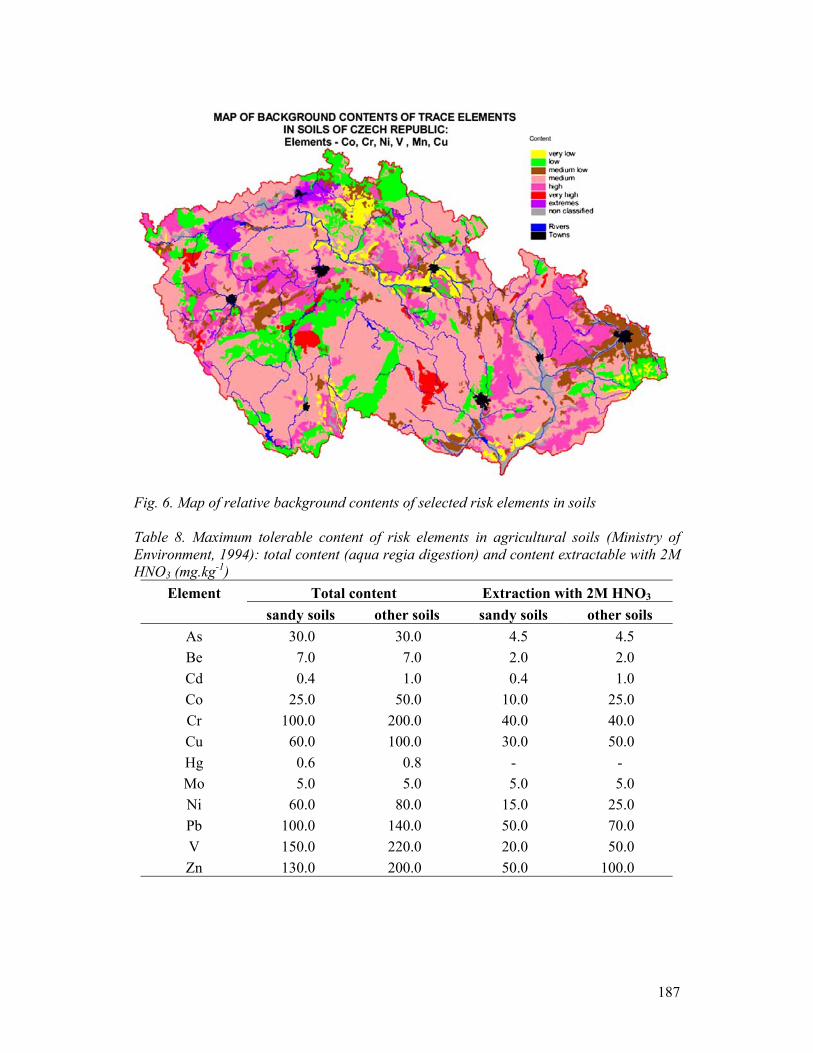
187
Fig. 6. Map of relative background contents of selected risk elements in soils
Table 8. Maximum tolerable content of risk elements in agricultural soils (Ministry of Environment, 1994): total content (aqua regia digestion) and content extractable with 2M HNO3 (mg.kg-1)
Element Total content Extraction with 2M HNO3 sandy soils other soils sandy soils other soils
As 30.0 30.0 4.5 4.5 Be 7.0 7.0 2.0 2.0 Cd 0.4 1.0 0.4 1.0 Co 25.0 50.0 10.0 25.0 Cr 100.0 200.0 40.0 40.0 Cu 60.0 100.0 30.0 50.0 Hg 0.6 0.8 - - Mo 5.0 5.0 5.0 5.0 Ni 60.0 80.0 15.0 25.0 Pb 100.0 140.0 50.0 70.0 V 150.0 220.0 20.0 50.0 Zn 130.0 200.0 50.0 100.0
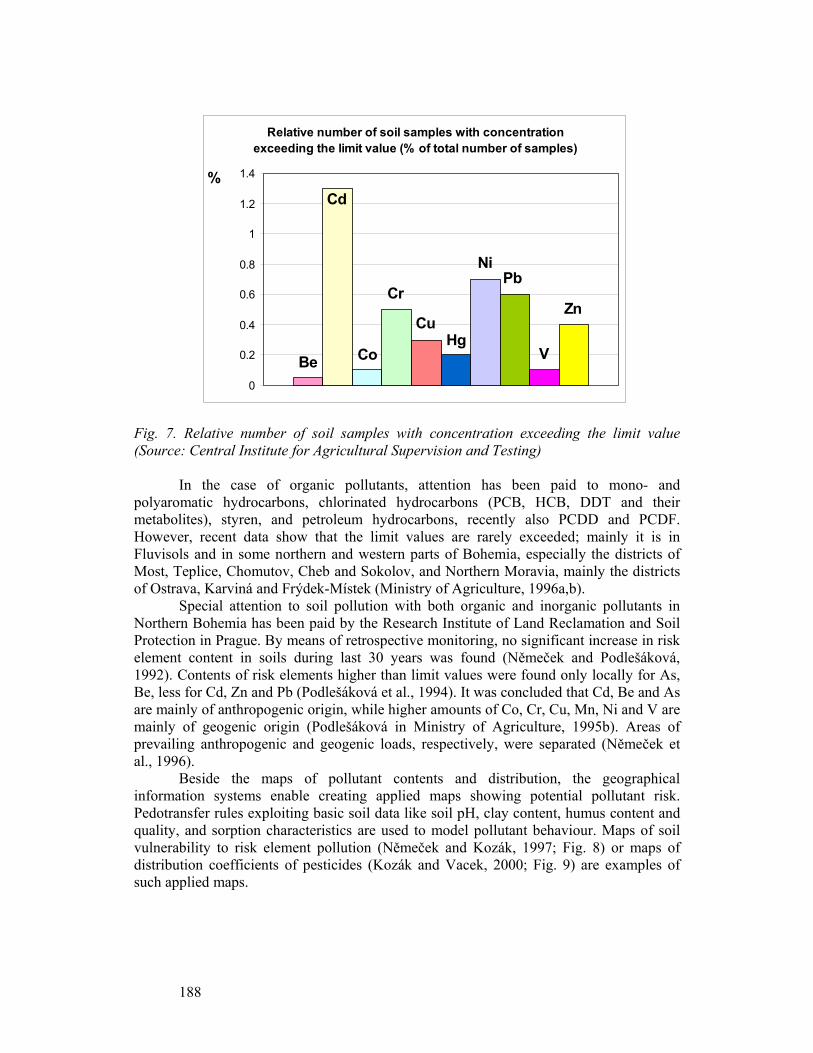
188
Fig. 7. Relative number of soil samples with concentration exceeding the limit value (Source: Central Institute for Agricultural Supervision and Testing)
In the case of organic pollutants, attention has been paid to mono- and
polyaromatic hydrocarbons, chlorinated hydrocarbons (PCB, HCB, DDT and their metabolites), styren, and petroleum hydrocarbons, recently also PCDD and PCDF. However, recent data show that the limit values are rarely exceeded; mainly it is in Fluvisols and in some northern and western parts of Bohemia, especially the districts of Most, Teplice, Chomutov, Cheb and Sokolov, and Northern Moravia, mainly the districts of Ostrava, Karviná and Frýdek-Místek (Ministry of Agriculture, 1996a,b).
Special attention to soil pollution with both organic and inorganic pollutants in Northern Bohemia has been paid by the Research Institute of Land Reclamation and Soil Protection in Prague. By means of retrospective monitoring, no significant increase in risk element content in soils during last 30 years was found (Němeček and Podlešáková, 1992). Contents of risk elements higher than limit values were found only locally for As, Be, less for Cd, Zn and Pb (Podlešáková et al., 1994). It was concluded that Cd, Be and As are mainly of anthropogenic origin, while higher amounts of Co, Cr, Cu, Mn, Ni and V are mainly of geogenic origin (Podlešáková in Ministry of Agriculture, 1995b). Areas of prevailing anthropogenic and geogenic loads, respectively, were separated (Němeček et al., 1996).
Beside the maps of pollutant contents and distribution, the geographical information systems enable creating applied maps showing potential pollutant risk. Pedotransfer rules exploiting basic soil data like soil pH, clay content, humus content and quality, and sorption characteristics are used to model pollutant behaviour. Maps of soil vulnerability to risk element pollution (Němeček and Kozák, 1997; Fig. 8) or maps of distribution coefficients of pesticides (Kozák and Vacek, 2000; Fig. 9) are examples of such applied maps.
Relative number of soil samples with concentration exceeding the limit value (% of total number of samples)
Be Co
Zn
V
PbNi
HgCu
Cr
Cd
0
0.2
0.4
0.6
0.8
1
1.2
1.4%
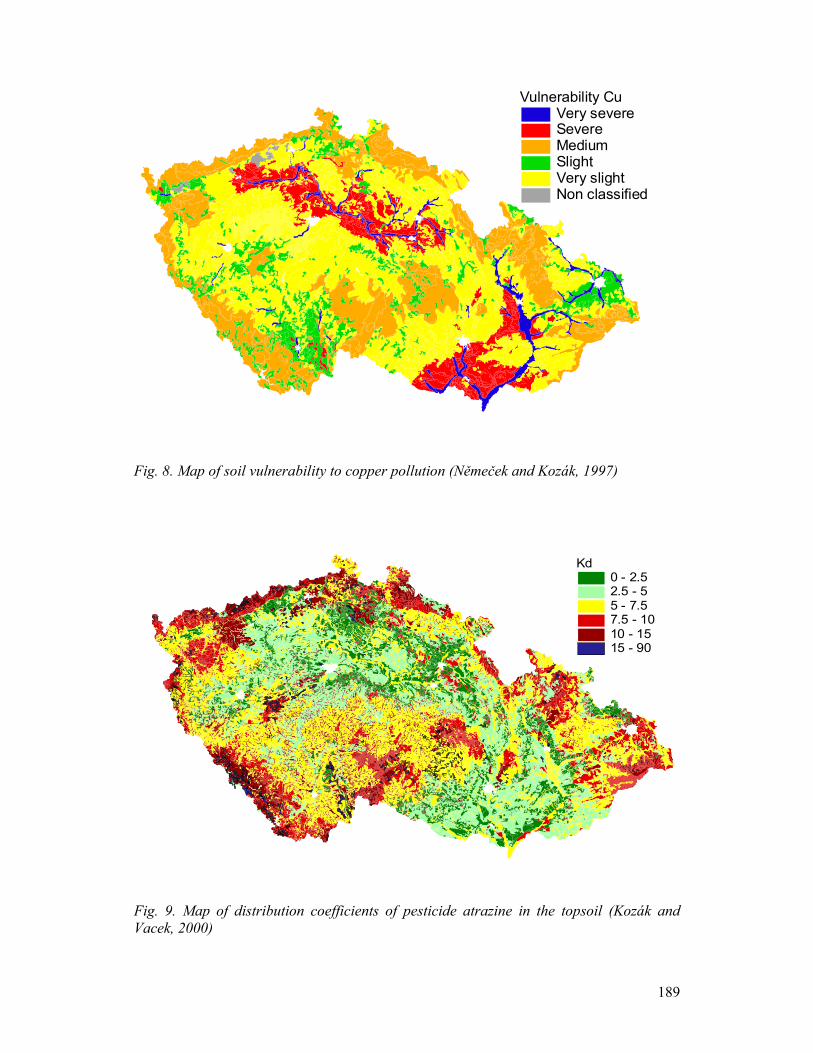
189
Kd0 - 2.52.5 - 55 - 7.57.5 - 1010 - 1515 - 90
Vulnerability CuVery severeSevereMediumSlightVery slightNon classified
Fig. 8. Map of soil vulnerability to copper pollution (Němeček and Kozák, 1997)
Fig. 9. Map of distribution coefficients of pesticide atrazine in the topsoil (Kozák and Vacek, 2000)
190
CONCLUSION
Prevailing soil fertility in the Czech Republic is rather medium or low, however, the main limitations of agricultural production are of economic kind. Soil degradation and in particular pollution is not of a large extent as it used to be presented generally in the early 1990’s. Nevertheless, it does not mean that soil ability to handle pollutant loadings and self-recover from degradation could be overestimated. Without careful soil management and cautious monitoring and control of the factors influencing soil development it is impossible to preserve all the soil production and non-production functions for the future, which is an essential condition of sustainable development.
Acknowledgement
This contribution was partially supported by the grant No. 526/00/0620 of the Grant Agency of the Czech Republic. The authors thank Karel Němeček for preparing the maps for this publication.
191
REFERENCES
Borůvka, L., Kozák, J., Drábek, O., 1998: Comparison of selected soil properties potentially affected by soil acidification between the regions of Krušné hory, Jizerské hory and Šumava. Pedologické dny 1998, Praha – Suchdol, 17.-18. listopadu 1998. In Pedologické dny 1998, sborník referátů, Česká pedologická společnost, Praha: p. 71
Borůvka, L., Kozák, J., Drábek, O., 1999: Species of Al ions in soils of Northern Bohemian mountains as related to selected soil characteristics. Rostl. Výr. 45: 229-236.
Central Institute for Agricultural Supervision and Testing, 1994: Průzkum obsahu rizikových prvků v půdách České republiky (1990-1993). State Institute for Agricultural Supervision and Testing: 67pp.
Chvátal, V., 1997: Development of soil properties in basal monitoring and in the system of soil fertility control. In: Soil monitoring. Proceedings from the III. international conference. Central Institute for Supervising and Testing in Agriculture, Brno: 19-21.
Kozák, J., 1999: Tvorba digitalizovaných map o půdě a terénu České republiky. Pedologické dny, Olomouc, 2 s.
Kozák, J., Borůvka, L., 1998: Species of Al ions as related to some characteristics of both agricultural and forest soils of the Šumava region. Rostl. Výr. 44: 419-426.
Kozák, J., Borůvka, L., Krištoufková, S., Mach, J., 1994: Toxické formy Al v půdním roztoku a možnosti jejich eliminace. Final report of the project Z-783-01-03: 12pp.
Kozák, J., Němeček, J., Jetmar, M., 1996: The database of soil information systems – PUGIS. Rostl. Výr. 42: 529-534.
Kozák, J., Němeček, J., Vacek, O., 1996: Digitalizované půdní mapy a datové báze v návaznosti na příslušné mezinárodní standardy. Pedologické dny 1996, sborník referátů. Česká pedologická společnost, Praha: 2-8.
Kozák, J., Vacek, O., 2000: Pedotransfer functions as a tool for estimation of pesticide behavior in soils. Rostl. Výr. 46: 69-76.
Matula, S. (ed.), 2000: Water resources management in the Czech Republic. In Water resources management in the Czech Republic, Hungary, Lithuania, Slovenia. International Commission on Irrigation and Drainage. DVWK Bulletin 21, GFA, Hennef: 1-189.
Ministry of Agriculture, 1995a: Půda, situační a výhledová zpráva. MZe ČR, Praha: 54 pp. Ministry of Agriculture, 1995b: Výsledky kontroly a monitoringu cizorodých látek -
Situace v roce 1994. Ministry of Agriculture, Prague: 83pp. Ministry of Agriculture, 1996a: Výsledky kontroly a monitoringu cizorodých látek -
Situace v roce 1995. Ministry of Agriculture, Prague: 87pp. Ministry of Agriculture, 1996b: Zpráva o výsledcích kontroly a monitoringu cizorodých
látek v roce 1996. Ministry of Agriculture, Prague: 87pp. Ministry of Agriculture, 1999: Půda, situační a výhledová zpráva. MZe ČR, Praha: 58 pp. Ministry of Environment, 1994: Vyhláška MŽP č. 13/1994Sb., kterou se upravují některé
podrobnosti ochrany zemědělského půdního fondu. Ministry of Environment of the Czech Republic, Prague.
Němeček, J., Kozák, J., 1997: Status of soil maps, information about human-induced land degradation and approaches to soil vulnerability asessment in the Czech Republic. Implementation of a Soil Degradation and Vulnerability Database for Central and Eastern Europe (SOVEUR Workshop), Wageningen, 1-3.10.: 35-38.
Němeček, J., Podlešáková, E., 1992: Retrospektivní experimentální monitoring rizikových prvků v půdach ČR. Rostl. Výr. 38: 433-436.
192
Němeček, J., et al., 2001: Taxonomický klasifikační systém půd České republiky. ČZU, Praha: 78pp.
Podlešáková, E., Němeček, J., 1996: Kritéria kontaminace a intoxikace půd. Rostl. Výr. 42: 357-364.
Podlešáková, E., Němeček, J., Hálová, G., 1996: Návrh limitů kontaminace půd potenciálně rizikovými stopovými prvky pro ČR. Rostl. Výr. 42: 119-125.
Podlešáková, E., Němeček, J., Vácha, R., 1994: Kontaminace půd severočeského regionu rizikovými prvky. Rostl. Výr. 40: 123-130.
193
THE PROBLEMS OF LAND DEGRADATION AND DESERTIFICATION
IN SOUTH CAUCASUS Prof. T.Urushadze, Dr. A.Urushadze
Georgian Soil Science Society, Tbilisi, Georgia The countries of South Caucasus are characterized by main types of soil degradation (loss of organic matters and biological activity, physical degradation, soil erosion, water logging, salinization and alkalization, acidification , loss of chemical fertility, disappearance of soil etc). Among main types of soil degradation the most significant is soil erosion caused by intensive degradation and desertification of land.. The countries of South Caucasus are situated in the area with intensive degradation and desertification of land. Most territories of these countries occupy arid and semi arid zones. These zones with intensive agriculture are rather densely populated. Negative climatic as well as anthropogenic influence result in land degradation and desertification. This undesirable tendency with the poor demography in the background may lead to the negative processes including political that may become difficult to control. The process of degradation and desertification is becoming worse year by year. In this connection the study of soil cover, land degradation and desertification is considered essential together with the study of the risk of erosion. Making series of soil maps in scale 1 : 100 000 with the use of GTS as well as effective monitoring of the above processes are also of crucial importance. The process of degradation and desertification in the countries of South Caucasus is the result of joint influence of both natural (climatic, hydrogeological, morphodinamiic and soil) and anthropogenic factors. The process of degradation is a complicated conglomerate of ecological, social, economic, climatic and other problems. Progressive tendency of land degradation and desertification raises a menace of migration of local population - a, so called, "soil migration" of population. This undesirable tendency with the poor demographic situation in the background may lead to the negative processes including political, that may become difficult to control. Considerable territories of Georgia, Azerbaijan and Armenia are situated in arid and semiarid zones, which are intensively used for agricultural purposes. In Georgia these territories are mainly covered with vineyards, orchards, corn fields (mainly winter wheat) and vegetable crops. It is also a zone of winter pastures. In Shida Kartli region planted areas make 60 426 ha (10 % of the country's whole planted area), in Kakheti - 171 222 ha (29 %), in Kvemo Kartli - 108 017 ha (18 %). On the whole, 339665 ha planted area is situated in arid zones, that makes 75 % of all country's whole planted area. In 2001 in Shida Kartli 95 573 tons of corn were harvested (12 % of the country's reserves), among them 59 849 tons of wheat (26 %) and 25 636 tons of maize (5 %). In Kakheti 182 948 tons of corn were harvested (23 %), among them 92 537 tons of wheat (41 %) and 81
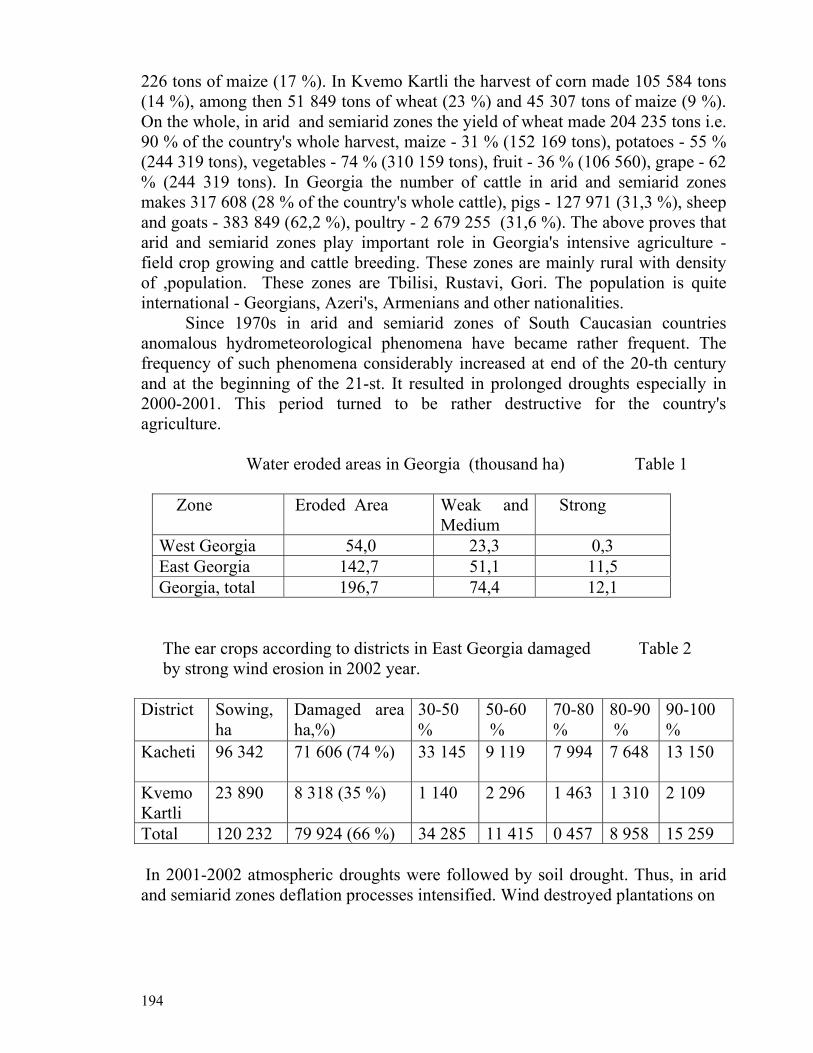
194
226 tons of maize (17 %). In Kvemo Kartli the harvest of corn made 105 584 tons (14 %), among then 51 849 tons of wheat (23 %) and 45 307 tons of maize (9 %). On the whole, in arid and semiarid zones the yield of wheat made 204 235 tons i.e. 90 % of the country's whole harvest, maize - 31 % (152 169 tons), potatoes - 55 % (244 319 tons), vegetables - 74 % (310 159 tons), fruit - 36 % (106 560), grape - 62 % (244 319 tons). In Georgia the number of cattle in arid and semiarid zones makes 317 608 (28 % of the country's whole cattle), pigs - 127 971 (31,3 %), sheep and goats - 383 849 (62,2 %), poultry - 2 679 255 (31,6 %). The above proves that arid and semiarid zones play important role in Georgia's intensive agriculture - field crop growing and cattle breeding. These zones are mainly rural with density of ,population. These zones are Tbilisi, Rustavi, Gori. The population is quite international - Georgians, Azeri's, Armenians and other nationalities. Since 1970s in arid and semiarid zones of South Caucasian countries anomalous hydrometeorological phenomena have became rather frequent. The frequency of such phenomena considerably increased at end of the 20-th century and at the beginning of the 21-st. It resulted in prolonged droughts especially in 2000-2001. This period turned to be rather destructive for the country's agriculture. Water eroded areas in Georgia (thousand ha) Table 1
Zone Eroded Area
Weak and Medium
Strong
West Georgia 54,0 23,3 0,3 East Georgia 142,7 51,1 11,5 Georgia, total 196,7 74,4 12,1
The ear crops according to districts in East Georgia damaged Table 2 by strong wind erosion in 2002 year. District Sowing,
ha Damaged area ha,%)
30-50 %
50-60 %
70-80 %
80-90 %
90-100 %
Kacheti 96 342 71 606 (74 %) 33 145
9 119 7 994 7 648 13 150
Kvemo Kartli
23 890 8 318 (35 %) 1 140 2 296 1 463 1 310 2 109
Total 120 232 79 924 (66 %) 34 285 11 415 0 457 8 958 15 259 In 2001-2002 atmospheric droughts were followed by soil drought. Thus, in arid and semiarid zones deflation processes intensified. Wind destroyed plantations on
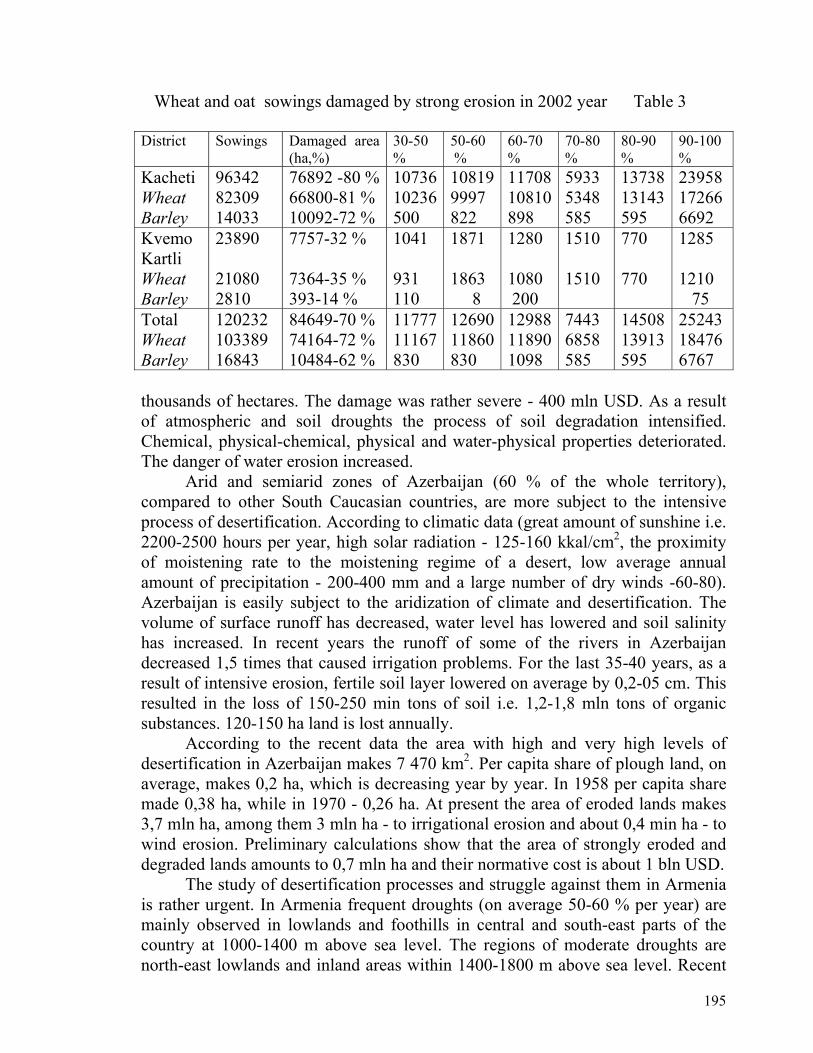
195
Wheat and oat sowings damaged by strong erosion in 2002 year Table 3 District Sowings Damaged area
(ha,%) 30-50 %
50-60 %
60-70 %
70-80 %
80-90 %
90-100 %
Kacheti Wheat Barley
96342 82309 14033
76892 -80 %66800-81 % 10092-72 %
1073610236500
108199997 822
1170810810898
5933 5348 585
1373813143595
23958 17266 6692
Kvemo Kartli Wheat Barley
23890 21080 2810
7757-32 % 7364-35 % 393-14 %
1041 931 110
1871 1863 8
1280 1080 200
1510 1510
770 770
1285 1210 75
Total Wheat Barley
120232 103389 16843
84649-70 % 74164-72 % 10484-62 %
1177711167830
1269011860830
12988118901098
7443 6858 585
1450813913595
25243 18476 6767
thousands of hectares. The damage was rather severe - 400 mln USD. As a result of atmospheric and soil droughts the process of soil degradation intensified. Chemical, physical-chemical, physical and water-physical properties deteriorated. The danger of water erosion increased. Arid and semiarid zones of Azerbaijan (60 % of the whole territory), compared to other South Caucasian countries, are more subject to the intensive process of desertification. According to climatic data (great amount of sunshine i.e. 2200-2500 hours per year, high solar radiation - 125-160 kkal/cm2, the proximity of moistening rate to the moistening regime of a desert, low average annual amount of precipitation - 200-400 mm and a large number of dry winds -60-80). Azerbaijan is easily subject to the aridization of climate and desertification. The volume of surface runoff has decreased, water level has lowered and soil salinity has increased. In recent years the runoff of some of the rivers in Azerbaijan decreased 1,5 times that caused irrigation problems. For the last 35-40 years, as a result of intensive erosion, fertile soil layer lowered on average by 0,2-05 cm. This resulted in the loss of 150-250 min tons of soil i.e. 1,2-1,8 mln tons of organic substances. 120-150 ha land is lost annually. According to the recent data the area with high and very high levels of desertification in Azerbaijan makes 7 470 km2. Per capita share of plough land, on average, makes 0,2 ha, which is decreasing year by year. In 1958 per capita share made 0,38 ha, while in 1970 - 0,26 ha. At present the area of eroded lands makes 3,7 mln ha, among them 3 mln ha - to irrigational erosion and about 0,4 min ha - to wind erosion. Preliminary calculations show that the area of strongly eroded and degraded lands amounts to 0,7 mln ha and their normative cost is about 1 bln USD. The study of desertification processes and struggle against them in Armenia is rather urgent. In Armenia frequent droughts (on average 50-60 % per year) are mainly observed in lowlands and foothills in central and south-east parts of the country at 1000-1400 m above sea level. The regions of moderate droughts are north-east lowlands and inland areas within 1400-1800 m above sea level. Recent
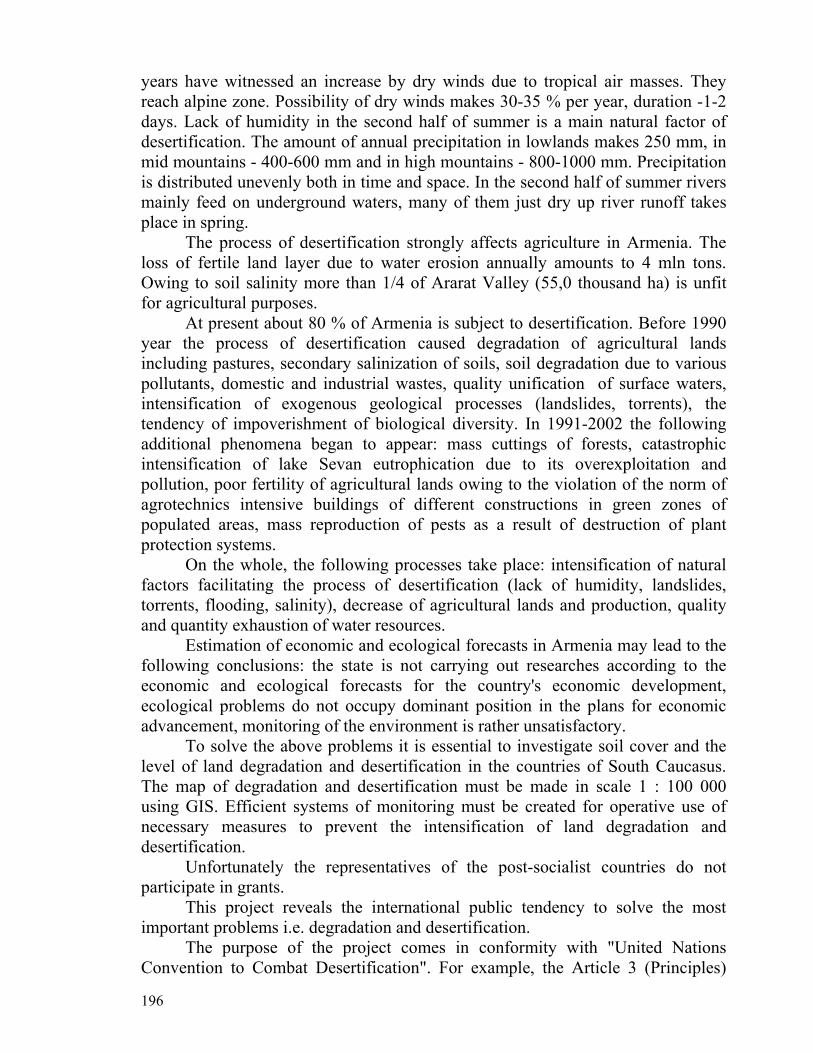
196
years have witnessed an increase by dry winds due to tropical air masses. They reach alpine zone. Possibility of dry winds makes 30-35 % per year, duration -1-2 days. Lack of humidity in the second half of summer is a main natural factor of desertification. The amount of annual precipitation in lowlands makes 250 mm, in mid mountains - 400-600 mm and in high mountains - 800-1000 mm. Precipitation is distributed unevenly both in time and space. In the second half of summer rivers mainly feed on underground waters, many of them just dry up river runoff takes place in spring. The process of desertification strongly affects agriculture in Armenia. The loss of fertile land layer due to water erosion annually amounts to 4 mln tons. Owing to soil salinity more than 1/4 of Ararat Valley (55,0 thousand ha) is unfit for agricultural purposes. At present about 80 % of Armenia is subject to desertification. Before 1990 year the process of desertification caused degradation of agricultural lands including pastures, secondary salinization of soils, soil degradation due to various pollutants, domestic and industrial wastes, quality unification of surface waters, intensification of exogenous geological processes (landslides, torrents), the tendency of impoverishment of biological diversity. In 1991-2002 the following additional phenomena began to appear: mass cuttings of forests, catastrophic intensification of lake Sevan eutrophication due to its overexploitation and pollution, poor fertility of agricultural lands owing to the violation of the norm of agrotechnics intensive buildings of different constructions in green zones of populated areas, mass reproduction of pests as a result of destruction of plant protection systems. On the whole, the following processes take place: intensification of natural factors facilitating the process of desertification (lack of humidity, landslides, torrents, flooding, salinity), decrease of agricultural lands and production, quality and quantity exhaustion of water resources. Estimation of economic and ecological forecasts in Armenia may lead to the following conclusions: the state is not carrying out researches according to the economic and ecological forecasts for the country's economic development, ecological problems do not occupy dominant position in the plans for economic advancement, monitoring of the environment is rather unsatisfactory. To solve the above problems it is essential to investigate soil cover and the level of land degradation and desertification in the countries of South Caucasus. The map of degradation and desertification must be made in scale 1 : 100 000 using GIS. Efficient systems of monitoring must be created for operative use of necessary measures to prevent the intensification of land degradation and desertification. Unfortunately the representatives of the post-socialist countries do not participate in grants. This project reveals the international public tendency to solve the most important problems i.e. degradation and desertification. The purpose of the project comes in conformity with "United Nations Convention to Combat Desertification". For example, the Article 3 (Principles)
197
involves: ". . . (b) the Parties should in a spirit of international solidarity and partnership, improve cooperation and coordination at subregional, regional and international levels, . . ."; the Article 4 (General Obligations) involves: "... the Parties shall: . . .(e) strengthen subregional, regional and international cooperation" and the Article 10 (National Action Programmes) involves: " . . . 4. Taking into account the circumstance and requirements specific to each affected country Party, national action programmes include, . . . in some . . . of the following priority fields . . . . strengthening of capabilities for assessment and systematic observation, . . .". The project carries a subregional significance and corresponds to the agreements between Georgia and Armenia and Georgia and Azerbaijan in the field of environment. The project involves that the Caucasus is one united region and ecological problems can be solved only with joint efforts.
198
Land degradation in Hungary
Erika MICHÉLI1 , György VÁRALLYAY2, László PÁSZTOR2, József SZABÓ2
1. Department of Soil Science and Agricultural Chemistry, Szent István University, Gödöllő, Hungary 2 Research Institute for Soil Science and Agricultural Chemistry of the Hungarian Academy of Sciences, Budapest, Hungary Abstract
Land and soil degradation is a complex process in which several components of soil deterioration contribute to the loss of land and soil and/or to the limitation of their normal functions. Since degradation generally affects land and soil through the same processes, this paper will focus on the major types of the degradation processes that occur in Hungary. The major types of degradation in Hungary are: erosion (on 24% of total land area), physical degradation (on 14% of total land area), acidification (on 12 % of total land area), salinization/alkalization (on 8% of total land area), extreme drying and water logging (on 5% of total land area). Associated with these degradation processes biological degradation and decrease of buffering capacity occur on broad areas. Introduction
Soils represent an important part of the natural resources of Hungary. The major factors that determine the types and quality of our soils are the highly variable physiographic, geologic and climatic conditions of the Carpathian basin, the various types of land use and farming practices and the changing agricultural and environmental policies. Rational land use and management, ensuring normal soil functions and the maintenance or increase of soil productivity, require adequate information on the soil. A large amount of information on the various natural factors (climate-weather, surface and subsurface waters, geology, geomorphology, vegetation) is available in the country (The National Atlas of Hungary, 1989). Information on soil resources resulted from mapping activities during the past 50 years on national (1:500,000), regional (1:100,000), farm (1:10,000-1:25,000) and field level scales (1:5,000-1:10,000). Thematic soil maps were also prepared for the whole country in the scale of 1:25,000 and for 70% of the agricultural area in the scale of 1:10,000 (Stefanovits and Szűcs, 1961; Várallyay et al., 1985; Stefanovits and Duck, 1964; Szabolcs et al., 1974; Várallyay and Leszták, 1989). In the frame of these projects land degradation processes were also thoroughly investigated and mapped (Várallyay 1989). Some of the originally analogue maps are available in digitized form and are part of National Soil Information Data Base (Várallyay et.al. 1998, Szabó, 1999). Types of Land degradation in Hungary Erosion
The major causes of erosion Hungary are related to the geological and topographic
setting, inappropriate land use, tillage practices and residue management and other types of poor management. Another influencing factor is the lack of an adequate agricultural and
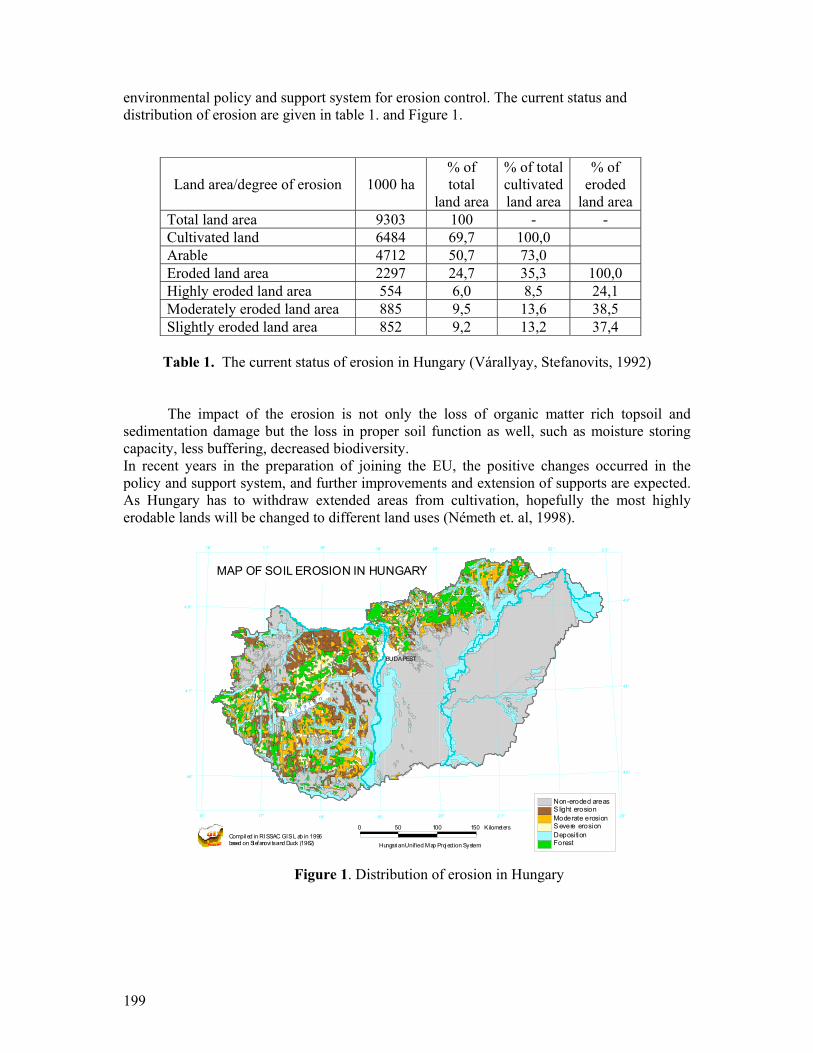
199
environmental policy and support system for erosion control. The current status and distribution of erosion are given in table 1. and Figure 1.
Land area/degree of erosion 1000 ha % of total
land area
% of total cultivatedland area
% of eroded
land area Total land area 9303 100 - - Cultivated land 6484 69,7 100,0 Arable 4712 50,7 73,0 Eroded land area 2297 24,7 35,3 100,0 Highly eroded land area 554 6,0 8,5 24,1 Moderately eroded land area 885 9,5 13,6 38,5 Slightly eroded land area 852 9,2 13,2 37,4
Table 1. The current status of erosion in Hungary (Várallyay, Stefanovits, 1992)
The impact of the erosion is not only the loss of organic matter rich topsoil and sedimentation damage but the loss in proper soil function as well, such as moisture storing capacity, less buffering, decreased biodiversity. In recent years in the preparation of joining the EU, the positive changes occurred in the policy and support system, and further improvements and extension of supports are expected. As Hungary has to withdraw extended areas from cultivation, hopefully the most highly erodable lands will be changed to different land uses (Németh et. al, 1998).
16° 1 7° 18° 19° 20° 21° 22 ° 2 3°
22 ° 23°2 1°20°19°18°17°16°
4 8°4 8°
47°4 7°
4 6°46°
BUDAPEST
B a l a t o
n
MAP OF SOIL EROSION IN HUNGARY
Non-eroded areasS light erosionModerate erosionS evere erosionDepositionForest
Compil ed in RISSAC GIS L ab in 1996based on Stefanovi ts and Duck (1962) Hungari an Unif ied Map Proj ect ion System
0 50 100 150 Kilometers
Figure 1. Distribution of erosion in Hungary
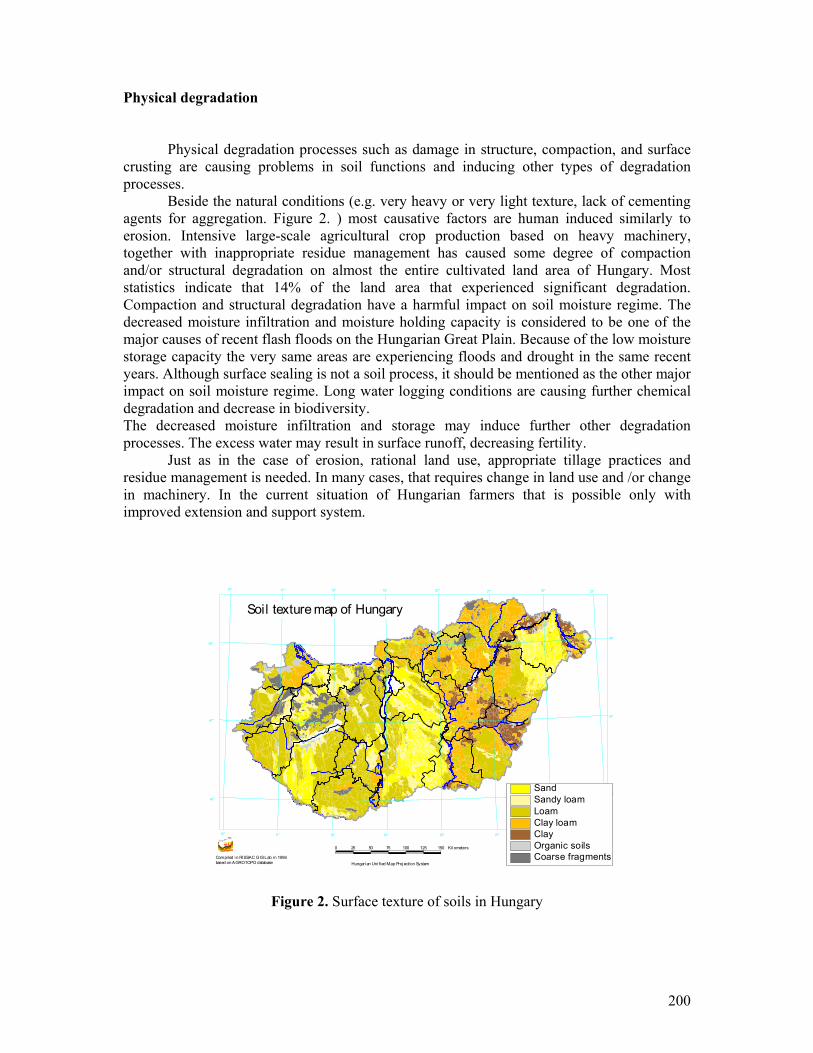
200
Physical degradation
Physical degradation processes such as damage in structure, compaction, and surface crusting are causing problems in soil functions and inducing other types of degradation processes.
Beside the natural conditions (e.g. very heavy or very light texture, lack of cementing agents for aggregation. Figure 2. ) most causative factors are human induced similarly to erosion. Intensive large-scale agricultural crop production based on heavy machinery, together with inappropriate residue management has caused some degree of compaction and/or structural degradation on almost the entire cultivated land area of Hungary. Most statistics indicate that 14% of the land area that experienced significant degradation. Compaction and structural degradation have a harmful impact on soil moisture regime. The decreased moisture infiltration and moisture holding capacity is considered to be one of the major causes of recent flash floods on the Hungarian Great Plain. Because of the low moisture storage capacity the very same areas are experiencing floods and drought in the same recent years. Although surface sealing is not a soil process, it should be mentioned as the other major impact on soil moisture regime. Long water logging conditions are causing further chemical degradation and decrease in biodiversity. The decreased moisture infiltration and storage may induce further other degradation processes. The excess water may result in surface runoff, decreasing fertility. Just as in the case of erosion, rational land use, appropriate tillage practices and residue management is needed. In many cases, that requires change in land use and /or change in machinery. In the current situation of Hungarian farmers that is possible only with improved extension and support system.
B a l a t o
n
46°46°
47°47°
48°48°
16° 17° 18° 19° 20° 21° 23°22°
23°22°21°20°19°18°17°16°
SandSandy loamLoamClay loamClayOrganic soilsCoarse fragments
Soil texture map of Hungary
Compiled in RISSAC GIS Lab in 1996based on AGROTOPO database Hungarian Uni fied Map Projecti on System
0 25 50 75 100 125 150 Kilometers
Figure 2. Surface texture of soils in Hungary

201
Acidification Based on the survey of soils of Hungary and the survey of agroecological potential of Hungary, 12% of the Hungarian soils are strongly acidic and 43% are slightly acidic. (Stefanovits, 1977; Várallyay et al., 1980, 1993). Acid soils can be mainly found in the West and South Transdanubia, the Transdanubia Mountains and the Northern Mountains, and the alluvial regions of Tisza and Rába rivers (Figure 3.). The Hungarian Soil Information and Monitoring System (TIM) is based on 1237 observation sites. Out of these sites, 22 are below pH 4.5, 147 are between pH 4.51-5.50, and 330 are between pH 5.51-6.8. (Szabóné, 1997)
16° 17° 18° 19° 20° 21° 22° 23°
22°21°20°19°18°17°16°
BUD APEST
B a l a t o
n
SUSCEPTIBILITY OF SOILS TOACIDIFICATION IN HUNGARY
Degree of haz ardStrongly acidic soi lsHighly susc eptible soi lsMedium susceptible soilsModerately susceptible soi lsSl ightly susceptible soilsNon susceptible soi lsCompi led i n RISSAC GIS Lab in 1996
based on HUNSOTER database H ungarian Uni f ied Map Proj ect ion System
0 50 100 150 Kil ometers
Figure 3. Map of Susceptibility of soils to acidification in Hungary
The major natural cause of soil acidification is the leaching of neutral or alkaline weathering products through the soil by the downward movement of precipitation. Among the anthropogenic influences the followings are important in the country: agricultural practices (harvesting crops, application of acidifying fertilizers), and acidic atmospheric deposition (SOx, NOx).
Stefanovits (1986) examined long-term acidification tendencies on forested and adjacent agricultural sites, from 1955 to 1985. He examined the pH and hydrolytic acidity values of these surface soils with the aim of comparing the differences in soil chemical properties under forest vegetation and under agricultural use. He found significant acidity increase between 1955 and 1985 in both forested and agricultural sites. Studies of the same sites in 1997 did not show significant further acidification, in fact several sites showed higher pH than in 1985. Among the reasons might be, that due to some new environmental policies acidic atmospheric deposition has decreased significantly (Figure 4.). In case of mineral fertilizer there was also a dramatic decrease in application rate and the elimination of acidifying (especially N fertilizers, mainly NH4NO3 and urea) products.
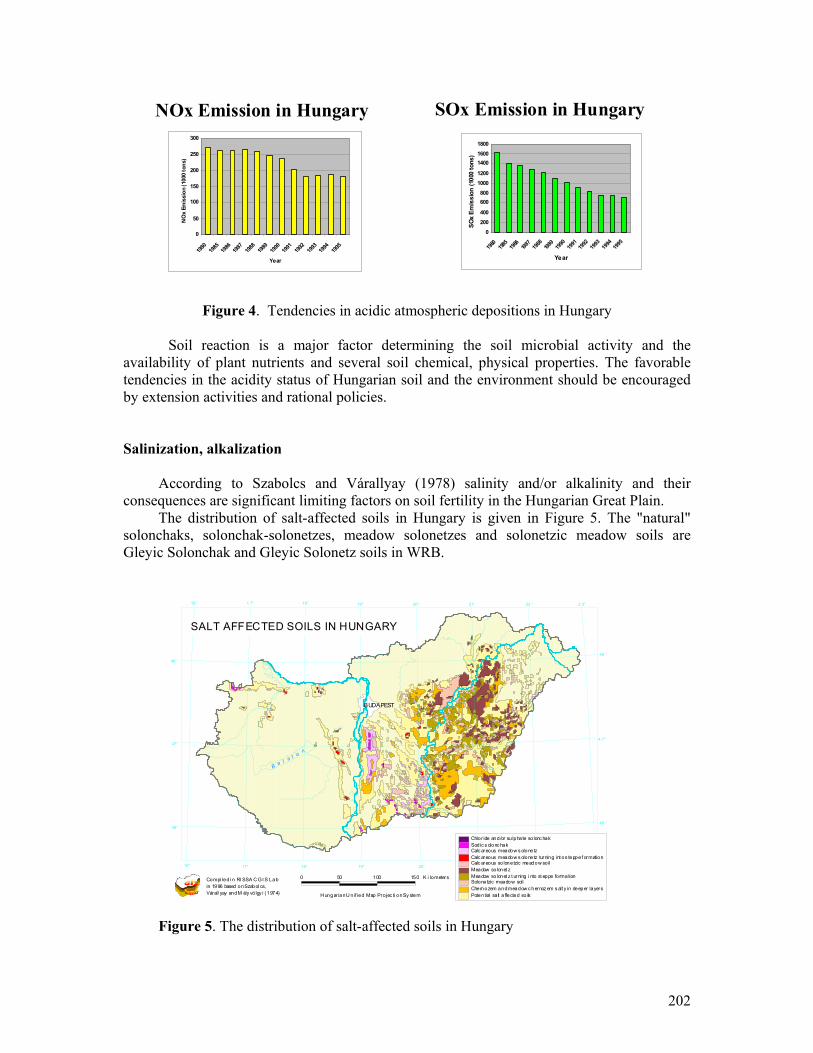
202
NOx Emission in Hungary
0
50
100
150
200
250
300
1980
1985
1986
1987
1988
1989
1990
1991
1992
1993
1994
1995
Year
NO
x Em
issi
on (1
000
tons
)
SOx Emission in Hungary
0200400
600800
10001200
140016001800
1980
1985
1986
1987
1988
1989
1990
1991
1992
1993
1994
1995
Year
SOx
Emis
sion
(100
0 to
ns)
Figure 4. Tendencies in acidic atmospheric depositions in Hungary
Soil reaction is a major factor determining the soil microbial activity and the
availability of plant nutrients and several soil chemical, physical properties. The favorable tendencies in the acidity status of Hungarian soil and the environment should be encouraged by extension activities and rational policies. Salinization, alkalization
According to Szabolcs and Várallyay (1978) salinity and/or alkalinity and their consequences are significant limiting factors on soil fertility in the Hungarian Great Plain.
The distribution of salt-affected soils in Hungary is given in Figure 5. The "natural" solonchaks, solonchak-solonetzes, meadow solonetzes and solonetzic meadow soils are Gleyic Solonchak and Gleyic Solonetz soils in WRB.
16° 1 7° 18° 19° 20° 21° 22 ° 2 3°
22° 2 3°2 1°20°19°18°17°16°
48°48 °
4 7°47°
46 °46°
BUDAPEST
B a l a t o n
SALT AFFECTED SOILS IN HUNGARY
Chlor ide and/or su lphate so lonc hakSodic s olonc hakCalc areous meadow s olonetzCalc areous meadow s olonetz turning int o s teppe f ormationCalc areous so lonetzic meadow so ilMeadow so lonet zMeadow so lonet z t urning i nto st eppe formationSolonetzic meadow soilChernozem and meadow c hernoz em s alt y in deeper layersPotential sa lt a ffected so ils
Compi led i n RI SSA C GI S Labin 1996 based on Szabol cs, Várall yay and M ély vö lgy i (1974) H ungar ian U nif ied Map Pro jec ti on Sy stem
0 50 100 150 K i lometers
Figure 5. The distribution of salt-affected soils in Hungary
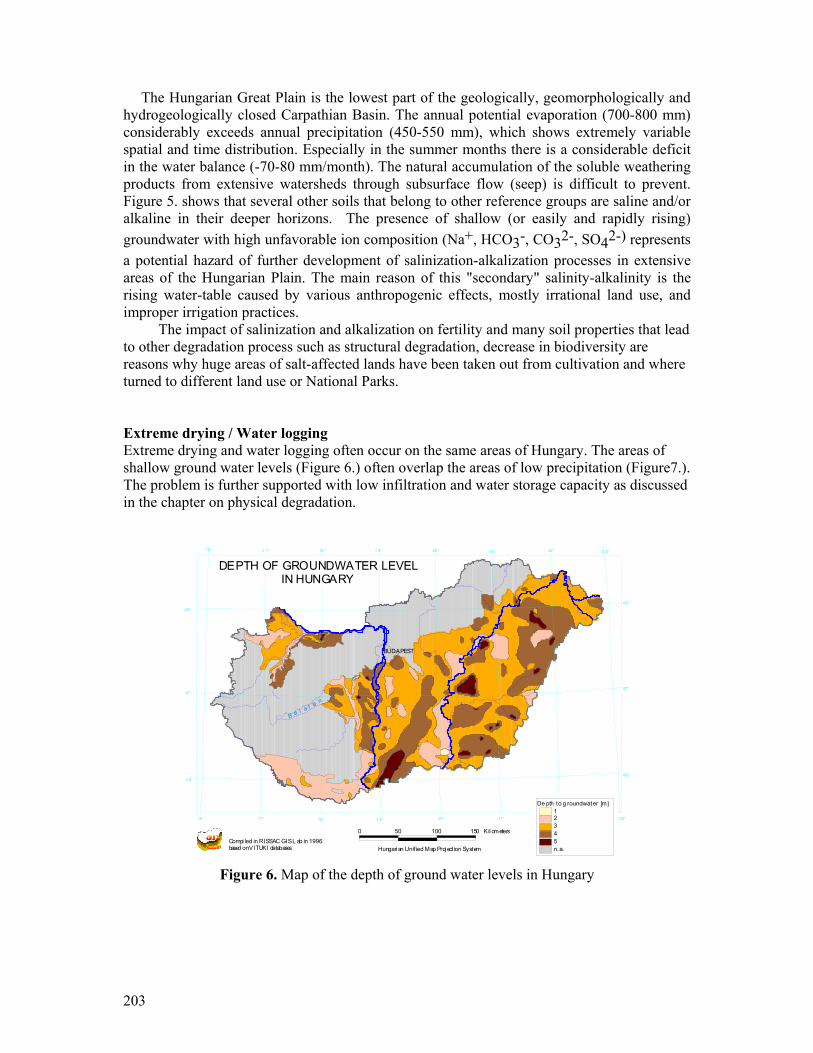
203
The Hungarian Great Plain is the lowest part of the geologically, geomorphologically and hydrogeologically closed Carpathian Basin. The annual potential evaporation (700-800 mm) considerably exceeds annual precipitation (450-550 mm), which shows extremely variable spatial and time distribution. Especially in the summer months there is a considerable deficit in the water balance (-70-80 mm/month). The natural accumulation of the soluble weathering products from extensive watersheds through subsurface flow (seep) is difficult to prevent. Figure 5. shows that several other soils that belong to other reference groups are saline and/or alkaline in their deeper horizons. The presence of shallow (or easily and rapidly rising) groundwater with high unfavorable ion composition (Na+, HCO3-, CO32-, SO42-) represents a potential hazard of further development of salinization-alkalization processes in extensive areas of the Hungarian Plain. The main reason of this "secondary" salinity-alkalinity is the rising water-table caused by various anthropogenic effects, mostly irrational land use, and improper irrigation practices.
The impact of salinization and alkalization on fertility and many soil properties that lead to other degradation process such as structural degradation, decrease in biodiversity are reasons why huge areas of salt-affected lands have been taken out from cultivation and where turned to different land use or National Parks. Extreme drying / Water logging Extreme drying and water logging often occur on the same areas of Hungary. The areas of shallow ground water levels (Figure 6.) often overlap the areas of low precipitation (Figure7.). The problem is further supported with low infiltration and water storage capacity as discussed in the chapter on physical degradation.
16° 1 7° 18 ° 1 9° 20° 21° 22° 2 3°
22° 23°21°20°1 9°18°17°16 °
48°4 8°
47°47°
4 6°4 6°
BUDAPEST
B a l a t o
n
DEPTH OF GROUNDWATER LEVELIN HUNGARY
De pth to g roundwater [m]12345n.a.
Compi led in RISSAC GIS L ab in 1996based on VITUKI databases Hungari an Unif ied Map Proj ect ion System
0 50 100 150 Kil ometers
Figure 6. Map of the depth of ground water levels in Hungary
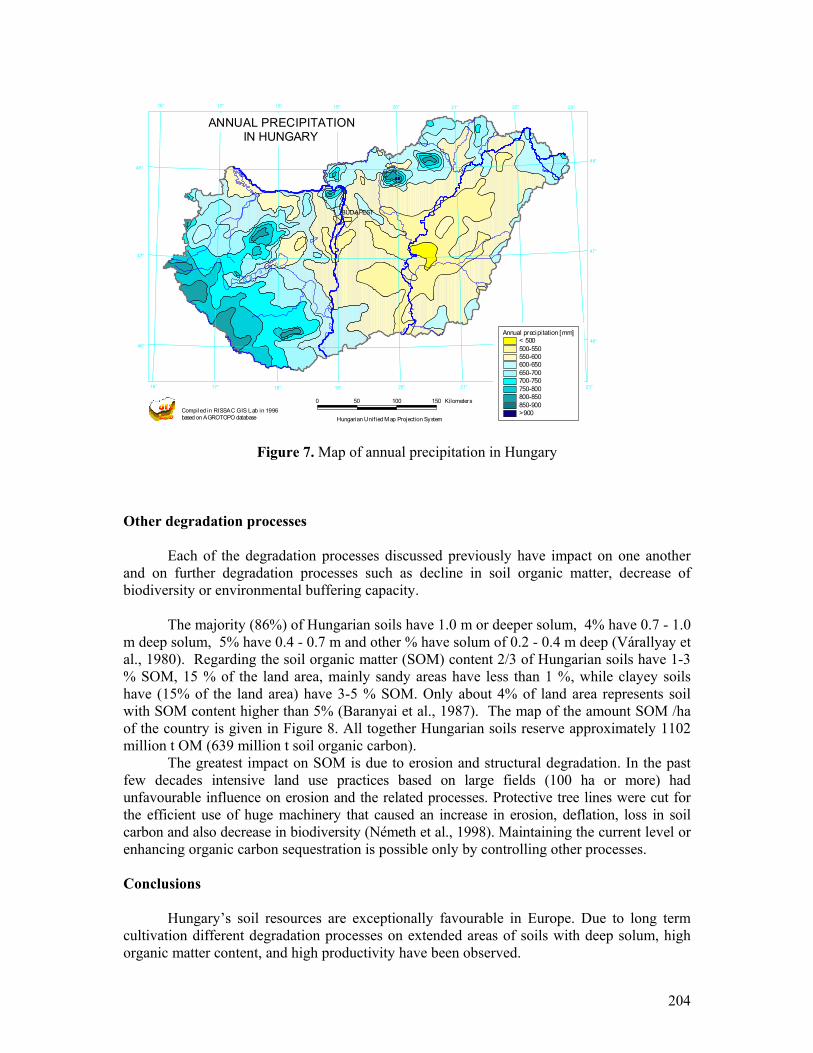
204
Figure 7. Map of annual precipitation in Hungary Other degradation processes
Each of the degradation processes discussed previously have impact on one another and on further degradation processes such as decline in soil organic matter, decrease of biodiversity or environmental buffering capacity.
The majority (86%) of Hungarian soils have 1.0 m or deeper solum, 4% have 0.7 - 1.0 m deep solum, 5% have 0.4 - 0.7 m and other % have solum of 0.2 - 0.4 m deep (Várallyay et al., 1980). Regarding the soil organic matter (SOM) content 2/3 of Hungarian soils have 1-3 % SOM, 15 % of the land area, mainly sandy areas have less than 1 %, while clayey soils have (15% of the land area) have 3-5 % SOM. Only about 4% of land area represents soil with SOM content higher than 5% (Baranyai et al., 1987). The map of the amount SOM /ha of the country is given in Figure 8. All together Hungarian soils reserve approximately 1102 million t OM (639 million t soil organic carbon).
The greatest impact on SOM is due to erosion and structural degradation. In the past few decades intensive land use practices based on large fields (100 ha or more) had unfavourable influence on erosion and the related processes. Protective tree lines were cut for the efficient use of huge machinery that caused an increase in erosion, deflation, loss in soil carbon and also decrease in biodiversity (Németh et al., 1998). Maintaining the current level or enhancing organic carbon sequestration is possible only by controlling other processes.
Conclusions Hungary’s soil resources are exceptionally favourable in Europe. Due to long term cultivation different degradation processes on extended areas of soils with deep solum, high organic matter content, and high productivity have been observed.
16° 17° 18° 19° 20° 21° 22° 23°
22° 23°21°20°19°18°17°16°
48°48°
47°47°
46°46°
BUDAPEST
B a l a t o
n
Annual precipi tation [mm]< 500500-550550-600600-650650-700700-750750-800800-850850-900>900
0 50 100 150 Kilometers
Hungarian Unif ied Map Projection SystemCompiled in RISSAC GIS Lab in 1996based on AGROTOPO database
ANNUAL PRECIPITATIONIN HUNGARY
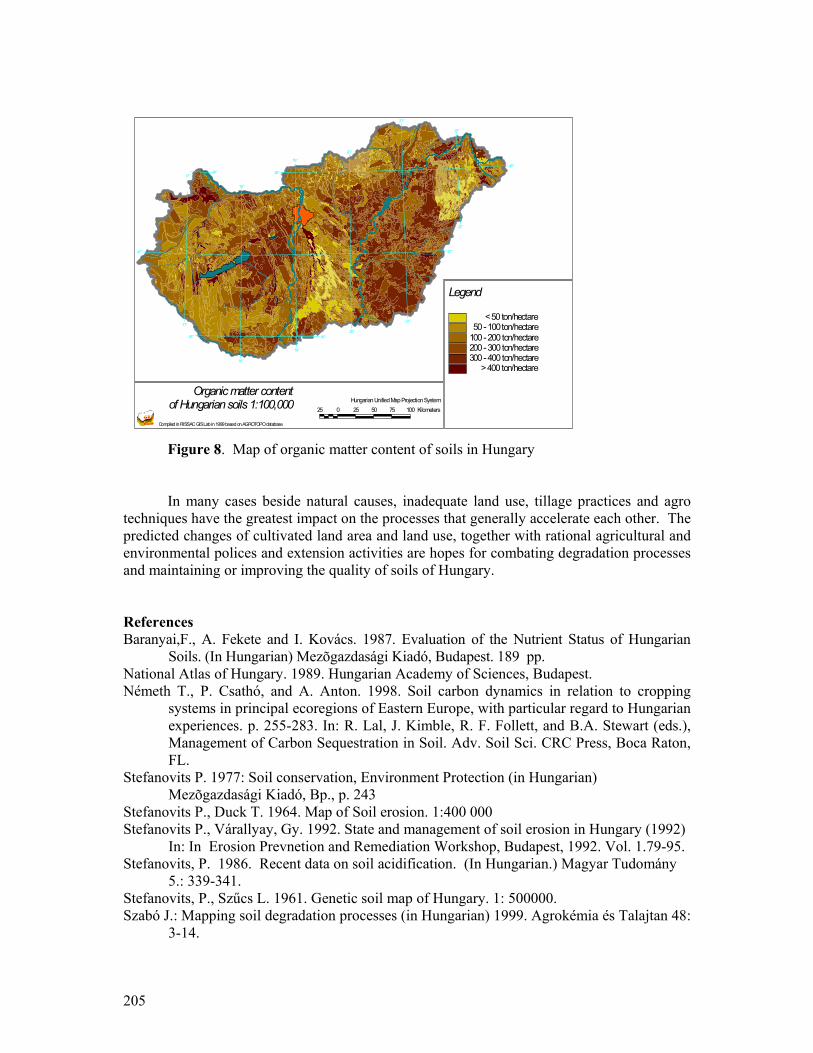
205
Figure 8. Map of organic matter content of soils in Hungary In many cases beside natural causes, inadequate land use, tillage practices and agro
techniques have the greatest impact on the processes that generally accelerate each other. The predicted changes of cultivated land area and land use, together with rational agricultural and environmental polices and extension activities are hopes for combating degradation processes and maintaining or improving the quality of soils of Hungary.
References Baranyai,F., A. Fekete and I. Kovács. 1987. Evaluation of the Nutrient Status of Hungarian
Soils. (In Hungarian) Mezõgazdasági Kiadó, Budapest. 189 pp. National Atlas of Hungary. 1989. Hungarian Academy of Sciences, Budapest. Németh T., P. Csathó, and A. Anton. 1998. Soil carbon dynamics in relation to cropping
systems in principal ecoregions of Eastern Europe, with particular regard to Hungarian experiences. p. 255-283. In: R. Lal, J. Kimble, R. F. Follett, and B.A. Stewart (eds.), Management of Carbon Sequestration in Soil. Adv. Soil Sci. CRC Press, Boca Raton, FL.
Stefanovits P. 1977: Soil conservation, Environment Protection (in Hungarian) Mezõgazdasági Kiadó, Bp., p. 243
Stefanovits P., Duck T. 1964. Map of Soil erosion. 1:400 000 Stefanovits P., Várallyay, Gy. 1992. State and management of soil erosion in Hungary (1992)
In: In Erosion Prevnetion and Remediation Workshop, Budapest, 1992. Vol. 1.79-95. Stefanovits, P. 1986. Recent data on soil acidification. (In Hungarian.) Magyar Tudomány
5.: 339-341. Stefanovits, P., Szűcs L. 1961. Genetic soil map of Hungary. 1: 500000. Szabó J.: Mapping soil degradation processes (in Hungarian) 1999. Agrokémia és Talajtan 48:
3-14.
46° 46°
47° 47°
48°48°
17°
18°
19°
20°
21°
22°
22°
21°
20°
19°
18°
17°48°
Organic matter contentof Hungarian soils 1:100,000
Compiled in RISSAC GIS Lab in 1999 based on AGROTOPO database
Hungarian Unified Map Projection System25 0 25 50 75 100 Kilometers
< 50 ton/hectare 50 - 100 ton/hectare100 - 200 ton/hectare200 - 300 ton/hectare300 - 400 ton/hectare > 400 ton/hectare
Legend
206
Szabolcs I., Várallyay G. , Mélyvölgyi Z. 1989. : Salt-affected soils. In: National Atlas of Hungary, 1989, Hungarian Academy of Sciences, Budapest.
Szabóné Kele Gabriella. 199. Soil Information and Monitoring System. Information sources on the Environment. Textbook. Gödöllő Univ. Ag. Hungary
Várallyay Gy., J. Szabó, L. Pásztor, E. Micheli. 1998. : A database for sustainable agriculture and environmental protection in Hungary. In: "LandInformation Systems. Developments for planning the sustainable use of land resources". European Soil Bureau. Research Report Ispra. 164. 151-164.
Várallyay, G., Leszták M. 1989. Map Susceptibility of soils to physical degradation. In: National Atlas of Hungary, 1989, Hungarian Academy of Sciences, Budapest.
Várallyay, Gy. 1989. Soil degradation processes and their control in Hungary. Land Degradation and Rehabilitation. 1. pp:171-188.
Várallyay, Gy. 1994. Soil management and environmental relationships in Central and Eastern Europe. Agrokémia és Talajtan. 43: 41-66.
Várallyay, Gy., L. Szücs, A. Murányi, K. Rajkai and P. Zilahy. 1980. Map of soil factors determining the agro-ecological potential of Hungary, 1:100 000, II. (In Hungarian). Agrokémia és Talajtan. 29:35-76.
Várallyay, Gy., Rédly, L., Murányi, A., Szabó, J. (1993): Map of Susceptibility of Soils to Acidification in Hungary. Agrokémia és Talajtan 42 (1-2) pp:263-289.
207
LAND DEGRADATION MEASURES IN LITHUANIA Vanda V. BUIVYDAITE Assoc. Prof. Dr.1
Danielius PIVORIUNAS Dr.2 1Department of Soil Science and Agrochemistry, Agronomy Faculty, Lithuanian University of Agriculture, Studentu St. 11, LT-4324 Akademija, Kaunas R., Lithuania Tel.: +370 37 397712; Fax: +370 37 397531; E-m@il: [email protected] 2Department of Landscape Ecology, Institute of Botany, Zaliuju Ezeru St. 47, 2021 Vilnius, Vilnius, Lithuania Tel.: +370 5 2663612; Fax: +370 5 2739950; E-m@il: [email protected]
Abstract Soil degradation is closely related with the entire environment. Some land degradation measures in
Lithuania on properties of soils, evaluation of productive space as a basis for regional distribution of crop production, hazards of soil erosion, soil contamination and industrial pollution, environmental factors affecting the application of fertilizers and liming are described.
Most distinct soil degradation processes in Lithuania are: acidification, soil erosion, soil contamination and pollution. On the Nemunas river delta almost every year hygrological risks occur.
Key words: soil degradation, soil acidification, soil erosion, soil contamination, soil pollution,
hydrogelogical risks.
Introduction Rational land use in Lithuania is very important. Agricultural plots are characterized
by using the State land cadastre indicators: distribution of farms and other agriculture lands, the land reclamation status, the evaluation of the efficiency of the farming. These indicators are expressed cartographically in land cadastre maps, also by consolidated data, characterizing not only land plots but also administration territories. All data are periodically updated by preparing territorial planning documents, foreseeing the formation of arable land plots, its regular configuration and farming constructions, the location of protected areas and other natural plots. Comporision of the land cadastre data shows the status of land use and changes of soil properties and, in some cases soil degradation. After 1990, with the reduction of the state funds for land reclamation, the processes of bog–formation, overgrowing with bushes and forests on farming lands occur, in some places they turn into virgin land. Other reasons, due to which the land use changes are follows: change of the farming system, change of property forms and land use subjects during the land reform, as well as unfavourable economic conditions. Having no possibilities for farming, landowners lease their land to other persons or abandon it. The lease is more active in the regions where fertile soil prevails, here officially registered land lease agreements reach up to 20 percent (and this data is growing) of the private land area. In these districts the land market is more intensive as well: in each district every month more than 20 private land purchase–sale or donation agreements are concluded. In districts with soils of low economic value private land is leased and sold very unsignificantly. By this it is possible to judge partly about the status of land use. A tendency of the decrease areas of farming and changing of soil properties is during the whole period of land reform, which will continue unless almost 3.2 million hectares of land for agricultural use will be privatized (at the end of 1999, almost 1.7 million hectares was privatized). It is predicted that in the year 2020 the area of farming lands will decrease (January 1, 2000, was 3.5 million hectares) to 3.0–3.2 million hectares (Aleknavicius et al., 2001).
Materials and Methods Soils are the main national natural resource of Lithuania; because of that agriculture is
very significant contributing part of GNP in national economic terms. The Republic of Lithuania is situated in the middle of Europe, with area of 65,305 square km, 58,794 km2 of which is covered by soils (Eidukeviciene et al., 2001). In respect of the European continent it
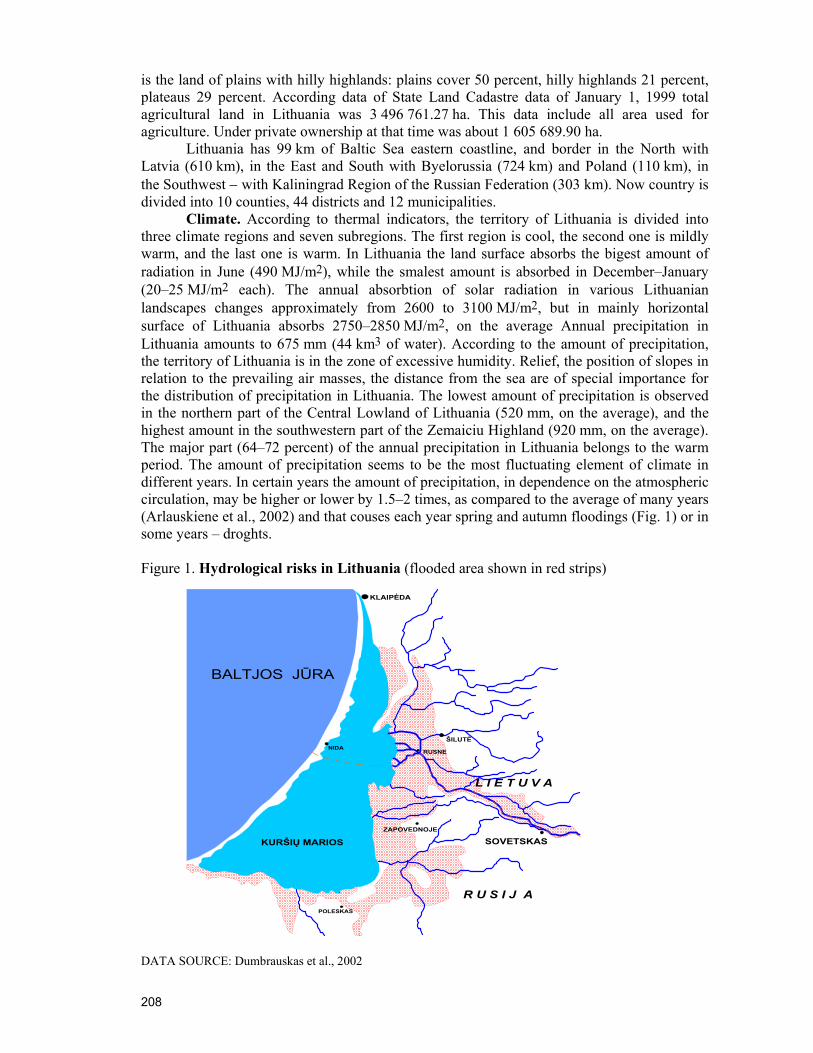
208
is the land of plains with hilly highlands: plains cover 50 percent, hilly highlands 21 percent, plateaus 29 percent. According data of State Land Cadastre data of January 1, 1999 total agricultural land in Lithuania was 3 496 761.27 ha. This data include all area used for agriculture. Under private ownership at that time was about 1 605 689.90 ha.
Lithuania has 99 km of Baltic Sea eastern coastline, and border in the North with Latvia (610 km), in the East and South with Byelorussia (724 km) and Poland (110 km), in the Southwest − with Kaliningrad Region of the Russian Federation (303 km). Now country is divided into 10 counties, 44 districts and 12 municipalities.
Climate. According to thermal indicators, the territory of Lithuania is divided into three climate regions and seven subregions. The first region is cool, the second one is mildly warm, and the last one is warm. In Lithuania the land surface absorbs the bigest amount of radiation in June (490 MJ/m2), while the smalest amount is absorbed in December–January (20–25 MJ/m2 each). The annual absorbtion of solar radiation in various Lithuanian landscapes changes approximately from 2600 to 3100 MJ/m2, but in mainly horizontal surface of Lithuania absorbs 2750–2850 MJ/m2, on the average Annual precipitation in Lithuania amounts to 675 mm (44 km3 of water). According to the amount of precipitation, the territory of Lithuania is in the zone of excessive humidity. Relief, the position of slopes in relation to the prevailing air masses, the distance from the sea are of special importance for the distribution of precipitation in Lithuania. The lowest amount of precipitation is observed in the northern part of the Central Lowland of Lithuania (520 mm, on the average), and the highest amount in the southwestern part of the Zemaiciu Highland (920 mm, on the average). The major part (64–72 percent) of the annual precipitation in Lithuania belongs to the warm period. The amount of precipitation seems to be the most fluctuating element of climate in different years. In certain years the amount of precipitation, in dependence on the atmospheric circulation, may be higher or lower by 1.5–2 times, as compared to the average of many years (Arlauskiene et al., 2002) and that couses each year spring and autumn floodings (Fig. 1) or in some years – droghts. Figure 1. Hydrological risks in Lithuania (flooded area shown in red strips)
DATA SOURCE: Dumbrauskas et al., 2002
ZAPOVEDNOJE
POLESKAS
RUSNE
ŠILUTĖ
KLAIPĖDA
NIDA
BALTJOS JŪRA
KURŠIŲ MARIOS SOVETSKAS
L I E T U V A
R U S I J A
209
The snow cover in eastern Lithuania and the Zemaiciu Highland reaches 25–30 cm,
and in other places 15–20 cm. In snowy winters the maximum thickness of snow cover may reach 70–80 cm, in the Zemaiciu Highland – 90 cm. The thin depth of the frozen soil is common in all Lithuania. The deepest frost in soils is observed in southern Lithuania, where dry Arenosols prevail and ground water is occurs deeply. Wind speed average on the Baltic Sea coast equals 5.5–6.0 m/s, and further to the continent it reduces to 2.9–3.5 m/s. In the cold season due to the active cyclonic activity the wind speed is 1–2 m/s greater than in summer (Arlauskiene et al., 2002).
Relief. A genetic differentiation of relief is based on land surface formation processes. The glaciation was the main factor that generated the Lithuanian relief. The glacial and closely related aquaglacial processes are syngenetic (synchronous) with primeval large forms of relief. The subsequent (epigenetic) processes changed the surface generated by syngenetic processes. The time of occurence of syngenetic and epingenetic processes should be related with deglaciation of the territory of Lithuania. All relief forming processes occurred diachronically. The action of some of them discontinued in the territory of Lithuania after the glacier melting (glacial, aquaglacial), other processes were active only temporary (thermokarst), the action of some others began in the glacial epoch and continues today (solifluction, erosion). The intensity of geomorphologic processes also varied: some of them permenantly were intensive, others could be characterized by fluctuations of intensity. Variable geomorphologic processes that formed the relief generated the heterogeneity of relief forms. The duration of processes was an important factor that determined the distribution of various genetic types and complexes of relief. The glacial ground moraine formations are prevailing and cover up 30 percent of the territory of Lithuania. These surfaces were generated by two glaciations: Medininkai (QII) and Nemunas (QIII). The Medininkai ground moraine formations are only on southeastern Lithuania (Eisiskes Plateau), whereas the Nemunas ground moraine formations occupy great areas in plains, plateaus and hillfoots. The glacier edge formations occupies up 27 percent of the territory of Lithuania. They include Medininkai and Nemunas glacier age. The Medininkai glacier edge formations exist only in the southeastern Lithuania (Medininkai Upland). The large hills are prevailing. The largest area of glacier edge formations makes the East Lithuanian phase relief of Aukstaiciu glacier stage. These formations stretches as a wide belt from the northeastern till the southwestern boundary of Lithuania even forming the nucleus of the Zemaiciu Highland. The Eastern Lithuanian glacier edge formations are characterized by a morphometric diversity of relief forms. There occur 17 morphometric types and complexes of relief. Medium hills are most widely spread (63 percent). The Southern Lithuanian glacier edge formations stretch as a wide belt along the western edge of Aukstaiciu and the northern edge of Suduva Upland, forming a wide ring around the Zemaiciu Highland. It is the main relief of the Zemaiciu Highland. Medium hills are prevailing and covers 46 percent of Southern Lithuanian glacier stage formations. The Central Lithuanian glacier edge formations are represented by long but narrow glacial moraine arcs linking scarce glacial moraine massifs. Large hills prevail here and cover up 45 percent of the area. Big areas are occupied by smoothened surfaces. Undulating and flat plains occupy 23 percent of the Central Lithuanian glacier edge formations area. The Northern Lithuanian glacier edge formations comprise 2 segments: Linkuva and Rimkai–Kintai. These are typical glacial moraine chains stretching for a few dozens of kilometres. In Western Lithuania the environs of Kalote, there exists a low Northern Lithuanian glacial moraine massif. The strongly smoothened surface prevails here. Undulaiting and flat plains represent more than a half of the Northern Lithuanian glacier edge formations. Karst formations here occupies two zones: active karst and karst. The old relief is represented by flat plain with shallow depressions. The zone of active karst abounds in steep–sloped karst pits, however, the processes of slope flattening here are rather active. The whole karst relief can be attributed to undulating plains. This area is only up 0.2 percent of

210
Lithuania’s territory. Erosion formations occupy 0.4 percent of Lithuania’s territory. It is represented by large linear formations generated by surface water wash out. Erosion processes began in the period of deglaciation of the territory and still is going on. Their chronological distribution is rather problematic. It is usually related with the stages of glacier edge accumulation. Glaciofluvial formations occupy 7 percent of the territory of Lithuania, even though they were generated in the period of deglaciation of the entire surface. The greatest areas are occupied by glaciofluvial formations in Southeastern Lithuania where a few different age tracts of these formations exist. Glaciofluvial deposits are constituted of course and fine gravel, but texture of those deposits is with sand fraction prevailing. Glaciofluvial deposits most frequently is stratified, especially this is common in sands of proximal outwash plains and glaciofluvial terraces. Glaciolacustrin formations cover up 23 percent of the Lithuanian area. They were generated through the whole period of Nemunas glacier age but largest areas by glaciolacustrin basins are occupied in Central and North Lithuania. The carbonate content and mineral composition of glaciolacustrin deposits were predetermined by the carbonate content and texture of the feeding area, from where the deposits were brought (for example, the carbonate content of the Musa basin is higher than that of the Jura–Sesupe). Therefore due to a great variety of deposits different soils were generated from the soil parent material of the same genesis. Fluvial formations occupy 11 percent of the territory of Lithuania. They comprise a few dendrite systems those related with the Lithuanian main river systems. Fluvial relief was started to generate in the period of early deglaciation and continued through the late Pleistocene and Holocene. The fluvial forms of relief partly inherited the structure of Holocene and glaciofluvial relief, this relation particular evident in Southern and Southeastern Lithuania. Special conditions of fluvial relief formation determine a rather variable morphometric structure. Marine (littoral) formations occupy only 0.4 percent of Lithuania’s territory. There are spread in the western part of the country where a few littoral surfaces of the Baltic Sea have been generated. All marine formations were generated in Holocene. The littoral processes affecting the Lithuanian coast has smoothened the land surface, therefore, the morphometric structure of these formations is monotonous. 90 percent of marine relief is represented by smoothened surfaces and only 10 percent of dissected ones. The dissected surfaces are represented by cliffs and steps of marine terraces affected by erosion processes. Eolian formations cover up 1 percent of the territory of Lithuania. Their generation began in the period of late deglaciation when shallow glaciolacustrine basins began to bacame dry. Eolian formations are represented in Lithuania’s territory in small segments. They are related with the deltas of periglacial basins, outwash plains and glaciofluvial flow valleys. Solitary eolian forms of relief occur in higher large river terraces: Neris and Nemunas. Organogenic formations occupy 1 percent of Lithuania’s territory. The organogenic relief is spread in places of large glaciolacustrine basins. It is represented by boggy depressions with a wet and flat or flat surface. It began to develop after a complete deglaciation when the climate became warmer, i.e., in Holocene (Arlauskiene et al., 2002).
Soil-parent material. Lithuanian soils inherited most of their properties from soil parent material. Soil profiles even now reflect the primary lithological structure. The most distinctive features of the soil formation are the existence of boulders, skeletal soil texture, chemical composition of clay fraction and carbonate content. The texture of soil parent material is subject to changes depending on certain conditions. Detailed research on this was carried out in West Lithuania only. The signs of soil formation in Lithuania are found in soil parent material up to 2 m thick. The thickness of a layer affected by the soil formation process depends on the age of soil parent material, texture, content of carbonate in it, relief, and moisture regime. Prevailing soil–parent material is glacial deposits: moraine, glaciofluvial and glaciolacustrine. In some places there are plots covered by flluvial, eolian and organic deposits. Moraines being most prevailing soil parent material are: glacier ground moraine, glacier edge and karst moraine formations. Moraines contains boulders, skeletal amount reaches up to 8–10 percent.
211
Soil age. The parent material of soils in Lithuania varies not only in genesis but also in age. Most common are Quaternary deposits. The thickness of Quaternary deposits varies from less than 10 m in North Lithuania to 200-300 m in Zemaiciai and Baltija Heights. In the larger areas it reaches 80-120 m. According to the absolute age, soils in the territory of Lithuania are young – of the Holocene period (< 10 000 years). Their age is related to the deglaciation of the Lithuanian territory. The formation of the soil cover in the East European Lowland started after thawing of the long–term frost 10 300–9300 years, most probably – 8000 years ago. The youngest soils in the territory of Lithuania are in the river valleys, Baltic Sea terraces and the dunes of the Curonian Spit, because relief in these territories was formed later. Buried soils occur in the Curonian Spit, their age is varies from 5000–4000 to 300 years. No special investigations of the soil age influence on the soil–forming process in moraine loamy soils were carried out in Lithuania. The relative age of moraine loamy soils has not been estimated very precisely – only according to the depth of calcareous horizon (carbonate washing out) – a relative criteria of the soil age. The reliability of hypothesis is greatest in the Baltic Highlands, because in determining the age of moraine loamy soils the most important factor is the different depth of calcareous horizon. On the basis of the research obtained in Lithuania it could be recognized that an indirect effect in the Holocene on the soil–formation process in the East European Lowland had geological and soil–formation processes that occurred in Central Valdai (QIII). It means that the difference of relative age of moraine loamy soils of contiguous phases (stages) shows the difference of the duration of the PreHolocene period, i.e. Upper Pleistocene (QIII). Therefore according to the relative age of the soils in the broadest sense (the Holocene soil–formation process and the PreHolocene Period processes), soils that generated from the Medininkai glacier moraine loamy soils should be considered older than those that were generated from the Nemunas glaciation, analogous soils that generated from moraine loamy soils should be treated as older than those that generated from the glaciolacustrine loamy soils and clays (Arlauskiene et al., 2002).
Soil Survey and Available Soil Data in Lithuania The maps of Quaternary deposits and geomorphology of different scale were compiled
and recently updated at the Institute of Geology and Geological Survey of Lithuania. The agro-climatic data for the whole area of Lithuania have been collected and stored in the Lithuanian Survey of Meteorology. This information could be used for the application of Lithuanian Soil Database (LTdDB) by special agreement. Soil maps of Lithuania mainly are based on the results of large-scale field research, profile descriptions, drillings, and laboratory analysis of soil samples, mainly at the Department of Soil Science of the Sate Land Survey Institute (VZI). Its research, among all others, includes field soil survey, soil mapping at various scales, and land evaluation for land reform going now in the country. The Agrochemical Research Center (ATC) of the Lithuanian Institue of Ariculture (LZI) has the data and general maps of pHKCl, liming requirements, contents of available P, K (4 times of investigation), Mg, microelements and organic matter. LZI as well as the Department of Soil Science and Agrochemistry of LZUU have agriculture crop yield data from experimental plots of plant nutrition with different amount of fertilizers application. Beside soil science LZUU also deals with the new Classification of the Soils of Lithuania (LTDK-99) mainly based on WRB (1998) soil cartography methods and systematization of soil cover structure of Lithuania. The Lithuanian Forest Inventory and Management Institute (LMTI) and Lithuanian Institute of Forests (LMI) have some data sets of research and investigations on the soils under the forest.
All principal centers of soil survey and investigation of the agricultural environment of Lithuania hold quite large land use data sets and research on soil properties, evaluation of productive space as a basis for regional distribution of crop production, hazards of soil erosion and industrial pollution, environmental factors affecting the application of fertilization, land evaluation covering more than 3 million ha and experimental data of plant nutrition and
212
application of fertilizers on arable land on different soils, collected during 40 years of the activities. This information is stored in the manuscripts, maps, tables, and some published papers in archives. However, none of these institutions has no DBMS/GIS to store and manage fully developed attributes and coding systems for the Lithuanian Database of Experiments of Fertilization (LTtbDB) and Lithuanian Soil Profile Analytical Database (LTdpaDB) and other environmental information on soils to store and manage all valuable information in comprehensive geocoded and georeferenced computerized Lithuanian Soil Database (LTdDB). This is now needed and would enable to do proper inventory of data quality and timely application of quantities of soil data to pressing environmental and land use, soil degradation problems those Lithuania confronts today.
Soil Maps of Lithuania In wider use were and still are the manuscripts of:
1) soil (type and variety) maps at various scales (1:10,000 – about 10,000 maps for each former farm up to 1991; 1:50,000 – 44 maps, for each region; 1:300,000 – 1 map for the whole country (J. Juodis et al., 1985).
2) soil maps of forest area of Lithuania at scale 1:10,000 is under control of LMTI; 3) the Map of the Relief of Lithuania at scale 1:300,000 – 1 map for whole country; 4) the Map of Organic Matter Content in Soils of Lithuania at scale 1:300,000 – 1 map
for the whole country and maps of some areas at scale 1:10,000; 5) the Morphoisographic Map of Land-Surface of Lithuania at scale 1:250,000 – 1 map
for the whole country. In addition to above mentioned soil maps (basicly based on genetic soil classification
which has been used in Lithuania until 1996) there are: 1) soil-agricultural (soil texture, wetness and stoniness, land reclamation) maps at
1:10,000 scale – about 10,000 sheets; 2) land evaluation maps at scale 1:10,000. In those maps has been defined the value of
the soils in terms of agricultural usefulness. 3) general maps of pHKCl and lime requirements, and contents of available P, K, at the
scale of 1:10,000 for former farms until 1991 and (for some areas) Mg and some trace elements.
GIS Based Soil Maps The program for developing the Land Resources Information System of Lithuania
(LTlrIS) has been started in 1996 at VZI with support of FAO. Has been started to scan and vectorise the different soil maps of Lithuania of different scales. The main problem remains that quite big amount of the data is not geo-referenced and not standard in terms of description and soil analyses. But LTlrIS was very good start to address and introduce new Classification of the Soils of Lithuania (Buivydaite et al., 2001), and beginning of creation of georeferenced Soil Database of Lithuania (LTdDB), to continue research on soil cover structure systematization and updating soil cartography methods for new generation soil maps. The future perspective of soil survey is with structural and systematic approach of soil cover structure – it foresees division of land surface into integral territorial units (soil cower structure systems).
Results and Discussion New Classification of the Soils of Lithuania
In Lithuania from the beginning of soil survey several different soil classification systems were used. Sometimes it has been the goal of soil scientists dealing with soils, with different their understandings, to determine soil nature of our country. One of main the Systematic List of Soils of the Baltic States has been presented at 1953 in Pocvovedenije and was based for genetic soil classification. This system with small corrections in 1965, 1979 and updates in 1992 has been used until 1996. Slightly it has been differentiated if it was used for
213
agriculture or forestry. Due to the start of creation of the LTdDB, before preparing new soil classification system, genetic soil classification in 1996 has been revised and correlated, prepared the General Systematic List of the Soil Typological Units of Lithuania (TDV-96). It has 98 soil tipological units (STU) and in the LTdDB is used as old local soil names (Lietuvos dirvozemiu klasifikacija, 2001). There was an attempt not loose the knowledge and some work on soil genesis also. TDV-96 was the background of the new comprehensive classification of soils in Lithuania (Buivydaite et al., 2001). During the working period in the first version of the new soil classification major soil groups and subgroups has been comprised with the FAO-UNESCO Soil Map of the World Legend (1990), latter on, for the last version Classification of the Soils of Lithuania (LTDK-99) – with Soil Map of the World Revised Legend with Corrections and Updates (1997). For third and lower levels of LTDK-99 as the basis has been used World Reference Base for Soil Resources (WRB, 1998) because WRB is developed to help encourage all scientists and agriculturists to use the same soil nomenclature, the same basic system, and, STU of third level for more detailed work is proposed. In Lithuania there is intent to ensure that the information about soils would be available and easily interpreted for use by land users, planners and scientists (Soils of Lithuania, 2001). There are 12 major groups of soils in Lithuania at I level of the international classification: Histosols (HS), Anthrosols (AT), Leptosols (LP), Fluvisols (FL), Gleysoils (GL), Podzols (PZ), Planosols (PL), Albeluvisols (AB), Luvisols (LV), Cambisols (CM), Arenosols (AR), and Regosols (RG). In LTDK-99 the name of the soil means only that specified soil properties are within stated limits. A particular soil name means that the soil has certain specified properties. Together with Lithuanian soil names, symbols and other terminology approved by State Commission of Lithuanian language of the Seimas of the Republic of Lithuania international (WRB, 1998) soil names are used as well. In full description of LTDK-99 there are given explanations of the formative elements of soil typological units (STU) of the 46 soil subgroups – II level of the classification. Additional characteristics are associated with 188 STU of the III, and 12 STU of IV level, also 43 differentiations on soil phases level. For the particular group of soils phase would applied to soil having differentiating characteristics, and it is included in soil definition. System is organized in such way that main knowledge from research on soils is arranged in a meaningful way, it is possible to group soils. It emphasizes important points and ignores irrelevant details.
Major Soils of Lithuania There are great differentiation and variety of soils and very complicated soil cover
structure in Lithuania. Some data shows that Albeluvisols occupy 30 percent of the whole territory. They are formed on less carbonated and deeply washed out loamy deposits, and prevail in Western Lithuania. In the places where soil parent material and topsoil contain more carbonates and are leached the various Luvisols prevails. In Mid Lithuania they occupies up to 27 percent with prevailing among them Cal(car)ic Luvisols (35 percent) and Gleyic Luvisols (34 percent). Quite wide areas are with prevailing Cambisols (13 percent), Calcaric Cambisols among them, Arenosols (12 percent) and Podzols (11 percent) mainly in forests. In smaller areas, in the depressions 5.3 percent are Gleysols on loam, clay loam and clay and in the lowest places of the relief distributed – Histosols.
Soil Degradation Soil degradation is closely related with the entire environment. Most distinct soil
degradation processes in Lithuania are: erosion, acidification, soil contamination and pollution. On the Nemunas river delta almost every year hygrological risks occure. The fertility of agricultural plants is the function of the climatic resources, the biological potential of the plants, properties of the soils and agrotechnics, which especially concerns with fertilization. Agrochemical and agrophysical properties of the soil are interrelated. They are changing under the action of anthropogenic factors. The most stable are the soil texture and
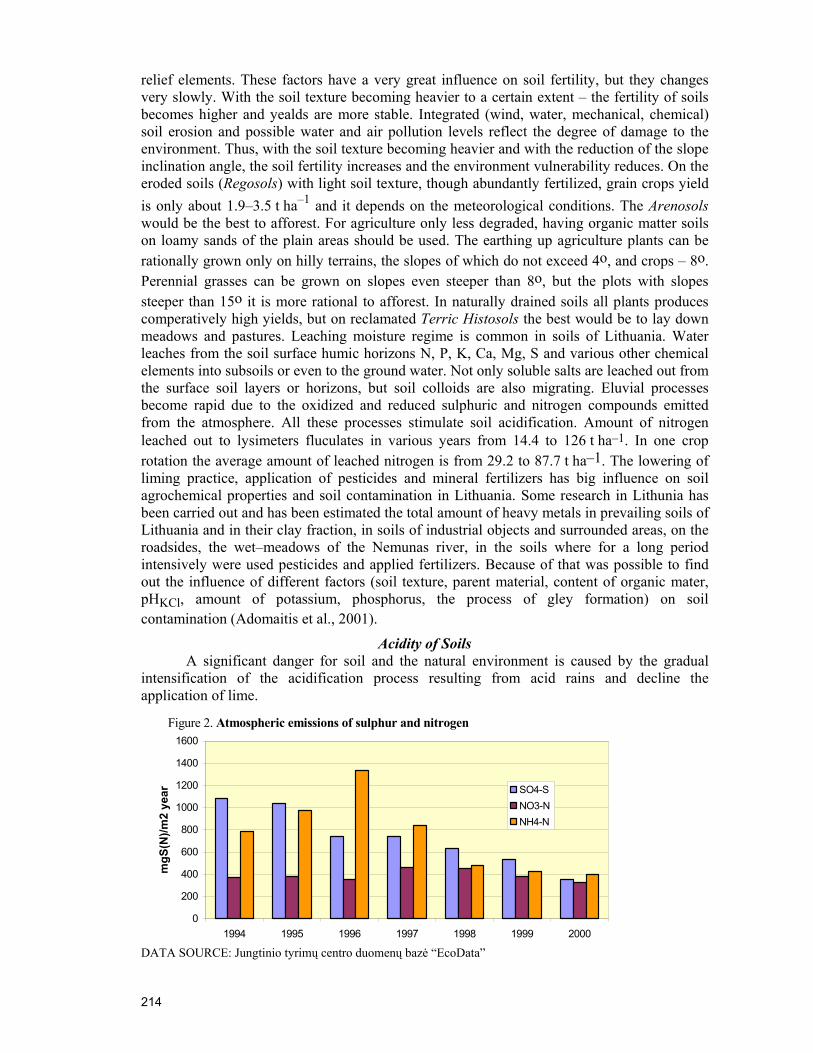
214
relief elements. These factors have a very great influence on soil fertility, but they changes very slowly. With the soil texture becoming heavier to a certain extent – the fertility of soils becomes higher and yealds are more stable. Integrated (wind, water, mechanical, chemical) soil erosion and possible water and air pollution levels reflect the degree of damage to the environment. Thus, with the soil texture becoming heavier and with the reduction of the slope inclination angle, the soil fertility increases and the environment vulnerability reduces. On the eroded soils (Regosols) with light soil texture, though abundantly fertilized, grain crops yield is only about 1.9–3.5 t ha–1 and it depends on the meteorological conditions. The Arenosols would be the best to afforest. For agriculture only less degraded, having organic matter soils on loamy sands of the plain areas should be used. The earthing up agriculture plants can be rationally grown only on hilly terrains, the slopes of which do not exceed 4o, and crops – 8o. Perennial grasses can be grown on slopes even steeper than 8o, but the plots with slopes steeper than 15o it is more rational to afforest. In naturally drained soils all plants produces comperatively high yields, but on reclamated Terric Histosols the best would be to lay down meadows and pastures. Leaching moisture regime is common in soils of Lithuania. Water leaches from the soil surface humic horizons N, P, K, Ca, Mg, S and various other chemical elements into subsoils or even to the ground water. Not only soluble salts are leached out from the surface soil layers or horizons, but soil colloids are also migrating. Eluvial processes become rapid due to the oxidized and reduced sulphuric and nitrogen compounds emitted from the atmosphere. All these processes stimulate soil acidification. Amount of nitrogen leached out to lysimeters fluculates in various years from 14.4 to 126 t ha–1. In one crop rotation the average amount of leached nitrogen is from 29.2 to 87.7 t ha–1. The lowering of liming practice, application of pesticides and mineral fertilizers has big influence on soil agrochemical properties and soil contamination in Lithuania. Some research in Lithunia has been carried out and has been estimated the total amount of heavy metals in prevailing soils of Lithuania and in their clay fraction, in soils of industrial objects and surrounded areas, on the roadsides, the wet–meadows of the Nemunas river, in the soils where for a long period intensively were used pesticides and applied fertilizers. Because of that was possible to find out the influence of different factors (soil texture, parent material, content of organic mater, pHKCl, amount of potassium, phosphorus, the process of gley formation) on soil contamination (Adomaitis et al., 2001).
Acidity of Soils A significant danger for soil and the natural environment is caused by the gradual
intensification of the acidification process resulting from acid rains and decline the application of lime.
DATA SOURCE: Jungtinio tyrimų centro duomenų bazė “EcoData”
Figure 2. Atmospheric emissions of sulphur and nitrogen
0
200
400
600
800
1000
1200
1400
1600
1994 1995 1996 1997 1998 1999 2000
mgS
(N)/m
2 ye
ar SO4-SNO3-NNH4-N
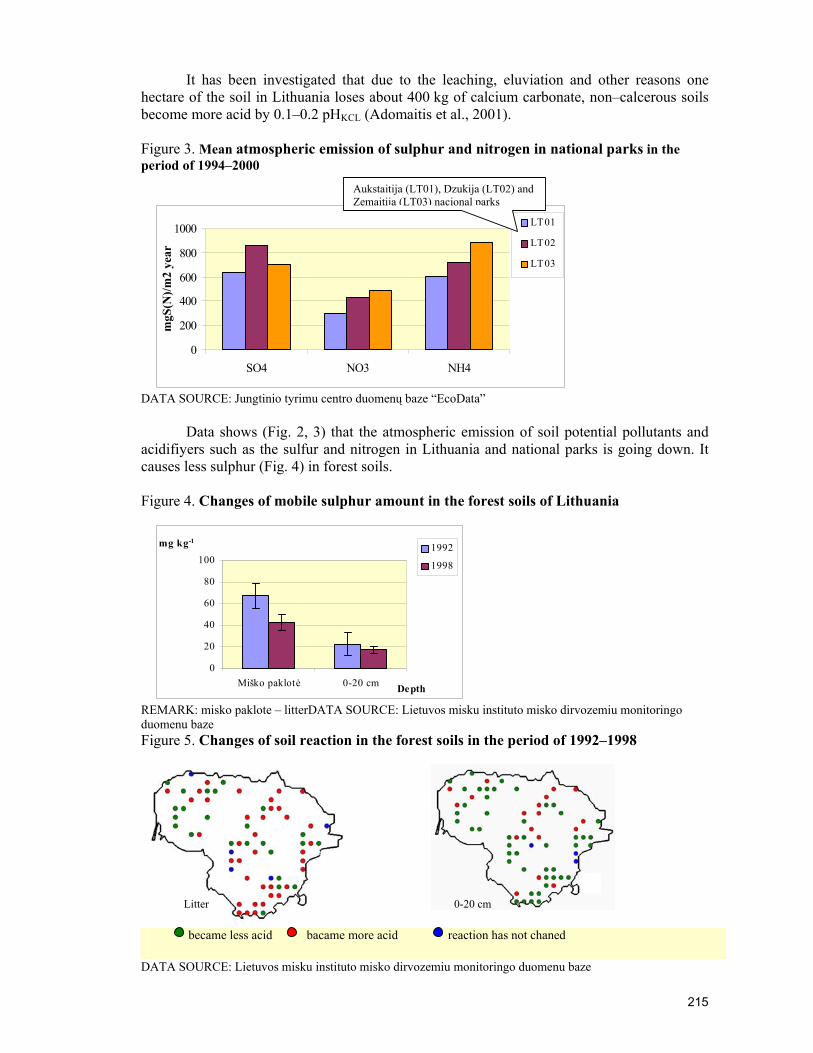
215
It has been investigated that due to the leaching, eluviation and other reasons one hectare of the soil in Lithuania loses about 400 kg of calcium carbonate, non–calcerous soils become more acid by 0.1–0.2 pHKCL (Adomaitis et al., 2001). Figure 3. Mean atmospheric emission of sulphur and nitrogen in national parks in the period of 1994–2000
DATA SOURCE: Jungtinio tyrimu centro duomenų baze “EcoData”
Data shows (Fig. 2, 3) that the atmospheric emission of soil potential pollutants and acidifiyers such as the sulfur and nitrogen in Lithuania and national parks is going down. It causes less sulphur (Fig. 4) in forest soils. Figure 4. Changes of mobile sulphur amount in the forest soils of Lithuania
REMARK: misko paklote – litterDATA SOURCE: Lietuvos misku instituto misko dirvozemiu monitoringo duomenu baze Figure 5. Changes of soil reaction in the forest soils in the period of 1992–1998
became less acid bacame more acid reaction has not chaned
DATA SOURCE: Lietuvos misku instituto misko dirvozemiu monitoringo duomenu baze
Litter 0-20 cm
0
20
40
60
80
100
Miško paklotė 0-20 cm Depth
mg kg-11992
1998
0
200
400
600
800
1000
SO4 NO3 NH4
mgS
(N)/m
2 ye
ar
LT01
LT02
LT03
Aukstaitija (LT01), Dzukija (LT02) and Zemaitija (LT03) nacional parks
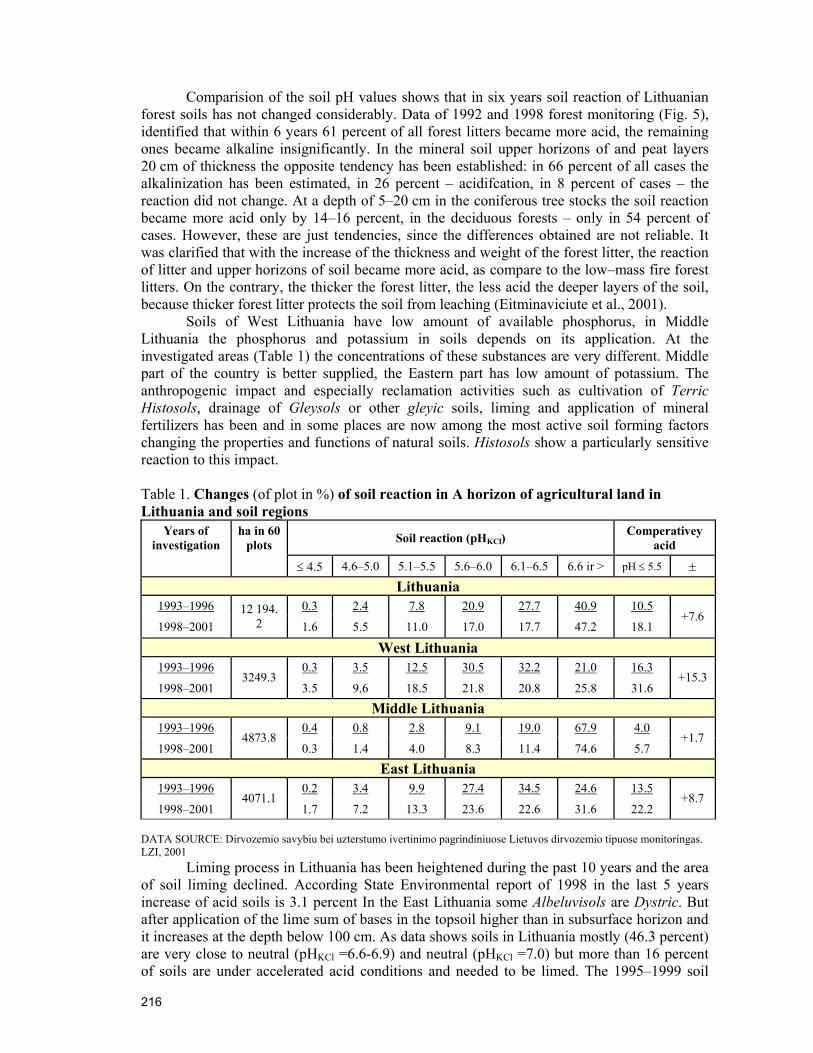
216
Comparision of the soil pH values shows that in six years soil reaction of Lithuanian
forest soils has not changed considerably. Data of 1992 and 1998 forest monitoring (Fig. 5), identified that within 6 years 61 percent of all forest litters became more acid, the remaining ones became alkaline insignificantly. In the mineral soil upper horizons of and peat layers 20 cm of thickness the opposite tendency has been established: in 66 percent of all cases the alkalinization has been estimated, in 26 percent – acidifcation, in 8 percent of cases – the reaction did not change. At a depth of 5–20 cm in the coniferous tree stocks the soil reaction became more acid only by 14–16 percent, in the deciduous forests – only in 54 percent of cases. However, these are just tendencies, since the differences obtained are not reliable. It was clarified that with the increase of the thickness and weight of the forest litter, the reaction of litter and upper horizons of soil became more acid, as compare to the low–mass fire forest litters. On the contrary, the thicker the forest litter, the less acid the deeper layers of the soil, because thicker forest litter protects the soil from leaching (Eitminaviciute et al., 2001).
Soils of West Lithuania have low amount of available phosphorus, in Middle Lithuania the phosphorus and potassium in soils depends on its application. At the investigated areas (Table 1) the concentrations of these substances are very different. Middle part of the country is better supplied, the Eastern part has low amount of potassium. The anthropogenic impact and especially reclamation activities such as cultivation of Terric Histosols, drainage of Gleysols or other gleyic soils, liming and application of mineral fertilizers has been and in some places are now among the most active soil forming factors changing the properties and functions of natural soils. Histosols show a particularly sensitive reaction to this impact. Table 1. Changes (of plot in %) of soil reaction in A horizon of agricultural land in Lithuania and soil regions
Soil reaction (pHKCl) Comperativey
acid
Years of investigation
ha in 60 plots
≤ 4.5 4.6–5.0 5.1–5.5 5.6–6.0 6.1–6.5 6.6 ir > pH ≤ 5.5 ±
Lithuania 1993–1996 0.3 2.4 7.8 20.9 27.7 40.9 10.5
1998–2001 12 194.
2 1.6 5.5 11.0 17.0 17.7 47.2 18.1 +7.6
West Lithuania 1993–1996 0.3 3.5 12.5 30.5 32.2 21.0 16.3
1998–2001 3249.3
3.5 9.6 18.5 21.8 20.8 25.8 31.6 +15.3
Middle Lithuania 1993–1996 0.4 0.8 2.8 9.1 19.0 67.9 4.0
1998–2001 4873.8
0.3 1.4 4.0 8.3 11.4 74.6 5.7 +1.7
East Lithuania 1993–1996 0.2 3.4 9.9 27.4 34.5 24.6 13.5
1998–2001 4071.1
1.7 7.2 13.3 23.6 22.6 31.6 22.2 +8.7
DATA SOURCE: Dirvozemio savybiu bei uzterstumo ivertinimo pagrindiniuose Lietuvos dirvozemio tipuose monitoringas. LZI, 2001
Liming process in Lithuania has been heightened during the past 10 years and the area of soil liming declined. According State Environmental report of 1998 in the last 5 years increase of acid soils is 3.1 percent In the East Lithuania some Albeluvisols are Dystric. But after application of the lime sum of bases in the topsoil higher than in subsurface horizon and it increases at the depth below 100 cm. As data shows soils in Lithuania mostly (46.3 percent) are very close to neutral (pHKCl =6.6-6.9) and neutral (pHKCl =7.0) but more than 16 percent of soils are under accelerated acid conditions and needed to be limed. The 1995–1999 soil
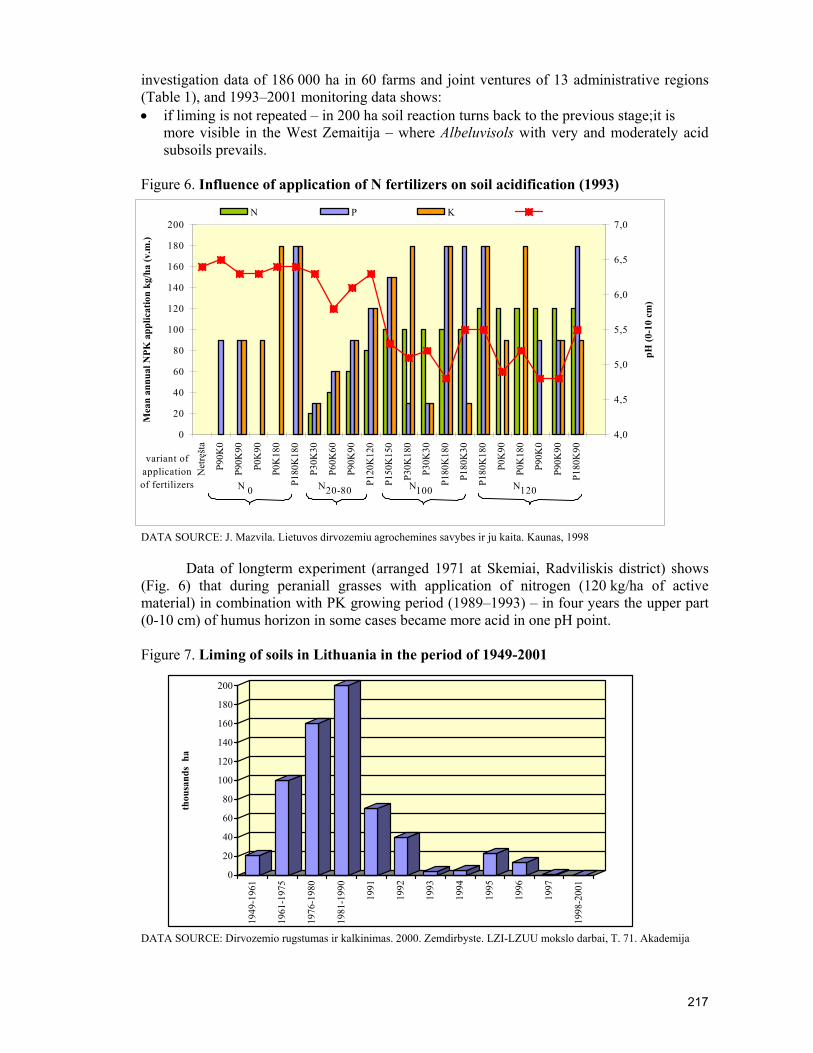
217
investigation data of 186 000 ha in 60 farms and joint ventures of 13 administrative regions (Table 1), and 1993–2001 monitoring data shows: • if liming is not repeated – in 200 ha soil reaction turns back to the previous stage;it is
more visible in the West Zemaitija – where Albeluvisols with very and moderately acid subsoils prevails.
Figure 6. Influence of application of N fertilizers on soil acidification (1993)
DATA SOURCE: J. Mazvila. Lietuvos dirvozemiu agrochemines savybes ir ju kaita. Kaunas, 1998 Data of longterm experiment (arranged 1971 at Skemiai, Radviliskis district) shows (Fig. 6) that during peraniall grasses with application of nitrogen (120 kg/ha of active material) in combination with PK growing period (1989–1993) – in four years the upper part (0-10 cm) of humus horizon in some cases became more acid in one pH point. Figure 7. Liming of soils in Lithuania in the period of 1949-2001
DATA SOURCE: Dirvozemio rugstumas ir kalkinimas. 2000. Zemdirbyste. LZI-LZUU mokslo darbai, T. 71. Akademija
0
20
40
60
80
100
120
140
160
180
200
Net
ręšt
a
P90K
0
P90K
90
P0K
90
P0K
180
P180
K18
0
P30K
30
P60K
60
P90K
90
P120
K12
0
P150
K15
0
P30K
180
P30K
30
P180
K18
0
P180
K30
P180
K18
0
P0K
90
P0K
180
P90K
0
P90K
90
P180
K90
Mea
n an
nual
NPK
app
licat
ion
kg/h
a (v
.m.)
4,0
4,5
5,0
5,5
6,0
6,5
7,0
pH (0
-10
cm)
N P K
variant of application of fertilizers N N N N0 20-80 100 120
0
20
40
60
80
100
120
140
160
180
200
thou
sand
s ha
1949
-196
1
1961
-197
5
1976
-198
0
1981
-199
0
1991
1992
1993
1994
1995
1996
1997
1998
-200
1
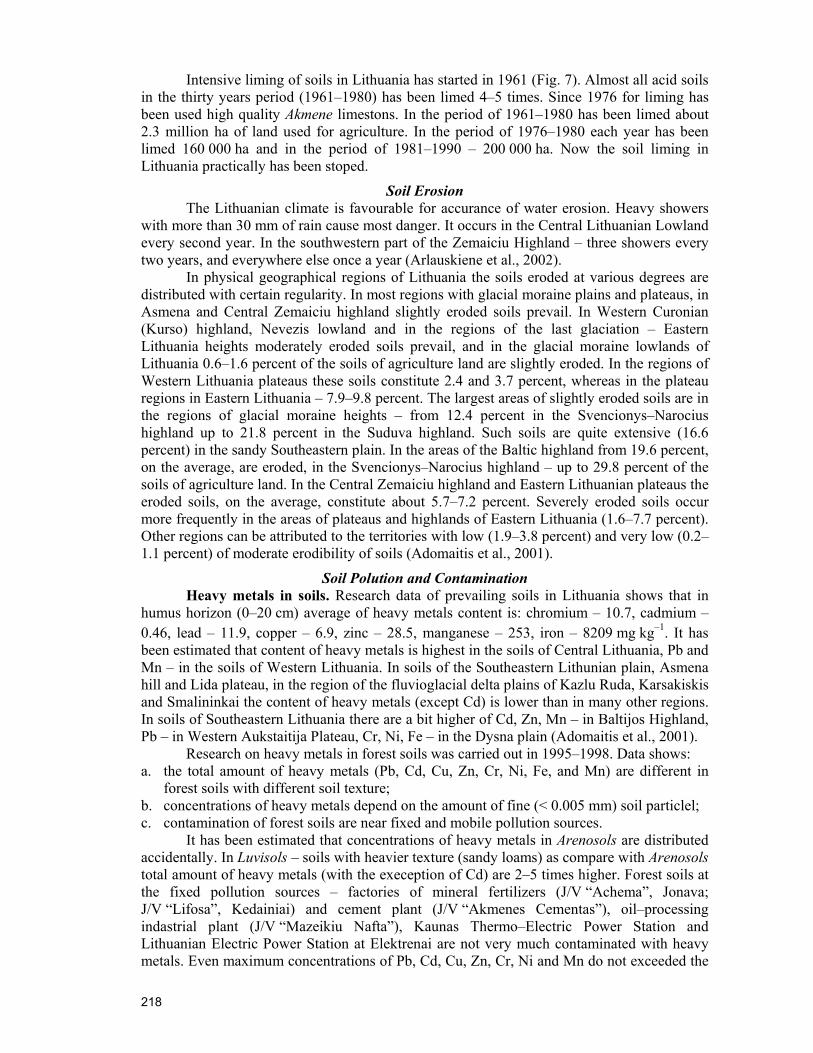
218
Intensive liming of soils in Lithuania has started in 1961 (Fig. 7). Almost all acid soils in the thirty years period (1961–1980) has been limed 4–5 times. Since 1976 for liming has been used high quality Akmene limestons. In the period of 1961–1980 has been limed about 2.3 million ha of land used for agriculture. In the period of 1976–1980 each year has been limed 160 000 ha and in the period of 1981–1990 – 200 000 ha. Now the soil liming in Lithuania practically has been stoped.
Soil Erosion The Lithuanian climate is favourable for accurance of water erosion. Heavy showers
with more than 30 mm of rain cause most danger. It occurs in the Central Lithuanian Lowland every second year. In the southwestern part of the Zemaiciu Highland – three showers every two years, and everywhere else once a year (Arlauskiene et al., 2002).
In physical geographical regions of Lithuania the soils eroded at various degrees are distributed with certain regularity. In most regions with glacial moraine plains and plateaus, in Asmena and Central Zemaiciu highland slightly eroded soils prevail. In Western Curonian (Kurso) highland, Nevezis lowland and in the regions of the last glaciation – Eastern Lithuania heights moderately eroded soils prevail, and in the glacial moraine lowlands of Lithuania 0.6–1.6 percent of the soils of agriculture land are slightly eroded. In the regions of Western Lithuania plateaus these soils constitute 2.4 and 3.7 percent, whereas in the plateau regions in Eastern Lithuania – 7.9–9.8 percent. The largest areas of slightly eroded soils are in the regions of glacial moraine heights – from 12.4 percent in the Svencionys–Narocius highland up to 21.8 percent in the Suduva highland. Such soils are quite extensive (16.6 percent) in the sandy Southeastern plain. In the areas of the Baltic highland from 19.6 percent, on the average, are eroded, in the Svencionys–Narocius highland – up to 29.8 percent of the soils of agriculture land. In the Central Zemaiciu highland and Eastern Lithuanian plateaus the eroded soils, on the average, constitute about 5.7–7.2 percent. Severely eroded soils occur more frequently in the areas of plateaus and highlands of Eastern Lithuania (1.6–7.7 percent). Other regions can be attributed to the territories with low (1.9–3.8 percent) and very low (0.2–1.1 percent) of moderate erodibility of soils (Adomaitis et al., 2001).
Soil Polution and Contamination Heavy metals in soils. Research data of prevailing soils in Lithuania shows that in
humus horizon (0–20 cm) average of heavy metals content is: chromium – 10.7, cadmium – 0.46, lead – 11.9, copper – 6.9, zinc – 28.5, manganese – 253, iron – 8209 mg kg–1. It has been estimated that content of heavy metals is highest in the soils of Central Lithuania, Pb and Mn – in the soils of Western Lithuania. In soils of the Southeastern Lithunian plain, Asmena hill and Lida plateau, in the region of the fluvioglacial delta plains of Kazlu Ruda, Karsakiskis and Smalininkai the content of heavy metals (except Cd) is lower than in many other regions. In soils of Southeastern Lithuania there are a bit higher of Cd, Zn, Mn – in Baltijos Highland, Pb – in Western Aukstaitija Plateau, Cr, Ni, Fe – in the Dysna plain (Adomaitis et al., 2001).
Research on heavy metals in forest soils was carried out in 1995–1998. Data shows: a. the total amount of heavy metals (Pb, Cd, Cu, Zn, Cr, Ni, Fe, and Mn) are different in
forest soils with different soil texture; b. concentrations of heavy metals depend on the amount of fine (< 0.005 mm) soil particlel; c. contamination of forest soils are near fixed and mobile pollution sources.
It has been estimated that concentrations of heavy metals in Arenosols are distributed accidentally. In Luvisols – soils with heavier texture (sandy loams) as compare with Arenosols total amount of heavy metals (with the exeception of Cd) are 2–5 times higher. Forest soils at the fixed pollution sources – factories of mineral fertilizers (J/V “Achema”, Jonava; J/V “Lifosa”, Kedainiai) and cement plant (J/V “Akmenes Cementas”), oil–processing indastrial plant (J/V “Mazeikiu Nafta”), Kaunas Thermo–Electric Power Station and Lithuanian Electric Power Station at Elektrenai are not very much contaminated with heavy metals. Even maximum concentrations of Pb, Cd, Cu, Zn, Cr, Ni and Mn do not exceeded the
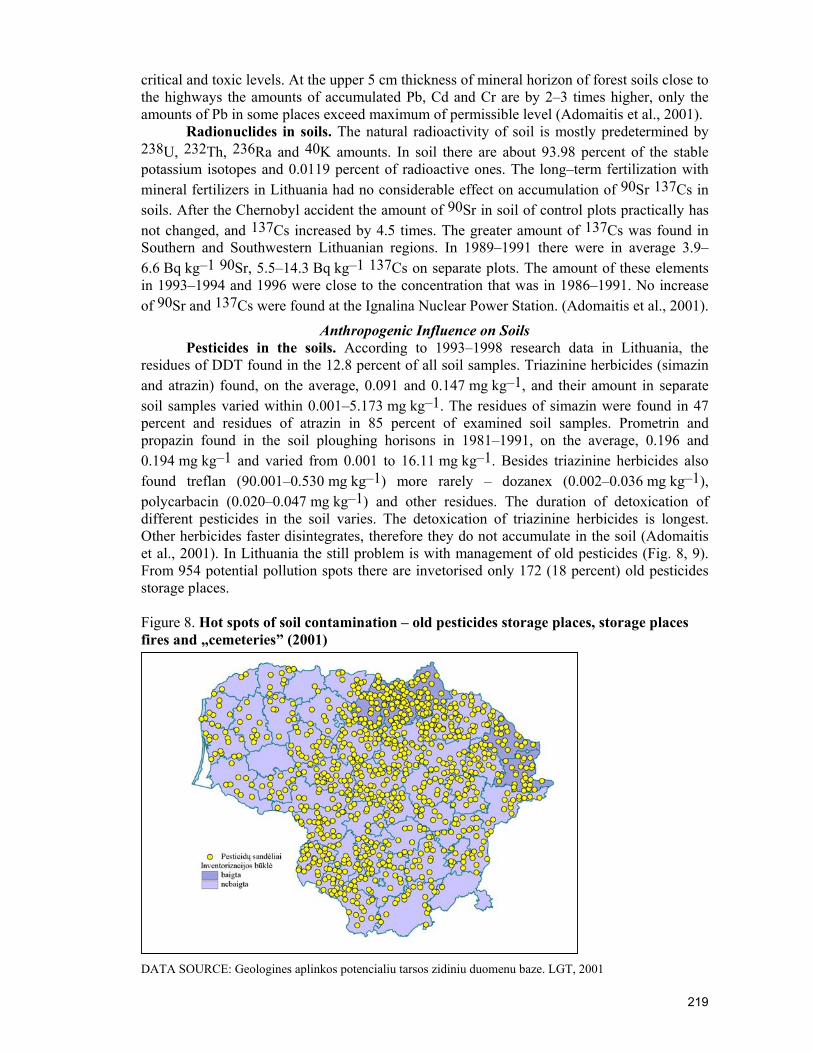
219
critical and toxic levels. At the upper 5 cm thickness of mineral horizon of forest soils close to the highways the amounts of accumulated Pb, Cd and Cr are by 2–3 times higher, only the amounts of Pb in some places exceed maximum of permissible level (Adomaitis et al., 2001).
Radionuclides in soils. The natural radioactivity of soil is mostly predetermined by 238U, 232Th, 236Ra and 40K amounts. In soil there are about 93.98 percent of the stable potassium isotopes and 0.0119 percent of radioactive ones. The long–term fertilization with mineral fertilizers in Lithuania had no considerable effect on accumulation of 90Sr 137Cs in soils. After the Chernobyl accident the amount of 90Sr in soil of control plots practically has not changed, and 137Cs increased by 4.5 times. The greater amount of 137Cs was found in Southern and Southwestern Lithuanian regions. In 1989–1991 there were in average 3.9–6.6 Bq kg–1 90Sr, 5.5–14.3 Bq kg–1 137Cs on separate plots. The amount of these elements in 1993–1994 and 1996 were close to the concentration that was in 1986–1991. No increase of 90Sr and 137Cs were found at the Ignalina Nuclear Power Station. (Adomaitis et al., 2001).
Anthropogenic Influence on Soils Pesticides in the soils. According to 1993–1998 research data in Lithuania, the
residues of DDT found in the 12.8 percent of all soil samples. Triazinine herbicides (simazin and atrazin) found, on the average, 0.091 and 0.147 mg kg–1, and their amount in separate soil samples varied within 0.001–5.173 mg kg–1. The residues of simazin were found in 47 percent and residues of atrazin in 85 percent of examined soil samples. Prometrin and propazin found in the soil ploughing horisons in 1981–1991, on the average, 0.196 and 0.194 mg kg–1 and varied from 0.001 to 16.11 mg kg–1. Besides triazinine herbicides also found treflan (90.001–0.530 mg kg–1) more rarely – dozanex (0.002–0.036 mg kg–1), polycarbacin (0.020–0.047 mg kg–1) and other residues. The duration of detoxication of different pesticides in the soil varies. The detoxication of triazinine herbicides is longest. Other herbicides faster disintegrates, therefore they do not accumulate in the soil (Adomaitis et al., 2001). In Lithuania the still problem is with management of old pesticides (Fig. 8, 9). From 954 potential pollution spots there are invetorised only 172 (18 percent) old pesticides storage places. Figure 8. Hot spots of soil contamination – old pesticides storage places, storage places fires and „cemeteries” (2001) DATA SOURCE: Geologines aplinkos potencialiu tarsos zidiniu duomenu baze. LGT, 2001
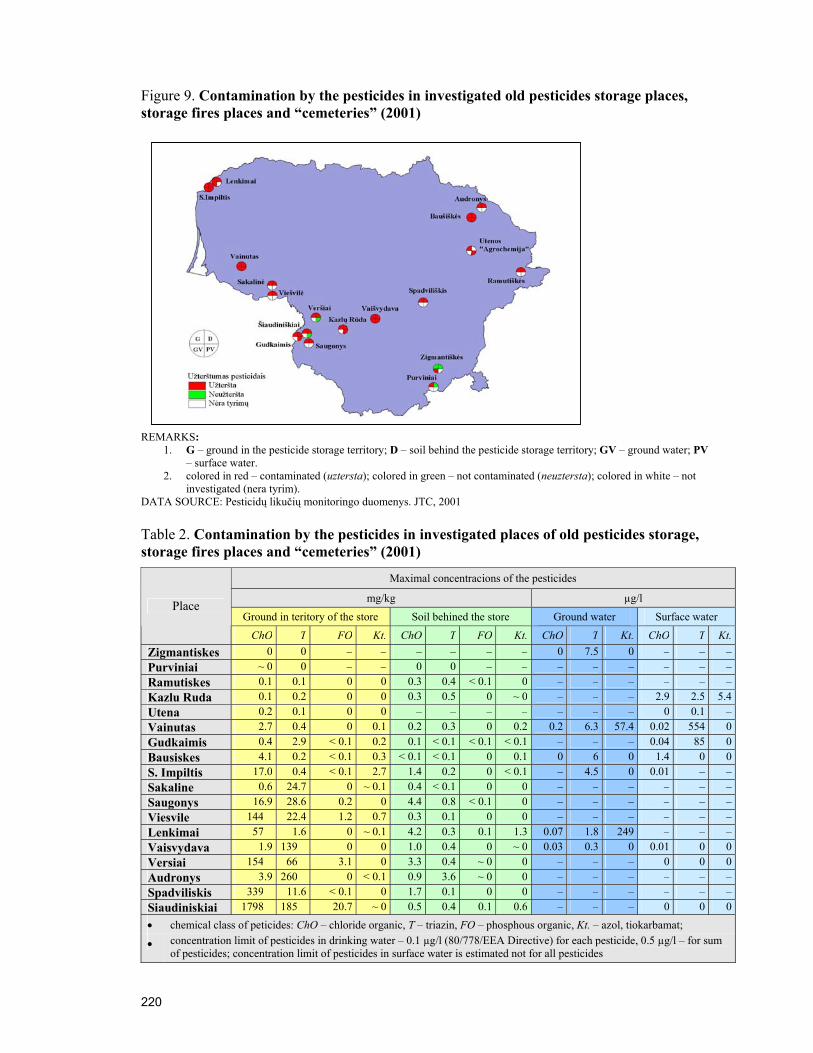
220
Figure 9. Contamination by the pesticides in investigated old pesticides storage places, storage fires places and “cemeteries” (2001)
REMARKS: 1. G – ground in the pesticide storage territory; D – soil behind the pesticide storage territory; GV – ground water; PV
– surface water. 2. colored in red – contaminated (uztersta); colored in green – not contaminated (neuztersta); colored in white – not
investigated (nera tyrim). DATA SOURCE: Pesticidų likučių monitoringo duomenys. JTC, 2001 Table 2. Contamination by the pesticides in investigated places of old pesticides storage, storage fires places and “cemeteries” (2001)
Maximal concentracions of the pesticides
mg/kg µg/l
Ground in teritory of the store Soil behined the store Ground water Surface water
Place
ChO T FO Kt. ChO T FO Kt. ChO T Kt. ChO T Kt.Zigmantiskes 0 0 – – – – – – 0 7.5 0 – – –Purviniai ~ 0 0 – – 0 0 – – – – – – – –Ramutiskes 0.1 0.1 0 0 0.3 0.4 < 0.1 0 – – – – – –Kazlu Ruda 0.1 0.2 0 0 0.3 0.5 0 ~ 0 – – – 2.9 2.5 5.4Utena 0.2 0.1 0 0 – – – – – – – 0 0.1 –Vainutas 2.7 0.4 0 0.1 0.2 0.3 0 0.2 0.2 6.3 57.4 0.02 554 0Gudkaimis 0.4 2.9 < 0.1 0.2 0.1 < 0.1 < 0.1 < 0.1 – – – 0.04 85 0Bausiskes 4.1 0.2 < 0.1 0.3 < 0.1 < 0.1 0 0.1 0 6 0 1.4 0 0S. Impiltis 17.0 0.4 < 0.1 2.7 1.4 0.2 0 < 0.1 – 4.5 0 0.01 – –Sakaline 0.6 24.7 0 ~ 0.1 0.4 < 0.1 0 0 – – – – – –Saugonys 16.9 28.6 0.2 0 4.4 0.8 < 0.1 0 – – – – – –Viesvile 144 22.4 1.2 0.7 0.3 0.1 0 0 – – – – – –Lenkimai 57 1.6 0 ~ 0.1 4.2 0.3 0.1 1.3 0.07 1.8 249 – – –Vaisvydava 1.9 139 0 0 1.0 0.4 0 ~ 0 0.03 0.3 0 0.01 0 0Versiai 154 66 3.1 0 3.3 0.4 ~ 0 0 – – – 0 0 0Audronys 3.9 260 0 < 0.1 0.9 3.6 ~ 0 0 – – – – – –Spadviliskis 339 11.6 < 0.1 0 1.7 0.1 0 0 – – – – – –Siaudiniskiai 1798 185 20.7 ~ 0 0.5 0.4 0.1 0.6 – – – 0 0 0• chemical class of peticides: ChO – chloride organic, T – triazin, FO – phosphous organic, Kt. – azol, tiokarbamat;
• concentration limit of pesticides in drinking water – 0.1 µg/l (80/778/EEA Directive) for each pesticide, 0.5 µg/l – for sum of pesticides; concentration limit of pesticides in surface water is estimated not for all pesticides
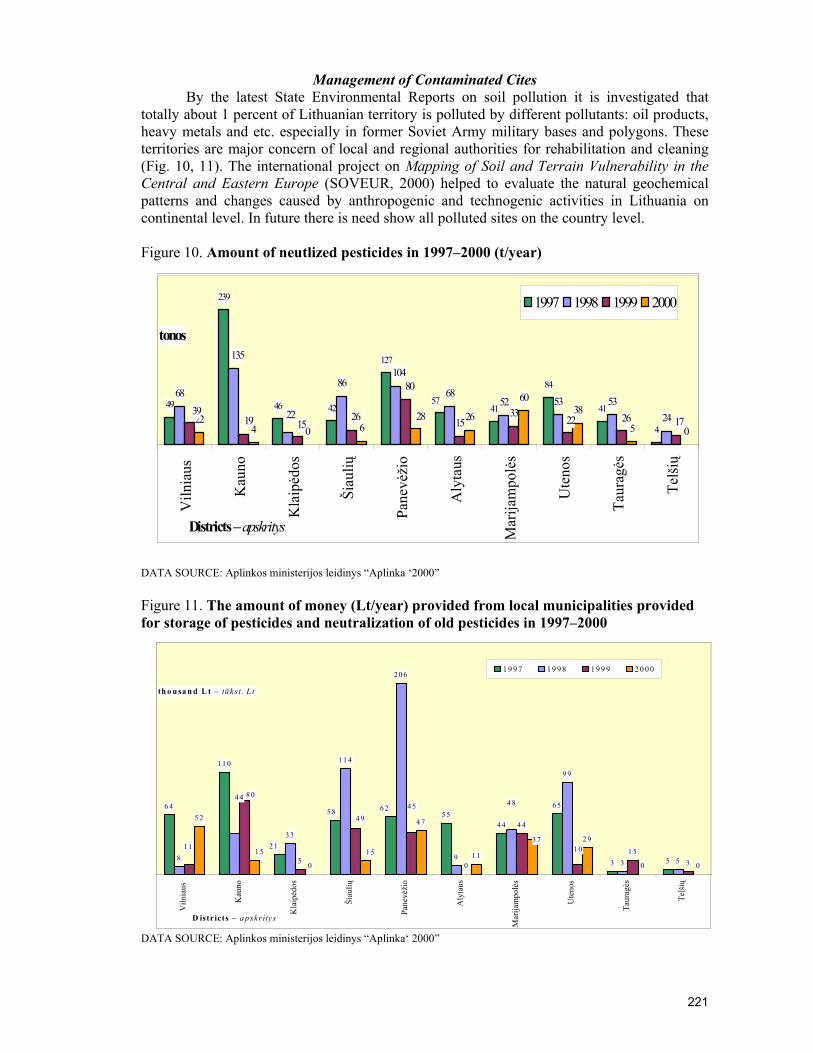
221
Management of Contaminated Cites By the latest State Environmental Reports on soil pollution it is investigated that
totally about 1 percent of Lithuanian territory is polluted by different pollutants: oil products, heavy metals and etc. especially in former Soviet Army military bases and polygons. These territories are major concern of local and regional authorities for rehabilitation and cleaning (Fig. 10, 11). The international project on Mapping of Soil and Terrain Vulnerability in the Central and Eastern Europe (SOVEUR, 2000) helped to evaluate the natural geochemical patterns and changes caused by anthropogenic and technogenic activities in Lithuania on continental level. In future there is need show all polluted sites on the country level. Figure 10. Amount of neutlized pesticides in 1997–2000 (t/year)
DATA SOURCE: Aplinkos ministerijos leidinys “Aplinka ‘2000” Figure 11. The amount of money (Lt/year) provided from local municipalities provided for storage of pesticides and neutralization of old pesticides in 1997–2000
DATA SOURCE: Aplinkos ministerijos leidinys “Aplinka‘ 2000”
49
239
46 42
127
41
84
41
4
6886
6852 53 53
24153322
4 0 626
6038
5 0
57
135
22
104
3919 15
80
22 26 1726 28
Viln
iaus
Kau
no
Kla
ipėd
os
Šiau
lių
Pane
vėži
o
Aly
taus
Mar
ijam
polė
s
Ute
nos
Taur
agės
Telš
ių
Districts – apskritys
tonos
1997 1998 1999 2000
1 1 0
5 54 4
6 5
3 58
3 3
1 1 4
2 0 6
9
9 9
3 55 0
4 4
1 53
5 2
0
4 7
1 1
2 9
0 0
2 1
5 8 6 26 44 4
4 84 58 0
1 1
4 9
1 01 51 53 7
Viln
iaus
Kau
no
Kla
ipėd
os
Šiau
lių
Pane
vėži
o
Aly
taus
Mar
ijam
polė
s
Ute
nos
Taur
agės
Telš
ių
D istr icts – a p skr itys
th o u sa n d L t – tū kst. L t
1 9 9 7 1 9 9 8 1 9 9 9 2 0 0 0
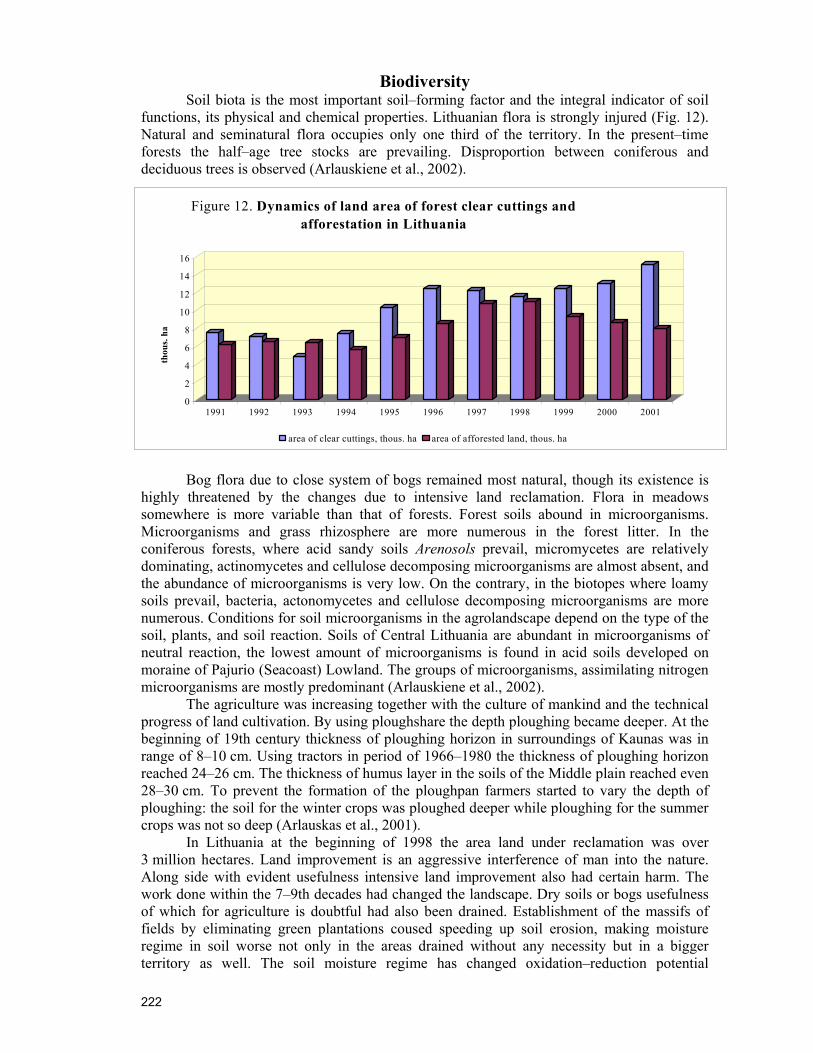
222
Biodiversity Soil biota is the most important soil–forming factor and the integral indicator of soil
functions, its physical and chemical properties. Lithuanian flora is strongly injured (Fig. 12). Natural and seminatural flora occupies only one third of the territory. In the present–time forests the half–age tree stocks are prevailing. Disproportion between coniferous and deciduous trees is observed (Arlauskiene et al., 2002).
Bog flora due to close system of bogs remained most natural, though its existence is highly threatened by the changes due to intensive land reclamation. Flora in meadows somewhere is more variable than that of forests. Forest soils abound in microorganisms. Microorganisms and grass rhizosphere are more numerous in the forest litter. In the coniferous forests, where acid sandy soils Arenosols prevail, micromycetes are relatively dominating, actinomycetes and cellulose decomposing microorganisms are almost absent, and the abundance of microorganisms is very low. On the contrary, in the biotopes where loamy soils prevail, bacteria, actonomycetes and cellulose decomposing microorganisms are more numerous. Conditions for soil microorganisms in the agrolandscape depend on the type of the soil, plants, and soil reaction. Soils of Central Lithuania are abundant in microorganisms of neutral reaction, the lowest amount of microorganisms is found in acid soils developed on moraine of Pajurio (Seacoast) Lowland. The groups of microorganisms, assimilating nitrogen microorganisms are mostly predominant (Arlauskiene et al., 2002).
The agriculture was increasing together with the culture of mankind and the technical progress of land cultivation. By using ploughshare the depth ploughing became deeper. At the beginning of 19th century thickness of ploughing horizon in surroundings of Kaunas was in range of 8–10 cm. Using tractors in period of 1966–1980 the thickness of ploughing horizon reached 24–26 cm. The thickness of humus layer in the soils of the Middle plain reached even 28–30 cm. To prevent the formation of the ploughpan farmers started to vary the depth of ploughing: the soil for the winter crops was ploughed deeper while ploughing for the summer crops was not so deep (Arlauskas et al., 2001).
In Lithuania at the beginning of 1998 the area land under reclamation was over 3 million hectares. Land improvement is an aggressive interference of man into the nature. Along side with evident usefulness intensive land improvement also had certain harm. The work done within the 7–9th decades had changed the landscape. Dry soils or bogs usefulness of which for agriculture is doubtful had also been drained. Establishment of the massifs of fields by eliminating green plantations coused speeding up soil erosion, making moisture regime in soil worse not only in the areas drained without any necessity but in a bigger territory as well. The soil moisture regime has changed oxidation–reduction potential
0
2
4
6
8
10
12
14
16
1991 1992 1993 1994 1995 1996 1997 1998 1999 2000 2001
Figure 12. Dynamics of land area of forest clear cuttings and afforestation in Lithuania
area of clear cuttings, thous. ha area of afforested land, thous. ha
thou
s. ha
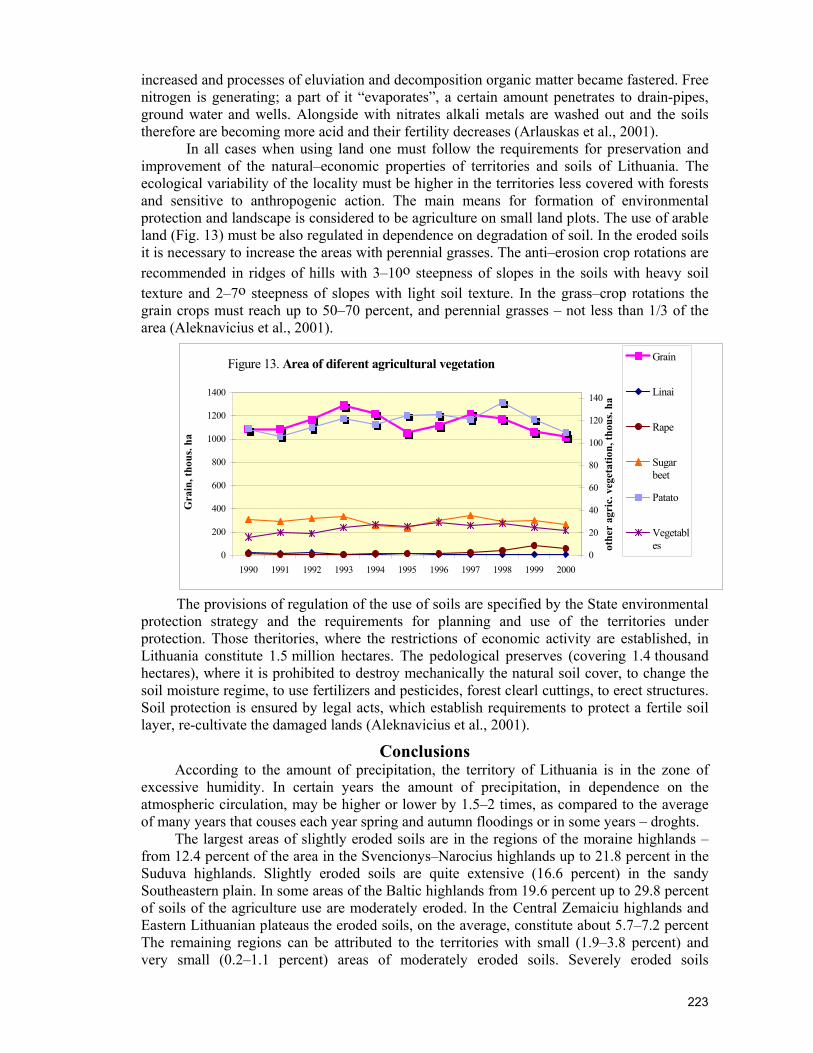
223
increased and processes of eluviation and decomposition organic matter became fastered. Free nitrogen is generating; a part of it “evaporates”, a certain amount penetrates to drain-pipes, ground water and wells. Alongside with nitrates alkali metals are washed out and the soils therefore are becoming more acid and their fertility decreases (Arlauskas et al., 2001).
In all cases when using land one must follow the requirements for preservation and improvement of the natural–economic properties of territories and soils of Lithuania. The ecological variability of the locality must be higher in the territories less covered with forests and sensitive to anthropogenic action. The main means for formation of environmental protection and landscape is considered to be agriculture on small land plots. The use of arable land (Fig. 13) must be also regulated in dependence on degradation of soil. In the eroded soils it is necessary to increase the areas with perennial grasses. The anti–erosion crop rotations are recommended in ridges of hills with 3–10o steepness of slopes in the soils with heavy soil texture and 2–7o steepness of slopes with light soil texture. In the grass–crop rotations the grain crops must reach up to 50–70 percent, and perennial grasses – not less than 1/3 of the area (Aleknavicius et al., 2001).
The provisions of regulation of the use of soils are specified by the State environmental protection strategy and the requirements for planning and use of the territories under protection. Those theritories, where the restrictions of economic activity are established, in Lithuania constitute 1.5 million hectares. The pedological preserves (covering 1.4 thousand hectares), where it is prohibited to destroy mechanically the natural soil cover, to change the soil moisture regime, to use fertilizers and pesticides, forest clearl cuttings, to erect structures. Soil protection is ensured by legal acts, which establish requirements to protect a fertile soil layer, re-cultivate the damaged lands (Aleknavicius et al., 2001).
Conclusions According to the amount of precipitation, the territory of Lithuania is in the zone of
excessive humidity. In certain years the amount of precipitation, in dependence on the atmospheric circulation, may be higher or lower by 1.5–2 times, as compared to the average of many years that couses each year spring and autumn floodings or in some years – droghts.
The largest areas of slightly eroded soils are in the regions of the moraine highlands – from 12.4 percent of the area in the Svencionys–Narocius highlands up to 21.8 percent in the Suduva highlands. Slightly eroded soils are quite extensive (16.6 percent) in the sandy Southeastern plain. In some areas of the Baltic highlands from 19.6 percent up to 29.8 percent of soils of the agriculture use are moderately eroded. In the Central Zemaiciu highlands and Eastern Lithuanian plateaus the eroded soils, on the average, constitute about 5.7–7.2 percent The remaining regions can be attributed to the territories with small (1.9–3.8 percent) and very small (0.2–1.1 percent) areas of moderately eroded soils. Severely eroded soils
Figure 13. Area of diferent agricultural vegetation
0
200
400
600
800
1000
1200
1400
1990 1991 1992 1993 1994 1995 1996 1997 1998 1999 2000
Gra
in, t
hous
. ha
0
20
40
60
80
100
120
140
othe
r ag
ric.
veg
etat
ion,
thou
s. ha
Grain
Linai
Rape
Sugarbeet
Patato
Vegetables
224
(Regosols) occur more frequently in the areas of plateaus and highlands of Eastern Lithuania (1.6–7.7 percent).
Data shows that atmospheric emission of soil potential pollutants and acidifiyers such as the sulfur and nitrogen in Lithuania and national parks is going down. It causes less sulphur in forest soils.
Comparision of the 1992 and 1998 soil pH values shows that in six years soil reaction of Lithuanian forest soils has not changed considerably.
Data shows that soils in Lithuania mostly (46.3 percent) are very close to neutral (pHKCl =6.6-6.9) and neutral (pHKCl =7.0) but more than 16 percent of soils are under accelerated acid conditions and needed to be limed.
The lowering of liming practice, application of pesticides and mineral fertilizers has big influence on soil agrochemical properties and its contamination. Soil is an ever-changing system. The need for new methods of soil research, for new information to be integrated, socially responsible for sustainable development of our country have not only theoretical but also practical sense.
There is need to seek establish a reference base for the assessment of land quality that would provide a scientific base for soil protection and contribute to identifying and solve existing problems of soil degradation in Lithuania.
References
Adomaitis, T., Armolaitis, K., Dilys, A., Eitminavicius, L., Ezerinskas, V., Jankauskas, B., Kiburys, B., Kubertaviciene, L., Lubyte, J., Masauskas, V., Mazvila, J., Morkunaite, R., Motuzas, A., Paskauskas, S., Raguotis, A., Sleinys, R., Svedas, A., Vaicys, M., Vaisvalavicius, R. 2001. Soil degradation. Lietuvos dirvozemiai: Monografija. Vilnius: Lietuvos mokslas, 2001. Kn. 32: 708–828. [In Lithuanian, Summary in English]
Aleknavicius, P., Baubinas, R., Jankauskaite, M., Jankausakas, B., Pakutinskas, J. 2001. Rational use and protection of soils. Lietuvos dirvozemiai: Monografija. Vilnius: Lietuvos mokslas, 2001. Kn. 32: 1137–1182. [In Lithuanian, Summary in English]
Arlauskas, M., Arlauskiene, E. A., Eidukeviciene, M., Eitminaviciute, I., Ezerinskas, V., Janusiene, V., Lapinskas, E., Lenksaite, E., Masauskas, V., Matusevicius, K., Mazvila, J., Milius, J., Morkunas, V., Pleseviciene, A. K., Sleinys, R., Svedas, A., Tripolskaja, L., Vaisvila, Z., Vasiliauskiene, V. 2001. Cultivation of soils. Lietuvos dirvozemiai: Monografija. Vilnius: Lietuvos mokslas, 2001. Kn. 32: 829–1024. [In Lithuanian, Summary in English]
Arlauskiene, E., Bagdanaviciene, Z., Baleviciene, J., Bukantis, A., Cesnulevicius, A., Eidukeviciene, M., Eitminaviciute, I., Grybauskas, J., Lapinskas, E., Raguotis, A., Strazdiene, V., Vaicys, M. 2001. Soil-forming factors. Lietuvos dirvozemiai: Monografija. Vilnius: Lietuvos mokslas, 2001. Kn. 32: 106–209. [In Lithuanian, Summary in English]
Buivydaite, V. V., Grybauskas, J., Juodis, A., Vaicys, M. 2001. Soil database for Lithuania. Lietuvos dirvozemiai: Monografija. Vilnius: Lietuvos mokslas, 2001. Kn. 32: 1063–1084. [In Lithuanian, Summary in English]
Buivydaite, V. V., Juodis, A., Motuzas A., Vaicys, M. 2001. Classification of soils in Lithuania. Lietuvos dirvozemiai: Monografija. Vilnius: Lietuvos mokslas, 2001. Kn. 32: 244–408. [In Lithuanian, Summary in English]
Dirvozemio rugstumas ir kalkinimas. 2000. Zemdirbyste. LZI-LZUU mokslo darbai, T. 71 Akademija. P. 3–20. [In Lithuanian, summary in English]
Eitminaviciute, I., Mazvila, J., Vaicys, M. 2001. Soil monitoring. Lietuvos dirvozemiai: Monografija. Vilnius: Lietuvos mokslas, 2001. Kn. 32: 1075–1136. [In Lithuanian, summary in English]
Erikson E. 1952. Composition of atmospheric precipitation. Tellus 4, 280–303 Kuylenstierna J.C.I., Rodhe H., Cinderby S. and Hicks K. 2001. Acidification in developing countries:
Ecosystem sensitivity and the critical load approach on a global scale. Ambio, 1, 20–28 Lietuvos dirvozemiu klasifikacija. 2001. Vilnius, Lietuvos mokslas. Kn. 34. 139. [In Lithuanian, Summary in
English] Soils of Lithuania. 2001. Monography. Vilnius, Lietuvos mokslas. Kn. 32. 1244. [In Lithuanian, Summary in
English] SOVEUR: Soil and Terrain Database, Land Degradation Status and Soil Vulnerability Assessment for Central
and Eastern Europe, Version 1.0 (1:2.5 million scale). 2000. CD-ROM. FAO Land and Water Digital Media Series 10. ISRIC, FAO
Vanmechelen L., Groenemans R., Van Ranst E. 1997. Forest Soil Condition in Europe (Results of a large-scale soil survey). FSCC. 261
225
LAND DEGRADATION IN POLAND
Szymon Szewrański, Józef Sasik, Romuald Żmuda
Faculty of Environmental Engineering and Geodesy Agricultural University of Wroclaw pl. Grunwaldzki 24,50-363 Wrocław POLAND tel. 0048713205534 fax. 0048713205574 [email protected] 1. GENERAL INFORMATION The total area of Poland is 312 700 km2. State territory is divided into 16 voivodships and 2 459 communes. Poland is sharing borders with Russia, Lithuania, Belarus and Ukraine in the East, Czech and Slovak Republics in the South and Germany in the West. In the North it is bounded by the Baltic Sea Poland lies in the basins of the 3 seas — Baltic (311900 km2), Northern (200 km2) and Black (600 km2). The main Polish rivers are Vistula (Wisla — 1047km) and the Oder (Odra — 742km). Poland's location in the middle latitudes (49º N – 54º50' N) determines its climate, vegetation, soils etc. Longitudes of 14º07'E ÷ 24º08'E determine, that Poland lies in a zone of the moderate climate. Average height of the state is 173 m above the sea level (the highest point — Rysy +2499m, the lowest point — Raczki Elblaskie –1,8m). 91.3% of the total area belongs to the lowland zone; upland and mountainous areas take 8.7% of territory. Different natural conditions and resources of mountains in the South, Baltic seashore in the North and numerous lake districts in the Lowlands make Poland to be the country of rich and diverse landscapes and regions of not heterogeneous land use pattern. 2. CLIMATE As mentioned above, Poland is under the moderate climate influence, between maritime and continental conditions. Prevailing western winds makes very important contribution in climate softening. During fairly wet and mild winters, the average monthly temperature is around 0°C and during heavy and dry winters — -10°C. Summer season and vegetation period are also varied. There are both hot and dry summers (with less than 20 mm of precipitation in June, July and August) as well as cold and wet ones of the monthly rainfall up to 200 mm. The annual temperatures range from 6.5°C to 8.5°C. In the lowland region the vegetation season with the mean temperature > 5°C lasts from 190 to 220 days. The mean annual precipitation is 583 mm and it is representative for the most regions of the country. In the uplands and the mountains the annual precipitation may reach 800 - 1500 mm; in Central Poland this value is about 450 - 550 mm, and in the sea coast — 500 - 600 mm. 3. LAND USE It is considered, that soil is a finite, non-renewable resource and its regeneration, through parent rock weathering, requires hundreds of years. Consumption of high-value agricultural soil by increasing urbanization and industrialization should always be under careful control. The total land area is under two significant land use forms — agriculture and forestry. Generally agricultural lands occupy 59,2% of the total state area, arable lands take 45,2%, orchards 1,0% and meadows and pastures — 13,0%. Afforested areas reach 29,2% of Poland’s territory. The others lands take 11,6 %. The
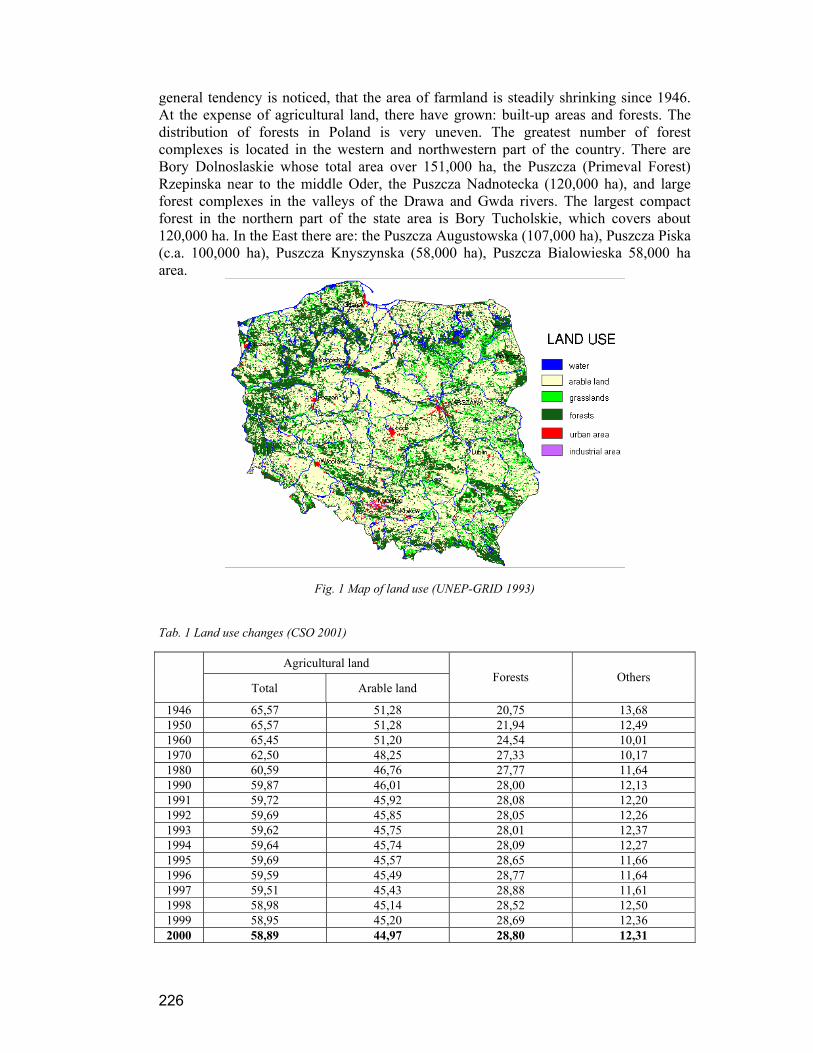
226
general tendency is noticed, that the area of farmland is steadily shrinking since 1946. At the expense of agricultural land, there have grown: built-up areas and forests. The distribution of forests in Poland is very uneven. The greatest number of forest complexes is located in the western and northwestern part of the country. There are Bory Dolnoslaskie whose total area over 151,000 ha, the Puszcza (Primeval Forest) Rzepinska near to the middle Oder, the Puszcza Nadnotecka (120,000 ha), and large forest complexes in the valleys of the Drawa and Gwda rivers. The largest compact forest in the northern part of the state area is Bory Tucholskie, which covers about 120,000 ha. In the East there are: the Puszcza Augustowska (107,000 ha), Puszcza Piska (c.a. 100,000 ha), Puszcza Knyszynska (58,000 ha), Puszcza Bialowieska 58,000 ha area.
Fig. 1 Map of land use (UNEP-GRID 1993) Tab. 1 Land use changes (CSO 2001)
Agricultural land
Total Arable land Forests Others
1946 65,57 51,28 20,75 13,68 1950 65,57 51,28 21,94 12,49 1960 65,45 51,20 24,54 10,01 1970 62,50 48,25 27,33 10,17 1980 60,59 46,76 27,77 11,64 1990 59,87 46,01 28,00 12,13 1991 59,72 45,92 28,08 12,20 1992 59,69 45,85 28,05 12,26 1993 59,62 45,75 28,01 12,37 1994 59,64 45,74 28,09 12,27 1995 59,69 45,57 28,65 11,66 1996 59,59 45,49 28,77 11,64 1997 59,51 45,43 28,88 11,61 1998 58,98 45,14 28,52 12,50 1999 58,95 45,20 28,69 12,36 2000 58,89 44,97 28,80 12,31
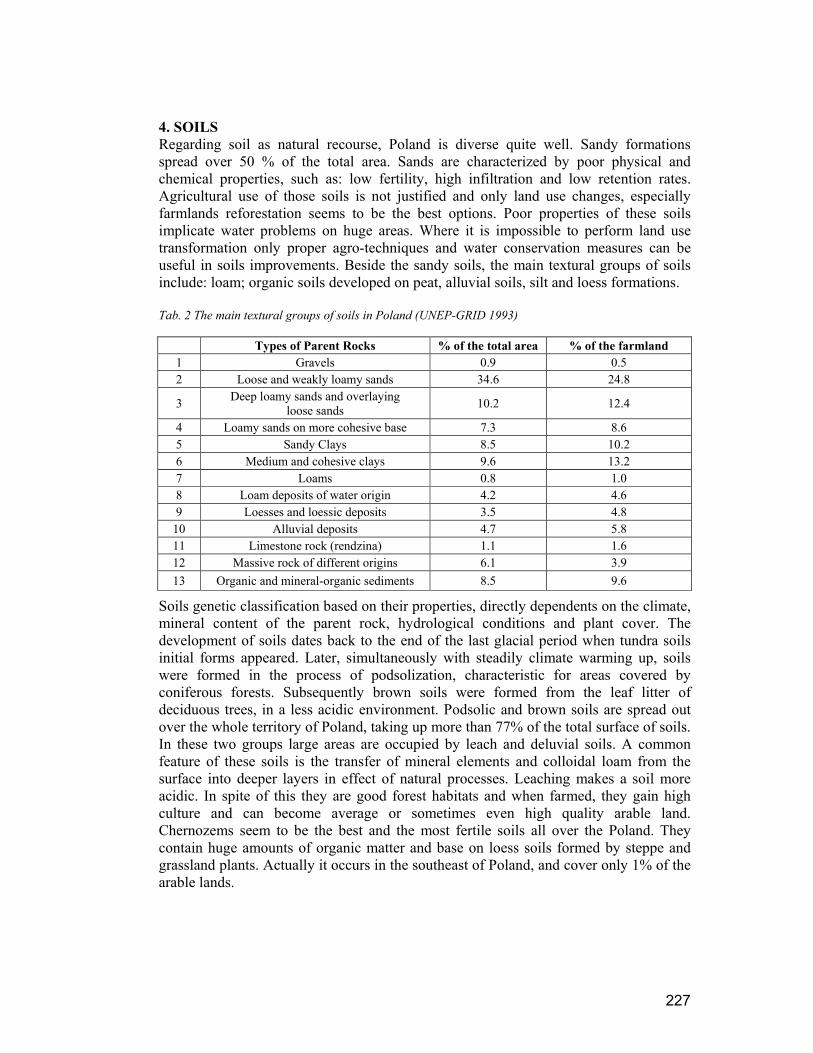
227
4. SOILS Regarding soil as natural recourse, Poland is diverse quite well. Sandy formations spread over 50 % of the total area. Sands are characterized by poor physical and chemical properties, such as: low fertility, high infiltration and low retention rates. Agricultural use of those soils is not justified and only land use changes, especially farmlands reforestation seems to be the best options. Poor properties of these soils implicate water problems on huge areas. Where it is impossible to perform land use transformation only proper agro-techniques and water conservation measures can be useful in soils improvements. Beside the sandy soils, the main textural groups of soils include: loam; organic soils developed on peat, alluvial soils, silt and loess formations. Tab. 2 The main textural groups of soils in Poland (UNEP-GRID 1993)
Types of Parent Rocks % of the total area % of the farmland 1 Gravels 0.9 0.5 2 Loose and weakly loamy sands 34.6 24.8
3 Deep loamy sands and overlaying loose sands 10.2 12.4
4 Loamy sands on more cohesive base 7.3 8.6 5 Sandy Clays 8.5 10.2 6 Medium and cohesive clays 9.6 13.2 7 Loams 0.8 1.0 8 Loam deposits of water origin 4.2 4.6 9 Loesses and loessic deposits 3.5 4.8
10 Alluvial deposits 4.7 5.8 11 Limestone rock (rendzina) 1.1 1.6 12 Massive rock of different origins 6.1 3.9 13 Organic and mineral-organic sediments 8.5 9.6
Soils genetic classification based on their properties, directly dependents on the climate, mineral content of the parent rock, hydrological conditions and plant cover. The development of soils dates back to the end of the last glacial period when tundra soils initial forms appeared. Later, simultaneously with steadily climate warming up, soils were formed in the process of podsolization, characteristic for areas covered by coniferous forests. Subsequently brown soils were formed from the leaf litter of deciduous trees, in a less acidic environment. Podsolic and brown soils are spread out over the whole territory of Poland, taking up more than 77% of the total surface of soils. In these two groups large areas are occupied by leach and deluvial soils. A common feature of these soils is the transfer of mineral elements and colloidal loam from the surface into deeper layers in effect of natural processes. Leaching makes a soil more acidic. In spite of this they are good forest habitats and when farmed, they gain high culture and can become average or sometimes even high quality arable land. Chernozems seem to be the best and the most fertile soils all over the Poland. They contain huge amounts of organic matter and base on loess soils formed by steppe and grassland plants. Actually it occurs in the southeast of Poland, and cover only 1% of the arable lands.
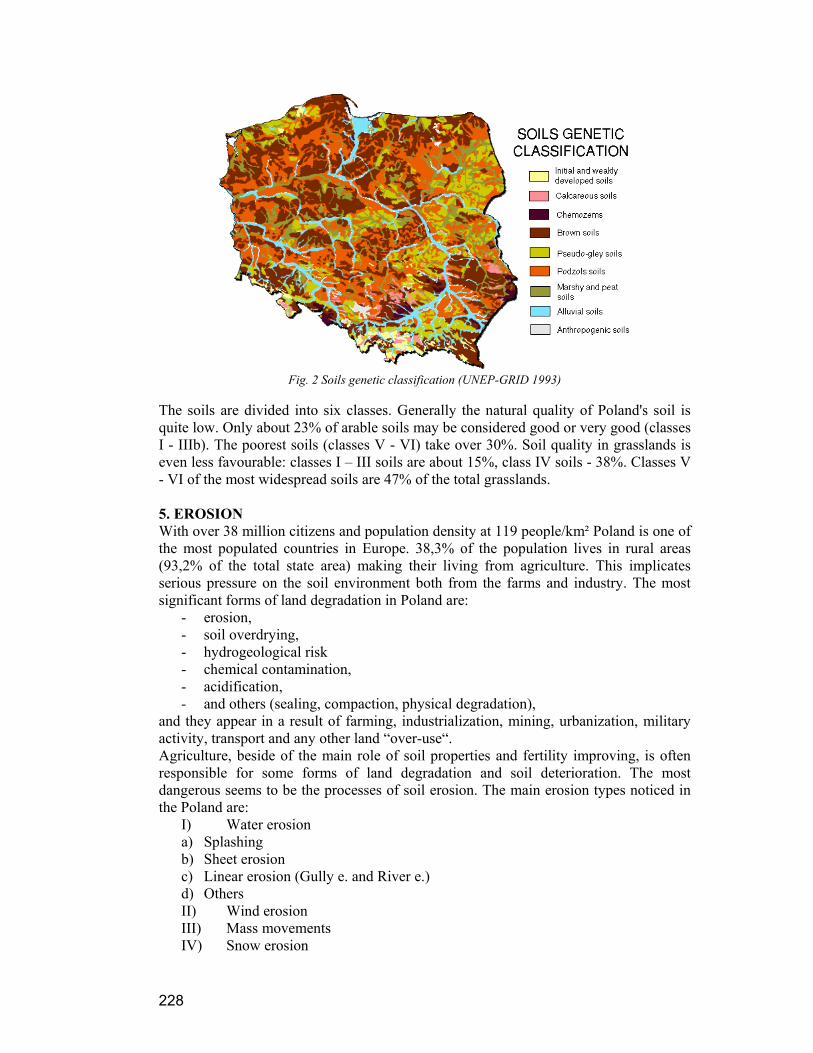
228
Fig. 2 Soils genetic classification (UNEP-GRID 1993)
The soils are divided into six classes. Generally the natural quality of Poland's soil is quite low. Only about 23% of arable soils may be considered good or very good (classes I - IIIb). The poorest soils (classes V - VI) take over 30%. Soil quality in grasslands is even less favourable: classes I – III soils are about 15%, class IV soils - 38%. Classes V - VI of the most widespread soils are 47% of the total grasslands. 5. EROSION With over 38 million citizens and population density at 119 people/km² Poland is one of the most populated countries in Europe. 38,3% of the population lives in rural areas (93,2% of the total state area) making their living from agriculture. This implicates serious pressure on the soil environment both from the farms and industry. The most significant forms of land degradation in Poland are:
- erosion, - soil overdrying, - hydrogeological risk - chemical contamination, - acidification, - and others (sealing, compaction, physical degradation),
and they appear in a result of farming, industrialization, mining, urbanization, military activity, transport and any other land “over-use“. Agriculture, beside of the main role of soil properties and fertility improving, is often responsible for some forms of land degradation and soil deterioration. The most dangerous seems to be the processes of soil erosion. The main erosion types noticed in the Poland are:
I) Water erosion a) Splashing b) Sheet erosion c) Linear erosion (Gully e. and River e.) d) Others II) Wind erosion III) Mass movements IV) Snow erosion

229
These phenomena induce two types of environmental impacts, need to be considered — “on-site” and “off-site” impacts. On-site impacts: Erosion reduces the ecological functions of soil, biomass production, crop yields, nutrients amounts, filtering capacity and disturbs hydrological cycle from precipitation to runoff). In the case of the high forms of gully erosion it can also completely change the landscape and make the production space to be definitely useless. Pollution due to transport of hazardous substances and sedimentation, disruption of the carbon and nutrient cycles are considered as the off-site impacts.
Fot. 1 Water erosion in Trzebnica Hills (Lower Silesia)
About 28,5% of the total Poland territory is under water erosion impact. Intensive rate is noticed on 3,7% of state area, medium erosion on 11% and the low form on 13,8% of the land. It affects mainly the mountains and highlands of Sudety, Carpatian Mountains and loess highlands of Trzebnica Hills, regions of Lublin and Cracow. Medium erosion threatens lake districts in the N and NW parts of Poland. The most common form of water erosion is surface erosion, which is on 50–60% of area eroded in medium and high rate, where clear signs of soil degradation are visible. Generally about 21% of arable lands, and 8% of forests is under water erosion impact.
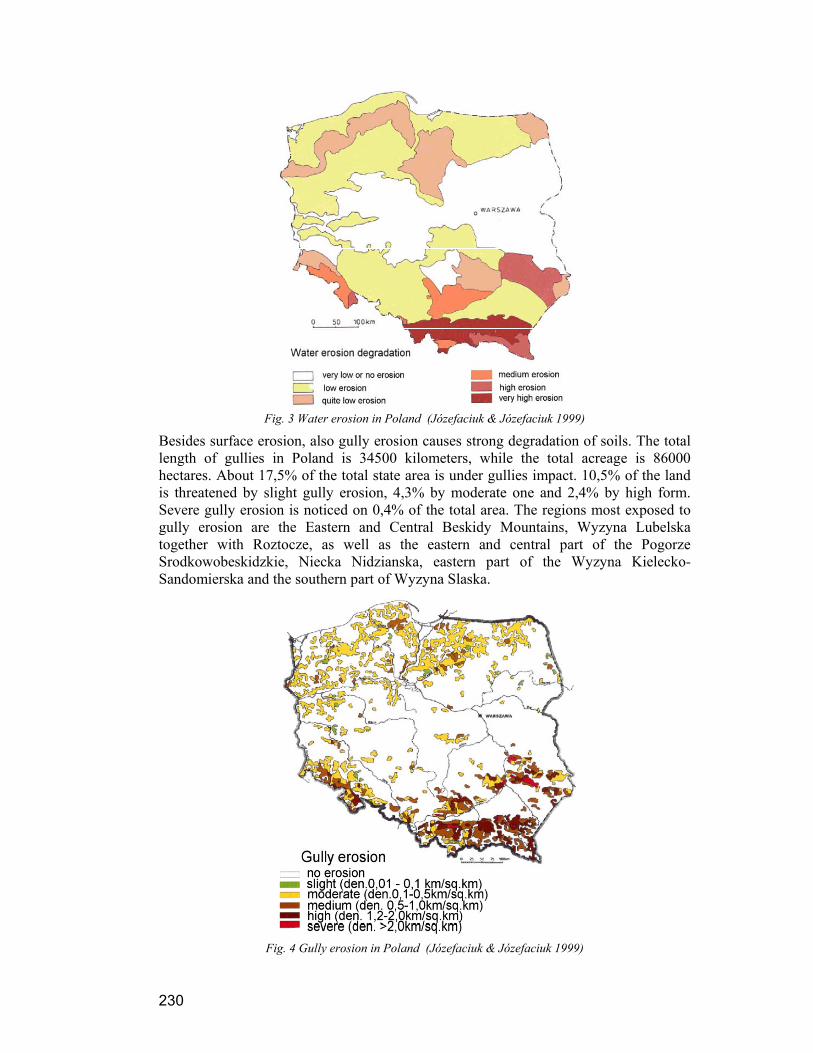
230
Fig. 3 Water erosion in Poland (Józefaciuk & Józefaciuk 1999)
Besides surface erosion, also gully erosion causes strong degradation of soils. The total length of gullies in Poland is 34500 kilometers, while the total acreage is 86000 hectares. About 17,5% of the total state area is under gullies impact. 10,5% of the land is threatened by slight gully erosion, 4,3% by moderate one and 2,4% by high form. Severe gully erosion is noticed on 0,4% of the total area. The regions most exposed to gully erosion are the Eastern and Central Beskidy Mountains, Wyzyna Lubelska together with Roztocze, as well as the eastern and central part of the Pogorze Srodkowobeskidzkie, Niecka Nidzianska, eastern part of the Wyzyna Kielecko-Sandomierska and the southern part of Wyzyna Slaska.
Fig. 4 Gully erosion in Poland (Józefaciuk & Józefaciuk 1999)
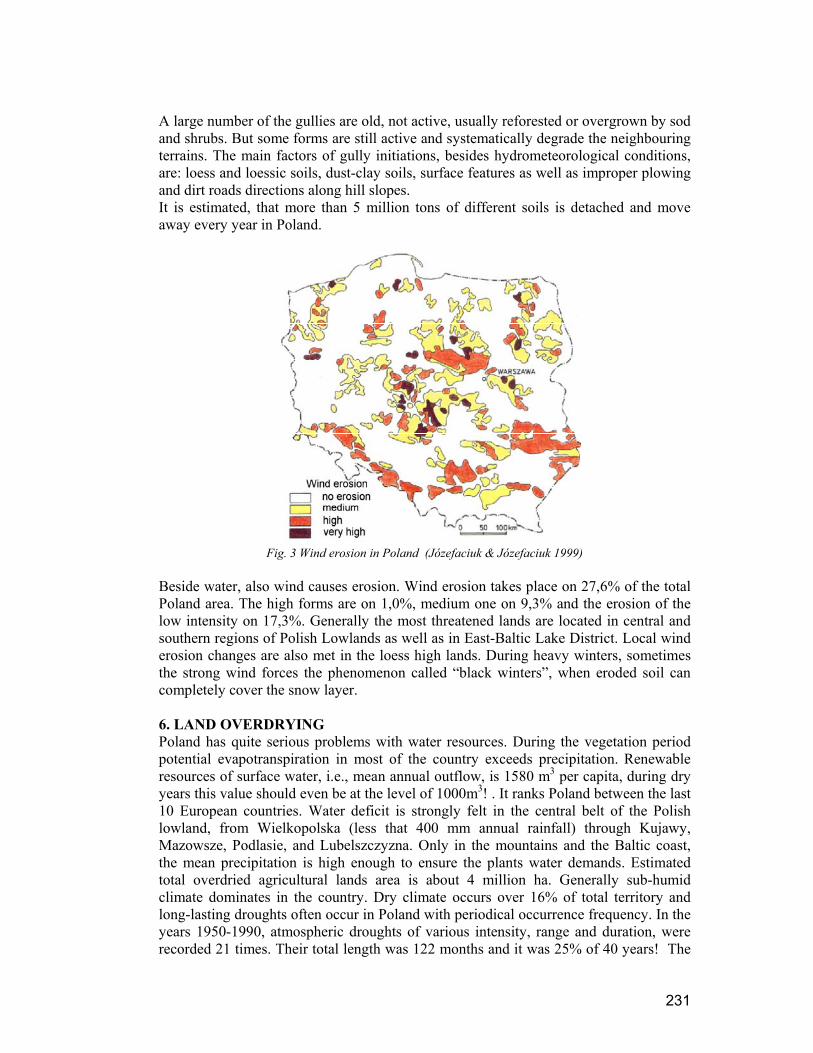
231
A large number of the gullies are old, not active, usually reforested or overgrown by sod and shrubs. But some forms are still active and systematically degrade the neighbouring terrains. The main factors of gully initiations, besides hydrometeorological conditions, are: loess and loessic soils, dust-clay soils, surface features as well as improper plowing and dirt roads directions along hill slopes. It is estimated, that more than 5 million tons of different soils is detached and move away every year in Poland.
Fig. 3 Wind erosion in Poland (Józefaciuk & Józefaciuk 1999)
Beside water, also wind causes erosion. Wind erosion takes place on 27,6% of the total Poland area. The high forms are on 1,0%, medium one on 9,3% and the erosion of the low intensity on 17,3%. Generally the most threatened lands are located in central and southern regions of Polish Lowlands as well as in East-Baltic Lake District. Local wind erosion changes are also met in the loess high lands. During heavy winters, sometimes the strong wind forces the phenomenon called “black winters”, when eroded soil can completely cover the snow layer. 6. LAND OVERDRYING Poland has quite serious problems with water resources. During the vegetation period potential evapotranspiration in most of the country exceeds precipitation. Renewable resources of surface water, i.e., mean annual outflow, is 1580 m3 per capita, during dry years this value should even be at the level of 1000m3! . It ranks Poland between the last 10 European countries. Water deficit is strongly felt in the central belt of the Polish lowland, from Wielkopolska (less that 400 mm annual rainfall) through Kujawy, Mazowsze, Podlasie, and Lubelszczyzna. Only in the mountains and the Baltic coast, the mean precipitation is high enough to ensure the plants water demands. Estimated total overdried agricultural lands area is about 4 million ha. Generally sub-humid climate dominates in the country. Dry climate occurs over 16% of total territory and long-lasting droughts often occur in Poland with periodical occurrence frequency. In the years 1950-1990, atmospheric droughts of various intensity, range and duration, were recorded 21 times. Their total length was 122 months and it was 25% of 40 years! The

232
drought of 1969/70 lasted for 19 months and affected 95% of the state territory. Another problem is hydrological drought, which occurs in effect of multi-years precipitation deficits. During mentioned 40 years such droughts took place 13 times and lasted 112 months (23% of the multiyear). 20% of the state area was under influence of these phenomena. There were noticed disturbances in groundwater table levels, pollutants concentration fluctuations, plant growth problems, limitation of water supply for people’s demands. The drought in 1992 lasted over 50 days and affected the whole Poland. The crop yield, in some regions was 40% lower then normally. In some rivers outflow reach only 20% of normal one and water conductivity norms were exceeded over 500%. The poor condition of the land is additionally deteriorated by extensive deforestation done in the past as well as the mistakes made in water resources management, for example badly designed land meliorations. There were provided excessive river channels straightening and deepening and the marshes, moors and periodically wet farmlands draining. During reclamation, drainage systems were introduced without care to water reserves. As a result of soil overdrying and the increased surface runoff groundwater table has lowered. Accelerated decomposition and mineralization of organic material caused a further reduction in their water storage capacity. Permanent environmental stress induced very specific phenomenon, called steppe forming. Nowadays reforestation programme is of particular significance to combat draught and desertification in Poland. Regarding legal regulations on this policy, about 21,1% of arable lands are suitable for reforestation. It’s planned that in the year 2020 all areas of VI class and half of V class will be afforested — 22% of the total farmlands. Further action would be held after 2020.
Fig. 4 Steppe forming in Central Poland (Skinder 1995)
The agricultural reclamations (meliorations) mentioned above, are strongly connected with soil related issues. Actually, corresponding to Water Act on 18th July 2001, meliorations are to improve the soils productivity and cultivation as well as to protect soils against floods. The most serious melioration developments were provided after the 1945, but the first hydraulic facilities for agricultural purposes were already made in
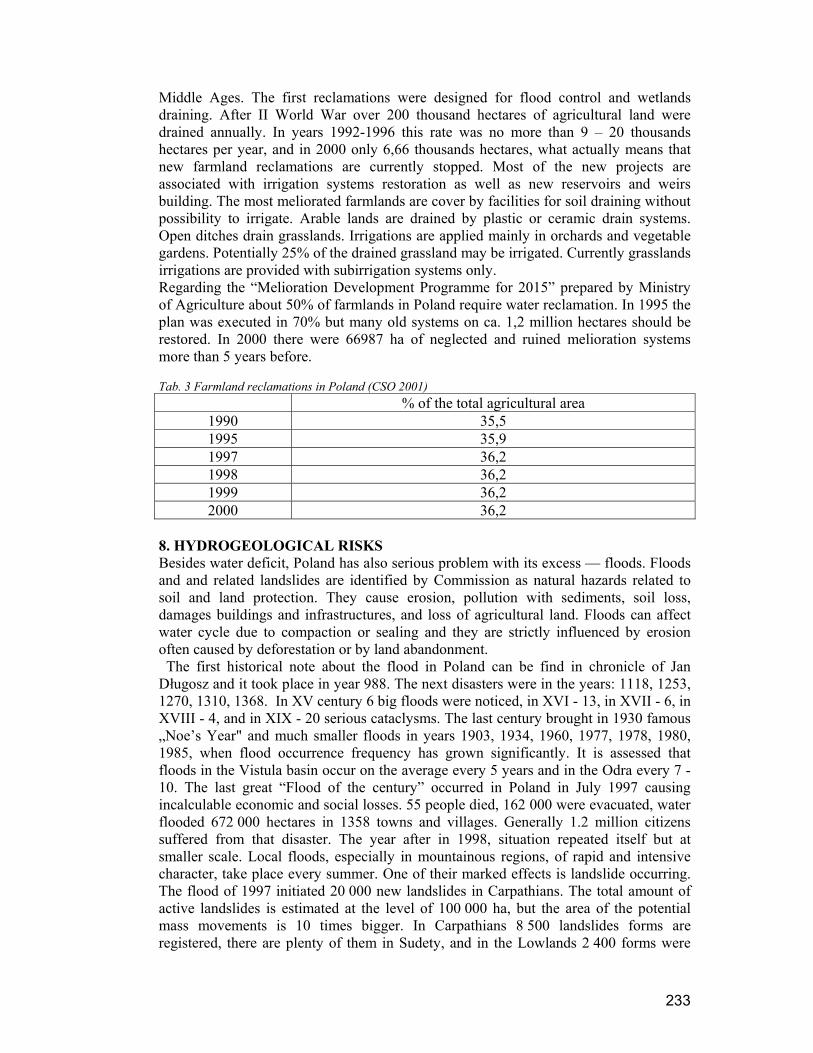
233
Middle Ages. The first reclamations were designed for flood control and wetlands draining. After II World War over 200 thousand hectares of agricultural land were drained annually. In years 1992-1996 this rate was no more than 9 – 20 thousands hectares per year, and in 2000 only 6,66 thousands hectares, what actually means that new farmland reclamations are currently stopped. Most of the new projects are associated with irrigation systems restoration as well as new reservoirs and weirs building. The most meliorated farmlands are cover by facilities for soil draining without possibility to irrigate. Arable lands are drained by plastic or ceramic drain systems. Open ditches drain grasslands. Irrigations are applied mainly in orchards and vegetable gardens. Potentially 25% of the drained grassland may be irrigated. Currently grasslands irrigations are provided with subirrigation systems only. Regarding the “Melioration Development Programme for 2015” prepared by Ministry of Agriculture about 50% of farmlands in Poland require water reclamation. In 1995 the plan was executed in 70% but many old systems on ca. 1,2 million hectares should be restored. In 2000 there were 66987 ha of neglected and ruined melioration systems more than 5 years before. Tab. 3 Farmland reclamations in Poland (CSO 2001)
% of the total agricultural area 1990 35,5 1995 35,9 1997 36,2 1998 36,2 1999 36,2 2000 36,2
8. HYDROGEOLOGICAL RISKS Besides water deficit, Poland has also serious problem with its excess — floods. Floods and and related landslides are identified by Commission as natural hazards related to soil and land protection. They cause erosion, pollution with sediments, soil loss, damages buildings and infrastructures, and loss of agricultural land. Floods can affect water cycle due to compaction or sealing and they are strictly influenced by erosion often caused by deforestation or by land abandonment. The first historical note about the flood in Poland can be find in chronicle of Jan Długosz and it took place in year 988. The next disasters were in the years: 1118, 1253, 1270, 1310, 1368. In XV century 6 big floods were noticed, in XVI - 13, in XVII - 6, in XVIII - 4, and in XIX - 20 serious cataclysms. The last century brought in 1930 famous „Noe’s Year" and much smaller floods in years 1903, 1934, 1960, 1977, 1978, 1980, 1985, when flood occurrence frequency has grown significantly. It is assessed that floods in the Vistula basin occur on the average every 5 years and in the Odra every 7 - 10. The last great “Flood of the century” occurred in Poland in July 1997 causing incalculable economic and social losses. 55 people died, 162 000 were evacuated, water flooded 672 000 hectares in 1358 towns and villages. Generally 1.2 million citizens suffered from that disaster. The year after in 1998, situation repeated itself but at smaller scale. Local floods, especially in mountainous regions, of rapid and intensive character, take place every summer. One of their marked effects is landslide occurring. The flood of 1997 initiated 20 000 new landslides in Carpathians. The total amount of active landslides is estimated at the level of 100 000 ha, but the area of the potential mass movements is 10 times bigger. In Carpathians 8 500 landslides forms are registered, there are plenty of them in Sudety, and in the Lowlands 2 400 forms were
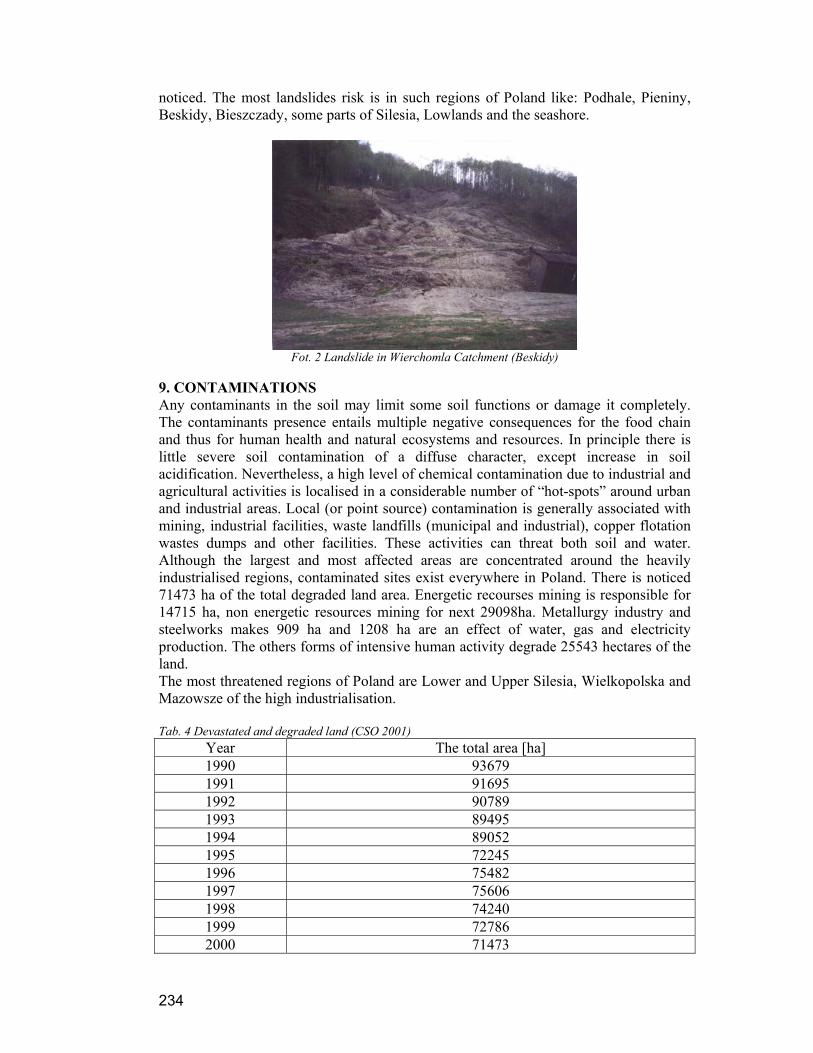
234
noticed. The most landslides risk is in such regions of Poland like: Podhale, Pieniny, Beskidy, Bieszczady, some parts of Silesia, Lowlands and the seashore.
Fot. 2 Landslide in Wierchomla Catchment (Beskidy)
9. CONTAMINATIONS Any contaminants in the soil may limit some soil functions or damage it completely. The contaminants presence entails multiple negative consequences for the food chain and thus for human health and natural ecosystems and resources. In principle there is little severe soil contamination of a diffuse character, except increase in soil acidification. Nevertheless, a high level of chemical contamination due to industrial and agricultural activities is localised in a considerable number of “hot-spots” around urban and industrial areas. Local (or point source) contamination is generally associated with mining, industrial facilities, waste landfills (municipal and industrial), copper flotation wastes dumps and other facilities. These activities can threat both soil and water. Although the largest and most affected areas are concentrated around the heavily industrialised regions, contaminated sites exist everywhere in Poland. There is noticed 71473 ha of the total degraded land area. Energetic recourses mining is responsible for 14715 ha, non energetic resources mining for next 29098ha. Metallurgy industry and steelworks makes 909 ha and 1208 ha are an effect of water, gas and electricity production. The others forms of intensive human activity degrade 25543 hectares of the land. The most threatened regions of Poland are Lower and Upper Silesia, Wielkopolska and Mazowsze of the high industrialisation. Tab. 4 Devastated and degraded land (CSO 2001)
Year The total area [ha] 1990 93679 1991 91695 1992 90789 1993 89495 1994 89052 1995 72245 1996 75482 1997 75606 1998 74240 1999 72786 2000 71473
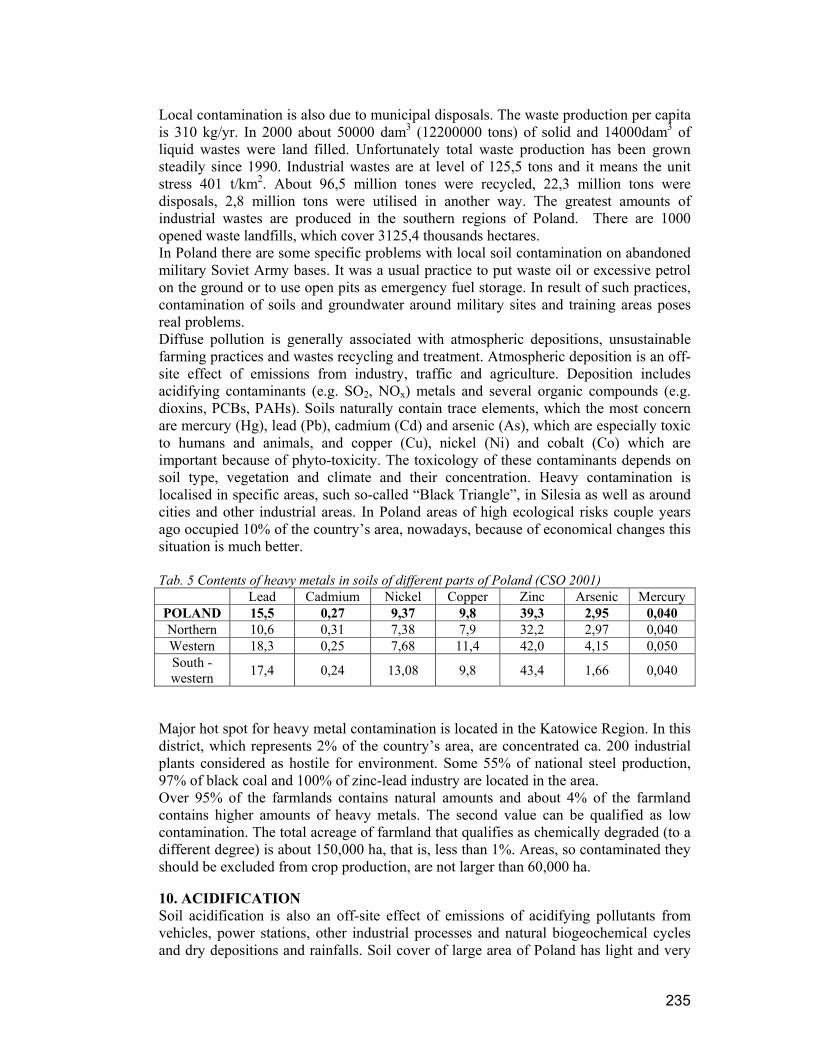
235
Local contamination is also due to municipal disposals. The waste production per capita is 310 kg/yr. In 2000 about 50000 dam3 (12200000 tons) of solid and 14000dam3 of liquid wastes were land filled. Unfortunately total waste production has been grown steadily since 1990. Industrial wastes are at level of 125,5 tons and it means the unit stress 401 t/km2. About 96,5 million tones were recycled, 22,3 million tons were disposals, 2,8 million tons were utilised in another way. The greatest amounts of industrial wastes are produced in the southern regions of Poland. There are 1000 opened waste landfills, which cover 3125,4 thousands hectares. In Poland there are some specific problems with local soil contamination on abandoned military Soviet Army bases. It was a usual practice to put waste oil or excessive petrol on the ground or to use open pits as emergency fuel storage. In result of such practices, contamination of soils and groundwater around military sites and training areas poses real problems. Diffuse pollution is generally associated with atmospheric depositions, unsustainable farming practices and wastes recycling and treatment. Atmospheric deposition is an off-site effect of emissions from industry, traffic and agriculture. Deposition includes acidifying contaminants (e.g. SO2, NOx) metals and several organic compounds (e.g. dioxins, PCBs, PAHs). Soils naturally contain trace elements, which the most concern are mercury (Hg), lead (Pb), cadmium (Cd) and arsenic (As), which are especially toxic to humans and animals, and copper (Cu), nickel (Ni) and cobalt (Co) which are important because of phyto-toxicity. The toxicology of these contaminants depends on soil type, vegetation and climate and their concentration. Heavy contamination is localised in specific areas, such so-called “Black Triangle”, in Silesia as well as around cities and other industrial areas. In Poland areas of high ecological risks couple years ago occupied 10% of the country’s area, nowadays, because of economical changes this situation is much better. Tab. 5 Contents of heavy metals in soils of different parts of Poland (CSO 2001)
Lead Cadmium Nickel Copper Zinc Arsenic Mercury POLAND 15,5 0,27 9,37 9,8 39,3 2,95 0,040 Northern 10,6 0,31 7,38 7,9 32,2 2,97 0,040 Western 18,3 0,25 7,68 11,4 42,0 4,15 0,050 South - western 17,4 0,24 13,08 9,8 43,4 1,66 0,040
Major hot spot for heavy metal contamination is located in the Katowice Region. In this district, which represents 2% of the country’s area, are concentrated ca. 200 industrial plants considered as hostile for environment. Some 55% of national steel production, 97% of black coal and 100% of zinc-lead industry are located in the area. Over 95% of the farmlands contains natural amounts and about 4% of the farmland contains higher amounts of heavy metals. The second value can be qualified as low contamination. The total acreage of farmland that qualifies as chemically degraded (to a different degree) is about 150,000 ha, that is, less than 1%. Areas, so contaminated they should be excluded from crop production, are not larger than 60,000 ha. 10. ACIDIFICATION Soil acidification is also an off-site effect of emissions of acidifying pollutants from vehicles, power stations, other industrial processes and natural biogeochemical cycles and dry depositions and rainfalls. Soil cover of large area of Poland has light and very

236
light soils, which are naturally acidic. Their original acidification was a result of the natural soil genetic process. In the last decades of 20th century the process of acidification of the soils has been intensified due to increased mineral fertilizer use, sulphur dioxide and nitrogen oxides gases air pollution. Contaminants load was transported to soil in a forms of acid rain or just dry deposits. In the last years, due to new environmental regulations and standards as well as economical crisis, the total emissions of acidifying pollutants was reduced significantly. Tab 6. The total emission of the main air pollutants [in thousands tons]in Poland (CSO 2001) 1990 1991 1992 1993 1994 1995 1996 1997 1998 1999 SO2 3210 2995 2820 2725 2605 2376 2368 2181 1897 1719 NO2 1280 1205 1130 1120 1105 1120 1154 1115 991 951 The average pH of rainfall water in Poland ranges from 4,3 to 4,8. It is assessed, that ca. 200 kg of sulphur dioxide is deposited on one hectare each year. About 25% of soils have a pH less than 4.5, despite an increase in liming. Natural sulphur content in noticed in 59,99% of soils of state area, higher content is in 25,36%. Low sulphur contamination is registered in 13,73% soils and high one in 3,92%. About 60% of farmland (61% of ploughland and 52% of grassland) shows an acidic reaction. Very acidic soils should be considered as chemically degraded. The acidification accelerates many processes, which provide to the base ions depletion (calcium, magnesium, potassium) and toxic elements freeing (aluminium, manganese) as well as acceleration of heavy metals mobility. The prevention of soil acidification is based on systematic liming (every four years) with proper dose (on average 200 kg CaO per year). 11. NUTRIENTS The high phosphorus and nitrogen content fertilizers or livestock manure over-application, together with acid deposition from nitrogen oxide and ammonia emissions to air, can affect on the soil environment. It changes nutrients provide capability, buffering and filtering capacity. Both nitrogen and phosphorous are essential elements for plant growth, but can become damaging when present in quantities excessive to plant requirements. The nutrient excess may be leached, eroded or simply washed and induces surface waters eutrophication. Fertilizer consumption in Poland has declined markedly, but in the future agriculture production, and fertilizer use, may be expected to increase again from its current reduced level. In the year 2000 the total pure nutrients load (NPK) was 86 kg/ha. In the future, the following scenario is planned: gradually farmland area decreasing with simultaneous intensification crop production. In 2000 the average productivity was 3 tons per hectare, in 2020 it should be 5 tons, and in 2030 – 6 tons. That means the total production increase by 30% by 2020 and 42% by 2030, while the total farmland area decrease by ca. 4 million hectares.
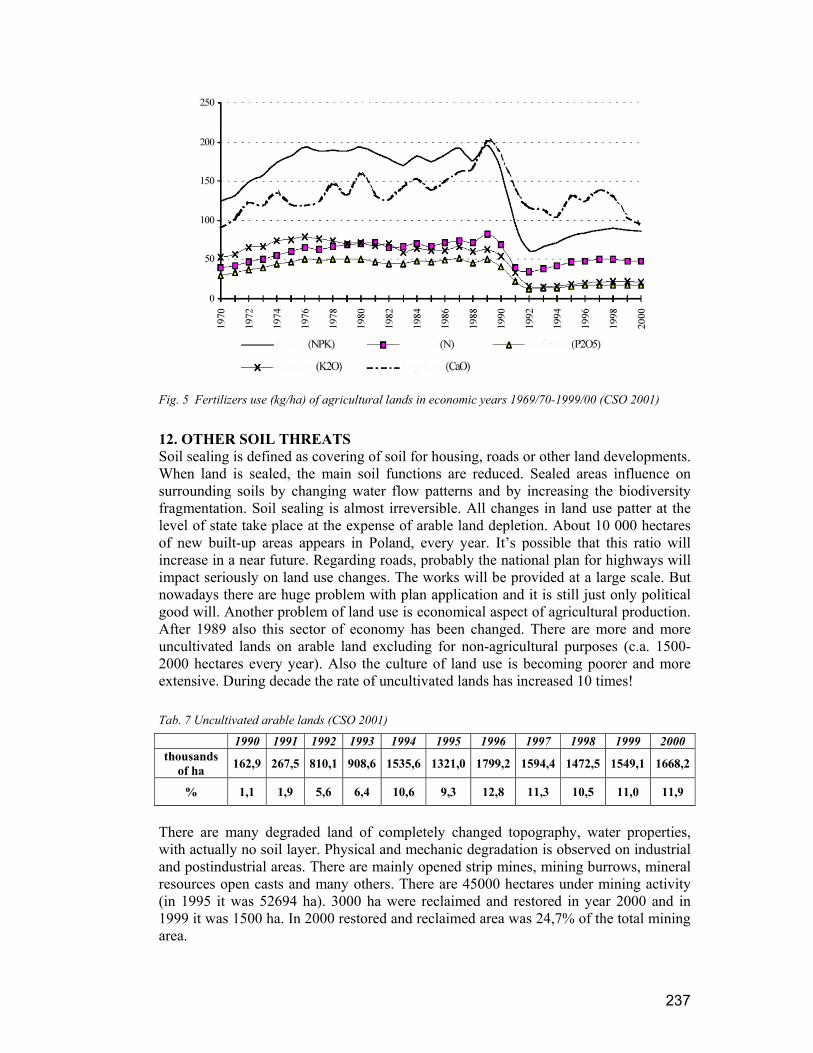
237
Fig. 5 Fertilizers use (kg/ha) of agricultural lands in economic years 1969/70-1999/00 (CSO 2001) 12. OTHER SOIL THREATS Soil sealing is defined as covering of soil for housing, roads or other land developments. When land is sealed, the main soil functions are reduced. Sealed areas influence on surrounding soils by changing water flow patterns and by increasing the biodiversity fragmentation. Soil sealing is almost irreversible. All changes in land use patter at the level of state take place at the expense of arable land depletion. About 10 000 hectares of new built-up areas appears in Poland, every year. It’s possible that this ratio will increase in a near future. Regarding roads, probably the national plan for highways will impact seriously on land use changes. The works will be provided at a large scale. But nowadays there are huge problem with plan application and it is still just only political good will. Another problem of land use is economical aspect of agricultural production. After 1989 also this sector of economy has been changed. There are more and more uncultivated lands on arable land excluding for non-agricultural purposes (c.a. 1500-2000 hectares every year). Also the culture of land use is becoming poorer and more extensive. During decade the rate of uncultivated lands has increased 10 times! Tab. 7 Uncultivated arable lands (CSO 2001)
1990 1991 1992 1993 1994 1995 1996 1997 1998 1999 2000 thousands
of ha 162,9 267,5 810,1 908,6 1535,6 1321,0 1799,2 1594,4 1472,5 1549,1 1668,2
% 1,1 1,9 5,6 6,4 10,6 9,3 12,8 11,3 10,5 11,0 11,9
There are many degraded land of completely changed topography, water properties, with actually no soil layer. Physical and mechanic degradation is observed on industrial and postindustrial areas. There are mainly opened strip mines, mining burrows, mineral resources open casts and many others. There are 45000 hectares under mining activity (in 1995 it was 52694 ha). 3000 ha were reclaimed and restored in year 2000 and in 1999 it was 1500 ha. In 2000 restored and reclaimed area was 24,7% of the total mining area.
238
In Poland the most number of coalmines is on the Upper Silesian coalfield. Mining on the Lower Silesian coalfield is actually ceased in 2000. In the east of the country there is one mine at Lublin. Restructuring Poland’s coal industry induces 100 000 unemployed miners and reduction in the coal production to 101 Mt in 2000. There are 42 active mines in Poland. Brown coal is exploited at opencast mines in the western part of the country. Active mines were: Belchatow, Turow, Konin, Adamow, Sieniawa. Generally, the total number of brown coal strip mines is 11. Very important are the copper mines at Boleslawiec and Lubin (3 active mines). Lead and zinc is mined in 2 places between Katowice and Krakow. Mining will cease until 2009. Chemical compounds are mined in Kłodawa (potash) and Wieliczka and Bochnia (salt rock). The total amount of employees in mining industry is 220 thousands of people. 13. SOIL PROTECTION IN LEGAL REGULATIONS The Second Environmental Policy implemented in 2001 regards soil protection and stopping the degradation processes to be one of the principal action directions. Specific actions are provided in following directions:
- Protection of agricultural and forest lands against assigning them for other purposes;
- Soils protection against degradation and pollution; - Reclamation of degraded soils.
Another important aspect of land protection is forest policy and management. Forest resources are shall ensure natural environment equilibrium. The afforestation programme leads to increase forest cover up to 33,8% of the country area. This is minimum perspective. The optimal scenario is 38,4% and maximum optimistic one — 43,1%. At present, in Poland there are some legal grounds for implementing the provisions of European Directives and Strategies as well we the UE Convention to Combat Desertification. They include:
- the Environmental Protection Law Act - the Nature Conservation Act - the Spatial Planning Act - the Forests Act - the Agricultural and Forest Land Protection Act - the Water Law Act - the Geological and Mining Law Act
as well as government or ministry decree regulations for these Acts. Environmental monitoring is one of key tools of Ecological Policy implementation. Sybsystem of soil monitoring has been started in 1995. These cyclical research, designed by IUNG in Pulawy, are focused at soil chemistry changes, mainly heavy mateals concentration, sulfur, PAH levels in arable soils. It is being mentioned that there is no data on spatial problems such water and wind erosion, mass movements, open casts, wastes landfills, mining land deformations, etc. Generally, monitoring in urban areas should be more developed. Recently government has adopted the Code of Good Agricultural Practice. There are a lot of newly developed programs and strategies i.e. Program for Small Retention Development, Ecological Policy for years 2003-2006, National Development Plan 2002-2006, Ecological State Development where soil protection is pointed ask important task.
239
Soils protection requires more investments and activities. The most important seems to be dumps liquidation, contaminated sites sanitation, afforestation, erosion and flood control. Other efforts shall be focused on education and training, research, monitoring etc. But all in all, the most important task is to create an effective lobbying for land and soil protection, which shall take place in every levels of state administration and national economy. 14. REFERENCES
1. Agenda 21 in Poland - 1992-2002. Warszawa 2002. 2. Communication from the Commission to the Council, the European Parliament, the
Economic and Social Committee and the Committee of the Regions "Towards a Thematic Strategy for Soil Protection" COM(2002) 179 final, Brussels, 2002
3. Down to earth: Soil degradation and sustainable development in Europe - A challenge for the 21st century, Environmental issue series No 16, UNEP & EEA, Copenhagen 2000.
4. Dulewski J., Madej B., Stan i niezbędne działania proekologiczne w górnictwie polskim. Inżynieria ekologiczna. PTIE, Warszawa 2002.
5. II Polityka Ekologiczna Państwa, Ministerstwo Środowiska, Warszawa 2000. 6. Józefaciuk A., Józefaciuk Cz., Ochrona gruntów przed erozją. IUNG Puławy 1999. 7. Land Degradation in Central and Eastern Europe: Proceedings of the Workshop on
Land Degradation/Desertification in Central and Eastern Europe in the context of the UNCCD, 8 - 9 May 2000, Brussels.
8. Mały Rocznik Statystyczny 2002, GUS, Warszawa 2002. 9. Mikulski Z., Gospodarka wodna. Wydawnictwa naukowe PWN, Warszawa 1998. 10. Podstawowe problemy środowiska - raport wskaźnikowy. IOŚ Biblioteka
Monitoringu Środowiska, Warszawa 2001. 11. Przegląd realizacji przez Polskę konwencji międzynarodowych oraz umów i
porozumień wielostronnych i dwustronnych w zakresie ochrony środowiska Materiał dla Sejmowej Komisji Ochrony i Środowiska, Zasobów Naturalnych i Leśnictwa, Ministerstwo Środowiska, Warszawa 2002
12. Raport - stan środowiska w Polsce. PIOŚ, Warszawa 1998. 13. Siuta J., Żukowski B., Ekologiczne podstawy racjonalizacji użytkowania ziemi.
Inżynieria ekologiczna. PTIE, Warszawa 2002. 14. Siuta J. (red.), Ochrona i rekultywacja gruntów w gminie, PTIE, Warszawa 1999. 15. Skinder W.N.: Chemia a ochrona środowiska, WSiP, Warszawa 1995. 16. Stan środowiska w Polsce. UNEP/GRID-Warszawa, Warszawa 1993. 17. Statistical Yearbook Environment 2001, Central Statistical Office, Warszawa 2001.
240
SYNTHESIS OF THE NATIONAL STRATEGY TO COMBAT
DESERTIFICATION, LANDS DEGRADATION AND DROUGHT IN ROMANIA
Report prepared by the research-development institutes from the
Academy of Agricultural and Forestry Sciences network and some other scientific units
1. INTRODUCTION
The climatic data in the last century, pointing out a progressive warming of the atmosphere and a decrease of rainfalls as well as a severe degradation of lands have become important limiting factors for the increase, development and productivity of ecosystems (agricultural, forestry and aquatic, a.s. on) from certain geographic areas of the country and the restricting factors for water resources allocation and use. Soil degradation processes affect to various extents more than 1/2 of the surface of the country. Among this processes, the most serious one from the point of view of extension and the socio-economic impact is water erosion, which together with landslides covers 7 mil. ha. The regions with the highest percentage of eroded soils are the following: the Moldavia Plateau, the Subcarpathian Hills between Trotus and Olt, the Transilvania Plateau and the Getic Piedmont, as well as the Dobrogea Plateau.
These phenomena already affect the presence and normal development of the respective regional communities as well as Romania's sustainable economic development.
In 1997 Romania signed (Law 629) "Convention to Combat Desertification (CCD)", adopted in Paris on 17th June 1994 and came into force on 26th December 1994 elaborated according to the resolution of the General Assembly of the United Nations 47/188 on 22nd December 1992 as a consequence of the United Nations Conference on Environment and Development from Rio de Janeiro (1991). The purpose of the Convention is "To combat desertification and decrease the drought effects in the countries with severe drought problems and/or desertification …. by efficient measures at all levels, …. to contribute at the sustainable development in affected areas".
The present paper represents the synthesis of the studies for the desertification problem drawn-up by nine research institutes, according with Annex 1. We also mention that the present strategy was improved as a result of contributions of some specialists from the Ministry of Waters and Environmental Protection (MWEP), Ministry of Agriculture, Food and Forestry (MAFF), Ministry of Public Works and Territory Management (MPWTM), Romanian Academy (RA), Academy of Agricultural and Forestry Sciences (AAFS) and Institute of Geography.
The present strategy followed the decisions of CCD and constituted the basis upon which the National Reports on the Implementation of the UNCCD in Romania were elaborated by the MWEP in 2000 and MAFF in 2002 (www.unccd.int/cop/reports/centraleu/centraleu.php).
2. PRESENT SITUATION OF ENVIRONMENTAL FACTORS FROM ROMANIA AND THEIR EVOLUTION TENDENCY IN THE HIGH-RISK DESERTIFICATION AREAS The geographical position of Romania in the world (at half distance from the Pole and the
Equator) and on the continent (at about 2000 km East from the Atlantic Ocean, 1000 km West from the Baltic Sea, 400 km East from the Adriatic Sea and riverain to the Black Sea) as well as the relief distributed into height levels (plains about 1/3 of the surface, hills 1/3, mountains 1/3) from 0 to about 2500 m, offer the climate a continental temperate character.
The masses of air penetrating Romania's territory in different synoptic contexts evolve in a very ample range from arctic to tropical (Saharan), conferring a transitional character to the climate.
At the same time, the instability of relationships between the main baric centers produces important variations in the duration of a certain meteorological context; in this way there can be recorded
241
both long periods of cyclone circulation which bring heavy rainfalls and important periods of drought specific anticyclonic regimes, as well as rapid transition from anticyclonic regimes to cyclone circulation and vice versa, with the corresponding weather modifications.
The presence of the Carpathians, hills and plateaus in the center of the country determines the appearance of 4 altitudinal climate levels, which are very different from the area climates. The first level, between 300-1400 m, has a warm to cool climate (9°C ÷ 4°C) and more humid (600-700 up to 1000-1100 mm); the second level, between 1400-1800 m, has a cold and humid climate (4°C ÷ 2°C and 1000-1400 mm); the third level, a very cold and humid climate (2°C ÷ 0°C and 1000-1400 mm) and the fourth level also has a very cold and humid climate (0°C ÷ -2,7°C, 1200-1400 mm).
In the territory with a high risk of desertification and drought, the climate is warm and dry with annual medium temperatures over 10°C, the sum of medium temperatures ≥ 0°C between 4000-4300°C and of those ≥ 10°C between 1600-1800°C. The sum of annual medium rainfalls is between 350-500 mm, of those from April-October between 200-350 mm, while the soil water reserves at a depth of 0-100 cm were on March 31st between 950-1500 m³/ha, representing 95-150 mm, as rainfalls equivalent.
The dryness index (R) as a ratio between the sum of annual rainfalls and potential evapotranspiration (P/ETP) separates the following areas: extremely arid (R > 0.05), arid (0.05 ≥ R ≥ 0.20), semi-arid (0.20 ≥ R ≥ 0.50), dry-sub-humid (0.50 ≥ R ≥ 0.65) and humid (R ≤ 0.65) lands.
In Romania semi-arid, dry-sub-humid and humid areas exist (fig. 1). The first two areas are extremely relevant for drought, desertification and land degradation, as well as the humid area especially for land degradation.
A few antropic factors such as: - severe decrease of the afforested surface (from about 80% in the past to 28% at present); - inadequate farming activities; - overexploitation of forest resources (especially for lumber); - overgrazing; - polluting industrial activities; - abusive commercial exploitation of some non-regenerative resources; - non-ecological urban development, together with unfavourable climatic factors, have generated and amplified desertification and
degradation of lands and drought consequences (table 1, fig. 2 and 3), which at present affect especially the South and East areas of Romania (about 8.3 mil ha, representing about 35% of the surface of the country).
The climatic modifications of the last 10 years on Romania's territory (the increase of annual medium temperatures with 0.2 - 0.6°C, the decrease of rainfalls with 10-50 mm in comparison with the average for 100 years), under the present conditions of the geosystem, emphasize the clear tendency for the intensification and spreading of desertification, land degradation and drought which will enhance:
• The water crisis in Romania; • The reduction of biodiversity; • The reduction of vegetal and animal production; • Forest decline; • The pauperization of population and the subsequent social effects; • The appearance of conflicts of interests regarding the utilization of resources, especially water.
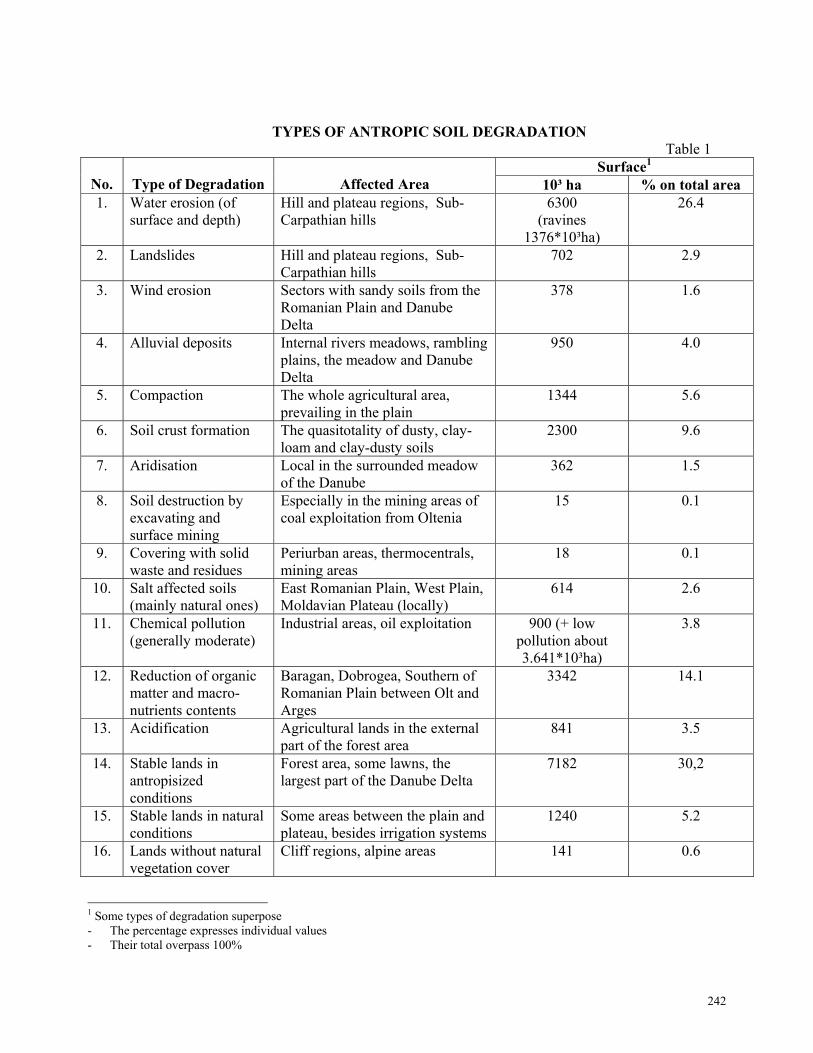
242
TYPES OF ANTROPIC SOIL DEGRADATION Table 1
Surface1 No.
Type of Degradation
Affected Area 10³ ha % on total area
1. Water erosion (of surface and depth)
Hill and plateau regions, Sub-Carpathian hills
6300 (ravines
1376*10³ha)
26.4
2. Landslides Hill and plateau regions, Sub-Carpathian hills
702 2.9
3. Wind erosion Sectors with sandy soils from the Romanian Plain and Danube Delta
378 1.6
4. Alluvial deposits Internal rivers meadows, rambling plains, the meadow and Danube Delta
950 4.0
5. Compaction The whole agricultural area, prevailing in the plain
1344 5.6
6. Soil crust formation The quasitotality of dusty, clay-loam and clay-dusty soils
2300 9.6
7. Aridisation Local in the surrounded meadow of the Danube
362 1.5
8. Soil destruction by excavating and surface mining
Especially in the mining areas of coal exploitation from Oltenia
15 0.1
9. Covering with solid waste and residues
Periurban areas, thermocentrals, mining areas
18 0.1
10. Salt affected soils (mainly natural ones)
East Romanian Plain, West Plain, Moldavian Plateau (locally)
614 2.6
11. Chemical pollution (generally moderate)
Industrial areas, oil exploitation 900 (+ low pollution about 3.641*10³ha)
3.8
12. Reduction of organic matter and macro-nutrients contents
Baragan, Dobrogea, Southern of Romanian Plain between Olt and Arges
3342 14.1
13. Acidification Agricultural lands in the external part of the forest area
841 3.5
14. Stable lands in antropisized conditions
Forest area, some lawns, the largest part of the Danube Delta
7182 30,2
15. Stable lands in natural conditions
Some areas between the plain and plateau, besides irrigation systems
1240 5.2
16. Lands without natural vegetation cover
Cliff regions, alpine areas 141 0.6
1 Some types of degradation superpose - The percentage expresses individual values - Their total overpass 100%
243
3. STRATEGY FOR PREVENTING AND COMBATING DESERTIFICATION, LAND DEGRADATION AND DROUGHT
3.1. GENERAL PRINCIPLES The following basic principles were taken into account in the elaboration of the strategy: • Sustainable development of agriculture and forestry; • Conservation of natural resources and biodiversity; • Prevention and reduction of risks on natural disasters; • Improvement of life quality, especially by rural development of areas exposed to land
desertification, degradation and drought. 3.2. SPECIFIC AND GENERAL STRATEGIC OBJECTIVES The general objectives take into account two distinct situations: • Prevention and control of land desertification, degradation and drought on the territories with
desertification risks; • Prevention and control of land degradation in wet areas where they have the highest
percentage. We also considered the degraded lands from wet areas because by increasing the processes of
degradation in the respective areas, these lands can become real desertification nuclei. The strategic objectives were grouped in 6 priorities (table 2), considering the necessity of solving the problem of desertification, namely:
• Legislation improvement and development; • Institutional development; • To ensure human resources (formation of specialists and the partnership with the civil
society); • Development of the technical-scientific basis; • Rural development and landscape reorganization in the areas with desertification risk; • Rural development and landscape reorganization in the wet areas with land degradation risks.

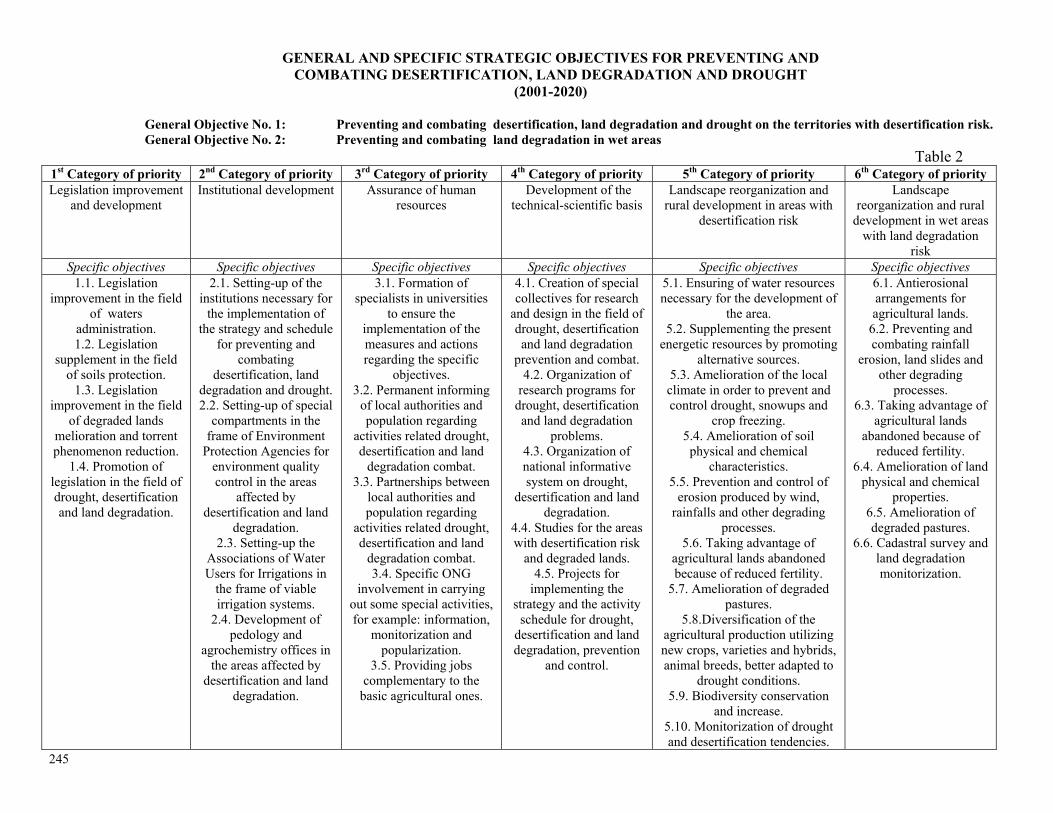
245
GENERAL AND SPECIFIC STRATEGIC OBJECTIVES FOR PREVENTING AND COMBATING DESERTIFICATION, LAND DEGRADATION AND DROUGHT
(2001-2020)
General Objective No. 1: Preventing and combating desertification, land degradation and drought on the territories with desertification risk. General Objective No. 2: Preventing and combating land degradation in wet areas Table 2 1st Category of priority 2nd Category of priority 3rd Category of priority 4th Category of priority 5th Category of priority 6th Category of priority Legislation improvement
and development Institutional development Assurance of human
resources Development of the
technical-scientific basis Landscape reorganization and
rural development in areas with desertification risk
Landscape reorganization and rural
development in wet areas with land degradation
risk Specific objectives Specific objectives Specific objectives Specific objectives Specific objectives Specific objectives
1.1. Legislation improvement in the field
of waters administration. 1.2. Legislation
supplement in the field of soils protection.
1.3. Legislation improvement in the field
of degraded lands melioration and torrent phenomenon reduction.
1.4. Promotion of legislation in the field of drought, desertification and land degradation.
2.1. Setting-up of the institutions necessary for
the implementation of the strategy and schedule
for preventing and combating
desertification, land degradation and drought. 2.2. Setting-up of special
compartments in the frame of Environment
Protection Agencies for environment quality control in the areas
affected by desertification and land
degradation. 2.3. Setting-up the
Associations of Water Users for Irrigations in
the frame of viable irrigation systems.
2.4. Development of pedology and
agrochemistry offices in the areas affected by
desertification and land degradation.
3.1. Formation of specialists in universities
to ensure the implementation of the measures and actions regarding the specific
objectives. 3.2. Permanent informing
of local authorities and population regarding
activities related drought, desertification and land
degradation combat. 3.3. Partnerships between
local authorities and population regarding
activities related drought, desertification and land
degradation combat. 3.4. Specific ONG
involvement in carrying out some special activities, for example: information,
monitorization and popularization.
3.5. Providing jobs complementary to the
basic agricultural ones.
4.1. Creation of special collectives for research
and design in the field of drought, desertification and land degradation
prevention and combat. 4.2. Organization of
research programs for drought, desertification and land degradation
problems. 4.3. Organization of national informative system on drought,
desertification and land degradation.
4.4. Studies for the areas with desertification risk
and degraded lands. 4.5. Projects for
implementing the strategy and the activity
schedule for drought, desertification and land degradation, prevention
and control.
5.1. Ensuring of water resources necessary for the development of
the area. 5.2. Supplementing the present
energetic resources by promoting alternative sources.
5.3. Amelioration of the local climate in order to prevent and control drought, snowups and
crop freezing. 5.4. Amelioration of soil physical and chemical
characteristics. 5.5. Prevention and control of
erosion produced by wind, rainfalls and other degrading
processes. 5.6. Taking advantage of
agricultural lands abandoned because of reduced fertility.
5.7. Amelioration of degraded pastures.
5.8.Diversification of the agricultural production utilizing new crops, varieties and hybrids, animal breeds, better adapted to
drought conditions. 5.9. Biodiversity conservation
and increase. 5.10. Monitorization of drought and desertification tendencies.
6.1. Antierosional arrangements for agricultural lands.
6.2. Preventing and combating rainfall
erosion, land slides and other degrading
processes. 6.3. Taking advantage of
agricultural lands abandoned because of
reduced fertility. 6.4. Amelioration of land
physical and chemical properties.
6.5. Amelioration of degraded pastures.
6.6. Cadastral survey and land degradation monitorization.
246
3.3. FRAMEWORK POLICIES The framework policies referred in the strategy are: • Territory utilization planning; • Sustainable administration of the natural capital; • Biodiversity conservation; • Sustainable development of agriculture and forestry; • Sustainable administration of water resources; • Regional cooperation; • Social-economic aspects. 3.3.1. Territory utilization planning The objectives, measures and actions of this strategy were correlated with the concepts and
objectives of the territory management in our country which are included in the European Map regarding territory management. These objectives are related to the balanced socio-economic development of regions, life quality amelioration, responsible administration of natural resources and their protection, rational utilization of the territory (fundamental objectives) as well as the development of urban and rural regions, coordination of border state policy, special arrangement and support for the territory in the mountain regions and less favored regions (peculiar objectives).
3.3.2. Sustainable administration of the natural capital The sustainable administration of the natural capital, especially in areas with high
desertification risk should start with the concept of "agroforestry" which implies some balanced ratios between agricultural (including the pastoral one) and forest ecosystems and the establishment of unitary standards for environmental protection.
The political and socio-economic premises concerning the conservation of natural capital are the following:
• A great importance given to the actions and measures regarding environmental protection and natural resources, in all national programs for economic development;
• Establishment of responsibilities of state institutions and other organizations for sustainable development;
• The involvement on non-governmental organizations in all decisions in order to emphasize the necessity of environmental protection;
The results of land desertification, degradation and drought are also reflected to a great extent into the natural capital degradation (natural and semi-natural ecologic systems and ergonomic ecologic systems). In order to attenuate these effects, the following framework policies will be promoted in order to reduce:
• Soil degradation and overexploitation; • Overexploitation and replacement of forest ecosystems with other types of ecosystems; • Degradation and overexploitation of water resources and renewable resources of aquatic
ecosystems; • Decrease of domestic and wild animals’ food resources by conservation and amelioration of
pasture and forest natural ecosystems; • The extension of areas affected by aridisation by promoting specific agrotechniques,
especially ecological ones; • Overexploitation of traditional energy resources (fire wood, coal etc.).
247
The following aspects will also be considered: • The usage of alternative sources of energy all over the country; • The study of the wind intensity and regime for creating an eolian energy mapping on
Romania's territory; • The creation of a technical scientific center for using alternative energy sources. 3.3.3. Biodiversity conservation The conservation of biodiversity in Romania is conditioned by the antropic impact generated by
sectorial economic activities manifested in the excessive pollution of soil, water, air, the lack of strict control on chemical fertilizer and pesticide utilization, the storage of domestic and industrial wastes, deforestation and excessive grazing.
In order to decrease the negative impact of sectorial economic activities on the biologic diversity, it is absolutely necessary to fulfill the following objectives:
• The introduction of modern technology in energetic and industrial enterprises and to endowing them with waste recycling and purification appliances;
• The improvement of the legal framework in order to diminish pollution; • The utilization of proper practices in forest management to ensure forest conservation; • A permanent control over the utilization of synthesis chemical products in agriculture and
forestry. For conserving biodiversity and increasing the resistance against desertification processes, the
following measures are necessary: • The extension of protected areas; • Phytocenose rehabilitation, both agricultural and silvic, with native species; • Implementation of in-situ and ex-situ biodiversity protection provisions of the international
conventions in which Romania is involved; • Restoration and extension of wet areas; • Development of regional and bilateral projects; • Development of international cooperation in the field of biodiversity protection. 3.3.4. Sustainable development of agriculture and forestry Agricultural and forest ecosystems represent the main parts of the natural capital. The actions
necessary for a sustainable development of agriculture are the following: • The development of an exploitation framework in agriculture that should eliminate any
economic and ecologic damage; • A gradual increase of the agricultural exploitation surface, by association and joining of
lands taking into account the specific of properties; • A gradual restriction of the arable surfaces on lands with slopes greater than 12% and
degraded soils, either by conversion to other agricultural utilization (pastures) or by afforestation (surfaces with severely eroded soils and/or affected by sliding);
• Crop rotations where an adequate ratio between hoeing crops, grain crops and leguminous crops will contribute to the protection of soil fertility (dry-farming);
• Utilization of compost organic fertilizer originating from various sources; • Employment of the best farming systems under various soil and relief conditions; • Plant protection integrated management through optimization of pesticide utilization;
248
• The integration of the field crops sector with the zootechnical and horticultural ones in a complex agricultural system characterized by a efficient use of resources;
• Ecologic reconstruction of lands degraded by industrial activities (surface mining, sterile and ash storage, pollution with oil and salty water, pollution with heavy metals etc.) on the basis of the principle that the polluting factor pays;
• Less productive soil amelioration (sands, salty soils, soils affected by humidity excess and/or strong acidity) only where the amelioration is justified by economic or national strategic interest considerations;
• Selection of plant varieties and hybrids highly resistant to drought; • Plantation of protective forest belts in the affected areas; • Extension and improvement of the crops insurance system; The actions necessary for a sustainable development of forestry are the following: • To ensure the preservation and development of the forestry; • To implement the concept of sustainable administration and to ensure the necessary
framework for this; • To ensure the stability and increase of the functional efficiency of forest ecosystems; • To rebuilt of non-corresponding forests; • To support the forest owners in order to achieve a sustainable administration of these lands; • To integrate the representative forest ecosystems into the national network of protected
areas; • Sustainable administration of cynegetic and fishing resources; • To develop the offer of services and products obtained from forests, others than lumber; • Adjustment of the structures of forest administration and control to the diverse conditions of
land property; • To inform the forest owners, the public and the decisional factors about the purpose and
importance of the silvic national patrimony. 3.3.5. Sustainable administration of water resources In the semiarid and subhumid dry areas, the lack of water has become a lasting phenomenon
with negative economic implications in agriculture (phytotechnics, vegetable crops and animal breeding), fish breeding, forestry. The consequences are also felt in other fields such as: water supply, transport, electric energy, health, especially during drought periods.
As water represents the most limiting factor for the sustainable development of the affected areas, the planning of water resources administration should be taken into account under normal and drought conditions for eliminating some sudden and aleatory reactions during the situations of crisis.
In this regard it is necessary: • To establish drought diagnostic indicators (aridity index, rainfalls, underground water
levels, the volume of water presence in accumulation lakes, water flows) according to the most objective criteria, to be assumed by the competent authority;
• To take actions and measures to establish the period when drought first occurs (alert or crisis moments);
• To establish responsibilities for institutions under drought conditions; • To ensure a permanent informing of population; • To know the water requirements under normal and drought conditions.
249
A strategy, but especially a water policy for drought situations should have in view: - To be efficient and based on collaborations between all the parts involved; - To contain provisions concerning the implementation of some organizational structures with
a coordinator and, at the same time, to be flexible; - To ensure financial resources for forecasting, monitorization, estimation and education; - To involve water users into the programs and strategy against drought; It is also necessary to have: - An institutional organization for water resources administration at the country level; - Special laws regarding the control of drought effects; - A system of prices and tariffs for water services and utilities in order to stimulate the
efficient utilization of water; - Educational programs for water providers and users. 3.3.6. Regional cooperation In order to be informed about the situation and evolution in space and time of environment in
general and especially the hydric environment, there is necessary to have data and information from a large spaces, stretching over states borders, hence the importance of inter-regional cooperation for problems regarding prevention and combat of desertification, land degradation and drought.
Considering these facts, it is necessary to: - Collect, analyze and exchange data and information relevant for ensuring a permanent
observation of land degradation in the affected areas and for a better understanding and estimation of drought and desertification effects;
- Establishing cooperations in the field of desertification, land degradation and drought effect monitorization;
- Initiate common research programs to establish the causes of such phenomena and the measures adopted for preventing and fighting them.
3.3.7. Social-economic measures From the social-economic point of view, the following measures should be taken in the areas
confronted with desertification, land degradation and drought: • The state will compensate from the budget, the agricultural damages caused by climatic
phenomena; • The diversification of the economic basis in the rural environment in order to actively
support the development of non-agricultural activities. For this reason, it is absolutely necessary to start development programs by stimulating the small and medium industry, infrastructure and services;
• Improvement of the legislation regarding the protection of forest-steppe areas which are predisposed to the risk of land degradation, desertification, and drought;
• Creation of training programs to adults from the rural environment, to support the population in acquiring general knowledge, especially in the field of ecology;
• Providing instructive ecologic programs and handbooks for the school pupils; • To stimulate ONGs' activities in the field of environment, pollution control and to attract
them in short and medium term programs; • Intensification of the education activity through the combined efforts of the local Councils,
Police, associations of the forest owners and mass-media; • Including into the local development programs a chapter with measures regarding the
control of land degradation, desertification and drought.
250
• To promote insurance systems against risk factors by informing the rural population, diversifying the offer and encouraging private insurance systems;
• To increase the capacity of the local public administration concerning the management in the field of drought, land degradation and desertification;
• To ensure technical support of technical and information. 3.4. COSTS TO IMPLEMENT THE STRATEGY
Considering that the issue of preventing and controlling desertification, land degradation and
drought is of national and international interest for short, medium and long periods of time, the allocation of funds should be done both from the state budget and external financing. The budget of the local communities from the areas that represent the object of the strategy should also reserve special funds for the actions mentioned above. Fund reservation and allocation should consider the priorities established by this strategy. The allocated funds should be directed towards two main purposes:
- Quality improvement of environmental factors; - Economic, social and cultural development of the affected areas. The costs of this strategy are estimated at about 4.465.324 thousands dollars, of which: • Legislation development and improvement - 139 thousands dollars. • Institutional development - 10.065 thousands dollars. • Human resources - 9.340 thousands dollars. • The technical-scientific bases - 306.300 thousands dollars. • Rural development and landscape reorganization in areas with desertification risks -
1.875.560 thousands dollars. • Landscape reorganization and rural development in the wet areas with degradation risks -
2.263.920 thousands dollars.
4. ROMANIAN PARTICIPATION IN RESEARCH PROJECTS AND SCIENTIFIC EVENTS, RELEVANT TO UNCCD The Research Institute for Soil Science and Agrochemistry (RISSA) from the Romanian
Academy of Agricultural and Forestry (AAFS) network contributed to the creation of a database of European soils, with a digital map representing the Romanian soils at a 1: 1,000,000 scale and a database of soil profiles from European countries. Other AAFS’ units contributions to relevant projects were:
FAO project, concerning the vulnerability to soil pollution classification within the Central and Eastern European countries (SOVEUR);
FAO project: Rehabilitation of polluted soils in Romania; INCO-COPERNICUS project: A simulation model with spatial distribution for the physical
and agro-physical state of the soil forecast (SIDASS); INCO-COPERNICUS project: Water and soil management for the agricultural output in
urban areas (SWAPUA); COST 718 project: Meteorological applications for agriculture; COST 829 project: Fundamental, agronomical and environmental aspects of sulphur
nutrition and assimilation in plants; COST 832 project: Methodologies for estimating the agricultural contribution to
eutrophication;
251
COST 836 project: Towards an organization of the integrated research in barriers: model for a strawberry of quality, in respect with the environment rules and consumers requirements;
COST 837 project: Plant biotechnology for the removal of organic pollutants and toxic metals from wastewater and contaminated sites;
COST 843 project: Quality enhancement of plant production through tissue culture. There were also submitted various project proposals for LIFE, ISPA, PHARE and FP5
programs. Romanian representatives have actively participated in different scientific events with CCD topics, such as:
o Conference on Soils in Central and Eastern European Countries, in the New Independent States, in Central Asian Countries and in Mongolia. Current situation and future prospects (Prague, 26-29 August, 2000);
o The Consultative Meeting for the Implementation of the UNCCD in Central and Eastern Europe (Prague, 3-4 September, 2001);
o Conference on Mitigation of the Drought Effects and Preventing Land Desertification (Bled, 21-24 April, 2002).
RISSA-AAFS coordinated the INCO-COPERNICUS Concerted Action “Experiences with the impact of subsoil compaction on soil nutrients, crop growth and environment, and ways to prevent subsoil compaction”. This program was the Central and Eastern European counter-part for to a similar program developed in the EC countries. The program has been closed with a Workshop in Busteni – Romania (14-18 June, 2001) attended by specialists from 11 countries.
On 3-6 September 2002 the International Conference on “Soils under Global Change – a Challenge for the 21st Century”, attended by more than 300 participants was organized in Constanta – Romania under RISSA-AAFS organization. One of the conference topic was “Drought under various soil and management conditions in inter-relations with farming and environment”.
5. COORDINATED ACTIONS FOR TAKING ADVANTAGE OF SYNERGIES WITH OTHER ENVIRONMENTAL CONVENTIONS AND EU STRATEGIES
It is considered as very important to correlate the UNCCD action plan and its strategic
objectives with the mitigation and adaptation measures required by other environmental conventions and EU strategies in which Romania is involved, such as:
o The United Nations Framework Convention on Climate Change (UNFCCC) and the Kyoto Protocol.
o The European Union Biodiversity Strategy and the Convention on Biological Diversity (CBD).
o The Convention on Wetlands of International Importance (Ramsar Convention). o The International Treaty on Plant Genetic Resources for Food and Agriculture. o The Cartagena Protocol on Biosafety. o The European Landscape Convention. o The Convention on International Trade in Endangered Species of Wild Fauna and Flora
(CITES). o The World Heritage Convention (WHT). o The Convention on Migratory Species (Bonn Convention). o The Convention on the Conservation of European Wildlife and Natural Habitats (Bern
Convention). o The European Union Sustainable Development Strategy. o The 6th Environmental Action Programme. o Thematic Strategy for Soil Protection. o Thematic Strategy on the Sustainable Use of Pesticides.
252
6. PAST, ONGOING AND FUTURE AGRICULTURAL AND ENVIRONMENTAL RELEVANT PROJECTS UNDER FOREIGN COORDINATION
In the last years, through cooperation between Romanian Government and various donors, there
were promoted (completed, under implementation or preparation) different projects as grants or loans, with agricultural and environmental topics, such as:
Agricultural Pollution Control (GEF) – Preparation Grant (WB); Danube Delta Bio-diversity (WB); Agriculture Sector Adjustment (WB); Private Farmers and Agricultural Enterprise Support (WB); Agricultural Pollution Control Project (WB); Biodiversity Conservation Management (WB); Forestry Development Project Preparation Grant (WB); Agricultural Support Services Project (WB); General Cadastre and Land Registration (WB); Afforestation of Degraded Agricultural Land (WB); Hazard Risks Mitigation and Emergency Preparedness Project (WB); Irrigation Rehabilitation Project (WB); Romanian Forest Development Program (WB); Rural Development (WB); Integrated Protected Areas and Conservation Management (WB);
Private Agribusiness Development and Policy Support Project (USAID); Romanian Crop Insurance Development (USAID); Romanian Water Users Associations (WUAs) Development (USAID); ECO-Links - Eurasian-American Partnership for Environmentally Sustainable Economies
(USAID); Environmental Policy Indefinite Quantity Contract (USAID); Environmental Management Systems and Pollution Prevention Program/EMS and P2
Program (USAID); Feasibility Study for Monitoring Floods and Accidental Pollution (USAID);
Agri-environmental Policies in Romania towards European Union Accession (EU-PHARE); Development of National Extension Service (EU-PHARE); Demonstration Farms and Producer Groups (EU-PHARE); Strategic Review of Agricultural Knowledge Information System (EU-PHARE); Crop Information Service (EU-PHARE); Agricultural Credit Guarantee Fund Project (EU-PHARE); Policy Advice and Technical Support for MAFF Agricultural Reform Development;
Program Implementation (EU-PHARE); Crop Information System (EU-PHARE); Agricultural Statistics, Agrometeorological Modelling, Cartography of the Ecosystem
Mapping, Mapping of Soil and Land Degradation (EU-PHARE); Technical Assistance for Romanian Cadastre (EU-PHARE); Farm Structure Survey (EU-PHARE); Supply Balance Sheets of crops in Romania (EU-PHARE); Environment Statistics (EU-PHARE); Employment in the Fisheries Sector (EU-PHARE);

253
Development and Strengthening of the Administrative Capacity to Take Over and Implement the Community Acquis in the Field of Animal Nutrition (EU-PHARE); Creation of the Proper Framework in the View of Providing the Basics on Integrated
Administration and Control System in Romania (EU-PHARE); Institution Building-Twinning in the Field of Chemicals to Improve the Legal Framework
and to Rise-up the Enforcement (EU-PHARE);
Support for the National Program on vegetal genetic resources in Romania (FAO); Urgent border control for livestock diseases from East and South Europe, regional with
Albania, Bosnia - Hertegovina, Croatia and Bulgaria (FAO); Project on the urgent distribution of maize seeds for the private farmers most by affected by
the drought of 2000 year (FAO); Strategy for agriculture and rural space development (FAO); Project on monitorization and combat the effects of Diabrotica vergifera pest (FAO); The development of an ecosystem for alpine pastures (FAO);
Regional Water and Environment Program (EBRD);
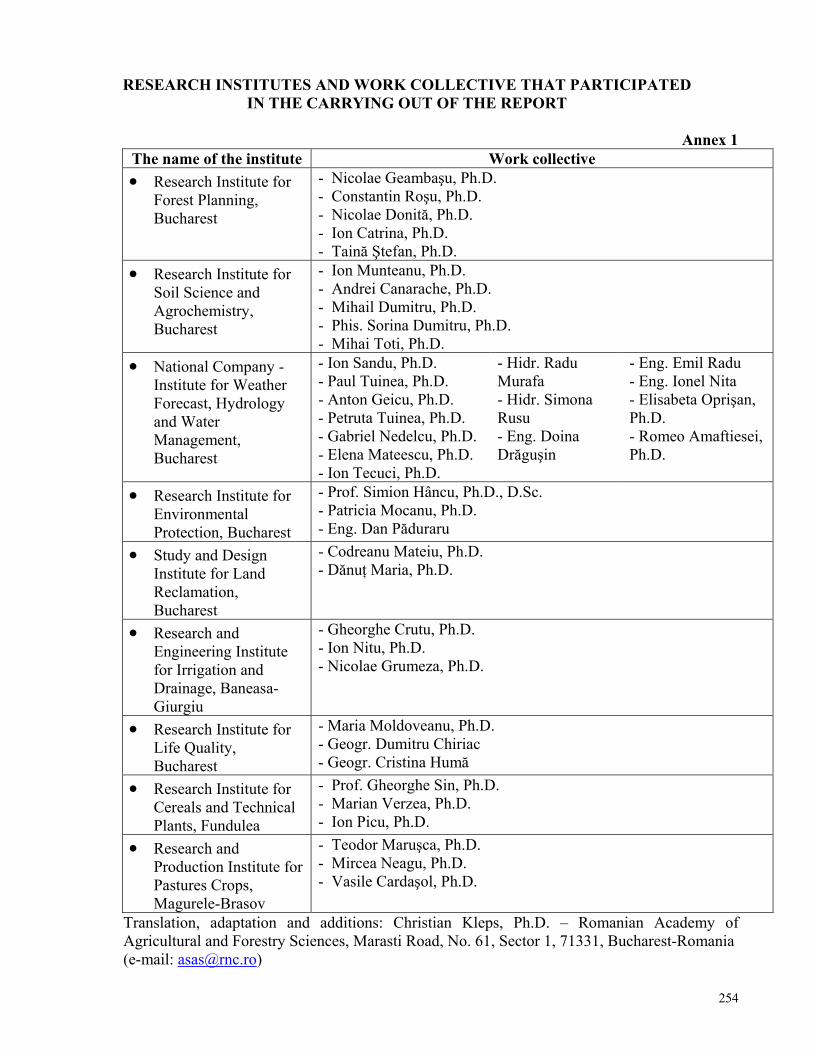
254
RESEARCH INSTITUTES AND WORK COLLECTIVE THAT PARTICIPATED IN THE CARRYING OUT OF THE REPORT
Annex 1
The name of the institute Work collective • Research Institute for
Forest Planning, Bucharest
- Nicolae Geambaşu, Ph.D. - Constantin Roşu, Ph.D. - Nicolae Donită, Ph.D. - Ion Catrina, Ph.D. - Taină Ştefan, Ph.D.
• Research Institute for Soil Science and Agrochemistry, Bucharest
- Ion Munteanu, Ph.D. - Andrei Canarache, Ph.D. - Mihail Dumitru, Ph.D. - Phis. Sorina Dumitru, Ph.D. - Mihai Toti, Ph.D.
• National Company - Institute for Weather Forecast, Hydrology and Water Management, Bucharest
- Ion Sandu, Ph.D. - Paul Tuinea, Ph.D. - Anton Geicu, Ph.D. - Petruta Tuinea, Ph.D. - Gabriel Nedelcu, Ph.D. - Elena Mateescu, Ph.D. - Ion Tecuci, Ph.D.
- Hidr. Radu Murafa - Hidr. Simona Rusu - Eng. Doina Drăguşin
- Eng. Emil Radu - Eng. Ionel Nita - Elisabeta Oprişan, Ph.D. - Romeo Amaftiesei, Ph.D.
• Research Institute for Environmental Protection, Bucharest
- Prof. Simion Hâncu, Ph.D., D.Sc. - Patricia Mocanu, Ph.D. - Eng. Dan Păduraru
• Study and Design Institute for Land Reclamation, Bucharest
- Codreanu Mateiu, Ph.D. - Dănuţ Maria, Ph.D.
• Research and Engineering Institute for Irrigation and Drainage, Baneasa-Giurgiu
- Gheorghe Crutu, Ph.D. - Ion Nitu, Ph.D. - Nicolae Grumeza, Ph.D.
• Research Institute for Life Quality, Bucharest
- Maria Moldoveanu, Ph.D. - Geogr. Dumitru Chiriac - Geogr. Cristina Humă
• Research Institute for Cereals and Technical Plants, Fundulea
- Prof. Gheorghe Sin, Ph.D. - Marian Verzea, Ph.D. - Ion Picu, Ph.D.
• Research and Production Institute for Pastures Crops, Magurele-Brasov
- Teodor Maruşca, Ph.D. - Mircea Neagu, Ph.D. - Vasile Cardaşol, Ph.D.
Translation, adaptation and additions: Christian Kleps, Ph.D. – Romanian Academy of Agricultural and Forestry Sciences, Marasti Road, No. 61, Sector 1, 71331, Bucharest-Romania (e-mail: [email protected])
255
SOILS AND SOIL DEGRADATION IN THE
SLOVAK REPUBLIC by
Professor Dr. Pavol Bielek, Dr.Sc.
Soil Science and Conservation Research Institute, Bratislava
Introduction
The Slovak republic is situated in central Europe. Limiting coordinates of the territory
are as follows: southern 47°43´55´´ N, western 18° 50´04´´ E and eastern 22°34´20´´
E. The maximum dimensions of the country are 226 km from north to south and 428
km from west to east. The total area of Slovakia is 49,035 km2 of which 40% lies
between sea level and 300 m in altitude, 45% between 300 and 800 m, 14% between
800 and 1500 m and 1% above 1500 m. The country divides into two main regions:
the Carpathian Area and the adjacent lowlands. The highest peak is Gerlachovsky
(2663 m) in the High Tatras. Water covers 93,955 ha. There are three main
catchments: the Danube, Tisza and Dunajec. The longest river is the Váh (378 km).
The most important river, economically and ecologically, is the Danube. Natural lakes
are important component of the country; there are 165 in the High Tatras alone.
Slovakia lies in the mild climatic zone.
The total population of the Slovak Republic is 5.3 million of whom 51.19% are
female. The average density of population is 108 people per 1 km2. The capital is
Bratislava, which has 442,000 inhabitants. The country contains about 2,400 species
of plants and about 40,000 species of animals. The distribution of land use is
2,446.000 ha of agricultural land of which 1,483,000 ha are under arable, 2,458,000
ha of non-agricultural land of which 1,991,000 ha is forest, 94,000 ha of water and
373,000 ha under urban and industrial use. There are some 724 protected areas
covering 92,000 km2.
The Slovak Republic is an industrialized country with a well-developed agriculture.
Both industry and agriculture are being restructured. The national economy is focused
256
mainly on the steel, machinery, chemical and food industries. Agriculture is a
relatively stable branch of the economy.
Slovakia was populated a very long time ago. A Neanderthal skeleton was found near
Poprad in the northern part of the country. In the 3rd century BC Celts moved into the
area. Two centuries later, Roman people occupied the southern part of the country. In
172 AD the Roman Emperor, Marcus Aurelius, was living in the south at Hron
(Graunas) river. Here he wrote his famous Meditations. In the second part of the 6 th
century the country formed part of Samo´s Empire. In the 9 th and 10 th centuries
Slovakia was part of the Great Moravian Empire which, in the 10 th century was
occupied by Hungarian tribes. Slovakia was then under Austro-Hungarian rule until
1918 when Czechoslovakia was established. During the 1939-45 War, Slovakia
became independent. In 1945 the Czechoslovakia was rebuilt and formed a socialistic
regime under the strong influence of the Soviet Union. On 1 January 1993, Slovakia
became a sovereign and independent state. Environmental debt from before this date
is a very heavy heritage for the future.
The natural resources (soil, water, forest, biota) of Slovakia have been exploited with
some negative effects, but generally no heavy damage. Since independence the
situation has either stabilized or improved. Public attitudes to natural resources and
environmental are more positive because of individual or company ownership of the
main resources, especially soil and forest. Some legal measures adopted in the last
few years have been helpful for environmental protection. In 1992, monitoring of
environment and natural resources began and the collection of data about
environmental quality was extended and accelerated. The Slovakian Constitution
declares an obligation to give information about the quality of the environment for
everybody who wants or needs to know.
Major regional environmental threats
Natural threats connected with soil erosion are a result of the mountainous character
of the landscape. Water erosion leads to the loss of soil, pollution of water sources and
deterioration of ecosystems. More than 50% of agricultural soils and more than 90%
257
of forest soils are potentially suffering from soil erosion. Some 40 million m3 of
sediment, of which 80% originates from soil erosion, is found in the 32 natural and
artificial lakes in Slovakia. A second serious problem, associated with extreme
rainfall, is localised flooding. The frequency of floods seems to have increased over
the last decade, maybe in response to global change of climate.
Human induced threats represent specific problems. Emissions from industry, energy
and traffic can seriously reduce the quality of nature and environment. Emissions are
dominated by SO2 and NOx but, surrounding some factories, heavy metal pollution
(mainly Cd, Cr, Mn) also occurs. Ten hot spot areas are identified from this point of
view. Over the last few years, however, the emission situation has improved. For
example, total production of SO2 emission has decreased from 569,000 tons in 1989
to 199,000 tons in 1997; NOx emissions have similarly declined from 226,000 to
123,000 tons.
Emissions of heavy metals and solid fall-out have also rapidly decreased as a result of
new cleaning technology and also a decrease in industrial production. Total human-
induced CO2 emissions were 46 million tons in 1996 compared with 60 million tons
in 1990. Methane emission decreased to 320,000 tons in 1996 from about 400,000
tons in 1990 and N2O emission to 8,000 tons from 13,000 tons with about 4,000 tons
coming from agricultural soils.
The negative impacts of emissions on air, soil, forest, biota, water sources and human
health are clear. For example, in 1957 air quality was found to be over the legal limit
on 53 days in Bratislava, 13 days in Martin, 23 days in Žiar nad Hronom and 1 day in
Košice. In spite of the threat of heavy metal pollution from big metallurgy and
machinery factories only about 30,000 ha of agricultural soils are over the limit for
pollution by heavy metals. Soil acidification as a result of air pollution (by SO2 and
NOx) occurs on 425,000 ha, particularly on some 50,000 ha surrounding the lime,
cement and magnesium industries where soil alkalization is taking place.
Water pollution in Slovakia is under permanent control. The quality of surface water
has remained stable or improved over the last few years due to new water cleaning
stations and decreased industrial activity. Water pollution from agriculture is not a

258
serious problem. Point source pollution is the main threat to the quality of water
sources. During the last decade all kinds of water pollution sources from agriculture
have been reduced due to a decrease in the consumption of nitrogen fertilizer (from 90
kg/ha in 1989 to 37 kg/ha in 1997), a decline in animal density to less than half the
level of 1989, a decrease in pesticides consumption and an improvement in the quality
of the pesticides used. Also the technology of manure production has generally
improved because solid manure production is preferred and a high level of stable
technology is achieved.
The quality of drinking water is relatively favourable; from 97 to 99.9% of regularly
performed drinking water analysis in 1997 showed contents of nitrates, Mn, Fe,
ammonium, nitrites, pH and microbiology to be under the legal limit. The amount of
water classed as suitable for irrigation represents 31.6 %,, that classed as conditionally
suitable for irrigation is 43.1% and 25.3% is considered unsuitable for irrigation. The
purest irrigation water is located in the Danube River Basin. Recently the use of
irrigation water has decreased, mostly due to the economic problems of farmers.
The status of the forest in Slovakia can be evaluated with the help of data obtained by
permanent monitoring. In 1997 only about 18% of trees were not damaged. Of the
remaining 82%, some 31% was damaged moderately or highly, mainly as a result of
air and soil pollution (from both national and transported sources). The problem of
biodiversity in Slovakia is similar to that of other countries. Large-scale agriculture
decreases the diversity of wild living organisms due to modern technology and use of
chemicals. Soil drainage destroys populations of wetland plants and animals.
Global changes of climatic will affect Slovakia. From several studies carried out over
the last few years, it is clear that the country is experiencing a gradual increase in
average air temperature and a decrease of water surpluses. The visible effects of
climate change are expected to become apparent by year 2025. Nevertheless local
flooding is already more frequent in comparison to past years and, though there may
be other causes, perhaps this marks the beginning of climate change in Slovakia.

259
Agriculture
Large-scale farming dominates Slovakian agriculture. More than 95% of agricultural
land is used by cooperative farms or other kinds of enterprises. Only 5% of
agricultural soils is in the hands of family farms (Table 1).
Table 1. Agricultural land holdings in the Slovak republic
(after Green Report, 2001)
Soil use
Number of
units
Average
area (ha)
Percentage of total
agricultural land
state farms 1 924 0.04%
cooperative farms 738 1579 47.74%
companies 647 1113 29.5%
family farms 20 355 10,6 8.88%
other 13.84%
Agriculture in Slovakia is becoming more intensified by new technologies and greater
inputs. The consumption of mineral fertilizers declined rapidly at the end of the 1980s
but is now increasing from year to year (Figures 1 and 2). Pesticides consumption fell
during the last decade and is now stabilized at a relatively low level. Annual farmyard
manure production decreased from 35,145,000 tons in 1990 to 7,478,000 tons in 1998
when it supplied some 12.8 kg N, 3.05 kg P and 18.3 kg K per ha of agricultural land.
Average crop yields are shown in Table 2.
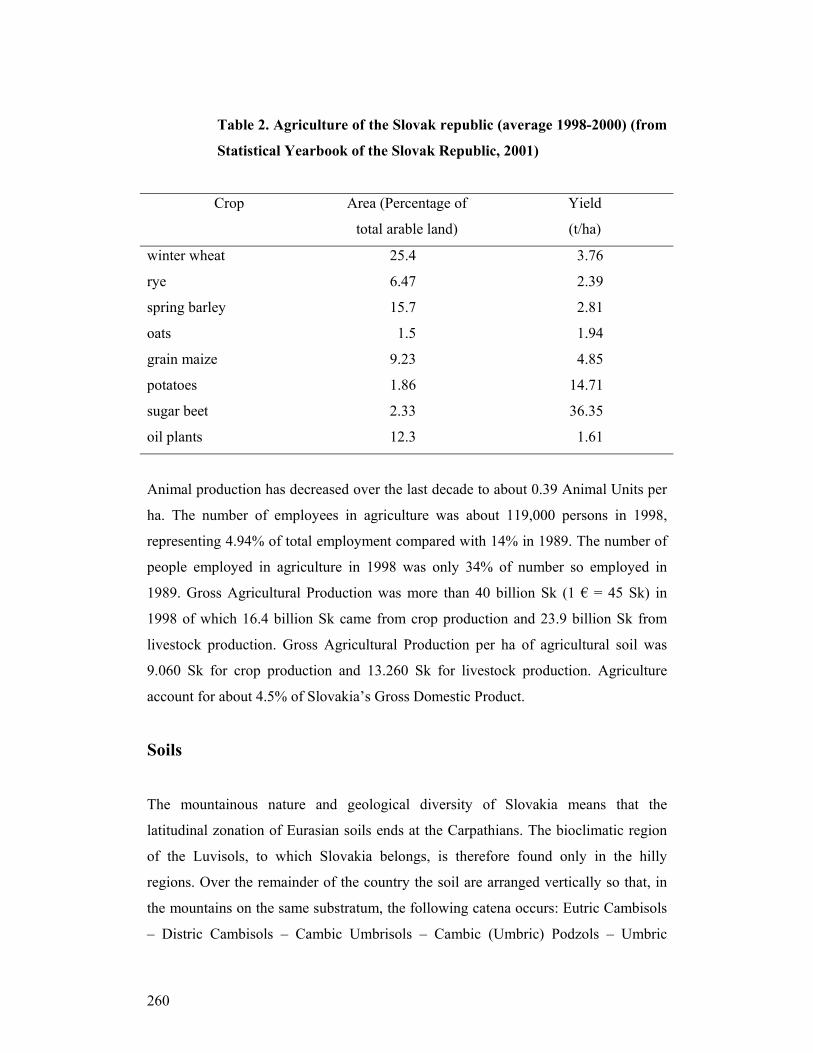
260
Table 2. Agriculture of the Slovak republic (average 1998-2000) (from
Statistical Yearbook of the Slovak Republic, 2001)
Crop Area (Percentage of
total arable land)
Yield
(t/ha)
winter wheat 25.4 3.76
rye 6.47 2.39
spring barley 15.7 2.81
oats 1.5 1.94
grain maize 9.23 4.85
potatoes 1.86 14.71
sugar beet 2.33 36.35
oil plants 12.3 1.61
Animal production has decreased over the last decade to about 0.39 Animal Units per
ha. The number of employees in agriculture was about 119,000 persons in 1998,
representing 4.94% of total employment compared with 14% in 1989. The number of
people employed in agriculture in 1998 was only 34% of number so employed in
1989. Gross Agricultural Production was more than 40 billion Sk (1 € = 45 Sk) in
1998 of which 16.4 billion Sk came from crop production and 23.9 billion Sk from
livestock production. Gross Agricultural Production per ha of agricultural soil was
9.060 Sk for crop production and 13.260 Sk for livestock production. Agriculture
account for about 4.5% of Slovakia’s Gross Domestic Product.
Soils
The mountainous nature and geological diversity of Slovakia means that the
latitudinal zonation of Eurasian soils ends at the Carpathians. The bioclimatic region
of the Luvisols, to which Slovakia belongs, is therefore found only in the hilly
regions. Over the remainder of the country the soil are arranged vertically so that, in
the mountains on the same substratum, the following catena occurs: Eutric Cambisols
– Distric Cambisols – Cambic Umbrisols – Cambic (Umbric) Podzols – Umbric
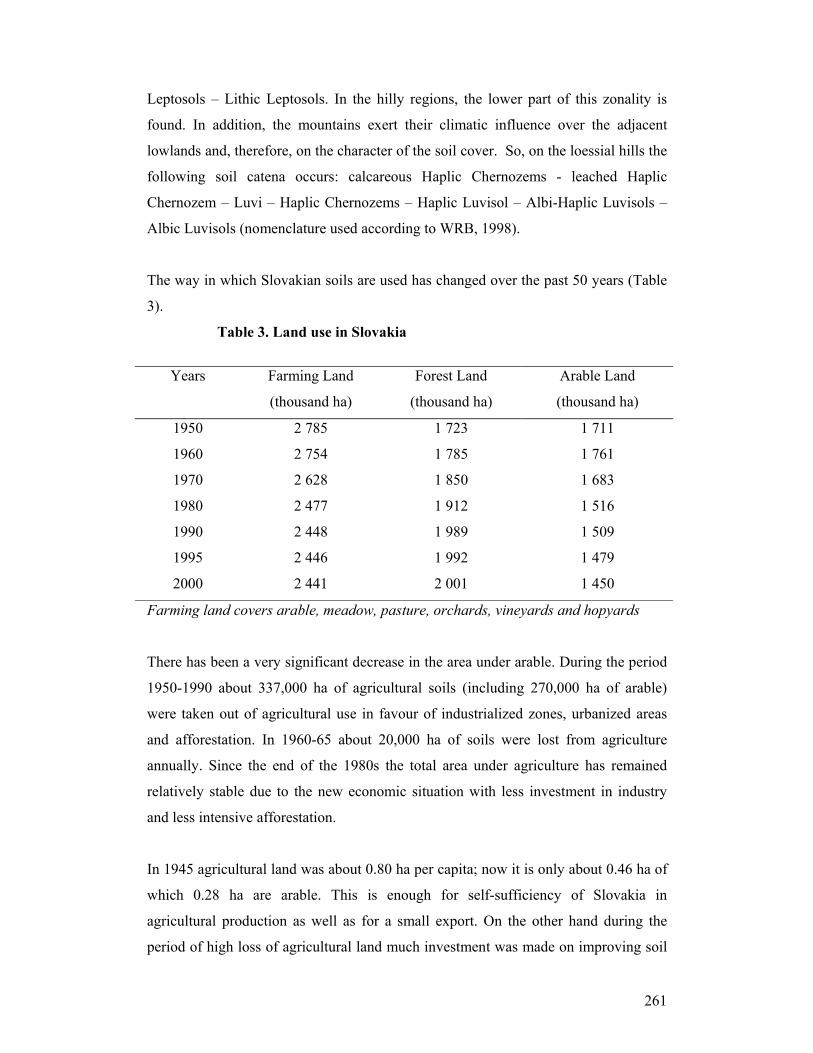
261
Leptosols – Lithic Leptosols. In the hilly regions, the lower part of this zonality is
found. In addition, the mountains exert their climatic influence over the adjacent
lowlands and, therefore, on the character of the soil cover. So, on the loessial hills the
following soil catena occurs: calcareous Haplic Chernozems - leached Haplic
Chernozem – Luvi – Haplic Chernozems – Haplic Luvisol – Albi-Haplic Luvisols –
Albic Luvisols (nomenclature used according to WRB, 1998).
The way in which Slovakian soils are used has changed over the past 50 years (Table
3).
Table 3. Land use in Slovakia
Years Farming Land
(thousand ha)
Forest Land
(thousand ha)
Arable Land
(thousand ha)
1950 2 785 1 723 1 711
1960 2 754 1 785 1 761
1970 2 628 1 850 1 683
1980 2 477 1 912 1 516
1990 2 448 1 989 1 509
1995 2 446 1 992 1 479
2000 2 441 2 001 1 450
Farming land covers arable, meadow, pasture, orchards, vineyards and hopyards
There has been a very significant decrease in the area under arable. During the period
1950-1990 about 337,000 ha of agricultural soils (including 270,000 ha of arable)
were taken out of agricultural use in favour of industrialized zones, urbanized areas
and afforestation. In 1960-65 about 20,000 ha of soils were lost from agriculture
annually. Since the end of the 1980s the total area under agriculture has remained
relatively stable due to the new economic situation with less investment in industry
and less intensive afforestation.
In 1945 agricultural land was about 0.80 ha per capita; now it is only about 0.46 ha of
which 0.28 ha are arable. This is enough for self-sufficiency of Slovakia in
agricultural production as well as for a small export. On the other hand during the
period of high loss of agricultural land much investment was made on improving soil
262
quality. About 450,000 ha of agricultural soils (about 18% total area) were drained
and irrigation was installed on 310,000 ha, which is on more than 20% the arable
land.
A complete Soil Survey of Slovakian Agricultural Soils was carried out during the
years 1960-1970, with a density of 1 soil pit per 14.6 ha of agricultural land. About
174,000 soil profiles were described fully and more than 400,000 soil samples were
taken covering all the agricultural soils of Slovakia. Other specific surveys were
carried out later including geochemical mapping of soils (1994-1998) and monitoring
of soil properties (officially started in 1992 at more than 300 places). Soil maps of
many scales have been created on the base of soil survey data (1:5,000; 1:10,000;
1:400,000; 1:500,000; 1:1,000,000; 1:2,500,000). A Geographical Information System
of Agricultural Soils of Slovakia has been built and is being continuously improved
by the Soil Science and Conservation Research Institute in Bratislava. The main
properties of Slovakian soils are summarised in Tables 4, 5, 6, 7 and 8.
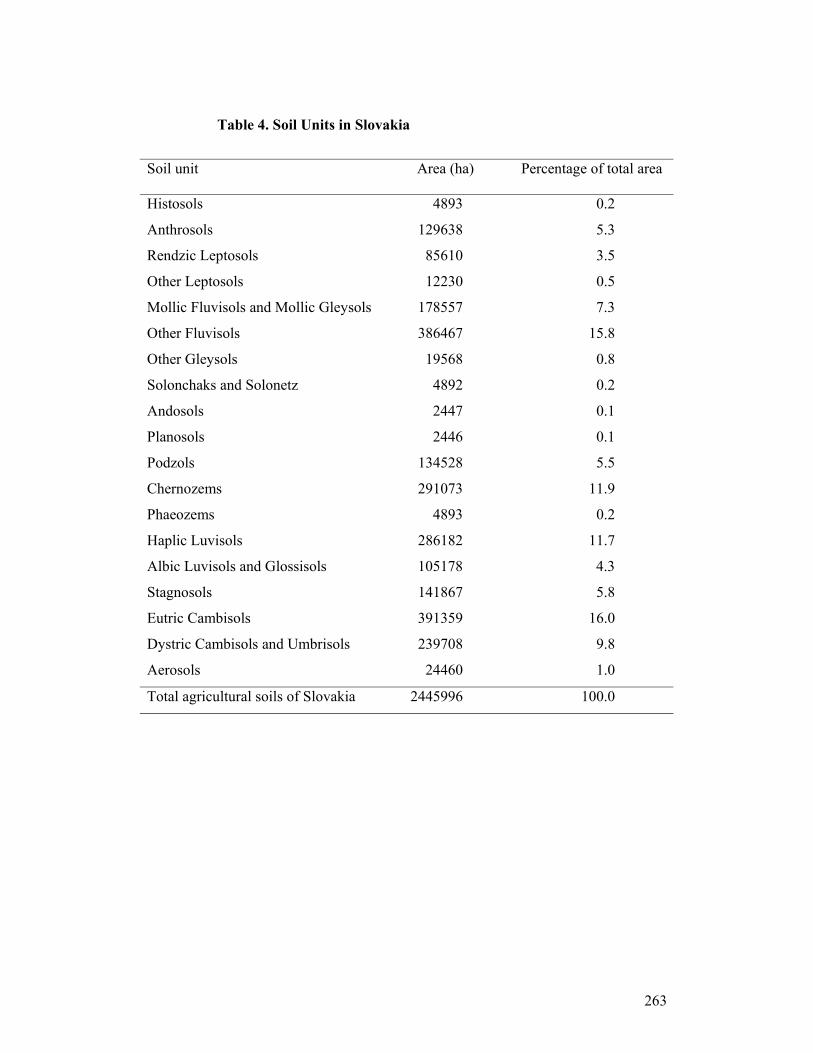
263
Table 4. Soil Units in Slovakia
Soil unit Area (ha) Percentage of total area
Histosols 4893 0.2
Anthrosols 129638 5.3
Rendzic Leptosols 85610 3.5
Other Leptosols 12230 0.5
Mollic Fluvisols and Mollic Gleysols 178557 7.3
Other Fluvisols 386467 15.8
Other Gleysols 19568 0.8
Solonchaks and Solonetz 4892 0.2
Andosols 2447 0.1
Planosols 2446 0.1
Podzols 134528 5.5
Chernozems 291073 11.9
Phaeozems 4893 0.2
Haplic Luvisols 286182 11.7
Albic Luvisols and Glossisols 105178 4.3
Stagnosols 141867 5.8
Eutric Cambisols 391359 16.0
Dystric Cambisols and Umbrisols 239708 9.8
Aerosols 24460 1.0
Total agricultural soils of Slovakia 2445996 100.0
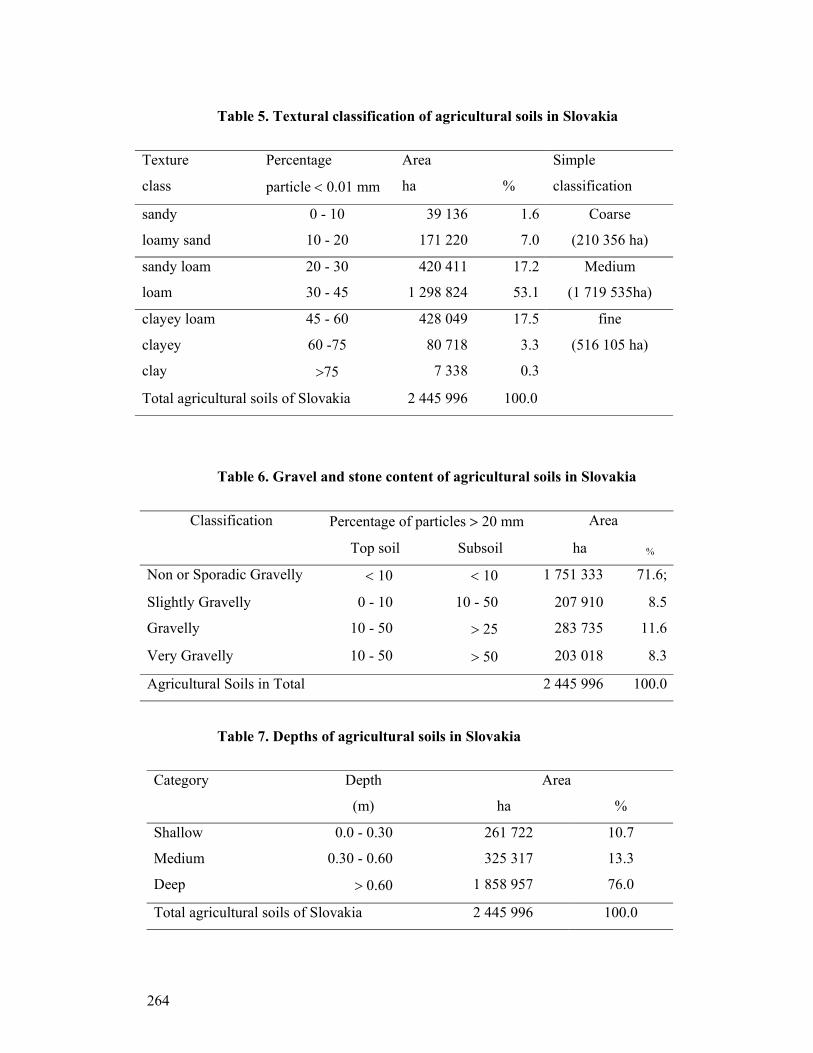
264
Table 5. Textural classification of agricultural soils in Slovakia
Texture
class
Percentage
particle < 0.01 mm
Area
ha %
Simple
classification
sandy 0 - 10 39 136 1.6 Coarse
loamy sand 10 - 20 171 220 7.0 (210 356 ha)
sandy loam 20 - 30 420 411 17.2 Medium
loam 30 - 45 1 298 824 53.1 (1 719 535ha)
clayey loam 45 - 60 428 049 17.5 fine
clayey 60 -75 80 718 3.3 (516 105 ha)
clay >75 7 338 0.3
Total agricultural soils of Slovakia 2 445 996 100.0
Table 6. Gravel and stone content of agricultural soils in Slovakia
Classification Percentage of particles > 20 mm Area
Top soil Subsoil ha %
Non or Sporadic Gravelly < 10 < 10 1 751 333 71.6;
Slightly Gravelly 0 - 10 10 - 50 207 910 8.5
Gravelly 10 - 50 > 25 283 735 11.6
Very Gravelly 10 - 50 > 50 203 018 8.3
Agricultural Soils in Total 2 445 996 100.0
Table 7. Depths of agricultural soils in Slovakia
Category Depth Area
(m) ha %
Shallow 0.0 - 0.30 261 722 10.7
Medium 0.30 - 0.60 325 317 13.3
Deep > 0.60 1 858 957 76.0
Total agricultural soils of Slovakia 2 445 996 100.0
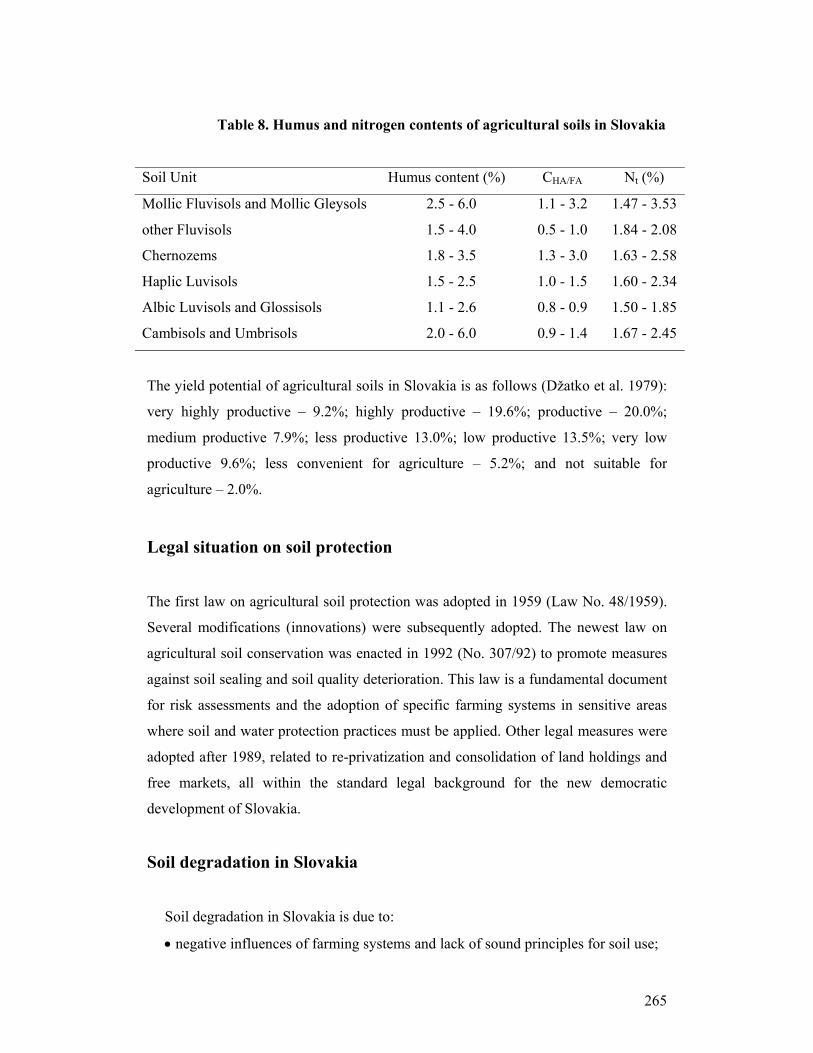
265
Table 8. Humus and nitrogen contents of agricultural soils in Slovakia
Soil Unit Humus content (%) CHA/FA Nt (%)
Mollic Fluvisols and Mollic Gleysols 2.5 - 6.0 1.1 - 3.2 1.47 - 3.53
other Fluvisols 1.5 - 4.0 0.5 - 1.0 1.84 - 2.08
Chernozems 1.8 - 3.5 1.3 - 3.0 1.63 - 2.58
Haplic Luvisols 1.5 - 2.5 1.0 - 1.5 1.60 - 2.34
Albic Luvisols and Glossisols 1.1 - 2.6 0.8 - 0.9 1.50 - 1.85
Cambisols and Umbrisols 2.0 - 6.0 0.9 - 1.4 1.67 - 2.45
The yield potential of agricultural soils in Slovakia is as follows (Džatko et al. 1979):
very highly productive – 9.2%; highly productive – 19.6%; productive – 20.0%;
medium productive 7.9%; less productive 13.0%; low productive 13.5%; very low
productive 9.6%; less convenient for agriculture – 5.2%; and not suitable for
agriculture – 2.0%.
Legal situation on soil protection
The first law on agricultural soil protection was adopted in 1959 (Law No. 48/1959).
Several modifications (innovations) were subsequently adopted. The newest law on
agricultural soil conservation was enacted in 1992 (No. 307/92) to promote measures
against soil sealing and soil quality deterioration. This law is a fundamental document
for risk assessments and the adoption of specific farming systems in sensitive areas
where soil and water protection practices must be applied. Other legal measures were
adopted after 1989, related to re-privatization and consolidation of land holdings and
free markets, all within the standard legal background for the new democratic
development of Slovakia.
Soil degradation in Slovakia
Soil degradation in Slovakia is due to:
• negative influences of farming systems and lack of sound principles for soil use;
266
• impacts of non-agricultural activities including emissions from industry, traffic
and urban areas;
• specific natural conditions favouring pollution, erosion and disasters (floods,
ravines).
The human impact on soil degradation in Slovakia is estimated on the levels of 50%
(for soil erosion, negative soil use, floods, ravines) to 80% (for soil pollution from
industrial and agricultural sources) with the additional 20% coming from natural
causes.
Physical degradation of soils
Physical soil degradation to the non-reversible or partially reversible demage to
physical, technological and profile properties of soils. Physical degradation results
from natural influences but over the last decade, human activities, most of all
agricultural practices, have also significantly accelerated the deterioration of soil
physical properties. The most important types of soil physical degradations in the
Slovak Republic are soil erosion and soil compaction.
Soil Erosion
Water erosion is a serious problem due to mountainous character of the territory and
because sloping fields use for arable land. The domination of large-scale farming
significantly accelerates soil erosion in Slovakia. Using the data of Soil Survey and
with help of the Geographical Information System about Agricultural Soils of
Slovakia, soil erosion areas were identified, summarized and elaborated in the form of
maps. (Figure 3; Table 9).
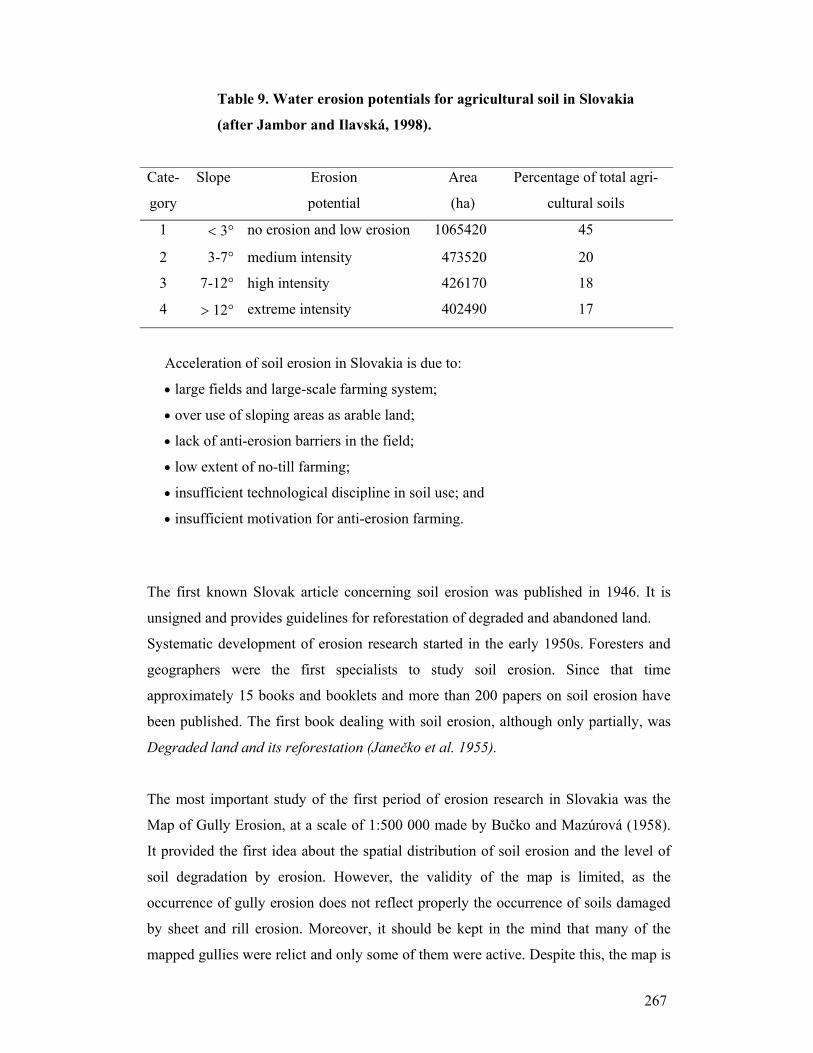
267
Table 9. Water erosion potentials for agricultural soil in Slovakia
(after Jambor and Ilavská, 1998).
Cate-
gory
Slope Erosion
potential
Area
(ha)
Percentage of total agri-
cultural soils
1 < 3° no erosion and low erosion 1065420 45
2 3-7° medium intensity 473520 20
3 7-12° high intensity 426170 18
4 > 12° extreme intensity 402490 17
Acceleration of soil erosion in Slovakia is due to:
• large fields and large-scale farming system;
• over use of sloping areas as arable land;
• lack of anti-erosion barriers in the field;
• low extent of no-till farming;
• insufficient technological discipline in soil use; and
• insufficient motivation for anti-erosion farming.
The first known Slovak article concerning soil erosion was published in 1946. It is
unsigned and provides guidelines for reforestation of degraded and abandoned land.
Systematic development of erosion research started in the early 1950s. Foresters and
geographers were the first specialists to study soil erosion. Since that time
approximately 15 books and booklets and more than 200 papers on soil erosion have
been published. The first book dealing with soil erosion, although only partially, was
Degraded land and its reforestation (Janečko et al. 1955).
The most important study of the first period of erosion research in Slovakia was the
Map of Gully Erosion, at a scale of 1:500 000 made by Bučko and Mazúrová (1958).
It provided the first idea about the spatial distribution of soil erosion and the level of
soil degradation by erosion. However, the validity of the map is limited, as the
occurrence of gully erosion does not reflect properly the occurrence of soils damaged
by sheet and rill erosion. Moreover, it should be kept in the mind that many of the
mapped gullies were relict and only some of them were active. Despite this, the map is
268
still one of most important studies on soil erosion and it has been used as background
information until today. The areas with strong gully erosion (gully density > 1 km.km-
2) cover 7.5% of the territory of Slovakia and in some regions the gully density reaches
3-7 km.km-2.
The first proceedings from a conference focused exclusively on erosion were produced
by Zachar (1958) with his Water Erosion in Slovakia. This contains a wide range of
studies on such as gully erosion, mapping of eroded soils in the highly elevated
mountains of Slovakia, measurements of sediment loads in rivers, reduction of river-
bank erosion and soil conservation on agricultural land.
During the 1960s and 1970s erosion research was focused mainly on soil conservation.
The most popular publication in this period was the book on soil erosion written by
Zachar. It was edited three times (1960 and 1970 in Slovak, and 1982 in English). This
was probably the most important achievement of Slovak erosion research and the book
is cited worldwide. Slovak editions involved a general part and several conventional
studies of erosion in the different geological regions of Slovakia. The English edition
was adopted for an international market and comprises of chapters on the classification
of erosion processes, the detailed description of erosion research methods, the
characterisation of water erosion processes and erosion factors, and the occurrence of
erosion over the world.
Comprehensive information about soil erosion in Slovakia was elaborated in the book
Threatened soil (Bielek et al. 1991). A lot of data is published here not only about
erosion of agricultural soils but also about erosion of forest soils.
During the 1960s and 1970s, in addition to foresters (Zachar, Midriak) and
geographers (Bučko, Mazúrová) many agricultural engineers were active in erosion
research. Karniš (1982) studied the spatial distribution of erosion and the level of soil
degradation caused by erosion. His assessment of eroded soils was based on
comparison of soil morphology, soil texture and some other characteristics. He made
soil erosion maps of several large regions of Slovakia.
269
In the 1980s erosion research was still focused on soil conservation. The main
requirement was to identify the areas endangered by erosion and to determine potential
erosion rates. The most popular tool became the Universal Soil Loss Equation. The
first handbooks of soil erosion estimation with the aid of the USLE were published
(Alena, 1986). These activities also required field measurements of erosion rates.
Although some measurements had been made earlier, the 1980s saw the first
systematic data sets on erosion rates (Stašík et al., 1983, Chomaničová, 1988). The
results range from 0 to 9 t.ha-1.year-1.
Work on development of the USLE was still active at the beginning of the 1990ts.
Alena (1991) and Malíšek (1990) elaborated maps of the R-factor. The two maps
differs considerably. The values of Malíšek are more varied. He calculated R-factor
values for 80 rainfall stations around the country. The values range from 4 MJ.ha-
1.cm.h-1 in the driest parts of the lowlands to 47 MJ.ha-1.cm.h-1 in highest mountains.
During the 1990s erosion research became still more intensive and covered more
topics. New methods involving the use of satellite images, radionuclide tracers, GIS
and computer erosion models enabled considerable deepening of the knowledge on
soil erosion. Some of the best achievements of the erosion research of last decade in
Slovakia are follows:
Since 1994 field measurements of erosion on small sized plots have built on
the studies of Stašík et al. (1983) and Chomaničová (1988). During 5 years of
measurements on several sites almost 80 plot years of data were collected
(maximum 28 plots during one year) covering almost 2000 rain events
(Fulajtár, 1997). The erosion rates range between 0 and 10 mm/y or up to 75
tons.ha-1.y-1. Some of the results are much higher than those measured by
earlier authors. However, in many cases erosion did not occur and where it did
the erosion rate was between 2 and 20 t ha-1.y-1 with a mean close to 15 t ha-1.y-
1 or 1 mm/y. The measured data were used for evaluation of the soil conserving
efficiency of the basic agricultural crops and for verification of USLE (Figure
4). The comparison of measured and calculated values showed that the USLE
usually over estimated soil loss for small rain events and underestimated it for
large erosion events.
Erosion and runoff measurements were carried out in elementary catchments.
Janský et al. (1994) made a series of measurements of runoff in relation to soil
270
hydraulic conductivity, slope inclination and length. Fulajtár (1998a) started
measurements of soil loss and pollution of surface waters by fertilisers and
pesticides from elementary catchments. This research project is still running
and the results are not yet evaluated. Erosion is measured by tipping bucket
devices installed on medium-sized monitoring plots and by H-flumes with
limnigraphs on brooks draining the catchments. Up to now the results shows
that chemical pollution of the water is below the acceptable limit. The sediment
loads concentrations are occasionally high discharges.
The relations between rainfall, runoff, soil loss and some erosion factors were
examined in laboratory conditions (Janský, 1993). For this purpose the lysimeters at
the National Research Institute of Agricultural Engineering in Tsukuba, Japan were
used in a framework of a research exchange between the Department of Pedology of
the Natural Science Faculty, Commenius University in Bratislava and several research
bodies in Japan. The runoff and erosion rates were studied in relation to rainfall, soil
properties and slope (Figure 5).
Janský studied sedimentation rates in many small water reservoirs. The measured rates
range between 0.4 and 15 mm/y. The sedimentation rate depends upon the forest cover
of the catchments (Figure 6).
Erosion rates and erosion spatial distribution of erosion were studied using
radionuclide tracers. Only the 137Cs-method was used. The first studies were for single
transects. The erosion rate was estimated according to the percentage reduction of 137Cs at eroded places and the thickness of deposition in valleys. Later, financial
support from the International Atomic Energy Agency in Vienna enabled multiple
transect to be investigated. Numerous data sets were interpreted with the aid of
calibration models developed at Exeter University in England. The erosion rate and
erosion pattern of the study site is shower in Figure 7. The erosion rates, calculated by
Mass Balance Model II, range from 10-to 30 t ha-1 y-1, and sometimes reach 60 t.ha-
1.year-1. The accumulation rates are 10 - 37 t ha-1 y-1. This study is one of the most
important in Slovakia as it provides first reliable estimation of long term mean erosion
rates.
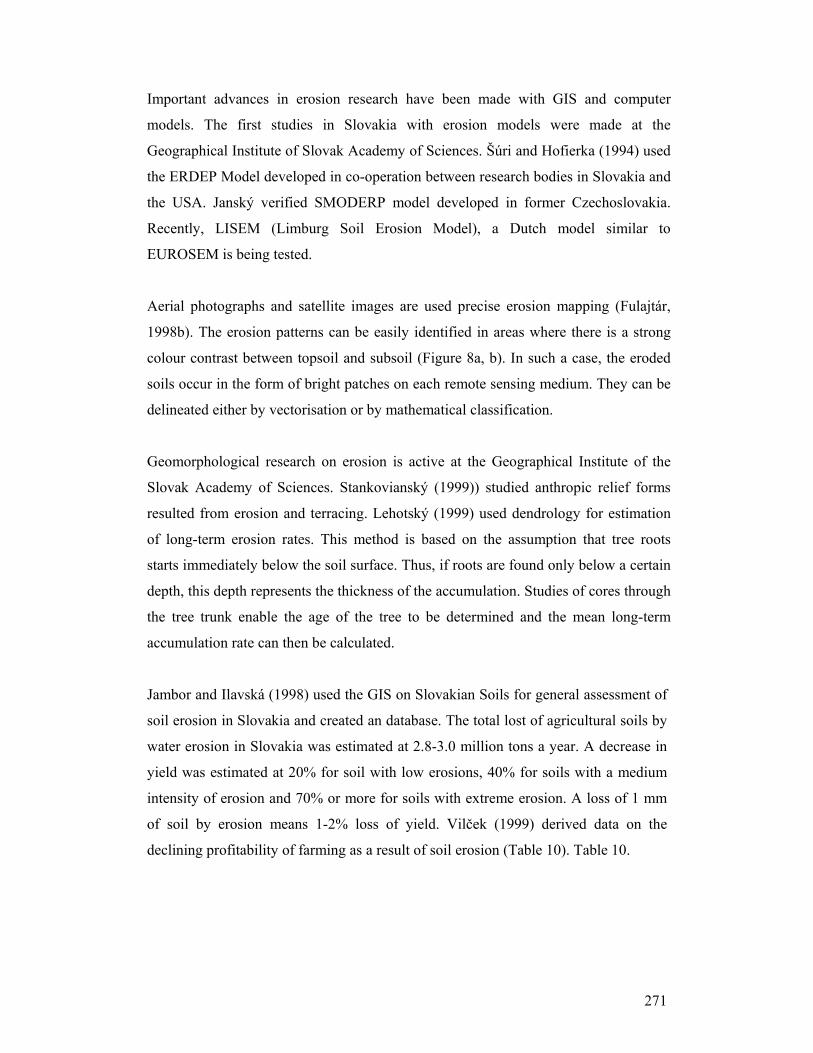
271
Important advances in erosion research have been made with GIS and computer
models. The first studies in Slovakia with erosion models were made at the
Geographical Institute of Slovak Academy of Sciences. Šúri and Hofierka (1994) used
the ERDEP Model developed in co-operation between research bodies in Slovakia and
the USA. Janský verified SMODERP model developed in former Czechoslovakia.
Recently, LISEM (Limburg Soil Erosion Model), a Dutch model similar to
EUROSEM is being tested.
Aerial photographs and satellite images are used precise erosion mapping (Fulajtár,
1998b). The erosion patterns can be easily identified in areas where there is a strong
colour contrast between topsoil and subsoil (Figure 8a, b). In such a case, the eroded
soils occur in the form of bright patches on each remote sensing medium. They can be
delineated either by vectorisation or by mathematical classification.
Geomorphological research on erosion is active at the Geographical Institute of the
Slovak Academy of Sciences. Stankovianský (1999)) studied anthropic relief forms
resulted from erosion and terracing. Lehotský (1999) used dendrology for estimation
of long-term erosion rates. This method is based on the assumption that tree roots
starts immediately below the soil surface. Thus, if roots are found only below a certain
depth, this depth represents the thickness of the accumulation. Studies of cores through
the tree trunk enable the age of the tree to be determined and the mean long-term
accumulation rate can then be calculated.
Jambor and Ilavská (1998) used the GIS on Slovakian Soils for general assessment of
soil erosion in Slovakia and created an database. The total lost of agricultural soils by
water erosion in Slovakia was estimated at 2.8-3.0 million tons a year. A decrease in
yield was estimated at 20% for soil with low erosions, 40% for soils with a medium
intensity of erosion and 70% or more for soils with extreme erosion. A loss of 1 mm
of soil by erosion means 1-2% loss of yield. Vilček (1999) derived data on the
declining profitability of farming as a result of soil erosion (Table 10). Table 10.
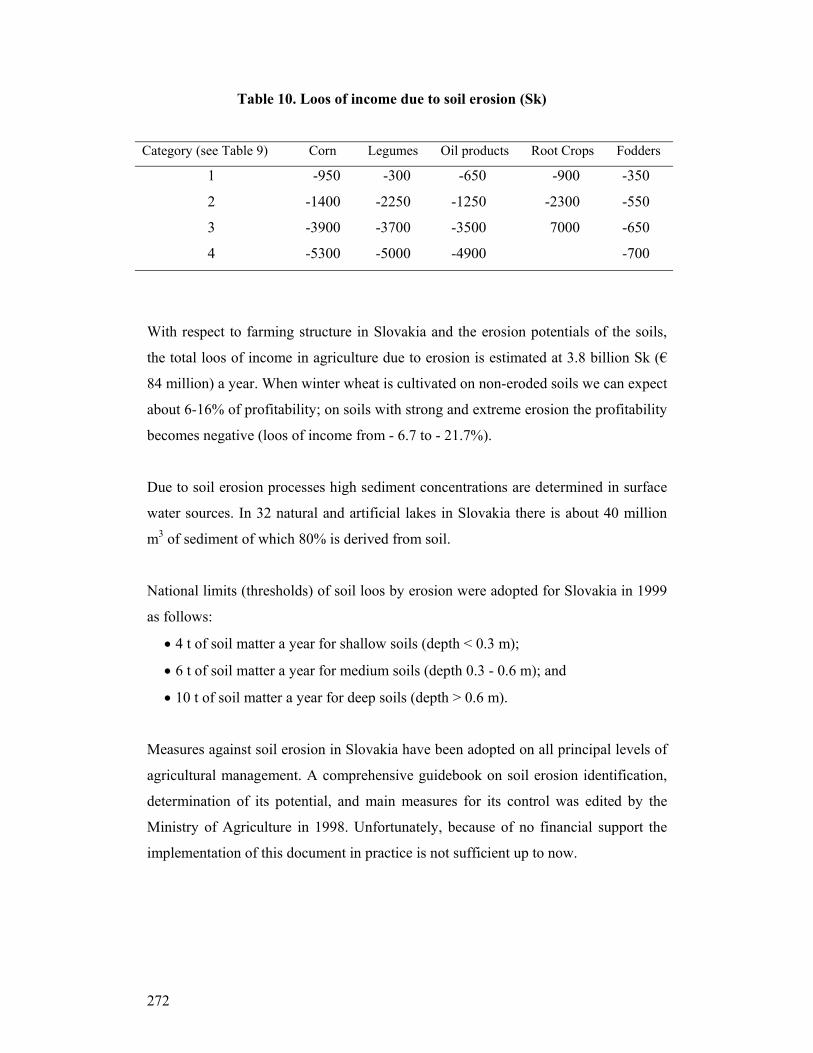
272
Table 10. Loos of income due to soil erosion (Sk)
Category (see Table 9) Corn Legumes Oil products Root Crops Fodders
1 -950 -300 -650 -900 -350
2 -1400 -2250 -1250 -2300 -550
3 -3900 -3700 -3500 7000 -650
4 -5300 -5000 -4900 -700
With respect to farming structure in Slovakia and the erosion potentials of the soils,
the total loos of income in agriculture due to erosion is estimated at 3.8 billion Sk (€
84 million) a year. When winter wheat is cultivated on non-eroded soils we can expect
about 6-16% of profitability; on soils with strong and extreme erosion the profitability
becomes negative (loos of income from - 6.7 to - 21.7%).
Due to soil erosion processes high sediment concentrations are determined in surface
water sources. In 32 natural and artificial lakes in Slovakia there is about 40 million
m3 of sediment of which 80% is derived from soil.
National limits (thresholds) of soil loos by erosion were adopted for Slovakia in 1999
as follows:
• 4 t of soil matter a year for shallow soils (depth < 0.3 m);
• 6 t of soil matter a year for medium soils (depth 0.3 - 0.6 m); and
• 10 t of soil matter a year for deep soils (depth > 0.6 m).
Measures against soil erosion in Slovakia have been adopted on all principal levels of
agricultural management. A comprehensive guidebook on soil erosion identification,
determination of its potential, and main measures for its control was edited by the
Ministry of Agriculture in 1998. Unfortunately, because of no financial support the
implementation of this document in practice is not sufficient up to now.
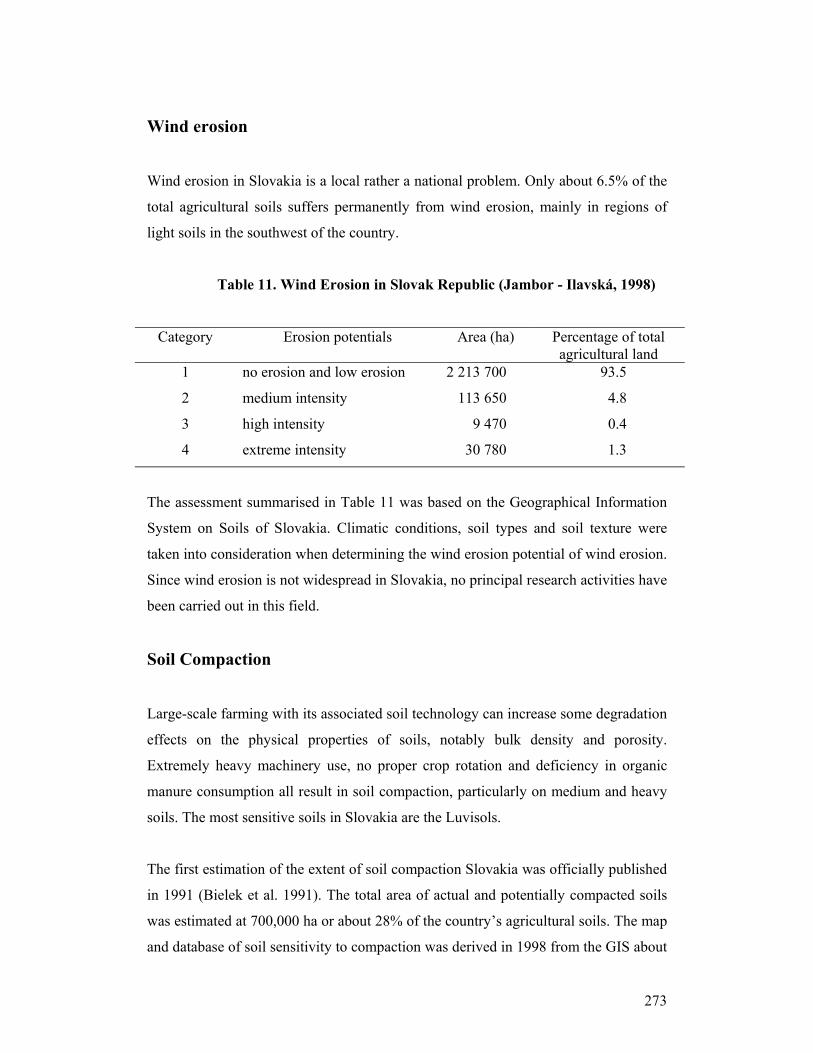
273
Wind erosion
Wind erosion in Slovakia is a local rather a national problem. Only about 6.5% of the
total agricultural soils suffers permanently from wind erosion, mainly in regions of
light soils in the southwest of the country.
Table 11. Wind Erosion in Slovak Republic (Jambor - Ilavská, 1998)
Category Erosion potentials Area (ha) Percentage of total agricultural land
1 no erosion and low erosion 2 213 700 93.5
2 medium intensity 113 650 4.8
3 high intensity 9 470 0.4
4 extreme intensity 30 780 1.3
The assessment summarised in Table 11 was based on the Geographical Information
System on Soils of Slovakia. Climatic conditions, soil types and soil texture were
taken into consideration when determining the wind erosion potential of wind erosion.
Since wind erosion is not widespread in Slovakia, no principal research activities have
been carried out in this field.
Soil Compaction
Large-scale farming with its associated soil technology can increase some degradation
effects on the physical properties of soils, notably bulk density and porosity.
Extremely heavy machinery use, no proper crop rotation and deficiency in organic
manure consumption all result in soil compaction, particularly on medium and heavy
soils. The most sensitive soils in Slovakia are the Luvisols.
The first estimation of the extent of soil compaction Slovakia was officially published
in 1991 (Bielek et al. 1991). The total area of actual and potentially compacted soils
was estimated at 700,000 ha or about 28% of the country’s agricultural soils. The map
and database of soil sensitivity to compaction was derived in 1998 from the GIS about
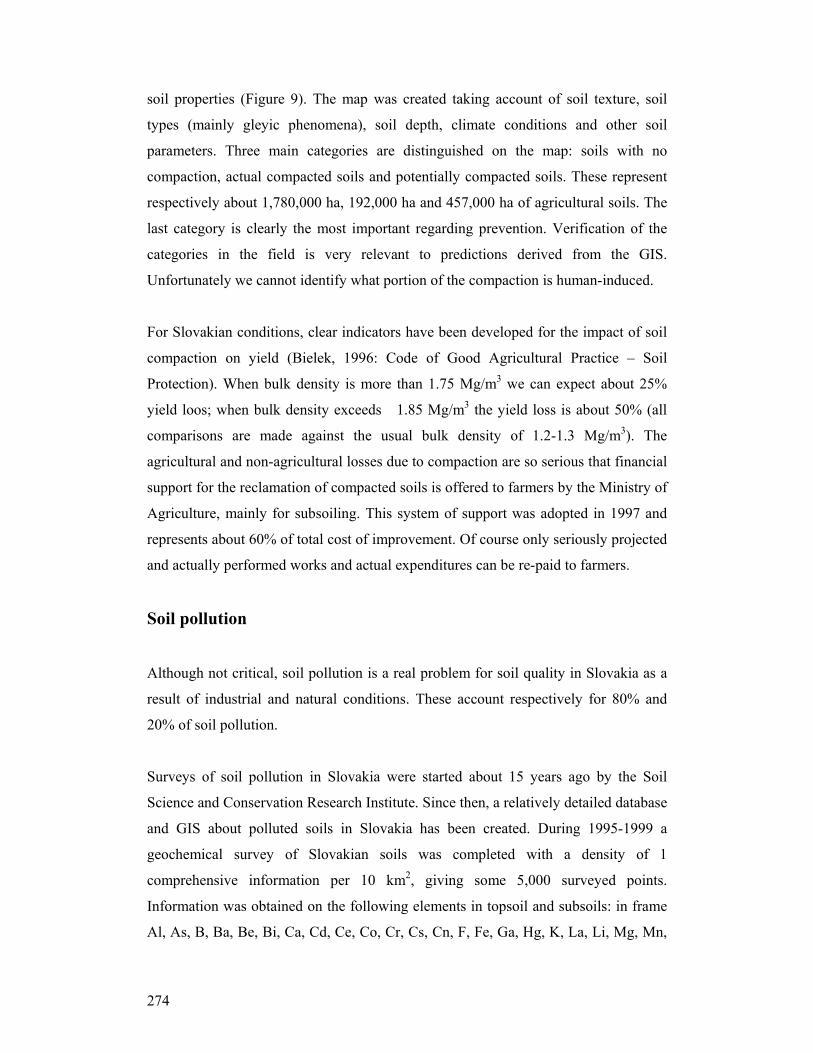
274
soil properties (Figure 9). The map was created taking account of soil texture, soil
types (mainly gleyic phenomena), soil depth, climate conditions and other soil
parameters. Three main categories are distinguished on the map: soils with no
compaction, actual compacted soils and potentially compacted soils. These represent
respectively about 1,780,000 ha, 192,000 ha and 457,000 ha of agricultural soils. The
last category is clearly the most important regarding prevention. Verification of the
categories in the field is very relevant to predictions derived from the GIS.
Unfortunately we cannot identify what portion of the compaction is human-induced.
For Slovakian conditions, clear indicators have been developed for the impact of soil
compaction on yield (Bielek, 1996: Code of Good Agricultural Practice – Soil
Protection). When bulk density is more than 1.75 Mg/m3 we can expect about 25%
yield loos; when bulk density exceeds 1.85 Mg/m3 the yield loss is about 50% (all
comparisons are made against the usual bulk density of 1.2-1.3 Mg/m3). The
agricultural and non-agricultural losses due to compaction are so serious that financial
support for the reclamation of compacted soils is offered to farmers by the Ministry of
Agriculture, mainly for subsoiling. This system of support was adopted in 1997 and
represents about 60% of total cost of improvement. Of course only seriously projected
and actually performed works and actual expenditures can be re-paid to farmers.
Soil pollution
Although not critical, soil pollution is a real problem for soil quality in Slovakia as a
result of industrial and natural conditions. These account respectively for 80% and
20% of soil pollution.
Surveys of soil pollution in Slovakia were started about 15 years ago by the Soil
Science and Conservation Research Institute. Since then, a relatively detailed database
and GIS about polluted soils in Slovakia has been created. During 1995-1999 a
geochemical survey of Slovakian soils was completed with a density of 1
comprehensive information per 10 km2, giving some 5,000 surveyed points.
Information was obtained on the following elements in topsoil and subsoils: in frame
Al, As, B, Ba, Be, Bi, Ca, Cd, Ce, Co, Cr, Cs, Cn, F, Fe, Ga, Hg, K, La, Li, Mg, Mn,

275
Mo, Na, Li, P, Pb, Rb, Sb, Se, Sn, Sr, V, W, Y, Zn. A Geochemical Atlas (part Soils)
was printed in September 1999 where each surveyed element is evaluated separately
for all the territory of Slovakia with separate evaluations of each surveyed element. A
database and GIS were also created and are available to anyone who needs them.
In addition, soil properties have been monitored since 1993 by the Soil Science and
Conservation Research Institute using a network of more than 300 sites of agricultural
soils. Soil pollution assessment is one of the most important aspects of pollutant
monitoring. Of coarse, this is not only single data about the content of each pollutant
in the soil, but is a systematic long-term observation of the polluted site. From the
results we can deduce that the pollution content in soils is relatively stable, being
largely heavy metals that are not degradable and very difficult to eliminate.
The picture of soil pollution situation in Slovakia is presented in Figure 10.
Quantitative data about structure of soil pollution can be identified from Figure 11
from which it can be deduced that not more than 45,000 ha of Slovakian soils (not
more than 30,000 ha of agricultural soils) are polluted at levels on or above acceptable
limits. This is not a critical situation. Moreover, on agricultural land it is under control
by farmers. The transport of pollutants from soil to the plant production is well
protected and no pollution of foods and fodders from soil has been found in the
framework of both soil and foods monitorings carried out in Slovakia since 1993.
With respect to emission almost all soil pollution in Slovakia is by heavy metals.
Organic pollution is not problem (oil pollution, PCB, PAH). Some small amounts of
Mg and Ca pollution occur locally with negative effects on soil properties but with no
effects on food contamination. Nevertheless serious investigations have been carried
out on the behaviour of pollutants in soil and the uptake of heavy metals by plants.
Comprehensive information on the potential mobility of heavy metals is presented in
Figure 12. The map was created with respect to soil properties (pH, organic matter
content, soil texture) and with help of the Geographical Information System on
Slovakian Soils. It is a document for the first step of risk assessment anywhere in
Slovakia.

276
From a theoretical point of view, several conclusions on soil pollution problems can
be made. Mostly we have results about heavy metal pollution. From parameters
affecting the bioavailability of heavy metals in soil we have to take into consideration
the soil texture. Higher heavy metals bioavailability can be expected in light soils in
comparison to medium and heavy soils. The pH range from 5.5 to 6.5 is the most
favourable for heavy metal bioavailability in soil. Lower humus content also leads to
higher bioavailability of heavy metals.
In field experiments in the polluted areas of Slovakia no effect of mineral fertilizers
on heavy metal contents in plants was found. Of course, higher yields with the use of
fertilizers led to the higher total uptake of heavy metals from soils. EDTA and 2 M
HNO3 were identified as the most representative soil extractants for assessing heavy
metals bioavailability in soils. The gave the best relations between determined
contents of heavy metals in soil and their contents in plants.
Soil organic pollutants (oil, PCB, PAH) were found mainly in accidentally polluted
small areas of soils. Larger oil pollution of soil was found only inside areas of military
use where serious cleaning up is now being carried out by special firms. Most
cleaning-up technologies use biologically enriched materials, which can accelerate the
breakdown of organic pollutants in soils. Past investigations focused on accelerating
the degradation of oil in soils by measures which support the natural potential of soils
for self-cleaning. Small scale field experiments were carried out using mineral or
organic fertilizers (or both). From the results we can deduce that effective acceleration
of the degradation of oil can be achieved after application of manure to the soil (60
t.ha). Also nitrogen and phosphorus mineral fertilizers can further increase the
intensity of the breakdown of oil in soil.
In field some 20% of applied oil (8 kg per/m2) was eliminated from a Eutric Fluvisol
soil after 40 days March-April compared with about 45% when manure was applied to
the soil. In the latter case almost 90% of the oil was lost after 3 months. When mineral
N and P fertilizers were applied the loss after 3 months was about 80% compared with
only about 70% in untreated soil. A more rapid breakdown of oil was achieved when
the polluted soil was composted with plant residues. Therefore we can recommend
this very effective procedure for cleaning-up soils polluted by small volumes of oil.
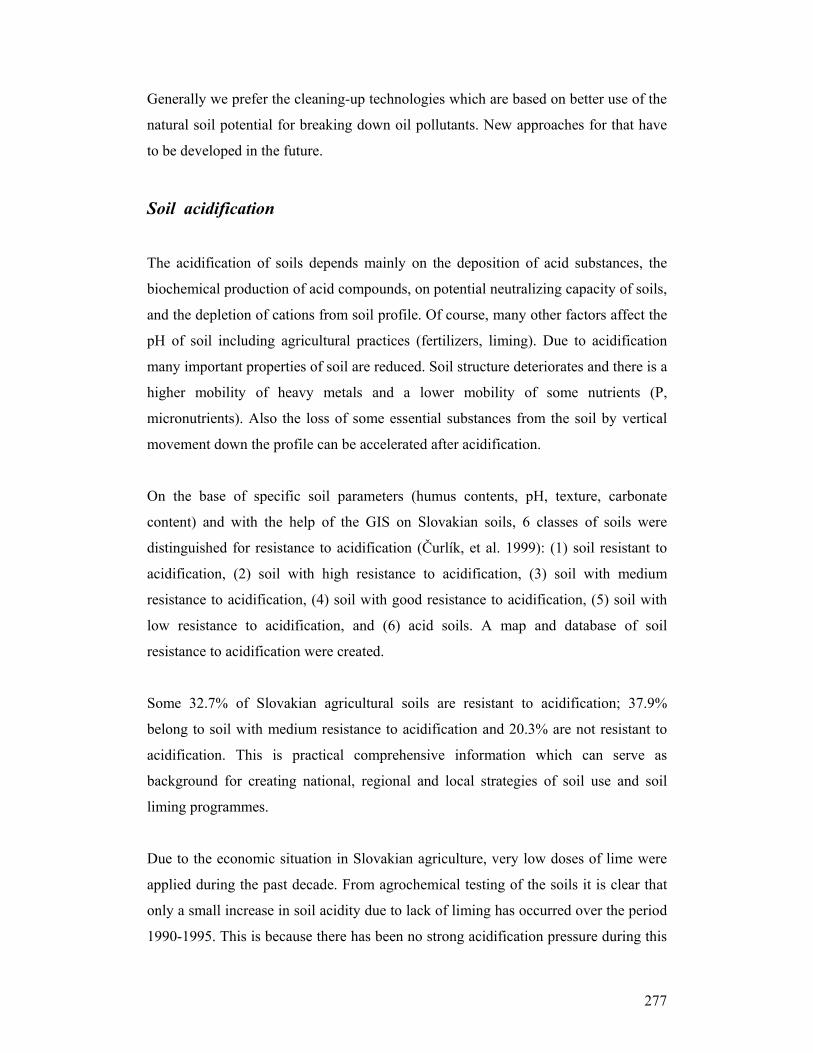
277
Generally we prefer the cleaning-up technologies which are based on better use of the
natural soil potential for breaking down oil pollutants. New approaches for that have
to be developed in the future.
Soil acidification
The acidification of soils depends mainly on the deposition of acid substances, the
biochemical production of acid compounds, on potential neutralizing capacity of soils,
and the depletion of cations from soil profile. Of course, many other factors affect the
pH of soil including agricultural practices (fertilizers, liming). Due to acidification
many important properties of soil are reduced. Soil structure deteriorates and there is a
higher mobility of heavy metals and a lower mobility of some nutrients (P,
micronutrients). Also the loss of some essential substances from the soil by vertical
movement down the profile can be accelerated after acidification.
On the base of specific soil parameters (humus contents, pH, texture, carbonate
content) and with the help of the GIS on Slovakian soils, 6 classes of soils were
distinguished for resistance to acidification (Čurlík, et al. 1999): (1) soil resistant to
acidification, (2) soil with high resistance to acidification, (3) soil with medium
resistance to acidification, (4) soil with good resistance to acidification, (5) soil with
low resistance to acidification, and (6) acid soils. A map and database of soil
resistance to acidification were created.
Some 32.7% of Slovakian agricultural soils are resistant to acidification; 37.9%
belong to soil with medium resistance to acidification and 20.3% are not resistant to
acidification. This is practical comprehensive information which can serve as
background for creating national, regional and local strategies of soil use and soil
liming programmes.
Due to the economic situation in Slovakian agriculture, very low doses of lime were
applied during the past decade. From agrochemical testing of the soils it is clear that
only a small increase in soil acidity due to lack of liming has occurred over the period
1990-1995. This is because there has been no strong acidification pressure during this
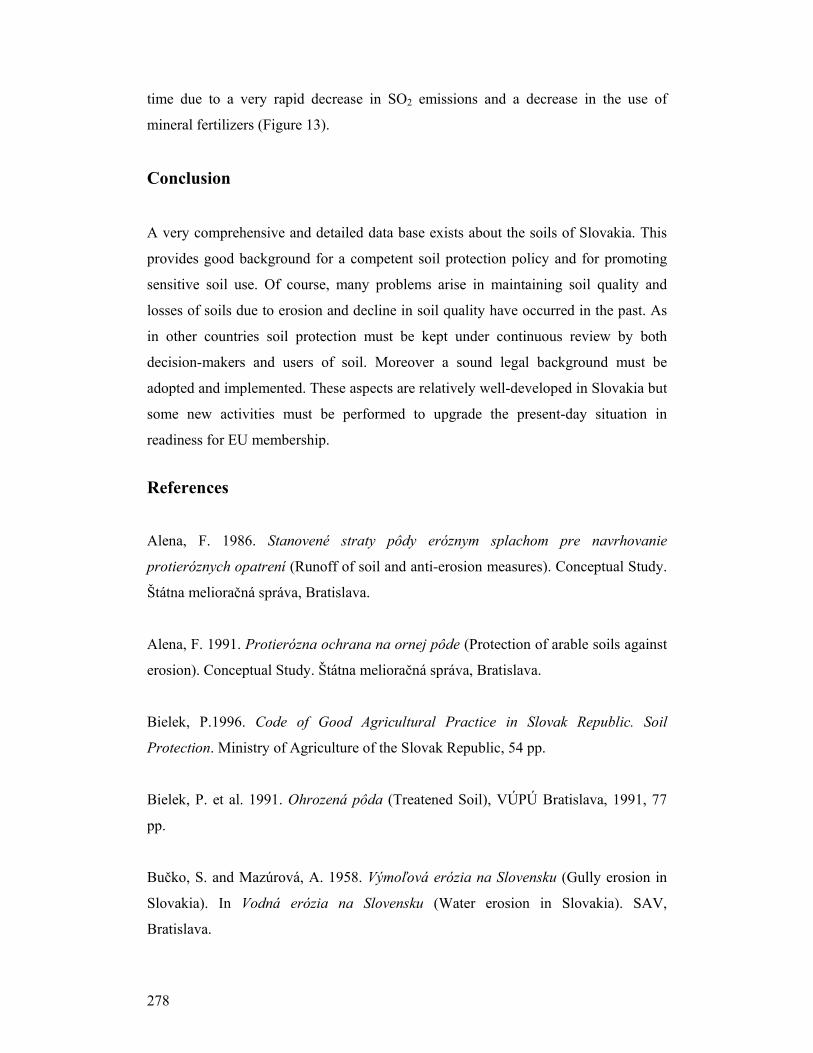
278
time due to a very rapid decrease in SO2 emissions and a decrease in the use of
mineral fertilizers (Figure 13).
Conclusion
A very comprehensive and detailed data base exists about the soils of Slovakia. This
provides good background for a competent soil protection policy and for promoting
sensitive soil use. Of course, many problems arise in maintaining soil quality and
losses of soils due to erosion and decline in soil quality have occurred in the past. As
in other countries soil protection must be kept under continuous review by both
decision-makers and users of soil. Moreover a sound legal background must be
adopted and implemented. These aspects are relatively well-developed in Slovakia but
some new activities must be performed to upgrade the present-day situation in
readiness for EU membership. References
Alena, F. 1986. Stanovené straty pôdy eróznym splachom pre navrhovanie
protieróznych opatrení (Runoff of soil and anti-erosion measures). Conceptual Study.
Štátna melioračná správa, Bratislava.
Alena, F. 1991. Protierózna ochrana na ornej pôde (Protection of arable soils against
erosion). Conceptual Study. Štátna melioračná správa, Bratislava.
Bielek, P.1996. Code of Good Agricultural Practice in Slovak Republic. Soil
Protection. Ministry of Agriculture of the Slovak Republic, 54 pp.
Bielek, P. et al. 1991. Ohrozená pôda (Treatened Soil), VÚPÚ Bratislava, 1991, 77
pp.
Bučko, S. and Mazúrová, A. 1958. Výmoľová erózia na Slovensku (Gully erosion in
Slovakia). In Vodná erózia na Slovensku (Water erosion in Slovakia). SAV,
Bratislava.
279
Chomaničová, A. 1988. Príčiny erózie a najvhodnejšie spôsoby protieróznej ochrany
pôd flyšovej oblasti (Erosion principles and most convenient measures against soil
erosion). Project Report, VSPU Bratislava, 38 pp.
Čurlík, J. 1999. Potenciál neutralizácie kyslých zrážok v pôdach SR (Potential of acid
rain neutralization in soils of Slovakia). In: Bielek, P. et al. Kvantifikácia a plošná
diferenciácia potenciálu ekologických funkcií v pôdach SR. Project Report, SSCRI
Bratislava, 256 pp.
Džatko, M. et al.1970. Hodnotenie relatívnej produkčnej schopnosti pôd ČSSR.
(Assessment of soil production potential in CSSR). Rostlinná Výroba 25, 7: 693 -
698.
Fulajtár, E., 1997. Meranie intenzity erózie na malorozmerných pozorovacích
plochách a testovanie metód mapovania erodovaných pôd s pomocou družicových a
leteckých snímok (Erosion determination with help of remote sensing methods).
Project Report, VÚPÚ/VÚVH Bratislava, 1110 pp.
Fulajtár, E. 1998a. Vplyv eróznych procesov v poľnohospodársky využívanej krajine na
kvalitu vodných tokov (Soil erosion influences on river water quality). Project Report,
VÚPÚ/VÚVH Bratislava, 50 pp.
Fulajtár, E. 1998b. Identification of severely eroded soils from remote sensing data
tested in Rišňovce and Levice. Pilot Areas, Proceedings of SFRI, Bratislava, 27-54.
Green Report of the Slovak Republic, 1997. Ministry of Agriculture. Bratislava, 165
pp.
Jambor, P. and Ilavská, B. 1998. Metodika protierózneho obrábania pôdy
(Methodology on anti-erosion measures). VÚPÚ Bratislava, 70 pp.
Janečko, J. et al. 1955. Spustnuté pôdy a ich zalesňovanie (Degraded land and its
reforestation). SVPN Bratislava, 129 pp.

280
Janský, L. 1993. Experimentálna štúdia povrchového odtoku a erózneho zmyvu na
svahu nekrytom vegetáciou (Experimental study on runoff of no planted soil). J.
Hydrology and Hydromechanics 41: 51-67.
Janský, L. 1992. Sediment accumulation in small water reservoirs utilised for
irrigation. In Land reclamation: Advances in research and technology. Proceedings
from International Symposium, Nashville, 76-82.
Janský, L., Kuraz, V., Mosny, V., Oshaka, O., Váška, J., Omura, H. 1994. Rainfall-
runoff relations in Elementary catchments on man-made upland soils in Japan,
International Conference on Development in Hydrology of Mountainous Areas, Stará
Lesná, 85-94.
Karniš, J. 1982. Erodovanosť pôd v okrese Lučenec (Erodobility of soils in Lučenec
district). Geografický Časopis, 34: 50-66.
Matúšková, L., Vojtáš, J. and Bielek, P. 1999. Potential mobility of heavy metals in
Slovakian soils. SSCRI, Bratislava (map).
Stankovianský, M. 1999. Geomorphic response of agricultural landscape to land use
changes associated with introduction of large scale farming in Slovakia. Proceedings,
Soil Conservation in Large-Scale Land Use, Bratislava, 31.21.
Stašík, V. et al. 1983. Kvantifikácia úniku živín najmä eróznymi procesmi v povodí
Čečejovky (Nutrients loss by erosion in catchment area of Čečejovka river). Project
Report, VÚPÚ Bratislava, 43 pp.
Šúri, M. and Hofierka, J. 1994. Soil water erosion identification using satellite and
dtm data, Proceedings of EGIS/MARI Conference, Paris, 120-127.
Vilček, J. 1999. Erózia pôdy výrazne ovplyvňuje ekonomiku výroby (Soil erosion
impact on economy of agriculture). Roľnícke noviny, 2.6.1999.

281
Zachar, D. 1958. Vodná erózia na Slovensku (Water erosion in Slovakia). SAV
Bratislava, 1410 pp.
Zachar, D. 1982. Soil Erosion. Elsevier, Amsterdam, 547 pp.
Zrubec, F. 1998. Metodika zúrodnenia zhutnených pôd (Methods of compacted soils
improvement). VÚPÚ Bratislava, 40 pp.
Prof. RNDr. Pavol Bielek, DrSc.
Soil Science and Conservation Research Institute
Gagarinova 10
827 13, Bratislava, Slovakia
282
ANNEX OF FIGURES
Figure 1. Consumption of nitrogen fertilizer in the Slovak republic
Figure 2. Consumption of N, P and K fertilizers in Slovakia
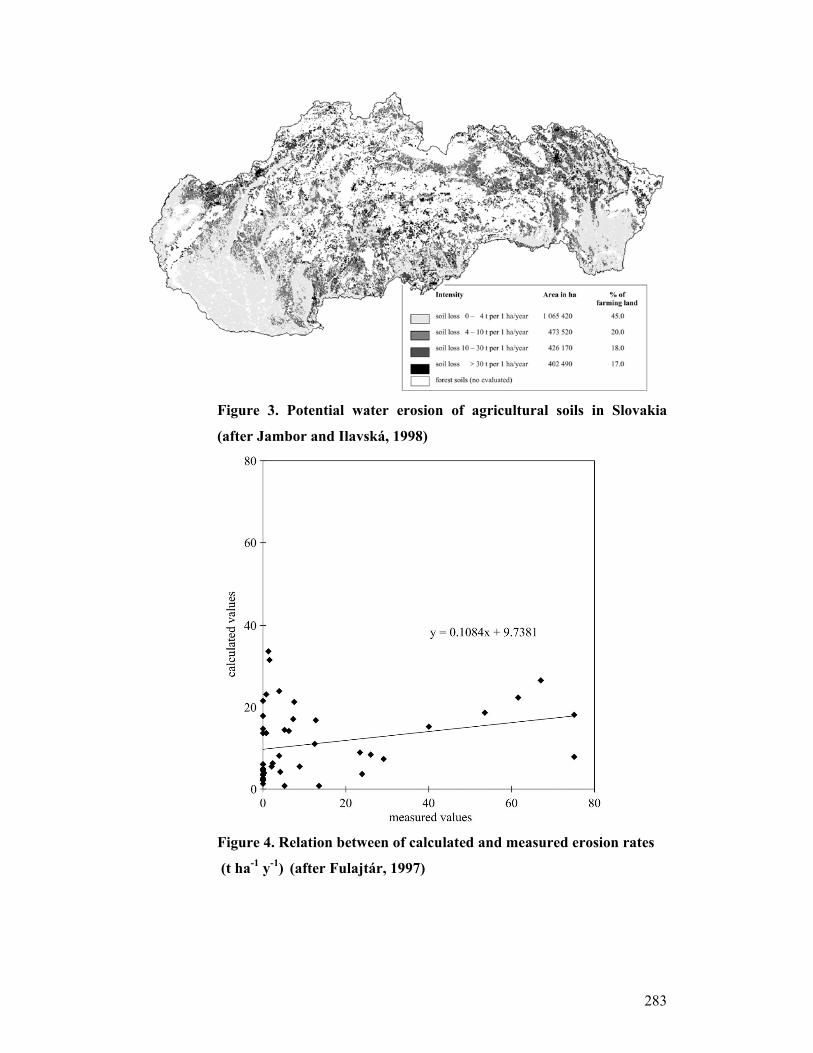
283
Figure 3. Potential water erosion of agricultural soils in Slovakia
(after Jambor and Ilavská, 1998)
Figure 4. Relation between of calculated and measured erosion rates
(t ha-1 y-1) (after Fulajtár, 1997)
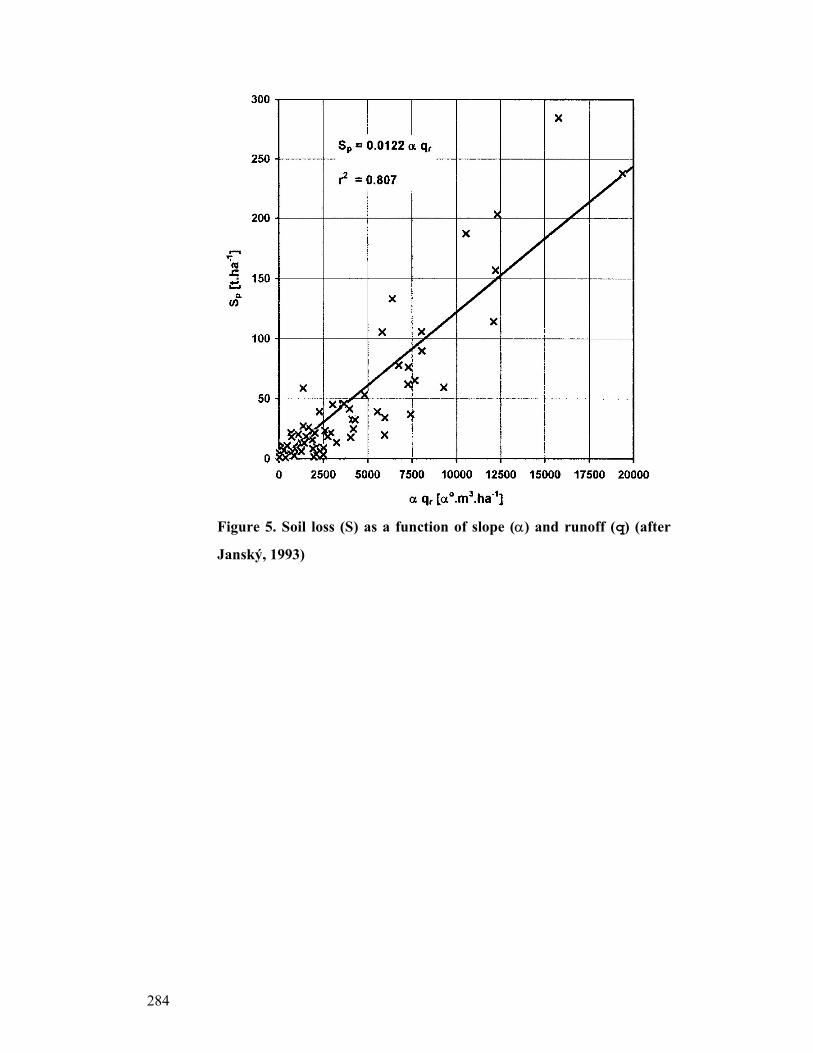
284
Figure 5. Soil loss (S) as a function of slope (α) and runoff (q) (after
Janský, 1993)
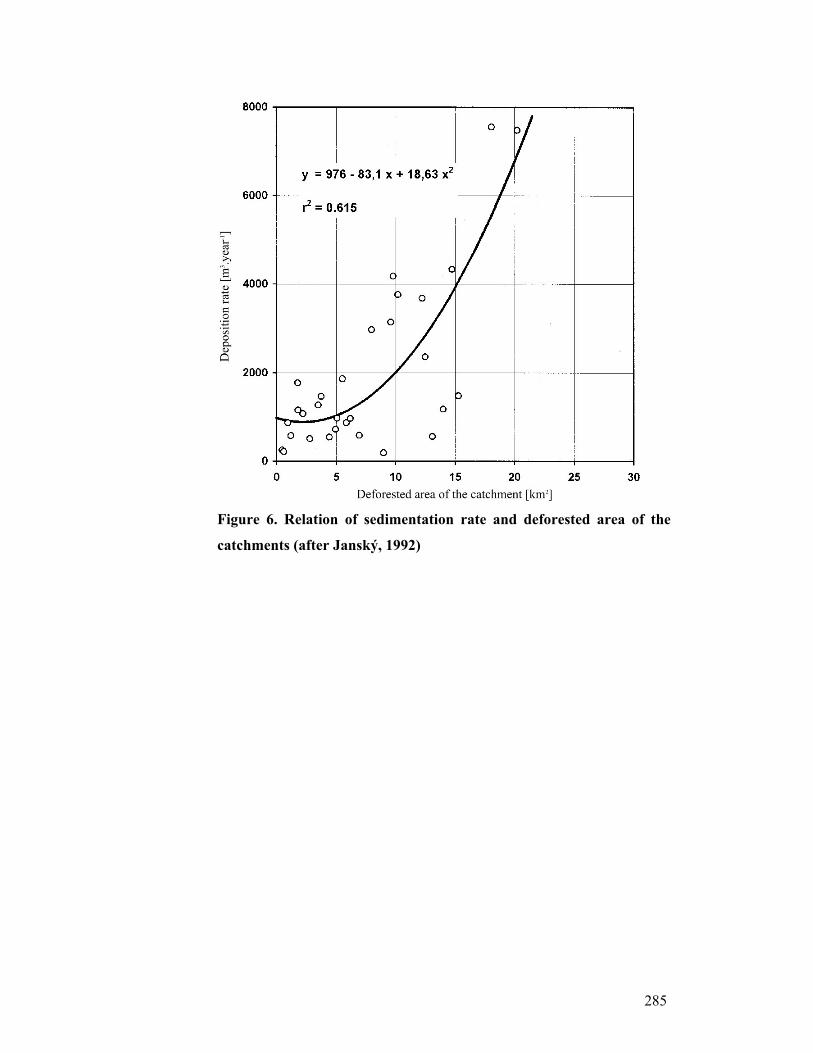
285
Figure 6. Relation of sedimentation rate and deforested area of the
catchments (after Janský, 1992)
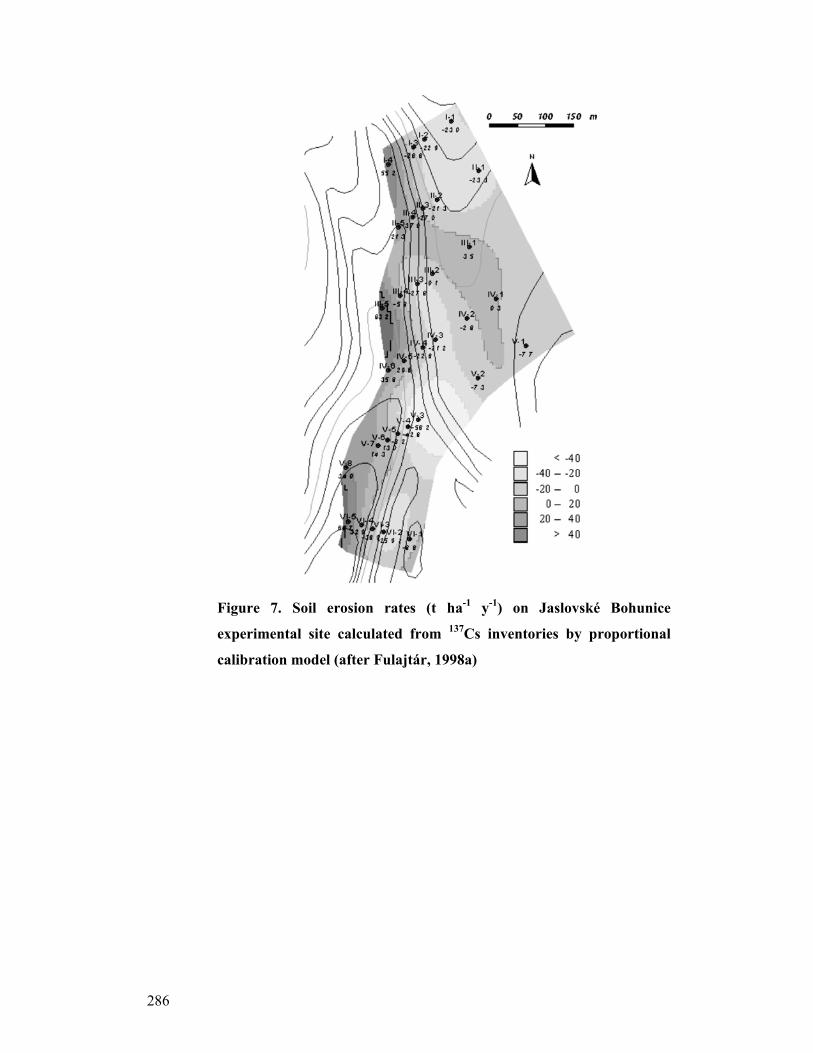
286
Figure 7. Soil erosion rates (t ha-1 y-1) on Jaslovské Bohunice
experimental site calculated from 137Cs inventories by proportional
calibration model (after Fulajtár, 1998a)
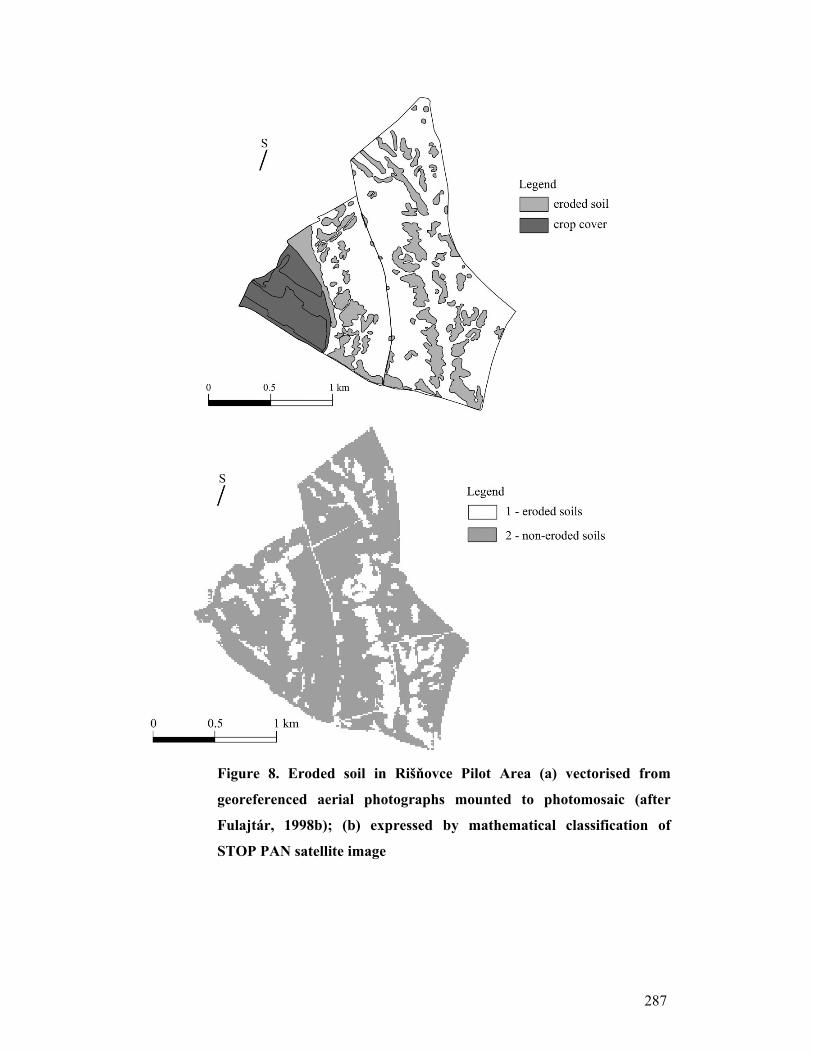
287
Figure 8. Eroded soil in Rišňovce Pilot Area (a) vectorised from
georeferenced aerial photographs mounted to photomosaic (after
Fulajtár, 1998b); (b) expressed by mathematical classification of
STOP PAN satellite image

288
Figure 9. Soil compaction in Slovakia (after Zrubec, 1998)
Figure 10. Soil pollution in the Slovak Republic
Figure 11. Soil pollution categories in the Slovak Republic

289
Figure 12. Potential mobility of heavy metals in Slovakian soil
Figure 13. Soil acidification in Slovakia

290
Land Degradation in Slovenia
F. Lobnik, B. Vrščaj, T. Prus
Centre for Soil and Environmental Science, Biotechnical Faculty, University of Ljubljana
Jamnikarjeva 101, SI 1000 Ljubljana, Slovenia e-mail: [email protected]
Introduction
To highlight a major role of soil in the function of an ecosystem and the importance of soil protection for the maintenance of a healthy environment, is really an important issue in future activities of ESB and its partners in EU in Accession Countries. The basic soil characteristics and most soil degradation processes in Slovenia will be systematically discussed. Soil Survey in Slovenia
In the late 1980s the Center for Soil Science and Environment1 (CSES) started to set up the digital soil map of Slovenia. The work on soil mapping continued with several interruptions until the end of January 1999, when all the territory of Slovenia was included in an operative digital soil map in the scale 1:25,000 (DSM25). DSM25 represents the core of digital soil data united in the Soil Information System (SIS), providing a wealth of information on Slovenian soils. Beside DSM25 two important soil information layers associated with DSM25 are included in SIS: measured data on ~1700 soil profiles (SP) and soil pollution point data layer (SPP). The Slovenian Soil Classification Until 1991 the Yugoslav soil classification system has officially been used in Slovenia. But practically, that system has been modified in many cases, as mentioned before. The need for a comprehensive classification system has been noticed with the start of a systematic digitalization and preparation of the attribute tables. In that time, the solution was a provisional Slovenian soil classification system, which has been upgraded several times during the process of digitalization. A parallel conversion of soil systematic units according to the Soil map of the World, Revised legend, Rome 1988 has been applied in that system. Distribution of Soil Types
The system is basically genetic and hierarchical, mostly influenced by the ideas of Kubiena. Four major groups are distinguished on the basis of water presence, soil permeability and presence of salt. They are Terrestrial (automorphic) soils,
1 Centre for Soil and Environmental Science, University of Ljubljana is the leading institution in Slovenia. CSES is National Reference Centre for Soil quality & soil monitoring networks; Soil sealing and Soil biodiversity. CSES was authorised by the Ministry of the Environment and Spatial Planning and Ministry for Agriculture, Food and Forestry of Slovenia to conduct Soil monitoring and soil mapping in Slovenia.

291
Hydromorphic soils, Salt affected soils and Underwater soils. The two latter groups are concerned to be present at marine coast and several larger lakes. The less developed soils are raw soils such as Lithosols (Lithic Leptosols), Regosols and Colluvial (deluvial) soils. Rendzina (Rendzic Leptosols), shallow soils with A-C or A-R profile are the most widespread soil types in Slovenia (ca. 24% of the mapped territory). They are formed on limestones and dolomites, which cover almost half of Slovenia territory (44%). Rendzina is classified in many details. Ranker (Dystric Leptosols) is relatively rare (4%). Soils with a developed cambic B-horizon are joined in the class of Cambic soils. Further division is done on the basis of parent material. In a word-for-word translation from Slovenian language they are called brown soils overlaying hard carbonate rocks and terra rossa (both Chromic Cambisols) which cover 14% of Slovenian territory, eutric brown soils (Eutric Cambisols) (14%), and dystric brown soils (Dystric Cambisols) (16%). Eutric Cambisols, often found on the bottom of basins and valleys or in terraced hilly regions, form the most fertile Slovenian agricultural land. Leached varieties of Chromic Cambisols and Luvisols are less widespread, but can be found on limestone and dolomite as well. Podzol, formed on siliceous parent materials is an extremely rare soil type. That is the reason for a not very precise further distinguishing of different types of Podzol. It is considered also as a natural phenomenon in Slovenia. The group of terrestrial soils has classes joining arable man-modified soils with the soil types such as Rigosol and Hortisol (Aric and Fimic Anthrosols), and deposited man-made soils such as, for example, municipal deposit soil (Urbic Anthrosols). They cover 1.6% of Slovenian territory. Hydromorphic soils can be found in tectonic basins and planar areas. Fluvisols, Eutric, Dystric and Calcaric classes are common along the rivers and cover more than 5% of Slovenian territory. Other Hydromorphic soils are common in these areas as well; they cover almost 9% of Slovenia. Eutric and Dystric Pseudogley (Planosols) are soils with periodical surplus of surface water originating directly from the atmosphere. If Gley (Gleysols) is characterised by seasonal water, surplus originating from the shallow groundwater table is known as hipogley. If a surface flooding water or water collected in a local catchment area is added to that soil, an amphigley soil is developed. Peat or organic soils (Histosols) are distinguished as lowland peat soils, highland peat soils and transitional peat soils. The group of Hydromophic soils is also ended with the class of man-modified soils. Ameliorated soils to which a drainage system is applied are the only representative. Available soil data - Soil Information System - SIS
Besides soil mapping many different research projects concerning soil and soil pollution have been accomplished in Slovenia. All together resulted a large amount of data that had to be organized and used in the most effective way; the data had to be stored in adequate geographic information system. In the present time, the available Slovenian soil data in digital form is united in Soil Information System of Slovenia (SIS), initiated, developed and maintained at CSES (Vrščaj, Prus 1994; Vrščaj 1995, Vrščaj, Prus,
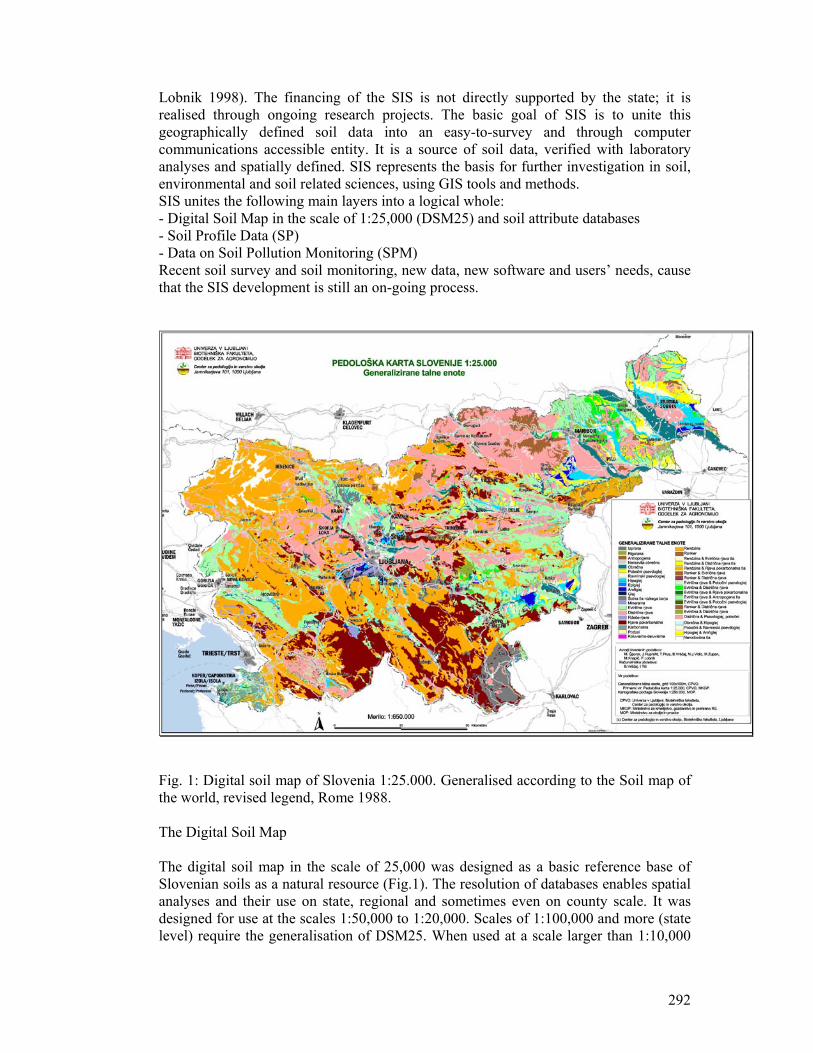
292
Lobnik 1998). The financing of the SIS is not directly supported by the state; it is realised through ongoing research projects. The basic goal of SIS is to unite this geographically defined soil data into an easy-to-survey and through computer communications accessible entity. It is a source of soil data, verified with laboratory analyses and spatially defined. SIS represents the basis for further investigation in soil, environmental and soil related sciences, using GIS tools and methods. SIS unites the following main layers into a logical whole: - Digital Soil Map in the scale of 1:25,000 (DSM25) and soil attribute databases - Soil Profile Data (SP) - Data on Soil Pollution Monitoring (SPM) Recent soil survey and soil monitoring, new data, new software and users’ needs, cause that the SIS development is still an on-going process.
Fig. 1: Digital soil map of Slovenia 1:25.000. Generalised according to the Soil map of the world, revised legend, Rome 1988. The Digital Soil Map
The digital soil map in the scale of 25,000 was designed as a basic reference base of Slovenian soils as a natural resource (Fig.1). The resolution of databases enables spatial analyses and their use on state, regional and sometimes even on county scale. It was designed for use at the scales 1:50,000 to 1:20,000. Scales of 1:100,000 and more (state level) require the generalisation of DSM25. When used at a scale larger than 1:10,000
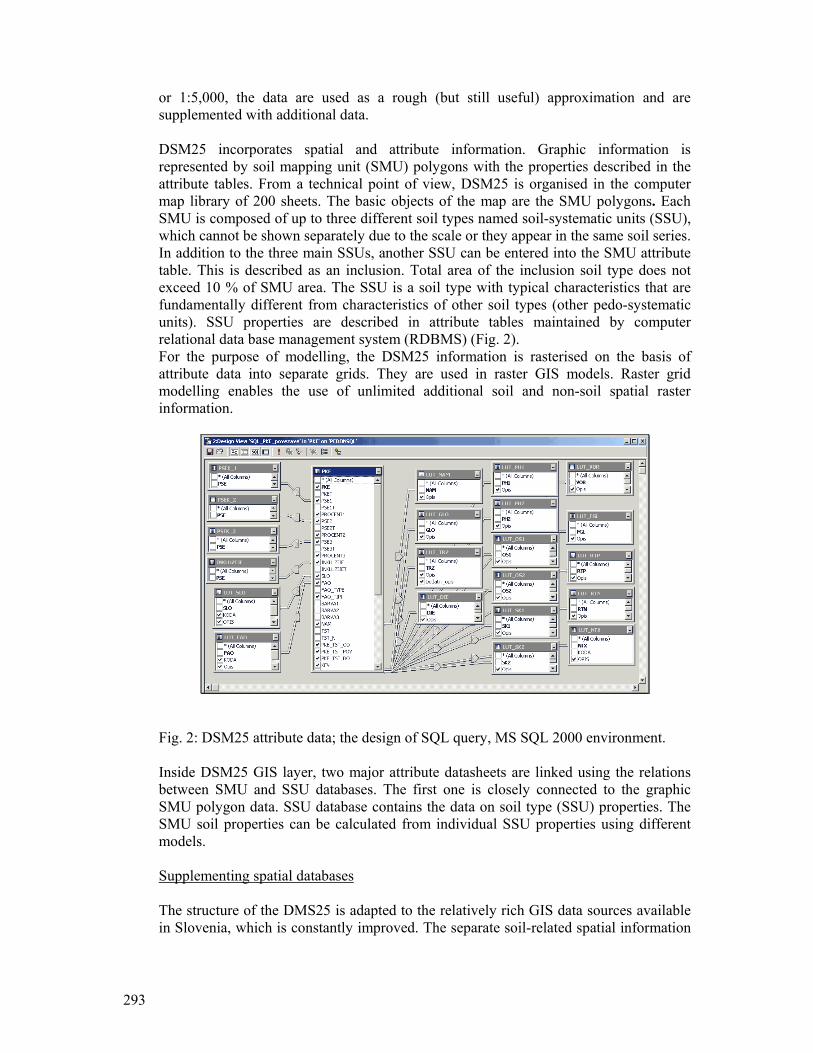
293
or 1:5,000, the data are used as a rough (but still useful) approximation and are supplemented with additional data. DSM25 incorporates spatial and attribute information. Graphic information is represented by soil mapping unit (SMU) polygons with the properties described in the attribute tables. From a technical point of view, DSM25 is organised in the computer map library of 200 sheets. The basic objects of the map are the SMU polygons. Each SMU is composed of up to three different soil types named soil-systematic units (SSU), which cannot be shown separately due to the scale or they appear in the same soil series. In addition to the three main SSUs, another SSU can be entered into the SMU attribute table. This is described as an inclusion. Total area of the inclusion soil type does not exceed 10 % of SMU area. The SSU is a soil type with typical characteristics that are fundamentally different from characteristics of other soil types (other pedo-systematic units). SSU properties are described in attribute tables maintained by computer relational data base management system (RDBMS) (Fig. 2). For the purpose of modelling, the DSM25 information is rasterised on the basis of attribute data into separate grids. They are used in raster GIS models. Raster grid modelling enables the use of unlimited additional soil and non-soil spatial raster information.
Fig. 2: DSM25 attribute data; the design of SQL query, MS SQL 2000 environment. Inside DSM25 GIS layer, two major attribute datasheets are linked using the relations between SMU and SSU databases. The first one is closely connected to the graphic SMU polygon data. SSU database contains the data on soil type (SSU) properties. The SMU soil properties can be calculated from individual SSU properties using different models. Supplementing spatial databases
The structure of the DMS25 is adapted to the relatively rich GIS data sources available in Slovenia, which is constantly improved. The separate soil-related spatial information
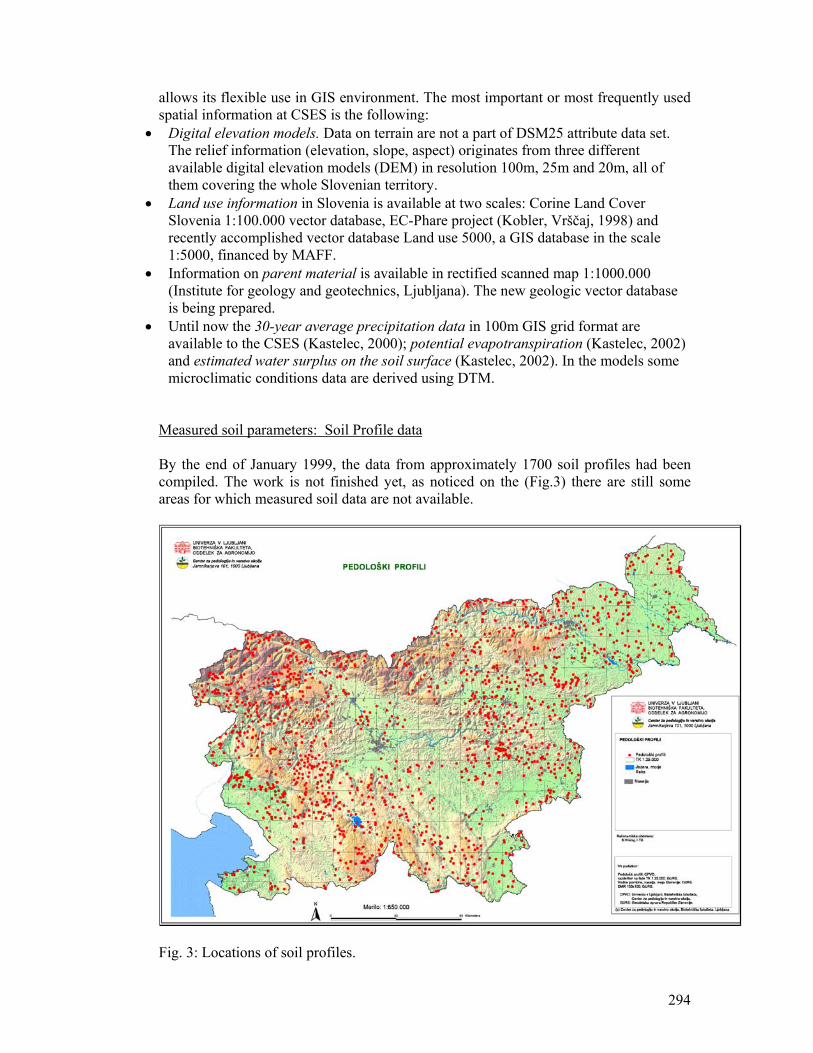
294
allows its flexible use in GIS environment. The most important or most frequently used spatial information at CSES is the following:
• Digital elevation models. Data on terrain are not a part of DSM25 attribute data set. The relief information (elevation, slope, aspect) originates from three different available digital elevation models (DEM) in resolution 100m, 25m and 20m, all of them covering the whole Slovenian territory.
• Land use information in Slovenia is available at two scales: Corine Land Cover Slovenia 1:100.000 vector database, EC-Phare project (Kobler, Vrščaj, 1998) and recently accomplished vector database Land use 5000, a GIS database in the scale 1:5000, financed by MAFF.
• Information on parent material is available in rectified scanned map 1:1000.000 (Institute for geology and geotechnics, Ljubljana). The new geologic vector database is being prepared.
• Until now the 30-year average precipitation data in 100m GIS grid format are available to the CSES (Kastelec, 2000); potential evapotranspiration (Kastelec, 2002) and estimated water surplus on the soil surface (Kastelec, 2002). In the models some microclimatic conditions data are derived using DTM.
Measured soil parameters: Soil Profile data
By the end of January 1999, the data from approximately 1700 soil profiles had been compiled. The work is not finished yet, as noticed on the (Fig.3) there are still some areas for which measured soil data are not available.
Fig. 3: Locations of soil profiles.
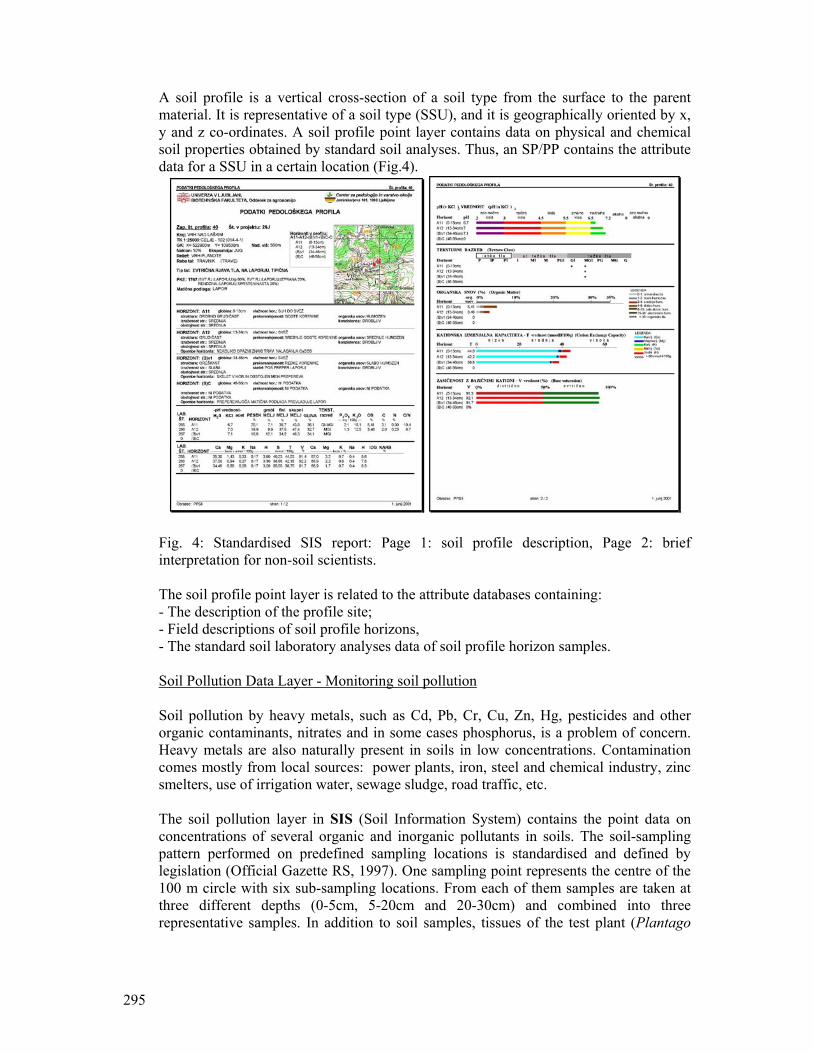
295
A soil profile is a vertical cross-section of a soil type from the surface to the parent material. It is representative of a soil type (SSU), and it is geographically oriented by x, y and z co-ordinates. A soil profile point layer contains data on physical and chemical soil properties obtained by standard soil analyses. Thus, an SP/PP contains the attribute data for a SSU in a certain location (Fig.4).
Fig. 4: Standardised SIS report: Page 1: soil profile description, Page 2: brief interpretation for non-soil scientists. The soil profile point layer is related to the attribute databases containing: - The description of the profile site; - Field descriptions of soil profile horizons, - The standard soil laboratory analyses data of soil profile horizon samples. Soil Pollution Data Layer - Monitoring soil pollution
Soil pollution by heavy metals, such as Cd, Pb, Cr, Cu, Zn, Hg, pesticides and other organic contaminants, nitrates and in some cases phosphorus, is a problem of concern. Heavy metals are also naturally present in soils in low concentrations. Contamination comes mostly from local sources: power plants, iron, steel and chemical industry, zinc smelters, use of irrigation water, sewage sludge, road traffic, etc. The soil pollution layer in SIS (Soil Information System) contains the point data on concentrations of several organic and inorganic pollutants in soils. The soil-sampling pattern performed on predefined sampling locations is standardised and defined by legislation (Official Gazette RS, 1997). One sampling point represents the centre of the 100 m circle with six sub-sampling locations. From each of them samples are taken at three different depths (0-5cm, 5-20cm and 20-30cm) and combined into three representative samples. In addition to soil samples, tissues of the test plant (Plantago
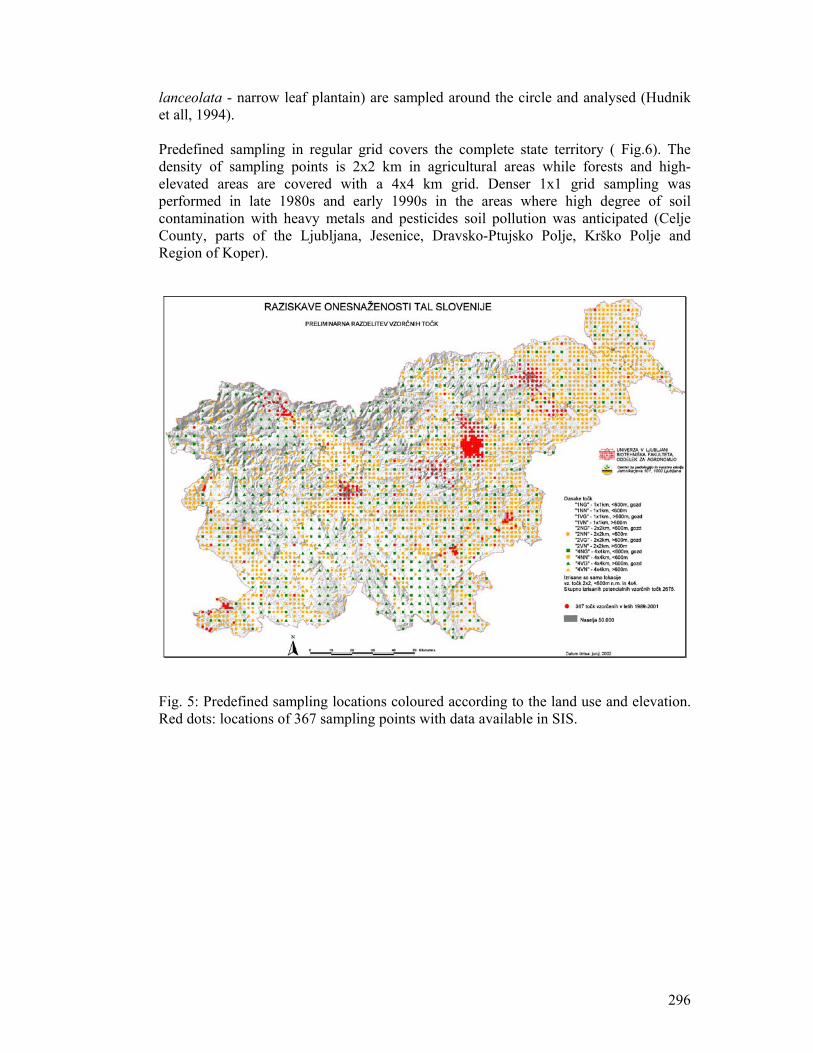
296
lanceolata - narrow leaf plantain) are sampled around the circle and analysed (Hudnik et all, 1994). Predefined sampling in regular grid covers the complete state territory ( Fig.6). The density of sampling points is 2x2 km in agricultural areas while forests and high-elevated areas are covered with a 4x4 km grid. Denser 1x1 grid sampling was performed in late 1980s and early 1990s in the areas where high degree of soil contamination with heavy metals and pesticides soil pollution was anticipated (Celje County, parts of the Ljubljana, Jesenice, Dravsko-Ptujsko Polje, Krško Polje and Region of Koper).
Fig. 5: Predefined sampling locations coloured according to the land use and elevation. Red dots: locations of 367 sampling points with data available in SIS.
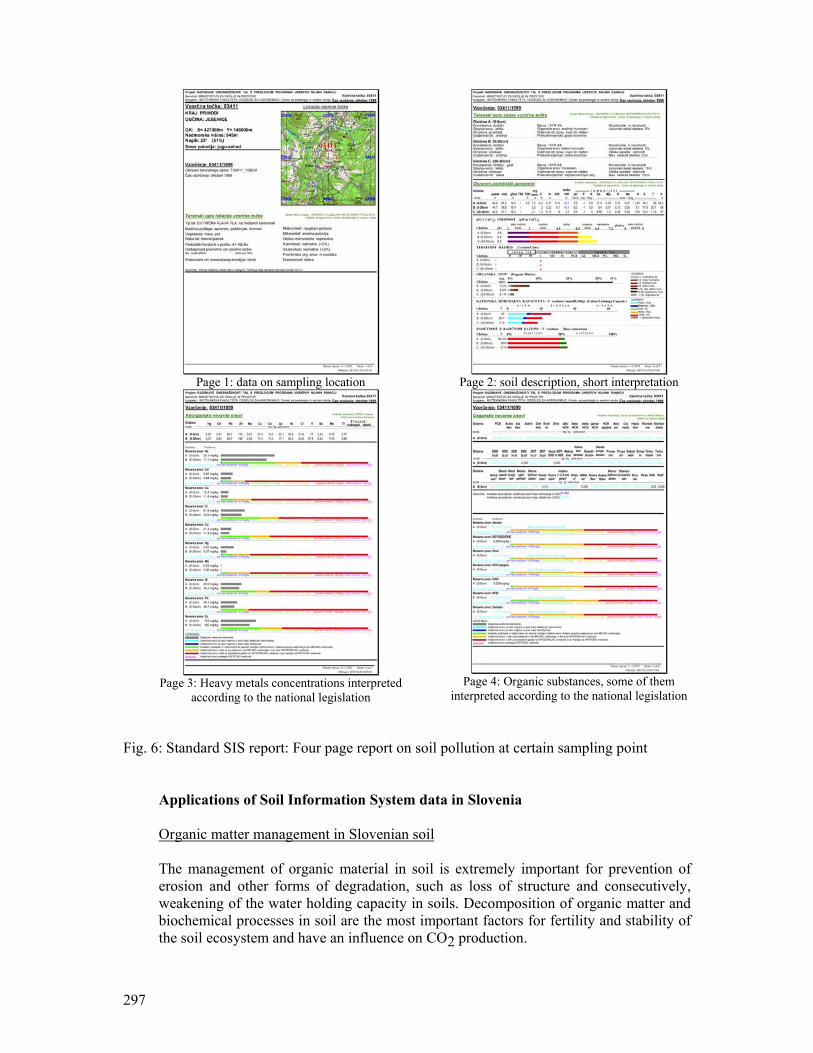
297
Page 1: data on sampling location
Page 2: soil description, short interpretation
Page 3: Heavy metals concentrations interpreted
according to the national legislation
Page 4: Organic substances, some of them
interpreted according to the national legislation
Fig. 6: Standard SIS report: Four page report on soil pollution at certain sampling point
Applications of Soil Information System data in Slovenia
Organic matter management in Slovenian soil The management of organic material in soil is extremely important for prevention of erosion and other forms of degradation, such as loss of structure and consecutively, weakening of the water holding capacity in soils. Decomposition of organic matter and biochemical processes in soil are the most important factors for fertility and stability of the soil ecosystem and have an influence on CO2 production.
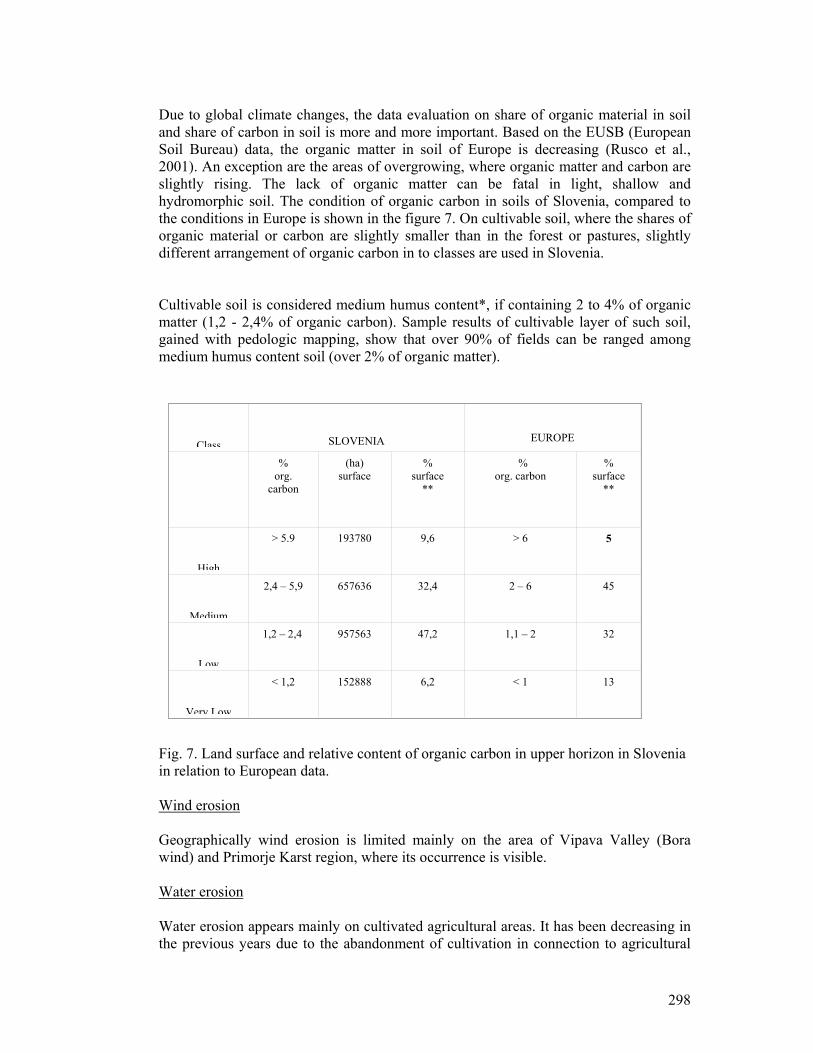
298
Due to global climate changes, the data evaluation on share of organic material in soil and share of carbon in soil is more and more important. Based on the EUSB (European Soil Bureau) data, the organic matter in soil of Europe is decreasing (Rusco et al., 2001). An exception are the areas of overgrowing, where organic matter and carbon are slightly rising. The lack of organic matter can be fatal in light, shallow and hydromorphic soil. The condition of organic carbon in soils of Slovenia, compared to the conditions in Europe is shown in the figure 7. On cultivable soil, where the shares of organic material or carbon are slightly smaller than in the forest or pastures, slightly different arrangement of organic carbon in to classes are used in Slovenia. Cultivable soil is considered medium humus content*, if containing 2 to 4% of organic matter (1,2 - 2,4% of organic carbon). Sample results of cultivable layer of such soil, gained with pedologic mapping, show that over 90% of fields can be ranged among medium humus content soil (over 2% of organic matter). Fig. 7. Land surface and relative content of organic carbon in upper horizon in Slovenia in relation to European data. Wind erosion Geographically wind erosion is limited mainly on the area of Vipava Valley (Bora wind) and Primorje Karst region, where its occurrence is visible. Water erosion Water erosion appears mainly on cultivated agricultural areas. It has been decreasing in the previous years due to the abandonment of cultivation in connection to agricultural
Class
SLOVENIA EUROPE
% org.
carbon
(ha) surface
% surface
**
% org. carbon
% surface
**
High
> 5.9
193780
9,6 > 6 5
Medium
2,4 – 5,9
657636 32,4
2 – 6
45
Low
1,2 – 2,4 957563
47,2 1,1 – 2
32
Very Low
< 1,2
152888 6,2 < 1 13
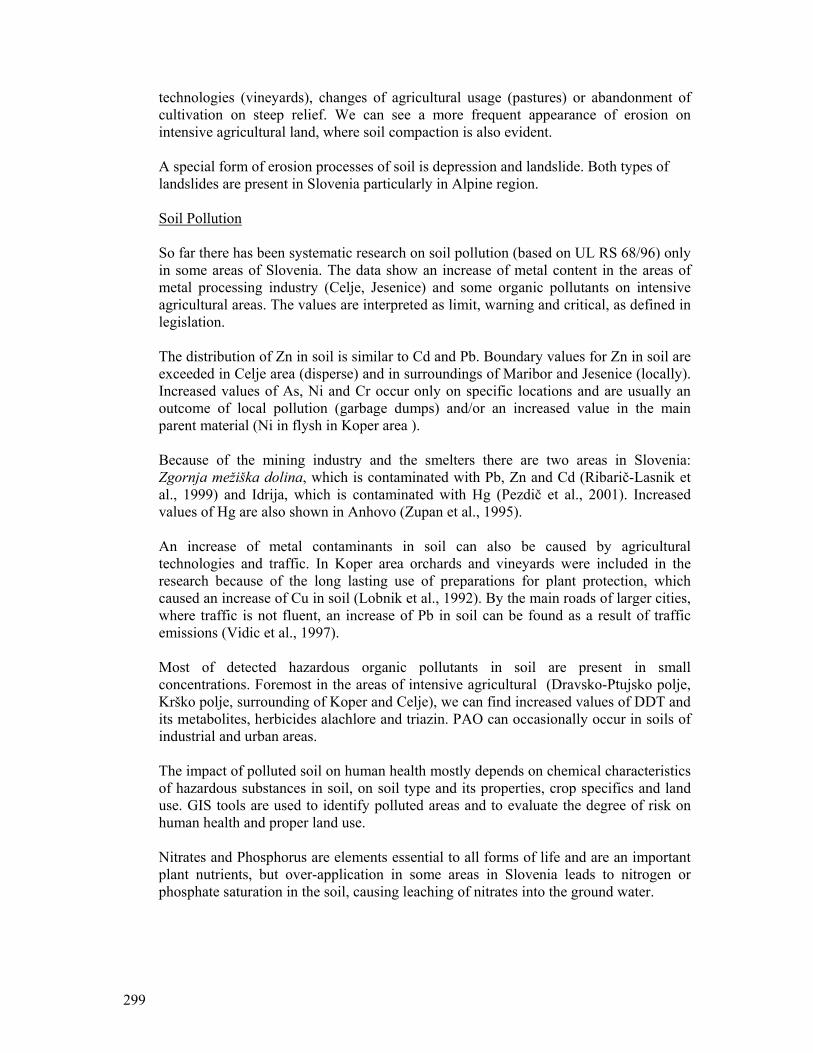
299
technologies (vineyards), changes of agricultural usage (pastures) or abandonment of cultivation on steep relief. We can see a more frequent appearance of erosion on intensive agricultural land, where soil compaction is also evident. A special form of erosion processes of soil is depression and landslide. Both types of landslides are present in Slovenia particularly in Alpine region. Soil Pollution
So far there has been systematic research on soil pollution (based on UL RS 68/96) only in some areas of Slovenia. The data show an increase of metal content in the areas of metal processing industry (Celje, Jesenice) and some organic pollutants on intensive agricultural areas. The values are interpreted as limit, warning and critical, as defined in legislation. The distribution of Zn in soil is similar to Cd and Pb. Boundary values for Zn in soil are exceeded in Celje area (disperse) and in surroundings of Maribor and Jesenice (locally). Increased values of As, Ni and Cr occur only on specific locations and are usually an outcome of local pollution (garbage dumps) and/or an increased value in the main parent material (Ni in flysh in Koper area ). Because of the mining industry and the smelters there are two areas in Slovenia: Zgornja mežiška dolina, which is contaminated with Pb, Zn and Cd (Ribarič-Lasnik et al., 1999) and Idrija, which is contaminated with Hg (Pezdič et al., 2001). Increased values of Hg are also shown in Anhovo (Zupan et al., 1995). An increase of metal contaminants in soil can also be caused by agricultural technologies and traffic. In Koper area orchards and vineyards were included in the research because of the long lasting use of preparations for plant protection, which caused an increase of Cu in soil (Lobnik et al., 1992). By the main roads of larger cities, where traffic is not fluent, an increase of Pb in soil can be found as a result of traffic emissions (Vidic et al., 1997). Most of detected hazardous organic pollutants in soil are present in small concentrations. Foremost in the areas of intensive agricultural (Dravsko-Ptujsko polje, Krško polje, surrounding of Koper and Celje), we can find increased values of DDT and its metabolites, herbicides alachlore and triazin. PAO can occasionally occur in soils of industrial and urban areas. The impact of polluted soil on human health mostly depends on chemical characteristics of hazardous substances in soil, on soil type and its properties, crop specifics and land use. GIS tools are used to identify polluted areas and to evaluate the degree of risk on human health and proper land use. Nitrates and Phosphorus are elements essential to all forms of life and are an important plant nutrients, but over-application in some areas in Slovenia leads to nitrogen or phosphate saturation in the soil, causing leaching of nitrates into the ground water.
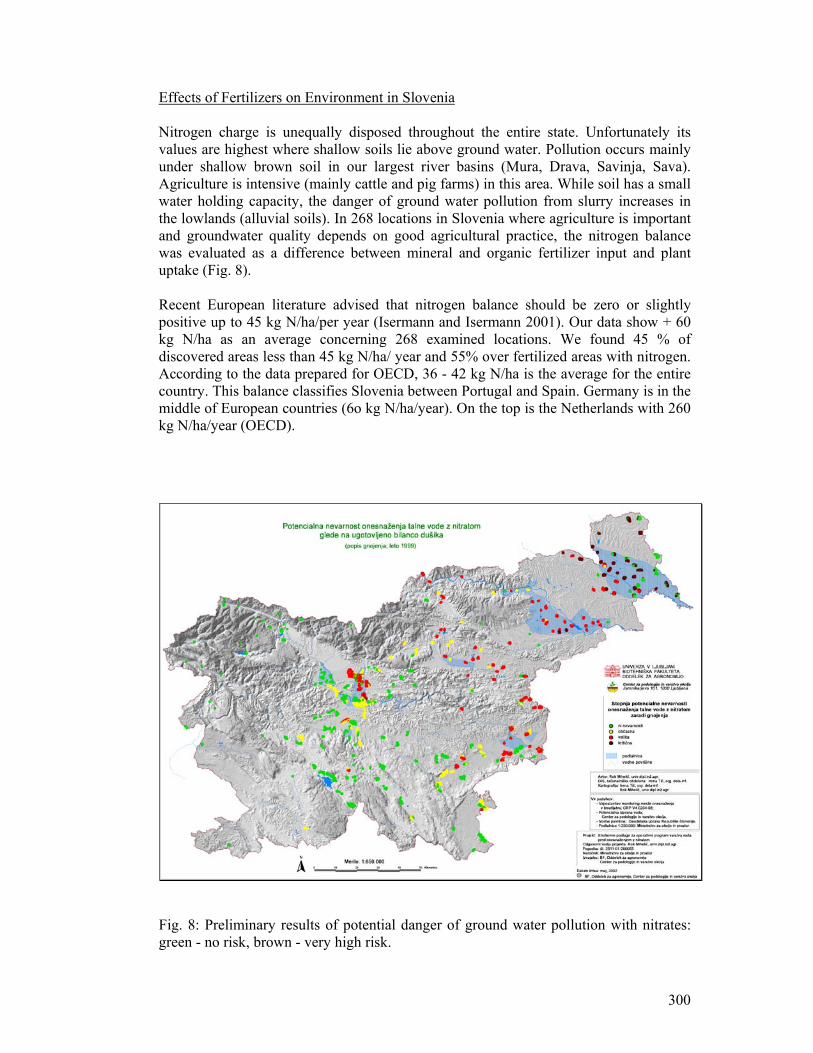
300
Effects of Fertilizers on Environment in Slovenia Nitrogen charge is unequally disposed throughout the entire state. Unfortunately its values are highest where shallow soils lie above ground water. Pollution occurs mainly under shallow brown soil in our largest river basins (Mura, Drava, Savinja, Sava). Agriculture is intensive (mainly cattle and pig farms) in this area. While soil has a small water holding capacity, the danger of ground water pollution from slurry increases in the lowlands (alluvial soils). In 268 locations in Slovenia where agriculture is important and groundwater quality depends on good agricultural practice, the nitrogen balance was evaluated as a difference between mineral and organic fertilizer input and plant uptake (Fig. 8). Recent European literature advised that nitrogen balance should be zero or slightly positive up to 45 kg N/ha/per year (Isermann and Isermann 2001). Our data show + 60 kg N/ha as an average concerning 268 examined locations. We found 45 % of discovered areas less than 45 kg N/ha/ year and 55% over fertilized areas with nitrogen. According to the data prepared for OECD, 36 - 42 kg N/ha is the average for the entire country. This balance classifies Slovenia between Portugal and Spain. Germany is in the middle of European countries (6o kg N/ha/year). On the top is the Netherlands with 260 kg N/ha/year (OECD).
Fig. 8: Preliminary results of potential danger of ground water pollution with nitrates: green - no risk, brown - very high risk.

301
Soil sealing The soil represents a physical medium for the development of infrastructure, industrial companies, roads, recreational surfaces and refuse dumps. Today, already built surfaces cover a large part of the best soils in Slovenia. Construction with urbanization prevails in more populated regions and larger industrial areas. Agricultural land, changing its purpose for motorways and other large infrastructure objects of state meaning Soil Legislation in Slovenia Parliament passed the Act on the Protection of the Environment in June 1993 (Official Journal of the Republic of Slovenia, No. 32/93). The Act contains general provisions and basic methods of protecting the environment and exploiting natural resources. On the basis of the Environmental Protection Act, a new legislation regarding soil protection has recently been adopted in Slovenia. A Decree on Input of Dangerous Substances and Plant Nutrients into the Soil (Official Journal of the Republic of Slovenia, No. 68/96) was also adopted in November 1996 in order to regulate the input of fertilizers (both mineral and organic: manure or slurry) and heavy metals in soil.
Work in the future vs. needs:
• To protect the landscapes, to reduce any kind of land degradation and to maintain soil quality and sustainability of soil and land.
• Serve the end-users better. • To improve and adapt existing soil information – soil maps, to enhance the
applicability and multifunctionality of data; • To derive important/basic soil parameters as a separate datasets in the resolution
suitable to be used in the county / watershed / landscape scale; • To develop a set of pedotransfer functions to cover air and water related soil properties
and to implement them in GIS modelling; • To improve the spatial resolution and accuracy of DSM25 using high resolution DTM
and EO data and new modelling techniques; • To enrich the soil datasets with new data; • To establish a very detailed national soil classification system, which is necessary for
land use planning and detailed studies in various ecosystems; • To give a possibility for conversion of national classification to world’s most spread
systems; • To explain certain phenomena in soil genesis that do not fit with known environmental
conditions; • To popularise and enhance the knowledge of the significance of the soil as a natural
phenomenon.
302
REFERENCES F. LOBNIK; M. ZUPAN; V. HUDNIK; N. J. VIDIC, 1994: A Soil and Plant pollution Case Study in an Industrial Area in Slovenia. Environ Geochem Health 16 (1994) 287-299. HUDNIK V., ZUPAN M., LOBNIK F., KOZAK-LEGIŠA Š., 1994: Bioavailability Assessments of Cd, Zn and Pb in Polluted Soils with Indicator Plant Plantago lanceolata L., Biogeochemistry of Trace Elements, A special issue of Environmental Geochemistry and Health, Volume 16, University of Bradford, UK, 1994, p. 39-51. KASTELEC D., BERGANT K., 2002: Potential evapotranspiration (Thornweit method) 30, 100m grid database. KLINGEBIEL A.A., MONTGOMERY P.H., 19961: Land capability classification. USDA Agriculture Hand Book No.120. KOBLER A.; VRŠČAJ B.: Corine Land Cover Slovenia GIS database – Current status, Phare, International Conference on GIS for Earth Science Application (ICGESA), Ljubljana, Maj 1998. Official Gazette RS, 1996: Decree on limit, alarm and critical values of hazardous substances in the soil. Official Gazette RS No. 68/96. Official Gazette RS, 1997: Rules on operation monitoring of the input of hazardous substances and plant nutrients in the soil Official Gazette RS No 55/97. PRUS T., VRŠČAJ B., 1997: Use of Soil Information System in the environmental impact assessment of highway construction in Slovenia, Third European Conference on Geographical Information, Vienna, Austria, April 16-18, 1997, p.385-393. RUPREHT J., PRUS T., VRŠČAJ B., ŠPORAR M., KNAPIČ M., KOČAR I., 1994a: Presoja vplivov na tla kot sestavni del okolja z valorizacijo pridelovalnega potenciala kmetijskih zemljišč za avtocestni odsek Arja vas - Vransko, Variantni pododseki: Južna, V1, V2, januar 1994, 25 p. RUPREHT J., ŠPORAR M., PRUS T., VRŠČAJ B., KNAPIČ M., KOČAR I., 1994c: Presoja vplivov na tla kot sestavni del okolja z valorizacijo pridelovalnega potenciala kmetijskih zemljišč za odsek avtoceste Razdrto-Vrtojba; pododseki Razdrto-Vipava, Vipava-Skrilje, Skrilje-Selo, Poročilo, november 1994,32 p. ŠKORIĆ A., 1986: Postanak, razvoj i sistematika tla, Sveučilišna naklada, Zagreb, 171p. VRŠČAJ B., PRUS T., LOBNIK F., 1998: The Soil Information System of Slovenia. International Conference on GIS for Earth Science Application (ICGESA), Ljubljana, Maj 1998. VRŠČAJ B., ZUPAN M., LOBNIK F., 2002: Data on soil pollution in urban planning. 17th Congress of Soil Science, Bangkok, 2002. VRŠČAJ B., ZUPAN M., LOBNIK F.,1989: Računalniška obdelava podatkov v projektu Tematska karta onesnaženosti tal in zemljišč celjske občine, Zbornik Biotehniške fakultete, supl,13, 1989, str 41 do 58. ZUPAN M., HUDNIK V., LOBNIK F.; KADUNC V.: Accumulation Of Pb, Cd, And Zn From Contaminated Soil to Various Plants And Evaluation of Soil Remediation With Indicator Plant (Plantago lanceolata). In Contaminated Soils: Third International Conference on the Biogeochemistry of Trace Elements, Paris, 1995 (ed. Prost R.), D:\data\communic\086.PDF, colloque 85, INRA Editions, Paris, France
303
LAND DEGRADATION IN TURKEY
S. Kapur1, E. Akça2, D.M. Özden3, N. Sakarya4, K.M. Çimrin5, U. Alagöz1, R. Ulusoy6, C. Darıcı7, Z. Kaya8, S. Düzenli7, H. Gülcan9
1Department of Archaeometry, University of Çukurova, 01330, Adana, Turkey 2Department of Geological Engineering, University of Yuzuncu Yil, 65080, Van, Turkey
3National Information Center for Soil and Water Resources, GDRS, 06275, Ankara, Turkey 4Department of Ceramics, University of Çukurova, 01330, Adana, Turkey
5Department of Soil Science, University of Yuzuncu Yil, 65080, Van, Turkey 6Department of Plant Protection, University of Çukurova, 01330, Adana, Turkey
7Department of Biology, University of Çukurova, 01330, Adana, Turkey 8Department of Soil Science, University of Çukurova, 01330, Adana, Turkey 9Departmnet of Field Crops, University of Çukurova, 01330, Adana, Turkey
ABSTRACT Turkey, with a total of 28.054.000 ha arable land, is still an agricultural country with prime
soils covering only 17.5% of this figure. The rest of the country comprises diverse topographical
features with an average of 1100m elevation and more than 6% slopes. Soil sealing and raw material
exploitation –the irreversible losses- which are the outcomes of high population increase and
migrations throughout the country along with erosion and salinity build-up are the main factors
inducing land degradation that also give rise and accelerate deforestation, overgrazing, improper
tillage and excess irrigation. The decline of organic matter, contamination due to overuse of fertilizers
and industrial waste products, loss of biodiversity and hydro-geological risks, such as floods and
landslides -the relatively reversible losses of land and soil still fulfilling functions in a reduced way- are
also the current problems of land degradation in Turkey.
Despite the struggle of the governmental bodies against poverty, the actual land use in Turkey
both reduces the quality of soils and induces the loss of natural resources, thus the welfare of the rural
dwellers ie 40% of the population.
OVERVIEW The total arable land of Turkey is 28.054.000 ha. The main income of the country is
agriculture and agriculture based industry. However, the prime soils cover only 17.5% of the total land
surface and the productivity of the rest of the soils is limited by topographical, chemical (eg high
calcium carbonate content, alkalinity and low organic matter), and physical (eg. water logging, texture)
attributes.
The diverse topography along with deforestation and unsuitable tillage and irrigation
management have been inducing the rate of erosion in the country for centuries. The majority of the
country’s soils (76.5%) are prone to erosion risk due to the dominant steep slopes (>6%), and 72% of
the soils are more or less affected from water and wind erosion (CCD-TURKEY, 2003). Alongside
these unsuitable conditions, the misuse of lands, ie soil sealing, exploitation of the soils for raw
materials, over use of fertilizers and irrigation, improper use of indigenous environmental friendly
(Kapur and Akça, 2003) agro-ecosystems, constantly degrade the soils of the country.
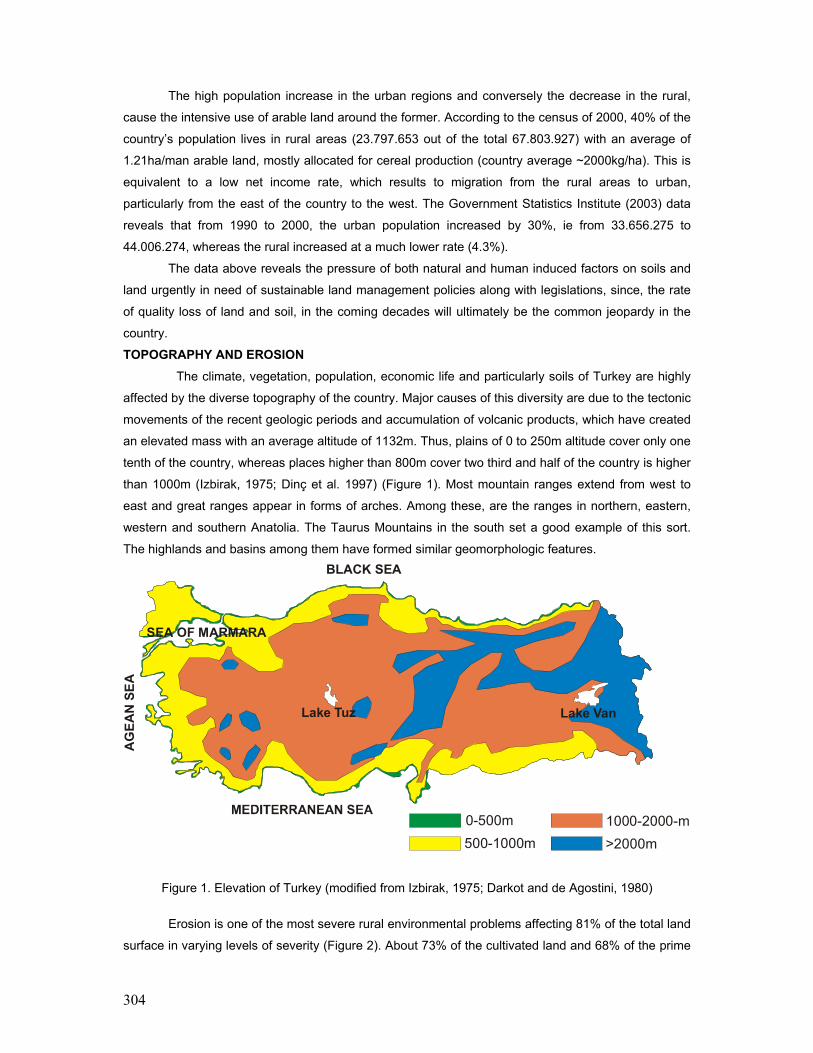
304
The high population increase in the urban regions and conversely the decrease in the rural,
cause the intensive use of arable land around the former. According to the census of 2000, 40% of the
country’s population lives in rural areas (23.797.653 out of the total 67.803.927) with an average of
1.21ha/man arable land, mostly allocated for cereal production (country average ~2000kg/ha). This is
equivalent to a low net income rate, which results to migration from the rural areas to urban,
particularly from the east of the country to the west. The Government Statistics Institute (2003) data
reveals that from 1990 to 2000, the urban population increased by 30%, ie from 33.656.275 to
44.006.274, whereas the rural increased at a much lower rate (4.3%).
The data above reveals the pressure of both natural and human induced factors on soils and
land urgently in need of sustainable land management policies along with legislations, since, the rate
of quality loss of land and soil, in the coming decades will ultimately be the common jeopardy in the
country.
TOPOGRAPHY AND EROSION The climate, vegetation, population, economic life and particularly soils of Turkey are highly
affected by the diverse topography of the country. Major causes of this diversity are due to the tectonic
movements of the recent geologic periods and accumulation of volcanic products, which have created
an elevated mass with an average altitude of 1132m. Thus, plains of 0 to 250m altitude cover only one
tenth of the country, whereas places higher than 800m cover two third and half of the country is higher
than 1000m (Izbirak, 1975; Dinç et al. 1997) (Figure 1). Most mountain ranges extend from west to
east and great ranges appear in forms of arches. Among these, are the ranges in northern, eastern,
western and southern Anatolia. The Taurus Mountains in the south set a good example of this sort.
The highlands and basins among them have formed similar geomorphologic features.
0-500m500-1000m
1000-2000-m>2000m
BLACK SEA
Lake Tuz Lake Van
SEA OF MARMARA
AG
EAN
SEA
Figure 1. Elevation of Turkey (modified from Izbirak, 1975; Darkot and de Agostini, 1980)
Erosion is one of the most severe rural environmental problems affecting 81% of the total land
surface in varying levels of severity (Figure 2). About 73% of the cultivated land and 68% of the prime
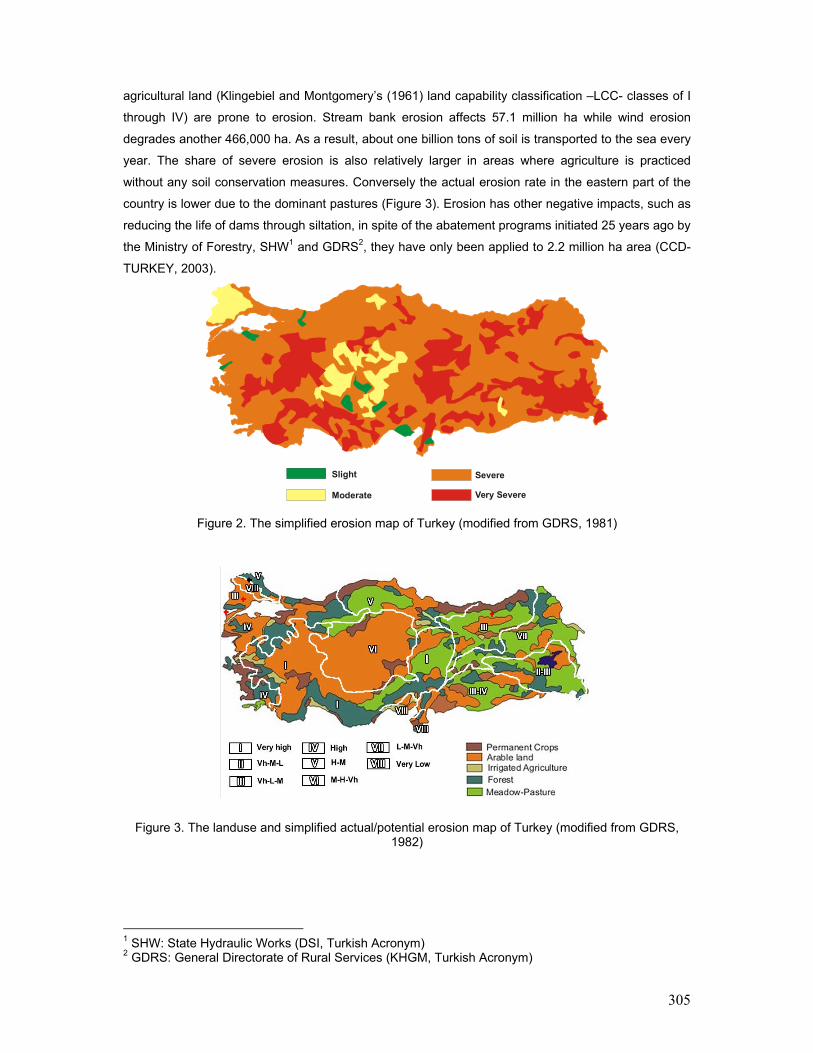
305
agricultural land (Klingebiel and Montgomery’s (1961) land capability classification –LCC- classes of I
through IV) are prone to erosion. Stream bank erosion affects 57.1 million ha while wind erosion
degrades another 466,000 ha. As a result, about one billion tons of soil is transported to the sea every
year. The share of severe erosion is also relatively larger in areas where agriculture is practiced
without any soil conservation measures. Conversely the actual erosion rate in the eastern part of the
country is lower due to the dominant pastures (Figure 3). Erosion has other negative impacts, such as
reducing the life of dams through siltation, in spite of the abatement programs initiated 25 years ago by
the Ministry of Forestry, SHW1 and GDRS2, they have only been applied to 2.2 million ha area (CCD-
TURKEY, 2003).
Slight
Moderate
Severe
Very Severe
Figure 2. The simplified erosion map of Turkey (modified from GDRS, 1981)
Figure 3. The landuse and simplified actual/potential erosion map of Turkey (modified from GDRS, 1982)
1 SHW: State Hydraulic Works (DSI, Turkish Acronym) 2 GDRS: General Directorate of Rural Services (KHGM, Turkish Acronym)
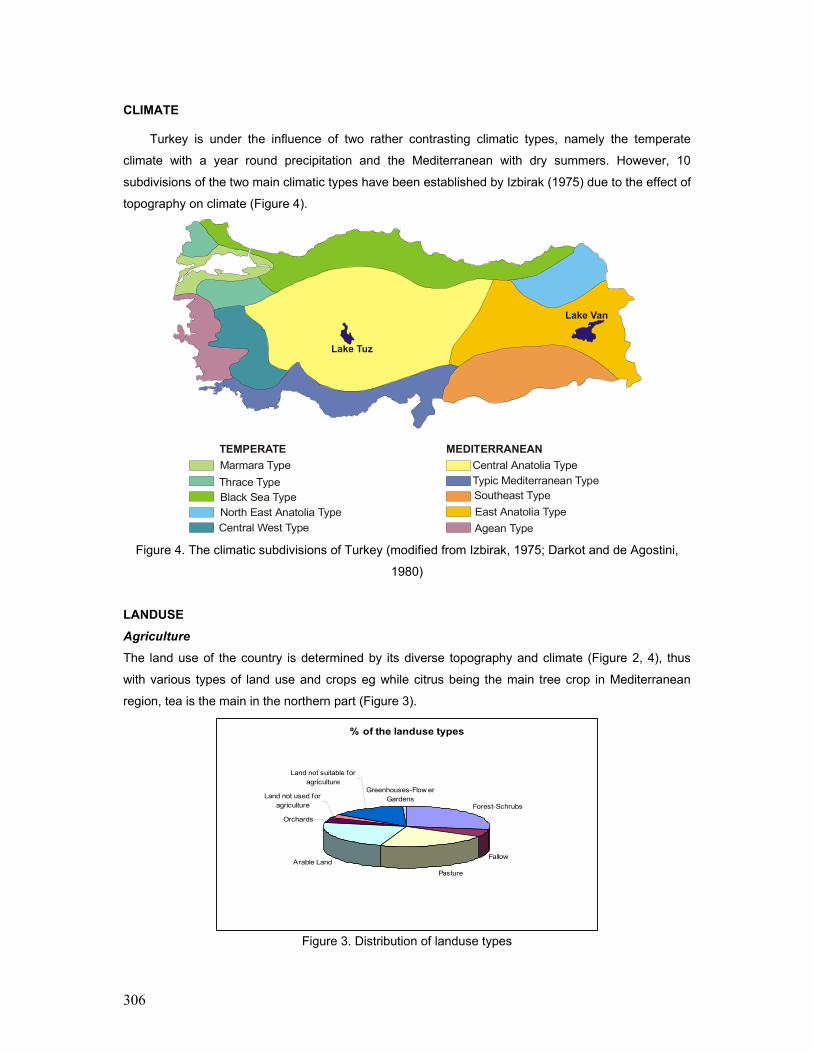
306
CLIMATE Turkey is under the influence of two rather contrasting climatic types, namely the temperate
climate with a year round precipitation and the Mediterranean with dry summers. However, 10
subdivisions of the two main climatic types have been established by Izbirak (1975) due to the effect of
topography on climate (Figure 4).
TEMPERATE MEDITERRANEANMarmara Type Central Anatolia Type
Typic Mediterranean TypeSoutheast TypeEast Anatolia TypeAgean Type
Thrace TypeBlack Sea TypeNorth East Anatolia TypeCentral West Type
Lake Tuz
Lake Van
Figure 4. The climatic subdivisions of Turkey (modified from Izbirak, 1975; Darkot and de Agostini,
1980) LANDUSE Agriculture The land use of the country is determined by its diverse topography and climate (Figure 2, 4), thus
with various types of land use and crops eg while citrus being the main tree crop in Mediterranean
region, tea is the main in the northern part (Figure 3).
% of the landuse types
Forest-Schrubs
Fallow
PastureArable Land
Orchards
Land not used for agriculture
Land not suitable for agriculture
Greenhouses-Flow er Gardens
Figure 3. Distribution of landuse types

307
The available water for irrigation is also an important factor limiting land use priorities. The
water resources of Turkey (26 Basins, 186.5km3 annual) are quite high when compared to the
countries in the Mediterranean Basin (State Hydraulic Works, 2003) (Figure 5). In spite of the
abundant water resources in the country, the economically viable irrigated land is only 8.5% of the
total arable land. Therefore, rainfed cereal production has been the major practice since centuries.
Followed by the use of the extensive rangelands mainly for small ruminant production particularly in
the Eastern parts, which has been an indigenous practice (Figure 3).
20-32km3
15-20km3
10-15km3
6-10km3
5-6km3
4-5km3
2-4km3
1-2km3
0.5-1km3
W. Black SeaMarmara
Susurluk Sakarya Kizilirmak
YesilirmakE. Black Sea Çoruh
Aras
Van
EuphratesKonya
E. Med.W. Med.
Antalya
Tigris
Ceyhan
Figure 5. The river basins of Turkey (av. annual flow –km3) (SHW, 2003)
Intensive production for two or three crops a year, along with greenhouse practices, are mainly
undertaken in the alluvial plains of the country in the Mediterranean and Aegean regions with high
yielding capacity due to the favorable climatic and soil conditions (Figure 3), whereas, constraints of
production arising from the low amounts of organic matter contents throughout the country apart from
the forest areas –the highlands- have to be considered together with minimal/optimal tillage, irrigation,
green manuring and fertilizer use for conservation management (Figure 6, 7). The sharp increase in
irrigated lands and fertilizer use in 1960 illustrated in Figure 7, is compatible to the increase in the
construction of water reservoirs throughout the country and shift of crop patterns. The drawbacks that
could develop from the increased use of fertilizers (other than nitrogen), especially phosphorous, may
result to the increase of toxic Cd in the soils. However, a detailed zinc (mainly associated with Cd in
soils and rocks) survey undertaken (Ozus, 2001, Eyüpoglu et al. 1995) in the soils of the country has
revealed its deficiency which may also point out to the non-toxic levels (low risk) of Cd apart from soils
developed on volcanic and metamorphic rocks.
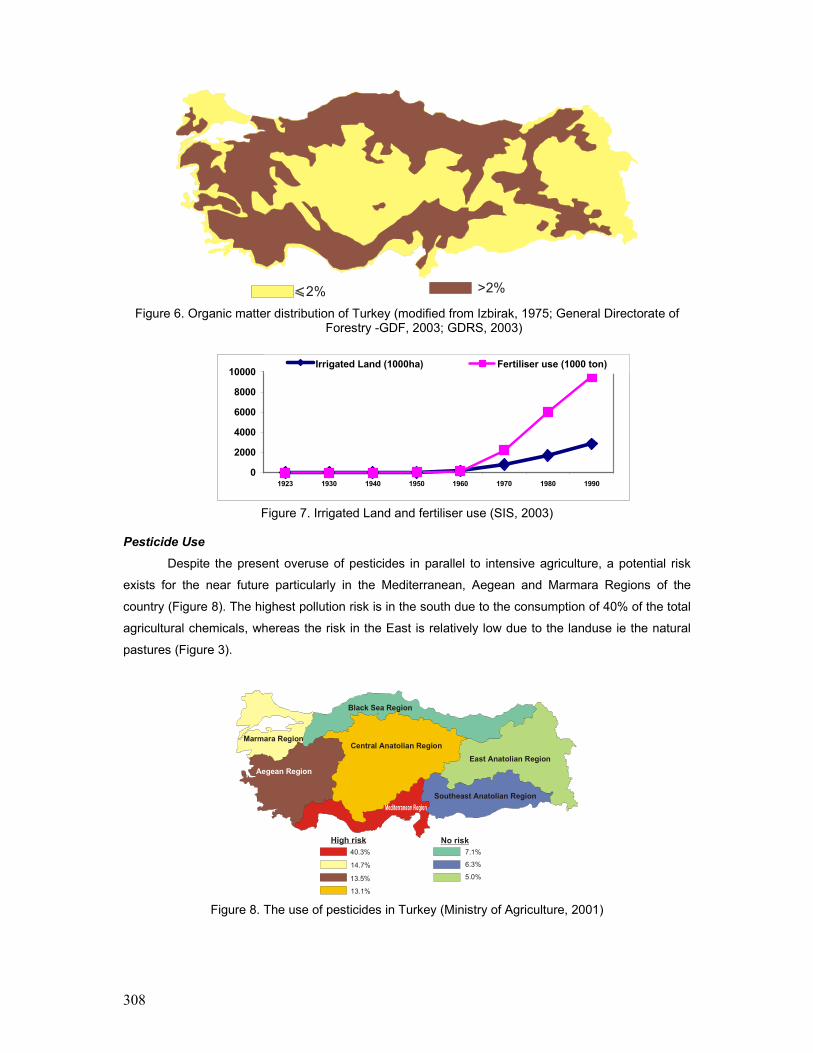
308
2% >2% Figure 6. Organic matter distribution of Turkey (modified from Izbirak, 1975; General Directorate of
Forestry -GDF, 2003; GDRS, 2003)
0
2000
4000
6000
8000
10000
1923 1930 1940 1950 1960 1970 1980 1990
Irrigated Land (1000ha) Fertiliser use (1000 ton)
Figure 7. Irrigated Land and fertiliser use (SIS, 2003)
Pesticide Use
Despite the present overuse of pesticides in parallel to intensive agriculture, a potential risk
exists for the near future particularly in the Mediterranean, Aegean and Marmara Regions of the
country (Figure 8). The highest pollution risk is in the south due to the consumption of 40% of the total
agricultural chemicals, whereas the risk in the East is relatively low due to the landuse ie the natural
pastures (Figure 3).
40.3%
14.7%
13.5%
13.1%
7.1%
6.3%
5.0%
High risk No risk
Central Anatolian Region
Aegean Region
Marmara Region
East Anatolian Region
Southeast Anatolian Region
Black Sea Region
Figure 8. The use of pesticides in Turkey (Ministry of Agriculture, 2001)
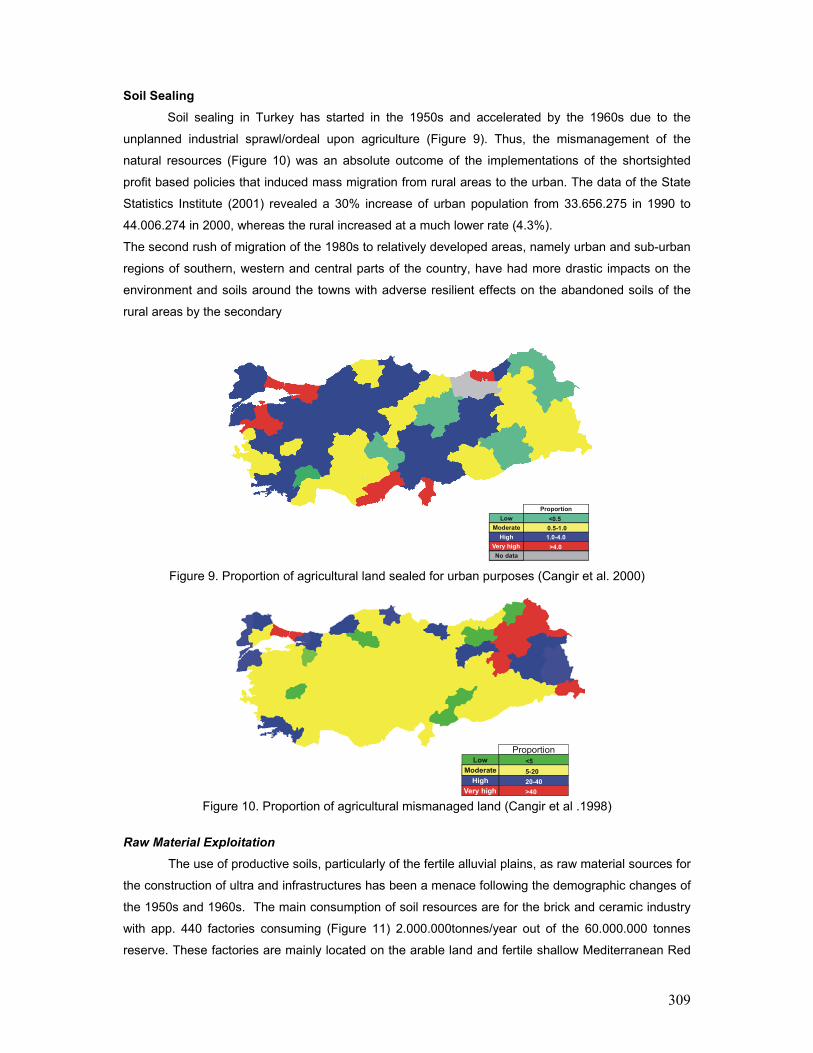
309
Soil Sealing Soil sealing in Turkey has started in the 1950s and accelerated by the 1960s due to the
unplanned industrial sprawl/ordeal upon agriculture (Figure 9). Thus, the mismanagement of the
natural resources (Figure 10) was an absolute outcome of the implementations of the shortsighted
profit based policies that induced mass migration from rural areas to the urban. The data of the State
Statistics Institute (2001) revealed a 30% increase of urban population from 33.656.275 in 1990 to
44.006.274 in 2000, whereas the rural increased at a much lower rate (4.3%).
The second rush of migration of the 1980s to relatively developed areas, namely urban and sub-urban
regions of southern, western and central parts of the country, have had more drastic impacts on the
environment and soils around the towns with adverse resilient effects on the abandoned soils of the
rural areas by the secondary
ProportionLow
ModerateHigh
Very highNo data
<0.50.5-1.01.0-4.0>4.0
Figure 9. Proportion of agricultural land sealed for urban purposes (Cangir et al. 2000)
ProportionLow
ModerateHigh
Very high
<55-2020-40>40
Figure 10. Proportion of agricultural mismanaged land (Cangir et al .1998)
Raw Material Exploitation The use of productive soils, particularly of the fertile alluvial plains, as raw material sources for
the construction of ultra and infrastructures has been a menace following the demographic changes of
the 1950s and 1960s. The main consumption of soil resources are for the brick and ceramic industry
with app. 440 factories consuming (Figure 11) 2.000.000tonnes/year out of the 60.000.000 tonnes
reserve. These factories are mainly located on the arable land and fertile shallow Mediterranean Red
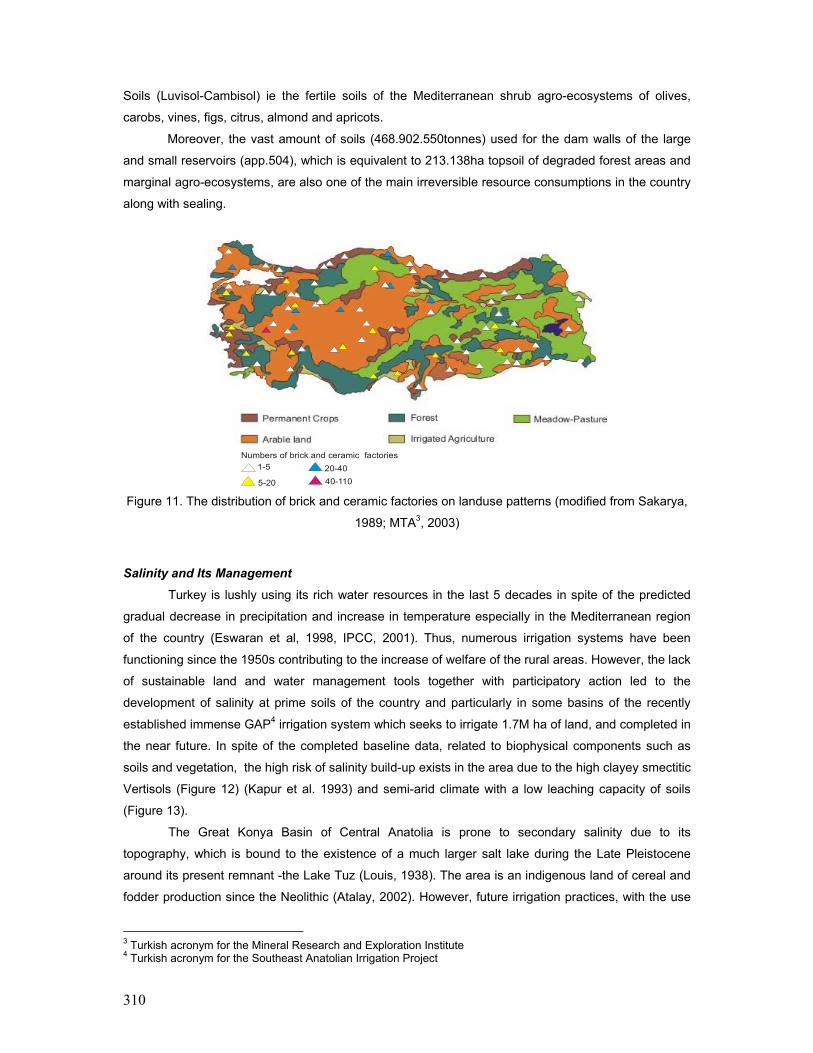
310
Soils (Luvisol-Cambisol) ie the fertile soils of the Mediterranean shrub agro-ecosystems of olives,
carobs, vines, figs, citrus, almond and apricots.
Moreover, the vast amount of soils (468.902.550tonnes) used for the dam walls of the large
and small reservoirs (app.504), which is equivalent to 213.138ha topsoil of degraded forest areas and
marginal agro-ecosystems, are also one of the main irreversible resource consumptions in the country
along with sealing.
Numbers of brick and ceramic factories1-5
5-20
20-4040-110
Figure 11. The distribution of brick and ceramic factories on landuse patterns (modified from Sakarya,
1989; MTA3, 2003)
Salinity and Its Management Turkey is lushly using its rich water resources in the last 5 decades in spite of the predicted
gradual decrease in precipitation and increase in temperature especially in the Mediterranean region
of the country (Eswaran et al, 1998, IPCC, 2001). Thus, numerous irrigation systems have been
functioning since the 1950s contributing to the increase of welfare of the rural areas. However, the lack
of sustainable land and water management tools together with participatory action led to the
development of salinity at prime soils of the country and particularly in some basins of the recently
established immense GAP4 irrigation system which seeks to irrigate 1.7M ha of land, and completed in
the near future. In spite of the completed baseline data, related to biophysical components such as
soils and vegetation, the high risk of salinity build-up exists in the area due to the high clayey smectitic
Vertisols (Figure 12) (Kapur et al. 1993) and semi-arid climate with a low leaching capacity of soils
(Figure 13).
The Great Konya Basin of Central Anatolia is prone to secondary salinity due to its
topography, which is bound to the existence of a much larger salt lake during the Late Pleistocene
around its present remnant -the Lake Tuz (Louis, 1938). The area is an indigenous land of cereal and
fodder production since the Neolithic (Atalay, 2002). However, future irrigation practices, with the use
3 Turkish acronym for the Mineral Research and Exploration Institute 4 Turkish acronym for the Southeast Anatolian Irrigation Project
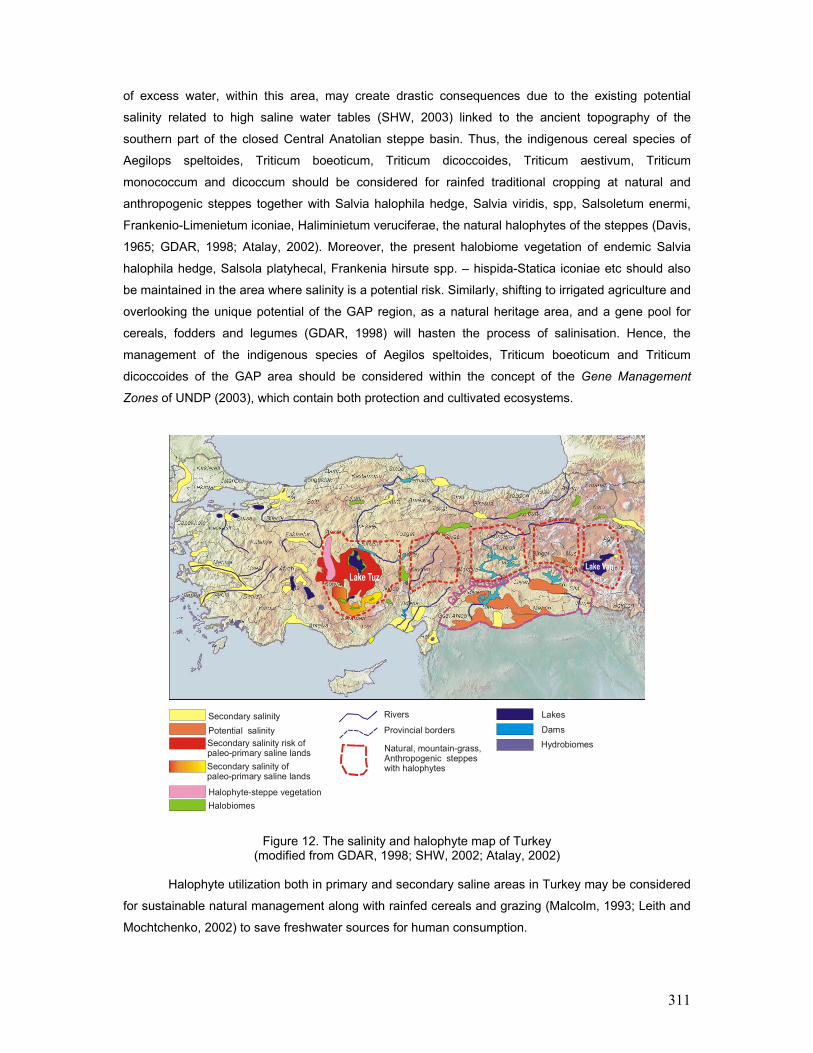
311
of excess water, within this area, may create drastic consequences due to the existing potential
salinity related to high saline water tables (SHW, 2003) linked to the ancient topography of the
southern part of the closed Central Anatolian steppe basin. Thus, the indigenous cereal species of
Aegilops speltoides, Triticum boeoticum, Triticum dicoccoides, Triticum aestivum, Triticum
monococcum and dicoccum should be considered for rainfed traditional cropping at natural and
anthropogenic steppes together with Salvia halophila hedge, Salvia viridis, spp, Salsoletum enermi,
Frankenio-Limenietum iconiae, Haliminietum veruciferae, the natural halophytes of the steppes (Davis,
1965; GDAR, 1998; Atalay, 2002). Moreover, the present halobiome vegetation of endemic Salvia
halophila hedge, Salsola platyhecal, Frankenia hirsute spp. – hispida-Statica iconiae etc should also
be maintained in the area where salinity is a potential risk. Similarly, shifting to irrigated agriculture and
overlooking the unique potential of the GAP region, as a natural heritage area, and a gene pool for
cereals, fodders and legumes (GDAR, 1998) will hasten the process of salinisation. Hence, the
management of the indigenous species of Aegilos speltoides, Triticum boeoticum and Triticum
dicoccoides of the GAP area should be considered within the concept of the Gene Management
Zones of UNDP (2003), which contain both protection and cultivated ecosystems.
Secondary salinity Rivers
Provincial borders
Natural, mountain-grass,Anthropogenic steppeswith halophytes
LakesDamsHydrobiomes
Potential salinitySecondary salinity risk ofpaleo-primary saline lands
Halophyte-steppe vegetationHalobiomes
Secondary salinity of paleo-primary saline lands
GAP REGION
Figure 12. The salinity and halophyte map of Turkey (modified from GDAR, 1998; SHW, 2002; Atalay, 2002)
Halophyte utilization both in primary and secondary saline areas in Turkey may be considered
for sustainable natural management along with rainfed cereals and grazing (Malcolm, 1993; Leith and
Mochtchenko, 2002) to save freshwater sources for human consumption.
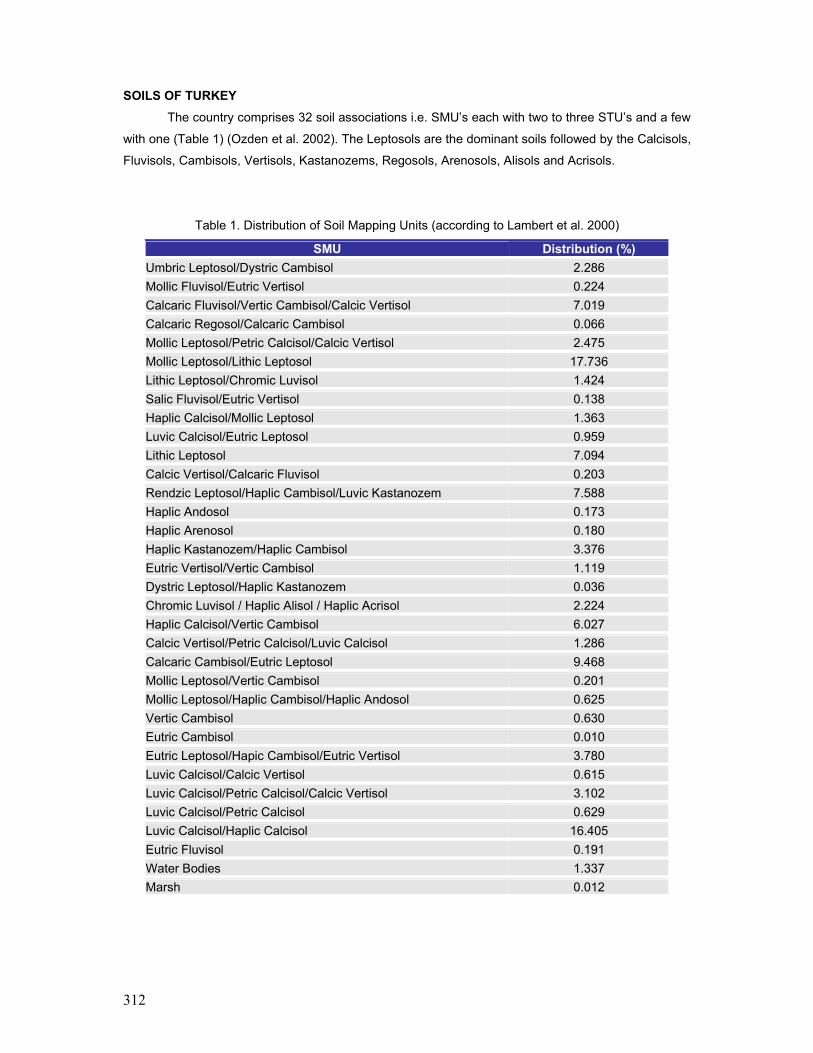
312
SOILS OF TURKEY The country comprises 32 soil associations i.e. SMU’s each with two to three STU’s and a few
with one (Table 1) (Ozden et al. 2002). The Leptosols are the dominant soils followed by the Calcisols,
Fluvisols, Cambisols, Vertisols, Kastanozems, Regosols, Arenosols, Alisols and Acrisols.
Table 1. Distribution of Soil Mapping Units (according to Lambert et al. 2000)
SMU Distribution (%) Umbric Leptosol/Dystric Cambisol 2.286 Mollic Fluvisol/Eutric Vertisol 0.224 Calcaric Fluvisol/Vertic Cambisol/Calcic Vertisol 7.019 Calcaric Regosol/Calcaric Cambisol 0.066 Mollic Leptosol/Petric Calcisol/Calcic Vertisol 2.475 Mollic Leptosol/Lithic Leptosol 17.736 Lithic Leptosol/Chromic Luvisol 1.424 Salic Fluvisol/Eutric Vertisol 0.138 Haplic Calcisol/Mollic Leptosol 1.363 Luvic Calcisol/Eutric Leptosol 0.959 Lithic Leptosol 7.094 Calcic Vertisol/Calcaric Fluvisol 0.203 Rendzic Leptosol/Haplic Cambisol/Luvic Kastanozem 7.588 Haplic Andosol 0.173 Haplic Arenosol 0.180 Haplic Kastanozem/Haplic Cambisol 3.376 Eutric Vertisol/Vertic Cambisol 1.119 Dystric Leptosol/Haplic Kastanozem 0.036 Chromic Luvisol / Haplic Alisol / Haplic Acrisol 2.224 Haplic Calcisol/Vertic Cambisol 6.027 Calcic Vertisol/Petric Calcisol/Luvic Calcisol 1.286 Calcaric Cambisol/Eutric Leptosol 9.468 Mollic Leptosol/Vertic Cambisol 0.201 Mollic Leptosol/Haplic Cambisol/Haplic Andosol 0.625 Vertic Cambisol 0.630 Eutric Cambisol 0.010 Eutric Leptosol/Hapic Cambisol/Eutric Vertisol 3.780 Luvic Calcisol/Calcic Vertisol 0.615 Luvic Calcisol/Petric Calcisol/Calcic Vertisol 3.102 Luvic Calcisol/Petric Calcisol 0.629 Luvic Calcisol/Haplic Calcisol 16.405 Eutric Fluvisol 0.191 Water Bodies 1.337 Marsh 0.012
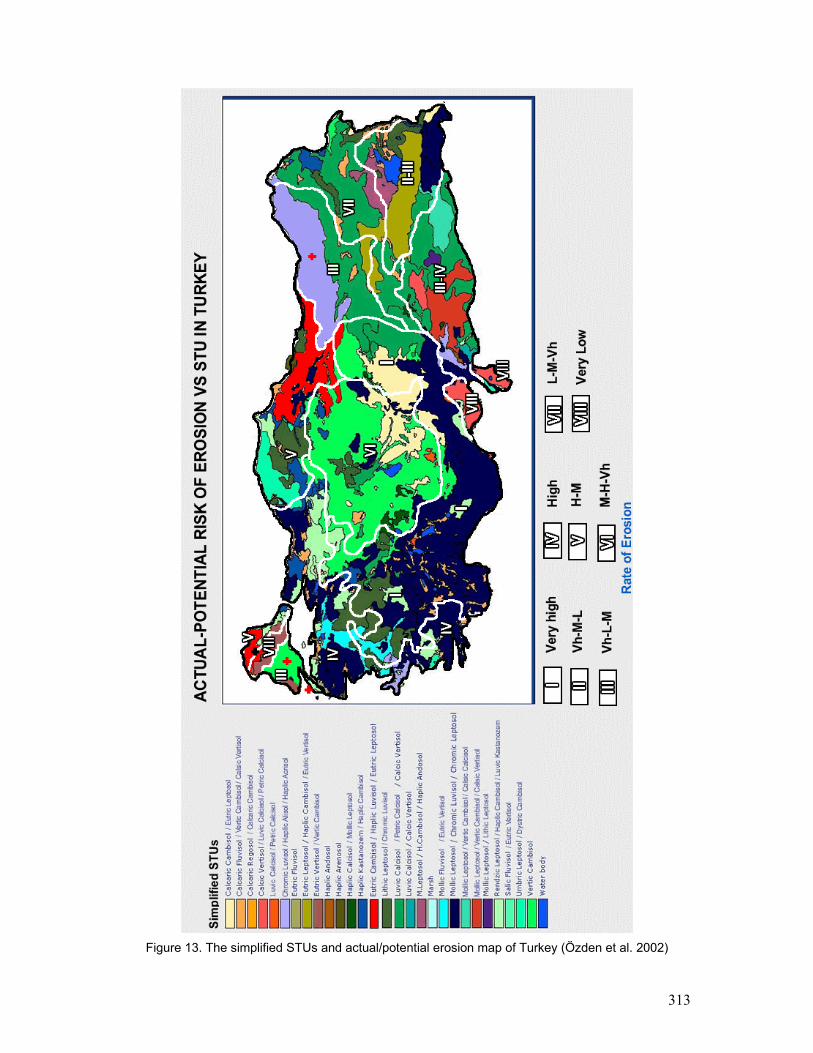
313
Figure 13. The simplified STUs and actual/potential erosion map of Turkey (Özden et al. 2002)

314
LEPTOSOLS
The abundance of Leptosols is the outcome of the vigorous Anatolian tectonic activities since
the Miocene (Neotectonics) resulting to the development of steep slopes and their inevitable
consequence causing mass transportation of soils and continuous destruction of the landscape (Erol,
1981).
CALCISOLS Calcisols are the next dominant soils of Turkey taking place in the drier parts of the country,
particularly developed on ancient lake basins and mudflow deposits developing to tectonically induced
terraces of the Quaternary (Dinç et al. 1997).
FLUVISOLS The Fluvisol association ie the widely distributed SMU’s throughout Turkey along river valleys
and lake basins are not determined in southeastern Turkey –the northern part of the Arabian Shield-
which is covered by the materials transported following Neotectonic activities. Thus, the widespread
Calcaric Fluvisols associating with Vertic Cambisols and Calcaric Vertisols are a good example for
catenary sequential continuum encountered in countries with vigorous and frequent tectonic
movements causing formation of prominent topographic/geomorphologic features/soils that are
subjected to a long history of exploitation since the Neolithic.
CAMBISOLS Cambisol associations, the soils of the slightly more temperate areas than the typical
Mediterranean, associating with Leptosols and Kastanozems, are frequently located at the northern
fringes of the Calcisols, which embrace the coastal areas of the north and south Mediterranean Basin.
VERTISOLS The Calcic Vertisols with less prominent cracking features and gilgai due to the coarse calcite
and palygorskite contents have developed from the transported Petric Calcisols ie the Quaternary
mudflow surfaces designated as the “glacis” ie the colluvials (Dinç et al. 1997; Kapur et al. 1990).
ACRISOLS One of the minor soil groups of Turkey are the Acrisols (Haplic) (Table 1) associating to Eutric
Cambisols overlying volcanic and metamorphic parent materials with the highest annual rainfall in the
area (1500-2000mm) and annual average temperatures of 12°C to 15°C, (northeast Black Sea
coastal) needs detailed filed trials and description of new profiles for the ultimate differentiation from
Podzols to Acrisols (Dinç et al. 1997).
REGOSOLS The Calcaric Regosol and Calcaric Cambisol association covers a small part of the country
(Table 1) and is located at a similar climate as the Lithic Leptosol/Chromic Luvisol association of the
Mediterranean Region (Dinç et al. 1997).
ARENOSOLS The Haplic Arenosol association represents the coastal sand dunes being on the ancient
and/or present courses of the large rivers of Anatolia intergrading to the coastal beach sands of the
Mediterranean covering a relatively small part of the country (Dinç et al. 1978; Dinç et al. 1997, Akça,
2001).
315
ANDOSOLS The Haplic Andosol STU has been recently defined in eastern Turkey and previously at the
northeast, south and western parts of the country (Kapur et al. 1980; Dinç et al. 1997).
The use of especially the major class levels of the parent materials 3000 and 3300 of Version
4.0 of the ESB/WRB has provided more inside in the development of a more geologically oriented
concept for the designation of Andosols that have developed on or in pyroclastic rocks (tephra).
CONCLUSIONS Land degradation, particularly pollution in Turkey, is not very severe and an
immediate threat when compared to other Western and Central European countries.
However, the diverse topography when coupled with precipitation, is responsible for the high
rate of erosion which is a major factor of natural degradation induced by human activities in
the country. The erosion of productive topsoil decreases the net income of the agriculture-
bound people and results migrations to industrialized urban areas causing the sealing of
prime soils. The irreversible consequence of soil sealing which is also accelerated with the
high population increase, causes shifting of forest areas, wetlands, primary saline zones and
other fragile environments to agriculture.
Excess use of irrigation water is responsible for the development of secondary salinity
in the primary (geologically) saline zones as well as the fertile alluvial plains of Turkey, which
are actually the gene zones of numerous crops particularly cereals, legumes and halophytes.
Thus, irrigation management plans should not only be based on the concept of conventional
cash crop production but also for the crops present on environmentally friendly and stable
indigenous rainfed agro-ecosystems, which necessitate the incorporation of the halophyte
production in Central Anatolia (steppe), the olive-carob-vine production in the semi-arid
Mediterranean (karstic), and cereals in the Southeast Anatolian Regions (calcrete). This
paradigm in sustainable landuse management aims to increase the welfare of the urban
people and decrease the threat of excess water use in fragile steppe, karstic and calcrete
topographies, which are also the carbon pools of the world. Hence, the concept of agro-
ecosystem based landuse assessment should primarily be considered in the development of
sustainable land management strategies particularly with the incorporation of indigenous
environmental friendly technical knowledge.
316
REFERENCES Akça, E. 2001. Determination of the soil development in Karapinar erosion control station following
rehabilitation. University of Çukurova, Institute of Basic and Applied Sciences. Doctoral Thesis. 195 P. Adana, Turkey.
Akça, E., Kelling, G., Kapur, S., Bal, Y., Gültekin, E., Everest, A., Yetiş, C., Şenol, S., Darıcı, C. 2002. Preserving Our Heritage: A Case Study From Southern Anatolia. In the Proceedings of the 31st Annual International Urban Fellows Conference of the Urban Growth: Preserving while Developing 9-15, June 2001. Mersin, Turkey. 68-76.
Atalay, I. 2002. Ecoregions of Turkey. Publication of the Ministry of Forestry. No. 163. 266 P. ISBN 975 – 8273 – 41 – 8.
Cangir, C., S. Kapur, D. Boyraz, E. Akça, 1998. Landuse in Turkey. The Problems of Agricultural Soils and Policies for Optimal Use. M. Şefik Yeşilsoy International Symposium On Arid Region Soils. Turkish Soil Science Society, 21- 24 September 1998. İzmir. 9-13.
Cangir, C., Kapur, S., Boyraz, D., Akça, E., and Eswaran, H. 2000. An Assessment of Land Resource Consumption in Relation to Land Degradation Turkey. Journal of Soil and Water Conservation. 253-259.
CCD-TURKEY. 2003. CCD Country Report. http://www.ccdturkiye.gov.tr (visited 10.01.2003). Davis, P.H. 1965. Flora of Turkey and East Aegean Islands. Vol. VII. Edinburgh University Press. UK. Darkot, B. and De Agostini, G.M. 1980. Modern Atlas of Turkey. Arkin Press, Istanbul. 144 P. Dinç, U., Yeşilsoy, Ş. M., Kapur, S., Berkman, A., Özbek, H. 1978. The Physical, Chemical and
mineralogical properties and the development of the Eastern Mediterranean Coastal Sand dunes. University of Çukurova, Faculty of Agriculture Pub.No. 2. 81-105.
Dinç, U., Şenol, S., Kapur, S., Cangir, C., Atalay, I. 1997. Soils of Turkey. University of Çukurova, Faculty of Agriculture Pub. No. 51 Adana. 233.
Erol, O. 1981. Neotectonic and Geomorphological Evolution of Turkey, Zeit. F. Geomorph. N. F. Supp. Bd. 40: 193-211.
Eswaran, H., Kapur, S., Reich, P., Akça, E., Şenol, S., and Dinç, U. 1998. Impact of Global Climate Change on Soil Resource Conditions: A Study of Turkey. M. Şefik Yeşilsoy International Symp. on Arid Region Soils. 21-24 Sep, İzmir.
Eyupoglu, F., Kuman, N., Talaz, S. 1995. The status of plant available micronutrients in Turkish soils. Institute of Soil and Fertiliser Research. Project No.620/A-002. Ankara (in Turkish).
GDAR. 1998. Information technology management plan (ITMP), database design, and GIS applications development project, PROJECT ATLAS. General Directorate of Agricultural Research. Project No. LOAN NO:3472 – TU. Ankara, Turkey. 32P.
GDF. 2003. Forest Map of Turkey. http://www.ogm.gov.tr/tf/tforests.htm. (visited 07.01.2003) GDRS. 1981. Erosion Map of Turkey, 1/800.000. Ministry of Agriculture, Ankara. GDRS. 1982. Soil Potential Survey and Landuse of Turkey. Pub No. 715; Ankara. Izbirak, R. 1975. Geography of Turkey. Directorate General of Press and Information. Ankara. 286 P. Kapur, S., Dinç, U., Göksu, Y., Özbek, H. 1980. Genesis and Classification of the Ando-like Soils
overlying Basaltic Tephra in the Osmaniye Region (S. Turkey). University of Çukurova. Annals of Faculty of Agriculture. Pub. No. 11. 1-4 Adana. Turkey.
Kapur, S., Gülüt, K. Y., Karaman, C., Akça, E., Kılavuz, M., 1993. Clay Mineralogy of the Southeastern Anatolia Region. 6th National Clay Mineralogy Symposium. 8-11 September 1993.Ankara. 279-290.
Klingebiel, A.A. and Montgomery, P.H. 1961. Land-capability classification. Washington D.C: U.S. Government Printing Office. United States Department of Agriculture (USDA) Agricultural Handbook No. 210.
Kapur, S., Çavuşgil, V. S., Şenol, M., Gürel, N. and Fitzpatrick, E. A. 1990. Geomorphology and Pedogenic Evolution of Quaternary Calcretes in the northern Adana Basin of southern Turkey. Zeitschrift für Geomorphologie, No.34, S. 49-59.
Kapur, S. and Akça, E. 2003. Technologies, Environmentally Indigenous Land Management Technologies. Encyclopedia of Soil Science. Marcel Dekker Inc. New York (in press).
Kuzucuoğlu, C., Parısh, R. And Karabıyıkoğlu, M. 1998. The dune systems of the Konya Plain (Turkey): their relation to environmental changes in Central Anatolia during the Late Pleistocene and Holocene. Geomorphology 23. 257-271.
Lambert, J.J., Daroussin, J., Eimberck, M., Jamagne, M., King, D. 2000. Instructions Guide for the Elaboration of the Soil Geopgraphical Database of Euro-Mediterranean Countries at a 1:1M scale Version 4.0. ESB. 44P.

317
Leith, H. and Mochtchenko, M (eds). 2002. Halophytes for future halophyte growers. Cashcrop Halophytes for future halophyte growers. Backuys Publishers. Leiden. 34 P.
Louis, H. 1938. Ice Age Sea in Anatolia. Z. Ges. Erdk. 267-285 (in German). Malcolm, C.V. 1993. Economic and Environmental Aspects of the Sustainable use of Halophytic
Forages. Halpohyte Utilisation in Agriculture. 12-26 September 1993. Agadir, Morocco. CIHEAM/IAM-B Advanced Course. 191-209.
Ministry of Agriculture. 2001. The Year 2001 Plant Protection Program and Application Principles. Pub. of Ministry of Agriculture Directorate of Protection and Control. Ankara. 199P.
Ozden, M., Keskin, S. Dinç, U., Akça, E., Şenol, S., Dinç, O. and Kapur, S. 2002. 1/1M Soil Map of Turkey. ESB-WRB. Report of the European Soils Bureau. Inst. for Environment and Sustainability. Milan.
Ozus, I. 2001. Determination of Cd Contents of Soils in the Konya Basin. MSc. Thesis. Univ. of Cukurova. Adana, Turkey.
IPCC 2001. Climate Change 2001: The Scientific Basis. J.T. Houghton, Y.Ding, D.J. Griggs, M. Noguer, P.J. van der Linden, X. Dai, K. Maskell, and C.A. Johnson, (eds), Cambridge University Press, Cambridge, UK, 881 pp.
Sakarya, N. 1989. Ceramic Raw Material Technology. Lecture Notes. Univ. of Çukurova. Vocational School of Osmaniye Pub. No. 11. Adana, Turkey.
SHW. 2003. State Hydraulic Works Web Service. http://www.dsi.gov.tr/enghm.htm (visited 01.01.2003).
SIS. 2003. State Institute of Statistics. www.die.gov.tr/ENGLISH/index.html (visited 8.01.2003) UNDP. 2003. Turkey. 1997. Mountain Section of Country Profile. United Nations Commission on
Sustainable Development. www.un.org/esa/agenda21/natlinfo/countr/turkey/
318
Section 3:
Conclusions and recommendations
319
THE JRC ENLARGEMENT ACTION Workshop 10-B
Land degradation Ispra
5-6 December 2002
RECOMMENDATIONS OF THE WORKSHOP PARTICIPANTS
The aim of the Workshop, in which representatives from the accession countries to the European Union, the European Commission and the Secretariat of the United Nations Convention to Combat Desertification (UNCCD) took part, was to gather more detailed information on the current situation in Candidate Countries concerning soil degradation. The new European initiatives, based on the communication of the EU Commission "Towards a Thematic Strategy for Soil Protection" were also presented. Since several candidates are also Parties to the UNCCD, reference were made in countries presentation and in the discussion to the implementation of this Convention at national level and to its regional implementation annexes for Northern Mediterranean (Annex IV) and Central and Eastern countries (Annex V).
During the Workshop, the JRC Enlargement Action and the EU Thematic Strategy on Soil, related EU research activities on soil and land degradation mainly in the 5th and 6th Framework Programme, and activities for the implementation of the UNCCD as well as the Land Degradation Assessment in Dryland Areas Project were discussed, including the planed activities related to Europe of the new Group of Experts of UNCCD/Committee on Sciences and Technology (CST) and the UNCCD-Annex IV and its importance for future strategies for the combat of land degradation and desertification in Europe. From this, the following recommendations and conclusions were drawn: 1. Countries have a different understanding when using the word “land” or “soil”. Therefore, national policy and/or research results demonstrate difference in the approach to land degradation and there is a need for harmonization.
2. Scientific knowledge and data on soil and land degradation in Europe has been
obtained within the 4th and 5th Framework Programme (FP) and should be made accessible to potential end users, in particular those who implement the CCD.
3. Further new orientations should be developed in the 6th FP to ensure the
operational scientific and technical approach to “combat” desertification and land degradation in Europe.

320
3. Exchange of experience on initiatives related to land degradation should be promoted between the UNCCD/CST Group of Experts and the European Commission to contribute to the harmonization of methodological approaches and to avoid duplication. One way would be by inviting the Chairman of the UNCCD/CST Group of experts to designate one European expert from the Group to take part as an observer in the EU Advisory Forum (expert group) on soil.
6. The participants of the Workshop came also to the conclusion that soil research is not sufficiently considered within the 6th Framework Programme and should be enlarged in order to foster the new initiatives on soil protection within the European Union and to support future activities of the implementation of the UNCCD in Europe.

321
Section 4:
Participants
322
Workshop Land Degradation
Leonardo 05/12/2002 - 06/12/2002
List of participants
Martin BANOV Ferdo BASIC Institute of Soil Science "Nikola Poushkarov" University of Zagreb, Faculty of Agriculture 7, Shosse Bankya street Svetosimunska 25 BG - 1080 SOFIA HR - ZAGREB tel. :+359-2-24 61 41 - fax: +359-2-24 89 37 tel. :+385 1 239 3815 - fax: +385 1 231 5300 e mail: [email protected] e mail: [email protected]
Giovanni BIDOGLIO Pavol BIELEK I.E.S. - Soil and Waste Unit Soil Science and Conservation Research JRC - Via Enrico Fermi Institute I - 21020 ISPRA Gagarinova 10 tel. :+39-0332-789383 - fax: +39-0332-789328 SK - 827 13 BRATISLAVA e mail: [email protected] tel. :+421 2 434 20 866 - fax: +421 2 295 487 e mail: [email protected]
Vanda Valerija BIVYDAITE Winfried BLUM Lithuanian Univ. of Agriculture IUSS Soil Sci. Dept., Agronomy Fac., 11 Studentu St., Gregor Mendel-Str.33 LIT - 4324 AKADEMIJA A - 1180 VIENNA tel. :+370 37 397712 - fax: +370 37 397531 tel. :+43 1 47891 07 - fax: +43 1 47891 10 e mail: [email protected] e mail: [email protected]
Elysabeth DAVID Ryszard DEBICKI UNCCD University of Maria Curie-Sklodowska Martin-Luther-King str. 8 Akademicka 19 D - BONN PL - 20-033 LUBLIN tel. :+49 0228 815 2834 - fax: +49 0228 815 2898 tel. :+48 81 5375026 - fax: +48 81 5375045 e mail: [email protected] e mail: [email protected]
Zdenek FILIP Arwyn JONES Federal Environmental Agency, I.E.S. - Soil and Waste Unit Langen Bldg., Paul Ehrlich Str., 29 JRC - Via Enrico Fermi D - 63225 LANGEN I - 21020 ISPRA tel. :+49 6103 704 160 - fax: +49 6103 704 147 tel. :+39-0332-789162 - fax: +39-0332786394 e mail: [email protected] e mail: [email protected]
323
Robert JONES Selim KAPUR I.E.S. - Soil and Waste Unit Dept. of Soil Sciences JRC - via Enrico Fermi University of Çukurova I - 21020 ISPRA TR - 01330 ADANA tel. :+39-0332-786330 - fax: +39-0332-786394 tel. :+90 322 338 60 84 - fax: +90 322 338 66 43 e mail: [email protected] e mail: [email protected]
Christian KLEPS Nikola KOLEV Ac. of Agric. & Forestry Sciences Inst. of Soil Science "N. Poushkarov" Marasti Road no. 61, Sector 1 7, Shosse Bankya St. RO - BUCHAREST BG - 1080 SOFIA tel. :+4021.2229128 - fax: +4201.2229139 tel. :+359-2-248-934 - fax: +359-2-248-937 e mail: [email protected] e mail: [email protected]
Josef KOZAK Franc LOBNIK Czech University of Agriculture University of Ljubljana Prague 6 Suchdol Jamnikarjeva 101 CZ - PRAGUE SLO - LJUBLJANA tel. :+420 220921642 - fax: +420 220921644 tel. :+386 41 663 713 - fax: +386 1 423 33 67 e mail: [email protected] e mail: [email protected]
Carmen Alina MARGINA Erika MICHELI UNCCD Dept of Soil Science & AG Chemistry Martin-Luther-King str 8 Szent Istvan University, Pater K.U. 1 D - BONN H - GODOLLO tel. :+49 0228 815 2820 - fax: +49 0228 815 2899 tel. :+36 28 410 200 - fax: +36 28 410 804 e mail: [email protected] e mail: [email protected]
Luca MONTANARELLA Marco MORETTINI I.E.S. - Soil and Waste Unit European Commission JRC - Via Enrico Fermi Rue de La Loi 200 I - 21020 ISPRA B - 1049 BRUSSELS tel. :+39-0332-785349 - fax: +39-0332-786394 tel. :+322 22990384 - fax: +322n 2992908 e mail: [email protected] e mail: [email protected]
Freddy NACHTERGAELE Svelta ROUSSEVA FAO Institute of Soil Science "Nikola Poushkarov" Via delle Terme di Caracalla 7, Shosse Bankya str. I - ROMA BG - 1080 SOFIA tel. :+39-06-57054888 - fax: +39-06-57056275 tel. :+359 2 24 61 41 - fax: +359 2 24 89 37 e mail: [email protected] e mail: [email protected]
324
Ezio RUSCO Stefan Rolf SOMMER I.E.S. - Soil and Waste Unit I.E.S. - Soil and Waste Unit JRC - Via Enrico Fermi JRC - via Enrico Fermi I - 21020 ISPRA I - 21020 Ispra tel. :+39-0332-786329 - fax: +39-0332-785601 tel. :+39-0332-789631 - fax: +39-0332-789469 e mail: [email protected] e mail: [email protected]
Ben SONNEVELD Vladimir STOLBOVOI Centre for World Food Studies of the Vrije Univ. International Inst. For Applied Systems Analysis De Boelelaan Schlossplatz 1 NL - 1081 HV AMSTERDAM RS - 2361 LAXENBURG tel. :+31 20 444 9304/21 - fax: +31 20 444 9325 tel. :+43 2236 807 534 - fax: +43 2236 807 599 e mail: [email protected] e mail: [email protected]
Szymon SZEWRANSKI Tengiz URUSHADZE Agricultural University of Wroclaw Georgian Soil Science Society pl. Grunwaldzki 24 52 Rustaveli ave., PL - 50-363 WROCLAW GE - 380008 TBILISI tel. :+4871 3205534 - fax: +4871 3205574 tel. : - fax: +995 e mail: [email protected] e mail: [email protected]
Ialina VINCI Nicholas YASSOGLOU ARPAV - Centro Agroambientale ARPA VENETO National Committee for Combating via Baciocchi 9 Desertification I - 31033 CASTELFRANCO VENETO Vrilision 20 tel. :+39 0423 422322 - fax: +39 0423 720388 GR - 15236 OLD PENTELI e mail: [email protected] tel. :+30 18041793 - fax: +30 8041793 e mail: [email protected]