Cobalt, Lithium, Manganese, Natural Graphite, Nickel - JRC ...
Upload
khangminh22Category
view
5download
0
EUR 29752 EN
OPPORTUNITIES, CHALLENGES AND THE WAY FORWARD

This publication is a Science for Policy report by the Joint Research Centre (JRC), the European Commission’s science and knowledge service. It aims to provide evidence-based scientific support to the European policymaking process. The scientific output expressed does not imply a policy position of the European Commission. Neither the European Commission nor any person acting on behalf of the Commission is responsible for the use that might be made of this publication.
Manuscript completed in April 2019
Contact informationCarlo LavalleEuropean Commission, Joint Research Centre, 26A 02/238, Via Fermi, 2749, 21027 Ispra (VA), [email protected].: +39 0332 785231
EU Science Hubhttps://ec.europa.eu/jrc
This report is linked to an Interactive online platform providing additional material that can be accessed at: https://urban.jrc.ec.europa.eu/thefutureofcities
JRC116711EUR 29752 ENPDF ISBN 978-92-76-03847-4 ISSN 1831-9424 doi:10.2760/375209 Print ISBN 978-92-76-03848-1 ISSN 1018-5593 doi:10.2760/364135
Luxembourg: Publications Office of the European Union, 2019
The reuse policy of the European Commission is implemented by Commission Decision 2011/833/EU of 12 December 2011 on the reuse of Commission documents (OJ L 330, 14.12.2011, p. 39). Reuse is authorised, provided the source of the document is acknowledged and its original meaning or message is not distorted. The European Commission shall not be liable for any consequence stemming from the reuse. For any use or reproduction of photos or other material that is not owned by the EU, permission must be sought directly from the copyright holders. The designations employed and the presentation of material on the maps do not imply the expression of any opinion whatsoever on the part of the European Union concerning the legal status of any country, territory, city or area or of its authorities, or concerning the delimitation of its frontiers or boundaries.
Cover © European Union, 2019 - graphic elaboration from olly ©AdobeStock, 2019.All content © European Union, 2019 except: p. 9 NicoElNino ©AdobeStock, 2019; p. 14 Виталий Сова ©AdobeStock, 2019; p. 18 GoogleEarth Landsat / Copernicus, 2019; p. 30 ©Alex Garland - Tenant Rights Rally - Flickr, 2017 - CC BY 2.0; p. 31 I-Wei Huang ©AdobeStock, 2019; p. 38 andongob ©AdobeStock, 2019; p. 44 ©Mert Kompil, 2017; p. 49 ©Alexandre Debieve - unsplash, 2019; p. 50 ©Roman Kraft - unsplash, 2019; p. 57 Google Earth ©DigitalGlobe, 2019; p. 58 ©FruitMonkey - Season’s Greetings Banksy, 2019 - CC BY 4.0; p. 65 ©Curtis MacNewton - unsplash, 2019; p. 66 ©Nina Strehl - unsplash, 2019; p. 71 ©Lienhard Schulz – Voliere 1 High Deck Siedlung, 2017 - CC BY 3.0; p. 72 Kletr ©AdobeStock, 2019; p. 73 tnog8080 ©AdobeStock, 2019; p. 77 ©USDAgov - Indoor vertical farming - Flickr, 2018 - CC BY 1.0; p. 78 reichdernatur ©AdobeStock, 2019; p. 81 sauletas ©AdobeStock, 2019; p. 82 ©chris-barbalis - unsplash, 2019; p. 87 vivalapenler ©AdobeStock, 2019; p. 92 Philophoto ©AdobeStock, 2019; p. 97 ©Will Truettner - unsplash, 2019; p. 98 Connect World ©AdobeStock, 2019; p. 102 ©Sidewalk Labs; p. 104 tostphoto ©AdobeStock, 2019; p. 111 ©Thomsen Photography/Tabakfabrik Linz, 2015; p. 112 ©jacek-dylag - unsplash, 2019; p. 116 Jannis Werner ©AdobeStock, 2019; p. 121 NJ ©AdobeStock, 2019; p. 122 Enrico Di Cino ©AdobeStock, 2019; p. 129 REDPIXEL ©AdobeStock, 2019; p. 133 ©GoogleEarth, 2019.
How to cite this report: Vandecasteele I., Baranzelli C., Siragusa A., Aurambout J.P. (Eds.), Alberti V., Alonso Raposo M., Attardo C., Auteri D., Barranco R., Batista e Silva F., Benczur P., Bertoldi P., Bono F., Bussolari I., Caldeira S., Carlsson J., Christidis P., Christodoulou A., Ciuffo B., Corrado S., Fioretti C., Galassi M. C., Galbusera L., Gawlik B., Giusti F., Gomez J., Grosso M., Guimarães Pereira Â., Jacobs-Crisioni C., Kavalov B., Kompil M., Kucas A., Kona A., Lavalle C., Leip A., Lyons L., Manca A.R., Melchiorri M., Monforti-Ferrario F., Montalto V., Mortara B., Natale F., Panella F., Pasi G., Perpiña C., Pertoldi M., Pisoni E., Polvora A., Rainoldi A., Rembges D., Rissola G., Sala S., Schade S., Serra N., Spirito L., Tsakalidis A., Schiavina M., Tintori G., Vaccari L., Vandyck T., Vanham D., Van Heerden S., Van Noordt C., Vespe M., Vetters N., Vilahur Chiaraviglio N., Vizcaino P., Von Estorff U., Zulian G., The Future of Cities – Opportunities, challenges and the way forward, EUR 29752 EN, Publications Office, Luxembourg, 2019, ISBN 978-92-76-03847-4, doi:10.2760/375209, JRC116711.

OPPORTUNITIES, CHALLENGES AND THE WAY FORWARD

2Table of contents
Executive Summary 4 About this report 10
PART 1: INTRODUCTORY CHAPTERS 13 1 Introduction 15 1.1 The importance of cities 151.2 Localising the Global Urban Agendas 151.3 A Role for Europe and its cities 16
2 What is a city? 19 2.1 What criteria are used to define a city? 19 2.2 Towards a global, people-based definition of cities
and settlements 192.3 Harmonised definitions of cities 21
3 Urbanisation 25 3.1 Trends and drivers 25
PART 2: CHALLENGES 29 4 Affordable housing 31 4.1 Urban property: prices, ownership and occupancy 314.2 Trends and key figures 32 5 Mobility 39 5.1 How can cities address future mobility challenges? 395.2 Trends and key figures 39 6 Provision of services 45 6.1 How accessible are city services? 456.2 Trends and key figures 45 7 Ageing 51 7.1 How can cities cater for an ageing society? 517.2 Trends and key figures 517.3 How does this affect cities? 537.4 How can cities respond? 56 8 Urban health 59 8.1 Ensuring general well-being in cities 598.2 Trends and key figures 59 9 Social segregation 67 9.1 How can cities become more inclusive? 679.2 Trends and key figures 68
TABLEOF CONTENTS

3 Table of contents
10 Environmental footprint 73 10.1 Water, energy and food security in urban areas 7310.2 Trends and key figures 7410.3 What impacts will these trends have in the future? 79 11 Climate action 83 11.1 How will climate change affect cities, and how can they take action? 8311.2 Trends and key figures 8411.3 Urban energy and climate governance 84 12 Challenges: work ahead 88 PART 3: PERSPECTIVES 91 13 Space and the city 93 13.1 How can public space in a city help to address future urban challenges? 9313.2 Emerging trends 94 14 Tech and the city 99 14.1 How can the opportunities provided by technology markets be fully harnessed? 9914.2 Emerging trends 100 15 Cities as innovation hubs 105 15.1 Harnessing the innovation potential 10515.2 Emerging trends 106 16 The citizen’s city 113 16.1 How can citizens improve their cities? 11316.2 Emerging trends 113 17 Urban governance 117 17.1 Good urban governance and the role of cities in global governance 11717.2 Emerging trends 117 18 The resilient city 123 18.1 Building on our communities’ strengths 12318.2 Emerging trends 12418.3 How are cities getting prepared? 126
19 Perspectives: open questions 128
20 Concluding considerations 130 List of abbreviations 134 Glossary 136 Endnotes 141 References 150 List of boxes 160 List of figures 161 Acknowledgments 164

4Executive summary
EXECUTIVE SUMMARY
This report identifies challenges influencing the future of cities in Europe and beyond. It also presents several perspectives from which to look at resolving these issues. It is an initiative of the Joint Research Centre (JRC)i, the science and knowledge service of the European Commission (EC), supported by the Commission’s Directorate-General for Regional and Urban Policy (DG REGIO). The main aim is to raise open questions and steer discussions on what the future of cities can, and should be, both within the scientific and policymaker communities. The report benefits greatly from the collective
intelligence put forward by the Members of the EC Community of Practice on Cities and is linked to an interactive online platform.
As yet there is no global agreement on the definition of a city. According to the UN, based on national definitions, which vary greatly, 56% of the world population currently lives in urban areas. The EC (along with the OECD, World Bank, FAO, ILO and UN-HABITAT) proposes a more comparable global definition of citiesii. Based on this definition, 75% of the world population lived in urban areas in 2015, while for the European Union this figure was 72%iii.
Future trendsWhile population is expected to continue growing exponentially across most of the globe, this is less so in Europe. While many challenges still faced are related to population pressure, Europe also has to cope with new challenges related to a declining and ageing population in many cities. Over half of European cities will see their population
decline in the future. This means that most of the change in Europe will have to take place in an integrated, affordable and sustainable fashion within pre-existing urban fabric.
Most European cities are expected to cover greater areas than in the past, and cities will have to increasingly recognise the importance
of optimising how their public space is both designed and used. An ageing EU population will require the further adaptation of infrastructure and services.
Cities will increasingly apply new technologies and innovation across a wide range of sectors, from transport and mobility to citizen engagement. This technology will need to be interoperable and integrated, and its implementation done in an inclusive way to benefit the overall functioning of cities.
423 5 7 99 1111 13 15 1911 3 5 7 13 15 191717
2 4 66 88 1010 1212 1414 1818 20201616
Perspectives: open questions
The resilient city
Urban governance
Tech and the city
Climateaction
Cities as innovation
hubs
Challenges:work ahead
Environmentalfootprint
Social segregation
Urban health
Ageing
Provision of services
MobilityUrbanisation
Affordablehousing
Introduction
What is a city?
PART 2: CHALLENGES
PART 1: INTRODUCTORY CHAPTERS
PART 3: PERSPECTIVES
p. 15 p. 25 p. 39 p. 51 p. 67 p. 83 p. 105 p. 128p. 117
p. 19 p. 31 p. 45 p. 59 p. 73 p. 88 p. 99 p. 123
Concluding considerations
p. 130
The citizen’scity
p. 113
p. 93
Space and the city

5 Executive summary
The dominance of personal cars should be drastically reduced in favour of more efficient public transport, shared and active mobility, and new working patterns.
Cities will still need to cope with existing major issues such as providing sufficient affordable housing to an increasingly varied population, ensuring inclusiveness and integration among its communities, and reducing environmental impacts. While cities are front runners in fighting climate change, they are also where the effects of energy poverty and water scarcity, to mention but a few, will be particularly evident.
Citizen engagement in policy processes is growing and should become more prevalent
in the future. New forms of urban governance are already being stimulated in many cities, and the importance of city networks is expected to further increase.
A role for Europe and its citiesCities have an important role to play in pushing forward societal change. Cities are increasingly embracing innovation and novel technologies and, thanks to the concentration of people, ideas and resources, they are leading the way towards solutions to global challenges beyond their own boundaries. City networks and associations play
an increasingly crucial and recognised role in shaping global agreements. The importance of cities in contributing towards a sustainable way of living for all is recognised in the Urban Agenda for the EU and in global agendas such as the New Urban Agenda.
Europe can further enhance its role as a key player in worldwide city development discussions both through its extensive policy experience and with regard to science and knowledge production. The fruitful interaction between EU institutions and European cities has great potential to make Europe a world reference point in identifying, experimenting and applying solutions to the future challenges that cities will face.
Main challenges identified AFFORDABLE HOUSING - Europe’s most in-demand cities have seen sharp increases in housing prices over the past years, affecting their capacity to provide adequate and affordable housing. The recent scale-up of foreign and corporate investments in residential urban property has transformed patterns of ownership. Prices are recovering faster than earnings, and the availability of housing is low. Short-term rental platforms may also cause property prices to spiral and negatively affect local liveability.
423 5 7 99 1111 13 15 1911 3 5 7 13 15 191717
2 4 66 88 1010 1212 1414 1818 20201616
Perspectives: open questions
The resilient city
Urban governance
Tech and the city
Climateaction
Cities as innovation
hubs
Challenges:work ahead
Environmentalfootprint
Social segregation
Urban health
Ageing
Provision of services
MobilityUrbanisation
Affordablehousing
Introduction
What is a city?
PART 2: CHALLENGES
PART 1: INTRODUCTORY CHAPTERS
PART 3: PERSPECTIVES
p. 15 p. 25 p. 39 p. 51 p. 67 p. 83 p. 105 p. 128p. 117
p. 19 p. 31 p. 45 p. 59 p. 73 p. 88 p. 99 p. 123
Concluding considerations
p. 130
The citizen’scity
p. 113
p. 93
Space and the city

Executive summary
MOBILITY - Environmental pollution, congestion, and long commuting times are just some of the issues related to mobility in cities. A decrease in ownership of private vehicles in favour of efficient and connected public transport and active mobility modes could greatly ease these problems. Legislation and appropriate governance measures will be needed to ensure new transport modes, such as autonomous electric vehicles, complement rather than compete with public transport.
PROVISION OF SERVICES - Public and commercial urban services should be sustainable, efficient, reusable, co-usable, modular, personalised and data-driven in the future. The provision of services could be improved by promoting compact urban development and the mixed use of land; developing integrated land use and mobility plans, and embracing new service-easing technologies.
AGEING - By 2070, life expectancy in the EU will rise to 88.2 years, while the old-age dependency ratio is expected to almost double. This will be an especially great challenge in cities where the overall population is in decline. Additional strain will be put on the welfare system, as growing costs for health care, pensions and social benefits will need to be covered by a shrinking labour force. Cities will have to adjust their services in areas such as health care and mobility, as well as public infrastructure, housing, and social policy.
URBAN HEALTH - While high population densities in cities may facilitate the spread of infectious diseases, they ensure economy of scale in the provision of healthcare. Well-being can be affected by where you live in a city, and can be improved by urban planning. Emerging trends, such as ageing, and the prevalence of obesity and mental health in cities have to be tackled with a long-term effort.
SOCIAL SEGREGATION - In European cities there is a growing polarisation, which can be addressed by inclusive and equitable place-based policies. These should take into account the multiple factors in play in deprived neighbourhoods
(e.g. health, housing conditions, and ethnic background), and look at the causes of, and solutions to segregation that go beyond the boundaries of the segregated area.
ENVIRONMENTAL FOOTPRINT - Providing water, energy and food security for urban populations results in significant environmental pressure beyond city boundaries. Four of nine planetary boundaries have already been exceeded due to human activities. Several lifestyle and behavioural changes can help city inhabitants significantly reduce their environmental footprint, such as shifting to a healthy diet, reducing waste, using active or public mobility modes or choosing sustainable energy sources.
CLIMATE ACTION - Cities generate about 70% of global GHG emissions, and, at the same time, are particularly vulnerable to the impacts of climate change. In the last two decades, city ambition has risen remarkably to go beyond
6
JRC | LUISA Refined land use map of Stockholm, Sweden (Rosina et al., 2018)

Executive summary
the nationally determined contributions towards climate-change targets. However, cities need support from their partners in national and regional governments, the private sector, academia, and civil society to meet these ambitious targets.
Perspectives, towards solutionsCities are uniquely equipped to tackle challenges – the abundance of available physical space, a large and diverse population, a certain level of autonomy, and openness to technological advancements and innovation, to name but a few, may offer ways to relieve the pressures cities face.
SPACE AND THE CITY - Public spaces make up between 2 and 15% of land in city centres in Europe. The greenness of European cities has increased by 38% over the last 25 years, with 44% of Europe’s urban population currently living within 300 metres of a public park. Well-designed public and green spaces can have a multitude
of benefits: improving air quality, providing microclimate regulation, and enhancing safety, social integration and public health.
TECH AND THE CITY - New and emerging technologies could help cities improve public services, better interact with citizens, increase productivity, and address environmental and sustainability challenges. However, they also raise several issues, including data privacy and ownership, appropriate and consistent legislation, data sharing and standards, and cybersecurity.
CITIES AS INNOVATION HUBS - Cities play a central role in innovation dynamics: geographical proximity of stakeholders and multidisciplinary interaction enable innovation. The variety of approaches to innovation enhances the identity of cities, their traditions and their cultural heritage. Although capital cities and metropolitan areas remain major drivers of creativity and innovation, favourable conditions can also be found in smaller cities.
THE CITIZEN’S CITY - The co-creation of strategies to tackle urban challenges is vital for their success – citizens can play a crucial role, often providing new perspectives and solutions. Novel technologies can significantly improve citizen participation, but there is a need to better understand and systematise current and emerging practices.
URBAN GOVERNANCE - Urban governance has gained a central role in global development efforts. At least 65% of the new urban agenda’s goals can only be achieved at the local level, particularly in urban areas. There is a trend towards strengthening urban governance in the EU, leading to the recent establishment of a wide range of new governance bodies and arrangements across EU cities. This includes large networks which are significantly empowering cities and accelerating the evolution of urban governance towards more horizontal cooperation and knowledge exchange.
7

Executive summary
THE RESILIENT CITY - A resilient city assesses, plans and acts to prepare for and respond to all hazards – sudden and slow onset, expected and unexpected. These include uncontrolled urbanisation, climate change and political instability, among others. Understanding social and economic vulnerabilities is essential to formulate actions for resilience adapted to local needs, with local communities playing a central role.
Main messagesEffectively seizing the opportunities and addressing the challenges cities face would substantially improve their future outlook. Several focal points for upcoming reflections on relevant research and policy exercises are identified below. When managed well, cities can harness powerful tools provided specifically within an urban context by technology and innovation, citizen engagement, good governance and the intrinsic resilience of communities.
1. Cities are key sites where innovation and technological advancement happens. While this is a major opportunity for cities, both social and technological innovation should be further stimulated and progress should be made alongside new forms of social engagement, urban governance and cultural creativity.
2. The appropriate management of new technologies and data is crucial. New tools and methods for better knowledge management are particularly important for enhancing the capacity to translate data into meaningful and relevant support to inform policy decisions. The use of real-time, consistent and reliable data (including big data and non-conventional sources) is essential and requires greater transparency and towards citizens.
3. Housing availability and affordability remains under threat due to changing acquisition and rental patterns, including new forms of financial
investment that see strategic opportunities for the conversion of volatile assets into physical ones in cities. This challenges obsolete social housing measures which would have to be re-thought to reduce social polarisation and conflicts.
4. Cities are essential hubs for both the implementation of global agendas and for citizens’ engagement in policy decisions. While committed to providing a good life for their citizens, cities can push forwards behavioural and institutional changes that will benefit all, taking an active role in global governance. Several European cities are at the forefront of issues such as governance and citizen engagement, innovation and creativity.
5. The fight for sustainability will be greatly influenced by what happens in cities. While cities usually place greater pressure on natural resources, they perform better in the use of resources and have a greater potential for energy efficiency. Actions on environmental sustainability, including climate change, are already being taken by many cities.
6. Cities and city networks have a large collective power to act and to scale up solutions quickly and efficiently. Their influence can be significant, from supporting global commitments to providing efficient local solutions. The EU has successfully created an environment of sharing of good practices between cities, both within and outside Europe. In this sense, cities also have a certain responsibility to act towards societal change.
7. There is a risk of polarisation both within and between cities. On the one hand, being unable to take stock of the issues highlighted will lead to even more inequalities within a city. On the other hand, a diverging path between cities falling behind and cities capitalising on emerging trends may cause additional social and economic imbalance between different urban areas.
8

9
8. The close linkage between space/service/people is at the core of cities’ capacities to respond to people’s needs and to manage new challenges in a wider context, beyond administrative boundaries and sectorial domains. A truly holistic approach is needed to optimise the provision of services and create an intelligent interaction between the city and its inhabitants while maintaining or enhancing quality of life.
In all of the above, city communities will play a substantial role in reshaping their own futures. Greater efforts will be required to fully anticipate the impacts that these trends will have, and to determine how to help communities become more resilient in the face of these
changes. Strengthening local administrations and empowering citizens will contribute to building urban resilience to new challenges and better protecting human, economic and natural assets in cities and their surroundings.
The future of cities is not set in stone and is not easy to predict, but the choices they make now will shape the lives of generations to come. By taking stock of current knowledge and understanding of city systems, this report highlights potential pitfalls cities should avoid and defines broad principles they should lean towards. It aims to foster discussion and help policymakers, individual cities and their citizens choose the best way forward.
Executive summary

1010
This report is an initiative of the Joint Research Centre (JRC), the science and knowledge service of the European Commission (EC), supported by the Commission’s Directorate-General for Regional and Urban Policy (DG REGIO). It highlights drivers shaping the urban future, identifying both the key challenges cities will have to address and the strengths they can capitalise on to proactively build their desired futures. The main aim of this report is to raise open questions and steer discussions on what the future of cities can, and should be, both within the scientific and policymaker communities. While addressing mainly European cities, examples from other world regions are also given since many challenges and solutions have a global relevance.
The report is particularly novel in two ways. First, it was developed in an inclusive manner – close collaboration with the EC’s Community of Practice on Cities1 (CoP-CITIES) provided insights from the broader research community and city networks, including individual municipalities, as well as Commission services and international organisations. It was also extensively reviewed by an Editorial Board2. Secondly, the report is supported by an online ‘living’ platform which will host future updates, including additional analyses, discussions, case studies, comments and interactive maps that go beyond the scope of the current version of the report. Steered by the JRC, the platform will offer a permanent virtual space to the research, practice and policymaking community to share and accumulate knowledge on the future of cities.
This report is produced in the framework of the EC Knowledge Centre for Territorial Policies3 and is part of a wider series of flagship Science for Policy reports by the JRC, investigating future perspectives concerning Artificial Intelligence, the Future of Road Transport, Resilience, Cybersecurity and Fairness.
The introductory part of this report sets the scene, explains how a city is defined, and gives an overview of urbanisation trends in Europe and globally. The second and third parts describe some of the main challenges cities face, and some of the opportunities or perspectives they can use to look for solutions, respectively:
The CHALLENGES series identifies, quantifies and explores existing issues and emerging trends that cities will have to mitigate in the near future, including provision of services, social segregation, mobility, health, housing, ageing, the environmental footprint and climate.
The PERSPECTIVES series looks at how cities may use their strengths to address the challenges faced, including the use of public space, citizen engagement, technology and innovation, urban governance and community resilience.
Finally, the report summarises open questions and key overarching concepts that are likely to shape the future of cities. These represent focal points for upcoming reflections on relevant research and policy exercises.
ABOUT THIS REPORT
About this report

1111
Cities as Innovation hubs
Affordable Housing
Climate Action
Urban Governance
The Citizen’s City
Mobility
Urban Health
AgeingProvision of Services
The Resilient City
Social Segregation
Tech and the City
Environmental Footprint
Space and the City
About this report
The report uses an integrated approach to analyse, understand and eventually translate challenges or issues faced at the urban level into tangible actions which can be taken towards
building a better future for cities. This is illustrated in Figure 1 below, which gives an overview of the different chapters and emphasises the many interlinkages.
Figure 1: Overview of the Challenges and Perspectives chapters, showing the multitude of interlinkages

PART 1: INTRODUCTORY
CHAPTERS

1. Introduction 1414

15 1. Introduction
‘City-systems’ are characterised by the close spatial proximity of areas with a high population density. Three of the main components of cities are the physical space they occupy, the level of services provided, and the pace of innovation and growth in creativity. These components work together to create an intelligent interaction between the city and its inhabitants, while enhancing the quality of life within and outside city borders (Harrison et al., 2010).
In recent years, many organisations and experts have shed light on the complexities of issues faced at the urban level. While facts and figures about cities are readily available and the process of urbanisation is increasingly well documented, it remains difficult to acquire a complete understanding of how the future of cities can and should be shaped.
1.1. The importance of cities
City networks and associations play an increasingly crucial and recognised role in shaping global agreements. Cities worldwide are reacting to global issues and improving the well-being of their citizens. For example, local authorities are already introducing smoking bans and imposing sugar taxes to improve public health, or banning the most polluting vehicles and heating installations to reduce air pollution and its impact on climate change (Futureagenda, 2017).
Cities have an important role to play in pushing forward societal change (EU and UN-HABITAT, 2016). They have always been hubs of economic growth, innovation, culture and creativity. Since urban areas can provide a high quality of life, that is where the vast majority of people choose to live. The effects of problems such as climate change, heatwaves and flooding, pollution, congestion, crime, a lack of affordable housing, and shortages
of clean water and electricity are also most acutely observed at the urban level. However, cities are increasingly embracing innovation and novel technologies and, thanks to the concentration of people, ideas and resources, they are leading the way towards solutions to global challenges beyond their own boundaries. In an increasingly urbanised world, the future of cities will determine the well-being of future generations.
1.2. Localising the global urban agendas
The 2030 Agenda for Sustainable Development, adopted in 20154 as a plan of action for people, planet and prosperity, includes 17 Sustainable Development Goals (SDGs). SDG 11 is specifically targeted at building sustainable cities and communities, making cities inclusive, safe and resilient. Cities themselves also have a significant
“Cities are complex systems whose infrastructural, economic and social components are strongly interrelated and therefore difficult to understand in isolation.” (Jacobs, 1961)
INTRODUCTION
15

role to play in achieving the other goals by 2030. In support of the urban agendas, cities should promote inclusiveness and equity, liveability and resilience. They should and do have the potential to provide an environment which stimulates social interaction, embraces innovation and is an engine of the local and global economy. As the global urban population continues to grow, cities are increasingly being challenged by persistent and emerging phenomena. They will need to evolve in response to their inhabitants’ changing needs and aspirations, and to respond to the ideals envisaged in the global agendas.
The Seville Commitment7, adopted in February 2019, is the latest of a number of declarations highlighting the crucial role of cities and local communities in implementing Agenda 2030 and achieving the global goals. It recognises
that localisation of the SDGs is a fundamental requirement in making Agenda 2030 a reality and achieving sustainable development while not leaving anyone behind. It is in cities that the battle for sustainability will ultimately be won or lost.8
1.3. A role for Europe and its cities
Over the past decade, the urban dimension of EU policies has gained momentum, culminating into the adoption of the Pact of Amsterdam in 2016, which established the framework for the Urban Agenda for the EU.
One important feature of the European approach to urban development is its integrated place-based approach to policymaking which assumes that the geographical context, with its unique spatial, social, cultural and institutional characteristics, thoroughly matters. A place-based policy is tailored to the context of a territory and is based on the effective use of its development potential. It implies close dialogue and cooperation in a multi-level, multi-actor and multi-sector pattern. This place-based approach is particularly well suited to the unique European territorial articulation. It also highlights that many issues are interconnected spatially and impact their surroundings, shaping a shared destiny between cities, suburbs, mid-sized towns and rural areas.
European cities are lead actors in the global arena. European examples of urban development policies are encouraging global initiatives9 and are shared in the framework of urban cooperation and exchange10 with key city partners around the world. Furthermore, the EC International Cooperation and Development policy plays an important role in key urban issues11, supporting cooperation among local authorities and peer learning. European cities have also enhanced their role as policy laboratories, further improving their knowledge and understanding of local urban processes and the potential impacts of specific policy measures.
1. Introduction 16
The importance of cities in contributing towards a sustainable way of living for all is recognised in the Urban Agenda for the EU5 and in global agendas such as the New Urban Agenda6.

● Fulfil their social function, […] with a view to progressively achieving the full realisation of the right to adequate housing as a component of the right to an adequate standard of living, without discrimination, universal access to safe and affordable drinking water and sanitation, as well as equal access for all to public goods and quality services;
● Are participatory, promote civic engagement, engender a sense of belonging and ownership among all their inhabitants;
● Achieve gender equality;
● Meet the challenges and opportunities of present and future sustained, inclusive and sustainable economic growth;
● Fulfil their territorial functions across administrative boundaries and act as hubs and drivers for balanced, sustainable and integrated urban and territorial development;
● Promote age- and gender-responsive planning and investment for sustainable, safe and accessible urban mobility for all;
● Adopt and implement disaster risk reduction and management;
● Protect, conserve, restore and promote their ecosystems, water, natural habitats and biodiversity.
1. Introduction17
From the new urban agenda, Quito declaration on sustainable cities and human settlements for all
The European Commission has developed a strong capacity to develop anticipatory trends and scenarios, along with a number of supporting tools12 and actions13, giving a consistent cross-disciplinary approach to urban issues.
Europe can further enhance its role as a key player in worldwide city development discussions
both through its extensive policy experience and with regard to science and knowledge production. The fruitful interaction between EU institutions and European cities has great potential to make Europe a world reference point in identifying, experimenting and applying solutions to the future challenges that cities will be confronted with.
We envisage cities and human settlements that:

2. What is a city? 18
Barcelona, Spain

WHAT IS A CITY? 2.1. What criteria are used
to define a city?
When discussing the future of cities, one of the first questions to answer is: what do we mean by ‘city’? As yet, there is no global agreement on what a city is: definitions vary widely from country to country, not only in terms of method, but also as regards the idea of urbanity that comes with it.
In many countries, a local administrative unit is termed a city when its population exceeds a certain threshold. For example, many countries use minimum population thresholds to define their cities. The vast majority use thresholds of 5 000 inhabitants or below – Japan and China are outliers, using minimums of 50 000 and 100 000 inhabitants respectively (Dijkstra et al., 2018). Other countries do not use quantitative measures which are easy to compare but consider, for example, the presence of certain services (such as health care, education, or governmental bodies, even five-star hotels) or when the majority of its population is employed in non-agricultural activities to define their cities. In many cases, governmental authorities issue ‘city’ declarations based on political evaluations and the distribution of financial resources.
A city is much more than a physical imprint on a map. It is an organic entity with its own identity and capacity to respond to the demands and needs of its inhabitants, as well as influence its surrounding territory. Nevertheless, in order to ensure significant and consistent figures on urban trends, phenomena and challenges, some definitions are required.
The variety of definitions used poses significant challenges in terms of comparison and benchmarking: for example, in which areas do we
calculate proximity to services, transport efficiency, distribution of green areas, and land consumption per capita? The definition of city extent greatly influences the quantification and monitoring of many of the issues presented in this report.
2.2. Towards a global, people-based definition of cities and settlements
The European Commission (EC) leads a group of international organisations (Organisation for Economic Co-operation and Development - OECD, World Bank, Food and Agriculture Organization - FAO, International Labour Organization - ILO and UN-HABITAT) committed to developing a global, people-based definition of cities and rural areas. This commitment was formally undertaken at the Habitat III Conference in Quito, Ecuador in 2016. The proposed definition is people-based and includes mainly criteria for population density and total population, starting from the method developed by the EC and OECD called the Degree of urbanisation (DEGURBA). This method is computed using maps of built-up areas and population density obtained from satellite images and national censuses.
19 2. What is a city?
The way we define the physical boundaries of a city greatly influences the quantification and monitoring of urban phenomena.

According to this definition, which allows for a comparison of indicators for cities around the globe:
● An urban centre consists of contiguous grid cells with a density of at least 1 500 inhabitants per km2 and a total population of at least 50 000;
● An urban cluster consists of contiguous grid cells with a density of at least 300 inhabitants per km2 and a total population of at least 5 000;
● Rural grid cells: grid cells outside urban clusters.
The JRC has produced an Urban Centre Database (Florczyk et al., 2019) which describes more than 10 000 cities identified by applying the DEGURBA to the Global Human Settlement Layer baseline data. Use of the DEGURBA enables a comparison to be made of all cities on the globe over time in a consistent way. For example, it is now possible to identify and compare global megacities (those with more than 10 million inhabitants): according to this dataset, in 1990, there were 16 megacities
worldwide; in 2015, there were 32 megacities worldwide, none of which were in Europe while 22 were in Asia (EC JRC, 2018). With population growing exponentially worldwide, the number of large cities has increased significantly over the last 30 years and, while less prominently in Europe, this trend is expected to continue into the foreseeable future. Figure 2 shows the patterns of population growth in city centres between 1990 and 2015.
Population growth in urban centres
Figure 2: Population growth change in city urban centres between 1990 and 2015 Source: JRC | Florczyk et al., 2019, https://ghsl.jrc.ec.europa.eu/ucdb2018Overview.php
2. What is a city? 20
box 1. Applying the DEGURBA to compare cities globally

Figure 3: From left to right: urban centre, city, commuting zone and functional urban area Source: JRC, DG REGIO, https://ghsl.jrc.ec.europa.eu/ucdb2018Overview.php
2.2. Harmonised definitions of cities
In recent years, many international organisations have pushed to adopt harmonised city definitions: indeed, since this report illustrates work done in a broad range of fields and thematic areas, the definition of a city used may vary. According to the specific needs of each topic, the following definitions are used:
● The New Degree of Urbanisation, identifying three types of areas: (1) cities (equivalent to the global definition); (2) towns and suburbs (municipalities where 50 % of the population lives in urban clusters and it is not a city); and (3) rural areas. Urban areas are defined as cities plus towns and suburbs.
● Metro regions are Nomenclature of Territorial Units for Statistics level 3 ( NUTS-3) regions
or groupings of NUTS-3 regions representing all functional urban areas of more than 250 000 inhabitants. The typology distinguishes three types of metro regions: capital city regions, second-tier metro regions, and smaller metro regions. The capital city region is the metro region which includes the national capital. Second-tier metro regions are the group of largest cities in the country excluding the capital.
● Local administrative units (LAUs) or municipalities comprise a system for dividing up the European Union’s economic territory for the purpose of statistics at the local level. They are compatible with NUTS regions.
● A functional urban area (FUA) combines the city with its commuting zone (Figure 3).
21 2. What is a city?

Besides making comparability and exchange of data easier, the FUA definition also allows us to look at what is happening within the city as compared to its usually much larger commuting or serving area. In Europe, one interesting emerging phenomenon is the move back to the inner city, particularly in capital cities. For FUAs in the EU-28, modelled using population projections from 2010-205014, we see two main trends:
Path 1: Stagnant or slightly increasing total populations, with medium densification of the city
centre and densifying suburbs. In some cases, mainly in capital cities, this trend is stronger, with the population increasing considerably; a significant densification of city centre and medium densification of suburbs is projected.
Path 2: A decreasing overall population, with the city centre de-densifying and suburbs slightly densifying (especially in Eastern Europe and Germany). In some cases (mainly in Spain), the same trend is seen but with strongly densifying suburbs.
Figure 4: Different paths of population change in FUAs, comparing the city centre to its surrounding commuting zone Source: JRC | LUISA elaborations
760 15203800 Kilometers
Path 1
Path 2
EU-boundaries
2. What is a city? 22
box 2. An application of the FUA definition: future population trends for EU cities

23 2. What is a city?
Detecting spatial patterns of inequalities from remote sensing – Towards mapping of deprived communities and poverty (Ehrlich et al., 2018)

3. Urbanisation 24
JRC | LUISA Refined land use map of Berlin, Germany (Rosina et al., 2018)

URBANISATION 3.1. Trends and drivers
Most international publications on cities state that the urbanisation rate15 exceeded 50% in 2015, although this figure is calculated applying national definitions of urban areas that vary widely from country to country. Applying the global, people-based definition of cities and settlements illustrated in the previous chapter16, which uses harmonised and consistent population data, it emerges that the world is much more urbanised than previously reported (Pesaresi et al., 2017): according to the most recent JRC studies, 75% of the world population currently live in urban areas. The urbanisation rate in Europe (EU-28) was 72% in 2015 (source: JRC calculation based on the GHSL datasets17).
In 2015, urban areas hosted over 6.1 billion people, nearly double that in 1975, and their surface area (built-up footprint) exceeded half a million km2 (a 20% increase since 2000). While in the rest of the world urban population increased
faster than or at roughly the same rate as the built-up area, in Europe and Northern America the inverse occurred, meaning that more land is now being consumed to accommodate new citizens than in the past. Cities in Asia hosted 1 billion more people in 2015 than in 1990 (+40%), while in Africa and Latin America and the Caribbean the urban population roughly doubled. The built-up footprint of urban areas in Africa almost doubled in just 25 years, while in Asia it increased by 65% and in Latin America and the Caribbean by more than a third. Nearly 40% of overall built-up expansion and nearly 80% of population growth has taken place in the last 25 years in urban areas in Africa and Asia (Melchiorri et al., 2018a).
While unprecedented urbanisation occurs in most other regions of the world, Europe shows some distinct trends, in part because historically it has been much more urbanised than other regions, but also because of the distinct patterns of urbanisation that take place in Europe. On average, the European network of cities is denser than in other parts of the world, with predominantly mid-sized rather than large cities. European cities, with a density of 3 000 residents per km2, are almost twice as dense as North American ones, but less dense than those in Africa and Asia. The majority of Europeans are concentrated in cities with populations between 250 000 and 5 million. Indeed, Europe has a low share of city residents in both large and small cities compared to the rest of the world18 (European Union and UN-HABITAT, 2016).
Key drivers of urbanisation include demographic changes (net population change as well as rural-urban migration, immigration and changing age structures), economic growth (GDP, investment in research and development, employment and innovation), and socio-economic factors (high quality of life and service provision in cities).
25 3. Urbanisation
Figure 5: Evolution of built-up areas and population in urbanareas per region of the world (1975-2015) Source: JRC | GHSL (Melchiorri et al., 2018a)
2
00 100 200 300
6
4
Popu
latio
n (1
09 pe
ople
)
Built-up (103 km²)
1975
1990
2000
2015 Asia
AfricaOceania
Europe
Northern America
Latin America and the Caribbean

JRC projections to 2030 show that most European regions hosting major cities are expected to experience urban population growth (Lavalle et al., 2017) (Figure 7, top). Indeed, some regions will see significant growth in their urban population (greater than 35%, and up to almost 60% in Stockholm), particularly in southern France, northern Italy and southern Germany. However, population decline is foreseen in core cities in Spain (Madrid, Barcelona and Valencia),
Portugal (Porto), and Lithuania (Vilnius), and in clusters of regions throughout most of Eastern Europe, Germany, and the Iberian Peninsula (35% and above). While the total population of European FUAs is projected to increase on average by 6.8% by 2050, half will actually lose population, with 12% of cities losing more than a quarter of their population between 2015 and 2050 (Figure 7, bottom).
Cities can drive forward the economies of their surrounding regions (GDP growth since 2000 was 50% faster in cities than in other areas19). Macroeconomic projections for the EU-28 for 2016-2050 (Figure 6)20 indicate that gross domestic product (GDP) will continue to grow steadily (1.35% per year) despite a reduction in labour input from 2025 onwards due to increasing productivity (TFP - total factor productivity) growth rates. Indeed, employment will see modest growth until the mid-2020s, before starting to decline (mainly due to ageing). Total population will peak in the mid-2040s, then start to decline.
Figure 6: GDP, employment, and population trends for the EU 28 to 2050 Source: The 2018 Ageing Report (EC, 2018b)
box 3. EU trends in GDP, employment and population to 2050
3. Urbanisation 26
90.0
100.0
110.0
120.0
130.0
140.0
150.0
160.0
2016
2018
2020
2022
2024
2026
2028
2030
2032
2034
2036
2038
2040
2042
2044
2046
2048
2050
2016
= 1
00
Population Employment GDP

27 3. Urbanisation
< 300 300 - 600600 - 900900 - 1200> 1200EU boundaries
Population change
Density 2015 (people/km²)
EU boundaries
< - 25 % 0 - -25 % 0 - 25 % > 25 %
Figure 7: (top): urban population density in 2015 for European FUAs in inhabitants/km2 ; (bottom): population changes between2015-2050 in European FUAsSource: JRC | LUISA elaborations


PART 2: CHALLENGES

4. Affordable housing 30
KEY MESSAGES
• Some of Europe’s most in-demand cities have seen sharp increases in housing prices over the past years. This threatens housing affordability as prices are reco-vering faster than earnings, and the availability of housing is low.
• The recent scale-up of foreign and corporate investments in residential urban pro-perty has transformed patterns of ownership, raising concerns on the social fabric of a city and on who can be held accountable for citizen’s rights to adequate and affordable housing.
• Short-term rental platforms, which are becoming increasingly popular, may cause property prices to spiral and negatively affect local liveability.
Tenant Rights Rally, Washington, USA, December 2017

AFFORDABLE HOUSING
4.1. Urban property: prices, ownership and occupancy
In July 2018, in a joint statement to the United Nations, the cities of Amsterdam, Barcelona, London, Montreal, Montevideo, New York and Paris declared that citizens’ rights to affordable housing are being jeopardised following the growing influence of speculators, investors and mass tourism on urban property markets21. The expanding role of financial actors on the housing market is referred to as the financialisation of housing. Although this development is not univocally considered problematic, significant concerns have been raised about its effects on affordability, accountability and liveability. The cities demanded more resources, power and tools to tackle these issues, indicating that they face a complex problem that is operating on a global level. Access to adequate housing is also the focus of one of the partnerships in the Urban Agenda for the EU22 (Box 4).
In 2016, UN special rapporteur on adequate housing, Leilani Farha, in partnership with United Cities and Local Government and the Office of the United Nations High Commissioner for Human Rights initiated ‘The Shift’, a global movement bringing together all levels of governments, civil society, different institutions and academia to reclaim the fundamental human right to housing. The aim is to move away from housing as a place to park excess capital, reinforcing inequality and the concentration of wealth. The Shift is strictly related to target 11.1 of the SDGs which aims to ensure access for all to adequate, safe and affordable housing and basic services by 2030.23
31 4. Affordable housing
“Housing should be seen as a human right, not a commodity.”Leilani Farha, UN special rapporteur on adequate housing24

4.2. Trends and key figures
In 2015, the Housing Partnership was one of the first partnerships to be established within the framework of the Urban Agenda for the EU. This partnership was given a three-year mandate to work on public and affordable housing, state-aid rules and general housing policy. Among its members were both cities and Member States, with Vienna and Slovakia in coordinating roles, as well as the European Commission, AEDES, EUROCITIES, the European Investment Bank, Housing Europe, the International Union of Tenants, Urban Development network programme (URBACT) and Union Habitat. In taking up these issues, their relevance for the EU and its citizens was
acknowledged, even though the EU does not have a direct mandate on housing. While taking into account all governmental levels, the partnership specifically focused on cities. In December 2018, the final action plan was presented, identifying 12 key actions, including: better guidance on EU regulation and public support for housing; capacity building for the application of state-aid rules in the affordable housing sector on city level; the establishment of an affordable housing good practices database; recommendations on improving the EU urban housing market data; and recommendations on the improvement of EU gender-poverty-energy nexus data25.
* Uncertainty range due to differing data quality
Figure 8: The number of years a skilled worker needs to work to be able to buy a 60m2 (650 sq.ft.) near the city centre Source: UBS, 2018
4. Affordable housing 32
box 4. Urban Agenda for the EU Housing Partnership
5 101 15 20 years
Hong KongLondonParisSingaporeTokyoNew York AmsterdamVancouverSydneyMunichGenevaSan FranciscoZurichTorontoStockholmFrankfurtMilanLos AngelesBostonChicago
Current value
Range*
Value in 2008

Affordability and pricing: the Global financial crisis (GFC) significantly reduced public investment in affordable and social housing across Europe, and the overall situation is still characterised by a shortage/backlog. Of the 220 million EU households, around 82 million citizens spend more than 40% of their disposable income on housing, and social housing waiting lists are at a record high. It is estimated that the lack of investment in affordable housing amounts to around EUR 57 billion per year, whereas demand is steadily growing26. Surveys27 show that, in 2015, most EU citizens found it more difficult to find affordable housing in capital cities than in other cities. Real estate markets appear least accessible in Paris, Stockholm, Helsinki, Amsterdam, Copenhagen, Luxembourg, Berlin, London and Dublin, where more than 80% of citizens indicate that they do not think it is easy to find good housing at a reasonable price.
According to recent data, a skilled service worker needs to work more years than before to be able to buy a 60m2 (650 sq.ft.) flat near the city centre. For example, in 2008, if a worker in Munich needed five years of salary to buy a dwelling, in 2018, the same worker needed nine years of salary. These data are based on a price-to-income ratio: the number of times the typical sale price is greater than the median annual household income. All European cities, except Milan, reported a higher price-to-income ratio in 2018 compared to 2008.
Although some property markets have shown slower growth rates or price decreases after a period of significant price increases (e.g. Stockholm and London), others are still displaying double-digit annual rises. In Europe, between September 2017 and 2018, Budapest, Porto, Rotterdam, Amsterdam and Berlin showed price hikes of 10 to 20%. Other cities, such as Bern, Dublin, Madrid and Malaga, experienced increases between 5-10%. Frankfurt’s housing market grew around 7% annually in the period 2013-2018, about 13% in 2018 alone28 . Amsterdam also showed strong price rises. However, some markets have seemingly peaked now, such as London, Zurich and Stockholm. According to recent studies (UBS 2018), urban Europe is currently experiencing a late cycle market (Urban Land Institute 2019). The dots in Figure 9 indicate the risk of a price bubble (red: at risk, pink: moderate risk, light blue: a relatively healthy market, and grey: undervaluation).
Investors: while investors have long been operating on real estate markets, in recent years urban property has increasingly become the commodity of choice to stash capital and excess liquidity. Between 2013 and 2014, corporate buying of larger properties in the top 100 recipient global cities rose from approximately EUR 520 billion to EUR 870 billion. These investments are characterised by more trans-border flows, with residential properties representing the largest single share. For example, during this period, foreign corporate buying of properties in Amsterdam/Randstad rose by 248%, and by
Figure 9: Inflation-adjusted price growth rates, annualisedin per cent Source: UBS, 2018
33 4. Affordable housing
FrankfurtAmsterdamVancouverHong KongSan FranciscoSingaporeMunichLos AngelesParisTokyoBostonChicagoMilanTorontoZurichNew York GenevaLondonSydneyStockholm
0–52017 2018 5 10 15
Last 5 yearsLast 4 quarters
Housing market risk assessment

180% in Madrid, (United Nations 2017, Sassen 2018). Increasing inflows of equity from wealthy individuals are also observed (mostly from Asia), rather than just from institutions. Although overall direct investment from Asia (notably Korea, Singapore and Japan) is expected to grow in the future, it accounted for only 9 of the 124 billion EUR (7%) of direct investment in urban real estate in Europe between January and mid-September 2018. The largest direct investor groups are from Western Europe and the UK, followed by North America. It should be noted, however, that direct investments do not take into account foreign commitments to funds that include EU property in their portfolios (ULI, 2019).
When remote investors own rented homes (or mortgages) money mainly flows out of communities. Moreover, many corporate owners of housing are anonymous, obscuring where and to whom exactly ownership belongs. In London, for example, shell companies registered in offshore havens hold more than 36 000 properties. Tenants living in places owned by absentee corporate landlords have complained of sharp rent increases and inadequate maintenance, being unable to hold anyone responsible (United Nations, 2017). Consequently, financialisation of the housing market has raised concerns over accountabilty as regards the right
to adequate housing. In some cities, a significant proportion of bought-up property is also left vacant, contributing to housing shortages. This phenomenon is referred to as ‘runaway real estate speculation’ or ‘buy to leave’ property. In Paris, around 7% of houses lie vacant – 40% of which are not even connected to the electricity grid. See Figure 10 for the percentage of vacant homes in different world cities29.
Tourism: another novelty of the current housing market is the increasing use of online rental platforms which have allowed homeowners to flexibly participate in the commercial market for short-term residential housing. While this has had some positive effects in some cities, including the renovation of older buildings located in historical centres, and boosting the local tourism industry, concerns have been expressed about its impact on housing affordability. Indeed, several studies suggest that the ‘Airbnb effect’ exists, and that the use, especially of this largest platform, is associated with rising property prices (Sheppard and Udell, 2016). It has also been pointed out that it is hard to disentangle the effect of Airbnb from other factors such as gentrification. Nevertheless, the effect of restrictions on short-term rentals on housing prices has been seen in 18 cities in Los Angeles County; a decline in Airbnb listings was associated with a fall in property values.
Figure 10: Percentage of total homes that lie vacant, as reported by local governments Source: Better Dwelling, 2017
4. Affordable housing 34
London New York Hong Kong Paris SingaporeSydney Vancouver Toronto Los Angeles0 %
1 %
2 %
3 %
4 %
5 %
6 %
7 %
8 %
9 %
San Francisco
Perc
enta
ge o
f to
tal h
omes

On average, restrictions on short-term rentals reduced housing prices by 3%, with a more significant effect in the most popular tourist areas: 14% within 5 km of Downtown LA, and almost 40% in Venice. These results strongly suggest that Airbnb has a positive effect on property values, especially in areas that attract tourists (Koster et al., 2018).
One reason why online rental platforms are so attractive to tourists is because they offer a local experience in a fully-equipped house for attractive prices. For example, Figure 11 (left) shows that, on average, Airbnb listings in Milan are cheaper than traditional accommodation options provided through Booking.com. Following this high demand, landlords have realised that short-term rentals are much more profitable than renting out to regular tenants, resulting either in them extracting their apartments from the regular market or sharply increasing the rent. Indeed, Figure 11 (right) shows that, on average, Airbnb can provide between 1.2 to 2.2 times more gross income than long-term rental in Milan.30
The competitive advantage of Airbnb over traditional accommodation options, combined with higher profitability than long-term renting, can drive existing and future housing into the short-term rental market. This is especially relevant in more
touristic areas. It has been estimated that New York’s long-term rents have increased by 1.4% over the last three years due to the growth in short-term rentals31. In order to curb these negative effects and protect the regular housing market, more and more cities have been putting policy measures in place. One such measure is to put a limit on the number of days you are allowed to rent out your dwelling annually. In Amsterdam, for example, you can only host Airbnb guests for 60 days; in London, the limit is 90 days, while Paris has a 120-day maximum. However, the EU General Data Protection Regulation and the E-commerce Directive limit the ability of cities to force rental platforms to share the data they need to detect violations of these regulations. Therefore, in January 2018, a number of cities32 addressed the European Commission in order to improve and update the enforcement of legislation for apartment holiday rentals, specifically asking for a legal initiative to secure their access to data. Later that year, the city of Barcelona actually struck a private deal with AirbnB, having threatened to sue the company if they did not remove those listings lacking the newly required city-approved licence for short-term rental33. Airbnb would support legislation restricting home sharing to one single home and allowing enforcement to focus on illegal hotel operators while protecting regular citizens34.
Figure 11: Analysis of price ranges (in euros) for properties as advertised on Airbnb.com compared to those (left): on Booking.com (cost per night); (right): available for long-term rent on immobiliare.it (cost per month in euros) Source: JRC | LUISA elaborations.
Freq
uenc
y
Cost / day0 50 100 150 200 250 300
0.0000
0.0025
0.0050
0.0075
0.0100
0.0125
0.0150
0.0175
BookingAirbnb
Milan: Airbnb vs. Booking
Long-term rentAirbnb
Freq
uenc
y
Cost / month0 2000 4000 6000 8000 10000 12000
0.0000
0.0001
0.0002
0.0003
0.0004
0.0005
0.0006
0.0007
Milan: Airbnb (daily) vs. long-term rent
35 4. Affordable housing

Despite concerns about the financialisation of the urban housing market, some cities consider the presence of investors as positive and encouraged this development during the years of the GFC. Cyprus, Greece, Portugal and Spain, for example, have specifically implemented policies to attract wealthy foreigners. One such policy is the so-called ‘golden visa’ that provides permanent residence or citizenship for those investing a minimum amount in property. Since 2012, Portugal has granted more than 5 500 such visas, mostly to Chinese investors, bringing in around EUR 3.4 billion35.
Finally, a trend has been detected whereby investors are embracing the idea of combining the long-term
sustainability of financial performance with a greater emphasis on its role in society, taking into account environmental and social values. In 2018, the CEO of BlackRock Inc., the world’s largest asset manager, sent a letter to all senior executives at the companies in which the firm has invested, stating that in order to prosper over time, companies must show how they make a positive contribution to society. For this reason, BlackRock now places significant emphasis on sustainble investment, incorporating environmental, social and governance criteria (ULI, 2019).
One way to mitigate the lack of affordable housing is through the creation of social housing, whereby local administrations and non-profit housing
Amsterdam has experienced a significant boom in its real estate market in recent years: between 2016 and 2018, property prices increased by 45%, well above the national average (UBS 2018). Concerns have been raised about the city’s affordability. It is estimated that if no measures are taken, the percentage of affordable housing will decline from 61% in 2015 to 43% in 2025, hitting low- to moderate-income households the hardest.36 The rising prices are related to a scarcity in properties for sale. For 2018, the scarcity indicator was 2.5, indicating very limited options for potential buyers, whereas any number below 5 points to a seller’s market. Following this, in recent years, surrounding markets have experienced a spillover effect, seeing their prices rising significantly as well. Moreover, over the course of 2018, for the first time in years, Amsterdam property prices rose less than the national average37. Investors have increasingly found their way into the city, an attractive market based on its strong economy, geographical location, internationally significant airport, relatively low transaction costs, and a friendly tax regime. In addition, it is expected that Amsterdam will attract more business from the UK following Brexit.
Figure 12 shows the increasing transaction volumes between 2009 and 2018. These include all kinds of property investment, although in 2018 residential investment overtook offices for the first time. Compared to London, housing prices are still very moderate, with an average of 5.169 per m2 versus 26.103 per m2, when comparing a 120m2 apartment in both cities. Although investor activity has increased, Amsterdam is not (yet) troubled by a significant share of buy-to-leave property38. However, in an effort to keep the housing market affordable and accessible, the city has launched several studies to get a better understanding of the situation and to assess how any negative developments should be curbed. As regards the latter, Amsterdam is also looking at other EU cities which have experienced similar problems.
9 10 11 12 13 14 15 16 17012345678
(€ bn)
Figure 12: Transaction volumes, 2009-2018 (third quarter) Source: ULI, 2018
4. Affordable housing 36
box 5. Case study: Amsterdam, the Netherlands

Figure 13: Property values in Amsterdam in 2017, in euros per m2
Source: City of Amsterdam, https://maps.amsterdam.nl
associations rent out government-subsidised dwellings. This type of housing is often associated with lower-quality constructions, seen as much less desirable and only for those with the lowest incomes. However, cities such as Vienna, where 62% of residents live in social housing, show that such housing can also serve a broader segment of the population. The annual income threshold to apply for social housing is around EUR 47 000 after tax, which is well above the national gross median income (approximately EUR 27 500). Moreover, a developer competition that includes panels of architects, lawyers and other housing experts to judge bids for the construction of new social housing, ensures competition between
developers to offer high-quality and energy-efficient homes39. While many cities lack a long-standing infrastructure or the resources for large-scale social housing schemes, some governments have recently implemented measures to stimulate a more inclusive approach to private investment in housing by means of financial incentives, such as offering free government land in exchange for the development of affordable units for the middle class. Other governments have become more prescriptive to protect the social dimension. In London, for example, the mayor recently announced that builders will be required to make 35% of their newly built homes truly affordable40.
37 4. Affordable housing
> 7699 6416-7699 5774-6416 5132-5774 4491-5132
3208-3849 2566-3208 1925-2566 < 1925
Property values in euros per m2
3849-4491

5. Mobility 38
KEY MESSAGES
• Mobility in cities is one of the sectors that will change most in the future as a result of technological innovation and behaviour changes.
• The ownership of private vehicles will decrease as mobility as a service, combining multiple modes of transport, becomes more prominent in cities.
• Legislation and appropriate governance measures will be needed to ensure new trans-port modes complement rather than compete with public transport.
• Autonomous electric vehicles could bring benefits to cities by reducing air pollution and congestion although they could also lead to negative socio-economic consequences as they replace existing professions.

MOBILITY 5.1. How can cities address
future mobility challenges?
The mobility of goods and people is one of the essential elements of urban development, characterising urban space and how it functions. Over the past 50 years, personal transport has been dominated by private vehicles powered by internal combustion engines. They have given users a great degree of freedom by allowing them to reach virtually any location. However, their mass adoption in cities has also led to congestion (with its economic impact and related increase in commuting time), has negatively impacted the environment (air and noise pollution), human health, personal safety, and reduced liveability and social inclusion. As the world population continues to concentrate in cities, the negative impacts associated with transporting people and goods are being exacerbated.
Cities are now actively starting to address these issues by implementing a range of different strategies, such as bringing in congestion charges and parking fees to internalise the negative impacts of transport41, improving and promoting the use of public transport (PT), encouraging non-motorised transport with dedicated pedestrian-bike paths, and restricting the access of certain vehicles to the city centre. Together with changes in transport behaviour and lifestyles, advances in urban mobility technology42 are opening up new pathways towards a decarbonised and sustainable urban transport system. The transition towards automated, connected, electrified and shared (ACES) mobility for both people and goods (e.g. last-mile delivery via autonomous pony express and drones) is already on the way. Changes in urban mobility will affect cities’ health, socio-economic conditions, land use, energy efficiency and use of renewables, requiring the appropriate policy framework, standards and planning.
5.2. Trends and key figures
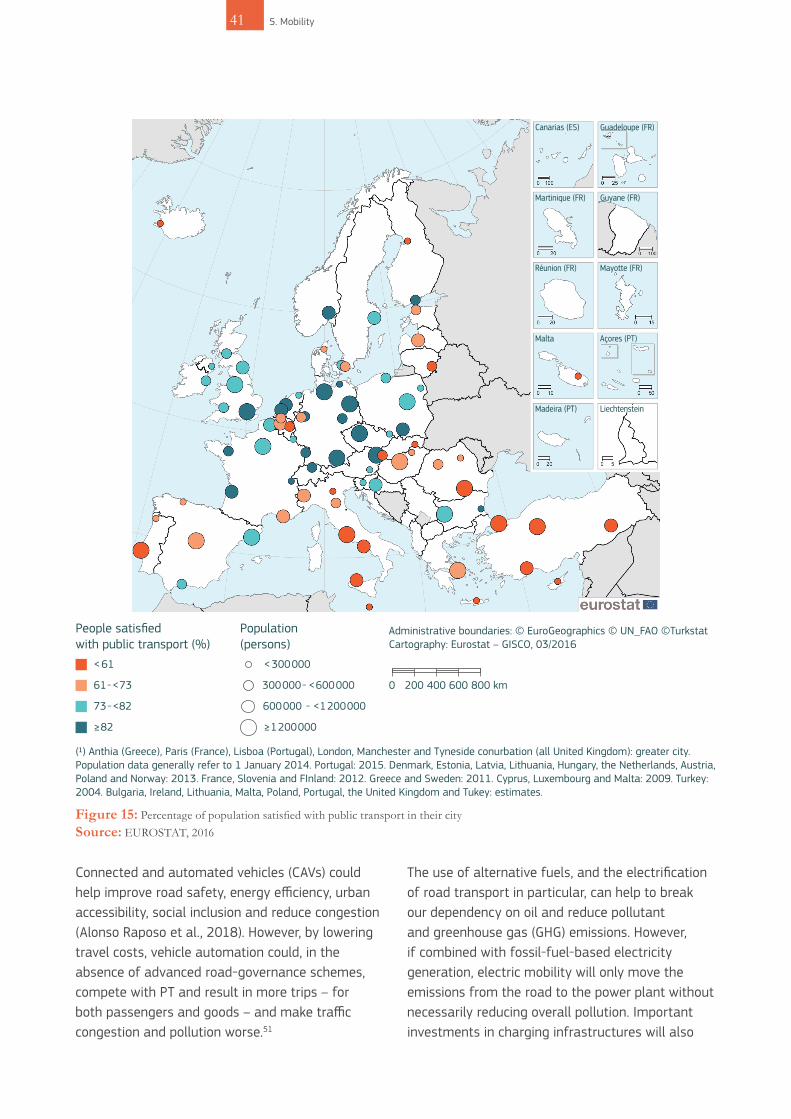
Almost one in three European cities will see its population increase by more than 10% in the next 30 years. This is likely to result in more road traffic and greater use of underground and rail services, the capacity of which could reach its limits. While on average car use has grown in Europe, in cities people have increasingly taken to other modes of transport. Capital cities have the lowest rates of residents using cars, although the variations among cities are stark: from over 70% in Lefkosia (CY) to less than 10% in Paris (FR) (European Union and UN-HABITAT, 2016). In response to fast-changing needs, future urban transport systems will have to introduce new mobility services and promote innovation, active transport infrastructure, PT and accessibility for all. To this end, sustainable urban mobility plans (Figure 15), including governance and planning, may prove particularly valuable (Pisoni et al., 2019).
39 5. Mobility
“We are on the cusp of one of the fastest, deepest, most consequential disruptions of transportation in history.” (Arbib and Seba, 2017)

Reliable, affordable and safe PT will also be key to sustainable mobility in cities. It can lower energy consumption and pollutant emissions and reduce congestion, thereby improving traffic flows and reducing travel times. The cost of PT is usually offset by incomes during peak urban traffic hours. Rather than focusing on low fares, PT agencies should therefore develop an incentivising, time-varying pricing scheme (as pioneered, for example, in Singapore45), that reflects the costs. Cities have a unique opportunity to provide optimised and efficient PT networks (bus, metro, train or alternative systems) to meet citizens’ needs. As an example of good practice, bus rapid transit (BRT)46 is expanding worldwide, particularly in Asia and Latin America47. Some cities are even introducing free PT systems (e.g. Dunkirk and Tallinn48).
However, substantial efforts are still required to increase satisfaction with PT across Europe (Figure 15). Walking and cycling are also important alternative transport modes in European cities. They promote a healthier lifestyle, increase accessibility and make the urban environment more attractive (Stevenson et al., 2016) while reducing noise and polluting emissions. Some cities have been extremely successful in promoting these modes of mobility, with more than 40% of the trips made on foot or by bike in Copenhagen, Helsinki, Amsterdam and Vienna.49 Many other cities can boost walking and cycling by making such modes more attractive and convenient and by improving traffic safety.
Both the private sector and cities themselves can incentivise the use of multimodal transport and new alternative modes of transport (shared electric bikes, scooters and walking) by introducing and operating new mobility services and making them easier to use. Mobile navigation apps help users to find the best way of getting from place to place, while bicycle-sharing points are becoming increasingly popular in cities of all sizes. For example, the city of Barcelona (ES) established the LIVE platform50 – a public-private partnership to coordinate, monitor and communicate e-mobility activities in Barcelona and the surrounding area.
Vehicle sharing is also growing in popularity and its wider adoption in cities could help reduce the need for parking, thereby freeing up space for new housing or green areas. However, car sharing alone would probably offer little relief for congestion in peak hours, when the majority of commuters need to arrive at work at the same time. Technological advances, such as GPS tracking or automatic registration-plate identification, could provide opportunities for dynamic road pricing which, in turn, could help steer mobility choice and reduce congestion (Vandyck and Rutherford 2018, Cramton et al., 2018). Such a system enabled Gothenburg (SE) to reduce traffic by over 10%, in 2013, and increase the use of PT.
Figure 14: Key factors to enable sustainable urban mobility (SUM)
5. Mobility 40
Governance Public transport
Active transport Mobility services and innovation
SUM
EUGermanyhours
in congestion in cities44
and1830
250 million cars in the EU
~1 car every 2 EU citizens43
Connected and automated vehicles (CAVs) could help improve road safety, energy efficiency, urban accessibility, social inclusion and reduce congestion (Alonso Raposo et al., 2018). However, by lowering travel costs, vehicle automation could, in the absence of advanced road-governance schemes, compete with PT and result in more trips – for both passengers and goods – and make traffic congestion and pollution worse.51
The use of alternative fuels, and the electrification of road transport in particular, can help to break our dependency on oil and reduce pollutant and greenhouse gas (GHG) emissions. However, if combined with fossil-fuel-based electricity generation, electric mobility will only move the emissions from the road to the power plant without necessarily reducing overall pollution. Important investments in charging infrastructures will also
< 61
People satisfied with public transport (%)
Population(persons)
Administrative boundaries: © EuroGeographics © UN_FAO ©TurkstatCartography: Eurostat – GISCO, 03/2016
(1) Anthia (Greece), Paris (France), Lisboa (Portugal), London, Manchester and Tyneside conurbation (all United Kingdom): greater city.Population data generally refer to 1 January 2014. Portugal: 2015. Denmark, Estonia, Latvia, Lithuania, Hungary, the Netherlands, Austria, Poland and Norway: 2013. France, Slovenia and FInland: 2012. Greece and Sweden: 2011. Cyprus, Luxembourg and Malta: 2009. Turkey: 2004. Bulgaria, Ireland, Lithuania, Malta, Poland, Portugal, the United Kingdom and Tukey: estimates.
61- <73
73- <82
≥82
< 300000
300000- <600000
600000 - <1200000
≥1200000
0 200 400 600 800 km
Malta
Madeira (PT)
Réunion (FR)
Martinique (FR)
Canarias (ES)
Açores (PT)
Liechtenstein
Mayotte (FR)
Guyane (FR)
Guadeloupe (FR)
41 5. Mobility
Figure 15: Percentage of population satisfied with public transport in their city Source: EUROSTAT, 2016

be needed to enable the mass uptake of such technology (Tsakalidis and Thiel, 2018).
In the future, more integrated urban transport solutions will make use of dedicated digital platforms to bring together all available means of transport combining, for example, PT with autonomous electric-car sharing and short- term bicycle rental applications to offer Mobility as a Service (MaaS). A recent study for the Greater Dublin Area showed that such a combination of shared mobility and light rail services could significantly help to reduce the need for private cars.52
While technological innovation and the development of alternative transport modes have the potential to cut travel time and increase mobility in cities, alternative governance approaches are trying to decrease the overall need for personal travel by:
Redesigning cities: new urban developments are promoting higher-density housing, thereby making PT more efficient while also promoting a new work - live - play urban model whereby all the necessary services/housing/entertainment are within walking distance.
Bringing services to the people: a growing proportion of workers can now work away from the office. In 2017, 14% of the EU’s urban population teleworked at least once a week53. This reduces the need for commuting trips. Online shopping has also increased dramatically recently, leading to fewer ‘shopping trips’. However, a decline in the need for personal transport has been offset by an increase in the number of trips made by last-mile delivery vehicles. The use of electric drones and autonomous pony express for last-mile delivery could replace traditional delivery trucks and reduce congestion and emissions. Recent work has identified that up to 7.5% of the EU population could have access to home-delivery
services (dispatched from drone beehives) if such services were legally authorised (Aurambout et al., 2019).
Adapting working hours: peak traffic hours often coincide with home-to-work and work-to-home trips. Thus, initiating dialogue with major employers to introduce more flexible working hours may help to redistribute traffic and lower congestion during peak hours.
Every city is unique and how mobility evolves will depend on a city’s current state (network and physical features) and its capacity to adopt new technologies and behaviour. Whilst large infrastructure investments, such as the implementation of new PT systems, may be possible in capital cities or cities which are growing very quickly, cheaper options, like optimising existing infrastructure and sharing, will be more feasible in others.
Information and communication technology (ICT) applications are already being used to facilitate on-demand transport services in areas with relatively low travel demand. While this market in particular could benefit from the growth of shared CAVs, there is a potential risk that such technology could be used as a substitute for PT rather than to complement it, and that by disrupting current mobility solutions, these technologies could also have socio-economic impacts on the EU labour market (particularly on the taxi, logistics and parking industries).
5. Mobility 42

Helsinki54 plans to implement a revolutionary mobility-on-demand system that will make car ownership unnecessary by 2025. Citizens will be provided with different mobility options that are easy to use, cheap, flexible and well-coordinated, to discourage private car ownership. A smartphone app will allow users to interact with the system either to plan trips or to pay for services.
The system will integrate shared (automated) vehicles, shared bikes, buses and ferries. In addition, sharing services are expected to contribute to reducing private car ownership. Potential concerns about the actual accessibility of mobility services (cost, use of smartphones and credit cards, integration with PT) are also being addressed.
Figure 16: Percentage of population potentially covered by drone services and estimated return of drone delivery hives per countrySource: JRC | Aurambout et al., 2019
43 5. Mobility
box 6. Mobility in Helsinki, Finland
0 %
5 %
10 %
15 %
20 %
25 %
FI PT ITHUPLDKSE FR DENLIEGR DK
0
2
4
6
8
10
12
14
16
Mill
ions
of
euro
s
Percentage of population in coverage Estimated return
JRC | LUISA Refined land use map of Helsinki, Finland (Rosina et al., 2018)

6. Provision of services 44
Street view in Amsterdam, the Netherlands, 2017
KEY MESSAGES
• In the future, specialised urban services – an essential part of a city – should be sustainable, efficient, reusable, co-usable, modular, personalised and data-driven.
• The nature of public and commercial services in cities is continuously transforming.
• Specialised (regional) services need a sizeable market close by and are thus more eco-nomically viable in larger cities.
• Provision of services could be improved by promoting compact urban development and the mixed use of land; developing integrated land use and mobility plans; and embracing new service-easing technologies.

PROVISION OF SERVICES
6.1. How accessible are city services?
Cities have always been places where the production and distribution of goods and services take place through a complex and dynamic system of social and economic interactions. An inclusive, productive and liveable city should have an efficient system for providing services to its residents and the population in its hinterland. Services that are well integrated with the built environment and have acceptable accessibility, affordability, quality, adequacy and flexibility features are one of the main components of a viable city, both now and undoubtedly in the future.
6.2. Trends and key figures
The nature of public and commercial services55 in cities is continuously transforming. Widespread use of the internet and mobile technologies are revolutionising the provision of urban services56,
for example, by enabling walk-out-shopping schemes such as Amazon Go which does away with the time customers spend in shops; by facilitating online renting and booking of short-term accommodation or touristic stays via Airbnb57
or Fairbnb (a community-centred alternative); and through new mobility services such as UBER and LYFT (app for peer-to-peer ride-sharing and taxi services). For instance, starting from a mobile app, 3 million UBER drivers provide 15 million rides every day in more than 600 cities58; there are over 4 million Airbnb listings worldwide and it averages about 500 000 stays per night59.
45 6. Provision of services
Having specialised services is an essential part of being a city.
Smart Sustainable
Efficient Re-useableCo-useable
Modular Personalised
Data driven
Digitalisation of services
The internet of things and sensors
Changing demographics and ageing population
Environmental friendly solutions
Flexible and adaptive firmsand services
User oriented services
provision of services
in the future
Tran
sfor
mat
ion
area
s

In the future, changes will continue in many more areas with the digitalisation of services, the Internet of Things and sensors, and flexible and adaptive firms and services60. Changing demographics and an ageing population, with the increasing importance of user-oriented services, will also shape the provision of services.
These key transformations might bring more opportunities to future services in cities to make them more sustainable and efficient. They will be more personalised, more informing and more data-driven. Personalised information, user preferences and their immediate feedback on specific services will help service providers to
adapt their activities. Services will be reused and recycled more. Co-using and co-sharing will have widespread impacts in many service areas, not just on housing and transport. Firms and services will be more flexible and adaptive where, for instance, their modular and multi-purpose facilities can be used for different purposes at different times of the day.
Policies that anticipate, support or promote sustainable and efficient provision of services in cities would be in different thematic fields such as urban form, transport and technology. They include promoting compact urban development, mixed-use of land and intensification and reorganisation of urban centres in order to keep services as close as possible to their users; developing integrated land-use and transportation plans, linking important services with PT systems, creating pedestrian streets and improving co-mobility, multimodality and sharing mobility services to make such services accessible via sustainable, low- and zero-emission transport modes; and deploying/facilitating technologies by service providers such as shop-and-go or pay-online and providing real-time information on various aspects of services, like quality, availability and price. The first two case studies in Box 7 are good examples of how the provision of services depends on different urban development patterns, whereas the third case illustrates for a specific city how they could be improved with proper policies and technologies used for urban areas.
6. Provision of services 46
Compact urban development, intensification and reorganisation of urban centres
Mixed use of land; innovative urban design
Easing technologies by service providers
Real-time information on various aspects of services (qulity, availability, price, etc.)
Integrated land-use and transport systems
Links to public transport systems, walkable pedestrian streets, co-mobility and shared
Urban form
Transport
Technology
Specialised (regional) services need a sizeable market close by and are thus more economically viable in larger cities.

case 1: service accessibility In EuropeWhat sets cities apart is the availability of many highly specialised services, such as universities, academic medical centres and speciality bookstores. Such services need a sizeable market of potential users close by and are thus more economically viable in larger cities. Indeed, larger cities perform better particularly as regards
accessing highly specialised regional services (Figure 17). A person living in a city with less than 100 000 inhabitants is expected to travel on average 30 km to reach a (generic) regional or specialised facility, whereas it is possible to find a regional facility within 6 to 8 kilometres in cities with over 1 million inhabitants (Kompil et al., 2019).
0
5
10
15
20
25
30
35
40
Towns and Suburbs 1 million - 5 million500.000 - 1 million<100 000 > 5 million100.000 - 500.000
Cities by population size
Aver
age
road
dis
tanc
e pe
r pe
rson
to
the
near
est
faci
lity
(km
)
Local facilities Regional facilities
Figure 17: Average road distance to the nearest (generic) local and regional facilitySource: JRC | Kompil et al., 2019
47 6. Provision of services
box 7. Three case studies on services
The economic logic that drives the choices of location for services and their inherent preference for larger cities is presumably as old as cities are. Today, technological advances introduce
the opportunity to drastically reduce the need to move to a service location, although questions remain as to viability, quality, effectiveness, sustainability and equity of services.

case 3: accessible MálagaThe World Health Organization (WHO) estimates that 15% of the global population live with some form of disability and cannot fully and equally enjoy recreation, community, or social resources, including travel. In Málaga (ES), enormous efforts are being made to adapt to the needs of people with disabilities. The city is eliminating barriers, providing access to cultural and natural resources, and creating standards for transport and the built environment. The majority of monuments, restaurants, streets and beaches have been adapted for people with disabilities61. For example, the city administration has introduced electronic devices that enable blind people
to enjoy swimming from Málaga’s public beaches. These devices are comprised of a wristwatch with an audio system that gives swimmers information on depth at all times, and with an alert button to call for help if needed62. In 2018, this strategy earned Málaga a European Smart Tourism Award in the ‘Accessibility’ category for providing outstanding accessible solutions for all of its visitors, regardless of age, physical disability and cultural background63. The strategy aims to improve the total accessibility of Málaga’s beachfront and to provide substantial pedestrianisation not only in its urban centre but in other districts, too, combined with good access to public transport64.
Luton, UKWorthing, UK
London, UKOxford, UK
Umeå, SE
Kuopio, FI
Tartu, EE
Del , NL0 500 1000 1500 2000 2500 3000 3500 4000 4500 5000
Population density by functional urban areas person/km
0
1
2
3
4
5
6
7
8
9
10
11
12
13
Net
wor
k le
ngth
per
per
son
met
res
Base
d on
obs
erve
d PT
sto
ps
Figure 18: Population density vs. observed network length per person in European functional urban areasSource: JRC | Kompil et al., 2018
6. Provision of services 48
case 2: public transport service efficiencyThere is a strong relationship between urban form, population distribution and efficient PT service provision in cities. For instance, the network length required per person for PT services in Europe’s
FUAs (e.g. bus and tram) decreases with population density (Figure 18) and becomes more efficient after 1 000 people/km2 (i.e. with fewer stops and kilometres to operate) (Kompil et al., 2018).

49 6. Provision of services

7. Ageing 50
KEY MESSAGES
• By 2070, life expectancy in the EU will rise to 88.2 years, while the old-age dependency ratio (the number of elderly people as a share of those of working age) is expected to almost double.
• While ageing is a global trend, it is of particular concern in regions where the overall population is in decline, which is increasingly the case in Europe. Additional strain will be put on the welfare system, as growing costs for health care, pensions and social benefits will need to be covered by a shrinking labour force, with the potential to impact overall GDP and innovation, too.
• Cities will have to adjust their services in areas such as health care and mobility, as well as public infrastructure, housing, and social policy to cater to the changing demographics.
AGEING 7.1. How can cities cater
for an ageing society?
Globally, life expectancy at birth is increasing. Moreover, we are staying healthy and sustaining a high quality of life longer into our old age. Modern medicine, technology, and service provision have enabled us to generally live longer and in better conditions than ever before. While this is very good news for the individual, an ageing population and changing demographic structure brings certain challenges for society as a whole and for cities in particular.
While population growth remains exponential in many parts of the world, in Europe, some cities are witnessing an overall population decline. If managed properly, however, the potential opportunities offered by these changes could outweigh the concerns. Adapting the built environment, service provision and mobility within cities in a way that takes into account the needs of a changing age structure may be beneficial to all citizens’ quality of life.
7.2. Trends and key figures
While ageing is a global trend, it is of particular concern in regions where the overall population is in decline and therefore the old-age dependency ratio65 is becoming even higher. According to projections from the Ageing Report 2018 (EC, 2018b), this is increasingly the case in Europe. In recent decades, Europe’s demographic structure has been changing significantly and will continue to do so in the foreseeable future. On average, Europeans now live 5.1 years longer than they did in 199566. Total death rates have also dropped significantly, especially among the older population (a 21.7% decline in the annual number of deaths for the
age group >65 years, as compared to an average 2.8% decrease among younger people). In 2016, the average life expectancy at birth in the EU-28 was 80, and it is expected to increase to 86.1 for men and 90.3 for women by 2070. The total population is projected to fall by 1.3% and the working-age population (15-64) by 15.5%. The old-age dependency ratio (is expected to almost double by 207067.
While the majority of larger cities, which remain highly attractive to all age groups, may not be so affected and can maintain mean population ages that are lower than the national average, a growing number of Europe’s cities are experiencing a shrinking total population, which means that old-age dependency ratios are rising. Although not always true, the median age of populations living within capital cities tends to be lower than the national average. Examples include Brussels (where people are on average six years younger than the national average), Paris and Amsterdam (both five years younger) (Eurostat, 2019).
51 7. Ageing
“By 2070, EU life expectancy is projected to increase to 88.2 years. The old-age dependency ratio will almost double.”(EC, 2018b)

As the European population becomes more mobile, the attractiveness of cities becomes increasingly important in understanding the future age distribution across Europe. The attraction of larger cities is clear for the working-age population as they provide many educational, employment, leisure and even partner-finding opportunities (Gautier et al., 2010).
Those opting to migrate after retirement may have very different criteria for choosing where they live. For example, Ostend (BE) and Porto (PT) – coastal cities with good services and recreational provisions – have a median age of 49, while their national averages are 41 and 44, respectively. Another example is Spain’s Costa del Sol which has a large community of foreign retirees who
30
35
40
45
50
PT IE EELUSKROPL HU ATLVCZES SI SE DK FR NLBGDE BE
National Average Capital
Figure 20: Median ages in European capital cities as compared to the national average (latest year available within 2011-2016)Source: JRC elaboration based on Eurostat data, accessed in December 2018.
7. Ageing 52
Figure 19: EU-28 population structure for 2016 compared to 2070 projectionsSource: EC, 2018b
10-1415-1920-2425-2930-3435-3940-4445-4950-5455-5960-6465-6970-7475-7980-8485-89
0 05000 500010000 1000015000 1500020000 20000
Males 2070Males 2016
0-45-9
90+
Females 2070Females 2016
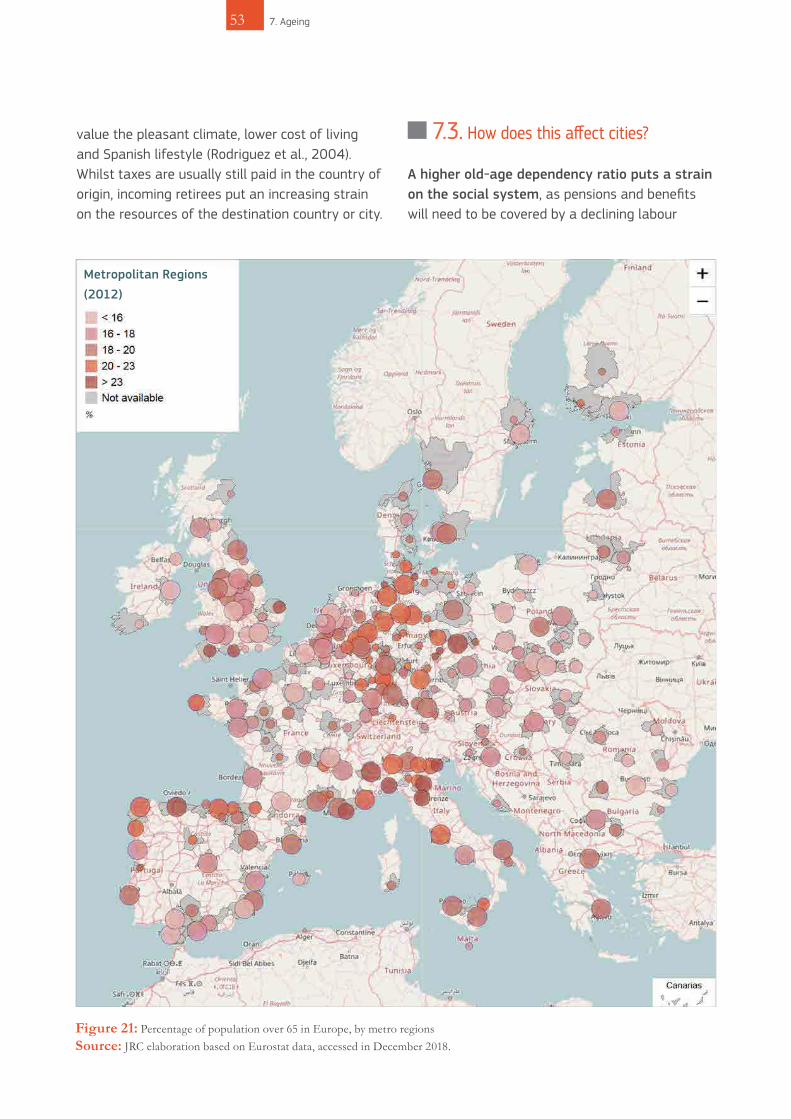
Figure 21: Percentage of population over 65 in Europe, by metro regions Source: JRC elaboration based on Eurostat data, accessed in December 2018.
53 7. Ageing
value the pleasant climate, lower cost of living and Spanish lifestyle (Rodriguez et al., 2004). Whilst taxes are usually still paid in the country of origin, incoming retirees put an increasing strain on the resources of the destination country or city.
7.3. How does this affect cities?
A higher old-age dependency ratio puts a strain on the social system, as pensions and benefits will need to be covered by a declining labour
Metropolitan Regions (2012)

Figure 22: Share of the total population aged 65 or over for the city of Bordeaux, France, in 2015Source: JRC | LUISA elaborations
Population trends by age have been mapped for several EU countries (Jacobs-Crisioni et al., 2019)68. The results show a large variety in spatial patterns, emphasising that the impacts will vary greatly based on geographic location, and that local action is needed. Indeed, even within a single urban agglomeration, there may be substantial differences in the share of older population by neighbourhood, as is seen in the results of the mapping exercise for Bordeaux (FR). City infrastructure and service provision should take this into account.
On average, in 2015, people over 65 years represent 17% of the population of FUAs [compared to 19%
nationally] and they will represent 24% by 2040 (a 41% increase) [25% nationally]. Figure 23 illustrates changes in the proportion of older people (aged 65 or over) in FUAs between 2015 and 2040. Overall, the share of older people is increasing in every city. The ratio of older to younger population remains lower in cities such as Paris, Lyon and Toulouse, presumably since they are mostly still growing their total population by providing sufficient employment and education opportunities for the younger, working population. However, the share increases significantly in cities along the Mediterranean coast (Marseilles, Montpelier and Avignon) as well as in north-eastern France.
7. Ageing 54
box 8. Mapping ageing patterns for Europe in 2030: France
ratiosd2015Percentage of old population in 2015
2 - 20 20 - 25 26 - 40 41 - 65 65 - 100

Figure 23: Average share of the total population aged 65 within FUAs in France in 2015 (left) and 2040 (right)Source: JRC | LUISA elaborations
55 7. Ageing
Ratio of old population in 2015
0 - 0.15 0.16 - 0.20 0.21 - 0.25 0.26 - 0.35
Ratio of old population in 2040
0 - 0.15 0.16 - 0.20 0.21 - 0.25 0.26 - 0.35

force, potentially also affecting overall GDP and innovation. The demand for adapted services, most notably health care and mobility, will need to be met. The proportion of people needing care will rise, requiring additional investments in the current long-term care systems. Older populations are at greater risk of social isolation and the associated problems of mental well-being, requiring specific care and novel initiatives geared towards better social integration. Public infrastructure, housing, and social policy will have to be adjusted to cater for the changing demographics.
A larger retired community also brings with it more specific issues such as the impact of rising pharmaceutical use on the environment. Older populations are also more sensitive to heatwaves and pollution peaks (which often occur in cities and may become more frequent with climate change), requiring cities to be prepared to provide suitable coping mechanisms.
On the other hand, the so-called European Silver Economy can offer many opportunities for growth in cities69.
7.4. How can cities respond?
The need to cater for these changing demographics provides an opportunity to make all aspects of daily life in cities more inclusive, accessible and efficient, which may encourage both social and technological innovation.
Those over the current pension age can represent considerable experienced labour resources. Pension reforms are under way in several European countries, with the OECD council recommending incentives for those over the retirement age to continue working, and restricting the use of publicly funded early-retirement schemes (OECD, 2015b). The increased use of assistive technologies and automation
The benefits of co-housing and intergenerational living are well recognised. Cities are attractive places for all age categories, but the provision of sufficient, affordable housing for all has become an issue. In Belgium, the tradition of the ‘kotmadam’, in which older people host students in part of their home, is now being somewhat lost due to competing large student housing projects and stricter regulations on student rooms. However, there are an increasing number of initiatives experimenting with housing options that mix generations and, in doing so, benefit all age groups.
In Deventer, the Netherlands, the Residential and Care Center Humanitas nursing home has started a programme offering free rent to university students in exchange for 30 hours a month of their time spent with the residents70.
The project benefits the students by providing affordable, quality housing; increases the chances that the involved students continue volunteering activities after their studies; and their presence can reduce the sense of loneliness and isolation often felt by older residents, and thus may improve their general well-being. Students are also asked to spend time interacting and teaching the residents useful skills such as using email, social media and art. Such interactions and learning opportunities can be particularly beneficial for those who may be suffering from conditions such as dementia.
Elsewhere in the Netherlands, in Houten-Zuid, a complex of 17 apartments has been built through a collaboration of the youth organisation Stichting Timon and the senior-specialised housing corporation Habion71. Four of these apartments have been set aside for seniors who are willing to act as ‘good neighbours’, supporting the young women and single mothers living in the remaining apartments.
7. Ageing 56
box 9. Intergenerational living

means that work can be less physically intensive and therefore increasingly accessible to older people, as long as sufficient training is provided. The way we organise and approach work needs to be rethought. Numerous initiatives already tackle age adaptation of the work environment, including flexible working hours and spaces, lifelong learning and developments such as the push for a four-day working week. Encouraging retirees to participate in voluntary community work, besides many other benefits, could also be a way to reduce the risk of isolation. There are already a number of programmes and projects specifically directed at engaging the older population: examples include Erasmus+ and specific local programmes such as the ‘Well-being Parties’ hosted in Turku and Tallinn (FI)72.
The housing stock, especially homes catering for older populations, will have to be enhanced. Service provision will be more efficient and cost-effective in densely populated areas, which is exactly where housing prices are at their highest. Where pensions are under pressure, there may be the need for more affordable housing within central areas. To help solve problems such as social isolation, there is a need for adapted housing that facilitates good integration, in contrast to traditional homes for the elderly. Several initiatives are experimenting with ways to keep older populations active, participating, and engaged with people of all ages.
The promotion of healthy lifestyles and improvements in preventitive care are particularly important for all age groups. Cities can provide compact environments where the necessary services can be reached within walking or cycling distance, as long as the infrastructure is adapted to cater safely for the less mobile. Active mobility is already being promoted for all ages: for example, the organisation Cycling without Age73 has gone global, having started in Copenhagen (DK).
Universal design (UD) or inclusive design, while already being adopted, will become increasingly important. Simple changes in building, infrastructure and even product design could make life easier for all age groups. Examples include the integration of dropped curbs and ramps, and providing sufficient public seating and sanitary facilities74. Japan is a leader in this field, widely applying UD to all aspects of daily life75. The use of technologies and ICT directed towards seniors is also on the rise. Online service delivery has obvious benefits, as does the use of robotics and smartphone apps76 – even the benefits of videogames for older populations are being tested77.
The European Innovation Partnership on Active and Healthy Ageing78 provides specific action groups on independent living solutions and age-friendly environments that can give valuable additional insights. The WHO’s Age-friendly Cities is a network of cities committed to adapting eight domains for better structures and services to the needs of older people. Many cities are also already developing their own strategies to address the demographic challenge and well-being of older populations, including Barcelona (ES), Manchester and Edinburgh (UK).
57 7. Ageing
Moscow, Russia

Season’s Greetings: a mural by graffiti artist Banksy, stencilled onto a garage in Port Talbot, Wales, United Kingdom, December 2018
8. Urban health 58
KEY MESSAGES
• While tightly connected human networks may facilitate the spread of infectious diseas-es in cities, they ensure economy of scale in the provision and effectiveness of health measures and services.
• Where you live in a city can determine your well-being – health outcomes can be im-proved by modifying the urban fabric of cities and towns: there is an essential role for urban planning in delivering health improvements.
• Emerging trends, such as ageing and the increasingly recognised role of cities in affecting mental health, have to be tackled with a long-term effort.

URBAN HEALTH 8.1. Ensuring general well-being in cities
The WHO defines health as ‘a state of complete physical, mental and social well-being and not merely the absence of disease or infirmity’ (WHO, 1946). Both individual and environmental or social health determinants shape individual and population health80. Today, there is growing recognition (WHO 2013b, Fouad et al., 2017, Badland et al., 2014) that health and health disparities must be addressed taking into account the broader societal context, including the characteristics of the local environment81 to which individuals are exposed.
Social and environmental factors influencing general well-being include education, employment and working conditions, income levels, the physical and built environment, and their relations with disease risk factors such as tobacco, alcohol and unhealthy diets82, many of which are negatively impacted in urban environments. Cities have higher population and infrastructure densities, leading to higher levels of noise and air pollution (also indoors), potential overcrowding, urban heat islands, and greater stress. Thus, urban areas can pose a higher risk to personal physical and mental well-being.
At the same time, there is a clear economy of scale in the provision of health services: the effectiveness of care, treatment and disease preventive measures such as vaccination or screening campaigns, may be higher in urban areas.
Back in the 1980s, the WHO had already recognised that understanding how the urban environment affects health outcomes at both collective and individual level is an urgent priority83. More recently, the New Urban Agenda (United Nations, 2016) has seconded
this, supported by a growing body of scientific evidence and an increasing number of political commitments expressed by local levels of government.
8.2. Trends and key figures
Urban health – advantage or penalty? There is evidence that the urban environment affects health outcomes, resulting in both an ‘urban health advantage’ and an ‘urban health penalty’ (Vlahov et al., 2005; Rydin et al., 2012). Indeed, cities display characteristics that can both promote or hinder health. High population densities themselves have both positive and negative implications: although they normally facilitate the spread of infectious diseases84, they may also improve the efficacy of public health policies, such as vaccination campaigns85.
Some urban residents enjoy better health and well-being than people living in rural areas because of better access to health infrastructure and services in general; improved sanitation; higher incomes; greater access to knowledge and information, including health literacy;
59 8. Urban health
Understanding how the urban environment affects health outcomes at both collective and individual level is an urgent priority.79

and higher levels of social support. A city’s socio-economic heterogeneity also has the potential to bring benefits within the reach of less-advantaged residents. Recent data from India (Mullen et al., 2016) exemplifies the concept of an urban health advantage, looking at temporal trends in epidemiology (under-fives’ mortality rates) and
service utilisation (child delivery in health facilities) between urban and rural contexts (Figure 24).
On the other hand, the concept of urban health penalty is frequently applied to describe poor health conditions that persist in entire cities or specific urban contexts, such as ‘inner cities’86.
Figure 24: Trends in under-five mortality rates and institutional delivery, urban and rural, in IndiaSource: Mullen et al., 2016
140.0
120.0
100.0
80.0
60.0
40.0
20.0
0.0
100.0
90.0
80.0
70.0
50.0
40.0
30.0
20.0
10.0
0.0
1992
-93
1995
1998
-99
2005
2005
-06
2009
2000
2012
1992
-93
1998
-99
2002
-04
2007
-08
2009
2013
-14
2005
-06
2014
131.0
rural
Under-five mortality Delivery in a health facility
urban
rural
urban
111.0 111.0
98.085.0
82.071.0
58.0
58.365.1
70.5
85.6 88.5 89.2
69.4 67.5
16.624.7
37.9
68.074.6
79.6
29.8 28.9
78.067.0 65.0
55.049.0 51.7
41.032.0
8. Urban health 60
‘A healthy city is one that is continually creating and improving those physical and social environments and expanding those community resources which enable people to mutually support each other in performing all the functions of life and developing to their maximum potential.’ (WHO, 1998)
The Ottawa Charter for Health Promotion (Ottawa Charter for Health Promotion, 1986) was adopted in 1986 (CSDH, 2008) and inspired the launch of the European Healthy Cities Network. This is a long-term international development project aiming to bring the WHO strategy for Health for
All to the local level in Europe. Any city can be a healthy city: the initiative stresses the process behind a particular health status rather than its achievement. Key is being conscious of what health and health equity means, and striving to improve it (Tsouros, 2015). Three main components of this process are: political commitment and common vision (locally); the involvement of a wide range of stakeholders; and strategy development within the local government (city health plan).
box 10. The WHO European Healthy Cities Network

LongBeach
Lancaster
Palmdale
SantaClarita
Glendale
Pomona
Torrance
Wilmington -Harbor City
Pasadena
SouthLA
Van Nuys -North
ShermanOaks
West Adams -Baldwin Hills -Leimert
Sun Valley -La TunaCanyon
SoutheastLA
Westchester -Playa del Rey
EastLA
ElMonte
LosAngeles
Sunland -Tujunga -
Lake View Terrace -Shadow Hills -
East La Tuna Canyon
DowneyInglewood
WestCovina
Norwalk
Burbank
GranadaHills -
Knollwood
Hollywood
Canoga Park -Winnetka -
Woodland Hills -West Hills
Compton
Carson
SantaMonica
SouthGate
85.1 – 83.3
90.5 – 85.2
83.2 – 82.1
82.0 – 80.7
80.6 – 75.8
LIFE EXPECTANCY (YEARS)
61 8. Urban health
Figure 25: Highway to Health: life expectancy in Los Angeles County, USASource: Measure of America, 2017

An unhealthy urban environment can contribute to a greater prevalence of non-communicable diseases (NCDs)87, communicable diseases through crowding and spreading of infections, lack of adequate ventilation and sanitation, and acute respiratory diseases from outdoor and indoor air pollution and mouldy housing interiors. Mental health is also frequently poorer in cities, due to negative social and environmental determinants (or stressors)88 (Dekker et al., 2008; Peen et al., 2010). Indeed, the urban health advantage has been questioned in more recent years, especially in developing countries, where accelerating urbanisation rates have led to the creation of increasingly extensive informal settlements and slums. Migration dynamics can also affect the overall health of the population: whether healthier migrants move to urban areas or the opposite happens89 i.e. weaker individuals move to cities in search of better health care.
Diversity of health outcomes within cities – The idea of an average urban advantage (or penalty) hides a huge diversity of health outcomes90 based on geographic location within cities (WHO, 1946; Montgomery, 2009) and which population group91 is considered. In today’s cities, there are significant health disparities. These may be related to where different population groups live, cluster, shop or eat92; the walkability of their neighbourhoods; how health determinants are distributed; and the presence of and access to health services (of different quality) within the city. This means that different population groups might live in different epidemiological worlds. The socio-economically disadvantaged and those living in deprived neighbourhoods are especially vulnerable.
The creation and maintenance of healthy cities will be shaped by several existing and emerging trends. In the EU today, we live longer than before and have better life satisfaction for most of our adult lives. However, on average, people can expect to live only 80% of their lives free of diseases or disability (OECD/EU, 2018). Overweight and obesity levels in both children and adults are
worryingly high, as is the incidence of diabetes, cardiovascular diseases or cancer, and of other diseases related to stress and mental well-being. The EU population is ageing and there is a growing need for additional healthcare support for older adults, not only for their physical well-being but also their mental health, including increasing concerns about social exclusion. Antimicrobial resistance issues are ever-more pressing, and although vaccination rates93 are generally high , scepticism towards vaccines has caused immunity gaps, such as for measles (Durrheim et al., 2017) and rubella (Dabbagh et al., 2018; WHO, 2018).
Besides a rise in specific incidences of chronic94 and acute conditions95, an ageing population requires specific adaptations of services and infrastructure96, while transformations in the community itself become necessary to ensure continuous and coordinated care outside of hospitals, too. ‘Ageing in place’97 may be the most acceptable and, in some cases, cost-effective way to grow old (Andrews et al., 2018; Jayantha et al., 2018) because it enables older adults to remain in a known environment whilst maintaining an adequate level of connection with social support services. This requires strategic planning within the urban environment98, including the adaptation of public rental housing estates.
Older adults are also among the population groups most vulnerable to heatwaves and extreme weather conditions, the effects of which may be greater in cities.
Mental health99 is a key priority in the promotion of overall well-being. Mental illness is one of the leading causes of disability at the global level100 and, on average, people with severe mental disorders101,102 generally die 10-20 years earlier than the general population (Hayes et al., 2015). Yet, the United Nations103 has estimated that up to 75% of people suffering from mental illness in low-income countries are not getting access to care, whereas in high-income countries the percentage still oscillates between 35%
8. Urban health 62

Although air quality has improved over the last decades, air pollution104 is still a major environmental risk for humans and ecosystems105, representing a clear example of an urban health penalty in both Western and developing countries (Vlahov et al., 2005). In Europe, air pollution is among the main causes of premature deaths (IHME, 2013) and the second biggest environmental concern for Europeans after climate change.
Implementation of the Clean Air Policy Package106 and recent efforts in cities107 have resulted in a general net decline in the urban population exposed to concentrations over the limits recommended by the WHO108.
However, this general decrease is not omogeneous all over Europe and many European cities are still exposed to dangerously high levels109 (EC, 2008).
Simulations show that full implementation of national legislations (as of 2013) for reducing NO2110 concentrations in Europe, will result in a net decrease in this pollutant by 2030, with only one tenth of those European cities which exceeded the legal limits in 2010 still having problems.
In addition, the impact of NO2 emission-reduction scenarios within cities may not be homogeneous, depending on local variations in pollutant concentrations due to factors such as road traffic intensity and urban micro-climate. Exposure will also vary within cities depending on population density and distribution of the most vulnerable groups.
In the case of Milan (Italy), emission-reduction measures coherent with the ECLIPSE scenario111 (Amann et al., 2014) were evaluated following the WHO Guidelines for Health Impact Assessments (WHO, 2013a). They resulted in a potential 2% reduction in natural deaths of people aged over 30112, unevenly distributed across the city.
Figure 27: Total number of deaths attributed to NO2 concentrations in Milan, projected in the year 2030Source: JRC | LUISA elaborations
63 8. Urban health
Figure 26: 2015 annual mean concentrations of NO2 in European cities (based on modelled results)Source: JRC | LUISA elaborations
box 11. Air quality in cities
Annual mean conc. µg/m35-10 10- 15 15 -20 ≥20
0 500 kmEC-JRC 2019
0-5
Non EU territoriesEU_28
Population size< 10000 10000 - 100000 100000 - 500000500000 - 1000000 >1000000
<1
Long term impact of NO2Inhab. death per 0.5 km2
1-5 5-10 10 -20 >20
0EC-JRC 2019
5 10 20 Kilometers

Figure 28: Self-perceived health and well-being: total depressive symptom as a percentage of the country population, per degree of urbanisationSource: JRC elaboration based on Eurostat 2014 survey data, accessed in December 2018.
8. Urban health 64
0 2 4 6 8 10 12 14
Portugal
Germany
Sweden
France
Hungary
Slovenia
Luxembourg
Bulgaria
Denmark
Estonia
Ireland
Poland
Malta
Spain
Austria
Italy
Finland
Latvia
Cyprus
Greece
Lithuania
Romania
Czechia
Slovakia
Croatia
[%]
Rural areas Towns&Suburbs Cities
0 2 4 6 8 10 12 14
Portugal
Germany
Sweden
France
Hungary
Slovenia
Luxembourg
Bulgaria
Denmark
Estonia
Ireland
Poland
Malta
Spain
Austria
Italy
Finland
Latvia
Cyprus
Greece
Lithuania
Romania
Czechia
Slovakia
Croatia
[%]
Rural areas Towns&Suburbs Cities

and 50%. Mental health problems affect about 84 million people across the EU (OECD/EU, 2018), and the associated costs (both direct and indirect) are substantial. An increasing number of European countries are implementing comprehensive policies addressing mental health promotion and awareness.113
Urban environments are often referred to as ‘obesogenic’114 as they can discourage physical activity and favour less-healthy dietary choices: for example, by increasing exposure to food marketing and fast-food outlets, or reducing access to fresh produce (Mackenbach, 2014).
New tools to support health promotion and care are on the rise, especially digital technologies. This includes electronic medical records (EMRs), telemedicine and ePrescriptions, as well as the increasing use of health-related and fitness apps. EMRs can help people become more involved in their health and long-term care, whereas ePrescribing has the potential to improve
the accuracy and efficiency of pharmaceutical drug dispensing. In general, the availability of health-related information (through the internet, for example) can also be beneficial and can empower citizens and patients. However, guaranteeing the quality of this information often requires additional medical involvement.
These new tools, accompanying and complenting traditional ones, can be elements of an integrated, place-based approach to health in support of better policymaking for improvements in health. Urban health advantages are not to be taken for granted. A healthy city is an extremely dynamic system that requires continuous improvement and monitoring. The health benefits of living in urban as opposed to rural areas must be actively created and maintained by means of policy interventions.
65 8. Urban health

9. Social segregation 66
KEY MESSAGES
• In European cities there is a growing polarisation of the extremes which can be addressed by inclusive and equitable policies.
• Integrated policies should take into account the multiple factors in play in deprived neigh-bourhoods (e.g. health, housing conditions, and ethnic background).
• Effective place-based policies look at the causes and solutions to segregation that go beyond the boundaries of the segregated area.
• Urban policies that promote diversity as a driving force for innovation

67 9. Social segregation
SOCIAL SEGREGATION
9.1. How can cities become more inclusive?
In the last 20 years, inequality among nations has diminished to some extent while the distribution of wealth within nations has become more unequal. The EU has found increasing wage inequality within most Member States. This phenomenon also has a spatial aspect which manifests itself particularly in cities (Fainstein and Fainstein, 2018).
Urban segregation is the unequal distribution of different social groups in the urban space, based mainly on occupation, income and education, as well as on gender and ethnicity. The quality of life and number of healthy life years differ among these groups, too. The widening gap between rich and poor is leading to more segregation in European cities, with both groups living in homogenous, separate and impermeable areas. While research on segregation often focuses on deprived areas, a concentration of the affluent in certain areas must also be taken into consideration. For example, in some cities the rich have established ‘gated communities’ in the sky by means of luxury apartment tower blocks. Another phenomenon worth exploring is ‘invisible segregation’, referring to the informal and often temporary settlement of refugees and migrants in urban areas, not appearing in official statistics.
While this phenomenon occurs all over Europe, there is much variation at the local level, and factors such as the type of welfare and housing regimes and planning histories influence the actual situation (Muster et al., 2017).
Socio-spatial segregation115 is not negative per se, since it can entail a high sense of local identity and cultural and social capital within a community (Bolt et al., 1998). However, it can have a detrimental effect on cities’ social stability and augment social fragmentation. Moreover, where vulnerable groups and deprived neighbourhoods are concerned, it can instigate stigmatisation and set in motion so-called neighbourhood effects, whereby segregated neighbourhoods are involved in a downward spiral leading to greater segregation and social
There are wide inequalities in the distribution of income within the EU: in 2016, the highest-earning 20% of the population received 5.2 times as much income as the lowest-earning 20%. (EC, 2018a)

exclusion. These neighbourhoods then suffer from multidimensional problems that reinforce each other. Furthermore, in many cases, deprived areas are those lacking access to public transport and services.
9.2. Trends and key figures
In 2017, 112 million EU inhabitants were at risk of poverty or social exclusion116, corresponding to 22% of the total population. Of this 112 million, 47 million people were living in cities. Compared to the situation only three years before (2014), the number of people living in vulnerable conditions in cities increased by 13 million. While
cities are often characterised by high standards of living, they are also places of high income inequality. Particularly in recent years, wealth has increasingly accumulated among the few, and the polarisation of wealth is most concentrated in urban areas. Cities in western Europe, in particular, are among the least inclusive, given their relatively high shares of people living at risk of poverty and in low work intensity households, and/or high unemployment rates (EUROSTAT, 2016). Figure 29 shows that in western European countries (BE, AT, UK, DK, DE, FR, NL) the likelihood of social exclusion is lower in the countryside – in apparent contrast to most EU-13 and southern European countries.
0.00
10.00
20.00
30.00
40.00
50.00
60.00
Cities Towns and suburbs Rural areas
Figure 29: Proportion of the population at risk of poverty or social exclusion, by degree of urbanisation, 2017Source: JRC elaboration based on Eurostat data, accessed in March 2019
9. Social segregation 68
The EU has promoted several specific initiatives to reverse trends of increasing socio-spatial inequalities within European cities. Three of the partnerships in the Urban Agenda for the EU deal with urban poverty117, housing118 and the inclusion of migrants and refugees119. During the programming period 2014-2020, EUR 14 billion of the European Structural and Investment Funds (ESIF) have been directly allocated to cities to develop integrated strategies of sustainable urban
development. About a quarter of these resources have been put towards reducing inequalities by investing in thematic objectives such as employment, inclusion and education. An analysis of sustainable development strategies through the JRC-DG REGIO tool STRAT-Board120 shows that of the 720 strategies surveyed, 66% deal with social inclusion, and 44% with disadvantaged neighbourhoods.
box 12. Integrated policies for neighbourhood regeneration
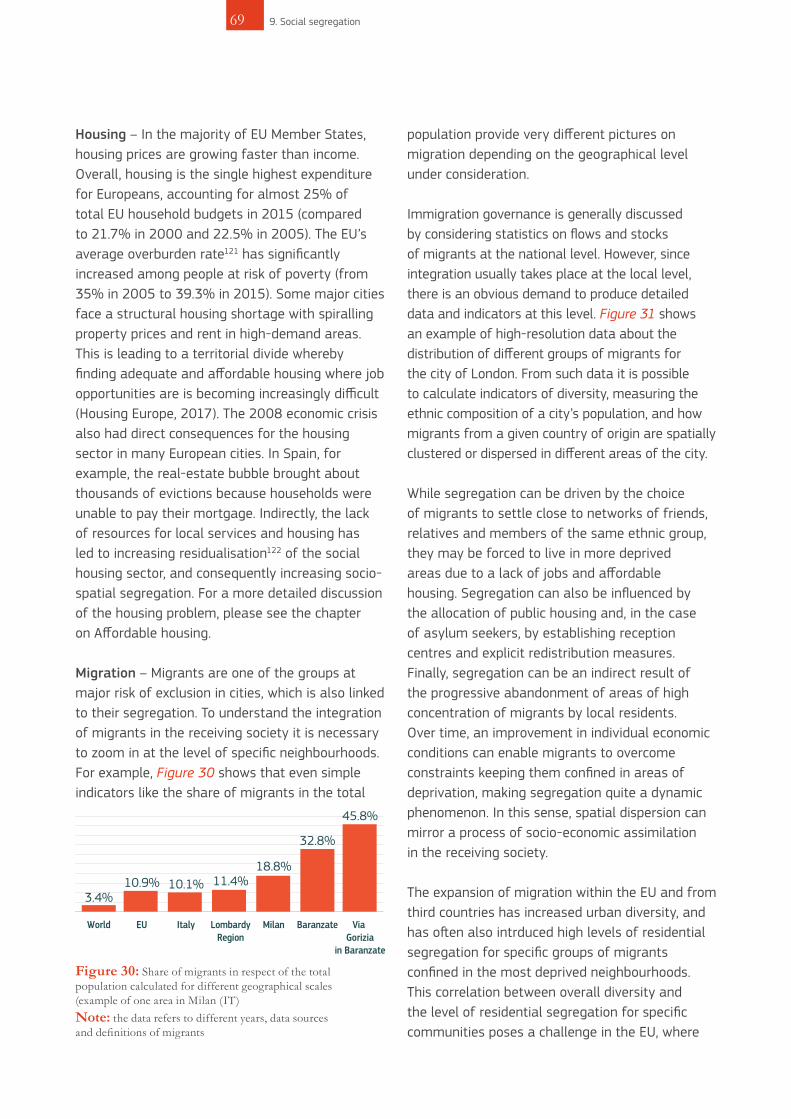
Housing – In the majority of EU Member States, housing prices are growing faster than income. Overall, housing is the single highest expenditure for Europeans, accounting for almost 25% of total EU household budgets in 2015 (compared to 21.7% in 2000 and 22.5% in 2005). The EU’s average overburden rate121 has significantly increased among people at risk of poverty (from 35% in 2005 to 39.3% in 2015). Some major cities face a structural housing shortage with spiralling property prices and rent in high-demand areas. This is leading to a territorial divide whereby finding adequate and affordable housing where job opportunities are is becoming increasingly difficult (Housing Europe, 2017). The 2008 economic crisis also had direct consequences for the housing sector in many European cities. In Spain, for example, the real-estate bubble brought about thousands of evictions because households were unable to pay their mortgage. Indirectly, the lack of resources for local services and housing has led to increasing residualisation122 of the social housing sector, and consequently increasing socio-spatial segregation. For a more detailed discussion of the housing problem, please see the chapter on Affordable housing.
Migration – Migrants are one of the groups at major risk of exclusion in cities, which is also linked to their segregation. To understand the integration of migrants in the receiving society it is necessary to zoom in at the level of specific neighbourhoods. For example, Figure 30 shows that even simple indicators like the share of migrants in the total
population provide very different pictures on migration depending on the geographical level under consideration.
Immigration governance is generally discussed by considering statistics on flows and stocks of migrants at the national level. However, since integration usually takes place at the local level, there is an obvious demand to produce detailed data and indicators at this level. Figure 31 shows an example of high-resolution data about the distribution of different groups of migrants for the city of London. From such data it is possible to calculate indicators of diversity, measuring the ethnic composition of a city’s population, and how migrants from a given country of origin are spatially clustered or dispersed in different areas of the city.
While segregation can be driven by the choice of migrants to settle close to networks of friends, relatives and members of the same ethnic group, they may be forced to live in more deprived areas due to a lack of jobs and affordable housing. Segregation can also be influenced by the allocation of public housing and, in the case of asylum seekers, by establishing reception centres and explicit redistribution measures. Finally, segregation can be an indirect result of the progressive abandonment of areas of high concentration of migrants by local residents. Over time, an improvement in individual economic conditions can enable migrants to overcome constraints keeping them confined in areas of deprivation, making segregation quite a dynamic phenomenon. In this sense, spatial dispersion can mirror a process of socio-economic assimilation in the receiving society.
The expansion of migration within the EU and from third countries has increased urban diversity, and has often also intrduced high levels of residential segregation for specific groups of migrants confined in the most deprived neighbourhoods. This correlation between overall diversity and the level of residential segregation for specific communities poses a challenge in the EU, where
69 9. Social segregation
Figure 30: Share of migrants in respect of the total population calculated for different geographical scales (example of one area in Milan (IT)Note: the data refers to different years, data sources and definitions of migrants
3.4%10.9% 10.1% 11.4%
18.8%
32.8%
45.8%
World EU Italy LombardyRegion
Milan Baranzate Via Gorizia
in Baranzate

Nigeria
London (United Kingdom) - Population by country of birth from
Bangladesh Poland India
Figure 31: Number of migrants in London by main country of originNote: the map has a resolution of grid cells of 100 by 100 m. The highest bars correspond to cells where the number of migrantsreaches 250. The cells are obtained after spatial processing of data from the 2001 census. Similar maps are produced by the JRC for around 45 000 LAUs in eight EU Member States123
9. Social segregation 70
diversity is a core value. European cities of all sizes are confronted with the need to reconcile the positive aspects of diversity with the negative consequences that segregation can bring for the integration of migrants.
Health – It has been acknowledged that residents from socio-economically deprived neighbourhoods may experience health disadvantages (Marmot et al., 2010). Life expectancy is affected by early childhood development, education, employment and working conditions, income levels, physical environment (such as air quality) and behavioural issues like smoking, alcohol consumption and access to physical activity and a healthy diet. In deprived neighbourhoods, all these factors often influence each other and are combined in the most negative way. In addition, people may also have less access to basic health care and infrastructure, and experience more types of stress. For example, life expectancy in London can vary by some 20 years depending on
where you live (Figure 32). Similar observations hold true for other cities: Turin (IT), Barcelona (ES), Stockholm (SE) and Helsinki (FI) reveal a significantly higher risk of death among residents in more deprived neighbourhoods, although the correlation differs between cities (Marinacci et al., 2017).
Many other health (or health-related) outcomes also show spatial segregation in cities or regions, such as overweight and obesity, incidence of diabetes type 2, incidence and mortality from cancer (e.g. lung cancer in men and cervical cancer in women, see Bryere, 2018), mental health and others. An example of the link between the unequal distribution of risk factors and health outcomes within European cities is provided by a study conducted in a cohort of 1 million adults in Rome (IT), showing gradients of increasing mortality risk ratios for exposure to fine particulate matter with area-based socio-economic position (Cesaroni et al., 2013).

In Berlin, the ESIF have been employed to co-finance the Future Initiative City District programme124 aimed at counteracting socio-economic segregation among neighbourhoods. The programme focuses on the physical and socio-economic regeneration of deprived neighbourhoods and on improving environmental conditions. Actions include: the provision of education and schooling for disadvantaged inhabitants, the improvement of local public spaces, the participation of local actors in the renewal and vitalisation of neighbourhoods, strengthening social cohesiveness, and promoting social and ethnic integration. These initiatives are embedded within a wider national policy called the Social City initiative125 that foresees the empowerment of communities, with the idea that neighbourhoods themselves can become the main actor behind their development.
71 9. Social segregation
box 13. Future Initiative City District, Berlin, Germany
Figure 32: The Lives on the Line project maps life expectancy at each London tube station, and child povertySource: J. Cheshire, University College London (UCL)126

10. Environmental footprint 72
KEY MESSAGES
• The consumption of resources influences not only local but also global sustainable devel-opment. Four of nine planetary boundaries have already been exceeded due to human activities.
• Providing water, energy and food security, amongst other services, for urban populations results in significant environmental pressure beyond city boundaries.
• While water use by most economic sectors in Europe has fallen since 1990, increased uncertainty over water availability is foreseen, impacted by extreme weather events and the changing demography.
• Several lifestyle and behavioural changes can help city inhabitants significantly reduce their environmental footprint, such as shifting to a healthy diet, reducing waste, using active or public mobility modes or choosing sustainable energy sources.

73 10. Environmental footprint
ENVIRONMENTAL FOOTPRINT
10.1. Water, energy and food security in urban areas: cities as consumers
Most resources used in urban environments come from outside city borders. The consumption of natural resources puts significant pressure on the environment and can lead to negative impacts such as water stress, terrestrial and aquatic eutrophication, biodiversity loss and climate change. The environmental footprint quantifies this pressure in terms of cities’ use of a scarce resource or the pollution they generate (Vanham et al., 2019). To date, actions aiming to increase urban sustainability have mainly looked at the direct effects on the urban environment. For example, the Green City Index (Siemens, 2012) rates municipal water use rather than the overall urban water footprint. Most urban citizens now live away from agricultural systems and industrial production zones and are unaware of the environmental pressures and impacts of the products they consume. As product supply chains have become increasingly complex due to international trade, their footprint has often expanded further than the cities’ direct hinterland into distant world regions.
The interactions and trade-offs between water-energy-food and the ecosystem (the WEFE Nexus) are increasingly being acknowledged by different institutions – including the European Commission (EC JRC, 2019) and the UN (FAO, 2019) – as important for policymaking. Water, for example, is interlinked with and affects all aspects of city life: agriculture, industry, energy
production and, of course, the environment. Water also has a cultural perspective, and is increasingly becoming a political argument.
Cities are highly dependent on their surrounding areas to provide water, energy and food security.

10.2. Trends and key figures
The planetary boundaries concept (Steffen et al., 2015) identifies thresholds for nine critical processes that should not be exceeded to keep our planet operating safely. Four of these boundaries have already been exceeded due to human activities: climate change, biosphere integrity, biogeochemical flows (nitrogen and phosphorus), and land-system change.
Environmental footprints address both the extent to which humanity has reached certain boundaries and how consumption behaviour in cities can contribute to reaching local and planetary boundaries (Vanham et al., 2019).
While the planetary boundary has not been violated for water, 4 billion people face severe water scarcity one month per year (Mekonnen and Hoekstra, 2016). Drinking water quality
in Europe is generally excellent, although the perception of it is very different – only 20% of EU citizens find water outside their home country as being acceptable, and slightly less than 60% consider themselves well-informed about their water (EC, 2015). Water distribution is the most expensive public infrastructure in European cities, especially in older cities where water infrastructure is ageing and deteriorating, making leakage management one of the biggest challenges (EC, 2015). The range in losses is substantial: for instance, the Finnish city of Helsinki loses some 41% of its drinking water to leakages, Ljubljana (SI) 35% and Łódź (PL) only 5% (Gawlik et al. 2017). Since their introduction, the European water policies have significantly improved the overall water situation in Europe: there has been a significant reduction in pollution in rivers; and all EU citizens have access to clean and safe drinking water, and can enjoy safe bathing along European coastlines127.
Figure 33: Food security, water security and energy security for cities are responsible for a large part of the total urban footprint; the dominant fraction of this urban footprint is located outside city bordersSource: JRC
10. Environmental footprint 74
SDGs 2, 6 & 7
Water securityFood security
Energy securityCITY
HINTERLANDPRESSURES
IMPACTS
Food production outside city bordersResources Water, land and material footprints, etc.
Pollution Carbon, nitrogen and chemical footprints, etc.
Water stress, euthrophication, climate change, biodiversity loss
SDGs 13, 14 &15*
Energy production outside city borders
Water production outside city borders
Crops Livestock Fish andseafood
Wild and atypical foods
Gas
Transport to the city
Coal
Renewables
Oil
*SDG 13: Climate action; SDG 14: Life below water; SDG 15: Life on land

Global inequities in water use are significant: in Africa, household water use averages 47 litre (l) per person per day, in Asia, the average is 95 l, while the EU average lies at 136 l. The minimum to meet basic human needs is set at 50 l/person/day (Brown and Matlock, 2011). Economic activities in Europe use on average around 243 cubic kilometres annually, of which only 57.6% are returned directly to the environment, often carrying potentially hazardous pollutants (EEA, 2015).
96 lBrussels EU Genoa Galati Eslöv
136l 249l 281l 371l
Figure 34: Total water use in Europe by sector Source: EEA, 2015
Figure 35: Total water use per day per personNote: These figures are to be taken with caution since data on water abstraction per household are scarce and both leakage rates and the age of water distribution infrastructure vary greatly across municipalitiesSource: Gawlik et al., 2017
The Water Exploitation Index (WEI), the ratio of water demand to the available freshwater resources, is a good indicator of water stress:
LjubljanaCopenhagen Lyon ManresaMaastricht
41.5%13.3% 80%6.3%1.7%
Figure 36: Water Exploitation Index (WEI, in per cent) based on JRC calculations Source: Gawlik et al., 2017
75 10. Environmental footprint
box 14. How much water do we use?
11.6 %
17.7 %
40.4 %
27.8 %
2.5 %
Agriculture
Electricity
Households
Service industries
Mining-manufacturing-construction

However, the ambition to reach a good status for all European water bodies has not yet been met, and new challenges are only now emerging (e.g. microplastics or antimicrobial resistance). In the future, pressures on water, such as pollution, over-abstraction, and the effects of climate change will worsen unless adaptation measures are embedded in local city agendas.
The environmental impacts associated with the production of food exceed that of all other sectors (Sala et al., 2019). This accounts for 29% of global human-induced GHG emissions (Vermeulen et al., 2012), with food waste leading to the emission of 170 million tonnes of CO2.128 In industrialised countries, more than 40% of
food losses129 and waste occur at retail and consumer levels (FAO 2011).
According to the FAO, sustainable diets are protective and respectful of biodiversity and ecosystems, culturally acceptable, accessible, economically fair and affordable; nutritionally adequate, safe and healthy, while optimising natural and human resources. Cities have a strategic role to play in developing sustainable food systems and promoting healthy diets. This is recognised by the 184 signatory cities of the Milan Urban Food Policy Pact initiative130, an action framework aiming to provide strategic options to achieve more sustainable food systems.
The water footprint (WF) of food consumption in the 131 municipalities of the Métropole du Grand Paris ranges from 3 543 to 4 039 litres per person per day – volumes much higher than the average 120 litres of daily water use at home. Almost all of this food originates from and is produced with water from outside city borders. Besides the health benefits, if the population were
to reduce their intake of meat, sugar, oil and fat and eat more fruit and vegetables the WF would decrease by 22 to 26%. A vegetarian diet would reduce the WF even further, by 43 to 49%. In fact, a study covering France, Germany and the UK shows that citizens can substantially reduce their WF when shifting to a more sustainable diet (Vanham et al., 2018).
Figure 37: Water footprint of food consumption for different diets in the 131 municipalities of the Métropole du Grand ParisSource: JRC | Vanham et al., 2018
10. Environmental footprint 76
box 15. Water footprint of food consumption in Paris

While the systems proposed for commercial urban agriculture occupy very little land, they use a substantial amount of energy, and therefore depend on sustainable and climate smart energy production. The provision of sufficient water of appropriate quality also requires a substantial amount of energy, especially for purification, distribution, and desalinisation where needed. Such trade-offs show the necessity of WEFE Nexus approaches in science and policy. The EU’s ambitious decarbonisation goals also rely on water-demanding energy technologies such as biofuels, carbon capture or nuclear power (EC JRC, 2019). Reducing carbon footprints can increase water footprints, depending on which energy sources and technologies are used. The WEFE Nexus is the realisation that acting from the perspective of individual sectors cannot help tackle future societal challenges (EC JRC, 2019).
While many cities are taking steps towards improving their energy security and there is a shift towards greater use of renewable energy sources, the supply of sufficient electricity in cities, and the impact that will have on the surrounding areas, remains a challenge.
The urban population also consumes other products, such as ‘mobility’, ‘housing and appliances’ and a wide variety of ‘household goods’, for which, in many cases, indirect impacts are also predominant compared to direct ones (Sala et al., 2019). The ‘rebound effect’, namely the increased use of products in light of their improved environmental performance, is an important element to take into consideration when assessing the environmental footprint. For mobility, for example, a reduction in vehicle emissions between 2010 and 2015, boosted
The production of fresh and nutritious food locally in densely populated urban areas can significantly reduce food waste and emissions from distribution, improve overall urban food security (Angotti, 2015), environmental and health conditions, and promote inclusive social interaction (Hirsch et al., 2016). New emerging technologies include rooftop greenhouses, aquaponics and indoor vertical farms. Urban agriculture is becoming increasingly mainstream, both commercially and by citizens individually or collectively, mobilising whole communities into producing food in their own neighbourhoods (Van Veenhuizen, 2014). An example is the Participatory Urban Agriculture Project (AGRUPAR) in Quito, Ecuador, carried out by the local government together with community organisations to contribute to food security, environmental management, gender equity, social inclusion and the generation of productive enterprises. The project uses low-cost infrastructure specially designed for the
urban and peri-urban orchards in a participatory process. In 2014, approximately 3 000 urban farmers (including younger people and 84% women) were supported by AGRUPAR, who also discussed the proposal for a municipal ordinance for urban agriculture in Quito131.
77 10. Environmental footprint
box 16. Urban agriculture

by EU regulations, was partly offset by a 10% growth in the kilometres travelled, which resulted in an overall increase in impact of about 5% (Sala et al., 2018). Initiatives to reduce the pressures and impacts of consumption should take into account both production – i.e. improving the environmental performance of processes – and consumption patterns, optimising and reducing where possible (Vanham et al., 2019; Sala et al., 2018).
In 2014, total waste production in the EU amounted to 2.5 billion tonnes. Only a limited (albeit increasing) share (36%) of this was recycled, the rest going to landfills or being burned, while an additional 600 million tonnes could have been recycled or reused. In terms of household waste alone, which accounts for 8% of all waste, each person in Europe is currently producing, on average, 482 kilograms per year. Only 47% of all municipal waste in the EU is recycled or composted and, in some countries, more than 80% still goes to landfills132. Turning waste into a resource is key to a circular economy. The EU’s approach to waste management is based on the ‘waste hierarchy’
which sets the following priority order when shaping waste policy and managing waste at the operational level: prevention, (preparing for) reuse, recycling, recovery and, as the least-preferred option, disposal (which includes landfilling and incineration without energy recovery). Improved waste management also helps to ease health and environmental problems, reduce GHG emissions (directly by cutting emissions from landfills and indirectly by recycling materials which would otherwise be extracted and processed), and avoid negative impacts at the local level, such as landscape deterioration due to landfilling, local water and air pollution, as well as littering.
Environmental awareness in the EU is growing. For example, in several European cities, groups of environmentally conscious citizens have started collective actions, such as Energy Communities and Solidarity Purchasing Groups (SPGs)133 (Fonte, 2013; Labanca, 2017). In the first case, citizens, sometimes with support from local authorities and small and medium-sized enterprises (SMEs), take direct control of parts of the energy supply chain in order to push for an increasing role for renewable energy alternatives. The dimensions
10. Environmental footprint 78

and the impact of energy communities varies substantially: for example, ranging from small groups sharing the cost of a photovoltaic system covering a condominium roof, to communities comprising thousands of people directly owning wind turbines or local distribution systems. SPGs use the weight of collective purchasing to ensure better and cheaper access to goods (mostly food), in compliance with their ethical values. SPGs often include environmental aspects in their criteria for selecting products, with a special focus on proximity (zero km), farming practices (biologic vs. intensive) and a short supply chain (direct buying from producers rather than from retail). Such initiatives can positively contribute to reducing the overall urban footprint.
10.3. What impacts will these trends have in the future?
While water use by most economic sectors in Europe has declined since 1990, Europe’s population has increased by 10% over the last two decades, most of whom have moved to urban areas. Mass tourism is already responsible for 9% of total annual water use in the EU and is expected to rise, further increasing the need for water in some regions during key periods of the year. In other words, water availability in European cities will become less predictable and certain in the future. A decline in overall available water resources is predicted, especially in Southern Europe and the Mediterranean region but also the Western Balkans. Flooding and droughts will remain a significant physical threat to many cities, increasing in frequency and magnitude. The most extreme events are expected to occur in summer with an increase in flood risk in the eastern part of Europe (e.g. Poland) and the Balkan countries, and extreme droughts in the Mediterranean region, affecting countries like Greece, Cyprus, Italy, Spain and Turkey (Bisselink et al., 2018).
Cities can and should take measures to minimise environmental pressure and impact on their hinterland. Citizens can look at their overall consumption patterns, including their water use and energy consumption at home, as well as their diets and amount of (food) waste. Food production puts significant pressure and the resulting impacts on the hinterland (Sala et al., 2018; Pichler et al., 2018; Castellani et al., 2017; Crenna et al., 2019). Shifting to a healthy diet has been recognised as substantially reducing urban footprints in the EU (Vanham et al., 2017; Vanham et al., 2018; Leip et al., 2014; Westhoek et al., 2014). Also, a reduction in consumer food waste, an SDG target, which amounts to about 150 kilograms per person per year, can substantially reduce pressure on the hinterland (Vanham et al., 2015; De Laurentiis et al., 2018)134. Other such measures include products’ environmental performance, urban farming, promotion of alternative proteins (Parodi et al., 2018), greater energy efficiency and self-sufficiency, and the promotion of active and public transport.
79 10. Environmental footprint
Promoting sustainable consumption behaviour by citizens is key to achieving the targets of the SDGs135.
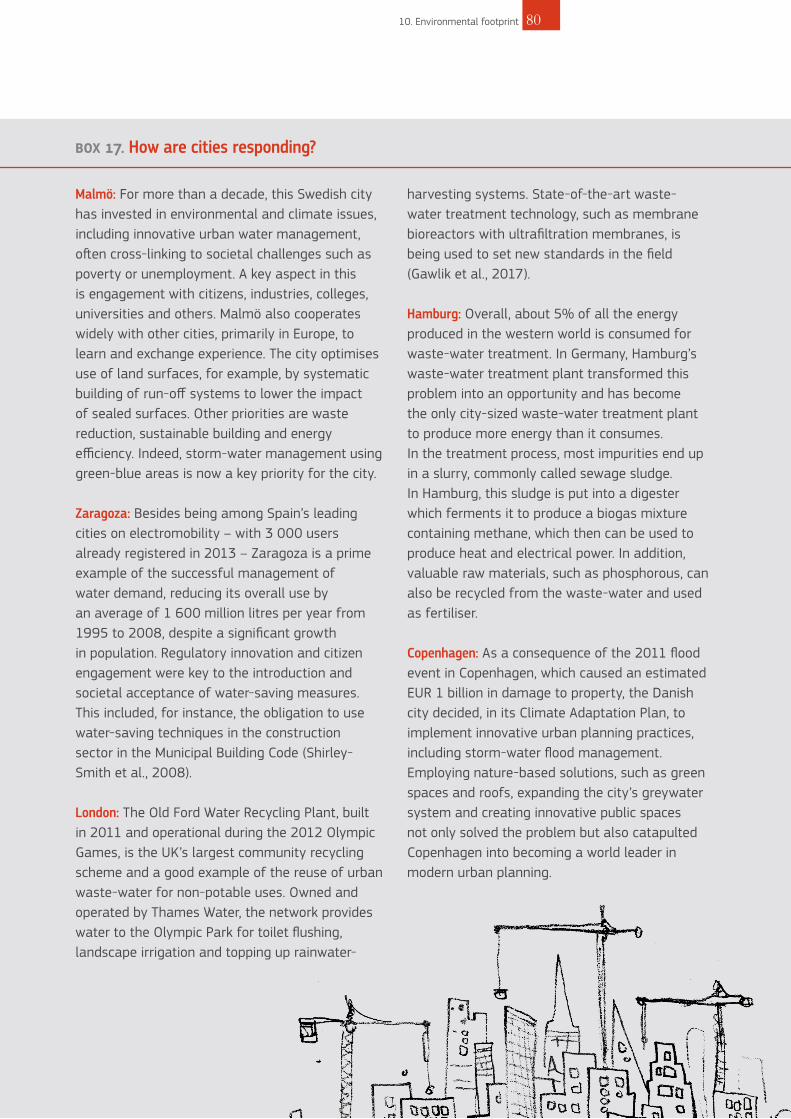
Malmö: For more than a decade, this Swedish city has invested in environmental and climate issues, including innovative urban water management, often cross-linking to societal challenges such as poverty or unemployment. A key aspect in this is engagement with citizens, industries, colleges, universities and others. Malmö also cooperates widely with other cities, primarily in Europe, to learn and exchange experience. The city optimises use of land surfaces, for example, by systematic building of run-off systems to lower the impact of sealed surfaces. Other priorities are waste reduction, sustainable building and energy efficiency. Indeed, storm-water management using green-blue areas is now a key priority for the city.
Zaragoza: Besides being among Spain’s leading cities on electromobility – with 3 000 users already registered in 2013 – Zaragoza is a prime example of the successful management of water demand, reducing its overall use by an average of 1 600 million litres per year from 1995 to 2008, despite a significant growth in population. Regulatory innovation and citizen engagement were key to the introduction and societal acceptance of water-saving measures. This included, for instance, the obligation to use water-saving techniques in the construction sector in the Municipal Building Code (Shirley-Smith et al., 2008).
London: The Old Ford Water Recycling Plant, built in 2011 and operational during the 2012 Olympic Games, is the UK’s largest community recycling scheme and a good example of the reuse of urban waste-water for non-potable uses. Owned and operated by Thames Water, the network provides water to the Olympic Park for toilet flushing, landscape irrigation and topping up rainwater-
harvesting systems. State-of-the-art waste-water treatment technology, such as membrane bioreactors with ultrafiltration membranes, is being used to set new standards in the field (Gawlik et al., 2017).
Hamburg: Overall, about 5% of all the energy produced in the western world is consumed for waste-water treatment. In Germany, Hamburg’s waste-water treatment plant transformed this problem into an opportunity and has become the only city-sized waste-water treatment plant to produce more energy than it consumes. In the treatment process, most impurities end up in a slurry, commonly called sewage sludge. In Hamburg, this sludge is put into a digester which ferments it to produce a biogas mixture containing methane, which then can be used to produce heat and electrical power. In addition, valuable raw materials, such as phosphorous, can also be recycled from the waste-water and used as fertiliser.
Copenhagen: As a consequence of the 2011 flood event in Copenhagen, which caused an estimated EUR 1 billion in damage to property, the Danish city decided, in its Climate Adaptation Plan, to implement innovative urban planning practices, including storm-water flood management. Employing nature-based solutions, such as green spaces and roofs, expanding the city’s greywater system and creating innovative public spaces not only solved the problem but also catapulted Copenhagen into becoming a world leader in modern urban planning.
10. Environmental footprint 80
box 17. How are cities responding?

81 10. Environmental footprint
Cleaned sewage water clarification waterwork

Bosco verticale, Milan, Italy
11. Climate action 82
KEY MESSAGES
• While being responsible for a high level of energy consumption and, therefore, generating about 70% of global GHG emissions, cities are particularly vulnerable to the impacts of climate change.
• Cities are most effective at taking measures to tackle climate change when aligned with each other and with national- and regional-level actors with whom they can share greater climate ambition and capacity.
• In the last two decades, city ambition has risen remarkably to go beyond the national governments’ climate-change targets as the IPCC Special Report on Global Warming of 1.5°C warns that current nationally determined contributions for the Paris Agreement are not sufficient.
• Cities need support from their partners in national and regional governments, the private sector, academia, and civil society to fully meet and exceed these ambitious targets.

83 11. Climate action
CLIMATE ACTION 11.1. How will climate change
affect cities, and how can they take action?
While responsible for a high level of energy consumption and generating about 70% of global GHG emissions, cities are particularly vulnerable to the impacts of climate change. Consequently, they play a key role in meeting the targets outlined in the Paris Agreement (UNFCC 2015) on climate change. The engagement of cities and urban stakeholders is supported by the New Urban Agenda and the 2030 SDGs. Cities are most effective at taking measures to tackle climate change when aligned with each other and national- and regional-level actors. In some cases, the level of ambition and response capacity is shared across these different actors, while in others, cities work as pioneers, providing
experimental environments for the testing of new strategies to integrate climate-change mitigation and adaptation activities. Worldwide, there are an increasing number of transnational networks on climate actions driven by cities and local governments, such as the Global Covenant of Mayors for Climate and Energy136. These international initiatives could accelerate the implementation and increase the effectiveness of national and local policies.
Cities have a key role to play in addressing the climate challenge.
Figure 38: The Global Covenant of Mayors signatory map 2018 Source: Global Covenant of Mayors, www.globalcovenantofmayors.org

11.2. Trends and key figures
Human-induced global warming has already reached 1 °C above pre-industrial levels and is increasing at approximately 0.2 °C per decade (Bazaz et al., 2018). The latest IPCC Special Report provided up-to-date scientific evidence of the transformative impacts of global warming on our environment, and its role in increasing the frequency and intensity of extreme weather events (EC COM, 2018). City residents and the critical infrastructure on which they depend will face more frequent flooding, drought, heatwaves and intense rain events along with other climate-related hazards. These will be translated into sea-level rise affecting coastal cities, impacts on built infrastructures, health problems arising from higher average temperatures and extreme events, an increase in energy demand and use, and adverse effects on water availability and resources. The expected growth in the global urban population could also lead to significant increases in GHG emissions across multiple sectors and changes to the urban microclimate due to the urban heat island effect (Oke, 1973; Mills, 2014).
These challenges require a rapid and massive decarbonisation of cities as well as improvements in their resilience. Achieving this transition will require cities to link on-the-ground scientific expertise to the needs and requirements of local decision-makers.
In 2008, the EC launched the Covenant of Mayors (CoM) initiative137, which was later formally merged with the Compact of Mayors, creating the Global Covenant of Mayors (GCoM). Today, GCoM includes 9 261 cities138, 8 800139 of which are in Europe. It is estimated that the aggregated potential of GCoM could reach annual reductions of 1.4 GtCO2-eq (gigatonnes of equivalent carbon dioxide) in 2030 and 2.8 GtCO2-eq in 2050140.
In the EU, the cities part of the Covenant signed an overall commitment to reducing emissions
of 27% by 2020 (Kona et al., 2018), well above the minimum requested EU target of 20%.
From progress reported on the implementation of EU cities’ climate action plans, almost 23% of overall emission reductions were achieved by 2018 compared to their baseline years.
11.3. Urban energy and climate governance Experience from the EU Covenant cities has shown that strong policy support from a synthesis of ‘urban climate governance’ options is required to transform the urban structure (Bertoldi et al., 2018). Strong cooperation and partnership with citizens and local businesses are the key to success (Figure 39).
Local authorities can set regulations and put forward urban planning principles141. Leveraging their capacity to govern through provision, they can effectively guide development in a way that increases energy efficiency in all urban sectors, support the transition to sustainable transport and promote local renewable-energy production. Municipal enabling presents opportunities that provide additional policy support for mobilising actors142.
In addition, local authorities can also act as implementers. Cities and local governments have varying degrees of capacity to govern their own activities and undertake strategic investments in municipality-owned assets, which include investments in energy efficiency and local energy generation based on renewable energy sources143. Moreover, the municipal self-governing mode of governance and awareness raising among public servants and communication among different departments are key measures for implementing climate action plans. Although big, wealthy and powerful cities have become important players in climate governance and many cities have reduced their CO2 emissions considerably, most small and
11. Climate action 84

8800+
THE EUROPEAN COVENANT OF MAYORS COMMUNITY
AMBITIOUS CITIES
million inhabitants covered = almost half of the EU population
230+
Several targets, one vision
Munster, Germany: Aims at 100 %renewables, 100 % electro-mobility from renewables & tripling buildings renovation rate by 2050
European cities committed
-40 % CO₂ emissions
Adapting to climate change
Alleviating energy poverty
-20 % CO₂ emissions Citizens live
in decarbonised and resilient cities
with access to sustainable, secure
and affordable energy
2050
20202030
Figure 39: The European Covenant of Mayors Community: targets and vision Source: European Covenant of Mayors, 2018, https://www.covenantofmayors.eu
85 11. Climate action
medium-sized municipalities in Europe have not yet started taking climate initiatives. Regional and local research on energy and climate governance is needed to support climate action strategies.
The first step to enable city action is the setting of an agenda driven by local governments as principal agents in the fight against climate change (Solecki et al., 2018). Following this line of thought, the GCoM launched the city-led initiative ‘Innovate4Cities’144 that proposes an agenda outlining research priorities145. Aligning research
agendas across sectors and government levels is necessary to support local government action with the data, information and technology that can unlock the financing and investment necessary to achieve a pathway that limits global warming to 1.5 °C. Cities and local governments, championing their role as vehicles for climate action in collaboration with partners, can be empowered with the capital, access to finance and private investment opportunities that will drive up shared climate ambition (Bazaz et al., 2018).

Sønderborg (Denmark) plans to be a CO2 neutral area by 2029146. The vision of the Sønderborg area (75 000+ inhabitants) of being a CO2 neutral growth area in 2029 can yield specific answers to the world’s problems because the vision is an innovation engine for new business concepts and technologies that can facilitate sustainable use of the world’s food, energy and water resources. Sønderborg’s Roadmap2020 is an invitation to cooperate: almost 100 Danish stakeholders have contributed to developing it, and more than 900 workplaces per year should be created
through its implementation. Since 2007, more than 1 100 home owners in the Sønderborg area have actively contributed to reducing their energy consumption. Investments of more than EUR 13.5 million have been made in the area and energy savings of more than 5 GWh have already been achieved as a result of the programme. As part of the initiative, the ZEROshop concept addresses the energy consumption of 300 shops; diplomas and labels, presented by the mayor, give visibility to the participating shops.
11. Climate action 86
box 18. The case of Sønderborg, Denmark
Urban sectors
URBA
N SE
CTOR
S IN
TEGR
ATIO
NUPSCALING AND REPLICATION
Municipal enabling(Stakeholder cooperation,
public-private partner, etc.)
Municipal self-governing (Strategic investments in municipal assets., etc.)
Regulation & planning(Standards, buiding codes, zoning, pricing, ordinances, etc.)
Governing through provision(Services and financial resource, etc.)
Buildings and infrastructure lighting Transport and mobility
Local renewable energy generation
Water and waste
Urban and land use planning
Modes of urban energy and climate governance
COHERENT POLICY MIX FRAMEWORK TO ACCELERATE CLIMATE ACTIONS
Figure 40: Modes of governance to accelerate climate action in urban areas

87 11. Climate action

12. Challenges: work ahead 88
Addressing the various challenges that could negatively impact cities in the future will require them to tackle several transversal research and policy questions.
Data availability and managementThe availability and reliability of data is a cross-cutting issue. Clear and effective evidence is needed to motivate change – which is especially true for climate and environmental action. The right scale and timeliness of data is also of particular importance. Many of the challenges described above are evolving rapidly and require real-time data at the local level to properly understand and enable action to be taken on specific issues. One example is housing, where the market is changing rapidly and data on the types of investors is scarce. Another is ageing, where the future distribution of retirees has to be better understood to allow cities to prepare accordingly. Data availability and consistency are particularly scarce for mental health, where the impacts on well-being of context factors such as neighbourhood aesthetics, greenness and sunlight exposure are still little understood. In the case of both mobility and health, there is huge potential for the use of crowd-sourced data – for example, collected through smartphone apps, wearable fitness devices and even social-media content analysis. On the other hand, issues of data management and processing as well as privacy still need to be addressed. The transparency of data, also with reference to private companies, remains an issue – for example, in the case of short-term rental platforms. This includes
the right of citizens to access correct and relevant data, and the avoidance of miscommunication.
Emerging technologiesA major research priority is how to get the most out of the introduction of emerging technologies. These technologies are presented as potential solutions to most challenges, including the introduction of automated and shared vehicles, e-services, and urban agricultural practices. Whilst these diverse technologies are being widely experimented with, especially at the city level, there is often a lack of data and analysis on both the full potential of specific technologies and their possible adverse impacts.
The role of societyIn many cases, the role and potential of stakeholder and citizen engagement needs to be better understood. While in many areas, such as the optimisation of public transport and management of individual health records, user control and involvement can have many benefits, its full implications must be better understood. The evolution of energy communities in Europe and their potential social innovation147 are of particular interest. As consumer behaviour will greatly influence the future impacts of resource and material consumption in cities, as well as personal and societal well-being, it needs to be better understood. Understanding the determinants of social cohesion in urban settings is also a research priority as it would open the door to designing policies that explicitly seek to address this issue.
CHALLENGES: WORK AHEAD

89 12. Challenges: work ahead
Integrated and targeted policy designFurther research is needed into how sustainable, place-based and integrated urban policies can be formulated so that they take into account the potential trade-offs and interlinkages between the challenges faced. Close cooperation between different levels of government (at urban, regional, national and international level), and across administrative boundaries and policy domains (urban, regional, transport, air quality, energy, and climate change mitigation) will be needed, including effective stakeholder engagement. Specific policies can provide important incentives for change although the consequences thereof need to be
anticipated within a broader picture. The scaling of initiatives and finding the right level at which action should be taken remains a hurdle to be overcome.
These considerations point towards cross-cutting themes which already reflect some of the opportunities and tools cities have at hand. These include an abundance of available physical space, a large and diverse population, a certain level of autonomy, and openness to technological advancements and innovation, all of which are further developed in the ‘Perspectives’ chapters which follow.
JRC | LUISA Refined land use map of Dublin, Ireland (Rosina et al., 2018)


PART 3: PERSPECTIVES

Buttes Chaumont, Paris, France
13. Space and the city 92
KEY MESSAGES
• Public spaces make up between 2 and 15% of land in city centres in Europe. Both their physical and social functions are essential and can relieve some of the pres-sures exerted on a city by a growing population.
• The greenness of European cities has increased by 38% over the last 25 years, with 44% of Europe’s urban population currently living within 300 metres of a public park. Well-designed public and green spaces can have a multitude of bene-fits: improving air quality, providing microclimate regulation, and enhancing safety, social integration and public health.
• In future cities, we will need to optimise the distribution and use of public space to ensure that it is safe, accessible and inclusive for all.

93 13. Space and the city
SPACE AND THE CITY 13.1. How can public space in a city
help to address future urban challenges?
Over the last 25 years, cities globally have grown in size by an area equal to that of Ireland (Melchiorri et al., 2018b). 59% of cities have also seen an increase in land consumed per new resident. As recognised by the SDG target 11.3.1, the efficiency of land use is key to enhancing inclusive and sustainable urbanisation. Urban sprawl and the inefficient use of land remains a problem, with varying impacts in different contexts.
Thus, there is a growing need to optimise the use of available space. In new neighbourhoods, many sustainable development principles can be applied directly when planning the area; however, this is much more challenging in historic and consolidated areas. Within urban contexts, public space has a key role in making cities liveable. Public space is hard to define and has vastly different features and elements depending on the geographical and cultural contexts. In several, especially Nordic countries, the freedom to roam is a basic right although restrictions vary according to country. Public space is anywhere accessible to gather people together on a public basis. This includes public squares, market places, monuments, parks, public beaches, riversides as well as pavements and streets (UN-HABITAT, 2013).
Public space makes room for play, social interaction, creativity, economic activities and entertainment, the very things a city thrives on.
Among public spaces, urban green spaces can have a multitude of benefits: hosting birds and bees, providing cleaner air, allowing water to infiltrate the soil, and reducing the impact of heatwaves.
As cities and urban populations continue to rapidly transform, there is a need to rethink how space is used.
Public spaces are all places publicly owned or of public use, accessible and enjoyable by all for free and without a profit motive(UN-HABITAT, 2015).

A city’s task in providing quality public space for its citizens lies not only in reserving sufficient areas but also in ensuring that the conditions – such as maintenance and management – enable it to be used to its full potential. This introduces additional concerns about the quality of the public space, ensuring safety of use, and its accessibility to all user groups as well as the financial burden incurred by the creation and maintenance of public spaces.
13.2. Emerging trends
National and local guidelines on the adequate amount of public space differ significantly from place to place. Adequate space for street networks is recommended, taking up some 30% of land, with at least 18 km of street length per km2 of urban area (UN-HABITAT, 2015). Other public spaces usually make up between 2 and 15% of land in city centres in Europe. The WHO recommends a minimum amount of 9m2 of green open space per person (WHO, 2009). While there are contradictions in how a city may define green space, many cities struggle to reach this recommended minimum while others aim to incorporate substantially more (for example, the Italian planning law requires 18m2 of green area per person in new developments).
As mentioned above, the variety and quality of available space is important, as is where it is located and how accessible it is to users in different neighbourhoods. Ideally, public areas should be easily accessible on foot, by bike or by using public transport, and, in particular, should cater for the most vulnerable groups of city users, including people with different abilities, children and the elderly.
On average, some 40% of the surface area of European cities is made up of urban green infrastructure, with around 18.2m2 of publicly accessible green space per inhabitant; 44% of Europe’s urban population lives within 300m of a public park. However, the presence of green
areas (both public and private) in cities varies greatly – whereas some city centres, such as Vienna (AT) and Freiburg (DE), even have forested areas within their city centres, others lack green areas (Zulian et al., 2018; Corbane et al., 2018), especially in Mediterranean regions.
The greenness of European cities has increased by 38% over the last 25 years while globally it has grown by 12% over the same period (Pesaresi et al., 2017).
To be used to their full potential, public spaces need to be safe, age-friendly, and accessible and inclusive for all. Demographic structures are changing (OECD, 2015b) – Europe is facing an ageing urban population, while 20% of the world population today is under 18. This calls for the redesign of public space to be age-friendly148. Designing public spaces via participative processes can contribute to its success – many examples of participatory design can be found in Europe, involving citizens right from the conception stage149.
Several cities are currently discussing strategies for passive protection (among them Barcelona and Nice), including introducing physical barriers.
13. Space and the city 94
Not only the total amount of public space, but also its spatial distribution throughout the city is important.

20°E0°
60°N
50°N
40°N
0 250 Km
0 125 Km
Public Green per inhabitant(m²)
< 4.5
4.5 - 9
9 - 20
20 - 45
> 45
< 150000
150 000-300000
300 000-600 000
600 000-1000000
> 1000 000
Population size
EU average: 18.2 m²/inhabitant
R oma
R iga
Oslo
Bern
Wien
Paris
Praha
Lisbon
Zagreb
Madrid
Sofiya
London
Berlin
Dublin
Athinai
Tallinn
Luxemb.
Nicosia
Brussel
Vilnius
Valletta
Kishinev
Helsinki
Budapest
Warszawa
Ljubljana
Stockholm
Kø benhavn
Bucuresti
Amsterdam
Bratislava
Milan
Figure 41: The available public green in European cities per inhabitantSource: JRC | Maes et al., 2019
The use of technology and monitoring infrastructure is also being explored to help reduce crime. The way public spaces in the city are laid out can heavily influence safety and security. Some cities are safer by design, e.g. being well-lit, with fewer exposed streets, denser road networks, and in general attracting more people out into public spaces.
So, what can be expected in the future? There is a global trend towards the privatisation of public
space (e.g. occupation of roads and squares by cafés and restaurants) as well as ‘pseudo-public’ spaces150 (privately owned, openly accessible areas).
The way public space is used is changing: there is a push to make optimal use of the space already available in cities in creative ways. In Europe, many cities are trying to (re)densify. In addition, many are even experiencing population shrinkage, resulting in buildings being abandoned. The regeneration of urban
95 13. Space and the city

The Padua City Lab mapped the potential of the city’s 55 000 public trees (255 different species) to improve air quality, carbon sequestration and pollination153. This supports the management of the city’s green infrastructure (e.g. tree species selection; pollinators close to agricultural
areas), and urban planning (e.g. regulations and compensation schemes). This is a pilot case for developing a consistent EU-wide database on public trees. Many cities have this data and could carry out a similar analysis.
Figure 42: The location of trees, both inside green areas and along streets in Padua (IT)Source: University of Trento, Department of Civil, Environmental and Mechanical Engineering
spaces provides opportunities to (re-)create cultural and recreational functions (the conversion of abandoned areas into co-working spaces, theatres, schools, etc.), reduce transport distances and promote walking and cycling. Increasingly, citizens are also being involved in the decision-making process, art is being incorporated, and existing public spaces are being used for
a multitude of simultaneous purposes151. Cities are even actively taking on projects to free up public space. For example, Barcelona is redirecting traffic and creating ‘superblocks’ where streets are reserved for pedestrians and cyclists, and are to be redeveloped to incorporate more public green space152.
13. Space and the city 96
box 19. Green infrastructure in Padua, Italy

97 13. Space and the city

14. Tech and the city 98
KEY MESSAGES
• New and emerging technologies could help cities improve public services (including mobility and well-being), better interact with citizens, increase productivity, and address environmental and sustainability challenges.
• Emerging technologies raise several issues, including data privacy and ownership, appropriate and consistent legislation, data sharing and standards, and cybersecurity.
• As dependence on certain technologies and resources grows, cities need to plan for more system redundancy and resilience.
• Some technologies could have a detrimental effect on part of the urban population, and maximising societal benefit will require careful regulation and forward planning.

99 14. Tech and the city
TECH AND THE CITY 14.1. How can the opportunities
provided by technology markets be fully harnessed?
Technology is visible everywhere in today’s cities and has long been used to address specific urban challenges. High population and infrastructure density, leading to lower implementation costs per capita, have made cities prime locations for new technologies to be implemented. Yet, certain technologies, on which cities critically depend, have not changed much over time. For example, most people still travel using manually operated personal cars, powered by the internal combustion engine which has been with us since the early 1900s. The technology behind traffic lights is often still based on manually synchronised mechanical timers, whilst reinforced concrete, the material from which our cities are mostly built, was also developed before 1900.
The recent development of cheap sensors, combined with the spread of mobile and high-speed internet and the miniaturisation of computing technology, have opened the way for a new technological revolution. The Internet of Things (IoT), Artificial Intelligence (AI), the high-resolution global positioning system (GPS), big data, and new building materials and techniques are expected to transform cities’ core functioning elements, affecting all aspects of our lives. While the introduction of many technologies have had positive impacts, others have had unintended consequences. For example, the development of motorised private cars has brought increased mobility but has also led to congestion and greater air pollution. How will this latest wave of emerging technologies change cities and their core systems, and what are the implications for city dwellers?
“The overall evidence suggests that we do not lack technologies, nor the data captured by technologies, but that the bigger challenge lies in governance, financing, and complex ownership structures that make it difficult to put the data to good use.” (University of Birmingham, 2014)

14.2. Emerging trends
The introduction of new technology has led to significant improvements in our quality of life, greater productivity, higher levels of public-service provision, less need for commuting and additional leisure time. Smart highways and the deployment of 5G technologies along roads are now being planned (the Munich-Bologna corridor154), and will vastly improve traffic information and management. Drones will greatly assist emergency services, reduce delivery costs and eventually will even transport people (ITF, 2018). In Paris alone, it has been predicted that drones will account for almost 20 000 flights per hour by 2035155. Electric and plug-in hybrid vehicles are expected to represent between 20% and 70% of vehicle sales by 2030156 (Tsakalidis and Thiel, 2018). More details concerning specific technologies and their potential impact on cities can be found in the emerging technologies horizon scanning table, available in the online version of this report.
Europeans are becoming increasingly connected – 19% use online shopping, 64% use online
devices to access live public transport schedule information, and 77% of the EU population use mobile mapping and navigation services (Figure 43). A growing number of people living in cities (14% in the EU-28, reaching as high as 32% in Denmark) are also using digital technologies to telework and are abandoning the daily commute. Big data and global monitoring are part of our daily lives. Sensor networks and new systems of data collection can now provide a real-time, constant stream of information that has a huge potential to improve city planning and tailor solutions to local conditions. Technological solutions creating the basis for the IoT and smart cities157, such as application programming interfaces (APIs) (which support interconnection among hetereogenous systems), have also increased enormously in recent years158,159.
Cities are major consumers of energy, with 72% of global primary energy use attributed to urban areas. To satisfy future demand, electricity generation in the EU is already foreseen to increase by 54% by 2050, and while electricity generation from fossil sources will decline by 19%,
Figure 43: Responses when European citizens were asked how frequently they use various technologies
0% 20% 40% 60% 80%
Online flight ticket purchasing
Online/ mobile access to live public transport schedule information
Mobile phone Map and/or Navigation application
Online public transport ticket purchasing
Always O�en Sometimes Never/na
14. Tech and the city 100
0% 20% 40% 60% 80%
Online flight ticket purchasing
Online/ mobile access to live public transport schedule information
Mobile phone Map and/or Navigation application
Online public transport ticket purchasing
Always O�en Sometimes Never/na
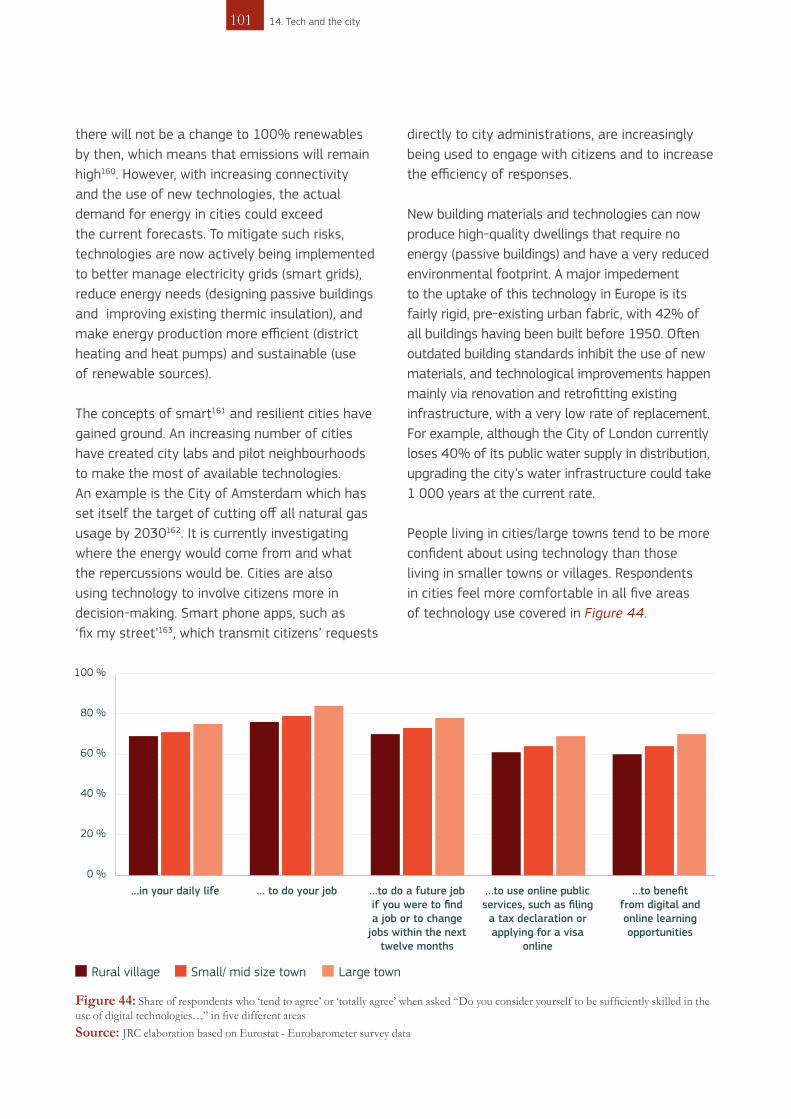
there will not be a change to 100% renewables by then, which means that emissions will remain high160. However, with increasing connectivity and the use of new technologies, the actual demand for energy in cities could exceed the current forecasts. To mitigate such risks, technologies are now actively being implemented to better manage electricity grids (smart grids), reduce energy needs (designing passive buildings and improving existing thermic insulation), and make energy production more efficient (district heating and heat pumps) and sustainable (use of renewable sources).
The concepts of smart161 and resilient cities have gained ground. An increasing number of cities have created city labs and pilot neighbourhoods to make the most of available technologies. An example is the City of Amsterdam which has set itself the target of cutting off all natural gas usage by 2030162. It is currently investigating where the energy would come from and what the repercussions would be. Cities are also using technology to involve citizens more in decision-making. Smart phone apps, such as ‘fix my street’163, which transmit citizens’ requests
directly to city administrations, are increasingly being used to engage with citizens and to increase the efficiency of responses.
New building materials and technologies can now produce high-quality dwellings that require no energy (passive buildings) and have a very reduced environmental footprint. A major impedement to the uptake of this technology in Europe is its fairly rigid, pre-existing urban fabric, with 42% of all buildings having been built before 1950. Often outdated building standards inhibit the use of new materials, and technological improvements happen mainly via renovation and retrofitting existing infrastructure, with a very low rate of replacement. For example, although the City of London currently loses 40% of its public water supply in distribution, upgrading the city’s water infrastructure could take 1 000 years at the current rate.
People living in cities/large towns tend to be more confident about using technology than those living in smaller towns or villages. Respondents in cities feel more comfortable in all five areas of technology use covered in Figure 44.
…in your daily life
Rural village Small/ mid size town Large town
0 %
20 %
40 %
60 %
80 %
100 %
… to do your job …to do a future job if you were to find a job or to change
jobs within the next twelve months
…to use online public services, such as filing
a tax declaration or applying for a visa
online
…to benefitfrom digital and online learning opportunities
Figure 44: Share of respondents who ‘tend to agree’ or ‘totally agree’ when asked “Do you consider yourself to be sufficiently skilled in theuse of digital technologies…” in five different areasSource: JRC elaboration based on Eurostat - Eurobarometer survey data
101 14. Tech and the city

The introduction of several new technologies may be delayed by legislation, which can vary greatly between levels of governance and cannot always keep pace with today’s fast-moving technological innovations. The use of automated vehicles and personal light electric vehicles (PLEVs), drones, AI, face-recognition software and 5G are just a few examples of technologies that have yet to be uniformly regulated. Technology tends to require implementation of a critical mass and substantial investment, and its benefits may therefore not be spread uniformly across all cities, depending on city size, budget and set priorities. High costs may also limit the capacity of certain individuals or businesses to benefit from new technologies164.
Will our society be prepared for further changes introduced by technology? The implementation of these new technologies will drastically change how our cities look and function. Advances in mobility, energy and data use may make our cities more compact, efficient, and inclusive.
New technology-monitoring initiatives are helping to keep track of these transformations. A local example is ICity Rate165, while at a more global scale, the World Economic Forum and the Transport Research and Innovation Monitoring and Information System (TRIMIS) (Tsakalidis et al., 2018) are mapping new developments across various sectors166 and supporting strategic
Schoonschip, Amsterdam (NL)Schoonschip is a floating residential neighbour-hood in Amsterdam North that aims to become one of the most sustainable, self-sufficient urban developments in Europe. A smart grid will be implemented, and each house will be equipped with local photovoltaic (PV) panels, battery storage, solar collectors, thermal storage, a smart heat pump and other smart-grid-ready appliances. The neighbourhood will also exclusively use shared electric cars167.
Quayside, Toronto (CA)Sidewalk Toronto168 is a project developed in cooperation between Sidewalk Labs and the City of Toronto to develop from scratch a new pedestrian neighbourhood called Quayside. The proposed pedestrian neighbourhood of 4.9 hectares could host 5 000 people and would bring together some of the most advanced technologies and best practices in several urban domains. It would be composed of climate-positive buildings (incorporating solar power, passive building, geothermal heating and energy monitoring) made from factory-built mass timber (wood) and using an automated pneumatic
waste-disposal system. It would also incorporate a share of affordable housing, provide extensive public spaces, and use nature-based storm-water management. However, as with all technologies, the privacy implications of this project as well as the proposed use of intellectual property (IP) generated from the collected data remain highly contentious.
14. Tech and the city 102
box 20. Case studies from Amsterdam and Toronto
Quayside, Toronto development plans(©Sidewalk Labs)
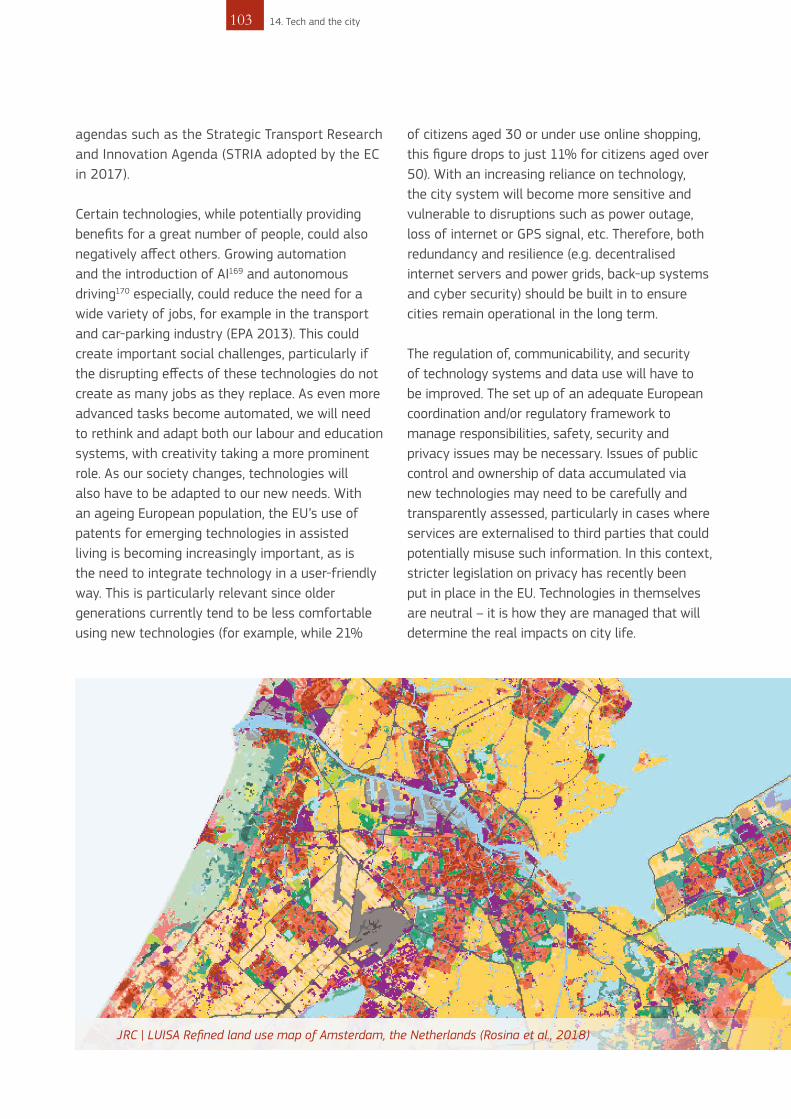
agendas such as the Strategic Transport Research and Innovation Agenda (STRIA adopted by the EC in 2017).
Certain technologies, while potentially providing benefits for a great number of people, could also negatively affect others. Growing automation and the introduction of AI169 and autonomous driving170 especially, could reduce the need for a wide variety of jobs, for example in the transport and car-parking industry (EPA 2013). This could create important social challenges, particularly if the disrupting effects of these technologies do not create as many jobs as they replace. As even more advanced tasks become automated, we will need to rethink and adapt both our labour and education systems, with creativity taking a more prominent role. As our society changes, technologies will also have to be adapted to our new needs. With an ageing European population, the EU’s use of patents for emerging technologies in assisted living is becoming increasingly important, as is the need to integrate technology in a user-friendly way. This is particularly relevant since older generations currently tend to be less comfortable using new technologies (for example, while 21%
of citizens aged 30 or under use online shopping, this figure drops to just 11% for citizens aged over 50). With an increasing reliance on technology, the city system will become more sensitive and vulnerable to disruptions such as power outage, loss of internet or GPS signal, etc. Therefore, both redundancy and resilience (e.g. decentralised internet servers and power grids, back-up systems and cyber security) should be built in to ensure cities remain operational in the long term.
The regulation of, communicability, and security of technology systems and data use will have to be improved. The set up of an adequate European coordination and/or regulatory framework to manage responsibilities, safety, security and privacy issues may be necessary. Issues of public control and ownership of data accumulated via new technologies may need to be carefully and transparently assessed, particularly in cases where services are externalised to third parties that could potentially misuse such information. In this context, stricter legislation on privacy has recently been put in place in the EU. Technologies in themselves are neutral – it is how they are managed that will determine the real impacts on city life.
103 14. Tech and the city
JRC | LUISA Refined land use map of Amsterdam, the Netherlands (Rosina et al., 2018)

15. Cities innovation hubs 104
KEY MESSAGES
• Cities play a central role in innovation dynamics: geographical proximity of stake-holders and multidisciplinary interaction enable innovation.
• Innovation is linked to the uniqueness of a territory: innovation is successful when local conditions and resources are actively taken into account.
• The variety of approaches to innovation enhances the identity of cities, their tradi-tions and their cultural heritage.
• Although capital cities and metropolitan areas remain major drivers of creativity and innovation, favourable conditions can also be found in smaller cities.
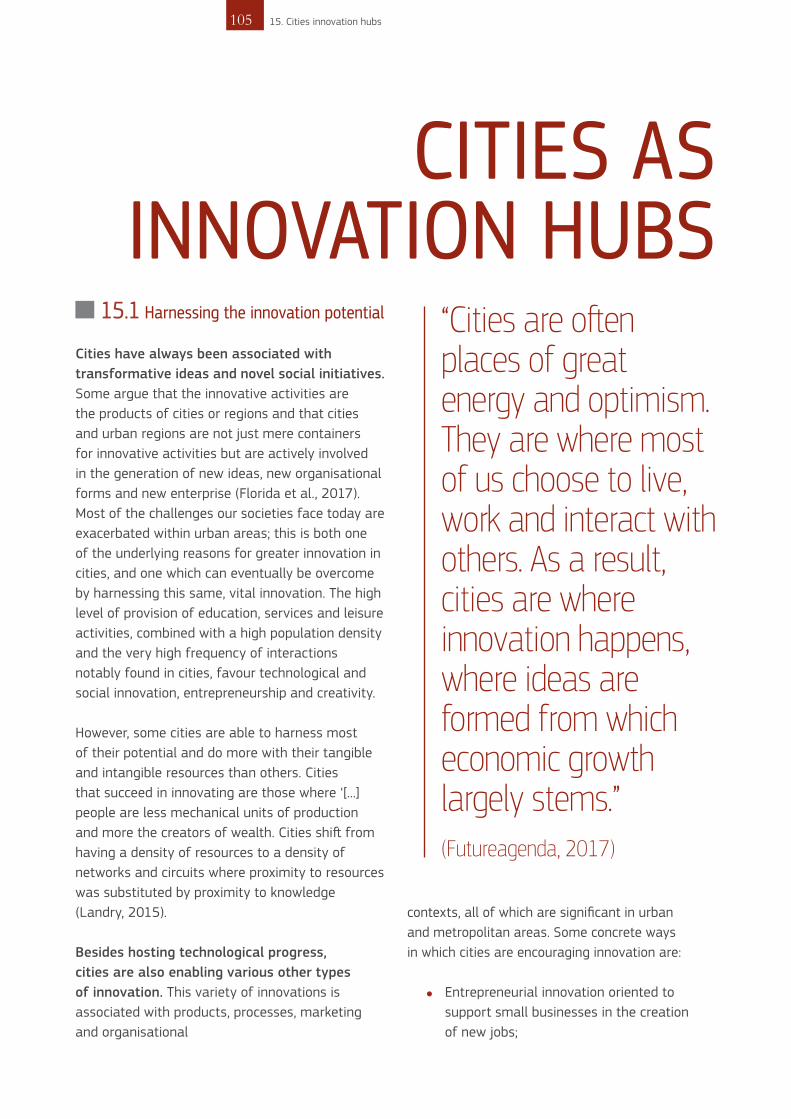
105 15. Cities innovation hubs
CITIES AS INNOVATION HUBS
15.1 Harnessing the innovation potential
Cities have always been associated with transformative ideas and novel social initiatives. Some argue that the innovative activities are the products of cities or regions and that cities and urban regions are not just mere containers for innovative activities but are actively involved in the generation of new ideas, new organisational forms and new enterprise (Florida et al., 2017). Most of the challenges our societies face today are exacerbated within urban areas; this is both one of the underlying reasons for greater innovation in cities, and one which can eventually be overcome by harnessing this same, vital innovation. The high level of provision of education, services and leisure activities, combined with a high population density and the very high frequency of interactions notably found in cities, favour technological and social innovation, entrepreneurship and creativity.
However, some cities are able to harness most of their potential and do more with their tangible and intangible resources than others. Cities that succeed in innovating are those where ‘[...] people are less mechanical units of production and more the creators of wealth. Cities shift from having a density of resources to a density of networks and circuits where proximity to resources was substituted by proximity to knowledge (Landry, 2015).
Besides hosting technological progress, cities are also enabling various other types of innovation. This variety of innovations is associated with products, processes, marketing and organisational
contexts, all of which are significant in urban and metropolitan areas. Some concrete ways in which cities are encouraging innovation are:
● Entrepreneurial innovation oriented to support small businesses in the creation of new jobs;
“Cities are often places of great energy and optimism. They are where most of us choose to live, work and interact with others. As a result, cities are where innovation happens, where ideas are formed from which economic growth largely stems.” (Futureagenda, 2017)
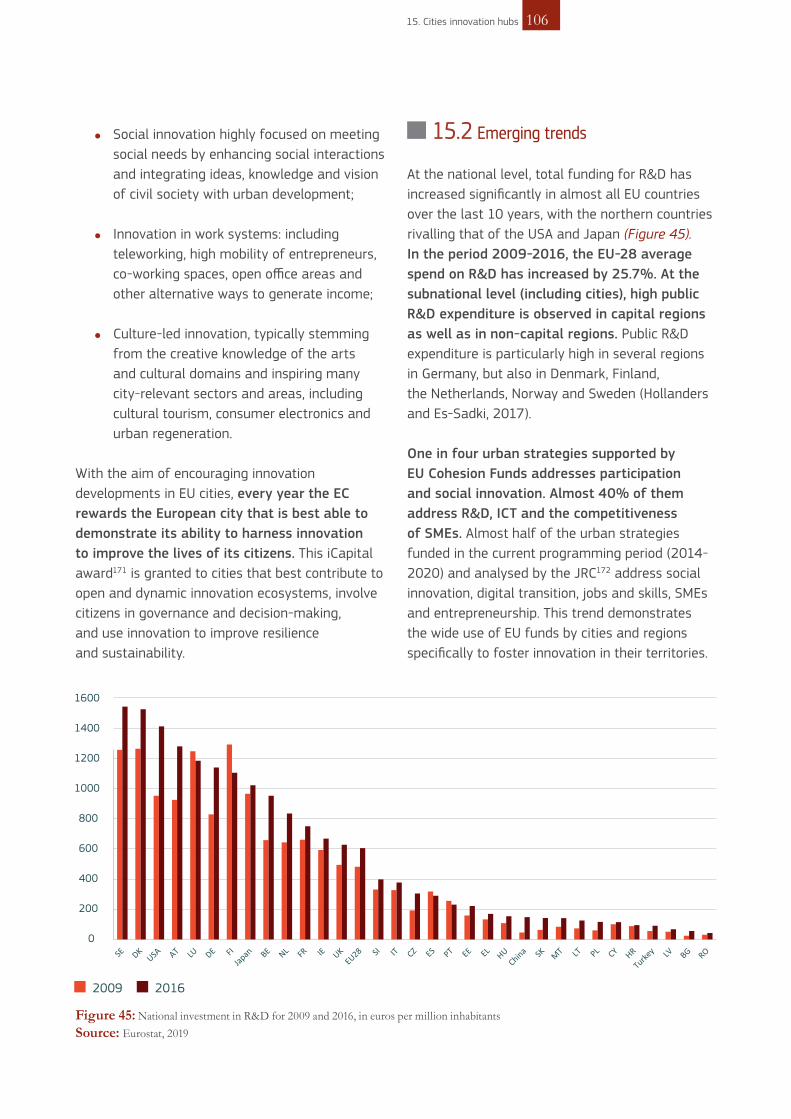
● Social innovation highly focused on meeting social needs by enhancing social interactions and integrating ideas, knowledge and vision of civil society with urban development;
● Innovation in work systems: including teleworking, high mobility of entrepreneurs, co-working spaces, open office areas and other alternative ways to generate income;
● Culture-led innovation, typically stemming from the creative knowledge of the arts and cultural domains and inspiring many city-relevant sectors and areas, including cultural tourism, consumer electronics and urban regeneration.
With the aim of encouraging innovation developments in EU cities, every year the EC rewards the European city that is best able to demonstrate its ability to harness innovation to improve the lives of its citizens. This iCapital award171 is granted to cities that best contribute to open and dynamic innovation ecosystems, involve citizens in governance and decision-making, and use innovation to improve resilience and sustainability.
15.2 Emerging trends
At the national level, total funding for R&D has increased significantly in almost all EU countries over the last 10 years, with the northern countries rivalling that of the USA and Japan (Figure 45). In the period 2009-2016, the EU-28 average spend on R&D has increased by 25.7%. At the subnational level (including cities), high public R&D expenditure is observed in capital regions as well as in non-capital regions. Public R&D expenditure is particularly high in several regions in Germany, but also in Denmark, Finland, the Netherlands, Norway and Sweden (Hollanders and Es-Sadki, 2017).
One in four urban strategies supported by EU Cohesion Funds addresses participation and social innovation. Almost 40% of them address R&D, ICT and the competitiveness of SMEs. Almost half of the urban strategies funded in the current programming period (2014-2020) and analysed by the JRC172 address social innovation, digital transition, jobs and skills, SMEs and entrepreneurship. This trend demonstrates the wide use of EU funds by cities and regions specifically to foster innovation in their territories.
0
200
400
600
800
1000
1200
1400
1600
2009 2016
Figure 45: National investment in R&D for 2009 and 2016, in euros per million inhabitants Source: Eurostat, 2019
15. Cities innovation hubs 106

At least 50% of the European Regional Development Fund (ERDF) 2014-2020 has been invested in urban areas (EC, 2017) and around EUR 14.5 billion (8%) of the total ERDF budget has been allocated directly to support over 900 integrated sustainable urban development strategies. To get the full picture, considerable additional financing from the 134 European Structural Funds and from other EU or domestic sources in a number of Member States must be taken into account (EC, 2017).
In cities, innovation is already increasingly being harnessed to tackle specific concerns among local stakeholders. For example, Gothenburg (SE), Paris (FR) and Viladecans (ES) are bringing together public authorities, energy producers and suppliers, real-estate developers, technological private firms and consumers to develop and implement energy-efficiency measures, paying great attention to their social implications, such as fuel poverty (Urban Innovative Actions 2018).
Figure 46: Number of patents in 2009 per million inhabitants, by metropolitan region (measure of competitiveness)Source: JRC elaborations based on Eurostat data (Eurostat, 2019)
107 15. Cities innovation hubs
Metropolitan Regions (2009)

Traditional services are being adapted in innovative ways to assist specific groups, in particular the most vulnerable, such as migrants. With its ‘Curing the Limbo’173 project, Athens is giving refugees and underprivileged citizens the chance to afford housing, develop work skills or find employment. In addition, the Digital Council has formed an alliance with private partners to support digital literacy and foster civic technology, such as smart recycling bins174. Other cities, such as Utrecht (NL), Antwerp (BE), Bologna (IT) and Vienna (AT), are introducing new elements co-designed with beneficiaries and local stakeholders175.
Cities are also experimenting with new ways to bridge the skill gaps in strategic sectors such as the green and blue economy, industry 4.0, robotics, 3D printing, and social inclusion. Milan, for example, is creating a living lab for social inclusion, job creation and open innovation along the food supply chain176.
Although capital cities and metropolitan areas remain major drivers of creativity and innovation, favourable conditions can also be found in smaller cities. Interestingly, the Cultural and Creative Cities Monitor developed by the JRC177 shows that capital cities obtain the highest score on ‘Creative Economy’ in 19 out of 24 countries (nearly 80%), although Austria, Germany, Italy, the Netherlands and Sweden are exceptions.
Cultural, historical, economic but also methodological factors may help explain the exceptions observed. In Italy, for instance, Milan comes first probably because of its agglomeration advantages that typically foster creative economies (Lorenzen and Frederiksen 2008) and are usually found in metropolitan areas and capital cities, as might be expected. Eindhoven, however, ranking just slightly above Amsterdam, probably owes its notable performance to its renowned and prolific high-tech and design-led environment which benefits from
Figure 47: Creative economy: ranked cities and related scores within EU Member States Note: Cities in Cyprus, Latvia, Luxembourg and Malta omitted due to poor data coverageSource: JRC | Cultural and Creative Cities Monitor
5
15
25
35
45
55
65
75
85
EL HR AT ES EE HU SI IT IE PT BG UK PL CZ DE FI SE LT RO NL BE DK SK FR
Capital city Other cities
Linz
Stuttgart
Milan
EindhovenUmeå
15. Cities innovation hubs 108

good relations with other levels of government (Lagendijk and Boekema, 2008). This medium-sized city has been able to ‘borrow size’ and sustain functions and performance that are usually linked to metropolitan areas (Meijers and Burger 2017). The first positions achieved by Linz (AT) and Umeå (SE) can rather be explained by the creative and innovative ecosystems these cities have been able to establish in the last 20 years thanks to targeted investment efforts. In Germany, many cities have creative strategies in place with a view to fostering new approaches to production and innovation in their (more consolidated) industrial systems178.
The multiple ways of innovation and the relevance of policies aligned with territorial specificities are strongly linked to place-based innovation. This describes the discovery of innovation potential in a territory, with attention to the inclusive dialogue among the public and private sectors, academy and civil society, multi-stakeholder governance and the selection of strategic priorities for investment. Place-based
innovation considers how actors in the innovation processes are empowered in a way that stakeholders’ tacit knowledge is mobilised and incorporated into decision-making and priority selection (Rissola et al., 2017).
In the EU, the smart specialisation strategy179 constitute a policy mechanism that has applied place-based innovation as a way to identify and acknowledge the innovation potential and diversity in EU regions, and implicitly in cities. For example, Bilbao (ES)180, Bielsko-Biala (PL)181 and Sofia (BG)182, among others, have aligned their actions between smart specialisation approaches at the regional and city level. Cities such as Amsterdam (NL), Barcelona (ES) and Helsinki (FI) have published visions of how to support innovation and entrepreneurship, with a public set of key performance indicators to measure their success183.
In addition, the variety of innovation approaches experienced by cities also contributes to improving connectivity and cooperation among
Ljubljana, Slovenia, hosts a vibrant start-up ecosystem184 with numerous new initiatives aimed at providing stimulating support to start-ups, from co-working spaces, to geek houses and hackathons, some bottom-up from entrepreneurial activity, others stimulated by public policy. Together they create a dynamic network which spreads beyond Ljubljana across the country, but also much wider across the Western Balkans and through the EU and USA. This network benefits from entrepreneurial intermediary bridging agents who play a catalysing role, based on wide networking,
flexibility and co-creation of new ideas, creating new opportunities and motivating individuals. One such actor is the Technology Park of Ljubljana (co-owned by the municipality) together with ABC accelerator, with the Slovenian Enterprise Fund providing seed capital for start-ups, Startup Slovenia providing the arena for peer collaboration and the Slovenian Smart Specialisation Strategy (S4) establishing a platform for sustainable collaboration of business entities and public research organisations.
109 15. Cities innovation hubs
box 21. Place-based innovation ecosystems

them. Inter-city collaboration on innovation is happening at Member-State level (e.g. 6Aika185, Finland’s six largest cities strategy for sustainable urban development), within the EU (e.g. Creative Spirits186, BoosINNO187, In Focus network188) and between the EU and the rest of the world (i.e. International Urban Cooperation189).
The future of cities, as regards innovation, is strongly linked to both enhancing human capital and highlighting territorial identities.
In urban policymaking processes addressing innovation, there will be more room for networking and dialogue among stakholders as a way to discover innovation. In a more globalised world, cooperation among cities will allow for a quicker process of knowledge sharing, facilitating rapid advances in innovation.
In the past two decades, Linz has become a major hot spot for the arts, media and new technologies. Tabakfabrik, the former tobacco factory has undergone a major re-adaptation process to become a space fully dedicated to cultivating new and creative ideas. Tabakfabrik Linz has established itself as a focal point providing spaces and support for cultural and creative start-ups and contributing to the international positioning of Linz as a cultural and creative city. As a flagship project in a newly designed city district, Tabakfabrik also plays a key role locally as it is supporting the geographical expansion of the city centre towards the industrial areas around the port in the east – a key objective
in Linz’s contemporary inner-city development concept mixing arts and industry.
Supported by such a flourishing and highly experimental creative ecosystem, Linz ranks second on the ‘Cultural and Creative Cities Index’ (C3 Index) in the group of cities with fewer than 250 000 inhabitants. The city records a particularly competitive performance on dimensions D1.1 - Cultural Venues & Facilities (score: 54.3/100), D1.2 - Cultural Participation & Attractiveness (51.2/100), D2.2 - Intellectual Property & Innovations (39.0/100) and D2.1 Creative & Knowledge-based Jobs (63.5/100).
15. Cities innovation hubs 110
box 22. Arts, media and new technologies in Linz, Austria

111 15. Cities innovation hubs
Thomsen Photography/Tabakfabrik Linz

16. The citizen’s city 112
KEY MESSAGES
• Citizens can play a crucial role in identifying or actively intervening in urban chal-lenges, often providing new perspectives and solutions.
• The co-creation of strategies to tackle urban challenges is crucial for their success and it can rely on both established or new and experimental participatory methods.
• Novel technologies can significantly improve citizen participation, but there is a need to better understand and systematise current and emerging practices.
• The research and policy agendas for citizen participation should be co-created with citizens and all relevant stakeholders and include appropriate and robust evaluation and impact mechanisms to enable effective engagement.

113 16. The citizen’s city
THE CITIZEN’S CITY 16.1 How can citizens improve
their cities?
Cities attract people from all walks of life, being at the same time a magnet, container and transformer (Mumford, 1961). This triggers a new way of thinking and allows people to exchange values, concepts and practices, enabling cities to become spaces for engagement, regardless of size, density or complexity. Citizens often create, negotiate and test ideas and solutions in this context, collectively contributing towards shaping the future urban condition (Sassen, 2010).
In a time when facts appear increasingly uncertain, values in dispute, stakes high and decisions urgent190, citizen inputs regarding the construction or governance of urban spaces are becoming crucial. From citizen-led projects at the grass-roots level to citizen engagement initiatives kick-started by public authorities, citizen participation regularly offers paths not considered or followed by other actors. For example, citizens can place pressure on approaches commonly used within cities to address complex issues, while also enlarging the available pool of knowledge and resources (Nascimento and Pólvora 2016). They may also help to improve the democratic traits of specific solutions, with good opportunities for networking or amplification effects via the use or creation of new technologies191. These developments are enshrined in the goals of the New Urban Agenda192 which calls for more inclusive, accountable and participatory sustainable urbanisation and settlement planning.
16.2 Emerging trends
A number of projects are now testing new roles and responsibilities for citizens, new forms of collaboration between citizens and several other
actors in city governance, and new methods and technologies to mediate these same roles and relationships. The increasing prevalence, affordability and availability of new technologies is opening up a particularly wide range of possibilities for citizen participation in addressing complex issues.
The following sections feature some examples in which citizen-led or citizen engagement activities are becoming increasingly significant to rethink the future of our urban territories.
Governing the city – More inclusive styles of urban governance are already being adopted but will require larger transformations in the management of cities in the future. Including a more diversified set of actors in urban deliberative processes193 is a key trend within bottom-up structures of governance now sprawling across the world to tackle diverse issues, from enhancing cultural diversity194 to off-grid production of food and energy195. In this transformation process, citizens can increasingly influence the governance of local matters, from neighbourhood assemblies to the use of participatory online platforms. Decidim.org196 is an example of an open source
The meaningful integration of citizens in urban governance processes is now valued more than ever.
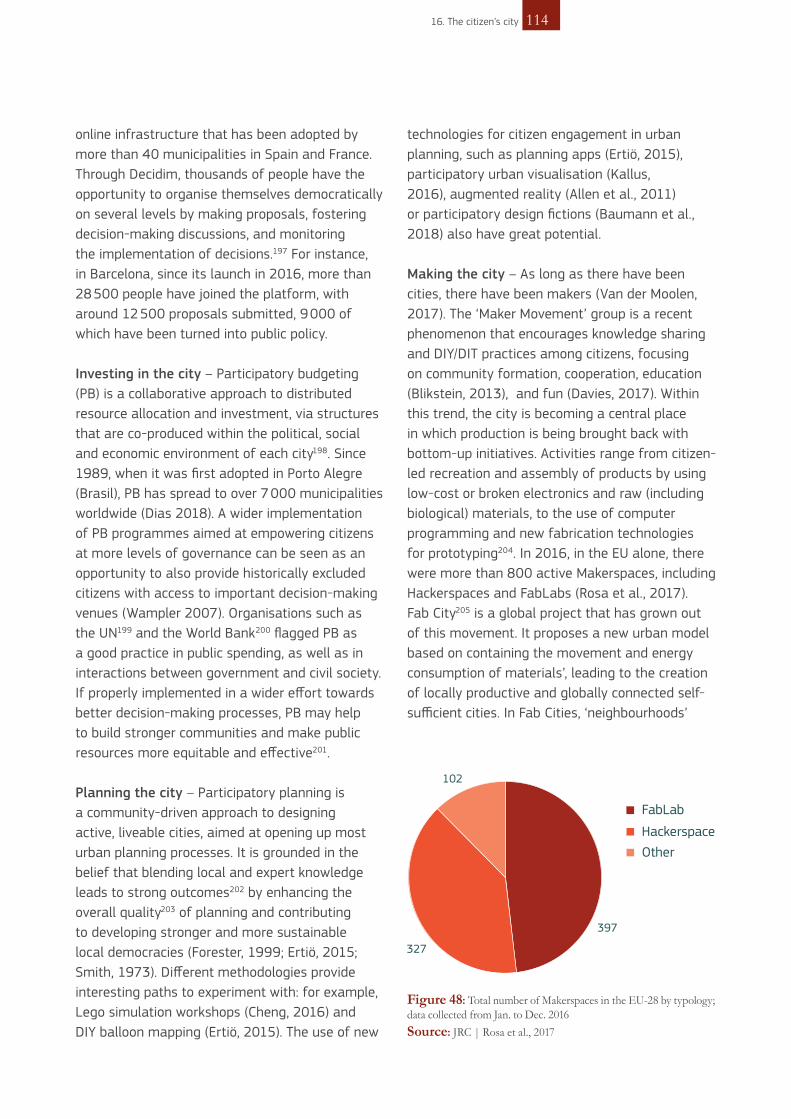
online infrastructure that has been adopted by more than 40 municipalities in Spain and France. Through Decidim, thousands of people have the opportunity to organise themselves democratically on several levels by making proposals, fostering decision-making discussions, and monitoring the implementation of decisions.197 For instance, in Barcelona, since its launch in 2016, more than 28 500 people have joined the platform, with around 12 500 proposals submitted, 9 000 of which have been turned into public policy.
Investing in the city – Participatory budgeting (PB) is a collaborative approach to distributed resource allocation and investment, via structures that are co-produced within the political, social and economic environment of each city198. Since 1989, when it was first adopted in Porto Alegre (Brasil), PB has spread to over 7 000 municipalities worldwide (Dias 2018). A wider implementation of PB programmes aimed at empowering citizens at more levels of governance can be seen as an opportunity to also provide historically excluded citizens with access to important decision-making venues (Wampler 2007). Organisations such as the UN199 and the World Bank200 flagged PB as a good practice in public spending, as well as in interactions between government and civil society. If properly implemented in a wider effort towards better decision-making processes, PB may help to build stronger communities and make public resources more equitable and effective201.
Planning the city – Participatory planning is a community-driven approach to designing active, liveable cities, aimed at opening up most urban planning processes. It is grounded in the belief that blending local and expert knowledge leads to strong outcomes202 by enhancing the overall quality203 of planning and contributing to developing stronger and more sustainable local democracies (Forester, 1999; Ertiö, 2015; Smith, 1973). Different methodologies provide interesting paths to experiment with: for example, Lego simulation workshops (Cheng, 2016) and DIY balloon mapping (Ertiö, 2015). The use of new
technologies for citizen engagement in urban planning, such as planning apps (Ertiö, 2015), participatory urban visualisation (Kallus, 2016), augmented reality (Allen et al., 2011) or participatory design fictions (Baumann et al., 2018) also have great potential.
Making the city – As long as there have been cities, there have been makers (Van der Moolen, 2017). The ‘Maker Movement’ group is a recent phenomenon that encourages knowledge sharing and DIY/DIT practices among citizens, focusing on community formation, cooperation, education (Blikstein, 2013), and fun (Davies, 2017). Within this trend, the city is becoming a central place in which production is being brought back with bottom-up initiatives. Activities range from citizen-led recreation and assembly of products by using low-cost or broken electronics and raw (including biological) materials, to the use of computer programming and new fabrication technologies for prototyping204. In 2016, in the EU alone, there were more than 800 active Makerspaces, including Hackerspaces and FabLabs (Rosa et al., 2017). Fab City205 is a global project that has grown out of this movement. It proposes a new urban model based on containing the movement and energy consumption of materials’, leading to the creation of locally productive and globally connected self-sufficient cities. In Fab Cities, ‘neighbourhoods’
16. The citizen’s city 114
102
397
327
FabLab
HackerspaceOther
Figure 48: Total number of Makerspaces in the EU-28 by typology;data collected from Jan. to Dec. 2016 Source: JRC | Rosa et al., 2017

Figure 49: Participatory budgeting distribution worldwideSource: Dias, 2018
Making Sense, an H2020 project206, focused on how citizens could use open source hardware and software, citizen-generated data, participatory design and community-building frameworks to make sense of their environment and effectively address problems such as air or noise pollution in urban settings. These goals were achieved through nine community-driven pilots in Amsterdam, Barcelona and Prishtina. Outputs were translated into a toolkit207 with methods, tools and overall best practices on citizen sensing, alongside use cases and stories from project participants.
One of the most impactful and lasting effects of Making Sense happened in Prishtina where young citizen volunteers and community organisers took charge of all project activities, from data collection and analysis to campaigning and civic action. After three intensive pilots on the ground, these citizens managed to successfully introduce
the issue of air pollution into the public discourse and media outlets, which in turn pushed for a raising of awareness from citizens to city and national government officials. As a major legacy for the communities in Prishtina and with the support of several experts and local NGOs208, the citizens leading or engaged in the project launched a platform in December 2017 to provide data visualisations from their participatory air-monitoring activities, together with additional information on health issues and air pollution209. Moreover, among several other contributions to change environmental power dynamics in urban spaces, the project’s bottom-up outputs were also key in decision-making processes by the Kosovo Ministry of Environment to push for a new national law aimed at suspending the use of coal and wood for heating in primary and high schools (Pólvora and Nascimento, 2017).
115 16. The citizen’s city
box 23. The Making Sense project – Prishtina, Kosovo
can become operation units where the ideas for making are tightly connected to the city’s social fabric and the notion of citizen empowerment,
with the involvement of schools, municipalities, libraries, museums, local businesses, new industries, etc. (Diez, 2018).

17. Urban governance 116
KEY MESSAGES
• There is a trend towards strengthening urban governance in the EU, leading to the recent establishment of a wide range of new governance bodies and arrange-ments across EU cities and metropolitan areas.
• Urban governance has gained a central role in global development efforts. At least 65% of the New Urban Agenda’s goals and their 169 targets can only be achieved at the local level, particularly in urban areas.
• Global commitments, advocacy, as well as mobilisation and socialisation through large networks such as the United Cities and Local Governments (UCLG), Metro-polis, C40, and the Global Covenant of Mayors, among others, are significantly empowering cities and accelerating the evolution of urban governance towards more horizontal cooperation, knowledge exchange and a demand for adequate resources for more and more decentralised competences and roles.
• Noted challenges to urban governance are: insufficient budget funds, the politi-cisation of local issues, the complexity of managing contemporary urban issues, and maladapted or outdated sectorial outlooks.

117 17. Urban governance
URBAN GOVERNANCE
17.1 Good urban governance and the role of cities in global governance
Urban governance is the formulation and pursuit of collective goals at the local level (Pierre and Peters, 2012).
Deciding how to plan, finance and manage urban areas is a continuous process of negotiation over the allocation of resources and political power. In addition to government bodies and agencies (local, regional, national and supranational), this commonly involves, among others, civil society, non-governmental organisations (NGOs), community-based organisations, social movements, trade unions, political parties, religious groups, and the private sector210.
Governance has important consequences for economic performance, citizens’ well-being and environmental outcomes in urban areas and their surrounding territory. The better governance arrangements are able to coordinate policies across jurisdictions and policy fields, the better the outcomes (OECD 2015a).
17.2 Emerging Trends
A new era of urban governanceThere is a trend towards strengthening urban governance in the EU211. In 2007, the Leipzig Charter marked a new era in European urban policy, laying down key principles to advance sustainable urban development by promoting an integrated and participatory approach and its related governance212. A decade after the signing of the Leipzig Charter, various forms of multi-level
and multi-stakeholder cooperation mechanisms have been implemented, including vertical (between government levels) and/or horizontal (between sectors) agreements and contracts. In this respect, the state mainly acts as a partner or enabler for metropolitan areas, regions and functional urban areas, providing frameworks for cooperation, funding and urban development strategies. Cities emerge as strong actors, taking part in numerous and various governance arrangements and cross-border cooperation213. A renewal of the Leipzig Charter is foreseen in 2020 during the German Presidency of the Council of the European Union.
Urban governance arrangements become especially important when administrative municipal borders do not correspond with the functional reality of urban areas. Cities often have to deal with the reality of broader functional urban areas or larger agglomerations while facing global problems.
Good urban governance is crucial due to the complexity and interdependency of policies in urban areas.

Local governments are increasingly using online platforms to include citizens in the urban governance process. Such ‘e-Participation’ can increase citizen engagement and promote the transparency and accountability of public services. For instance, Participatory Budgeting (PB) platforms in Madrid enable citizens to decide directly on how to distribute a part of the municipal budget, while in Brussels, citizens are able to report local problems in the public space to the local authorities via an online platform. e-Participation in urban development is considered particularly constructive, as citizens generally have unique knowledge about the area in which they live.
Metropolitan GovernanceSince the 1990s, there has been renewed interest in the governance of metropolitan regions (Figure 50)214. Over the past 20 years, a wide range of organisations, or ‘metropolitan governance bodies’ have been specifically created (or reformed) to organise and coordinate responsibilities among public authorities.
The OECD identifies four types of metropolitan bodies, varying in terms of budget, legal status, power, and composition: informal/soft coordination bodies, inter-municipal bodies, supra-municipal authorities, and a special status of metropolitan
0
5
10
15
20
25
30
35
40
45
50
1951-60 1961-70 1971-80 1981-90 1991-2000 2001-10
18 % 31% 52%
51%
Metropolitan governance body with regulatory powers
8 %
Metropolitan cities
No metropolitan governance body coordination
Metropolitan governance body without regulatory powers
24 %
16 %
Inter-municipal authorities
Supra-municipal authorities
Figure 50: Average number of metropolitan governance bodies created (or reformed) in OECD countries per decade Source: OECD 2015a
Figure 51: (left): share of metropolitan areas with and without a metropolitan governance body; (right): breakdown of metropolitan are by type of governance arrangementSource: OECD 2015a Metropolitan Governance Survey (2014) as illustrated in the OECD Governing the City report (2015)
17. Urban governance 118

cities (cities that exceed a legally defined population threshold, putting them on an equal footing with the next government level). Generally speaking, governance bodies with special metropolitan status have the most influence over a metropolitan area, while informal/soft coordination bodies are the least stringent. Figure 51 (left) shows that the majority of metropolitan governance bodies215 are without regulatory powers (51% versus 18% with such powers). Figure 51 (right) illustrates that most existing governance bodies are informal/soft coordination bodies.
EU and global initiativesIn 2016, the launch of the Urban Agenda for the EU provided a new framework for cities’ involvement in the development and implementation of EU policy, building upon the principles of partnership and multi-level, cross-border cooperation. Each priority theme216 of the Urban Agenda is addressed by a thematic partnership, comprising cities, Member States, the EC, EU organisations (European Investment Bank - EIB, European and Economic Social Committee - EESC and the Committee of the Regions), partner states, experts, umbrella organisations (e.g. EUROCITIES and the Council of European Municipalities and Regions - CEMR), knowledge organisations (e.g. URBACT and ESPON) and other relevant stakeholders (NGOs, business, etc.)217.
Besides using multi-level urban governance partnerships as a key delivery mechanism for the Urban Agenda for the EU itself, all partnerships have agreed to take into account effective urban governance (including citizen participation and new forms of governance) when addressing their thematic issues. Cross-sectoral integration and area-based perspectives are also being actively promoted218.
Following this trend, the most recent programming period of EU funding (2014-2020) also shows a significantly strengthened urban dimension in the Cohesion Policy. Urban authorities are included in the governance structure of integrated sustainable
urban development (SUD) strategies, financed by the ERDF. This regulation empowers cities to directly manage part of the EU funding, and thereby recognises the importance of cities in delivering the Europe 2020 strategy.
In an increasingly urban world with fewer barriers and differences, urban governance
119 17. Urban governance
Our citizens deserve real commitment from all European stakeholders, Member States and the European Commission for a renewed and transparent governance of urban issues in Europe, beyond simple cooperation. Johanna Roland, Mayor of Nantes and EUROCITIES President219

has also gained a central role as regards global development efforts. The UN’s New Urban Agenda, the Agenda 2030, the Paris Agreement on Climate Change, and the Sendai Framework for Disaster Risk Reduction all acknowledge the contribution that cities and local authorities play in achieving their targets. In particular, the Agenda 2030 will be essential for local governance in the coming decades. It has been calculated that at least 65% of the SDGs and their 169 targets can only be achieved at the local level, and particularly in urban areas (Cities Alliance, 2015). If cities exert many competences which impact on the global agendas and their fulfilment, it is inevitable that these agendas will also have an impact on institutional balance, mechanisms and governance across different levels. The global and European commitments empower cities and accelerate the evolution towards new urban governance systems, institutional structures and capacities.
Whilst in many cases the future of urban development remains highly dependent on decisions made at the national or state level (Da Cruz et al., 2018), there is an increasing readiness among cities to respond to transnational
problems (Barber, 2013). During the period 2016-2018, there were valuable signs of progress around the world, with Europe at the forefront of this trend. Cities such as Madrid, Barcelona and Athens have been pioneers in aligning their municipal plans with the SDGs. Several cities and provinces in Spain, Ireland, Greece, Latvia, Poland and Lithuania have established consultation mechanisms among cities, as well as with their national government and civil society. In 17 European countries out of the 30 that have reported to the United Nations to date on the SDGs, local and regional governments have been concretely involved either in the reporting process or in follow-up mechanisms established at the national level. Global commitments, advocacy, as well as mobilisation and socialisation through large networks such as the UCLG, Metropolis, C40, and the Global Covenant of Mayors, among others, are significantly empowering cities and accelerating the evolution of urban governance towards more horizontal cooperation, knowledge exchange and a demand for adequate resources for more and more decentralised competences and roles. Europe has historically been leading this wave.
For the last three years, the UCLG, the global network of local and regional governments, has studied220 the initiatives and policies that local governments – and cities in particular – have put into practice to achieve the SDGs, and how these goals have affected the emergence of new institutional structures (e.g. committees on sustainable development, high-level bodies with representatives from different levels of governance) or institutional mechanisms (e.g. new consultations across governance levels, strategic alignment of local, national and global agendas and plans).
In order to grasp the peculiarities of metropolitan governance in the context of strong socio-economic
interlinkage across a territory, the UCLG has promoted a Forum of Peripheral Cities – led by the French town of Nanterre, part of the Paris metropolitan area. The Forum is collecting several practices and examples of governance at the border of the metropolitan system, a token of the specific balances of power and competences among local governments in complex urban hubs. Similarly, the UCLG is coordinating a Forum of Intermediary Cities (Europe’s most common settlement category) to provide support, share knowledge and define rational governance models for intermediary cities within complex systems of cities, territorial interconnections, access to markets and infrastructures.
17. Urban governance 120
box 24. UCLG: forums of peripheral and intermediate cities

121 17. Urban governance

KEY MESSAGES
• A resilient city assesses, plans and acts to prepare for and respond to all hazards – sudden and slow onset, expected and unexpected.
• Today, cities and city inhabitants are facing increasing challenges as a result of uncontrolled urbanisation, climate change and political instability, among others.
• Understanding social and economic vulnerabilities is essential to formulate actions for resilience adapted to local needs.
18. The resilient city 122

THE RESILIENT CITY 18.1 Building on our communities’
strengths
Financial and economic crises, population flows, environment and climate phenomena, natural and anthropogenic disasters, social conflicts and terrorism are just a few of the challenges that cities may experience.
While many cities have been exposed simultaneously to combinations of these threats over time, almost no major city has been abandoned in recent history (Campanella and Godschalk, 2011). Whereas this may indicate that cities can cope well with shocks, recovery is often lengthy, affecting the proper functioning of the city and even altering its social structure. Cities are complex systems and such shocks are often both the causes and the effects of the current conditions of urban communities. The more vulnerable the community, the greater it may be affected.
A resilient city is able to maintain a continuity of services and functions throughout any shock or stress, while protecting and enhancing people’s lives.
However, an effective and comprehensive definition and method of measuring a city’s resilience capacity is still missing. The JRC has
developed a framework (Manca et al., 2017) that defines a resilient system (or society) as being able to face shocks and persistent structural changes in such a way that it keeps on delivering societal well-being without compromising that of future generations. This approach focuses on individual and societal well-being and emphasises the role of social capital. It can therefore be adapted to complex ‘human’ systems, such as cities.
In addition to targeted measures and strategies for specific hazards (Kourti et al., 2019), the overall resilience to environmental, socio-economic and political uncertainties is intrinsically linked to the design of more equitable and liveable cities.
123 18. The resilient city
“A city is more than the sum of its buildings. [...] it may also be only as resilient as its citizens.”(Campanella and Godschalk, 2011)
The framework proposed by the OECD (Figueiredo et al. 2018) focuses on four dimensions that call for different types of objectives. The economic dimension targets diversification and innovation; the social one ensures that society is inclusive and cohesive; the environmental component focuses
on sustainable urban development and adequate and reliable infrastructures; and the governance aspects require long-term vision, sufficient resources, collaboration with other levels of government; and a participatory government.
box 25. The OECD indicator framework for resilience
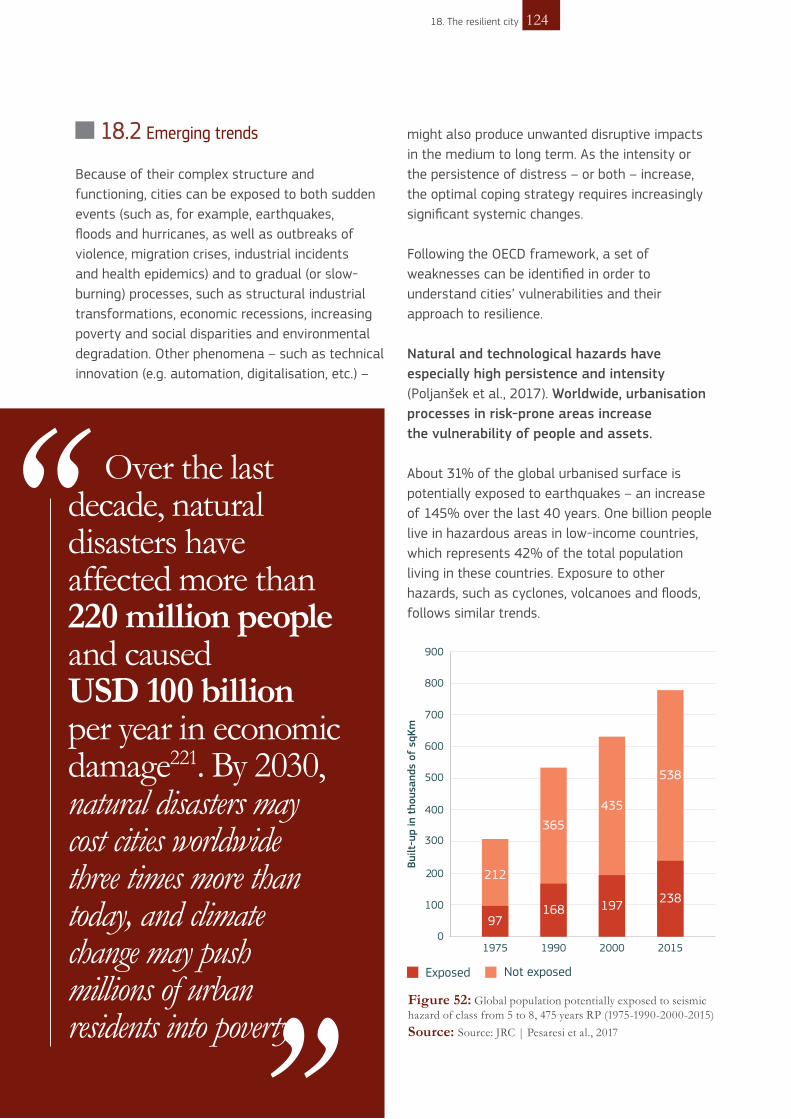
18.2 Emerging trends
Because of their complex structure and functioning, cities can be exposed to both sudden events (such as, for example, earthquakes, floods and hurricanes, as well as outbreaks of violence, migration crises, industrial incidents and health epidemics) and to gradual (or slow-burning) processes, such as structural industrial transformations, economic recessions, increasing poverty and social disparities and environmental degradation. Other phenomena – such as technical innovation (e.g. automation, digitalisation, etc.) –
might also produce unwanted disruptive impacts in the medium to long term. As the intensity or the persistence of distress – or both – increase, the optimal coping strategy requires increasingly significant systemic changes.
Following the OECD framework, a set of weaknesses can be identified in order to understand cities’ vulnerabilities and their approach to resilience.
Natural and technological hazards have especially high persistence and intensity (Poljanšek et al., 2017). Worldwide, urbanisation processes in risk-prone areas increase the vulnerability of people and assets.
About 31% of the global urbanised surface is potentially exposed to earthquakes – an increase of 145% over the last 40 years. One billion people live in hazardous areas in low-income countries, which represents 42% of the total population living in these countries. Exposure to other hazards, such as cyclones, volcanoes and floods, follows similar trends.
1975 1990 2000 20150
100
200
300
400
500
600
700
800
900
97
212
168
365
197
435
238
538
Built
-up
in t
hous
ands
of
sqKm
Not exposedExposed
Figure 52: Global population potentially exposed to seismichazard of class from 5 to 8, 475 years RP (1975-1990-2000-2015) Source: Source: JRC | Pesaresi et al., 2017
18. The resilient city 124
Over the last decade, natural disasters have affected more than 220 million people and caused USD 100 billion per year in economic damage221. By 2030, natural disasters may cost cities worldwide three times more than today, and climate change may push millions of urban residents into poverty.

Population displacement, whether triggered by rapid urbanisation, migration, natural disasters or conflicts, is putting pressure on housing, infrastructure, the labour market, the urban environment and community cohesion, among others. Large informal urban settlements are exacerbated by social polarisations, potentially making cities more vulnerable to crises. A major and substantial transformation is needed towards the effective adoption of mitigating and preventive policies in those countries affected worldwide.
In European cities, the recent financial and economic crisis led to increased social disparities.
The 2008-2009 crisis affected the overall quality of life in European cities. Urban areas have followed different paths of economic recovery, getting back to their pre-crisis status after a variable period, depending on the size and characteristics of each area (Dijkstra et al.,
2015). The persisting negative impact on social conditions – in particular on the level of poverty and exclusion in some countries – has revealed the lack of readiness to react with measures taken and implemented at the most appropriate level of governance.
Poverty and social exclusion (European Union and UN-HABITAT 2016) naturally increase the vulnerability of communities (Hillier and Castillo 2013) and – together with concerns related to violence, poverty and loneliness222 – contribute to undermining the perception of safety and security among citizens, which is a fundamental step toward resilience buildingin cities.
Although cities are places where risks tend to concentrate, they are also well equipped to seize opportunities to become more resilient. The benefits of urbanisation lie in the availability of a wide variety of resources: not only tangible
-35%-34%-31%
-21%-21%-21%-17%-16%
-8%-5% -4% -4% -3% -2% -1%
2%4% 4%
7%9% 13% 13% 14%
16%
25%29%
33%
40%
-40 %
-30 %
-20 %
-10 %
0 %
10 %
20 %
30 %
40 %
50 %
Change between 2009 and 2017 Change between 2009 and 2014
Member States
Perc
enta
ge c
hang
e (%
)
Figure 53: Evolution of poverty or social exclusion in European cities (%) in 2009, 2014 and 2017. Positive values indicate an increase in the population at risk since 2009. Cities in Hungary, Ireland, Cyprus, Lithuania, Malta, Sweden, Slovakia and Czechia managed to reduce poverty and exclusion rates in 2017 after an initial worsening in the period 2009-2014Source: Eurostat 2019
125 18. The resilient city

(physical infrastructures) and monetary (capital), but also social, thanks to the presence of complex, dynamic and supportive networks. Local stakeholders, in coordination with higher levels of governance, can mobilise these resources, building a framework to tackle challenges in a coherent and far-sighted way, thereby enhancing a city’s overall resilience.
Human and social capital plays an important role in determining a city’s economic resilience. The Cultural and Creative Cities Index (C3 Index), for instance, shows that leading cultural and creative cities in Europe appear to be the most economically resilient ones. Between 2009 and 2013, the annual GDP per capita grew more in the cities that recorded the best results on the C3 Index, despite the acute economic crisis during those years223.
18.3 How are cities getting prepared?
Some shocks and disasters are often unpredictable, whereas other long-term stresses may be foreseeable and somehow predictable. Local communities and actors must understand cities’ vulnerabilities and, in a timely manner, implement initiatives enhancing the ability to react to possible shocks and stresses (UN-HABITAT, 2017).
The UN-HABITAT’s ‘City Resilience Profiling Programme’ provides national and local governments with tools for measuring and increasing resilience to multiple hazards, including those associated with climate change. Specific effort is made to understand vulnerable situations from a social perspective and assessing the availability of services and utilities responding to people’s needs. Actions for resilience are therefore adapted to local needs and can be implemented by local stakeholders224.
Other initiatives have been launched at international level by the United Nations Development Programme (UNDP) with the ‘Community-Based Resilience Analysis’ (for measuring and identifying the key building blocks of community resilience and assessing humanitarian interventions), and the United Nations Office for Disaster Risk Reduction (UNISDR)
through the ‘Making Cities Resilient Campaign’ (supporting sustainable urban development by promoting resilience activities and increasing local understanding of disaster risk). The World Bank has set up the ‘City Resilience Program’ to help cities increase their ability to prepare, adapt and recover rapidly from disruptions related to climate change, natural disasters and other systemic shocks. The Resilient Cities programme from the International Council for Local Environment Initiatives (ICLEI) covers issues surrounding climate change mitigation and adaptation, disaster risk reduction and food security, while cities in the URBACT Resilient Europe Network225 work together to learn and share experiences with the aim of fostering resilience and sustainability.
European policies for regional development support improving the capacity of regions and cities to mitigate the impact of adverse events and to accelerate recovery. The European Climate-ADAPT platform226 – built in partnership between the European Commission and the European Environment Agency – provides tools and guidance for developing climate change adaptation
GDP
2013+750 euros+1
point in the Index
Figure 54: The Cultural and Creative Cities Index: economicrecovery (GDP growth between 2009 and 2013) as compared to the score given.Source: JRC | Cultural and Creative Cities Index
18. The resilient city 126

strategies and plans in cities. The 100 Resilient Cities programme launched by the Rockefeller Foundation, helps cities to develop new resilience strategies, providing principles, indicators and practices.
The projected intensification of urbanisation processes, expecially in some areas of the world, the growing socio-economic disparities coupled with needs for basic infrastructure and
services for all, call for new adaptive strategies to prepare cities for the risks of tomorrow.
In addition, taking into account the risks and uncertainties related to climate change [see the chapter on Energy and Climate] and to the unintended consequences of new technologies, cities are well suited to dealing with systemic challenges in an adaptive and flexible way, following an inclusive and holistic approach.
The Benthemplein Water Square project in Rotterdam (NL) is combining temporal water storage and improving the quality of urban public spaces. Cities such as Mexico City, Surat, Norfolk, Bangkok and New Orleans are carrying out similar interventions.
The Danish city of Vejle produced a set of innovative infrastructure and social intervention mechanisms targeting the challenge of sea-level rise, via community engagement practices.
Milan (IT) is addressing its combined urban heat island and energy poverty challenge. With its multidimensional School Oasis project, Paris (FR) is aiming at social integration and climate mitigation goals. Athens (EL) is involved in a wide pilot scheme launched with the European Investment Bank and additional resources dedicated to a technical assistance programme to share similar experiences in Europe.
Thessaloniki (EL) is focusing on the ‘Urban regeneration through transport investment’ priority which provides a collaboration framework for a range of social, private and public-sector actors in the city and beyond. Barcelona (ES) is working on reimagining the conversation around gender equality and women empowerment at city level.
Wellington (NZ) uses data for community engagement and disaster management by developing a virtual reality programme on the future of the city. Tel Aviv-Yafo (IL), like Belfast in Northern Ireland, is attempting to bridge the gap of technology innovation and city governance. Santa Fe (US) is working on creating a platform for training and assistance, to strengthen the local economic fabric. Porto Alegre (BR) worked with local schools to develop the Urban Low Emissions Development Strategy programme.
127 18. The resilient city
box 26. Examples from the 100 Resilient Cities programme

PERSPECTIVES: OPEN QUESTIONS
Several research and policy questions are still to be addressed if the full potential presented by these perspectives is to be exploited:
Urban design and public spaceAn appropriate design and use of space can relieve many of the pressures put on a city, including reducing environmental impacts, improving access to services, providing affordable housing and efficient mobility, and increasing social cohesion and a city’s overall liveability. In turn, specific policies on, for example, transport and mobility will greatly impact the way cities look and how they are planned in the future. While the advantages of urban design are clearly recognised, much work remains to be done on the appropriate optimisation of public space. As yet, there is no consistent database of public spaces in Europe or globally that could also support measuring the SDG 11.7 target. Although most data are currently derived from earth observation procedures, new techniques can be used to harmonise open data, such as user-generated datasets. The availability of this data would enable a more in-depth analysis of certain correlations, e.g. lighting in public spaces with criminality; and the presence and distribution of public space with the quality of life and health costs. An important aspect to be investigated at the regional scale is how to link the behaviour of city users with the presence, quality and distribution of public and green space. Not only the spatial layout but also the quality of public spaces is becoming increasingly important, with an emphasis on the integration of different social groups and adaptability to all ages.
Innovation and technologyWhile the importance of stimulating innovation and technological advancement is acknowledged, we still do not understand which are the best enablers to promote cities as innovation powerhouses227, and how to make them available across the EU. This includes, for example, investigations into generic enablers for place-based innovation, the impact of different data-governance approaches, and the role of digital technologies.
The wider implications of introducing specific technologies must be better understood, including the interaction, dependencies and feedback between different technologies. Efficient city systems need to fully integrate diverse technologies essential to a city’s functioning, such as water, food, energy distribution, logistics, mobility, and sewage and waste disposal. Europe may benefit from having a consolidated ‘common market’ of components and solutions that can work together via a set of interoperable standards228. While there is an increasing availability of big data, it is not always evident how this data can (best) be processed and the maximum derived from it. This is already being worked on in certain cities, often in public-private partnerships with major IT companies. Finally, the integration of technology needs to be done in a way that can tangibly benefit as many people as possible, regardless of their affinity for technology, their socio-economic status, i.e. age, gender, education and income, and in which data usage is transparent to the citizen.
19. Perspectives: open questions 128

Urban governance and the power of community involvementThe Urban Governance Survey (2016)229 shows that half of city representatives regard insufficient funds as the biggest urban governance challenge, followed by the politicisation of local issues, the complexity of managing contemporary urban issues, and maladapted or outdated policy silos. There may be a mismatch between research and the actual reported concerns of city administrators (Da Cruz et al., 2018), calling for more informed and targeted analyses on how cities are governed.
While cities are called on to take action in a number of areas, their level of responsibility should match their actual capacity to act. The level of authority, availability of resources and need to coordinate with other levels of government play an important role in how a city can efficiently tackle issues that go beyond its administrative boundaries (CEMR 2016). Assessments of the usefulness and applicability of new forms of governance in the urban context, such as e-governance and agile governance, should be stimulated.
The successful implementation of participatory approaches to city planning, development and governance requires more robust evidence on what works where, how it works, why it works, and who it works with (Pólvora and Nascimento, 2017). As yet, there is a shortage of large-scale and exportable experiments, and often the population involved is still limited and not necessarily representative of the overall community, as per gender, age or ethnicity (Nascimento, 2014). Citizen engagement should not be seen as a silver bullet, and currently it still has shortcomings of an economic, environmental, and even political nature.
While the number of positive examples of cities building their own capacity is growing, the majority of cities still require targeted support to better protect human, economic and natural
assets. Better knowledge and future research are needed to develop and support local and community-based resilience strategies, integrated in wider regional and (inter)national contexts. These should include the analysis of vulnerabilities and responses in cities; and the evaluation of measures aiming to create new opportunities for innovation and employment, and the reduction of disparities.
129 19. Perspectives: open questions

This report identifies a first set of challenges and perspectives, cross-linking various components of the city system which will likely influence the future of cities in Europe and beyond. It benefits greatly from the collective intelligence put forward by the members of the EC Community of Practice on Cities and is linked to an interactive online platform that accompanies the report and provides a permanent space for the exchange of information and ideas.
What will the future of cities look like?Most European cities will cover greater areas than in the past. Trends show that built-up area per capita will continue to increase both globally and in the EU. Cities will have to increasingly recognise the importance of organising their urban space and are already starting to optimise how public space is both designed and used.
Cities are ageing: EU cities will have to deal with the needs of an increasingly older population, including the adaptation of infrastructure and services, and potentially higher burdens in destination areas as pensioners become more mobile.
Cities will be more technological, applying new technologies and innovation across a wide range of sectors, from transport and mobility to citizen engagement. Cities will be more connected, and increasingly use real-time high-resolution data to enable better management of urban systems. Although new technologies present huge opportunities to improve the quality of life in cities, they also represent significant challenges. Technology will need to be interoperable and
integrated to benefit the overall functioning of cities. The implementation of digital innovation should also be done in an inclusive way, taking care not to alienate groups which cannot easily access them.
The dominance of cars should be drastically reduced in favour of more efficient public transport, and shared and active mobility modes. Car-dependent neighbourhoods may become less attractive and new working patterns, such as teleworking, may create more decentralised urban nodes and decrease the need to commute long distances.
Cities will still need to cope with existing major issues such as providing sufficient affordable housing to an increasingly varied population, ensuring inclusiveness and integration among its communities, and reducing environmental impacts. While creativity and innovation
CONCLUDING CONSIDERATIONS
Cities face numerous challenges now and towards the future, but many already have the tools at hand to resolve them.
20. Concluding considerations 130

contribute to the promotion of cities and their services, thereby attracting new actors and stakeholders, housing availability and affordability may be threatened by changing acquisition and rental patterns. Indeed, if there is a trend towards greater social segregation in cities, this may lead to a lack of accessibility to services for certain parts of the population. While cities are front runners in fighting climate change, they are also where the effects of energy poverty and water scarcity, to mention but a few, will be particularly evident.
Citizen engagement in policy processes is growing and should become more prevalent in the future. New forms of urban governance are already being stimulated in many cities, and the importance of city networks is expected to further increase.
The future will look different from city to city, depending on their history, culture, size, socio-economic development, and specific demographic trends. Growing cities will probably become denser with new neighbourhoods benefiting from a higher quality of life and being more sustainable and ‘self-contained’ than older suburbs. However, over half of European cities will see their population decline in the future, and approximately 80 cities will experience strong (more than 25% loss) urban depopulation. Whilst these cities will face challenges, such as difficulties in maintaining both an oversized infrastructure and quality of life for their citizens, these trends may also create opportunities. Lower property prices may attract a more creative population who would previously have been relinquished to the city edge and lead to innovation and a rejuvenation of cities (creative depopulation). The availability of new means of communication, such as high-speed internet, combined with less congestion may also attract non location-dependent industries such as online businesses. These cities could also be more open to testing novel approaches and new social experiments, like regrouping the population to densify specific areas.
While much can be learned from both the successes and failures of new city and neighbourhood developments, which are freer to take on new technologies and novel designs (e.g. Masdar City, United Arab Emirates; Songdo, Republic of Korea; Poundbury, UK; Aspern (Vienna), Austria; Nærheden (Copenhagen), Denmark), most of the change in Europe will have to take place in an integrated, affordable and sustainable fashion within pre-existing urban fabric. This comes as both a challenge and an opportunity – how can existing opportunities be effectively exploited? And how is it possible to enhance what is already there in a way that is beneficial to all? How can cities drive their own transformation towards their future?
Main messagesEffectively seizing the opportunities and addressing the challenges cities face would substantially improve their future outlook. Several focal points for upcoming reflections on relevant research and policy exercises are identified below. When managed well, cities can harness powerful tools provided specifically within an urban context by technology and innovation, citizen engagement, good governance and the intrinsic resilience of communities.
1. Cities are key sites where innovation and technological advancement happens. While this is a major opportunity for cities, both social and technological innovation should be further stimulated and progress should be made alongside new forms of social engagement, urban governance and cultural creativity.
2. The appropriate management of new technologies and data is crucial. New tools and methods for better knowledge management are particularly important for enhancing the capacity to translate data into meaningful and relevant support to inform policy decisions. The use of real-time, consistent and reliable data (including
131 20. Concluding considerations

big data and non-conventional sources) is essential and requires greater transparency and strengthening of ties with citizens.
3. Housing availability and affordability remains under threat due to changing acquisition and rental patterns, including new forms of financial investment that see strategic opportunities for the conversion of volatile assets into physical ones in cities. This would challenge obsolete social housing measures which would have to be re-thought to reduce social polarisation and conflicts.
4. Cities are essential hubs for both the implementation of global agendas and for citizens’ engagement in policy decisions directly affecting their lives. While committed to providing a good life for their citizens, cities can push forwards behavioural and institutional changes that will benefit all, taking a more active role in global governance. Several European cities are at the forefront of issues such as governance and citizen engagement, innovation and creativity.
5. The fight for sustainability will be greatly influenced by what happens in cities. While cities usually place greater pressure on natural resources, they perform better in the use of resources and have a greater potential for energy efficiency. Actions on environmental sustainability, including climate change, are already being taken by many cities.
6. Cities and city networks have a large collective power to act and to scale up solutions quickly and efficiently. Their influence can be significant, from supporting global commitments to providing efficient local solutions. The EU has successfully created an environment of sharing of good practices between cities, both within and outside Europe. In this sense, cities also have a certain responsibility to act towards societal change.
7. There is a risk of polarisation both within and between cities. On the one hand, being unable to take stock of the issues highlighted will lead to even more inequalities within the city. On the other hand, a diverging path between cities falling behind and cities capitalising on emerging trends may cause additional social and economic unbalance in different urban areas.
8. The close linkage between space/service/people is at the core of cities’ capacities to respond to people’s needs and to manage new challenges in a wider context, beyond administrative boundaries and sectorial domains, adopting a truly holistic approach to optimise the provision of services and create an intelligent interaction between the city and its inhabitants while maintaining or enhancing quality of life.
In all of the above, city communities will play a substantial role in reshaping their own futures. Greater efforts will be required to fully anticipate the impacts that these trends will have, and to determine how to help communities become more resilient in the face of these changes. Strengthening local administrations and empowering citizens contributes to building urban resilience to new challenges and better protecting human, economic and natural assets in cities and their surroundings.
The future of cities is not set in stone and is not easy to predict, but the choices they make now will shape the lives of generations to come. By taking stock of current knowledge and understanding of city systems, this report highlights potential pitfalls cities should avoid and defines broad principles they should lean towards. It aims to foster discussion and help policymakers, individual cities and their citizens choose the best way forward.
20. Concluding considerations 132

133 20. Concluding considerations
Melbourne, Australia

List of abbreviations 134
LIST OF ABBREVIATIONS
5G 5th Generation telecommunication standard
ACES Automated, connected, electrified and shared mobility
AEDES Association of Housing Corporations
AGRUPAR Participatory Urban Agriculture Project
AI Artificial intelligence
APIs Application programming interfaces
BRT Bus rapid transit
C3 Index Cultural Creative Cities Index
C40 Cities Climate Leadership Group
CAVs Connected and automated vehicles
CCS Cultural and creative sectors
CEMR Council of European Municipalities and Regions
CoM Covenant of Mayors
CoP-CITIES Community of Practice on Cities
CoR Committee of the Regions
DEGURBA Degree of Urbanisation
DIY/DIT Do it Yourself/ Do it Together
EC European Commission
EEA European Environmental Agency
EESC European Economic and Social Committee
EIB European Investment bank
EMR Electronic medical record
ERDF European Regional Development Fund
ESIF European Structural and Investment Funds
ESPON European Spatial Planning Observation Network
EU European Union
FAO Food and Agricultural Organization
FUA Functional urban area
GCoM Global Covenant of Mayors
GDP Gross domestic product
GFC Global financial crisis
GHG Greenhouse gas
GHSL Global Human Settlement Layer
GPS Global positioning system
GtCO2-eq Gigatonnes of equivalent carbon dioxide
ICLEI International Council for Local Environmental Initiatives
ICT Information and communications technology

135 List of abbreviations
ILO International Labour Organization
IPPC Intergovernmental Panel on Climate change
JRC Joint Research Centre of the European Commission
LCA Life cycle assessment
LAU Local administrative unit
LUISA LUISA Territorial Modelling Platform
MaaS Mobility as a Service
NCDs Non-communicable diseases
NGO Non-governmental organisation
NUTS Nomenclature of territorial units for statistics
OECD Organisation for Economic Co-operation and Development
PLEVs Personal light electric vehicles
PB Participatory budgeting
PT Public transport
PV Photovoltaic
R&D Research and development
R&I Research and innovation
S3 Smart specialisation strategies
S4 Slovenian Smart Specialisation Strategy
SDGs Sustainable Development Goals
SMEs Small and medium-sized enterprises
SPG Solidarity Purchasing Group
STRIA Strategic Transport Research and Innovation Agenda
STRAT-board Territorial and Urban Strategies Dashboard
SUM Sustainable urban mobility
TRIMIS Transport Research and Innovation Monitoring and Information System
UCLG United Cities and Local Governments
UD Universal design
UN United Nations
UNDP United Nations Development Programme
UNFCCC United Nations Framework Convention on Climate Change
UN-HABITAT United Nations Human Settlements Programme
UNISDR United Nations Office for Disaster Risk Reduction
URBACT Urban Development network programme
WEFE Nexus Water-Energy-Food-Ecosystem Nexus
WEI Water Exploitation Index
WF Water footprint
WHO World Health Organization

Glossary 136
GLOSSARYAccessibility: In the context of this report, accessibility
refers to transport accessibility, a measure of the ease
of reaching (and interacting with) destinations.
Application Programming Interface: Set of sub-routine
definitions, communication protocols and tools for building
software. In general terms, this is a set of clearly defined
methods of communication among various components.
Artificial Intelligence: Generic term that refers to any
machine or algorithm that is capable of observing its
environment, learning and, based on the knowledge
and experience gained, taking intelligent action or
proposing decisions.
Augmented reality: Technology that combines the real-
world environment with computer-generated perceptual
information and imagery.
Big data Information assets characterised by such a high
volume, velocity and variety to require specific technology
and analytical methods for its transformation into value.
Built-up area: Area covered by enclosed constructions
above ground intended as or used for sheltering humans,
animals, things or for the production of economic goods,
and referring to any structure constructed or erected on its
site. No permanency condition is imposed, allowing also
for refugee camps, informal settlements, slums and other
temporary settlements and shelter to be included within
the concept of a built-up area (Pesaresi et al., 2013).
Bus rapid transit: Bus-based public transport system
making use of dedicated roads and giving buses priority over
other traffic to improve capacity and reliability.
Buy-to-leave (or ‘runaway real-estate speculation’): Property which is bought as an investment and left
unoccupied in the expectation that its value will rise.
Carbon sequestration: Carbon sequestration refers to the pro-
cess through which, during photosynthesis, plants extract carbon
from the atmosphere in the form of CO2 and use it to grow.
Cities: In the context of this report, the statistical definition
of cities refers to the specific database used in the analysis.
Please refer to the chapter ‘What is a city?’.
City lab: In the context of this report, a city lab
or laboratory represents a space where evidence-based
information can be presented to stakeholders (citizens,
governing bodies) to improve their understanding
of certain issues and help them to take decisions.
Community of practice: Group of people who share
a concern or passion for something they do and learn how
to do it better as they interact regularly. In the context of the
JRC, they enable those Commission staff with responsibilities
and interests in an area of work to share knowledge and
learn from each other; to coordinate and link currently
unconnected activities and initiatives addressing a similar
knowledge domain; and to work together on specific actions
and deliverables and ultimately to build the Commission’s
knowledge capital in their respective areas of work.
Commuting zone: A commuting zone includes a city’s
surrounding travel-to-work areas where at least 15 %
of employed residents are working in a city.
Cultural and creative cities monitor: This is
a tool developed by the JRC to monitor and assess
the performance of ‘cultural and creative cities’
in Europe vis-à-vis their peers, using both quantitative and
qualitative data.
Degree of urbanisation: DEGURBA indicates the character
of an area. The latest update of this classification is based on
the 2011 population grid and the 2016 local administrative
units (LAU) boundaries. The next major update will be based
on the 2020 census results.

137 Glossary
Direct investment / foreign direct investment: International investment that reflects an investor’s aim
of securing a lasting interest in an economy or enterprise
located where the investor is not resident.
Disrupting effect: Effect caused by disruptive innovation
that creates a new market and value network and eventually
disrupts an existing market and value network, displacing
established market-leading firms, products and alliances.
District heating: System for distributing heat generated in
a centralised location through a system of insulated pipes
for residential and commercial heating requirements such as
space heating and water heating.
Drone: Unmanned aerial vehicles which can be controlled
remotely or autonomously piloted.
Electronic medical records (EMR): Systematised
collection of patient and population health information
electronically stored in a digital format.
Environmental footprint: This is a measure of the impact
human activities have on the environment in terms of
natural resource usage or the volume of pollutants they emit.
EU-13: EU Member States that have joined since 2004.
EU-28: All EU Member States (as of 15 April 2019).
ePrescriptions: Electronic record of medecines prescribed
by a doctor (including direction for consumption)
and dispensed to a patient.
EU Cohesion Policy: Strategy to promote and support
the ‘overall harmonious development’ of the EU Member
States and regions.The EU’s Cohesion Policy aims to
strengthen economic and social cohesion by reducing
disparities in the level of development between regions.
European Structural Investment Funds: This is
a financial tool set up to implement the EU’s regional policy.
It is composed of five separate EU funds; European Regional
Development Fund, European Social Fund, Cohesion Fund,
European Agricultural Fund for Rural Development
and the European Maritime and Fisheries Fund.
Food loss: Refers to any food that is lost in the supply chain
between the producer and the market, while ‘food waste’
refers to the discarding or alternative (non-food) use of food
that is safe and nutritious for human consumption.
Freedom to roam: This refers to the general public’s right to
access certain public or privately owned land, lakes and rivers
for recreation and exercise. In Scotland, the Nordic countries
of Finland, Iceland, Norway and Sweden, the Baltic countries
of Estonia, Latvia and Lithuania, and the Central European
countries of Austria, Czechia and Switzerland, the freedom
to roam takes the form of general public rights which are
sometimes codified in law.
Functional urban areas: This consists of a city plus its
commuting zone, according to the EU OECD FUA definition,
and was formerly known as LUZ (larger urban zone).
Gated community: Residential housing where access
is restricted and public areas within the development are
privatised (Blakely and Snyder 1997).
Greenness: This is the highest value of the Normalized
Difference Vegetation Index (NDVI) as derived from Landsat
annual top-of-atmosphere (TOA) reflectance composites
(Corbane et al., 2018).
Gross domestic product: Monetary measure of the market
value of all the final goods and services produced over
a period of time, often annually.
H2020: Horizon 2020 is the 8th Framework Programme
implemented by the European Commission to fund research,
technological development and innovation.
Heat pump: A device, such as an air-conditioner
or a heater, that uses electricity to transfer heat energy from
a source of heat to a heat sink.
High presence of green: An area with greenness value
(NDVI) above 0.66 (EC JRC, 2018).
Housing overburden rate: Households where
the total housing costs represent more than 40%
of the disposable income.

Glossary 138
Internet of Things: A network of devices, such as vehicles,
and home appliances that contain electronics, software,
sensors, actuators and connectivity which enable these
things to connect, interact and exchange data.
Leipzig Charter: The Leipzig Charter on Sustainable
European Cities is a political document adopted in 2007 in
which all EU Member States commit to adopt and strengthen
an integrated approach to urban development, marking a
new era in EU urban policy. The Charter presents two key
principles for policymakers to advance the sustainable
development of cities: 1) to make greater use of integrated
urban development policy approaches, and 2) to give special
attention to deprived neighbourhoods within the context
of the city as a whole.
Life Cycle Assessments (LCA): A technique to assess
environmental impacts associated with all the stages
of a product’s life from raw material extraction through
materials processing, manufacture, distribution, use, repair
and maintenance, and disposal or recycling.
Life expectancy at birth: The mean number of years
a new-born child can expect to live if subjected throughout
his/her life to the current mortality conditions.
Local administrative units (LAU): The LAUs are:
administrative for reasons such as the availability of data
and policy implementation capacity; a subdivision of
the NUTS 3 regions covering the whole economic territory of
the Member States; appropriate for the implementation of
local-level typologies included in TERCET, namely the coastal
area and DEGURBA classification.
Local facilities: Facilities serving 5 000-10 000 people
preferably within a distance by road of 5 kilometres, such
as schools, small health facilities, childcare services, sport
facilities, and small markets.
Metro regions: Metro regions are NUTS-3 regions
or groupings of NUTS-3 regions representing all urban
agglomerations of more than 250 000 inhabitants. They
are approximations of the LUZs as used in the Urban Audit.
The typology distinguishes three types of metro regions:
1. capital city regions; 2. second-tier metro regions;
and 3. smaller metro regions.
Mobility as a Service (MaaS): This is a trans-portation
concept where personally owned modes of transport
are replaced by a combination of public and private
transportation services which users can pay for with
a single account.
Mortality rate: Number of deaths in a certain age group
expressed as a proportion of the total population.
Navigation services: These systems incorporate GPS
systems to give users access to a map of their surrounding
area as well as directions to selected locations.
Nomenclature of territorial units for statistics: The NUTS classification (Nomenclature of territorial units
for statistics) is a hierarchical system for dividing up
the economic territory of the EU for the purpose of: the
collection, development and harmonisation of European
regional statistics; socio-economic analyses of the regions;
the framing of EU regional policies.
Obesogenic: Societal and lifestyle conditions that promote
obesity in individuals or populations.
Old-age dependency ratio: The number of people in
a state of dependency due to old age (those older than 65)
relative to the working-age population (15-64 years).
Passive building: A building designed to high-energy
standards that requires little energy for space heating
or cooling.
Passive protection: Protection measures making use
of physical structures that discourage or impede actions
that could threaten populations.
Plug-in hybrid vehicle: A vehicle that combines
a conventional internal combustion engine system with
an electric propulsion system and which has a battery
that can be recharged by plugging it into an external source
of electric power, as well as via its on-board engine
and generator.
Pollination: The process in which pollen is taken from one
plant or part of a plant to another so that new plant seeds
can be produced.

139 Glossary
Regional facilities: Facilities serving 500 000 to 1 million
people preferably within 100 kilometres by road, such as
specialised centres for education and health, large facilities
for sports and cultural activities, governmental organisations,
and other high-tech services.
Residualisation: Residualisation refers to the concentration
of the most disadvantaged households in social housing
due to a combination of limited availability of social housing
and a high demand. Thus, only those in greatest need will
be eligible.
Risk of poverty or social exclusion: People are
considered to be at risk of poverty or social exclusion when
they experience one or more of the following conditions:
a) being severely materially deprived with living conditions
constrained by a lack of resources; b) living in a jobless
household or household with very low work intensity; c) being
at risk of poverty, having a disposable income that is below
the risk of poverty threshold (which is set at 60% of the
national median equivalised income after social transfers).
Segregation: In the context of ‘the future of cities’, urban
segregation is the unequal distribution of different social
groups in the urban space, based mainly on occupation,
income and education, as well as on gender and ethnicity.
Sensor: A device that detects events or changes in
its environment and sends the information to another
computer processor.
Social housing / public housing: This is a type of housing
where property is owned by a government authority in a bid
to provide more affordable rents.
Smart city: Urban area that uses different types of
electronic data-collection sensors to supply information,
which is used to manage assets and resources efficiently.
This includes data collected from citizens, devices and assets
that is processed and analysed to monitor and manage
traffic and transportation systems, power plants, water-
supply networks, waste management, law enforcement,
information systems, schools, libraries, hospitals, and other
community services.
Smart grids: These electrical grids include a variety of
operational and energy measures including smart meters,
smart appliances, renewable energy resources and energy-
efficient resources.
Smart specialisation: A place-based approach
characterised by the identification of strategic areas for
intervention based both on the analysis of the strengths
and potential of the economy and on an entrepreneurial
discovery process (EDP) with wide stakeholder involvement.
It is outward looking and embraces a broad view of
innovation including, but certainly not limited to, technology-
driven approaches supported by effective monitoring
mechanisms.
Social exclusion: A process in which individuals or groups
of people are systematically blocked from (or denied full
access to) various rights, opportunities and resources that
are normally available to members of a different group,
and which are fundamental to social integration and the
observance of human rights within that particular group.
Telemedicine: The use of information and
telecommunication technology to provide health
services from a distance.
Teleworking: A work arrangement whereby employers
allow employees to work from a location other than
their central place of work and thus to avoid the need for
commuting.
Third countries: In the context of this report, third countries
refer to countries other than the EU Member States.
Total factor productivity: The portion of economic output
not explained by traditionally measured inputs of labour
and capital used in production. It is a measure of economic
efficiency and accounts for part of the differences in cross-
country per-capita income.
Twinning activities: This EU instrument is for institutional
cooperation between public administrations in the EU
Member States and for beneficiary or partner countries.
Twinning projects bring together public-sector expertise from

Glossary 140
EU Member States and beneficiary countries with the aim of
achieving concrete mandatory operational results through
peer-to-peer activities.
Universal design (or ‘inclusive design’): Design practice
aiming to produce goods and services that can be used and
enjoyed equally by all members of society.
Urban sprawl: This mainly refers to the unrestricted growth
in many urban areas of housing, commercial development,
and roads over large expanses of land, with little concern
for urban planning.
Walk-out-shopping schemes: This type of store combines
a dedicated mobile phone application with cameras
and other sensors to track shoppers and record the items
they pick up and automatically charge to their account as
they leave the store. This allows customers to walk out of
the store without queuing through a traditional cashier outlet.
Water Exploitation Index (WEI): The ratio of water
demand to the available freshwater resources.

141 Endnotes
ENDNOTESi In the framework of the Knowledge Centre for Territorial Policies, https://ec.europa.eu/knowledge4policy/
territorial_en.
ii Dijkstra and Poelman, 2014.
iii https://ghsl.jrc.ec.europa.eu, Pesaresi et al., 2013.
1 https://ec.europa.eu/knowledge4policy/territorial/topic/urban_en#CoP_CITIES.
2 This comprises several members of the Community of Practice on Cities, including representatives from the
Global Covenant of Mayors, Committee of the Regions, Eurocities, Urban Europe Research Alliance, URBACT,
UCLG and CEMR.
3 https://ec.europa.eu/knowledge4policy/territorial_en
4 https://www.un.org/sustainabledevelopment/development-agenda
5 The Pact of Amsterdam was adopted in May 2016, establishing the EU Urban Agenda to strengthen
the urban dimension of EU policies, to better coordinate EU policies impacting cities, and to better involve
cities in EU policy developments. More information and the thematic priorities identified can be found here:
https://ec.europa.eu/futurium/en/urban-agenda.
6 Available at http://habitat3.org/the-new-urban-agenda.
7 https://www.agenda2030.gob.es/sites/default/files/recursos/Seville%20Commitment.%2027%2002%202019.pdf.
8 Amina J. Mohammed, UN Deputy Secretary-General. 5 September 2017: https://www.un.org/press/en/2017/
dsgsm1080.doc.htm.
9 Such as the Global Covenant of Mayors which originated in Europe: https://www.covenantofmayors.eu.
10 Such as the International Urban Cooperation: https://ec.europa.eu/regional_policy/en/policy/cooperation/
international/urban and the European Urban Knowledge Network: https://www.eukn.eu.
11 http://www.regiocitiesconf2019.eu/en
12 e.g. The EC Knowledge Centre for Territorial Policies provides a repository of tools and instruments to produce
and share knowledge on urban areas. More details at: https://ec.europa.eu/knowledge4policy/tools-urban-
focus_en.
13 e.g. The EU and the Commission provide support to cities through a wide range of funding programmes.
An overview is provided at: https://ec.europa.eu/info/eu-regional-and-urban-development/topics/cities-and-
urban-development/funding-cities_en.
14 Baseline scenario as computed by LUISA Territorial Modelling Platform.
15 Number of people living in urban areas as a percentage of the total global population.
16 Dijkstra and Poelman, 2014, fully explained in this report in the chapter ‘What is a city?’.
17 https://ghsl.jrc.ec.europa.eu.
18 Cities with a population below 250 000 account for a larger share of city residents in Africa (33%) than in
Europe (28%) although this share is even lower in North America (17%).
19 Data elaborated from the Urban Data Platform, accessible at: https://urban.jrc.ec.europa.eu.
20 DG ECFIN projections rely on EUROPOP 2013 demographic projections for the period 2015-2050
and are originally released at national level.
21 https://citiesforhousing.org
22 https://ec.europa.eu/futurium/en/housing
23 www.unhousingrapp.org/the-shif
ENDNOTES

Endnotes 142
24 https://www.theguardian.com/society/2017/feb/28/luxury-real-estate-housing-crisis-un-homelessness
25 https://ec.europa.eu/futurium/en/housing
26 Background paper Urban Agenda for the EU Partnership on Housing, 2018:
https://www.iut.nu/news-events/now-official-the-findings-of-the-eu-urban-agenda-housing-partnership.
27 Eurostat 2015, Perception surveys.
28 Knight Frank Global Residential Cities Index:
https://content.knightfrank.com/research/1026/documents/en/global-residential-cities-index-q3-2018-6052.pdf.
29 Vacant homes are a global epidemic and Paris is fighting it with a 60% tax (2 March 2017):
https://betterdwelling.com/vacant-homes-global-epidemic-paris-fighting-60-tax.
30 Data calculations based on data sourced from Airbnb (insideairbnb.com) on 13 January 2019, and monthly
rental prices sourced from immobiliare.it on 11 January 2019. Note that this is the assumed potential gross
income at full occupancy based on the cost of rental, and is not a comparison of actual profit.
31 https://www.citylab.com/equity/2018/03/what-airbnb-did-to-new-york-city/552749
32 Amsterdam, Barcelona, Berlin, Brussels, Cologne, Dortmund, Kraków, Madrid, Paris, Reykjavik, Valencia
and Vienna.
33 Barcelona finds a way to control its Airbnb market. Citylab, June 2018:
https://www.citylab.com/life/2018/06/barcelona-finds-a-way-to-control-its-airbnb-market/562187/?utm_
source=twitter&utm_medium=social&utm_campaign=citylab-staff&utm_term=feargus-osullivan
34 https://www.citylab.com/equity/2018/03/what-airbnb-did-to-new-york-city/552749.
35 Portugal is finally in fashion, but real estate booms and tourism have locals worried. Global Post, August
2018. https://www.pri.org/stories/2018-08-09/portugal-finally-fashion-real-estate-and-tourism-booms-have-
some-locals-worried.
36 Gemeente Amsterdam Woonagenda 2025. 2017: https://bewonersplatformzuidas.nl/wp/wp-content/
uploads/2017/05/woonagenda_2025_versie_april_2017.pdf.
37 Nederlandse Vereniging van Makelaars (NVM) Analyse woningmarkt, 4e kwartaal 2018:
https://www.nvm.nl/marktinformatie/marktinformatie.
38 Kadaster 2018: www.kadaster.nl.
39 https://www.huffpost.com/entry/vienna-affordable-housing-paradise_n_5b4e0b12e4b0b15aba88c7b0
40 https://urbact.eu/housing-more-financing-less-affordability
41 https://ec.europa.eu/transport/sites/transport/files/2018-year-multimodality-external-costs-presentations.zip
42 For more information, see the JRC Science for Policy report on the Future of Road Transport (Alonso Raposo
et al., 2019).
43 https://www.acea.be/statistics/article/report-vehicles-in-use-europe-2018
44 Average number of hours spent in peak-hour congestion in 784 European cities and in German cities in 2017:
http://inrix.com/scorecard.
45 http://www.environmentportal.in/files/ERP-Singapore-Lessons.pdf
46 Bus rapid transit (BRT) systems are high-performance bus systems on urban corridors with a high demand for
public transport. BRT systems mimic rail systems with an efficient, high-capacity bus-based scheme which is
often cheaper and faster to implement. In particular, BRT systems can address public transport challenges
if rail-based systems are not feasible.
47 http://thecityfix.com/blog/new-bus-rapid-transit-brt-data-cities-increased-commitment-sustainable-transport-
luisa-zottis
48 https://www.dunkirk-tourism.com/Explore/Focus-on/Free-buses-in-Dunkirk;
https://www.theguardian.com/cities/2016/oct/11/tallinn-experiment-estonia-public-transport-free-cities
49 JRC Travel Survey, 2018.
50 http://www.uemi.net/toolkit.html

143 Endnotes
51 For an overview of possible enhanced road-governance approaches enabled by CAVs, see Alonso Raposo
et al. (2019) The Future of Road Transport.
52 https://www.itf-oecd.org/sites/default/files/docs/shared-mobility-simulations-dublin.pdf
53 JRC Travel Survey, 2018.
54 https://www.smartcitiesdive.com/ex/sustainablecitiescollective/helsinki-aims-be-car-free-2025/297026
55 Services of General Interest (SGI) are defined as Services of General Economic Interest (SGEI) and Social Services
of General Interest (SSGI). SGEI include technical infrastructure such as, e.g. gas, electricity, energy, transport
as well as water and waste management and communication infrastructure, such as, e.g. ICT, electronic
communications and postal services. SSGI are defined as labour-market services, education, healthcare,
childcare, elderly care, social care, (social) housing and social assistance services (ESPON, SGEI project, 2013).
56 Such as accommodation, shopping, mobility, e-citizenship, etc.
57 See also the Affordable Housing chapter in this report.
58 https://expandedramblings.com/index.php/uber-statistics - December 2018.
59 https://ipropertymanagement.com/airbnb-statistics - February 2019.
60 World Economic Forum, 2015, Inspiring Future Cities & Urban Services: Shaping the Future of Urban
Development & Services Initiative.
61 https://blog.solaga.co.uk/malaga-accessible-tourism-disability
62 http://www.malagaweb.com/blog/costa-del-sol/news-307
63 https://smarttourismcapital.eu/cities
64 https://www.efe.com/efe/english/life/eu-tourism-day-malaga-awarded-in-brussels-as-a-model-of-accessible/
50000263-3806214
65 Ratio of people aged 65 or over to those aged 15 to 64.
66 Eurostat, 2019 database, https://ec.europa.eu/eurostat/data/database, accessed in February 2019.
67 Population by age group and gender, 2016-70 (thousands). Source: Commission services, Eurostat.
68 By the JRC and the OECD, based on Eurostat’s ‘Europop2013’ projections. Using the JRC’s large-scale land-
use model (LUISA Territorial Modelling Platform), high-resolution maps (100m) were produced, taking into
account factors affecting the residential mobility of different age classes, and a ‘business as usual’ scenario
for urban expansion.
69 http://www.smartsilvereconomy.eu
70 https://www.ageofnoretirement.org/stories/jurrienmentink; https://www.citylab.com/equity/2015/10/the-nursing-
home-thats-also-a-dorm/408424
71 http://www.herbestemmingacademie.nl/bijzonder-project-in-houten
72 http://www.eseniors.eu/projet.php?p=erasmus; http://database.centralbaltic.eu/project/19
73 https://cyclingwithoutage.org
74 The Young Foundation 2010 - Innovating better ways of living in later life.
75 Accessible Design Foundation Japan: http://www.kyoyohin.org/en.
76 https://www.theguardian.com/cities/2017/jul/12/dutch-app-elderly-hack-pedestrian-crossings
77 https://www.scmp.com/news/world/united-states-canada/article/2120338/study-shows-video-games-could-
cut-elderly-dementia; https://www.ncbi.nlm.nih.gov/pmc/articles/PMC4130645; https://www.sciencedaily.com/
releases/2017/12/171206141648.htm
78 https://ec.europa.eu/eip/ageing/home_en
79 At the World Health Day 2010, under the theme ‘urbanisation and health’. https://www.who.int/world-health-
day/2010/en.
80 Examples: socio-economic status (income, education and occupation), material well-being, deprivation,
food security, food habits, stress, environmental exposure (toxins and pollution), built environment, housing
conditions, physical safety, infrastructural decay, social capital, culture, civic engagement, etc.

Endnotes 144
81 Physical activity environment (e.g. walkability), availability of healthy food establishments, income inequalities, etc.
82 Unhealthy diets can be defined as diets high in sugar, salt and fats, and/or poor in fruit, vegetables
and wholegrains.
83 At the World Health Day 2010, under the theme ‘urbanisation and health’.
84 Yet specific infectious diseases display different dynamics. Leprosy, for instance, is a silent and not easily
diagnosed disease that affects areas with scarce medical resources disproportionally more than cities.
85 Data on the 2010 pandemic influenza, for instance, do not show a clear urban health penalty, possibly
indicating an effective response to the outbreak during the previous year (e.g. vaccination campaigns),
especially in cities (Choi et al., 2018).
86 Inner cities are usually identified as lower-income residential neighbourhoods located within or close
by the city centre.
87 Including obesity, cardiovascular and pulmonary diseases, asthma and heat-related strokes.
88 Examples: criminality and violence rate, air and noise pollution, etc.
89 The literature refers to this phenomenon as ‘reverse selection’.
90 Recent studies in developing-country contexts have found that although the average health status of urban
residents is higher than the average of their rural counterparts, such averages obscure the disadvantages
suffered by the poorest urban residents who may have health outcomes equal to or worse than rural residents.
91 For instance, people of different ages, education and income levels, among others.
92 By age, socio-economic status, and others.
93 According to recent surveys (ECDC, 2018), influenza vaccination coverage rates are still insufficient across
EU Member States and achieving high coverage rates for those particularly at risk of developing severe
complications remains a serious public health challenge: https://ecdc.europa.eu/en/news-events/influenza-
vaccination-coverage-rates-insufficient-across-eu-member-states.
94 For instance, neurodegenerative disorders.
95 For instance, increased frequency of bone fractures.
96 For instance, adapted healthcare provision (also in terms of medical and nursing profiles), a larger capacity
for long-term care, and adaptation of the housing stock and city mobility.
97 Sometimes referred to as ‘free-living’ older adults, as opposed to ‘institutionalised’ older adults.
98 This also includes straightforward measures such as increasing the number of benches and strategically
placing them across cities.
99 According to the WHO, ‘mental health is a state of well-being in which the individual realises his or her own
abilities, can cope with the normal stresses of life, can work productively and fruitfully, and is able to make
a contribution to his or her community’.
100 https://vizhub.healthdata.org/gbd-compare/#
101 Examples: severe depression, bipolar disorder and schizophrenia.
102 https://www.who.int/mental_health/management/en
103 https://www.who.int/mental_health/mhgap/en, accessed in December 2018.
104 Pollutant emissions come mainly from large combustion plants, industrial installations, agriculture
and transport. In cities, the combustion of fossil fuels for transport and heating are the main sources of
pollution; consequently, the pollutants of main concern are NO2, particles (PM2.5 and PM10) and SO2.
105 According to the World Health Organization, air-pollution levels remain dangerously high in many parts
of the world, with 9 out of 10 people breathing air containing high levels of pollutants.
106 The Clean Air Policy Package was adopted in 2013: it establishes ambient air-quality standards, national
emission ceilings and emission standards for key sources of pollution. Its implementation relies on national,
regional and local measures tailored to specific needs and circumstances: http://ec.europa.eu/environment/air/
clean_air/review.htm.

145 Endnotes
107 Mainly to reducing traffic emissions by promoting cleaner vehicles and public transport to reduce traffic flows.
108 The data collected in the European Environment Agency (EEA) AirBase database show that, since year 2000,
the percentage of population exposed to levels over 40 µg/m3 (the limit value established within the AQ
Directive), has fallen from almost 26% to approximately 7%: https://www.eea.europa.eu/data-and-maps/data/
aqereporting-8 (last accessed 18 January 2019).
109 According to the EEA, during 2015, monitoring stations in 17% of EU cities reported mean average values
of concentration over the limits established by legislation.
110 NO2 is a pollutant of significant concern as it is highly emitted in urban environments.
111 The Clean Air Programme for Europe sets future objectives for 2020 and 2030 on reducing concentrations of
the main pollutants. The ECLIPSE emission control scenario takes into account full implementation of national
legislations as of 2013. According to this scenario, there will be a general reduction in NOx emissions, which
are particularly relevant in the transport sector.
112 Compared to those reported for the year 2015, the results already take into account the new age levels
in the population.
113 https://ec.europa.eu/health/non_communicable_diseases/mental_health_en
114 An environment that promotes gaining weight and is not conducive to weight loss as it promotes high energy
intake and sedentary behaviour.
115 In this context, the term segregation refers to clustering and isolation among communities.
116 People are considered to be at risk of poverty or social exclusion when they experience one or more of
the following conditions: a) being severely materially deprived with living conditions constrained by a lack
of resources; b) living in a jobless household or household with very low work intensity; and c) being at risk
of poverty, having a disposable income that is below the risk of poverty threshold (which is set at 60%
of the national median equivalised income after social transfers).
117 https://ec.europa.eu/futurium/en/urban-poverty
118 https://ec.europa.eu/futurium/en/housing
119 https://ec.europa.eu/futurium/en/inclusion-of-migrants-and-refugees
120 The STRAT-Board tool was commissioned from the JRC by the EC’s Directorate-General for Regional
and Urban Policy: https://urban.jrc.ec.europa.eu/strat-board.
121 Households where total housing costs represent more than 40% of the disposable income.
122 Residualisation refers to the concentration of the most disadvantaged households in social housing
due to a combination of the limited availability of social housing and a high demand. Thus, only those
with the greatest need will be eligible.
123 https://bluehub.jrc.ec.europa.eu/datachallenge
124 http://www.stadtentwicklung.berlin.de/wohnen/quartiersmanagement/index_en.shtml
125 https://www.quartiersmanagement-berlin.de/english/program-social-city.html
126 http://tubecreature.com/#/livesontheline/current/same/U/*/TFTFTF/13/-0.1000/51.5200
127 Despite a slight drop in results, 85% of swimming sites across Europe monitored in 2017 met the EU’s highest
and most stringent ‘excellent’ quality standards, according to the latest annual European bathing water quality
report: https://www.eea.europa.eu/highlights/good-news-for-holiday-makers.
128 EP Press release, ‘Cutting food waste’, 2017.
129 ‘Food loss’ refers to any food that is lost in the supply chain between the producer and the market, while
‘food waste’ refers to the discarding or alternative (non-food) use of food that is safe and nutritious for
human consumption.
130 www.milanurbanfoodpolicypact.org
131 Available at: https://www.latinno.net/en/case/8145.

Endnotes 146
132 Compiled from: http://ec.europa.eu/environment/waste/index.htm, http://www.europarl.europa.eu/news/en/
headlines/society/20180328STO00751/eu-waste-management-infographic-with-facts-and-figures.
133 https://www.rescoop.eu
134 https://eur-lex.europa.eu/legal-content/EN/TXT/?uri=COM%3A2018%3A29%3AFIN
135 In fact, SDG 12 is specifically on Responsible Consumption and Production.
136 The Global Covenant of Mayors for Climate and Energy is the largest global alliance of cities and local
governments voluntarily committed to actively combatting climate change and transitioning to a low-carbon
and climate-resilient economy.
137 This initiative encourages local authorities to implement sustainable energy policies within their territories
with the aim of reaching the EU 2020/2030 GHG emission reduction targets.
138 Representing more than 800 million people worldwide.
139 Representing 44% of the current European population.
140 Collective emissions in the business as usual (BAU) scenario by 2050 amount to 5.4 GtCO2-eq. Further
details can be found at ‘Implementing Climate Ambition: Global Covenant of Mayors 2018 Global Aggregation
Report’, Global Aggregation Report, Brussels: Global Covenant of Mayors for Climate & Energy, 10 September
2018: https://www.globalcovenantofmayors.org/wp-content/uploads/2018/10/2018_GCOM_report_web.pdf.
141 Among other tools, local authorities can revise building codes to promote the improvement of energy efficiency
in buildings, impose road charging to reduce congestion, provide public transport and promote sustainable
mobility as well as incentivise the use of renewable energy in the building stock for distributed generation.
142 Examples: public-private partnerships, awareness-raising and training activities, and community cooperatives
for local energy projects.
143 The main tools applied by local authorities are energy audits, demonstration projects in public facilities
and public procurement, which can be used to better manage the local authority estate.
144 https://www.covenantofmayors.eu/about/covenant-community/signatories/action-plan.html?scity_id=5915
145 ‘Innovate4Cities - A Global Climate Action Accelerator: Research and Innovation Priorities’, Innovate4Cities,
Brussels: Global Covenant of Mayors for Climate & Energy, 26 September 2018: https://www.
globalcovenantofmayors.org/wp-content/uploads/2018/09/GCoM_Innovate4Cities-OPS_Booklet_8.5x11.pdf.
146 The applied research and technological innovations will arm local government practitioners with the capabilities
to successfully make the case – and advance their efforts – with city- and national-level leaders, the private
sector, academia, and civil society as they strive to bridge the gap from climate ambition to action delivery.
147 https://e3p.jrc.ec.europa.eu/events/workshop-local-communities-and-social-innovation-energy-transition
148 World Urban Campaign: http://www.worldurbancampaign.org/citiscope-hong-kong-plans-city-%E2%80%99s-
growing-older.
149 Some examples can be found here: http://www.interazioniurbane.org/category/progetti.
150 https://www.theguardian.com/cities/2017/jul/24/pseudo-public-space-explore-data-what-missing and
https://www.toronto.ca/city-government/planning-development/planning-studies-initiatives/privately-owned-
publicly-accessible-spaces-pops
151 One such example is the Benthemplein in Rotterdam, a plaza and sports field which doubles as a rainwater
reservoir http://www.urbanisten.nl/wp/?portfolio=waterplein-benthemplein.
152 http://www.bcnecologia.net/en/conceptual-model/superblocks
153 Enhancing Resilience of Urban Ecosystems through Green Infrastructure (EnRoute): http://oppla.eu/enroute.
154 https://magazine.fbk.eu/en/news/5g-carmen-a-digital-corridor-for-the-mobility-of-the-future
155 https://www.thestar.com.my/tech/tech-news/2018/09/18/keeping-skies-safe-in-the-age-of-the-drones, accessed
in November 2018.
156 European Roadmap electrification of Road Transport: https://egvi.eu/wp-content/uploads/2018/01/
electrification_roadmap_web.pdf.

147 Endnotes
157 https://bbvaopen4u.com/en/actualidad/data-apis-essential-development-smart-cities
158 https://www.digitalinformationworld.com/2014/04/the-api-revolution-infographic.html
159 https://www.infoworld.com/article/3088994/apis/how-apis-enable-egovernment.html
160 European Commission Joint research Centre EREBILAND project, European Regional Energy Balance
and Innovation LANDscape.
161 https://eu-smartcities.eu
162 https://energypost.eu/a-revolution-the-netherlands-kisses-gas-goodbye-but-will-it-help-the-climate
163 https://www.fixmystreet.com
164 As discussed in a 2016 workshop on the territorial impact of drones, keeping the rules flexible and simple
would help start-ups to start their business more easily, since many of them have neither the funds nor
the knowledge on how to request registration or certification. The full report is available at:
https://cor.europa.eu/en/our-work/Documents/Territorial-impact-assessment/aircraft-systems.pdf.
165 http://www.forumpa.it/smart-city/icity-rate-2018-la-classifica-delle-citta-intelligenti-italiane-settima-edizione
166 https://toplink.weforum.org/knowledge/insight/a1Gb0000000LiPhEAK/explore/summary
167 http://www.spaceandmatter.nl/schoonschip
168 https://waterfrontoronto.ca/nbe/portal/waterfront/Home/waterfronthome/projects/quayside
169 For more detailed information on AI, see the JRC report on Artificial Intelligence – A European Perspective.
170 For more detailed information, see the JRC report on the Future of Road Transport (Alonso Raposo et al., 2019).
171 https://ec.europa.eu/info/research-and-innovation/funding/funding-opportunities/prizes/icapital_en#why
172 Data obtained through the STRAT-Board tool which offers interactive mapping and a visual overview
of sustainable urban development (SUD) and integrated territorial investment (ITI) strategies supported
by EU Cohesion Policy. So far, almost 1 000 strategies have been mapped and data collection is ongoing:
https://ec.europa.eu/knowledge4policy/online-resource/strat-board_en.
173 https://curingthelimbo.gr
174 http://athenspartnership.org/digital-council
175 Innovations in the design and delivery of social services, with an important role played by ICTs, have been
studied by the JRC in the last five years. Building on a database of 800 social innovation initiatives, results of
this research are reported in: Misuraca et al., 2017.
176 Urban Innovative Actions (2018), Defining innovation in the context of the UIA initiative, p.6:
i. https://www.uia-initiative.eu/sites/default/files/2017-03/Definition%20of%20innovation%20in%20UIA%20
context%20Final%20version.pdf. Project site: https://www.uia-initiative.eu/en/uia-cities/milan, accessed
in March 2019.
177 https://composite-indicators.jrc.ec.europa.eu/cultural-creative-cities-monitor
178 See, for instance, the Stuttgart Region Creative Industries Strategy:
https://wrs.region-stuttgart.de/uploads/media/publikationen_Creative_Industries_Stuttgart_Region.pdf.
179 http://s3platform.jrc.ec.europa.eu
180 http://urbact.eu/sites/default/files/media/in_focus_bilbao_summary_en.pdf
181 http://urbact.eu/sites/default/files/media/in_focus_bielsko_biala_iap_en.pdf
182 http://www.sofia-da.eu/en/strategic-documents/innovation-strategy-for-smart-specialization-of-sofia.html
183 Cities, city initiatives for technology, innovation and entrepreneurship, 2015:
https://media.nesta.org.uk/documents/citie_report_2015.pdf.
184 This example is part of a collection of experiences included in a JRC publication series addressing ‘Place-
based innovation ecosystems’, resulting from a fruitful collaboration with the Committee of the Regions.
185 https://6aika.fi/in-english
186 CREATIVE SPIRITS is a network of nine European cities, funded by the EU within the framework
of the URBACT III programme: http://urbact.eu/creative-spirits.

Endnotes 148
187 BoostINNO stands for boosting social innovation in European cities. This network of cities is promoted by the
URBACT programme,integrates the visions of 10 large cities: https://urbact.eu/boostinno.
188 In Focus is a network of cities willing to enhance their competitiveness and job-creation capability
by positioning themselves on the new economic landscape according to their specialisation strategies,
each of which are currently focused on a variety of different productive backgrounds and sectorial priorities:
http://urbact.eu/In-Focus.
189 http://www.iuc.eu/about
190 A formulation of post-normal science, as developed in Funtowicz and Ravetz, 1993.
191 https://dcentproject.eu
192 https://unhabitat.org/new-urban-agenda-and-the-sustainable-development-goals-to-human-rights-brochure
193 https://realisingjustcities-rjc.org/participatory-cities
194 Jeannotte, M. 2016. Story-telling about place: Engaging citizens in cultural mapping. City, Culture and Society,
v7, n1, pp.35-41.
195 e.g. https://www.sciencealert.com/this-dutch-town-will-grow-its-own-food-live-off-grid-and-handle-its-own-waste
196 http://www.eurocities.eu/eurocities/documents/Decidim-barcelona-WSPO-AZ9ATM
197 Any group of people can use it, whether it is an NGO, university, trade union, cooperative, neighbourhood
association or any other type of citizen-led or community-driven initiative, etc.
198 https://www.participatorybudgeting.org
199 https://unhabitat.org/books/72-frequently-asked-questions-about-participatory-budgeting
200 https://siteresources.worldbank.org/PSGLP/Resources/ParticipatoryBudgeting.pdf
201 https://www.participatorybudgeting.org
202 Participatory planning, as defined by Active Neighbourhoods Canada; available at: https://participatoryplanning.
ca/participatory-planning.
203 In terms of robustness, effectiveness and adaptiveness.
204 Examples: 3D printing, laser cutting, wearables and several open source hardware and software tools.
205 Core to this concept is a network of cities, regions and countries that have pledged to work towards producing
everything they consume by 2054. Citizens, FabLabs and city officials from Paris to Santiago in Chile
collaborate locally to implement new urban models through interventions in governance and policy:
https://fab.city.
206 The project ran between 2015 and 2018 and combined the efforts of the Waag Society (NL), Institute
for Advanced Architecture of Catalonia (ES), Peer Educators Network (KS), University of Dundee (UK)
and the Joint Research Centre (BE): http://making-sense.eu.
207 http://making-sense.eu/wp-content/uploads/2018/01/Citizen-Sensing-A-Toolkit.pdf
208 Peer Educators Network and Science for Change Kosovo, among others.
209 http://ajriprishtines.info
210 https://gsdrc.org/topic-guides/urban-governance/concepts-and-debates/what-is-urban-governance
211 As described in a 2017 study on the legacy of the Leipzig Charter on Sustainable European Cities, conducted
by the European Urban Knowledge Network across all EU Member States and beyond:
https://agendastad.nl/wp-content/uploads/2017/08/Ten-years-after-the-Leipzig-Charter-low-res.pdf.
212 https://ec.europa.eu/regional_policy/archive/themes/urban/leipzig_charter.pdf
213 https://agendastad.nl/wp-content/uploads/2017/08/Ten-years-after-the-Leipzig-Charter-low-res.pdf
214 The survey covers 263 metropolitan areas (93 of which are in the EU) of at least 500 000 inhabitants.
215 For the purpose of the OECD study, an organisation is classified as a metropolitan governance body when
it meets the following four criteria: geographical scope (the organisation must cover the central city
and a large share of the remaining parts of the metropolitan area); involved actors (national or sub-national
governments must be dominant actors within the organisation, or the organisation itself must have the status

149 Endnotes
of a sub-national government); thematic focus (the organisation must primarily deal with issues that are
directly and predominantly relevant to metropolitan area governance); and thematic width (the organisation
must have a mandate that allows it to work on more than one issue that is related to metropolitan area
governance). For a detailed explanation, see OECD 2015.
216 At the time of writing, these priority themes are: air quality, climate adaptation, circular economy, culture
and cultural heritage, digital transition, energy transition, inclusion of migrants and refugees, housing, jobs
and skills in the local economy, urban poverty, urban mobility, public procurement, security in public spaces,
and sustainable land use.
217 https://ec.europa.eu/futurium/en/node/1819
218 In particular, the New Urban Agenda positions governance as a central enabling condition for a more
sustainable future. It further establishes a range of concrete aspirations for developing urban-governance
systems, institutional structures and capacities. Finally, it aims to establish a global urban governance
‘observatory’ that will serve as a platform to encourage reforms on the ground and the achievement of these
aspirations: http://wuf9.org/programme/networking-events/towards-a-new-urban-governance-observatory.
219 Johanna Roland, Mayor of Nantes and Eurocities President: http://www.eurocities.eu/eurocities/news/Pact-of-
Amsterdam-a-new-role-for-cities-in-EU-policy-making-WSPO-AACJ6K.
220 The reports are presented annually at the United Nations’ High-Level Political Forum in July. Each edition
of the HLPF selects a group of SDGs which will be assessed with a specific focus. A fully intergovernmental
initiative, the HLPF offers only a limited space to ‘major groups’ and other interest-based groups to present
alternative approaches and views on issues regarding implementation of the global agendas. The UCLG
reports, backed by the Global Taskforce of Local and Regional Governments, represent the point of view of
cities, regions and territories on the matter and are available at: https://www.gold.uclg.org/reports/other/local-
governments-and-localization-sdgs. UCLG is also preparing a larger global report on ‘localisation’ of the SDGs
which will be published in November 2019.
221 UN-HABITAT, World Cities Day 2018.
222 http://www3.weforum.org/docs/WEF_Global_Risks_Report_2019.pdf : “Many capital cities have even
higher proportions of so-called ‘solitaries’ –for example, 50% in Paris and 60% in Stockholm. In mid-town
Manhattan, 94% of households are single-person.”
223 The C3 Index score is the result of the weighted average of the ‘Cultural Vibrancy’ (40%), ‘Creative Economy’
(40%) and ‘Enabling Environment’ (20%) sub-index scores (Montalto, et al., 2017).
224 UN-HABITAT, Social Resilience Guide; available at: https://unhabitat.org/urban-resilience-enhancer-social-
resilience.
225 https://urbact.eu/ready-future-urban-resilience-practice
226 https://climate-adapt.eea.europa.eu
227 As shown in recent JRC studies, among the many available enablers, new financing mechanisms known
as ‘impact investment’ also play a crucial role as a policy tool for fostering the scaling up and spread
of innovation-led initiatives: Maduro et al., 2018.
228 For instance, an interoperability lab is being set up at the JRC to test if and which household appliances can
actually talk to each other.
229 The survey was developed by the London School of Economics (LSE) Cities, UN Habitat and the United Cities
and Local Governments (UCLG).

References 150
Allen M., Regenbrecht H., Abbott, M. 2011. Smart-phone augmented reality for public participation in urban planning.
In Proceedings of the 23rd Australian computer-human interaction conference, p. 11-20, ACM.
Alonso Raposo M., Ciuffo B. (Eds.), Ardente F., Aurambout J-P., Baldini G., Braun R., Christidis P., Christodoulou A., Duboz A.,
Felici S., Ferragut J., Georgakaki A., Gkoumas K., Grosso M., Iglesias M., Julea A., Krause J., Martens B., Mathieux F., Menzel G.,
Mondello S., Navajas Cawood E., Pekár F., Raileanu I-C., Scholz H., Tamba M., Tsakalidis A., van Balen M., Vandecasteele I.
2019. The future of road transport - Implications of automated, connected, low-carbon and shared mobility,
EUR 29748 EN, Publications Office of the European Union, Luxembourg, 2019, ISBN 978-92-76-03409-4,
doi:10.2760/9247.
Alonso Raposo, M., Grosso M., Després J., Fernández Macías E., Galassi C., Krasenbrink A., Krause J., Levati L.,
Mourtzouchou A., Saveyn B., Thiel C., Ciuffo B. 2018. An analysis of possible socio-economic effects of a Cooperative,
Connected and Automated Mobility (CCAM) in Europe - Effects of automated driving on the economy, employment
and skills, EUR 29226 EN, Publications Office of the European Union, Luxembourg, ISBN 978-92-79-85857-4,
doi:10.2760/777.
Amann M., Borken-Kleefeld J., Cofala J., Hettelingh J.-P., Heyes C., Höglund-Isaksson L., Holland M., Kiesewetter G.,
Klimont Z., Rafaj P., Posch M., Sander R., Schöpp W., Wagner F., Winiwarter W. 2014. The Final Policy Scenarios of the EU
Clean Air Policy Package (No. TSAP Report #11 Version 1.1a). International Institute for Applied Systems Analysis,
Laxenburg, Austria.
Andrews G.J., Cutchin M., McCracken K., Phillips D.R., Wiles J. 2007. Geographical Gerontology: The constitution of
a discipline. Social Science & Medicine, Vol. 65, Iss. 1, doi:10.1016/j.socscimed.2007.02.047.
Angotti T. 2015. Urban agriculture: long-term strategy or impossible dream? Lessons from prospect farm in Brooklyn,
New York. Public health, 129(4), 336-341.
Arbib J., Seba T. 2017. Rethinking Transportation 2020-2030 - The Disruption of Transportation and the Collapse of
the Internal-Combustion Vehicle and Oil Industries. A RethinkX Sector Disruption Report. https://static1.squarespace.com/
static/585c3439be65942f022bbf9b/t/591a2e4be6f2e1c13df930c5/1509063152647/RethinkX+Report_051517.pdf.
Aurambout J.P., Gkoumas K., Ciuffo B. 2019. Last mile delivery by drones: an estimation of viable market potential
and access to citizens across European cities, European Transport research Review, in press.
Badland H., Whitzman C., Lowe M., Davern M., Aye L., Butterworth I., Hes D., Giles-Corti B. 2014. Urban liveability:
Emerging lessons from Australia for exploring the potential for indicators to measure the social determinants of health,
Social Science & Medicine, 111, 64-73, ISSN 0277-9536.
Barber B.R. 2013. If mayors ruled the world: Dysfunctional nations, rising cities. Yale University Press. Cities Alliance,
Sustainable Development Goals and Habitat III: Opportunities for a Successful New Urban Agenda (2015); available at:
https://www.citiesalliance.org/sites/default/files/Opportunities%20for%20the%20New%20Urban%20Agenda.pdf.
Baumann K., Caldwell B., Bar F., Stokes B. 2018. Participatory Design Fiction: Community Storytelling for Speculative Urban
Technologies. In Extended Abstracts of the 2018 CHI Conference on Human Factors in Computing Systems p. VS09, ACM.
Bazaz, A., Bertoldi P., Buckeridge M., Cartwright A., de Coninck H., Engelbrecht F., Jacob D. et al. Summary for Urban
Policymakers – What the IPCC Special Report on 1.5C Means for Cities, Brussels, 10 December 2018: http://iihs.co.in/
knowledge-gateway/summary-for-urban-policymakers-what-the-ipcc-special-report-on-1-5c-means-for-cities-2.
Bertoldi P., Kona A., Palermo V., Zangheri P., Serrenho T., Rivas S., Labanca N., Kilkis S., Lah O., Glancy R., Follador M.,
Barbosa P., Andreanidou K., Zancanella P. 2018. Guidebook ‘How to develop a Sustainable Energy and Climate Action Plan
(SECAP)’: PART 3 - Policies, key actions, good practices for mitigation and adaptation to climate change and financing
SECAP(s), EUR 29412. Luxembourg, Publications Office of the European Union.
REFERENCES

Better Dwelling. 2017, https://betterdwelling.com/vacant-homes-global-epidemic-paris-fighting-60-tax, Accessed
in December 2018.
Bisselink B., Bernhard J., Gelati E., Adamovic M., Guenther S., Mentaschi L., De Roo A. 2018. Impact of a changing
climate, land use, and water usage on Europe’s water resources, EUR 29130 EN, Publications Office of the European
Union, Luxembourg, ISBN 978-92-79-80287-4, doi:10.2760/847068.
Blakely E.J., Snyder M.G. 1997. Fortress America: Gated Communities in the United States. Washington, D.C., Brookings
Institution Press.
Blikstein P. 2013. Digital fabrication and ‘making’ in education: The democratization of invention. In FabLabs: Of machines,
makers and inventors, 4, 1-21.
Bolt G., Burgers J., Van Kempen R. 1998. On the social significance of spatial location: spatial segregation and social
inclusion. Netherlands Journal of Housing and the Built Environment, 13(1): 83-95.
Brown A., Matlock M.D. 2011. A review of water scarcity indices and methodologies: https://www.eea.europa.eu/data-and-
maps/indicators/use-of-freshwater-resources-2/newly-created-rationalereference.
Campanella T.J., Godschalk D.R., 2011. Chapter 12. Resilience. In the Oxford Handbook of Urban Planning, edited by Rachel
Weber, Randall Crane, Oxford University Press.
Castellani V., Fusi A., Sala S. 2017. Consumer Footprint. Basket of Products indicator on Food, EUR 28764 EN, Publications
Office of the European Union, Luxembourg, ISBN 978-92-79-73194-5, doi:10.2760/668763.
Cesaroni G., Badaloni C., Gariazzo C., Stafoggia M., Sozzi R., Davoli M., Forastiere F. 2013. Long-term exposure to urban air
pollution and mortality in a cohort of more than a million adults in Rome. Environmental health perspectives, 121(3),
324-331: https://www.ncbi.nlm.nih.gov/pubmed/23308401.
Cheng P.T. 2016. Toward a multi-scale participatory urban policymaking platform: co-designing Mass Transit using LEGO
bricks, open data, and interactive pixels, doctoral dissertation, Massachusetts Institute of Technology.
City of Amsterdam. 2019. https://maps.amsterdam.nl, accessed in January 2019.
Commission on Social Determinants of Health (CSDH) 2008. Closing the gap in a generation: health equity through
action on the social determinants of health. Final report of the Commission on social determinants of health. World Health
Organization, Geneva.
Corbane C., Pesaresi M., Politis P., Florczyk J.A., Melchiorri M., Freire S., Schiavina M., Ehrlich D., Naumann G., Kemper T.
2018. The grey-green divide: Multitemporal analysis of greenness across 10 000 urban centres derived from the Global
Human Settlement Layer (GHSL), International journal of Digital Earth, in press.
Council of European Municipalities and Regions (CEMR) 2016. Local and Regional Governments in Europe Structures and
Competences: http://www.ccre.org/img/uploads/piecesjointe/filename/CEMR_structures_and_competences_2016_EN.pdf.
Cramton P., Geddes R.R., Ockenfels A. 2018. Set road charges in real time to ease traffic, Nature, 560, 23-25.
Crenna E., Sinkko T., Sala S. 2019. Biodiversity impacts due to food consumption in Europe, Journal of Cleaner Production,
Volume 227, 2019, Pages 378-391, ISSN 0959-6526, https://doi.org/10.1016/j.jclepro.2019.04.054.
Da Cruz N.F., Rode P., McQuarrie M. 2018. New urban governance: A review of current themes and future priorities,
Journal of Urban Affairs, 41:1: 1-19. https://doi.org/10.1080/07352166.2018.1499416.
Dabbagh A., Laws R.L., Steulet C., Dumolard L., Mulders M.N., Kretsinger K., Alexander J. P., Rota P.A., Goodson J.L. 2018.
Progress Toward Regional Measles Elimination – Worldwide, 2000-2017. MMWR Morb Mortal Wkly Rep 67:1323-1329.
doi: http://dx.doi.org/10.15585/mmwr.mm6747a6.
Davies S.R. 2017. Hackerspaces: making the maker movement, John Wiley & Sons.
De Laurentiis V., Sara Corrado S., Serenella Sala S. 2018. Quantifying household waste of fresh fruit and vegetables
in the EU, Waste Management, Vol. 77, p. 238-251, ISSN 0956-053X, https://doi.org/10.1016/j.wasman.2018.04.001.
Dekker J., Peen J., Koelen J., Smit F., Schoevers R. 2008. Psychiatric disorders and urbanization in Germany, BMC public
health, 8, 17. doi:10.1186/1471-2458-8-17.
Dias N. (Ed.) 2018. Hope for Democracy. 30 Years of Participatory Budgeting Worldwide. Epopeia Records Oficina.
https://www.oficina.org.pt/uploads/7/0/6/1/70619115/hope_for_democracy_-_digital.pdf.
151 References

References 152
Diez T. (Ed.) 2018. Fab City: The Mass Distribution of (Almost) Everything. IAAC.
Dijkstra L., Florczyk A., Freire S., Pesaresi M., Kemper T. 2018. ‘Applying the Degree of Urbanisation to the globe: a new
harmonised definition reveals a different picture of global urbanisation.’ In 16th Conference of IAOS. OECD Headquarters,
19-21 September 2018, 19-21. Paris, France: https://www.oecd.org/iaos2018/programme/IAOS-OECD2018_Lewis-et-al.pdf.
Dijkstra L., Garcilazo E., McCann P. 2015. The Effects of the Global Financial Crisis on European Regions and Cities, Journal
of Economic Geography 15 (2015) pp. 935-94. doi:10.1093/jeg/lbv032.
Dijkstra L., Poelman H. 2014. A harmonised definition of cities and rural areas: the new degree of urbanisation. Regional
Working Paper, European Commission Directorate-General for Regional and Urban Policy. https://ec.europa.eu/regional_
policy/sources/docgener/work/2014_01_new_urban.pdf.
Durrheim D.N. 2017. Measles Virus Is Unforgiving Where Immunity Gaps Exist, The Journal of Infectious Diseases, Volume
216, Issue 10, 5 December 2017, pp. 1183-1184, https://doi.org/10.1093/infdis/jix452.
Ehrlich, D., Schiavina, M., Pesaresi, M., Kemper, T., Detecting spatial pattern of inequalities from remote sensing – Towards
mapping of deprived communities and poverty, EUR 29465 EN, European Union, Luxembourg, 2018, ISBN 978-92-79-
97528-8, doi:10.2760/642218, JRC113941.
Ertiö T.P. 2015. Participatory apps for urban planning – space for improvement. Planning Practice & Research,
30(3), 303-321.
European Centre for Disease Prevention and Control (ECDC) 2018. Seasonal influenza vaccination and antiviral use
in EU/EEA Member States – Overview of vaccine recommendations for 2017-2018 and vaccination coverage rates
for 2015-2016 and 2016-2017 influenza seasons. Stockholm. doi: 10.2900/721517
European Commission (EC) 2008. EU Directive 2008/50/EC of the European Parliament and of the Council of 21 May
2008 on Ambient Air Quality and Cleaner Air for Europe.
European Commission (EC) 2017. My Region, My Europe, Our Future. Seventh Report on Economic, Social and Territorial
Cohesion, Luxembourg, Publications Office of the European Union. doi:10. 2776/176864
European Commission (EC) 2018a. Income inequality in the EU: https://ec.europa.eu/eurostat/web/products-eurostat-news/
-/EDN-20180426-1 (accessed 9 November 2018).
European Commission (EC) 2018b. The 2018 Ageing Report, Economic & Budgetary Projections for the 28 EU Member
States (2016-2070), doi:10.2765/615631; available at: https://ec.europa.eu/info/publications/economy-finance/2018-
ageing-report-economic-and-budgetary-projections-eu-member-states-2016-2070_en.
European Commission (EC), Joint Research Centre (JRC) 2018. Atlas of the Human Planet 2018 – A World of Cities,
EUR 29497 EN, European Commission, Luxembourg, ISBN 978-92-79-98185-2, doi:10.2760/124503.
European Commission (EC), Joint Research Centre (JRC) 2019. Water – Energy Nexus in Europe - Analysis of the potential
of the water system as a source of flexibility for the European power system. JRC Science for Policy report, in process.
European Commission, COM 2018 773 Final. Communication from the Commission to the European Parliament, the
European Council, the European Economic and Social Committee, the Committee of the Regions and the European
Investment Bank: A Clean Planet for all – A European strategic long-term vision for a prosperous, modern, competitive
and climate neutral economy.
European Environmental Agency (EEA) 2015. Freshwater resources for 2015, derived from https://www.eea.europa.eu/
data-and-maps/indicators/use-of-freshwater-resources-2/assessment-3.
European Parking Association (EPA) 2013. Scope of Parking in Europe. Eur Park Assoc Data Coll. 48.
European Union (EU) and United Nations Human Settlements Programme (UN-HABITAT) 2016. The State of European
Cities 2016. Cities leading the way to a better future.
EUROSTAT 2016. Urban Europe statistics on cities, towns and suburbs, 2016 edition, Publications office of the European
Union, Luxembourg.
Fainstein N., Fainstein S. 2018. The spatial dimension of poverty, In: Western Capitalism in Transition: Global Processes,
Local Challenges, edited by Andrea Andreotti et al., Manchester University Press, p. 239-255.

Figueiredo L., Honiden T., Schumann A. 2018. Indicators for Resilient Cities. OECD Regional Development Working Papers,
2018/02, OECD Publishing, Paris. http://dx.doi.org/10.1787/6f1f6065-en.
Florczyk A., Melchiorri M., Corbane C., Schiavina, M., Maffenini M., Pesaresi M., Politis P., Sabo S., Freire S., Ehrlich D.,
Kemper T., Tommasi P., Airaghi D., Zanchetta L. 2019. Description of the GHS Urban Centre Database 2015,
Public Release 2019, Version 1.0, Publications Office of the European Union, Luxembourg, ISBN 978-92-79-99753-2,
doi:10.2760/037310.
Florida R., Adler P., Mellander C. 2017. The city as innovation machine, Regional Studies, 51:1, 86-96,
doi:10.1080/00343404.2016.1255324.
Fonte M. 2013. Food consumption as social practice: Solidarity Purchasing Groups in Rome, Italy, Journal of Rural Studies,
32, 230-239.
Food and Agriculture Organization of the United Nations (FAO) 2011. Global food losses and food waste – Extent, causes
and prevention. Rome.
Food and Agriculture Organization of the United Nations (FAO) 2019. Water-Energy-Food-Nexus: http://www.fao.org/
energy/water-food-energy-nexus/en.
Forester J. 1999. The deliberative practitioner: Encouraging participatory planning processes, MIT Press.
Fouad M.N., Oates G.R., Scarinci I.C., Demark-Wahnefried W., Hamby B.W., Bateman L.B., Estrada J.J., Payton M., Sims M.,
Miele L., Partridge E.E. 2017. Advancing the Science of Health Disparities Through Research on the Social Determinants
of Health. American Journal of Preventive Medicine, 52(1S1), S1-S4.
Funtowicz S.O., Ravetz J.R. 1993. Science for the post-normal age. Futures, 25(7), 739-755.
Futureagenda 2017. Future of Cities. Insights from Multiple Expert Discussions Around the World.
https://www.futureofcities.city/pdf/full/Future%20of%20Cities%20Report%202017.pdf.
Gautier P.A., Svarer M., Teulings C.N. 2010. Marriage and the city: Search friction and sorting of singles. Journal of Urban
Economics 67, 206-218.
Gawlik B.M., Easton P., Koop S., Van Leeuwen K., Elelman R. (Eds.) 2017. Urban Water Atlas for Europe. European
Commission, Publications Office of the European Union, Luxembourg.
Global Covenant of Mayors 2019. www.globalcovenantofmayors.org, accessed in March 2019
Harrison C., Eckman B., Hamilton R., Hartswick P., Kalagnanam J., Paraszczak J., Williams P. 2010. Foundations for smarter
cities. IBM Journal of Research and Development, 54(4): 1-16.
Hayes J.F., Miles J., Walters K., King M., Osborn D.P.J. 2015. A systematic review and meta-analysis of premature mortality
in bipolar affective disorder. Acta Psychiatr Scand 131: 417-425.
Hillier D., Castillo G. 2013. No accident: Resilience and the inequality of risk, Oxfam Briefing Paper, No. 172, Oxfam
International, Oxford, United Kingdom.
Hirsch D., Meyer C., Klement J., Hamer M., Terlau W. 2016. Urban Agriculture and Food Systems Dynamics: Urban
Gardening and Urban Farming of the Bonn-Rhein-Sieg region, Germany. Proceedings in Food System Dynamics, 406-419.
Hollanders H., Es-Sadki N. (Eds.) 2017. Regional Innovation Scoreboard 2017.
https://ec.europa.eu/docsroom/documents/31491/attachments/1/translations/en/renditions/pdf.
Housing Europe 2017. The state of housing in the EU 2017, The European Federation of Public, Cooperative and Social
Housing, Brussels.
Institute for Health Metrics and Evaluation (IHME) 2013. The Global Burden of Disease: Generating Evidence, Guiding
Policy. Seattle, WA, ISBN 978-0-9840910-6-5.
International Transport Forum (ITF). 2018. (Un)certain Skies? Drones in the World of Tomorrow. https://www.itf-oecd.org/
sites/default/files/docs/uncertain-skies-drones_0.pdf.
Jacobs J. 1961. The Death and Life of Great American Cities, Random House.
Jacobs-Crisioni C., Kucas A., Lavalle C., Ahrend R., Lembcke A.C. 2019. Ageing in regions and cities: High resolution
projections for Europe in 2030, mimeo.
153 References

References 154
Jayantha W.M., Qian Q.K., Yi C.O. 2018. Applicability of ‘Aging in Place’ in redeveloped public rental housing estates
in Hong Kong, Cities, 83, p.140-151, ISSN 0264-2751: https://doi.org/10.1016/j.cities.2018.06.016.
Kallus R. 2016. Citizenship in action: participatory urban visualization in contested urban space. Journal of Urban Design,
21(5), 616-637.
Kompil M., Barranco R., Lavalle C. 2018. Urban form efficiency and access to public transport services, Conference
proceeding presented at NECTAR Cluster 6 Workshop on accessibility in urban modelling: from measurement to policy
instruction, 18-19 June 2018, Lyon, France.
Kompil M., Jacobs-Crisioni C., Dijkstra L., Lavalle C., 2019. Mapping accessibility to generic services in Europe:
a market-potential based approach, Sustainable Cities and Society, 46, https://doi.org/10.1016/j.scs.2018.11.047.
Kona A., Bertoldi P., Monforti-Ferrario F., Rivas S., Dallemand J.F. 2018. ‘Covenant of mayors signatories leading the way
towards 1.5 degree global warming pathway’, Sustain. Cities Soc., vol. 41.
Koster H.R.A., van Ommeren J.N., Volkhausen N. 2018. Short-term rentals and the housing market: quasi-experimental
evidence from Airbnb in Los Angeles, CEPR Discussion paper, 13094.
Kourti N., Kempner T., Marin Ferrer M., Luoni S., Antofie T., Tsionis G., Negro P., Giannopoulos G., Galbusera L., Krausmann
E., Girgin S. Theocharidou M. 2019. “Strategies for improving Urban Resilience in Europe”, 13th International Conference
on Applications of Statistics and Probability in Civil Engineering, ICASP13 Seoul, South Korea, 26-30 May 2019.
Labanca N. (Ed.) 2017. Complex Systems and Social Practices in Energy Transitions: framing energy sustainability
in the time of renewables, Springer, ISBN 978-3-319-33753-1.
Lagendijk A., Boekema F. 2008. Global Circulation and Territorial Development: South-east Brabant from a Relational
Perspective. European Planning Studies, 16(7), 925-939: https://doi.org/10.1080/09654310802163710.
Landry C. 2015. Cities of ambition, Comedia.
Lavalle C., Pontarollo N., Batista E Silva F., Baranzelli C., Jacobs-Crisioni C., Kavalov B., Kompil M., Perpina Castillo C.,
Vizcaino M.P., Ribeiro Barranco R., Vandecasteele I., Pinto Nunes Nogueira Diogo V., Aurambout J.P., Serpieri C., Marin
Herrera M.A., Rosina K., Ronchi S., Auteri D. 2017. European Territorial Trends - Facts and Prospects for Cities and Regions.
JRC Science for Policy Report: https://doi.org/10.2760/28183.
Leip A., Weiss F., Lesschen J.P., Westhoek H. 2014. The nitrogen footprint of food products in the European Union. J. Agric.
Sci. 152, 20-33: https://doi.org/10.1017/S0021859613000786.
Lorenzen M., Frederiksen L. 2008. Why do Cultural Industries Cluster? Localization, Urbanization, Products and Projects.
In P. Cook & L. R. (Eds.), Creative Cities, Cultural Clusters, and Local Economic Development (Chelternha, pp. 155-179),
Edward Elgar Publishing.
Mackenbach J.D., Rutter H., Compernolle S., Glonti K., Oppert J.M., Charreire H., De Bourdeaudhuij I., Brug J., Nijpels G.,
Lakerveld J. 2014. Obesogenic environments: a systematic review of the association between the physical environment
and adult weight status, the SPOTLIGHT project. BMC public health, 14, 233. doi:10.1186/1471-2458-14-233.
Maduro M., Pasi G., Misuraca G. Social impact investment in the EU. Financing strategies and outcome oriented
approaches for social policy innovation: narratives, experiences, and recommendations. EUR 29190 EN, Publications Office
of the European Union, Luxembourg, 2018, ISBN 978-92-79-81783-0, doi:10.2760/159402, JRC111373.
Maes J., Zulian G., Günther S., Thijssen M., Raynal J. 2019. Enhancing Resilience of Urban Ecosystems through Green
Infrastructure. Final Report, EUR 29630 EN, Publications Office of the European Union, Luxembourg,
ISBN 978-92-79-98984-1, doi:10.2760/602928, JRC115375.
Manca A.R., Benczur P., Giovannini E. 2017. Building a scientific narrative towards a more resilient EU society, Part 1:
a conceptual framework, Publications Office of the European Union, Luxembourg, ISBN 978-92-79-67660-4,
EUR 28548 EN, doi:10.2760/635528.
Marinacci C., Demaria M., Melis G., Borrell C., Corman D., Dell’Olmo M.M., Rodriguez M., Costa G. 2017. The Role
of Contextual Socioeconomic Circumstances and Neighborhood Poverty Segregation on Mortality in 4 European Cities,
International Journal of Health Services, Vol. 47(4) 636-654.

Marmot M.G., Allen J., Goldblatt P., Boyce T., McNeish D., Grady M., Geddes I. 2010. Fair society, healthy lives: Strategic
review of health inequalities in England post-2010. The Marmot Review: London UK.
Measure of America. 2017. A Portrait of Los Angeles County (Measure of America, 29 November 2017):
http://www.measureofamerica.org/los-angeles-county.
Meijers E. J., Burger M.J. 2017. Stretching the concept of ‘borrowed size’. Urban Studies, 54(1), 269-291:
https://doi.org/10.1177/0042098015597642.
Mekonnen M.M.,Hoekstra A.Y. 2016. Four billion people facing severe water scarcity, Science Advances, Vol. 2, No. 2,
e1500323: https://doi.org/10.1126/science.1259855.
Melchiorri M., Florczyk A.J., Freire S., Schiavina M., Pesaresi M., Kemper T. 2018a. ‘Unveiling 25 Years of Planetary
Urbanization with Remote Sensing: Perspectives from the Global Human Settlement Layer’. Remote Sensing 10 (5): 768:
https://doi.org/10.3390/rs10050768.
Melchiorri M., Florczyk A.J., Corbane C., Schiavina M., Pesaresi M. 2018b. Monitoring 25 years of Land Use Efficiency
in 10,000 Urban Centers: perspectives from the Global Human Settlements Layer. Proceedings of the 6th International
Conference on Sustainable Development, New York, 26-28 September 2018.
Mills, G. 2014. Urban climatology: history, status and prospects. Urban Clim. 10, 479-489.
Misuraca G., Geppert L., Codagnone C. 2017. i-FRAME – Assessing impacts of social policy innovation in the EU,
EUR 28824 EN, Publications Office of the European Union, Luxembourg, ISBN 978-92-79-74271-2, doi:10.2760/83089.
Montalto V., Tacao Moura C.J., Langedijk S., Saisana M. 2017. The Cultural and Creative Cities Monitor 2017 Edition.
European Commission. doi:10.2760/58643
Montgomery, M.R. 2009. Urban Poverty and Health in Developing Countries. Population Bulletin 64, no. 2.
Mullen P. M., Nair D., Nigam J., Seth K. 2016. Urban health advantages and penalties in India: overview and case studies -
discussion paper. Washington, DC: World Bank Group.
Mumford L. 1961. The City in History: Its Origins, its Transformations and its Prospects. Harmondsworth: Penguin Books.
Muster S., Marcinczak S., Van Ham M., Tammaru T. 2017. Socioeconomic segregation in European capital cities. Increasing
separation between poor and rich, Urban Geography, 38:7, 1062-1083.
Nascimento S. 2014. Critical Notions of Technology and the Promises of Empowerment in Shared Machine Shops.
Journal of Peer-Production: http://peerproduction.net/issues/issue-5-shared-machine-shops/editorial-section/critical-
notions-of-technology-and-the-promises-of-empowerment-in-shared-machine-shops.
Nascimento S., Pólvora A. 2016. Social Sciences in the Transdisciplinary Making of Sustainable Artefacts. Social Science
Information Vol.55 No.1, pp-28-42. Thousand Oaks, CA: SAGE Publications.
OECD. 2015a. Governing the City, OECD Publishing: http://dx.doi.org/10.1787/9789264226500-en.
OECD. 2015b. Ageing in Cities, OECD Publishing, Paris: http://dx.doi.org/10.1787/9789264231160-en.
OECD. 2018. Oslo Manual 2018 - Guidelines for Collecting, Reporting and Using Data on Innovation, 4th Edition. OECD, Paris.
OECD/EU. 2018. Health at a Glance: Europe 2018: State of Health in the EU Cycle, OECD Publishing, Paris:
https://doi.org/10.1787/health_glance_eur-2018-en.
Oke T.R. 1973. City size and the urban heat island. Atmos. Environ. 7, 769-779.
Ottawa Charter for Health Promotion. 1986. In: Health Promotion, Vol. 1: iii-v. Adopted at the international WHO
conference in Ottawa, Canada, in November 1986.
Parodi A., Leip A., De Boer I.J., Slegers P.M. Ziegler F., Temme E.H., Herrero M., Tuomisto H., Valin H., Van Middelaar C.E.,
Van Loon J.J.A. Van Zanten H.H.E. 2018. The potential of future foods for sustainable and healthy diets. Nature
Sustainability, 1, 782-789, https://doi.org/10.1038/s41893-018-0189-7.
Peen J., Schoevers R.A., Beekman A.T., Dekker J. 2010. The current status of urban-rural differences in psychiatric disorders.
Acta Psychiatrica Scandinavica, 121: 84-93: doi:10.1111/j.1600-0447.2009.01438.x.
Pesaresi M., Ehrlich D., Kemper T., Siragusa A., Florczyk A.J., Freire S., Corbane C. 2017. Atlas of the Human Planet 2017:
Global Exposure to Natural Hazards, EUR 28556 EN, doi:10.2760/19837.
155 References

References 156
Pesaresi M., Huadong G., Blaes X., Enrlich D., Ferri S., Gueguen L., Halkia M., Kauffmann M., Kemper T., Lu L., Marin-Herrera
M.A., Ouzounis G.K., Scavazzon M., Soille P., Syrris V., Zanchetta L. 2013. A Global Human Settlement Layer from Optical
HR/VHR RS Data: concept and first results. IEEE Journal of Selected Topics in Applied Earth Observation and Remote
Sensing, 6(5), 2102-31.
Pichler P.-P., Zwickel T., Chavez A., Kretschmer T., Seddon J., Weisz H .2018. Reducing Urban Greenhouse Gas Footprints,
Scientific Reports, 7, 14659, https://doi.org/10.1038/s41598-017-15303-x.
Pierre J., Peters B.G. 2012. Urban Governance. In: The Oxford Handbook of Urban Politics, K. Mossenberger, S.E. Clarke
and P. John (eds.), Oxford: Oxford University Press.
Pisoni A., Christidis P., Thunis P., Trombetti M. 2019. Evaluating the impact of “Sustainable Urban Mobility Plans” on urban
background air quality, Journal of Environmental Management, Vol. 231, pp. 249-255.
Poljanšek K., Marín Ferrer M., De Groeve T., Clark I. (Eds.). 2017. Science for disaster risk management 2017:
knowing better and losing less. EUR 28034 EN, Publications Office of the European Union, Luxembourg, Chapter 1.
doi:10.2788/688605.
Pólvora A., Nascimento S. 2017. Impact Assessment and Recommendations. Making Sense - H2020 CAPS Project,
EUR 29093 EN, Publications Office of the European Union, Luxembourg, ISBN 978-92-79-79336-3,
doi:10.2760/395368.
Pólvora A., Nascimento S., Sanders E.B.-N., Grael, M. 2016. Co-Designing Participatory Approaches for Communities.
Making Sense – Experiments and Advances in Participatory Sensing. http://making-sense.eu/wp-content/uploads/2016/08/
Making-Sense-D42-CoDesigning-Participatory-Approaches.pdf.
Rissola G., Hervas F., Slavcheva M., Jonkers, K. 2017. Place-Based Innovation Ecosystems: Espoo Innovation Garden
and Aalto University (Finland), EUR 28545 EN, Publications Office of the European Union, Luxembourg,
ISBN 978-92-79-67467-9, doi:10.2760/949545.
Rivas S., Melica G., Kona A., Zancanella P., Serrenho T., Iancu A., Koffi B., Gabrielaitiene I., Janssens-Maenhout G.
and Bertoldi P. 2015. The Covenant of Mayors: In-depth Analysis of Sustainable Energy Actions Plans, EUR 27526 EN,
Publications Office of the European Union, Luxembourg, ISBN 978-92-79-52780-7, doi:10.2790/043140.
Rodriguez V., Fernandez-Mayoralas G., Rojo-Pérez F. 2004. International Retirement Migration: Retired Europeans Living
on the Costa Del Sol, Spain, Population Review, 43(1): 1-36.
Rosa P., Ferretti F., Guimarães Pereira Â., Panella F., Wanner M. 2017. Overview of the Maker Movement in
the European Union, EUR 28686 EN, Publications Office of the European Union, Luxembourg, ISBN 978-92-79-70525-0,
doi:10.2760/227356.
Rosa P., Guimarães Pereira Â., Ferretti F. 2018. Futures of Work. Perspectives from makerspaces, EUR 29296 EN,
Publications Office of the European Union, Luxembourg, ISBN 978-92-79-89734-4, doi:10.2760/96812.
Rosina K., Batista e Silva F., Vizcaino P., Marín Herrera M., Freire S., Schiavina M. 2018. Increasing the detail
of European land use/cover data by combining heterogeneous data sets, International Journal of Digital Earth,
doi:10.1080/17538947.2018.1550119.
Rydin Y., Bleahu A., Davies M., Dávila J.D., Friel S., De Grandis G., Groce N., Hallal P.C., Hamilton I., Howden-Chapman P.,
Lai K.M., Lim C.J., Martins J., Osrin D., Ridley I., Scott I., Taylor M., Wilkinson P., Wilson J. 2012. Shaping cities for health:
complexity and the planning of urban environments in the 21st century, Lancet (London, England), 379(9831), 2079-108.
Sala S., Beylot A., Corrado S., Crenna E., Sanyé-Mengual E., Secchi M. 2019. Indicators and Assessment of
the environmental impact of EU consumption. Consumption and Consumer Footprints for assessing and monitoring
EU policies with Life Cycle Assessment, EUR 29648 EN, Publications Office of the European Union, Luxembourg,
ISBN 978-92-79-99672-6, doi:10.2760/403263.
Sassen S. 2010. The city: Its return as a lens for social theory, City, Culture and Society, 1 (1): 3-11.
Sassen S. 2018. Buying up pieces of cities? In: In the post-urban world. Emergent transformation of cities and regions
in the innovative global economy (pp. 249-259). Routledge: London.

Sheppard S., Udell A. 2016. Do Airbnb properties affect house prices? No 2016-03, Department of Economics Working
Papers, Department of Economics, Williams College, https://EconPapers.repec.org/RePEc:wil:wileco:2016-03.
Shirley-Smith C., Cheeseman C., Butler D. 2008. Sustainability of water management in Zaragoza city, Water
and Environment Journal, 22(4), 287-296, https://doi.org/10.1111/j.1747-6593.2007.00103.x.
Siemens, Economist Intelligence Unit, 2012. The Green City Index - A Summary of the Green City Index Research
Series, Munich. https://www.siemens.com/entry/cc/features/greencityindex_international/all/en/pdf/gci_report_summary.pdf
Smith R.W. 1973. A theoretical basis for participatory planning, Policy Science, 4(3), 275-295:
https://doi.org/10.1007/BF01435125.
Solecki W., Rosenzweig C., Dhakal S., Roberts D., Barau A.S., Schultz S., Ürge-Vorsatz D. 2018. City Transformations
in a 1.5 °C Warmer World, Nature Climate Change, 8(3), 177, https://doi.org/10.1038/s41558-018-0101-5
Sonnino R., Tegoni C.L., De Cunto A. 2019. The challenge of systemic food change: Insights from cities, Cities, 85,
110-116.
Steffen W., Richardson K., Rockström J., Cornell S.E., Fetzer I., Bennett E.M., Biggs R., Carpenter S.R., De Vries W.,
De Wit C.A., Folke C. 2015. Planetary boundaries: Guiding human development on a changing planet, Science, 347(6223),
1259855, https://doi.org/10.1126/science.1259855.
Stevenson M., Thompson J., de Sá T.H., Ewing R., Mohan D., McClure R., Roberts I., Tiwari G., Giles-Corti B., Sun X., Wallace M.
2016. Land use, transport, and population health: estimating the health benefits of compact cities, The lancet,
388(10062), 2925-2935.
Trapenberg Frick K. 2016. Citizen activism, conservative views & mega planning in a digital era. Planning Theory
& Practice, 17(1), 93-118.
Tsakalidis A., Thiel C. 2018a. Electric vehicles in Europe from 2010 to 2017: is full-scale commercialisation beginning?
An overview of the evolution of electric vehicles in Europe, EUR 29401 EN, Publications Office of the European Union,
Luxembourg, ISBN 978-92-79-96719-1, doi:10.2760/8053.
Tsakalidis A., van Balen M., Gkoumas K., Grosso M., Haq G., Pekar, F. 2018b. Towards an integrated monitoring
and assessment framework for the Strategic Transport Research and Innovation Agenda: Using TRIMIS as a policy
support mechanism, EUR 29314 EN, Publications Office of the European Union, Luxembourg, ISBN 978-92-79-92583-2,
doi:10.2760/788905.
Tsouros A.D. 2015. Twenty-seven years of the WHO European Healthy Cities movement: a sustainable movement
for change and innovation at the local level, Health Promotion International, Volume 30, Issue suppl_1, p. i3–i7.
UBS 2018. Global Real Estate Bubble Index 2018: https://www.ubs.com/global/en/wealth-management/chief-investment-
office/our-research/life-goals/2018/global-real-estate-bubble-index-2018.html.
United Nations (UN) 2016. A new urban agenda. Quito Declaration on Sustainable Cities and Human Settlements for All;
available at: http://habitat3.org/the-new-urban-agenda.
United Nations (UN) 2018. Sustainable Development Goal 6. Synthesis Report 2018 on Water and Sanitation; available
at: http://www.unwater.org/publications/highlights-sdg-6-synthesis-report-2018-on-water-and-sanitation-2.
United Nations (UN), General Assembly 2017. The Financialization of Housing, Report of the Special Rapporteur on
adequate housing as a component of the right to an adequate standard of living, and on the right to non-discrimination
in this context, A/HRC/34/51 (January 2017); available at: http://www.unhousingrapp.org/user/pages/04.resources/
Thematic-Report-3-The-Financialization-of-Housing.pdf.
United Nations Framework Convention on Climate Change (UNFCC) 2015. Decision FCCC/CP/2015/L.9/Rev.1: Addendum
to the Report of the Conference of the Parties on its twenty-first session.
United Nations Human Settlements Programme (UN-HABITAT) 2013. Streets as Public Spaces – Drivers of Prosperity;
available at: https://unhabitat.org/books/streets-as-public-spaces-and-drivers-of-urban-prosperity/#.
157 References

References 158
United Nations Human Settlements Programme (UN-HABITAT) 2015. Global Public Space Toolkit: From global Principles
to Local Policies and Practice; available at: https://unhabitat.org/wp-content/uploads/2015/10/Global%20Public%20
Space%20Toolkit.pdf.
United Nations Human Settlements Programme (UN-HABITAT) 2017. Trends in Urban Resilience.
ISBN: 978-92-1-132743-4; available at: https://unhabitat.org/books/trends-in-urban-resilience-2017/#.
United Nations Population Fund (UNFPA) 2002. Water: A Critical Resource. Global Inequities in Water Use; available at:
http://lwvlaplata.org/files/unfpa_water_1_.pdf.
University of Birmingham. 2014. Future Urban Living. The Report 2014. https://www.birmingham.ac.uk/Documents/
research/policycommission/future-urban-living/future-urban-living-policy-commission-report.pdf.
Urban Innovative Actions (UIA) 2018. Defining innovation in the context of the UIA initiative, p.6; available at:
https://www.uia-initiative.eu/sites/default/files/2017-03/Definition%20of%20innovation%20in%20UIA%20context%20
Final%20version.pdf.
Urban Land Institute (ULI) 2019. Emerging Trends in real Estate. Creating an Impact. Europe 2019; available at:
https://ulidigitalmarketing.blob.core.windows.net/emergingtrendspdfs/EmergingTrendsEurope2019.pdf#ulip=etre19emeabtn.
Van der Moolen K. 2017. From neighbourhoods to MakerHoods, available at: https://waag.org/en/article/neighbourhoods-
makerhoods.
Van Veenhuizen R. (Ed.) 2014. Cities farming for the future: Urban agriculture for green and productive cities, IDRC.
Vandyck T., Rutherford T.F. 2018. Regional labour markets, commuting, and the economic impact of road pricing.
Regional Science and Urban Economics, 73, 217-236.
Vanham D., Bouraoui F., Grizzetti B., Bidoglio G. 2015. Lost water and nitrogen resources due to EU consumer food waste,
Environmental Research Letters, 10, 084008: https://doi.org/10.1088/1748-9326/10/8/084008.
Vanham D., Comero S., Gawlik B., Bidoglio G. 2018. The water footprint of different diets within European sub-national
geographical entities, Nature Sustainability, 1, 518-525: https://doi.org/10.1038/s41893-018-0133-x.
Vanham D., Gawlik B.M., Bidoglio G. 2017. Cities as hotspots of indirect water consumption: The case study of Hong Kong.
Journal of hydrology, in press: https://doi.org/10.1016/j.jhydrol.2017.12.004.
Vanham et al. 2019. Environmental footprint family to address local to planetary sustainability and deliver on the SDGs,
submitted.
Vermeulen S.J., Campbell B.M., Ingram J.S.I. 2012. Climate Change and Food Systems, Annual Review of Environment
and Resources 37:1, p.195-222.
Vlahov D., Galea S., Freudenberg N. 2005. The urban health “advantage”. J Urban Health, 82(1):1-4:
doi:10.1093/jurban/jti001.
Wampler B. 2007. A Guide to Participatory Budgeting. In Shah, A. (Ed.) Participatory budgeting. Washington: The International
Bank for Reconstruction and Development/The World Bank: Public sector governance and accountability series.
Westhoek H., Lesschen J.P., Rood T., Wagner S., De Marco A., Murphy-Bokern D., Leip A., van Grinsven H., Sutton M.A.,
Oenema O. 2014. Effects of cutting Europe’s meat and dairy intake. Glob. Environ. Chang. 26:
https://doi.org/10.1016/j.gloenvcha.2014.02.004.
World Health Organization (WHO) 1946. Constitution of the World Health Organization: http://www.who.int/governance/eb/
who_constitution_en.pdf [accessed 9 January 2019].
World Health Organization (WHO) 1998. Health Promotion Glossary, Geneva.
World Health Organization (WHO) 2009. Urban planning and Human health in the European City, Report to the World
Health Organisation, International Society of City and Regional Planners (ISOCARP).
World Health Organization (WHO) 2013a. Health risks of air pollution in Europe – HRAPIE project: Recommendations
for concentration-response functions for cost-benefit analysis of particulate matter, ozone and nitrogen dioxide.
Copenhagen, WHO Regional Office for Europe: (http://www.euro.who.int/__data/assets/pdf_file/0006/238956/Health_
risks_air_pollution_HRAPIE_project.pdf?ua=1, accessed 21 January 2019).

World Health Organization (WHO) 2013b. Regional Office for Europe, WHO Centre for Urban Health (Europe)
& International Centre for Health and Society (2003). Social determinants of health: the solid facts Second Edition - edited
by Richard Wilkinson and Michael Marmot. Copenhagen: WHO Regional Office for Europe.
World Health Organization (WHO) 2018. 2018 Assessment report of the Global Vaccine Action Plan. Strategic Advisory
Group of Experts on Immunization. Geneva: World Health Organization; 2018 (WHO/IVB/18.11). Licence: CC BY-NC-SA 3.0 IGO.
Zulian G., Thijssen M., Günther S., Maes, J. 2018. Enhancing Resilience of Urban Ecosystems through Green
Infrastructure (EnRoute). Progress report, EUR 29048 EN, Publications Office of the European Union, Luxembourg,
ISBN 978-92-79-77697-7, doi:10.2760/958542.
159 References

LIST OF BOXES Box 1: Applying the DEGURBA to compare cities globally 20 Box 2: An application of the FUA definition: future population trends for EU cities 22 Box 3: EU trends in GDP, employment and population to 2050 26 Box 4: Urban Agenda for the EU Housing Partnership 32 Box 5: Case study: Amsterdam, the Netherlands 36 Box 6: Mobility in Helsinki, Finland 43 Box 7: Three case studies on services 47 Box 8: Mapping ageing patterns: Europe in 2030: France 54 Box 9: Intergenerational living 56 Box 10: The WHO European Healthy Cities Network 60 Box 11: Air quality in cities 63 Box 12: Integrated policies for neighbourhood regeneration 68 Box 13: Future Initiative City District, Berlin, Germany 71 Box 14: How much water do we use? 75 Box 15: Water footprint of food consumption in Paris 76 Box 16: Urban agriculture 77 Box 17: How are cities responding? 80 Box 18: The case of Sønderborg, Denmark 86 Box 19: Green infrastructure in Padua, Italy 96 Box 20: Case studies from Amsterdam and Toronto 102 Box 21: Place-based innovation ecosystems 109 Box 22: Arts, media and new technologies in Linz, Austria 110 Box 23: The Making Sense project – Prishtina, Kosovo 115 Box 24: UCLG: forums of peripheral and intermediate cities 120 Box 25: The OECD indicator framework for resilience 123 Box 26: Examples from the 100 Resilient Cities programme 126
List of boxes 160

LIST OF FIGURES Figure 1: Overview of the Challenges and Perspectives chapters, showing the multitude of interlinkages 11 Figure 2: Population growth change in city urban centres between 1990 and 2015 20 Figure 3: From left to right: urban centre, city, commuting zone and functional urban area 21 Figure 4: Different paths of population change in FUAs, comparing the city centre to its surrounding
commuting zone 22 Figure 5: Evolution of built-up areas and population in urban areas per region of the world (1975-2015) 25 Figure 6: GDP, employment, and population trends for the EU-28 to 2050 26 Figure 7: (top): urban population density in 2015 for European FUAs in inhabitants/km2;
(bottom): population changes between 2015-2050 in European FUAs 27 Figure 8: The number of years a skilled worker needs to work to be able to buy a 60m2 (650 sq.ft.)
near the city centre 32 Figure 9: Inflation-adjusted price growth rates, annualised in per cent 33 Figure 10: Percentage of total homes that lie vacant, as reported by local governments 34 Figure 11: Analysis of price ranges (in euros) for properties as advertised on Airbnb compared to those (left):
on Booking.com (cost per night); (right): available for long-term rent (cost per month) 35 Figure 12: Transaction volumes, 2009-2018 (third quarter) 36 Figure 13: Property values in Amsterdam in 2017, in euros per m2 37 Figure 14: Key factors to enable sustainable urban mobility (SUM) 40 Figure 15: Percentage of population satisfied with public transport in their city 41 Figure 16: Percentage of population potentially covered by drone services and estimated return
of drone delivery hives per country 43 Figure 17: Average road distance to the nearest (generic) local and regional facility 47 Figure 18: Population density vs. observed network length per person in European functional urban areas 48 Figure 19: EU-28 population structure for 2016 compared to 2070 projections 52 Figure 20: Median ages in European capital cities as compared to the national average
(latest year available within 2011-2016) 52 Figure 21: Percentage of population over 65 in Europe, by metro regions 53 Figure 22: Share of the total population aged 65 or over for the city of Bordeaux, France, in 2015 54 Figure 23: Average share of the total population aged 65 within FUAs in France in 2015 (left) and 2040 (right) 55 Figure 24: Trends in under-five mortality rates and institutional delivery, urban and rural, in India 60 Figure 25: Highway to Health: life expectancy in Los Angeles County, USA 61 Figure 26: 2015 annual mean concentrations of NO2 in European cities (based on modelled results) 63 Figure 27: Total number of deaths attributed to NO2 concentrations in Milan, projected in the year 2030 63 Figure 28: Self-perceived health and well-being: total depressive symptom as percentage of the country
population, per degree of urbanisation 64 Figure 29: Proportion of the population at risk of poverty or social exclusion, by degree of urbanisation, 2017 68 Figure 30: Share of migrants in respect of the total population calculated for different geographical scales
(example of one area in Milan (IT) 69 Figure 31: Number of migrants in London by main country of origin 70 Figure 32: The Lives on the Line project maps life expectancy at each London tube station, and child poverty 71
161 List of figures

Figure 33: Food security, water security and energy security for cities are responsible for a large part
of the total urban footprint; the dominant fraction of this urban footprint is located outside city borders 74 Figure 34: Total water use in Europe by sector 75 Figure 35: Total water use per day per person 75 Figure 36: Water Exploitation Index (WEI, in per cent) based on JRC calculations (Gawlik et al., 2017) 75 Figure 37: Water footprint of food consumption for different diets in the 131 municipalities
of the Métropole du Grand Paris 76 Figure 38: The Global Covenant of Mayors signatory map 2018 83 Figure 39: The European Covenant of Mayors Community: targets and vision 85 Figure 40: Modes of governance to accelerate climate action in urban areas 86 Figure 41: The available public green in European cities per inhabitant (Maes et al., 2019) 95 Figure 42: The location of trees, both inside green areas and along streets in Padua (IT) 96 Figure 43: Responses when European citizens were asked how frequently they use various technologies 100 Figure 44: Share of respondents who ‘tend to agree’ or ‘totally agree’ when asked “Do you consider yourself
to be sufficiently skilled in the use of digital technologies…” in five different areas 101 Figure 45: National investment in R&D for 2009 and 2016, in euros per million inhabitants 106 Figure 46: Number of patents in 2009 per million inhabitants, by metropolitan region (measure of competitiveness) 107 Figure 47: Creative economy: ranked cities and related scores within EU Member States 108 Figure 48: Total number of Makerspaces in the EU-28 by typology; data collected from Jan. to Dec. 2016 114 Figure 49: Participatory budgeting distribution worldwide 115 Figure 50: Average number of metropolitan governance bodies created (or reformed) in OECD countries per decade 118 Figure 51: (left): share of metropolitan areas with and without a metropolitan governance body;
(right): breakdown of metropolitan are by type of governance arrangement 118 Figure 52: Global population potentially exposed to seismic hazard of class from 5 to 8, 475 years RP
(1975-1990-2000-2015) 124 Figure 53: Evolution of poverty or social exclusion in European cities (%) in 2009, 2014 and 2017.
Positive values indicate an increase in the population at risk since 2009. Cities in Hungary, Ireland, Cyprus,
Lithuania, Malta, Sweden, Slovakia and Czechia managed to reduce poverty and exclusion rates in 2017
after an initial worsening in the period 2009-2014 125 Figure 54: The Cultural and Creative Cities Index: economic recovery (GDP growth between 2009 and 2013)
as compared to the score given. 126
List of figures 162


This report is the result of strong collaboration between many internal units of the JRC with wide- ranging experience, as well as external discussions, review, and specific inputs received from the Community of Practice on Cities.
The editors would especially like to thank the following organisations for specific contributions received:• The Rockefeller Foundation: 100 Resilient Cities: Konstantina Karydi, Luis Alvarado, Sam Kernaghan
(The Resilient City);• City of Amsterdam: City Strategy team, Janne Taks, Marike ter Linden (Affordable Housing); • Global Covenant of Mayors: Benjamin Jance, Amanda Eichel (Climate Action);• European Commission, Directorate-General for Regional and Urban Policy: Lewis Dijkstra (What is a City?); • Organisation for Economic Co-operation and Development (OECD): Alexander Lembke (Ageing);• United Cities and Local Governments (UCLG): Andrea Ciambra, Edgardo Bilsky (Urban Governance);• University of Trento, Department of Civil, Environmental and Mechanical Engineering: Chiara Cortinovis
(Space and the City)
In addition, we would like to thank the following members of the Editorial board for providing us with valuable feedback and comments at various stages in the production of the report:• Committee of the Regions (CoR): Igor Caldeira, Gustavo Lopez Cutillas• Council of European Municipalities and Regions (CEMR): Marine Gaudron;• Eurocities: Silvia Ganzerla, Alex Godson• European Commission, Directorate-General for Environment: Benjamin Caspar, Michael Klinkenberg,
Sven Schade• European Commission, Directorate-General for Internal Market, Industry, Entrepreneurship and SMEs:
Ilektra Papadaki• European Commission, Directorate-General for International Cooperation and Development: Carolina
Mateo• European Commission, Directorate-General for Regional and Urban Policy: Laura Hagemann Arellano,
Pia Laurila, Lewis Dijkstra• European Commission, Directorate-General for Research and Innovation: Phebe Dudek, Tatiana Tallarico,
Dusan Sandor, Nicolas Faivre, Violeta Kuzmickaite• European Commission, Directorate-General Joint Research Centre: Vladimír Šucha (DG), Charlina
Vitcheva (DDG);• European Urban Knowledge Network (EUKN): Mart Grisel, Lea Scheurer• Global Parliament of Mayors: Eric Corijn• United Cities and Local Governments (UCLG): Andrea Ciambra, Edgardo Bilsky• URBACT: Unit for Capitalisation and Communication, Nuala Morgan• Urban Innovative Actions (UIA): Raffaele Barbato• Urban Europe Research Alliance (UERA): Judith Borsboom• United Nations Human Settlements Programme (UNHABITAT): Frederic Saliez• Vision Sofia (City of Sofia): Kaloyan Karamitov
ACKNOWLEDGEMENTS

GETTING IN TOUCH WITH THE EU
IN PERSONAll over the European Union there are hundreds of Europe Direct information centres. You can find the address of the centre nearest you at: https://europa.eu/european-union/contact_en.
ON THE PHONE OR BY EMAILEurope Direct is a service that answers your questions about the European Union. You can contact this service:- by freephone: 00 800 6 7 8 9 10 11 (certain operators may charge for these calls),- at the following standard number: +32 22999696, or- by electronic mail via: https://europa.eu/european-union/contact_en.
FINDING INFORMATION ABOUT THE EU
ONLINEInformation about the European Union in all the official languages of the EU is available on the Europa website at: https://europa.eu/european-union/index_en.
EU PUBLICATIONSYou can download or order free and priced EU publications from EU Bookshop at: https://publications.europa.eu/ en/publications. Multiple copies of free publications may be obtained by contacting Europe Direct or your local information centre (see https://europa.eu/european-union/contact_en).
EU LAW AND RELATED DOCUMENTSFor access to legal information from the EU, including all EU law since 1952in all the official language versions, go to EUR-Lex at: http://eur-lex.europa.eu.
OPEN DATA FROM THE EUThe EU Open Data Portal (http://data.europa.eu/euodp/en) provides access to datasets from the EU. Data can be downloaded and reused for free, for both commercial and non-commercial purposes.

JRC MissionAs the science and knowledge service of the European Commission, the Joint Research Centre’s mission is to support EU policies with independent evidence throughout the whole policy cycle.
@EU_ScienceHub
EU Science Hub - Joint Research Centre
EU Science, Research and Innovation
EU Science Hub
EU Science Hub ec.europa.eu/jrc
The European Commission’s science and knowledge service Joint Research Centre
KJ-N
A-29752-EN-N
ISBN 978-92-76-03847-4 doi:10.2760/375209
Copyright © 2022 FDOKUMEN