INDUSTRIAL R&I - JRC Policy Insights - EU Science Hub
9
JRC122086 - Seville, Spain: European Commission, 2020 - © European Union, 2020 INDUSTRIAL R&I - JRC Policy Insights ECONOMIC COMPLEXITY FOR COMPETITIVENESS AND INNOVATION A NOVEL BOTTOM-UP STRATEGY LINKING GLOBAL AND REGIONAL CAPACITIES Innovation for Green Deal BRIEFS SERIES– October 2020 Economic Complexity is a data driven empirical approach developed to inform the study of territorial development with quantitative metrics. Techniques inspired by complex systems analysis and network theory allow measuring the intangible capabilities necessary for a country or region to be competitive, both in overall terms and in specific markets. We exemplarily analyse the case of Slovakia’s industrial and innovation competitiveness by looking at the overall potential of the country and focusing on its Electronics sector. 1. Current Policy Challenges The European Union faces several challenges, ranging from shifts in global value chains 1 to the urgent need to address environmental issues. In this respect, the Political Guidelines and the six priorities of the new President of the European Commission 2 constitute a strategy for growth where the attention to people’s and the planet’s needs is combined with the necessary long-term view on European industrial innovation and competitiveness. The aim is to boost Europe’s competitiveness based on cutting-edge innovation in a broad sense – not only technological innovation, but also social and service innovation, eco-innovation, design and creative industries, new business models and practice-based innovation. Together with this, the new Commission’s structure emphasises the need for structural transformation of our economy and the need for crosscutting policy support. This ambitious vision requires traditional and novel tools to inform policy makers about the complex dynamics linking the various dimensions of the productive and innovation systems. Indeed, to develop effective industrial policies policy makers require an answer to several questions: broadly speaking, they need a measure of the innovation and production capabilities of countries and regions, both in general and in specific sectors, products, markets. To do so is the aim of this policy brief. 1 https://op.europa.eu/en/publication-detail/- /publication/5f21b462-1a33-11ea-8c1f-01aa75ed71a1 2 https://ec.europa.eu/commission/sites/beta- political/files/political-guidelines-next-commission_en.pdf It uses the example of Slovakia to show-case the methodology and its ability to inform policy. The brief starts with a country level analysis, using Economic Complexity to forecast growth trajectories and sectoral export patterns. It then deep-dives into one sector, to give detailed information about specific markets. Finally, it passes to the analysis of the innovation system, giving additional information on market opportunities of the country in question and on a regional level disaggregation. What is Economic Complexity? Economic Complexity is a framework building on earlier evolutionary and institutional literature (Hirschman, 1958; Cimoli & Dosi, 1995; Teece, et al., 1994) to tackle the complexity of economic systems. It describes the economy as an evolutionary process of globally interconnected ecosystems. The main recent advance with respect to the earlier literature is the use of newly developed network science and complex and dynamical systems (Hausmann & Klinger, 2006; Hidalgo & Hausmann, 2009; Tacchella, et al., 2012) to separate the random noise from the underlying signal. The Economic Complexity framework shifts the focus of economic analysis from aggregate quantities (What is the GDP of the country? How many patents are published?) to their disaggregation (In which industrial sectors do countries specialize? Which patents are published?), with the aim to provide information that is complementary to more traditional analysis. This shift creates the opportunity of impacting several cross-cutting themes and answering quantitatively several policy relevant questions that could otherwise only be answered qualitatively, or in specific case studies, or by ad hoc metrics.
-
Upload
khangminh22 -
Category
Documents
-
view
0 -
download
0
Transcript of INDUSTRIAL R&I - JRC Policy Insights - EU Science Hub
JRC122086 - Seville, Spain: European Commission, 2020 - © European Union, 2020
INDUSTRIAL R&I - JRC Policy Insights
ECONOMIC COMPLEXITY FOR COMPETITIVENESS AND INNOVATION A NOVEL BOTTOM-UP STRATEGY LINKING GLOBAL AND REGIONAL CAPACITIES
Innovation for Green Deal BRIEFS SERIES– October 2020
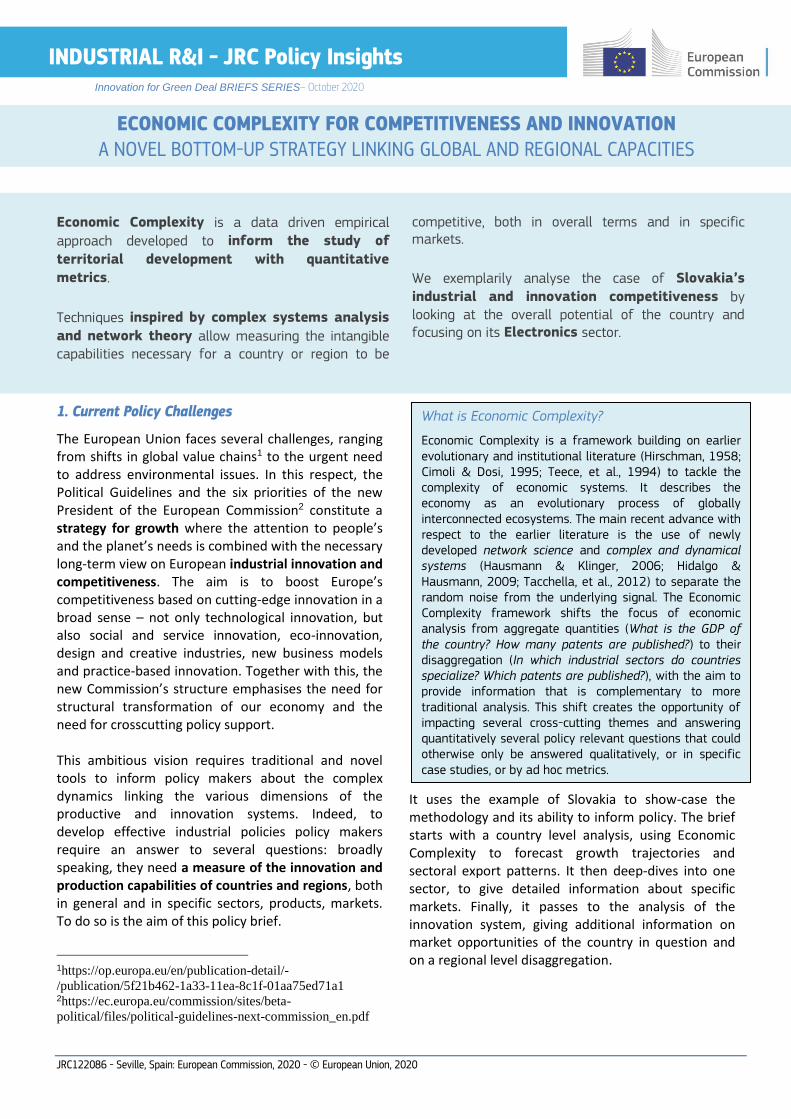
Economic Complexity is a data driven empirical
approach developed to inform the study of
territorial development with quantitative
metrics.
Techniques inspired by complex systems analysis
and network theory allow measuring the intangible capabilities necessary for a country or region to be
competitive, both in overall terms and in specific markets.
We exemplarily analyse the case of Slovakia’s
industrial and innovation competitiveness by looking at the overall potential of the country and focusing on its Electronics sector.
1. Current Policy Challenges
The European Union faces several challenges, ranging from shifts in global value chains1 to the urgent need to address environmental issues. In this respect, the Political Guidelines and the six priorities of the new President of the European Commission2 constitute a strategy for growth where the attention to people’s and the planet’s needs is combined with the necessary long-term view on European industrial innovation and competitiveness. The aim is to boost Europe’s competitiveness based on cutting-edge innovation in a broad sense – not only technological innovation, but also social and service innovation, eco-innovation, design and creative industries, new business models and practice-based innovation. Together with this, the new Commission’s structure emphasises the need for structural transformation of our economy and the need for crosscutting policy support. This ambitious vision requires traditional and novel tools to inform policy makers about the complex dynamics linking the various dimensions of the productive and innovation systems. Indeed, to develop effective industrial policies policy makers require an answer to several questions: broadly speaking, they need a measure of the innovation and production capabilities of countries and regions, both in general and in specific sectors, products, markets. To do so is the aim of this policy brief.
1https://op.europa.eu/en/publication-detail/-
/publication/5f21b462-1a33-11ea-8c1f-01aa75ed71a1 2https://ec.europa.eu/commission/sites/beta-
political/files/political-guidelines-next-commission_en.pdf
It uses the example of Slovakia to show-case the methodology and its ability to inform policy. The brief starts with a country level analysis, using Economic Complexity to forecast growth trajectories and sectoral export patterns. It then deep-dives into one sector, to give detailed information about specific markets. Finally, it passes to the analysis of the innovation system, giving additional information on market opportunities of the country in question and on a regional level disaggregation.
What is Economic Complexity?
Economic Complexity is a framework building on earlier evolutionary and institutional literature (Hirschman, 1958; Cimoli & Dosi, 1995; Teece, et al., 1994) to tackle the complexity of economic systems. It describes the economy as an evolutionary process of globally interconnected ecosystems. The main recent advance with respect to the earlier literature is the use of newly developed network science and complex and dynamical systems (Hausmann & Klinger, 2006; Hidalgo & Hausmann, 2009; Tacchella, et al., 2012) to separate the random noise from the underlying signal. The Economic Complexity framework shifts the focus of economic analysis from aggregate quantities (What is the GDP of the country? How many patents are published?) to their disaggregation (In which industrial sectors do countries specialize? Which patents are published?), with the aim to provide information that is complementary to more traditional analysis. This shift creates the opportunity of impacting several cross-cutting themes and answering quantitatively several policy relevant questions that could otherwise only be answered qualitatively, or in specific case studies, or by ad hoc metrics.

This paper is published through a cooperation of the JRC Units B3 and B5. The opinions expressed and the arguments employed do not necessarily reflect the official view of the European Commission
ECONOMIC COMPLEXITY TO ADDRESS CURRENT CHALLENGES IN INNOVATION SYSTEMS: A NOVEL EMPIRICAL STRATEGY FOR REGIONAL DEVELOPMENT
www.ec.europa.eu/jrc/en/publications
This allows having insights on the growth prospects of Slovakia as a whole and on specific markets in specific regions of that country. 2. Development trajectories and GDP Forecast
We start from a country level perspective of Slovakia and a set of comparator countries, by looking at the dynamics of their Economic Fitness. The Economic Fitness of a country is a measure of the complexity of the country’s productive structure (Hidalgo & Hausmann, 2009; Tacchella, et al., 2012). Complex economies are characterized by their diversification and their ability to compete globally with complex (i.e. non-ubiquitous) industrial products. The Fitness of a country has been shown to be a very effective indicator of competitiveness. It is based on an intensive measure of diversification and therefore carries complementary information with respect to more standard quantifications of economic output, such as the GDP of a country.
The interplay between Fitness and GDP per capita at purchasing power parity (GDPpcppp) gives rise to rich dynamics (Cristelli, et al., 2015). A quantitative analysis of the microscopic features of the country
trajectories in the GDP-Fitness plane allows for a rigorous, statistically robust description of macroeconomic dynamics. With techniques inspired by the physics of dynamical systems, it is possible to forecast medium term (5-years) GDP growth up to 25% more precisely than mainstream approaches, such as the IMF (Tacchella, et al., 2018).
The Selective Predictability Scheme (SPS) approach, as discussed in (Tacchella, et al., 2018), provides forecasts that are not relying on specific assumptions, that can be computed for each country through a single model and that provide a robust error estimation.
We have applied the SPS technique to forecast the GDP of Slovakia and three economies moving in the same area of the GDP-Fitness plane: Lithuania, Romania, and Bulgaria. In Figure 1 we show the historical trajectories and the forecasts, in terms of probability distributions projected on the axes, obtained with the SPS methodology.
Slovakia shows slowly increasing Fitness but has GDP-Growth estimates still high (median Compound Annual Growth Rate (CAGR) 2017-2022: 2.09%) with respect to similar income countries (LTU). Slovakia’s
Figure 1 Solid lines: Trajectories in the GDP-Fitness space for Slovakia, Romania, Bulgaria, Estonia and Lithuania from 2007 to 2017. Dashed lines: Forecast 2017-2022. (Axes distributions:) Probability distribution of expected Fitness and GDPpcppp for 2022 obtained as in (Tacchella, et al., 2018). For GDP growth we show first quartile, median and third quartile of expected Compound Annual Growth Rate (CAGR).
*GDP Per Capita at Purchase Power Parity in 2017 Constant US$
This paper is published through a cooperation of the JRC Units B3 and B5. The opinions expressed and the arguments employed do not necessarily reflect the official view of the European Commission
ECONOMIC COMPLEXITY TO ADDRESS CURRENT CHALLENGES IN INNOVATION SYSTEMS: A NOVEL EMPIRICAL STRATEGY FOR REGIONAL DEVELOPMENT
www.ec.europa.eu/jrc/en/publications
first quartile is especially high, signalling low probability of very slow growth.
Romania and Bulgaria show a continuously increasing fitness trend, with GDP-Growth estimates expected to be the strongest within the considered group (median CAGR 2017-2022: 2.65% and 2.62% respectively) due to the high Fitness and lowest GDPpc.
For Lithuania SPS indicates slower growth prospects (median CAGR 2017-2022: 1.87%), but a continued trend of rapidly increasing Fitness.
This holistic view of the countries obtained through the Economic Fitness lens can be decomposed into much finer details, down to the sector and product level.
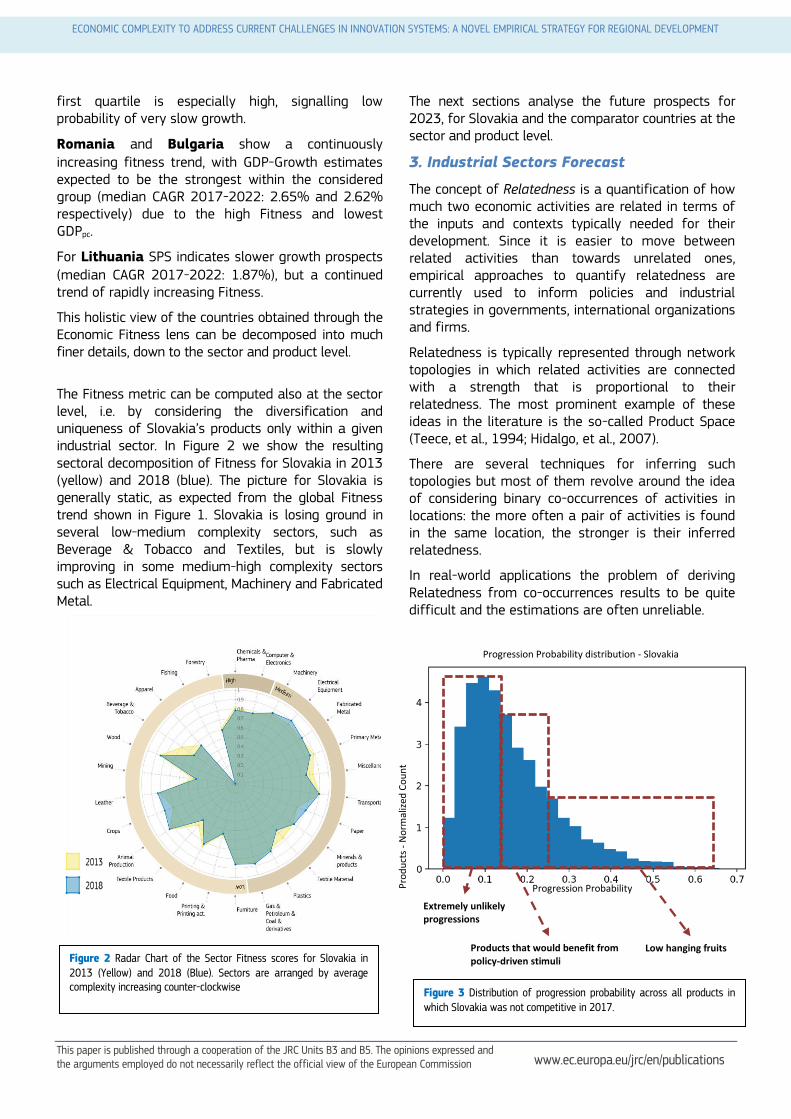
The Fitness metric can be computed also at the sector level, i.e. by considering the diversification and uniqueness of Slovakia’s products only within a given industrial sector. In Figure 2 we show the resulting sectoral decomposition of Fitness for Slovakia in 2013 (yellow) and 2018 (blue). The picture for Slovakia is generally static, as expected from the global Fitness trend shown in Figure 1. Slovakia is losing ground in several low-medium complexity sectors, such as Beverage & Tobacco and Textiles, but is slowly improving in some medium-high complexity sectors such as Electrical Equipment, Machinery and Fabricated Metal.
The next sections analyse the future prospects for 2023, for Slovakia and the comparator countries at the sector and product level.
3. Industrial Sectors Forecast
The concept of Relatedness is a quantification of how much two economic activities are related in terms of the inputs and contexts typically needed for their development. Since it is easier to move between related activities than towards unrelated ones, empirical approaches to quantify relatedness are currently used to inform policies and industrial strategies in governments, international organizations and firms.
Relatedness is typically represented through network topologies in which related activities are connected with a strength that is proportional to their relatedness. The most prominent example of these ideas in the literature is the so-called Product Space (Teece, et al., 1994; Hidalgo, et al., 2007).
There are several techniques for inferring such topologies but most of them revolve around the idea of considering binary co-occurrences of activities in locations: the more often a pair of activities is found in the same location, the stronger is their inferred relatedness.
In real-world applications the problem of deriving Relatedness from co-occurrences results to be quite difficult and the estimations are often unreliable.
Figure 2 Radar Chart of the Sector Fitness scores for Slovakia in 2013 (Yellow) and 2018 (Blue). Sectors are arranged by average complexity increasing counter-clockwise
Progression Probability distribution - Slovakia
Progression Probability
Low hanging fruits Products that would benefit from policy-driven stimuli
Extremely unlikely progressions
Figure 3 Distribution of progression probability across all products in which Slovakia was not competitive in 2017.
Pro
du
cts
- N
orm
aliz
ed C
ou
nt
This paper is published through a cooperation of the JRC Units B3 and B5. The opinions expressed and the arguments employed do not necessarily reflect the official view of the European Commission
ECONOMIC COMPLEXITY TO ADDRESS CURRENT CHALLENGES IN INNOVATION SYSTEMS: A NOVEL EMPIRICAL STRATEGY FOR REGIONAL DEVELOPMENT
www.ec.europa.eu/jrc/en/publications
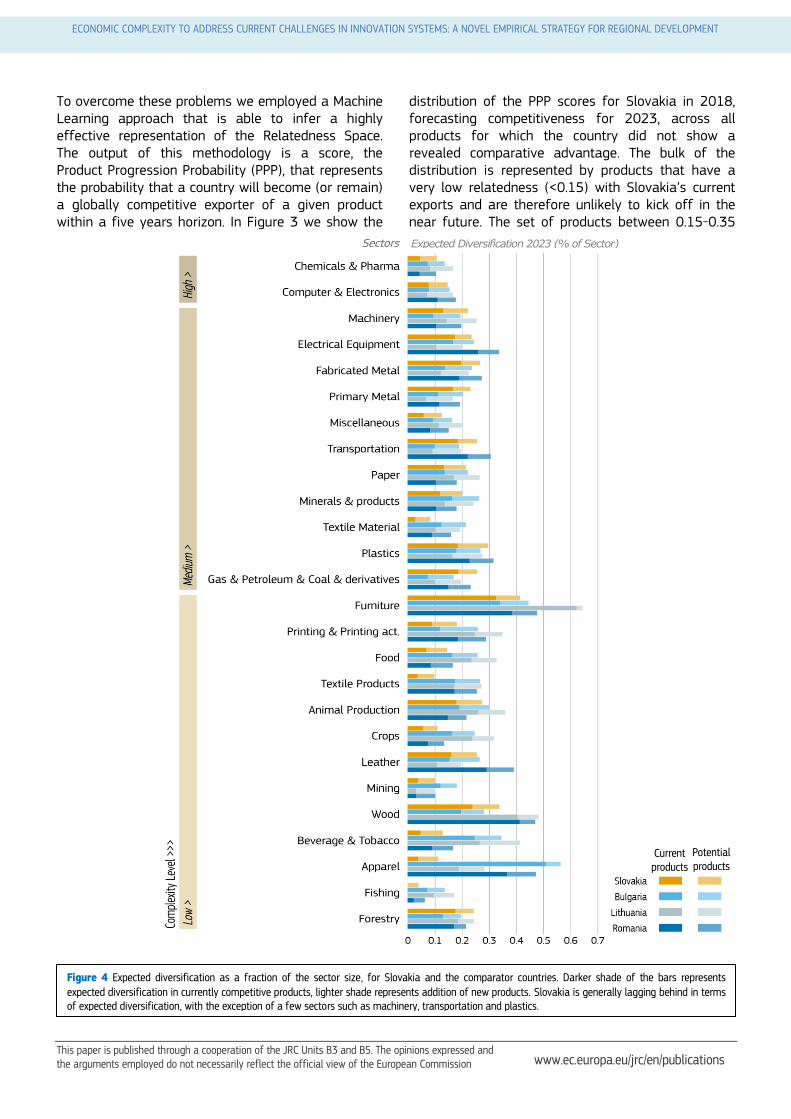
To overcome these problems we employed a Machine Learning approach that is able to infer a highly effective representation of the Relatedness Space. The output of this methodology is a score, the Product Progression Probability (PPP), that represents the probability that a country will become (or remain) a globally competitive exporter of a given product within a five years horizon. In Figure 3 we show the
distribution of the PPP scores for Slovakia in 2018, forecasting competitiveness for 2023, across all products for which the country did not show a revealed comparative advantage. The bulk of the distribution is represented by products that have a very low relatedness (<0.15) with Slovakia’s current exports and are therefore unlikely to kick off in the near future. The set of products between 0.15-0.35
Figure 4 Expected diversification as a fraction of the sector size, for Slovakia and the comparator countries. Darker shade of the bars represents expected diversification in currently competitive products, lighter shade represents addition of new products. Slovakia is generally lagging behind in terms of expected diversification, with the exception of a few sectors such as machinery, transportation and plastics.
Expected Diversification 2023 (% of Sector)
Current products
Potential products
This paper is published through a cooperation of the JRC Units B3 and B5. The opinions expressed and the arguments employed do not necessarily reflect the official view of the European Commission
ECONOMIC COMPLEXITY TO ADDRESS CURRENT CHALLENGES IN INNOVATION SYSTEMS: A NOVEL EMPIRICAL STRATEGY FOR REGIONAL DEVELOPMENT
www.ec.europa.eu/jrc/en/publications
PPP score are products that are moderately feasible for Slovakia and are likely to benefit from policy driven stimuli. Finally, the tail of the distribution contains ‘low-hanging fruits’, i.e. products that are highly related to Slovakia’s current exports, and that can therefore turn into competitive exports even without policy intervention.
In Figure 4 we show the sectorial expected diversification in 2023 (i.e. the sum of the probability scores across the products of the sector) for Slovakia, Lithuania, Romania and Bulgaria, expressed as a fraction of the number of products in the sector. The darker shade is the expected diversification coming from already competitive products, while the lighter shade represents additional products, not yet competitive in 2018.
From this analysis emerges that Expected diversification is heterogeneous across sectors. Slovakia appears to be lagging behind its comparators in most low-complexity sectors with few exceptions (e.g. Forestry). The gap is much smaller in medium complexity sectors, with Slovakia often ranked first or second among the comparators (e.g. Primary Metal, Transportation). All the four countries
are expected to be poorly diversified in high complexity sectors.
The Transportation sector emerges as one of the most promising medium-high complexity sectors for Slovakia and the list of top 15 products in the sector ranked by progression probabilities for the country is reported in Table 1.
The focus of the analysis will now shift to analyse Slovakia’s innovation system, at the national as well as at the regional level. In Section 4 there will be an analysis of the general technological capabilities of the country and its regions, while Section 5 will focus on the technological fields driving competitiveness in a specific export market. This last exercise will analyse the Transportation sector, which was identified as particularly interesting by the sector level analysis of this Section.
4. Regional Innovation System
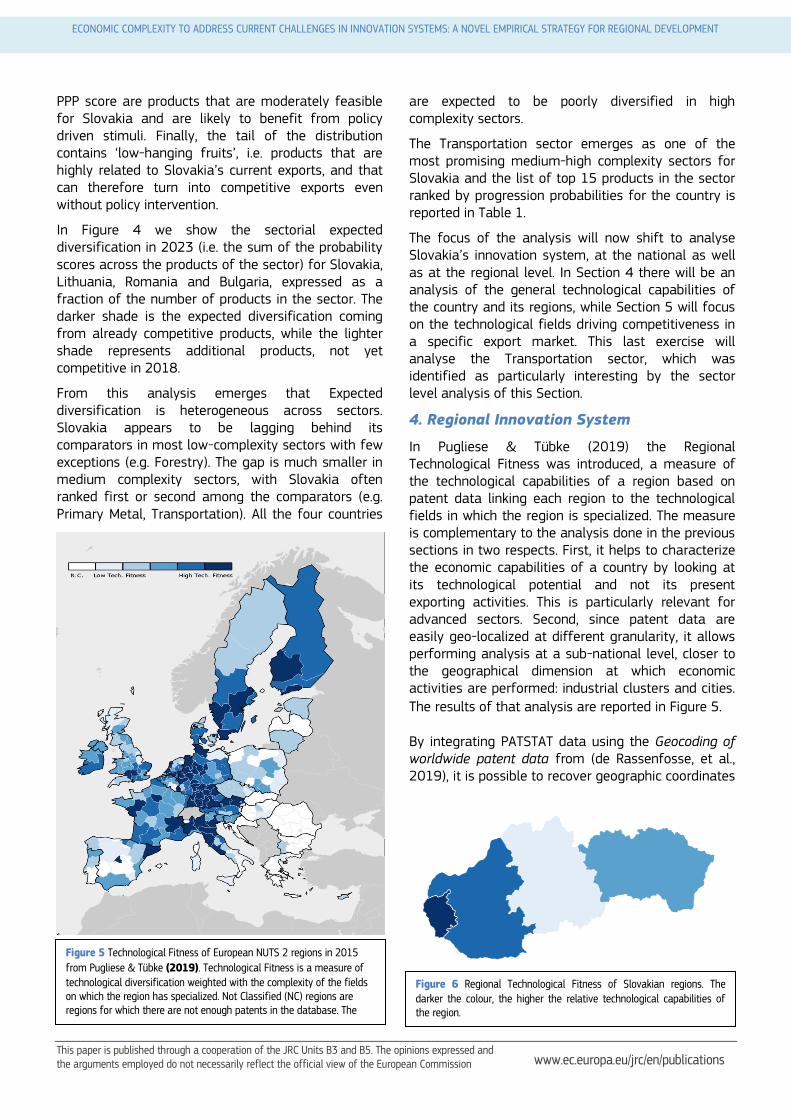
In Pugliese & Tübke (2019) the Regional Technological Fitness was introduced, a measure of the technological capabilities of a region based on patent data linking each region to the technological fields in which the region is specialized. The measure is complementary to the analysis done in the previous sections in two respects. First, it helps to characterize the economic capabilities of a country by looking at its technological potential and not its present exporting activities. This is particularly relevant for advanced sectors. Second, since patent data are easily geo-localized at different granularity, it allows performing analysis at a sub-national level, closer to the geographical dimension at which economic activities are performed: industrial clusters and cities.
The results of that analysis are reported in Figure 5. By integrating PATSTAT data using the Geocoding of worldwide patent data from (de Rassenfosse, et al., 2019), it is possible to recover geographic coordinates
Figure 6 Regional Technological Fitness of Slovakian regions. The darker the colour, the higher the relative technological capabilities of the region.
Figure 5 Technological Fitness of European NUTS 2 regions in 2015
from Pugliese & Tübke (2019). Technological Fitness is a measure of technological diversification weighted with the complexity of the fields on which the region has specialized. Not Classified (NC) regions are regions for which there are not enough patents in the database. The rest of the regions are split in equally populated quintiles.
This paper is published through a cooperation of the JRC Units B3 and B5. The opinions expressed and the arguments employed do not necessarily reflect the official view of the European Commission
ECONOMIC COMPLEXITY TO ADDRESS CURRENT CHALLENGES IN INNOVATION SYSTEMS: A NOVEL EMPIRICAL STRATEGY FOR REGIONAL DEVELOPMENT
www.ec.europa.eu/jrc/en/publications
for inventor and applicant location in 18.8 million patent documents, from all major patent offices. This gives a higher coverage of peripheral regions. We can therefore repeat the same analysis for Slovakian regions, as reported in Figure 6. The analysis shows - as expected - the crucial role of Bratislava for the national innovation system. This analysis can give unique information to guide policy, since, as in the previous exercises, it is not dependent on traditional quantitative measures (like the number of patents in the region) but on qualitative measures (which patents and in which technological fields the region is specialized in) from which a quantitative measure is recovered as an emergent property.
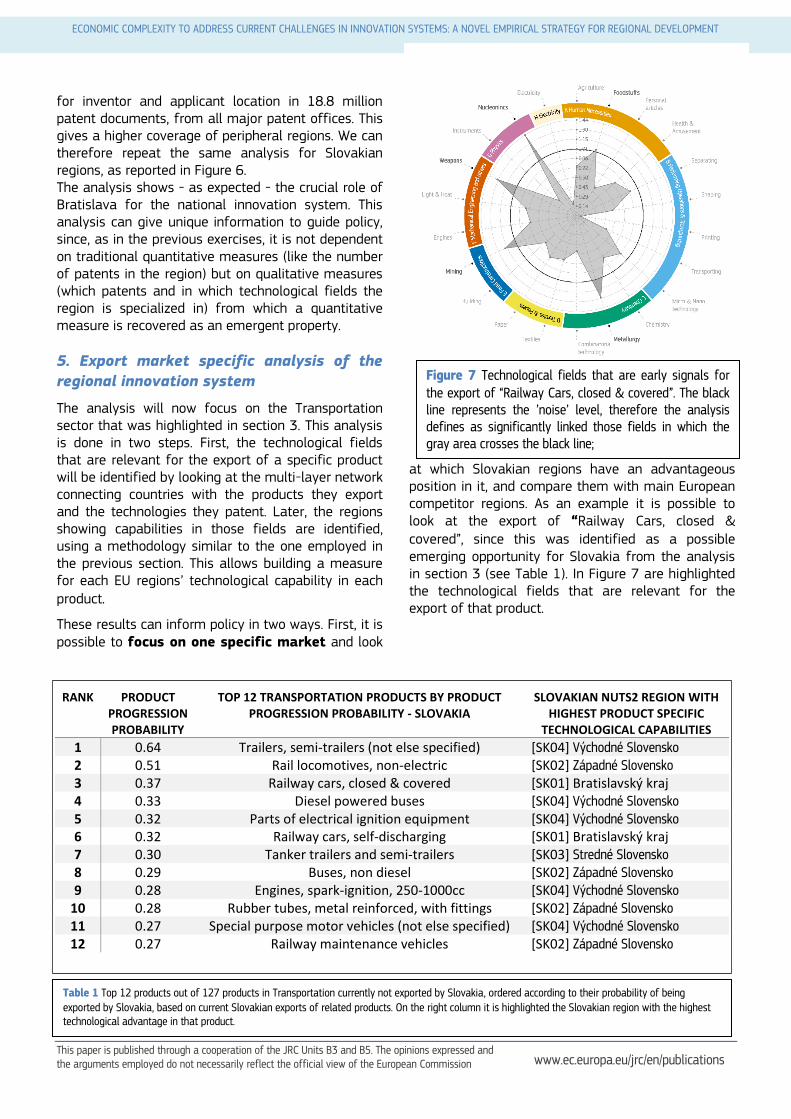
5. Export market specific analysis of the
regional innovation system
The analysis will now focus on the Transportation sector that was highlighted in section 3. This analysis is done in two steps. First, the technological fields that are relevant for the export of a specific product will be identified by looking at the multi-layer network connecting countries with the products they export and the technologies they patent. Later, the regions showing capabilities in those fields are identified, using a methodology similar to the one employed in the previous section. This allows building a measure for each EU regions’ technological capability in each product.
These results can inform policy in two ways. First, it is possible to focus on one specific market and look
at which Slovakian regions have an advantageous position in it, and compare them with main European competitor regions. As an example it is possible to look at the export of “Railway Cars, closed & covered”, since this was identified as a possible emerging opportunity for Slovakia from the analysis in section 3 (see Table 1). In Figure 7 are highlighted the technological fields that are relevant for the export of that product.
Figure 7 Technological fields that are early signals for the export of “Railway Cars, closed & covered”. The black line represents the ’noise’ level, therefore the analysis defines as significantly linked those fields in which the gray area crosses the black line;
Table 1 Top 12 products out of 127 products in Transportation currently not exported by Slovakia, ordered according to their probability of being exported by Slovakia, based on current Slovakian exports of related products. On the right column it is highlighted the Slovakian region with the highest technological advantage in that product.
RANK PRODUCT PROGRESSION PROBABILITY
TOP 12 TRANSPORTATION PRODUCTS BY PRODUCT PROGRESSION PROBABILITY - SLOVAKIA
SLOVAKIAN NUTS2 REGION WITH HIGHEST PRODUCT SPECIFIC
TECHNOLOGICAL CAPABILITIES
1 0.64 Trailers, semi-trailers (not else specified) [SK04] Východné Slovensko 2 0.51 Rail locomotives, non-electric [SK02] Západné Slovensko 3 0.37 Railway cars, closed & covered [SK01] Bratislavský kraj 4 0.33 Diesel powered buses [SK04] Východné Slovensko 5 0.32 Parts of electrical ignition equipment [SK04] Východné Slovensko 6 0.32 Railway cars, self-discharging [SK01] Bratislavský kraj 7 0.30 Tanker trailers and semi-trailers [SK03] Stredné Slovensko 8 0.29 Buses, non diesel [SK02] Západné Slovensko 9 0.28 Engines, spark-ignition, 250-1000cc [SK04] Východné Slovensko
10 0.28 Rubber tubes, metal reinforced, with fittings [SK02] Západné Slovensko 11 0.27 Special purpose motor vehicles (not else specified) [SK04] Východné Slovensko 12 0.27 Railway maintenance vehicles [SK02] Západné Slovensko
This paper is published through a cooperation of the JRC Units B3 and B5. The opinions expressed and the arguments employed do not necessarily reflect the official view of the European Commission
ECONOMIC COMPLEXITY TO ADDRESS CURRENT CHALLENGES IN INNOVATION SYSTEMS: A NOVEL EMPIRICAL STRATEGY FOR REGIONAL DEVELOPMENT
www.ec.europa.eu/jrc/en/publications
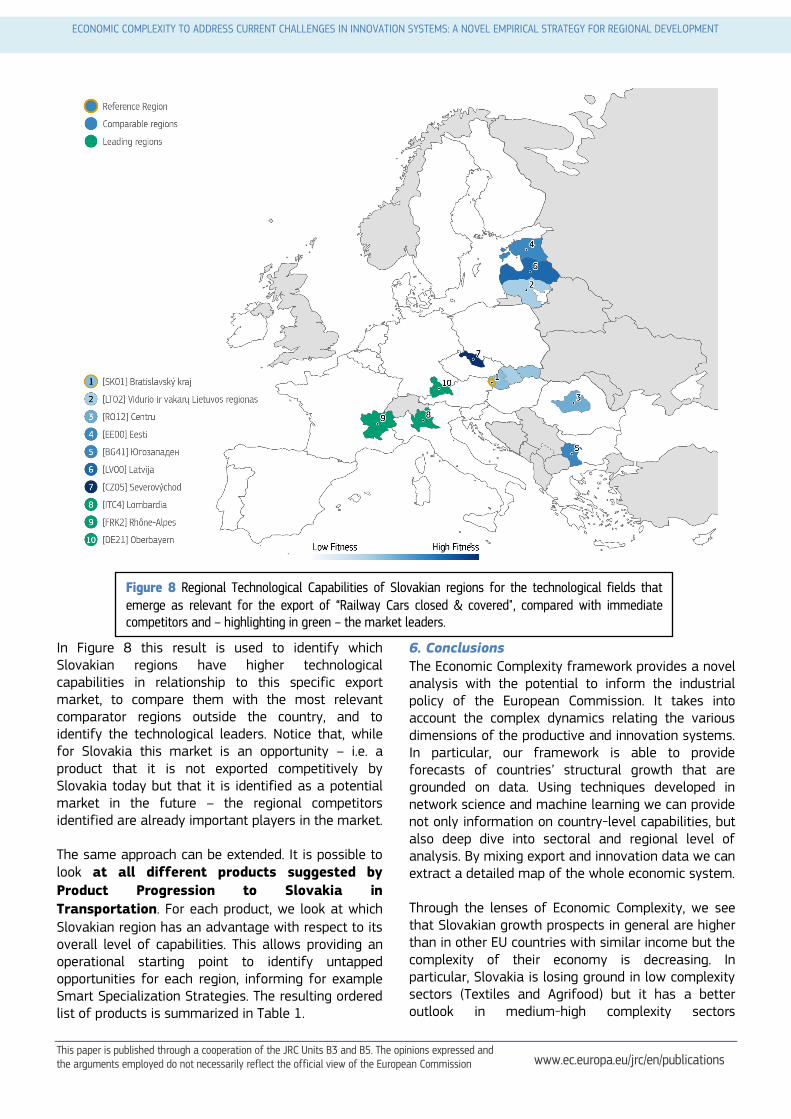
In Figure 8 this result is used to identify which Slovakian regions have higher technological capabilities in relationship to this specific export market, to compare them with the most relevant comparator regions outside the country, and to identify the technological leaders. Notice that, while for Slovakia this market is an opportunity – i.e. a product that it is not exported competitively by Slovakia today but that it is identified as a potential market in the future – the regional competitors identified are already important players in the market. The same approach can be extended. It is possible to look at all different products suggested by
Product Progression to Slovakia in
Transportation. For each product, we look at which Slovakian region has an advantage with respect to its overall level of capabilities. This allows providing an operational starting point to identify untapped opportunities for each region, informing for example Smart Specialization Strategies. The resulting ordered list of products is summarized in Table 1.
6. Conclusions The Economic Complexity framework provides a novel analysis with the potential to inform the industrial policy of the European Commission. It takes into account the complex dynamics relating the various dimensions of the productive and innovation systems. In particular, our framework is able to provide forecasts of countries’ structural growth that are grounded on data. Using techniques developed in network science and machine learning we can provide not only information on country-level capabilities, but also deep dive into sectoral and regional level of analysis. By mixing export and innovation data we can extract a detailed map of the whole economic system. Through the lenses of Economic Complexity, we see that Slovakian growth prospects in general are higher than in other EU countries with similar income but the complexity of their economy is decreasing. In particular, Slovakia is losing ground in low complexity sectors (Textiles and Agrifood) but it has a better outlook in medium-high complexity sectors
Figure 8 Regional Technological Capabilities of Slovakian regions for the technological fields that emerge as relevant for the export of “Railway Cars closed & covered", compared with immediate competitors and – highlighting in green – the market leaders.

This paper is published through a cooperation of the JRC Units B3 and B5. The opinions expressed and the arguments employed do not necessarily reflect the official view of the European Commission
ECONOMIC COMPLEXITY TO ADDRESS CURRENT CHALLENGES IN INNOVATION SYSTEMS: A NOVEL EMPIRICAL STRATEGY FOR REGIONAL DEVELOPMENT
www.ec.europa.eu/jrc/en/publications
(Transportation, Electrical Equipment). Even more in detail, we provide information on specific products that Slovakia is not currently exporting competitively but that could be easily accessible in view of its capabilities. By looking at the patenting activities of Slovakian regions, we can localize new market opportunities for Slovakia and inform industrial policy. This policy brief serves as a showcase for the techniques. Indeed, similar analysis are systematically provided for different countries and sectors and can thus help to strengthen the foresight capacity of the EU Commission
Selected References
Anderson, P., Arrow, K. & Pines, D., 1987. The economy as an evolving complex system: the proceedings of the Evolutionary Paths of the Global Economy Workshop. Santa Fe: Santa Fe Institute Series. Balland, P. A., Boschma, R., Crespo, J. & Rigby, D. L., 2018. Smart specialization policy in the European Union: relatedness, knowledge complexity and regional diversification. Regional Studies. Boschma, R., Balland, P.-A. & Kogler, D. F., 2015. Relatedness and Technological Change in Cities: the Rise and Fall of Technological Knowledge in US Metropolitan Areas from 1981 to 2010. Industrial and corporate change, pp. 223-250. Bozeman, B., 2000. Technology transfer and public policy: a review of research and theory. Research Policy, pp. 627-655. Breschi, S., Lissoni, F. & Malerba, F., 2003. Knowledge-Relatedness in Firm Technological Diversification. Research Policy, pp. 69-87. Cimoli, M. & Dosi, G., 1995. Technological paradigms, patters of learning and development: an introductory roadmap. Journal of Evolutionary Economics, pp. 243-268. de Rassenfosse, G., Kozak, J. & Florian, S., 2019. Geocoding of worldwide patent data, s.l.: SSRN. Hausmann, R. & Klinger, B., 2006. Structural transformation and patterns of comparative advantage in the product space. CID Working Papers. Hidalgo, C. A. & Hausmann, R., 2009. The building blocks of economic complexity. Proceedings of the national academy of sciences, pp. 10570-10575. Hidalgo, C. A., Klinger, B., Barabási , A.-L. & Hausmann, R., 2007. The product space conditions the development of nations.. Science, pp. 482-487. Hirschman, A. O., 1958. Strategy of Economic Development. New Haven: Yale University Press.
Maraut, S. et al., 2008. The OECD REGPAT Database: A Presentation. OECD Science, Technology and Industry Working Papers, p. 02. Nesta, L. & Saviotti, P. P., 2005. Coherence of the knowledge base and the firm's innovative performance: Evidence from the U.S. pharmaceutical industry. Journal of Industrial Economics, pp. 123-142. Operti, F. G. et al., 2018. Dynamics in the Fitness-Income plane: Brazilian states vs World countries. PLOS ONE. Pugliese, E., Chiarotti, G. L., Zaccaria, A. & Pietronero, L., 2017. Complex economies have a lateral escape from the poverty trap. PloS one, p. e0168540. Pugliese, E. et al., 2017. Unfolding the innovation system for the development of countries: co-evolution of Science, Technology and Production. arXiv, p. 1707.05146. Pugliese, E. & Tübke, A., 2019. Economic complexity to address current challenges in innovation systems: A novel empirical strategy linked to the territorial dimension, Sevilla: Technology and Innovation Challenges 2030 Brief Series - European Commission. Tacchella, A. et al., 2012. A new metrics for countries' fitness and products' complexity. Scientific reports, p. 723. Tacchella, A., Mazzilli, D. & Pietronero, L., 2018. A dynamical systems approach to gross domestic product forecasting. Nature Physics, p. 861. Teece, D. J., Rumelt, R., Dosi, G. & Winter, S., 1994. Understanding corporate coherence: Theory and evidence. Journal of economic behavior & organization, pp. 1-30. Data Source and Methodology The general workflow in Economic Complexity is to start from micro-data at the level of industrial agents to build a network binary structure connecting countries and regions to the activities in which firms excel that are localized there. This network – connecting technological, scientific or production activities to a geographical location – is the basic element of analysis. This map is used to infer information on the hidden layer of unobservable capabilities that were behind its dynamical evolution. In this work two data sources are used: patent data – localized through their applicant at the country and region level – extracted from OECD REGPAT (Maraut, et al., 2008) and from Geocoding of worldwide patent data (de Rassenfosse, et al., 2019), and trade data at the country level from UN COMTRADE.
The analysis in Section 2 is based on (Tacchella, et al., 2018).

This paper is published through a cooperation of the JRC Units B3 and B5. The opinions expressed and the arguments employed do not necessarily reflect the official view of the European Commission
ECONOMIC COMPLEXITY TO ADDRESS CURRENT CHALLENGES IN INNOVATION SYSTEMS: A NOVEL EMPIRICAL STRATEGY FOR REGIONAL DEVELOPMENT
www.ec.europa.eu/jrc/en/publications
The analysis in Section 3 is based on the Random Forest algorithm. The basic idea behind is to increase the number of available data points (a method known as Data Augmentation in machine learning) and then learn complex non-linear relations between products. This allows to go beyond the simple binary co-occurrences and to relate patterns of presence and absence of many products at the same time. This approach vastly outperforms standard Product-Space techniques in its ability to provide reliable forecasts of diversification patterns.
The methodology in Section 4 adapts the methodology recently developed for export products called Exogenous Fitness (Operti, et al., 2018) to technologies. The idea of Exogenous Fitness is to run the Fitness-Complexity algorithm in one setting in which there is abundance of information (all world countries) to extract the complexity of products, and then use those complexities to infer the Fitness of geographical entities in a different setting where there is not as much information (subnational regions). The idea of adapting techniques developed for products to be used with patents and technological classes is not new (Breschi, et al., 2003; Balland, et al., 2018), as there are many similarities in the data structure. Since the measure in (Pugliese & Tübke, 2019) was computed on REGPAT data, a database connecting patents from the European Patent Office (EPO) to regions, the measure did not cover adequately peripheral EU regions, as EPO patents are costly patents not commonly filed by smaller firms. This is visible in Figure 4, where regions without enough patents for computing their Regional Technological Fitness are reported in white. In Slovakia, only the Bratislava region would have enough data to be analysed. In this exercise we employed therefore additional data from Geocoding of worldwide patent data (de Rassenfosse, et al., 2019), geolocalizing data from 18.8 million patents from every patent office. This allow us to carry out a regional analysis for all Slovakian regions.
The analysis in Section 5 is based on previous academic work (Pugliese, et al., 2019), and the interested reader is pointed to such work for more
information. The methodology introduced in that article allows identifying whether the activity in specific technological fields in a country are early signals of the potential capabilities to export a specific (advanced) product in the future. The connection between this and the regional analysis performed in Section 5 is introduced in (Pugliese & Tübke, 2019). While it is founded on well-tested scientific work, at this point it is just a prototype that needs to be further validated.
Acknowledgements The authors thank Dario Diodato, Robert Marschinski and Alex Tübke for the useful and insightful comments.
How to cite
Pugliese, E. and Tacchella, A. "Economic Complexity for competitiveness and innovation: a novel bottom-up strategy linking global and regional capacities" Industrial R&I – JRC Policy Insights – 2020
Contact information
Pugliese, Emanuele - Economic Analyst, DG JRC - Territorial Development Unit (B3) [email protected] Edificio Expo - C/ Inca Garcilaso 3 - E-41092 Seville (Spain)