
RESILIENCE - JRC Publications Repository
177
RESILIENCE The 2 nd International Workshop on Modelling of Physical, Economic and Social Systems for Resilience Assessment 14-16 December 2017 Volume II Ispra Joint Research Centre
-
Upload
khangminh22 -
Category
Documents
-
view
1 -
download
0
Transcript of RESILIENCE - JRC Publications Repository

RESILIENCEThe 2nd International Workshop on Modelling of Physical, Economic and Social Systems for Resilience Assessment
14-16 December 2017
Volume IIIspra
JointResearchCentre
Resilience — The 2
nd International Workshop on M
odelling of Physical, Economic and Social System
s for Resilience Assessment


RESILIENCEThe 2nd International Workshop on
Modelling of Physical, Economic and Social Systems for Resilience Assessment
14-16 December 2017Ispra
Volume II

Neither the European Commission nor any person acting on behalf of the Commission is responsible for the use that might be made of the following information.
Luxembourg: Publications Office of the European Union, 201�
© European Union, 201�
Reuse is authorised provided the source is acknowledged.
The reuse policy of European Commission documents is regulated by Decision 2011/833/EU (OJ L 330, 14.12.2011, p. 39).
For any use or reproduction of photos or other material that is not under the EU copyright, permission must be sought directly from the copyright holders.
Print ISBN 978-92-79-79924-2 doi:10.2760/39325 KJ-04-18-134-EN-C
PDF ISBN 978-92-79-79923-5 doi:10.2760/727592 KJ-04-18-134-EN-N

3 |
Contents
Developing an Assessment Methodology for Community Resilience ........................................................................5
The Value of Environmental Variables and Complex System tools in Conflict Risk Modelling ...............................................................................................................................................................14
A holistic approach to agricultural risk management for improving resilience ..................................................24
Resilience of Immigrant Students ............................................................................................................................................37
Community Resilience Assessment using Discrete Finite Elements .......................................................................47
The role of performance-based engineering in achieving community resilience: a first step.............................................................................................................................................................................................62
Food security resilience to shocks in Niger: preliminary findings on potential measurement and challenges from LSMS-ISA data ......................................................................................................................................69
The NEPAD – Africa Resilience Coordination Hub (ARCH) .............................................................................................76
Resilience to oppression and to violent conflict escalation through nonviolent action .................................82
All-hazards impact scenario assessment methodology as decision support tool in the field of resilience-based planning and emergency management ..............................................................92
Math programming to facilitate exploration of decision alternatives for community resilience planning .........................................................................................................................................................................102
Towards more aligned/standardized solutions for indicator-based resilience assessment ....................111
Measuring Resilience: Lesson Learned and Alternative Approaches ...................................................................122
What Drives Housing Recovery? .............................................................................................................................................140
Modelling conflict resilience in the Global Conflict Risk Index ..................................................................................149
Towards resilient migration governance in the EU: A conceptual appraisal .....................................................155
Integration of detailed household characteristic data with critical infrastructure and its implementation to post-hazard resilience modelling ..................................................................................164


5 |
Developing an Assessment Methodology for Community ResilienceMaria K. DillardCommunity Resilience Program, National Institute of Standards and Technology (NIST), US Department of Commerce
AbstractCommunities can be characterized as complex systems, with resilience as an emergent property. Complex systems are systems composed of interconnected parts that exhibit emergent properties that arise from the collective and cannot be derived from the individual parts. Communities are composed of dependent social, economic, natural, and physical systems. Understanding how the performance or functionality of these community systems impacts overall resilience can improve planning, policy formation, and decision-making for hazards as well as chronic stressors. The systematic measurement of community resilience requires a coherent methodological approach that depends upon metric development. Meaningful, objective metrics will support systems modeling efforts for resilience and will help communities with long term monitoring and evaluation. The metrics, while enabling assessment of a community’s ability to respond to hazards, will be independent of hazard events.
The research aim is to develop a methodology for measuring resilience of social, economic, and physical systems at the community scale. The method draws on a social science based approach to composite indicator development as a means of developing a suite of metrics for the characterization of baseline conditions. Ultimately, the methodology will support the development of the tools necessary for communities to quantitatively assess their resilience over time using community resilience indicators that account for relevant aspects of the overall system.
1. IntroductionCommunity resilience is a complex, multi-dimensional problem that relies on engineering, social sciences, earth sciences, and other disciplines to improve the way communities1 prepare for, resist, respond to, and recover from disruptive events, whether those events are due to natural or human-caused hazards. To date, empirical studies have failed to provide a strong methodological foundation for the integration of community systems into a cohesive measurement for resilience. For example, when social dimensions are incorporated, they are o"en limited to economic factors as opposed to a broader, more complex set of social factors (e.g., factors related to institutions, social demographics, socio-cultural resources). Further, metrics are o"en designed to either assess baseline conditions or post-event recovery conditions, but not both. Community resilience will be advanced by establishing a more comprehensive, integrated suite of metrics across the systems that remain meaningful, even in the absence of a hazard event.
1 Communities are defined as “places (such as towns, cities, or counties), designated by geographical boundaries, that function under the jurisdiction of a governance structure” (NIST 2016). Communities include social institutions (e.g., economy, government, education, religion) as well as buildings and physical infrastructure that support the needs of its members.
Keywords:resilience,
community, metrics, indicators, complex
systems, social science

| 6
In the past, communities were encouraged to consider and plan for resilience with little guidance or tools at their disposal. Recently, NIST released the Community Resilience Planning Guide for Buildings and Infrastructure Systems (NIST 2016) to help communities plan and implement prioritized measures for the built environment based on social and economic needs, with the aim of strengthening overall resilience to hazard events. The next phase of NIST’s work is focused on providing communities with the tools necessary to evaluate and measure their resilience and to support the exploration of decisions that may enhance their resilience to hazards. A more resilient community will have, among other characteristics, improved functionality of buildings and infrastructure systems, a shorter recovery time of community functions following disruption, good governance, and economic security.
In this paper, the necessary steps of a methodology for assessing community resilience are proposed (see Box 1). These steps are partially adapted from work by the Organisation for Economic Cooperation and Development and the Joint Research Centre (Nardo et al. 2008) and the National Oceanic and Atmospheric Administration (Dillard et al. 2013). A selection of these steps, particularly 1 through 4, will be addressed in subsequent sections.
© iStock.com
/PeopleImages
Box 1. Proposed Steps of Methodology to Assess Community Resilience
1. Development of a theoretical framework
2. Seek consensus among existing resilience methodologies, frameworks, and researchers via a modified Delphi process
3. Selection of a quantitative measurement approach
4. Data and measure selection
5. Imputation of missing data
6. Multivariate analysis
7. Normalization, weighting and aggregation
8. Uncertainty and sensitivity analysis
9. Deconstructing measurement, identifying relationships with other variables
10. Visualization and presentation of measurement
11. Validation studies
12. Finalization of methodology
13. Dissemination of methodology and best practices

7 |
1.1. Conceptual foundation
Development of an assessment methodology for measuring community resilience is an essential component of systems modeling efforts, particularly those focused on providing decision support for community resilience. The assessment methodology being developed will be based on several important theoretical propositions. Several of these propositions are based on systems thinking, which refers to the approach to understanding a system through an understanding of its components and their relationships, as well as the properties and behavior of the system as a whole (von Bertalanffy, 1976; Miller and Page, 2007). This approach offers value in both theoretical and methodological terms.
1. Communities can be characterized as complex systems with emergent properties, such as resilience. Complex systems are systems composed of interconnected parts that exhibit emergent properties that arise from the collective and cannot be derived from the individual parts. Communities are composed of dependent social, economic, natural, and physical systems.
2. Community functions are linked to buildings and infrastructure systems. Examples of community functions include the following: housing, economic activity, health, education, public safety, communication, transportation, social connectedness, and recreation. Each function is delivered through interconnected components of the social system (e.g., education system, health care system), the economic system (e.g., businesses), the physical system (e.g., building clusters, transportation networks, communication networks), and the natural system (e.g., natural resources).
3. Resilience is a function of community state. Characteristics of community systems (or their point-in-time state) are assessed over time to measure the resilience of the community. In this way, the characteristics of the community before the hazard event determine, in part, the community response to the event, including the recovery trajectory.
4. To capture the response of the community to a hazard event and more common, chronic stressors, resilience assessment requires tracking the same set of characteristics over time.
5. Resilience is not the only emergent property of integrated community systems; there are other emergent properties. These include, social capital, adaptive capacity, and vulnerability. These properties may influence the response of the community to the hazard event.
Much work has been done on the conceptual clarification of resilience and its associated characteristics (e.g., Holling, 2001; Carpenter et al., 2001; Cumming et al., 2005; Perrings, 2006; Gallopin, 2006; Adger, 2006; Brand and Jax, 2007). This body of work provides an important theoretical basis for the measurement of resilience. The step Development of a theoretical framework in Box 1 above includes the establishment of the theoretical basis for measurement, including identifying and defining core concepts, selecting composite indicators, and determining essential components of the composites. As part of this step, NIST researchers are beginning with the critical task of identifying characteristics theoretically linked to community resilience.
2. Challenges in the assessment of community resilienceTo date, empirical studies have failed to provide a strong methodological foundation for the integration of the social, economic, and physical dimensions of resilience into a cohesive measurement model. These methodologies are o"en only focused on the resilience of a single system and rarely represent a tight integration of physical and social systems (Lavelle et al., 2015). Further, dependencies among social or physical systems are not taken into account. Finally, metrics are o"en designed to either assess baseline conditions or post-event recovery conditions, but not both. These methodologies, if fully developed, are rarely validated (Lavelle et al., 2015).

| 8
2.1. Measurement challenges
A significant body of literature attempts to address the complexity of interacting systems, while dealing with problems of scale (organizational, spatial, and temporal), causality, and scale mismatches (e.g., Krieger, 2001; Redman et al., 2004; Adger et al., 2005; Anderies, Walker, and Kinzig, 2006; Cumming, Cumming, and Redman, 2006; Gunderson et al., 2006). This work routinely encounters problems associated with empirical measurement. As a result, few researchers in this area have successfully tackled the formidable task of measurement. Thus, much work remains theoretical or conceptual.
Several challenges need to be addressed in the development of a measurement for community resilience (see Lavelle et al., 2015; Kwasinski et al., 2016). These include: interdependencies among the systems, the unbounded nature of communities, the diversity of dimensions that are part of a community’s resilience, tradeoffs between simplicity and accuracy, limited validation, and the need for replicability. Further, there is a mismatch of spatial and temporal scales when combining measurement of social and physical systems. Also, there is a need for empirical linkages between the built environment and the social services being supported
A measurement methodology must include indicators that assess and are relevant to both the pre-event state of the community as well as the post-event response (i.e., leading and lagging indicators). These indicators must all be capable of capturing change. Finally, it is critical that the indicators be focused on items that can be altered by community resilience policies and actions.
2.2. Methodology challenges
There remain fundamental decisions related to the methodology itself. It is essential to strike some balance between resource intensive, place and time specific data collections and the efficiency and replicability of methodologies that rely on secondary or existing data. While the main challenge confronting assessment of community resilience is the complexity of the integrated systems, there are methods for simplifying this complexity. These methods can be used to highlight important and useful composite indicators, indicators, and measures to track over time. Though the problem is complex, the assessment must be simple and practical for use in applied settings (Kwasinski et al., 2016). The assessment must also be scientifically grounded so that the outcomes are of value to communities who wish to improve or maintain their resilience.
2.3. Criteria for the methodological approach
Criteria for a robust methodology are proposed in Box 2. These criteria will be sought in the development of the assessment methodology. To advance the field and avoid duplication, NIST researchers are working to enumerate and evaluate existing indicators and accompanying assessment methodologies; these criteria support this process.

9 |
Box 2. Criteria for community resilience assessment methodology
• Systems level measurement
• Community scale
• Takes into account empirical relationships between systems (interdependencies)
• Over time measurement, including the baseline and post-event recovery stages
• Can address varying spatio-temporal scales
• Links to resilience policies and actions
• Scientifically grounded
• Practical for decision making
• Specific enough to be meaningful
• Replicable
• Has been validated
3. Approach to measuring community resilience To address the challenges associated with the development of the measurement of resilience, NIST researchers will use methodologies common to social sciences (e.g., exploratory factor analysis, structural equation modeling) to develop a measurement method for community resilience. The standardized methodology will guide identification, evaluation, selection, and development of composite indicators for community resilience. This approach will be well grounded in theory and will seek to achieve consensus among existing resilience methodologies, frameworks, and researchers via a modified Delphi process. Furthermore, the approach will emphasize validation studies as a means of exploring the types of relationships (e.g., correlation, causal) between resilience metrics and outcomes we would associate with a resilient system (e.g., shorter recovery time, better performance during hazard event).
Resilience metrics will also be developed with attention to their function in the systems model being developed by NIST researchers. Though effort will be made to create a systems model that captures all community systems, including the complexity of social systems, the assessment methodology will include a number of composite indicators that cannot be fully characterized in the systems model. Composite indicators that are not captured by recovery time, reduced probability of failure, and cost, may also be used in post-analysis to support the evaluation of decision alternatives for their resilience benefits.
This work draws heavily on social indicators methods. The use of indicators spans many distinct disciplines and fields. These include international and community development, public health, and education, where they support the tracking of development, outcomes and performance, as well as in environmental sciences and natural resource management to measure and monitor biophysical phenomena (Dillard et al., 2013). This project aims to move the field forward in part through the explicit inclusion of validation studies of the resilience metrics as well as by establishing a more comprehensive, integrated suite of composite indicators across the systems that remain meaningful in the absence of a disruptive event.

| 10
3.1. From concept to quantity
A foundational understanding of terms is an essential component of an effective resilience assessment methodology. In Table 1, the definitions for composite indicator, indicator, and measure are provided along with examples for the social system and the physical system. Composite indicators are aggregations of multiple measures using mathematical computation to produce a single value (Saisana and Tarantola, 2002).
Table 1. Composite Indicators, Indicators, and Measures: Definitions and Examples
COMPOSITE INDICATORS INDICATORS MEASURES
An index or composite based upon two or more indicators and generated by mathematical computation
A quantitative or qualitative measurement that provides reliable means to assess a particular phenomenon or attribute, o!en indirectly
A qualitative or quantitative value
Example 1: Community health status
Population health
Healthcare access
Investment in prevention
Disease rates in community
Hospital beds per capita
Expenditures in public health outreach
Example 2: Structural condition
Age
Maintenance
Damage state
Year structure built
Level of maintenance
Level of observed damage Composite indicators are able to simultaneously simplify complex measurement and communicate the underlying complexity. Most importantly, composite indicators respond to the pragmatic need “to rate individual units… for some assigned purpose” (Paruolo, Saisana, and Saltelli, 2013). Indicators are “quantitative or qualitative measures derived from a series of observed facts that can reveal relative position in a given area and, when measured over time, can point out the direction of change” (Freudenberg, 2003). Measures are the foundational units by which an indicator is quantified (Nardo, et al. 2008). In this paper, the term metrics is used as a general means of referring to the measurement of resilience and other complex concepts using composite indicators.
Figure 1 depicts the process of moving from the theoretical framework to the data and measure selection steps of the approach. The measure development moves from right to le", as movement from the more abstract, higher level concept gets grounded in measureable phenomena. Beginning with the most abstract, higher level concept, the researcher goes through a process of determining first “what are the essential components of this concept?” and then, “how are these components measured?”. Despite the linear presentation, most measure development is highly iterative and requires some flexibility in the starting point and direction of progress.
Figure 1. The relationship between measures, indicators, and composite indicators
# fulltimestaff
$ annularevenues
# plansin place
Proactive Wellresourced
Goodgovernance
measures indicators composite indicators

11 |
3.2. Development of composite indicators
Social science based approaches to composite indicator development typically include several of the steps referenced in Box 1. To complete each of the steps, several underlying activities must take place. For example, the completion of Development of a theoretical framework will require the establishment of linkages between building and infrastructure functions and societal functions through the identification of empirical relationships; development of a dra" framework of community resilience indicators for physical, social, and economic systems; and, engagement of broader community of researchers to gain consensus around a priority list of resilience indicators (through a modified Delphi methodology). The Delphi method solicits the expert opinions through a series of questionnaires interspersed with information and opinion feedback with the aim of achieving convergence of opinion through the process (Helmer-Hirschberg, 1967).
Critical decisions in the development of the methodology include the choice of criteria to apply in the evaluation of indicators. For example, a criterion of including both leading and lagging indicators would require the use of both types of indicators for measuring resilience so as to gain an understanding of community resilience levels before and a"er hazard events. Likewise, the use of a policy relevance criterion would require that indicators measure, whether directly or indirectly, conditions that can be altered with resilience-related policy and action.
3.2.1. Mapping relationships for community resilience measurement
To identify empirical relationships between building and infrastructure functions and societal functions, the possible dynamics must first be mapped conceptually. Each community resilience metric will ideally be linked to either probability of failure/success, recovery time, or other modeled component to have utility in the systems model. Below, an example of the process of mapping each resilience composite indicator to component indicators that could impact the performance of the physical system is provided.
In Figure 2, an indicator of governance is diagrammed to show its relationship to recovery time.
Figure 2. Example of linking resilience indicators to the performance of the physical system
Increase full time, paid staff in government
more human resources both before and a"er disaster
more efficient permitting, more effective enforcement of existing codes, better maintenance (e.g. road conditions)
lower probability of failure and therefore, less damage
overall shorter recovery time
3.3. Supporting methodology
The final NIST methodology is planned to include the following:
1. selected priority composite indicators, indicators, and measures,
2. the analytical approach(es) for computing each indicator over time for at least one spatial scale,
3. best practices for how the approach can be replicated for different spatial scales,

| 12
4. public data sources for all composite indicators, indicators, and measures,
5. data visualization for the composite indicators, indicators, and measures,
6. multivariate analyses to examine relationships between composite indicators, indicators, and measures,
7. sensitivity and uncertainty analysis,
8. and validation studies.
The assessment methodology will ultimately be developed for use by communities and will be science-based, user-friendly, and applicable to communities of varying sizes without requiring extensive technical support to implement. The outcomes of the methodology are envisioned to be presented as a web-based tool for obtaining resilience indicator scores over time for a particular community along with the methodology to support the development of scores for geographic scales not provided by NIST.
4. Conclusion The systematic measurement of community resilience requires a coherent methodological approach that includes, and o"en depends upon metric development. Meaningful, objective metrics will support systems modeling efforts for resilience and will help communities with long term monitoring and evaluation. The metrics, while enabling assessment of a community’s ability to respond to hazards, will be evaluated in the absence of hazard events. Through the discussion of key issues, this paper aims to provide a shared foundation to facilitate the contributions of a broad community of researchers to the development of metrics that function at varying spatio-temporal scales and reflect resilience and related concepts.
An assessment methodology allows for baseline assessment of the system and for tracking change over time for evaluation of decisions and investments as well as progress towards goals. Several steps of the NIST Community Resilience Planning Guide (CRPG) for Buildings and Infrastructure Systems (2016) would be strengthened by a standardized approach for measuring resilience. For example, the concept of a baseline assessment of the state of the community is central to CRPG Step 2: “Understand the Situation.” While this assessment could be conducted using a variety of methods including self-assessments, a standard, quantitative approach would be of great use. In Step 3: “Determine Goals and Objectives, metrics could be used to aid goal setting for community resilience.” For example, a goal might be a 20% improvement in 5 years in the community’s governance composite indicator. This goal could then be tied to a series of actions that improve components of governance, such as constituent participation, long term planning, and increased financial and human resources. Finally, in Step 6: “Plan Implementation and Maintenance,” resilience metrics could be used for evaluation of ongoing investments and activities that are part of plan implementation. Investments in resilience can then be optimized for maximum impact. Each example emphasizes the importance of the steady tracking of resilience metrics as opposed to event specific assessment. It is essential to assess the metrics well before and long a"er hazard events to understand the community’s trajectory and reasonable assumptions for its recovery.

13 |
ReferencesAdger NW, Hughes TP, Folke C, Carpenter SR, Rockstro J. ‘Social-Ecological Resilience to Coastal Disasters’, Science, 302:5737, 2005.
Anderies JM, Walker BH, Kinzig AP. ‘Fi"een weddings and a funeral: case studies and resilience-based management’, Ecology and Society, 11:1, 2006.
Bayrak T. ‘Performance evaluation of disaster monitoring systems’, Natural Hazards, 58, 2011.
Cumming GS, Cumming DHM, Redman CL. ‘Scale mismatches in social-ecosystems: causes, consequences, and solutions’, Ecology and Society, 11:1, 2006.
Dillard MK, Goedeke TL, Lovelace S, Orthmeyer A. Monitoring Well-being and Changing Environmental Conditions in Coastal Communities: Development of an Assessment Method, NOAA Technical Memorandum NOS NCCOS 174, National Oceanic and Atmospheric Administration, Silver Spring, MD, 2013.
Freudenberg M. Composite Indicators of Country Performance: A Critical Assessment, Organization for Economic Cooperation and Development, OECD Publishing, Paris, France, 2003.
Gunderson LH, Carpenter SR, Folke C, Olsson P, Peterson GD. ‘Water RATs (resilience, adaptability, and transformability) in Lake and Wetland Social-Ecological Systems’, Ecology and Society, 11:1, 2006.
Helmer-Hirschberg O. Analysis of the Future: The Delphi Method, Santa Monica, CA: The RAND Corporation; 1967.
Krieger N. ‘Theories for Social Epidemiology in the 21st Century: An Ecosocial Perspective’, International Journal of Epidemiology, 30, 2001.
Kwasinski A, Trainor J, Wolshon B, Lavelle FM. A Conceptual Framework for Assessing Resilience at the Community Scale, National Institute of Standards and Technology, Gaithersburg, MD, 2016.
Lavelle FM, Ritchie LA, Kwasinski A, Wolshon B. Critical Assessment of Existing Methodologies for Measuring or Representing Community Resilience of Social and Physical Systems, NIST GCR 15-1010, National Institute of Standards and Technology, Gaithersburg, MD, 2015.
Miller JH, Page SE. Complex Adaptive Systems, Princeton University Press, Princeton, NJ, 2007.
Nardo M, Saisana M, Saltelli A, Tarantola S, Hoffmann A, Giovannini E. Handbook On Constructing Composite Indicators: Methodology and User Guide, Organization for Economic Co-Operation and Development and Joint Research Centre of the European Commission, 2008.
[NIST] National Institute of Standards and Technology. Community Resilience Planning Guide for Buildings and Infrastructure Systems, 2016.
Paruolo P, Saisana M, Saltelli A. ‘Ratings and rankings: voodoo or science?’, Journal of the Royal Statistical Society, Series A (Statistics in Society), 2012.
Redman CL, Grove JM, Kuby LH. ‘Integrating Social Science into the Long-Term Ecological Research (LTER) Network: Social Dimensions of Ecological Change and Ecological Dimensions of Social Change’, Ecosystems, 7:2, 2004.
Saisana M, Tarantola S. State-of-the-art report on current methodologies and practices for composite indicator development, European Commission, Joint Research Centre, Institute for the Protection and the Security of the Citizen, Technological and Economic Risk Management Unit, 2002.
von Bertalanffy L. General System Theory: Foundations, Development, Applications, George Braziller, New York, NY, 1976.

| 14
The Value of Environmental Variables and Complex System tools in Conflict Risk ModellingMarie Schellens1,2
1 Department of Physical Geography, Stockholm University, 2 Environment and Natural Resources Programme, Iceland University
AbstractIt is argued that there exists a close relation between natural resources and conflict risk by the relatively recently emerged study field of environmental security. Understanding the interlinkages between natural resources and conflict is increasingly important when considering projected trends regarding natural resources and the environment, such as climate change and increased consumption. However, not many socio-natural conflict models exist which integrate understanding of both the physical environment and social processes leading to conflict. Moreover, most existing conflict models hit the statistical limits of their method, unable to account for complex interlinkages between variables.
This study addresses those two gaps by comparing several adapted versions of the Global Conflict Risk Index (GCRI), a multiple linear regression model, mainly based on socio-economic variables (De Groeve, Hachemer, and Vernaccini 2014). On the one hand, new sets of predicting variables concerning environment and natural resources are included in the model and the performance is compared with the original version. On the other hand, new complexity-based modelling techniques, such as a neural network and random forest methods, are compared to the original statistical modelling technique.
The complexity-based models achieve higher performance than the statistical models, indicating presence of complex interactions and non-linearities. The performance of models with environmental variables is higher when applying complexity-based approaches, while the linear models’ predictive power decreases when adding environmental variables. This could indicate that environmental variables are important to conflict risk, but are complexly interlinked with the socio-economic variables. A deeper understanding of these interlinkages is necessary to understand the causal processes connecting natural resources with conflict risk and to avert environmental conflicts.
1. IntroductionThe current way in which we use our natural resources is reaching its limits, both regarding to its sources and sinks (Boulding 1966; Meadows, Randers, and Meadows 2004; Rockström et al. 2009; W. Steffen et al. 2015). Further, it is clear how much natural resources are coupled with society and therefore also tightly coupled to each other within a so-called resource nexus (Graedel and van der Voet 2010; Andrews-Speed et al. 2012). One specific societal process of interest, i.e. conflict, is related to natural resources in many complicated ways (UNEP 2009). Understanding these interlinkages becomes even more important when considering projected trends regarding natural resources, such as climate change and increased consumption through population growth and increased living standards (Lee et al.
KeywordsConflict risk, Environment, Natural Resources, Complex systems, Modelling, Neural Network, Random Forest

15 |
2012; Steffen et al. 2015). It is o"en claimed that these trends can lead to increased conflict risk by the relatively recently emerged study field of environmental security (Dalby 2009; Homer-Dixon 1999; Schnurr and Swatuk 2012). Other scholars, however, critically debate this statement and whether there is a linkage between natural resources and violent conflict.
Many computational models studying different aspects of conflict have been developed and a review of these yields the following research gaps:
• While there is an ongoing critical debate about the linkage between natural resources andconflict, I have not encountered many interdisciplinary socio-natural models of security,conflict or cooperation, bringing together the physical and the social sciences on the topic.
• Many existing conflict models hit the statistical limits of their method, e.g. because of dataavailability, data continuity, difficulty and impossibility to measure some (o"en social)variables, vague or ambiguous causality with conflict risk, multicollinearity, autocorrelationof the observations, input data is not normally distributed, etc.
In an attempt to address these two research gaps, the objective of this study is twofold: first, to investigate the linkage between environmental variables and conflict risk and secondly, to improve the predictive ability of an already existing and applied conflict risk index (the GCRI) for early-warning. A complex system approach seems very suitable to integrate knowledge about biophysical and social systems which comes from very different ontological backgrounds, while at the same time providing alternative modelling techniques to the more conventional linear regression model. Hence, the following two research questions emerge for this study:
1. Does adding of environmental variables increase the performance of conflict risk models,specifically the GCRI, in explaining/calculating conflict risk?
2. Can computational tools from complex systems increase the performance of an alreadyexisting conflict risk index, i.e. the GCRI?
© Im
age Source/Getty Images

| 16
2. Data and methodsIn an attempt to answer these questions, alternative versions of an existing statistical conflict risk model were developed and compared between each other. On the one hand, new sets of predicting variables concerning environment and natural resources are applied to train the model and the performance is compared with the original version, which is mainly based on socio-economic variables. On the other hand, new complexity-based modelling techniques, such as a neural network and random forest methods, are compared to the original statistical modelling technique.
2.1. Starting point: The Global Conflict Risk Model
A very useful framework and multiple linear regression model around conflict risk exists, i.e. the Global Conflict Risk Index (GCRI) by De Groeve, Hachemer, and Vernaccini (2014). Itincludes a solid base of definitions and categorizations of different types of conflict. However,the link to environmental factors and natural resources is underdeveloped and the multiplelinear regression model, as it is now, cannot be used for analysis of the explanatory valueof the separate variables because of above mentioned statistical limitations (see Section1. Introduction). Therefore, the explanatory value of environmental and natural resources-related variables for conflict risk cannot be tested with this conventional statistical method.The models’ predictive value and performance can however be assessed and compared withother models.
The GCRI categorizes violent conflicts into 3 types: subnational conflicts, conflicts over national power and interstate conflicts. Subnational conflicts involve mainly non-state actors. In national power conflicts, a national government is standing against one or several non-state actors. Interstate conflicts involve the national governments of two or more states. For each conflict type, a separate regression model is fitted and later combined in an overall conflict risk indicator. In recent years, most conflicts have been subnational in character and there are not enough interstate conflicts in the database to make a significant statistical analysis. Therefore, this study focuses on subnational conflicts and the related subnational conflict risk regression of the complete GCRI model.
Further, the GCRI is close to publishing an updated version and uploading all new materials online, including the codes to the model for other researchers to experiment with (Halkia et al. 2017).
2.2. Sets of new variables
First, I compared the reference GCRI to models trained on different sets of predictive variables, including extra and excluding environmental variables to find out their relevance for conflict risk modelling. Table 1 gives an overview of the environmental and natural resource-related variables in this analysis, including both original GCRI variables and newly added environmental variables.

17 |
Table 1. List of natural resource and environmental variables in this analysis, both from the original GCRI model and newly added variables. Per variable, an explanationis given, as well as its source and whether it is replacing an original GCRI environmental variable or whether it is an additional environmental variable.
Variable Explanation Source Replacement of original variable or additional variable
The environmental and natural resource-related variables already included in the original GCRI (Smidt et al. 2016)
Fuel export % of merchandise export products (World Bank 2017)
Food security Combination of 4 sub-indexes of the FAO food security index: Average dietary energy supply adequacy, Domestic food price level index, Prevalence of undernourishment, Domestic food price volatility
(FAO 2015)
Water stress Total overall water risk in 2013 (Gassert et al. 2013) Replaced in certain variable sets, see below
Population size Total population, log transformed (United Nations, Department of Economic and Social Affairs, Population Division 2015)
Replaced in certain variable sets, see below
Structural constraints
Extent to which structural difficulties constrain the political leadership’s governance capacity, including extreme poverty, lack of educated workforce, disadvantageous geographical location, infrastructural deficiencies, natural disasters and pandemics
(BTI 2016) Replaced in certain variable sets, see below
New environmental variables added
Natural resource base
Arable land % of arable land (World Bank 2017) Additional
Food production net food production per capita (FAO 2017) Additional to the food security (which more relates to access to food)
Forest area % of forest area (World Bank 2017) Additional
Ores and metal exports
% of merchandise export products (World Bank 2017) Additional to fuel export
Renewable energy production
Renewable electricity output (% of total electricity output)
(World Bank 2017) Additional
Natural resource rents
Total natural resources rents are the sum of oil rents, natural gas rents, coal rents (hard and so#), mineral rents, and forest rents (% of GDP)
(World Bank 2017) Additional
Water access Percentage of population with access to improved drinking water sources
(World Bank 2017) Replacement of water stress
Water withdrawal
Annual freshwater withdrawals, total (% of internal resources)
(World Bank 2017) Replacement of water stress
Water reserves Renewable internal freshwater resources per capita (cubic meters)
(World Bank 2017) Replacement of water stress
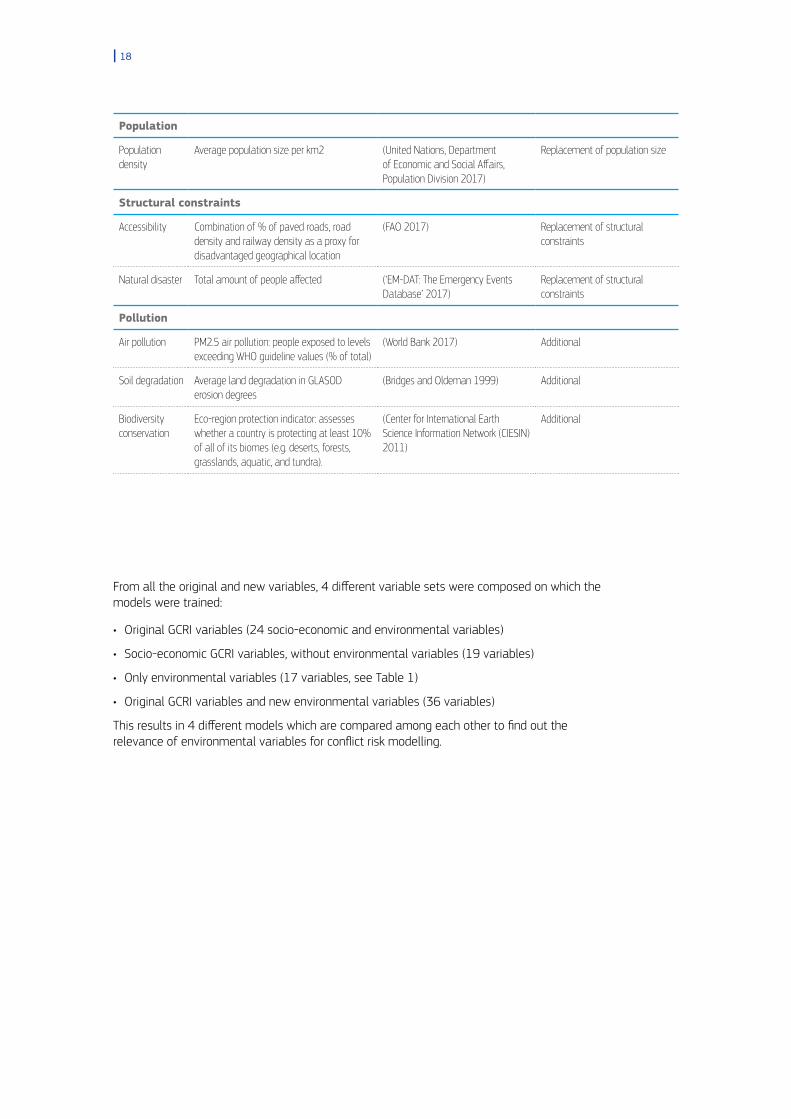
| 18
Population
Population density
Average population size per km2 (United Nations, Department of Economic and Social Affairs, Population Division 2017)
Replacement of population size
Structural constraints
Accessibility Combination of % of paved roads, road density and railway density as a proxy for disadvantaged geographical location
(FAO 2017) Replacement of structural constraints
Natural disaster Total amount of people affected (‘EM-DAT: The Emergency Events Database’ 2017)
Replacement of structural constraints
Pollution
Air pollution PM2.5 air pollution: people exposed to levels exceeding WHO guideline values (% of total)
(World Bank 2017) Additional
Soil degradation Average land degradation in GLASOD erosion degrees
(Bridges and Oldeman 1999) Additional
Biodiversity conservation
Eco-region protection indicator: assesses whether a country is protecting at least 10% of all of its biomes (e.g. deserts, forests, grasslands, aquatic, and tundra).
(Center for International Earth Science Information Network (CIESIN) 2011)
Additional
From all the original and new variables, 4 different variable sets were composed on which the models were trained:
• Original GCRI variables (24 socio-economic and environmental variables)
• Socio-economic GCRI variables, without environmental variables (19 variables)
• Only environmental variables (17 variables, see Table 1)
• Original GCRI variables and new environmental variables (36 variables)
This results in 4 different models which are compared among each other to find out the relevance of environmental variables for conflict risk modelling.

19 |
2.3. Alternative complexity-based modelling techniques
Furthermore, 3 different modelling techniques are applied to compare between linear-based vs. complexity-based models, i.e. multiple linear regression (as the GCRI), artificial neural network and random decision forest.
Artificial neural networks, also called multi-layer perceptrons, are computing systems inspired by the biological learning mechanism in our human brains. Through iteratively applying learning algorithms, a network of nodes connected by iteratively adjusted weights fits itself to reproduce certain given output data from the related input data (Schmidhuber 2015). An advantage compared to linear regression models is that it allows for any type of input data, non-linearities, and complex interactions between variables. A disadvantage, however, is that it is a black box: by training itself, it is difficult to find out in how far which variables explain certain outcomes in your model. In this study, a simple network architecture is chosen which looks like this:
• one input node/neuron for each input variable (or independent variable from the regression model);
• the amount of output nodes are as many as there are output variables (here only 1: conflict risk on a sub-national scale);
• and in between those, 1 layer of hidden nodes connecting them all together, with as many nodes as the average of the number of input and output nodes.
Random decision forest, or random forest in short, is another machine learning technique combining a myriad of decision trees for regression or classification. A random forest is a way to address the overfitting issue of a decision tree by producing a multitude of decision trees on random subsets of the dataset (subset of observations and variables) and then averaging out the outcome over all decision trees (Ho 1995). Advantages of this modelling approach is that it also catches interactions between variables, and non-linearities. Moreover, it is called a white box in contrast with the neural network black box because of the possibility to go into the forest and investigate successful decision trees and the relations they find between their subset of variables. The set-up of this random forest includes 500 decision trees. Each tree is constructed from a different random training sample of about two-thirds of the observations of the whole dataset. The amount of predictor variables randomly sampled for each split in a decision tree is the amount of predictor variables in the dataset divided by 3. This thus depends on the variable set used, as described above. Lastly, the decision trees are grown to their maximum size (Breiman 2001).
The different measures of fit, calculated to assess the performance of all these models, are all related to the classical coefficient of determination: R-squared. The R-squared and adjusted R-squared are calculated both on the training data and on the validation data. Training data and validation data are split up by selecting randomly 70% of the observations for training vs. the 30% remaining for validation. To compare between the 3 modelling techniques and the 4 variable sets for model training, the mean adjusted R-squared was focused on as model performance measure.
3. ResultsAs results, first the different measures of fit are shown for the fitness of the models based on the 3 modelling techniques, all trained on the set of variables combining the original GCRI variables with extra environmental variables (Figure 1). In general, there are no big differences between the R-squared and adjusted R-squared. Conversely, there are big differences between R-squared measured on training and validation data for the multiple regression and neural network, where the one calculated on the validation data is much smaller. Especially the neural network has very high values for both of the R-squared measured on the training data. This is not true for the random forest model which has a similar value around 0,8 for all fitness measures.

| 20
Figure 1. R-squared and adjusted R-squared on training data and validation data ofa variable set of original GCRI variables and extra environmental variables, compared between 3 models based on 3 different modelling techniques: multiple linear regression, neural network, random forest
0,1-0
0,10,20,30,40,50,60,70,80,9
1
R2 training data adjusted R2training data
R2 validation data adjusted R2validation data
Valu
e of
the
spec
ified
R-s
quar
ed
Linear regression Neural network Random forest
Figure 2 presents adjusted the R-squared calculated from validation data, which is the most rigorous predictive performance measure from the four described above and presented in Figure 1. Figure 2 allows us to compare 12 models’ predictive performance based on the 4 different variable sets and 3 modelling techniques. The random forest models always have the highest predictive power, with an adjusted R-squared around 0,8 for the models from all variables sets. The random forests including environmental variables show a slightly higher R-squared. Then, the neural networks perform intermediary with adjusted R-squared between 0,4 and 0,6. The performance of the neural network is around 0,55 for all variables sets. Lastly, the multiple linear regression models have the lowest predictive power with an R-squared of 0,27 and lower (even negative). Of the linear regression models, the one based on the original GCRI variables, i.e. the original model, performs best. A"er that, the performance lowers more and more respectively for the regression based on only socio-economic variables, the regression based on only environmental variables, and the regression based on the combination of original and new environmental variables.
Figure 2. Adjusted R-squared on validation data of 12 conflict risk models differentiated by: (1) the set of variables they are trained on; and (2) the modelling technique applied
0,1-0
0,10,20,30,40,50,60,70,80,9
Mea
n ad
just
ed R
-squ
ared
Linear regression Neural network Random forest
Original GCRIvariables
Socio-economicoriginal variables
Environmentalvariables
Original GCRIvariables and
environmental variables

21 |
4. DiscussionThe difference between the four R-squared measures in Figure 1 tells us a lot about the modelling process. The normal R-squared will always increase when adding extra variables since it has more flexibility to fit itself to the output data, regardless of the predictive or explanatory value of the variable added. The adjusted R-squared tackles this issue by taking into account the number of predictive variables applied in the model and thus will always be lower than the normal R-squared. The fact that adjusted R-squared is not much lower than the normal R-squared for the models presented in Figure 1 indicates that there are not too much variables in the model without any added predictive power. However, the models include very much variables and additional statistical analysis should be done to investigate and nuance this unlikely statement that all variables in the model have predictive and/or explanatory value to conflict risk. Further, the lower R-squared calculated from validation data compared to the ones calculated from training data indicates overfitting of the multiple regression and neural network models. The random forest model however shows to be very robust and not overfitting at all.
In Figure 2, the complexity-based models, i.e. neural network and random forest, have higher predictive performances than the linear regression models. This indicates the presence of non-linearities and complex interactions to which can be captured by more flexible complexity-based techniques. The performance of models with environmental variables compared to more socio-economic based models is higher for complexity-based approaches, while the linear models’ predictive power decreases with inclusion of environmental variables. This could mean that environmental variables are important to conflict risk modelling, but are interlinked with the socio-economic variables in complex ways. A deeper understanding of these complex interlinkages is necessary to understand the causal processes connecting natural resources with conflict risk and to be able to prevent environmental conflicts. Further exploration of the causal processes can be done by deeper analysis of the established random forest models or with other complexity based modelling approaches such as agent-based and system dynamic models.
Moreover, in the future, environmental conditions and resource constraints may be significantly different (Steffen et al. 2015). If the future system is significantly different from the past, both conventional statistics and machine learning approaches, equally based on historical data, may be less suitable methods. In such a situation, scenario-based models, such as system dynamics and agent-based models, may be more suited. Nevertheless, improving currently used indexes is both needed and valuable from an applied early warning perspective aiming at, ideally, pro-active measures from the international community against sub-national conflicts.
5. ConclusionA preliminary conclusion from this analysis of the GCRI and its alternative versions is that the linear regression and neural network model show signs of overfitting. The higher predictive performance of neural network and random forest models shows presence of many complex interactions between the variables, which the linear regression model cannot capture. The performance of models with environmental variables included is higher for complexity-based approaches, while the linear models’ predictive power decreases. This might indicate that environmental variables are important to conflict risk modelling, but are interlinked with the socio-economic variables in very complex ways. Further exploration of these complexities would be very interesting and necessary to understand better in what ways natural resources and the environment interact with conflict risk. Only then, applied early warning indexes can be developed to inform pro-active counter measures to environmental conflicts.

| 22
This is work in progress which I’m glad to present and receive feedback on here at the conference. All comments and discussions are very welcome. Continued work will be threefold: (1) reapplying this analysis to the updated version of the GCRI (Halkia et al. 2017); (2) deeper analysis into each variable and their interconnections, especially by means of the random forest model; and (3) comparing with another set of variables related to environmental change instead of a certain environmental condition. Work further in the future could focus on increasing understanding of the interactions between socio-economic and environmental variables through other complexity based modelling techniques allowing for scenario development, such as agent-based modelling and system dynamics modelling. For more details on methods, technicalities, data, and/or results don’t hesitate to contact me.
Acknowledgments
This project has received funding from the European Union’s Horizon 2020 research and innovation programme under the Marie Skłodowska-Curie grant agreement no. 675153. The author is grateful to Peter Schlyter for supervisory support and to him and Jóhanna Gísladóttir for feedback on the manuscript. The author would also like to thank John Miller and Scott Page from the Santa Fe Institute for helping to develop the idea for this study during the Graduate Workshop in Computational Social Science that they organise.

23 |
ReferencesAndrews-Speed, P., Bleischwitz, R., Boersma, T., Johnson, C., Kemp, G. and VanDeveer, S. D., The Global Resource Nexus: The Struggles for Land, Energy, Food, Water, and Minerals, Transatlantic Academy, Washington DC, 2012.
Boulding, K. E., ‘The Economics of the Coming Spaceship Earth’, Environmental Quality in a Growing Economy, edited by H. Jarrett, The Johns Hopkins University Press, Baltimore, 1966, pp. 3–14.
Breiman, L., ‘Random Forests’, Machine Learning, Vol. 45, No 1, 2001, pp. 5-32.
Bridges, E.M. and Oldeman, L. R., ‘Global Assessment of Human-Induced Soil Degradation’, Arid Soil Research and Rehabilitation, Vol. 13, No 4, 1999, pp. 319-325.
BTI, Transformation Index of the Bertelsmann Sti!ung 2016: Codebook for Country Assessments, Bertelsmann Sti"ung (BTI), Gütersloh, Germany, 2016.
Center for International Earth Science Information Network (CIESIN), Natural Resource Management Index (NRMI), 2011 Release, NASA Socioeconomic Data and Applications Center (SEDAC), Columbia University, Palisades, NY, 2011, available online at http://sedac.ciesin.columbia.edu/data/set/nrmi-natural-resource-management-index-2011, accessed August 2017.
Dalby, S., Security and Environmental Change, Polity, Cambridge, 2009.
De Groeve, T., Hachemer, P. and Vernaccini, L., Global Conflict Risk Index: A Quantitative Model: Concept and Methodology, EUR 26880, JRC Scientific and Policy Reports, Publications Office of the European Union, Luxembourg, 2014, doi:10.2788/184.
EM-DAT: The Emergency Events Database, CRED, D. Guha-Sapir, Université catholique de Louvain (UCL), Brussels, Belgium, available online at: www.emdat.be, accessed August 2017.
FAO, FAOSTAT, Food and agricultural Organisation of the United Nations, Nairobi, available online at: http://www.fao.org/faostat/en/#data, accessed 2015.
FAO, FAOSTAT, Food and agricultural Organisation of the United Nations, Nairobi, available online at: http://www.fao.org/faostat/en/#data, accessed August 2017.
Gassert, F., Reig, P., Luo, T. and Maddocks, A., Aqueduct country and river basin rankings: a weighted aggregation of spatially distinct hydrological indicators, Working paper, World Resources Institute, Washington, DC, December 2013. Available online at http://wri.org/publication/aqueduct-country-river-basin-rankings.
Graedel, T. E., and van der Voet, E., Linkages of Sustainability, MIT Press, Cambridge, Massachusetts, 2010.
Halkia, M., Ferri, S., Joubèrt-Boitat, I. and Saporiti, F., Conflict Risk Indicators: Significance and Data Management in the GCRI, JRC Technical Reports, Publications Office of the European Union, Luxembourg, In press 2017.
Ho, T. K., ‘Random Decision Forests’, Proceedings of 3rd International Conference on Document Analysis & Recognition, Issue 1, 1995, pp. 278–82.
Homer-Dixon, T. F., Environment, Scarcity, and Violence, Princeton University Press, Princeton, 1999.
Lee, B., Preston, F., Kooroshy, J., Bailey, R., and Lahn, G. (eds.), Resources futures, Royal Institute of International Affairs, London, 2012.
Meadows, D., Randers, J. and Meadows, D. , Limits to Growth: The 30-Year Update, Chelsea Green Publishing, White River Junction, Vermont, 2004.
Rockström, J., Steffen, W., Noone, K., Persson, Å., Chapin, F.S., Lambin, E.F., Lenton, T. M., Scheffer, M., Folke, C., Schellnhuber, H. J., and others ‘A Safe Operating Space for Humanity’, Nature, Vol. 461, No 7263, 2009, pp. 472–475.
Schmidhuber, J., ‘Deep Learning in Neural Networks: An Overview’, Neural Networks, Vol. 61, 2015, pp. 85–117.
Schnurr, M. A., and Swatuk, L.A., Natural Resources and Social Conflict : Towards Critical Environmental Security. Palgrave Macmillan, Basingstoke, 2012.
Smidt, M., Vernaccini, L., Hachemer, P. and De Groeve, T., The Global Conflict Risk Index (GCRI): Manual for Data Management and Product Output, Version 5: Code Documentation and Methodology Summary, EUR 27908, JRC Technical Reports. Publications Office of the European Union, Luxembourg, 2016, doi:10.2788/705817.
Steffen, W., Richardson, K., Rockström, J., Cornell, S. E., Fetzer, I., Bennett, E. M., Biggs, R. And others, ‘Planetary Boundaries: Guiding Human Development on a Changing Planet’, Science, Vol. 347, No 6223, 2015, pp. 736-746.
Steffen, W., Broadgate, W., Deutsch, L., Gaffney, O. and Ludwig, C., ‘The Trajectory of the Anthropocene: The Great Acceleration’, The Anthropocene Review, Vol. 2, No 1, 2015, pp. 81–98.
United Nations, Department of Economic and Social Affairs, Population Division, World Population Prospects: The 2015 Revision, DVD Edition, 2015.
United Nations Environmental Programme (UNEP), ‘From Conflict to Peacebuilding: The Role of Natural Resources and the Environment’, Policy Paper no. 1, February 2009, United Nations Environment Programme, Nairobi, 2009.
World Bank, ‘World Bank Open Data’, available online at: https://data.worldbank.org, accessed August 2017.

| 24
A holistic approach to agricultural risk management for improving resilienceIlaria Tedesco1
Platform for Agricultural Risk Management (PARM)
AbstractAgricultural sector is subject to a large number of risks: not only to the ones faced by most businesses but also to all the risks associated working with organic and living material, such as seeds, livestock and fresh produce, and their biological processes. Agricultural risk management (ARM) aims at protecting agricultural businesses, farmers, and countries from the potential losses incurred due to unpredictable events, becoming also a means to boost the resilience at different levels. PARM has identified which are the elements that make an agricultural/rural project an ARM-proofed one. PARM has developed a participatory approach that identifies five pillars that if included in a project have the potential of reducing agricultural risks and/or limit consequences of the negative shocks. Managing properly agricultural risks ultimately translates in better resilience and food security.
1. Introduction Agriculture is a particularly vulnerable sector, not only affected by idiosyncratic risks faced by most businesses but also by covariate events (i.e. weather) and all the risks associated working with organic and living material, such as seeds, livestock and fresh produce, and their biological processes. These risks negatively affect farmers’ livelihoods, production and the capacity of the sector to invest and innovate.
There is a consensus that shocks like droughts, floods, epidemics, conflicts, and market volatility, have become more and more frequent, complex and severe, hitting with more intensity the well-being of populations and entire countries, in particular of most vulnerable groups in developing countries (Constas and Barrett, 2013).
Between 2003 and 2013, natural hazards and disasters affected almost 2 billion people causing USD 494 billion in estimated damage in developing countries; in these areas, agriculture has absorbed more than 20% of economic impact caused by medium to large scale hazards and disasters (FAO, 2015).
Both agricultural risk management (ARM) and resilience initiatives work towards managing the consequences of negative shocks and in synergy for the common goals of li"ing people
1 This proceedings is the result of the experience gained by the Platform for Agricultural Risk Management (PARM) through work at country-level, workshops, capacity development seminars and trainings, etc. During the years it has benefited from the inputs of many individuals, in particular those of Jesús Antón (OECD), Massimo Giovanola (PARM), Karima Cherif (PARM), Carlos E. Arce and David G. Kahan. The paper borrows extensively from the findings of the outcome publication of PARM workshop on “Agricultural Risk Management: practices and lessons learned for development” held in IFAD HQ on 25 October 2017. The publication is being developed by Gaelle Perrin with the inputs of an ad-hoc Technical Committee constituted by Carlos Arce (PARM); Federica Carfagna, African Risk Capacity (ARC); Ilaria Firmian, International Fund for Agricultural Development (IFAD); Alessandra Garbero, IFAD; Åsa Giertz, World Bank (WB); Gideon Onumah, Natural Resources Institute (NRI)/AGRINATURA; Mariam Soumare, New Partnership for Africa’s Development (NEPAD). Errors and omissions remain those of the author of this report only. The views expressed herein are those of the author and should not be attributed to IFAD.
KeywordsAgricultural Risk, Agricultural Risk Managment, Resilience

25 |
from poverty traps, enabling farmers to protect their assets, and improving food security at local and macro level.
Resilience has recently regained attention moving from a humanitarian concept at the catastrophic level to a positive capacity to reduce, transfer, cope with and/or cope to a wider array of negative hazards to generate enduring solutions to chronic poverty (Constas and Barrett, 2013).
The definition of resilience includes two important mechanisms: resistance to change and recovery from change (Timpane-Padgham el al., 2017). Walker et al. (2004) defines resilience as the capacity of a system to absorb disturbance and reorganize in ways that retain essentially the same functions. This is essentially what ARM does but with of course a specific focus on agriculture risks: anticipating and managing potential risks for the agricultural sector, planning solutions in advance to limit negative consequences with actions that contain both the elements of disturbance absorption and reorganization of the activities.
There is a clear two-way relation between ARM and resilience: ARM practices aim to mitigate negative shocks and boost resilience and, at the same time, the understanding of single component of resilience can help to better target ARM strategies in a virtuous circle.
The theoretical link between ARM and resilience is clear. ARM contributes to building resilience at the household, community and country levels, strengthening the ability of stakeholders along agricultural supply chains to mitigate the effects of disasters and crises as well as to anticipate, and recovering from them in a timely, efficient and sustainable manner. In that sense, ARM can be seen as one of the building blocks of resilience, looking specifically at risks related to agriculture, and identifying and implementing risk management strategies for agricultural stakeholders and government to better plan for and face a variety of shocks.
At practical level, ARM is very context specific, and the effectiveness of ARM strategies are complex to measure. Data analysis can help identifying specific ad-hoc interventions to improve ARM impacts on resilience. However, best practices to develop an ARM project that can be applied across the board should be identified.
PARM has advanced to investigate in a qualitative manner the elements that make a good ARM-proofed project. The ultimate goal is to create a framework of principles that follows a holistic approach to agricultural risk management that can, in turn, lead to progress in building resilience.
© iStock.com
/fotokostic

| 26
This proceedings has been developed by the Platform for Agricultural Risk Management (PARM)1 from the results of the workshop “Agricultural Risk Management: practices and lessons learned for development” held on 25 October 2017 at the Headquarters of the International Fund for Agricultural Development (IFAD)2. The purpose of the workshop was to bring together various practitioners3 involved in designing, implementing or evaluating programmes and policies related to ARM to learn from the opportunities and challenges of an existing set of ARM initiatives and to reach a consensus over a set of methodological guidelines and measures for good ARM practices.
In the next sessions, we concentrate on what are a risk and the need for a holistic approach, and on the five pillars that synthetize what makes a good ARM-proofed project.
2. What is a risk and what is an holistic approach to agricultural risk management
Agricultural risks affect farm activities and farmers’ livelihoods – and at a broader level, the entire value chain, related businesses, and the economy as a whole. Risk is a key reason why a business may not be profitable, nor reach its potential, or not be sustainable over time (PARM, 2018a).
Risks faced by agricultural stakeholders are numerous and are o"en context-specific depending on climate conditions, farming system, market context, etc. They vary from unpredictable extreme weather events to market disruption, from policy or institutional changes to biological harm. These risks can be systemic, idiosyncratic, isolated, and correlated. What they have in common is that stakeholders are o"en not sufficiently prepared to face them and therefore recovery from shocks o"en implies depletion of assets and disruption of livelihood, particularly important in the presence of systemic risk (PARM, 2017a).
Risk is composed by three elements: threat, uncertainty, and loss. In this sense, risk is the threat of loss or damage caused by an unfavourable event which is uncertain. The uncertain event can be both the result of natural hazards or human activities.
Risk is therefore a combination of the likelihood of the event and the severity of loss caused by the event. Likelihood refers to the possibility of an event occurring; it can be measured qualitatively (e.g. highly likely) or quantitatively (e.g. a 30% chance). Severity refers to the extent of the impact, o"en measured as physical damage (e.g. % of crop damaged, number of livestock dead, etc.) or monetary losses. Negative consequences of risks can be contained or mitigated through preventive actions, transferred to a third party, or absorbed.
ARM is the process of dealing with (agricultural) risks. It requires anticipating potential problems and planning solutions, so as to limit their negative consequences. Many are the ways to manage agricultural risks. Choosing the most appropriate tool(s) depends on the type of risk, farmer’s and household’s approach to risks and availability of resources, development goals, and services and infrastructure available in the geographical area.
1 The Platform for Agricultural Risk Management (PARM) is a global initiative focused on making risk management an integral part of policy planning and implementation in the agricultural sector in developing countries. This facility is a mandate of the G8 and G20 discussions on food security and agricultural growth, supported by a multi-stakeholder partnership between the European Commission (EC), the French Development Agency (AFD), the Italian Development Cooperation (DGCS) the International Fund for Agricultural Development (IFAD), the German Cooperation (BMZ/KfW). In Africa the platform has developed a strategic partnership with the New Partnership for Africa’s Development (NEPAD) and operates within the Comprehensive Africa Agriculture Development Programme (CAADP) framework. More on www.p4arm.org
2 All workshop proceedings can be found in the workshop related publication “Agricultural Risk Management: practices and lessons learned for development”, 25 October 2017, International Fund for Agricultural Development (IFAD) (in progress).
3 They included officers of United Nations agencies, international financial organizations, governments, research institutes, farmers’ organizations, non-governmental organizations and the private sector.

27 |
Once aware of the risks for their activities, stakeholders may develop a range of methods for managing them, which can be classified as:
• Ex ante measures, i.e. measures taken before the potentially damaging event occurs such as crop diversification, share cropping, drought-tolerant crop varieties and pest and disease management;
• Ex post measures, i.e. measures taken a"er the damaging event has occurred, to try to limit its negative consequences such as the use of emergency irrigation and replanting, using savings to maintain an adequate livelihood and off-farm employment.
Agricultural risk management strategies are typically a combination of both to anticipate for a broader range of intensity of events, from mild ones to catastrophic risk. Ideally risk management strategies for both should be identified and implemented prior to risk events; some ex ante plans provide for actions to be taken on an ex post basis. Reacting to risks entirely on ad-hoc basis is usually a more costly risk management option (PARM, 2017a).
A holistic approach to agricultural risks means to consider a broad range of risk and a broad range of solutions, and that no risk is considered in isolation (OECD, 2009). This implies dealing at the same time with different and synchronized actions to manage risks. Taking the definition in a broader way, an holistic approach not only encompasses all of the interlinked risks involved but also on the various participants along the agricultural supply chains and on the whole set of ARM tools available. In taking into account different elements, the holistic approach aims to design comprehensive ARM strategies that contribute to resilience building from farm to country level.
Although the ultimate goal is to improve farmers’ livelihood, ARM covers in fact the key stakeholders that work at different levels and with different responsibilities. Micro-level stakeholders includes actors operating on individual basis, producing or delivering products or services with the primary concern of raising output and incomes of their respective farms and businesses; they are for example farmers and small businesses. Meso-level actors instead implies a higher level of portfolio activities and therefore higher risk aggregation, including farmers’ organizations, NGOs, suppliers of inputs, financial service providers. Macro-level players refer to the highest aggregation of agricultural activities at sector level, which risks are mostly the concern of governments and international organizations. Their responsibility lays on the strategic planning, policy making, and the provision of public goods for risk management for the whole sector and vulnerable stakeholders in particular.
An illustration for looking at a holistic approach is as shown in Figure 1, whereby the 3 risk management strategies (i.e. risk mitigation, risk transfer, and risk coping) can be planned in a layered manner to be deployed depending on the severity of risk that shocks the sector. In this illustration, risk mitigation strategies aim at retaining as much risk as possible at farm level. Whatever residual risk that cannot be retained, then some of it could be transferred to third parties willing to buy the risk. For risks that cannot be mitigated or transferred, then coping strategies come into play, particularly important is the role of government in coping mechanisms at catastrophic levels as a key component in the resilience of vulnerable stakeholders.

| 28
Figure 1. Risk management strategies and risk layeringPr
obab
ility
Farmers/Households/Community Markets
Severity
LAYER 1
high frequency,low losses
Risk Mitigation
LAYER 2
very low frequency,very high losses
Risk Mitigation+ Risk Transfer+ Risk Coping
LAYER 2
low frequency,medium losses
Risk Mitigation+ Risk Transfer
Governments
Risk Layering
Source: PARM (2017a) adapted from World Bank (2016)
In the next paragraph we investigate the cross-cutting elements that make a good ARM-proofed project taking into account all the stakeholders involved.
3. What makes a good ARM-proofed project: five pillars for agricultural risk management
Despite the diversity of contexts and approaches to managing risks, some general steps and basic guidelines emerge from field experiences. They can be grouped in five key pillars that can be applied when designing or implementing an initiative that include an ARM component, to ensure sustained management of agricultural risks.
They are:
1. Risk assessment and prioritization. At the inception of project that includes an ARM component, assessing and prioritizing risks is a key element;
2. Tools identification and implementation. Appropriate tools that match with the risk prioritized should be identified, as well as it should be known their availability and accessibility, and the responsibility for their implementation;
3. Access to information and capacity building. Information is crucial to plan ahead and take decisions while capacity building empowers to take informed decisions on ARM;
4. Partnerships and policy integration. Coordinated actions taken at various levels are crucial to create synergies and effectively manage risks. The integration of ARM into policies enables its sustainability;
5. Monitoring and evaluation. These two components are therefore necessary to allow for ARM adaptation and learning considering ARM as a continuous process prone to recurring changes.
29 |
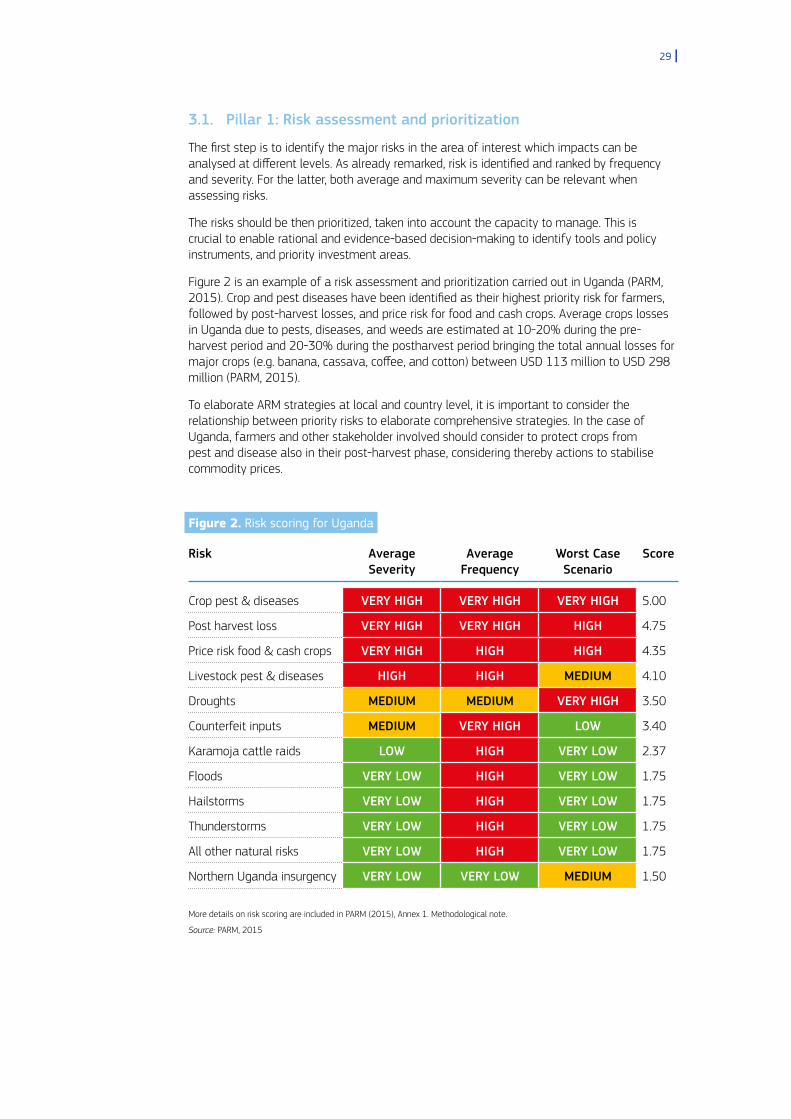
3.1. Pillar 1: Risk assessment and prioritization
The first step is to identify the major risks in the area of interest which impacts can be analysed at different levels. As already remarked, risk is identified and ranked by frequency and severity. For the latter, both average and maximum severity can be relevant when assessing risks.
The risks should be then prioritized, taken into account the capacity to manage. This is crucial to enable rational and evidence-based decision-making to identify tools and policy instruments, and priority investment areas.
Figure 2 is an example of a risk assessment and prioritization carried out in Uganda (PARM, 2015). Crop and pest diseases have been identified as their highest priority risk for farmers, followed by post-harvest losses, and price risk for food and cash crops. Average crops losses in Uganda due to pests, diseases, and weeds are estimated at 10-20% during the pre-harvest period and 20-30% during the postharvest period bringing the total annual losses for major crops (e.g. banana, cassava, coffee, and cotton) between USD 113 million to USD 298 million (PARM, 2015).
To elaborate ARM strategies at local and country level, it is important to consider the relationship between priority risks to elaborate comprehensive strategies. In the case of Uganda, farmers and other stakeholder involved should consider to protect crops from pest and disease also in their post-harvest phase, considering thereby actions to stabilise commodity prices.
Figure 2. Risk scoring for Uganda
Risk Average Severity
Average Frequency
Worst Case Scenario
Score
Crop pest & diseases VERY HIGH VERY HIGH VERY HIGH 5.00
Post harvest loss VERY HIGH VERY HIGH HIGH 4.75
Price risk food & cash crops VERY HIGH HIGH HIGH 4.35
Livestock pest & diseases HIGH HIGH MEDIUM 4.10
Droughts MEDIUM MEDIUM VERY HIGH 3.50
Counterfeit inputs MEDIUM VERY HIGH LOW 3.40
Karamoja cattle raids LOW HIGH VERY LOW 2.37
Floods VERY LOW HIGH VERY LOW 1.75
Hailstorms VERY LOW HIGH VERY LOW 1.75
Thunderstorms VERY LOW HIGH VERY LOW 1.75
All other natural risks VERY LOW HIGH VERY LOW 1.75
Northern Uganda insurgency VERY LOW VERY LOW MEDIUM 1.50
More details on risk scoring are included in PARM (2015), Annex 1. Methodological note.
Source: PARM, 2015

| 30
To allow a deeper reflection upon this pillar, good practices and issues to consider have been elaborated for risk assessment and prioritization (Table 1).
Table 1. Good practices and issues to consider for Pillar 1:Risk Assessment and prioritization
Good practices Issues to consider
• Identifying all risks, although only prioritised ones will be analysed in detail
• Identifying the capacity to manage risk by stakeholders affected by these risks, taking into account their characteristics (age, gender, etc.);
• Assessing frequency and severity of risks at the level of analysis (farm, supply chain, geographical area, and sector).
• Using a historical data on a long-term period or, if not available, developing a qualitative analysis
• Estimating the potential economic impact of the assessed risks developing different scenario (average and worst case scenario)
• Involving local stakeholders in the risk assessment and prioritization to ensure engagement across the process (risk analysis, tools identification…)
• Defining clear roles and responsibilities to manage the risks and tools prioritized at the macro, meso and micro levels
• Sources, quantity, quality and accuracy of data used
• Scale of the level of risk aggregation under assessment: local, regional or national assessments will not yield the same results. Aggregation masks risk at lower level of aggregation.
• The difference between risks, trends and constraints for the strategies to address only risk.
• Gender differences as there might be a gendered differentiated impact and response.
• Compounding factors that can exacerbate or mitigate risk impact
• Risks causality, interaction and correlation.
Source: Proceedings of the workshop “Agricultural Risk Management: practices and lessons learned for development”, 25 October 2017, International Fund for Agricultural Development (IFAD)
3.2. Pillar 2: Tools identification and implementation
Following the identification and prioritization of the risks, adequate tools or instruments (among the available ones) need to be chosen and implemented. Considering the holistic approach, a combination of tools to handle the prioritized risk(s) is the best option. There is consensus to consider capacity development (or capacity building) and information systems as two cross-cutting ARM instruments, to complement specific tools (see par. 3.3).
ARM tools generally fall into three categories: risk mitigation; risk transfer; and risk coping.
1. Risk mitigation strategies (ex-ante) aim at reducing the impact of a risk or the severity of the losses. They can be undertaken directly by the farmers individually or at community level, and include climate smart agriculture, good agricultural practices, income diversification, irrigation systems, etc. Though these measures are implemented by farmers, their availability and accessibility might depend on support from governments as public goods provision;
2. Risk transfer strategies (ex-ante) are put in place for the residual risk whose effects cannot be completely mitigated. Risk transfer tools allow for the transfer of the potential financial consequences of a risk to a willing third party, o"en against a fee, such as in the case of insurance. These strategies o"en require the intervention of private actors (banks, insurance companies) to design and operate programmes accessed by the farmers.

31 |
3. Risk coping (ex-post). For risks that cannot be mitigated or transferred, coping mechanisms are necessary to enable farmers to recover once the shock has happened. These include social protection programmes, specific disaster compensations (cash or in-kind). Although they are used once the risk has materialized, they need to be planned in advance, and are the main responsibility of governments.
Following the risk assessment, PARM feasibility study on crop pests and disease management in Uganda (PARM, 2017b) identified improving access to high-quality inputs as one of the tools to manage risk for participants along the agricultural supply chains. The existence of adulterated and counterfeit products in fact places a risk and discourage farmers’ investment in input use. Although is farmers’ responsibility to use quality seeds, many are the stakeholders involved in managing risk: from extension service and seeds providers (i.e. meso-level) with tasks related respectively to material inspection and inputs commercialization, to government (macro-level) to enforce seeds regulation.
Likewise, PARM has been working with the Ministry of Agriculture in Senegal to understand how to use remittances for ARM purpose in the rural areas (PARM, 2018b). The idea is to involve in the future financial institutions and global payment services to create risk transfer tools using remittances to overcome emergencies and the negative impact of climate hazards and natural disasters.
In the context of risk coping, PARM Risk Assessment Study (RAS) in Niger (2016a) highlighted that the multiplication food crises have stimulated the use of a large part of the state budget and external aid to alleviate cyclical food insecurity. This was also reflected in the ARM tools analysis on access to information and warehouse receipt system both linked to food insecurity programs and contingency plan leaded by the government and bilateral partners.
Table 2 presents good practices and issues to consider in the choice of tool identification and related implementation.
Table 2. Good practices and issues to consider for Pillar 2: Tools identificationand implementation
Good practices Issues to consider
• Consideration of the applicable context
• Strengthening existing tools that have proven to be successful
• Checking the applicability of new tools in the context in order to ensure its uptake by stakeholders and the sustainability
• Acceptance by stakeholders as an effective and practical solution
• Doing a cost/benefits analysis of the potential tools
• Monitoring the implementation and the functioning of each tool
• Validate the conditions for replicability
• When possible, designing clear indicators to measure the results of each individual tool, and to understand better the results of the combination of tools implemented
• Factoring planned and unplanned costs of the tools’ implementation
Source: Proceedings of the workshop “Agricultural Risk Management: practices and lessons learned for development”, 25 October 2017, International Fund for Agricultural Development (IFAD)

| 32
3.3. Pillar 3: Access to information and capacity building
In managing risks, timely access to information and capacity building activities are essential to agricultural stakeholders, as well as to extension workers or policy makers to make informed decisions and progressively enhance their skills on ARM practices. As already mentioned, regardless of the tools being put in place, these should be considered as cross-cutting requirements.
Information is a key component for all the stakeholders. It is critical for planting crops, for avoiding post-harvest losses, for fetching the highest price in the market, for placing a bank loan, for designing policies.
Information sources are diverse, and their accuracy, accessibility and costs vary tremendously. Information can be collected by the farmers themselves, through ad-hoc surveys (primary data); they can come from dedicated systems such as specialized weather agencies, websites, mobile-based applications, radio, newspapers, country national bureau of statistics.
Countries need to be particularly sensitive to the issue of access to information for ARM. Besides elaborated few feasibility studies on access to information at country level (e.g. in Senegal, Niger and Cameroon), a cross-country study was conducted in seven PARM countries1 to examine information availability, quality, and accessibility for different areas. The study finds that information systems for ARM on prices, satellite images and trade are relatively strong in most countries while the areas with poorest information are plant health, commodity stock and inputs (PARM, 2016b).
Capacity development is another essential cross-cutting feature of ARM to improve knowledge and management capacity among different stakeholders. Such activities should be undertaken a"er a thorough needs assessment, targeting its audience and in partnership with local institutions.
Box 1 presents the capacity development strategy elaborated by PARM in various countries.
Box 1. PARM Capacity Development Strategy
PARM supports capacity development (CD) activities to drive a sustainable institutional and behavioural change. CD on ARM works towards empowering and strengthening endogenous capabilities of all the stakeholders involved, transferring knowledge and expertise to allow national and local system to manage similar tasks for the future, planning strategies and mainstreaming solutions in the national policy agenda.
In details, PARM CD strategy is articulated in three levels:
• General ARM training (CD1). It is a 2-day seminar aiming at raising awareness and providing basic knowledge on ARM. In general CD1 targets farmers and public officers;
• Institutionalization of high level ARM knowledge (CD2). It aims at creating a pool of local ARM experts though an advanced training delivered by local Universities and/or research centres. It is meant to be a training of trainers (ToT): trainees are expected to train agricultural stakeholders across the country. Target groups are extension workers, university students, and public officers with higher educational background. The ARM training can be also incorporated into academic curricula;
• Specific ARM tool capacity development (CD3). It is a flexible way to transfer knowledge on specific tools to create awareness and expertise on specific risks targeted by each country.
Source: PARM, 2017d
1 It includes Uganda, Ethiopia, Senegal, Niger, Cameroon, Mozambique and Cape Verde.

33 |
To extend the elements incorporated in this pillar, good practices and issues are also listed (Table 3).
Table 3. Good practices and issues to consider for Pillar 3: Access to information and capacity building
Good practices Issues to consider
• Identifying existing information systems and areas for possible cooperation and/or integration
• Assessing the quality of available data
• Identifying data needs of stakeholders and obstacles to accessing this data
• Identifying the key stakeholders for capacity development
• Assessing the capacity development needs of each target group
• Adapting the material taught to the specific needs and role of the various stakeholders
• Linking theoretical knowledge with practical experiences and know-how
• Knowing what type of data is being collected, what type can be collected and who is collecting it
• Determining the price that stakeholders are willing to pay for information- compared to the costs of setting-up or strengthening an information system
• Keeping in mind that information is strategic- there might be specific reasons why information is not shared by farmers, governments, or private sector actors
• Integrating the high turnover rate of government officials and international staff into capacity development strategies
• Assessing possible synergies but also consistency with other trainings available in an area, to make sure that the target audience has incentives to participate in the activities and that time is utilized effectively
• Planning for follow-up and application of the concepts learned during capacity development
Source: Proceedings of the workshop “Agricultural Risk Management: practices and lessons learned for development”, 25 October 2017, International Fund for Agricultural Development (IFAD)
3.4. Pillar 4: Partnerships and policy integration
The facilitation of a holistic approach to ARM materializes synergies and partnerships across different level of stakeholders, from farmers’ cooperatives to international institutions. The role of the government, in particularly for the integration of ARM into policies and interventions, is essential to consolidate partnerships, and create the framework to ensure ARM strategies’ sustainability and an enabling environment for investment.
Partnerships allow the coordination of actors dealing with different types of risks or tools, the pooling of resources and the design of broad development activities while avoiding duplication of work, implementation of contradicting instruments or conflicting agendas. This is particularly important for ARM that o"en requires actions at different levels to reach a common goal, with stakeholders having different operating methods and purposes.
The integration and mainstreaming of ARM in national policies is important also to shape the political agenda in favour of agricultural, trade and environmental policies. In this way ARM becomes not only more sustainable and operationalized, but also cross-cutting by integrating risk management strategies and tools into new operations and guiding actions for the private sector and development partners.

| 34
From its early stage, a priority for PARM has been to contribute to this pillar. Using the Uganda case again as illustration, PARM has worked with country and international actors to create partnerships, mainly in the areas of information accessibility for farmers, through the following actions (PARM, 2017c):
• Supporting the Centre for Agriculture and Biosciences International (CABI) in developing a comprehensive Plant Health Investment plan for Uganda of USD 24 million in five years to upgrade the Ugandan Plant Pest management system and make it sustainable, a proposal built on existing programmes and plans by the Ministry of Agriculture and other development partners;
• Endorsing a public-private partnership to enhance access to information and risk analysis for farmers and service providers. The proposal called Financial Information and Risk Management (FIRM) was developed by FIT Uganda (private agri-business consultant and developer), and AgriRiskAnalyser (developer of a risk assessment so"ware solution). to complement information system for financial institutions, service providers and farmers through: i) providing risk profiles of farmers that wish to access financial products and ii) make it accessible to all the stakeholders involved;
• A partnership on ARM capacity development has been developed with the support of PARM between Makerere University and the extension services of the Ministry of Agriculture. A"er the pilot ARM training facilitated by PARM, Makerere University is expected to run other ARM training targeting agriculture extension workers and non-state agricultural service providers.
Table 4 presents good practices and issues to consider for partnership and policy mainstreaming.
Table 4. Good practices and issues to consider for Pillar 4: Partnerships and policy integration
Good practices Issues to consider
• Identifying local actors already engaged in ARM and finding out their needs and possible complementarities with their work
• Building partnerships with different types of actors for enhanced effectiveness and sustainability
• Working with various ministries or with an inter-ministerial body/positioning ARM as a cross-cutting issue
• Finding a key resource person with successful experience in implementing ARM to promote it within the country/specific context
• Defining clearly the roles and responsibilities in partnerships
• Ensuring coherence at different levels and between the action of different actors (government, development partners)
• Try to synchronize ARM proposals with government budgeting and planning.
Source: Proceedings of the workshop “Agricultural Risk Management: practices and lessons learned for development”, 25 October 2017, International Fund for Agricultural Development (IFAD)

35 |
3.5. Pillar 5: Monitoring and evaluation
By definition a holistic approach to ARM is characterized by different and synchronized actions which effects and spillovers are difficult to disentangle. Direct results or impact of ARM tools cannot be easily established both in short- and long-term.
Tool monitoring and evaluation are however essential steps to understand the performance of ARM tools and strategy. Monitoring involves the routine surveillance of tool(s) or an overall strategy; evaluation implies a comparison between the outcomes or performance of the tools and strategy in place with their expected or required results.
It is important that information derived from M&E is adequately reported and updated. This process requires regular reporting, and clear performance indicators set when the ARM strategy is designed. For example, if pests and disease emerged as major risks, and pesticides are used at farm level, farmers should monitor how useful and effective the pesticides are on the crops under cultivation, and redefine the risk prioritization in the event that risk characteristics may change.
The evaluation of an ARM strategy, whether immediately ex-post or to look at the longer terms impacts, aims at determining whether the intervention has succeeded in strengthening the ARM capacities of farmers. This evaluation enables progress and potentially the comparison between several ARM initiatives based on their costs and benefits. The evaluation of public policies related to agricultural risk management is also necessary to guide government actions.
To extend the elements incorporated in this pillar, good practices and issues are also listed (Table 5).
Table 5. Good practices and issues to consider for Pillar 5: Monitoring and evaluation
Good practices Issues to consider
• Building a M&E system from the inception of the initiative (identify a baseline): defining clear indicators, timing and responsibility for data collection
• Collecting age and sex-disaggregated data to assess the effectiveness of the tool(s) for different groups
• Raising awareness of stakeholders on the importance of record keeping and monitoring
• Considering external factors to contextualise impact
• Developing a qualitative approach for some activities that are difficult to monitor quantitatively (e.g. capacity building)
Source: Proceedings of the workshop “Agricultural Risk Management: practices and lessons learned for development”, 25 October 2017, International Fund for Agricultural Development (IFAD)

| 36
ReferencesConstas M. and Barrett C., Principles of resilience measurement for food insecurity: metrics, mechanisms, and implementation plans. Paper presented at the Expert Consultation on Resilience Measurement Related to Food Security sponsored by the Food and Agricultural Organization (FAO) and the World Food Programme (WFP), Rome, February 19-21, 2013.
Food and Agriculture Organization of the UN. The impact of natural hazards and disasters on agriculture and food security and nutrition, Rome, 2015 http://www.fao.org/3/a-i4434e.pdf
Organisation for Economic Co-operation and Development. Managing Risks in Agriculture: a Holistic Approach, Paris, 2009.
Platform for Agricultural Risk Management. Agricultural Risk Assessment Study in Uganda, Rome, 2015.
Platform for Agricultural Risk Management. Evaluation des risques agricoles au Niger; Focus sur l’accès des petits producteurs aux services financiers, aux marchés et à l’information, Rome, 2016a.
Platform for Agricultural Risk Management. Information Systems for Agricultural Risk Management: Executive Summary Report, Rome, 2016b.
Platform for Agricultural Risk Management. Managing risks at farm level, Manual., Rome, 2017a.
Platform for Agricultural Risk Management. Crop pests and disease management in Uganda: status and investment needs, Rome,2017b.
Platform for Agricultural Risk Management. Uganda Final Report. Rome, 2017c.
Platform for Agricultural Risk Management. PARM Capacity Development Strategy, Rome, 2017d.
Platform for Agricultural Risk Management. Les transferts d’argent comme instrument de gestion des risques agricoles au Sénégal, 2018b (forthcoming).
Platform for Agricultural Risk Management. Agricultural Risk Management: practices and lessons learned for development, proceedings of the workshop, Rome, 25 October 2017.
Platform for Agricultural Risk Management. Agricultural Risk Assessment and Management for Food Security in Developing Countries, Rome, 2018a (forthcoming)
Timpane-Padgham B.L., Beechie T., Klinger T. A systematic review of ecological attributed that confer resilience to climate change in environmental restoration. PLoS ONE 12(3), 2017: e0173812. https://doi.org/10.1371/journal.pone.0173812.
Walker B, Holling C.S., Carpenter S.R., Kinzig A. Resilience, adaptability and transformability in social-ecological systems. Ecology and society, Vol. 9, n.2, 2004.
World Bank. Agricultural Sector Risk Assessment: Methodological Guidance for Practitioners. World Bank Group, Washington, 2016.
4. ConclusionsA holistic and long-term approach to ARM is necessary, as this allows agricultural stakeholders involved to become aware, empowered and resilient to agricultural risk. A two-way relation exists between ARM and resilience: ARM practices aim to mitigate negative shocks and boost resilience and, at the same time, understanding resilience can contribute to build more grounded ARM strategies.
PARM offers a platform to develop appropriate practices and policy solutions to assist stakeholders, in particular farmers and governments, in responding to the range of risks they face. Through a participatory approach, PARM has identified five pillars that should be included in a project aiming at reducing agricultural risks and/or limiting consequences of the negative shocks.
In order to guarantee the success of ARM initiatives, some substantial questions remain to be addressed. These include for example the scalability of ARM proofed projects and the adaptability of ARM technology to stakeholder’s realities, since different contexts and external validity elements remain constraints to be handled.

37 |
Resilience of Immigrant StudentsFrancesca Borgonovi, Lucie Cerna, Alessandro FerraraOECD
AbstractThe paper examines immigrant students’ resilience, conceived as the capacity for successful adjustment despite experiencing adverse circumstances. Foreign-born students and the children of foreign-born parents o"en experience stress and trauma because of displacement, language barriers and cultural differences. They are also generally more likely to be subject to greater risk factors such as moving school because of precarious living and working conditions of their parents, to attend socio-economically disadvantaged schools, to have parents with less social, economic and cultural capital, and are more likely to be susceptible to the negative effects these conditions have for academic and broader well-being.
Drawing on the Programme of International Student Assessment (PISA), the paper develops in-depth analyses to examine immigrant students’ academic and broader adjustment and factors that are associated with individual differences in vulnerability to experiencing adversity, as well as their susceptibility to risk and protective factors so that they thrive in school and beyond. PISA data are unique because of the wide international coverage,
representativeness of samples and detailed standardised information on information processing skills, as well as social and emotional well-being. The paper classifies countries according to their ability to promote the overall adjustment of immigrant students, considering differences across countries in the make-up of their immigrant student population, including socio-economic conditions.
1. IntroductionMany OECD countries, especially in Europe, have seen a sharp increase in the number of immigrants entering their territories – including unprecedented numbers of asylum-seekers and children. An estimated 5 million permanent migrants arrived to OECD countries in 2015, an increase of about 20% relative to 2014, with family reunification and free movement accounting each for about a third of these entries. The recent wave of migration has reinforced a long and steady upward trend in the share of the immigrant population in OECD countries, which has grown by more than 30% and has become increasingly diverse since 2000. Accommodating the unprecedented inflows of migrant children into education systems is one of the key challenges that host countries will face in the upcoming years. The response of education systems to migration shocks has immediate consequences on the public perception of countries’ abilities to cope with migration flows but it also impacts the long-term economic and social consequences of migration.
The ability of European societies to withstand the pressures to social cohesion posed by migration flows depend on the long-term integration of new arrivals, which includes both their capacity to adapt and become part of, labour markets and social networks in countries of destinations. Education is o"en considered an important element of migrant integration because it enables migrants to acquire skills that will lead them to enter the labour market and because education systems help migrants understand the cultural traditions of their country of destination.
Given the importance that academic success and social and emotional well-being play for the long term labour market and social outcomes of migrants, the aim of this paper is to
KeywordsResilience,
immigrant students, PISA, skills, well-being.
| 38
develop a framework to analyse and examine between-country differences in the outcomes of immigrant students. The paper uses the framework of resilience to identify how countries can promote immigrants’ long-term integration prospects through education.
1. The resilience of immigrant students Past research on student resilience arose from empirical research in education identifying large socio-economic disparities in academic achievement (Coleman et al., 1966; Crane, 1996; Sutton and Soderstrom, 1999; Martin et al., 2012; Mullis et al., 2012; OECD, 2011; Sandoval-Hernandez and Cortes, 2012; Sirin, 2005). Although most applied work identifies socio-economic disadvantage as a risk factor for poor academic performance, some disadvantaged students beat the odds against them and achieve good academic outcomes despite their background. Resilience research attempts to determine whether certain factors are related to the ability of some disadvantaged students to achieve academically.
Resilience in this paper is conceived as the capacity for successful adjustment despite experiencing adverse circumstances. Successful adjustment is operationalised as the capacity of students to reach baseline levels of academic proficiency, as well as motivational and social and emotional well-being. Foreign-born students and the children of foreign-born parents are exposed to adverse circumstances because they o"en experience stress and trauma because of displacement, language barriers and cultural differences. They are also more likely to be subject to greater risk factors such as moving school because of precarious living and working conditions of their parents, to attend socio-economically disadvantaged schools, to have parents with less social, economic and cultural capital, and are more likely to be susceptible to the negative effects these conditions have for academic and broader well-being.
The programme identifies how data from the Programme of International Student Assessment (PISA) can be used to characterise the extent to which different countries are able to promote the resilience of immigrant students.
In recognising that education systems should strive to promote academic achievement and students’ well-being, the paper is concerned with academic, social and emotional resilience, i.e. students’ ability to achieve at least baseline levels of performance in the core PISA subjects (science, reading and mathematics), their sense of belonging at school and their satisfaction with life.
© iS
tock
.com
Raw
pixe
l

39 |
1.1 Analytical Framework
Figure 1 illustrates the key elements that we identify as characterising resilience and how they relate to each other.
Figure 1. A graphical description of the elements characterising resilience
Adversity Adjustment
Riskfactors
Protectivefactors
Vulnerability
Adversity refers to the process of international migration as it applies to the group of students who either have directly experienced the difficulties associated with having to settle in a new country or have parents who did. While people migrate out of the hope to build a better life for themselves and their loved ones, the act of displacement forces individuals to adapt to a new reality. It can break or loosen individuals’ connectedness with their community, and forces them to create new social networks and learn new ways of being and behaving in their host community. Many migrants have to learn a new language; others may face economic hardship and find it difficult to access welfare and social services. Many have fled war, political insecurity or persecution.
Adjustment refers to children’s positive adaptation. Since this study focuses on the role education systems can play in integrating immigrant students, the measures of adjustment considered here reflect the goals and roles of education systems. Thus, in this report, adjustment is manifested in students’ acquisition of academic skills and in their social and emotional well-being. These are key determinants of immigrant children’s current well-being. Moreover, they are key indicators of these children’s capacity to thrive economically, socially and emotionally as adults.
Vulnerability refers to the likelihood that immigrant students will be able to acquire key academic skills and report good levels of social and emotional well-being. Implicit in the concept of vulnerability is a comparison with students who did not experience adversity because they or their families do not have an immigrant background.
Risk and protective factors refer to all individual, household, school and system-level characteristics that influence vulnerability because they explain the degree to which immigrant students can be expected to have acquired academic skills and to report social and emotional well-being. The paper considers two mechanisms through which risk and protective factors can determine immigrant students’ outcomes: the extent to which immigrant students are more or less exposed to risk and protective factors than native-born students are, and the extent to which risk and protective factors are differently related to outcomes, depending on students’ immigrant background.

| 40
2.1.1. Adversity
Migration is a life-changing experience that fundamentally reshapes individuals’ lives. Researchers identify key stressors that are associated with moving and settling in a new country, including the loss of close relationships and social networks, housing problems, obtaining legal documentation, learning a new language, changing family roles, and adjusting to new school systems and labour markets (Garza, Reyes and Trueba, 2004; Igoa, 1995; Portes and Rumbaut, 2001; Suarez-Orozco and Suarez-Orozco, 2001; Zhou, 1997). Immigrant children, as dependents of their parents, rarely have much to say about the decision to migrate. They follow their families and bear both the positive and negative consequences of migration (Suarez-Orozco and Suarez-Orozco, 2001). In fact, the hope to build a better future for their children is usually what drives families to migrate to a new country in the first place.
We consider two key factors that determine the type of adversity immigrant children might suffer: whether the child directly experienced migration or whether the child’s parents did.
2.1.2 Adjustment
Key to resilience research is conceptualising and measuring adjustment (Masten, 2011; Rutter, 2012a; Ungar, 2011). Individuals are generally considered to be resilient if they experienced adversity but have “better-than-expected” outcomes. While one line of research has conceptualised “better-than-expected” as achieving a baseline level that is generally not achieved by individuals who have faced hardships (McCormick, Kuo and Masten, 2011), others have considered “better-than-expected” as implying achievement well above the average level of outcomes in various domains.
Identifying the threshold above which an individual facing adversity should be considered as resilient, and the outcomes considered when defining adjustment have important implications for designing the policies and programmes that can mitigate the negative consequences of adversity. Research on student resilience, particularly cross-country research designed to identify the role of education systems (OECD, 2011), considers positive adjustment in terms of subject-specific academic skills. It defines “better-than-expected” outcomes in terms of students’ ability to excel academically despite the hardships they face. The seminal report on student resilience, which introduced the concept of resilience in the context of PISA – Against the Odds: Disadvantaged Students Who Succeed in School (OECD, 2011) – defines student resilience as the ability of students in the bottom quarter of the national distribution of socio-economic status to perform in the top quarter of the international distribution of subject-specific performance, discounted for the association, at the international level, between socio-economic status and subject-specific performance.
We define resilience as students’ ability to acquire a strong foundation in the core subjects of reading, mathematics and science – skills needed for a smooth transition from compulsory schooling into further education, training or the labour market. More specifically, positive adjustment requires that a student reaches PISA proficiency Level 2, considered to be the baseline level of proficiency, in those subjects. Longitudinal studies suggest that students who reach the PISA baseline level of proficiency do better in life than those who do not (OECD 2010; OECD 2012).
Yet, performance in standardised assessments has been found to explain only so much of students’ success later in life (Stankov 1999; Sternberg 1995). In fact, employment and full participation in society require much more than just cognitive abilities (Levin, 2012). Recent theoretical and methodological developments support the need to apply measures of well-being when assessing the efficiency of different policy interventions (see CAE, 2011, also known as the final report of the Stiglitz-Sen-Fitoussi Commission on the Measurement of Economic Performance and Social Progress); academic results represent only one dimension of student well-being (Borgonovi and Pal, 2016). Consequently, education systems should also be evaluated in terms of their capacity to develop all aspects of human potential.
Adaptation therefore encompasses not only students’ ability to achieve a baseline level of skills in all core academic subjects, but also their ability to attain baseline levels of

41 |
self-reported satisfaction with life and social integration. Figure 2 shows the outcomes considered in this study.
Figure 2. Adjustment as a multidimensional outcome
AcademicProficiency Level 2
in reading, mathematics and science
SocialSense of belonging
EmotionalLife
satisfaction
2.1.3 Vulnerability: Risk and protective factors
Immigrant children are at risk of suffering poor educational outcomes (Fazel and Stein, 2002; Williams, 1991; Wolff and Fesseha, 1999). However, not all do and some children cope successfully in spite of facing adversity (Rutter, 2000; Masten, 2001; Ungar, 2005). A key objective of this report is to replace a “deficit model” of immigrant students, in which these students are perceived as a liability for host countries, with a “resource model”, in which these students are regarded as potential contributors to their host communities.
The study of resilience is essentially the study of individuals’ unique capacity to beat the odds that are stacked against them and overcome disadvantage and adversity. Individuals vary in their ability to overcome disadvantage because of their willingness and ability to mobilise their own psychological and physical resources, and the resources available in their social and physical environment (Wong, 2008). In other words, in order to understand why student outcomes differ even when students experience similar types of disadvantage, it is important to identify the personality characteristics and environmental resources that moderate the negative effects of stress (Bernard, 1995; Masten, 1994; Werner and Smith, 1992).
In most cases, researchers identify three sets of risk and protective factors that moderate the effects of adversity and promote academic resilience: attributes of the children themselves; characteristics of their families; and attributes of their wider social environment, which encompasses the school, the neighbourhood and the wider community (Masten and Garmezy, 1985; Werner and Smith, 1982, 1992). Resilience research has shown that some of the risk factors that are generally associated with increased vulnerability to adversity, if experienced at particular times, at specific degrees, and at times during which individuals have sufficient coping mechanisms, can have unexpected “steeling effects” and reduce vulnerability (Rutter, 2012b). Just as vaccinations protect individuals from specific diseases by prompting immune systems’ production of antibodies, so manageable risk factors can help individuals develop effective coping mechanisms. Risk and protective factors are of multilevel nature, ranging from individual, family, school, neighbourhood to system-level factors.
Lerner (2006) argues that the study of resilience requires a multidimensional approach because resilience involves the interaction between individuals and their social and institutional environments. Individual attributes refer to children’s characteristics and experiences, family attributes refer to socioeconomic background and parenting related issues, whereas the extra-familial level includes neighbourhood, school and system level related factors (Rutter, 2000; Masten, 2001; Fraser, 2004; Luthar and Cicchetti, 2000).
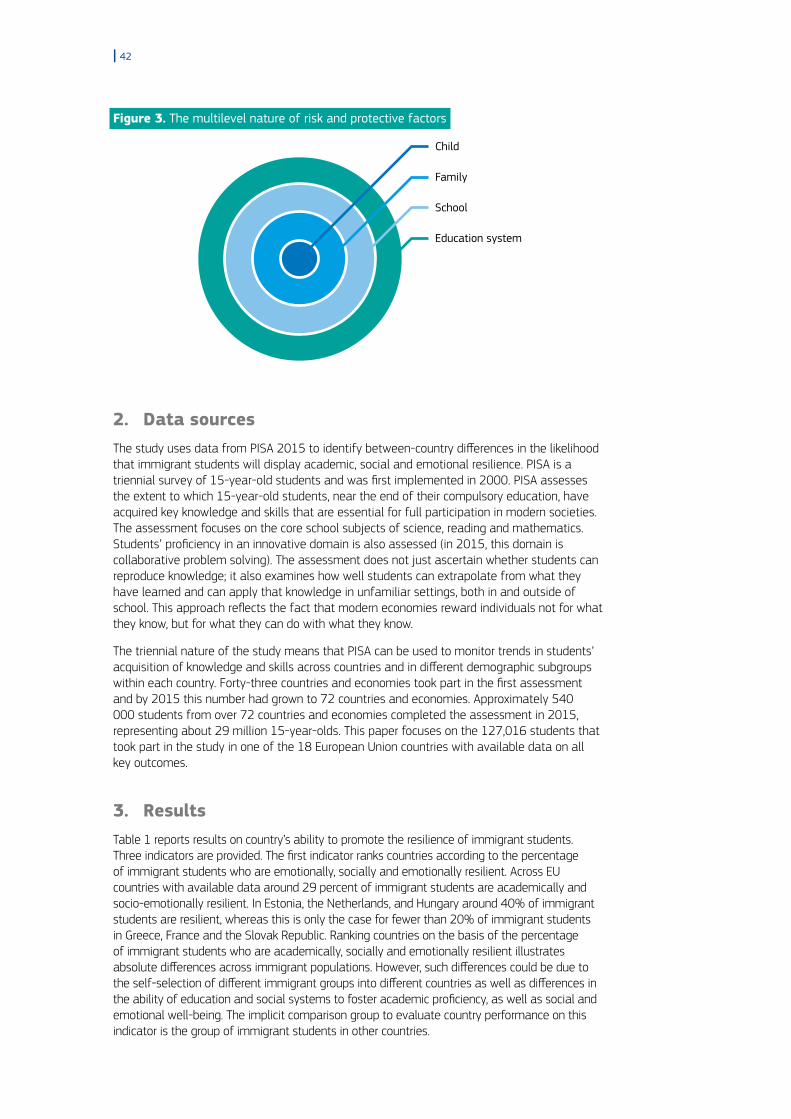
| 42
Figure 3. The multilevel nature of risk and protective factors
Child
Family
School
Education system
2. Data sourcesThe study uses data from PISA 2015 to identify between-country differences in the likelihood that immigrant students will display academic, social and emotional resilience. PISA is a triennial survey of 15-year-old students and was first implemented in 2000. PISA assesses the extent to which 15-year-old students, near the end of their compulsory education, have acquired key knowledge and skills that are essential for full participation in modern societies. The assessment focuses on the core school subjects of science, reading and mathematics. Students’ proficiency in an innovative domain is also assessed (in 2015, this domain is collaborative problem solving). The assessment does not just ascertain whether students can reproduce knowledge; it also examines how well students can extrapolate from what they have learned and can apply that knowledge in unfamiliar settings, both in and outside of school. This approach reflects the fact that modern economies reward individuals not for what they know, but for what they can do with what they know.
The triennial nature of the study means that PISA can be used to monitor trends in students’ acquisition of knowledge and skills across countries and in different demographic subgroups within each country. Forty-three countries and economies took part in the first assessment and by 2015 this number had grown to 72 countries and economies. Approximately 540 000 students from over 72 countries and economies completed the assessment in 2015, representing about 29 million 15-year-olds. This paper focuses on the 127,016 students that took part in the study in one of the 18 European Union countries with available data on all key outcomes.
3. ResultsTable 1 reports results on country’s ability to promote the resilience of immigrant students. Three indicators are provided. The first indicator ranks countries according to the percentage of immigrant students who are emotionally, socially and emotionally resilient. Across EU countries with available data around 29 percent of immigrant students are academically and socio-emotionally resilient. In Estonia, the Netherlands, and Hungary around 40% of immigrant students are resilient, whereas this is only the case for fewer than 20% of immigrant students in Greece, France and the Slovak Republic. Ranking countries on the basis of the percentage of immigrant students who are academically, socially and emotionally resilient illustrates absolute differences across immigrant populations. However, such differences could be due to the self-selection of different immigrant groups into different countries as well as differences in the ability of education and social systems to foster academic proficiency, as well as social and emotional well-being. The implicit comparison group to evaluate country performance on this indicator is the group of immigrant students in other countries.

43 |
The second indicator ranks countries according to the difference in the likelihood that immigrant and native students will reach baseline levels of academic proficiency and social and emotional well-being. This indicator helps to identify if countries give immigrant students the same opportunities that they give native students. Table 1 shows that relative rankings differ considerably when countries are evaluated on the relative gap between immigrant and native students. The gap between native students who attain baseline levels in academic and socio-emotional outcomes and immigrant students who are academically and socio-emotionally resilient is particularly pronounced in countries such as Finland (23 % points difference), the Slovak Republic (22 % points difference), Spain (20 % points difference) and Austria (18 % points difference).
Table 1. Percentage of immigrant students who are academically and socio-emotionally resilient and native students who attain baseline levelsin academic and socio-emotional outcomes
Country 1. Immigrant students
2. Native-immigrant gap (immigrant — native)
2. Native-immigrant gap accounting for socio-economic background
Ranking on 1st indicators
Ranking on 2nd indicators
Ranking on 3rd indicators
% S. E. % point diff. S. E. % point diff. S. E.
EU average 28.43 (0.63) -14.46 (0.67) -11.02 (0.66)
Austria 27.85 (1.80) -18.16 (2.06) -10.87 (2.10) 11 15 10
Belgium 22.09 (2.07) -10.30 (2.26) -5.46 (2.37) 14 4 2
Czech Republic
23.25 (4.00) -13.12 (4.00) -11.92 (3.92) 13 8 12
Estonia 39.38 (2.23) -13.29 (2.35) -12.93 (2.29) 2 9 14
Finland 35.15 (3.61) -23.08 (3.79) -17.85 (3.59) 4 18 17
France 17.07 (1.81) -9.26 (1.99) -1.92 (1.91) 17 2 1
Germany 31.41 (2.25) -15.76 (2.28) -10.64 (2.28) 8 12 9
Greece 19.57 (2.49) -15.88 (2.78) -9.39 (2.91) 16 13 7
Ireland 38.06 (2.00) -9.51 (2.09) -10.12 (2.08) 3 3 8
Italy 21.14 (1.84) -12.31 (1.95) -8.68 (1.94) 15 7 6
Latvia 34.17 (3.22) -10.54 (3.52) -13.38 (3.36) 5 5 15
Luxembourg 27.87 (0.95) -15.28 (1.51) -8.12 (1.61) 10 10 5
Netherlands 42.53 (3.50) -15.39 (3.59) -7.84 (3.48) 1 11 4
Portugal 33.28 (2.43) -11.83 (2.59) -11.70 (2.56) 6 6 11
Slovakia 11.07 (4.47) -22.34 (4.51) -23.30 (4.81) 18 17 18
Slovenia 25.77 (2.69) -16.59 (2.97) -12.66 (3.01) 12 14 13
Spain 31.75 (1.96) -20.11 (2.20) -15.09 (2.11) 7 16 16
United Kingdom
30.39 (2.17) -7.53 (2.34) -6.45 (2.17) 9 1 3
Notes: Statistically significant differences are marked in a darker tone. Countries are sorted by the percentage of resilient immigrant students. Immigrant students who are academically resilient are students who reach at least PISA proficiency level two in all three PISA core subjects: mathematics, reading and science. Students who are academically socio-emotionally resilient are students who: 1) reported that the “agree” or “strongly agree” with the statement “I feel like I belong in school” and “disagree” or “strongly disagree” with the statement “I feel like an outsider at school” and 2) who reported a life satisfaction level of 7, on a scale from 1 to 10. These are compared with native students attaining baseline levels of academic proficiency, who report a sense of belonging at school and being satisfied with life.Figures for Denmark and Sweden are not reported because the question of life satisfaction was not asked in the country. Figures for Poland and Hungary are not shown because the number of immigrant students is too low to guarantee reliable estimates. Immigrant students are students who have two foreign-born parents, irrespective of their place of birth.
Source: OECD, PISA 2015 Database.

| 44
The third indicator proposed to evaluate countries’ readiness to promote the resilience of immigrant students is the difference in the likelihood of reaching baseline outcomes between immigrant and native students with a similar socio-economic background. A rich literature indicates that immigrant students have a disadvantaged socio-economic background (Bianchi et al., 2004; Feinstein, Duchworth and Sabates, 2008; Marks, 2006; Martin, 1998; Portes and MacLeod, 1996; Schmidt et al. 2015). Table 1 suggests that, a"er accounting for socio-economic background, the native-immigrant gap remains high in countries such as the Slovak Republic (23% point difference) and Finland (18% point difference), whereas the gap is the lowest in Belgium (5.5% point difference) and the United Kingdom (6.5% point difference). In most EU countries, the native-immigrant gap decreases when socio-economic condition is accounted for. In Austria, France, Luxembourg and the Netherlands, the gap shrinks by more than seven percentage points. However, in some countries (e.g. Slovak Republic, Ireland, Latvia) the gap increases when accounting for socio-economic background.
4. ConclusionsThe paper has examined immigrant students’ resilience, conceived as the capacity for successful adjustment despite experiencing adverse circumstances. Successful adjustment was operationalised as the capacity of students to reach baseline levels of academic proficiency, as well as social and emotional well-being. The paper illustrates that evaluating countries’ readiness to promote immigrant students’ resilience depend, to a large extent, on the specific measure used, thereby suggesting that most countries need to improve on some dimensions.
When considering the overall results of immigrant students, Estonia and the Netherlands are the best performing countries in the EU, with around 40% of immigrant students classified as resilient. By contrast, Greece, France and the Slovak Republic are the worst performers with only around 20% of immigrant students who are resilient.
However, France, Ireland and the United Kingdom are the top performers when success is evaluated on the basis of the gap in the likelihood of reaching baseline levels of academic proficiency, social and emotional well-being between immigrant and native students. Such gap is particularly pronounced in Finland, the Slovak Republic, Spain and Austria. When immigrant and native students of similar socio-economic condition are compared, the United Kingdom and Belgium are the best performers while Finland and the Slovak Republic are the lowest achievers.
Country rankings differ according to which outcome indicator is used. For example, the Netherlands ranks number 1 when considering the percentage of resilient immigrant students, number 11 when the gap between native students is considered, and number 4 when immigrant and native students of similar socio-economic backgrounds are compared.
The forthcoming OECD report “The resilience of immigrant students: risk and protective factors that shape immigrant students’ well-being” will explore in detail reasons behind the rankings identified, immigrants’ relative disadvantage in academic, social and emotional dimensions and what factors ultimately help immigrant students beat the odds and be resilient.

45 |
ReferencesBernard, B. (1995), Fostering resiliency in kids: Protective factors in the family school and community, West Ed Regional Educational Laboratory, San Francisco.
Bianchi, S. et al. (2004), “Inequality in parental investment in child-rearing: Expenditures, time and health”, in K. Neckerman (ed.), Social Inequality, pp. 189-219, Russell Sage Foundation, New York, NY.
Borgonovi, F. and J. Pál (2016), “A Framework for the Analysis of Student Well-Being in the PISA 2015 Study: Being 15 In 2015”, OECD Education Working Papers, No. 140, OECD Publishing, Paris. http://dx.doi.org/10.1787/5jlpszwghvvb-en
CAE (2011), Report by the Commission on the Measurement of Economic Performance and Social Progress, European Commission. http://ec.europa.eu/eurostat/documents/118025/118123/Fitoussi+Commission+report
Coleman, J. S. et al. (1966), Equality of Educational Opportunity, U.S. Department of Health, Education, & Welfare, Washington, DC.
Crane, J. (1996), “Effects of home background, SES, and maternal test scores on mathematics achievement” Journal of Educational Research, 89(5), 305-314.
Fazel, M., and A. Stein (2002), “The mental health of refugee children”, Archives of disease in childhood, 87(5), 366-370.
Feinstein, L., K. Duckworth and R. Sabates (2008), Education and the Family: Passing Success across the Generations, Routledge, London, United Kingdom.
Fraser, Mark (2004), “The ecology of childhood: A multisystems perspective” in Fraser, Mark (2004) (ed), Risk and resilience in childhood. An ecological perspective, National Association of Social Workers, Washington DC.
Garza, E., P. Reyes and E. Trueba (2004), Resiliency and success: Migrant children in the United States, Paradigm, Boulder, CO.
Igoa, 1995. Igoa, C. (1995), The inner world of the immigrant child, Lawrence Erlbaum, Mahwah, NJ.
Lerner, R. M. (2006), “Developmental science, developmental systems, and contemporary theories of human development”, in W. Damon & R. M. Lerner (Series Eds.) & R. M. Lerner (Vol. Ed.), Handbook of child psychology: Vol 1. Theoretical models of human development, 6th ed., pp. 1–17, Wiley, Hoboken, NJ.
Levin, H. (2012), “More than just test scores”, Prospects 42(3), pp. 269-284.
Luthar, S. S., and D. Cicchetti (2000), The construct of resilience: Implications for interventions and social policies, Development and psychopathology, 12(04), 857-885.
Marks, G. (2006), “Accounting for immigrant non-immigrant differences in reading and mathematics in twenty countries”, Ethnic and Racial Studies 28(5), pp. 925-946.
Martin, J. (1978), The Migrant Presence. Sydney: George Allen & Unwin.
Martin, M.O. et al. (2012), TIMSS 2011 international results in science, TIMSS & PIRLS International Study Center, Boston College, Chestnut Hill, MA.
Masten, A. and N. Garmezy (1985), “Risk, vulnerability, and protective factors in developmental psychopathology”, in B. Lahey & A. Kazdin (Eds.), Advances in clinical child psychology, Vol. 8, pp. 1–52, Plenum Press, New York.
Masten, A.S. (1994), “Resilience in individual development: Successful adaptation despite risk and adversity”, in M. C. Wang & E.W. Gordon (Eds.), Educational resilience in inner-city America: Challenges and prospects, pp. 3-25, Lawrence Erlbaum, Hillsdale, NJ.
Masten, A. S. (2001), “Ordinary magic: Resilience processes in development”, American Psychologist, 56, 227–238. doi:10.1037//0003-066X.56.3.227
Masten, A. (2011), “Resilience in children threatened by extreme adversity: Frameworks for research, practice, and translational synergy”, Development and Psychopathology, 23, 493–506.
McCormick, C. M., S. I.-C. Kuo and A.S. Masten (2011), “Developmental tasks across the lifespan”, in K. L. Fingerman, C. Berg, T. C. Antonucci, & J. Smith (Eds.), The handbook of lifespan development, Springer, New York, NY.
Mullis, I.V.S. et al. (2012), TIMSS 2011 international results in mathematics, TIMSS & PIRLS International Study Center, Boston College, Chestnut Hill, MA.
OECD (2010), Pathways to Success: How Knowledge and Skills at Age 15 Shape Future Lives in Canada, OECD Publishing, Paris, http://dx.doi.org/10.1787/9789264081925-en.
OECD (2011), Against the Odds: Disadvantaged Students Who Succeed in School, OECD Publishing, Paris. http://dx.doi. org/10.1787/9789264090873-en
OECD (2012), Learning beyond Fi!een: Ten Years a!er PISA, OECD Publishing, Paris, http://dx.doi.org/10.1787/9789264172104-en.
OECD (forthcoming), The Resilience of Immigrant Students: Risk and protective factors that shape immigrant students’ well-being, OECD Publishing, Paris.
Portes, A. and MacLeod, D. (1996), “Educational progress of children of immigrants: the roles of class, ethnicity and school context”, Sociology of Education 69(4), pp. 255-275.

| 46
Portes, A., and R.G. Rumbaut (2001), Legacies: The story of the immigrant second generations. University of California Press, Berkeley.
Rutter, M. (2000), “Resilience Reconsidered: Conceptual Considerations, Empirical findings, and Policy Implications”, in J.P. Shonkoff and S.J. Meisels (eds) Handbook of Early Childhood intervention, Cambridge University Press.
Rutter, M. (2012a), “Resilience: Causal pathways and social ecology”, in M. Ungar (ed.), The social ecology of resilience: A handbook of theory and practice, pp. 33–42, Springer, New York.
Rutter, M. (2012b), “Resilience as a dynamic concept”, Development and Psychopathology 24, pp. 335–344.
Sandoval-Hernandez, A., and D. Cortes (2012), Factors and conditions that promote academic resilience: A cross-country perspective, Paper presented at the annual meeting of the 56th Annual Conference of the Comparative and International Education Society, Caribe Hilton, San Juan, Puerto Rico.
Schmidt, W.H. et al. (2015), “The role of schooling in perpetuating educational inequality: an international perspective”. Educational Researcher, Vol. 44/7, pp. 371-386, http://dx.doi.org/10.3102/0013189X15603982.
Sirin, S. R. (2005), “Socioeconomic status and academic achievement: A meta-analytic review of research”, Review of Educational Research, 75(3), pp. 417-453, http://dx.doi.org/10.3102/00346543075003417.
Stankov, L. (1999), “Mining on the “no man’s land” between intelligence and personality”, P.L Ackerman and P.C Kyllonen (eds.), Learning and Individual Differences: Process, Trait and Content
Determinants, American Psychological Association, Washington, DC, pp. 315–337.
Sternberg, R. (1995), “Diversifying instruction and assessment”, The Educational Forum 59(1), pp. 47-52.
Suarez-Orozco, C. and M.M. Suarez-Orozco, (2001), Children of immigration, Harvard University Press, Cambridge, MA.
Sutton, A. and I. Soderstrom (1999) “Predicting elementary and secondary school achievement with school-related and demographic factors”, Journal of Educational Research, 92(6), pp. 330-338.
Ungar, Michael (2005), “Resilience among children in child welfare, corrections, mental health and education settings: Recommendations for service Child & youth Care Forum”, 34 (6), December 2005 Springer Science + Business media Inc.
Ungar, M. (2011), “Community resilience for youth and families: Facilitative physical and social capital in contexts of adversity”, Children and Youth Social Services Review, 33, pp. 1742–1748.
Werner, E.E. and R.S. Smith (1982), Vulnerable but invincible: A longitudinal study of resilient children and youth, McGraw-Hill, New York.
Werner, E.E. and R.S. Smith, (1992), Overcoming the odds: High-risk children from birth to adulthood, Cornell University Pres, New York.
Williams, Carolyn (1991), “Primary prevention and the need for a public health approach”, in: Westermeyer, J., Williams, C.L., and Nguyen, A.N. (eds), Mental health service for refugees, US. Government Printing Office, Washington DC,
Wolff, P. and G. Fesseha (1999), “The orphans of Eritrea. A five- year follow up study”, Journal of Child Psychiatry, Vol. 40, No 8 Cambridge University Press www.sou.gov.se/barniasylproc/dokument/ud_asylum_060918.pdf
Wong, D. F. K. (2008), ‘Differential impacts of stressful life events and social support on the mental health of mainland Chinese immigrant and local youth in Hong Kong: A resilience perspective”, British Journal of Social Work, 38(2), pp. 236–52.
Zhou, M. (1997), “Growing up American: The challenge of immigrant children and children of immigrants”, Annual Review of Sociology, 23, pp. 63-95.

47 |
Community Resilience Assessment using Discrete Finite ElementsHussam Mahmoud1 and Akshat Chulahwat2, 1 Associate Professor, Colorado State University, Fort Collins, CO 80523, Email: [email protected], 2 Graduate Ph.D. Student, Colorado State University, Fort Collins, CO 80523, Email: [email protected]
AbstractIn this study, we present a dynamic theoretical model for quantifying community resilience that integrates infrastructural, social, and economic sectors. The underlying fundamentals of the proposed theory hinges on the principle of a damped harmonic oscillator by assuming the behavior of a community in response to a hazard is equivalent to the response of a vibrating mass of finite stiffness and damping. The dynamic model is implemented through the development of a finite element formulation capable of quantifying resilience both temporally and spatially. The finite element model is further utilized to devise a new hazard-agnostic definition of community resilience, which is demonstrated through logical verification
tests conducted on a fictitous. Through various analysis and sensitivity studies, it is observed that the model can be used to identify vulnerable areas in a community as well as provide a spatial and temporal measure of community resilience for various types of hazards such as physical disruptions and even social disorder.
1. IntroductionAt present, cities around the world have higher population density than rural areas (Swiss Reinsurance Company 2013; Census Bureau, 2013). As a result, the increasing number of man-made and natural hazards suggests an increase in population vulnerability (Reinsurance Company 2013). It is no longer possible to rely solely on performance design alone as a way to achieve community resilience. A community should not be just capable of minimizing damage against a hazard but should also be stable enough to recover quickly and efficiently from the damage sustained. The concept of ‘Resilience’, which is described as the ability of a community to withstand external shocks to its population and/or infrastructure and to recover from such shocks efficiently and effectively (Timmerman 1981; Pimm 1984). In light of increased risk and advancements in civil engineering a paradigm shi" in structural design philosophy is required which would combine structural engineering with the essential social and economic features of community in an innovative frameworks that is capable of minimizing disruption to communities. Community in itself is quite complex as it cannot be considered a single entity; instead, it is a collaboration of several essential units which work together to sustain the inhabitants. Each of these units is being studied extensively and some researches have provided a sound foundation for future developments in the direction of community resilience.
There are fundamental studies regarding community resilience (Miles and Chang 2006; Twigg 2009 Cutter et al. 2010 McAllister 2015); however most of the studies target only a specific part of community resilience; hence the prime issue of quantifying community resilience
KeywordsResilience,
Community, Finite element.

| 48
still eludes us. A community can be considered analogous to a multi-cellular organism as it also comprises of several sub-units which work in tandem with each other to ensure proper functioning. Due to its complex nature it is quite difficult to develop a quantitative approach that can encapsulate the nuances of community resilience while providing a holistic framework that is practical enough to be implemented on large-scale such as towns and cities. Current studies pertaining to community resilience, while provide valuable contribution, share a trait of commonality that each study approaches the problem of community resilience by means of a Bottom-up approach. In this study, the authors present a novel spatial and temporal model of studying community resilience using a new finite element model of resileicne (FEAR).
2. Finite Element Analytical model of Resilience (FEAR)The FEM framework was developed by first formulating a set of base differential equations describing the variation in behaviour of the lifeline systems, both temporally and spatially. Eq. 1 shows the generalized coupled second order differential equation for nth degree of freedom or lifeline system. The concept of this generalized differential equation is derived from the general 2-D wave propagation equation and it resembles the differential equation of a 2-D vibrating plate. The le"-hand side term is the Laplacian of the disturbance in the nth lifeline system which varies equally in both x and y-directions in proportion to the effective stability/functioning (ΣN
l=1 Knl) of the respective lifeline system. The effective stability is the integral stability of the system reduced by the sum of the interdependency terms. The right-hand side terms are the force, damping and mass terms, which represents the relative damage, long-term economic investment and a combination of social vulnerability index and short-term economic investment of each lifeline system. Detailed discussion for the specificity of this representation can be found in Mahmoud and Chulahwat (2017).
All performance parameters involved were formulated to be dimensionless. The independent variables of the equations were normalized by the maximum damage incurred to all lifelines (in terms of $). The independent variables x and y were normalized by the maximum distance in x and y directions, and time t was normalized by a reference time measure.
© iS
tock
.com
/pat
pitc
haya
(1)

49 |
The coupled differential equation given by Eq. 1 was used to derive the ‘weak form’ using the Ritz-Galerkin method for the FE formulation of the resiliency model. The weak form was solved by discretization, using a custom 4-node planar iso-parametric element approximation. The custom 4-node element represents 6 degrees of freedom at each of the 4 boundary nodes. On discretization, the respective stiffness, damping and mass matrices for N lifeline systems were derived by Eq. 2, 3, 4 and the force/disruption matrix was derived by Eq. 5. In these equations, ψinl and ψjnl are the ith and jth shape functions, and Mnl, Cnl, Knl and Fn are the economic vulnerability, economic investment, infrastructure robustness and interdependencies, and Monetary damage values of disruption, respectively, for nth lifeline. The local element matrices are assembled into a global matrix for each parameter to obtain a set of coupled differential equations representing each node. These are solved using the Newmark method (Newmark, 1959), to obtain the normalized nodal disruption curve for each node (Xi /F).
(2)
(3)
(4)
(5)
The initial displacements/disruptions, required for solving the coupled equations are obtained from Eq. 6, where [Kglobal], [Fglobal] and [XI] are the global infrastructure matrix, initial disruptions vector for each node, and global damage vector for each node. The initial velocity is assumed to be zero to keep the analysis on the conservative side and the initial acceleration is obtained from the initial disruption using Eq. 7.
(6)
(7)
3. Results and discussionsCommunity in itself is quite complex as it cannot be considered a single entity, instead, it is a collaboration of several essential units which work together to sustain the masses. These important sub-units can be referred to as the ‘lifelines’, which are critical to the proper functioning of a community. The lifelines can be classified into two categories – physical and social systems, based on their functioning purpose. The physical systems are the ones which provide the necessary physical infrastructure for the proper functioning of a community, for instance – energy network, water and wastewater system, and transportation network. The social systems on the other hand tend to focus on providing a stable social structure to the community by empowering the masses and improving their resilience. These two systems work in collaboration with each other to increase a community’s resilience and enable it to withstand and recover from a hazard. The following 6 lifeline systems were considered in this study to describe the proposed theory; however any number of sub-systems can be used in the formulation.
1. Medical Sector (Physical System)
2. Water Sector (Physical System)
3. Housing System (Physical System)
4. Communication Sector (Social System)
5. Transport Sector (Physical System)
6. Power Sector (Physical System)

| 50
Figure 1. (a) Mesh layout for Island model and (b) loading locations
The model was tested on a hypothetical community shown in Figure 1(a), which is divided into 2 sections. There exists an isolated part of the community, which acts as an island to the rest of the community. The island or the isolated section of the community, is equipped with all the basic lifeline systems but the systems are not correlated to the systems of the rest of the community. For instance, if the power grid or the communication network of the outside community fails it will not have an effect on the island section as it has its own lifeline systems and vice-versa. The key aspect of the island model are the three bridges that isolate the island from the rest of the community. The stiffness matrix of the elements representing the infrastructure in the community were formulated as shown in Table 1. The bridges connecting the different regions are assumed to be identical to each other in terms of physical properties and are modeled using the matrix shown in Table 2. All lifelines, except the transportation lifeline, do not exist in these elements; hence, they are assigned a robustness (diagonal elements) of 1 and due to lack of any interdependencies, the off-diagonal terms are assigned as 0. The black cells shown in the figure represent empty cells which indicate a null matrix for that specific element and the black nodes represent fixed boundary nodes. Three loading cases were considered for the tests on the Island model:
Table 1. Infrastructure Matrix for community infrastructure
Lifelines Health Water Housing Communication Transportation PowerHealth 0.90 -0.17 -0.14 -0.07 -0.045 -0.18
Water -0.13 0.85 0.0 0.0 -0.11 -0.15
Housing -0.08 -0.12 0.72 0.0 -0.05 -0.19
Communication -0.16 0.0 0.0 0.80 -0.06 -0.21
Transportation -0.15 0.0 0.0 0.0 0.87 0.0
Power -0.12 0.0 0.0 -0.13 -0.16 0.82
Table 2. Infrastructure matrix for Bridge elements
Lifelines Health Water Housing Communication Transportation PowerHealth 1.0 0.0 0.0 0.0 0.0 0.0
Water 0.0 1.0 0.0 0.0 0.0 0.0
Housing 0.0 0.0 1.0 0.0 0.0 0.0
Communication 0.0 0.0 0.0 1.0 0.0 0.0
Transportation 0.0 0.0 0.0 0.0 0.5 0.0
Power 0.0 0.0 0.0 0.0 0.0 1.0
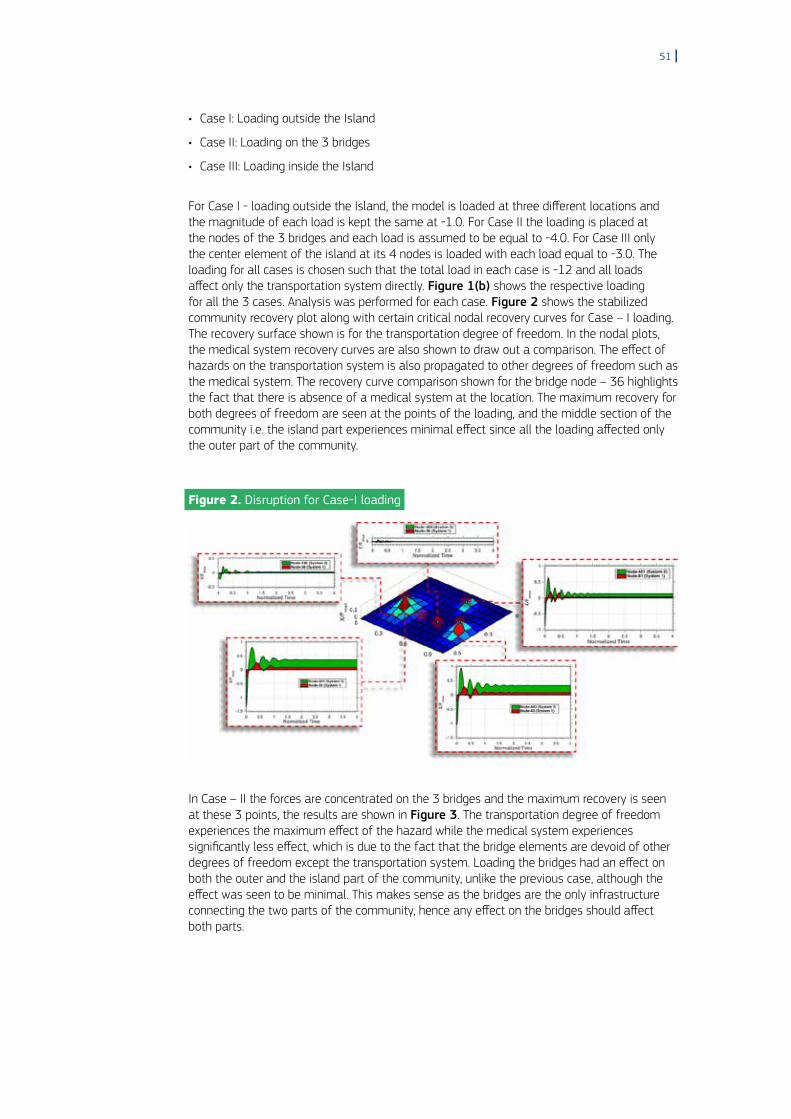
51 |
• Case I: Loading outside the Island
• Case II: Loading on the 3 bridges
• Case III: Loading inside the Island
For Case I - loading outside the Island, the model is loaded at three different locations and the magnitude of each load is kept the same at -1.0. For Case II the loading is placed at the nodes of the 3 bridges and each load is assumed to be equal to -4.0. For Case III only the center element of the island at its 4 nodes is loaded with each load equal to -3.0. The loading for all cases is chosen such that the total load in each case is -12 and all loads affect only the transportation system directly. Figure 1(b) shows the respective loading for all the 3 cases. Analysis was performed for each case. Figure 2 shows the stabilized community recovery plot along with certain critical nodal recovery curves for Case – I loading. The recovery surface shown is for the transportation degree of freedom. In the nodal plots, the medical system recovery curves are also shown to draw out a comparison. The effect of hazards on the transportation system is also propagated to other degrees of freedom such as the medical system. The recovery curve comparison shown for the bridge node – 36 highlights the fact that there is absence of a medical system at the location. The maximum recovery for both degrees of freedom are seen at the points of the loading, and the middle section of the community i.e. the island part experiences minimal effect since all the loading affected only the outer part of the community.
Figure 2. Disruption for Case-I loading
In Case – II the forces are concentrated on the 3 bridges and the maximum recovery is seen at these 3 points, the results are shown in Figure 3. The transportation degree of freedom experiences the maximum effect of the hazard while the medical system experiences significantly less effect, which is due to the fact that the bridge elements are devoid of other degrees of freedom except the transportation system. Loading the bridges had an effect on both the outer and the island part of the community, unlike the previous case, although the effect was seen to be minimal. This makes sense as the bridges are the only infrastructure connecting the two parts of the community, hence any effect on the bridges should affect both parts.

| 52
Figure 3. Disruption for Case-II loading
For the final case, only the island part experiences the hazard and the results are shown in Figure 4. As expected, the effect of the hazard is contained within the island due to the bridge elements. The nodes in the outer part display minimal effect from the hazard. This entire case study showcased an exam ple framework to model discontinuities among different degrees of freedom within a community and how they tend to affect the community as a whole. It also showed how each element in the FEAR model can be modified to account for absence of any degree of freedom. The results seen from the case study were in accordance with logical expectations as it clearly showed patterns that one would expect in such a community.
Figure 4. Disruption for Case-III loading

53 |
4. ConclusionIn this paper, we proposed a novel dynamic finite element model for resilience (FEAR) to quantify community resilience both temporally and spatially using traditional mechanics. The model takes into account the governing systems of a community and their correlations with each other. Only 6 key lifelines were incorporated – Health, Water, Housing, Communication, Transport and Energy Sectors; however the model can be modified easily to include any number of systems. Unlike, previous resilience models, the dynamic model not only considers Physical Infrastructure Stability but also 2 other key factors of resilience – Social Stability and Economic Investment, as well. The dynamic model evaluates recovery curves for a community for each system, but it assumes a single node representation of the entire community.
In the scope of this study, the proposed resilience model could not be verified on account of lack of data, however the above-mentioned tests gave a hint of the immense capabilities of the model. Quantification of resilience is quite a complex problem and the current models of resilience lack in their ability of capturing the complete picture. Certain detailed models are also being worked to quantify resilience which take into account a plethora of factors, however therein also lies limitations. These models are so intricate in nature that they can only be used by highly trained individuals and the amount of input data required increases the pre-processing time substantially in addition to the processing time required, as a result they cannot be used for emergency purposes. The FEAR. model on the other hand is a FE based model, hence it follows the same working principle as an FE so"ware. This makes the proposed model highly user-friendly and in addition, the input data required is not too significant as the model utilizes a presbyopic point of view i.e. it looks at the bigger picture and does not consider minute factors, or rather does not differentiate between them. Furthermore, the processing time of FEAR is a function of the mesh developed by the user for the community, hence it provides substantial flexibility in its use thereby making it quite suitable for emergency planning or preliminary investigation. This can be considered as a limitation of the proposed model as it gives the recovery only at respective nodes of the mesh, which represent a specific area. Therefore, the model cannot determine the local behaviour within the region covered by the node and neither can it give any information on systems except the ones incorporated in its formulation. However, as already mentioned before these issues can be resolved to some extent by modifying the mesh and by altering the FE formulation to include other systems.
In short, FEAR. is a unique simplistic resilience model as it is first of a kind to provide both temporal and spatial quantification of resilience while maintaining significant flexibility in its use.
ReferencesSwiss Reinsurance Company Ltd. (2013). Mind the Risk: A global ranking of cities under threat from natural disasters. Zurich.
U.S. Census Bureau (Producer). (2013). Growth in Urban Population Outpaces Rest of Nation, Census Bureau Reports. Census.gov.
Mahmoud, H. and Chulahwat, A. (2017). Spatial and Temporal Quantification of Community Resilience: Gotham City under Attack, Computer Aided Civil and Infrastructure Engineering, DOI: 10.1111/mice.12318.
Timmerman, P. (1981). “Vulnerability. Resilience and the collapse of society: A review of models and possible climatic applications.” Environmental Monograph, Institute for Environmental Studies, Univ. of Toronto, Canada.
Pimm, S. (1984). “The Complexity and Stability of Ecosystems.” Nature, 307(5949); 321–326.
Miles and Chang (2006) “Modeling community recovery from earthquakes,” Earthq. Spectra, 22(2): 439–458.
Twigg J. (2009). “Characteristics of a Disaster- Resilient Community: A Guidance Note,” 2nd ed., Disaster Risk Reduction Interagency Coordination Group, London.
Cutter, S. L. Burton, C.G., and Emrich, C.T. (2010) “Disaster resilience indictor for benchmarking baseline conditions.” J. Homeland Security and Emergency Management, 7(1): Article 51.
McAllister T. (2015) “Research Needs for Developing a Risk-Informed Methodology for Community Resilience,” Journal of Structural Engineering, 142(8)
| 54
Effect of Seismic Fragilities on Resilience Quantification of a Steel Hospital
Hussam Mahmoud1 and Emad M. Hassan2
1 Associate Professor, Colorado State University, Fort Collins, CO 80523, Email: [email protected], 2 Graduate Ph.D. Student, Colorado State University, Fort Collins, CO 80523, Email: [email protected]
AbstractNumerical finite element simulations are considered a reliable tool for response assessment of structures under earthquake loading. When developing finite elements models, various geometrical and behavioral assumptions are typically made to simplify the modeling approach so as to minimize the computational cost. The effect of these assumptions, however, on analysis results could be substantial. As a result, subsequent decision pertianing to design, assessment, or retrofit of the structure can be different depending on the numerical model used. This could particulalry be critical when the performance of the structure of interest is critical for the recovery of the community as would be in the case of a hospital for example. In this study, the seismic response of a six-story hospital building with buckling restrained braces located in Memphis, Tennessee, is evaluated for different modeling resolution levels. The object-oriented, so"ware framework OpenSees is used to evaluate the seismic perofrmance and develope fragility functions for all models. The models comprise of both 2D models of the lateral load resisting frames as well as 3D models of the entire structure. The models vary in their level of complexity in terms of connection charactrization, cyclic behavior representation, and soil-structure interaction idealization. The results highlight the importance of including representative member and connection models and the significance of performing 3D simulations as well as capturing the soil-structure interaction for accurate predictions of system response. The system fragilities are utilized to quantify the direct and indirect social and economic losses, which are then used to quantify the resilience, measured by recovery time, of the hospital building while accounting for the interdependency between the hospital and various infrastructure lifelines. The results show the substantial dependency of the outcome on the modeling approach utilized.
1. IntroductionResilience refers to the ability to recover functionality quickly and effectively a"er a mjoar event. To analytically quantify resilience of an infrastructure structural, non-structural, and content losses should be estimated. Determining these losses, however, depends on the developed fragility functions for the structure of interest. The fragilities represent the probability of exceeding a certain performance limit state for various levels of hazard intensities. Therefore, accurate development of fragility functions is critiical for ensuring proper esimation of losses and the subsequent functionality recovery curves. Fragilities can be estimated using empirical functions, experimental testing, expert judgment, numerical finite element analysis (FEA), or hybrid approaches. The most commonly relied upon approach for developing fragility functions is FEA. Undoubtedly, the FEA utilized will have an impact on
KeywordsModel performance, 3-D modeling, Soil-structure interaction, Hospital fragility, Resilience.

55 |
the produced results. Different levels of modeling resolutions have been used by researchers to estimate building fragilities (e.g. Kinali & Ellingwood, 2007; Xu & Gardoni, 2016). Nevertheless, the effect of the modeling level on the fragilities and system recovery are yet to be investigated.
In this study, different levels of finite element model resolutions are introduced and a comparison between their effect on fragilities, losses and resilience is evaluated. The models vary from “basic” that are commonly used by designers to “comprehensive” that are usually developed by researchers. The different models are subjected to a suite of earthquake excitations in an incremental dynamic analysis (IDA). The results of the dynamic analysis are then utilized to develop fragility functions for structural and the non-structural components of the building. In addition, the effect of modeling resolution of the hospital on the recovery and the resilience of other lifelines in a virtual community is investigate.
2. Building description and modellingThe subject building is a buckling restrained braced (BRB) hospital, which was professionally designed to develop cost premiums by comparing building design requirements found in national codes and current local codes, both with and without seismic requirements (NEHRP Consultants Joint Venture, 2013a, 2013b). The building, designed for Memphis, Tennessee, is six bays in the N-S direction and five bays in the E-W direction and is six stories in height, in addition to a basement floor. The typical by width is 9.14 m and the typical floor height is 4.27 m, except for the first floor which is 6.10 m high. The building foundation system is isolated footings for the interior columns and reinforced concrete rested on strip footings for the exterior columns. Five different finite element models are used to simulate the behaviour of the hospital building. The variations in the models encompass material modelling of the steel, BRBs element representation and their connections to the beams and columns, beam-to-column connection idealization for both pinned and rigid connections, and inclusion/exclusion of the supporting foundations and soil at the column bases. Table 1 summarizes the details of each model.
© iStock.com
/Francesco Scatena

| 56
Table 1. Different model components.
B-2D-NS 1 E-2D-NS 1 E-2D-WS 1 E-3D-NS 1 E-3D-WS 1
Material modeling of steel elements
Elastic-plastic w/o fatigue damage effect
Elastic-plastic with strain hardening and fatigue damage
BRB element Truss element and exclusion of the non-yielding zones
Beam-column element and inclusion of the non-yielding and connection zones
BRB-to-beam or to beam-column connection
Ture pin Initial stiffness and rotational capacity based on an analytical solution
Rigid connection Fully rigid Initial stiffness and rotational capacity are based on numerical modeling
Pinned and semi-rigid connection
Ture pin Initial stiffness and rotational capacity are based on numerical modeling and literature
Column bases Fully fixed Fully fixed Beam on Winkler soil
Fully fixed Beam on Winkler soil
1
Three different material models are used to model various elements including Steel02 for the steel elements, Concrete02 for the concrete members and Steel04 for the BRBs. However, the material’s strain hardening and low cycle fatigue effects are only implemented in the enhanced models as shown in Figure 1(a). The BRBs are divided into three different zones based on the expected behaviour of each zone. These are the connection zone, the non-yielding zone, and the yielding zone. The connection and the non-yielding zones are usually designed to be in the elastic range; however, the yielding zone is designed to yield. Therefore, both the connection and the non-yielding zones are modelled using elastic elements and the yielding zone is modelled using the Steel04 material as shown in Figure 1(b). Based on design drawings of the building (NEHRP Consultants Joint Venture, 2013b), four different connection types are used to attach the beams to the columns. These connections are rigid, semi-rigid, pinned and BRB connections. The BRB connections are modelled using different springs to capture the connection’s in-plane and out-of-plane stiffness and strength as shown in Figure 1(c). The methods proposed by Tsai and Hsiao (Tsai & Hsiao, 2008) and by Koetaka et al. (Koetaka, Kinoshita, Inoue, & Iitani, 2008) are utilized to obtain the in-plane and out-of-plane behaviour, respectively, of the BRB connections. Moreover, the moment-rotation relationships for the rigid and the semi-rigid connections in the enhanced models are generated by developing an ANSYS 3-D finite element model of the connections and conducting non-linear analysis to obtain the corresponding moment-rotation curves. In the ANSYS models, the beam and column are modelled using shell elements and the welds are modelled using a non-linear constraint weld joint elements as shown in Figure 1(d) and (e). An ANSI/AISC 341-05 seismic provision’s cyclic loading protocol (ANCI/AISC 341-05, 2005) is used to investigate the hysteretic behaviour of the connections in the ANSYS models. The curves obtained from the detailed ANSYS analysis are then inserted in the OpenSees models to represent the cyclic behaviour of the connections. The pinned connections are modelled using rotational springs based on the proposed model by Astaneh-Asl (Astaneh-asl, 2005) as shown in Figure 1(f). Unlike the enhanced models, in the basic models the connections are presented as either full rigid or simple pin connections. In the enhanced models, the soil-structure interaction behaviour is captured using the Beam-On-Nonlinear-Winkler-Foundation (BNWF) Model (Raychowdhury, 2008), which is commonly used to simulate shallow foundations as shown in Figure 1(g). The underneath soil classifications mentioned in the NEHRP report (NEHRP Consultants Joint Venture, 2013a) and the corresponding soil properties are estimated based on ATC-40 (ATC 40, 1996). More details pertaining to the model components can be found in Hassan and Mahmoud (2017c).
1 B = Basic; E = Enhanced; 2D = Two-dimensional; 3D = Three-dimensional; NS = No soil; WS = With soil.

57 |
Figure 1. Hospital component’s models: (a) steel material, (b) BRB core, (c) BRB connection, (d) rigid connection, (e) semi-rigid connection, (f) pinned connection and (g) soil-structure interaction.
3. MethodologyThe framework utilized to estimate hospital resilience is shown in Figure 2. The framework starts with the development of the five different finite element models. Therea"er, incremental dynamic analysis (IDA) is conducted on all models using the 22 ground motions (in two directions) listed in FEMA P695 (2009), a"er appropriately scaling them. The results of the IDA are then assessed against the damage limit states from HAZUS-MH MR5 (2001) to generate the fragility functions for the different hospital models. A scenario-based event is assumed and the fragilities are then used to estimate the building losses. The assumed event is characterized by an earthquake intensity (Sa=1.0 g), occurring at 2:00 AM. Two different loss functions are used to represent the overall direct losses (LD) for the hospital building. These are the direct economic losses (LDE) and the direct social losses (LDS). The equations presented in the HAZUS-MH 2.1 Technical Manual (2015) and in Cimellaro (2016) are used to estimate the different loss categories.
Figure 2. Resilience framework.
Fragilityanalysis
Lossestimation
Functionalityevaluation
Recoveryestimation
Resilienceestimation
Damage states
Modelingprocess
Infrastructure damage
Available resources Interdependence

| 58
To estimate the hospital building functionality level and recovery process, the framework introduced by Hassan and Mahmoud (2017a, 2017b) is implemented. In that framework, hospital functionality is estimated based on combining the quantity of the service (number of available staffed beds) with the quality of the service (patient’s waiting time). A virtual community is assumed, which, in addition to healthcare (hospital building), comprises of five different lifelines: Electricity, Transportation, Telecommunication, Water supply, and Wastewater. The selected five lifelines are essential for not only the functioning of the community as a hole but also to the functioning of the hospital building. Because the scope of this study is focused on comparing the results obtained using different modelling resolutions of the hospital building, a damage state for different lifelines, except the hospital building, is assumed based on data from HAZUS-MH 2.1 Technical Manual (2015). The recovery process of all six lifelines (including the hospital) is assumed to follow a Markov stochastic process as per the proposed framework by Zhang (1992). However, for considering interdependency between different lifelines, an interaction matrix (interdependency matrix-E) is assumed based on the work by Cimellaro (2016). Moreover, modelling of resources scarcity in the community is implemented using assumptions of the available repair crews. The total number of available repair crews is assumed to have different levels and it is assumed to be at its minimal directly following earthquake occurrence. This number then rapidly increases to a maximum value depending on the size of community. Therea"er, the number of repair crews further increases to reach an ultimate value as result of the additional aid provided by the surrounding communities. A"erwards, the number of repair crews drop again reflecting return of the external aids back to their respective communities when most of the lifelines reach certain level of functionality. Dynamic optimization is conducted to distribute the limited number of repair crews per the damaged lifelines to ensure maximum income return for the community. The income return for each lifeline is assumed based on the importance of each lifeline for the community. For instance, the assigned income return for the transportation was the highest as all other lifelines functionality depend heavily on the transportation functionality. In addition, starting the repair process of most of lifelines will be delayed if the transportation’s functionality is less than a certain level. Finally, resilience is estimated as the area underneath the total functionality curve of the hospital. More details pertaining to the implemented methodology can be found in Hassan and Mahmoud (2017a, 2017b).
4. Results and discussionsIn this section, the results from the different finite element models of the hospital building are presented. The results include fragility analysis, losses estimation, recovery and system resilience. The fragilities for the hospital are shown in Figure 3(a) and (b) for the structural, non-structural dri"-sensitive fragilities and the non-structural acceleration-sensitive fragilities for the N-S and E-W directions, respectively. For the structural damage fragilities of both the N-S and E-W directions, a large difference in the structural damage fragility can be noticed for the 3-D models compared with the 2-D models. This clearly indicates that reliance on the 2-D model can lead to unrealistic estimates of the vulnerability. The difference between the 2D models and the 3D models is much less apparent for the non-structural damage fragility as shown in Figure 3. The effect of soil-structure interaction on building fragility is significant at higher earthquake intensities. It is important to note that coincidently the results for the basic 2-D model appear to fall within those of the 3-D models.

59 |
Figure 3. Seismic fragilities: (a) N-S direction and (b) E-W direction.
1
0.8
0.6
0.4
0.2
0Prob
abili
ty o
f Ex
ceed
ance
0 0.5 1 1.5Sa (g)
2 2.5 3
1
0.8
0.6
0.4
0.2
00 0.5 1 1.5
Sa (g)2 2.5 3
1
0.8
0.6
0.4
0.2
00 0.5 1 1.5
Sa (g)2 2.5 3
1
0.8
0.6
0.4
0.2
00 0.5 1 1.5
Sa (g)2 2.5 3
1
0.8
0.6
0.4
0.2
00 0.5 1 1.5
Sa (g)2 2.5 3
1
0.8
0.6
0.4
0.2
00 0.5 1 1.5
Sa (g)2 2.5 3
(a) N-S direction
(b) E-W direction
Slight
B-2D-NS E-2D-NS
Moderate Extensive Complete
StructuralDamagefragility
Non-structuraldri! sensitivefragility
Non-structuralacceleration sensitive fragility
StructuralDamagefragility
Non-structuraldri! sensitivefragility
Non-structuralacceleration sensitive fragility
E-2D-WS E-3D-NS E-3D-WS
Prob
abili
ty o
f Ex
ceed
ance
The hospital direct economic and social losses for different modelling resolutions for the N-S and E-W directions are shown in Figure 4(a) and (b), respectively. The direct losses estimated using the E-3D-WS model are the highest compared to the other introduced models. However, the results are more sensitive to using 3-D modelling than including soil-structure interaction. While the basic 2-D model gives apparent good estimation of the losses for the hospital building, as it matches that of the 3D model, it is not representative of the true behaviour and it is not recommended to be used to develop fragilities for critical infrastructures. The E-3D-WS model with the earthquake in the E-W direction results in the highest direct social losses ratio of a 0.0398. The low overall social loss ratios is due to the earthquake selected occurrence time scenario of 2:00 AM. This number is expected to be higher, however, if the earthquake occurrence time scenario is during the day (e.g. 2:00 PM).
Figure 4. Estimated direct losses: (a) N-S direction and (b) E-W direction.
1
0.8
0.6
0.4
0.2
0
N-S directionE-W direction
(a)
Dire
ct e
cono
mic
loss
es ra
tio
B-2D-NS E-2D-NS E-2D-WS E-3D-NS E-3D-WS
1
0.8
0.6
0.4
0.2
0
N-S directionE-W direction
(b)
B-2D-NS E-2D-NS E-2D-WS E-3D-NS E-3D-WS

| 60
Figure 5(a) shows the functionality recovery pattern of six different lifelines for the case of the E-3D-WS model and earthquake in the E-W direction. The presented hospital functionality comprises the quantity and quality of the offered hospitalization service.
Figure 5(b) shows the resilience of the investigated hospital using different modelling approaches and considering both the N-S and E-W directions. It is clear from the figure that the resilience is sensitive to the utilized fragility function associated with the different models.
Figure 5. (a) Infrastructure’s Recovery for the E-3D-WS model and E-W earthquakecase and (b) total hospital functionality.
1
0.8
0.6
0.4
0.2
0
N-S directionE-W direction
(b)(a)
Resi
lienc
e
Func
tiona
lity
Time (day)B-2D-NS E-2D-NS E-2D-WS E-3D-NS E-3D-WS
Hospitalbuildingrecovery
All li
felin
e’s to
tal r
ecov
ery
ElectricityTransportationTelecommunication
Water SupplyWastewaterHospital
1.2
1
0.8
0.6
0.4
0.2
00 50 100 150 200
E-W direction
5. ConclusionThis study pertains to evaluating the effect of modelling level selection on resilience of a critical infrastructure. Building fragility, losses, functionality recovery, and resilience are used to compare between the different models. The following preliminary conclusions can be drawn for the results:
• Implementing the enhanced finite element models for the investigated hospital building, using soil-structure interaction and utilizing the 3-D modelling approach, are essential for simulating the true behaviour and realistic damage of the investigated hospital.
• Estimating the hospital losses is shown to be dependent on the resolution of the finite element model used in addition to the earthquake shaking direction and intensity.
• Including of soil-structure interaction and using 3-D modelling have different effect on the building, which is shown by the comparison between the N-S and the E-W directions.
• Estimating the hospital resilience is not only dependent on the surrounding lifelines but also on the finite element resolution used for modelling the building.

61 |
ReferencesANCI/AISC 341-05. (2005). Seismic Provesion for Structural Steel Buildings.
Astaneh-asl, A. (2005). Design of Shear Tab Connections for Gravity and Seismic Loads (pp. 0–65). University of California, Berkeley.
ATC 40. (1996). Seismic evaluation and retrofit of concrete buildings (Vol. 1).
Cimellaro, G. P. (2016). Urban Resilience for Emergency Response and Recovery. Springer International Publishing Switzerland.
FEMA P695. (2009). Quantification of Building Seismic Performance Factors.
Hassan, E. M., & Mahmoud, H. (2017a). A Framework for Estimating Direct Interdependent Functionality Reduction of a Steel Hospital Following a Seismic Event. Manuscript submitted for publication.
Hassan, E. M., & Mahmoud, H. (2017b). Full Functionality and Recovery Assessment Framework for a Hospital Subjected to a Scenario Earthquake Event. Manuscript submitted for publication.
Hassan, E. M., & Mahmoud, H. (2017c). Modeling resolution effects on the seismic response of a hospital steel building. Journal of Constructional Steel Research, 139, 254–271. http://doi.org/10.1016/j.jcsr.2017.09.032
Hazus-MH 2.1. (2015). Multi-hazard loss estimation methodology.
Hazus-MH MR5. (2001). Earthquake Loss Estimation Methodology.
Kinali, K., & Ellingwood, B. R. (2007). Seismic fragility assessment of steel frames for consequence-based engineering: A case study for Memphis, TN. Engineering Structures, 29(6), 1115–1127. http://doi.org/10.1016/j.engstruct.2006.08.017
Koetaka, Y., Kinoshita, T., Inoue, K., & Iitani, K. (2008). Criteria of Buckling-Restrained Braces to Prevent Out-of-Plane Buckling. In The 14 World Conference on Earthquake Engineering.
NEHRP Consultants Joint Venture. (2013a). Cost Analyses and Benefit Studies for Construction in Memphis, Tennessee. NIST GCR 14-917-26, U.S. Department of Commerce National Institute of Standards and Technology, Gaithersburg, MD.
NEHRP Consultants Joint Venture. (2013b). Cost Analyses and Benefit Studies for Construction in Memphis, Tennessee Design Drawings. NIST GCR 14-917-26, U.S. Department of Commerce National Institute of Standards and Technology, Gaithersburg, MD.
R. H. Zhang. (1992). Lifeline interaction and post earthquake urban system reconstruction. Earthquake Engineering, Tenth World Conference.
Raychowdhury, P. (2008). Nonlinear Winkler-based shallow foundation model for performance assessment of seismically loaded structures. University of California San Diego.
Tsai, K.-C., & Hsiao, P.-C. (2008). Pseudo-dynamic test of a full-scale CFT/BRB frame—Part II: Seismic performance of buckling-restrained braces and connections. Earthquake Engineering & Structural Dynamics, 37(7), 1099–1115. http://doi.org/10.1002/eqe.803
Xu, H., & Gardoni, P. (2016). Probabilistic capacity and seismic demand models and fragility estimates for reinforced concrete buildings based on three-dimensional analyses. Engineering Structures, 112, 200–214. http://doi.org/10.1016/j.engstruct.2016.01.005

| 62
The role of performance-based engineering in achieving community resilience: a first stepBruce R. Ellingwood1, Naiyu Wang2, James Robert Harris3 and Therese P. McAllister4
1 Colorado State University, Fort Collins, CO 20523 USA,2 University of Oklahoma, Norman, OK 73019 USA3 President, J. R. Harris and Company, Denver, CO 80203 USA4 National Institute of Standards and Technology, Gaithersburg, MD USA 20899 USA
AbstractThe resilience of communities depends on the performance of the built environment and on supporting social, economic and public institutions on which the welfare of the community depends. The built environment is susceptible to damage due to a spectrum of environmental, geophysical, and anthropogenic hazards, which are characterized by large uncertainties in spatial and temporal domains. The performance of the built environment within a community depends on the integrated collective performance of its civil infrastructure, which is largely designed by codes, standards, and regulations. Advances in community resilience modeling and assessment will require a fundamental change in the way that code and standard-writing groups approach their tasks to ensure that performance and functionality of the built environment is consistent with community-wide resilience goals. The new design paradigm of performance-based engineering (or PBE) offers the framework for engineers and planners to achieve these desired levels of performance and functionality. Herein, we introduce, from a structural engineering perspective, some issues in developing and implementing performance-based design guidelines and practices aimed at achieving community resilience goals.
IntroductionThe resilience of communities under disruptive events depends on the performance of the built environment, as well as on supporting social, economic and public institutions which are essential for immediate community response and long-term recovery [e.g., Bruneau et al. 2003; Miles and Chang 2006; Cutter et al. 2010; Cimellaro et al. 2010; Bocchini and Frangopol 2012; Franchin and Cavalieri 2015; Jia et al. 2017]. The built environment is susceptible to damage due to disruptive natural hazards, such as hurricane wind storms and floods, tornadoes, earthquakes, tsunamis, and wildfires, as well as anthropogenic hazards, such as industrial accidents and malevolence. The human and economic losses and social disruption caused by failure of the built environment is o"en disproportionate to the physical damage incurred. The potential exists for even larger losses, given the growth of population and economic development to hazard-prone areas in many countries, including the United States, and global climate change.
Investigations conducted in the a"ermath of recent disasters, have revealed the importance of planning, development and mitigation policies that focus on the resilience of the community as a whole, rather than those that simply address safety and functionality of
KeywordsClimate Change, Critical Infrastructure, Impact Assessment, Natural Hazards

63 |
individual civil infrastructure facilities [McAllister 2013]. Nevertheless, the performance of buildings, bridges, and other civil infrastructure systems, which are key to community resilience, is largely determined by codes and standards that are developed through separate, independent processes (e.g., ASCE Standard 7-16 [ASCE 2016; AASHTO 2017]). For example, building codes are applicable to individual facilities and generally consider the role of the building in the community indirectly through risk categories. Such risk categories provide higher levels of structural performance, but may not result in the desired levels of functionality. In the United States, these codes and standards are - and have been - focused on life safety goals, because of the nature of the building regulatory process. The role played by the performance of individual buildings in fulfilling community resilience goals is unknown. Moreover, design requirements for civil infrastructure facilities have been developed by different professional groups, o"en with different objectives, and the consistency of these governing standards with community goals seldom has been achieved [McAllister 2016].
The importance of the built environment to community resilience means that a fundamental change must occur in the way that code and standard-writing groups approach the development of guidelines and requirements for design of buildings, bridges, and other civil infrastructure, to ensure that performance of physical infrastructure will support a resilient community. Community resilience planning requires communication across broad disciplines and stakeholder groups, including engineering, socioeconomic sciences, information technology, urban planning, government and the public at large. The National Institute of Standards and Technology (NIST) Community Resilience Planning Guide [NIST 2015] provides a general framework for developing resilience plans with the aim of ensuring that the performance objectives for building clusters and infrastructure are aligned with specific functionality goals defined at the community level, which are based on performance needs of social institutions. However, the Guide does not provide the technical approach to linking component, system and community-level performance goals with the design standards for individual facilities.
This paper takes a first step at filling this gap, drawing upon the paradigm of performance-based engineering (or PBE), which provides a framework for engineers and planners to respond to evolving public expectations and to achieve desired levels of performance and functionality of civil infrastructure that is essential for community resilience. A structural engineering perspective is presented on some of the major challenges faced in extending performance-based design concepts for individual facilities to align with and support community resilience goals.
© iStock.com
/Simm
iSimons

| 64
Community resilience goals and metricsCommunity resilience goals are aspirational statements of how the community should perform, given the occurrence of a disruptive event. Some high-level goals are common to virtually all communities, such as continuity of physical and social services, population and economic stability, and availability of critical services (e.g., fire, police, etc.). Other goals might be community-specific. Performance metrics measure whether the performance goal is achieved, rely on available data, and should support community decision making. The metrics should be meaningful, both before the disruptive event and during the post-event recovery period to be useful in pre-event planning, design, and mitigation and to support long-term assessment of community resilience. For example, continuity of physical services might be measured by the percentage of buildings that remain functional by occupancy, or by functionality of the urban transportation network in terms of connectivity or travel time. Population stability might be measured by the percentage of people leaving the community or who can remain in shelters or their homes following a disruptive event or by population count [Burton et al. 2015], which would allow to measure the population change during recovery. Economic stability might be measured by household income, employment or earnings by sector of the economy. Examples of social services stability include the availability of health care and educational facilities. Governance stability may include public safety services, such as police, fire, and emergency operation centers. Such metrics must be quantified in a risk-informed manner because of the large uncertainties in hazard levels and the associated response of the existing built environment [NAE 1996; Bocchini and Frangopol 2010; Lin and Wang 2016].
The performance objectives for individual buildings, building portfolios and infrastructure can be derived from such resilience goals defined at the community level [Mieler et al. 2015], through a process known as de-aggregation (as shown in Figure 1) [Wang and Ellingwood 2015; Lin et al. 2016; Wang et al. 2017] which will be illustrated subsequently. While each community might develop a unique set of goals related to its functionality and recovery, it is not readily apparent how these goals can be related to current design practice based on building codes. Thus, general models that communities can follow for deriving performance objectives and metrics for their specific goals are essential.
PBE objectives and metrics for community infrastructureFor a community to be resilient against natural or anthropogenic hazards, the built environment must be designed to function in a predictable manner as an integrated system of systems. Community infrastructure is interdependent; for example, availability of water depends on electrical power; healthcare depends on building integrity and availability of water, electrical power, and transportation services. Since the design requirements for interdependent infrastructure have been developed by different professional groups with different performance objectives and with limited coordination, it is not surprising that communities seldom perform as integrated systems during or following a disruptive event.
Performance-based engineering is a process that facilitates the development of engineered facilities that have predictable performance when subjected to a spectrum of external conditions and demands. The International Code Council Performance Code for Buildings and Facilities [ICC 2015] is one of the few regulatory documents that has explicitly incorporated the notion of performance requirements. However, PBE as a design concept, to date, has focused on design of individual facilities and is o"en applied to modify specific features that otherwise would be required by prescriptive codes in order to achieve cost savings for equivalent performance. When extended to building inventories and infrastructure, PBE should begin with performance objectives based on social, economic, and infrastructure resilience goals for the entire community. Depending on the role of buildings, bridges and other civil infrastructure in the community, a differentiated approach for design may be needed. This includes checks related to public safety, infrastructure damage, and recovery of functionality for key infrastructure. For example, a community may have decided to address its resilience,

65 |
given the occurrence of an earthquake with magnitude Mw = 6.8, by setting performance goals where 90% of the population can shelter in place, 30% of essential services would be recovered within 2 weeks, and 75 % of the essential services would be recovered within 3 months. To meet these community goals with PBE, engineering requirements should be coupled to socioeconomic performance expectations and cost constraints, and provide support for risk-informed decision-making in the public interest. In light of the large uncertainties associated with hazard demands and with the response of civil infrastructure, it is important that the performance objectives be articulated probabilistically. Furthermore, for many disruptive events, scenario events need to be selected to represent the hazard of interest correctly over a geographic area.
PBE objectives and metrics for individual buildings In the traditional practice of structural engineering, design acceptability is measured through conformance to given criteria on materials, configuration, detailing, strength, and stiffness. Such procedures have been deemed to provide buildings and other structures with acceptable performance throughout their service lives; however, performance goals are not evaluated explicitly in terms of building functionality or recovery characteristics. While PBE guidelines offer more flexibility in meeting desired performance objectives, a means to implement them in structural design practice is needed. At a fundamental level, this may take the form of a set of risk-consistent safety checks (load factors and load combinations and design strengths) similar to those appearing in ASCE 7-16 and other design standards. Many of these safety checks focus on member or component performance; however, to support community resilience, the checks should be based on system behavior. At a higher level, one could envision a set of target structural system fragilities for different functionality goals (e.g., immediate occupancy, impaired occupancy, life safety) that would need to be matched by the design to support the resilience objective [Wang et al. 2017]. PBE for earthquake provides the following example [ASCE 7-2016, Section 21.2.1]: the probability of collapse, given the occurrence of the Maximum Considered Earthquake, must be lower than 10%. Note that this example focuses on the life safety performance goal; this is an important part of public safety, but not sufficient for the various functionality goals that are evaluated in a community resilience assessment, either immediately following an earthquake or during an extended recovery period. Similar metrics that can be used as reliable metrics of community system performance need to be identified. Finally, it should be noted that resilience-based design will not replace traditional safety requirements for the built environment entirely; probability-based limit states design, as currently practiced, will still control the design of most facilities. However, resilience-based functionality requirements may increase some of the design requirements beyond traditional levels.
Hazard definitions for buildings and communitiesNatural and anthropogenic hazard events can be specified for community resilience assessment from either scenario or probabilistic hazard analysis (PHA). PHA has been widely used for the past decades in simulating the intensity of a demand variable (ground motion intensity, 3-sec gust wind speed, flood elevation, etc.) for purposes of design, insurance underwriting, and other applications directed toward evaluating performance of a single facility. PHA most o"en yields a mean return period event for a particular location, and o"en it is used to design individual facilities [ASCE 7-2016]. However, a PHA cannot capture the spatial variation in the demand that is necessary for resilience assessment at community or regional scales. To capture the spatial variation in the community, a hazard scenario is o"en used in community resilience assessment to represent one possible realization of a future event (e.g., an earthquake with Mw = 6.8 and known epicenter and fault rupture geometry; a Category 4 hurricane with postulated track and time of landfall). However, since a mean annual return period generally cannot be associated with a scenario event, a range of scenarios associated with the intensity levels of interest must be considered to assess the

| 66
vulnerability of the community to a specific hazard. Resolving the dichotomy between PHA-based and scenario-based hazards for structural design purposes presents one of the major challenges to PBE-based design of individual facilities and their role in supporting community resilience performance objectives.
De-aggregation in support of PBEOne of the major challenges for using PBE for community resilience is the development of performance objectives for individual buildings and other structures that collectively achieve community resilience goals. The link between goals and objectives can be developed through the tiered de-aggregation framework [Wang et al, 2017], shown in Figure 1. The upper-level de-aggregation (ULD) can be formulated as an inverse multi-objective optimization problem, where a search is performed to identify the minimum performance criteria for each community system (i.e., building inventories and other infrastructure). When satisfied simultaneously they enable the overarching community resilience goals to be achieved. This ULD is performed at the community scale, and it decouples the interdependencies among the community systems for the subsequent analysis. Once the set of minimum resilience goals are obtained for the community systems, they are de-aggregated further in a lower-level de-aggregation (LLD) to obtain the minimum performance objectives for the individual components (e.g. individual buildings or bridges) in each system (e.g. building inventory or roadway network). The LLD can also be formulated as an inverse multi-objective optimization problem. Finally, once the performance objectives for individual structures are established, performance-based design can be implemented at the individual facility level, in which building (or infrastructure component) attributes can be identified and parameterized to meet the performance objectives resulted from the LLD.
Closing remarksIn the coming decades, best practices of architects and engineers and decisions by city planners and regulatory authorities are likely to evolve to support common community resilience goals. At the same time, it seems probable that buildings, bridges and other civil infrastructure facilities will continue to be designed individually. PBE provides a path forward for addressing and resolving the inherent challenges and constraints that will arise in addressing both facility and community needs. These challenges are complex and will likely result in departures from present code development procedures, among them:
• Common community resilience goals need to be identified by a broadly based stakeholder group; general models should be developed for an overall structure and guidance that communities can follow for deriving performance objectives and metrics;
• Performance objectives articulated for building portfolios (e.g., residential building inventories, commercial facilities, schools, health care facilities) or socioeconomic institutions need to be expressed as requirements that are compatible with engineering practice and practical to implement from an engineering perspective;
• PBE to support community resilience needs to acknowledge the reality of the building regulatory process as practiced in the US;
• Hazards for PBE must be stipulated in a risk-consistent manner (PHA vs scenario analysis);
• Reliability targets for individual buildings in current structural design practices (e.g., ASCE 7-16 Section 1.3) set a floor on minimum performance requirements, mostly at the component level; target performance criteria at the system level that support community resilience goals are needed;
• Codes and standards for buildings, bridges, and other civil infrastructure need to be coordinated to support community resilience goals.

67 |
Finally, establishing community resilience goals will involve a serious economic analysis component. The questions of how much up-front cost is justified by future risks and the differentiation between who pays the costs and who receives the benefits will drive the debate in most communities. Engineers are equipped to work on the first question. The second one is inherently political and extremely difficult to predict or model.
Figure 1. A concept of a tiered de-aggregation framework
Communityresiliencegoals
PBE objectivesfor infrastructuresystems
PBE objectivesfor individualbuildings
Performance-baseddesign criteria
e.g. less than 10% outmigration a!er a Mw 6.8 earthquake.
e.g. less that 8% residential building clusternon-functional, less than 5% customers out of power, less than 5% customers out ofwater, etc. a!er a Mw 6.8 earthquake.
e.g. target reliability (or target fragilityfunctions) for Category II buildings w.r.t. alimit state of 5% inter-story dri! (or anyother limit states of concern) is, say, 4.5.
e.g. load combinations, resistance factorsand other criteria that ensure the abovetarget reliability is achieved in design
Upper-LevelDe-aggregation
(ULD)
Lower-LevelDe-aggregation
(LLD)
Calibration ofDesign Criteria
AcknowledgementThe science-based measurement tools to evaluate performance and resilience at community scales, fully integrated supporting databases, and risk-informed decision frameworks to support optimal life-cycle technical and social policies aimed at enhancing community resilience are under development at the Center of Excellence for Risk-Based Community Resilience Planning, established by The National Institute of Standards and Technology at Colorado State University and supported under NIST Financial Assistance Award Number: 70NANB15H044. The views expressed are those of the authors/presenter, and may not represent the official position of the National Institute of Standards and Technology or the US Department of Commerce.

| 68
ReferencesAASHTO (2017). AASHTO LRFD Bridge Design Specifications, 8th Edition. American Association of State Highway and Transportation Officials, Washington, DC.
ASCE (2016). Minimum design loads for buildings and other structures (ASCE Standard 7-16). American Society of Civil Engineers, Reston, VA.
Bocchini, P., and Frangopol, D. M. (2010). Optimal resilience-and cost-based postdisaster intervention prioritization for bridges along a highway segment. J. of Bridge Engrg. ASCE 17(1), 117-129
Bocchini, P., and Frangopol, D. M. (2012). Restoration of bridge networks a"er an earthquake: multicriteria intervention optimization. Earthquake Spectra, 28, 426–455.
Bruneau, M., Chang, S., Eguchi, R., Lee, G., O’Rourke, T., Reinhorn, A. M., & Winterfelt, D. V. (2003). A framework to quantitatively assess and enhance the seismic resilience of communities. Earthquake Spectra, 19, 733–752.
Burton, H., Deierlein, G., Lallemant, D. and Lin, T. (2015). Framework for incorporating probabilistic building performance in the assessment of community seismic resilience.” J. Struct. Engrg. ASCE 142(8): [dx.doi.org/10.1061/(ASCE)ST.1943-541X.0001321].
Cimellaro, G., Reinhorn, A. M., and Bruneau, M. (2010). Framework for analytical quantification of disaster resilience. Engineering Structures, 32, 3639–3649.
Cutter, S. L., Burton, C. G., and Emrich, C. T. (2010). Disaster resilience indictor for benchmarking baseline conditions. Journal of Homeland Security and Emergency Management,7. Article 51, 1–22.
Ellingwood, B.R., van de Lindt, J.W. and McAllister, T.P. (2016). Developing measurement science for community resilience assessment. Sustainable & Resilient Infrastructure 1(3-4):93.
Franchin, P., and Cavalieri, F. (2015). Probabilistic assessment of civil infrastructure resilience to earthquakes. Computer-Aided Civil and Infrast. Engrg. 30, 583–600.
ICC (2015). International code council performance code. International Code Council, Brea, CA.
Jia, G., Tabandeh, A., and Gardoni, P., (2017). “Life-cycle Analysis of Engineering Systems: Modeling Deterioration, Instantaneous Reliability, and Resilience,” in Risk and Reliability Analysis: Theory and Applications (P. Gardoni, ed.) Springer.
Lin, P., Wang, N. and Ellingwood, B.R. (2016). A risk de-aggregation framework that relates community resilience goals to building performance objectives, Sustainable & Resilient Infrastructure, 1(1-2): 1-13
Lin, P. and Wang, N. (2016). Building portfolio fragility functions to support scalable community resilience assessment. Sustainable & Resilient Infrastructure 1(3-4):108.
McAllister, T. (2013). Developing guidelines and standards for disaster resilience of the built environment: A research needs assessment. NIST Technical Note 1795, National Institute of Standards and Technology, Gaithersburg, MD [dx.doi.org/10.6028/NIST.TN.1795]
McAllister, T. (2016). Research Needs for Developing a Risk-Informed Methodology for Community Resilience, J. Struct. Eng., ASCE 142(8): DOI: 10.1061/(ASCE)ST.1943-541X.0001379.
Mieler, M., Stojadinovic, B., Budnitz, R., and Mahin, S. (2015). A framework for linking community resilience goals to specific performance targets for the built environment. Earthquake Spectra, 31, 1267–1283.
Miles and Chang (2006) “Modeling community recovery from earthquakes,” Earthq. Spectra, 22(2): 439–458.
NAE, (1996). Understanding Risk: Informing decisions in a democratic society. The National Academies, Washington, D.C.
NIST. (2015). Community resilience planning guide for buildings and infrastructure systems (in two volumes). NIST Special Publication 1190 (Vols. 1 and 2), National Institute of Standards and Technology, Gaithersburg, MD.
Wang, N., and Ellingwood, B. R. (2015). Disaggregating community resilience objectives to achieve building performance goals. Proc., Int. conference on applications of statistics and probability to civil engineering (ICASP12), University of British Columbia, Vancouver, BC.
Wang, Y., Wang, N., Lin, P., Ellingwood, B., Mahmoud, H., and Maloney, T. (2017). De-aggregation of Community Resilience Goals to Obtain Minimum Performance Objectives for Buildings under Tornado Hazards. Structural Safety. DOI: 10.1016/j.strusafe.2017.10.003.

69 |
Food security resilience to shocks in Niger: preliminary findings on potential measurement and challenges from LSMS-ISA dataJose M Rodriguez-Llanes1, Francois Kayitakire1
1 European Commission, Joint Research Centre, Food Security Unit, Ispra, Italy
AbstractThe measurement of food security resilience (FSR) to shocks is yet hampered by inherent aspects of its complexity mixed up with that of food security assessment itself. Yet, there is an urgent need for scientific evidence on which to base decision-making and policies to build resilience. Niger is one of the most underdeserved and underdevelopped coutries worldwide. We took advantage of the LSMS-ISA data to attempt defining as flexibly as possible the concept of FSR and move forward with its measurement and the investigation of policy-actionable drivers taking a multisectorial perspective.
Food security was measured as reportedly self-assessed by household heads through Food Insecurity Experience Scale (FIES) collected by panel design in two waves from September to November 2014 (post-planting) and January to March 2015 (post-harvest) and representative of Niger and 26 additional strata representing settings and agroecological zones. According to changes in food security status (food secure vs food insecure) from one wave to the next, we identify four potential trajectories, two of which are compatible with resilient trajectories of recovery and resistance to shock impacts. Two exposures were considered, rain deficits at onset of rainy season (May-June) or being affected by drought in previous year to the time of interview. Weighted estimates of each trajectory were provided for the country and rural vs urban areas. Associations with socio-economic factors were explored using multinomial logistic regression models.
Our preliminary findings point to a severe lack of food security in general and in particular lack of FSR to shocks in the country, and extremely low in rural areas. A better road network, access to markets, improved rural-urban connectivity and increasing education level might be helpful in building up resilience. Farmers and female-headed households are particular vulnerable groups and need special and effective protection policies to improve their FSR.
1. IntroductionFollowing a rising interest in the concept of resilience among policy circles, scientists have engaged into the task of its conceptualization and measurement. In the field of food security, this undertaking is hampered by the inherent complexity of measuring food security, which include its four pillars, multiple indicators, and their hierarchical interdependence and scale issues (Barrett and Constas, 2014; Upton, Cissé and Barrett, 2016). Many of these remain a challenge for scientists working in the field. Resilience comes then with its own challenges adding a second layer of complexity. It attempts to goes beyond vulnerability by expanding from the capacity of standing (absorbing) a shock to the dynamic capacity of keeping or quickly recovering a system’ functionality a"er a shock, and in occasions leading to systems’
Keywordsresilience, Sahel, drought, rainfall,
rural, farming, climate change,
education

| 70
transformation when this capacity is compromised (Benczur et al., 2017). While the concept of resilience can be particularly suitable and useful under increasing shocks due to climate change extreme weather, increasing urbanization and urbanization in at risk areas (Pesaresi et al., 2017), land use changes and transformation derived from current agricultural practices, there is need for clear and flexible definition of food security resilience (FSR) to allow its measurement. Measuring it properly and frequently enough might be the basis for a monitoring tool, supplementing other initiatives currently monitoring food security such as The Integrated Food Security Phase Classification (IPC, 2017), and one helping the international donors’ community to assess the influence of policy interventions to resilient outcomes as well as developing a necessary analytical framework to investigate the influence of policy-actionable drivers on FSR.
Niger is, by nearly any human development indicator, one of the most underdeserved and underdeveloped countries worldwide. With a staggering national poverty rate at 44% (2014), stagnated adult literacy rate at about 15% (2001-2012) and a rapidly rising population at 21 million inhabitants, it is highly affected by the current instability of the region with refugee influxes from conflicts in neighboring Mali and Nigeria, high dependency on imports from Nigeria and Burkina for staple food cereals such as millet, sorghum or maize, which contribute to price instability and food insecurity (World Bank, 2017). In addition, the Sahel region is being increasingly affected by erratic rain, droughts and other weather shocks, important contributors for further deterioration of the situation within the entire region. In consequence, Niger is an obvious candidate for studies aiming to guide future directions for most priority development investments in the country with tangible impact on resilience building.
Taking advantage of the rich and recent datasets collected in Niger, including variables on agriculture, food security and multiple societal sectors, we proposed here a flexible and operational definition to provide a first estimate of FSR in Niger as a measurable outcome under two shocks, drought and delayed onset of rain, and explore associations with socio-economic and demographic variables.
2. MethodsThe World Bank Living Standard Measurement Studies (LSMS) is an international programme initiated in the Eighties to gather survey panel data on developing countries for development analysis and decision making. More recently similarly inspired surveys but with a dedicated agriculture module, the so called Integrated Surveys of Agriculture (ISA) were conducted in
© E
urop
ean
Unio
n/EC
HO/A
nouk
Del
afor
trie
71 |
eight African countries (Niger, Mali, Burkina Faso, Nigeria, Tanzania, Ethiopia, Malawi and Uganda). The LSMS-ISA project (funded by the Melinda and Bill Gates Foundation) have been supporting the design and implementation of these surveys, including the Niger Enquête Nationale sur les Conditions de Vie des Ménages et l’Agriculture (ECVM/A), also known as the National Household Living Conditions and Agriculture (The World Bank, 2017). The ECVM/A was implemented by the Niger Institut National de la Statistique (INS).
The ECVM/A was designed to be nationally representative, and provide representative estimates from both urban and rural areas in all 8 Niger administrative regions including agro-ecological zones of the country divided as agricultural, agro-pastoral and pastoral. The target population was drawn from households in all regions of the country with the exception of areas in Arlit (Agadez Region) because of difficulties to travel there, very low population density, and collective housing. A total of 36,000 people were not included in the sample design, of whom 29,000 lived in Arlit and 7,000 in collective housing elsewhere. The sample was obtained in a two stage selection process. In the first stage, 270 Enumeration Areas or clusters (known in French as Zones de Dénombrement or ZDs) were selected through Probability Proportional to Size (PPS) sampling using the 2001 General Census of Population and Housing as the base for the sampling frame, and the number of households as a measure of size. At the second stage of selection, 12 or 18 households were selected with equal probability in each urban or rural ZD respectively. The sampling frame at this stage was an exhaustive listing of households for each selected cluster compiled before the start of the survey. The total estimated size of the sample was 4,074 households. The fact that this is the first survey with panel households to be revisited in the future was taken into account in the design and therefore it was possible to lose households between the two surveys with minimal adverse effects on the analyses (The World Bank, 2017).
The first survey in Niger during 2011/12 and a second in 2014/15 were used for our study. However, the focus was on shocks and outcomes collected during 2014/15. Each survey was composed by two waves of data collection, one so called post-planting from September to November 2014 and the so called post-harvest, from January to March 2015. A total 4,000 households were successfully surveyed in the first wave of the initial 2011 survey. The sample suffered from substantial attrition due to household migration and missingness on key variables in the following three waves. As such the final analyzed sample size was about 3,100 households, depending slightly on the shock analyzed.
The outcome was the Food Insecurity Experience Scale (FIES), a self-reported measure of food security validated across countries and cross-cultural settings (FAO, 2017). We used the developed dichotomic version of this scale to characterize households as food secure (if they answered negatively to all eight questions) or food insecure (if at least one answer was affirmative). Using the change in food security status within a household across the two waves, we defined four trajectories: resistant if they reported being food secure in both waves (post-planting and post-harvest), recovered if they were food insecure in first and food secure in the second, worsened if they moved from food secure to food insecure and chronically food insecure if they remain in this situation in both waves. According to current definitions of FSR (Box 1), those resistant and recovered might be two forms of resilient households.
We considered here two distinct shocks, rainfall deficits at the onset of the rainy season (May-June) needed for most rain-fed agriculture production (sorghum and millet mostly) and livestock production within the year of study. This variable was reported by each head of household
Box 1. Selected definitions of Food Security Resilience
“Food security resilience is the capacity over time of a person, household or other aggregate unit to maintain food security in the face of various stressors and in the wake of myriad shocks. If and only if that capacity is and remains high over time, then the unit is resilient” (inspired from Barrett & Constas 2014; Upton, Cissé & Barrett 2016)
“The capacity of a household to bounce back to a previous level of well-being (for instance food security) a"er a shock” (FAO, 2016)

| 72
interviewed. Shocks experienced by each household were also reported. Here we investigated only drought, reported as one having an impact to a household within a year from interview in September-November 2014. Both shocks were confirmed to the best possible extent by climatic data on precipitation and drought condition (SPEI, Vicente-Serrano, Begueria and Lopez-Moreno, 2010).
Regarding potential predictor variables, wellbeing level (low, middle, high) – based on per capita-adjusted expenditure, agro-ecological zones (urban, agricultural, agropastoral, pastoral), rurality (urban vs rural), household size (median=6), household-head gender, age and education level (only 20% attended primary school or more), household occupation (agriculture vs any other) and distances (in km) from household to 1) main national road, 2) nearest town >20,000 inhabitants, 3) FEWSNET key market centers 4) admin1 capital 5) admin2 capital 6) other national borders.
Figure 1. Rain deficits at onset of rainy season in Niger, 2014
Lighter red (1) indicates high congruence at cluster level on household responses pointing to perceived rain deficits at onset of rainy season. Darker color (2) show those clusters with nearly all households reporting average timing for rainy season onset or masking a balance of contrasting responses with average near 2. The lighter blue represents clusters reporting mostly onset of rains earlier than usual within the rainy season. Weights (hhweight) show the relative importance of each cluster sample to the country total.
Statistical analysis were conducted using R so"ware (v 3.4.0). The survey package was used to provide representative estimates on different quantities using available sampling weights (hhweights). Associations were explored through multinomial logistic regression models using the package nnet. First, univariate multinomial logistic regression models were run on each predictor variable among exposed cases to both shocks (rain deficits and drought in the previous year). If any significance association was found with the outcome (p<0.05), it was selected for inclusion into the multivariate model. Model reduction was based on variance inflation factor (VIF) using the vif function. This to avoid collinearity issues with a conservative cutoff of 3. The variable having the largest VIF value was removed first and the model rerun in an iterative process until all variables had values below 3. The model was further reduced using backward selection based on p-value (p<0.05), eliminating larger p-values first. Multinomial Logistic Regression model coefficients were exponentiated to be shown as odds ratios (ORs) with associated standard errors (se).
Results Looking at the shocks considered, rain deficits at the onset of the rainy season occurred in 32.1% (95% CI 29.6-34.6) of the households during 2014. Droughts were also common affecting a 24.9% (95% CI 22.5-27.4) of all households in the country in the last year.
Overall, an important finding was the shocking prevalence of chronic food insecurity in rural areas, compared to urban (table 1). Urban households were also more likely to maintain food security (resistant) relative to rural areas.

73 |
Table 1. National-representative estimates of food security trajectories in Niger 2014-15.
Urban Rural Multinomial
n % (95% CI) n % (95% CI) P-value
Chronically food insecure
421 37.1 (33.1-41.0) 1215 65.8 (63.8-68.7) p<0.01
Recovered 181 13.8 (11.2-16.4) 179 10.3 (8.4-12.1) NS
Resistant 432 36.3 (32.4-40.3) 227 10.6 (8.9-12.3) p<0.01
Worsened 164 12.8 (10.2-15.3) 281 13.3 (11.4-15.2) Ref.
Regarding droughts, they showed to increase the likelihood of a household reporting chronic food insecurity and on the other hand decreased the likelihood of maintaining food security across waves (table 2).
Table 2. National-representative estimates of food security trajectories by drought affectedness in Niger 2014.
Drought-affected Unaffected Multinomial
n % (95% CI) n % (95% CI) P-value
Chronically food insecure
445 74.9 (70.4-79.5) 1193 56.3 (53.3-59.2) p<0.01
Recovered 51 8.4 (5.6-11.2) 310 11.7 (9.8-13.6) Ref.
Resistant 47 5.8 (3.7-8.0) 614 18.0 (16.0-20.0) p<0.01
Worsened 83 10.8 (7.6-14.0) 365 14.0 (12.1-16.0) NS
For rain deficits at onset of rainy season, we found a more pronounced difference for those able to recovering favoring those not affected and an increased proportion of households in a worsening trajectory if rain deficits were noted, which seems reasonable given the difference from these shocks in terms of intensity, timing, complexity and potential to erode livelihoods (table 3).
Table 3. National-representative estimates of food security trajectories households affected by delayed rainy season, Niger 2014.
Delayed Rainy Season Non-delayed
n % (95% CI) n % (95% CI)
Chronically food insecure 587 60.9 (57.8-64.0) 1049 61.1 (56.7-65.4)
Recovered 131 9.4 (7.6-11.3) 229 13.9 (10.9-16.9)
Resistant 236 15.3 (13.2-17.4) 423 14.3 (11.7-16.9)
Worsened 130 14.4 (12.3-16.5) 315 10.7 (8.0-13.4)
Multivariate models for both shocks considered were rather congruent. Female-headed households were less resilient and in the case of drought, most evidence pointed to these households being chronically food insecure (table 4). In households affected by rainfall deficits, the likelihood was lower for resistant households (table 5). More education seemed to confer some protection in the case of drought (table 4), but the effect was much clearer in the case of rain deficits (table 5). Lack of rain early on the rainy season was particularly negative for farmers, which were at much higher risk of becoming food insecure, compared to households

| 74
dedicated to other professional activities. While drought is a more long-lasting process and can affect many societal sectors, vulnerable groups, and professional activities rain deficits should typically affect mostly activities relying on timing of rains such as agriculture.
Table 4. Multivariate associations of socio-economic and demographic variables with FS trajectories in drought-affected households.
Recovered Resistant WorsenedVariables OR se OR se OR se
Gender (female vs male) 0.283** 0.609 0.093** 1.018 0.213*** 0.527
Education (prim. vs none) 2.122** 0.375 0.900 0.500 0.597 0.453
** p<0.05, *** p<0.01; Reference: Chronically food insecure
Table 5. Multivariate associations of socio-economic and demographic variables with FS trajectories in households experiencing rain deficits at onset of rainy season.
Recovered Resistant Worsened
Variables OR se OR se OR se
Gender (female vs male) 1.041 0.244 0.504*** 0.237 0.628 0.277
Education (prim. vs none) 1.924*** 0.243 2.811*** 0.189 0.925 0.282
Farming (Yes. vs other) 0.687 0.207 0.360*** 0.174 0.637** 0.205
** p<0.05, *** p<0.01; Reference: Chronically food insecure
In the case of associations of distance to major markets, national roads, borders and cities of varying size, the likelihood of worsening was closely related to the distance to a market. Vicinity to a national road was protective in the case of drought and rain deficits but being close to a local capital did increase the likelihood of maintaining food security in the case of having experienced rain deficits. Overall this result points to connectivity and basic infrastructure as key elements to increase food security resiliency to shocks in Niger (tables 6, 7).
Table 6. Multivariate associations of distance to markets, roads, borders and cities with FS trajectories in drought-affected households.
Recovered Resistant Worsened
Distance in km OR se OR se OR se
Market 1.006 0.004 1.007 0.004 1.010*** 0.003
National Road 0.967*** 0.012 0.980** 0.009 0.989 0.006
** p<0.05, *** p<0.01; Reference: Chronically food insecure
Table 7. Multivariate associations of socio-economic and demographic variables with FS trajectories in households experiencing rain deficits at onset of rainy season.
Recovered Resistant WorsenedDistance in km OR se OR se OR se
Market 1.002 0.002 1.001 0.002 1.006*** 0.002
National Road 0.968*** 0.007 0.989 0.006 0.997 0.005
Local capital 0.999 0.003 0.988*** 0.003 0.997 0.003
** p<0.05, *** p<0.01; Reference: Chronically food insecure

75 |
ReferencesHeadey, D. and Barrett, C. B. Opinion: Measuring development resilience in the world’s poorest countries. Proceedings of the National Academy of Sciences, 112(37), 2015, 11423-11425.
Barrett, C. and B.Headey, D. Measuring resilience in a volatile world: a proposal for a multicountry system of sentinel sites. 2020 Conference, May 2014.
Benczur, P., Kayitakire, F., et al. Building resilience for sustainable development. In Science for the AU-EU Partnership: building knowledge for sustainable development, Chapter: Part 2, Chapter 4, Publications Office of the European Union, Luxembourg, 2017.
FAO. Resilience Index Measurement and Analysis – II. Food and Agriculture Organization of the United Nations Rome, 2016.
Food and Agriculture Organization of the United Nations (FAO). Voices of the Hunger, The Food Insecurity Experience Scale, 2017 Available at: http://www.fao.org/in-action/voices-of-the-hungry/fies/en/
Pesaresi, M., Ehrlich, D., Kemper, T., Siragusa, A., Florczyk, A.J., Freire, S. and Corbane, C. Atlas of the Human Planet 2017: Global Exposure to Natural Hazards, EUR 28556 EN, Publications Office of the European Union, Luxembourg, 2017 doi: 10.2760/19837
R Core Team. R: A language and environment for statistical computing. R Foundation for Statistical Computing, Vienna, Austria, 2013. http://www.R-project.org/ The Integrated Food Security Phase Classification (IPC), 2017, Available at http://www.ipcinfo.org/
The World Bank. The Living Standards Measurement Study Integrated Agriculture Module (LSMS-ISA), 2017, Available at http://go.worldbank.org/BCLXW38HY0
The World Bank Open Data, 2017, Available at https://data.worldbank.org/
Vicente-Serrano SM, Begueria S, Lopez-Moreno JI. A multiscalar drought index sensitive to global warming: The standardized precipitation evapotranspiration index. J. Clim. 2010;23:1696–1718. doi: 10.1175/2009JCLI2909.1
3. Way ForwardThe above are first and preliminary observations on the LSMS-ISA data, which are encouraging to move forward with further investigations. Our approach was resilient-focussed and multi-sectorial instead of agriculture-based. We adopted a flexible definition of resilience to allow us moving forward with its understanding, measurement and investigation of its drivers. Our early results point to a general lack of food security resiliency to shocks in the country, and particularly low in rural areas. Basic investments in the country, including roads, markets and better connectivity and education might be helpful in building resilience up. Farmers, which represent around 50% of the country’s households might require targeted policies as well as female-headed households as shown by our initial analyses. Investments and strategies into these directions and a more engaged debate should be initiated. Our results warrant further analyses and research. Our work comes with limitations and our commitment for further analysis will include the inclusion of further exposures, isolation of exposure effect, consideration of multiple simultaneous exposures, consideration of interaction analysis and inclusion of further variables to get a more inclusive picture.

| 76
The NEPAD – Africa Resilience Coordination Hub (ARCH)Building Community Resilience through Agriculture and Food Insecurity Risk Management
Mariam Sow, Senior Program Manager, Agriculture and Food Insecurity Risk Management (AFIRM) UnitNATURAL RESOURCE GOVERNANCE AND FOOD SECURITY PROGRAM NEPAD AGENCY
AbstractSince 2012, the NEPAD/Agriculture and Food Insecurity Risk Management unit1 (AFIRM) supports African countries and regions in raising awareness about the need to build resilience of smallholder rural producers through the implementation of a combination of interventions including risk management tools and policy instruments, capacity and infrastructure development in rural areas. It builds on its knowledge acquired through extensive consultative processes with countries and regions, and the evidence produced through the Platform for Agriculture Risk Management (PARM) which has conducted since 2015, risk assessment studies at the national level in seven African countries including Cabo Verde, Cameroon, Ethiopia, Liberia, Niger, Senegal and Uganda. Through this process, PARM identifies and prioritises agriculture risk factors, conducts pre-feasilibility studies on key risk management tools, initiates capacity development of national stakeholders and should in a second phase, facilitate involvement of service providers for implementation of risk management solutions.
Following up on such developments, NEPAD/AFIRM is developing in close collaboration with the World Food Programme (WFP) and the Partners Enhancing Resilience for People Exposed to Risks2 (Periperi U) consortium, an implementation framework to support countries and regions in building more evidence for better planning, programming and implementing risk management solutions, hence providing an improved articulation of the demand and the supply sides, in particular (but not only) at the community level. Indeed as risk is context specific and affects households at the local/community level, there is need to assess livelihoods patterns against related existing risks and constraints faced at disaggregated levels. This contributes to identifying in a participatory and inclusive manner, the appropriate risk management solutions defined as the relevant combination of interventions in which smallholder rural producers and communities are at a center stage. The required mechanisms for sustainability and upscaling of identified solutions, and for transitioning from one set of solutions to another are also investigated using the same participatory and inclusive principles for planning, programming and implementation.
1 This program has been developed since 2012 by the NEPAD Agency through the support of several financial and technical partners. Several consultative processes including workshops, policy consultations and field visits to countries have contributed to building knowledge on the subject matter and provide the background documentation for this paper.
2 The Periperi U consortium is a network of 12 African Universities which acts as a platform for advancing university action on risk and vulnerability reduction in Africa. Its secretariat is based at Stellenbosch University (South Africa).
Keywordsrisk management tools and policy instruments, capacity development, infrastructure development, inclusive and participatory planning and programming, upscaling.
77 |
“If crises in the Sahel are happening every 2-3 years, while we know that it takes from 2-3 years for rural producers to recover from a crisis, then we better understand how critical it is to get out of humanitarian assistance and build resilience of smallholders”.
1. IntroductionThe key objective of the AFIRM program is to set the foundations upon which Rural Transformation may take place through building resilience of smallholder rural producers. African institutions need to move out of crisis prevention and management in which they are still deeply involved, to adopt a long term, productive and sustainable risk management approach embedded into a combination of structural and consistent interventions. The required interventions are derived from evidence generated using a combination of geo-referenced information on food security and natural resources trends and patterns with a participatory and inclusive planning and programming process at the national, sub-national and local/community levels involving communities themselves but also technical partners, national technical services and the private sector.
A real paradigm shi" is necessary to undertake in order to effectively and efficiently manage risk and move away from managing crisis and only compensating in the short term for its devastating consequences. The underlying assumptions to risk management and resilience building are based on productive and market systems, policy and institutional structural reform. Market and institutional failures need to be tackled using appropriate policy instruments.
Risk has to be managed at the regional, national, community and household levels. It implies: 1) being informed about the probability of occurrence of hazards and shocks potentially leading to a crisis (through effective information systems); 2) making enough provisions ahead of time, to prevent them from happening (through prevention and disaster risk reduction mechanisms and tools); 3) when it happens, facing them without being taken by surprise (through preparedness mechanisms), in order to avoid or mitigate their impact. Risk management also includes preventing such reoccurrence of shocks and building/increasing resilience to avoid the negative impact of up-coming shocks. Any specific action taken a"er a shock is part of preparedness and should be geared towards preventing it from happening again. In countries facing recurrent crises, this option should translate in a collusion between ex-ante and ex-post strategies.
© W
estend61/Robert_Ford

| 78
Concept Framework for AFIRM
Achieving the objectives of the Comprehensive Africa Agriculture Development Program (CAADP) among which 6% annual productivity growth in the sector, requires a more radical approach towards addressing recurrent shocks and hazards.
The Comprehensive Africa Agriculture Development Program (CAADP) approach to risk management is not just about preventing and responding to crises. African farmers and rural producers have been hit by recurrent shocks for several decades and are chronically vulnerable. Therefore chronic situations have to be tackled through the adoption of comprehensive and holistic risk management strategies.
At the household level, it is important to understand how as a whole and as individuals, they are impacted/do react sometimes differently, to shocks; what the implications are to household welfare and what factors permit or allow them to respond to shocks in such a way that their resilience to future shocks is not compromised.
At the community level, it is crucial to examine the quality of the community of practice and socio-economic systems geared towards preventing the re-occurrence of shocks through a shared information system and preparedness mechanisms that allow providing first and timely responses. Those responses should be based on shared responsibilities, solidarity, inclusion, subsidiarity and mutual accountability.
At the sub-regional and national levels, risk is managed through various institutions and partners. Interministerial coordination and interaction among them is crucial for information sharing and design of appropriate and complementary tools and mechanisms.
Therefore risk management includes a series of activities taking place at different levels, before, during and a"er a shock, which should be conducted not on an ad hoc, but on a permanent and long term basis, at several levels and involving a large range of stakeholders. It suggests using a combination of various tools and policy instruments capable of being activated simultaneously by relevant stakeholders. These tools and policy instruments relate to the productive sector (agriculture, livestock, fisheries, forestry…), to trade (including regional and cross-border), market structure and functioning and prices, to institutions that are supposed to provide information on the probability of occurrence and impact of shocks and on the food security status of the population, on the response provided for prevention, mitigation and adaptation, and its impact on the well-being of the population, in particular of the most vulnerable.
This program will be implemented through the NEPAD Africa-Resilience Coordination Hub (NEPAD-ARCH), including key partners among which the World Food Program and the Periperi U network, involved in capacity strengthening and research in the area of Disaster Risk Reduction and Management. While creating knowledge and building capacities of a critical mass of experts and practitioners, the NEPAD-ARCH aims at institutionalising risk management for resilience building in learning institutions, Government administrations and service providers in order to consistently and sustainably strengthen resilience of smallholder rural producers.
This paper includes three main sections presenting the components of the NEPAD-ARCH implementation framework, mainly the evidence building phase, the planning and programming and the implementation phase at the community level. It also presents the critical cross-cutting dimensions of gender, capacity development, monitoring and evaluation for results and impact.
2. Building evidence for Risk assessment Generating evidence for resilience building involves understanding both the complex interaction of hazards and shocks and the physical-social and economic and systems environment, which determine the way communities and rural producers are responding. From there, gaps and intervention needs can be identified.
2.1. Adopting a holistic approach to Agriculture and Food Insecurity risk management is critical for building resilience in a sustainable and scalable manner. It involves understanding

79 |
the interaction between risk factors (shocks and hazards) and long term trends and patterns related to natural resources, demographics, farming systems, markets, institutions, household consumption and livelihoods, and infrastructure. It also includes the need to understand how macro (both global, regional and national) level factors affect subsequent meso (sub-national) and micro levels (local and community). It means that while national level risk assessment is critical, such information needs to be disaggregated and analysed taking into account specificities at lower administrative and agro-ecological levels which determine the physical conditions and socio-economic environment where communities and smallholder producers operate. The outcome in building such evidence is a top-down approach in the sense that understanding risk factors’ interaction at higher levels, will determine the way lower levels are affected, adapt and cope, taking into consideration their own specific risk and constraint factors.
2.2 Understanding the level of exposure to risk is a required complementary step in defining the impact of risk on each specific community, based on its endowments in terms of assets and the way physical and socio-economic systems interact. Hence, the same shock defined in terms of intensity will affect differently various communities and households/individuals within the same community and their level of vulnerability which is a key criteria for assessing the impact of risk. Indeed, based on the absence of any other risk management mechanism.
• Based on the generated evidence, advocacy and policy dialogue can be conducted with key policy decision makers and AFIRM practitioners. The objective is to mainstream AFIRM strategies into national development and investment planning and budgeting processes, and to set-up institutional arrangements for improved coordination and communication amongst several ministerial departments, partners, local governments and communities.
3. Planning design and programming for Resilience building
At the stage of planning and programming, the process for resilience building may be guided by several principles among which:
3.1. Using a participatory and inclusive approach to design policies and programs
3.1.1. Stakeholder consultation in an inclusive and participatory manner is an appropriate methodology that contributes to identifying at a disaggregated level, all the various context-specific risks and challenges faced by households, groups and communities in conducting their livelihoods;
3.1.1. Such a methodology should be applied using a holistic approach where:
3.1.2.1. National, sub-national and local levels of evidence are investigated for evidence-based planning. Such an approach contributes to prioritizing geographic and territorial areas more prone to risk and vulnerability; within each territory, the inclusiveness criteria allows to identify women and the youth specific needs and gaps in the planning and programming process;
3.1.2.1. A multisectorial analysis including natural resources endowment, market structure, access and performance, institutional arrangements, household consumption and livelihoods, the needs in terms of so" and hard infrastructure is reviewed; such an approach helps to link risk factors to related constraints/infrastructure and to identify the appropriate combination of risk management solutions comprising tools, policies, infrastructure and capacity development;
3.2. Local knowledge strengthened through science, innovation and technologies In the past, local knowledge used to perform in dealing with risk factors. This is not the case anymore in the era of climate change and extreme variabilities. It has to be enhanced

| 80
through scientific research and innovation adapted to the local context. Higher learning and research institutions have a key role to play in this endeavour.
3.3. Designing risk management instruments which are relevant, adequate (tailored to the needs of the target beneficiaries), accessible/cost-effective and sustainable
A large number of risk management instruments to be applied on the African continent are still in the process of being designed and tested this is the case for index-insurance for crops and livestock, warehouse receipt systems, commodity exchanges contract farming and others.
3.4. Developing local capacities and institutions for a mindset shi" towards managing risk
Indeed, capacity development is a cross-cutting issue that needs to be implemented at all stages. In particular for translating gathered evidence into planning and programmatic design, thorough advocacy and policy dialogue efforts need to be conducted with policy makers and relevant stakeholders at national, subnational and community level. This will contribute to embracing a new way of thinking and conducting business in the area of agriculture and food insecurity risk management.
4. An integrated implementation framework for community resilience building
While a broad range of technical partners should be involved in supporting implementation of risk management solutions, these are first and foremost the responsibility of communities themselves. Risk management interventions have to be embedded into their daily activities and are meant to support and strengthen their livelihoods.
4.1. Risk management solutions as a blend of combined interventions
4.1.1. Interaction between different risk management instruments is critical to achieve effectiveness and efficiency. While a combination of tools, policy instruments and infrastructure development is required to make an impact, based on a broad technical partnership, it is also important to recognise that one size does not fit all;
4.1.2. Market and non-market interventions Provided the level of vulnerability, non-market and market policies and interventions need to be blended in a progressive manner according to the level of resilience achieved by each community/group or individuals;
4.1.3 Sequencing of interventions and graduation While identification of cost-effective and scalable options for risk management is important, it is also critical to discuss with communities about the appropriate sequencing of interventions, and the need to re-prioritize according to the occurrence of hazards and shocks and the linkages between humanitarian, rehabilitation and development interventions. Rather than exit strategies, graduation strategies seem more realistic and may be designed around moving from one set of interventions to another, more related to market opportunities;
4.1.4. Public and private interventions are both required and have to be combined through partnerships, hence contributing to reduce risk aversion of private sector investors, in particular financial institutions in the rural sector;
4.2. Addressing both risks and constraints
At the implementation phase, addressing risks without addressing constraints will slow down the resilience building process. So" and hard infrastructure taking into account the optimal level for operationalisation, efficiency and sustainability, are required to address the constraints faced; (infrastructure requirements)

81 |
4.3. A bottom-up approach to institutional arrangements and coordination
Provided the variety of stakeholders at play, coordination and institutional arrangements are key for an effective risk management strategy and resilience building implementation. Equally, an integrated approach needs building formal and regular channels of communication and information sharing. Implementation of programs at macro, meso and micro levels will require appropriate interactions and coordinated approaches if tangible impacts and results are to be achieved at each level. Improving interministerial coordination could contribute to joint planning and action of several departments at local, sub-regional and national levels. At community and sub-national levels, it is easier to make such synergies effective, as this is where implementation takes place (which is less the case at national level). However in the objective of reaching sustainability and upscaling, it is critically important for community and sub-national levels to influence national policy planning and budgeting, hence reinforcing resilience building interventions.
5. Cross-cutting dimensions of agriculture and food insecurity risk management
Among the cross-cutting dimensions, information and gender are key elements and have to be embedded since the first phase of evidence building, in order to get a baseline information that will provide relevant disaggregated indicators for monitoring progress and assessing impact. Appropriate decision making processes can then take place in terms of adjustment, re-planning and re-programming.
6. Monitoring and Evaluation, impact assessmentMonitoring will be provided through the technical implementation teams and relevant technical services and producers’ associations in the field.
Evaluation will be external, linked to the processes for measurement and monitoring risk management and resilience initiatives.
African higher learning institutions and academia have a comparative advantage in tracking changes and progress over time, through students and academic surveys and research. Lessons learned and replicable practices will be shared to better inform local development planning and policy making which will in turn feed into subnational and national planning processes.
7. Capacity developmentCapacity development cuts across all the pillars, from building evidence to planning, programming and implementation. The African continent is lagging behind in the area of Agriculture and Food Insecurity Risk Management, and resilience building. Therefore, the most efficient way for building the capacities of a critical mass of experts and practitioners is to institutionalise such learning, for sustainable knowledge and skills creation. This can be achieved mainly through existing learning institutions, from higher learning to secondary vocational and technical training, to extension services for direct impact on rural producers and communities.
8. ConclusionRisk management tools and policy measures are the drivers of resilience building while infrastructure equipment and capacity development are the enablers and catalytic instruments. They all contribute to building the foundations for sustained increased investment aimed at boosting agriculture productivity and economic growth at community level and all along the value chain. These are major pre-requisites for broad-based and inclusive wealth creation. As such, it is worth investing in it for Agriculture Transformation. However, more research is needed on the interaction between socio-economic systems where assets are created and the identified infrastructure to ensure operation, maintenance, sustainability and upscaling of such investments in a resilience building context.

| 82
Resilience to oppression and to violent conflict escalation through nonviolent actionMayeul Kauffmann1
1 IRNC (Institut de recherches sur la Résolution Non violente des Conflits)
AbstractOppressed social, cultural or ethnic groups that suffer long term oppression o"en resort to violent uprising in a desperate effort to survive or improve their conditions. This has been the source of numerous violent conflicts. Nevertheless, as noted by Hannah Arendt, “in a contest of violence against violence the superiority of the government has always been absolute [...]” (Arendt, 1970, p. 240), and the creation of alternative democratic institutions before or during a campaign for major societal change o"en determines whether sustainable democracy is achieved once the initial victory is won (Arendt, On Revolution, 1965). In this respect, several movements have tried nonviolent forms of action and resistance in order to promote slower pace changes, but in a more sustainable, resilient way than by using violent means; societies that chose such a path to democracy could be expected to be more resilient to violent conflict escalation. Analysing such political changes, Sharp identified 198 methods of nonviolent actions.
Our paper will first summarise Sharp’s work. The second part will be based on a global qualitative and quantitative database, which used Sharp’s ontology to categorize hundreds of case studies of past nonviolent movements. We will use statistical methods to study some of Arendt’s claims and design ways to assess which strategies are the most efficient in providing resilience to oppression, and resilience to violent conflict escalation.
1. IntroductionRepressive regimes use violence to constrain the freedom and free will of their citizens. As such, they are inherently unstable. Opponents of a dictatorial or totalitarian regime face three options: Resignation, violent change, non-violent change.
Resignation causes discontent which, in turn, will lead to a desire for change; long-lasting dictatorial regime are harder to change as they durably weaken the culture of democracy in a society.
Violent change is sometimes seen as an easy, fast solution; still, dictatorships that have been overthrown in a violent way are sometimes revived easily, for instance by reactivating the same political structures, maybe with a different leader. Challenged dictators may resort to international conflicts as a way to create a diversion from internal problems (Levy, 1989). In other cases, the “democratic revolutionary group” sets up a regime whose violent practices resemble those of the defunct democracy. Those regimes born in violent events o"en lead to civil wars. In statistical models, rapid regime changes appear to be a strong factor of internal armed conflicts.1
Hence, given the potentially unstable nature of dictatorships and the subsequent risks of armed conflicts mentioned above, well-structured and organised non-violent methods to
1 Cf. Chapter 4 of Kauffmann (May 2006) and Kauffmann « Gouvernance économique mondiale et guerres civiles » (2008).

83 |
© iStock.com
/baona
progress from dictatorships to democracy are considered by some researchers, politicians and activists as the best strategy in such cases.
In particular, following the work of Gene Sharp, a whole corpus of theory (supported by numerous case studies) suggest that non-violent change can be a way to significantly improve the resilience of societies in repressive regimes. While violent revolution causes the risk of a destruction of large parts of the political and social institutions, non-violent change is seen as a safer, more robust way of dealing with change in repressive contexts, by using methods that are resilient to repressive reaction and by strengthening existing social and political networks.
We start by reviewing Gene Sharp’s work in this context, then use statistical methods on a database of non-violent actions (the Global Nonviolent Action Database) to assess the empirical evidence.
2. “From Dictatorship to Democracy”The process of going from dictatorship to democracy using non-violent means and avoiding armed conflict has been thoroughly studied by Gene Sharp, and summarised in one of his books, “From Dictatorship to Democracy”.
This book is a guide to developing a transition strategy from dictatorship to democracy for a given country. It presents the most effective methods to dismantle dictatorships with the lowest possible cost in human lives, in order to establish durable, resilient democracies. Avoiding the pitfalls of guerrilla warfare and angelism, it suggests to generalize political defiance against dictatorship, by implementing a carefully planned strategy. The result is a work that is action-oriented.
2.1. No armed fight nor negotiation: political defianceA"er briefly recalling examples of dictatorships that have fallen without a fight, Gene Sharp dismisses two strategies, that of armed struggle and that of negotiation. On the one hand, armed struggle means fighting a dictatorship on the ground where it is the strongest. It usually causes an even more violent reaction from the dictator. If a guerrilla succeeds to replace a dictator, the new regime is frequently more dictatorial even than its predecessor. Moreover, the armed struggle does not change the structures of political power and therefore does not allow the establishment of a sustainable democracy (for the same reason, the hope

| 84
aroused by an armed foreign intervention is a delusion). On the other hand, any negotiation between a dictator and his democratic opponents is destined to lead to a fool’s bargain: the “romantic” vision of dictators who would be ready to make major concessions, and negotiations based on arguments of law and ethics (and not power), is at best unrealistic: if a dictator wants to relax his regime, he does not need to negotiate to do it. This vision can even be dangerous: negotiations give the dictator legitimacy. The only possible negotiation is that allowing a weakened dictator to flee his country safely.
The author proposes a third way, starting from an observation: a dictatorship cannot be maintained without the submission, the support (active or passive) and the obedience of its population. The proposed strategy is that of political defiance. Mass disobedience is likely to strongly weaken a dictatorship and, if it continues despite the repression that might follow, it usually leads to the collapse of the dictatorship. The author lists the many weaknesses of authoritarian regimes: internal struggles, inefficient management of information by bureaucracy, opposition of disadvantaged groups, wear of power... It is on these grounds, where dictators are most at their disadvantage, that democrats must fight (and not on the grounds of armed battle). This implies absolute nonviolent discipline on the part of the democrats.
All the weapons of political defiance must be used together, whether these weapons are psychological, social, economic or political. Improvised struggles failed because they used only one or two of the available methods. The author lists no less than 198 methods, grouped into three categories: 1) protest and persuasion (e.g. demonstrations, parades...); 2) social, economic or political non-cooperation 1; 3) nonviolent intervention (e.g. lightning occupations). Action must be collective, hence the role of organisations. These methods can be targeted towards the weaknesses of a dictatorship or the type of rights to be defended. For example, economic noncooperation (decline in productivity, deliberate “mistakes”, strikes, boycotts...) is o"en adapted to fight against an economically fragile dictatorship or to obtain the recognition of economic rights. Correctly conducted, nonviolent struggle alters the conflictual context and society, so that the adversary can no longer act as he sees fit. There are then various types of evolutions. “Accommodation” is possible if the stake appears limited to the eyes of the adversary and if it gains by appeasing the situation. “Nonviolent coercion” may be the result of a massive refusal to cooperate within the country’s economic, social, political (or even military) forces. In more extreme cases of “disintegration”, defiance is widespread, including in the bureaucratic apparatus, the police and the army; the system breaks up. There are also some cases of “conversion”, when a member of the oppressing group is moved by the suffering endured by nonviolent resistors, or persuaded by ethical arguments – but these cases are isolated.
2.2. Indispensable strategic planning
Thus, nonviolent struggle is complex. It therefore requires long-term strategic planning, taking into account the state of the society and available resources, in order to consider realistic phases of action and articulate the four levels of planning that are the “grand strategy” (definition of the main objectives and the type of method), the strategy (order and sequencing in campaigns), the tactics (choices concerning a limited action) and the methods (means of action, for example strike or demonstration).
Failure is the most common outcome of a lack of planning or a narrow strategy: “knocking down the dictator” is an underachievement. It is necessary to aim for the establishment of a democratic and free society and to define the various intermediate objectives that contribute to it, in all fields. It is necessary to carry out a precise evaluation of the organizational means, channels of communication with the general public, possible reactions of the dictator, possibilities of international support (non-military), etc. The first campaign (and if possible the next two) must be fully planned from the beginning and must aim at a symbolic and limited objective (at the risk otherwise of turning into a massacre). The following campaigns should selectively disseminate nonviolent struggle, with targeted social groups taking different action. The strengthening of these social groups will facilitate the subsequent generalization of mass political defiance. Some phases are crucial and must be carefully prepared. It is thus
1 For examples of how those can be articulated, see e.g. Kauffmann (Summer 1998).

85 |
necessary to develop a particular strategy aimed at obtaining the support or at least the neutrality of a part of the army and the police. The continuous evaluation of the methods, objectives and their realization must allow a rapid readjustment of the strategy if necessary.
Once achieved, the fall of a dictatorship should not lead to a decrease in vigilance: the risk of a return to dictatorship is high. Preparing and disseminating a response strategy to a coup attempt can be a deterrent against a potential coup. The dra"ing of a democratic constitution understandable by all is also a major objective, which is only the beginning of a long work of establishing a solid democracy: the political, economic and social problems bequeathed by the dictatorship are in effect likely to last for years.
2.3. A book aimed at guiding action This book is not an ordinary book. While Gene Sharp has published academic works containing numerous bibliographic references, here the facts are presented in a general way to allow more room for reflection on strategy and methods. The reader is referred to other more factual books, written by Gene Sharp or other authors. The result is a book entirely focused on action. Given the format, there is little time to conquer the reader why this or that tactic is the best. The author recognizes his incompetence to judge the adequacy of each technique with the situation of a given country: it is the reader who, if he knows his country well, is the best judge of it. Thus, the highest quality of the work is undoubtedly its realism. Far from being angelic, the author warns that the fight against dictatorships can be difficult and costly, o"en even in human life, but that the number of victims will always be much lower than that of an armed “solution”.
Finally, it is impossible to discuss the contents of this book without mentioning its modes and places of diffusion. Synthetic but clear, of moderate length, its format is actually intended for activists rather than academics. In order to facilitate its dissemination, the English text is in the public domain and is available on the website of the Albert Einstein Institution and in bookstores. These means implemented to disseminate this book are consistent with its objective: to achieve democracy, a regime characterized by transparency. The way to do this must be in accordance with this principle: the organization of nonviolent struggle must not be based on secrecy. Secret conspiracies and organizations are sooner or later infiltrated by the state police and this risk is a source of mistrust between conspirators. On the contrary, transparency and information about the objectives and the means to be used give the image of a powerful resistance movement, inspire confidence and encourage the population to join the movement. Moreover, this information ensures the durability of the democratic movement if its leaders are arrested. This book, by making this strategy public, implements this principle. This publication is in itself a strong act.
The diffusion and the use made of it in several countries illustrate this. Among the languages in which the work has been translated, there are several languages of dictatorial countries. Its publication and distribution to several thousand copies in some countries preceded a few “colored revolutions”, such as the “October 5 Revolution” in Serbia in 2000 (publication in Serbian in 1999), the Ukrainian “Orange Revolution” of November 2004 (publication in Ukrainian in May 2004), the “Tulip Revolution” of 24 March 2005 in Kyrgyzstan (published in Kyrgyz in February 2005). The book, published for the first time in 1993 by the Burmese democratic opposition, was translated and disseminated in Burmese (in 1994, then in four other Burmese dialects in 2001), in Indonesian (1997), in Spanish (2003), Persian and Arabic (2004), Azeri, Belarusian, Russian, Mandarin (traditional and simplified), Khmer and Vietnamese (2005), in 2006 in Tibetan and Tigrinya (language spoken in Eritrea and Ethiopia), in 2009 in French.
Hence, the pivotal role that Gene Sharp’s book played in several non-violent revolutions, the firm theoretical bases for analysis grounded on political science and the systematic cataloguing of possible methods provide a useful framework for study.1 The Global Nonviolent Action Database uses it.
Our second section will present this database and show the results of statistical analysis performed on it.
1 See also Kauffmann (2009), Postface of Sharp (2002); Kauffmann (2008) Review of Sharp (2002).

| 86
3. Global Nonviolent Action DatabaseThe Global Nonviolent Action Database is an online database. Its content is presented below.
3.1. Content of the database
The Global Nonviolent Action Database (herea"er GNVAD) is freely available at available at https://nvdatabase.swarthmore.edu. It is a database of close to 1,200 cases of non-violent action cases, mostly from 1944 to now. Some cases last just a few hours (for instance a sit-in or a demonstration) while some last many years. The database is closely related to the work of Gene Sharp in that it uses his typology of 198 types of non-violent methods.
3.2. Study of some strengths and limitations of the database
The database as some strengths and some limitations; we list here just a few1.
2.2.1. Originality of the database coverage
The first limitation is the lack of comprehensiveness, as many campaigns are not referenced; still, seeing this database as a work in progress, it appears as outstanding. In effect, the main strength of the database is the unique coverage it has: most databases on political action and events tend to over-represent events that lead to armed violence (especially war) over events that do not lead to violence; in particular, there is in the discipline a huge imbalance between the widespread study of armed conflicts (which are covered by dozens of databases with various definitions2) when nonviolent strategies, campaigns and movements are largely ignored3.
2.2.2. Limits of the scope of the database
With respect to the scope and coverage of the database, the main limitation we are able to note is due to the use of Sharp’s taxonomy, which seems a bit weak with respect to modern, IT-based method to perform nonviolent action (Martin 1996, 2001).
2.2.3. Clear and detailed typology of events
If we compare the work of the GNVAD with that of the field of armed violence, it is noteworthy that while decades were needed to have significant progress in the ontology of armed conflict as used in databases (if we consider that this work started with Quincy Wright in 1944 and Lewis F. Richardson in 1948), the GNVAD uses the very detailed typology of Gene Sharp.
2.2.4. Sharing model and data formatting
The way the data are shared (through html pages on a website) does not facilitate the work of researchers who use statistical so"ware to perform numeric or graphic analysis. To illustrate this, it is worth noting that several hours of technical coding work were necessary just to download the data and be able to convert them in a standard, tabulated format that is (only partly) proper for analytical work.
1 A discussion of some limitations is done on the website of the database. We hereby focus more deeply on those that are not or barely mentioned.
2 For critical reviews, see chapters of Kauffmann (ed., 2008) : Kuperman, “Foreword”; Eberwein , “The Creation and Use of Data”; Eck, “An Overview and Typology of Conflict Data”.
3 We should note here the interesting work done at Denver University with the NAVCO database, see Chenoweth and Lewis (2013).

87 |
Even so, it was not possible to perform a full quantitative analysis as some data were not stored in format that would allow it. To give just an example, here is a small sample of the value stored in the date fields (start date, end date):
• (1787) 1700’s
• (19 April 1619) 1600’s
• (495 BCE) Before A.D.
• (Early 385) 300’s
• (July 1656) 1600’s
• 06-JUN 2013
• 1170 BCE Before A.D.
• 13 October 1960
• 1600’s
• 27 February 1964
• February 2011 to June 2011
• July 19 1942
• late June 1989
• March 1912
• May 19, 1999
• Mid-April 1944
• Noon 20 November 1996
• November 2014 - January 2015
• roughly 1959-1964
• Spring 1960
• Spring of 40 C.E. 0’s
• Summer/Fall of 40 C.E. 0’s
Those text strings are simply impossible to analyse in such a format. There are simple solutions to manage uncertainty and imprecise time data (such as “Summer/Fall”) while retaining a numeric tabular format suited for automated analysis; using such formats would greatly improve the usability of the database (See Kauffmann, “Enhancing Openness…” 2008).
Similarly to the temporal dimension, the spatial dimension could be better coded, allowing more advance geographic analysis with GIS so"ware (Geographic Information Systems, see Kucera; Kauffmann et al. 2011).

| 88
2.2.5. Unequal level of experience of the contributors
The experience of the various contributors in terms of the number of cases they contribute is highly unequal, as shown by the following diagram.
Figure 1. Repartition of contributions
25
20
15
10
5
0Cont
ribut
ors
to th
e da
taba
se (o
rder
ed b
y de
crea
sing
num
ber o
f cas
es c
ontri
bute
d)
Source: Author computation from Global Nonviolent Action Database, 2017.
There were, as of the 7th of December 2017, 250 different contributors or groups of contributors. From the above diagram, we see that two contributors contributed more than 20 cases (24 and 23 cases, respectively), while 43 contributors (or group of contributors) contributed 10 to 15 cases, 73 contributors contributed 2 to 9 cases and 92 contributors contributed one case.
It could be assumed fairly that contributors that wrote 10 to 24 cases are more experienced than contributors who wrote only one case. However, 39 cases where contributed by two contributors working together (one of the two being Max Rennebohm, who also contributed 24 cases on his own), and one case was written by 3 contributors. Thanks to collaboration, experienced contributors made new contributors benefit their expertise in data collection and coding.
2.2.6. Good bibliographic coverage, even for cases contributed by researchers with less experience
We searched for potential evidence supporting the hypothesis that author with a low number of contributions could take the data collection less seriously. Actually, the length of the reference section is quite long enough for most contributors, and even slightly longer for occasional contributors. On average, each contribution has 1490 characters, which represents generally about half a dozen references.
However, this average number of 1490 characters hides a large disparity among contributions. It is noteworthy that one case has 207 (sic!) references (see https://nvdatabase.swarthmore.edu/content/haitians-demand-civilian-government-and-democratic-elections-1986-88).
The following diagram shows, on the horizontal axis, various contributors, ordered by the number of cases they contributed to the database (the values, 1 to 24, is the number of contributions). On the vertical axis is measured the length of the bibliography section of each contributed case (in number of characters). Each circle on the X-Y plot is a contributed case.

89 |
Figure 2. Length of bibliography section
30 000
25 000
20 000
15 000
10 000
5 000
0
Leng
th (n
umbe
r of c
hara
cter
s) o
f the
bib
liogr
aphy
sec
tion
Number of cases contributed by the author(s)
5 10 15 20
Source: Author computation from Global Nonviolent Action Database, 2017.
Since it is difficult to grasp any general tendency from the above diagram, a linear model linking the two above-mentioned variables was estimated by the least-square regression method. The results are shown below.
lm(formula = nchar(as.character(x$c_sources)) ~ x$c_author_count)
Estimate Std. Error t value Pr(>|t|)
(Intercept) 1656.09 111.78 14.816 <2e-16 ***
x$c_author_count -19.04 11.18 -1.703 0.089 .
The experience of the author(s) (measured by the number of cases they contributed) has no significant influence (at the 5% level) on the length of the bibliography section.
3.3. Brief statistical analysis of the efficiency of nonviolent action
The method used for the statistical analysis of the database is simple and should be considered as an early, preliminary research. We try here to have a first tentative assessment of the efficacy of nonviolent action. In particular, we try to see whether it is possible to find explanatory variables for the success or failure of nonviolent campaigns.
It is on purpose that we do not use advanced statistical techniques: given the limitations of the database mentioned above in terms of data format and data dissemination model1, some analysis cannot be done without tedious data conversion and data management (which should rather be done “upstream”); using advanced techniques on data that still require additional preparatory treatment could lead to spurious results.
Using a linear model,2 there is a significant effect of the diversity of methods used on the outcome (measured by the success score, between 1 and 6).
lm(formula = x$c_success_points ~ c_methods_codes_len) Estimate Std. Error t value Pr(>|t|) (Intercept) 3.4212794 0.1184888 28.874 <2e-16 ***c_methods_codes_len 0.0018713 0.0008732 2.143 0.0323 *
1 In particular, data structured in a RDBMS (Relational Database Management System) should be provided to the users of the database, which would allow much more advance analysis.
2 An introduction for such models in political science is presented in Kauffmann (March 2009).

| 90
ReferencesArendt, Hannah, On Revolution, 1965.
Arendt, Hannah, On violence. New York: A Harvest Book, 1970.
Chenoweth, Erica and Orion A. Lewis, “Unpacking Nonviolent Campaigns: Introducing the NAVCO 2.0 Dataset”, Journal of Peace Research, May 2013.
Eberwein, Wolf-Dieter, “The Creation and Use of Data: Scientific Requirements and Political Utility” in Kauffmann, M. (ed.), Building and Using Datasets on Armed Conflicts.
Eck, Kristine, “An Overview and Typology of Conflict Data: The Advantages of Data Diversity” in Kauffmann, M. (ed.), Building and Using Datasets on Armed Conflicts
Kauffmann, Mayeul (editor) Building and Using Datasets on Armed Conflicts, May 2008, Amsterdam: IOS Press, 204 p. ISBN: 978-1586038472 http://ebooks.iospress.nl/volume/building-and-using-datasets-on-armed-conflicts (NATO Science for Peace and Security Programme).
Kauffmann, Mayeul, “Enhancing Openness and Reliability in Conflict Dataset Creation” in Kauffmann, Mayeul (ed.), Building and Using Datasets on Armed Conflicts, (op. cit.), pp. 107-132. http://ebooks.iospress.nl/volume/building-and-using-datasets-on-armed-conflicts
Kauffmann, Mayeul, “Introduction”, in Kauffmann, Mayeul (ed.), Building and Using Datasets on Armed Conflicts, (op. cit.), pp. 1-9. http://ebooks.iospress.nl/volume/building-and-using-datasets-on-armed-conflicts
Kauffmann, Mayeul, “Short Term and Event Interdependence Matter: A Political Economy Continuous Model of Civil War”, in Peace Economics, Peace Science and Public Policy, Vol. 13, Issue 1, 2007, BE-Press (Berkeley), 19 p.
However, this explains only a small part of the success rate. Using instead a probit model on the binary “survival” outcome, there is a very mild statistical evidence that campaigns with more diversified methods are more likely to survive, but the effect is not statistically significant.
glm(formula = x$c_survival_point ~ c_methods_codes_len, family =
binomial(link = “probit”))
Estimate Std. Error z value Pr(>|z|)
(Intercept) 1.0198670 0.0830359 12.282 <2e-16 ***
c_methods_codes_len 0.0005409 0.0006305 0.858 0.391
4. ConclusionMore sophisticated statistical analysis could be implemented to get a better idea of why some non-violent campaign methods fail while some others do not, taking advantage for instance of the fact that each campaign is split into six equal periods which have their own attributes.1 Theoretical modelling could even be possibly explored.2
However, this would require some (relatively minor) adjustments of the database, including some recoding of some free text fields (for instance: leaders, opponents…) in a more structured format, and a dissemination of the data as an RDBMS.
1 For a discussion of how more detailed and structured data allow for finer historical statistical analysis, see: Kauffmann “Introduction”, in Kauffmann (2008); Kauffmann (2007).
2 Using modelling techniques inspired by the microeconomic analysis of rational agents with “bounded rationality”, adapted to the field of political science as examplified in: Kauffmann, Seiglie (2004). Kauffmann, « Les couples dans l’étude empirique du modèle libéral néo-kantien » (2006).

91 |
Kauffmann, Mayeul, « Gouvernance économique mondiale et guerres civiles » [World Economic Governance and Civil Wars], chap. 1 of La guerre est-elle une bonne affaire ? Cahier du GIPRI, N° 6/2007, January 2008, GIPRI (Geneva International Peace Research Institute)/L’Harmattan, Paris, 110 p. Foreword by Jean-Pierre Stroot and Gabriel Galice. http://www.editions-harmattan.fr/index. =catalogue&obj=livre&no=25366&razSqlClone=1
Kauffmann, Mayeul, « Les couples dans l’étude empirique du modèle libéral néo-kantien » [Dyads in empirical analysis of the neo-Kantian liberal model], in Arès, special issue on dyads in International Relations, Vol. XXII-2, n. 57, CESICE, Grenoble, November 2006, pp. 87-104.
Kauffmann, Mayeul, Gouvernance économique mondiale et conflits armés. Banque mondiale, FMI et GATT-OMC [Global economic governance and prevention of armed conflicts. World Bank, IMF and GATT-WTO], Paris: l’Harmattan, Coll. La Librairie des Humanités, May 2006, 330 p. http://www.editions-harmattan.fr/index.asp?navig=catalogue&obj=livre&no=21588
Kauffmann, Mayeul, Postface of: Gene Sharp (2002), “De la Dictature à La Démocratie. Un cadre conceptuel pour la libération. (Translated by Dora Atger, English title below), foreword by Federico Mayor, Director-General of UNESCO), 2009, L’Harmattan, Paris. ISBN: 978-2296108721. www.aeinstein.org/wp-content/uploads/2013/09/FDTD_French.pdf
Kauffmann, Mayeul, Review of: Gene Sharp (2002), “From Dictatorship to Democracy. A Conceptual Framework for Liberation”, Albert Einstein Institute, Boston. Review published in Hérodote 2008/2, n. 129, pp. 249-251. https://www.cairn.info/revue-herodote-2008-2-page-247.htm#pa15
Kauffmann, Mayeul. « Rationalité des entreprises et intervention civile », in Alternatives non violentes, Ventabren, France: ANV, review associated with the IRNC (Institut de recherche sur la Résolution non Violente des Conflits), n. 107, Summer 1998, pp. 38-44. (Corporate ethics, public opinion and the potential role of economic actors in conflict resolution thanks to the internalization of “peace-building externalities”.) http://www.non-violence.ch/catalogue/index.php?lvl=notice_display&id=70995
Kauffmann, Mayeul. Méthodes statistiques appliquées aux questions internationales [Statistical methods applied to international issues], March 2009, 197 p., L’Harmattan, Paris. (A handbook on quantitative methodology to study international issues). ISBN : 978-2-296-07982-3. http://www.editions-harmattan.fr/index.asp?navig=catalogue&obj=livre&no=28405
Kauffmann, Mayeul; Seiglie, Carlos “The Economics of Chemical and Biological Weapons”, in “Economics of Peace and Security”, section edited by James K. Galbraith, in Encyclopedia of Life Support Systems (EOLSS), developed under the Auspices of the UNESCO, EOLSS Publishers, Oxford, UK, 2004. https://www.eolss.net/Sample-Chapters/C13/E6-28A-04-02.pdf
Kucera, Jan; Kauffmann, Mayeul; Duta, Ana-Maria; Soler, Ivette Tarrida; Tenerelli, Patrizia; Trianni, Giovanna; Hale, Catherine; Rizzo, Lauren; Ferri, Stefano. Armed conflicts and natural resources - Scientific report on Global Atlas and Information Centre for Conflicts and Natural Resources. 2011. European Commission - Scientific and Technical Research Reports. ISBN 978-92-79-20498-2.
Kuperman, Ranan D., “Foreword”, in Kauffmann, M. (ed.), Building and Using Datasets on Armed Conflicts, (op. cit.).
Levy, Jack. 1989. “The diversionary theory of war: A critique”. In Handbook of war studies, ed. M. I. Midlarsky , 259-288. Boston: Unwin Hyman.
Martin, Brian, “Communication technology and nonviolent action”, in Media Development, Vol. 43, No. 2, 1996, pp. 3-9. Available at http://www.bmartin.cc/pubs/96md.html
Martin, Brian, Technology for nonviolent struggle, London: War Resisters’ International, 2001, ISBN 0903517 18 3. Full book available from http://www.bmartin.cc/pubs/01tnvs/tnvsall.html
Richardson, Lewis Fry, Statistics of Deadly Quarrels, ed. by Quincy Wright and C. C. Lienau, 307 p., Chicago: Quadrangle Books, 1960.
Sharp, Gene, From Dictatorship to Democracy, East Boston, MA: Albert Einstein Institution, 2003.
Sharp, Gene, The Methods of Nonviolent Action, 1973.

| 92
All-hazards impact scenario assessment methodology as decision support tool in the field of resilience-based planning and emergency managementGiulio Zuccaro1, Mattia Federico Leone2, Daniela De Gregorio1
1 University of Napoli Federico II, Department of Structures for Engineering and Architecture (DiST); PLINIVS Study Centre (LUPT) 2 University of Napoli Federico II, Department of Architecture(DiARC); PLINIVS Study Centre (LUPT)
AbstractUnderstanding the expected impacts of natural and man-made hazards on the built environment and communities, as well as their resilience capacity, represents an emerging priority both in the field of urban planning and building design, both to support emergency planning and management at national and local level. Economic losses from natural hazards have increased almost 10 times during the past 40 years (Swiss-RE, 2015), with 10 billion yearly losses only in the EU context, and there is an increasing awareness that Sustainable Development Goals and priorities of the Sendai Framework cannot be achieved without a comprehensive approach able to promote the effective implementation of Disaster Risk Reduction and Climate Change Adaptation measures within resilient regeneration processes and the integration of impact scenario analyses in support of Disaster Risk Management procedures.
1. IntroductionIn the domain of urban mitigation and adaptation there is an increasing evidence of how both physical and economic impacts of natural hazards can be reduced only through a resilient design approach in new construction and retrofitting. In this sense, an “all-hazards” approach, addressing multiple risk conditions (including Natech and cascading effects) and integrating DRR and CCA design strategies, show a highly cost-effective potential, maximizing the effect of complementary measures and optimizing mitigation/adaptation design techniques within a multi-scale resilience perspective (building/neighbourhood/city), delivering at the same time socio-economic benefits linked to the improvement of urban spaces’ liveability and environmental quality. Through this approach, the conventional geophysical and hydrogeological hazard mitigation strategies (e.g. structural retrofitting), can be combined with measures for climate change mitigation (e.g. energy retrofitting and NZEB) and adaptation (e.g. blue/green infrastructures and SUDs). Emergency planning and management is also strongly influenced by the ability of defining DRM strategies based on a detailed quantification of physical, social and economic impacts according to the different natural and man-made hazards, depending on the risk proneness of a given territory, as well as on the potential benefits, in terms of vulnerability and impact reduction, deriving from
KeywordsAll-hazards, Vulnerability analysis, Impact modelling, Resilient design

93 |
the implementation of long- to short-term preparedness measures. An effective simulation-based scenario assessment methodology aims at increasing the potential for use of scientific results by decision-makers to streamline national to local DRR and CCA policies. The approach outlined in the following sections combines multi-hazard and dynamic impact scenarios with cost-benefit and multi-criteria analyses, tailored according the specific applications to assess the effectiveness of alternative “Adaptive Mitigation” and “Build Back Better” options, as well as to identify trade-offs, co-benefits, common resilience pathways and management approaches, highlighting synergies of integrated actions responding simultaneously to geophysical and climate-related hazard conditions.
2. Understanding vulnerabilities and quantifying impacts: PLINIVS models and tools
Vulnerability and impact assessments (including simulation-based scenarios) represent an effective approach to make science understandable to decision makers and streamline national to local mitigation/adaptation actions, especially if integrated with effective tools for cost-benefit and multi-criteria analyses, tailored according end-users’ needs, to assess the effectiveness of alternative options. Resilient land-use planning and building/open spaces design can indeed take advantage from simulation scenario analysis approaches, which allow the understanding of physical and economic impacts due to natural, technological or natech hazards.
The experiences conducted in the last 30 years at PLINIVS Study Centre of University of Naples Federico II allowed the development of several probabilistic simulation models to assess the impacts of natural hazards, taking into account the impact distribution in time and space and the cumulative damage produced by possible cascading effects, as well as a continuous data collection activity on built environment and population, at national and regional scale in Italy, that allowed building up a comprehensive GIS database, that includes population data, classification of different building typologies (detailed at the level of technical elements: vertical structures, walls, roofs, openings, etc.), features of transport networks and critical infrastructures. The database includes vulnerability classes of each element at risk considered (population, buildings, infrastructure, economy, etc.) with respect to the main hazards considered. The database is integrated into impact models,
© iStock.com
/Tinieder

| 94
allowing to derive the expected impact of a given event on the territory with a detail of municipalities at national level, 500x500m mesh at regional scale and 250x250m mesh at sub-regional scale. The methodology applied within PLINIVS models (which includes Probabilistic dynamics modelling, Bayesian networks, Event tree analysis, Monte Carlo Method, fuzzy logics and error propagation calculation for uncertainties treatment) allows to determine realistic impacts on selected elements at risk, deriving hazard modelling information from specialized research institutions, such as, in Italy, the INGV for geophysical hazards, the National Weather Service for meteorological hazards and the CMCC for climate change projections. The current development of the impact models is based on a constant evolution and integration within several research and innovation projects (see Acknowledgements) (Zuccaro and De Gregorio, 2013; Zuccaro et al. 2013; Mavrouli et al., 2015; Zuccaro and Leone, 2016). The features of the main models and tools developed at PLINIVS can be summarised as follows:
• Seismic Impact Simulation (SIS). Real time estimation of expected impact of earthquakes on the entire Italian territory. During seismic crises, the “impact maps” are used by the Italian National Department of Civil Protection to manage the early phases of the emergency and coordinate Search&Rescue activities. In peace time the model is used to assess the effectiveness of seismic improvement actions on buildings, including the cost-benefit evaluation of measures that integrate structural and energy retrofitting.
• Volcanic Impact Simulation (VIS). Time-dependent and cumulative damage on exposed elements following the different hazards (earthquake, ash fall, pyroclastic flow and lahars) characterizing the explosive eruption time history.
• Landslide Impact Simulation (LIS). Buildings’ behaviour under dynamic load due to rapid landslide. Vulnerability classes for structural and non-structural building elements defined and computed through limit state analyses and experimental tests.
• Climate risk Impact Simulation (CIS). Impact of heat waves, extreme precipitation and hydrogeological events and their variation induced by climate change. The model is based on the elaboration of climate projections downscaled to include urban microclimate conditions and simulate the impacts on population, residential and strategic buildings, transport infrastructure and local economy.
• Cascading Effects Impact model (CEI). Cumulative damage from a sequence of natural and/or technological hazards, including the propagation of damage across critical infrastructures (transport, power, communication and water supply networks).
• Economic Impact Model of natural hazards (EIM). Direct and indirect economic impacts (ranging from emergency operations and reconstruction costs, to losses in local GDP for business interruption) of single hazards and cascading effects, including cost-benefit evaluation of mitigation measures on building components (seismic strengthening of structures, strengthening of roofs against ash fall, protection of openings).
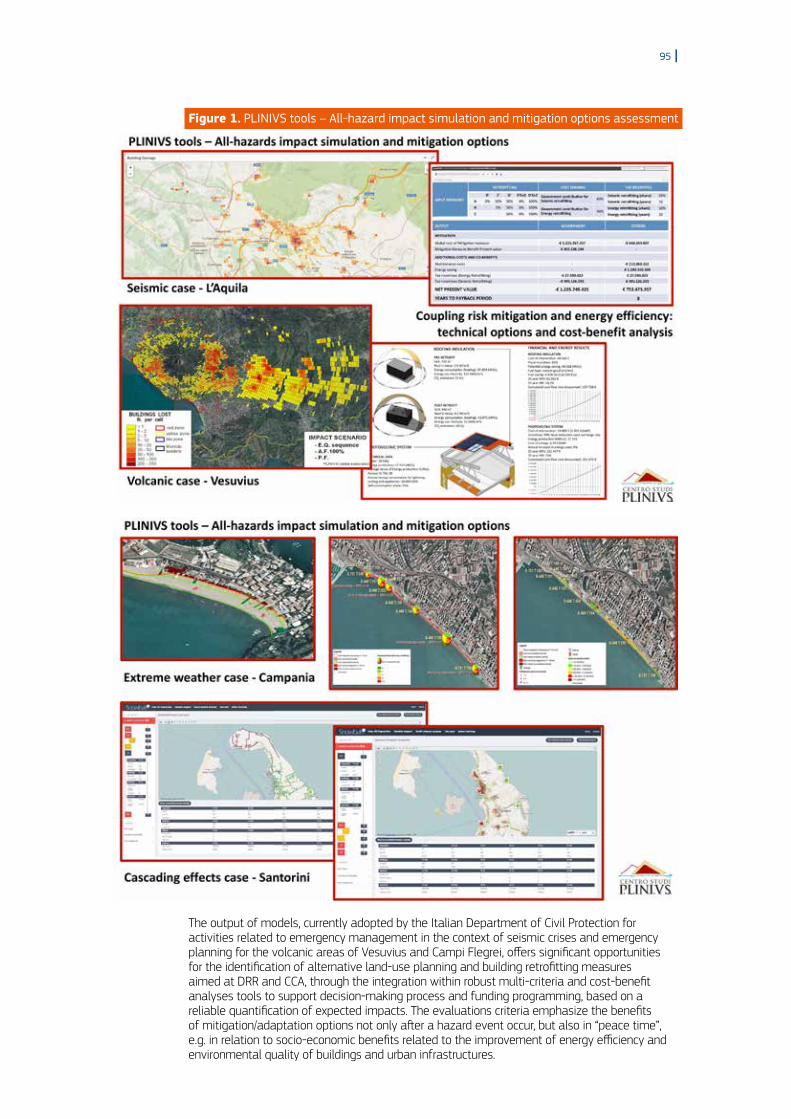
95 |
Figure 1. PLINIVS tools – All-hazard impact simulation and mitigation options assessment
The output of models, currently adopted by the Italian Department of Civil Protection for activities related to emergency management in the context of seismic crises and emergency planning for the volcanic areas of Vesuvius and Campi Flegrei, offers significant opportunities for the identification of alternative land-use planning and building retrofitting measures aimed at DRR and CCA, through the integration within robust multi-criteria and cost-benefit analyses tools to support decision-making process and funding programming, based on a reliable quantification of expected impacts. The evaluations criteria emphasize the benefits of mitigation/adaptation options not only a"er a hazard event occur, but also in “peace time”, e.g. in relation to socio-economic benefits related to the improvement of energy efficiency and environmental quality of buildings and urban infrastructures.
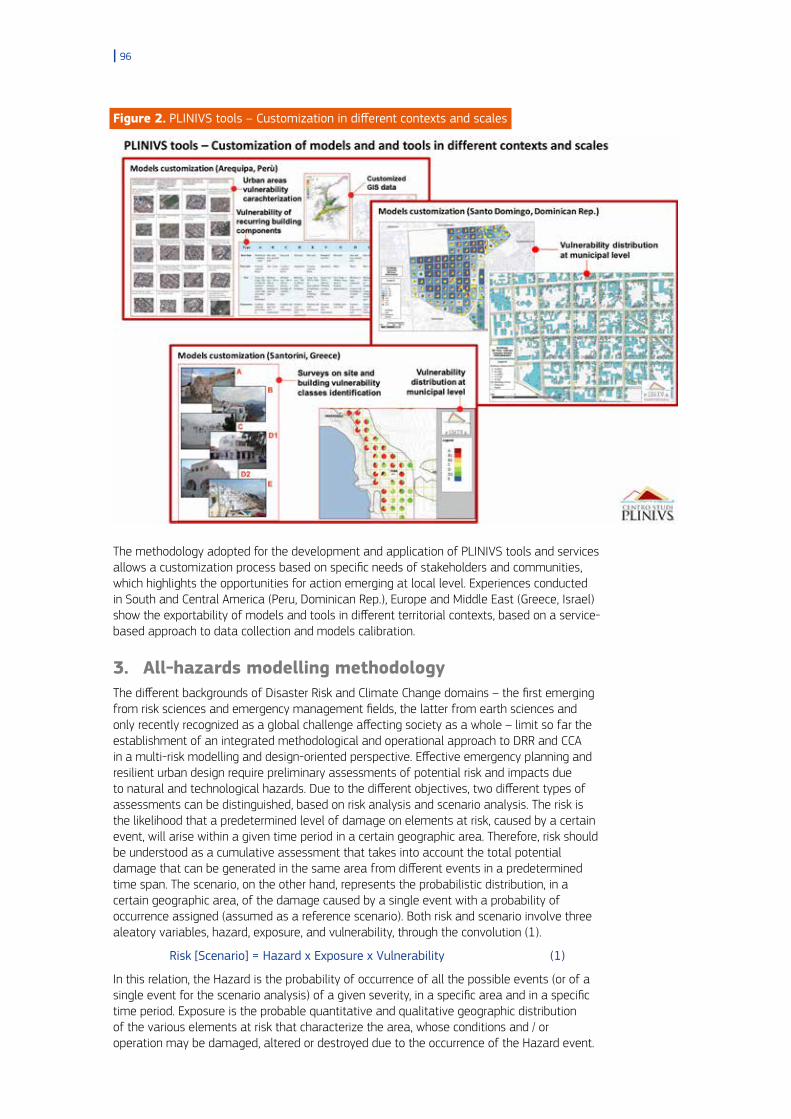
| 96
Figure 2. PLINIVS tools – Customization in different contexts and scales
The methodology adopted for the development and application of PLINIVS tools and services allows a customization process based on specific needs of stakeholders and communities, which highlights the opportunities for action emerging at local level. Experiences conducted in South and Central America (Peru, Dominican Rep.), Europe and Middle East (Greece, Israel) show the exportability of models and tools in different territorial contexts, based on a service-based approach to data collection and models calibration.
3. All-hazards modelling methodologyThe different backgrounds of Disaster Risk and Climate Change domains – the first emerging from risk sciences and emergency management fields, the latter from earth sciences and only recently recognized as a global challenge affecting society as a whole – limit so far the establishment of an integrated methodological and operational approach to DRR and CCA in a multi-risk modelling and design-oriented perspective. Effective emergency planning and resilient urban design require preliminary assessments of potential risk and impacts due to natural and technological hazards. Due to the different objectives, two different types of assessments can be distinguished, based on risk analysis and scenario analysis. The risk is the likelihood that a predetermined level of damage on elements at risk, caused by a certain event, will arise within a given time period in a certain geographic area. Therefore, risk should be understood as a cumulative assessment that takes into account the total potential damage that can be generated in the same area from different events in a predetermined time span. The scenario, on the other hand, represents the probabilistic distribution, in a certain geographic area, of the damage caused by a single event with a probability of occurrence assigned (assumed as a reference scenario). Both risk and scenario involve three aleatory variables, hazard, exposure, and vulnerability, through the convolution (1).
Risk [Scenario] = Hazard x Exposure x Vulnerability (1)
In this relation, the Hazard is the probability of occurrence of all the possible events (or of a single event for the scenario analysis) of a given severity, in a specific area and in a specific time period. Exposure is the probable quantitative and qualitative geographic distribution of the various elements at risk that characterize the area, whose conditions and / or operation may be damaged, altered or destroyed due to the occurrence of the Hazard event.

97 |
Vulnerability is the probability that the exposed element of a certain typological characteristic (vulnerability class) undergoes a certain degree of damage or state changes, with reference to an appropriate scale, due to a Hazard event of assigned intensity.
To specialize the relationship (1), the risk of reaching a certain level of damage can be determined through the relationship (2).
(2)
where: Hi is the probability of occurrence of an event of severity level “i” over a period of time and on a certain site; Vl,i,m is the probability of occurrence of an assigned damage level “l” following the event “i” for a certain category “m” (vulnerability class) of elements at risk; Em is the percentage of elements for the “m” category.
The scenario for a certain damage “l” level, due to a single intensity event “i”, can instead be determined through the relationship (3).
(3)
In emergency and territorial planning, both risk analysis and scenarios can be used, in response to different purposes: risk assessments allow comparative evaluations of risk-prone areas to take strategic decisions on preparedness and response intervention strategies (e.g. evacuation) and for the definition of priority areas for adaptation and mitigation actions; scenario analyses, by providing a detailed impact assessment following the reference hazard event(s) selected, allow a much more fine-tuned quantification of the expected damage in a given territorial area, thus enabling a proper estimation of (human and financial) resources required for emergency management and resilience-based urban design and planning.
Due to the extreme complexity of a full probabilistic risk assessment approach when dealing with multiple hazards (both independent and interconnected), the all-hazards modelling methodology developed at PLINIVS is based on a “scenario analysis” approach, which allows the assessment of damage induced on the elements at risk (e.g. people, buildings, critical infrastructures, service networks, economy, etc.) by a series of single hazards (e.g. earthquakes, floods, landslides) in a multi-risk prone area, or a sequence of interconnected hazards within a cascading effects or NaTech timeline of events. Thus, the “scenario analysis” consists in the measure of the damage induced (space- and time-dependent) by a single event (hazard) or a single chain of events of assigned intensity and probability, on the elements at risk considered (exposure) in function of the response of the element under effect of the hazard(s) (vulnerability). The output of the assessment consists in a detailed quantification of expected impact on the elements at risk considered (e.g. for people, the n. of deaths, injured and homeless; for buildings and infrastructure the damage levels ranging from D0-no damage to D5-total collapse), which allows in turn a reliable quantification of direct and indirect economic impacts (e.g. for buildings rehabilitation and reconstruction, for business interruption, etc.).
This approach, based on a consolidated scientific framework in the field of risk science and theory of decisions (from UNDRO, 1979 to IPCC, 2014), has been recently formalized in the framework of Snowball project, as a theoretical model to address multi-risk and cascading effects through a scenario assessment methodology (Zuccaro et al. 2018a). The methodology expands the logic of the scenario assessment described above to propose a holistic approach to perform impact scenario analyses in an “all-hazards” perspective. The different elementary bricks, Space (s); Time (t); Hazards (H); Initial Exposure (E); Initial Vulnerability (V); Dynamic vulnerability (DV); Human behaviour influence; Damage (D), are defined in relation to the the required inputs of the models and can be schematized in Figure 3.
Space and Time constitute the reference frame of other bricks. Hazards, Exposure and Vulnerability identify the input data of the “impact model” at initial time (in peace time). Dynamic vulnerability identifies the routine that update the response (vulnerability) of a specific element exposed induced by sequence of two or more hazards. The human behaviour is a variable able to influence the hazard chains (in the case of cascading effects and NaTech), the exposure, the vulnerability and the damage induced (e.g. in relation to preparedness measures such as evacuation or other self-protection measures). Its effect is considered through the introduction of an opportune influence factor (α). Damage on element exposed (in time and space) is the output data of the impact model(s) applied.

| 98
Figu
re 3
. Ele
men
tary
bric
ks o
f th
e PL
INIV
S th
eore
tical
mod
el (l
e") a
nd a
pplic
atio
n to
the
casc
adin
g eff
ects
/NaT
ech
sim
ulat
ion
(righ
t)
REFE
REN
CE F
RAM
E
HAZA
RDS
(H)
H k [M
(MRU
)]
Spat
ial d
istrib
utio
nof
mag
nitu
de M
of
all h
azar
ds(H
0, H
1, ...
, Hk,
..., H
n)H0
= tr
igge
ring
haza
rd,
Hk =
ass
ocia
ted
haza
rds
-3-
EXPO
SURE
(E)
[VC je|
Hk(M
RU)] t0
Spat
ial d
istrib
utio
nat
sta
rt tim
e t 0 o
fVu
lner
abilit
y Cl
asse
sVC
j of e
ach
elem
ent
expo
sed
e (p
eopl
e,bu
ildin
gs, ..
.) un
der
effec
t of s
ingl
eHa
zard
Hk
-4-
VULN
ERAB
ILIT
Y(V
)
V [P
(D≥D
i∩H k)]
Vuln
erab
ility
Func
tions
of e
ach
elem
ent e
xpos
ed e
un
der e
ffect
of e
ach
singl
e Ha
zard
Hk.
-5-
DYN
AMIC
7VU
LNER
ABIL
ITY
(DV)
E (t k)
= f [
D(t k-
1)]
Time
upda
te a
t tk
of th
e ex
posu
rein
func
tion
ofth
e da
mag
eoc
curre
d at
tim
e t k-
1.
-6-
DAM
AGE
(D)
D e [(M
RU)] t
Time
and
spat
ial
dist
ribut
ion
ofda
mag
e in
duce
d on
each
ele
men
tex
pose
d e
byca
scad
ing
even
ts.
-7-
OUT
PUT
INPU
T
SPAC
E(M
INIM
UMRE
FERE
NCE
UN
IT,
MRU
)
TIM
E(t
)
MRU T
Mun
icipa
lity,
Cens
us s
ectio
n, Ce
ll of
a g
eogr
aphi
c grid
, ...
Times
(t0,
t 1, ...,
t k, ...,
t n)...c
hain
of e
vent
s an
d "d
ecisi
on p
oint
s".
-1-
-2-
HUM
AN7
BEHA
VIO
UR
α
Hum
an b
ehav
iour
influ
ence
fact
or
-8-
EXPO
SURE
VUL
NERA
BILI
TYE’
= E
LEM
ENTS
D EX
POSE
DTO
A S
INGL
E HA
ZAR
V’ =
VUL
NERA
BILI
TYDO
FDE
E’’ =
ELE
MEN
TS E
XPOS
EDTO
MOR
E HA
ZARD
SV’
= V
ULNE
RABI
LITY
OF
E’’
HAZA
RD(c
hain
Cij…
k)
DAM
AGE
LEVE
L(D
0, D
1, D
…, D
5)
TIM
E
HUM
AN B
EHAV
IOUR
E’ (t
Hij…
k)
E’’(t
Hij…
k)V’
(t Hij…
k)
V’’(t
Hij…
k)E’
(tHi
j)
E’’(t
Hij)
V’(t Hi
j)
V’’(t
Hij)
...
...E’
(tHi)
E’’(
t Hi)
V’(t Hi
)
V’’(t
Hi)
E’ (t
H)
E’’(
t H)V’
(t H)
V’’(
t H)
D Hij...
k=D’
Hij...
k+D’
’ Hij...
k
D Hij=
D’Hi
j+D’
’ Hi,
...D Hi
=D’
Hi+D
’’ Hi
D H=D’
H+D’
’ H
E’(t 0)
V’(t 0)t 0
t Ht Hi
t Hij
...t Hi
j...k
TH
α H
HiHi
j...
Hij..
.k
α Hiα Hi
jα Hi
j...
α Hij..
.k
FINA
LDA
MAG
ESI
NGLE
DAM
AGE
ONEL
EMEN
TS E
XPOS
ED T
O A
SING
LE H
AZAR
D IN
THE
CHA
IN
CUM
ULAT
IVE
DAM
AGE
ONDE
LEM
ENTS
EXP
OSED
TO M
ORE
HAZA
RDS
IN T
HE C
HAIN
ΣD’
ΣD’’
+
VOLC
ANIC
UNRE
STTI
ME
HIST
ORY
3 —
Sub
-Plin
ian
unre
st in
Nea
Kam
eni (
high
pro
b.)
t 0t 0
t 1,2
EQ1
DAMA
GE ON
BUILD
INGS
AND P
EOPL
E
t 2
EQ2
CUMU
LATIV
E DAM
AGE
ON BU
ILDIN
GSAN
D RES
IDEN
TS
t 3EF
t 4LS
CUMU
LATIV
E DAM
AGE
ON BU
ILDIN
GS AN
DDA
MAGE
ON PO
RTS
t 7
AF/V
G
t 8t 9
EF C
F
CUMU
LATIV
E DAM
AGE O
NBU
ILD., D
AMAG
E ON
POW
ERPL
ANTS
AND A
IR TR
ANSP
t 10
AF/V
G
CUMU
LATIV
E DAM
AGE
ON BU
ILD. A
ND DA
MAGE
ON PO
RTS
t 5EF
t 6
WF
DAMA
GE ON
DESA
LINAT
ION
PLAN
T
DECI
SION
POI
NT 1
:Ev
acua
tion
ofal
l tou
rists
NO E
VAC
t 2,3
DECI
SION
POI
NT 2
:Ev
acua
tion
ofen
tire
popu
latio
n
VOLC
ANIC
UNRE
STTI
ME
HIST
ORY
3 —
Sub
-Plin
ian
unre
st in
Nea
Kam
eni (
high
pro
b.)
t 0t 1,
2t 1
EQ1
DAMA
GE ON
BUILD
INGS
t 3EF
t 4LS
CUMU
LATIV
E DAM
AGE
ON BU
ILDIN
GS AN
DDA
MAGE
ON PO
RTS
t 2
EQ2
CUMU
LATIV
E DAM
AGE
ON BU
ILDIN
GSAN
D RES
IDEN
TS
t 7
AF/V
G
t 8t 9
EF C
F
CUMU
LATIV
E DAM
AGE O
NBU
ILD., D
AMAG
E ON
POW
ERPL
ANTS
AND A
IR TR
ANSP
t 10
AF/V
G
CUMU
LATIV
E DAM
AGE
ON BU
ILD. A
ND DA
MAGE
ON PO
RTS
t 5EF
t 6
WF
DAMA
GE ON
DESA
LINAT
ION
PLAN
T
DECI
SION
POI
NT 1
:Ev
acua
tion
ofal
l tou
rists
EVAC
1
t 2,3
DECI
SION
POI
NT 2
:Ev
acua
tion
of e
ntire
po
pula
tion
VOLC
ANIC
UNRE
STTI
ME
HIST
ORY
3 —
Sub
-Plin
ian
unre
st in
Nea
Kam
eni (
high
pro
b.)
t 0t 1
t 1,2
EQ1
DAMA
GE ON
BUILD
INGS
AND P
EOPL
E
t 2
EQ2
CUMU
LATIV
E DAM
AGE
ON BU
ILDIN
GSAN
D SOM
E RES
IDEN
TS
t 3EF
t 4LS
CUMU
LATIV
E DAM
AGE
ON BU
ILDIN
GS AN
DDA
MAGE
ON PO
RTS
t 7
AF/V
G
t 8t 9
EF C
F
CUMU
LATIV
E DAM
AGE O
NBU
ILD., D
AMAG
E ON
POW
ERPL
ANTS
AND A
IR TR
ANSP
t 10
AF/V
G
CUMU
LATIV
E DAM
AGE
ON BU
ILD. A
ND DA
MAGE
ON PO
RTS
t 5EF
t 6
WF
DAMA
GE ON
DESA
LINAT
ION
PLAN
T
DECI
SION
POI
NT 1
:Ev
acua
tion
ofal
l tou
rists
EVAC
2
t 2,3
DECI
SION
POI
NT 2
:Ev
acua
tion
of e
ntire
pop
ulat
ion
t 1,2
DECI
SION
POI
NT 2
: Eva
cuat
ion
of re
siden
ts (1
0% o
f res
iden
tsre
fuse
to e
vacu
ate)
99 |
The impact scenario can thus be assessed by the convolution (3). It represents the time (t) - space (Minimum Reference Unit - MRU) distribution of damage occurred on the different elements exposed e in relation to the hazard(s) considered: De [(MRU)]t. The reliability of the impact scenario analysis is strongly influenced by the ability to provide accurate information in relation to the three key variables H, E, V and manage the related uncertainties thresholds. However, it is always possible to perform impact analyses with different levels of detail and reliability according to the data available.
Hazard characterization needs to be modelled through the support of experts in the specific field of investigation (e.g. seismology, hydrogeology, climate sciences, etc.), deriving probabilities of occurrence of different event’s magnitude, time and spatial extension. The choice of the reference event object of the simulation is defined according to end-users’ needs, ranging from a series of simulation of diverse types of events with attached probabilities of occurrence, to single events (or chains of events) deterministically chosen for specific reasons (e.g. analyse the “worst-case” or the “most probable” scenario).
Exposure and inventory data include all the collection of relevant information in relation to the elements at risk considered in the analysis, ranging from the geometric typological, morphological and construction features of built environment (buildings, open spaces, transport and networks, critical infrastructure, etc.), census data (e.g. population distribution, socio-economic data, etc.), catalogued and geo-referenced according to the MRU to be analysed. It can benefit of the significant innovation in the field of satellite surveys and big data analytics, thus allowing to simplify the collection of a minimum datasets of information at global scale, which is used to customize and calibrate the vulnerability and impact models.
Vulnerability analysis represents the crucial step to build a reliable and flexible all-hazards impact model. The proposed approach is based on a two-fold level of analysis with different resolutions. At National level, (Italy), census data and satellite information are detailed with a MRU constituted by the Region and/or the municipality. A continuous activity on field data collection (including post-event surveys in areas affected by seismic and hydrogeological events) allows to refine the general vulnerability functions in relation to the various hazards investigated and specific characteristics of the elements at risk in the study area (e.g. recurring building and construction typologies, land use, population occupancy, etc.). Such refinement allows to provide a more precise information on the expected impacts of the reference event(s), with a MRU based on a territorial mesh on the territory up to a 250x250 size. The customization of the models on different geographical areas is generally subject to a field survey aimed at establishing the due correlations among the vulnerability functions available in relation to the Italian and Campania Region models, with the specific features of the elements at risk in the study area (Ettinger et al., 2015; Zuccaro et al. 2018b).
4. Conclusions: All-hazards impact modelling as decision support tool
Dealing with DRR and CCA in a decision-support perspective entails the clear need of strengthening the collaboration between areas characterized by diverse research backgrounds, but all complementary to effectively contribute to identify answers and solutions adequate to the systemic complexity of the challenge. Human settlements can be conceived as complex systems resulting from the interaction of different subsystems: physical system, functional system and socio-economic system. Disaster Risk and Climate Change are producing increasing crises in each of these subsystems, with consequences to the society as whole. The challenge of bridging scientific research and technological innovation with transnational policies and operational practices needs to be supported by a multidisciplinary systemic approach to the transformation of the built environment, where engineering, architectural and urban disciplines, probabilistic modelling and risk science, systems’ engineering, social studies, earth sciences, IT and data visualization, are called to focus on identifying and communicating effective and adaptive solutions to the challenge of a sustainable growth and resilient societies in a globally connected world, dealing with increasingly complex disaster risk conditions aggravated by the inevitable climate change perspective.

| 100
The relevance of reliable impact simulation models and decision-support tools is strictly connected to the need of enabling a knowledge-exchange between scientific communities, governance institutions, industry and practitioners, and society, as all essential actors for the implementation of resilience pathways. In this sense, a collective effort is needed to take advantage of the most advanced science-based hazard/impact assessment methods, to streamline their contribution to the needed policy and legislation evolution. A common field of research and implementation needs to be targeted, based on identified priorities: a service-oriented thinking, aimed at maximising the usability and the user-tailoring of simulation models and tools developed by the scientific community, both to support technical policy improvements and specific actions’ implementation; the exploitation of big data and satellite/remote sensing information, to improve high level assessment and identify priorities at international and regional scales; the quantitative assessment of losses (physical, functional and economic) and their propagation among different geographical areas, infrastructure networks and economic sectors.
Some main scientific gaps and needs are identified in this sense: 1) there is an increasing need of standardizing risk and impact modelling methodologies, at least at macro-regional/national scale (EC, 2010), to take advantage of the potential integration of methods and tools developed by a variety of actors (governments, research centres, industry, SMEs, etc.) which would meet the need for a more useful, usable and evidence-based knowledge to inform resilient planning and emergency management (full DRM cycle approach); 2) operational and organizational modelling (and thus a stronger link with human behavioral aspects) represents a priority when assessing social and systemic, as well as service networks and critical infrastructures vulnerability, which is essential to properly model functional and economic losses (Critical Infrastructures still remain black boxes in this sense); 3) the need of producing time-dependent and multi-hazard vulnerability analyses of systems and their elements, so as reliable impact evaluation approaches, require a substantial methodological shi" with respect to the conventional probabilistic simulation methods, o"en limited to hazard characterization and risk assessment, and thus with a limited application potential in a resilient design-oriented perspective, where the quantification of potential losses and the benefits related to adaptation/mitigation measures is essential to define standards, protocols and guidelines (Zuccaro and Leone, 2012; Zuccaro and Leone, 2014). Similarly, effective common methodologies for multi-sectorial resilience assessments are needed, with indicators and metrics strictly connected in terms of input/output to innovative impact simulation models, to provide decision-makers and end-users with actionable information to be incorporated in regulatory and policy improvements (Zuccaro and Leone, 2015).
Acknowledgements The paper presents the methodological approach developed at PLINIVS Study Centre and the experimental applications implemented within past and ongoing EU and National projects, such as SISMA (Campania Region, 1987), focusing on earthquakes VESUVIUS (EU-FP5, 1998-2000), EXPLORIS (EU-FP6, 2002-2005) and SPEED (Italian Department of Civil Protection, 2007-2012), focusing on volcanic eruption; SAFELAND (EU-FP7, 2009-2012), focusing on hydrogeological hazards; CRISMA (EU-FP7, 2012-2015), focusing on models’ integration, economic impacts, web services and tools for crisis management decision support; SNOWBALL (EU-FP7, 2014-2017), focusing on cascading effects and natech hazards, CLARITY (H2020, 2017-2019), focusing on climate change induced hazards (extreme heat, drought and precipitation events).Classification of potential energy accidents in a risk class according to the possible characteristics of country cluster, energy chain, infrastructure type and event chain sequence.
The possible use of the decision rules for the classification of new accidents is illustrated with three realistic accidents (n1-n3) in Table 2, together with the standard and advanced recommendation schemes applied with rough set methodology.

101 |
ReferencesEC - European Commission, Risk Assessment and Mapping Guidelines for Disaster Management. Commission Staff Working Paper, 2010.
Ettinger S., Mounaud L., Magill C., Yao-Lafourcade A.F., ThouretJ.C., Manville V., Negulescu C., Zuccaro G., De Gregorio D., Nardone S., Luque Uchuchoque J.A., Arguedas A., Macedo L., Manrique Llerena N. ‘Building vulnerability to hydro-geomorphic hazards: Estimating damage probability from qualitative vulnerability assessment using logistic regression’. Journal of Hydrology, Vol. 541, 2015, pp. 563-581.
IPCC, Climate Change 2014: Impacts, Adaptation, and Vulnerability. Summaries, Frequently Asked Questions, and Cross-Chapter Boxes. A Contribution of Working Group II to the Fi!h Assessment Report of the Intergovernmental Panel on Climate Change, World Meteorological Organization, Geneva, Switzerland, 2014.
Mavrouli O., Fotopoulou S., Pitilakis K., Zuccaro G., Corominas J., Santo A., Cacace F., De Gregorio D., Di Crescenzo G., Foerster E., Ulrich T. ‘Vulnerability assessment for reinforced concrete buildings exposed to landslides’. Bull Eng Geol Environ., Vol. 52, 2014, pp. 265-289.
Swiss-RE, Sigma, 2, 2015.
UNDRO, Natural Disasters and Vulnerability Analysis: Report of Expert Group Meeting, 9-12 July 1979. Office of the United Nations Disaster Relief Coordinator, United Nations Disaster Relief Organization (UNDRO), Geneva, 1980.
Zuccaro G., De Gregorio D. ‘Time and Space dependency in impact damage evaluation of a sub-Plinian eruption at Mount Vesuvius’. Natural Hazards, Vol. 69, N. 3, 2013, pp.1399-1423.
Zuccaro, G., Leone, M.F., Del Cogliano, D., Sgroi, A. ‘Economic impact of explosive volcanic eruptions: A simulation-based assessment model applied to Campania region volcanoes’, J. Volcanol. Geotherm. Res., Vol. 266, 2013, pp. 1-15.
Zuccaro, G., Leone, M.F., ‘Building Technologies for the Mitigation of Volcanic Risk: Vesuvius and Campi Flegrei’, Nat. Hazards Rev. ASCE, Vol. 13, N. 3, 2012, pp. 221-232.
Zuccaro, G., Leone, M.F., ‘The mitigation of volcanic risk as opportunity for an ecological and resilient city’, TECHNE Journal of Technology for Architecture and Environment, Vol. 7, 2014, pp. 101–107.
Zuccaro, G., Leone, M.F., ‘Seismic and energy retrofitting of residential buildings: a simulation-based approach’, UPLanD. Journal of Urban Planning, Landscape & environmental Design, Vol. 1, 2016, pp. 11-25.
Zuccaro, G. De Gregorio, D. Leone. M.F. ‘Theoretical model for cascading effects analyses’. International Journal of Disaster Risk Reduction, Special Issue: Understanding and mitigating cascading crises in the global interconnected system, 2018a.
Zuccaro, G. De Gregorio, D. Leone. M.F. Barberi, F. Papazachos, C. Baxter, P.J. Santo, A. Forte, G. De Falco, M. Jenkins. S. ‘Analyses of cascading effects induced by volcanic eruptions in Santorini Island’. International Journal of Disaster Risk Reduction, Special Issue: Understanding and mitigating cascading crises in the global interconnected system, 2018b.

| 102
Math programming to facilitate exploration of decision alternatives for community resilience planningHarrison, Ken1
1 National Institute of Standards and Technology (NIST)
AbstractIn the development of models to support community resilience planning, the scale and interdependencies of the system and the complexities of the planning process must be acknowledged and addressed. This work focuses on the development of math programming models that are the basis of an interactive screening tool for community-scale resilience planning. The goal of the tool is for stakeholders to interactively explore solutions that perform well with respect to objectives that are included in the model (e.g., cost, resilience) and not included in the model (e.g., social and political feasibility). It is characterized as a “screening” tool as significant model simplifications are made to shorten solution times (via a class of optimization algorithms); solutions of interest would undergo more detailed analysis. To address objectives not in the model, modelling-to-generate-alternatives is applied to explore tradeoffs and efficiently search for maximally different alternatives, respectively. “Community-scale” is meant to imply that a broad range of decisions across the community are to be considered in a joint manner and with recognition of their dependencies (e.g., home retrofits lessening the need for emergency response). Challenges in the design of the tool include the need to tie together pre-disaster (i.e., preparedness) and post-disaster (i.e., recovery) decisions and to account for the stochastic nature of the hazards and system failure.
1. IntroductionNIST has provided initial guidance (NIST, 2016) on community resilience planning. This paper concerns one aspect of this guidance, that of identifying solutions that can meet the community’s resilience goals. This is a nontrivial task given the scale of the systems involved and the complexity of the decision-making processes. Fortunately, there are methods to address these complexities. Mathematical programming, dating to World War II, concerns decision-making for large-scale systems. In this paper, a few strategies are specifically examined for successfully applying mathematical programming to this challenging problem of community resilience planning. These strategies are being implemented in an early so"ware prototype for community resilience planning that is under development at NIST.
Keywordscommunity resilience planning, mathematical programming, decision support

103 |
2. Key challenges to prescriptive modelling for community resilience
There are several attributes of the community resilience planning problem that are challenging for prescriptive modelling. In Table 1, these attributes are listed in the first column. Most relate to the immense scale of the system and messiness of the decision problem. The community resilience system has been described aptly as a “system of systems”, including interdependent economic, social and physical systems. This system of systems also has stochastic elements, for example, hazards and component failure. In addition, there is considerable scientific uncertainty that is important to address. For example, there is uncertainty in predicting the evolution of community recovery and in quantifying resilience. Moreover, there are important dynamics at play, including land use change, infrastructure aging, and changes in hazard frequency and severity (i.e., non-stationarity). In addition, there are multiple decision stages in the preparedness and mitigation period, which are pre-event, and in the recovery period, which is post-event. Finally, with community resilience involving public-sector decisions, the decision-making process must accommodate multiple stakeholders with o"en competing objectives and multiple jurisdictions.
These attributes pose significant challenges to prescriptive modelling. In Table 1, the challenges stemming from these features are distilled down to “size and complexity” and “quantifiability”. The greater the size and complexity of the modelled systems and of the decision process, the greater the need for attention to computational feasibility, so"ware maintenance, and multidisciplinary input and coordination. Quantifiability here refers to the ability to quantify the system behaviours and the decision-making objectives. A strategy is needed to address a lack of quantifiability where it exists.
In Table 1, those challenges marked “xx” are particularly problematic. Multiple decision stages need to be considered in community resilience planning and this greatly exacerbates the problem size and complexity. At its simplest, it is a two-stage stochastic programming problem, a nested decision problem with an outer “preparedness and mitigation” planning problem and an inner “recovery” problem. Solving the outer problem requires knowing how the inner problem will be solved for the full range of hazard event outcomes. The inner problem alone can computationally demanding to solve. The quantifiability challenge is most exacerbated by the public nature of community resilience planning. Not all stakeholder objectives can be quantified and some may be revealed only upon seeing solutions put forward.
© iStock.com
/christopherhall

| 104
Table 1. Attributes of the community resilience planning problem that present significant challenges to prescriptive modelling.
Challenges to prescriptive modeling (x=exacerbating; xx=greatly exacerbating)
Attributes Size and complexity Quantifiability
System of large-scale, interdependent systems x x
Stochastic behavior & Uncertainty x x
Dynamical behavior x x
Multi-stage decision-making process xx x
Public sector decision-making x xx
At NIST, several decisions were taken in the mathematical programming approach to community resilience planning to address these challenges. Below, the scope is limited to two basic decisions. The first decision concerns the decision to pursue integer linear programming (ILP), which is discussed in section 3. The second decision, described in section 4, concerns how dependencies are captured in a way that addresses the size and complexity of the problem and, in turn, concerns of computation time, so"ware maintenance, and expert communication. The third decision, presented in section 5, relates to the objectives, with an emphasis on the treatment of unquantified objectives.
3. An integer linear programming (ILP) frameworkThe field of math programming encompasses many methods, ranging from linear programming to metaheuristics (e.g., evolutionary computation, simulated annealing). In selecting a specific approach, it is important to consider trade-offs between modelling objectives, including lessening the need for approximation (model precision), identifying solutions quickly (solution time), and having confidence that the solutions found are optimal to the formulated problem (solution precision). For example, with metaheuristics (e.g., genetic algorithms, evolutionary computation), existing simulation models may be used without modification, resulting in high model precision, but may require a long solution time and result in solutions of unknown degree of optimality (to the stated problem). In contrast, linear programming can require varying degrees of approximation, from mild to extreme, but has the benefit of being solved quickly and with the knowledge that resulting solutions are guaranteed to be optimal within the uncertainty imposed by the approximation.
Initial exploratory testing suggested that, despite considerable approximation, many important relationships in the community resilience system could be captured within an integer linear programming (ILP) framework, which is one consisting of continuous and integer variables, and linear constraints and objective function. To date, testing has been limited in the size and scope of the system under consideration. The main test problem concerns a small semi-rural community for which the main hazard is riverine flooding. Resilience decisions are limited to changes to key infrastructure and housing. The test problem discussed here is patterned a"er a partial set of experiences of Lumberton, NC, which was severely flooded from Hurricane Matthew in 2016. Further testing is needed to investigate its scalability to a larger and more complete system.
For purposes of illustration, here we consider a scaled down version of the test problem, one that includes the key infrastructure components listed in Table 2. Each component c has a baseline resistance, rc, which for the riverine flooding test problem is the component’s elevation. Resistance measures for each of these components are being actively considered in Lumberton, NC. The main decision variables are the amount by which each component is to be elevated, DeltaRc. The resistance following the decision is:
(1)

105 |
The riverine flood hazard is assumed fully characterized by a single scalar, flood stage. The set of flood stages considered is referred to as HAZ_EVENTS, with each event ev having probability, pev. The simple “bathtub” flooding model is assumed, meaning that within the community the elevation associated with the flood stage is equated with the loading to the component, Lc,ev.
The set of components is named COMPS_BINFXN to indicate that the components are of binary function, either functioning or not (“failure”). The state of function of component c is denoted yc,ev, with a value of 1 indicating “non-functioning” and value of 0 indicating “functioning”.
The number of decision objectives is limited for the illustrative problem. Here, only net costs, which includes mitigation costs and expected direct losses associated with component failure, and utility restoration time are considered. They are defined fully later in the paper. It does not include as objectives, for example, the numbers displaced from their home due to flooding, which is accounted for in the full test problem. Finally, it is also important to consider that the decision problem here is oriented towards recovery and not towards the maximization of resilience itself. Unquantified objectives (e.g., social and political feasibility) are addressed with application of Modelling to Generate Alternatives (MGA) as described below.
The math program is coded using an algebraic modelling language for optimization (AMPL). The list of components and their attributes, and other needed information, including the networks described in the next section, are drawn fully from databases. The math program code itself does not change as the list of components and the size of the networks grows. For purposes of exposition of the math program, this list is kept short.
Table 2. Example components vulnerable to riverine flood hazards. This example is used in the discussion to illustrate aspects of the ILP math program.
Component with binary function (Functional/Not functional)
Short name
Levee Levee
Water intake electrical controls WaterIntake
Electrical power substation ElecSub
Water treatment plant controls WTPControls
Water treatment plant berm WTPBerm
4. Defining “dependency” networks translatable into ILP constraint sets
There are several kinds of dependencies among the many and varied components of the resilience system. The strategy taken in the development of the ILP model was to define “dependency” networks in such a way that they could be translated into sets of constraints for the ILP model.
This approach has several benefits. First, by defining a language for the dependencies, the ILP algebraic formulation is kept simple, which facilitates maintenance of the codes, and therefore avoids errors, in implementing the math program. The math program ingests data tables that contain lists of the system components and other data tables that encode the dependency networks. Examples are shown below. Second, the networks themselves have the added benefit of facilitating communication about dependencies among experts in different domains, as well as with stakeholders.
Three dependency networks are described, the first depicting dependencies related to hazard resistance, the second capturing failure propagation, and third representing recovery.

| 106
4.1. Lines of Defense (LOD) network
Hazard resistance dependencies for the example set of components are represented in a tree network (Figure 1). The node NO_PROT is a dummy component that has an infinitely negative protection and for which it is infinitely costly to increase resistance. In this “lines of defense” (LOD) network, the protection of a component is defined as the maximum of its own resistance and that of its ancestral line.
For example, as shown in Figure 1, the water treatment plant electrical control system (WTPControls) has its own resistance to flood, defined by its elevation, but may be provided more protection more by a berm; in turn, the berm has its own resistance but may be protected by the levee. The protection of the treatment plant controls is the maximum of the elevations of the controls, berm and levee. This network, a set of child-parent relationships is referred to as LOD_LINKS.
Within the ILP program, a maximum function is disallowed (as it is a nonlinear function). However, certain properties of the problem allow it to be effectively represented with addition of some auxiliary variables and constraints. A continuous variable, R―c, is introduced to represent the overall resistance of component c when considering this line of defense. A binary variable, ycself represents whether the component’s overall resistance is defined by its own resistance Rc, in which case ycself=1, or by the overall resistance of its, R–parent, in which case ycself=0. Two constraints are added, only one of which is to hold:
(1)
(2)
M refers to a large number (e.g., 10,000) to ensure that only one of the constraints holds. Note that these are inequalities that place a cap on R–c. In the solution process to meet the objective (e.g., minimization of damages, minimization of recovery time), R–c is driven up against Rc (if ycself=1) or R–parent (if ycself=0).
Figure 1. Lines of Defense Network. The protection of a node is the maximum of its own resistance and that of its lineage. From this network, a “protection” set of ILP constraints is constructed.
NO_PROT
WTPBerm
WaterIntake ElecSub WTPControls
Levee

107 |
4.2. Failure cascade network
Failure can occur in one of two ways, either directly or through failure of another component. Direct failure of a component (yc,ev=1) occurs when for hazard event scenario ev, the loading to the component Lc,ev, exceeds the component’s overall resistance:
(3)
Note that direct failure can only be avoided under hazard event ev, the condition yc,ev=0, if the loading does not exceed the component’s overall resistance.
The second way for failure to occur is via failure of another component, either directly or indirectly. Figure 2 shows the failure cascade network for the illustrative problem.
Capturing this dependency is achieved with the following constraint set:
(4)
Failure is thereby forced to occur with failure of an immediate predecessor, and can propagate through the system.
Figure 2. Failure Cascade network. Failure of a component can occur either directly from loading exceeding a component’s resistance or, as illustrated here, via failure of anothercomponent on which it depends. A successor in the figure will fail if any predecessor fails.A “failure cascade” set of ILP constraints is constructed from the information in this network.
ElecSub PowerDelivery
WTPControls
WaterDelivery
WaterIntakeUtilitiesDelivery
4.3. Recovery network
Failure and recovery are closely linked. The total set of recovery activities is referred to as RECOV_ACTS. A failure-recovery table, CASC_RECOV_LINKS (not shown; within (COMPBINFXN,RECOV_ACTS)), specifies for each component what recovery activities must occur if failure is observed. In some cases, failure of a component, for example the water intake controls, may simply require one recovery activity, replacement or repair of the component. In other cases, failure can require two or more activities. For example, failure of the levee may require two recovery activities: 1) repair of the levee and 2) pumping out the water trapped behind the levee. The latter activity must be accounted for because the water treatment plant in the example resides just behind the levee. (Repair of the levee is not considered in this illustrative example network as it does not feed into the ‘Utilities restored’ node considered below).

| 108
Figure 3. Recovery Activity network. For successor activities to begin, all predecessor activities must be completed. A “recovery” set of ILP constraints is constructed from the information in this network.
Many recovery activities must wait on the completion of other recovery activities. The network in Figure 3 captures these relationships for the illustrative example; it is encoded as a data table consisting of pairings of activities (RECOV_LINKS) where the first activity is a predecessor and the second is the successor activity. In Figure 3, the network makes clear that before water delivery is restored both the water intake and water treatment plant electrical control system must be restored. They, in turn, must wait on the receding of the floodwaters.
Conditioned on there being a precipitating failure, each activity act within RECOV_ACTS is assumed here to be of fixed duration durGivenFact. (Here, the duration time is indexed only by activity, and is assumed independent of the triggering hazard, though it could be indexed also by the hazard event). The actual duration time DURact,ev only applies if the triggering component indeed fails, which is captured by:
(5)
For community resilience planning, the earliest finish times of each activity EFTact,ev are of interest; other parts of the math program involve the setting of limits on these times. The earliest finish times are constrained by:
(6)
The constraint requires that the earliest start time (EFT-DUR) of the successor activity be greater than the earliest finish time of the predecessor activity.
5. Addressing unquantified objectives
5.1. Objective functions for modelled objectives
The cost objective, which includes the net expected costs of the resistance changes and expected damages is defined as follows:
(7)
where deltaRc is the change in resistance (resistance units, e.g., meters), UnitCostc is the unit cost of the change ($/resistance units), pev is the probability of the hazard event scenario, and Damagec is the damage associated with the failure of component c. The damage may include losses including its repair or replacement costs and other associated losses (excluding

109 |
losses to the other components in Table 2). (Note: for simplicity, a linear cost function is assumed here. More generally, a piece-wise linear cost function could be used within the ILP framework.)
As described earlier, the utility restoration objective is limited to one flood stage, ev*. The relevant constraints that define EFTUtilitiesRestored,ev* are given in Equation 6.
5.2. Multi-objective programming
Multi-objective programming has received much attention in the literature. Multi-objective programming methods are helpful in finding solutions that optimally trade off competing known objectives. These methods produce solutions on the optimal trade-off surface, or “noninferior set”. So, for example, a trade-off curve could be developed for the NetExpCosts objective, defined in Equation 7, and the EFTUtilitiesRestored,ev* objective, as defined in Equation 6.
The math program consists of the set of decision variables:
With the objective:
(8)
subject to constraints:
(9)
Technical constraints (Equations 1-7) (10)
Solution of the math program defined by Eq. 8-10 is solved repeatedly with different values of EFTlimitUtilitiesRestored,ev* to plot a trade-off curve representing the noninferior set for expected cost and recovery time. The curve helps make the trade-offs transparent to the decision-maker.
5.3. Modelling to generate alternatives (MGA)
However, for “messy” public-sector planning problems like community resilience planning, there are objectives that likely are not be incorporated in the math program, either because they may not be known a priori or because they have not been quantified or are difficult to quantify. Where important objectives are not incorporated, it has been observed that the “best” solution likely will not be in the “noninferior set” but instead fall within the inferior region (Brill 1979).
Optimization, however, still has an important role to play for these messy public sector problems (Liebman 1976). The role for optimization, it has been proposed, is to screen out from consideration solutions that perform poorly with respect to the modelled objectives. More strongly, the role for optimization is to facilitate search for a small set of alternatives, ones that perform well with respect to the modelled objectives, but that are maximally different from each other in decision space, and therefore likely to vary with respect to objectives that are not included in the model (Brill, Chang et al. 1982). This approach is referred to as Modelling to Generate Alternatives (MGA) (Brill, Chang et al. 1982).
The MGA method “Hop, Skip and Jump (HSJ)” (Brill, Chang et al. 1982) applies mathematical programming to this goal of generating maximally different decision alternatives. How “maximally” is defined is limited by the form of mathematical program, e.g., linear for linear programming problems.
The method is straightforward to implement and can be illustrated with reference to our problem.

| 110
ReferencesGalbusera L., Azzini I., Giannopoulos G. (2016) A Methodology for Resilience Optimisation of Interdependent Critical Infrastructures. In: Rome E., Theocharidou M., Wolthusen S. (eds) Critical Information Infrastructures Security. CRITIS 2015. Lecture Notes in Computer Science, vol 9578. Springer, Cham
Brill, E. D. (1979). “The Use of Optimization Models in Public-Sector Planning.” Management Science 25(5): 413-422.
Brill, E. D., et al. (1982). “Modeling to Generate Alternatives: The HSJ Approach and an Illustration Using a Problem in Land Use Planning.” Management Science 28(3): 221-235.
Harrison, K. W., et al. (2001). “Decision Support Tool for Life-Cycle-Based Solid Waste Management.” Journal of Computing in Civil Engineering 15(1): 44-58.
Liebman, J. C. (1976). “Some Simple-Minded Observations on the Role of Optimization in Public Systems Decision-Making.” Interfaces 6(4): 102-108.
1. Find a starting solution for exploring alternatives. For this problem, solve the math program defined by Equations 1-10. Refer to the
solution as deltaR0c, and the corresponding optimal objective value, NetExpCosts0.
2. Create room for exploring solutions by relaxing the limits on the modelled objectives: In this step, some room is given for exploring solutions. For example, a relaxed limit on
net expected costs, NetExpCostsLimit, could be set to a value 10% greater than NetExpCosts0:
(12)
The limits on recovery time, Eq. 9, could similarly be relaxed to allow more room to explore alternatives.
3. Construct a new objective function that rewards differences from the current solution. In linear programming problems, we are limited in that we cannot maximize a
direct measure of difference. Instead, in applications of MGA for linear programming problems, positive-valued variables in the original solution are driven out. One way of accomplishing this is to keep a count, countc, of the number of times a variable is positive-valued in prior solutions. For the initial solution from step 1, the count is either 1 or 0. To penalize components in the prior solution(s) the following sum is minimized:
(11)
4. Run the modified math program to identify a new alternative The math program is defined by Eq. 11-12, 9, and technical constraints Eq. 1-7.
5. Store the alternative solution. Repeat steps 2-4.
Through these steps, one is essentially exploring the degree of flexibility in the decision for meeting the expected cost and recovery target. Alternatives of interest can serve as a starting point for more detailed analysis.
6. SummaryAn integer linear programming formulation has been presented that addresses key challenges to community resilience planning. The formulation addresses the identification of alternative solutions to meet resilience and cost targets while modelling important dependencies. In addition, the method Modeling to Generate Alternatives (MGA) is applied for efficient generation of alternatives as a means of addressing unquantified objectives.

111 |
Towards more aligned/standardized solutions for indicator-based resilience assessmentA. S. Jovanovic1,2, O. Renn3,1, F. Petit4
1 EU-VRi – European Virtual Institute for Integrated Risk Management, Stuttgart, Germany 2 Steinbeis Advanced Risk Technologies, Stuttgart, Germany 3 IASS, Potsdam, Germany 4 Argonne National Laboratory, Argonne, Chicago, USA
AbstractSeveral The approaches to the resilience assessment made in some of the EU projects from the Horizon 2020 DRS-line of calls, especially in the project SmartResilience, are compared
with some of the respective efforts in the US. Methodologically, the focus of the paper is on the resilience indicators based approaches and resilience indicator-based assessment. The approaches must be able to deal with new emerging issues, such as regional resilience and smart infrastructures, as well as the practical use of big data. The proposed alignment should go towards an extension of current risk and resilience (e.g. ISO) standards and extended international collaboration in the area.
1. Introduction Joint Workshop “Aligning the resilience-related research efforts in the EU DRS projects’’ which has taken place in conjunction with the EU Community of Users Meeting of September 12-14, 2017 (Jovanović, Bellini, 2017) has clearly shown that the new approaches to the resilience assessment and management methods, new guidelines and new tools being developed in current EU projects need alignment. Resilience assessment has many aspects and the same applies to the research and practical efforts related to it.
The same applies also to the efforts done in different countries or in different application areas. This a prerequisite to achieving “global resilience”, needed for the modern world endangered by the global shocks (OECD, 2011). This was one of the main messages sent by the group of over 150 scientist and practitioners in the area, presenting the work of the leading EU, international and US institutions there. In particular, the results from the EU DRS 7&14 projects DARWIN, IMPROVER, RESILENS, RESOLUTE, SMR, and SmartResilience, the research from the Organisation for Economic Co-operation and Development (OECD), the United States Department of Homeland Security (DHS) and the Argonne National Laboratory (ANL) were presented. This international perspective provided the workshop participants a broader view of resilience assessment methods and tools, as well as a deeper understanding of how application cases from different projects might yield valuable lessons for international cooperation in the area of resilience. However, on the other side, meetings like this one show also the other side of the issue: aligning is a difficult and complex task and the possibilities (and readiness) to search for compromises o"en limited.
Keywordsresilience, resilience
indicators, resilience matrix,
resilience assessment

| 112
This paper, therefore, goes for the practical and pragmatic solutions. It proposes to align search the alignment in three main practical areas: the resilience concept (definitions, approaches), the resilience metrics (indicators) and the resilience tools.
2. Aligning resilience approaches
2.1. Resilience definition
The work done in, e.g., SmartResilience EU project (), has extended the definition of the resilience proposed by Linkov (2014).
© iS
tock
.com
/tim
star
key
Box 1. Resilience (SmartResilience project)
Resilience of an infrastructure is the ability to anticipate possible adverse scenarios/events (including the new/emerging ones) representing threats and leading to possible disruptions in operation/functionality of the infrastructure, prepare for them, withstand/absorb their impacts, recover optimally from disruptions caused by them and adapt to the changing conditions
The main reason for the “update” se amendments were the need to bring the definition more in line with the other aspects of the approach, namely the resilience indicators, resilience matrix, risk (especially emerging risk) analysis and the standards currently applicable in the area (see the referenced ISO standards).
113 |
2.2. Resilience matrix
Resilience approaches so far have used different number of phases in describing the resilience cycle. From 4 (e.g. Linkov, 2014) to 8 (e.g. Øien, 2012). SmartResilience has proposed to align them within a 5x5 matrix containing 5 resilience phases
1. Understand risks
2. Anticipate / prepare
3. Absorb / withstand
4. Respond / recover
5. Adapt / transform
And 5 resilience “dimensions”:
1. System / physical
2. Information / smartness
3. Organizational / business
4. Societal / political
5. Cognitive / decision-making
An example of the matrix is in Figure 2, whereas the examples of the issues one would look for in different cells of the matrix is given in Table 1.
2.3. Resilience of (smart) critical infrastructures
Modern critical infrastructures are becoming increasingly “smarter” (e.g. the “smart cities”). Making the infrastructures “smarter” usually means making them smarter in the normal operation and use: more adaptive, more intelligent. However, will these smart critical infrastructures (SCIs) behave “smartly” and be “smartly resilient” also when exposed to extreme threats, such as extreme weather disasters or terrorist attacks? If making existing infrastructure “smarter” is achieved by making it more complex, would it also make more vulnerable? Would this affect resilience of an SCI as its ability to anticipate, prepare for, adapt and withstand, respond to, and recover? Providing clear and practicable answers to the above questions, accepted by possibly large group of stakeholders, is the main specific objective of this proposal.

| 114
Table 1. Sample combinations infrastructure-scenario targeted by the SmartResilience project
PHASE I. UNDERSTAND RISK
II. ANTICPATE / PREPARE
III. ABSORB / WITHSTAND
IV. RESPOND /RECOVER
V. ADAPT / TRANSFORMDIMENTION
a. SYSTEM / PHYSICAL
Review of the risk for the physical infrastructure and the network of infrastructures
State and ability of physical assets e.g. barriers, alert systems, entrance controls
Physical safety system and redundant components
Flexibility in system design, temporary system installation
Ability to update of system configurations based on lessons learned
b. INFORMATION / SMARTNESS
Information about adequacy of existing barriers against possible risks
Information from previous events (what went wrong/right) to learn from
Real-time monitoring and actions triggering smart devices
Information about centralized facilities and distribution of essential supplies and services
Information from smart sensors about events, response operations and lessons learned
c. ORGANIZATION / BUSINESS
Periodic organizational review of the relevant risks, reports about previous events
Budget and plans for preparedness
Availability of action plan and competent personnel for immediate reaction to event
Availability of enough emergency response budget and resources
Debriefing of the event and the response operations to personnel directly involved
d. SOCIETAL /POLITICAL
Exchange of knowledge about risks (including risk perceptions in the society)
Seeking information from authorities on threat assessments and preparing
External alert and communication, Coordination between actors
Contact/liaison with authorities/ media and regular communication
Communication with local governments and stakeholders to transform the previous practices
e. COGNITIVE / DECISION MAKING
Decision criteria of individuals (Risk perception, mental models, values)
Ability (biases previous knowledge used) of the individuals to alert others of specific threat
Situational awareness ability of the individuals to evaluate the performance during the event
Transperency in response and recovery decision making and communication
Improvement in decision making to deal with future events

115 |
Table 2. Sample combinations infrastructure-scenario targeted by the SmartResilience project
Infrastructure (CI) / Scenarios Terrorist attack
Cyber attack
Extreme weather
Cross-cutting issues
Smart cities (Germany, Ireland) ( )
Insurance, law enforcements, legislation, …
Smart financial system (UK) ( )
Smart health care (hospitals, Austria) ( ) ( )
Smart energy supply systems (Finland) ( ) ( )
Smart industrial/production plants (incl. Industry 4.0 plants)
Smart transportation (airports; Hungary)
Smart water supply (Drinking water supply, Sweden) ( )
SmartResilience project, for instance, envisages answering the above questions in several steps, by addressing the following specific, practical objectives:
1. identifying existing indicators suitable for assessing resilience of SCIs
2. identifying new “smart” resilience indicators (RIs) – including those from Big Data
3. developing a new advanced resilience assessment methodology based on smart RIs (“resilience indicators cube”, including the resilience matrix)
4. developing the interactive “SCI Dashboard” tool
5. applying the methodology/tools in 8 case studies, integrated under one virtual, smart-city-like, European case study (see Table 2).
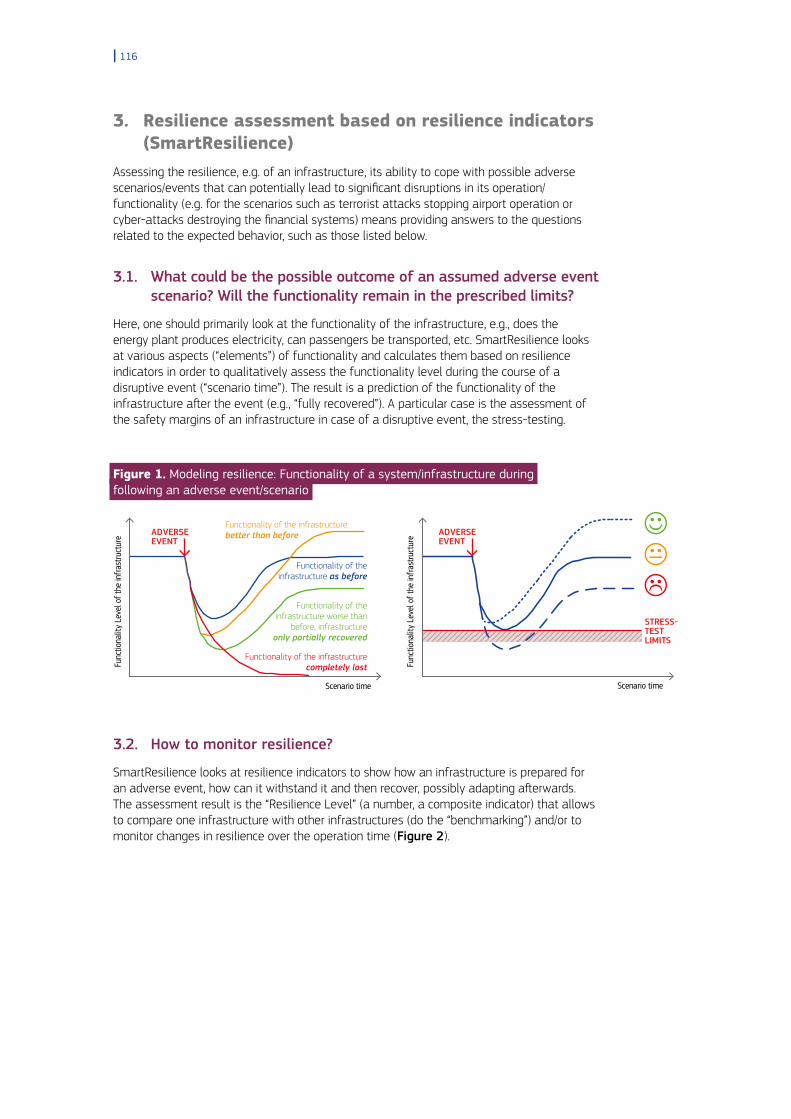
| 116
3. Resilience assessment based on resilience indicators (SmartResilience)
Assessing the resilience, e.g. of an infrastructure, its ability to cope with possible adverse scenarios/events that can potentially lead to significant disruptions in its operation/functionality (e.g. for the scenarios such as terrorist attacks stopping airport operation or cyber-attacks destroying the financial systems) means providing answers to the questions related to the expected behavior, such as those listed below.
3.1. What could be the possible outcome of an assumed adverse event scenario? Will the functionality remain in the prescribed limits?
Here, one should primarily look at the functionality of the infrastructure, e.g., does the energy plant produces electricity, can passengers be transported, etc. SmartResilience looks at various aspects (“elements”) of functionality and calculates them based on resilience indicators in order to qualitatively assess the functionality level during the course of a disruptive event (“scenario time”). The result is a prediction of the functionality of the infrastructure a"er the event (e.g., “fully recovered”). A particular case is the assessment of the safety margins of an infrastructure in case of a disruptive event, the stress-testing.
Figure 1. Modeling resilience: Functionality of a system/infrastructure during following an adverse event/scenario
ADVERSEEVENT
Scenario time
Functionality of the infrastructure better than before
Func
tiona
lity
Leve
l of t
he in
frast
ruct
ure
Func
tiona
lity
Leve
l of t
he in
frast
ruct
ure
Functionality of theinfrastructure as before
Functionality of theinfrastructure worse than
before, infrastructureonly partially recovered
Functionality of the infrastructurecompletely lost
Scenario time
STRESS-TESTLIMITS
ADVERSEEVENT
3.2. How to monitor resilience?
SmartResilience looks at resilience indicators to show how an infrastructure is prepared for an adverse event, how can it withstand it and then recover, possibly adapting a"erwards. The assessment result is the “Resilience Level” (a number, a composite indicator) that allows to compare one infrastructure with other infrastructures (do the “benchmarking”) and/or to monitor changes in resilience over the operation time (Figure 2).

117 |
3.3. Influence of interconnectedness: How the operation of one infrastructure can impact the operation of others?
Looking at interdependencies between infrastructures means understanding how, in a case of a problem on one of them, the functionality of others can be impacted. In other words, how one can assess the influence of interconnectedness is a more difficult task. In practice, one can model the interdependency both by the top-down and by the bottom-up approach. In the first one, the upstream, internal, downstream dependencies, as well as the, e.g., cyber, logical, geographical and functional interdependencies (Figure 3, le") are to be analyzed (Pettit, Lewis, 2017) and graphically represented. They can include also the operating environment, coupling and response behavior, type of failure, infrastructure characteristics, and state of operations. In the second case (bottom-up), the indicators and issues describing the resilience of an infrastructure/system are used to create a web-semantics based network (Figure 3, right) is created and this can show the “content” of the interconnectedness (i.e. what are the topics that practically describe the situation in interdependent infrastructures).
Figure 2. Monitoring resilience by means of resilience indicators
Resilience (cycle) Phases
Resil
ienc
e Di
men
sions
Understandrisks
Absorb /withstand
Anticipate /prepare
Respond /recover
Adapt /transform
System /physical
Information /smartness
Organization /business
Societal /political
Cognitive /decision making
Excellent
Average Average
Average Average
Average
AverageGood Good GoodGood
GoodGood
Good
Good
Poor
Poor PoorExcellent
Excellent
Excellent
Excellent
ExcellentCritical
Excellent
I. Understand risks I.1. Register of accidents/incidents; ID-2071
I.1.1. The existence of a register of accidents/incidents; ID-2072 I.1.2. Frequency of communication with units about an occured incidents;
I.2. Safety risk registry; ID-2060
I.2.1. Does the Safety Risk registry exist?; ID-2061 I.2.2. Using of Safety Risk registry in deision making; ID-2062 I.2.3. Frequency of revision of Safety Risk registry defined?; ID-2063
I.3. Management of change – MoC; ID-2064
I.3.1. Is Procedure for Management of change established?; ID-2065
Issues
Indicators
Operation Time
Resil
ienc
e Le
vel
t₁ t₂ t₃ … tn
Excellent
Good
Average
Poor
Critical
Figure 3. Modelling interdependencies among infrastructures: logical/functional (le")and big data based ones (right)
Reserves
ECHOProduction
DELTA:Transportation (airport)
CHARLIE:Health Care
FOXTROT:Water supply
ALFA:Financial system
HOTEL:Energy supply
GOLF:Government (flood)
BRAVO:Smart City
Storage
Transportinfrastructure
Level of toxicity
Drinking water supply
Financialinfrastructure
1
ATM
ACCIDENT:man-causedrelease of toxicaromatic liquids
21
1
24
3
5
4 5
2
Emergency services
Reservoir
Online banking
Water supply infrastructure
Emergency services
Medicine supply
Reserves CooperationInsurancecompanies
Trafficlights
Powersuply
Power points
Number ofpassengers
Undergroundstorage
Crisismanagement
Evaluation of emergency planning
Critical dependencies in SCADA
Cooperation Municipal emergency planning
Support measures forcommunities
Continuity planningSecurity standards
Organizational learning
Organizational responsecapacity
Specificcompetence
during vacation
Lack of organizationalmanagment
Lack of data sources
Flood vulnerabilitiesDecision making review
Response efficiency
Lack of community
Lack of coordination
Lessons learned communityengagement
Lessons learnedLessons learned
Response plancompliance
Protection measurecapacity
Community capacity towithstand
Energy supply systems
Water supplysystems
Haelth care system
Transportation system
ICT systemsLack of critical data nodes
Preparedness
Recover efficiency
Preparednessof citizens
Preparedness of citizens
Industrialproductionsystems
Evaluation ofcompetence/training
CompetenceInformation
Communication
Community communication response capacity
Engagement

| 118
3.4. Investment in resilience optimization: How to get the best value for the money invested in resilience improvement?
Various resilience improvement measures (“resilience improvement measure portfolios”, the “RIMPs” in the SmartResilience methodology/terminology) are constantly taking place in systems/infrastructures. Implementation of these measures (portfolios), e.g. educating people, improving communication, investing in new equipment, etc. Generally, these investments lead to improving the resilience level (ΔRL) of an infrastructure and, again generally this investment will have its costs and the time needed for implementation. Of, course, also other, different criteria can be taken into account, too, and included into the search for the optimal portfolio of measures to improve resilience (Figure 4).
Figure 4. Defining the optimal investment strategy; Example: RIMP1 bringing the best improvement for the money and time invested
RIM
P 1
Elements belonging to RIMP1 ΔRL Time Cost
Indicator Value RL
0.58
€€Equipment ok? 5 Excellent
Maintenance conducted? 5 Excellent
Procedures ok? 4 Good
RIM
P 2
Elements belonging to RIMP2 ΔRL Time Cost
Indicator Value RL
0.31
€€
€€
Big Data analysed? 5 Excellent
Big Data Analyst employed? 5 Excellent
Procedures ok? 4 Good
RIM
P 3
Elements belonging to RIMP3 ΔRL Time Cost
Indicator Value RL
0.41 €€
€
People qualified? 5 Excellent
Maintenance conducted? 5 Excellent
Equipment ok? 4 Excellent
Resil
ienc
e Le
vel (
RL)
Implementation time 0 20 40 60 80 100 0
5
RIMP3
RIMP1RIMP1
RIMP1
RIMP1
RIMP2
RIMP: ResilienceImprovementMeasures Portfolio
t0 t1 t2 t3
Source: SmartResilience project, Jovanovic et al., T5.2, 2017

119 |
3.5. Final outcome of the analysis
As the final outcome, the aligned resilience analysis process yields the following main outputs:
1. Agreed resilience assessment report allowing (SmartResilience has proposed an “extended, NFPA-like” template for reporting (NFPA 1600))
2. Benchmarking and monitoring (comparing resilience of selected infrastructures)
3. Providing overviews and interactions in complex infrastructures (e.g. infrastructures of infrastructures, Figure 5).
Figure 5. GIS-based outcome of the analysis of a health care infrastructures (including interdependencies and interrelations): overall map and the detail
Source: SmartResilience project, Klimek et al., CHARLIE, 2017
4. Aligning and possible standardizing the resilience concepts and approaches
4.1. Alignment through collaboration
Exercises like the EU Workshop all confirm the need to increase the level of collaboration with goal to increase also the level of alignment of approaches, metrics and tools. Apart from such exercises, targeted agreements and joint project among institutions active in the area. An example of such a targeted agreement between the ANL and EU-VRi (see Figure 6), covering issues such as resilience indicators, resilience assessment methods, resilience assessment tools, resilience auditing and certification, as well as the networking of stakeholders, projects and data pools.
Figure 6. Collaboration in the area of resilience, between US (ANL, Argonne NationalLaboratory) and the EU (EU-VRi, European Institute for integrated Risk Management),covered by the respective agreement (approved by the DHS on the US side)
Resilience of CriticalInfrastructures: Networking and
collaboration (US-EU)
Comparisons / Mapping / Joint projects / Joint reports / Joint publications
US Stakeholders
US Projects
US Data Pools
US Tools
US Best practices
EU Stakeholders
EU Projects
EU Data Pools
EU Tools
EU Best practices

| 120
4.2. Possible standardization path: new “work item”
Based on the work in the different EU and other projects, as well as the work related to the ISO 31000 standard (revision 2 released in 2018, the initial revision 1 in 2009) and the standards of the ISO 223xx family, much of the current alignment in the risk and resilience standardization is focused on the effort to create an aligned procedure on how to manage emerging (new, unknown) risks coupling the risk management and the resilience management covered by the ISO 223xx-series of standards. Practically it will mean establishing an internationally agreed procedure on how to look (“scan the horizon”) for emerging risks, and proposing the metrics for assessing the resilience. A New Work Item Proposal (NWIP) on “Emerging risks and resilience” is being prepared as a new standard in the ISO 31000:2018(E) family of standards. It will include, but will not be limited to, terminology, criteria, principles and technical specifications for the procedures and their implementation. In addition, it will include the recommendations for the definition of common metrics, primarily in form of indicators, both for the characterization of emerging risks and for definition of the resilience framework.
5. ConclusionsThe proposed approach to alignment of approaches in the area of resilience assessment (practically implemented in the SmartResilience project) will allow to better measure resilience performance of different infrastructures and compare their performance over time, before, during and a"er adverse events. On the EU and, possibly, global level it can provide a basis for better comparison and stress testing. This would also allow policy-makers to take decisions based on a coherent and reliable assessments. As a consequence, comparability of resilience performance could be further enhanced. While other resilience measurement approaches (such as the Infrastructure Report Card) compare different scales of resilience at a point in time, the proposed method would allow (since index building is transparent and enables analysis of single indicators), to better trace results of resilience assessments in real time and better exploit indicators which can be derived from big and open data.
Furthermore, widespread use of smart system/technologies (Jovanović, Vollmer 2017) will pose new challenges to the operators of critical infrastructures, especially when exposed to extreme events. If advantages of smart systems in the normal operation will also be present in these situations can only be answered on a case by case basis, e.g. by means of resilience stress-tests. The methodology to measure resilience of smart critical infrastructures developed in SmartResilience can support the process of answering these questions, but in order it to be efficient it has to be adopted broadly, e.g. by promoting the standardization activities, possibly at the international (ISO) level.
AcknowledgmentsThe paper is based on the work in the Grant Agreement No. 700621 supporting the work on the SmartResilience project provided by the Research Executive Agency (REA), under the power delegated by the European Commission. This support is gladly acknowledged here, as well as the collaboration of all the partners and persons involved in the project.

121 |
ReferencesISO Guide 73: Risk management - Vocabulary
ISO 22301: Societal security - Business continuity management systems - Requirements
ISO 28000: Specification for security management systems for the supply chain
ISO 31000: Risk management - Principles and guidelines
ISO/DIS 34001: Security and resilience - Security management system for organizations assuring authenticity, integrity and trust for products and documents
ISO/IEC 31010*IEC/ISO 31010: Risk management - Risk assessment techniques
Jovanović, A., Bellini, E. (Eds.), Aligning the resilience-related research efforts in the EU-DRS projects (Non-Print), Joint Workshop DRS-7&14 projects | Brussels, September 13–14, 2017, Steinbeis Edition, Stuttgart, Germany 2017, ISBN 978-3-95663-143-6 2017 | E-Book (PDF), 165 p.
Jovanović, A., Vollmer, M., Do smart technologies improve resilience of critical infrastructures? Challenges, opportunities, practical applications, Critical Infrastructure Protection Review, Autumn 2017, ISSN 2516-0087 (Print), ISSN 2516-0095 (Online)
Linkov, I. et al., Changing the resilience paradigm. NATURE CLIMATE CHANGE, Vol. 4, June 2014
NFPA 1600: Standard on Disaster/Emergency Management and Business Continuity/Continuity of Operations Programs, U.S. Department of Homeland Security (a voluntary consensus standard for emergency preparedness) 2016
OECD, Future Global Shocks, Improving Risk Governance. OECD Reviews of Risk Management Policies. OECD, Paris, France 2011, ISBN 978-94-09520-5. 139 p
Øien, K., Massaiu S., Tinmannsvik R., K., Guideline for implementing the REWI method. Resilience based Early Warning Indicators. SINTEF report A22026 (2012).
Petit, F., Lewis, P., Risk management and business continuity assessment: Importance of considering logical interdependencies, Critical Infrastructure Protection Review, Autumn 2017, ISSN 2516-0087 (Print), ISSN 2516-0095 (Online)
SmartResilience: Smart Resilience Indicators for Smart Critical Infrastructures – The European Union’s Horizon 2020 Research and Innovation Programme, Grant Agreement No 700621 (2016-2019). Coordinator: EU-VRi, www.smartresilience.eu-vri.eu

| 122
Measuring Resilience: Lesson Learned and Alternative ApproachesNigussie Tefera and Francois Kayitakire
AbstractBuilding resilience for food and nutrition security is ‘sensitive to specific shocks’. This paper explores resilience building capacity of households through examining arrays of shocks that households experienced and its impacts on their wellbeing as well as the coping strategies use to mitigate shocks. The paper also explores supporting resources, services and institutions that helps households to build their resilience capacity and recommend what vulnerable households need from government, national and international organizations for building their resilience capacities. Using the Ethiopian Living Standards and Measurement Survey (LSMS) in three waves (2011/12, 2013/14 and 2015/16) and employing multidimensional concept of resilience, the study has shown that less-resilient households are worse-off in terms of their consumption expenditure, income generating activities, assets holding, use of modern technologies, and access to basic services, among others, as compared to their more-resilient counterparts.
1. IntroductionThe lives and livelihoods of the poorest and vulnerable people in the world are disproportionately endangered by arrays of shocks & stressors including economic shocks such as volatile and high food prices, lack of access to markets and financial resources; environmental shocks including climate change and variability; natural hazards such as earthquake, flooding, tsunami; health shocks; political shocks and conflicts, among others. These shocks & stressors are evolving and become more frequent or intense and are further threatening the wellbeing of vulnerable people or groups (IFPRI, 2014).
Building resilience can help individuals, households, communities, countries as well as regions anticipate, prepare for, cope with, and bouncing back from shocks & stressors. It is not only about bouncing back but also learning from the past and becomes in a better shape to withstand next shocks & stressors. Building resilience also requires foreseeable investments in local capacity development, strengthening of local institutions, engaging various actors in an inclusive partnership platform and fostering social cohesion of vulnerable communities against shocks & stressors, among others. It also urges development actors and humanitarian responses traditionally operating in silos to integrate in programs design, planning, implementation and analysis. The integration or cooperation among these actors are immense as ‘Humanitarian activities in response to shocks have saved lives, but in many cases they have done little to help communities to withstand the next shock that comes along’(Headey & Kennedy, 2012). At the same time, ‘Longer-term development activities designed to ensure food and nutrition security, reduce poverty, and promote growth have done little to incorporate responses to inevitable shocks, and at times may even exacerbate vulnerabilities’.
There is a general understanding that building resilience could be expressed through three interlinking capacities – absorptive capacity, adaptive capacity and transforming capacity, which could also be expressed in different forms. Absorptive capacity is the ability of individuals, households, communities or higher level systems to minimize their exposure to shocks & stressors and also recover quickly when exposed using different normative coping strategies

123 |
(GHI, 2013; Béné, 2013; Choularton et al., 2015). It leads to endurance or continuity (GHI, 2013). On the other hand, adaptive capacity is the ability to learn from experience and make proactive and informed choice about alternative livelihoods strategies based on changing environments, climatic, social, political and economic conditions and yet continuous operating (GHI, 2013; Bene, 2014; Maxwell et al., 2015; Choularton et al., 2015)). This capacity lead to incremental changes or adjustment (GHI, 2013). While GHI (2013) defined transformative capacity as the ability to create fundamentally new systems when ecological, economic and social structure makes the existing system untenable, (Choularton et al., 2015) expressed it as the ability to create an enabling environment through investment in good governance, infrastructure, formal and informal social protection mechanisms, basic service delivery, and policies/regulations that constitute the conditions necessary for systemic changes.
The three interlinked capacities can be responding to different shocks & stresses depending on the extent or intensity of changes in a broadly hierarchical manner (GHI, 2013). ‘The lower the intensity of the shock, the more likely the household, community, or system will be able to resist it effectively, absorbing its impacts without changing its function, status, or state, When the shock or stressor exceeds this absorptive capacity, however, individuals and communities will then exercise their adaptive resilience, which involves making incremental changes to keep functioning without major qualitative changes in function or structure. If, however, those incremental changes associated with adaptive capacity are not enough to prevent a household, community, or system from avoiding dire circumstances, a more substantial transformation must take place. These changes permanently alter the system or structure in question’.
2. Methodology Although there have been various debates on conceptual framework of resilience, there is no consensus among field practitioners, researchers, academia and policymakers on how to measuring resilience in the context of food and nutrition security (see also Maxwell et al., 2014; Béné, 2013). The proposed framework ranges from questioning whether resilience could actually be measured (Levine, 2014), at its infancy (IFPRI, 2014), using proxy latent components or variables derived from observed variables based on multivariate factor analysis (Alinovi, et al., 2010)although the concept of vulnerability is dynamic and forward-looking, almost all statistical methodologies applied until now have been static and unable to predict future
© iStock.com
/AlexRaths

| 124
events. The main reasons for this are conceptual \u2013 for example, arising from the complexity (multidimensionality, expressing in terms of monetary costs of recovery (Béné, 2013), to using of resilience programming and funding outcome indicators (IFPRI, 2014; Tefera and Kayitakire, 2014; Constas et al., 2014; Constans and Wendy, 2015).
Lack of common analytical framework, among institutions and organizations, initiated the establishment of Resilience Measurement Technical Working Group (RM-TWG) in 2013, under the auspices of the Food Security Information Network (FSIN), jointly led by Food and Agriculture Organization (FAO) and World Food Programme (WFP). The RM-TWG proposed 10 principles of resilience measurements and one of them stated that resilience is ‘sensitive to specific shock & stressors’ and building resilience at different levels should be measured with respective to the presence of specific shocks & stressors and their possible impacts on individuals, households and communities wellbeing that could vary depending on intensity of shocks & stressors and sensitivity of individuals, households and communities to those shocks & stressors (See Tefera and Kayitakire, 2016; Constas et al., 2014). The RM-TWG also underscored that it is challenging to come up with a universal approaches of measuring resilience (Constas, et al., 2014) but suggested resilience should be measured against ‘outcome variables’ depending on intensity of shocks & stressors as well as sensitivity of individuals, households and communities to shocks & stressors.
Various institutions use different approaches to measure resilience, including Resilience Index Measurement Analysis (RIMA, later called ,RIMA II) by FAO; DIFD/TANGO’s consultant resilience framework; Livelihoods Change over time (LCOT) model by Tu" University; from characteristic-based approaches to capacity-focused approaches by Oxfam and ACCRA, Community Based Resilience Analysis (CoBRA) and a Structurally Integrated Metrics for Resilience (SIMI-R) approach, among others. Notwithstanding, to the best of our knowledge, most of them are purely a theoretical framework and yet indicating how to measure resilience from shocks & stressors perspectives. Few of them use household surveys data for measuring resilience but have their own limitations1.
Since building resilience is sensitive to shocks & stressors specific that could vary depending on individuals, households and communities ability to respond to those shocks & stressors, this paper propose a simplified approaches of measuring resilience through exploring arrays of shocks & stressors at different levels and their impacts on the wellbeing (food and nutrition security, health, poverty, etc.,). The paper presumes that resilient individuals, households and communities are less sensitive to the occurrence of shocks & stressors as compared to their non-resilient counterparts. In another words, it assumes that shocks can easily affect various pillars of wellbeing of less-resilient households than their more-resilient households. Moreover, it assumes that less-resilient households or communities may not be easily access to basic services than more-resilient counterparts. The approach helps to understand what make individuals, households and communities to better withstand shocks & stressors; and what less-resilient individuals, households and communities are missing to withstand shocks and stressors, and what types or kinds of supporting resources and services and institutions they need from government, national and international communities or organization in order to be resilient enough to better withstand upheavals. The supporting resources include physical capital (land, labour, livestock, water, other assets), human capital, social capital, financial capital and environmental resources, among others. Services include basic services such as schooling, hospital and marketing; social safety net, transfer in-the form of in-kind or in-cash, among others. Moreover, well-functioning institutions, governmental structures and policies will help individuals, households and communities to be resilient to upheavals in one-way or another. Some of the resources and services they need could have short-term, long-term or a mix short-and long-term impact on their lives and livelihoods.
The analysis also consider various activities households have been performing, over time, in order to protect their lives and livelihoods and withstands shocks will it be occurred. For mixed farming rural households in Ethiopian, more-resilient households are likely participating in income diversification strategies, possessing various types of livestock (oxen, cow, dra" animals, and small ruminants), more likely invest on fertility of cultivable land (cultivate fertile land), use modern inputs, develop thrust among community members through involvement in building social capital and also could have more access to basic information, more access to basic public services and also less sensitive to shocks and stressors. Poor and vulnerable households are also more likely rely on social safety net programme in supporting their resilience building capacities, among others.
1 Discussion of the limitation of each methodological approach is beyond the scope of this paper

125 |
The most challenging exercise is then how all these variables can be aggregated in order to estimate resilience capacity proxy score for a given household. These could be done in different ways including through weighing each dimensions using professional judgments or using multivariate statistical factors and principal components analysis. Both factor and principle components analysis are used to reduce the number of variables in a data set into smaller number of ‘dimensions’. However, there are significant difference between them; while factor analysis assume underlying unobservable (latent) variables that are reflected in the observed variables, principal component analysis use to derive a relatively small number of components that can account for the variability found in a relatively large number of measures. We use principal components analysis in determining the weights for the index of resilience capacity variables, as it has been used in literature on building asset index, a proxy for socio-economic status, (Filmer and Pritechett, 2001; Vyas and Kumaranayake, 2006, McKenzie, 2004; Habyarimana et al., 2015; Córdova, 2008). Principal components uses for extracting a set of variables those few orthogonal linear combinations of the variables that capture the common information most successfully (Filmer and Pritechett, 2001). Since each component of the PC analysis measures different dimension of the variables underconstruct, we consider only the first component for constructing resilience index (see also Filmer and Pritechett, 2001; Habyarimana et al., 2015; Vyas and Kumaranayake, 2006).
Since possessing resources, participation in different income generating activities or access to some basic information and public services help in building resilience capacities, we are applying binary indicators (1 or 0), whether they own resources or access basic services, for each resilience capacity building indicators. These include whether households are diversifying income sources, own different assets, including land cultivation, livestock and other productive and durable assets, use modern technologies, access to social networks, and access to basic services, among others. Household income diversifications are measured using participation in crop production, self-employment, wage income and/or income from livestock or sales of its products. Livestock are differently measured by ownership of oxen, cow and dra" animals such as horse, donkey and camel, and small-stocks such as goats, sheep and chickens, among others. Land ownership is represented by whether household cultivated his/her own land, and their perception on quality of their cultivated land (lem, teff or lem-teff), agricultural input include use of manure, chemical fertilizer and improved seed varieties. A proxy for social capita formation include network-based collective action arrangement driven by motives of reciprocity and altruism such as equib (rotating saving and credit association), iddir (emergency and funeral insurance), and participation in wenfel (local labor sharing arrangements) and also involved in loan giving and taking activities (trust development among community members). Whether household is receiving cash transfer and food aid/gi" is used as a proxy for participation in social safety net program. Access to information is represented by whether head of households are literate, visited by extension agents during a year and whether any family members were/are in the leadership position; and access to public services are measured by accessibility of health, education and veterinary services and local markets within 5km radius. We also consider, household reporting neither crop damage, due to drought, nor loss of family members due to death.
3. Data and Basic DescriptiveMeasuring resilience in the context of food and nutrition security is challenging not only from methodological perspective but also due to lack of sufficient information on shocks and coping modules in most of household surveys. Carletto et al. (2015) for instancce, explore available data typology of questions asked for shocks and coping modules and found that the most widely asked questions related to shocks include experienced shock in the past, coping types (mitigation strategies) and cost of loses (in currency). The World Bank’s Living Standards Measurement Study, Integrated Survey on Agriculture (LSMS-ISA) is one of a few households survey that have collected relevant information on shocks, their impacts on wellbeing and coping strategies adopted by households. This analysis is then uses the LSMS-ISA, Ethiopia Rural Socioeconomic Survey (ERSS) conducted in three waves. The first survey is conducted in 2011/12 from nationally representative of 3,969 sample households living in rural1 and small town areas. The second was subsequently surveyed in 2013/14 and further extended
1 The rural households are a sub-sample from the Central Statistical Authority’s CSA’s Annual Agricultural Sample Survey (AgSS)

| 126
to nationally representative of 5,262 sample households in rural, small town, medium and large town, and the third survey was conducted in 2015/16 from 4,952 sample households in the later three locations. It is a panel household survey; about 3,636 sample households are repeatedly surveyed in all three waves. The survey has detailed information on household demographics such as age, sex, education and health; housing characteristics; assets such as land and livestock ownership; agricultural activities; consumption expenditure; food security; shocks and coping strategies, among others.
The analysis begin with a simple descriptive statistics exploring existence of any shocks and stressors (it could be covariate or idiosyncratic) reported by individuals, households and communities, and their impact on wellbeing outcomes (income, production, consumption, health, poverty) and then exploring any coping strategies to mitigate shocks & stressors. Table 1 presents shocks, at household levels, that had occurred in the last 12 months, prior to survey period, and average number of times the shocks had occurred in the last 12 months as well as in the last 5 years. Over the last three years, between 2011/12 and 2015/16, on average, about 20% to 27% of households reported increased in food prices as the major shocks that had occurred, on average for about 3 months in a year and about for 4 years in the last 5 years. Drought is the second important shocks reported by about 11% to 21% of households. Illness of household members and increase in prices of inputs (seed and fertilizer) are ranked as the third and fourth shocks reported by 15% to 20% and 10% to 12% of households, respectively. Death of livestock/ “great loss” and crop damage were reported by about 7% and 5% of households, respectively. Table 1 also presents another shocks such as death of head of households (main bread earner), flooding, decrease in food prices and heavy rains preventing works, among others, but these shocks were reported by less than 4% of households.
Table 1. Households reporting shocks occurrences in the last 12 months of the survey period
2011/12 2013/14 2015/16 Average number of times occurred
Shock variables
N % N % N % Last 12
month
Last 5 year
Increasing in prices of food items 956 26.3% 906 28.7% 1,166 20.5% 2.7 3.9
Drought 576 15.9% 339 10.8% 1,174 20.7% 1.6 2.4
Illness of household member 539 14.9% 499 15.8% 1,145 20.2% 2.1 2.9
Increase in price of inputs (seed, fertilizer) 437 12.0% 352 11.2% 533 9.4% 1.9 2.8
Great loss/death of livestock 267 7.4% 145 4.6% 334 5.9% 1.4 2.0
Crop damage 178 4.9% 148 4.7% 309 5.4% 1.4 2.1
Death of household member (main bread earner) 133 3.7% 87 2.8% 105 1.9% 1.5 1.7
Flood 132 3.6% 78 2.5% 48 0.9% 1.4 2.3
Price fall of food items 87 2.4% 129 4.1% 190 3.4% 2.2 3.2
Heavy rains preventing work 86 2.4% 53 1.7% 109 1.9% 1.5 2.2
The#/Robbery and other violence 40 1.1% 39 1.2% 62 1.1% 1.2 1.6
Loss of non-farm Jobs of household member 29 0.8% 73 2.3% 91 1.6% 2.4 3.5
Local unrest/Violence 23 0.6% 21 0.7% 76 1.3% 2.0 4.1
Landslides/avalanches 22 0.6% 10 0.3% 20 0.4% 1.6 2.1
Involuntary loss of house/land 16 0.4% 19 0.6% 26 0.5% 1.5 1.1
Fire 14 0.4% 14 0.4% 23 0.4% 1.0 1.0
Displacement (Due to government development projects) 7 0.2% 10 0.3% 27 0.5% 1.5 1.1
Death of other household member 99 3.1% 141 2.5% 1.2 1.4
Death/ abortion /still birth of child 30 0.5% 1.4 1.6
Other (Specify) 88 2.4% 132 4.2% 67 1.2% 2.2 3.4
Source: Authors computation from ERSS (LSMS-ISA) survey in three waves (2011/12, 2013/14 and 2015/16)

127 |
Table 2 presents the impacts of those major shocks on wellbeing of households. An increase in food prices, drought, illness of household members, increase in input prices (seed and fertilizer) and death of livestock have led to decrease in wellbeing indicators such as income, assets, food production, food stock and purchase at different levels. For instance, drought results in declining in income, food production and food in stock for more than 90% of households reporting drought shocks. Similarly, livestock death also decrease in income and assets for about 90% and 85% of households, respectively. Crop damage decrease income, food production and food stocks for more than 90% of household reporting those shocks. Those shocks also couldn’t bring changes on wellbeing for substantial proportions of households reporting them. These households could be considered as more resilient to shocks probably depending on different coping strategies they adopted. Most of these shocks could also lead to increase in food purchase. For instance, an increase in food prices led to increase in food purchase for about 23% of households, which could have different implication based on net-marketing position of the households reporting food prices increase as a major shocks. While it has positive and encouraging impacts for better-off and net-sellers of food items, it adversely affects the poorest and vulnerable net-buyer households. An increase in food purchase due to drought and illness, and increase in input prices, livestock death are threatened the livelihoods of the poorest and vulnerable households.
Table 2. Impact of shocks on wellbeing of households (average over all waves)
Impacts on …
Shocks Income Assets Food production
Food in stock
Food purchase
Increase in prices of food items Increase 2.9% 1.1% 1.7% 2.2% 19.9%
Decrease 76.8% 56.8% 60.2% 70.2% 63.3%
No change 20.3% 42.2% 38.2% 27.6% 16.7%
Drought Increase 0.8% 0.5% 0.7% 1.2% 32.5%
Decrease 93.9% 65.7% 91.4% 88.9% 41.3%
No change 5.3% 33.8% 7.9% 9.9% 26.3%
Illness of household members Increase 1.1% 0.9% 0.9% 1.3% 16.8%
Decrease 79.9% 51.5% 53.5% 54.4% 29.5%
No change 19.0% 47.7% 45.6% 44.3% 53.7%
Increase in price of inputs (seed, fertilizer)
Increase 2.8% 1.8% 3.0% 2.7% 16.9%
Decrease 84.1% 62.2% 75.5% 75.3% 41.7%
No change 13.1% 35.9% 21.5% 22.0% 41.4%
Great Loss/death of livestock Increase 2.5% 1.3% 0.7% 1.0% 14.1%
Decrease 88.6% 84.2% 59.9% 54.2% 34.6%
No change 8.9% 14.6% 39.5% 44.8% 51.3%
Crop damage Increase 0.8% 0.1% 0.8% 1.8% 38.3%
Decrease 90.0% 60.8% 94.5% 90.4% 30.9%
No change 9.2% 39.1% 4.8% 7.8% 30.8%
Source: Authors’ computation from ERSS (LSMS-ISA) survey in three waves (2011/12, 2013/14 and 2015/16)

| 128
Households use different coping strategies to mitigate the impacts of shocks on their livelihoods or wellbeing. More than a quarter of households rely on their own-saving for mitigating various shocks such as increasing in food prices, drought, illness and increase in input prices (Table 3). Relying on own-saving as coping strategies are considered as absorptive capacity of the households, one components of building resilience capacity. Livestock sales is the second best coping strategies; quite common strategies for mixed farming rural households in Ethiopia as livestock are used as a precautionary saving besides of being use as dra" animals. However, this strategy could possibly lead to destocking their livestock. Moreover, livestock prices could decline with shocks such as drought and adversely affect the poor households. Furthermore, drought could also lead to death of significant number of livestock and adversely affect the holders. Households received unconditional help from government, as coping strategies, account for 15% and 12% for drought and livestock death, respectively. About 10% of households received unconditional help from relatives in the case of illness of household members. Moreover, about 15%, 20% and 16% of households reported “Doing nothing” with an increase in food prices, inputs price and livestock death, respectively. These groups could seek for supporting in the effort of building their resilience capacity. About 12% and 18% of households are engaging in spiritual efforts for illness of household members and livestock death, respectively. Furthermore, there are also another coping strategies but only few of them are reporting using to mitigate the impact of shocks.
The study also explores whether there are substantial differences on wellbeing of more resilient households (those who didn’t be affected by shocks) and their non-resilient counterparts (those who affected by shocks). This exercise helps to understand whether there will be a significant difference in wellbeing indicators and also intend to recommend what need to be done for non-resilient households. During survey period, nearly half of the sample household reported at least one shock had affected their wellbeing (Table 4). The results show that households that don’t be affected by shocks are better-off in terms of per capita food and non-food consumption expenditure; i.e. own food production, food purchase, food received as a gi" and non-food expenditures, except in the first wave. Moreover, these households are also better-off in terms of per capita income and sales i.e. they have higher income from crop production and crop output sales, and grain reserves for consumption and also in terms of transfer received, pension and rental and sales of assets income. These households are also cultivated relatively larger land size (in ha). But there is no statistically significant difference in terms of income received from permeant crops, fruits and vegetables. We also couldn’t find statistically significant difference in terms of total livestock owned (in TLU). Absence of substantial difference in terms of livestock ownership may not be surprising as livestock sales are used as means of coping strategies to mitigate the impact of shocks as indicated above (Table 3).
Furthermore, resilient households uses more inputs (fertilizer) than their counterparts. In contrast, households that experienced shock rely on productive safety net program and received another support from government and national and international organization. The social network and institutional support help the poor and vulnerable households to build their resilience capacity and withstand shocks & stressors. Moreover, resilient households (those reported relatively less number of shock with no impact) have also better access to public services such as access to better road facilities, bus stations, urban centres, weekly markets, public phone, schooling, health centre and medicine. Finally, resilient households have lower family size and better-off in terms of level of literacy (Table 4).
In conclusion, households facing the impact of major shock are among the disadvantages group in terms of per capita consumption, own crop production, ownership of assets and access to basic public services. These groups, although they have received assistance from social safety-net programme such as productive safety net program (PSNP) and also some other assistance from government and other national and international organization, it might not be sufficient enough to mitigate the impact of shocks. Policies should be geared towards helping the poor and vulnerable groups in the community to improve their production capacity through providing smart subsidy for inputs, which in terms helps to improve their production and consumption and helping them to build their assets and resilience capacity at different level as well as improving infrastructures such as road, schooling, and health facilities, among others.

129 |
Tabl
e 3.
Res
pons
es to
sho
cks
so a
s to
rem
ain
on th
e sa
me
leve
l of
wel
fare
sta
tus
as b
efor
e sh
ocks
(ave
rage
ove
r thr
ee w
aves
)
Shoc
ks
Resp
onse
ran
ked
as 1
stIn
crea
se in
fo
od p
rices
Drou
ght
Illne
ss o
f ho
useh
old
mem
ber
Incr
ease
in
inpu
t pr
ices
Grea
t lo
ss/d
eath
of
live
stoc
kCr
op d
amag
e
Relie
d on
ow
n-Sa
ving
s (in
the
form
of c
ash)
29.0
%23
.4%
31.0
%25
.3%
17.6
%27
.5%
Rece
ived
unc
ondi
tiona
l hel
p fr
om re
lativ
es3.
5%5.
4%9.
0%4.
7%3.
3%2.
4%
Rece
ived
unc
ondi
tiona
l hel
p fr
om g
over
nmen
t5.
6%15
.9%
3.1%
2.0%
11.7
%6.
7%
Rece
ived
unc
ondi
tiona
l hel
p fr
om N
GO/re
ligio
us in
stitu
tion
1.0%
2.2%
0.4%
0.8%
1.4%
0.8%
Chan
ged
eatin
g pa
tter
ns*
1.7%
0.7%
1.4%
0.8%
0.5%
1.2%
Took
on
mor
e em
ploy
men
t2.
4%1.
9%2.
1%2.
7%2.
8%4.
6%
Adul
t mem
ber p
revi
ousl
y no
t wor
king
had
to fi
nd a
wor
k2.
4%1.
5%1.
3%2.
0%1.
8%2.
5%
Hous
ehol
d m
embe
rs m
igra
ted
0.3%
0.3%
0.2%
0.4%
0.1%
0.4%
Redu
ced
expe
nditu
res
on h
ealth
/edu
catio
n0.
9%0.
7%1.
5%0.
5%1.
0%0.
2%
Obt
aine
d cr
edit
4.8%
2.3%
4.4%
5.1%
3.2%
5.9%
Sold
agr
icul
tura
l ass
ets
0.6%
0.4%
0.4%
0.4%
0.1%
0.2%
Sold
dur
able
ass
ests
0.9%
0.3%
0.8%
0.7%
0.0%
0.0%
Sold
land
/ bu
ildin
gs0.
8%0.
7%0.
6%0.
8%0.
8%0.
8%
Sold
cro
p st
ock
1.7%
0.2%
2.6%
2.6%
1.7%
1.4%
Sold
live
stoc
k14
.3%
21.9
%12
.0%
19.1
%9.
3%16
.8%
Inte
nsify
fish
ing
0.0%
0.0%
0.0%
0.0%
0.0%
0.1%
Sent
chi
ldre
n to
live
els
ewhe
re0.
2%0.
5%0.
1%0.
3%0.
1%0.
1%
Enga
ged
in s
pirit
ual e
fforts
12.3
%12
.3%
14.3
%9.
7%17
.3%
9.9%
Did
not d
o an
ythi
ng14
.9%
7.6%
11.9
%19
.7%
23.6
%15
.6%
Sour
ce: A
utho
rs c
ompu
tatio
n fr
om E
RSS
(LSM
S-IS
A) s
urve
y in
thre
e w
aves
(201
1/12
, 201
3/14
and
201
5/16
). N
ote.
Res
pons
e w
ith h
ighe
r pro
porti
ons
are
high
light
ed

| 130
Tabl
e 4.
Res
ourc
es o
wne
d by
hou
seho
lds
repo
rtin
g sh
ocks
effe
cts
vs w
ithou
t-sh
ocks
effe
cts
2011
/12
2013
/14
2015
/16
Varia
bles
No
sho
ck
effec
ts
(49.
8%)
With
sho
ck
effec
ts
(50.
2%)
t-va
lues
Sig.
le
vel
No s
hock
eff
ects
(3
5.6%
)
With
sho
ck
effec
ts
(64.
4%)
t-va
lues
Sig.
le
vel
No s
hock
eff
ects
(5
8.9%
)
With
sho
ck
effec
ts
(41.
1%)
t-va
lues
Sig.
le
vel
Per c
apita
food
and
non
-foo
d ex
pend
iture
Qu
anity
of f
ood
cons
umpt
ion
(in kg
/per
son)
44.3
43.8
40.
5135
.17
31.7
54.
7***
43.3
338
.85.
12***
Tota
l foo
d co
nsum
ptio
n (in
Birr
/per
son)
24.5
525
.31
-1.3
921
1.37
184.
354.
92***
532.
3534
8.57
1.92
**
Own
prod
uctio
n co
nsum
ptio
n (in
Birr
/per
son)
18.6
418
.01
0.62
114.
2110
8.24
1.27
146.
8712
1.59
4.75
***
Purch
ased
for c
onsu
mpt
ion
(in B
irr/p
erso
n)12
9.57
115.
312.
53**
176.
3416
5.11
1.89
*31
1.34
250.
256.
22***
Food
rece
ived
as a
gi#
(in
Birr/
pers
on)
11.7
212
.96
-0.2
410
1.68
81.1
31.
91*
86.6
979
.28
1.01
Non-
food
cons
umpt
ion
(in B
irr/p
erso
n)62
.947
.45
8.27
***12
5.61
96.8
86.
22***
150.
0194
.18
3.48
***
Per c
apita
inco
me
from
diff
eren
t sou
rces
Yil
ed (m
ajor
crop
s out
put (
in kg
/ha)
1,84
2.83
1,59
6.08
2.09
**3,
241.
542,
888.
582.
22**
3,72
4.72
3,10
3.05
3.25
***
Crop
pro
duct
ion
(in B
irr/p
erso
n)10
3.06
65.8
64.
25***
1,95
9.71
1,46
5.26
2.82
***2,
779.
022,
257.
832.
51**
Reve
nue
from
crop
pro
duct
ion
sale
s (in
Birr/
pers
on)
419.
8625
6.97
2.68
**60
7.89
305.
743.
68***
458.
4540
8.23
0.94
Incom
e fro
m liv
esto
ck p
rodu
ct sa
le (B
irr/p
erso
n)72
.769
.52
1.13
68.8
757
.71
4.57
***92
5.59
1,00
5.33
-0.4
9
Incom
e fro
m tr
ansf
er, p
ensio
n, re
tnat
l and
sale
s of A
sset
s in
the
12
mon
ths (
in Bi
rr/pe
rson
)85
4.04
496.
565.
57***
1,98
8.38
1,33
7.20
4.07
***1,
859.
731,
594.
351.
48
Valu
e of
har
vest
ed [c
rop]
save
d fo
r see
d (in
Birr
/per
son)
123.
5182
.02
5.69
***13
9.82
115.
891.
5317
5.63
149.
731.
43
Prod
uctio
n re
serv
ed fo
r con
sum
ptio
n (in
Birr
/per
son)
939.
8657
1.28
6.97
***87
5.23
630.
993.
84***
1,18
4.36
810.
12.
83***
Incom
e fro
m p
erm
anen
t or f
ruits
& v
eget
able
s (in
Birr/
pers
on)
295.
6824
7.75
1.69
*27
1.41
306.
84-1
.39
335.
9938
2.1
-1.1
4
Asse
ts o
wner
ship
Culti
vate
d la
nd (i
n ha
)1.
911.
731.
041.
551.
124.
74***
1.53
1.28
2.53
Lives
tock
ow
ned
(in T
LU)
4.56
5.15
-2.5
2**
4.77
4.88
-0.5
25.
645.
50.
56
Asse
t ind
ex (s
core
of 1
st co
mpo
nene
ts)
3.17
2.74
6.59
***3.
912.
396.
53***
3.58
2.68
3.71
***
Use
of m
oder
n te
chno
logi
es
DAP
ferti
lizer
app
licat
ion
(in kg
)66
.17
54.1
2.72
**75
.81
50.8
14.
6***
82.2
966
.94
1.98
*
Urea
ferti
lizer
app
licat
ion
(in kg
)51
.31
36.8
53.
8***
62.5
841
.77
3.46
***64
.78
76.8
6-1
.03
Ferti
lizer
app
licat
ion
rate
((DA
P +U
rea)
in kg
/ha)
109.
9167
.39
1.47
137.
4382
.11
1.55
178.
332,
032.
03-1
.4
Is [Fi
eld]
und
er E
xten
sion
Prog
ram
?0.
30.
225.
09***
0.33
0.26
4.38
***0.
330.
292.
58**

131 |
Do y
ou u
se a
ny m
anur
e on
[Fiel
d]?
0.48
0.53
-2.5
7**
0.51
0.47
2.11
**0.
490.
49-0
.49
Do y
ou u
se a
ny co
mpo
st o
n th
e fie
ld0.
10.
11-0
.63
0.11
0.08
2.89
***0.
090.
071.
56
Is [Fi
eld]
irrig
ated
?0.
10.
11-0
.63
0.09
0.11
-2.4
3**
0.07
0.1
-3.3
6***
Do y
ou u
se o
rgan
ic fe
rtilzi
er o
n a
plot
0.63
0.65
-1.2
50.
660.
594.
14***
0.65
0.59
3.19
***
Do y
ou u
se a
ny o
rgan
ic fe
rtiliz
er o
n [Fi
eld]
?0.
120.
12-0
.64
0.03
0.02
1.22
0.04
0.04
0.43
Is th
e pl
ot p
reve
nted
from
ero
ssio
n0.
060.
06-0
.01
0.61
0.59
1.27
0.58
0.63
-2.8
7***
Acce
ss to
soc
ial a
ssist
ance
Pa
rticip
atio
n in
PSNP
(at l
east
one
mem
ber o
f hh)
0.33
0.47
-9.2
9***
0.26
0.37
-8.3
6***
0.22
0.39
-12.
92***
Cash
ass
istan
ce re
ceive
d fro
m g
ov’t,
PSNP
, NGO
s (in
Birr/
pers
on)
19.1
356
.95
-8.3
6***
19.3
950
.32
-7.5
8***
17.8
456
.87
-9.6
8***
Acce
ss to
bas
ic se
rives
Dist
ance
to th
e ne
ares
t asp
alt r
oad
(in ki
lom
etre
)51
.57
56.6
-2.1
1**
28.2
629
.84
-1.2
22.8
430
.65
-6.2
2***
Dist
ance
to th
e ne
ares
t bus
stat
ions
(in ki
lom
etre
)17
.49
23.0
4-6
.1***
11.7
613
.81
-2.1
7*
11.2
114
.92
-3.9
4***
Dist
ance
to th
e ne
ares
t wor
eda
tow
n (in
kilom
etre
)20
.04
20.3
9-0
.46
22.0
322
.41
-0.4
419
.47
22.4
7-4
.16
***
Dist
ance
to th
e ne
ares
t urb
an to
wn
(in ki
lom
etre
)78
.483
.79
-1.9
3**
70.1
771
.56
-0.6
379
.79
78.9
60.
25
Dist
ance
to th
e la
rges
t mar
ket p
lace
(in ki
lom
etre
)6.
777.
81-2
.72
**12
.51
15.5
2-3
.58
***10
.65
19.5
4-5
.25
***
Dist
ance
to th
e ne
ares
t pho
ne ce
nter
(inkil
omet
re)
10.4
112
.63
-4.8
***15
.66
20.0
8-5
.6***
7.54
13.2
8-3
.63
***
Dist
ance
to th
e ne
ares
t prim
ary
scho
ol(in
kilo
met
ers)
1.36
0.53
5.67
***3.
162.
181.
110.
680.
77-1
.08
Dist
ance
to th
e ne
ares
t sec
onda
ry sc
hool
(in ki
lom
etre
)12
.76
15.2
6-5
.15
***11
.115
.55
-3.1
1***
6.96
9.85
-4.3
7***
Dist
ance
to th
e ne
ares
t med
icine
cent
er(in
kilo
met
re)
10.4
48.
551.
93**
14.9
214
.35
0.25
8.73
11.1
5-4
.59
***
Dist
ance
to th
e ne
ares
t hea
lth p
ost(i
n kil
omet
re)
1.29
1.41
-0.7
54.
285.
92-3
.52
***8.
18.
27-0
.13
Dist
ance
to th
e ne
ares
t hea
th ce
nter
with
doc
tor(i
n kil
omet
re)
11.7
613
.12
-2.4
6**
4.28
5.92
-3.5
2***
8.1
8.27
-0.1
3
Dist
ance
to th
e ne
ares
t ban
k cen
ter(i
n kil
omet
ers)
29.9
631
.52
-1.3
824
.26
26.7
6-1
.919
.13
23.9
5-5
.49
***
Dist
ance
to th
e ne
ares
t micr
o-fin
ance
inst
itutio
n(in
kilom
etre
)13
.45
13.2
10.
4516
.81
21.7
5-5
.41
***15
.421
.49
-6.9
***
Dist
ance
to t
he n
eare
st w
ater
conn
ectio
n ce
nter
(in ki
lom
etre
)0.
610.
63-0
.29
0.13
0.14
-1.5
90.
190.
24-3
.13
***
Hous
ehol
d De
mog
raph
icsHH
age
(in
year
s)42
.02
45.0
3-5
.85
***43
.07
45.9
6-6
.47
***44
.07
46.5
4-5
.13
***
HH lit
erac
y le
vel: 1
liter
ate;
0 ot
herw
ise0.
370.
323.
34***
0.51
0.41
7.34
***0.
510.
417.
08***
Hous
ehol
d fa
mily
size
4.51
4.99
-6.2
9***
4.8
5.1
-4.0
8***
5.07
5.57
-6.7
1***
Num
ber o
f mal
e ho
useh
old
mem
ber
2.25
2.5
-4.9
4***
2.36
2.5
-2.8
8***
2.47
2.74
-5.4
1***
Num
ber o
f fem
ale
hous
ehol
d m
embe
r2.
262.
49-5
.08
***2.
442.
6-3
.65
***2.
62.
83-5
.09
***
Sour
ce: A
utho
rs’ c
ompu
tatio
n fr
om E
RSS
(LSM
S-IS
A) in
thre
e w
aves
(201
1/12
, 201
3/14
and
201
5/16
)

| 132
4. Regression resultsBesides of basic descriptive statistics, we also explores the dynamic of resilience building capacities at household level based on supporting resources and services and then running standardized regression analysis. The analysis begins with discussion of results derived from principal component analysis. Table 5 presents the scoring factors of the first principal component along with mean and standard deviation of the respective variables for pooled data at different livelihood strategies and by survey rounds, while Annex 1 shows results for as much as four component whose eigenvalues are greater or equal to 1 (cut-off points for determining the number of components retains). The resilience proxy score is determined by the 1st factor score as all the components are orthogonal to each other or measures different dimension on a vector spaces (see also Filmer and Pritechett, 2001; Habyarimana et al., 2015; Vyas and Kumaranayake, 2006). Each indices have a correlation of 0.85 or more with overall index made up of all indicators. In almost all cases, the scoring factors are positive except for income from rent, pension, sales of productive assets. The scoring coefficients have been rescaled by the standard deviation of their respective variables so as to represent the effects of a change from 0 to 1 in the dummy variables of our interest.
Table 5 (column (1)) present 1st the rescaled factor component of resilience proxy score derived from income diversification indicator variables that explain about 48.4% of total variations with maximum loading (at least 0.80) on whether households are participating in production of major cereals crops and/or any crops during harvesting season as well as whether households having saving crops output for either input or future consumption. This is plausible as more-resilient rural households are more likely engaging in crop production and able to save their production for both inputs and future consumption. Table 5 (column (2)) presents an extension to asset ownerships (land and livestock) that will explains 49.2% of variation in building resilience proxy score. For mixed farming rural households in Ethiopia, ownership of assets is a pillars for building resilience capacities of households. More-resilient households could have more assets as compared to their less-resilient counterparts. Furthermore, whilst the third column extends the analysis to social protection, the four column extends the analysis to use of modern technologies for building resilience capacities. The results by survey rounds (waves) reveals the same pattern with some minor variation as compared with the pooled data set. In the analysis we also included access to basic services but drops a"er most of the variables are negatively contributing and leads to further declining the proportion of variation of the components.
Table 5 also present the mean and standard deviation of respective variables. More than 40% of households are participating in major crop production (and 52% in any crop production). About 65% cultivate their land for crop production and owned livestock. About 35% of households or any member of households have participated in PSNP, among others.

133 |
Tabl
e 5.
Res
ults
fro
m 1
st c
ompo
nent
s of
Prin
cipa
l Com
pone
nt A
naly
sis
by p
oole
d da
tase
t and
wav
es
All w
aves
(201
1/12
-201
5/16
)20
11/1
2 (w
ave
1)20
13/1
4 (w
ave
2)20
15/1
6 (w
ave
3)
1st f
acto
r com
pone
nt d
ivide
d by
std.
D
Cate
gory
Varia
bles
(1)
(2)
(3)
(4)
Mea
nSt
d.De
v.Fa
ctor
sc
ore1
/SD
Mea
nSt
d.De
vFa
ctor
sc
ore1
/SD
Mea
nSt
d.De
vFa
ctor
sc
ore1
/SD
Mea
nSt
d.De
v
Inco
me
dive
rsifi
catio
nPa
rticip
atio
n in
maj
or cr
op p
rodu
ctio
n0.
850.
730.
720.
610.
370.
480.
600.
330.
470.
590.
360.
480.
620.
410.
49
Parti
cpat
in in
any
crop
prod
uctio
n0.
840.
730.
730.
620.
510.
500.
640.
420.
490.
590.
510.
500.
670.
590.
49
Rece
ived
incom
e fro
m cr
op sa
les
0.79
0.65
0.64
0.53
0.26
0.44
0.53
0.28
0.45
0.53
0.27
0.44
0.53
0.24
0.43
Rece
ived
incm
e fro
m p
ensio
n, re
nt, a
sset
-0.2
5-0
.22
-0.2
2-0
.17
0.33
0.47
-0.1
00.
300.
46-0
.18
0.35
0.48
-0.1
80.
320.
47
Rece
ived
incom
e fro
m ro
ot cr
ops s
ales
0.53
0.47
0.47
0.41
0.27
0.44
0.38
0.29
0.45
0.42
0.26
0.44
0.39
0.27
0.44
Rece
ived
incom
e fro
m liv
esto
ck p
rodu
ct sa
les0.
580.
570.
570.
460.
470.
500.
460.
540.
500.
510.
510.
500.
400.
380.
48
Crop
save
d fo
r inp
uts
0.87
0.74
0.74
0.60
0.43
0.50
0.67
0.54
0.50
0.60
0.42
0.49
0.59
0.35
0.48
Crop
save
d fo
r con
sum
ptio
n0.
890.
770.
760.
640.
470.
500.
690.
550.
500.
630.
460.
500.
620.
410.
49
Asse
t own
ersh
ipLa
nd o
wne
rshi
p0.
740.
740.
610.
650.
480.
740.
770.
420.
590.
610.
490.
580.
610.
49
Lives
tock
ow
ners
hip
0.71
0.71
0.59
0.62
0.48
0.59
0.67
0.47
0.58
0.58
0.49
0.59
0.63
0.48
Socia
l saf
ety
net
Parti
cipat
ion
in PS
NP0.
190.
170.
340.
470.
030.
400.
490.
200.
300.
460.
210.
320.
47
Rece
ived
assis
tanc
e inc
ome
0.37
0.30
0.99
0.09
0.39
0.98
0.14
0.27
0.99
0.07
0.36
1.00
0.06
Mod
ern
inpu
t use
Use
of fe
rtiliz
er o
n th
e fie
ld0.
640.
460.
500.
670.
500.
500.
620.
440.
500.
640.
450.
50
Field
und
er e
xten
sion
prog
ram
e0.
530.
210.
410.
490.
210.
410.
530.
210.
410.
540.
220.
42
Use
of m
anur
e th
e a
field
0.58
0.36
0.48
0.61
0.40
0.49
0.56
0.34
0.47
0.57
0.36
0.48
Use
of co
mpo
ste
on th
e fie
ld0.
450.
070.
250.
460.
080.
270.
490.
070.
250.
400.
060.
23
Use
of ir
rigat
ion
on th
e fie
ld0.
370.
070.
260.
390.
080.
270.
350.
070.
250.
370.
070.
25
Field
pre
vent
ed fr
om e
ross
ion
0.52
0.32
0.47
0.35
0.05
0.21
0.58
0.41
0.49
0.58
0.45
0.50
Eige
nval
ue a
ssoc
iate
d w
ith th
e fir
st co
mpo
nent
3.86
94.
933
4.96
96.
768
5.60
37.
533
7.23
5
Shar
e of
var
ianc
e as
socia
ted
with
firs
t com
pone
nt0.
484
0.49
30.
414
0.37
60.
311
0.41
90.
402
Over
all K
aise
r-Mey
er-O
lkin
mea
sure
of s
ampl
ing a
dequ
acy
0.83
90.
873
0.87
30.
902
0.83
30.
919
0.92
0
Num
ber o
f var
iabl
e us
ed8
1012
1818
1818
Not
e: A
ll va
riabl
es a
re d
umm
ies
and
scor
ing
fact
or is
the
wei
ght a
ssig
ned
to e
ach
varia
bles
(nor
mal
ized
by
subt
ract
ing
its m
eans
) in
the
linea
r com
bina
tions
of v
aria
bles
com
pris
ing
the
1st p
rinci
pal c
ompo
nent
. An
nex
I , p
rese
nt th
e po
oled
resu
lts fo
r all
com
pone
nts
with
eig
enva
lue
>= 1
Sour
ce: A
utho
rs’ c
ompu
tatio
n fr
om E
RSS
(LSM
S-IS
A) in
thre
e w
aves
(201
1/12
, 201
3/14
and
201
5/16
)

| 134
Using the scoring of the first components as a proxy for resilience capacity indicator, the households are grouped into quintiles; households in the first quintiles are less-resilient than households in the higher quintiles. A simple cross check has also shows that majority of households affected by shocks belongs to the lower quintiles (Table A1). The results partially reflects that shocks affects resilience capacity of households and hence households in the first quintile are relatively less resilient for food and nutrition security as compared with households in the highest quintiles. It is followed by conducting a sensitivity test using various wellbeing and related indicators at household level such as total income, crop income, income from self-employment and wage earning, total food assistance/aid, expenditure, total livestock ownership, fertilizer application, among others. Figure 1 presents those indicators, overtime (in each survey period) household in the higher quintile (more resilient households) are better in terms of total income, crop production income and income generated from self-employment activities. Moreover, they are better in terms of total livestock owned (in TLU) as well as total number of oxen and cow ownership. They also cultivated more size of land and use more fertilizer inputs for production. In contrast, there is no a such significant difference in wage earning but higher proportion of less resilient households received food aid/assistance. Not surprisingly, the impact of drought is more pronounced for middle quintile group then lowest and highest group. The inter-quintile regression analysis also reveals that total income and livestock ownership have positive and significant impact on household resilience building capacities (Table 6). It also reveals that the resilience capacity of household has improved overtime due to increase in income and total livestock ownership.

135 |
Figures 1. Household level socioeconomic indicators by resilience quintiles
2011/12
Total Income
2013/14 2015/16
Q1 Q2 Q3 Q4 Q5
2 000
0
2011/12
Wage Income
2013/14 2015/16
Q1 Q2 Q3 Q4 Q5
4 000
2 000
0
2011/12
Fertilizer application quantity (in kg)
2013/14 2015/16
Q1 Q2 Q3 Q4 Q5
500
0
2011/12
Consumption per capita
2013/14 2015/16
Q1 Q2 Q3 Q4 Q5
400
200
0
2011/12
Receieved food as a gifit
2013/14 2015/16
Q1 Q2 Q3 Q4 Q5
1
0
2011/12
Oxen ownership
2013/14 2015/16
Q1 Q2 Q3 Q4 Q5
10
5
0
2011/12
Crop income
2013/14 2015/16
Q1 Q2 Q3 Q4 Q5
20 000
0
2011/12
Household received food assistance(in proportion)
2013/14 2015/16
Q1 Q2 Q3 Q4 Q5
1
0
2011/12
Cow ownership
2013/14 2015/16
Q1 Q2 Q3 Q4 Q5
5
0
2011/12
Self-employment Income
2013/14 2015/16
Q1 Q2 Q3 Q4 Q5
5 000
0
2011/12
Total livestock owned (in TLU)
2013/14 2015/16
Q1 Q2 Q3 Q4 Q5
50
0
2011/12
Total cultivated land (in ha)
2013/14 2015/16
Q1 Q2 Q3 Q4 Q5
10
0

| 136
Tabl
e 6.
Qua
ntile
Reg
ress
ion
Para
met
er e
stim
ates
LSM
S-IS
A, E
RSS
(201
1/12
-201
5/16
))
Quan
tile
Regr
essio
nOL
S
Q.10
Q.20
Q.40
Q.50
Q.80
βSE
βSE
βSE
βSE
βSE
βSE
Cons
tant
3.22
5***
1.16
04.
099*
**1.
085
5.32
5***
0.79
65.
546*
**0.
653
6.81
9***
1.35
5-3
.569
***0.
188
Log
of y
ield
for m
ajor
crop
s0.
349*
*0.
161
0.32
3***
0.08
60.
270*
*0.
114
0.24
8***
0.09
10.
418*
**0.
100
Log
of a
ssist
ance
per
capi
ta0.
023
0.09
20.
075
0.07
10.
149
0.09
80.
139*
0.08
00.
036
0.07
80.
242*
**0.
009
Log
of in
com
e fro
m o
ther
sour
ces
-0.1
94*
0.10
7-0
.248
**0.
114
-0.0
960.
081
-0.0
160.
063
-0.1
100.
090
1.69
0***
0.03
1
Log
of liv
esto
ck in
com
e pe
r cap
ita0.
106
0.14
70.
171
0.12
80.
145
0.09
30.
133
0.08
50.
084
0.09
50.
078*
**0.
006
Log
of se
ed sa
ved
per c
apita
-0.2
20*
0.12
6-0
.253
**0.
118
-0.1
790.
134
-0.1
510.
100
-0.0
040.
080
-0.0
39***
0.00
7
Log
of g
rains
inst
ock p
er ca
pita
-0.0
100.
157
0.18
90.
146
0.04
10.
071
-0.0
520.
106
0.08
40.
069
Log
of la
nd cu
ltiva
ted
(in h
a)0.
125
0.28
8-0
.094
0.33
5-0
.085
0.37
10.
040
0.29
7-0
.281
0.22
60.
152*
**0.
024
Log
of to
tal li
vest
ock o
wne
d 0.
409*
*0.
184
0.37
7***
0.14
30.
346*
0.17
90.
379*
**0.
142
0.23
3*0.
139
-0.0
08***
0.00
2
Log
of fe
rtiliz
er u
sed
(in kg
)0.
356*
0.20
00.
078
0.14
30.
200
0.12
50.
320*
**0.
097
0.11
90.
133
-0.0
580.
047
Hous
ehol
d fa
mily
size
-0.0
200.
097
-0.0
070.
077
-0.0
340.
079
-0.0
280.
053
-0.0
280.
064
-0.0
13*
0.00
7
Hous
ehol
d se
x; 1=
mal
e0.
079
0.27
20.
025
0.27
70.
797*
*0.
356
0.48
80.
408
0.22
60.
425
0.00
00.
000
HH a
ge (i
n ye
ars)
0.02
4***
0.00
90.
028*
**0.
009
0.01
30.
009
0.01
6**
0.00
80.
010
0.00
80.
297*
**0.
041
* p<0
.1; *
* p<0
.05;
*** p
<0.0
1

137 |
-2.0
00.
002.
004.
00
0 .2 .4 .6 .8 1Quantile
-4.0
0-2
.00
0.00
2.00
0 .2 .4 .6 .8 1Quantile
-1.0
0-0
.50
0.00
0.50
0 .2 .4 .6 .8 1Quantile
-1.00
-0.50
0.50
0.00
1.00
0 .2 .4 .6 .8 1Quantile
-0.5
00.
000.
50
0 .2 .4 .6 .8 1Quantile
-0.5
0-0
.00
0.50
1.00
0 .2 .4 .6 .8 1Quantile
-1.50
-0.50
0.50
-1.00
0.00
1.00
0 .2 .4 .6 .8 1Quantile
-1.0
00.
001.
002.
00
0 .2 .4 .6 .8 1Quantile
-0.5
00.
501.
000.
001.
50
0 .2 .4 .6 .8 1Quantile
-0.5
00.
000.
501.
00
0 .2 .4 .6 .8 1Quantile
-5.00
0.00
1.00
0.50
1.50
0 .2 .4 .6 .8 1Quantile
-0.0
50.
000.
050.
10
0 .2 .4 .6 .8 1Quantile
-10.0
0-0
.500.0
010
.005.0
0
0 .2 .4 .6 .8 1Quantile
Inte
rcep
t
ln_y
ield
ln_p
c_as
sista
nce
ln_p
c_ot
h_in
com
e
ln_p
c_liv
pinc
ome
ln_p
c_sa
veds
eed
ln_p
c_st
ored
grai
n
ln_l
andh
a
ln_t
lives
tock
ln_f
erth
a
Hous
ehol
d fa
mily
size
Sex
of h
ouse
hold
hea
d; 1
= m
ale;
0=fe
mal
e
HH a
ge (i
n ye
ars)
5. Concluding remarks and way forward The paper explores an alternative approaches to measuring resilience for food and nutrition security. The discussion began with a concept that building resilience is specific to shocks & stressors that would adversely influence the wellbeing of individuals, households and communities. These entities are rely on certain coping strategies that help to mitigate shocks & stressors and even being in a better position. Households reported increase in food prices, drought, death of family members and death of livestock as the major shocks in the last 12 months prior to the survey period and also in the last 5 years. These shocks were reported as having an adverse impact on households’ income, assets, food production, food stock and purchase. Households were using different coping strategies to mitigate shocks including use of their own-saving, livestock sales, receiving unconditional transfer from government, relatives and NOGs, among others.
The analysis also further explore different level of wellbeing among those reporting impact of shocks on their wellbeing against their counterparts (reporting no shock impacts). The results reveal that household with no or minor shocks impacts on their livelihoods are better-off in terms of per capita consumption expenditure, income, asset holding, use of agricultural inputs (fertilizer and improved seeds) and have better access to basic public services. Households reporting impact of major shock have received assistance from social safety net program, namely productive safety net program (PSNP) and also assistance from government and NGOs, among others. The paper conclude that policy intervention for building resilience need to be geared towards improving income of households, building productive assets, improving access to use of improved technologies and provision of access to basic services at all levels. More importantly, it is well recognize that building resilience is multidimensional, multisector

| 138
and multiyear programme with sustainable funding from development and humanitarian actors in an integrated way. Such initiatives have to be strengthen so as to build household resilience for food and nutrition security.
References:Alinovi, L., Mane, E., & Romano, D. (2010). Measuring Household Resilience to Food Insecurity: Application to Palestinian Households. Agricultural Survey Methods. doi:10.1002/9780470665480.ch21
Béné, C. (2013). Towards a Quantifiable Measure of Resilience (No. 434). Retrieved from http://mobile.opendocs.ids.ac.uk/opendocs/handle/123456789/2990
Carletto, C., Banerjee, R., & Zezza, A. (2015). Household Data Sources for Measuring and Understanding Resilience. Resilience Measurement Technical Working Group. Technical Series No. 3. Rome: Food Security Information Network. Available at: http://www.fsincop.net/fileadmin/user_upload/fsin/docs/resour, (3).
Choularton, R., & Frankenberger, T., Kurtz J. & Nelson, S. (2015). Measuring Shocks and Stressors as Part of Resilience Measurement. Resilience Measurement Technical Working Group. Technical Series No. 5. Rome: Food Security Information Network. Available at: http://www.fsincop.net/fileadmin/user_upload/fsin/docs/resourc, (5).
Constans, M., & Wendy, M. (2015). A proposed Framework for Harmonized Resilience Metrics: A Structurally Integrated Matrix of Indicators for Resilience. Food and Nutrition Security and Resilience Analysis Are we effectively using the right data? Food Security Information Network Technica, (November).
Constas, M. A., Frankenberger, T. R., & Hoddinott, J. (2014). Resilience Measurement Principles: Toward an agenda for measurement design. Resilience Measurement Technical Working Group. Technical Series No. 1. Food Security Infoamtion Network. Available at http://www.fsincop.net/fileadmin/user_upload/fsin/docs/resou, (1), 31.
Constas, M. A., Frankenberger, T. R., Hoddinott, J., Mock, N., Romano, D., Béné, C., & Maxwell, D. (2014). A common analytical model for resilience measurement; Causal Framework and Methodological Options. Resileince Measurement Technical Working Group. Technical Series No. 2. Food Security Information Network., (2), 46. Retrieved from http://www.fsincop.net/fileadmin/user_upload/fsin/docs/resources/FSIN_Paper2_WEB_1dic (WEB).pdf
GHI. (2013). Global Hunger Index: The Challenge of Hunger: Building Resilience to Achieve Food and Nutrition Security.
Headey, D., & Kennedy, A. (2012). Enhancing Resilience in the Horn of Africa: Sythesis of An Evidence based Workshop. Washington, D.C.: US Agency for International Development and International Food Policy Research Institute.
Hoddinott, J., & Quisumbing, A. (2010). Methods for microeconometric risk and vulnerability assessment in Risk, Vulnerability and Human Development: On the brinke, by Fuentes-Nieva R. and Seck P. London: Palgrave Macmillan – United Nations Development Programme (UNDP), 2010.
IFPRI. (2014). Resilience For Food and Nutrition Security. (F. Shanggen, P.-L. Rajul, & Y. Sivan, Eds.) (1st ed.). Washington DC: International Food Policy Research Institute. doi:http://dx.doi.org/10.2499/9780896296787
Levine, S. (2014). Assessing resilience: why quantification misses the point. HPG Working Paper. Retrieved from http://www.odi.org/sites/odi.org.uk/files/odi-assets/publications-opinion-files/9049.pdf
Maxwell, D., Constas, M. A., Frankenberger, T. R., Klaus, D., & Mock, N. (2015). Qualitative Data and Subjective Indicators for Resilience Measurement. Resilience Measurement Technical Working Group. Technical Series No. 4. Food Security Information Network. Available at: http://www.fsincop.net/fileadmin/user_upload/fsin/ docs/resourc, (4).
Mock, N., Bene, C., Constas, M. A., & Frankenberger, T. R. (2015). Systems Analysis in the Context of Resilience. Resilience Measurement Technical Working Group. Technical Series No. 6. Rome: Food Security Information Network. Available at: http://www.fsincop.net/fileadmin/user_upload/fsin/docs/resourc, (6).
Tefera, N., & Kayitakire, F. (2014). Household Resilience for Food and Nutrition Security: Empirical Evidence from Rural Household in Ethiopia; JRC Working paper.
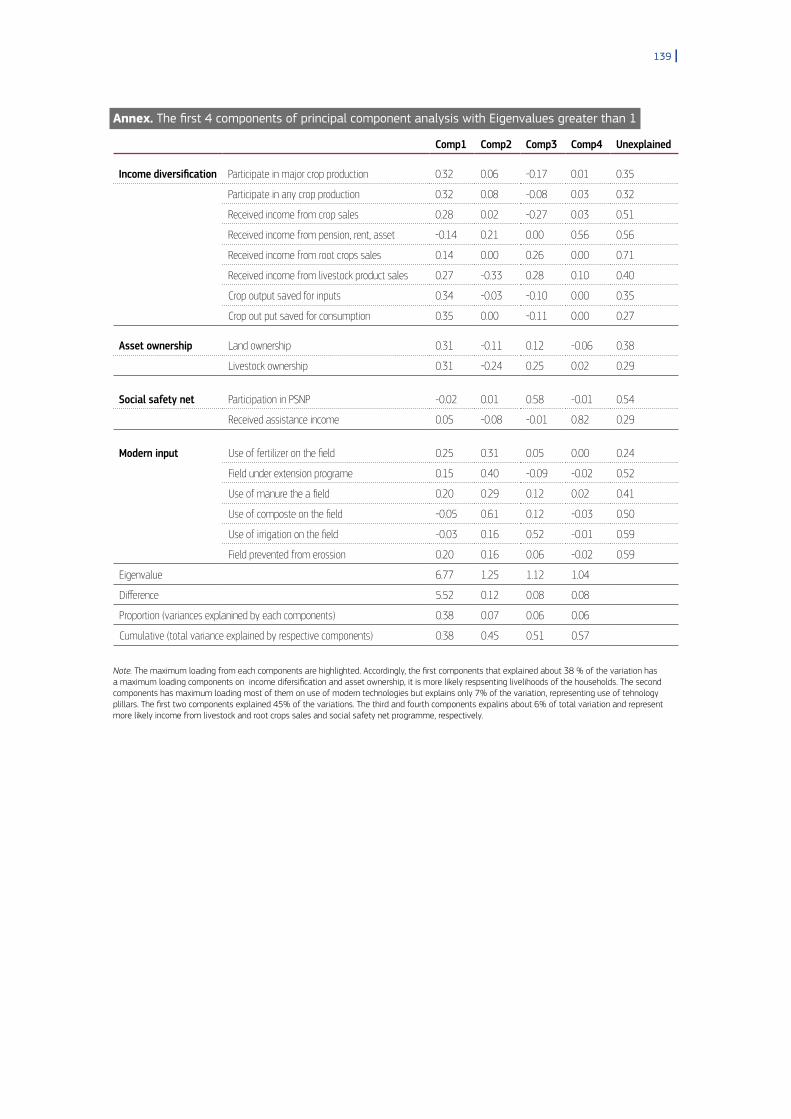
139 |
Annex. The first 4 components of principal component analysis with Eigenvalues greater than 1
Comp1 Comp2 Comp3 Comp4 Unexplained
Income diversification Participate in major crop production 0.32 0.06 -0.17 0.01 0.35
Participate in any crop production 0.32 0.08 -0.08 0.03 0.32
Received income from crop sales 0.28 0.02 -0.27 0.03 0.51
Received income from pension, rent, asset -0.14 0.21 0.00 0.56 0.56
Received income from root crops sales 0.14 0.00 0.26 0.00 0.71
Received income from livestock product sales 0.27 -0.33 0.28 0.10 0.40
Crop output saved for inputs 0.34 -0.03 -0.10 0.00 0.35
Crop out put saved for consumption 0.35 0.00 -0.11 0.00 0.27
Asset ownership Land ownership 0.31 -0.11 0.12 -0.06 0.38
Livestock ownership 0.31 -0.24 0.25 0.02 0.29
Social safety net Participation in PSNP -0.02 0.01 0.58 -0.01 0.54
Received assistance income 0.05 -0.08 -0.01 0.82 0.29
Modern input Use of fertilizer on the field 0.25 0.31 0.05 0.00 0.24
Field under extension programe 0.15 0.40 -0.09 -0.02 0.52
Use of manure the a field 0.20 0.29 0.12 0.02 0.41
Use of composte on the field -0.05 0.61 0.12 -0.03 0.50
Use of irrigation on the field -0.03 0.16 0.52 -0.01 0.59
Field prevented from erossion 0.20 0.16 0.06 -0.02 0.59
Eigenvalue 6.77 1.25 1.12 1.04
Difference 5.52 0.12 0.08 0.08
Proportion (variances explanined by each components) 0.38 0.07 0.06 0.06
Cumulative (total variance explained by respective components) 0.38 0.45 0.51 0.57
Note. The maximum loading from each components are highlighted. Accordingly, the first components that explained about 38 % of the variation has a maximum loading components on income difersification and asset ownership, it is more likely respsenting livelihoods of the households. The second components has maximum loading most of them on use of modern technologies but explains only 7% of the variation, representing use of tehnology plillars. The first two components explained 45% of the variations. The third and fourth components expalins about 6% of total variation and represent more likely income from livestock and root crops sales and social safety net programme, respectively.

| 140
What Drives Housing Recovery?Elaina J. Sutley, Ph.D., Sara Hamideh, Ph.D.Civil, Environmental and Architectural Engineering, University of Kansas Community and Regional Planning, Iowa State University
AbstractMany previous disasters have demonstrated the need for extensive personal, public, and governmental expenditures for housing recovery. The share of housing in community recovery and the extensive financial reinvestment from individuals and the government required for restoring a damaged housing sector highlight the importance of studying housing recovery. Yet, much research is still needed to fully understand the multi-faceted and complex nature of housing recovery. Housing is inherently a physical infrastructure system, a social system, and an economic system. When disrupted, many sectors within the community are disrupted and must be re-established in unison. An effective housing recovery model must capture the relationships with the other community sectors, and account for the differences observed in these relationships at different geographic scales (e.g., parcel-level versus community-level).
The present study focuses on re-establishing permanent housing. A systematic literature review was conducted and used to identify the causal factors which influence the recovery of housing. The literature review uncovered data from previous disasters spanning earthquake, hurricane, flood, tornado, and tsunami hazards. Regardless of hazard type or geographic scale, damage measures to be the biggest indicator for the extent of disruption and a significant predictor for the timeline of recovery. The present work quantifies the causal relationship of physical damage to residential structures on housing recovery, and quantifies less commonly discussed causal relationships, including various measures of social vulnerability. The ultimate goal of this research is to create a model capable of predicting housing recovery in future potential disaster scenarios, and identifying disparities at the community level for risk-informed interventions.
1. IntroductionWorldwide, housing is a major sector of the physical building, financial, and social infrastructure. Housing provides shelter and sanctuary to households, and accounts for approximately half of natural-hazard induced disaster losses through direct, insured, and indirect losses. Rebuilding housing is one of the most important collective goals a"er a disaster. Yet limited research has investigated the housing recovery process, or the factors which contribute to it. This is generally because housing is complex and multi-faceted; it operates at the intersection of physical, social, and economic systems, and there is limited data to support advanced models. The goal of this research was to develop a predictive model of housing recovery that embodied its complexity and intersctionality across physical, social, and economic sectors using a combination of theory, empirical data, and advancated probability and statistical methods. In an effort to accomplish this goal, the approach shown in Figure 1 was adhered.
KeywordsHousing; Recovery; Restoration; Fragility; Hurricane Ike

141 |
Figure 1. Multi-faceted approach to developing a predictive housing recovery model
SystematicLiterature
Review PredictiveHousingRecovery
ModelTestbedStudies Hindcast
Studies
FieldStudies
Looking at Figure 1, first a systematic literature review was performed in which two disciplinary-specific (e.g., social science and engineering) online databases of published technical literature were surveyed using a series of strategic keyword sets to identify all existing literature on post-disaster housing recovery. This literature was used to identify existing and develop new qualitative and quantitative theory on post-disaster housing recovery, as well as to identify the state of knowledge in defining, measuring, modeling, and predicting housing recovery.
Second, and simulatenously with the literature review, a testbed (with associated empirical data) was adopted for developing the predictive model, and for testing out identified theories. The testbed adopted in this study was 2008 Hurricane Ike, a category 4 hurricane that caused catastrophic damage to Galveston, Texas. Recovery is a longterm process. Therefore, selection of a disaster that occured approximately a decade ago allowed investigation of the detailed recovery progress that unfolded over time.
The literature review and testbed allowed for initial development of a quantitive model, however, additional data was needed to fill in specific quantitative relationships. Thus 2015 Hurricane Matthew’s catastrophic flooding in Lumberton, North Carolina was selected as
© iStock.com
/demaerre

| 142
the field study. A team of NIST COE researchers performed a field study approximately one month, and one year a"er the flooding to collect data on initial damage and disruption, and progress towards recovery.
These three, namely the literature review, testbed studies, and field studies, were used to formulate the predictive housing recovery model presented in this paper. A hindcast has adopted, namely the EF5 tornado that destroyed a significant portion of Joplin, Missouri in 2011, for validating the model. The following sections present the progress-to-date on the detailed development of the predictive housing recovery model.
2. Defining Housing RecoveryThe systematic literature review utilized SCOPUS and ENGINEERINGVILLAGE, and 68 keyword sets (e.g., ‘post-disaster AND housing AND recovery’ being one keyword set) to identify all of the existing and relevant literature on post-disaster housing recovery. Through a specific three-step inclusion and exclusion process, a final count of 182 articles were identified and coded in the qualitative analysis so"ware ATLAS.ti.
During the literature review, four primary definitions were observed for how post-disaster housing recovery was described or modelled. The first three focused on the process of rebuilding. The first definition can be synthesized as rebuilding back to the same number of pre-event residential units (Hirayama, 2000; Paul and Che, 2011). A major shortcoming of this first definition is that households come and go, and zoning o"en changes a"er a catastrophic disaster, so reaching a pre-disaster number of units may be arbitrary. The second definition overcomes this limitation, and is stated as completion of planned reconstruction projects (Lu and Xu, 2014). This second definition improves upon the first by taking into consideration the changes (growth or decline) that may occur through the initial disaster impact and response stages. However, on a global level anecdotal evidence suggests that o"en times rebuilding has not taken into consideration the local culture or needs of the local population. When this occurs, people have refused to occupy the new infrastructure (Boano 2009; Arlikatti and Andrews, 2012). A third definition from the literature accommodates this discrepancy by defining housing recovery as occupancy of permanent housing units (Green et al., 2007; Quarantelli, 1982). This third definition follows suite with the focus on reconstruction, and is so, still limiting. Housing recovery is a long, complex process that is more complicated that re-occupancy of residential units. Housing recovery, rather, is best defined as when a sense of security has been provided to the residents by allowing them to call a place home and re-establishing their daily routines (Ganapati and Mukherji, 2014). In this latter definition, reconstruction and re-occupancy are important steps towards the greater end goal.
3. Predicting Housing Recovery via Restoration AnalysisThe systematic literature review led towards a comprehensive coverage of the existing work on modelling housing recovery, and on a comprehensive understanding of existing theory on housing recovery. The existing theory was used to formulate a qualitative system dynamics model of the housing recovery system (Sutley and Hamideh, 2017). This effort pointed out a critical modelling need, e.g., data, to support the quantitative formulation of the housing recovery process.
3.1. Galveston Testbed
In September 2008, a Category 4 hurricane hit the coast of Galveston, Texas. Hurricane Ike killed approximately 195 people, and caused an estimated $24.9 billion (USD) in property damage. Galveston is a barrier island with approximately 50,000 population members. Galveston consists of three geographically defined areas: the West End, Bolivar, and the urban

143 |
core. Figure 2 provides approximately geographic boundaries identifying the three areas of the Galveston testbed. These three areas differ in housing make-up and use. As discussed in more detail in Hamideh, Peacock, and Van Zandt (2018), the West End consists of over 79% seasonal-use homes that remain vacant for a significant portion of the year. Bolivar consists of approximately 50% to 77% seasonal use vacation homes. Lastly, the urban core has over half of its home used for year-round use.
Figure 2. Map of Galveston testbed
Texas City
Percentage of vacant houses that are seasonal
50% or moreLess than 50%
Bolivar Peninsula
East End
Urban Core
West End
In addition to housing, and socio-demographic and economic differences across these three areas, they also differed by the amount of damage experienced from the 2008 hurricane. Figure 3 provides the distribution of ‘none’, minor’, ‘moderate’, and ‘extensive’ damage experienced in the three areas. From Figure 3, one can see that Bolivar suffered the most extensive damage. It is important to point out too, that some of the west end vacation homes sit well above surge level and received only wind damage; hence, the lower percentage of extensively damaged homes.
Figure 3. Damage distribution to homes in Galveston
Urban core
None, 3%
Minor, 27%Extensive, 26%
Moderate, 44% Moderate, 15%
West end
None, 6%
Bolivar
None, 5%Extensive, 7% Extensive, 72%Minor, 29% Minor, 8%
Moderate, 58%

| 144
3.2. Two-part Restoration Analysis
Parcel-level tax assessment data from 2008 to 2015 was obtained for Galveston, Texas. In the U.S., tax assessments are performed every year. The analysis presented here is limited to single-family dwellings. The tax assessment data included nearly 24,000 single-family dwelling parcels. The data consists of many variables, including the assessed value, housing size (square feet), and the year of construction. Assessed value is defined as the value of the structure on the property; it excludes land value. Previous work has demonstrated the merits of tracking assessed value before and a"er a disaster in modelling housing recovery (Peacock et al., 2014). A proxy for initial damage can be computed by taking the difference in the assessed value from the pre-disaster year and the first year a"er the disaster. In this case, initial damage would be formulated as
Where IVx is the improvement value recorded in year x. Although at a different scale (block group as opposed to parcel), census data can be overlaid to supply additional variables, including household annual income, household race and ethnicity, and tenure status (renter or owner). The census data is in terms of averages or percentages for the block group, whereas the tax data is specified at the parcel scale.
Figure 4 provides the restoration trajectory of six different parcels in the dataset. These six were extracted to demonstrate that the goal of restoration is to reach and/or exceed the pre-disaster assessed value, and that this can happen at different rates. Furthermore, the goal of this work is to investigate and understand why some parcels restore faster than others. Therefore, in this application, housing recovery is being defined as the restoration of pre-disaster assessed value. This leads to two overlying research questions: (1) what factors influence parcels to reach restoration sooner; (2) how can this information be used to predict restoration time for other and future events?
Figure 4. A collection of restored single-family parcels in Galveston, Texas following Hurricane Ike
1.2
10
8
6
4
x 104
2008 2009 2010 2011 2012 2013 2014 2015
Asse
ssed
Val
ue (S
)
Hurricane Ike
Time to Reach and Maintain Pre-Ike Assessed Value (years)
Restored in 2 yearsRestored in 3 yearsRestored in 4 yearsRestored in 5 yearsRestored in 6 yearsRestored in 7 years
A two-part approach was taken to address these questions. First, a logistic panel model predicting the logged odds of reaching or exceeding pre-disaster assessments controlling for a number of key variables was run. Second, the part 1 results were used to formulate exceedance probability functions, referred to here as probabilistic fragility models.
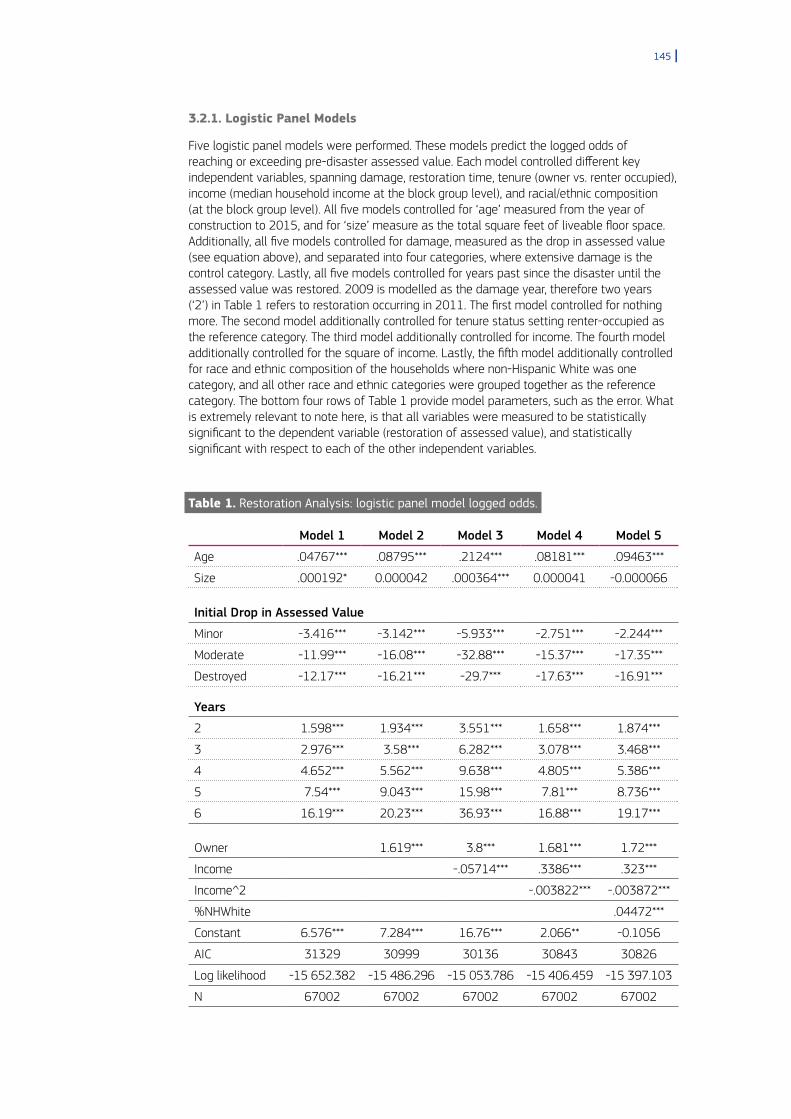
145 |
3.2.1. Logistic Panel Models
Five logistic panel models were performed. These models predict the logged odds of reaching or exceeding pre-disaster assessed value. Each model controlled different key independent variables, spanning damage, restoration time, tenure (owner vs. renter occupied), income (median household income at the block group level), and racial/ethnic composition (at the block group level). All five models controlled for ‘age’ measured from the year of construction to 2015, and for ‘size’ measure as the total square feet of liveable floor space. Additionally, all five models controlled for damage, measured as the drop in assessed value (see equation above), and separated into four categories, where extensive damage is the control category. Lastly, all five models controlled for years past since the disaster until the assessed value was restored. 2009 is modelled as the damage year, therefore two years (‘2’) in Table 1 refers to restoration occurring in 2011. The first model controlled for nothing more. The second model additionally controlled for tenure status setting renter-occupied as the reference category. The third model additionally controlled for income. The fourth model additionally controlled for the square of income. Lastly, the fi"h model additionally controlled for race and ethnic composition of the households where non-Hispanic White was one category, and all other race and ethnic categories were grouped together as the reference category. The bottom four rows of Table 1 provide model parameters, such as the error. What is extremely relevant to note here, is that all variables were measured to be statistically significant to the dependent variable (restoration of assessed value), and statistically significant with respect to each of the other independent variables.
Table 1. Restoration Analysis: logistic panel model logged odds.
Model 1 Model 2 Model 3 Model 4 Model 5
Age .04767*** .08795*** .2124*** .08181*** .09463***
Size .000192* 0.000042 .000364*** 0.000041 -0.000066
Initial Drop in Assessed Value
Minor -3.416*** -3.142*** -5.933*** -2.751*** -2.244***
Moderate -11.99*** -16.08*** -32.88*** -15.37*** -17.35***
Destroyed -12.17*** -16.21*** -29.7*** -17.63*** -16.91***
Years
2 1.598*** 1.934*** 3.551*** 1.658*** 1.874***
3 2.976*** 3.58*** 6.282*** 3.078*** 3.468***
4 4.652*** 5.562*** 9.638*** 4.805*** 5.386***
5 7.54*** 9.043*** 15.98*** 7.81*** 8.736***
6 16.19*** 20.23*** 36.93*** 16.88*** 19.17***
Owner 1.619*** 3.8*** 1.681*** 1.72***
Income -.05714*** .3386*** .323***
Income^2 -.003822*** -.003872***
%NHWhite .04472***
Constant 6.576*** 7.284*** 16.76*** 2.066** -0.1056
AIC 31329 30999 30136 30843 30826
Log likelihood -15 652.382 -15 486.296 -15 053.786 -15 406.459 -15 397.103
N 67002 67002 67002 67002 67002

| 146
Table 1 provides the measurement that owner-occupied homes were positively related to reaching restoration compared to renter-occupied homes, as observed by all four models (Models 2 – 5). Higher income was negatively related to the logged odds of reaching restoration in Model 3. However, once the squared income was included (Model 4 and 5), only the highest levels of income were negatively related to reaching restoration; others were positively related to the logged odds of reaching restoration. Additionally, higher percentages of non-Hispanic Whites were positively related to the logged odds of reaching restoration (Model 5). All of these align with the theoretical and empirical literature, except income. The third model resulted in a negative coefficient for income, which therefore prompted the need for the fourth model to control for squared income. In the case of the fourth model, it was only the highest levels of income (income squared coefficient = -0.003822 versus income coefficient for model 4 = +0.3386) with the negative relationship. This can be explained by an understanding that the block groups that hosted residents in the highest income category consisted of mostly seasonal-use vacation homes. This can be explained by assuming that these wealthiest households delayed repair of their vacation homes since they were still able to reside in their primary residence a"er the disaster.
3.2.2. Probabilistic Fragility Models
The results from Part 1 of the restoration analysis are used here to formulate a series of probabilistic fragility models for predicting housing assessed value restoration. The formulation of a fragility model is expressed as
Where PE is the exceedance probability; AV is assessed value; a is age of structure; s is size of structure, d is initial damage, y is years past since the disaster, t is tenure status, i is income, i2 is income squared, and r is race and ethnic composition. This expression reads as ‘the probability of exceeding pre-disaster assessed value given age, size, initial damage, years past, tenure status, income, income squared, and race and ethnic composition. For brevity, only a portion of the model 3 (Figure 5) and model 5 (Figure 6) results are presented here.
Figure 5. Probabilistic Fragility Functions for Model 3.
1
0.9
0.8
0.7
0.6
0.5
0.4
0.3
0.2
0.1
00 3 6 9 12 15
PE [R
T | D
amag
e, T
enur
e, a
nd In
com
e]
Years to Restore Assessed Value
PE Restoration time | Damage State, Tenure and Income
DS1, Owner, <$50DS1, Owner, >=$50DS2, Owner, <$50DS2, Owner, >=$50DS3, Owner, <$50DS3, Owner, >=$50DS4, Owner, <$50DS4, Owner, >=$50DS1, Renter, <$50DS1, Renter, >=$50DS2, Renter, <$50DS2, Renter, >=$50DS3, Renter, <$50DS3, Renter, >=$50DS4, Renter, <$50DS4, Renter, >=$50

147 |
Figure 6. Probabilistic Fragility Functions for Model 5
1
0.9
0.8
0.7
0.6
0.5
0.4
0.3
0.2
0.1
0 0 3 6 9 12
PE [R
T | D
amag
e, T
enur
e, a
Inco
me
Race
and
Eth
nici
ty]
Years to Restore Assessed Value
PE Restoration time | Damage State, Tenure and Income
DS1, Owner, <$50, <47%NHWDS1, Owner, >=$50, <47%NHWDS2, Owner, <$50, <47%NHWDS2, Owner, >=$50, <47%NHWDS3, Owner, <$50, <47%NHWDS3, Owner, >=$50, <47%NHWDS4, Owner, <$50, <47%NHWDS4, Owner, >=$50, <47%NHWDS1, Owner, <$50, >47%NHWDS1, Owner, >=$50, >47%NHWDS2, Owner, <$50, >47%NHWDS2, Owner, >=$50, >47%NHWDS3, Owner, <$50, >47%NHWDS3, Owner, >=$50, >47%NHWDS4, Owner, <$50, >47%NHWDS4, Owner, >=$50, >47%NHW
DS1, Renter, <$50, <47%NHWDS1, Renter, >=$50, <47%NHWDS2, Renter, <$50, <47%NHWDS2, Renter, >=$50, <47%NHWDS3, Renter, <$50, <47%NHWDS3, Renter, >=$50, <47%NHWDS4, Renter, <$50, <47%NHWDS4, Renter, >=$50, <47%NHWDS1, Renter, <$50, >47%NHWDS1, Renter, >=$50, >47%NHWDS2, Renter, <$50, >47%NHWDS2, Renter, >=$50, >47%NHWDS3, Renter, <$50, >47%NHWDS3, Renter, >=$50, >47%NHWDS4, Renter, <$50, >47%NHWDS4, Renter, >=$50, >47%NHW
In both Figures 5 and 6, there is a wide range of 50-th percentile restoration times spanning approximately 3 years in Figure 5 and five years in Figure 6. This demonstrates the discrepancy in reach restoration for different parcels. In both cases, income is separated into two categories: below or above $50,000 per year (USD), damage is separated into four categories, and tenure is separated into two categories. Additionally, in Figure 6, race and ethnicity is separated into two categories: below or above 47% of the population, where NHW is non-Hispanic White. These cut-offs selected for income and race and ethnicity represent the medians for Galveston, Texas.
Looking closer at both Figure 5 and Figure 6, one can see that restoration time moves linearly with increasing damage level. Within a given damage level, owner occupied housing, and housing in areas with higher than 47% of NHWs restored faster than their counterparts. The major conclusion in both cases is that as damage increases, social inequality characteristics increase, and so too does the restoration time.
4. Conclusions and Next StepsRecovery models, including housing recovery models, should be developed at the finest resolution feasible to make sure that models, and resulting policies, do not overlook those community members that have the greatest vulnerabilities. Furthermore, recovery models should take a multi-tired, multiple feedback approach balancing theory, reality, available data, and computational cost.
At the time of this writing, the model was only a portion of the way through the development approach shown in Figure 1. The new data collection via field study is on-going with a major data collection effort completed in January 2018. It is the continued work of the authors to analyse and integrate the data collected through the field study, use it to expand the model to include incoming financial recovery resources, such as insurance, federal and local level financial support, and financial aid from non-government organizations. Upon completion of the data integration, the model will be validated using the described hindcast approach.
It is intended for the fragility models shown in Figures 5 and 6 to be applied to other areas and other (future) disasters. The authors caution this until the work has been expanded using the field study data, and validated using the hindcast approach.

| 148
AcknowledgementsThe authors would like to thank Professor Walter G. Peacock for running the logistic panel models presented in this paper.
The authors would like to acknowledge the Risk-Based Community Resilience Planning Center of Excellence funded by the National Institute of Standards and Technology. The Center for Risk-Based Community Resilience Planning is a NIST-funded Center of Excellence; the Center is funded through a cooperative agreement between the U.S. National Institute of Standards and Technology and Colorado State University (NIST Financial Assistance Award Number: 70NANB15H044). The views expressed are those of the author(s), and may not represent the official position of the National Institute of Standards and Technology or the U.S. Department of Commerce.
ReferencesArlikatti, S. and Andrews, S. ‘Housing design and longterm recovery processes in the a"ermath of the 2004 Indian ocean tsunami’, Natural Hazards Review, Vol. 13, 2012, pp. 34-44.
Boano, C. ‘Housing anxiety and multiple geographies in post-tsunami Sri Lanka’, Journal Compliation, Overseas Development Institute, Vol. 33, 2009, pp. 762-785.
Ganapati, N. E. and Mukherji, A. ‘Out of sync: World Bank funding for housing recovery, postdisaster planning, and participation’, Natural Hazards Review, Vol. 15, No. 1, 2014, pp. 58-73.
Green, R., Bates, L., and Smyth, A. ‘Impediments to recovery in New Orleans’ upper and lower ninth ward: One year a"er Hurricane Katrina’, Disasters, Vol. 31, 2007, pp. 311–335.
Hamideh, S., Peacock, W., and Van Zandt, S. ‘Housing recovery a"er disasters: primary versus seasonal and vacation housing markets in coastal communities’, Natural Hazards Review, Vol. 19, No. 2, 2018, 04018003.
Hirayama, Y. ‘Collapse and reconstruction: Housing recovery policy in Kobe a"er the Hanshin great earthquake’, Housing Studies, Vol. 15, 2000, pp. 111–128.
Lu, Y. and Xu, J. ‘Comparative study on the key issues of post-earthquake recovery and reconstruction planning: Lessons from the United States, Japan, Iran, and China’, Natural Hazards Review, Vol. 16, 2014, 04014033.
Paul, B., and Che, D. ‘Opportunities and challenges in rebuilding tornado-impacted Greensburg, Kansas as “stronger, better, and greener”’, GeoJournal, Vol. 76, 2011, pp. 93–108.
Peacock, W., Van Zandt, S., Zhang, Y., and Highfield, W. ‘Inequities in long-term housing recovery a"er disasters’, Journal of the American Planning Association, Vol. 80, 2014, pp. 356–371.
Quarantelli, E. ‘What is disaster? The need for clarification in definition and conceptualization in research’, Disasters and Mental Health Selected Contemporary Perspectives, 1982, pp. 41–73.
Sutley, E.J. and Hamideh, S. ‘An interdisciplinary system dynamics model for post-disaster housing recovery’, Sustainable and Resilience Infrastructure, 2017, DOI: 10.1080/23789689.2017.1364561.

149 |
Modelling conflict resilience in the Global Conflict Risk IndexMatina Halkia1, Stefano Ferri1, Francesca Saporiti21European Commission, Joint Research Centre, via Fermi 2427, Ispra, Italy,2Piksel Ltd Italian Branch, Via Breda 176, Milano, Italy
AbstractThe Global Conflict Risk Index (GCRI) is a quantitative method for the prediction of conflict risk in a country in the next 1-4 years. It is modelled on 24 variables, in five dimensions: political, economical, social, environmental and the country’s security status.
In this paper, we explore a definition of conflict resilience as the capacity of a country to demonstrate a decreased conflict intensity, than what would be expected given its specific structural profile.
We investigate the relationship between the two GCRI variables, conflict intensity and political repression, under the assumption that the eruption of a conflict in a country takes place when the population of that specific state is deprived of its fundamental rights. We note that there exists a correlation between repression and the eruption of a conflict. The correlation matrix shows that repression (REPRESS) and internal conflict (CON_INT) variables have a correlation coefficient of 0.62, which is overall one of the highest coefficients in GCRI. We then observe which countries are resilient to conflicts when they have to bear a high or increasing level of repression. The study of the regression trend lines, allows us to classify the country’s type of conflict resilience according to the coefficient of the regression line (high m, low m) and the intercepts (q>0, q<0). We theorize conflict resilience as: i) stability in the face of conflict risk
due to the increased level of repression, and therefore absorptive capacity, and ii) resilience as flexibility, and therefore adaptive capacity. We also observe a number of countries with reduced conflict resilience to armed conflict in the face of political repression.
In the future, we plan to test resilience as the transformative capacity a"er the eruption of armed conflict, and the recovery rate of a country to an improved conflict risk status, using the GCRI historical data.
1. IntroductionIn the literature three different schools have theorized the relation between repression and conflict: the Grievance Based Approach, the Opportunity Approach, and the Regime Type Approaches. According to the first approach, government repression generates grievances, which increases the level of protest: “relative deprivation arguments” (Gurr, 1970). When “individuals feel deprived, they may respond violently, and individuals are likely to feel deprived when they experience repression” (Abouharb, et al). Therefore, higher levels of repression will lead to more anti-government protest and violence, until the capacity of the state to inflict damage to its opponents overwhelm the opponents’ protests. Thus the relationship between government repression and violence is non-linear.
The Opportunity Approach states that the citizens of a country will protest against it if the benefits of demonstrating are higher than the costs (Collier and Hoeffler, 2004; Lichbach, 1987; Mason, 2004).
Keywordsconflict, resilience,
repression, Global Conflict Risk
Index

| 150
The Regime Type Approaches argue that the effects of repression varies depending on which type of regime is imposing it; for example “authoritarian regimes may have high levels of repression and in doing so reduce citizens’ opportunities for protest (Regan and Henderson, 2002 in Abouharb, et al). In contrast, democracies provide many opportunities for citizens to express their opinions.
The GCRI describes the relation between repression and conflict as follows: “if a state suppresses oppositional movements, restricts the work of the press or uses force against separatist unrest, it is more likely to encounter full-scale violent conflict” (De Grove et al. 2014). As a consequence, the prediction is that the level of repression in a country is on one hand a good forecast for social tensions that might lead to conflict, and on the other it is used to identify a potential climate of state abuse that leads to the aggravation of existing conflict (Fox, 2004 and Regan and Norton, 2005).
In this paper we explore the trends resulting from a study of the correlation between repression and conflict intensity at country level, from 1989 to 2016, using the GCRI data input.
2. Data and Method
1.1 Data
The data used to conduct the analysis are provided by the Global Conflict Risk Index (GCRI), which is an early warning system designed to give policy makers a global risk assessment based on economic, social, environmental, security and political factors. The GCRI is composed of 24 variables; the one used in the first stage of our study are repression (REPRESS), conflict intensity (CON_INT), and years since the last highly violent conflict (YRS_HVC). Moreover, the GCRI categorizes conflicts according to their type: High Violent Conflict (HVC) or Violent Conflict (VC). For each type, a distinction between two different dimensions is made: national (NP) and subnational (SN). Based on these categorisations, the index calculates four different probability of conflicts: P_HVC_NP, P_HVC_SN, P_VC_NP, and P_VC_SN. These four probabilities are integrated in our analysis as variables to test.
© iS
tock
.com
/tim
star
key

151 |
Each indicator is based on data for 191 countries, obtained from 1989 till 2016, on an annual basis.
1.2 Method
The analysis conducted is structured in two steps: the first one consists in testing both Fox’s, and Regan’s and Norton’s hypothesis; that repression is positively correlated with the onset of civil war. The second step consists in a linear regression using R.
Step 1: a correlation analysis was performed on all the GCRI variables shown in the table below. The results of the test show that the correlation between repression, and the six variables related to conflicts is positive, therefore verifying Fox’s, and Regan’s and Norton’s theories. Besides the fact that all the coefficients are positive, it is also possible to say that the variables considered have either moderate or strong correlation, according to Evans’s classification (1996)1.
Table1. Correlation
CON_INT YRS_HVC P_HVC_NP P_HVC_SN P_VC_NP P_VC_SNREPRESS 0.62 0.49 0.58 0.59 0.67 0.72
REPRESS = RepressionCON_INT = Conflict intensityYRS_HVC = Years since the last high violent conflictP_HVC_NP = Probability of a highly violent national conflictP_HVC_SN = Probability of a highly violent subnational conflictP_VC_NP = Probability of a violent national conflictP_VC_SN = Probability of a violent subnational conflict
= strong = moderate
At this stage of our analysis we decided to focus on the relation between REPRESS and CON_INT.
Step 2: the scope of the regression is to verify if conflicts depend/are influenced by the value of repression and therefore to see if countries are resilient to conflict in case of increasing repression. In our linear regression, repression is the independent variable (x), and conflict intensity is the dependent variable (y).
Linear Regression mathematical formula:
y = f(x) = m*x + q
Linear Regression applied formula:
CON_INT = f(REPRESS) = m * REPRESS + q
3. ResultsR has calculated the parameters m and q for all the countries and here below we present the results of our findings through a graphical representation.
1 Evans suggests the following classification: .00-.19 “very weak”, .20-.39 “weak”, .40-.59 “moderate”, .60-.79 “strong”, .80-1.0 “very strong”.

| 152
Figure 1. Resilience trend lines
All countries trend lines
CON
T_IN
T
REPRESS
10
8
6
4
2
0
0 2 4 6 8 10
Type 1 (m>0): Algeria
CON
T_IN
TREPRESS
10
8
6
4
2
0
0 2 4 6 8 10
Type 1a (0<m=<1): India
CON
T_IN
T
REPRESS
10
8
6
4
2
0
0 2 4 6 8 10
Type 2 (m~0): Equatorial Guinea
CON
T_IN
T
REPRESS
10
8
6
4
2
0
0 2 4 6 8 10
Type 3 (m~0 then m>0): Dominican Republic
CON
T_IN
T
REPRESS
10
8
6
4
2
0
0 2 4 6 8 10
Type 4 (m<0): Papua New Guinea
CON
T_IN
T
REPRESS
10
8
6
4
2
0
0 2 4 6 8 10

153 |
The general trend line (blue) shows that in general countries have an absorptive capacity up to a certain point, however as shown in the first graph countries have four different tendencies: no conflict resilience (type 1) or some conflict resilience (type 1a), conflict resilience (type 2), absorptive capacity up to a certain point (type 3), and flexibility (type 4).
Countries grouped in Type 1, if subject to increasing repression, react with an increase in conflict intensity, while changes in repression have a more mild effect on states of Type 1a. In case of Type 2, countries demonstrate an absorptive capacity because an increased repression does not have any impact on conflict. Type 3 states show an absorptive capacity up to the point where they start reacting either as in Type 1 or Type 1a. Type 4 shows an inverted tendency in respect to Type 1.
4. DiscussionWe can conclude that political stability increases conflict resilience. However a country, which demonstrates absorptive capacity when repression increases, demonstrates stability as a social system, even in the presence of political pressures. This might be the case of the countries we observe with m~0 then m>0, where resources exist to withstand conflict eruption due to repression, up to a certain point. In other countries, we observe a lack of correlation between repression and conflict intensity, however these are outliers, and require further study.
Overall, we confirm, as we hypothesized, that there is positive correlation between repression and conflict intensity, even if countries appear more or less resilient (m>0 and m<1).
Then, there is yet a number of countries, which demonstrate an adaptive capacity to repression, and show flexibility to political pressure. In these countries there is a negative correlation between repression and conflict intensity. Further study is required to investigate the structural profile of these countries that may explain which socio-economic profile supports such adaptive capacity to political repression.
However, conflict resilience is, a"er all, the capacity of recovery a"er an event has occurred, and therefore the temporal element is necessary to complete this study. It is, therefore, necessary to observe the rate of recovery and the structural conditions facilitating a faster rate of recovery and supporting the transformative capacity of a country in the face of armed conflict to complete this study.
5. ConclusionsWe posit the relation between repression and conflict intensity, as one definition of conflict resilience we aim to model. The more the political repression in a country the highest the conflict intensity of an ensuing armed conflict. The hypothesis is theorized in the relevant political science literature, and we confirm it empirically. In detail, studying two of the 24 GCRI variables, conflict intensity and repression, we observe a positive correlation between the two. Additionally, the highest correlation between any two GCRI variables is the one existing between conflict intensity and repression.
We then study the specific trends between repression and conflict intensity in the 191 countries of observation for events of armed conflict between 1989 and 2016. Notwithstanding investigation of the temporal element of conflict resilience, e.g. the recovery of a state a"er the occurrence of an armed-conflict event, we conclude that countries, when they express conflict resilience, they demonstrate absorptive and adaptive capacity or stability and flexibility in the face of political pressure. More research will point to the structural conditions of a country whose transformative capacity facilitates speedy recovery once a conflict event has occurred.

| 154
ReferencesAbouharb, M. R., Aaronson, S. A., Gaines, N. S., Citizens Always Respond To Repression: Repression Types And Their Consequences For Non-Violent And Violent Civil Conflict, London, University College London.
Collier, P. & Hoeffler, A., 2004, Greed and Grievance in Civil War, Oxford Economic Papers, Vol. 56, No.4, pp. 563-I595.
De Groeve, T., Hachemer, P., Vernaccini, L., 2014, The Global Conflict Risk Index (GCRI) A Quantitative Model, Concept and Methodology; EUR 26880 EN; doi:10.2788/184
Fox, J., 2004. The rise of religious nationalism and conflict: Ethnic conflict and revolutionary wars, 1945-2001. 6th ed. Journal of Peace Research 41, pp. 715-731.
Gurr, T. R., 1970, Why Men Rebel, Princeton, Princeton University Press.
Lichbach, M. I., 1987, Deterrence or Escalation? The Puzzle of Aggregate Studies of Repression and Dissent, The Journal of Conflict Resolution, Vol. 31, No. 2, pp. 266-297.
Mason, T. D., 2004, Caught in the Crossfire: Revolutions, Repression, and the Rational Peasant, New York, Rowman and Littlefield.
Regan, P. M. & Henderson E. A., 2002, Democracy, Threats and Political Repression in Developing Countries: Are Democracies Internally Less Violent?, Third World Quarterly, Vol. 23, No. 1, pp. 119-136.
Regan, P. M. & Norton, D., 2005, Greed, Grievance and Mobilization in Civil Wars. 3rd ed. Journal of Conflict Resolution 49, pp. 319-336.

155 |
Towards resilient migration governance in the EU: A conceptual appraisalDr. Regine Paul1, Prof. Christof Roos2
1 Bielefeld University/ CES Harvard University 2 Flensburg University
1. IntroductionWith its Global Strategy the EU has transferred the concept of resilience from food security and development policies to the realm of external relations. While this explicitly discusses EU migration governance in one paragraph, the Global Strategy stays silent on what exactly resilience means in the context of migration and how it can be meaningfully assessed, let alone managed, in the future. To elaborate this debate further we offer a conceptual appraisal of resilience. Such conceptual groundwork is required for a systematic development of workable resilience assessment and management strategies in future policy design. For that purpose, our qualitative document analysis first shows how the concept evolved in the EU (section 2) and how existing strategies and communications evoke resilience in the context of migration governance (section 3). We then situate the Commission’s still rather vague definition within conceptualizations of resilience and migration systems in migration policy research to identify additional lines along which the EU’s resilience thinking could be developed further (section 4). We finish by offering some recommendations on how to advance resilience assessments in EU migration governance.
2. The Development of Resilience as a Regulatory Concept in the EU
An obvious path towards illuminating the possible meaning of resilience in the context of EU migration governance – and related methodical questions about resilience assessment – is to look back at how the EU first adopted the concept and how it morphed towards its present role in the Global Strategy.
To structure our evaluation it is useful to understand resilience as a regulatory concept (Baldwin et al. 2013) that consists of four elements: a definition of a referent control system, a regulatory goal of resilience management, a definition of the regulatory problem believed to threaten the resilience of the reference system, and control parameters for designing interventions which can enhance the resilience of the system. We delineate briefly below how the regulatory concept of resilience morphed within the EU’s adoptions of the term.
The first serious uptake of a resilience concept features in a 2012 Communication on food security crisis in the Sahel and the Horn of Africa (Commission of the European Communities 2012). Frustrating experiences of non-succeeding EU development policies in the region provoked what scholars came to describe as a ‘new paradigm’ or a new ‘Leitmotif’ (Joseph 2014; Juncos 2017; Wagner and Anholt 2016). In the 2012 document, the Commission defines resilience as “the ability of an individual, a household, a community, a country or a region to withstand, adapt and quickly recover from stresses and shocks” (Commission of the European Communities 2012: 5). This largely draws on the Montpellier Panel’s report (2012) on agricultural development in Africa. Both documents define as the guiding regulatory goal food security and see the chief regulatory problem in environmental shock such as droughts which cause harvest failures. A 2013 Action Plan on the matter highlights food security as

| 156
“integral part of the poverty reduction and lifesaving aims of the EU’s external assistance” (Commission of the European Communities 2013: 3). The related resilience assessment has two control dimensions: “the inherent strength of an entity – an individual, a household, a community or a larger structure – to better resist stress and shock and the capacity of this entity to bounce back rapidly from the impact.” (Commission of the European Communities 2012: 5). In terms of intervention planning, this definition leads the Commission to suggest that increased resilience can be achieved “either by enhancing the entity’s strength, or by reducing the intensity of the impact, or both” (ibid). The document cites interventions from the SHARE and AGIR pilot projects such as a focus on food diversification, insurance schemes, storage instruments for farmers or emergency stocks of food, intensified regional integration and mutual support systems, or a better coordination of donors in crises (ibid). Such understanding marks a pragmatic departure from the previous development approach in as much it accepts crises will continue occurring and focuses on reducing its detrimental effects by tailored investment in individual communities’ ability to resist and/or resurrect from shocks.
The EU’s 2016 Global Strategy for the European Union’s Foreign and Security Policy (High Representative of the Union for Foreign Affairs and Security Policy 2016) has transferred the resilience concept from the seemingly more technical food security domain into the political spheres of governing the EU’s security and external relations. The strategy’s conceptualization of resilience is closely interwoven with its pragmatic (and some argue problematic) departure from a normatively-guided vision of Europe as a “civilian power” (e.g., Mälksoo 2016; Tocci 2016; Wagner and Anholt 2016). The new focus on security – under the impression of both increasing fears of terrorist threats and increasing reluctance of allied forces, mainly the U.S., to alleviate violent conflicts in Europe’s immediate neighborhood – implies an expansion of the regulatory concept of resilience from the narrower food security perspective. The regulatory goal becomes to secure peace and stability in Europe; the major regulatory problems are seen in “governmental, economic, societal and climate/energy fragility” (High Representative of the Union for Foreign Affairs and Security Policy 2016: 9). Importantly, these definitions broaden the previous concept in as far they no longer concern environmental shocks only but the fragility of democratic and economic institutions as well. In addition, they re-focus the regulatory goal on internal security whilst treating the threats mainly as external: “fragility beyond our borders threatens all our vital interests” in Europe (ibid: 23). From such an understanding also flows an
© E
urop
ean
Unio
n/EC
HO/S
amy
Cecc
hin

157 |
expanded concept of the control parameters which EU policies have to keep in mind when trying to increase European security. According to scholarly observers (Wagner and Anholt 2016: 415) the best “working definition” of resilience within the global strategy is the following “the ability of states and societies to reform, thus withstanding and recovering from internal and external crisis” (High Representative of the Union for Foreign Affairs and Security Policy 2016: 23). This specifically includes expanding the view “to the east stretching into Central Asia, and to the south down to Central Africa” (ibid: 9). Suggestions for regulatory interventions include tailor-made partnerships with neighboring countries, enhanced opportunities for mobility, education and research exchanges, or civil society platforms (ibid: 25).
Table 1. The development of resilience as a regulatory concept in the EU
EU Development Policies EU Global StrategyReferent system Food systems in Africa EU relations with neighbourhood
Regulatory goal Food security (poverty reduction, life-saving) Security in Europe
Regulatory problem Environmental shocks (e.g., droughts) Governmental, economic, societal and climate/energy fragility in EU’s neighborhood
Control parameters for enhancing resilience
Entity’s ability to resist shocks (to be enhanced by policies)
Entity’s ability to recover from shocks (to be enhanced by policies)
States’ and societies’ ability to reform thus to withstand and recover from internal and external crisis
3. Resilience and Migration Governance in the Global Strategy
As a 2017 communication by the Commission specifies, the Global Strategy contains first ideas about “a strategic approach” to migration and what resilience might mean in this context. The strategic approach to migration is rather general emphasizing the need for knowledge of migration drivers, risk assessment, and monitoring in designing effective policy responses: “A resilience approach to migration means designing policy to reflect how migratory patterns respond to the complex interaction between demography, institutional and democratic weaknesses, economic and social imbalances, violent conflict, environmental degradation and climate change. It means continuing to invest in a sound evidence base for policy, and making timely investments in response.” (CEC 2017a: 10).
The resilience concept as it features in the Global Strategy focuses mostly on external migration governance. It identifies a “more effective migration policy” (High Representative of the Union for Foreign Affairs and Security Policy 2016: 27f) as the regulatory goal in the EU’s relationship with countries of origin and transit. By means of tailor-made EU policy instruments in the areas of development, diplomacy, border management, readmission or return the Global Strategy seeks to tackle problems such as “root causes of displacement” in countries of origin or “reception and asylum capacities” in transit countries. In addition to the external dimension of migration governance, the Global Strategy also aims to reform EU migration policies in terms of creating legal channels for immigration and the further development of the Common European Asylum System (CEAS).

| 158
Table 2. EU Migration Governance as part of Global Strategy
Referent system Regulatory Goal Regulatory Problem Control ParametersOrigin countries Effective migration
managementDisplacement
Trans-border crime (smuggling and trafficking)
Development
Preventive Diplomacy
Mediation
Readmission and return
Transit countries Effective migration management
Reception and asylum capacities
Trans-border crime
Livelihood opportunities for migrants
Diplomacy
Readmission and return
EU common asylum and migration policy
Effective migration management
Ineffective and incomplete common asylum and migration policy
Enhancement and implementation of legal and circular channels
Provision of international protection
Solidarity (global and local)
Resilience in migration governance as it is presented in the communication is rather unsystematic and focuses heavily on the EU’s neighbourhood. For migration governance it identifies problems and areas of possible EU action but does not discuss a real ‚strategy’ on how to act beyond knowledge production and the re-labelling of already applied EU policy instruments in terms of resilience. In this regard, it seems as if migration was one of the issue areas such an EU global ‚strategy’ needs to consider, however the exact way the issue should be tackled inside and outside of the EU by EU governance remains oblique.
Beyond the Global Strategy ‘resilience’ hardly provides for a reference concept in the most recent EU strategy on migration governance, the European Agenda on Migration of 2015 and its progress report from 2017 (CEC 2015; CEC 2017b). The initial 2015 document, published a"er yet another shipwreck of a vessel carrying migrants in the Mediterranean and before the major migrant inflow of the fall of 2015, did not mention ‘resilience’. However, the 2017 progress report on the Agenda’s implementation progress mentions two projects on alleviating economic root causes of migration in countries of the Middle East as well as Asia. In these projects ‘resilience’ describes the capacity of local communities to withstand emigration pressures by improving employability (Egypt) and developing sustainable livelihoods (Afghanistan, Iran, Iraq, Pakistan and Bangladesh) (CEC 2017b, 10, 13).
Our review of ‘resilience’ in EU migration governance showed little conceptual clarity. Without a coherent and operationable concept, however, it is difficult to advance a workable analytical framework with added value for EU policy design. We therefore turn to security studies and migration policy research next to identify more elaborated notions of the concept that facilitate better assessment of what ‘resilience in migration governance’ could be and, eventually, how it can be modelled and managed.
4. Working Towards Resilience Assessments in EU Migration Governance
Resilience scholars in the natural sciences highlight that “resilience thinking is systems thinking” (Walker and Salt 2006: 31). Accordingly, they assume that different social and ecological systems are intrinsically linked, that they are complex adaptive systems which self-organize and change endogenously all the time, and that they can absorb certain levels of stresses and disturbances without changing their basic functions, relationships and structures (e.g. without a threshold being crossed into an alternate “regime”). Migration

159 |
scholar Oliver Bakewell (2014: p) has equally highlighted the “self-equilibrating properties” of social systems (cf. Room 2011). When talking about complex adaptive systems, however, what scholars highlight is that stability is not to be understood as equilibrium. Rather, social-ecological systems gravitate dynamically towards – but never stably achieve – equilibria and there are always alternate stable states (or regimes) in which a system would fulfill different functions or display different relationships between its parts (e.g., as populations of bugs in an eco-system). Resilience is then not so much about avoiding system breakdown, but about preventing a system crossing thresholds to alternate regimes of functions and interactions when such alternate regimes seem (normatively) less desirable. “Managing for resilience is all about understanding a social-ecological system with particular attention to the drivers that cause it to cross thresholds between alternate regimes, knowing where the threshold may lie, and enhancing aspects of the system that enable it to maintain its resilience.” (Walker and Salt 2006: 59). Policies, in this context, are no uni-directional or straight-forward shapers of the social world. They are best understood as attempts of “tilting” the institutional landscape by interventions so that mutually beneficial interactions – from the viewpoint of stakeholders – within a migration system become possible and likely (Room 2011).
Based on these somewhat more abstract insights on resilient systems, our theorization of the relationship between migration governance and resilience starts off with a reflection of the nature of international migration itself. As the communication in 2017 on the Global Strategy rightly acknowledges, migration management needs to account for the “complex interaction between demography, institutional and democratic weaknesses, economic and social imbalances, violent conflict, environmental degradation and climate change” (p. 10). The EU does not evoke the systems term as such, we suggest that resilience thinking along the lines of such “complex interactions” requires an explicit definition of migration systems. This also makes sense from the regulatory perspective discussed above, as regulatory goals, problems and control parameters need to be defined in the context of a referent control system. In other words: without an understanding of what hangs together and how, or with isolated manipulations of parts of a system without assessment of feedback loops in other parts of that same system, interventions cannot but fail and create adverse effects.
We understand migration to take place within systems that are a “set of relatively stable exchanges of people between certain nations, complemented by parallel flows of goods, capital, ideas and information, yielding an identifiable geographic structure that persists across space and time” (Massey et al. 1998: 61). Beyond patterns of labour migration in Europe, in a globalized world, migration systems can be trans-continental. They are reinforced by trade relations, socio-economic dynamics, and migrant networks in countries of origin and destination (Castles 2004: 222). Situating migration as systems allows us to link concepts for resilient migration governance to the interlinked nature of social and ecosystems. The system functions as the sum of its parts and modifications with one element has repercussions on the dynamics within the system as well as its environment (Bakewell 2014: 310). International South-North migration towards the EU describes such a migration system that is complemented inter alia by trade relations, capital transfers (remittances), supply and demand structures in labour markets, and migrant networks (Castles 2004: 222). For example, the Mediterranean migration system between North Africa and Europe reacted to changing labour market conditions in crisis ridden European countries by diversification of flows, legal and illegal, as well as destinations (Trenz and Triandafyllidou 2017). For any migration system, permeable borders are vital. From a systems perspective, the closure of borders means the collapse for the migration system (Bakewell 2014: 313): while it will not make migration pressures disappear, restrictive border policies will create adverse feedback effects in affected parts of the migration system and lead to reinforced efforts to cross border through irregular channels. A good example is highlighted in Frontex’ 2017 risk analysis about a shi" in migration patterns from the Balkan route – a"er the migration management deal with Turkey – to an aerial route via Istanbul and South America via Spain into the EU. Therefore, it seems vital to us to integrate migration systems into a workable concept of resilient EU migration governance. The goal of effective migration management by avoiding uncontrolled movements may only be achieved if policy design acknowledges the EU’s embeddedness into the dynamics and causal mechanisms of international migration systems. This means we have to consider contexts for migration in countries of origin, transit and destination as well as the relationships that unfold between them (Bakewell 2014: 314).
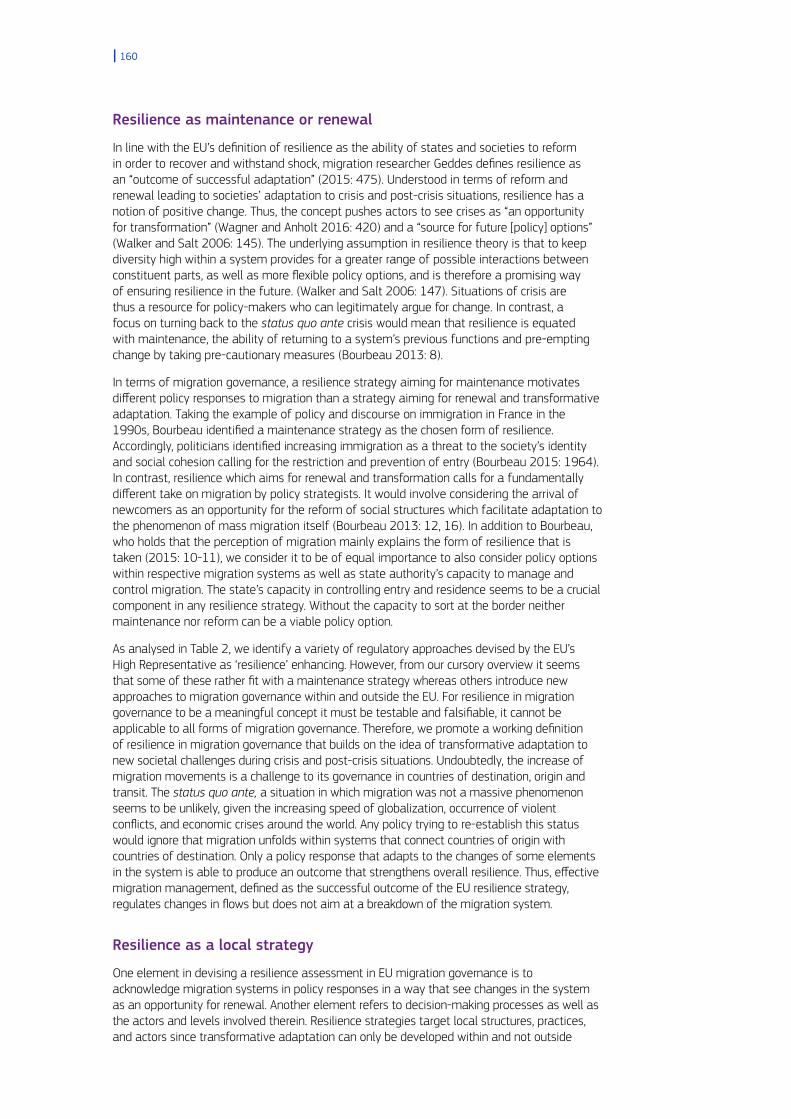
| 160
Resilience as maintenance or renewal
In line with the EU’s definition of resilience as the ability of states and societies to reform in order to recover and withstand shock, migration researcher Geddes defines resilience as an “outcome of successful adaptation” (2015: 475). Understood in terms of reform and renewal leading to societies’ adaptation to crisis and post-crisis situations, resilience has a notion of positive change. Thus, the concept pushes actors to see crises as “an opportunity for transformation” (Wagner and Anholt 2016: 420) and a “source for future [policy] options” (Walker and Salt 2006: 145). The underlying assumption in resilience theory is that to keep diversity high within a system provides for a greater range of possible interactions between constituent parts, as well as more flexible policy options, and is therefore a promising way of ensuring resilience in the future. (Walker and Salt 2006: 147). Situations of crisis are thus a resource for policy-makers who can legitimately argue for change. In contrast, a focus on turning back to the status quo ante crisis would mean that resilience is equated with maintenance, the ability of returning to a system’s previous functions and pre-empting change by taking pre-cautionary measures (Bourbeau 2013: 8).
In terms of migration governance, a resilience strategy aiming for maintenance motivates different policy responses to migration than a strategy aiming for renewal and transformative adaptation. Taking the example of policy and discourse on immigration in France in the 1990s, Bourbeau identified a maintenance strategy as the chosen form of resilience. Accordingly, politicians identified increasing immigration as a threat to the society’s identity and social cohesion calling for the restriction and prevention of entry (Bourbeau 2015: 1964). In contrast, resilience which aims for renewal and transformation calls for a fundamentally different take on migration by policy strategists. It would involve considering the arrival of newcomers as an opportunity for the reform of social structures which facilitate adaptation to the phenomenon of mass migration itself (Bourbeau 2013: 12, 16). In addition to Bourbeau, who holds that the perception of migration mainly explains the form of resilience that is taken (2015: 10-11), we consider it to be of equal importance to also consider policy options within respective migration systems as well as state authority’s capacity to manage and control migration. The state’s capacity in controlling entry and residence seems to be a crucial component in any resilience strategy. Without the capacity to sort at the border neither maintenance nor reform can be a viable policy option.
As analysed in Table 2, we identify a variety of regulatory approaches devised by the EU’s High Representative as ‘resilience’ enhancing. However, from our cursory overview it seems that some of these rather fit with a maintenance strategy whereas others introduce new approaches to migration governance within and outside the EU. For resilience in migration governance to be a meaningful concept it must be testable and falsifiable, it cannot be applicable to all forms of migration governance. Therefore, we promote a working definition of resilience in migration governance that builds on the idea of transformative adaptation to new societal challenges during crisis and post-crisis situations. Undoubtedly, the increase of migration movements is a challenge to its governance in countries of destination, origin and transit. The status quo ante, a situation in which migration was not a massive phenomenon seems to be unlikely, given the increasing speed of globalization, occurrence of violent conflicts, and economic crises around the world. Any policy trying to re-establish this status would ignore that migration unfolds within systems that connect countries of origin with countries of destination. Only a policy response that adapts to the changes of some elements in the system is able to produce an outcome that strengthens overall resilience. Thus, effective migration management, defined as the successful outcome of the EU resilience strategy, regulates changes in flows but does not aim at a breakdown of the migration system.
Resilience as a local strategy
One element in devising a resilience assessment in EU migration governance is to acknowledge migration systems in policy responses in a way that see changes in the system as an opportunity for renewal. Another element refers to decision-making processes as well as the actors and levels involved therein. Resilience strategies target local structures, practices, and actors since transformative adaptation can only be developed within and not outside
161 |
of communities (Wagner and Anholt 2016: 417). The social structures and functions of a local community are best known by the people and actors ‘owning’ them. Consequently, this means broadening the actor base in designing strategies for resilience. These include actors from various governmental levels but potentially also non-governmental actors. Critically put, going local could also mean shi"ing responsibility from the state to the community level and “responsibilizing subjects for their own vulnerabilities” (Wagner and Anholt 2016: 420).
In terms of migration governance, local actors and structures are key in the implementation of policies which target countries of origin and transit of migration. Issues such as root causes of migration or re-integration of returning migrants can hardly be tackled by policies that do not consider local contexts and actors. The EU’s Global Strategy, of course, acknowledges the importance of local governance structures already, but needs to elaborate on how to meaningfully boost local resilience strategies for the migration domain. Juncos observes that this focus on local conditions marks a departure from former foreign policy agendas that promote the export of ready-made policy solutions. A turn towards resilience constrains policy design and the classical means of implementation, coercion or conditionality (Juncos 2017: 4). The inclusiveness of resilience in EU external migration governance is put to a test in implementation and decision-making processes where conditionality o"en characterizes the relationship between EU and non-EU actors in which local actors or civil society usually do not have any position (Yildiz 2016). Migration governance that aims for resilience should re-consider these patterns and include local contexts and actors into policy design and implementation.
Transformative resilience limits policy options
Resilience in migration governance within and outside the EU precludes certain policy options. Geddes rightly points out that migration itself can be part of a resilience strategy, for example migrant remittances help sustain the livelihoods of families le" behind in the country of emigration (2015: 484). He further criticizes that migration and its facilitation means adaptation to adverse socio-economic conditions outside the EU, while from inside the EU resilience seems to be achieved if these people stay in their place (Geddes 2015: 476). Whether contradictions between EU internal and external resilience come about depends on the EU’s understanding of resilience in migration policy, aka maintenance or reform. An understanding of resilience as maintenance, labour migration may be prevented rather than encouraged. In contrast, considering resilience in terms of transformation and reform, migration may be incorporated into a strategy that considers effects of movements on countries within and outside the EU. That way, the characteristics of the respective migration system can be acknowledged and become part of the resilience strategy aiming towards effective migration management. Accordingly, if resilience is taken seriously as a concept in EU internal and external migration governance it is a concept that also precludes certain policy options.
In theory, the elements determining resilient EU migration governance might be easiest to identify regarding international labour migration. Supply and demand for migrant labour, as well as the role of migrant networks in determining migratory decisions are well known and to a certain extent already part of EU migration governance. For example, the EU directive on highly skilled migrants’ options for mobility between countries of origin and destination. Thus, the policy respects the circularity of movements and the role that these migrants have in personal and professional relations with their community of origin (Directive 2009/50/EC). A similar example for resilient migration management is the policy of mobility partnerships. Those enable cooperation between EU and non-EU countries on temporary labour migration for low and medium skilled migrants into the EU. At the same time these partnerships include capacity building with regard to migration and border control in third countries (Reslow 2015: 126). Whether capacity building in terms of mobility facilitation and its control respects migration systems between and beyond the participating countries defines a possible threshold for resilient EU migration governance.
To define resilience regarding refugee migration is much more difficult. Forced movements are a reaction to violent conflict or persecution and due to their temporary nature do not evolve within established migration systems. However, policy that responds to refugee migration
| 162
by closing borders creates fertile ground for the establishment of a new migration system, the so-called “migration industry” of people smuggling (Castles 2004: 209). This system of migrant smugglers is highly resilient towards EU attempts in breaking down such activity by engaging more people into the network and flexibly changing travel routes (Molenaar and El Kamouni-Janssen 2017). A resilient approach to refugee migration understands these contexts and tries to avoid creating feedback into the smuggling business. Measures tackling the ‘refugee crisis’ need to consider protection capacity within and outside the EU allowing the external EU border to manage parts of the flow rather than stopping it altogether. In fact, the EU-Turkey statement can be considered an element of a resilient management of refugee migration. Turkey offers protection close to the country of origin while the EU supports these efforts by financial contributions and resettlement of some refugees to the EU. Thereby, smuggling has become less of a necessity for people seeking protection. However, as the migration industry is an extremely resilient system its complete breakdown is hardly possible. As said above, Frontex sees the establishment of new routes taking detours including Latin America into people smuggling towards Europe (Frontex 2017).
We only gave a cursory overview of how EU policy meets the requirements of resilient migration governance. A comprehensive assessment of the EU policy with ‘resilience’ in mind had to consider whether and how EU policies have outcomes that are either contradictory or interfere with migration systems in a way that are normatively undesirable.
5. ConclusionThis conceptual appraisal of resilient migration management in EU policy found a rather broad concept of resilience in EU documents and tried to further define this framework in terms of its regulatory goals, problems, and respective control parameters. From our analysis of the EU’s Global Strategy we identify resilience to be the ability of states and societies to reform, thus withstanding and recovering from internal and external crisis” (High Representative of the Union for Foreign Affairs and Security Policy 2016: 23). In terms of migration management, we conclude that resilience means the ability of transformation and reform of systems rather than them bouncing back to the status quo ante crisis or stress. To put this framework into practice entails an understanding of migration in terms of systems that are self-sustaining and determined by a multitude of causal factors. In a way, the High Representative’s Global Strategy already understands resilience in terms of a sensible interaction with migration systems when it acknowledges the many factors that need to be tackled in effectively governing migration. We suggest, that such a system’s thinking should be made explicit and further qualified. Resilience prescribes a consideration of system dynamics as well as local actors participation in policy design and implementation. Ready-made concepts that apply to all migration systems the EU wants to manage had to be customized and adapted to the specificities of the respective migration pattern.
As a result, we need to learn about the various systems before we can possibly apply a respective approach towards resilient management. Then, resilience does not only mean ‘effective management’ but defines a concrete regulatory goal and problem with respect to the system at hand. For example, brain drain from third countries and the aim for increased economic competitiveness of the EU had to be mediated or the way climate change affects migration patterns and interacts with existing economic, social and political systems had to be understood and acted upon. We suggest that migration systems can be global and transcontinental in terms of the relevant interactions, but at the same time very local in their resilience implications - the relationships between origin, transit and destination countries clearly matter - as do environmental, social, economic and political factors in each of these - but how they affect resilience is also shaped in local interactions. A next step would be to identify and theorize about thresholds at which a system changes and is no longer able to produce resilient outcomes. Then, effective migration management cannot be achieved because governance is not able to renew and reform according to changing parameters.

163 |
ReferencesBaldwin, R., Cave, M. and Lodge, M. (2013) Understanding Regulation: Theory, Strategy, and Practice, Auflage: 2nd edition., New York: Oxford University Press, U.S.A.
Bakewell, O. (2014) ‘Relaunching migration systems’, Migration Studies, 2(3): 300–318.
Bourbeau, P. (2013) ‘Resiliencism: premises and promises in securitisation research’, Resilience, 1(1): 3–17.
Bourbeau, P. (2015) ‘Migration, Resilience and Security: Responses to New Inflows of Asylum Seekers and Migrants’, Journal of Ethnic and Migration Studies, 41(12): 1958–1977.
Castles, S. (2004) ‘Why migration policies fail’, Ethnic and Racial Studies, 27 (2): 2015-227
Commission of the European Communities (2012) The EU Approach to Resilience: Learning from the Food Security Crisis, Brussels, available at http://ec.europa.eu/echo/files/policies/resilience/com_2012_586_resilience_en.pdf.
Commission of the European Communities (2013) Action Plan for Resilience in Crisis Prone Countries 2013-2020, Brussels, available at http://ec.europa.eu/echo/files/policies/resilience/com_2013_227_ap_crisis_prone_countries_en.pdf.
Commission of the European Communities (2015) A European Agenda on Migration, Brussels, available at https://ec.europa.eu/home-affairs/sites/homeaffairs/files/what-we-do/policies/european-agenda-migration/background-information/docs/communication_on_the_european_agenda_on_migration_en.pdf
Commission of the European Communities (2017a) A Strategic Approach to Resilience in the EU’s External Action, Brussels, available at https://eeas.europa.eu/sites/eeas/files/join_2017_21_f1_communication_from_commission_to_inst_en_v7_p1_916039.pdf.
Commission of the European Communities (2017b) Progress report on the Euoropean Agenda on Migration, Brussels, available at https://ec.europa.eu/home-affairs/sites/homeaffairs/files/what-we-do/policies/european-agenda-migration/20171114_progress_report_on_the_european_agenda_on_migration_en.pdf.
High Representative of the Union for Foreign Affairs and Security Policy (2016) Shared Vision, Common Action: A Stronger Europe. A Global Strategy for the European Union’s Foreign and Security Policy, Brussels, available at http://eeas.europa.eu/archives/docs/top_stories/pdf/eugs_review_web.pdf.
Joseph, J. (2014) ‘The EU in the Horn of Africa: Building Resilience as a Distant Form of Governance’, JCMS: Journal of Common Market Studies 52(2): 285–301.
Juncos, A. E. (2017) ‘Resilience as the new EU foreign policy paradigm: a pragmatist turn?’, European Security 26(1): 1–18.
Mälksoo, M. (2016) ‘From the ESS to the EU Global Strategy: external policy, internal purpose’, Contemporary Security Policy 37(3): 374–388.
Massey, D.S., Arango, J., Graeme, H., Kouaouci, A., Pellegrino, A., Tayler, E.J. (1998) Worlds in Motion. Understanding International Migration at the End of the Millenium, Oxford: University Press
Molenaar, F., El Kamouni-Janssen, F. (2017) ‘Turning the tide. The politics of irregular migration in the Sahel and Libya’, CRU Report, The Hague: Clingendael Netherlands Institute for International Relations
Reslow, N. (2015) ‘EU “Mobility” Partnerships: An Initial Assessment of Implementation Dynamics’, Politics and Governance 3(2): 117-128
Room, G. (2011) Complexity, institutions and public policy : agile decision-making in a turbulent world, Cheltenham: Edward Elgar.
The Montpellier Panel (2012) Growth with Resilience: Opportunities in African Agriculture, London: Agriculture for Impact, available at https://workspace.imperial.ac.uk/africanagriculturaldevelopment/Public/Montpellier%20Panel%20Report%202012.pdf.
Tocci, N. (2016) ‘The making of the EU Global Strategy’, Contemporary Security Policy 37(3): 461–472.
Trenz, H.-J., Triandafyllidou, A. (2017) ‘Complex and dynamic integration processes in Europe: intra EU mobility and international migration in times of recession’, Journal of Ethnic and Migration Studies, 43(4): 546-559
Wagner, W. and Anholt, R. (2016) ‘Resilience as the EU Global Strategy’s new leitmotif: pragmatic, problematic or promising?’, Contemporary Security Policy 37(3): 414–430.
Walker, B. H. and Salt, D. (2006) Resilience thinking: sustaining ecosystems and people in a changing world, Washington: Island Press.
Yildiz, A. G. (2016) The European Union’s Immigration Policy. Managing Migration in Turkey and Morocco. Basingstoke: Palgrave.

| 164
Integration of detailed household characteristic data with critical infrastructure and its implementation to post-hazard resilience modelling
Nathanael Rosenheim1,3, Roberto Guidotti2,3 and Paolo Gardoni2,3
1 Department of Landscape Architecture and Urban Planning, Hazard Reduction and Recovery Center, Texas A&M University, College Station, TX, USA2 Department of Civil and Environmental Engineering, MAE Center, University of Illinois at Urbana-Champaign, Urbana, IL, USA3 NIST Center of Excellence for Risk-Based Community Resilience Planning, Colorado State University, Fort Collins, CO, USA
AbstractA critical step in reliability and resilience analysis of critical infrastructure is the assessment of functionality loss following a disrupting event. Network-specific models of the physical flow need to be considered to evaluate the impact of the hazardous event on the damaged network. Moreover, population characteristics are not uniformly or randomly distributed within communities, and spatially locating their significant variations is critical to model hazard impacts and recovery. Researchers have recognized the importance of community resilience models that capture differences in household response to natural or anthropogenic hazards. In particular, a"er a disrupting event, networks may not be able to satisfy pre-event demands, and the post-event demands are challenging to model because of the uncertainties in the human behaviour/response (e.g., evacuation or the decision to relocate.) This work presents a probabilistic procedure to integrate physical and social systems of infrastructure that incorporates the spatial heterogeneity of household characteristics (such as size, race, and tenure status) with detailed infrastructure data for residential structures and potable water supply networks. The methodology is applied to Seaside, Oregon, a coastal community with a year-round population of 6,000 persons. This paper describes how areal unit population data from the U.S. Census Bureau may be stochastically matched to an inventory of residential structures. The detailed population data includes demographic information and represents the state-of-the-art for modelling social response to disruptions in critical infrastructure. Under a given seismic scenario, the population dislocation is estimated with a logistic regression model, based on the expected residential structural damage and the corresponding value loss. This paper compares dislocation based on tenure status. Once the water flow analysis is completed, possible lack of potable water at specific nodes may result in further population dislocation leading to an iterative process that demonstrates the interdependency between physical and social systems of infrastructure. Altogether, this paper presents a general workflow for data shared between social science and engineering researchers that produce integrated models for community resilience. Such models are designed to respond to natural and anthropogenic hazards and predict both prompt effects and estimates of time for initial recovery, helping to put complex systems into motion.
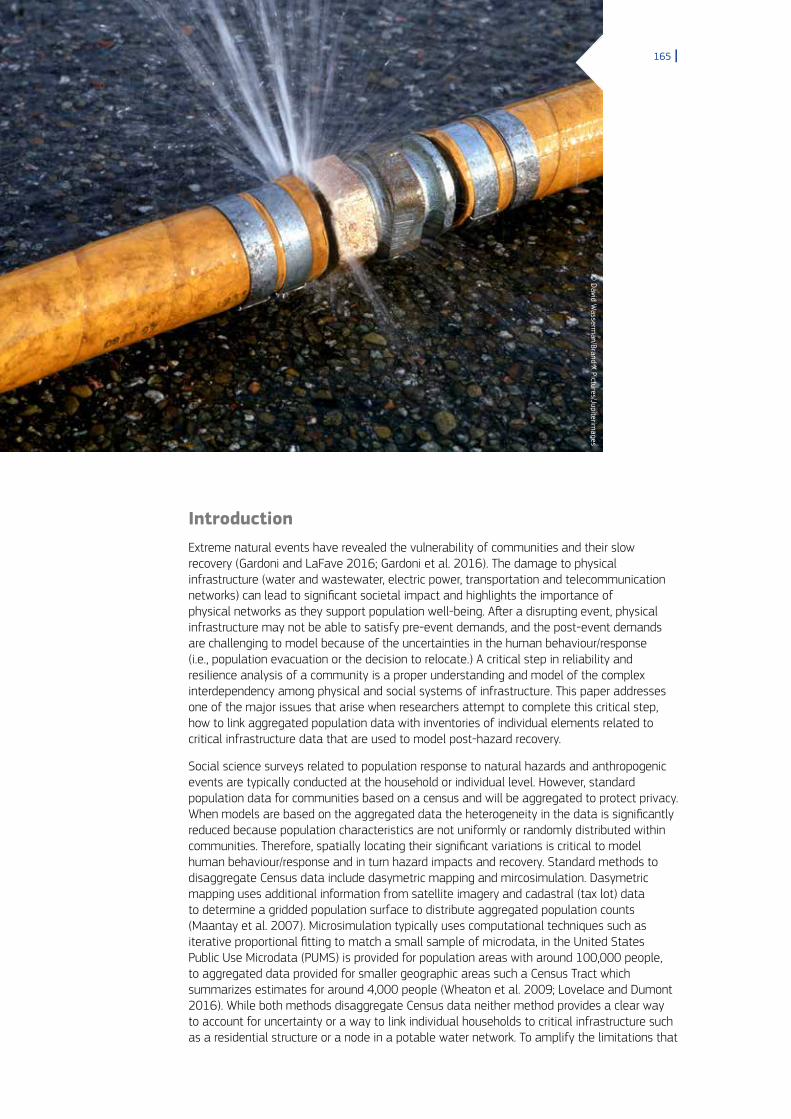
165 |
IntroductionExtreme natural events have revealed the vulnerability of communities and their slow recovery (Gardoni and LaFave 2016; Gardoni et al. 2016). The damage to physical infrastructure (water and wastewater, electric power, transportation and telecommunication networks) can lead to significant societal impact and highlights the importance of physical networks as they support population well-being. A"er a disrupting event, physical infrastructure may not be able to satisfy pre-event demands, and the post-event demands are challenging to model because of the uncertainties in the human behaviour/response (i.e., population evacuation or the decision to relocate.) A critical step in reliability and resilience analysis of a community is a proper understanding and model of the complex interdependency among physical and social systems of infrastructure. This paper addresses one of the major issues that arise when researchers attempt to complete this critical step, how to link aggregated population data with inventories of individual elements related to critical infrastructure data that are used to model post-hazard recovery.
Social science surveys related to population response to natural hazards and anthropogenic events are typically conducted at the household or individual level. However, standard population data for communities based on a census and will be aggregated to protect privacy. When models are based on the aggregated data the heterogeneity in the data is significantly reduced because population characteristics are not uniformly or randomly distributed within communities. Therefore, spatially locating their significant variations is critical to model human behaviour/response and in turn hazard impacts and recovery. Standard methods to disaggregate Census data include dasymetric mapping and mircosimulation. Dasymetric mapping uses additional information from satellite imagery and cadastral (tax lot) data to determine a gridded population surface to distribute aggregated population counts (Maantay et al. 2007). Microsimulation typically uses computational techniques such as iterative proportional fitting to match a small sample of microdata, in the United States Public Use Microdata (PUMS) is provided for population areas with around 100,000 people, to aggregated data provided for smaller geographic areas such a Census Tract which summarizes estimates for around 4,000 people (Wheaton et al. 2009; Lovelace and Dumont 2016). While both methods disaggregate Census data neither method provides a clear way to account for uncertainty or a way to link individual households to critical infrastructure such as a residential structure or a node in a potable water network. To amplify the limitations that
© David W
asserman/Brand X Pictures/Jupiterim
ages

| 166
exist in methods to disaggregate Census data, researchers have recognized the importance of data integration for community resilience models that capture differences in household response to natural or anthropogenic hazards. Detailed household characteristics such as tenure status and ability to understand risk related warnings have been correlated with reduced likelihood to take protective action (Van Zandt et al 2012). Additionally, gender, ethnicity, and socio-economic status have been found to influence response to natural hazards (Peacock et al., 1997; Mileti and Peek, 2000; Mileti and Sorensen, 1990).
A"er a damaging event, physical infrastructure experience a change in its capacity due to the direct damage to their components (e.g., Kang et al., 2008; Guikema and Gardoni, 2009; Lee et al., 2011; Guidotti et al., 2017a.) Infrastructure are interconnected and their response to damaging events should also include the cascading effects (indirect damage) resulting from the interdependencies among them (e.g., Guidotti et al., 2017b.) The interest in the understanding of the community recovery a"er a damaging event led to several studies on the resilience of critical infrastructure (e.g., Bruneau et al., 2003; Chang and Shinozuka, 2004; Gardoni et al., 2007; Bocchini et al., 2012; González et al., 2016; Guidotti et al., 2016; Sharma et al., 2017.) The reliability and resilience of infrastructure is typically addressed at the connectivity level. Connectivity-based studies capture the impact of damaging events assessing the variation of a set of connectivity-based metrics in the immediate a"ermath and during the recovery process. However, network reliability and resilience studies limited to the connectivity of infrastructure may provide only a partial and possibly misleading response. Being connected is a necessary condition toward a fully recovered network. However, the recovery of critical infrastructure has to be measured in terms of their ability to provide essential goods and services to the community they serve.
This paper presents a probabilistic procedure to integrate physical and social systems of infrastructure that incorporates the spatial heterogeneity of household characteristics (such as size, race, and tenure status) with detailed infrastructure data for residential structures and potable water supply networks.
Probabilistic Procedure to Integrate Physical and Social Systems of InfrastructureGuidotti et al. (2017c) proposed a general procedure for network reliability and resilience analysis. The procedure can be summarized in the following four steps:
Step 1: Definition of the network and of the state variables of its components. In the first step, topology models are used to define the spatial extension (footprint) and the level of granularity of the analysis. In this step, the inventory of the physical infrastructure is defined. Information on the population living in the community is also included as a state variable for the distribution nodes of the infrastructure to obtain the initial amount of goods and services (nodal demands) requested by the infrastructure. In this step, the procedure assign the number of people to a specific tributary area (Rosenheim et al., 2017).
Step 2: Definition of the initial damage state for the considered infrastructure. Models of capacity and demand at single component level are used to determine the damage to the physical components of the network. Hazard-specific models are used to generate maps of the intensity measures of interest. In this step, fragility functions (Gardoni et al. 2002, 2003) and repair rate curves (e.g., ALA, 2001; O’Rourke & Ayala, 1993) may be used to assess the physical damage to nodal and linear network components, respectively.
Step 3: Assessment of cascading effects due to physical interdependencies and definition of the human response. The population served by each demand node may change according to the human response model. In this step, the probability of household dislocation due to structural damage to buildings is calculated based on a logistic regression model that represents the state-of-the art for modeling social response to disruption in critical infrastructure (Lin 2009, Rosenheim et al., 2017). In this step, the proposed procedure might differentiate internal and external population dislocation models to determine the change

167 |
in population size and distribution. In the first case, dislocation results in a reduction of the population size. Internal dislocation results in an increase of the population size at the assembly points, as for example shelters, local schools or gyms and large open areas.
Step 4: Functionality loss assessment over time for each damaged physical infrastructure. Network specific models of the physical flow are considered in this step. They allow assessing the ability of the damaged network to provide essential goods and services (i.e., water at a given pressure at demand nodes for potable water network.) At each considered time step and at each different level of granularity, the procedure captures the functionality loss. The recovery of physical components can be estimated with recovery functions (e.g., FEMA, 2003) or based on a sequence of recovery activities that take into account the amount of resources and rate and prioritization of their mobilization. The lack of essential goods and services for an extended period may induce further people dislocation. Also, external or internal people dislocation might result in significantly different scenarios in the a"ermath of a disrupting event and lead to different recovery processes.
Overview of Study Area, Datasets and Data Integration MethodsIn this paper, the probabilistic procedure described in the previous section is applied to the city of Seaside, Oregon subject to seismic hazard, to model the interdependency between physical and social infrastructure, namely its potable water network and the human response.
Study Area
The State of Oregon is located in the northwest United States and Seaside, Oregon is located in Clatsop County in the on the northern Pacific coast of Oregon. Seaside, Oregon is a small low-lying coastal community with a year-round population of 6,000 persons and a seasonal population that adds an additional 7,000 persons over the summer months. Seaside, Oregon has high hazard exposure as it is located near the Cascadia Subduction Zone (CSZ), which creates significant earthquake and tsunami risk (Park and Cox, 2016). Researchers have estimated that up to 88% of the city's buildings could be damaged by a major earthquake and that the economic losses could exceed $1 billion (Wiebe and Cox, 2014).
Input Data
Detailed Household Characteristic Data
The detailed household characteristics data was based on data files from the April 1, 2010 Decennial Census. The April population is during the off-season and therefore is more representative of the year-round permanent population. The data includes housing subjects summarized to the block level. These data formed the basis for a population inventory. The steps for data processing included expanding the Census Block level housing unit data into a file where the unit of analysis was a household or group quarters (Rosenheim et al., 2017). Together housing units and group quarters define the two potential living quarters types. The census data provided detailed counts of households, group quarters, and vacant housing units. For the household data, counts were broken down by tenure status (see Table 1), household size, race and ethnicity. Counts of population within group quarters were broken down by group quarters type – such as dorms, prisons, or nursing homes. Counts of vacant housing were provided by reason for vacancy – which include for sale, for rent or seasonal rental. Based on the census data the final population inventory provided a detailed description of the state of the community in terms of social characteristics. The analysis for this paper compares owners versus renters.

| 168
Table 1. Number of Persons by Tenure Status for Seaside, Oregon.
CountTotal Population 6,440
Owner Population 2,871
Renter Population 3,569
Critical Infrastructure Data - Building Inventory
The parcel data from Clatsop County was obtained through communication with the county. The parcel data included information about the land use code of the structure based on Oregon Administrative Rules (OAR 150-308-215(8)). A subset of the County Parcel Data containing 5,784 parcels was generated for the community of Seaside, Oregon. The parcel data was merged with the 2010 Census Block data, which included the expected number of housing units within each block. The housing unit data was used to estimate the number of housing units per parcel. Commercial properties and parcels without a structure were not assigned housing units.
Critical Infrastructure Data - Potable Water Network
The model of the potable water network (WN) of Seaside has been based on the available data, secured from the city engineers. The data include information on the piping system (length, diameter, material, year of installation), on the main reservoir, located in the south fork of the Necanicum River, few km southeast of Seaside, and on the main pumping stations and tanks of the WN. In the proposed model, we added a portion from new development areas for which no data were available. The WN in those areas has been modelled following current practice and design criteria (Ysusi, 2000). The resulting piping system consists of about 100 km of pipes of various material (mainly cast iron) with diameter varying from 2” to 24”, one main reservoir, two tanks and nine pumping stations. To assess the nodal demands, we used the following set of information: i) the water average daily use, of about 1.8 MGD (http://www.cityofseaside.us); ii) the population inventory, consisting of 6,440 inhabitants, obtained from the 2010 Decennial Census data (Rosenheim et al., 2017); iii) the available zoning of Seaside, distinguishing the areas of the city based on the land use, i.e. residential, commercial and industrial zone (http://maps.co.clatsop.or.us); and iv) tables of estimated daily use of water per capita and per acre, based on land use (Ysusi, 2000).
Data Integration Methods
Hazard Modeling - Seismic Scenario
In this example, the city of Seaside is subject to a seismic event. We considered an earthquake of magnitude 7.0 located approximately 25 km southwest of Seaside, offshore the Oregon coast, on the Cascadia subduction zone. Ground motion attenuation equations (Boore and Atkinson, 2008) have been used to describe the seismic intensity in terms of peak ground acceleration (PGA). In the interested area, values of PGA range from 0.7 to 0.84 g. A building damage analysis with the corresponding value loss estimation has been performed relying on the considered seismic scenario and on available fragility curves from HAZUS-MH (FEMA 2003). As for the WN, fragility curves are used to assess the damage state of the nodal components (i.e., pumping stations and tanks) and repair rate curves are used for linear elements (i.e., pipeline).
Population Dislocation with Stochastic Inventory Matching
Under a given seismic scenario, the population dislocation is estimated with a logistic regression model, based on the expected residential structural damage and the corresponding value loss (Lin 2009). To account for the uncertainty associated with the model of dislocation Monte Carlo (MC) methods were used. Uncertainty was associated with the stochastic

169 |
matching between the population inventory and the building inventory, the percentage of property value loss due to the hazard scenario, and the probability of dislocation due to the value loss. For each iteration of the MC process the building inventory and population inventory were merged based on a merge order determined by a random number assigned to each household and each dwelling unit within each Census Block. To account for the uncertainty associated with the damage states a value loss for each potential damage state was assigned based on the mean and standard deviation (Bai et al. 2009). The probability of each damage state and the sampled value loss were used as inputs into the model for the probability of dislocation (Rosenheim et al., 2017). With a predicted probability of dislocation assigned to each household, a random number between 0 and 1 was assigned to each household, when this number was less than the predicted probability of dislocation the household was assigned a value of 1 and determined to have dislocated. Within each MC iteration, households with higher probabilities of dislocation were more likely to be assigned to dislocate from the community. With each iteration, the total number of persons dislocated was summed for the total population and based on tenure.
Water Flow Analysis
A pressure-driven flow-based network analysis is conducted with the so"ware IN-CORE, developed within the Center for Risk-Based Community Resilience Planning to assess the loss of functionality of the WN. For the flow-analysis, the so"ware includes the EPANET (Rossman, 2000) and EPANET-Emitter (Pathirana, 2010) engines adopting a pressure-driven approach when the WN is damaged. The analysis links the loss of functionality with the impossibility of the network to provide to the distribution nodes the requested flow of goods and services. In this case, damage to the components of the WN may affects the network functionality. The WN may not be able to satisfy a given demand and a minimum pressure at the distribution nodes. In particular, if the pressure at a distribution node is below a certain threshold cross-contamination phenomena may occur. In the example of the WN of Seaside, we consider the operating pressure at the nodes, function of the water flow in the network, as the quantity of interest to monitor to assess the loss of functionality of the network in the a"ermath of a damaging event and during the recovery process.
Results
People Dislocation
Table 2 summarizes the result of the dislocation models and compares dislocation for owners and renters. The model for population dislocation predicts dislocation for households even if the structure they live in does not have estimated damage. This is based on research from Hurricane Andrew (Peacock et al. 1997) that found that households o"en dislocate a"er a disaster due to reasons other than property damage. In the model used for population dislocation, a household living in a single-family structure with zero property value loss had however a 23-28% probability of dislocation, depending on the demographics of their neighbourhood. Similarly, a household living in a multifamily structure with no damage had a 33-40% probability of dislocation. Households in structures with estimated damage had a 24-89% probability of dislocation depending on the severity of the damage, structure type and neighbourhood characteristics. Based on the stochastic matching process of the population inventory and the building inventory the probability of dislocation between owners and renters can be compared. As shown in Table 2 renters are statistically more likely to dislocate than owners. With 57% of the renter population dislocating and 50% of the owner population dislocating. This difference is due in part to the model which is based on empirical evidence that people in multifamily structures are more likely to be dislocated, however the results also suggest that people who are renters are living in structures that are more likely to be damaged.

| 170
Table 2. Range and Distribution of Dislocated Persons by Tenure.
Population Dislocation by Count Dislocation by Percentage
min max mean st. dev. min max mean st. dev.
Owner 1,293 1,574 1,422 44 0.45 0.55 0.50 0.02
Renter 1,897 2,195 2,041 50 0.53 0.62 0.57 0.01
Total 3,231 3,658 3,463 66 0.50 0.57 0.54 0.01
Table 2 shows the range and distribution of population dislocation based on Monte Carlo Simulation. This distribution captures the uncertainty associated in the model of dislocation, the damage states of individual structures, and the number of persons living in individual structures. The 95% confidence interval for dislocation in Seaside for the given seismic event is between 3,333 person and 3,593 persons or between 52% and 55% of the total population. The upper bound of the confidence interval, 3,593 persons, was used to determine the reduction in demand on the water network.
3.2 Functionality of the Water Network
Figure 1 shows the loss of functionality for the skeletonized WN of Seaside in the immediate a"ermath of the damaging event. The presented results refer to a Monte Carlo Simulation (MCS) in which at each run the damage state of the network components is determined. The flow analysis in the damaged network allows to determine the value of the operating pressure q at each distribution node and at each run of the MCS. A termination criterion based on the coefficient of variation (C.O.V=0.1) of the percentage of nodes meeting a minimum operating pressure has been adopted in the analysis. The colour of the nodes indicates the most likely among three states, representative of the functionality of the node: i) red represents an operating pressure q equal or below 0; ii) yellow represents a q between 0 and 15 psi; iii) green represents a q greater than 15 psi (acceptable condition). The WN experiences a large disruption, with more than 90% of the nodes with not acceptable (red or yellow) operating pressure.
Figure 1. Map of the loss of functionality for the WN of Seaside.
Immediate a"ermath (to+) t = 72 h, without population dislocation
t = 72 h, with population dislocation
45°5
7’0
N46
°01’
2 N
123°57’2 W 123°53’2 W 123°57’2 W 123°53’2 W 123°57’2 W 123°53’2 W
45°5
7’0
N46
°01’
2 N 46°01’2 N
45°57’0 N
Nodes able to maintain an operating pressure above 15 psi are concentrated in the new development areas, on the hills in the eastern side of the city. Identifying the areas of the city with a larger impact, the skeletonized model is able to capture the spatial variability of the functionality loss of the WN. However, the skeletonized model provides an average response at the equivalent node; to capture the variability of the response at a finer granularity a
3,333 3,463 3,593
171 |
pressure-driven flow-based analysis should be performed on a detailed WN model. In the a"ermath of the damaging event, the population served by each demand node may change according to the human response model. Figure 1 Center and Right shows the loss of functionality at the equivalent repair time of 72 hours. Figure 1 Right shows that to consider the people dislocation in the recovery process results in a larger number of nodes attaining or exceeding the acceptable condition for q. To consider population dislocation the demand on the WN is reduced by more than 55% percent of the population with 3,593 dislocated people leaving the city (see Table 2). Factoring in the reduced demand results in a larger number of nodes attaining or exceeding the acceptable condition for q with respect to the scenario that disregards the population dislocation. In addition, the lack of essential goods and services (i.e. not acceptable value of q) for an extended time may induce further dislocation, showing the interdependency between physical and social infrastructure.
ConclusionsThe procedure presented in the paper can be adopted to update the initial demand for critical infrastructure, such as water distribution, electric power and transportation network. In the example of a water network, possible lack of potable water at specific nodes may result in further population dislocation leading to an iterative process that demonstrates the interdependency between physical and social systems of infrastructure. Overall, this paper presents a potential workflow for data shared between social science and engineering researchers that produce integrated models for communityresilience. Such models are designed to respond to natural and anthropogenic hazards and predict both prompt effects and estimates of time for initial recovery, helping put complex systems into motion.
AcknowledgementsThe research presented in this paper was supported by the Center for Risk-Based Community Resilience Planning funded by the U.S. National Institute of Standards and Technology (NIST Financial Assistance Award Number: 70NANB15H044). We thank our colleagues from The Center for Risk-Based Community Resilience Planning, in particular W. G. Peacock, O. M. Elabd, D. Cox and A. Barbosa, who provided insight and valuable expertise that greatly assisted the research. The authors gratefully acknowledge the help of the City Engineer of Seaside, Oregon, Mr. Liljenwall in the data acquisition process. References to any specific commercial products do not imply authors’ endorsement.
ReferencesALA. (2001). Seismic fragility formulations for water Systems:Part 1 – guideline, American lifelines alliance, April, ASCE. Retrieved from http://www.americanlifelinesalliance.org/
Bai, Jong-Wha, Mary Beth D. Hueste, and Paolo Gardoni. "Probabilistic assessment of structural damage due to earthquakes for buildings in Mid-America." Journal of Structural Engineering 135.10 (2009): 1155-1163.
Bocchini, P., Deco, A., & Frangopol, D. M. (2012). Probabilistic functionality recovery model for resilience analysis. In F. Biondini & D. M. Frangopol (Eds.), Bridge Maintenance, Safety, Management, Resilience and Sustainability (pp. 1920–1927). UK: CRC Press, Taylor and Francis.
Boore, D. M., & Atkinson, G. M. (2008). Ground-motion prediction equations for the average horizontal component of PGA, PGV, and 5%-damped PSA at spectral periods between 0.01 s and 10.0 s. Earthquake Spectra, 24(1), 99-138.
Bruneau, M., Chang, S. E., Eguchi, R. T., Lee, G. C., O’Rourke, T. D., Reinhorn, A. M., von Winterfeldt, D. (2003). A framework to quantitatively assess and enhance the seismic resilience of communities. Earthquake Spectra, 19, 733–752.
Chang, S. E., & Shinozuka, M. (2004). Measuring improvements in the disaster resilience of communities. Earthquake Spectra, 20(3), 739-755.
Federal Emergency Management Agency (FEMA) (2003), HAZUS-MH. Technical Manual, Washington DC.

| 172
Gardoni, P., Der Kiureghian A., Mosalam K.M., (2002). “Probabilistic capacity models and fragility estimates for RC columns based on experimental observations,” ASCE Journal of Engineering Mechanics, 128 (10), 1024-1038.
Gardoni, P., Mosalam K.M., Der Kiureghian A., (2003). “Probabilistic seismic demand models and fragility estimates for RC bridges,” Journal of Earthquake Engineering, 7 (Special Issue 1), 79-106.
Gardoni, P., Reinschmidt, K.F., and Kumar, R., (2007). “A probabilistic framework for Bayesian adaptive forecasting of project progress,” Computer-Aided Civil and Infrastructure Engineering, 22 (3), 182-196.
Gardoni, P., and LaFave, J., (Eds.) (2016). Multi-hazard Approaches to Civil Infrastructure Engineering, Springer.
Gardoni, P., Murphy, C., Rowell, A., (Eds.) (2016). Societal Risk Management of Natural Hazards, Springer.
González, A. D., Dueñas-Osorio, L., Sánchez-Silva, M., & Medaglia, A. L. (2016). The interdependent network design problem for optimal infrastructure system restoration. Computer-Aided Civil and Infrastructure Engineering, 31(5), 334-350.
Guidotti, R., Chmielewski, H., Unnikrishnan, V., Gardoni, P., McAllister, T., and van de Lindt, J. (2016). "Modeling the resilience of critical infrastructure: the role of network dependencies," Sustainable and Resilient Infrastructure, 1(3-4), 153-168.
Guidotti, R., Gardoni, P., and Chen, Y. (2017a). "Network reliability analysis with link and nodal weights and auxiliary nodes," Structural Safety, 65, 12-26
Guidotti, R., Gardoni, P., and Chen, Y. (2017b). “Multi-layer heterogeneous network model for interdependent infrastructure systems”. 12th International Conference on Structural Safety & Reliability (ICOSSAR 2017), TU Wien, Vienna (Austria).
Guidotti, R., Gardoni, P., and Rosenheim, N. (2017c) “Integration of Physical and Social Systems of Infrastructure in Communities Reliability and Resilience Analysis”, Reliability Engineering & System Safety (in preparation).
Guikema, S., and Gardoni, P., (2009). “Reliability estimation for networks of reinforced concrete bridges,” ASCE Journal of Infrastructure Systems, 15 (2), 61-69.
Kang, W.-H., Song, J., and Gardoni, P., (2008). “Matrix-based system reliability method and applications to bridge networks,” Reliability Engineering and System Safety, 93, 1584-1593.
Lee, Y.-J., Song, J., and Gardoni, P., Lim, H.-W., (2011). “Post-hazard flow capacity of bridge transportation networks considering structural deterioration of bridges,” Structure and Infrastructure Engineering, 7 (7), 509-521.
Lin, Y. S. (2009). Development of algorithms to estimate post-disaster population dislocation - a research-based approach. Ph.D. Thesis, Texas A&M University.
Lovelace, R. and Dumont, M., 2016. Spatial microsimulation with R. CRC Press.
Maantay, J.A., Maroko, A.R. and Herrmann, C. Mapping population distribution in the urban environment: The cadastral-based expert dasymetric system (CEDS). Cartography and Geographic Information Science, 34(2), 2007, pp.77-102.
Mileti, D.S. and Sorensen, J.H., 1990. Communication of emergency public warnings: A social science perspective and state-of-the-art assessment (No. ORNL-6609). Oak Ridge National Lab., TN (USA).
Mileti, D.S. and Peek, L.. The social psychology of public response to warnings of a nuclear power plant accident. Journal of hazardous materials, 75(2), 2000, pp.181-194.
O’Rourke, M. J., & Ayala, G. (1993). Pipeline damage due to wave propagation. Journal of Geotechnical Engineering, 119, 1490–1498.
Park, H. and Cox, D.T. Probabilistic assessment of near-field tsunami hazards: Inundation depth, velocity, momentum flux, arrival time, and duration applied to Seaside, Oregon. Coastal Engineering, 117, 2016, pp.79-96.
Pathirana, A. (2010). EPANET2 desktop application for pressure driven demand modeling. In Water Distribution Systems Analysis 2010 (pp. 65-74).
Peacock, W.G., Morrow, B.H. and Gladwin, H. eds., 1997. Hurricane Andrew: Ethnicity, gender, and the sociology of disasters. Psychology Press.
Rossman L.A. (2000). EPANET 2 users manual. Cincinnati, OH: National Risk Management Research Laboratory, Office of Research and Development, US Environmental Protection Agency.
Rosenheim, N, Guidotti, R., and Gardoni, P. (2017) “Integration of Detailed Household Characteristic Data with Critical Infrastructure and Its Implementation to Post-Hazard Resilience Modeling”, Sustainable and Resilient Infrastructure (in preparation).
Sharma, N., Tabandeh, A., and Gardoni, P., (2017). “Resilience analysis: A mathematical formulation to model resilience of engineering systems,” Sustainable and Resilient Infrastructure (Accepted)
Van Zandt, S., Peacock, W.G., Henry, D.W., Grover, H., Highfield, W.E. and Brody, S.D. Mapping social vulnerability to enhance housing and neighborhood resilience. Housing Policy Debate, 22(1), 2012, pp.29-55.
Wheaton, W.D., Cajka, J.C., Chasteen, B.M., Wagener, D.K., Cooley, P.C., Ganapathi, L., Roberts, D.J. and Allpress, J.L., 2009. Synthesized population databases: A US geospatial database for agent-based models. Methods report (RTI Press), 2009(10), p.905.
Wiebe, D.M. and Cox, D.T. Application of fragility curves to estimate building damage and economic loss at a community scale: a case study of Seaside, Oregon. Natural hazards, 71(3), 2014, pp.2043-2061.
Ysusi, M. A. (2000). System design: An overview. Water distribution systems handbook, 3-1.


GETTING IN TOUCH WITH THE EU
In person
All over the European Union there are hundreds of Europe Direct information centres. You can find the address of the centre nearest you at: https://europa.eu/european-union/contact_en
On the phone or by email
Europe Direct is a service that answers your questions about the European Union. You can contact this service:
- by freephone: 00 800 6 7 8 9 10 11 (certain operators may charge for these calls),
- at the following standard number: +32 22999696, or
- by electronic mail via: https://europa.eu/european-union/contact_en
FINDING INFORMATION ABOUT THE EU
Online
Information about the European Union in all the official languages of the EU is available on the Europa website at: https://europa.eu/european-union/index_en
EU publications You can download or order free and priced EU publications from EU Bookshop at: https://publications.europa.eu/en/publications. Multiple copies of free publications may be obtained by contacting Europe Direct or your local information centre (see https://europa.eu/european-union/contact_en).

KJ-04-18-134-EN-N
doi:10.2760/727592
ISBN 978-92-79-79923-5