Supporting employee resilience: theoretical and ... - TNO Publications
59
Earth, Life & Social Sciences Kampweg 5 3769 DE Soesterberg P.O. Box 23 3769 ZG Soesterberg The Netherlands www.tno.nl T +31 88 866 15 00 F +31 34 635 39 77 TNO report TNO 2015 R11465 Supporting employee resilience: theoretical and technological developments Date December 2015 Author(s) G. Paradies MSc I.M. de Hoogh MSc Dr. T.Y.P. Preenen T.R. Wabeke MSc Drs. M.H.J. van Zwieten Dr. W. Kamphuis Dr. R. Delahaij Number of pages 59 (incl. appendices) Number of appendices 5 Sponsor Michael Holewijn Project name ERP Human Enhancement Project number 060 14391/0.01 All rights reserved. No part of this publication may be reproduced and/or published by print, photoprint, microfilm or any other means without the previous written consent of TNO. In case this report was drafted on instructions, the rights and obligations of contracting parties are subject to either the General Terms and Conditions for commissions to TNO, or the relevant agreement concluded between the contracting parties. Submitting the report for inspection to parties who have a direct interest is permitted. © 2016 TNO
-
Upload
khangminh22 -
Category
Documents
-
view
3 -
download
0
Transcript of Supporting employee resilience: theoretical and ... - TNO Publications

Earth, Life & Social Sciences Kampweg 5 3769 DE Soesterberg P.O. Box 23 3769 ZG Soesterberg The Netherlands www.tno.nl T +31 88 866 15 00 F +31 34 635 39 77
TNO report TNO 2015 R11465
Supporting employee resilience: theoretical and technological developments
Date December 2015 Author(s) G. Paradies MSc
I.M. de Hoogh MSc Dr. T.Y.P. Preenen T.R. Wabeke MSc Drs. M.H.J. van Zwieten Dr. W. Kamphuis Dr. R. Delahaij
Number of pages 59 (incl. appendices) Number of appendices 5 Sponsor Michael Holewijn Project name ERP Human Enhancement Project number 060 14391/0.01 All rights reserved. No part of this publication may be reproduced and/or published by print, photoprint, microfilm or any other means without the previous written consent of TNO. In case this report was drafted on instructions, the rights and obligations of contracting parties are subject to either the General Terms and Conditions for commissions to TNO, or the relevant agreement concluded between the contracting parties. Submitting the report for inspection to parties who have a direct interest is permitted. © 2016 TNO
2 / 45 TNO report | TNO 2015 R11465
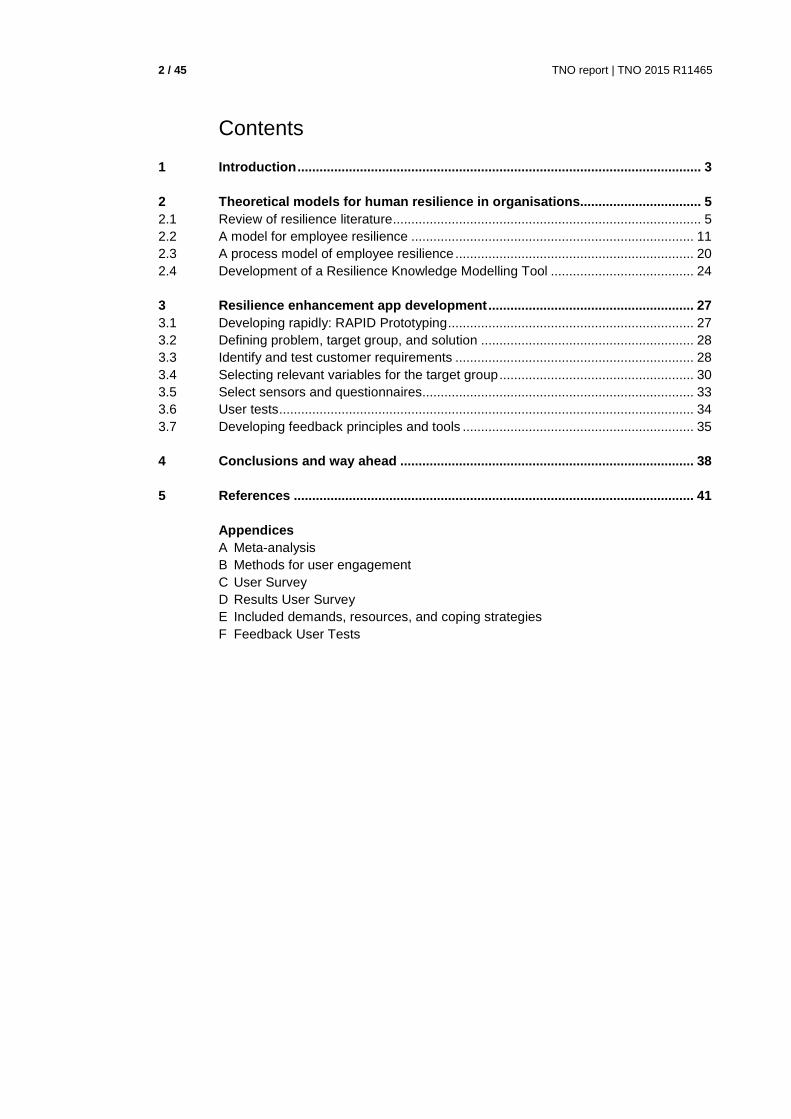
Contents
1 Introduction ...................................... ........................................................................ 3
2 Theoretical models for human resilience in organisa tions................................. 5
2.1 Review of resilience literature .................................................................................... 5
2.2 A model for employee resilience ............................................................................. 11
2.3 A process model of employee resilience ................................................................. 20
2.4 Development of a Resilience Knowledge Modelling Tool ....................................... 24
3 Resilience enhancement app development ............ ............................................ 27
3.1 Developing rapidly: RAPID Prototyping ................................................................... 27
3.2 Defining problem, target group, and solution .......................................................... 28
3.3 Identify and test customer requirements ................................................................. 28
3.4 Selecting relevant variables for the target group ..................................................... 30
3.5 Select sensors and questionnaires .......................................................................... 33
3.6 User tests ................................................................................................................. 34
3.7 Developing feedback principles and tools ............................................................... 35
4 Conclusions and way ahead ......................... ....................................................... 38
5 References ........................................ ..................................................................... 41
Appendices A Meta-analysis
B Methods for user engagement C User Survey
D Results User Survey
E Included demands, resources, and coping strategies
F Feedback User Tests
TNO report | TNO 2015 R11465 3 / 45
1 Introduction
At present, almost half of all work disability is related to psychosocial factors, which is a rise from 30% since 1998. Due to physical and psychosocial work demands, employees may become less motivated, less productive, and run the risk of developing health problems (Eurofound & EU-OSHA, 2014; Boermans et al, 2013). Resilient employees and teams are better able to cope with, and overcome exposure to these conditions, both in the short term and in the longer term. Resilience can be broadly defined as the ability to maintain performance, motivation and well-being despite exposure to demands. Therefore, supporting individuals to become more resilient so they bounce-back from set-backs, maintain high performance and mental and physical fitness, and even thrive in tough times, is a much needed development (Kamphuis & Delahaij, 2014). Front runner companies realise that resilient workers perform better (e.g. Van den Heuvel et al., 2010) and that insight in and development of human resilience is a prerequisite for improving employee performance, health, and employability, and eventually for organisational effectiveness and efficiency. The ‘quantified self’ developments in (mobile) technology offer opportunities to strengthen the resilience of employees and organizations. For individuals, mobile and wireless technology are a growing area in supporting health and wellbeing (Free et al, 2013; Direito et al., 2014; European Commission, 2014; Swan 2012). One of the advantages of mobile technology is the ability to continuously and unobtrusively self-track user’s behaviour, physiological data, and feelings using, for example, smartphone and wearable sensors (Swan, 2012).These technologies have the possibility to better asses the user’s needs and preference, and to deliver context aware, personalized, adaptive and anticipatory interventions that increase performance, motivation, and wellbeing (Aarts & De Ruyter, 2009). Although the importance of employee’s resilience is widely accepted, and the use of personal wearable technology is seen as an important opportunity to strengthen this resilience, adequate mobile resilience tools and interventions are lacking at this moment. Many applications on the market claim to be able to improve resilience, or resilience related factors, but an integrated theory and predictive model is still missing, as a result of which existing applications are not able to adequately provide users with personal, predictive, and preventive information about their resilience (e.g., Aarts & de Ruyter, 2009; Free et al., 2013; Snyderman & Yoediono, 2008; Vullers et al., 2013). This means that organizations are not able to benefit from the full potential of their employees with regard to performance, employability, and health. Being able to fully exploit this potential would result in better operational performance and large financial savings through improved employee wellbeing, motivation and performance. Resilience data from employees may not only help employees themselves, but can also help organizations in improving the performance, engagement and wellbeing of their employees, and eventually the performance of teams and the organization as a whole. HR analytics focus on predicting future developments, for instance to identify future talent shortages, diversity problems or retention.
4 / 45 TNO report | TNO 2015 R11465
Although psychosocial and physiological data gathered directly from individual employees are seen as a valuable source for HR analytics, most applications in this domain do not use this kind of data (Paradies et al., 2015), and scientific literature on HR analytics is scarce (Johannink, 2015). In order to be able to develop better applications for improving human resilience, knowledge development on a number of issues is necessary. First and foremost, a predictive model integrating psychological, physiological, and social factors is necessary to provide users with relevant feedback to improve well-being, performance, and motivation. Furthermore, knowledge development is needed with respect to aggregating and reporting data gathered with wearable technology to different organisational systems (line management, Human Resource management, Health and Safety management). In addition, knowledge is needed about how to measure relevant resilience factors with wearable technology in a valid manner, how to personalize resilience feedback, and how to keep users of such an application engaged. The research line Human Resilience in the ERP Human Enhancement develops knowledge on integrative and predictive modelling of employee resilience, measurement of psychosocial and physiological resilience factors using wearable technology, user engagement, and using individual resilience data for personalized feedback and aggregated resilience data for feedback at organizational levels. This knowledge development will be applied to the domain of wearable technology for employee well-being and performance and can eventually be integrated into product offerings, taking into account the fast development of personal health registration systems (e.g., Microsoft Band, Fit Bit, Apple Watch). This report focusses on the one hand on the integration of state of the art knowledge in psychosocial and physiological scientific disciplines on resilience in a generic resilience model for employees and a process model of resilience, which, together, enable the development of a multidimensional prospective model. These models provide insight in the complex interaction between factors in the different domains and will be the core of new individual monitoring and organisational intervention applications. This knowledge was developed in the first work package of the product line. On the other hand, this report describes the process of the development of a first prototype of an application that uses this knowledge to better support resilience of employees. This prototype development takes place to test assumptions stemming from the knowledge development on the different aspects covered in this research line, and to gather data that can be used for further development of this knowledge. This combination of knowledge push and technology pull is central to the ERP Human Resilience. Lessons learned about the integration of these two will also be discussed in the report. In the second chapter, the theoretical models developed for employee resilience will be discussed. In the third chapter, the prototype development process, the first experiences with the development of the prototype, and the way theoretical models and assumptions are integrated will be discussed. In the final chapter, conclusions will be provided, the lessons learned about the interaction between theoretical and technological development will be discussed, and new research questions will be formulated.
TNO report | TNO 2015 R11465 5 / 45
2 Theoretical models for human resilience in organisations
The goal of the workpackage ‘integrative modelling’ of the research line Human Resilience was to bring together knowledge within TNO on employee resilience and develop an integrative model that can serve as a basis for further research in the research program. For this a multidisciplinary team was formed consisting of subject matter experts in social psychology, organizational psychology, stress physiology, and movement sciences. The aim of this collaboration was to produce a multifactorial conceptualization of employee resilience and identify key factors related to employee resilience from different disciplines. These experts had all worked on projects within TNO that were related to (employee) resilience In this chapter a short review is provided of the resilience literature (Section 2.1) based on earlier TNO projects, furthermore the development of a generic human resilience model identifying key factors for employee resilience is discussed (Section 2.2), and the development of a process model describing resilience as a behavioural process is included (Section 2.3). These models form the scientific basis for developments within the research line Human Resilience.
2.1 Review of resilience literature
In earlier research programs and projects conducted by TNO, extensive research of the literature on resilience was conducted. A summary and conclusions for the current project of these reviews is provided here. The models described here are mostly qualitative and descriptive. The second model (systems health resilience) has been partly quantified through expert judgement.
2.1.1 A psychosocial model of military resilience In the Defense research program ‘Enhancing military resilience’ (2011-2015) a literature review was conducted and a model was developed including the psychosocial determinants of military resilience. What follows is a summary of the key results as described in the report entitled ‘Psychosocial determinants of military resilience’ (Kamphuis et al., 2012). The literature review focused on resilience in high risk professions and revealed that the construct of resilience has been defined and operationalized in many different ways. Considerable debate has been devoted to the question whether resilience can best be viewed as an individual trait, a dynamic process, an outcome, or all the above. Many definitions, however, share in common the idea of successful adaptation to adversity (Meredith et al., 2011). For the Netherlands Armed Forces (NLDAF), the process approach was used. Military resilience was defined as ‘the ability to continue to perform optimally during stressful situations, shocking incidents and setbacks, and to make a positive recovery afterwards, both in the short term and in the longer term, while still having the motivation to remain in and achieve the goals of military service’.
6 / 45 TNO report | TNO 2015 R11465
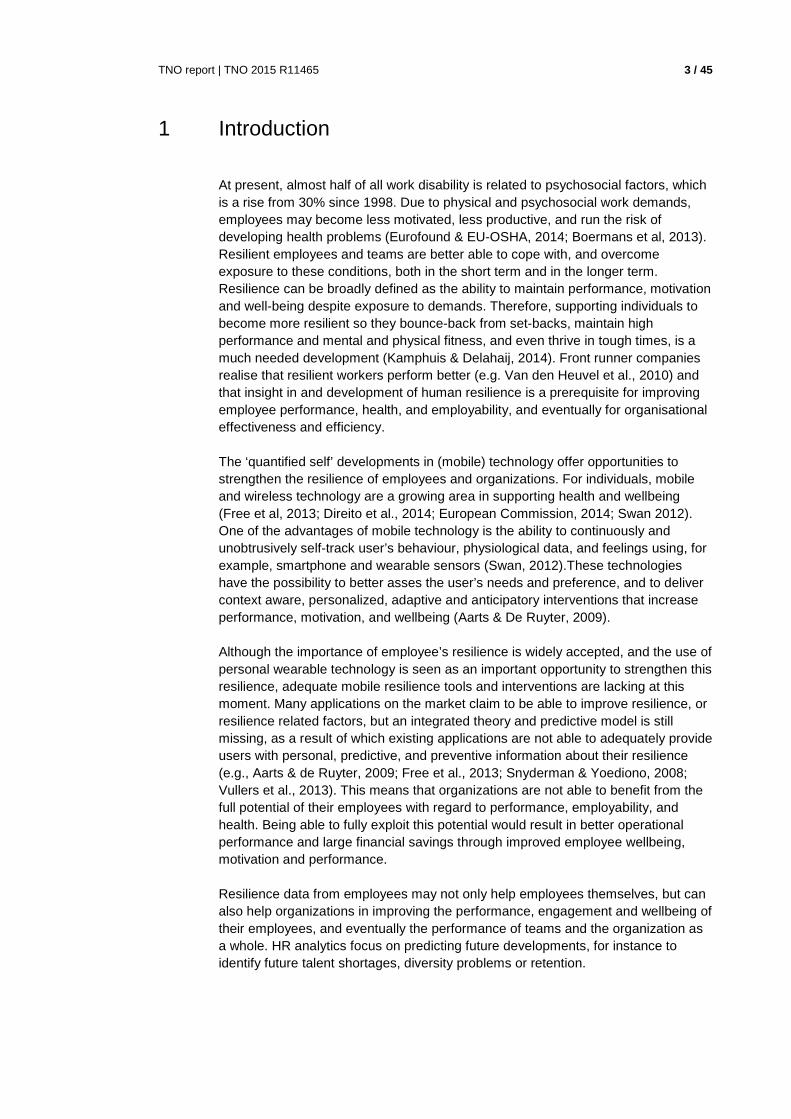
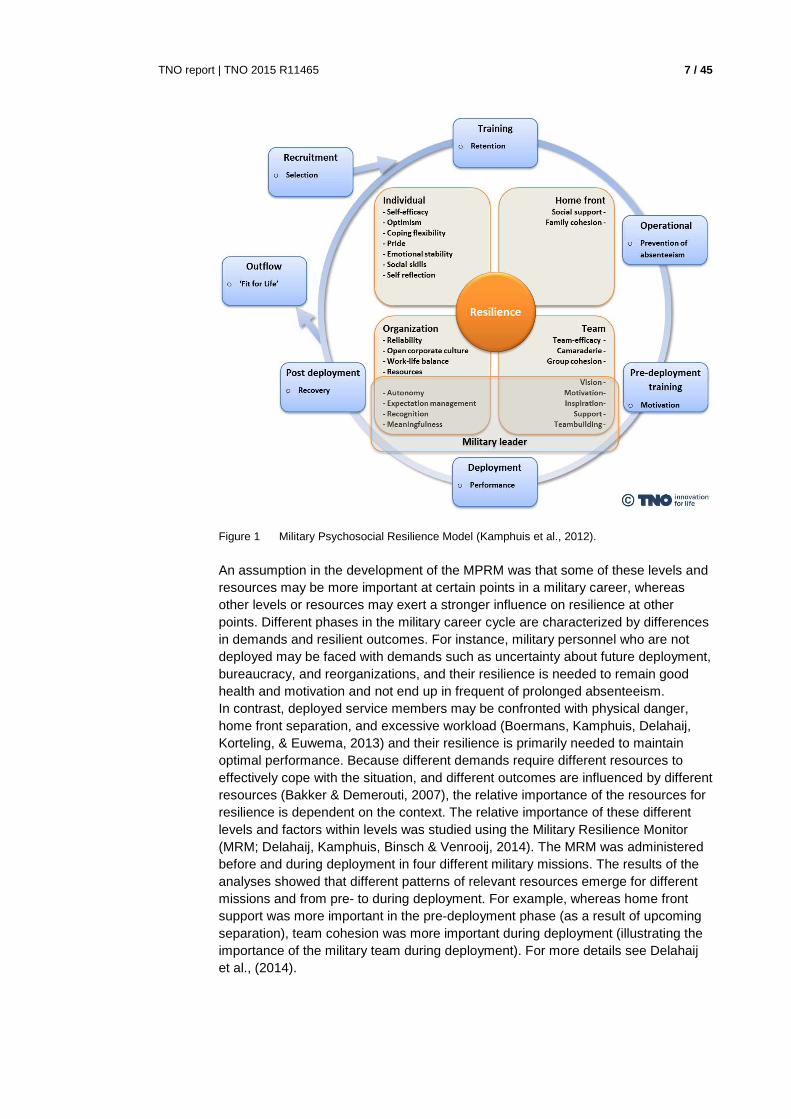
This definition describes the kind of adversity service members may encounter and specifies three types of successful adaptation relevant for the military: maintenance of performance (Nash, Steenkamp, Conoscenti, & Litz, 2011), psychological and physical recovery, and sustainability of motivation (Zautra, Hall & Murray 2010). A key assumption was that this process is driven by resources that can be used to deal with adversity. Resources can be part of the individual or his or her environment. For the program ‘enhancing military resilience’ a Military Psychological Resilience Model (MPRM, see Figure 1) was developed including relevant psychosocial resources (physical or physiological resources were not part of this model). This model was based on a systematic review of the literature on resilience in so-called high-risk professions combined with insights gathered from a series of interviews with Defence experts on psychological resilience. The integration of the systematic literature review and the interviews resulted in a list of 25 resources (contributing factors) for resilience in the military context. For a more detailed review of these factors and the literature see Kamphuis (2012). To make the results comprehensible, recognizable and actionable for military decision makers, the results were visualized in the MPRM shown in Figure 1. As such the MPRM does not depict the relationships between variables that would be included in a scientific theoretical model. The primary purpose of the model is to enable the NLDAF to have a more evidence-informed debate about promoting resilience throughout the organization, and to effectively align and coordinate the different practices in this area. However, the rationale and content of the model is based on testable hypotheses about the relationship between resources and resilient outcomes and therefore can be used to integrate and guide research in this area. The MPRM differentiates between five levels at which resources for resilience can be found (individual, home front, team, military leader, and organization). By explicitly depicting these different levels, the model aims to draw attention to the different entrances for improving resilience of service members. Where the focus of interventions may often be the individual (Boermans, Delahaij, Korteling, & Euwema, 2012), research distinguishes intrinsic, individual factors that promote resilience within an individual from extrinsic, environmental factors at different levels (e.g., family, team, organization) (Zautra, Hall, & Murray, 2010). Each environmental level may contain many leverage points for promoting resilience. The first level pertains to the individual; the traits, characteristics, and skills an individual possesses, that promote resilience. The second level is the home front of the service member, consisting of service members’ family and friends. The third level is the team, the organizationally defined group of people in which the service member collaborates most closely. The fourth level pertains to the military leader. Leadership plays a role in the resilience of service members both at a team level, in the person of the direct leader, and at an organizational level, by means of the senior management in the Defence organisation. Finally, the fifth level is the organisation as a whole: the structures, the strategy, the values, the resources etc. that make up the organisation. These five levels thus represent five different points of application for interventions to promote resilience.
TNO report | TNO 2015 R11465 7 / 45
Figure 1 Military Psychosocial Resilience Model (Kamphuis et al., 2012).
An assumption in the development of the MPRM was that some of these levels and resources may be more important at certain points in a military career, whereas other levels or resources may exert a stronger influence on resilience at other points. Different phases in the military career cycle are characterized by differences in demands and resilient outcomes. For instance, military personnel who are not deployed may be faced with demands such as uncertainty about future deployment, bureaucracy, and reorganizations, and their resilience is needed to remain good health and motivation and not end up in frequent of prolonged absenteeism. In contrast, deployed service members may be confronted with physical danger, home front separation, and excessive workload (Boermans, Kamphuis, Delahaij, Korteling, & Euwema, 2013) and their resilience is primarily needed to maintain optimal performance. Because different demands require different resources to effectively cope with the situation, and different outcomes are influenced by different resources (Bakker & Demerouti, 2007), the relative importance of the resources for resilience is dependent on the context. The relative importance of these different levels and factors within levels was studied using the Military Resilience Monitor (MRM; Delahaij, Kamphuis, Binsch & Venrooij, 2014). The MRM was administered before and during deployment in four different military missions. The results of the analyses showed that different patterns of relevant resources emerge for different missions and from pre- to during deployment. For example, whereas home front support was more important in the pre-deployment phase (as a result of upcoming separation), team cohesion was more important during deployment (illustrating the importance of the military team during deployment). For more details see Delahaij et al., (2014).

8 / 45 TNO report | TNO 2015 R11465
These results underline that when developing resilience models and using them to intervene on employee resilience ‘contextualisation’ is necessary to measure the relevant resources. In other words, a resilience model that is used to monitor employee resilience should be ‘dynamic’ in the sense that the relative importance of resources can change over time. These assumed changes should be based on data.
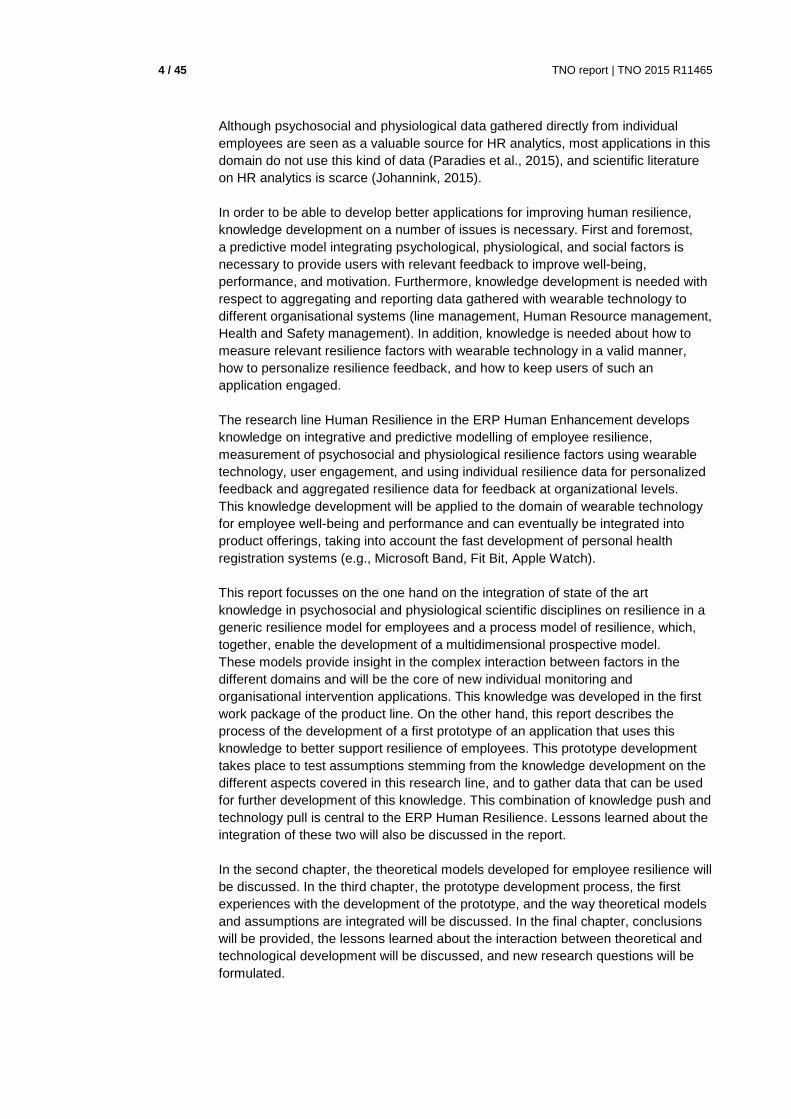
2.1.2 A multidimensional model on human resilience In the TNO Enabling Technology Program on Systems Biology (2011-2014) a multidimensional model on systems health resilience was developed including psychosocial, physiological and biological determinants of resilience. This model was not developed for a specific population and focused on the way factors from different subsystems of human functioning interact. What follows is a summary of the key results as described in the report entitled ‘Multidimensional resilience assessment and optimization’ (Wietmarschen et al., 2014; some texts were included integrally from the original report). Within the systems biology project, resilience was defined as an adaptive process in which internal (i.e. physiological, psychosocial, energetic, cognitive, and gastro-intestinal) and external resources (e.g., social support, training) buffer the negative effects of adversity or risk factors in such a way that health, well-being and performance is sustained in the long term. This definition was based on a broad literature review showing that resilience is not simply a construct composed of psychological characteristics (i.e., coping skills, self-efficacy, hardiness; e.g., Boermans et al., 2012; Delahaij, Gaillard, & van Dam, 2010; Zautra, Murray & Hall, 2010). Biological and physiological characteristics are also essential for the ability of the individual to self-regulate under stressful situations. Pre-existing conditions, psychological traumas, genetics, epigenetics, sleep habits, nutritional intake and physical and cardiovascular fitness also play a role in the individual‘s ability to be resilient (e.g., Beckie, Fletcher et al. 2008, Karatsoreos & McEwen, 2013). Perturbations in behaviours such as sleep and diet can have a significant impact on the ability of the individual to respond resiliently to adverse events or situations (Christensen, Skou et al. 2001, Reifman 2004). The role that these biological and physiological factors play is often ignored in resilience programs and existing definitions of resilience, resulting in only a partial understanding and ability to build resilience capacity. Furthermore, external resources (i.e., within the environment, social context, cultural context; e.g., Delahaij, Theunissen & Six, 2014; van Liempt 2012) also play a central role to individual resilience. The conclusion of this review was that although factors in different domains seem to contribute to resilience, there is no such thing as an optimal set of resilience variables, rather people tend to develop different styles in different situations (Ryff & Friedman, 2012). Again, within the systems biology project, the issue of contextualization was brought to the fore and a method to address this issue was developed. The goal of the project on systems biology was to get a comprehensive understanding of resilience and the interaction between the determinants of resilience for particular subgroups or particular contexts. Whereas the military resilience project used data to pinpoint relevant resources for resilience in different contexts, the project on systems biology used group model building to develop a semi-quantitative systems health resilience model that can provide insights and new hypotheses about the relative relevance of resources in different contexts.
TNO report | TNO 2015 R11465 9 / 45
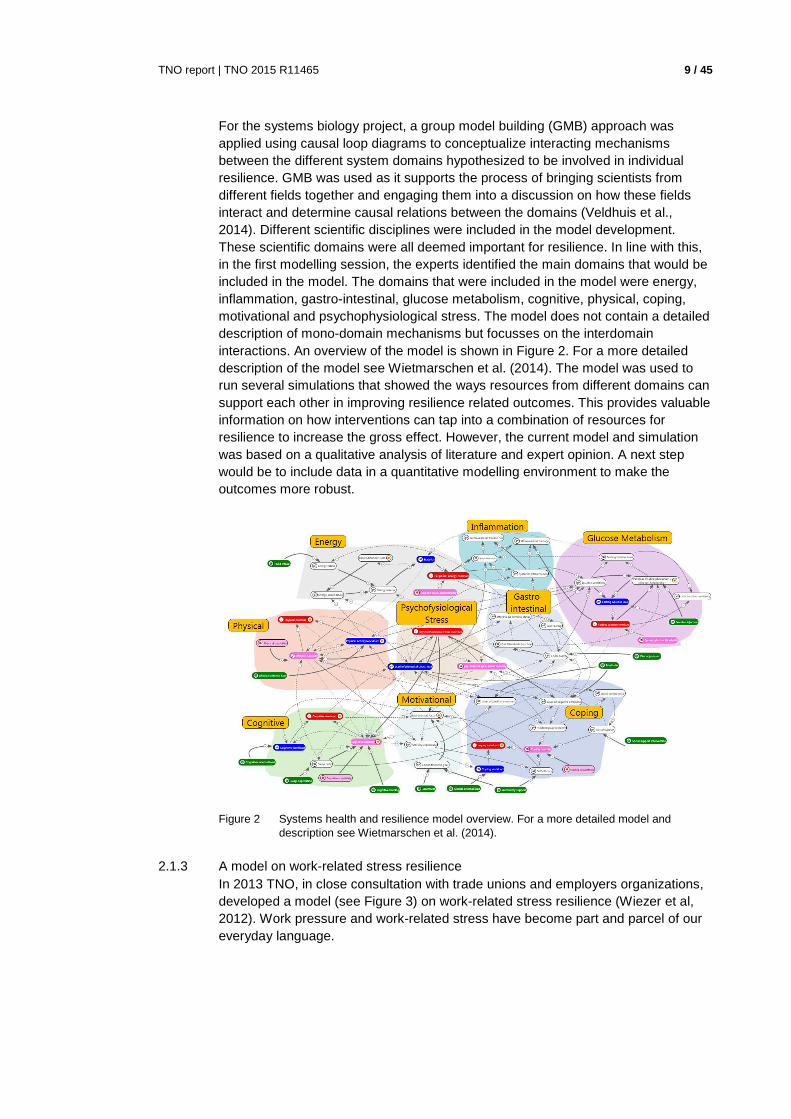
For the systems biology project, a group model building (GMB) approach was applied using causal loop diagrams to conceptualize interacting mechanisms between the different system domains hypothesized to be involved in individual resilience. GMB was used as it supports the process of bringing scientists from different fields together and engaging them into a discussion on how these fields interact and determine causal relations between the domains (Veldhuis et al., 2014). Different scientific disciplines were included in the model development. These scientific domains were all deemed important for resilience. In line with this, in the first modelling session, the experts identified the main domains that would be included in the model. The domains that were included in the model were energy, inflammation, gastro-intestinal, glucose metabolism, cognitive, physical, coping, motivational and psychophysiological stress. The model does not contain a detailed description of mono-domain mechanisms but focusses on the interdomain interactions. An overview of the model is shown in Figure 2. For a more detailed description of the model see Wietmarschen et al. (2014). The model was used to run several simulations that showed the ways resources from different domains can support each other in improving resilience related outcomes. This provides valuable information on how interventions can tap into a combination of resources for resilience to increase the gross effect. However, the current model and simulation was based on a qualitative analysis of literature and expert opinion. A next step would be to include data in a quantitative modelling environment to make the outcomes more robust.
Figure 2 Systems health and resilience model overview. For a more detailed model and description see Wietmarschen et al. (2014).
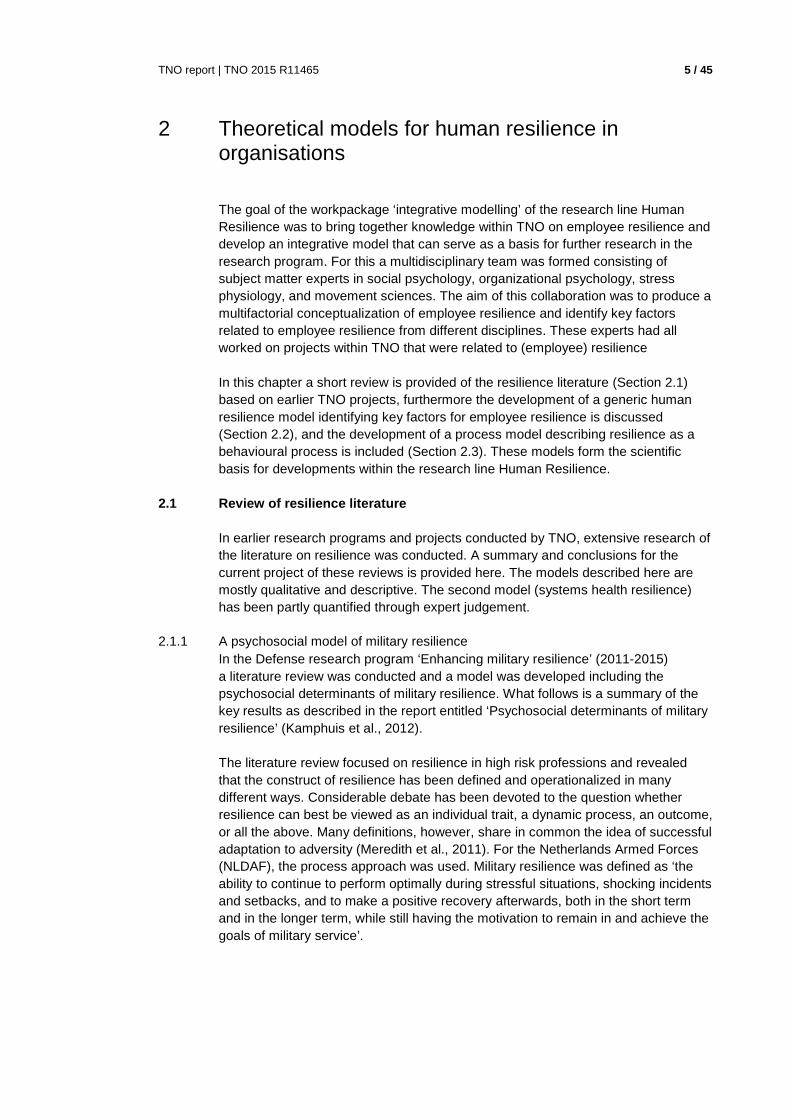
2.1.3 A model on work-related stress resilience In 2013 TNO, in close consultation with trade unions and employers organizations, developed a model (see Figure 3) on work-related stress resilience (Wiezer et al, 2012). Work pressure and work-related stress have become part and parcel of our everyday language.
10 / 45 TNO report | TNO 2015 R11465
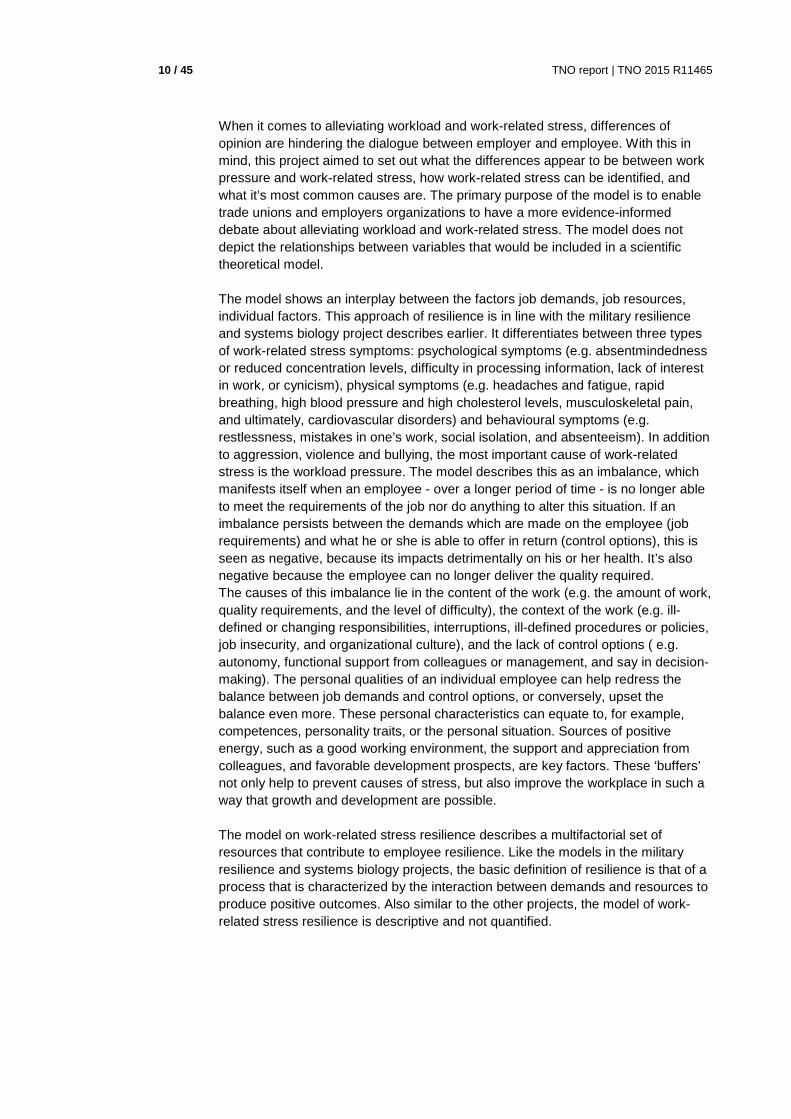
When it comes to alleviating workload and work-related stress, differences of opinion are hindering the dialogue between employer and employee. With this in mind, this project aimed to set out what the differences appear to be between work pressure and work-related stress, how work-related stress can be identified, and what it’s most common causes are. The primary purpose of the model is to enable trade unions and employers organizations to have a more evidence-informed debate about alleviating workload and work-related stress. The model does not depict the relationships between variables that would be included in a scientific theoretical model. The model shows an interplay between the factors job demands, job resources, individual factors. This approach of resilience is in line with the military resilience and systems biology project describes earlier. It differentiates between three types of work-related stress symptoms: psychological symptoms (e.g. absentmindedness or reduced concentration levels, difficulty in processing information, lack of interest in work, or cynicism), physical symptoms (e.g. headaches and fatigue, rapid breathing, high blood pressure and high cholesterol levels, musculoskeletal pain, and ultimately, cardiovascular disorders) and behavioural symptoms (e.g. restlessness, mistakes in one’s work, social isolation, and absenteeism). In addition to aggression, violence and bullying, the most important cause of work-related stress is the workload pressure. The model describes this as an imbalance, which manifests itself when an employee - over a longer period of time - is no longer able to meet the requirements of the job nor do anything to alter this situation. If an imbalance persists between the demands which are made on the employee (job requirements) and what he or she is able to offer in return (control options), this is seen as negative, because its impacts detrimentally on his or her health. It’s also negative because the employee can no longer deliver the quality required. The causes of this imbalance lie in the content of the work (e.g. the amount of work, quality requirements, and the level of difficulty), the context of the work (e.g. ill-defined or changing responsibilities, interruptions, ill-defined procedures or policies, job insecurity, and organizational culture), and the lack of control options ( e.g. autonomy, functional support from colleagues or management, and say in decision-making). The personal qualities of an individual employee can help redress the balance between job demands and control options, or conversely, upset the balance even more. These personal characteristics can equate to, for example, competences, personality traits, or the personal situation. Sources of positive energy, such as a good working environment, the support and appreciation from colleagues, and favorable development prospects, are key factors. These ‘buffers’ not only help to prevent causes of stress, but also improve the workplace in such a way that growth and development are possible. The model on work-related stress resilience describes a multifactorial set of resources that contribute to employee resilience. Like the models in the military resilience and systems biology projects, the basic definition of resilience is that of a process that is characterized by the interaction between demands and resources to produce positive outcomes. Also similar to the other projects, the model of work-related stress resilience is descriptive and not quantified.
TNO report | TNO 2015 R11465 11 / 45
Figure 3 Work-related stress resilience model.
2.2 A model for employee resilience
What can be concluded from the existing work and literature on employee resilience is that resilience is considered to be a process and that there is a trend towards including resources and outcomes from multiple domains to help explain this process. In addition, contextualising models to fit a certain population and demands is necessary. However, the development of multifactorial models has been mostly qualitatively. A quantitative approach to integration of factors of multiple domains would enable assessment of the relative importance of different types of resources and aid contextualisation. This would in turn provide more evidence base for which type of resources should be tapped into when developing interventions to enhance employee resilience. This was the starting point of the model developments in the current ERP project. A main goal of the ERP project was to develop a generic model for employee resilience bringing together knowledge from different disciplines (see Section 2.1). This model would form the basis for further quantification of an employee resilience model in a specific context. In line with the definition in the projects described above, for the ERP research program we adopted a definition of employee resilience that considers resilience to be a process in which employees sustain performance, motivation and health under demanding conditions using resources within themselves (e.g., beliefs, skills, personality) and in their social environment (e.g., team, leader, organisation, family). Based on this a generic descriptive and qualitative resilience model was developed including a broad range of relevant factors for employee resilience. A first overview model was developed that captures this conceptualization and the relevant factors (see Figure 4).
12 / 45 TNO report | TNO 2015 R11465
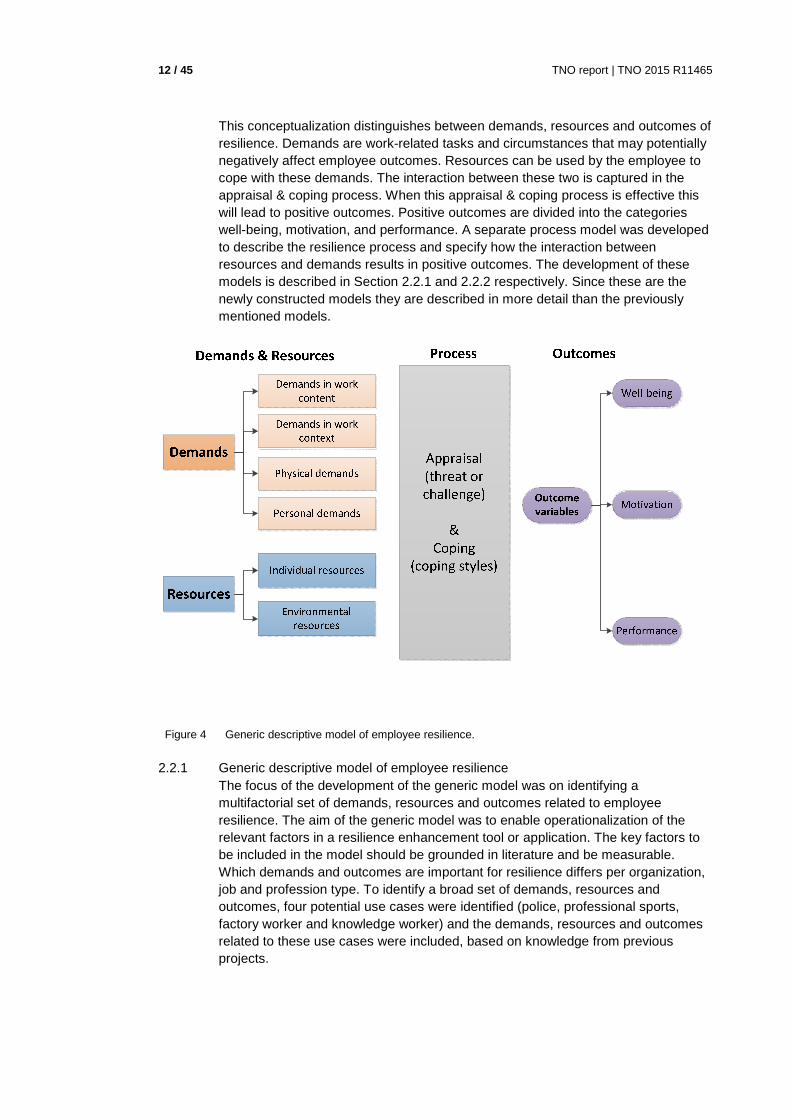
This conceptualization distinguishes between demands, resources and outcomes of resilience. Demands are work-related tasks and circumstances that may potentially negatively affect employee outcomes. Resources can be used by the employee to cope with these demands. The interaction between these two is captured in the appraisal & coping process. When this appraisal & coping process is effective this will lead to positive outcomes. Positive outcomes are divided into the categories well-being, motivation, and performance. A separate process model was developed to describe the resilience process and specify how the interaction between resources and demands results in positive outcomes. The development of these models is described in Section 2.2.1 and 2.2.2 respectively. Since these are the newly constructed models they are described in more detail than the previously mentioned models.
Figure 4 Generic descriptive model of employee resilience.
2.2.1 Generic descriptive model of employee resilience The focus of the development of the generic model was on identifying a multifactorial set of demands, resources and outcomes related to employee resilience. The aim of the generic model was to enable operationalization of the relevant factors in a resilience enhancement tool or application. The key factors to be included in the model should be grounded in literature and be measurable. Which demands and outcomes are important for resilience differs per organization, job and profession type. To identify a broad set of demands, resources and outcomes, four potential use cases were identified (police, professional sports, factory worker and knowledge worker) and the demands, resources and outcomes related to these use cases were included, based on knowledge from previous projects.
TNO report | TNO 2015 R11465 13 / 45
In addition, the most common work related demands, resources and outcomes from the NEA (Nationale Enquete Arbeidsomstandigheden; van Zwieten et al., 2014) and Military resilience Monitor (MRM; Delahaij et al., 2014) were included. This overview of resources, demands and outcomes for employee resilience was finalized by determining the key factors per category, by removing overlapping factors in several sessions, in which consensus was sought among the subject matter experts. Figure 4 provides an overview of this classification. In Section 2.2.1.1, 2.2.1.2 and 2.2.1.3 the factors within this classification are described.
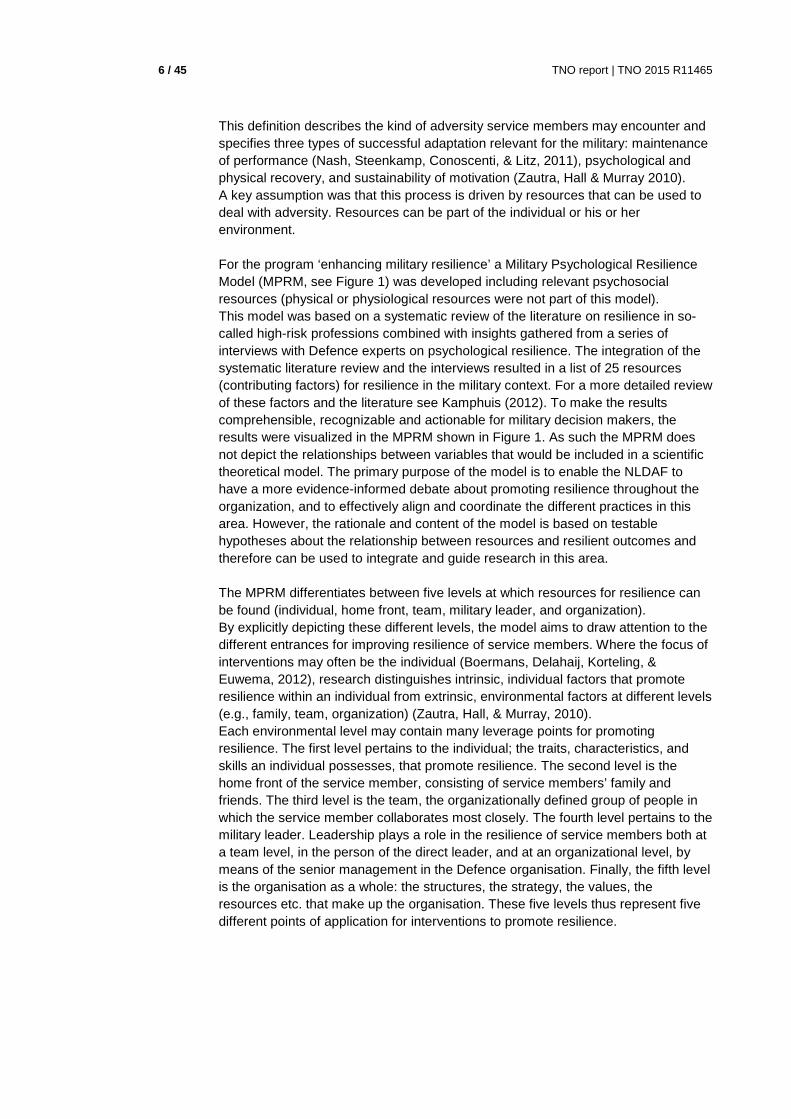
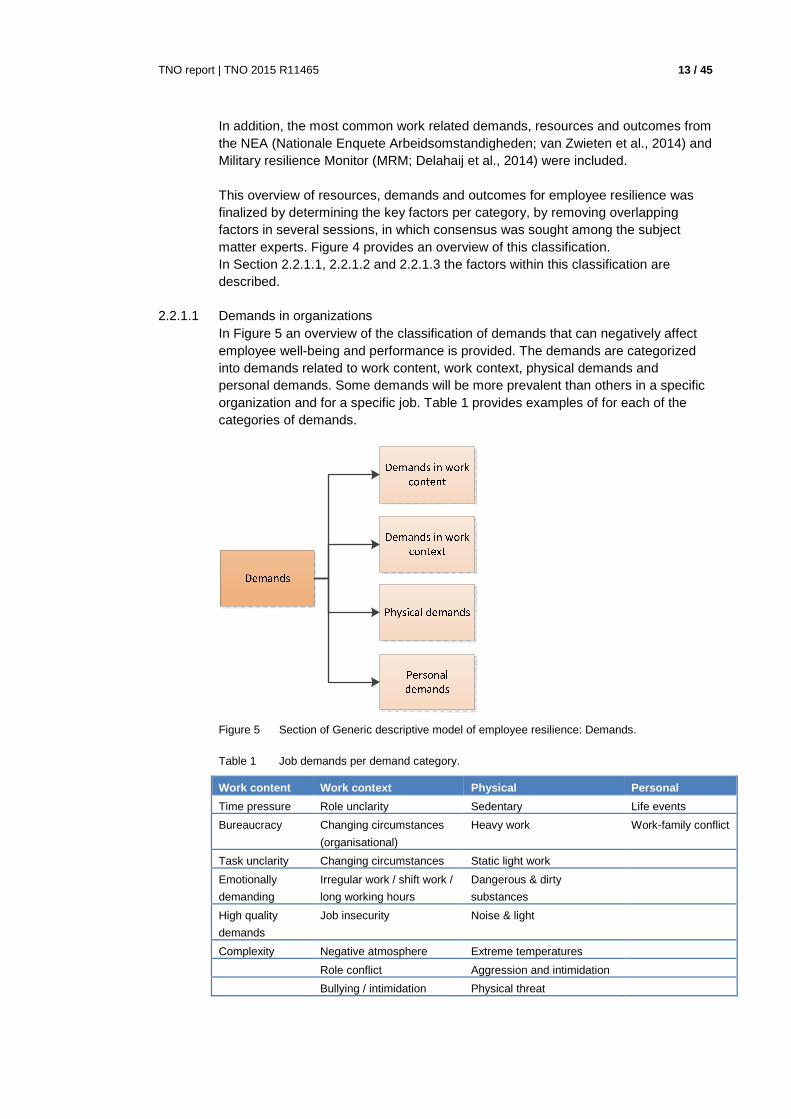
2.2.1.1 Demands in organizations In Figure 5 an overview of the classification of demands that can negatively affect employee well-being and performance is provided. The demands are categorized into demands related to work content, work context, physical demands and personal demands. Some demands will be more prevalent than others in a specific organization and for a specific job. Table 1 provides examples of for each of the categories of demands.
Figure 5 Section of Generic descriptive model of employee resilience: Demands.
Table 1 Job demands per demand category.
Work content Work context Physical Personal
Time pressure Role unclarity Sedentary Life events
Bureaucracy Changing circumstances
(organisational)
Heavy work Work-family conflict
Task unclarity Changing circumstances Static light work
Emotionally
demanding
Irregular work / shift work /
long working hours
Dangerous & dirty
substances
High quality
demands
Job insecurity Noise & light
Complexity Negative atmosphere Extreme temperatures
Role conflict Aggression and intimidation
Bullying / intimidation Physical threat
14 / 45 TNO report | TNO 2015 R11465
Work content Work context Physical Personal
Error avoidance culture
Competitiveness
Unpredictability
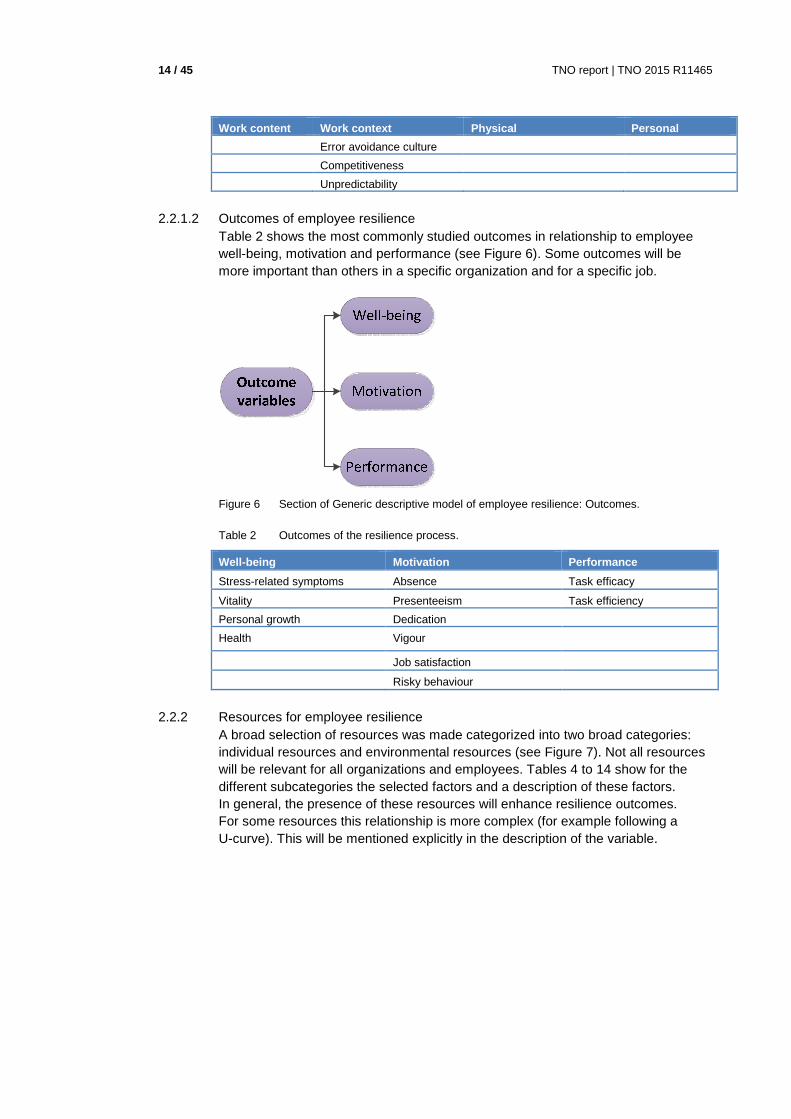
2.2.1.2 Outcomes of employee resilience Table 2 shows the most commonly studied outcomes in relationship to employee well-being, motivation and performance (see Figure 6). Some outcomes will be more important than others in a specific organization and for a specific job.
Figure 6 Section of Generic descriptive model of employee resilience: Outcomes.
Table 2 Outcomes of the resilience process.
Well-being Motivation Performance
Stress-related symptoms Absence Task efficacy
Vitality Presenteeism Task efficiency
Personal growth Dedication
Health Vigour
Job satisfaction
Risky behaviour
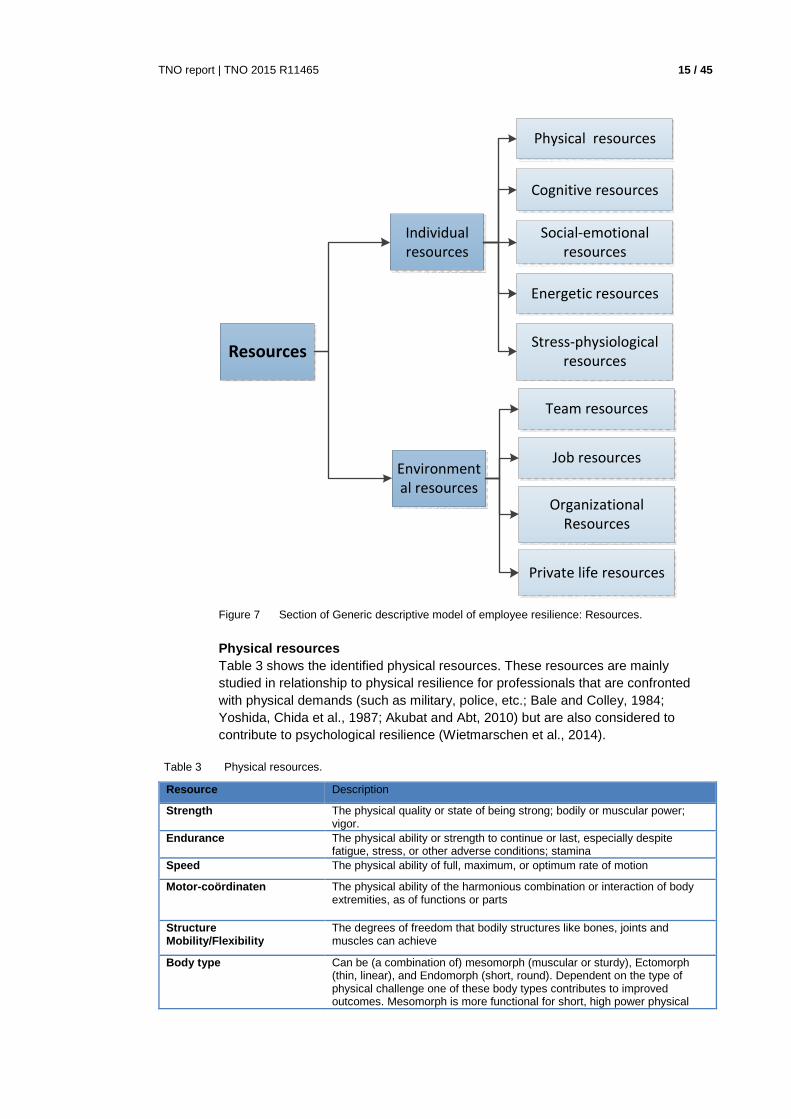
2.2.2 Resources for employee resilience A broad selection of resources was made categorized into two broad categories: individual resources and environmental resources (see Figure 7). Not all resources will be relevant for all organizations and employees. Tables 4 to 14 show for the different subcategories the selected factors and a description of these factors. In general, the presence of these resources will enhance resilience outcomes. For some resources this relationship is more complex (for example following a U-curve). This will be mentioned explicitly in the description of the variable.
TNO report | TNO 2015 R11465 15 / 45
Physical resources
Cognitive resources
Social-emotional
resources
Team resources
Organizational
Resources
Private life resources
Job resources
Individual
resources
Environment
al resources
Resources
Energetic resources
Stress-physiological
resources
Figure 7 Section of Generic descriptive model of employee resilience: Resources.
Physical resources Table 3 shows the identified physical resources. These resources are mainly studied in relationship to physical resilience for professionals that are confronted with physical demands (such as military, police, etc.; Bale and Colley, 1984; Yoshida, Chida et al., 1987; Akubat and Abt, 2010) but are also considered to contribute to psychological resilience (Wietmarschen et al., 2014).
Table 3 Physical resources.
Resource Description
Strength The physical quality or state of being strong; bodily or muscular power; vigor.
Endurance The physical ability or strength to continue or last, especially despite fatigue, stress, or other adverse conditions; stamina
Speed The physical ability of full, maximum, or optimum rate of motion
Motor-coördinaten The physical ability of the harmonious combination or interaction of body extremities, as of functions or parts
Structure Mobility/Flexibility
The degrees of freedom that bodily structures like bones, joints and muscles can achieve
Body type Can be (a combination of) mesomorph (muscular or sturdy), Ectomorph (thin, linear), and Endomorph (short, round). Dependent on the type of physical challenge one of these body types contributes to improved outcomes. Mesomorph is more functional for short, high power physical
16 / 45 TNO report | TNO 2015 R11465
Resource Description
demands, ectomorph is more functional for enduring physical demands. Endomorph is not functional in countering physical demands.
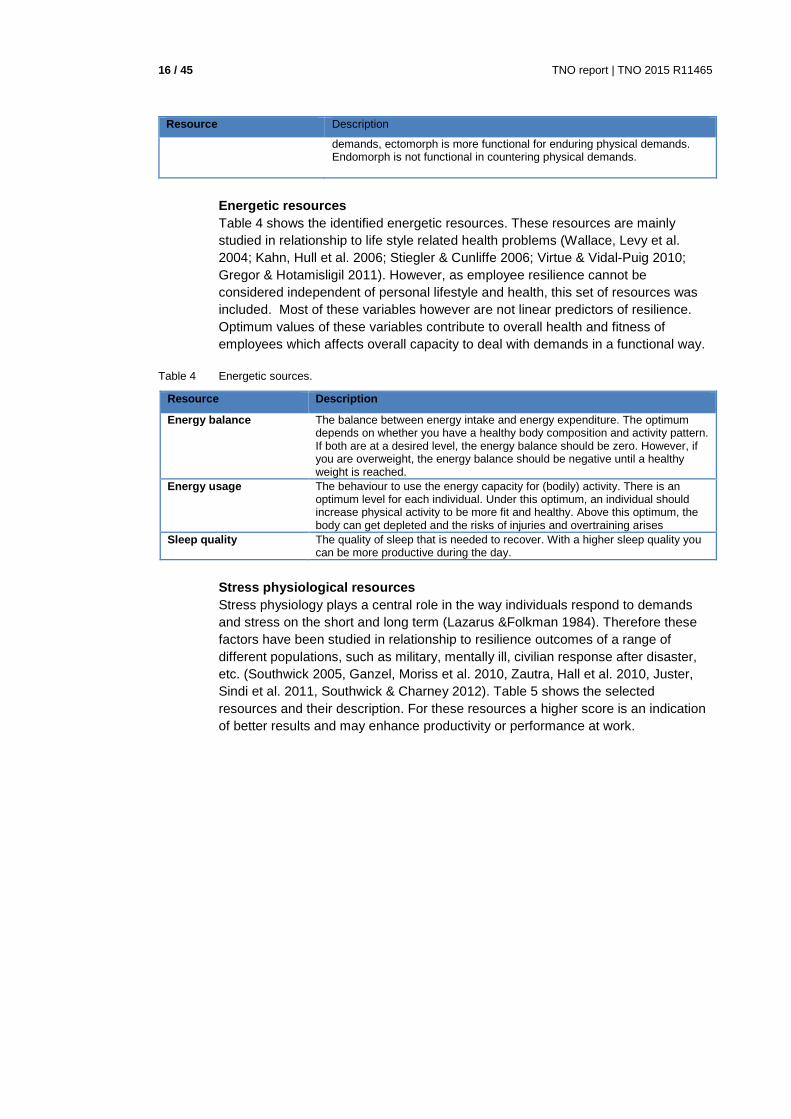
Energetic resources Table 4 shows the identified energetic resources. These resources are mainly studied in relationship to life style related health problems (Wallace, Levy et al. 2004; Kahn, Hull et al. 2006; Stiegler & Cunliffe 2006; Virtue & Vidal-Puig 2010; Gregor & Hotamisligil 2011). However, as employee resilience cannot be considered independent of personal lifestyle and health, this set of resources was included. Most of these variables however are not linear predictors of resilience. Optimum values of these variables contribute to overall health and fitness of employees which affects overall capacity to deal with demands in a functional way.
Table 4 Energetic sources.
Resource Description
Energy balance The balance between energy intake and energy expenditure. The optimum depends on whether you have a healthy body composition and activity pattern. If both are at a desired level, the energy balance should be zero. However, if you are overweight, the energy balance should be negative until a healthy weight is reached.
Energy usage The behaviour to use the energy capacity for (bodily) activity. There is an optimum level for each individual. Under this optimum, an individual should increase physical activity to be more fit and healthy. Above this optimum, the body can get depleted and the risks of injuries and overtraining arises
Sleep quality The quality of sleep that is needed to recover. With a higher sleep quality you can be more productive during the day.
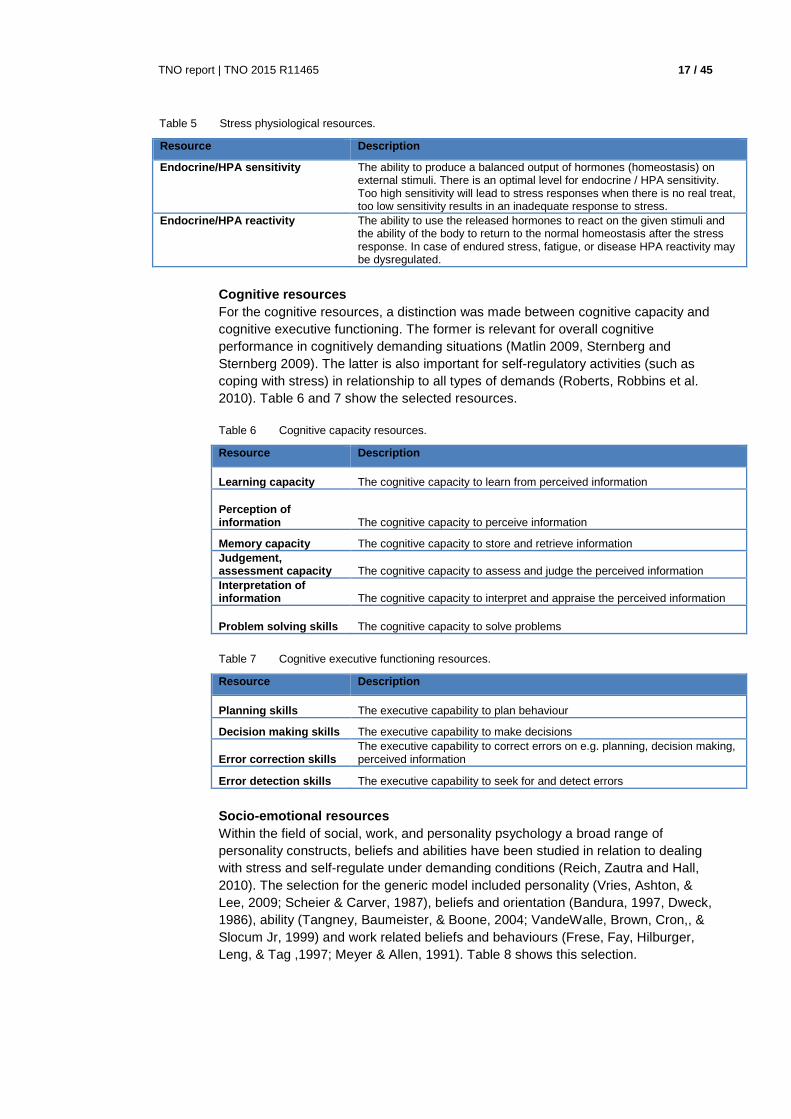
Stress physiological resources Stress physiology plays a central role in the way individuals respond to demands and stress on the short and long term (Lazarus &Folkman 1984). Therefore these factors have been studied in relationship to resilience outcomes of a range of different populations, such as military, mentally ill, civilian response after disaster, etc. (Southwick 2005, Ganzel, Moriss et al. 2010, Zautra, Hall et al. 2010, Juster, Sindi et al. 2011, Southwick & Charney 2012). Table 5 shows the selected resources and their description. For these resources a higher score is an indication of better results and may enhance productivity or performance at work.
TNO report | TNO 2015 R11465 17 / 45
Table 5 Stress physiological resources.
Resource Description
Endocrine/HPA sensitivity The ability to produce a balanced output of hormones (homeostasis) on external stimuli. There is an optimal level for endocrine / HPA sensitivity. Too high sensitivity will lead to stress responses when there is no real treat, too low sensitivity results in an inadequate response to stress.
Endocrine/HPA reactivity The ability to use the released hormones to react on the given stimuli and the ability of the body to return to the normal homeostasis after the stress response. In case of endured stress, fatigue, or disease HPA reactivity may be dysregulated.
Cognitive resources For the cognitive resources, a distinction was made between cognitive capacity and cognitive executive functioning. The former is relevant for overall cognitive performance in cognitively demanding situations (Matlin 2009, Sternberg and Sternberg 2009). The latter is also important for self-regulatory activities (such as coping with stress) in relationship to all types of demands (Roberts, Robbins et al. 2010). Table 6 and 7 show the selected resources.
Table 6 Cognitive capacity resources.
Resource Description
Learning capacity The cognitive capacity to learn from perceived information Perception of information The cognitive capacity to perceive information
Memory capacity The cognitive capacity to store and retrieve information Judgement, assessment capacity The cognitive capacity to assess and judge the perceived information Interpretation of information The cognitive capacity to interpret and appraise the perceived information
Problem solving skills The cognitive capacity to solve problems
Table 7 Cognitive executive functioning resources.
Resource Description
Planning skills The executive capability to plan behaviour
Decision making skills The executive capability to make decisions
Error correction skills The executive capability to correct errors on e.g. planning, decision making, perceived information
Error detection skills The executive capability to seek for and detect errors
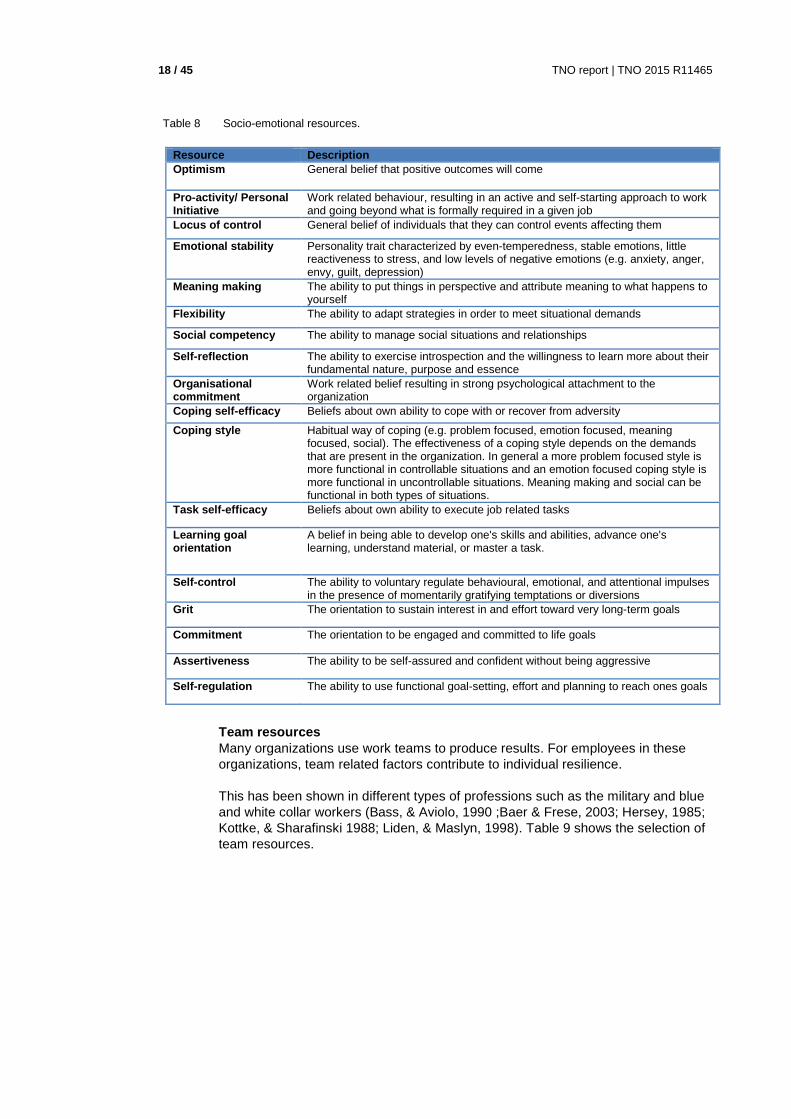
Socio-emotional resources Within the field of social, work, and personality psychology a broad range of personality constructs, beliefs and abilities have been studied in relation to dealing with stress and self-regulate under demanding conditions (Reich, Zautra and Hall, 2010). The selection for the generic model included personality (Vries, Ashton, & Lee, 2009; Scheier & Carver, 1987), beliefs and orientation (Bandura, 1997, Dweck, 1986), ability (Tangney, Baumeister, & Boone, 2004; VandeWalle, Brown, Cron,, & Slocum Jr, 1999) and work related beliefs and behaviours (Frese, Fay, Hilburger, Leng, & Tag ,1997; Meyer & Allen, 1991). Table 8 shows this selection.
18 / 45 TNO report | TNO 2015 R11465
Table 8 Socio-emotional resources.
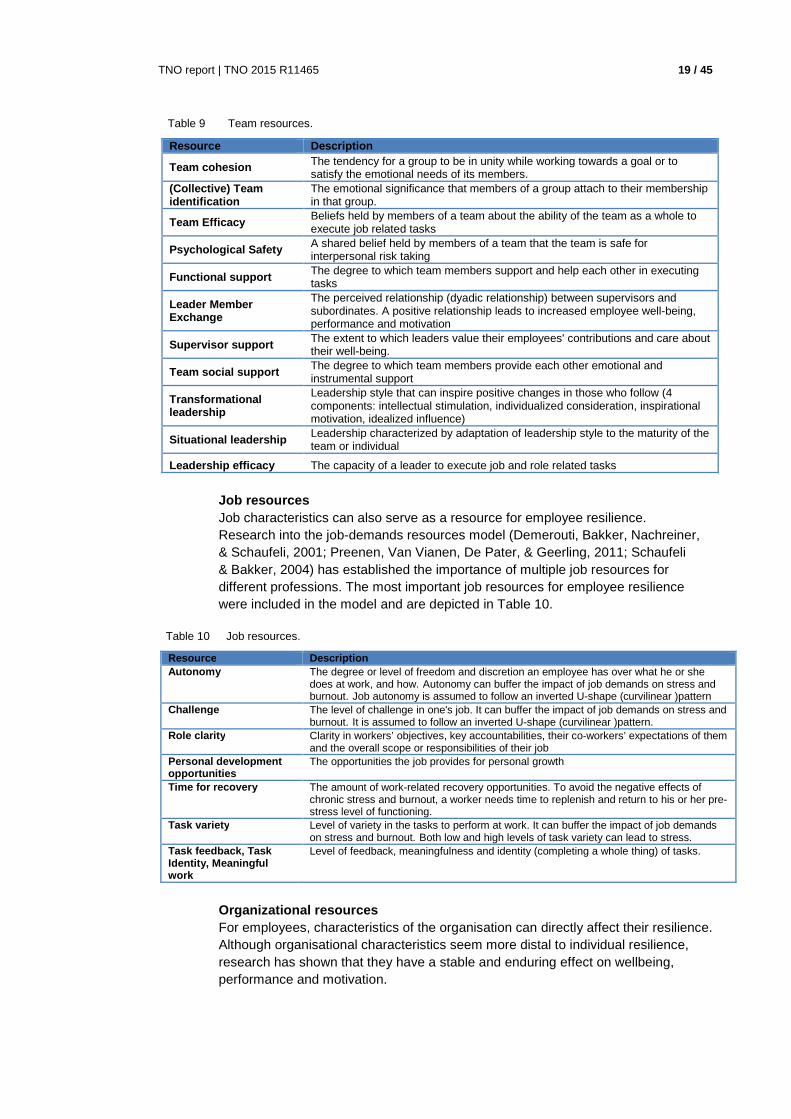
Team resources Many organizations use work teams to produce results. For employees in these organizations, team related factors contribute to individual resilience. This has been shown in different types of professions such as the military and blue and white collar workers (Bass, & Aviolo, 1990 ;Baer & Frese, 2003; Hersey, 1985; Kottke, & Sharafinski 1988; Liden, & Maslyn, 1998). Table 9 shows the selection of team resources.
Resource Description Optimism General belief that positive outcomes will come
Pro-activity/ Personal Initiative
Work related behaviour, resulting in an active and self-starting approach to work and going beyond what is formally required in a given job
Locus of control General belief of individuals that they can control events affecting them
Emotional stability Personality trait characterized by even-temperedness, stable emotions, little reactiveness to stress, and low levels of negative emotions (e.g. anxiety, anger, envy, guilt, depression)
Meaning making The ability to put things in perspective and attribute meaning to what happens to yourself
Flexibility The ability to adapt strategies in order to meet situational demands
Social competency The ability to manage social situations and relationships
Self-reflection The ability to exercise introspection and the willingness to learn more about their fundamental nature, purpose and essence
Organisational commitment
Work related belief resulting in strong psychological attachment to the organization
Coping self-efficacy Beliefs about own ability to cope with or recover from adversity
Coping style Habitual way of coping (e.g. problem focused, emotion focused, meaning focused, social). The effectiveness of a coping style depends on the demands that are present in the organization. In general a more problem focused style is more functional in controllable situations and an emotion focused coping style is more functional in uncontrollable situations. Meaning making and social can be functional in both types of situations.
Task self-efficacy Beliefs about own ability to execute job related tasks
Learning goal orientation
A belief in being able to develop one's skills and abilities, advance one's learning, understand material, or master a task.
Self-control The ability to voluntary regulate behavioural, emotional, and attentional impulses in the presence of momentarily gratifying temptations or diversions
Grit The orientation to sustain interest in and effort toward very long-term goals
Commitment The orientation to be engaged and committed to life goals
Assertiveness The ability to be self-assured and confident without being aggressive
Self-regulation The ability to use functional goal-setting, effort and planning to reach ones goals
TNO report | TNO 2015 R11465 19 / 45
Table 9 Team resources.
Resource Description
Team cohesion The tendency for a group to be in unity while working towards a goal or to satisfy the emotional needs of its members.
(Collective) Team identification
The emotional significance that members of a group attach to their membership in that group.
Team Efficacy Beliefs held by members of a team about the ability of the team as a whole to execute job related tasks
Psychological Safety A shared belief held by members of a team that the team is safe for interpersonal risk taking
Functional support The degree to which team members support and help each other in executing tasks
Leader Member Exchange
The perceived relationship (dyadic relationship) between supervisors and subordinates. A positive relationship leads to increased employee well-being, performance and motivation
Supervisor support The extent to which leaders value their employees' contributions and care about their well-being.
Team social support The degree to which team members provide each other emotional and instrumental support
Transformational leadership
Leadership style that can inspire positive changes in those who follow (4 components: intellectual stimulation, individualized consideration, inspirational motivation, idealized influence)
Situational leadership Leadership characterized by adaptation of leadership style to the maturity of the team or individual
Leadership efficacy The capacity of a leader to execute job and role related tasks
Job resources Job characteristics can also serve as a resource for employee resilience. Research into the job-demands resources model (Demerouti, Bakker, Nachreiner, & Schaufeli, 2001; Preenen, Van Vianen, De Pater, & Geerling, 2011; Schaufeli & Bakker, 2004) has established the importance of multiple job resources for different professions. The most important job resources for employee resilience were included in the model and are depicted in Table 10.
Table 10 Job resources.
Resource Description Autonomy The degree or level of freedom and discretion an employee has over what he or she
does at work, and how. Autonomy can buffer the impact of job demands on stress and burnout. Job autonomy is assumed to follow an inverted U-shape (curvilinear )pattern
Challenge The level of challenge in one's job. It can buffer the impact of job demands on stress and burnout. It is assumed to follow an inverted U-shape (curvilinear )pattern.
Role clarity Clarity in workers’ objectives, key accountabilities, their co-workers’ expectations of them and the overall scope or responsibilities of their job
Personal development opportunities
The opportunities the job provides for personal growth
Time for recovery The amount of work-related recovery opportunities. To avoid the negative effects of chronic stress and burnout, a worker needs time to replenish and return to his or her pre-stress level of functioning.
Task variety Level of variety in the tasks to perform at work. It can buffer the impact of job demands on stress and burnout. Both low and high levels of task variety can lead to stress.
Task feedback, Task Identity, Meaningful work
Level of feedback, meaningfulness and identity (completing a whole thing) of tasks.
Organizational resources For employees, characteristics of the organisation can directly affect their resilience. Although organisational characteristics seem more distal to individual resilience, research has shown that they have a stable and enduring effect on wellbeing, performance and motivation.

20 / 45 TNO report | TNO 2015 R11465
The identified resources all contribute to employee resilience by reducing demands or enabling employees to functionally cope with demands (Baer & Frese, 2003; Elovainio, M., Kivimäki, & Vahtera, 2002; Bannai, & Tamakoshi, A. 2014). see Table 11 for selection of resources.
Table 11 Organizational resources.
Resource Description
Performance The performance of an organization
Job mobility (inside organisations) The possibilities for changing jobs within the organization; opportunity to grow or try something new by moving to a different part of the organization
Quality of workspace The quality of the work environment (e.g., light, odour, climate)
Organisational support The extent to which an employee feels supported by his or her organization
Learning, creative culture Organizational climate which is supportive of learning and creativity
Organisational justice The extent to which an employee judges the behaviour of the organization to be fair
Open communication Low hierarchy and possibilities for open communication in the organization
Voice and participation The amount of voice and influence employees have over decisions made in the organization
Private life resources The demands and resources for resilience are not independent of an employee’s private life situation. As such several resources for employee resilience are identified that are related to the private life of the employee. Research has shown that private life factors affect employee resilience in a range of professions such as the military and the police force (Bakker & Demerouti, 2007; Delahaij et al., 2014). see Table 12 for selection of resources.
Table 12 Private life resources.
Resource Description
Acceptance Acceptance by the family of the employee’s job demands
Financial security Level of financial security in the family that is sustainable
Social support The social support received from the family
2.3 A process model of employee resilience
The generic descriptive model of employee resilience (see Figure 7) provides a conceptualization of resilience and a way to identify the most important resources, demands and outcomes to be operationalized for a specific population. However, the model does not provide insight in the way resources and demands interact and affect employee resilience in a specific context. For the development of resilience enhancement tools, especially for the provision of feedback on how to enhance resilience to the individual, insight into these mechanisms is needed. Therefore a process model of resilience was also developed (see Figure 8). The model was developed to have the characteristics of a mechanistic model as it needs to have tangible factors and relationships that can be operationalized through physiological and psychosocial monitoring, and applied in a feedback algorithm. “A mechanistic approach aims to simulate human behaviour by using mechanisms that are the same as those that support human behaviour. The mechanistic program seeks to reverse engineer the human brain and peer inside the black box” (Sakamoto, Jones, Love, 2008).
TNO report | TNO 2015 R11465 21 / 45
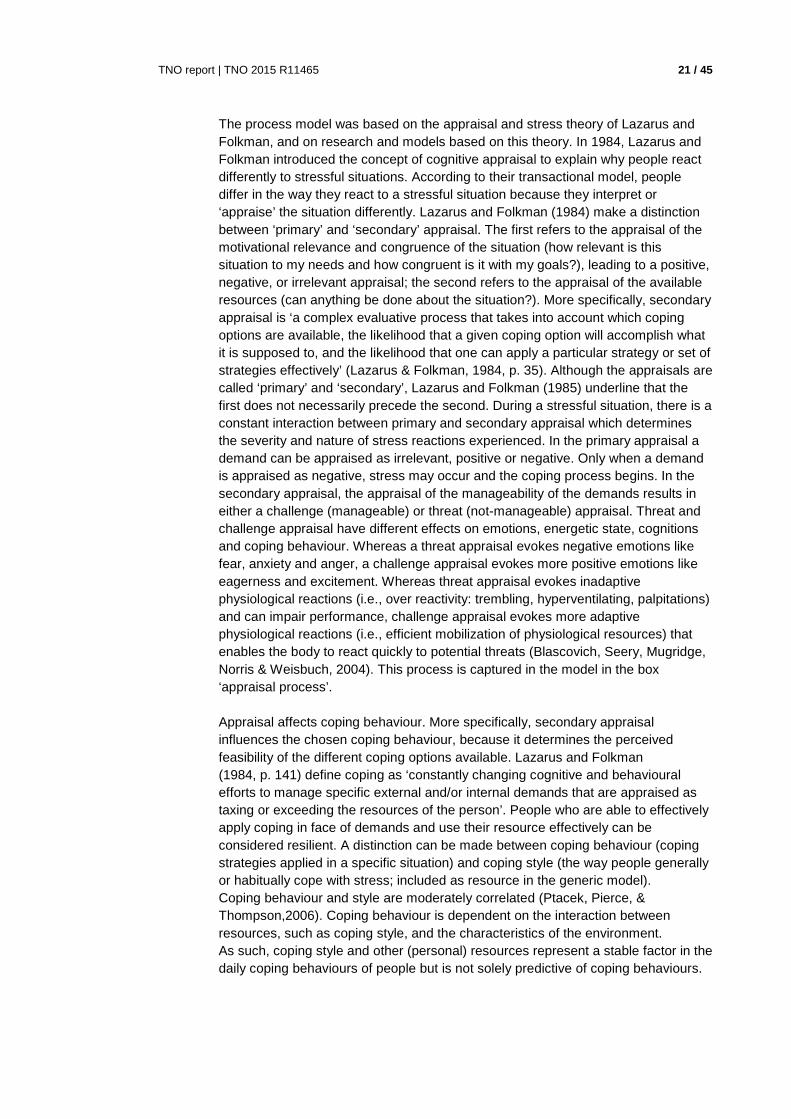
The process model was based on the appraisal and stress theory of Lazarus and Folkman, and on research and models based on this theory. In 1984, Lazarus and Folkman introduced the concept of cognitive appraisal to explain why people react differently to stressful situations. According to their transactional model, people differ in the way they react to a stressful situation because they interpret or ‘appraise’ the situation differently. Lazarus and Folkman (1984) make a distinction between ‘primary’ and ‘secondary’ appraisal. The first refers to the appraisal of the motivational relevance and congruence of the situation (how relevant is this situation to my needs and how congruent is it with my goals?), leading to a positive, negative, or irrelevant appraisal; the second refers to the appraisal of the available resources (can anything be done about the situation?). More specifically, secondary appraisal is ‘a complex evaluative process that takes into account which coping options are available, the likelihood that a given coping option will accomplish what it is supposed to, and the likelihood that one can apply a particular strategy or set of strategies effectively’ (Lazarus & Folkman, 1984, p. 35). Although the appraisals are called ‘primary’ and ‘secondary’, Lazarus and Folkman (1985) underline that the first does not necessarily precede the second. During a stressful situation, there is a constant interaction between primary and secondary appraisal which determines the severity and nature of stress reactions experienced. In the primary appraisal a demand can be appraised as irrelevant, positive or negative. Only when a demand is appraised as negative, stress may occur and the coping process begins. In the secondary appraisal, the appraisal of the manageability of the demands results in either a challenge (manageable) or threat (not-manageable) appraisal. Threat and challenge appraisal have different effects on emotions, energetic state, cognitions and coping behaviour. Whereas a threat appraisal evokes negative emotions like fear, anxiety and anger, a challenge appraisal evokes more positive emotions like eagerness and excitement. Whereas threat appraisal evokes inadaptive physiological reactions (i.e., over reactivity: trembling, hyperventilating, palpitations) and can impair performance, challenge appraisal evokes more adaptive physiological reactions (i.e., efficient mobilization of physiological resources) that enables the body to react quickly to potential threats (Blascovich, Seery, Mugridge, Norris & Weisbuch, 2004). This process is captured in the model in the box ‘appraisal process’. Appraisal affects coping behaviour. More specifically, secondary appraisal influences the chosen coping behaviour, because it determines the perceived feasibility of the different coping options available. Lazarus and Folkman (1984, p. 141) define coping as ‘constantly changing cognitive and behavioural efforts to manage specific external and/or internal demands that are appraised as taxing or exceeding the resources of the person’. People who are able to effectively apply coping in face of demands and use their resource effectively can be considered resilient. A distinction can be made between coping behaviour (coping strategies applied in a specific situation) and coping style (the way people generally or habitually cope with stress; included as resource in the generic model). Coping behaviour and style are moderately correlated (Ptacek, Pierce, & Thompson,2006). Coping behaviour is dependent on the interaction between resources, such as coping style, and the characteristics of the environment. As such, coping style and other (personal) resources represent a stable factor in the daily coping behaviours of people but is not solely predictive of coping behaviours.
22 / 45 TNO report | TNO 2015 R11465
In the model (see Figure 8) this interaction between relatively stable resources and environmental characteristics (demands) is represented by the ingoing arrows of resources and demands on the appraisal process. In coping research, traditionally a distinction is made between two kinds of coping strategies: emotion-focused and problem-focused coping (Folkman & Moskowitz, 2004; Stanton, Kirk, Cameron, & Danoff-Burg, 2000; Folkman & Lazarus, 1985; Lazarus & Folkman, 1984). Emotion-focused coping refers to coping efforts aimed at managing the emotional distress itself. Emotion-focused coping entails focusing attention on controlling emotional and physiological reactions, for example by venting emotions. Problem-focused coping refers to coping efforts aimed at managing the problem or situation that is causing the distress, for example by analyzing the situation or taking action. Some scholars have added other categories of coping, such as avoidance-oriented or meaning-focused coping. Avoidance-oriented coping refers to coping aimed at distancing oneself from the situation, for example by physically leaving a stressful situation (e.g., Endler & Parker, 1990, 1994). Meaning-focused coping is aimed at reframing the situation (e.g., Mikulciner & Florian, 1996), for example by interpreting job loss as an opportunity to make a career change. In the process model the types of coping relate demands to resources and outcomes. We distinguish five categories of coping, based on the direction of the coping towards the different parts of the resilience model: appraisal directed, secondary appraisal directed, resource directed and demand directed (see Table 13). It makes sense to look at the aimed effect of the coping be able to see what kind of changes in resilience can be expected. Is the coping only directed at decreasing stress? Or is it also directed at handling the demand, or increasing the resources to handle the (future) demand? In this sense we follow in the tradition of emotion (secondary appraisal) versus problem (demand)-focused coping, and complement it with appraisal focused coping (cognitive reappraisal; Troy, Wilhelm, Shallcross & Mauss, 2010) and resource focused coping (related to pro-active coping; Aspinwall & Taylor, 1997). Which type of coping is effective in coping with a certain demand, and thus is positively related to outcomes such as well-being, motivation and performance, will depend on demand characteristics and will differ between individuals. Moreover, Skinner et al. (2003) argue that single functions (e.g., problem vs. emotion focused) are no good action categories because any given way of coping is likely to serve many functions. Nor are topological distinctions (e.g., approach vs. avoidance, active vs. passive, or cognitive vs. behavioural) good action categories, because all ways of coping are multidimensional. Therefore, no explicit general hypotheses about coping effectiveness are included in the model. Based on individual monitoring of the appraisal and coping process (which is one of the aims in tool development), individual-level predictive models can be developed that can determine effectiveness of coping for a specific individual.
TNO report | TNO 2015 R11465 23 / 45
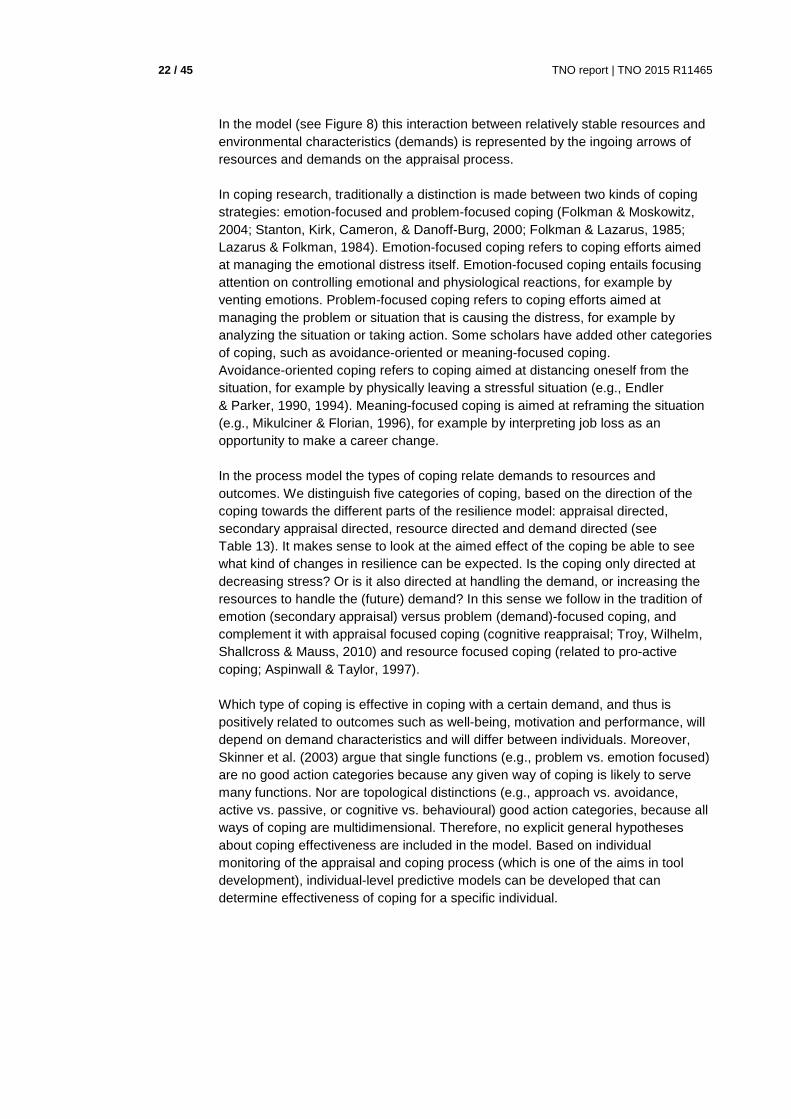
What is included in the model is a positive feedback loop from resilience outcomes to resources. This effect captures the ‘gain cycle’ that is characterized by overcoming demands successfully and thereby reinforcing one’s resources (e.g., beliefs in own capacity to deal with stress; Llorens, Schaufeli, Bakker, & Salanova, 2007).
Figure 8 A mechanistic process model of resilience.
Table 13 Coping categories in process model of resilience.
Appraisal directed
coping
Reexamining the demand and whether the demand is relevant to
ones goals, and whether someone thinks he is able to deal with a
demand successfully in the end (it is a challenge) or not (it is a
threat), with regard to his or her resources (Lazarus &
Folkman,1984). In fig 4: direct relationship to primary appraisal.
Secondary appraisal
directed coping
Attempting to reduce the stress caused by the appraisal by using
resources. For example by physical exercises, breathing exercises or
emotional support from a colleague. In fig 4: direct relationship to
secondary appraisal and stress levels.
Resource directed Enlarging or strengthening ones resources by strategies such as

24 / 45 TNO report | TNO 2015 R11465
coping networking, training and education, therapy or negotiation with one’s
employer. In fig 4: direct relationship to resources.
Demand directed coping Handling the demand to either diminish or remove it by using
resources. For example by completing a difficult task using resources
such as instrumental help from others. In fig 4: direct relationship to
demands
2.4 Development of a Resilience Knowledge Modelling Tool
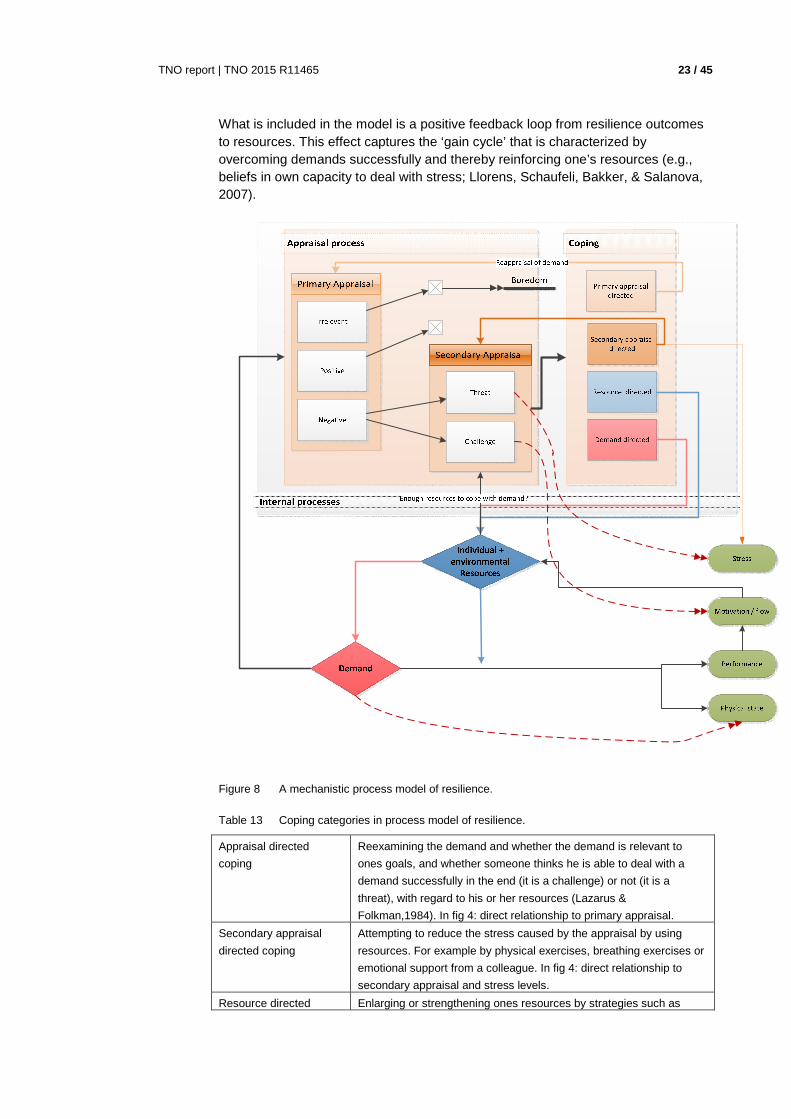
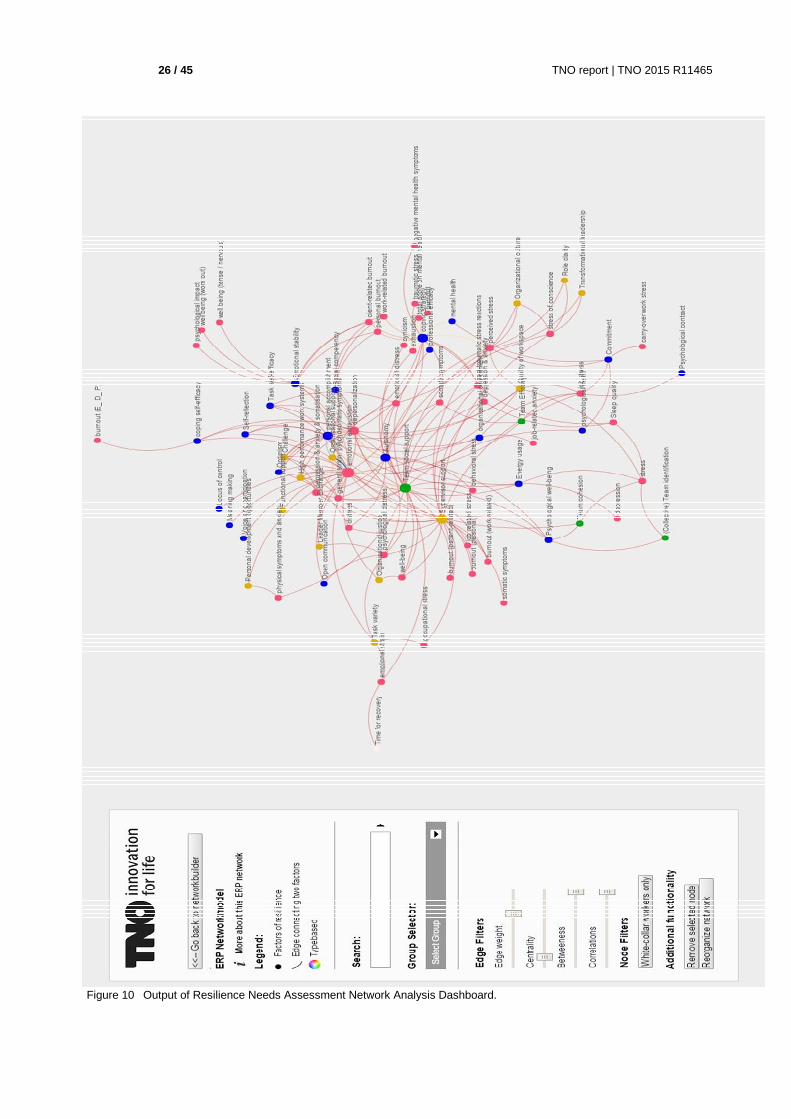
The set of identified resources, demands and outcomes for employee resilience define (a rather broad) scope of the generic model for employee resilience. However, for specific organizations and professions only a subset of the resources, demands and outcomes will be relevant. When developing a resilience enhancement tool for a specific population this subset has to be identified. In former TNO research programs subject matter experts and domain expert opinion was mostly used to identify this subset. Although this method has proven valuable, there can be a potential bias in the identification of relevant factors as experts do not base their judgement on systematic review of resilience related aspects in the organization. A more robust way to define this subset is through the systematic analysis of literature (i.e. meta-analysis) and the use of existing datasets from specific populations. Based on this, a quantitative estimation can be made on the relative power with which a subset of resilience resources can predict resilience related outcomes. Ideally, results from meta-analyses and different data-sets from specific combinations should be integrated and analyzed jointly to enable experts to select the most relevant set of multifactorial resources for a specific population. Therefore, in work package 1 of the research program, a proof of concept of a Resilience Knowledge Modelling Tool was developed that enables resilience researchers to upload relevant data from literature and resilience data-sets and analyze these through a Resilience Needs Assessment Tool. The Resilience Knowledge Modelling Tool consists of a database in which findings from research on resilience can be gathered. For the input of relevant literature into this tool a meta-analysis protocol was developed and tested for a specific population (see Appendix A for details). For the input of the literature data in the Resilience Knowledge Modelling Tool based on this meta-analysis protocol, a web-based tool was developed to enable coding of literature through this protocol. The Resilience Needs Assessment Tool consisted of a two-step prototype dashboard. In the first step, the user can apply different selection strategies to review the literature (see Figure 9) to select factors (i.e., based on types of demands and outcomes) and subpopulations ( based on type of worker, organization, age, education level etc.). These options are based on the meta-analysis protocol attributes for the literature. In the second step, the selected data can be analyzed through network analysis principles (see Figure 10). Network analysis is a method that enable researchers to study complex phenomena without a priori assumptions on causality and order (Borsboom & Cramer, 2013). As such it provides the user with a flexible way to assess the relative importance of demands, resources and resilience outcomes for a specific population and get insight in key resources that are central (because they are connected to relevant demands and outcomes) to resilience in a specific population.
TNO report | TNO 2015 R11465 25 / 45
The Resilience Knowledge Management Tool will be further developed and filled during the ERP Human Resilience. It can serve as basis for the target group needs assessment and can be used to disseminate knowledge on resilience related research with researchers within and outside TNO.
Figure 9 Resilience Needs Assessment Scoping Dashboard.
26 / 45 TNO report | TNO 2015 R11465
Figure 10 Output of Resilience Needs Assessment Network Analysis Dashboard.

TNO report | TNO 2015 R11465 27 / 45
3 Resilience enhancement app development
3.1 Developing rapidly: RAPID Prototyping
To develop an application, the RAPID prototyping method was chosen (Ries, 2011). RAPID prototyping is a collective noun for different techniques and ways of working that allow quick development of (physical) prototypes. In software development this is also referred to as RAPID application development. This method focusses less on process and planning, and more on fast (rapid) developing, testing, and adjusting. The RAPID prototyping approach globally consists of four phases, namely: 1) the requirements planning phase – in which users, researchers and developers discuss the problem, needs, scope, constraints and system requirements; 2) the user design phase – in which users interact with developers, researchers and prototypes that represent the desired system processes, inputs and outputs; 3) the construction phase – in which the application is being developed in cooperation with users who can still provide feedback; and 4) the cutover phase – in which the application is finalised and implemented. The construction phase is described in a related document (Binsch, Wabeke, Koot, Venrooij, & Valk, 2016). The cutover phase, in which the app is finalised and implemented, was not part of the scope of the current development. The goal of the project was to develop knowledge to support the development of tools to enhance employee resilience. An import aim was to develop methods that can translate theoretical, evidence based knowledge into technology solutions. Applying a RAPID prototyping approach in combination with evidence based input steered the process of combining theory-push and technology pull. Development team For the development of the prototype a team should consist of experts of the different disciplines involved in employee resilience in addition to technical experts. Therefore two separate teams were created: the tech-team and the subject-matter-expert-team. The tech-team consisted of members with backgrounds in media mining, machine learning, pattern recognition, artificial intelligence and programming. The subject-matter-expert-team consisted of member with backgrounds in social psychology, personnel management, organizational psychology, nutrition, and behaviour change. The subject matter experts worked on the selection of questionnaires and the behaviour change strategy. The tech-team worked on the creation of the technical workings of the tool, such as the input, the database, and the development of a dashboard to provide the user with feedback. Meetings were held with the separate teams as well as with the two teams together. In addition there were cross-team bilateral meetings to work on specific parts of the integration.
28 / 45 TNO report | TNO 2015 R11465
3.2 Defining problem, target group, and solution
Target group For the first app development a target group was needed that was easily accessible, research minded, and tolerant towards being involved in a development process. Therefore, a population within TNO was sought. Because since a few years, employee engagement research has shown that TNO employees younger than 35 experience relatively high levels of burn-out related complaints (Venrooij, 2014), it was decided that this would be the target group for this prototype. Determining the scope of the app A brainstorm was conducted to collect ideas for tools and application that could be used to enhance human resilience as described in Chapter 2. An additional requirement was that the tool should be based on quantified-self-like technology, since personal data is essential in providing insight into one’s own potential for growth, and providing personalized feedback, supporting the behaviour change that is necessary to increase one’s resilience. The brainstorm was performed by the aforementioned team, with both subject matter experts and technicians. The ideas were based on knowledge as well as personal experiences, and contained a lot of assumptions that needed to be tested later on. During the brainstorm a problem with existing apps was identified that should be addressed in this app development: most applications and tools are used for only a short time as users are not engaged enough to stay committed to using the app for a longer period of time. This was considered one of the biggest challenges in app development in the research line Human Resilience since the sustainable use of the app is vital for data collection, which in turn is required to deliver a sound intervention in order to increase resilience. Scientific articles concerning the use of E-health almost all mention high levels of non-adherence. Users are prone to stop using a technology after a while (Kelders, 2012). Different principles to engage users were explored (see Appendix B for an overview of these principles), and it was decided to explore the principle of using a real life mentor or coach. Based on this principle the concept of the “Buddy app” was developed: an application that measures personal data related to resilience, and that can be used together with a buddy: a coach, or mentor, who has insight into the data of the coachee (the subject of coaching). The assumption was that sustained efforts to induce behavioural change using an app can be stimulated by contact with another person in the form of a coach. The coach could remind the coachee to reflect on the data, and help to implement changes based on the data in daily life. The goal of the application was to enhance resilience by providing an overview of one’s resilience as described by the resilience models in Chapter 2, subsequently supporting to choose a specific and personal resilience enhancing goal, and monitoring progress towards this goal.
3.3 Identify and test customer requirements
To test the assumptions that were included in the idea of the “Buddy app” a list of assumption was created with hypotheses like: “young TNO employees want to be coached in coping with their problems at work”, “young TNO employees are willing to share their data with their coach” and “young TNO employees would be willing to answer a short questionnaire on their smartphone every day”.
TNO report | TNO 2015 R11465 29 / 45
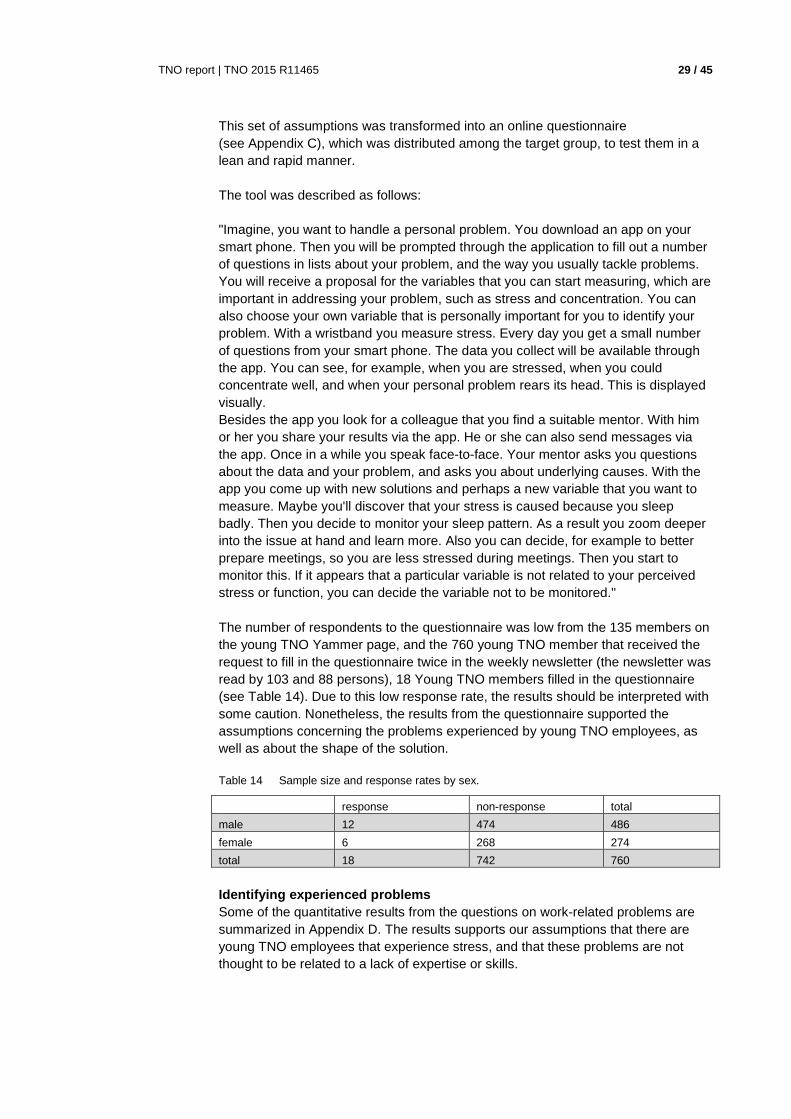
This set of assumptions was transformed into an online questionnaire (see Appendix C), which was distributed among the target group, to test them in a lean and rapid manner. The tool was described as follows: "Imagine, you want to handle a personal problem. You download an app on your smart phone. Then you will be prompted through the application to fill out a number of questions in lists about your problem, and the way you usually tackle problems. You will receive a proposal for the variables that you can start measuring, which are important in addressing your problem, such as stress and concentration. You can also choose your own variable that is personally important for you to identify your problem. With a wristband you measure stress. Every day you get a small number of questions from your smart phone. The data you collect will be available through the app. You can see, for example, when you are stressed, when you could concentrate well, and when your personal problem rears its head. This is displayed visually. Besides the app you look for a colleague that you find a suitable mentor. With him or her you share your results via the app. He or she can also send messages via the app. Once in a while you speak face-to-face. Your mentor asks you questions about the data and your problem, and asks you about underlying causes. With the app you come up with new solutions and perhaps a new variable that you want to measure. Maybe you'll discover that your stress is caused because you sleep badly. Then you decide to monitor your sleep pattern. As a result you zoom deeper into the issue at hand and learn more. Also you can decide, for example to better prepare meetings, so you are less stressed during meetings. Then you start to monitor this. If it appears that a particular variable is not related to your perceived stress or function, you can decide the variable not to be monitored." The number of respondents to the questionnaire was low from the 135 members on the young TNO Yammer page, and the 760 young TNO member that received the request to fill in the questionnaire twice in the weekly newsletter (the newsletter was read by 103 and 88 persons), 18 Young TNO members filled in the questionnaire (see Table 14). Due to this low response rate, the results should be interpreted with some caution. Nonetheless, the results from the questionnaire supported the assumptions concerning the problems experienced by young TNO employees, as well as about the shape of the solution.
Table 14 Sample size and response rates by sex.
response non-response total
male 12 474 486
female 6 268 274
total 18 742 760
Identifying experienced problems Some of the quantitative results from the questions on work-related problems are summarized in Appendix D. The results supports our assumptions that there are young TNO employees that experience stress, and that these problems are not thought to be related to a lack of expertise or skills.
30 / 45 TNO report | TNO 2015 R11465
The most urgent problems for young TNO employees were ‘feeling rushed’ (53% of the sample) and ‘I’m not sure what I want to do’ (37% of the sample). These were also the problems they would like to work on. Testing assumptions Our assumption that young TNO employees are willing to contribute to changing these problems themselves was confirmed. Results showed 48% of the included young TNO employees think that their most urgent problem is something they can change themselves, while another 47,8% thinks that this should be a combined effort from themselves and the organization. Just one participant felt only the organization should change something. A few assumptions on data collection with the Buddy app were tested. About 50% of the respondents was interested in collecting individual data, while only 5% was not, the remainder was undecided. The participants that were interested in collecting individual data were both willing to answer questionnaires as well as to use wearable sensors. A large majority of the participants was willing to answer short questionnaires at work (74%). The questionnaire also contained some questions on coaching, which showed promising results. About 65% of the respondents indicated that they were interested in involving a coach in addressing their problems. Most of these respondents indicated that they preferred a real, professional coach over a colleague as a “buddy”. Using a smartphone application that collects individual user data and uses this for individual monitoring, as well as coaching, thus proved to be a promising approach for the prototype. Finally, on the question whether the respondents would use the buddy app if it was provided to them, 36% of the respondents said ‘yes’ and 42% said ‘maybe’; only 15% of the respondents is not interested in using the app. This suggests that the use of the application is dependent on the specific features the application will have. However, it seemed the target group was in general positive toward the idea of a Buddy-app. Testing these assumptions can identify problems in the application concept to be developed before it is developed. Identifying these problems at an early stage will reduce costs and time spent on app development.
3.4 Selecting relevant variables for the target gro up
Enhancing resilience is different for every organisation, since each organization has a different set of job demands and offers different resources that help employees deal with demands. Therefore an application or tool with the goal to enhance resilience should be tailored to the organisation at hand. In addition, the resilience enhancing tool or application also needs to be tailored to the needs of the specific target group within the organisation. It is possible that within an organisation different target groups can be identified that have to deal with different types of demands.
TNO report | TNO 2015 R11465 31 / 45
This “target group needs assessment” is also part of the first step of the RAPID-process which is used for the successful development of software applications (Ries, 2011), as well as the first step of a method to more specifically develop usable, effective, and reproducible persuasive technology for health promotion (Blanson-Henkemans, Empelen, Paradies, Looije, & Neerincx, 2015). To select the relevant variables (resources, demands, coping strategies, and outcomes) and thereby to ensure an optimally predictive model and reduce risk of omitting key variables, the available literature on resilience related to the target should be studied. The Resilience Knowledge Modelling Tool enables researchers to make a (first) selection of relevant variables (see Chapter 2). This Tool offers a large amount of factors that are relevant to resilience, and the relationships between these factors. However, as the Tool was not yet available during the development process of the Buddy-app, the selection of relevant variables for the development of the Buddy-app was based on a first selection of factors in the overview model and expert judgement of the experts involved in model development (see Section 3.1). After this first selection of factors based on the literature, a secondary selection was made, to further reduce and specify the factors, by identifying (objective and subjective) job demands for the target group. Based on these demands relevant resources and outcomes were identified. For each part of the process model (see Chapter 2) relevant variables were selected in order to create an overview of a person’s resilience, with the ultimate goal of behaviour change, in order to increase an individual’s resilience.
3.4.1 Identifying job demands For the secondary selection of key factors of resilience for the specific target group, two strategies were used: 1) selection of demands based on the organization structure (‘objective demands’) 2) finding perceived demands from employees within the organization (‘subjective demands’). The organisation structure can provide information about which demands are most important for a target group of employees. In addition, the employees can themselves be used as a source of information by asking them about the demands they perceive as most threatening. The first approach is more objective but can produce results that are not in line with employee perception. The second approach will align with employee perception but might not include all demands that actually are threatening because employee’s can be biased to over report some demands and underreport others (for a range of different reasons such as social desirability, cognitive bias, etc.). Selection of demands based on the organisation structure The first selection is based on how the organization is organized. The organisation structure will determine many of the demands in the organization. Subsequently, the demands determine which resources are required to avoid that the demands will lead to too much stress (stress buffering resources) and which type of coping is most functional. Besides stress buffering resources, there are also resources that can strengthen activation, i.e. lead to more challenge. This is applicable in specialized organizations with a lot of repetitive work and a risk of bore-out. This is to a large extent dependent on the function profile.
32 / 45 TNO report | TNO 2015 R11465
According to research conducted in the ‘organization part’ of this ERP project, two types of organizations can be distinguished in relationship to resilience: those with a functional way of organizing the production process and design of jobs, and those with a flow way. Organizations with a functional structure have a stricter division of labor between managing and executing tasks (specialization), while organizations with a flow structure have a division of labor that is less strict (more generalization. A functional structure enables very efficient and modular high volume production, while a flow structure enables a very effective and made to measure production of small batches and thus flexibility (Oeij, Paradies & Kraan, 2015). Due to these differences, other types of demands and resources are of importance. When applied to our target organization, TNO, it appeared that TNO uses both a functional and a flow task organization. The technical research departments use mainly the functional approach, while the social-environmental departments use more flow-oriented work. Consequently, all variables (demands and resources) could be relevant for TNO employees. This first approach therefore proved difficult to apply for selection of variables for TNO. Therefore, it was decided to leave this selection strategy out of scope for the first prototype of the buddy app. In addition, it was also concluded that the categorization of organizations into functional or flow type needs to be further specified, in order to be useful for practical application. Identifying perceived demands within the target group Previous quantitative research has shown that the target group experiences relatively high levels of burn-out related complaints (Venrooij, 2014). Follow-up interviews that were completed identified a few (probable) causes of stress and burn-out complaints under young employees. We used this information to identify initial customer requirements (Section 3.3), and to select the variables the tool would need to measure (Section 3.4). The following perceived demands were identified amongst young TNO employees: − Too little guidance in the starting phase. − Problems with organizing your own work. − Filling in hour registration sheets. − Working on a project basis.
3.4.2 Identify associated resources based on the demands The next step was to identify relevant resources that help employees to deal with these demands, relevant coping strategies and outcomes. The resources and coping strategies were derived from qualitative research by TNO’s HR department complemented with expert input. For each of the found demands this is elaborated on in the Tables in Appendix E. This approach will be different when the Knowledge Modeling Tool and Resilience Needs Assessment Tool (Section 2.4) are ready for use. These tools integrate existing knowledge from literature on human resilience, and visualize the relationships between specific demands and resources.
3.4.3 Including the coping process As described in the process model (Chapter 2) appraisal of the demand is an important step in the resilience process since it describes whether a demand is perceived as challenging, resulting in favourable outcomes for the individual, or threatening, potentially resulting in unfavourable outcomes.
TNO report | TNO 2015 R11465 33 / 45
These different appraisals lead to different physiological, emotional, and behavioural responses from the individual. Appraisal can be measured in a similar manner for every target group. A questionnaire was chosen that measured both threat and challenge emotions (Folkman & Lazarus, 1985). In addition, the app should be able to measure coping strategies that mediate between the demands, resources and outcomes. The resilience process model (see Chapter 2) divides coping strategies in four categories: appraisal directed coping (see demands in terms of challenges instead of threats), stress directed coping (decreasing the overwhelming feeling of stress), resource directed coping (increasing skills, strength, and energy that can be used to tackle demands), and demand directed coping (coming into action to tackle demands). A broad range of coping strategies was included so that users can get a good understanding of the different types. We used an existing list of coping strategies and divided them into the four categories of the resilience process model (see in Appendix E). Most of the coping strategies are derived from the brief COPE (Carver, 1997). We found that resource directed coping was underrepresented, therefore we looked for additional coping questionnaires to supplement this category. Suitable items were found in the Response to stressful experiences scale (RSES; Johnson, et al., 2011).
3.4.4 Identify relevant outcome variables Outcome variables are variables that are the outcome of dealing with demands, like stress, burn-out complaints, productivity, absenteeism, and engagement. These outcomes can have a direct effect on employee’s well-being and organisational goals and are therefore important indicators for the organisation to intervene on employee resilience. There are three issues that should be considered when selecting specific outcomes for an application: 1) what the employees are interested in regarding their personal goals, 2) what different kinds of users (e.g., management, and HR) within the organization are interested in, and 3) which data has previously been collected in the organization, that can provide a benchmark, showing an increase or decrease over the years. All three aspects can be investigated by quantitative and qualitative research. For the buddy app, firstly, “burn-out complaints” were included, since these have been collected within the organization for years and could serve as a benchmark. Another consideration was that it was the high level of burn-out complaints among young employees that signaled the need for a resilience enhancing application. Also, the respondents to the questionnaire that was sent out (see previous Section) framed their goals in terms of stress and burn-out complaints. Secondly, the results of our questionnaire were studied further to see in which terms respondents framed their problems and goals. Some of them mentioned they were not motivated by their current work, others were worried about their performance. Therefore, we also included “motivation” as well as “performance”.
3.5 Select sensors and questionnaires
As the goal of the ERP is to combine physiological and psychological data to monitor employee resilience, both wearable sensors and questionnaires to measure the identified factors were included in the development of the buddy app.
34 / 45 TNO report | TNO 2015 R11465
Most variables selected in the previous section were measured as an intake: the demands, resources, coping styles, and outcome variables. The intake measures more stable variables, that provide a picture of how a person is functioning at that moment. The user was asked to fill out a questionnaire when he opened the app for the first time. The idea is that this measurement is repeated a few times a year, but not daily. The intake consisted of validated scales from the literature and constructs from the employee engagement survey of TNO. We included these questions to have a benchmark for these variables. The overview that these measures formed, provided the coach and the user with information which aspects of resilience could be improved. Together with a coach, the user formulated a personal development goal, such as: being able to work with more concentration. Several variables were measured more often, because these variables are less stable, and provide useful information for enhancing resilience when measured more frequently. A measure of experienced challenge and threat (Folkman & Lazarus, 1985) was included as a daily measure since appraisal related emotions are experienced frequently. In addition, a question concerning the achievement of a personal goal (I was able to work in a concentrated manner), and one question concerning the specific behaviour that was thought to be relevant to reach the goal (I worked on a limited amount of projects today), were included. These variables were measured at the end of each work day, or at the end of each work week, depending on the user’s preference. In addition, a Microsoft Band was used to measure heart rate as a proxy for stress and different motion related measures for physical activity. This application was used off the shelve and proved to lack the appropriate algorithms to provide relevant feedback (see next section).
3.6 User tests
After the design of the application and as a part of the actual building of the application we performed several user tests. The first user tests consisted of a day long test within our team. The team found several technical issues such as a malfunction in the data transfer from the Microsoft Band to the smartphone. For the second user test, three individuals from our target group participated for a week. Participants reported it was interesting to look at a graph of their heartrate and physical activity, but that it was difficult to interpret this data in this raw form. They also reported they received too many notifications. They would prefer to get one notification at the end of the workday since this is a good moment for reflection. Not all variables that were measured daily were visible as feedback, which made it difficult to track the progress towards their goal. In addition, they found wearing the Microsoft Band uncomfortable, and there were some technical issues concerning the connection between the Band and the application. Another issue that was addressed in the evaluation was that stress, and stress-related outcomes are a long term process, while sensors gather data at the very short term. For more on the user tests see Appendix F.
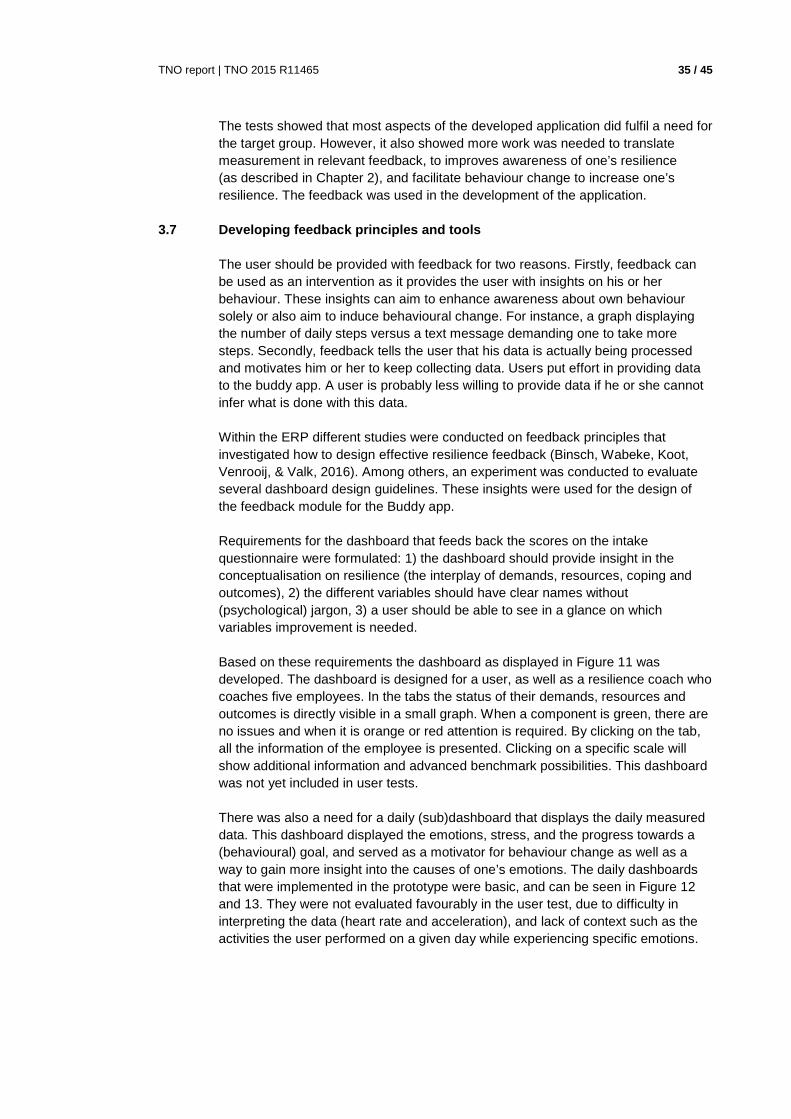
TNO report | TNO 2015 R11465 35 / 45
The tests showed that most aspects of the developed application did fulfil a need for the target group. However, it also showed more work was needed to translate measurement in relevant feedback, to improves awareness of one’s resilience (as described in Chapter 2), and facilitate behaviour change to increase one’s resilience. The feedback was used in the development of the application.
3.7 Developing feedback principles and tools
The user should be provided with feedback for two reasons. Firstly, feedback can be used as an intervention as it provides the user with insights on his or her behaviour. These insights can aim to enhance awareness about own behaviour solely or also aim to induce behavioural change. For instance, a graph displaying the number of daily steps versus a text message demanding one to take more steps. Secondly, feedback tells the user that his data is actually being processed and motivates him or her to keep collecting data. Users put effort in providing data to the buddy app. A user is probably less willing to provide data if he or she cannot infer what is done with this data. Within the ERP different studies were conducted on feedback principles that investigated how to design effective resilience feedback (Binsch, Wabeke, Koot, Venrooij, & Valk, 2016). Among others, an experiment was conducted to evaluate several dashboard design guidelines. These insights were used for the design of the feedback module for the Buddy app. Requirements for the dashboard that feeds back the scores on the intake questionnaire were formulated: 1) the dashboard should provide insight in the conceptualisation on resilience (the interplay of demands, resources, coping and outcomes), 2) the different variables should have clear names without (psychological) jargon, 3) a user should be able to see in a glance on which variables improvement is needed. Based on these requirements the dashboard as displayed in Figure 11 was developed. The dashboard is designed for a user, as well as a resilience coach who coaches five employees. In the tabs the status of their demands, resources and outcomes is directly visible in a small graph. When a component is green, there are no issues and when it is orange or red attention is required. By clicking on the tab, all the information of the employee is presented. Clicking on a specific scale will show additional information and advanced benchmark possibilities. This dashboard was not yet included in user tests. There was also a need for a daily (sub)dashboard that displays the daily measured data. This dashboard displayed the emotions, stress, and the progress towards a (behavioural) goal, and served as a motivator for behaviour change as well as a way to gain more insight into the causes of one’s emotions. The daily dashboards that were implemented in the prototype were basic, and can be seen in Figure 12 and 13. They were not evaluated favourably in the user test, due to difficulty in interpreting the data (heart rate and acceleration), and lack of context such as the activities the user performed on a given day while experiencing specific emotions.
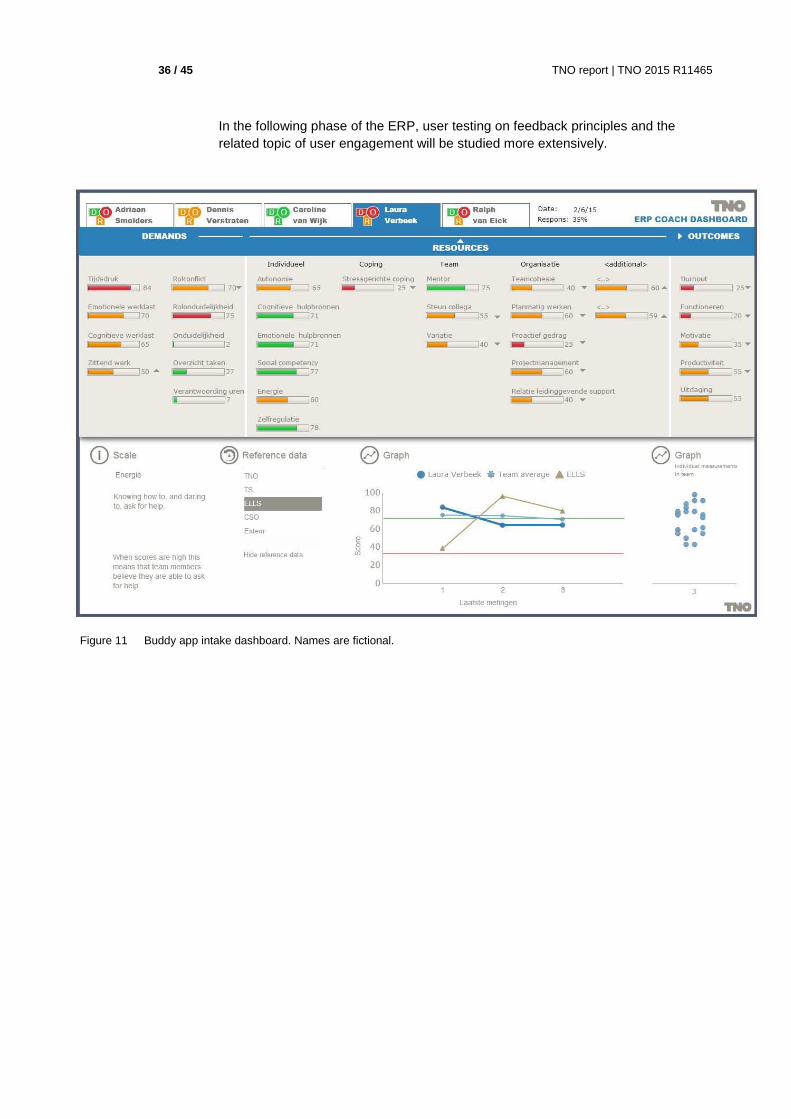
36 / 45 TNO report | TNO 2015 R11465
In the following phase of the ERP, user testing on feedback principles and the related topic of user engagement will be studied more extensively.
Figure 11 Buddy app intake dashboard. Names are fictional.
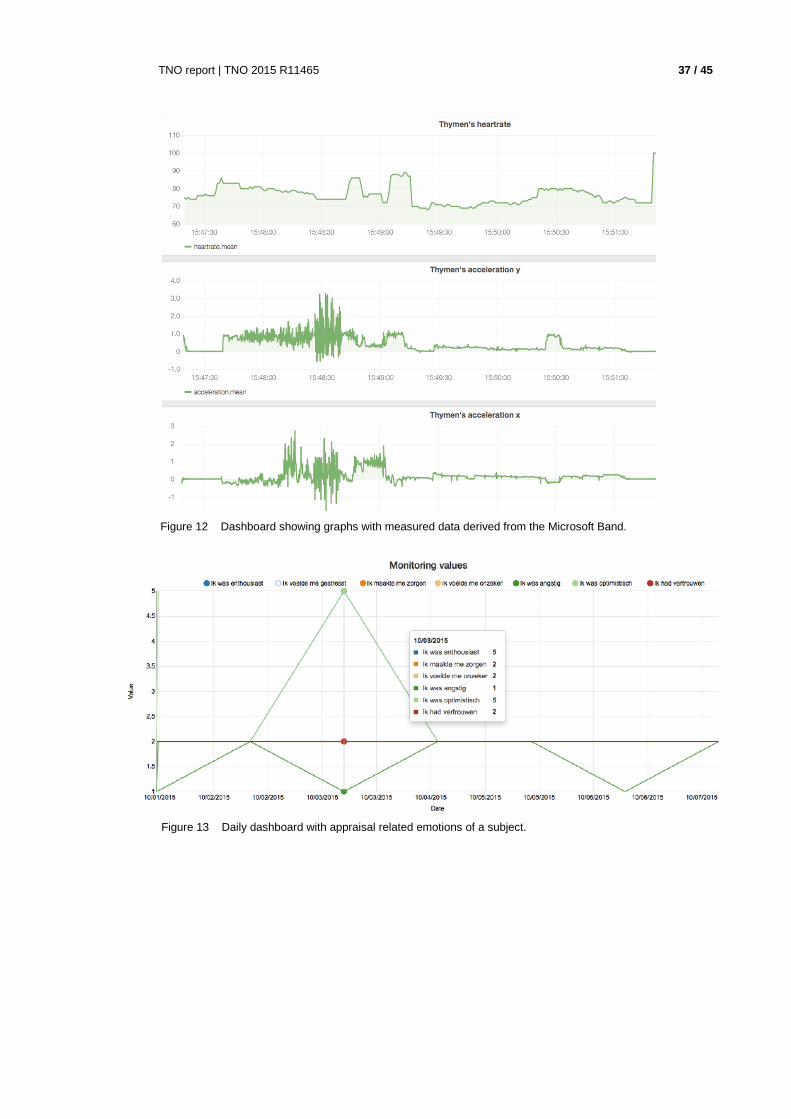
TNO report | TNO 2015 R11465 37 / 45
Figure 12 Dashboard showing graphs with measured data derived from the Microsoft Band.
Figure 13 Daily dashboard with appraisal related emotions of a subject.
38 / 45 TNO report | TNO 2015 R11465
4 Conclusions and way ahead
In this report the theoretical development of employee resilience models was described and the development of a first resilience enhancement application based on these theoretical assumptions. Both activities were an important part of the first year of the ERP research line Human Resilience to lay out the ground work for the theoretical approach and technological development approach. The former ensures an evidence-based/informed foundation of further developments in the program, the latter provides a modus operandi for applying this evidence base in a technological app development process. As such these activities underline the combination of knowledge push and technology pull that is central to the ERP Human Resilience. Other knowledge developments within the ERP (i.e., the embedding of resilience apps in the organisation context, the development of sensing and monitoring tools and feedback principles) were not discussed extensively as these are discussed in other reports. However, to the extent that the insights from these activities were used in the application development, they will be discussed below as well. Next a short summary, main conclusions, and future research questions will be discussed regarding the development of the theoretical models, the application development and the interaction between these activities. Employee resilience model development The conceptualisation of employee resilience within this project was based on literature and earlier work on this topic within TNO. Employee resilience is conceptualised as a process in which employees sustain performance, motivation and health under demanding conditions using resources within themselves (e.g., beliefs, skills, personality) and in their social environment (e.g., team, leader, organisation, family). Based on this conceptualisation a first overview model was developed including the main categories of demands, resources and outcomes for employees. Subsequently, this overview model was specified, identifying a broad range of demands, resources and outcomes for employees in a generic model. A key assumption was that the organizational context determines for a large part which demands, resources and outcomes are relevant for a specific domain (e.g., police, nurses, knowledge workers, etc.) and also determines partly the nature of the interactions between resources and demands. Therefore, a (demo) tool (Resilience Knowledge Modelling Tool) was developed, using the principles of meta-analysis and network analysis, to enable researchers to systematically review literature and identify the most important factors that should be included when developing a resilience enhancement application for a specific organisation. This Tool can be updated with state-of-the-art scientific knowledge continuously to prevent it from being outdated. In addition, a process model of resilience was developed in which the actual mechanisms in which demands in interaction with resources produce outcomes for employees is described. This process model provides the theoretical basis for daily monitoring and feedback to be implemented in resilience enhancement apps. Both models represent the state-of-the art of scientific knowledge on resilience. However, as the models are described at a generic level (and not for a specific population), quantification of the relationships within the models was not possible yet. This quantification should be based on expertise and data from a specific domain or organisation.
TNO report | TNO 2015 R11465 39 / 45
Therefore, a research question for the coming year concerns investigating data and methods that can be used to quantify the models for a specific population. In addition, one of the requirements of the application to be developed in the ERP is to use prospective modelling based on the data collected by the app (to be able to go beyond description of current status of resilience and predict what needs to be done to improve future status of resilience). Prospective modelling should be a combination of theoretical assumptions and data-driven pattern recognition. As such, in the coming year the theoretical models will be used as a basis to (develop methods to) develop predictive models for specific populations. Resilience enhancement application development A prototype named the Buddy app was developed, and tested among several members of the target group. The goal of the application was to enhance resilience among young (<35y) TNO employees by providing an overview of one’s resilience as described by the resilience models in Chapter 2, and subsequently supporting to choose a specific and personal resilience enhancement goal, and monitoring progress towards this goal. The development of the prototype was supported by knowledge from other parts of the project in order to select the most relevant variables to measure, to select sensors and questionnaires, and to provide relevant feedback to the user. RAPID-prototyping was used as a development process for the first resilience enhancing prototype. This iterative method suits the purpose of this project since new versions are developed rapidly allowing new knowledge from other parts of the project to be incorporated in a newer version of the prototype. On the other hand, the basic principle on which the prototype is based is unlikely to be changed in a next iteration. What makes the method difficult to implement is that developing rapidly in time requires longer stretches of focussed time, which is not always available due to employees working on parallel projects, and tight project budgets. For example: in the last year only one cycle of design, building and testing was completed. The development of the resilience enhancement application also led to some insights on what knowledge development is further needed to improve the content and process of the application development. In the described prototype a buddy or coach was included to stimulate user engagement and provide support in behaviour change required for enhancing individual resilience. Since a coach can be expensive, in the next phase of the ERP, other interventions for user engagement should be investigated. Key research questions therefore are: What kind of methods for user engagement can be applied? How could a resilience enhancement tool support the user in a tailored (personalized) manner? And which type of data (analysis) is required to provide this kind of support? While developing the prototype, the resilience model was, in combination with relevant literature and other sources, used to support the inclusion of relevant variables to measure in the application. The next step would be to identify common demands based on the characteristics of the organization (Oeij, Paradies, & Kraan, 2015). Characteristics of the organization are an objective way to look at relevant demands (in addition to qualitative research).
40 / 45 TNO report | TNO 2015 R11465
However, the selection of the demands and resources for a specific target group was not yet guided by characteristics of the organization as the organisation typology developed in the ERP did not suit TNO. Therefore a question for the future is which characteristics of an organization are relevant when selecting variables. Based on user feedback, a preliminary design principal was identified: provide relevant feedback. Participants were not interested in measuring without feedback, seeing feedback they could not derive meaning from, like a graph of their heartrate, or seeing feedback on measures they were not interested in. Therefore, in the future, meaningful ways of processing and displaying data should be developed. Users have a need for analysis and actionable insights (Fawcett, 2015). The development of predictive models, as described above, could be an important step in providing more meaningful feedback. Being able to analyse what the causes are of specific outcome scores, and receiving information about which behavioural change options one has to influence these scores, may keep users engaged and make these applications more effective. Combining knowledge push and technology pull The activities (theoretical and application development) described in this report ran largely parallel to each other. This placed some constraints on the optimal use of theory in application development, as the theoretical models matured while application development was already on its way. Ideally, these activities would be conducted more serially. However, as technologically and theoretical/scientific developments are continuous it would never be possible to optimally include state-of-the –art knowledge on both in a serial way. For example, the generic model and resilience knowledge management tool were not available yet when prototype development started. Within the current application development process, this issue was addressed by using multidisciplinary teams consisting of subject-matter experts and tech experts. The multidisciplinary nature of the teams had the advantage that technology and theory were integrated in collaboration, allowing translation mistakes (from theory to practice) to be corrected on the spot. However, it was still a challenge to incorporate new knowledge into an existing prototype. In the future it would be beneficial to have procedure embedded in the process that ensures ready to use knowledge is implemented at a right stage of the application development. Future Research Questions Based on these findings some future research questions have been identified that will be addressed in 2016: How can we quantify and scope the generic model for a specific use case to enable predictive modelling? What methods are available and effective to make predictions within the presumptions of the model and based on data? How can we engage employees to use Human Resilience Applications to perform healthy work behaviour on a long-term? How can we define the most relevant resources to strengthen workers’ resilience, given the typology of the organization (functional type or flow type)?
TNO report | TNO 2015 R11465 41 / 45
5 References
E., De Ruyter B. (2009). New research perspectives on ambient intelligence. Journal of Ambient Intelligence and Smart Environments, 1, 5-14. Akubat, I. and G. Abt (2010). Intermittent exercise alters the heart rate–blood
lactate relationship used for calculating the training impulse (TRIMP) in team sport players. Journal of Science and Medicine in Sport, 14, 249-253.
Allen, A. B., & Leary, M. R. (2010). Self‐Compassion, stress, and coping. Social and Personality Psychology Compass, 4(2), 107-118. Amichai-Hamburger, Y., Klomek, A. B., Friedman, D., Zuckerman, O., & Shani- Sherman, T. (2014). The future of online therapy. Computers in Human Behaviour, 41, 288-294. Aspinwall L.G., Taylor, S.E. (1997). A stitch in time: self-regulation and proactive coping. Psychology Bulletin, 121, 417-36. Ba, A., et al. (2008). Post-exercise heart rate recovery in healthy, obeses, and
COPD subjects: relationships with blood lactic acid and PaO2 levels. Clin Res Cardiol, 98: 52-58.
Bale, P. and E. Colley (1984). Size and Somatotype correlates of strength hand physiological performance in adult male students. The Australian Journal of Science and Medicine in Sport, 4, 2-6.
Binsch, O., Wabeke, T., Koot, G. & Venrooij, W. (2015). Enhancing resilience: monitoring, sensing and feedback (TNO 2015 R11632). TNO, Soesterberg, The Netherlands.
Blanson Henkemans, O. A., Empelen, P. V., Paradies, G. L., Looije, R., & Neerincx, M. A. (2015). Lost in persuasion a multidisciplinary approach for developing usable, effective, and reproducible persuasive technology for health promotion. In PervasiveHealth 2015-9th International Conference on Pervasive Computing Technologies for Healthcare, At Istanbul, Turkey. Boermans, S., Kamphuis, W., Delahaij, R., Korteling, H., & Euwema, M. (2013).
Perceived demands during modern military operations. Military Medicine, 178, 722-728.
Borsboom, D., & Cramer, A. (2013). Network Analysis: An integrative approach to the structure of psychopathology. Annual Review of Clinical Psychology, 91-121.
Breines, J. G., & Chen, S. (2012). Self-compassion increases self-improvement motivation. Personality and Social Psychology Bulletin, 38(9), 1133-1143.
Carver, C. S. (1997). You want to measure coping but your protocol’too long: Consider the brief cope. International journal of behavioural medicine, 4(1), 92-100.
Christensen, J., et al. (2001). Marine n-3 fatty acids, wine intake, and heart rate variability in patients referred for coronary angiography. Circulation,103 (5),651- 657. Delahaij, R., Gaillard, A. W. K. , & van Dam, K. (2010). Hardiness and the response to stressful situations: Investigating mediating processes. Personality and Individual Differences, 49, 386-390.
Delahaij, R., Kamphuis, W., Binsch, O., Venrooij, W. (2014). Ontwikkeling Militaire Resilience Monitor [Development of the Military Resilience Monitor] (TNO R11652). Soesterberg, The Netherlands, TNO
42 / 45 TNO report | TNO 2015 R11465
Delahaij, R., Theunissen, N. C. & Six, C. (2014). The influence of autonomy support on self-regulatory processes and attrition in the Royal Dutch Navy. Learning and Individual Difference, 30, 177-181. Demerouti, E., Bakker, A. B., Nachreiner, F., & Schaufeli, W. B. (2001). The job demands-resources model of burnout. Journal of Applied psychology, 86(3), 499.
Direito A, Pfaeffli Dale L, Shields E, Dobson R, Whittaker R, Maddison R. (2014). Do physical activity and dietary smartphone applications incorporate evidence-based behaviour change techniques? BMC Public Health,14, 646.
Dweck, C. S. (1986). Motivational processes affecting learning. American psychologist, 41(10), 1040. Endler, N. S., & Parker, J. D. A. (1994). Assessment of multidimensional coping: Task, emotion, and avoidance strategies. Psychological Assessment, 6, 50-60. Eurofound & EU-OSHA (2014). Psychosocial risks in Europe: prevalence and
strategies for preventions. Publications office of the European Union, Luxembourg.
Fawcett, T. (2015). Mining the quantified self: personal knowledge discovery as a challenge for data science. Big Data, 3, 249-266.
Folkman, S., & Lazarus, R. S. (1985). If it changes it must be a process: Study of emotion and coping during three stages of a college examination. Journal of Personality and Social Psychology, 48, 150-170. Folkman, S., & Moskowitz, J. T. (2004). Coping: pitfalls and promise. Annual Review of Psychology, 55, 745-747. Free, C, Phillips, G, Galli, L, Watson, L, Felix, L, Edwards, P, Patel, V, Haines, A.
(2013). The effectiveness of mobile-health technology-based health behaviour change or disease management interventions for health care consumers: a systematic review. PLoS Medicine; 10(1): 1-45.
Frese, M., Fay, D., Hilburger, T., Leng, K., & Tag, A. (1997). The concept of personal initiative: Operationalization, reliability and validity in two German samples. Journal of occupational and organizational psychology, 70, 139-162. Ganzel, B., et al. (2010). Allostasis and the human brain: Integrating models of
stress from the social and life sciences. Psychological reviews, 117(1): 134-174. Gregor, M. and G. Hotamisligil (2011). Inflammatory mechanisms in obesity. Annu
Rev Immonol, 29: 415-445. Hersey, P. (1985). The situational leader. New York, NY: Warner Books Houtman, I.L.D., Goudswaard, A., Dhondt, S., Grinten, M. van der, Hildebrandt, V. & M. Kompier (1995). Evaluatie van de monitorstudie naar stress en lichamelijke belasting. Den Haag: VUGA. Huber, M., Knottnerus, J. A., Green, L., van der Horst, H., Jadad, A. R., Kromhout,
D., & Schnabel, P. (2011). How should we define health? Bmj,343, d4163. Johannink, R. (2015). The Future of HR Analytics: a Delphi method study. 5th IBA
Bachelor Thesis Conference, July 2nd, 2015 Enschede, Netherlands. Johnson, D.C., Polusny, M.A., Erbes, C.R., King, D.K., King, L., Litz, B.T., Schnurr, P.P., Friedman, M., Pietrzak, R.H., Southwick, S.M. (2011). Development of initial validation of the response to stressful experiences scale. Military Medicine, 176, 161-169. Juster, R.-P., et al. (2011). A clinical allostatic load index is associated with burnout
symptoms and hypocortisolemic profiles in healthy workers. Psychoneuroendocrinology, 36, 797-805.
Kahn, S., et al. (2006). Mechanisms linking obesity to insulin resistance and type 2 diabetes. Nature 444, (7121): 840-846.
Kamphuis, W., et al. (2012). Psychosociale determinanten van mentale veerkracht in de krijgsmacht [Psychosocial determinants of psychological resilience in the armed forces]. Soesterberg, the Netherlands: TNO. TNO 2012 R10246.
TNO report | TNO 2015 R11465 43 / 45
Kamphuis, W., Delahaij, R. (2014). The Relevance of Resources for Resilience at Different Organizational Levels within the Military Deployment Cycle. In I. Herrera, J. M. Schraagen, J. Van der Vorm, & D. Woods (Eds.). Proceedings 5th Symposium on Resilience Engineering, Managing trade-offs; June 24-27, Soesterberg, Netherlands (pp. 137-142). Sophia Antipolis Cedex, France: Resilience Engineering Association.
Kamphuis, W., Delahaij, R., Vorm, J. K. J. van der, Preenen, T. Y. P. (2013). Resilience on individual, team, and organizational level: A multilevel approach (TNO 2013 M10187). Soesterberg, The Netherlands, TNO. Karatsoreos, I. and B. McEwen (2011). Psychobiological allostasis: resistance, resilience and vulnerability. Trends in Cognitive Sciences, 15, (12): 576-584. Kahneman, N., Pejovic, V., Rachuri, K. K., Mascolo, C., Musolesi, M., & Rentfrow, P. J. (2013). Smartphones for large-scale behaviour change interventions. IEEE Pervasive Computing, (3), 66-73. Kelders, S. M. (2012). Understanding adherence to web-based interventions. Thesis, Enschede, the Netherlands: University of Twente. Kottke, J. L., & Sharafinski, C. E. (1988). Measuring perceived supervisory and organizational support. Educational and Psychological Measurement, 48(4), 1075-1079. Lazarus, R. S. & Folkman, S. (1984). Stress, appraisal and coping. New York: Springer.Liden, R. C., & Maslyn, J. M. (1998). Multidimensionafity of leader- member exchange: An empirical assessment through scale development. Journal of management, 24(1), 43-72. Llorens, S., Schaufeli, W., Bakker, A., & Salanova, M. (2007). Does a positive gain spiral of resources, efficacy beliefs and engagement exist? Computers in Human Behaviour, 23, 825-841. Matlin, M. (2009). Cognition. Hoboken, NJ, John Wiley & Sons. Meyer, J. P.; Allen, N. J. (1991). A three-component conceptualization of organizational commitment. Human Resource Management Review, 1, 61. doi:10.1016/1053-4822(91)90011-Z. Mikulincer, M., & Florian, V. (1996). Coping and adaptation to trauma and loss. In M. Zeidner & N. S. Endler (Eds.), Handbook of coping: Theory, research, applications (pp. 554-572). New York: Wiley. Morath, R. A., Leonard, A. L., Zaccaro, S. J. 2011 Military leadership: An Overview and Introduction to the special issue. Mil Psychol, 23, 453-461. (doi:10.1080/08995605.2011.600133) Niforatos, E., & Karapanos, E. (2015). EmoSnaps: a mobile application for emotion recall from facial expressions. Personal and Ubiquitous Computing, 19(2), 425- 444. Oeij, P. R. A., Paradies, G. L. & Kraan, K. O. (2015). De keuze voor resilience- variabelen op basis van organisatiekenmerken (WP2.1). TNO report 2015 R10990. Paradies, G. L., Wabeke, T. R., & Korte, E. M., de (2015). Empowering employees
and organizations with self-tracking technologies: the state of the art and future opportunities. Manuscript submitted for publication.
Preenen, P. T. Y., Van Vianen, A. E. M., De Pater, I. E., & Geerling, R. (2011). Ervaren uitdaging op het werk: Ontwikkeling van een meetinstrument. Gedrag en Organisatie, (24)1, 64-83. Ptacek, J. T., Pierce, G. R., & Thompson, E. L. (2006). Finding evidence of dispositional coping. Journal of Research in Personality, 40, 1137-1151. Reich, J.W., Zautra, J.W., & Hall., J.S. (2010). Handbook of adult resilience. New York, Guilford Press. Ries, E. (2011). The Lean Startup. New York: Crown Business.
44 / 45 TNO report | TNO 2015 R11465
Roberts, A., et al. (2010). The prefrontal cortex. Executive and cognitive functions. Oxford University Press. Oxford, Oxford University Press.
Ryff, C. and B. Friedman (2012). Varieties of resilience in MIDUS. Soc Personal Psychological Compass,6, (11), 1-14. Sakamoto, Y., Jones, M, Love, B. C. (2008). Memory & Cognition, 36, 1057-1065. Scheier, M. F. & Carver, C. S. (1985). Optimism, coping, and health: Assessment and implications of generalized outcome expectancies. Health Psychology,4, 219-247. Snyderman R., Yoediono Z. (2008). Perspective: Prospective health care and the
role of academic medicine: Lead, follow, or get out of the way. Acad Med, 83, 07–714.
Southwick, S. and D. Charney (2012). The Science of Resilience: Implications for the Prevention and Treatment of Depression. Science, 338 (79): 79-82.
Southwick, S., et al. (2005). The Psychobiology of Depression and Resilience to Stress: Implications for Prevention and Treatment. Annu Rev Clin Psychol, 1, 255-291.
Stanton, A. L., Kirk, S. B., Cameron, C. L., & Danoff-Burg, S. (2000). Coping through emotional approach: scale construction and validation. Journal of Personality and Social Psychology, 78, 1150-1169. Sternberg, R. and K. Sternberg (2009). Cognitive Psychology. Belmont, CA,
Wadsworth, Cengage Learning. Stiegler, P. and A. Cunliffe (2006). The Role of Diet and Exercise for the
Maintenance of Fat-Free Mass and Weight Loss. Sport Med, 36(3): 239-262. Swan, M. (2012). Sensor Mania! The internet of things, wearable computing,
objective metrics, and the quantified self 2.0 – Review. Journal of Sensor and Actuator Networks 1, 217-253; doi: 10.3390/jsan1030217.
Swan, M. (2013). The quantified self: Fundamental disruption in big data science and biological discovery. Big Data, 1(2), 85-99. Tangney, J. P., Baumeister, R. F., & Boone, A. L. (2004). High self‐control predicts good adjustment, less pathology, better grades, and interpersonal success. Journal of personality, 72(2), 271-324. Troy, A. S., Wilhelm, F. H., Shallcross, A. J., & Mauss, I. B. (2010). Seeing the silver lining: cognitive reappraisal ability moderates the relationship between stress and depressive symptoms. Emotion, 10(6), 783. VandeWalle, D., Brown, S. P., Cron, W. L., & Slocum Jr, J. W. (1999). The influence of goal orientation and self-regulation tactics on sales performance: A longitudinal field test. Journal of Applied Psychology, 84(2), 249 Van den Heuvel S. G., Geuskens G. A., Hooftman W. E., Koppes L. L. J., Van den
Bossche, S. N. J. (2010). Productivity loss at work; health related and work-related factors. Journal of Occupational Rehabilitation, 20, 331-339. DOI 10.007/s10926-009-9219-7.
Van Liempt, S. (2012). Sleep disturbances and PTSD: a perpetual circle? Eur J Psychotraumatol, 3. Veldhuis, G., et al. (2014). Development of a generic Smart City model using MARVEL. 32nd International Conference of the System Dynamics Society, Delft, the Netherlands. Virtue, S. and A. Vidal-Puig (2010). Adipose tissue expandability, lipotoxicity and
the Metabolic Syndrome--an allostatic perspective. Biochim Biophys Acta, 1801(3): 338-349.
Vries, R. E., de, Ashton, M. C., & Lee, K. (2009). De zes belangrijkste persoonlijkheidsdimensies en de HEXACO persoonlijkheidsvragenlijst. Gedrag en Organisatie, 22, 232-274.

TNO report | TNO 2015 R11465 45 / 45
Vullers, R., Penders, J., Brongersma, S., Wijsman, J., Altini, M., & Van Hoof, C. (2013). Wearable Smart Systems for Personal Healthcare and Lifestyle. Unpublished manuscript.
Wallace, T., et al. (2004). Use and abuse of HOMA modeling. Diabetes Care, 27(6): 1487-1495.
Wietmarschen, H., Delahaij, R, Beurden, M., Hoogh, I., deGraaf, A., Binsch, O., Scheepstal, P., & Valk, P. (2014). Multidimensional resilience assessment and optimization. Zeist; TNO 2014 R11868. Yoshida, T., et al. (1987). Blood lactate parameters related to aerobic capacity and
endurance performance. Eur J Appl Physiol, 56, 7-11. Zautra, A. J., Hall, J. S., & Murray, K. E. (2010). Resilience: The meanings, methods, and measures of a fundamental characteristic of human adaptation. In Reich, J.W., Zautra, J.W., & Hall., J.S. Handbook of adult resilience. New York, Guilford Press.

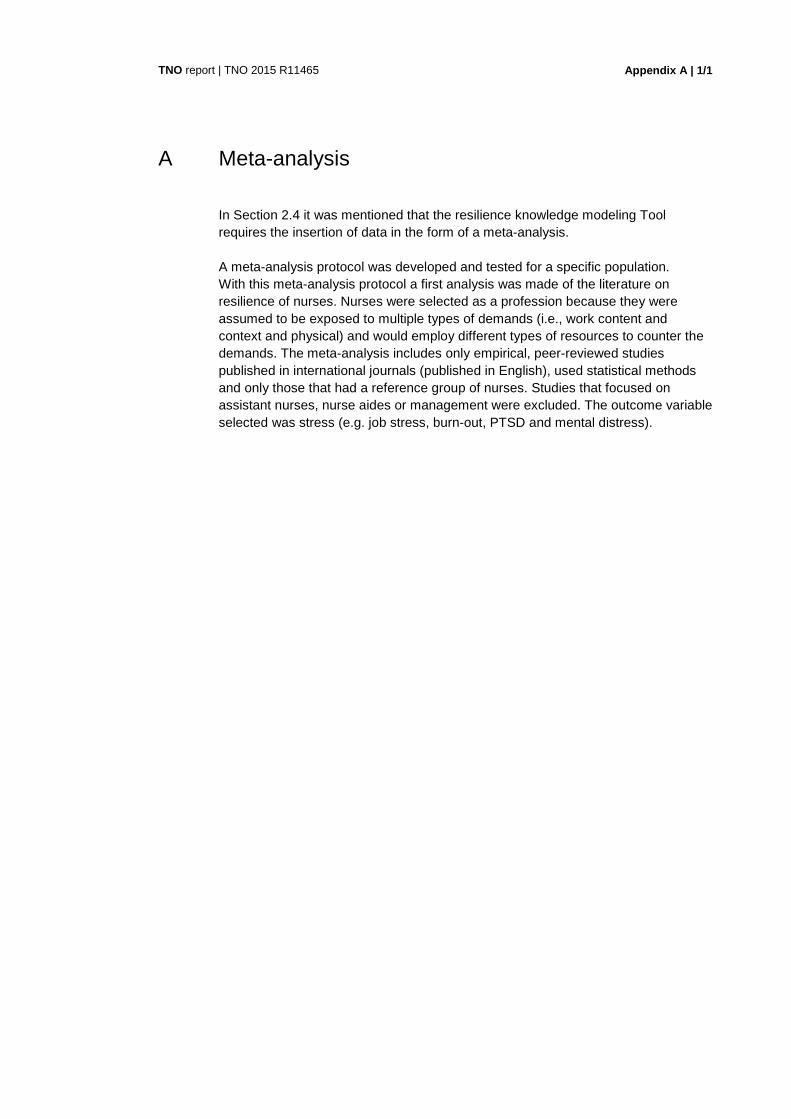
Appendix A | 1/1
TNO report | TNO 2015 R11465
A Meta-analysis
In Section 2.4 it was mentioned that the resilience knowledge modeling Tool requires the insertion of data in the form of a meta-analysis. A meta-analysis protocol was developed and tested for a specific population. With this meta-analysis protocol a first analysis was made of the literature on resilience of nurses. Nurses were selected as a profession because they were assumed to be exposed to multiple types of demands (i.e., work content and context and physical) and would employ different types of resources to counter the demands. The meta-analysis includes only empirical, peer-reviewed studies published in international journals (published in English), used statistical methods and only those that had a reference group of nurses. Studies that focused on assistant nurses, nurse aides or management were excluded. The outcome variable selected was stress (e.g. job stress, burn-out, PTSD and mental distress).

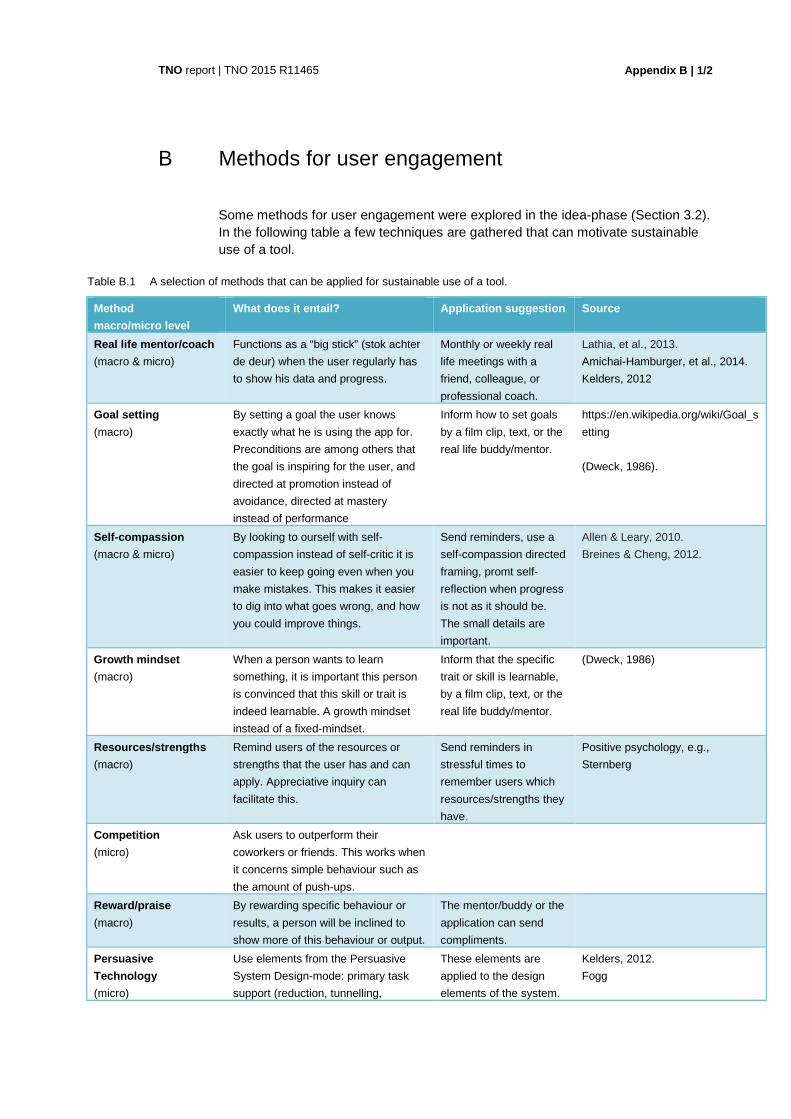
Appendix B | 1/2
TNO report | TNO 2015 R11465
B Methods for user engagement
Some methods for user engagement were explored in the idea-phase (Section 3.2). In the following table a few techniques are gathered that can motivate sustainable use of a tool.
Table B.1 A selection of methods that can be applied for sustainable use of a tool.
Method
macro/micro level
What does it entail? Application suggestion Source
Real life mentor/coach
(macro & micro)
Functions as a “big stick” (stok achter
de deur) when the user regularly has
to show his data and progress.
Monthly or weekly real
life meetings with a
friend, colleague, or
professional coach.
Lathia, et al., 2013.
Amichai-Hamburger, et al., 2014.
Kelders, 2012
Goal setting
(macro)
By setting a goal the user knows
exactly what he is using the app for.
Preconditions are among others that
the goal is inspiring for the user, and
directed at promotion instead of
avoidance, directed at mastery
instead of performance
Inform how to set goals
by a film clip, text, or the
real life buddy/mentor.
https://en.wikipedia.org/wiki/Goal_s
etting
(Dweck, 1986).
Self-compassion
(macro & micro)
By looking to ourself with self-
compassion instead of self-critic it is
easier to keep going even when you
make mistakes. This makes it easier
to dig into what goes wrong, and how
you could improve things.
Send reminders, use a
self-compassion directed
framing, promt self-
reflection when progress
is not as it should be.
The small details are
important.
Allen & Leary, 2010.
Breines & Cheng, 2012.
Growth mindset
(macro)
When a person wants to learn
something, it is important this person
is convinced that this skill or trait is
indeed learnable. A growth mindset
instead of a fixed-mindset.
Inform that the specific
trait or skill is learnable,
by a film clip, text, or the
real life buddy/mentor.
(Dweck, 1986)
Resources/strengths
(macro)
Remind users of the resources or
strengths that the user has and can
apply. Appreciative inquiry can
facilitate this.
Send reminders in
stressful times to
remember users which
resources/strengths they
have.
Positive psychology, e.g.,
Sternberg
Competition
(micro)
Ask users to outperform their
coworkers or friends. This works when
it concerns simple behaviour such as
the amount of push-ups.
Reward/praise
(macro)
By rewarding specific behaviour or
results, a person will be inclined to
show more of this behaviour or output.
The mentor/buddy or the
application can send
compliments.
Persuasive
Technology
(micro)
Use elements from the Persuasive
System Design-mode: primary task
support (reduction, tunnelling,
These elements are
applied to the design
elements of the system.
Kelders, 2012.
Fogg
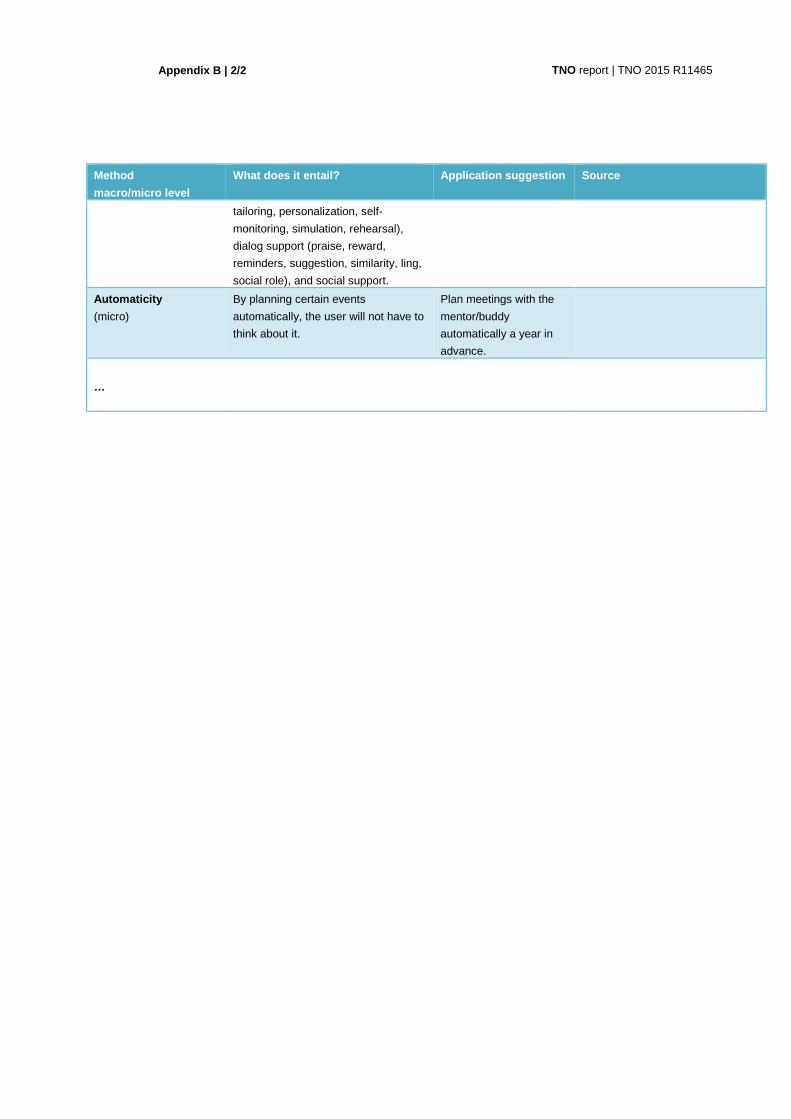
Appendix B | 2/2
TNO report | TNO 2015 R11465
Method
macro/micro level
What does it entail? Application suggestion Source
tailoring, personalization, self-
monitoring, simulation, rehearsal),
dialog support (praise, reward,
reminders, suggestion, similarity, ling,
social role), and social support.
Automaticity
(micro)
By planning certain events
automatically, the user will not have to
think about it.
Plan meetings with the
mentor/buddy
automatically a year in
advance.
…
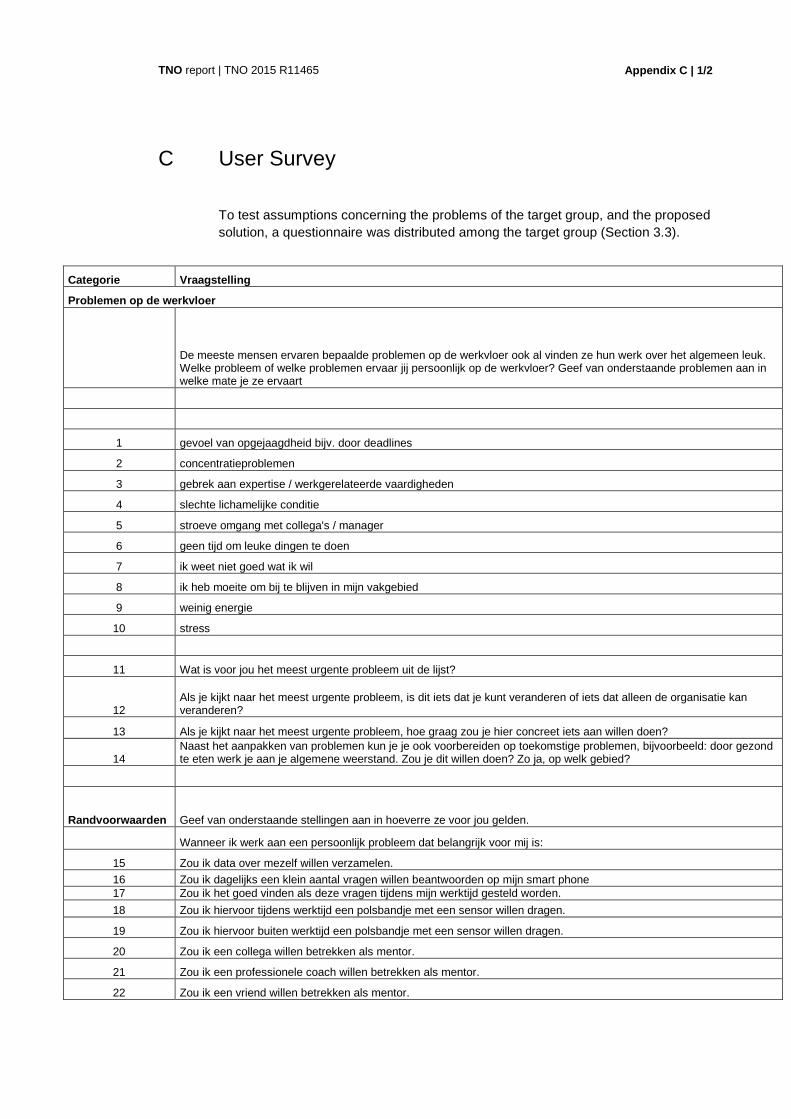
Appendix C | 1/2
TNO report | TNO 2015 R11465
C User Survey
To test assumptions concerning the problems of the target group, and the proposed solution, a questionnaire was distributed among the target group (Section 3.3).
Categorie Vraagstelling
Problemen op de werkvloer
De meeste mensen ervaren bepaalde problemen op de werkvloer ook al vinden ze hun werk over het algemeen leuk. Welke probleem of welke problemen ervaar jij persoonlijk op de werkvloer? Geef van onderstaande problemen aan in welke mate je ze ervaart
1 gevoel van opgejaagdheid bijv. door deadlines
2 concentratieproblemen
3 gebrek aan expertise / werkgerelateerde vaardigheden
4 slechte lichamelijke conditie
5 stroeve omgang met collega's / manager
6 geen tijd om leuke dingen te doen
7 ik weet niet goed wat ik wil
8 ik heb moeite om bij te blijven in mijn vakgebied
9 weinig energie
10 stress
11 Wat is voor jou het meest urgente probleem uit de lijst?
12 Als je kijkt naar het meest urgente probleem, is dit iets dat je kunt veranderen of iets dat alleen de organisatie kan veranderen?
13 Als je kijkt naar het meest urgente probleem, hoe graag zou je hier concreet iets aan willen doen?
14 Naast het aanpakken van problemen kun je je ook voorbereiden op toekomstige problemen, bijvoorbeeld: door gezond te eten werk je aan je algemene weerstand. Zou je dit willen doen? Zo ja, op welk gebied?
Randvoorwaarden Geef van onderstaande stellingen aan in hoeverre ze voor jou gelden.
Wanneer ik werk aan een persoonlijk probleem dat belangrijk voor mij is:
15 Zou ik data over mezelf willen verzamelen.
16 Zou ik dagelijks een klein aantal vragen willen beantwoorden op mijn smart phone 17 Zou ik het goed vinden als deze vragen tijdens mijn werktijd gesteld worden.
18 Zou ik hiervoor tijdens werktijd een polsbandje met een sensor willen dragen.
19 Zou ik hiervoor buiten werktijd een polsbandje met een sensor willen dragen.
20 Zou ik een collega willen betrekken als mentor.
21 Zou ik een professionele coach willen betrekken als mentor.
22 Zou ik een vriend willen betrekken als mentor.
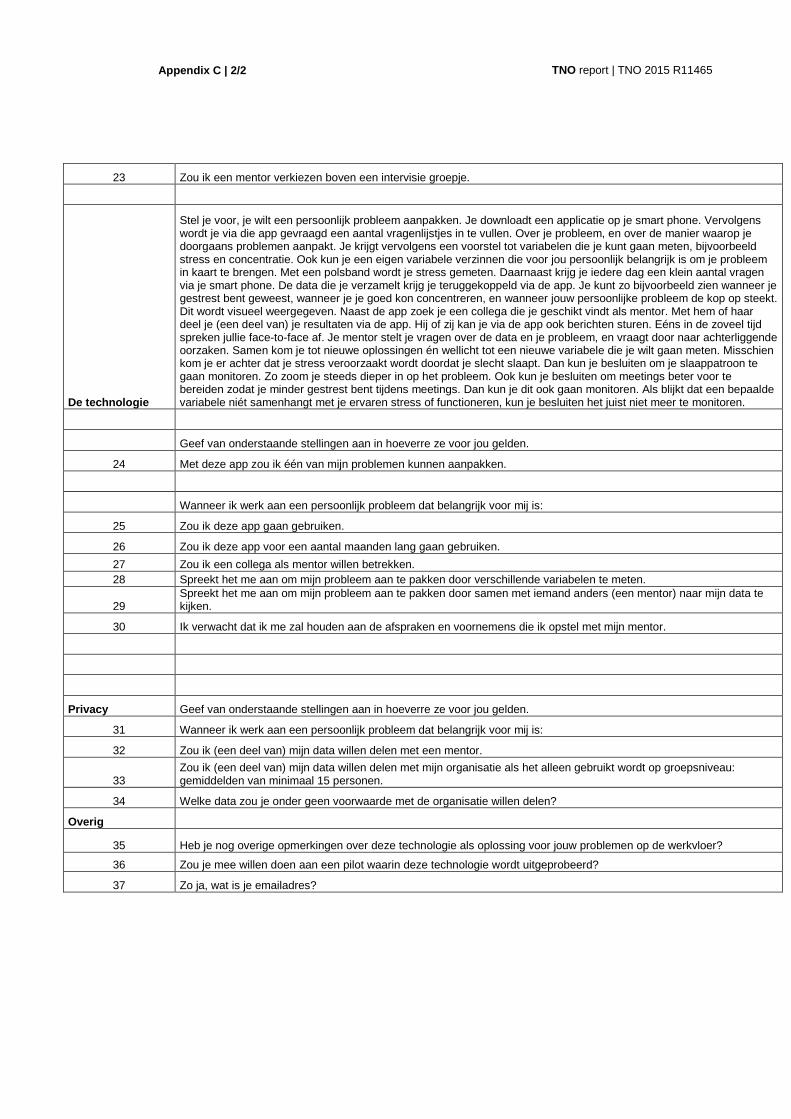
Appendix C | 2/2
TNO report | TNO 2015 R11465
23 Zou ik een mentor verkiezen boven een intervisie groepje.
De technologie
Stel je voor, je wilt een persoonlijk probleem aanpakken. Je downloadt een applicatie op je smart phone. Vervolgens wordt je via die app gevraagd een aantal vragenlijstjes in te vullen. Over je probleem, en over de manier waarop je doorgaans problemen aanpakt. Je krijgt vervolgens een voorstel tot variabelen die je kunt gaan meten, bijvoorbeeld stress en concentratie. Ook kun je een eigen variabele verzinnen die voor jou persoonlijk belangrijk is om je probleem in kaart te brengen. Met een polsband wordt je stress gemeten. Daarnaast krijg je iedere dag een klein aantal vragen via je smart phone. De data die je verzamelt krijg je teruggekoppeld via de app. Je kunt zo bijvoorbeeld zien wanneer je gestrest bent geweest, wanneer je je goed kon concentreren, en wanneer jouw persoonlijke probleem de kop op steekt. Dit wordt visueel weergegeven. Naast de app zoek je een collega die je geschikt vindt als mentor. Met hem of haar deel je (een deel van) je resultaten via de app. Hij of zij kan je via de app ook berichten sturen. Eéns in de zoveel tijd spreken jullie face-to-face af. Je mentor stelt je vragen over de data en je probleem, en vraagt door naar achterliggende oorzaken. Samen kom je tot nieuwe oplossingen én wellicht tot een nieuwe variabele die je wilt gaan meten. Misschien kom je er achter dat je stress veroorzaakt wordt doordat je slecht slaapt. Dan kun je besluiten om je slaappatroon te gaan monitoren. Zo zoom je steeds dieper in op het probleem. Ook kun je besluiten om meetings beter voor te bereiden zodat je minder gestrest bent tijdens meetings. Dan kun je dit ook gaan monitoren. Als blijkt dat een bepaalde variabele niét samenhangt met je ervaren stress of functioneren, kun je besluiten het juist niet meer te monitoren.
Geef van onderstaande stellingen aan in hoeverre ze voor jou gelden.
24 Met deze app zou ik één van mijn problemen kunnen aanpakken.
Wanneer ik werk aan een persoonlijk probleem dat belangrijk voor mij is:
25 Zou ik deze app gaan gebruiken.
26 Zou ik deze app voor een aantal maanden lang gaan gebruiken.
27 Zou ik een collega als mentor willen betrekken. 28 Spreekt het me aan om mijn probleem aan te pakken door verschillende variabelen te meten.
29 Spreekt het me aan om mijn probleem aan te pakken door samen met iemand anders (een mentor) naar mijn data te kijken.
30 Ik verwacht dat ik me zal houden aan de afspraken en voornemens die ik opstel met mijn mentor.
Privacy Geef van onderstaande stellingen aan in hoeverre ze voor jou gelden.
31 Wanneer ik werk aan een persoonlijk probleem dat belangrijk voor mij is:
32 Zou ik (een deel van) mijn data willen delen met een mentor.
33 Zou ik (een deel van) mijn data willen delen met mijn organisatie als het alleen gebruikt wordt op groepsniveau: gemiddelden van minimaal 15 personen.
34 Welke data zou je onder geen voorwaarde met de organisatie willen delen?
Overig
35 Heb je nog overige opmerkingen over deze technologie als oplossing voor jouw problemen op de werkvloer?
36 Zou je mee willen doen aan een pilot waarin deze technologie wordt uitgeprobeerd?
37 Zo ja, wat is je emailadres?
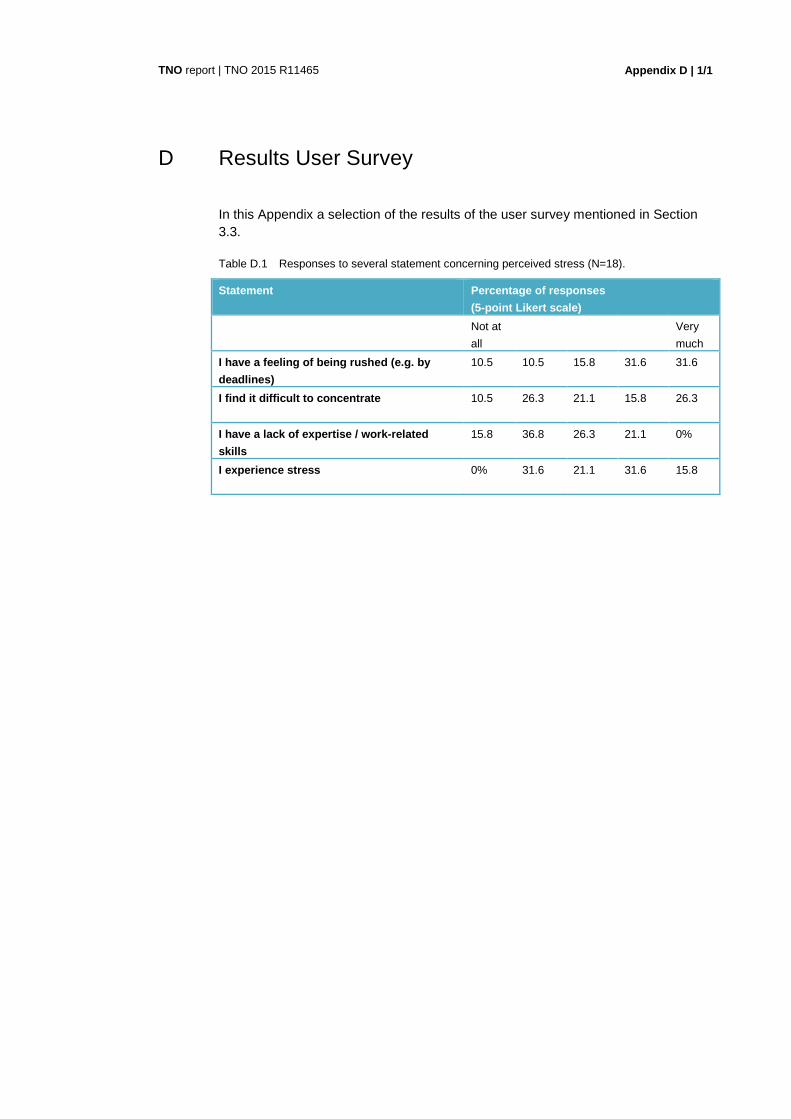
Appendix D | 1/1
TNO report | TNO 2015 R11465
D Results User Survey
In this Appendix a selection of the results of the user survey mentioned in Section 3.3.
Table D.1 Responses to several statement concerning perceived stress (N=18).
Statement Percentage of responses
(5-point Likert scale)
Not at
all
Very
much
I have a feeling of being rushed (e.g. by
deadlines)
10.5 10.5 15.8 31.6 31.6
I find it difficult to concentrate
10.5 26.3 21.1 15.8 26.3
I have a lack of expertise / work-related
skills
15.8 36.8 26.3 21.1 0%
I experience stress
0% 31.6 21.1 31.6 15.8

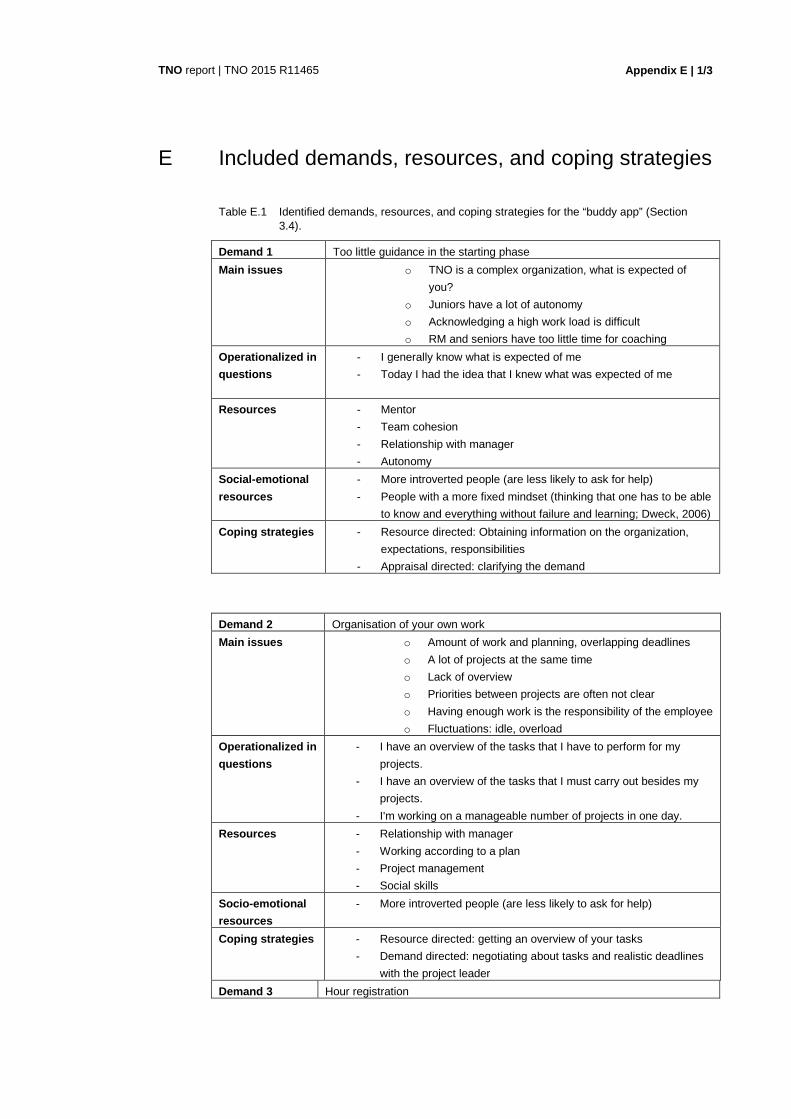
Appendix E | 1/3
TNO report | TNO 2015 R11465
E Included demands, resources, and coping strategies
Table E.1 Identified demands, resources, and coping strategies for the “buddy app” (Section 3.4).
Demand 1 Too little guidance in the starting phase
Main issues o TNO is a complex organization, what is expected of
you?
o Juniors have a lot of autonomy
o Acknowledging a high work load is difficult
o RM and seniors have too little time for coaching
Operationalized in
questions
- I generally know what is expected of me
- Today I had the idea that I knew what was expected of me
Resources - Mentor
- Team cohesion
- Relationship with manager
- Autonomy
Social-emotional
resources
- More introverted people (are less likely to ask for help)
- People with a more fixed mindset (thinking that one has to be able
to know and everything without failure and learning; Dweck, 2006)
Coping strategies - Resource directed: Obtaining information on the organization,
expectations, responsibilities
- Appraisal directed: clarifying the demand
Demand 2 Organisation of your own work
Main issues o Amount of work and planning, overlapping deadlines
o A lot of projects at the same time
o Lack of overview
o Priorities between projects are often not clear
o Having enough work is the responsibility of the employee
o Fluctuations: idle, overload
Operationalized in
questions
- I have an overview of the tasks that I have to perform for my
projects.
- I have an overview of the tasks that I must carry out besides my
projects.
- I'm working on a manageable number of projects in one day.
Resources - Relationship with manager
- Working according to a plan
- Project management
- Social skills
Socio-emotional
resources
- More introverted people (are less likely to ask for help)
Coping strategies - Resource directed: getting an overview of your tasks
- Demand directed: negotiating about tasks and realistic deadlines
with the project leader
Demand 3 Hour registration

Appendix E | 2/3
TNO report | TNO 2015 R11465
Main issues o Completing hour registration is stressful due to the
pressure on direct hours
o Too little time for completing tasks within projects, too little
time for working
o Unclear how to register indirect tasks like time for thinking,
drinking coffee, helping a colleague
o Too little instruction on how you should register your
hours (good is good enough)
Operationalized
in questions
- I generally feel satisfied when I fill in my timesheet
- I generally feel confident when I fill in my timesheet
- I worry during work about how I should justify my hours
Resources - Team cohesion
Demand 4 Project based work
Main issues o Tight project budget
o Little overview (overlap with demand 2)
o Project leader gives little guidance and control, unclear
expectations
Operationalized in
questions
- I have sufficient hours to complete my tasks
- I know what is expected of me within projects
Resources - Sufficient hours to complete tasks
- Feeling able to negotiate about hours
Table E.2 Included coping strategies in the “buddy app” (Section 3.4).
Think back to a few stressful situations at work, in the last
three months. Which strategies did you use in response?
Derived from brief
COPE
Category
resilience
model
Selection of one item per coping strategy
venting stress
directed
I've been expressing my negative feelings
humour stress
directed
I've been making jokes about it
use of emotional
support
stress
directed
I've been getting comfort and understanding from someone
substance use stress
directed
I've been using alcohol or other drugs to make myself feel
better
self-distraction stress
directed
I've been doing something to think about it less, such as
going to movies, watching tv, daydreaming, sleeping or
shopping
self-blame stress
directed
I've been blaming myself for things that happened
religion stress
directed
I've been praying or meditating
positive
reappraisal
appraisal
directed
I've been looking for something good in what is happening
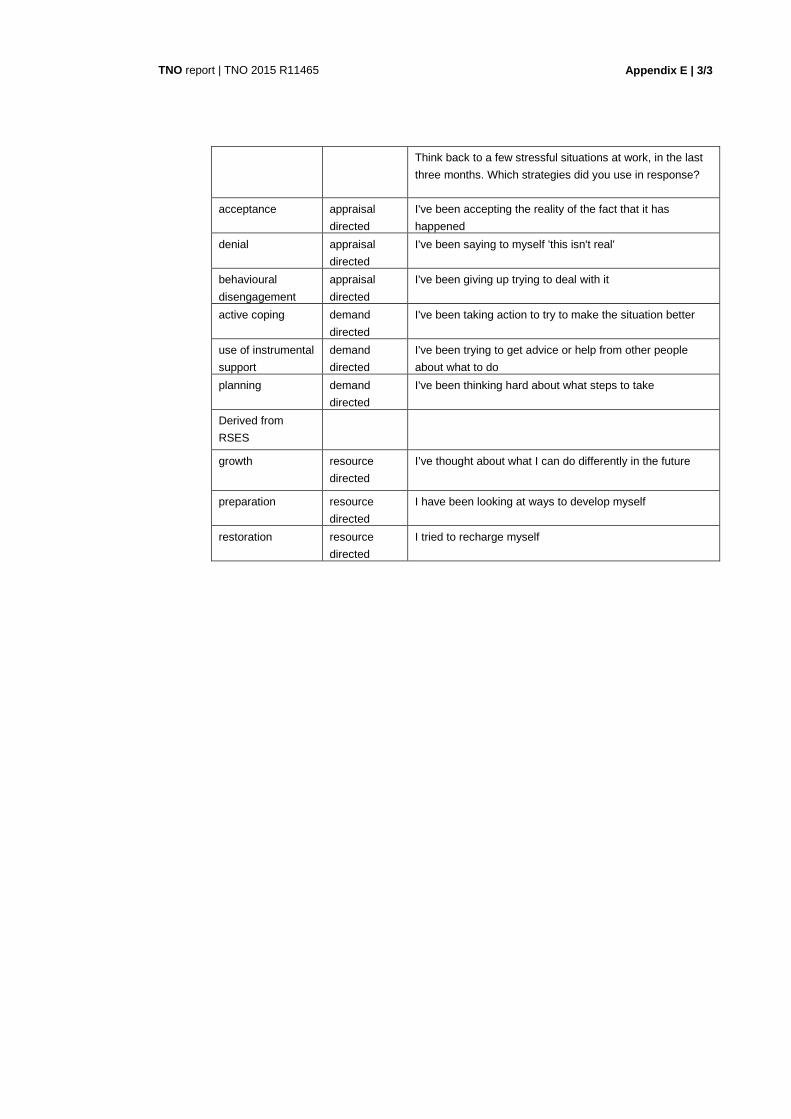
Appendix E | 3/3
TNO report | TNO 2015 R11465
Think back to a few stressful situations at work, in the last
three months. Which strategies did you use in response?
acceptance appraisal
directed
I've been accepting the reality of the fact that it has
happened
denial appraisal
directed
I've been saying to myself 'this isn't real'
behavioural
disengagement
appraisal
directed
I've been giving up trying to deal with it
active coping demand
directed
I've been taking action to try to make the situation better
use of instrumental
support
demand
directed
I've been trying to get advice or help from other people
about what to do
planning demand
directed
I've been thinking hard about what steps to take
Derived from
RSES
growth resource
directed
I’ve thought about what I can do differently in the future
preparation resource
directed
I have been looking at ways to develop myself
restoration resource
directed
I tried to recharge myself

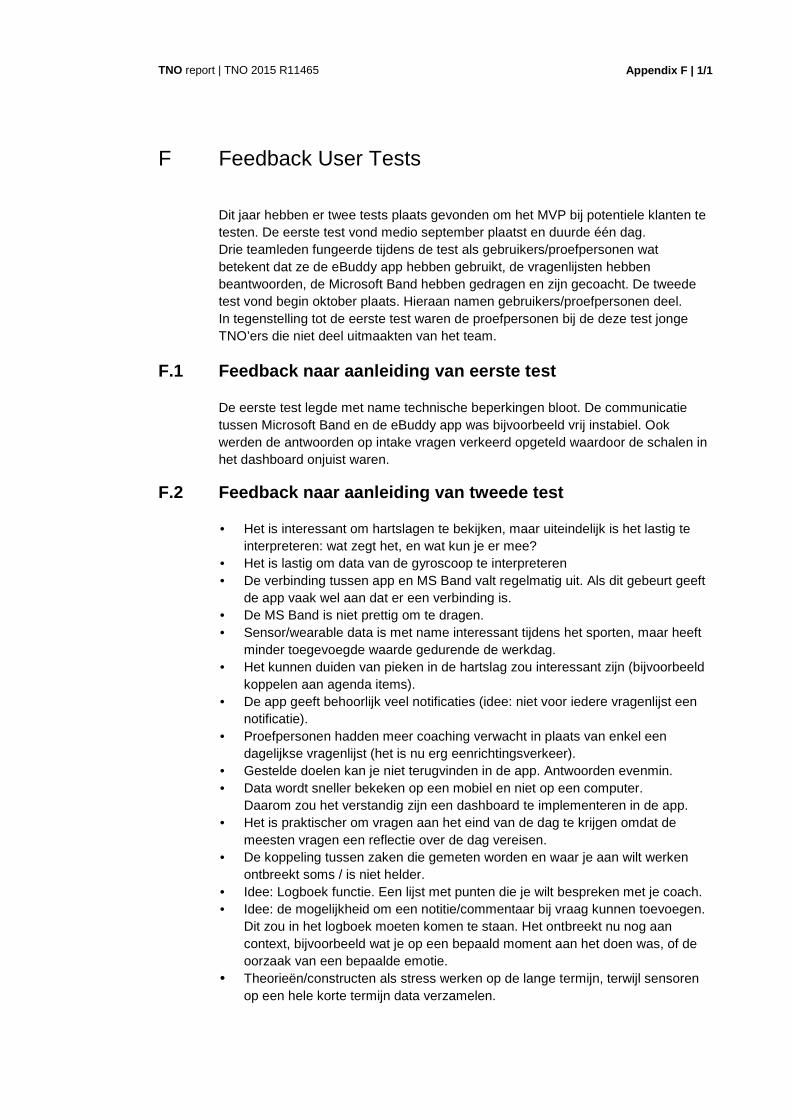
Appendix F | 1/1
TNO report | TNO 2015 R11465
F Feedback User Tests
Dit jaar hebben er twee tests plaats gevonden om het MVP bij potentiele klanten te testen. De eerste test vond medio september plaatst en duurde één dag. Drie teamleden fungeerde tijdens de test als gebruikers/proefpersonen wat betekent dat ze de eBuddy app hebben gebruikt, de vragenlijsten hebben beantwoorden, de Microsoft Band hebben gedragen en zijn gecoacht. De tweede test vond begin oktober plaats. Hieraan namen gebruikers/proefpersonen deel. In tegenstelling tot de eerste test waren de proefpersonen bij de deze test jonge TNO’ers die niet deel uitmaakten van het team.
F.1 Feedback naar aanleiding van eerste test
De eerste test legde met name technische beperkingen bloot. De communicatie tussen Microsoft Band en de eBuddy app was bijvoorbeeld vrij instabiel. Ook werden de antwoorden op intake vragen verkeerd opgeteld waardoor de schalen in het dashboard onjuist waren.
F.2 Feedback naar aanleiding van tweede test
• Het is interessant om hartslagen te bekijken, maar uiteindelijk is het lastig te interpreteren: wat zegt het, en wat kun je er mee?
• Het is lastig om data van de gyroscoop te interpreteren • De verbinding tussen app en MS Band valt regelmatig uit. Als dit gebeurt geeft
de app vaak wel aan dat er een verbinding is. • De MS Band is niet prettig om te dragen. • Sensor/wearable data is met name interessant tijdens het sporten, maar heeft
minder toegevoegde waarde gedurende de werkdag. • Het kunnen duiden van pieken in de hartslag zou interessant zijn (bijvoorbeeld
koppelen aan agenda items). • De app geeft behoorlijk veel notificaties (idee: niet voor iedere vragenlijst een
notificatie). • Proefpersonen hadden meer coaching verwacht in plaats van enkel een
dagelijkse vragenlijst (het is nu erg eenrichtingsverkeer). • Gestelde doelen kan je niet terugvinden in de app. Antwoorden evenmin. • Data wordt sneller bekeken op een mobiel en niet op een computer.
Daarom zou het verstandig zijn een dashboard te implementeren in de app. • Het is praktischer om vragen aan het eind van de dag te krijgen omdat de
meesten vragen een reflectie over de dag vereisen. • De koppeling tussen zaken die gemeten worden en waar je aan wilt werken
ontbreekt soms / is niet helder. • Idee: Logboek functie. Een lijst met punten die je wilt bespreken met je coach. • Idee: de mogelijkheid om een notitie/commentaar bij vraag kunnen toevoegen.
Dit zou in het logboek moeten komen te staan. Het ontbreekt nu nog aan context, bijvoorbeeld wat je op een bepaald moment aan het doen was, of de oorzaak van een bepaalde emotie.
• Theorieën/constructen als stress werken op de lange termijn, terwijl sensoren op een hele korte termijn data verzamelen.