THE CHANGING NATURE OF WORK - JRC Publications ...
104
THE CHANGING NATURE OF WORK AND SKILLS IN THE DIGITAL AGE EUR 29823 EN
-
Upload
khangminh22 -
Category
Documents
-
view
1 -
download
0
Transcript of THE CHANGING NATURE OF WORK - JRC Publications ...

THE CHANGING NATURE OF WORK
AND SKILLS IN THE DIGITAL AGE
EUR 29823 EN
This publication is a Science for Policy report by the Joint Research Centre (JRC), the European Commission’s science and knowledge service. It aims to provide evidence-based scientific support to the European policymaking process. The scientific output expressed does not imply a policy position of the European Commission. Neither the European Commission nor any person acting on behalf of the Commission is responsible for the use that might be made of this publication. The designations employed and the presentation of material on the maps do not imply the expression of any opinion whatsoever on the part of the European Union concerning the legal status of any country, territory, city or area or of its authorities, or concerning the delimitation of its frontiers or boundaries. For information on the methodology and quality underlying the data used in this publication for which the source is neither Eurostat nor other Commission services, users should contact the referenced source.
Manuscript completed in August 2019
Contact informationIgnacio González VázquezEuropean Commission, Joint Research Centre Rue du Champ de Mars 21, 1050 Brussels, [email protected]
EU Science Hubhttps://ec.europa.eu/jrc
JRC 117505EUR 29823 EN
PDF ISBN 978-92-76-09206-3 ISSN 1831-9424 doi:10.2760/679150Print ISBN 978-92-76-09207-0 ISSN 1018-5593 doi:10.2760/373892
Luxembourg: Publications Office of the European Union, 2019
© European Union, 2019
The reuse policy of the European Commission is implemented by the Commission Decision 2011/833/EU of 12 December 2011 on the reuse of Commission documents (OJ L 330, 14.12.2011, p. 39). Except otherwise noted, the reuse of this document is authorised under the Creative Commons Attribution 4.0 International (CC BY 4.0) licence (https://creativecommons.org/licenses/by/4.0/). This means that reuse is allowed provided appropriate credit is given and any changes are indicated. For any use or reproduction of photos or other material that is not owned by the EU, permission must be sought directly from the copyright holders.
All content © European Union, 2019, except: Cover: photomontage integrating elements from ©Alexey Kuznetsov, ©everettovrk, ©LoloStock, ©Sergey Nivens, ©sebra, ©heyengel, ©LIGHTFIELD STUDIOS, ©Kzenon, ©grechsantos - all of which: stock.adobe.com; p. 8 ©kavee29 - stock.adobe.com; p. 11 ©Gorodenkoff - stock.adobe.com; p. 12 ©beeboys - stock.adobe.com; p. 23 ©phonlamaiphoto - stock.adobe.com; p. 28 ©faithie - stock.adobe.com; p. 35 ©markus-spiske-Skf7HxARcoc-unsplash; p. 38 ©faithie - stock.adobe.com; p. 45 ©Monkey Business - stock.adobe.com; p. 51 ©Rawpixel.com - stock.adobe.com; p. 54 ©agnormark - stock.adobe.com; p. 69 ©kavee29 - stock.adobe.com; p. 70 ©thevinman - stock.adobe.com; p. 77 ©jotily - stock.adobe.com; p. 85 ©Kalawin - stock.adobe.com.
How to cite this report: Gonzalez Vazquez, I., Milasi, S., Carretero Gomez, S., Napierala, J., Robledo Bottcher, N., Jonkers, K., Goenaga, X. (eds.), Arregui Pabollet, E., Bacigalupo, M., Biagi, F., Cabrera Giraldez, M., Caena, F., Castano Munoz, J., Centeno Mediavilla, C., Edwards, J., Fernandez Macias, E., Gomez Gutierrez, E., Gomez Herrera, E., Inamorato Dos Santos, A., Kampylis, P., Klenert, D., López Cobo, M., Marschinski, R., Pesole, A., Punie, Y., Tolan, S., Torrejon Perez, S., Urzi Brancati, C., Vuorikari, R. The changing nature of work and skills in the digital age, EUR 29823 EN, Publications Office of the European Union, Luxembourg, 2019, ISBN 978-92-76-09206-3, doi:10.2760/679150, JRC 117505.

THE CHANGING NATURE OF WORK
AND SKILLS IN THE DIGITAL AGE
TABLEOF CONTENTS
Executive summary 6 Introduction 10 1 The impact of technology on the labour market 13 1.1 Automation will disrupt millions of jobs in the EU 131.2 Advanced technologies could radically transform the world of work 191.3 Technological innovation also creates new job opportunities 25
2 Digital and non-cognitive skills in the new world of work 29 2.1 Skills for a changing labour market 292.2 The EU labour force has an insufficient level of digital skills 352.3 Non-cognitive skills are crucial to thrive in the new world of work 402.4 An evolving world calls for changes in how skills are provided 46 3 New forms of work in the EU 53 3.1 Technology is facilitating the emergence of new forms of work in the EU 53 3.2 Platform work remains small but relevant in the EU 583.3 Challenges for workers: unstable jobs, unclear work relationships and limited earning potential 65
4 The structure of jobs at regional level in the EU 71 4.1 Several factors affect job structures: technology is a key one 714.2 Job structures and their evolution vary widely across EU regions 75 4.3 Stark differences in employment structure between peripheral and capital regions 79
References 92 List of boxes 99 List of figures 100 Acknowledgements 102
4Table of contents

5 Table of contents
6
EXECUTIVE SUMMARY
Social media manager, Airbnb host, influencer, SEO specialist, app developer, Uber driver, driverless car engineer, podcast producer and drone operator; these are just some of the jobs that did not exist 10 years ago. What will happen in the future? What will today's 10-year-olds do when they are 25? What kind of jobs will disappear, what will be created and why? Which new skills will be valuable in the job market? What new forms of work are emerging?
In the European Union (EU), the technological revolution is causing significant changes in the world of work. Some jobs are at risk of being lost to machines. Others are being transformed and new ones are being created. As a result, the skills we need are also changing. At the same time, new forms of employment are on the rise. Occupational structures are shifting, often leading to polarisation in employment and wages which in turn, can increase inequalities.
New technologies will reshape millions of jobs in the EUSome jobs are highly vulnerable to automation. The jobs that are most exposed to automation appear to be those that require relatively low levels of formal education, those that do not involve relatively complex social interaction and those that involve routine manual tasks.
Technology also creates new jobs. New jobs related to the development, maintenance and upgrading of artificial intelligence (AI) technologies and big data infrastructures are among those expected to grow. Yet, it is difficult to know in advance how many jobs like these will
be created, and in what sectors they will emerge. Nevertheless, the kinds of jobs that are predicted to grow the most in the EU-28 by 2030 appear to be those that require higher education, intensive use of social and interpretative skills, and at least a basic knowledge of ICT.
However, new technologies affect tasks, not jobs. This explains why digital technologies do not simply create and destroy jobs: they also change what people do on the job, and how they do it. Job profiles could change substantially through the addition of new tasks or the modification of existing ones, requiring workers to adapt to new working methods, work organisation and tools. For example, the use of computers in the workplace has already had an impact on the nature of work: it appears to have shifted employment towards jobs with less routine and more social tasks. At the same time, computerisation has made work in certain jobs more repetitive and dependent on production targets and quality standards. This standardisation of work may pave the way for automation in the future.
Human-centred work organisation is the ultimate barrier to job automation. The aspects of work that require key attributes of human labour, such as creativity, full autonomy and sociability, are beyond the current capabilities of advanced AI. However, when work is organised in a discrete, standardised and predictable way, the automation of work becomes far more feasible.
Therefore, any reconfiguration of jobs due to the new technologies will entail the adaptation,
Executive summary

7
shifting and modification of roles — and thus, skills and knowledge. What are the implications of these changes in terms of skills and education?
Digital and non-cognitive skills are becoming increasingly necessary to seize emerging job opportunitiesIn future, it is likely that a moderate level of digital skills combined with strong non-cognitive skills will be in greater demand. The growing importance of both digital and non-cognitive skills is reflected in increasing wage differences between workers who are equipped with these skills and those who are not.
Yet, the digital skills shortage remains significant. One third of the EU labour force has no or almost no digital skills. Employers in the EU report that a large number of workers are not ready to respond to the rising demand for digital skills.
Workers will need non-cognitive skills to cope in an ever-changing workplace. It is increasingly important that, in addition to knowledge, individuals acquire skills that help them to anticipate changes and to become more flexible and resilient. For low-
skilled workers in particular, in the future, it will be harder to find employment without prior reskilling or upskilling. However, teaching non-cognitive skills seems to have been neglected across the EU despite its effectiveness.
But most importantly, the faster-evolving world requires change in the way that skills are provided. Europeans will need to learn throughout their entire life, both inside and outside of formal education.
Technology is a key driver of new forms of workDisaggregation of work into specific tasks is happening across all Member States, to varying degrees. Technology provides incentives for employers to contract out work, and enables workers to work remotely, both as employees and freelancers.
In fact, new forms employment such as casual work, ICT-based mobile work, and digitally-enabled forms of self-employment are gaining traction across the EU.
Executive summary
p. 13
The impact of technology on the
labour market
p. 29
Digital and non-cognitive skills
in the new world of work
p. 71
The structure of jobs at
regional level in the EU
p. 53
New forms of work in the EU

8Executive summary

9
Platform work remains small but significant in the EU, involving many young people and highly educated workers. Around 11 % of the working age population (aged 16-74) have provided services via online platforms at least once — up from 9.5 % in 2017. However, providing labour services mediated by platforms is the main work activity for only 1.4 % of the working-age population. The average age of platform workers is just below 34 years, while close to 60 % of those who provide services on platforms as their main job have at least tertiary education.
Platform work is a clear example of how digital transformation can offer new job opportunities while creating policy challenges. Working conditions for platform workers vary greatly depending on the type of work, its intensity and frequency. For instance, platform workers who predominantly provide professional services are typically better paid than other platform workers, although also more likely to suffer from stress. Conversely, non-professional online platform workers, while experiencing less stress, are more likely to have lower pay and limited learning opportunities. Meanwhile, platform workers are at a particularly high risk of having unclear employment status.
Last but not least, there are significant differences between Member States as regards the prevalence of platform work, which demonstrates the importance of local- and regional-level analysis beyond EU-level averages.
The employment landscape is evolving differently across the EU, widening the gap between regionsTechnological change contributes to transforming the overall structure of employment. However, the various patterns of employment restructuring across EU countries and regions suggests that, beyond technology, many other factors, including urbanisation, deindustrialisation and labour-market institutions, are at play.
Patterns of employment restructuring vary considerably among EU regions. Looking at changes in job structures across EU regions between 2002 and 2017, no prevalent pattern of employment transformation emerges. Around one third of regions have experienced heightened job polarisation. However, at the same time, there has been a remarkable occupational upgrading in some mainly rural regions while, in many others, the labour market structure has been significantly downgraded.
Capital city regions show a much larger share of high-paid jobs than other regions within their respective countries. They are also more likely to experience job polarisation. This is the result of a long-term trend which has seen capital city regions, and more generally highly urbanised areas, benefiting disproportionately from employment growth, mostly in the highly-paid segment. Meanwhile, the employment structure of peripheral European regions is not converging to that of central and northern Europe. For instance, the share of low-paid jobs in some peripheral regions is around twice as large as in core EU regions.
Executive summary

10Introduction
INTRODUCTIONThe changing nature of work and skills has emerged as an important and controversial issue in the public policy debate. Interest in this topic from think-tanks, businesses, international organisations, governments and the broader public has continued to grow over the last five years (see Figure 1).
While a wide range of factors, such as globalisation, ageing or climate change, might impact how work and skills are being reshaped, the debate on the potential drivers of change often focuses on just one: technology. This is because new technologies such as robotics and AI are expected to have a strong and wide-ranging impact on the quantity, nature and organisation of work, as well as on skills.
Robust evidence is essential for designing future-proof policies that fully grasp the new opportunities offered by technology, whilst tackling the emerging challenges. Although in the last few years a vast amount of scientific and grey literature have proliferated around this topic, the evidence base to inform policy decisions in these areas is often
incomplete or inconclusive, leading to confusion among policymakers and the public.
This JRC report on the changing nature of work and skills in the digital age aims to help policymakers and the broader public to make sense of the vast amount of evidence available on the future of work and education, while bringing new elements for reflection into the debate.
0
20
40
60
80
100
6/7/14 6/7/15 6/7/16 6/7/17 6/7/18 30/6/19
Figure 1: Google Search Volume for 'Future of Work' (Global level, peak=100) Source: JRC from Google Trends data

11
It combines a synthesis of the most recent and robust scientific evidence available with original JRC research on issues that have often been overlooked by existing studies. In particular, the report provides new insights into the interplay between automation and work organisation, the extent and nature of platform work, and the patterns of occupational changes across EU regions.
The report is structured as follows:
The first chapter discusses the impact of technology on employment. It summarises the most recent estimates
on technology- induced job creation and destruction, and provides new insights into the role of workplace organisation in shaping the effect of new technologies on labour markets.
The second chapter discusses how skills needs are shifting
towards digital and non-cognitive skills, showing that education systems need to adapt to address labour market needs.
The third chapter reviews the opportunities and challenges related to the recent upwards trend
in new forms of mployment in the EU, focusing on new data on the prevalence and characteristics of platform work in the EU.
The final chapter presents results from a new JRC-Eurofound (European
Foundation for the Improvement of Living and Working Conditions) study on the patterns of occupational change in EU regions in the last 15 years. These show increasing territorial disparities both between and within EU Member States.
Introduction
New technologies such as robotics and AI are expected to have a strong and wide-ranging impact on the quantity, nature and organisation of work, as well as on skills and education systems.

12
SUMMARY
Technology has broad-ranging implications for labour markets: automation can destroy some jobs and transform many others, although new technologies create new jobs, too.
Up-and-coming technologies are increasingly able to perform not only repetitive tasks but also less predictable ones, such as retrieving information or recognising patterns. Thus, a large body of research has suggested that millions of jobs could be radically transformed by these new technologies at some point in the future - even though there is disagreement on the extent of the phenomenon.
Yet, even if a machine is able to replace human labour from a purely technical perspective, it does not mean that it will actually happen. As shown in this chapter, the potential to automate a job ultimately depends on how work is organised: the more discrete, repetitive and predictable it is, the more susceptible to automation it becomes. This means that key attributes of human labour, such as autonomy, sociability and creativity, remain the ultimate barrier to automation.
Meanwhile, new technologies may still create more jobs than they destroy, especially in occupations where social and interpretative tasks are intensive. Entirely new profiles dealing with developing, maintaining and upgrading new technologies are also likely to emerge.
1. The impact of technology on the labour market

13 1. The impact of technology on the labour market
THE IMPACT OF TECHNOLOGY ON
THE LABOUR MARKET 1.1 Automation will disrupt millions
of jobs in the EU
Fears of the widespread replacement of jobs by machines have always accompanied phases of technological breakthrough. A general observation in the existing literature is that, to date, the net aggregate effect of technological change on employment appears to be neutral or even positive, once adjustment processes between firms and sectors have been taken into account (Craglia et al., 2018). Looking back, between 1999 and 2010, recent technological change, such as the computerisation of work, appears to have led to net employment growth in the EU (Gregory et al., 2019), while the same appears to hold for the increasing deployment of industrial robots in manufacturing. Indeed, in line with previous studies (e.g. Graetz and Michaels, 2018), new JRC evidence suggests the absence of any significant negative relationship between the installation of robots and employment in manufacturing in Europe in the period 1995-2015 (Klenert et al., forthcoming). A small but significant positive impact on labour productivity can also be observed (Jungmittag and Pesole, forthcoming).
The recent accelerating pace of technological change is fuelling new anxieties. Until now, long-lasting technology-induced unemployment has not occurred (Mokyr et al., 2015; Autor, 2015). Although there is still
no empirical evidence available, some elements suggest that the nature of AI is different from previous technological change (Martens and Tolan, 2018). The range of tasks that could potentially be automated is gradually expanding, increasingly involving tasks which cannot readily be codified, such as retrieving information, recognising patterns, and generating predictions (Brynjolfsson and Mitchell, 2017). Indeed, thanks to machine learning, and the ever-expanding collection of data in all domains of life, AI-enabled machines are grasping the ability to learn and improve from experience to perform a wide range of tasks without being explicitly programmed for that purpose.
Even conservative estimates put millions of EU jobs at high risk of automation. A number of studies have attempted to estimate the proportion of current jobs that could technically
Technology transforms, destroys and creates jobs, leading to profound labour market changes.

1. The impact of technology on the labour market 14
be automated in the future given ongoing technological advancements (Box 1). These studies first assess the technical feasibility of automating existing tasks then, on this basis, provide an estimate of how many tasks within a certain job are susceptible to automation at some point in the future.
Of course, it is important to keep in mind that these studies only refer to jobs that are particularly at risk of being automated; they remain silent on the number of jobs that will be created in the future. Recent survey
Estimates of the share of jobs that could be automated in the future vary widely.
Estimates of the share of jobs that could be automated in the future vary widely (Figure 2). Frey and Osborne (2013) were among the first to investigate the future effect on employment of recent technological progress. Starting from an expert assessment of the risks of automation, they estimated the probability of computerisation for 702 detailed occupations, based on the tasks these occupations involve. They found that 47 % of total employment in the USA is at ‘high risk’ of automation (defined as having a probability of being automated of at least 70 %). Application of Frey and Osborne’s (2013) methodology to the EU finds that across EU-28 countries, the proportion of jobs at high risk of computerisation ranges from around 45 % to over 60 % (Bowles, 2014).
Other studies argue that such an aggregated occupation-level approach severely overestimates the potential impact of automation, because it neglects the substantial heterogeneity of tasks within occupations as well as the fact that workers adapt their tasks to new technologies (Arntz et al., 2016; 2017).
For example, for Frey and Osborne, book-keeping, accounting and auditing clerks have a 98 % probability
of their work being automated in the near future, irrespective of the variation in tasks across workplaces within this profession. However, Arntz et al. (2016) and Nedelkoska and Quintini (2018) take into consideration the fact that many workers in such highly exposed occupations also perform tasks that machines struggle with, such as problem-solving or influencing.
These studies still find that it will be possible to automate some tasks in most jobs. However, they also show that fewer jobs are at high risk of automation (defined as jobs where 70 % of the tasks involved could be performed by new technology). Arntz et al. (2016) estimate that just 9 % of jobs are at high risk of being automated across Organisation for Economic Co-operation and Development (OECD) countries, with values ranging from 6 % in Korea to 12 % in Germany and Austria.
Similarly, Nedelkoska and Quintini (2018) find that the share of jobs at high risk of automation ranges from 6 % in Norway to 33 % in Slovakia – as against an average of 14 % in OECD countries. Using a different methodology, Lordan (2018) estimates higher shares of fully automatable jobs, ranging from 37 % in Norway to 69 % in Czechia (Figure 2).
box 1. Estimating the risk of automation on current jobs

1. The impact of technology on the labour market 15
Frey and Osborne (2013, US)
Arntz et al. (2016, 21 OECD)
Nedelkoska and Quintini (2018, 32 OECD countries)
Lordan (2018, 26 EU countries)
80
70
60
50
40
30
20
10
0
Max47
7
Percentile 25 Percentile 75
10
12
19
49.4
58.4
Min 6 Min 6
Max12
Max33
Max69.2
Min 37.4
Figure 2: Estimates of the share of jobs at high risk of automation: variation across and within seminal studies Note: Estimates reported for Lordan (2018) refer to the share of ‘recently fully automatable jobs’, defined as jobs that could be automated now, or over the next decade, given ongoing technological developments. Estimates for Frey and Osborne (2013) refer to the share of occupations which are at high risk of automation in the USA only. Source: JRC from Frey and Osborne (2013), Arntz et al. (2016), Nedelkoska and Quintini (2018), Lordan (2018)
data for the United Kingdom reveal a very mixed set of outcomes, for both work and employment, from the introduction of AI for cognitive and physical tasks within organisations (Hunt et al., forthcoming). Around 40 % of those organisations introducing AI reported job losses, while 48 % reported no job losses. In terms of job creation, 43 % of organisations reported that jobs had been created. As discussed in section 1.3, job creation may offset the job-displacement effects due to automation.
Differences in occupational composition and workplace organisation explain why the risk of job automation differs across countries and regions (Box 2).Differences in industrial and occupational structures are often cited as the main reason for differences in job susceptibility to automation across countries and regions. For instance, to the extent that manufacturing is more exposed to automation than services, countries with larger shares of employment in manufacturing will show a higher average susceptibility to automation (Muro et al., 2019). However, the majority of differences between countries are actually

161. The impact of technology on the labour market
explained by differences in occupational composition within economic sectors, as well as by how tasks are designed within the same occupation (Nedelkoska and Quintini, 2018).
This means that a given job can be more susceptible to automation in some countries or regions than in others, depending on how the work is organised. In France, for example, less than 50 % of non-managerial, professional and technical occupations in the textile and leather sector could potentially be automated by 2030, whereas in Poland this figure is close to 78 % (Eurofound, 2019b). In turn, work organisation can vary onsiderably across territories, even within the same sector and occupation. This can largely depend on the extent to which past waves of technology, such as ICT and industrial robots have been adopted (Arntz et al., 2016; Nedelkoska and Quintini, 2018).
A given job can be more susceptible to automation in some countries or regions than in others depending on how work is organised.
By estimating the prevalence of jobs that are intensive in tasks more easily replaced by new technologies, it is possible to compare the potential risk that different geographical areas will face in future in terms of job automation.
The last OECD Regional Outlook (OECD, 2019b) shows that the prevalence of jobs at risk of automation is much higher than average for the sample in eastern Europe (Slovakia, Slovenia, Poland) and southern Europe (Greece, Spain), while Nordic countries and the UK seem to face a lower risk (Figure 3).
If we analyse differences at the regional level (as presented in Chapter 4, with complementary analyses on shifts in occupational structures at regional level in the EU over the last 20 years), it is obvious that there is an important gap in some countries between capital city regions and the rest of the territory. This is especially the case in Slovakia, France and Czechia, although the same thing occurs in most other countries.
This tendency could be explained by the comparatively higher share of high-paid jobs located in many capital city regions, as shown in Chapter 4. The higher potential these regions usually have, when attracting investments and human capital from other areas, may also play a role. Sections 4.2 and 4.3 provide more data and arguments to support this explanation.
box 2. The exposure of regions to the challenge of automation

17 1. The impact of technology on the labour market
box 2. The exposure of regions to the challenge of automation
Norway
Finlan
d
Sweden
United
States
United
king
do,
Czechia
Denmark
Franc
e
Fland
ers Italy
Canad
aSpa
in
Irelan
d
Austria
Polan
dGree
ce
Sloven
ia
Slovak
Repub
lic
Bottom region Top region
4.3 5.0 6.310.5
8.4 9.6 10.211.9
12.8 13.7 14.7 15.1 15.3 15.518.1
22.423.9
30.3
6.47.8
8.5
13.7
11.2
17.012.9
18.5 17.0 15.6 16.0
26.9
17.3 17.9
21.7
27.227.6
39.3
Figure 3: Percentage of jobs at high risk of automation; highest- and lowest-performing regions by country, 2016Note: High risk of automation refers to the share of workers in jobs facing a risk of automation of 70 % or above. Data from Germany correspond to 2013. For Flanders (Belgium), sub-regions are considered (corresponding to NUTS 2 level of the European classification). Source: OECD (2019b), OECD (2018b) based on Nedelkoska and Quintini (2018)

181. The impact of technology on the labour market
The risk of automation also differs significantly across occupations (Figure 4). The types of jobs most exposed to automation appear to be:
• Jobs that require relatively low levels of formal education (food preparation, machine operators in manufacturing, personal service occupations, administrative support workers).
• Occupations that do not involve relatively complex social interaction, such as influencing or persuading others, assisting and caring for others, training others or managing other people’s work (drivers and machine-plant operators, cleaners and helpers, general and keyboard clerks).
• Occupations that involve routine manual tasks (such as assemblers).
More research is needed to fully gauge the potential effects of automation on the future of work. The estimates presented above on the share of jobs at high risk of automation represent a key starting point for assessing the risk of job automation from a purely technical perspective. However, it is important to acknowledge that the possibility of actually automating a job depends on a range of interrelated factors which go well beyond the mere technical feasibility of automation. Indeed, predicting the automation potential of a job requires strong assumptions about future demand for goods and services, organisation of production processes, rate of adoption of technologies, cultural and institutional factors, and changes in consumer preferences (Manyika et al., 2017). Meanwhile, a lack of high-quality data on the nature of work, workplace organisation, and human-
Figure 4: Occupations expected to be most and least affected by automationSource: Nedelkoska and Quintini (2018)
Jobs that require relatively low levels of formal education or do not involve relatively complex social interaction are most exposed to automation.
Average probability of automation by type of occupation.
Most affected Highly transformed Least affected
Food preparation assistants
Assemblers
Cleaners and helpers
Labourers in mining, construction, manufacturing and transport
Drivers and mobile plant operators
Hospitality, retail and other services managers
Health professionals
Sales workers
Teaching professionals
Chief executives, senior officials and legislator
Administrative and commercial managers
20 % 30 % 40 % 50 % 60 % 70 %
Customer services clerks
Health associateprofessionals
Information and communications technician
Personal care workers
Least affected: occupations that require high level of education, a lot of social interaction as well as abilities in managing, planning and coordinating complex environment.
Year
s un
til u
sed
by 2
5% o
f th
e U
S po
pula
tion
First commercially available year
1873 1897 1926 1975 1983 1991 20101876
Electricity
Telephone
Radio
Television
Mobile phone
Internet
Smartphone
PC
0
10
20
30
40
50
19 1. The impact of technology on the labour market
machine complementarity further complicates our understanding of the impact of new technologies on the future of work (Frank et al., 2019). This calls for greater efforts to support the collection of reliable data in these domains.
1.2 Advanced technologies could radically transform the world of work
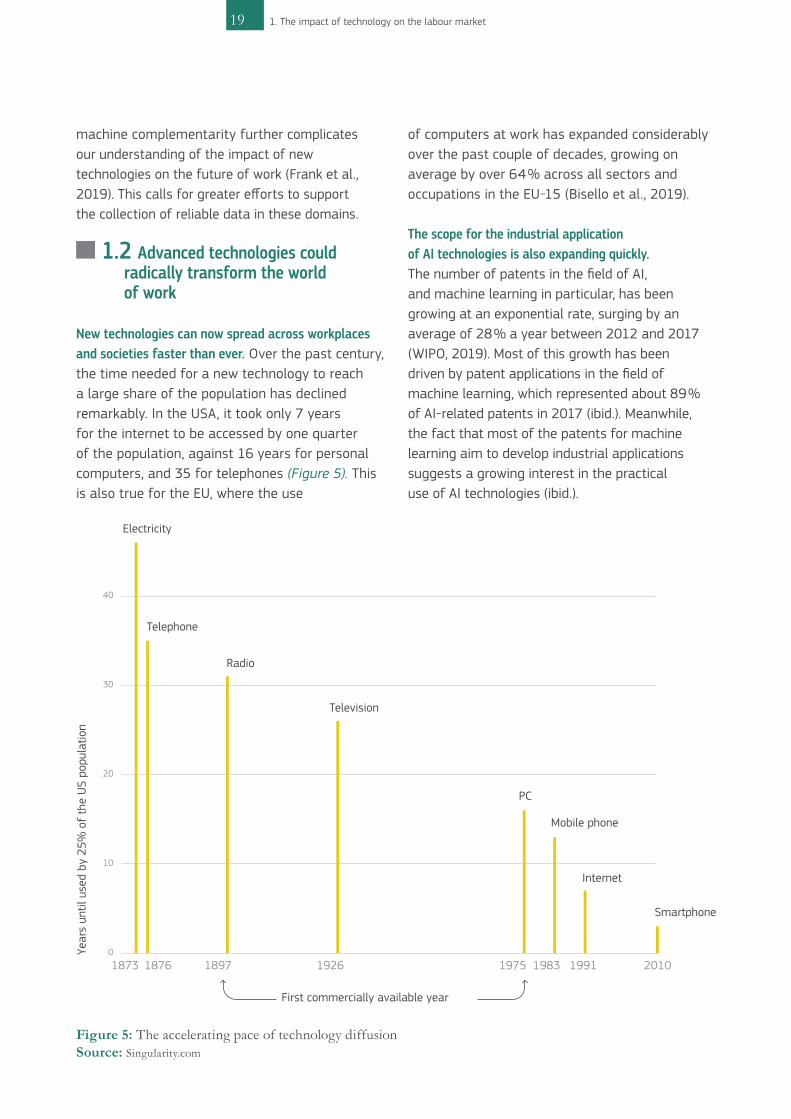
New technologies can now spread across workplaces and societies faster than ever. Over the past century, the time needed for a new technology to reach a large share of the population has declined remarkably. In the USA, it took only 7 years for the internet to be accessed by one quarter of the population, against 16 years for personal computers, and 35 for telephones (Figure 5). This is also true for the EU, where the use
of computers at work has expanded considerably over the past couple of decades, growing on average by over 64 % across all sectors and occupations in the EU-15 (Bisello et al., 2019).
The scope for the industrial application of AI technologies is also expanding quickly. The number of patents in the field of AI, and machine learning in particular, has been growing at an exponential rate, surging by an average of 28 % a year between 2012 and 2017 (WIPO, 2019). Most of this growth has been driven by patent applications in the field of machine learning, which represented about 89 % of AI-related patents in 2017 (ibid.). Meanwhile, the fact that most of the patents for machine learning aim to develop industrial applications suggests a growing interest in the practical use of AI technologies (ibid.).
Figure 5: The accelerating pace of technology diffusionSource: Singularity.com

Existing estimates concur that a large share of jobs will be transformed as a result of technological progress. For example, Nedelkoska and Quintini (2018) find that 32 % of jobs across OECD countries have a 50 70 % chance of being automated. This means that even if these jobs will not be completely automated, the majority of the tasks they involve may be. In most cases, machines replace specific tasks but not others, changing the content of jobs and occupations.
Digital technologies not only determine job losses or creation but also shape the content and methods of work by changing what people do on the job, and how they do it. Job profiles could change substantially through the addition of new tasks or modification of existing ones, requiring the adaptation by workers to new jobs, work organisation and work tools. This is because technological transformations contribute to changes in the tasks involved in jobs (Bisello et al., 2019). Eurostat data show that for 21 % of individuals whose work involved using any type of computer, portable device or computerised equipment or machinery, the main job tasks changed as a result of the introduction of new software or computerised equipment (2018).
The use of computers in the workplace has fostered a shift in employment towards jobs with less routine and more social tasks. A new JRC-Eurofound analysis of changes in the task content and methods of work across EU-15 countries shows that the routine content of work is decreasing as jobs intensive in routine tasks are more easily displaced by automation (Bisello et al., 2019).
201. The impact of technology on the labour market
0
50 000
100 000
150 000
1965 70 8075 85 90 200095 05 10 201715
Patent families
Scientific publicationsThe number of patents in the field of Artificial Intelligence increased at an exponential rate, surging by an average of 28 % a year between 2012 and 2017
Figure 6: Growth of AI patent families and scientific publications Source: WIPO (2019)
Robotics and AI have the potential to reconfigure jobs.

21 1. The impact of technology on the labour market
The study shows that, in the last 20 years, jobs involving more social tasks – i.e. those tasks whose primary aim is direct interaction with other people – have expanded in relation to the rest. However, it also shows a remarkable, but often overlooked consistency: work in the remaining jobs is actually becoming more repetitive and standardised.
At the same time, computerisation has also standardised work in certain jobs, while reducing the need for direct social interaction in some sectors.Some occupations which were scarcely routinised in 1995, such as professionals, technicians and managers, have witnessed a rapid expansion in the use of computers since then. Thus, computers seem to create a somewhat contradictory effect: they replace routine tasks — and thus displace labour towards non-routine tasks and occupations — while, at the same time, routinising the remaining tasks and occupations (see Figure 7).
Looking at occupations within specific sectors provides insights into how the interaction between the computerisation and standardisation of work may contribute to reducing the amount of social interaction in certain jobs. In fact, the extent of social interaction has declined in particular in those service-sector jobs which have simultaneously seen a rapid increase in the standardisation and computerisation of work, such as:
• Mid-level jobs in financial intermediation. Online and mobile banking and the increasing use of cash-free payments through digital interfaces have radically changed banking and financial services (Cedefop, 2016b). Many tasks involving processing payments, developing routine sources of information or maintaining records are increasingly being dealt with in a highly automated or algorithmic way. As a result, workers in financial intermediation, from clerical support
0.14
0.12
0.10
0.08
0.06
0.04
0.02
0
-0.020.00 0.10 0.20 0.30 0.40 0.50 0.60 0.70 0.80
Professionals
Service and sales workers
Managers Clerical support workers
Technicals and associate professionals
Plant and machine operatos
Crast and related trade workers
Elementary occupations
Skilled agricultural workers
Inde
x of
sta
ndar
disa
tion
of
wor
k pr
oced
ure,
cha
nge
1995
to
2015
Index of computer use at work, average (1995-2015)
The growing use of computers is associatedwith greater standardisation of work procedures in some occupations, such as professionals, technicians and managers, which were little routinized in 1995.
Figure 7: Linking the rise of computer use at work with the standardisation of work Source: JRC from Bisello et al (2019)

1. The impact of technology on the labour market 22
Figure 8: Linking the risk of automation and methods of work across 38 occupations Note: The closer the value is to 1, the greater the relevance of a given method of work for that occupation.Source: : JRC based on European Jobs Monitor Task Indicator dataset, Eurofound (2016) and Nedelkoska and Quintini (2018)
Inde
x of
tea
mw
ork
inte
nsit
y 0.7
0.8
0.6
0.5
0.4
0.3
0.2
0.1
00.0 0.1 0.2 0.3 0.4 0.5 0.6 0.7
Average probability of automation
0.7
0.8
0.6
0.5
0.4
0.3
0.2
0.1
00.0 0.1 0.2 0.3 0.4 0.5 0.6 0.7
Average probability of automation
Inde
x of
aut
onom
y at
wor
kIn
dex
of r
outi
nisa
tion
at
wor
k
Average probability of automation
0.7
0.8
0.6
0.5
0.4
0.3
0.2
0.1
00.0 0.1 0.2 0.3 0.4 0.5 0.6 0.7

to technicians, have seen an increasing use of computers combined with declining direct social interaction and the growing standardisation of work procedures.
• A similar pattern can be observed across a number of other jobs, such as clerical support workers in public administration, services and sales workers in hotels and restaurants, and professionals in real estate and business activities.
These developments may have paved the way for further automation because occupations where work organisation is highly routinised and social interaction is limited are at a higher risk of automation (Autor and Dorn, 2013). Workers are generally required to deal with uncertainty at work, contribute with their own creativity and coordinate with other workers within complex production processes. All these aspects of work require key attributes of human labour, such as autonomy and sociability, which are beyond the current capabilities of advanced AI-enabled machines (Deming, 2017).
Yet, as Figure 8 shows, when work is organised in a very discrete, standardised and predictable way, the automation of work tasks becomes far more possible (Brynjolfsson and Mitchell, 2017).
The organisation of work is a key factor in predicting job automation. A specific job can be performed in very different ways, depending on how work is organised and the technologies used in production, with important implications for its susceptibility to automation. There are a number of occupations which, despite having a high probability of automation, according to existing studies, show a relatively low routine content along with high levels of social interaction. For instance, sales workers rank among the 10 occupations with the highest risk of automation (Nedelkoska and Quintini, 2018), although their work is usually not highly routinised and rich in social interactions, and is thus, theoretically, less prone to automation. Nevertheless, will sales workers be automated in the near future? This is very difficult to predict, but crucially the possibility depends on the technology and social
23 1. The impact of technology on the labour market
When work is organised in a very discrete, standardised and predictable way, the automation of work tasks becomes far more possible.

1. The impact of technology on the labour market 24
organisation of their workplaces, along with other factors such as consumer preferences, rather than on the type of tasks they carry outat work. In fact, even for the same occupation, the method of work can vary considerably across sectors with different work organisations. For instance, whilst the task structure of a sales worker in real estate is very similar to that of a sales worker in the retail sector, the first is typically more exposed to teamwork and less standardised methods of work than the second, and thereby less exposed to automation (Figure 9).
Jobs involving the development, maintenance and upgrading of new technologies are expected to proliferate quickly.
Two workers in the same occupation can face different probabilities of seeing their job automated, and this largely depends on how their work is organised.
The sales worker in the real estate sector does much more teamwork and is less subject to standardised work procedures (e.g. meeting performance targets or precise quality standards) than the sale worker in retail trade. This may make the sales worker in real estate less exposed to automation.
Task indexesSales workers in retail trade Sales workers in real-estate activities
Serving or attending
Selling or influence
0.61
0.60
Method of workAutonomy 0.53Teamwork 0.39
Standardisation 0.45
0.5 100.51 0
0.61
0.66
0.44
0.97
0.05
Figure 9: Work tasks and methods for sales workers in two different sectorsNote: The indexes are constructed in a way that 0 represents the lowest possible of the task/method of work in question, and 1 the highest possible intensity. These indexes measure the extent to which the different types of jobs (i.e. occupations in specific sectors) involve carrying out a certain category of task and method or work. Source: : European Jobs Monitor Task Indicator dataset, Eurofound (2016)

There are three different channels through which technological advancement can generate jobs/tasks. Whether the current wave of technological progress may lead to a net increase or decrease in employment ultimately depends on the relative size of the displacement effects (technology replacing labour in tasks that it used to perform) and compensating effects (see Acemoglu and Autor, 2011 and Acemoglu and Restrepo, 2018 for a theoretical framework):
Productivity effect. The substitution of labour by cheaper machines reduces production costs, induces falling prices and expands demand and production
and, in turn, employment. Moreover, new technologies may raise the quality of products or enable new products and services, raising demand and production if consumers value this rise in quality or these new products and services. This expansion of the economy increases demand for labour. The magnitude of the productivity effect on employment depends on the magnitude of the price elasticity of demand: if it is sufficiently high, the increase in demand can offset the labour-saving effect of technology (Bessen, 2018).
Capital accumulation effect. The adoption of new technologies implies rising demand for new machines and intangible capital, which increases
demand for knowledge-based tasks and for labour tasks that involve producing, implementing, maintaining and upgrading the new technologies in use.
Reinstatement effect. New technologies induce the creation of new tasks for workers for two reasons: first, the displacement
of workers from old tasks could make more workers available to take over new, more productive tasks. Secondly, new machines and the rise in knowledge-based capital may directly require new tasks (such as machine operation) or enable new tasks (such as platform work). The creation of new tasks directly counteracts the displacement effect by raising demand for labour.
25 1. The impact of technology on the labour market
1.3 Technological innovation also creates new job opportunities
A number of foresight analyses suggest that the job-creation effects of technology may compensate for job destruction linked to automation (WEF, 2016; WEF, 2018; Cedefop and Eurofound, 2018). The first section of this chapter shows that new technologies have the potential to displace some workers from their tasks, even causing some jobs to disappear entirely. However, this short-term displacement effect, in which workers are replaced by new technologies, may be
counteracted or even entirely compensated for by other effects (see Box 3). For instance, for 24 OECD economies, Autor and Salomons (2018) show that while displacing employment in the industries where it originates, automation induces indirect employment gains in customer industries and increases in aggregate demand, ultimately leading to net employment growth. Similarly positive conclusions can be drawn from previous studies focusing on technologies replacing routine tasks, such as computers or industrial robots (Gregory et al., 2019; Graetz and Michaels, 2018).
box 3. How does technological progress create jobs?
261. The impact of technology on the labour market
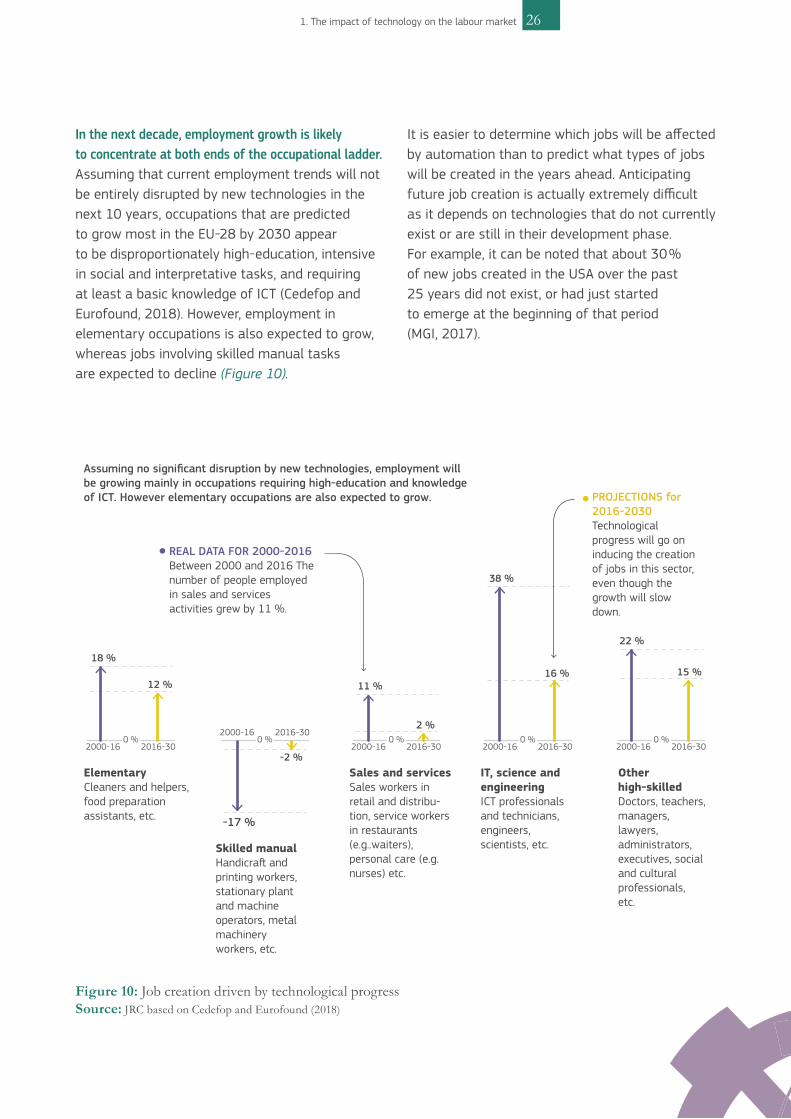
In the next decade, employment growth is likely to concentrate at both ends of the occupational ladder. Assuming that current employment trends will not be entirely disrupted by new technologies in the next 10 years, occupations that are predicted to grow most in the EU-28 by 2030 appear to be disproportionately high-education, intensive in social and interpretative tasks, and requiring at least a basic knowledge of ICT (Cedefop and Eurofound, 2018). However, employment in elementary occupations is also expected to grow, whereas jobs involving skilled manual tasks are expected to decline (Figure 10).
It is easier to determine which jobs will be affected by automation than to predict what types of jobs will be created in the years ahead. Anticipating future job creation is actually extremely difficult as it depends on technologies that do not currently exist or are still in their development phase. For example, it can be noted that about 30 % of new jobs created in the USA over the past 25 years did not exist, or had just started to emerge at the beginning of that period (MGI, 2017).
Skilled manualHandicra� and printing workers, stationary plant and machine operators, metal machinery workers, etc.
Sales and servicesSales workers in retail and distribu-tion, service workers in restaurants (e.g..waiters), personal care (e.g. nurses) etc.
Other high-skilledDoctors, teachers, managers, lawyers, administrators, executives, social and cultural professionals, etc.
-17 %
-2 %IT, science and engineeringICT professionals and technicians, engineers, scientists, etc.
2000-16 2016-30
38 %
16 %
0 %
ElementaryCleaners and helpers, food preparation assistants, etc.
2000-16 2016-30
18 %
12 %
0 %2000-16 2016-30
22 %
15 %
0 %2000-16 2016-30
11 %
2 %0 %
2000-16 2016-300 %
REAL DATA FOR 2000-2016 Between 2000 and 2016 The number of people employed in sales and services activities grew by 11 %.
PROJECTIONS for 2016-2030Technological progress will go on inducing the creation of jobs in this sector, even though the growth will slow down.
Assuming no significant disruption by new technologies, employment will be growing mainly in occupations requiring high-education and knowledge of ICT. However elementary occupations are also expected to grow.
Figure 10: Job creation driven by technological progressSource: JRC based on Cedefop and Eurofound (2018)

27 1. The impact of technology on the labour market
Yet, even if we cannot name the jobs that will appear in the future, we may be in a better position to describe what workers will be doing in these jobs. For instance, as suggested by Wilson et al. (2017), some of the AI-related profiles sought by employers may be:
Trainers – workers managing large amounts of data and designing algorithms to train AI systems;
Explainers – workers able to interpret the outcomes of AI systems;
Architects – workers responsible for organising AI systems and seizing opportunities for AI adoption;
Ethicists – workers responsible for setting guidelines and ensuring they are upheld so that AI systems are accountable both internally and externally.
Eurofound (2019a) suggests that advances in industrial robotics could generate employment in the provision of robotics support services to manufacturing firms, as well as in the manufacturing of robots. Roles in these areas would include programmers and specialists in robot maintenance. Although these occupations would not be entirely new, they would involve new combinations of skills.
Job profiles involving the management and elaboration of large amounts of data will also be in high demand. As economies and technologies become increasingly data-driven, it will be necessary to expand job opportunities for data professionals. In 2017, data professionals already accounted for 3.5 % of total employment in the EU-28 (up from 3.2 % in 2013), with percentages around or above 4 % in the Netherlands, Sweden and the UK (EU Data Landscape). Looking forward, this share is expected to approach 4 % in the EU-28 by 2025.
'New jobs’ may not have the same characteristics or emerge in the same industries and places as the ‘old jobs’ that are being destroyed. Even if the net employment effect of technological change will ultimately be positive, the redesign of existing jobs and the emergence of new job roles may significantly transform the demand for skills. Therefore, in order to fully seize, and share equally, the potential gains from technological progress, it is of growing importance to anticipate and meet emerging skills needs (see Chapter 2).

2. Digital and non-cognitive skills in the new world of work 28
SUMMARY
The digital revolution has already modified the nature of work, causing changes in skills demand and favouring individuals who possess both digital and non-cognitive skills. However, the lack of digital skills may prevent many EU workers and companies from fully profiting from the opportunities emerging in the digital economy. Non-cognitive skills are also increasingly important for labour market success.
To adequately address future skills demand, education systems should evolve from being focused on simply disseminating knowledge in order to equip people with the necessary non-cognitive skills. Such skills would help individuals to anticipate changes and be more flexible, creative and resilient at work. Non-cognitive skills are also important for having a fulfilled life.
The acquisition of knowledge only through formal education will not be enough to thrive in the constantly changing world, which calls for the implementation of a lifelong-learning approach. The constant re- and upskilling of workers requires greater cooperation between stakeholders at the local level, which could be strengthened by new online education tools.

2.1 Skills for a changing labour market
The skills demanded by employers change as digital technology modifies job content. Automation is leading to the transformation of the very nature of a myriad of occupations (WEF, 2018). As shown in Chapter 1, digital technology has penetrated the labour market, altering the distribution of tasks among people and machines.
The greater capacity for data collection, processing and analytics, paired with machine learning and AI, entails tasks that require more analytical and digital skills from workers. At the same time, while robots, software and machines powered by AI perform an increasing share of the work currently done by humans, computers are still very poor at simulating human interaction.
Digital technology is unable to substitute those jobs that require ‘the simultaneous use of a wide range of skills and involve dealing with unforeseen scenarios’ (Harari, 2018). In that sense, besides literacy and numeracy, the jobs available increasingly demand unique human skills (WEF, 2018; Baldwin, 2019). Indeed, as shown in Figure 11, in the next decade it is expected that technological change will bring about a decline in physical tasks, and an increase in cognitive and social tasks, digital tools, and autonomy and
teamwork (Cedefop, 2018). Therefore, digital and non-cognitive skills (see Boxes 4 and 5, respectively, for definitions) are likely to be in greater demand.
The EU labour market is already demanding more non-cognitive and digital skills, and specifically a combination of both. As Figure 12 shows, almost all the occupations that have expanded in recent years are either professionals or service and commercial managers who require a combination of ICT use and non-cognitive skills, e.g. to deal with customers and teams. Conversely, on average, occupations demanding low digital skills and/or poor social interaction and emotional capacities at work have declined, with a few exceptions.
29 2. Digital and non-cognitive skills in the new world of work
DIGITAL AND NON-COGNITIVE
SKILLS IN THE NEW WORLD OF WORK
A fast-evolving world requires individuals to acquire digital and non-cognitive skills to improve their employability and self-fulfilment.

30
For example, in the future, due to population ageing, the demand for professional carers — a profession that requires a diversity of non-cognitive skills — is expected to grow. This caring work, especially when provided for older people in their own homes, is socio-economically important but tends to be undeclared and overlooked in statistics. For that reason, the real growth in demand for this occupation is usually underestimated in labour market forecasts. Although digital technology has changed the job quality of care managers, it has had minimal impact on the day-to-day work of professional carers themselves. However, even though digital technology has yet to fully penetrate this sector, the digital skills required of carers has risen (Green et al., 2018). This also indicates the growing importance of the acquisition of basic digital skills among this group of workers (Carretero et al., 2015; Carretero, 2015).
2. Digital and non-cognitive skills in the new world of work
Phys
ical
ta
sks
Inte
llect
ual
task
sSo
cial
ta
sks
Met
hods
Tool
s
-0.008 -0.006 -0.004 -0.008 0.000 0.002 0.004 0.006 0.008 0.010
Strength
Dexterity
Literacy - Business
Literacy - Technical
Literacy - Humanities
Numeracy - Analytic
Information-gathering and evaluation
Creativity
Serving / attending
Selling / persuading
Teaching
Managing
Autonomy
Teamwork
Repetiveness
Standarisation
Machines
ICT - Basic IT
ICT - Programming
Numeracy - Accounting
We define digital skills according to the Council Recommendation of 22 May 2018 on key competences for lifelong learning, based on the European Digital Competence Framework (DigComp) (Vuorikari et al., 2016; Carretero et al., 2017):
‘Digital competence involves the confident, critical and responsible use of, and engagement with, digital technologies for learning, at work, and for participation in society. It includes information and data literacy, communication and collaboration, media literacy, digital content creation (including programming), safety (including digital well-being and competences related to cybersecurity), intellectual property related questions, problem solving and critical thinking.’
box 4. Digital skills
Figure 11: Change in the task content, methods and tools of work indexes in the EU, 2015 to 2030Source: Eurofound (2018c), Wage and task profiles of employment in Europe in 2030, p. 8

31 2. Digital and non-cognitive skills in the new world of work
0.10
0.20
0.30
0.40
0.50
0.60
0.70
0.80
0.90
0.00 0.10 0.20 0.30 0.40 0.50 0.60 0.70 0.80 0.90
GrowingStableDeclining
ICT professionals
General and keyboard clerks
Assemblers
Cleaners and helpersNumerical and material recording clerks
Personal service workers
Sales workers
Legal, social and cultural professionals
Administrative and commercial managers
Production, specialised services managers
Information and communications technicians
Index of ICT use at work
Index of social content of work
Occupations where both use of ICT and social interaction are above the average are those that have been growing the most since 2011.
AVERAGEHealth professionals
Other clerical support workersHospitality, retail, other services managers
Electrical and electronic trades workers
Handicrast and printing workers
Non-cognitive skills are referred to in the literature in different ways: soft skills, personality traits, character skills, human literacy, 21st century skills, life skills, key competences, or social and emotional skills. This is because non-cognitive skills relate to individuals’ different properties or attributes (Kautz et al., 2014; Sánchez-Puerta et al., 2016).
Indeed, in the empirical research, non-cognitive skills refer among others to: open-mindedness, openness to learn and to change, flexibility, curiosity, innovation, creativity, entrepreneurship, resilience, planning/organisation, responsibility, persistence, teamwork, communication, initiative, sociability, empathy, collaboration, emotional control and positivity. There have been some attempts to classify non-cognitive skills, mainly in the field of psychology – for instance, the Big Five taxonomy (Goldsmith et al., 1987; Almlund et al., 2011). The importance of non-cognitive skills has long been overlooked in most contemporary policy discussions and in economic models of choice behaviour (Kautz
et al., 2014). The Council Recommendation of 22 May 2018 on key competences for lifelong learning already acknowledged a set of non-cognitive skills for three of its eight key competences. In addition, the Entrepreneurship Competence Framework (EntreComp) includes non-cognitive skills such as creativity, taking initiative, perseverance and the ability to work collaboratively (Bacigalupo et al., 2016).
Current evidence on the relationship between non-cognitive skills and educational and job performance is mostly available at US level, but limited for the EU. The reasons for this lack of quantitative data on non-cognitive skills are diverse. The intelligence and achievement tests used in the educational sector and the labour market do not properly capture non-cognitive skills (Kautz et al., 2014). For example, when collecting information on non-cognitive skills, international surveys either rely on parents’ and/or teachers’ judgement or are based on individual perceptions, generating measurement error problems and comparison difficulties (Brunello and Schlotter, 2011).
box 5. What are non-cognitive skills?
Figure 12: Degree of social tasks and ICT use at work across occupations that have expanded, declined or remained stable over the period 2011-16
Source: JRC based on employment data from Cedefop and Eurofound (2018) and data on the task and tools of work from Bisello et al. (2019)

322. Digital and non-cognitive skills in the new world of work
A moderate level of digital skills and strong non-cognitive skills are expected to be required for most jobs in the future. As technology-driven production processes become more complex and interconnected, workers are increasingly required to organise these processes and to coordinate among themselves, often by using digital tools. In fact, as shown in a Cedefop study, most of the jobs which are anticipated to expand until 2025 require at least a moderate level of digital skills combined with strong non-cognitive skills (e.g. communication and teamwork) (see Figure 13). Another study argues that in order to cope in unknown and evolving circumstances — which best characterises expected future work environments — jobs will require workers to be equipped with diverse skills: cognitive and meta-cognitive skills (e.g. critical thinking,
Jobs anticipated to expand in the future will require at least a moderate level of digital skills combined with strong non-cognitive skills.
Figure 13: Average degree of importance of skills across jobs with a positive employment outlook, 2015-25, EU28 Note: The levels of skills were self-declared by surveyed workers.Source: JRC from Cedefop (2016a); Cedefop European skills and jobs survey; Cedefop European skills forecasts
Basic
Moderate ICT
Advanced17 %79 %
82 %
82 %
83 %
38 %
58 %
40 %
52 %
20 %
Problem solving
Advanced literacy
Basic literacy
Teamworking
Planning
Communication
The majority of jobs in the future will require at least moderate level of ICT knowledge.
ICT KNOWLEDGECOGNITIVE SKILLSNON-COGNITIVE SKILLS
The use of non-cognitive skills will be the common denominator of most of emerging jobs in the future.
Advanced numeracy
A moderate level of digital skills and strong non-cognitive skills are expected to be requested for most of the jobs of the future.
100%

33 2. Digital and non-cognitive skills in the new world of work
MODERATE OR ADVANCED USE OF ICT
Non - routine
Routine
LOW OR NO USE OF ICT
Non - routine
Routine
Low wage Medium low Medium high High wage
The probability of being in a high-paying job is greatest for workers combining non-routine tasks (which typically require a strong set of non-cognitive skills) with moderate to advanced use of ICT
13.9 25.3 31.729.1
20 29.3 27.3 23.4
30.8 32.5 20.8 15.9
40.1 33 16.4 10.5
Figure 14: Jobs combining non-routine tasks with ICT use are most likely to be highly paid (% of workers by wage quartile and type of job)Note: To identify workers in (non-)routine jobs, the following question from the European Skills and Jobs Survey (ESJ) has been used: ‘How often, if at all, does your job involve responding to non-routine situations during the course of your daily work?’ Workers responding ‘Always’ or ‘Usually’ were considered to be in non-routine jobs, and those responding ‘Sometimes’ or ‘Never’ in routine jobs. Based on the question ‘Which of the following best describes the highest level of ICT knowledge required to do your job?’ workers were divided into two groups: those who responded ‘Moderate or Advanced’ use of ICT, and those who reported ‘Low or No’ use of ICT. High (low) wage individuals are those in the top (bottom) quartile of the income distribution. Source: JRC based on Cedefop's European Skills and Jobs Survey (microdata, 2016)
creative thinking, learning to learn and self-regulation); non-cognitive skills (e.g. empathy and collaboration); and digital skills (e.g. using new digital devices) (OECD, 2018b).
Digital skills and non-cognitive skills are linked to larger wage premiums. Wage differences are widening between workers who are equipped with these skills and those who are not. In fact, as shown in Figure 14, the probability of being in a high-paying job is greatest for workers combining
non-routine tasks (which typically require a strong set of non-cognitive skills) with moderate to advanced use of ICT. Survey data across the EU-28 reveal that more than 32 % of these workers are in the top quartile of the wage distribution. In comparison, only 16 % of workers who perform non-routine tasks with little or no knowledge of ICT are found in the same wage quartile. Similarly, workers in routine jobs requiring the use of ICT are twice as likely to be at the top of wage distribution.
342. Digital and non-cognitive skills in the new world of work
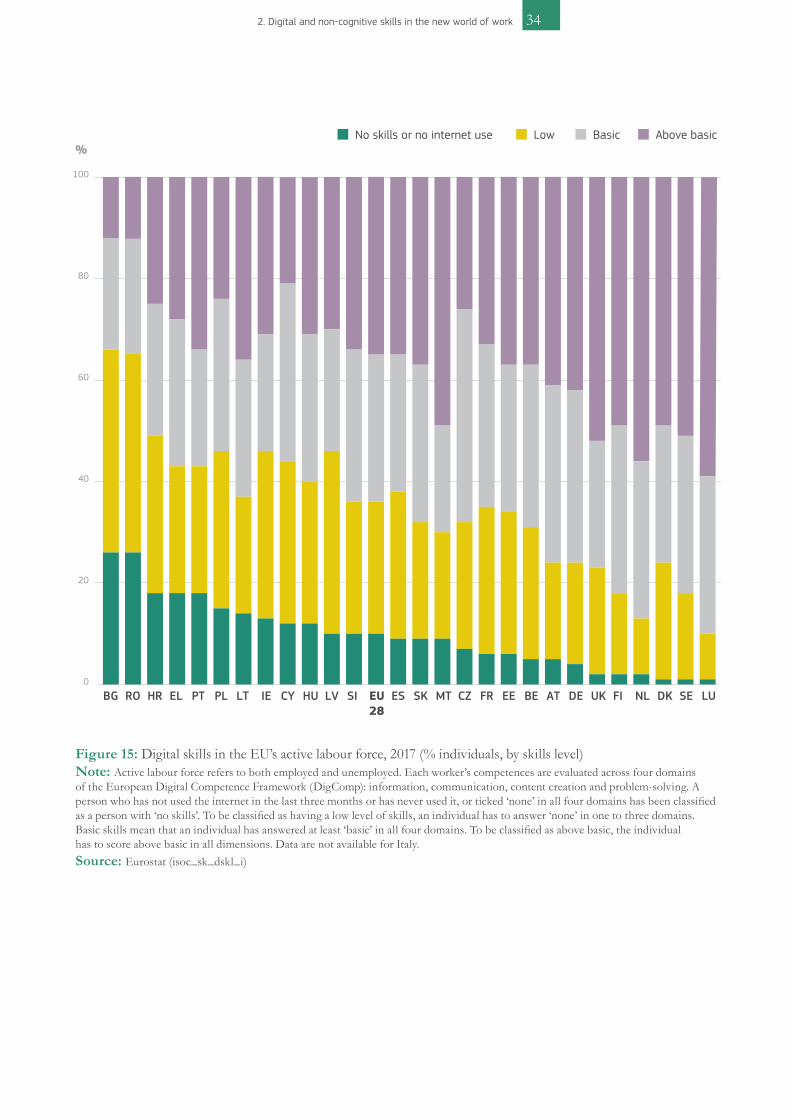
Figure 15: Digital skills in the EU’s active labour force, 2017 (% individuals, by skills level)Note: Active labour force refers to both employed and unemployed. Each worker’s competences are evaluated across four domains of the European Digital Competence Framework (DigComp): information, communication, content creation and problem-solving. A person who has not used the internet in the last three months or has never used it, or ticked ‘none’ in all four domains has been classified as a person with ‘no skills’. To be classified as having a low level of skills, an individual has to answer ‘none’ in one to three domains. Basic skills mean that an individual has answered at least ‘basic’ in all four domains. To be classified as above basic, the individual has to score above basic in all dimensions. Data are not available for Italy.Source: Eurostat (isoc_sk_dskl_i)
BG RO HR EL PT PL LT IE CY HU LV SI EU28
ES SK MT CZ FR EE BE AT DE UK FI NL DK SE LU0
20
40
60
80
100
No skills or no internet use Low Basic Above basic%

2.2 The EU labour force has an insufficient level of digital skills
One third of the EU’s active labour force has no or only a low level of digital skills. According to the Digital Economy and Society Index (DESI), in 2017, 10 % of the EU active labour force lacked digital skills, and a further 26 % reported only a low level of digital skills (Figure 15). Indeed, in a recent Vodafone study, 1 in 5 people aged 18-24 across 15 countries1 admitted that they feel under-prepared for the digital economy (YouGov, 2018). DESI also shows the huge variation across Member States: the share of active labour force with basic or above basic digital skills ranges from only 34 % in Bulgaria to 89% in Luxembourg. Digital skills are particularly low among people with no, or low to medium formal education and the unemployed (DESI, 2018, 2019).
European employers report that a large share of workers seem not ready to respond to the rising demand for digital skills. A European Commission study (Curtarelli et al., 2017) pointed out
that around one in seven employers (15 %) consider that some of their staff are not fully proficient when carrying out tasks using digital technologies at work, and therefore report digital skills gaps among their workforce. This is problematic given the increasing digitalisation of different areas of life and work, and the expected automation of a number of work-related tasks. Indeed, around 90 % of occupations now require digital skills (Curtarelli et al., 2017; Servoz, 2019). Digital skills can compensate for a lack of formal higher qualifications, while the opposite does not hold true and the lack of digital literacy may severely impair wage prospects (Falck et al., 2016; Lane and Conlon, 2016). As seen in Figure 16, larger employers are more likely than smaller ones to report digital skills gaps. As explained by Curtarelli et al. (2017), large employers are more likely to have the financial resources to invest in new digital technologies than small employers, which directly translates into a greater demand for employees equipped with digital skills.
35 2. Digital and non-cognitive skills in the new world of work
Increasing digitalisation of different areas of life and work raises the demand for digital skills.

362. Digital and non-cognitive skills in the new world of work
12.3
23.9
23.3
0,6
22.2
19.5
18.0
13.7
17.1
14.8
56.7
Firm
siz
eEU
-28
Sect
or
2-9
10-49
50-249
250 or more
Agriculture
Manufacturing and utilities
Construction
Education
Total
Information and communication, Professional, scientific and technical activities, Administrative services
Commerce, transport, accomodation and food service
Figure 16: Workplaces reporting digital skill gaps by sector and size, EU28 (% of workplaces)Note: From the responses to the following request: ‘Please provide your best estimate of the approximate number or share of employees carrying out such tasks and indicate how many of them are fully proficient in carrying out the tasks. Please note that a proficient employee is someone who is able to do the job/carrying out the task to the required level.’ Number of valid responses: 4 569; N = 5 634 045.Source: European Digital Skills Survey (weighted values), extracted from Curtarelli et al. (2017)
A moderate level of digital skills will be essential in the future, but mismatches in advanced digital skills are also expected in over half of the EU Member States in the period 2016-30. In 2018, 53 % of companies had difficulties in filling vacancies for ICT specialists (DESI, 2019). Despite the positive evolution in recent years, the gap between demand and supply for ICT specialists in the EU is expected to widen further. For example, due to the growing use of digital technologies in critical sectors such as transport, energy, health and finance, Europe can expect a shortage of skilled professionals to help address new digital trends, such as the increasing number of cybersecurity attacks (Negreiro and Belluomini, 2019).
Figure 17 shows potential mismatches at Member State level based on a simple and static comparison of the projected growth in the number of occupations requiring advanced digital skills with recent trends in graduation rates. Despite the anticipated continuing growth in the overall number of ICT graduates, 14 Member States could face shortages in ICT graduates by 2030. Conversely, in those countries expected to experience surpluses, this is mainly because the demand for ICT graduates’ skills is set to grow at a slower pace than the predicted growth in supply. Yet, in a more dynamic scenario, if the spread of digitalisation across all sectors accelerates at the greater pace predicted based

37 2. Digital and non-cognitive skills in the new world of work
Surplus countriesCluster 1Surplus of graduates due to the lower growth in demand for individuals with advanced digital skills: BG, DK, CY - the growth of the average annual number of graduates for 2013-2016* is higher than the implicit growth rate neede to meet labour demand.
Cluster 2Surplus of graduates to shrinking labour market demand for higher education digital skills: DE, IE, EL, ES, FR, HU - countries that experience a positive growth of the average annual number of graduates 2013-2016* while a negative implicit growth rate world suffice to meet labour demand.
Cluster 3Surplus of graduates due to shrinking labour market demand and a slower decrease in higher education graduates: AT, PL, RO, SK.
Shortage countriesCluster 4Shortage of graduates: BE, HR, LU, FI, SE - despite the positive growth of the average annual number of graduates in 2013-2016* the implicit growth rate needed to meet labour demand is higher.
Cluster 5Shortage of graduates due to the number of graduates falling quicker than the demand on the labour market: CZ, LV, SI.
Cluster 6Shortage of graduates: EE, IT, LT, NL, PT, UK - situation when a positive implicit growth rate is needed to meet labour demand while the country is experiencing a negative average annual growth of the number of graduates
Cluster 1
Cluster 2
Cluster 3
Cluster 4
Cluster 5
Cluster 6
Surplus countries Shortage countries
Figure 17: Projections of future demand and supply of ICT graduates in Europe Note: This is a simple and static approach, with the assumption that European higher education systems will continue to expand or decrease at the same rate as in the period 2013-16. The cluster groups correspond to six possible scenarios. Data for Malta are missing.Source: JRC based on Cedefop and Eurofound (2018). Skills forecast: trends and challenges to 2030, pp. 140
on historical data, the situation may be reversed in the countries with projected surpluses. Overall, these figures imply that the evolution of the wage premium for advanced digital skills may be uneven across EU Member States, narrowing in those showing surpluses of
advanced digital skills and widening where there are shortages. Of course, this also depends on the degreeof mobility of ICT graduates across EU countries, which could either ease or exacerbate projected shortages and surpluses.

382. Digital and non-cognitive skills in the new world of work
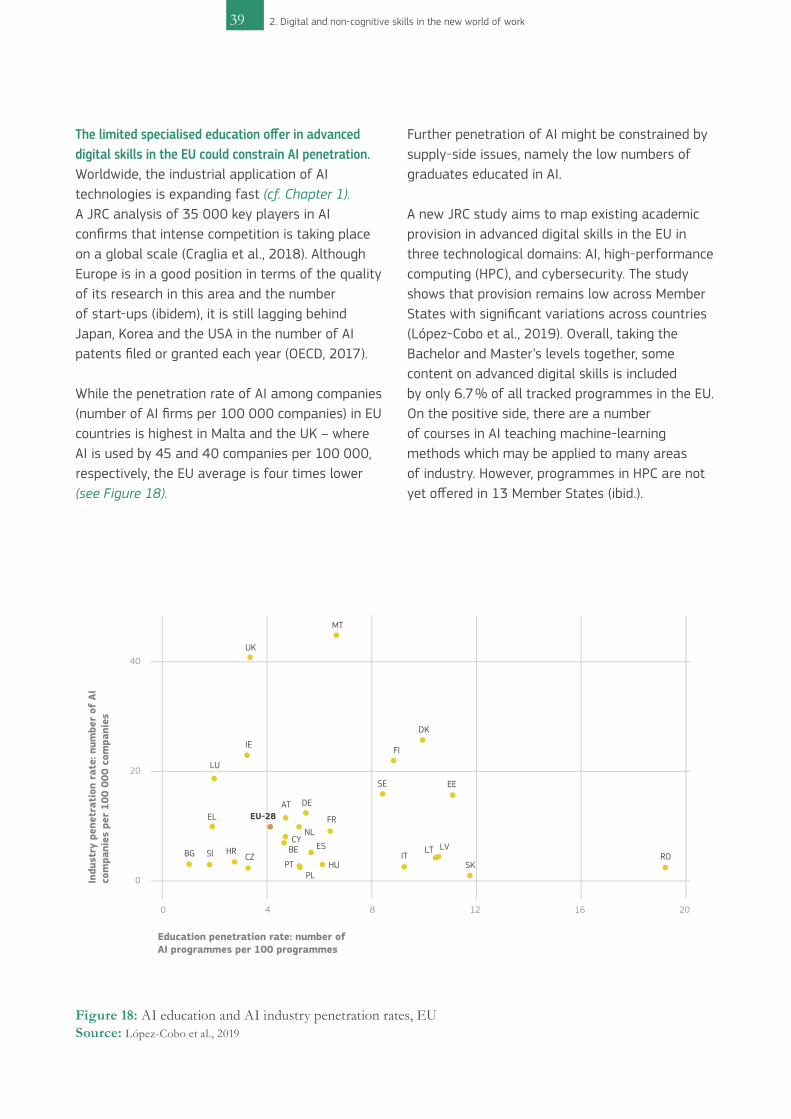
The limited specialised education offer in advanced digital skills in the EU could constrain AI penetration. Worldwide, the industrial application of AI technologies is expanding fast (cf. Chapter 1). A JRC analysis of 35 000 key players in AI confirms that intense competition is taking place on a global scale (Craglia et al., 2018). Although Europe is in a good position in terms of the quality of its research in this area and the number of start-ups (ibidem), it is still lagging behind Japan, Korea and the USA in the number of AI patents filed or granted each year (OECD, 2017).
While the penetration rate of AI among companies (number of AI firms per 100 000 companies) in EU countries is highest in Malta and the UK – where AI is used by 45 and 40 companies per 100 000, respectively, the EU average is four times lower (see Figure 18).
Further penetration of AI might be constrained by supply-side issues, namely the low numbers of graduates educated in AI.
A new JRC study aims to map existing academic provision in advanced digital skills in the EU in three technological domains: AI, high-performance computing (HPC), and cybersecurity. The study shows that provision remains low across Member States with significant variations across countries (López-Cobo et al., 2019). Overall, taking the Bachelor and Master’s levels together, some content on advanced digital skills is included by only 6.7 % of all tracked programmes in the EU. On the positive side, there are a number of courses in AI teaching machine-learning methods which may be applied to many areas of industry. However, programmes in HPC are not yet offered in 13 Member States (ibid.).
39 2. Digital and non-cognitive skills in the new world of work
Education penetration rate: number of AI programmes per 100 programmes
Indu
stry
pen
etra
tion
rat
e: n
umbe
r of
AI
com
pani
es p
er 1
00 0
00 c
ompa
nies
0
20
40
0 4 8 12 16 20
BG Sl HRCZ
EL
LU
IE
DK
FI
SE EE
LVLTIT
SKRO
FRNL
CYBE ES
HUPL
PT
DEAT
UK
MT
EU-28
Figure 18: AI education and AI industry penetration rates, EUSource: López-Cobo et al., 2019

402. Digital and non-cognitive skills in the new world of work
2.3 Non-cognitive skills are crucial to thrive in the new world of work
Today, education should evolve from only transmitting knowledge to enabling individuals to participate fully in society. Traditionally, education systems were based on the rule that ‘yesterday’s problems shape the present school’ (Dalin and Rust, 1996). Nowadays, however, they need to teach people in order to prepare them to deal with the complexity of the world (Dominici, 2018). Today’s society faces a more interlinked and connected world. Every realm of life related to technological change is changing. This presents challenges to all citizens and calls for a rethink of education systems: besides knowledge, individuals need competences which will enable them to participate fully in today’s society and gain a sense of belonging and well-being during their lifespan (Kyllönen, 2019).
Nurturing non-cognitive skills is becoming increasingly important for individuals' success in the labour market. Wage heterogeneity, especially among highly educated workers, increasingly depends on individual characteristics related to non-cognitive skills, which currently are not fully covered by formal education (Altonji et al., 2014; Card et al., 2015; Green and Henseke, 2016; Edin et al., 2017). For example, in a sample of tertiary graduates working in technology-intensive environments, those equipped with non-cognitive skills are more likely to be at the top of the wage distribution (see Figure 19). According to Aoun (2017), to respond to labour-market demand in the digitised world, as well as learning technological and data literacy2, individuals should also invest in non-cognitive skills. The author considers creativity, innovation, entrepreneurship, empathy and teamwork to be the most fundamental skills to becoming ‘robot-proof’.
The wage premium for non-cognitive skills has increased over time. Although difficult to measure, non-cognitive skills have been connected with better academic and job performance (Weinberger, 2014; Schanzenbach et al., 2016; Deming, 2017). One potential reason for this link at job-performance level is the rising complexity and interconnectedness of production processes, both within and across firms (Arntz et al., 2016).
For example, as can be seen in Figure 20, analysis of cumulative change in real hourly wages, by occupation task intensity, in the USA, the returns on non-cognitive skills (referred to in the figure as ‘social’) increased strongly in the same period, regardless of the level of cognitive skills (referred to as ‘math’) (Deming, 2017). Moreover, the share of jobs requiring a high level of social interaction increased by 12 percentage points between 1980 and 2012 (Deming, 2017).
Non-cognitive skills help individuals to adapt better to the changing work and life environment.

41 2. Digital and non-cognitive skills in the new world of work
The best-paid graduates (Top 25%) are more likely to have jobs where the use of non-cognitive skills is considered important
Problem solving skills
Communication skills
Teamworking skills
Planning/ organization skills
67.4
81.6
67.0
77.5
64.6
74.4
60.5
74.6
Bottom 50 % wage earnersTop 25 % wage earners
Figure 19: Share of tertiary graduates working in science, engineering or ICT who rate this skill as very important or essential in doing their job (% within each wage group)Note: The sample includes workers with tertiary education (ISCED5-6) who work in science, engineering or ICT. The graph shows the share of workers in this sample who rated the importance of a certain skill to their job at least 8 (on a scale of 0 to 10, where 10 is essential and 0 not at all important).Source: JRC based on Cedefop's European Skills and Jobs Survey (microdata, 2016)
-0.10
0.00
0.10
0.20
0.30
1980 1990 2000 2005 2012
High social, low math
High social, high math
Low social, high math
Low social, low math
Figure 20: Cumulative change in real hourly wages, by occupation task intensity, 1980 to 2012 (US data)Note: Occupational task Intensities based on 1998 O*NETSource: Deming, 2017

capacity to act upon ideas and opportunities to generate social, economic and cultural values (Bacigalupo et al., 2016).
Individuals need to learn to anticipate change and to be more flexible and adaptive to it. This wave of automation, which is bringing further robotisation of routine tasks, will make it harder for low-skilled
Employers seek teamworkers who can adapt to change and are open to learning. Developing non-cognitive skills is potentially as important for succeeding in the labour market as having advanced numeracy and literacy. The World Economic Forum (WEF, 2015) emphasises that workers equipped with non-cognitive skills, such as collaboration, creativity, persistence, curiosity and initiative, are those most able to thrive in today’s innovation-driven economy.
For instance, data from millions of online job vacancies across 18 EU countries reveal that being able to adapt to changing situations and work in a team are skills which employers seek just as much as being able to use a computer (Figure 21). These data measure the skills that employers want and point out those skills which are important for them. More generally, being able to adapt to changes, such as a new workplace environment, and work in a team are non-cognitive skills demanded in virtually any type of occupation, from software developers, to shop sales assistant and freight handler (Cedefop, 2018).
Non-cognitive skills, such as entrepreneurial and creative skills, could foster forms of self-employment. As described later in this report, digital technology facilitates the emergence of new forms of work in the EU, which translates into a dynamic increase in the number of self-employed workers (see Chapter 3). Various indicators highlight that EU citizens are not entrepreneurial in their working life (GEM, 2018), while population surveys confirm insufficient provision of entrepreneurial education at all levels (European Commission, 2012). There is also a gender dimension to the problem, with a very significant under-representation of women among the entrepreneur population (Halabisky, 2017). Yet, being entrepreneurial involves more than learning the skills required to set up a business. As defined by EntreComp, entrepreneurship is transversal to any aspect of life and entails a broader set of knowledge, skills and attitudes than those required to start up and run a company. It refers to the generic
422. Digital and non-cognitive skills in the new world of work
Figure 21: Most-requested skills, as mentioned in the Skills Online Vacancy Analysis Tool for Europe (Skills-OVATE)
English
others skills
accounting
adapt to changing situations
administerICT system
analyse so�ware specifications
assistcustomers
business ICT systems
communication
computerprogramming
customersegmentation
customerservice
develop creative
ideas
economics
engineering processes
foreign languages forinternational
careers
human resourcemanagement
officeadministration
onlineanalyticalprocessing
projectmanagement
salesactivities
sales argumentation
sales strategies
team building
teamworkprinciples
think proactively
use a computer use microso�
use object-orientedprogramming
use office systems
use so�ware design patterns
work as a team
1M 20M
Number of times a certain skill appears across all online job vacancies
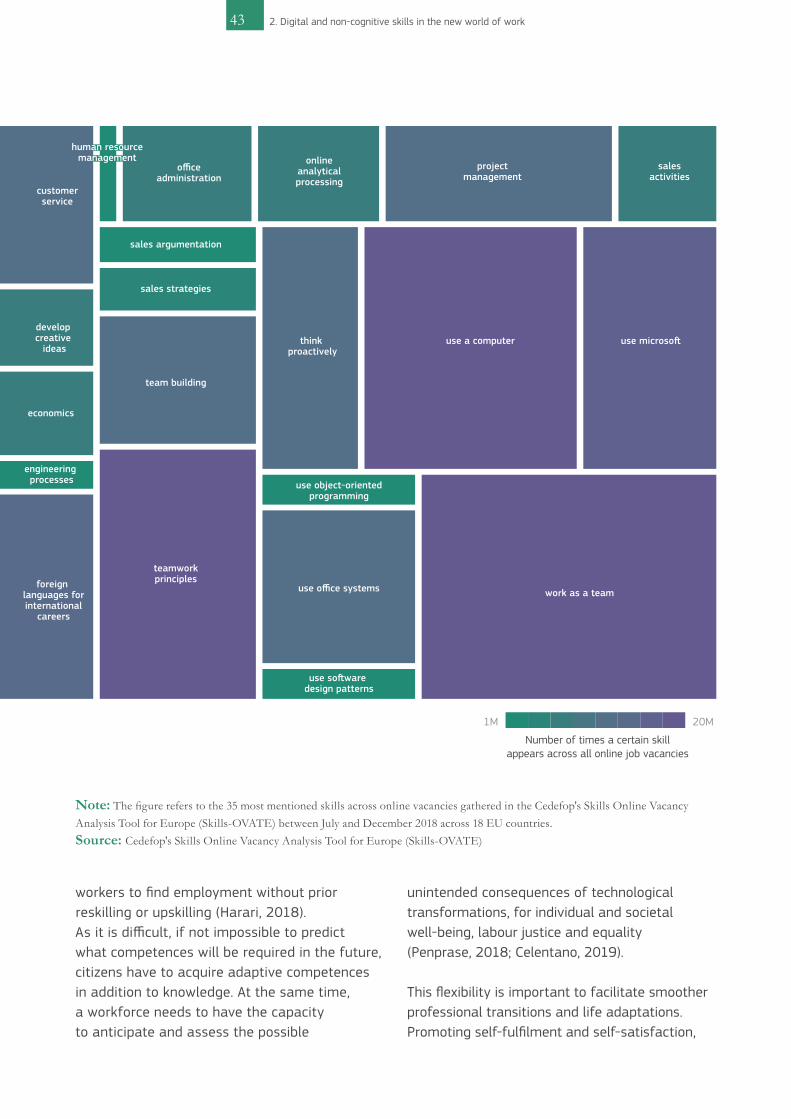
43 2. Digital and non-cognitive skills in the new world of work
workers to find employment without prior reskilling or upskilling (Harari, 2018). As it is difficult, if not impossible to predict what competences will be required in the future, citizens have to acquire adaptive competences in addition to knowledge. At the same time, a workforce needs to have the capacity to anticipate and assess the possible
unintended consequences of technological transformations, for individual and societal well-being, labour justice and equality (Penprase, 2018; Celentano, 2019).
This flexibility is important to facilitate smoother professional transitions and life adaptations. Promoting self-fulfilment and self-satisfaction,
English
others skills
accounting
adapt to changing situations
administerICT system
analyse so�ware specifications
assistcustomers
business ICT systems
communication
computerprogramming
customersegmentation
customerservice
develop creative
ideas
economics
engineering processes
foreign languages forinternational
careers
human resourcemanagement
officeadministration
onlineanalyticalprocessing
projectmanagement
salesactivities
sales argumentation
sales strategies
team building
teamworkprinciples
think proactively
use a computer use microso�
use object-orientedprogramming
use office systems
use so�ware design patterns
work as a team
1M 20M
Number of times a certain skill appears across all online job vacancies
Note: The figure refers to the 35 most mentioned skills across online vacancies gathered in the Cedefop's Skills Online Vacancy Analysis Tool for Europe (Skills-OVATE) between July and December 2018 across 18 EU countries.Source: Cedefop's Skills Online Vacancy Analysis Tool for Europe (Skills-OVATE)
English
others skills
accounting
adapt to changing situations
administerICT system
analyse so�ware specifications
assistcustomers
business ICT systems
communication
computerprogramming
customersegmentation
customerservice
develop creative
ideas
economics
engineering processes
foreign languages forinternational
careers
human resourcemanagement
officeadministration
onlineanalyticalprocessing
projectmanagement
salesactivities
sales argumentation
sales strategies
team building
teamworkprinciples
think proactively
use a computer use microso�
use object-orientedprogramming
use office systems
use so�ware design patterns
work as a team
1M 20M
Number of times a certain skill appears across all online job vacancies

which have a positive impact on both individuals and their communities, is also key in this respect (Cefai et al., 2018). Evidence suggests that educating individuals to become more flexible, resilient and creative, and to pursue personal well-being helps them to adapt better to the changing work and life environment (see Box 6).
Teaching non-cognitive skills is not covered as a core area across the EU, despite its effectiveness. The introduction of social and emotional learning as a key area for curricula, and as a transversal cross-curricular theme to develop non-cognitive skills among students, is highly recommended (Cefai et al., 2018). Some studies using Dutch and German data found that there is a significant correlation between non-cognitive skills related to diligence, responsibility, organisation and emotional control and more years of schooling (Van Eijck and De Graaf, 2004; Almlund et al., 2011). Various other studies in Europe show positive returns on investment for school-based
non-cognitive education programmes, in the UK (Clarke et al., 2015) and in Sweden (Belfield et al., 2015).
Yet, social and emotional learning is not mandatory in curricula among 17 Member States analysed (Cefai et al., 2018). For example, only half of the EU population aged 15 years and over agree that their school education helped them to develop a sense of initiative and a kind of entrepreneurial attitude (European Commission, 2012). Non-cognitive skills are not prominent in lifelong learning in the EU. For instance, in most EU countries, encouraging creativity, innovation and entrepreneurship has not been an important topic in vocational education and training (VET) (Cedefop, 2015).
Interactive learning contributes to the development of non-cognitive skills. Interactive teaching practices (e.g. problem-based learning (PBL), see Box 7) require students to work in groups and use non-
442. Digital and non-cognitive skills in the new world of work
Resilience has increasingly been identified as contributing to well-being and performance within education, but also to successfully navigating life and employment. New approaches include policies targeted at supporting parents and teachers, boosting social networks, and creating positive learning environments (Donlevy et al., 2019). One example is the EU-funded EMPAQT (empathic and supportive teachers) programme which has pioneered an innovative training programme for primary school teachers aimed at introducing inclusive pedagogies to combat early school leaving. This programme focuses on five core teaching pillars: positive emotions, values and character strengths, positive purpose, positive coping and positive relationships. It is designed to boost resilience and positivity, nurture well-being and positive relationships, and improve overall academic success.
The literature highlights that changes in the knowledge and skills required by modern societies and, more specifically, uncertainty about the future knowledge that will be needed, drive heightened attention to creativity and the need to think about how to teach creativity in schools (ibid.). For example, fostering creativity can enhance problem-solving skills in individuals. A key function of education should be to enable pupils to become creative learners able to address future changes (ibid.). In addition, various authors stress that enhancing creativity in education relies more broadly on open-mindedness in teaching, in practice involving a change in mindset from teaching to learning, and towards accepting newness and developing an ability to take risks (Fennel, 2017).
box 6. Educating individuals in non-cognitive skills to have a purposeful life and pursue personal well-being

cognitive skills in their discussions, to listen to one another when solving problems, or to make choices about their own learning (WEF, 2016). PBL can contribute to developing a student’s cognitive skills (Becker et al., 2017) and, together with interdisciplinary learning, can facilitate the acquisition of non-cognitive skills by emphasising the importance of flexibility and innovation (OECD, 2018b).
We have seen that teaching through such approaches may integrate the acquisition of non-cognitive skills such as those related to entrepreneurship throughout the curriculum (see Box 7). At the same time, interactive approaches to teaching, while benefiting the learning experience, are often more costly to implement than teaching via classical lectures. The innovative use of technology may offer solutions to this problem.
45 2. Digital and non-cognitive skills in the new world of work
Problem-based learning (PBL) is central to the educational approaches of many EU universities. A JRC analysis of 20 universities across Europe indicates that these forms of education are increasingly being integrated into the curricula of some of Europe's universities.
For instance, in Finland, Aalto University's Product Development Project courses and the Product Innovation Project offered at KU Leuven (Belgium) apply a PBL approach. At Denmark’s Aalborg Centre for PBL in Engineering Science and Sustainability, students learn through work on real cases, interacting with companies and public institutions.
This centre's model, which is problem and result-oriented, teaches students how to acquire knowledge and skills independently and how to work in interdisciplinary groups.
The European Institute of Innovation and Technology's education programmes apply a challenge-based learning approach which can be described as learning by doing. To build a specific competence, students are put into a situation where they have to explore and take action. They work on real-life challenges (e.g. how to address climate change) and develop innovative solutions to address the needs of the market and society.
box 7. Examples of problem-based learning in EU educational institutions

2.4 An evolving world calls for changes in how skills are provided
Individual investments in higher education are less rewarding than in the past. Since the beginning of the 2000s, the share of Europeans in the 30-34 age group with tertiary education has grown significantly, satisfying the EU-28 target for tertiary educational attainment in 2018 (set at 40 %). In spite of these improvements, the labour market situation for young graduates has worsened in recent years. In many EU countries, the relative earnings of workers aged 25-34 with tertiary education has fallen in comparison to the earnings of workers in the same age group with upper secondary education (Figure 22). Although, in general, more highly educated workers have better labour market prospects than the less
well educated, over the last decade, an increasing number of graduates have started to witness rather unexpectedly modest returns on their education (Castex and Dechter, 2014; Reinhold and Thomsen, 2015).
The share of young workers not working in the field in which they were educated is growing (horizontal mismatch). Figure 23 shows that a large share of tertiary graduates aged 25-34 and employed in the EU-28 occupy a position in a different field from that in which they have been trained. The overall incidence of horizontal mismatch among this group of workers has not declined between 2014 and 2017. It is highest in the humanities and, in the last three years, has increased in engineering.
462. Digital and non-cognitive skills in the new world of work
-20
-15
-10
-5
0
5
10
15
SE AT IT NL HU LU PL SK CZ UK PT DE IE EL FI DK ES EE BE FR
Figure 22: Changes in the earnings of workers aged 25-34 with tertiary education relative to those of workers in the same age group with upper secondary education, in selected EU countriesNote: The periods considered are: 2012-16 for AT, DK, EE, DE, EL, HU, LU, PL, SK, SE and UK; 2011-16 for BE, IE and PT; 2011-15 for CZ, FI and ES; and 2010-14 for IT, FR and NL. Source: OECD
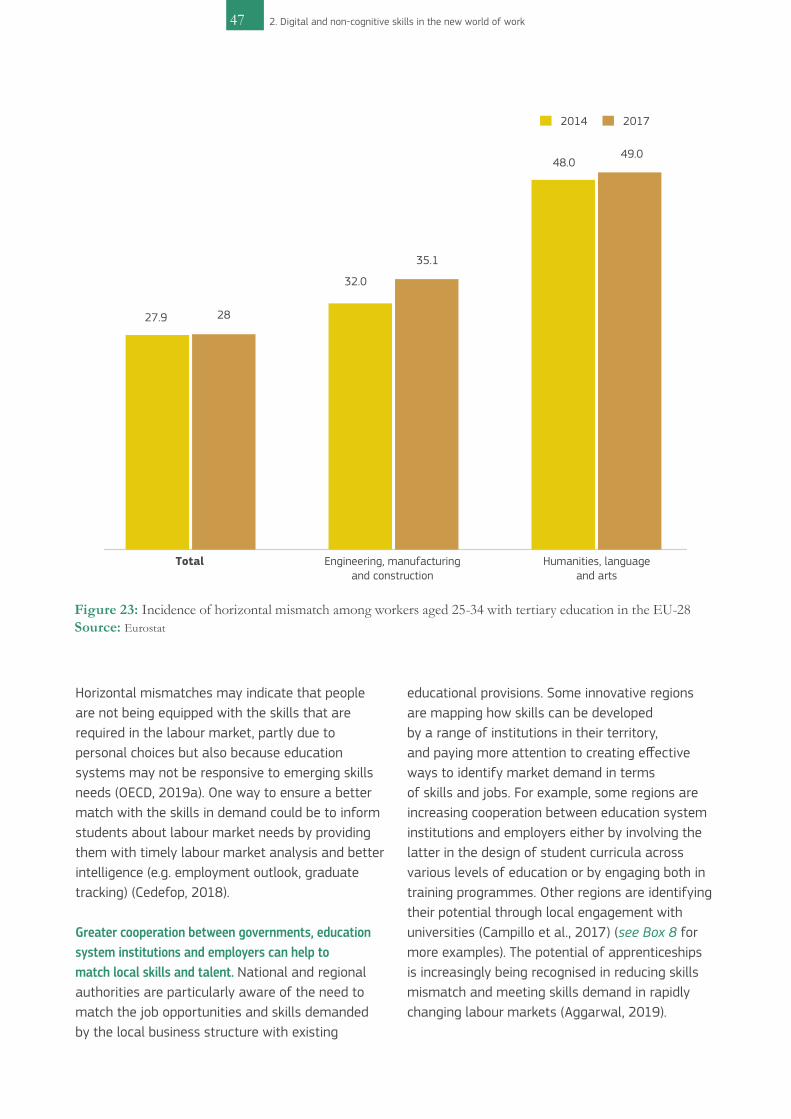
47 2. Digital and non-cognitive skills in the new world of work
Horizontal mismatches may indicate that people are not being equipped with the skills that are required in the labour market, partly due to personal choices but also because education systems may not be responsive to emerging skills needs (OECD, 2019a). One way to ensure a better match with the skills in demand could be to inform students about labour market needs by providing them with timely labour market analysis and better intelligence (e.g. employment outlook, graduate tracking) (Cedefop, 2018).
Greater cooperation between governments, education system institutions and employers can help to match local skills and talent. National and regional authorities are particularly aware of the need to match the job opportunities and skills demanded by the local business structure with existing
educational provisions. Some innovative regions are mapping how skills can be developed by a range of institutions in their territory, and paying more attention to creating effective ways to identify market demand in terms of skills and jobs. For example, some regions are increasing cooperation between education system institutions and employers either by involving the latter in the design of student curricula across various levels of education or by engaging both in training programmes. Other regions are identifying their potential through local engagement with universities (Campillo et al., 2017) (see Box 8 for more examples). The potential of apprenticeships is increasingly being recognised in reducing skills mismatch and meeting skills demand in rapidly changing labour markets (Aggarwal, 2019).
Total Engineering, manufacturing and construction
27.9 28
32.0
35.1
48.049.0
Humanities, language and arts
2014 2017
Figure 23: Incidence of horizontal mismatch among workers aged 25-34 with tertiary education in the EU-28Source: Eurostat

Lifelong learning could be an adequate way of reskilling and upskilling individuals and preventing skills loss, but it needs a boost. Lifelong learning means that learning happens in different contexts, over the course of a lifetime. It takes place not only in schools and universities in the form of formal education, but also through informal3 and non-formal education4. There is a strong consensus on the benefits of giving greater visibility to those skills and competences that people have gained through life and work experience. Indeed, the EU is responding by providing tools to validate informal and non-formal learning, such as the European inventory on validation of non-formal and informal learning (Cedefop et al., 2017). Whilst the participation of mature students and lifelong
learners – referred to as the ‘post-traditional student’, over 22 years old – is already quite high in the USA (Hazelkorn and Edwards, 2018), just 11.1 % of adults (aged 25-64) participated in lifelong learning in 2018 in the EU-28.
Moreover, in 2018, only 7 Member States had reached the Europe 2020 target (15 % of adults aged 25-64 should participate in lifelong learning by 2020) (see Figure 24). People most in need of education, training and upskilling (older people, low skilled and unemployed people) are less likely to participate in learning activities (Cedefop, 2017). In addition, participation in training is observed as being lower among workers in jobs at high risk of automation.
482. Digital and non-cognitive skills in the new world of work
The Regional Observatory of Higher Education (ORES) and Regional Observatory of Employment and Training (OREF) in the Centre-Val de Loire region, France, play an important part in the region’s strategic orientations and prospective studies. Both observatories have shared databases to track student cohorts and enhance the link between education and employment (Arregui-Pabollet et al., 2018).
Aalborg University in Denmark cooperates with key partners to jointly develop course curricula. The University of Trieste in Italy also actively involves regional firms in curriculum design. Some universities taking part in the knowledge and innovation communities at the European Institute of Innovation and Technology conduct skills forecasts when adopting their curricula (Tijssen et al., forthcoming).
In the UK, more prominence has been given to employers when designing the occupational standards upon which the apprenticeship system is founded (Cedefop, 2018).
In addition, the Employer Skills Survey (ESS) provides a robust picture of skills needs and training investment in the UK.
In Lithuania, in 2014-15, the Ministry of Education and Science signed collaboration agreements with eight employers’ associations to involve them in planning, implementation and review of vocational and educational training (VET) (European Commission, 2016).
More generally, in Germany and Switzerland, VET is referred to as the ‘dual-corporatist model’, and training takes place alternatively in schools and in firms. The latter are financially engaged in the training programme and provide skills which are tailor-made for the job the trainee will eventually hold. Social partners of both employers and employees are involved at several stages in curriculum design, setting of occupational standards, and assessment.
box 8. Examples of activities addressing skills matching

49 2. Digital and non-cognitive skills in the new world of work
0.9-6.66.6-14.614.6-36.1Data not available
Figure 24: Share of the adult population (aged 25-64) participating in learning in 2018Source: Eurostat [sdg_04_60]

502. Digital and non-cognitive skills in the new world of work
Online innovations in education, such as massive open online courses (MOOCs), are potentially a way forward in helping to leverage the adult learning gap. Data from worldwide MOOC providers say that, in 2018, 20 million new learners enrolled in at least one MOOC while the total number of learners surpassed 100 million (Shah, 2018). Workers see MOOCs as a useful tool for acquiring the new skills needed in the labour market and for keeping them updated in their field. In particular, data from the JRC’s MOOCKnowledge survey5 show that workers consider MOOCs more useful for acquiring skills to perform better in their current job than for getting a better position (see Figure 25). This evidence suggests that MOOCs could overcome the lack of formal training opportunities and be used as a lifelong learning tool to reskill and upskill individuals who would gain occupational or even task-specific skills in a flexible and personalised way.
Nevertheless, it would seem that not many employers acknowledge the potential of MOOCs for reskilling or upskilling their employees, as few participants stated that they have used MOOCs during their working time (Castaño-Muñoz et al., 2017). Moreover, not all individuals have the digital skills needed for MOOC participation. Indeed, MOOC learners are typically well educated and have already acquired a good level of digital competence (Hansein and Reich, 2015; Castaño-Muñoz et al., 2017).
Better job position Better skills
2.02.1
2.22.3
3.3
3.7 3.6
4.0
Getting a pay increase
Getting a promotion
Changing to a new carreer
Changing to a better job
Doing new things in my current job
Acquiring valuable skills for
the labour market
Acquiring enhanced
skills for my current job
Keeping me up to date in my field
Figure 25: Workers’ benefits from taking MOOCsNote: Scale of usefulness from 1 (not useful) to 5 (very useful); n=268.Source: JRC MOOCKnowledge survey

51 2. Digital and non-cognitive skills in the new world of work
MOOCs could be used as a lifelong learning tool to reskill and upskill individuals.

SUMMARY
Technology clearly facilitates the dissemination of new forms of work: ICTs make working remotely easier than ever, while allowing firms to adopt a more agile and flexible organisation structure. Meanwhile, digital platforms enable firms and clients to reach hundreds of workers simultaneously, offering opportunities for many, from tech-savvy freelancers to taxi drivers. As this chapter shows, platform work attracts thousands of young people and highly educated workers in the EU.
Besides opportunities, digital transformation also brings new policy challenges. ICTs create incentives for firms to contract out work, which risks making work more like a transaction to undertake well-defined tasks than a fully-fledged job. In fact, signs of an increasing fragmentation of work are already visible in the EU, not only in the growing number of platform workers, but also in the declining job tenure and fewer working hours.
In addition, some emerging forms of work are not clearly defined by law, leaving room for misclassification of the employment relationship. This is particularly true for many platform workers who, despite faced with working schedules and a degree of auton-omy comparable to those of an employee, do not have access to the same levels of job security and benefits.
3. New forms of work in the EU 52
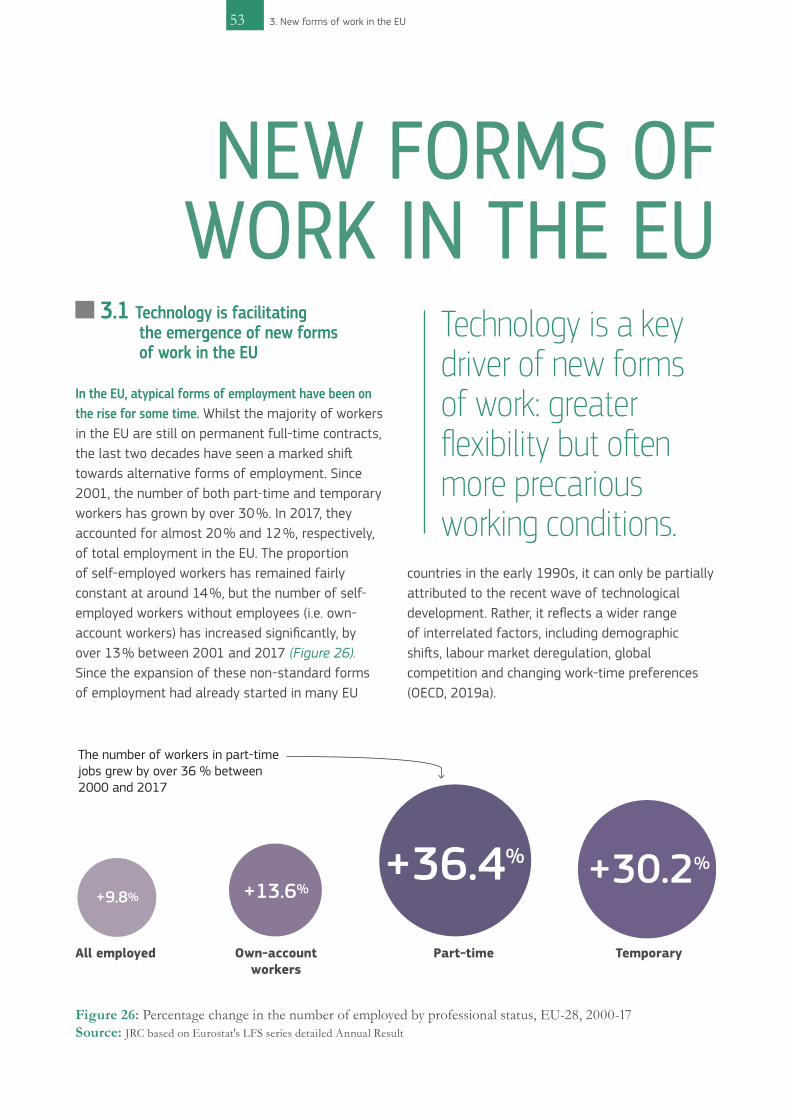
NEW FORMS OF WORK IN THE EU
3.1 Technology is facilitating the emergence of new forms of work in the EU
In the EU, atypical forms of employment have been on the rise for some time. Whilst the majority of workers in the EU are still on permanent full-time contracts, the last two decades have seen a marked shift towards alternative forms of employment. Since 2001, the number of both part-time and temporary workers has grown by over 30 %. In 2017, they accounted for almost 20 % and 12 %, respectively, of total employment in the EU. The proportion of self-employed workers has remained fairly constant at around 14 %, but the number of self-employed workers without employees (i.e. own-account workers) has increased significantly, by over 13 % between 2001 and 2017 (Figure 26). Since the expansion of these non-standard forms of employment had already started in many EU
countries in the early 1990s, it can only be partially attributed to the recent wave of technological development. Rather, it reflects a wider range of interrelated factors, including demographic shifts, labour market deregulation, global competition and changing work-time preferences (OECD, 2019a).
Technology is a key driver of new forms of work: greater flexibility but often more precarious working conditions.
53 3. New forms of work in the EU
All employed
+9.8% +13.6%+36.4% +30.2%
Own-accountworkers
Part-time Temporary
The number of workers in part-timejobs grew by over 36 % between 2000 and 2017
Figure 26: Percentage change in the number of employed by professional status, EU-28, 2000-17Source: JRC based on Eurostat's LFS series detailed Annual Result

Technology is a key driver of new forms of work. Whilst the previous expansion of temporary and part-time employment was only partially driven by technological change (OECD, 2019a), the role of the latest wave of technological development in facilitating the emergence of newer forms of work is clear. In particular, technology is leading to stronger work standardisation while facilitating job matching and reducing monitoring and supervisory costs. This gives employers incentives to contract out work while enabling workers to work remotely, both as employees and freelancers (see Box 9).
According to Eurofound (2015a), these new forms of work can be broadly classified into three groups:
i. Employee-oriented forms of work (e.g. employee sharing, job sharing, casual work, interim management). This first group mainly includes forms of employment that are not confined within the traditional framework of a stable ‘one employer-one employee’ employment relationship.
ii. Self-employment-oriented forms of work
(e.g. portfolio work, crowd work, collaborative employment) which includes options for self-employment that are mediated by virtual platforms matching customers with service providers, as well as forms of cooperation among freelancers. For example, crowd work refers to the use of an online platform to enable organisations or individuals to access an indefinite and unknown group of other organisations or individuals in order to solve specific problems or to provide specific services or products in exchange for payment.
iii. Mixed forms of work (e.g. voucher-based work,
ICT-based mobile work), including workers who have an employment status somewhere in-between employees and self-employed and, depending on the case, can be classified as either of the two.
543. New forms of work in the EU
Technology is leading to stronger work standardisation while facilitating job matching and reducing monitoring and supervisory costs.

55 3. New forms of work in the EU
There are several possible channels through which technological progress can contribute to the rise in new work arrangements, both directly and indirectly:
1. Technological change leads to stronger work standardisation and the disintermediation of work tasks, while reducing monitoring and supervisory costs, thereby making it easier to contract out work.
2. The intensification of competitive pressure due to
different rates of technological adoption requires firms to be more flexible, which may lead them to hire more self-employed contractors for non-core activities, ranging from janitorial to IT-related services.
3. Technology facilitates online work arrangements such as short-term work that is organised and managed through online platforms and mobile applications.
4. Technology makes people more mobile, allowing the self-employed (but increasingly often employees, too) to work from anywhere, at any time.
5. E-commerce platforms provide the self-employed
and micro-enterprises with a new channel to sell their products and manage other aspects of production and product delivery.
box 9. How technology is contributing to the rise of new forms of work
However, the classification of new forms of work is not always so straightforward. There are situations where employment relationships are not clearly defined by legislation – as is the case for platform work in many EU countries – which leaves room for the misclassification of employment relationships (see section 3.3, Eurofound, 2015a, and Eurofound 2018b).
With some variation, new forms of work are being introduced in all Member States. Among the new forms of dependent employment, casual work – whereby employees do not have a regular and systematic work schedule but are called on a daily basis when the need arises – is extremely widespread in the EU, with the exception of southern European countries (see Figure 27 and Eurofound, 2015a). Employee-sharing schemes – through which a worker is jointly hired by a group of employers – are also becoming
increasingly present across EU Member States, especially in north-western Europe. Meanwhile, job-sharing schemes, in which a single employer hires two or more workers to jointly fill a specific vacancy, are gaining relevance in central and eastern Europe. ICT-based mobile work – whereby workers (whether employees or self-employed) operate from various possible locations outside their employers’ premises – is gaining traction in the majority of EU Member States. Similarly, there is fast-paced diffusion of digitally enabled and collaborative forms of self-employment.
Source: Evidence from various papers, including: Bresnahan, Brynjolfsson and Hitt (2002); Aubert, Caroli and Roger (2006); Goldschmidt and Schmieder (2017); and Katz and Krueger (2017)

56
New work patterns are also reflected in many Member States in the reduction in working hours for part-time workers. The rapid growth of part-time employment over the past couple of decades (see Figure 26) only partly reflects changes in workers' work-time preferences (see section 3.3). It more likely reflects structural factors such as the expansion of low-wage occupations in the service sector, where new forms of employment with no guaranteed working hours are more typically widespread (ILO, 2018; OECD, 2019a). In fact, since 2000, most EU Member States have witnessed growth in short part-time work (less
than 19 hours a week), with increases particularly pronounced in those countries where on-call and casual work arrangements are comparatively more widespread (Figure 28) (OECD, 2019a).
Digital platforms may be one of the factors underpinning the rapid growth in high-skilled solo entrepreneurs. Self-employed workers without employees (i.e. own-account workers) make up over 70 % of all self-employed workers in the EU. The number of own-account workers providing specialised intellectual or technical services has grown markedly over the past
3. New forms of work in the EU
Collaborative employment
Crowd work
Portfolio work
Voucher-based work
ICT-based mobile work
Interim management
Casual work
Job sharing
Employee sharing
Self
-em
ploy
ed -
ori
ente
dM
ixed
Empl
oyee
-ori
ente
d
North-western Europe
SouthernEurope
Central and Eastern Europe
6
4
3
2
8
1
5
2
6 1 3
1 5
1 5
1 3
3 4
1 3
4 3
4 3
4 2
Number of EU countries
4 668620 66
Figure 27: New forms of employment identified as increasingly relevant across European countries in 2015Note: In line with the categories of the ‘Seventh report on economic, social and territorial cohesion’, the three geographical regions are defined as follows: north-western Europe (Austria, Belgium, Denmark, Finland, France, Germany, Ireland, Luxembourg, the Netherlands, Sweden and the UK); southern Europe (Cyprus, Greece, Italy, Malta, Portugal and Spain); and central and eastern Europe (Bulgaria, Czechia, Estonia, Hungary, Latvia, Lithuania, Poland, Romania, Slovakia and Slovenia). See Eurofound (2015a) for a detailed definition of the various new forms of employment.Source: JRC based on Table 1 in Eurofound (2015a)

57 3. New forms of work in the EU
decade, although most of the 20 million own-account workers in the EU are still in low-value-added sectors, such as agriculture and construction.
For instance, own-account workers operating in professional, scientific and technical activities, which often require intensive use of ICT or are supported by digital platforms, have expanded by over 35 % since 2008 (Figure 29) – and almost doubling in countries such as France and Estonia. The number of own-account workers has also increased significantly in other knowledge-intensive sectors, such as ICT and education. Beyond the rise of digital platforms, other factors, such as labour and product market regulation, taxation systems and workers' preferences may be underpinning the growth of high-skilled solo entrepreneurs.
Hunga
ryLa
tviaPo
land
Lithu
ania
Czechia
Sloven
ia
Slovak
ia
Eston
ia
Portu
gal
Loxem
bourg
Greece
Spain
Franc
eIta
ly
Sweden
Belgium
Finlan
d
Austria
Irelan
d
United
Kingdo
m
German
y
Denmark
Netherl
ands
0
5
10
15
20
25
2000 2017
Figure 28: Short part-time employment as a share of dependent employment, all ages (%)Note: Short part-time is defined as usually working 1-19 hours per week. Source: JRC from OECD (2019a)
The number of own-account workers operating in professional, scientific and technical activities has expanded by over 35 % since 2008.

58
3.2 Platform work remains small but relevant in the EU
The number of EU citizens who have ever engaged in platform work appears to be growing. A forthcoming JRC study shows that, in 2018, around 11 % of the working-age population (aged 16-74) across the 16 EU Member States surveyed had provided services via online platforms at least once. This represents a small increase on the 9.5 % found in 2017 (see Figure 30 - Box 10).
The share of workers performing platform work as their main work activity remains small but significant. In 2018, half the platform workers provided services on a sporadic (2.4 %) or marginal (3.1 %)
basis, while another 4.1 % of the working-age population provided labour services via platforms as a secondary job. Only 1.4 % of the working-age population were found to have provided labour services mediated by platforms as their main work activity. These figures include platform workers providing services both digitally (e.g. freelancing, clerical and data entry) and on location (e.g. transport, delivery, housekeeping, etc.).
3. New forms of work in the EU
140
140
120
110
100
90
80
2008 2009 2010 2011 2012 2013 2014 2015 2016 2017
Own-account workers in PST
Own-account workers in ICT
All own-account workers
All self- employed
Figure 29: Growth index for selected categories of self-employment (millions of workers in 2008=100)Note: PST refers to professional, scientific and technical activities.Source: JRC based on Eurostat's LFS series detailed Annual Result
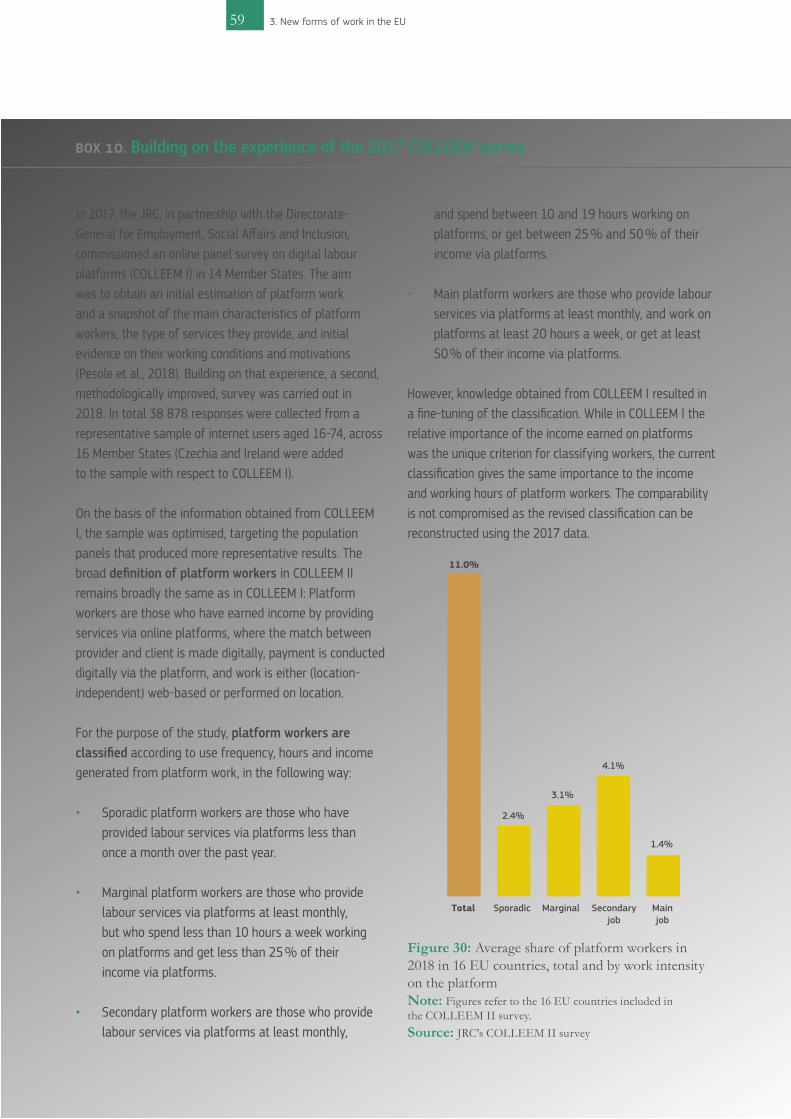
In 2017, the JRC, in partnership with the Directorate-General for Employment, Social Affairs and Inclusion, commissioned an online panel survey on digital labour platforms (COLLEEM I) in 14 Member States. The aim was to obtain an initial estimation of platform work and a snapshot of the main characteristics of platform workers, the type of services they provide, and initial evidence on their working conditions and motivations (Pesole et al., 2018). Building on that experience, a second, methodologically improved, survey was carried out in 2018. In total 38 878 responses were collected from a representative sample of internet users aged 16-74, across 16 Member States (Czechia and Ireland were added to the sample with respect to COLLEEM I).
On the basis of the information obtained from COLLEEM I, the sample was optimised, targeting the population panels that produced more representative results. The broad definition of platform workers in COLLEEM II remains broadly the same as in COLLEEM I: Platform workers are those who have earned income by providing services via online platforms, where the match between provider and client is made digitally, payment is conducted digitally via the platform, and work is either (location-independent) web-based or performed on location.
For the purpose of the study, platform workers are classified according to use frequency, hours and income generated from platform work, in the following way:
• Sporadic platform workers are those who have provided labour services via platforms less than
once a month over the past year. • Marginal platform workers are those who provide
labour services via platforms at least monthly, but who spend less than 10 hours a week working on platforms and get less than 25 % of their income via platforms.
• Secondary platform workers are those who provide labour services via platforms at least monthly,
and spend between 10 and 19 hours working on platforms, or get between 25 % and 50 % of their income via platforms.
• Main platform workers are those who provide labour services via platforms at least monthly, and work on platforms at least 20 hours a week, or get at least 50 % of their income via platforms.
However, knowledge obtained from COLLEEM I resulted in a fine-tuning of the classification. While in COLLEEM I the relative importance of the income earned on platforms was the unique criterion for classifying workers, the current classification gives the same importance to the income and working hours of platform workers. The comparability is not compromised as the revised classification can be reconstructed using the 2017 data.
59 3. New forms of work in the EU
Total
11.0%
Sporadic
2.4%
3.1%
4.1%
1.4%
Marginal Secondary job
Main job
Figure 30: Average share of platform workers in 2018 in 16 EU countries, total and by work intensity on the platformNote: Figures refer to the 16 EU countries included in the COLLEEM II survey.Source: JRC's COLLEEM II survey
box 10. Building on the experience of the 2017 COLLEEM survey
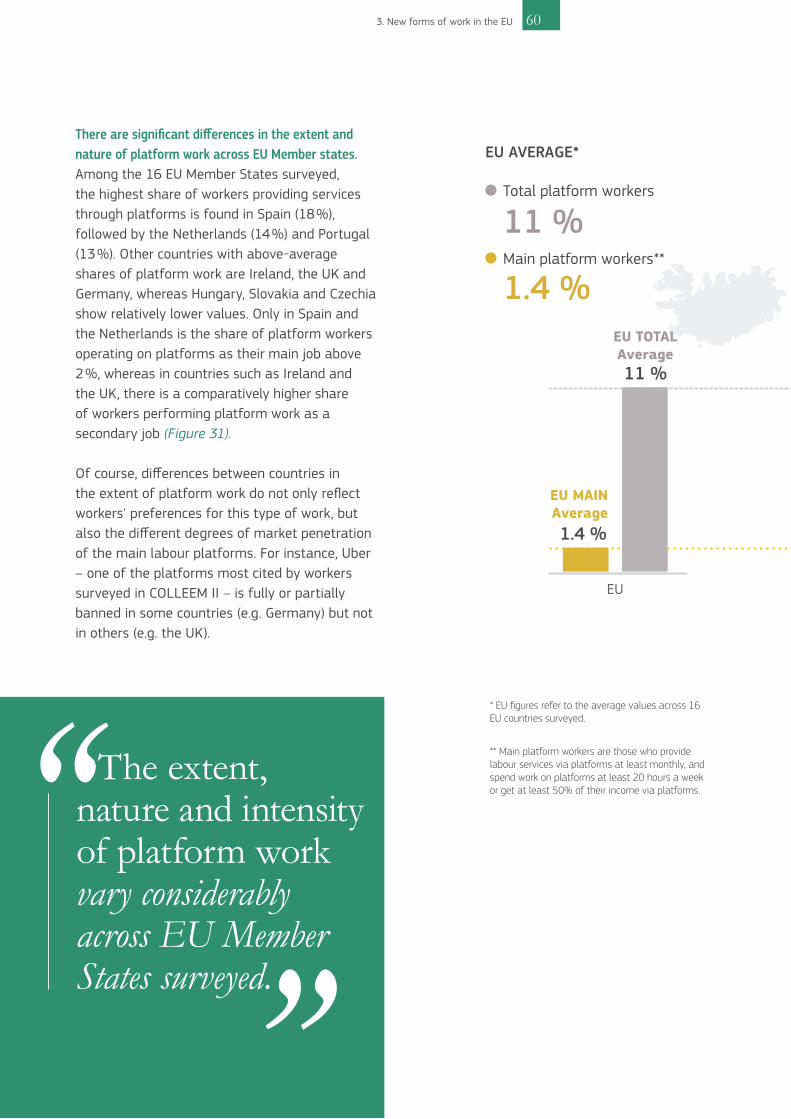
Romania and Hungary total platform workers levels are under the EU average but shares of main platform workers are similar to the EU average. We can see the opposite situation in Lithuania.
13
Ireland
2.0
12,8
UK
1.6
11.9
Germany
1.5
11.8
Lithuania
1.2
10.7
Croatia
1.1
18.1
Spain
2.6
14
Netherlands
2.7
13
Portugal
1.51.4 %
11 %
EU TOTALAverage
EU AVERAGE*
EU MAINAverage
In Netherlands and in Spain the share of platform workers operating on platforms as their main job is above 2%.
** Main platform workers are those who provide labour services via platforms at least monthly, and spend work on platforms at least 20 hours a week or get at least 50% of their income via platforms.
France
7.8
0.9
Finland
6.7
0.6
Hungary
6.5
1.4
Slovakia
6.1
0.9
Czech Rep.
5.9
0.9
Romania
10.5
1.4
Sweden
10.2
0.9
Italy
8.8
0.9
EU
* EU figures refer to the average values across 16 EU countries surveyed.
Main platform workers**
Total platform workers
1.4 %
11 %
Slovakia, Czechia and Finland show relatively lower shares of main platform workers
60
There are significant differences in the extent and nature of platform work across EU Member states. Among the 16 EU Member States surveyed, the highest share of workers providing services through platforms is found in Spain (18 %), followed by the Netherlands (14 %) and Portugal (13 %). Other countries with above-average shares of platform work are Ireland, the UK and Germany, whereas Hungary, Slovakia and Czechia show relatively lower values. Only in Spain and the Netherlands is the share of platform workers operating on platforms as their main job above 2 %, whereas in countries such as Ireland and the UK, there is a comparatively higher share of workers performing platform work as a secondary job (Figure 31).
Of course, differences between countries in the extent of platform work do not only reflect workers' preferences for this type of work, but also the different degrees of market penetration of the main labour platforms. For instance, Uber – one of the platforms most cited by workers surveyed in COLLEEM II – is fully or partially banned in some countries (e.g. Germany) but not in others (e.g. the UK).
3. New forms of work in the EU
The extent, nature and intensity of platform work vary considerably across EU Member States surveyed.
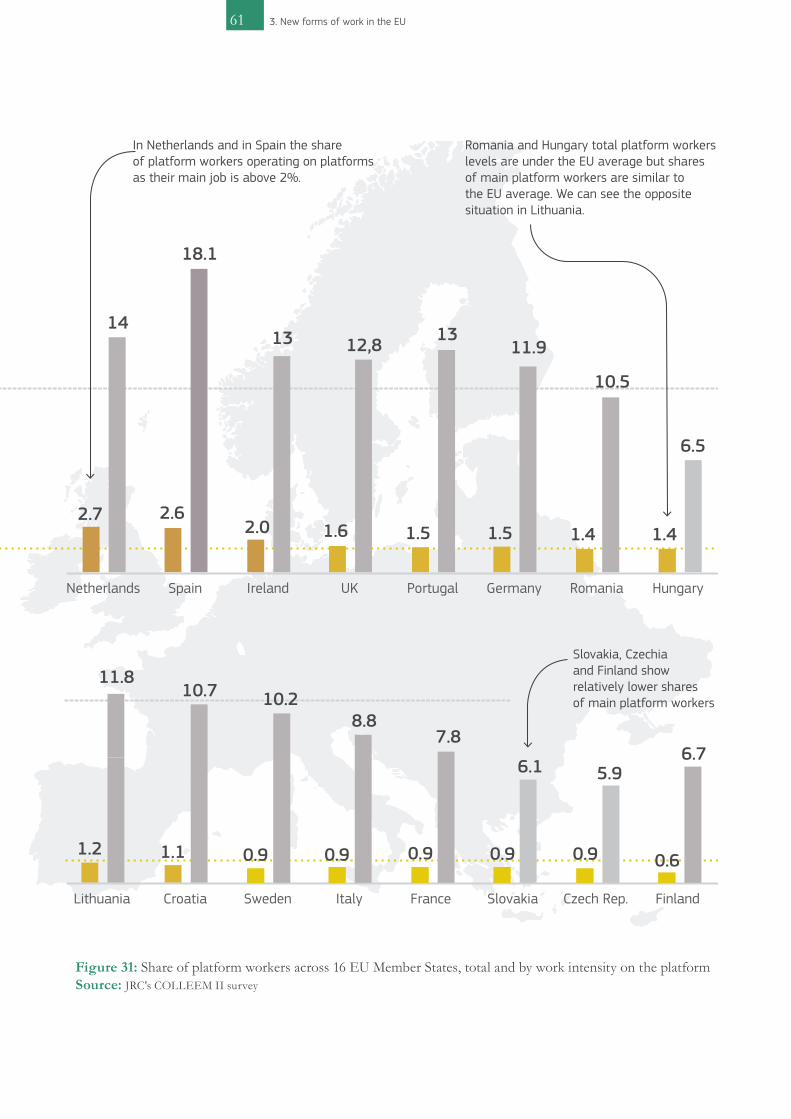
Romania and Hungary total platform workers levels are under the EU average but shares of main platform workers are similar to the EU average. We can see the opposite situation in Lithuania.
13
Ireland
2.0
12,8
UK
1.6
11.9
Germany
1.5
11.8
Lithuania
1.2
10.7
Croatia
1.1
18.1
Spain
2.6
14
Netherlands
2.7
13
Portugal
1.51.4 %
11 %
EU TOTALAverage
EU AVERAGE*
EU MAINAverage
In Netherlands and in Spain the share of platform workers operating on platforms as their main job is above 2%.
** Main platform workers are those who provide labour services via platforms at least monthly, and spend work on platforms at least 20 hours a week or get at least 50% of their income via platforms.
France
7.8
0.9
Finland
6.7
0.6
Hungary
6.5
1.4
Slovakia
6.1
0.9
Czech Rep.
5.9
0.9
Romania
10.5
1.4
Sweden
10.2
0.9
Italy
8.8
0.9
EU
* EU figures refer to the average values across 16 EU countries surveyed.
Main platform workers**
Total platform workers
1.4 %
11 %
Slovakia, Czechia and Finland show relatively lower shares of main platform workers
61 3. New forms of work in the EU
Figure 31: Share of platform workers across 16 EU Member States, total and by work intensity on the platformSource: JRC's COLLEEM II survey

62
The typical European platform worker is a young male although the proportion of young women is growing rapidly. The average age of platform workers is just under 34. Young people aged 16-25 are particularly highly represented, accounting for over 26 % of all secondary platform workers and 23 % of main platform workers.
Whilst male platform workers under the age of 35 represent around 37 % of all platform workers (overall, two thirds of platform workers are male), the proportion of young women appears to be growing rapidly. As regards COLLEEM I, the fraction of young women performing platform work as a secondary or main activity increased by approximately 6.4 and 7.1 percentage points, respectively.
Platform workers are more likely to live in larger households, have family responsibilities, and be foreign-born than ‘offline’ workers. Over one third of main and secondary platform workers live in a household of four or more people (compared with 26.7 % of offline workers) (Figure 32). Meanwhile, platform workers are considerably more likely than offline workers to have dependent children, and more of them.
In addition, over 50 % of workers who perform platform work as their main activity are foreign-born, while this figure is below 7 % among offline workers. The share of foreign-born platform workers is particularly high (more than 30 %) in Ireland, Finland and the UK.
Platform workers tend to be more educated than offline ones although this is not the case among young cohorts. Some 58 % of platform workers who provide services on platforms as their main job have at least a tertiary level of education, compared to 36 % of offline workers. Among secondary and marginal platform workers, the share of highly educated workers is also comparatively higher, reaching 47 % and 49 %, respectively. However, the average level of education of young platform workers is lower
than that of their offline counterparts. For instance, while 56 % of offline workers aged 26-35 have some form of tertiary education, this percentage drops to 49 % among young platform workers (Figure 32).
The majority of platform workers in Europe provide highly skilled online services, but the share of on-location service providers is expanding. On average, half of the platform workers perform both online and on-location services and are active on two or more platforms. The majority of platform workers provide professional services (such as software development, writing or translation) which demand high skill levels. In particular, a large and growing proportion (40 %, up from 26 % in COLLEEM I) of main platform workers provide translation services, a trend partly reflecting the growing engagement of women in platform work. In fact, while the provision of services such as software development and transport are the most
3. New forms of work in the EU
58 % of platform workers who provide services on platforms as their main job have at least a tertiary level of education.

63 3. New forms of work in the EU
male-dominated services, translation is mainly female-dominated. This also holds for on-location services (e.g. housekeeping) which, unlike other non-professional activities (e.g. micro-tasking, clerical work, sales), are becoming increasingly prevalent among platform workers.
Online platform work is a growing global phenomenon, with potentially significant cross-border employment effects. Although comprehensive data are not yet available on the extent and nature of service provision through online labour platforms, a number of sources agree that, while remaining limited, work mediated by digital platform is increasing worldwide. For instance, according
to the Oxford University’s Online Labour Index, the use of online labour for freelance work – as measured on four of the largest English-speaking online freelancing/outsourcing platforms – increased by around 25 % between May 2016 and May 2019. Online freelancers are predominantly found in emerging and developing economies, while employers are mainly located in advanced economies, notably the USA and the EU. This implies that freelancers in Europe, especially those providing software development and multimedia-related services, may inevitably face competition from workers located in countries with comparatively lower average wages (Box 11 and Figure 33).
Share of high educated(ISCED 5-8)
Share of those with dependants Share of those living in large households (4 people or more)
Share of female
Share of male
0 %
100 %
Main platform workers are more likely to have university-level education than the regular worker.
Main Platform workers are those who provide labour services via platforms at least monthly, and spend work on platforms at least 20 hours a week or get at least 50% of their income via platforms.
Main platform workers
37.1
22.8
36.2
57.1
49 15.3
17.1
26.7
39
29
Main platform workers are likely to have dependants and live in larger household.
Offline workers refer to survey respondents who are in the workforce, but do not provide services via platforms.
Offline workers
Figure 32: Share of offline/main platform workers by type of characteristicNote: Data are weighted using population weights.Source: JRC COLLEM II data

643. New forms of work in the EU
According to data from the Online Labour Index at Oxford University in the UK, the largest overall suppliers of online labour are traditional outsourcing countries in Asia, such as India and Bangladesh, which together account for over 40 % of the global market share, followed by the USA (12 %).
Overall, Europe accounts for 13 of platform workers globally. Not surprisingly, half of these are typically engaged in software development and technology -related activities.
These workers are found in particular in the UK and east European countries, whereas in southern Europe, writing and translation are the most common activities among online freelancers. Rather, workers in northern European countries are stronger providers of creative and multimedia work, as well as sales and marketing support. Overall, this shows that on online labour platforms, too, the distribution of work reflects a distinct geographical pattern, potentially reflecting different skill endowments among countries.
box 11. Where are online workers located?
Asia
Europe
NorthAmerica
Africa
SouthAmerica
Oceania
0 10 20 30 40 50 60 70
Creative and multimedia
So�ware development and technology
Sales and marketing support
Writing and translations
Professional services
Clerical and data entry
Figure 33: International division of online work by region and type of service (% market share)Note: The worker supplement of the Online Labour Index is collected from four of the largest English-speaking online freelancing/outsourcing platforms: Fiverr, Freelancer, Guru, and PeoplePerHour. Estimates show that these four platforms make up at least 40 % of the global market for platform-based online work.Source: The Online Labour Index, Oxford University, UK

3.3 Challenges for workers: unstable jobs, unclear work relationships and limited earning potential
Short-term work contracts of one year or less are becoming increasingly common in the EU. In 2018, temporary employment accounted for around 20 % of all dependent employment in the EU-28, involving more than 27 million workers. Over 8 million of these had a work contract lasting less than 6 months, while close to 7 million had work contracts of between 6 months and 1 year.
As shown in Figure 34, the number of workers with short-term work contracts of one year or less has increased by over 10 % since 2008. Furthermore, temporary contracts of a longer duration (at least 2 years) — which are supposedly more likely to represent a stepping stone towards better employment opportunities — have declined by almost 23 % over the same period.
The declining average duration of temporary work contracts is part of a broader trend whereby jobs in advanced economies are becoming less and less stable (OECD, 2019a). The intensifying international competition, outsourcing of jobs, and fragmentation of work tasks enabled by digital labour platforms contribute significantly to making jobs (especially low-wage ones) increasingly short-lived. However, declining job stability also reflects greater mobility between jobs, as well as from dependent employment to self-employment. In fact, thanks to ICT technologies and digital labour platforms, job search and job matching between employees and employers is becoming easier and cheaper (OECD, 2019a).
Part-time and temporary employment is often taken on involuntarily. Unlike self-employment, a considerable share of those working in either part-time or temporary employment are in such employment involuntarily, namely because they could not find a full-time or permanent job, respectively. As of 2018, one quarter of part-time
65 3. New forms of work in the EU
The number of workers with work contracts of one year or less has increased by over 10 % since 2008.
0
2
4
6
8
Less than 6 months
Between 6 months and 1 year
Between 1 and 2 years
Over 2 years
Mill
ions
of
wor
kers
2008 2018
In 2018 over 15 M people had a work contract lasting one year or less
Figure 34: Number of workers by duration of temporary contract in the EU-28 (millions)Source: JRC based on Eurostat's LFS series detailed Annual Result

66
workers and over half of temporary employees in the EU-28 were in such forms of employment involuntarily (Figure 35).
While these shares have only slightly increased since 2006, there is still a large variation between EU-28 countries. The proportion of involuntary part-time employment ranges from over 50 % in some southern European countries to 10 % or less in most north-west European Member States. Involuntary temporary workers account for 80 % or more of all temporary employees in most southern and eastern European countries, compared with less than 20 % in central European countries. However, fewer than 6 % of own-account workers in the EU-28 would rather be in a dependent employment role, suggesting that being a solo entrepreneur mainly reflects personal preferences and attitudes towards work.6
The outsourcing of jobs risks blurring the line between dependent employment and self-employment. As seen above, the expansion of the digital economy appears to have opened doors for independent highly skilled professionals. However, across the EU-27 countries, some own-account workers find themselves in ambiguous work relationships, closer to dependent employment than self-employment. The so-called ‘economically dependent’ self-employed are own-account workers who have one client from whom they earn at least 50 % of their total income.
In some cases, despite being registered as self-employed, the dependent self-employed also have little or no autonomy as to what they do at work, or how they do it. For instance, more than one third of dependent own-account workers have no autonomy, and another quarter
3. New forms of work in the EU
100
90
80
70
60
50
40
30
20
10
02006 2018 2006 2018 2017
Involuntary part-time workers(% of total part-time employment)
Involuntary temporary workers(% of total temporary employment)
Involuntary own account work
(% of total own account work)
EU-28 Min Max
Figure 35: Share of involuntary employment in the EU-28, by type of employmentNote: The rage of variation across EU-28 countries is not provided for involuntary own-account work, due to limited data availability.Source: JRC based on Eurostat LFS series detailed Annual Result and LFS ad-hoc module on Self-Employment (2017)
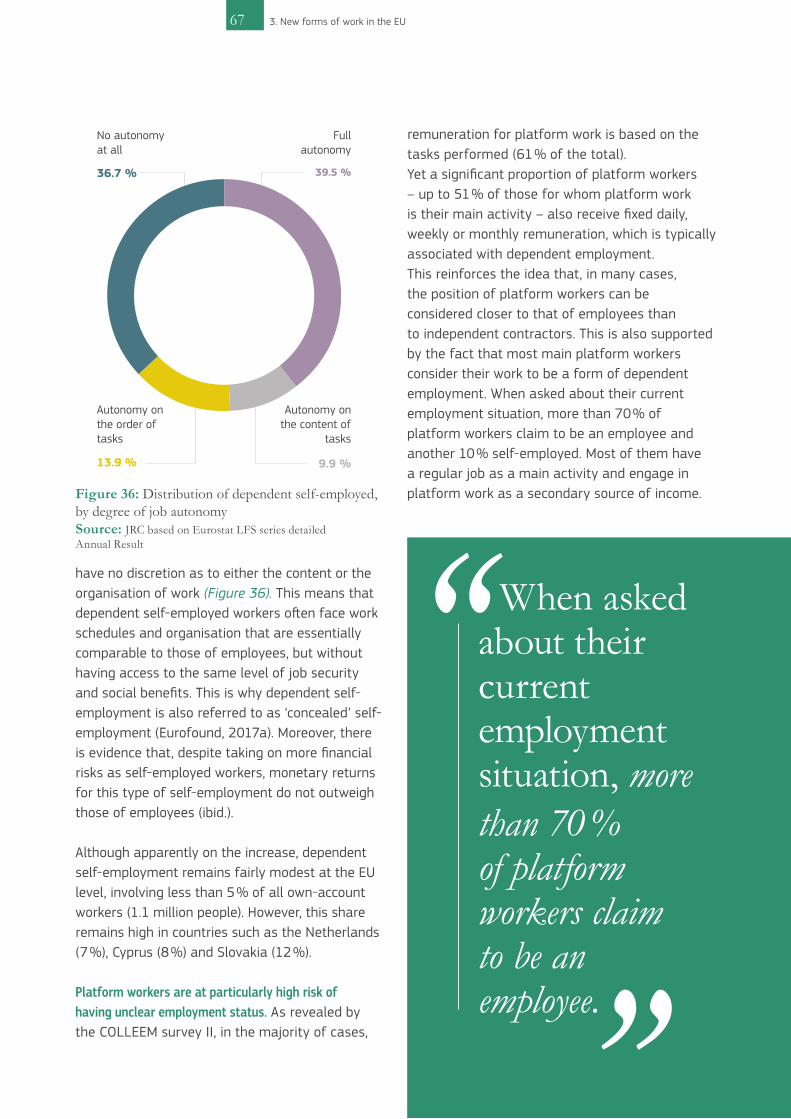
67 3. New forms of work in the EU
have no discretion as to either the content or the organisation of work (Figure 36). This means that dependent self-employed workers often face work schedules and organisation that are essentially comparable to those of employees, but without having access to the same level of job security and social benefits. This is why dependent self-employment is also referred to as ‘concealed’ self-employment (Eurofound, 2017a). Moreover, there is evidence that, despite taking on more financial risks as self-employed workers, monetary returns for this type of self-employment do not outweigh those of employees (ibid.).
Although apparently on the increase, dependent self-employment remains fairly modest at the EU level, involving less than 5 % of all own-account workers (1.1 million people). However, this share remains high in countries such as the Netherlands (7 %), Cyprus (8 %) and Slovakia (12 %).
Platform workers are at particularly high risk of having unclear employment status. As revealed by the COLLEEM survey II, in the majority of cases,
remuneration for platform work is based on the tasks performed (61 % of the total). Yet a significant proportion of platform workers – up to 51 % of those for whom platform work is their main activity – also receive fixed daily, weekly or monthly remuneration, which is typically associated with dependent employment. This reinforces the idea that, in many cases, the position of platform workers can be considered closer to that of employees than to independent contractors. This is also supported by the fact that most main platform workers consider their work to be a form of dependent employment. When asked about their current employment situation, more than 70 % of platform workers claim to be an employee and another 10 % self-employed. Most of them have a regular job as a main activity and engage in platform work as a secondary source of income.
No autonomy at all
Fullautonomy
Autonomy on the order of tasks
Autonomy on the content of
tasks
36.7 % 39.5 %
13.9 % 9.9 %
Figure 36: Distribution of dependent self-employed, by degree of job autonomySource: JRC based on Eurostat LFS series detailed Annual Result
When asked about their current employment situation, more than 70 % of platform workers claim to be an employee.

68
Working conditions vary considerably across types of platform workers. Respondents who predominantly provide professional services are typically better paid than other types of platform workers, but also more likely to face stressful situations. On the other hand, non-professional online platform workers, while facing less stressful situations, are more likely to perform routine tasks (e.g. data entry, micro-tasks) and to have few learning opportunities. Importantly, workers’ conditions tend to worsen with the intensity
of platform work. For instance, more than half of main platform workers consider their work via online platforms is often stressful. In terms of working hours, three quarters of the platform workers surveyed work less than 30 hours a week, although 13 % of platform workers report very long working hours, in excess of 60 hours a week. Ultimately, findings suggest that the working conditions of platform workers are very heterogeneous, depending on the type of work performed, its intensity and frequency (Box 12).
3. New forms of work in the EU
Eurofound (2018a) has identified 10 different types of platform work which are already common in Europe. Three of these have been explored as regards their effects on working and employment conditions, in particular:
• On-location platform-determined routine work covers low-skilled work delivered in person and assigned to the worker by the platform. The platform often takes the role of the employer without, in most cases, providing an employment contract. This type of platform work offers workers good access to the labour market and low, but decent and relatively predictable, income. However, autonomy and career development opportunities are very limited and workers can suffer from low-quality working time and risks to physical health and safety.
• On-location worker-initiated moderately skilled work refers to low- to medium-skilled work refers to low- to medium-skilled work whereby tasks are
selected and delivered on location by the worker. They benefit from autonomy in selecting tasks and setting prices, and dependence on the platform is limited. This type of platform work is also used by professionals to enlarge their client pool.
• Online contestant specialist work is highly skilled online work where the client selects the worker by means of a contest, often related to creative tasks. Workers benefit from a high level of flexibility as regards selecting and performing the tasks, as well as the opportunity to build up professional experience. However, work assignments and hence income are very unpredictable, and workers may experience high work intensity due to tight deadlines, as well as social and professional isolation.
box 12. The many faces and challenges of platform work

69 3. New forms of work in the EU

704. The structure of jobs at regional level in the EU
SUMMARY
Technological change is a key driver of structural change in the labour market. If we identify the tasks and jobs that new technologies are replacing, boosting or creating we will also be better able to understand the implications of these new developments from the point of view of inequality. And the last wave of technological change seems to promote employment polarisation.
But there is a diversity of structural change patterns in EU labour markets, both at national and regional level. This suggests that many other factors beyond technology are at play and are mediating the effect technological change has on employment structures.
On the other hand, the dynamics of employment at the regional level show that re-gions with higher innovation capacity are more likely to attract high-quality jobs. Those with high shares of high-paid jobs tend to cluster together within each country, usually around capital city regions, suggesting that some network effects do exist. Conversely, low-paid jobs are more common in peripheral regions. But capital city regions do not only attract skilled labour – they also attract low-skilled service workers. As a result, capital city regions are those most likely to show signs of employment polarisation.

THE STRUCTURE OF JOBS AT REGIONAL
LEVEL IN THE EU 4.1 Several factors affect job
structures: technology is a key one
Technological change does not only create and destroy jobs (see Chapter 1) but it also contributes significantly to transforming the overall structure of employment by shifting skills requirements (see Chapter 2).
A main finding from the early literature is that, during the 1970s and 1980s, technological change was mainly ‘skill-biased’, leading to rising labour demand for highly skilled workers relative to lower-skilled ones. As a result of this trend, technical change would lead to growth in higher-skilled occupations relative to lower-skilled ones, leading to an overall upgrading of the employment structure. This appeared to hold until the early 1980s when, in fact, a large share of the workforce in Europe shifted from low-skilled to mid- or high-skilled occupations. However, starting with computerisation in the late 1980s, the way technology affects the structure of jobs started to change (Goos et al., 2019).
The latest wave of technological change is seen as having a polarising effect on employment structure.As discussed in Chapter 1, the latest waves of technological change, specifically computerisation, tend to substitute workers in routine occupations – typically in middle-wage occupations – while simultaneously expanding demand for jobs at both the bottom and top of wage and skills distribution.
This pattern of ‘routine-biased’ technological change has been a key factor driving greater job polarisation in some EU countries over the past couple of decades (see Box 13; Craglia et al., 2018; Sebastian and Biagi, 2018).
However, only a few countries experienced pervasive job polarisation over the past couple of decades. During the period 1995-2007, evidence for job polarisation was mainly found across western European countries, including France, Germany, the Netherlands and the UK (Fernández-Macías, 2012). In some of these countries, notably the Netherlands and the UK, the job structure has also continued to polarise in more recent years (Panel A, Figure 37).
Since 2011, other countries, including Belgium, Denmark, Italy and Romania, joined the group of EU Member States with polarising labour
71 4. The structure of jobs at regional level in the EU
The structure of jobs evolves differently across regions and countries in the EU, deepening territorial disparities.
72
markets (Panel A, Figure 37), in contrast to other EU Member States, such as France and Germany, where job polarisation declined. Moreover, it is worth noting that, with a few exceptions (e.g. Italy), job-polarisation patterns have rarely been symmetrical, with employment gains often concentrated in the upper part of wage distribution.
4. The structure of jobs at regional level in the EU
A growing body of empirical literature has been analysing the long-term transformations in occupational structure across European countries over the past few decades. Many studies point to an increase in employment in both low- and high-earning occupations, relative to those in the middle – which is typically defined as a pattern of job polarisation (see, for example, Goos et al., 2014; Michaels et al., 2014; Wang et al., 2015). A more recent strand of literature, focusing on regional differences in employment restructuring within individual EU Member States, also finds support for the job polarisation hypothesis in Germany (Dauth, 2014; Blien and Dauth, 2016), Spain (Consoli and Barrioluengo, 2016; Torrejón, 2019a; 2019b) and the UK (Kaplanis, 2007). However, other studies find the case for job polarisation in Europe rather limited, instead demonstrating a plurality of structural employment change patterns across EU Member States (Fernández-Macías, 2012; Fernández-Macías and Hurley, 2017).
These differences in findings can be attributed to a number of factors, including variations in the time period and country sample under consideration, unit of analysis (occupations vs. jobs), data sources and, more importantly, the way job polarisation is measured. Following Goos and Manning (2007), some studies measure job polarisation by estimating a quadratic regression model between changes in employment in a given job and the initial wage percentile for that job.
Other studies try to construct an index that measures shifts away from the middle of the wage distribution (for instance, Jones and Green, 2009), while others look at relative change in employment by wage quintile (see Figure 37; Fernández-Macías, 2012; Eurofound, 2017b). Although each of these approaches has its own merits and limitations, they all contribute to a better understanding of structural shifts in employment across Europe.
To explore patterns of structural employment change across 130 regions in 9 EU countries, the analysis presented in this chapter relies on an adjusted version of the methodology used by Eurofound (2017b), which looks at relative change in employment by wage tercile (rather than quintile) as regards the EU-9 average. Box 14 gives more details on this methodology.
box 13. Job polarisation in the EU: an overview of the current evidence
Technological change does not only create and destroy jobs but; it also contributes to transforming the overall structure of employment.

73 4. The structure of jobs at regional level in the EU
Figure 37: Change in the number of employed people, by job wage quintile, in selected EU countries, 2011 Q2 – 2016 Q2 (thousands)Note: The x-axis shows absolute changes in employment in thousands for each quintile. The quintiles are sorted by wage level, from low on the left to high on the right. See Annex 2 in Eurofound (2017b) for further details. Source: Eurofound (2017b)
Belgium Netherlands Italy Czechia
Denmark United Kingdom Romania France
120
80
40
0
-40
-80
80604020
0-20-40
1200
900
600
300
0
-300
400
200
0
-200
-400
400
200
0
-200
-400
Germany Sweden Finland Estonia
Poland Portugal Austria Croatia
80
60
40
20
0
-20
600
400
200
0
-200
-400
200
150
100
50
0
-50
800
600
400
200
0
600
400
200
0
-200
-400
160
80
0
-80
-160
-240
160120
8040
0-40-80
80
40
0
-40
-80
-120
Cyprus Greece
Hungary Slovenia
Spain Ireland20
10
0
-10
-20
-30
80
30
-20
240
160
80
0
40
20
0
-20
-40
160
80
0
-80
-160
-240
800
400
0
-400
-800
240
160
80
0
-80
20
10
0
-10
-20
-30
80
40
0
-40
2011-13 2013-16 Total
Pane
l A: J
ob p
olar
isat
ion
Pane
l B: U
pgra
ding
Pane
l C: D
owng
radi
ng o
r M
iddl
ing
PoorestWAGE
QUINTILE Richest PoorestWAGE
QUINTILE Richest
PoorestWAGE
QUINTILE Richest PoorestWAGE
QUINTILE Richest PoorestWAGE
QUINTILE Richest PoorestWAGE
QUINTILE Richest

74
Occupational upgrading was the most frequently observed pattern in employment change. Over the period 1995-2007, the majority of EU countries saw employment shares in the highest part of wage distribution growing faster than those at the bottom (Fernández-Macías, 2012). Such occupational upgrading has continued in several EU countries more recently, especially after 2013 when economic growth in the EU strengthened (see Figure 37). In particular, employment shifted significantly towards higher-paid jobs in countries such as Poland, Portugal, Sweden, Germany and, to a lesser extent, Croatia and Estonia. A common feature across these countries is that jobs at the very top of the wage distribution (fifth quintile) grew the most, which suggests a slight tendency towards job polarisation, even in the context of occupational upgrading.
A few EU countries witnessed expanding shares of low- and middle-paid jobs, mostly after 2013. Over the period 1995-2007, only a few EU countries witnessed jobs in the bottom half of wage distribution growing faster than the rest (Fernández-Macías, 2012). However, this trend has become somewhat more prominent since 2013, in most southern European countries but also in Ireland, Hungary and Slovenia (see Panel C in Figure 37, and Eurofound, 2017b).
Since 2013, the growing shares of low- and middle-paid jobs are not only the result of long-standing institutional and labour market features but they also reflect swings in the macroeconomic cycle (Eurofound, 2017b). For instance, following the sudden drop in the aftermath of the 2008-11 economic downturn in the EU, low-paid jobs rebounded considerably in countries such as Greece, Spain and Cyprus, mainly as the result of stronger economic growth (ibid.).
The diversity of employment change patterns across EU countries suggests that many factors other than technology are at play. Assuming that technological change is the only or most important factor shaping labour markets, observation of widespread
job polarisation across all EU countries would be expected. Yet, as discussed above, over the past couple of decades, pervasive job polarisation has only occurred in a relatively small number of EU countries, with other EU Member States showing a plurality of patterns in occupational change. Such heterogeneity clearly suggests that there is no single driver but several factors that simultaneously affect the shape of labour market developments in the EU (Autor, 2010; Eurofound, 2017b).
Other interlinked megatrends, such as globalisation and de-industrialisation, strongly influence changes in employment structures. Whilst it has been confirmed that technology has a fundamental role in shaping long-term labour market transformations, a number of studies point to other complementary forces. In particular, recent research emphasises the role played by the offshoring of routine tasks (Oldenski, 2014), import competition (Autor et al., 2013; Keller and Utar, 2016) and de-industrialisation (OECD, 2017) as other key drivers of employment change. In particular, it has been found that declining manufacturing sectors account for around one third of the overall job polarisation observed across OECD countries between 1995 and 2015 (ibid.). At the same time, developments observed in occupational structure also reflect changes in workforce structure related to higher female participation in the labour market, increasing labour mobility, and the educational upgrading of the population (Eurofound, 2017b). For instance, job polarisation in Germany was found to be slower than in other western European countries, due to the strong apprenticeship system which reduced incentives for firms to substitute these skilled workers (Rendall and Weiss, 2016).
Institutions and labour-market policies mediate the effect of technological change and other megatrends on the structure of employment. Country-specific institutions and policies also appear to mitigate the labour-market consequences of technological change, especially for workers at the lower end of wage distribution (Eurofound, 2017b;
4. The structure of jobs at regional level in the EU
75 4. The structure of jobs at regional level in the EU
Hurley et al., 2013; Oesch, 2013; Tahlin, 2007). In particular, stronger unions, high minimum wages and generous unemployment benefits, compressing the wage structure, may have contributed to limiting the creation of a low-wage sector in some EU countries (Oesch and Rodríguez, 2011).
4.2 Job structures and their evolution vary widely across EU regions
Observing employment shifts at the regional level can provide key insights into the variety of patterns across the EU. Whilst interesting, the analysis of structural employment changes at Member-State level often hides highly heterogeneous employment dynamics across regions within the same Member State. Yet, and despite the large
amount of evidence both at international and sub-national level (see Box 13), little is known about changes in occupational structure across European regions in many countries. The analysis presented below aims to fill this gap. The JRC and Eurofound have conducted a new study observing employment shifts at the regional level for a sample of 130 regions across 9 EU Member States – representing around two thirds of the population employed in the EU-28 in 2018. The study systematically investigates the diversity of employment shifts across EU regions, setting the EU-9 average employment structure as a common benchmark against which regional employment structures and shifts over time can be assessed (see Box 14 for details on the methodology).
Regional employment structures and their evolution over time are too diverse to be measured and interpreted consistently using traditional methodologies (see Box 13). A way of alleviating this complexity is to use the overall EU-9 employment structure as a common benchmark for all European regions, then analyse changes as either convergence towards or divergence from that structure. To provide a sufficiently synthetic way of analysing change in employment structure by regions, the following steps were taken: 1) A matrix of ‘jobs’ – i.e. occupation in a specific sector is created for each region; 2) Each job is ranked in terms of its percentile position in the wage distribution of each of 9 EU countries; 3) The percentile positions for any given job are averaged across all 9 EU countries, to compute the weighted average percentile position of each job across the whole EU-9; 4) The average EU-9 percentile position is then normalised again according to the overall EU employment structure; and 5) The overall EU employment structure is divided into three equal-sized groups (terciles) of jobs, ranked from the lowest to the highest wage. Jobs assigned to the bottom tercile of wage distribution are classified as low-paid jobs; those
in the top tercile as high-paid jobs; and those in the middle third as middle-paid jobs. According to the way in which employment shifts across terciles, four patterns of structural employment transformation can be identified: 1) Polarisation: job growth in the top and bottom terciles is faster than in the middle; 2) Upgrading: job growth in the upper tercile is faster than in the bottom one; 3) Middling: jobs in the middle tercile expand faster than jobs in the other two; 4) Downgrading: jobs in the lower tercile grow faster than jobs in the upper ones.
Comparing regional job structures and their changes with a common benchmark has a number of advantages:
• It ensures a high degree of comparability, as jobs classified as high-, middle- or low-paid are exactly the same across all regions, according to their average wage in all the countries together.
• It allows for an analysis of how regions' employment structures compare to the EU average, from both a static and a dynamic perspective.
box 14. Measuring changes in regional employment structures relative to the EU-9: a tercile approach

764. The structure of jobs at regional level in the EU
• It provides a consistent framework for analysing the degree of convergence and divergence in regional job structures compared to the EU average.
It is important to keep in mind that, as shown in this chapter, regional patterns of employment transformation must be interpreted as a deviation from the EU-9 average occupational structure. Therefore, to have a clear
understanding of regional employment structure and shifts over time, it is important to consider how the EU 9 average job structure has evolved over time. Evidence shows that, since 2002, despite some differences depending on the sub-period under consideration, jobs in the top and middle thirds of the EU-9 wage distribution have expanded faster than those at the bottom (Figure 38).
2002-2007 2008-2010 2011-2017
-4
0
4
8
Mill
ions
of
wor
kers
Low-paid jobs(bottom tercile)
Middle-paid jobs(middle tercile)
High-paid jobs(top tercile)
Figure 38: Total change in the number of jobs by wage tercile across EU-9 countries (millions)Source: JRC and Eurofound calculations based on EU-LFS

77 4. The structure of jobs at regional level in the EU
Looking at changes in job structures across EU regions between 2002 and 2017, no prevalent pattern of employment transformation emerges. On average, changes in the occupational structures in different European regions tend to be similar to those of their respective countries. For instance, in line with what is observed for the whole country, since 2002, the employment structure of virtually all Polish regions has upgraded compared to the EU-9 average. However, there are cases where job structures across regions of the same country have evolved very differently from one another – for example in France and Spain. And while there are some signs of convergence across EU regions – particularly with eastern European regions converging towards the average European occupational structure – the overall degree of diversity across regional occupational structures in Europe is growing rather than shrinking.
Around one third of the regions analysed experienced greater job polarisation. The distinctive feature of a polarising labour market is the shift away of employment from middle-paid jobs to low- and high-paid ones. Between 2002 and 2017, a similar pattern was only observed across most regions in France, the UK and Sweden, as well as several Spanish ones (Figure 39). The main underlying trend in many of these regions was the decline in middle-paid manufacturing jobs which was offset by growth in both high- and low-paid ones in the service sector.
Occupational upgrading took place mainly in Spanish and Polish regions. Virtually all Polish regions and a few Spanish ones have witnessed a considerable improvement in their job structure, experiencing falling numbers of low-paid jobs and a rising prevalence of middle- and high-paid jobs (Figure 39).
Patterns of employment restructuring vary considerably between EU regions, more so than between countries.

78
This improvement, especially among Polish regions, is largely the result of falling shares of agricultural employment – where the prevalence of low-paid jobs is typically high – being compensated mainly by growth in mid- and high-paid jobs in services and manufacturing. Nevertheless, the share of employment in agriculture, and more generally the share of low-paid jobs, remains far higher in these fast-converging regions than in most other regions within their respective country and in Europe as a whole (see section 4.3).
In contrast, in several regions, the labour market structure has been downgraded considerably. Since 2002, regions in Germany and Italy, as well as some in Spain, have witnessed a reduction in the share of high-paid jobs combined with growing shares in both middle- and low-paid jobs. This trend is driven by regions with an intermediate population density, where fewer jobs in high-paid sectors have been compensated for by the expansion of mid- and low-paid employment (Figure 39). For some regions in southern Italy and Spain, where in 2002 the job structure was already lagging behind the majority of other EU-9 regions, the expansion of low-paid jobs has led to further divergence from the EU-9 average. Few regions have witnessed a growing concentration of employment in the middle of wage distribution. In a small fraction of EU regions (mostly in Czechia, Italy and Germany) middle-paid jobs have expanded faster than low- and high paid ones. As a result, the occupational structure of employment has gone through a process of ‘middling’ – actually showing a pattern of change which is the opposite of polarisation. In some cases, such as in Czechian regions, growing shares in middle-paid jobs resulted mainly from employment shifting away from low-paid jobs, and was only marginally due to shrinking shares of high-paid employment. Conversely, the process of middling across German and Italian regions was mostly driven by employment shifts from high- to middle-paid jobs – a pattern resembling occupational downgrading rather than middling.
Regions which are innovation leaders according to the EU Regional Innovation Scoreboards have on average much larger shares of high-paid jobs than regions which are considered moderate innovators – a gap that has been increasing since 2002. Meanwhile, the average share of low-paid jobs in these innovation leader regions is around two thirds lower than in moderate innovator regions (Figure 40). With the exception of regional innovation leaders, neither strong nor moderate regional innovators have shown signs of job polarisation. In fact, in both groups of regions, the share of middle-paid jobs has increased since 2002, with stagnant or even falling shares of high- and low-paid jobs.
4. The structure of jobs at regional level in the EU
Regions with higher innovation capacity tend to have more high-paid jobs and less low-paid ones, whilst also showing some signs of increasing job polarisation.

79 4. The structure of jobs at regional level in the EU
Of course, diverging regional employment transformations do not only reflect variations in regional innovation potential, but also different patterns of industrial specialisation, degree of population density, and urbanisation (see next section).
4.3 Stark differences in employment structure between peripheral and capital regions
The prevalence of low-paid jobs in some peripheral regions is around twice as large as that of core EU regions. Although some of the peripheral European
regions — most notably Polish, with a few Spanish ones — have experienced a remarkable upgrade in their employment composition over the past 15 years, their employment structure remains far from convergent with that prevalent in most EU regions.
This is particularly the case for regions located in southern Italy and Spain, as well as for some Polish ones, where the share of low-paid jobs exceeded 50 % in 2017. However, to a lesser extent, relatively high shares of low-paid jobs are also observed in some regions of France and the UK (Figure 41).
More high-paid jobsin 2017 than 2002
Upgraded
Fewer high-paid jobsin 2017 than 2002
Fewer low-paidjobs in 2017than 2002
More low-paidjobs in 2017
than 2002
-5
0
5
10
-21 -10 0.0 10
BE CZ DE ES FR IT PL SE UK
Polarised
Midding Downgraded
Figure 39: Regional employment changes relative to the EU-9 average, 2002-17Note: The horizontal axis shows by how much the percentage point difference between the share of low-paid jobs (lowest tercile) in the region vis-à-vis the EU-9 average (approximately 33.3 % – see Box 14 for details) in 2017 changed when compared to 2002. The vertical axis indicates by how much the percentage point difference between the share of high-paid jobs (highest tercile) in the region vis-à-vis the EU-9 (again, approximately 33.3 % by construction) in 2017 changed relative to 2002.Source: JRC and Eurofound calculations based on EU-LFS
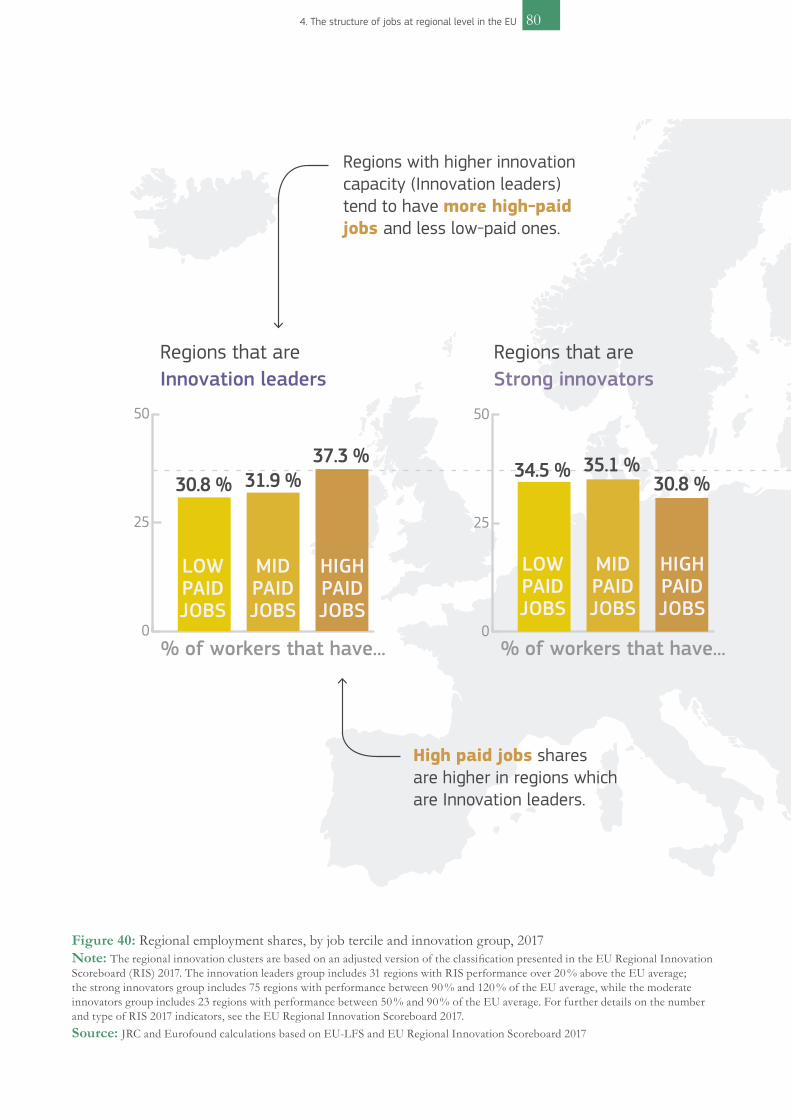
804. The structure of jobs at regional level in the EU
Figure 40: Regional employment shares, by job tercile and innovation group, 2017Note: The regional innovation clusters are based on an adjusted version of the classification presented in the EU Regional Innovation Scoreboard (RIS) 2017. The innovation leaders group includes 31 regions with RIS performance over 20 % above the EU average; the strong innovators group includes 75 regions with performance between 90 % and 120 % of the EU average, while the moderate innovators group includes 23 regions with performance between 50 % and 90 % of the EU average. For further details on the number and type of RIS 2017 indicators, see the EU Regional Innovation Scoreboard 2017.Source: JRC and Eurofound calculations based on EU-LFS and EU Regional Innovation Scoreboard 2017
0
25
50
Innovation leaders
% of workers that have...
30.8 % 31.9 %37.3 %
Regions that are
LOWPAIDJOBS
HIGHPAIDJOBS
MIDPAIDJOBS
% of workers that have...0
25
50
Strong innovators
34.5 % 35.1 %30.8 %
Regions that are
0
25
50
Moderate innovators
27.1 %34 %
38.8 %
Regions that are
Low paid jobs shares are higher in regions which are less innovative.
High paid jobs shares are higher in regions which are Innovation leaders.
LOWPAIDJOBS
HIGHPAIDJOBS
MIDPAIDJOBS
LOWPAIDJOBS
HIGHPAIDJOBS
MIDPAIDJOBS
% of workers that have...
Regions with a lower innovation capacity (Moderate innovators) tend to have more low-paid jobs.
Regions with higher innovation capacity (Innovation leaders) tend to have more high-paid jobs and less low-paid ones.

Regions with very high shares of high-paid jobs tend to cluster together within each country, with some exceptions. In almost all of the nine EU Member States analysed, capital city regions and their neighbours have a significantly higher share of high-paid jobs than the rest of country. In the UK, Sweden, Belgium and, to some extent, Germany and France, regions with relatively higher shares of high-paid jobs are often geographical neighbours, suggesting the existence of a network effect across regions. However, this is not always the case – for instance, capital city regions in Spain and Poland are bordering regions where the share of high-paid jobs is fairly low (Figure 42).
81 4. The structure of jobs at regional level in the EU
The share of high-paid jobs in capital city regions and their neighbours is significantly higher than in the rest of the country.
0
25
50
Innovation leaders
% of workers that have...
30.8 % 31.9 %37.3 %
Regions that are
LOWPAIDJOBS
HIGHPAIDJOBS
MIDPAIDJOBS
% of workers that have...0
25
50
Strong innovators
34.5 % 35.1 %30.8 %
Regions that are
0
25
50
Moderate innovators
27.1 %34 %
38.8 %
Regions that are
Low paid jobs shares are higher in regions which are less innovative.
High paid jobs shares are higher in regions which are Innovation leaders.
LOWPAIDJOBS
HIGHPAIDJOBS
MIDPAIDJOBS
LOWPAIDJOBS
HIGHPAIDJOBS
MIDPAIDJOBS
% of workers that have...
Regions with a lower innovation capacity (Moderate innovators) tend to have more low-paid jobs.
Regions with higher innovation capacity (Innovation leaders) tend to have more high-paid jobs and less low-paid ones.

Figure 41: Share of low-paid jobs, by region (2017, %)Note: The share of low-paid jobs across regions is measured following the methodology outlined in Box 14. As explained in greater detail in Box 14, jobs in each region are first ranked on the base of some criterion, mainly the mean hourly wage, and then an aggregated EU-9 job-wage ranking is then calculated based on the employment-weighted average job ranking across the 9 Member States analysed. Therefore, the share of low-paid jobs reflect the percentage of jobs in each region which belong to the bottom third (first tercile) of the aggregate job-wage distribution in the EU-9.Source: JRC and Eurofound calculations based on EU-LFS
824. The structure of jobs at regional level in the EU
Despite considerable improve-ment since 2002, the share of low-paid jobs remains sizable in some Polish regions.
Germany shows quite low and homogenous shares of low-paid jobs across regions.
Regional differences in the prevalence of low-paid jobs are widest in France, Italy, and Poland.
22 % 53 %

The share of high-paid jobs tend to be higher in capital city regions, but with large differences across countries.
Regions in southern UK and Sweden are those showing the highest
shares of high-paid jobs.
None of the Italian regions show a share of high-paid jobs above 32 %.
21 % 49 %
Figure 42: Share of high-paid jobs, by region (2017, %)Note: The share of high-paid jobs across regions is measured following the methodology outlined in Box 14. As explained in greater detail in Box 14, jobs in each region are first ranked on the base of some criterion, mainly the mean hourly wage, and then an aggregated EU-9 job-wage ranking is then calculated based on the employment-weighted average job ranking across the 9 Member States analysed. Therefore, the share of high-paid jobs reflect the percentage of jobs in each region which belong to the top third (third tercile) of the aggregate job-wage distribution in the EU-9. Source: JRC and Eurofound calculations based on EU-LFS
83 4. The structure of jobs at regional level in the EU
Despite considerable improve-ment since 2002, the share of low-paid jobs remains sizable in some Polish regions.
Germany shows quite low and homogenous shares of low-paid jobs across regions.
Regional differences in the prevalence of low-paid jobs are widest in France, Italy, and Poland.
22 % 53 %

Capital city regions show a much larger share of high-paid jobs than other regions within their respective countries. This is especially the case for the capital city regions in Czechia, France, Sweden and the UK. For instance, while the share of high-paid jobs in the Prague region is around 15 percentage points (pp) above the EU-9 average, this share
remains below the EU-9 average in six of the other seven Czechian regions (Figure 43). This is the result of a long-term trend which has seen capital city regions, and more generally highly urbanised areas, benefiting disproportionally from employment growth, mostly in the highly paid segment of the workforce. Indeed, on average, the share of high-paid jobs in capital regions grew from 41.9 % in 2002 to 44.7 % in 2017.
It is worth noting that, while some capital city regions lead in their own country, they lag behind many other regions in the rest of the EU. This is notably the case for Rome, Madrid and Warsaw regions, which in 2017 had by far the lowest share of high-paid jobs among all capital city regions analysed, also below almost any other region in Sweden or the UK, for example. (Box 15).
In terms of the prevalence of low-paid jobs, differences between capital city regions and the rest are less stark. Within each of the nine EU Member States analysed, capital city regions are among those with the lowest shares of low-paid jobs relative to the EU-9 average (Figure 44). However, the share
844. The structure of jobs at regional level in the EU
Share of high-paid jobs above the EU-9 average
Share of high-paid jobs below theEU-9 average
-10
-15
0
10
20
Belgium Czechia Germany Spain France Italy Poland Sweden UK
Capital city region Region
Figure 43: Difference in the share of high-paid jobs across regions in 2017 (pp deviation from EU-9 average)Source: JRC and Eurofound calculations based on EU-LFS
Capital city regions and highly urbanised areas benefit disproportionally from employment growth in high paid-jobs.

85 4. The structure of jobs at regional level in the EU
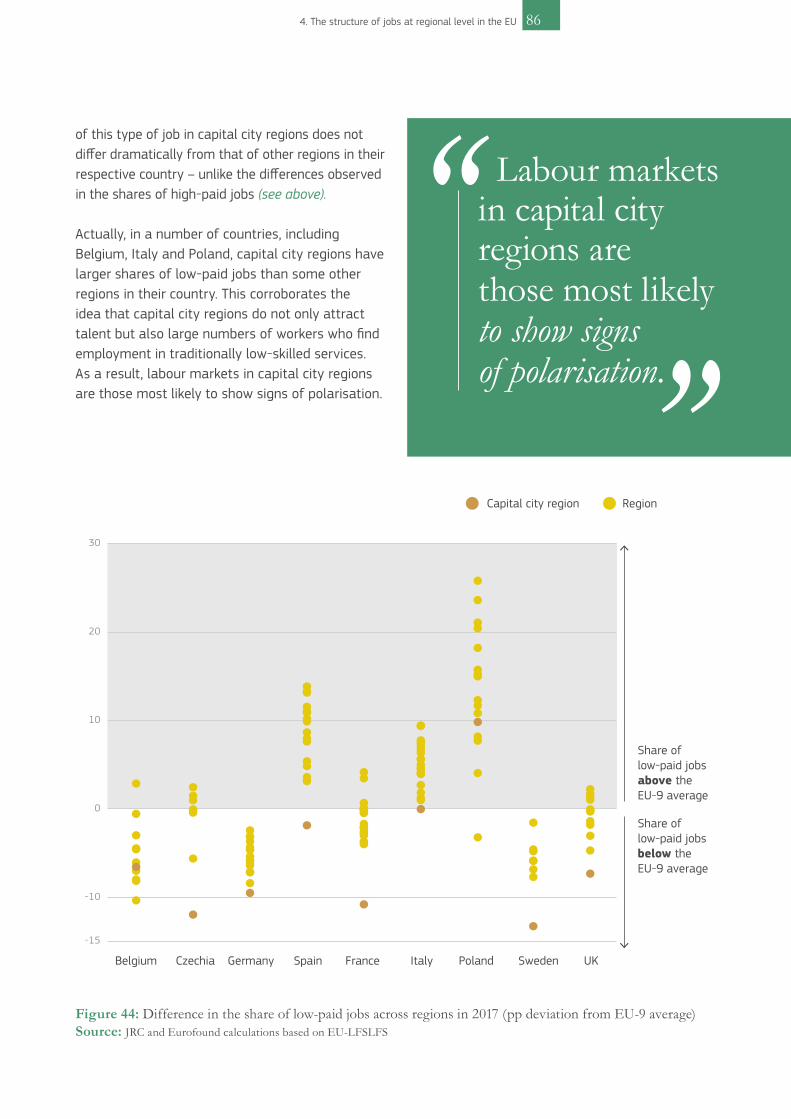
86
of this type of job in capital city regions does not differ dramatically from that of other regions in their respective country – unlike the differences observed in the shares of high-paid jobs (see above).
Actually, in a number of countries, including Belgium, Italy and Poland, capital city regions have larger shares of low-paid jobs than some other regions in their country. This corroborates the idea that capital city regions do not only attract talent but also large numbers of workers who find employment in traditionally low-skilled services. As a result, labour markets in capital city regions are those most likely to show signs of polarisation.
4. The structure of jobs at regional level in the EU
-10
-15
0
10
20
30
Belgium Czechia Germany Spain France Italy Poland Sweden UK
Share of low-paid jobs above the EU-9 average
Share of low-paid jobs below the EU-9 average
Capital city region Region
Figure 44: Difference in the share of low-paid jobs across regions in 2017 (pp deviation from EU-9 average)Source: JRC and Eurofound calculations based on EU-LFSLFS
Labour markets in capital city regions are those most likely to show signs of polarisation.
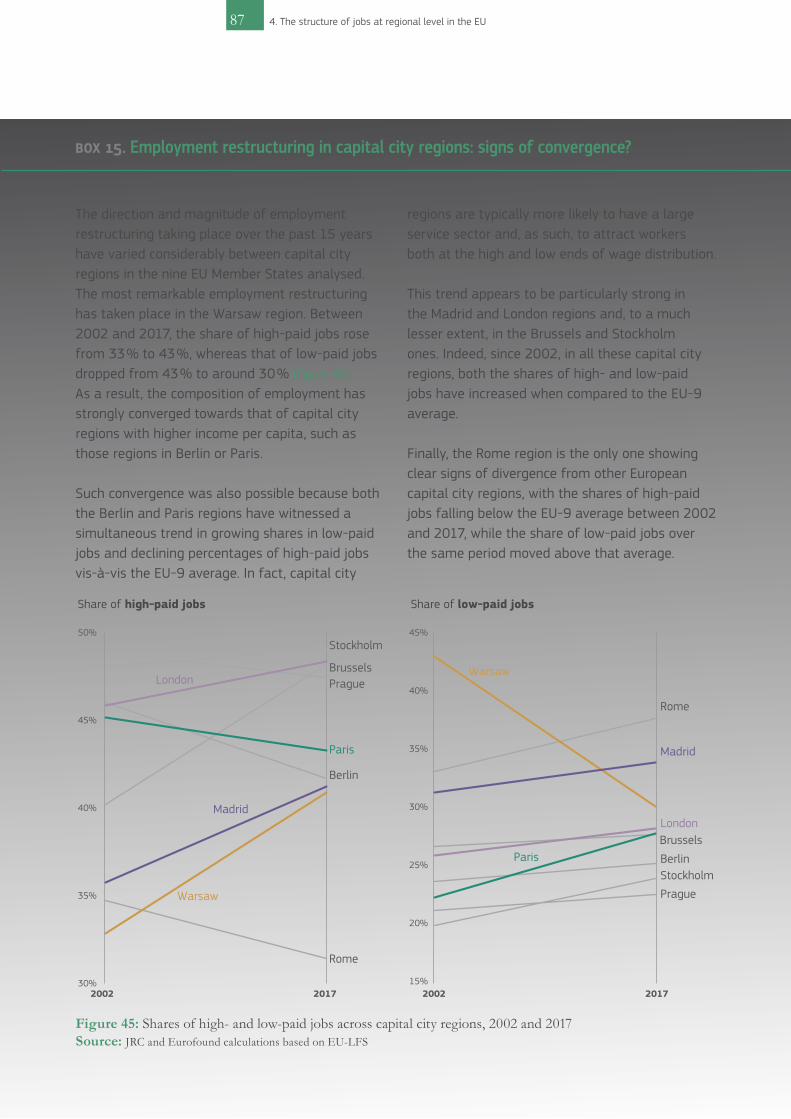
87 4. The structure of jobs at regional level in the EU
The direction and magnitude of employment restructuring taking place over the past 15 years have varied considerably between capital city regions in the nine EU Member States analysed. The most remarkable employment restructuring has taken place in the Warsaw region. Between 2002 and 2017, the share of high-paid jobs rose from 33 % to 43 %, whereas that of low-paid jobs dropped from 43 % to around 30 % (Figure 45). As a result, the composition of employment has strongly converged towards that of capital city regions with higher income per capita, such as those regions in Berlin or Paris.
Such convergence was also possible because both the Berlin and Paris regions have witnessed a simultaneous trend in growing shares in low-paid jobs and declining percentages of high-paid jobs vis-à-vis the EU-9 average. In fact, capital city
regions are typically more likely to have a large service sector and, as such, to attract workers both at the high and low ends of wage distribution.
This trend appears to be particularly strong in the Madrid and London regions and, to a much lesser extent, in the Brussels and Stockholm ones. Indeed, since 2002, in all these capital city regions, both the shares of high- and low-paid jobs have increased when compared to the EU-9 average.
Finally, the Rome region is the only one showing clear signs of divergence from other European capital city regions, with the shares of high-paid jobs falling below the EU-9 average between 2002 and 2017, while the share of low-paid jobs over the same period moved above that average.
box 15. Employment restructuring in capital city regions: signs of convergence?
Share of high-paid jobs Share of low-paid jobs
50%Stockholm
BrusselsPrague
Berlin
Rome
London
Paris
Madrid
Warsaw
45%
40%
35%
30%2002 2017
Stockholm
Brussels
Prague
Berlin
Rome
London
Paris
Madrid
Warsaw
45%
40%
35%
30%
25%
20%
15%2002 2017
Figure 45: Shares of high- and low-paid jobs across capital city regions, 2002 and 2017Source: JRC and Eurofound calculations based on EU-LFS

88Concluding remarks

This report aims to shed light on some of the key drivers to be taken into account when assessing the effect of new technologies on the future of work and skills.
A careful review of existing evidence, combined with new JRC research, suggests that uncertainty regarding the magnitude and nature of technology-driven changes to labour markets and education systems will endure for some time – at least until more and better data are collected about the nature of work, workplace organisation and complementarity between humans and machines.
This does not mean, however, that societies and governments must wait to prepare themselves to respond to the challenges ahead. In fact, quite the opposite.
There is clear evidence that the digital age is already disrupting labour markets and transforming skills needs in the EU.
It is also clear that the speed at which new technologies are spreading across workplaces and societies raises difficult questions for policymakers in the EU. These include, for example, the design of all levels of education, the provision of and access to training and lifelong learning, the regulation of labour markets, the future of tax and benefits systems, and the protection of social rights.
It is therefore crucial that policymakers and other stakeholders at EU, Member State and regional level act now, and not only to address emerging policy challenges. Policy interventions must also aim to shape the future world of work and employment.
Only in this way will it be possible to seize the opportunities and limit the challenges created by the ongoing wave of technological progress.
In a fast-changing environment which has important implications for EU policies, ensuring the close monitoring of developments and deepening the evidence base to design future-proof policies is of the utmost importance.
Although more and better evidence is being developed, more needs to be done to ensure that the EU is well equipped to deal with emerging challenges. Over the last two years, the JRC has expanded and deepened its research activities around the changing nature of work and skills. It will continue to provide updated policy-relevant evidence in the future to ensure that policy responses meet the challenges.
It will also be crucial to ensure that the policy discourse and decisions are aligned with societal values, as policymakers will have to face difficult choices to shape the future of work and skills in Europe.
89 Concluding remarks
CONCLUDING REMARKS


ENDNOTES1 The 15 countries included in the survey were: UK, Turkey, Spain, Italy, Germany, India, Ireland, Hungary, Czechia,
Greece, South Africa, New Zealand, Portugal, Romania and Egypt.
2 Meaning, understanding machines and how to interact with machines, and the sea of information being
generated by machines, respectively.
3 Learning resulting from daily activities related to work, family or leisure. It is not organised or structured in terms
of objectives, time or learning support. In most cases, Informal learning is unintentional from the learner’s
perspective (Cedefop, 2014).
4 Learning which is embedded in planned activities not explicitly designated as learning (in terms of learning
objectives, learning time or learning support), but which include an important learning element. Non-formal
learning is intentional from the learner’s point of view. It typically does not lead to certification (Cedefop 2014).
5 https://ec.europa.eu/jrc/en/moocknowledge
6 Survey evidence suggests that this share might actually be higher (Eurofound, 2017).
91 Endnotes

92
Acemoglu, D. and Autor, D., Skills, ‘Tasks and Technologies: Implications for Employment and Earnings’, Handbook of Labor Economics, Vol. 4b, Elsevier, 2011, pp. 1043-1171. Acemoglu, D. and Restrepo, P., Artificial Intelligence, Automation and Work, Nber working paper series, No. 24196, 2018. Aggarwal, A., Quality Apprenticeships: Addressing skills mismatch and youth unemployment, Skills for Employment Policy Brief, International Labour Organization, 2019. Almlund, M., Duckworth, A. L., Heckman, J. and Kautz, T., ‘Personality psychology and economics’, Handbook of the Economics of Education, Elsevier, vol. 4, 2011, pp. 1-181. Altonji, J. G., Kahn, L. B. and Speer, J. D., Trends in earnings differentials across college majors and the changing task composition of jobs, American Economic Review, 104, 2014, pp. 387-393. Aoun, J., Robot-Proof. Higher Education in the Age of Artificial Intelligence, MIT University Press Group Ltd, 2017. Arntz, M., Gregory, T. and Zierahn, U., The Risk of Automation for Jobs in OECD Countries: A Comparative Analysis, OECD Social, employment and migration working papers, 189, OECD Publishing, Paris, 2016. Arntz, M., Gregory, T. and Zierahn, U., Revisiting the risk of automation. Economics Letters, 159, 2017, pp. 157–160. Arregui-Pabollet, E., Edwards, J. and Rousseau, J-M. Higher Education for Smart Specialisation: The Case of Centre-Val de Loire, France, Luxembourg: Publications Office of the European Union, 2018. Aubert, P., Caroli, E. and Roger, M., New technologies, organization and age: firm‐level evidence, The Economic Journal, 116 (509), 2006. Autor, D., The Polarization of Job Opportunities in the U.S. Labor Market, Center for American Progress and The Hamilton Project, 2010. Autor, D., Why Are There Still So Many Jobs? The History and Future of Workplace Automation, Journal of Economic Perspectives, 29(3), 2015, pp. 3–30. Autor, D. and Dorn, D., The Growth of Low-Skill Service Jobs and the Polarization of the US Labor Market, American Economic Review, Vol. 103, No. 5, 2013, pp. 1553-97. Autor, D. and Salomons, A., Is Automation Labor Share–Displacing? Productivity Growth, Employment, and the Labor Share, Brookings Papers on Economic Activity, 2018, pp. 1-63. Autor, D., Dorn, D. and Hanson, G. H., The China Syndrome: Local Labor Market Effects of Import Competition in the United States, American Economic Review, 103 (6), 2013, pp. 2121-68. Bacigalupo, M., Kampylis, P., Punie, Y. and Van den Brande, G., EntreComp: The Entrepreneurship Competence Framework, Luxembourg: Publication Office of the European Union, 2016. Baldwin, R., The Globotics Upheaval: Globalization, Robotics, and the Future of Work, Oxford University Press, 2019. Becker, M. R., Winn, P. and Beaty, D., Engage Students in the Digital Classroom with Problem-Based Learning, The Journal of the Effective Schools Project, Vol 24, 2017. Belfield, C., Bowden, A., Klapp, A., Levin, H., Shand, R., and Zander, S., The Economic Value of Social and Emotional Learning, Journal of Benefit-Cost Analysis, 6 (3), 2015, pp. 508-544. Bessen, J. AI and jobs: the role of demand, Nber Working Paper Series, No. 24235, 2018. Bisello, M., Fernández-Macías, E., Peruffo, E. and Rinaldi, R., How computerisation is transforming jobs: Evidence from the European Working Conditions Survey, Joint Research Centre-Eurofound report, 2019. Blien, U. and Dauth, W., “Job polarization on local labour markets?”, 56th Congress of the European Regional Science Association: Cities & Regions: Smart, Sustainable, Inclusive?, European Regional Science Association (ERSA), Vienna (Austria), 2016.
REFERENCES
References

93
Bowles, J., Chart of the Week: 54% of EU jobs at risk of computerization, Bruegel, 2014. Bresnahan, T. F., Brynjolfsson, E., and Hitt, L. M., Information technology, workplace organization, and the demand for skilled labor: Firm-level evidence, The Quarterly Journal of Economics, 117 (1), 2002, pp. 339-376. Brunello, X. and Schlotter, X., Non Cognitive Skills and Personality Traits: Labour Market Relevance and their Development in Education and Training Systems, IZA Discurssion Papers, No. 5743, 2011. Brynjolfsson, E., and Mitchell, T., What can machine learning do? Workforce Implications, Science, 358 (6370), 2017, pp. 1530-1534. Campillo, I., Arregui Pabollet, E. and Gomez Prieto, J., Higher Education for Smart Specialisation: The case of Navarre, JRC Technical Report, Seville, 2017. Card, D., Kluve, J and Weber, A., What Works? A Meta Analysis of Recent Active Labour Market Program Evaluations, Discussion Paper No. 9236, 2015. Carretero, S., Technology-enabled services for older people living at home independently: Lessons for public long-term care authorities in the EU Member States, Luxembourg: Publications Office of the European Union, 2015. Carretero, S., Stewart, J., and Centeno, C., Information and communication technologies for informal carers and paid assistants: benefits from micro-, meso-, and macro-levels, European Journal of Ageing, 12(2), 2015, pp. 163–173. Carretero, S., Vuorikari, R. and Punie, Y., DigComp 2.1: The Digital Competence Framework for Citizens with eight proficiency levels and examples of use, Luxembourg: Publications Office of the European Union, 2017. Castaño-Muñoz, J., Kreijns, K., Kalz, M., and Punie, Y., Does digital competence and occupational setting influence MOOC participation? Evidence from cross-course survey. Journal of Computing in Higher Education, 29(1), 2017, pp. 28–46. Castex, G. and Dechter, E. K., The Changing Roles of Education and Ability in Wage Determination, Journal of Labour Economics, Vol. 32, No. 4, 2014, pp. 685-710. Cedefop, Terminology of European education and training policy: a selection of 130 terms, 2nd Ed, Luxembourg: Publications Office, 2014. Cedefop, Skill shortages and gaps in European enterprises: striking a balance between vocational education and training and the labour market, Luxembourg: Publications Office, No. 102, 2015. Cedefop, ‘Rise of the machines’, ESJ survey INSIGHTS, No. 8, 2016a. Cedefop, ‘Customer clerks: skills, opportunities and challenges’, Skills Panorama, 2016b. Cedefop, Investing in skills pays off: the economic and social cost of low-skilled adults in the EU, Cedefop research paper, No. 60, Luxembourg: Publications Office, 2017. Cedefop, Insights into skill shortages and skill mismatch: Learning from Cedefop’s European skills and jobs survey, 2018. Cedefop and Eurofound, Skills forecast: trends and challenges to 2030, Cedefop reference series, Luxembourg: Publication Office, No. 108, 2018, pp. 140. Cedefop, European Commission and ICF, European inventory on validation of non-formal and informal learning – 2016 update. Synthesis report, Luxembourg: Publications Office, 2017. Cefai, C., Bartolo, P. A., Cavioni, V. and Downes, P., Strengthening Social and Emotional Education as a core curricular area across the EU. A review of the international evidence, NESET II report, Luxembourg: Publications Office of the European Union, 2018. Celentano, D., Automation, Labour Justice, and Equality, Ethics and Social Welfare, 13(1), 2019, pp. 33-50. Clarke, A.M., Morreale, S., Field, C.A., Hussein, Y., and Barry, M.M. What works in enhancing social and emotional skills development during childhood and adolescence? A review of the evidence on the effectiveness of school-based and out-of-school programmes in the UK, World Health Organization Collaborating Centre for Health Promotion Research, National University of Ireland Galway, 2015.
References
94
Consoli, D. and Barrioluengo, M., Polarization and the growth of low-skill employment in Spanish Local Labor Markets. Papers in Evolutionary Economic Geography, 16.28, 2016, pp. 1-39. Craglia, M. (Ed.), Annoni, A., Benczur, P., Bertoldi, P., Delipetrev, P., De Prato, G., Feijoo, C., Fernández-Macías, E., Gomez, E., Iglesias, M., Junklewitz, H., López Cobo, M., Martens, B., Nascimento, S., Nativi, S., Polvora, A., Sánchez, I., Tolan, S. and Vesnic Alujevic, J., Artificial Inteligence – A European Perspective, Publications Office, Luxembourg, 2018. Curtarelli, M., Gualteri, V., Shater Jannati, M. and Donlevy, V., ICT for work: Digital skills in the workplace. Luxembourg, Publications Office of the European Union, 2017. Dalin, O., and Rust, V., Towards schooling for the twenty-first century, London: Cassell, 1996. Dauth, W., Job polarization on local labor markets, IAB Discussion Paper, 18, 2014. Deming, D. J. The growing importance of social skills in the labor market. The Quarterly Journal of Economics, 132(4), 1593-1640. 2017. DESI, Digital Economy and Society Index, Luxembourg, Publications Office of the European Union, 2017. DESI, Digital Economy and Society Index, Luxembourg, Publications Office of the European Union, 2018. DESI, Digital Economy and Society Index, Luxembourg, Publications Office of the European Union, 2019. Dominici, P., For an inclusive innovation. Healing the fracture between the human and the technological in the hypercomplex society, European Journal of Futures Research, 6 (3), 2018. Donlevy, V., van Driel, B., Horeau McGrath, C., Education as self-fulfilment and selfsatisfaction, European Commission, Seville, 2019, JRC117548. Edin, P., Fredriksson, P., Nybom, M. and Öckert, B., The Rising Return to Non-Cognitive Skill. IZA DP No. 10914, 2017. Eurofound, New forms of employment, Publications Office of the European Union, Luxembourg, 2015a. Eurofound, Upgrading or polarisation? Long-term and global shifts in the employment structure, European Jobs Monitor 2015, Publications Office of the European Union, Luxembourg, 2015b. Eurofound, European Jobs Monitor Task Indicator Dataset, 2016. Eurofound, Exploring self-employment in the European Union, Publications Office of the European Union, Luxembourg, 2017a. Eurofound, Occupational change and wage inequality, European Jobs Monitor 2017, Publications Office of the European Union, Luxembourg, 2017b. Eurofound, Employment and working conditions of selected types of platform work, Publications Office of the European Union, Luxembourg, 2018a. Eurofound, Overview of new forms of employment – 2018 update, Publications Office of the European Union, Luxembourg, 2018b. Eurofound, Wage and task profiles of employment in Europe in 2030, Publications Office of the European Union, Luxembourg, 2018c, pp. 8. Eurofound, The future of manufacturing in Europe, Publications Office of the European Union, Luxembourg, 2019a. Eurofound, Technology scenario: Employment implications of radical automation, Publications Office of the European Union, Luxembourg, 2019b. European Commission, High-performance apprenticeships & work-based learning: 20 guiding principles, 2016, European Commission. European Commission, Eurobarometer 77.1, Eurobarometer Surveys, 2012, available at: https://ec.europa.eu/
echo/resources-campaigns/publications/eurobarometer2012_en
Eurostat, Digital Economy and Society database, 2018. Falck, O., Heimisch, A and Wiederhold, S., Returns to ICT Skills, OECD Education Working Papers, No. 134, OECD Publishing, Paris, 2016. Fennel, A., Designing a creativity friendly learning environment, conference presentation: ‘Fostering creativity in children and young people through education and culture’, in Durham, United Kingdom: OECD and Durham University, 4-5 September 2017.
References

95
Fernández-Macías, E., Job Polarization in Europe? Changes in the Employment Structure and Job Quality, 1995-2007, Work and Occupations, 39 (2), 2012, pp. 157–182. Fernández-Macías, E. and Hurley, J., Routine-biased technical change and job polarization in Europe, Socio-Economic Review, Vol. 15, No. 3, 2017, pp. 563–585. Frank, M. R., Autor, D., Bessen, J. E., Brynjolfsson, E., Cebrian, M., Deming, D. J., Feldman, M. G., Lobo, J., Moro, E., Wang, D., Youn, H. and Rahwan, I., Toward understanding the impact of artificial intelligence on labor, Proceedings of the National Academy of Sciences, 116 (14), 2019. Frey, C. B., and Osborne, M. A., The Future of Employment: How Susceptible are Jobs to Computerization?, Oxford Martin Programme on Technology and Employment, 2013. GEM, Global Report 2017/ 2018. Global Entrepreneurship Research Association, 2018. Goldschmidt, D., and Schmieder, J. F., The Rise of Domestic Outsourcing and the Evolution of the German Wage Structure, Quarterly Journal of Economics, 2017. Goldsmith, H. H., Buss, A. H., Plomin, R., Rothbart, M. K., Thomas, A., Chess, S., Hinde, R. A and McCall, R. B., What is temperament? Four approaches, Child Development, Vol. 58, No. 2, 1987, pp. 505–529. Goos, M., and Manning, A., Lousy and Lovely Jobs: The Rising Polarization of Work in Britain, Review of Economics and Statistics, Vol. 89, Issue 1, 2007, pp. 118-133. Goos, M., Arntz, M., Zierahn, U., Gregory, T., Carretero Gómez, S., González Vázquez, I. and Jonkers, K., The Impact of Technological Innovation on the Future of Work, JRC Working Papers Series on Labour, Education and Technology, European Commission, Seville, 2019. Goos, M., Manning, A. and Salomons, A., Explaining Job Polarization: Routine-Biased Technological Change and Offshoring, American Economic Review, 104 (8), 2014, pp. 2509-26. Graetz, G. and Michaels, G., Robots at work? Review of Economics and Statistics, 100 (5), 2018, pp. 753–768. Green, F. and Henseke, G., Should governments of OECD countries worry about graduate underemployment? Oxford Review of Economic Policy, Vol. 32, No. 4, 2016, pp. 514–537. Green, A., Illéssy, M., Koene, B. A. S., Makó, C. and Wright, S., ‘Innovation, Job Quality and Employment Outcomes in Care: Evidence from Hungary, the Netherlands and the UK’. In K. Jaehrling (ed.), Virtuous circles between innovations, job quality and employment in Europe? Case study evidence from the manufacturing sector, private and public service sector, QuInnE Working Paper No. 6, Horizon 2020, 2018. Gregory, T., Salomons, A., and Zierahn, U., Racing With or Against the Machine? Evidence from Europe, Centre for European Economic Research, Discussion Paper No. 16-053, 2016. Halabisky, D., Policy Brief on Women’s Entrepreneurship, OECD SME and Entrepreneurship Papers, No. 8, OECD Publishing, Paris, 2017. Hansen, J. and Reich, J., Democratizing education? Examining access and usage patterns in massive open online courses, Science, 350 (6265), 2015, pp. 1245–1248. Harari, Y. N., 21 Lessons for the 21st Century, 2018. Hazelkorn, E. and Edwards, J., ‘Understanding higher education’. In Edwards, J and Marinelli, E (eds) Higher Education for Smart Specialisation: A Handbook (Version 1.0), Seville: European Commission, 2018. Hunt, W., Sarkar, S. and Warhurst, C., Investment in Work Technology, London: Chartered Institute for Personnel and Development, forthcoming. Hurley, J., Fernández-Macías, E. and Storrie, D., Employment polarisation and job quality in the crisis, European Jobs Monitor 2013, Dublin: Eurofound, 2013. International Labour Organisation (ILO), Digital labour platforms and the future of work: towards decent work in the online world, International Labour Office, Geneva, 2018. Jones, P. S., and Green, A. E., The Quantity and Quality of Jobs: Changes in UK Regions, 1997–2007, Environment and Planning A: Economy and Space, 41(10), 2009, pp. 2474–2495. Jungmittag, A. and Pesole, A., The impact of robots on labour productivity: A panel data approach covering nine industries and 12 countries, JRC LET working paper series, forthcoming.
References

96
Kaplanis, I., The Geography of Employment Polarisation in Britain, Institute for Public Policy Research, 2007. Katz, L. F., and Krueger, A. B., The Role of Unemployment in the Rise in Alternative Work Arrangements, American Economic Review Papers and Proceedings, 107 (5), 2017, pp. 388-92. Kautz, T., Heckman, J. J., Diris, R., Ter Weel, V. and Borghans, L., Fostering and Measuring Skills: Improving Cognitive and Non-cognitive Skills to Promote Lifetime Success, OECD Education Working Papers, No. 110, OECD Publishing, Paris, 2014. Keller, W. and Utar, H., International Trade and Job Polarization: Evidence at the Worker Level, CESifo Working Paper Series, No. 5978, CESifo Group Munich, 2016. Klenert, D., Antón, J.I. and Fernández-Macías, E., Robots and Employment in Europe. A sector approach, JRC LET working paper series, forthcoming. Kyllönen M., ‘A New Narrative for the Future: Learning, Social Cohesion and Redefining “Us”’. In: Cook J. (eds) Sustainability, Human Well-Being, and the Future of Education, Palgrave Macmillan, Cham, 2019. Lane, M. and Conlon, G., The Impact of Literacy, Numeracy and Computer Skills on Earnings and Employment Outcomes, OECD Education Working Papers, No. 129, OECD Publishing, Paris, 2016. López Cobo, M., De Prato, G., Alaveras, G., Righi, R., Samoili, S., Hradec, J., Ziemba, L.W., Pogorzelska, K. and Cardona, M., Academic offer and demand for advanced profiles in the EU. Artificial Intelligence, High Performance Computing and Cybersecurity, Publications Office of the European Union, Luxembourg, 2019. Lordan, G., Robots at work: A report on automatable and non-automatable employment shares in Europe, Luxembourg: Publications Office of the European Union, 2018. Manyika, J., Chui, M., Miremadi, M., Bughin, J., George, K., Willmott, P. and Dewhurst, M., A future that works: automation, employment and productivity, McKinsey Global Institute, 2017. Martens, B. and Tolan, S., Will this time be different? A review of the literature on the Impact of Artificial Intelligence on Employment, Incomes and Growth, Digital Economy Working Paper 2018-08, JRC Technical Reports, 2018. MGI, Technology, jobs and the future of work, McKinsey Global Institute Briefing Note, 2017. Michaels, G., Natraj, A. and Van Reenen, J., Has ICT polarized skill demand? Evidence from eleven countries over 25 years, Review of Economics and Statistics, 96 (1), 2014, pp. 60-77. Mokyr, J., Vickers, C., and Ziebarth, N. L., The History of Technological Anxiety and the Future of Economic Growth: Is This Time Different? Journal of Economic Perspectives, 29(3), 2015, pp. 31–50. Muro, M., Maxim, R. and Withon, J., Automation and artificial intelligence: how machines are affecting people and places, Metropolitan Polocy Program at Brookings, 2019. Nedelkoska, L. and Quintini, G., Automation, skills use and training, OECD Social, Employment and Migration Working Papers, No. 202, OECD Publishing, Paris, 2018. Negreiro, M. and Belluomini, A., The new European cybersecurity competence centre and network, European Parliamentary Research Service, 2019. OECD, OECD Science, Technology and Industry Scoreboard 2017: The digital transformation, OECD Publishing, Paris, 2017. OECD, Job Creation and Local Economic Development 2018: Preparing for the Future of Work, OECD Publishing, Paris, 2018a. OECD, The future of education and skills: education 2030. OECD Publishing, Paris, 2018b. OECD, OECD Employment Outlook 2019: The Future of Work, OECD Publishing, Paris, 2019a. OECD, OECD Regional Outlook 2019: Leveraging Megatrends for Cities and Rural Areas, OECD Publishing, Paris, 2019b. Oesch, D., Occupational Change in Europe: How Technology and Education Transform the Job Structure, Oxford University Press, 2013. Oesch, D. and Rodríguez, J., Upgrading or polarization? Occupational change in Britain, Germany, Spain and Switzerland, 1990-2008, Socio-Economic Review, vol. 9, No. 3, 2011.
References

97
Oldenski, L., Offshoring and the Polarization of the U.S. Labor Market, ILR Review, 67 (3_suppl), 2014, pp. 734–761. Penprase, B. E., ‘The Fourth Industrial Revolution and Higher Education’. In N. W. Gleason (Ed.), Higher Education in the Era of the Fourth Industrial Revolution, Singapore: Springer Singapore, 2018, pp. 207-229. Pesole, A., Urzí, M.C., Fernández-Macías, E., Biagi, F. and González, I., Platform Workers in Europe, Publications Office of the European Union, Luxembourg, 2018. Reinhold, M. and Thomsen, S., Patterns of Labour Market Entry of High-Skilled Workers in Germany, Annual Conference 2015 (Muenster): Economic Development - Theory and Policy 113018, Verein für Socialpolitik / German Economic Association, 2015. Rendall, M., and Weiss, F. J., Employment polarization and the role of the apprenticeship system, European Economic Review, Vol. 82, 2016, pp. 166-186. Sánchez Puerta, M. L., Valerio, A. and Gutiérrez Bernal, M., Taking stock of programs to develop socioemotional skills: a systematic review of program evidence, Directions in development, Washington, D.C: WBG, 2016. Schanzenbach, D., Nunn, R., Bauer, L., Mumford, M. and Breitwieser, A., Seven Facts on Noncognitive Skills from Education to the Labor Market, The Hamilton Project, 2016. Sebastian R. and Biagi F., The Routine Biased Technical Change hypothesis: a critical review, European Commission, Luxembourg, 2018. Servoz, M., The future of work? Work the future! On how artificial intelligence, robotics and automation are transforming jobs and the economy in Europe, European Commission, 2019. Shah, D., By the Numbers: MOOCs in 2018, Class Central Mooc Report, 2018. Tahlin, M., ‘Skills and Wages in European Labour Markets: Structure and Change’, in: Gallie, D. (ed.) Employment Regimes and the Quality of Work, Oxford: Oxford University Press, 2007. Tijssen, R.J.W., Gavigan, J., and Jonkers, K. (eds.), A regional innovation impact assessment framework for universities, forthcoming. Torrejón, S., El cambio estructural del empleo en España a lo largo del ciclo económico (1995-2014). Diagnósticos y pronósticos de futuro, CSIC: Politeya. Estudios de Política y Sociedad, vol. 35, Madrid, 2019a. Torrejón, S., Changes in the employment structure in Spain along the economic cycle: Patterns of change and drivers (1995-2014), Papers - Revista de Sociologia, [S.l.], 2019b. Van Eijck, K., and de Graaf, P. M., The big five at school: The impact of personality on educational attainments, The Netherlands’ Journal of Social Sciences, 41(1), 2004, pp. 24-42. Vuorikari, R., Punie, Y., Carretero S., and Van den Brande, G., DigComp 2.0: The Digital Competence Framework for Citizens. Update Phase 1: The Conceptual Reference Model, Publication Office of the European Union, Luxembourg, 2016. Wang, J., Caminada, K., Goudswaard, K. and Wang, C., Decomposing Income Polarization and Tax – Benefit Changes Across 31 European Countries and Europe Wide, 2004-2012, Department of Economics Research Memorandum, Leiden University, 2015. WEF, New Vision for Education: Unlocking the Potential of Technology, World Economic Forum, 2015. WEF, New Vision for Education: Fostering Social and Emotional Learning through Technology, World Economic Forum, 2016. WEF, The Future of Jobs Report 2018, Insight Report, Centre for the New Economy and Society, World Economic Forum, Cologny/Geneva, 2018. Weinberger, C., The Increasing Complementarity between Cognitive and Social Skills, The Review of Economics and Statistics, 96:5, 2014, pp. 849-861. Wilson, H. J., Daugherty, P., and Bianzino, N., The jobs that artificial intelligence will create, MIT Sloan Management Review, 58(4), 2017, pp. 14. WIPO, WIPO Technology Trends 2019: Artificial Intelligence, World Intellectual Property Organization, Geneva, 2019. YouGov, The State of iGen, Vodafon Study, 2018.
References


LIST OF BOXES Box 1: Estimating the risk of automation of current jobs 14 Box 2: The exposure of regions to the challenge of automation 16 Box 3: How does technological progress create jobs? 24 Box 4: Digital skills 30 Box 5: What are non-cognitive skills? 31 Box 6: Educating individuals in non-cognitive skills to have a purposeful life and pursue their personal wellbeing 44 Box 7: Examples of Problem-Based Learning at educational institutions in the EU 45 Box 8: Examples of activities addressing skills-matching 48 Box 9: How technology contributes to the rise of new forms of work 55 Box 10: Building on the experience of the 2017 COLLEEM survey 59 Box 11: Where are online workers located? 64 Box 12: The many faces and challenges of platform work 68 Box 13: Job polarisation in the EU: An overview of existing evidence 72 Box 14: How to measure changes in regional employment structures relative to the EU-9? A tercile approach 75 Box 15: Employment restructuring in capital city regions: signs of convergence? 87
99 List of boxes

100List of figures
LIST OF FIGURES Figure 1. Google Search Volume for "Future of Work" (Global level, peak=100). 10 Figure 2. Estimates of the share of jobs at high risk of automation: variation across and within seminal studies 15 Figure 3. Percentage of jobs at high risk of automation, highest and lowest performing regions by country, 2016 17 Figure 4. Occupations expected to be most and least affected by automation 18 Figure 5. The accelerating pace of technology diffusion 19 Figure 6. Growth of AI patent families and scientific publications 20 Figure 7. Linking the rise of computer use at work with standardisation of work 21 Figure 8. Linking risk of automation and methods of work across 38 occupations 22 Figure 9. Tasks and methods of work for sales workers in two different sectors 24 Figure 10. Job creation driven by technological progress 26 Figure 11. Change in the task content, methods and tools of work indices in the EU, 2015 to 2030 30 Figure 12. Degree of social tasks and ICT use at work across occupation that have expanded, declined
or remained stable over the period 2011-16 31 Figure 13. Average degree of importance of skills across jobs with a positive employment
outlook, 2015-25, EU28 32 Figure 14. Jobs combining non-routine tasks with ICT use are the most likely to be high-paid 33 Figure 15. Digital skills of the EU active labour force, 2017 (% individuals, by skills level) 34 Figure 16. Workplaces reporting digital skill gaps by sector and size, EU28 (% of workplaces) 36 Figure 17. Projections of future demand and supply of ICT graduates in Europe 37 Figure 18. AI Education and AI industry penetration rates, EU 39 Figure 19. Share of tertiary graduates working in science, engineering or ICT who rate this skill as very important
or essential in doing their job (% within each wage group) 41 Figure 20. Cumulative change in real hourly wages, by occupation task intensity, 1980 to 2012 (US Data) 41 Figure 21. Most requested skills as mentioned in the Skills Online Vacancy Analysis Tool for Europe (Skills-OVATE) 42 Figure 22. Changes in the earnings of workers aged 25-34 with tertiary education, relative to the earnings
of workers in the same age group with upper secondary education - selected EU countries 46 Figure 23. Incidence of horizontal mismatch among workers aged 25-34 with tertiary education in the EU-28 47 Figure 24. Share of the adult population (aged 25-64) participating in learning in 2018 49 Figure 25. Workers’ benefits from taking MOOCs 50 Figure 26. Percentage change in the number of employed by professional status, EU-28, 2000-17 53 Figure 27. New forms of employment identified as increasingly relevant across European countries in 2015. 56 Figure 28. Short part-time employment as a share of dependent employment, all ages 57 Figure 29. Growth Index for selected categories of self-employment (millions of workers in 2008=100) 58 Figure 30. Average share of platform workers in 2018 in 16 EU countries, total and by work
intensity on the platform 58 Figure 31. Share of platform workers across 16 EU Member States, total and by work intensity on the platform 60 Figure 32. Share of offline/main platform workers by type of characteristic 63 Figure 33. International division of online work by region and type of service (% market share) 64 Figure 34. Number of workers by duration of temporary contract in the EU-28 (millions) 65

101
Figure 35. Share of involuntary employment in the EU-28, by type of employment 66 Figure 36. Distribution of dependent self-employed, by degree of job autonomy 67 Figure 37. Change in the number of employed people, by job wage quintile, in selected EU countries,
2011 Q2 - 2016 Q2 (thousands) 73 Figure 38. Total change in the number of jobs by wage tercile across EU-9 countries (millions) 76 Figure 39. Regional employment changes relative to the EU-9 average, 2002-17 79 Figure 40. Regional employment shares, by job tercile and innovation group, 2017 80 Figure 41. Share of low-paid jobs, by regions (2017, %) 82 Figure 42. Share of high-paid jobs, by region (2017, %) 83 Figure 43. Difference in the share of high-paid jobs across regions in 2017 (pp deviation from EU-9 average) 84 Figure 44. Difference in the share of low-paid jobs across regions in 2017 (pp deviation from EU-9 average) 86 Figure 45. Shares of high- and low-paid jobs across capital city regions, 2002 and 2017 87
List of figures
1. How the blockchain works
This JRC report on The Changing nature of work and skills in the digital age was edited by Ignacio González Vázquez, Santo Milasi, Stephanie Carretero Gómez, Joanna Napierała, Nicolas Robledo Bottcher, Koen Jonkers and Xabier Goenaga, collecting contributions from Eskarne Arregui Pabollet, Margherita Bacigalupo, Federico Biagi, Marcelino Cabrera Giráldez, Francesca Caena, Jonatan Castaño, Isabel Clara Centeno Mediavilla, John Edwards, Enrique Fernández-Macías, Emilia Gómez Gutiérrez, Estrella Gómez Herrera, Andreia Inamorato Dos Santos, Panagiotis Kampylis, David Klenert, Montseratt López Cobo, Robert Marschinski, Annarosa Pesole, Yves Punie, Songül Tolan, Sergio Torrejón Perez, Cesira Urzi Brancati and Riina Vuorikari.
The report has especially benefitted from contributions, insights, and background data provided by Enrique Fernández-Macías and Yves Punie. The editors would like to thank Vladimír Šucha, Charlina Vitcheva , Laura Cassio, and Marion Dewar for useful discussions throughout the preparation of this report.
We are particularly grateful to the reviewers for their valuable comments and suggestions, in particular: Peter Benczur (JRC), Alexandr Hobza (Directorate-General for Economic and Financial Affairs), John Hurley (Eurofound), Irene Mandl (Eurofound), Maria Chiara Morandini (Directorate-General for Economic and Financial Affairs), Rafael Muñoz de Bustillo (University of Salamanca), Giuseppe Piroli (Directorate-General for Employment, Social Affairs and Inclusion), Andrea Glorioso (Directorate-General for Communication Networks, Content and Technology) and Chris Warhurst (University of Warwick). The editors would also like to thank colleagues at Eurofound for their feedback and collaboration at various stages of this report.
The report has also greatly benefitted from a number of background studies conducted in collaboration with experts including Melanie Arntz (ZEW and University of Heidelberg), Maarten Goos (Utrecht School of Economics), Terry Gregory (IZA and ZEW), Chris Warhurst (University of Warwick), Wil Hunt (University of Warwick) and Ulrich Zierahn (ZEW).
Finally, we are very grateful to Micaela Ballario for the design, layout and cover, to Prodigioso Volcán for their work on graphs and infographics and to Emiliano Bruno for the editorial and graphic production coordination.
ACKNOWLEDGEMENTS

1. How the blockchain works
GETTING IN TOUCH WITH THE EU
IN PERSONAll over the European Union there are hundreds of Europe Direct information centres. You can find the address of the centre nearest you at: https://europa.eu/european-union/contact_en.
ON THE PHONE OR BY EMAILEurope Direct is a service that answers your questions about the European Union. You can contact this service:- by freephone: 00 800 6 7 8 9 10 11 (certain operators may charge for these calls),- at the following standard number: +32 22999696, or- by electronic mail via: https://europa.eu/european-union/contact_en.
FINDING INFORMATION ABOUT THE EU
ONLINEInformation about the European Union in all the official languages of the EU is available on the Europa website at: https://europa.eu/european-union/index_en.
EU PUBLICATIONSYou can download or order free and priced EU publications from EU Publications at: https://publications.europa.eu/en/publications. Multiple copies of free publications may be obtained by contacting Europe Direct or your local information centre (see https://europa.eu/european-union/contact_en).
EU LAW AND RELATED DOCUMENTSFor access to legal information from the EU, including all EU law since 1952in all the official language versions, go to EUR-Lex at: http://eur-lex.europa.eu.
OPEN DATA FROM THE EUThe EU Open Data Portal (http://data.europa.eu/euodp/en) provides access to datasets from the EU. Data can be downloaded and reused for free, for both commercial and non-commercial purposes.

JRC MissionAs the science and knowledge service of the European Commission, the Joint Research Centre’s mission is to support EU policies with independent evidence throughout the whole policy cycle.
@EU_ScienceHub
EU Science Hub - Joint Research Centre
EU Science, Research and Innovation
EU Science Hub
EU Science Hub ec.europa.eu/jrc
The European Commission’s science and knowledge service Joint Research Centre
KJ-N
A-29823-EN-N
ISBN 978-92-76-09206-3 doi:10.2760/679150