QUALITY - Sage Publications
60
5 QUALITY 197 Q uality has been an important concern ever since firms began producing goods or delivering services and managers realized the importance of meeting standards. Quality has emerged as one of the key dimensions of customer value; however, customers define quality in various ways, partly dependent on whether the customers are internal or external to the firm. In general, quality may be defined as meeting or exceed- ing the requirements, needs, and expectations of the customer—whether or not those needs have been articulated. QUALITY DEFINED It is widely accepted that quality represents an important attribute underlying customer value. Quality is often a difficult attribute to assess, and many consumers, when asked to identify quality, are likely to respond, “I know it when I see it.” Managers need to understand the elements of quality, as perceived by the user, to assess whether a product or service is of high quality. Garvin (1988) identified eight dimensions of quality: • Performance: measurable primary characteristics of a product or service • Features: added characteristics that enhance the appeal of a product or service • Conformance: meeting specifications or industry standards • Reliability: consistency of performance over time • Durability: useful life of a product or service • Serviceability: resolution of problems and complaints • Aesthetics: the sensory characteristics of a product or service • Perceived quality: subjective assessment of quality based on cues related to the product To design and deliver quality, a company’s products need not be rated high on each dimension. Manufacturers of food products, such as Noram Foods, might focus heavily on conformance, reliability, and aesthetics. In contrast, a diesel engine manufacturer, such as LongXi Machinery Works, could emphasize performance (i.e., power) and features relative 05-Klassen-4641.qxd 4/1/2005 6:47 PM Page 197
-
Upload
khangminh22 -
Category
Documents
-
view
2 -
download
0
Transcript of QUALITY - Sage Publications

5QUALITY
197
Quality has been an important concern ever since firms began producing goods ordelivering services and managers realized the importance of meeting standards.Quality has emerged as one of the key dimensions of customer value; however,
customers define quality in various ways, partly dependent on whether the customers areinternal or external to the firm. In general, quality may be defined as meeting or exceed-ing the requirements, needs, and expectations of the customer—whether or not those needshave been articulated.
QUALITY DEFINED
It is widely accepted that quality represents an important attribute underlying customervalue. Quality is often a difficult attribute to assess, and many consumers, when askedto identify quality, are likely to respond, “I know it when I see it.” Managers need tounderstand the elements of quality, as perceived by the user, to assess whether a productor service is of high quality.
Garvin (1988) identified eight dimensions of quality:
• Performance: measurable primary characteristics of a product or service• Features: added characteristics that enhance the appeal of a product or service• Conformance: meeting specifications or industry standards• Reliability: consistency of performance over time• Durability: useful life of a product or service• Serviceability: resolution of problems and complaints• Aesthetics: the sensory characteristics of a product or service• Perceived quality: subjective assessment of quality based on cues related to the product
To design and deliver quality, a company’s products need not be rated high on eachdimension. Manufacturers of food products, such as Noram Foods, might focus heavily onconformance, reliability, and aesthetics. In contrast, a diesel engine manufacturer, such asLongXi Machinery Works, could emphasize performance (i.e., power) and features relative
05-Klassen-4641.qxd 4/1/2005 6:47 PM Page 197

to competitors. Thus, customers (and managers) must choose which dimensions of qualityto emphasize, meaning that trade-offs between these dimensions might be necessary.
Not all of Garvin’s (1988) eight dimensions of quality apply equally well to both goodsand services. For services, which are often intangible in nature, it is also necessary toassess a number of process-based elements. Parasuraman, Zeithaml, and Berry (1988)posit five dimensions to service quality:
• Reliability: ability to perform the promised service dependably and accurately• Responsiveness: willingness to help customers and provide prompt service• Assurance: employees’ knowledge, courtesy, and their ability to inspire trust and confidence• Empathy: caring, individualized attention given to customers• Tangibles: appearance of physical facilities, equipment, personnel, and written material
Assessing service quality, which is a critical task for managers and employees of BlueMountain Resorts and Mutual Life of Canada, is primarily done through surveying cus-tomers on their expectations and perceptions of performance across various dimensions.
These definitions of quality have, as seen in the cases that follow, significant impli-cations for the operational control and improvement of quality. Irrespective of howquality is defined in the manufacturing or service context, the strategic elements, practices,and tools necessary for the successful management of quality fall under the umbrelladescriptor “total quality management.”
QUALITY DELIVERED
Total quality management (TQM) requires the managing of the entire organization so that itexcels in all dimensions of goods and services that are important to the customer. TQM rep-resents a pragmatic and comprehensive system for managing quality. The “total” componentof TQM emphasizes that performance excellence needs to exist throughout all the firm’soperational activities: design, procurement, production, distribution, and service. Further-more, involvement from all firm stakeholder—employees, suppliers, and customers—is critical to the TQM effort. Successful implementation of TQM transcends culture, asillustrated in the LongXi Machinery Works case, and requires customer focus, top manage-ment support, active involvement of all employees, continuous improvement and learning,business planning and performance measurement, management by fact, and collaborativerelationships. Each of these contributes to the synergy required for effective TQM.
Many firms have achieved significant performance benefits—operationally, financially,or customer based—from implementing an effective TQM system. These benefits are theresult of successfully deploying both the philosophical elements and generic tools ofTQM. In the Noram Foods case, for example, you will have to address the philosophicalimplications to managing quality resulting from an analysis of statistical process controldata.
Although quality may be an important priority for an organization’s survival, it alone maynot guarantee success. Indeed, managers recognize that there are both quantitative and qual-itative costs for poor quality. Some of these quantitative and qualitative costs include scrap,rework, downtime, lost customers, and negative word of mouth. Implemented successfully,TQM provides managers with new strategic options. Given increased customer expectations
198 • CASES IN OPERATIONS MANAGEMENT
05-Klassen-4641.qxd 4/1/2005 6:47 PM Page 198

on quality, cost, delivery, and flexibility, companies are challenged to design, produce, anddeliver products and services better, faster, and cheaper. TQM represents an integratedapproach to addressing such challenges.
Furthermore, TQM’s emphasis on continuous improvement affects the efficiency andeffectiveness of many operational practices, including those related to process design andplanning and control. For example, manufacturers implementing just-in-time productionas part of a broader supply chain management system are required to first achieve stableand capable production processes. TQM can be effectively employed to achieve therequired stability and capability through the continual focus on identifying and eliminat-ing predictable variability that results in waste. Most organizations that have implementedquality management have quickly recognized the importance of continuous improvementand that the rate of improvement achieved is as important as the resulting performanceimprovements. For these reasons, the management of quality represents an importantcomponent for achieving world-class operations (see Figure 5.1).
The cases in this quality management module generally involve the definition, control,and improvement of quality, for products or processes, in both service and manufacturingorganizations. The module includes discussions of the costs of poor quality, statisticalquality control, benchmarking, standards such as ISO 9000, quality guarantees, and oper-ational options for improving quality.
Quality • 199
Processdesign
Supplychain
managementQuality
Planning& control
Operationsstrategy
Projectmanagement
Figure 5.1 Quality Management
05-Klassen-4641.qxd 4/1/2005 6:47 PM Page 199

LONGXI MACHINERY WORKS—QUALITY IMPROVEMENT (A)
Zhang Lin, the assistant engineer in the Thermal Treatment Department of LongXiMachinery Works, a state-owned enterprise in China, has received approval for the for-mation of a new quality control group to reduce the high defect rate of a critical part. Thishigh defect rate had significant implications for LongXi’s future development because itcaused costly production delays and engine failures at a time when many industry playerswere fighting for survival. Lin must decide who will be directly involved in the qualitycontrol group, which data must be collected and analyzed, what is the cause of the prob-lem, and which actions should be taken. LongXi’s total quality concept is presented withinthe context of a specific quality problem. (Note: This case is the first of a three-part seriesthat applies the principles and tools of total quality management in a Chinese setting. Thiscase can either be used independently or in combination with the (B) case, 9A98D002, and(C) case, 9A98D003.)
Learning objectives: compare and contrast TQM concepts, frameworks, and tools,especially in an international setting; assess quality systems; and apply quality tools andimprovement cycle.
BLUE MOUNTAIN RESORTS: THE SERVICE QUALITY JOURNEY
Blue Mountain Resorts had been driving its business with a service quality program forseveral years, which the vice president of human resources, David Sinclair, was responsi-ble for coordinating. With a new ski season under way and the critical Christmas seasonapproaching, Sinclair wanted to continue progress of the program by introducing a new setof initiatives. He had recently gathered together a team of Blue Mountain Resort man-agers, from a variety of different areas in the company, to identify opportunities to improveservice quality. The group provided three proposals that he felt warranted consideration.At the upcoming executive team meeting, Sinclair would be expected to set the prioritiesfor the coming year and recommend what action, if any, should be taken for each. He hadto decide which programs made the most sense for immediate action and which onesrequired additional study and analysis. Each of the proposals affected different parts of theorganization, so Sinclair also needed to be concerned about who else in the companyshould be involved in further evaluation and implementation.
Learning objectives: differentiate product and service quality, illustrate quality man-agement in services, and examine the role of internal and external customers.
NORAM FOODS
Noram Foods, a major producer of consumer food products known for its high-qualitybrands, had recently experienced a period of declining profits when the Canadian econ-omy suffered under conditions of high unemployment, high interest rates, and high infla-tion. The president of Noram Foods has expressed the need to exploit revenue-increasingand cost-reduction opportunities wherever possible. Pat Marsden, the plant manager forNoram Foods, was considering the impact of changing Noram’s policy on package weight,as the weight control issue represented a major opportunity for reevaluation and increasedperformance. Marsden had to decide whether to recommend to Noram executives that
200 • CASES IN OPERATIONS MANAGEMENT
05-Klassen-4641.qxd 4/1/2005 6:47 PM Page 200

company standards on package weight control be lowered to secure cost savings.Government regulations were more lenient than Noram’s corporate standards, but a cita-tion for weight violations might seriously affect its brand image with customers.
Learning objectives: understand statistical process control, contrast “voice ofcustomer” and “voice of process” quality perspectives, and assess ethical trade-offs inoperating decisions.
HILCREST AUTO
Mark Bailey, quality manager and business unit manager of the Small Parts Division ofHilcrest Auto, discovered that scrapped parts had been used in a shipment to a major cus-tomer. Although Hilcrest had experienced quality problems for some time, this shipmentdecision could have a potentially disastrous effect on the firm’s future. Bailey must decidewhat action to take regarding the scrapped parts shipment and determine which amongfour options to choose to address quality issues. Each of these options would result inoperational changes to the production facility for heating core tubing. However, some ofthe improvements required additional investments and expenditures. Bailey felt the needto ensure that strong quantitative support and a convincing qualitative rationale formed thebasis for his decision.
Learning objectives: examine costs of quality, apply quality management tools forimprovement, and implement quality-based changes in operational policies, procedures,and practices.
MUTUAL LIFE OF CANADA—THE GROUP
CLIENT SERVICE GUARANTEE (A)
Alex Brown, the senior vice president and head of Mutual Life’s group division, was try-ing to decide whether to proceed with a plan to guarantee his division’s services as a taskforce had recommended. If the division decided to proceed, he would have to decidewhether to accept the task force’s suggestions on the design of the guarantee and answera number of questions that they have left unanswered. Brown was currently consideringthree distinct service guarantee options and was faced with an urgent decision as the taskforce would expect that any service guarantee be implemented quickly. (Note: A sequel tothis case bearing the same title, case 9A94D017, describes the guarantee and an issue thathas arisen.)
Learning objectives: design, assess, and implement service guarantees; understandoperational and marketing implications for service quality; and evaluate informationalrequirements for quality management.
MANAGEMENT QUESTIONS ADDRESSED IN QUALITY CHAPTER
1. How is quality defined? What is the goal of total quality management (TQM)? Why is TQMimportant?
2. Who are the quality gurus? Compare and contrast the gurus in terms of how they definedquality and how quality was to be managed.
Quality • 201
05-Klassen-4641.qxd 4/1/2005 6:47 PM Page 201

3. How does quality and the management of quality differ between manufacturing and serviceorganizations?
4. What role should the customer play in the management of quality?
5. What tools and practices are commonly used in TQM? Describe the types of qualitativeand quantitative tools and practices commonly employed in TQM and indicate under whatcircumstances they are likely to be effective or ineffective.
6. How should an organization’s TQM efforts be assessed? What approaches are available formeasuring quality?
7. What is required for successful TQM implementation? What are the challenges in imple-menting an effective TQM program?
8. Compare and contrast TQM with business process reengineering (BPR)? What is required forsuccessful BPR?
REFERENCES
Garvin, D. A. (1988). Managing quality: The strategic and competitive edge. New York: Free Press.Parasuraman, A., Zeithaml, V. Z., & Berry, L. L. (1988, Spring). SERVQUAL: A multiple-item scale
for measuring consumer perceptions of service quality. Journal of Retailing, pp. 12–40.
202 • CASES IN OPERATIONS MANAGEMENT
LONGXI MACHINERY WORKS - QUALITY IMPROVEMENT (A)
Larry Li
Tom Gleave
Rob Klassen
Copyright © 1998, Ivey Management Services Version: (A)1998–05–04
As the end of September 1996 neared, Mr. Shi,Manager of the Quality Management Depart-ment at LongXi Machinery Works (Longxi) inZhangzhou, China, was reviewing an applicationfor the formation of a new quality control (QC)group. Mr. Lin, an assistant engineer in theThermal Treatment Department, was proposingthat this group focus on growing quality concernswith the production of a critical part, called theduo-gear shaft (DGS).1 This part was used inLongxi’s multi-cylinder diesel engines to transferpower between gears. If a DGS did not meet min-imum performance standards, it could crack, and
then break, possibly resulting in complete seizureof the engine.
This was not the first time that qualityconcerns about this part had come to Shi’sattention. He recalled recently receiving a reportfrom the Inspection Department complainingabout numerous quality problems originating inthe Thermal Treatment Workshop. When similarproblems had occurred several years ago,Longxi’s engineers had been unable to determinethe precise cause of the quality problems. At thattime, after noticing a marked improvement inDGS quality following the rainy season, the
05-Klassen-4641.qxd 4/1/2005 6:47 PM Page 202

engineers simply attributed the problem to thechanging temperature and humidity in the plant.
While the DGS part itself was relatively smalland inexpensive (RMB 15),2 continued qualityproblems would have significant implicationsfor Longxi’s future business. Longxi’s multi-cylinder engines were used in the agriculturalsector, and there had been a growing number ofcustomer complaints about losses in productiontime resulting from engine breakdowns. Sincethe beginning of the year, there had been 14 inci-dents related to failure of this part. Becausespecial equipment was needed to fix any failure,Longxi was forced to cover the costs of sendinga mechanic to replace the part, or in cases ofsevere damage, of replacing the engine com-pletely at a cost of RMB 4,000.
While the Inspection Department identifiedmost defective parts before their final assemblyinto engines, the high defect rate, 44 per centin September, had resulted in costly delays toengine production at a time when industry play-ers were competing fiercely with each other.After reviewing and approving Lin’s application,Shi commented:
Unfortunately, the number of reliable supplierswho could produce this part is extremely limited,and those that could possibly help us are alreadyover-stretching their production capacity. I believethat purchasing from these suppliers would furtheraggravate our quality problem. Thus, Longxi hasno choice—we must find a way to improve qualityin-house. If we are not successful, we run the riskof jeopardizing our long term strategy, which callsfor expanding our product sales both at home andabroad.
CHINA’S SMALL DIESEL ENGINE INDUSTRY
China’s agricultural machinery sector, Longxi’sprimary market, had been experiencing profoundchange since 1978 when a series of economicreforms designed to boost China’s overall farmoutput were introduced. The reforms providedfarmers with incentives to exceed their tradi-tional quotas and proved to be a considerablesuccess as China’s total agricultural output
increased dramatically in the ensuing years. Thisled to increased buying power in the rural sector,resulting in a rising demand for low-cost, smallto medium-sized diesel engines for use on small-scale agricultural units. Reform measures alsohad encouraged the development of larger coop-erative farming efforts that benefit from greatereconomies of scale. Cooperative farms, in turn,translated into additional demand for largermodel engines, thus encouraging manufacturersto offer a greater range of product options.
Sales of diesel-powered agricultural machin-ery and vehicles in China had grown by morethan 10 per cent annually since 1985, and thisgrowth rate was forecast to continue until at leastthe year 2000. This year, Longxi estimated thatdomestic manufacturers across this sector wouldcombine to produce 1.91 million small tractors,85,000 domestically produced medium to largetractors, 15,200 seeders and 23,600 threshers,along with a host of other agricultural machines,such as irrigation pumps and small transportationvehicles. Approximately 85 per cent of thisequipment used single-cylinder diesel engines.
Four large manufacturers jointly accountedfor approximately 45 per cent of China’s produc-tion of single-cylinder engines. The remainder ofthe market was divided among several medium-sized (including Longxi) and numerous smallerfirms. Over the past several years, industry con-solidation and rationalization had reduced thenumber of medium-sized firms from the previ-ous high of 30 to about 15. This trend wasexpected to continue over the next five years.
The principal strategy employed by mostChinese manufacturers was to compete on thebasis of low cost production. For example,Chinese firms typically were able to produceengines at 25 per cent of the cost of theirJapanese counterparts, who currently had thesecond largest single-cylinder diesel engineindustry in the world. Recent investment hadpushed the industry into a state of overcapacityfor single-cylinder engines. Yet, many manu-facturers continued to add capacity as theyupgraded production technology to lower costsand improve quality. As a result, it was widelyexpected that a price war was imminent.
Quality • 203
05-Klassen-4641.qxd 4/1/2005 6:47 PM Page 203

In contrast, the market for small multi-cylinder diesel engines was much more promis-ing. Although sales levels were currently wellbelow those of single-cylinder engines, customerdemands for more power were being heard asefforts were made to further increase productiv-ity in the agricultural sector. One factor was theformation of larger cooperative farms, with theirdrive for economies of scale. Another was thegreater need for small transportation vehiclesin the agricultural sector to move more productsgreater distances. Moreover, multi-cylinderengines also offered greater versatility, with abroader range of applications across both agri-cultural and other small machinery sectors.Because demand was growing faster than supply,manufacturers had been able to impose priceincreases on multi-cylinder engines.
COMPANY BACKGROUND
LongXi Machinery Works (Longxi) was a state-owned enterprise (SOE) located in Zhangzhou,Fujian, a southern coastal Chinese provincesituated across from Taiwan. The company wasfounded in 1957 as a result of the mergerbetween a military machinery works fromSichuan province (in China’s southwest interior)and an agricultural machinery plant owned bythe city government of Zhangzhou.
Since its inception, Longxi had producedvarious single and multi-cylinder diesel enginesprimarily for the agricultural sector. Theseengines were typically used in the powertrainsof four-wheel and three-wheel tractors, hand-held tractors, as well as related equipment suchas tillers, seeders and threshers. They also weremodified for use as irrigation pumps. Thesevarying applications meant that the companyserviced four primary customer groups: tractormanufacturers, ancillary equipment manufac-turers, engine wholesalers and farmers whobought directly from the plant.
In the early years, Longxi produced onlyone model of single-cylinder, low-speed dieselengine. This model was primarily sold in the
domestic market, although a small volume wereexported to Africa, Latin America and SoutheastAsia. In the 1970s, the plant shifted its focustoward the production of single-cylinder, high-speed engines which were sold both locally andin export markets. By the 1980s, the product linehad further expanded to include several two- andthree-cylinder models. It was during this periodthat Longxi began exporting its multi-cylinderproducts to the United States. In the last fiveyears, the company had broadened its productline to include a series of four-cylinder, high-speed units.
At this time, Longxi’s most popular multi-cylinder unit was the SL2100,3 a two-cylindermodel generating 28 horsepower (hp). Manage-ment felt that this particular engine was thekey to future sales for several reasons. First, theprimary market for these engines, 25–30 hpwheeled tractors, was expected to remain buoy-ant over the next several years. This engine alsocould be readily adapted for other agriculturalequipment use, further increasing its marketpotential.
Second, the marketplace was increasinglyviewing an older, multi-cylinder engine—modelS295—as having insufficient power. The two-cylinder S295, produced by competitors, gener-ated only 24 hp, was larger, and was of lowerquality. This view was particularly prevalent inexport markets like the U.S. Longxi’s new modelSL2100 recently had received favorable feedbackfrom U.S. importers, and the company believedthat there was strong potential for the SL2100 toreplace the S295 throughout the industry.
Third, the SL2100 offered a wider rangeof uses outside the agricultural equipment sectorthan other single or two-cylinder models. Forexample, the SL2100 could be used in 0.8 tonand 1.5 ton front-end loaders, as well as 2.0 tonforklifts. This engine also could be easily adaptedfor electrical generators and small boat engines.
Management was confident that sales of thismodel would increase dramatically in 1997 to aprojected total of 12,000 units. Company-wide,financial results for the year to date indicated thatLongxi was on target to reach revenues of RMB
204 • CASES IN OPERATIONS MANAGEMENT
05-Klassen-4641.qxd 4/1/2005 6:47 PM Page 204
176 million in 1996, with an income of RMB6.5 million in 1996. These figures were based onprojected sales of 80,000 single-cylinder enginesand 6,900 multi-cylinder engines in 1996.
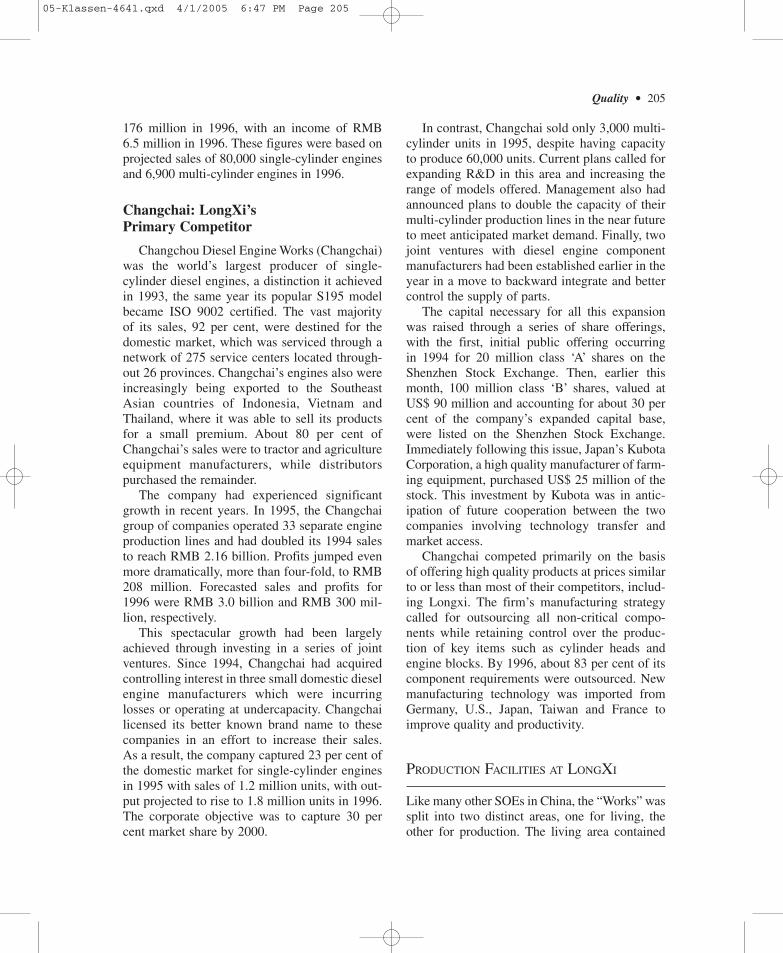
Changchai: LongXi’sPrimary Competitor
Changchou Diesel Engine Works (Changchai)was the world’s largest producer of single-cylinder diesel engines, a distinction it achievedin 1993, the same year its popular S195 modelbecame ISO 9002 certified. The vast majorityof its sales, 92 per cent, were destined for thedomestic market, which was serviced through anetwork of 275 service centers located through-out 26 provinces. Changchai’s engines also wereincreasingly being exported to the SoutheastAsian countries of Indonesia, Vietnam andThailand, where it was able to sell its productsfor a small premium. About 80 per cent ofChangchai’s sales were to tractor and agricultureequipment manufacturers, while distributorspurchased the remainder.
The company had experienced significantgrowth in recent years. In 1995, the Changchaigroup of companies operated 33 separate engineproduction lines and had doubled its 1994 salesto reach RMB 2.16 billion. Profits jumped evenmore dramatically, more than four-fold, to RMB208 million. Forecasted sales and profits for1996 were RMB 3.0 billion and RMB 300 mil-lion, respectively.
This spectacular growth had been largelyachieved through investing in a series of jointventures. Since 1994, Changchai had acquiredcontrolling interest in three small domestic dieselengine manufacturers which were incurringlosses or operating at undercapacity. Changchailicensed its better known brand name to thesecompanies in an effort to increase their sales.As a result, the company captured 23 per cent ofthe domestic market for single-cylinder enginesin 1995 with sales of 1.2 million units, with out-put projected to rise to 1.8 million units in 1996.The corporate objective was to capture 30 percent market share by 2000.
In contrast, Changchai sold only 3,000 multi-cylinder units in 1995, despite having capacityto produce 60,000 units. Current plans called forexpanding R&D in this area and increasing therange of models offered. Management also hadannounced plans to double the capacity of theirmulti-cylinder production lines in the near futureto meet anticipated market demand. Finally, twojoint ventures with diesel engine componentmanufacturers had been established earlier in theyear in a move to backward integrate and bettercontrol the supply of parts.
The capital necessary for all this expansionwas raised through a series of share offerings,with the first, initial public offering occurringin 1994 for 20 million class ‘A’ shares on theShenzhen Stock Exchange. Then, earlier thismonth, 100 million class ‘B’ shares, valued atUS$ 90 million and accounting for about 30 percent of the company’s expanded capital base,were listed on the Shenzhen Stock Exchange.Immediately following this issue, Japan’s KubotaCorporation, a high quality manufacturer of farm-ing equipment, purchased US$ 25 million of thestock. This investment by Kubota was in antic-ipation of future cooperation between the twocompanies involving technology transfer andmarket access.
Changchai competed primarily on the basisof offering high quality products at prices similarto or less than most of their competitors, includ-ing Longxi. The firm’s manufacturing strategycalled for outsourcing all non-critical compo-nents while retaining control over the produc-tion of key items such as cylinder heads andengine blocks. By 1996, about 83 per cent of itscomponent requirements were outsourced. Newmanufacturing technology was imported fromGermany, U.S., Japan, Taiwan and France toimprove quality and productivity.
PRODUCTION FACILITIES AT LONGXI
Like many other SOEs in China, the “Works” wassplit into two distinct areas, one for living, theother for production. The living area contained
Quality • 205
05-Klassen-4641.qxd 4/1/2005 6:47 PM Page 205

apartments for employees and their families, anemployee club, entertainment center, hospital andcanteen, all provided by Longxi. Employmenthad steadily declined from 2,300 at the beginningof this decade to the current level of approxi-mately 1,880.
As employees entered the production area(Exhibit 1), they were greeted at the entranceby the company’s two guiding slogans: “LoveLongXi, Complete Contribution,” and “Market,Management, Quality, Profit.” Most of thefacilities were built during the 1960s and 1970s,although several new engine assembly lines had
been added more recently as the company hadexpanded its range of multi-cylinder products.Most recently, new technologies, such as groupprocessing centers, had been acquired fromGermany, Britain, Japan and Taiwan to helpbolster both the company’s component andmachine manufacturing capabilities. These cen-ters were capable of cutting, grinding anddrilling engine parts and were especially valu-able for rapidly developing and testing enginecomponent prototypes. However, the operationof much of the older equipment still relied heav-ily on human judgment.
206 • CASES IN OPERATIONS MANAGEMENT
Warehouse
sawingmachines (6)
Inspectionofficematerial storage
Exhibit 1 Plant Layout
Machining Department
othermachining
areas
DrillsLathesGrinders
DGS areaInspection
office
aisle
Thermal Treatment Department
aisle preheat furnacequenching pool
DGS areatempering furnance
Inspectionoffice
process vats
main furnance
1 Warehouse2 Machining Department3 Heat Treating Department
1
3
2
05-Klassen-4641.qxd 4/1/2005 6:47 PM Page 206
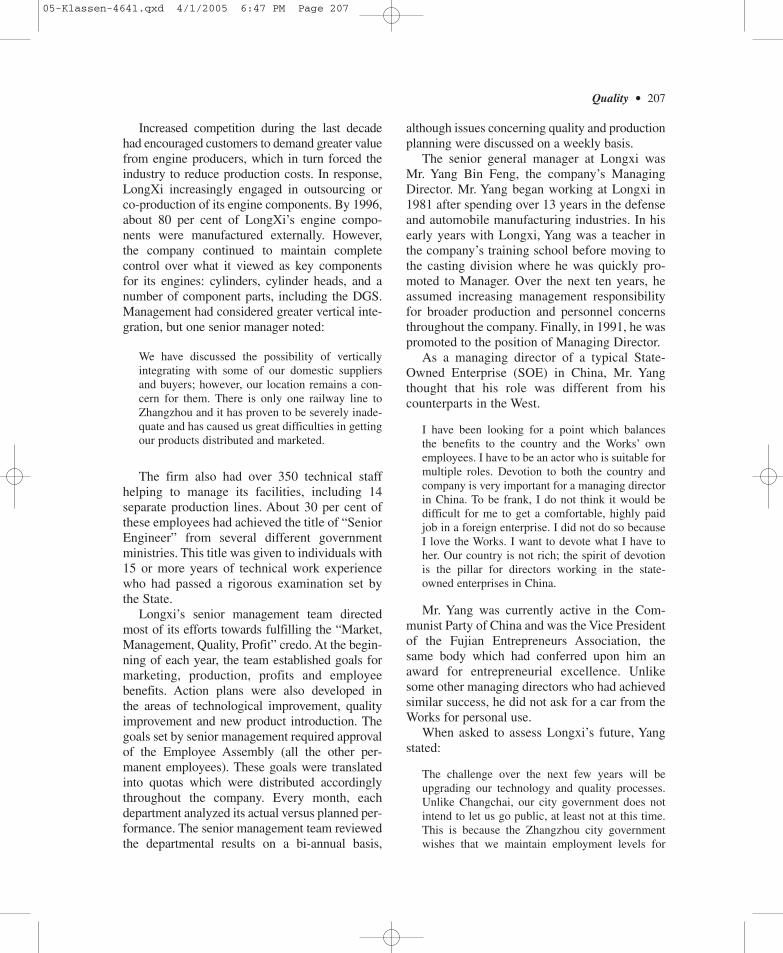
Increased competition during the last decadehad encouraged customers to demand greater valuefrom engine producers, which in turn forced theindustry to reduce production costs. In response,LongXi increasingly engaged in outsourcing orco-production of its engine components. By 1996,about 80 per cent of LongXi’s engine compo-nents were manufactured externally. However,the company continued to maintain completecontrol over what it viewed as key componentsfor its engines: cylinders, cylinder heads, and anumber of component parts, including the DGS.Management had considered greater vertical inte-gration, but one senior manager noted:
We have discussed the possibility of verticallyintegrating with some of our domestic suppliersand buyers; however, our location remains a con-cern for them. There is only one railway line toZhangzhou and it has proven to be severely inade-quate and has caused us great difficulties in gettingour products distributed and marketed.
The firm also had over 350 technical staffhelping to manage its facilities, including 14separate production lines. About 30 per cent ofthese employees had achieved the title of “SeniorEngineer” from several different governmentministries. This title was given to individuals with15 or more years of technical work experiencewho had passed a rigorous examination set bythe State.
Longxi’s senior management team directedmost of its efforts towards fulfilling the “Market,Management, Quality, Profit” credo. At the begin-ning of each year, the team established goals formarketing, production, profits and employeebenefits. Action plans were also developed inthe areas of technological improvement, qualityimprovement and new product introduction. Thegoals set by senior management required approvalof the Employee Assembly (all the other per-manent employees). These goals were translatedinto quotas which were distributed accordinglythroughout the company. Every month, eachdepartment analyzed its actual versus planned per-formance. The senior management team reviewedthe departmental results on a bi-annual basis,
although issues concerning quality and productionplanning were discussed on a weekly basis.
The senior general manager at Longxi wasMr. Yang Bin Feng, the company’s ManagingDirector. Mr. Yang began working at Longxi in1981 after spending over 13 years in the defenseand automobile manufacturing industries. In hisearly years with Longxi, Yang was a teacher inthe company’s training school before moving tothe casting division where he was quickly pro-moted to Manager. Over the next ten years, heassumed increasing management responsibilityfor broader production and personnel concernsthroughout the company. Finally, in 1991, he waspromoted to the position of Managing Director.
As a managing director of a typical State-Owned Enterprise (SOE) in China, Mr. Yangthought that his role was different from hiscounterparts in the West.
I have been looking for a point which balancesthe benefits to the country and the Works’ ownemployees. I have to be an actor who is suitable formultiple roles. Devotion to both the country andcompany is very important for a managing directorin China. To be frank, I do not think it would bedifficult for me to get a comfortable, highly paidjob in a foreign enterprise. I did not do so becauseI love the Works. I want to devote what I have toher. Our country is not rich; the spirit of devotionis the pillar for directors working in the state-owned enterprises in China.
Mr. Yang was currently active in the Com-munist Party of China and was the Vice Presidentof the Fujian Entrepreneurs Association, thesame body which had conferred upon him anaward for entrepreneurial excellence. Unlikesome other managing directors who had achievedsimilar success, he did not ask for a car from theWorks for personal use.
When asked to assess Longxi’s future, Yangstated:
The challenge over the next few years will beupgrading our technology and quality processes.Unlike Changchai, our city government does notintend to let us go public, at least not at this time.This is because the Zhangzhou city governmentwishes that we maintain employment levels for
Quality • 207
05-Klassen-4641.qxd 4/1/2005 6:47 PM Page 207

now. Instead, we may seek to obtain loans frombanks for any investment or expansion project. Ourborrowing will be in smaller increments over alonger period of time, rather than borrowing a largeamount at any one time. By doing so, we will beable to repay our obligations. I expect that 70 percent of this money will be used to improve ourtechnological processes.
Development of Quality Management
Prior to 1978, the only formal mechanismfor assessing quality at Longxi resided with theInspection Department which examined compo-nents and engines after they were produced. Thischanged that summer, when managers at Longxiwere invited to participate in a two-week TotalQuality Management (TQM) training coursegiven by China’s Ministry of Machinery andIndustry. During the previous spring, a seniordirector from the Ministry had spent threemonths in Japan learning the Japanese approachto TQM. Deeply impressed by his findings, thedirector persuaded the Ministry to sponsor aformalized TQM training program, to be taughtby himself and given to selected state-ownedenterprises (SOEs).
Longxi accepted the Ministry’s invitation andsent its Managing Director, Inspection Depart-ment Manager and an Inspection Departmentengineer to attend the training course. Havingbeen one of the first companies in China to receiveTQM training, Longxi was mandated by theprovincial government to provide similar trainingto other SOEs in Fujian province. The followingyear, Longxi established a Quality ManagementDepartment (QMD), which included three groups:Inspection, Measurement, and ManagementGroups. If defects were reported by the InspectionGroup, the QMD was allowed to summon theheads of any other departments that it felt couldassist in resolving the issue.
However, in 1981, Longxi’s senior manage-ment concluded that QMD had weakened theinspection function. In practice, for the QMD tocarry out its mandate to resolve quality issues,production lines often needed to be shut down.
The QMD was reluctant to intervene in this way,and typically allowed operations to continuedespite conditions of substandard quality. Inresponse, senior management separated theInspection Group from the QMD. A name changeaccompanied this restructuring: QMD becameknown as the Office of TQM.
During the 1980s, the Office of TQM grad-ually developed plant-wide quality control sys-tems for many of the company’s productionactivities. In August 1986, the provincial govern-ment formally recognized Longxi for its achieve-ments in quality management by awarding it thecertificate of “Provincial Excellence in TQM.”Since then, the company had been consistentlyviewed as having one of the strongest qualitymanagement teams in Fujian.
By the end of the 1980s, senior managementrealized that the growing Office of TQM wasoverloaded with responsibilities, and separatedthe Office into two parts: the Quality Manage-ment Department (QMD) and the EnterpriseManagement Office (EMO).
In its newest incarnation, the four peopleassigned to the QMD became responsible for:
• planning and administering all of Longxi’squality management activities, as well as ensur-ing that all State and company regulations werebeing adhered to properly;
• ongoing development of the company’s qualityassurance system, including the design andimplementation of quality improvements;
• organizing all of QC group activities; and• training of employees in quality management
concepts and techniques.
As part of quality improvement efforts, thequality reward system was changed so thatemployees were rewarded according to productquality in their department. Employees startedwith 100 quality points each month, which wasequivalent to 40 per cent of their base salary.Formerly, the reward system had been based onplant-wide quality performance. Now, if qualitylevels fell below standards in their department,all employees in that department lost qualitypoints, resulting in a lower quality bonus. The
208 • CASES IN OPERATIONS MANAGEMENT
05-Klassen-4641.qxd 4/1/2005 6:47 PM Page 208

number of points lost varied by the severity ofthe quality problem, although the number ofpoints lost typically was quite small.
The “Method”
In 1994, Longxi put into place what laterbecame viewed as one of the cornerstones ofits overall approach to TQM: the developmentof an evolving manual entitled “ManagementMethods of Quality Improvement Activities,”otherwise known as “The Method.” The contentof the “Method” was based on the structure ofISO 9000. Among the details included in theMethod were guidelines governing the sys-tematic change of working routines, rules forestablishing quality improvement targets andimplementation of brainstorming techniques.Instructions to govern activities such as harness-ing employee enthusiasm for solving qualityproblems and incorporating customer’s sugges-tions also were included.
In addition, the Method described the proce-dures for designing and using QC groups as ameans for achieving quality improvements. Sincethat time, QC groups had become an increasinglypopular means for resolving quality issues atLongxi. All QC group activities within the plantcame under the direct responsibility of the QMD,including the registration of QC groups, verifi-cation of quality issues, establishment of rulesgoverning group activities, provision of generalguidance and inspection of group results.
The QMD also was responsible for recog-nizing the input of individual group membersand communicating their contributions to others.For example, if a QC group developed a notablequality improvement, the QMD would ask theEmployee Assembly to confer the title of“Excellent Employee” on their champions anddisplay their pictures on the wall at the mainentrance to the plant. These people receiveddiplomas which were presented to them by thecompany’s senior executives at the annualEmployee Assembly. If the results of a group’sactivities were of great significance, the QMDwould recommend that the QC group present
their findings to the appropriate city, provincialor central government authorities.
In sum, management felt that this approachto quality had proven very successful. Throughoutthe 1990s the company received several awardsfrom both the Provincial and State governments.These awards included the following:
• 1993 Provincial QC Excellence Award forstabilizing the engine painting process;
• 1994 Provincial QC Excellence Award forimproved technology and new product;
• 1995 Ministry of Industry QC Excellence Awardfor improving the tidiness of single-cylinderengines; and
• 1996 Ministry of Industry QC ExcellenceAward for increasing first-test pass rates forrunning engines.
Notwithstanding these quality-related achieve-ments, senior management realized that furtherefforts were needed before the company wouldbecome a true world-class competitor. Whilemany employees understood the need for qualityand how TQM could be applied to their workingenvironments, many others did not. Technicalsupport continued to be inadequate for manyemployees, particularly production line workers.For example, several workshops did not scheduletechnicians who were capable of providing sup-port during the night shift. Furthermore, flawsin some operating procedures continued to con-tribute to the plant’s quality troubles. All of thismeant that further employee development,hands-on supervision and operating processrefinements were required throughout manyareas of the plant.
Views of TQM at LongXi
Since being promoted to Managing Director,Mr. Yang had received direct exposure to Westernmanagement ideas and approaches which wereof potential benefit to the company. In 1992,he attended a four-week training course inNew York which focused on the principles ofgeneral management. Later, in 1994, he and 200other managers from mainland China attended
Quality • 209
05-Klassen-4641.qxd 4/1/2005 6:47 PM Page 209

a general management training program inHong Kong where he received instruction inmarketing, finance and quality management.
In terms of his personal role in the devel-opment of TQM at Longxi, Yang offered thefollowing:
When it comes to TQM, I see myself as a strategicdecision maker. It is my view that a good seniormanager needs to be a good negotiator and an arbi-trator. I do not have time to become involved in thesmaller details of TQM, but I do wish to provideguidance and counselling when it is needed.
Other senior managers noted that Yang hadadopted a more democratic approach than hispredecessors, with responsibility being placed atlower levels in the firm and the use of teams forQC groups. As a result, more workers becamedirectly involved in quality improvement efforts.These efforts bore fruit in 1995 as two single-cylinder models were among the first productsto be awarded the designation of PrestigiousProducts in Fujian province.
Reflecting upon Longxi’s past accomplish-ments, and the future role that quality improve-ments would play in achieving the firm’sobjectives, Yang stated:
There are three achievements which have con-tributed to Longxi’s record of quality improvementover the past 10 years for which we can be espe-cially proud. The first is the company’s qualitymethods manual [The Method]. This manual hasbecome “the Bible” of quality management atLongxi. The second has to do with our trainingsystem. We have trained our workers to understandboth the concepts of quality management, as wellas the skills they need to do their jobs properly.The third achievement is that we have establishedan effective reward system which is based on acombination of spiritual and material rewards.
Prior to submitting his application for theDGS QC Group to Mr. Shi in the QMD, Mr. LinZhang had participated in one other QC groupproject. Lin had received his Bachelor’s degreein Thermal Treatment from the University ofFuzhou in 1992, the same year he started his
career at Longxi and joined the CommunistParty. Work on this project, like other QCgroups at Longxi, required the use of employ-ees’ spare time. In explaining his motivationfor wanting to develop the DGS project group,Lin remarked:
The primary reason that I wanted to participate inthis QC group was not because of money. Instead,QC group projects give me a chance to apply whatI learned in school. Other types of projects do notallow me to refresh my knowledge so thoroughly.
Another reason is the knowledge I expect toreceive from other people. Sometimes, when I haveencountered problems in the past and have run outof possible solutions, I have taken the chance toask other more experienced people for their ideas.Their insightful opinions have helped, and theyhave become big brothers to me. However, many ofthem have been promoted and given many admin-istrative responsibilities, which I believe does notmake full use of their technical expertise.
On the issue of top management involvementin TQM, Lin suggested that:
Top management should be more involved in QCgroup activities. They should require reports fromthe plant’s middle level management detailingQC group actions. This would ensure that the QCgroups get more support. From my point of view, aplant is an army at peace time. It should have strictorders to keep production and other activities inorder. Without strict control systems, we canexpect problems to keep recurring.
Recurring problems are related to our rewardsystem. A good reward system should keep pacewith our QC group activities. Sometimes a prob-lem recurs simply because people made the samemistakes again. These people were not motivatedenough to do a good job. So, as time passes, theygo back to their old tricks. Technical personnel alsoneed to be motivated. The reason why we havefailed to solve some problems sooner is becausetechnical personnel have failed to foresee the prob-lem, or else they simply tried to avoid addressingthe problem. These people need to be motivated toattend training seminars and work towards theirpotential.
210 • CASES IN OPERATIONS MANAGEMENT
05-Klassen-4641.qxd 4/1/2005 6:47 PM Page 210
ISO 9000 Certification
Unlike Changchai, Longxi had not yetreceived ISO 9000 certification for any of itsproducts. However, the ISO process formed thebasis for the Method. On achieving certification,Lin offered the following view:
There are two reasons why I don’t think that weneed to have such a certificate at this point of time.First, it is costly. An ISO 9000 certificate requiresrenewal each year. This just tells me that they[ISO] want people to spend money repeatedly forthe same thing. The second, and most importantreason, is that ISO 9000 has lost its credibilitywith me. I know that there are some plants whichhave ISO 9000, yet their products have muchlower quality than ours. How did they get thecertificate?
There are many quality control systems in theworld these days. They are all very good. The keyis not which system a plant has chosen to adopt,but whether it can produce quality products. Ourproducts are superior to other plants in terms ofquality. Our plant’s environment and workingstations are cleaner and our workers work harder,too. That is what matters.
Mr. Yang further elaborated,
With respect to ISO 9000, we are actually practis-ing it, but have not got the certificate yet. Whatis more, renewing this certification on an annualbasis takes a significant amount of time andmoney. However, the certificate is becoming apowerful marketing weapon. With our expansioninto the international market, we will seek toachieve certification by 1998 or 1999.
THE DUO-GEAR SHAFT (DGS)
The duo-gear shaft (DGS) was one of thecritical parts used in the production of two-cylinder diesel engines (Exhibit 2). This part wasassembled into the Gear Housing Assembly(Exhibit 3), which coordinated the functionsof other assemblies and transferred power fromthe engine to the drive train. Because quantitieswere considered small, Longxi had decided
against purchasing sophisticated equipmentwhich would have automated DGS production.
Production involved four basic sets of opera-tions across three different departments: raw mate-rial preparation, followed by machining, heattreatment, and then, final machining (Exhibit 1).Based on demand forecasts, the ProductionDepartment initiated the production of DGS partsby scheduling the movement of raw steel rodsfrom storage in the warehouse to sawing machines,located in the same building. Overhead cranesmoved a maximum of three rods, each measuring6m by 58mm, to one of several sawing machinesthat cut the rods into short, 46mm lengths. Whilesix sawing machines were available, usually only amaximum of three were used simultaneously toprepare the raw material for this part.
Quality Inspection
Approximately 130 inspectors were respon-sible for scrutinizing quality throughout the Works.In raw material preparation, as with other pro-duction steps, an inspector periodically performedthree types of Professional Inspections duringthe sawing operation: Initial Inspection; PatrolInspection; and Completion Inspection. After thefirst unit of each batch (i.e., 125 parts at the saw-ing operation) was produced, the inspector wouldperform an Initial Inspection to confirm that theunit conformed to specifications. For cutting, theinspector would confirm that the shafts were madeof the proper grade of steel, HB45, and the dimen-sions were correct. After granting approval, theinspector would give a plate of Initial Inspectionto the sawing machine operator. Without this platehanging at an operator’s position, further produc-tion could not proceed.
During the remaining production of thatbatch, typically twice per shift, the inspectorwould return to conduct a Patrol Inspection toensure that production was continuing accordingto specifications. Finally, when the batch ofparts had moved through all the required opera-tions in a department, such as Machining orThermal Treatment Departments, describednext, an inspector conducted a Completion
Quality • 211
05-Klassen-4641.qxd 4/1/2005 7:46 PM Page 211

Inspection. This final inspection was necessaryto authorize the release of the batch to the nextdepartment.
Workers also were responsible for ensuringhigh quality production. During the sawing oper-ation, as with other operations, workers were
told to inspect the quality of their own produc-tion, termed Self Inspection. In addition, workersexamined the quality of parts received fromupstream operations, called Mutual Inspection,to confirm that they continued to work on goodparts. For raw material preparation, Mutual
212 • CASES IN OPERATIONS MANAGEMENT
25 mm44 mm
46 mm
7 mm
Section B-B
Section A-AFront View
A∅ 9 mm
∅ 5 mm
∅ 4 mm
∅ 4 mm
10 mm
10 mm
BB
A
9.5 mm
57 mm
Exhibit 2 Duo Gear Shaft (DGS)
05-Klassen-4641.qxd 4/1/2005 6:47 PM Page 212
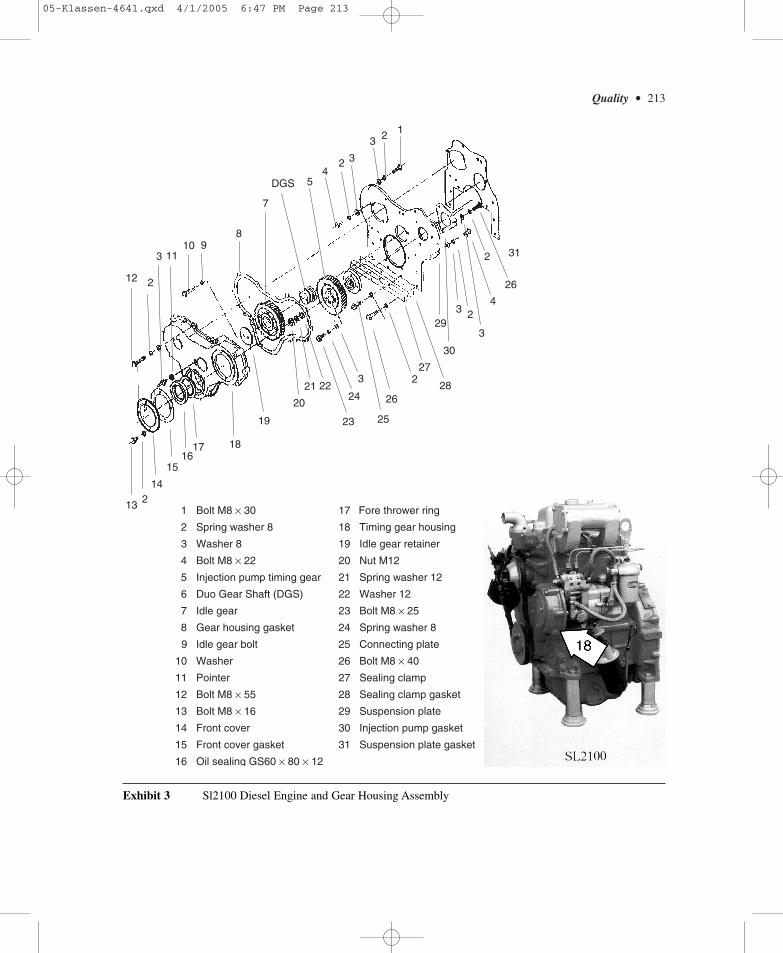
Quality • 213
1 Bolt M8 × 30
2 Spring washer 8
3 Washer 8
4 Bolt M8 × 22
5 Injection pump timing gear
6 Duo Gear Shaft (DGS)
7 Idle gear
8 Gear housing gasket
9 Idle gear bolt
10 Washer
11 Pointer
12 Bolt M8 × 55
13 Bolt M8 × 16
14 Front cover
15 Front cover gasket
16 Oil sealing GS60 × 80 × 12
17 Fore thrower ring
18 Timing gear housing
19 Idle gear retainer
20 Nut M12
21 Spring washer 12
22 Washer 12
23 Bolt M8 × 25
24 Spring washer 8
25 Connecting plate
26 Bolt M8 × 40
27 Sealing clamp
28 Sealing clamp gasket
29 Suspension plate
30 Injection pump gasket
31 Suspension plate gasket
12 2
2
3
3
3
1110 9
8
7
DGS 54
4
2 3
3 2 1
13 2
2
14
1516
17 18
19
20
21 22
23
24
3
25
26
26
2
27
31
30
28
29
Exhibit 3 Sl2100 Diesel Engine and Gear Housing Assembly
05-Klassen-4641.qxd 4/1/2005 6:47 PM Page 213
214 • CASES IN OPERATIONS MANAGEMENT
Inspections relied on visually checking the parts.Finally, the worker was responsible for notifyingthe inspector to conduct other necessary inspec-tions (such as Initial Inspection and CompletionInspection).
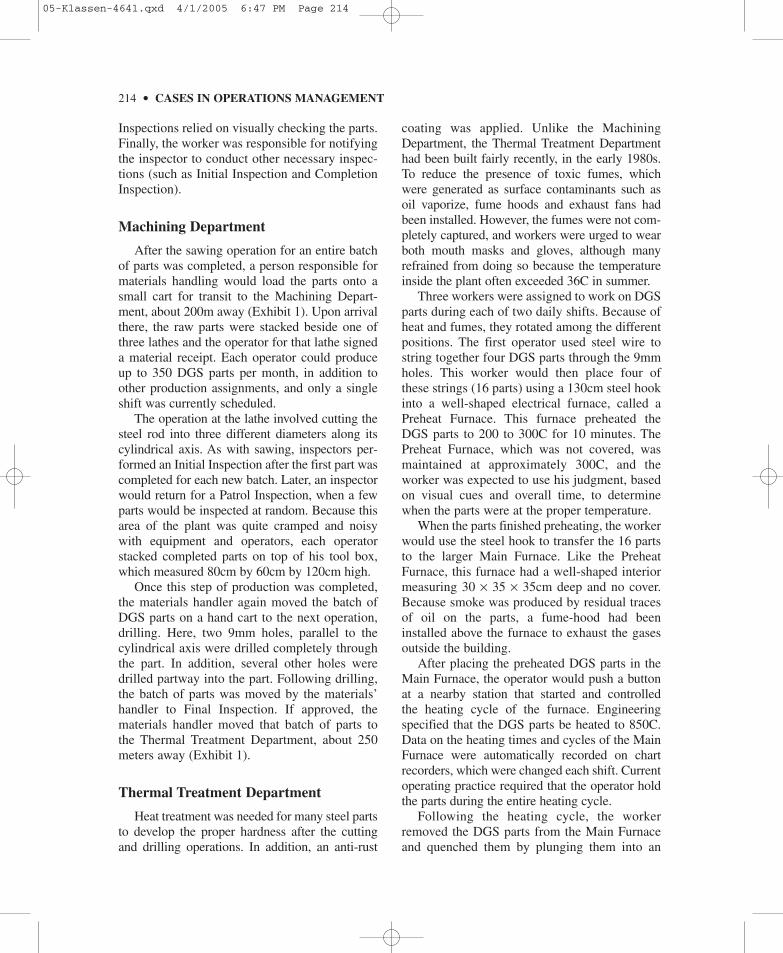
Machining Department
After the sawing operation for an entire batchof parts was completed, a person responsible formaterials handling would load the parts onto asmall cart for transit to the Machining Depart-ment, about 200m away (Exhibit 1). Upon arrivalthere, the raw parts were stacked beside one ofthree lathes and the operator for that lathe signeda material receipt. Each operator could produceup to 350 DGS parts per month, in addition toother production assignments, and only a singleshift was currently scheduled.
The operation at the lathe involved cutting thesteel rod into three different diameters along itscylindrical axis. As with sawing, inspectors per-formed an Initial Inspection after the first part wascompleted for each new batch. Later, an inspectorwould return for a Patrol Inspection, when a fewparts would be inspected at random. Because thisarea of the plant was quite cramped and noisywith equipment and operators, each operatorstacked completed parts on top of his tool box,which measured 80cm by 60cm by 120cm high.
Once this step of production was completed,the materials handler again moved the batch ofDGS parts on a hand cart to the next operation,drilling. Here, two 9mm holes, parallel to thecylindrical axis were drilled completely throughthe part. In addition, several other holes weredrilled partway into the part. Following drilling,the batch of parts was moved by the materials’handler to Final Inspection. If approved, thematerials handler moved that batch of parts tothe Thermal Treatment Department, about 250meters away (Exhibit 1).
Thermal Treatment Department
Heat treatment was needed for many steel partsto develop the proper hardness after the cuttingand drilling operations. In addition, an anti-rust
coating was applied. Unlike the MachiningDepartment, the Thermal Treatment Departmenthad been built fairly recently, in the early 1980s.To reduce the presence of toxic fumes, whichwere generated as surface contaminants such asoil vaporize, fume hoods and exhaust fans hadbeen installed. However, the fumes were not com-pletely captured, and workers were urged to wearboth mouth masks and gloves, although manyrefrained from doing so because the temperatureinside the plant often exceeded 36C in summer.
Three workers were assigned to work on DGSparts during each of two daily shifts. Because ofheat and fumes, they rotated among the differentpositions. The first operator used steel wire tostring together four DGS parts through the 9mmholes. This worker would then place four ofthese strings (16 parts) using a 130cm steel hookinto a well-shaped electrical furnace, called aPreheat Furnace. This furnace preheated theDGS parts to 200 to 300C for 10 minutes. ThePreheat Furnace, which was not covered, wasmaintained at approximately 300C, and theworker was expected to use his judgment, basedon visual cues and overall time, to determinewhen the parts were at the proper temperature.
When the parts finished preheating, the workerwould use the steel hook to transfer the 16 partsto the larger Main Furnace. Like the PreheatFurnace, this furnace had a well-shaped interiormeasuring 30 × 35 × 35cm deep and no cover.Because smoke was produced by residual tracesof oil on the parts, a fume-hood had beeninstalled above the furnace to exhaust the gasesoutside the building.
After placing the preheated DGS parts in theMain Furnace, the operator would push a buttonat a nearby station that started and controlledthe heating cycle of the furnace. Engineeringspecified that the DGS parts be heated to 850C.Data on the heating times and cycles of the MainFurnace were automatically recorded on chartrecorders, which were changed each shift. Currentoperating practice required that the operator holdthe parts during the entire heating cycle.
Following the heating cycle, the workerremoved the DGS parts from the Main Furnaceand quenched them by plunging them into an
05-Klassen-4641.qxd 4/1/2005 6:47 PM Page 214
adjacent vat of water. The temperature rapidlydropped to 200 to 300C. This process was mon-itored visually and required careful experiencedobservation. If the DGS was removed from thewater too soon, it became too soft; if it wasremoved too late, it became brittle.
The worker then used a steel hook to place the16 parts into a heavy iron basket sitting nearbyon the concrete floor. Within 10 minutes, anoverhead crane transferred the iron basket into alarger Tempering Furnace for a further two-hourtempering process. The purpose of temperingwas to stabilize the part’s material structure andlower internal stresses, thereby reducing thechances of cracks and premature failure. Thisfurnace, located 10 meters away, also was elec-trically controlled and had a cover to reduceenergy losses. The crane would remove thecover, place the basket of parts inside, possiblyremove another basket of parts from Tempering,and then replace the cover.
After removal from the Tempering Furnace,the overhead crane moved the basket of partsto a series of process vats. First, the parts werewashed. Following washing, a worker removedthe steel wires from the bundles of parts and aninspector tested the hardness of the steel of theseparts. If approved, a worker placed the parts backinto the basket and used a small electrical craneto dip the parts into a hot alkalized water cabinfor three to 10 minutes. The alkali bath removedany remaining traces of contaminants from thesurface of the parts.
Next, a hot acid bath, again for three to 10minutes, prepared the parts for subsequent coat-ing with a thin anti-oxidant to prevent rust. Thenthe basket was dipped into a hot, specially for-mulated anti-oxidant liquid for 35 to 45 minutes.After this, the parts were again washed in a waterbath and coated with oil by dipping them in anearby oil vat. Finally, the semi-finished partswere placed on a drying rack to await CompletionInspection. The hardness of each part was mea-sured using a specifically designed instrument,while the thickness of the anti-rust layer wasinspected visually. If approved, a materials han-dler stacked the parts for return to the MachiningDepartment for a final grinding operation.
Return to Machining Department
After returning the parts to this department,the grinding machine operator signed for theirreceipt. Two shifts were used for grinding, usu-ally with one operator per shift. One surfaceof each part was ground to ensure precise align-ment of the DGS with the Idle Gear in the finalassembly of the Gear Housing Assembly.
As before, Initial Inspections were performedafter the first part was complete, with PatrolInspections occurring in both shifts. Finally, thefinished product was sent to the MachiningDepartment’s inspection station for the finalCompletion Inspection. Once approved, the DGSparts were forwarded to a finished productswarehouse where an administrator stacked themand assistants would coat each DGS, one by one,with oil as further anti-rust treatment.
QC GROUP 96020
Following review by Mr. Shi of the application,Zhang Lin was elated to receive rapid approvalto establish a new QC group, license number96020. At the same time, Lin realized that muchwork needed to be done. Lin’s previous QCgroup experience had taught him that an impor-tant first step for ensuring group effectivenesswas selecting the right people to be involved inthe process.
First, he solicited support from people work-ing in the Metallurgical Division to have accessto their experience. In particular, he believed thatmuch of the DGS problem(s) was related to themetallurgical techniques being used in the plant.Lin approached and tried to recruit the bestavailable people.
In addition, he followed the accepted Chinesepractice that required subordinates to invite themanager of their respective department to becomethe head of the QC group. For example, whileMr. Chen, Manager of the Thermal TreatmentDepartment, did not necessarily have the strongestbackground with respect to metallurgy, he wasnevertheless invited to provide the leadershiprole to this group. Chen’s role became one of
Quality • 215
05-Klassen-4641.qxd 4/1/2005 6:47 PM Page 215

216 • CASES IN OPERATIONS MANAGEMENT
coordinating the activities of group members,as well as monitoring and communicating theprogress of the process. In total, the QC grouphad six members, including Lin.
All of the older members of QC Group96020 had gained experience at Longxi byworking in a variety of departments over theyears. The two youngest employees, Lin andQ.Y. Chen, had worked exclusively for thethermal treatment department. They, along withP.Y. Chen, were the only members who pos-sessed specialized, university-level training inthermal treatment.
As the group members prepared to tackle theproject, P.Y. Chen stated:
Our success will depend on whether or not we attackthe correct problem. To do so, we need to be diligentand careful when collecting data. Honesty is alsorequired when it comes time for drawing conclu-sions. If the problem is due to people not fulfillingtheir responsibilities, we need to point this out. Weshould not be afraid of embarrassing anyone.
This view matched that of Mr. Yang, Longxi’sManaging Director, who was pushing peopletoward “Fact Management” rather than the tra-ditional “Relationship Management,” termedguanxi, where each individual tries to “save face.”
THE NEXT STEPS
With the membership of the QC group established,the process of gathering and analyzing data couldbegin in earnest. Ultimately, Lin knew that thisgroup needed to recommend credible improve-ments that would fix this recurring problem.
NOTES
1. Also translated as idle gear shaft.2. In 1996, the Renminbi (RMB) exchange rate
was about US $1.00 = 8.30 RMB.3. Chinese small diesel engine model numbers
were consistent between firms. For example, 2100 des-ignates a two-cylinder engine, with piston diameter of100 mm. A single-cylinder engine with piston diameterof 95 mm is designated by 195.
QC Member
Chen K.F.
Lin Zhang
Chen X.N.
Chen C.S.
Chen Q.Y.
Chen P.Y.
Title
Manager,ThermalTreatment
AssistantEngineer
Line Worker
Line Worker
AssistantEngineer
Engineer
TQCTraining
60 hours
60 hours
48 hours
48 hours
60 hours
80 hours
Years atLongxi
27
4
18
9
5
28
BLUE MOUNTAIN RESORTS: THE SERVICE QUALITY JOURNEY
Mark Sheppard
P. Fraser Johnson
Copyright © 2002, Ivey Management Services Version: (B) 2002–10–18
Dave Sinclair, vice-president of human resourcesat Blue Mountain Resort, was considering hisoptions concerning the company’s service qual-ity program. It was Thursday December 2, 1999,
and a light snow was falling outside. Since 1991,Blue Mountain Resorts had been driving itsbusiness with a service quality program, whichhe was responsible for coordinating. With the
05-Klassen-4641.qxd 4/1/2005 6:47 PM Page 216

Quality • 217
1999–2000 ski season now underway and thecritical Christmas period approaching, he wantedto continue progress of the program by introduc-ing a new set of initiatives.
Dave had recently gathered together a teamof 25 Blue Mountain Resort managers, from avariety of different areas in the company, to iden-tify opportunities to improve service quality.They had provided Dave with a number of spe-cific proposals that he felt warranted considera-tion. On the following Monday, Dave wouldbe reviewing his plans for the service qualityprogram at the executive team meeting. In prepa-ration for the meeting, Dave wanted to evaluatethe proposals and decide on a course of action.
THE CANADIAN SKI
AND SNOWBOARD INDUSTRY
There were a total of two million skiers and snow-boarders in Canada in 1999. The total number ofskier and snowboarder visits to Canadian resorts inthe 1998–1999 season was 17.3 million, up 12 percent from the previous season. British Columbiaand Alberta captured approximately half of themarket, with popular resorts in Whistler and Banff,followed by Quebec with approximately 30 percent, and Ontario with most of the balance.
A number of factors influenced decisionsregarding which resorts skiers visited, namelylocation, cost, quality of the runs, speed andcapacity of lifts and amenities. Ticket pricescould vary according to a number of factors,such as ski conditions, time of year, time of dayand day of week.
BLUE MOUNTAIN RESORTS
The Greater Toronto Area (GTA) was home to anestimated 400,000 active skiers and snowboard-ers. Although Ontario had approximately 60 pri-vate and public resorts available for skiing andsnowboarding, the Toronto market was servedprimarily by five public resorts: Blue Mountain,Talisman, Horseshoe Valley, Mount St. Louis/Moonstone, and Snow Valley.
Blue Mountain Resort (BMR), located 135kilometres north of Toronto, was one of Ontario’smost popular ski resorts, with 18 percent of theOntario skier and snowboarder visits in 1998–1999. Situated near the town of Collingwood,BMR was founded in 1941 by the Czechoslovakianborn Jozo Weider.
BMR had expanded and modernized asthe sport gained popularity. In the 1980s, thecompany added a year round four star resorthotel and conference centre, a condominiumdevelopment and the Monterra Golf course.
By 1999 BMR was a four season resort.However, winter sports, skiing and snowboard-ing, were still its dominant activities, accountingfor approximately 65 per cent of total revenues.The ski hill offered 251 acres of ski-able terrainwith a vertical drop of 721 feet and an additional50 acres was available for future trail devel-opment. BMR had fifteen lifts to service thearea and the longest run was four thousand feet,approximately 1.2 kilometres. The terrain brokedown to 17 per cent beginner, 42 per cent inter-mediate, and 41 per cent advanced. Special facil-ities, to accommodate snowboarders, had beenintroduced, keeping up with the trends in theindustry. For night skiing, BMR had 11 trails on88 acres under lights. In general, Blue Mountainwas regarded as having a good variety of skiingand snowboarding facilities, which tended toattract large crowds. Exhibit 1 provides a mapof BMR.
In the 1998–1999 season, BMR hosted415,920 skier visits, the second highest in thecompany’s history. During the previous threeyears attendance in skier visits at BMR had been358,000 in 1997–1998, 368,000 in 1996–1997,and 416,000 in 1995–1996. Approximately 60per cent of the skiers at Blue Mountain camefrom the GTA, while the balance came fromother parts of Ontario and United States. BMR’saverage lift ticket price was approximately $24and the expected average total revenue per personper visit for the coming season was approxi-mately $40, which included revenue generatedby the other operations on site.
Blue Mountain offered over 15 different skiand snowboard package options, but the three
05-Klassen-4641.qxd 4/1/2005 6:47 PM Page 217

218
P
P
P
P
P
P
THE
BIG BABY TRIPLE
VOYAGEUR DOUBLE
O-HILL DOUBLE
SOUTH DOUBLE
L-HILL TRIPLE
SILVER BULLET QUAD
GRADUATE
BADLANDS DOUBLE
SPECTACULAR DOUBLE
NORTH DOUBLE
CENTURY EXPRESS
EASY STREET DOUBLE
APPLE BOWL DOUBLE
SUGAR SHACK DOUBLE
Ski P
atro
lHe
adqu
arte
rsSn
owm
akin
g
Mon
terr
aTe
nnis
Dom
e
Cach
et C
ross
ing
Mon
terr
aPa
vilio
n
Win
terg
reen
Mon
terr
aGo
lf
1st H
ole
18th
Hol
e
Olse
r Blu
ff Ro
ad
Coun
ty R
d.
High
Stre
et
Sixth Street
Blue Mtn Road
To M
eafo
rd
Huro
ntar
io S
treet
To T
oron
to
Blue
Mou
ntai
n Re
sort
GEO
RG
IAN
B
AY
First St.
24
26
26
26
Blue
Mou
ntain
Roa
d
Pond
To G
olf H
oles
3–1
7To
Mon
terr
a Es
tate
s
Pond
Pond
Cent
ral B
ase
Lodg
e
Mou
ntai
nW
alk
SNOW
MAK
ING
RESE
RVOI
R
Ski/
Snow
-bo
ard
Scho
ol
Sout
h Ba
seLo
dge
Rent
als
Rent
als
Chat
eau
Ridg
e
Ski/
Snow
boar
d Sc
hool
To H
wy.
26
To T
oron
to S
ki C
lub
To C
ollin
gwoo
d Sk
i Clu
b
To S
cenic
Ca
ves To
Col
lingw
ood
(11k
m)
Not t
o Sc
ale
Bus
Entra
nce
Gues
t Se
rvic
esBl
ue
Mou
ntai
nIn
n
Wat
erSl
ides
Oper
atio
ns
N
BlueM
ount
ain
Road
Blu
eLagoonPrivateBeach
MountainDrive
SkiSho
p
10
Exh
ibit
1M
ap o
f B
lue
Mou
ntai
n R
esor
ts
05-Klassen-4641.qxd 4/1/2005 6:47 PM Page 218

Quality • 219
most popular price packages—the weekendindividual or “walk-ups,” midweek individualand the full season pass—made up 54 per cent oflift ticket sales. Group tickets made up 12 percent of ticket sales. Destination ticket holderscomprised of the three day package ski ticket,and the one week pass made up one per cent ofsales. BMR catered to a wide range of skiers—20 per cent were beginner to novice, 40 per centwere intermediate, and the balance were advan-ced to expert. The company estimated that inter-mediate level skiers and snowboarders typicallycame to the resort an average of 4.1 times peryear, while advanced and expert level customerscame an average of 6.7 and 9.4 times per yearrespectively.
INTRAWEST INVESTMENT IN BMR
In 1999 Blue Mountain Resorts was the largestfamily operated ski resort in Canada. GordonCanning, president and chief executive officerof BMR, was the son-in-law of the founder,Jozo Weider. Gordon joined the company in1971, and became president in 1978. On January14th, 1999, BMR announced that it would sella 50 per cent interest in the company toIntrawest Corporation. Intrawest, headquarteredin Vancouver, British Columbia, was a leadingdeveloper and operator of village centeredresorts across North America. The companyowned ten properties, including Whistler/Blackcomb, North America’s most popularmountain resort.
In conjunction with its investment in BMR,Intrawest also purchased 16 acres of developablereal estate lands at the base of the BMR resort,with plans for a village development. Thisexpansion would include approximately 1,000condo-hotel units, 200 townhouse units and100,000 square feet of commercial space. Intra-west announced plans to develop a four seasonpedestrian village, complete with quality restau-rants, shopping and nightlife similar to Intrawest’svillage at Tremblant. Gordon Canning com-mented on the Intrawest investment in BMR:
Our business plan called for continued capitalinvestments to maintain our growth. We are nolonger just a ski hill—Blue Mountain is a four sea-son resort with golfing, waterslides, tennis, beachand meeting facilities. We felt that to capitalize onthe opportunities we needed a strategic partner thatcould help provide financing and managementexpertise. Overall, we expect a $585 million invest-ment to develop an authentic Victorian style Ontariovillage at the Blue Mountain. This will includewalkways and parklands to enhance the four seasonaspect of the resort throughout the village.
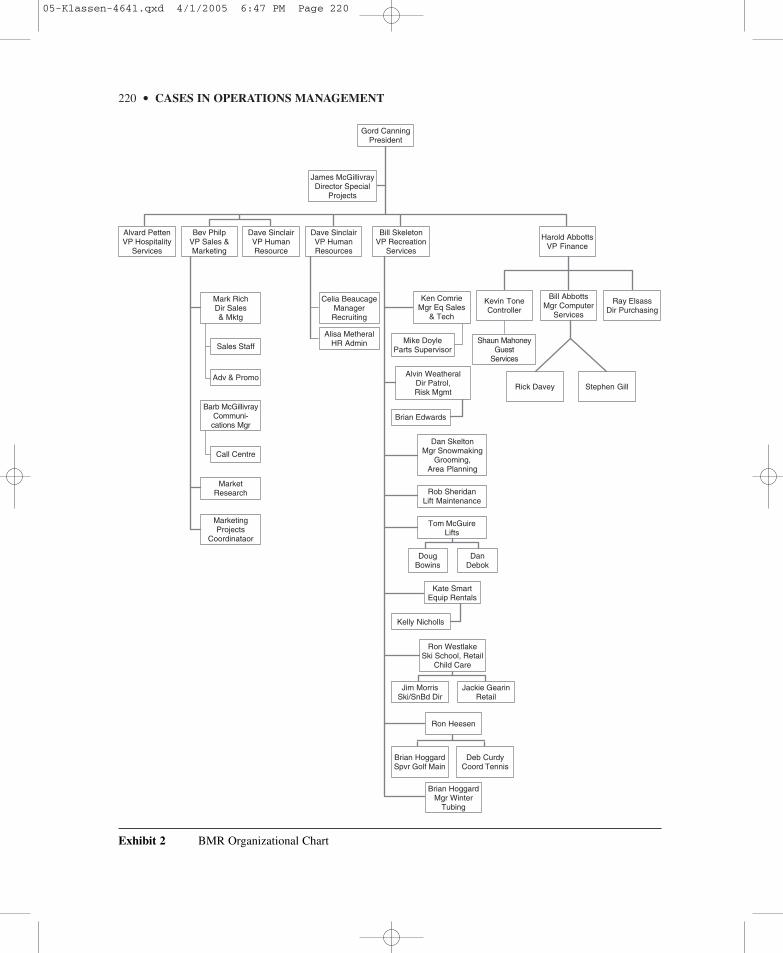
A primary attraction of BMR to Intrawestwas the existence of an experienced managementteam. Consequently, Gordon Canning and hismanagement team remained in place followingthe Intrawest investment. Exhibit 2 provides acorporate organization chart.
BMR OPERATIONS
BMR operations included facilities and guestservices, the ski hill, golf course and summerrecreation facilities. BMR employed a yearround staff of 200, and hired an additional750 winter seasonal employees and 250 summerseasonal employees. Dave Sinclair, commentedon the managing staff:
Despite the growth in our summer business, ouroperations are still quite seasonal. We hire a lotof seasonal employees who require orientation andtraining. With an annual payroll of over $10 mil-lion, our staff costs are a large part of our expense.However, we still have to be respectful of ouremployee needs and carefully plan staffing levelsand remain flexible where possible if the weatherdoesn’t cooperate.
Facilities and Guest Services
For many customers initial contact withBMR came through its call center. DaveSinclair described the call center operations:
We have 16 people working in the call centerduring peak periods, with 10 people at any onetime. In terms of average calls per day, they handle
05-Klassen-4641.qxd 4/1/2005 6:47 PM Page 219
220 • CASES IN OPERATIONS MANAGEMENT
Bev PhilpVP Sales & Marketing
Alvard PettenVP Hospitality
Services
Dave SinclairVP Human Resource
Dave SinclairVP Human Resources
Bill SkeletonVP Recreation
Services
Harold AbbottsVP Finance
Ray ElsassDir Purchasing
Bill AbbottsMgr Computer
Services
Stephen GillRick Davey
Shaun MahoneyGuest
Services
Alisa MetheralHR Admin
Celia BeaucageManagerRecruiting
Alvin WeatheralDir Patrol,Risk Mgmt
Brian Edwards
Dan SkeltonMgr Snowmaking
Grooming,Area Planning
Rob SheridanLift Maintenance
Tom McGuireLifts
DougBowins
DanDebok
Kate SmartEquip Rentals
Kelly Nicholls
Ron WestlakeSki School, Retail
Child Care
Jim MorrisSki/SnBd Dir
Jackie GearinRetail
Ron Heesen
Brian HoggardSpvr Golf Main
Deb CurdyCoord Tennis
Brian HoggardMgr Winter
Tubing
Mike DoyleParts Supervisor
Ken ComrieMgr Eq Sales
& Tech
Kevin ToneController
Mark RichDir Sales& Mktg
Sales Staff
Adv & Promo
Barb McGillivrayCommuni-cations Mgr
Call Centre
MarketResearch
MarketingProjects
Coordinataor
Gord CanningPresident
James McGillivrayDirector Special
Projects
Exhibit 2 BMR Organizational Chart
05-Klassen-4641.qxd 4/1/2005 6:47 PM Page 220
anywhere from a high in January and February of950, to a low in April of 230. Our professionallytrained call center operators can answer questionsabout the resort, reserve accommodations, givedirections, book golf tee times, and sell a variety ofprograms available at the resort.
There were eight different food servicefacilities at the resort that included a wide rangeof restaurants, from food court style cafeteriato fine dining. BMR conference facilities hadcapacity to handle conferences and large meet-ings for a total of up to 5,600 people, and in1998–1999 Blue Mountain hosted 19,000 peoplein 350 different conferences and large meetings.Although these facilities operated year round,the peak period was between September/Octoberand May/June.
Winter guests at BMR could shop at the threeretail stores located on the resort. The retailshops were located at the two Base Lodge loca-tions and hotel. The main lodge held a shop thatoffered a full line of ski fashions, accessories,and logo items. The South Base Lodge carried asmaller selection of fashions.
A daycare facility was open daily from 9:00 to4:30 during the ski season, and could accommo-date children from 15 months to five years of age.Weekend programs were available for childrenfrom ages six to 12 on weekends and holidays.In addition, BMR operated an eight week TinyTykes program at the South Base Lodge.
Ski rental and repair shops were in two loca-tions. The Central Base lodge had 1,000 pairsof skis and 250 snowboards available for rental,while there were an additional 600 pairs of skiswere available for rent at the South Base lodge.These shops also handled repairs for customers.
Finally, BMR also offered a number of othermiscellaneous services to its guests, such as achalet rental location service to provide assis-tance finding seasonal accommodation.
Ski Hill Operations
Hill grooming and snowmaking played animportant part in BMR’s operations. DaveSinclair explained:
We estimate that our ski hill has the capacity tohandle 7,500 skiers comfortably during any partic-ular day, while night skiing handles an additional3,000. Since we can’t control the weather, hillgrooming and snowmaking help us get maximumutilization of the hill. Each night the trails aregroomed with special machines with hydraulicattachments. We have about 12 people working insnowmaking, and another eight in the hill groom-ing operations.
BMR offered a wide variety of services toskiers and snowboarders. Among the mostimportant was the ski school, located at theCentral and South Base Lodges. It employed180 ski and snowboarding professionals, whichmade it one of the largest ski and snowboardingschools in the country.
A number of systems were in place to helpskiers. Electronic message centers that werelocated at all chair lifts displayed which liftswere operating and the current waiting time ateach. Fourteen mountain guide volunteers wereavailable to greet bus groups, answer questionsand give guidance on the slopes and in the baselodges. There were 15 full time and 15 part timeski patrollers plus an additional 75 volunteerswho promoted safe skiing and snowboarding,and provided first aid assistance. There werealso 10 staff dedicated to the Badlands TerrainPark, and another 25 staff assigned to the snowtube area.
Golf Course andSummer Recreation Facilities
BMR had been moving steadily into a fourseason resort since 1977 when the Great SlideRide was built for summer sledding down themountain. By 1999 BMR had 225 part time sea-sonal staff working in its summer recreation facil-ities, which included the Monterra Golf Course,tennis, outdoor pools and water park complex.The Monterra Pavilion, opened in 1990, was thefocal point of BMR’s summer recreation activi-ties. It included the Monterra Bar and Grill, proshop, condominium check-in center, conferencefacilities, and outdoor pool and whirlpool.
Quality • 221
05-Klassen-4641.qxd 4/1/2005 6:47 PM Page 221

BMR SERVICE QUALITY PROGRAM
In spring 1991 David Sinclair was hired asBMR’s first director of human resources. Davehad extensive experience as a human resourcemanager in a large consumer products company,and he commented on the situation in 1991 whenhe joined BMR:
Blue Mountain enjoyed very good times duringthe 1980s. However, the focus had been revenuegrowth and facility expansion. Although the com-pany had been profitable, it began to develop areputation for long line-ups and poor service. BlueMountain competed based on our location, expect-ing skiers to show up every season.
Gordon Canning decided to survey the employeesin 1990, and the results indicated problems withmorale. Consequently, a consulting company washired to conduct a series of seminars that focusedon communication, team performance, and improv-ing supervision techniques. The issues that cameup during the course of the meetings indicatedemployee concerns about a number issues rangingfrom working conditions to frustration concerningservice quality levels.
When I arrived, one of the first requests that I madewas for a management training program aimed atimproving service at the resort. From my per-spective, a major problem was one of poor servicethat was affecting employee morale and jobperformance—it costs us five times as much toattract a new customer as it does to retain an exist-ing one. However, it was evident that our servicequality problems were not going to be an easyfix—it would involve a complicated process and along-term commitment from senior management.
I then began looking into organizations thatmight be able to help us and eventually contacted aconsultant at a firm called Achieve International,who agreed to help us. We started the processwith an executive retreat, which included the sixpeople who made up the senior management team:Gordon Canning, president; Harold Abbotts, vice-president of finance; Beverly Philp, vice-presidentof marketing; Bill Skelton vice-president of recre-ation services; Dale McNichol vice-president of
accommodations, food and beverage; and myself.Throughout the two day workshop we consideredthe future vision of the company, focusing on ourvision for the organization and values that we con-sidered critical for creating a supportive corporateculture. The people from Achieve Internationalprovided some very persuasive data concerningthe advantages of service oriented culture and thepotential benefits to the company, its employeesand our customers. At the end of the two day ses-sion they left us at a decision point. We consideredthe individual and corporate costs to beginninga service quality journey. As the change was per-ceived to be significant, it was, for some, not aneasy decision.
We reconvened to decide what, if anything, weshould do next. At that point we made the commit-ment to develop a service quality philosophy, andwe adopted Achieve International’s book, Firingon All Cylinders, as our service quality bible. Wealso developed a vision statement—”To be the bestresort in Canada at exceeding customer expecta-tions”; a value statement—”caring, trusting andcommitted”; and a method—the three rings of per-ceived quality: basic service or product, support,and enhanced service (see Exhibit 3). We subscribeto the same basic vision, values and method todayin spirit, although the words have changed slightlyin order to be consistent with our new partner,Intrawest.
Part of the commitment involved designating aservice quality coordinator, a role that became partof my job description. I was to spend half my timeon human resource activities and the other halfas the service quality coordinator. As part of mynew responsibilities, I went on a one-week trainingretreat to learn Achieve International’s quality phi-losophy. Interestingly, I found that that all otherfirms represented were in manufacturing indus-tries. It was during this training that I developeda rough draft for a two year plan, which identifiedour priorities, methods and goals. This plan wasbased on Achieve International’s implementationframework (Exhibit 4).
At the start of the service quality programGordon Canning made the following commentsregarding the opportunities of improved servicequality for BMR and its employees:
222 • CASES IN OPERATIONS MANAGEMENT
05-Klassen-4641.qxd 4/1/2005 6:47 PM Page 222

Quality • 223
Enhanced Service
Support
Basic Service or Product
Exhibit 3 The Three Rings of Service
Source: Achieve Group Inc.
Basic Service: Skiing/snowboarding, golf,tennis, summer attractions,conferences, food & beverage.
Support: Call centre, housekeeping, frontdesk, accounting, humanresources, maintenance, lifts.
Enhanced: Anything a service provider doesfor a guest or anything providedby the company that isunexpected or considered overand above.
Vision
Surveys
Implementation
(focusing the future state)
(analyzing the present state)
(managing the transition)
Skills
Team
Coaching
Personal
Alignment
Standards andMeasures
Marketing Strategies
ImprovementActivities
Reward andRecognition
Systems
Deployment
AssignedResponsibilities
Planning andReporting
Infrastructure
Values
Hiring and Orienting
Education andAwareness
Listening toInternal/External
Customers
Signaling Commitment
Exhibit 4 Achieve International FrameworkSource: Achieve International
05-Klassen-4641.qxd 4/1/2005 6:47 PM Page 223
The world is experiencing a service revolution.An organization must continuously improve justto keep up with the competition. Our challenge isto be better than others at exceeding customerexpectations. Today the most important capitalinvestment we can make is in our people. It isessential that Blue Mountain Resorts provide alevel of service which sets it apart. This may bethe most important thing the resort will do in thenineties—a decade when companies will rise, orfall, on their level of customer service.1
Early Service Quality Initiatives
The service quality program was introducedin the fall of 1991, in time for the 1991–1992ski season. The program resulted in severalchanges at the company. Management felt thatthey had been too focused on external services,and that the term “customer” needed to beredefined. Consequently, as part of the servicequality vision statement, customers weredefined as internal and external, in order to rec-ognize the importance of satisfying the needs ofinternal stakeholders.
Although BMR had been collecting customerdata for several years, the new service qualityprogram forced management to act on the infor-mation. Dave Sinclair explained:
We needed a place to start so we used the bench-marking question on our customer survey—“How does Blue Mountain’s service compare toother Canadian resorts?” Customers were giventhree alternatives: better, same or worse. Wefocused attention on the ‘better’ category and settargets to steadily improve our rating. If we hitour targets, then employees received an incentivebonus that represent about $50 for a seasonalemployee and $200 for a full-time staff member.In 1991–1992 19.6 per cent of our customersclassified us as better, in 1992–1993 our ratingincreased to 30 per cent and it reached 41 per centin the 1993–1994 season. Meantime, customersthat classified us as worse than other Canadianresorts fell from 16.5 per cent to three per centover the same period.
Initially we were looking for exposure with ouremployees and simple method of communicatingperformance. Eventually we reached a ceiling withrespect to our ratings and by about 1996 wechanged our approach. In the early years, however,it worked well for us.
In 1993 BMR changed its hiring practicewith the objective of matching job demands withemployee capabilities. A more structured inter-view process was developed and front line staffwere invited to participate in some hiring activi-ties. This was intended to build better teams inallowing those participating to decide on theirfuture team members.
Finally, the management team prepared annualservice quality reports. BMR published 10,000reports each year to communicate to both theemployees and to stakeholders what Blue Moun-tain’s commitment to service quality entailed. Thereports showcased improvement initiatives andrecognized the many successful service qualityinitiatives coordinated by the employees.
The Move to Enhanced Service
The results of the first year of service-qualityprogram encouraged management to consider howthey could move quickly to enhanced service, theouter ring in the model (see Exhibit 3). Dave com-mented on the strategy adopted for the 1993–1994season:
We felt that we weren’t doing enough to “wow” thecustomer—that service quality meant impressingthe customer by exceeding their expectations. Webegan to focus on enhanced service and ignoredthe fundamental aspects of good operations neces-sary for high levels of quality service.
Let me give you an example. At the Christmas hol-iday season we staffed up to put people on the hillto handle complaints and to answer questions fromguests. We also put people on the hill to provideservices to our guests that they might not expect—we had staff on the hill handing out hors d’oeuvreson silver platters and others were handing out hotchocolate drinks.
224 • CASES IN OPERATIONS MANAGEMENT
05-Klassen-4641.qxd 4/1/2005 6:47 PM Page 224
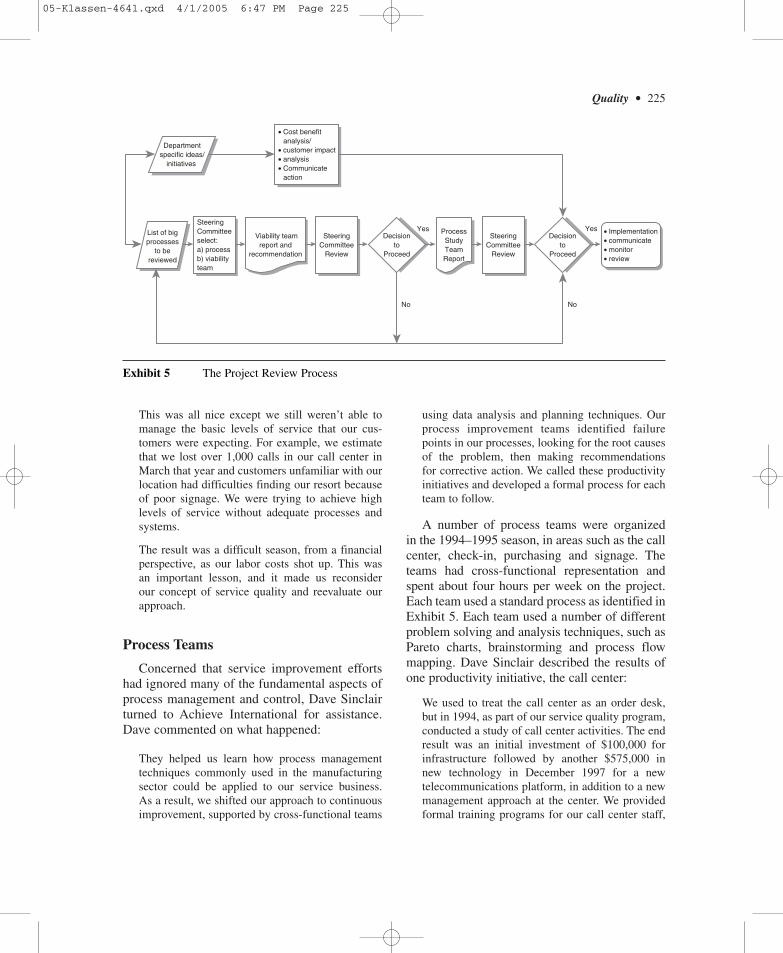
This was all nice except we still weren’t able tomanage the basic levels of service that our cus-tomers were expecting. For example, we estimatethat we lost over 1,000 calls in our call center inMarch that year and customers unfamiliar with ourlocation had difficulties finding our resort becauseof poor signage. We were trying to achieve highlevels of service without adequate processes andsystems.
The result was a difficult season, from a financialperspective, as our labor costs shot up. This wasan important lesson, and it made us reconsiderour concept of service quality and reevaluate ourapproach.
Process Teams
Concerned that service improvement effortshad ignored many of the fundamental aspects ofprocess management and control, Dave Sinclairturned to Achieve International for assistance.Dave commented on what happened:
They helped us learn how process managementtechniques commonly used in the manufacturingsector could be applied to our service business.As a result, we shifted our approach to continuousimprovement, supported by cross-functional teams
using data analysis and planning techniques. Ourprocess improvement teams identified failurepoints in our processes, looking for the root causesof the problem, then making recommendationsfor corrective action. We called these productivityinitiatives and developed a formal process for eachteam to follow.
A number of process teams were organizedin the 1994–1995 season, in areas such as the callcenter, check-in, purchasing and signage. Theteams had cross-functional representation andspent about four hours per week on the project.Each team used a standard process as identified inExhibit 5. Each team used a number of differentproblem solving and analysis techniques, such asPareto charts, brainstorming and process flowmapping. Dave Sinclair described the results ofone productivity initiative, the call center:
We used to treat the call center as an order desk,but in 1994, as part of our service quality program,conducted a study of call center activities. The endresult was an initial investment of $100,000 forinfrastructure followed by another $575,000 innew technology in December 1997 for a newtelecommunications platform, in addition to a newmanagement approach at the center. We providedformal training programs for our call center staff,
Quality • 225
Yes
No No
Yes
Departmentspecific ideas/
initiatives
• Cost benefit analysis/• customer impact• analysis• Communicate action
• Implementation• communicate• monitor• review
Decisionto
Proceed
SteeringCommittee
Review
SteeringCommittee
Review
ProcessStudyTeamReport
Decisionto
Proceed
Viability teamreport and
recommendation
SteeringCommitteeselect:a) processb) viability team
List of bigprocesses
to bereviewed
Exhibit 5 The Project Review Process
05-Klassen-4641.qxd 4/1/2005 6:47 PM Page 225

226 • CASES IN OPERATIONS MANAGEMENT
set performance targets and started using the callcenter to help manage revenues. For example, onthe performance measurement side, we aim for80 per cent of our calls to be answered within20 seconds, and we monitor the rate that calls areabandoned. We are now using yield managementtechniques in the call center to offer variable pric-ing structures for bookings in an effort to bettermanage revenues, and the call center is set up forone-stop shopping. They handle anything frombookings for accommodations, to tee off times, toBBQ rentals.
A move was also made to improve com-munications between management and staff.Employees were invited to join Gordon Canningover lunch. This provided an opportunity forGordon and the staff to discuss a wide range ofissues in an informal setting.
Finally, in the 1994–1995 season the com-pany decided to abandon its incentive programbased on percentage of customers classifyingBlue Mountain’s service as better than otherCanadian resorts. By the summer of 1994 itsrating had hit 50 per cent, and management feltthat it would be difficult to consistently achievea better rating. Consequently, a new measure wasestablished—the percentage of customers thatranked staff friendliness as a 10 on a ten-pointscale. In 1994–1995, 17.2 per cent of customersgave BMR staff ratings of 10 on the staff friend-liness question. The company set targets toincrease their rating in this area, starting withan objective of 18 per cent for the 1995–1996 sea-son. Management expected to steadily increasethe targets each year, and had set an objective of24 per cent for the 1998–1999 season.
THE SWOP PROGRAM
“SWOP” was the strengths, weaknesses, oppor-tunities and proposals program that DaveSinclair had initiated several months prior tocontinue the improvement of customer service.In June 1999, Dave had organized five teams offive BMR managers and staff from different
functional areas. Each team was asked to identifyspecific areas where they felt an opportunityexisted for BMR to improve its service qualityand to submit a one- or two-page SWOP pro-posal describing the issues to be resolved andto provide specific recommendations. A totalof twenty-five separate proposals were submittedfrom the five teams.
Once the reports were completed, severalwere presented to the executive managementteam and acted on immediately and others werediscounted as not being feasible. However, Daveidentified three proposals that he felt requiredcareful consideration: customer flow, speed ofservice and information technology. Daveselected these proposals because he believed thatthey offered significant opportunities to improveservice quality at BMR.
1. Customer Flow
Problems familiarizing guests with the resortarea and its services had become increasinglydifficult as BMR expanded. This had in turncreated problems particularly for first time guests,who sometimes became frustrated because theywere unable to find a particular service or becausethey had been misdirected to the wrong line. DebLynch, manager of the Monterra Bar and Grill,described the problem:
Having people find the resort easily isn’t the onlycustomer logistics issue. Obviously our regularcustomers are familiar with our services and theyknow the best way to navigate through the resort.However, customers less familiar with BlueMountain need help understanding everythingfrom where to park to where they can find the skiand snowboard rentals. Guests have a lot of spe-cific questions as well, such as: Are there lockers?Is the terrain right for my ability? Is there child-care? Can I get my skis repaired? Where willI meet my tour bus?
One big problem is parking. Apparently many ofour guests aren’t familiar with the parking areasbecause we have to tow cars from restricted areas,which causes obvious problems.
05-Klassen-4641.qxd 4/1/2005 6:47 PM Page 226
Quality • 227
Another problem is that sometimes people are sentfrom one line to another and then to a third. Forexample, a guest might start at the south base lodgeinformation desk where they are directed to admin-istrative guest services and then get redirected tohotel front desk activities. Also, sometimes guestslooking for rentals are sent from administrationto the rentals desk at Central Base Lodge, only todiscover that they are out of stock.
As the resort has expanded, problems associatedwith customer flow have become more pro-nounced. Obviously Intrawest plans to grow ourfacilities, so if anything this problem is going toget worse.
Right now we have approximately 14 mountainguides on the hills to answer questions. However,these people are only able to address the needsof guests after they are out on the mountain. TheSWOP team felt that we should get to our cus-tomers earlier and identified a number of possiblesolutions. We could hire three attendants at a costof approximately $9.50 per hour to work in theparking lot to address customer questions andcoordinate parking.2 However, they also identifieda number of other alternatives including using aninternal website, call center, hotel condo TV chan-nel, walk-up information booths, drive-throughinformation booths, a FM radio station or computerterminal kiosks.
2. Speed of Service
The second major recommendation was toimprove speed of customer service. Weekendsand holidays could cause problems at the resortas the number of guests approached the resort’scapacity. The result was long line-ups, whichguests equated as poor service. The SWOP teamsaw this as an area of frustration for the staff andan opportunity to improve customer service andmade six recommendations that they felt wouldimprove speed of service:
• Better forecasting in order to predict changes inbusiness activity;
• Improved communication between departments;• Provide fast and accurate information to staff;
• Train staff to be more flexible to adopt newapproaches to their work;
• Adopt self-service information technologyapplications for guests;
• Schedule staffing levels based on a scientificexamination of staff capacity to processcustomers.
Although BMR had made substantialimprovements over recent years to shortencustomer waiting times, Dave Sinclair agreedthat speed of service represented a potentialarea for improvement and made the followingobservations:
BMR guests are increasingly concerned with thespeed of service, especially as families make up alarge portion of the target market. There are a greatnumber of line-ups that guests work though forservices and products. These range from wait timeon the phone to get information, to waiting in lineto check into their room, to waiting in line to pick-up equipment—all before they even get on the hill.We feel that the acceptable time for the lift line isten minutes. If we consider the times that guestsspend in consecutive queues for complementaryservices, then we are exceeding this limit by agreat deal.
Recently we had one of our most successful week-ends in history. A storm system dumped fresh snowon Friday night and Saturday opened up with beau-tiful sunshine. We had stuff happening on the hill,including three major suppliers doing demonstra-tions. Additionally, it was the American Presidents’Day long weekend—they love our dollar. So wehad a big turnout. The place was jumping, but itwas to the point where we were overwhelmed. Theparking lot was jammed; there were crowds at thelifts, at the cafeterias, at the bars, at the rentals. Onthe one hand everyone seemed willing to pay theprice, but we exceeded our comfortable carryingcapacity. We knew we’d not met expectations ofsome guests.
3. Information System
BMR’s information system consisted ofseveral independent databases and operating
05-Klassen-4641.qxd 4/1/2005 6:47 PM Page 227
228 • CASES IN OPERATIONS MANAGEMENT
systems. For example, vendor information,invoices and other purchasing data, tee timeinfo, and conference center guest history werein the AS/400 system. Payroll, hotel guesthistory, ski and snowboard revenue, and callcenter data was held on the Novell system.Finally, rental revenue, golf and tennis member-ships, ticketing sales, skier visits and otherretail information were on stand-alone systems.Dave Sinclair described how the SWOP teamsaw the problem:
Our information system had grown up with thecompany. We added capacity and features as weneeded new capabilities. However, we never wor-ried about system integration. The team felt thatstaff needed the capability to access informationon a common system. For example, the call centercould benefit from customer purchase historywhen processing information requests or bookinga reservation. Staff at the information desk wouldbenefit from tracking ski and snowboard rentalbookings so to understand if equipment is availablewhen responding to guest inquiries. An onlineinformation system would allow managers to makeappropriate changes one time and provide accessto all staff as needed—from telephone sales reps,front desk clerks, and conference sales and servicepersonnel. Right now all of our information ison hard copies, so staff sometimes have to siftthrough different binders to find what they need.Unfortunately the information is sometimes inac-curate or badly outdated. With an on-line informa-tion system it could be checked for accuracy andupdate on a regular basis.
I can see where such a system could be veryexpensive. Installing a PC on each call centerdesk, for example, would cost approximately$50,000. We would also have substantial costs forsetting up the intranet system and database, not tomention the costs of installing the infrastructureand cabling.
The team proposed that we should hire a graduatelevel co-op student on site for approximately five
months to help us get our information systemsorganized. They expected that such a person mightcost $600 to $800 per week, and he or she couldinvestigate and document the databases and ourcurrent reporting requirements, and identify a long-term plan and budget. For example, evaluate theappropriateness of our Crystal Reports programover the long term and evaluate the viability ofestablishing an Intranet system.
CURRENT SITUATION
As Dave considered the three proposals beforehim, he knew that he would be asked for his rec-ommendations on Monday. Although each hadits merits, he recognized that Gordon Canningwould expect him to set priorities for the comingyear and recommend what action, if any, shouldbe taken for each. Dave felt that he had to decidewhich programs made the most sense for imme-diate action and which ones required additionalstudy and analysis. If there were a need for addi-tional information, Dave needed to identify whatinformation was still required and how long itwould take to get it. Furthermore, each of theproposals affected different parts of the organiza-tion, and Dave needed to be concerned aboutwho else in the company should be involved inboth further evaluation and implementation.Finally, Dave also recognized that he had to con-sider the investment that Intrawest would makein the resort and how his recommendations mightfit with the aggressive expansion plans for BlueMountain.
NOTES
1. Source: Ontario Skills Development Office,1993 promotional publication.
2. Labour cost based on $8.00 per hour plus 18per cent for benefits
05-Klassen-4641.qxd 4/1/2005 6:47 PM Page 228
Pat Marsden, plant manager for Noram Foods(Noram) of Toronto, Ontario, was consideringthe impact of changing Noram’s policy on pack-age weight. Pat knew this was a matter of overallconcern for the corporation. Before raising thepossibility of a change in policy with the com-pany’s executive committee, Pat wished to havea clearer picture of the options available and theimplications of any change in policy. Pat wasparticularly concerned about the capability of theplant to hold tolerances on weights.
COMPANY BACKGROUND
Noram Foods was a major producer of a varietyof consumer food products, including baby foods,cereals, and a variety of canned products. NoramCanada was part of Noram International whichhad plants in 12 different countries. The headoffice of Noram International was located in NewYork. Head office control was primarily financial,as part of Noram’s success was based on givingits international units a large amount of localautonomy. Moreover, food tended to be subjectto specific and different legislation in eachcountry in which Noram produced its products.Noram Foods had existed in Canada for over80 years and its brands were extensively adver-tised. Even though management had frequentlybeen pressured to do custom packaging or pro-duce “no-name” products, it had steadfastlyrefused to get involved in either. Managementbelieved that exclusive concentration on the pro-duction of high-quality branded products was inthe corporation’s best interest.
Noram Foods in Canada had an enviablerecord of sound financial performance. Recently,however, the president had called for specialvigilance by all managers to look for opportuni-ties to increase revenues or reduce costs. PatMarsden believed the weight control issue repre-sented a major opportunity for re-evaluation andincreased performance.
Policy on Weight Control
Pat’s concern was with the company’s currentpolicy on weight control, which read:
At least 95 per cent of all packaged net weightsshipped will be above the stated net weight.
Pat believed this policy could result in toohigh a proportion of overweight packages atsubstantial cost to Noram, and had thereforerequested a meeting with Noram’s packagingengineer, Joe Turner. Joe was the recognizedexpert in the company on statistical quality con-trol, and filling and weighing equipment. In dis-cussing the current policy with Joe, Pat said:
I know that Noram has had this policy for manyyears and that during this period Noram hasnever been cited for putting out underweightproducts. A lot of things have happened over theyears, however. For example, today’s weighingtechnology is a heck of a lot better than it used tobe. I think we could save a bundle if we took amore realistic look at our policy. The last timeI brought this issue up at an executive meetingwas about 10 years ago. At that time, the vicepresident of marketing was completely opposedto any changes. I can still remember how upsetshe was. She said:
Quality • 229
NORAM FOODS
M. R. Leenders
John Walsh
based on research by Professors Forsyth and Wood
Copyright © 1982, Ivey Management Services Version: (A) 2003–07–15
05-Klassen-4641.qxd 4/1/2005 6:47 PM Page 229
The consequences of underweight product reachingthe public could be disastrous for this company. Wehave a fantastic reputation to protect and I don’twant to run any risk that we will lose somethingthat took decades to build and on which we havespent tens of millions of advertising and promotiondollars. If you’re proposing that we start playingstatistical games with the government and the con-sumer, I don’t want any part of it.
Pat continued:
Nevertheless, especially in today’s economicclimate, we would be remiss if we didn’t at leastlook at any major opportunity at cost reduction.Before I propose anything to the executive com-mittee, however, I want to be sure I’m on safeground. I want to be absolutely sure, for example,that I do not propose anything we’re not capableof doing in this plant.
Joe Turner replied:
Pat, I think I know what you’re saying, but it is morethan just a matter of statistics and technology in fill-ing and weighing. From time to time, I’ve had dis-cussions with our marketing people about this wholearea. They keep insisting that if we ever get caughtwith underweight packages, it will be seen by con-sumers as just as serious as a citation of unsanitaryconditions. It is a topic where a lot of corporate psy-chology is involved. We see ourselves as real corpo-rate winners in the food field. Our current policieson sanitation, weight control, package design, anda host of other areas all reflect that winning atti-tude. In that kind of environment, how much of arisk should this company take? Also, as you can wellappreciate, our wide product diversity makes it dif-ficult to apply the same weight policy to everythingwe do. Even now, on some products, we have sub-stantially less than five per cent of our packagesunderweight, just to make sure we run no chance ofrunning below the government permitted tolerances.
Both Joe and Pat agreed that raising the issueof weight control without getting down tospecifics was going to be meaningless. They,therefore, agreed to concentrate on a specificproduct line, pre-cooked baby cereals, to seewhat options might be available and what impactany change in policy might possibly have. Patand Joe decided they would go and have a goodlook at the pre-cooked baby cereal package line.
FILLING OPERATIONS
Weight and Volume Standards
Noram used a variety of filling equipmentin its plant. For some less popular products, orproducts with unusual physical characteristics,some older equipment was used. Almost all ofthe larger-volume product lines were producedon sophisticated modern, high-speed fillingequipment that was developed especially for thetypes of products Noram manufactured. Aninteresting design trade-off on filling equipmentinvolved speed of fill versus tolerance holdingability on weight or volume. Obviously, a greaterfilling speed resulted in a higher capacity of theequipment and a lower labor cost per unit pro-duced. On the other hand, a lower filling speedafforded better weight and volume control,resulting in a package weight and volume closerto specifications. Overweight packages resultedin higher material costs for Noram, but under-weight packages might result in adverse con-sumer reactions or government citation.
For many products, Noram not only had weightstandards, but also volume standards. “Settling”of product in a package after filling was always aconcern, as Noram managers believed consumersmight be upset if on opening a box or bag theyfound a substantial empty space at the top of thepackage. Special vibrators were attached to thefilling equipment to encourage settling beforepackaging closure. Particle size and weight alsoaffected filling rates and weight and volume con-trol. For example, a granola-type cereal, with par-ticles ranging in weight from one-half gram toseven grams and particle size up to about a cubiccentimetre, was much more difficult to controlthan pre-cooked baby rice cereal in which unitsize and weight were small and uniform.
Operation for Pre-Cooked Baby Cereals
For pre-cooked baby cereals, the filling opera-tion was performed on a double line consistingof nine pieces of equipment (see Exhibit 1). Theparallel lines were designed to optimize staffing,since one operator could attend to two pieces ofequipment at the same time. The first unit in each
230 • CASES IN OPERATIONS MANAGEMENT
05-Klassen-4641.qxd 4/1/2005 6:47 PM Page 230
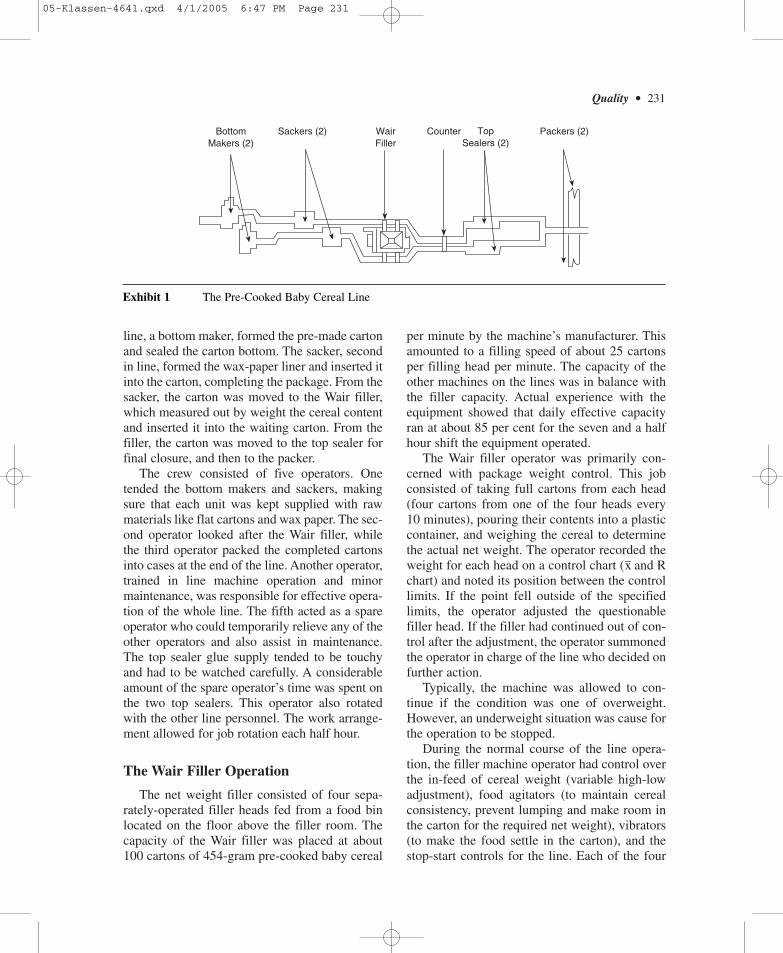
line, a bottom maker, formed the pre-made cartonand sealed the carton bottom. The sacker, secondin line, formed the wax-paper liner and inserted itinto the carton, completing the package. From thesacker, the carton was moved to the Wair filler,which measured out by weight the cereal contentand inserted it into the waiting carton. From thefiller, the carton was moved to the top sealer forfinal closure, and then to the packer.
The crew consisted of five operators. Onetended the bottom makers and sackers, makingsure that each unit was kept supplied with rawmaterials like flat cartons and wax paper. The sec-ond operator looked after the Wair filler, whilethe third operator packed the completed cartonsinto cases at the end of the line. Another operator,trained in line machine operation and minormaintenance, was responsible for effective opera-tion of the whole line. The fifth acted as a spareoperator who could temporarily relieve any of theother operators and also assist in maintenance.The top sealer glue supply tended to be touchyand had to be watched carefully. A considerableamount of the spare operator’s time was spent onthe two top sealers. This operator also rotatedwith the other line personnel. The work arrange-ment allowed for job rotation each half hour.
The Wair Filler Operation
The net weight filler consisted of four sepa-rately-operated filler heads fed from a food binlocated on the floor above the filler room. Thecapacity of the Wair filler was placed at about100 cartons of 454-gram pre-cooked baby cereal
per minute by the machine’s manufacturer. Thisamounted to a filling speed of about 25 cartonsper filling head per minute. The capacity of theother machines on the lines was in balance withthe filler capacity. Actual experience with theequipment showed that daily effective capacityran at about 85 per cent for the seven and a halfhour shift the equipment operated.
The Wair filler operator was primarily con-cerned with package weight control. This jobconsisted of taking full cartons from each head(four cartons from one of the four heads every10 minutes), pouring their contents into a plasticcontainer, and weighing the cereal to determinethe actual net weight. The operator recorded theweight for each head on a control chart (x− and Rchart) and noted its position between the controllimits. If the point fell outside of the specifiedlimits, the operator adjusted the questionablefiller head. If the filler had continued out of con-trol after the adjustment, the operator summonedthe operator in charge of the line who decided onfurther action.
Typically, the machine was allowed to con-tinue if the condition was one of overweight.However, an underweight situation was cause forthe operation to be stopped.
During the normal course of the line opera-tion, the filler machine operator had control overthe in-feed of cereal weight (variable high-lowadjustment), food agitators (to maintain cerealconsistency, prevent lumping and make room inthe carton for the required net weight), vibrators(to make the food settle in the carton), and thestop-start controls for the line. Each of the four
Quality • 231
BottomMakers (2)
Sackers (2) WairFiller
Counter TopSealers (2)
Packers (2)
Exhibit 1 The Pre-Cooked Baby Cereal Line
05-Klassen-4641.qxd 4/1/2005 6:47 PM Page 231

232 • CASES IN OPERATIONS MANAGEMENT
heads on the Wair operated independently of theothers and could be adjusted without affectingthe operation of the other heads. By operating theWair with a split heads setup, at least part of theline could continue to operate at all times exceptunder severe breakdown conditions.
Efficiency
When Joe and Pat observed the fillingoperation, they noted everything was runningsmoothly. The line was running pre-cookedbaby cereal and seemed to be meeting its dailyproduction goal of about 38,000 cartons. Sincethe rice cereal was the most popular of thepre-cooked baby cereals, and since the 454-gram size was the most popular package weight,approximately 60 days a year were scheduledfor this package size and cereal alone. Theremainder of the year, the machine produceda variety of package sizes in rice, soya, barley,oats, and mixed pre-cooked baby cereals. Patbelieved that the cost of 454 grams of pre-cooked baby cereal was about one dollar. Thiswas a fully allocated cost, including an appro-priate share of overhead in the various process-ing departments prior to filling, as well as ashare of general plant overhead.
The equipment in the baby cereal area wasabout three years old and had operated well sinceits original installation. When Pat asked Joe whatnew technology was coming along on the hori-zon, to replace it, Joe replied:
As you know, Pat, the technology in measuring andweighing and packing equipment is changing allthe time. They are always trying to increase speedand accuracy. However, the costs are going up sub-stantially as well. I’m not aware of anything at themoment that would make it worthwhile for us topull out this line now and substitute it with some-thing better. It may well be that in another year orso, somebody may have some new equipment that’sattractive enough for us to take a good look at.Frankly, compared to some of the older equipmentin other parts of our plant, the performance of thesetwo lines and this particular filler is quite astound-ing. We really have no problem staying within aplus or minus one per cent range on weight controlin this department, which, considering the speedswe’re running at, is outstanding performance.
Joe moved to the Wair filler and asked theoperator to show Pat the weight control charts.Pat noted that the equipment was consistentlyrunning within the control limits specified. (SeeExhibit 2 for a typical Wair filler plot.) Joe alsoselected at random one of the sheets summariz-ing the previous day’s operations (see Exhibit 3).It summarized both the day’s performance forone of the filling heads, as well as the month’s todate statistics for the same head. Pat asked Joe tomake a copy of this and also to bring the latestgovernment regulations on weight control. Thegovernment had issued regulations on acceptabletolerances, and Pat wanted to be absolutely surethat they had the latest information available onconsumer packaged goods.
LEGISLATION
Joe returned to Pat’s office later in the day. Hebrought with him, not only a copy of the Wairfiller chart that Pat had requested, but also copiesof the consumer packaging and labelling act andvarious amendments and information brochuresprovided by the Department of Consumer andCorporate Affairs of Canada. Joe said:
Pat, I’ve gone through all of this governmentmaterial. As you can appreciate, the primary reasonfor its existence is to protect the consumer frommisrepresentation by the manufacturer of con-sumer packaged products. I have underlined here afew specific points which deal with the net weightissue you’re trying to raise.
7(3): where a declaration of net quantity shows thepurported net quantity of the pre-packaged productto which it is applied, that declaration shall bedeemed not to be a false or misleading representa-tion of the net quantity if the pre-packaged productis, subject to the prescribed tolerance, not less thanthe declared net quantity of the pre-packaged prod-uct and the declaration otherwise meets the require-ments of this Act and the regulations.
Tolerances
39. (1) For the purposes of Schedule 1, “catchweight product” means a product that because ofits nature cannot normally be portioned to a prede-termined quantity and is, as a result, usually sold inpackages of varying quantity.
05-Klassen-4641.qxd 4/1/2005 6:47 PM Page 232

Quality • 233
R UCL 454g LCLX_ UCLX
_X_
***********3********************************************
4
2
#
••••••••••••••••••••••••••••••••••••
••••••••••••••••••••••
#
#
#
#
#
#
#
#2
4
2
2
2
2
2
2
2
2
2
2
2
2#
1
1
1
1
1
1
1
1
1
1
1
1
1
1
1
4
4
4
4
4
4
4
4
4
4
4
4
4
4
3
3
3
3
3
3
3
3
3
3
3
3
3
3
#
#
#
##
+++++++++++++++++++++++++++++++++++++++++++++++++++++++++++
1, 2, 3, 4 = Individual sample weights
# - sample means - sample ranges
Exhibit 2 Wair Filler Plot, Head No. 3
05-Klassen-4641.qxd 4/1/2005 6:47 PM Page 233
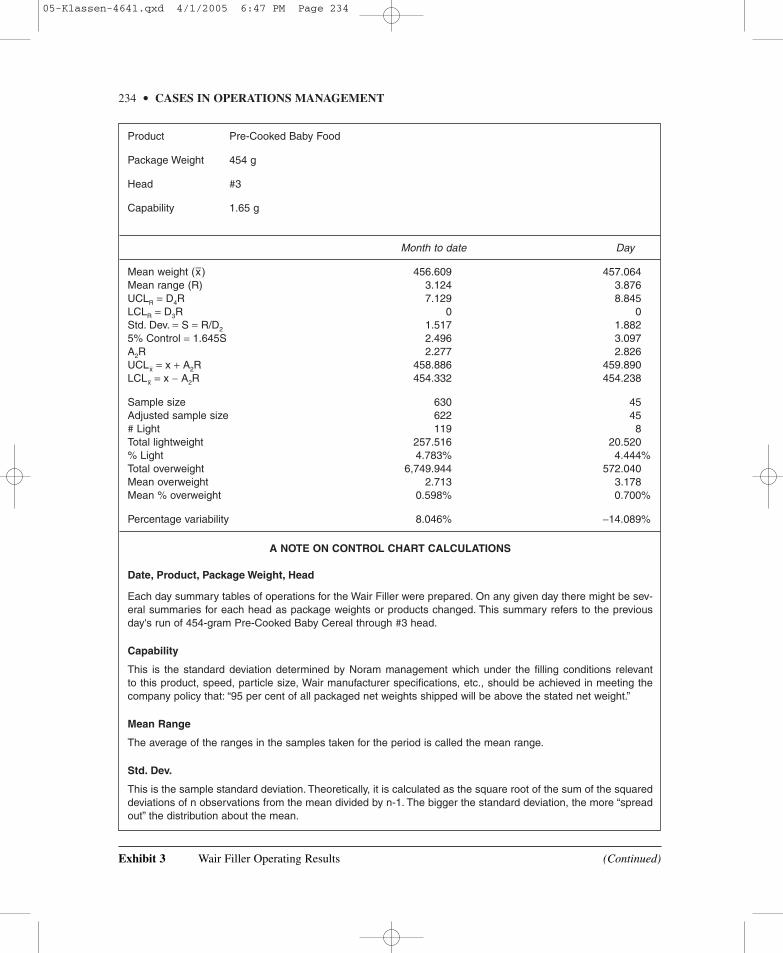
234 • CASES IN OPERATIONS MANAGEMENT
Product Pre-Cooked Baby Food
Package Weight 454 g
Head #3
Capability 1.65 g
Month to date Day
Mean weight (x−) 456.609 457.064Mean range (R) 3.124 3.876UCLR = D4R 7.129 8.845LCLR = D3R 0 0Std. Dev. = S = R/D2 1.517 1.8825% Control = 1.645S 2.496 3.097A2R 2.277 2.826UCLx− = x + A2R 458.886 459.890LCLx− = x − A2R 454.332 454.238
Sample size 630 45Adjusted sample size 622 45# Light 119 8Total lightweight 257.516 20.520% Light 4.783% 4.444%Total overweight 6,749.944 572.040Mean overweight 2.713 3.178Mean % overweight 0.598% 0.700%
Percentage variability 8.046% −14.089%
A NOTE ON CONTROL CHART CALCULATIONS
Date, Product, Package Weight, Head
Each day summary tables of operations for the Wair Filler were prepared. On any given day there might be sev-eral summaries for each head as package weights or products changed. This summary refers to the previousday's run of 454-gram Pre-Cooked Baby Cereal through #3 head.
Capability
This is the standard deviation determined by Noram management which under the filling conditions relevantto this product, speed, particle size, Wair manufacturer specifications, etc., should be achieved in meeting thecompany policy that: “95 per cent of all packaged net weights shipped will be above the stated net weight.”
Mean Range
The average of the ranges in the samples taken for the period is called the mean range.
Std. Dev.
This is the sample standard deviation. Theoretically, it is calculated as the square root of the sum of the squareddeviations of n observations from the mean divided by n-1. The bigger the standard deviation, the more “spreadout” the distribution about the mean.
Exhibit 3 Wair Filler Operating Results (Continued)
05-Klassen-4641.qxd 4/1/2005 6:47 PM Page 234

Quality • 235
In Noram’s case, S is calculated from the mean range instead of from the individual observations. Dividing theMean Range by the factor D2 (from Table A at the end of this Exhibit) provides a very close approximation of thepopulation standard deviation. Table A shows D2, to be 2.059 for subgroups of four, so for the month to date:
Std. Dev. = S = R/D2 = 3.124/2.059 = 1.517
UCLR
The upper control limit on the range is calculated as D4 times the mean range. D4 equals 2.282 for a sample ofn = 4 (see Table A). For the month to date:
UCLR = D4R = 2.282 × 3.124 = 7.129
LCLR
The lower control limit on the range is calculated as D3 × mean range. Since D3 is equal to zero for a sample offour, the lower control limit on the range is also zero.
Operators use the upper and lower control limits on the range to monitor the filling operation.
5% Control
This setting ensures that 95 per cent of the packages are filled with 454 grams or more.To assure ourselves that 95 per cent of the observations will exceed a certain mean value, we first note that
50 per cent will be at or above the mean. Thus, we need only determine the number of standard deviations belowthe mean that are needed to account for the remaining 95 per cent minus 50 per cent = 45 per cent of the obser-vations. Do this by locating 0.4500 in the body of Table B and read off 1.645. For the month to date:
5% Control = 1.645 × 1.517 = 2.496
A2R
The 3-sigma control limits on the mean are based on A2R. For samples of four packages Table A shows that A2
is 0.729. For the month to date:
A2R = 0.729 × 3.124 = 2.277
UCLx-
The upper control limit on the mean is calculated as mean weight plus A2R. For the month to date:
UCLx- = 456.609 + 2.277 = 458.886
LCLx-
The lower control limit on the mean is calculated as mean weight minus A2R. For the month to date:
LCLx- = 456.609 − 2.277 = 454.322
Sample Size
This is the unadjusted size. Each sample consists of four packages. Thus, the 630 samples reported for themonth to date represent 2,520 individual packages.
Exhibit 3 Wair Filler Operating Results (Continued)
S =∑(Y − y– )
√
n − 1
05-Klassen-4641.qxd 4/1/2005 6:47 PM Page 235
236 • CASES IN OPERATIONS MANAGEMENT
Adjusted Sample Size
The adjusted sample discards “wild” samples. We can think of two kinds of “causes” for package weight variation.There are statistical variations which we can regard as normal fluctuations around a mean and which arise fromacceptable operating characteristics of the equipment, and there are assignable variations where the variationfrom target is a result of some malfunction. If a blockage occurs, for example, and produces a half-filled packagein a sample, this would be termed “wild” by Noram and the sample would be discarded for computational pur-poses. The reasoning here is that Noram wishes to track statistical variation and not malfunctions. In the eventof a wild sample being detected, operators would remove affected packages. A total of eight such samples wereomitted from the adjusted sample for the month to date. The 622 samples reported for the month to date repre-sent 2,488 packages.
# Light
This is the number of packages in the samples under the net weight of 454 grams. For example, if, in one of thesamples of four packages, one of the packages was less than 454 grams, this would count as one light package.For the month to date 119 such packages have been recorded.
Total Light Weight
This is the amount in grams of underweight in the light packages. For example, if a light package has beendetected in a sample, weighing in at 451 grams, this would be recorded as three grams of light weight. The totallight weight associated with the 119 light packages for the month to date is 257.516 grams.
% Light
This is the percentage of packages in the adjusted sample under the net weight. It is calculated as # light dividedby the number of packages in the adjusted sample size and expressed as a percentage.Thus, for the month to date:
% Light = 119/2,488 = 4.783%
Total Overweight
This is the total weight in grams in excess of the net weight requirements. Each package that weighed in excessof 454 grams would contribute to the total overweight.
Mean Overweight
This is the total overweight divided by the number of packages in the adjusted sample size. Noram does notdeduct the number of light packages from the adjusted sample size in computing mean overweight. Thus, for themonth to date:
Mean Overweight = 6,749.944/2,488 = 2.713g
Mean % Overweight
This is the mean overweight divided by the package weight and expressed as a percentage. Thus, for the monthto date:
Mean % Overweight = 2.713/454 = 0.598%
Percentage Variability
This can be interpreted as a measure of Wair Filler performance against “standard.” It is calculated as capabilityminus std. dev. and expressed as a percentage of capability. A positive figure indicates performance better thanstandard, while a negative result suggests worse. Thus, for the month to date:
Percentage Variability = (1.650 – 1.517)/1.650 = 8.061%
Exhibit 3 Wair Filler Operating Results (Continued)
05-Klassen-4641.qxd 4/1/2005 6:47 PM Page 236

(2) Subject to subsection (3), the amount set outin column II of an item of the appropriate Part ofSchedule I is the tolerance prescribed for thepurposes of subsection 7(3) of the Act for the netquantity set out in column 1 of that item.
(3) Where the net quantity of a prepackagedproduct referred to in Part I, II, III, IV, V, or VI ofSchedule I is declared by weight or volume andthat net quantity is not set out in column I of thatPart, the tolerance prescribed for the purposes ofsubsection 7(3) of the Act for that net quantity is anamount based upon linear interpolation betweenthe appropriate tolerances1 appearing in column IIof that Part.
Inspection
40. (1) Where an inspector wishes to inspect anylot, shipment, proposed shipment or identifiablequantity of prepackaged products all purportingto contain the same net quantity or product (here-inafter referred to as a “lot”) to determine whetherthe lot meets the requirements of the Act and theseRegulations respecting the declaration of net quan-tity and where, in his opinion, it is impractical orundesirable to inspect all the separate prepackaged
products in the lot, he may inspect the lot by select-ing and examining a sample of the lot.
THE DECISION
Pat thanked Joe for his work and concluded:
Joe, why don’t both of us think this whole situationout for a week or so and then get together on itagain. I want to be thoroughly familiar with thiswhole situation before I look at any options or pro-pose any changes. I like the idea of concentratingfirst at the pre-cooked cereal line, because it is asteady seller and it is an area we appear to haveunder reasonable control. I know we can’t stopthere, but it is a good place to start.
NOTE
1. Excerpt from Consumer Packaging andLabelling Act, Consumer Packaging and LabellingRegulations amendment, P.C. 1975–479 4 March1975, See Exhibit 4 for Schedule 1.
Quality • 237
Table A: Factors For Determining The3-Sigma Control Limits For X
−−and R Charts
Number of observations insubgroup
n
2345
6789
10
Factor for X Chart
A2
1.8801.0230.7290.577
0.4830.4190.3730.3370.308
Std. Dev.D2
1.1281.6932.0592.326
2.5342.7042.8472.9703.078
LCLRD3
0000
00.0760.1360.1840.223
UCLRD4
3.2672.5752.2822.115
2.0041.9241.8641.8161.777
Exhibit 3 Wair Filler Operating Results (Continued)
Source: Adapted from J. R. Evans and W. M. Lindsay, The Management and Control of Quality, Second Edition. West, 1993.Appendix B, page 661.
Factors for R Chart
05-Klassen-4641.qxd 4/1/2005 7:47 PM Page 237

238 • CASES IN OPERATIONS MANAGEMENT
0 Z
Exhibit 3 Wair Filler Operating Results
Source: Op cit Appendix A, page 660.
z
0.00.10.20.30.40.5
0.60.70.80.91.0
1.11.21.31.41.5
1.61.71.81.92.0
2.12.22.32.42.5
2.62.72.82.93.0
0.00
0.00000.03980.07930.11790.15540.1915
0.22570.25800.28810.31590.3413
0.36430.38490.40320.41920.4332
0.44520.45540.46410.47130.4772
0.48210.48610.48930.49180.4938
0.49530.49650.49740.49810.4987
0.01
0.00400.04380.08320.12170.15910.1950
0.22910.26110.29100.31860.3438
0.36650.38690.40490.42070.4345
0.44630.45640.46490.47190.4778
0.48260.48640.48960.49200.4940
0.49550.49660.49750.49820.4987
0.02
0.00800.04780.08710.12550.16280.1985
0.23240.26420.29390.32120.3461
0.36860.38880.40660.42220.4357
0.44740.45730.46560.47260.4783
0.48300.48680.48980.49220.4941
0.49560.49670.49760.49820.4987
0.03
0.01200.05170.09100.12930.16640.2019
0.23570.26730.29670.32380.3485
0.37080.39070.40820.42360.4370
0.44840.45820.46640.47320.4788
0.48340.48710.49010.49250.4943
0.49570.49680.49770.49830.498
0.04
0.01600.05570.09480.13310.17000.2054
0.23890.27040.29950.32640.3508
0.37290.39250.40990.42510.4382
0.44950.45910.46710.47380.4793
0.48380.48750.49040.49270.4945
0.49590.49690.49770.49840.4988
0.05
0.01990.05960.09870.13680.17360.2088
0.24220.27340.30230.32890.3531
0.37490.39440.41150.42650.4394
0.45050.45990.46780.47440.4798
0.48420.48780.49060.49290.4946
0.49600.49700.49780.49840.4989
0.06
0.02390.06360.10260.14060.17720.2123
0.24540.27640.30510.33150.3554
0.37700.39620.41310.42790.4406
0.45150.46080.46860.47500.4803
0.48460.48810.49090.49310.4948
0.49610.49710.49790.49850.4989
0.07
0.02790.06750.10640.14430.18080.2157
0.24860.27940.30780.33400.3577
0.37900.39800.41470.42920.4418
0.45250.46160.46930.47560.4808
0.48500.48840.49110.49320.4949
0.49620.49720.49790.49850.4989
0.08
0.03190.07140.11030.14800.18440.2190
0.25170.28230.31060.33650.3599
0.38100.39970.41620.43060.4429
0.45350.46250.46990.47610.4812
0.48540.48870.49130.49340.4951
0.49630.49730.49800.49860.4990
0.09
0.03590.07530.11410.15170.18790.2224
0.25490.28520.31330.33890.3621
0.38300.40150.41770.43190.4441
0.45450.46330.47060.47670.4817
0.48570.48900.49160.49360.4952
0.49640.49740.49810.49860.4990
Table B: Areas Under The Normal Curve
05-Klassen-4641.qxd 4/1/2005 6:47 PM Page 238
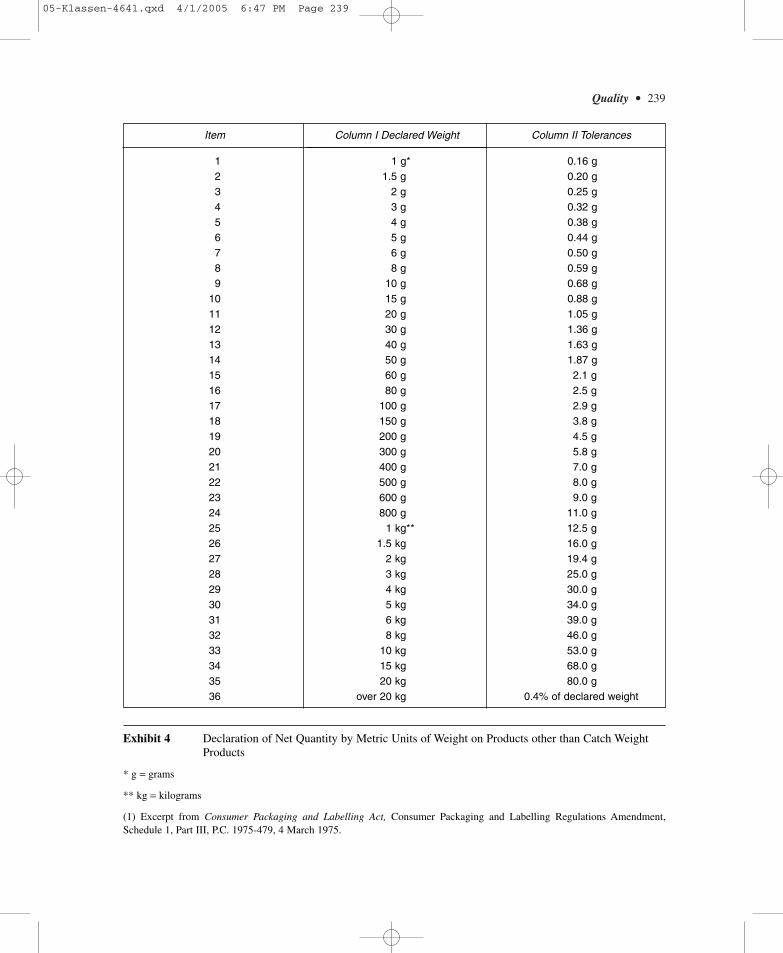
Quality • 239
Exhibit 4 Declaration of Net Quantity by Metric Units of Weight on Products other than Catch WeightProducts
* g = grams
** kg = kilograms
(1) Excerpt from Consumer Packaging and Labelling Act, Consumer Packaging and Labelling Regulations Amendment,Schedule 1, Part III, P.C. 1975-479, 4 March 1975.
Item
123456789
101112131415161718192021222324252627282930313233343536
Column I Declared Weight
1 g*1.5 g
2 g3 g4 g5 g6 g8 g
10 g15 g20 g30 g40 g50 g60 g80 g
100 g150 g200 g300 g400 g500 g600 g800 g
1 kg**1.5 kg
2 kg3 kg4 kg5 kg6 kg8 kg
10 kg15 kg20 kg
over 20 kg
Column II Tolerances
0.16 g0.20 g0.25 g0.32 g0.38 g0.44 g0.50 g0.59 g0.68 g0.88 g1.05 g1.36 g1.63 g1.87 g2.1 g2.5 g2.9 g3.8 g4.5 g5.8 g7.0 g8.0 g9.0 g
11.0 g12.5 g16.0 g19.4 g25.0 g30.0 g34.0 g39.0 g46.0 g53.0 g68.0 g80.0 g
0.4% of declared weight
05-Klassen-4641.qxd 4/1/2005 6:47 PM Page 239
HILCREST AUTO
Carlie Bell
Elizabeth M. A. Grasby
Copyright © 2F001, Ivey Management Services Version: (B) 2003–09–09
240 • CASES IN OPERATIONS MANAGEMENT
Late one afternoon in March 2000, Mark Baileyreturned from an emergency out-of-town meet-ing to discover that scrapped parts had been usedin a shipment to one of Hilcrest Auto’s majorcustomers. Although the company had beenexperiencing quality problems for some time,this shipment decision could have disastrouseffects on the future of the firm. Bailey, qualitymanager and business unit manager of the SmallParts Division of Hilcrest Auto (Hilcrest), hadto decide what action, if any, he should takeregarding the scrapped parts shipment. As well,he would have to determine which of fouroptions to choose to address the quality issuesas soon as possible: buying a second bendingmachine, adding a third shift, continuing as iswith more overtime production, and/or request-ing a change to the contract to allow more vari-ance in the specifications of the part.
THE AUTOMOTIVE
INDUSTRY IN NORTH AMERICA
The automotive supply industry consisted ofcompanies competing for contracts to produceparts for automobile assemblers dominated byFord, GM and Daimler-Chrysler, known as the“big three” automotive assembly companies,and/or the Tier One and Tier Two1 manufacturersof automotive parts in North America. In 1999,GM held 33.26 per cent of the North Americanautomobile market, Ford had captured 26.38 percent, and Daimler-Chrysler held 18.67 per cent.
North American automobile sales recordeda banner year in 1999, and PriceWaterhouse-Cooper’s AUTOFACTS had forecast that NorthAmerican car and truck production would rise
from 53.18 million cars and trucks producedin 1999 to 54.06 million produced in 2000.Although North America would continue to bethe largest production region with a 30.55 percent share of global production in 2000, thisfigure would represent a drop of 1.12 percentagepoints from 1999 as foreign manufacturers(Mazda, Honda, Volkswagen) increased theirglobal market share.2
The Office for the Study of AutomotiveTransportation at the University of Michiganforecasted that while the amount of productdesign and engineering occurring in NorthAmerica by international automakers wouldincrease from 15 per cent in 1999 to 30 per centby 2009,3 domestic manufacturers would sourcean increasing percentage of parts from outsideNorth America. Therefore, as the global industrycontinued to experience growth, North Americanparts manufacturers were under intense pressureto remain competitive by improving quality andat the same time by decreasing costs.
The industry experienced some seasonalityin response to plant shutdowns, often occurring inDecember, July and August. The number of com-petitors in the industry had decreased sinceHilcrest first entered the market, and those thatremained were dependent upon winning contractsto supply the “big three” to ensure continued suc-cess. To win a contract, suppliers submitted abid and attempted to prove themselves more reli-able, more capable, and more cost effective thanother bidders. It was an intense process, and the“big three” had the power to demand additionalcost-cutting measures and service requirementsthat would affect the profitability of the smallersuppliers. Additionally, the “big three” demandedloyalty from their suppliers. As a result, GM,
05-Klassen-4641.qxd 4/1/2005 6:47 PM Page 240

Quality • 241
Ford and Daimler-Chrysler often received uniqueparts and had total control over their suppliers,such that it was impossible for a supplier to sell tothe other members of the “big three.”
HILCREST AUTO COMPANY BACKGROUND
Michael Hill opened Hilcrest Auto in the earlyseventies in Hamilton, Ontario, an industrial citylocated at the western end of Lake Ontario, alongthe Niagara Escarpment. Hilcrest produced steeltubing components that were used in the assemblyof numerous automotive units. Hill chose thislocation because of its proximity to major trans-portation routes between other manufacturingcities in Ontario and the United States. This siteensured that Hilcrest had easy access to the steelrequired to produce steel tubing and to the ship-ping routes to its customers, many of whom werelocated within the southwestern Ontario region.By 1998, the majority of Hamilton’s population ofapproximately 500,000 was employed in heavyindustries such as iron, steel, and machinery.
The business grew slowly but steadily overthe years and Hill passed the business to his son,Dennis, in the late 1980s. Dennis had earned anengineering degree at The University of WesternOntario and a master’s degree in business (MBA)from the Richard Ivey School of Business. CarlWilson, Hill’s son-in-law, was offered the role ofvice-president and material control manager forHilcrest. Carl had no formal business education,but was excited to be offered a role in the familybusiness, and accepted the role enthusiastically.Under Dennis and Carl’s leadership, Hilcrestearned its QS90004 certification, and by March2000, Hilcrest’s annual sales topped $30,000,000and the company employed over 160 non-union-ized employees.
MARK BAILEY AND THE SMALL
PARTS DIVISION OF HILCREST AUTO
Upon graduating with a B.Sc. in mechanicalengineering from The University of Western
Ontario and later obtaining an MBA degree,Bailey worked as a quality control manager forseveral firms before joining Hilcrest in 1998. Asthe quality manager and business unit managerof the Small Parts Division of Hilcrest, Baileywas responsible for the manufacture of tubingused in the production of heater cores for vehi-cles.5 All vehicles with heating systems neededheater cores, and many companies competed tosupply the market with the tubing for theseheater core units. Hilcrest won a three-year con-tract to supply a major Tier One company withthe tubing, at $1.05 per heater core tube, in 1999.Weekly demand by the major Tier One customerranged from 17,000 to 20,000 units, and fore-casted demand for the year 2001 was expected toincrease to 35,000 units per week. The qualityproblems Hilcrest had been experiencing werethreatening Hilcrest’s contract with this cus-tomer, who demanded that the tubing be “free,perfect, and yesterday.”
TUBING PRODUCTION
The heater core tubing production process wasnot complex. One operator (who earned $12 perhour for 50 weeks each year) was needed toensure that the process ran smoothly. Pre-cutsteel tubing, supplied by a United States supplierat a cost of $0.93 per piece, was manually loadedinto a pressing machine that rounded both endsof the tube in about seven seconds. The operatorthen unloaded the rounded tubes into bins. Sincethe pressing machine was also used to produceanother unrelated part, 30,000 units of roundedtubes were kept in inventory at all times. Oncea bin was full of rounded tubes, the operatorloaded the bin into a custom-designed bendingmachine where the tubing was bent into a zigzagshape to fit into the heater core. This step took13 seconds per tube. The bent tubing was thenwashed for about one minute in batches of about1,000 pieces to remove any oil or grime that hadcontaminated the tube. Finally, the heater coretube was ready for shipping to the customer.
The production process normally operatedtwo eight-hour shifts each day, five days a week,
05-Klassen-4641.qxd 4/1/2005 6:47 PM Page 241

and produced between 1,000 and 2,000 finishedheater core tubes per shift. Lately, the productionof 1,300 units on a shift was considered “a goodday.” When production fell behind demand,Hilcrest used voluntary overtime to increaseoutput. Workers were paid time-and-a-half onSaturday and double-time on Sunday, withSunday shifts difficult to staff. Overtime shiftswere often unproductive because if the operatorexperienced trouble with the machinery or wasconcerned about the quality of parts, no supportpersonnel was available to assist the unskilledoperator, and production was usually halted as aresult.
MACHINE PROBLEMS
The bending machine was a chief concern withinthe process. The bender was required to operatecontinuously in order to meet demand, leavingno time for scheduled preventive maintenance.Maintenance could not be performed during thenight because no supervisory or maintenancestaff were available. As a result, equipment fail-ures requiring maintenance would cause anunscheduled downtime of up to three or fourshifts. To avoid this unscheduled downtime, themachine required a proper overhaul that couldtake up to a week and had to be done offsite. Thisoverhaul had not been performed, however,because the machine could not produce enoughinventory to meet the contractual obligationswhile the overhaul was being performed.
In addition, because of the lack of mainte-nance, the bending machine often slightlysqueezed the rounded ends of the tubes as it bentthe tubing. Hilcrest performed only infrequentchecks on this particular feature, but were awarethat the ends of the tubing did not meet the exactspecifications of the contract because of thismachine error. Bailey believed this slight distor-tion of the tubing ends in no way affected thesafety or function of either the tubing or the com-pleted heater cores; however, the fact remainedthat the shipped parts to the customer were notalways “up to spec.”
THE RETURNED SHIPMENT
Hilcrest had sent this Tier One customer slightly“out-of-round” tubing for quite some time, butrecently this customer had performed a qualitycheck on 8,000 heater core tubes received andphoned Bailey to inform him that the tubing didnot meet specifications and, therefore, wouldbe returned. Bailey authorized the return of theshipment, and desperately began to try to sort outthe in-house situation to ensure that the nextshipment met contract specifications.
Inconveniently, Bailey was forced to attendanother major company emergency out of town.Upon his return a few days later, Bailey washorrified to discover that the returned parts wereno longer in the holding area. In response toBailey’s inquiry, Carl Wilson stated that due tothe plant’s inability to hastily produce 8,000 per-fect units, and because the customer had nevernoticed the distortion before, he had instructed theshipping department to re-package the returnedorder and re-send it to the customer.
Since the customer had already received the“new” shipment, had obviously not inspected theunits, and was using the parts in the assembly ofthe heater core units, Bailey was unsure what todo. He was certain that informing the customer ofthe error now would be costly to Hilcrest becauseonce the tubing had been installed into the heatercores, the entire heater core unit would have tobe scrapped if any component was deemed to bedefective. In addition to the replacement tubingcosts, Hilcrest would have to pay the Tier Onecustomer $60 per heater core (as written in thecontract). Bailey did not know if he could saveHilcrest’s relationship with this customer if hedid report the “error” to the customer.
CHANGING THE PROCESS
Given this most recent event, Bailey was moredetermined than ever to fix the capacity andquality issues within the heater core tubingdepartment. He was considering several options.It appeared that the purchase of a second bending
242 • CASES IN OPERATIONS MANAGEMENT
05-Klassen-4641.qxd 4/1/2005 6:47 PM Page 242

Quality • 243
machine would successfully address the volumeconstraint and improve the quality of the finishedproduct. However, the custom-designed bendingmachine would cost $70,000 and, combined withthe old machine, the new duo-machine processwould require another operator. The addition ofa second bending machine would not affect anyof the other stations on the line. Bailey knew hewould have to justify these expenses to Dennisand Carl. Further, since the new bender wouldtake up to four months to arrive, Bailey wasgoing to have to make some interim changes toproduction quality and output.
To improve in-house quality immediately,Bailey could add two more steps to the produc-tion process. After the tubing was bent, it couldpass through a re-work station where the dis-torted ends of the tubing would be re-shaped intoproper rounds in less than seven seconds pertube. Once re-shaped, the tubes would passthrough a 100 per cent gauge inspection stationwhere the ends of the tubes would be automati-cally measured to ensure they had been re-workedto the required specifications. The gauge inspec-tion would take virtually no time at all. This newprocess would result in the rejection of five percent of the finished tubes, which would be totallyscrapped. Because the current single operatorwould be unable to keep up with the new process,an additional (full-time) employee would haveto be hired to ensure that production was nothindered further. Bailey would need to assesswhether these new steps should be continuedafter the new bender arrived.
Bailey also considered approaching theengineers of the final customer—one of the threemajor automakers—to re-evaluate and re-testthe heater core units with the intent to approve acontractual print change allowing Hilcrest awider range of acceptable variance in the shapeof the round tube ends. It was the Big Threeautomakers that ultimately dictated the specifi-cations for the heater core units. Bailey wasconcerned, however, that this request would neg-atively impact Hilcrest’s reputation and hinderpotential future contracts with other Tier Onecompanies, especially since Hilcrest had won
this contract by stating it could produce thenecessary quality and quantity of parts.
To increase output, Bailey was consideringeither the implementation of a mandatory over-time policy or the addition of a new third shift.He was concerned about the effect mandatoryovertime might have on employee morale andproductivity, but it could be a more cost-effectiveway to produce tubing than adding another full-time shift. If a third shift were added, in additionto hiring new tubing operators, maintenance andother support personnel would have to be avail-able to assist the operators and to ensure that theadditional shift was equally productive.
DECISION
Bailey knew he had little time to make some majordecisions. He questioned how he could justify thepurchase of a new bending machine to manage-ment. He wondered how to most effectively andefficiently improve the quality and output of theheater core tubing operation while waiting for thenew machine’s arrival. Should any short-termchanges made to the production process be contin-ued once the new bender was operational? Rightnow, he had to decide what to do about the “out-of-round” parts re-sent to the customer.
Bailey believed that making long-term changesto improve quality and output was the right movefor Hilcrest; it was a good step toward growthand would help the company remain competitivewithin this industry. However, he also knew thathe would have to present a strong case to DennisHill and Carl Wilson when seeking approval foradditional investments and expenditures. Baileywanted to ensure that he had both strong quantita-tive support and a convincing qualitative rationaleto make the necessary changes to the heater coretubing production facility.
NOTES
1. Tier One suppliers manufacture most of theirproducts and ship them to automotive assembly plants.Tier Two suppliers, in turn supply Tier One companies
05-Klassen-4641.qxd 4/1/2005 6:47 PM Page 243

with some of the parts required (parts the Tier Onecompanies either do not want to or are unable to man-ufacture) in the finished goods shipped to the automo-tive assembly plants.
2. Automotive market information: Dale Jewett,Automotive Industries: Industry Statistics, January,2000. http://www.findarticles.com/cf_atinds/m3012/1_180/59035633/pl/article.jhtml (August 16, 2001).
3. University of Michigan News and InformationServices, Auto Industry Will Be Challenged byTechnology, Regulations and Global Competition” April3, 2000. http://www.umich.edu/~newsinfo/Releases/2000/Apr00/r040300a.html (August 16, 2001).
4. QS9000 is the set of fundamental qualityrequirements established primarily by Chrysler, Fordand General Motors to reduce the confusion and cost
that came from having different quality standardswhich suppliers had to meet. Derived from ISO9001,the international standards for manufacturing quality,QS9000 includes requirements and measurablesspecific to the automotive industry.
5. The heater core is a smaller version of theradiator that is used to keep your toes warm when it'scold outside. It is mounted under the dashboard. Someof the hot coolant is routed through this little radiator,by more hoses. A small electric fan is also mountedthere especially for the purpose of directing the heatinside the car. The principle is exactly the same as theone used in the radiator for your engine, except thatthe heat is released inside the car instead of outside.(Source: India MART Network, http://www/auto/indiamart.com/auto-part/autopart-html, May 31, 2001.)
244 • CASES IN OPERATIONS MANAGEMENT
MUTUAL LIFE OF CANADA—THEGROUP CLIENT SERVICE GUARANTEE (A)
Janet DeSilva
John Haywood-Farmer
Copyright © 1994, Ivey Management Services Version: (A) 2002–12–11
In August 1992, Alex Brown, senior vice-president of Mutual Life of Canada’s GroupDivision, was preparing for the meeting of theGroup Division Quality Council the next day.One item on the agenda was the decision on thegroup client service guarantee. For four monthsthe Service Guarantee Working Group, reportingto Mr. Brown, had been investigating the possi-bility of the division guaranteeing some of itsservices. The working group had now preparedits final report which, although recommendingthat the division proceed with a service guaran-tee, raised a number of questions and left amajor design decision unanswered. Mr. Brownnow had to decide if he should endorse thegroup’s recommendations. Mr. Brown believedthat no Canadian insurance company had yetissued a service guarantee, although he thoughtthat one company in the United States had.
Although the opportunity looked attractive, heknew that the stakes were high.
THE MUTUAL GROUP
The Mutual Group, one of Canada’s largestinsurers (over $20 billion in total assets underadministration), was the marketing name of afinancial services organization led by MutualLife Assurance Company of Canada (MutualLife). The company’s headquarters were inWaterloo, Ontario, approximately 100 kilome-tres west of Toronto. It operated from offices andagencies across Canada and the northern UnitedStates. The Mutual Group, which began in 1868with the incorporation of Canada’s first mutuallife insurance company (The Ontario MutualLife Assurance Company), comprised a number
05-Klassen-4641.qxd 4/1/2005 6:47 PM Page 244

Quality • 245
of financial services companies offering a widerange of insurance, employee group benefit,investment, and trust company products andservices. Exhibit 1 lists the companies of TheMutual Group, all of which were subsidiaries ofMutual Life. In addition, Mutual Life had four
divisions (Individual, Group, Investment, andCorporate), each headed by a senior or executivevice-president.
Because Mutual Life was a mutual organiza-tion, clients buying participating life insurancebecame owners of the firm, entitling them to vote
1. The Mutual Life Assurance Company of Canada (Mutual Life of Canada). Products and services include lifeand health insurance, annuities, registered retirement income funds (RRIFs), registered retirement savingsplans (RRSPs), life income funds (LIFs), pensions, commercial mortgages, real estate financing, andcorporate lending offered to both individuals and groups.
2. Mutual Diversico Limited. Administrator of The Mutual Group of Funds (mutual funds); responsible forprocessing of purchase, redemption and exchange orders, distributions, and service to unit holders.
3. Mutual Investco Inc. Distributes and markets The Mutual Group of Funds (mutual funds); registered with the12 Securities Administrators (regulatory authorities) across Canada; Investco agents are all dual-licensedas life insurance agents of Mutual Life of Canada.
4. Mutual Asset Management Ltd. Once regulatory approval is granted, Mutual Asset Management Ltd. willmanage Mutual Life of Canada’s stock and marketable bond portfolios and provide investment managementservices for The Mutual Group of Funds.
5. R.D.C. Property Services Limited. Manages revenue-producing real estate properties.
6. Mississauga Executive Enterprises Limited. Fifty owned by Mutual Life of Canada; real estate development.
7. Mu-Cana Investment Counselling Ltd. Investment management services for pension funds and other tax-able and non-taxable assets, for Canadian corporations, unions, universities, foundations, and individuals.
8. Mu-Cana Data Services Ltd. Microfiche services for Mutual Life of Canada and client companies in theKitchener-Waterloo area.
9. The Mutual Trust Company. Federally chartered trust company located in Toronto; gathers deposits throughthe marketing network of Mutual Life of Canada; invests primarily in residential mortgages.
10. Mutual Securities Inc. Member of the Investment Dealers of Canada; carries on investment banking activi-ties principally related to mortgages and real estate offerings.
11. The Mutual Group (U.S.), Inc. An operating company responsible for strategic planning and investmentmanagement.
12. TMG Life Insurance Company
The Mutual Group (U.S.)/Employee Benefits. Based in Brookfield, Wisconsin; serves the small group mar-ketplace with health, life, short- and long-term disability, stop loss and dental insurance; and offers flexiblebenefits and managed care health services.
The Mutual Group (U.S.)/Personal Financial Services. Based in Fargo, North Dakota; specializes in the saleof individual life insurance and annuities.
Exhibit 1 The Composition of the Mutual Group
Source: Mutual Life of Canada Annual Report.
05-Klassen-4641.qxd 4/1/2005 6:47 PM Page 245

at the annual meeting and also to share in thefirm’s financial success. Although mutual com-panies were not obliged to pay dividends whichreflected this ownership, in 1990 Mutual Lifebroke with tradition, becoming the first mutualinsurance company to pay participating policyholders an ownership dividend (it totalled$30 million). Historically, such companies hadapplied earned surpluses as “participating divi-dends” to reduce future premiums. Mutual Lifewas committed to both participating dividends aswell as triennial ownership dividends.
MUTUAL LIFE OF
CANADA—GROUP DIVISION
Mutual Life’s Group Division, headed byAlex Brown, had several departments led byvice-presidents. It specialized in employee groupbenefit programs such as life, health, rehabi-litation, and pension products. Exhibit 2 givessome data comparing the 1991 performance of20 of Canada’s leading group insurers. Overall,Mutual Life had the fourth largest group pre-mium income. An industry publication claimedthat the industry was very competitive.1 The largestcompanies were growing at a rate above theindustry average; in 1991 the five largest firmshad increased their collective market share by2.4 per cent over 1990. The Group Division wasfinding 1992 to be particularly challenging froma bottom-line perspective.
The division served approximately 1.35 mil-lion Canadians in 9,600 groups, many of whichhad been Mutual Life clients for decades.Groups with life and health plans represented 56per cent of the total; groups with pension plansrepresented the remaining 44 per cent. The divi-sion segmented groups as small (up to 50 livesinsured), medium (50 to 500 lives), or large (over500 lives). Like its competitors, the divisionoffered its largest clients many special servicesincluding assignment of group policyholder ser-vice officers to manage the relationship. Unlikesmaller insurance companies which tended tospecialize by benefit and group size, the division
offered a broad range of products to a fullspectrum of groups.
The division’s mission was to be a leader inthe group life, health, and pension markets interms of its products, the quality of service itprovided, and the degree of innovation it broughtto the marketplace. The division prided itselfon being in touch with clients and their needs.It believed that it was the only company in theindustry that routinely measured speed of settle-ment and payment accuracy. Mutual Life clientsurveys showed that the division was numberone in the eyes of customers. Audits showed thatit was considerably better than the 99 per centindustry standard for accuracy. The division had ahigh degree of confidence in its ability to deliver.
The division offered benefit programs intwo categories: life and health benefits and pen-sion plans. Exhibit 3 gives some details of typi-cal coverage. Annually, the division estimatedits costs for the next year in three categories:claims (using, for example, actuarial tables), ser-vices claimed (using, for example, semiprivatehospital room rates, dental fee guides), andadministration (e.g., for processing claims, pre-miums, accepting contributions, generating taxand employee statements, investing deposits, andhandling enquiries). Employers typically paidlife and health fees; employers or employeesusually paid pension fees, either directly or asadjusted investment returns on contributions.
Many groups designed their own plans, typi-cally with the help of an advisor: the groupdecided what coverage it wanted and then soughtbids and possibly presentations from potentialinsurers. Exhibit 4 shows a typical request froma benefits consultant for a sales presentation; onJuly 31, the client awarded Mutual Life this con-tract, worth $6 million per year. Although pricewas the dominant criterion in choosing aninsurer, others were also important: the structureof costs, the continued financial viability of theorganization, their systems capabilities, specialvalue-added services (such as individualizedstatements and special seminars), interpersonalrelationships, etc. Insurers based their proposalson their estimates of initial and on-going costs.
246 • CASES IN OPERATIONS MANAGEMENT
05-Klassen-4641.qxd 4/1/2005 6:47 PM Page 246

Gro
up P
ensi
on
Gro
up L
ife
Pre
miu
m
Pen
sion
Adm
inis
trat
ive
Gro
up H
ealth
M
arke
tC
ompa
nyP
rem
ium
sC
ash
Flo
wA
sset
sS
ervi
ces
Onl
yP
rem
ium
sTo
tal B
usin
ess
Sha
re
247
Con
fede
ratio
n Li
feG
reat
Wes
t Li
feS
un L
ifeM
utua
l Life
Can
ada
Life
Lond
on L
ifeS
tand
ard
Life
Met
ropo
litan
Life
Aet
na C
anad
aM
anul
ife F
inan
cial
Nor
th A
mer
ican
Life
Pru
dent
ial I
nsur
ance
Ont
ario
Blu
e C
ross
Cro
wn
Life
Mar
itim
e Li
feIn
dust
rial A
llian
ce L
ifeLa
uren
tian/
Impe
rial
SS
Q D
’Ass
uran
ceP
rude
ntia
l Ass
uran
ceG
reen
Shi
eld
Sam
ple
To
tals
Ind
ust
ry T
ota
ls2
$143 146
201 79 144 90 23 93 56 31 65 56 37 29 22 38 30
$1,2
83
$1,4
27
(10.
4%)
(0.1
%)
(11.
2%)
(−5.
1%)
(−11
.6%
)(3
.2%
)(4
.1%
)(5
.4%
)(0
.6%
)(−
3.4%
)(1
7.0%
)(1
0.0%
)
(−5.
0%)
(5.1
%)
(9.3
%)
(52.
6%)
(−1.
6%)
(3.8
%)
(6.9
%)
$561 324
597
470
343
254
464
103
116
248
194 60 101 73 185
115 24 228
$4,4
60
$4,6
21
$5,4
403,
479
3,45
33,
948
5,29
91,
973
3,22
71,
147
717
2,58
31,
395
109
847
336
1,24
71,
083
173
1,66
1
$38,
117
$39,
340
$434 455
190
252
119
100 21 174
177 98 135 25 75 32 158
$2,4
45
$2,6
61
(18.
1%)
(17.
2%)
(18.
4%)
(52.
0%)
(31.
8%)
(18.
2%)
(35.
6%)
(11.
3%)
(18.
6%)
(8.2
%)
(−12
.5%
)(−
38.4
%)
(12.
7%)
(5.3
%)
(10.
4%)
(16.
3%)
(14.
5%)
$315 501
422
262
208
312 87 142
124
170
150
169
225
112 96 106
180
$3,5
81
$4,3
12
(2.9
%)
(3.6
%)
(6.8
%)
(1.5
%)
(26.
5%)
(1.4
%)
(47.
6%)
(−11
.4%
)(−
7.1%
)(3
.2%
)(3
0.2%
)(2
8.0%
)(9
.2%
)(−
1.7%
)(−
0.4%
)
(15.
7%)
(11.
7%)
(7.0
%)
(7.2
%)
$1,4
521,
448
1,41
81,
076
814
756
596
513
473
453
412
390
360
274
273
268
268
266
228
201
$11,
939
$13,
178
(27.
7%)
(4.5
%)
(12.
1%)
(9.8
%)
(5.1
%)
(10.
6%)
(37.
7%)
(−16
.7%
)(4
.1%
)(1
0.2%
)(2
8.8%
)(3
5.9%
)(−
0.1%
)(−
10.1
%)
(3.5
%)
(27.
5%)
(−6.
1%)
(19.
8%)
(37.
6%)
(13.
0%)
(11.
2%)
(6.3
%)
11.0
%11
.0%
10.8
%8.
2%6.
2%5.
7%4.
6%3.
9%3.
6%3.
4%3.
1%3.
0%2.
7%2.
1%2.
1%2.
0%2.
0%2.
0%1.
7%1.
5%
(90.
6%)
(100
.0%
)
Exh
ibit
2D
ata
on C
anad
a’s
Top
20 G
roup
Ins
urer
s (f
or th
e ye
ar e
ndin
g D
ecem
ber
31,1
991)
1
Sour
ce:
Ben
efit
s C
anad
a,Ju
ly-A
ugus
t,19
92,p
p. 3
2–35
.
1. F
inan
cial
num
bers
are
in m
illio
ns o
f do
llars
; num
bers
in p
aren
thes
es a
re th
e pe
rcen
tage
incr
ease
s fr
om 1
990;
bla
nks
indi
cate
una
vaila
ble
info
rmat
ion.
2. N
umbe
rs d
o no
t add
to th
e to
tals
sho
wn
beca
use
of d
ata
from
oth
er c
over
age
cate
gori
es n
ot in
clud
ed in
the
tabl
e an
d 23
sm
alle
r fi
rms
in th
e su
rvey
.
05-Klassen-4641.qxd 4/1/2005 6:47 PM Page 247

248 • CASES IN OPERATIONS MANAGEMENT
Group Life and Health Programs
Life typically a multiple of salary (e.g., two years)
Accidental death lump sums paid in the event of accidental death; reducedamounts and dismemberment for dismemberment
Extended health includes items such as drug reimbursement, vision,hospital (e.g., upgrade to semi-private), supplementarycare (e.g., wheelchairs, nursing care)
Dental includes semi-annual check-up and cleaning,non-orthodontic dental treatment
Short-term disability salary coverage for periods up to 17 weeks
Long-term disability salary coverage for periods exceeding 17 weeks
Group Pension Plans
Registered Retirement Savings Plans (RRSP)
Registered Pension Plans (RPP)
Deferred Profit Sharing Plans (DPSP)
Exhibit 3 Typical Types of Group Coverage
Source: Company files.
July 10, 1992
Based on our analysis of the proposals submitted to the client on its Canadian Group Benefit Program and the findingsand recommendations presented to the client's Canadian companies, we are pleased to advise that three companies havebeen selected to participate in finalist presentations. The client's Human Resource Council will receive presentations asidentified below. A representative of our company will attend to facilitate the discussions.
Date, Place, and Time
The presentations will be held on July 29, 1992 at the company’s offices. Directions from Toronto are attached. Thepresentations will be 1½ hours each, including 30 to 45 minutes for questions and discussion. The times have beenscheduled as follows, as previously confirmed by telephone.
Competitor A 9:00 a.m.Mutual Life 10:30 a.m.Competitor B 1:30 p.m.
Insurance Company Representatives
It is expected that each competing insurer will have a presentation team of four representatives which may be comprisedas follows:
1. The Ontario group representative who will be directly responsible for the client’s Ontario-based companies andhave on-going responsibility for the overall account;
2. The Quebec group representative who will be directly responsible for the client’s Quebec-based companies;
3. A disability claims specialist or manager who can describe the facilities, philosophies, techniques, procedures,and special advantages or skills which your company applies in the successful management of disability claimsand rehabilitation efforts;
4. One or two other representative(s) chosen at your discretion, who you believe would best round out yourpresentation team. However, the client has requested that all those in attendance have an on-going role inservicing or managing the client's account, and thus be accessible to the client's companies in the future.
Exhibit 4 A Benefits Consultant’s Recent Request for a Competitive Sales Presentation1 (Continued)
05-Klassen-4641.qxd 4/1/2005 6:47 PM Page 248
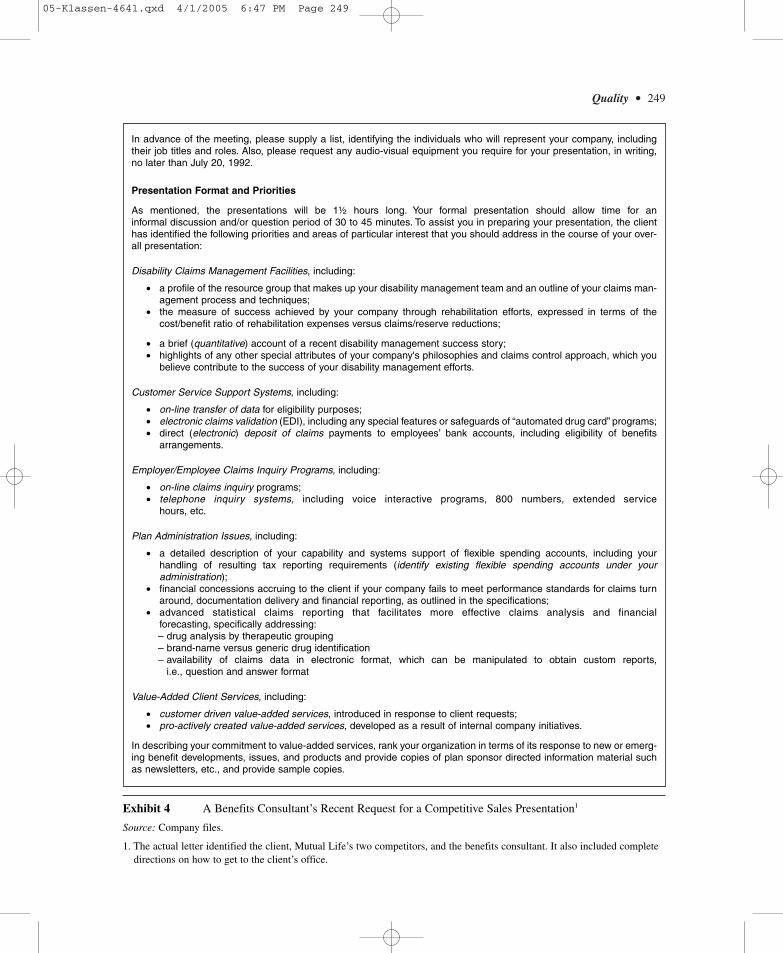
Quality • 249
In advance of the meeting, please supply a list, identifying the individuals who will represent your company, includingtheir job titles and roles. Also, please request any audio-visual equipment you require for your presentation, in writing,no later than July 20, 1992.
Presentation Format and Priorities
As mentioned, the presentations will be 1½ hours long. Your formal presentation should allow time for aninformal discussion and/or question period of 30 to 45 minutes. To assist you in preparing your presentation, the clienthas identified the following priorities and areas of particular interest that you should address in the course of your over-all presentation:
Disability Claims Management Facilities, including:
• a profile of the resource group that makes up your disability management team and an outline of your claims man-agement process and techniques;
• the measure of success achieved by your company through rehabilitation efforts, expressed in terms of thecost/benefit ratio of rehabilitation expenses versus claims/reserve reductions;
• a brief (quantitative) account of a recent disability management success story;• highlights of any other special attributes of your company's philosophies and claims control approach, which you
believe contribute to the success of your disability management efforts.
Customer Service Support Systems, including:
• on-line transfer of data for eligibility purposes;• electronic claims validation (EDI), including any special features or safeguards of “automated drug card” programs;• direct (electronic) deposit of claims payments to employees’ bank accounts, including eligibility of benefits
arrangements.
Employer/Employee Claims Inquiry Programs, including:
• on-line claims inquiry programs;• telephone inquiry systems, including voice interactive programs, 800 numbers, extended service
hours, etc.
Plan Administration Issues, including:
• a detailed description of your capability and systems support of flexible spending accounts, including yourhandling of resulting tax reporting requirements (identify existing flexible spending accounts under youradministration);
• financial concessions accruing to the client if your company fails to meet performance standards for claims turnaround, documentation delivery and financial reporting, as outlined in the specifications;
• advanced statistical claims reporting that facilitates more effective claims analysis and financialforecasting, specifically addressing:– drug analysis by therapeutic grouping– brand-name versus generic drug identification– availability of claims data in electronic format, which can be manipulated to obtain custom reports,
i.e., question and answer format
Value-Added Client Services, including:
• customer driven value-added services, introduced in response to client requests;• pro-actively created value-added services, developed as a result of internal company initiatives.
In describing your commitment to value-added services, rank your organization in terms of its response to new or emerg-ing benefit developments, issues, and products and provide copies of plan sponsor directed information material suchas newsletters, etc., and provide sample copies.
Exhibit 4 A Benefits Consultant’s Recent Request for a Competitive Sales Presentation1
Source: Company files.
1. The actual letter identified the client, Mutual Life’s two competitors, and the benefits consultant. It also included completedirections on how to get to the client’s office.
05-Klassen-4641.qxd 4/1/2005 6:47 PM Page 249

Because of the uniqueness of each plan and thecomplexity of the decision-making process, itwas difficult to compare insurers. Groups almostalways used the services of brokers or special-ist benefits consultants. Although contracts wereusually for one year, insurers expected them tobe renewed; indeed, because of a contract’sinitial costs, insurers often would not see profitsfor several years. The insurer reset rates and con-tract terms annually on the basis of experience.The group might decide to take the business tothe market to test the viability of the new terms.
The typical process worked as follows. Amember of a group plan received dental serviceand subsequently paid the dentist. The planmember and the dentist completed a form whichthe plan member then sent to Mutual Life, pos-sibly after the group administrator had checkedit. Mutual Life checked to make sure that theclaimant was covered, that the dental proceduresperformed were included in the group plan, andthat the dentist’s fee was within accepted guide-lines. The company then reimbursed the planmember. In some cases Mutual Life paid the den-tist directly. Increasingly, the dentist transferredthe information electronically to Mutual Life.
TOTAL QUALITY
MANAGEMENT AT THE MUTUAL GROUP
Although Mutual Life had considered itself to bea provider of top quality service for decades, itfirst incorporated the principles of quality serviceinto its mission statement in a formal way in1990. It believed that one of a financial servicesorganization’s key objectives was to focus onclient needs. Its stated vision was: “To be the bestin the financial markets we serve.” One of theorganization’s goals was to be recognized by itsclients as a provider of excellent value and ser-vice. The company developed specific programsand initiatives to ensure that quality servicebecame part of every staff member’s work habits.
The company established Quality Councilsin every division and offered special leadershipand quality management training to ensure thatevery member of the organization had the
knowledge and support needed to meet or exceedclient needs. Mutual Life actively sought feed-back from clients using devices such as ques-tionnaires and focus groups. It viewed feedbackas vital because it enabled the organization tosolve problems and develop better processes todeliver services important to its clients.
The growing focus on quality service duringthe late 1980s led employers to demand morefrom the administrators of their benefit programs.In the United States several large companieshad negotiated performance-based contracts,including penalty clauses, with their benefit planadministrators with reported savings of threeto 10 per cent of paid claims.2 These contractsfocused on maintaining specific standards andmaking improvements in claims processing,payments, clerical work, and pricing. The portionof employers negotiating such contracts rosesteadily from six per cent for those with fewerthan 500 employees to 57 per cent for those withover 40,000 employees. The items covered in thecontracts varied: turnaround time, 92 per cent ofcontracts; financial error rate, 64 per cent; admin-istrative error rate, 66 per cent; percentage of ben-efits paid in error, 41 per cent. The most popularform of penalty was a cash payment (78 per cent).
DEVELOPMENT OF A
SERVICE GUARANTEE AT MUTUAL LIFE
In early 1992, the concept of guaranteeingpolicyholders’ satisfaction was raised at one ofthe regular meetings of the Group Division’sseven-person Quality Service Council, whosemembership included vice-presidents. The ideaof guaranteeing service had originally occurredto Mr. Brown when he had seen an advertisementfrom a shipping company that, in essence, said:“If we don’t deliver, you don’t pay.” Mr. Brownthought: “Why couldn’t we do something likethat?” The Council subsequently discussed thenotion but reached no conclusions because itremained quite divided on the merits and fea-sibility of a service guarantee. Subsequently,the Council decided to refer the concept fordetailed study to a working group responsible
250 • CASES IN OPERATIONS MANAGEMENT
05-Klassen-4641.qxd 4/1/2005 6:47 PM Page 250
Quality • 251
to Mr. Brown. It wanted the working group torepresent the whole division, to be small enoughto be effective, to represent opinions that werestrong, but different, and to be composed ofstaff who would be affected by a guarantee—marketing people, line area managers, andactuaries.
In late April Mr. Brown chose eight stafffor the working group, and appointed the com-pany’s quality service officer, Maureen Long,who was also a Council member, as the chair-person. He explained that the concept was toguarantee policyholders’ satisfaction or “yourmoney refunded.” In his words: “Because ourerrors increase our clients’ costs, we shouldreimburse them.”
Mr. Brown outlined one possible approachto the working group: survey policyholdersjust before their anniversary dates to determinesatisfaction levels and reduce plan expensesfor the following year by one to 10 per centdepending on the degree of dissatisfaction, withno questions asked, and indicate that a companymanager would follow up to investigate thereasons for dissatisfaction.
Mr. Brown asked the working group todetermine if there were overwhelming reasonsnot to proceed, and if not, how the GroupDivision could put the service guarantee con-cept into action. In his memorandum to thegroup he cited some potential advantages of aservice guarantee:
• provide an opportunity to gain a competitiveedge by being the first Canadian company toadd this feature;
• send a message to people, both inside and out-side the company, that Mutual Life was seriousabout quality service; and,
• open the door to more feedback from clients.
He asked the working group to report by lateMay.
The working group met for two or three daysduring May, produced a report in early June,and met with the Quality Council in mid-Juneto review progress. The Council agreed that theworking group had not yet finished the job.Subsequently, the working group performed
additional analysis and met twice. Now, theworking group’s final report was complete.
THE WORKING GROUP’S REPORT3
The working group did not find the task easy.Their meetings generated what they called “con-siderable fiery debate.” As they commented:
A performance guarantee is really not a very diffi-cult concept, except for the few million details.And it was those few million details that generatedmuch debate over the course of our meetings.
Objectives
The working group recognized that a serviceguarantee would differentiate the division byvisibly demonstrating its commitment to serviceand leadership in the Canadian marketplace.Their report commented that visibility wouldhelp distinguish Mutual Life from all the othercompanies which claimed to be committed to,and providing, high quality service. Mutual Lifeconsidered that it already was a good providerof service and that a guarantee would allow itto do more than just talk about it. The workinggroup also recognized that a service guaranteewould help the division develop a stronger,more aggressive, and innovative image in themarketplace.
Principles
The group identified the following principlesas being important in guarantee design:
1. Clients should see the guarantee as being sim-ple and uncomplicated. A simple “money backguarantee” would lose all of its sizzle if it waslayered with conditions that the client had tomeet before making a claim.
2. Although the division could always make itsguarantee better over time, once it launched theguarantee, it could not revoke it—at least notwithout considerable market damage. Theworking group wanted the guarantee to stretchthe division, but not unrealistically—there had
05-Klassen-4641.qxd 4/1/2005 6:47 PM Page 251

to be a good chance of success. They wantedthe division to be capable of meeting the needsof at least 95 per cent of its clients.
3. The division wanted an opportunity for clientsto tell it why they were dissatisfied so the divi-sion could learn and improve.
4. The cost of the guarantee should come fromthe bottom line rather than be recovered fromclients through higher administrative fees. Theworking group believed that because the guar-antee would bring the division new business,keep business on the books longer, and helpreduce expenses through process improvement,the division should view its cost as an invest-ment to help reach these objectives.
Options
The working group considered several options,including the following:
1. The division would guarantee to meetcertain specified standards for turnaround time,accuracy, responsiveness, and courteousness,expressed as 100 per cent achievement withinX days; if the client believed that the divisionhad not met the guarantee, the division wouldpay, no questions asked.
The working group believed that althoughOption 1 would make the strongest statement toclients, it would also be the most difficult for thedivision to live up to. Once the division guaran-teed 100 per cent performance, it could not laterback off to 90 per cent without suffering signifi-cant market damage. The working group agreedthat, although all clients wanted good perfor-mance on the proposed measures, the real issuewas how much they valued these features com-pared to others such as cost and flexibility.
The group believed that the division wasalready close to meeting the proposed standards.However, committing to perform at the statedlevel consistently was another matter. Would thecompany be prepared to add the needed spaceand human resources? Would staff be preparedto work shifts of variable length to match fluctu-ating work volumes? Would support areas inthe rest of the company, such as mail services,
computer systems, and translation, function wellenough?
The group realized that, although the divisionwould not always be able to meet the standards,if it met them 97 to 99 per cent of the time, manyclients would not make a claim.
2. The division would guarantee client satis-faction, and would provide guidelines for whatto expect for turnaround time, accuracy, respon-siveness, and courteousness, expressed as, forexample, 85 per cent achievement within Y days.It would also state that, although the divisionexpected to be able to meet or exceed the statedstandards, the guarantee was not built aroundmeeting them; if the client was not satisfied withthe division’s performance on these dimensions,the division would pay, no questions asked.
The attractive features of Option 2 were that itwould require neither the large initial investmentof Option 1, nor immediate adherence to the stan-dards. However, the working group recognizedthat this option also had some potential problems:
• The service guidelines might be for items thatclients did not value.
• This option might not have an impact on clients.• Any advantage it offered might not be
sustainable.
3. The division would guarantee client satis-faction. If the division’s efforts did not satisfy theclient, the division would pay, no questions asked.
The working group described this option asthe most wide open. Because clients would haveto initiate claims against the guarantee, the divi-sion would get important information concerningwhat clients valued. On the other hand, there wasthe potential that this option could flood the divi-sion with relatively minor items; for example,some clients might want duplicate copies offorms, or request that multiple copies be mailedto different addresses. Although Option 3 allowedthe division an attempt to resolve the problem, itmight decide not to support the changes neededto implement the correction. How would the divi-sion deal with a similar claim the next year?Would this option really add value?
252 • CASES IN OPERATIONS MANAGEMENT
05-Klassen-4641.qxd 4/1/2005 6:47 PM Page 252

The working group was unable to chooseamong the options without input from seniormanagement on several questions:
• How serious is the division about this?• How big a splash does the division want to
make in the marketplace?• How difficult does the division want to make it
for competitors to copy it?• Is the division prepared to make a service guar-
antee its primary focus and defer or eliminateother initiatives?
The Amount and Structure of Payment
The working group decided to abandontwo proposals: paying claimants a percentage ofadministrative expenses paid, and paying them apercentage of premiums paid. They rejected thefirst because many clients did not readily knowhow much they paid in administrative expenses,and the second because the very small (singledigit) percentages involved would not have muchimpact. However, this second method wouldbe much more visible to clients. In the end, theworking group decided to recommend a flat rateper member. The working group recommendedthat for clients with several plans, payment belimited to the number of members covered in thesection making the claim.
The working group decided that the launch ofthe guarantee should focus on the fact that thedivision’s preparedness to refund administrativeexpenses, rather than concentrate on the detailsof how it calculated those expenses. In theirwords: “We do not want the details to detractfrom the impact of our message.” The divisionwould explain details to clients when they madea claim.
Payment of the Guarantee
The working group recommended that thedivision immediately issue a cheque for the fullamount of the refund payable to the plan sponsor.An alternative was to issue a credit against futureexpenses or assess it against a plan deficit. Thegroup also recommended that the division be
prepared to make the cheque payable to achosen charity, or to allocate refunds directlyto members should the client be unable to accepta refund. These variations would require somechanges to the division’s internal processes andrecord keeping. For clients with multiple plans,the working group believed that it was preferableto make payment through the client’s mainadministrative section so that the client wasaware that one of its sections was making aclaim. Should the plan sponsor demand a differ-ent route, the division should at least inform theclient’s main section.
Collecting Feedback From Clients
The working group believed that collectingfeedback regularly from clients would representan excellent opportunity for the division,whether or not it proceeded with a service guar-antee. They recommended that the divisionformally ask clients to evaluate the divisionannually at renewal time. They also recom-mended that clients be sent a short, informalcomment card each month to encourage them tosend in their comments—both good and bad—only some of which might be related to guaran-teed items. The working group advised that thecards be distributed with monthly statements;clients that did not receive monthly statementswould be given a number of cards in advanceso that they could submit comments with theirregular mailings to the division.
The working group recognized that the divi-sion would face the critical challenge of havingto deal with the comments in a timely, effectivemanner. They recommended that sufficient staffat a junior management level be allocated to thistask. These staff would be responsible for resolv-ing the issues raised; this would most likelyinvolve coordinating the activities of line man-agers. Because client concerns entered the divi-sion at many points, it was difficult to determinehow many comments the division received now;making it easier for clients to comment shouldincrease the number of enquiries. Centralizingresponsibility for responding to comments would
Quality • 253
05-Klassen-4641.qxd 4/1/2005 6:47 PM Page 253
give the division a better overall feel for clientconcerns and ensure that dealing with clientconcerns would become a priority. It would beimportant for the client contact person to act firstand inform others second. Although it would beimportant to keep front line sales and serviceworkers informed, waiting to ensure that repre-sentatives were involved before responding toa client concern would unacceptably reduceresponsiveness.
The working group recommended that thedivision develop a simple on-line tracking systemto capture data on client comments and the actiontaken to resolve them. If used wisely, such a database could both keep field staff informed effi-ciently and allow better client management. Theyrecognized that they had to do more analysis of atracking system, particularly as it affected otherdata systems within the division.
Launch Date
The working group established September1992 as a target for launch with the guaranteebeing announced and effective immediately.They chose this date because competition forclients with January renewal dates was high inthe fourth quarter.
Preparation for Launch
The working group recognized that the divi-sion would have to be ready prior to launch,especially if it chose Option 1. They believedthat it would be unfair and very stressful toexpect managers to react to new standards with-out prior warning. However, they also realizedthat the division wanted no public discussion ofthe guarantee until shortly before implementa-tion. The working group recommended that thedivision talk to the managers most affected aboutthe new standards and level of service towardswhich it wished to work without revealing thatthey were tied to a guarantee. In September,when the division hoped to meet the standards, itcould go the extra step of announcing that it wasprepared to guarantee its performance.
The working group acknowledged thatcommunication to staff at all levels would be acritical factor for success. They recommendedthat any communication be done in person, notwriting. It was important to communicate that:the division believed it was a good serviceprovider; it wanted to continue to improve; theguarantee initiative would demonstrate to itsclients its commitment to quality service; and,the guarantee would help to focus the division’simprovement efforts on items clients valuedmost (through client feedback). It would beimportant that the division’s devotion of time,money, systems, and people to the guarantee bevisible to staff.
The working group believed that thedivision should inform management staff first,followed shortly by non-management staff.Regarding announcing the guarantee to Groupand Claims offices, the working group sug-gested that a video with a message fromMr. Brown, supported by written material,would be appropriate.
The working group decided that representa-tives should receive two weeks’ advance noticeand promotional material to give them time tonotify their market sources.
The pre-launch preparation would have toinclude internal services, such as translation,computer systems, and mail services. Thisoption would require early involvement, sup-port, and commitment. Regardless of the optionchosen, the division would have to ensure thatinternal services did not make changes thatmight affect the Group Division without priordiscussion.
The working group decided that Mr. Brownshould inform clients of the guarantee by letter.They suggested that the division inform potentialclients, using such media as newspaper advertis-ing or industry magazines.
Finally, the working group recognized a needfor follow-up communication to increase thedivision’s profile for its work on this initiativeand to capture positive staff reaction. They sug-gested using existing company newsletters forthis purpose.
254 • CASES IN OPERATIONS MANAGEMENT
05-Klassen-4641.qxd 4/1/2005 6:47 PM Page 254
Financial Impact
The working group projected the financialimpact of a number of scenarios. However, theyhad no idea what the actual claim rate or theclaim amount would be.
Measuring Effectiveness
The working group concluded that althoughno one measure would be definitive, the divisionshould measure several items to gauge the guar-antee’s effectiveness. Although the workinggroup identified these items, they recognized thatthey would not be easy to measure and that itwould be even more difficult to establish causeand effect relationships between their values andthe service guarantee. The working group pro-posed that the division could measure perfor-mance using surveys, and feedback (bothsolicited and unsolicited) from sales staff andbusiness sources. They also pointed out the needfor good measures of the division’s processes toallow it to identify and correct problems beforethey became issues to clients. The identifieditems were:
1. The retention of the division’s block of busi-ness compared to pre-guarantee levels andindustry averages.
2. Staff awareness and demonstrated commitmentto quality service.
3. Market response to the division’s delivery ofquality service.
4. Client satisfaction.
5. The effect of the guarantee in generating newbusiness.
6. The direct cost of the guarantee.
7. The benefits realized from improved processesand services.
8. The division’s responsiveness in fixing con-cerns raised by clients.
9. The effectiveness of advance warning controlsin identifying and correcting problems beforethey became issues for clients.
Uncontrollable Factors
Guaranteeing service was a big move.Although the division could take action onseveral fronts to support the guarantee, manyother factors, which could affect service or clientperceptions about service, remained outside itscontrol. These included:
1. Communication between offices could fail—orexample, through postal strikes, or failure ofequipment or services.
2. Legislation could add to Mutual Life’s admin-istrative load and/or change its environment.For example, when the government introducedits registered retirement savings plan (RRSP)home buyers’ loan plan, Mutual Life’s require-ments increased, affecting the company’s abil-ity to complete RRSP withdrawals within itsstated time frame.
3. Actions taken by agents and other divisionsand offices within The Mutual Group couldaffect client satisfaction because clients didnot differentiate among the various arms ofMutual Life.
Problems
In its report, the working group identified anumber of questions or potential problems. Theywere concerned whether the message to staffshould be an objective or a by-product of the guar-antee. If a message to staff were the objective, wasa service guarantee the right way to do it?
Second, the working group pointed outthat, no matter how well the division performed,some clients might abuse a guarantee. How largewould this group be? How much might theycost? What should the division do about them?
A final issue concerning client feedback hadto do with clients that did not fit well with thedivision. How should the division deal with suchclients?
CONCLUSION
Although the working group had recommendedthat the division proceed with the notion of a
Quality • 255
05-Klassen-4641.qxd 4/1/2005 6:47 PM Page 255

service guarantee, they left several questionsunresolved. Should the division guarantee itsservice? If so, what should the details of theguarantee be? If not, what would happen if oneor more of the division’s competitors success-fully introduced a guarantee? Mr. Brown nowhad to decide whether to accept the workinggroup’s main recommendation, and, if so, whatchanges he should make to the proposal and howhe should answer the unresolved issues. Thedecision was not an easy one for him:
A guarantee is really a leap of faith. I don’tthink anyone can really tell in advance exactlywhat will happen. The guarantee could be seen asa blank cheque and going with one is essentially anirreversible decision. Once we offer one, it will be
almost impossible to step back from it, or even tomake significant changes. But, if we don’t offerone, how else can we continue to demonstrate ourcommitment to service and differentiate ourselves?
NOTES
1. J. Charles, “Sea of Shove,” Benefits Canada, 10(7), 32–35, (July-August 1992).
2. N. Connors, “Employees Are Demanding MoreFrom Their Claims Administrators,” Business andHealth, 10 (5), 70–73, April, 1992; and, “Data Watch:Tackling Claims Administration Expenses,” Businessand Health, 10 (5), 18–19, April, 1992.
3. This section presents edited extracts from thereport, not the report in its entirety.
256 • CASES IN OPERATIONS MANAGEMENT
05-Klassen-4641.qxd 4/1/2005 6:47 PM Page 256