Here for good - HKEXnews
396
ANNUAL REPORT 2018 Here for good Driving commerce and prosperity through our unique diversity
-
Upload
khangminh22 -
Category
Documents
-
view
0 -
download
0
Transcript of Here for good - HKEXnews
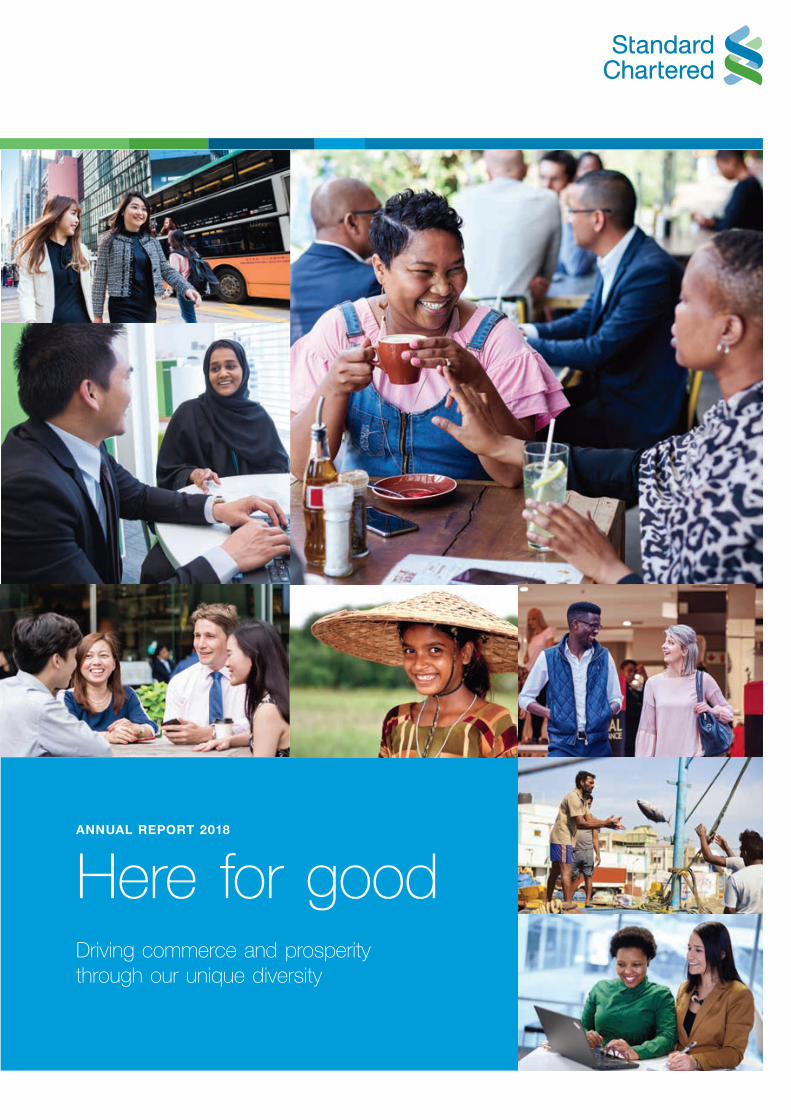
ANNUAL REPORT 2018
Here for goodDriving commerce and prosperity through our unique diversity
LSE Stock code: STAN.LN HKSE Stock code: 02888 BSE/NSE Stock code: STAN.IN
CONTACT INFORMATION
Global headquarters Standard Chartered Group 1 Basinghall Avenue London, EC2V 5DD United Kingdom
telephone: +44 (0)20 7885 8888 facsimile: +44 (0)20 7885 9999
Digital Annual Report and Accounts
sc.com/annualreport
Shareholder enquiriesShareCare informationwebsite: sc.com/shareholders helpline: 0370 702 0138
ShareGift information website: ShareGift.orghelpline: 020 7930 3737
Registrar informationUKComputershare Investor Services PLC The Pavilions Bridgwater Road Bristol, BS99 6ZZ Helpline: 0370 702 0138
Hong KongComputershare Hong Kong Investor Services Limited 17M Floor, Hopewell Centre 183 Queen’s Road East Wan Chai Hong Kongwebsite: computershare.com/hk/investors
Indian Depository ReceiptsKarvy Fintech Private Limited Karvy Selenium Tower B, Plot 31-32 Financial District Nanakramguda Hyderabad 500032, India
Chinese translationComputershare Hong Kong Investor Services Limited 17M Floor, Hopewell Centre 183 Queen’s Road East Wan Chai Hong Kong
Register for electronic communicationswebsite: investorcentre.co.uk
Sta
nd
ard
Ch
artered
PLC
Annual R
eport 2018

Designed and produced by Friend www.friendstudio.com
Printed by Park Communications on FSC® certified paper.
Park is an EMAS certified company and its Environmental Management System is certified to ISO 14001.
100% of the inks used are vegetable oil based, 95% of press chemicals are recycled for further use and, on average, 99% of any waste associated with this production will be recycled.
This document is printed on Revive 50 silk, a paper containing 50% recycled fibre (25% post-consumer and 25% pre-consumer) and 50% virgin fibre sourced from well-managed, responsible, FSC® certified forests. The pulp used in this product is bleached using an elemental chlorine free (ECF) process.
This document is fully recyclable.
© Standard Chartered PLC. All rights reserved.
The STANDARD CHARTERED word mark, its logo device and associated product brand names are owned by Standard Chartered PLC and centrally licensed to its operating entities.
Registered Office: 1 Basinghall Avenue, London EC2V 5DD. Telephone +44 (0) 20 7885 8888.
Principal place of business in Hong Kong: 32nd Floor, 4-4A Des Voeux Road, Central, Hong Kong.
Registered in England No. 966425.
Standard Chartered Annual Report 2018
About this report
Sustainability reporting is embedded across our Annual Report and Accounts and is also available in consolidated form in our Sustainability Summary at sc.com/sustainabilitysummary
The Group uses a number of alternative performance measures in the discussion of its performance. These measures exclude certain items which management believe are not representative of the underlying performance of the business and which distort period-on-period comparison. They provide the reader with insight into how management measures the performance of the business.
For more information please visit sc.com
Photo competition
In 2018 we ran our Annual Report staff photo competition again, this time showcasing our three valued behaviours. The top three entrants can be found on the front and back cover, and there is further information on pages 134, 224 and 356.
Unless another currency is specified, the word ‘dollar’ or symbol ‘$’ in this document means US dollar and the word ‘cent’ or symbol ‘c’ means one-hundredth of one US dollar.Those disclosures marked ‘unaudited’ are not within the scope of KPMG LLP’s audit.Unless the context requires, within this document, ‘China’ refers to the People’s Republic of China and, for the purposes of this document only, excludes Hong Kong Special Administrative Region (Hong Kong), Macau Special Administrative Region (Macau) and Taiwan. ‘Korea’ or ‘South Korea’ refers to the Republic of Korea. Greater China & North Asia (GCNA) includes China, Hong Kong, Japan, Korea, Macau and Taiwan; ASEAN & South Asia (ASA) includes Australia, Bangladesh, Brunei, Cambodia, India, Indonesia, Laos, Malaysia, Myanmar, Nepal, Philippines, Singapore, Sri Lanka, Thailand and Vietnam; and Africa & Middle East (AME) includes Bahrain, Egypt, Iraq, Jordan, Lebanon, Oman, Pakistan, Qatar, Saudi Arabia and the United Arab Emirates (UAE).Within the tables in this report, blank spaces indicate that the number is not disclosed, dashes indicate that the number is zero and nm stands for not meaningful.Standard Chartered PLC is headquartered in London. The Group’s head office provides guidance on governance and regulatory standards. Standard Chartered PLC stock codes are: HKSE 02888; LSE STAN.LN; and BSE/NSE STAN.IN.
@StanChart
linkedin.com/company/standard-chartered-bank
facebook.com/standardchartered
Further information is available where you see these icons:
More information is available online
Additional information can be found within the report
Standard Chartered is a leading international banking group.
Our heritage and values are expressed in our brand promise, Here for good. Our operations reflect Our Purpose, which is to drive commerce and prosperity through our unique diversity. We are present in 60 markets and serve clients in a further 85. Our businesses serve four client segments in four regions, supported by our global functions.
Greater China & North Asia
Read more on page 26
ASEAN & South Asia
Read more on page 27
Europe & Americas
Read more on page 29
Africa & Middle East
Read more on page 28

Risk review
and Cap
ital reviewS
TR
AT
EG
IC R
EP
OR
TS
upp
lementary info
rmatio
nFinancial statem
entsD
irectors’ rep
ort
01
OUR PURPOSE AND PROGRESS
Delivering our strategyOver the past year we have made substantial progress in executing the turnaround plan
laid out in 2015. We have significantly improved profitability, balance sheet quality, conduct and financial returns and we are now evolving our strategy to focus on our next horizon. We gauge our annual progress against a set of Group key performance indicators (KPIs), a selection of which are shown below, as well as client segment KPIs, some of which are
shown on pages 21 to 24.
Contents
Strategic report
02 Who we are and what we do
04 Group Chairman’s statement
07 Group Chief Executive’s review
12 Market environment
14 Business model
16 Our strategy
21 Client segment reviews
26 Regional reviews
30 Group Chief Financial Officer’s review
38 Group Chief Risk Officer’s review
42 Stakeholders and responsibilities
52 Non-financial information statement
53 Viability statement
54 Directors’ report
134 Risk review and Capital review
224 Financial statements
356 Supplementary information
OTHER FINANCIAL MEASURES
Operating income
$14,968m 5%Underlying basis
$14,789m 3%Statutory basis
Profit before tax
$3,857m 28%Underlying basis
$2,548m 6%Statutory basis
Earnings per share
61.4 cents 14.2 cents
Underlying basis
18.7 cents 4.8 centsStatutory basis
FINANCIAL KPIS
Return on tangible equity
5.1% 120bps
Underlying basis
1.6% 40bps
Statutory basis
Return on equity
4.6% 110bps
Underlying basis
1.4% 30bps
Statutory basis
Common Equity Tier 1 ratio
14.2% 60bps
Total shareholder return
(21.5)%
NON-FINANCIAL KPIS
Diversity and inclusion: women in senior roles
27.7% 2%
Sustainability Aspirations met or on track
90.9% 2%
Read more on page 5
Read more on page 5
Read more on page 44
Read more on page 47
Read more on page 31 Read more on page 31 Read more on page 31
Clients Regulators & governments
InvestorsColleagues Society Suppliers
Throughout this report, we use these icons to represent the different stakeholders groups for whom we create value.
Read more on page 15 and 42-51
Read more on page 5
nm
STRATEGIC REPORT Our business
Standard Chartered Annual Report 201802
Here for goodWho we are and what we do
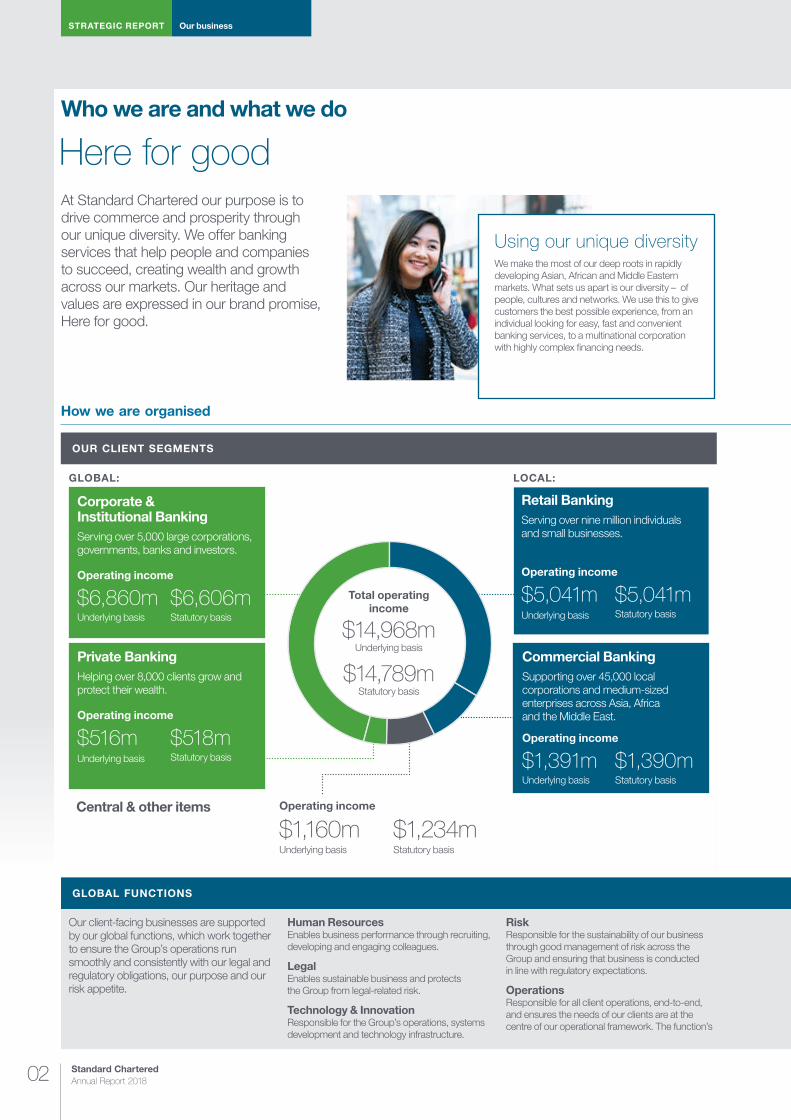
GLOBAL FUNCTIONS
Our client-facing businesses are supported by our global functions, which work together to ensure the Group’s operations run smoothly and consistently with our legal and regulatory obligations, our purpose and our risk appetite.
Human Resources Enables business performance through recruiting, developing and engaging colleagues.
Legal Enables sustainable business and protects the Group from legal-related risk.
Technology & InnovationResponsible for the Group’s operations, systems development and technology infrastructure.
Risk Responsible for the sustainability of our business through good management of risk across the Group and ensuring that business is conducted in line with regulatory expectations.
OperationsResponsible for all client operations, end-to-end, and ensures the needs of our clients are at the centre of our operational framework. The function’s
At Standard Chartered our purpose is to drive commerce and prosperity through our unique diversity. We offer banking services that help people and companies to succeed, creating wealth and growth across our markets. Our heritage and values are expressed in our brand promise, Here for good.
Using our unique diversityWe make the most of our deep roots in rapidly developing Asian, African and Middle Eastern markets. What sets us apart is our diversity – of people, cultures and networks. We use this to give customers the best possible experience, from an individual looking for easy, fast and convenient banking services, to a multinational corporation with highly complex financing needs.
How we are organised
GLOBAL:
Corporate & Institutional BankingServing over 5,000 large corporations, governments, banks and investors.
Operating income
$6,860mUnderlying basis
$6,606mStatutory basis
Private BankingHelping over 8,000 clients grow and protect their wealth.
Operating income
$516mUnderlying basis
$518mStatutory basis
Commercial BankingSupporting over 45,000 local corporations and medium-sized enterprises across Asia, Africa and the Middle East.
Operating income
$1,391mUnderlying basis
$1,390mStatutory basis
Retail BankingServing over nine million individuals and small businesses.
Operating income
$5,041mUnderlying basis
$5,041mStatutory basis
LOCAL:
OUR CLIENT SEGMENTS
Central & other items Operating income
$1,160mUnderlying basis
$1,234mStatutory basis
Total operating income
$14,968mUnderlying basis
$14,789mStatutory basis
Risk review
and Cap
ital reviewS
TR
AT
EG
IC R
EP
OR
TS
upp
lementary info
rmatio
nFinancial statem
entsD
irectors’ rep
ort
03
GLOBAL FUNCTIONS
strategy is supported by consistent performance metrics, standards and practices that are aligned to client outcomes.
Group CFO Comprises seven support functions: Finance, Treasury, Strategy, Investor Relations, Corporate Development, Supply Chain and Property. The leaders of these functions report directly to Andy Halford, Group Chief Financial Officer.
Corporate Affairs & Brand and MarketingManages the Group’s communications and engagement with stakeholders in order to protect and promote the Group’s reputation, brand and services.
Group Internal AuditAn independent function whose primary role is to help the Board and Executive Management to
protect the assets, reputation and sustainability of the Group.
Conduct, Financial Crime and ComplianceEnables sustainable business by delivering the right outcomes for our clients and our markets by driving the highest standards in conduct, fighting financial crime and compliance.
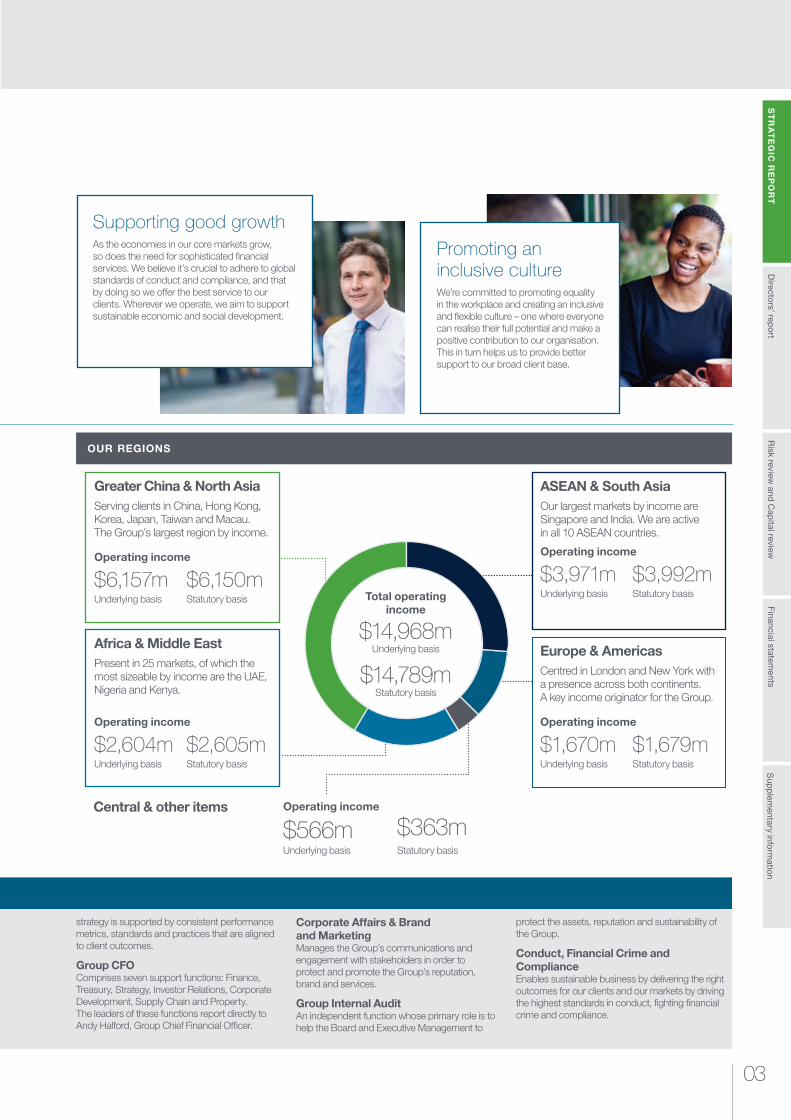
Supporting good growthAs the economies in our core markets grow, so does the need for sophisticated financial services. We believe it’s crucial to adhere to global standards of conduct and compliance, and that by doing so we offer the best service to our clients. Wherever we operate, we aim to support sustainable economic and social development.
How we are organised
Greater China & North AsiaServing clients in China, Hong Kong, Korea, Japan, Taiwan and Macau. The Group’s largest region by income.
Operating income
$6,157mUnderlying basis
$6,150mStatutory basis
Africa & Middle EastPresent in 25 markets, of which the most sizeable by income are the UAE, Nigeria and Kenya.
Operating income
$2,604mUnderlying basis
$2,605mStatutory basis
ASEAN & South AsiaOur largest markets by income are Singapore and India. We are active in all 10 ASEAN countries.
Operating income
$3,971mUnderlying basis
$3,992mStatutory basis
Europe & AmericasCentred in London and New York with a presence across both continents. A key income originator for the Group.
Operating income
$1,670mUnderlying basis
$1,679mStatutory basis
OUR REGIONS
Central & other items Operating income
$566mUnderlying basis
$363mStatutory basis
Total operating income
$14,968mUnderlying basis
$14,789mStatutory basis
Promoting an inclusive cultureWe’re committed to promoting equality in the workplace and creating an inclusive and flexible culture – one where everyone can realise their full potential and make a positive contribution to our organisation. This in turn helps us to provide better support to our broad client base.
STRATEGIC REPORT Group Chairman’s statement
Standard Chartered Annual Report 201804
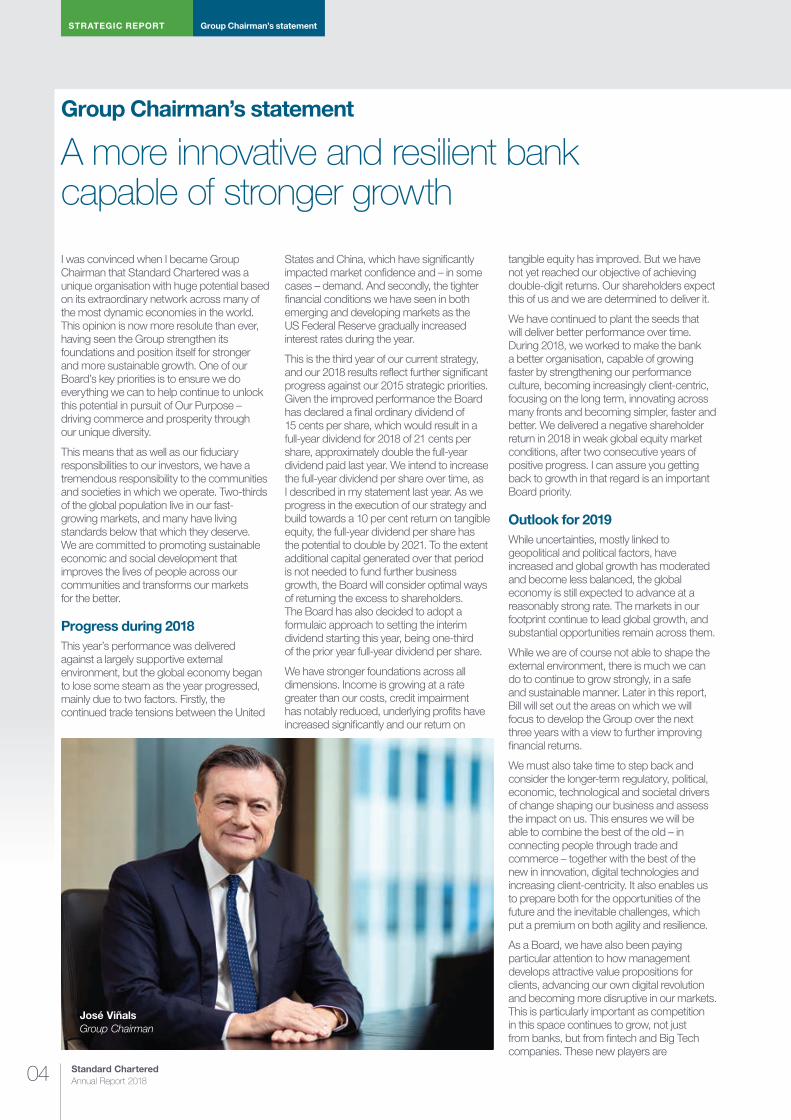
Group Chairman’s statement
A more innovative and resilient bank capable of stronger growth
I was convinced when I became Group Chairman that Standard Chartered was a unique organisation with huge potential based on its extraordinary network across many of the most dynamic economies in the world. This opinion is now more resolute than ever, having seen the Group strengthen its foundations and position itself for stronger and more sustainable growth. One of our Board’s key priorities is to ensure we do everything we can to help continue to unlock this potential in pursuit of Our Purpose – driving commerce and prosperity through our unique diversity.
This means that as well as our fiduciary responsibilities to our investors, we have a tremendous responsibility to the communities and societies in which we operate. Two-thirds of the global population live in our fast-growing markets, and many have living standards below that which they deserve. We are committed to promoting sustainable economic and social development that improves the lives of people across our communities and transforms our markets for the better.
Progress during 2018This year’s performance was delivered against a largely supportive external environment, but the global economy began to lose some steam as the year progressed, mainly due to two factors. Firstly, the continued trade tensions between the United
States and China, which have significantly impacted market confidence and – in some cases – demand. And secondly, the tighter financial conditions we have seen in both emerging and developing markets as the US Federal Reserve gradually increased interest rates during the year.
This is the third year of our current strategy, and our 2018 results reflect further significant progress against our 2015 strategic priorities. Given the improved performance the Board has declared a final ordinary dividend of 15 cents per share, which would result in a full-year dividend for 2018 of 21 cents per share, approximately double the full-year dividend paid last year. We intend to increase the full-year dividend per share over time, as I described in my statement last year. As we progress in the execution of our strategy and build towards a 10 per cent return on tangible equity, the full-year dividend per share has the potential to double by 2021. To the extent additional capital generated over that period is not needed to fund further business growth, the Board will consider optimal ways of returning the excess to shareholders. The Board has also decided to adopt a formulaic approach to setting the interim dividend starting this year, being one-third of the prior year full-year dividend per share.
We have stronger foundations across all dimensions. Income is growing at a rate greater than our costs, credit impairment has notably reduced, underlying profits have increased significantly and our return on
tangible equity has improved. But we have not yet reached our objective of achieving double-digit returns. Our shareholders expect this of us and we are determined to deliver it.
We have continued to plant the seeds that will deliver better performance over time. During 2018, we worked to make the bank a better organisation, capable of growing faster by strengthening our performance culture, becoming increasingly client-centric, focusing on the long term, innovating across many fronts and becoming simpler, faster and better. We delivered a negative shareholder return in 2018 in weak global equity market conditions, after two consecutive years of positive progress. I can assure you getting back to growth in that regard is an important Board priority.
Outlook for 2019While uncertainties, mostly linked to geopolitical and political factors, have increased and global growth has moderated and become less balanced, the global economy is still expected to advance at a reasonably strong rate. The markets in our footprint continue to lead global growth, and substantial opportunities remain across them.
While we are of course not able to shape the external environment, there is much we can do to continue to grow strongly, in a safe and sustainable manner. Later in this report, Bill will set out the areas on which we will focus to develop the Group over the next three years with a view to further improving financial returns.
We must also take time to step back and consider the longer-term regulatory, political, economic, technological and societal drivers of change shaping our business and assess the impact on us. This ensures we will be able to combine the best of the old – in connecting people through trade and commerce – together with the best of the new in innovation, digital technologies and increasing client-centricity. It also enables us to prepare both for the opportunities of the future and the inevitable challenges, which put a premium on both agility and resilience.
As a Board, we have also been paying particular attention to how management develops attractive value propositions for clients, advancing our own digital revolution and becoming more disruptive in our markets. This is particularly important as competition in this space continues to grow, not just from banks, but from fintech and Big Tech companies. These new players are
José Viñals Group Chairman
Risk review
and Cap
ital reviewS
TR
AT
EG
IC R
EP
OR
TS
upp
lementary info
rmatio
nFinancial statem
entsD
irectors’ rep
ort
05
increasingly providing financial services with developed technology platforms and lower costs, often with more limited regulatory obligations at present.
We must also consider how we see the balance between returns and risk. In this context, the Board is supportive of an environment where our colleagues feel freer to innovate, collaborate and grow within the limits defined by our Risk Appetite.
Strengthening our defencesThis year, we have been encouraged by the significant further progress we have made in improving our Risk Management Framework across all dimensions, alongside our stronger capital and liquidity position. The fight against
financial crime remains paramount to us, both in our operations and in leading and partnering in initiatives to combat it more effectively.
Our enhanced Risk Appetite Statement and our improved attention to non-financial risks are two further key areas which make us stronger, and we have also passed the latest round of the Bank of England stress tests without any caveats.
That said, we are by no means complacent. One risk domain which remains top of mind is cyber risk. We continue to expand our capabilities in this area and enhance our operating models to strengthen our defences and keep pace with ever-evolving cyber threats.
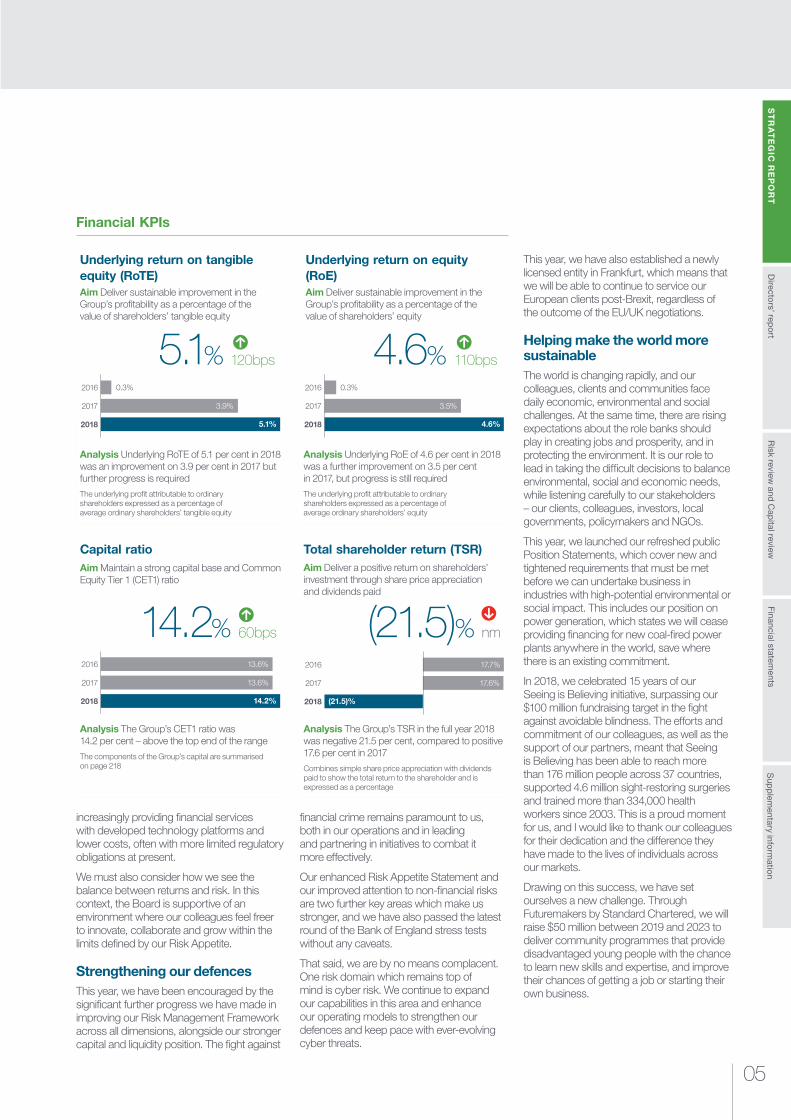
Financial KPIs
Underlying return on tangible equity (RoTE)Aim Deliver sustainable improvement in the Group’s profitability as a percentage of the value of shareholders’ tangible equity
Analysis Underlying RoTE of 5.1 per cent in 2018 was an improvement on 3.9 per cent in 2017 but further progress is required
The underlying profit attributable to ordinary shareholders expressed as a percentage of average ordinary shareholders’ tangible equity
5.1% 120bps
2018
2017
2016 0.3%
3.9%
5.1%
Capital ratioAim Maintain a strong capital base and Common Equity Tier 1 (CET1) ratio
Analysis The Group’s CET1 ratio was 14.2 per cent – above the top end of the range
The components of the Group’s capital are summarised on page 218
14.2%
2018
2017
2016 13.6%
13.6%
14.2%
60bps
Total shareholder return (TSR)Aim Deliver a positive return on shareholders’ investment through share price appreciation and dividends paid
Analysis The Group’s TSR in the full year 2018 was negative 21.5 per cent, compared to positive 17.6 per cent in 2017
Combines simple share price appreciation with dividends paid to show the total return to the shareholder and is expressed as a percentage
(21.5)%
2018
2017
2016 17.7%
17.6%
(21.5)%
Underlying return on equity (RoE)Aim Deliver sustainable improvement in the Group’s profitability as a percentage of the value of shareholders’ equity
Analysis Underlying RoE of 4.6 per cent in 2018 was a further improvement on 3.5 per cent in 2017, but progress is still required
The underlying profit attributable to ordinary shareholders expressed as a percentage of average ordinary shareholders’ equity
4.6% 110bps
2018
2017
2016 0.3%
3.5%
4.6%
This year, we have also established a newly licensed entity in Frankfurt, which means that we will be able to continue to service our European clients post-Brexit, regardless of the outcome of the EU/UK negotiations.
Helping make the world more sustainableThe world is changing rapidly, and our colleagues, clients and communities face daily economic, environmental and social challenges. At the same time, there are rising expectations about the role banks should play in creating jobs and prosperity, and in protecting the environment. It is our role to lead in taking the difficult decisions to balance environmental, social and economic needs, while listening carefully to our stakeholders – our clients, colleagues, investors, local governments, policymakers and NGOs.
This year, we launched our refreshed public Position Statements, which cover new and tightened requirements that must be met before we can undertake business in industries with high-potential environmental or social impact. This includes our position on power generation, which states we will cease providing financing for new coal-fired power plants anywhere in the world, save where there is an existing commitment.
In 2018, we celebrated 15 years of our Seeing is Believing initiative, surpassing our $100 million fundraising target in the fight against avoidable blindness. The efforts and commitment of our colleagues, as well as the support of our partners, meant that Seeing is Believing has been able to reach more than 176 million people across 37 countries, supported 4.6 million sight-restoring surgeries and trained more than 334,000 health workers since 2003. This is a proud moment for us, and I would like to thank our colleagues for their dedication and the difference they have made to the lives of individuals across our markets.
Drawing on this success, we have set ourselves a new challenge. Through Futuremakers by Standard Chartered, we will raise $50 million between 2019 and 2023 to deliver community programmes that provide disadvantaged young people with the chance to learn new skills and expertise, and improve their chances of getting a job or starting their own business.
nm
STRATEGIC REPORT Group Chairman’s statement
Standard Chartered Annual Report 201806
Group Chairman’s statement continued
Governance and cultureA strong culture and robust governance are essential. The Board continues to strive for a culture of open communication and challenge inside the boardroom, where the Board can hold management accountable for execution and delivery of the Board-approved strategy. We also need to continue setting the tone from the top on the right culture for the Group. Leading by example is today more important than ever. Only fully ethical leadership based on the right values and behaviours can succeed over the longer term. Anything else
is a mirage and bound to evaporate sooner or later. It is as much about how we do things as what we do.
Having a strong performance culture should be closely aligned to the Group’s values. If we can outperform by making globalisation work through our diversity of markets and people, then we have put a solid stake in the ground about our values throughout all our markets.
At a Board level, our role is to champion this so that our brand promise, Here for good, becomes even more of a reality, always and
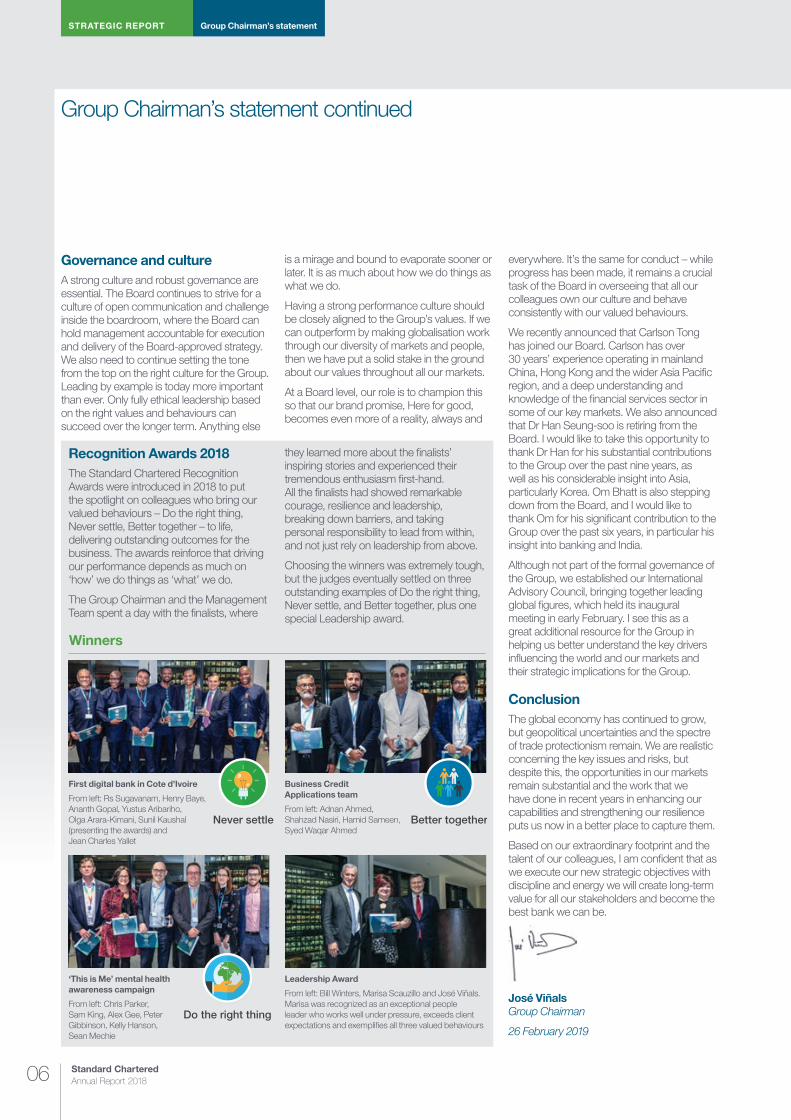
Recognition Awards 2018The Standard Chartered Recognition Awards were introduced in 2018 to put the spotlight on colleagues who bring our valued behaviours – Do the right thing, Never settle, Better together – to life, delivering outstanding outcomes for the business. The awards reinforce that driving our performance depends as much on ‘how’ we do things as ‘what’ we do.
The Group Chairman and the Management Team spent a day with the finalists, where
they learned more about the finalists’ inspiring stories and experienced their tremendous enthusiasm first-hand. All the finalists had showed remarkable courage, resilience and leadership, breaking down barriers, and taking personal responsibility to lead from within, and not just rely on leadership from above.
Choosing the winners was extremely tough, but the judges eventually settled on three outstanding examples of Do the right thing, Never settle, and Better together, plus one special Leadership award.
Never settle Better togetherDo the right thing Never settle Better togetherDo the right thing
Never settle Better togetherDo the right thing
Winners
First digital bank in Cote d’Ivoire
From left: Rs Sugavanam, Henry Baye, Ananth Gopal, Yustus Aribariho, Olga Arara-Kimani, Sunil Kaushal (presenting the awards) and Jean Charles Yallet
Business Credit Applications team
From left: Adnan Ahmed, Shahzad Nasiri, Hamid Sameen, Syed Waqar Ahmed
‘This is Me’ mental health awareness campaign
From left: Chris Parker, Sam King, Alex Gee, Peter Gibbinson, Kelly Hanson, Sean Mechie
Leadership Award
From left: Bill Winters, Marisa Scauzillo and José Viñals. Marisa was recognized as an exceptional people leader who works well under pressure, exceeds client expectations and exemplifies all three valued behaviours
everywhere. It’s the same for conduct – while progress has been made, it remains a crucial task of the Board in overseeing that all our colleagues own our culture and behave consistently with our valued behaviours.
We recently announced that Carlson Tong has joined our Board. Carlson has over 30 years’ experience operating in mainland China, Hong Kong and the wider Asia Pacific region, and a deep understanding and knowledge of the financial services sector in some of our key markets. We also announced that Dr Han Seung-soo is retiring from the Board. I would like to take this opportunity to thank Dr Han for his substantial contributions to the Group over the past nine years, as well as his considerable insight into Asia, particularly Korea. Om Bhatt is also stepping down from the Board, and I would like to thank Om for his significant contribution to the Group over the past six years, in particular his insight into banking and India.
Although not part of the formal governance of the Group, we established our International Advisory Council, bringing together leading global figures, which held its inaugural meeting in early February. I see this as a great additional resource for the Group in helping us better understand the key drivers influencing the world and our markets and their strategic implications for the Group.
ConclusionThe global economy has continued to grow, but geopolitical uncertainties and the spectre of trade protectionism remain. We are realistic concerning the key issues and risks, but despite this, the opportunities in our markets remain substantial and the work that we have done in recent years in enhancing our capabilities and strengthening our resilience puts us now in a better place to capture them.
Based on our extraordinary footprint and the talent of our colleagues, I am confident that as we execute our new strategic objectives with discipline and energy we will create long-term value for all our stakeholders and become the best bank we can be.
José ViñalsGroup Chairman
26 February 2019
Risk review
and Cap
ital reviewS
TR
AT
EG
IC R
EP
OR
TS
upp
lementary info
rmatio
nFinancial statem
entsD
irectors’ rep
ort
07
Delivering sustainable, high-quality growth
We have made tremendous progress since 2015 when we set out to build strong foundations, get lean and focus on our strengths, and invest and innovate to delight our customers. In 2018, we saw further evidence of this strategy coming through – we grew profits and returns, reinstated the interim dividend, improved our customer satisfaction measures in key products and segments, invested in exciting transformative initiatives and became more agile in capturing attractive opportunities in our markets.
Our purpose Standard Chartered is a unique bank. We have deep roots in, and a non-replicable network across, many of the world’s most dynamic markets, where half of the global GDP growth is expected to be generated over the next five years. Every day, our 85,000 employees of 125 nationalities help millions of people and companies succeed by growing, investing and protecting their wealth, while supporting sustainable economic and social development in the communities in which we operate. It has become fashionable to talk about purpose, but this is not new for us. Throughout our history, this purpose – to drive commerce and prosperity through our unique diversity – has always guided our decisions, behaviours and everything that we do.
Just as it has in the past, our purpose will continue to enable our success in the future. It therefore underpins the refreshed priorities that we are announcing today.
2018 performance2018 was a year in which commerce and prosperity encountered their fair share of challenges. While the year started strongly with good momentum across all businesses, client sentiment in our markets dipped later in the year, coming under pressure from geopolitical uncertainties, the rapid escalation of trade tensions between the US and China, as well as slower growth in the global economy. Despite these conditions we have continued to make good progress on delivering our key areas of focus.
Our Greater China & North Asia and Retail Banking businesses overall continue to go from strength to strength. Our Transaction Banking business has taken an increasing share of a competitive market, allowing it to excel on the back of higher interest rates. Our Financial Markets business, which is one of our higher-returning activities and a major contributor to our network franchise, has grown in an environment where most others shrank, and we expect stronger performance from the refreshed team.
We grew in all segments and regions on a year-on-year basis, except for Africa & Middle East, where continued macro-political issues, exacerbated by currency depreciations, dampened income momentum.
Over half of our income is now generated from the network and wealth management activities in which we have invested. This income is growing quickly and generating premium returns. This transition to higher quality growth, together with tight cost and risk control, means we have improved our underlying return on tangible equity (RoTE) a further 120 basis points in 2018 to 5.1 per cent. While we are encouraged by the steady improvement, we are acutely aware that this level of return remains below our cost of capital.
So, what now? The Group, now on secured foundations and poised for sustainable, higher-returning growth, is at another inflection point. The refreshed priorities that we are announcing today will help realise the value of the franchise, measured not only in monetary terms but also in the positive impact on our clients, stakeholders and communities. We expect to reach a double-digit RoTE by 2021 by continuing to build a purpose-led organisation which propels global trade and investment, helps our customers and markets achieve wealth and prosperity, while doing everything that we can to make the world a cleaner, safer and more sustainable place.
Wealth and prosperityWe are here to help our clients become more prosperous – whether they are international companies fostering trade and investment, or individual customers who seek help in managing their wealth.
We continue to improve our services for the emerging affluent. We launched Premium Banking in eight markets in 2018. Priority and Premium customers now make up 56 per cent of our Retail Banking income, compared to 27 per cent in 2014. This is no coincidence – we are laser-focused on improving their banking experience with us, as exemplified by the fact that the Group is ranked by RFi Group as the best-in-class international bank for the Priority segment in seven of our top eight retail markets. Our open-architecture wealth management platform, from which we now generate 30 per cent of our Retail Banking income compared to 20 per cent in 2014, also appeals to savers and investors.
Group Chief Executive’s review
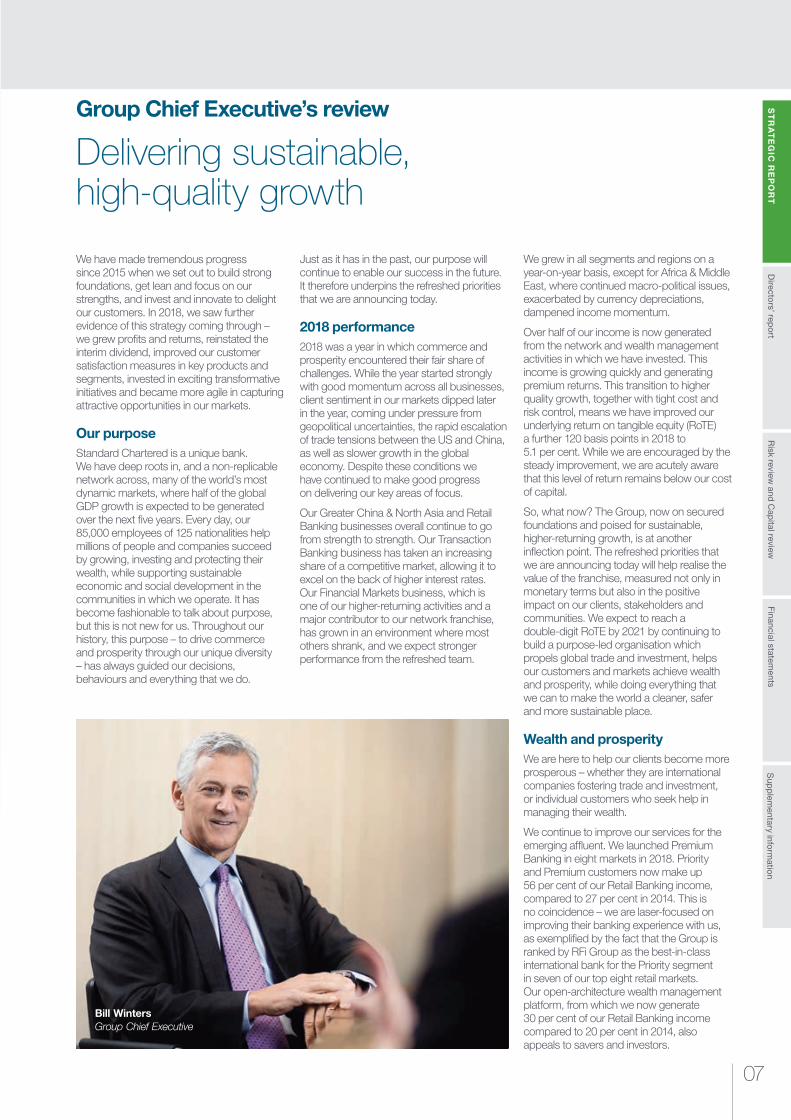
Bill Winters Group Chief Executive

STRATEGIC REPORTGroup Chief Executive’s review
Standard Chartered Annual Report 201808
Group Chief Executive’s review continued
We are investing in our digital capabilities to drive transformation in profitability, opportunities and financial inclusion in the retail mass market. We are combining world-class expertise with local knowledge to be nimble and disruptive. Following the successful testing and launch of our first digital retail bank in Côte d’Ivoire last year, we have rolled out a similar model in Uganda, Tanzania and Ghana, and have plans to roll out in Kenya in the first quarter of 2019, subject to regulatory approval, and in most of our African markets by the end of the year. We have also made over 50 banking services available on a single mobile app in India. By collaborating with best-in-class partners, we can rapidly develop and roll out exceptional client propositions. Not only have we applied to establish a virtual challenger bank in Hong Kong, we, together with Alibaba’s Ant Financial, have launched two real-time, cross-border, blockchain-based payment services for the Hong Kong-Philippines and Malaysia-Pakistan remittance corridors, with plans to do more. As we advance our digital capabilities, we remain committed to increasing our investments in our cyber resilience and security. We believe that easy and immediate access to banking and wealth advisory services, enabled by mobile connectivity, will drive wealth and prosperity in even the most remote corners of our emerging markets – we have an important role to play.
Trade and investmentAs a global bank with deep local expertise in Asia, Africa and the Middle East, we strongly believe in the powerful benefits of globalisation. For over 160 years, we have facilitated trade and investment in and across our markets, contributing to the rapid economic development of countries from China to Nigeria, from Singapore to the UAE.
While the benefits of globalisation have not been equally distributed, as evidenced by the rising populism in many countries, it cannot be disputed that global investment and trade have lifted more than a billion people out of extreme poverty. Supporting these global capital flows is at the heart of our business; not only is it one of our differentiated customer propositions, but it also enables us to play a key role in tackling inequality.
Our refreshed strategic priorities include reinforcing our efforts to support China’s opening and Africa’s development. As one of the largest international banks in China, and the only global bank present in scale across Africa, we are ideally positioned to help facilitate cross-border trade and investment into and out of both regions.
Beyond China and Africa, our presence in 60 markets, including 45 along the Belt & Road Initiative routes, as well as our wider network, which serves clients in a further 85 markets, is proving highly attractive to our clients. Large multinational corporates and institutions are signing up in increasing numbers because we can help them manage their own businesses efficiently and safely across multiple borders. In a report conducted by East & Partners in 2018, we ranked first for customer satisfaction in trade finance across Asia. About two-thirds of the income generated by our Corporate & Institutional Banking business is now from clients that are using the network, a significant increase compared with 2015 when the Group was more focused on capital-intensive lending to support the in-country needs of clients.
Our client income is now more diversified, less capital-intensive, stickier and higher-returning. But there are still some key markets where we have not yet fulfilled our potential. We are targeting higher-returning income and efficiencies in India, Korea, the UAE and Indonesia. Realising the opportunities those markets present will significantly enhance the Group’s financial performance and returns.
As one of the leading trade banks in the world, we are investing and innovating in the way global trade finance operates to improve our customers’ experiences. In addition to working with blockchain platforms like Ripple for real-time cross-border currency settlement and supply chain financing, we are collaborating with Siemens Financial Services and TradeIX to create the industry’s first blockchain-based smart guarantees, digitising the end-to-end process in trade finance.
$1.6bn 2017: $1.5bn2016: $1.4bn
Invested in 2018
Proportion of Retail Banking income generated from Priority clients
47%2017: 45%2016: 39%
Proportion of Retail Banking clients that are digitally active
49%2017: 45%2016: 40%
Risk review
and Cap
ital reviewS
TR
AT
EG
IC R
EP
OR
TS
upp
lementary info
rmatio
nFinancial statem
entsD
irectors’ rep
ort
09
Sustainable bankingSince its launch in 2010, our brand promise, Here for good, has been deeply embedded into the fabric of our organisation. At its core is the promise that we will be a force for good, helping clients navigate complex threats and manage their finances consistent with their own sustainability goals.
Our unique diversity helps us to be a force for good. In addition to being included in the Bloomberg Gender Equality Index for the fourth consecutive year, the Group has been recognised by Equileap last year as a top performing UK company for gender equality, ranking third in the UK and 26th globally – a significant improvement from 42nd in 2017. However, we still have room to improve. Although we have virtually no gender pay gaps in our major markets when adjusted for level and business area, we continue to have an overall gender pay gap in the UK and other major markets, reflecting the fact that we have fewer females than males in senior roles and in businesses where the market rates of pay are highest. You may read more in our 2018 Gender Pay Gap disclosure on page 46. It will take some time and hard work, but we will not settle until the gap is fully closed.
It remains our commitment to be a leader in the fight against financial and cyber crime while partnering with others to do so. We continue to invest heavily in improving standards across our markets and with our clients. In addition to our highly successful correspondent banking and new NGO academies, we – along with a group of global banks – established a joint initiative to build a digital Trade Information Network, which will enable better assessment of risks, particularly around double financing and fraudulent trade information.
We are remediating the Group’s historical conduct issues and have made substantial progress in resolving past financial crime control issues. The New York State Department of Financial Services has acknowledged the Group’s progress in remediating and improving its financial crime controls to the point that a monitor is no longer necessary and has been replaced by an independent consultant.
We have received a decision notice from the Financial Conduct Authority (FCA) concerning the Group’s historical financial crime controls and we continue our discussions relating to the potential resolution of the investigation by the US authorities relating to historical violations of US sanctions, the vast majority of which pre-date 2012. As announced on 20 February 2019, we have made a provision for potential penalties relating to the US investigation, the FCA decision and previously disclosed foreign exchange trading issues. Further details are set out in Note 26 on page 305.
It is our responsibility to do everything in our power to make the world cleaner and our communities more sustainable. In addition to launching the world’s first sovereign blue bond designed to support sustainable marine and fisheries projects for the Republic of Seychelles, we refreshed and consolidated our Position Statements and announced our decision not to finance any new coal-fired power plants. We are developing ways to measure and reduce our aggregate carbon footprint, including those related to our financing activities, and will be working with our clients and other stakeholders to drive this commitment around the world. We are also working with a range of partners to increase the industry’s understanding of its role in stopping the illegal wildlife trade.
We continue to invest in our communities to promote sustainable economic and social development. As José mentioned in his statement, we began to shift our focus in 2018 to delivering community programmes that promote economic inclusion and address the challenge of inequality in our markets.
From turnaround to transformationOur refreshed strategic priorities build on our purpose and earlier areas of focus, but mark a change in the way we operate as we go from turnaround to transformation. We are determined to build a culture of excellence, grow sustainably, and build long-term returns. We are doubling-down on what we have done well, focusing on how we build partnerships with others to deliver better outcomes, and refining our approach to low-returning areas where we can and must do better. We will:
¼ Embed a performance-orientated and innovative culture, which emphasises conduct and sustainability
¼ Invest to further accelerate growth in our higher returning international network and affluent client businesses, supporting China’s opening and Africa’s development
¼ Eliminate the drag on our returns from several low-returning markets, including India, Korea, the UAE and Indonesia, through cost and capital actions, investments in our affluent client franchise and potentially disruptive partnerships
¼ Streamline our own operations to ensure we delight our clients, and drive productivity
¼ Invest in digital initiatives to transform our business – augmenting strong positions in more mature markets and disrupting elsewhere, and collaborating with best-in-class partners to quickly roll-out top-class products and services
¼ Rapidly expand sustainable financing to drive a positive social, environmental and economic impact
By doing so, we expect to grow income between five and seven per cent, which is well above the anticipated rate of growth for the global economy, maintain strong discipline on costs to generate significant operating leverage and improve our funding and capital efficiency, producing surplus capital which can be reinvested or returned to shareholders. It is this combination that we expect will deliver a RoTE above 10 per cent by 2021.
OutlookWe remain cautiously optimistic on the global macroeconomic environment, but the range of possible outcomes from an array of matters is wider than it has been in a long time. This creates uncertainty among policymakers as well as our clients. We believe that as multinational companies grapple with the possibility that barriers to trade could rise and supply chains may be impacted, they will find it even more important to deal with banks like ours that have the sophistication, market presence and determination to help them navigate an increasingly complex world.
STRATEGIC REPORTGroup Chief Executive’s review
Standard Chartered Annual Report 201810
Group Chief Executive’s review continued
Undoubtedly there will be shocks and bumps along the way, but as we are far more resilient now, we will be ready to absorb them when – not if – they come our way, and will seek to take advantage of disruptions if they occur.
Conclusion My colleagues and I have great pride in the Group and that for which it stands. Adding a sharper performance edge to that is essential. In all the markets that I have visited this year I have delivered one consistent message to our teams: our business can only thrive if our customers feel that we are helping them in extraordinary ways. We are delivering on that commitment.
I am proud of our achievements in 2018 and excited for what we have in store for 2019 and beyond. There are always external factors which are beyond our control, but they will not be accepted as excuses. We have what it takes to perform excellently, and we will plough through obstacles we find in our way to deliver – responsibly and innovatively – the bank we know we can be.
Bill WintersGroup Chief Executive
26 February 2019
10.
6.
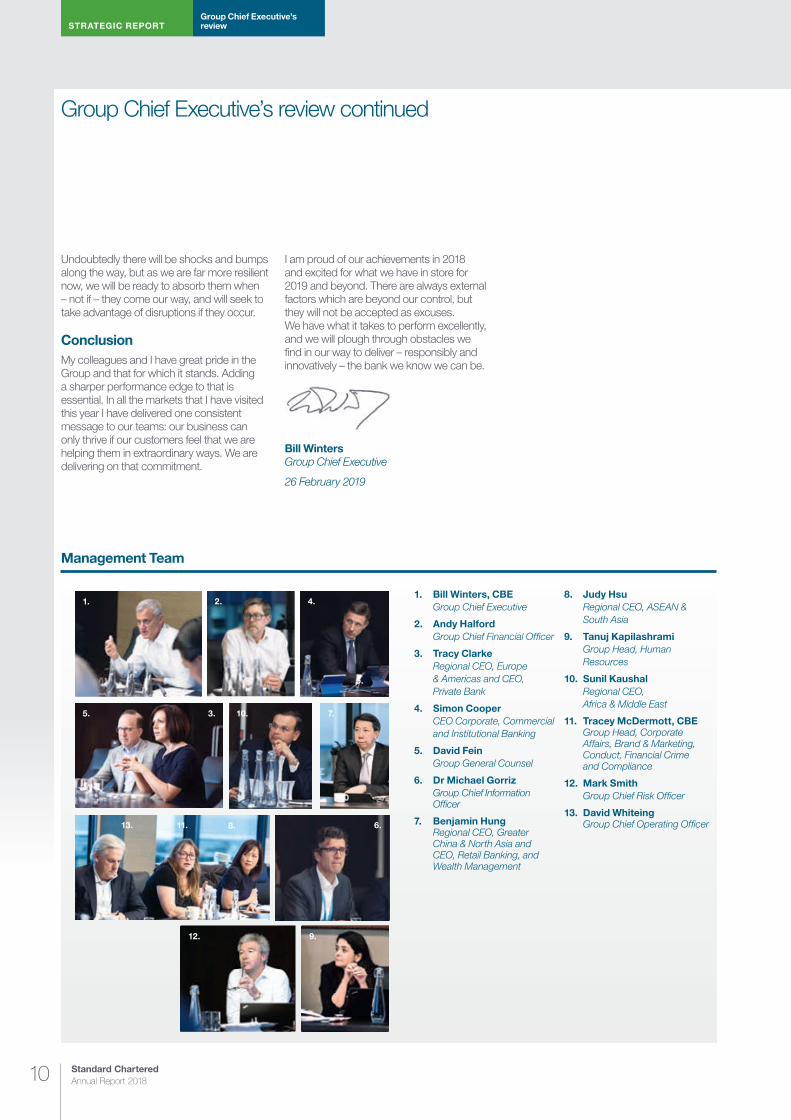
Management Team
1. Bill Winters, CBE Group Chief Executive
2. Andy Halford Group Chief Financial Officer
3. Tracy Clarke Regional CEO, Europe
& Americas and CEO, Private Bank
4. Simon Cooper CEO Corporate, Commercial and Institutional Banking
5. David Fein Group General Counsel
6. Dr Michael Gorriz Group Chief Information Officer
7. Benjamin Hung Regional CEO, Greater China & North Asia and CEO, Retail Banking, and Wealth Management
8. Judy Hsu Regional CEO, ASEAN & South Asia
9. Tanuj Kapilashrami Group Head, Human Resources
10. Sunil Kaushal Regional CEO, Africa & Middle East
11. Tracey McDermott, CBE Group Head, Corporate Affairs, Brand & Marketing, Conduct, Financial Crime and Compliance
12. Mark Smith Group Chief Risk Officer
13. David Whiteing Group Chief Operating Officer
13. 6.
12.
14.
5. 3.
8.
11. 8.
5.
4.
13.
7.
1. 2.
12. 9.
13.

Risk review
and Cap
ital reviewS
TR
AT
EG
IC R
EP
OR
TS
upp
lementary info
rmatio
nFinancial statem
entsD
irectors’ rep
ort
Risk review
and Cap
ital reviewS
TR
AT
EG
IC R
EP
OR
TS
TR
AT
EG
IC R
EP
OR
TS
TR
AT
EG
IC R
EP
OR
TS
upp
lementary info
rmatio
nFinancial statem
entsD
irectors’ rep
ort
GROW WITH CLIENTS
Supporting a fruitful export business in Mumbai
Mumbai-headquartered Patel Retail, a manufacturer and exporter of food and home and personal care items, signed an INR 100,000,000 ($1.4 million) credit facility with Standard Chartered in January 2018.
The funds were provided in the form of cash credit and packing credit and have enabled the firm to expand its export business and, as a result, its top line growth. Since taking the facility Patel Retail has seen its sales revenue increase by INR 42.5 million ($600,567), or 15 per cent each month.
“We are expanding our export business across the globe and Standard Chartered is doing business across the globe, so this facility will help us with our global activity.”Patel Retail CFO | Deepak Jain
The company’s Chief Financial Officer, Deepak Jain, stated that it chose to work with Standard Chartered over other banks owing to its unique global footprint.
The company is planning to continue to grow its sales and export business by 20 per cent per annum over the next five years. Patel Retail was established in 2007 in Ambernath, India. As well as running a manufacturing and export business for the overseas market, it also owns a chain of Patel R Mart supermarkets in Mumbai.
11
o Deepak Jain,Patel Retail CFO
STRATEGIC REPORT Market environment
Standard Chartered Annual Report 201812
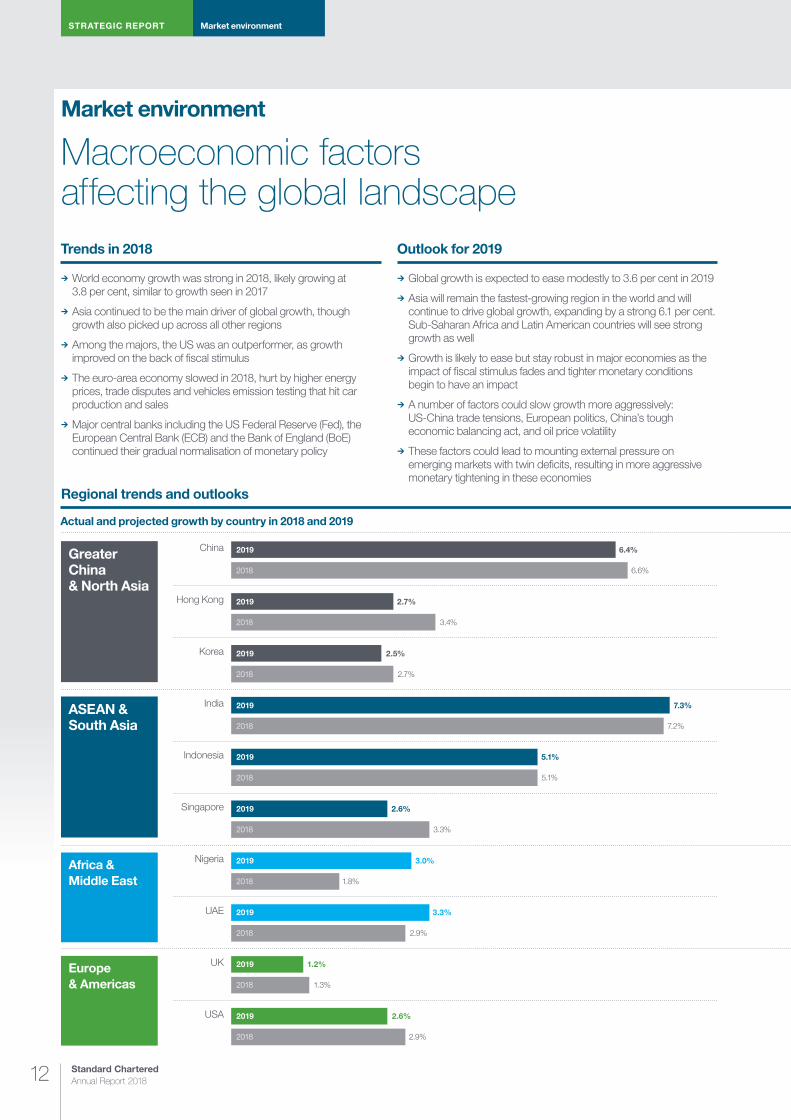
Macroeconomic factors affecting the global landscape
Actual and projected growth by country in 2018 and 2019
Europe & Americas
Africa & Middle East
ASEAN & South Asia
Greater China & North Asia
Outlook for 2019
¼ Global growth is expected to ease modestly to 3.6 per cent in 2019
¼ Asia will remain the fastest-growing region in the world and will continue to drive global growth, expanding by a strong 6.1 per cent. Sub-Saharan Africa and Latin American countries will see strong growth as well
¼ Growth is likely to ease but stay robust in major economies as the impact of fiscal stimulus fades and tighter monetary conditions begin to have an impact
¼ A number of factors could slow growth more aggressively: US-China trade tensions, European politics, China’s tough economic balancing act, and oil price volatility
¼ These factors could lead to mounting external pressure on emerging markets with twin deficits, resulting in more aggressive monetary tightening in these economies
Trends in 2018
¼ World economy growth was strong in 2018, likely growing at 3.8 per cent, similar to growth seen in 2017
¼ Asia continued to be the main driver of global growth, though growth also picked up across all other regions
¼ Among the majors, the US was an outperformer, as growth improved on the back of fiscal stimulus
¼ The euro-area economy slowed in 2018, hurt by higher energy prices, trade disputes and vehicles emission testing that hit car production and sales
¼ Major central banks including the US Federal Reserve (Fed), the European Central Bank (ECB) and the Bank of England (BoE) continued their gradual normalisation of monetary policy
Regional trends and outlooks
Market environment
USA
UK
UAE
Nigeria
Singapore
Indonesia
India
Korea
Hong Kong
China 2019
2018
2019 2.7%
2018 3.4%
2019 2.5%
2018 2.7%
2019 7.3%
2018 7.2%
2019 5.1%
2018 5.1%
2019 2.6%
2018 3.3%
2019 3.0%
2018 1.8%
2019
2018
3.3%
2.9%
2019
2018
1.2%
1.3%
2019
2018
2.6%
2.9%
6.4%
6.6%
Risk review
and Cap
ital reviewS
TR
AT
EG
IC R
EP
OR
TS
upp
lementary info
rmatio
nFinancial statem
entsD
irectors’ rep
ort
13
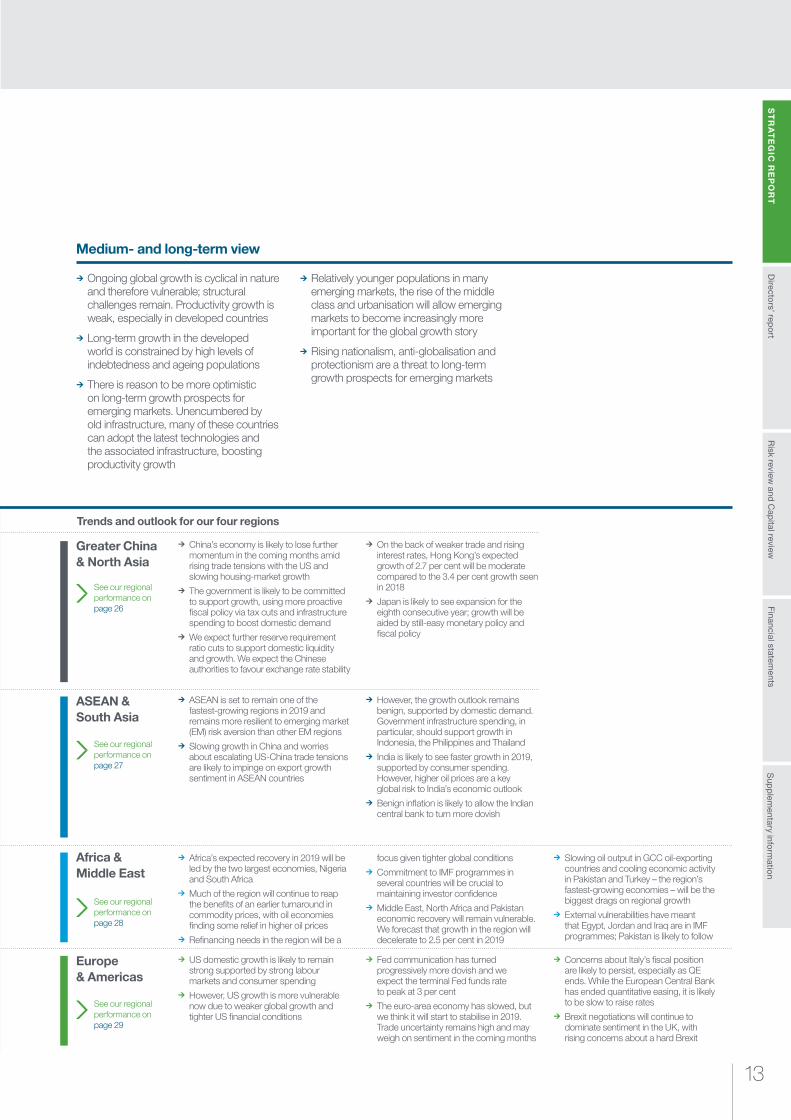
¼ China’s economy is likely to lose further momentum in the coming months amid rising trade tensions with the US and slowing housing-market growth
¼ The government is likely to be committed to support growth, using more proactive fiscal policy via tax cuts and infrastructure spending to boost domestic demand
¼ We expect further reserve requirement ratio cuts to support domestic liquidity and growth. We expect the Chinese authorities to favour exchange rate stability
¼ On the back of weaker trade and rising interest rates, Hong Kong’s expected growth of 2.7 per cent will be moderate compared to the 3.4 per cent growth seen in 2018
¼ Japan is likely to see expansion for the eighth consecutive year; growth will be aided by still-easy monetary policy and fiscal policy
Greater China & North Asia
ASEAN & South Asia
¼ ASEAN is set to remain one of the fastest-growing regions in 2019 and remains more resilient to emerging market (EM) risk aversion than other EM regions
¼ Slowing growth in China and worries about escalating US-China trade tensions are likely to impinge on export growth sentiment in ASEAN countries
¼ However, the growth outlook remains benign, supported by domestic demand. Government infrastructure spending, in particular, should support growth in Indonesia, the Philippines and Thailand
¼ India is likely to see faster growth in 2019, supported by consumer spending. However, higher oil prices are a key global risk to India’s economic outlook
¼ Benign inflation is likely to allow the Indian central bank to turn more dovish
¼ Africa’s expected recovery in 2019 will be led by the two largest economies, Nigeria and South Africa
¼ Much of the region will continue to reap the benefits of an earlier turnaround in commodity prices, with oil economies finding some relief in higher oil prices
¼ Refinancing needs in the region will be a
focus given tighter global conditions ¼ Commitment to IMF programmes in several countries will be crucial to maintaining investor confidence
¼ Middle East, North Africa and Pakistan economic recovery will remain vulnerable. We forecast that growth in the region will decelerate to 2.5 per cent in 2019
¼ Slowing oil output in GCC oil-exporting countries and cooling economic activity in Pakistan and Turkey – the region’s fastest-growing economies – will be the biggest drags on regional growth
¼ External vulnerabilities have meant that Egypt, Jordan and Iraq are in IMF programmes; Pakistan is likely to follow
¼ US domestic growth is likely to remain strong supported by strong labour markets and consumer spending
¼ However, US growth is more vulnerable now due to weaker global growth and tighter US financial conditions
¼ Fed communication has turned progressively more dovish and we expect the terminal Fed funds rate to peak at 3 per cent
¼ The euro-area economy has slowed, but we think it will start to stabilise in 2019. Trade uncertainty remains high and may weigh on sentiment in the coming months
¼ Concerns about Italy’s fiscal position are likely to persist, especially as QE ends. While the European Central Bank has ended quantitative easing, it is likely to be slow to raise rates
¼ Brexit negotiations will continue to dominate sentiment in the UK, with rising concerns about a hard Brexit
See our regional performance on page 29
See our regional performance on page 28
See our regional performance on page 27
See our regional performance on page 26
Africa & Middle East
Europe & Americas
Trends and outlook for our four regions
Medium- and long-term view
¼ Ongoing global growth is cyclical in nature and therefore vulnerable; structural challenges remain. Productivity growth is weak, especially in developed countries
¼ Long-term growth in the developed world is constrained by high levels of indebtedness and ageing populations
¼ There is reason to be more optimistic on long-term growth prospects for emerging markets. Unencumbered by old infrastructure, many of these countries can adopt the latest technologies and the associated infrastructure, boosting productivity growth
¼ Relatively younger populations in many emerging markets, the rise of the middle class and urbanisation will allow emerging markets to become increasingly more important for the global growth story
¼ Rising nationalism, anti-globalisation and protectionism are a threat to long-term growth prospects for emerging markets
Regional trends and outlooks
STRATEGIC REPORT Business model
Standard Chartered Annual Report 201814
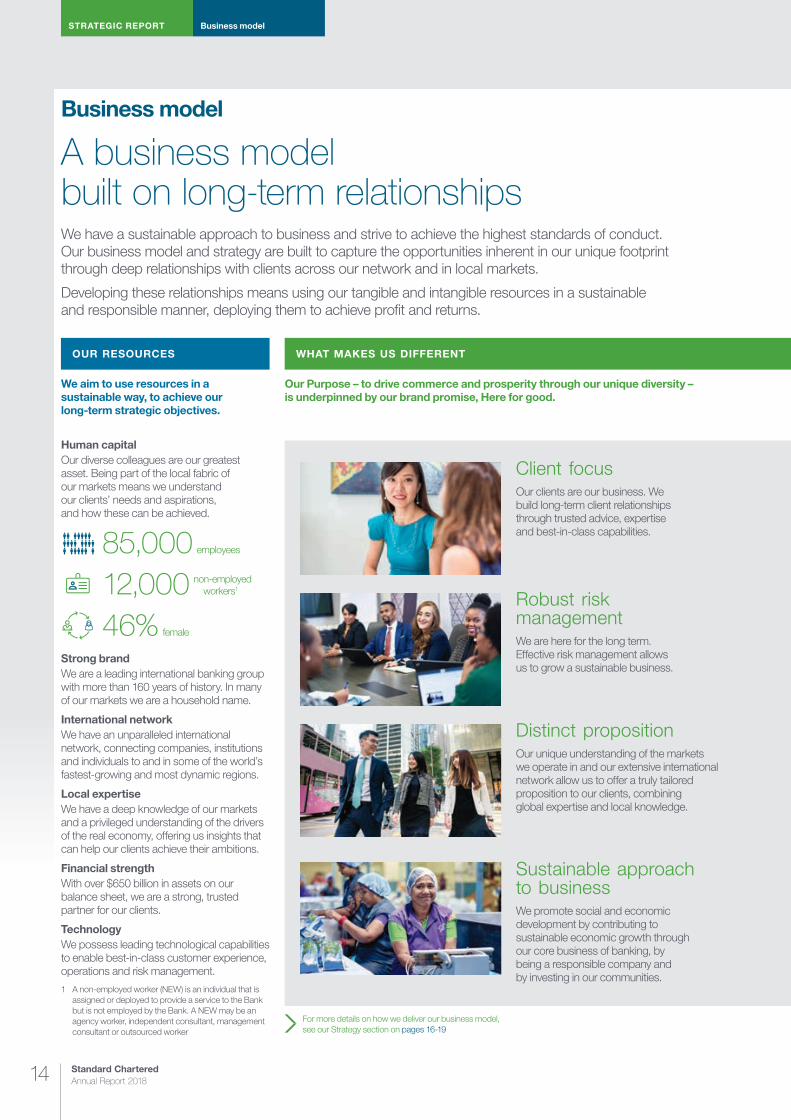
A business model built on long-term relationships We have a sustainable approach to business and strive to achieve the highest standards of conduct. Our business model and strategy are built to capture the opportunities inherent in our unique footprint through deep relationships with clients across our network and in local markets.
Developing these relationships means using our tangible and intangible resources in a sustainable and responsible manner, deploying them to achieve profit and returns.
Business model
OUR RESOURCES
Our Purpose – to drive commerce and prosperity through our unique diversity – is underpinned by our brand promise, Here for good.
Client focusOur clients are our business. We build long-term client relationships through trusted advice, expertise and best-in-class capabilities.
Robust risk managementWe are here for the long term. Effective risk management allows us to grow a sustainable business.
Distinct propositionOur unique understanding of the markets we operate in and our extensive international network allow us to offer a truly tailored proposition to our clients, combining global expertise and local knowledge.
Sustainable approach to businessWe promote social and economic development by contributing to sustainable economic growth through our core business of banking, by being a responsible company and by investing in our communities.
WHAT MAKES US DIFFERENT
For more details on how we deliver our business model, see our Strategy section on pages 16-19
Human capitalOur diverse colleagues are our greatest asset. Being part of the local fabric of our markets means we understand our clients’ needs and aspirations, and how these can be achieved.
We aim to use resources in a sustainable way, to achieve our long-term strategic objectives.
85,000 employees
12,000 non-employed workers1
46% female
Strong brandWe are a leading international banking group with more than 160 years of history. In many of our markets we are a household name.
International networkWe have an unparalleled international network, connecting companies, institutions and individuals to and in some of the world’s fastest-growing and most dynamic regions.
Local expertiseWe have a deep knowledge of our markets and a privileged understanding of the drivers of the real economy, offering us insights that can help our clients achieve their ambitions.
Financial strengthWith over $650 billion in assets on our balance sheet, we are a strong, trusted partner for our clients.
TechnologyWe possess leading technological capabilities to enable best-in-class customer experience, operations and risk management.
1 A non-employed worker (NEW) is an individual that is assigned or deployed to provide a service to the Bank but is not employed by the Bank. A NEW may be an agency worker, independent consultant, management consultant or outsourced worker
Risk review
and Cap
ital reviewS
TR
AT
EG
IC R
EP
OR
TS
upp
lementary info
rmatio
nFinancial statem
entsD
irectors’ rep
ort
15
More detail can be found in our stakeholders and responsibilities section on pages 42 to 51
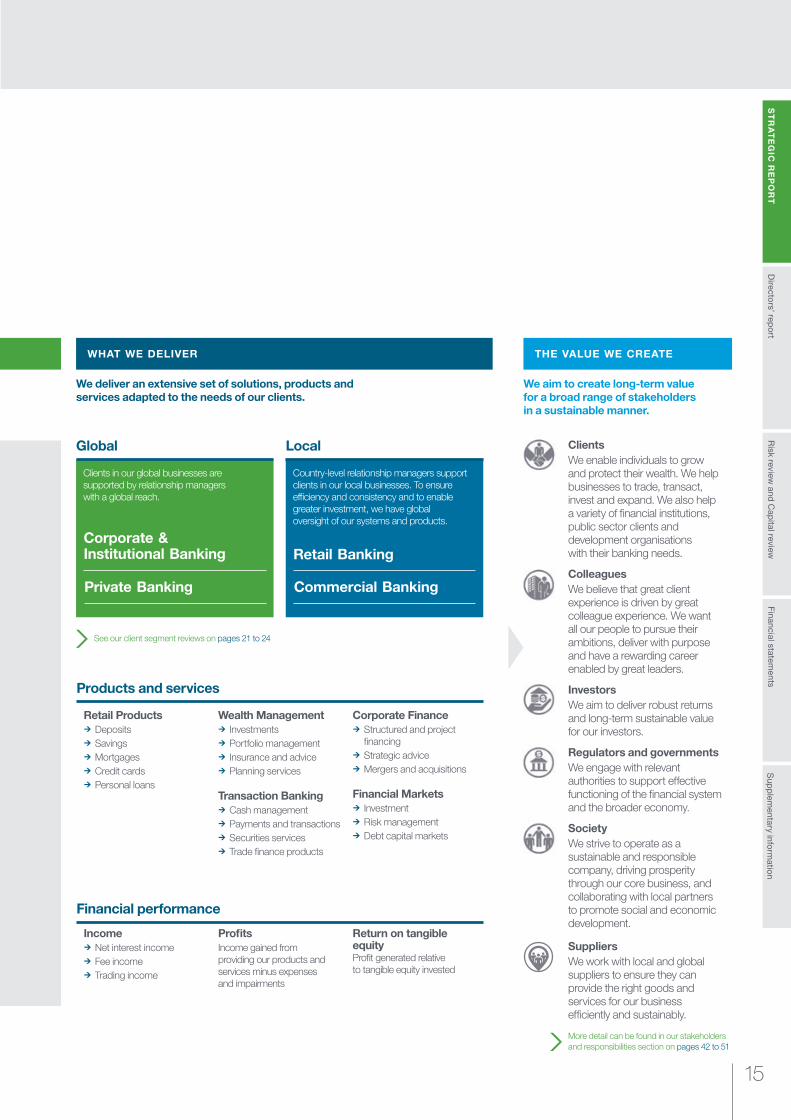
We aim to create long-term value for a broad range of stakeholders in a sustainable manner.
ClientsWe enable individuals to grow and protect their wealth. We help businesses to trade, transact, invest and expand. We also help a variety of financial institutions, public sector clients and development organisations with their banking needs.
ColleaguesWe believe that great client experience is driven by great colleague experience. We want all our people to pursue their ambitions, deliver with purpose and have a rewarding career enabled by great leaders.
InvestorsWe aim to deliver robust returns and long-term sustainable value for our investors.
Regulators and governmentsWe engage with relevant authorities to support effective functioning of the financial system and the broader economy.
SocietyWe strive to operate as a sustainable and responsible company, driving prosperity through our core business, and collaborating with local partners to promote social and economic development.
SuppliersWe work with local and global suppliers to ensure they can provide the right goods and services for our business efficiently and sustainably.
THE VALUE WE CREATE
We deliver an extensive set of solutions, products and services adapted to the needs of our clients.
WHAT MAKES US DIFFERENT WHAT WE DELIVER
Corporate & Institutional Banking
Private Banking
Global
Clients in our global businesses are supported by relationship managers with a global reach.
Retail Banking
Commercial Banking
Country-level relationship managers support clients in our local businesses. To ensure efficiency and consistency and to enable greater investment, we have global oversight of our systems and products.
Retail Products ¼ Deposits ¼ Savings ¼ Mortgages ¼ Credit cards ¼ Personal loans
Wealth Management ¼ Investments ¼ Portfolio management ¼ Insurance and advice ¼ Planning services
Transaction Banking ¼ Cash management ¼ Payments and transactions ¼ Securities services ¼ Trade finance products
Corporate Finance ¼ Structured and project financing
¼ Strategic advice ¼ Mergers and acquisitions
Financial Markets ¼ Investment ¼ Risk management ¼ Debt capital markets
Products and services
Income ¼ Net interest income ¼ Fee income ¼ Trading income
ProfitsIncome gained from providing our products and services minus expenses and impairments
Return on tangible equityProfit generated relative to tangible equity invested
Financial performance
See our client segment reviews on pages 21 to 24
Local
STRATEGIC REPORT Our strategy
Standard Chartered Annual Report 201816
Update on our progressOur strategy – what we have achieved since 2015
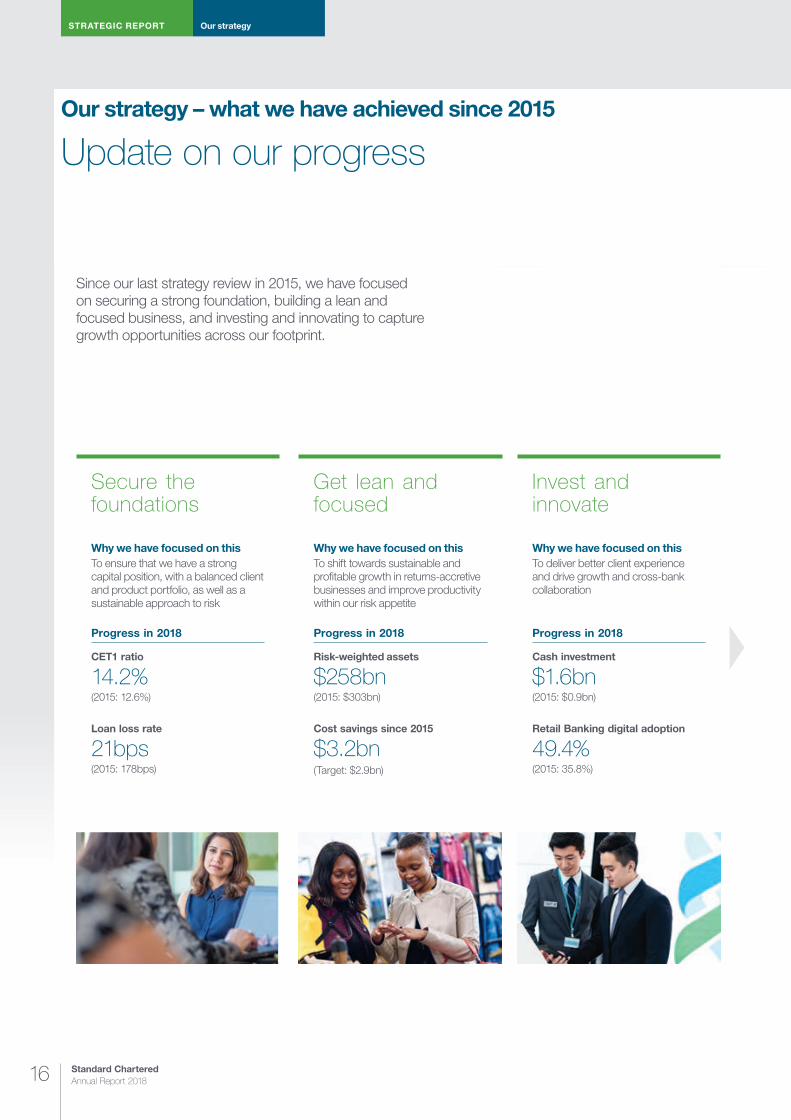
Since our last strategy review in 2015, we have focused on securing a strong foundation, building a lean and focused business, and investing and innovating to capture growth opportunities across our footprint.
Secure the foundations
Why we have focused on thisTo ensure that we have a strong capital position, with a balanced client and product portfolio, as well as a sustainable approach to risk
Progress in 2018
CET1 ratio
14.2%(2015: 12.6%)
Loan loss rate
21bps(2015: 178bps)
Get lean and focused
Why we have focused on thisTo shift towards sustainable and profitable growth in returns-accretive businesses and improve productivity within our risk appetite
Progress in 2018
Risk-weighted assets
$258bn(2015: $303bn)
Cost savings since 2015
$3.2bn(Target: $2.9bn)
Invest and innovate
Why we have focused on thisTo deliver better client experience and drive growth and cross-bank collaboration
Progress in 2018
Cash investment
$1.6bn(2015: $0.9bn)
Retail Banking digital adoption
49.4%(2015: 35.8%)
Risk review
and Cap
ital reviewS
TR
AT
EG
IC R
EP
OR
TS
upp
lementary info
rmatio
nFinancial statem
entsD
irectors’ rep
ort
17
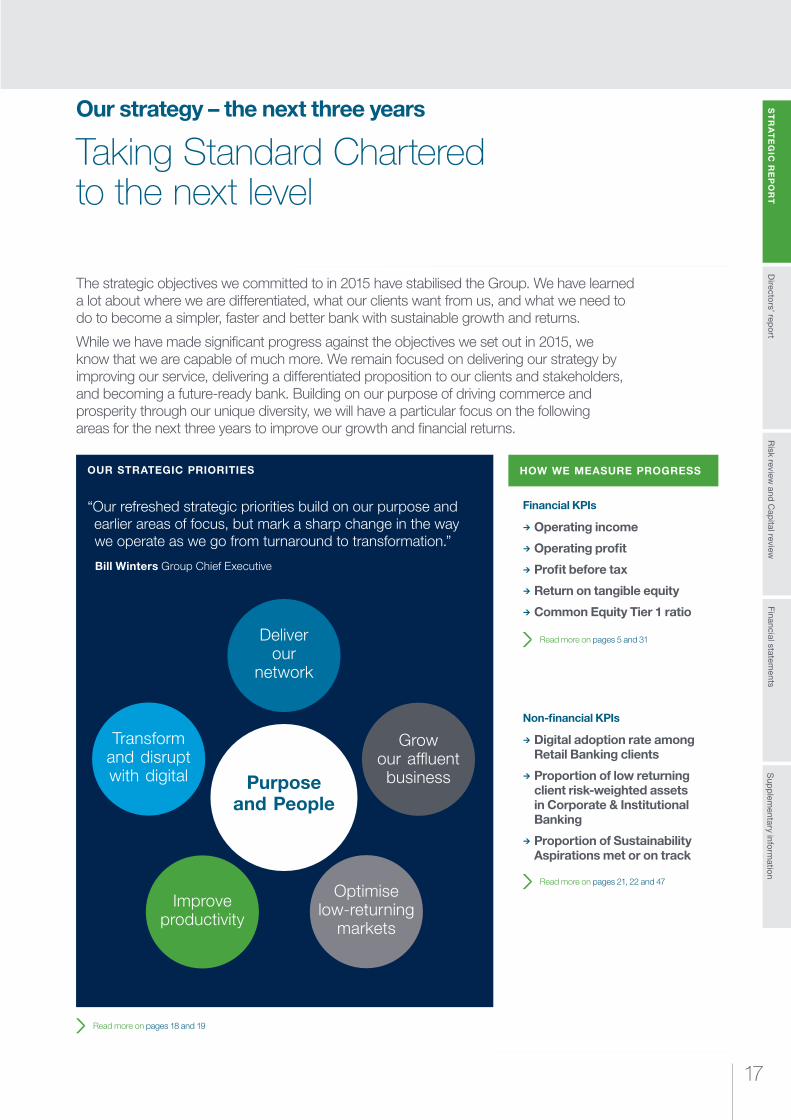
Taking Standard Chartered to the next level
Our strategy – the next three years
The strategic objectives we committed to in 2015 have stabilised the Group. We have learned a lot about where we are differentiated, what our clients want from us, and what we need to do to become a simpler, faster and better bank with sustainable growth and returns.
While we have made significant progress against the objectives we set out in 2015, we know that we are capable of much more. We remain focused on delivering our strategy by improving our service, delivering a differentiated proposition to our clients and stakeholders, and becoming a future-ready bank. Building on our purpose of driving commerce and prosperity through our unique diversity, we will have a particular focus on the following areas for the next three years to improve our growth and financial returns.
Read more on pages 18 and 19
HOW WE MEASURE PROGRESS
Non-financial KPIs
¼ Digital adoption rate among Retail Banking clients
¼ Proportion of low returning client risk-weighted assets in Corporate & Institutional Banking
¼ Proportion of Sustainability Aspirations met or on track
Financial KPIs
¼ Operating income
¼ Operating profit
¼ Profit before tax
¼ Return on tangible equity
¼ Common Equity Tier 1 ratio
Read more on pages 5 and 31
Read more on pages 21, 22 and 47
OUR STRATEGIC PRIORITIES
“Our refreshed strategic priorities build on our purpose and earlier areas of focus, but mark a sharp change in the way we operate as we go from turnaround to transformation.”
Bill Winters Group Chief Executive
Purpose and People
Deliver our
network
Grow our affluent business
Improve productivity
Optimise low-returning
markets
Transform and disrupt with digital
STRATEGIC REPORT Our strategy
Standard Chartered Annual Report 201818
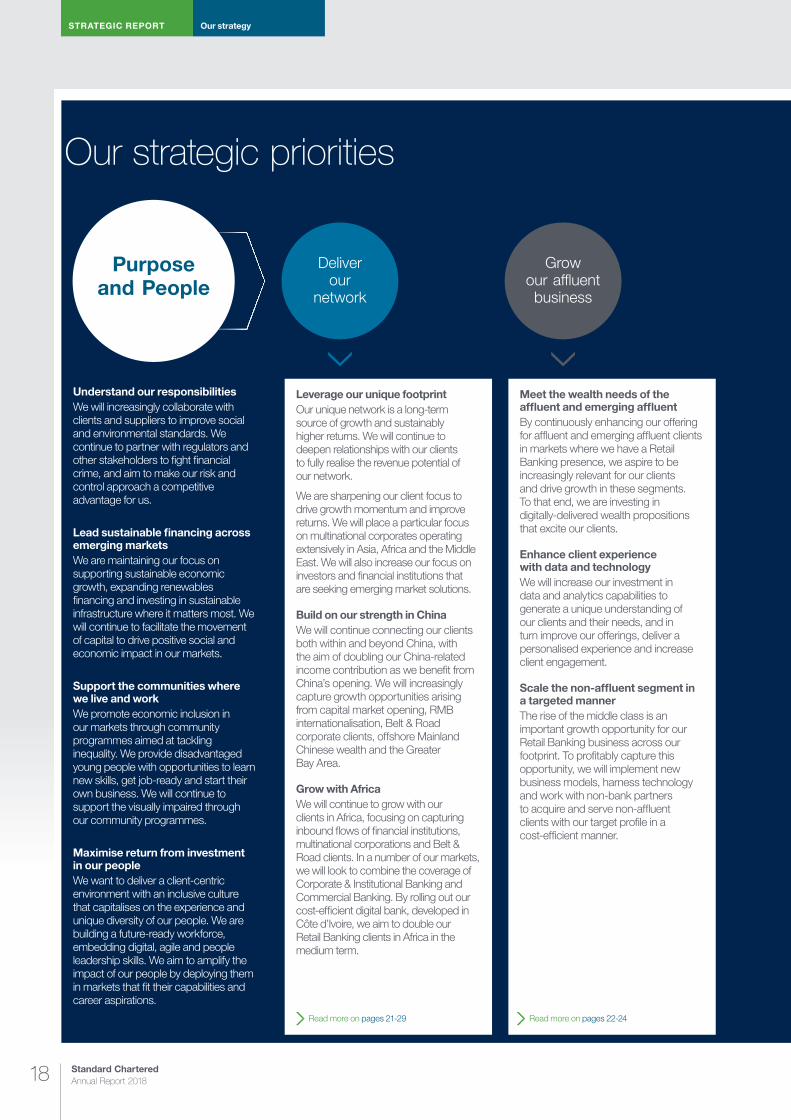
Leverage our unique footprintOur unique network is a long-term source of growth and sustainably higher returns. We will continue to deepen relationships with our clients to fully realise the revenue potential of our network.
We are sharpening our client focus to drive growth momentum and improve returns. We will place a particular focus on multinational corporates operating extensively in Asia, Africa and the Middle East. We will also increase our focus on investors and financial institutions that are seeking emerging market solutions.
Build on our strength in ChinaWe will continue connecting our clients both within and beyond China, with the aim of doubling our China-related income contribution as we benefit from China’s opening. We will increasingly capture growth opportunities arising from capital market opening, RMB internationalisation, Belt & Road corporate clients, offshore Mainland Chinese wealth and the Greater Bay Area.
Grow with AfricaWe will continue to grow with our clients in Africa, focusing on capturing inbound flows of financial institutions, multinational corporations and Belt & Road clients. In a number of our markets, we will look to combine the coverage of Corporate & Institutional Banking and Commercial Banking. By rolling out our cost-efficient digital bank, developed in Côte d’Ivoire, we aim to double our Retail Banking clients in Africa in the medium term.
Read more on pages 21-29
Meet the wealth needs of the affluent and emerging affluentBy continuously enhancing our offering for affluent and emerging affluent clients in markets where we have a Retail Banking presence, we aspire to be increasingly relevant for our clients and drive growth in these segments. To that end, we are investing in digitally-delivered wealth propositions that excite our clients.
Enhance client experience with data and technologyWe will increase our investment in data and analytics capabilities to generate a unique understanding of our clients and their needs, and in turn improve our offerings, deliver a personalised experience and increase client engagement.
Scale the non-affluent segment in a targeted mannerThe rise of the middle class is an important growth opportunity for our Retail Banking business across our footprint. To profitably capture this opportunity, we will implement new business models, harness technology and work with non-bank partners to acquire and serve non-affluent clients with our target profile in a cost-efficient manner.
Read more on pages 22-24
Understand our responsibilitiesWe will increasingly collaborate with clients and suppliers to improve social and environmental standards. We continue to partner with regulators and other stakeholders to fight financial crime, and aim to make our risk and control approach a competitive advantage for us.
Lead sustainable financing across emerging marketsWe are maintaining our focus on supporting sustainable economic growth, expanding renewables financing and investing in sustainable infrastructure where it matters most. We will continue to facilitate the movement of capital to drive positive social and economic impact in our markets.
Support the communities where we live and workWe promote economic inclusion in our markets through community programmes aimed at tackling inequality. We provide disadvantaged young people with opportunities to learn new skills, get job-ready and start their own business. We will continue to support the visually impaired through our community programmes.
Maximise return from investment in our peopleWe want to deliver a client-centric environment with an inclusive culture that capitalises on the experience and unique diversity of our people. We are building a future-ready workforce, embedding digital, agile and people leadership skills. We aim to amplify the impact of our people by deploying them in markets that fit their capabilities and career aspirations.
Our strategic priorities
Purpose and People
Deliver our
network
Grow our affluent business
Risk review
and Cap
ital reviewS
TR
AT
EG
IC R
EP
OR
TS
upp
lementary info
rmatio
nFinancial statem
entsD
irectors’ rep
ort
19
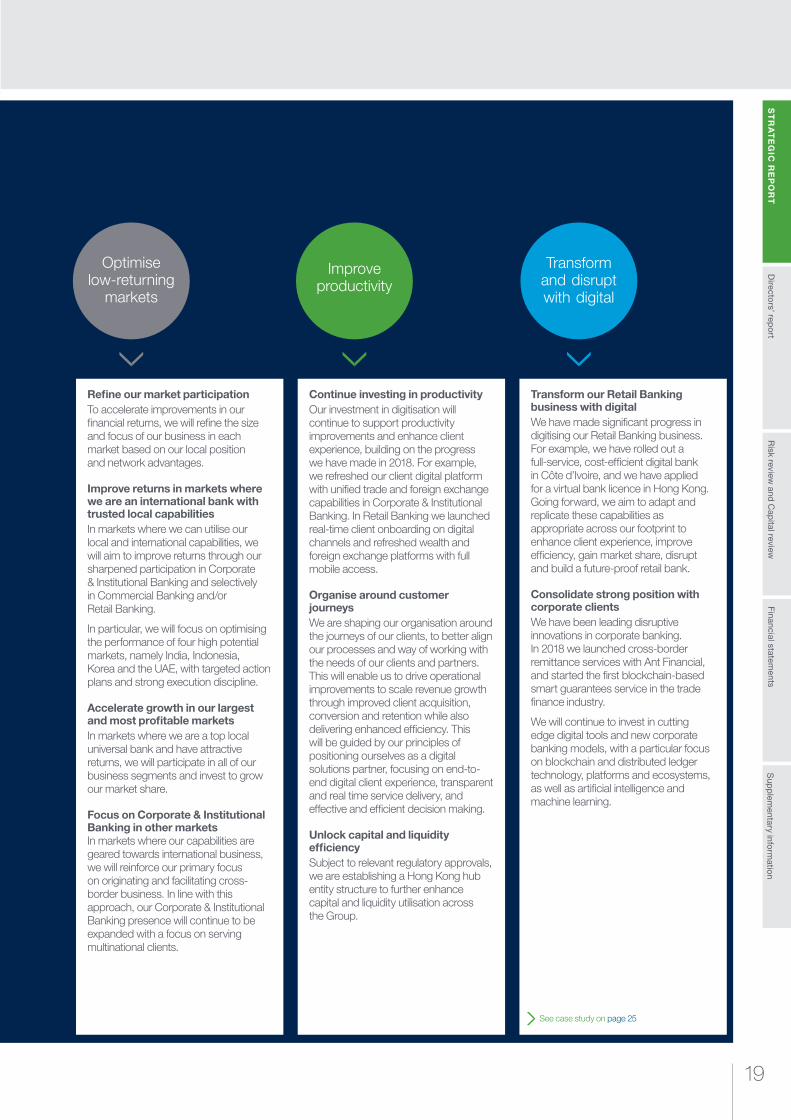
Refine our market participationTo accelerate improvements in our financial returns, we will refine the size and focus of our business in each market based on our local position and network advantages.
Improve returns in markets where we are an international bank with trusted local capabilitiesIn markets where we can utilise our local and international capabilities, we will aim to improve returns through our sharpened participation in Corporate & Institutional Banking and selectively in Commercial Banking and/or Retail Banking.
In particular, we will focus on optimising the performance of four high potential markets, namely India, Indonesia, Korea and the UAE, with targeted action plans and strong execution discipline.
Accelerate growth in our largest and most profitable marketsIn markets where we are a top local universal bank and have attractive returns, we will participate in all of our business segments and invest to grow our market share.
Focus on Corporate & Institutional Banking in other markets In markets where our capabilities are geared towards international business, we will reinforce our primary focus on originating and facilitating cross-border business. In line with this approach, our Corporate & Institutional Banking presence will continue to be expanded with a focus on serving multinational clients.
Continue investing in productivityOur investment in digitisation will continue to support productivity improvements and enhance client experience, building on the progress we have made in 2018. For example, we refreshed our client digital platform with unified trade and foreign exchange capabilities in Corporate & Institutional Banking. In Retail Banking we launched real-time client onboarding on digital channels and refreshed wealth and foreign exchange platforms with full mobile access.
Organise around customer journeysWe are shaping our organisation around the journeys of our clients, to better align our processes and way of working with the needs of our clients and partners. This will enable us to drive operational improvements to scale revenue growth through improved client acquisition, conversion and retention while also delivering enhanced efficiency. This will be guided by our principles of positioning ourselves as a digital solutions partner, focusing on end-to-end digital client experience, transparent and real time service delivery, and effective and efficient decision making.
Unlock capital and liquidity efficiencySubject to relevant regulatory approvals, we are establishing a Hong Kong hub entity structure to further enhance capital and liquidity utilisation across the Group.
Transform our Retail Banking business with digitalWe have made significant progress in digitising our Retail Banking business. For example, we have rolled out a full-service, cost-efficient digital bank in Côte d’Ivoire, and we have applied for a virtual bank licence in Hong Kong. Going forward, we aim to adapt and replicate these capabilities as appropriate across our footprint to enhance client experience, improve efficiency, gain market share, disrupt and build a future-proof retail bank.
Consolidate strong position with corporate clientsWe have been leading disruptive innovations in corporate banking. In 2018 we launched cross-border remittance services with Ant Financial, and started the first blockchain-based smart guarantees service in the trade finance industry.
We will continue to invest in cutting edge digital tools and new corporate banking models, with a particular focus on blockchain and distributed ledger technology, platforms and ecosystems, as well as artificial intelligence and machine learning.
See case study on page 25
Transform and disrupt with digital
Optimise low-returning
markets
Improve productivity

GREEN LENDING
Supporting green lending in the Middle East
As part of our commitment to sustainable finance, we’re creating products and services that enable clients to improve their own sustainability performance.
In 2018, we acted as green loan coordinator on a transaction that repriced and extended a $2 billion conventional and Murabaha (Islamic) revolving credit facility to DP World. One of our major clients in the Middle East, DP World is a leading enabler of global trade through its ports and terminals, maritime services, and industrial parks, logistics and economic zones.
The transaction team drew on global expertise from across the Standard Chartered network to develop a product that put the client’s needs at the centre of the process
Recognising DP World’s ambition to be a pioneer in the region’s capital markets and a leader in sustainability, we proposed the Middle East’s first green loan to link pricing to the company’s carbon emissions and the first with this linkage in an Islamic format. The loan provides DP World with a financial incentive to improve its environmental performance.
Aligned to our new Sustainability Philosophy, the deal demonstrates our commitment to finding innovative ways to mobilise capital to have a positive environmental and social impact in our markets.
Standard Chartered Annual Report 201820
Risk review
and Cap
ital reviewS
TR
AT
EG
IC R
EP
OR
TS
upp
lementary info
rmatio
nFinancial statem
entsD
irectors’ rep
ort
21
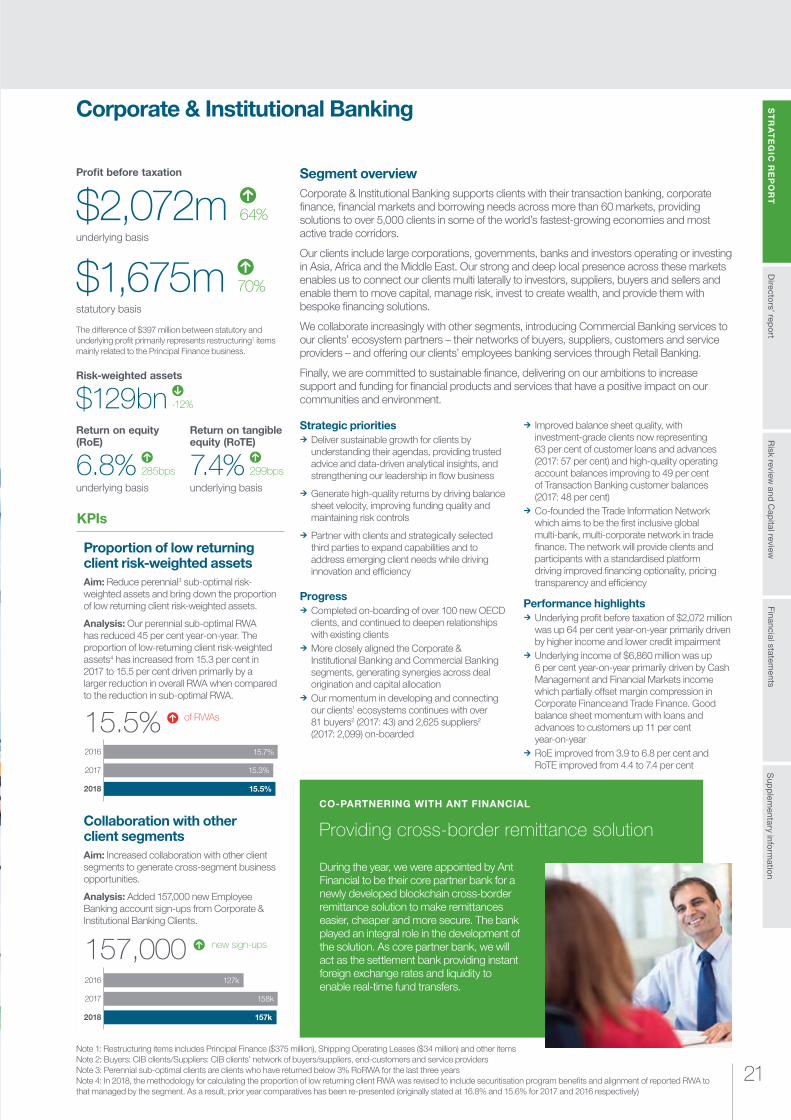
Risk-weighted assets
$129bn -12%
Return on equity (RoE)
6.8% 285bps underlying basis
Return on tangible equity (RoTE)
7.4% 299bps underlying basis
$1,675m 70%statutory basis
Profit before taxation
$2,072m 64%underlying basis
Segment overviewCorporate & Institutional Banking supports clients with their transaction banking, corporate finance, financial markets and borrowing needs across more than 60 markets, providing solutions to over 5,000 clients in some of the world’s fastest-growing economies and most active trade corridors.
Our clients include large corporations, governments, banks and investors operating or investing in Asia, Africa and the Middle East. Our strong and deep local presence across these markets enables us to connect our clients multi laterally to investors, suppliers, buyers and sellers and enable them to move capital, manage risk, invest to create wealth, and provide them with bespoke financing solutions.
We collaborate increasingly with other segments, introducing Commercial Banking services to our clients’ ecosystem partners – their networks of buyers, suppliers, customers and service providers – and offering our clients’ employees banking services through Retail Banking.
Finally, we are committed to sustainable finance, delivering on our ambitions to increase support and funding for financial products and services that have a positive impact on our communities and environment.
Strategic priorities ¼ Deliver sustainable growth for clients by understanding their agendas, providing trusted advice and data-driven analytical insights, and strengthening our leadership in flow business
¼ Generate high-quality returns by driving balance sheet velocity, improving funding quality and maintaining risk controls
¼ Partner with clients and strategically selected third parties to expand capabilities and to address emerging client needs while driving innovation and efficiency
Progress ¼ Completed on-boarding of over 100 new OECD clients, and continued to deepen relationships with existing clients
¼ More closely aligned the Corporate & Institutional Banking and Commercial Banking segments, generating synergies across deal origination and capital allocation
¼ Our momentum in developing and connecting our clients’ ecosystems continues with over 81 buyers2 (2017: 43) and 2,625 suppliers2 (2017: 2,099) on-boarded
¼ Improved balance sheet quality, with investment-grade clients now representing 63 per cent of customer loans and advances (2017: 57 per cent) and high-quality operating account balances improving to 49 per cent of Transaction Banking customer balances (2017: 48 per cent)
¼ Co-founded the Trade Information Network which aims to be the first inclusive global multi-bank, multi-corporate network in trade finance. The network will provide clients and participants with a standardised platform driving improved financing optionality, pricing transparency and efficiency
Performance highlights ¼ Underlying profit before taxation of $2,072 million was up 64 per cent year-on-year primarily driven by higher income and lower credit impairment
¼ Underlying income of $6,860 million was up 6 per cent year-on-year primarily driven by Cash Management and Financial Markets income which partially offset margin compression in Corporate Finance and Trade Finance. Good balance sheet momentum with loans and advances to customers up 11 per cent year-on-year
¼ RoE improved from 3.9 to 6.8 per cent and RoTE improved from 4.4 to 7.4 per cent
Corporate & Institutional Banking
During the year, we were appointed by Ant Financial to be their core partner bank for a newly developed blockchain cross-border remittance solution to make remittances easier, cheaper and more secure. The bank played an integral role in the development of the solution. As core partner bank, we will act as the settlement bank providing instant foreign exchange rates and liquidity to enable real-time fund transfers.
Providing cross-border remittance solution
CO-PARTNERING WITH ANT FINANCIAL
KPIs
Collaboration with other client segmentsAim: Increased collaboration with other client segments to generate cross-segment business opportunities.
Analysis: Added 157,000 new Employee Banking account sign-ups from Corporate & Institutional Banking Clients.
Proportion of low returning client risk-weighted assetsAim: Reduce perennial3 sub-optimal risk-weighted assets and bring down the proportion of low returning client risk-weighted assets.
Analysis: Our perennial sub-optimal RWA has reduced 45 per cent year-on-year. The proportion of low-returning client risk-weighted assets4 has increased from 15.3 per cent in 2017 to 15.5 per cent driven primarily by a larger reduction in overall RWA when compared to the reduction in sub-optimal RWA.
157,000
of RWAs15.5%
new sign-ups
Note 1: Restructuring items includes Principal Finance ($375 million), Shipping Operating Leases ($34 million) and other itemsNote 2: Buyers: CIB clients/Suppliers: CIB clients’ network of buyers/suppliers, end-customers and service providersNote 3: Perennial sub-optimal clients are clients who have returned below 3% RoRWA for the last three yearsNote 4: In 2018, the methodology for calculating the proportion of low returning client RWA was revised to include securitisation program benefits and alignment of reported RWA to that managed by the segment. As a result, prior year comparatives has been re-presented (originally stated at 16.8% and 15.6% for 2017 and 2016 respectively)
2018
2017
2016 15.7%
15.3%
15.5%
2018
2017
2016 127k
158k
157k
The difference of $397 million between statutory and underlying profit primarily represents restructuring1 items mainly related to the Principal Finance business.

STRATEGIC REPORT Client segment reviews
Standard Chartered Annual Report 201822
$965m 13%statutory basis
Profit before taxation
$1,033m 18%underlying basis
Segment overview Retail Banking serves over nine million individuals and small businesses, with a focus on affluent and emerging affluent in many of the world’s fastest-growing cities. We provide digital banking services with a human touch to our clients with services spanning across deposits, payments, financing products and wealth management, as well as supporting their business banking needs.
Retail Banking generates approximately one-third of the Group’s operating income and one-quarter of its operating profit. We are closely integrated with the Group’s other client segments; for example, offering employee banking services to Corporate & Institutional Banking clients, and Retail Banking provides a high-quality liquidity source for the Group.
Increasing levels of wealth across Asia, Africa and the Middle East support our opportunity to grow the business sustainably. We aim to improve productivity and client experience through driving digitisation, cost efficiencies and simplifying processes.
Strategic priorities ¼ Continue to focus on affluent and emerging affluent clients and their wealth needs and capture the significant rise of the middle class in our markets
¼ Continue to build on our client ecosystem and alliances initiatives
¼ Improve our clients’ experience through an enhanced end-to-end digital offering, with intuitive platforms, best-in-class products and service responding to the change in digital habits of clients in our markets
Progress ¼ Increased the share of income from Priority clients from 45 per cent in 2017 to 47 per cent as a result of strong Wealth Management and Deposit income growth and increasing client numbers
¼ Launched the first digital-only bank in Côte d’Ivoire with a plan to roll out across other markets in the Africa & Middle East region and develop stand-alone digital banking propositions in key markets in Asia
¼ Launched real time on-boarding in India, enabling straight-through current and savings account opening and more efficient Credit Cards and Personal Loan applications with significantly improved customer experience
¼ Launched Premium Banking in eight markets ¼ A further improvement in digital adoption, with 49 per cent of clients now actively using online or mobile banking compared to 45 per cent in 2017
Performance highlights ¼ Underlying profit before taxation of $1,033 million was up 18 per cent year-on-year as income growth and lower credit impairment more than offset increased expenses
¼ Underlying income of $5,041 million was up 4 per cent year-on-year with growth of 8 per cent in Greater China & North Asia, and 4 per cent in ASEAN & South Asia, partially offsetting a 6 per cent decline in Africa & Middle East
¼ Strong income momentum from Deposits with improved margins and balance growth together with growth in Wealth Management, particularly in the first half of the year. Together, Deposits and Wealth Management income, representing 61 per cent of Retail Banking income, grew 15 per cent year-on-year
¼ RoE improved from 9.2 to 10.8 per cent and RoTE improved from 10.3 to 11.8 per cent
Retail Banking
We are thoughtfully and consistently investing in digital capabilities to enhance our products and services, drive end-to-end process improvements and increase the ability of our clients to self-serve their needs. This investment has resulted in our new voice recognition platforms and cross-border payment options on mobile and tablet devices for clients who need to bank anytime, anywhere. Every innovation is based on insights: we spend time getting to know our clients and understanding their banking needs and financial goals.
Building relationships through technology
UNDERSTANDING CLIENTS’ BANKING NEEDS
KPIs
Priority client focusAim: Increase the proportion of income from Priority clients, reflecting the strategic shift in client mix towards affluent and emerging affluent clients.
Analysis: The share of Retail Banking income from Priority clients increased from 44.8 per cent in 2017 to 47 per cent in 2018, supported by more than 100,000 new-to-bank Priority clients in the year.
Digital adoptionAim: Align the Group’s services to how clients want to interact and increase efficiency by reducing the amount of manual processing.
Analysis: Online applications have continued to grow year-on-year with the proportion of Retail Banking clients that are digital-active up from 44.7 per cent in 2017 to 49.4 per cent at the end of 2018.
49.4% number of clients
47.0% share of income
2018
2017
2016 39.6%
44.7%
49.4%
2018
2017
2016 39.0%
44.8%
47.0%
The difference of $68 million between statutory and underlying profit represents restructuring.
Return on equity (RoE)
10.8% 163bps underlying basis
Return on tangible equity (RoTE)
11.8% 149bps underlying basis
Risk-weighted assets
$43bn -3%
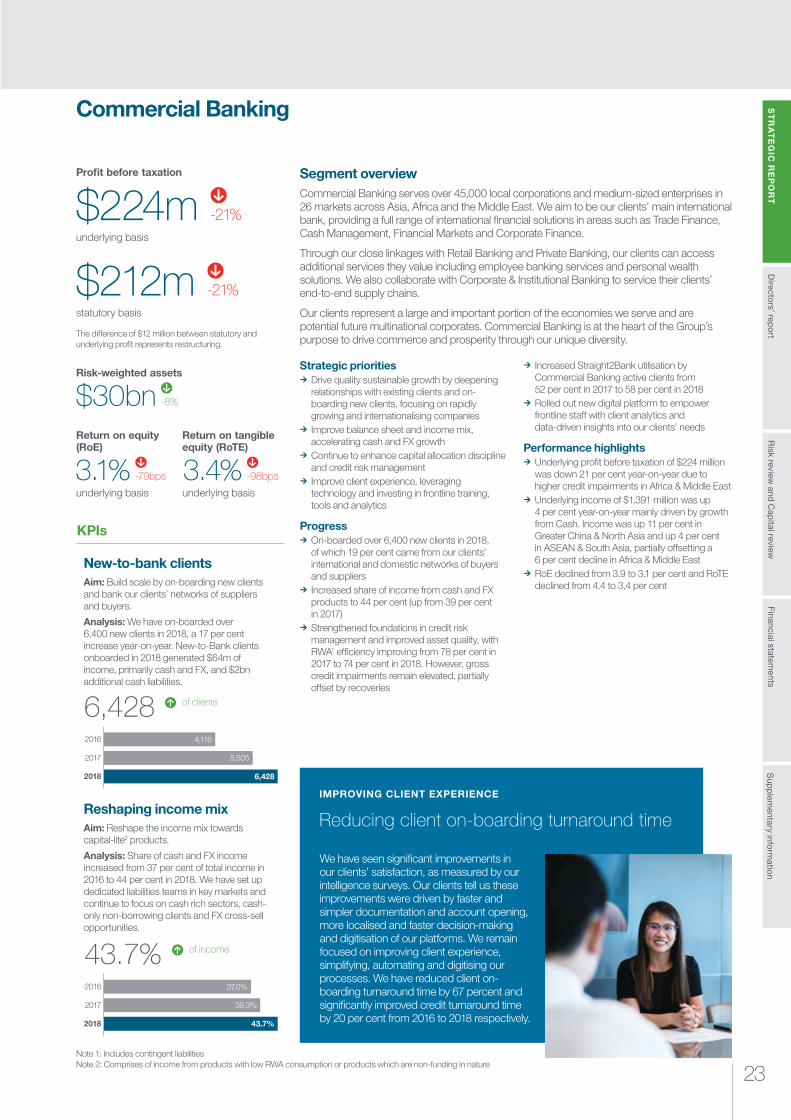
Risk review
and Cap
ital reviewS
TR
AT
EG
IC R
EP
OR
TS
upp
lementary info
rmatio
nFinancial statem
entsD
irectors’ rep
ort
23
$212m -21%statutory basis
Profit before taxation
$224m -21%underlying basis
Segment overview Commercial Banking serves over 45,000 local corporations and medium-sized enterprises in 26 markets across Asia, Africa and the Middle East. We aim to be our clients’ main international bank, providing a full range of international financial solutions in areas such as Trade Finance, Cash Management, Financial Markets and Corporate Finance.
Through our close linkages with Retail Banking and Private Banking, our clients can access additional services they value including employee banking services and personal wealth solutions. We also collaborate with Corporate & Institutional Banking to service their clients’ end-to-end supply chains.
Our clients represent a large and important portion of the economies we serve and are potential future multinational corporates. Commercial Banking is at the heart of the Group’s purpose to drive commerce and prosperity through our unique diversity.
Strategic priorities ¼ Drive quality sustainable growth by deepening relationships with existing clients and on-boarding new clients, focusing on rapidly growing and internationalising companies
¼ Improve balance sheet and income mix, accelerating cash and FX growth
¼ Continue to enhance capital allocation discipline and credit risk management
¼ Improve client experience, leveraging technology and investing in frontline training, tools and analytics
Progress ¼ On-boarded over 6,400 new clients in 2018, of which 19 per cent came from our clients’ international and domestic networks of buyers and suppliers
¼ Increased share of income from cash and FX products to 44 per cent (up from 39 per cent in 2017)
¼ Strengthened foundations in credit risk management and improved asset quality, with RWA1 efficiency improving from 78 per cent in 2017 to 74 per cent in 2018. However, gross credit impairments remain elevated, partially offset by recoveries
¼ Increased Straight2Bank utilisation by Commercial Banking active clients from 52 per cent in 2017 to 58 per cent in 2018
¼ Rolled out new digital platform to empower frontline staff with client analytics and data-driven insights into our clients’ needs
Performance highlights ¼ Underlying profit before taxation of $224 million was down 21 per cent year-on-year due to higher credit impairments in Africa & Middle East
¼ Underlying income of $1,391 million was up 4 per cent year-on-year mainly driven by growth from Cash. Income was up 11 per cent in Greater China & North Asia and up 4 per cent in ASEAN & South Asia, partially offsetting a 6 per cent decline in Africa & Middle East
¼ RoE declined from 3.9 to 3.1 per cent and RoTE declined from 4.4 to 3.4 per cent
Commercial Banking
We have seen significant improvements in our clients’ satisfaction, as measured by our intelligence surveys. Our clients tell us these improvements were driven by faster and simpler documentation and account opening, more localised and faster decision-making and digitisation of our platforms. We remain focused on improving client experience, simplifying, automating and digitising our processes. We have reduced client on-boarding turnaround time by 67 percent and significantly improved credit turnaround time by 20 per cent from 2016 to 2018 respectively.
Reducing client on-boarding turnaround time
IMPROVING CLIENT EXPERIENCE
KPIs
Reshaping income mixAim: Reshape the income mix towards capital-lite2 products.
Analysis: Share of cash and FX income increased from 37 per cent of total income in 2016 to 44 per cent in 2018. We have set up dedicated liabilities teams in key markets and continue to focus on cash rich sectors, cash-only non-borrowing clients and FX cross-sell opportunities.
New-to-bank clientsAim: Build scale by on-boarding new clients and bank our clients’ networks of suppliers and buyers.
Analysis: We have on-boarded over 6,400 new clients in 2018, a 17 per cent increase year-on-year. New-to-Bank clients onboarded in 2018 generated $64m of income, primarily cash and FX, and $2bn additional cash liabilities.
6,428 of clients
43.7% of income
2018
2017
2016 4,116
5,505
6,428
2018
2017
2016 37.0%
39.3%
43.7%
The difference of $12 million between statutory and underlying profit represents restructuring.
Return on equity (RoE)
3.1% -79bps underlying basis
Return on tangible equity (RoTE)
3.4% -98bps underlying basis
Risk-weighted assets
$30bn -8%
Note 1: Includes contingent liabilitiesNote 2: Comprises of income from products with low RWA consumption or products which are non-funding in nature
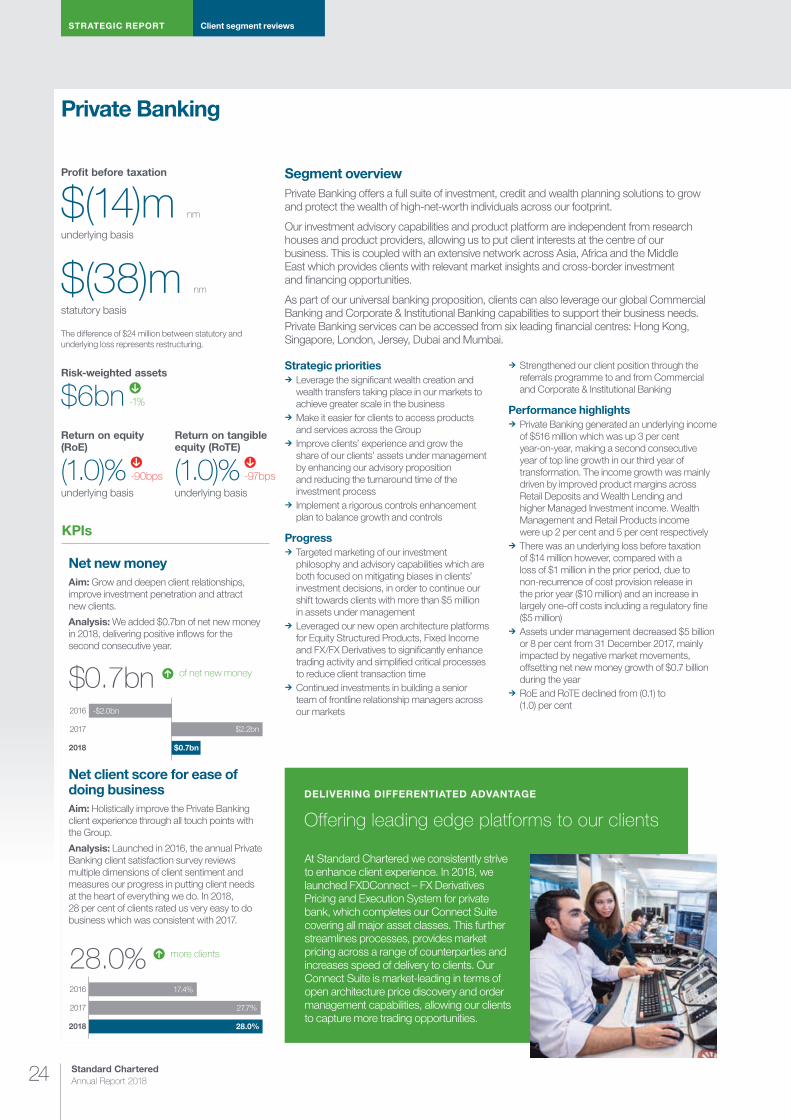
STRATEGIC REPORT Client segment reviews
Standard Chartered Annual Report 201824
$(38)m nm
statutory basis
Profit before taxation
$(14)m nm
underlying basis
Segment overviewPrivate Banking offers a full suite of investment, credit and wealth planning solutions to grow and protect the wealth of high-net-worth individuals across our footprint.
Our investment advisory capabilities and product platform are independent from research houses and product providers, allowing us to put client interests at the centre of our business. This is coupled with an extensive network across Asia, Africa and the Middle East which provides clients with relevant market insights and cross-border investment and financing opportunities.
As part of our universal banking proposition, clients can also leverage our global Commercial Banking and Corporate & Institutional Banking capabilities to support their business needs. Private Banking services can be accessed from six leading financial centres: Hong Kong, Singapore, London, Jersey, Dubai and Mumbai.
Strategic priorities ¼ Leverage the significant wealth creation and wealth transfers taking place in our markets to achieve greater scale in the business
¼ Make it easier for clients to access products and services across the Group
¼ Improve clients’ experience and grow the share of our clients’ assets under management by enhancing our advisory proposition and reducing the turnaround time of the investment process
¼ Implement a rigorous controls enhancement plan to balance growth and controls
Progress ¼ Targeted marketing of our investment philosophy and advisory capabilities which are both focused on mitigating biases in clients’ investment decisions, in order to continue our shift towards clients with more than $5 million in assets under management
¼ Leveraged our new open architecture platforms for Equity Structured Products, Fixed Income and FX/FX Derivatives to significantly enhance trading activity and simplified critical processes to reduce client transaction time
¼ Continued investments in building a senior team of frontline relationship managers across our markets
¼ Strengthened our client position through the referrals programme to and from Commercial and Corporate & Institutional Banking
Performance highlights ¼ Private Banking generated an underlying income of $516 million which was up 3 per cent year-on-year, making a second consecutive year of top line growth in our third year of transformation. The income growth was mainly driven by improved product margins across Retail Deposits and Wealth Lending and higher Managed Investment income. Wealth Management and Retail Products income were up 2 per cent and 5 per cent respectively
¼ There was an underlying loss before taxation of $14 million however, compared with a loss of $1 million in the prior period, due to non-recurrence of cost provision release in the prior year ($10 million) and an increase in largely one-off costs including a regulatory fine ($5 million)
¼ Assets under management decreased $5 billion or 8 per cent from 31 December 2017, mainly impacted by negative market movements, offsetting net new money growth of $0.7 billion during the year
¼ RoE and RoTE declined from (0.1) to (1.0) per cent
Private Banking
At Standard Chartered we consistently strive to enhance client experience. In 2018, we launched FXDConnect – FX Derivatives Pricing and Execution System for private bank, which completes our Connect Suite covering all major asset classes. This further streamlines processes, provides market pricing across a range of counterparties and increases speed of delivery to clients. Our Connect Suite is market-leading in terms of open architecture price discovery and order management capabilities, allowing our clients to capture more trading opportunities.
Offering leading edge platforms to our clients
DELIVERING DIFFERENTIATED ADVANTAGE
KPIs
Net client score for ease of doing businessAim: Holistically improve the Private Banking client experience through all touch points with the Group.
Analysis: Launched in 2016, the annual Private Banking client satisfaction survey reviews multiple dimensions of client sentiment and measures our progress in putting client needs at the heart of everything we do. In 2018, 28 per cent of clients rated us very easy to do business which was consistent with 2017.
Net new moneyAim: Grow and deepen client relationships, improve investment penetration and attract new clients.
Analysis: We added $0.7bn of net new money in 2018, delivering positive inflows for the second consecutive year.
$0.7bn of net new money
28.0% more clients
2018
2017
2016 -$2.0bn
$2.2bn
$0.7bn
2018
2017
2016 17.4%
27.7%
28.0%
The difference of $24 million between statutory and underlying loss represents restructuring.
Return on equity (RoE)
(1.0)% -90bps underlying basis
Return on tangible equity (RoTE)
(1.0)% -97bps underlying basis
Risk-weighted assets
$6bn -1%

Risk review
and Cap
ital reviewS
TR
AT
EG
IC R
EP
OR
TS
upp
lementary info
rmatio
nFinancial statem
entsD
irectors’ rep
ort
Risk review
and Cap
ital reviewS
TR
AT
EG
IC R
EP
OR
TS
TR
AT
EG
IC R
EP
OR
TS
TR
AT
EG
IC R
EP
OR
TS
upp
lementary info
rmatio
nFinancial statem
entsD
irectors’ rep
ort
DIGITAL AND INNOVATION
Our first digital-only bank in Africa
Increased prosperity has made Sub-Saharan Africa’s population more financially savvy, with many looking for new and easy ways to handle their money. This is why, in March 2018, we launched our first digital-only bank in Côte d’Ivoire.
Côte d’Ivoire has led the way in the adoption of digital financial transactions in West Africa
This is a reflection of its ongoing economic transformation. Mobile money account usage stands at 34 per cent of all adults – among the highest in West Africa – demonstrating that the population is opting to use mobile money accounts as opposed to traditional financial institutions.
As part of our offering in Côte d’Ivoire, we have digitised over 70 of the most popular banking services, including account openings. Customers can open a new account entirely through our app anytime, anywhere – from the comfort of their own home or while on the road.
We expect Côte d’Ivoire bank account take-up – led by digital – to rise rapidly over the next five years, with the country poised to act as a digital banking catalyst for the wider region, just as Kenya sparked East Africa’s mobile money revolution a decade ago.
25
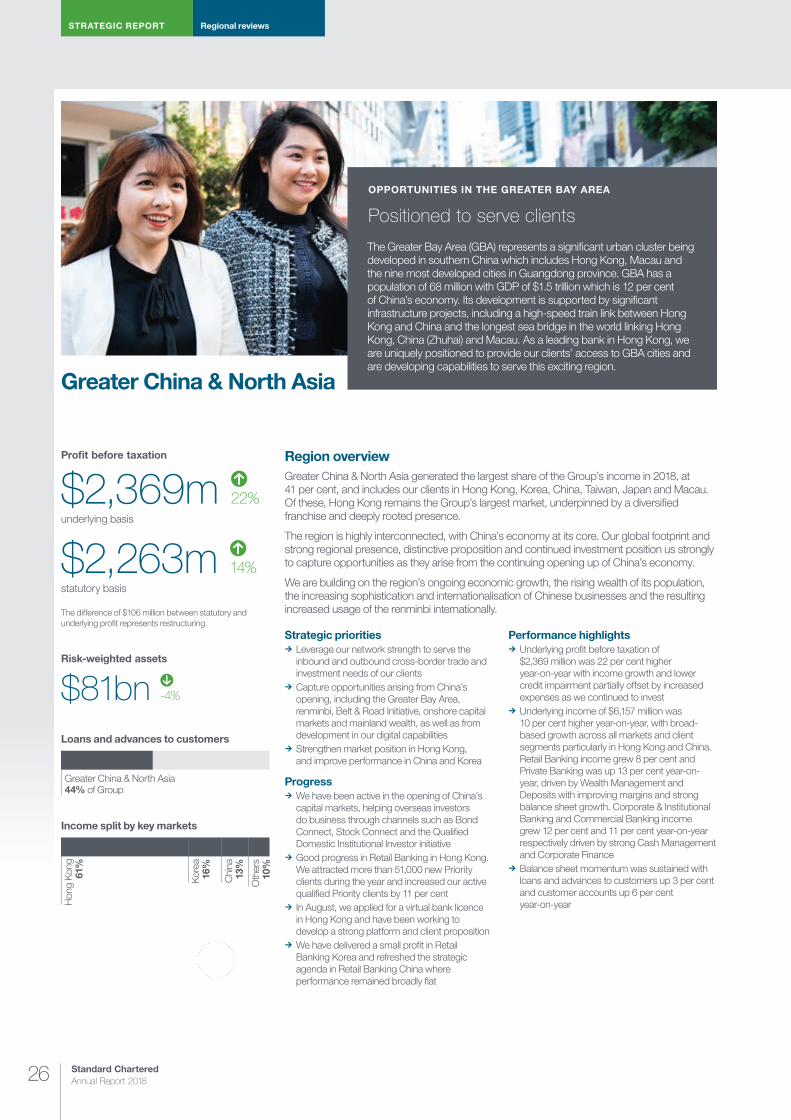
STRATEGIC REPORT Regional reviews
Standard Chartered Annual Report 201826
Greater China & North Asia
$2,263m 14%statutory basis
Profit before taxation
$2,369m 22%underlying basis
$81bn -4%
Risk-weighted assets
The Greater Bay Area (GBA) represents a significant urban cluster being developed in southern China which includes Hong Kong, Macau and the nine most developed cities in Guangdong province. GBA has a population of 68 million with GDP of $1.5 trillion which is 12 per cent of China’s economy. Its development is supported by significant infrastructure projects, including a high-speed train link between Hong Kong and China and the longest sea bridge in the world linking Hong Kong, China (Zhuhai) and Macau. As a leading bank in Hong Kong, we are uniquely positioned to provide our clients’ access to GBA cities and are developing capabilities to serve this exciting region.
Positioned to serve clients
OPPORTUNITIES IN THE GREATER BAY AREA
Region overviewGreater China & North Asia generated the largest share of the Group’s income in 2018, at 41 per cent, and includes our clients in Hong Kong, Korea, China, Taiwan, Japan and Macau. Of these, Hong Kong remains the Group’s largest market, underpinned by a diversified franchise and deeply rooted presence.
The region is highly interconnected, with China’s economy at its core. Our global footprint and strong regional presence, distinctive proposition and continued investment position us strongly to capture opportunities as they arise from the continuing opening up of China’s economy.
We are building on the region’s ongoing economic growth, the rising wealth of its population, the increasing sophistication and internationalisation of Chinese businesses and the resulting increased usage of the renminbi internationally.
Strategic priorities ¼ Leverage our network strength to serve the inbound and outbound cross-border trade and investment needs of our clients
¼ Capture opportunities arising from China’s opening, including the Greater Bay Area, renminbi, Belt & Road Initiative, onshore capital markets and mainland wealth, as well as from development in our digital capabilities
¼ Strengthen market position in Hong Kong, and improve performance in China and Korea
Progress ¼ We have been active in the opening of China’s capital markets, helping overseas investors do business through channels such as Bond Connect, Stock Connect and the Qualified Domestic Institutional Investor initiative
¼ Good progress in Retail Banking in Hong Kong. We attracted more than 51,000 new Priority clients during the year and increased our active qualified Priority clients by 11 per cent
¼ In August, we applied for a virtual bank licence in Hong Kong and have been working to develop a strong platform and client proposition
¼ We have delivered a small profit in Retail Banking Korea and refreshed the strategic agenda in Retail Banking China where performance remained broadly flat
Performance highlights ¼ Underlying profit before taxation of $2,369 million was 22 per cent higher year-on-year with income growth and lower credit impairment partially offset by increased expenses as we continued to invest
¼ Underlying income of $6,157 million was 10 per cent higher year-on-year, with broad-based growth across all markets and client segments particularly in Hong Kong and China. Retail Banking income grew 8 per cent and Private Banking was up 13 per cent year-on-year, driven by Wealth Management and Deposits with improving margins and strong balance sheet growth. Corporate & Institutional Banking and Commercial Banking income grew 12 per cent and 11 per cent year-on-year respectively driven by strong Cash Management and Corporate Finance
¼ Balance sheet momentum was sustained with loans and advances to customers up 3 per cent and customer accounts up 6 per cent year-on-year
Loans and advances to customers
Greater China & North Asia44% of Group
Income split by key markets
Hon
g K
ong
61%
Kor
ea16
%
Chi
na13
%
Oth
ers
10%
The difference of $106 million between statutory and underlying profit represents restructuring.
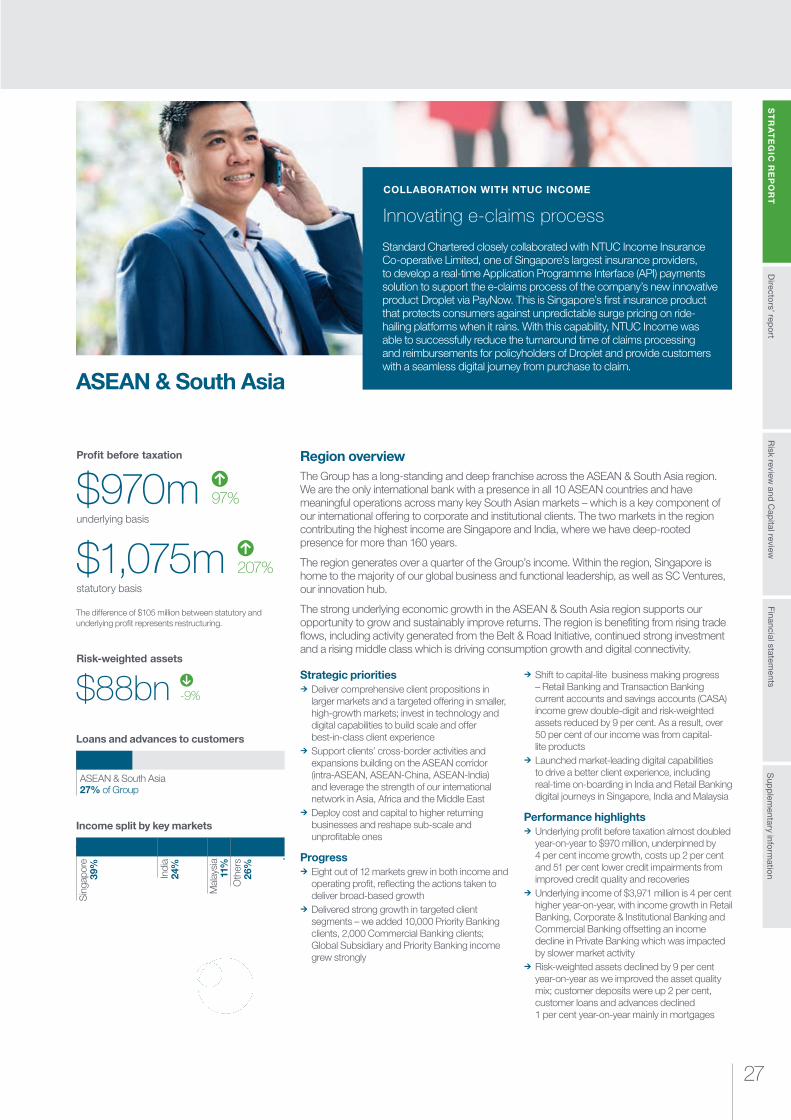
Risk review
and Cap
ital reviewS
TR
AT
EG
IC R
EP
OR
TS
upp
lementary info
rmatio
nFinancial statem
entsD
irectors’ rep
ort
27
$88bn -9%
Risk-weighted assets
$1,075m 207%statutory basis
Profit before taxation
$970m 97%underlying basis
ASEAN & South Asia
Region overview The Group has a long-standing and deep franchise across the ASEAN & South Asia region. We are the only international bank with a presence in all 10 ASEAN countries and have meaningful operations across many key South Asian markets – which is a key component of our international offering to corporate and institutional clients. The two markets in the region contributing the highest income are Singapore and India, where we have deep-rooted presence for more than 160 years.
The region generates over a quarter of the Group’s income. Within the region, Singapore is home to the majority of our global business and functional leadership, as well as SC Ventures, our innovation hub.
The strong underlying economic growth in the ASEAN & South Asia region supports our opportunity to grow and sustainably improve returns. The region is benefiting from rising trade flows, including activity generated from the Belt & Road Initiative, continued strong investment and a rising middle class which is driving consumption growth and digital connectivity.
Strategic priorities ¼ Deliver comprehensive client propositions in larger markets and a targeted offering in smaller, high-growth markets; invest in technology and digital capabilities to build scale and offer best-in-class client experience
¼ Support clients’ cross-border activities and expansions building on the ASEAN corridor (intra-ASEAN, ASEAN-China, ASEAN-India) and leverage the strength of our international network in Asia, Africa and the Middle East
¼ Deploy cost and capital to higher returning businesses and reshape sub-scale and unprofitable ones
Progress ¼ Eight out of 12 markets grew in both income and operating profit, reflecting the actions taken to deliver broad-based growth
¼ Delivered strong growth in targeted client segments – we added 10,000 Priority Banking clients, 2,000 Commercial Banking clients; Global Subsidiary and Priority Banking income grew strongly
¼ Shift to capital-lite business making progress – Retail Banking and Transaction Banking current accounts and savings accounts (CASA) income grew double-digit and risk-weighted assets reduced by 9 per cent. As a result, over 50 per cent of our income was from capital- lite products
¼ Launched market-leading digital capabilities to drive a better client experience, including real-time on-boarding in India and Retail Banking digital journeys in Singapore, India and Malaysia
Performance highlights ¼ Underlying profit before taxation almost doubled year-on-year to $970 million, underpinned by 4 per cent income growth, costs up 2 per cent and 51 per cent lower credit impairments from improved credit quality and recoveries
¼ Underlying income of $3,971 million is 4 per cent higher year-on-year, with income growth in Retail Banking, Corporate & Institutional Banking and Commercial Banking offsetting an income decline in Private Banking which was impacted by slower market activity
¼ Risk-weighted assets declined by 9 per cent year-on-year as we improved the asset quality mix; customer deposits were up 2 per cent, customer loans and advances declined 1 per cent year-on-year mainly in mortgages
Loans and advances to customers
ASEAN & South Asia27% of Group
Income split by key markets
Sin
gapo
re39
%
Indi
a24
%
Mal
aysi
a11
%O
ther
s26
%Standard Chartered closely collaborated with NTUC Income Insurance Co-operative Limited, one of Singapore’s largest insurance providers, to develop a real-time Application Programme Interface (API) payments solution to support the e-claims process of the company’s new innovative product Droplet via PayNow. This is Singapore’s first insurance product that protects consumers against unpredictable surge pricing on ride-hailing platforms when it rains. With this capability, NTUC Income was able to successfully reduce the turnaround time of claims processing and reimbursements for policyholders of Droplet and provide customers with a seamless digital journey from purchase to claim.
Innovating e-claims process
COLLABORATION WITH NTUC INCOME
The difference of $105 million between statutory and underlying profit represents restructuring.
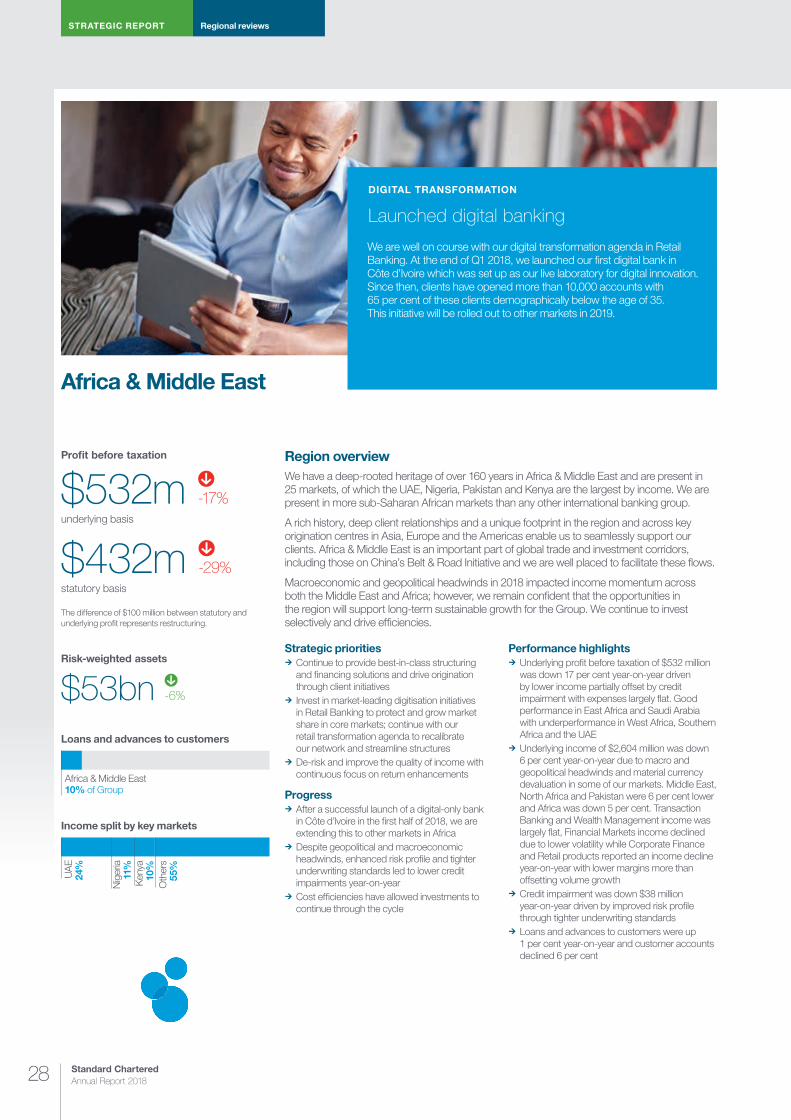
STRATEGIC REPORT Regional reviews
Standard Chartered Annual Report 201828
Africa & Middle East
$432m -29%statutory basis
Profit before taxation
$532m -17%underlying basis
$53bn -6%
Risk-weighted assets
Region overview We have a deep-rooted heritage of over 160 years in Africa & Middle East and are present in 25 markets, of which the UAE, Nigeria, Pakistan and Kenya are the largest by income. We are present in more sub-Saharan African markets than any other international banking group.
A rich history, deep client relationships and a unique footprint in the region and across key origination centres in Asia, Europe and the Americas enable us to seamlessly support our clients. Africa & Middle East is an important part of global trade and investment corridors, including those on China’s Belt & Road Initiative and we are well placed to facilitate these flows.
Macroeconomic and geopolitical headwinds in 2018 impacted income momentum across both the Middle East and Africa; however, we remain confident that the opportunities in the region will support long-term sustainable growth for the Group. We continue to invest selectively and drive efficiencies.
Strategic priorities ¼ Continue to provide best-in-class structuring and financing solutions and drive origination through client initiatives
¼ Invest in market-leading digitisation initiatives in Retail Banking to protect and grow market share in core markets; continue with our retail transformation agenda to recalibrate our network and streamline structures
¼ De-risk and improve the quality of income with continuous focus on return enhancements
Progress ¼ After a successful launch of a digital-only bank in Côte d’lvoire in the first half of 2018, we are extending this to other markets in Africa
¼ Despite geopolitical and macroeconomic headwinds, enhanced risk profile and tighter underwriting standards led to lower credit impairments year-on-year
¼ Cost efficiencies have allowed investments to continue through the cycle
Performance highlights ¼ Underlying profit before taxation of $532 million was down 17 per cent year-on-year driven by lower income partially offset by credit impairment with expenses largely flat. Good performance in East Africa and Saudi Arabia with underperformance in West Africa, Southern Africa and the UAE
¼ Underlying income of $2,604 million was down 6 per cent year-on-year due to macro and geopolitical headwinds and material currency devaluation in some of our markets. Middle East, North Africa and Pakistan were 6 per cent lower and Africa was down 5 per cent. Transaction Banking and Wealth Management income was largely flat, Financial Markets income declined due to lower volatility while Corporate Finance and Retail products reported an income decline year-on-year with lower margins more than offsetting volume growth
¼ Credit impairment was down $38 million year-on-year driven by improved risk profile through tighter underwriting standards
¼ Loans and advances to customers were up 1 per cent year-on-year and customer accounts declined 6 per cent
Loans and advances to customers
Africa & Middle East10% of Group
Income split by key markets
UA
E24
%
Nig
eria
11%
Ken
ya10
%O
ther
s55
%
We are well on course with our digital transformation agenda in Retail Banking. At the end of Q1 2018, we launched our first digital bank in Côte d’Ivoire which was set up as our live laboratory for digital innovation. Since then, clients have opened more than 10,000 accounts with 65 per cent of these clients demographically below the age of 35. This initiative will be rolled out to other markets in 2019.
Launched digital banking
DIGITAL TRANSFORMATION
The difference of $100 million between statutory and underlying profit represents restructuring.
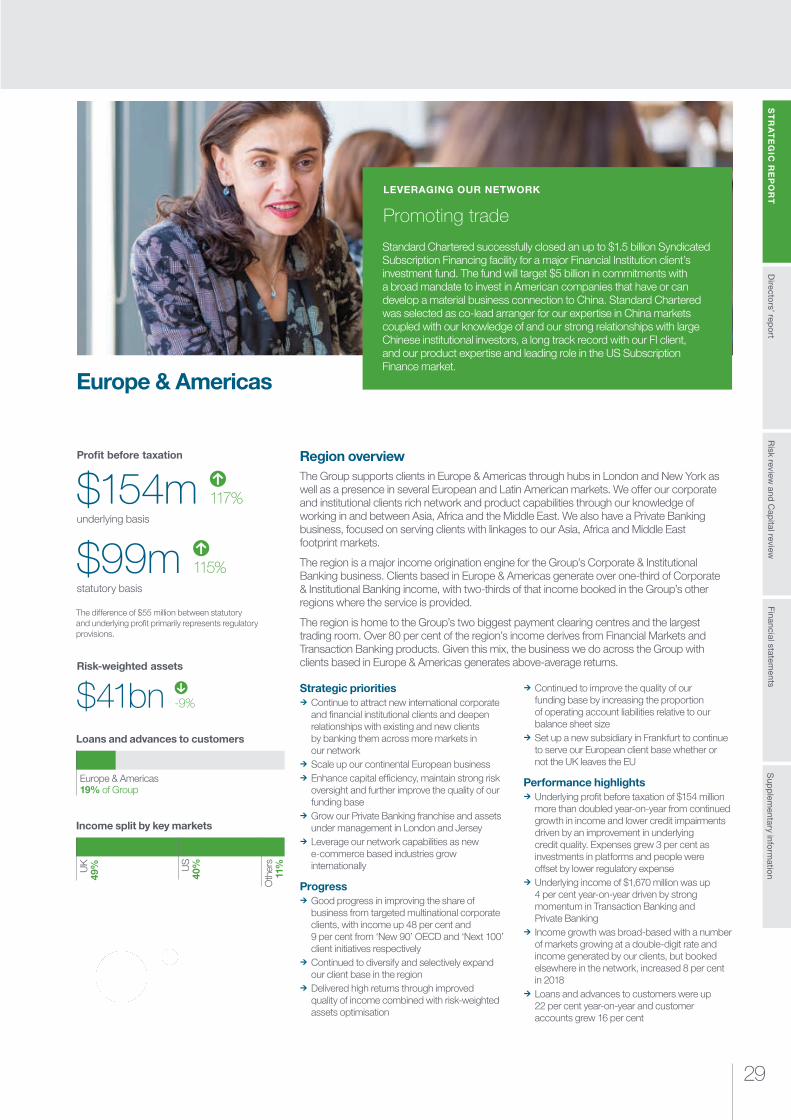
Risk review
and Cap
ital reviewS
TR
AT
EG
IC R
EP
OR
TS
upp
lementary info
rmatio
nFinancial statem
entsD
irectors’ rep
ort
29
$41bn -9%
Risk-weighted assets
$99m 115%statutory basis
Profit before taxation
$154m 117%underlying basis
Europe & Americas
Region overview The Group supports clients in Europe & Americas through hubs in London and New York as well as a presence in several European and Latin American markets. We offer our corporate and institutional clients rich network and product capabilities through our knowledge of working in and between Asia, Africa and the Middle East. We also have a Private Banking business, focused on serving clients with linkages to our Asia, Africa and Middle East footprint markets.
The region is a major income origination engine for the Group’s Corporate & Institutional Banking business. Clients based in Europe & Americas generate over one-third of Corporate & Institutional Banking income, with two-thirds of that income booked in the Group’s other regions where the service is provided.
The region is home to the Group’s two biggest payment clearing centres and the largest trading room. Over 80 per cent of the region’s income derives from Financial Markets and Transaction Banking products. Given this mix, the business we do across the Group with clients based in Europe & Americas generates above-average returns.
Strategic priorities ¼ Continue to attract new international corporate and financial institutional clients and deepen relationships with existing and new clients by banking them across more markets in our network
¼ Scale up our continental European business ¼ Enhance capital efficiency, maintain strong risk oversight and further improve the quality of our funding base
¼ Grow our Private Banking franchise and assets under management in London and Jersey
¼ Leverage our network capabilities as new e-commerce based industries grow internationally
Progress ¼ Good progress in improving the share of business from targeted multinational corporate clients, with income up 48 per cent and 9 per cent from ‘New 90’ OECD and ‘Next 100’ client initiatives respectively
¼ Continued to diversify and selectively expand our client base in the region
¼ Delivered high returns through improved quality of income combined with risk-weighted assets optimisation
¼ Continued to improve the quality of our funding base by increasing the proportion of operating account liabilities relative to our balance sheet size
¼ Set up a new subsidiary in Frankfurt to continue to serve our European client base whether or not the UK leaves the EU
Performance highlights ¼ Underlying profit before taxation of $154 million more than doubled year-on-year from continued growth in income and lower credit impairments driven by an improvement in underlying credit quality. Expenses grew 3 per cent as investments in platforms and people were offset by lower regulatory expense
¼ Underlying income of $1,670 million was up 4 per cent year-on-year driven by strong momentum in Transaction Banking and Private Banking
¼ Income growth was broad-based with a number of markets growing at a double-digit rate and income generated by our clients, but booked elsewhere in the network, increased 8 per cent in 2018
¼ Loans and advances to customers were up 22 per cent year-on-year and customer accounts grew 16 per cent
Loans and advances to customers
Europe & Americas19% of Group
Income split by key markets
UK
49% US
40%
Oth
ers
11%
Standard Chartered successfully closed an up to $1.5 billion Syndicated Subscription Financing facility for a major Financial Institution client’s investment fund. The fund will target $5 billion in commitments with a broad mandate to invest in American companies that have or can develop a material business connection to China. Standard Chartered was selected as co-lead arranger for our expertise in China markets coupled with our knowledge of and our strong relationships with large Chinese institutional investors, a long track record with our FI client, and our product expertise and leading role in the US Subscription Finance market.
Promoting trade
LEVERAGING OUR NETWORK
The difference of $55 million between statutory and underlying profit primarily represents regulatory provisions.
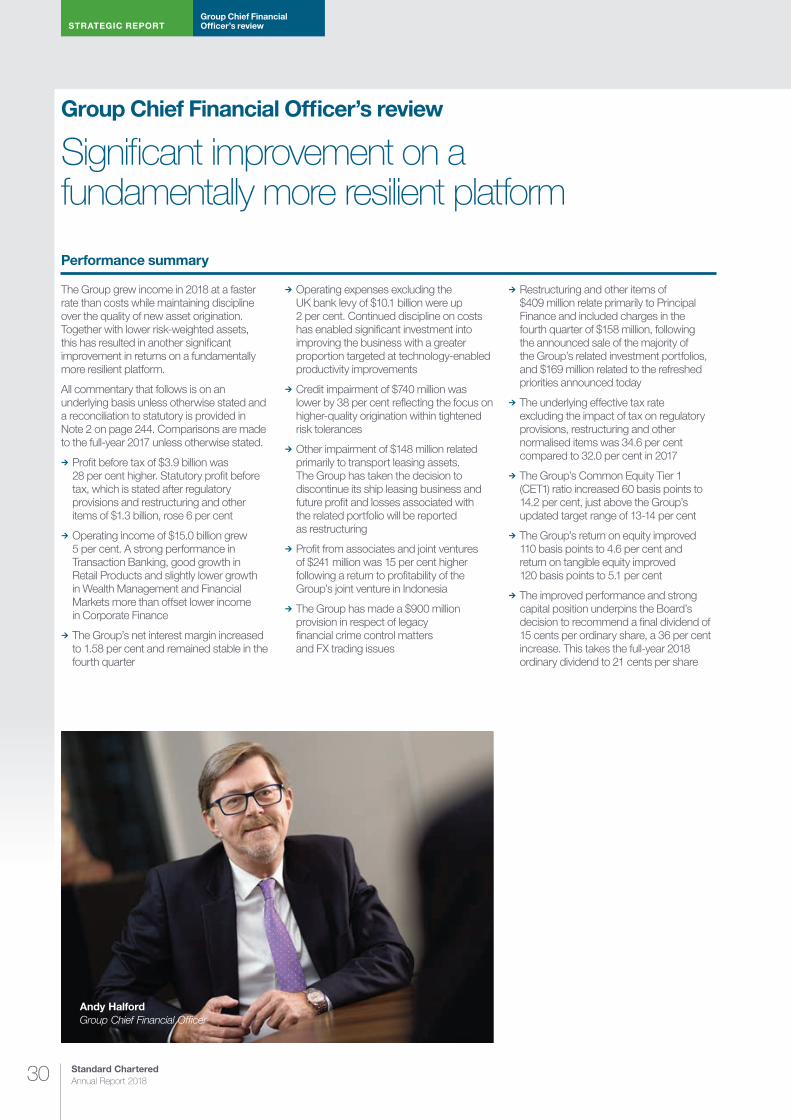
STRATEGIC REPORTGroup Chief Financial Officer’s review
Standard Chartered Annual Report 201830
Significant improvement on a fundamentally more resilient platform
Group Chief Financial Officer’s review
Performance summary
The Group grew income in 2018 at a faster rate than costs while maintaining discipline over the quality of new asset origination. Together with lower risk-weighted assets, this has resulted in another significant improvement in returns on a fundamentally more resilient platform.
All commentary that follows is on an underlying basis unless otherwise stated and a reconciliation to statutory is provided in Note 2 on page 244. Comparisons are made to the full-year 2017 unless otherwise stated.
¼ Profit before tax of $3.9 billion was 28 per cent higher. Statutory profit before tax, which is stated after regulatory provisions and restructuring and other items of $1.3 billion, rose 6 per cent
¼ Operating income of $15.0 billion grew 5 per cent. A strong performance in Transaction Banking, good growth in Retail Products and slightly lower growth in Wealth Management and Financial Markets more than offset lower income in Corporate Finance
¼ The Group’s net interest margin increased to 1.58 per cent and remained stable in the fourth quarter
¼ Operating expenses excluding the UK bank levy of $10.1 billion were up 2 per cent. Continued discipline on costs has enabled significant investment into improving the business with a greater proportion targeted at technology-enabled productivity improvements
¼ Credit impairment of $740 million was lower by 38 per cent reflecting the focus on higher-quality origination within tightened risk tolerances
¼ Other impairment of $148 million related primarily to transport leasing assets. The Group has taken the decision to discontinue its ship leasing business and future profit and losses associated with the related portfolio will be reported as restructuring
¼ Profit from associates and joint ventures of $241 million was 15 per cent higher following a return to profitability of the Group’s joint venture in Indonesia
¼ The Group has made a $900 million provision in respect of legacy financial crime control matters and FX trading issues
¼ Restructuring and other items of $409 million relate primarily to Principal Finance and included charges in the fourth quarter of $158 million, following the announced sale of the majority of the Group’s related investment portfolios, and $169 million related to the refreshed priorities announced today
¼ The underlying effective tax rate excluding the impact of tax on regulatory provisions, restructuring and other normalised items was 34.6 per cent compared to 32.0 per cent in 2017
¼ The Group’s Common Equity Tier 1 (CET1) ratio increased 60 basis points to 14.2 per cent, just above the Group’s updated target range of 13-14 per cent
¼ The Group’s return on equity improved 110 basis points to 4.6 per cent and return on tangible equity improved 120 basis points to 5.1 per cent
¼ The improved performance and strong capital position underpins the Board’s decision to recommend a final dividend of 15 cents per ordinary share, a 36 per cent increase. This takes the full-year 2018 ordinary dividend to 21 cents per share
Andy HalfordGroup Chief Financial Officer
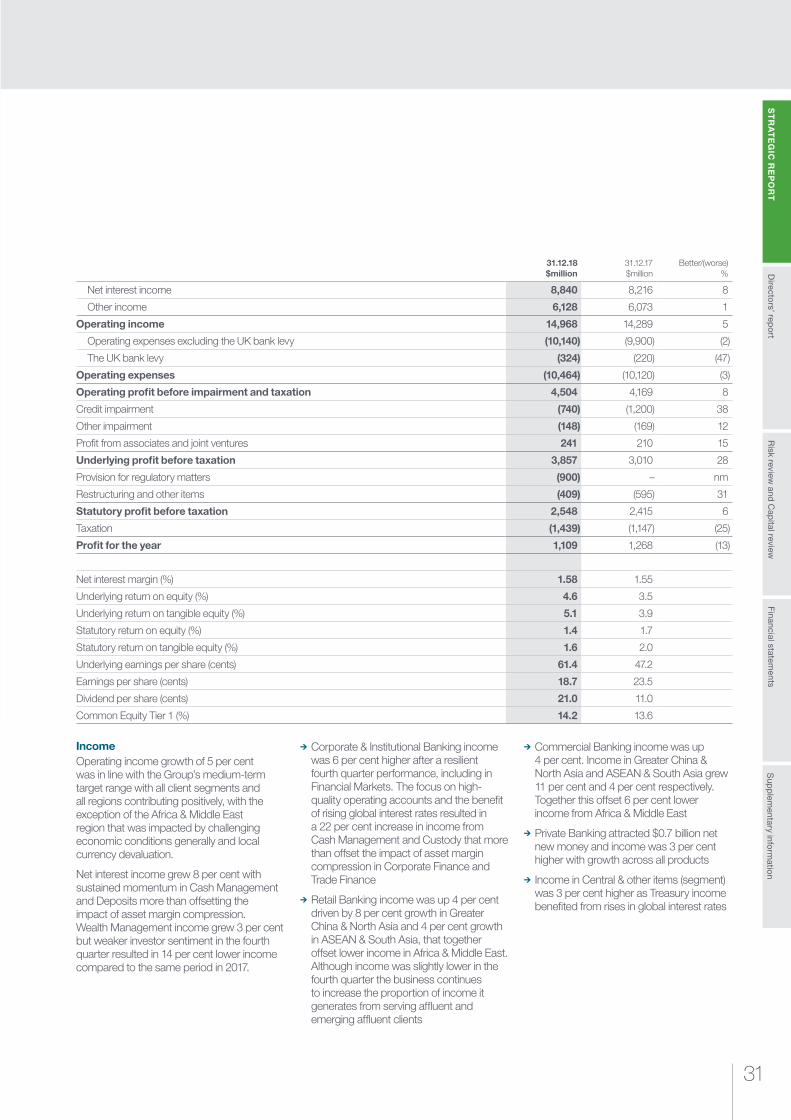
31
Risk review
and Cap
ital reviewS
TR
AT
EG
IC R
EP
OR
TS
upp
lementary info
rmatio
nFinancial statem
entsD
irectors’ rep
ort
31.12.18 $million
31.12.17 $million
Better/(worse) %
Net interest income 8,840 8,216 8
Other income 6,128 6,073 1
Operating income 14,968 14,289 5
Operating expenses excluding the UK bank levy (10,140) (9,900) (2)
The UK bank levy (324) (220) (47)
Operating expenses (10,464) (10,120) (3)
Operating profit before impairment and taxation 4,504 4,169 8
Credit impairment (740) (1,200) 38
Other impairment (148) (169) 12
Profit from associates and joint ventures 241 210 15
Underlying profit before taxation 3,857 3,010 28
Provision for regulatory matters (900) – nm
Restructuring and other items (409) (595) 31
Statutory profit before taxation 2,548 2,415 6
Taxation (1,439) (1,147) (25)
Profit for the year 1,109 1,268 (13)
Net interest margin (%) 1.58 1.55
Underlying return on equity (%) 4.6 3.5
Underlying return on tangible equity (%) 5.1 3.9
Statutory return on equity (%) 1.4 1.7
Statutory return on tangible equity (%) 1.6 2.0
Underlying earnings per share (cents) 61.4 47.2
Earnings per share (cents) 18.7 23.5
Dividend per share (cents) 21.0 11.0
Common Equity Tier 1 (%) 14.2 13.6
IncomeOperating income growth of 5 per cent was in line with the Group’s medium-term target range with all client segments and all regions contributing positively, with the exception of the Africa & Middle East region that was impacted by challenging economic conditions generally and local currency devaluation.
Net interest income grew 8 per cent with sustained momentum in Cash Management and Deposits more than offsetting the impact of asset margin compression. Wealth Management income grew 3 per cent but weaker investor sentiment in the fourth quarter resulted in 14 per cent lower income compared to the same period in 2017.
¼ Corporate & Institutional Banking income was 6 per cent higher after a resilient fourth quarter performance, including in Financial Markets. The focus on high-quality operating accounts and the benefit of rising global interest rates resulted in a 22 per cent increase in income from Cash Management and Custody that more than offset the impact of asset margin compression in Corporate Finance and Trade Finance
¼ Retail Banking income was up 4 per cent driven by 8 per cent growth in Greater China & North Asia and 4 per cent growth in ASEAN & South Asia, that together offset lower income in Africa & Middle East. Although income was slightly lower in the fourth quarter the business continues to increase the proportion of income it generates from serving affluent and emerging affluent clients
¼ Commercial Banking income was up 4 per cent. Income in Greater China & North Asia and ASEAN & South Asia grew 11 per cent and 4 per cent respectively. Together this offset 6 per cent lower income from Africa & Middle East
¼ Private Banking attracted $0.7 billion net new money and income was 3 per cent higher with growth across all products
¼ Income in Central & other items (segment) was 3 per cent higher as Treasury income benefited from rises in global interest rates
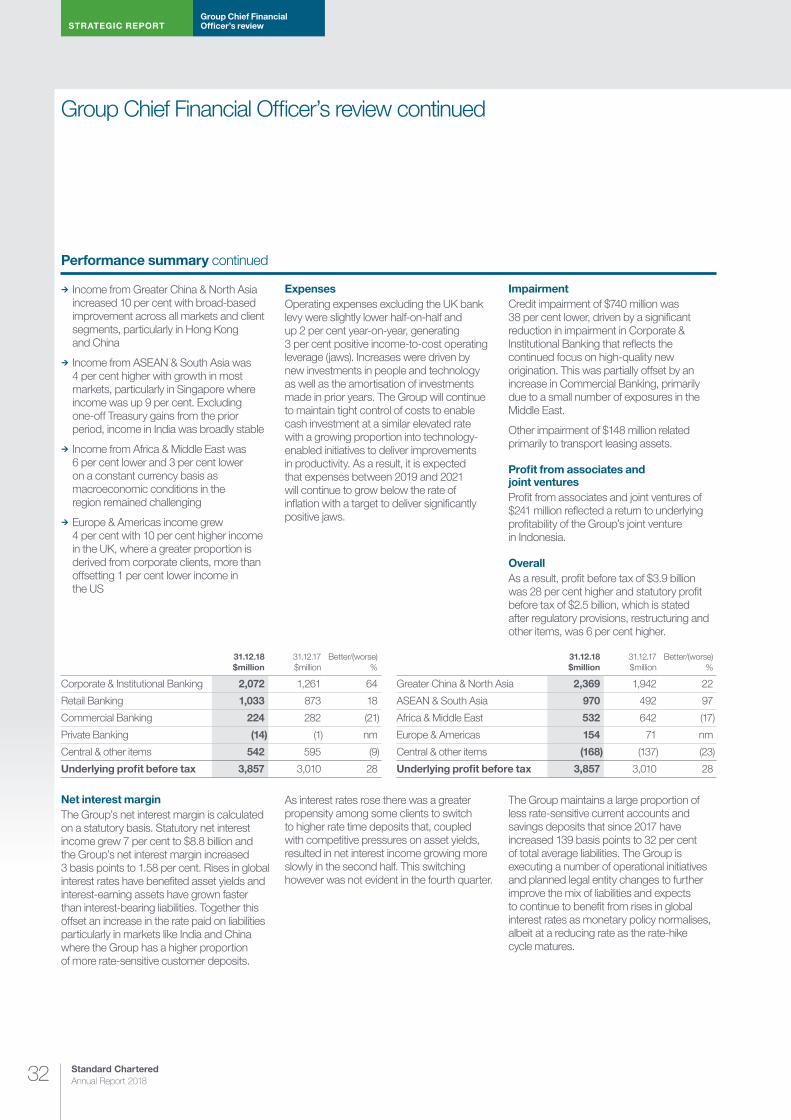
STRATEGIC REPORTGroup Chief Financial Officer’s review
Standard Chartered Annual Report 201832
Group Chief Financial Officer’s review continued
Performance summary continued
¼ Income from Greater China & North Asia increased 10 per cent with broad-based improvement across all markets and client segments, particularly in Hong Kong and China
¼ Income from ASEAN & South Asia was 4 per cent higher with growth in most markets, particularly in Singapore where income was up 9 per cent. Excluding one-off Treasury gains from the prior period, income in India was broadly stable
¼ Income from Africa & Middle East was 6 per cent lower and 3 per cent lower on a constant currency basis as macroeconomic conditions in the region remained challenging
¼ Europe & Americas income grew 4 per cent with 10 per cent higher income in the UK, where a greater proportion is derived from corporate clients, more than offsetting 1 per cent lower income in the US
ExpensesOperating expenses excluding the UK bank levy were slightly lower half-on-half and up 2 per cent year-on-year, generating 3 per cent positive income-to-cost operating leverage (jaws). Increases were driven by new investments in people and technology as well as the amortisation of investments made in prior years. The Group will continue to maintain tight control of costs to enable cash investment at a similar elevated rate with a growing proportion into technology-enabled initiatives to deliver improvements in productivity. As a result, it is expected that expenses between 2019 and 2021 will continue to grow below the rate of inflation with a target to deliver significantly positive jaws.
ImpairmentCredit impairment of $740 million was 38 per cent lower, driven by a significant reduction in impairment in Corporate & Institutional Banking that reflects the continued focus on high-quality new origination. This was partially offset by an increase in Commercial Banking, primarily due to a small number of exposures in the Middle East.
Other impairment of $148 million related primarily to transport leasing assets.
Profit from associates and joint venturesProfit from associates and joint ventures of $241 million reflected a return to underlying profitability of the Group’s joint venture in Indonesia.
OverallAs a result, profit before tax of $3.9 billion was 28 per cent higher and statutory profit before tax of $2.5 billion, which is stated after regulatory provisions, restructuring and other items, was 6 per cent higher.
31.12.18 $million
31.12.17 $million
Better/(worse) %
31.12.18 $million
31.12.17 $million
Better/(worse) %
Corporate & Institutional Banking 2,072 1,261 64 Greater China & North Asia 2,369 1,942 22
Retail Banking 1,033 873 18 ASEAN & South Asia 970 492 97
Commercial Banking 224 282 (21) Africa & Middle East 532 642 (17)
Private Banking (14) (1) nm Europe & Americas 154 71 nm
Central & other items 542 595 (9) Central & other items (168) (137) (23)
Underlying profit before tax 3,857 3,010 28 Underlying profit before tax 3,857 3,010 28
Net interest marginThe Group’s net interest margin is calculated on a statutory basis. Statutory net interest income grew 7 per cent to $8.8 billion and the Group’s net interest margin increased 3 basis points to 1.58 per cent. Rises in global interest rates have benefited asset yields and interest-earning assets have grown faster than interest-bearing liabilities. Together this offset an increase in the rate paid on liabilities particularly in markets like India and China where the Group has a higher proportion of more rate-sensitive customer deposits.
As interest rates rose there was a greater propensity among some clients to switch to higher rate time deposits that, coupled with competitive pressures on asset yields, resulted in net interest income growing more slowly in the second half. This switching however was not evident in the fourth quarter.
The Group maintains a large proportion of less rate-sensitive current accounts and savings deposits that since 2017 have increased 139 basis points to 32 per cent of total average liabilities. The Group is executing a number of operational initiatives and planned legal entity changes to further improve the mix of liabilities and expects to continue to benefit from rises in global interest rates as monetary policy normalises, albeit at a reducing rate as the rate-hike cycle matures.

33
Risk review
and Cap
ital reviewS
TR
AT
EG
IC R
EP
OR
TS
upp
lementary info
rmatio
nFinancial statem
entsD
irectors’ rep
ort
31.12.18 $million
31.12.17 $million
Statutory net interest income 8,793 8,181
Average interest-earning assets 558,135 527,691
Average interest-bearing liabilities 484,068 475,432
Gross yield (%) 3.09 2.74
Rate paid (%) 1.75 1.32
Net yield (%) 1.34 1.42
Net interest margin (%)1 1.58 1.55
1 Statutory net interest income divided by average interest-earning assets
Credit quality
Continued focus on high-quality origination within a more granular risk appetite has enabled sustained improvements in credit quality in 2018 and resulted in a balance sheet that is significantly more resilient. This is evidenced by the increase in exposure to investment grade clients from 57 per cent to 62 per cent.
The Group remains alert to broader geopolitical uncertainties and performs regular reviews and stress tests to identify early signs of emerging risks.
IFRS 9 became effective from 1 January 2018 and the Group has not restated comparative information. Accordingly, comparisons are made to balances as at
1 January 2018. This primarily impacts credit impairment, which is determined using an expected credit loss approach under IFRS 9 compared with an incurred loss approach under IAS 39.
Ongoing businessGross credit-impaired (stage 3) loans in the ongoing business of $5.6 billion were $894 million lower. A lower level of new inflows, particularly in Corporate & Institutional Banking, as well as debt sales, write-offs and repayments more than offset higher inflows of Commercial Banking exposures that had been on early alert for some time. The cover ratio of stage 3 loans in the ongoing business remained stable both
before and after collateral, credit grade 12 accounts were broadly unchanged at $1.4 billion and early alerts were down $3.9 billion or 45 per cent.
Liquidation portfolioGross loans and advances in the liquidation portfolio were lower by $887 million reflecting further significant progress made exiting these exposures since 2015. The remaining $1.4 billion gross loans and advances are 93 per cent covered after collateral. Recognising that the Group has substantially completed the run-down of this portfolio it will be reported in underlying performance in 2019.
31.12.18 $million
01.01.18 $million
Ongoing business
Liquidation portfolio Total
Ongoing business
Liquidation portfolio Total
Gross loans and advances to customers1 260,094 1,361 261,455 255,589 2,248 257,837
Of which stage 1 and 2 254,445 86 254,531 249,046 22 249,068
Of which stage 3 5,649 1,275 6,924 6,543 2,226 8,769
Expected credit loss provisions (3,932) (966) (4,898) (4,704) (1,626) (6,330)
Of which stage 1 and 2 (838) (4) (842) (1,048) – (1,048)
Of which stage 3 (3,094) (962) (4,056) (3,656) (1,626) (5,282)
Net loans and advances to customers 256,162 395 256,557 250,885 622 251,507
Of which stage 1 and 2 253,607 82 253,689 247,998 22 248,020
Of which stage 3 2,555 313 2,868 2,887 600 3,487
Cover ratio of stage 3 before collateral (%) 55 75 59 56 73 60
Cover ratio of stage 3 after collateral (%) 78 93 81 78 88 81
Credit grade 12 accounts ($million) 1,437 86 1,523 1,483 22 1,505
Early alerts ($million) 4,767 – 4,767 8,668 – 8,668
Investment grade corporate exposures (%) 62 – 62 57 – 57
1 Includes reverse repurchase agreements and other similar secured lending held at amortised cost of $3,151 million at 31 December 2018 and $4,566 million at 01 January 2018

STRATEGIC REPORTGroup Chief Financial Officer’s review
Standard Chartered Annual Report 201834
Group Chief Financial Officer’s review continued
Restructuring and other items
The Group’s statutory performance is adjusted for profits or losses of a capital nature, amounts consequent to investment transactions driven by strategic intent, other infrequent and/or exceptional transactions that are significant or material in the context of the Group’s normal business earnings for the period and items which management and investors would ordinarily identify separately when assessing performance period- by period.
The Group has made a provision of $900 million for potential penalties relating to previously disclosed matters, namely, the US investigation into historical violation of sanctions laws and regulations, the decision
notice from the Financial Conduct Authority concerning the Group’s historical financial crime controls, and investigations related to foreign exchange trading issues. Further details of these and other legal and regulatory matters can be found in Note 26 on page 305.
Restructuring charges of $478 million related primarily to Principal Finance and included a $158 million charge following the announced agreement to sell the majority of the business’s related investment portfolio. The total restructuring charge arising from the Group’s planned actions announced in 2015 totalled $3.4 billion.
As well as the fourth quarter restructuring charge related to Principal Finance the Group has as a result of the refreshed strategic priorities announced today incurred a $124 million expense to reduce ongoing costs and $34 million other impairment related to the decision to discontinue the ship leasing business. The Group expects to incur a further $500 million of restructuring charges over the next three years in order to execute the refreshed priorities.
Following the Group’s decision that its joint venture investment in PT Bank Permata Tbk is no longer core, profits related to it will in 2019 be reported in restructuring.
31.12.18$million
31.12.17$million
Provision for regulatory
matters Restructuring Other items Restructuring Other items
Operating income – (248) 69 58 78
Operating expenses (900) (283) – (297) –
Credit impairment – 87 – (162) –
Other impairment – (34) – (10) (320)
Profit from associates and joint ventures – – – 58 –
Profit/(loss) before taxation (900) (478) 69 (353) (242)
Balance sheet and liquidity
The Group’s balance sheet is strong, highly liquid and diversified.
Loans and advances to customers were up 2 per cent to $257 billion with broad-based growth across a range of products.
Customer accounts were up 6 per cent as the Group continued to focus on improving the quality and mix of its liabilities.
The advances-to-deposits ratio decreased slightly to 65 per cent.
As a result of classification and measurement of financial assets under IFRS 9, $45 billion of reverse repurchase agreement assets and $38 billion of repurchase agreement liabilities were on 1 January 2018 reclassified as financial assets held at fair value through profit or loss. Further details are provided in Note 13 to the financial statements.
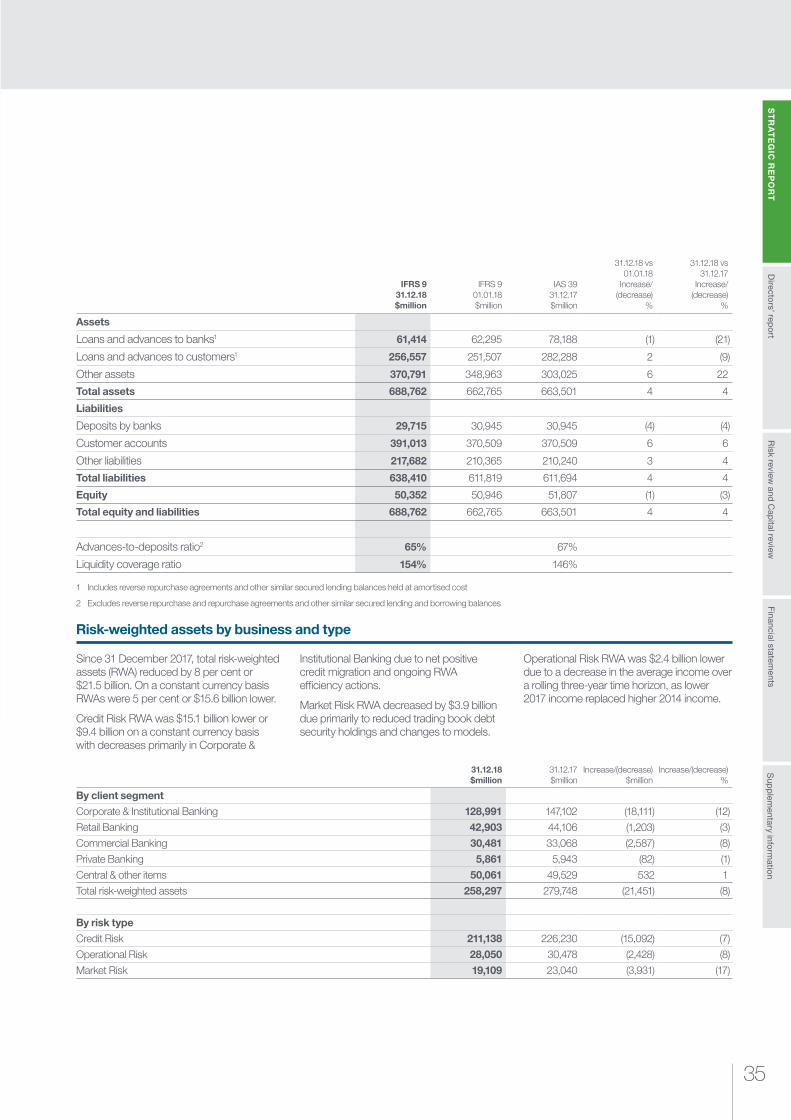
35
Risk review
and Cap
ital reviewS
TR
AT
EG
IC R
EP
OR
TS
upp
lementary info
rmatio
nFinancial statem
entsD
irectors’ rep
ort
IFRS 931.12.18 $million
IFRS 901.01.18 $million
IAS 3931.12.17 $million
31.12.18 vs 01.01.18
Increase/ (decrease)
%
31.12.18 vs 31.12.17
Increase/ (decrease)
%
Assets
Loans and advances to banks1 61,414 62,295 78,188 (1) (21)
Loans and advances to customers1 256,557 251,507 282,288 2 (9)
Other assets 370,791 348,963 303,025 6 22
Total assets 688,762 662,765 663,501 4 4
Liabilities
Deposits by banks 29,715 30,945 30,945 (4) (4)
Customer accounts 391,013 370,509 370,509 6 6
Other liabilities 217,682 210,365 210,240 3 4
Total liabilities 638,410 611,819 611,694 4 4
Equity 50,352 50,946 51,807 (1) (3)
Total equity and liabilities 688,762 662,765 663,501 4 4
Advances-to-deposits ratio2 65% 67%
Liquidity coverage ratio 154% 146%
1 Includes reverse repurchase agreements and other similar secured lending balances held at amortised cost
2 Excludes reverse repurchase and repurchase agreements and other similar secured lending and borrowing balances
Risk-weighted assets by business and type
Since 31 December 2017, total risk-weighted assets (RWA) reduced by 8 per cent or $21.5 billion. On a constant currency basis RWAs were 5 per cent or $15.6 billion lower.
Credit Risk RWA was $15.1 billion lower or $9.4 billion on a constant currency basis with decreases primarily in Corporate &
Institutional Banking due to net positive credit migration and ongoing RWA efficiency actions.
Market Risk RWA decreased by $3.9 billion due primarily to reduced trading book debt security holdings and changes to models.
Operational Risk RWA was $2.4 billion lower due to a decrease in the average income over a rolling three-year time horizon, as lower 2017 income replaced higher 2014 income.
31.12.18 $million
31.12.17 $million
Increase/(decrease) $million
Increase/(decrease) %
By client segment
Corporate & Institutional Banking 128,991 147,102 (18,111) (12)
Retail Banking 42,903 44,106 (1,203) (3)
Commercial Banking 30,481 33,068 (2,587) (8)
Private Banking 5,861 5,943 (82) (1)
Central & other items 50,061 49,529 532 1
Total risk-weighted assets 258,297 279,748 (21,451) (8)
By risk type
Credit Risk 211,138 226,230 (15,092) (7)
Operational Risk 28,050 30,478 (2,428) (8)
Market Risk 19,109 23,040 (3,931) (17)
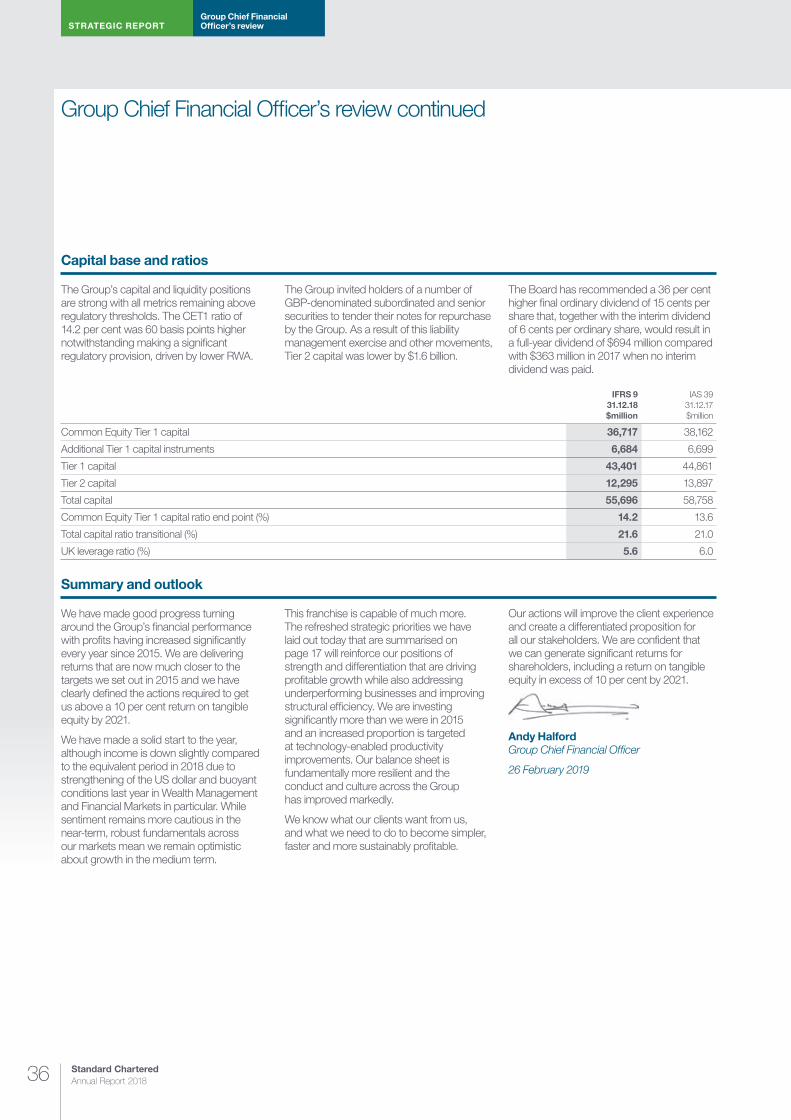
STRATEGIC REPORTGroup Chief Financial Officer’s review
Standard Chartered Annual Report 201836
Group Chief Financial Officer’s review continued
Capital base and ratios
The Group’s capital and liquidity positions are strong with all metrics remaining above regulatory thresholds. The CET1 ratio of 14.2 per cent was 60 basis points higher notwithstanding making a significant regulatory provision, driven by lower RWA.
The Group invited holders of a number of GBP-denominated subordinated and senior securities to tender their notes for repurchase by the Group. As a result of this liability management exercise and other movements, Tier 2 capital was lower by $1.6 billion.
The Board has recommended a 36 per cent higher final ordinary dividend of 15 cents per share that, together with the interim dividend of 6 cents per ordinary share, would result in a full-year dividend of $694 million compared with $363 million in 2017 when no interim dividend was paid.
IFRS 9 31.12.18 $million
IAS 39 31.12.17 $million
Common Equity Tier 1 capital 36,717 38,162
Additional Tier 1 capital instruments 6,684 6,699
Tier 1 capital 43,401 44,861
Tier 2 capital 12,295 13,897
Total capital 55,696 58,758
Common Equity Tier 1 capital ratio end point (%) 14.2 13.6
Total capital ratio transitional (%) 21.6 21.0
UK leverage ratio (%) 5.6 6.0
Summary and outlook
We have made good progress turning around the Group’s financial performance with profits having increased significantly every year since 2015. We are delivering returns that are now much closer to the targets we set out in 2015 and we have clearly defined the actions required to get us above a 10 per cent return on tangible equity by 2021.
We have made a solid start to the year, although income is down slightly compared to the equivalent period in 2018 due to strengthening of the US dollar and buoyant conditions last year in Wealth Management and Financial Markets in particular. While sentiment remains more cautious in the near-term, robust fundamentals across our markets mean we remain optimistic about growth in the medium term.
This franchise is capable of much more. The refreshed strategic priorities we have laid out today that are summarised on page 17 will reinforce our positions of strength and differentiation that are driving profitable growth while also addressing underperforming businesses and improving structural efficiency. We are investing significantly more than we were in 2015 and an increased proportion is targeted at technology-enabled productivity improvements. Our balance sheet is fundamentally more resilient and the conduct and culture across the Group has improved markedly.
We know what our clients want from us, and what we need to do to become simpler, faster and more sustainably profitable.
Our actions will improve the client experience and create a differentiated proposition for all our stakeholders. We are confident that we can generate significant returns for shareholders, including a return on tangible equity in excess of 10 per cent by 2021.
Andy HalfordGroup Chief Financial Officer
26 February 2019

Risk review
and Cap
ital reviewS
TR
AT
EG
IC R
EP
OR
TS
upp
lementary info
rmatio
nFinancial statem
entsD
irectors’ rep
ort
Risk review
and Cap
ital reviewS
TR
AT
EG
IC R
EP
OR
TS
TR
AT
EG
IC R
EP
OR
TS
TR
AT
EG
IC R
EP
OR
TS
upp
lementary info
rmatio
nFinancial statem
entsD
irectors’ rep
ort
FIGHTING FINANCIAL CRIME
Correspondent Banking Academies
As part of our efforts in the fight against financial crime, since 2015 we have been partnering with our client banks to help them build robust controls for managing financial crime risk.
Between 2015 and 2018, we have delivered our ‘de-risking through education’ training programme to 5,000 people from 1,200 client banks in more than 70 countries
This helps people understand and improve their anti-money laundering and financial crime compliance controls.
In 2018 alone, we ran 21 academies for a total of 335 client banks, with 1,173 attendees. Our 2018 academies included new modules on anti-human trafficking, new payment methods, illegal wildlife trafficking and illicit antiquities.
Over 95 per cent of attendees said they would recommend the programme to members of their institution, and 97 client banks have signed up to the related e-learning portal. In addition, regulators have participated in 35 of our workshops, demonstrating the support we’ve had from the sector.
37
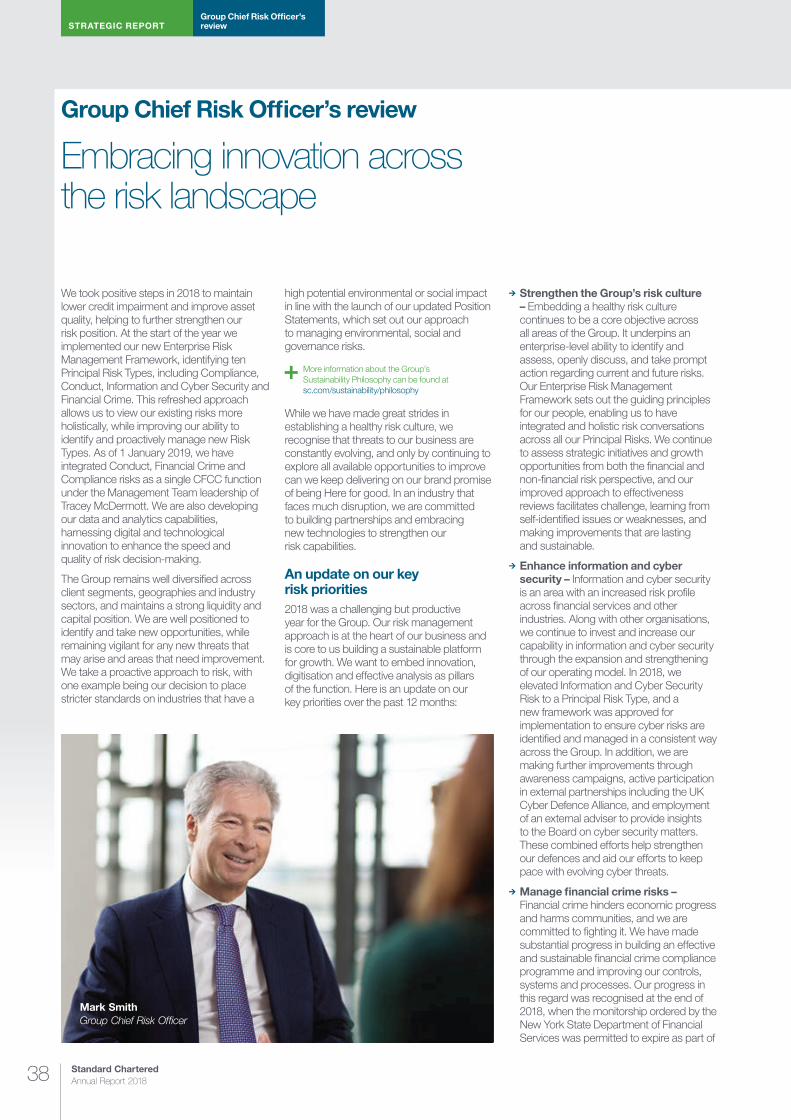
STRATEGIC REPORTGroup Chief Risk Officer’s review
Standard Chartered Annual Report 201838
Embracing innovation across the risk landscape
Group Chief Risk Officer’s review
We took positive steps in 2018 to maintain lower credit impairment and improve asset quality, helping to further strengthen our risk position. At the start of the year we implemented our new Enterprise Risk Management Framework, identifying ten Principal Risk Types, including Compliance, Conduct, Information and Cyber Security and Financial Crime. This refreshed approach allows us to view our existing risks more holistically, while improving our ability to identify and proactively manage new Risk Types. As of 1 January 2019, we have integrated Conduct, Financial Crime and Compliance risks as a single CFCC function under the Management Team leadership of Tracey McDermott. We are also developing our data and analytics capabilities, harnessing digital and technological innovation to enhance the speed and quality of risk decision-making.
The Group remains well diversified across client segments, geographies and industry sectors, and maintains a strong liquidity and capital position. We are well positioned to identify and take new opportunities, while remaining vigilant for any new threats that may arise and areas that need improvement. We take a proactive approach to risk, with one example being our decision to place stricter standards on industries that have a
high potential environmental or social impact in line with the launch of our updated Position Statements, which set out our approach to managing environmental, social and governance risks.
More information about the Group’s Sustainability Philosophy can be found at sc.com/sustainability/philosophy
While we have made great strides in establishing a healthy risk culture, we recognise that threats to our business are constantly evolving, and only by continuing to explore all available opportunities to improve can we keep delivering on our brand promise of being Here for good. In an industry that faces much disruption, we are committed to building partnerships and embracing new technologies to strengthen our risk capabilities.
An update on our key risk priorities2018 was a challenging but productive year for the Group. Our risk management approach is at the heart of our business and is core to us building a sustainable platform for growth. We want to embed innovation, digitisation and effective analysis as pillars of the function. Here is an update on our key priorities over the past 12 months:
¼ Strengthen the Group’s risk culture – Embedding a healthy risk culture continues to be a core objective across all areas of the Group. It underpins an enterprise-level ability to identify and assess, openly discuss, and take prompt action regarding current and future risks. Our Enterprise Risk Management Framework sets out the guiding principles for our people, enabling us to have integrated and holistic risk conversations across all our Principal Risks. We continue to assess strategic initiatives and growth opportunities from both the financial and non-financial risk perspective, and our improved approach to effectiveness reviews facilitates challenge, learning from self-identified issues or weaknesses, and making improvements that are lasting and sustainable.
¼ Enhance information and cyber security – Information and cyber security is an area with an increased risk profile across financial services and other industries. Along with other organisations, we continue to invest and increase our capability in information and cyber security through the expansion and strengthening of our operating model. In 2018, we elevated Information and Cyber Security Risk to a Principal Risk Type, and a new framework was approved for implementation to ensure cyber risks are identified and managed in a consistent way across the Group. In addition, we are making further improvements through awareness campaigns, active participation in external partnerships including the UK Cyber Defence Alliance, and employment of an external adviser to provide insights to the Board on cyber security matters. These combined efforts help strengthen our defences and aid our efforts to keep pace with evolving cyber threats.
¼ Manage financial crime risks – Financial crime hinders economic progress and harms communities, and we are committed to fighting it. We have made substantial progress in building an effective and sustainable financial crime compliance programme and improving our controls, systems and processes. Our progress in this regard was recognised at the end of 2018, when the monitorship ordered by the New York State Department of Financial Services was permitted to expire as part of
Mark Smith Group Chief Risk Officer
Risk review
and Cap
ital reviewS
TR
AT
EG
IC R
EP
OR
TS
upp
lementary info
rmatio
nFinancial statem
entsD
irectors’ rep
ort
39
a Second Supplemental Consent Order was replaced by an independent consultant. The Order acknowledges that we had demonstrated our commitment to complying with state and federal anti-money laundering and sanctions laws and regulations and had substantially remediated and enhanced our anti-money laundering compliance programme. We continue to advocate for more modern ways of fighting financial crime, maintaining our involvement in public-private information sharing partnerships in the UK, US, Singapore and Hong Kong, and pursuing innovation by partnering with RegTech firms in the areas of surveillance and investigations. In addition, we are proud to support the United for Wildlife Financial Taskforce (of which our Group General Counsel, David Fein is Vice Chair), an initiative dedicated to increasing awareness of, and improving, how the financial industry can combat illegal wildlife trafficking. Initiatives like this are in line with our Sustainability Philosophy and target those at the heart of financial crime from multiple angles. By cutting off their sources of funds, we can help to make the financial system a hostile environment for criminals, while supporting economic development across all of our markets.
More information about the Group’s commitment to fighting financial crime can be found at sc.com/fightingfinancialcrime
¼ Strengthen our conduct environment – Conduct remains a key focus across the Group. In 2018, we elevated Conduct Risk to a Principal Risk Type and made it a priority to review, refine and further strengthen our approach to conduct, ensuring that Conduct Risk is considered not just in the day to day but in all our strategic decisions and activities. While the Group Code of Conduct sets expectations for individual behaviour, the refreshed Conduct Risk Type Framework provides a more robust and consistent approach to allow us to assess and monitor Conduct risk across the Group’s businesses and functions. A key priority in 2019 will be to embed Conduct Risk considerations into the other non-financial risks, to ensure that we make the right holistic decisions. While incidents cannot be entirely avoided across the Group, we have no appetite for breaches of laws or regulations, and we expect nothing less than the highest standards at all levels.
More information on our Group Code of Conduct can be found at sc.com/codeofconduct
¼ Enhance our compliance infrastructure – In 2018, we established a multi-year programme to review and strengthen our existing structures and processes, and we have already delivered tangible progress in several areas. We implemented a new Regulatory Obligations Management system, and in the first quarter of 2019 we will install a refreshed system for Issue Management and Policy and Document Management. We rolled out an enhanced learning programme for our compliance officers, as well as a progressive development path. In the second half of 2018, we launched a shared service centre for surveillance in Kuala Lumpur, equipped with staff providing a broad range of capabilities across Trade and Communications Surveillance. We also implemented a knowledge-sharing tool that explains important trends in the world of technology and highlights the key compliance issues that may arise as a result. These improvements help our people to make better informed and consistent decisions and raise our ability to innovate in response to the ever-changing regulatory landscape.
¼ Improve our efficiency and effectiveness – The Group has continued to invest in improvements to infrastructure, including exposure management, data quality and stress testing. Further enhancements are planned for Operational Risk management, workflow and reporting. We are working with fintech partners and innovating internally to explore new opportunities with machine learning, artificial intelligence and data analytics infrastructure. We continue to streamline and simplify our processes to serve clients better and drive internal efficiencies.
Our risk profile and performance in 2018The Group’s portfolios remain strong and well diversified. Our continued focus on high-quality origination within a more granular Risk Appetite has enabled sustained improvements in the credit quality of our corporate portfolios, with the percentage of net exposure to investment grade clients increasing to 62 per cent (2017: 57 per cent) of total corporate net exposure. The Group’s client exposures also remain predominantly short tenor. Despite this improvement we remain alert to broader geopolitical uncertainties that continue to affect sentiment. An example is Brexit, although the Group’s credit portfolio should not be materially impacted by the UK’s withdrawal from the European Union.
Our subsidiary in Germany is established and we are focused on managing the operational and regulatory risks that will arise as a result of Brexit. We continue to focus on early identification of emerging risks across all our portfolios so that we can proactively manage any areas of weakness. We also perform regular reviews and stress tests of our portfolio to help mitigate any risks that might arise. Our risk management capability has also improved through investment in credit structuring and distribution resources.
Credit impairment in the ongoing book reduced further in 2018 to $740 million (2017: $1,200 million), driven primarily by improvements in the Corporate & Institutional Banking portfolio where there was a decrease of $428 million (2018: $229 million, 2017: $657 million). This reflects an improvement in the risk profile of the segment, through a continued focus on high-quality new origination and recoveries and releases that were observed across all segments. Commercial Banking ongoing business credit impairment increased by 45 per cent (2018: $244 million, 2017: $168 million) compared to 2017, which saw a release of $63 million of portfolio impairment provisions held against certain sectors of the portfolios that were no longer required. Africa & Middle East contributed 60 per cent of the full-year 2018 charge. Retail credit impairment continued to reduce (2018: $267 million; 2017: $374 million) driven by portfolio improvements, and run down of high-risk segments in several unsecured portfolios, as well as one-off provision releases in Korea and Indonesia.
Gross credit-impaired (stage 3) loans for the Group are down 21 per cent in the year, having decreased to $6.9 billion (1 January 2018: $8.8 billion) with a reduction of $1.0 billion observed in the liquidation portfolio as we continued to exit these exposures. Gross stage 3 loans in the ongoing business decreased to $5.6 billion (1 January 2018: $6.5 billion); mainly driven by repayments and write-offs in Corporate & Institutional Banking. Stage 3/non-performing loan (NPL) inflows in Corporate & Institutional Banking were also significantly lower, as historically high inflows from stressed portfolios such as India and the Oil and Gas sectors were muted. Stage 3/NPL inflows in Commercial Banking were higher, driven by exposures in Greater China & North Asia and Africa & Middle East, with no specific industry concentration.
The stage 3 cover ratio in the total book has reduced marginally to 59 per cent in 2018 (1 January 2018: 60 per cent), largely driven by the impact of write-offs and settlements in the liquidation portfolio.
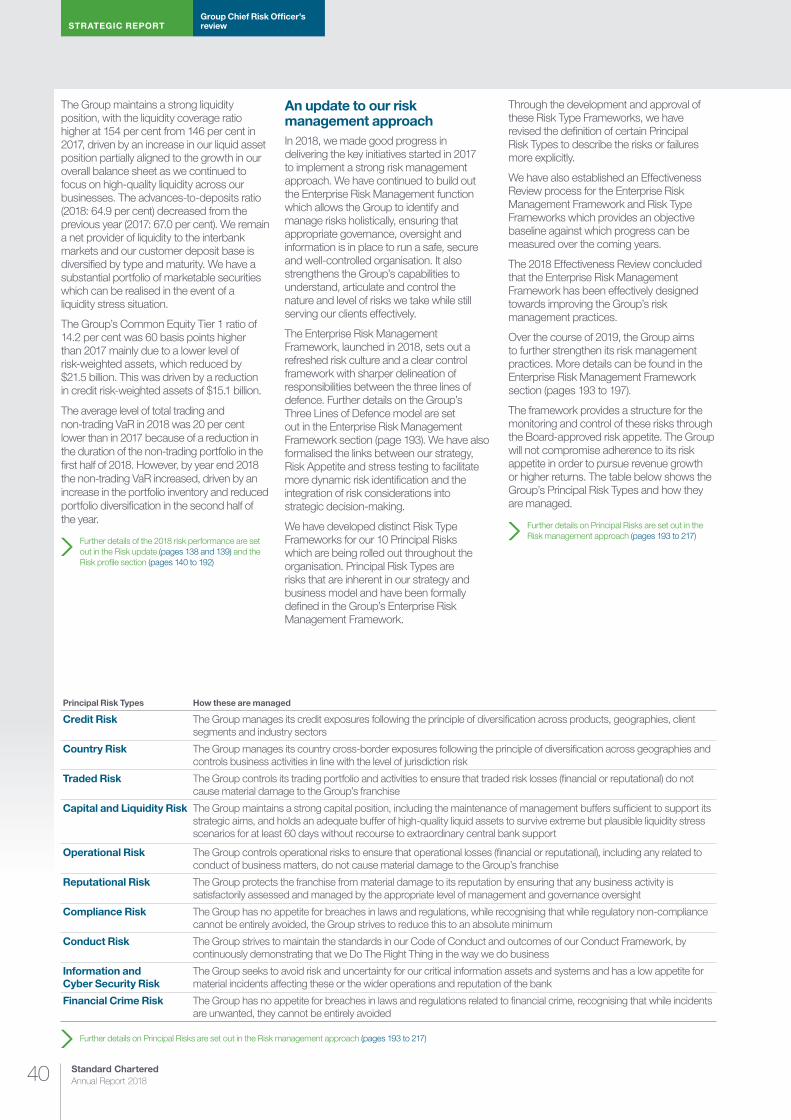
STRATEGIC REPORTGroup Chief Risk Officer’s review
Standard Chartered Annual Report 201840
The Group maintains a strong liquidity position, with the liquidity coverage ratio higher at 154 per cent from 146 per cent in 2017, driven by an increase in our liquid asset position partially aligned to the growth in our overall balance sheet as we continued to focus on high-quality liquidity across our businesses. The advances-to-deposits ratio (2018: 64.9 per cent) decreased from the previous year (2017: 67.0 per cent). We remain a net provider of liquidity to the interbank markets and our customer deposit base is diversified by type and maturity. We have a substantial portfolio of marketable securities which can be realised in the event of a liquidity stress situation.
The Group’s Common Equity Tier 1 ratio of 14.2 per cent was 60 basis points higher than 2017 mainly due to a lower level of risk-weighted assets, which reduced by $21.5 billion. This was driven by a reduction in credit risk-weighted assets of $15.1 billion.
The average level of total trading and non-trading VaR in 2018 was 20 per cent lower than in 2017 because of a reduction in the duration of the non-trading portfolio in the first half of 2018. However, by year end 2018 the non-trading VaR increased, driven by an increase in the portfolio inventory and reduced portfolio diversification in the second half of the year.
Further details of the 2018 risk performance are set out in the Risk update (pages 138 and 139) and the Risk profile section (pages 140 to 192)
An update to our risk management approach In 2018, we made good progress in delivering the key initiatives started in 2017 to implement a strong risk management approach. We have continued to build out the Enterprise Risk Management function which allows the Group to identify and manage risks holistically, ensuring that appropriate governance, oversight and information is in place to run a safe, secure and well-controlled organisation. It also strengthens the Group’s capabilities to understand, articulate and control the nature and level of risks we take while still serving our clients effectively.
The Enterprise Risk Management Framework, launched in 2018, sets out a refreshed risk culture and a clear control framework with sharper delineation of responsibilities between the three lines of defence. Further details on the Group’s Three Lines of Defence model are set out in the Enterprise Risk Management Framework section (page 193). We have also formalised the links between our strategy, Risk Appetite and stress testing to facilitate more dynamic risk identification and the integration of risk considerations into strategic decision-making.
We have developed distinct Risk Type Frameworks for our 10 Principal Risks which are being rolled out throughout the organisation. Principal Risk Types are risks that are inherent in our strategy and business model and have been formally defined in the Group’s Enterprise Risk Management Framework.
Through the development and approval of these Risk Type Frameworks, we have revised the definition of certain Principal Risk Types to describe the risks or failures more explicitly.
We have also established an Effectiveness Review process for the Enterprise Risk Management Framework and Risk Type Frameworks which provides an objective baseline against which progress can be measured over the coming years.
The 2018 Effectiveness Review concluded that the Enterprise Risk Management Framework has been effectively designed towards improving the Group’s risk management practices.
Over the course of 2019, the Group aims to further strengthen its risk management practices. More details can be found in the Enterprise Risk Management Framework section (pages 193 to 197).
The framework provides a structure for the monitoring and control of these risks through the Board-approved risk appetite. The Group will not compromise adherence to its risk appetite in order to pursue revenue growth or higher returns. The table below shows the Group’s Principal Risk Types and how they are managed.
Further details on Principal Risks are set out in the Risk management approach (pages 193 to 217)
Principal Risk Types How these are managed
Credit Risk The Group manages its credit exposures following the principle of diversification across products, geographies, client segments and industry sectors
Country Risk The Group manages its country cross-border exposures following the principle of diversification across geographies and controls business activities in line with the level of jurisdiction risk
Traded Risk The Group controls its trading portfolio and activities to ensure that traded risk losses (financial or reputational) do not cause material damage to the Group’s franchise
Capital and Liquidity Risk The Group maintains a strong capital position, including the maintenance of management buffers sufficient to support its strategic aims, and holds an adequate buffer of high-quality liquid assets to survive extreme but plausible liquidity stress scenarios for at least 60 days without recourse to extraordinary central bank support
Operational Risk The Group controls operational risks to ensure that operational losses (financial or reputational), including any related to conduct of business matters, do not cause material damage to the Group’s franchise
Reputational Risk The Group protects the franchise from material damage to its reputation by ensuring that any business activity is satisfactorily assessed and managed by the appropriate level of management and governance oversight
Compliance Risk The Group has no appetite for breaches in laws and regulations, while recognising that while regulatory non-compliance cannot be entirely avoided, the Group strives to reduce this to an absolute minimum
Conduct Risk The Group strives to maintain the standards in our Code of Conduct and outcomes of our Conduct Framework, by continuously demonstrating that we Do The Right Thing in the way we do business
Information and Cyber Security Risk
The Group seeks to avoid risk and uncertainty for our critical information assets and systems and has a low appetite for material incidents affecting these or the wider operations and reputation of the bank
Financial Crime Risk The Group has no appetite for breaches in laws and regulations related to financial crime, recognising that while incidents are unwanted, they cannot be entirely avoided
Further details on Principal Risks are set out in the Risk management approach (pages 193 to 217)

Risk review
and Cap
ital reviewS
TR
AT
EG
IC R
EP
OR
TS
upp
lementary info
rmatio
nFinancial statem
entsD
irectors’ rep
ort
41
Principal uncertainties Principal uncertainties refer to unpredictable and uncontrollable outcomes from certain events and circumstances which may have the potential to materially impact our business. As part of our continual risk identification process, we have updated the list disclosed in the 2018 half year Report. The table below summarises the current principal uncertainties that the Group faces, and the steps we are taking to manage them.
Principal uncertaintiesRisk trend since 2017 How these are mitigated/next steps
Geopolitical events, in particular: extended trade tensions, the Middle East political situation and Brexit implications
¼ We monitor geopolitical events continuously to assess horizon risks and, where appropriate, manage the impact to the Group and our clients
¼ We conduct stress tests and portfolio reviews at a Group, country and business level to assess the impact of extreme but plausible geopolitical events
Macroeconomic conditions, in particular: China slowdown and impact to regional economies with close ties to China, and Emerging Market risks
¼ We have a Business Risk Horizon framework that provides a 12- to 18-month forward looking view of the economic, business and credit conditions across our key markets, enabling us to take proactive action
¼ We monitor economic trends and conduct stress tests and portfolio reviews at a Group, country and business level to assess the impact of extreme but plausible events
¼ We continue to adjust our outlook and ratings based on political events and volatility
Climate-related physical risks and transition risks1
¼ We have participated in the development of pilot scenario analysis tools for physical and transition risks for energy utilities clients and other high-emitting sectors. We are also involved in a wide range of collaborative initiatives related to climate risk management
¼ We have reduced our risk appetite to carbon-intensive sectors by introducing technical standards for coal-fired power plants, and restrictions on new coal mining clients and projects. In September 2018, we announced that we would no longer provide financing for new coal-fired power plants anywhere in the world
¼ We achieved, two years ahead of schedule, our public target to fund and facilitate $4 billion toward clean technology between 2016 and 2020
Regulatory reviews, investigations and legal proceedings
¼ We have invested in enhancing systems and controls, and implementing remediation programmes (where relevant)
¼ We are cooperating with all relevant ongoing reviews, requests for information and investigations, and we actively manage legal proceedings
¼ We continue to train and educate our people on conduct, conflicts of interest, information security and financial crime compliance in order to reduce our exposure to legal and regulatory proceedings
Regulatory changes ¼ We actively monitor regulatory initiatives across our footprint to identify any potential impact and change to our business model
¼ We have established relevant project management programmes to review and improve end-to-end processes in terms of oversight and accountability, transparency, permission and controls, legal entity level limits and training
New technologies and digitisation (including business disruption risk, responsible use of artificial intelligence and obsolescence risk)
¼ We monitor emerging trends, opportunities and risks in the technology space which may have implications on the banking sector
¼ We are engaged in building our capabilities to ensure we remain relevant and are able to capitalise rapidly on technology trends
¼ We continue to make headway in harnessing new technologies, and we are investing in machine learning solutions that rapidly analyse large datasets and fine-tune the accuracy of our financial crime surveillance tools
¼ We are actively targeting the reduction of obsolescent/end of support technology following a technology and innovation led approach
Increased data privacy and security risks from strategic and wider use of data
¼ We have existing governance and control frameworks for the deployment of new technologies ¼ We have designed a programme to manage the risks posed by rapidly evolving cyber security threats ¼ We maintain a vigilant watch on legal and regulatory developments in relation to data protection to identify any potential impact to the business
Risk heightened in 2018 Risk remained consistent with 2017 levels
1 Physical risks refer to the risk of increased extreme weather events while transition risks refer to the risk of changes to market dynamics due to governments’ response to climate change
Further details on principal uncertainties, including key changes since 2017, are set out in the Risk management approach (pages 213 to 217)
SummaryThe external environment is becoming increasingly uncertain even as the expectations of our customers and shareholders continue to rise. Nonetheless, we continue to put our clients at the heart of all we do, and are strongly positioned to deliver our vision of increasing prosperity through taking risk. We are a function that champions innovation, and our focus remains on building a strong and sustainable business which will benefit our clients, our people, and our society for generations to come.
Mark SmithGroup Chief Risk Officer
26 February 2019
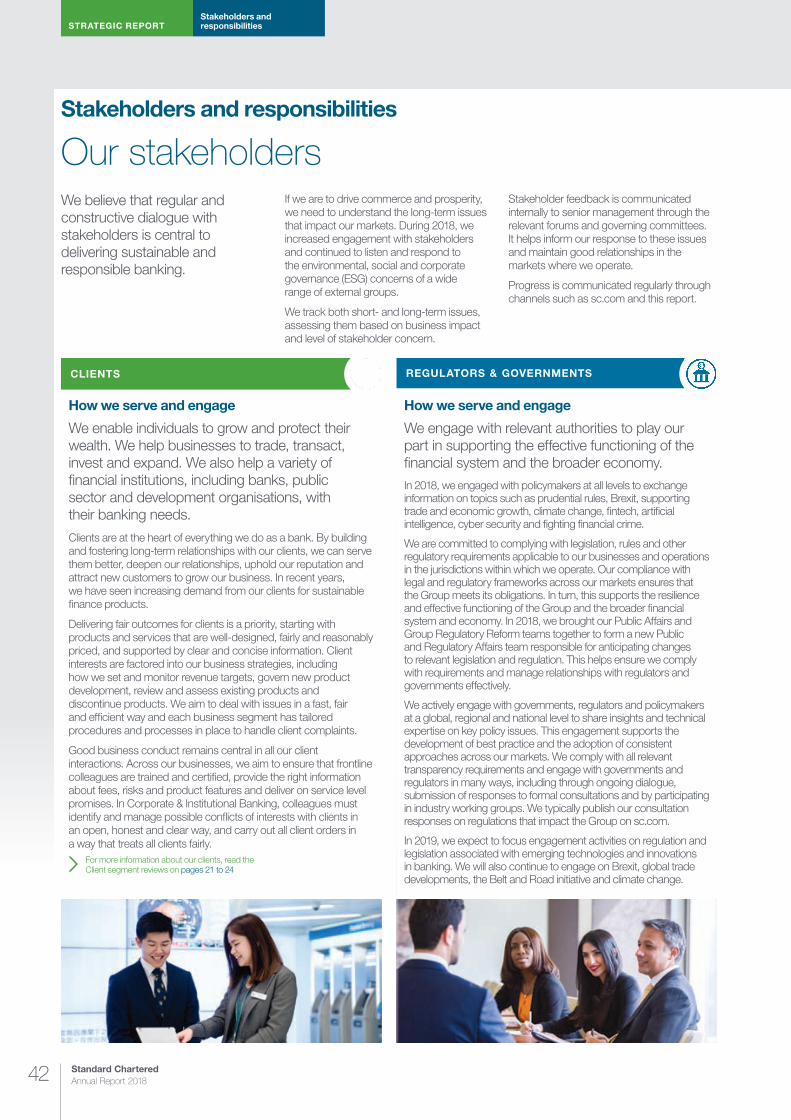
STRATEGIC REPORTStakeholders and responsibilities
Standard Chartered Annual Report 201842
Stakeholders and responsibilities
We believe that regular and constructive dialogue with stakeholders is central to delivering sustainable and responsible banking.
If we are to drive commerce and prosperity, we need to understand the long-term issues that impact our markets. During 2018, we increased engagement with stakeholders and continued to listen and respond to the environmental, social and corporate governance (ESG) concerns of a wide range of external groups.
We track both short- and long-term issues, assessing them based on business impact and level of stakeholder concern.
Stakeholder feedback is communicated internally to senior management through the relevant forums and governing committees. It helps inform our response to these issues and maintain good relationships in the markets where we operate.
Progress is communicated regularly through channels such as sc.com and this report.
How we serve and engage
We enable individuals to grow and protect their wealth. We help businesses to trade, transact, invest and expand. We also help a variety of financial institutions, including banks, public sector and development organisations, with their banking needs.
Clients are at the heart of everything we do as a bank. By building and fostering long-term relationships with our clients, we can serve them better, deepen our relationships, uphold our reputation and attract new customers to grow our business. In recent years, we have seen increasing demand from our clients for sustainable finance products.
Delivering fair outcomes for clients is a priority, starting with products and services that are well-designed, fairly and reasonably priced, and supported by clear and concise information. Client interests are factored into our business strategies, including how we set and monitor revenue targets, govern new product development, review and assess existing products and discontinue products. We aim to deal with issues in a fast, fair and efficient way and each business segment has tailored procedures and processes in place to handle client complaints.
Good business conduct remains central in all our client interactions. Across our businesses, we aim to ensure that frontline colleagues are trained and certified, provide the right information about fees, risks and product features and deliver on service level promises. In Corporate & Institutional Banking, colleagues must identify and manage possible conflicts of interests with clients in an open, honest and clear way, and carry out all client orders in a way that treats all clients fairly.
For more information about our clients, read the Client segment reviews on pages 21 to 24
Our stakeholders
REGULATORS & GOVERNMENTSCLIENTS
How we serve and engage
We engage with relevant authorities to play our part in supporting the effective functioning of the financial system and the broader economy.In 2018, we engaged with policymakers at all levels to exchange information on topics such as prudential rules, Brexit, supporting trade and economic growth, climate change, fintech, artificial intelligence, cyber security and fighting financial crime.
We are committed to complying with legislation, rules and other regulatory requirements applicable to our businesses and operations in the jurisdictions within which we operate. Our compliance with legal and regulatory frameworks across our markets ensures that the Group meets its obligations. In turn, this supports the resilience and effective functioning of the Group and the broader financial system and economy. In 2018, we brought our Public Affairs and Group Regulatory Reform teams together to form a new Public and Regulatory Affairs team responsible for anticipating changes to relevant legislation and regulation. This helps ensure we comply with requirements and manage relationships with regulators and governments effectively.
We actively engage with governments, regulators and policymakers at a global, regional and national level to share insights and technical expertise on key policy issues. This engagement supports the development of best practice and the adoption of consistent approaches across our markets. We comply with all relevant transparency requirements and engage with governments and regulators in many ways, including through ongoing dialogue, submission of responses to formal consultations and by participating in industry working groups. We typically publish our consultation responses on regulations that impact the Group on sc.com.
In 2019, we expect to focus engagement activities on regulation and legislation associated with emerging technologies and innovations in banking. We will also continue to engage on Brexit, global trade developments, the Belt and Road initiative and climate change.

Risk review
and Cap
ital reviewS
TR
AT
EG
IC R
EP
OR
TS
upp
lementary info
rmatio
nFinancial statem
entsD
irectors’ rep
ort
43
How we serve and engage
We aim to deliver robust returns and long-term sustainable value for our investors.
Our operating footprint, along with a commitment to sustainable and responsible banking, uniquely connects investors in established capital markets with opportunities in emerging markets. In this context, we believe that an integrated approach to ESG issues and a strong risk and compliance culture provide a competitive advantage.
Using the capital that we receive from equity and debt investors, we execute our business model with a focus on delivering sustainable value for all shareholders. Whether they have a short- or long-term investment horizon, we provide all investors with information about all aspects of our financial and sustainability performance.
During 2018, we engaged with investors in a number of ways including at conferences and on roadshows. In May, we hosted a seminar on our second largest business, Retail Banking, in London. Increasingly, investors are engaging us on ESG matters including the United Nations (UN) Sustainable Development Goals, climate change, coal and human rights. Following our commitment at the AGM, we hosted several bilateral engagements covering our Sustainability Philosophy, updated Position Statements and our Prohibited Activities list. These and other topics were covered at the Chairman’s stewardship and strategy forum in September.
We engage with sustainability analysts and participate in sustainability indices that provide independent benchmarking of our performance. We are included in FTSE4Good and submit to the Carbon Disclosure Project (CDP).
In 2019, we will continue to engage with investors on how we will sustainably improve our returns to create value over the long term.
For more information about Board engagement with shareholders in 2018, see page 70 in the corporate governance section of the Directors’ report
How we serve and engage
We work with local and global suppliers to ensure they can provide the right goods and services for our business, efficiently and sustainably.
Engagement with suppliers is guided by our Supplier Charter, which sets out what we expect of vendors on issues such as ethics, anti-bribery and anti-corruption, human rights and environmental performance. Suppliers must recommit to the charter annually, and regular engagement to monitor performance is built into our procurement practices and standards. In 2018, we hosted vendor forums across a number of our markets where we discussed the Bank’s valued behaviours and conduct expectations.
We engage globally and locally to create value through the supply chain for both our business and our vendors. Our strategic supplier relationship management programme helps build relationships with our 36 key suppliers. In 2018, we held engagement sessions in Hong Kong and the UK to strengthen collaboration and innovation with strategic suppliers. Small and medium-sized business owners are given the opportunity to participate in our sourcing activities and local supply teams engage them within our markets to help them meet the standards set out in our Supplier Charter. We also work with small and medium-sized fintechs with SC Ventures to drive greater innovation in our supply chain.
We are committed to embedding sustainability in our procurement practices and in 2019, we will define targets to encourage greater diversity in our supply chain. This includes supporting sourcing from businesses owned by women, and micro and small businesses. Our new supply chain management system, SCBuy will provide improved data on sustainability issues such as modern slavery and diversity and inclusion. The first phase of SCBuy was implemented in 2018. It will be completed in 2021.
Download our Supplier Charter at sc.com/suppliercharter
INVESTORS SUPPLIERS
See pages 44 to 46
See pages 47 to 51
SOCIETY
COLLEAGUES

STRATEGIC REPORTStakeholders and responsibilities
Standard Chartered Annual Report 201844
Stakeholders and responsibilities continued
How we serve and engage
We believe that great client experience is driven by great colleague experience. We want our people to pursue their ambitions, to deliver with purpose, and have a rewarding career enabled by great people leaders.
Purpose-led cultural changeOur culture is the foundation for delivering on our purpose to drive commerce and prosperity through our unique diversity. We continue to embed our culture through our valued behaviours (Never Settle, Do the Right Thing and Better Together), which describe a culture that balances innovation, client focus, ethics and inclusion. We have integrated these refreshed valued behaviours into the way we hire, recognise, reward and develop our people.
Engaging our colleagues More than 73,000 (90 per cent) of our people took part in our annual engagement survey. When asked ‘How does working for the Bank make you feel?’, emotions such as pride,
happiness and optimism ranked highly, while colleagues expressed some frustration with work processes. Engagement levels are at 67 per cent (in-line with 2017 results, and up from 2016) with 96 per cent of respondents committed to doing what is required to help us succeed. Follow-up actions include simplifying company processes, promoting innovative practices and encouraging colleagues to identify small changes in our work processes that can make a big difference.
The Board hosts engagement sessions with colleagues when travelling to our markets and we are also introducing new ways for colleagues and the Board to interact, for example, through online discussions. This aligns with the new UK Corporate Governance Code requirements on workforce engagement.
We proactively manage risks associated with our workforce (such as engagement, attrition, development and conduct) through our risk management frameworks. Additionally, we continue to review our people agenda in light of the changing needs of the future workforce so that we can remain an employer of choice for the talent upon which we depend.
Our commitment to wellbeingWe are committed to bringing out the best in colleagues by establishing and maintaining a work environment that promotes positive wellbeing and healthy lifestyle choices. Our vision is to create a culture where employees have access to a range of wellbeing resources to help them remain happy and healthy, and can seek help when they need it. We recognise that every employee has different needs and our four wellbeing pillars – mental, physical, social and financial – allow us to provide support to employees at every stage of their lives.
Developing our colleagues Developing our people and finding the right opportunities for them to succeed is a priority for us. In 2018, we identified and brought together two global talent pools for emerging and high potential talent. These are groups of talented leaders at different stages in their career who have the potential to operate in more senior and complex leadership roles in the future. The pools are designed to prepare and accelerate their readiness for succession to Management Team roles over the short, medium and long-term.
COLLEAGUES
Female representation
Female
30.8%(2017: 30.8%)
Board
Female
35.7%(2017: 42.9%)
Management Team
Female
27.7%(2017: 25.7%)
Senior management (Bands 1-4)
Female
45.9%(2017: 45.8%)
All employees
2017
20182017
2018
2017
20182017
2018

Risk review
and Cap
ital reviewS
TR
AT
EG
IC R
EP
OR
TS
upp
lementary info
rmatio
nFinancial statem
entsD
irectors’ rep
ort
45
One of the ways we nurtured talent in 2018 is through mentoring relationships between our independent non-executive directors and leaders from our global talent pool. This enabled future leaders to learn from external perspectives to shape their own personal and professional growth.
For identifying talent in the external market, we have invested in our Global Talent Research team to directly source talent. Over 50 per cent of the external talent that was sourced and hired by this team in 2018 was female talent.
Learning as a lever for culture, capability and performance Leadership is pivotal to our culture, capability and performance, and our people leaders are central to developing our employees and supporting their career aspirations.
In 2018, we rolled out new executive development programmes ‘It’s On Us’ and ‘Make it Real’ in partnership with Duke Corporate Education. We reached 90 per cent of our top 250 leaders and 34 per cent of our executive leaders this year.
The programmes are focused on our clients, our purpose and our valued behaviours, challenging the way our leaders lead as individuals and collectively.
Following research on what makes a great people leader at Standard Chartered, we have defined five people leader personas from ‘aspiring’ to ‘experienced’ and nine practices to make colleagues feel safe, motivated and empowered. We are redeveloping our leadership development programmes to reflect these principles and piloted the first of these with new leaders in November 2018. We will roll this out to all first-time leaders in 2019. We have provided more than 10,000 days of leadership and management training and an average of three days of formal training to all colleagues in 2018.
Embracing diversity to achieve our purposeUnique diversity underpins our purpose. We can only drive commerce and prosperity by embracing the power of our diversity and unleashing its full potential. An inclusive culture is central to enabling our diversity, prompting innovation and driving performance.
In 2018, we defined our long-term approach to diversity and inclusion (D&I) for our colleagues, clients and communities, setting out key objectives and focus areas to build a culture of inclusion, respect and equality.
Our Group-wide D&I Standard sets out our intent to ensure a respectful workplace, with fair and equal treatment and the provision of opportunities for colleagues to participate fully and reach their full potential in an appropriate working environment.
Our global D&I Council, comprising of senior leaders across the organisation, is now responsible for overseeing the development and implementation of the D&I strategy. It reports progress to the Management Team and Brand Values and Conduct Committee. Our global D&I agenda is supported by business and country councils, which execute initiatives locally. We have 50 employee resource groups in 20 countries that represent the passion of our colleagues for D&I.
An Integration Group has also been formed to implement D&I best practice through employee and business processes, including
Group KPI: Diversity and inclusion
Gender diversity in senior rolesAim Improve gender diversity in the Group’s top levels of management by supporting, developing, promoting and retaining senior female colleagues.
Analysis Since signing the Women in Finance Charter in 2016, we have seen a positive trend in female representation in our senior leadership roles, increasing to 27.7 per cent at the end of 2018. This takes us closer towards our pledge of having women occupy 30 per cent of the top four levels of senior roles by 2020.
27.7% +2.0%
The total number of women in the most senior (band 1–4) roles expressed as a percentage of total band 1–4 roles
Group KPI: Employee engagement
Employee Net Promoter Score (eNPS) Aim Increase engagement across the Group by creating a better working environment for our colleagues, that should translate into an improved client experience.
Analysis eNPS has increased steadily over the past 12 months (5.9 in H2 2017 vs 9.6 in H1 2018 vs 11.3 in H2 2018) suggesting that the Group is becoming a better place to work and employee advocacy reflects this.
+11.3 +5.0%
eNPS measures the number of promoters (who would recommend the Group as a great place to work) compared to detractors on a scale from -100 to +100. This is reflected in the percentage change calculation.
Our commitment to wellbeing
A wellbeing programme consisting of four pillars – mental, physical, social and financial – has been launched globally. More than 80 per cent of our colleagues have access to offerings under all four pillars. A detailed review in 15 of our largest markets has provided a better understanding of the local wellbeing challenges being faced and how best to strengthen our wellbeing programme in 2019 and beyond.
2018
2017
2016 2.4
5.9
11.3
2018
2017
2016 25.5%
25.7%
27.7%
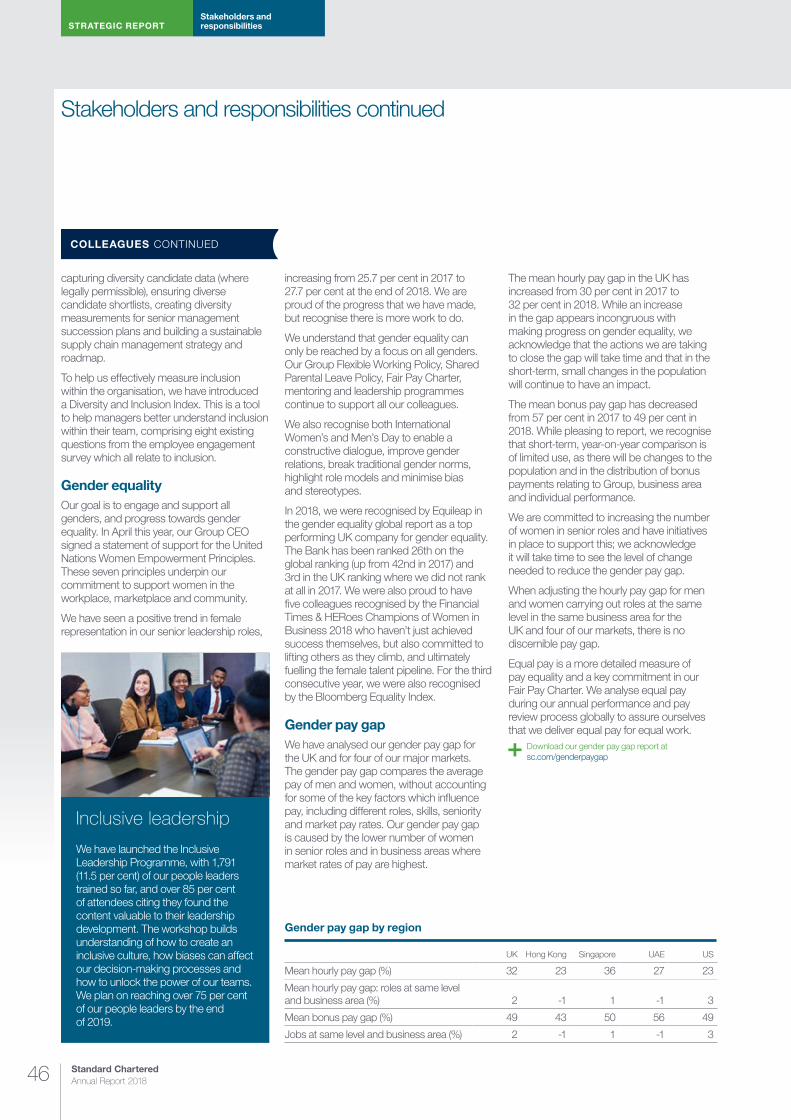
STRATEGIC REPORTStakeholders and responsibilities
Standard Chartered Annual Report 201846
Stakeholders and responsibilities continued
capturing diversity candidate data (where legally permissible), ensuring diverse candidate shortlists, creating diversity measurements for senior management succession plans and building a sustainable supply chain management strategy and roadmap.
To help us effectively measure inclusion within the organisation, we have introduced a Diversity and Inclusion Index. This is a tool to help managers better understand inclusion within their team, comprising eight existing questions from the employee engagement survey which all relate to inclusion.
Gender equalityOur goal is to engage and support all genders, and progress towards gender equality. In April this year, our Group CEO signed a statement of support for the United Nations Women Empowerment Principles. These seven principles underpin our commitment to support women in the workplace, marketplace and community.
We have seen a positive trend in female representation in our senior leadership roles,
increasing from 25.7 per cent in 2017 to 27.7 per cent at the end of 2018. We are proud of the progress that we have made, but recognise there is more work to do.
We understand that gender equality can only be reached by a focus on all genders. Our Group Flexible Working Policy, Shared Parental Leave Policy, Fair Pay Charter, mentoring and leadership programmes continue to support all our colleagues.
We also recognise both International Women’s and Men’s Day to enable a constructive dialogue, improve gender relations, break traditional gender norms, highlight role models and minimise bias and stereotypes.
In 2018, we were recognised by Equileap in the gender equality global report as a top performing UK company for gender equality. The Bank has been ranked 26th on the global ranking (up from 42nd in 2017) and 3rd in the UK ranking where we did not rank at all in 2017. We were also proud to have five colleagues recognised by the Financial Times & HERoes Champions of Women in Business 2018 who haven’t just achieved success themselves, but also committed to lifting others as they climb, and ultimately fuelling the female talent pipeline. For the third consecutive year, we were also recognised by the Bloomberg Equality Index.
Gender pay gap We have analysed our gender pay gap for the UK and for four of our major markets. The gender pay gap compares the average pay of men and women, without accounting for some of the key factors which influence pay, including different roles, skills, seniority and market pay rates. Our gender pay gap is caused by the lower number of women in senior roles and in business areas where market rates of pay are highest.
The mean hourly pay gap in the UK has increased from 30 per cent in 2017 to 32 per cent in 2018. While an increase in the gap appears incongruous with making progress on gender equality, we acknowledge that the actions we are taking to close the gap will take time and that in the short-term, small changes in the population will continue to have an impact.
The mean bonus pay gap has decreased from 57 per cent in 2017 to 49 per cent in 2018. While pleasing to report, we recognise that short-term, year-on-year comparison is of limited use, as there will be changes to the population and in the distribution of bonus payments relating to Group, business area and individual performance.
We are committed to increasing the number of women in senior roles and have initiatives in place to support this; we acknowledge it will take time to see the level of change needed to reduce the gender pay gap.
When adjusting the hourly pay gap for men and women carrying out roles at the same level in the same business area for the UK and four of our markets, there is no discernible pay gap.
Equal pay is a more detailed measure of pay equality and a key commitment in our Fair Pay Charter. We analyse equal pay during our annual performance and pay review process globally to assure ourselves that we deliver equal pay for equal work.
Download our gender pay gap report at sc.com/genderpaygap
COLLEAGUES CONTINUED
Gender pay gap by region
UK Hong Kong Singapore UAE US
Mean hourly pay gap (%) 32 23 36 27 23
Mean hourly pay gap: roles at same level and business area (%) 2 -1 1 -1 3
Mean bonus pay gap (%) 49 43 50 56 49
Jobs at same level and business area (%) 2 -1 1 -1 3
Inclusive leadership
We have launched the Inclusive Leadership Programme, with 1,791 (11.5 per cent) of our people leaders trained so far, and over 85 per cent of attendees citing they found the content valuable to their leadership development. The workshop builds understanding of how to create an inclusive culture, how biases can affect our decision-making processes and how to unlock the power of our teams. We plan on reaching over 75 per cent of our people leaders by the end of 2019.
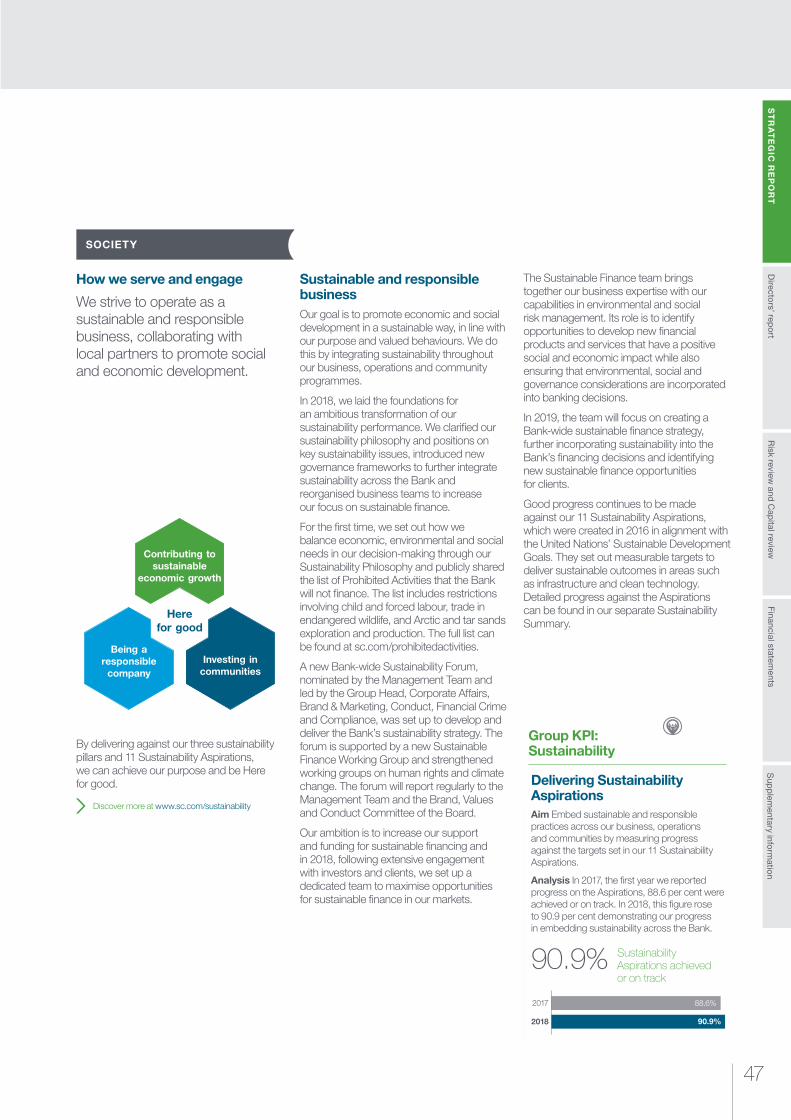
Risk review
and Cap
ital reviewS
TR
AT
EG
IC R
EP
OR
TS
upp
lementary info
rmatio
nFinancial statem
entsD
irectors’ rep
ort
47
How we serve and engage
We strive to operate as a sustainable and responsible business, collaborating with local partners to promote social and economic development.
Sustainable and responsible businessOur goal is to promote economic and social development in a sustainable way, in line with our purpose and valued behaviours. We do this by integrating sustainability throughout our business, operations and community programmes.
In 2018, we laid the foundations for an ambitious transformation of our sustainability performance. We clarified our sustainability philosophy and positions on key sustainability issues, introduced new governance frameworks to further integrate sustainability across the Bank and reorganised business teams to increase our focus on sustainable finance.
For the first time, we set out how we balance economic, environmental and social needs in our decision-making through our Sustainability Philosophy and publicly shared the list of Prohibited Activities that the Bank will not finance. The list includes restrictions involving child and forced labour, trade in endangered wildlife, and Arctic and tar sands exploration and production. The full list can be found at sc.com/prohibitedactivities.
A new Bank-wide Sustainability Forum, nominated by the Management Team and led by the Group Head, Corporate Affairs, Brand & Marketing, Conduct, Financial Crime and Compliance, was set up to develop and deliver the Bank’s sustainability strategy. The forum is supported by a new Sustainable Finance Working Group and strengthened working groups on human rights and climate change. The forum will report regularly to the Management Team and the Brand, Values and Conduct Committee of the Board.
Our ambition is to increase our support and funding for sustainable financing and in 2018, following extensive engagement with investors and clients, we set up a dedicated team to maximise opportunities for sustainable finance in our markets.
The Sustainable Finance team brings together our business expertise with our capabilities in environmental and social risk management. Its role is to identify opportunities to develop new financial products and services that have a positive social and economic impact while also ensuring that environmental, social and governance considerations are incorporated into banking decisions.
In 2019, the team will focus on creating a Bank-wide sustainable finance strategy, further incorporating sustainability into the Bank’s financing decisions and identifying new sustainable finance opportunities for clients.
Good progress continues to be made against our 11 Sustainability Aspirations, which were created in 2016 in alignment with the United Nations’ Sustainable Development Goals. They set out measurable targets to deliver sustainable outcomes in areas such as infrastructure and clean technology. Detailed progress against the Aspirations can be found in our separate Sustainability Summary.
By delivering against our three sustainability pillars and 11 Sustainability Aspirations, we can achieve our purpose and be Here for good.
Discover more at www.sc.com/sustainability
Contributing to sustainable
economic growth
Here for good
Investing in communities
Being a responsible
company
SOCIETY
Group KPI: Sustainability
Delivering Sustainability Aspirations Aim Embed sustainable and responsible practices across our business, operations and communities by measuring progress against the targets set in our 11 Sustainability Aspirations.
Analysis In 2017, the first year we reported progress on the Aspirations, 88.6 per cent were achieved or on track. In 2018, this figure rose to 90.9 per cent demonstrating our progress in embedding sustainability across the Bank.
90.9% Sustainability Aspirations achieved or on track
2018
2017 88.6%
90.9%
STRATEGIC REPORTStakeholders and responsibilities
Standard Chartered Annual Report 201848
Stakeholders and responsibilities continued
We regularly measure the social and economic impact of the Bank’s activities in our markets and in 2018, we focused on our impact in Kenya, Tanzania and Uganda. Using 2016 data, our report into Standard Chartered’s socio-economic impact in East Africa determined that the Bank provided $3.4 billion of financing, direct and indirect value-added impacts of $2.8 billion, and direct and indirect employment to more than one million people.
Read our Sustainability Philosophy at sc.com/sustainabilityphilosophy
Download our Sustainability Summary at sc.com/sustainabilitysummary
Download the East Africa Impact Report at sc.com/sustainability
Contributing to sustainable economic growthWe finance key sectors and create products and services that drive sustainable economic growth while managing environmental and social risks associated with our financing.
Managing environmental and social risksOur most significant environmental and social impacts come from the business we finance.
Following a comprehensive review, in 2018 we released our revised cross-sector environmental and social risk framework and updated Position Statements, which have been consolidated across five sectors and two themes. These draw on International Finance Corporation (IFC) Performance Standards, the Equator Principles and global best practice, setting out the conditions under which we will support the activities of clients operating in sectors with a high potential environmental or social impact.
The review resulted in a revised position on power generation and a decision to end financing for new coal-fired power plants, save where we have an existing commitment.
We identify and assess environmental and social risks related to our Corporate & Institutional, Commercial and Business Banking clients, and embed our environmental and social risk framework directly into our credit approval process. All relationship managers and credit officers are offered training in assessing environmental and social risk against our criteria, as well as access to online resources.
In 2018, we reviewed 827 transactions that presented potential specific risks against our Position Statements. Where possible, we work collaboratively with clients to mitigate all identified risks. Where this is not possible, transactions have been, and will continue to be, turned down.
During 2019, we will build on this momentum embedding the Position Statements through e-learning and classroom-based training for frontline and risk colleagues and extending transaction reviews to the Private Bank. As a member of the Equator Principles (EP) Steering Committee, we will also play an active part in the review of EP4 during 2019.
Assessing climate changeDuring 2018, we advanced our approach to climate change and concluded work with the University of Oxford to assess the impact of climate change on energy utilities clients. We collaborated with 15 banks and the UN Environment Programme to pilot scenario analysis for physical and transition risks in key sectors. This provided preliminary information on climate impacts and will help us as we develop further climate analytics.
We published our first report aligning to the recommendations of the Taskforce on Climate-related Financial Disclosures (TCFD)and announced our intention to develop a methodology to measure, manage and ultimately reduce the emissions related to our activities and those related to the financing of our clients. We will progress this in 2019 alongside work with the Banking Environment Initiative Bank 2030 project to identify climate opportunities.
Read our Position Statements at sc.com/positionstatements
Being a responsible companyWe strive to manage our business sustainably and responsibly, drawing on our purpose, brand promise, valued behaviours and Code of Conduct to enable us to make the right decisions.
Promoting good conductRecognising its importance, we identified conduct as a Principal Risk Type in 2018 and clarified how we define Conduct Risk, re-emphasising our focus on ensuring fair client outcomes. We updated the framework and policy that embed the practices that help us identify, aggregate and measure conduct-related risks.
Our Code of Conduct remains the central tool through which we set out our conduct expectations. Our goal is to create the right environment to support ethical behaviour so all employees know, understand and play their part. Leaders are encouraged to recruit and recognise colleagues based on good conduct, while performance objectives and reward mechanisms are directly linked to the our valued behaviours.
Conduct training is obligatory and colleagues are asked annually to recommit to the Code of Conduct. In 2018, 99.6 per cent reconfirmed their commitment to the code. Failure to adhere to the code can result in disciplinary action and potentially dismissal.
Our focus in 2019 is to embed the requirements of the new framework across businesses and functions.
SOCIETY CONTINUED
Speaking Up
YearTotal cases
raised1 In scope2
Closed3
Substantiated4 Unsubstantiated
2018 1,469 606 318 290
2017 1,183 460 194 273
1 Total concerns raised within the reporting year
2 A reportable concern under the FCA whistleblowing rules that is raised within the reporting year and considered within the scope of the Speaking Up programme
3 This represents all cases closed within the reporting year. This includes cases that were raised in the reporting year and in previous years
4 Closed and with sufficient evidence supporting original allegation(s)

Risk review
and Cap
ital reviewS
TR
AT
EG
IC R
EP
OR
TS
upp
lementary info
rmatio
nFinancial statem
entsD
irectors’ rep
ort
49
Speaking UpSpeaking Up is our confidential and anonymous whistleblowing programme. It includes independent and secure channels for anyone – colleagues, contractors, suppliers and members of the public – to raise concerns.
During 2018, 1,469 concerns were raised through Speaking Up, of which 606 were within scope and investigated. Themes included concerns involving employee behaviour, breaches of internal controls, conflicts of interest and allegations of fraud.
In 2018, 608 cases were closed following investigation (these included cases raised in 2018 as well as cases raised in prior years). The concerns raised were substantiated in 318 of those cases while 290 were found to be unsubstantiated. A range of actions have been taken in response to these cases including improvements to processes or controls, additional training and, in the most serious cases, disciplinary action and dismissals.
We are committed to providing a safe environment for colleagues to report concerns. Trust and confidence in the Speaking Up programme has grown. This is evidenced by an increase in the number of concerns being raised. It is supported by the results from our My Voice employee survey, in which 91 per cent of colleagues responded favourably to the statement: ‘I feel comfortable to Speak Up if I see a violation of the Bank’s policies, valued behaviours and Code of Conduct’.
In 2019, we will continue to educate colleagues on how to use Speaking Up channels.
Download our Group Code of Conduct at sc.com/codeofconduct and visit sc.com/speakingup to find more about how our Speaking Up programme works
Fighting �nancial crime Our aim is partnering to lead in the fight against financial crime, protecting our business, clients and wider communities from its damaging effects. By cutting off their sources of funds, we can help make the financial system a hostile environment for criminals, while supporting economic development across all our markets.
We maintain sound defences against money laundering, terrorist financing, sanctions compliance breaches, bribery and other forms of corruption. A dedicated Financial Crime Compliance (FCC) team leads our risk management activities, which include adhering to anti-money laundering and sanctions policies, and applying core controls such as client due-diligence screening and monitoring. Anti-bribery and corruption (ABC) policies aim to prevent colleagues, or third parties working on our behalf, from participating in active or passive bribery or corruption, or from making facilitation payments.
In 2018, we strengthened several of the key tools and platforms that support our FCC activities and contributed to reducing financial crime across the sector through public-private information sharing partnerships in the UK, the US, Singapore and Hong Kong. We are a member of the United for Wildlife Financial Taskforce, which has been formed to create and deliver actionable intelligence to combat the illegal wildlife trade.
In 2018, 99.9 per cent of colleagues completed ABC training, 99.9 per cent completed anti-money laundering training and 99.9 per cent completed sanctions training.
For more, visit sc.com/fightingfinancialcrime
Respecting human rightsWe are committed to respecting human rights and seek to ensure they are not adversely impacted in our role as an employer, financial services provider and procurer of goods and services. We recognise that our footprint and supply chain give us the opportunity to raise awareness of human rights and modern slavery in a wide range of markets and industries.
Our Position Statement on human rights outlines our approach, reflecting the International Bill of Human Rights, the UN Guiding Principles and the UK Modern Slavery Act. This is then embedded across a range of internal policies and risk management frameworks, including our Group Code of Conduct and Supplier Charter.
Serious about carbon reduction
We have measured our energy use and greenhouse gas emissions since 2008. In 2018, we set ambitious new Science Based Targets to significantly reduce our carbon footprint over three time horizons from a 2017 baseline of 187,936 tonnes: 36 per cent to 121,000 tonnes by 2025; 55 per cent to 84,000 tonnes by 2030; and 90 per cent to 18,000 tonnes by 2050. Recognising the need for industry-wide solutions to climate change, we also joined the Science Based Targets Expert Advisory Group. Meeting these challenging targets will require efficiency improvements across our properties, including a review of fuel usage and a further increase in renewable energy sources.
Colleagues who recommitted to the Group Code of Conduct in 2018
99.6%
Employees who completed anti-money laundering training in 2018
99.9%Employees who completed anti-bribery training in 2018
99.9%
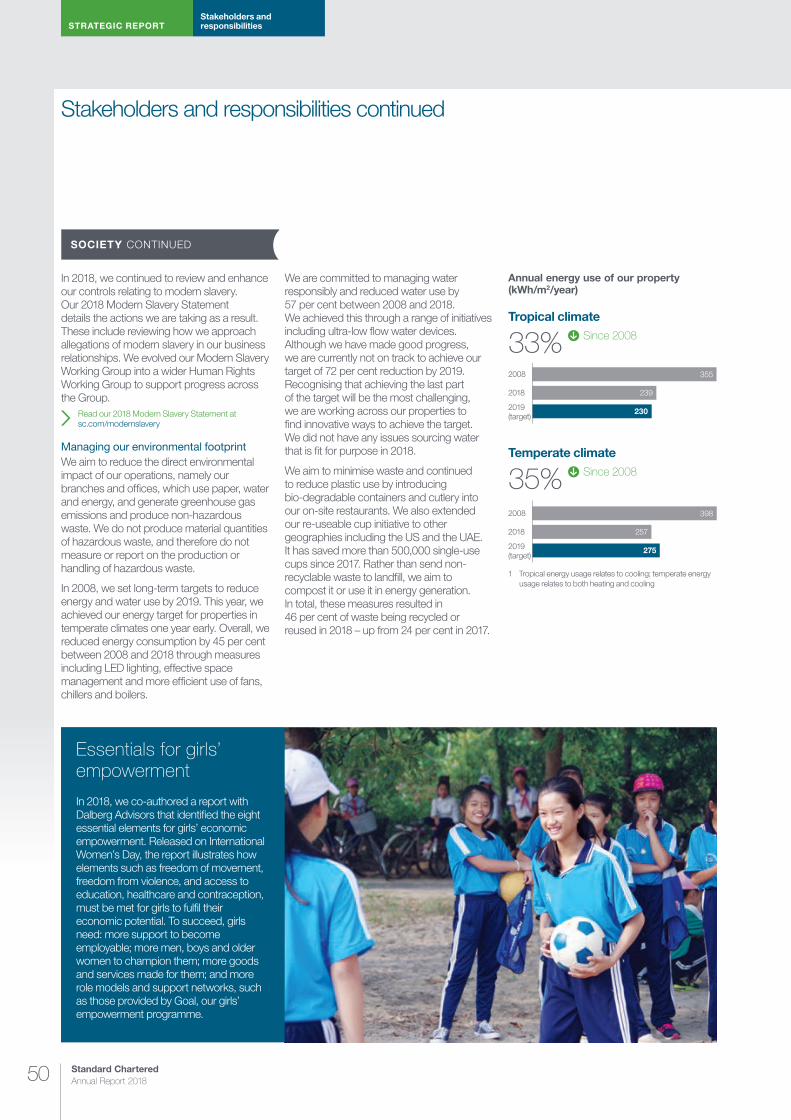
STRATEGIC REPORTStakeholders and responsibilities
Standard Chartered Annual Report 201850
Stakeholders and responsibilities continued
In 2018, we continued to review and enhance our controls relating to modern slavery. Our 2018 Modern Slavery Statement details the actions we are taking as a result. These include reviewing how we approach allegations of modern slavery in our business relationships. We evolved our Modern Slavery Working Group into a wider Human Rights Working Group to support progress across the Group.
Read our 2018 Modern Slavery Statement at sc.com/modernslavery
Managing our environmental footprintWe aim to reduce the direct environmental impact of our operations, namely our branches and offices, which use paper, water and energy, and generate greenhouse gas emissions and produce non-hazardous waste. We do not produce material quantities of hazardous waste, and therefore do not measure or report on the production or handling of hazardous waste.
In 2008, we set long-term targets to reduce energy and water use by 2019. This year, we achieved our energy target for properties in temperate climates one year early. Overall, we reduced energy consumption by 45 per cent between 2008 and 2018 through measures including LED lighting, effective space management and more efficient use of fans, chillers and boilers.
We are committed to managing water responsibly and reduced water use by 57 per cent between 2008 and 2018. We achieved this through a range of initiatives including ultra-low flow water devices. Although we have made good progress, we are currently not on track to achieve our target of 72 per cent reduction by 2019. Recognising that achieving the last part of the target will be the most challenging, we are working across our properties to find innovative ways to achieve the target. We did not have any issues sourcing water that is fit for purpose in 2018.
We aim to minimise waste and continued to reduce plastic use by introducing bio-degradable containers and cutlery into our on-site restaurants. We also extended our re-useable cup initiative to other geographies including the US and the UAE. It has saved more than 500,000 single-use cups since 2017. Rather than send non-recyclable waste to landfill, we aim to compost it or use it in energy generation. In total, these measures resulted in 46 per cent of waste being recycled or reused in 2018 – up from 24 per cent in 2017.
Annual energy use of our property (kWh/m2/year)
Tropical climate
33% Since 2008
Temperate climate
35% Since 2008
Essentials for girls’ empowerment
In 2018, we co-authored a report with Dalberg Advisors that identified the eight essential elements for girls’ economic empowerment. Released on International Women’s Day, the report illustrates how elements such as freedom of movement, freedom from violence, and access to education, healthcare and contraception, must be met for girls to fulfil their economic potential. To succeed, girls need: more support to become employable; more men, boys and older women to champion them; more goods and services made for them; and more role models and support networks, such as those provided by Goal, our girls’ empowerment programme.
2019 (target)
2018
2008 355
239
230
2019 (target)
2018
2008 398
257
275
1 Tropical energy usage relates to cooling; temperate energy usage relates to both heating and cooling
SOCIETY CONTINUED

Risk review
and Cap
ital reviewS
TR
AT
EG
IC R
EP
OR
TS
upp
lementary info
rmatio
nFinancial statem
entsD
irectors’ rep
ort
51
We continue to identify ways to improve our environmental performance. In 2019, we will review the methodology used to measure our energy, greenhouse gas (GHG) emissions, water and waste. In addition to external assurance for our GHG emissions, we will conduct external assurance of waste and water performance data and increase monitoring of plastic usage to set more robust reduction targets.
Read the methodology for measuring our environmental performance at sc.com/environmentcriteria
Read the independent assurance for our energy and greenhouse gases emissions, at sc.com/environmentalassurance
Investing in communitiesWe aim to create more inclusive economies by sharing our skills and expertise, and developing community programmes that transform lives. In 2018, we invested $49.2 million in our communities. In addition, colleagues contributed more than 65,000 volunteering days.
Our donations are guided by our Group Sponsorship and Donations Policy. Country teams receive annual training on the policy, which is applied globally.
In 2018, we raised $5.2 million through fundraising and Bank-matching for Seeing is Believing (SiB), our global initiative to tackle avoidable blindness and visual impairment and exceeded our $100 million fundraising target two years early, raising $103.6 million for SiB between 2003 and 2018. We will deliver SiB projects until the end of 2020 and will continue to support visually impaired people through our community programmes.
As we approached our SiB target, we engaged colleagues and external stakeholders to understand the current social and economic challenges facing our communities and how we can address these needs through our community programmes. We launched a new global initiative – Futuremakers by Standard Chartered – that aims to tackle inequality and promote greater economic inclusion. Our ambition is to raise $50 million between 2019 and 2023, (through fundraising and Bank-matching) to empower the next generation to learn, earn and grow. We will deliver this through new and existing programmes in education, employability and entrepreneurship for disadvantaged young people.
We will integrate our current financial education programmes into Futuremakers and build on Goal, our existing education programme to empower girls and young women through sport and life-skills training. Goal reached more than 100,000 girls and young women in 2018 and more than 480,000 girls between 2006 and 2018. We trained more than 111,000 young people on financial education in 2018 and over 5,400 entrepreneurs, of whom 90 per cent were women.
In 2019, we will focus on implementing Futuremakers by Standard Chartered across our markets.
Our community expenditure 2018
1. Leverage1 5.9%
2. Management costs 9.1%
3. Gifts in kind 0.2%
4. Cash contributions 46.6%
5. Employee time (non-cash item) 38.2%
1 Leverage data relates to the proceeds from staff and other fundraising activity
$49.2m
12
4
5
3
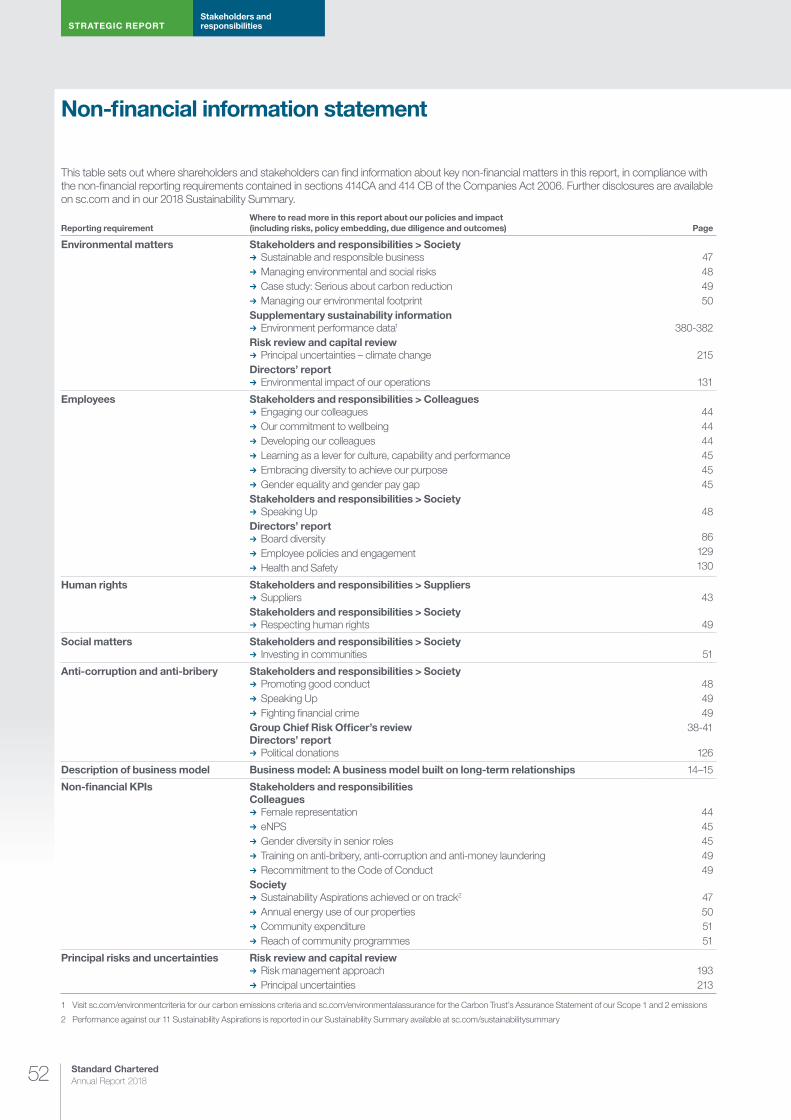
STRATEGIC REPORTStakeholders and responsibilities
Standard Chartered Annual Report 201852
Non-financial information statement
This table sets out where shareholders and stakeholders can find information about key non-financial matters in this report, in compliance with the non-financial reporting requirements contained in sections 414CA and 414 CB of the Companies Act 2006. Further disclosures are available on sc.com and in our 2018 Sustainability Summary.
Reporting requirementWhere to read more in this report about our policies and impact (including risks, policy embedding, due diligence and outcomes) Page
Environmental matters Stakeholders and responsibilities > Society U Sustainable and responsible business U Managing environmental and social risks U Case study: Serious about carbon reduction U Managing our environmental footprint
Supplementary sustainability information U Environment performance data1
Risk review and capital review U Principal uncertainties – climate change
Directors’ report U Environmental impact of our operations
47484950
380-382
215
131
Employees Stakeholders and responsibilities > Colleagues U Engaging our colleagues U Our commitment to wellbeing U Developing our colleagues U Learning as a lever for culture, capability and performance U Embracing diversity to achieve our purpose U Gender equality and gender pay gap
Stakeholders and responsibilities > Society U Speaking Up
Directors’ report U Board diversity U Employee policies and engagement U Health and Safety
444444454545
48
86
129130
Human rights Stakeholders and responsibilities > Suppliers U Suppliers
Stakeholders and responsibilities > Society U Respecting human rights
43
49
Social matters Stakeholders and responsibilities > Society U Investing in communities
51
Anti-corruption and anti-bribery Stakeholders and responsibilities > Society U Promoting good conduct U Speaking Up U Fighting financial crime
Group Chief Risk Officer’s reviewDirectors’ report
U Political donations
484949
38-41
126
Description of business model Business model: A business model built on long-term relationships 14–15
Non-financial KPIs Stakeholders and responsibilities Colleagues
U Female representation U eNPS U Gender diversity in senior roles U Training on anti-bribery, anti-corruption and anti-money laundering U Recommitment to the Code of Conduct
Society U Sustainability Aspirations achieved or on track2
U Annual energy use of our properties U Community expenditure U Reach of community programmes
4445454949
47505151
Principal risks and uncertainties Risk review and capital review U Risk management approach U Principal uncertainties
193213
1 Visit sc.com/environmentcriteria for our carbon emissions criteria and sc.com/environmentalassurance for the Carbon Trust’s Assurance Statement of our Scope 1 and 2 emissions
2 Performance against our 11 Sustainability Aspirations is reported in our Sustainability Summary available at sc.com/sustainabilitysummary
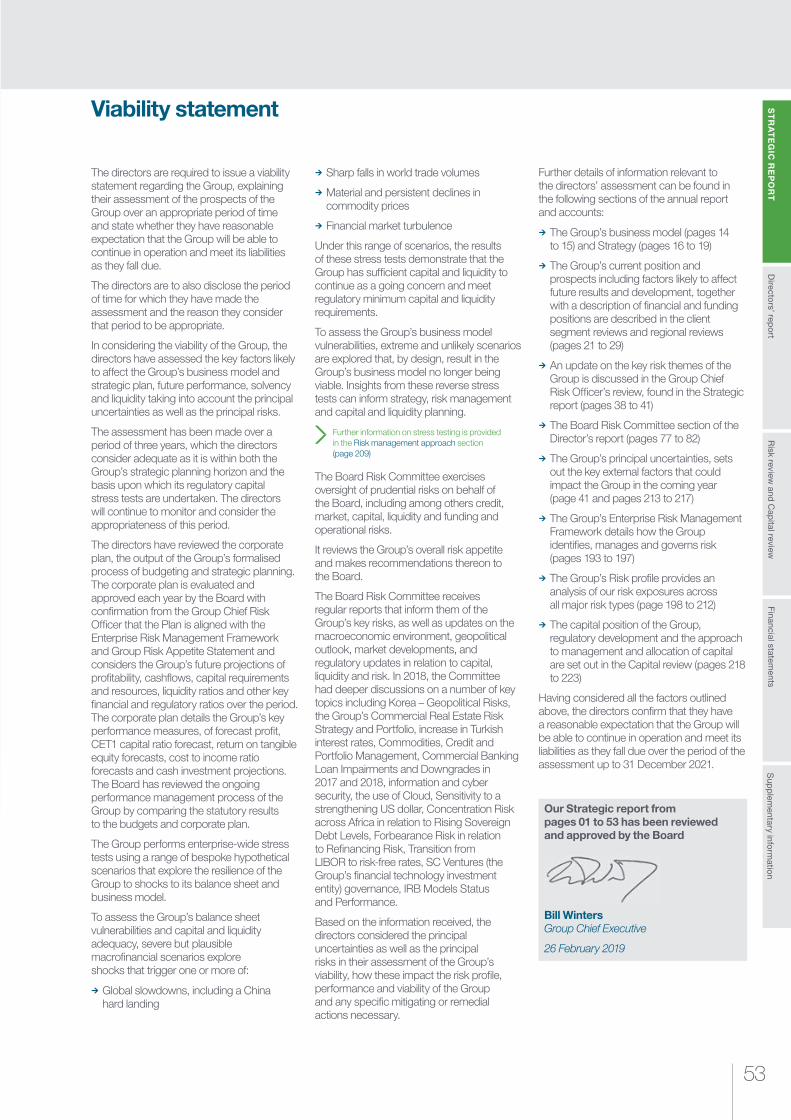
53
Risk review
and Cap
ital reviewS
TR
AT
EG
IC R
EP
OR
TS
upp
lementary info
rmatio
nFinancial statem
entsD
irectors’ rep
ort
Viability statement
The directors are required to issue a viability statement regarding the Group, explaining their assessment of the prospects of the Group over an appropriate period of time and state whether they have reasonable expectation that the Group will be able to continue in operation and meet its liabilities as they fall due.
The directors are to also disclose the period of time for which they have made the assessment and the reason they consider that period to be appropriate.
In considering the viability of the Group, the directors have assessed the key factors likely to affect the Group’s business model and strategic plan, future performance, solvency and liquidity taking into account the principal uncertainties as well as the principal risks.
The assessment has been made over a period of three years, which the directors consider adequate as it is within both the Group’s strategic planning horizon and the basis upon which its regulatory capital stress tests are undertaken. The directors will continue to monitor and consider the appropriateness of this period.
The directors have reviewed the corporate plan, the output of the Group’s formalised process of budgeting and strategic planning. The corporate plan is evaluated and approved each year by the Board with confirmation from the Group Chief Risk Officer that the Plan is aligned with the Enterprise Risk Management Framework and Group Risk Appetite Statement and considers the Group’s future projections of profitability, cashflows, capital requirements and resources, liquidity ratios and other key financial and regulatory ratios over the period. The corporate plan details the Group’s key performance measures, of forecast profit, CET1 capital ratio forecast, return on tangible equity forecasts, cost to income ratio forecasts and cash investment projections. The Board has reviewed the ongoing performance management process of the Group by comparing the statutory results to the budgets and corporate plan.
The Group performs enterprise-wide stress tests using a range of bespoke hypothetical scenarios that explore the resilience of the Group to shocks to its balance sheet and business model.
To assess the Group’s balance sheet vulnerabilities and capital and liquidity adequacy, severe but plausible macrofinancial scenarios explore shocks that trigger one or more of:
¼ Global slowdowns, including a China hard landing
¼ Sharp falls in world trade volumes
¼ Material and persistent declines in commodity prices
¼ Financial market turbulence
Under this range of scenarios, the results of these stress tests demonstrate that the Group has sufficient capital and liquidity to continue as a going concern and meet regulatory minimum capital and liquidity requirements.
To assess the Group’s business model vulnerabilities, extreme and unlikely scenarios are explored that, by design, result in the Group’s business model no longer being viable. Insights from these reverse stress tests can inform strategy, risk management and capital and liquidity planning.
Further information on stress testing is provided in the Risk management approach section (page 209)
The Board Risk Committee exercises oversight of prudential risks on behalf of the Board, including among others credit, market, capital, liquidity and funding and operational risks.
It reviews the Group’s overall risk appetite and makes recommendations thereon to the Board.
The Board Risk Committee receives regular reports that inform them of the Group’s key risks, as well as updates on the macroeconomic environment, geopolitical outlook, market developments, and regulatory updates in relation to capital, liquidity and risk. In 2018, the Committee had deeper discussions on a number of key topics including Korea – Geopolitical Risks, the Group’s Commercial Real Estate Risk Strategy and Portfolio, increase in Turkish interest rates, Commodities, Credit and Portfolio Management, Commercial Banking Loan Impairments and Downgrades in 2017 and 2018, information and cyber security, the use of Cloud, Sensitivity to a strengthening US dollar, Concentration Risk across Africa in relation to Rising Sovereign Debt Levels, Forbearance Risk in relation to Refinancing Risk, Transition from LIBOR to risk-free rates, SC Ventures (the Group’s financial technology investment entity) governance, IRB Models Status and Performance.
Based on the information received, the directors considered the principal uncertainties as well as the principal risks in their assessment of the Group’s viability, how these impact the risk profile, performance and viability of the Group and any specific mitigating or remedial actions necessary.
Further details of information relevant to the directors’ assessment can be found in the following sections of the annual report and accounts:
¼ The Group’s business model (pages 14 to 15) and Strategy (pages 16 to 19)
¼ The Group’s current position and prospects including factors likely to affect future results and development, together with a description of financial and funding positions are described in the client segment reviews and regional reviews (pages 21 to 29)
¼ An update on the key risk themes of the Group is discussed in the Group Chief Risk Officer’s review, found in the Strategic report (pages 38 to 41)
¼ The Board Risk Committee section of the Director’s report (pages 77 to 82)
¼ The Group’s principal uncertainties, sets out the key external factors that could impact the Group in the coming year (page 41 and pages 213 to 217)
¼ The Group’s Enterprise Risk Management Framework details how the Group identifies, manages and governs risk (pages 193 to 197)
¼ The Group’s Risk profile provides an analysis of our risk exposures across all major risk types (page 198 to 212)
¼ The capital position of the Group, regulatory development and the approach to management and allocation of capital are set out in the Capital review (pages 218 to 223)
Having considered all the factors outlined above, the directors confirm that they have a reasonable expectation that the Group will be able to continue in operation and meet its liabilities as they fall due over the period of the assessment up to 31 December 2021.
Our Strategic report from pages 01 to 53 has been reviewed and approved by the Board
Bill WintersGroup Chief Executive
26 February 2019

DIRECTORS’ REPORT
Standard Chartered Annual Report 201854
By funding projects run by local and international eye health organisations, SiB provides access to affordable and quality eye health services to people in low- and middle-income countries.
Since it began, it has reached more than 176 million people through medical interventions, eye examinations, and eye health education and training.
We will implement planned eye-health projects to the end of 2020 and build on SiB’s legacy by supporting the Vision Catalyst Fund, a proposed $1 billion global eye-care fund.
Our support for visually-impaired people continues through Futuremakers by Standard Chartered, our new global initiative to tackle inequality and promote greater economic inclusion in our markets.
Seeing is believingAvoidable blindness is a key health issue across our markets. In 2003, to celebrate the Bank’s 150th anniversary, our employees committed to raise enough money for 28,000 sight-restoring surgeries – one for every employee at the time.
They succeeded and their commitment grew into Seeing is Believing (SiB), our global initiative to tackle avoidable blindness and visual impairment.
In 2011, we set an ambitious target to raise $100 million for SiB between 2003 and 2020, through fundraising and Bank-matching. This year, we reached that target two years early, raising a total of $103.6 million.
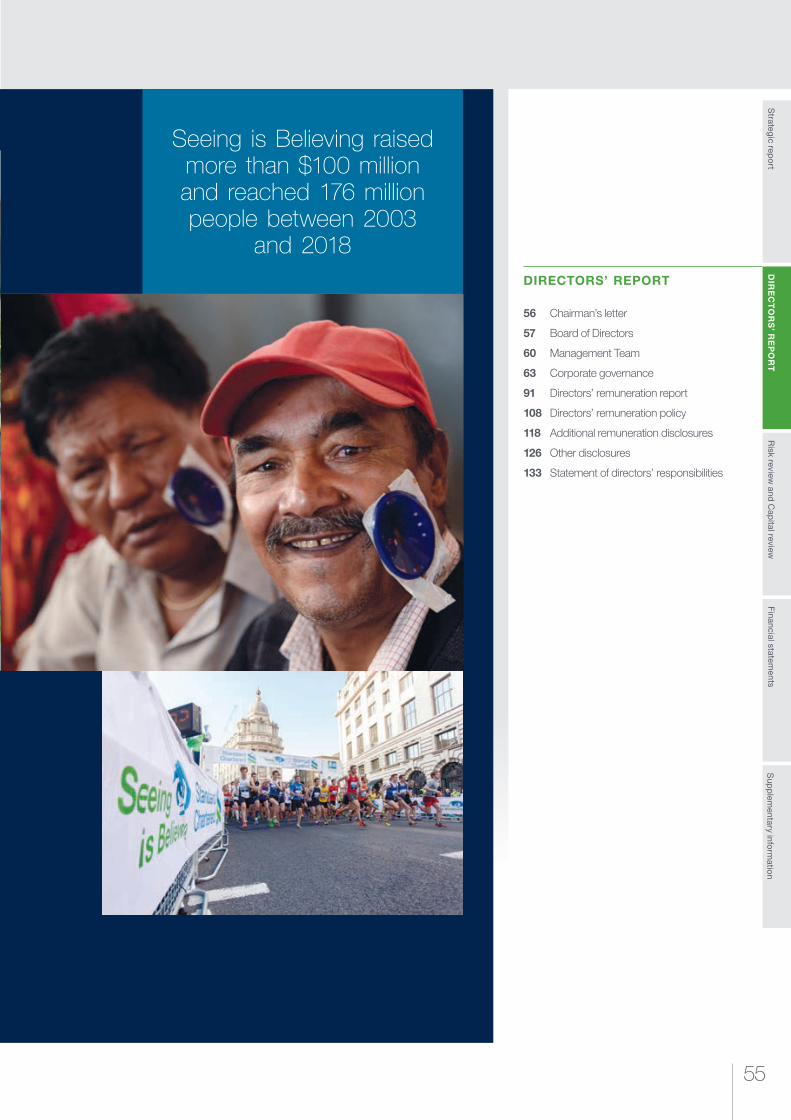
55
Risk review
and Cap
ital reviewS
trategic repo
rtS
upp
lementary info
rmatio
nFinancial statem
entsD
IRE
CT
OR
S’ R
EP
OR
T
DIRECTORS’ REPORT
56 Chairman’s letter
57 Board of Directors
60 Management Team
63 Corporate governance
91 Directors’ remuneration report
108 Directors’ remuneration policy
118 Additional remuneration disclosures
126 Other disclosures
133 Statement of directors’ responsibilities
Seeing is Believing raised more than $100 million and reached 176 million people between 2003
and 2018

Standard Chartered Annual Report 201856
DIRECTORS’ REPORT Chairman’s letter
Chairman’s letter
Dear Shareholder,
This year, the Board, alongside the Management Team, has been focused on delivering stronger performance with the ultimate objective of achieving our purpose – driving commerce and prosperity through our unique diversity. We have continued to make significant progress in reshaping and strengthening the Group through 2018, improving financial returns, enhancing the Group’s resilience and strengthening the performance culture and overall culture in line with the Group’s valued behaviours. As a Board, one of our key responsibilities is to set the strategic direction for the Group, approve the strategy and hold management accountable for its execution.
During 2018, the Board also took the opportunity to examine some of the broader global trends shaping the industry and impacting our business – including geopolitical and economic factors, cyber threats, the rapidly changing nature of technology and the increasing competition coming from the fintech and Big Tech sectors. This has helped us develop a clearer vision of the Group over the long term and better orientate the evolution of our strategy. Some of the key areas discussed and reviewed by the Board during the year are detailed on page 66.
While the composition of the Board remained unchanged during the year, the Governance and Nomination Committee spent a significant amount of time discussing Board succession, in particular identifying an independent non-executive director with a diverse and varied background from the Greater China and North Asia region. This wide-ranging search culminated in the appointment of Carlson Tong to the Board on 21 February 2019. Carlson has over 30 years’ experience operating in one of our key regions and with significant experience and knowledge of the financial services sector in mainland China and Hong Kong. More details on Carlson and the other Board members can be viewed on pages 57 to 59.
Alongside Carlson’s appointment we announced Dr Han Seung-soo’s retirement from the Board. I would like to take this opportunity to thank Dr Han for his substantial contributions to the Group over the past nine years, as well as his considerable insight into Asia, particularly Korea. Om Bhatt also stepped down from the Board as an independent non-executive director. I would like to thank Om for his important contribution to the Group over the past six years, in particular his insight into banking and India.
During the year, the Board continued to deepen its insight into our markets and understand the opportunities and the progress we are making in delivering on our strategic priorities. More detail can be found on pages 18 and 19. As a Board, we collectively visited three very different markets during 2018, holding our meetings in India, Nigeria and Korea. Alongside these Board and committee meetings we also met with our clients and other stakeholders, including engaging with our local colleagues.
The UK’s Corporate Governance framework has continued to evolve with the Financial Reporting Council’s publication of its new UK Corporate Governance Code. The new Code places more emphasis on the application of an updated set of principles focused on the value of good corporate governance to companies’ long-term success. The Governance and Nomination Committee, on behalf of the Board, oversaw the work to assess the impact of the new Code on the Group. This included a focus on stakeholders, particularly formalising a mechanism for an effective two-way engagement with our workforce. Further details on the review can be found on page 87. We will report against the new Code in full in next year’s Corporate Governance report; however, where practical to do so we have measured ourselves against the new Code this year.
As a Group we have taken measures to ensure that following the UK’s departure from the European Union in 2019, we can continue supporting our clients across Europe. Securing a full banking licence for our new subsidiary in Germany strengthens our footprint in Europe and supports the growth we expect to achieve in our European business.
The Board delegates certain responsibilities to its committees for their more detailed oversight and receives updates throughout the year on how they discharge their responsibilities. Further details on the areas each committee has considered during 2018 can be found in the individual committee sections within this report.
José Viñals Group Chairman
“ The Board took the opportunity to examine some of the broader global trends shaping the industry and impacting our business”

57
Risk review
and Cap
ital reviewS
trategic repo
rtS
upp
lementary info
rmatio
nFinancial statem
entsD
IRE
CT
OR
S’ R
EP
OR
T
Board of Directors
Bill Winters, CBE (57) Group Chief Executive
Andy Halford (59)Group Chief Financial Officer
Naguib Kheraj (54)Deputy Chairman
Committee Chair shown in green Audit Committee Board Risk Committee Brand, Values and Conduct Committee Governance and Nomination Committee Board Financial Crime Risk Committee Remuneration Committee
A
Ri
V
N
C
R
Committee key
Appointed: October 2016 and Group Chairman in December 2016.
Experience: José has substantive experience in the international regulatory arena and has exceptional understanding of the economic, financial and political dynamics of our markets and of global trade, and a deep and broad network of decision-makers in the jurisdictions in our footprint.
Career: José began his career as an economist and as a member of the faculty at Stanford University, before spending 25 years at the Central
Bank of Spain, where he rose to be the Deputy Governor. José has held many other board and advisory positions including Chair of Spain’s Deposit Guarantee Fund, Chair of the International Relations Committee at the European Central Bank, member of the Economic and Financial Committee of the European Union, and Chair of the Working Group on Institutional Investors at the Bank for International Settlements. José joined the International Monetary Fund (IMF) in 2009 and stepped down in September 2016 to join Standard Chartered PLC. He was the Financial
Counsellor and the Director of the Monetary and Capital Markets Department and was responsible for the oversight and direction of the IMF’s monetary and financial sector work. He was the IMF’s chief spokesman on financial matters, including global financial stability.
During his tenure at the IMF, José was a member of the Plenary and Steering Committee of the Financial Stability Board, playing a key role in the reform of international financial regulation.
Committees: N
Appointed: June 2015.
Experience: Bill is a career banker with significant frontline global banking experience and a proven track record of leadership and financial success. He has extensive experience of working in emerging markets and a proven record in spotting and nurturing talent.
Career: Bill began his career with JP Morgan, where he went on to become one of its top five most senior executives and later co-chief executive officer at the investment
bank from 2004 until he stepped down in 2009. Bill was invited to be a committee member of the Independent Commission on Banking, established in 2010, to recommend ways to improve competition and financial stability in banking. Subsequently, he served as an adviser to the Parliamentary Commission on Banking Standards and was asked by the Court of the Bank of England to complete an independent review of the bank’s liquidity operations. In 2011, Bill founded Renshaw Bay, an alternative
asset management firm, where he was chairman and CEO. He stepped down on appointment to the Standard Chartered PLC Board.
Bill was previously a non-executive director of Pension Insurance Corporation plc and RIT Capital Partners plc. He received a CBE in 2013.
External appointments: Bill is an independent non-executive director of Novartis International AG.
Bill Winters leads the Management Team
Appointed: July 2014.
Experience: Andy has a strong finance background and deep experience of managing complex international businesses across dynamic and changing markets.
Career: Andy was finance director at East Midlands Electricity plc prior to joining Vodafone in 1999 as financial director for Vodafone Limited, the UK operating company. Andy was later appointed financial director for
Vodafone’s Northern Europe, Middle East and Africa region, and later the chief financial officer of Verizon Wireless in the US. He was a member of the board of representatives of the Verizon Wireless Partnership. Andy was appointed chief financial officer of Vodafone Group plc in 2005, a position he held for nine years. As Group Chief Financial Officer at Standard Chartered, Andy is responsible for Finance, Corporate
Treasury, Group Corporate Development, Group Investor Relations, Property and Supply Chain Management functions.
External appointments: Andy is senior independent director and chair of the audit committee at Marks and Spencer Group plc.
Andy Halford also sits on the Management Team
Appointed: January 2014 and Deputy Chairman in December 2016.
Experience: Naguib has significant banking and finance experience.
Career: Naguib began his career at Salomon Brothers in 1986 and went on to hold senior positions at Robert Fleming, Barclays, JP Morgan Cazenove and Lazard. Over the course of 12 years at Barclays, Naguib served as group finance director and vice-chairman and in various business leadership positions
in wealth management, institutional asset management and investment banking. Naguib was also a Barclays’ nominated non-executive director of ABSA Group in South Africa and of First Caribbean International Bank. He also served as chief executive officer of JP Morgan Cazenove.
Naguib is a former non-executive director of NHS England and served as a senior adviser to Her Majesty’s Revenue and Customs and to the Financial Services Authority in the UK.
External appointments: Naguib is Chairman of Rothesay Life, a specialist pensions insurer. He was appointed a member of the Board of Governors of the Wellcome Trust with effect from 1 January 2019 and is a member of its investment committee. He is also a member of the Finance Committee of the Oxford University Press. Naguib spends a substantial amount of his time as a senior adviser to the Aga Khan Development Network and serves on the boards of various entities within its network.
Committees: Ri R N CA
José Viñals (64) Group Chairman

DIRECTORS’ REPORT Board of Directors
Standard Chartered Annual Report 201858
David Conner (70)Independent Non-Executive Director
Appointed: January 2016
Experience: David has significant global and corporate, investment and retail banking experience, strong risk management credentials and an in-depth knowledge of Asian markets.
Career: David spent his career in the financial services industry, living and working across Asia for 37 years, for both Citibank and OCBC Bank.
He joined Citibank in 1976 as a management trainee and went on to hold a number of Asia-based senior management roles, including chief executive officer of Citibank India and managing director and marketing manager at Citibank Japan, before leaving Citibank in 2002. David joined OCBC Bank in Singapore as chief executive officer and director in 2002. He implemented a strategy of growth and led the bank through a period of
significant turbulence. David stepped down as chief executive officer in 2012 but remained as a non-executive director on the board of OCBC Bank, before leaving the group in 2014.
External appointments: David is a non-executive director of GasLog Ltd
Committees: A N CRi David is also a member of the Combined US Operations Risk Committee of Standard Chartered Bank
Christine Hodgson (54)Senior Independent Director
Appointed: September 2013 and Senior Independent Director in February 2018
Experience: Christine has strong business leadership, finance, accounting and technology experience.
Career: Christine held a number of senior positions at Coopers & Lybrand and was corporate
development director of Ronson plc before joining Capgemini in 1997, where she held a variety of roles including chief financial officer for Capgemini UK plc and chief executive officer of technology services for North West Europe. Christine was previously a trustee of MacIntyre Care and was a non-executive director of Ladbrokes Coral Group plc.
External appointments: Christine is chair of Capgemini UK plc, sits on the board of The Prince of Wales’ Business in the Community and is chair of The Careers & Enterprise Company Ltd, a government- backed company established to help inspire and prepare young people for the world of work.
Committees: VA N CR
Jasmine Whitbread (55) Independent Non-Executive Director
Appointed: April 2015
Experience: Jasmine has significant business leadership experience as well as first-hand experience of operating across our markets.
Career: Jasmine began her career in international marketing in the technology sector and joined Thomson Financial in 1994, becoming managing director of the Electronic Settlements Group.
After completing the Stanford Executive Program, Jasmine set up one of Oxfam’s first regional offices, managing nine country operations in West Africa, later becoming international director responsible for Oxfam’s programmes worldwide. Jasmine joined Save the Children in 2005, where she was responsible for revitalising one of the UK’s most established charities. In 2010, she was appointed as Save the Children’s
first international chief executive officer, a position she held until she stepped down in 2015.
External appointments: Jasmine is chief executive of London First, a business campaigning group with a mission to make London the best city in the world to do business. She is also a non-executive director of BT Group plc.
Committees: R NV
Gay Huey Evans, OBE (64)Independent Non-Executive Director
Appointed: April 2015
Experience: Gay has extensive banking and financial services experience with significant commercial and UK regulatory and governance experience.
Career: Gay spent over 30 years working within the financial services industry, the international capital markets and with the financial regulator. Gay spent seven years with the Financial Services Authority from 1998 to 2005, where she was director of markets division, capital
markets sector leader, with responsibility for establishing a market-facing division for the supervision of market infrastructure, oversight of market conduct and developing markets policy. From 2005 to 2008, Gay held a number of roles at Citibank, including head of governance, Citi Alternative Investments, EMEA, before joining Barclays Capital where she was vice chair of investment banking and investment management. She was previously a non-executive director at Aviva plc and the London Stock
Exchange Group plc. She received an OBE for services to financial services and diversity in 2016.
External appointments: Gay is a non-executive director of ConocoPhillips and Bank Itau BBA International plc, is deputy chair of the Financial Reporting Council and in January 2019 was appointed a non-executive member of HM Treasury.
Committees: RiC
Dr Louis Cheung (55)Independent Non-Executive Director
Appointed: January 2013
Experience: Louis has a wide breadth of knowledge and experience of financial services, particularly in a Greater China context.
Career: Louis was a global partner of McKinsey & Company and a leader in its Asia Pacific financial institutions practice prior to joining Ping An Insurance Group in 2000. Louis worked in several senior roles
at Ping An, including chief financial officer, before becoming group president in 2003 and executive director from 2006 to 2011.
External appointments: Louis is managing partner of Boyu Capital Advisory Co, a China-focused private equity investment firm, independent non-executive director of Fubon Financial Holding Company. He is also a Fellow and Council Member of the Hong Kong Management
Association and a director of The Friends of Cambridge University in Hong Kong.
Committees: R

59
Risk review
and Cap
ital reviewS
trategic repo
rtS
upp
lementary info
rmatio
nFinancial statem
entsD
IRE
CT
OR
S’ R
EP
OR
T
Dr Byron Grote (70)Independent Non-Executive Director
Appointed: July 2014
Experience: Byron has broad and deep commercial, financial and international experience.
Career: From 1988 to 2000, Byron worked across BP in a variety of commercial, operational and executive roles. He was appointed as chief executive of BP Chemicals and a managing director of BP plc in 2000 and had regional group-level accountability for BP’s activities in
Asia from 2001 to 2006. Byron was chief financial officer of BP plc from 2002 until 2011, subsequently serving as BP’s executive vice president, corporate business activities, from 2012 to 2013 with responsibility for the group’s integrated supply and trading activities, alternative energy, shipping and technology. Byron was a non-executive director at Unilever plc and Unilever NV before stepping down in 2015.
External appointments: Byron is senior independent director of Anglo American plc, a non-executive director of Tesco PLC and is deputy chairman of the supervisory board at Akzo Nobel NV. He is also a member of the European Audit Committee Leadership Network.
Committees: A R
Dr Ngozi Okonjo-Iweala (64)Independent Non-Executive Director
Carlson Tong (64) Independent Non-Executive Director
Appointed: November 2017
Experience: Ngozi has significant geopolitical, economic, risk and development experience and expertise at a governmental and intergovernmental level.
Career: A development economist, Ngozi spent 25 years working at the World Bank in various positions. After leaving in 2003, she served as the Finance Minister of Nigeria from 2003 to 2006. She returned to the World Bank in 2007, serving as a Managing Director until 2011, when she was appointed to the role of Minister of Finance and Coordinating Minister of
Economy in the Nigerian government, a position she held until 2015. During her time in government she spearheaded Nigeria’s successful programme to obtain debt relief and is credited with developing reforms that helped improve governmental transparency to stabilise and grow the Nigerian economy.
External appointments: Ngozi was appointed an independent director of Twitter, Inc in 2018. Ngozi is also Chair of GAVI, the Global Alliance for Vaccines and Immunisations and Co-Chair of Lumos Global, an off-grid solar provider. She also holds a number of prestigious international
advisory positions including Lazard and the Asian Infrastructure Investment Bank and holds advisory panel and chair positions at a range of global institutions, including charitable foundations, non-governmental organisations and intergovernmental organisations. Ngozi chairs the African Risk Capacity, a weather based insurance organisation of the African Union. She is a member of the G20 Eminent Persons Group reviewing Global Financial Governance and is an ambassador of the Open Government Partnership.
Committees: V
Appointed: February 2019
Experience: Carlson has a deep understanding and knowledge of operating in mainland China and Hong Kong and has significant experience of the financial services sector in those markets.
Career: Carlson joined KPMG UK in 1979, becoming an Audit Partner of the Hong Kong firm in 1989. He was elected Chairman of KPMG China and Hong Kong in 2007, before becoming Asia Pacific Chairman and a member of the global board and global executive team in 2009. He
spent over 30 years at KPMG and was actively involved in the work of the securities and futures markets, serving as a member of the Main Board and Growth Enterprise Market Listing Committee of the Stock Exchange of Hong Kong from 2002 to 2006 (Chair from 2004 to 2006). After retiring from KPMG in 2011, he was appointed a non-executive director of the Securities and Futures Commission, becoming its Chair in 2012 until he stepped down in October 2018. He oversaw a number of major policy initiatives during his term as the Chair including the
introduction of the Hong Kong and Shanghai/Shenzhen stock connect schemes and the mutual recognition of funds between the mainland and Hong Kong.
External appointments: Carlson sits on various Hong Kong SAR government bodies, including as a non-executive director of the Airport Authority of Hong Kong, Chair of the University Grants Committee and a member of the Hong Kong Exchange Fund Advisory Committee.
Committees: A Ri C
Liz Lloyd, CBE (47)Group Company Secretary
Appointed: Liz was appointed Group Company Secretary in January 2016. Liz will step down as Group Company Secretary in 2019.
Liz joined Standard Chartered in 2008, initially within Group Compliance, focused on regulatory risk and regulatory relationships, before being appointed as Group
Head of Public Affairs, responsible for coordinating the Group’s policies and positioning on all political and regulatory matters. In 2013, she was appointed Chief Executive Officer of Standard Chartered Bank Tanzania, a position she held until October 2015. She received a CBE in 2008.

Standard Chartered Annual Report 201860
DIRECTORS’ REPORT Management Team
Management Team
Tracy Clarke (52) Regional CEO, Europe & Americas and CEO, Private Bank
Simon Cooper (51)CEO, Corporate, Commercial & Institutional Banking
Judy Hsu (55)Regional CEO, ASEAN & South Asia
Benjamin Hung (54)Regional CEO, Greater China & North Asia and CEO Retail Banking and Wealth Management
Appointed: Tracy was appointed CEO, Europe & Americas in October 2015 and assumed her additional role of CEO, Private Bank in March 2018.
Career: Tracy joined Standard Chartered in 1985 and has held a number of roles in Retail, Commercial and Corporate Banking, in addition to Group functions, both in the UK and in Hong Kong. From 2013 until 2015, Tracy led a broad portfolio including
Legal and Compliance, Human Resources, Corporate Affairs and Brand & Marketing. In her role as CEO, Europe and Americas she is responsible for the Corporate & Institutional Banking, Private and Retail Banking businesses in the US, Latin America, UK, Jersey, Germany, France, Nordics and Turkey.
Tracy was appointed as a Director of Standard Chartered Bank in January 2013, became Regional CEO, Europe
& Americas in October 2015 and CEO of the Private Bank in March 2018. Tracy was an independent non-executive director of Sky plc from 2012 until it was taken private in 2018.
External appointments: Tracy is an independent non-executive director of Inmarsat plc and sits on the board of England Netball. She is also a director of City UK.
Appointed: Simon joined the Group as CEO, Corporate & Institutional Banking in April 2016 and assumed the additional responsibility for Commercial Banking in March 2018.
Career: Simon was previously group managing director and chief executive of Global Commercial Banking at HSBC. He has extensive experience across our markets and
client segments. Simon joined HSBC in 1989 and held a number of senior roles there, including deputy chairman and chief executive officer, Middle East and North Africa; chief executive officer, Korea; and head of Corporate and Investment Banking, Singapore. He has significant experience in the areas of corporate finance, corporate banking and transaction banking.
External appointments: Simon is a member of the advisory board of the Lee Kong Chian School of Business.
Appointed: Judy was appointed Regional CEO, ASEAN & South Asia on 1 June 2018.
Career: Judy joined Standard Chartered in December 2009 as the Global Head of Wealth Management. She led the strategic advancement of the Group’s wealth and bancassurance business for six years before assuming the role of CEO, Singapore in 2015. Prior to joining Standard Chartered, Judy
spent 18 years at Citibank, where her last role was the Regional Head of Retail Bank Asia Pacific and Country Business Manager for International Personal Banking in Singapore.
External appointments: Judy is a member of The Institute of Banking and Finance Council and sits on the Board of Workforce Singapore and the Board of Urban Redevelopment Authority, Singapore.
Appointed: Ben was appointed Regional CEO, Greater China & North Asia, on 1 October 2015 and CEO, Retail Banking on 30 November 2017. He assumed his additional role as CEO, Wealth Management in March 2018.
Career: Ben was previously CEO for the Greater China Region. He joined Standard Chartered in 1992 and has held a number of senior management positions spanning corporate,
commercial and retail banking in the UK and Hong Kong. From 2008 to 2014, he was the CEO of Standard Chartered Bank (Hong Kong) Ltd. Ben was previously a board member of the Hong Kong Airport Authority, the Hong Kong Hospital Authority and a Council Member of the Hong Kong University.
External appointments: Ben is a member of the Hong Kong Chief Executive’s Council of Advisers on
Innovation and Strategic Development and the Financial Services Development Council. He also sits on the Exchange Fund Advisory Committee and is a member of the General Committee of the Hong Kong General Chamber of Commerce and Hong Kong Trade Development Council Belt and Road Committee.
Bill Winters, CBE (57) Group Chief Executive
Andy Halford (59)Group Chief Financial Officer

61
Risk review
and Cap
ital reviewS
trategic repo
rtS
upp
lementary info
rmatio
nFinancial statem
entsD
IRE
CT
OR
S’ R
EP
OR
T
David Fein (58) Group General Counsel
Dr Michael Gorriz (58) Group Chief Information Officer
Sunil Kaushal (53) Regional CEO, Africa & Middle East
Appointed: David joined the Group in September 2013 as Group General Counsel, advising the Board and the Court of the Bank on all material legal matters. He oversees Standard Chartered’s Legal function, Group Corporate Secretariat and Shared Investigative Services. David also serves as Chairman of Seeing is Believing, the Group’s flagship philanthropic effort dedicated to eliminating avoidable blindness.
Career: David has held various senior roles in the US Government, including as US Attorney for the District of Connecticut and as Associate Counsel to the President. He has extensive experience fighting financial crime and a track record of forming and supporting public- private partnerships.
External appointments: David is Vice Chair of the United for Wildlife Financial Taskforce and a member of the board of directors of Guiding Eyes for the Blind.
Appointed: Michael joined Standard Chartered as Group Chief Information Officer in July 2015.
Career: An industry award winner, Michael joined from Daimler AG where he was most recently vice president and CIO with responsibility for the smooth operation of all Daimler systems and the management of IT projects globally.
He has held various CIO roles within the Daimler group and has spent many years working across our footprint.
External appointments: None
Appointed: Sunil was appointed Regional CEO, Africa & Middle East on 1 October 2015.
Career: Sunil has nearly 30 years of banking experience in diverse markets across Asia and Africa & Middle East and has been with Standard Chartered for more than 20 years, holding senior roles across the Wholesale and Consumer Bank. Sunil has rich experience across the Group’s footprint, having served as
the Head of Corporate Banking in UAE, Head of Originations and Client Coverage in Singapore, Global Head, Small and Medium Enterprises and New Ventures in Singapore and Chief Executive Officer of Standard Chartered Bank (Taiwan) Ltd and Regional CEO, South Asia and CEO, India. Before joining Standard Chartered in 1998, Sunil held various banking positions at a number of leading international financial institutions.
External appointments: None
Tanuj Kapilashrami (41)Group Head, HR
Appointed: Tanuj joined the Management Team as Group Head, HR in November 2018. She joined the Group in March 2017 as Group Head, Talent, Learning and Culture and took on additional responsibility as Global Head, HR, Corporate, Commercial and Institutional Banking in May 2018.
Career: Prior to joining the Group, Tanuj built her career at HSBC. She has worked across multiple HR disciplines in many of our footprint markets (Hong Kong, Singapore, Dubai, India and London).
External appointments: None
Tracey McDermott, CBE (49) Group Head, Corporate Affairs, Brand & Marketing, Conduct, Financial Crime and Compliance
Appointed: Tracey was appointed Group Head of Corporate, Public and Regulatory Affairs in March 2017; Brand & Marketing was added to her portfolio in December 2017. In March 2018, she assumed her additional role of Group Head, Compliance which expanded to include Conduct and Financial Crime in January 2019.
Career: Prior to joining the bank, Tracey served as Acting Chief Executive of the Financial Conduct Authority (FCA) from September 2015 to June 2016. She joined the then
Financial Services Authority (FSA) in 2001 where she held a number of senior roles, including: Director of Supervision and Authorisations, and Director of Enforcement and Financial Crime. Tracey also served as a Board Member of the FSA from April 2013, as a member of the Financial Policy Committee of the Bank of England, and as Non-Executive Director of the Prudential Regulatory Authority (PRA) from September 2015 to June 2016. Prior to joining the FCA, Tracey worked as a lawyer in private
practice, having spent time in law firms in the UK, USA and Brussels. She received a CBE in 2016.
External appointments: Tracey is a board member of UK Finance; a member of the International Regulatory Strategy Group Council; and an Honorary Professor at the Centre for Commercial Law Studies, Queen Mary University of London.

DIRECTORS’ REPORT Management Team
Standard Chartered Annual Report 201862
Management Team continued
Pam Walkden was Group Head, HR during the year before stepping down from the Management Team in November 2018, and retiring from the Group on 31 December 2018. Tanuj Kapilashrami was appointed Group Head, HR in November 2018.
Doris Honold stepped down as Group Chief Operating Officer on 9 January 2019 and from the Management Team on 15 January 2019.
Mark Smith (57)Group Chief Risk Officer
Appointed: Mark was appointed Group Chief Risk Officer and a director of Standard Chartered Bank in January 2016. Mark is responsible for managing Credit, Market and Operational Risk across the Group and ensuring the broader risk framework is effective.
Career: Before joining Standard Chartered, Mark was the chief risk officer Europe, Middle East and Africa and global head, Wholesale Credit and Traded Risk for HSBC. He had a long and successful career at HSBC, having joined Midland Bank as a graduate trainee prior to its
acquisition by HSBC. Other roles at HSBC included chief operating officer, Global Corporate & Institutional Banking. He has worked in London and Hong Kong.
External appointments: None
David Whiteing (50)Group Chief Operating Officer
Appointed: David joined Standard Chartered as Group Chief Operating Officer in September 2018.
Career: David joined Standard Chartered from the Commonwealth Bank of Australia (CBA) where he was the Group CIO, responsible for all of the technology and operations teams of the Group and for delivering the Group’s strategic pillar of ‘world leading application of operations and
technology.’ He is a highly experienced executive with a track record of delivering cultural transformation in Australia and overseas. Prior to joining the CBA Group in 2013, David was Vice President of Enterprise Systems at BP in the UK. He is a former Accenture technology and operations partner with extensive transformation experience.
External appointments: David is an independent director of Silicon Quantum Computing Ltd.

63
Risk review
and Cap
ital reviewS
trategic repo
rtS
upp
lementary info
rmatio
nFinancial statem
entsD
IRE
CT
OR
S’ R
EP
OR
T
Corporate governance
Board decisions and responsibilities, and delegation of authoritiesThe Board discharges some of its responsibilities directly and delegates certain other responsibilities to its committees to assist it in carrying out its function of ensuring independent oversight and stewardship. Details of the main topics discussed by the committees in 2018 can be found in this report. The Board also delegates authority for the operational management of the Group’s business to the Group Chief Executive for further delegation by him in respect of matters that are necessary for the effective day-to-day running and management of the business. The Board holds the Group Chief Executive accountable in discharging his delegated responsibilities.
A clear schedule of matters reserved for the Board and terms of reference for each of its committees are reviewed annually against industry best practice and corporate governance provisions and guidance, including the Prudential Regulation Authority (PRA) Supervisory Statement on Board Responsibilities. With the exception of the Governance and Nomination Committee, which in line with best practice is chaired by the Group Chairman, and the Board Financial Crime Risk Committee, which includes three external adviser members, all of the Board committees comprise solely independent non-executive directors who bring a diversity of skills, experience and knowledge to the discussion, and play an important role in supporting the Board.
The full schedule of matters reserved for the Board, along with written terms of reference for the Board’s committees can be viewed at sc.com/termsofreference
Code compliance
The UK Corporate Governance Code 2016 (the Code) and the Hong Kong Corporate Governance Code contained in Appendix 14 of the Hong Kong Listing Rules (HK Code) are the standards against which we measured ourselves in 2018. While the UK Corporate Governance Code 2018 (2018 Code) does not come into effect until 1 January 2019, where practical to do so we have applied some provisions of the 2018 Code early.
The directors are pleased to confirm that Standard Chartered PLC (the Company) complied with all of the provisions set out in the Code and the HK Code for the year under review.
Throughout this corporate governance report we have provided an insight of how governance operates within the Group and our application of the principles set out in the Code and HK Code.
The Group confirms that it has adopted a code of conduct regarding directors’ securities transactions on terms no less exacting than required by Appendix 10 of the Hong Kong Listing Rules. Having made specific enquiry of all directors, the Group confirms that all directors have complied with the required standards of the adopted code of conduct.
Copies of the Code and the Hong Kong Corporate Governance Code can be found at frc.org.uk and hkex.com.hk respectively
Management TeamThe Management Team comprises the Group Chief Executive and the Group Chief Financial Officer; four regional CEOs; client segment CEOs; and our global function heads. It has responsibility for executing the strategy. Details of the Group’s Management Team can be found on pages 60 to 62.
Audit CommitteeOversight and review of financial, audit, internal financial control and non-financial crime issues.
Read more on page 72
Board Risk CommitteeOversight and review of principal risks including credit, traded, capital and liquidity, operational, country, reputational, compliance, conduct, information and cyber security and financial crime risks.
Read more on page 77
Standard Chartered PLCThe Board is collectively responsible for the long-term success of the Group and for ensuring leadership within a framework of effective controls. The Board sets the strategic direction of the Group, approves the strategy and takes the appropriate action to ensure that the Group is suitably resourced to achieve its strategic aspirations. The Board considers the impact of its decisions and its responsibilities to all of the Group’s stakeholders, including the Group’s employees, shareholders, regulators, clients, suppliers, the environment and the communities in which it operates.
Board and committee structure
Group Chief ExecutiveResponsible for the management of all aspects of the Group’s businesses, developing the strategy in conjunction with the Chairman and the Board, and leading its implementation.
Brand, Values and Conduct CommitteeOversight of the Group’s brand, culture, values, conduct, government and regulatory relations, sustainability priorities and processes for managing reputational risk.
Read more on page 83
Governance and Nomination CommitteeOversight and review of the Board and executive succession, overall Board effectiveness and corporate governance issues.
Read more on page 85
Board Financial Crime Risk CommitteeOversight and review of all financial crime compliance matters.
Read more on page 89
Remuneration CommitteeOversight and review of remuneration, share plans and other incentives.
Read more on page 91
The full schedule of matters reserved for the Board’s decision, along with written terms of reference for the Board’s committees, can be viewed at sc.com/termsofreference

DIRECTORS’ REPORT Corporate governance
Standard Chartered Annual Report 201864
Board composition, roles and attendance in 2018
AGM
Attendance
ResponsibilitiesScheduled
ChairmanJ Viñals
8/8 Responsible for leading the Board, the development of the Group’s culture and ensuring its effectiveness in all aspects of its role. Promotes high standards of integrity and governance across the Group and ensures effective communication between the Board, management, shareholders and wider stakeholders.
Deputy ChairmanN Kheraj
8/8 Provides support and guidance to the Chairman as required and, in coordination with the Chairman, acts as an ambassador for the Board and Group in its relationships with governments, regulators, staff, and clients. Deputises for the Chairman at Board, general shareholder, or other meetings when the Chairman is unable to attend.
Senior Independent Director*C M Hodgson 8/8
Provides a sounding board for the Chairman and discusses concerns that are unable to be resolved through the normal channels or where such contact would be inappropriate with shareholders and other stakeholders. Chairs the Governance and Nomination Committee when considering succession of the Chairman.
Executive directors
Group Chief ExecutiveW T Winters
8/8 Responsible for the management of all aspects of the Group’s businesses, developing the strategy in conjunction with the Chairman and the Board and leading its implementation.
Group Chief Financial OfficerA N Halford
8/8 Responsible for Finance, Corporate Treasury, Group Corporate Development, Group Investor Relations, Property and Supply Chain Management functions.
Independent non-executive directors
O P Bhatt 8/8 Independent non-executive director: Provide an independent perspective, constructive challenge, and monitor the performance and delivery of the strategy within the risk appetite and controls set by the Board.
Dr L Cheung 8/8
D P Conner 8/8
Dr B E Grote 8/8
Dr Han Seung-soo, KBE 7/81
G Huey Evans, OBE 8/8
Dr N Okonjo-Iweala 8/8
J M Whitbread 8/8
* As Senior Independent Director, Christine Hodgson is available to shareholders if they have concerns that cannot be resolved or for which the normal channels would be inappropriate. She may be contacted via the Group Company Secretary at 1 Basinghall Avenue, London EC2V 5DD
1 Dr Han Seung-soo, KBE was unable to attend the Board meeting held on 13 December 2018 due to a prior arranged business commitment
In 2018, the Group held one general meeting, our Annual General Meeting, on 9 May 2018, which was attended by all of the directors. Ngozi Okonjo-Iweala was proposed for election and all other directors were proposed for annual re-election. Ngozi Okonjo-Iweala and all other directors were successfully elected/re-elected.
The roles of the Chairman and Group Chief Executive are quite distinct from one another and are clearly defined in detailed role descriptions which can be viewed at sc.com/roledescriptions
Independence of directorsThe Chairman is committed to ensuring that the Board comprises a majority of independent non-executive directors. In determining whether a non-executive director is independent, the Board considers each individual against the criteria set out in the UK Corporate Governance Code and the Hong Kong Listing Rules, and also considers their contribution and conduct at Board meetings, including how they demonstrate objective judgement and independent thinking.
The Board considers all of the non- executive directors to be independent of Standard Chartered and has concluded that there are no relationships or circumstances likely to impair any individual non-executive director’s judgement.
It was announced on 18 February 2019 that Dr Han Seung-soo would retire from the Board on 23 February 2019 having served as an independent non-executive director for nine years. It was also announced that Om Bhatt would step down from the Board, after six years as an independent non-executive director, with effect from 23 February 2019.
All of the directors will stand for re-election at the 2019 Annual General Meeting (AGM) with the support of the Board.
On 18 February 2019, it was also announced that Carlson Tong would join the Board as an independent non-executive director with effect from 21 February 2019. Carlson will stand for election at the 2019 AGM.
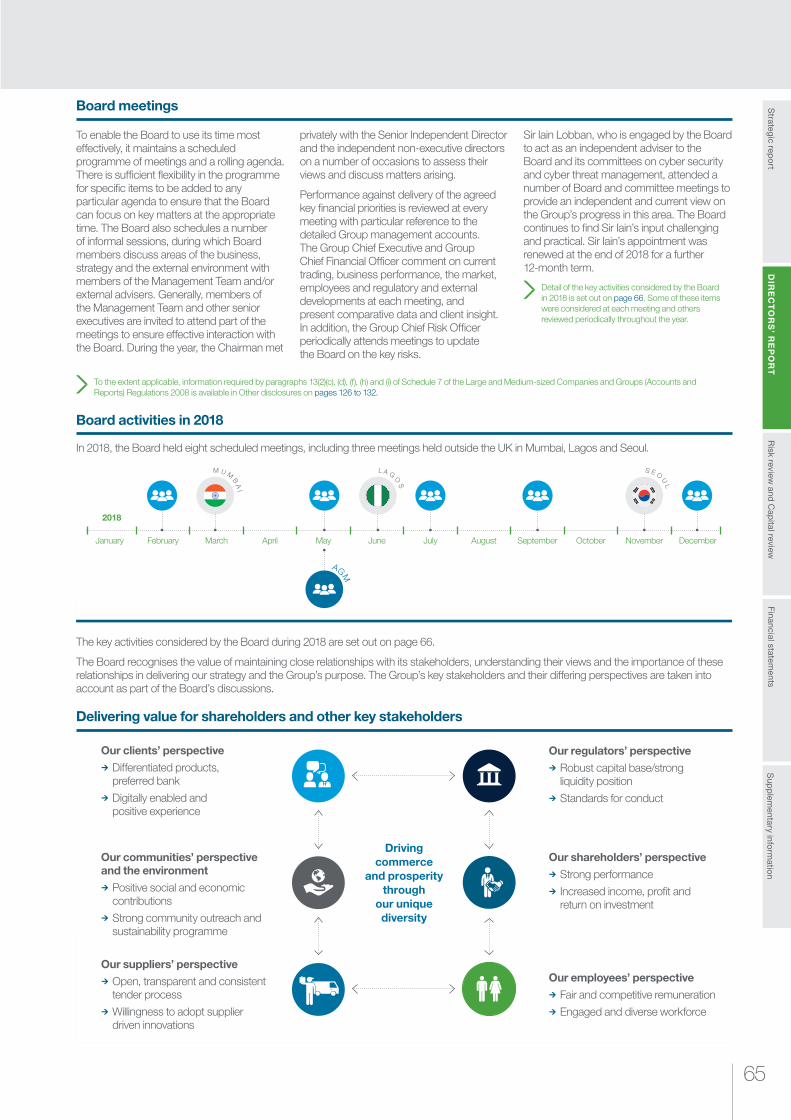
65
Risk review
and Cap
ital reviewS
trategic repo
rtS
upp
lementary info
rmatio
nFinancial statem
entsD
IRE
CT
OR
S’ R
EP
OR
T
Board meetings
To enable the Board to use its time most effectively, it maintains a scheduled programme of meetings and a rolling agenda. There is sufficient flexibility in the programme for specific items to be added to any particular agenda to ensure that the Board can focus on key matters at the appropriate time. The Board also schedules a number of informal sessions, during which Board members discuss areas of the business, strategy and the external environment with members of the Management Team and/or external advisers. Generally, members of the Management Team and other senior executives are invited to attend part of the meetings to ensure effective interaction with the Board. During the year, the Chairman met
privately with the Senior Independent Director and the independent non-executive directors on a number of occasions to assess their views and discuss matters arising.
Performance against delivery of the agreed key financial priorities is reviewed at every meeting with particular reference to the detailed Group management accounts. The Group Chief Executive and Group Chief Financial Officer comment on current trading, business performance, the market, employees and regulatory and external developments at each meeting, and present comparative data and client insight. In addition, the Group Chief Risk Officer periodically attends meetings to update the Board on the key risks.
Sir Iain Lobban, who is engaged by the Board to act as an independent adviser to the Board and its committees on cyber security and cyber threat management, attended a number of Board and committee meetings to provide an independent and current view on the Group’s progress in this area. The Board continues to find Sir Iain’s input challenging and practical. Sir Iain’s appointment was renewed at the end of 2018 for a further 12-month term.
Detail of the key activities considered by the Board in 2018 is set out on page 66. Some of these items were considered at each meeting and others reviewed periodically throughout the year.
To the extent applicable, information required by paragraphs 13(2)(c), (d), (f), (h) and (i) of Schedule 7 of the Large and Medium-sized Companies and Groups (Accounts and Reports) Regulations 2008 is available in Other disclosures on pages 126 to 132.
The key activities considered by the Board during 2018 are set out on page 66.
The Board recognises the value of maintaining close relationships with its stakeholders, understanding their views and the importance of these relationships in delivering our strategy and the Group’s purpose. The Group’s key stakeholders and their differing perspectives are taken into account as part of the Board’s discussions.
Delivering value for shareholders and other key stakeholders
Our regulators’ perspective ¼ Robust capital base/strong liquidity position
¼ Standards for conduct
Our shareholders’ perspective ¼ Strong performance ¼ Increased income, profit and return on investment
Our communities’ perspective and the environment
¼ Positive social and economic contributions
¼ Strong community outreach and sustainability programme
Our employees’ perspective ¼ Fair and competitive remuneration ¼ Engaged and diverse workforce
Our clients’ perspective ¼ Differentiated products, preferred bank
¼ Digitally enabled and positive experience
Driving commerce
and prosperity through
our unique diversity
In 2018, the Board held eight scheduled meetings, including three meetings held outside the UK in Mumbai, Lagos and Seoul.
January February March April May June July August September October November December
2018
M U M
BA
I
L A G
OS
S E O
UL
AGM
Board activities in 2018
Our suppliers’ perspective ¼ Open, transparent and consistent tender process
¼ Willingness to adopt supplier driven innovations

DIRECTORS’ REPORT Corporate governance
Standard Chartered Annual Report 201866
Key focus of the Board in 2018
Group strategy ¼ Reviewed and approved the five-year corporate plan, as a basis for preparation of the 2019 budget, receiving confirmation from the Group Chief Risk Officer that the plan is aligned to the Enterprise Risk Management Framework and the Group Risk Appetite Statement
¼ Discussed progress of the costs and investment initiatives and programmes
¼ Reviewed and scrutinised the strategic and operational performance of the business across client segments, product groups and regions, which included details of their priorities, progress and opportunities
¼ Monitored and assessed the strength of the Group’s capital and liquidity positions
¼ Received regular corporate development updates
¼ Monitored the delivery of the IT and Operations strategy for the Group
¼ Approved the establishment of a Global Business Services Centre in Poland
¼ Approved the sale of the Group’s Principal Finance businesses
¼ Received an update and progress on:– GCNA and Korea– the priorities for the ASEAN & South Asia
region, including an update on the India and Indonesia strategy
– executing the strategy in Africa & Middle East and Nigeria
– the execution of the Corporate Plan in Europe and Americas
– the delivery of the Group’s Retail Banking and Private Banking strategy
– the Corporate & Institutional Banking and Commercial Banking business
– the Group’s technology strategy ¼ Approved the renewal of the Liverpool Football Club shirt sponsorship
¼ Considered the value of the Group’s network
Risk management ¼ Received regular risk reports from the Group Chief Risk Officer
¼ Considered and endorsed the Group’s information and cyber security transformation and remediation programme, received updates on progress and approved the investment plan and three-year roadmap to address the key cyber security risks
¼ Approved the renewal of the Group’s insurance policies for 2018/19 including the purchase of cyber insurance
¼ Members of the Board took part in a cyber crisis simulation (further details below)
Budget and performance oversight ¼ Approved the Group’s 2019 budget ¼ Monitored the Group’s financial performance ¼ Noted that management had made presentations to the Bank of England in respect of the 2018 stress test submission
¼ Approved the full year and half year results and considered the key internal and external factors in determining payment of a final and interim dividend
¼ Received updates on the Group’s investment portfolio for 2018
¼ Approved contributions into the Standard Chartered Bank UK Pension Fund
¼ Reviewed People, Culture and Values ¼ Discussed the launch of the Group’s new Valued Behaviours which support the Group’s Purpose
¼ Reported on the launch of the Group’s Global Diversity & Inclusion Council
¼ Approved the Group’s Modern Slavery Statement
¼ Reviewed and endorsed the approach to advancing the Group’s sustainability strategy, including its approach on climate change and sustainable finance and embedding the Sustainability Aspirations
¼ Received an update on succession planning for the Management Team
¼ Noted the development of the people strategy and the engagement of our people
¼ Discussed productivity measurements ¼ Received initial impressions on operations from the new Chief Operating Officer
External environment ¼ Received internal and external briefings, input and discussions across a range of topics including: – market perceptions on the Group– exponential thinking discussion– future of banking discussion – insight and training on emerging
technologies– IBOR transition
Governance ¼ Approved the separation of the roles of Deputy Chairman and Senior Independent Director and appointed Christine Hodgson as Senior Independent Director
¼ Noted progress against the 2017/18 Board Effectiveness action plan and discussed the observations and themes arising from the 2018 Board and committee effectiveness review and approved the 2019 Action Plan
¼ Received reports at each meeting from the Board Committee Chairs on key areas of the focus for the committee
¼ Received an update on the impact of the UK Corporate Governance Code 2018 and approved the mechanisms to ensure Board engagement with the workforce
¼ Reviewed the Group’s corporate entity structure and discussed re-organisations for proposed hub entity structure
¼ Approved revisions to the Board Diversity Policy
¼ Approved the re-appointment of Sir Iain Lobban as an independent external adviser on cyber
Shareholder and stakeholder engagement
¼ Engaged with investors, held meetings with brokers, discussed the views of institutional shareholders and responded to retail shareholders’ questions at the Annual General Meeting
¼ Received an update on the Group’s brand and corporate narrative
¼ As part of their overseas travel, some Board members participated in community engagement activities and projects
¼ Engaged with the PRA on the findings of the 2018 Periodic Summary Meeting Letter
¼ Engaged with our key regulators, including the PRA and FCA, on the structure and governance of the Group’s proposed legal entity changes
¼ Focused on the client proposition and how to ensure clients are at the heart of decisions
¼ Met with clients across our markets both collectively and individually
¼ Engaged with regulators in our markets ¼ Discussed periodic updates from Investor Relations which included receiving updates on the share price, performance metrics and investor and analyst sentiment
¼ Noted regulatory developments, throughout the year including in respect to the ongoing investigations conducted by certain US authorities
For a detailed overview of Our strategy see pages 16 to 19
Information and cyber security – crisis simulation
In November 2018, members of the Board took part in a crisis exercise to simulate scenarios in a real life information and cyber security attack.
The purpose of the Board’s involvement was to enhance its understanding of the processes, the expectations and demands
on the Board and to rehearse the actions required during a severe, but plausible hypothetical incident.
Information and cyber security is one of the Group’s Principal Risk Types and is a crucial area of focus for the Board and the Board Risk Committee. Sir Iain Lobban has been
active in advising the Board and the Board Risk Committee as well as providing input on the cyber scenarios used for crisis exercises.
More information on the issues considered by the Board Risk Committee can be found on page 77.

67
Seoul, South Korea
The Board met with some major technology client companies and took the opportunity to engage directly with local employees on a range of topics.
Mumbai, India
Directors discussed some of the key tech projects which are improving our client experience and received a demonstration of our real-time on-boarding and live account opening solution.
Lagos, Nigeria
As part of the Board’s visit to Nigeria, directors took part in an interactive session with participants of the Goal programme, which aims to empower girls with confidence, knowledge and skills they need to fulfil their economic and leadership potential.
STAKEHOLDER ENGAGEMENT
Engaging in our markets
Our independent non-executive directors have full, transparent and wide-ranging access to management and information across our markets, which assists in maintaining a high level of governance across the Group.
In 2018, our independent non-executive directors made a significant number of visits to our markets both collectively as a Board and independently. These trips continue to provide the independent non-executive directors with a significant on-the-ground understanding of the markets, the opportunities and the risks we face, and to test the Group’s strategy. In addition, the overseas Board meetings and adjoining organised programmes enable the Board to meet with the Group’s senior management, and key internal and external stakeholder groups throughout the network, including clients, employees, regulators, shareholders and others.
In 2018, the Chairman, our independent non-executive directors and the external adviser members to the Board Financial Crime Risk Committee made 85 visits across our markets, which included three overseas Board meeting programmes, held in Mumbai, Lagos and Seoul.
Europe & Americas Visits
Dublin, Ireland 2
Washington DC, US 2
New York, US 6
San Francisco, US 1
Frankfurt, Germany 1
St Helier, Jersey 1
ASEAN & South Asia Visits
Kuala Lumpur, Malaysia 3
Mumbai, India 10
Chittagong, Bangladesh 1
Dhaka, Bangladesh 4
Singapore 6
Chennai, India 2
Bangalore, India 1
Bangkok, Thailand 1
Africa & Middle East Visits
Lagos, Nigeria 14
Abidjan, Cote d’Ivoire 4
Accra, Ghana 1
Zanzibar, Tanzania 1
Doha, Qatar 1
Karachi, Pakistan 2
Greater China & North Asia Visits
Beijing, China 1
Hong Kong 4
Seoul, South Korea 10
Shenzhen, China 1
Hangzhou, China 1
Suzhou, China 1
Taipei, Taiwan 3

DIRECTORS’ REPORT Corporate governance
Standard Chartered Annual Report 201868
External directorships and other business interestsBoard members hold external directorships and other outside business interests. We recognise the benefits that greater boardroom exposure provides our directors. However, we closely monitor the number of directorships our directors take on to satisfy ourselves that any appointment will not adversely impact their role at Standard Chartered and that all of our Board members are compliant with the PRA requirements and shareholder advisory groups’ guidance on ‘over-boarding’. These requirements impose a limit on the number of directorships both executive and independent non-executive directors are permitted to hold.
Details of the directors’ external directorships can be found in their biographies on pages 57 to 59. Before committing to an additional appointment, directors confirm the existence of any potential or actual conflicts; that the role will not breach their limit as set out by the PRA; and provide the necessary assurance that the appointment will not adversely impact their ability to continue to fulfil their role as a director of the Group. The Board’s executive directors are permitted to hold only one non-executive directorship. Of our executive directors, Bill Winters is a non-
executive director of Novartis International AG, listed on SIX Swiss Exchange and Andy Halford is the senior independent director at Marks and Spencer Group plc, listed on the FTSE 100.
Time commitment Our independent non-executive directors commit sufficient time in discharging their responsibilities. In general, we estimate that each independent non-executive director spent approximately 35 to 50 days on Board-related duties, and considerably more for those who chair or are members of multiple committees.
Ongoing development plansTraining and development of our directors does not end following their induction; ongoing and continual development of our Board directors is crucial to ensure that they remain highly engaged, effective and well-informed. In addition, mandatory training and ongoing engagement plans are a key element of director’s fit and proper assessment as required under the Senior Managers Regime. During the year, all directors received a combination of mandatory training, briefings, presentations, guest speakers and papers on a range of
subjects to ensure that each director’s contribution to the Board remains relevant, that they are updated of their duties, responsibilities and obligations as directors and are well informed of changes to the regulatory environment. In addition, this year the Board took the opportunity to consider some of the broader issues impacting the industry and the business across its markets over the medium to long term.
Director’s ongoing training took the form of: refresher training on their statutory duties, responsibilities and obligations; a review of the changes to corporate governance in 2018, with a particular focus on the introduction of the new UK Corporate Governance Code 2018; managing conflicts of interest; briefings on the market perceptions of the Group; a discussion on the future of banking; training and insight into emerging technologies; IBOR transition training; and a presentation from the Singularity University. The table below details who received these briefings.
Support is provided to the directors by the Group Company Secretary and the Group Corporate Secretariat team. Directors also have access to independent professional advice at the Group’s expense where they judge it necessary to discharge their responsibilities.
Directors’ induction and ongoing development in 2018
Induction training1
Directors’ duties and regulatory
updates
Visits to our markets and
meetings with local
management
Market perceptions of the Group2
Future of banking
discussion
Exponential thinking
discussion2
INED IBOR transition
training2
Insight and training on emerging
technologies2
J Viñals N/A
W T Winters N/A N/A
A N Halford N/A N/A
O P Bhatt N/A
Dr L Cheung N/A
D P Conner N/A
Dr B E Grote N/A
Dr Han Seung-soo, KBE N/A
C M Hodgson N/A
G Huey Evans, OBE N/A
N Kheraj N/A
Dr N Okonjo-Iweala
J M Whitbread N/A
1 Applicable to directors who received induction training during 2018
2 These briefings took the form of a combination of presentations and discussions
Director attended the session
Director did not attend the session but received the accompanying material
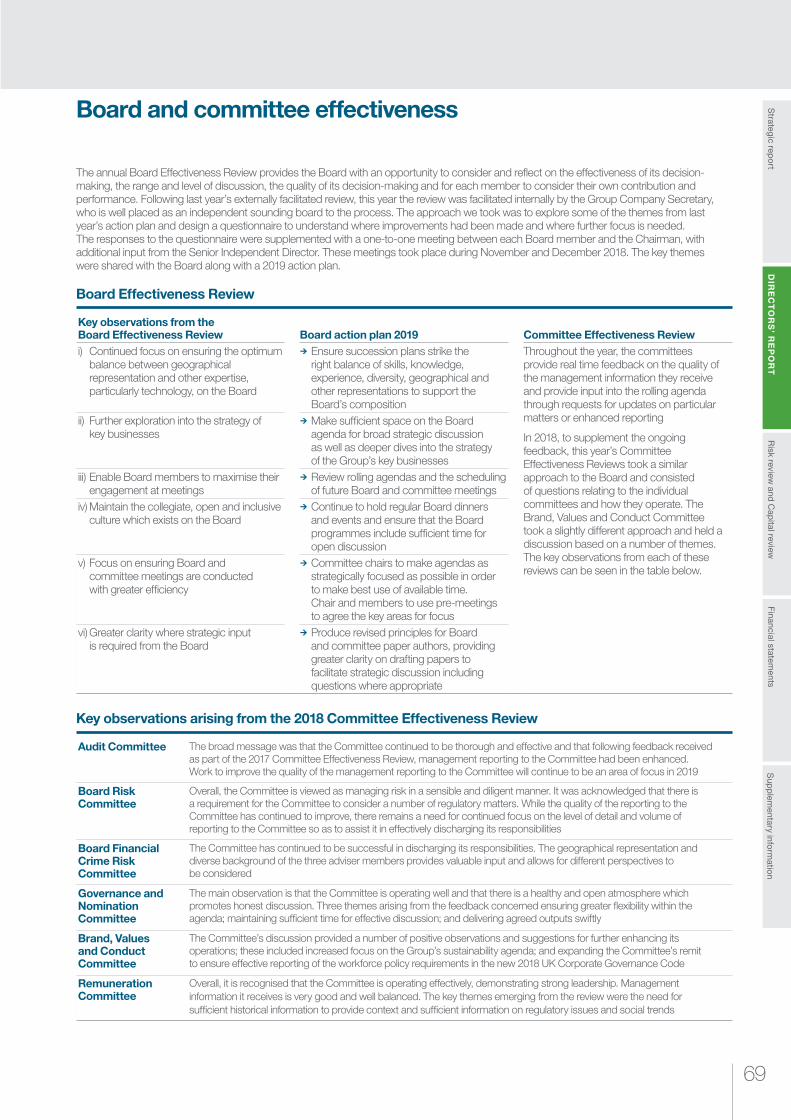
69
Risk review
and Cap
ital reviewS
trategic repo
rtS
upp
lementary info
rmatio
nFinancial statem
entsD
IRE
CT
OR
S’ R
EP
OR
T
Board and committee effectiveness
The annual Board Effectiveness Review provides the Board with an opportunity to consider and reflect on the effectiveness of its decision-making, the range and level of discussion, the quality of its decision-making and for each member to consider their own contribution and performance. Following last year’s externally facilitated review, this year the review was facilitated internally by the Group Company Secretary, who is well placed as an independent sounding board to the process. The approach we took was to explore some of the themes from last year’s action plan and design a questionnaire to understand where improvements had been made and where further focus is needed. The responses to the questionnaire were supplemented with a one-to-one meeting between each Board member and the Chairman, with additional input from the Senior Independent Director. These meetings took place during November and December 2018. The key themes were shared with the Board along with a 2019 action plan.
Board Effectiveness Review
Key observations from the Board Effectiveness Review Board action plan 2019 Committee Effectiveness Reviewi) Continued focus on ensuring the optimum
balance between geographical representation and other expertise, particularly technology, on the Board
¼ Ensure succession plans strike the right balance of skills, knowledge, experience, diversity, geographical and other representations to support the Board’s composition
Throughout the year, the committees provide real time feedback on the quality of the management information they receive and provide input into the rolling agenda through requests for updates on particular matters or enhanced reporting
In 2018, to supplement the ongoing feedback, this year’s Committee Effectiveness Reviews took a similar approach to the Board and consisted of questions relating to the individual committees and how they operate. The Brand, Values and Conduct Committee took a slightly different approach and held a discussion based on a number of themes. The key observations from each of these reviews can be seen in the table below.
ii) Further exploration into the strategy of key businesses
¼ Make sufficient space on the Board agenda for broad strategic discussion as well as deeper dives into the strategy of the Group’s key businesses
iii) Enable Board members to maximise their engagement at meetings
¼ Review rolling agendas and the scheduling of future Board and committee meetings
iv) Maintain the collegiate, open and inclusive culture which exists on the Board
¼ Continue to hold regular Board dinners and events and ensure that the Board programmes include sufficient time for open discussion
v) Focus on ensuring Board and committee meetings are conducted with greater efficiency
¼ Committee chairs to make agendas as strategically focused as possible in order to make best use of available time. Chair and members to use pre-meetings to agree the key areas for focus
vi) Greater clarity where strategic input is required from the Board
¼ Produce revised principles for Board and committee paper authors, providing greater clarity on drafting papers to facilitate strategic discussion including questions where appropriate
Key observations arising from the 2018 Committee Effectiveness Review
Audit Committee The broad message was that the Committee continued to be thorough and effective and that following feedback received as part of the 2017 Committee Effectiveness Review, management reporting to the Committee had been enhanced. Work to improve the quality of the management reporting to the Committee will continue to be an area of focus in 2019
Board Risk Committee
Overall, the Committee is viewed as managing risk in a sensible and diligent manner. It was acknowledged that there is a requirement for the Committee to consider a number of regulatory matters. While the quality of the reporting to the Committee has continued to improve, there remains a need for continued focus on the level of detail and volume of reporting to the Committee so as to assist it in effectively discharging its responsibilities
Board Financial Crime Risk Committee
The Committee has continued to be successful in discharging its responsibilities. The geographical representation and diverse background of the three adviser members provides valuable input and allows for different perspectives to be considered
Governance and Nomination Committee
The main observation is that the Committee is operating well and that there is a healthy and open atmosphere which promotes honest discussion. Three themes arising from the feedback concerned ensuring greater flexibility within the agenda; maintaining sufficient time for effective discussion; and delivering agreed outputs swiftly
Brand, Values and Conduct Committee
The Committee’s discussion provided a number of positive observations and suggestions for further enhancing its operations; these included increased focus on the Group’s sustainability agenda; and expanding the Committee’s remit to ensure effective reporting of the workforce policy requirements in the new 2018 UK Corporate Governance Code
Remuneration Committee
Overall, it is recognised that the Committee is operating effectively, demonstrating strong leadership. Management information it receives is very good and well balanced. The key themes emerging from the review were the need for sufficient historical information to provide context and sufficient information on regulatory issues and social trends

DIRECTORS’ REPORT Corporate governance
Standard Chartered Annual Report 201870
Directors’ performance During 2018, José Viñals met with each of the directors to evaluate their individual performance. The performance reviews are used as the basis for recommending the re-election of directors by shareholders and to assist the Chairman in assessing whether each director continues to contribute effectively and demonstrate their commitment to the role, including time commitment for Board and committee meetings and other duties.
For each of the independent non-executive directors, the discussion between the independent non-executive directors and the Chairman included consideration of:
¼ Assessment against the core competencies
¼ Their time commitment, including (where relevant) the potential impact of any outside interests
¼ The Board’s composition, taking into account the combination of skills, experience and knowledge and when each independent non-executive director envisaged stepping down from the Board
¼ The current and future committee membership and structure
Chairman’s performance The Senior Independent Director met with each of the independent non-executive directors separately, to seek their views on the Chairman’s performance. These meetings took place before the independent non-executive directors met collectively at a private meeting without the Chairman present, to evaluate his performance. The views of the executive directors were taken into account as part of this evaluation. The feedback was collated and given to José Viñals.
Engagement with shareholders
Our approachWe aim to deliver robust returns and long-term sustainable value for our shareholders. Trusted and open relationships with our investors are important to us and we believe strengthened by ensuring we consistently and openly seek feedback.
The Chairman and other Board directors maintain direct contact with investors and advisory voting bodies and receive regular updates from the Investor Relations team including reports on market and investor sentiment.
During the year, we maintained a comprehensive programme of engagement with investors and other key stakeholders, including investor advisory bodies and credit rating agencies, and provided updates on progress made to secure our foundations and the steps being taken to reposition the Group for improved returns.
José Viñals and other independent non-executive directors spent a time engaging with shareholders including at the AGM and the Chairman’s annual stewardship and strategy forum. In addition, Christine Hodgson, Chair of the Remuneration Committee, continued to discuss with and collect feedback from shareholders on remuneration matters.
Bill Winters and Andy Halford are the primary spokespeople for the Group. Throughout the year they engaged extensively with existing shareholders and potential new investors during individual or group meetings and on either roadshows or at investor conferences. In addition, each member of the Management Team responsible for a client segment or a geographic region met with investors to promote greater awareness and understanding of the strategy in their respective areas, as well as taking the opportunity to receive investor feedback first hand.
February2017 Full year results
MarchConferences and roadshows
AprilQ1 Interim management statement
MayAGMRetail Banking investor seminar
JuneConferences and roadshows
August2018 Half year results
SeptemberChairman’s stewardship and strategy forum
OctoberQ3 Interim management statement
NovemberConference and roadshows
Engagement with shareholders: what we did in 2018
71
Risk review
and Cap
ital reviewS
trategic repo
rtS
upp
lementary info
rmatio
nFinancial statem
entsD
IRE
CT
OR
S’ R
EP
OR
T
Institutional shareholders programmeThe Group maintains a diverse, high-quality and predominantly institutional shareholder base. The Investor Relations team has primary responsibility for managing day-to-day communications with these shareholders and provides support to the Group Chairman, Group Chief Executive, Group Chief Financial Officer, other Board members and senior management in conducting a comprehensive engagement programme.
All presentation material and webcast transcripts are made available on the Group’s website and can be viewed at sc.com/investors
Debt investor programmeOur Treasury team has primary responsibility for managing the Group’s relationships with debt investors and the three major rating agencies with country chief executives and chief financial officers leading on subsidiary ratings. In 2018, management met with debt investors across Europe, North America and Asia and maintained a regular dialogue with the rating agencies. It is important that the Group, as an active issuer of senior unsecured and non-equity capital maintains regular contact with debt investors to ensure continued appetite for the Group’s credit. The Group’s credit ratings are an important part of the external perception of our financial strength and creditworthiness.
Further information can be viewed at sc.com/investors
Retail shareholders programmeThe Group Company Secretary oversees communication with our retail shareholders. Our AGM held on 9 May 2018 provided an opportunity for the Board to meet with our retail shareholders, listen to their views and respond to their questions. It was well-attended and all of the proposed resolutions were passed with shareholder support for each ranging from 95.35 to 99.95 per cent.
The results of the voting on each resolution at the 2018 AGM can be viewed at sc.com/investors
Board committees
The Board places significant reliance on its committees by delegating a broad range of responsibilities and issues to them. It therefore remains crucial that effective linkages are in place between the committees and the Board as a whole, not least as it is impracticable for all independent non-executive directors to be members of all of the committees. Mechanisms are in place to facilitate these linkages, including ensuring that there are no gaps or unnecessary duplications between the remit of each committee and overlapping membership between Board committees. Alongside interconnected committee membership, the Board receives a written summary of each of the committee’s meetings and verbal updates as necessary.
In addition, the committees strive to ensure that appropriate linkages are in place with the subsidiary board committees. This is achieved in a variety of ways:
i) During the year, the Audit Committee held an annual call hosted by the Audit Committee Chair and attended by the chairs of subsidiary audit committees. The Chief Financial Officer, Group Head of Internal Audit, Group Head, Compliance, lead audit partner of the Group’s statutory auditor and the Group Company Secretary also participated in the call.
ii) In conjunction with the Chair of the Board Financial Crime Risk Committee, the Board Risk Committee Chair hosted its annual call with the chairs of the subsidiary board risk committees, and where the Group’s subsidiaries do not have a risk committee, the chairs of the board audit committees. The Group Chief Risk Officer and Group Company Secretary also participated in the call.
iii) In September 2018, the Group Chairman hosted an annual call with the independent directors of the Group’s banking subsidiaries. The Group Company Secretary also participated in the call.
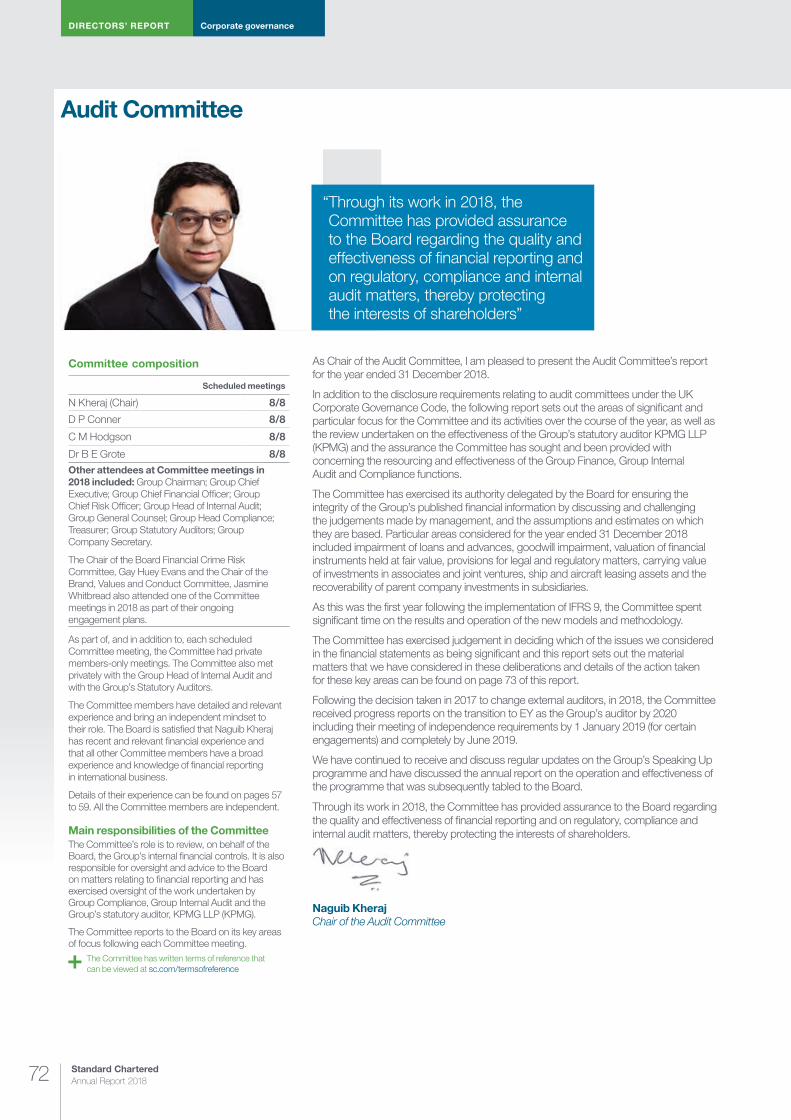
DIRECTORS’ REPORT Corporate governance
Standard Chartered Annual Report 201872
Audit Committee
As Chair of the Audit Committee, I am pleased to present the Audit Committee’s report for the year ended 31 December 2018.
In addition to the disclosure requirements relating to audit committees under the UK Corporate Governance Code, the following report sets out the areas of significant and particular focus for the Committee and its activities over the course of the year, as well as the review undertaken on the effectiveness of the Group’s statutory auditor KPMG LLP (KPMG) and the assurance the Committee has sought and been provided with concerning the resourcing and effectiveness of the Group Finance, Group Internal Audit and Compliance functions.
The Committee has exercised its authority delegated by the Board for ensuring the integrity of the Group’s published financial information by discussing and challenging the judgements made by management, and the assumptions and estimates on which they are based. Particular areas considered for the year ended 31 December 2018 included impairment of loans and advances, goodwill impairment, valuation of financial instruments held at fair value, provisions for legal and regulatory matters, carrying value of investments in associates and joint ventures, ship and aircraft leasing assets and the recoverability of parent company investments in subsidiaries.
As this was the first year following the implementation of IFRS 9, the Committee spent significant time on the results and operation of the new models and methodology.
The Committee has exercised judgement in deciding which of the issues we considered in the financial statements as being significant and this report sets out the material matters that we have considered in these deliberations and details of the action taken for these key areas can be found on page 73 of this report.
Following the decision taken in 2017 to change external auditors, in 2018, the Committee received progress reports on the transition to EY as the Group’s auditor by 2020 including their meeting of independence requirements by 1 January 2019 (for certain engagements) and completely by June 2019.
We have continued to receive and discuss regular updates on the Group’s Speaking Up programme and have discussed the annual report on the operation and effectiveness of the programme that was subsequently tabled to the Board.
Through its work in 2018, the Committee has provided assurance to the Board regarding the quality and effectiveness of financial reporting and on regulatory, compliance and internal audit matters, thereby protecting the interests of shareholders.
Naguib KherajChair of the Audit Committee
Committee composition
Scheduled meetings
N Kheraj (Chair) 8/8
D P Conner 8/8
C M Hodgson 8/8
Dr B E Grote 8/8Other attendees at Committee meetings in 2018 included: Group Chairman; Group Chief Executive; Group Chief Financial Officer; Group Chief Risk Officer; Group Head of Internal Audit; Group General Counsel; Group Head Compliance; Treasurer; Group Statutory Auditors; Group Company Secretary.
The Chair of the Board Financial Crime Risk Committee, Gay Huey Evans and the Chair of the Brand, Values and Conduct Committee, Jasmine Whitbread also attended one of the Committee meetings in 2018 as part of their ongoing engagement plans.
As part of, and in addition to, each scheduled Committee meeting, the Committee had private members-only meetings. The Committee also met privately with the Group Head of Internal Audit and with the Group’s Statutory Auditors.
The Committee members have detailed and relevant experience and bring an independent mindset to their role. The Board is satisfied that Naguib Kheraj has recent and relevant financial experience and that all other Committee members have a broad experience and knowledge of financial reporting in international business.
Details of their experience can be found on pages 57 to 59. All the Committee members are independent.
Main responsibilities of the CommitteeThe Committee’s role is to review, on behalf of the Board, the Group’s internal financial controls. It is also responsible for oversight and advice to the Board on matters relating to financial reporting and has exercised oversight of the work undertaken by Group Compliance, Group Internal Audit and the Group’s statutory auditor, KPMG LLP (KPMG).
The Committee reports to the Board on its key areas of focus following each Committee meeting.
The Committee has written terms of reference that can be viewed at sc.com/termsofreference
“ Through its work in 2018, the Committee has provided assurance to the Board regarding the quality and effectiveness of financial reporting and on regulatory, compliance and internal audit matters, thereby protecting the interests of shareholders”
73
Risk review
and Cap
ital reviewS
trategic repo
rtS
upp
lementary info
rmatio
nFinancial statem
entsD
IRE
CT
OR
S’ R
EP
OR
T
Activities in the year
Financial reporting
¼ Satisfied itself that the Group’s accounting policies and practices are appropriate
¼ Reviewed the clarity and completeness of the disclosures made within the published financial statements
¼ Considered any changes in disclosures arising from best practice in applying the UK Finance Disclosure Code for Financial Reporting Disclosure and the Financial Reporting Council (FRC) publications on aspects of UK reporting
¼ Monitored the integrity of the Group’s published financial statements and formal announcements relating to the Group’s financial performance, reviewing the significant financial judgements and accounting issues
Significant accounting judgements considered during 2018 included:Key area Action taken
Impairment of loans and advances Reviewed and considered, on a quarterly basis, reports detailing the composition and credit quality of the loan book, concentrations of risk and provisioning levels. In respect of high-risk credit grade exposures, the Committee was also briefed on business plans including remedial actions, management assessment of the recoveries and collateral available. This analysis also included a post-implementation review of IFRS 9 and the operation and refinement of models and their impact on reported results
Goodwill impairment Reviewed management’s annual assessment of impairment covering key assumptions (including forecasts, discount rate, significant changes from the previous year), headroom availability and sensitivities to possible changes in key assumptions
Valuation of financial instruments held at fair value
Received reports and updates at each reporting period detailing the key processes undertaken to produce and validate valuations of financial instruments, including any changes in methodology from prior years and significant valuation judgements in respect of Level 3 instruments and the use of non-market-based unobservable inputs
Taxation Reviewed and considered management’s judgements and assumptions with respect to tax exposure risks and ensured adequate disclosure in the financial statements has been made. This included co-ordination of the Group’s effective tax rate, the quantum and basis of recognition of deferred tax assets and the UK bank levy charge for the year
Provisions for legal and regulatory matters
Considered advice presented on the current status of significant legal and regulatory matters, and considered management’s judgements on the level of provisions and the adequacy of disclosure, as set out in Notes 24 and 26 on pages 304 and 305
Carrying value of investments in associates and joint arrangements
Reviewed and considered management’s carrying value assessments on the Group’s investments in PT Bank Permata and China Bohai Bank, covering key assumptions and potential sensitivity to changes
Recoverability of parent company’s investment in subsidiaries
Discussed and received confirmation from management that they had adequately assessed the recoverability of investments in subsidiaries, together with any intercompany indebtedness
The Committee can confirm that the key judgements and significant issues reported are consistent with the disclosures of key estimation uncertainties and critical judgements as set out in Note 1 on page 244
Going concern and viability statements
¼ Reviewed management’s process, assessment and conclusions with respect to the Group’s viability statement, including principal risks and uncertainties and key assumptions (including the potential impact of Brexit). Ensured that the viability statement is consistent with the Group’s Strategic report and other risk disclosures. Further details can be found on page 53
Fair, balanced and understandable
¼ The Committee considered, satisfied itself and recommended to the Board, that the processes and procedures in place ensure that the Annual Report and Accounts, taken as a whole, is fair, balanced and understandable, and provides the information necessary for shareholders to assess the Group’s position and performance, business model and strategy and the business risks it faces. The statement is underpinned by the Committee’s, and the Board’s, belief that all important elements have been disclosed and that the descriptions of the Group’s business as set out in the Strategic report are consistent with those used for financial reporting in the Group’s financial statements
Deeper discussions into specific topics
¼ Tax: Discussed the Group’s tax exposures and deferred tax assets as at 31 March 2018 and emerging taxation issues
¼ Pensions: Received and discussed an update on financial risks relating to pensions including the key judgements and assumptions made in the preparation of the Group’s financial statements
¼ Balance sheet reconciliation and substantiation: Received and discussed an overview of the Group’s financial control framework and sought and gained assurance of management’s focus on the balance sheet reconciliation and substantiation process and the initiatives underway to continuously enhance related controls
¼ Hedge accounting: Received and discussed the control enhancements to the Group’s hedge accounting practices to address KPMG’s 2017 audit observations and the refinement of valuation methodologies to ensure the Group is in line with good market practice
DIRECTORS’ REPORT Corporate governance
Standard Chartered Annual Report 201874
Group statutory auditor
Overseen the work undertaken by KPMG as the Group’s statutory auditor. In particular:
¼ Discussed the risks covered by KPMG’s audit planning, seeking and receiving assurance that these risks have been properly addressed in the audit strategy and plan reviewed by the Committee
¼ Enquired and satisfied itself that KPMG has allocated sufficient resources to address these risks
¼ Sought and received assurance that no undue pressure has been asserted on the level of audit fees to ensure that there is no risk to audit work being conducted effectively and independently
¼ Performed an annual review of the performance and effectiveness of KPMG. Input was received from Committee members, chairs of Group subsidiary audit committees, the Group’s Management Team, country chief executive officers, regional/country chief financial officers, members of the Group Finance management team and country heads of audit. The results of the input were discussed by the Committee. Overall, it was felt that KPMG is considered to be effective, objective and independent in its role as Group statutory auditor
¼ Received overviews from KPMG’s local regional partners from Bangladesh, Korea, Pakistan and Hong Kong which provided insight into the challenges faced in the Group’s markets from a statutory audit perspective and providing the Committee with the local audit partner’s assessment of the Group’s control systems and infrastructure in these markets, the quality of the Group’s management from a control perspective and a benchmark of the Group’s control environment against local and international peers. The overviews also provided insight into local regulatory developments and the Group’s standing with local regulators
¼ The Committee has also met privately with the lead audit engagement partner and also met with the Global Chairman of KPMG and the Senior Partner of KPMG UK to seek assurances on steps being taken by KPMG to strengthen its international audit practices
¼ As Audit Committee Chair, Naguib has met regularly with KPMG during the course of the year
The Company complies with the Statutory Audit services for Large Companies Market Investigation (Mandatory Use of Competitive Tender Process and Audit Committee responsibilities) Order 2014. KPMG has been the Group’s statutory auditor for over 25 years. During 2018, the lead audit engagement partner was rotated, the previous rotation having taken place in 2015. The new lead audit engagement partner has a background of auditing banks and understands the markets in which the Group operates. Following the 2017 Audit tender EY will become the Group’s statutory auditor for the financial year ending 31 December 2020
Audit transition ¼ Received and discussed two updates on the status of the transition to EY as the Group’s auditor by 2020 and to meet independence requirements by 1 January 2019 (for certain engagements) and completely by 1 June 2019
Non-audit services
¼ Responsible for setting, reviewing and monitoring the appropriateness of the provision of non-audit services, applying the Group’s policy on the award of non-audit services to the external auditor, while taking into account the relevant ethical guidance
¼ Approved a revised non-audit services policy and satisfied itself that all the requirements of the non-audit services policy have been met
¼ In 2018, the Group spent $0.6 million on non-audit services provided by KPMG and $7.0 million on audit-related services such as quarterly and half year reviews, and regulatory reporting. Further details on non-audit services provided by KPMG can be found in Note 38 on page 329, and the Group’s approach to non-audit services on page 132.
Internal controls
¼ Discussed reports from Group Internal Audit (GIA) that provide GIA’s view on the system of internal controls across all risk types, business and country functions, including summary highlights of the most significant matters being monitored by GIA and areas of thematic interest that have arisen as part of the audits and warrant the Committee’s attention. The Board Risk Committee, the Board Financial Crime Risk Committee and the Brand, Values and Conduct Committee discuss separate reports from the Group Head of Internal Audit on GIA’s appraisal of controls across key risks subject to each committee’s oversight. Collectively, the reports received by these committees provide assurance that there are effective internal controls within the Group
¼ Discussed KPMG’s observations of Group’s controls arising from KPMG’s audit for the year ended 2017 and management’s responses to the findings together with proposed timelines for addressing the findings. The observations raised by KPMG did not suggest any fundamental concerns over the control framework or procedures
Considered reports requested by the Committee from management in respect of the control environment concerning:
¼ Third-party risk management
¼ Retail Banking credit card and personal loan onboarding process
¼ UK booking model framework and governance
Further details on internal controls can be found on page 129.
Activities in the year continued

75
Risk review
and Cap
ital reviewS
trategic repo
rtS
upp
lementary info
rmatio
nFinancial statem
entsD
IRE
CT
OR
S’ R
EP
OR
T
Group Internal Audit
Received and discussed a supplemental report from GIA providing additional information on significant areas referred to in the GIA report including:
¼ Summaries of the control environment grade from audits over the past 12 months
¼ Management Control Approach (MCA) opinions. Quarterly MCA scorecards enable GIA to provide management with summaries of their areas of responsibility in order to support good risk and control governance, and give recognition where key risks are well understood, controls are regularly reviewed for effectiveness and control weaknesses have been identified and are being rectified. This is separate to the opinion given in the GIA report on the state of the Group’s control environment
¼ Group high-risk issues identified since the last report to the Committee
¼ Open Group high-risk issues and overdue audit issues
¼ Audit reports issued since the last report to the Committee
GIA identified seven themes to be covered in the 2018 audit plan. The objective was to ensure that there was sufficient audit coverage for GIA to provide an opinion on each of these key risk areas. Updates on these themes have been provided through GIA reporting to the Committee throughout the year
The seven themes were:
– Quality of Income and Risk Appetite
– Client Outcomes
– Enterprise Wide Risk Management
– Regulatory Change, Expectations and Compliance
– Information and Cyber Security
– IT Change
– Data Quality Governance
During 2018, for the most significant matters being monitored by GIA, business and/or regional management has been invited to attend meetings to provide updates on the steps being taken to enhance the control environment and address internal audit findings.
¼ Reviewed the resourcing and proposed work plans for GIA and is satisfied that these are appropriate in light of proposed areas of focus, expertise and skills that are required
¼ Assessed the role and effectiveness of the GIA function, including reviewing and monitoring GIA’s progress against its 2018 audit plan and the review and monitoring of post-audit actions. In 2019, an external assessment of GIA will be undertaken in accordance with the Institute of Internal Audit’s Internal Standards for Professional Practice Framework requirements. The Committee considered and approved the proposed coverage and approach for this assessment and will discuss the findings and any recommended action during 2019
¼ Considered and approved GIA’s 2019 audit plan
¼ Received a report from the Head of GIA Quality Assurance
¼ Conducted an annual review of and approved GIA’s charter
¼ The Committee is satisfied with the independence of the GIA function. Throughout the year, Naguib has met regularly with the Group Head of Internal Audit, the Head Quality and Assurance Group Internal Audit and the Group Internal Audit Management Team. The Committee has also met privately with the Group Head of Internal Audit
Group compliance
Regular compliance reporting to the Committee describes the work being undertaken by Compliance and any significant compliance and regulatory risks facing the Group, together with key actions being taken to address or mitigate these risks
In particular, the Committee received updates on:
¼ The Group’s programme to improve compliance effectiveness and efficiency
¼ Supervisory themes and regulatory relationships
¼ The General Data Protection Regulation
¼ The Second Payment Services Directive
¼ The Group’s compliance with the Volcker Rule
¼ The Group’s compliance with MiFID II
¼ Transaction reporting
¼ Reviewed and discussed the functional agenda and annual plan for Group Compliance
As Committee Chair, Naguib has met regularly throughout the year with the Group Head, Compliance
Activities in the year continued
DIRECTORS’ REPORT Corporate governance
Standard Chartered Annual Report 201876
Activities in the year continued
Speaking Up programme
The Group’s Speaking Up programme has been designed to comply with the Group’s UK lead regulators, the PRA and the Financial Conduct Authority Whistleblowing Rules
Our whistleblowing channels, (sc.com/speakingup) are available to anyone – colleagues, contractors, suppliers and members of the public – to raise concerns confidentially and anonymously
Through the Compliance Regulatory Report, the Committee is provided with an update on the number of Speaking Up disclosures received, referral rates and the number of open Speaking Up investigations and the time taken to close such investigations
Over the course of the year, Naguib met regularly with the Group Head, Speaking Up and also met with a number of Speaking Up advocates in several of the Group’s jurisdictions. He was also personally involved in overseeing a number of cases which were referred to him in his capacity as the Board’s Whistleblowing Champion
The Committee discussed an annual report on the operation and effectiveness of the Speaking Up programme that was subsequently tabled to the Board. The report provided the Committee with assurance of the Group’s ongoing compliance with the Whistleblowing Rules
Interaction with regulators
On an annual basis, the Committee meets with the PRA without members of management being present. The purpose of such meetings is to enable a discussion between the Committee and the PRA concerning areas of focus for both the Committee and the PRA. As Committee Chair, Naguib also attends a trilateral meeting with KPMG and the PRA as well as periodic individual meetings with the PRA
Committee effectiveness reviewObservations from the 2018 effectiveness review, undertaken by the Committee, can be found on page 69 of the Directors’ report.
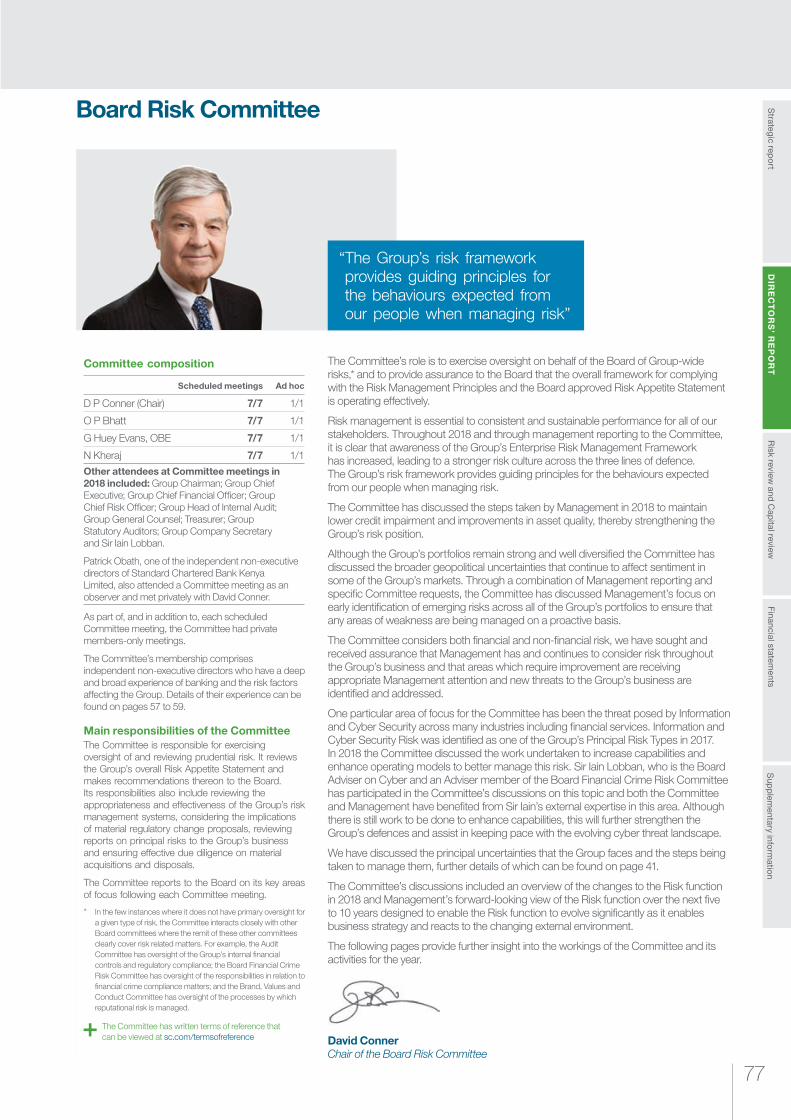
77
Risk review
and Cap
ital reviewS
trategic repo
rtS
upp
lementary info
rmatio
nFinancial statem
entsD
IRE
CT
OR
S’ R
EP
OR
T
Board Risk Committee
The Committee’s role is to exercise oversight on behalf of the Board of Group-wide risks,* and to provide assurance to the Board that the overall framework for complying with the Risk Management Principles and the Board approved Risk Appetite Statement is operating effectively.
Risk management is essential to consistent and sustainable performance for all of our stakeholders. Throughout 2018 and through management reporting to the Committee, it is clear that awareness of the Group’s Enterprise Risk Management Framework has increased, leading to a stronger risk culture across the three lines of defence. The Group’s risk framework provides guiding principles for the behaviours expected from our people when managing risk.
The Committee has discussed the steps taken by Management in 2018 to maintain lower credit impairment and improvements in asset quality, thereby strengthening the Group’s risk position.
Although the Group’s portfolios remain strong and well diversified the Committee has discussed the broader geopolitical uncertainties that continue to affect sentiment in some of the Group’s markets. Through a combination of Management reporting and specific Committee requests, the Committee has discussed Management’s focus on early identification of emerging risks across all of the Group’s portfolios to ensure that any areas of weakness are being managed on a proactive basis.
The Committee considers both financial and non-financial risk, we have sought and received assurance that Management has and continues to consider risk throughout the Group’s business and that areas which require improvement are receiving appropriate Management attention and new threats to the Group’s business are identified and addressed.
One particular area of focus for the Committee has been the threat posed by Information and Cyber Security across many industries including financial services. Information and Cyber Security Risk was identified as one of the Group’s Principal Risk Types in 2017. In 2018 the Committee discussed the work undertaken to increase capabilities and enhance operating models to better manage this risk. Sir Iain Lobban, who is the Board Adviser on Cyber and an Adviser member of the Board Financial Crime Risk Committee has participated in the Committee’s discussions on this topic and both the Committee and Management have benefited from Sir Iain’s external expertise in this area. Although there is still work to be done to enhance capabilities, this will further strengthen the Group’s defences and assist in keeping pace with the evolving cyber threat landscape.
We have discussed the principal uncertainties that the Group faces and the steps being taken to manage them, further details of which can be found on page 41.
The Committee’s discussions included an overview of the changes to the Risk function in 2018 and Management’s forward-looking view of the Risk function over the next five to 10 years designed to enable the Risk function to evolve significantly as it enables business strategy and reacts to the changing external environment.
The following pages provide further insight into the workings of the Committee and its activities for the year.
David ConnerChair of the Board Risk Committee
“ The Group’s risk framework provides guiding principles for the behaviours expected from our people when managing risk”
Committee composition
Scheduled meetings Ad hoc
D P Conner (Chair) 7/7 1/1
O P Bhatt 7/7 1/1
G Huey Evans, OBE 7/7 1/1
N Kheraj 7/7 1/1
Other attendees at Committee meetings in 2018 included: Group Chairman; Group Chief Executive; Group Chief Financial Officer; Group Chief Risk Officer; Group Head of Internal Audit; Group General Counsel; Treasurer; Group Statutory Auditors; Group Company Secretary and Sir Iain Lobban.
Patrick Obath, one of the independent non-executive directors of Standard Chartered Bank Kenya Limited, also attended a Committee meeting as an observer and met privately with David Conner.
As part of, and in addition to, each scheduled Committee meeting, the Committee had private members-only meetings.
The Committee’s membership comprises independent non-executive directors who have a deep and broad experience of banking and the risk factors affecting the Group. Details of their experience can be found on pages 57 to 59.
Main responsibilities of the CommitteeThe Committee is responsible for exercising oversight of and reviewing prudential risk. It reviews the Group’s overall Risk Appetite Statement and makes recommendations thereon to the Board. Its responsibilities also include reviewing the appropriateness and effectiveness of the Group’s risk management systems, considering the implications of material regulatory change proposals, reviewing reports on principal risks to the Group’s business and ensuring effective due diligence on material acquisitions and disposals.
The Committee reports to the Board on its key areas of focus following each Committee meeting.
* In the few instances where it does not have primary oversight for a given type of risk, the Committee interacts closely with other Board committees where the remit of these other committees clearly cover risk related matters. For example, the Audit Committee has oversight of the Group’s internal financial controls and regulatory compliance; the Board Financial Crime Risk Committee has oversight of the responsibilities in relation to financial crime compliance matters; and the Brand, Values and Conduct Committee has oversight of the processes by which reputational risk is managed.
The Committee has written terms of reference that can be viewed at sc.com/termsofreference

DIRECTORS’ REPORT Corporate governance
Standard Chartered Annual Report 201878
Activities in the year
Risk Appetite Closely followed and challenged the formulation of the Group’s Risk Appetite Statement in order to assure that it is effective in setting appropriate boundaries in respect of Principal Risk Types
Considered and recommended to the Board for approval the Group’s Risk Appetite Statement. As part of the 2018 review of Risk Appetite, emphasis was placed on leading indicators and inherent risk metrics to support a more informed risk decision-making process. New metrics were proposed to and approved by the Committee for Capital and Liquidity to capture Interest Rate Risk in the banking book, double leverage and minimum requirement for own funds and eligible liabilities
As Financial Risk Appetite metrics are now considered more mature and well embedded within the Group, greater focus was given to developing metrics for non-financial Principal Risk Types to align with the roll out of the Group’s new Risk Type Frameworks and to take into account increased regulatory scrutiny on operational resilience and heightened Information and Cyber Security risks
New inherent risk metrics were proposed and approved for Information and Cyber Security, Operational Risk (to focus on operational resilience associated with system obsolescence and critical third-party risks), Compliance (to provide insight to material regulatory actions and adverse regulatory relationships) and for Financial Crime (to measure the level of concentration to higher-risk-rated clients)
Monitored actual exposures relative to Risk Appetite limits using regular risk information reports provided by management
Tracked a wide range of risk metrics that are periodically reported to the Committee
Further details of the Group’s Risk Appetite are set out on page 194
Principal Risk Types The Group’s Principal Risk Types are reported on at each scheduled Committee meeting through a Board Risk Information Report which accompanies the Group Chief Risk Officer’s Report. In addition to this reporting, the Committee has had deeper discussions on the following topics:
¼ Information and Cyber Security Risk:
Information and Cyber Security Risk is the potential for loss from a breach of confidentiality, integrity and availability of the Group’s information systems and assets through cyber-attack, insider activity, error or control failure. The Group has continued its increased focus on cyber risk management capabilities. Cyber risk is a continually evolving threat for the financial services industry and high-profile security breaches were a recurring focus in the media and among regulators throughout 2018
The Committee discussed reports from management on the work to improve the Group’s defences and create a stronger control framework. In addition to this reporting, the Committee discussed:
¼ An external assessment by Booz Allen Hamilton of the Group’s Information and Cyber Security controls
¼ The Marsh and TheCityUK Report on Governing Cyber Risk – A Guide for Company Boards
Sir Iain Lobban, who is one of the external adviser members of the Board Financial Crime Risk Committee and an independent adviser to the PLC Board on cyber and security threats, joined the Committee meetings for these discussions together with the Group Chief Information Officer and the Chief Information Security Officer
¼ Operational risk:
The Group defines operational risk as the potential for loss resulting from inadequate or failed internal processes and systems, human error, or from the impact of external events
The Committee:
– Reviewed and recommended to the Board new metrics for Operational Risk to focus on operational resilience associated with system obsolescence and critical third-party risks
– Received updates on Operational Risk Events requiring root cause reviews including trend analysis and themes
¼ Capital Risk and Liquidity Risk:
Capital Risk is the potential for insufficient level or composition of capital to support the Group’s normal activities. Liquidity Risk is the risk that the Group may not have sufficient stable or diverse sources of funding to meet its obligations as they fall due. The Committee receives a Treasurer’s report which covers market developments, liquidity, capital, recovery and resolution planning together with rating agency updates. During the year, the Committee considered and discussed the Group’s capital and liquidity position and the regulatory environment including the approval of the regulatory submissions of the Group’s Internal Capital Adequacy Assessment Process (in order to satisfy itself that the Group’s approach to capital planning is comprehensive, rigorous and consistent with both the current regulatory requirements and the likely anticipated outlook) and the Group’s Individual Liquidity Adequacy Assessment Process (which considers the Group’s liquidity position, its framework and whether sufficient liquidity resources are being maintained to meet liabilities as they fall due)
Further details concerning the Group’s Liquidity Coverage Ratio are set out on page 185 and details concerning Capital are set out on page 218
79
Risk review
and Cap
ital reviewS
trategic repo
rtS
upp
lementary info
rmatio
nFinancial statem
entsD
IRE
CT
OR
S’ R
EP
OR
T
Activities in the year continued
Principal Risk Types continued
¼ Credit Risk
Credit risk is the potential for loss due to the failure of a counterparty to meet its obligations to pay the Group. Credit exposures arise from both the banking and trading books. The Committee:
Received and discussed updates on changes in the Credit Risk portfolio. Such discussions were further enhanced through deep dives
¼ Country Risk
Country Risk is defined as the potential for default or losses due to political or economic events in a country. The Committee:
¼ Discussed Country Cross Border Risk, sovereign and financial institution exposures across the Africa portfolio; specifically, in relation to rising debt levels across the continent
¼ Received an overview of recent enhancements within the Group Country Risk function and key country risk themes across the Group’s four regions
¼ Traded Risk
Traded Risk is the potential for loss resulting from activities undertaken by the Group in financial markets. Under the Risk Management Framework, the introduction of the Traded Risk Framework in 2018 sought to bring together all risk types exhibiting risk features common to Traded Risk. The Committee:
Discussed the new Traded Risk Framework together with an update on market conditions, the Group’s exposures and stress testing, the control environment and Traded Risk Management projects. The discussion also covered the overall XVA (Credit and Funding Valuation Adjustment) Risk profile and hedging thereof
Further details on the Group’s Principal Risk Types can be found on page 40
Stress testing Provided oversight and challenge for stress testing scenario design and test execution and reviewed the outcomes of the expanded 2018 Bank of England Stress Test scenario (Annual Cyclical Scenario) which the Group, along with the other largest UK banks, was required to undertake
Reviewed the results of the 2018 reverse stress rest prior to regulatory submission
Discussed the findings of the Group’s Cyber Security stress test and the resulting management actions
Further details of stress testing are set out on page 195
Internal controls Discussed reports from the Group Head of Internal Audit on her assessment of controls across key risks subject to the Committee’s oversight, together with key risk issues identified by Group Internal Audit’s work and management actions put in place to address the findings
The Audit Committee, Board Financial Crime Risk Committee and the Brand, Values and Conduct Committee discuss separate reports from the Group Head of Internal Audit on Group Internal Audit’s appraisal of controls across key risk types subject to each committee’s oversight. Collectively, the reports received by these Committees provide assurance that there are effective internal controls within the Group
Remuneration as a risk management tool
Ensured the Group Chief Risk Officer advised the Remuneration Committee concerning the risk factors to be taken into account by the Remuneration Committee in determining the incentive structure for the Group Chief Executive, the executive directors and such other senior executives as appropriate. Such advice assists the Remuneration Committee in its assessment as to whether the Group’s remuneration policy, practices and procedures are consistent with and promote sound and effective risk management and do not encourage risk-taking that exceeds the level of tolerated risk of the Group
Further details concerning the Group’s approach to using remuneration as a risk management tool are set out in the Directors’ remuneration report
Regulatory ¼ BCBS 239 Principles
The Committee noted the results of the annual self-assessment of compliance with the BCBS 239 Principles which was submitted to the Prudential Regulation Authority (PRA) on 28 February 2018
The results of this assessment confirmed the Group continues to be materially compliant with all 11 principles
¼ Annual resolution letter from the Bank of England
Considered the annual resolution letter from the Bank of England and agreed that the resolution work-plan for the Group remained appropriate
¼ Recovery Plan
The Committee received a briefing on the main components of the Group Recovery Plan Framework ahead of the discussion and subsequent approval of the submission to the PRA of the 2018 Group’s Recovery Plan, further details of which can be found on page 204
DIRECTORS’ REPORT Corporate governance
Standard Chartered Annual Report 201880
Activities in the year continued
Deeper discussions into specific topics
¼ Korea deep dive and geopolitical risks
In view of heightened geopolitical risks over the Korean peninsula earlier in the year, the Committee discussed the Group’s exposures to South Korea. The discussion included management’s assessment of geopolitical risks, a review of the Group’s exposures, and management actions to mitigate these as well as updated stress testing results on a highly unlikely, but extreme scenario of military conflict
¼ Commercial Real Estate Risk Strategy and portfolio review
Discussed the Group’s Commercial Real Estate business, with a specific focus on strategy, returns, risks and opportunities
¼ Increase in Turkish interest rates
Following the increase of interest rates by 625bps to 24 per cent on 13 September 2018 by the Central Bank of Turkey, the Committee discussed the Group’s exposure and the resulting management actions
¼ Commodities
Discussed the Group’s Commodities portfolio including the market overview, business strategy and risk and mitigants
¼ Credit and Portfolio Management
Discussed a progress report on the Credit and Portfolio Management three-year programme to improve first-line ownership of risk, reduce profit and loss volatility and optimise capital and liquidity for Corporate & Institutional Banking, and therefore, the Group
¼ PRA’s Programme Management Review feedback
Following the PRA’s review of the Programme Management Framework and alignment of investments to strategy in the second quarter of 2017, the Committee discussed the issues raised and the action to be taken to address these
¼ Use of Cloud – governance and mitigation
Discussed the strategy, business case, risks and governance for Cloud use in support of the Group’s digitisation strategy including the rationale and benefits of the long-term objective of moving to the Cloud, the major risks and challenges with the proposed approach together with the actions to address the challenges and to strengthen the governance, implementation and security of Cloud based services
¼ Commercial Banking loan impairments and downgrades in 2017 and 2018 – challenges and forward priorities
The Group undertook a credit risk management transformation in Commercial Banking from 2015 to 2017. The Committee discussed the trends observed for Loan Impairment and downgrades to Credit Grade 12–14 with a focus on the fourth quarter of 2017 and the 2018 challenges and forward priorities
¼ Sensitivity to a strengthening US dollar
Discussed a country level view of the impact on loan impairment charges and sovereign debt levels arising from a strengthening USD and rising US interest rates
¼ Enterprise Risk Management Framework
The Group’s Enterprise Risk Management Framework (ERMF) was launched in 2018 through which enterprise-wide risks are managed with the objective of maximising risk-adjusted returns while remaining in the Group’s risk appetite. The ERMF Effectiveness Review process will provide the Committee with an objective baseline against which progress can be measured over the coming years
¼ Output from Enterprise Risk Management Forum
The Enterprise Risk Management Forum provides an integrated platform for all the Risk Framework Owners and the regional and client-business Chief Risk Officers to discuss the key themes relevant to the Group’s Principal Risk Types. Global Research, Group Strategy, Corporate Communications and Business representatives also participate and provide insights from an external lens perspective on risk themes, threats and opportunities. The outputs are used to maintain a dynamic risk inventory for the Group covering the 10 Principal Risk Types and the relative movements in their sub-types, emerging risks and principal uncertainties. Reporting to the Committee covered the key risk themes emerging from the Forum’s discussions that were deemed to be moderate or potentially material for the Group and actions that are being undertaken to understand these better
The Forum identified Africa as a region with elevated macroeconomic, fiscal and operational risk challenges and initiated a review on the concentration risks the Group faces across the continent which led to a paper on concentration risk across Africa in relation to rising sovereign debt levels coming to the Committee
¼ Evolution of the Treasury function
Towards the end of 2016, the Group’s balance sheet, liquidity and capital management activities were integrated within one Treasury function. The Committee discussed an update on the evolution of the Treasury function and management’s response to the PRA’s review of the Treasury function. The Committee was supportive that the changes made provided comfort that risk and control in Treasury is being satisfactory managed and the Committee discussed how management intended to address the areas for improvement
81
Risk review
and Cap
ital reviewS
trategic repo
rtS
upp
lementary info
rmatio
nFinancial statem
entsD
IRE
CT
OR
S’ R
EP
OR
T
Activities in the year continued
Deeper discussions into specific topics continued
¼ Group Special Asset Management review
Received and discussed two papers over the course of the year concerning Group Special Asset Management (GSAM). The Committee’s first discussion focused on a review of the GSAM portfolio covering Credit Grade 12 and Non-Performing Assets (Credit Grade 12–13) flows, impairments and recoveries. The second discussion covered GSAM’s organisation structure, resources and operations
¼ Enterprise Risk Management Function
At the beginning of the year, the Committee discussed the future remit of the Enterprise Risk Review Function (ERR) that included the expansion of the formal remit of the review team’s activity and proposed schedule of activity for 2018. At a subsequent meeting, the Committee discussed an update on the reviews undertaken by ERR of China Corporate & Institutional Banking and Commercial Banking, the Private Bank, US Corporate & Institutional Banking and the Group’s Aviation portfolio. A common theme arising from the reviews was that there was an acceptable credit control environment with improvements seen in most reviews, albeit the pace of improvement varied
¼ Brexit impact
Received and discussed an update on the level of preparedness of the Group’s Brexit programme to mitigate the risks of a disorderly Brexit; a legal assessment of the specific Brexit impact to contractual continuity; currency clearing and cross border services, and its impact to the Group’s business operations and a macro level assessment of the impact of a hard Brexit or no-deal Brexit scenario to the Group’s market and liquidity risk positions using stress scenarios
¼ Forbearance Risk in relation to Refinancing Risk
In response to a request from the Audit Committee, the Committee was provided with and discussed an internal assessment of the Group’s risk management approach and practices in identifying and managing forbearance in Corporate & Institutional Banking and Commercial Banking. Refinancing Risk is now recognised as one of the five risk sub-types within the Credit Risk Type Framework. Management are also exploring establishing metrics covering refinancing risk through the Risk Appetite framework
¼ Cross-border risk and returns
Discussed how management analyses the Group’s risk-return profile through client relationships, network income, country cross-border limits, exposure and returns and cost of funds
¼ SC Ventures governance
SC Ventures is a business unit created to promote innovation, invest in disruptive financial technology and explore alternative business models. SC Ventures will operate within the overall Group Risk Appetite. The Committee discussed the risk management framework for SC Ventures which will be managed in line with the Group’s Enterprise Risk Management Framework
¼ Transition from LIBOR to risk-free rates
In July 2017, the FCA announced that it would no longer support the London Interbank Offered Rate (LIBOR) after 2021, signalling that LIBOR may cease to exist, at least in its current form, beyond that date. The Committee was apprised of the background of the transition away from LIBOR to Risk-Free Rates and the risk associated with this transition both to the Group’s processes and transactions and how those risks are being managed
¼ Internal Ratings Based (IRB) models status and performance
Received and discussed an update on the status and performance of the IRB models and sought and received assurance that the IRB models continue to perform adequately and remain conservative against actual performance
Risk information provided to the CommitteeThe Committee is authorised to investigate or seek any information relating to an activity within its Terms of Reference and receives regular reports on risk management and tracks a wide range of risk metrics through a risk information report. This report provides an overview of the Group’s risk profile against the Group’s Risk Appetite Statement. The Group Chief Risk Officer’s report covers the macroeconomic environment, geopolitical outlook, material disclosures and ongoing risks.
The Committee has the authority to request and receive relevant information consistent with the requirements of BCBS 239 that will allow the Committee to fulfil its governance mandate relating to risks to which the Group is exposed, and alert senior management when risk reports do not meet its requirements.
Risk management disclosuresThe Committee has reviewed the risk disclosures in the Annual Report and Accounts and the Half Year Report and has also reviewed and approved the disclosures regarding the work of the Committee.
Interaction with the Group Chief Risk Officer As Committee Chair, David Conner meets individually with the Group Chief Risk Officer and the Committee has also met privately with the Group Chief Risk Officer without other members of management being present. These meetings allow open discussion of any matters relating to issues arising from the Committee’s formal discussions.

DIRECTORS’ REPORT Corporate governance
Standard Chartered Annual Report 201882
Interaction with management The Committee is mindful of the need to hold management directly accountable when issues have arisen and have been reported by the Group Chief Risk Officer. Senior management has attended Committee meetings for deeper discussions in such instances.
Interaction with regulators As Committee Chair, David Conner meets periodically with one of the Group’s UK lead regulators, the Prudential Regulation Authority (PRA). In addition, and on an annual basis, the Committee meets with the PRA without members of management being present. The purpose of such meetings is to enable a discussion between the Committee and the PRA concerning prudential focused topics.
Interaction between Board committees on risk related issuesIn the few instances where it does not have primary oversight for a given type of risk, the Committee interacts closely with other Board committees where the remit of these other committees clearly covers risk related matters. For example, the Audit Committee has oversight of the Group’s internal financial controls and regulatory compliance; the Board Financial Crime Risk Committee has oversight of the responsibilities in relation to financial crime compliance matters; and the Brand, Values and Conduct Committee has oversight of the mechanisms by which reputational risk is managed. The interaction assists the Committee in ensuring that it is well informed on discussions held, and the close collaboration of the committee chairs helps to ensure that there are no gaps and any potential for unnecessary duplication is avoided.
Risk function resourcingThe Committee has sought and received assurance that the Risk function is adequately resourced to perform its function effectively. The Committee’s discussions included an overview of the changes to the Risk function in 2018 and management’s forward-looking view of the Risk function over the next five to 10 years.
Committee effectiveness reviewObservations from the 2018 effectiveness review, undertaken by the Committee, can be found on page 69 of the Directors’ report.
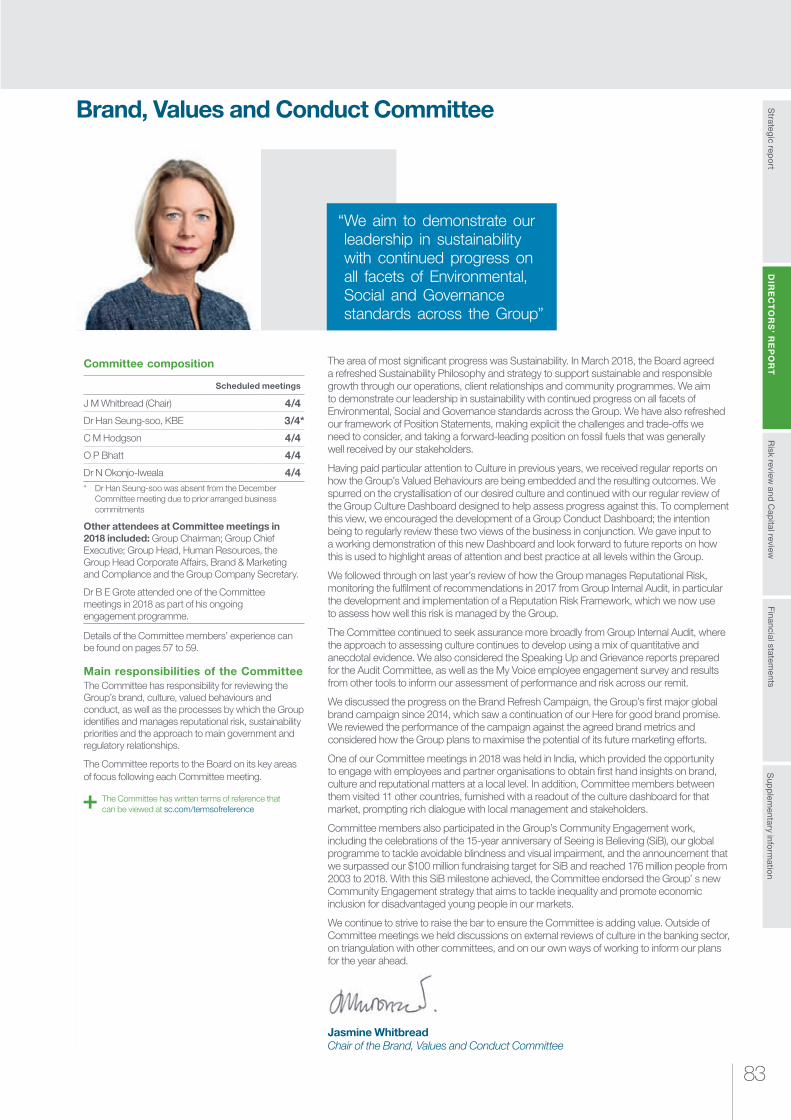
83
Risk review
and Cap
ital reviewS
trategic repo
rtS
upp
lementary info
rmatio
nFinancial statem
entsD
IRE
CT
OR
S’ R
EP
OR
T
Brand, Values and Conduct Committee
The area of most significant progress was Sustainability. In March 2018, the Board agreed a refreshed Sustainability Philosophy and strategy to support sustainable and responsible growth through our operations, client relationships and community programmes. We aim to demonstrate our leadership in sustainability with continued progress on all facets of Environmental, Social and Governance standards across the Group. We have also refreshed our framework of Position Statements, making explicit the challenges and trade-offs we need to consider, and taking a forward-leading position on fossil fuels that was generally well received by our stakeholders.
Having paid particular attention to Culture in previous years, we received regular reports on how the Group’s Valued Behaviours are being embedded and the resulting outcomes. We spurred on the crystallisation of our desired culture and continued with our regular review of the Group Culture Dashboard designed to help assess progress against this. To complement this view, we encouraged the development of a Group Conduct Dashboard; the intention being to regularly review these two views of the business in conjunction. We gave input to a working demonstration of this new Dashboard and look forward to future reports on how this is used to highlight areas of attention and best practice at all levels within the Group.
We followed through on last year’s review of how the Group manages Reputational Risk, monitoring the fulfilment of recommendations in 2017 from Group Internal Audit, in particular the development and implementation of a Reputation Risk Framework, which we now use to assess how well this risk is managed by the Group.
The Committee continued to seek assurance more broadly from Group Internal Audit, where the approach to assessing culture continues to develop using a mix of quantitative and anecdotal evidence. We also considered the Speaking Up and Grievance reports prepared for the Audit Committee, as well as the My Voice employee engagement survey and results from other tools to inform our assessment of performance and risk across our remit.
We discussed the progress on the Brand Refresh Campaign, the Group’s first major global brand campaign since 2014, which saw a continuation of our Here for good brand promise. We reviewed the performance of the campaign against the agreed brand metrics and considered how the Group plans to maximise the potential of its future marketing efforts.
One of our Committee meetings in 2018 was held in India, which provided the opportunity to engage with employees and partner organisations to obtain first hand insights on brand, culture and reputational matters at a local level. In addition, Committee members between them visited 11 other countries, furnished with a readout of the culture dashboard for that market, prompting rich dialogue with local management and stakeholders.
Committee members also participated in the Group’s Community Engagement work, including the celebrations of the 15-year anniversary of Seeing is Believing (SiB), our global programme to tackle avoidable blindness and visual impairment, and the announcement that we surpassed our $100 million fundraising target for SiB and reached 176 million people from 2003 to 2018. With this SiB milestone achieved, the Committee endorsed the Group’ s new Community Engagement strategy that aims to tackle inequality and promote economic inclusion for disadvantaged young people in our markets.
We continue to strive to raise the bar to ensure the Committee is adding value. Outside of Committee meetings we held discussions on external reviews of culture in the banking sector, on triangulation with other committees, and on our own ways of working to inform our plans for the year ahead.
Jasmine WhitbreadChair of the Brand, Values and Conduct Committee
“ We aim to demonstrate our leadership in sustainability with continued progress on all facets of Environmental, Social and Governance standards across the Group”
Committee composition
Scheduled meetings
J M Whitbread (Chair) 4/4
Dr Han Seung-soo, KBE 3/4*
C M Hodgson 4/4
O P Bhatt 4/4
Dr N Okonjo-Iweala 4/4* Dr Han Seung-soo was absent from the December
Committee meeting due to prior arranged business commitments
Other attendees at Committee meetings in 2018 included: Group Chairman; Group Chief Executive; Group Head, Human Resources, the Group Head Corporate Affairs, Brand & Marketing and Compliance and the Group Company Secretary.
Dr B E Grote attended one of the Committee meetings in 2018 as part of his ongoing engagement programme.
Details of the Committee members’ experience can be found on pages 57 to 59.
Main responsibilities of the CommitteeThe Committee has responsibility for reviewing the Group’s brand, culture, valued behaviours and conduct, as well as the processes by which the Group identifies and manages reputational risk, sustainability priorities and the approach to main government and regulatory relationships.
The Committee reports to the Board on its key areas of focus following each Committee meeting.
The Committee has written terms of reference that can be viewed at sc.com/termsofreference
DIRECTORS’ REPORT Corporate governance
Standard Chartered Annual Report 201884
Activities in the year
Culture and Valued Behaviours
¼ Regularly reviewed the Group’s Culture Dashboard and provided feedback on how the metrics can be enhanced, including discussions on how the Group proposed to embed a high-performance culture into its employee lifecycle and the next steps for the Dashboard in 2019
¼ Provided feedback on the Group’s Diversity and Inclusion Strategy and discussed the results from the employee My Voice survey
¼ In India, the Committee held a discussion with representatives from the local management team to understand the initiatives underway to build a high-performance culture
¼ Discussed the challenges of embedding the Group’s Valued Behaviours across the Group
¼ Received and discussed a report covering a thematic review of the Speaking Up, Business Referral and Grievance Processes and their insights on the Group’s Culture
Brand ¼ Received and discussed a progress report on the Brand Refresh Campaign with a focus on achievements against the metrics established for the campaign
¼ Discussed the Group’s forward-looking approach to marketing, focusing on how the Group is maximising the potential of its marketing effort to drive business
¼ In India, the Committee discussed brand metrics, social media sentiment, and reviewed the India Retail Banking digital capabilities campaign
Conduct ¼ Received an update on the analytical tools currently used by the Group to identify patterns of behaviour to detect Conduct-related issues
¼ The Committee was also provided with demonstrations on the ongoing development of a prototype of a revised Group Conduct Dashboard which will help identify indicators of potential trends which reflects adverse Conduct Risk outcomes across the three lines of defence
¼ Discussed the findings of the Banking Standard Board (BSB) Assessment of the Group. The BSB was established in 2015 to promote high standards of behaviour and competence across UK banks and building societies. The feedback in the BSB report was aligned to the employee My Voice survey findings. The Committee discussed the findings from the report and the management action plans to address the areas where improvements are needed
Reputational Risk management
The Group’s Reputational Risk Policy (effective as of 5 November 2018), established the Group’s new governance approach and management of Reputational Risk, and addressed issues previously identified by Group Internal Audit. Reputational Risk reporting will be further enhanced in 2019 to provide insights and thematic areas for consideration
The Committee:
¼ Reviewed the processes by which the Group manages Reputational Risk in an effective and transparent manner, consistent with the Board approved Group Risk Appetite Statement
¼ Received an overview of the key Reputational Risk decisions made in 2017
¼ Requested that for future reporting, more thematic issues be brought to the Committee for discussion
¼ Sought and received assurance on how the Group’s Position Statements are aligned to the Group’s Risk Appetite.
Further details on the Group’s Statements can be found on page 48 and in the separate Sustainability Summary at sc.com/sustainabilitysummary
Sustainability The Group’s sustainability strategy is framed by a new Sustainability Philosophy and a refresh of its Position Statement framework. The Committee:
¼ Received updates on actions taken since the Board meeting in March 2018 to deliver the revised strategy and on 2019 priorities
¼ Reviewed and provided feedback on progress in delivering the Group’s sustainability strategy, including the Group’s approach to managing key environmental and social risks thorough its environmental and social risk management framework and Position Statements
¼ Discussed a range of means by which the Group can measure its progress in becoming a more sustainable organisation which will be used to develop a sustainability dashboard for the Group which will be presented to the Committee going forward
¼ Discussed and provided feedback on the Group’s new global initiative, Futuremakers by Standard Chartered, which aims to tackle inequality and promote greater economic inclusion. Further details can be found on page 51
Government and regulatory relationships
¼ Reviewed the Group’s approach to its main government and regulatory relationships across the Group’s key markets, focusing on the quality of these relationships and engagement in place
¼ Provided input on the areas of priority for 2019, including regulatory reform, Brexit, Belt & Road, climate change, fintech and innovation, and country/regional specific issues
Committee effectiveness reviewObservations from the 2018 effectiveness review, undertaken by the Committee, can be found on page 69 of the Directors’ report.
85
Risk review
and Cap
ital reviewS
trategic repo
rtS
upp
lementary info
rmatio
nFinancial statem
entsD
IRE
CT
OR
S’ R
EP
OR
T
Governance and Nomination Committee
The Committee has been active across all areas of its responsibility during 2018, with a particular focus on further strengthening the composition and succession plans for the Board and its committees. Ensuring we have a truly diverse Board comprising a range of perspectives, experiences, knowledge and skills is key to the Board’s continuing effectiveness. The Board Diversity Policy, which sets out our approach to diversity on the Board, was once again reviewed by the Committee this year to ensure that we continue to enhance progress in this area.
While the composition of the Board remained unchanged during 2018, the Committee, conscious of Dr Han Seung-soo’s tenure on the Board, commissioned a wide-ranging search for an independent non-executive director with particular expertise in the Greater China & North Asia region. Carlson Tong emerged from that search as a very credible and well respected candidate. He has significant experience and insight of operating in mainland China and Hong Kong and will bring a fresh perspective to the Board. The Committee recommended his appointment to the Board in January 2019 and he joined on 21 February 2019. Dr Han Seung-soo retired and Om Bhatt stepped down from the Board as independent non-executive directors on 23 February 2019.
Our focus on succession planning was not confined to discussions on the Board and its committees, we also considered succession readiness and plans for the executive directors and other senior executives, to assure ourselves that key roles have plans in place for the medium term and in the immediate term if required.
The Committee also provided oversight of the annual Board and committee effectiveness reviews, which were internally facilitated in 2018. More details on the themes and outcomes can be reviewed on page 69.
Throughout 2018, we also provided support for the implementation of the Group’s International Advisory Council (IAC). This new initiative will provide significant strategic insight into the changing dynamics of our markets and further enhance the Group’s relationship with our stakeholders. The Committee provided oversight of the IAC’s development and reviewed potential Council members. The IAC, chaired by Dominic Barton had its inaugural meeting on 4 February 2019.
The Committee also spent a great deal of time overseeing its governance responsibilities, which included reviewing the regional subsidiary governance processes, considering changes to the Group’s corporate governance arrangements to reflect the proposed new hub entity structure and overseeing the Group’s approach to compliance with the new UK Corporate Governance Code 2018. The Committee paid particular attention to the development of initiatives to enable the Board to engage effectively and directly with our workforce. We will report against the new Code in full in next year’s report.
José ViñalsChair of the Governance and Nomination Committee
“ Ensuring we have a truly diverse Board comprising a range of perspectives, experiences, knowledge and skills is key to the Board’s continuing effectiveness”
Committee composition
Scheduled meetings Ad hoc
J Viñals (Chair) 3/3 1/1
N Kheraj 3/3 1/1
C M Hodgson 3/3 1/1
J M Whitbread 3/3 1/1
D P Conner 3/3 1/1
Other attendees at Committee meetings in 2018 included: Group Chief Executive; Group Head, HR; Group Company Secretary
Biographical details of the Committee members can be viewed on pages 57 to 59
Main responsibilities of the CommitteeThe Committee has responsibility for keeping the size, structure and composition of the Board and its committees under review. As part of the Committee’s succession planning, it takes into account the Group’s strategy and challenges and makes recommendations to the Board in respect to any adjustments to the Board’s composition.
It also keeps under review the leadership needs of, and succession plans for, the Group in relation to both executive directors and other senior executives; has oversight of the process by which the Board, its committees and individual directors assess their effectiveness; keeps the diversity of the Board under review and monitors progress towards achieving its objectives in this area; considers any potential situational conflicts of interest declared by our Board members; and considers the impact of material changes to corporate governance regulation and legislation affecting the Group, and has oversight of the Group’s approach to subsidiary corporate governance.
The Committee reports to the Board on its key areas of focus following each committee meeting.
The Committee has written terms of reference that can be viewed at sc.com/termsofreference
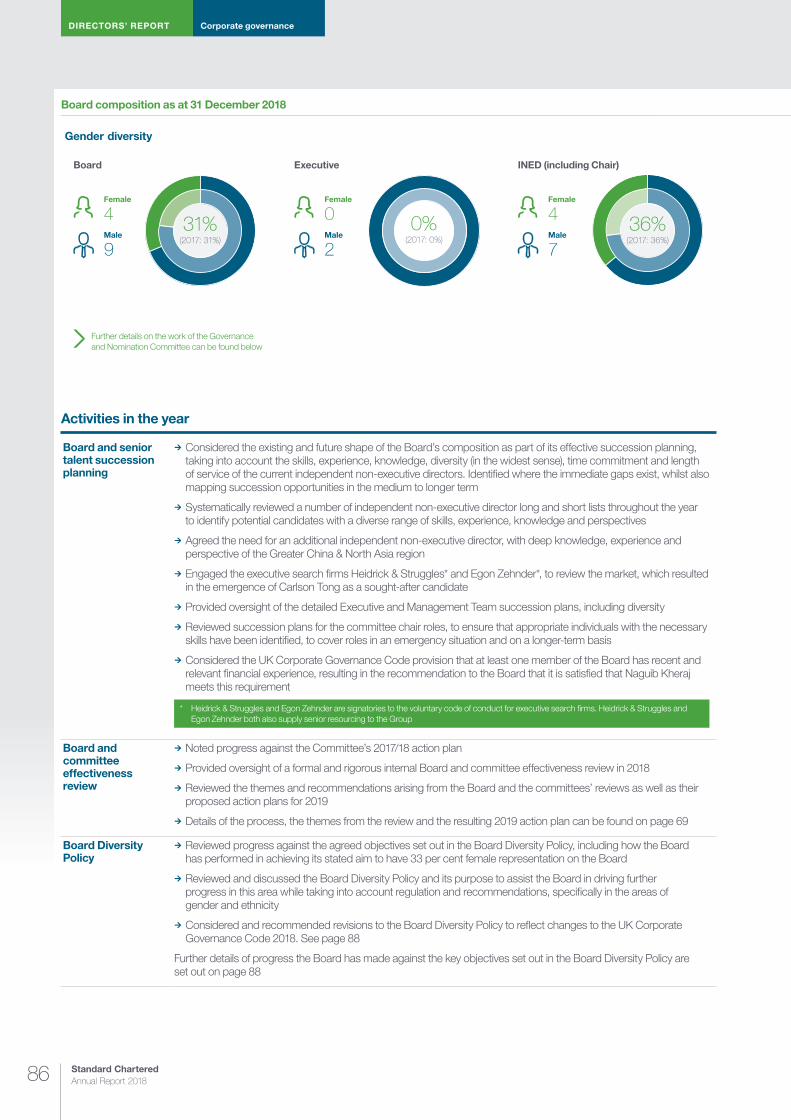
DIRECTORS’ REPORT Corporate governance
Standard Chartered Annual Report 201886
Activities in the year
Board and senior talent succession planning
¼ Considered the existing and future shape of the Board’s composition as part of its effective succession planning, taking into account the skills, experience, knowledge, diversity (in the widest sense), time commitment and length of service of the current independent non-executive directors. Identified where the immediate gaps exist, whilst also mapping succession opportunities in the medium to longer term
¼ Systematically reviewed a number of independent non-executive director long and short lists throughout the year to identify potential candidates with a diverse range of skills, experience, knowledge and perspectives
¼ Agreed the need for an additional independent non-executive director, with deep knowledge, experience and perspective of the Greater China & North Asia region
¼ Engaged the executive search firms Heidrick & Struggles* and Egon Zehnder*, to review the market, which resulted in the emergence of Carlson Tong as a sought-after candidate
¼ Provided oversight of the detailed Executive and Management Team succession plans, including diversity
¼ Reviewed succession plans for the committee chair roles, to ensure that appropriate individuals with the necessary skills have been identified, to cover roles in an emergency situation and on a longer-term basis
¼ Considered the UK Corporate Governance Code provision that at least one member of the Board has recent and relevant financial experience, resulting in the recommendation to the Board that it is satisfied that Naguib Kheraj meets this requirement
* Heidrick & Struggles and Egon Zehnder are signatories to the voluntary code of conduct for executive search firms. Heidrick & Struggles and Egon Zehnder both also supply senior resourcing to the Group
Board and committee effectiveness review
¼ Noted progress against the Committee’s 2017/18 action plan
¼ Provided oversight of a formal and rigorous internal Board and committee effectiveness review in 2018
¼ Reviewed the themes and recommendations arising from the Board and the committees’ reviews as well as their proposed action plans for 2019
¼ Details of the process, the themes from the review and the resulting 2019 action plan can be found on page 69
Board Diversity Policy
¼ Reviewed progress against the agreed objectives set out in the Board Diversity Policy, including how the Board has performed in achieving its stated aim to have 33 per cent female representation on the Board
¼ Reviewed and discussed the Board Diversity Policy and its purpose to assist the Board in driving further progress in this area while taking into account regulation and recommendations, specifically in the areas of gender and ethnicity
¼ Considered and recommended revisions to the Board Diversity Policy to reflect changes to the UK Corporate Governance Code 2018. See page 88
Further details of progress the Board has made against the key objectives set out in the Board Diversity Policy are set out on page 88
Board composition as at 31 December 2018
Gender diversity
Further details on the work of the Governance and Nomination Committee can be found below
Board
Female
4Male
9
Executive
Female
0Male
2
INED (including Chair)
Female
4Male
731%
(2017: 31%)
36%(2017: 36%)
0%(2017: 0%)
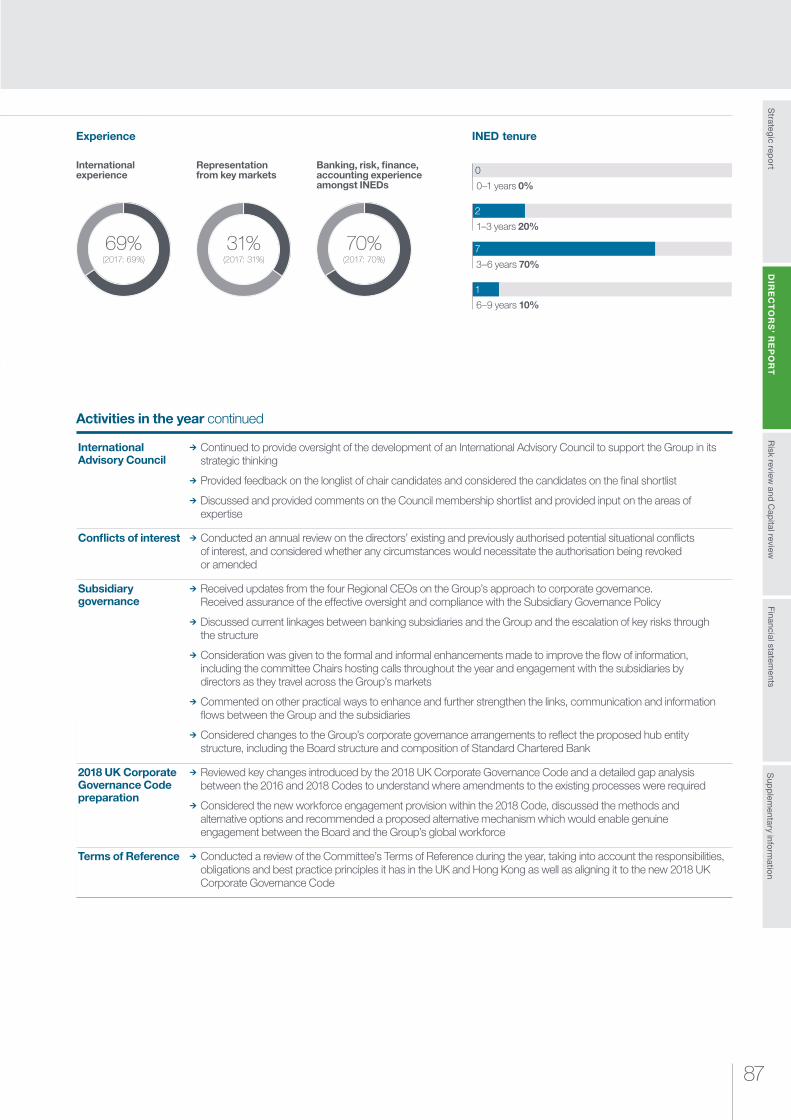
87
Risk review
and Cap
ital reviewS
trategic repo
rtS
upp
lementary info
rmatio
nFinancial statem
entsD
IRE
CT
OR
S’ R
EP
OR
T
Activities in the year continued
International Advisory Council
¼ Continued to provide oversight of the development of an International Advisory Council to support the Group in its strategic thinking
¼ Provided feedback on the longlist of chair candidates and considered the candidates on the final shortlist
¼ Discussed and provided comments on the Council membership shortlist and provided input on the areas of expertise
Conflicts of interest ¼ Conducted an annual review on the directors’ existing and previously authorised potential situational conflicts of interest, and considered whether any circumstances would necessitate the authorisation being revoked or amended
Subsidiary governance
¼ Received updates from the four Regional CEOs on the Group’s approach to corporate governance. Received assurance of the effective oversight and compliance with the Subsidiary Governance Policy
¼ Discussed current linkages between banking subsidiaries and the Group and the escalation of key risks through the structure
¼ Consideration was given to the formal and informal enhancements made to improve the flow of information, including the committee Chairs hosting calls throughout the year and engagement with the subsidiaries by directors as they travel across the Group’s markets
¼ Commented on other practical ways to enhance and further strengthen the links, communication and information flows between the Group and the subsidiaries
¼ Considered changes to the Group’s corporate governance arrangements to reflect the proposed hub entity structure, including the Board structure and composition of Standard Chartered Bank
2018 UK Corporate Governance Code preparation
¼ Reviewed key changes introduced by the 2018 UK Corporate Governance Code and a detailed gap analysis between the 2016 and 2018 Codes to understand where amendments to the existing processes were required
¼ Considered the new workforce engagement provision within the 2018 Code, discussed the methods and alternative options and recommended a proposed alternative mechanism which would enable genuine engagement between the Board and the Group’s global workforce
Terms of Reference ¼ Conducted a review of the Committee’s Terms of Reference during the year, taking into account the responsibilities, obligations and best practice principles it has in the UK and Hong Kong as well as aligning it to the new 2018 UK Corporate Governance Code
INED tenure
2
1–3 years 20%
0
0–1 years 0%
7
3–6 years 70%
1
6–9 years 10%
International experience
69%(2017: 69%)
Banking, risk, finance, accounting experience amongst INEDs
70%(2017: 70%)
Representation from key markets
31%(2017: 31%)
Experience
DIRECTORS’ REPORT Corporate governance
Standard Chartered Annual Report 201888
Implementation of the Board Diversity Policy The Board’s Diversity Policy (the Policy) sets out the approach the Group takes to diversity on its Board to ensure that diversity, in its broadest sense, remains a central feature of the Board. The Policy acknowledges that we have a distinctive footprint and international outlook and a long history of diverse board membership.
We strive to maintain a diverse Board, recognising the benefits of having a Board made up of individuals with a diverse mix of gender, social and ethnic backgrounds, knowledge, personal attributes, skills and experience. This diversity provides a mix of perspectives which contribute to the effective Board dynamics.
Aligned to this broad objective, the Policy has five specific objectives which the Board is committed to in order to further enhance progress in this area:
¼ Increasing the representation of women on the Board with an aim to have a minimum of 33 per cent female representation
¼ Ensuring that our Board reflects the diverse markets in which we operate
¼ Ensuring that the Board comprises a good balance of skills, experience, knowledge, perspective and varied backgrounds
¼ Only engaging search firms who are signed up to the Voluntary Code of Conduct for Executive Search firms
¼ Reporting annually on the diversity of the executive pipeline as well as the diversity of the Board, including progress being made on reaching the Board’s gender target
The Committee conducted an annual review of the Policy during 2018, to ensure that it continues to drive diversity in its broadest sense, while continuing to take account of best practice initiatives, most recently the Parker Report into ethnic diversity, the Hampton-Alexander Review on women in leadership positions and the new 2018 UK Corporate Governance Code.
The Policy is implemented through the Committee, which considers the Policy’s objectives as part of its overall succession planning discussions as well as part of its selection and recommendation of individual candidates.
Details of the Board’s diverse composition are set out on pages 57 to 59 of this report, and the diverse make up of Management Team can be found on pages 60 to 62. Gender representation across the Group can be found on page 44 of this report.
A copy of the full Board Diversity Policy can be viewed at sc.com/boarddiversitypolicy
Progress against the key objectives set out in the Board Diversity Policy is set out below.
Board Diversity Policy objectives Progress update
Increasing the representation of women on the Board with an aim to have to have a minimum of 33 per cent female representation
¼ Achieving a more balanced gender representation on the Board is an integral part of the Board’s succession planning process. The target to have a minimum of 33 per cent female representation on the Board is now a realistic and welcome reality. The Board has seen female representation increase from 10 per cent in 2014 to 31 per cent at 31 December 2018
Ensuring that the Board reflects the diverse markets in which we operate
¼ What sets us apart is our diversity of people, cultures and networks. At the end of 2018 the Board had representation from a mix of our regions in which we operate, including the UK, US, India, Korea, Hong Kong and Nigeria. As part of the Committee’s Board succession planning discussions it has considered a range of potential future INED candidates from across our markets
Ensuring that the Board comprises a good balance of skills, experience, knowledge, perspective and varied backgrounds
¼ Throughout the year the Committee has focused on balancing the composition and make up of the Board, identifying where skills, experience, knowledge and diversity gaps exist, both immediately and in the longer term, and systematically reviewed candidate longlists to strengthen the pipeline of potential future INEDs
Only engaging search firms who are signed up to the Voluntary Code of Conduct for Executive Search firms
¼ We continue to only engage search firms signed up to the Voluntary Code of Conduct. During 2018, the Committee engaged Egon Zehnder and Heidrick & Struggles to assist in identifying potential INED candidates and build a pipeline of high quality individuals. Egon Zehnder and Heidrick & Struggles are both signed up to the Voluntary Code and are committed in supporting our ambitions to widen all aspects of diversity on the Board
Reporting annually on the diversity of the executive pipeline as well as the diversity of the Board, including progress being made on reaching the Board’s gender target
¼ We have continued to improve our oversight of Board and senior talent succession planning as well as highlighting the importance and value placed on diversity in its broadest sense in the boardroom to continue to ensure that the Board’s effectiveness is enhanced
Committee effectiveness review Observations from the 2018 effectiveness review, undertaken by the Committee, can be found on page 69 of the Directors’ report.
89
Risk review
and Cap
ital reviewS
trategic repo
rtS
upp
lementary info
rmatio
nFinancial statem
entsD
IRE
CT
OR
S’ R
EP
OR
T
Board Financial Crime Risk Committee
Since 2012, the Group has implemented programmes of remediation and enhancement in managing financial crime risk. The Financial Crime Risk Mitigation Programme (FCRMP) was set up to deliver a significant improvement in the Group’s financial crime risk management consistent with our strategic aspiration “to prove that Standard Chartered is leading the way in combating financial crime, while providing quality service for our clients.” Five years later, we assess that – while there is always more to do – the Group’s financial crime controls framework has been substantially transformed through a combination of business as usual enhancements and the workstreams initiated under the FCRMP.
Today, the Group expects to benchmark as being industry leading in the areas of financial crime compliance governance, risk assessment, client risk assessment within customer due diligence, and reporting. The Group also aspires to be industry leading in assurance but it is not yet there and the Committee will continue to monitor progress against achieving this.
The Group’s refreshed financial crime mission is “partnering to lead in the fight against financial crime.” Through its work, the Committee has sought and received assurances that the Group has the right foundations to succeed in this objective which contains three core elements. First, ‘partnering’ recognises that financial crime risk management requires more than a financial crime compliance function; we need to collaborate closely with the businesses and functions within the Group. It is also necessary to partner with external parties such as peer banks, clients, policy makers and law enforcement. ‘Lead’ maintains the Group’s desire to be operating beyond a minimum acceptable level. The Group aims to raise standards in its markets, leading the industry in specific areas of focus and seeking to make financial crime compliance a source of competitive advantage. The third core element, ‘fight against financial crime’, is recognition that the Group aspires to do more than regulatory compliance. Standard Chartered aims to be active in denying financial criminals access to the financial system. This element is directly relevant to the Group’s purpose of “driving commerce and prosperity through our unique diversity” as financial crime undermines prosperity.
Towards the end of 2017, Management prepared a Financial Crime Compliance Global Threat Assessment, designed to identify and evaluate the most significant financial crime threats faced by the Group and to develop a set of key recommendations in response to these threats. In 2018, the Committee discussed the financial crime future threats posed by virtual currencies, the illegal wildlife trade, and the broader money laundering and sanctions threats linked to Russia. The Group’s global footprint means that we are well placed to offer a unique perspective on this last issue.
At the end of 2018, John Cusack stepped down as the Group’s Global Head of Financial Crime Compliance (FCC) and Patricia Sullivan and David Howes were appointed Co-Heads of FCC. I would like to thank John for his work in helping the Committee discharge its responsibilities since its formation in 2015 and welcome David and Patricia to their new roles.
Gay Huey Evans, OBEChair of the Board Financial Crime Risk Committee
“ The Group’s refreshed financial crime mission is ‘Partnering to lead in the fight against financial crime’”
Committee composition
Scheduled meetings
G Huey Evans, OBE (Chair) 4/4
D P Conner 4/4
C M Hodgson 4/4
N Kheraj 4/4
External adviser members
B H Khoo 4/4
Sir Iain Lobban 4/4
F Townsend 4/4Other attendees at Committee meetings in 2018 included: Group Chairman; Group Chief Executive; Group Chief Risk Officer; Group Head of Internal Audit; Group General Counsel; Global Head, Financial Crime Compliance; Group Head Compliance; Group Company Secretary.
Dr Ngozi Okonjo-Iweala also attended a Committee meeting as part of her ongoing engagement programme.
As part of, and in addition to, each scheduled Committee meeting, the Committee had private members-only meetings.
The Committee’s membership comprises four independent non-executive directors and three independent external adviser members who are neither directors nor employees of the Group but who provide a valuable external perspective and have extensive experience in counter-terrorism, cyber security and international security. Details on the independent non-executive directors can be found in their biographies on pages 57 to 59.
Main responsibilities of the CommitteeThe Committee provides oversight of the effectiveness of the Group’s policies, procedures, systems, controls and assurance arrangements designed to identify, assess, manage, monitor and prevent and/or detect money laundering, non-compliance with sanctions, bribery, corruption and tax crime by third parties.
The Committee reports to the Board on its key areas of focus following each Committee meeting.
The Committee has written terms of reference that can be viewed at sc.com/termsofreference

DIRECTORS’ REPORT Corporate governance
Standard Chartered Annual Report 201890
Activities in the year
Financial Crime Risk Mitigation Programme and US Supervisory Remediation Programme
¼ Exercised ongoing oversight of the Group’s FCRMP ¼ Discussed and challenged progress reports as to the status of the FCRMP and discussed the findings of the independent testing that has been undertaken on the FCRMP
¼ Received and discussed proposals from the Group Chief Information Officer on the FCRMP technology project deliverables and enhancements to embed more effective control over end-to-end data quality in support of financial crime risk management
¼ Exercised oversight of the activity required to comply with the requirements of the US Deferred Prosecution Agreements (DPAs). More information about the DPAs can be found in Note 26 on page 305
¼ Exercised oversight of the Group’s enhanced sanctions compliance programme
Assessment of financial crime risk
¼ Discussed reports on the financial crime risks faced by the Group across a number of the Group’s client segments and the regions in which it operate, and seeking and receiving assurance on the actions taken and being taken to strengthen controls in relation to these risks in a number of the Group’s markets
Financial crime risk control environment
¼ Discussed Group Internal Audit’s view on the Group’s control environment relating to financial crime risk. Such discussions include the grading of audit reports across the financial crime compliance risk themes, gaps and deficiencies that have been identified and sought and received assurance concerning management’s response and resulting management actions
¼ Discussed the continuing importance of employee engagement with regard to the seriousness of financial crime risk and how this can be embedded in a sustainable way as part of business as usual
Financial crime future threats
¼ The Group has a Financial Crime Compliance Global Threat Assessment, designed to identify and evaluate the most significant financial crime threats faced by Standard Chartered, and to develop a set of key recommendations in response to these threats. In 2018, the Committee discussed the financial crime future threats posed by virtual currencies, the illegal wildlife trade and the broader money laundering and sanctions threats linked to Russia
Group Risk Appetite Statement in relation to financial crime
¼ Considered, discussed and recommended to the Board the Group’s Risk Appetite Statement in relation to financial crime risk
¼ Reviewed metrics to measure against Financial Crime Risk Appetite
Financial crime compliance Speaking Up
The ability of employees to disclose genuine concerns, including breaches of regulatory requirements, is essential to the maintenance of the Group’s values. The principles and requirements relating to Speaking Up are detailed in the Group Speaking Up Policy and, specifically for financial crime, the Group Anti-Money Laundering and Counter Terrorist Financing Policy
¼ Received and discussed a report on escalations relating to financial crime. One route for financial crime Speaking Up escalations is through Suspicious Activity Reports (SARs). The number of SARs demonstrates a good level of employee awareness regarding the need to raise concerns. Further details of the Group’s Speaking Up programme can be found on pages 48 and 49
Financial Crime Compliance Function
The Committee discussed: ¼ The refreshed mission of “Partnering to lead in the fight against financial crime” and the challenges to delivering this mission
¼ The eight key objectives for the Financial Crime Compliance function for the next one to three years, proposed as part of the transition of Financial Crime Compliance to new leadership.
At the beginning of 2019, Financial Crime Compliance will also refresh its self-assessment against the industry benchmarking criteria developed by EY to evaluate the FCRMP
Financial Crime information sharing
¼ Received updates on significant financial crime compliance-related matters, including information-sharing initiatives in which the Group is playing a leading role. This includes the UK’s Joint Money Laundering Intelligence Taskforce, Hong Kong’s Fraud & Money Laundering Intelligence Taskforce and Singapore’s Anti-Money Laundering and Countering the Finance of Terrorism Industry Partnership
¼ Received updates on the principal partnerships in which the Group participates that aim to protect the integrity of the global financial system and improve the effectiveness of the contributions of financial institutions to fighting financial crime
Committee meetings held overseas
Committee meetings as part of the overseas Board visits enable the Committee members to engage with local management and local Financial Crime Compliance teams outside of formal Committee meetingsOne of the four Committee meetings in 2018 was held as part of the overseas Board visit to Nigeria. While in Nigeria, the Committee met with various local experts to discuss financial crime in Nigeria. The Committee also met with local management, business heads and the Financial Crime Compliance team to discuss an overview of the Nigeria risk environment, local financial crime risks, local Financial Crime Compliance audit findings, correspondent banking and the management of suspicious activities, transaction monitoring and name and transaction screening
Committee effectiveness reviewObservations from the 2018 effectiveness review, undertaken by the Committee, can be found on pages 69 of the Directors’ report.
Risk review
and Cap
ital reviewS
trategic repo
rtS
upp
lementary info
rmatio
nFinancial statem
entsD
IRE
CT
OR
S’ R
EP
OR
T
91
Directors’ remuneration report
Committee composition
Scheduled meetings
C M Hodgson (Chair) 5/5
Dr L Cheung 5/5
Dr B E Grote 5/5
N Kheraj 5/5
J M Whitbread1 4/51 Jasmine Whitbread was unable to attend the meeting
held on 25 July 2018 due to a prior arranged business commitment
Other attendees for relevant parts of Committee meetings in 2018 included: Group Chairman; Group Chief Executive; Group Head, HR; Global Head, Performance, Reward and Conduct; Group Company Secretary; Group Chief Financial Officer; Group Chief Risk Officer; Group General Counsel; Group Head of Compliance.
The Committee has written terms of reference that can be viewed at sc.com/termsofreference
Main responsibilities of the CommitteeThe Committee is responsible for setting the governance framework for remuneration for all colleagues. The Committee is already well positioned against the requirements of the revised UK Corporate Governance Code. In particular, the Committee:
¼ Determines and agrees with the Board the remuneration framework and policies for the Group Chairman, executive directors and other senior executives, taking into account workforce remuneration and the alignment of incentives and reward with culture
¼ Approves Group discretionary incentives, including risk adjustment
¼ Reviews and approves the Group’s Fair Pay Charter which includes oversight of the development and implementation of workforce remuneration policies and practices, ensuring they are consistent with sound and effective risk management, the Group’s Culture and Valued Behaviours and long-term sustainable success
¼ Oversees the identification of material risk takers and ensures their incentives are structured in accordance with the requirements of the prevailing remuneration rules
Directors’ remuneration report94 Remuneration summary96 The Remuneration Committee97 Directors’ remuneration in 2018103 Group-wide remuneration in 2018108 Proposed new directors’ remuneration policy116 2019 policy implementation for directors118 Additional remuneration disclosures
“ Delivering fair, transparent and competitive remuneration, rewarding improved financial and strategic performance”
Highlights
¼ The Committee considered the improved financial and strategic performance in 2018 alongside other factors and concluded that remuneration outcomes should reflect a Group scorecard assessment of 55 per cent of the maximum
¼ 2018 Group discretionary incentives of $1,179 million which are 3 per cent higher than in 2017, compared with a 28 per cent increase in underlying profit
¼ Annual incentive award of 50 per cent of fixed remuneration for Bill Winters, Group Chief Executive, and 48 per cent of fixed remuneration for Andy Halford, Group Chief Financial Officer
¼ Good progress made on delivering against the commitments set out in our Fair Pay Charter
¼ A new directors’ remuneration policy will be proposed for implementation in 2019, subject to shareholder approval at the Annual General Meeting (AGM). The key elements of the proposed policy are:– Simplified structure of fixed remuneration– Alignment of pension contribution for new directors to the contribution level for
UK employees– Unchanged structure of variable remuneration– In certain specific retirement situations the Committee will have the flexibility to
choose to disapply the time proration of long-term incentive plan (LTIP) awards. This will not be automatic and the Committee will consider the circumstances of each case at the relevant time
– Significantly increased shareholding requirements– Introduction of post-employment shareholding requirements
IntroductionOn behalf of the Remuneration Committee, I am pleased to present the directors’ remuneration report for the year ended 31 December 2018.
This directors’ remuneration report is subject to two shareholder votes at the 2019 AGM:
¼ The application in 2018 of the existing directors’ remuneration policy is subject to an advisory vote
¼ A binding vote on the proposed directors’ remuneration policy which, if approved, will apply from the date of the AGM. The policy sets out the framework for directors’ remuneration for up to three years
Our Fair Pay Charter sets out the principles we use to make remuneration decisions that are fair, transparent, competitive and strongly reflect business and individual performance, supporting us in embedding a high performance culture. Our approach to remuneration promotes long-term focus and alignment with shareholder interests, and reflects the achievement of financial and strategic results as well as the demonstration of our valued behaviours in pay decisions. We seek to keep remuneration as simple as possible, ensure we meet all regulatory requirements and incorporate evolving best practice. In making decisions on remuneration for 2018 for all colleagues, and in setting the direction for 2019, the Committee considered these principles as well as the progress made since 2015, the overall performance of the Group in 2018 and our refreshed strategic priorities for 2019 to 2021.
DIRECTORS’ REPORTDirectors’ remuneration report
Standard Chartered Annual Report 201892
We believe that our decisions deliver competitive remuneration, fairly differentiated to reward colleagues for the financial and strategic performance which has delivered the fundamentally stronger platform off which to grow and transform the business further.
For the year ahead, remuneration decisions will reflect our refreshed strategy for 2019 to deliver our next phase of growth. The strategy seeks to improve productivity significantly and to deliver strong results to our stakeholders.
Our Fair Pay Charter Attracting, retaining and motivating a diverse, future-ready workforce is essential to delivering on our purpose, long-term strategy and shareholder returns. In support of this, in 2017 the Committee developed our Fair Pay Charter which sets out the principles we use to determine and deliver pay for all colleagues globally, including senior management and executive directors. We are proud to share in this report more details about how we meet the commitments in the Charter and our plans for making further progress against the stretching goals we have set ourselves. One of these goals is to pay a living wage across all 60 of our markets. During 2018, we developed our understanding of living wages and took action to pay all employees at or above this level, meeting our commitment one year ahead of our target. We have also developed our wellbeing programme with benefits which underpin our four pillars: mental, physical, social and financial wellbeing, and have begun a multi-year programme introducing flexibility to allow colleagues to tailor their benefits to their individual needs.
Remuneration outcomes for 2018In 2015, we announced a strategic plan to secure the Group’s foundations, get lean and focused, and invest and innovate. Substantial progress has been made in executing the strategy. Underlying profit is four times higher and return on equity (RoE) on an underlying basis has increased to 4.6 per cent. The quality of our loan portfolio is greatly improved and our Common Equity Tier 1 (CET1) ratio has reached 14.2 per cent, which – together with our improved profitability – allowed us to reinstate the full year and interim dividends during 2018. The progress made in building a fundamentally stronger platform is a critical enabler to delivering sustainable returns above the cost of capital over the medium term. When determining 2018 remuneration outcomes, the Committee:
¼ Considered the importance of rewarding employees for the improved strategic and financial performance in the year. Underlying profit has increased by 28 per cent year-on-year. Organic capital generation and enhanced risk management have further increased the Group’s resilience. Strategic progress has been made including improved client satisfaction, credit quality and cost savings, growth in digital volumes and significant improvements in innovation
¼ Acknowledged the disappointing share price performance in 2018 and, that despite improved profitability, returns are not yet above the cost of capital
¼ Took account of current and future risks identified by the Group’s Principal Risk Types including operational, conduct, information and cyber security and financial crime risks
¼ Considered the wage inflation pressures in many of the emerging markets in which we operate. 95 per cent of colleagues are based outside of Europe & Americas
Considering these factors, the Committee concluded that remuneration outcomes should reflect a Group scorecard assessment of 55 per cent of the maximum. This resulted in discretionary incentives in 2018 of $1,179 million, representing an increase of 3 per cent on 2017 compared with a 28 per cent increase in underlying profit.
The status of historical financial crime controls was taken in to consideration by the Committee when determining historical incentives and risk adjustments were made at that time. The ongoing remediation of financial crime control issues formed part of the scorecards used to determine 2018 remuneration outcomes, and maintaining and enhancing effective financial crime compliance controls is also reflected in the scorecards that will be used to determine 2019 remuneration outcomes. The Committee will continue to monitor the resolution of the US investigation and the FCA process and consider it as part of remuneration decision-making as new information comes to light.
Directors’ remuneration in 2018Under the existing policy, approved by shareholders in May 2016, executive directors were eligible for a maximum annual incentive of 80 per cent of fixed remuneration (see 2018 annual incentive awards below) and a maximum long-term incentive plan award of 120 per cent of fixed remuneration (see 2019–21 LTIP awards to be granted in March 2019 below) in respect of 2018.
2018 annual incentive awardsThe Committee determined that Bill and Andy should receive annual incentives of 50 and 48 per cent of fixed remuneration respectively based on Group and individual performance (compared with 61 per cent in 2017). Notwithstanding the improvement in Group performance and the strong personal performance against their objectives, the more stretching targets set for 2018 and the Committee’s consideration of other factors including share price performance during the year resulted in a 17 per cent year-on-year reduction in the annual incentive award for Bill and an 18 per cent year-on-year reduction for Andy. Further information on the determination of the annual incentive awards is provided on pages 97 to 99.
2019–21 LTIP awards to be granted in March 20192019–21 LTIP awards will be granted in March 2019, delivered in ordinary shares and with a value of 120 per cent of fixed remuneration at the time of award. Depending on performance over the next three years, awards will be deferred over seven years and an additional one-year retention period will apply post-vesting. Performance will be assessed based on return on tangible equity (RoTE) (with a CET1 underpin), total shareholder return (TSR) relative to a peer group, and the achievement of strategic measures that are aligned to the Group’s refreshed strategic priorities; to deliver our network and grow our affluent business; transform and disrupt with digital; and purpose and people.
RoTE is one of the financial KPIs that will be used to measure progress against our refreshed strategic priorities (see pages 17 to 19). The Committee considers target setting carefully before each grant and is committed to setting targets that are challenging and act as an effective incentive for executive directors to execute the strategy. The RoTE target range for 2019–21 LTIP awards is 8 to 11 per cent, which has been set considering the Group’s current financial position and plan, and the market environment and outlook. The broadly equivalent RoE range is 7 to 10 per cent which represents a continued increase in the stretch of our performance targets over recent years, from an RoE target range of 5 to 8 per cent for the 2017–19 LTIP and from a range of 6 to 9 per cent for the 2018–20 LTIP. Further information on the grant of the 2019–21 LTIP awards is provided on pages 99 to 100.
2016–18 LTIP awards vesting in May 2019The 2016–18 LTIP awards are due to vest in May 2019 and are subject to performance over three years from 2016 to 2018. Following an assessment of the performance conditions, 27 per cent of these awards are expected to vest. This reflects zero vesting for the RoE and TSR measures which are below the threshold targets set and strong performance against our strategic objectives, securing the foundations needed to deliver higher returns in the medium-term.
Risk review
and Cap
ital reviewS
trategic repo
rtS
upp
lementary info
rmatio
nFinancial statem
entsD
IRE
CT
OR
S’ R
EP
OR
T
93
Further information on the vesting of the 2016–18 LTIP awards is provided on pages 100 to 101.
Single total figure of remuneration for 2018The 2018 single total figure of remuneration consists of fixed remuneration received in 2018, annual incentives relating to 2018 performance (see above section on 2018 annual incentive awards), and long-term incentives where 2018 is the last year of the performance cycle (see above section on 2016–18 LTIP awards vesting in May 2019). The single figure for Bill for 2018 is £5,950,000 and for Andy is £3,645,000.
This represents a year-on-year increase of 27 and 28 per cent respectively, reflecting the first LTIP awards vesting to Bill and Andy since their appointments in 2015 and 2014 respectively.
A significant portion of their total remuneration is delivered in shares which will be released over the next five years. The deferral, retention and recovery provisions reinforce continued alignment with shareholder interests and the Group’s long-term performance. Further information on the single total figure of remuneration is provided on page 101.
Proposed new directors’ remuneration policyWe will be proposing a new directors’ remuneration policy to shareholders for approval at the AGM in May 2019. The Committee conducted a detailed review of the directors’ remuneration policy in 2018 and considered views of shareholders, our refreshed strategic priorities, market benchmarking and best practice.
The current policy is well-supported by shareholders (receiving a 94 per cent vote in favour when it was implemented in 2016) and continues to support the delivery of our long-term strategy. During our review of the policy, alternative variable remuneration structures were considered, such as removing the long-term incentive component and introducing restricted shares. Following careful consideration, the Committee decided to retain the key features of the current policy, and to enhance some components in order to achieve further simplicity, increase shareholder alignment and reinforce sustained long-term focus on our strategic priorities. The refreshed policy ensures continued regulatory compliance and reflects evolving best practice in many areas. The key features of the new policy are:
¼ A simplified fixed pay structure combining salary and fixed pay allowances (FPA) into ‘total salary’ delivered as a combination of cash and shares. This reflects that both of these elements are considered when determining the pay of the executive directors for their role, skills and experience
¼ For future directors we will set the pension contribution at 10 per cent of total salary in line with the pension contribution rate for all employees in the UK. For the existing directors, to deliver the current contractual value and to reflect the change to total salary, pension will be set at 20 per cent of total salary
¼ Significantly increased shareholding requirements to 250 per cent of total salary for the Group Chief Executive and 200 per cent of total salary for the Group Chief Financial Officer. This significantly increases the value of the required holding and changes the structure of the requirement from a specified number of shares to a percentage of total salary, which is more common practice
¼ A new post-employment shareholding requirement of 100 per cent of the shareholding requirement in place for one year and 50 per cent of the requirement in place in the second year following cessation of employment
Currently, if an executive director retires, their LTIP awards vest on a pro rata basis depending on time served during the performance period. The Committee has carefully considered, and discussed with major shareholders, the inclusion of a provision in the policy to provide them with the flexibility to disapply time proration on the vesting of LTIP
awards in certain circumstances. This would reinforce the alignment of executive directors’ remuneration with the Group’s financial and strategic performance and shareholders’ interests beyond their tenure. Before considering whether to exercise their discretion to disapply proration to the vesting of LTIP awards the Committee would need to be satisfied that the executive director:
¼ Has more than five years’ service on the Board
¼ Is retiring from full-time employment in financial services and comparable roles in other industries
¼ Has demonstrated satisfactory conduct and achieved their performance objectives
¼ Has a Board approved handover plan in place to support the transition to an identified successor
If these criteria have been met the Committee would then carefully consider using its discretion to disapply time proration on a case-by-case basis, taking into account all of the circumstances at that time. If the flexibility were to be used, typically, there would be no LTIP award in the final year of employment or additional payments in lieu of notice and there will be clear and detailed disclosure in the subsequent directors’ remuneration report explaining the circumstances and why the decision was made. If an executive director retires and subsequently takes up comparable executive employment again, unvested awards that had proration disapplied will lapse and the executive will be expected to re-pay any vested awards.
Details of the proposed directors’ remuneration policy for 2019 and how it will be implemented are set out on pages 108 to 117.
Directors’ remuneration for 2019Following a review of fixed remuneration, the Committee noted that there had been no increase for Bill since his appointment in June 2015. Taking this into account, together with his development in the role since joining the Group and his remuneration compared with global peers, the Committee awarded a total salary increase of 3 per cent, from £2,300,000 to £2,370,000, with effect from 1 April 2019. In making this decision the Committee also took into account the pay increases made to the broader employee population, which have been, on average, 4 per cent per year since 2015.
Following the review, no increase was made to fixed remuneration for Andy. His fixed remuneration components will be rebalanced to maintain the same total fixed remuneration and a similar proportion of cash under the new policy as currently (details are provided on page 116).
The Committee will continue to review fixed remuneration annually. The structure of remuneration in 2019 will be set by the new directors’ remuneration policy being proposed at the May 2019 AGM, which is summarised above with full details on pages 108 to 115.
We have consulted shareholders extensively as part of reviewing our directors’ remuneration policy and I would like to thank them for their engagement and valuable contribution. I look forward to further engagement with stakeholders during 2019 and hearing your views.
Christine HodgsonChair of the Remuneration Committee
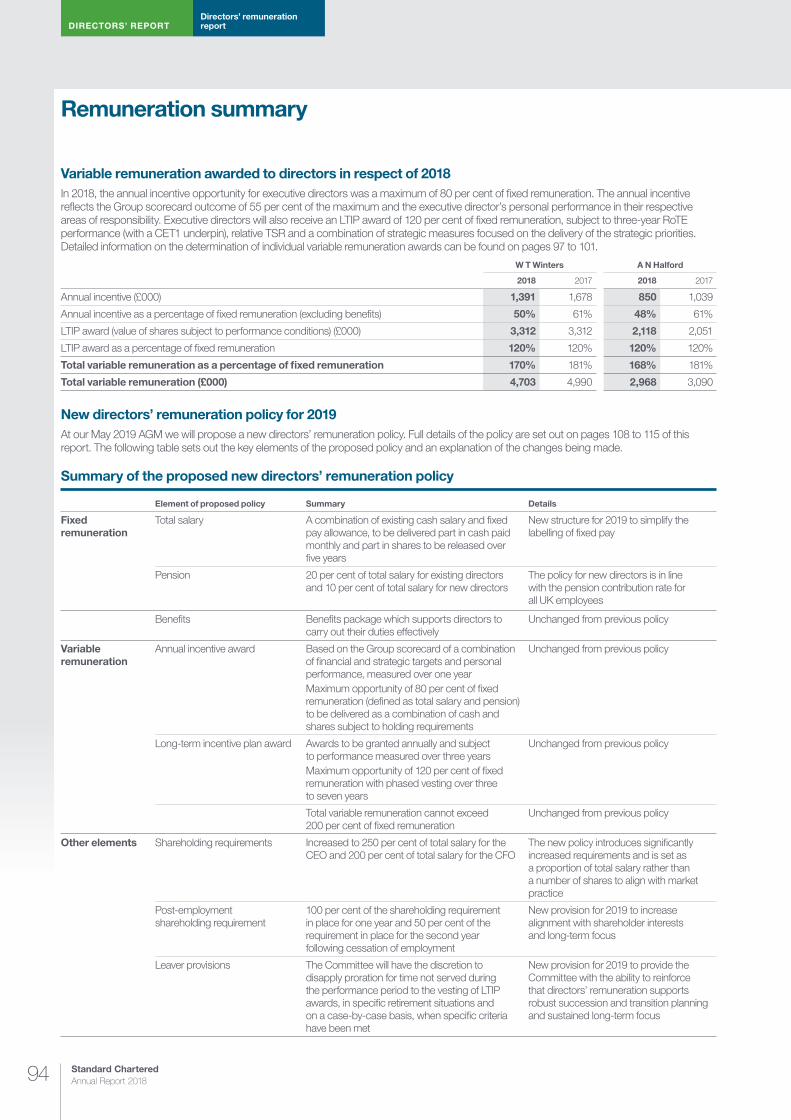
DIRECTORS’ REPORTDirectors’ remuneration report
Standard Chartered Annual Report 201894
Remuneration summary
Variable remuneration awarded to directors in respect of 2018In 2018, the annual incentive opportunity for executive directors was a maximum of 80 per cent of fixed remuneration. The annual incentive reflects the Group scorecard outcome of 55 per cent of the maximum and the executive director’s personal performance in their respective areas of responsibility. Executive directors will also receive an LTIP award of 120 per cent of fixed remuneration, subject to three-year RoTE performance (with a CET1 underpin), relative TSR and a combination of strategic measures focused on the delivery of the strategic priorities. Detailed information on the determination of individual variable remuneration awards can be found on pages 97 to 101.
W T Winters A N Halford
2018 2017 2018 2017
Annual incentive (£000) 1,391 1,678 850 1,039
Annual incentive as a percentage of fixed remuneration (excluding benefits) 50% 61% 48% 61%
LTIP award (value of shares subject to performance conditions) (£000) 3,312 3,312 2,118 2,051
LTIP award as a percentage of fixed remuneration 120% 120% 120% 120%
Total variable remuneration as a percentage of fixed remuneration 170% 181% 168% 181%
Total variable remuneration (£000) 4,703 4,990 2,968 3,090
New directors’ remuneration policy for 2019At our May 2019 AGM we will propose a new directors’ remuneration policy. Full details of the policy are set out on pages 108 to 115 of this report. The following table sets out the key elements of the proposed policy and an explanation of the changes being made.
Summary of the proposed new directors’ remuneration policy
Element of proposed policy Summary Details
Fixed remuneration
Total salary A combination of existing cash salary and fixed pay allowance, to be delivered part in cash paid monthly and part in shares to be released over five years
New structure for 2019 to simplify the labelling of fixed pay
Pension 20 per cent of total salary for existing directors and 10 per cent of total salary for new directors
The policy for new directors is in line with the pension contribution rate for all UK employees
Benefits Benefits package which supports directors to carry out their duties effectively
Unchanged from previous policy
Variable remuneration
Annual incentive award Based on the Group scorecard of a combination of financial and strategic targets and personal performance, measured over one yearMaximum opportunity of 80 per cent of fixed remuneration (defined as total salary and pension)to be delivered as a combination of cash and shares subject to holding requirements
Unchanged from previous policy
Long-term incentive plan award Awards to be granted annually and subject to performance measured over three yearsMaximum opportunity of 120 per cent of fixed remuneration with phased vesting over three to seven years
Unchanged from previous policy
Total variable remuneration cannot exceed 200 per cent of fixed remuneration
Unchanged from previous policy
Other elements Shareholding requirements Increased to 250 per cent of total salary for the CEO and 200 per cent of total salary for the CFO
The new policy introduces significantly increased requirements and is set as a proportion of total salary rather than a number of shares to align with market practice
Post-employment shareholding requirement
100 per cent of the shareholding requirement in place for one year and 50 per cent of the requirement in place for the second year following cessation of employment
New provision for 2019 to increase alignment with shareholder interests and long-term focus
Leaver provisions The Committee will have the discretion to disapply proration for time not served during the performance period to the vesting of LTIP awards, in specific retirement situations and on a case-by-case basis, when specific criteria have been met
New provision for 2019 to provide the Committee with the ability to reinforce that directors’ remuneration supports robust succession and transition planning and sustained long-term focus
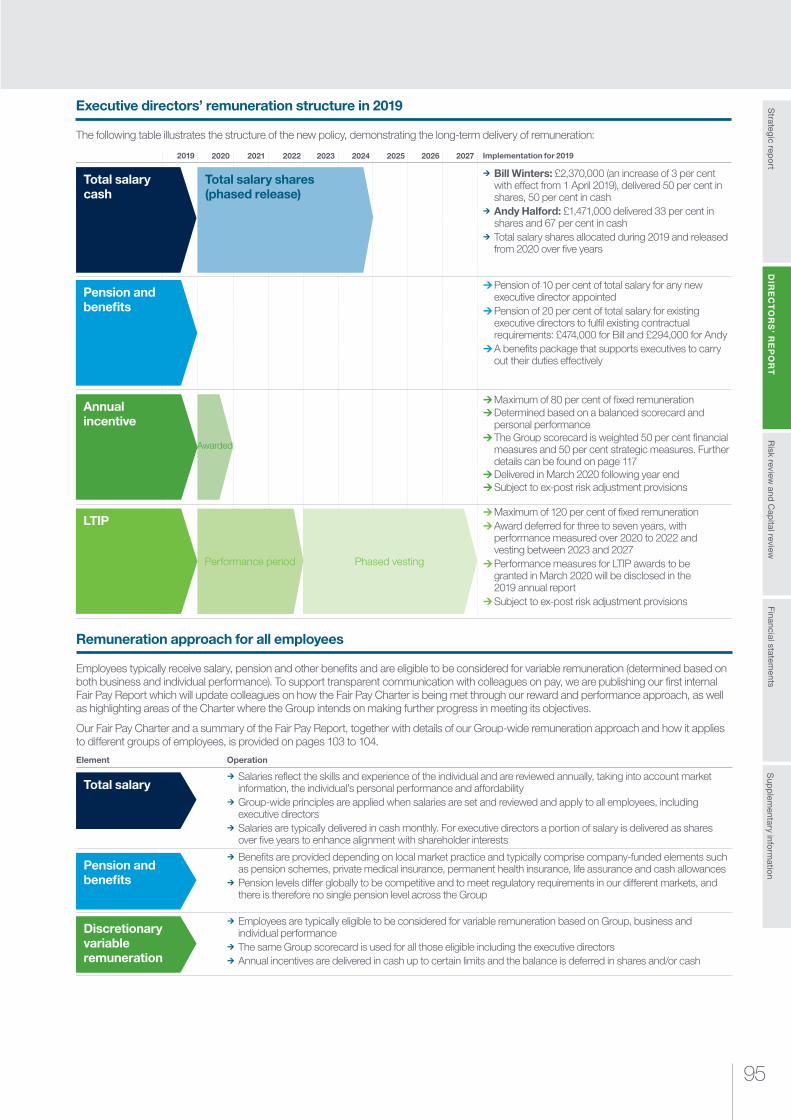
Risk review
and Cap
ital reviewS
trategic repo
rtS
upp
lementary info
rmatio
nFinancial statem
entsD
IRE
CT
OR
S’ R
EP
OR
T
95
Remuneration approach for all employees
Employees typically receive salary, pension and other benefits and are eligible to be considered for variable remuneration (determined based on both business and individual performance). To support transparent communication with colleagues on pay, we are publishing our first internal Fair Pay Report which will update colleagues on how the Fair Pay Charter is being met through our reward and performance approach, as well as highlighting areas of the Charter where the Group intends on making further progress in meeting its objectives.
Our Fair Pay Charter and a summary of the Fair Pay Report, together with details of our Group-wide remuneration approach and how it applies to different groups of employees, is provided on pages 103 to 104.
Element Operation
¼ Salaries reflect the skills and experience of the individual and are reviewed annually, taking into account market information, the individual’s personal performance and affordability
¼ Group-wide principles are applied when salaries are set and reviewed and apply to all employees, including executive directors
¼ Salaries are typically delivered in cash monthly. For executive directors a portion of salary is delivered as shares over five years to enhance alignment with shareholder interests
¼ Benefits are provided depending on local market practice and typically comprise company-funded elements such as pension schemes, private medical insurance, permanent health insurance, life assurance and cash allowances
¼ Pension levels differ globally to be competitive and to meet regulatory requirements in our different markets, and there is therefore no single pension level across the Group
¼ Employees are typically eligible to be considered for variable remuneration based on Group, business and individual performance
¼ The same Group scorecard is used for all those eligible including the executive directors ¼ Annual incentives are delivered in cash up to certain limits and the balance is deferred in shares and/or cash
Executive directors’ remuneration structure in 2019
The following table illustrates the structure of the new policy, demonstrating the long-term delivery of remuneration:
¼ Bill Winters: £2,370,000 (an increase of 3 per cent with effect from 1 April 2019), delivered 50 per cent in shares, 50 per cent in cash
¼ Andy Halford: £1,471,000 delivered 33 per cent in shares and 67 per cent in cash
¼ Total salary shares allocated during 2019 and released from 2020 over five years
¼Pension of 10 per cent of total salary for any new executive director appointed ¼Pension of 20 per cent of total salary for existing executive directors to fulfil existing contractual requirements: £474,000 for Bill and £294,000 for Andy ¼A benefits package that supports executives to carry out their duties effectively
¼Maximum of 80 per cent of fixed remuneration ¼Determined based on a balanced scorecard and personal performance ¼The Group scorecard is weighted 50 per cent financial measures and 50 per cent strategic measures. Further details can be found on page 117 ¼Delivered in March 2020 following year end ¼Subject to ex-post risk adjustment provisions
¼Maximum of 120 per cent of fixed remuneration ¼Award deferred for three to seven years, with performance measured over 2020 to 2022 and vesting between 2023 and 2027 ¼Performance measures for LTIP awards to be granted in March 2020 will be disclosed in the 2019 annual report ¼Subject to ex-post risk adjustment provisions
Implementation for 20192021 202320202019 2022 2024 2025 2026 2027
Total salary shares (phased release)
Phased vesting
Awarded
Total salary cash
Total salary
Pension and benefits
Discretionary variable remuneration
Pension and benefits
Annual incentive
Performance period
LTIP
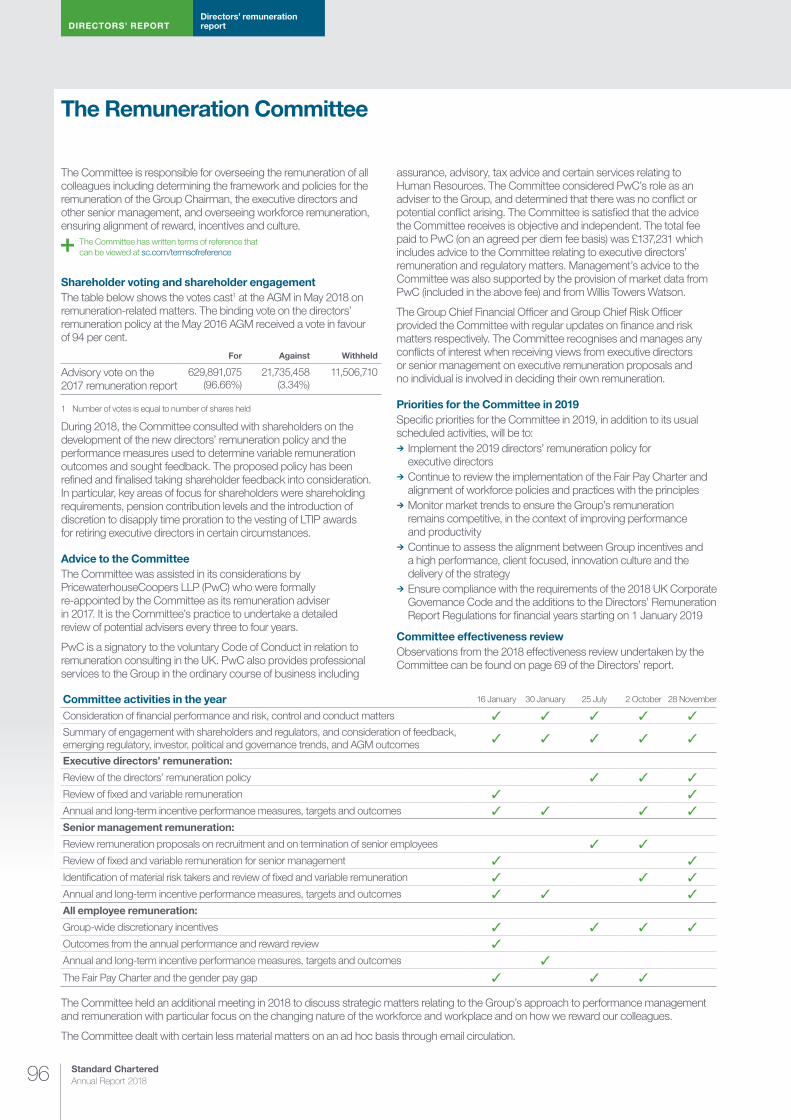
DIRECTORS’ REPORTDirectors’ remuneration report
Standard Chartered Annual Report 201896
The Remuneration Committee
The Committee is responsible for overseeing the remuneration of all colleagues including determining the framework and policies for the remuneration of the Group Chairman, the executive directors and other senior management, and overseeing workforce remuneration, ensuring alignment of reward, incentives and culture.
The Committee has written terms of reference that can be viewed at sc.com/termsofreference
Shareholder voting and shareholder engagementThe table below shows the votes cast1 at the AGM in May 2018 on remuneration-related matters. The binding vote on the directors’ remuneration policy at the May 2016 AGM received a vote in favour of 94 per cent.
For Against Withheld
Advisory vote on the 2017 remuneration report
629,891,075 (96.66%)
21,735,458 (3.34%)
11,506,710
1 Number of votes is equal to number of shares held
During 2018, the Committee consulted with shareholders on the development of the new directors’ remuneration policy and the performance measures used to determine variable remuneration outcomes and sought feedback. The proposed policy has been refined and finalised taking shareholder feedback into consideration. In particular, key areas of focus for shareholders were shareholding requirements, pension contribution levels and the introduction of discretion to disapply time proration to the vesting of LTIP awards for retiring executive directors in certain circumstances.
Advice to the CommitteeThe Committee was assisted in its considerations by PricewaterhouseCoopers LLP (PwC) who were formally re-appointed by the Committee as its remuneration adviser in 2017. It is the Committee’s practice to undertake a detailed review of potential advisers every three to four years.
PwC is a signatory to the voluntary Code of Conduct in relation to remuneration consulting in the UK. PwC also provides professional services to the Group in the ordinary course of business including
assurance, advisory, tax advice and certain services relating to Human Resources. The Committee considered PwC’s role as an adviser to the Group, and determined that there was no conflict or potential conflict arising. The Committee is satisfied that the advice the Committee receives is objective and independent. The total fee paid to PwC (on an agreed per diem fee basis) was £137,231 which includes advice to the Committee relating to executive directors’ remuneration and regulatory matters. Management’s advice to the Committee was also supported by the provision of market data from PwC (included in the above fee) and from Willis Towers Watson.
The Group Chief Financial Officer and Group Chief Risk Officer provided the Committee with regular updates on finance and risk matters respectively. The Committee recognises and manages any conflicts of interest when receiving views from executive directors or senior management on executive remuneration proposals and no individual is involved in deciding their own remuneration.
Priorities for the Committee in 2019Specific priorities for the Committee in 2019, in addition to its usual scheduled activities, will be to:
¼ Implement the 2019 directors’ remuneration policy for executive directors
¼ Continue to review the implementation of the Fair Pay Charter and alignment of workforce policies and practices with the principles
¼ Monitor market trends to ensure the Group’s remuneration remains competitive, in the context of improving performance and productivity
¼ Continue to assess the alignment between Group incentives and a high performance, client focused, innovation culture and the delivery of the strategy
¼ Ensure compliance with the requirements of the 2018 UK Corporate Governance Code and the additions to the Directors’ Remuneration Report Regulations for financial years starting on 1 January 2019
Committee effectiveness reviewObservations from the 2018 effectiveness review undertaken by the Committee can be found on page 69 of the Directors’ report.
Committee activities in the year 16 January 30 January 25 July 2 October 28 November
Consideration of financial performance and risk, control and conduct matters
Summary of engagement with shareholders and regulators, and consideration of feedback, emerging regulatory, investor, political and governance trends, and AGM outcomes
Executive directors’ remuneration:
Review of the directors’ remuneration policy
Review of fixed and variable remuneration
Annual and long-term incentive performance measures, targets and outcomes
Senior management remuneration:
Review remuneration proposals on recruitment and on termination of senior employees
Review of fixed and variable remuneration for senior management
Identification of material risk takers and review of fixed and variable remuneration
Annual and long-term incentive performance measures, targets and outcomes
All employee remuneration:
Group-wide discretionary incentives
Outcomes from the annual performance and reward review
Annual and long-term incentive performance measures, targets and outcomes
The Fair Pay Charter and the gender pay gap
The Committee held an additional meeting in 2018 to discuss strategic matters relating to the Group’s approach to performance management and remuneration with particular focus on the changing nature of the workforce and workplace and on how we reward our colleagues.
The Committee dealt with certain less material matters on an ad hoc basis through email circulation.
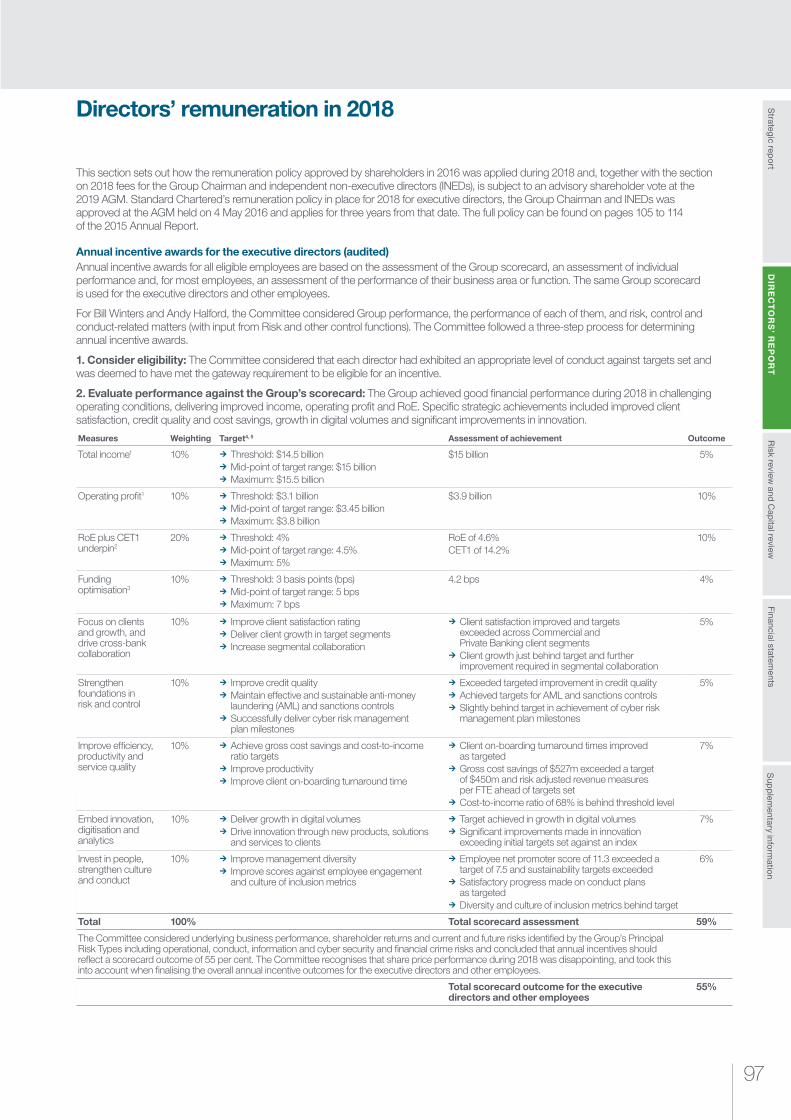
Risk review
and Cap
ital reviewS
trategic repo
rtS
upp
lementary info
rmatio
nFinancial statem
entsD
IRE
CT
OR
S’ R
EP
OR
T
97
This section sets out how the remuneration policy approved by shareholders in 2016 was applied during 2018 and, together with the section on 2018 fees for the Group Chairman and independent non-executive directors (INEDs), is subject to an advisory shareholder vote at the 2019 AGM. Standard Chartered’s remuneration policy in place for 2018 for executive directors, the Group Chairman and INEDs was approved at the AGM held on 4 May 2016 and applies for three years from that date. The full policy can be found on pages 105 to 114 of the 2015 Annual Report.
Annual incentive awards for the executive directors (audited) Annual incentive awards for all eligible employees are based on the assessment of the Group scorecard, an assessment of individual performance and, for most employees, an assessment of the performance of their business area or function. The same Group scorecard is used for the executive directors and other employees.
For Bill Winters and Andy Halford, the Committee considered Group performance, the performance of each of them, and risk, control and conduct-related matters (with input from Risk and other control functions). The Committee followed a three-step process for determining annual incentive awards.
1. Consider eligibility: The Committee considered that each director had exhibited an appropriate level of conduct against targets set and was deemed to have met the gateway requirement to be eligible for an incentive.
2. Evaluate performance against the Group’s scorecard: The Group achieved good financial performance during 2018 in challenging operating conditions, delivering improved income, operating profit and RoE. Specific strategic achievements included improved client satisfaction, credit quality and cost savings, growth in digital volumes and significant improvements in innovation.
Measures Weighting Target4, 5 Assessment of achievement Outcome
Total income1 10% ¼ Threshold: $14.5 billion ¼ Mid-point of target range: $15 billion ¼ Maximum: $15.5 billion
$15 billion 5%
Operating profit1 10% ¼ Threshold: $3.1 billion ¼ Mid-point of target range: $3.45 billion ¼ Maximum: $3.8 billion
$3.9 billion 10%
RoE plus CET1 underpin2
20% ¼ Threshold: 4% ¼ Mid-point of target range: 4.5% ¼ Maximum: 5%
RoE of 4.6%CET1 of 14.2%
10%
Funding optimisation3
10% ¼ Threshold: 3 basis points (bps) ¼ Mid-point of target range: 5 bps ¼ Maximum: 7 bps
4.2 bps 4%
Focus on clients and growth, and drive cross-bank collaboration
10% ¼ Improve client satisfaction rating ¼ Deliver client growth in target segments ¼ Increase segmental collaboration
¼ Client satisfaction improved and targets exceeded across Commercial and Private Banking client segments
¼ Client growth just behind target and further improvement required in segmental collaboration
5%
Strengthen foundations in risk and control
10% ¼ Improve credit quality ¼ Maintain effective and sustainable anti-money laundering (AML) and sanctions controls
¼ Successfully deliver cyber risk management plan milestones
¼ Exceeded targeted improvement in credit quality ¼ Achieved targets for AML and sanctions controls ¼ Slightly behind target in achievement of cyber risk management plan milestones
5%
Improve efficiency, productivity and service quality
10% ¼ Achieve gross cost savings and cost-to-income ratio targets
¼ Improve productivity ¼ Improve client on-boarding turnaround time
¼ Client on-boarding turnaround times improved as targeted
¼ Gross cost savings of $527m exceeded a target of $450m and risk adjusted revenue measures per FTE ahead of targets set
¼ Cost-to-income ratio of 68% is behind threshold level
7%
Embed innovation, digitisation and analytics
10% ¼ Deliver growth in digital volumes ¼ Drive innovation through new products, solutions and services to clients
¼ Target achieved in growth in digital volumes ¼ Significant improvements made in innovation exceeding initial targets set against an index
7%
Invest in people, strengthen culture and conduct
10% ¼ Improve management diversity ¼ Improve scores against employee engagement and culture of inclusion metrics
¼ Employee net promoter score of 11.3 exceeded a target of 7.5 and sustainability targets exceeded
¼ Satisfactory progress made on conduct plans as targeted
¼ Diversity and culture of inclusion metrics behind target
6%
Total 100% Total scorecard assessment 59%
The Committee considered underlying business performance, shareholder returns and current and future risks identified by the Group’s Principal Risk Types including operational, conduct, information and cyber security and financial crime risks and concluded that annual incentives should reflect a scorecard outcome of 55 per cent. The Committee recognises that share price performance during 2018 was disappointing, and took this into account when finalising the overall annual incentive outcomes for the executive directors and other employees.
Total scorecard outcome for the executivedirectors and other employees
55%
Directors’ remuneration in 2018

DIRECTORS’ REPORTDirectors’ remuneration report
Standard Chartered Annual Report 201898
Notes to the 2018 Group scorecard assessment1 Total income and operating profit are on an underlying basis. Certain items are presented as restructuring and other items that are excluded from the underlying results of the Group.
These are income, costs and impairment and resulting operating profit relating to identifiable business units, products or portfolios from the relevant dates that they have been approved for restructuring, disposal, wind down or redundancy. This includes realised and unrealised gains and losses from management’s decisions to dispose of assets as well as residual income, direct costs and impairment of related legacy assets of those identifiable business units, products or portfolios. See Note 2 page 246
2 RoE was based on profit attributed to ordinary shareholders, adjusted, on a tax-effected basis, for profits or losses of a capital nature, restructuring charges, amounts consequent to investment transactions driven by strategic intent and infrequent/exceptional transactions that are significant or material in the context of the Group’s normal business earnings for the period. The CET1 underpin was set at the higher of 12 per cent or the minimum regulatory level as at 31 December 2018 (taking into account any transition rules or material changes in regulatory rules). Unaudited
3 Funding optimisation was an initiative that targets an efficient level and mix of funding (liabilities) to support the Group’s growth aspirations. Measured in basis points reduction in funding costs relative to a normalised benchmark, which excludes the impact of interest rate movement, but requires a minimum level of growth in quality funding. Unaudited
4 A maximum/minimum performance threshold was set for each performance measure. The Committee used its judgement to determine scorecard outcomes within this range (with a higher than 50 per cent outcome for performance above target and a lower than 50 per cent outcome for below target performance)
5 Strategic targets are aligned to internal scorecards measuring in-year progress on multi-year initiatives. Unaudited
3. Assess personal performance and finalise awards: As outlined in the policy, the Committee can make an upwards or downwards adjustment to the scorecard outcome for personal performance, consistent with the approach for other employees who were eligible to be considered for discretionary incentives. When considering whether such an adjustment is appropriate, the Committee considers the particular areas of responsibility of the executive director together with the objectives that they were asked to prioritise for the year and their personal contribution to the scorecard outcome. The adjustment will usually be in the range of +/- 10 percentage points to the scorecard outcome.
Bill Winters
The Committee assessed Bill as having outstanding personal performance against his personal objectives during 2018 and in role modelling the valued behaviours expected by the Board. During 2018, Bill’s leadership has secured the improved performance reflected in the scorecard, as well as broader successes in strengthening the Group’s foundations and in the increased impetus to becoming a simpler, more productive and more innovative organisation.
Taking this into account, the Committee considered an adjustment of 8 percentage points to be appropriate and determined to award an annual incentive of 63 per cent of the maximum opportunity. This equates to 50 per cent of fixed remuneration (61 per cent in 2017). Key objectives Achievement
Lead by example and role model the Group’s valued behaviours
¼ The Committee considered Bill as having role modelled the conduct and behaviour expected by the Board, setting the very strong tone from the top and the high bar on conduct, which have been instrumental in delivering the 2018 financial and strategic objectives
¼ This is supported by feedback from colleagues across the Group, the leadership team and the Board, showing that Bill is a very effective, respected and trusted executive leader
Embed culture change, instilling a challenging, high performance culture
¼ During 2018, Bill continued to build on his efforts in 2017 to strengthen the culture across all levels and areas of the business. He personally led the refresh and launch of our valued behaviours and has devoted considerable time and effort to embedding these
¼ Bill’s energy and focus has had positive results, with the stronger performance culture evident to the Board, both in improved performance and in day-to-day operations
¼ Bill personally led initiatives to embed a new approach to problem-solving that increases simplicity and speed in client processes and injected a new focus on innovation, meeting key objectives set by the Board
Develop refreshed long-term vision and strategy for the Group
¼ During 2018, Bill met his objective to better understand the long-term challenges the Group is facing from external domains and to put plans in place to turn these into opportunities for longer-term growth. The results of this are evident in the refreshed strategic priorities
Maintain effective and constructive relationships with our stakeholders
¼ The Committee considered Bill to have delivered against this objective based on regulatory, investor and client feedback
¼ Bill took significant time personally to cultivate and maintain important client relationships
Andy Halford
The Committee assessed Andy as having made a strong personal performance during 2018 against his personal objectives and in demonstrating the valued behaviours expected by the Board. During 2018 Andy led the successful design of key strategic initiatives for the Group, improving efficiency and productivity. Taking these achievements into account, alongside Andy’s personal contribution to the scorecard outcome, the Committee considered an adjustment of 5 percentage points to be appropriate and determined to award an annual incentive of 60 per cent of the maximum opportunity. This equates to 48 per cent of fixed remuneration (61 per cent in 2017).
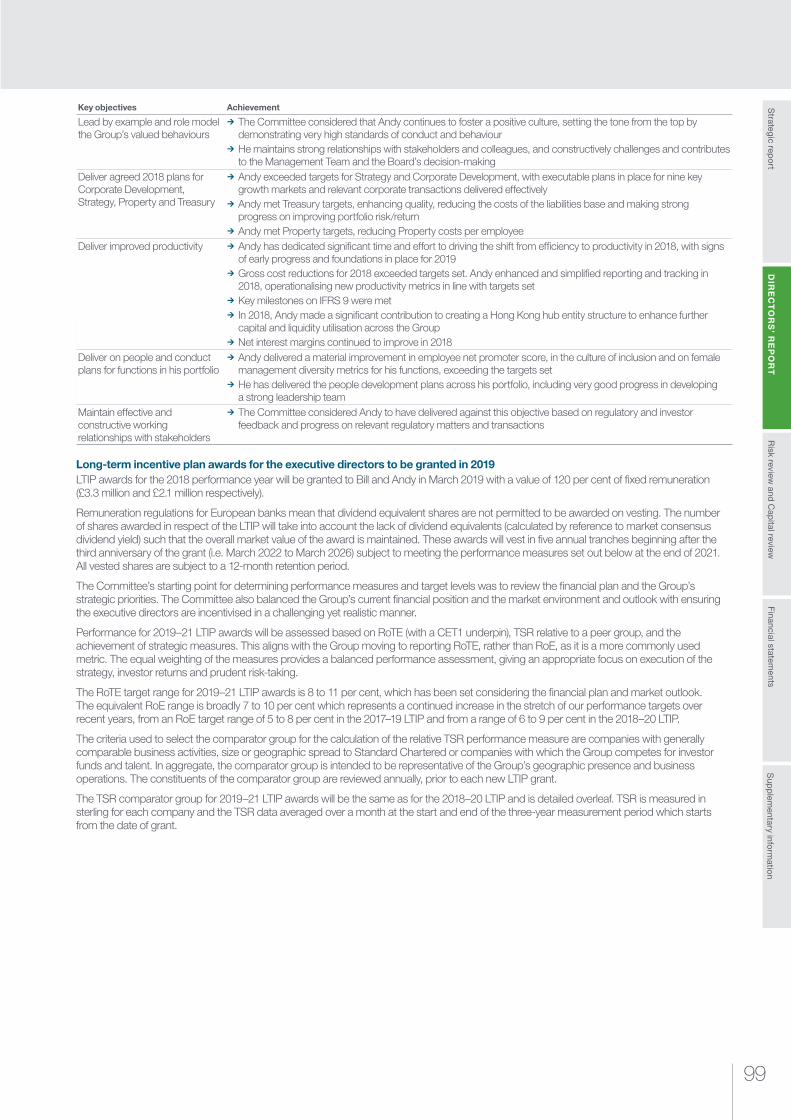
Risk review
and Cap
ital reviewS
trategic repo
rtS
upp
lementary info
rmatio
nFinancial statem
entsD
IRE
CT
OR
S’ R
EP
OR
T
99
Key objectives Achievement
Lead by example and role model the Group’s valued behaviours
¼ The Committee considered that Andy continues to foster a positive culture, setting the tone from the top by demonstrating very high standards of conduct and behaviour
¼ He maintains strong relationships with stakeholders and colleagues, and constructively challenges and contributes to the Management Team and the Board’s decision-making
Deliver agreed 2018 plans for Corporate Development, Strategy, Property and Treasury
¼ Andy exceeded targets for Strategy and Corporate Development, with executable plans in place for nine key growth markets and relevant corporate transactions delivered effectively
¼ Andy met Treasury targets, enhancing quality, reducing the costs of the liabilities base and making strong progress on improving portfolio risk/return
¼ Andy met Property targets, reducing Property costs per employeeDeliver improved productivity ¼ Andy has dedicated significant time and effort to driving the shift from efficiency to productivity in 2018, with signs
of early progress and foundations in place for 2019 ¼ Gross cost reductions for 2018 exceeded targets set. Andy enhanced and simplified reporting and tracking in 2018, operationalising new productivity metrics in line with targets set
¼ Key milestones on IFRS 9 were met ¼ In 2018, Andy made a significant contribution to creating a Hong Kong hub entity structure to enhance further capital and liquidity utilisation across the Group
¼ Net interest margins continued to improve in 2018Deliver on people and conduct plans for functions in his portfolio
¼ Andy delivered a material improvement in employee net promoter score, in the culture of inclusion and on female management diversity metrics for his functions, exceeding the targets set
¼ He has delivered the people development plans across his portfolio, including very good progress in developing a strong leadership team
Maintain effective and constructive working relationships with stakeholders
¼ The Committee considered Andy to have delivered against this objective based on regulatory and investor feedback and progress on relevant regulatory matters and transactions
Long-term incentive plan awards for the executive directors to be granted in 2019LTIP awards for the 2018 performance year will be granted to Bill and Andy in March 2019 with a value of 120 per cent of fixed remuneration (£3.3 million and £2.1 million respectively).
Remuneration regulations for European banks mean that dividend equivalent shares are not permitted to be awarded on vesting. The number of shares awarded in respect of the LTIP will take into account the lack of dividend equivalents (calculated by reference to market consensus dividend yield) such that the overall market value of the award is maintained. These awards will vest in five annual tranches beginning after the third anniversary of the grant (i.e. March 2022 to March 2026) subject to meeting the performance measures set out below at the end of 2021. All vested shares are subject to a 12-month retention period.
The Committee’s starting point for determining performance measures and target levels was to review the financial plan and the Group’s strategic priorities. The Committee also balanced the Group’s current financial position and the market environment and outlook with ensuring the executive directors are incentivised in a challenging yet realistic manner.
Performance for 2019–21 LTIP awards will be assessed based on RoTE (with a CET1 underpin), TSR relative to a peer group, and the achievement of strategic measures. This aligns with the Group moving to reporting RoTE, rather than RoE, as it is a more commonly used metric. The equal weighting of the measures provides a balanced performance assessment, giving an appropriate focus on execution of the strategy, investor returns and prudent risk-taking.
The RoTE target range for 2019–21 LTIP awards is 8 to 11 per cent, which has been set considering the financial plan and market outlook. The equivalent RoE range is broadly 7 to 10 per cent which represents a continued increase in the stretch of our performance targets over recent years, from an RoE target range of 5 to 8 per cent in the 2017–19 LTIP and from a range of 6 to 9 per cent in the 2018–20 LTIP.
The criteria used to select the comparator group for the calculation of the relative TSR performance measure are companies with generally comparable business activities, size or geographic spread to Standard Chartered or companies with which the Group competes for investor funds and talent. In aggregate, the comparator group is intended to be representative of the Group’s geographic presence and business operations. The constituents of the comparator group are reviewed annually, prior to each new LTIP grant.
The TSR comparator group for 2019–21 LTIP awards will be the same as for the 2018–20 LTIP and is detailed overleaf. TSR is measured in sterling for each company and the TSR data averaged over a month at the start and end of the three-year measurement period which starts from the date of grant.

DIRECTORS’ REPORTDirectors’ remuneration report
Standard Chartered Annual Report 2018100
Performance measures for 2019–21 long-term incentive plan awards
Conduct gateway requirement to be met in order for awards to vest An appropriate level of individual valued behaviours and conduct have to be exhibited before the vesting of awards is considered.
Measure WeightingAmount vesting (as a % of total award)
Threshold performance target
Maximum performance target
1. RoTE1,2 in 2021 plus CET1 underpin of the higher of 13% or the minimum regulatory requirement
One-third ¼ Maximum – 33.3% ¼ Threshold – 8.3% ¼ Below threshold – 0%
8% 11%
2. Relative TSR3 against peer group One-third ¼ Maximum – 33.3% ¼ Threshold – 8.3% ¼ Below threshold – 0%
Median Upper quartile
3. Strategic measures One-third ¼ Maximum – 33.3% ¼ Minimum – 0%
¼ Performance against each component of the scorecard will be assessed by the Committee using proof points to determine the percentage of the award that may vest
Deliver our network and grow our affluent business ¼ Improve client satisfaction rating ¼ Deliver client growth in target segments ¼ Capitalise on China opportunities including through RMB and mainland wealth growth
¼ Develop Africa through digital growth, increasing the number of clients and improving client satisfaction
¼ Maintain credit quality
Transform and disrupt with digital ¼ Use partnership, platforms and technologies to improve client experience
¼ Deliver progression through growth in digital volumes
Purpose and people ¼ Enhance compliance and financial crime compliance controls
¼ Successfully deliver cyber risk management plan milestones
¼ Develop Human Capital by improving diversity, employee engagement and culture of inclusion metrics and by delivering conduct plans
1 Normalised RoTE is based on profit attributed to ordinary shareholders, adjusted, on a tax-affected basis, for any fair value changes relating to gains/losses on disposals, exceptional transactions and restructuring gains and losses, expenses and impairments that are significant or material in the context of the Group’s normal business for the period, less the average goodwill and intangibles for the reporting period. Normalised RoTE normally excludes regulatory fines but, for remuneration purposes, this would be subject to review by the Remuneration Committee
2 If RoTE reaches 8 per cent then 8.3 per cent of the award vests. If RoTE reaches 11 per cent then 33.3 per cent of the award vests. If RoTE is between the threshold and maximum, vesting is calculated on a straight-line basis between these two points
3 Relative TSR is measured against a comparator group. If the Group’s TSR performance is at least equivalent to the median ranked company then 8.3 per cent of the award vests. If the Group’s TSR performance is at least equal to the upper quartile ranked company then 33.3 per cent of the award vests. Between these points, the Group’s TSR is compared to that of the comparators positioned immediately above and below it and straight-line vesting applies
The comparator group for the TSR measure in the 2019–21 LTIP is set out below:
Banco Santander Barclays DBS Group ICICI Société Générale United Overseas Bank
Bank of America BNP Paribas Deutsche Bank JPMorgan Chase Standard Bank
Bank of China Citigroup HSBC KB Financial Group State Bank of India
Bank of East Asia Credit Suisse ICBC Oversea Chinese Banking Corporation
UBS
Performance outcomes for 2016–18 long-term incentive plan awardsLTIP awards were granted to Bill and Andy in 2016 with a face value of 200 per cent of fixed remuneration, to reinforce the achievement of the business turnaround and incentivise the new executive directors. The Committee determined there would be no annual incentives in respect of 2015 due to the Group’s financial performance.
The award was share-based and subject to the satisfaction of stretching performance measures over three years. The conduct gateway requirement must be met before any awards would vest. The awards were then subject to RoE and relative TSR targets and a qualitative and quantitative assessment of the strategic measures.
The Committee concluded that Bill and Andy exhibited appropriate conduct during the performance period and therefore the conduct gateway was met. The threshold RoE target has not been achieved and the relative TSR threshold target will be measured in March 2019 but is estimated not to have been achieved and, therefore, there will be no vesting for the 66.6 per cent of the awards subject to these measures. The strategic element of the LTIP was designed to measure progress against key elements of the strategic objectives set out for the Group in 2015. The Committee considered performance against the proof points as set out in the table below and determined that in the majority of
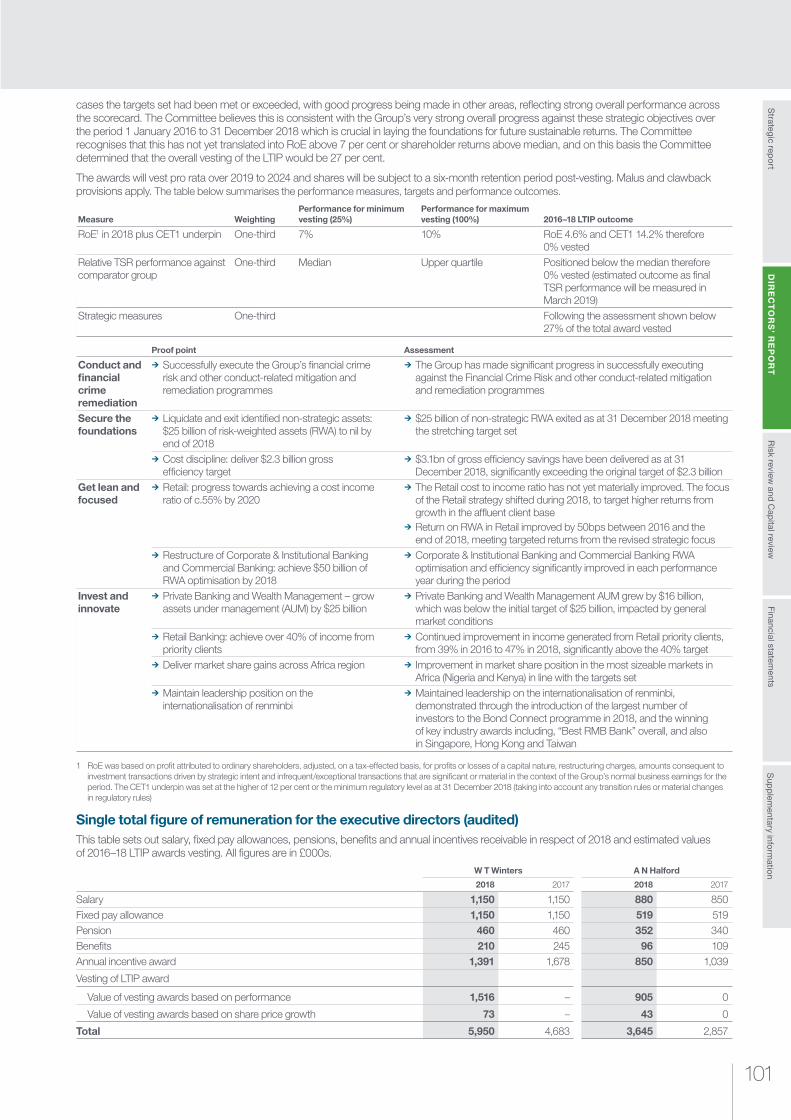
Risk review
and Cap
ital reviewS
trategic repo
rtS
upp
lementary info
rmatio
nFinancial statem
entsD
IRE
CT
OR
S’ R
EP
OR
T
101
cases the targets set had been met or exceeded, with good progress being made in other areas, reflecting strong overall performance across the scorecard. The Committee believes this is consistent with the Group’s very strong overall progress against these strategic objectives over the period 1 January 2016 to 31 December 2018 which is crucial in laying the foundations for future sustainable returns. The Committee recognises that this has not yet translated into RoE above 7 per cent or shareholder returns above median, and on this basis the Committee determined that the overall vesting of the LTIP would be 27 per cent.
The awards will vest pro rata over 2019 to 2024 and shares will be subject to a six-month retention period post-vesting. Malus and clawback provisions apply. The table below summarises the performance measures, targets and performance outcomes.
Measure WeightingPerformance for minimum vesting (25%)
Performance for maximum vesting (100%) 2016–18 LTIP outcome
RoE1 in 2018 plus CET1 underpin One-third 7% 10% RoE 4.6% and CET1 14.2% therefore 0% vested
Relative TSR performance against comparator group
One-third Median Upper quartile Positioned below the median therefore 0% vested (estimated outcome as final TSR performance will be measured in March 2019)
Strategic measures One-third Following the assessment shown below 27% of the total award vested
Proof point Assessment
Conduct and financial crime remediation
¼ Successfully execute the Group’s financial crime risk and other conduct-related mitigation and remediation programmes
¼ The Group has made significant progress in successfully executing against the Financial Crime Risk and other conduct-related mitigation and remediation programmes
Secure the foundations
¼ Liquidate and exit identified non-strategic assets: $25 billion of risk-weighted assets (RWA) to nil by end of 2018
¼ $25 billion of non-strategic RWA exited as at 31 December 2018 meeting the stretching target set
¼ Cost discipline: deliver $2.3 billion gross efficiency target
¼ $3.1bn of gross efficiency savings have been delivered as at 31 December 2018, significantly exceeding the original target of $2.3 billion
Get lean and focused
¼ Retail: progress towards achieving a cost income ratio of c.55% by 2020
¼ The Retail cost to income ratio has not yet materially improved. The focus of the Retail strategy shifted during 2018, to target higher returns from growth in the affluent client base
¼ Return on RWA in Retail improved by 50bps between 2016 and the end of 2018, meeting targeted returns from the revised strategic focus
¼ Restructure of Corporate & Institutional Banking and Commercial Banking: achieve $50 billion of RWA optimisation by 2018
¼ Corporate & Institutional Banking and Commercial Banking RWA optimisation and efficiency significantly improved in each performance year during the period
Invest and innovate
¼ Private Banking and Wealth Management – grow assets under management (AUM) by $25 billion
¼ Private Banking and Wealth Management AUM grew by $16 billion, which was below the initial target of $25 billion, impacted by general market conditions
¼ Retail Banking: achieve over 40% of income from priority clients
¼ Continued improvement in income generated from Retail priority clients, from 39% in 2016 to 47% in 2018, significantly above the 40% target
¼ Deliver market share gains across Africa region ¼ Improvement in market share position in the most sizeable markets in Africa (Nigeria and Kenya) in line with the targets set
¼ Maintain leadership position on the internationalisation of renminbi
¼ Maintained leadership on the internationalisation of renminbi, demonstrated through the introduction of the largest number of investors to the Bond Connect programme in 2018, and the winning of key industry awards including, “Best RMB Bank” overall, and also in Singapore, Hong Kong and Taiwan
1 RoE was based on profit attributed to ordinary shareholders, adjusted, on a tax-effected basis, for profits or losses of a capital nature, restructuring charges, amounts consequent to investment transactions driven by strategic intent and infrequent/exceptional transactions that are significant or material in the context of the Group’s normal business earnings for the period. The CET1 underpin was set at the higher of 12 per cent or the minimum regulatory level as at 31 December 2018 (taking into account any transition rules or material changes in regulatory rules)
Single total figure of remuneration for the executive directors (audited)This table sets out salary, fixed pay allowances, pensions, benefits and annual incentives receivable in respect of 2018 and estimated values of 2016–18 LTIP awards vesting. All figures are in £000s.
W T Winters A N Halford
2018 2017 2018 2017
Salary 1,150 1,150 880 850Fixed pay allowance 1,150 1,150 519 519Pension 460 460 352 340Benefits 210 245 96 109Annual incentive award 1,391 1,678 850 1,039
Vesting of LTIP award
Value of vesting awards based on performance 1,516 – 905 0
Value of vesting awards based on share price growth 73 – 43 0
Total 5,950 4,683 3,645 2,857
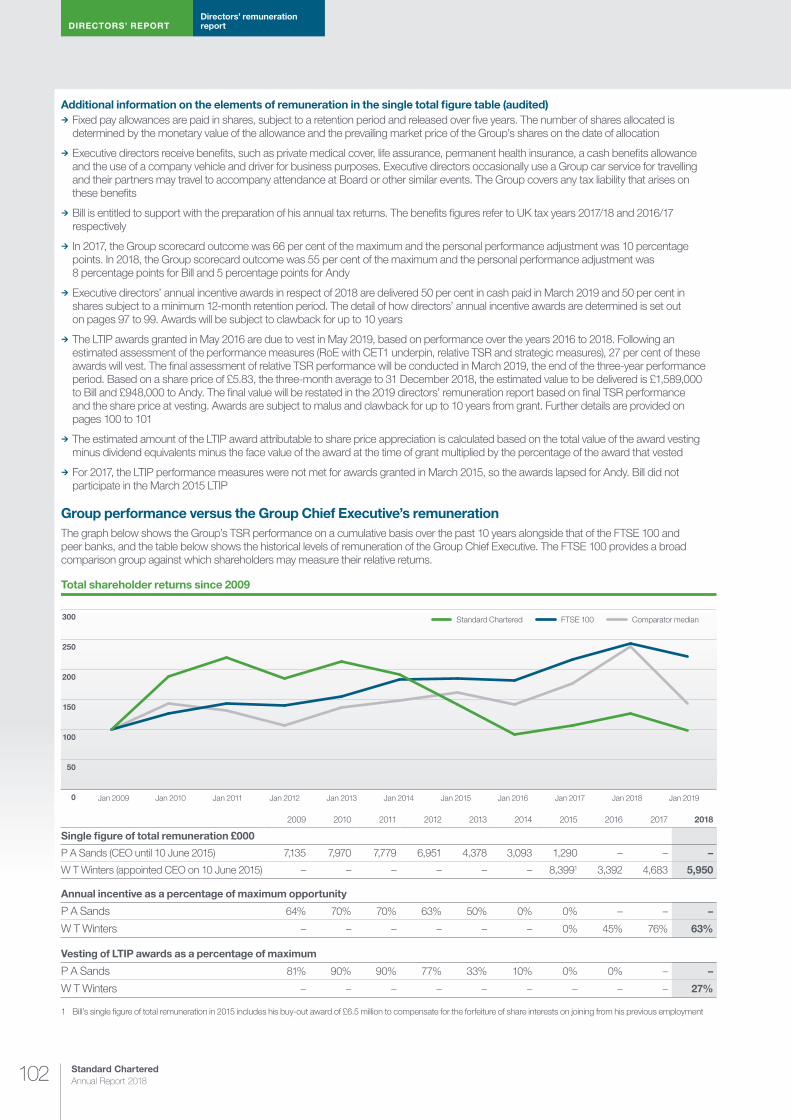
DIRECTORS’ REPORTDirectors’ remuneration report
Standard Chartered Annual Report 2018102
Additional information on the elements of remuneration in the single total figure table (audited) ¼ Fixed pay allowances are paid in shares, subject to a retention period and released over five years. The number of shares allocated is determined by the monetary value of the allowance and the prevailing market price of the Group’s shares on the date of allocation
¼ Executive directors receive benefits, such as private medical cover, life assurance, permanent health insurance, a cash benefits allowance and the use of a company vehicle and driver for business purposes. Executive directors occasionally use a Group car service for travelling and their partners may travel to accompany attendance at Board or other similar events. The Group covers any tax liability that arises on these benefits
¼ Bill is entitled to support with the preparation of his annual tax returns. The benefits figures refer to UK tax years 2017/18 and 2016/17 respectively
¼ In 2017, the Group scorecard outcome was 66 per cent of the maximum and the personal performance adjustment was 10 percentage points. In 2018, the Group scorecard outcome was 55 per cent of the maximum and the personal performance adjustment was 8 percentage points for Bill and 5 percentage points for Andy
¼ Executive directors’ annual incentive awards in respect of 2018 are delivered 50 per cent in cash paid in March 2019 and 50 per cent in shares subject to a minimum 12-month retention period. The detail of how directors’ annual incentive awards are determined is set out on pages 97 to 99. Awards will be subject to clawback for up to 10 years
¼ The LTIP awards granted in May 2016 are due to vest in May 2019, based on performance over the years 2016 to 2018. Following an estimated assessment of the performance measures (RoE with CET1 underpin, relative TSR and strategic measures), 27 per cent of these awards will vest. The final assessment of relative TSR performance will be conducted in March 2019, the end of the three-year performance period. Based on a share price of £5.83, the three-month average to 31 December 2018, the estimated value to be delivered is £1,589,000 to Bill and £948,000 to Andy. The final value will be restated in the 2019 directors’ remuneration report based on final TSR performance and the share price at vesting. Awards are subject to malus and clawback for up to 10 years from grant. Further details are provided on pages 100 to 101
¼ The estimated amount of the LTIP award attributable to share price appreciation is calculated based on the total value of the award vesting minus dividend equivalents minus the face value of the award at the time of grant multiplied by the percentage of the award that vested
¼ For 2017, the LTIP performance measures were not met for awards granted in March 2015, so the awards lapsed for Andy. Bill did not participate in the March 2015 LTIP
Group performance versus the Group Chief Executive’s remunerationThe graph below shows the Group’s TSR performance on a cumulative basis over the past 10 years alongside that of the FTSE 100 and peer banks, and the table below shows the historical levels of remuneration of the Group Chief Executive. The FTSE 100 provides a broad comparison group against which shareholders may measure their relative returns.
Jan 2009 Jan 2010 Jan 2011
Standard Chartered
Jan 2012 Jan 2013 Jan 2014 Jan 2015 Jan 2016 Jan 2017 Jan 2018 Jan 20190
50
100
150
200
250
300 FTSE 100 Comparator median
Total shareholder returns since 2009
2009 2010 2011 2012 2013 2014 2015 2016 2017 2018
Single figure of total remuneration £000
P A Sands (CEO until 10 June 2015) 7,135 7,970 7,779 6,951 4,378 3,093 1,290 – – –
W T Winters (appointed CEO on 10 June 2015) – – – – – – 8,3991 3,392 4,683 5,950
Annual incentive as a percentage of maximum opportunity
P A Sands 64% 70% 70% 63% 50% 0% 0% – – –
W T Winters – – – – – – 0% 45% 76% 63%
Vesting of LTIP awards as a percentage of maximum
P A Sands 81% 90% 90% 77% 33% 10% 0% 0% – –
W T Winters – – – – – – – – – 27%
1 Bill’s single figure of total remuneration in 2015 includes his buy-out award of £6.5 million to compensate for the forfeiture of share interests on joining from his previous employment
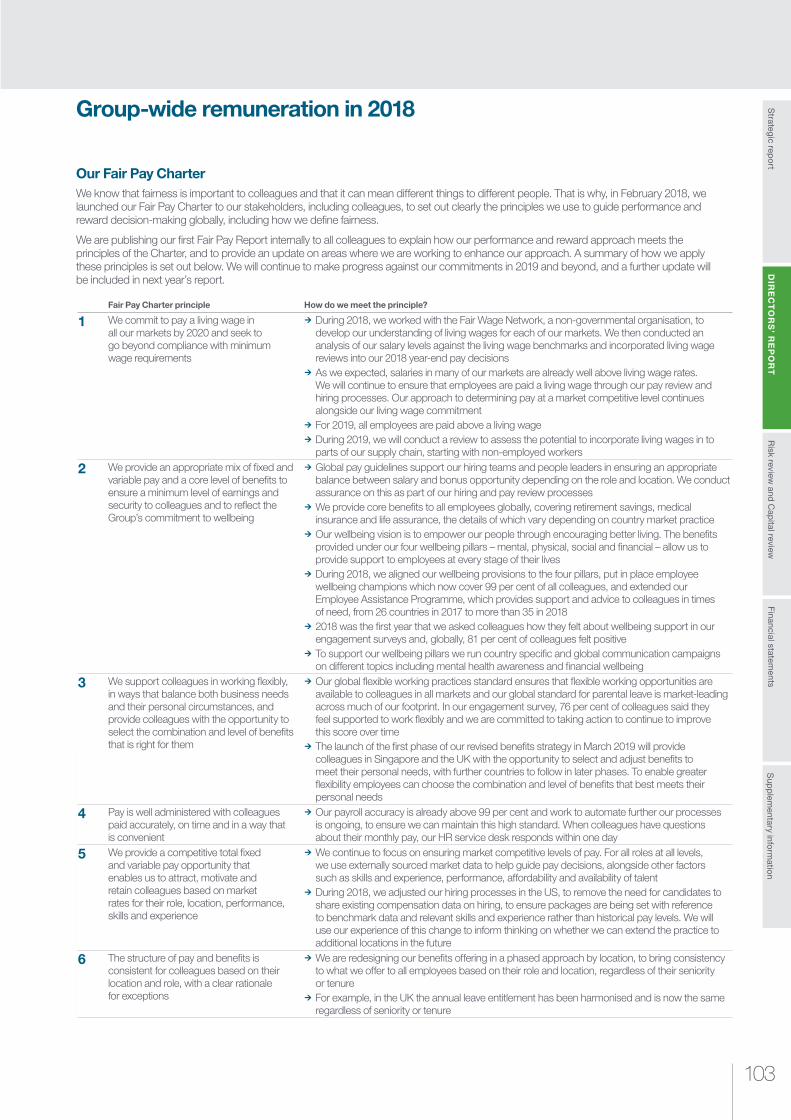
Risk review
and Cap
ital reviewS
trategic repo
rtS
upp
lementary info
rmatio
nFinancial statem
entsD
IRE
CT
OR
S’ R
EP
OR
T
103
Group-wide remuneration in 2018
Our Fair Pay CharterWe know that fairness is important to colleagues and that it can mean different things to different people. That is why, in February 2018, we launched our Fair Pay Charter to our stakeholders, including colleagues, to set out clearly the principles we use to guide performance and reward decision-making globally, including how we define fairness.
We are publishing our first Fair Pay Report internally to all colleagues to explain how our performance and reward approach meets the principles of the Charter, and to provide an update on areas where we are working to enhance our approach. A summary of how we apply these principles is set out below. We will continue to make progress against our commitments in 2019 and beyond, and a further update will be included in next year’s report.
Fair Pay Charter principle How do we meet the principle?
1 We commit to pay a living wage in all our markets by 2020 and seek to go beyond compliance with minimum wage requirements
¼ During 2018, we worked with the Fair Wage Network, a non-governmental organisation, to develop our understanding of living wages for each of our markets. We then conducted an analysis of our salary levels against the living wage benchmarks and incorporated living wage reviews into our 2018 year-end pay decisions
¼ As we expected, salaries in many of our markets are already well above living wage rates. We will continue to ensure that employees are paid a living wage through our pay review and hiring processes. Our approach to determining pay at a market competitive level continues alongside our living wage commitment
¼ For 2019, all employees are paid above a living wage ¼ During 2019, we will conduct a review to assess the potential to incorporate living wages in to parts of our supply chain, starting with non-employed workers
2 We provide an appropriate mix of fixed and variable pay and a core level of benefits to ensure a minimum level of earnings and security to colleagues and to reflect the Group’s commitment to wellbeing
¼ Global pay guidelines support our hiring teams and people leaders in ensuring an appropriate balance between salary and bonus opportunity depending on the role and location. We conduct assurance on this as part of our hiring and pay review processes
¼ We provide core benefits to all employees globally, covering retirement savings, medical insurance and life assurance, the details of which vary depending on country market practice
¼ Our wellbeing vision is to empower our people through encouraging better living. The benefits provided under our four wellbeing pillars – mental, physical, social and financial – allow us to provide support to employees at every stage of their lives
¼ During 2018, we aligned our wellbeing provisions to the four pillars, put in place employee wellbeing champions which now cover 99 per cent of all colleagues, and extended our Employee Assistance Programme, which provides support and advice to colleagues in times of need, from 26 countries in 2017 to more than 35 in 2018
¼ 2018 was the first year that we asked colleagues how they felt about wellbeing support in our engagement surveys and, globally, 81 per cent of colleagues felt positive
¼ To support our wellbeing pillars we run country specific and global communication campaigns on different topics including mental health awareness and financial wellbeing
3 We support colleagues in working flexibly, in ways that balance both business needs and their personal circumstances, and provide colleagues with the opportunity to select the combination and level of benefits that is right for them
¼ Our global flexible working practices standard ensures that flexible working opportunities are available to colleagues in all markets and our global standard for parental leave is market-leading across much of our footprint. In our engagement survey, 76 per cent of colleagues said they feel supported to work flexibly and we are committed to taking action to continue to improve this score over time
¼ The launch of the first phase of our revised benefits strategy in March 2019 will provide colleagues in Singapore and the UK with the opportunity to select and adjust benefits to meet their personal needs, with further countries to follow in later phases. To enable greater flexibility employees can choose the combination and level of benefits that best meets their personal needs
4 Pay is well administered with colleagues paid accurately, on time and in a way that is convenient
¼ Our payroll accuracy is already above 99 per cent and work to automate further our processes is ongoing, to ensure we can maintain this high standard. When colleagues have questions about their monthly pay, our HR service desk responds within one day
5 We provide a competitive total fixed and variable pay opportunity that enables us to attract, motivate and retain colleagues based on market rates for their role, location, performance, skills and experience
¼ We continue to focus on ensuring market competitive levels of pay. For all roles at all levels, we use externally sourced market data to help guide pay decisions, alongside other factors such as skills and experience, performance, affordability and availability of talent
¼ During 2018, we adjusted our hiring processes in the US, to remove the need for candidates to share existing compensation data on hiring, to ensure packages are being set with reference to benchmark data and relevant skills and experience rather than historical pay levels. We will use our experience of this change to inform thinking on whether we can extend the practice to additional locations in the future
6 The structure of pay and benefits is consistent for colleagues based on their location and role, with a clear rationale for exceptions
¼ We are redesigning our benefits offering in a phased approach by location, to bring consistency to what we offer to all employees based on their role and location, regardless of their seniority or tenure
¼ For example, in the UK the annual leave entitlement has been harmonised and is now the same regardless of seniority or tenure
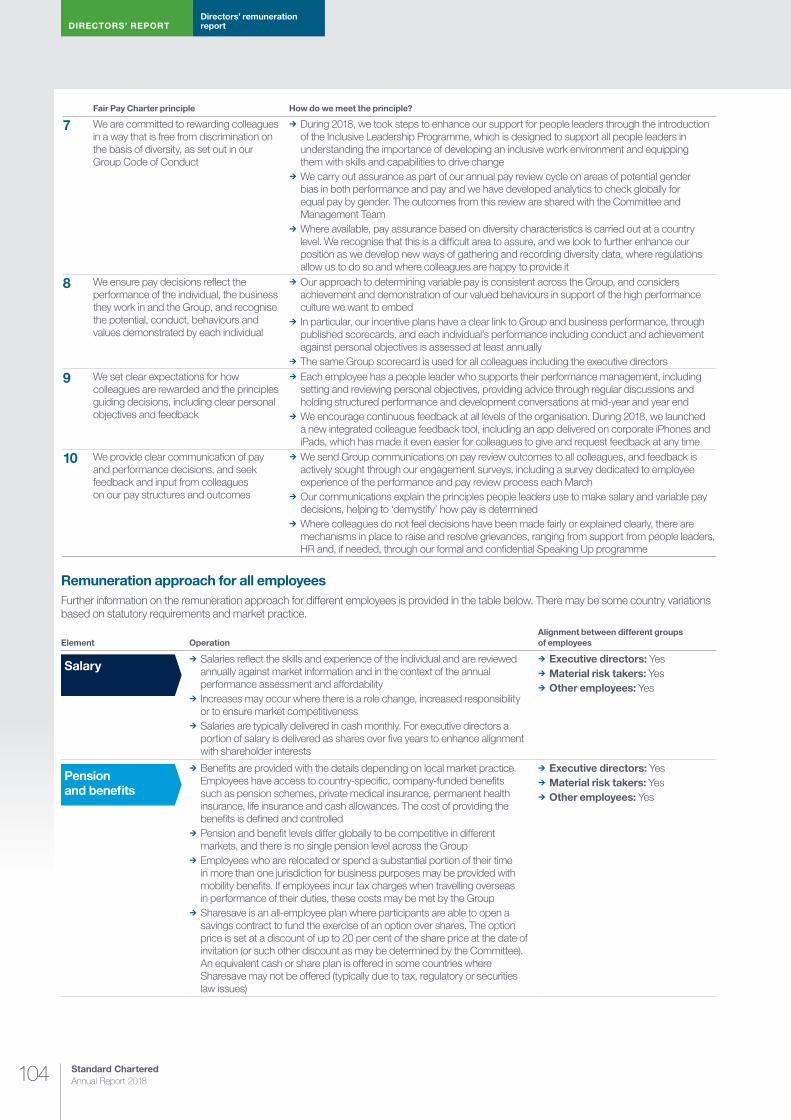
DIRECTORS’ REPORTDirectors’ remuneration report
Standard Chartered Annual Report 2018104
Fair Pay Charter principle How do we meet the principle?
7 We are committed to rewarding colleagues in a way that is free from discrimination on the basis of diversity, as set out in our Group Code of Conduct
¼ During 2018, we took steps to enhance our support for people leaders through the introduction of the Inclusive Leadership Programme, which is designed to support all people leaders in understanding the importance of developing an inclusive work environment and equipping them with skills and capabilities to drive change
¼ We carry out assurance as part of our annual pay review cycle on areas of potential gender bias in both performance and pay and we have developed analytics to check globally for equal pay by gender. The outcomes from this review are shared with the Committee and Management Team
¼ Where available, pay assurance based on diversity characteristics is carried out at a country level. We recognise that this is a difficult area to assure, and we look to further enhance our position as we develop new ways of gathering and recording diversity data, where regulations allow us to do so and where colleagues are happy to provide it
8 We ensure pay decisions reflect the performance of the individual, the business they work in and the Group, and recognise the potential, conduct, behaviours and values demonstrated by each individual
¼ Our approach to determining variable pay is consistent across the Group, and considers achievement and demonstration of our valued behaviours in support of the high performance culture we want to embed
¼ In particular, our incentive plans have a clear link to Group and business performance, through published scorecards, and each individual’s performance including conduct and achievement against personal objectives is assessed at least annually
¼ The same Group scorecard is used for all colleagues including the executive directors
9 We set clear expectations for how colleagues are rewarded and the principles guiding decisions, including clear personal objectives and feedback
¼ Each employee has a people leader who supports their performance management, including setting and reviewing personal objectives, providing advice through regular discussions and holding structured performance and development conversations at mid-year and year end
¼ We encourage continuous feedback at all levels of the organisation. During 2018, we launched a new integrated colleague feedback tool, including an app delivered on corporate iPhones and iPads, which has made it even easier for colleagues to give and request feedback at any time
10 We provide clear communication of pay and performance decisions, and seek feedback and input from colleagues on our pay structures and outcomes
¼ We send Group communications on pay review outcomes to all colleagues, and feedback is actively sought through our engagement surveys, including a survey dedicated to employee experience of the performance and pay review process each March
¼ Our communications explain the principles people leaders use to make salary and variable pay decisions, helping to ‘demystify’ how pay is determined
¼ Where colleagues do not feel decisions have been made fairly or explained clearly, there are mechanisms in place to raise and resolve grievances, ranging from support from people leaders, HR and, if needed, through our formal and confidential Speaking Up programme
Remuneration approach for all employeesFurther information on the remuneration approach for different employees is provided in the table below. There may be some country variations based on statutory requirements and market practice.
Element OperationAlignment between different groups of employees
¼ Salaries reflect the skills and experience of the individual and are reviewed annually against market information and in the context of the annual performance assessment and affordability
¼ Increases may occur where there is a role change, increased responsibility or to ensure market competitiveness
¼ Salaries are typically delivered in cash monthly. For executive directors a portion of salary is delivered as shares over five years to enhance alignment with shareholder interests
¼ Executive directors: Yes ¼ Material risk takers: Yes ¼ Other employees: Yes
¼ Benefits are provided with the details depending on local market practice. Employees have access to country-specific, company-funded benefits such as pension schemes, private medical insurance, permanent health insurance, life insurance and cash allowances. The cost of providing the benefits is defined and controlled
¼ Pension and benefit levels differ globally to be competitive in different markets, and there is no single pension level across the Group
¼ Employees who are relocated or spend a substantial portion of their time in more than one jurisdiction for business purposes may be provided with mobility benefits. If employees incur tax charges when travelling overseas in performance of their duties, these costs may be met by the Group
¼ Sharesave is an all-employee plan where participants are able to open a savings contract to fund the exercise of an option over shares. The option price is set at a discount of up to 20 per cent of the share price at the date of invitation (or such other discount as may be determined by the Committee). An equivalent cash or share plan is offered in some countries where Sharesave may not be offered (typically due to tax, regulatory or securities law issues)
¼ Executive directors: Yes ¼ Material risk takers: Yes ¼ Other employees: Yes
Pension and benefits
Salary

Risk review
and Cap
ital reviewS
trategic repo
rtS
upp
lementary info
rmatio
nFinancial statem
entsD
IRE
CT
OR
S’ R
EP
OR
T
105
Element OperationAlignment between different groups of employees
¼ Employees are typically eligible to be considered for variable remuneration ¼ Individual incentives are determined with reference to Group, business area and individual performance considering both what they have achieved and their demonstration of our valued behaviours
¼ Balanced scorecards are used to assess Group, business and individual performance. The scorecards include financial and strategic measures and are designed to drive the right outcome for clients while ensuring prudent risk-taking
¼ Discretionary variable remuneration is delivered in the form of an annual incentive and, for eligible employees, an LTIP award
¼ Annual incentives are delivered in the form of cash, shares and/or deferred shares and deferred cash
¼ Typically awarded to senior management, LTIP awards are delivered in shares and subject to long-term performance measures
¼ The variable remuneration of employees in the Audit, Risk and Compliance functions is set independently of the business they oversee
¼ Senior management incentives are deferred for up to seven years ¼ When determining levels of variable remuneration, the Group considers the overall level of performance and risk events in the year
¼ The proportion of variable to fixed remuneration is carefully monitored to ensure compliance with regulatory requirements
¼ All incentives are subject to the Group’s ex-post risk adjustment of remuneration policy. This provides the Group with the ability to reduce or revoke variable remuneration in respect of a risk, control or conduct issue, event or behaviour
¼ Executive directors: Yes, annual incentive (cash and shares) and LTIP award
¼ Material risk takers: Yes, annual incentives (paid in cash up to certain limits and the balance deferred in shares and/or cash for between three and seven years) and/or an LTIP award. At least 50 per cent of discretionary variable remuneration is delivered in shares. Material risk takers are subject to the 2:1 maximum ratio of variable to fixed remuneration
¼ Other employees: Yes, most employees are considered for an annual incentive (paid in cash up to certain limits and the balance is deferred over three years in shares and/or cash) and/or LTIP award
Approach to risk adjustmentAt an individual level, variable remuneration is aligned with the long-term interests of the business and the timeframe over which financial risks crystallise through:
¼ A proportion of variable remuneration being delivered in the form of deferred awards: having an appropriate level of variable remuneration deferred for a sufficient period of time that can have risk adjustments applied
¼ Performance adjustment: potential diminution in the value of any deferred variable remuneration award through non-vesting due to performance measures and share price movement until vesting
The operation of in-year adjustments, malus and clawback is summarised in the following table:
Criteria includes Application
Individual level ¼ Deemed to have i) caused in full or in part a material loss for the Group as a result of reckless, negligent or wilful actions or ii) exhibited inappropriate valued behaviours or applied a lack of appropriate supervision
¼ The individual failed to meet appropriate standards of fitness and propriety
¼ In-year adjustment, malus and clawback may be applied to all or part of an award at the Committee’s discretion
Business unit and/or Group level
¼ Material restatement of the Group’s financials ¼ Significant failure in risk management ¼ Discovery of endemic problems in financial reporting ¼ As a result of financial losses, due to a material breach of regulatory guidelines
¼ The exercise of regulatory or government action to recapitalise the Group following material financial losses
¼ In-year adjustment, malus and clawback may be applied to all or part of an award at the Committee’s discretion
Determining Group-wide 2018 discretionary incentivesIn determining 2018 incentives, the Committee considered:
¼ 2018 performance measured using the Group and business scorecards, ensuring risk-taking did not exceed the Group’s Risk Appetite
¼ Strong financial performance with improving profitability and rising return on equity despite difficult operating conditions
¼ Improved client satisfaction, credit quality and cost savings, growth in digital volumes and significant improvements in innovation
¼ The importance of rewarding and incentivising colleagues to execute the Group’s long-term goals and of driving sustainable growth for our shareholders
¼ The need to position remuneration in the Group to pay good performers competitively and recognising the demonstration of valued behaviours
¼ Continued focus on competitive levels of pay and of taking a global approach to remuneration, considering wage inflation pressures in many of the emerging markets in which the Group operates
¼ The Group’s capital position and current and future risks identified by the Group’s Principal Risk Types including operational, conduct, information and cyber security and financial crime risks
In determining the Group’s total incentives, the Committee used its judgement to establish the right balance between the performance of the Group and its ability to attract and retain talent that will drive the delivery of the Group’s strategy. In 2018, the Committee took into account Group, business and regional scorecards which were aligned to the Group’s strategy, a range of risk-adjusted metrics and advice from both the Group Chief Financial Officer and Group Chief Risk Officer on performance. The Committee recognises that share price performance during 2018 was disappointing and took this into account when finalising the overall annual incentive outcomes.
Discretionary variable remuneration
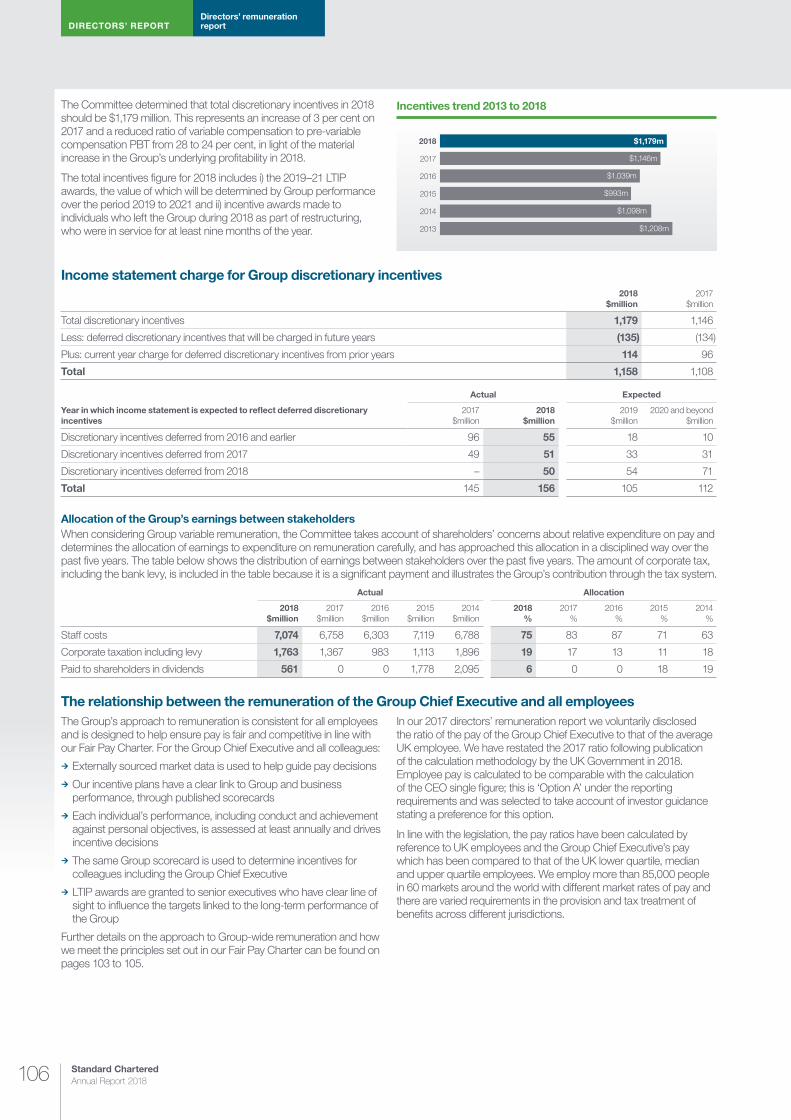
DIRECTORS’ REPORTDirectors’ remuneration report
Standard Chartered Annual Report 2018106
The Committee determined that total discretionary incentives in 2018 should be $1,179 million. This represents an increase of 3 per cent on 2017 and a reduced ratio of variable compensation to pre-variable compensation PBT from 28 to 24 per cent, in light of the material increase in the Group’s underlying profitability in 2018.
The total incentives figure for 2018 includes i) the 2019–21 LTIP awards, the value of which will be determined by Group performance over the period 2019 to 2021 and ii) incentive awards made to individuals who left the Group during 2018 as part of restructuring, who were in service for at least nine months of the year. 2013
2014
2015
2016
2017
2018
$1,098m
$1,208m
$993m
$1,039m
$1,146m
$1,179m
Incentives trend 2013 to 2018
Income statement charge for Group discretionary incentives2018
$million2017
$million
Total discretionary incentives 1,179 1,146
Less: deferred discretionary incentives that will be charged in future years (135) (134)
Plus: current year charge for deferred discretionary incentives from prior years 114 96
Total 1,158 1,108
Year in which income statement is expected to reflect deferred discretionary incentives
Actual Expected
2017 $million
2018 $million
2019 $million
2020 and beyond $million
Discretionary incentives deferred from 2016 and earlier 96 55 18 10
Discretionary incentives deferred from 2017 49 51 33 31
Discretionary incentives deferred from 2018 – 50 54 71
Total 145 156 105 112
Allocation of the Group’s earnings between stakeholdersWhen considering Group variable remuneration, the Committee takes account of shareholders’ concerns about relative expenditure on pay and determines the allocation of earnings to expenditure on remuneration carefully, and has approached this allocation in a disciplined way over the past five years. The table below shows the distribution of earnings between stakeholders over the past five years. The amount of corporate tax, including the bank levy, is included in the table because it is a significant payment and illustrates the Group’s contribution through the tax system.
Actual Allocation
2018 $million
2017 $million
2016 $million
2015 $million
2014 $million
2018 %
2017 %
2016 %
2015 %
2014 %
Staff costs 7,074 6,758 6,303 7,119 6,788 75 83 87 71 63
Corporate taxation including levy 1,763 1,367 983 1,113 1,896 19 17 13 11 18
Paid to shareholders in dividends 561 0 0 1,778 2,095 6 0 0 18 19
The relationship between the remuneration of the Group Chief Executive and all employeesThe Group’s approach to remuneration is consistent for all employees and is designed to help ensure pay is fair and competitive in line with our Fair Pay Charter. For the Group Chief Executive and all colleagues:
¼ Externally sourced market data is used to help guide pay decisions
¼ Our incentive plans have a clear link to Group and business performance, through published scorecards
¼ Each individual’s performance, including conduct and achievement against personal objectives, is assessed at least annually and drives incentive decisions
¼ The same Group scorecard is used to determine incentives for colleagues including the Group Chief Executive
¼ LTIP awards are granted to senior executives who have clear line of sight to influence the targets linked to the long-term performance of the Group
Further details on the approach to Group-wide remuneration and how we meet the principles set out in our Fair Pay Charter can be found on pages 103 to 105.
In our 2017 directors’ remuneration report we voluntarily disclosed the ratio of the pay of the Group Chief Executive to that of the average UK employee. We have restated the 2017 ratio following publication of the calculation methodology by the UK Government in 2018. Employee pay is calculated to be comparable with the calculation of the CEO single figure; this is ‘Option A’ under the reporting requirements and was selected to take account of investor guidance stating a preference for this option.
In line with the legislation, the pay ratios have been calculated by reference to UK employees and the Group Chief Executive’s pay which has been compared to that of the UK lower quartile, median and upper quartile employees. We employ more than 85,000 people in 60 markets around the world with different market rates of pay and there are varied requirements in the provision and tax treatment of benefits across different jurisdictions.

Risk review
and Cap
ital reviewS
trategic repo
rtS
upp
lementary info
rmatio
nFinancial statem
entsD
IRE
CT
OR
S’ R
EP
OR
T
107
Ratio of the pay of the Group Chief Executive to that of the UK lower quartile, median and upper quartile employees
Year Method
Pay ratio
25th percentile 50th percentile (median) 75th percentile
2018 A 76:1 48:1 29:1
2017 A 61:1 39:1 23:1
Additional information on the ratio of the pay of the Group Chief Executive to that of employees
¼ 2017 ratios are restated to be in line with the published methodology, using Option A
¼ The ratio published for 2017 in the 2017 directors’ remuneration report was 47:1 and was based on comparing the Group Chief Executive single figure of total remuneration with the median average of UK employee remuneration. The methodology used this year and restated for 2017 uses a median and quartile analysis of the single figure for all employees
¼ Employee pay data is based on full time equivalent pay for UK employees as at 31 December 2018 and as at 31 December 2017, for 2018 and 2017 respectively. For each employee, total pay is calculated in line with the single figure methodology (i.e. fixed pay accrued during the financial year and the value of performance-based incentive awards vesting in relation to the performance year)
¼ Employee pay data excludes leavers, joiners and employee transfers in or out of the UK during the year, to help ensure data is on a like-for-like basis, and data for life assurance and long-term illness cover are based on the value of notional premia. No other calculation adjustments or assumptions have been made
¼ CEO pay is as per the single total figure of remuneration for 2018 and for 2017, as disclosed on page 101
¼ The 2018 ratio will be restated in the 2019 directors’ remuneration report to take account of the final LTIP vesting data for eligible employees and for the CEO
¼ The Committee has considered the pay data for the three individuals identified for 2017 and 2018 and believes that it fairly reflects pay at the relevant quartiles among the UK employee population. Each of the individuals identified was a full-time employee during the year and received remuneration in line with the Group remuneration policy, and none received exceptional pay
Salary and total remuneration used to calculate the ratio of payTo provide further context, the table below shows the CEO and the employee percentile pay used to determine the 2018 pay ratios.
CEO£000
25th percentile£000
50th percentile (median)£000
75th percentile£000
Total salary1 2,300 53 91 152
Total remuneration (single figure) 5,950 78 123 208
1 Total salary includes FPA for the Group Chief Executive and the Group Chief Financial Officer which are paid in shares, subject to a retention period and released over five years
Our long-term incentive plan is intended to link total remuneration to the achievement of the Group’s long-term strategy and to reinforce alignment between executive remuneration and shareholder interests. Therefore, participation is typically senior employees who have line of sight to influence directly the performance targets on the awards. The lower quartile, median and upper quartile employees identified this year are not participants in the long-term incentive plan. With a significant proportion of the pay of our Group Chief Executive linked to performance and share price over the longer-term, it is expected that the ratio will depend materially on long-term incentive outcomes each year, and accordingly may fluctuate.
Therefore, the Committee also discloses below the quartile and median pay ratios for 2018 and 2017 covering total salary and total salary plus annual incentive, with all UK employees being eligible to be considered for an annual incentive based on Group, business and individual performance.
The year-on-year increase in the pay ratios in the tables below will be significantly influenced by the increase in the CEO single total figure of remuneration which reflects the first LTIP award vesting to Bill since his appointment in 2015.
Additional ratios of pay based on total salary and total salary plus annual incentive
2018CEO£000
Pay ratio
25th percentile 50th percentile (median) 75th percentile
Total salary 2,300 43:1 25:1 15:1
Total salary plus annual incentive 3,691 52:1 33:1 19:1
Total remuneration (single figure) 5,950 76:1 48:1 29:1
2017
Total salary 2,300 42:1 28:1 19:1
Total salary plus annual incentive 3,978 58:1 39:1 22:1
Total remuneration (single figure) 4,683 61:1 39:1 23:1
The chart opposite shows the percentage change in remuneration between the 2017 and 2018 performance years for the Group Chief Executive and the wider employee population. The Committee awarded an annual incentive of 50 per cent of fixed remuneration to the Group Chief Executive for 2018, compared with 61 per cent for 2017.
1 For the ‘all employees’ group, the percentage change in salary represents the difference in the salary component of staff costs in 2017 and in 2018 for the global employee population. The taxable benefits comparison is based on UK employees as it is deemed the most appropriate comparison for the Group Chief Executive given the varied requirements in the provision and tax treatment of benefits across different jurisdictions. The annual incentive data is based on the global employee population who are eligible to receive annual incentives
Group CEO and all employee percentage change in remuneration 2017 to 2018
Annual incentive
Taxable benefits1
Salary 6%0%
-14%
Group CEO
1%
-17% 3%
All employees

DIRECTORS’ REPORTDirectors’ remuneration report
Standard Chartered Annual Report 2018108
Proposed new directors’ remuneration policy
This section sets out the revised directors’ remuneration policy which will be put forward to shareholders at the AGM for a binding vote and, if approved, will apply from 8 May 2019 for up to three years.
The current remuneration policy for executive directors, the Chairman and independent non-executive directors was approved at the AGM held on 4 May 2016 and has applied for three years from that date. The policy was well supported by shareholders and continues to support the delivery of our strategy.
The Board and the Committee conducted a detailed review of the policy in 2018 and considered the views of shareholders, the strategic objectives of the Group, the remuneration of all colleagues, market benchmarking and best practice. Following careful consideration, the Committee decided to retain the current policy, and to enhance some components in order to achieve further simplicity, increase shareholder alignment and reinforce sustained long-term focus on our strategic objectives. Within this framework, several changes are being made which are summarised in the table opposite. The refinements to the remuneration policy will ensure it continues to reinforce achievement of the business strategy and shareholder value creation, and promote alignment with colleagues. The refreshed policy ensures continued regulatory compliance and alignment with evolving best practice in many areas.
Consideration of stakeholder viewsThe Committee Chair maintains regular contact with the Group’s major shareholders on remuneration and ensures the Committee is informed of their views. During 2017 and 2018, shareholders representing approximately 70 per cent of our share register were consulted during the development of the new policy proposals. The shareholder feedback has been considered and reflected in the proposed remuneration policy, with some elements of the policy being changed in response to specific feedback.
The remuneration of the Group Chairman, executive directors, senior management and all colleagues was considered in the development of the new policy. The Committee considered the remuneration of the wider workforce to provide greater alignment with Group-wide remuneration arrangements. The policy is designed to reflect the Group’s purpose, valued behaviours and culture ambitions as well as following the principles of the Fair Pay Charter used to make remuneration decisions for all colleagues in the Group.
When determining pay levels, the Committee takes account of pay increases across the Group, particularly for those employees based in the UK. Variable pay outcomes are based on Group and business performance, based on measures cascaded from the Group scorecard, and each individual’s performance is determined based on achievement of their objectives, conduct and valued behaviours.
The Group seeks feedback from all colleagues on remuneration as well as on other workforce policies and practices through a wide range of mechanisms, including:
¼ Board engagement sessions with colleagues when travelling to our markets
¼ Employee focus groups such as our Employee Representative Groups and our partnerships with our recognised unions and work councils
¼ Feedback from our Group and Country Diversity and Inclusion Councils responsible for promoting diversity and inclusion across the Group
¼ Feedback mechanisms such as Speaking Up where employees can raise concerns in confidence
¼ Biannual engagement surveys of all colleagues on reward, workforce practices and culture and an annual survey dedicated to the employee experience of the performance and pay review process each March
¼ Forums with our Board and/or with management such as town halls
The key components of the directors’ remuneration policy will be explained to the workforce following the AGM.
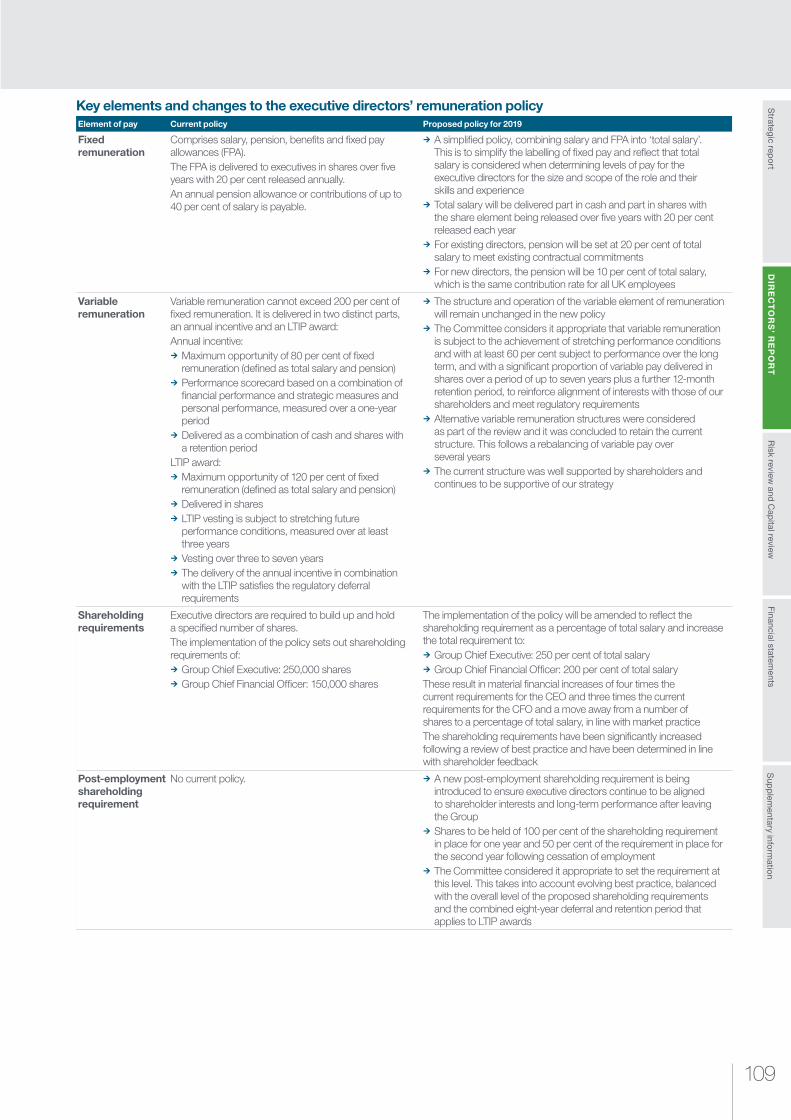
Risk review
and Cap
ital reviewS
trategic repo
rtS
upp
lementary info
rmatio
nFinancial statem
entsD
IRE
CT
OR
S’ R
EP
OR
T
109
Key elements and changes to the executive directors’ remuneration policyElement of pay Current policy Proposed policy for 2019
Fixed remuneration
Comprises salary, pension, benefits and fixed pay allowances (FPA).The FPA is delivered to executives in shares over five years with 20 per cent released annually.An annual pension allowance or contributions of up to 40 per cent of salary is payable.
¼ A simplified policy, combining salary and FPA into ‘total salary’. This is to simplify the labelling of fixed pay and reflect that total salary is considered when determining levels of pay for the executive directors for the size and scope of the role and their skills and experience
¼ Total salary will be delivered part in cash and part in shares with the share element being released over five years with 20 per cent released each year
¼ For existing directors, pension will be set at 20 per cent of total salary to meet existing contractual commitments
¼ For new directors, the pension will be 10 per cent of total salary, which is the same contribution rate for all UK employees
Variable remuneration
Variable remuneration cannot exceed 200 per cent of fixed remuneration. It is delivered in two distinct parts, an annual incentive and an LTIP award:Annual incentive:
¼ Maximum opportunity of 80 per cent of fixed remuneration (defined as total salary and pension)
¼ Performance scorecard based on a combination of financial performance and strategic measures and personal performance, measured over a one-year period
¼ Delivered as a combination of cash and shares with a retention period
LTIP award: ¼ Maximum opportunity of 120 per cent of fixed remuneration (defined as total salary and pension)
¼ Delivered in shares ¼ LTIP vesting is subject to stretching future performance conditions, measured over at least three years
¼ Vesting over three to seven years ¼ The delivery of the annual incentive in combination with the LTIP satisfies the regulatory deferral requirements
¼ The structure and operation of the variable element of remuneration will remain unchanged in the new policy
¼ The Committee considers it appropriate that variable remuneration is subject to the achievement of stretching performance conditions and with at least 60 per cent subject to performance over the long term, and with a significant proportion of variable pay delivered in shares over a period of up to seven years plus a further 12-month retention period, to reinforce alignment of interests with those of our shareholders and meet regulatory requirements
¼ Alternative variable remuneration structures were considered as part of the review and it was concluded to retain the current structure. This follows a rebalancing of variable pay over several years
¼ The current structure was well supported by shareholders and continues to be supportive of our strategy
Shareholding requirements
Executive directors are required to build up and hold a specified number of shares.The implementation of the policy sets out shareholding requirements of:
¼ Group Chief Executive: 250,000 shares ¼ Group Chief Financial Officer: 150,000 shares
The implementation of the policy will be amended to reflect the shareholding requirement as a percentage of total salary and increase the total requirement to:
¼ Group Chief Executive: 250 per cent of total salary ¼ Group Chief Financial Officer: 200 per cent of total salary
These result in material financial increases of four times the current requirements for the CEO and three times the current requirements for the CFO and a move away from a number of shares to a percentage of total salary, in line with market practiceThe shareholding requirements have been significantly increased following a review of best practice and have been determined in line with shareholder feedback
Post-employment shareholding requirement
No current policy. ¼ A new post-employment shareholding requirement is being introduced to ensure executive directors continue to be aligned to shareholder interests and long-term performance after leaving the Group
¼ Shares to be held of 100 per cent of the shareholding requirement in place for one year and 50 per cent of the requirement in place for the second year following cessation of employment
¼ The Committee considered it appropriate to set the requirement at this level. This takes into account evolving best practice, balanced with the overall level of the proposed shareholding requirements and the combined eight-year deferral and retention period that applies to LTIP awards

DIRECTORS’ REPORTDirectors’ remuneration report
Standard Chartered Annual Report 2018110
Element of pay Current policy Proposed policy for 2019
Leaver provisions
The Committee has the discretion under the relevant plan rules to determine how eligible leaver status should be applied on termination, including the ability to award eligible leaver status in respect of some but not all of an executive director’s unvested awards.
Typically, when a director leaves, LTIP awards would be prorated for time served. To reinforce a long-term strategic focus for retiring executive directors, the Committee will introduce the flexibility to disapply proration for time not served during the performance period to the vesting of LTIP awards in certain retirement situations (where specific criteria have been met). Following engagement with our largest shareholders, the criteria below would need to be met as a minimum before the Committee would consider the disapplication of proration:
¼ The executive director has more than five years’ service on the Board
¼ The executive director is retiring from full-time employment in financial services and comparable roles in other industries
¼ The executive director has demonstrated satisfactory conduct and has achieved their performance objectives
¼ A clear, Board approved, handover plan is in place to transition to an identified successor
If these criteria have been met the Committee would then carefully consider using its discretion to disapply time proration on a case-by-case basis, which we expect to be rare, taking into account all of the circumstances at that time. If the flexibility were to be used, typically, there would be no LTIP award in the final year of employment or additional payments in lieu of office. If the individual leaves and subsequently takes up executive employment unvested awards that had proration disapplied will lapse and the executive will be expected to re-pay any vested awards. There will be no change in performance conditions nor any acceleration of vesting.
Proposed executive directors’ remuneration policyThe proposed executive directors’ remuneration policy, to be effective from the date of the Group’s AGM in May 2019 and beyond, is set out in the following table.
Fixed remuneration
Element and purpose in supporting the Group’s strategic objectives Operation
Additional detail including maximum value and performance measures
Total salarySupport the recruitment and retention of executive directors, recognising the size and scope of the role and the individual’s skills and experience.Set at a level, together with other fixed remuneration, that enables the Group to operate fully flexible variable remuneration.
¼ Delivered part in cash and part in shares ¼ The share element is subject to a holding period of five years, with 20 per cent being released annually
¼ Reviewed annually with increases generally applying from April
¼ When determining total salary levels, consideration is given to the following:– The size and scope of the role– The individual’s skills and experience– Pay at international banks of a similar size
and international scope– Pay within large UK-listed companies
(including the major UK-listed banks)
¼ Increases may be made at the Committee’s discretion to take account of circumstances such as:– Increase in scope or responsibility– Increase to reflect the individual’s development
in role (e.g. for a new appointment where salary may be increased over time rather than set directly at the level of the previous incumbent or market level)
– Alignment to market-competitive levels– Consideration to increases given in the context
of salary increases across the Group
PensionThe pension arrangements comprise part of a competitive remuneration package and facilitate long-term retirement savings for directors.
¼ Normally paid as a cash allowance or contribution to a defined contribution scheme
¼ Pension contributions may also be made in lieu of any waived salary (and the cash amount of any annual incentive)
¼ An annual pension allowance or contributions of up to 20 per cent of total salary are payable to the executive directors appointed to the Board prior to 2019
¼ For future directors, an annual pension allowance or contributions of up to 10 per cent of total salary will be payable
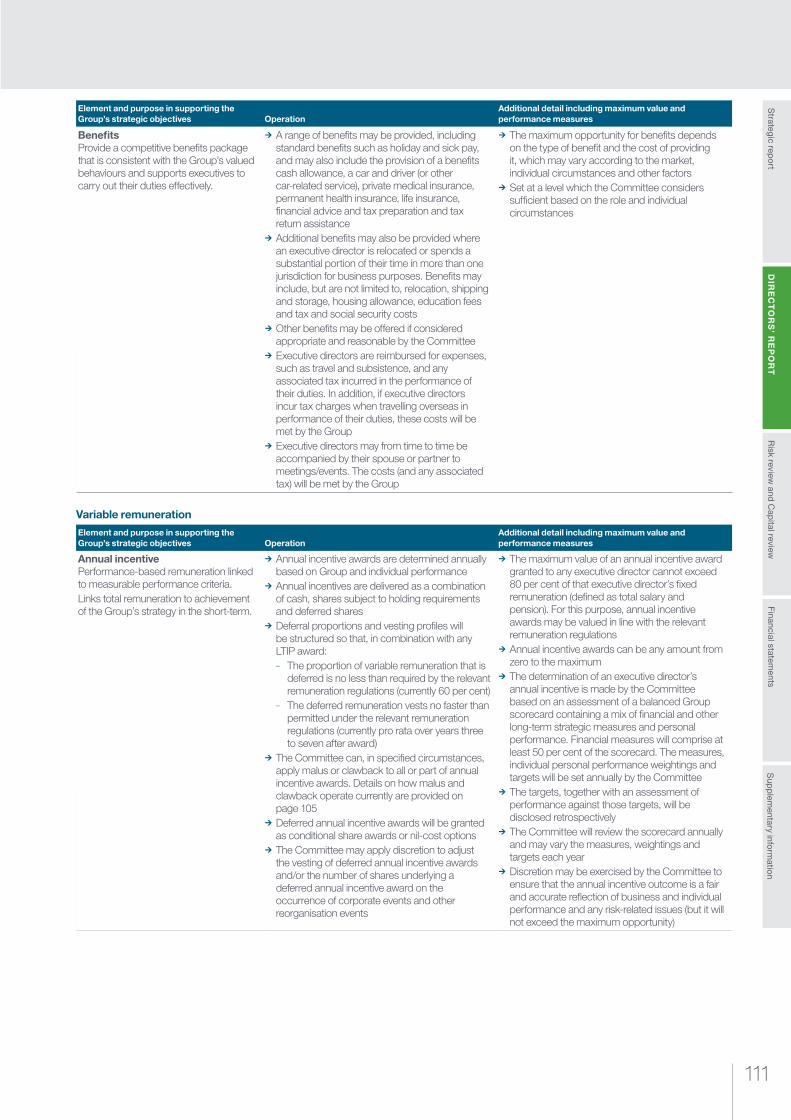
Risk review
and Cap
ital reviewS
trategic repo
rtS
upp
lementary info
rmatio
nFinancial statem
entsD
IRE
CT
OR
S’ R
EP
OR
T
111
Element and purpose in supporting the Group’s strategic objectives Operation
Additional detail including maximum value and performance measures
BenefitsProvide a competitive benefits package that is consistent with the Group’s valued behaviours and supports executives to carry out their duties effectively.
¼ A range of benefits may be provided, including standard benefits such as holiday and sick pay, and may also include the provision of a benefits cash allowance, a car and driver (or other car-related service), private medical insurance, permanent health insurance, life insurance, financial advice and tax preparation and tax return assistance
¼ Additional benefits may also be provided where an executive director is relocated or spends a substantial portion of their time in more than one jurisdiction for business purposes. Benefits may include, but are not limited to, relocation, shipping and storage, housing allowance, education fees and tax and social security costs
¼ Other benefits may be offered if considered appropriate and reasonable by the Committee
¼ Executive directors are reimbursed for expenses, such as travel and subsistence, and any associated tax incurred in the performance of their duties. In addition, if executive directors incur tax charges when travelling overseas in performance of their duties, these costs will be met by the Group
¼ Executive directors may from time to time be accompanied by their spouse or partner to meetings/events. The costs (and any associated tax) will be met by the Group
¼ The maximum opportunity for benefits depends on the type of benefit and the cost of providing it, which may vary according to the market, individual circumstances and other factors
¼ Set at a level which the Committee considers sufficient based on the role and individual circumstances
Variable remuneration
Element and purpose in supporting the Group’s strategic objectives Operation
Additional detail including maximum value and performance measures
Annual incentivePerformance-based remuneration linked to measurable performance criteria.Links total remuneration to achievement of the Group’s strategy in the short-term.
¼ Annual incentive awards are determined annually based on Group and individual performance
¼ Annual incentives are delivered as a combination of cash, shares subject to holding requirements and deferred shares
¼ Deferral proportions and vesting profiles will be structured so that, in combination with any LTIP award:– The proportion of variable remuneration that is
deferred is no less than required by the relevant remuneration regulations (currently 60 per cent)
– The deferred remuneration vests no faster than permitted under the relevant remuneration regulations (currently pro rata over years three to seven after award)
¼ The Committee can, in specified circumstances, apply malus or clawback to all or part of annual incentive awards. Details on how malus and clawback operate currently are provided on page 105
¼ Deferred annual incentive awards will be granted as conditional share awards or nil-cost options
¼ The Committee may apply discretion to adjust the vesting of deferred annual incentive awards and/or the number of shares underlying a deferred annual incentive award on the occurrence of corporate events and other reorganisation events
¼ The maximum value of an annual incentive award granted to any executive director cannot exceed 80 per cent of that executive director’s fixed remuneration (defined as total salary and pension). For this purpose, annual incentive awards may be valued in line with the relevant remuneration regulations
¼ Annual incentive awards can be any amount from zero to the maximum
¼ The determination of an executive director’s annual incentive is made by the Committee based on an assessment of a balanced Group scorecard containing a mix of financial and other long-term strategic measures and personal performance. Financial measures will comprise at least 50 per cent of the scorecard. The measures, individual personal performance weightings and targets will be set annually by the Committee
¼ The targets, together with an assessment of performance against those targets, will be disclosed retrospectively
¼ The Committee will review the scorecard annually and may vary the measures, weightings and targets each year
¼ Discretion may be exercised by the Committee to ensure that the annual incentive outcome is a fair and accurate reflection of business and individual performance and any risk-related issues (but it will not exceed the maximum opportunity)

DIRECTORS’ REPORTDirectors’ remuneration report
Standard Chartered Annual Report 2018112
Element and purpose in supporting the Group’s strategic objectives Operation
Additional detail including maximum value and performance measures
LTIPPerformance-based remuneration linked to measurable, long-term performance criteria.Ensures a market-competitive remuneration package.Links total remuneration to achievement of the Group’s long-term strategy.
¼ LTIP awards are granted annually, with award levels set to provide appropriate levels of long-term incentives to executive directors, with performance of the Group and of the individual considered in determining the award level
¼ LTIP awards are delivered in shares and may be subject to holding requirements
¼ Vesting profiles are structured so that no LTIP award vests before the third anniversary of grant and in combination with any annual incentive award:– The proportion of variable remuneration that is
deferred is no less than required by the relevant remuneration regulations (currently 60 per cent)
– The deferred remuneration vests no faster than permitted under the relevant remuneration regulations (currently pro rata over years three to seven after award)
¼ The Committee can, in specified circumstances, apply malus or clawback to all or part of any LTIP awards. Details on how malus and clawback operate currently are provided on page 105
¼ LTIP awards will be granted as conditional share awards or nil-cost options
¼ The Committee may apply discretion to adjust the vesting of LTIP awards and/or the number of shares underlying an LTIP award on the occurrence of corporate events and other reorganisation events
¼ The maximum value of an LTIP award granted to any executive director cannot, in combination with the annual incentive opportunity in respect of any particular year, exceed 200 per cent of that executive director’s fixed remuneration (defined as total salary and pension)
¼ For this purpose, LTIP awards may be valued in line with the relevant remuneration regulations
¼ The Committee will, for each year, determine the split of the overall variable remuneration opportunity between the LTIP award and annual incentive opportunity at the start of the year and disclose this split in advance. The maximum LTIP award will form at least 120 per cent of fixed remuneration (i.e. at least 60 per cent of the maximum variable remuneration opportunity for any financial year), so that the majority of the variable remuneration opportunity is based on long-term performance
¼ LTIP awards can be any amount from zero to the maximum
¼ LTIP awards will be subject to long-term performance measures, measured over a period of at least three years
¼ The long-term performance measures may be a mix of financial measures and other long-term strategic measures. Financial measures will comprise at least 50 per cent of the performance measures. Weightings and targets will be set in advance of each grant by the Committee and disclosed prospectively, and performance against those measures will be disclosed retrospectively. For financial measures, vesting will be on a sliding-scale basis between threshold and maximum with no more than 25 per cent vesting at threshold performance
Shareholding requirementA requirement for executive directors to hold a specified value of shares to ensure alignment with the interests of shareholders during employment.
¼ Executive directors are required to hold a specified level of shares, to be built up over a reasonable timeframe from the date of appointment as an executive director (or, if later, from the date of any changes to the terms of the shareholding requirement)
¼ Shares that count towards the requirement are beneficially owned shares including the share element of total salary and vested share awards subject to a retention period and unvested share awards for which performance conditions have been satisfied (on a net-of-tax basis)
¼ The shareholding requirement is expressed as a percentage of total salary and is reviewed by the Committee on an annual basis
SharesaveProvide an opportunity to invest voluntarily in the Group.
¼ Sharesave is an all-employee plan where participants (including executive directors) are able to open a savings contract to fund the exercise of an option over shares
¼ The option price is set at a discount of up to 20 per cent of the share price at the date of invitation, or such other discount as may be determined by the Committee
¼ An equivalent cash or share plan is offered in some countries where Sharesave may not be offered (typically due to tax, regulatory or securities law issues)
¼ Savings per month of between £5 and the maximum set by the Group which is currently £250
Legacy arrangementsHonour existing payments.
¼ Any previous commitments or arrangements entered into with current or former directors will be honoured, including remuneration arrangements entered into under the previously approved directors’ remuneration policy
¼ In line with existing commitments
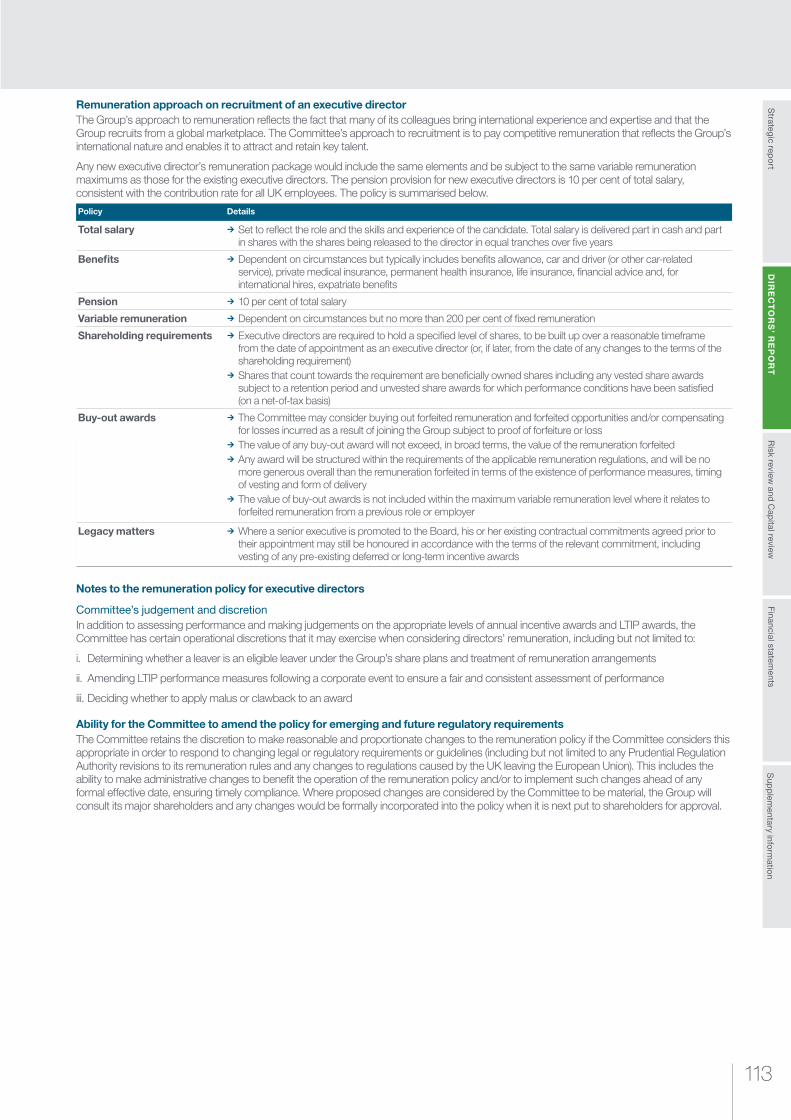
Risk review
and Cap
ital reviewS
trategic repo
rtS
upp
lementary info
rmatio
nFinancial statem
entsD
IRE
CT
OR
S’ R
EP
OR
T
113
Remuneration approach on recruitment of an executive directorThe Group’s approach to remuneration reflects the fact that many of its colleagues bring international experience and expertise and that the Group recruits from a global marketplace. The Committee’s approach to recruitment is to pay competitive remuneration that reflects the Group’s international nature and enables it to attract and retain key talent.
Any new executive director’s remuneration package would include the same elements and be subject to the same variable remuneration maximums as those for the existing executive directors. The pension provision for new executive directors is 10 per cent of total salary, consistent with the contribution rate for all UK employees. The policy is summarised below.
Policy Details
Total salary ¼ Set to reflect the role and the skills and experience of the candidate. Total salary is delivered part in cash and part in shares with the shares being released to the director in equal tranches over five years
Benefits ¼ Dependent on circumstances but typically includes benefits allowance, car and driver (or other car-related service), private medical insurance, permanent health insurance, life insurance, financial advice and, for international hires, expatriate benefits
Pension ¼ 10 per cent of total salary
Variable remuneration ¼ Dependent on circumstances but no more than 200 per cent of fixed remuneration
Shareholding requirements ¼ Executive directors are required to hold a specified level of shares, to be built up over a reasonable timeframe from the date of appointment as an executive director (or, if later, from the date of any changes to the terms of the shareholding requirement)
¼ Shares that count towards the requirement are beneficially owned shares including any vested share awards subject to a retention period and unvested share awards for which performance conditions have been satisfied (on a net-of-tax basis)
Buy-out awards ¼ The Committee may consider buying out forfeited remuneration and forfeited opportunities and/or compensating for losses incurred as a result of joining the Group subject to proof of forfeiture or loss
¼ The value of any buy-out award will not exceed, in broad terms, the value of the remuneration forfeited ¼ Any award will be structured within the requirements of the applicable remuneration regulations, and will be no more generous overall than the remuneration forfeited in terms of the existence of performance measures, timing of vesting and form of delivery
¼ The value of buy-out awards is not included within the maximum variable remuneration level where it relates to forfeited remuneration from a previous role or employer
Legacy matters ¼ Where a senior executive is promoted to the Board, his or her existing contractual commitments agreed prior to their appointment may still be honoured in accordance with the terms of the relevant commitment, including vesting of any pre-existing deferred or long-term incentive awards
Notes to the remuneration policy for executive directors
Committee’s judgement and discretion In addition to assessing performance and making judgements on the appropriate levels of annual incentive awards and LTIP awards, the Committee has certain operational discretions that it may exercise when considering directors’ remuneration, including but not limited to:
i. Determining whether a leaver is an eligible leaver under the Group’s share plans and treatment of remuneration arrangements
ii. Amending LTIP performance measures following a corporate event to ensure a fair and consistent assessment of performance
iii. Deciding whether to apply malus or clawback to an award
Ability for the Committee to amend the policy for emerging and future regulatory requirements The Committee retains the discretion to make reasonable and proportionate changes to the remuneration policy if the Committee considers this appropriate in order to respond to changing legal or regulatory requirements or guidelines (including but not limited to any Prudential Regulation Authority revisions to its remuneration rules and any changes to regulations caused by the UK leaving the European Union). This includes the ability to make administrative changes to benefit the operation of the remuneration policy and/or to implement such changes ahead of any formal effective date, ensuring timely compliance. Where proposed changes are considered by the Committee to be material, the Group will consult its major shareholders and any changes would be formally incorporated into the policy when it is next put to shareholders for approval.
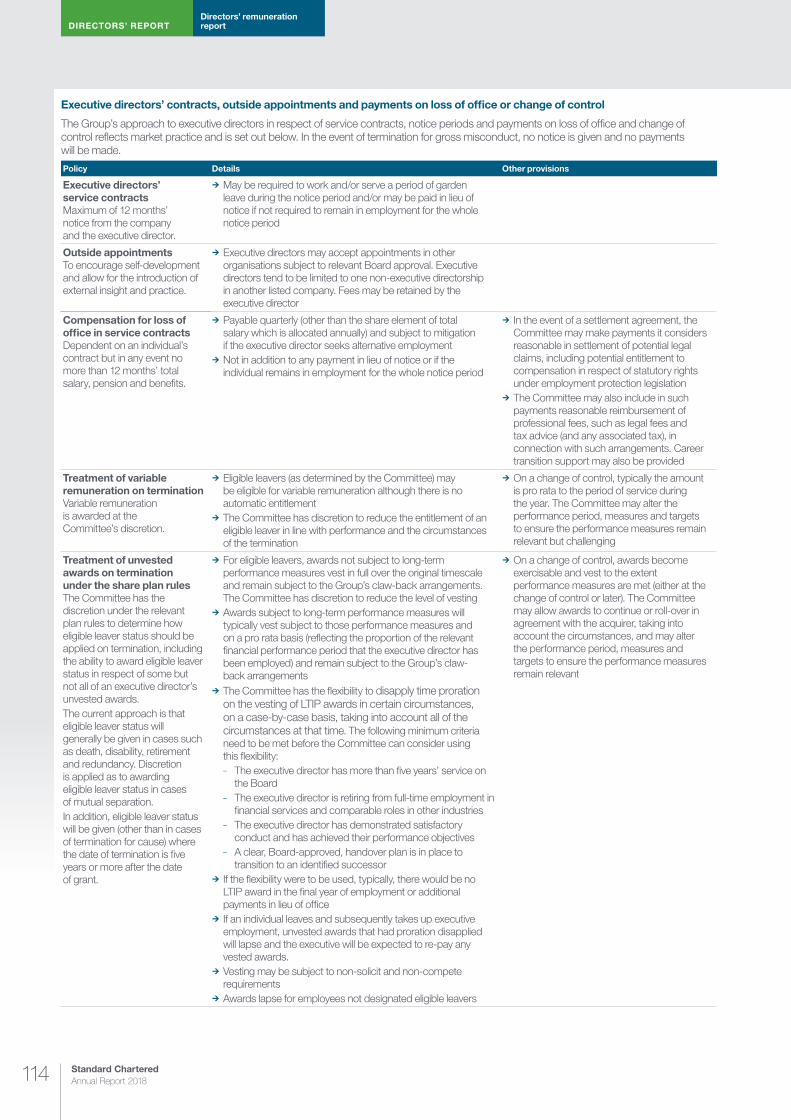
DIRECTORS’ REPORTDirectors’ remuneration report
Standard Chartered Annual Report 2018114
Executive directors’ contracts, outside appointments and payments on loss of office or change of control
The Group’s approach to executive directors in respect of service contracts, notice periods and payments on loss of office and change of control reflects market practice and is set out below. In the event of termination for gross misconduct, no notice is given and no payments will be made.
Policy Details Other provisions
Executive directors’ service contractsMaximum of 12 months’ notice from the company and the executive director.
¼ May be required to work and/or serve a period of garden leave during the notice period and/or may be paid in lieu of notice if not required to remain in employment for the whole notice period
Outside appointmentsTo encourage self-development and allow for the introduction of external insight and practice.
¼ Executive directors may accept appointments in other organisations subject to relevant Board approval. Executive directors tend to be limited to one non-executive directorship in another listed company. Fees may be retained by the executive director
Compensation for loss of office in service contractsDependent on an individual’s contract but in any event no more than 12 months’ total salary, pension and benefits.
¼ Payable quarterly (other than the share element of total salary which is allocated annually) and subject to mitigation if the executive director seeks alternative employment
¼ Not in addition to any payment in lieu of notice or if the individual remains in employment for the whole notice period
¼ In the event of a settlement agreement, the Committee may make payments it considers reasonable in settlement of potential legal claims, including potential entitlement to compensation in respect of statutory rights under employment protection legislation
¼ The Committee may also include in such payments reasonable reimbursement of professional fees, such as legal fees and tax advice (and any associated tax), in connection with such arrangements. Career transition support may also be provided
Treatment of variable remuneration on terminationVariable remuneration is awarded at the Committee’s discretion.
¼ Eligible leavers (as determined by the Committee) may be eligible for variable remuneration although there is no automatic entitlement
¼ The Committee has discretion to reduce the entitlement of an eligible leaver in line with performance and the circumstances of the termination
¼ On a change of control, typically the amount is pro rata to the period of service during the year. The Committee may alter the performance period, measures and targets to ensure the performance measures remain relevant but challenging
Treatment of unvested awards on termination under the share plan rulesThe Committee has the discretion under the relevant plan rules to determine how eligible leaver status should be applied on termination, including the ability to award eligible leaver status in respect of some but not all of an executive director’s unvested awards.The current approach is that eligible leaver status will generally be given in cases such as death, disability, retirement and redundancy. Discretion is applied as to awarding eligible leaver status in cases of mutual separation.In addition, eligible leaver status will be given (other than in cases of termination for cause) where the date of termination is five years or more after the date of grant.
¼ For eligible leavers, awards not subject to long-term performance measures vest in full over the original timescale and remain subject to the Group’s claw-back arrangements. The Committee has discretion to reduce the level of vesting
¼ Awards subject to long-term performance measures will typically vest subject to those performance measures and on a pro rata basis (reflecting the proportion of the relevant financial performance period that the executive director has been employed) and remain subject to the Group’s claw- back arrangements
¼ The Committee has the flexibility to disapply time proration on the vesting of LTIP awards in certain circumstances, on a case-by-case basis, taking into account all of the circumstances at that time. The following minimum criteria need to be met before the Committee can consider using this flexibility:– The executive director has more than five years’ service on
the Board– The executive director is retiring from full-time employment in
financial services and comparable roles in other industries– The executive director has demonstrated satisfactory
conduct and has achieved their performance objectives– A clear, Board-approved, handover plan is in place to
transition to an identified successor ¼ If the flexibility were to be used, typically, there would be no LTIP award in the final year of employment or additional payments in lieu of office
¼ If an individual leaves and subsequently takes up executive employment, unvested awards that had proration disapplied will lapse and the executive will be expected to re-pay any vested awards.
¼ Vesting may be subject to non-solicit and non-compete requirements
¼ Awards lapse for employees not designated eligible leavers
¼ On a change of control, awards become exercisable and vest to the extent performance measures are met (either at the change of control or later). The Committee may allow awards to continue or roll-over in agreement with the acquirer, taking into account the circumstances, and may alter the performance period, measures and targets to ensure the performance measures remain relevant

Risk review
and Cap
ital reviewS
trategic repo
rtS
upp
lementary info
rmatio
nFinancial statem
entsD
IRE
CT
OR
S’ R
EP
OR
T
115
Policy Details Other provisions
Post-employment shareholding requirement
¼ On cessation of employment executive directors will be required to hold 100 per cent of the shareholding requirement in place for one year and 50 per cent of the requirement in the second year (or, if lower, the actual shareholding on departure)
Chairman and independent non-executive directors’ remuneration policyDuring 2018, the Board reviewed the remuneration policy for independent non-executive directors (INEDs) and determined there would be no change to the fee structure.
Element and purpose in supporting the Group’s strategic objectives Operation
Additional detail including maximum value and performance measures
Fees
Attract a Chairman and INEDs who, together with the Board as a whole, have a broad range of skills and experience to determine Group strategy and oversee its implementation.
¼ Fees are paid in cash or shares. Post-tax fees may be used to acquire shares
¼ The Chairman and INED fees are reviewed periodically. The Board sets INED fees and the Committee sets the Chairman’s fees. The Chairman and INEDs excuse themselves from any discussion on their fees
¼ INEDs may also receive fees as directors of subsidiaries of Standard Chartered PLC, to the extent permitted by regulation
¼ Overall aggregate base fees paid to the Chairman and all INEDs will remain within the limit stated in the Articles of Association (currently £1.5 million)
¼ Fees are set at a level which reflect the duties, time commitment and contribution expected from the Chairman and INEDs
¼ Fees are reviewed and appropriately positioned against those for the Chairman and INEDs in banks and other companies of a similar scale and complexity
¼ There are no recovery provisions or performance measures
Benefits
Attract a Chairman and INEDs who together with the Board as a whole have a broad range of skills and experience to determine Group strategy and oversee its implementation.
¼ The Chairman is provided with benefits associated with the role, including a car and driver and private medical insurance, permanent health insurance and life insurance. Any tax costs associated with these benefits are paid by the Group. Any future Chairman based outside of the UK may receive assistance with their relocation consistent with the support offered to individuals under the Group’s international mobility policies
¼ The INEDs are paid fees for chairmanship and membership of Board committees and for the Deputy Chairman and Senior Independent Director roles
¼ The Chairman and INEDs are reimbursed for expenses, such as travel and subsistence (and including any associated tax), incurred in the performance of their duties, and may receive tax preparation and tax return assistance
¼ In exceptional circumstances the Chairman and INEDs may be accompanied by their spouse or partner to meetings or events. The costs (and any associated tax) are paid by the Group
¼ There are no performance measures
Approach on recruitment for Chairman or INEDs
Fees and benefits for a new Chairman or INED will be in line with the Chairman and independent non-executive directors’ remuneration policy.
Service contracts and policy on payment for loss of office for the Chairman and INEDs
The Chairman is provided a notice period of up to 12 months and is entitled to a payment in lieu of notice in respect of any unexpired part of the notice period at the point of termination.
INEDs are appointed for a period of one year unless terminated earlier by either party with three months’ written notice. No entitlement to the payment of fees or provision of benefits continues beyond termination of the appointment and INEDs are not entitled to any payments for loss of office (other than entitlements under contract law, such as a payment in lieu of notice if notice is not served).

DIRECTORS’ REPORTDirectors’ remuneration report
Standard Chartered Annual Report 2018116
The structure of remuneration in 2019 will be in line with the new directors’ remuneration policy as detailed on pages 108 to 115 of this report subject to shareholder approval at the May 2019 AGM. The key elements of remuneration will include total salary (delivered in cash and shares), pension, benefits, an annual incentive and a long-term incentive plan award.
The Committee reviews the salaries of the executive directors on an annual basis, taking into account, changes to the scope or responsibility of the role, the individual’s development in the role, and alignment to market-competitive levels. The Committee also takes into account the average salary increases made to the broader employee population.
For 2019, the Committee determined that an increase to total salary for Bill Winters from £2,300,000 to £2,370,000 (an increase of 3 per cent) with effect from 1 April 2019 was appropriate. In making the decision, the Committee noted that his fixed remuneration was below that of some of his global peers, that he had not received a salary increase since his appointment in 2015 and his development in the role since that time. The Committee also took into account the average salary increase made to the broader employee population since 2015 which was, on average, 4 per cent each year.
Bill’s pension will continue to be delivered as a contribution to a defined contribution plan and as a cash allowance.
For 2019, the Committee determined that there should be no change to the quantum of fixed remuneration for Andy Halford.
Andy’s pension will continue to be delivered as a cash allowance. The components of Andy’s fixed remuneration will be rebalanced with no change to the overall quantum that he is contractually entitled to. Total salary will increase by 4 per cent and the proportion of total salary delivered in cash will increase to offset the 17 per cent reduction in the pension cash allowance. As a result of the rebalancing, the proportion of total fixed pay delivered in cash will increase by 1 per cent.
Details of fixed remuneration for Bill and Andy are set out below. All figures are in £000s.
W T Winters A N Halford
2019 2018 % change 2019 2018 % change
Total salary in cash 1,185 1,150 3% 986 890 11%
Total salary in shares 1,185 1,150 3% 485 519 (6%)
Total salary 2,370 2,300 3% 1,471 1,409 4%
Pension 474 460 3% 294 356 (17%)
Total fixed pay 2,844 2,760 3% 1,765 1,765 0%
Proportion of total fixed pay paid in cash 58% 58% 72% 71%
Proportion of total fixed pay paid in shares 42% 42% 28% 29%
Illustration of application of the 2019 remuneration policyThe charts below illustrate the potential outcomes under the proposed directors’ remuneration policy being put to shareholders for approval at the AGM in May 2019 (i.e. for awards that would be made in March 2020, based on 2019 total fixed pay). The charts show potential remuneration outcomes for each executive director in four performance scenarios: minimum, on-target, maximum performance and maximum performance with 50 per cent share price appreciation in line with reporting requirements. The percentages shown in each bar represent the amount of total remuneration provided by each element of pay.
0
2,000
4,000
6,000
8,000
10,000
12,000
Maximum with 50%share price appreciation
MaximumTargetMinimum0
2,000
4,000
6,000
8,000
10,000
12,000
Maximum with 50%share price appreciation
MaximumTargetMinimum
2019 total salary
3,054
78%
22%
5,898
40%
12%19%
29%
8,742
27%
8%
26%
39%
10,448
23%
6%
22%
49%
Pension and benefits 2019 Annual incentive award 2020–22 LTIP award
Bill Winters 2019 remuneration (£’000)
1,861
79%21%
3,626
41%11%
29%19%
5,391
28%7%26%
39%
6,450
23%6%22%
49%
Andy Halford 2019 remuneration (£’000)
1 Total salary as at 1 April 2019
2 Benefits based on 2018 single figure. Actual fixed pay in 2019 will be dependent on the cost of benefits
3 Minimum performance assumes no annual incentive is awarded and no LTIP award vests
4 Target performance assumes an annual incentive of 50 per cent of the maximum opportunity and LTIP vesting at 50 per cent of the total award, i.e. an annual incentive award of 40 per cent of fixed pay and the vesting of the LTIP at 60 per cent of fixed pay
5 Maximum performance assumes the maximum annual incentive opportunity and LTIP vesting in full, i.e. an annual incentive of 80 per cent of fixed pay and an LTIP award of 120 per cent of fixed pay
6 Maximum performance with 50 per cent share price appreciation is as footnote 5, plus a 50 per cent share price appreciation in the value of the vested LTIP award since the time of grant
2019 policy implementation for executive directors
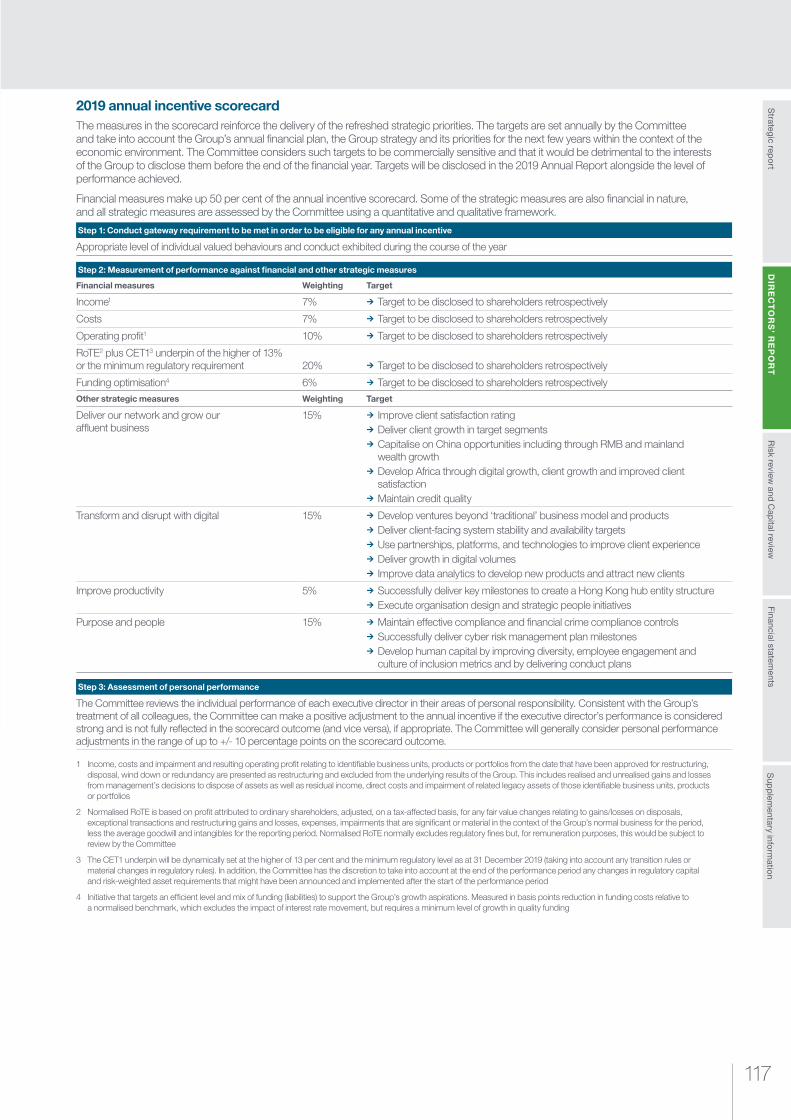
Risk review
and Cap
ital reviewS
trategic repo
rtS
upp
lementary info
rmatio
nFinancial statem
entsD
IRE
CT
OR
S’ R
EP
OR
T
117
2019 annual incentive scorecardThe measures in the scorecard reinforce the delivery of the refreshed strategic priorities. The targets are set annually by the Committee and take into account the Group’s annual financial plan, the Group strategy and its priorities for the next few years within the context of the economic environment. The Committee considers such targets to be commercially sensitive and that it would be detrimental to the interests of the Group to disclose them before the end of the financial year. Targets will be disclosed in the 2019 Annual Report alongside the level of performance achieved.
Financial measures make up 50 per cent of the annual incentive scorecard. Some of the strategic measures are also financial in nature, and all strategic measures are assessed by the Committee using a quantitative and qualitative framework.
Step 1: Conduct gateway requirement to be met in order to be eligible for any annual incentive
Appropriate level of individual valued behaviours and conduct exhibited during the course of the year
Step 2: Measurement of performance against financial and other strategic measures
Financial measures Weighting Target
Income1 7% ¼ Target to be disclosed to shareholders retrospectively
Costs 7% ¼ Target to be disclosed to shareholders retrospectively
Operating profit1 10% ¼ Target to be disclosed to shareholders retrospectively
RoTE2 plus CET13 underpin of the higher of 13% or the minimum regulatory requirement 20% ¼ Target to be disclosed to shareholders retrospectively
Funding optimisation4 6% ¼ Target to be disclosed to shareholders retrospectivelyOther strategic measures Weighting Target
Deliver our network and grow our affluent business
15% ¼ Improve client satisfaction rating ¼ Deliver client growth in target segments ¼ Capitalise on China opportunities including through RMB and mainland wealth growth
¼ Develop Africa through digital growth, client growth and improved client satisfaction
¼ Maintain credit quality
Transform and disrupt with digital 15% ¼ Develop ventures beyond ‘traditional’ business model and products ¼ Deliver client-facing system stability and availability targets ¼ Use partnerships, platforms, and technologies to improve client experience ¼ Deliver growth in digital volumes ¼ Improve data analytics to develop new products and attract new clients
Improve productivity 5% ¼ Successfully deliver key milestones to create a Hong Kong hub entity structure ¼ Execute organisation design and strategic people initiatives
Purpose and people 15% ¼ Maintain effective compliance and financial crime compliance controls ¼ Successfully deliver cyber risk management plan milestones ¼ Develop human capital by improving diversity, employee engagement and culture of inclusion metrics and by delivering conduct plans
Step 3: Assessment of personal performance
The Committee reviews the individual performance of each executive director in their areas of personal responsibility. Consistent with the Group’s treatment of all colleagues, the Committee can make a positive adjustment to the annual incentive if the executive director’s performance is considered strong and is not fully reflected in the scorecard outcome (and vice versa), if appropriate. The Committee will generally consider personal performance adjustments in the range of up to +/- 10 percentage points on the scorecard outcome.
1 Income, costs and impairment and resulting operating profit relating to identifiable business units, products or portfolios from the date that have been approved for restructuring, disposal, wind down or redundancy are presented as restructuring and excluded from the underlying results of the Group. This includes realised and unrealised gains and losses from management’s decisions to dispose of assets as well as residual income, direct costs and impairment of related legacy assets of those identifiable business units, products or portfolios
2 Normalised RoTE is based on profit attributed to ordinary shareholders, adjusted, on a tax-affected basis, for any fair value changes relating to gains/losses on disposals, exceptional transactions and restructuring gains and losses, expenses, impairments that are significant or material in the context of the Group’s normal business for the period, less the average goodwill and intangibles for the reporting period. Normalised RoTE normally excludes regulatory fines but, for remuneration purposes, this would be subject to review by the Committee
3 The CET1 underpin will be dynamically set at the higher of 13 per cent and the minimum regulatory level as at 31 December 2019 (taking into account any transition rules or material changes in regulatory rules). In addition, the Committee has the discretion to take into account at the end of the performance period any changes in regulatory capital and risk-weighted asset requirements that might have been announced and implemented after the start of the performance period
4 Initiative that targets an efficient level and mix of funding (liabilities) to support the Group’s growth aspirations. Measured in basis points reduction in funding costs relative to a normalised benchmark, which excludes the impact of interest rate movement, but requires a minimum level of growth in quality funding
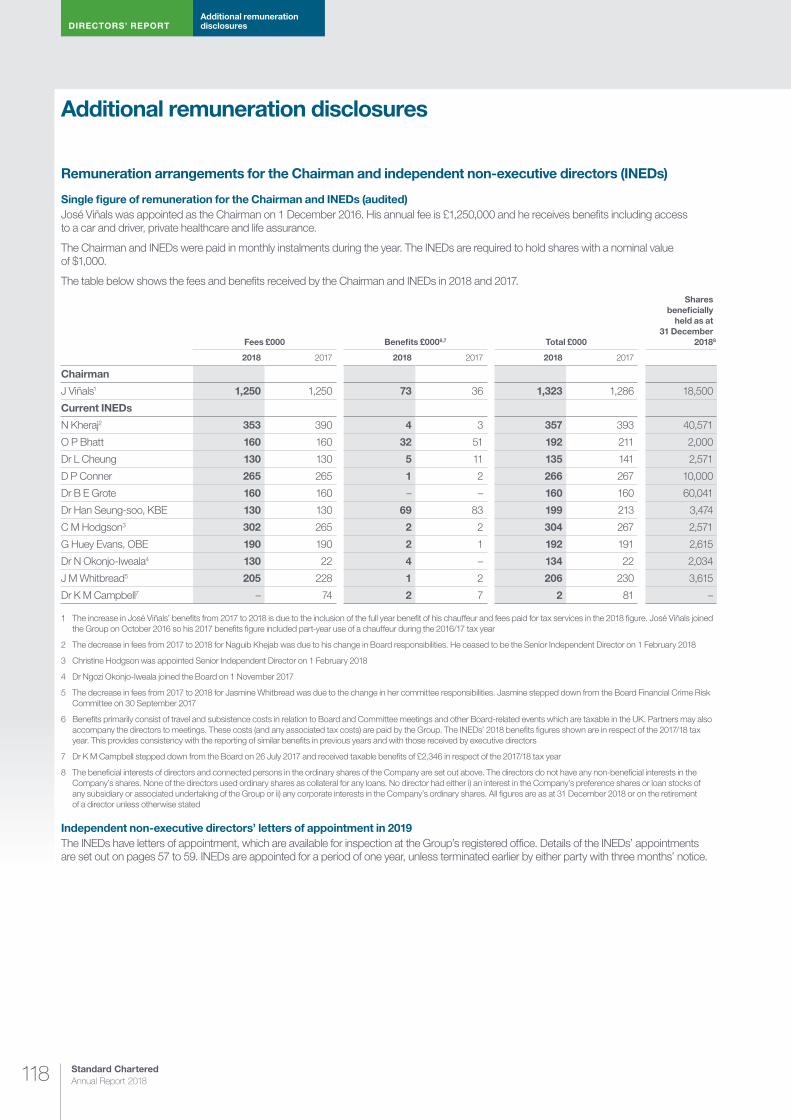
DIRECTORS’ REPORTAdditional remuneration disclosures
Standard Chartered Annual Report 2018118
Remuneration arrangements for the Chairman and independent non-executive directors (INEDs)
Single figure of remuneration for the Chairman and INEDs (audited)José Viñals was appointed as the Chairman on 1 December 2016. His annual fee is £1,250,000 and he receives benefits including access to a car and driver, private healthcare and life assurance.
The Chairman and INEDs were paid in monthly instalments during the year. The INEDs are required to hold shares with a nominal value of $1,000.
The table below shows the fees and benefits received by the Chairman and INEDs in 2018 and 2017.
Fees £000 Benefits £0006,7 Total £000
Shares beneficially
held as at 31 December
20188
2018 2017 2018 2017 2018 2017
Chairman
J Viñals1 1,250 1,250 73 36 1,323 1,286 18,500
Current INEDs
N Kheraj2 353 390 4 3 357 393 40,571
O P Bhatt 160 160 32 51 192 211 2,000
Dr L Cheung 130 130 5 11 135 141 2,571
D P Conner 265 265 1 2 266 267 10,000
Dr B E Grote 160 160 – – 160 160 60,041
Dr Han Seung-soo, KBE 130 130 69 83 199 213 3,474
C M Hodgson3 302 265 2 2 304 267 2,571
G Huey Evans, OBE 190 190 2 1 192 191 2,615
Dr N Okonjo-Iweala4 130 22 4 – 134 22 2,034
J M Whitbread5 205 228 1 2 206 230 3,615
Dr K M Campbell7 – 74 2 7 2 81 –
1 The increase in José Viñals’ benefits from 2017 to 2018 is due to the inclusion of the full year benefit of his chauffeur and fees paid for tax services in the 2018 figure. José Viñals joined the Group on October 2016 so his 2017 benefits figure included part-year use of a chauffeur during the 2016/17 tax year
2 The decrease in fees from 2017 to 2018 for Naguib Khejab was due to his change in Board responsibilities. He ceased to be the Senior Independent Director on 1 February 2018
3 Christine Hodgson was appointed Senior Independent Director on 1 February 2018
4 Dr Ngozi Okonjo-Iweala joined the Board on 1 November 2017
5 The decrease in fees from 2017 to 2018 for Jasmine Whitbread was due to the change in her committee responsibilities. Jasmine stepped down from the Board Financial Crime Risk Committee on 30 September 2017
6 Benefits primarily consist of travel and subsistence costs in relation to Board and Committee meetings and other Board-related events which are taxable in the UK. Partners may also accompany the directors to meetings. These costs (and any associated tax costs) are paid by the Group. The INEDs’ 2018 benefits figures shown are in respect of the 2017/18 tax year. This provides consistency with the reporting of similar benefits in previous years and with those received by executive directors
7 Dr K M Campbell stepped down from the Board on 26 July 2017 and received taxable benefits of £2,346 in respect of the 2017/18 tax year
8 The beneficial interests of directors and connected persons in the ordinary shares of the Company are set out above. The directors do not have any non-beneficial interests in the Company’s shares. None of the directors used ordinary shares as collateral for any loans. No director had either i) an interest in the Company’s preference shares or loan stocks of any subsidiary or associated undertaking of the Group or ii) any corporate interests in the Company’s ordinary shares. All figures are as at 31 December 2018 or on the retirement of a director unless otherwise stated
Independent non-executive directors’ letters of appointment in 2019The INEDs have letters of appointment, which are available for inspection at the Group’s registered office. Details of the INEDs’ appointments are set out on pages 57 to 59. INEDs are appointed for a period of one year, unless terminated earlier by either party with three months’ notice.
Additional remuneration disclosures

119
Risk review
and Cap
ital reviewS
trategic repo
rtS
upp
lementary info
rmatio
nFinancial statem
entsD
IRE
CT
OR
S’ R
EP
OR
T
Fees (audited) The Board reviewed the fee levels as it does regularly, considering market data and the duties, time commitment and contribution expected. The last increase to the base fee was in 2009. The Board determined that an increase to the base fee of 5 per cent was appropriate and begins to reflect the significant increase in time commitment since 2009. Increases to fees levels for the roles of Remuneration Committee Chair, Audit Committee member and Risk Committee member were also considered appropriate. The revised fees are set out in the table below:
As at 1 January 2019
£000
As at 1 January 2018
£000
Board member 105 100
Additional responsibilities
Deputy Chairman 75 75
Senior Independent Director 40 40
Chair
– Audit Committee 70 70
– Board Risk Committee 70 70
– Remuneration Committee 70 60
– Board Financial Crime Risk Committee 60 60
– Brand, Values and Conduct Committee 60 60
Membership
– Audit Committee 35 30
– Board Risk Committee 35 30
– Board Financial Crime Risk Committee 30 30
– Brand, Values and Conduct Committee 30 30
– Remuneration Committee 30 30
– Governance and Nomination Committee 15 15
Service contracts for executive directorsCopies of the executive directors’ service contracts are available for inspection at the Group’s registered office. These contracts have rolling 12-month notice periods and the dates of the executive directors’ service contracts are shown below. Executive directors are permitted to hold non-executive directorship positions in other organisations (but no more than one position with a FTSE 100 company). Where such appointments are agreed with the Board, the executive directors may retain any fees payable for their services. Both executive directors served as non-executive directors elsewhere and received fees for the period covered by this report.
Date of Standard Chartered employment contract1
Details of any non-executive directorship
Fees retained for any non-executive directorship (local currency)
W T Winters 8 April 2016 Novartis International AG CHF 325,000
A N Halford 10 February 2016 Marks and Spencer Group plc £88,750
1 Date the latest employment contract was entered into, not date of taking up employment with the Group
Executive directors’ shareholdings and share interests including share awards (audited) Executive directors are required to hold a certain number of shares, to be built up over a reasonable timeframe from the date of appointment as an executive director (or, if later, from the date of any change to the terms of the shareholding requirement). Shares that count towards the requirement are beneficially owned shares including any vested share awards subject only to a retention period. The shareholding requirement for 2018 was expressed as a number of shares, set as 250,000 shares for the Group Chief Executive and 150,000 shares for the Group Chief Financial Officer. Both Bill Winters and Andy Halford have met their shareholding requirement as outlined below.
In addition to the shareholding requirement, executive directors held a considerable number of fixed pay allowance (FPA) shares which are released over five years. Unreleased FPA shares were not counted towards the 2018 shareholding requirements. The levels of unreleased FPA shares as at 31 December 2018 were: Bill: 249,250; and Andy: 111,079.
Shareholdings1 Share awards1
Shares held beneficially2
Shareholding as a percentage
of salary3
Actual shareholding requirement
in number of shares
Alignment to requirement
Vested but unexercised
share awards
Unvested share awards not subject to performance
measures
Unvested share awards subject to performance
measures
W T Winters3 1,148,875 609% 250,000 Met – 314,916 2,127,423
A N Halford 476,374 326% 150,000 Met 1,612 – 1,295,328
1 All figures are as at 31 December 2018 unless stated otherwise. There were no changes to any executive director’s interests in ordinary shares between 31 December 2018 and 26 February 2019. No director had either (i) an interest in Standard Chartered PLC’s preference shares or loan stocks of any subsidiary or associated undertaking of the Group or (ii) any corporate interests in Standard Chartered PLC’s ordinary shares
2 The beneficial interests of directors and connected persons in the ordinary shares of the Company are set out above. The executive directors do not have any non-beneficial interests in the Company’s shares. None of the executive directors used ordinary shares as collateral for any loans
3 Shareholding as a percentage of salary is calculated using the closing share price on 31 December 2018 (£6.09)
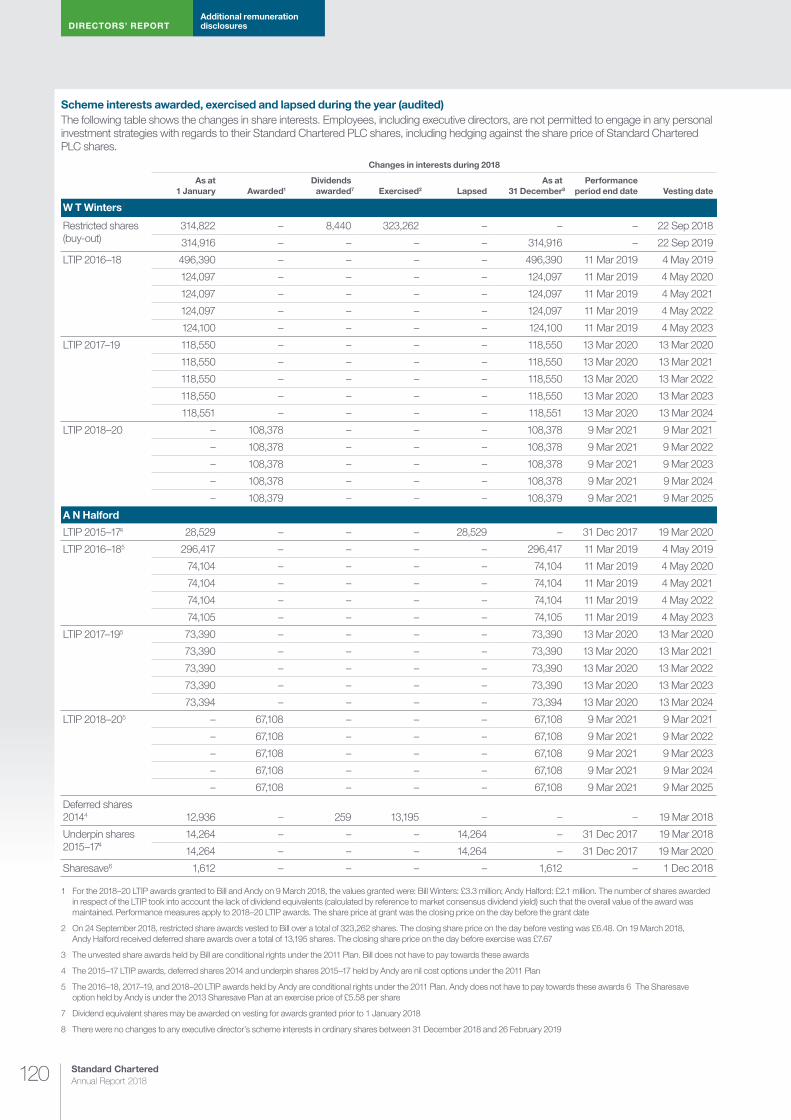
DIRECTORS’ REPORTAdditional remuneration disclosures
Standard Chartered Annual Report 2018120
Scheme interests awarded, exercised and lapsed during the year (audited)The following table shows the changes in share interests. Employees, including executive directors, are not permitted to engage in any personal investment strategies with regards to their Standard Chartered PLC shares, including hedging against the share price of Standard Chartered PLC shares.
Changes in interests during 2018
As at 1 January Awarded1
Dividends awarded7 Exercised2 Lapsed
As at 31 December8
Performance period end date Vesting date
W T Winters4
Restricted shares 3 (buy-out)
314,822 – 8,440 323,262 – – – 22 Sep 2018
314,916 – – – – 314,916 – 22 Sep 2019
LTIP 2016–18 496,390 – – – – 496,390 11 Mar 2019 4 May 2019
124,097 – – – – 124,097 11 Mar 2019 4 May 2020
124,097 – – – – 124,097 11 Mar 2019 4 May 2021
124,097 – – – – 124,097 11 Mar 2019 4 May 2022
124,100 – – – – 124,100 11 Mar 2019 4 May 2023
LTIP 2017–19 118,550 – – – – 118,550 13 Mar 2020 13 Mar 2020
118,550 – – – – 118,550 13 Mar 2020 13 Mar 2021
118,550 – – – – 118,550 13 Mar 2020 13 Mar 2022
118,550 – – – – 118,550 13 Mar 2020 13 Mar 2023
118,551 – – – – 118,551 13 Mar 2020 13 Mar 2024
LTIP 2018–20 – 108,378 – – – 108,378 9 Mar 2021 9 Mar 2021
– 108,378 – – – 108,378 9 Mar 2021 9 Mar 2022
– 108,378 – – – 108,378 9 Mar 2021 9 Mar 2023
– 108,378 – – – 108,378 9 Mar 2021 9 Mar 2024
– 108,379 – – – 108,379 9 Mar 2021 9 Mar 2025
A N Halford
LTIP 2015–174 28,529 – – – 28,529 – 31 Dec 2017 19 Mar 2020
LTIP 2016–185 296,417 – – – – 296,417 11 Mar 2019 4 May 2019
74,104 – – – – 74,104 11 Mar 2019 4 May 2020
74,104 – – – – 74,104 11 Mar 2019 4 May 2021
74,104 – – – – 74,104 11 Mar 2019 4 May 2022
74,105 – – – – 74,105 11 Mar 2019 4 May 2023
LTIP 2017–195 73,390 – – – – 73,390 13 Mar 2020 13 Mar 2020
73,390 – – – – 73,390 13 Mar 2020 13 Mar 2021
73,390 – – – – 73,390 13 Mar 2020 13 Mar 2022
73,390 – – – – 73,390 13 Mar 2020 13 Mar 2023
73,394 – – – – 73,394 13 Mar 2020 13 Mar 2024
LTIP 2018–205 – 67,108 – – – 67,108 9 Mar 2021 9 Mar 2021
– 67,108 – – – 67,108 9 Mar 2021 9 Mar 2022
– 67,108 – – – 67,108 9 Mar 2021 9 Mar 2023
– 67,108 – – – 67,108 9 Mar 2021 9 Mar 2024
– 67,108 – – – 67,108 9 Mar 2021 9 Mar 2025
Deferred shares 20144 12,936 – 259 13,195 – – – 19 Mar 2018
Underpin shares 2015–174
14,264 – – – 14,264 – 31 Dec 2017 19 Mar 2018
14,264 – – – 14,264 – 31 Dec 2017 19 Mar 2020
Sharesave6 1,612 – – – – 1,612 – 1 Dec 2018
1 For the 2018–20 LTIP awards granted to Bill and Andy on 9 March 2018, the values granted were: Bill Winters: £3.3 million; Andy Halford: £2.1 million. The number of shares awarded in respect of the LTIP took into account the lack of dividend equivalents (calculated by reference to market consensus dividend yield) such that the overall value of the award was maintained. Performance measures apply to 2018–20 LTIP awards. The share price at grant was the closing price on the day before the grant date
2 On 24 September 2018, restricted share awards vested to Bill over a total of 323,262 shares. The closing share price on the day before vesting was £6.48. On 19 March 2018, Andy Halford received deferred share awards over a total of 13,195 shares. The closing share price on the day before exercise was £7.67
3 The unvested share awards held by Bill are conditional rights under the 2011 Plan. Bill does not have to pay towards these awards
4 The 2015–17 LTIP awards, deferred shares 2014 and underpin shares 2015–17 held by Andy are nil cost options under the 2011 Plan
5 The 2016–18, 2017–19, and 2018–20 LTIP awards held by Andy are conditional rights under the 2011 Plan. Andy does not have to pay towards these awards 6 The Sharesave option held by Andy is under the 2013 Sharesave Plan at an exercise price of £5.58 per share
7 Dividend equivalent shares may be awarded on vesting for awards granted prior to 1 January 2018
8 There were no changes to any executive director’s scheme interests in ordinary shares between 31 December 2018 and 26 February 2019
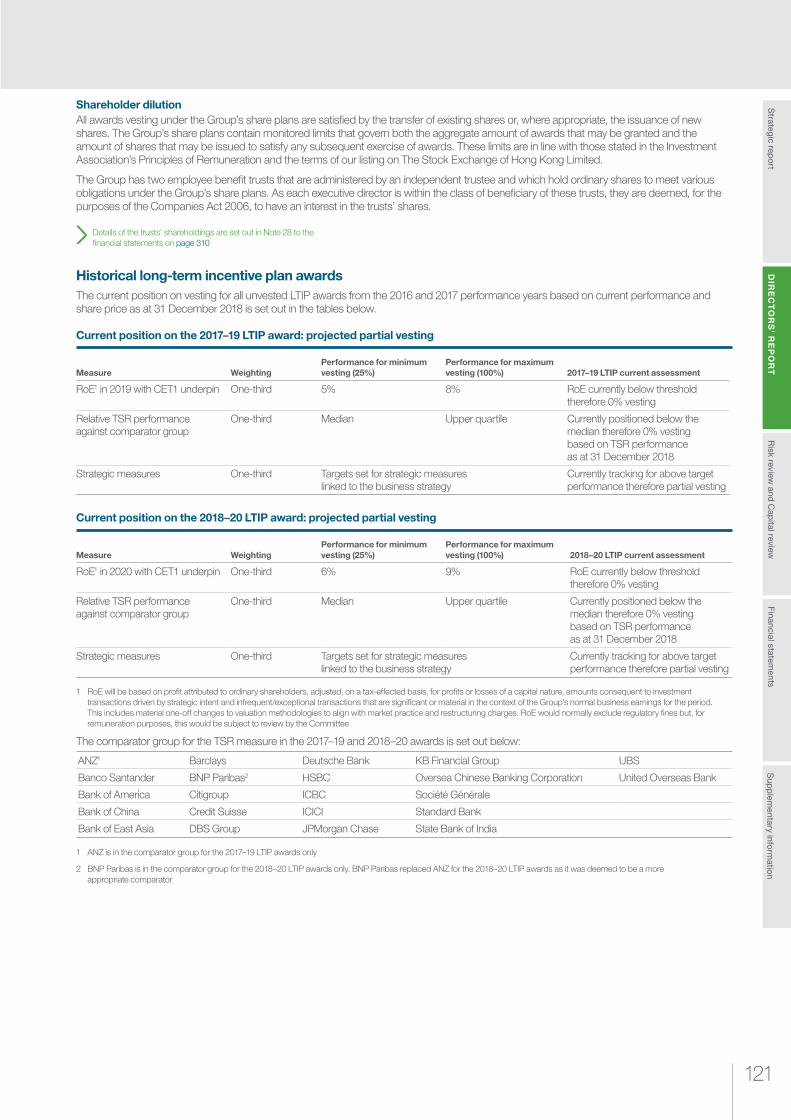
121
Risk review
and Cap
ital reviewS
trategic repo
rtS
upp
lementary info
rmatio
nFinancial statem
entsD
IRE
CT
OR
S’ R
EP
OR
T
Shareholder dilutionAll awards vesting under the Group’s share plans are satisfied by the transfer of existing shares or, where appropriate, the issuance of new shares. The Group’s share plans contain monitored limits that govern both the aggregate amount of awards that may be granted and the amount of shares that may be issued to satisfy any subsequent exercise of awards. These limits are in line with those stated in the Investment Association’s Principles of Remuneration and the terms of our listing on The Stock Exchange of Hong Kong Limited.
The Group has two employee benefit trusts that are administered by an independent trustee and which hold ordinary shares to meet various obligations under the Group’s share plans. As each executive director is within the class of beneficiary of these trusts, they are deemed, for the purposes of the Companies Act 2006, to have an interest in the trusts’ shares.
Details of the trusts’ shareholdings are set out in Note 28 to the financial statements on page 310
Historical long-term incentive plan awards The current position on vesting for all unvested LTIP awards from the 2016 and 2017 performance years based on current performance and share price as at 31 December 2018 is set out in the tables below.
Current position on the 2017–19 LTIP award: projected partial vesting
Measure WeightingPerformance for minimum vesting (25%)
Performance for maximum vesting (100%) 2017–19 LTIP current assessment
RoE1 in 2019 with CET1 underpin One-third 5% 8% RoE currently below threshold therefore 0% vesting
Relative TSR performance against comparator group
One-third Median Upper quartile Currently positioned below the median therefore 0% vesting based on TSR performance as at 31 December 2018
Strategic measures One-third Targets set for strategic measures linked to the business strategy
Currently tracking for above target performance therefore partial vesting
Current position on the 2018–20 LTIP award: projected partial vesting
Measure WeightingPerformance for minimum vesting (25%)
Performance for maximum vesting (100%) 2018–20 LTIP current assessment
RoE1 in 2020 with CET1 underpin One-third 6% 9% RoE currently below threshold therefore 0% vesting
Relative TSR performance against comparator group
One-third Median Upper quartile Currently positioned below the median therefore 0% vesting based on TSR performance as at 31 December 2018
Strategic measures One-third Targets set for strategic measures linked to the business strategy
Currently tracking for above target performance therefore partial vesting
1 RoE will be based on profit attributed to ordinary shareholders, adjusted, on a tax-effected basis, for profits or losses of a capital nature, amounts consequent to investment transactions driven by strategic intent and infrequent/exceptional transactions that are significant or material in the context of the Group’s normal business earnings for the period. This includes material one-off changes to valuation methodologies to align with market practice and restructuring charges. RoE would normally exclude regulatory fines but, for remuneration purposes, this would be subject to review by the Committee
The comparator group for the TSR measure in the 2017–19 and 2018–20 awards is set out below:
ANZ1 Barclays Deutsche Bank KB Financial Group UBS
Banco Santander BNP Paribas2 HSBC Oversea Chinese Banking Corporation United Overseas Bank
Bank of America Citigroup ICBC Société Générale
Bank of China Credit Suisse ICICI Standard Bank
Bank of East Asia DBS Group JPMorgan Chase State Bank of India
1 ANZ is in the comparator group for the 2017–19 LTIP awards only
2 BNP Paribas is in the comparator group for the 2018–20 LTIP awards only. BNP Paribas replaced ANZ for the 2018–20 LTIP awards as it was deemed to be a more appropriate comparator
DIRECTORS’ REPORTAdditional remuneration disclosures
Standard Chartered Annual Report 2018122
Pillar 3 disclosures on material risk takers’ remuneration and disclosures on the highest-paid employees
Identification of material risk takers The table opposite summarises the groups of employees who have been identified in accordance with regulatory requirements as material risk takers for remuneration purposes. Individuals have been identified as material risk takers in alignment with the qualitative and quantitative criteria set out in the European Banking Authority’s Regulatory Technical Standard (EU 604/2014 adopted by the UK Prudential Regulatory Authority) that came into force in June 2014.
Quantitative criteria
The quantitative criteria identify employees who:
¼ Have been awarded total remuneration of EUR500,000 or more in the previous financial year
¼ Are within the 0.3 per cent of the number of staff on a global basis who have been awarded the highest total remuneration in the preceding financial year
¼ Were awarded total remuneration in the preceding financial year that was equal to or greater than the lowest total remuneration awarded that year to certain specified groups of employees
Employees identified by only the quantitative criteria can be excluded from being identified as material risk takers if it can be evidenced that they do not have the ability to have a material impact on the Group’s risk profile.
Qualitative criteria
The qualitative criteria broadly identifies the following employees:
¼ Directors (both executive and non-executive) of Standard Chartered PLC
¼ A member of senior management, which is defined as one or more of the following:
– A Senior Manager under the Prudential Regulation Authority or Financial Conduct Authority Senior Manager Regime
– A member of the Group Management Team
¼ Senior management (the level beneath the Management Team)
¼ Senior employees within the audit, compliance, legal and risk functions
¼ Senior employees within material business units
¼ Employees who are members of specific committees
¼ Employees who are able to initiate or approve credit risk exposures above a certain threshold and sign off on trading book transactions at or above a specific value at risk limit
For the purpose of the Pillar 3 tables, unless otherwise stated, senior management is defined as directors of Standard Chartered PLC (both executive and non-executive), senior managers under the PRA or FCA Senior Manager Regime and members of the Group Management Team.
Material risk takers’ remuneration delivery Remuneration for material risk takers was delivered in 2018 through a combination of salary, pension, benefits and variable remuneration.
Variable remuneration for material risk takers is structured in line with the PRA and FCA’s remuneration rules. For the 2018 performance year, the following will apply to variable remuneration awarded to material risk takers in accordance with the regulations:
¼ At least 40 per cent of a material risk taker’s variable remuneration will be deferred over a minimum period of three years depending on the category of material risk taker (see chart on page 123)
¼ Non-deferred variable remuneration will be delivered 50 per cent in shares, subject to a minimum 12-month retention period, and 50 per cent in cash
¼ At least 50 per cent of deferred variable remuneration will be delivered entirely in shares, subject to a minimum 12-month retention period (with the exception of deferred shares awarded to risk managers, which are subject to a six-month minimum retention period) in line with the regulations
¼ For some material risk takers, part of their 2018 variable remuneration may be in share awards which vest after a minimum of three years, subject to the satisfaction of performance measures
¼ Variable remuneration awards are subject to remuneration adjustment provisions. This provides the Group with the ability to reduce or revoke variable remuneration in respect of a risk, control or conduct issue, event or behaviour
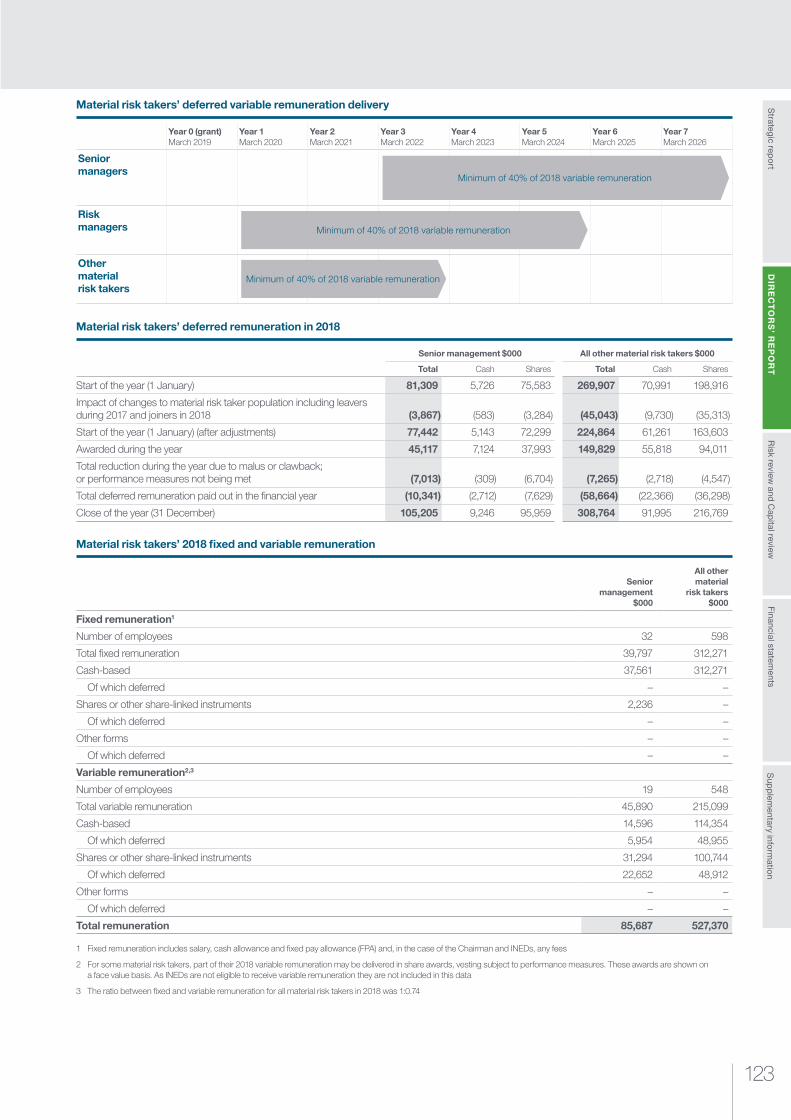
123
Risk review
and Cap
ital reviewS
trategic repo
rtS
upp
lementary info
rmatio
nFinancial statem
entsD
IRE
CT
OR
S’ R
EP
OR
T
Material risk takers’ deferred variable remuneration delivery
Year 0 (grant)March 2019
Year 1March 2020
Year 2March 2021
Year 3March 2022
Year 4March 2023
Year 5March 2024
Year 6March 2025
Year 7March 2026
Senior managers
Risk managers
Other material risk takers
Material risk takers’ deferred remuneration in 2018
Senior management $000 All other material risk takers $000
Total Cash Shares Total Cash Shares
Start of the year (1 January) 81,309 5,726 75,583 269,907 70,991 198,916
Impact of changes to material risk taker population including leavers during 2017 and joiners in 2018 (3,867) (583) (3,284) (45,043) (9,730) (35,313)
Start of the year (1 January) (after adjustments) 77,442 5,143 72,299 224,864 61,261 163,603
Awarded during the year 45,117 7,124 37,993 149,829 55,818 94,011
Total reduction during the year due to malus or clawback; or performance measures not being met (7,013) (309) (6,704) (7,265) (2,718) (4,547)
Total deferred remuneration paid out in the financial year (10,341) (2,712) (7,629) (58,664) (22,366) (36,298)
Close of the year (31 December) 105,205 9,246 95,959 308,764 91,995 216,769
Material risk takers’ 2018 fixed and variable remuneration
Senior management
$000
All other material
risk takers $000
Fixed remuneration1
Number of employees 32 598
Total fixed remuneration 39,797 312,271
Cash-based 37,561 312,271
Of which deferred – –
Shares or other share-linked instruments 2,236 –
Of which deferred – –
Other forms – –
Of which deferred – –
Variable remuneration2,3
Number of employees 19 548
Total variable remuneration 45,890 215,099
Cash-based 14,596 114,354
Of which deferred 5,954 48,955
Shares or other share-linked instruments 31,294 100,744
Of which deferred 22,652 48,912
Other forms – –
Of which deferred – –
Total remuneration 85,687 527,370
1 Fixed remuneration includes salary, cash allowance and fixed pay allowance (FPA) and, in the case of the Chairman and INEDs, any fees
2 For some material risk takers, part of their 2018 variable remuneration may be delivered in share awards, vesting subject to performance measures. These awards are shown on a face value basis. As INEDs are not eligible to receive variable remuneration they are not included in this data
3 The ratio between fixed and variable remuneration for all material risk takers in 2018 was 1:0.74
Minimum of 40% of 2018 variable remuneration
Minimum of 40% of 2018 variable remuneration
Minimum of 40% of 2018 variable remuneration
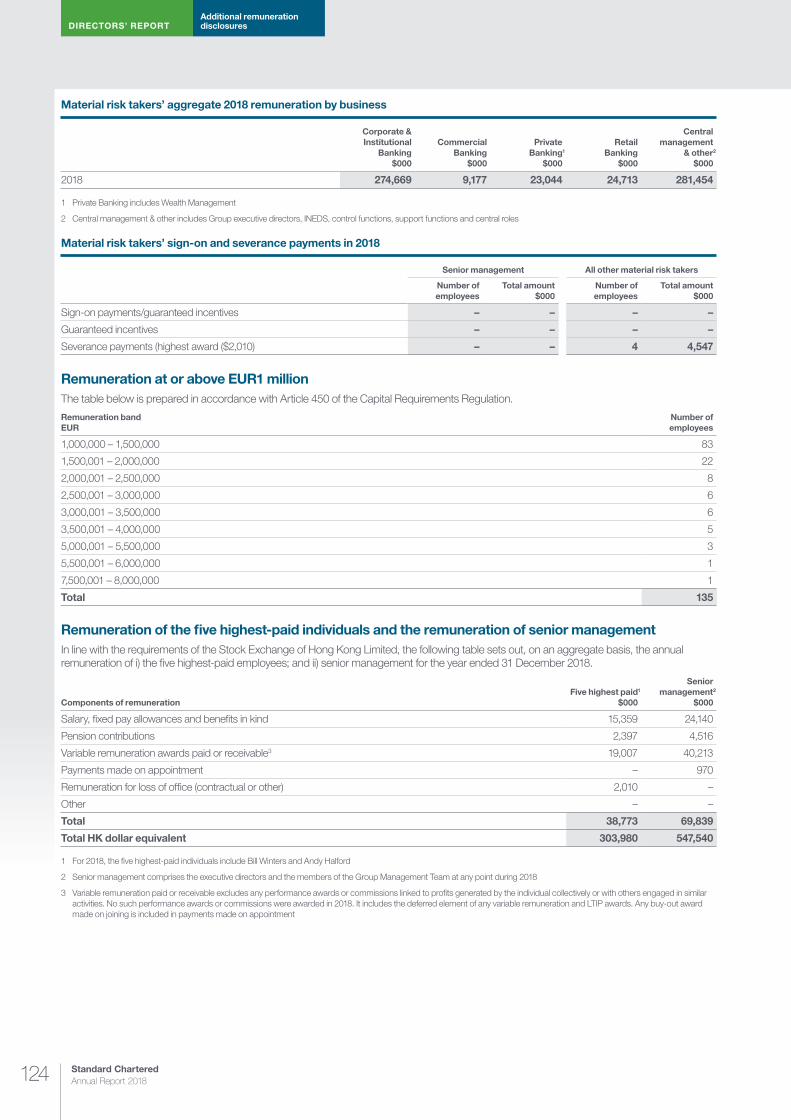
DIRECTORS’ REPORTAdditional remuneration disclosures
Standard Chartered Annual Report 2018124
Material risk takers’ aggregate 2018 remuneration by business
Corporate & Institutional
Banking $000
Commercial Banking
$000
Private Banking1
$000
Retail Banking
$000
Central management
& other2 $000
2018 274,669 9,177 23,044 24,713 281,454
1 Private Banking includes Wealth Management
2 Central management & other includes Group executive directors, INEDS, control functions, support functions and central roles
Material risk takers’ sign-on and severance payments in 2018
Senior management All other material risk takers
Number of employees
Total amount $000
Number of employees
Total amount $000
Sign-on payments/guaranteed incentives – – – –
Guaranteed incentives – – – –
Severance payments (highest award ($2,010) – – 4 4,547
Remuneration at or above EUR1 millionThe table below is prepared in accordance with Article 450 of the Capital Requirements Regulation.
Remuneration band EUR
Number of employees
1,000,000 – 1,500,000 83
1,500,001 – 2,000,000 22
2,000,001 – 2,500,000 8
2,500,001 – 3,000,000 6
3,000,001 – 3,500,000 6
3,500,001 – 4,000,000 5
5,000,001 – 5,500,000 3
5,500,001 – 6,000,000 1
7,500,001 – 8,000,000 1
Total 135
Remuneration of the five highest-paid individuals and the remuneration of senior managementIn line with the requirements of the Stock Exchange of Hong Kong Limited, the following table sets out, on an aggregate basis, the annual remuneration of i) the five highest-paid employees; and ii) senior management for the year ended 31 December 2018.
Components of remunerationFive highest paid1
$000
Senior management2
$000
Salary, fixed pay allowances and benefits in kind 15,359 24,140
Pension contributions 2,397 4,516
Variable remuneration awards paid or receivable3 19,007 40,213
Payments made on appointment – 970
Remuneration for loss of office (contractual or other) 2,010 –
Other – –
Total 38,773 69,839
Total HK dollar equivalent 303,980 547,540
1 For 2018, the five highest-paid individuals include Bill Winters and Andy Halford
2 Senior management comprises the executive directors and the members of the Group Management Team at any point during 2018
3 Variable remuneration paid or receivable excludes any performance awards or commissions linked to profits generated by the individual collectively or with others engaged in similar activities. No such performance awards or commissions were awarded in 2018. It includes the deferred element of any variable remuneration and LTIP awards. Any buy-out award made on joining is included in payments made on appointment

125
Risk review
and Cap
ital reviewS
trategic repo
rtS
upp
lementary info
rmatio
nFinancial statem
entsD
IRE
CT
OR
S’ R
EP
OR
T
The table below shows the emoluments of i) the five highest-paid employees; and ii) senior management for the year ended 31 December 2018.
Remuneration band HKD
Remuneration band USD equivalent
Number of employees
Five highest paid
Senior management1
9,000,001 – 9,500,000 1,147,959 – 1,211,735 – 1
19,500,001 – 20,000,000 2,487,245 – 2,551,020 – 1
20,500,001 – 21,000,000 2,614,796 – 2,678,571 – 1
21,000,001 – 21,500,000 2,678,572 – 2,742,347 – 1
21,500,001 – 22,000,000 2,742,347 – 2,806,122 – 1
23,500,001 – 24,000,000 2,997,449 – 3,061,224 – 1
24,000,001 – 24,500,000 3,061,225 – 3,125,000 – 1
28,500,001 – 29,000,000 3,635,204 – 3,698,980 – 1
30,500,001 – 31,000,000 3,890,306 – 3,954,082 – 1
33,500,001 – 34,000,000 4,272,959 – 4,336,735 – 1
34,500,001 – 35,000,000 4,400,510 – 4,464,286 – 1
35,500,001 – 36,000,000 4,528,061 – 4,591,837 – 1
37,000,001 – 37,500,000 4,719,388 – 4,783,163 – 1
46,500,001 – 47,000,000 5,931,123 – 5,994,898 1 –
50,500,001 – 51,000,000 6,441,327 – 6,505,102 1 1
51,000,001 – 51,500,000 6,505,102 – 6,568,878 1 –
74,500,001 – 75,000,000 9,502,551 – 9,566,327 1 1
80,500,001 – 81,000,000 10,267,857 – 10,331,633 1 1
Total 5 16
1 Senior management comprises the executive directors and the members of the Group Management Team at any point during 2018
The exchange rates used in this reportUnless an alternative exchange rate is detailed in the notes to the relevant table, the exchange rates used to convert the disclosures to US dollars are set out in the table below.
2018 2017
EUR 0.8782 0.8455
GBP 0.7464 0.7796
HKD 7.8400 7.7915
Christine HodgsonChair of the Remuneration Committee
26 February 2019

DIRECTORS’ REPORT Other disclosures
Standard Chartered Annual Report 2018126
Other disclosures
The Directors’ report for the year ended 31 December 2018 comprises pages 56 to 132 of this report (together with the sections of the Annual Report and Accounts incorporated by reference). Both the Strategic report and the Directors’ report have been drawn up and presented in accordance with English company law, and the liabilities of the directors in connection with that report shall be subject to the limitations and restrictions provided by such law. Other information to be disclosed in the Directors’ report is given in this section. In addition to the requirements set out in the Disclosure Guidance and Transparency Rules relating to the Annual Report and Accounts, information required by Listing Rule 9.8.4 to be included in the Annual Report and Accounts where applicable, is set out in the table below and cross-referenced.
Information to be included in the Annual Report and Accounts (LR 9.8.4)Relevant Listing Rule Page
LR 9.8.4 (1) (2) (5-14) (A) (B) N/A
LR 9.8.4 (4) 119 to 120
Principal activitiesStandard Chartered is a leading international banking group, with more than 160-years of history in some of the world’s most dynamic markets. Our purpose is driving commerce and prosperity through our unique diversity. The Group’s roots in trade finance and commercial banking have been at the core of its success throughout its history, but the Group is now more broadly based across Retail Banking in its footprint markets in Asia, Africa and the Middle East. The Group comprises a network of more than 944 branches and outlets in 60 markets.
Further details on our business can be found within the Strategic report on pages 1 to 53
Fair, balanced and understandableOn behalf of the Board, the Audit Committee has reviewed the Annual Report and Accounts and the process by which the Group believes that the Annual Report and Accounts, taken as a whole, is fair, balanced and understandable and provides the information necessary for shareholders to assess the position and performance, strategy and business model of the Group. Following its review, the Audit Committee has advised the Board that such a statement can be made in the Annual Report and Accounts.
Code for Financial Reporting Disclosure The Group’s 2018 financial statements have been prepared in accordance with the principles of the UK Finance Disclosure Code for Financial Reporting Disclosure.
Disclosure of information to auditorAs far as the directors are aware, there is no relevant audit information of which the Group statutory auditor, KPMG is unaware. The directors have taken all reasonable steps to ascertain any relevant audit information and ensure that the Group statutory auditors are aware of such information.
Going concern Having made appropriate enquiries, the Board is satisfied that the Company and the Group as a whole have adequate resources to continue operational businesses for a period of at least 12 months from the date of this report and therefore continue to adopt the going concern basis in preparing the financial statements.
ViabilityThe directors’ viability statement in respect to the Group can be found in the Strategic report on page 53.
Sufficiency of public floatAs at the date of this report, the Company has maintained the prescribed public float under the rules governing the listing of securities on The Stock Exchange of Hong Kong Limited (the HK Listing Rules), based on the information publicly available to the Company and within the knowledge of the directors.
Research and developmentDuring the year, the Group invested $1.56 billion (2017: $1.47 billion) in research and development, primarily relating to the planning, analysis, design, development, testing, integration, deployment and initial support of technology systems.
Political donationsThe Group has a policy in place which prohibits donations being made that would: (i) improperly influence legislation or regulation, (ii) promote political views or ideologies, and (iii) fund political causes. In alignment to this, no political donations were made in the year ended 31 December 2018.
Directors and their interestsThe membership of the Board, together with their biographical details, are given on pages 57 to 59. Details of the directors’ beneficial and non-beneficial interests in the ordinary shares of the Company are shown in the Directors’ remuneration report on pages 91 to 125. The Group operates a number of share-based arrangements for its directors and employees.
Details of these arrangements are included in the Directors’ remuneration report and in Note 31 to the financial statements on page 316

127
Risk review
and Cap
ital reviewS
trategic repo
rtS
upp
lementary info
rmatio
nFinancial statem
entsD
IRE
CT
OR
S’ R
EP
OR
T
The Company has received from each of the independent non-executive directors an annual confirmation of independence pursuant to Rule 3.13 of the HK Listing Rules and still considers all of the non-executive directors to be independent.
At no time during the year did any director hold a material interest in any contracts of significance with the Company or any of its subsidiary undertakings.
In accordance with the Companies Act 2006, we have established a process requiring directors to disclose proposed outside business interests before any are entered into. This enables prior assessment of any conflict or potential conflict of interest and any impact on time commitment. On behalf of the Board, the Governance and Nomination Committee reviews actual or potential conflicts of interest annually to consider if they continue to be appropriate, and also to revisit the terms upon which they were provided. The Board is satisfied that our processes in this respect continue to operate effectively.
Subject to company law, the Articles of Association and the authority granted to directors in general meeting, the directors may exercise all the powers of the Company and may delegate authorities to committees. The Articles of Association contain provisions relating to the appointment, re-election and removal of directors. Newly appointed directors retire at the AGM following appointment and are eligible for election. All directors are nominated for annual re-election by shareholders subject to continued satisfactory performance based upon their annual assessment.
Non-executive directors are appointed for an initial period of one year and, subject to re-election by shareholders at AGMs. In line with the UK Corporate Governance Code, all directors will stand for annual (re) election at the 2019 AGM.
The Company has granted indemnities to all of its directors on terms consistent with the applicable statutory provisions. Qualifying third-party indemnity provisions for the purposes of section 234 of the Companies Act 2006 were accordingly in force during the course of the financial year ended 31 December 2018, and remain in force at the date of this report.
Significant agreementsThe Company is not party to any significant agreements that would take effect, alter or terminate following a change of control of the Company. The Company does not have agreements with any director or employee that would provide compensation for loss of office or employment resulting from a takeover, except that provisions of the Company’s share schemes and plans may cause options and awards granted to employees under such schemes and plans to vest on a takeover.
Future developments in the business of the GroupAn indication of likely future developments in the business of the Group is provided in the Strategic report.
Results and dividends2018: paid interim dividend of 6 cents per ordinary share (2017: nil interim dividend paid)
2018: proposed final dividend of 15 cents per ordinary share (2017: paid 11 cents per ordinary share)
2018: total dividend of 21 cents per ordinary share (2017: total dividend, 11 cents per ordinary share)
Share capitalThe issued ordinary share capital of the Company was increased by 12,239,341 shares during the year. 10,008,515 ordinary shares were issued under the Company’s employee share plans at prices between nil and 620 pence. The Company has one class of ordinary shares, which carries no rights to fixed income. On a show of hands, each member present has the right to one vote at our general meetings. On a poll, each member is entitled to one vote for every $2 nominal value of share capital held. The issued nominal value of the ordinary shares represents 87 per cent of the total issued nominal value of all share capital. The remaining 13 per cent comprises preference shares, which have preferential rights to income and capital but which, in general, do not confer a right to attend and vote at our general meetings.
Further details of the Group’s share capital can be found in Note 28 to the financial statements on page 308
There are no specific restrictions on the size of a holding nor on the transfer of shares, which are both governed by the general provisions of the Articles of Association and prevailing legislation. There are no specific restrictions on voting rights and the directors are not aware of any agreements between holders of the Company’s shares that may result in restrictions on the transfer of securities or on voting rights. No person has any special rights of control over the Company’s share capital and all issued shares are fully paid.
Articles of AssociationThe Articles of Association may be amended by special resolution of the shareholders; no changes to the Company’s Articles of Association were made during the year.
Authority to purchase own sharesAt the AGM held on 9 May 2018, our shareholders renewed the Company’s authority to make market purchases of up to 660,126,858 (US$330,063,429) ordinary shares, equivalent to approximately 10 per cent of issued ordinary shares as at 15 March 2018, and up to all of the issued preference share capital. These authorities were not used during the year and remained in force at 31 December 2018.
In accordance with the terms of a waiver granted by The Stock Exchange of Hong Kong Limited (HKSE) as subsequently modified, the Company will comply with the applicable law and regulation in the UK in relation to holding of any shares in treasury and with the conditions of granting the waiver by the HKSE. No treasury shares were held during the year.
Further details can be found in Note 28 to the financial statements on page 308
Authority to issue sharesThe Company is granted authority to issue shares by the shareholders at its AGM. The size of the authorities granted depends on the purposes for which shares are to be issued and is within applicable legal and regulatory requirements.

DIRECTORS’ REPORT Other disclosures
Standard Chartered Annual Report 2018128
Shareholder rightsUnder the Companies Act 2006, shareholders holding 5 per cent or more of the paid-up share capital of the Company carrying the right of voting at general meetings of the Company are able to require the directors to hold a general meeting. A request may be in hard copy or electronic form and must be authenticated by the shareholders making it. Where such a request has been duly lodged with the Company, the directors are obliged to call a general meeting within 21 days of becoming subject to the request and must set a date for the meeting not more than 28 days from the date of the issue of the notice convening the meeting. Under the Companies Act 2006, shareholders holding 5 per cent or more of the total voting rights at an AGM of the Company, or 100 shareholders entitled to vote at the AGM with an average of at least £100 paid-up share capital per shareholder,
are entitled to require the Company to circulate a resolution intended to be moved at the Company’s next AGM. Such a request must be made not later than six weeks before the AGM to which the request relates or, if later, the time notice is given of the AGM. The request may be in hard copy or electronic form, must identify the resolution of which notice is to be given and must be authenticated by the shareholders making it.
Shareholders are able to put forward proposals to shareholder meetings and enquiries to the Board and/or the Senior Independent Director by using the ‘contact us’ information on the Company’s website sc.com or by emailing the Group Corporate Secretariat at [email protected]
Major interests in shares and voting rightsAs at 31 December 2018, Temasek Holdings (Private) Limited (Temasek) is the only shareholder that has an interest of more
than 10 per cent in the Company’s issued ordinary share capital carrying a right to vote at any general meeting.
Information provided to the Company pursuant to the Financial Conduct Authority’s (FCA) Disclosure and Transparency Rules (DTRs) is published on a Regulatory Information Service and on the Company’s website.
As at 21 February 2019, the Company has been notified of the following information, in accordance with DTR 5, from holders of notifiable interests in the Company’s issued share capital. The information provided below was correct at the date of notification; however, the date received may not have been within 2018. It should be noted that these holdings are likely to have changed since the Company was notified. However, notification of any change is not required until the next notifiable threshold is crossed.
Notifiable interests Ordinary sharesPercentage of
capital disclosedNature of holding as per disclosure
Temasek Holdings (Private) Limited 517,051,383 15.77 Indirect
BlackRock Inc. 183,640,172 5.55 Indirect (5.01%)Securities Lending (0.39%)
Contracts for Difference (0.14%)
Norges Bank 99,314,269 3.002 Direct
Related-party transactionsDetails of transactions with directors and officers and other related parties are set out in Note 36 on page 328.
Connected/continuing connected transactionsBy virtue of its shareholding of over 10 per cent in the Company, Temasek and its associates are related parties and connected persons of the Company for the purposes of the UK Listing Rules and the Listing Rules of The Stock Exchange of Hong Kong Limited (the HK Listing Rules) respectively (together ‘the Rules’).
The Rules are intended to ensure that there is no favourable treatment to Temasek or its associates to the detriment of other shareholders in the Company. Unless transactions between the Group and Temasek or its associates are specifically exempt under the Rules or are subject to a specific waiver, they may require a combination of announcements, reporting and independent shareholders’ approval.
On 19 October 2015, the HKSE extended a waiver (‘the 2015 Waiver’) it previously granted to the Company for the revenue banking transactions with Temasek which do not fall under the passive investor exemption (the Passive Investor Exemption) under Rules 14A.99 and 14A.100. Under the 2015 Waiver, the HKSE agreed to waive the announcement requirement, the requirement
to enter into a written agreement and set an annual cap and the reporting (including annual review) requirements under Chapter 14A for the three-year period ending 31 December 2018 on the conditions that:
a) The Company will disclose details of the 2015 Waiver (including nature of the revenue banking transactions with Temasek and reasons for the 2015 Waiver) in subsequent annual reports
b) The Company will continue to monitor the revenue banking transactions with Temasek during the three years ending 31 December 2018 to ensure that the 5 per cent threshold for the revenue ratio will not be exceeded
The main reasons for seeking the 2015 Waiver were:
¼ The nature and terms of revenue banking transactions may vary and evolve over time; having fixed-term written agreements would not be suitable to accommodate the various banking needs of the Company’s customers (including Temasek) and would be impractical and unduly burdensome
¼ It would be impracticable to estimate and determine an annual cap on the revenue banking transactions with Temasek as the volume and aggregate value of each transaction are uncertain and unknown to the Company as a banking group due to multiple factors including market driven factors
¼ The revenues generated from revenue banking transactions were insignificant. Without a waiver from the HKSE or an applicable exemption, these transactions would be subject to various percentage ratio tests which cater for different types of connected transactions and as such may produce anomalous results
For the year ended 31 December 2018, the Group provided Temasek with money market placement products and services that were revenue transactions in nature.
As a result of the Passive Investor Exemption and the 2015 Waiver, the vast majority of the Company’s transactions with Temasek and its associates fall outside of the connected transactions regime. However, non-revenue transactions with Temasek or any of its associates continue to be subject to monitoring for connected transaction issues.
The Company confirms that:
¼ The revenue banking transactions entered into with Temasek in 2018 were below the 5 per cent threshold for the revenue ratio test under the HK Listing Rules
The Company therefore satisfied the conditions of the 2015 Waiver.
On 27 December 2018, the HKSE extended the 2015 Waiver for another three years ending 31 December 2021 (‘the 2018 Waiver’). Further details of the 2018 Waiver will be disclosed in subsequent annual reports. The Company will continue to monitor the revenue banking transactions
129
Risk review
and Cap
ital reviewS
trategic repo
rtS
upp
lementary info
rmatio
nFinancial statem
entsD
IRE
CT
OR
S’ R
EP
OR
T
with Temasek during the three years ending 31 December 2021 to ensure that the 5 per cent threshold for the revenue ratio will not be exceeded.
Fixed assetsDetails of additions to fixed assets are presented in Note 18 on page 299.
Loan capitalDetails of the loan capital of the Company and its subsidiaries are set out in Note 27 on page 307.
Debenture issues and equity-linked agreementsDuring the financial year ended 31 December 2018, the Company made no issuance of debentures or equity linked agreements.
Risk management The Board is responsible for maintaining and reviewing the effectiveness of the risk management system. An ongoing process for identifying, evaluating and managing the significant risks that we face is in place. The Board is satisfied that this process constitutes a robust assessment of all of the principal risks and uncertainties facing the Group, including those that would threaten its business model, future performance, solvency or liquidity.
The Risk review and Capital review on pages 136 to 223 sets out the principal risks and uncertainties, our approach to risk management, including our risk management principles, an overview of our Enterprise Risk Management Framework and the policies and practices for each principal risk type. The Board-approved Risk Appetite Statement can be found on page 193
In accordance with Article 435(e) of the Capital Requirements Regulation, the Board Risk Committee, on behalf of the Board, has considered the adequacy of the risk management arrangements of the Group and has sought and received assurance that the risk management systems in place are adequate with regard to the Group’s profile and strategy.
Internal controlThe Board is responsible for maintaining and reviewing the effectiveness of the internal control system. The effectiveness of our internal control system is reviewed regularly by the Board, its committees, the Management Team and Group Internal Audit. The Audit Committee has reviewed the effectiveness of the Group’s system of internal control during the year ended 31 December 2018. The Committee’s review was supported by an annual business self-certification process, which was managed by Group Internal Audit. Group Internal Audit monitors compliance with policies and standards and the effectiveness
of internal control structures across the Group through its programme of audits. The work of Group Internal Audit is focused on the areas of greatest risk as determined by a risk-based assessment methodology. The Board considers the internal control systems of the Company to be effective and adequate. Group Internal Audit reports regularly to the Audit Committee, the Chairman and the Group Chief Executive. The findings of all adverse audits are reported to the Audit Committee, the Chairman and the Group Chief Executive where immediate corrective action is required. The Board Risk Committee has responsibility for overseeing the management of the Company’s fundamental risks as well as reviewing the effectiveness of the Company’s Enterprise Risk Management Framework. The Audit Committee monitors the integrity of the Company’s financial reporting, compliance and internal control environment.
The risk management approach on page 196 describes the Group’s risk management oversight committee structure
Our business is conducted within a developed control framework, underpinned by policy statements, written procedures and control manuals. There are written policies and procedures designed to ensure the identification and management of risk, including credit risk, country risk, traded risk, capital and liquidity risk, operational risk, reputational risk, compliance risk, conduct risk, information and cyber security risk and financial crime risk. The Board has established a management structure that clearly defines roles, responsibilities and reporting lines. Delegated authorities are documented and communicated. Executive risk committees regularly review the Group’s risk profile. The performance of the Group’s businesses is reported regularly to senior management and the Board. Performance trends and forecasts, as well as actual performance against budgets and prior periods, are monitored closely. Financial information is prepared using appropriate accounting policies, which are applied consistently. Operational procedures and controls have been established to facilitate complete, accurate and timely processing of transactions and the safeguarding of assets. These controls include appropriate segregation of duties, the regular reconciliation of accounts and the valuation of assets and positions. In respect of handling inside information, we have applied relevant controls on employees who are subject to handling inside information, including controls over the dissemination of such information and their dealings in the Company’s shares. Such systems are designed to manage rather than eliminate the risk of failure to achieve business objectives, and can only provide reasonable and not absolute assurance against material misstatement or loss.
Employee policies and engagementWe work hard to ensure that our colleagues are kept informed about matters affecting or of interest to them, but more importantly to provide opportunities for feedback and dialogue. We have a clear set of communications mechanisms that are used to inform colleagues of key business activity at a global, regional, business and function level. We continue to evolve and develop our internal communications following feedback from colleagues. We continue to listen to ensure internal communications remain impactful, meaningful and support the Group’s strategy and transformation.
The primary channel for communicating with our colleagues continues to be the Bridge – our business collaboration platform. The Bridge provides global, local, business and function communications and allows our people to collaborate, exchange ideas, feedback, comment, innovate, communicate, and find experts all through one space, wherever they are located.
The Bridge is supported by Group, local and business newsletters, targeted audio calls, videos, success story bulletins, town halls and engagement events including brown bag lunches, leadership events, regional meetings, and focus groups. Business or time-critical information is sent directly to our people’s inboxes through a measurable email platform.
Our senior leaders and People Leaders continue to have a critical role to play in engaging our people, ensuring that they are kept up to date on key business information, our performance and strategy, their role in executing the strategy and ensuring that they consult and listen to their teams’ views, feedback and concerns. Across the organisation, team meetings with People Leaders, one-to-one discussions, and management meetings enable our people to discuss and clarify anything they have heard or read and address any questions they may have. The individual performance reviews also provide the opportunity to discuss how individuals, the team and the business area contributed to our overall performance and how any compensation awards relate to this.
This mix of channels ensures that all our colleagues receive relevant information promptly regardless of how they prefer to be communicated with and regardless of where they sit in the organisation.
Colleagues, past, present and future are able to follow our progress through social networks including the Group’s LinkedIn network, Facebook page and Twitter stream. As well as capturing our people’s feedback and views through team meetings, two-way communications and day-to-day dialogue, our employee engagement survey has been
DIRECTORS’ REPORT Other disclosures
Standard Chartered Annual Report 2018130
an important way for us to gather feedback on how our colleagues feel about the organisation, the challenges we are facing and how we can make the Group a better place to work. More information on the engagement survey and its results can be found within the Colleagues section of the Strategic Report.
We seek to build productive and enduring partnerships with various employee representative bodies (including unions and work councils). In our recognition and interactions, we are heavily influenced by 1948 United Nations Universal Declaration of Human Rights (UDHR), and several International Labour Organisation (ILO) conventions including the Right to Organise and Collective Bargaining Convention, 1949 (No. 98) and the Freedom of Association and Protection of the Right to Organise Convention, 1948 (No. 87). Additionally, we abide by all local country labour laws and acts that protect employees’ rights to organise.
In June 2018, we integrated the components of our Group Equal Opportunities, Diversity, Inclusion and Dignity at Work Policy into our Group Code of Conduct. Everyone who works at Standard Chartered is bound by the Code, whether they are full-time, fixed term, a director, a contractor, a subcontractor, a secondee, a temporary employee or a voluntary worker, working in any subcontracted company and in any capacity. The Group Code of Conduct is well understood throughout the Group, supported by significant Group communication, and this is evident through our last My Voice Survey results where 96 per cent of colleagues responded saying that they understood what the Group Code of Conduct meant for them in their role.
Holistically, the Group Code of Conduct reinforces our commitment to providing equality of opportunity and fair treatment in employment. We do not accept unlawful discrimination in our recruitment and employment practices, terms, procedures, processes and decisions on any grounds including but not limited to: sex, gender, nationality, ethnicity, race, colour, native or indigenous origin, disability, age, marital or civil partner status, pregnancy and maternity, sexual orientation, gender identity, expression or reassignment, HIV or AIDS status, parental status, employment status, military and veteran status flexibility of working arrangements, religion, or belief.
The Group will strive for recruitment, employment, redundancy and redeployment training, development, succession planning and promotion practices that are free of barriers, both systemic and deliberate, and do not directly or indirectly discriminate.
Recruitment, employment, training, development and promotion decisions are based on existing skills, knowledge and behaviour required to perform the role to the Group’s standards. Implied in all terms is the commitment to equal pay for equal work. Employees are rewarded in a way that is free from discrimination. Their potential, conduct and valued behaviours should be considered as set out in the Fair Pay Charter.
The Group aims to be a disability confident organisation with a focus on removing barriers and increasing accessibility. The Group shall make reasonable workplace adjustments, including for disabilities and religious practices. If colleagues become disabled, efforts are made to ensure their employment continues, with appropriate training and workplace adjustments where necessary. This is supported by the Global Guideline and Process for Workplace Adjustment that was re-launched in 2016 to support colleagues with disabilities.
The Group’s approach to misconduct issues (including dismissals) is guided by the Fair Accountability principles which endorse thoughtful judgement, proportionality, procedural appropriateness and fairness of outcomes. Dismissals because misconduct issues and performance (where required by law to follow a disciplinary process) are governed by the Group Disciplinary Policy and Procedure with clear standards. Where local law or regulation requires a different process with regards to dismissals and other disciplinary actions, country procedures vary accordingly to account for local law and regulation.
The Group has a Flexible Working Practices Policy which was rolled out in 2017, allowing colleagues a range of flexible working options– this includes flexible time, working from home or part-time working. Our global Parental Leave Benefits were also revised in 2017, to support working parents no matter where they are across the Group. We now provide a minimum of 20 calendar weeks fully paid maternity leave, a minimum of leave of two calendar weeks for spouses or partners, and two calendar weeks for adoption leave. Combined, this places the Group above the International Labour Organisation minimum standards.
Health and safetyOur Health and Safety (H&S) programme covers both mental and physical wellbeing. The Group complies with both external regulatory requirements and internal policy and standards for H&S in all markets. It is Group policy to ensure that the more stringent of the two requirements is always met, ensuring our H&S practices meet or exceed the regulatory minimum.
Compliance rates are reported quarterly to each country’s management team. Based on our risk profile, our H&S standards define our requirements for H&S governance and assurance, workstation ergonomics, fire safety, first aid, indoor air quality and the work environment, vehicle and driving safety, incident reporting and investigation, and accessible design.
Major customersOur five-largest customers together accounted for 1.8 per cent of our total operating income in the year ended 31 December 2018.
Major SuppliersOur five largest suppliers together accounted for less than 15 per cent of purchases in the year ended 31 December 2018.
Supply chain managementFor information about how the Group engages with suppliers on environmental and social matters, please see our Supplier Charter. As set out under the UK Modern Slavery Act 2015, the Group is required to publish a Modern Slavery Statement annually. The Group’s 2018 Modern Slavery Statement will be issued in line with the Annual Report and Accounts. This document will give further detail on how the Group has managed social risks in its supply chain during 2018.
Our Supplier Charter can be viewed at sc.com/suppliercharter
Product responsibilityWe design and offer products and services based on an understanding of our client needs and best interests; we aim to treat our clients fairly at all times; we protect client privacy; we manage potential conflicts of interest, and we seek and use client feedback and complaints to improve our products. The Group has in place policies and procedures to ensure products and services are sold to suitable target markets, deliver fair outcomes to clients, and comply with relevant laws and regulations.
Group Code of ConductThe Board has adopted a Group Code of Conduct (the Code) relating to the lawful and ethical conduct of business and this is supported by the Group’s core values. It has been communicated to all directors and employees, all of whom are expected to observe high standards of integrity and fair dealing in relation to customers, employees and regulators in the communities in which the Group operates. Directors and employees are asked to recommit to the Code annually, and this was done during September 2018.
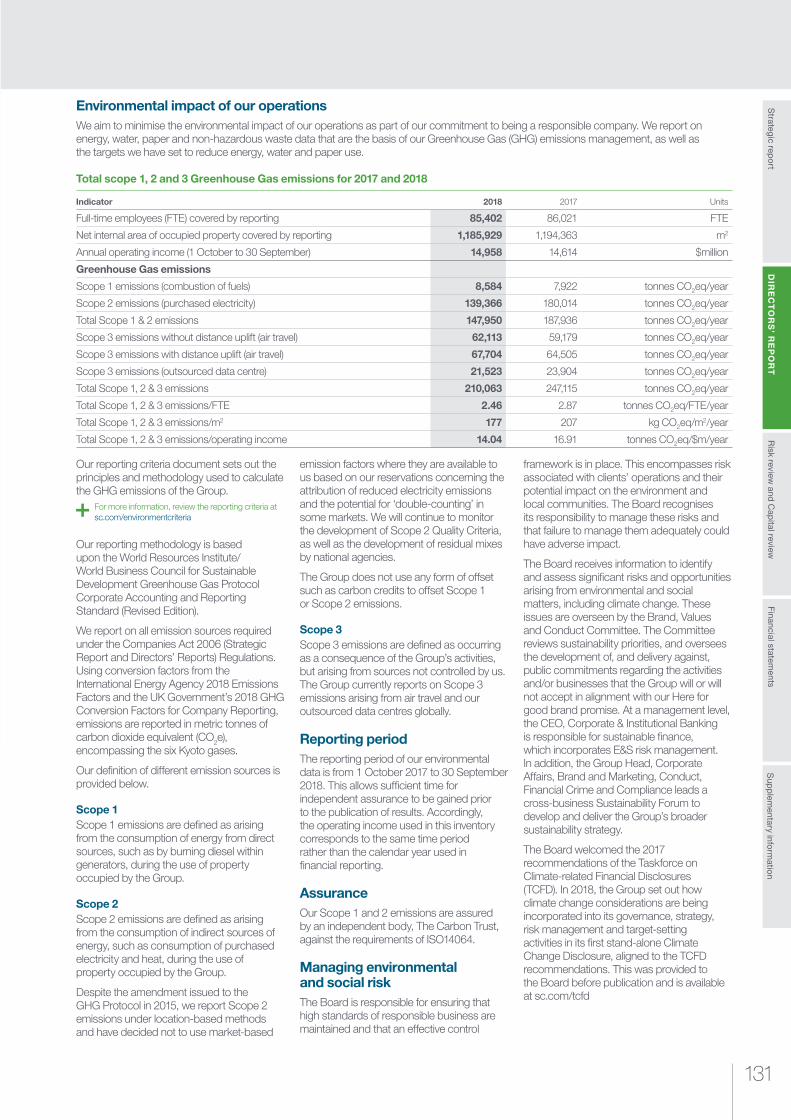
131
Risk review
and Cap
ital reviewS
trategic repo
rtS
upp
lementary info
rmatio
nFinancial statem
entsD
IRE
CT
OR
S’ R
EP
OR
T
Environmental impact of our operationsWe aim to minimise the environmental impact of our operations as part of our commitment to being a responsible company. We report on energy, water, paper and non-hazardous waste data that are the basis of our Greenhouse Gas (GHG) emissions management, as well as the targets we have set to reduce energy, water and paper use.
Total scope 1, 2 and 3 Greenhouse Gas emissions for 2017 and 2018
Indicator 2018 2017 Units
Full-time employees (FTE) covered by reporting 85,402 86,021 FTE
Net internal area of occupied property covered by reporting 1,185,929 1,194,363 m2
Annual operating income (1 October to 30 September) 14,958 14,614 $million
Greenhouse Gas emissions
Scope 1 emissions (combustion of fuels) 8,584 7,922 tonnes CO2eq/year
Scope 2 emissions (purchased electricity) 139,366 180,014 tonnes CO2eq/year
Total Scope 1 & 2 emissions 147,950 187,936 tonnes CO2eq/year
Scope 3 emissions without distance uplift (air travel) 62,113 59,179 tonnes CO2eq/year
Scope 3 emissions with distance uplift (air travel) 67,704 64,505 tonnes CO2eq/year
Scope 3 emissions (outsourced data centre) 21,523 23,904 tonnes CO2eq/year
Total Scope 1, 2 & 3 emissions 210,063 247,115 tonnes CO2eq/year
Total Scope 1, 2 & 3 emissions/FTE 2.46 2.87 tonnes CO2eq/FTE/year
Total Scope 1, 2 & 3 emissions/m2 177 207 kg CO2eq/m2/year
Total Scope 1, 2 & 3 emissions/operating income 14.04 16.91 tonnes CO2eq/$m/year
Our reporting criteria document sets out the principles and methodology used to calculate the GHG emissions of the Group.
For more information, review the reporting criteria at sc.com/environmentcriteria
Our reporting methodology is based upon the World Resources Institute/ World Business Council for Sustainable Development Greenhouse Gas Protocol Corporate Accounting and Reporting Standard (Revised Edition).
We report on all emission sources required under the Companies Act 2006 (Strategic Report and Directors’ Reports) Regulations. Using conversion factors from the International Energy Agency 2018 Emissions Factors and the UK Government’s 2018 GHG Conversion Factors for Company Reporting, emissions are reported in metric tonnes of carbon dioxide equivalent (CO2e), encompassing the six Kyoto gases.
Our definition of different emission sources is provided below.
Scope 1Scope 1 emissions are defined as arising from the consumption of energy from direct sources, such as by burning diesel within generators, during the use of property occupied by the Group.
Scope 2Scope 2 emissions are defined as arising from the consumption of indirect sources of energy, such as consumption of purchased electricity and heat, during the use of property occupied by the Group.
Despite the amendment issued to the GHG Protocol in 2015, we report Scope 2 emissions under location-based methods and have decided not to use market-based
emission factors where they are available to us based on our reservations concerning the attribution of reduced electricity emissions and the potential for ‘double-counting’ in some markets. We will continue to monitor the development of Scope 2 Quality Criteria, as well as the development of residual mixes by national agencies.
The Group does not use any form of offset such as carbon credits to offset Scope 1 or Scope 2 emissions.
Scope 3Scope 3 emissions are defined as occurring as a consequence of the Group’s activities, but arising from sources not controlled by us. The Group currently reports on Scope 3 emissions arising from air travel and our outsourced data centres globally.
Reporting periodThe reporting period of our environmental data is from 1 October 2017 to 30 September 2018. This allows sufficient time for independent assurance to be gained prior to the publication of results. Accordingly, the operating income used in this inventory corresponds to the same time period rather than the calendar year used in financial reporting.
AssuranceOur Scope 1 and 2 emissions are assured by an independent body, The Carbon Trust, against the requirements of ISO14064.
Managing environmental and social riskThe Board is responsible for ensuring that high standards of responsible business are maintained and that an effective control
framework is in place. This encompasses risk associated with clients’ operations and their potential impact on the environment and local communities. The Board recognises its responsibility to manage these risks and that failure to manage them adequately could have adverse impact.
The Board receives information to identify and assess significant risks and opportunities arising from environmental and social matters, including climate change. These issues are overseen by the Brand, Values and Conduct Committee. The Committee reviews sustainability priorities, and oversees the development of, and delivery against, public commitments regarding the activities and/or businesses that the Group will or will not accept in alignment with our Here for good brand promise. At a management level, the CEO, Corporate & Institutional Banking is responsible for sustainable finance, which incorporates E&S risk management. In addition, the Group Head, Corporate Affairs, Brand and Marketing, Conduct, Financial Crime and Compliance leads a cross-business Sustainability Forum to develop and deliver the Group’s broader sustainability strategy.
The Board welcomed the 2017 recommendations of the Taskforce on Climate-related Financial Disclosures (TCFD). In 2018, the Group set out how climate change considerations are being incorporated into its governance, strategy, risk management and target-setting activities in its first stand-alone Climate Change Disclosure, aligned to the TCFD recommendations. This was provided to the Board before publication and is available at sc.com/tcfd
DIRECTORS’ REPORT Other disclosures
Standard Chartered Annual Report 2018132
Community engagementWe collaborate with local partners to support social and economic development in communities across our markets. For more on how we engage with communities go to the Stakeholders and responsibilities section on page 42.
ESG Reporting GuideWe comply with the requirements for environmental, social and governance reporting under Appendix 27 of the Hong Kong Listing Rules with the exception of A1.3 and A.16 on production and handling of hazardous waste and A2.5 on packaging. As an office-based financial services provider, we generate minimal hazardous waste or packaging material. As such, these issues are not material and we do not report them.
Electronic communicationThe Board recognises the importance of good communications with all shareholders. Directors are in regular contact with our institutional shareholders and general presentations are made when we announce our financial results. The AGM presents an opportunity to communicate with all shareholders. Our shareholders are encouraged to receive our corporate documents electronically. The annual and interim financial statements and Notice of AGM are available electronically. If you do not already receive your corporate documents electronically and would like to do so in future, please contact our registrars at the address on page 384.
Shareholders are also able to vote electronically on the resolutions being put to the AGM through our registrars’ website at investorcentre.co.uk
Annual General MeetingOur 2019 AGM will be held at 11:00am (UK time) (6:00pm Hong Kong time) on 8 May 2019 at etc.venues, 200 Aldersgate, St Paul’s, London EC1A 4HD. Detail of the business to be conducted at the meeting is contained in the 2019 Notice of AGM.
Our 2018 AGM was held on 9 May 2018 at 11:00am (London time) (6:00pm Hong Kong time) at etc.venues, 200 Aldersgate, St Paul’s, London EC1A 4HD. Special business at the meeting included the approval of the power to allot ECAT1 Securities for cash without certain formalities. All resolutions were passed at the meeting, the details of which can be viewed on our website.
Non-audit servicesThe Group’s non-audit services policy (the policy) was reviewed and approved by the Audit Committee on 28 November 2018. The policy is based on an overriding principle that, to avoid any actual or perceived conflicts of interest, the Group’s auditor should only be used when either there is evidence that there
is no alternative in terms of quality and there is no conflict with their duties as auditor. KPMG can be used where the statutory auditor is required to be used due to regulatory or legal requirements.
The policy clearly sets out the criteria for when the Audit Committee’s prior written approval is required. The policy requires a conservative approach to be taken to the assessment of requests for KPMG to provide non-audit services. Subject to the overriding principle, the Audit Committee’s view is that KPMG can be of value in a range of non-audit service activities and should be allowed to tender subject to the terms of the policy. The Group is required to take a conservative approach to interpreting the potential threats to auditor independence and requires commensurately robust safeguards against them.
EU legislation and guidance from the Financial Reporting Council (FRC) sets out threats to audit independence including self-interest, self-review, familiarity, taking of a management role or conducting advocacy. In particular, maintaining KPMG’s independence from the Group requires KPMG to avoid taking decisions on the Group’s behalf. It is also recognised as essential that management retains the decision-making capability as to whether to act on advice given by KPMG as part of a non-audit service. This means not just the ability to action the advice given, but to have sufficient knowledge of the subject matter to be able to make a reasoned and independent judgement as to its validity. All of this is contained within the policy.
By way of (non-exhaustive) illustration of the application of the principles set out in the policy, the following types of non-audit services are likely to be permissible under the policy:
¼ Audit-related services – the Group would also extend this to work on investor circulars in most foreseeable circumstances
¼ An objective view as to whether the Group has applied external laws and regulations appropriately, such as checks over regulatory compliance
¼ Internal control review services
¼ Due diligence over potential purchases or sales
Not permissible under the policy:
¼ Any services that are prohibited (or to the extent they are restricted) by the published guidance from time to time
¼ Tax or regulatory structuring proposals
¼ Services where fees are paid on a contingent basis (in whole or in part)
¼ Consulting services that actively assist in running the business in place of
management as opposed to providing or validating information, which management then utilises in the operation of the business
¼ The policy is not a prescribed list of non-audit services that KPMG is permitted to provide. Rather, each request for KPMG to provide non-audit services will be assessed on its own merits. The Audit Committee believes that such a case-by-case approach best accommodates (i) the need for the appropriate rigour and challenge to be applied to each request for KPMG to provide non-audit services while (ii) preserving sufficient flexibility for the Group to engage KPMG to provide non-audit services where they are able to deliver particular value to the Group and where the proposed services can be provided without compromising KPMG’s objectivity and independence.
There is a cap on non-audit services provided by KPMG and such fees cannot exceed 70 per cent of the average Group audit fee from the previous three consecutive financial years, excluding audit related non-audit services and services carried out pursuant to legislation. For 2018 the ratio was 2 per cent. Details relating to KPMG’s remuneration as the Group statutory auditor and a description of the broad categories of the types of non-audit services provided by KPMG are given in Note 38 on page 329.
AuditorThe Audit Committee reviews the appointment of the Group statutory auditor, its effectiveness and its relationship with the Group, which includes monitoring our use of the auditors for non-audit services and the balance of audit and non-audit fees paid.
Following a review of the independence and effectiveness of our Group statutory auditor (details of which can be found on page 74), resolutions to appoint KPMG and to determine its remuneration will be proposed at the 2019 Annual General Meeting.
Each director believes that there is no relevant information of which our Group statutory auditor is unaware. Each has taken all steps necessary as a director to be aware of any relevant audit information and to establish that KPMG is made aware of any pertinent information.
By order of the Board
Liz LloydGroup Company Secretary
26 February 2019
Standard Chartered PLC
Registered No. 966425
133
Risk review
and Cap
ital reviewS
trategic repo
rtS
upp
lementary info
rmatio
nFinancial statem
entsD
IRE
CT
OR
S’ R
EP
OR
T
Statement of directors’ responsibilities
The directors are responsible for preparing the Annual Report and the Group and Company financial statements in accordance with applicable law and regulations.
Company law requires the directors to prepare Group and Company financial statements for each financial year. Under that law they are required to prepare the Group financial statements in accordance with International Financial Reporting Standards as adopted by the European Union (IFRSs as adopted by the EU) and applicable law and have elected to prepare the Company financial statements on the same basis.
Under company law the directors must not approve the financial statements unless they are satisfied that they give a true and fair view of the state of affairs of the Group and Company and of their profit or loss for that period. In preparing each of the Group and Company financial statements, the directors are required to:
¼ Select suitable accounting policies and then apply them consistently;
¼ Make judgements and estimates that are reasonable, relevant and reliable;
¼ State whether they have been prepared in accordance with IFRSs as adopted by the EU;
¼ Assess the Group and the Company’s ability to continue as a going concern, disclosing, as applicable, matters related to going concern; and
¼ Use the going concern basis of accounting unless they either intend to liquidate the Group or the Company or to cease operations, or have no realistic alternative but to do so
The directors are responsible for keeping adequate accounting records that are sufficient to show and explain the Company’s transactions and disclose with reasonable accuracy at any time the financial position of the Company and enable them to ensure that its financial statements comply with the Companies Act 2006. They are responsible for such internal control as they determine is necessary to enable the preparation of financial statements that are free from material misstatement, whether due to fraud or error, and have general responsibility for taking such steps as are reasonably open to them to safeguard the assets of the Group and to prevent and detect fraud and other irregularities.
Under applicable law and regulations, the directors are also responsible for preparing a Strategic Report, Directors’ Report, Directors’ Remuneration Report and Corporate Governance Statement that complies with that law and those regulations.
The directors are responsible for the maintenance and integrity of the corporate and financial information included on the Company’s website. Legislation in the UK governing the preparation and dissemination of financial statements may differ from legislation in other jurisdictions.
Responsibility statement of the directors in respect of the annual financial report
We confirm that to the best of our knowledge:
¼ The financial statements, prepared in accordance with the applicable set of accounting standards, give a true and fair view of the assets, liabilities, financial position and profit or loss of the Company and the undertakings included in the consolidation taken as a whole; and
¼ The Strategic report includes a fair review of the development and performance of the business and the position of the Company and the undertakings included in the consolidation taken as a whole, together with a description of the principal risks and uncertainties that they face
We consider the Annual Report and Accounts, taken as a whole, is fair, balanced and understandable and provides the information necessary for shareholders to assess the Group’s position and performance, business model and strategy.
By order of the Board
Andy HalfordGroup Chief Financial Officer
26 February 2019

RISK REVIEW AND CAPITAL REVIEW
Standard Chartered Annual Report 2018134
This photograph is of a charming ten-year old girl who is a travel guide at Ratargul Swamp Forest in Sylhet, a beautiful city in Bangladesh. She helps by lending umbrellas and hats to travellers, always with a smile, to protect themselves from adverse weather.
She is a strong girl with an innocent smile and her actions demonstrate that she has strong ethics which drive her to #DoTheRightThing. This photograph inspires me as we always admire people who accomplish their tasks with sincerity and honesty.
I believe there is no right way of doing the wrong thing or wrong way of doing the right thing. Our integrity should guide us in our decision making. Which is why we all must be committed to #DoTheRightThing.
Competition winnerMd. Ahidul Hasan
VALUED BEHAVIOURS
Do the right thingOur valued behaviours are the expression of Our Purpose, and will help us to truly be Here for good. Do the right thing underpins our other valued behaviours, Never Settle and Better Together. We must always act in a way that’s right.
Md. Ahidul Hasan
Never settle Better togetherDo the right thing

135
RIS
K R
EV
IEW
AN
D C
AP
ITAL R
EV
IEW
Strategic rep
ort
Sup
plem
entary inform
ation
Financial statements
Directo
rs’ repo
rt
RISK REVIEW AND CAPITAL REVIEW
136 Risk index
138 Risk update
140 Risk profile
193 Risk management approach
218 Capital review
Our presence across a unique footprint allows us to see what others often miss and gives us the opportunity to
do the right thing.
Nilesh Trivedi
Andy Fang
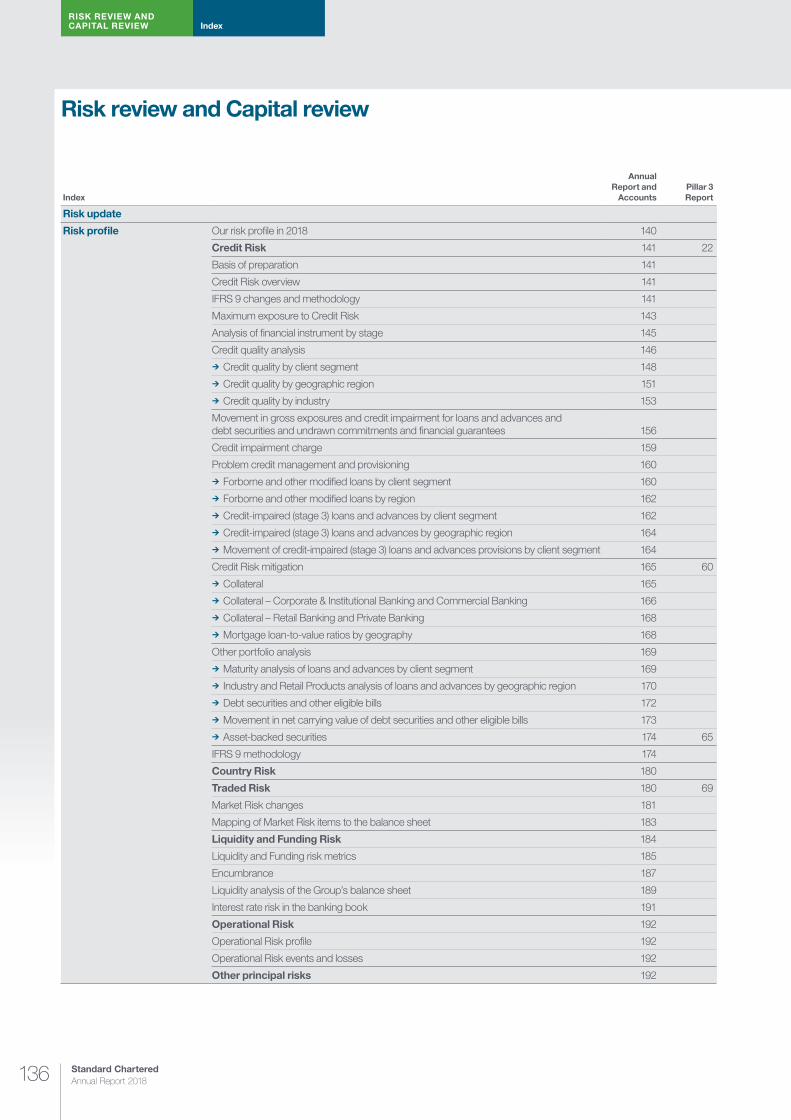
RISK REVIEW AND CAPITAL REVIEW Index
Standard Chartered Annual Report 2018136
Index
Annual Report and
AccountsPillar 3 Report
Risk update
Risk profile Our risk profile in 2018 140
Credit Risk 141 22
Basis of preparation 141
Credit Risk overview 141
IFRS 9 changes and methodology 141
Maximum exposure to Credit Risk 143
Analysis of financial instrument by stage 145
Credit quality analysis 146
¼ Credit quality by client segment 148
¼ Credit quality by geographic region 151
¼ Credit quality by industry 153
Movement in gross exposures and credit impairment for loans and advances and debt securities and undrawn commitments and financial guarantees 156
Credit impairment charge 159
Problem credit management and provisioning 160
¼ Forborne and other modified loans by client segment 160
¼ Forborne and other modified loans by region 162
¼ Credit-impaired (stage 3) loans and advances by client segment 162
¼ Credit-impaired (stage 3) loans and advances by geographic region 164
¼ Movement of credit-impaired (stage 3) loans and advances provisions by client segment 164
Credit Risk mitigation 165 60
¼ Collateral 165
¼ Collateral – Corporate & Institutional Banking and Commercial Banking 166
¼ Collateral – Retail Banking and Private Banking 168
¼ Mortgage loan-to-value ratios by geography 168
Other portfolio analysis 169
¼ Maturity analysis of loans and advances by client segment 169
¼ Industry and Retail Products analysis of loans and advances by geographic region 170
¼ Debt securities and other eligible bills 172
¼ Movement in net carrying value of debt securities and other eligible bills 173
¼ Asset-backed securities 174 65
IFRS 9 methodology 174
Country Risk 180
Traded Risk 180 69
Market Risk changes 181
Mapping of Market Risk items to the balance sheet 183
Liquidity and Funding Risk 184
Liquidity and Funding risk metrics 185
Encumbrance 187
Liquidity analysis of the Group’s balance sheet 189
Interest rate risk in the banking book 191
Operational Risk 192
Operational Risk profile 192
Operational Risk events and losses 192
Other principal risks 192
Risk review and Capital review

137
RIS
K R
EV
IEW
AN
D C
AP
ITAL R
EV
IEW
Strategic rep
ort
Sup
plem
entary inform
ation
Financial statements
Directo
rs’ repo
rt
Index
Annual Report and
AccountsPillar 3 Report
Risk management approach Enterprise Risk Management Framework 193
Principal Risks 198
Principal Uncertainties 213
Capital review Capital summary 218 11
¼ Capital ratios 219 13
¼ CRD IV capital base 219 12
¼ Movement in total capital 220
Risk-weighted assets 221 16
UK leverage ratio 223 19-20
The following parts of the Risk review and Capital review form part of the financial statements and are reviewed by external auditors:
¼ From the start of the ‘Credit Risk Review’ section (page 141) to the end of ‘Other principal risks’ in the same section (page 212), excluding:
Risk section Page
Credit quality by geographic region 151
Credit quality by industry 153
Forborne and other modified loans by region 162
Credit-impaired (stage 3) loans and advances by geographic region 164
Industry and Retail Products analysis by geographic region 170
Asset-backed securities 174
Country Risk 180
Risks not in VaR 182
Backtesting 182
Mapping of market risk items to the balance sheet 183
Liquidity coverage ratio 185
Stressed coverage 185
Net stable funding ratio (NSFR) 186
Liquidity pool 186
Encumbrance 187
Interest rate risk in the banking book 191
Operational Risk 192
Other Principal risks 192
¼ From the start of ‘CRD IV capital base’ (page 219) to the end of ‘Impact of IFRS 9 on CET1’ excluding capital ratios and risk-weighted assets (RWA) (page 220)
Disclosures noted as ‘Unaudited’ are not within the scope of KPMG LLP’s review.

RISK REVIEW Risk update
Standard Chartered Annual Report 2018138
Our portfolio qualityOur core objective is to build a strong and sustainable business and in 2018 we made progress towards this end. We have secured the foundations of the Group, having overseen a continued reduction in credit impairment, and show resilience as evidenced by strong capital and liquidity metrics. Our Risk Appetite Statement is
approved by the Board and is set to enable us to grow sustainably while avoiding shocks to earnings or our general financial health, and to manage our Reputational Risk in a way that would not materially undermine the confidence of our investors and all internal and external stakeholders. In 2018, we added further granularity to our Risk Appetite, including cascading critical Risk Appetite metrics down to countries with significant business operations. The Group will not compromise adherence to its Risk Appetite to pursue revenue growth or higher returns.
Credit quality has continued to improve in 2018, as the positive momentum from the previous year was carried over in many important areas. We further reduced our liquidation portfolio by 39 per cent to $1.4 billion at the end of 2018 (2017: $2.2 billion) through active management, with net loans and advances of $0.3 billion (2017: $0.7 billion), after provisions. From 2019, the
Group will report the liquidation portfolio as part of its underlying business. Credit grade 12 balances were flat year-on-year, while we observed a decrease in net exposure on early alert from $8.7 billion to $4.8 billion, mainly due to reductions in counterparty exposure and accounts being regularised. The percentage of investment grade clients in our corporate net exposure increased to 62 per cent (2017: 57 per cent), and new origination is carried out within Risk Appetite. We remain alert to broader geopolitical uncertainties that have affected sentiment in some of our markets, and we continue to focus on early identification of emerging risks across all our portfolios to proactively manage any areas of potential weakness.
The Group continues to be well diversified, across industry sectors, products and geographies, and exposures remain predominantly short tenor. The Group remains selective in cyclical sectors such
Risk update
All risk types, both financial and non-financial, are managed and reported in accordance with the Group’s Enterprise Risk Management Framework. 2018 saw sustained progress towards improving the resilience of the Group’s portfolios as shown here by the key highlights from the past year.
2018 Key highlights
¼ Lower credit impairment in the ongoing book – 38 per cent reduction on levels seen in 2017
¼ Improved credit quality of the Corporate portfolios
¼ Further strengthening of our capital position
Key indicators 31.12.18 (IFRS 9)
01.01.18 (IFRS 9)
31.12.17 (IAS 39)
31.12.16 (IAS 39)
Group total business1
Stage 3 loans, credit-impaired (2018)2/non-performing loans (2017) ($ billion) 6.9 8.8 8.7 9.7Stage 3 cover ratio 59% 60% 60%3 60%3
Stage 3 cover ratio (including collateral) 81% 81% 81% 76%Group ongoing business1
Stage 1 loans ($ billion) 237.1 228.5Stage 2 loans ($ billion) 17.4 20.6Stage 3 loans, credit-impaired (2018)2/non-performing loans (2017) ($ billion) 5.6 6.5 6.5 5.9Stage 3 cover ratio 55% 56% 56%4 57%4
Stage 3 cover ratio (including collateral) 78% 78% 79% 74%Corporate & Institutional Banking and Commercial Banking5
Investment grade corporate net exposures as a percentage of total corporate net exposures 62% 57% 56%Loans and advances maturing in one year or less as a percentage of total loans and advances to customers 60%6 70% 70%Early alert portfolio net exposures ($ billion) 4.8 8.7 12.9Credit grade 12 net exposures ($ billion) 1.5 1.5 1.5Aggregate top 20 corporate net exposures as a percentage of Tier 1 capital 55% 50% 55%Collateralisation of sub-investment grade net exposures maturing in more than one year 51% 55% 55%Retail Banking5
Loan-to-value ratio of retail mortgages 45% 47% 49%
1 These numbers represent total loans and advances to customers2 Following adoption of IFRS 9, the definitions of stage 3 and non-performing loans have been aligned. See Note 41 to the financial statements3 2017 and 2016 total business cover ratios rebased to exclude portfolio impairment provisions to align to IFRS 9 (IAS 39: 65 per cent on 31 December 2017; 67 per cent on
31 December 2016)4 2017 and 2016 ongoing business cover ratios rebased to exclude portfolio impairment provisions to align to IFRS 9 (IAS 39: 63 per cent on 31 December 2017; 69 per cent on
31 December 2016) 5 These metrics are not impacted by the adoption of IFRS 9, hence data as at 1 January 2018 is not needed for comparative purposes 6 Excludes fair value through profit or loss (including fair value through profit or loss: 70%)
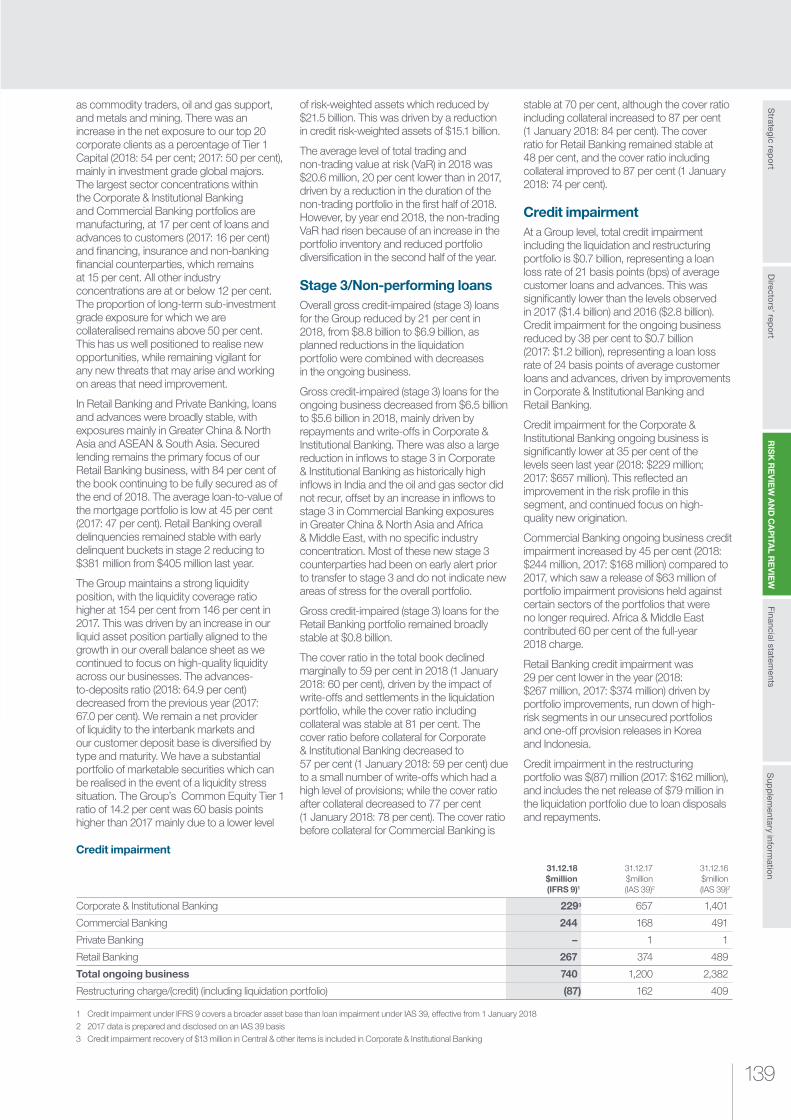
139
RIS
K R
EV
IEW
AN
D C
AP
ITAL R
EV
IEW
Strategic rep
ort
Sup
plem
entary inform
ation
Financial statements
Directo
rs’ repo
rt
as commodity traders, oil and gas support, and metals and mining. There was an increase in the net exposure to our top 20 corporate clients as a percentage of Tier 1 Capital (2018: 54 per cent; 2017: 50 per cent), mainly in investment grade global majors. The largest sector concentrations within the Corporate & Institutional Banking and Commercial Banking portfolios are manufacturing, at 17 per cent of loans and advances to customers (2017: 16 per cent) and financing, insurance and non-banking financial counterparties, which remains at 15 per cent. All other industry concentrations are at or below 12 per cent. The proportion of long-term sub-investment grade exposure for which we are collateralised remains above 50 per cent. This has us well positioned to realise new opportunities, while remaining vigilant for any new threats that may arise and working on areas that need improvement.
In Retail Banking and Private Banking, loans and advances were broadly stable, with exposures mainly in Greater China & North Asia and ASEAN & South Asia. Secured lending remains the primary focus of our Retail Banking business, with 84 per cent of the book continuing to be fully secured as of the end of 2018. The average loan-to-value of the mortgage portfolio is low at 45 per cent (2017: 47 per cent). Retail Banking overall delinquencies remained stable with early delinquent buckets in stage 2 reducing to $381 million from $405 million last year.
The Group maintains a strong liquidity position, with the liquidity coverage ratio higher at 154 per cent from 146 per cent in 2017. This was driven by an increase in our liquid asset position partially aligned to the growth in our overall balance sheet as we continued to focus on high-quality liquidity across our businesses. The advances- to-deposits ratio (2018: 64.9 per cent) decreased from the previous year (2017: 67.0 per cent). We remain a net provider of liquidity to the interbank markets and our customer deposit base is diversified by type and maturity. We have a substantial portfolio of marketable securities which can be realised in the event of a liquidity stress situation. The Group’s Common Equity Tier 1 ratio of 14.2 per cent was 60 basis points higher than 2017 mainly due to a lower level
of risk-weighted assets which reduced by $21.5 billion. This was driven by a reduction in credit risk-weighted assets of $15.1 billion.
The average level of total trading and non-trading value at risk (VaR) in 2018 was $20.6 million, 20 per cent lower than in 2017, driven by a reduction in the duration of the non-trading portfolio in the first half of 2018. However, by year end 2018, the non-trading VaR had risen because of an increase in the portfolio inventory and reduced portfolio diversification in the second half of the year.
Stage 3/Non-performing loansOverall gross credit-impaired (stage 3) loans for the Group reduced by 21 per cent in 2018, from $8.8 billion to $6.9 billion, as planned reductions in the liquidation portfolio were combined with decreases in the ongoing business.
Gross credit-impaired (stage 3) loans for the ongoing business decreased from $6.5 billion to $5.6 billion in 2018, mainly driven by repayments and write-offs in Corporate & Institutional Banking. There was also a large reduction in inflows to stage 3 in Corporate & Institutional Banking as historically high inflows in India and the oil and gas sector did not recur, offset by an increase in inflows to stage 3 in Commercial Banking exposures in Greater China & North Asia and Africa & Middle East, with no specific industry concentration. Most of these new stage 3 counterparties had been on early alert prior to transfer to stage 3 and do not indicate new areas of stress for the overall portfolio.
Gross credit-impaired (stage 3) loans for the Retail Banking portfolio remained broadly stable at $0.8 billion.
The cover ratio in the total book declined marginally to 59 per cent in 2018 (1 January 2018: 60 per cent), driven by the impact of write-offs and settlements in the liquidation portfolio, while the cover ratio including collateral was stable at 81 per cent. The cover ratio before collateral for Corporate & Institutional Banking decreased to 57 per cent (1 January 2018: 59 per cent) due to a small number of write-offs which had a high level of provisions; while the cover ratio after collateral decreased to 77 per cent (1 January 2018: 78 per cent). The cover ratio before collateral for Commercial Banking is
stable at 70 per cent, although the cover ratio including collateral increased to 87 per cent (1 January 2018: 84 per cent). The cover ratio for Retail Banking remained stable at 48 per cent, and the cover ratio including collateral improved to 87 per cent (1 January 2018: 74 per cent).
Credit impairmentAt a Group level, total credit impairment including the liquidation and restructuring portfolio is $0.7 billion, representing a loan loss rate of 21 basis points (bps) of average customer loans and advances. This was significantly lower than the levels observed in 2017 ($1.4 billion) and 2016 ($2.8 billion). Credit impairment for the ongoing business reduced by 38 per cent to $0.7 billion (2017: $1.2 billion), representing a loan loss rate of 24 basis points of average customer loans and advances, driven by improvements in Corporate & Institutional Banking and Retail Banking.
Credit impairment for the Corporate & Institutional Banking ongoing business is significantly lower at 35 per cent of the levels seen last year (2018: $229 million; 2017: $657 million). This reflected an improvement in the risk profile in this segment, and continued focus on high-quality new origination.
Commercial Banking ongoing business credit impairment increased by 45 per cent (2018: $244 million, 2017: $168 million) compared to 2017, which saw a release of $63 million of portfolio impairment provisions held against certain sectors of the portfolios that were no longer required. Africa & Middle East contributed 60 per cent of the full-year 2018 charge.
Retail Banking credit impairment was 29 per cent lower in the year (2018: $267 million, 2017: $374 million) driven by portfolio improvements, run down of high- risk segments in our unsecured portfolios and one-off provision releases in Korea and Indonesia.
Credit impairment in the restructuring portfolio was $(87) million (2017: $162 million), and includes the net release of $79 million in the liquidation portfolio due to loan disposals and repayments.
Credit impairment
31.12.18 $million (IFRS 9)1
31.12.17 $million (IAS 39)2
31.12.16 $million (IAS 39)2
Corporate & Institutional Banking 2293 657 1,401
Commercial Banking 244 168 491
Private Banking – 1 1
Retail Banking 267 374 489
Total ongoing business 740 1,200 2,382
Restructuring charge/(credit) (including liquidation portfolio) (87) 162 409
1 Credit impairment under IFRS 9 covers a broader asset base than loan impairment under IAS 39, effective from 1 January 2018 2 2017 data is prepared and disclosed on an IAS 39 basis 3 Credit impairment recovery of $13 million in Central & other items is included in Corporate & Institutional Banking

Standard Chartered Annual Report 2018140
RISK REVIEW Risk profile
Risk profile
Our risk profile in 2018Through our well-established risk governance structure and Enterprise Risk Management Framework (ERMF), we closely manage our risks with the objective of maximising risk-adjusted returns while remaining in compliance with the Risk Appetite Statement. We manage uncertainties through a dynamic risk scanning process that provides a forward-looking view of the economic,
business and credit conditions across the Group’s key markets, enabling us to proactively manage our portfolio.
We continue to reposition the Group’s corporate portfolio, exiting weaker credit or lower-returning clients and adding new clients selectively. We remain alert to broader geopolitical uncertainties that have affected sentiment in some of our markets, and we continue to focus on early identification of
emerging risks across all our portfolios to manage any areas of potential weakness on a proactive basis. The Group’s portfolio is well diversified across dimensions such as industries, geographies and products.
The table below highlights the Group’s overall risk profile associated with our business strategy.
Our risk profile in 2018
Stronger risk culture across the Three Lines of Defence from increased awareness of the ERMF
¼ In 2018, we developed consistent and integrated Risk Type Frameworks for our ten Principal Risk Types
¼ We formalised links between our Strategy, Risk Appetite and risk identification to integrate risk considerations into strategic decision-making
¼ We enhanced our Risk Appetite coverage on non-financial Principal Risk Types
¼ We established clear individual accountability for risk management across the three lines of defence
¼ We aligned our risk committees to the ERMF
¼ We augmented our risk scanning processes to enable more dynamic and forward-looking assessments of risk
¼ We rolled out an ERMF Effectiveness Review process to measure progress in an objective manner
Further details on the Enterprise Risk Management Framework can be found in the Risk management approach (page 193)
Corporate portfolios remain well diversified and exhibit improving credit quality
¼ Credit impairment for the total ongoing business reduced by 38 per cent on 2017
¼ We further reduced our liquidation portfolio by 39 per cent in the year through active management
¼ Within the Corporate & Institutional Banking and Commercial Banking portfolios:
– Exposure to investment grade clients has increased to 62 per cent of the total corporate book in 2018 (2017: 57 per cent)
– The largest sector concentration are manufacturing at 17 per cent of loans and advances to customers, and financing, insurance and non-banking financial counterparties at 15 per cent. All other industry concentrations are at 12 per cent or lower of the total customer portfolio
¼ Over 50 per cent of long-term sub-investment grade exposures within the corporate portfolio remain collateralised
¼ Within the Retail Banking portfolio, secured lending remains our primary focus, with 84 per cent of the book continuing to be fully secured. Our overall loan-to-value ratio is low at 45 per cent
Robust capital and liquidity position ¼ We remain well capitalised and our balance sheet remains highly liquid
¼ We have a strong advances-to-deposits ratio
¼ We remain a net provider of liquidity to interbank markets and our customer deposit base is diversified by type and maturity
¼ We have a substantial portfolio of marketable securities which can be realised in the event of a liquidity stress situation
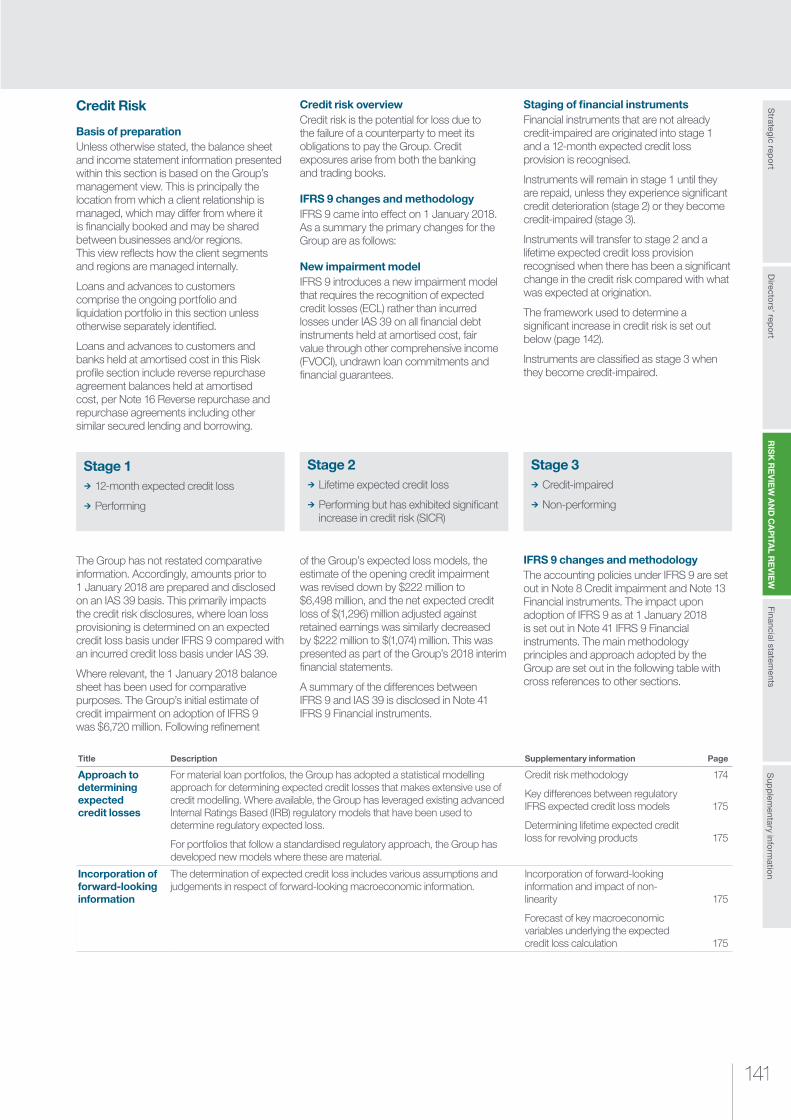
141141
RIS
K R
EV
IEW
AN
D C
AP
ITAL R
EV
IEW
Strategic rep
ort
Sup
plem
entary inform
ation
Financial statements
Directo
rs’ repo
rt
Credit Risk
Basis of preparationUnless otherwise stated, the balance sheet and income statement information presented within this section is based on the Group’s management view. This is principally the location from which a client relationship is managed, which may differ from where it is financially booked and may be shared between businesses and/or regions. This view reflects how the client segments and regions are managed internally.
Loans and advances to customers comprise the ongoing portfolio and liquidation portfolio in this section unless otherwise separately identified.
Loans and advances to customers and banks held at amortised cost in this Risk profile section include reverse repurchase agreement balances held at amortised cost, per Note 16 Reverse repurchase and repurchase agreements including other similar secured lending and borrowing.
Credit risk overviewCredit risk is the potential for loss due to the failure of a counterparty to meet its obligations to pay the Group. Credit exposures arise from both the banking and trading books.
IFRS 9 changes and methodologyIFRS 9 came into effect on 1 January 2018. As a summary the primary changes for the Group are as follows:
New impairment modelIFRS 9 introduces a new impairment model that requires the recognition of expected credit losses (ECL) rather than incurred losses under IAS 39 on all financial debt instruments held at amortised cost, fair value through other comprehensive income (FVOCI), undrawn loan commitments and financial guarantees.
Staging of financial instrumentsFinancial instruments that are not already credit-impaired are originated into stage 1 and a 12-month expected credit loss provision is recognised.
Instruments will remain in stage 1 until they are repaid, unless they experience significant credit deterioration (stage 2) or they become credit-impaired (stage 3).
Instruments will transfer to stage 2 and a lifetime expected credit loss provision recognised when there has been a significant change in the credit risk compared with what was expected at origination.
The framework used to determine a significant increase in credit risk is set out below (page 142).
Instruments are classified as stage 3 when they become credit-impaired.
Stage 1 ¼ 12-month expected credit loss
¼ Performing
Stage 2 ¼ Lifetime expected credit loss
¼ Performing but has exhibited significant increase in credit risk (SICR)
Stage 3 ¼ Credit-impaired
¼ Non-performing
The Group has not restated comparative information. Accordingly, amounts prior to 1 January 2018 are prepared and disclosed on an IAS 39 basis. This primarily impacts the credit risk disclosures, where loan loss provisioning is determined on an expected credit loss basis under IFRS 9 compared with an incurred credit loss basis under IAS 39.
Where relevant, the 1 January 2018 balance sheet has been used for comparative purposes. The Group’s initial estimate of credit impairment on adoption of IFRS 9 was $6,720 million. Following refinement
of the Group’s expected loss models, the estimate of the opening credit impairment was revised down by $222 million to $6,498 million, and the net expected credit loss of $(1,296) million adjusted against retained earnings was similarly decreased by $222 million to $(1,074) million. This was presented as part of the Group’s 2018 interim financial statements.
A summary of the differences between IFRS 9 and IAS 39 is disclosed in Note 41 IFRS 9 Financial instruments.
IFRS 9 changes and methodologyThe accounting policies under IFRS 9 are set out in Note 8 Credit impairment and Note 13 Financial instruments. The impact upon adoption of IFRS 9 as at 1 January 2018 is set out in Note 41 IFRS 9 Financial instruments. The main methodology principles and approach adopted by the Group are set out in the following table with cross references to other sections.
Title Description Supplementary information Page
Approach to determining expected credit losses
For material loan portfolios, the Group has adopted a statistical modelling approach for determining expected credit losses that makes extensive use of credit modelling. Where available, the Group has leveraged existing advanced Internal Ratings Based (IRB) regulatory models that have been used to determine regulatory expected loss.
For portfolios that follow a standardised regulatory approach, the Group has developed new models where these are material.
Credit risk methodology
Key differences between regulatory IFRS expected credit loss models
Determining lifetime expected credit loss for revolving products
174
175
175
Incorporation of forward-looking information
The determination of expected credit loss includes various assumptions and judgements in respect of forward-looking macroeconomic information.
Incorporation of forward-looking information and impact of non-linearity
Forecast of key macroeconomic variables underlying the expected credit loss calculation
175
175

Standard Chartered Annual Report 2018142
RISK REVIEW Risk profile
Title Description Supplementary information Page
Significant increase in credit risk (SICR)
Expected credit loss for financial assets will transfer from a 12-month basis to a lifetime basis when there is a significant increase in credit risk (SICR) relative to that which was expected at the time of origination, or when the asset becomes credit-impaired. On transfer to a lifetime basis, the expected credit loss for those assets will reflect the impact of a default event expected to occur over the remaining lifetime of the instrument rather than just over the 12 months from the reporting date.
SICR is assessed by comparing the risk of default of an exposure at the reporting date with the risk of default at origination (after considering the passage of time). ‘Significant’ does not mean statistically significant nor is it reflective of the extent of the impact on the Group’s financial statements. Whether a change in the risk of default is significant or not is assessed using quantitative and qualitative criteria, the weight of which will depend on the type of product and counterparty.
Quantitative criteria
Significant increase in credit risk thresholds
Specific qualitative and quantitative criteria per segment:
Corporate & Institutional and Commercial Banking clients
Retail Banking clients
Private Banking clients
Debt securities
177
177
177
178
178
178
178
Assessment of credit-impaired financial assets
Credit-impaired financial assets comprise those assets that have experienced an observed credit event and are in default. Default represents those assets that are at least 90 days past due in respect of principal and interest payments and/or where the assets are otherwise considered unlikely to pay. This definition is consistent with internal credit risk management and the regulatory definition of default.
Unlikely to pay factors include objective conditions such as bankruptcy, debt restructuring, fraud or death. It also includes credit-related modifications of contractual cash flows due to significant financial difficulty (forbearance) where the Group has granted concessions that it would not ordinarily consider.
Retail Banking clients
Corporate & Institutional Banking clients
Commercial Banking and Private Banking clients
178
178
178
Modified financial assets
Where the contractual terms of a financial instrument have been modified, and this does not result in the instrument being derecognised, a modification gain or loss is recognised in the income statement representing the difference between the original cashflows and the modified cash flows, discounted at the effective interest rate. The modification gain/loss is directly applied to the gross carrying amount of the instrument.
If the modification is credit-related, such as forbearance or where the Group has granted concessions that it would not ordinarily consider, then it will be considered credit-impaired. Modifications that are not credit related will be subject to an assessment of whether the asset’s credit risk has increased significantly since origination by comparing the remaining lifetime probability of default (PD) based on the modified terms to the remaining lifetime PD based on the original contractual terms.
Forbearance and other modified loans
257
Transfers between stages
Assets will transfer from stage 3 to stage 2 when they are no longer considered to be credit-impaired. Assets will not be considered credit-impaired only if the customer makes payments such that they are paid to current in line with the original contractual terms. In addition:
¼ Loans that were subject to forbearance measures must remain current for 12 months before they can be transferred to stage 2
¼ Retail loans that were not subject to forbearance measures must remain current for 180 days before they can be transferred to stage 2 or stage 1
Assets may transfer to stage 1 if they are no longer considered to have experienced a significant increase in credit risk. This will be immediate when the original PD based transfer criteria are no longer met (and as long as none of the other transfer criteria apply). Where assets were transferred using other measures, the assets will only transfer back to stage 1 when the condition that caused the significant increase in credit risk no longer applies (and as long as none of the other transfer criteria apply).
Movement in loan exposures and expected credit losses
156
Governance and application of expert credit judgement in respect of expected credit losses
The determination of expected credit losses requires a significant degree of management judgement which had an impact on governance processes, with the output of the expected credit models assessed by the IFRS 9 Impairment Committee.
Group Credit Model Assessment Committee
IFRS 9 Impairment Committee
179
179
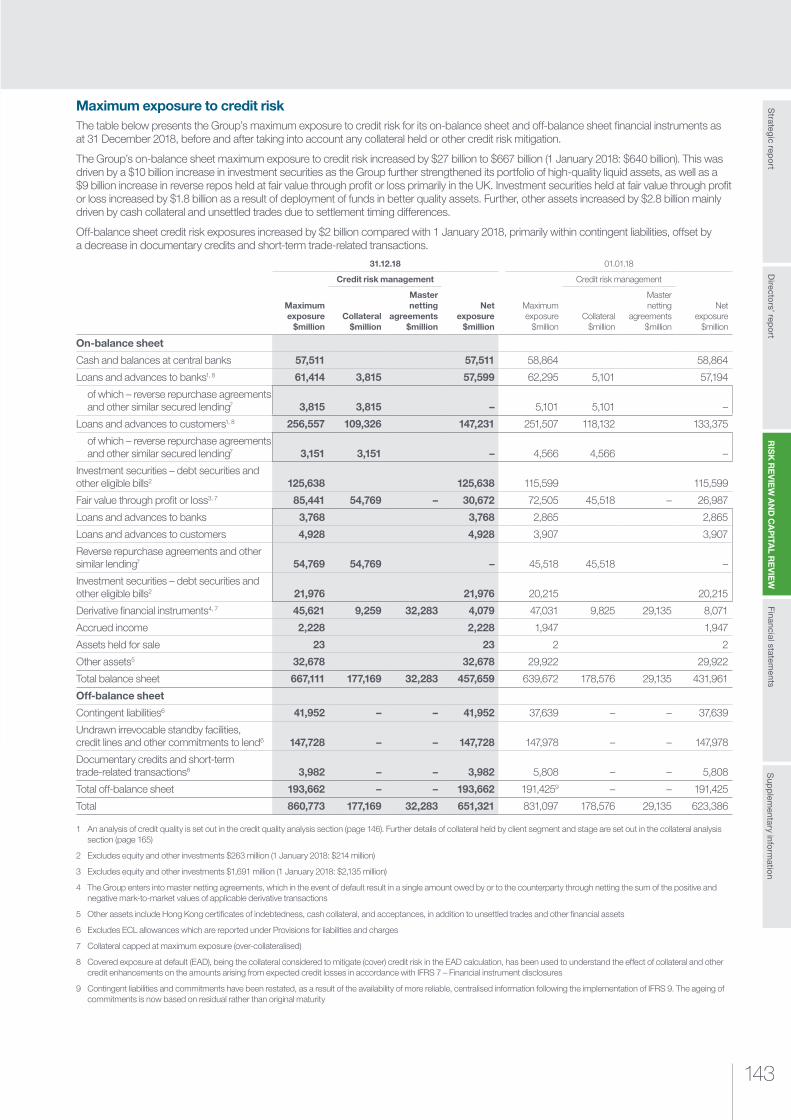
143143
RIS
K R
EV
IEW
AN
D C
AP
ITAL R
EV
IEW
Strategic rep
ort
Sup
plem
entary inform
ation
Financial statements
Directo
rs’ repo
rt
Maximum exposure to credit risk The table below presents the Group’s maximum exposure to credit risk for its on-balance sheet and off-balance sheet financial instruments as at 31 December 2018, before and after taking into account any collateral held or other credit risk mitigation.
The Group’s on-balance sheet maximum exposure to credit risk increased by $27 billion to $667 billion (1 January 2018: $640 billion). This was driven by a $10 billion increase in investment securities as the Group further strengthened its portfolio of high-quality liquid assets, as well as a $9 billion increase in reverse repos held at fair value through profit or loss primarily in the UK. Investment securities held at fair value through profit or loss increased by $1.8 billion as a result of deployment of funds in better quality assets. Further, other assets increased by $2.8 billion mainly driven by cash collateral and unsettled trades due to settlement timing differences.
Off-balance sheet credit risk exposures increased by $2 billion compared with 1 January 2018, primarily within contingent liabilities, offset by a decrease in documentary credits and short-term trade-related transactions.
31.12.18 01.01.18
Maximum exposure
$million
Credit risk management
Net exposure
$million
Maximum exposure
$million
Credit risk management
Net exposure
$millionCollateral
$million
Master netting
agreements $million
Collateral $million
Master netting
agreements $million
On-balance sheet
Cash and balances at central banks 57,511 57,511 58,864 58,864
Loans and advances to banks1, 8 61,414 3,815 57,599 62,295 5,101 57,194
of which – reverse repurchase agreements and other similar secured lending7 3,815 3,815 – 5,101 5,101 –
Loans and advances to customers1, 8 256,557 109,326 147,231 251,507 118,132 133,375
of which – reverse repurchase agreements and other similar secured lending7 3,151 3,151 – 4,566 4,566 –
Investment securities – debt securities and other eligible bills2 125,638 125,638 115,599 115,599
Fair value through profit or loss3, 7 85,441 54,769 – 30,672 72,505 45,518 – 26,987
Loans and advances to banks 3,768 3,768 2,865 2,865
Loans and advances to customers 4,928 4,928 3,907 3,907
Reverse repurchase agreements and other similar lending7 54,769 54,769 – 45,518 45,518 –
Investment securities – debt securities and other eligible bills2 21,976 21,976 20,215 20,215
Derivative financial instruments4, 7 45,621 9,259 32,283 4,079 47,031 9,825 29,135 8,071
Accrued income 2,228 2,228 1,947 1,947
Assets held for sale 23 23 2 2
Other assets5 32,678 32,678 29,922 29,922
Total balance sheet 667,111 177,169 32,283 457,659 639,672 178,576 29,135 431,961
Off-balance sheet
Contingent liabilities6 41,952 – – 41,952 37,639 – – 37,639
Undrawn irrevocable standby facilities, credit lines and other commitments to lend6 147,728 – – 147,728 147,978 – – 147,978
Documentary credits and short-term trade-related transactions6 3,982 – – 3,982 5,808 – – 5,808
Total off-balance sheet 193,662 – – 193,662 191,4259 – – 191,425
Total 860,773 177,169 32,283 651,321 831,097 178,576 29,135 623,386
1 An analysis of credit quality is set out in the credit quality analysis section (page 146). Further details of collateral held by client segment and stage are set out in the collateral analysis section (page 165)
2 Excludes equity and other investments $263 million (1 January 2018: $214 million)
3 Excludes equity and other investments $1,691 million (1 January 2018: $2,135 million)
4 The Group enters into master netting agreements, which in the event of default result in a single amount owed by or to the counterparty through netting the sum of the positive and negative mark-to-market values of applicable derivative transactions
5 Other assets include Hong Kong certificates of indebtedness, cash collateral, and acceptances, in addition to unsettled trades and other financial assets
6 Excludes ECL allowances which are reported under Provisions for liabilities and charges
7 Collateral capped at maximum exposure (over-collateralised)
8 Covered exposure at default (EAD), being the collateral considered to mitigate (cover) credit risk in the EAD calculation, has been used to understand the effect of collateral and other credit enhancements on the amounts arising from expected credit losses in accordance with IFRS 7 – Financial instrument disclosures
9 Contingent liabilities and commitments have been restated, as a result of the availability of more reliable, centralised information following the implementation of IFRS 9. The ageing of commitments is now based on residual rather than original maturity
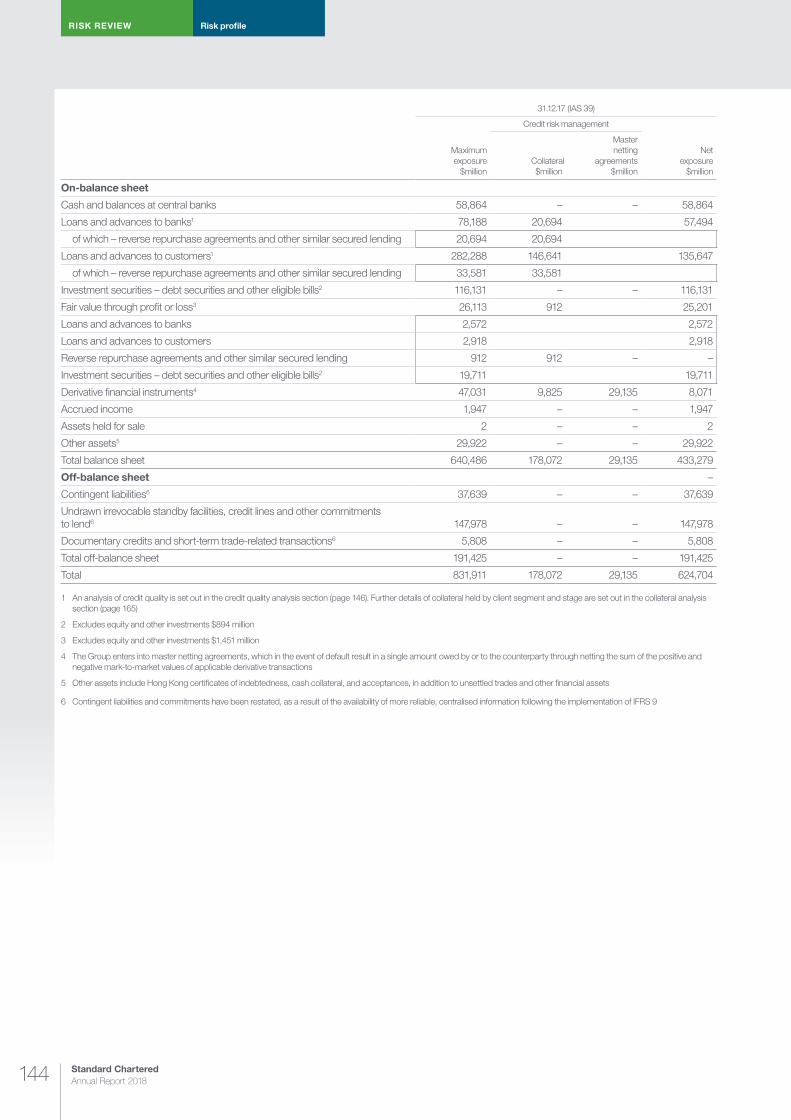
Standard Chartered Annual Report 2018144
RISK REVIEW Risk profile
31.12.17 (IAS 39)
Maximum exposure
$million
Credit risk management
Net exposure
$millionCollateral$million
Master netting
agreements $million
On-balance sheet
Cash and balances at central banks 58,864 – – 58,864
Loans and advances to banks1 78,188 20,694 57,494
of which – reverse repurchase agreements and other similar secured lending 20,694 20,694
Loans and advances to customers1 282,288 146,641 135,647
of which – reverse repurchase agreements and other similar secured lending 33,581 33,581
Investment securities – debt securities and other eligible bills2 116,131 – – 116,131
Fair value through profit or loss3 26,113 912 25,201
Loans and advances to banks 2,572 2,572
Loans and advances to customers 2,918 2,918
Reverse repurchase agreements and other similar secured lending 912 912 – –
Investment securities – debt securities and other eligible bills2 19,711 19,711
Derivative financial instruments4 47,031 9,825 29,135 8,071
Accrued income 1,947 – – 1,947
Assets held for sale 2 – – 2
Other assets5 29,922 – – 29,922
Total balance sheet 640,486 178,072 29,135 433,279
Off-balance sheet –
Contingent liabilities6 37,639 – – 37,639
Undrawn irrevocable standby facilities, credit lines and other commitments to lend6 147,978 – – 147,978
Documentary credits and short-term trade-related transactions6 5,808 – – 5,808
Total off-balance sheet 191,425 – – 191,425
Total 831,911 178,072 29,135 624,704
1 An analysis of credit quality is set out in the credit quality analysis section (page 146). Further details of collateral held by client segment and stage are set out in the collateral analysis section (page 165)
2 Excludes equity and other investments $894 million
3 Excludes equity and other investments $1,451 million
4 The Group enters into master netting agreements, which in the event of default result in a single amount owed by or to the counterparty through netting the sum of the positive and negative mark-to-market values of applicable derivative transactions
5 Other assets include Hong Kong certificates of indebtedness, cash collateral, and acceptances, in addition to unsettled trades and other financial assets
6 Contingent liabilities and commitments have been restated, as a result of the availability of more reliable, centralised information following the implementation of IFRS 9
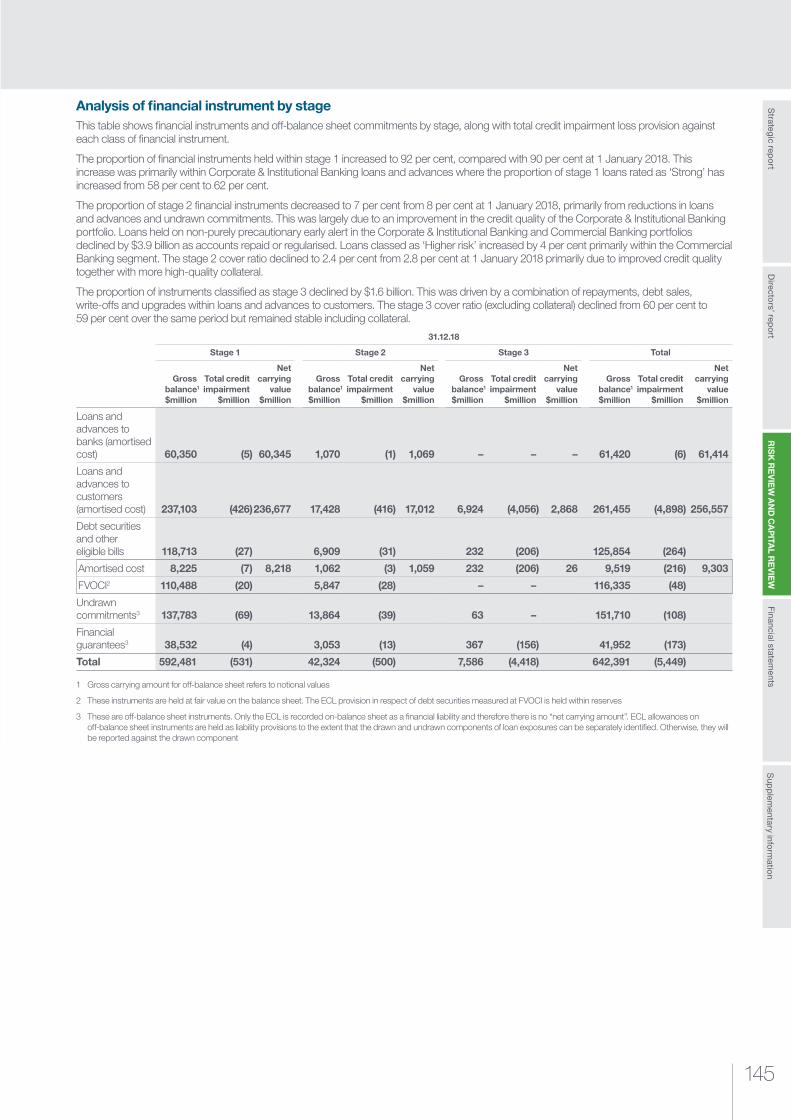
145145
RIS
K R
EV
IEW
AN
D C
AP
ITAL R
EV
IEW
Strategic rep
ort
Sup
plem
entary inform
ation
Financial statements
Directo
rs’ repo
rt
Analysis of financial instrument by stage This table shows financial instruments and off-balance sheet commitments by stage, along with total credit impairment loss provision against each class of financial instrument.
The proportion of financial instruments held within stage 1 increased to 92 per cent, compared with 90 per cent at 1 January 2018. This increase was primarily within Corporate & Institutional Banking loans and advances where the proportion of stage 1 loans rated as ‘Strong’ has increased from 58 per cent to 62 per cent.
The proportion of stage 2 financial instruments decreased to 7 per cent from 8 per cent at 1 January 2018, primarily from reductions in loans and advances and undrawn commitments. This was largely due to an improvement in the credit quality of the Corporate & Institutional Banking portfolio. Loans held on non-purely precautionary early alert in the Corporate & Institutional Banking and Commercial Banking portfolios declined by $3.9 billion as accounts repaid or regularised. Loans classed as ‘Higher risk’ increased by 4 per cent primarily within the Commercial Banking segment. The stage 2 cover ratio declined to 2.4 per cent from 2.8 per cent at 1 January 2018 primarily due to improved credit quality together with more high-quality collateral.
The proportion of instruments classified as stage 3 declined by $1.6 billion. This was driven by a combination of repayments, debt sales, write-offs and upgrades within loans and advances to customers. The stage 3 cover ratio (excluding collateral) declined from 60 per cent to 59 per cent over the same period but remained stable including collateral.
31.12.18
Stage 1 Stage 2 Stage 3 Total
Gross balance1
$million
Total credit impairment
$million
Net carrying
value $million
Gross balance1
$million
Total credit impairment
$million
Net carrying
value $million
Gross balance1
$million
Total credit impairment
$million
Net carrying
value $million
Gross balance1
$million
Total credit impairment
$million
Net carrying
value $million
Loans and advances to banks (amortised cost) 60,350 (5) 60,345 1,070 (1) 1,069 – – – 61,420 (6) 61,414
Loans and advances to customers (amortised cost) 237,103 (426)236,677 17,428 (416) 17,012 6,924 (4,056) 2,868 261,455 (4,898) 256,557
Debt securities and other eligible bills 118,713 (27) 6,909 (31) 232 (206) 125,854 (264)
Amortised cost 8,225 (7) 8,218 1,062 (3) 1,059 232 (206) 26 9,519 (216) 9,303
FVOCI2 110,488 (20) 5,847 (28) – – 116,335 (48)
Undrawn commitments3 137,783 (69) 13,864 (39) 63 – 151,710 (108)
Financial guarantees3 38,532 (4) 3,053 (13) 367 (156) 41,952 (173)
Total 592,481 (531) 42,324 (500) 7,586 (4,418) 642,391 (5,449)
1 Gross carrying amount for off-balance sheet refers to notional values
2 These instruments are held at fair value on the balance sheet. The ECL provision in respect of debt securities measured at FVOCI is held within reserves
3 These are off-balance sheet instruments. Only the ECL is recorded on-balance sheet as a financial liability and therefore there is no “net carrying amount”. ECL allowances on off-balance sheet instruments are held as liability provisions to the extent that the drawn and undrawn components of loan exposures can be separately identified. Otherwise, they will be reported against the drawn component

Standard Chartered Annual Report 2018146
RISK REVIEW Risk profile
01.01.18
Stage 1 Stage 2 Stage 3 Total
Gross balance1
$million
Total credit impairment
$million
Net carrying
value $million
Gross balance1
$million
Total credit impairment
$million
Net carrying
value $million
Gross balance1
$million
Total credit impairment
$million
Net carrying
value $million
Gross balance1
$million
Total credit impairment
$million
Net carrying
value $million
Loans and advances to banks (amortised cost) 59,926 (6) 59,920 2,372 (2) 2,370 9 (4) 5 62,307 (12) 62,295
Loans and advances to customers (amortised cost) 228,485 (472) 228,013 20,583 (576) 20,007 8,769 (5,282) 3,487 257,837 (6,330) 251,507
Debt securities and other eligible bills 107,308 (26) 8,302 (58) 221 (213) 115,831 (297)
Amortised cost2 6,204 (3) 6,201 995 (16) 979 221 (213) 8 7,420 (232) 7,188
FVOCI3 101,104 (23) 7,307 (42) – – 108,411 (65)
Undrawn commitments4 138,804 (66) 14,982 (90) – – 153,786 (156)
Financial guarantees4 31,292 (6) 6,148 (16) 199 (77) 37,639 (99)
Total 565,815 (576) 52,387 (742) 9,198 (5,576) 627,400 (6,894)
1 Gross carrying amount for off-balance sheet refers to notional values
2 Stage 3 gross balance and total credit impairment of debt securities and other eligible bills – amortised cost has increased by $208 million, with no impact on net carrying value. The balances have been restated to present securities with zero carrying value previously classified as available-for-sale under IAS 39 on a gross basis as required under IFRS 9
3 These instruments are held at fair value on the balance sheet. The ECL provision in respect of debt securities measured at fair value through other comprehensive income is held within reserves
4 These are off-balance sheet instruments. Only the ECL is recorded on-balance sheet as a financial liability and therefore there is no ‘net carrying amount’. ECL allowances on off-balance sheet instruments are held as liability provisions to the extent that the drawn and undrawn components of loan exposures can be separately identified. Otherwise they will be reported against the drawn component. Contingent liabilities and commitments gross balances have been restated, as a result of the availability of more reliable, centralised information following the implementation of IFRS 9
Credit quality analysis
Credit quality by client segmentFor Corporate & Institutional Banking and Commercial Banking portfolios, exposures are analysed by credit grade (CG), which plays a central role in the quality assessment and monitoring of risk (page 199). All loans are assigned a CG, which is reviewed periodically and amended in light of changes in the borrower’s circumstances or behaviour. CGs 1 to 12 are assigned to stage 1 and stage 2 (performing) clients or accounts, while CGs 13 and 14 are assigned to stage 3 (non-performing or defaulted) clients. The mapping of credit quality is as follows.
Mapping of credit qualityThe Group uses the following internal risk mapping to determine the credit quality for loans.
Credit quality description
Corporate & Institutional Banking and Commercial Banking Private Banking1 Retail Banking
Default grade mapping
S&P external ratings equivalent Regulatory PD range (%) Internal ratings Number of days past due
Strong Grades 1–5 AAA/AA+ to BB+/BBB- 0.000–0.425 Class I and Class IV Current loans (no past dues nor impaired)
Satisfactory Grades 6–8 BB+ to BB-/B+ 0.426–2.350 Class II and Class III Loans past due till 29 days
Grades 9–11 B+/B to B-/CCC 2.351–15.750
Higher Risk Grade 12 B-/CCC 15.751–50.000 GSAM managed Past due loans 30 days and over till 90 days
1 For Private Banking, classes of risk represent the type of collateral held. Class I represents facilities with liquid collateral, such as cash and marketable securities. Class II represents unsecured/partially secured facilities and those with illiquid collateral, such as equity in private enterprises. Class III represents facilities with residential or commercial real estate collateral. Class IV covers margin trading facilities
147147
RIS
K R
EV
IEW
AN
D C
AP
ITAL R
EV
IEW
Strategic rep
ort
Sup
plem
entary inform
ation
Financial statements
Directo
rs’ repo
rt
The table overleaf sets out the gross loans and advances held at amortised cost, expected credit loss provisions and expected credit loss coverage by business segment and stage. Expected credit loss coverage represents the expected credit loss reported for each segment and stage as a proportion of the gross loan balance for each segment and stage.
Stage 1 loans increased by 4 per cent compared with 1 January 2018 and represent 91 per cent of total loans and advances to customers as of 31 December 2018. The largest increase of stage 1 loans in any region was $4.1 billion in Europe & Americas. Stage 1 loans in Greater China & North Asia increased by $3.4 billion while ASEAN & South Asia and Africa & Middle East were broadly stable over the year.
The proportion of Corporate & Institutional Banking loans held within stage 1 improved to 87 per cent from 81 per cent at 1 January 2018. This was concentrated in the ‘Strong’ category which increased from 58 per cent of stage 1 loans at 1 January 2018 to 62 per cent at 31 December 2018, as the Group continued to focus on the origination of investment grade lending.
In Commercial Banking, the proportion of stage 1 loans declined from 79 per cent to 78 per cent due to a small number of downgrades to stage 2. However, the proportion of stage 1 loans categorised as ‘Strong’ increased from 24 per cent to 25 per cent in line with the Group’s strategy to increase the proportion of new loans to higher credit quality clients. Across Corporate & Institutional Banking and Commercial Banking, the largest industry contributors to the growth in stage 1 lending were the manufacturing sector, up $2.8 billion, and loans to governments, up $4.0 billion.
The proportion of Retail Banking stage 1 loans was slightly lower at 96 per cent of the total portfolio compared with 97 per cent at 1 January 2018, with the proportion rated as ‘Strong’ decreasing from 99 per cent to 98 per cent of total stage 1 loans mainly due to the decrease of the mortgage portfolio and the staging methodology change in the Korea Mortgage portfolio. Stage 1 mortgage loans declined by $4.4 billion, mainly due to tightened regulations in Korea and price competition in Hong Kong which resulted in a reduction in new booking. This was offset by growth of $3.8 billion in secured wealth products and $0.7 billion in credit cards and personal loans (CCPL) and other unsecured lending.
Stage 2 loans fell by $3.2 billion, or 15 per cent, compared with 1 January 2018, primarily driven by a decline in Corporate & Institutional Banking and Commercial Banking non-purely precautionary early alert balances.
In Corporate & Institutional Banking, 73 per cent of stage 2 loans were rated as ‘Satisfactory’ compared with 59 per cent at 1 January 2018. This does not represent a decline in overall credit quality as it is primarily driven by improvements in stage 2 investment grade loans which repaid or transferred back into stage 1. The majority of stage 2 loans within Commercial Banking continue to be classified as ‘Satisfactory’ (31 December 2018: 84 per cent; 1 January 2018: 82 per cent). Within Corporate & Institutional Banking and Commercial Banking, overall stage 2 loans decreased by $3.9 billion. The reduction spread across a number of sectors, with the manufacturing and financing and non-banking sectors seeing the largest decreases, $1.3 billion and $1.0 billion respectively, as early alert balances declined.
Retail Banking stage 2 loans increased by $0.7 billion, mainly driven by a change in the staging methodology in the Korea mortgage portfolio. 69 per cent are within the ‘Strong’ category, and the proportion of past due loans reduced from 34 per cent at 1 January 2018 to 31 per cent at 31 December 2018. Driven by an increase in the proportion of Mortgages held in Stage 2 and the rundown of the high-risk segments in the personal loans portfolio for ASEAN & South Asia, the requirement for ECL coverage has dropped from 7.8 per cent to 4.7 per cent.
Stage 3 loans fell by $1.8 billion, or 21 per cent, compared with 1 January 2018, with overall stage 3 provisions declining by $1.2 billion to $4.1 billion. The stage 3 cover ratio declined to 59 per cent from 60 per cent largely driven by the impact of write-offs and settlements in the liquidation portfolio.
All regions were lower compared with 1 January 2018, with the decline primarily in ASEAN & South Asia. In Corporate & Institutional Banking and Commercial Banking, stage 3 loans fell by $1.9 billion compared with 1 January 2018 due to repayments, debt sales, write-offs and upgrades in Corporate & Institutional Banking. Provisions against Corporate & Institutional Banking and Commercial Banking loans also fell by $1.2 billion from $4.8 billion to $3.6 billion.
Inflows into stage 3 for Corporate & Institutional Banking were 65 per cent lower than 2017 reflecting the continued improvement in the Corporate & Institutional Banking portfolio. Stage 3 inflows increased for Commercial Banking, driven by exposures in Greater China & North Asia and Africa & Middle East with no specific industry concentration. The majority of new stage 3 counterparties in Corporate and Institutional Banking and Commercial Banking in 2018 had been on early alert for a period and do not indicate new areas of stress.
Retail stage 3 loans were broadly stable at $0.8 billion.

Standard Chartered Annual Report 2018148
RISK REVIEW Risk profile
Loans and advances by client segment
Amortised cost
31.12.18
Banks $million
Customers
Corporate & Institutional
Banking $million
Retail Banking $million
Commercial Banking $million
Private Banking $million
Central & other items
$million
Customers total
$million
Stage 1 60,350 93,848 98,393 21,913 12,705 10,244 237,103
– Strong 47,860 58,167 96,506 5,527 9,447 10,193 179,840
– Satisfactory 12,490 35,681 1,887 16,386 3,258 51 57,263
Stage 2 1,070 9,357 2,837 4,423 785 26 17,428
– Strong 403 1,430 1,956 270 713 – 4,369
– Satisfactory 665 6,827 500 3,732 – 26 11,085
– Higher risk 2 1,100 381 421 72 – 1,974
Of which (stage 2):
– Less than 30 days past due 27 232 500 198 – – 930
– More than 30 days past due – 190 381 99 3 – 673
Stage 3, credit-impaired financial assets – 4,084 832 1,773 235 – 6,924
Gross balance1 61,420 107,289 102,062 28,109 13,725 10,270 261,455
Stage 1 (5) (94) (299) (24) (9) – (426)
– Strong (2) (32) (149) (1) (9) – (191)
– Satisfactory (3) (62) (150) (23) – – (235)
Stage 2 (1) (192) (132) (92) – – (416)
– Strong – (11) (42) (5) – – (58)
– Satisfactory (1) (66) (50) (45) – – (161)
– Higher risk – (115) (40) (42) – – (197)
Of which (stage 2):
– Less than 30 days past due – (34) (50) (9) – – (93)
– More than 30 days past due – (2) (40) (4) – – (46)
Stage 3, credit-impaired financial assets – (2,326) (396) (1,234) (100) – (4,056)
Total credit impairment (6) (2,612) (827) (1,350) (109) – (4,898)
Net carrying value 61,414 104,677 101,235 26,759 13,616 10,270 256,557
Stage 1 0.0% 0.1% 0.3% 0.1% 0.1% 0.0% 0.2%
– Strong 0.0% 0.1% 0.2% 0.0% 0.1% 0.0% 0.1%
– Satisfactory 0.0% 0.2% 7.9% 0.1% 0.0% 0.0% 0.4%
Stage 2 0.1% 2.1% 4.7% 2.1% 0.0% 0.0% 2.4%
– Strong 0.0% 0.8% 2.1% 1.9% 0.0% – 1.3%
– Satisfactory 0.2% 1.0% 10.0% 1.2% – 0.0% 1.5%
– Higher risk 0.0% 10.5% 10.5% 10.0% 0.0% – 10.0%
Of which (stage 2):
– Less than 30 days past due 0.0% 14.7% 10.0% 4.5% – – 10.0%
– More than 30 days past due – 1.1% 10.5% 4.0% 0.0% – 6.8%
Stage 3, credit-impaired financial assets – 57.0% 47.6% 69.6% 42.6% 0.0% 58.6%
Cover ratio 0.0% 2.4% 0.8% 4.8% 0.8% 0.0% 1.9%
Fair value through profit or loss
Performing 20,651 41,886 400 479 – 4 42,769
– Strong 19,515 33,178 395 247 – 3 33,823
– Satisfactory 1,136 8,700 4 232 – 1 8,937
– Higher risk – 8 1 – – – 9
Impaired – 12 – 33 – – 45
Gross balance2 20,651 41,898 400 512 – 4 42,814
Net carrying value (incl FVTPL) 82,065 146,575 101,635 27,271 13,616 10,274 299,371
1 Loans and advances includes reverse repurchase agreements and other similar secured lending of $3,151 million under Customers and of $3,815 million under Banks, held at amortised cost
2 Loans and advances includes reverse repurchase agreements and other similar secured lending of $37,886 million under Customers and of $16,883 million under Banks, held at fair value through profit or loss
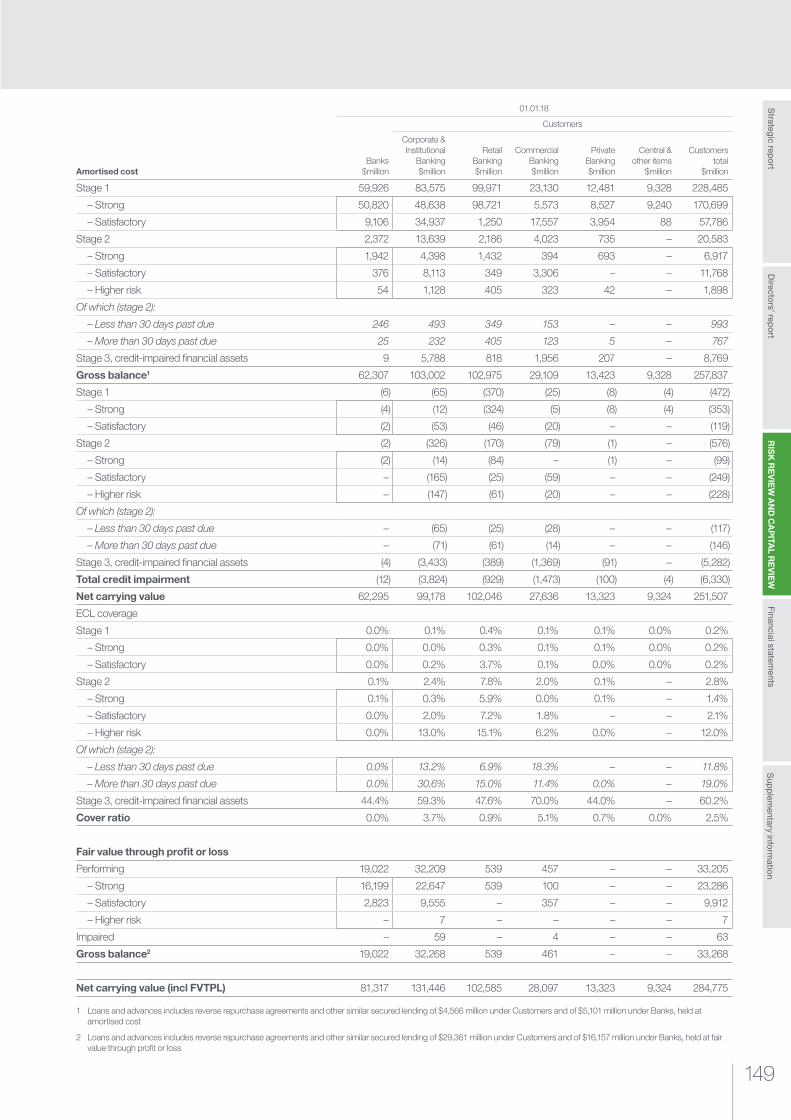
149149
RIS
K R
EV
IEW
AN
D C
AP
ITAL R
EV
IEW
Strategic rep
ort
Sup
plem
entary inform
ation
Financial statements
Directo
rs’ repo
rt
Amortised cost
01.01.18
Banks $million
Customers
Corporate & Institutional
Banking $million
Retail Banking $million
Commercial Banking $million
Private Banking $million
Central & other items
$million
Customers total
$million
Stage 1 59,926 83,575 99,971 23,130 12,481 9,328 228,485
– Strong 50,820 48,638 98,721 5,573 8,527 9,240 170,699
– Satisfactory 9,106 34,937 1,250 17,557 3,954 88 57,786
Stage 2 2,372 13,639 2,186 4,023 735 – 20,583
– Strong 1,942 4,398 1,432 394 693 – 6,917
– Satisfactory 376 8,113 349 3,306 – – 11,768
– Higher risk 54 1,128 405 323 42 – 1,898
Of which (stage 2):
– Less than 30 days past due 246 493 349 153 – – 993
– More than 30 days past due 25 232 405 123 5 – 767
Stage 3, credit-impaired financial assets 9 5,788 818 1,956 207 – 8,769
Gross balance1 62,307 103,002 102,975 29,109 13,423 9,328 257,837
Stage 1 (6) (65) (370) (25) (8) (4) (472)
– Strong (4) (12) (324) (5) (8) (4) (353)
– Satisfactory (2) (53) (46) (20) – – (119)
Stage 2 (2) (326) (170) (79) (1) – (576)
– Strong (2) (14) (84) – (1) – (99)
– Satisfactory – (165) (25) (59) – – (249)
– Higher risk – (147) (61) (20) – – (228)
Of which (stage 2):
– Less than 30 days past due – (65) (25) (28) – – (117)
– More than 30 days past due – (71) (61) (14) – – (146)
Stage 3, credit-impaired financial assets (4) (3,433) (389) (1,369) (91) – (5,282)
Total credit impairment (12) (3,824) (929) (1,473) (100) (4) (6,330)
Net carrying value 62,295 99,178 102,046 27,636 13,323 9,324 251,507
ECL coverage
Stage 1 0.0% 0.1% 0.4% 0.1% 0.1% 0.0% 0.2%
– Strong 0.0% 0.0% 0.3% 0.1% 0.1% 0.0% 0.2%
– Satisfactory 0.0% 0.2% 3.7% 0.1% 0.0% 0.0% 0.2%
Stage 2 0.1% 2.4% 7.8% 2.0% 0.1% – 2.8%
– Strong 0.1% 0.3% 5.9% 0.0% 0.1% – 1.4%
– Satisfactory 0.0% 2.0% 7.2% 1.8% – – 2.1%
– Higher risk 0.0% 13.0% 15.1% 6.2% 0.0% – 12.0%
Of which (stage 2):
– Less than 30 days past due 0.0% 13.2% 6.9% 18.3% – – 11.8%
– More than 30 days past due 0.0% 30.6% 15.0% 11.4% 0.0% – 19.0%
Stage 3, credit-impaired financial assets 44.4% 59.3% 47.6% 70.0% 44.0% – 60.2%
Cover ratio 0.0% 3.7% 0.9% 5.1% 0.7% 0.0% 2.5%
Fair value through profit or loss
Performing 19,022 32,209 539 457 – – 33,205
– Strong 16,199 22,647 539 100 – – 23,286
– Satisfactory 2,823 9,555 – 357 – – 9,912
– Higher risk – 7 – – – – 7
Impaired – 59 – 4 – – 63
Gross balance2 19,022 32,268 539 461 – – 33,268
Net carrying value (incl FVTPL) 81,317 131,446 102,585 28,097 13,323 9,324 284,775
1 Loans and advances includes reverse repurchase agreements and other similar secured lending of $4,566 million under Customers and of $5,101 million under Banks, held at amortised cost
2 Loans and advances includes reverse repurchase agreements and other similar secured lending of $29,361 million under Customers and of $16,157 million under Banks, held at fair value through profit or loss
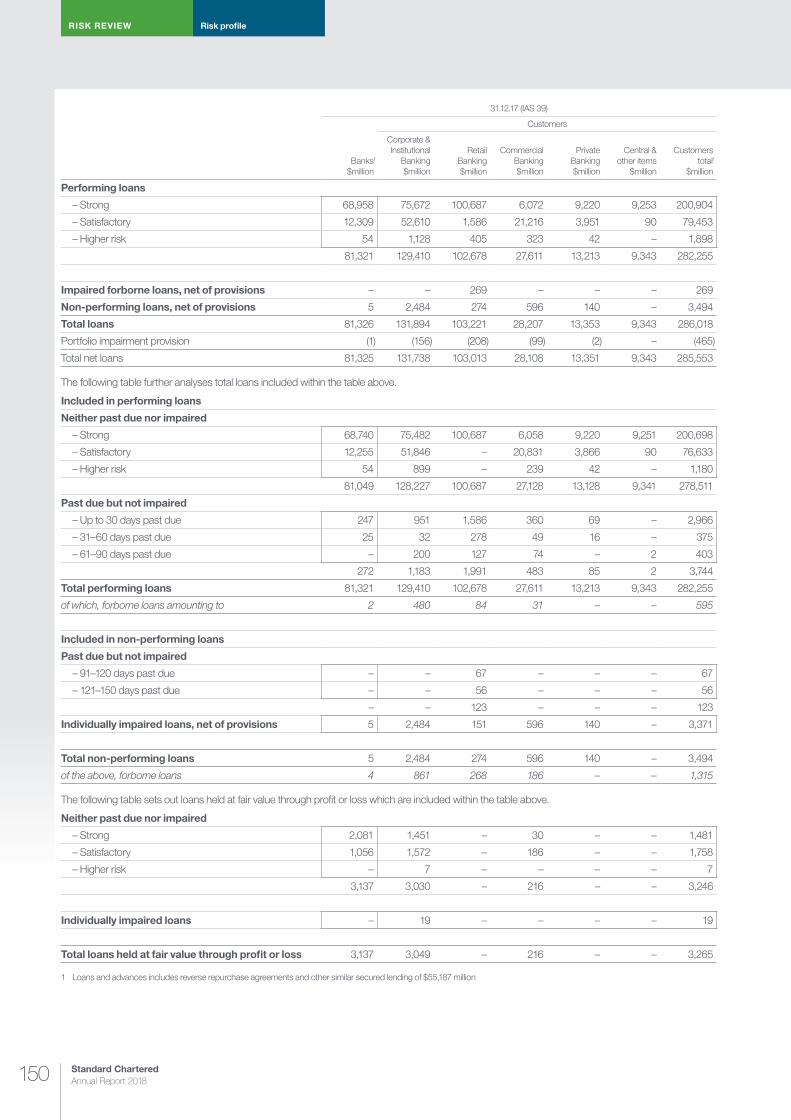
Standard Chartered Annual Report 2018150
RISK REVIEW Risk profile
31.12.17 (IAS 39)
Banks1
$million
Customers
Corporate & Institutional
Banking $million
Retail Banking $million
Commercial Banking $million
Private Banking $million
Central & other items
$million
Customers total1
$million
Performing loans
– Strong 68,958 75,672 100,687 6,072 9,220 9,253 200,904
– Satisfactory 12,309 52,610 1,586 21,216 3,951 90 79,453
– Higher risk 54 1,128 405 323 42 – 1,898
81,321 129,410 102,678 27,611 13,213 9,343 282,255
Impaired forborne loans, net of provisions – – 269 – – – 269
Non-performing loans, net of provisions 5 2,484 274 596 140 – 3,494
Total loans 81,326 131,894 103,221 28,207 13,353 9,343 286,018
Portfolio impairment provision (1) (156) (208) (99) (2) – (465)
Total net loans 81,325 131,738 103,013 28,108 13,351 9,343 285,553
The following table further analyses total loans included within the table above.
Included in performing loans
Neither past due nor impaired
– Strong 68,740 75,482 100,687 6,058 9,220 9,251 200,698
– Satisfactory 12,255 51,846 – 20,831 3,866 90 76,633
– Higher risk 54 899 – 239 42 – 1,180
81,049 128,227 100,687 27,128 13,128 9,341 278,511
Past due but not impaired
– Up to 30 days past due 247 951 1,586 360 69 – 2,966
– 31–60 days past due 25 32 278 49 16 – 375
– 61–90 days past due – 200 127 74 – 2 403
272 1,183 1,991 483 85 2 3,744
Total performing loans 81,321 129,410 102,678 27,611 13,213 9,343 282,255
of which, forborne loans amounting to 2 480 84 31 – – 595
Included in non-performing loans
Past due but not impaired
– 91–120 days past due – – 67 – – – 67
– 121–150 days past due – – 56 – – – 56
– – 123 – – – 123
Individually impaired loans, net of provisions 5 2,484 151 596 140 – 3,371
Total non-performing loans 5 2,484 274 596 140 – 3,494
of the above, forborne loans 4 861 268 186 – – 1,315
The following table sets out loans held at fair value through profit or loss which are included within the table above.
Neither past due nor impaired
– Strong 2,081 1,451 – 30 – – 1,481
– Satisfactory 1,056 1,572 – 186 – – 1,758
– Higher risk – 7 – – – – 7
3,137 3,030 – 216 – – 3,246
Individually impaired loans – 19 – – – – 19
Total loans held at fair value through profit or loss 3,137 3,049 – 216 – – 3,265
1 Loans and advances includes reverse repurchase agreements and other similar secured lending of $55,187 million
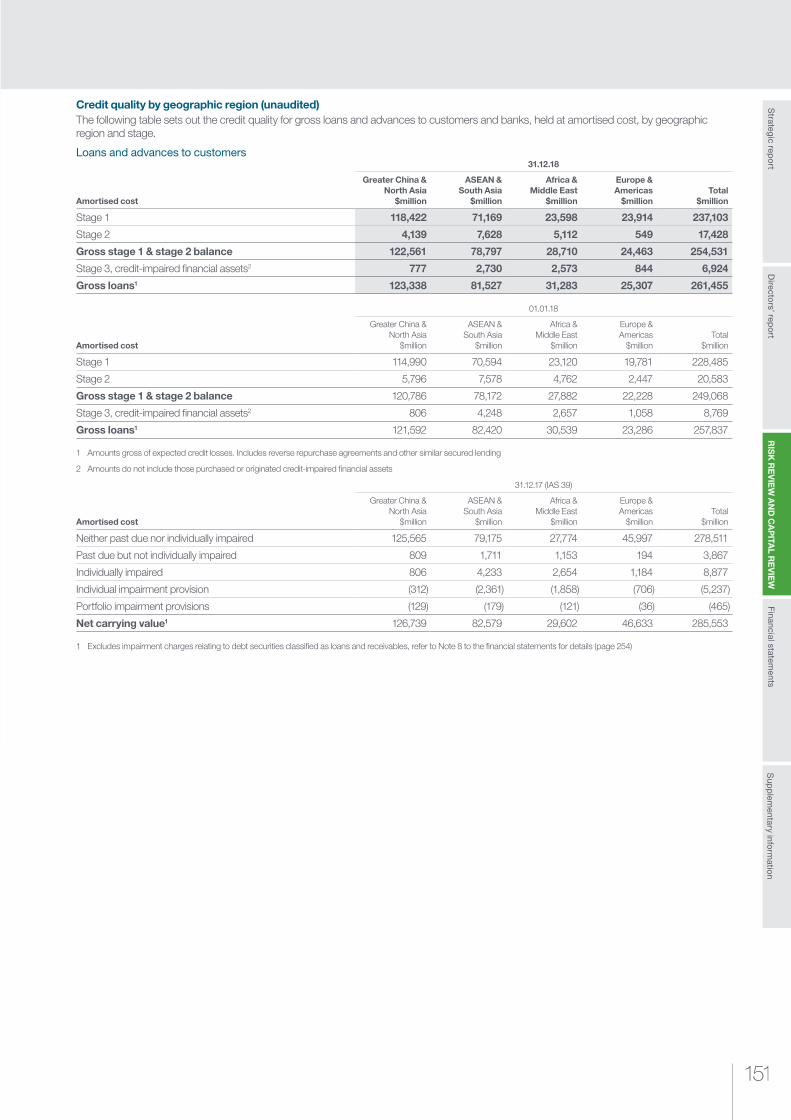
151151
RIS
K R
EV
IEW
AN
D C
AP
ITAL R
EV
IEW
Strategic rep
ort
Sup
plem
entary inform
ation
Financial statements
Directo
rs’ repo
rt
Credit quality by geographic region (unaudited)The following table sets out the credit quality for gross loans and advances to customers and banks, held at amortised cost, by geographic region and stage.
Loans and advances to customers
Amortised cost
31.12.18
Greater China & North Asia
$million
ASEAN & South Asia
$million
Africa & Middle East
$million
Europe & Americas
$millionTotal
$million
Stage 1 118,422 71,169 23,598 23,914 237,103
Stage 2 4,139 7,628 5,112 549 17,428
Gross stage 1 & stage 2 balance 122,561 78,797 28,710 24,463 254,531
Stage 3, credit-impaired financial assets2 777 2,730 2,573 844 6,924
Gross loans1 123,338 81,527 31,283 25,307 261,455
Amortised cost
01.01.18
Greater China & North Asia
$million
ASEAN & South Asia
$million
Africa & Middle East
$million
Europe & Americas
$millionTotal
$million
Stage 1 114,990 70,594 23,120 19,781 228,485
Stage 2 5,796 7,578 4,762 2,447 20,583
Gross stage 1 & stage 2 balance 120,786 78,172 27,882 22,228 249,068
Stage 3, credit-impaired financial assets2 806 4,248 2,657 1,058 8,769
Gross loans1 121,592 82,420 30,539 23,286 257,837
1 Amounts gross of expected credit losses. Includes reverse repurchase agreements and other similar secured lending
2 Amounts do not include those purchased or originated credit-impaired financial assets
Amortised cost
31.12.17 (IAS 39)
Greater China & North Asia
$million
ASEAN & South Asia
$million
Africa & Middle East
$million
Europe & Americas
$millionTotal
$million
Neither past due nor individually impaired 125,565 79,175 27,774 45,997 278,511
Past due but not individually impaired 809 1,711 1,153 194 3,867
Individually impaired 806 4,233 2,654 1,184 8,877
Individual impairment provision (312) (2,361) (1,858) (706) (5,237)
Portfolio impairment provisions (129) (179) (121) (36) (465)
Net carrying value1 126,739 82,579 29,602 46,633 285,553
1 Excludes impairment charges relating to debt securities classified as loans and receivables, refer to Note 8 to the financial statements for details (page 254)
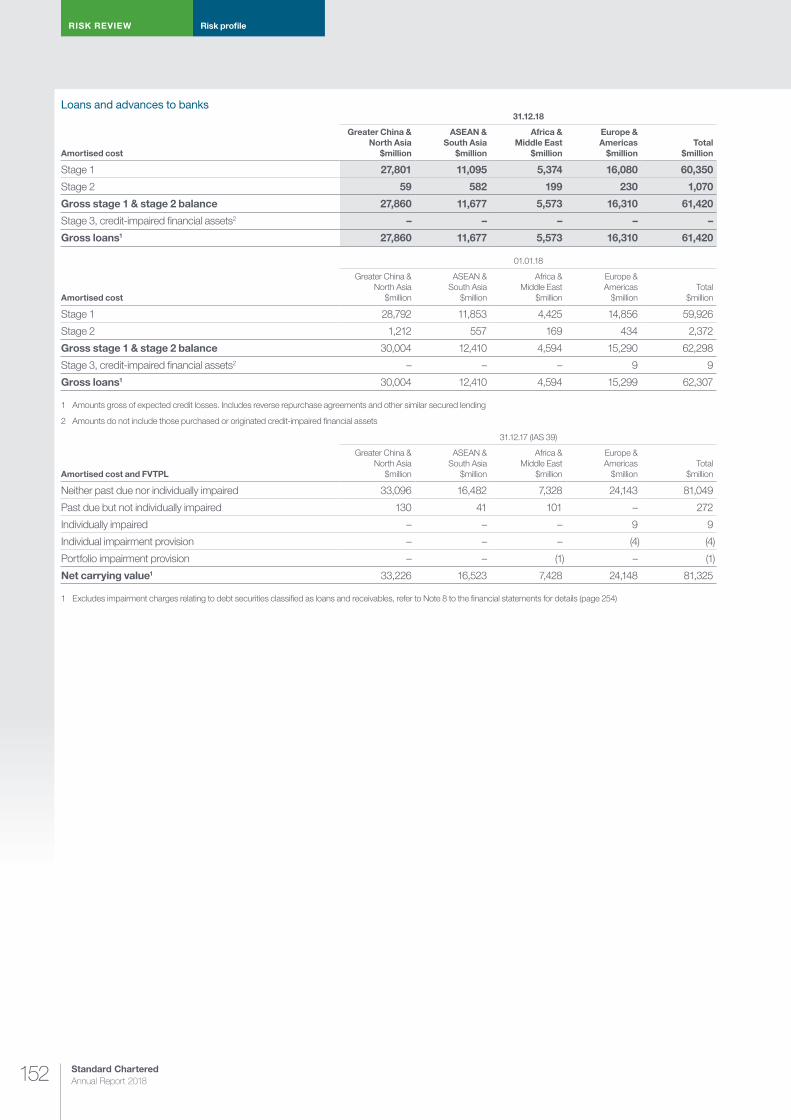
Standard Chartered Annual Report 2018152
RISK REVIEW Risk profile
Loans and advances to banks
Amortised cost
31.12.18
Greater China & North Asia
$million
ASEAN & South Asia
$million
Africa & Middle East
$million
Europe & Americas
$millionTotal
$million
Stage 1 27,801 11,095 5,374 16,080 60,350
Stage 2 59 582 199 230 1,070
Gross stage 1 & stage 2 balance 27,860 11,677 5,573 16,310 61,420
Stage 3, credit-impaired financial assets2 – – – – –
Gross loans1 27,860 11,677 5,573 16,310 61,420
Amortised cost
01.01.18
Greater China & North Asia
$million
ASEAN & South Asia
$million
Africa & Middle East
$million
Europe & Americas
$millionTotal
$million
Stage 1 28,792 11,853 4,425 14,856 59,926
Stage 2 1,212 557 169 434 2,372
Gross stage 1 & stage 2 balance 30,004 12,410 4,594 15,290 62,298
Stage 3, credit-impaired financial assets2 – – – 9 9
Gross loans1 30,004 12,410 4,594 15,299 62,307
1 Amounts gross of expected credit losses. Includes reverse repurchase agreements and other similar secured lending
2 Amounts do not include those purchased or originated credit-impaired financial assets
Amortised cost and FVTPL
31.12.17 (IAS 39)
Greater China & North Asia
$million
ASEAN & South Asia
$million
Africa & Middle East
$million
Europe & Americas
$millionTotal
$million
Neither past due nor individually impaired 33,096 16,482 7,328 24,143 81,049
Past due but not individually impaired 130 41 101 – 272
Individually impaired – – – 9 9
Individual impairment provision – – – (4) (4)
Portfolio impairment provision – – (1) – (1)
Net carrying value1 33,226 16,523 7,428 24,148 81,325
1 Excludes impairment charges relating to debt securities classified as loans and receivables, refer to Note 8 to the financial statements for details (page 254)

153153
RIS
K R
EV
IEW
AN
D C
AP
ITAL R
EV
IEW
Strategic rep
ort
Sup
plem
entary inform
ation
Financial statements
Directo
rs’ repo
rt
Credit quality by industry (unaudited)Loans and advances This section provides an analysis of the Group’s amortised cost portfolio by industry on a gross, total credit impairment and net basis.
The Group has reduced exposures across the energy and construction sectors primarily within stage 2 and stage 3, while increasing exposures in stage 1 across manufacturing, government and financing, insurance and non-banking.
Amortised cost
31.12.18
Stage 1 Stage 2 Stage 3 Total
Gross balance $million
Total credit impairment
$million
Net carrying amount $million
Gross balance $million
Total credit impairment
$million
Net carrying amount $million
Gross balance $million
Total credit impairment
$million
Net carrying amount $million
Gross balance $million
Total credit impairment
$million
Net carrying amount $million
Industry:
Energy 14,530 (18) 14,512 2,198 (46) 2,152 890 (554) 336 17,618 (618) 17,000
Manufacturing 21,627 (23) 21,604 1,932 (86) 1,846 719 (530) 189 24,278 (639) 23,639
Financing, insurance and non-banking 20,419 (7) 20,412 379 (10) 369 225 (119) 106 21,023 (136) 20,887
Transport, telecom and utilities 12,977 (21) 12,956 2,495 (25) 2,470 818 (474) 344 16,290 (520) 15,770
Food and household products 7,558 (7) 7,551 1,851 (15) 1,836 718 (376) 342 10,127 (398) 9,729
Commercial real estate 13,516 (16) 13,500 1,299 (27) 1,272 342 (79) 263 15,157 (122) 15,035
Mining and quarrying 4,845 (7) 4,838 1,047 (29) 1,018 439 (309) 130 6,331 (345) 5,986
Consumer durables 7,328 (5) 7,323 906 (13) 893 534 (348) 186 8,768 (366) 8,402
Construction 2,565 (4) 2,561 512 (22) 490 636 (385) 251 3,713 (411) 3,302
Trading companies and distributors 2,512 (2) 2,510 385 (2) 383 353 (239) 114 3,250 (243) 3,007
Government 13,488 (1) 13,487 250 – 250 – – – 13,738 (1) 13,737
Other 4,639 (7) 4,632 552 (8) 544 183 (147) 36 5,374 (162) 5,212
Retail Products:
Mortgage 73,437 (9) 73,428 1,936 (9) 1,927 343 (98) 245 75,716 (116) 75,600
CCPL and other unsecured lending 16,622 (277) 16,345 560 (117) 443 437 (263) 174 17,619 (657) 16,962
Auto 670 (2) 668 4 – 4 1 – 1 675 (2) 673
Secured wealth products 17,074 (18) 17,056 825 (5) 820 236 (112) 124 18,135 (135) 18,000
Other 3,296 (2) 3,294 297 (2) 295 50 (23) 27 3,643 (27) 3,616
Net carrying value (customers)1 237,103 (426) 236,677 17,428 (416) 17,012 6,924 (4,056) 2,868 261,455 (4,898) 256,557
1 Includes reverse repurchase agreements and other similar secured lending held at amortised cost of $3,151 million
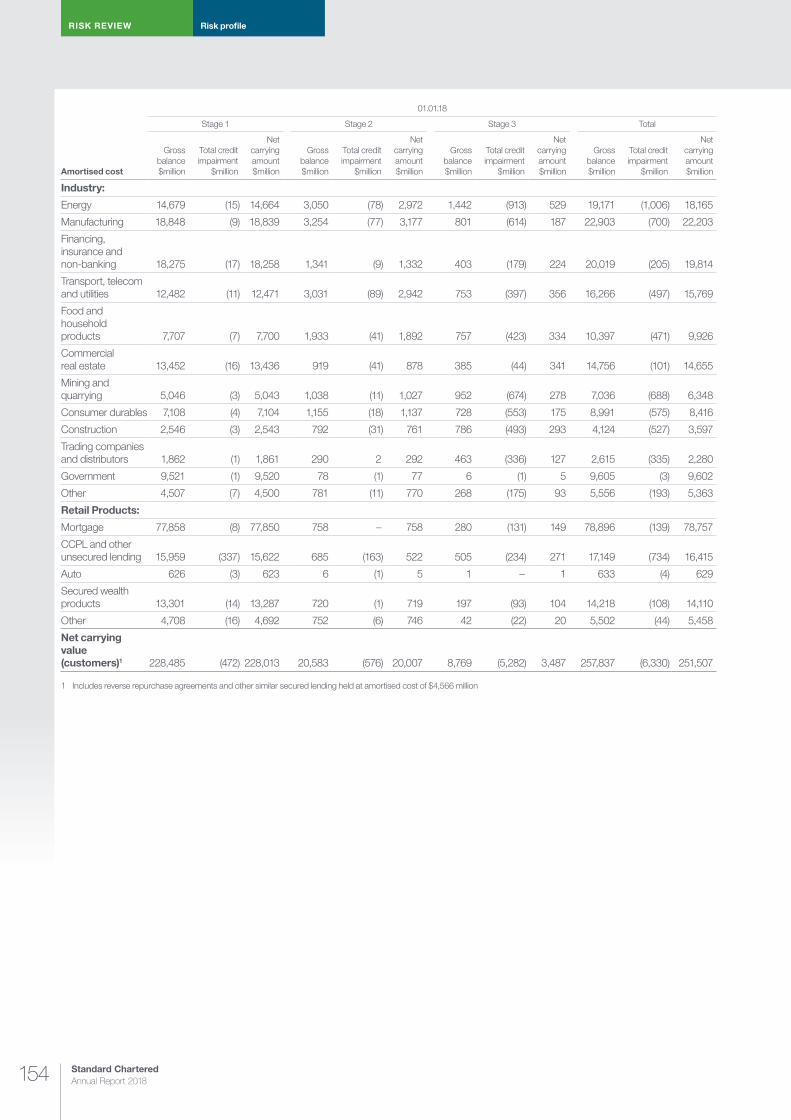
Standard Chartered Annual Report 2018154
RISK REVIEW Risk profile
Amortised cost
01.01.18
Stage 1 Stage 2 Stage 3 Total
Gross balance $million
Total credit impairment
$million
Net carrying amount $million
Gross balance $million
Total credit impairment
$million
Net carrying amount $million
Gross balance $million
Total credit impairment
$million
Net carrying amount $million
Gross balance $million
Total credit impairment
$million
Net carrying amount $million
Industry:
Energy 14,679 (15) 14,664 3,050 (78) 2,972 1,442 (913) 529 19,171 (1,006) 18,165
Manufacturing 18,848 (9) 18,839 3,254 (77) 3,177 801 (614) 187 22,903 (700) 22,203
Financing, insurance and non-banking 18,275 (17) 18,258 1,341 (9) 1,332 403 (179) 224 20,019 (205) 19,814
Transport, telecom and utilities 12,482 (11) 12,471 3,031 (89) 2,942 753 (397) 356 16,266 (497) 15,769
Food and household products 7,707 (7) 7,700 1,933 (41) 1,892 757 (423) 334 10,397 (471) 9,926
Commercial real estate 13,452 (16) 13,436 919 (41) 878 385 (44) 341 14,756 (101) 14,655
Mining and quarrying 5,046 (3) 5,043 1,038 (11) 1,027 952 (674) 278 7,036 (688) 6,348
Consumer durables 7,108 (4) 7,104 1,155 (18) 1,137 728 (553) 175 8,991 (575) 8,416
Construction 2,546 (3) 2,543 792 (31) 761 786 (493) 293 4,124 (527) 3,597
Trading companies and distributors 1,862 (1) 1,861 290 2 292 463 (336) 127 2,615 (335) 2,280
Government 9,521 (1) 9,520 78 (1) 77 6 (1) 5 9,605 (3) 9,602
Other 4,507 (7) 4,500 781 (11) 770 268 (175) 93 5,556 (193) 5,363
Retail Products:
Mortgage 77,858 (8) 77,850 758 – 758 280 (131) 149 78,896 (139) 78,757
CCPL and other unsecured lending 15,959 (337) 15,622 685 (163) 522 505 (234) 271 17,149 (734) 16,415
Auto 626 (3) 623 6 (1) 5 1 – 1 633 (4) 629
Secured wealth products 13,301 (14) 13,287 720 (1) 719 197 (93) 104 14,218 (108) 14,110
Other 4,708 (16) 4,692 752 (6) 746 42 (22) 20 5,502 (44) 5,458
Net carrying value (customers)1 228,485 (472) 228,013 20,583 (576) 20,007 8,769 (5,282) 3,487 257,837 (6,330) 251,507
1 Includes reverse repurchase agreements and other similar secured lending held at amortised cost of $4,566 million
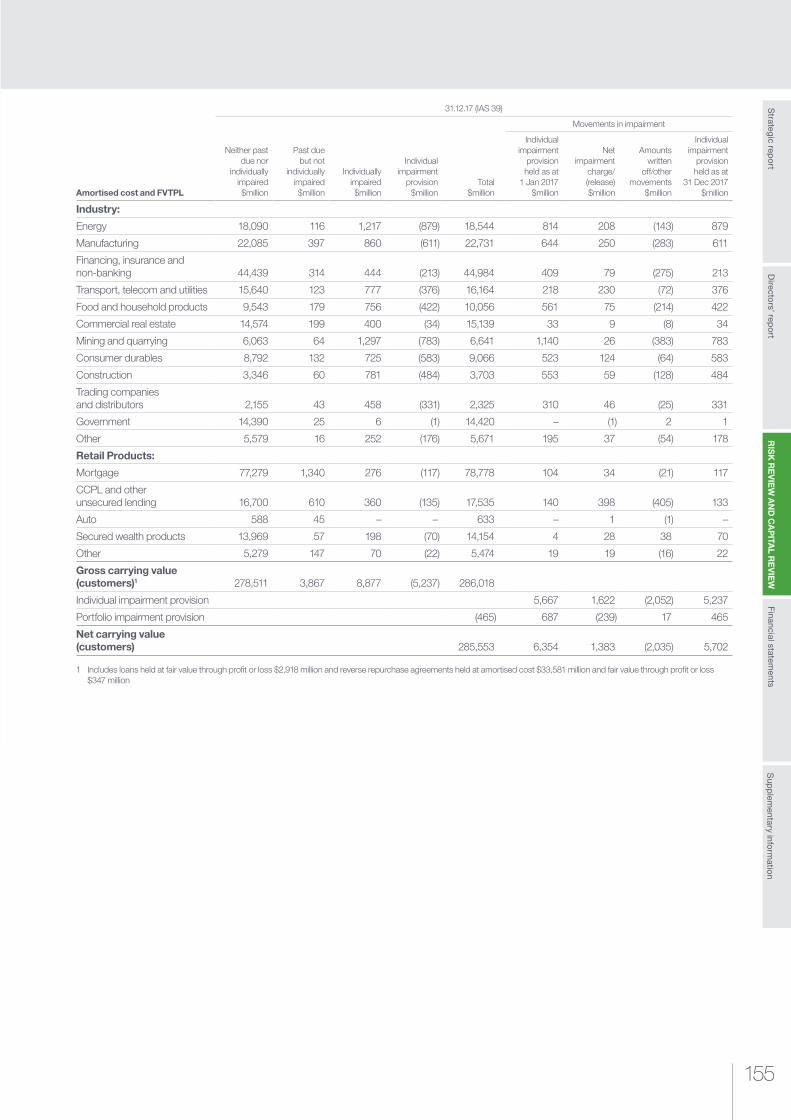
155155
RIS
K R
EV
IEW
AN
D C
AP
ITAL R
EV
IEW
Strategic rep
ort
Sup
plem
entary inform
ation
Financial statements
Directo
rs’ repo
rt
Amortised cost and FVTPL
31.12.17 (IAS 39)
Neither past due nor
individually impaired $million
Past due but not
individually impaired $million
Individually impaired $million
Individual impairment
provision $million
Total $million
Movements in impairment
Individual impairment
provision held as at
1 Jan 2017 $million
Net impairment
charge/(release) $million
Amounts written
off/other movements
$million
Individual impairment
provision held as at
31 Dec 2017 $million
Industry:
Energy 18,090 116 1,217 (879) 18,544 814 208 (143) 879
Manufacturing 22,085 397 860 (611) 22,731 644 250 (283) 611
Financing, insurance and non-banking 44,439 314 444 (213) 44,984 409 79 (275) 213
Transport, telecom and utilities 15,640 123 777 (376) 16,164 218 230 (72) 376
Food and household products 9,543 179 756 (422) 10,056 561 75 (214) 422
Commercial real estate 14,574 199 400 (34) 15,139 33 9 (8) 34
Mining and quarrying 6,063 64 1,297 (783) 6,641 1,140 26 (383) 783
Consumer durables 8,792 132 725 (583) 9,066 523 124 (64) 583
Construction 3,346 60 781 (484) 3,703 553 59 (128) 484
Trading companies and distributors 2,155 43 458 (331) 2,325 310 46 (25) 331
Government 14,390 25 6 (1) 14,420 – (1) 2 1
Other 5,579 16 252 (176) 5,671 195 37 (54) 178
Retail Products:
Mortgage 77,279 1,340 276 (117) 78,778 104 34 (21) 117
CCPL and other unsecured lending 16,700 610 360 (135) 17,535 140 398 (405) 133
Auto 588 45 – – 633 – 1 (1) –
Secured wealth products 13,969 57 198 (70) 14,154 4 28 38 70
Other 5,279 147 70 (22) 5,474 19 19 (16) 22
Gross carrying value (customers)1 278,511 3,867 8,877 (5,237) 286,018
Individual impairment provision 5,667 1,622 (2,052) 5,237
Portfolio impairment provision (465) 687 (239) 17 465
Net carrying value (customers) 285,553 6,354 1,383 (2,035) 5,702
1 Includes loans held at fair value through profit or loss $2,918 million and reverse repurchase agreements held at amortised cost $33,581 million and fair value through profit or loss $347 million
Standard Chartered Annual Report 2018156
RISK REVIEW Risk profile
Movement in gross exposures and credit impairment for loans and advances, debt securities, undrawn commitments and financial guaranteesThe tables overleaf set out the movement in gross exposures and credit impairment by stage in respect of amortised cost loans to banks and customers, undrawn committed facilities, undrawn cancellable facilities, debt securities classified at amortised cost and FVOCI and financial guarantees. The tables are presented for the Group, and the Corporate & Institutional Banking, Commercial Banking and Retail Banking segments.
MethodologyThe movement lines within the tables are an aggregation of monthly movements over the year and will therefore reflect the accumulation of multiple trades during the year. The credit impairment charge in the income statement comprises the amounts within the boxes in the table below less recoveries of amounts previously written off.
The approach for determining the key line items in the tables is set out below.
¼ Transfers – transfers between stages are deemed to occur at the beginning of a month based on prior month closing balances
¼ Net remeasurement from stage changes – the remeasurement of credit impairment provisions arising from a change in stage is reported within the stage that the assets are transferred to. For example, assets transferred into stage 2 are remeasured from a 12 month to a lifetime expected credit loss, with the effect of remeasurement reported in stage 2. For stage 3, this represents the initial remeasurement from specific provisions recognised on individual assets transferred into stage 3 in the year
¼ Net changes in exposures – comprises new business written less repayments in the year. Within stage 1, new business written will attract up to 12 months of expected credit loss charges. Repayments of non-amortising loans (primarily within Corporate & Institutional Banking and Commercial Banking) will have low amounts of expected credit loss provisions attributed to them, due to the release of provisions over the term to maturity. In stages 2 and 3, the amounts principally reflect repayments although stage 2 may include new business written where clients are on non-purely precautionary early alert, are a credit grade 12, or when non-investment grade debt securities are acquired
¼ Changes in risk parameters – for stages 1 and 2, this reflects changes in the probability of default (PD), loss given default (LGD) and exposure at default (EAD) of assets during the year, which includes the impact of releasing provisions over the term to maturity. It also includes the effect of changes in forecasts of macroeconomic variables during the year. In stage 3, this line represents additional specific provisions recognised on exposures held within stage 3
Movements during the yearFor Corporate & Institutional Banking and Commercial Banking businesses, the gross exposures in stage 1 increased from $292 billion at 1 January 2018 to $305 billion at 31 December 2018, primarily due to new business written within Corporate & Institutional Banking. This contributed to the increase in stage 1 provisions from $154 million to $181 million offset by improvements in credit quality across the portfolio. Within stage 2 gross exposures and credit impairment provisions declined compared with 1 January 2018, largely driven by a lower level of exposures within Corporate & Institutional Banking on non-purely precautionary early alert, which either repaid or transferred back to stage 1.
Retail Banking stage 1 exposures increased by $2 billion to $133 billion at 31 December 2018, driven by increased lending of secured wealth products, which along with portfolio quality improvements resulted in stage 1 provisions reducing from $381 million to $313 million. Stage 2 exposures increased from $8 billion at 1 January 2018 to $8.9 billion at 31 December 2018, largely due to increased inflows of mortgages, which contributed to a reduction in stage 2 provisions from $178 million at 1 January 2018 to $132 million at 31 December 2018. The increase in provisions from ‘Changes in risk parameters’ within stage 2 reflects the normal flow of accounts and is not in itself an indicator that there is a significant weakness in the portfolio.
Across both stage 1 and stage 2 for all segments, the improvement in macroeconomic forecasts during the year reduced stage 1 and 2 provisions by $42 million within an overall benign environment.
Across all segments, at 31 December 2018 approximately 35 per cent of gross exposures held in stage 2 are as a result of meeting the PD significant increase in credit risk thresholds, 24 per cent as a result of having ‘higher risk’ credit quality, 13 per cent due to being on non-purely precautionary early alert, 11 per cent being more than 30 days past due with the remainder primarily relating to Private Banking and other factors.
Stage 3 exposures fell from $9.2 billion at 1 January 2018 to $7.6 billion at 31 December, primarily due to repayments and write-offs within Corporate & Institutional Banking and Commercial Banking, and this was also reflected in lower stage 3 provisions, which fell from $5.6 billion at 1 January 2018 to $4.4 billion at 31 December 2018.
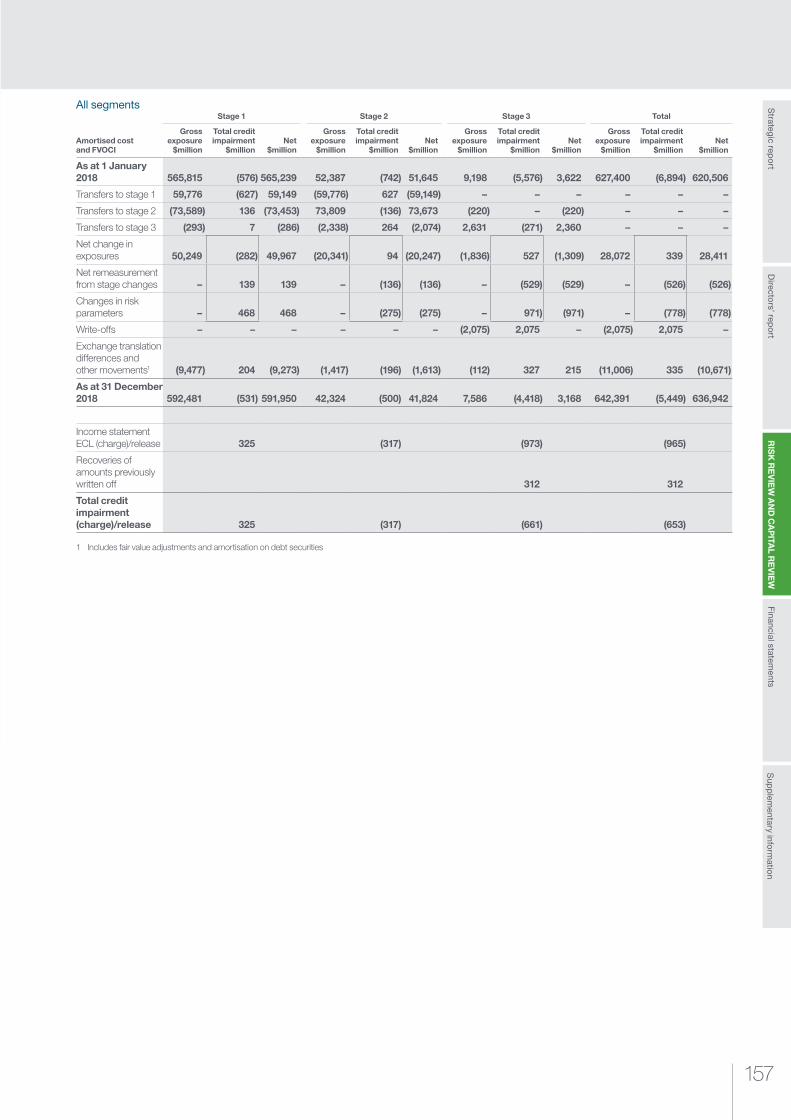
157157
RIS
K R
EV
IEW
AN
D C
AP
ITAL R
EV
IEW
Strategic rep
ort
Sup
plem
entary inform
ation
Financial statements
Directo
rs’ repo
rt
All segments
Amortised cost and FVOCI
Stage 1 Stage 2 Stage 3 Total
Gross exposure
$million
Total credit impairment
$millionNet
$million
Gross exposure
$million
Total credit impairment
$millionNet
$million
Gross exposure
$million
Total credit impairment
$millionNet
$million
Gross exposure
$million
Total credit impairment
$millionNet
$million
As at 1 January 2018 565,815 (576) 565,239 52,387 (742) 51,645 9,198 (5,576) 3,622 627,400 (6,894) 620,506
Transfers to stage 1 59,776 (627) 59,149 (59,776) 627 (59,149) – – – – – –
Transfers to stage 2 (73,589) 136 (73,453) 73,809 (136) 73,673 (220) – (220) – – –
Transfers to stage 3 (293) 7 (286) (2,338) 264 (2,074) 2,631 (271) 2,360 – – –
Net change in exposures 50,249 (282) 49,967 (20,341) 94 (20,247) (1,836) 527 (1,309) 28,072 339 28,411
Net remeasurement from stage changes – 139 139 – (136) (136) – (529) (529) – (526) (526)
Changes in risk parameters – 468 468 – (275) (275) – 971) (971) – (778) (778)
Write-offs – – – – – – (2,075) 2,075 – (2,075) 2,075 –
Exchange translation differences and other movements1 (9,477) 204 (9,273) (1,417) (196) (1,613) (112) 327 215 (11,006) 335 (10,671)
As at 31 December 2018 592,481 (531) 591,950 42,324 (500) 41,824 7,586 (4,418) 3,168 642,391 (5,449) 636,942
Income statement ECL (charge)/release 325 (317) (973) (965)
Recoveries of amounts previously written off 312 312
Total credit impairment (charge)/release 325 (317) (661) (653)
1 Includes fair value adjustments and amortisation on debt securities
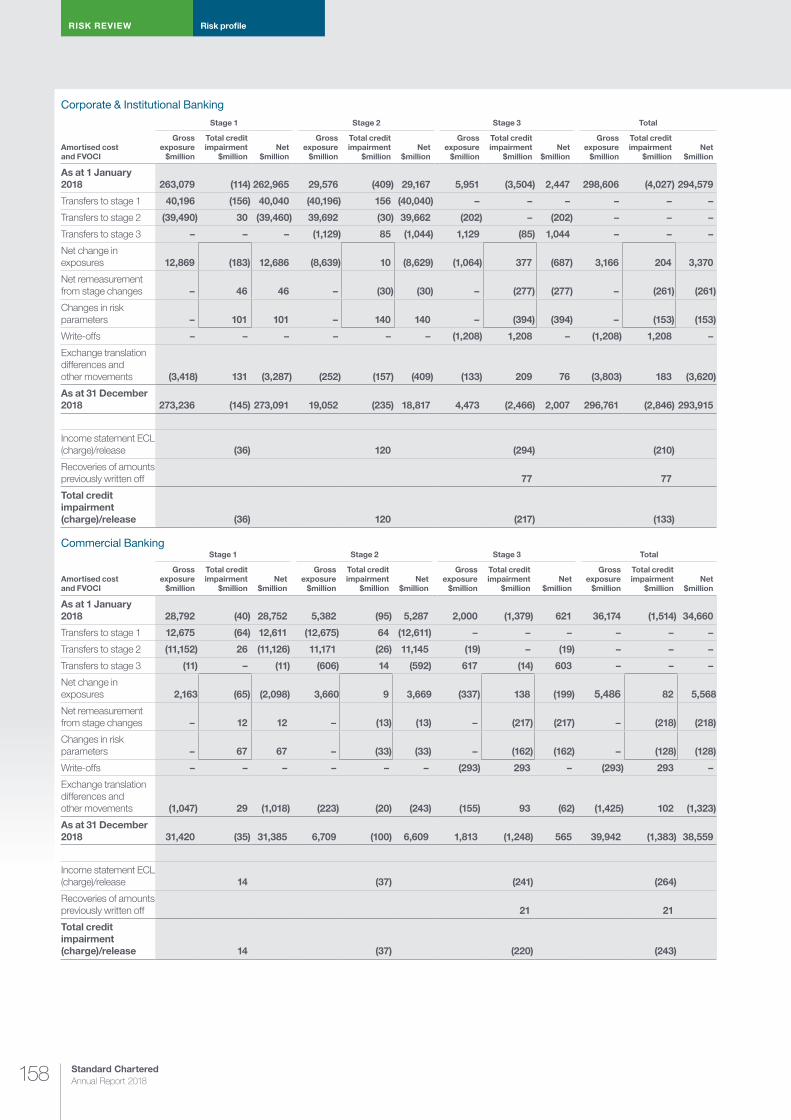
Standard Chartered Annual Report 2018158
RISK REVIEW Risk profile
Corporate & Institutional Banking
Amortised cost and FVOCI
Stage 1 Stage 2 Stage 3 Total
Gross exposure
$million
Total credit impairment
$millionNet
$million
Gross exposure
$million
Total credit impairment
$millionNet
$million
Gross exposure
$million
Total credit impairment
$millionNet
$million
Gross exposure
$million
Total credit impairment
$millionNet
$million
As at 1 January 2018 263,079 (114) 262,965 29,576 (409) 29,167 5,951 (3,504) 2,447 298,606 (4,027) 294,579
Transfers to stage 1 40,196 (156) 40,040 (40,196) 156 (40,040) – – – – – –
Transfers to stage 2 (39,490) 30 (39,460) 39,692 (30) 39,662 (202) – (202) – – –
Transfers to stage 3 – – – (1,129) 85 (1,044) 1,129 (85) 1,044 – – –
Net change in exposures 12,869 (183) 12,686 (8,639) 10 (8,629) (1,064) 377 (687) 3,166 204 3,370
Net remeasurement from stage changes – 46 46 – (30) (30) – (277) (277) – (261) (261)
Changes in risk parameters – 101 101 – 140 140 – (394) (394) – (153) (153)
Write-offs – – – – – – (1,208) 1,208 – (1,208) 1,208 –
Exchange translation differences and other movements (3,418) 131 (3,287) (252) (157) (409) (133) 209 76 (3,803) 183 (3,620)
As at 31 December 2018 273,236 (145) 273,091 19,052 (235) 18,817 4,473 (2,466) 2,007 296,761 (2,846) 293,915
Income statement ECL (charge)/release (36) 120 (294) (210)
Recoveries of amounts previously written off 77 77
Total credit impairment (charge)/release (36) 120 (217) (133)
Commercial Banking
Amortised cost and FVOCI
Stage 1 Stage 2 Stage 3 Total
Gross exposure
$million
Total credit impairment
$millionNet
$million
Gross exposure
$million
Total credit impairment
$millionNet
$million
Gross exposure
$million
Total credit impairment
$millionNet
$million
Gross exposure
$million
Total credit impairment
$millionNet
$million
As at 1 January 2018 28,792 (40) 28,752 5,382 (95) 5,287 2,000 (1,379) 621 36,174 (1,514) 34,660
Transfers to stage 1 12,675 (64) 12,611 (12,675) 64 (12,611) – – – – – –
Transfers to stage 2 (11,152) 26 (11,126) 11,171 (26) 11,145 (19) – (19) – – –
Transfers to stage 3 (11) – (11) (606) 14 (592) 617 (14) 603 – – –
Net change in exposures 2,163 (65) (2,098) 3,660 9 3,669 (337) 138 (199) 5,486 82 5,568
Net remeasurement from stage changes – 12 12 – (13) (13) – (217) (217) – (218) (218)
Changes in risk parameters – 67 67 – (33) (33) – (162) (162) – (128) (128)
Write-offs – – – – – – (293) 293 – (293) 293 –
Exchange translation differences and other movements (1,047) 29 (1,018) (223) (20) (243) (155) 93 (62) (1,425) 102 (1,323)
As at 31 December 2018 31,420 (35) 31,385 6,709 (100) 6,609 1,813 (1,248) 565 39,942 (1,383) 38,559
Income statement ECL (charge)/release 14 (37) (241) (264)
Recoveries of amounts previously written off 21 21
Total credit impairment (charge)/release 14 (37) (220) (243)

159159
RIS
K R
EV
IEW
AN
D C
AP
ITAL R
EV
IEW
Strategic rep
ort
Sup
plem
entary inform
ation
Financial statements
Directo
rs’ repo
rt
Retail Banking
Amortised cost and FVOCI
Stage 1 Stage 2 Stage 3 Total
Gross exposure
$million
Total credit impairment
$millionNet
$million
Gross exposure
$million
Total credit impairment
$millionNet
$million
Gross exposure
$million
Total credit impairment
$millionNet
$million
Gross exposure
$million
Total credit impairment
$millionNet
$million
As at 1 January 2018 131,280 (381) 130,899 7,964 (178) 7,786 818 (389) 429 140,062 (948) 139,114
Transfers to stage 1 5,570 (388) 5,182 (5,570) 388 (5,182) – – – – – –
Transfers to stage 2 (9,954) 74 (9,880) 9,954 (74) 9,880 – – – – – –
Transfers to stage 3 (281) 8 (273) (511) 164 (347) 792 (172) 620 – – –
Net change in exposures 9,858 (17) 9,841 (2,628) 78 (2,550) (398) – (398) 6,832 61 6,893
Net remeasurement from stage changes – 72 72 – (90) (90) – (12) (12) – (30) (30)
Changes in risk parameters – 264 264 – (373) (373) – (402) (402) – (511) (511)
Write-offs – – – – – – (575) 575 – (575) 575 –
Exchange translation differences and other movements (2,989) 55 (2,934) (322) (47) (369) 195 6 201 (3,116) 14 (3,102)
As at 31 December 2018 133,484 (313) 133,171 8,887 (132) 8,755 832 (394) 438 143,203 (839) 142,364
Income statement ECL (charge)/release 319 (385) (414) (480)
Recoveries of amounts previously written off 214 214
Total credit impairment (charge)/release 319 (385) (200) (266)
Credit impairment chargeThe total ongoing credit impairment charge decreased significantly to $740 million in 2018 (2017: $1.2 billion), down 38 per cent primarily due to improvements in portfolio quality driven by significant actions taken since 2016 to improve the Group’s credit quality.
The ongoing business credit impairment charge in Corporate & Institutional Banking of $229 million for 2018 is 65 per cent lower than 2017. This was due to lower stage 3 impairment which was driven by lower losses particularly in ASEAN & South Asia and recoveries from a small number of major exposures in India and the Middle East.
Commercial Banking ongoing business credit impairment charge increased by 45 per cent (2018: $244 million, 2017: $168 million) compared to 2017, which saw a release of $63 million of portfolio impairment provisions held against certain sectors of the portfolios that were no longer required. Africa & Middle East contributed 60 per cent of the full-year 2018 charge.
Retail Banking credit impairment reduced 29 per cent (2018: $267 million, 2017: $374 million), mainly driven by continued improvement in portfolio shape and performance, particularly within the unsecured portfolios, as well as one-off provision releases in Korea and Indonesia.
Stage 3 reductions were partly offset by lower releases of $12 million in stage 1 and 2 compared to Portfolio Impairment Provisions (PIP under IAS 39) as 2017 benefited from material releases of PIP specific risk adjustments of $190 million.
In the liquidation portfolio, there was a net release of $79 million due to loan disposals and repayments.
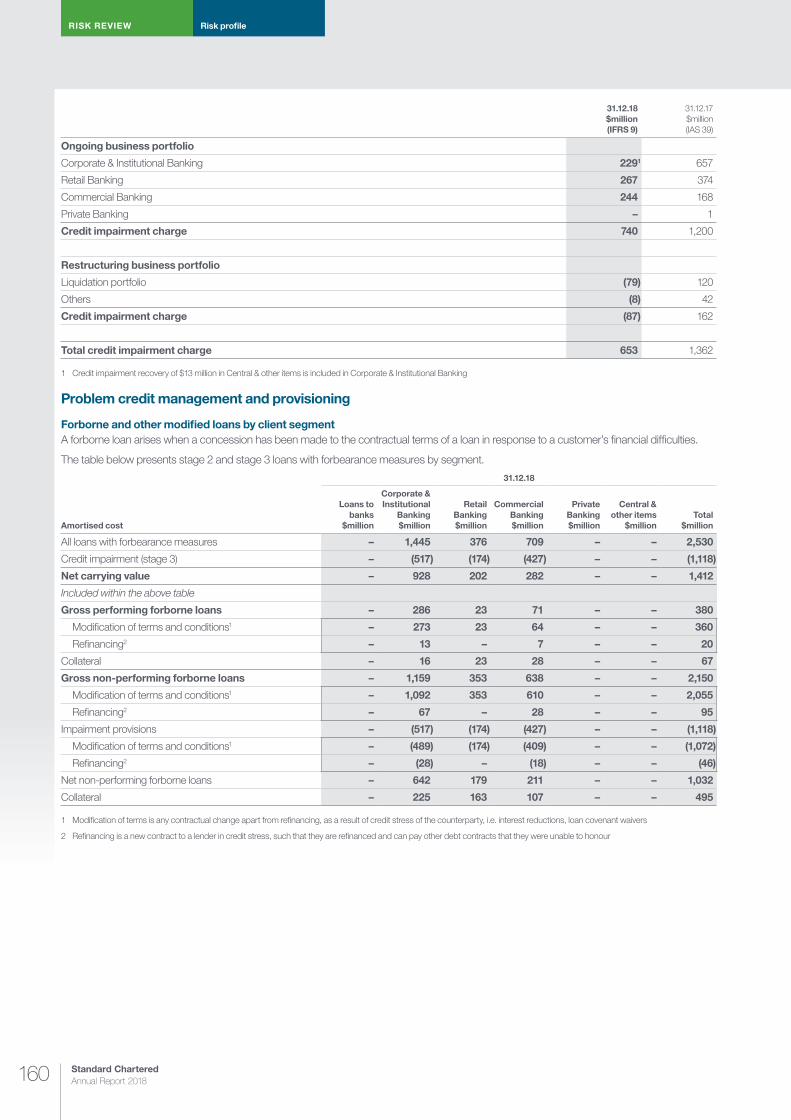
Standard Chartered Annual Report 2018160
RISK REVIEW Risk profile
31.12.18 $million (IFRS 9)
31.12.17 $million (IAS 39)
Ongoing business portfolio
Corporate & Institutional Banking 2291 657
Retail Banking 267 374
Commercial Banking 244 168
Private Banking – 1
Credit impairment charge 740 1,200
Restructuring business portfolio
Liquidation portfolio (79) 120
Others (8) 42
Credit impairment charge (87) 162
Total credit impairment charge 653 1,362
1 Credit impairment recovery of $13 million in Central & other items is included in Corporate & Institutional Banking
Problem credit management and provisioning
Forborne and other modified loans by client segmentA forborne loan arises when a concession has been made to the contractual terms of a loan in response to a customer’s financial difficulties.
The table below presents stage 2 and stage 3 loans with forbearance measures by segment.
Amortised cost
31.12.18
Loans to banks
$million
Corporate & Institutional
Banking $million
Retail Banking $million
Commercial Banking $million
Private Banking $million
Central & other items
$millionTotal
$million
All loans with forbearance measures – 1,445 376 709 – – 2,530
Credit impairment (stage 3) – (517) (174) (427) – – (1,118)
Net carrying value – 928 202 282 – – 1,412
Included within the above table
Gross performing forborne loans – 286 23 71 – – 380
Modification of terms and conditions1 – 273 23 64 – – 360
Refinancing2 – 13 – 7 – – 20
Collateral – 16 23 28 – – 67
Gross non-performing forborne loans – 1,159 353 638 – – 2,150
Modification of terms and conditions1 – 1,092 353 610 – – 2,055
Refinancing2 – 67 – 28 – – 95
Impairment provisions – (517) (174) (427) – – (1,118)
Modification of terms and conditions1 – (489) (174) (409) – – (1,072)
Refinancing2 – (28) – (18) – – (46)
Net non-performing forborne loans – 642 179 211 – – 1,032
Collateral – 225 163 107 – – 495
1 Modification of terms is any contractual change apart from refinancing, as a result of credit stress of the counterparty, i.e. interest reductions, loan covenant waivers
2 Refinancing is a new contract to a lender in credit stress, such that they are refinanced and can pay other debt contracts that they were unable to honour

161161
RIS
K R
EV
IEW
AN
D C
AP
ITAL R
EV
IEW
Strategic rep
ort
Sup
plem
entary inform
ation
Financial statements
Directo
rs’ repo
rt
Amortised cost
01.01.18
Loans to banks
$million
Corporate & Institutional
Banking $million
Retail Banking $million
Commercial Banking $million
Private Banking $million
Central & other items
$millionTotal
$million
All loans with forbearance measures 6 2,143 797 612 – – 3,558
Credit impairment (stage 3) – (802) (176) (394) – – (1,372)
Net balance 6 1,341 621 218 – – 2,186
Included within the above table
Gross performing forborne loans 2 480 353 31 – – 866
Modification of terms and conditions1 2 480 353 28 – – 863
Refinancing2 – – – 3 – – 3
Collateral – 4 2 – – – 6
Gross non-performing forborne loans 4 1,663 384 581 – – 2,632
Modification of terms and conditions1 4 1,314 384 524 – – 2,226
Refinancing2 – 349 – 57 – – 406
Impairment provisions – (802) (116) (394) – – (1,312)
Modification of terms and conditions1 – (554) (116) (364) – – (1,034)
Refinancing2 – (248) – (30) – – (278)
Net non-performing forborne loans 4 861 268 187 – – 1,320
Collateral – 52 20 34 – – 106
1 Modification of terms is any contractual change apart from refinancing, as a result of credit stress of the counterparty, i.e. interest reductions, loan covenant waivers
2 Refinancing is a new contract to a lender in credit stress, such that they are refinanced and can pay other debt contracts that they were unable to honour
31.12.17 (IAS 39)
Loans to banks
$million
Corporate & Institutional
Banking $million
Retail Banking $million
Commercial Banking $million
Private Banking $million
Central & other items
$millionTotal
$million
All loans with forbearance measures 6 2,143 797 647 – – 3,593
Accumulated impairment – (802) (176) (430) – – (1,408)
Net balance 6 1,341 621 217 – – 2,185
Included within the above table
Gross performing forborne loans 2 480 353 31 – – 866
Modification of terms and conditions1 2 480 353 28 – – 863
Refinancing2 – – – 3 – – 3
Collateral – 4 2 – – – 6
Gross non-performing forborne loans 4 1,663 384 616 – – 2,667
Modification of terms and conditions1 4 1,314 384 559 – – 2,261
Refinancing2 – 349 – 57 – – 406
Impairment provisions – (802) (116) (430) – – (1,348)
Modification of terms and conditions1 – (554) (116) (400) – – (1,070)
Refinancing2 – (248) – (30) – – (278)
Net non-performing forborne loans 4 861 268 186 – – 1,319
Collateral – 52 20 34 – – 106
1 Modification of terms is any contractual change apart from refinancing, as a result of credit stress of the counterparty, i.e. interest reductions, loan covenant waivers
2 Refinancing is a new contract to a lender in credit stress, such that they are refinanced and can pay other debt contracts that they were unable to honour

Standard Chartered Annual Report 2018162
RISK REVIEW Risk profile
Forborne and other modified loans by region (unaudited)
Amortised cost
31.12.18
Greater China & North Asia
$million
ASEAN & South Asia
$million
Africa & Middle East
$million
Europe & Americas
$millionTotal
$million
Not impaired 114 109 113 44 380
Impaired 233 344 179 276 1,032
Total forborne loans 347 453 292 320 1,412
Amortised cost
31.12.17 (IAS 39)
Greater China & North Asia
$million
ASEAN & South Asia
$million
Africa & Middle East
$million
Europe & Americas
$millionTotal
$million
Not impaired 56 40 395 106 597
Impaired 353 778 202 255 1,588
Total forborne loans 409 818 597 361 2,185
Credit-impaired (stage 3) loans and advances by client segment
Gross credit-impaired (stage 3) loans for the Group are down 21 per cent in the year, to $6.9 billion (1 January 2018: $8.8 billion) with significant reductions in the liquidation portfolio as we continued to exit these exposures. Gross stage 3 loans in the ongoing business decreased to $5.6 billion (1 January 2018: $6.5 billion), driven by repayments, debt sales, write-offs and transfers to stage 2 in Corporate & Institutional Banking.
The inflows of stage 3 loans in Corporate & Institutional Banking were also significantly lower, at around 35 per cent of the level seen in 2017 (2018: $0.8 billion; 2017: $2.3 billion), reflecting the continued improvement in the Corporate & Institutional Banking portfolio. Stage 3 inflows in Commercial Banking were higher (2018: $0.6 billion; 2017: $0.4 billion), driven by exposures in Greater China & North Asia and Africa & Middle East. Stage 3 loans in Retail Banking were broadly stable (31 December 2018: $0.8 billion; 1 January 2018: $0.8 billion).
Stage 3 cover ratioThe stage 3 cover ratio measures the proportion of stage 3 impairment provisions to gross stage 3 loans, and is a metric commonly used in considering impairment trends. This metric does not allow for variations in the composition of stage 3 loans and should be used in conjunction with other credit risk information provided, including the level of collateral cover.
The cover ratio before collateral for Corporate & Institutional Banking reduced from 59 per cent to 57 per cent due to debt sales and write-offs on clients who had a high level of provisions. The cover ratio for Retail Banking remained stable at 48 per cent and cover ratio including collateral improved to 87 per cent (1 January 2018: 74 per cent).
The Private Banking segment remains fully covered taking into account the collateral held.
The balance of stage 3 loans not covered by stage 3 impairment provisions represents the adjusted value of collateral held and the net outcome of any workout or recovery strategies.
Collateral provides risk mitigation to some degree in all client segments and supports the credit quality and cover ratio assessments post impairment provisions. Further information on collateral is provided in the credit risk mitigation section.
The table below presents the balance of the gross stage 3 loans to banks and customers, together with the provisions held, for all segments and the respective cover ratios. For the reconciliation between the non-performing loans under IAS 39 and under IFRS 9, refer to Note 41.
Amortised cost
31.12.18
Corporate & Institutional
Banking $million
Retail Banking $million
Commercial Banking $million
Private Banking $million
Total $million
Gross credit-impaired 4,084 832 1,773 235 6,924
Credit impairment provisions (2,326) (396) (1,234) (100) (4,056)
Net credit-impaired 1,758 436 539 135 2,868
Cover ratio 57% 48% 70% 43% 59%
Collateral ($ million) 802 324 302 135 1,563
Cover ratio (after collateral) 77% 87% 87% 100% 81%
Of the above, included in the liquidation portfolio:
Gross credit-impaired 1,029 – 89 157 1,275
Credit impairment provisions (780) – (89) (93) (962)
Net credit-impaired 249 – – 64 313
Cover ratio 76% – 100% 59% 75%
Collateral ($ million) 159 – – 64 223
Cover ratio (after collateral) 91% – 100% 100% 93%
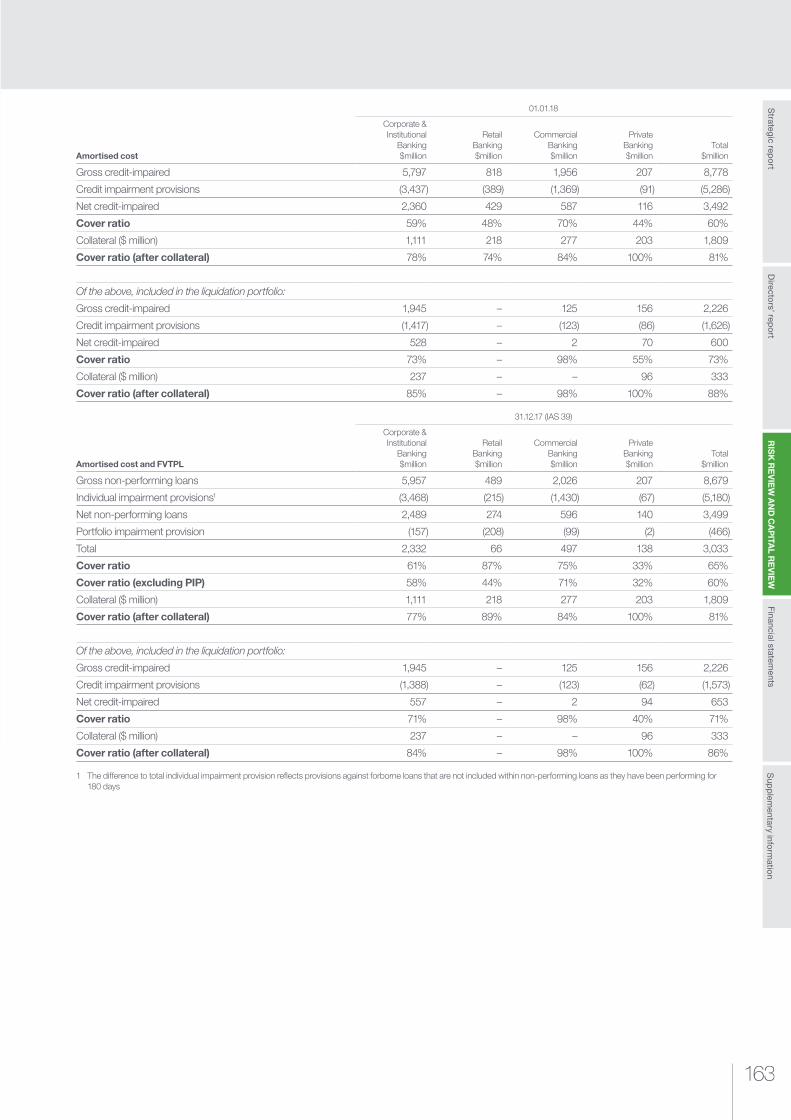
163163
RIS
K R
EV
IEW
AN
D C
AP
ITAL R
EV
IEW
Strategic rep
ort
Sup
plem
entary inform
ation
Financial statements
Directo
rs’ repo
rt
Amortised cost
01.01.18
Corporate & Institutional
Banking $million
Retail Banking $million
Commercial Banking $million
Private Banking $million
Total $million
Gross credit-impaired 5,797 818 1,956 207 8,778
Credit impairment provisions (3,437) (389) (1,369) (91) (5,286)
Net credit-impaired 2,360 429 587 116 3,492
Cover ratio 59% 48% 70% 44% 60%
Collateral ($ million) 1,111 218 277 203 1,809
Cover ratio (after collateral) 78% 74% 84% 100% 81%
Of the above, included in the liquidation portfolio:
Gross credit-impaired 1,945 – 125 156 2,226
Credit impairment provisions (1,417) – (123) (86) (1,626)
Net credit-impaired 528 – 2 70 600
Cover ratio 73% – 98% 55% 73%
Collateral ($ million) 237 – – 96 333
Cover ratio (after collateral) 85% – 98% 100% 88%
Amortised cost and FVTPL
31.12.17 (IAS 39)
Corporate & Institutional
Banking $million
Retail Banking $million
Commercial Banking $million
Private Banking $million
Total $million
Gross non-performing loans 5,957 489 2,026 207 8,679
Individual impairment provisions1 (3,468) (215) (1,430) (67) (5,180)
Net non-performing loans 2,489 274 596 140 3,499
Portfolio impairment provision (157) (208) (99) (2) (466)
Total 2,332 66 497 138 3,033
Cover ratio 61% 87% 75% 33% 65%
Cover ratio (excluding PIP) 58% 44% 71% 32% 60%
Collateral ($ million) 1,111 218 277 203 1,809
Cover ratio (after collateral) 77% 89% 84% 100% 81%
Of the above, included in the liquidation portfolio:
Gross credit-impaired 1,945 – 125 156 2,226
Credit impairment provisions (1,388) – (123) (62) (1,573)
Net credit-impaired 557 – 2 94 653
Cover ratio 71% – 98% 40% 71%
Collateral ($ million) 237 – – 96 333
Cover ratio (after collateral) 84% – 98% 100% 86%
1 The difference to total individual impairment provision reflects provisions against forborne loans that are not included within non-performing loans as they have been performing for 180 days
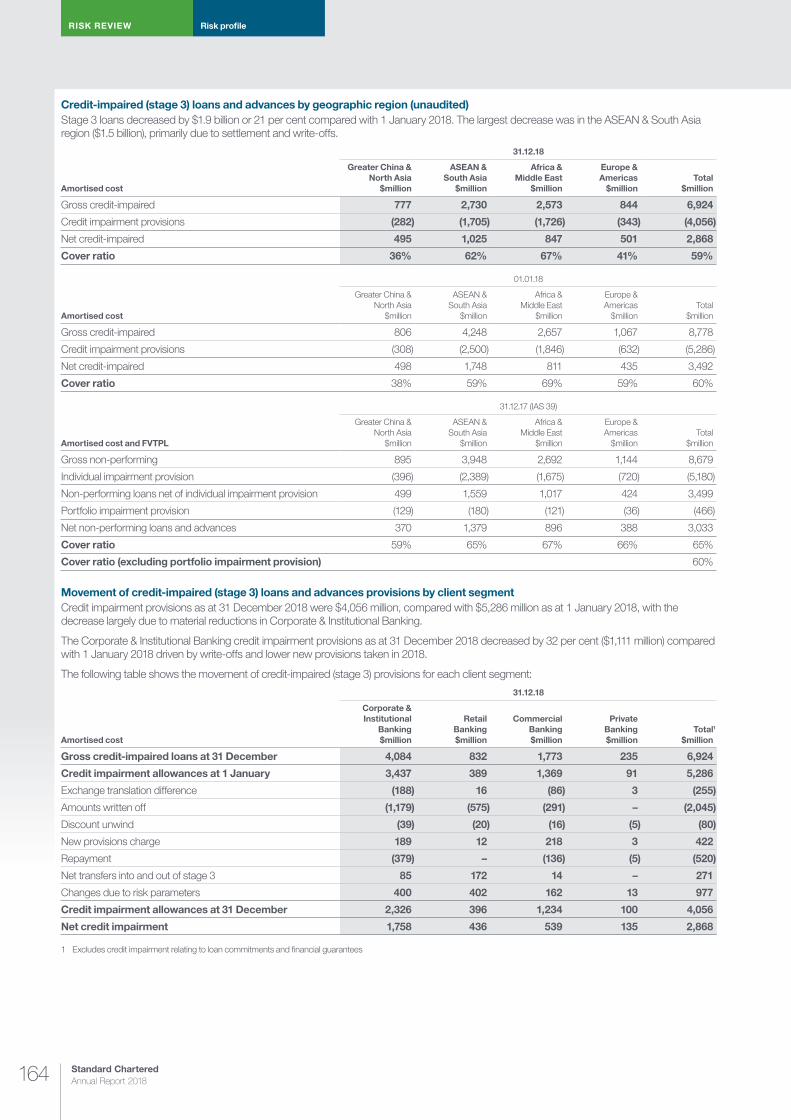
Standard Chartered Annual Report 2018164
RISK REVIEW Risk profile
Credit-impaired (stage 3) loans and advances by geographic region (unaudited)Stage 3 loans decreased by $1.9 billion or 21 per cent compared with 1 January 2018. The largest decrease was in the ASEAN & South Asia region ($1.5 billion), primarily due to settlement and write-offs.
Amortised cost
31.12.18
Greater China & North Asia
$million
ASEAN & South Asia
$million
Africa & Middle East
$million
Europe & Americas
$millionTotal
$million
Gross credit-impaired 777 2,730 2,573 844 6,924
Credit impairment provisions (282) (1,705) (1,726) (343) (4,056)
Net credit-impaired 495 1,025 847 501 2,868
Cover ratio 36% 62% 67% 41% 59%
Amortised cost
01.01.18
Greater China & North Asia
$million
ASEAN & South Asia
$million
Africa & Middle East
$million
Europe & Americas
$millionTotal
$million
Gross credit-impaired 806 4,248 2,657 1,067 8,778
Credit impairment provisions (308) (2,500) (1,846) (632) (5,286)
Net credit-impaired 498 1,748 811 435 3,492
Cover ratio 38% 59% 69% 59% 60%
Amortised cost and FVTPL
31.12.17 (IAS 39)
Greater China & North Asia
$million
ASEAN & South Asia
$million
Africa & Middle East
$million
Europe & Americas
$millionTotal
$million
Gross non-performing 895 3,948 2,692 1,144 8,679
Individual impairment provision (396) (2,389) (1,675) (720) (5,180)
Non-performing loans net of individual impairment provision 499 1,559 1,017 424 3,499
Portfolio impairment provision (129) (180) (121) (36) (466)
Net non-performing loans and advances 370 1,379 896 388 3,033
Cover ratio 59% 65% 67% 66% 65%
Cover ratio (excluding portfolio impairment provision) 60%
Movement of credit-impaired (stage 3) loans and advances provisions by client segmentCredit impairment provisions as at 31 December 2018 were $4,056 million, compared with $5,286 million as at 1 January 2018, with the decrease largely due to material reductions in Corporate & Institutional Banking.
The Corporate & Institutional Banking credit impairment provisions as at 31 December 2018 decreased by 32 per cent ($1,111 million) compared with 1 January 2018 driven by write-offs and lower new provisions taken in 2018.
The following table shows the movement of credit-impaired (stage 3) provisions for each client segment:
Amortised cost
31.12.18
Corporate & Institutional
Banking $million
Retail Banking $million
Commercial Banking $million
Private Banking $million
Total1
$million
Gross credit-impaired loans at 31 December 4,084 832 1,773 235 6,924
Credit impairment allowances at 1 January 3,437 389 1,369 91 5,286
Exchange translation difference (188) 16 (86) 3 (255)
Amounts written off (1,179) (575) (291) – (2,045)
Discount unwind (39) (20) (16) (5) (80)
New provisions charge 189 12 218 3 422
Repayment (379) – (136) (5) (520)
Net transfers into and out of stage 3 85 172 14 – 271
Changes due to risk parameters 400 402 162 13 977
Credit impairment allowances at 31 December 2,326 396 1,234 100 4,056
Net credit impairment 1,758 436 539 135 2,868
1 Excludes credit impairment relating to loan commitments and financial guarantees
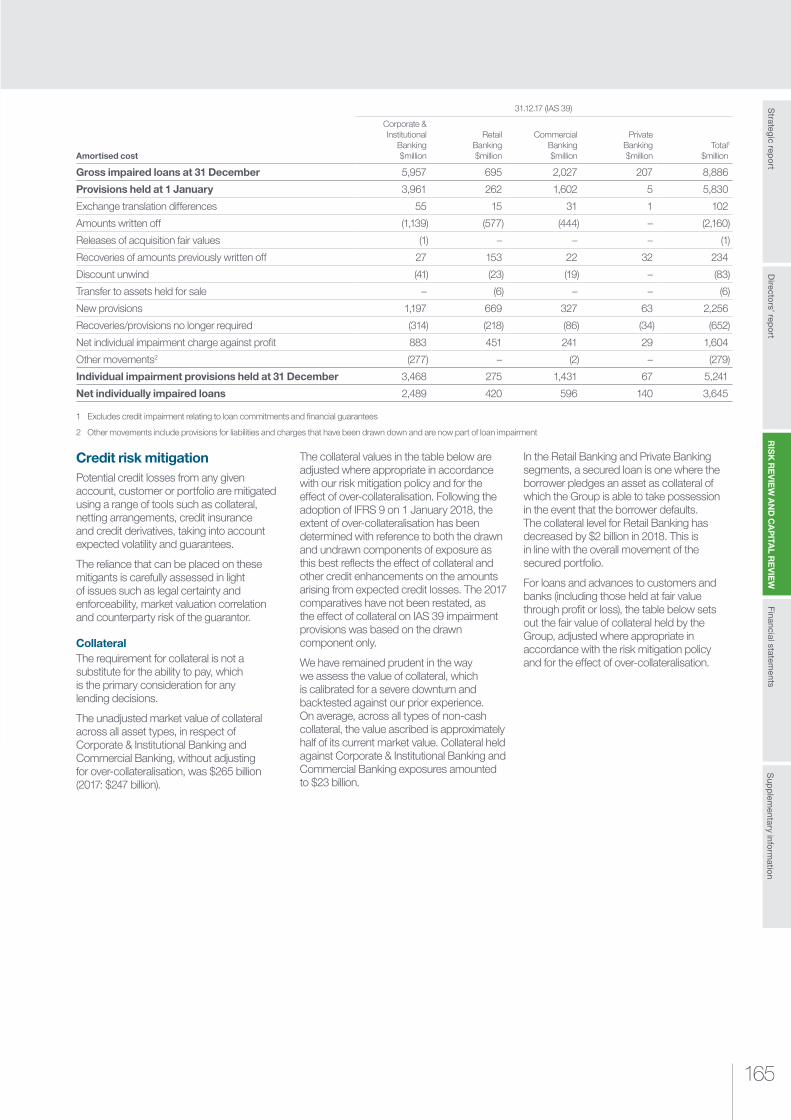
165165
RIS
K R
EV
IEW
AN
D C
AP
ITAL R
EV
IEW
Strategic rep
ort
Sup
plem
entary inform
ation
Financial statements
Directo
rs’ repo
rt
Amortised cost
31.12.17 (IAS 39)
Corporate & Institutional
Banking $million
Retail Banking $million
Commercial Banking $million
Private Banking $million
Total1
$million
Gross impaired loans at 31 December 5,957 695 2,027 207 8,886
Provisions held at 1 January 3,961 262 1,602 5 5,830
Exchange translation differences 55 15 31 1 102
Amounts written off (1,139) (577) (444) – (2,160)
Releases of acquisition fair values (1) – – – (1)
Recoveries of amounts previously written off 27 153 22 32 234
Discount unwind (41) (23) (19) – (83)
Transfer to assets held for sale – (6) – – (6)
New provisions 1,197 669 327 63 2,256
Recoveries/provisions no longer required (314) (218) (86) (34) (652)
Net individual impairment charge against profit 883 451 241 29 1,604
Other movements2 (277) – (2) – (279)
Individual impairment provisions held at 31 December 3,468 275 1,431 67 5,241
Net individually impaired loans 2,489 420 596 140 3,645
1 Excludes credit impairment relating to loan commitments and financial guarantees
2 Other movements include provisions for liabilities and charges that have been drawn down and are now part of loan impairment
Credit risk mitigationPotential credit losses from any given account, customer or portfolio are mitigated using a range of tools such as collateral, netting arrangements, credit insurance and credit derivatives, taking into account expected volatility and guarantees.
The reliance that can be placed on these mitigants is carefully assessed in light of issues such as legal certainty and enforceability, market valuation correlation and counterparty risk of the guarantor.
CollateralThe requirement for collateral is not a substitute for the ability to pay, which is the primary consideration for any lending decisions.
The unadjusted market value of collateral across all asset types, in respect of Corporate & Institutional Banking and Commercial Banking, without adjusting for over-collateralisation, was $265 billion (2017: $247 billion).
The collateral values in the table below are adjusted where appropriate in accordance with our risk mitigation policy and for the effect of over-collateralisation. Following the adoption of IFRS 9 on 1 January 2018, the extent of over-collateralisation has been determined with reference to both the drawn and undrawn components of exposure as this best reflects the effect of collateral and other credit enhancements on the amounts arising from expected credit losses. The 2017 comparatives have not been restated, as the effect of collateral on IAS 39 impairment provisions was based on the drawn component only.
We have remained prudent in the way we assess the value of collateral, which is calibrated for a severe downturn and backtested against our prior experience. On average, across all types of non-cash collateral, the value ascribed is approximately half of its current market value. Collateral held against Corporate & Institutional Banking and Commercial Banking exposures amounted to $23 billion.
In the Retail Banking and Private Banking segments, a secured loan is one where the borrower pledges an asset as collateral of which the Group is able to take possession in the event that the borrower defaults. The collateral level for Retail Banking has decreased by $2 billion in 2018. This is in line with the overall movement of the secured portfolio.
For loans and advances to customers and banks (including those held at fair value through profit or loss), the table below sets out the fair value of collateral held by the Group, adjusted where appropriate in accordance with the risk mitigation policy and for the effect of over-collateralisation.

Standard Chartered Annual Report 2018166
RISK REVIEW Risk profile
Collateral held on loans and advancesThe table below details collateral held against exposures, separately disclosing stage 3 exposure and corresponding collateral.
Amortised cost
31.12.18
Amount outstanding Collateral Net exposure
Total $million
Stage 2 financial
assets $million
Credit-impaired financial
assets (S3) $million
Total3 $million
Stage 2 financial
assets $million
Credit-impaired financial
assets (S3) $million
Total $million
Stage 2 financial
assets $million
Credit-impaired financial
assets (S3) $million
Corporate & Institutional Banking1 166,091 10,234 1,758 15,882 1,314 802 150,209 8,920 956
Retail Banking 101,235 2,705 436 74,485 2,092 324 26,750 613 112
Commercial Banking 26,759 4,331 539 6,767 3,966 302 19,992 365 237
Private Banking 13,616 785 135 9,729 783 135 3,887 2 –
Central & other items 10,270 26 – 6,278 – – 3,992 26 –
Total2 317,971 18,081 2,868 113,141 8,155 1,563 204,830 9,926 1,305
1 Includes loans and advances to banks
2 Excludes FVTPL
3 Excludes collateral held against FVTPL exposures, and is adjusted for over-collateralisation based on the drawn and undrawn components of exposures
Amortised cost and FVTPL
31.12.17 (IAS 39)
Maximum exposure Collateral Net exposure
Total $million
Past due but not
individually impaired
loans $million
Individually impaired
loans $million
Total2
$million
Past due but not
individually impaired
loans $million
Individually impaired
loans $million
Total $million
Past due but not
individually impaired
loans $million
Individually impaired
loans $million
Corporate & Institutional Banking1 193,442 1,455 5,957 70,499 160 1,111 122,943 1,295 4,846
Retail Banking 103,371 2,114 695 76,543 1,514 218 26,828 600 477
Commercial Banking 29,602 483 2,027 6,570 247 277 23,032 236 1,750
Private Banking 13,359 85 207 9,296 82 203 4,063 3 4
Central & other items 27,570 2 – 5,339 – – 22,231 2 –
Total 367,344 4,139 8,886 168,247 2,003 1,809 199,097 2,136 7,077
1 Includes loans and advances to banks
2 Includes collateral held against FVTPL exposures, and is adjusted for over-collateralisation based on the drawn component of exposures
Collateral – Corporate & Institutional Banking and Commercial Banking Collateral held against Corporate & Institutional Banking and Commercial Banking exposures amounted to $23 billion. Following the adoption of IFRS 9, on 1 January 2018 $44.6 billion of reverse repurchase loans, with associated collateral, was classified and measured at fair value through profit and loss. 2017 comparatives have not been restated.
Collateral taken for longer-term and sub-investment grade corporate loans continues to be high at 51 per cent.
Our underwriting standards encourage taking specific charges on assets and we consistently seek high-quality, investment grade collateral. 83 per cent of tangible collateral held comprises physical assets or is property based, with the remainder largely in cash and investment securities.
Non-tangible collateral such as guarantees and standby letters of credit is also held against corporate exposures, although the financial effect of this type of collateral is less significant in terms of recoveries. However, this type of collateral is considered when determining probability of default and other credit-related factors. Collateral is also held against off-balance sheet exposures, including undrawn commitments and trade-related instruments.
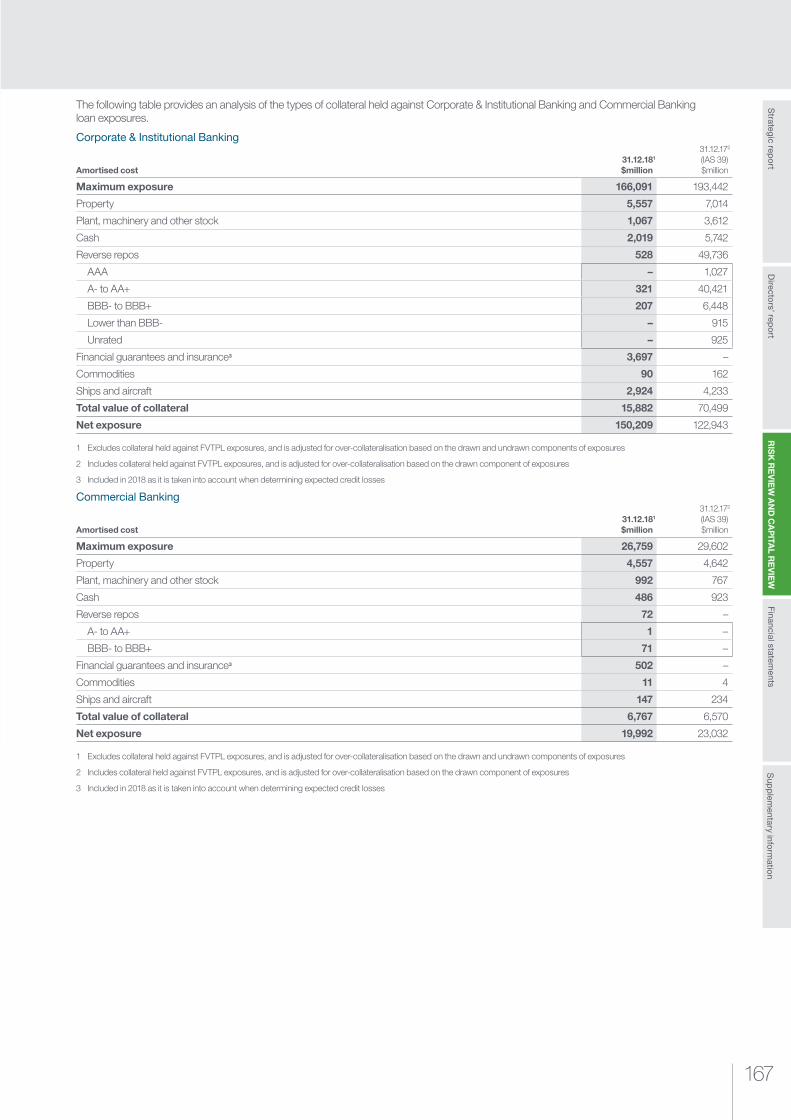
167167
RIS
K R
EV
IEW
AN
D C
AP
ITAL R
EV
IEW
Strategic rep
ort
Sup
plem
entary inform
ation
Financial statements
Directo
rs’ repo
rt
The following table provides an analysis of the types of collateral held against Corporate & Institutional Banking and Commercial Banking loan exposures.
Corporate & Institutional Banking
Amortised cost31.12.181
$million
31.12.172 (IAS 39) $million
Maximum exposure 166,091 193,442
Property 5,557 7,014
Plant, machinery and other stock 1,067 3,612
Cash 2,019 5,742
Reverse repos 528 49,736
AAA – 1,027
A- to AA+ 321 40,421
BBB- to BBB+ 207 6,448
Lower than BBB- – 915
Unrated – 925
Financial guarantees and insurance3 3,697 –
Commodities 90 162
Ships and aircraft 2,924 4,233
Total value of collateral 15,882 70,499
Net exposure 150,209 122,943
1 Excludes collateral held against FVTPL exposures, and is adjusted for over-collateralisation based on the drawn and undrawn components of exposures
2 Includes collateral held against FVTPL exposures, and is adjusted for over-collateralisation based on the drawn component of exposures
3 Included in 2018 as it is taken into account when determining expected credit losses
Commercial Banking
Amortised cost31.12.181
$million
31.12.172 (IAS 39) $million
Maximum exposure 26,759 29,602
Property 4,557 4,642
Plant, machinery and other stock 992 767
Cash 486 923
Reverse repos 72 –
A- to AA+ 1 –
BBB- to BBB+ 71 –
Financial guarantees and insurance3 502 –
Commodities 11 4
Ships and aircraft 147 234
Total value of collateral 6,767 6,570
Net exposure 19,992 23,032
1 Excludes collateral held against FVTPL exposures, and is adjusted for over-collateralisation based on the drawn and undrawn components of exposures
2 Includes collateral held against FVTPL exposures, and is adjusted for over-collateralisation based on the drawn component of exposures
3 Included in 2018 as it is taken into account when determining expected credit losses
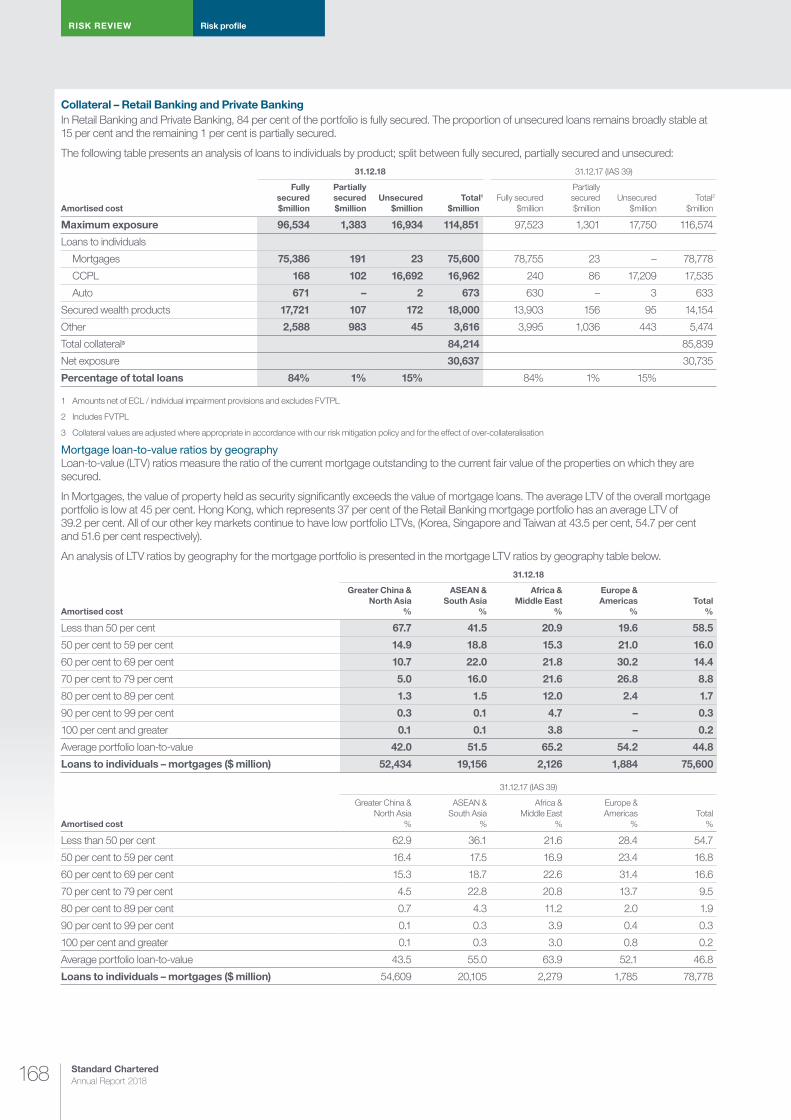
Standard Chartered Annual Report 2018168
RISK REVIEW Risk profile
Collateral – Retail Banking and Private Banking In Retail Banking and Private Banking, 84 per cent of the portfolio is fully secured. The proportion of unsecured loans remains broadly stable at 15 per cent and the remaining 1 per cent is partially secured.
The following table presents an analysis of loans to individuals by product; split between fully secured, partially secured and unsecured:
Amortised cost
31.12.18 31.12.17 (IAS 39)
Fully secured $million
Partially secured $million
Unsecured $million
Total1
$millionFully secured
$million
Partially secured $million
Unsecured $million
Total2
$million
Maximum exposure 96,534 1,383 16,934 114,851 97,523 1,301 17,750 116,574
Loans to individuals
Mortgages 75,386 191 23 75,600 78,755 23 – 78,778
CCPL 168 102 16,692 16,962 240 86 17,209 17,535
Auto 671 – 2 673 630 – 3 633
Secured wealth products 17,721 107 172 18,000 13,903 156 95 14,154
Other 2,588 983 45 3,616 3,995 1,036 443 5,474
Total collateral3 84,214 85,839
Net exposure 30,637 30,735
Percentage of total loans 84% 1% 15% 84% 1% 15%
1 Amounts net of ECL / individual impairment provisions and excludes FVTPL
2 Includes FVTPL
3 Collateral values are adjusted where appropriate in accordance with our risk mitigation policy and for the effect of over-collateralisation
Mortgage loan-to-value ratios by geography Loan-to-value (LTV) ratios measure the ratio of the current mortgage outstanding to the current fair value of the properties on which they are secured.
In Mortgages, the value of property held as security significantly exceeds the value of mortgage loans. The average LTV of the overall mortgage portfolio is low at 45 per cent. Hong Kong, which represents 37 per cent of the Retail Banking mortgage portfolio has an average LTV of 39.2 per cent. All of our other key markets continue to have low portfolio LTVs, (Korea, Singapore and Taiwan at 43.5 per cent, 54.7 per cent and 51.6 per cent respectively).
An analysis of LTV ratios by geography for the mortgage portfolio is presented in the mortgage LTV ratios by geography table below.
Amortised cost
31.12.18
Greater China & North Asia
%
ASEAN & South Asia
%
Africa & Middle East
%
Europe & Americas
%Total
%
Less than 50 per cent 67.7 41.5 20.9 19.6 58.5
50 per cent to 59 per cent 14.9 18.8 15.3 21.0 16.0
60 per cent to 69 per cent 10.7 22.0 21.8 30.2 14.4
70 per cent to 79 per cent 5.0 16.0 21.6 26.8 8.8
80 per cent to 89 per cent 1.3 1.5 12.0 2.4 1.7
90 per cent to 99 per cent 0.3 0.1 4.7 – 0.3
100 per cent and greater 0.1 0.1 3.8 – 0.2
Average portfolio loan-to-value 42.0 51.5 65.2 54.2 44.8
Loans to individuals – mortgages ($ million) 52,434 19,156 2,126 1,884 75,600
Amortised cost
31.12.17 (IAS 39)
Greater China & North Asia
%
ASEAN & South Asia
%
Africa & Middle East
%
Europe & Americas
%Total
%
Less than 50 per cent 62.9 36.1 21.6 28.4 54.7
50 per cent to 59 per cent 16.4 17.5 16.9 23.4 16.8
60 per cent to 69 per cent 15.3 18.7 22.6 31.4 16.6
70 per cent to 79 per cent 4.5 22.8 20.8 13.7 9.5
80 per cent to 89 per cent 0.7 4.3 11.2 2.0 1.9
90 per cent to 99 per cent 0.1 0.3 3.9 0.4 0.3
100 per cent and greater 0.1 0.3 3.0 0.8 0.2
Average portfolio loan-to-value 43.5 55.0 63.9 52.1 46.8
Loans to individuals – mortgages ($ million) 54,609 20,105 2,279 1,785 78,778
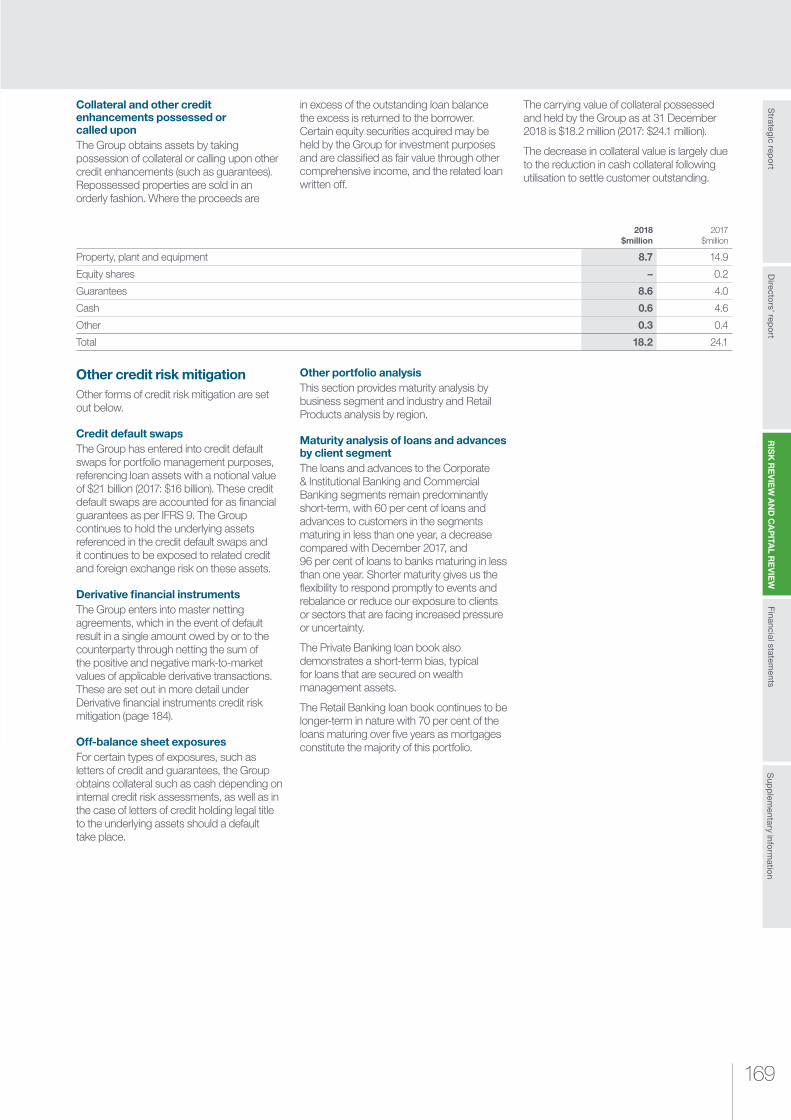
169169
RIS
K R
EV
IEW
AN
D C
AP
ITAL R
EV
IEW
Strategic rep
ort
Sup
plem
entary inform
ation
Financial statements
Directo
rs’ repo
rt
Collateral and other credit enhancements possessed or called upon The Group obtains assets by taking possession of collateral or calling upon other credit enhancements (such as guarantees). Repossessed properties are sold in an orderly fashion. Where the proceeds are
in excess of the outstanding loan balance the excess is returned to the borrower. Certain equity securities acquired may be held by the Group for investment purposes and are classified as fair value through other comprehensive income, and the related loan written off.
The carrying value of collateral possessed and held by the Group as at 31 December 2018 is $18.2 million (2017: $24.1 million).
The decrease in collateral value is largely due to the reduction in cash collateral following utilisation to settle customer outstanding.
2018 $million
2017 $million
Property, plant and equipment 8.7 14.9
Equity shares – 0.2
Guarantees 8.6 4.0
Cash 0.6 4.6
Other 0.3 0.4
Total 18.2 24.1
Other credit risk mitigationOther forms of credit risk mitigation are set out below.
Credit default swapsThe Group has entered into credit default swaps for portfolio management purposes, referencing loan assets with a notional value of $21 billion (2017: $16 billion). These credit default swaps are accounted for as financial guarantees as per IFRS 9. The Group continues to hold the underlying assets referenced in the credit default swaps and it continues to be exposed to related credit and foreign exchange risk on these assets.
Derivative financial instrumentsThe Group enters into master netting agreements, which in the event of default result in a single amount owed by or to the counterparty through netting the sum of the positive and negative mark-to-market values of applicable derivative transactions. These are set out in more detail under Derivative financial instruments credit risk mitigation (page 184).
Off-balance sheet exposuresFor certain types of exposures, such as letters of credit and guarantees, the Group obtains collateral such as cash depending on internal credit risk assessments, as well as in the case of letters of credit holding legal title to the underlying assets should a default take place.
Other portfolio analysisThis section provides maturity analysis by business segment and industry and Retail Products analysis by region.
Maturity analysis of loans and advances by client segment The loans and advances to the Corporate & Institutional Banking and Commercial Banking segments remain predominantly short-term, with 60 per cent of loans and advances to customers in the segments maturing in less than one year, a decrease compared with December 2017, and 96 per cent of loans to banks maturing in less than one year. Shorter maturity gives us the flexibility to respond promptly to events and rebalance or reduce our exposure to clients or sectors that are facing increased pressure or uncertainty.
The Private Banking loan book also demonstrates a short-term bias, typical for loans that are secured on wealth management assets.
The Retail Banking loan book continues to be longer-term in nature with 70 per cent of the loans maturing over five years as mortgages constitute the majority of this portfolio.

Standard Chartered Annual Report 2018170
RISK REVIEW Risk profile
Amortised cost
31.12.18
One year or less $million
One to five years $million
Over five years $million
Total $million
Corporate & Institutional Banking 60,794 36,164 10,330 107,288
Retail Banking 16,372 14,091 71,600 102,063
Commercial Banking 21,085 5,660 1,364 28,109
Private Banking 12,710 396 618 13,724
Central & other items 10,265 7 – 10,272
Gross loans and advances to customers 121,226 56,318 83,912 261,456
Impairment provisions (4,329) (294) (276) (4,899)
Net loans and advances to customers 116,897 56,024 83,636 256,557
Net loans and advances to banks 58,784 2,597 33 61,414
Amortised cost and FVTPL
31.12.17 (IAS 39)
One year or less $million
One to five years $million
Over five years $million
Total $million
Corporate & Institutional Banking 90,613 31,827 9,454 131,894
Retail Banking 24,200 17,341 61,680 103,221
Commercial Banking 21,683 5,293 1,231 28,207
Private Banking 12,407 270 676 13,353
Central & other items 9,335 6 2 9,343
Net of individual impairment provisions 158,238 54,737 73,043 286,018
Portfolio impairment provision (465)
Net carrying value (customers) 285,553
Net carrying value (banks) 77,739 2,974 612 81,325
Industry and Retail Products analysis of loans and advances by geographic region (unaudited)This section provides an analysis of the Group’s amortised cost loan portfolio, net of provisions, by industry and region.
In the Corporate & Institutional Banking and Commercial Banking segments our largest industry exposure is manufacturing, which constitutes 17 per cent of Corporate & Institutional Banking and Commercial Banking loans and advances to customers (1 January 2018: 16 per cent). The manufacturing sector group is spread across a diverse range of industries, including automobiles and components, capital goods, pharmaceuticals, biotech and life sciences, technology hardware and equipment, chemicals, paper products and packaging, with lending spread over 4,639 clients.
The financing, insurance and non-banking industry group constitutes 15 per cent of Corporate & Institutional Banking and Commercial Banking loans and advances to customers. Clients are mostly investment grade institutions and this lending forms part of the liquidity management of the Group.
Loans and advances to the energy sector have dropped by 1 per cent to 12 per cent of total loans and advances to Corporate & Institutional Banking and Commercial Banking (1 January 2018: 13 per cent). The energy sector lending is spread across five subsectors and over 438 clients.
The Group provides loans to commercial real estate counterparties of $15 billion, which represents 6 per cent of total customer loans and advances. In total, $8.8 billion of this lending is to counterparties where the
source of repayment is substantially derived from rental or sale of real estate and is secured by real estate collateral. The remaining commercial real estate loans comprise working capital loans to real estate corporates, loans with non-property collateral, unsecured loans and loans to real estate entities of diversified conglomerates. The average LTV ratio of the commercial real estate portfolio has increased to 43 per cent, compared with 41 per cent in 2017. The proportion of loans with an LTV greater than 80 per cent has remained at 1 per cent during the same period.
The mortgage portfolio continues to be the largest portion of the Retail Products portfolio, at 66 per cent. CCPL and other unsecured lending remain broadly stable at 15 per cent of total Retail Products loans and advances.
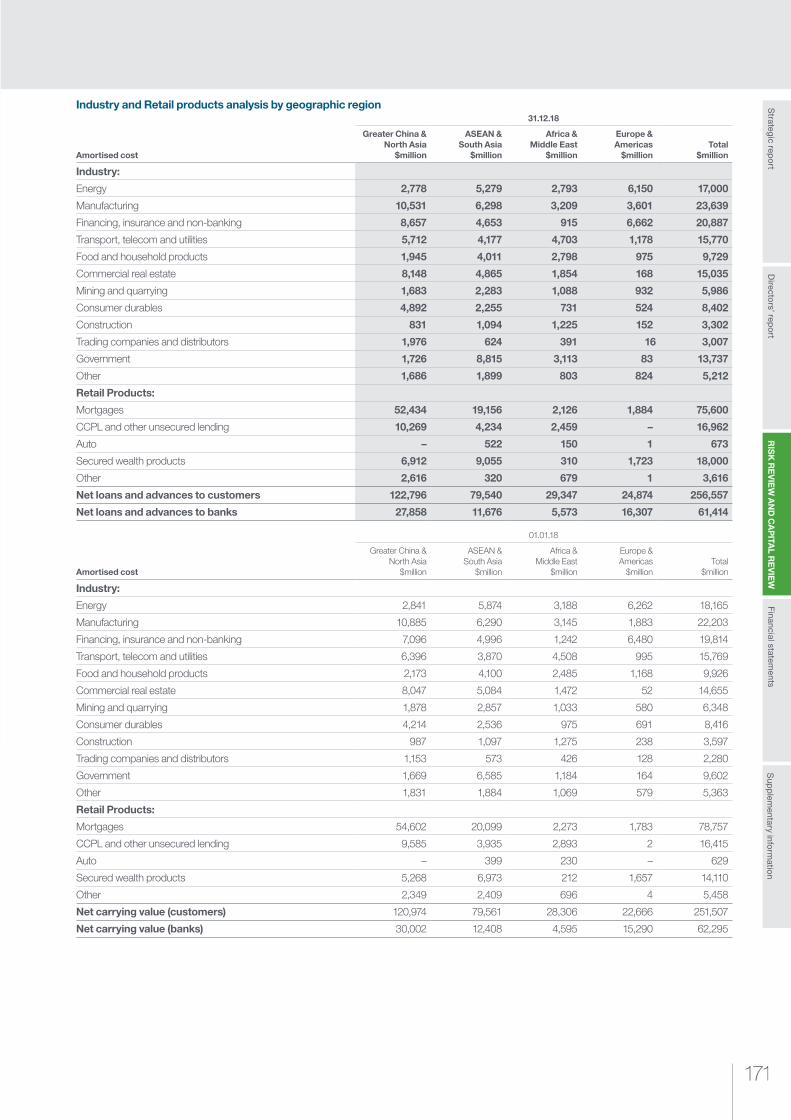
171171
RIS
K R
EV
IEW
AN
D C
AP
ITAL R
EV
IEW
Strategic rep
ort
Sup
plem
entary inform
ation
Financial statements
Directo
rs’ repo
rt
Industry and Retail products analysis by geographic region
Amortised cost
31.12.18
Greater China & North Asia
$million
ASEAN & South Asia
$million
Africa & Middle East
$million
Europe & Americas
$millionTotal
$million
Industry:
Energy 2,778 5,279 2,793 6,150 17,000
Manufacturing 10,531 6,298 3,209 3,601 23,639
Financing, insurance and non-banking 8,657 4,653 915 6,662 20,887
Transport, telecom and utilities 5,712 4,177 4,703 1,178 15,770
Food and household products 1,945 4,011 2,798 975 9,729
Commercial real estate 8,148 4,865 1,854 168 15,035
Mining and quarrying 1,683 2,283 1,088 932 5,986
Consumer durables 4,892 2,255 731 524 8,402
Construction 831 1,094 1,225 152 3,302
Trading companies and distributors 1,976 624 391 16 3,007
Government 1,726 8,815 3,113 83 13,737
Other 1,686 1,899 803 824 5,212
Retail Products:
Mortgages 52,434 19,156 2,126 1,884 75,600
CCPL and other unsecured lending 10,269 4,234 2,459 – 16,962
Auto – 522 150 1 673
Secured wealth products 6,912 9,055 310 1,723 18,000
Other 2,616 320 679 1 3,616
Net loans and advances to customers 122,796 79,540 29,347 24,874 256,557
Net loans and advances to banks 27,858 11,676 5,573 16,307 61,414
Amortised cost
01.01.18
Greater China & North Asia
$million
ASEAN & South Asia
$million
Africa & Middle East
$million
Europe & Americas
$millionTotal
$million
Industry:
Energy 2,841 5,874 3,188 6,262 18,165
Manufacturing 10,885 6,290 3,145 1,883 22,203
Financing, insurance and non-banking 7,096 4,996 1,242 6,480 19,814
Transport, telecom and utilities 6,396 3,870 4,508 995 15,769
Food and household products 2,173 4,100 2,485 1,168 9,926
Commercial real estate 8,047 5,084 1,472 52 14,655
Mining and quarrying 1,878 2,857 1,033 580 6,348
Consumer durables 4,214 2,536 975 691 8,416
Construction 987 1,097 1,275 238 3,597
Trading companies and distributors 1,153 573 426 128 2,280
Government 1,669 6,585 1,184 164 9,602
Other 1,831 1,884 1,069 579 5,363
Retail Products:
Mortgages 54,602 20,099 2,273 1,783 78,757
CCPL and other unsecured lending 9,585 3,935 2,893 2 16,415
Auto – 399 230 – 629
Secured wealth products 5,268 6,973 212 1,657 14,110
Other 2,349 2,409 696 4 5,458
Net carrying value (customers) 120,974 79,561 28,306 22,666 251,507
Net carrying value (banks) 30,002 12,408 4,595 15,290 62,295
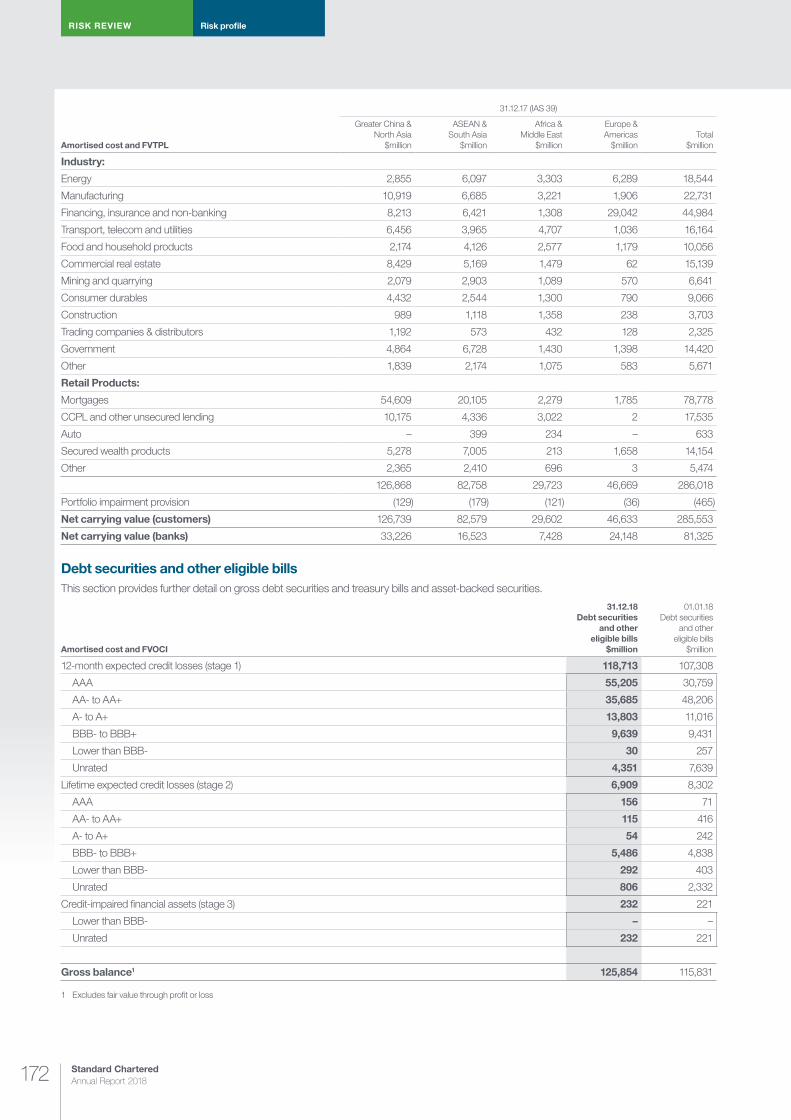
Standard Chartered Annual Report 2018172
RISK REVIEW Risk profile
Amortised cost and FVTPL
31.12.17 (IAS 39)
Greater China & North Asia
$million
ASEAN & South Asia
$million
Africa & Middle East
$million
Europe & Americas
$millionTotal
$million
Industry:
Energy 2,855 6,097 3,303 6,289 18,544
Manufacturing 10,919 6,685 3,221 1,906 22,731
Financing, insurance and non-banking 8,213 6,421 1,308 29,042 44,984
Transport, telecom and utilities 6,456 3,965 4,707 1,036 16,164
Food and household products 2,174 4,126 2,577 1,179 10,056
Commercial real estate 8,429 5,169 1,479 62 15,139
Mining and quarrying 2,079 2,903 1,089 570 6,641
Consumer durables 4,432 2,544 1,300 790 9,066
Construction 989 1,118 1,358 238 3,703
Trading companies & distributors 1,192 573 432 128 2,325
Government 4,864 6,728 1,430 1,398 14,420
Other 1,839 2,174 1,075 583 5,671
Retail Products:
Mortgages 54,609 20,105 2,279 1,785 78,778
CCPL and other unsecured lending 10,175 4,336 3,022 2 17,535
Auto – 399 234 – 633
Secured wealth products 5,278 7,005 213 1,658 14,154
Other 2,365 2,410 696 3 5,474
126,868 82,758 29,723 46,669 286,018
Portfolio impairment provision (129) (179) (121) (36) (465)
Net carrying value (customers) 126,739 82,579 29,602 46,633 285,553
Net carrying value (banks) 33,226 16,523 7,428 24,148 81,325
Debt securities and other eligible billsThis section provides further detail on gross debt securities and treasury bills and asset-backed securities.
Amortised cost and FVOCI
31.12.18 Debt securities
and other eligible bills
$million
01.01.18 Debt securities
and other eligible bills
$million
12-month expected credit losses (stage 1) 118,713 107,308
AAA 55,205 30,759
AA- to AA+ 35,685 48,206
A- to A+ 13,803 11,016
BBB- to BBB+ 9,639 9,431
Lower than BBB- 30 257
Unrated 4,351 7,639
Lifetime expected credit losses (stage 2) 6,909 8,302
AAA 156 71
AA- to AA+ 115 416
A- to A+ 54 242
BBB- to BBB+ 5,486 4,838
Lower than BBB- 292 403
Unrated 806 2,332
Credit-impaired financial assets (stage 3) 232 221
Lower than BBB- – –
Unrated 232 221
Gross balance1 125,854 115,831
1 Excludes fair value through profit or loss
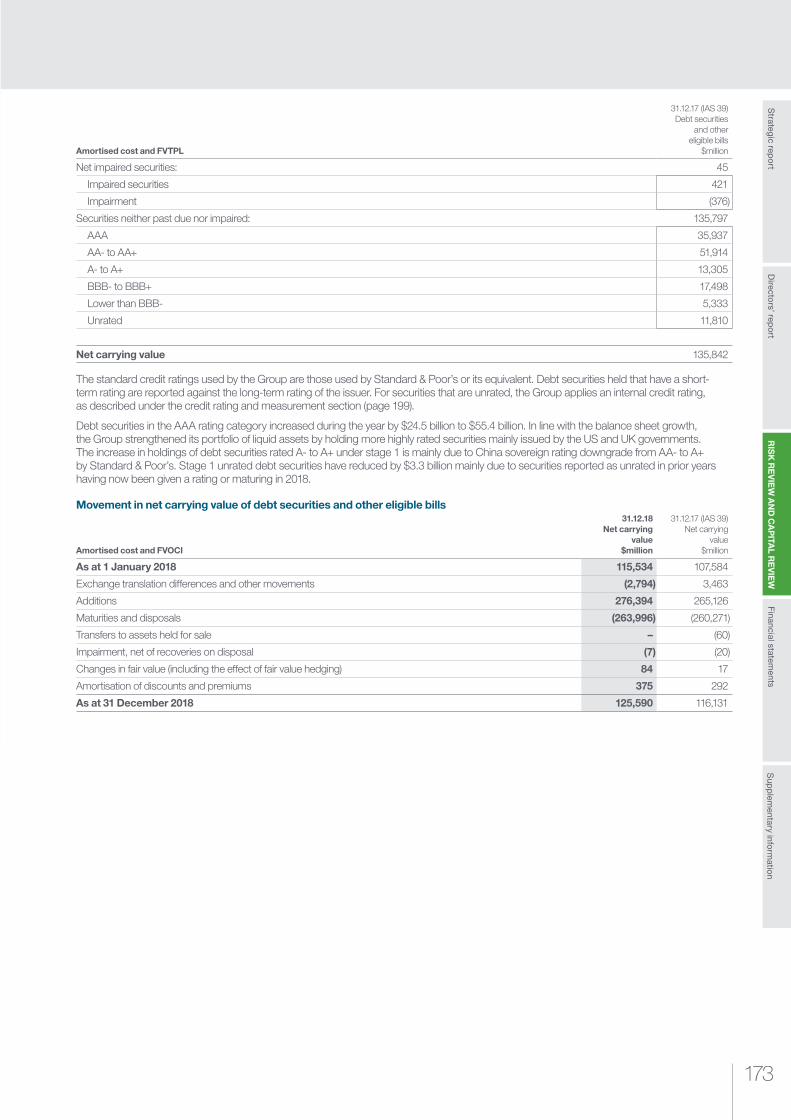
173173
RIS
K R
EV
IEW
AN
D C
AP
ITAL R
EV
IEW
Strategic rep
ort
Sup
plem
entary inform
ation
Financial statements
Directo
rs’ repo
rt
Amortised cost and FVTPL
31.12.17 (IAS 39) Debt securities
and other eligible bills
$million
Net impaired securities: 45
Impaired securities 421
Impairment (376)
Securities neither past due nor impaired: 135,797
AAA 35,937
AA- to AA+ 51,914
A- to A+ 13,305
BBB- to BBB+ 17,498
Lower than BBB- 5,333
Unrated 11,810
Net carrying value 135,842
The standard credit ratings used by the Group are those used by Standard & Poor’s or its equivalent. Debt securities held that have a short- term rating are reported against the long-term rating of the issuer. For securities that are unrated, the Group applies an internal credit rating, as described under the credit rating and measurement section (page 199).
Debt securities in the AAA rating category increased during the year by $24.5 billion to $55.4 billion. In line with the balance sheet growth, the Group strengthened its portfolio of liquid assets by holding more highly rated securities mainly issued by the US and UK governments. The increase in holdings of debt securities rated A- to A+ under stage 1 is mainly due to China sovereign rating downgrade from AA- to A+ by Standard & Poor’s. Stage 1 unrated debt securities have reduced by $3.3 billion mainly due to securities reported as unrated in prior years having now been given a rating or maturing in 2018.
Movement in net carrying value of debt securities and other eligible bills
Amortised cost and FVOCI
31.12.18 Net carrying
value $million
31.12.17 (IAS 39) Net carrying
value $million
As at 1 January 2018 115,534 107,584
Exchange translation differences and other movements (2,794) 3,463
Additions 276,394 265,126
Maturities and disposals (263,996) (260,271)
Transfers to assets held for sale – (60)
Impairment, net of recoveries on disposal (7) (20)
Changes in fair value (including the effect of fair value hedging) 84 17
Amortisation of discounts and premiums 375 292
As at 31 December 2018 125,590 116,131
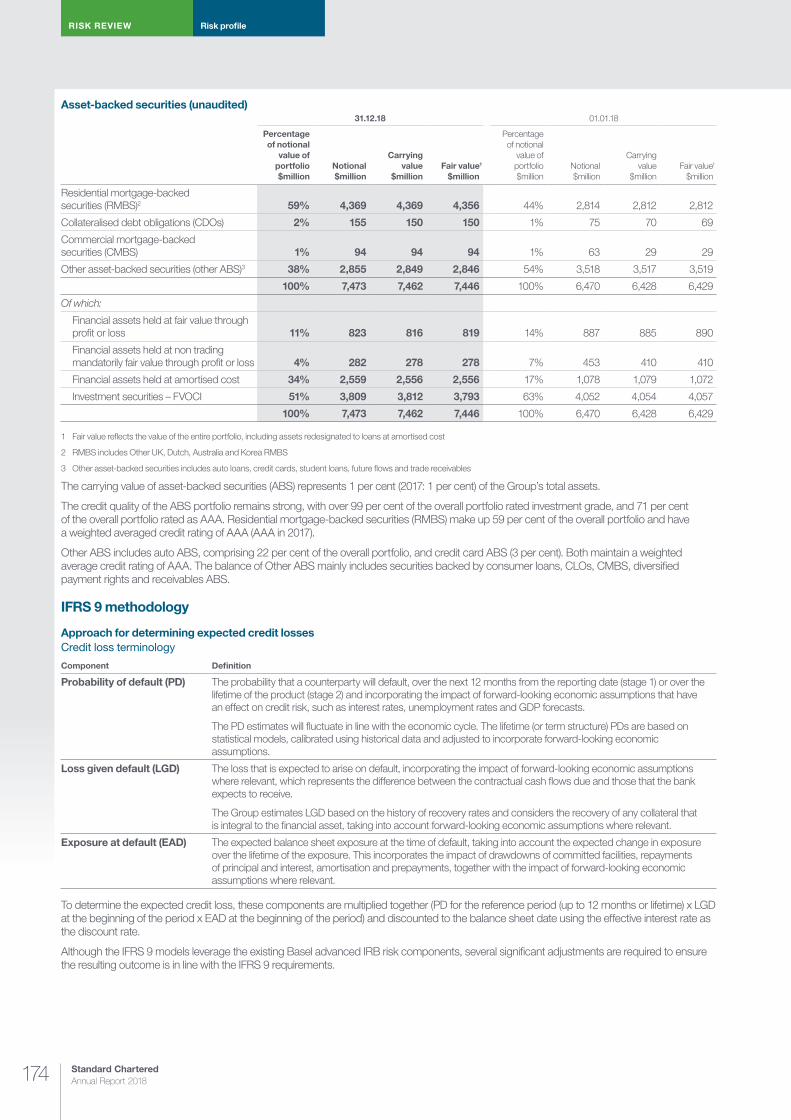
Standard Chartered Annual Report 2018174
RISK REVIEW Risk profile
Asset-backed securities (unaudited)31.12.18 01.01.18
Percentage of notional
value of portfolio $million
Notional $million
Carrying value
$millionFair value1
$million
Percentage of notional
value of portfolio $million
Notional $million
Carrying value
$millionFair value1
$million
Residential mortgage-backed securities (RMBS)2 59% 4,369 4,369 4,356 44% 2,814 2,812 2,812
Collateralised debt obligations (CDOs) 2% 155 150 150 1% 75 70 69
Commercial mortgage-backed securities (CMBS) 1% 94 94 94 1% 63 29 29
Other asset-backed securities (other ABS)3 38% 2,855 2,849 2,846 54% 3,518 3,517 3,519
100% 7,473 7,462 7,446 100% 6,470 6,428 6,429
Of which:
Financial assets held at fair value through profit or loss 11% 823 816 819 14% 887 885 890
Financial assets held at non trading mandatorily fair value through profit or loss 4% 282 278 278 7% 453 410 410
Financial assets held at amortised cost 34% 2,559 2,556 2,556 17% 1,078 1,079 1,072
Investment securities – FVOCI 51% 3,809 3,812 3,793 63% 4,052 4,054 4,057
100% 7,473 7,462 7,446 100% 6,470 6,428 6,429
1 Fair value reflects the value of the entire portfolio, including assets redesignated to loans at amortised cost
2 RMBS includes Other UK, Dutch, Australia and Korea RMBS
3 Other asset-backed securities includes auto loans, credit cards, student loans, future flows and trade receivables
The carrying value of asset-backed securities (ABS) represents 1 per cent (2017: 1 per cent) of the Group’s total assets.
The credit quality of the ABS portfolio remains strong, with over 99 per cent of the overall portfolio rated investment grade, and 71 per cent of the overall portfolio rated as AAA. Residential mortgage-backed securities (RMBS) make up 59 per cent of the overall portfolio and have a weighted averaged credit rating of AAA (AAA in 2017).
Other ABS includes auto ABS, comprising 22 per cent of the overall portfolio, and credit card ABS (3 per cent). Both maintain a weighted average credit rating of AAA. The balance of Other ABS mainly includes securities backed by consumer loans, CLOs, CMBS, diversified payment rights and receivables ABS.
IFRS 9 methodology
Approach for determining expected credit lossesCredit loss terminology
Component Definition
Probability of default (PD) The probability that a counterparty will default, over the next 12 months from the reporting date (stage 1) or over the lifetime of the product (stage 2) and incorporating the impact of forward-looking economic assumptions that have an effect on credit risk, such as interest rates, unemployment rates and GDP forecasts.
The PD estimates will fluctuate in line with the economic cycle. The lifetime (or term structure) PDs are based on statistical models, calibrated using historical data and adjusted to incorporate forward-looking economic assumptions.
Loss given default (LGD) The loss that is expected to arise on default, incorporating the impact of forward-looking economic assumptions where relevant, which represents the difference between the contractual cash flows due and those that the bank expects to receive.
The Group estimates LGD based on the history of recovery rates and considers the recovery of any collateral that is integral to the financial asset, taking into account forward-looking economic assumptions where relevant.
Exposure at default (EAD) The expected balance sheet exposure at the time of default, taking into account the expected change in exposure over the lifetime of the exposure. This incorporates the impact of drawdowns of committed facilities, repayments of principal and interest, amortisation and prepayments, together with the impact of forward-looking economic assumptions where relevant.
To determine the expected credit loss, these components are multiplied together (PD for the reference period (up to 12 months or lifetime) x LGD at the beginning of the period x EAD at the beginning of the period) and discounted to the balance sheet date using the effective interest rate as the discount rate.
Although the IFRS 9 models leverage the existing Basel advanced IRB risk components, several significant adjustments are required to ensure the resulting outcome is in line with the IFRS 9 requirements.
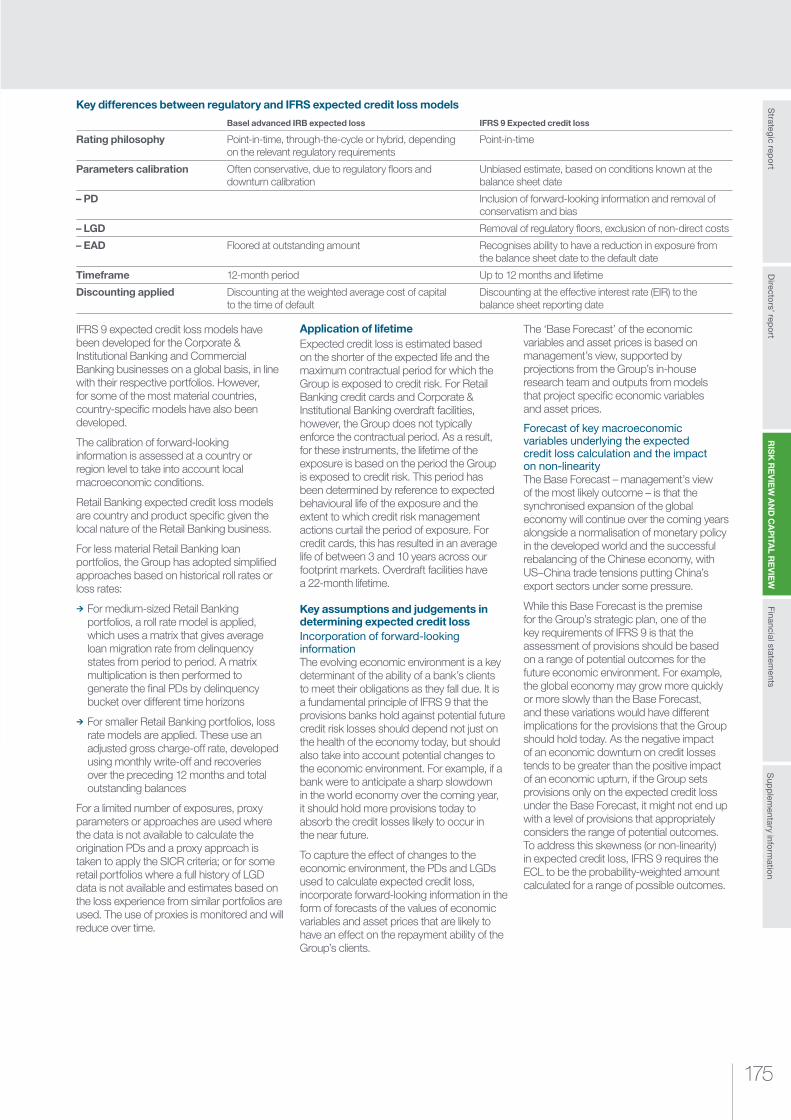
175175
RIS
K R
EV
IEW
AN
D C
AP
ITAL R
EV
IEW
Strategic rep
ort
Sup
plem
entary inform
ation
Financial statements
Directo
rs’ repo
rt
Key differences between regulatory and IFRS expected credit loss models
Basel advanced IRB expected loss IFRS 9 Expected credit loss
Rating philosophy Point-in-time, through-the-cycle or hybrid, depending on the relevant regulatory requirements
Point-in-time
Parameters calibration Often conservative, due to regulatory floors and downturn calibration
Unbiased estimate, based on conditions known at the balance sheet date
– PD Inclusion of forward-looking information and removal of conservatism and bias
– LGD Removal of regulatory floors, exclusion of non-direct costs
– EAD Floored at outstanding amount Recognises ability to have a reduction in exposure from the balance sheet date to the default date
Timeframe 12-month period Up to 12 months and lifetime
Discounting applied Discounting at the weighted average cost of capital to the time of default
Discounting at the effective interest rate (EIR) to the balance sheet reporting date
IFRS 9 expected credit loss models have been developed for the Corporate & Institutional Banking and Commercial Banking businesses on a global basis, in line with their respective portfolios. However, for some of the most material countries, country-specific models have also been developed.
The calibration of forward-looking information is assessed at a country or region level to take into account local macroeconomic conditions.
Retail Banking expected credit loss models are country and product specific given the local nature of the Retail Banking business.
For less material Retail Banking loan portfolios, the Group has adopted simplified approaches based on historical roll rates or loss rates:
¼ For medium-sized Retail Banking portfolios, a roll rate model is applied, which uses a matrix that gives average loan migration rate from delinquency states from period to period. A matrix multiplication is then performed to generate the final PDs by delinquency bucket over different time horizons
¼ For smaller Retail Banking portfolios, loss rate models are applied. These use an adjusted gross charge-off rate, developed using monthly write-off and recoveries over the preceding 12 months and total outstanding balances
For a limited number of exposures, proxy parameters or approaches are used where the data is not available to calculate the origination PDs and a proxy approach is taken to apply the SICR criteria; or for some retail portfolios where a full history of LGD data is not available and estimates based on the loss experience from similar portfolios are used. The use of proxies is monitored and will reduce over time.
Application of lifetimeExpected credit loss is estimated based on the shorter of the expected life and the maximum contractual period for which the Group is exposed to credit risk. For Retail Banking credit cards and Corporate & Institutional Banking overdraft facilities, however, the Group does not typically enforce the contractual period. As a result, for these instruments, the lifetime of the exposure is based on the period the Group is exposed to credit risk. This period has been determined by reference to expected behavioural life of the exposure and the extent to which credit risk management actions curtail the period of exposure. For credit cards, this has resulted in an average life of between 3 and 10 years across our footprint markets. Overdraft facilities have a 22-month lifetime.
Key assumptions and judgements in determining expected credit lossIncorporation of forward-looking information The evolving economic environment is a key determinant of the ability of a bank’s clients to meet their obligations as they fall due. It is a fundamental principle of IFRS 9 that the provisions banks hold against potential future credit risk losses should depend not just on the health of the economy today, but should also take into account potential changes to the economic environment. For example, if a bank were to anticipate a sharp slowdown in the world economy over the coming year, it should hold more provisions today to absorb the credit losses likely to occur in the near future.
To capture the effect of changes to the economic environment, the PDs and LGDs used to calculate expected credit loss, incorporate forward-looking information in the form of forecasts of the values of economic variables and asset prices that are likely to have an effect on the repayment ability of the Group’s clients.
The ‘Base Forecast’ of the economic variables and asset prices is based on management’s view, supported by projections from the Group’s in-house research team and outputs from models that project specific economic variables and asset prices.
Forecast of key macroeconomic variables underlying the expected credit loss calculation and the impact on non-linearity The Base Forecast – management’s view of the most likely outcome – is that the synchronised expansion of the global economy will continue over the coming years alongside a normalisation of monetary policy in the developed world and the successful rebalancing of the Chinese economy, with US–China trade tensions putting China’s export sectors under some pressure.
While this Base Forecast is the premise for the Group’s strategic plan, one of the key requirements of IFRS 9 is that the assessment of provisions should be based on a range of potential outcomes for the future economic environment. For example, the global economy may grow more quickly or more slowly than the Base Forecast, and these variations would have different implications for the provisions that the Group should hold today. As the negative impact of an economic downturn on credit losses tends to be greater than the positive impact of an economic upturn, if the Group sets provisions only on the expected credit loss under the Base Forecast, it might not end up with a level of provisions that appropriately considers the range of potential outcomes. To address this skewness (or non-linearity) in expected credit loss, IFRS 9 requires the ECL to be the probability-weighted amount calculated for a range of possible outcomes.

Standard Chartered Annual Report 2018176
RISK REVIEW Risk profile
To take account of the potential non-linearity in expected credit loss, the Group simulates a set of 50 scenarios around the Base Forecast and calculates the expected credit loss under each of them. These scenarios are generated by a Monte Carlo simulation, which considers the degree of uncertainty (or volatility) around economic outcomes and how these outcomes have tended to move in relation to one another (or correlation). The use of Monte Carlo simulation is motivated by the number and spread of countries in which the Group operates. This implies that the number of countries’ macroeconomic variables to forecast is large, but more importantly the observation that a downturn in one part of the world is never perfectly synchronised with downturns everywhere else means that the Group may be challenged to capture a full range of scenarios with a handful of manually tuned scenarios.
While the 50 scenarios do not each have a specific narrative, they reflect a range of plausible hypothetical alternative outcomes for the global economy. Some imply an unwinding of the current shocks and uncertainty leading to higher global economic activity and higher asset prices, while others represent an intensification of current shocks
or introduction of new shocks that raise uncertainty, leading to lower global economic activity and lower asset prices.
The table below provides a summary of the Group’s Base Forecast, alongside the corresponding range seen across the multiple scenarios.
Over the medium term – five years ahead – there has been relatively little change in the forecast level of activity relative to the start of the year. At the margin, the ongoing trade policy tensions between the US and China have reduced prospective export growth in China, particularly in the near term. The effect of the external trade shock is expected to be offset by moderate domestic policy stimulus by Chinese authorities and so average real GDP growth projections over the medium term have been revised downwards only marginally, to 6.0 per cent from 6.1 per cent. Some policy stimulus was provided during 2018, for example an easing of monetary policy by the People’s Bank of China (PBoC). This policy stance is expected to persist and so the projected average three-month interbank interest rate over the medium term has been revised down materially to 3.1 per cent from 4.2 per cent.
In contrast to the Chinese economy, the US economy continued to grow above trend during 2018, prompting the Federal Reserve to raise US policy interest rates faster than expected. For those countries where the monetary policy framework is based on managing the level of the currency in reference to the US dollar – either as a currency board (Hong Kong) or as a currency basket (Singapore) – domestic interest rates rise, to some degree, with US interest rates. The revised outlook for short-term interbank interest rates is not expected to have a material effect on activity, property price inflation or unemployment in those countries over the medium term.
The most material revision in the base forecast is to the oil price. At the start of the year oil prices were expected to average around US$61/barrel over the medium term, but by the end of the year that projection had been revised up to around US$85. While current prices have been impacted by speculative movements out of oil, a number of supply and demand factors together determine the oil price. The most important driver of the rise in projected oil prices over the medium term was the decision by the US government not to renew waivers on certain sanctions on Iran, including the export of oil.
31.12.2018
China Hong Kong Korea Singapore India
Base forecast Low2 High3
Base forecast Low2 High3
Base forecast Low2 High3
Base forecast Low2 High3
Base forecast Low2 High3
GDP growth (YoY%) 6.0 4.3 7.7 3.0 0.6 5.6 2.9 0.4 5.3 2.4 (1.7) 6.4 7.7 5.6 10.1
Unemployment (%) 4.0 3.8 4.2 3.4 2.4 4.6 3.2 2.4 4.0 3.0 2.3 3.7 N/A N/A N/A
3-month interest rates (%) 3.1 2.0 4.3 3.0 1.8 4.2 2.6 1.4 4.0 2.4 1.3 3.8 6.9 5.1 8.9
House prices (YoY%) 5.8 3.4 8.5 2.3 (8.1) 12.1 3.5 1.3 6.1 4.4 (1.5) 10.6 8.4 1.4 15.1
01.01.2018
China Hong Kong Korea Singapore India
Base forecast Low2 High3
Base forecast Low2 High3
Base forecast Low2 High3
Base forecast Low2 High3
Base forecast Low2 High3
GDP growth (YoY%) 6.1 4.5 7.6 3.0 0.3 5.4 2.9 0.8 5.6 2.3 (2.0) 6.1 7.5 5.4 9.7
Unemployment (%) 4.0 3.8 4.2 3.6 2.4 4.8 3.3 2.5 4.6 2.8 2.2 3.5 N/A1 N/A1 N/A1
3-month interest rates (%) 4.2 2.9 5.6 1.7 1.0 3.7 2.3 1.4 4.3 1.7 1.2 3.9 6.2 5.3 9.0
House prices (YoY%) 5.4 3.5 8.0 2.0 (7.5) 12.3 3.5 1.4 6.0 3.8 (1.8) 9.2 8.5 1.3 15.5
31.12.2018Base
forecast Low2 High3
Crude price Brent, $ pb 85 40 118
01.01.2018Base
forecast Low2 High3
Crude price Brent, $ pb 61 35 92
1 Not available
2 Represents the 10th percentile in the range used to determine non-linearity
3 Represents the 90th percentile in the range used to determine non-linearity
The final expected credit loss reported by the Group is a simple average of the expected credit loss for each of the 50 scenarios. The impact of non-linearity on expected credit loss is set out in the table below:
Including non-linearity
$million
Excluding non-linearity
$millionDifference
%
Total expected credit loss1 1,163 1,139 2.1
1 Total modelled expected credit loss comprises stage 1 and stage 2 balances of $1,031 million and $132 million of modelled expected credit loss on stage 3 loans

177177
RIS
K R
EV
IEW
AN
D C
AP
ITAL R
EV
IEW
Strategic rep
ort
Sup
plem
entary inform
ation
Financial statements
Directo
rs’ repo
rt
The average expected credit loss under multiple scenarios is 2.1 per cent higher than the expected credit loss calculated using only the most likely scenario (the Base Forecast). Portfolios that are more sensitive to non-linearity include those with greater leverage and/or a longer tenor, such as Project and Shipping Finance portfolios. Other portfolios display minimal non-linearity owing to limited their responsiveness to macroeconomic impacts for structural reasons such as significant collateralisation as with the Retail Banking mortgage portfolios.
Credit-impaired assets managed by Group Special Assets Management (GSAM) incorporate forward-looking economic assumptions in respect of the recovery outcomes identified and are assigned individual probability weightings. These assumptions are not based on a Monte Carlo simulation but are informed by the Base Forecast.
Sensitivity of expected credit loss calculation to macroeconomic variablesThe expected credit loss calculation relies on multiple variables and is inherently non-linear and portfolio-dependent, which implies that no single analysis can fully demonstrate the sensitivity of the expected credit loss to changes in the macroeconomic variables. The Group has conducted a series of analyses with the aim of identifying the macroeconomic variables which might have the greatest impact on overall expected credit loss. These encompassed single variable and multi-variable exercises, using simple up/down variation and extracts from actual calculation data, as well as bespoke scenario design and assessment.
The primary conclusion of these exercises is that no individual macroeconomic variable is materially influential – that is, likely to result in an impact of at least 1 per cent of the Group’s expected credit loss. The Group believes this is plausible, because the number of variables used in the expected credit loss calculation is large. This does not mean that macroeconomic variables are uninfluential; rather, that the Group believes that consideration of macroeconomics should involve whole scenarios, as this aligns with the multi-variable nature of the calculation.
As the Group has two principal uncertainties related to the macroeconomic outlook, a sensitivity analysis of ECL was undertaken to explore the combined effect of these: extended trade tensions that could lead to a China slowdown with spillovers to emerging markets. In this scenario, current trade policy tensions between the US and China increase dramatically. The US targets trading partners with which it has a material trade deficit and pushes through highly protectionist measures, initiating trade tensions with Asia focused on China. Indirectly, economies
reliant on global trade flows are vulnerable to the trade shock. The escalating trade tensions create uncertainty which reduces risk appetite, leading to a decline in asset prices and lower consumption and investment across developed and emerging markets. This leads to a global slowdown and a sharp fall in commodity prices. As an indication, China annual real GDP growth troughs at circa. 4 per cent, representing a marked divergence from the base forecast growth of around 6 per cent, while China exports growth dips negative for the first time since 2009. US GDP slows from a trend rate of about 2 per cent down to 1 per cent. Crude oil prices fall, and residential property indices in China and Hong Kong dip negative. To contextualise this scenario relative to the Monte Carlo generated scenarios, the China and US GDP dips approach the lowest growth boundary of the 50 scenarios in 2019, crude oil remains closer to the middle than to the bottom edge, but the China property price index falls well below the simulated lower bound over a period of years.
Applying this scenario, modelled stage 1 and 2 expected credit loss provisions would be approximately $362 million higher than the reported base case expected credit loss provision (excluding the impact of non-linearity). This includes the impact of exposures transferring to stage 2 from stage 1 but does not consider an increase in stage 3 defaults. The proportion of exposures in stage 2 would increase from 8 per cent to 10 per cent. As expected, this has an impact on our corporate exposures in China, Hong Kong and Singapore. Within Retail Banking, the Group’s credit card portfolios in Hong Kong and Singapore were impacted. Note that the actual outcome of any scenario may be materially different due to, amongst other factors, the effect of management actions to mitigate potential increases in risk and changes in the underlying portfolio.
Significant increase in credit riskQuantitative criteriaSICR is assessed by comparing the risk of default at the reporting date to the risk of default at origination. Whether a change in the risk of default is significant or not is assessed using quantitative and qualitative criteria. These quantitative significant deterioration thresholds have been separately defined for each business and where meaningful are consistently applied across business lines.
Assets are considered to have experienced SICR if they have breached both relative and absolute thresholds for the change in the average annualised lifetime probability of default over the residual term of the exposure.
The absolute measure of increase in credit risk is used to capture instances where the PDs on exposures are relatively low at initial recognition as these may increase by several multiples without representing a significant increase in credit risk. Where PDs are relatively high at initial recognition, a relative measure is more appropriate in assessing whether there is a significant increase in credit risk, as the PDs increase more quickly.
The SICR thresholds have been calibrated based on the following principles:
¼ Stability – The thresholds are set to achieve a stable stage 2 population at a portfolio level, trying to minimise the number of accounts moving back and forth between stage 1 and stage 2 in a short period of time
¼ Accuracy – The thresholds are set such that there is a materially higher propensity for stage 2 exposures to eventually default than is the case for stage 1 exposures
¼ Dependency from backstops – The thresholds are stringent enough such that a high proportion of accounts transfer to stage 2 due to movements in forward-looking PD rather than relying on backward-looking backstops such as arrears
¼ Relationship with business and product risk profiles – The thresholds reflect the relative risk differences between different products, and are aligned to business processes
For Corporate & Institutional Banking and Commercial Banking clients, the relative threshold is a 100 per cent increase in PD and the absolute change in PD is between 50 and 100 bps.
For Retail Banking clients, the relative threshold is a 100 per cent increase in PD and the absolute change in PD is between 100 and 350 bps depending on the product. Certain countries have a higher absolute threshold reflecting the lower default rate within their personal loan portfolios compared with the Group’s other personal loan portfolios.
Private Banking clients are assessed qualitatively, based on a delinquency measure relating to collateral top-ups or sell-downs.
Debt securities with an internal credit rating mapped to an investment grade equivalent are allocated to stage 1 and all other debt securities to stage 2.
Qualitative criteriaQualitative factors that indicate that there has been a significant increase in credit risk include processes linked to current risk management, such as placing loans on non-purely precautionary early alert.

Standard Chartered Annual Report 2018178
RISK REVIEW Risk profile
BackstopAcross all portfolios, accounts that are 30 or more days past due (DPD) on contractual payments of principal and/or interest that have not been captured by the criteria above are considered to have experienced a significant increase in credit risk.
Expert credit judgement may be applied in assessing significant increase in credit risk to the extent that certain risks may not have been captured by the models or through the above criteria. Such instances are expected to be rare, for example due to events arising close to the reporting date.
Corporate & Institutional Banking and Commercial Banking clientsQuantitative criteriaExposures are assessed based on both the absolute and the relative movement in the PD from origination to the reporting date as described above.
To account for the fact that the mapping between internal credit grades (used in the origination process) and PDs is non-linear (e.g. a one-notch downgrade in the investment grade universe results in a much smaller PD increase than in the sub-investment grade universe), the absolute thresholds have been differentiated by credit quality at origination, as measured by internal credit grades being investment grade or sub-investment grade.
Qualitative criteriaAll assets of clients that have been placed on early alert (for non-purely precautionary reasons) are deemed to have experienced a significant increase in credit risk.
An account is placed on non-purely precautionary early alert if it exhibits risk or potential weaknesses of a material nature requiring closer monitoring, supervision or attention by management. Weaknesses in such a borrower’s account, if left uncorrected, could result in deterioration of repayment prospects and the likelihood of being downgraded. Indicators could include a rapid erosion of position within the industry, concerns over management’s ability to manage operations, weak/deteriorating operating results, liquidity strain and overdue balances among other factors.
All client assets that have been assigned a CG12 rating, equivalent to ‘higher risk’, are deemed to have experienced a significant increase in credit risk. Accounts rated CG12 are managed by the GSAM unit. All Corporate & Institutional Banking and Commercial Banking clients are placed on CG12 when they are 30 DPD unless they are granted a waiver through a strict governance process.
Retail Banking clientsQuantitative criteriaMaterial portfolios (defined as a combination of country and product, for example Hong Kong mortgages, Taiwan credit cards), for which a statistical model has been built, are assessed based on both the absolute and relative movement in the PD from origination to the reporting date as described previously (page 177). For these portfolios, the original lifetime PD term structure is determined based on the original application score or risk segment of the client.
Qualitative criteriaAccounts that are 30 DPD that have not been captured by the quantitative criteria are considered to have experienced a significant increase in credit risk. For less material portfolios, which are modelled based on a roll rate or loss rate approach, significant increase in credit risk is primarily assessed through the 30 DPD trigger.
Private Banking clientsFor Private Banking clients, significant increase in credit risk is assessed by referencing the nature and the level of collateral against which credit is extended (known as ‘Classes of risk’).
Qualitative criteriaFor all Private Banking classes, in line with risk management practice, an increase in credit risk is deemed to have occurred where margining or LTV covenants have been breached.
For Class I assets, if these margining requirements have not been met within 30 days of a trigger, a significant increase in credit risk is assumed to have occurred.
For Class I and Class III assets, a significant increase in credit risk is assumed to have occurred where the bank is unable to ‘sell down’ the applicable assets to meet revised collateral requirements within five days of a trigger.
Class II assets are typically unsecured or partially secured, or secured against illiquid collateral such as shares in private companies. Significant credit deterioration of these assets is deemed to have occurred when any early alert trigger has been breached.
Debt securitiesQuantitative criteriaThe bank is utilising the low credit risk simplified approach. All debt securities with an internal credit rating mapped to an investment grade equivalent are allocated to stage 1 and all other debt securities are allocated to stage 2.
Qualitative criteriaDebt securities utilise the same qualitative criteria as the Corporate & Institutional Banking and Commercial Banking client segments, including being placed on early alert or being classified as CG12.
Assessment of credit-impaired financial assetsRetail Banking clients The core components in determining credit-impaired expected credit loss provisions are the value of gross charge-off and recoveries. Gross charge-off and/or loss provisions are recognised when it is established that the account is unlikely to pay through the normal process. Recovery of unsecured debt post credit impairment is recognised based on actual cash collected, either directly from clients or through the sale of defaulted loans to third-party institutions. Release of credit impairment provisions for secured loans is recognised if the loan outstanding is paid in full (release of full provision), or the provision is higher than the loan outstanding (release of the excess provision).
Corporate & Institutional Banking, Commercial Banking and Private Banking clientsCredit-impaired accounts are managed by the Group’s specialist recovery unit, Group Special Assets Management (GSAM), which is independent from its main businesses. Where any amount is considered irrecoverable, a stage 3 credit impairment provision is raised. This stage 3 provision is the difference between the loan-carrying amount and the probability-weighted present value of estimated future cash flows, reflecting a range of scenarios (typically the best, worst and most likely recovery outcomes). Where the cash flows include realisable collateral, the values used will incorporate the impact of forward-looking economic information.
The individual circumstances of each client are considered when GSAM estimates future cash flows and timing of future recoveries which involve significant judgement. All available sources, such as cash flow arising from operations, selling assets or subsidiaries, realising collateral or payments under guarantees, are considered. In any decision relating to the raising of provisions, the Group attempts to balance economic conditions, local knowledge and experience, and the results of independent asset reviews.

179179
RIS
K R
EV
IEW
AN
D C
AP
ITAL R
EV
IEW
Strategic rep
ort
Sup
plem
entary inform
ation
Financial statements
Directo
rs’ repo
rt
Write-offsWhere it is considered that there is no realistic prospect of recovering a portion of an exposure against which an impairment provision has been raised, that amount will be written off.
Governance and application of expert credit judgement in respect of expected credit lossesThe models used in determining expected credit losses are reviewed and approved by the Group Credit Model Assessment Committee (CMAC), which is appointed by the Model Risk Committee. The CMAC has the responsibility to assess and approve the use of models and to review all IFRS 9 interpretations related to models. The CMAC also provides oversight on operational matters related to model development, performance monitoring and model validation activities including standards, regulatory and Group Internal Audit matters.
Prior to submission to the CMAC for approval, the models have been validated by Group Model Validation (GMV), a function which is independent of the business and the model developers. GMV’s analysis comprises review of model documentation, model design and methodology; data validation; review of model development and calibration process; out-of-sample performance testing; and assessment of compliance review against IFRS 9 rules and internal standards.
Key inputs into the calculation and resulting expected credit loss provisions are subject to review and approval by the IFRS 9 Impairment Committee which is appointed by the Group Risk Committee. The IFRS 9 Impairment Committee consists of senior representatives from Risk, Finance, and Group Economic Research. It meets at least twice every quarter, once before the models are run to approve key inputs into the calculation, and once after the models are run to approve the expected credit loss provisions and any judgemental override that may be necessary.
The IFRS 9 Impairment Committee:
¼ Oversees the appropriateness of all Business Model Assessment and Solely Payments of Principal and Interest (SPPI) tests
¼ Reviews and approves expected credit loss for financial assets classified as stages 1, 2 and 3 for each financial reporting period
¼ Reviews and approves stage allocation rules and thresholds
¼ Approves material adjustments in relation to expected credit loss for FVOCI and amortised cost financial assets
¼ Reviews, challenges and approves base macroeconomic forecasts and (the multiple macroeconomic scenarios approach) that are utilised in the forward-looking expected credit loss calculations
The IFRS 9 Impairment Committee is supported by an Expert Panel which reviews and challenges the full extended version of base case projections and multiple macroeconomic scenarios. The Expert Panel consists of members of Enterprise Risk Management (which includes the Scenario Design team), Finance, Group Economic Research and country representatives of major jurisdictions.

Standard Chartered Annual Report 2018180
RISK REVIEW Risk profile
Country Risk (unaudited) Country cross-border risk is the risk that the Group will be unable to obtain payment from counterparties on their contractual obligations as a result of certain actions taken by foreign governments, chiefly relating to convertibility and transferability of foreign currency.
The profile of the Group’s country cross-border exposures as at 31 December 2018 remained consistent with its strategic focus on core franchise countries. Changes in the pace of economic activity and portfolio management activity had an impact on the growth of cross-border exposure for certain territories.
Country cross-border exposure to China remains predominantly short-term (85 per cent of exposure had a tenor of less than one-year). During 2018, the Group’s cross-border exposure to China decreased, primarily driven by a loan portfolio reduction, as well as repayment of some large-scale term and bridge loans.
Country cross-border exposure to Hong Kong rose marginally, with strong loan book growth largely offset by a decline in trade finance exposures; reflecting a more subdued global trade environment and domestic economic headwinds.
Singapore’s cross-border exposure declined during 2018 due to a reduction in exposure from corporate business loans and structured finance transactions, partially offset by an uptick in interbank exposures.
The increase in United Arab Emirates cross-border exposure reflects growth in the loan book and trade finance. Growth is supported by new exposures to Abu Dhabi government-related entities and core Dubai corporates, increased refinancing activities and bridging loans to acquisition transactions.
The decrease in cross-border exposure to South Korea reflects a reduction in marketable securities held, as well as economic and external headwinds stemming from uncertainty around the ongoing trade tensions and monetary tightening in the United States.
India’s cross-border exposure declined, primarily driven by facility roll-offs on the loan book, as well as a reduction in both issuer risk and private bank exposures.
Cross-border exposure to developed countries in which the Group does not have a major presence, predominantly relates to treasury and liquidity management activities, which can change significantly from period to period. Exposure to such markets also represents global corporate business for customers with interests in our footprint. The increase in exposures to the United States, Germany and Australia are all largely attributed to Group liquidity management operations during the year.
The table below, which is based on the Group’s internal country cross-border risk reporting requirements, shows cross- border exposures that exceed 1 per cent of total assets.
31.12.18 31.12.17
Less than one year $million
More than one year $million
Total $million
Less than one year $million
More than one year $million
Total $million
China1 37,039 6,458 43,497 38,676 6,204 44,880
United States 15,369 8,986 24,355 10,068 9,524 19,592
Hong Kong1 11,451 8,819 20,270 11,686 7,964 19,650
Singapore 12,799 5,921 18,720 13,555 5,955 19,510
United Arab Emirates 8,531 9,139 17,670 7,932 8,341 16,273
South Korea 12,210 4,550 16,760 14,513 4,331 18,844
India 10,536 5,674 16,210 11,687 5,819 17,506
Germany 3,236 7,080 10,316 3,022 4,505 7,527
Australia 2,495 5,335 7,830 1,916 4,045 5,961
1 Cross-border exposures for 31.12.17 (IAS 39) relating to China and Hong Kong have been restated to reflect methodology amendments:
¼ China – Less than one-year bucket restated from $40,351 million to $38,676 million. Consequently the total is restated from $46,455 million to $44,880 million
¼ Hong Kong – More than one-year bucket restated from $7,867 million to $7,964 million. Consequently the total is restated from $19,552 million to $19,650 million
Traded riskTraded risk is the potential for loss resulting from activities undertaken by the bank in financial markets. Under the Enterprise Risk Management Framework, the introduction of the Traded Risk Framework in 2018 sought to bring together all risk types exhibiting risk features common to traded risk.
These risk types include Market risk, Counterparty Credit risk, Issuer risk, XVA, Algorithmic trading and Pension risk. Traded Risk Management (TRM, formerly Market and Traded Credit Risk) is the core risk management function supporting market-facing businesses, specifically Financial Markets and Treasury Markets.
Market riskMarket risk is the potential for loss of economic value due to adverse changes in financial market rates or prices. The Group’s exposure to market risk arises predominantly from the following sources:
¼ Trading book: the Group provides clients access to financial markets, facilitation of which entails the Group taking moderate market risk positions. All trading teams support client activity; there are no proprietary trading teams. Hence, income earned from market risk-related activities is primarily driven by the volume of client activity rather than risk-taking.
¼ Non-trading book:
– The Treasury Markets desk is required to hold a liquid assets buffer, much of which is held in high-quality marketable debt securities
– The Group has capital invested and related income streams denominated in currencies other than US dollars. To the extent that these are not hedged, the Group is subject to structural foreign exchange risk which is reflected in reserves
A summary of our current policies and practices regarding market risk management is provided in the Principal Risks section (page 202).
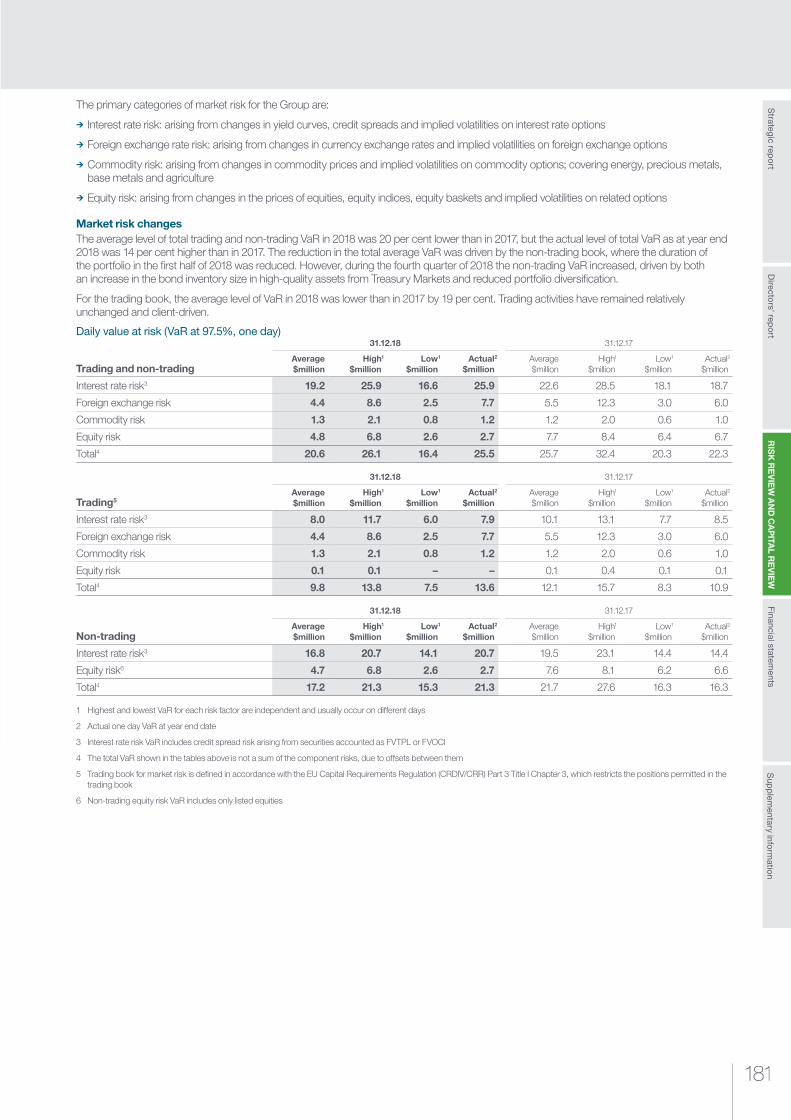
181181
RIS
K R
EV
IEW
AN
D C
AP
ITAL R
EV
IEW
Strategic rep
ort
Sup
plem
entary inform
ation
Financial statements
Directo
rs’ repo
rt
The primary categories of market risk for the Group are:
¼ Interest rate risk: arising from changes in yield curves, credit spreads and implied volatilities on interest rate options
¼ Foreign exchange rate risk: arising from changes in currency exchange rates and implied volatilities on foreign exchange options
¼ Commodity risk: arising from changes in commodity prices and implied volatilities on commodity options; covering energy, precious metals, base metals and agriculture
¼ Equity risk: arising from changes in the prices of equities, equity indices, equity baskets and implied volatilities on related options
Market risk changesThe average level of total trading and non-trading VaR in 2018 was 20 per cent lower than in 2017, but the actual level of total VaR as at year end 2018 was 14 per cent higher than in 2017. The reduction in the total average VaR was driven by the non-trading book, where the duration of the portfolio in the first half of 2018 was reduced. However, during the fourth quarter of 2018 the non-trading VaR increased, driven by both an increase in the bond inventory size in high-quality assets from Treasury Markets and reduced portfolio diversification.
For the trading book, the average level of VaR in 2018 was lower than in 2017 by 19 per cent. Trading activities have remained relatively unchanged and client-driven.
Daily value at risk (VaR at 97.5%, one day)
Trading and non-trading
31.12.18 31.12.17
Average $million
High1
$millionLow1
$millionActual2
$millionAverage $million
High1
$millionLow1
$millionActual2
$million
Interest rate risk3 19.2 25.9 16.6 25.9 22.6 28.5 18.1 18.7
Foreign exchange risk 4.4 8.6 2.5 7.7 5.5 12.3 3.0 6.0
Commodity risk 1.3 2.1 0.8 1.2 1.2 2.0 0.6 1.0
Equity risk 4.8 6.8 2.6 2.7 7.7 8.4 6.4 6.7
Total4 20.6 26.1 16.4 25.5 25.7 32.4 20.3 22.3
Trading5
31.12.18 31.12.17
Average $million
High1
$millionLow1
$millionActual2
$millionAverage $million
High1
$millionLow1
$millionActual2
$million
Interest rate risk3 8.0 11.7 6.0 7.9 10.1 13.1 7.7 8.5
Foreign exchange risk 4.4 8.6 2.5 7.7 5.5 12.3 3.0 6.0
Commodity risk 1.3 2.1 0.8 1.2 1.2 2.0 0.6 1.0
Equity risk 0.1 0.1 – – 0.1 0.4 0.1 0.1
Total4 9.8 13.8 7.5 13.6 12.1 15.7 8.3 10.9
Non-trading
31.12.18 31.12.17
Average $million
High1
$millionLow1
$millionActual2
$millionAverage $million
High1
$millionLow1
$millionActual2
$million
Interest rate risk3 16.8 20.7 14.1 20.7 19.5 23.1 14.4 14.4
Equity risk6 4.7 6.8 2.6 2.7 7.6 8.1 6.2 6.6
Total4 17.2 21.3 15.3 21.3 21.7 27.6 16.3 16.3
1 Highest and lowest VaR for each risk factor are independent and usually occur on different days
2 Actual one day VaR at year end date
3 Interest rate risk VaR includes credit spread risk arising from securities accounted as FVTPL or FVOCI
4 The total VaR shown in the tables above is not a sum of the component risks, due to offsets between them
5 Trading book for market risk is defined in accordance with the EU Capital Requirements Regulation (CRDIV/CRR) Part 3 Title I Chapter 3, which restricts the positions permitted in the trading book
6 Non-trading equity risk VaR includes only listed equities
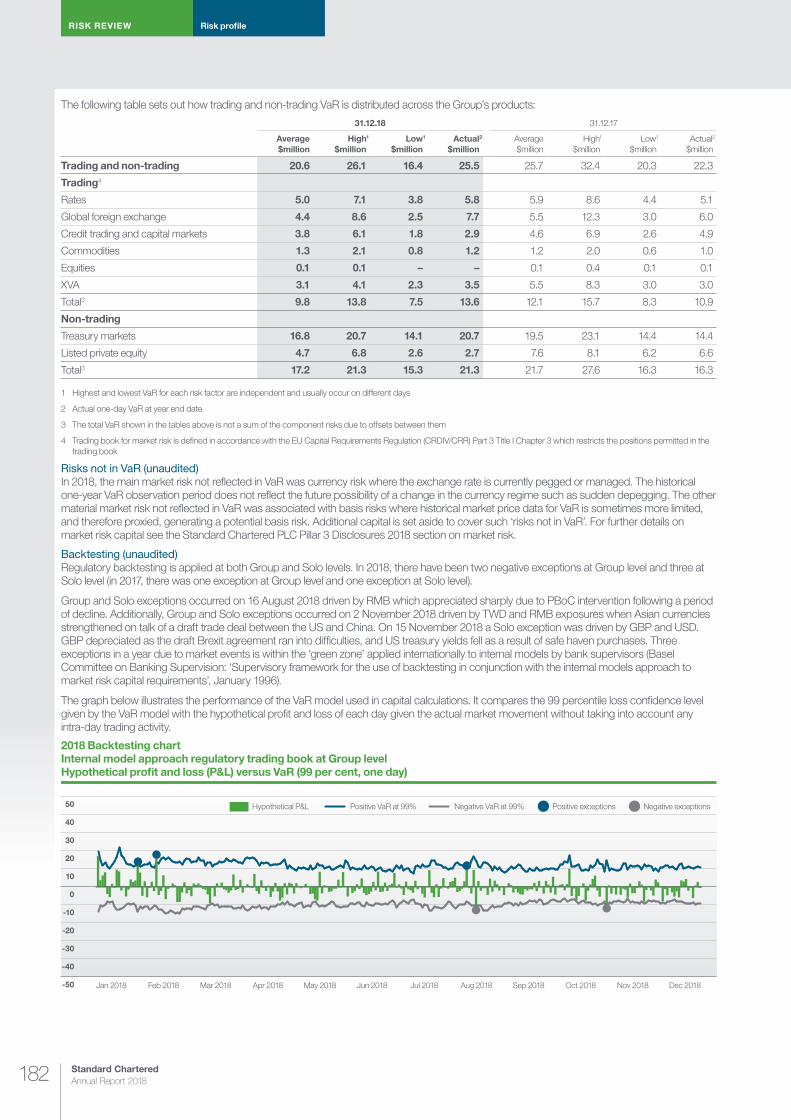
Standard Chartered Annual Report 2018182
RISK REVIEW Risk profile
The following table sets out how trading and non-trading VaR is distributed across the Group’s products:
31.12.18 31.12.17
Average $million
High1
$millionLow1
$millionActual2
$millionAverage $million
High1
$millionLow1
$millionActual2
$million
Trading and non-trading 20.6 26.1 16.4 25.5 25.7 32.4 20.3 22.3
Trading4
Rates 5.0 7.1 3.8 5.8 5.9 8.6 4.4 5.1
Global foreign exchange 4.4 8.6 2.5 7.7 5.5 12.3 3.0 6.0
Credit trading and capital markets 3.8 6.1 1.8 2.9 4.6 6.9 2.6 4.9
Commodities 1.3 2.1 0.8 1.2 1.2 2.0 0.6 1.0
Equities 0.1 0.1 – – 0.1 0.4 0.1 0.1
XVA 3.1 4.1 2.3 3.5 5.5 8.3 3.0 3.0
Total3 9.8 13.8 7.5 13.6 12.1 15.7 8.3 10.9
Non-trading
Treasury markets 16.8 20.7 14.1 20.7 19.5 23.1 14.4 14.4
Listed private equity 4.7 6.8 2.6 2.7 7.6 8.1 6.2 6.6
Total3 17.2 21.3 15.3 21.3 21.7 27.6 16.3 16.3
1 Highest and lowest VaR for each risk factor are independent and usually occur on different days
2 Actual one-day VaR at year end date
3 The total VaR shown in the tables above is not a sum of the component risks due to offsets between them
4 Trading book for market risk is defined in accordance with the EU Capital Requirements Regulation (CRDIV/CRR) Part 3 Title I Chapter 3 which restricts the positions permitted in the trading book
Risks not in VaR (unaudited)In 2018, the main market risk not reflected in VaR was currency risk where the exchange rate is currently pegged or managed. The historical one-year VaR observation period does not reflect the future possibility of a change in the currency regime such as sudden depegging. The other material market risk not reflected in VaR was associated with basis risks where historical market price data for VaR is sometimes more limited, and therefore proxied, generating a potential basis risk. Additional capital is set aside to cover such ‘risks not in VaR’. For further details on market risk capital see the Standard Chartered PLC Pillar 3 Disclosures 2018 section on market risk.
Backtesting (unaudited)Regulatory backtesting is applied at both Group and Solo levels. In 2018, there have been two negative exceptions at Group level and three at Solo level (in 2017, there was one exception at Group level and one exception at Solo level).
Group and Solo exceptions occurred on 16 August 2018 driven by RMB which appreciated sharply due to PBoC intervention following a period of decline. Additionally, Group and Solo exceptions occurred on 2 November 2018 driven by TWD and RMB exposures when Asian currencies strengthened on talk of a draft trade deal between the US and China. On 15 November 2018 a Solo exception was driven by GBP and USD. GBP depreciated as the draft Brexit agreement ran into difficulties, and US treasury yields fell as a result of safe haven purchases. Three exceptions in a year due to market events is within the ‘green zone’ applied internationally to internal models by bank supervisors (Basel Committee on Banking Supervision: ‘Supervisory framework for the use of backtesting in conjunction with the internal models approach to market risk capital requirements’, January 1996).
The graph below illustrates the performance of the VaR model used in capital calculations. It compares the 99 percentile loss confidence level given by the VaR model with the hypothetical profit and loss of each day given the actual market movement without taking into account any intra-day trading activity.
-50
-40
-30
-20
-10
0
10
20
30
40
50
2018 Backtesting chartInternal model approach regulatory trading book at Group levelHypothetical profit and loss (P&L) versus VaR (99 per cent, one day)
Hypothetical P&L Positive VaR at 99% Negative VaR at 99% Negative exceptions
Jan 2018 Feb 2018 Mar 2018 Apr 2018 May 2018 Jun 2018 Jul 2018 Aug 2018 Sep 2018 Oct 2018 Nov 2018 Dec 2018
Positive exceptions

183183
RIS
K R
EV
IEW
AN
D C
AP
ITAL R
EV
IEW
Strategic rep
ort
Sup
plem
entary inform
ation
Financial statements
Directo
rs’ repo
rt
Financial Markets loss days 31.12.18 31.12.17
Number of loss days reported for Financial Markets trading book total product income1 8 15
1 Reflects total product income for Financial Markets:
¼ Including CVA and FVA risk
¼ Excluding Treasury Markets business (non-trading) and periodic valuation changes for Capital Markets, expected loss provisions and OIS discounting
Average daily income earned from market risk related activities1
Trading31.12.18 $million
31.12.17 $million
Interest rate risk 3.1 3.5
Foreign exchange risk 3.9 3.7
Commodity risk 0.8 0.6
Equity risk – –
Total 7.8 7.8
Non-trading
Interest rate risk 2.4 2.4
Equity risk 0.4 0.3
Total 2.8 2.7
1 Includes the elements of Trading income, Interest income and Other income which are generated from market risk-related activities. XVA income is included under Interest rate risk
Mapping of market risk items to the balance sheet (unaudited)Market risk contributes 7.4 per cent of the Group’s regulatory capital risk-weighted asset (RWA) requirement (refer to risk-weighted assets tables (page 221)). As highlighted in the VaR disclosure, during 2018 the majority of market risk was managed within Treasury Markets and Financial Markets, which span both the trading book and non-trading book. The non-trading equity market risk is generated by listed private equity holdings within Principal Finance. Treasury manages the market risk associated with debt and equity capital issuance.
Amounts as per financial statements
$million
Exposure to trading
risk $million
Exposure to non-trading
risk $million Market risk type
Financial assets
Derivative financial instruments 45,621 45,386 235 Interest rate, foreign exchange, commodity or equity risk
Loans and advances to banks 82,065 19,319 62,746 Interest rate or foreign exchange risk
Loans and advances to customers 299,371 42,436 256,935 Interest rate or foreign exchange risk
Debt securities and other eligible bills 147,614 22,494 125,120 Interest rate mainly, but also foreign exchange or equity risk
Equities 1,954 1,347 607 Equities risk mainly, but also interest or foreign exchange risk
Other assets 35,401 6,666 28,735 Interest rate, foreign exchange, commodity or equity risk
Total 612,026 137,648 474,378
Financial liabilities
Deposits by banks 35,017 – 35,017 Interest rate or foreign exchange risk
Customer accounts 437,181 – 437,181 Interest rate or foreign exchange risk
Debt securities in issue 53,859 – 53,859 Interest rate mainly, but also foreign exchange or equity risk
Derivative financial instruments 47,209 46,839 370 Interest rate, foreign exchange, commodity or equity risk
Short positions 3,226 3,226 – Interest rate, foreign exchange, commodity or equity risk
Total 576,492 50,065 526,427
Standard Chartered Annual Report 2018184
RISK REVIEW Risk profile
Structural foreign exchange exposuresThe table below sets out the principal structural foreign exchange exposures (net of investment hedges) of the Group.
31.12.18 $million
01.01.18 $million
31.12.17 $million
Hong Kong dollar 7,792 7,028 7,119
Indian rupee 3,819 4,782 4,806
Renminbi 2,900 3,767 3,784
Singapore dollar 2,852 2,874 2,972
Korean won 2,148 2,284 2,361
Taiwanese dollar 1,238 1,569 1,589
UAE dirham 1,852 1,785 1,842
Malaysian ringgit 1,513 1,453 1,512
Thai baht 1,304 1,277 1,277
Indonesian rupiah 999 1,073 1,090
Pakistani rupee 458 545 543
Other 3,999 3,909 4,000
30,874 32,346 32,895
As at 31 December 2018, the Group had taken net investment hedges using derivative financial investments of $2,137 million (2017: $2,003 million) to partly cover its exposure to the Korean won, $800 million (2017: $792 million) to partly cover its exposure to the Taiwanese dollar, $1,606 million (2017: $490 million) to partly cover its exposure to the Renminbi and $712 million to partly cover its exposure to the Indian rupee. An analysis has been performed on these exposures to assess the impact of a 1 per cent fall in the US dollar exchange rates, adjusted to incorporate the impacts of correlations of these currencies to the US dollar. The impact on the positions above would be an increase of $336 million (2017: $357 million). Changes in the valuation of these positions are taken to reserves.
For analysis of the Group’s capital position and requirements, refer to the Capital Review (page 218).
Counterparty credit riskCounterparty credit risk is the potential for loss in the event of the default of a derivative counterparty, after taking into account the value of eligible collaterals and risk mitigation techniques. The Group’s counterparty credit exposures are included in the Credit risk section.
Derivative financial instruments credit risk mitigationThe Group enters into master netting agreements, which in the event of default result in a single amount owed by or to the counterparty through netting the sum of the positive and negative mark-to-market values of applicable derivative transactions. The value of exposure under master netting agreements is $32,283 million (2017: $29,135 million).
In addition, the Group enters into credit support annexes (CSAs) with counterparties where collateral is deemed a necessary or desirable mitigant to the exposure. Cash collateral includes collateral called under a variation margin process from counterparties if total uncollateralised mark-to-market exposure exceeds the threshold and minimum transfer amount specified in the CSA. With certain counterparties, the CSA is reciprocal and requires us to post collateral if the overall mark-to-market values of positions are in the counterparty’s favour and exceed an agreed threshold. The Group holds $6,834 million (2017: $6,562 million) under CSAs.
Liquidity and Funding riskLiquidity and Funding risk is the risk that we may not have sufficient stable or diverse sources of funding to meet our obligations as they fall due.
The Group’s liquidity and funding risk approach requires each country to ensure that it operates within predefined liquidity limits and remain in compliance with Group liquidity policies and practices, as well as local regulatory requirements.
The Group achieves this through a combination of setting Risk Appetite and associated limits, policy formation, risk measurement and monitoring, prudential and internal stress testing, governance and review.
Since the beginning of the year, there were no significant changes in treasury policies as disclosed in the 2017 Annual Report and Accounts.
The Group has relatively low levels of sterling and euro funding and exposures within the context of the overall Group balance sheet.
The result of the UK referendum to leave the EU has therefore not had a material first order liquidity impact.
Primary sources of fundingThe Group’s funding strategy is largely driven by its policy to maintain adequate liquidity at all times, in all geographic locations and for all currencies, and hence to be in a position to meet all obligations as they fall due. The Group’s funding profile is therefore well diversified across different sources, maturities and currencies.
A substantial portion of our assets are funded by customer deposits aligned with our policy to fund customer assets predominantly using customer deposits. Wholesale funding is diversified by type and maturity and represents a stable source of funds for the Group.
We maintain access to wholesale funding markets in all major financial centres in which we operate. This seeks to ensure that we have market intelligence, maintain stable funding lines and can obtain optimal pricing when performing our interest rate risk management activities.
In 2018, the Group issued approximately $4.6 billion of senior debt securities and $0.5 billion of subordinated debt securities from its holding company (HoldCo) Standard Chartered PLC (2017: $1.5 billion of term senior debt and $1 billion of Additional Tier 1).
Debt refinancing levels are low. In the next 12 months approximately $3.9 billion of the Group’s HoldCo senior debt is falling due for repayment either contractually or callable by the Group.
The information presented in the Liquidity pool section (page 186) is on a financial view. This is the location in which the transaction or balance was booked and provides a more accurate view of where liquidity risk is actually located.
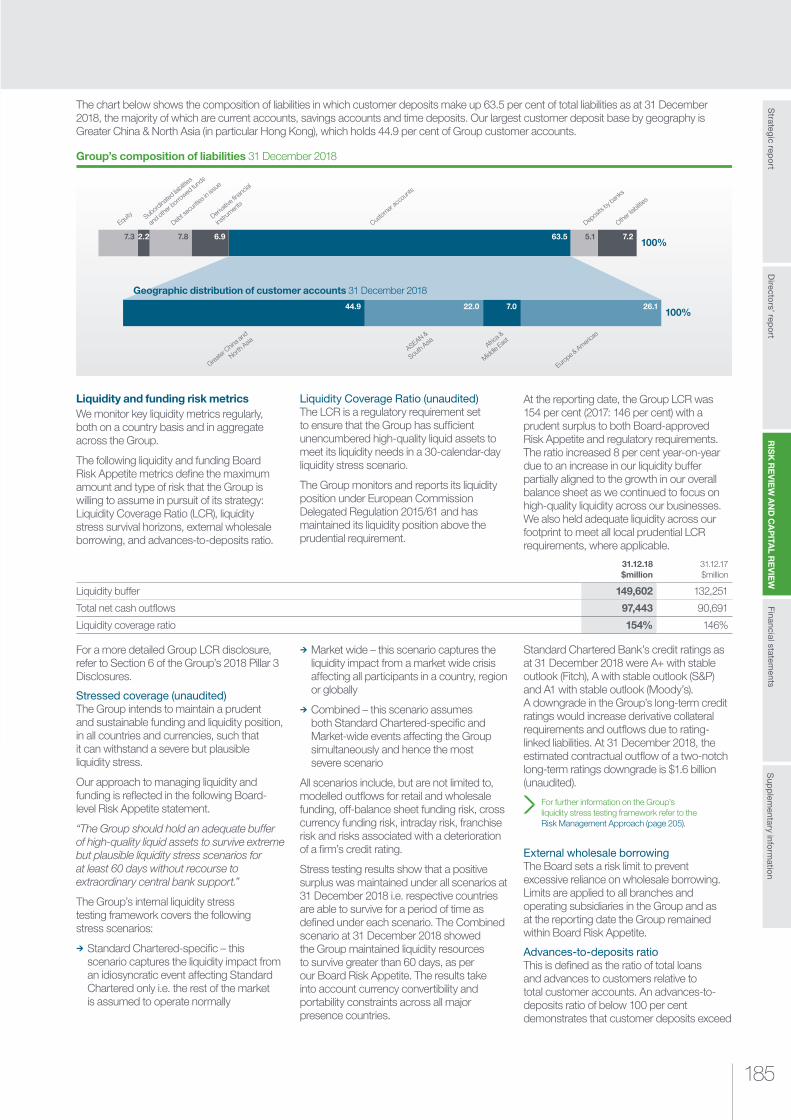
185185
RIS
K R
EV
IEW
AN
D C
AP
ITAL R
EV
IEW
Strategic rep
ort
Sup
plem
entary inform
ation
Financial statements
Directo
rs’ repo
rt
The chart below shows the composition of liabilities in which customer deposits make up 63.5 per cent of total liabilities as at 31 December 2018, the majority of which are current accounts, savings accounts and time deposits. Our largest customer deposit base by geography is Greater China & North Asia (in particular Hong Kong), which holds 44.9 per cent of Group customer accounts.
Group’s composition of liabilities 31 December 2018
7.3 7.8
Geographic distribution of customer accounts 31 December 2018
Subordina
ted lia
bilities
and o
ther b
orrow
ed fu
nds
Equity
Debt s
ecuri
ties in
issue
Deriva
tive fin
ancia
l
instru
ments
Custom
er ac
coun
ts
Depos
its by b
anks
Other lia
bilities
6.9 63.5 5.1 7.2100%
2.2
Greater
Chin
a and
North
AsiaASEAN &
South
Asia Africa &
Middle Eas
t
Europe &
America
s
100%44.9 22.0 7.0 26.1
Liquidity and funding risk metricsWe monitor key liquidity metrics regularly, both on a country basis and in aggregate across the Group.
The following liquidity and funding Board Risk Appetite metrics define the maximum amount and type of risk that the Group is willing to assume in pursuit of its strategy: Liquidity Coverage Ratio (LCR), liquidity stress survival horizons, external wholesale borrowing, and advances-to-deposits ratio.
Liquidity Coverage Ratio (unaudited)The LCR is a regulatory requirement set to ensure that the Group has sufficient unencumbered high-quality liquid assets to meet its liquidity needs in a 30-calendar-day liquidity stress scenario.
The Group monitors and reports its liquidity position under European Commission Delegated Regulation 2015/61 and has maintained its liquidity position above the prudential requirement.
At the reporting date, the Group LCR was 154 per cent (2017: 146 per cent) with a prudent surplus to both Board-approved Risk Appetite and regulatory requirements. The ratio increased 8 per cent year-on-year due to an increase in our liquidity buffer partially aligned to the growth in our overall balance sheet as we continued to focus on high-quality liquidity across our businesses. We also held adequate liquidity across our footprint to meet all local prudential LCR requirements, where applicable.
31.12.18 $million
31.12.17 $million
Liquidity buffer 149,602 132,251
Total net cash outflows 97,443 90,691
Liquidity coverage ratio 154% 146%
For a more detailed Group LCR disclosure, refer to Section 6 of the Group’s 2018 Pillar 3 Disclosures.
Stressed coverage (unaudited)The Group intends to maintain a prudent and sustainable funding and liquidity position, in all countries and currencies, such that it can withstand a severe but plausible liquidity stress.
Our approach to managing liquidity and funding is reflected in the following Board-level Risk Appetite statement.
“The Group should hold an adequate buffer of high-quality liquid assets to survive extreme but plausible liquidity stress scenarios for at least 60 days without recourse to extraordinary central bank support.”
The Group’s internal liquidity stress testing framework covers the following stress scenarios:
¼ Standard Chartered-specific – this scenario captures the liquidity impact from an idiosyncratic event affecting Standard Chartered only i.e. the rest of the market is assumed to operate normally
¼ Market wide – this scenario captures the liquidity impact from a market wide crisis affecting all participants in a country, region or globally
¼ Combined – this scenario assumes both Standard Chartered-specific and Market-wide events affecting the Group simultaneously and hence the most severe scenario
All scenarios include, but are not limited to, modelled outflows for retail and wholesale funding, off-balance sheet funding risk, cross currency funding risk, intraday risk, franchise risk and risks associated with a deterioration of a firm’s credit rating.
Stress testing results show that a positive surplus was maintained under all scenarios at 31 December 2018 i.e. respective countries are able to survive for a period of time as defined under each scenario. The Combined scenario at 31 December 2018 showed the Group maintained liquidity resources to survive greater than 60 days, as per our Board Risk Appetite. The results take into account currency convertibility and portability constraints across all major presence countries.
Standard Chartered Bank’s credit ratings as at 31 December 2018 were A+ with stable outlook (Fitch), A with stable outlook (S&P) and A1 with stable outlook (Moody’s). A downgrade in the Group’s long-term credit ratings would increase derivative collateral requirements and outflows due to rating-linked liabilities. At 31 December 2018, the estimated contractual outflow of a two-notch long-term ratings downgrade is $1.6 billion (unaudited).
For further information on the Group’s liquidity stress testing framework refer to the Risk Management Approach (page 205).
External wholesale borrowing The Board sets a risk limit to prevent excessive reliance on wholesale borrowing. Limits are applied to all branches and operating subsidiaries in the Group and as at the reporting date the Group remained within Board Risk Appetite.
Advances-to-deposits ratioThis is defined as the ratio of total loans and advances to customers relative to total customer accounts. An advances-to-deposits ratio of below 100 per cent demonstrates that customer deposits exceed
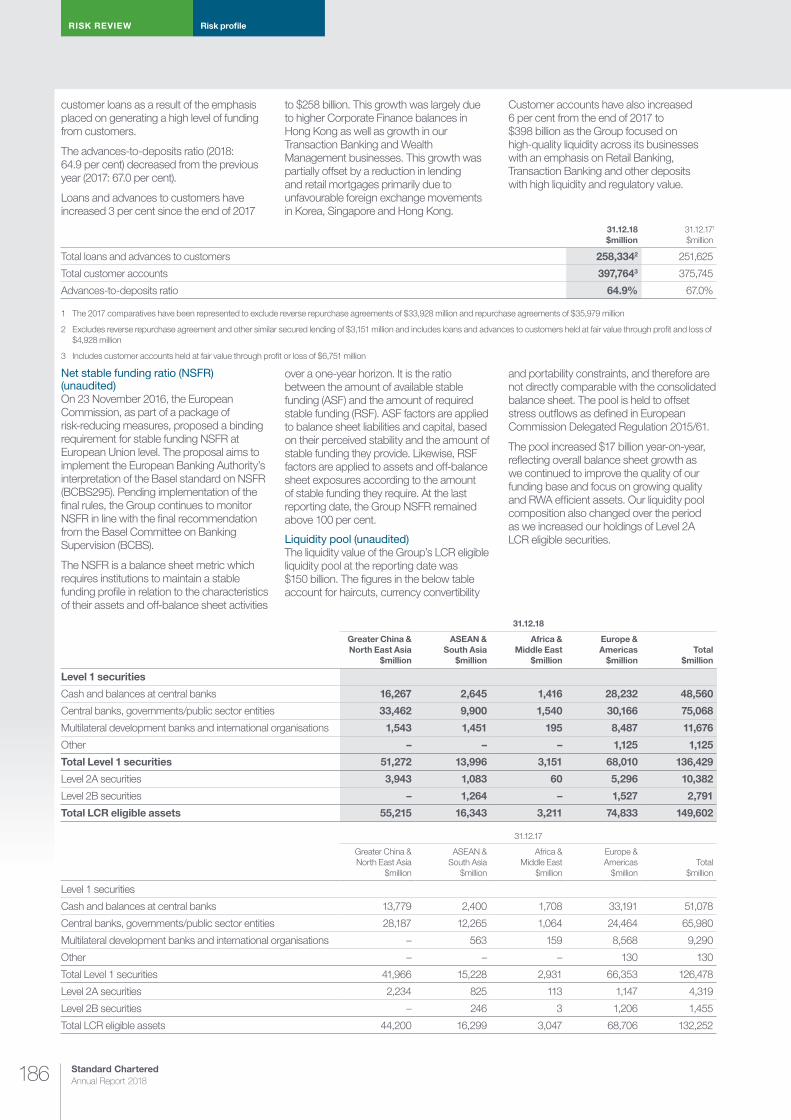
Standard Chartered Annual Report 2018186
RISK REVIEW Risk profile
customer loans as a result of the emphasis placed on generating a high level of funding from customers.
The advances-to-deposits ratio (2018: 64.9 per cent) decreased from the previous year (2017: 67.0 per cent).
Loans and advances to customers have increased 3 per cent since the end of 2017
to $258 billion. This growth was largely due to higher Corporate Finance balances in Hong Kong as well as growth in our Transaction Banking and Wealth Management businesses. This growth was partially offset by a reduction in lending and retail mortgages primarily due to unfavourable foreign exchange movements in Korea, Singapore and Hong Kong.
Customer accounts have also increased 6 per cent from the end of 2017 to $398 billion as the Group focused on high-quality liquidity across its businesses with an emphasis on Retail Banking, Transaction Banking and other deposits with high liquidity and regulatory value.
31.12.18 $million
31.12.171 $million
Total loans and advances to customers 258,3342 251,625
Total customer accounts 397,7643 375,745
Advances-to-deposits ratio 64.9% 67.0%
1 The 2017 comparatives have been represented to exclude reverse repurchase agreements of $33,928 million and repurchase agreements of $35,979 million
2 Excludes reverse repurchase agreement and other similar secured lending of $3,151 million and includes loans and advances to customers held at fair value through profit and loss of $4,928 million
3 Includes customer accounts held at fair value through profit or loss of $6,751 million
Net stable funding ratio (NSFR) (unaudited)On 23 November 2016, the European Commission, as part of a package of risk-reducing measures, proposed a binding requirement for stable funding NSFR at European Union level. The proposal aims to implement the European Banking Authority’s interpretation of the Basel standard on NSFR (BCBS295). Pending implementation of the final rules, the Group continues to monitor NSFR in line with the final recommendation from the Basel Committee on Banking Supervision (BCBS).
The NSFR is a balance sheet metric which requires institutions to maintain a stable funding profile in relation to the characteristics of their assets and off-balance sheet activities
over a one-year horizon. It is the ratio between the amount of available stable funding (ASF) and the amount of required stable funding (RSF). ASF factors are applied to balance sheet liabilities and capital, based on their perceived stability and the amount of stable funding they provide. Likewise, RSF factors are applied to assets and off-balance sheet exposures according to the amount of stable funding they require. At the last reporting date, the Group NSFR remained above 100 per cent.
Liquidity pool (unaudited)The liquidity value of the Group’s LCR eligible liquidity pool at the reporting date was $150 billion. The figures in the below table account for haircuts, currency convertibility
and portability constraints, and therefore are not directly comparable with the consolidated balance sheet. The pool is held to offset stress outflows as defined in European Commission Delegated Regulation 2015/61.
The pool increased $17 billion year-on-year, reflecting overall balance sheet growth as we continued to improve the quality of our funding base and focus on growing quality and RWA efficient assets. Our liquidity pool composition also changed over the period as we increased our holdings of Level 2A LCR eligible securities.
31.12.18
Greater China & North East Asia
$million
ASEAN & South Asia
$million
Africa & Middle East
$million
Europe & Americas
$millionTotal
$million
Level 1 securities
Cash and balances at central banks 16,267 2,645 1,416 28,232 48,560
Central banks, governments/public sector entities 33,462 9,900 1,540 30,166 75,068
Multilateral development banks and international organisations 1,543 1,451 195 8,487 11,676
Other – – – 1,125 1,125
Total Level 1 securities 51,272 13,996 3,151 68,010 136,429
Level 2A securities 3,943 1,083 60 5,296 10,382
Level 2B securities – 1,264 – 1,527 2,791
Total LCR eligible assets 55,215 16,343 3,211 74,833 149,602
31.12.17
Greater China & North East Asia
$million
ASEAN & South Asia
$million
Africa & Middle East
$million
Europe & Americas
$millionTotal
$million
Level 1 securities
Cash and balances at central banks 13,779 2,400 1,708 33,191 51,078
Central banks, governments/public sector entities 28,187 12,265 1,064 24,464 65,980
Multilateral development banks and international organisations – 563 159 8,568 9,290
Other – – – 130 130
Total Level 1 securities 41,966 15,228 2,931 66,353 126,478
Level 2A securities 2,234 825 113 1,147 4,319
Level 2B securities – 246 3 1,206 1,455
Total LCR eligible assets 44,200 16,299 3,047 68,706 132,252
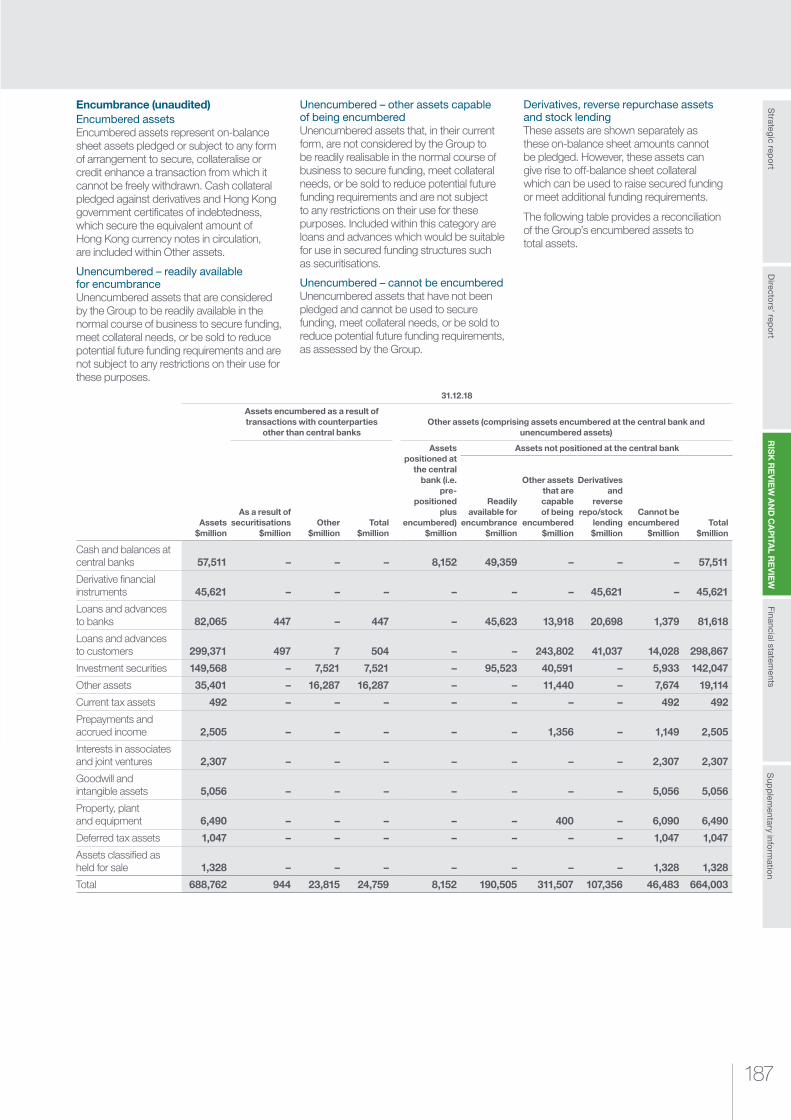
187187
RIS
K R
EV
IEW
AN
D C
AP
ITAL R
EV
IEW
Strategic rep
ort
Sup
plem
entary inform
ation
Financial statements
Directo
rs’ repo
rt
Encumbrance (unaudited)Encumbered assetsEncumbered assets represent on-balance sheet assets pledged or subject to any form of arrangement to secure, collateralise or credit enhance a transaction from which it cannot be freely withdrawn. Cash collateral pledged against derivatives and Hong Kong government certificates of indebtedness, which secure the equivalent amount of Hong Kong currency notes in circulation, are included within Other assets.
Unencumbered – readily available for encumbrance Unencumbered assets that are considered by the Group to be readily available in the normal course of business to secure funding, meet collateral needs, or be sold to reduce potential future funding requirements and are not subject to any restrictions on their use for these purposes.
Unencumbered – other assets capable of being encumbered Unencumbered assets that, in their current form, are not considered by the Group to be readily realisable in the normal course of business to secure funding, meet collateral needs, or be sold to reduce potential future funding requirements and are not subject to any restrictions on their use for these purposes. Included within this category are loans and advances which would be suitable for use in secured funding structures such as securitisations.
Unencumbered – cannot be encumbered Unencumbered assets that have not been pledged and cannot be used to secure funding, meet collateral needs, or be sold to reduce potential future funding requirements, as assessed by the Group.
Derivatives, reverse repurchase assets and stock lendingThese assets are shown separately as these on-balance sheet amounts cannot be pledged. However, these assets can give rise to off-balance sheet collateral which can be used to raise secured funding or meet additional funding requirements.
The following table provides a reconciliation of the Group’s encumbered assets to total assets.
31.12.18
Assets $million
Assets encumbered as a result of transactions with counterparties
other than central banksOther assets (comprising assets encumbered at the central bank and
unencumbered assets)
As a result of securitisations
$millionOther
$millionTotal
$million
Assets positioned at
the central bank (i.e.
pre-positioned
plus encumbered)
$million
Assets not positioned at the central bank
Readily available for
encumbrance $million
Other assets that are capable of being
encumbered $million
Derivatives and
reverse repo/stock
lending $million
Cannot be encumbered
$millionTotal
$million
Cash and balances at central banks 57,511 – – – 8,152 49,359 – – – 57,511
Derivative financial instruments 45,621 – – – – – – 45,621 – 45,621
Loans and advances to banks 82,065 447 – 447 – 45,623 13,918 20,698 1,379 81,618
Loans and advances to customers 299,371 497 7 504 – – 243,802 41,037 14,028 298,867
Investment securities 149,568 – 7,521 7,521 – 95,523 40,591 – 5,933 142,047
Other assets 35,401 – 16,287 16,287 – – 11,440 – 7,674 19,114
Current tax assets 492 – – – – – – – 492 492
Prepayments and accrued income 2,505 – – – – – 1,356 – 1,149 2,505
Interests in associates and joint ventures 2,307 – – – – – – – 2,307 2,307
Goodwill and intangible assets 5,056 – – – – – – – 5,056 5,056
Property, plant and equipment 6,490 – – – – – 400 – 6,090 6,490
Deferred tax assets 1,047 – – – – – – – 1,047 1,047
Assets classified as held for sale 1,328 – – – – – – – 1,328 1,328
Total 688,762 944 23,815 24,759 8,152 190,505 311,507 107,356 46,483 664,003

Standard Chartered Annual Report 2018188
RISK REVIEW Risk profile
Assets $million
31.12.17 (IAS 39)
Assets encumbered as a result of transactions with counterparties
other than central banksOther assets (comprising assets encumbered at the central bank and
unencumbered assets)
As a result of securitisations
$millionOther
$millionTotal
$million
Assets positioned at
the central bank (i.e.
pre- positioned
plus encumbered)
$million
Assets not positioned at the central bank
Total $million
Readily available for
encumbrance $million
Other assets that are capable of being
encumbered $million
Derivatives and
reverse repo/stock
lending $million
Cannot be encumbered
$million
Cash and balances at central banks 58,864 – – – 9,761 49,103 – – – 58,864
Derivative financial instruments 47,031 – – – – – – 47,031 – 47,031
Loans and advances to banks 81,325 – – – – 47,380 5,333 21,260 7,352 81,325
Loans and advances to customers 285,553 11 – 11 – – 232,328 33,928 19,286 285,542
Investment securities 138,187 – 8,213 8,213 178 91,928 29,967 – 7,901 129,974
Other assets 33,490 – 14,930 14,930 – – 11,604 – 6,956 18,560
Current tax assets 491 – – – – – – – 491 491
Prepayments and accrued income 2,307 – – – – – 1,503 – 804 2,307
Interests in associates and joint ventures 2,307 – – – – – – – 2,307 2,307
Goodwill and intangible assets 5,013 – – – – – 352 – 4,661 5,013
Property, plant and equipment 7,211 – – – – – 1,148 – 6,063 7,211
Deferred tax assets 1,177 – – – – – – – 1,177 1,177
Assets classified as held for sale 545 – – – – – – – 545 545
Total 663,501 11 23,143 23,154 9,939 188,411 282,235 102,219 57,543 640,347
The Group received $85,768 million (2017: $72,982 million) as collateral under reverse repurchase agreements, that was eligible for repledging; of this the Group sold or repledged $40,552 million (2017: $34,018 million) under repurchase agreements.

189189
RIS
K R
EV
IEW
AN
D C
AP
ITAL R
EV
IEW
Strategic rep
ort
Sup
plem
entary inform
ation
Financial statements
Directo
rs’ repo
rt
Liquidity analysis of the Group’s balance sheetContractual maturity of assets and liabilitiesThe following table presents assets and liabilities by maturity groupings based on the remaining period to the contractual maturity date as at the balance sheet date on a discounted basis. Contractual maturities do not necessarily reflect actual repayments or cashflows.
Within the tables below, cash and balances with central banks, interbank placements and investment securities that are fair value through other comprehensive income are used by the Group principally for liquidity management purposes.
As at the reporting date, assets remain predominantly short-dated, with 61 per cent maturing in under one year. Our less than three month cumulative net funding gap increased from the previous year, largely due to an increase in customer accounts as the Group focused on improving the quality of its deposit base. In practice, these deposits are recognised as stable and have behavioural profiles that extend beyond their contractual maturities.
31.12.18
One month or less
$million
Between one month and three
months $million
Between three
months and six months
$million
Between six months
and nine months $million
Between nine months
and one year
$million
Between one year and two
years $million
Between two years
and five years
$million
More than five years
and undated $million
Total $million
Assets
Cash and balances at central banks 49,359 – – – – – – 8,152 57,511
Derivative financial instruments 6,902 5,861 5,827 3,509 2,333 4,458 8,079 8,652 45,621
Loans and advances to banks1,2 38,331 20,549 11,209 5,214 2,835 2,584 1,064 279 82,065
Loans and advances to customers1,2 84,846 33,756 18,133 11,641 10,321 17,519 39,306 83,849 299,371
Investment securities 15,297 13,589 14,131 14,300 17,402 25,695 31,303 17,851 149,568
Other assets 21,155 8,909 2,385 224 135 96 155 21,567 54,626
Total assets 215,890 82,664 51,685 34,888 33,026 50,352 79,907 140,350 688,762
Liabilities
Deposits by banks1,3 30,368 2,593 572 553 397 244 230 60 35,017
Customer accounts1,4 331,633 51,553 23,643 10,966 11,634 3,631 1,154 2,967 437,181
Derivative financial instruments 7,467 6,072 6,136 3,544 2,140 5,257 8,886 7,707 47,209
Senior debt 1,259 959 509 5,087 667 2,878 6,327 10,093 27,779
Other debt securities in issue1 4,893 9,792 8,062 177 715 1,030 16 1,395 26,080
Other liabilities 22,835 8,698 4,130 852 536 868 401 11,823 50,143
Subordinated liabilities and other borrowed funds 23 17 – – – 2,522 4,421 8,018 15,001
Total liabilities 398,478 79,684 43,052 21,179 16,089 16,430 21,435 42,063 638,410
Net liquidity gap (182,588) 2,980 8,633 13,709 16,937 33,922 58,472 98,287 50,352
1 Loans and advances, investment securities, deposits by banks, customer accounts and debt securities in issue include financial instruments held at fair value through profit or loss, see Note 13 Financial instruments
2 Loans and advances include reverse repurchase agreements and other similar secured lending of $61.7 billion
3 Deposits by banks include repurchase agreements and other similar secured borrowing of $5 billion
4 Customer accounts include repurchase agreements and other similar secured borrowing of $39.4 billion
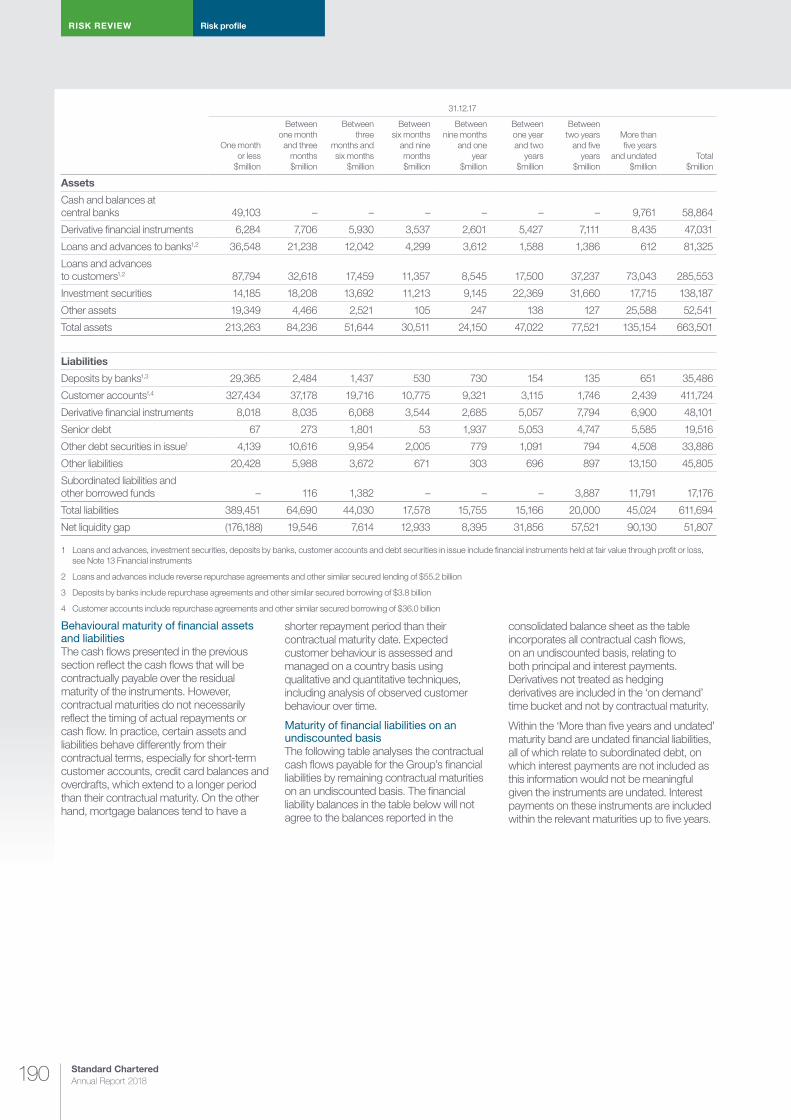
Standard Chartered Annual Report 2018190
RISK REVIEW Risk profile
31.12.17
One month or less
$million
Between one month and three
months $million
Between three
months and six months
$million
Between six months
and nine months $million
Between nine months
and one year
$million
Between one year and two
years $million
Between two years
and five years
$million
More than five years
and undated $million
Total $million
Assets
Cash and balances at central banks 49,103 – – – – – – 9,761 58,864
Derivative financial instruments 6,284 7,706 5,930 3,537 2,601 5,427 7,111 8,435 47,031
Loans and advances to banks1,2 36,548 21,238 12,042 4,299 3,612 1,588 1,386 612 81,325
Loans and advances to customers1,2 87,794 32,618 17,459 11,357 8,545 17,500 37,237 73,043 285,553
Investment securities 14,185 18,208 13,692 11,213 9,145 22,369 31,660 17,715 138,187
Other assets 19,349 4,466 2,521 105 247 138 127 25,588 52,541
Total assets 213,263 84,236 51,644 30,511 24,150 47,022 77,521 135,154 663,501
Liabilities
Deposits by banks1,3 29,365 2,484 1,437 530 730 154 135 651 35,486
Customer accounts1,4 327,434 37,178 19,716 10,775 9,321 3,115 1,746 2,439 411,724
Derivative financial instruments 8,018 8,035 6,068 3,544 2,685 5,057 7,794 6,900 48,101
Senior debt 67 273 1,801 53 1,937 5,053 4,747 5,585 19,516
Other debt securities in issue1 4,139 10,616 9,954 2,005 779 1,091 794 4,508 33,886
Other liabilities 20,428 5,988 3,672 671 303 696 897 13,150 45,805
Subordinated liabilities and other borrowed funds – 116 1,382 – – – 3,887 11,791 17,176
Total liabilities 389,451 64,690 44,030 17,578 15,755 15,166 20,000 45,024 611,694
Net liquidity gap (176,188) 19,546 7,614 12,933 8,395 31,856 57,521 90,130 51,807
1 Loans and advances, investment securities, deposits by banks, customer accounts and debt securities in issue include financial instruments held at fair value through profit or loss, see Note 13 Financial instruments
2 Loans and advances include reverse repurchase agreements and other similar secured lending of $55.2 billion
3 Deposits by banks include repurchase agreements and other similar secured borrowing of $3.8 billion
4 Customer accounts include repurchase agreements and other similar secured borrowing of $36.0 billion
Behavioural maturity of �nancial assets and liabilitiesThe cash flows presented in the previous section reflect the cash flows that will be contractually payable over the residual maturity of the instruments. However, contractual maturities do not necessarily reflect the timing of actual repayments or cash flow. In practice, certain assets and liabilities behave differently from their contractual terms, especially for short-term customer accounts, credit card balances and overdrafts, which extend to a longer period than their contractual maturity. On the other hand, mortgage balances tend to have a
shorter repayment period than their contractual maturity date. Expected customer behaviour is assessed and managed on a country basis using qualitative and quantitative techniques, including analysis of observed customer behaviour over time.
Maturity of �nancial liabilities on an undiscounted basisThe following table analyses the contractual cash flows payable for the Group’s financial liabilities by remaining contractual maturities on an undiscounted basis. The financial liability balances in the table below will not agree to the balances reported in the
consolidated balance sheet as the table incorporates all contractual cash flows, on an undiscounted basis, relating to both principal and interest payments. Derivatives not treated as hedging derivatives are included in the ‘on demand’ time bucket and not by contractual maturity.
Within the ‘More than five years and undated’ maturity band are undated financial liabilities, all of which relate to subordinated debt, on which interest payments are not included as this information would not be meaningful given the instruments are undated. Interest payments on these instruments are included within the relevant maturities up to five years.
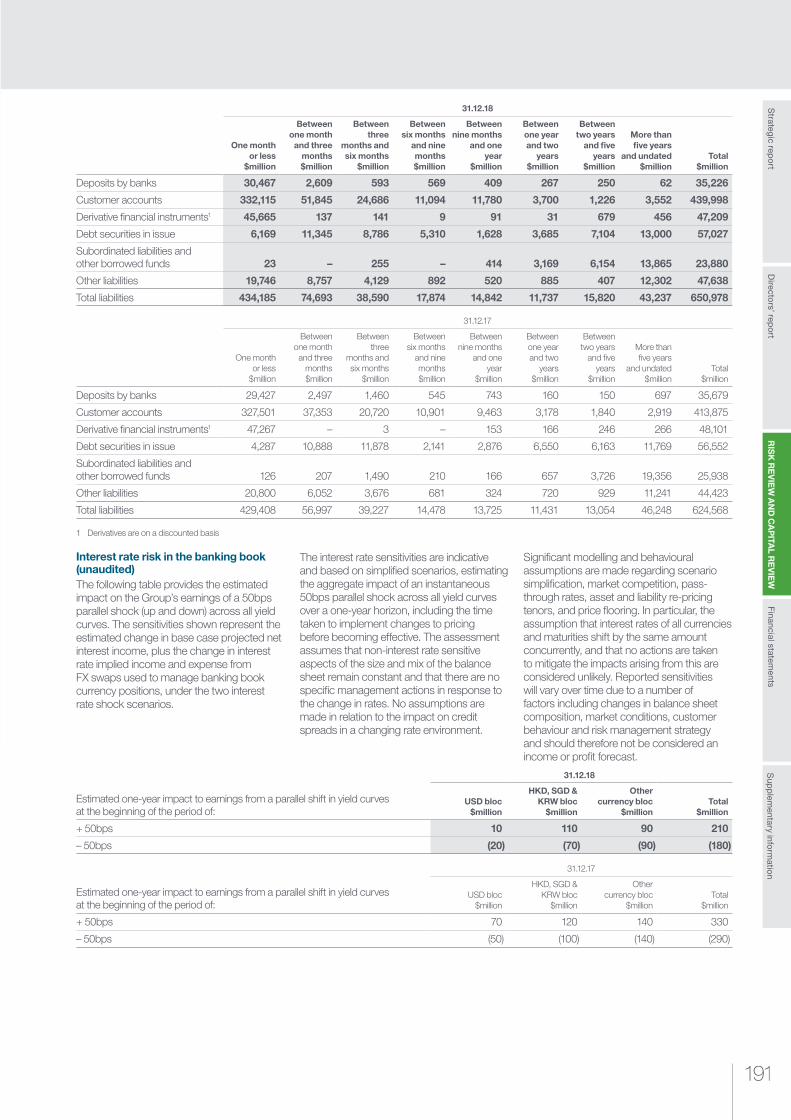
191191
RIS
K R
EV
IEW
AN
D C
AP
ITAL R
EV
IEW
Strategic rep
ort
Sup
plem
entary inform
ation
Financial statements
Directo
rs’ repo
rt
31.12.18
One month or less
$million
Between one month and three
months $million
Between three
months and six months
$million
Between six months
and nine months $million
Between nine months
and one year
$million
Between one year and two
years $million
Between two years
and five years
$million
More than five years
and undated $million
Total $million
Deposits by banks 30,467 2,609 593 569 409 267 250 62 35,226
Customer accounts 332,115 51,845 24,686 11,094 11,780 3,700 1,226 3,552 439,998
Derivative financial instruments1 45,665 137 141 9 91 31 679 456 47,209
Debt securities in issue 6,169 11,345 8,786 5,310 1,628 3,685 7,104 13,000 57,027
Subordinated liabilities and other borrowed funds 23 – 255 – 414 3,169 6,154 13,865 23,880
Other liabilities 19,746 8,757 4,129 892 520 885 407 12,302 47,638
Total liabilities 434,185 74,693 38,590 17,874 14,842 11,737 15,820 43,237 650,978
31.12.17
One month or less
$million
Between one month and three
months $million
Between three
months and six months
$million
Between six months
and nine months $million
Between nine months
and one year
$million
Between one year and two
years $million
Between two years
and five years
$million
More than five years
and undated $million
Total $million
Deposits by banks 29,427 2,497 1,460 545 743 160 150 697 35,679
Customer accounts 327,501 37,353 20,720 10,901 9,463 3,178 1,840 2,919 413,875
Derivative financial instruments1 47,267 – 3 – 153 166 246 266 48,101
Debt securities in issue 4,287 10,888 11,878 2,141 2,876 6,550 6,163 11,769 56,552
Subordinated liabilities and other borrowed funds 126 207 1,490 210 166 657 3,726 19,356 25,938
Other liabilities 20,800 6,052 3,676 681 324 720 929 11,241 44,423
Total liabilities 429,408 56,997 39,227 14,478 13,725 11,431 13,054 46,248 624,568
1 Derivatives are on a discounted basis
Interest rate risk in the banking book (unaudited)The following table provides the estimated impact on the Group’s earnings of a 50bps parallel shock (up and down) across all yield curves. The sensitivities shown represent the estimated change in base case projected net interest income, plus the change in interest rate implied income and expense from FX swaps used to manage banking book currency positions, under the two interest rate shock scenarios.
The interest rate sensitivities are indicative and based on simplified scenarios, estimating the aggregate impact of an instantaneous 50bps parallel shock across all yield curves over a one-year horizon, including the time taken to implement changes to pricing before becoming effective. The assessment assumes that non-interest rate sensitive aspects of the size and mix of the balance sheet remain constant and that there are no specific management actions in response to the change in rates. No assumptions are made in relation to the impact on credit spreads in a changing rate environment.
Significant modelling and behavioural assumptions are made regarding scenario simplification, market competition, pass-through rates, asset and liability re-pricing tenors, and price flooring. In particular, the assumption that interest rates of all currencies and maturities shift by the same amount concurrently, and that no actions are taken to mitigate the impacts arising from this are considered unlikely. Reported sensitivities will vary over time due to a number of factors including changes in balance sheet composition, market conditions, customer behaviour and risk management strategy and should therefore not be considered an income or profit forecast.
Estimated one-year impact to earnings from a parallel shift in yield curves at the beginning of the period of:
31.12.18
USD bloc $million
HKD, SGD & KRW bloc
$million
Other currency bloc
$millionTotal
$million
+ 50bps 10 110 90 210
– 50bps (20) (70) (90) (180)
Estimated one-year impact to earnings from a parallel shift in yield curves at the beginning of the period of:
31.12.17
USD bloc $million
HKD, SGD & KRW bloc
$million
Other currency bloc
$millionTotal
$million
+ 50bps 70 120 140 330
– 50bps (50) (100) (140) (290)
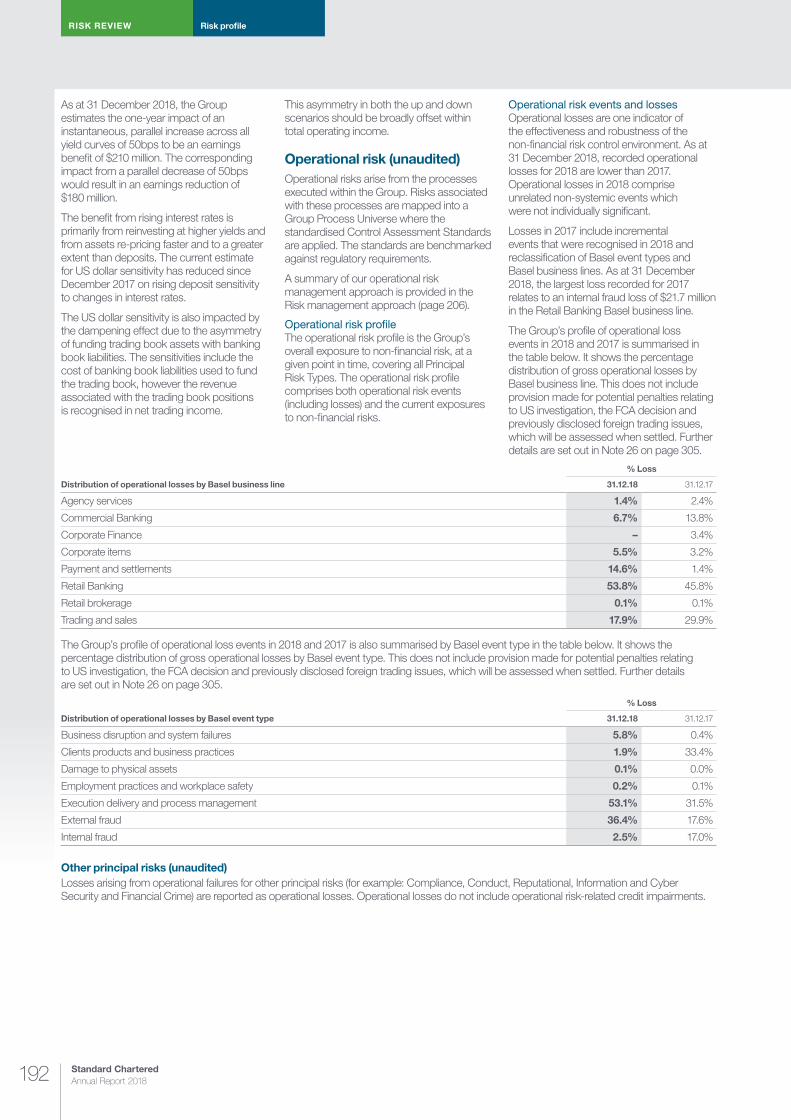
Standard Chartered Annual Report 2018192
RISK REVIEW Risk profile
As at 31 December 2018, the Group estimates the one-year impact of an instantaneous, parallel increase across all yield curves of 50bps to be an earnings benefit of $210 million. The corresponding impact from a parallel decrease of 50bps would result in an earnings reduction of $180 million.
The benefit from rising interest rates is primarily from reinvesting at higher yields and from assets re-pricing faster and to a greater extent than deposits. The current estimate for US dollar sensitivity has reduced since December 2017 on rising deposit sensitivity to changes in interest rates.
The US dollar sensitivity is also impacted by the dampening effect due to the asymmetry of funding trading book assets with banking book liabilities. The sensitivities include the cost of banking book liabilities used to fund the trading book, however the revenue associated with the trading book positions is recognised in net trading income.
This asymmetry in both the up and down scenarios should be broadly offset within total operating income.
Operational risk (unaudited) Operational risks arise from the processes executed within the Group. Risks associated with these processes are mapped into a Group Process Universe where the standardised Control Assessment Standards are applied. The standards are benchmarked against regulatory requirements.
A summary of our operational risk management approach is provided in the Risk management approach (page 206).
Operational risk pro�leThe operational risk profile is the Group’s overall exposure to non-financial risk, at a given point in time, covering all Principal Risk Types. The operational risk profile comprises both operational risk events (including losses) and the current exposures to non-financial risks.
Operational risk events and lossesOperational losses are one indicator of the effectiveness and robustness of the non-financial risk control environment. As at 31 December 2018, recorded operational losses for 2018 are lower than 2017. Operational losses in 2018 comprise unrelated non-systemic events which were not individually significant.
Losses in 2017 include incremental events that were recognised in 2018 and reclassification of Basel event types and Basel business lines. As at 31 December 2018, the largest loss recorded for 2017 relates to an internal fraud loss of $21.7 million in the Retail Banking Basel business line.
The Group’s profile of operational loss events in 2018 and 2017 is summarised in the table below. It shows the percentage distribution of gross operational losses by Basel business line. This does not include provision made for potential penalties relating to US investigation, the FCA decision and previously disclosed foreign trading issues, which will be assessed when settled. Further details are set out in Note 26 on page 305.
Distribution of operational losses by Basel business line
% Loss
31.12.18 31.12.17
Agency services 1.4% 2.4%
Commercial Banking 6.7% 13.8%
Corporate Finance – 3.4%
Corporate items 5.5% 3.2%
Payment and settlements 14.6% 1.4%
Retail Banking 53.8% 45.8%
Retail brokerage 0.1% 0.1%
Trading and sales 17.9% 29.9%
The Group’s profile of operational loss events in 2018 and 2017 is also summarised by Basel event type in the table below. It shows the percentage distribution of gross operational losses by Basel event type. This does not include provision made for potential penalties relating to US investigation, the FCA decision and previously disclosed foreign trading issues, which will be assessed when settled. Further details are set out in Note 26 on page 305.
Distribution of operational losses by Basel event type
% Loss
31.12.18 31.12.17
Business disruption and system failures 5.8% 0.4%
Clients products and business practices 1.9% 33.4%
Damage to physical assets 0.1% 0.0%
Employment practices and workplace safety 0.2% 0.1%
Execution delivery and process management 53.1% 31.5%
External fraud 36.4% 17.6%
Internal fraud 2.5% 17.0%
Other principal risks (unaudited)Losses arising from operational failures for other principal risks (for example: Compliance, Conduct, Reputational, Information and Cyber Security and Financial Crime) are reported as operational losses. Operational losses do not include operational risk-related credit impairments.
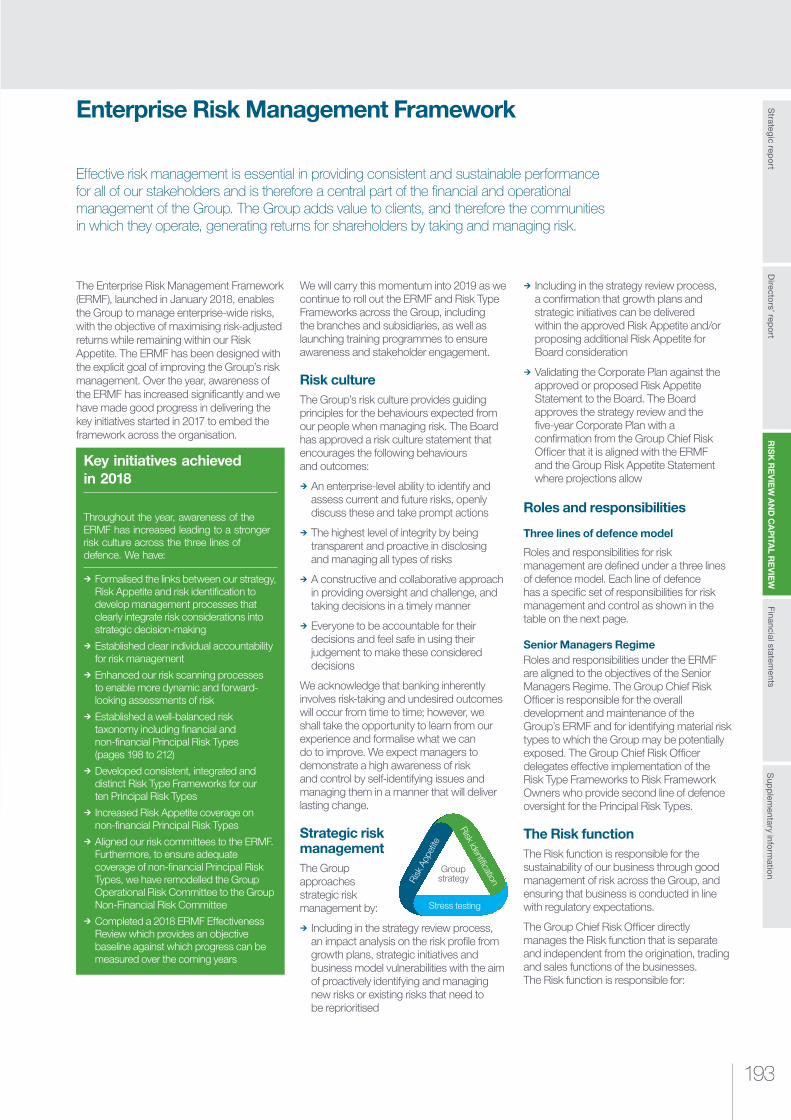
193193
RIS
K R
EV
IEW
AN
D C
AP
ITAL R
EV
IEW
Strategic rep
ort
Sup
plem
entary inform
ation
Financial statements
Directo
rs’ repo
rt
Enterprise Risk Management Framework
Effective risk management is essential in providing consistent and sustainable performance for all of our stakeholders and is therefore a central part of the financial and operational management of the Group. The Group adds value to clients, and therefore the communities in which they operate, generating returns for shareholders by taking and managing risk.
The Enterprise Risk Management Framework (ERMF), launched in January 2018, enables the Group to manage enterprise-wide risks, with the objective of maximising risk-adjusted returns while remaining within our Risk Appetite. The ERMF has been designed with the explicit goal of improving the Group’s risk management. Over the year, awareness of the ERMF has increased significantly and we have made good progress in delivering the key initiatives started in 2017 to embed the framework across the organisation.
Key initiatives achieved in 2018
Throughout the year, awareness of the ERMF has increased leading to a stronger risk culture across the three lines of defence. We have:
¼ Formalised the links between our strategy, Risk Appetite and risk identification to develop management processes that clearly integrate risk considerations into strategic decision-making
¼ Established clear individual accountability for risk management
¼ Enhanced our risk scanning processes to enable more dynamic and forward-looking assessments of risk
¼ Established a well-balanced risk taxonomy including financial and non-financial Principal Risk Types (pages 198 to 212)
¼ Developed consistent, integrated and distinct Risk Type Frameworks for our ten Principal Risk Types
¼ Increased Risk Appetite coverage on non-financial Principal Risk Types
¼ Aligned our risk committees to the ERMF. Furthermore, to ensure adequate coverage of non-financial Principal Risk Types, we have remodelled the Group Operational Risk Committee to the Group Non-Financial Risk Committee
¼ Completed a 2018 ERMF Effectiveness Review which provides an objective baseline against which progress can be measured over the coming years
We will carry this momentum into 2019 as we continue to roll out the ERMF and Risk Type Frameworks across the Group, including the branches and subsidiaries, as well as launching training programmes to ensure awareness and stakeholder engagement.
Risk cultureThe Group’s risk culture provides guiding principles for the behaviours expected from our people when managing risk. The Board has approved a risk culture statement that encourages the following behaviours and outcomes:
¼ An enterprise-level ability to identify and assess current and future risks, openly discuss these and take prompt actions
¼ The highest level of integrity by being transparent and proactive in disclosing and managing all types of risks
¼ A constructive and collaborative approach in providing oversight and challenge, and taking decisions in a timely manner
¼ Everyone to be accountable for their decisions and feel safe in using their judgement to make these considered decisions
We acknowledge that banking inherently involves risk-taking and undesired outcomes will occur from time to time; however, we shall take the opportunity to learn from our experience and formalise what we can do to improve. We expect managers to demonstrate a high awareness of risk and control by self-identifying issues and managing them in a manner that will deliver lasting change.
Strategic risk managementThe Group approaches strategic risk management by:
¼ Including in the strategy review process, an impact analysis on the risk profile from growth plans, strategic initiatives and business model vulnerabilities with the aim of proactively identifying and managing new risks or existing risks that need to be reprioritised
¼ Including in the strategy review process, a confirmation that growth plans and strategic initiatives can be delivered within the approved Risk Appetite and/or proposing additional Risk Appetite for Board consideration
¼ Validating the Corporate Plan against the approved or proposed Risk Appetite Statement to the Board. The Board approves the strategy review and the five-year Corporate Plan with a confirmation from the Group Chief Risk Officer that it is aligned with the ERMF and the Group Risk Appetite Statement where projections allow
Roles and responsibilities
Three lines of defence model
Roles and responsibilities for risk management are defined under a three lines of defence model. Each line of defence has a specific set of responsibilities for risk management and control as shown in the table on the next page.
Senior Managers RegimeRoles and responsibilities under the ERMF are aligned to the objectives of the Senior Managers Regime. The Group Chief Risk Officer is responsible for the overall development and maintenance of the Group’s ERMF and for identifying material risk types to which the Group may be potentially exposed. The Group Chief Risk Officer delegates effective implementation of the Risk Type Frameworks to Risk Framework Owners who provide second line of defence oversight for the Principal Risk Types.
The Risk functionThe Risk function is responsible for the sustainability of our business through good management of risk across the Group, and ensuring that business is conducted in line with regulatory expectations.
The Group Chief Risk Officer directly manages the Risk function that is separate and independent from the origination, trading and sales functions of the businesses. The Risk function is responsible for:
Risk identification
Group strategy
Stress testing
Risk
App
etite
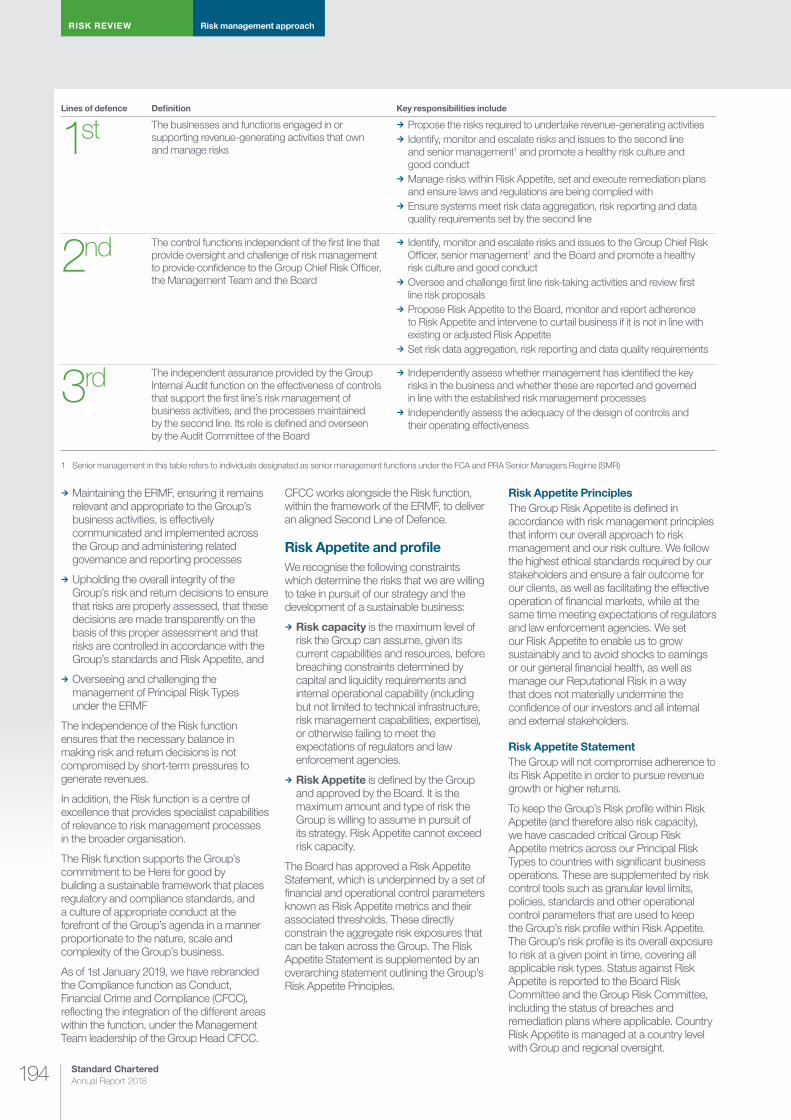
Standard Chartered Annual Report 2018194
RISK REVIEW Risk management approach
Lines of defence Definition Key responsibilities include
1st The businesses and functions engaged in or supporting revenue-generating activities that own and manage risks
¼ Propose the risks required to undertake revenue-generating activities ¼ Identify, monitor and escalate risks and issues to the second line and senior management1 and promote a healthy risk culture and good conduct
¼ Manage risks within Risk Appetite, set and execute remediation plans and ensure laws and regulations are being complied with
¼ Ensure systems meet risk data aggregation, risk reporting and data quality requirements set by the second line
2nd The control functions independent of the first line that provide oversight and challenge of risk management to provide confidence to the Group Chief Risk Officer, the Management Team and the Board
¼ Identify, monitor and escalate risks and issues to the Group Chief Risk Officer, senior management1 and the Board and promote a healthy risk culture and good conduct
¼ Oversee and challenge first line risk-taking activities and review first line risk proposals
¼ Propose Risk Appetite to the Board, monitor and report adherence to Risk Appetite and intervene to curtail business if it is not in line with existing or adjusted Risk Appetite
¼ Set risk data aggregation, risk reporting and data quality requirements
3rd The independent assurance provided by the Group Internal Audit function on the effectiveness of controls that support the first line’s risk management of business activities, and the processes maintained by the second line. Its role is defined and overseen by the Audit Committee of the Board
¼ Independently assess whether management has identified the key risks in the business and whether these are reported and governed in line with the established risk management processes
¼ Independently assess the adequacy of the design of controls and their operating effectiveness
1 Senior management in this table refers to individuals designated as senior management functions under the FCA and PRA Senior Managers Regime (SMR)
¼ Maintaining the ERMF, ensuring it remains relevant and appropriate to the Group’s business activities, is effectively communicated and implemented across the Group and administering related governance and reporting processes
¼ Upholding the overall integrity of the Group’s risk and return decisions to ensure that risks are properly assessed, that these decisions are made transparently on the basis of this proper assessment and that risks are controlled in accordance with the Group’s standards and Risk Appetite, and
¼ Overseeing and challenging the management of Principal Risk Types under the ERMF
The independence of the Risk function ensures that the necessary balance in making risk and return decisions is not compromised by short-term pressures to generate revenues.
In addition, the Risk function is a centre of excellence that provides specialist capabilities of relevance to risk management processes in the broader organisation.
The Risk function supports the Group’s commitment to be Here for good by building a sustainable framework that places regulatory and compliance standards, and a culture of appropriate conduct at the forefront of the Group’s agenda in a manner proportionate to the nature, scale and complexity of the Group’s business.
As of 1st January 2019, we have rebranded the Compliance function as Conduct, Financial Crime and Compliance (CFCC), reflecting the integration of the different areas within the function, under the Management Team leadership of the Group Head CFCC.
CFCC works alongside the Risk function, within the framework of the ERMF, to deliver an aligned Second Line of Defence.
Risk Appetite and profileWe recognise the following constraints which determine the risks that we are willing to take in pursuit of our strategy and the development of a sustainable business:
¼ Risk capacity is the maximum level of risk the Group can assume, given its current capabilities and resources, before breaching constraints determined by capital and liquidity requirements and internal operational capability (including but not limited to technical infrastructure, risk management capabilities, expertise), or otherwise failing to meet the expectations of regulators and law enforcement agencies.
¼ Risk Appetite is defined by the Group and approved by the Board. It is the maximum amount and type of risk the Group is willing to assume in pursuit of its strategy. Risk Appetite cannot exceed risk capacity.
The Board has approved a Risk Appetite Statement, which is underpinned by a set of financial and operational control parameters known as Risk Appetite metrics and their associated thresholds. These directly constrain the aggregate risk exposures that can be taken across the Group. The Risk Appetite Statement is supplemented by an overarching statement outlining the Group’s Risk Appetite Principles.
Risk Appetite PrinciplesThe Group Risk Appetite is defined in accordance with risk management principles that inform our overall approach to risk management and our risk culture. We follow the highest ethical standards required by our stakeholders and ensure a fair outcome for our clients, as well as facilitating the effective operation of financial markets, while at the same time meeting expectations of regulators and law enforcement agencies. We set our Risk Appetite to enable us to grow sustainably and to avoid shocks to earnings or our general financial health, as well as manage our Reputational Risk in a way that does not materially undermine the confidence of our investors and all internal and external stakeholders.
Risk Appetite StatementThe Group will not compromise adherence to its Risk Appetite in order to pursue revenue growth or higher returns.
To keep the Group’s Risk profile within Risk Appetite (and therefore also risk capacity), we have cascaded critical Group Risk Appetite metrics across our Principal Risk Types to countries with significant business operations. These are supplemented by risk control tools such as granular level limits, policies, standards and other operational control parameters that are used to keep the Group’s risk profile within Risk Appetite. The Group’s risk profile is its overall exposure to risk at a given point in time, covering all applicable risk types. Status against Risk Appetite is reported to the Board Risk Committee and the Group Risk Committee, including the status of breaches and remediation plans where applicable. Country Risk Appetite is managed at a country level with Group and regional oversight.

195195
RIS
K R
EV
IEW
AN
D C
AP
ITAL R
EV
IEW
Strategic rep
ort
Sup
plem
entary inform
ation
Financial statements
Directo
rs’ repo
rt
The Group Risk Committee, the Group Financial Crime Risk Committee, the Group Non-Financial Risk Committee and the Group Asset and Liability Committee are responsible for ensuring that our risk profile is managed in compliance with the Risk Appetite set by the Board. The Board Risk Committee and the Board Financial Crime Risk Committee (for Financial Crime Compliance) advise the Board on the Risk Appetite Statement and monitor the Group’s compliance with it.
The individual Principal Risk Types’ Risk Appetite Statements approved by the Board are set out in the Principal Risks section (pages 198 to 212)
Risk identification and assessmentIdentification and assessment of potentially adverse risk events is an essential first step in managing the risks of any business or activity. To ensure consistency in communication we use Principal Risk Types to classify our risk exposures. Nevertheless, we also recognise the need to maintain an overall perspective since a single transaction or activity may give rise to multiple types of risk exposure, risk concentrations may arise from multiple exposures that are closely correlated, and a given risk exposure may change its form from one risk type to another.
To facilitate the above, the Group maintains a dynamic risk scanning process with inputs on the internal and external risk environment, as well as considering potential threats and opportunities from the business and client perspectives. The Group maintains an inventory of the Principal Risk Types and sub-types that are inherent to the strategy and business model, near-term emerging risks that can be measured and mitigated to some extent, and uncertainties that are longer-term matters that should be on the radar but are not yet fully measurable.
Stress testing The objective of stress testing is to support the Group in assessing that it:
¼ Does not have a portfolio with excessive concentrations of risk that could produce unacceptably high losses under severe but plausible scenarios
¼ Has sufficient financial resources to withstand severe but plausible scenarios
¼ Has the financial flexibility to respond to extreme but plausible scenarios
¼ Understands the key business model risks, considers what kind of event might crystallise those risks – even if extreme with a low likelihood of occurring – and identifies, as required, actions to mitigate the likelihood or the impact
Enterprise stress tests include Capital and Liquidity Adequacy Stress Tests, including in the context of recovery and resolution, and stress tests that assess scenarios where our business model becomes unviable, such as reverse stress tests.
Stress tests are performed at Group, country, business and portfolio level. Bespoke scenarios are applied to our traded and liquidity positions as described in the sections on Traded Risk (page 202) and Liquidity Risk (page 204). In addition to these, our stress tests also focus on the potential impact of macroeconomic, geopolitical and physical events on relevant regions, client segments and risk types.
The Board delegates approval of stress test submissions to the Bank of England to the Board Risk Committee who reviews the recommendations from the Stress Testing Committee. The Stress Testing Committee is appointed by the Group Risk Committee to review and challenge the stress test scenarios, assumptions and results.
Based on the stress test results, the Group Chief Risk Officer and Group Chief Financial Officer can implement strategic actions to ensure that the Group Strategy remains within the Board-approved Risk Appetite.
Principal Risk Types
Principal Risk Types are risks that are inherent in our strategy and our business model and have been formally defined in the Group’s ERMF. These risks are managed through distinct Risk Type Frameworks (RTF) which are approved by the Group Chief Risk Officer. The Principal Risk Types and associated Risk Appetite Statements are approved by the Board.
In 2018, through the development of the RTFs, we have revised the definition of certain Principal Risk Types to describe the risks or failures more explicitly. In addition, Market Risk has been renamed to Traded Risk to encompass all sensitivities to traded price risk. Traded risk now includes Market Risk, Counterparty Credit Risk, Issuer Risk, Valuation Adjustments, Pension Risk and Algorithmic Trading as risk sub-types. The table below shows the Group’s current Principal Risk Types.
Principal Risks Types Definition
Credit Risk ¼ Potential for loss due to the failure of a counterparty to meet its agreed obligations to pay the Group
Country Risk ¼ Potential for losses due to political or economic events in a country
Traded Risk ¼ Potential for loss resulting from activities undertaken by the Group in financial markets
Capital and Liquidity Risk ¼ Capital: potential for insufficient level, composition or distribution of capital to support our normal activities ¼ Liquidity: potential for loss where we may not have sufficient stable or diverse sources of funding or financial resources to meet our obligations as they fall due
Operational Risk ¼ Potential for loss resulting from inadequate or failed internal processes and systems, human error, or from the impact of external events (including legal risks)
Reputational Risk ¼ Potential for damage to the franchise, resulting in loss of earnings or adverse impact on market capitalisation because of stakeholders taking a negative view of the organisation, its actions or inactions – leading stakeholders to change their behaviour
Compliance Risk ¼ Potential for penalties or loss to the Group or for an adverse impact to our clients, stakeholders or to the integrity of the markets we operate in through a failure on our part to comply with laws or regulations
Conduct Risk ¼ Risk of detriment to the Group’s customers and clients, investors, shareholders, market integrity, competition and counterparties or from the inappropriate supply of financial services, including instances of willful or negligent misconduct
Information and Cyber Security Risk ¼ Potential for loss from a breach of confidentiality, integrity and availability of the Group’s information systems and assets through cyber attack, insider activity, error or control failure
Financial Crime Risk ¼ Potential for legal or regulatory penalties, material financial loss or reputational damage resulting from the failure to comply with applicable laws and regulations relating to international sanctions, anti-money laundering and anti-bribery and corruption
Further details of our principal risks and how these are being managed are set out in the Principal Risks section (pages 198 to 212)
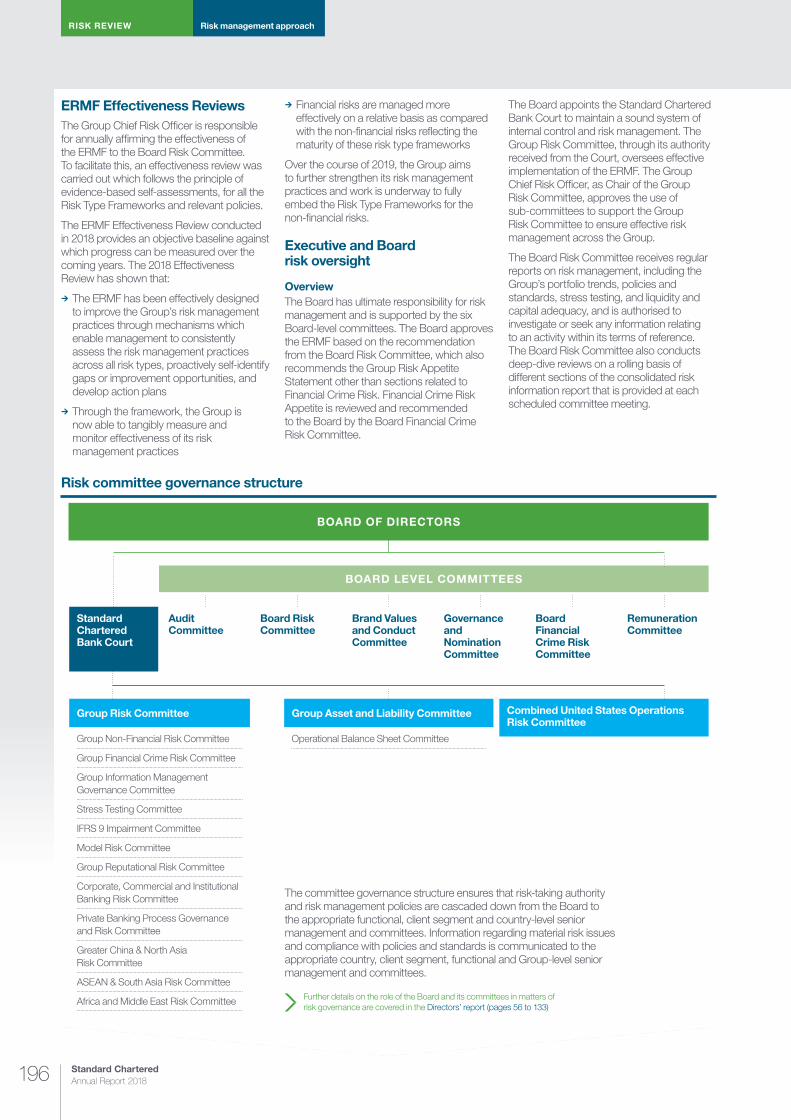
Standard Chartered Annual Report 2018196
RISK REVIEW Risk management approach
ERMF Effectiveness ReviewsThe Group Chief Risk Officer is responsible for annually affirming the effectiveness of the ERMF to the Board Risk Committee. To facilitate this, an effectiveness review was carried out which follows the principle of evidence-based self-assessments, for all the Risk Type Frameworks and relevant policies.
The ERMF Effectiveness Review conducted in 2018 provides an objective baseline against which progress can be measured over the coming years. The 2018 Effectiveness Review has shown that:
¼ The ERMF has been effectively designed to improve the Group’s risk management practices through mechanisms which enable management to consistently assess the risk management practices across all risk types, proactively self-identify gaps or improvement opportunities, and develop action plans
¼ Through the framework, the Group is now able to tangibly measure and monitor effectiveness of its risk management practices
¼ Financial risks are managed more effectively on a relative basis as compared with the non-financial risks reflecting the maturity of these risk type frameworks
Over the course of 2019, the Group aims to further strengthen its risk management practices and work is underway to fully embed the Risk Type Frameworks for the non-financial risks.
Executive and Board risk oversight
OverviewThe Board has ultimate responsibility for risk management and is supported by the six Board-level committees. The Board approves the ERMF based on the recommendation from the Board Risk Committee, which also recommends the Group Risk Appetite Statement other than sections related to Financial Crime Risk. Financial Crime Risk Appetite is reviewed and recommended to the Board by the Board Financial Crime Risk Committee.
The Board appoints the Standard Chartered Bank Court to maintain a sound system of internal control and risk management. The Group Risk Committee, through its authority received from the Court, oversees effective implementation of the ERMF. The Group Chief Risk Officer, as Chair of the Group Risk Committee, approves the use of sub-committees to support the Group Risk Committee to ensure effective risk management across the Group.
The Board Risk Committee receives regular reports on risk management, including the Group’s portfolio trends, policies and standards, stress testing, and liquidity and capital adequacy, and is authorised to investigate or seek any information relating to an activity within its terms of reference. The Board Risk Committee also conducts deep-dive reviews on a rolling basis of different sections of the consolidated risk information report that is provided at each scheduled committee meeting.
Risk committee governance structure
Group Asset and Liability CommitteeGroup Risk Committee Combined United States Operations Risk Committee
BOARD OF DIRECTORS
Audit Committee
Standard Chartered Bank Court
Brand Values and Conduct Committee
Board Financial Crime Risk Committee
Board Risk Committee
Governance and Nomination Committee
Remuneration Committee
Group Non-Financial Risk Committee
Group Financial Crime Risk Committee
Group Information Management Governance Committee
Stress Testing Committee
IFRS 9 Impairment Committee
Model Risk Committee
Group Reputational Risk Committee
Corporate, Commercial and Institutional Banking Risk Committee
Private Banking Process Governance and Risk Committee
Greater China & North Asia Risk Committee
ASEAN & South Asia Risk Committee
Africa and Middle East Risk Committee
Operational Balance Sheet Committee
Further details on the role of the Board and its committees in matters of risk governance are covered in the Directors’ report (pages 56 to 133)
The committee governance structure ensures that risk-taking authority and risk management policies are cascaded down from the Board to the appropriate functional, client segment and country-level senior management and committees. Information regarding material risk issues and compliance with policies and standards is communicated to the appropriate country, client segment, functional and Group-level senior management and committees.
BOARD LEVEL COMMITTEES

197197
RIS
K R
EV
IEW
AN
D C
AP
ITAL R
EV
IEW
Strategic rep
ort
Sup
plem
entary inform
ation
Financial statements
Directo
rs’ repo
rt
Group Risk Committee The Group Risk Committee is responsible for ensuring the effective management of risk throughout the Group in support of the Group’s strategy. The Group Chief Risk Officer chairs the Group Risk Committee, whose members are drawn from the Group’s Management Team. The Committee determines the ERMF for the Group, including the delegation of any part of its authorities to appropriate individuals or properly constituted sub-committees.
The Committee requests and receives relevant information to fulfil its governance mandates relating to the risks to which the Group is exposed. As with the Board Risk Committee, the Group Risk Committee and Group Asset and Liability Committee receive reports that include information on risk measures, Risk Appetite metrics and thresholds, risk concentrations, forward-looking assessments, updates on specific risk situations and actions agreed by these committees to reduce or manage risk.
Group Risk Committee sub-committeesThe Group Non-Financial Risk Committee, chaired by the Group Head, Operational Risk, was established in 2018 to replace the Group Operational Risk Committee and ensures effective management of inherent non-financial principal risks throughout the Group. The non-financial Principal Risk Types in scope governed under the Group Non-Financial Risk Committee are Operational Risk, Compliance Risk, Conduct Risk, Information and Cyber Security Risk and Reputational Risk that is consequential in nature arising from the failure of all other principal risks (secondary Reputational Risk). The Committee also reviews and challenges the adequacy of the internal control systems across all Principal Risk Types.
The Group Financial Crime Risk Committee, chaired by the Group Head, CFCC, provides oversight of the effectiveness of the Group’s policies, procedures, systems, controls and assurance arrangements designed to identify, assess, manage, monitor, prevent and/or detect money laundering, non-compliance with sanctions, bribery, corruption and tax crime by third parties.
The Group Information Management Governance Committee, chaired by the Group Chief Information Officer, ensures that the Group has an effective strategy and approach for data quality management framework, and that priorities, standards and metrics are in place and maintained taking into account the information- related requirements of internal and external stakeholders.
The Stress Testing Committee, chaired by the Global Head, Enterprise Risk Management, ensures the effective management of capital and liquidity-related enterprise stress testing in line with the Group’s enterprise stress testing policy and applicable regulatory requirements. In addition, the Committee approves and provides oversight over stress testing models pertaining to Credit Risk, Traded Risk, Liquidity Risk and valuation models.
The IFRS 9 Impairment Committee, chaired by the Global Head, Enterprise Risk Management, ensures the effective management of expected credit loss computation as well as stage allocation of financial assets for quarterly financial reporting within the authorities set by the Group Risk Committee.
The Model Risk Committee, chaired by the Global Head, Enterprise Risk Management, ensures the effective measurement and management of model risk in support of the Group’s strategy. The Committee also defines and approves the Group’s model Risk Appetite, approves the Group’s most material models and monitors the Group’s model landscape and risk profile against the model Risk Appetite.
The Group Reputational Risk Committee, chaired by the Group Head, CFCC, oversees the effective management of Reputational Risk across the Group, including risks arising from decisions related to clients, products, transactions or pursuit of strategy at the time of decision-making (primary Reputational risk) and secondary Reputational Risk. The Committee takes decisions on material and thematic Reputational Risk issues.
The Corporate, Commercial & Institutional Banking Risk Committee (CCIBRC) covers risks arising from the Group’s activities in Corporate & Institutional Banking and Commercial Banking globally and in the Europe & Americas region as well as Group-wide Traded risk, including oversight for Treasury Markets. The CCIBRC is chaired by the Chief Risk Officer, Corporate & Institutional Banking.
The Private Banking Process Governance and Risk Committee covers risks arising from the Group’s activities in Private Banking and Wealth Management globally. It is jointly chaired by the Chief Risk Officer, Commercial Banking and Private Banking and the Global Head, Private Banking and Wealth Management.
The three regional risk committees, chaired by the Chief Risk Officer for each respective region, cover risks arising from their respective regions.
Group Asset and Liability CommitteeThe Group Asset and Liability Committee is chaired by the Group Chief Financial Officer. Its members are drawn principally from the Management Team. The Committee is responsible for determining the Group’s approach to balance sheet management and ensuring that, in executing the Group’s strategy, the Group operates within internally approved Risk Appetite and external requirements relating to capital, liquidity and leverage risk. It is also responsible for policies relating to balance sheet management, including management of our liquidity and capital adequacy, structural foreign exchange, interest rate and tax exposure.
Combined United States Operations Risk CommitteeThe Combined United States Operations Risk Committee was established in 2016 to comply with the Dodd-Frank Act section 165 Enhanced Prudential Standards (EPS Rules). The EPS Rules legislated a number of enhanced obligations on the US operations commensurate with its structure, risk profile, complexity, activities and size. The Committee receives its authority from the Standard Chartered Bank Court and is chaired by the Group Chief Risk Officer with membership drawn from the Standard Chartered Bank Court and one Independent Non-Executive Director of Standard Chartered PLC. Its responsibilities are drawn from the EPS Rules and pertain to liquidity, risk governance and oversight.
Standard Chartered Annual Report 2018198
RISK REVIEW Risk management approach
Principal risks
Credit Risk
Risk Appetite Statement
The Group manages its credit exposures following the principle of diversification across products, geographies, client segments and industry sectors
The Group defines Credit Risk as the potential for loss due to the failure of a counterparty to meet its agreed obligations to pay the Group
Roles and responsibilitiesThe Credit Risk Type Frameworks for the Group are set and owned by the Chief Risk Officers for the Corporate & Institutional Banking, Commercial Banking, Private Banking, and Retail Banking segments. The Credit Risk function is the second line control function responsible for independent challenge, monitoring and oversight of the Credit risk management practices of the business and functions engaged in or supporting revenue-generating activities, which constitute the first line of defence. In addition, to ensure that credit risks are properly assessed and are transparent, credit decisions are controlled in accordance with the Group’s Risk Appetite and credit policies and standards.
Credit policies and standards are established and approved by the Credit Risk Type Framework owners or by individuals with delegated authorities. Segment specific policies are in place for the management of Credit risk. For Corporate & Institutional Banking and Commercial Banking, policies address large exposures, credit initiation, approval, monitoring, credit grading and documentation. For Retail Banking, policies address management of retail and business banking lending, account and portfolio monitoring, collections management and forbearance programmes. In addition, there are other Group-wide policies integral to Credit Risk management such as those relating to stress testing, risk measurement and impairment provisioning.
MitigationThe Group credit policies set out the key considerations for eligibility, enforceability and effectiveness of Credit Risk mitigation arrangements. Potential credit losses from any given account, client or portfolio are mitigated using a range of tools such as collateral, netting agreements, credit
insurance, credit derivatives and guarantees. The reliance that can be placed on risk mitigants is carefully assessed in light of issues such as legal certainty and enforceability, market valuation, correlation and counterparty risk of the protection provider. The requirement for risk mitigation is not a substitute for the ability to pay, which is the primary consideration for any lending decision.
Collateral types that are eligible as risk mitigants include: cash; accounts receivable; residential, commercial and industrial property; fixed assets such as motor vehicles, aircraft, plant and machinery; marketable securities; commodities; risk participations; guarantees; derivatives; credit insurance; and standby letters of credit. Physical collateral, such as property, fixed assets and commodities, and financial collateral must be independently valued and an active secondary resale market must exist. The collateral must be valued prior to drawdown and regularly thereafter as required to reflect current market conditions, the probability of recovery and the period of time to realise the collateral in the event of liquidation. Stress tests are performed on changes in collateral values for key portfolios to assist senior management in managing the risks in those portfolios. The Group also seeks to diversify its collateral holdings across asset classes and markets.
Documentation must be held to enable the Group to realise the collateral without the cooperation of the obligor in the event that this is necessary. For certain types of lending, typically mortgages or asset financing where a first charge over the risk mitigant must be attained, the right to take charge over physical assets is significant in terms of determining appropriate pricing and recoverability in the event of default. Physical collateral is required to be insured at all times against risk of physical loss or damage.
Where guarantees, credit insurance, standby letters of credit or credit derivatives are used as Credit Risk mitigation, the creditworthiness of the protection provider is assessed and monitored using the same credit approval process applied to the obligor. The main types of guarantors include banks, insurance companies, parent companies, governments and export credit agencies.
Governance committee oversightAt the Board level, the Board Risk Committee oversees the effective management of Credit Risk.
At the executive level, the Group Risk Committee appoints sub-committees for the management of Credit Risk – in particular the CCIBRC, the Private Banking Process Governance and Risk Committee, and the regional risk committees for Greater China & North Asia, ASEAN & South Asia and Africa & Middle East. These committees are responsible for overseeing the Credit Risk profile of the Group within the respective business areas and regions. Meetings are held regularly and the committees monitor all material Credit Risk exposures, as well as key internal developments and external trends, and ensure that appropriate action is taken.
The Group Risk Committee appoints sub-committees for effective management of enterprise stress testing, model governance for Credit Risk, and approval of impairment provisions computed under the IFRS 9 expected credit loss model to the Stress Testing Committee, the Model Risk Committee and the IFRS 9 Impairment Committee respectively.
We manage and control our Principal Risk Types through distinct Risk Type Frameworks, policies and Board-approved Risk Appetite.
199199
RIS
K R
EV
IEW
AN
D C
AP
ITAL R
EV
IEW
Strategic rep
ort
Sup
plem
entary inform
ation
Financial statements
Directo
rs’ repo
rt
Decision-making authorities and delegationThe Credit Risk Type Frameworks are the formal mechanism which delegate Credit Risk authorities to individuals such as the Group Chief Risk Officer, the segments’ Chief Risk Officers and Global Heads of Risks based on their abilities and management responsibilities. Named individuals further delegate credit authorities to individual credit officers by applying delegated credit authority matrices by customer type or portfolio. These matrices establish the maximum limits that the delegated credit officers are authorised to approve, based on risk-adjusted scales which take into account the estimated maximum expected loss from a given customer or portfolio. Credit Risk authorities are reviewed at least annually to ensure they remain appropriate. In Corporate & Institutional Banking, Commercial Banking and Private Banking, the individuals delegating the Credit Risk authorities perform oversight by reviewing a sample of the limit applications approved by the delegated credit officers on a monthly basis. In Retail Banking, credit decision systems and tools (e.g. application scorecards) are used for credit decisioning. Where manual credit decisions are applied, these are subject to periodic quality control assessment and assurance checks.
All credit proposals are subject to a robust Credit Risk assessment. It includes a comprehensive evaluation of the client’s credit quality, including willingness, ability and capacity to repay. The primary lending consideration is based on the client’s credit quality and the repayment capacity from operating cashflows for counterparties; and personal income or wealth for individual borrowers. The risk assessment gives due consideration to the client’s liquidity and leverage position. Where applicable, the assessment includes a detailed analysis of the Credit Risk mitigation arrangements to determine the level of reliance on such arrangements as the secondary source of repayment in the event of a significant deterioration in a client’s credit quality leading to default. Lending activities that are considered as higher risk or non-standard are subject to stricter minimum requirements and require escalation to a senior credit officer or authorised senior executives for approval.
MonitoringWe regularly monitor credit exposures, portfolio performance, and external trends that may impact risk management outcomes. Internal risk management reports that are presented to risk committees contain information on key political and economic trends across major portfolios and countries; portfolio delinquency and loan impairment performance.
Credit Risk committees meet regularly to assess the impact of external events and trends on the Group’s Credit Risk portfolios and to define and implement our response in terms of the appropriate changes to portfolio shape, underwriting standards, risk policy and procedures.
In Corporate & Institutional Banking and Commercial Banking, clients or portfolios are subjected to additional review when they display signs of actual or potential weakness; for example, where there is a decline in the client’s position within the industry, financial deterioration, a breach of covenants, non-performance of an obligation within the stipulated period, or there are concerns relating to ownership or management. Such accounts and portfolios are subjected to a dedicated process overseen by the Credit Issues Committees in the relevant countries where client account strategies and credit grades are re-evaluated. In addition, remedial actions are agreed and monitored. Remedial actions include, but are not limited to, exposure reduction, security enhancement, exiting the account or immediate movement of the account into the control of Group Special Assets Management (GSAM), which is our specialist recovery unit for Corporate & Institutional Banking, Commercial Banking and Private Banking that operates independently from our main business.
For Retail Banking exposures, portfolio delinquency trends are monitored on an ongoing basis. Account monitoring is based on behaviour scores and bureau performance (where available). Accounts that are past due (or perceived as high risk and not yet past due) are subject to a collections or recovery process managed by a specialist function independent from the origination function. In some countries, aspects of collections and recovery activities are outsourced.
Credit rating and measurementRisk measurement plays a central role, along with judgement and experience, in informing risk-taking and portfolio management decisions. Since 1 January 2008, we have used the advanced internal ratings-based approach under the Basel regulatory framework to calculate Credit Risk capital requirements.
A standard alphanumeric Credit Risk grade system is used for Corporate & Institutional Banking and Commercial Banking. The numeric grades run from 1 to 14 and some of the grades are further sub-classified. Lower numeric credit grades are indicative of a lower likelihood of default. Credit Grades 1 to 12 are assigned to performing customers, while Credit Grades 13 and 14 are assigned to non-performing or defaulted customers.
Retail Banking internal ratings-based portfolios use application and behavioural credit scores that are calibrated to generate a probability of default and then mapped to the standard alphanumeric Credit Risk grade system. We refer to external ratings from credit bureaus (where these are available); however, we do not rely solely on these to determine Retail Banking credit grades.
Advanced internal ratings-based models cover a substantial majority of our exposures and are used in assessing risks at a customer and portfolio level, setting strategy and optimising our risk-return decisions. Material internal ratings-based risk measurement models are approved by the Model Risk Committee. Prior to review and approval, all internal ratings-based models are validated in detail by a model validation team which is separate from the teams that develop and maintain the models. Models undergo annual validation by the model validation team. Reviews are also triggered if the performance of a model deteriorates materially against predetermined thresholds during the ongoing model performance monitoring process which takes place between the annual validations.
Standard Chartered Annual Report 2018200
RISK REVIEW Risk management approach
Credit concentration riskCredit concentration risk may arise from a single large exposure to a counterparty or a group of connected counterparties, or from multiple exposures across the portfolio that are closely correlated. Large exposure concentration risk is managed through concentration limits set for a counterparty or a group of connected counterparties based on control and economic dependence criteria. Risk Appetite metrics are set at portfolio level and monitored to control concentrations, where appropriate, by industry, specific products, tenor, collateralisation level, top 20 concentration and exposure to holding companies. Single name credit concentration thresholds are set by client group depending on credit grade, and by customer segment. For concentrations that are material at a Group level, breaches and potential breaches are monitored by the respective governance committees and reported to the Group Risk and Board Risk Committees.
Credit impairmentEffective from 1 January 2018, we have adopted the impairment requirements of IFRS 9 Financial Instruments, where expected credit losses are determined for all financial assets that are classified as amortised cost or fair value through other comprehensive income. Expected credit losses are computed as an unbiased, probability-weighted amount determined by evaluating a range of plausible outcomes, the time value of money, and considering all reasonable and supportable information including that which is forward-looking. When determining forward looking expected credit losses, the Group also considers a set of critical global or country-specific macroeconomic variables that influence Credit Risk. Global macroeconomic variables include commodity prices such as crude oil, commodity indices, bond indices and others such as aircraft prices. Country-specific macroeconomic variables include foreign exchange rates, interest rates, fiscal indicators like government spending and government debt, country economic indicators such as real GDP, unemployment rate and consumer price indices, and property indicators like residential property indices.
At the time of origination or purchase of a non-credit-impaired financial asset (stage 1), expected credit losses represent cash shortfalls arising from possible default events up to 12 months into the future from the balance sheet date. Expected credit losses continue to be determined on this basis until there is a significant increase in the Credit Risk of the asset (stage 2), in which case, an expected credit loss provision is recognised for default events that may occur over the lifetime of the asset. If there is observed objective evidence of credit impairment or default (stage 3), expected credit losses continue to be measured on a lifetime basis.
The Group’s definition of default is aligned with the regulatory definition of default as set out in European Capital Requirements Regulation (CRR178) and related guidelines, where the obligor is at least 90 days past due in respect of principal and/or interest. A loan is considered past due (or delinquent), when the customer has failed to make a principal or interest payment in accordance with the loan contract. Financial assets are also considered to be credit-impaired where the obligors are unlikely to pay on the occurrence of one or more observable events that have a detrimental impact on the estimated future cash flows of the financial asset.
In Corporate & Institutional Banking, Commercial Banking and Private Banking, a loan is considered credit-impaired where analysis and review indicate that full payment of either interest or principal, including the timeliness of such payment, is questionable, or as soon as payment of interest or principal is 90 days overdue. These credit-impaired accounts are managed by our specialist recovery unit (GSAM).
In Retail Banking, a loan is considered credit-impaired as soon as payment of interest or principal is 90 days overdue or meets other objective evidence of impairment such as bankruptcy, debt restructuring, fraud or death.
Financial assets are written off when there is no realistic prospect of recovery and the amount of loss has been determined. For Retail Banking assets, a financial asset is written off when it meets certain threshold conditions which are set at the point where empirical evidence suggests that the client is unlikely to meet their contractual obligations, or a loss of principal is expected.
Estimating the amount and timing of future recoveries involves significant judgement, and considers the assessment of matters such as future economic conditions and the value of collateral, for which there may not be a readily accessible market. The total amount of the Group’s impairment provision is inherently uncertain, being sensitive to changes in economic and credit conditions across the regions in which the Group operates. For more details on sensitivity analysis of expected credit losses under IFRS 9, please refer to page 177.
Stress testingStress testing is a forward-looking risk management tool that constitutes a key input into the identification, monitoring and mitigation of Credit Risk, as well as contributing to Risk Appetite calibration. Periodic stress tests are performed on the credit portfolio/segment to anticipate vulnerabilities from stressed conditions and initiate timely right-sizing and mitigation plans. Additionally, multiple enterprise-wide and country-level stress tests are mandated by regulators to assess the ability of the Group and its subsidiaries to continue to meet their capital requirements during a plausible, adverse shock to the business. These regulatory stress tests are conducted in line with the principles stated in the Enterprise Stress Testing Policy. The Group’s enterprise stress testing programme adopted IFRS 9 in full in 2018 and all enterprise stress tests conducted during 2018 were performed on an IFRS 9 basis. Stress tests for key portfolios are reviewed by the Credit Risk Type Framework owners (or delegates) as part of portfolio oversight; and matters considered material to the Group are escalated to the Group Chief Risk Officer and respective regional risk committees.
201201
RIS
K R
EV
IEW
AN
D C
AP
ITAL R
EV
IEW
Strategic rep
ort
Sup
plem
entary inform
ation
Financial statements
Directo
rs’ repo
rt
Country Risk
Risk Appetite Statement
The Group manages its country cross-border exposures following the principle of diversification across geographies and controls business activities in line with the level of jurisdiction risk
The Group defines Country Risk as the potential for losses due to political or economic events in a country
Roles and responsibilitiesThe Country Risk Type Framework provides clear accountability and roles for managing risk through the three lines of defence model. The Global Head, Enterprise Risk Management is responsible for the management and control of Country Risk across the Group and is supported by the Regional Chief Risk Officers and Country Chief Risk Officers who provide second line oversight and challenge to the first line Country Risk management activities. The first line ownership of Country Risk resides with the country CEOs who are responsible for the implementation of policy and allocation of approved Country Risk limits across relevant businesses and product lines, as well as the identification and measurement of Country Risks and communication of these and any non-compliance with policy or standards to the second line.
MitigationStandards are developed and deployed to implement requirements and controls that all countries must follow to ensure effective management of Country Risk. The standards outline the process for Country Risk limit setting, monitoring and reporting exposures. In response to growing concerns over the Country Risk outlook for a particular country, sovereign ratings may be downgraded and country limits may also be reduced.
Governance committee oversightAt the Board level, the Board Risk Committee oversees the effective management of Country Risk. At the executive level, the Group Risk Committee is responsible for approving policies and control risk parameters, monitoring material risk exposures and directing appropriate action in response to material risk issues or themes that come to the Committee’s attention that relate to Country Risk. At a country level, the Country Risk Committee (or Executive Risk Committee for subsidiaries) is responsible for monitoring all risk issues for the respective country, including Country Risk.
Decision-making authorities and delegationThe Country Risk Type Framework is the formal mechanism through which the delegation of Country Risk authorities is made. Decision-making and approval authorities are guided by country capacity levels, which are guidelines to set country limits in respect of Country Risk. The capacity levels are assessed by the Group Country Risk function and are derived from factors including: Group Tier 1 capital, transfer risk grade, Group strategy, portfolio composition (short and medium-term) and each country’s total foreign currency earnings.
MonitoringMonitoring and reporting of Country Risk is included in the standards and covers the monitoring of exposures relative to Risk Appetite thresholds and limits, as well as the reporting of material exposures to internal committees and externally where appropriate. The Group Risk Committee monitors Risk Appetite thresholds on a traffic-light indicator basis, and these provide an early warning signal of stress and concentration risk. An escalation process to the Board Risk Committee is in place based on the traffic-light indicators monitoring system. In addition, the Group Risk Committee and the Board Risk Committee receive regular reports on Country Risk exposures in excess of 1 per cent of total Group assets.
Stress testingThe Group Country Risk team produces stressed Sovereign ratings which are used by the relevant Credit and Traded Risk teams in calculating risk-weighted assets during described extreme but plausible stress scenarios.
Standard Chartered Annual Report 2018202
RISK REVIEW Risk management approach
Traded Risk
Risk Appetite Statement
The Group should control its trading portfolio and activities to ensure that Traded Risk losses (financial or reputational) do not cause material damage to the Group’s franchise
The Group defines Traded Risk as the potential for loss resulting from activities undertaken by the Group in financial markets
Under the Enterprise Risk Management Framework, the introduction of the Traded Risk Type Framework (TRTF) in 2018 sought to bring together all risk types exhibiting risk features common to Traded Risk.
These risk types include Market Risk, Counterparty Credit Risk, Issuer Risk, XVA, Algorithmic Trading and Pension Risk. Traded Risk Management (TRM, formerly Market and Traded Credit Risk) is the core risk management function supporting market-facing businesses, specifically Financial Markets and Treasury Markets.
Roles and responsibilitiesThe TRTF, which sets the roles and responsibilities in respect of Traded Risk for the Group, is owned by the Global Head, Traded Risk Management. The front office, acting as first line of defence, are responsible for the effective management of risks within the scope of its direct organisational responsibilities set by the Board. The TRM function is the second line control function that performs independent challenge, monitoring and oversight of the Traded Risk management practices of the first line of defence. The first and second lines of defence are supported by the organisation structure, job descriptions and authorities delegated by Traded Risk control owners.
MitigationThe Group controls its trading portfolio and activities to ensure that Traded Risk losses (financial or reputational) do not cause material damage to the Group’s franchise by assessing the various Traded Risk factors. These are captured and analysed using proprietary and custom-built analytical tools, in addition to risk managers’ specialist market and product knowledge.
TRM has a framework, policies and standards in place ensuring that appropriate Traded Risk limits are implemented. The Group’s Traded Risk exposure is aligned with its appetite for Traded Risk, and assessment of potential losses that might be incurred by the Group as a consequence of extreme but plausible events.
Traded Risk limits are applied as required by the TRTF and related standards. All businesses incurring Traded risk must do so in compliance with the TRTF. The TRTF requires that Traded Risk limits are defined at a level appropriate to ensure that the Group remains within Traded Risk Appetite. All exposures throughout the Group that the TRM function is responsible for aggregate up to TRM’s Group-level reporting. This aggregation approach ensures that the limits structure across the Group is consistent with the Group’s Risk Appetite.
The TRTF and Enterprise Stress Testing Policy ensure that adherence to stress-related Risk Appetite metrics is achieved. Stress testing aims at supplementing other risk metrics used within the Group by providing a forward-looking view of positions and an assessment of their resilience to stressed market conditions. Stress testing is performed on all Group businesses with Traded risk exposures, either where the risk is actively traded or where material risk remains. This additional information is used to inform the management of the Traded risks taken within the Group. The outcome of stress tests is discussed across the various business lines and management levels so that existing and potential risks can be reviewed, and related management actions can be decided upon where appropriate.
Policies are reviewed and approved by the Global Head, TRM annually to ensure their ongoing effectiveness and sustainability.
Governance committee oversightAt the Board level, the Board Risk Committee oversees the effective management of Traded Risk. At the executive level, the Group Risk Committee delegates responsibilities to the CCIBRC to act as the primary risk governance body for Traded Risk, and to the Stress Testing Committee for stress testing and the Model Risk Committee for model risk.
Decision-making authorities and delegationThe Group’s Risk Appetite Statement, along with the key associated Risk Appetite metrics, is approved by the Board with responsibility for Traded Risk limits, then tiered accordingly.
Subject to the Group’s Risk Appetite for Traded Risk, the Group Risk Committee sets Group-level Traded Risk limits, via delegation to the GCRO. The GCRO delegates authority for the supervision of major business limits to the CRO, Corporate & Institutional Banking and for all other Traded Risk limits to the TRTF Owner (Global Head, TRM) who in turn delegates approval authorities to individual Traded Risk managers.
Additional limits are placed on specific instruments, positions, and portfolio concentrations where appropriate. Authorities are reviewed at least annually to ensure they remain appropriate and to assess the quality of decisions taken by the authorised person. Key risk-taking decisions are made only by certain individuals with the skills, judgement and perspective to ensure that the Group’s control standards and risk-return objectives are met. Authority delegators are responsible for monitoring the quality of the risk decisions taken by their delegates and the ongoing suitability of their authorities.
203203
RIS
K R
EV
IEW
AN
D C
AP
ITAL R
EV
IEW
Strategic rep
ort
Sup
plem
entary inform
ation
Financial statements
Directo
rs’ repo
rt
Market Risk – Value at Risk The Group applies VaR as a measure of the risk of losses arising from future potential adverse movements in market rates, prices and volatilities. VaR, in general, is a quantitative measure of Market Risk that applies recent historical market conditions to estimate the potential future loss in market value that will not be exceeded in a set time period at a set statistical confidence level. VaR provides a consistent measure that can be applied across trading businesses and products over time and can be set against actual daily trading profit and loss outcomes.
VaR is calculated for expected movements over a minimum of one business day and to a confidence level of 97.5 per cent. VaR is calculated on our exposure as at the close of business, generally UK time. Intra-day risk levels may vary from those reported at the end of the day.
The Group applies two VaR methodologies:
¼ Historical simulation: this involves the revaluation of all existing positions to reflect the effect of historically observed changes in Market Risk factors on the valuation of the current portfolio. This approach is applied for general Market Risk factors and the majority of specific (credit spread) risk VaRs
¼ Monte Carlo simulation: this methodology is similar to historical simulation but with considerably more input risk factor observations. These are generated by random sampling techniques, but the results retain the essential variability and correlations of historically observed risk factor changes. This approach is applied for some of the specific (credit spread) risk VaR in relation to idiosyncratic exposures in credit markets
In both methods, a historical observation period of one year is chosen and applied.
A small proportion of Market Risk generated by trading positions is not included in VaR or cannot be appropriately captured by VaR. This is recognised through a Risks-not-in-VaR Framework, which estimates these risks and applies capital add-ons.
To assess their ongoing performance, VaR models are backtested against actual results.
An analysis of VaR and backtesting results in 2018 is available in the Risk profile section (pages 180 to 183).
Counterparty Credit RiskCredit Risk from traded products derives from the positive mark-to market value of the underlying instruments, and an additional component to cater for potential future market movements. This Counterparty Credit Risk is managed within the Group’s overall credit Risk Appetite for corporate and financial institutions. In addition to analysing potential future movements, the Group uses various single factor or multi-risk factor stress test scenarios to identify and manage Counterparty Credit Risk across derivatives and securities financing transactions.
UnderwritingThe limits for the underwriting of securities to be held for sale are approved by the Underwriting Committee, under the authority of the CCIBRC. The limits include the overall size of the securities inventory, the maximum holding period, the daily VaR, and sensitivities to interest rate and credit spread moves. The Underwriting Committee approves individual proposals to underwrite new security issues for our clients.
Day-to-day Credit Risk management activities for traded securities are carried out by a specialist team within TRM whose activities include oversight and approval within the levels delegated by the Underwriting Committee. Issuer credit risk, including settlement and pre-settlement risk, and price risks are controlled by TRM. Where an underwritten security is held for a period longer than the target sell-down period, the final decision on whether to sell the position rests with TRM.
MonitoringTRM monitors the overall portfolio risk and ensures that it is within specified limits and therefore Risk Appetite. The annual and mid-year limit review processes provide opportunities for the business and TRM to review risk in light of performance.
Traded Risk exposures are monitored daily against approved limits. Intra-day risk exposures may vary from those reported at the end of the day. Limit excess approval decisions are informed by factors such as an assessment of the returns that will result from an incremental increase to the business risk exposure. Limits and excesses can only be approved by a Traded Risk manager with the appropriate delegated authority. Financial Markets traders may adjust their Traded Risk exposures within approved limits and assess risk and reward trade-offs according to market conditions.
TRM reports and monitors limits applied to stressed exposures. Stress scenario analysis is performed on all Traded Risk exposures in Financial Markets and in portfolios outside Financial Markets such as syndicated loans and principal finance. Stress loss excesses are discussed with the business and approved where appropriate based on delegated authority levels.
Stress testingThe VaR measurement is complemented by weekly stress testing of Market Risk exposures to highlight the potential risk that may arise from extreme market events that are deemed rare but plausible.
Stress testing is an integral part of the Traded Risk management framework and considers both historical market events and forward-looking scenarios. A consistent stress testing methodology is applied to trading and non-trading books. The stress testing methodology assumes that scope for management action would be limited during a stress event, reflecting the decrease in market liquidity that often occurs.
Stress scenarios are regularly updated to reflect changes in risk profile and economic events. The TRM function reviews stress testing results and, where necessary, enforces reductions in overall Market Risk exposure. The Group Risk Committee considers the results of stress tests as part of its supervision of Risk Appetite.
Regular stress test scenarios are applied to interest rates, credit spreads, exchange rates, commodity prices and equity prices. This covers all asset classes in the Financial Markets banking and trading books, including XVA (CVA and FVA). Ad hoc scenarios are also prepared, reflecting specific market conditions and for particular concentrations of risk that arise within the business. Where required by local statute or regulation, TRM’s Group and business-wide stress and scenario testing will be supplemented by entity stress testing at a country level. This stress testing is coordinated at the country level and subject to the relevant local governance.
Standard Chartered Annual Report 2018204
RISK REVIEW Risk management approach
Capital and Liquidity Risk
Risk Appetite Statement
The Group should maintain a strong capital position including the maintenance of management buffers sufficient to support its strategic aims and hold an adequate buffer of high-quality liquid assets to survive extreme but plausible liquidity stress scenarios for at least 60 days without recourse to extraordinary central bank support
The Group defines Capital Risk as the potential for insufficient level, composition or distribution of capital to support our normal activities, and Liquidity Risk as the risk that we may not have sufficient stable or diverse sources of funding to meet our obligations as they fall due
Roles and responsibilitiesThe Treasurer is responsible for developing a risk type framework for Capital and Liquidity Risk and for complying with regulatory requirements at a Group level. The Treasury and Finance functions, as the Second Line of Defence, provide independent challenge and oversight of the first line risk management activities relating to Capital and Liquidity Risk. In country, the Treasurer is supported by Treasury and Finance in implementing the Capital and Liquidity Risk Type Framework.
MitigationThe Group develops policies to address material Capital and Liquidity risks and aims to maintain its risk profile within Risk Appetite. Risk Appetite is set for the Group and cascaded down to the countries in the form of limits and management action triggers. The Group also maintains a Recovery Plan which is a live document to be used by management in a liquidity or solvency stress. The Recovery Plan includes a set of Recovery Indicators, an escalation framework and a set of management actions capable of being implemented in a stress. A Recovery Plan is also maintained within each major country.
The approach to mitigation is detailed further below.
Capital planning On an annual basis, strategic business and capital plans are drawn up covering a five-year horizon, and are approved by the Board. The capital plan ensures that adequate levels of capital, including loss absorbing capacity, and an efficient mix of the different components of capital are maintained to support our strategy and business plans. Treasury is responsible for the ongoing assessment of the demand for capital and the updating of the Group’s capital plan.
Capital planning takes the following into account:
¼ Current regulatory capital requirements and our assessment of future standards and how these might change
¼ Demand for capital due to the business and loan impairment outlook and potential market shocks or stresses
¼ Available supply of capital and capital raising options, including ongoing capital accretion from the business
Structural FX riskThe Group’s structural position results from the Group’s non-US dollar investment in the share capital and reserves of subsidiaries and branches. The FX translation gains or losses are recorded in the Group’s Translation Reserves with a direct impact on the Group’s CET1 ratio.
The Group contracts hedges to manage its structural FX position in accordance with a Board-approved Risk Appetite, and as a result the Group has taken net investment hedges to partly cover its exposure to the Korean won, Chinese renminbi, Taiwanese dollar and Indian rupee to mitigate the FX impact of such positions on its capital ratios.
Liquidity Risk At Group and country level we implement various business-as-usual and stress risk metrics and monitor these against limits and management action triggers. This ensures that the Group maintains an adequate and well-diversified liquidity buffer as well as a stable funding base. A funding plan is also developed for efficient liquidity projection to ensure that the Group is adequately funded, in the required currencies, to meet its obligations and client funding needs. The approach to managing the risks and the Board Risk Appetite is assessed annually through the Internal Liquidity Adequacy Assessment Process.
Interest rate risk in banking bookThe Group defines interest rate risk in the banking book (IRRBB) as the potential for a reduction in future earnings or economic value due to changes in interest rates. This risk arises from differences in the re-pricing profile, interest rate basis, and optionality of banking book assets, liabilities and off-balance sheet items. The Group monitors IRRBB against a Board-approved Risk Appetite.

205205
RIS
K R
EV
IEW
AN
D C
AP
ITAL R
EV
IEW
Strategic rep
ort
Sup
plem
entary inform
ation
Financial statements
Directo
rs’ repo
rt
Governance committee oversightAt the Board level, the Board Risk Committee oversees the effective management of Capital and Liquidity Risk. At the executive level, the Group Asset and Liability Committee ensures the effective management of risk throughout the Group in support of the Group’s strategy, and guides the Group’s strategy on balance sheet optimisation and ensures that the Group operates within the internally approved Risk Appetite, as well as other external and internal capital and liquidity requirements. The Group Asset and Liability Committee delegates part of this responsibility to the Operational Balance Sheet Committee to ensure alignment with business objectives.
Country oversight under the capital and liquidity framework resides with country Asset and Liability Committees. Countries must ensure that they remain in compliance with Group capital and liquidity policies and practices, as well as local regulatory requirements.
The Stress Testing Committee ensures the effective management of capital and liquidity-related enterprise stress testing in line with the Group’s Enterprise Stress Testing Policy and applicable regulatory requirements. The Stress Testing Committee reviews, challenges and approves stress scenarios, results and management actions for all enterprise stress tests. Insights gained from the stress tests are used to inform underwriting decisions, risk management, capital and liquidity planning and strategy.
Decision-making authorities and delegationThe Group Chief Financial Officer has responsibility for capital, funding and liquidity under the Senior Managers Regime. The Group Chief Financial Officer and Group Chief Risk Officer have delegated the Risk Framework Owner responsibilities associated with Capital and Liquidity Risk to the Treasurer. The Treasurer delegates second line oversight and challenge responsibilities to relevant and suitably qualified Treasury and Finance individuals.
MonitoringOn a day-to-day basis, the management of Capital and Liquidity Risk is performed by the country Chief Executive Officer and Treasury Markets respectively. The Group regularly reports and monitors capital and liquidity risks inherent in its business activities and those that arise from internal and external events. The management of capital and liquidity is monitored by Treasury and Finance with appropriate escalation processes in place.
Internal risk management reports covering the balance sheet and the capital and liquidity position of the Group are presented to the Operational Balance Sheet Committee and the Group Asset and Liability Committee. The reports contain key information on balance sheet trends, exposures against Risk Appetite and supporting risk measures which enable members to make informed decisions around the overall management of the Group’s balance sheet. Oversight at a country level is provided by the country Asset and Liability Committee, with a focus on the local capital and liquidity risks, local prudential requirements and risks that arise from local internal and external events.
Stress testingStress testing and scenario analysis are an integral part of the capital and liquidity framework, and are used to ensure that the Group’s internal assessment of capital and liquidity considers the impact of extreme but plausible scenarios on its risk profile. They provide an insight into the potential impact of significant adverse events on the Group’s capital and liquidity position and how this could be mitigated through appropriate management actions to ensure the Group remains within the approved Risk Appetite and regulatory limits.

Standard Chartered Annual Report 2018206
RISK REVIEW Risk management approach
Operational Risk
Risk Appetite Statement
The Group aims to control operational risks to ensure that operational losses (financial or reputational), including any related to conduct of business matters, do not cause material damage to the Group’s franchise
The Group defines Operational Risk as the potential for loss resulting from inadequate or failed internal processes and systems, human error, or from the impact of external events (including legal risks)
Roles and responsibilitiesThe Operational Risk Type Framework (ORTF) is set by the Group Head, Operational Risk and is applicable enterprise-wide. This Framework defines and collectively groups operational risks which have not been classified as Principal Risk Types into non-Principal Risk Types (non-PRTs) and sets standards for the identification, control, monitoring and treatment of risks. These standards are applicable across all PRTs and non-PRTs. The non-PRTs relate to execution capability, fraud, corporate governance, reporting and obligations, model, safety and security, legal enforceability, and operational resilience (including client service, third party vendor services, change management, and system availability).
The ORTF reinforces clear accountability for managing risk throughout the Group and delegates second line of defence responsibilities to identified subject matter experts. For each non-PRT, the expert sets policies for the organisation to comply with, and provides guidance, oversight and challenge over the activities of the Group. They ensure that key risk decisions are only taken by individuals with the requisite skills, judgement, and perspective to ensure that the Group’s risk/return objectives are met.
MitigationThe ORTF sets out the Group’s overall approach to the management of Operational Risk in line with the Group’s Operational Risk Appetite. This is supported by Control Assessment Standards (CAS) which define roles and responsibilities for the identification, control and monitoring of risks (applicable to all non-PRTs and PRTs).
The CAS are used to determine the design strength and reliability of each process, and require:
¼ The recording of processes run by client segments, products, and functions into a process universe
¼ The identification of potential breakdowns to these processes and the related risks of such breakdowns
¼ An assessment of the impact of the identified risks based on a consistent scale
¼ The design and monitoring of controls to mitigate prioritised risks
¼ Assessments of residual risk and prompt actions for elevated risks
Risks that exceed the Group’s Operational Risk Appetite require treatment plans to address underlying causes.
Governance committee oversightAt the Board level, the Board Risk Committee oversees the effective management of Operational risk. At the executive level, the Group Risk Committee delegates authority primarily to the Group Non-Financial Risk Committee (GNFRC) to monitor the Group’s Operational Risk Appetite and to oversee the Group’s Operational risk profile. The GNFRC has the authority to challenge, constrain and, if required, stop business activities where risks are not aligned with the Group’s Operational Risk Appetite.
Regional, business segments and functional-committees also provide enterprise oversight of their respective processes and related operational risks. In addition, Country Non-Financial Risk Committees (CNFRCs) oversee the management of Operational risks at the country (or entity) level. In smaller countries, the responsibilities of the CNFRC may be exercised directly by the Country Risk Committee (for Branches) or Executive Risk Committee (for Subsidiaries).
MonitoringTo deliver services to clients and to participate in the financial services sector, the Group runs processes which are exposed to operational risks. The Group prioritises and manages risks which are significant to clients and to the financial services sectors. Control indicators are regularly monitored to determine the residual risk the Group is exposed to. The residual risk assessments and reporting of events form the Group’s Operational Risk profile. The completeness of the Operational Risk profile ensures appropriate prioritisation and timeliness of risk decisions, including risk acceptances with treatment plans for risks that exceed acceptable thresholds.
The Board is informed on adherence to Operational Risk Appetite through metrics reported for selected risks. These metrics are monitored and escalation thresholds are devised based on the materiality and significance of the risk. These Operational Risk Appetite metrics are consolidated on a regular basis and reported at relevant Group committees. This provides senior management with the relevant information to inform their risk decisions.
Stress testingStress testing and scenario analysis are used to assess capital requirements for operational risks. This approach considers the impact of extreme but plausible scenarios on the Group’s Operational Risk profile. A number of scenarios have been identified to test the robustness of the Group’s processes, and assess the potential impact on the Group. These scenarios include anti-money laundering, sanctions, information and cyber security and external fraud.

207207
RIS
K R
EV
IEW
AN
D C
AP
ITAL R
EV
IEW
Strategic rep
ort
Sup
plem
entary inform
ation
Financial statements
Directo
rs’ repo
rt
Reputational Risk
Risk Appetite Statement
The Group aims to protect the franchise from material damage to its reputation by ensuring that any business activity is satisfactorily assessed and managed by the appropriate level of management and governance oversight
The Group defines Reputational Risk as the potential for damage to the franchise, resulting in loss of earnings or adverse impact on market capitalisation because of stakeholders taking a negative view of the organisation, its actions or inactions – leading stakeholders to change their behaviour
Roles and responsibilitiesThe Global Head, Enterprise Risk Management is the Risk Framework Owner for Reputational Risk under the Group’s Enterprise Risk Management Framework. For primary risks, the responsibility of Reputational Risk management at country level is delegated to Country Chief Risk Officers. Both the Global Head, Enterprise Risk Management and Country Chief Risk Officers constitute the second line of defence, overseeing and challenging the first line which resides with the Chief Executive Officers, Business Heads and Product Heads in respect of risk management activities of reputational-related risks. The Group recognises that there is also the potential for consequential Reputational Risk should it fail to control other Principal Risk Types. Such secondary reputational risks are managed by the Risk Framework Owners of each Principal Risk Type who are responsible for enhancing existing risk management frameworks to incorporate Reputational Risk management approaches.
MitigationThe Group’s Reputational Risk policy sets out the principal sources of Reputational Risk and the responsibilities and procedures for identifying, assessing and escalating primary and secondary reputational risks. The policy also defines the control and oversight standards to effectively manage Reputational Risk. The Group takes a structured approach to the assessment of risks associated with how individual client, transaction, product and strategic coverage decisions may affect perceptions of the organisation and its activities. Wherever a potential for stakeholder concerns is identified, issues are subject to prior approval by a management authority commensurate with the materiality of matters being considered. Such authorities may accept or decline the risk or impose conditions upon proposals, to protect the Group’s reputation. Secondary Reputational Risk mitigation derives from the effective management of other Principal Risk Types.
Governance committee oversightThe Brand, Values and Conduct Committee retains Board-level oversight responsibility for Reputational Risk. Oversight from an operational perspective falls under the remit of the Group Risk Committee and the Board Risk Committee. The Group Reputational Risk Committee ensures the effective management of primary Reputational Risk across the Group.
The Group Reputational Risk Committee’s remit is to:
¼ Challenge, constrain and, if required, stop business activities where risks are not aligned with the Group’s Risk Appetite
¼ Make decisions on Reputational Risk matters assessed as high or very high based on the Group’s primary Reputational Risk materiality assessment matrix, and matters escalated from the regions or client businesses
¼ Provide oversight of material Reputational Risk and/or thematic issues arising from the potential failure of other risk types
The Group Non-Financial Risk Committee has oversight of the effective management of secondary Reputational Risk.
Decision-making authorities and delegationThe Group Risk Committee provides Group-wide oversight on Reputational Risk, approves policy and monitors material risks. The Group Reputational Risk Committee is authorised to approve or decline Reputational Risk aspects of any business transaction, counterparty, client, product, line of business and market within the boundaries of the Group’s Risk Appetite, and any limits and policies set by authorised bodies of the Group.
MonitoringReputational Risk policies and standards are applicable to all Group entities. However, local regulators in some markets may impose additional requirements on how banks manage and track Reputational Risk. In such cases, these are complied with in addition to Group policies and standards. Exposure to Reputational Risk is monitored through:
¼ A requirement that process owners establish triggers to prompt consideration of Reputational Risk and escalation where necessary
¼ The tracking of risk acceptance decisions
¼ The tracking of thematic trends in secondary risk arising from other Principal Risk Types
¼ The analysis of prevailing stakeholder concerns
Stress testingAlthough Reputational Risk is not an explicit separate regulatory factor in enterprise stress tests, it is incorporated into the Group’s stress testing scenarios. For example, the Group may consider what impact a hypothetical event leading to loss of confidence among liquidity providers in a particular market might have, or what the implications might be for supporting part of the organisation in order to protect the brand.

Standard Chartered Annual Report 2018208
RISK REVIEW Risk management approach
Compliance Risk
Risk Appetite Statement
The Group has no appetite for breaches in laws and regulations; while recognising that regulatory non-compliance cannot be entirely avoided, the Group strives to reduce this to an absolute minimum
The Group defines Compliance Risk as potential for penalties or loss to the Group or for an adverse impact to our clients, stakeholders or to the integrity to markets we operate in through a failure on our part to comply with laws, or regulations
Roles and responsibilitiesThe Group Head, Conduct, Financial Crime and Compliance (CFCC), as Risk Framework Owner for Compliance Risk provides support to senior management on regulatory and compliance matters by:
¼ Providing interpretation and advice on regulatory requirements and their impact on the Group;
¼ Setting enterprise-wide standards for compliance, through the establishment and maintenance of a risk-based compliance framework, the Compliance Risk Type Framework (Compliance RTF);
¼ Setting a programme for monitoring Compliance Risk
The Compliance RTF sets out the roles and responsibilities in respect of Compliance Risk for the Group. All activities that the Group engages in must be designed to comply with the applicable laws and regulations in the countries in which we operate. The CFCC function is the Second Line of Defence that ensures the overall operation of the framework and for significant areas of laws and regulations, provides oversight and challenge of the first line risk management activities that relate to Compliance Risk.
The Compliance RTF defines Compliance Risk sub-types and, where relevant, assigns responsibility for these to the most appropriate other Principal Risk Type Owner or control function. This ensures that effective oversight and challenge of the first line can be provided by the appropriate second line function. Each of these assigned second line functions sets policies for the organisation to comply with, and provides guidance, oversight, and challenge over the activities of the Bank. They ensure that key risk decisions are only taken by individuals with the requisite skills, judgement, and perspective to ensure that the Group’s Compliance Risk is appropriately managed.
MitigationThe Compliance RTF sets the Group’s overall approach to the management of Compliance Risk. In support of this, the Compliance function develops and deploys relevant policies and standards setting out requirements and controls for adherence by the Group to ensure continued compliance with applicable laws and regulations. Through a combination of risk assessment, control standard setting, control monitoring and compliance review activities, the Compliance Risk Framework Owner seeks to ensure that all policies are operating as expected to mitigate the risk that they cover. The installation of appropriate processes and controls is the primary tool for the mitigation of Compliance Risk. In this, the requirements of the Operational Risk Type Framework are followed to ensure a consistent approach to the management of processes and controls.
Governance committee oversightCompliance risk and the risk of non-compliance with laws and regulations resulting from failed processes and controls are overseen by Business, Product and Function Non-Financial Risk Committees. The Conduct and Compliance Non-Financial Risk Committee has a consolidated view of these risks, and ensures that appropriate governance is in place for these. In addition, the Committee ensures that elevated levels of Compliance risk are reported to the Group Non-Financial Risk Committee, Group Risk Committee and Board Audit Committee. Within each country, oversight of Compliance Risk is delegated through the Country Non-Financial Risk Committee where the Operational Risk Control Assessment Standards will form a primary part of the monitoring of Compliance Risk.
Decision-making authorities and delegationDecision making and approval authorities follow the Enterprise Risk Management Framework approach and risk thresholds.
The Group Head, CFCC has the authority to delegate second line responsibilities within the CFCC function to relevant and suitably qualified individuals. In addition, second line responsibilities, including policy development, implementation and validation, as well as oversight and challenge of first line processes and controls are delegated based on the most appropriate other Principal Risk Type or control function for certain compliance risk sub-types.
MonitoringThe monitoring of controls designed to mitigate the risk of regulatory non-compliance in processes are governed in line with the Operational Risk Type Framework. The Group has a monitoring and reporting process in place for Compliance Risk, which includes the aggregation of compliance exposures from across the Group and escalation and reporting to Conduct and Compliance Non-Financial Risk Committee, Group Risk Committee and Board Risk Committee as appropriate. In addition, there is a Group Regulatory Reform team set up to monitor regulatory reforms in key markets and establish a protocol of horizon scanning for emerging Compliance Risk. This protocol ensures that regulatory reforms with the potential to affect the Group in multiple markets are identified and steps taken in good time to ensure compliance with these.
Stress testingStress testing and scenario analysis are used to assess capital requirements for Compliance Risk and form part of the overall scenario analysis portfolio managed under the Operational Risk Type Framework. Specific scenarios are developed annually with collaboration between the business who own and manage the risk and the CFCC function who are second line to incorporate significant Compliance risk tail events. This approach considers the impact of extreme but plausible scenarios on the Group’s Compliance Risk profile.
209209
RIS
K R
EV
IEW
AN
D C
AP
ITAL R
EV
IEW
Strategic rep
ort
Sup
plem
entary inform
ation
Financial statements
Directo
rs’ repo
rt
Conduct Risk
Risk Appetite Statement
The Group strives to maintain the standards in our Code of Conduct and outcomes of our Conduct Framework, by continuously demonstrating that we are doing the right thing in the way we do business
The Group defines Conduct Risk as the risk of detriment to the Group’s customers and clients, investors, shareholders, market integrity, competition and counterparties or from the inappropriate supply of financial services, including instances of wilful or negligent misconduct
In addition to the Group’s external stakeholders, Conduct Risk may also arise in respect to our behaviour towards each other as colleagues. The Group believes that everyone is entitled to a fair and safe working environment that is free from discrimination, exploitation, bullying, harassment or inappropriate language.
Roles and responsibilitiesConduct Risk management and abiding by the Group Code of Conduct is the responsibility of all employees across the organisation.
The first line of defence is required to ensure that potential conduct risks arising in the business, functions and countries are identified, assessed and managed appropriately. Senior management in the first line of defence are accountable for embedding the right culture relating to Conduct Risk. The CFCC function is the second line for Conduct Risk, and is responsible for providing independent guidance, oversight, and challenge to the first line, as well as setting the risk management standards that the first line must adhere to. The CFCC function owns the risk sub-types, and where relevant, they are delegated to other functions or Risk Framework Owners in the Group.
Conduct PlanThe Conduct Plan is a live document and must be kept regularly updated, including as and when there are potential or materialised conduct risks identified through other PRTs. Identified conduct risks and the corresponding mitigation should be monitored by relevant governance committees to ensure effective and timely resolution. The Conduct Plans should meet minimum standards as follows:
¼ Conduct Plans are owned by the management of each country, region, business and function within the Group. As the first line of defence, management is responsible to ensure that the Conduct Plans are regularly reviewed and updated
¼ The Compliance function as the second line of defence and Risk Framework Owner is responsible for challenging management on the quality and completeness of the plan, as well as the effectiveness and timeliness of the remediation strategy
¼ The Conduct Plans highlight the key conduct risks that are inherent to the processes and activities performed or impacted within a country, region, business or function
¼ The Group Conduct Management Principles, which highlight various conduct outcomes, should be used as a guide to help with the process of identifying relevant conduct risks
¼ For each of the risks identified, appropriate remediation action, enhancements to the control environment, responsible action owners and timeframes for resolution must be clearly recorded within the Conduct Plan
¼ Regular engagement should take place between owners of the Group and geographic Conduct Plans to ensure appropriate escalation and communications related to conduct risks and the mitigation strategy applied
¼ Conduct Plans also reflect Conduct Risks based on one-off projects, adverse trends from conduct management information, internal conduct incidents, deficiencies identified through internal assurance activities across the three lines of defence, emerging risks/trends and external developments
Governance committee oversightThe Board Risk Committee, Brand Values and Conduct Committee, Group Risk Committee, Group Non-Financial Risk Committee and the Compliance Regulatory Risk Committee are responsible for ensuring that the Group effectively manages its Conduct risk. As Risk Framework Owner for Conduct Risk, Group Head, CFCC sets reporting thresholds for escalation
of Conduct Risk to the Conduct and Compliance Risk Committee, Group Non-Financial Risk Committee and Group Risk Committee. The Board Risk Committee and the Brand Values and Conduct Committee receive periodic reports on Conduct Risk assurance against businesses and functions.
Decision-making authorities and delegationConduct Risk challenge and acceptance authority is exercised by the Group Head, CFCC and delegated within the CFCC function as second line.
Monitoring and mitigationThe Compliance Assurance team perform assurance reviews to monitor Conduct Risk outcomes. In limited or special circumstances, a specific thematic conduct review may be performed. This may be considered in scenarios where countries or businesses have significant and potentially systemic Conduct Risk issues, which may warrant a more focused assessment of the end-to-end controls.
These reviews supplement other compliance activities from a Second Line of Defence perspective. These activities include compliance stakeholder representation and challenge at first line governance committees and conduct forums; surveillance activity – such as trade surveillance, e-communication surveillance, and sales and suitability surveillance; Control Room management – such as outside business interests, personal account dealing, and information walls; and validating or challenging the Group performance scorecard for conduct.
Stress testingThe assessment of Conduct Risk vulnerabilities under stressed conditions or extreme events with a low likelihood of occurring are carried out through enterprise stress testing. This is currently covered primarily through Operational Risk and Financial Crime driven stress scenarios.
Standard Chartered Annual Report 2018210
RISK REVIEW Risk management approach
Information and Cyber Security Risk
Risk Appetite Statement
The Group seeks to avoid risk and uncertainty for our critical information assets and systems and has a low appetite for material incidents affecting these or the wider operations and reputation of the Group
The Group defines Information and Cyber Security Risk as the potential for loss from a breach of confidentiality, integrity or availability of the Group’s information systems and assets through cyber attack, insider activity, error or control failure
Roles and responsibilitiesIn 2018, the Group approved a Risk Type Framework (RTF) to formally set out the Group-wide strategy for managing Information and Cyber Security (ICS) Risk. The RTF has strengthened the role of the business for managing ICS Risk. As a result, through 2018 there has been significant expansion of first line responsibilities to ensure in-depth ownership and understanding of ICS Risk by the first line of defence.
The RTF defines the first line roles of Information Asset Owners, Information System Owners, and Information Custodians. information asset owners and Information System Owners are named individuals within each business who have accountability for classifying and managing risks to the information assets and systems they own respectively. Information Custodians are named individuals, typically within the Technology and Innovation (T&I) function, responsible for providing secure processing of information commensurate to the level specified by the Information Asset or Information System Owner. In addition, each business and region has recruited Heads of ICS to provide Information Asset and System Owners a centralised first line point of contact to ensure controls are embedded effectively and consistently across the Group. The business, alongside T&I Security Technology Services, is responsible for remediation activities to strengthen the Group’s ICS Risk controls to protect against any new threats in an evolving environment.
The Chief Information Security Officer (CISO) has overall responsibility for strategy, governance and oversight of ICS Risk across the Group and operates as the second line of defence. The CISO defines policy for ICS Risk, overseeing and challenging the operational implementation of controls at the first line.
MitigationICS Risk is managed through a structured ICS Policy Framework comprised of a risk assessment methodology and supporting policies, procedures and standards which are aligned to industry best practice models.
Information Asset Owners, Information System Owners, and Information Custodians are responsible for compliance with the ICS Policy Framework. This requires the first line to embed applicable ICS policy controls, and measure the performance of these controls with key indicators against thresholds set by the Board. Additional controls may be added by the business area to reflect any specific characteristics of the reporting area which may be relevant, depending on concurrence from the CISO.
The CISO function monitors compliance to the ICS Policy Framework through an assessment of each key control domain defined by the ICS RTF through the Risk profile report. Within the risk profile view, appropriate mitigating activity for each key control domain is identified, undertaken and reported against by the business.
All business units, group functions, countries and regions (Information Asset/System Owner and Information Custodians) complete a risk assessment of each relevant key control domain for their operational environment by completing a risk profile. These are submitted to the CISO and to relevant governance committees for continuous oversight and challenge against Risk Appetite requirements.
Governance committee oversightThe ICS Risk within the Group is currently governed via the Board Risk Committee who has responsibility for approving the definition of ICS Risk and the Group Risk Appetite. In addition, the Group Risk Committee has delegated authority to the Group Non-Financial Risk Committee (GNFRC) to ensure effective implementation of the ICS RTF. The GRC, and GNFRC retain responsibility for oversight of ICS Risk control domains rated very high and high respectively. Sub-committees of the GNFRC have oversight of the management of ICS risks arising from business and functional areas.
These governance committees have responsibility for providing oversight of ICS risks against Risk Appetite and measuring performance of ICS Risk management activities across the first line. Chairs of governance committees ensure adequate representation for all business units and countries across the Group who are responsible for managing ICS Risk. Escalation of risks which fall outside the defined appetite for the Group are overseen by these committees to ensure effective mitigation.
Decision-making authorities and delegationThe ICS RTF is the formal mechanism through which the delegation of ICS Risk authorities is made. The GCRO has delegated Risk Framework Owner authority to the CISO. The CISO has, where appropriate, delegated second line authority to information security officers to assume the responsibilities for approval for business, functions, and countries.
Approval of ICS Risk ratings follow an approval matrix defined by the ICS RTF where the GCRO and CISO sign off very high and high risks respectively.
211211
RIS
K R
EV
IEW
AN
D C
AP
ITAL R
EV
IEW
Strategic rep
ort
Sup
plem
entary inform
ation
Financial statements
Directo
rs’ repo
rt
Information Asset Owners, Information System Owners, and Information Custodians are responsible for the identification, creation and implementation of processes as required to comply with the ICS Policy Framework.
MonitoringMonitoring and reporting on the Risk Appetite profile ensures that performance which falls outside the approved Risk Appetite is highlighted and reviewed at the appropriate governance committee or authority levels, and ensures that adequate remediation actions are in place where necessary. Identification of ICS risks are performed through the following processes:
¼ Scanning of external environment: The dynamic risk identification process includes scanning of the external environment through industry and specialist activities; inputs from legal, regulatory, and mandatory bodies; changes to information and technology use in society, opportunities or incidents; and identifying emerging threats to our information assets and systems
¼ ICS Risk profile assessment exercise: Risks to information assets and systems must be identified using the approach defined within the RTF and a risk rating ascertained. Risks identified within the key control domains defined in the RTF are documented within risk profiles and reviewed monthly as part of risk governance to ensure effective mitigation against the approved appetite. During these reviews, the status of each risk is assessed to identify any changes to materiality and likelihood, which in turn affect the overall risk score and rating. Risks which exceed defined thresholds are escalated to appropriate governance bodies. The CISO performs a consolidation of completed risk profiles for the Group and produces a holistic aggregated risk position with appropriate key control and risk indicators, which are used to govern the overall ICS Risk
¼ Threat identification: During the risk identification process, the CISO works with the T&I function to ensure an accurate threat profile definition. Business areas report on their threat profile each month to the Business, Product and Functional level Non-Financial Risk Committees ensuring continuous monitoring of threat identification. This is then reported to the GNFRC, who reviews the reports at an enterprise level. Improvements to the Group’s threat intelligence capability are being implemented through 2019
Stress testingThe CISO will determine ICS Risk controls to be subjected to scenario-based resiliency stress testing and sensitivity analysis, which is aimed to either ensure robustness of control or ability to respond should a control fail. The Group’s stress testing approach entails:
¼ The CISO oversees all ICS Risk-related stress testing the Group carries out to meet regulatory requirements
¼ Incident scenarios affecting information assets and systems are periodically tested to assess the incident management capability in the Group
¼ Penetration testing and vulnerability scanning are performed against the Group’s internet-facing services and critical information assets/systems
Standard Chartered Annual Report 2018212
RISK REVIEW Risk management approach
Financial Crime Risk
Risk Appetite Statement
The Group has no appetite for breaches in laws and regulations related to financial crime, recognising that while incidents are unwanted, they cannot be entirely avoided
The Group defines Financial Crime Risk as the potential for legal or regulatory penalties, material financial loss or reputational damage resulting from the failure to comply with applicable laws and regulations relating to international sanctions, anti-money laundering and anti-bribery
Roles and responsibilitiesThe Global Head, Conduct, Financial Crime and Compliance (CFCC) has overall responsibility for Financial Crime Risk and is responsible for the establishment and maintenance of effective systems and controls to meet legal and regulatory obligations in respect of Financial Crime Risk. The Global Head, CFCC is the Group’s Money-Laundering Reporting Officer and performs the Financial Conduct Authority controlled function and senior management function in accordance with the requirements set out by the Financial Conduct Authority, including those set out in their handbook on systems and controls.
As the first line, the business unit process owners have responsibility for the application of policy controls and the identification and measurement of risks relating to financial crime. Business units must communicate risks and any policy non-compliance to the second line for review and approval following the model for delegation of authority.
MitigationThere are three Group policies in support of the Financial Crime Risk Type Framework:
¼ Anti-bribery and corruption as set out in the Group Anti-Bribery and Corruption Policy
¼ Anti-money laundering and countering terrorists financing as set out in the Group Anti-Money Laundering and Counter Terrorist Financing Policy
¼ Sanctions as set out in the Group Sanctions Policy
The Group operates risk-based controls in support of its Financial Crime Risk programme, including (but not limited to):
¼ Client due diligence, to meet Know Your Customer requirement
¼ Surveillance, including transaction screening, name screening and transaction monitoring
¼ Global risk assessment, to understand and quantify the inherent and residual Financial Crime Risk across the organisation
The strength of these controls are tested and assessed through the Group’s Operational Risk Type Framework, in addition to oversight by the Financial Crime Compliance Assurance and Group Internal Audit.
Governance committee oversightFinancial Crime Risk within the Group is governed by the Group Financial Crime Risk Committee which is appointed by and reports into the Group Risk Committee. The Group Financial Crime Risk Committee is responsible for ensuring the effective management of Operational Risk relating to Financial Crime Risk compliance throughout the Group in support of the Group’s strategy and in line with the Group’s Risk Appetite, Enterprise Risk Management Framework and Financial Crime Risk Type Framework.
The Board Financial Crime Risk Committee is appointed by the Board, to provide oversight of the effectiveness of the Group’s policies, procedures, systems, controls and assurance mechanism designed to identify, assess, manage, monitor, detect or prevent money laundering, non-compliance with sanctions, bribery, corruption, and tax crime by third parties.
Decision-making authorities and delegationThe Global Head, CFCC is the Risk Framework Owner for Financial Crime Risk under the Group’s Enterprise Risk Management Framework, and has delegated authorities to effectively implement the Financial Crime Risk Type Framework, to the Co-Heads, Financial Crime Compliance.
Certain aspects of Financial Crime Compliance, second line oversight and challenge, are further delegated within the CFCC function. Approval frameworks are in place to allow for risk-based decisions on client on-boarding, potential breaches of sanctions regulation or policy, and situations of potential anti-money laundering and anti-bribery and corruption.
MonitoringThe Group monitors Financial Crime Risk compliance against a set of Risk Appetite metrics that are approved by the Board. These metrics are reviewed periodically and reported regularly to both the Group Financial Crime Risk Committee and Board Financial Crime Risk Committee.
Stress testingThe assessment of Financial Crime vulnerabilities under stressed conditions or extreme events with a low likelihood of occurring is carried out through Enterprise Stress Testing.

213213
RIS
K R
EV
IEW
AN
D C
AP
ITAL R
EV
IEW
Strategic rep
ort
Sup
plem
entary inform
ation
Financial statements
Directo
rs’ repo
rt
Principal uncertainties
In 2018, we undertook a thorough review of our principal uncertainties, using the approach described in the Enterprise Risk Management Framework section (pages 193 to 197). The key results of the review are detailed below.
Key changes to our principal uncertaintiesThe following item has been removed as a principal uncertainty:
¼ Korean peninsula geopolitical tensions – Due to the denuclearisation discussions relating to the Korean peninsula, we believe this risk has decreased; however, we continue to conduct regular stress tests and assess contagion risks arising from risk levels and associated contingency plans
The following items have been amended or added as new principal uncertainties:
¼ Extended trade tensions driven by geopolitics and trade imbalance – This risk was previously known as “Increase in trade protectionism driven by nationalist agenda” and has been renamed to cover increasing concerns on potential trade tensions and the adoption of protectionist policies
¼ China slowdown and impact on regional economies with close ties to China – This risk was previously known as “Moderation of growth in key footprint markets led by China” and has been renamed to monitor and assess the impact from slowdown in China and associated regional economies
¼ Emerging Markets – upcoming elections, interest rate rises and foreign exchange (FX) risks – This risk was previously known as “Sharp interest rate rises and asset price corrections” and has been broadened to cover Emerging Market (EM) risks
¼ New technologies and digitisation – This risk has been split into two to adequately capture the opportunity or business disruption and obsolescence risk from new technologies and increased data privacy and security risks respectively which could impact many elements of banking
Based on our current knowledge and assumptions, our list of principal uncertainties is set out below, with our subjective assessment of their impact, likelihood and velocity of change. This reflects the latest internal assessment of material risks that the Group faces as identified by senior management. This list is not designed to be exhaustive and there may be additional risks which could materialise or have an adverse effect on the Group. Our mitigation approach for these risks may not be successful in completely eliminating them, but rather shows the Group’s attempt to reduce or manage the risk. As certain risks develop and materialise over time, management will take appropriate incremental steps based on the materiality of the impact of the risk to the operations of the Group.
In addition to our Principal Risk Types that we manage through Risk Type Frameworks, policies and Risk Appetite, we also maintain an inventory of our principal uncertainties. Principal uncertainties refer to unpredictable and uncontrollable outcomes from certain events which may have the potential to impact our business materially
Geopolitical considerations (Risk ranked according to severity)Principal uncertainties
Risk trend since 2017 Context How these are mitigated/next steps
Extended trade tensions driven by geopolitics and trade imbalance
Potential impact: High
Likelihood: High
Velocity of change: Moderate
¼ Trade tensions between the United States and China continue to rise driven by trade imbalance as well as geopolitical tensions. The US imposed trade tariffs on a further $200 billion of imports from China in late September 2018 (China retaliated with tariffs on $60 billion of goods). A 25% tariff may be imposed if the two countries are unable to reach an agreement which could start another round of devaluation
¼ A full-fledged and/or extended US–China trade tensions could destabilise the world economy. The adoption of protectionist policies driven by nationalist agendas could disrupt established supply chains and invoke retaliatory actions. Other countries could introduce tariffs on goods and services available domestically or from other economies. These would impact global trade
¼ The Group has a significant revenue stream from supporting cross-border trade
¼ A sharp slowdown in world trade and global growth is a feature of the Group stress scenarios including the Internal Capital Adequacy Assessment Process (ICAAP) and the annual Bank of England stress testing exercise. These stress tests provide visibility to key vulnerabilities so that management can implement timely interventions
Risk heightened in 2018 Risk remained consistent with 2017 levels
Potential impact (Gross risk assessment)Refers to the extent to which a risk event might affect the Group
Likelihood (Gross risk assessment)Refers to the possibility that a given event will occur
Velocity of changeRefers to when the risk event might materialise
High (significant financial or non-financial risk) High (almost certain) Fast (risk of sudden developments with limited time to respond)
Medium (some financial or non-financial risk) Medium (likely or possible) Moderate (moderate pace of developments for which we expect there will be time to respond)
Low (marginal financial or non-financial risk) Low (unlikely or rare) Steady (gradual or orderly developments)

Standard Chartered Annual Report 2018214
RISK REVIEW Risk management approach
Principal uncertainties
Risk trend since 2017 Context How these are mitigated/next steps
Middle East political situation
Potential impact: Medium
Likelihood: Medium
Velocity of change: Moderate
¼ Qatar has adjusted to the trade and diplomatic embargo by the Gulf Cooperation Council (GCC). It is unlikely that the parties to the dispute will rush to pursue a diplomatic solution which may leave a lasting rift in the GCC
¼ There is risk of escalation between Saudi Arabia and Turkey as events surrounding the death of journalist Jamal Kashoggi develop. The US congress is likely to sustain pressure on Saudi Arabia despite the efforts of the Trump administration and Saudi Arabia to de-escalate
¼ With US sanctions against Iran having come into effect in November 2018, we anticipate that the stand-off between Iran and Saudi Arabia will continue
¼ The Group has a material presence across the region
¼ The impact of the Qatar diplomatic crisis on our portfolio has been limited so far. Risk Appetite and underwriting standards have been adjusted to reflect current conditions
¼ There is constant monitoring at regional and country level to detect horizon risks and analyse any potential adverse developments. This included a planned Strategy and Portfolio Review of Saudi Arabia in November 2018
Brexit implications
Potential impact: Low
Likelihood: High
Velocity of change: Fast
¼ The exit of the UK from the European Union (EU) (Brexit) could have implications on the economic outlook for the eurozone and the UK, which might in turn have global implications because of change in policy direction. The uncertainties linked to the Brexit negotiations process could delay corporate investment decisions until there is more clarity
¼ There continues to be uncertainty on UK’s exit from Europe
¼ The first order impact of Brexit on the Group from a Credit Risk or portfolio perspective is limited given the nature of the Group’s activities. However, as we have set up a new EU subsidiary, the operating environment and client migration to the new subsidiary are impacted given the uncertainty on Brexit negotiations
¼ We continue to assess and manage post-Brexit risk and the practical implications through the Brexit Executive Committee chaired by a Management Team member. We have also evaluated the potential implications from a transition and will continue monitoring the progress of the political negotiations
¼ We have set up a new EU subsidiary and optimised our EU structure to mitigate any potential impact to our clients, our staff and the Group as a result of Brexit, including loss of EU passporting rights. Set-up activities are progressing well and we have obtained the full banking licence to commence operations in March 2019
Macroeconomic considerations
Principal uncertainties
Risk trend since 2017 Context How these are mitigated/next steps
China slowdown and impact on regional economies with close ties to China
Potential impact: High
Likelihood: Medium
Velocity of change: Steady
¼ Asia remains the main driver of global growth supported by internal drivers, led by China
¼ China’s economy has performed strongly since the beginning of 2018. However key focus remains on the government-led deleveraging efforts, economic reforms, state owned enterprises, and recent monitory policy actions to cut the reserve requirements for most banks
¼ Macroeconomic environment in the Greater China/North Asia region is threatened by US-China trade tensions
¼ Highly trade oriented economies such as Hong Kong and Singapore with close ties to China would weaken in the event of an economic slowdown in China. Regional supply chain economies such as Korea, Taiwan and Malaysia would be impacted from a fall in economic activity
¼ Greater China, North Asia and South-East Asian economies remain key strategic regions for the Group
¼ As part of our stress tests, severe stress in the global economy associated with a sharp slowdown in China was assessed in the ICAAP and Bank of England stress testing in 2018
¼ Exposures that result in material loan impairment charges and risk-weighted assets inflation under stress tests are regularly reviewed and actively managed
¼ A global downturn with shocks concentrated on China and countries with close trade links with China is one of the regular run market and traded risk stress tests
¼ We continue to monitor data from Greater China, North Asia and South-East Asia
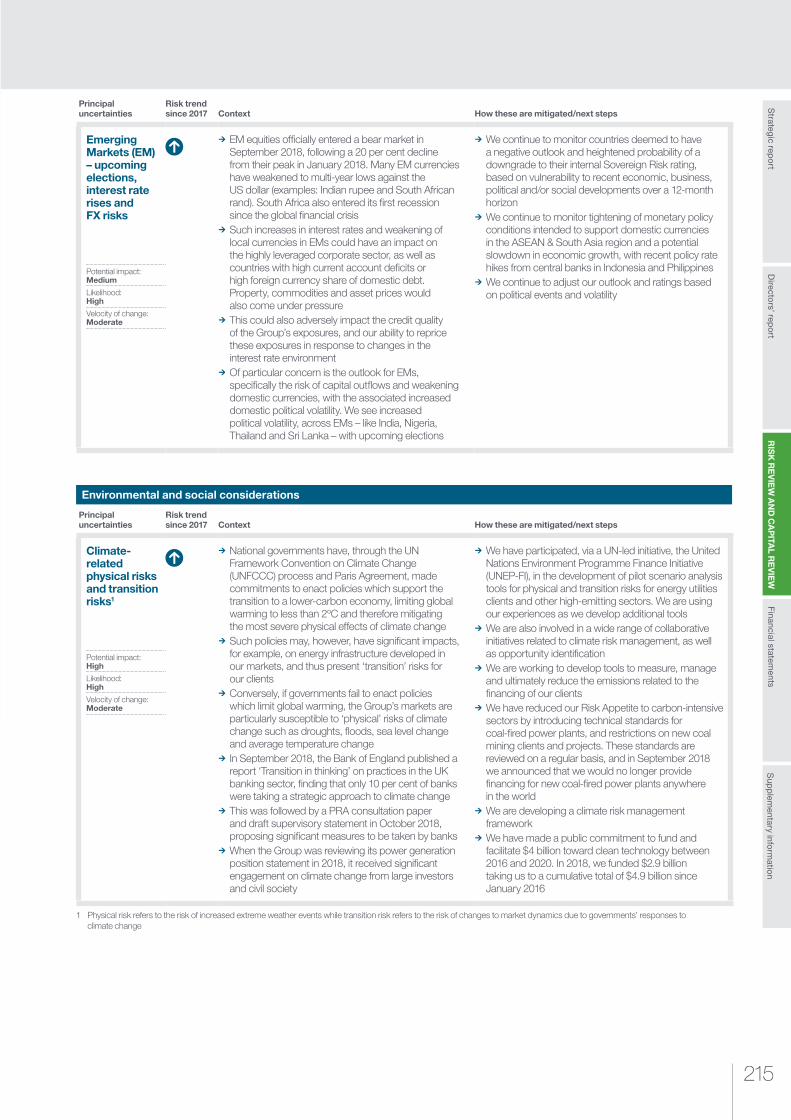
215215
RIS
K R
EV
IEW
AN
D C
AP
ITAL R
EV
IEW
Strategic rep
ort
Sup
plem
entary inform
ation
Financial statements
Directo
rs’ repo
rt
Environmental and social considerations
Principal uncertainties
Risk trend since 2017 Context How these are mitigated/next steps
Emerging Markets (EM) – upcoming elections, interest rate rises and FX risks
Potential impact: Medium
Likelihood: High
Velocity of change: Moderate
¼ EM equities officially entered a bear market in September 2018, following a 20 per cent decline from their peak in January 2018. Many EM currencies have weakened to multi-year lows against the US dollar (examples: Indian rupee and South African rand). South Africa also entered its first recession since the global financial crisis
¼ Such increases in interest rates and weakening of local currencies in EMs could have an impact on the highly leveraged corporate sector, as well as countries with high current account deficits or high foreign currency share of domestic debt. Property, commodities and asset prices would also come under pressure
¼ This could also adversely impact the credit quality of the Group’s exposures, and our ability to reprice these exposures in response to changes in the interest rate environment
¼ Of particular concern is the outlook for EMs, specifically the risk of capital outflows and weakening domestic currencies, with the associated increased domestic political volatility. We see increased political volatility, across EMs – like India, Nigeria, Thailand and Sri Lanka – with upcoming elections
¼ We continue to monitor countries deemed to have a negative outlook and heightened probability of a downgrade to their internal Sovereign Risk rating, based on vulnerability to recent economic, business, political and/or social developments over a 12-month horizon
¼ We continue to monitor tightening of monetary policy conditions intended to support domestic currencies in the ASEAN & South Asia region and a potential slowdown in economic growth, with recent policy rate hikes from central banks in Indonesia and Philippines
¼ We continue to adjust our outlook and ratings based on political events and volatility
Principal uncertainties
Risk trend since 2017 Context How these are mitigated/next steps
Climate-related physical risks and transition risks1
Potential impact: High
Likelihood: High
Velocity of change: Moderate
¼ National governments have, through the UN Framework Convention on Climate Change (UNFCCC) process and Paris Agreement, made commitments to enact policies which support the transition to a lower-carbon economy, limiting global warming to less than 2ºC and therefore mitigating the most severe physical effects of climate change
¼ Such policies may, however, have significant impacts, for example, on energy infrastructure developed in our markets, and thus present ‘transition’ risks for our clients
¼ Conversely, if governments fail to enact policies which limit global warming, the Group’s markets are particularly susceptible to ‘physical’ risks of climate change such as droughts, floods, sea level change and average temperature change
¼ In September 2018, the Bank of England published a report ‘Transition in thinking’ on practices in the UK banking sector, finding that only 10 per cent of banks were taking a strategic approach to climate change
¼ This was followed by a PRA consultation paper and draft supervisory statement in October 2018, proposing significant measures to be taken by banks
¼ When the Group was reviewing its power generation position statement in 2018, it received significant engagement on climate change from large investors and civil society
¼ We have participated, via a UN-led initiative, the United Nations Environment Programme Finance Initiative (UNEP-FI), in the development of pilot scenario analysis tools for physical and transition risks for energy utilities clients and other high-emitting sectors. We are using our experiences as we develop additional tools
¼ We are also involved in a wide range of collaborative initiatives related to climate risk management, as well as opportunity identification
¼ We are working to develop tools to measure, manage and ultimately reduce the emissions related to the financing of our clients
¼ We have reduced our Risk Appetite to carbon-intensive sectors by introducing technical standards for coal-fired power plants, and restrictions on new coal mining clients and projects. These standards are reviewed on a regular basis, and in September 2018 we announced that we would no longer provide financing for new coal-fired power plants anywhere in the world
¼ We are developing a climate risk management framework
¼ We have made a public commitment to fund and facilitate $4 billion toward clean technology between 2016 and 2020. In 2018, we funded $2.9 billion taking us to a cumulative total of $4.9 billion since January 2016
1 Physical risk refers to the risk of increased extreme weather events while transition risk refers to the risk of changes to market dynamics due to governments’ responses to climate change

Standard Chartered Annual Report 2018216
RISK REVIEW Risk management approach
Legal considerations
Principal uncertainties
Risk trend since 2017 Context How these are mitigated/next steps
Regulatory reviews and investigations, legal proceedings
Potential impact: High
Likelihood: High
Velocity of change: Moderate
¼ The Group has been, and may continue to be, subject to regulatory actions, reviews, requests for information (including subpoenas and requests for documents) and investigations across our markets, the outcomes of which are generally difficult to predict and could be material to the Group
¼ In recent years, authorities have exercised their discretion to impose increasingly severe penalties on financial institutions in connection with violation of laws and regulations, and there can be no assurance that future penalties will not be of increased severity
¼ The Group is also party to legal proceedings from time to time, which may give rise to financial losses or adversely impact our reputation in the eyes of our customers, investors and other stakeholders
¼ We have invested in enhancing systems and controls, and implementing remediation programmes (where relevant)
¼ We are cooperating with all relevant ongoing reviews, requests for information and investigations and actively managing legal proceedings with respect to legacy issues (refer to Note 26 – Legal and regulatory matters)
¼ We continue to train and educate our people on conduct, conflicts of interest, information security and financial crime compliance in order to reduce our exposure to legal and regulatory proceedings
Regulatory changes
Potential impact: Medium
Likelihood: High
Velocity of change: Fast
¼ In July 2017, the CEO of the UK Financial Conduct Authority (FCA) announced that beyond 2021 the FCA would no longer encourage panel banks to submit quotes to LIBOR. While we do not submit to LIBOR, LIBOR is heavily relied upon by the Group as a reference rate, in various client products and for enterprise-level processes and funding. Regulators are trying to catalyse a voluntary transition to alternative risk-free rates (RFRs)
¼ Rules have been defined in many key areas of regulation that could impact our business model and how we manage our capital and liquidity. In particular, the upcoming Basel III proposed changes to capital calculation methodology for Credit and Operational risk, revised framework for securitisation and Credit Valuation Adjustment risk, fundamental review of the trading book, large exposures and implementation of margin reforms, and bank recovery and resolution directive for total loss absorbing capacity
¼ Ongoing regulatory scrutiny and emphasis on local responsibilities for remotely booked business. The degree of reliance on global controls is reducing, and the focus is on local controls and governance
¼ Increased sanctions risk due to the US exiting the Joint Comprehensive Plan of Action (JCPOA, or commonly known as the Iran Nuclear Deal)
¼ We actively monitor regulatory initiatives across our footprint to identify any potential impact and change to our business model
¼ A Group-wide programme is being established to manage the transition from LIBOR to alternate RFRs over the coming years
¼ With respect to Basel III:– We are closely monitoring developments, and
conducting sensitivity analyses on the potential headwinds and opportunities
– We continuously review a menu of prospective capital accretive actions, along with impact to the Group strategy and financial performance
¼ Relevant product areas have implemented project management or programme oversight to review and improve the end-to-end process, including oversight and accountability, policies and standards, transparency and management information, permission and controls, legal-entity level limits and training
¼ We are monitoring the potential changes to the Iran sanctions regime and will take actions accordingly to ensure compliance

217217
RIS
K R
EV
IEW
AN
D C
AP
ITAL R
EV
IEW
Strategic rep
ort
Sup
plem
entary inform
ation
Financial statements
Directo
rs’ repo
rt
Technological considerations
Principal uncertainties
Risk trend since 2017 Context How these are mitigated/next steps
New technologies and digitisation (including business disruption risk, responsible use of AI and obsolescence risk)
Potential impact: High
Likelihood: High
Velocity of change: Moderate
¼ New technologies have continued to gather speed with a growing number of use cases that address evolving customer expectations
¼ In Retail Banking, we continue to observe significant shifts in customer value propositions as markets deepen. Fintechs and existing payment players are increasing digital-only banking offerings to provide consumers with the convenience of banking on-the-go. There is growing usage of AI and machine learning to personalise customer experiences, e.g. virtual chatbots to provide digital financial advice and predictive analytics to cross-sell products.
¼ In Corporate Banking, we observe an increasing focus on process digitisation to boost cost efficiencies. There are growing use cases for blockchain technologies, e.g. to streamline cross-border payments, automate Know Your Customer compliance processes. AI and machine learning have also been increasingly used in predictive risk modelling, e.g. loan default forecasts
¼ Regulators are increasing emphasis on the importance of resilient technology infrastructure in terms of elimination of cyber risk and improving reliability. The challenge is in renewing the estate to reduce the risks presented by obsolescence when the demands of ongoing technology investment delivering into this tech estate and its required performance levels continue to rise significantly.
¼ We continue to monitor emerging trends and new developments, opportunities and risks in the technology space, which may have implications on the banking sector
¼ In 2017, the Group set up the SC Ventures unit to spearhead bank-wide digital advancement. The unit is gaining momentum to promote innovation, invest in disruptive technologies and deliver client digital solutions. SC Ventures focuses its activities in three key areas:– Catalysts: Internal consulting team to support the
Group’s business units in problem-solving and developing best practices in innovation
– Investments: Professional investment team to manage the Group’s minority investments in third-party fintechs
– Ventures: Venture management unit to sponsor and oversee new wholly and partially owned ventures, with a focus on disrupting business models in the Group’s operating markets
¼ The Group has continued to make headway in harnessing new technologies to develop innovative solutions, e.g. blockchain-based cross-border wallet remittance service between Hong Kong and Philippines in partnership with Ant Financial. We have also invested in new machine learning technologies that rapidly analyse large datasets and fine-tune the accuracy of our financial crime surveillance tools
¼ In addition, we are developing a framework to ensure Fairness, Ethics, Accountability and Transparency (FEAT) in the Group’s usage of AI. We continue to deploy risk-minded controls to ensure that all cloud-based services adhere to a common governance model
¼ We are actively targeting the reduction of obsolescent/end of support technology following a Technology & Innovation-led approach under the oversight of Risk Management and the Group’s senior executives. The target is to address the Group’s obsolescence risk, by evergreening and use of new technologies such as the Cloud. In addition, we also continue our client focus by delivering outage reductions, enhanced protection by raising cyber defences and efficiency by improvements to technology deployment
Increased data privacy and security risks from strategic and wider use of data
Potential impact: High
Likelihood: High
Velocity of change: Fast
¼ As digital technologies grow in sophistication and become further embedded across the banking and financial services industry, the potential impact profile with regards to data risk is changing. The cyber threat landscape is evolving in terms of scope and pace. Banks may become more susceptible to technology-related data security risks as well as customer privacy. The growing use of big data for analysis purposes and cloud computing solutions are examples of this
¼ In addition, these risks represent an emerging and topical theme both from a regulatory and compliance perspective (i.e. the EU General Data Protection Regulation (GDPR) raises the profile of data protection compliance)
¼ As the Group moves towards cloud computing solutions, the increasing use of big data for analysis purposes leads to increased susceptibility to data security and customer privacy risks
¼ We have existing governance and control frameworks for the deployment of new technologies and services
¼ To manage the risks posed by rapidly evolving cyber security threats and technology adoption, we have designed a programme to focus on security improvements and build a sustainable plan that will secure its information and technology assets for the long term. The programme is progressing with capability being built out in multiple areas including governance, investment prioritisation and execution risk management
¼ We maintain a vigilant watch on legal and regulatory developments in relation to data protection and customer privacy to identify any potential impact to the business and to implement appropriate mechanisms to control this risk
¼ For the Group, GDPR principally impacts Group locations and client segments in the EU, functions such as Human Resources and downstream suppliers such as hubs and external vendors that process personal data caught by the GDPR (EU personal data). A GDPR programme has been established to review and remediate vendor contracts and intra-group agreements that involve the processing of EU personal data

Standard Chartered Annual Report 2018218
CAPITAL REVIEW Capital review
Capital summaryThe Group’s capital and leverage position is managed within the Board-approved risk appetite. The Group is well capitalised with low leverage and high levels of loss-absorbing capacity.
Capital, leverage and RWA 31.12.18 31.12.17
CET1 capital 14.2% 13.6%
Tier 1 capital 16.8% 16.0%
Total capital 21.6% 21.0%
UK leverage 5.6% 6.0%
Risk-weighted assets (RWA) $million 258,297 279,748
The Group’s Common Equity Tier 1 (CET1) capital and Tier 1 leverage position were ahead of both the current requirements and the expected end-state requirements for 2019. For further detail see the Standard Chartered PLC Pillar 3 Disclosures 2018 section on Capital.
The Group’s current Pillar 2A requirement reduced in 2018 to 2.9 per cent of RWA, of which at least 1.6 per cent must be held in CET1. This requirement can vary over time.
The Group currently estimates its minimum requirement for own funds and eligible liabilities (MREL) at 21.8 per cent of RWA from 1 January 2022. The Group’s combined buffer (the capital conservation, global systemically important institution (G-SII) and countercyclical buffers) is additive, resulting in a current estimate of its total loss absorbing capacity requirement of 25.7 per cent of RWA from 1 January 2022. The Group estimates that its MREL position was around 27.2 per cent of RWA and around 9.5 per cent of leverage exposure at 31 December 2018.
The Group continued its programme of MREL issuance from its holding company in 2018, issuing $5.0 billion of MREL eligible securities across senior debt and Tier 2 during the period including the Group’s inaugural issuance of US dollar callable senior notes. As part of its proactive approach to capital management, the Group successfully conducted a liability management exercise to buy back British pound sterling denominated debt and improve the capital efficiency of the non-equity capital stock.
Regulatory updateThe European Commission has proposed amendments to the Capital Requirements Directive, the Capital Requirements Regulation and the Bank Recovery and Resolution Directive. Any proposed reforms remain subject to change and until the proposals are in final form it is uncertain how they will affect the Group.
The Group remains a G-SII, with a 1.0 per cent G-SII CET1 buffer which phases in at a rate of 0.25 per cent per year and was fully implemented on 1 January 2019. The Standard Chartered PLC 2017 G-SII disclosure is published at: http://investors.sc.com/fullyearresults
In line with previous guidance, the decrease in the CET1 capital ratio on adoption of the IFRS 9 accounting standard was around 13 basis points (bps) after considering the offset against existing regulatory expected losses. Under transitional rules, the day-one impact on the CET1 ratio was negligible.
In the Bank of England’s 2018 stress tests, under the hypothetical annual cyclical scenario, the Group exceeded all hurdle rates. The Group has a diverse and liquid balance sheet and these results demonstrate the Group’s continued capital strength and increased resilience to stress.
Capital review
The Capital review provides an analysis of the Group’s capital and leverage position and requirements
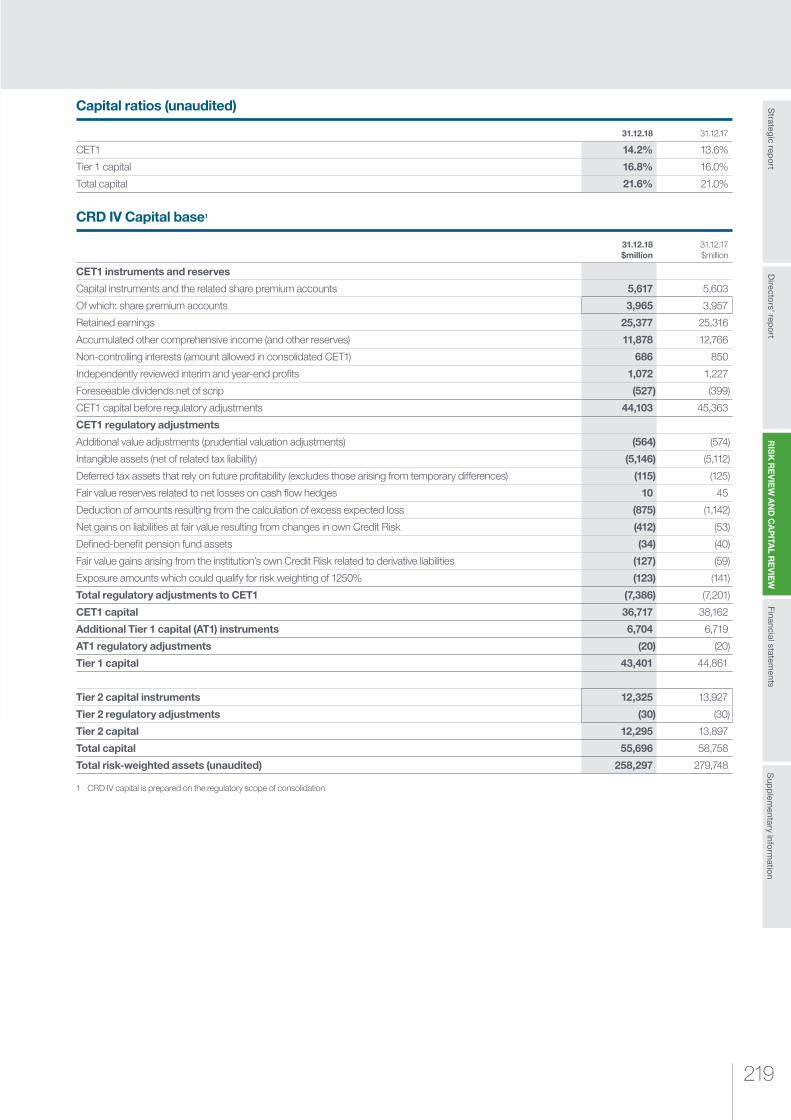
219219
RIS
K R
EV
IEW
AN
D C
AP
ITAL R
EV
IEW
Strategic rep
ort
Sup
plem
entary inform
ation
Financial statements
Directo
rs’ repo
rt
Capital ratios (unaudited)
31.12.18 31.12.17
CET1 14.2% 13.6%
Tier 1 capital 16.8% 16.0%
Total capital 21.6% 21.0%
CRD IV Capital base1
31.12.18 $million
31.12.17 $million
CET1 instruments and reserves
Capital instruments and the related share premium accounts 5,617 5,603
Of which: share premium accounts 3,965 3,957
Retained earnings 25,377 25,316
Accumulated other comprehensive income (and other reserves) 11,878 12,766
Non-controlling interests (amount allowed in consolidated CET1) 686 850
Independently reviewed interim and year-end profits 1,072 1,227
Foreseeable dividends net of scrip (527) (399)
CET1 capital before regulatory adjustments 44,103 45,363
CET1 regulatory adjustments
Additional value adjustments (prudential valuation adjustments) (564) (574)
Intangible assets (net of related tax liability) (5,146) (5,112)
Deferred tax assets that rely on future profitability (excludes those arising from temporary differences) (115) (125)
Fair value reserves related to net losses on cash flow hedges 10 45
Deduction of amounts resulting from the calculation of excess expected loss (875) (1,142)
Net gains on liabilities at fair value resulting from changes in own Credit Risk (412) (53)
Defined-benefit pension fund assets (34) (40)
Fair value gains arising from the institution’s own Credit Risk related to derivative liabilities (127) (59)
Exposure amounts which could qualify for risk weighting of 1250% (123) (141)
Total regulatory adjustments to CET1 (7,386) (7,201)
CET1 capital 36,717 38,162
Additional Tier 1 capital (AT1) instruments 6,704 6,719
AT1 regulatory adjustments (20) (20)
Tier 1 capital 43,401 44,861
Tier 2 capital instruments 12,325 13,927
Tier 2 regulatory adjustments (30) (30)
Tier 2 capital 12,295 13,897
Total capital 55,696 58,758
Total risk-weighted assets (unaudited) 258,297 279,748
1 CRD IV capital is prepared on the regulatory scope of consolidation
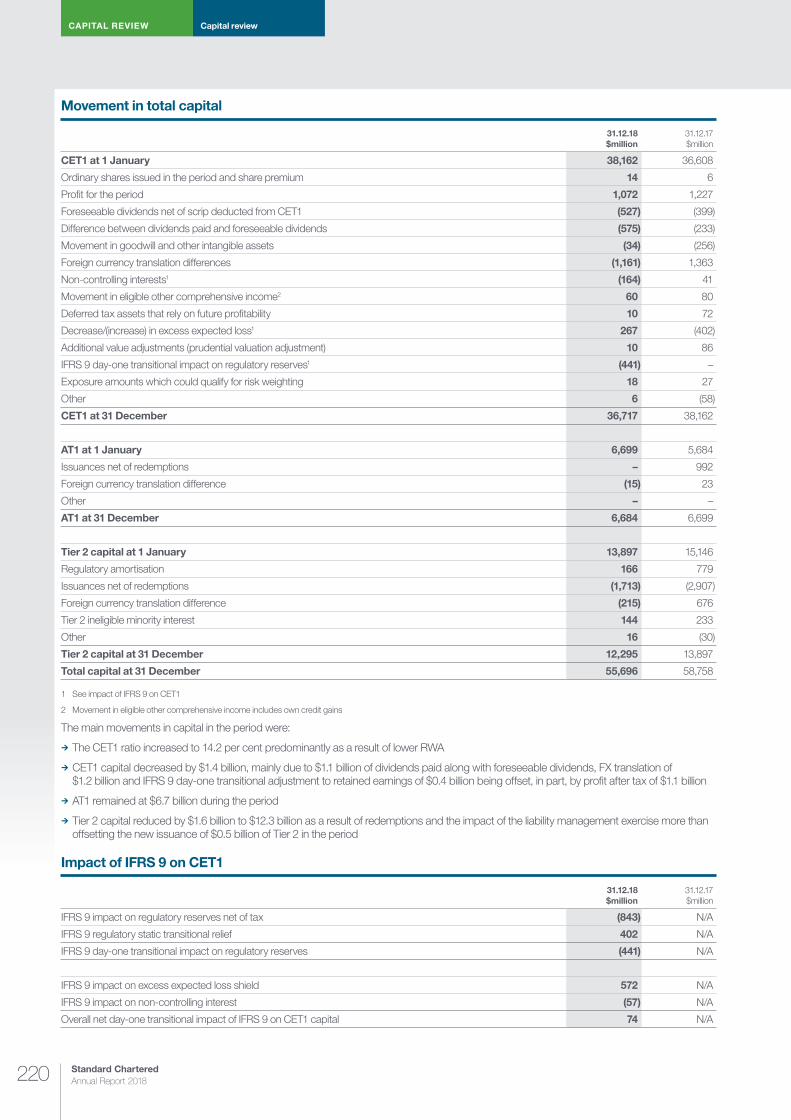
Standard Chartered Annual Report 2018220
CAPITAL REVIEW Capital review
Movement in total capital
31.12.18 $million
31.12.17 $million
CET1 at 1 January 38,162 36,608
Ordinary shares issued in the period and share premium 14 6
Profit for the period 1,072 1,227
Foreseeable dividends net of scrip deducted from CET1 (527) (399)
Difference between dividends paid and foreseeable dividends (575) (233)
Movement in goodwill and other intangible assets (34) (256)
Foreign currency translation differences (1,161) 1,363
Non-controlling interests1 (164) 41
Movement in eligible other comprehensive income2 60 80
Deferred tax assets that rely on future profitability 10 72
Decrease/(increase) in excess expected loss1 267 (402)
Additional value adjustments (prudential valuation adjustment) 10 86
IFRS 9 day-one transitional impact on regulatory reserves1 (441) –
Exposure amounts which could qualify for risk weighting 18 27
Other 6 (58)
CET1 at 31 December 36,717 38,162
AT1 at 1 January 6,699 5,684
Issuances net of redemptions – 992
Foreign currency translation difference (15) 23
Other – –
AT1 at 31 December 6,684 6,699
Tier 2 capital at 1 January 13,897 15,146
Regulatory amortisation 166 779
Issuances net of redemptions (1,713) (2,907)
Foreign currency translation difference (215) 676
Tier 2 ineligible minority interest 144 233
Other 16 (30)
Tier 2 capital at 31 December 12,295 13,897
Total capital at 31 December 55,696 58,758
1 See impact of IFRS 9 on CET1
2 Movement in eligible other comprehensive income includes own credit gains
The main movements in capital in the period were:
¼ The CET1 ratio increased to 14.2 per cent predominantly as a result of lower RWA
¼ CET1 capital decreased by $1.4 billion, mainly due to $1.1 billion of dividends paid along with foreseeable dividends, FX translation of $1.2 billion and IFRS 9 day-one transitional adjustment to retained earnings of $0.4 billion being offset, in part, by profit after tax of $1.1 billion
¼ AT1 remained at $6.7 billion during the period
¼ Tier 2 capital reduced by $1.6 billion to $12.3 billion as a result of redemptions and the impact of the liability management exercise more than offsetting the new issuance of $0.5 billion of Tier 2 in the period
Impact of IFRS 9 on CET1
31.12.18 $million
31.12.17 $million
IFRS 9 impact on regulatory reserves net of tax (843) N/A
IFRS 9 regulatory static transitional relief 402 N/A
IFRS 9 day-one transitional impact on regulatory reserves (441) N/A
IFRS 9 impact on excess expected loss shield 572 N/A
IFRS 9 impact on non-controlling interest (57) N/A
Overall net day-one transitional impact of IFRS 9 on CET1 capital 74 N/A
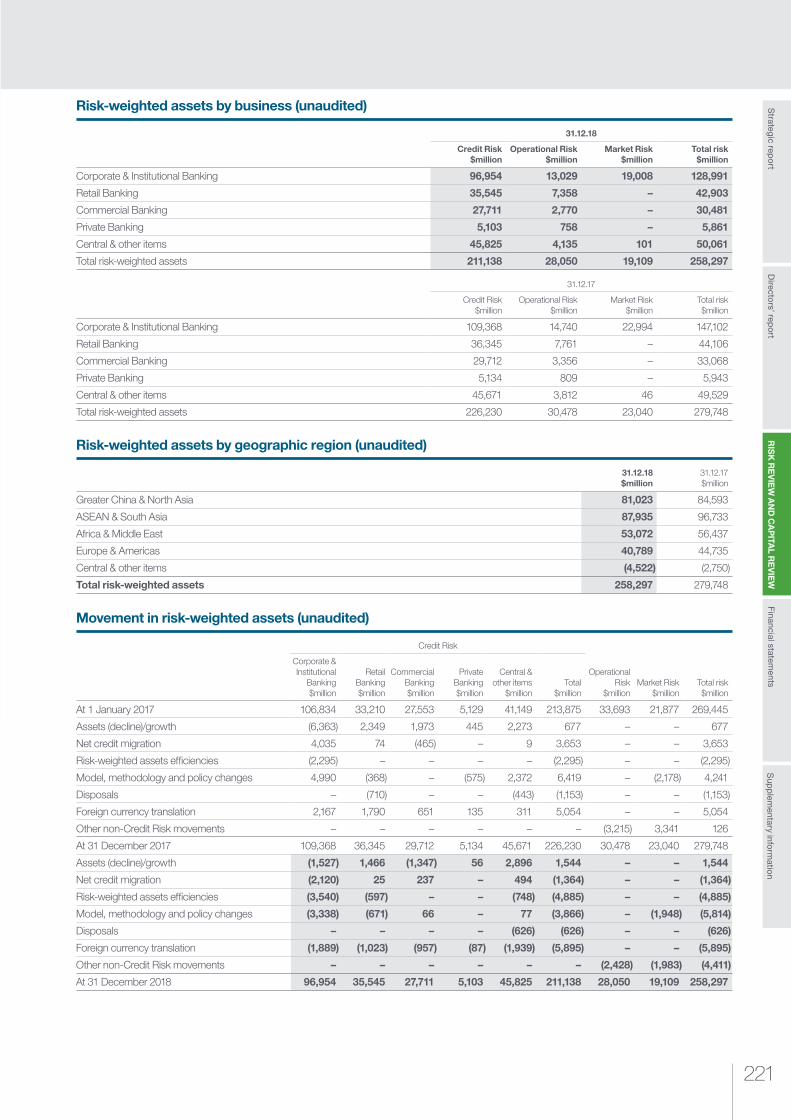
221221
RIS
K R
EV
IEW
AN
D C
AP
ITAL R
EV
IEW
Strategic rep
ort
Sup
plem
entary inform
ation
Financial statements
Directo
rs’ repo
rt
Risk-weighted assets by business (unaudited)
31.12.18
Credit Risk $million
Operational Risk $million
Market Risk $million
Total risk $million
Corporate & Institutional Banking 96,954 13,029 19,008 128,991
Retail Banking 35,545 7,358 – 42,903
Commercial Banking 27,711 2,770 – 30,481
Private Banking 5,103 758 – 5,861
Central & other items 45,825 4,135 101 50,061
Total risk-weighted assets 211,138 28,050 19,109 258,297
31.12.17
Credit Risk $million
Operational Risk $million
Market Risk $million
Total risk $million
Corporate & Institutional Banking 109,368 14,740 22,994 147,102
Retail Banking 36,345 7,761 – 44,106
Commercial Banking 29,712 3,356 – 33,068
Private Banking 5,134 809 – 5,943
Central & other items 45,671 3,812 46 49,529
Total risk-weighted assets 226,230 30,478 23,040 279,748
Risk-weighted assets by geographic region (unaudited)
31.12.18 $million
31.12.17 $million
Greater China & North Asia 81,023 84,593
ASEAN & South Asia 87,935 96,733
Africa & Middle East 53,072 56,437
Europe & Americas 40,789 44,735
Central & other items (4,522) (2,750)
Total risk-weighted assets 258,297 279,748
Movement in risk-weighted assets (unaudited)
Credit Risk
Operational Risk
$millionMarket Risk
$millionTotal risk $million
Corporate & Institutional
Banking $million
Retail Banking $million
Commercial Banking $million
Private Banking $million
Central & other items
$millionTotal
$million
At 1 January 2017 106,834 33,210 27,553 5,129 41,149 213,875 33,693 21,877 269,445
Assets (decline)/growth (6,363) 2,349 1,973 445 2,273 677 – – 677
Net credit migration 4,035 74 (465) – 9 3,653 – – 3,653
Risk-weighted assets efficiencies (2,295) – – – – (2,295) – – (2,295)
Model, methodology and policy changes 4,990 (368) – (575) 2,372 6,419 – (2,178) 4,241
Disposals – (710) – – (443) (1,153) – – (1,153)
Foreign currency translation 2,167 1,790 651 135 311 5,054 – – 5,054
Other non-Credit Risk movements – – – – – – (3,215) 3,341 126
At 31 December 2017 109,368 36,345 29,712 5,134 45,671 226,230 30,478 23,040 279,748
Assets (decline)/growth (1,527) 1,466 (1,347) 56 2,896 1,544 – – 1,544
Net credit migration (2,120) 25 237 – 494 (1,364) – – (1,364)
Risk-weighted assets efficiencies (3,540) (597) – – (748) (4,885) – – (4,885)
Model, methodology and policy changes (3,338) (671) 66 – 77 (3,866) – (1,948) (5,814)
Disposals – – – – (626) (626) – – (626)
Foreign currency translation (1,889) (1,023) (957) (87) (1,939) (5,895) – – (5,895)
Other non-Credit Risk movements – – – – – – (2,428) (1,983) (4,411)
At 31 December 2018 96,954 35,545 27,711 5,103 45,825 211,138 28,050 19,109 258,297

Standard Chartered Annual Report 2018222
CAPITAL REVIEW Capital review
Movements in risk-weighted assetsRWA decreased by $21.5 billion, or 7.7 per cent, from 31 December 2017 to $258.3 billion. This was principally due to a decrease in Credit Risk RWA of $15.1 billion, or 6.7 per cent, and reductions in both Market and Operational Risk RWA of $3.9 billion and $2.4 billion respectively.
Corporate & Institutional BankingCredit Risk RWA decreased by $12.4 billion to $97.0 billion mainly due to:
¼ $3.5 billion decrease due to RWA efficiencies, mainly $2.4 billion in Financial Markets through novation, trade compressions and process enhancement in collateral recognition and $1.1 billion of savings from RWA efficiency initiatives on sovereign and financial institution exposures
¼ $3.3 billion decrease in model, methodology and policy changes, mainly due to $2.9 billion PRA-approved internal ratings-based (IRB) model changes relating to LGD parameters
¼ $2.1 billion decrease due to net credit migration principally in ASEAN & South Asia (ASA)
¼ $1.9 billion decrease from foreign currency translation due to depreciation of currencies in India, Europe and China against the US dollar
¼ $1.5 billion RWA decrease from asset balance reduction in Principal Finance and Transaction Banking
Retail BankingCredit Risk RWA decreased by $0.8 billion to $35.5 billion mainly due to:
¼ $1.0 billion decrease from foreign currency translation mainly due to depreciation of currencies in Korea and India against the US dollar
¼ $0.7 billion RWA decrease due to model changes in mortgages in ASA
¼ $0.6 billion of benefit from RWA efficiency initiatives on exposures secured by residential real estate, partially offset by
¼ $1.5 billion RWA increase from asset balance growth, primarily in Greater China & North Asia (GCNA)
Commercial BankingCredit Risk RWA decreased by $2.0 billion to $27.7 billion mainly due to:
¼ $1.3 billion RWA decrease from asset balance reductions in Transaction Banking and Corporate Finance
¼ $0.9 billion decrease from foreign currency translation mainly due to depreciation of currencies in India, Pakistan against the US dollar, partially offset by
¼ $0.2 billion increase due to net credit migration in GCNA
Private BankingCredit Risk RWA is broadly flat at $5.1 billion. Decreases from foreign currency translation were mostly offset by changes in asset balance growth in Wealth Management products.
Central & other itemsCentral & other items RWA mainly relates to the Treasury Markets liquidity portfolio, the Group’s principal joint venture investment, PT Bank Permata Tbk, equity investments and deferred/current tax assets.
Credit Risk RWA increased by $0.2 billion to $45.8 billion mainly due to:
¼ $2.9 billion increase in Credit Risk RWA mainly due to higher liquid assets over year end in Treasury Markets
¼ $0.5 billion increase due to net credit migration in Africa & Middle East (AME) on sovereign exposures
¼ $0.1 billion increase in model, methodology and policy changes, due to PRA approved IRB model changes relating to LGD parameters, partially offset by
¼ $1.9 billion decrease from foreign currency translation mainly due to depreciation of currencies in Indonesia, India and Pakistan against the US dollar
¼ $0.7 billion of benefit from RWA efficiency initiatives on sovereign exposures
¼ $0.6 billion saving from the disposal of an investment in ASA
Market Risk Total Market Risk RWA (MRWA) decreased by $3.9 billion, or 17.1 per cent from 31 December 2017 to $19.1 billion. This change was due mainly to reduced trading book debt security holdings and to changes in internal models approach (IMA) scope and model.
Operational Risk Operational Risk RWA reduced by $2.4 billion to $28.1 billion, due to a decrease in the average income over a rolling three-year time horizon, as lower 2017 income replaced higher 2014 income. This represents a 7.9 per cent year-on-year reduction in Operational Risk RWA.
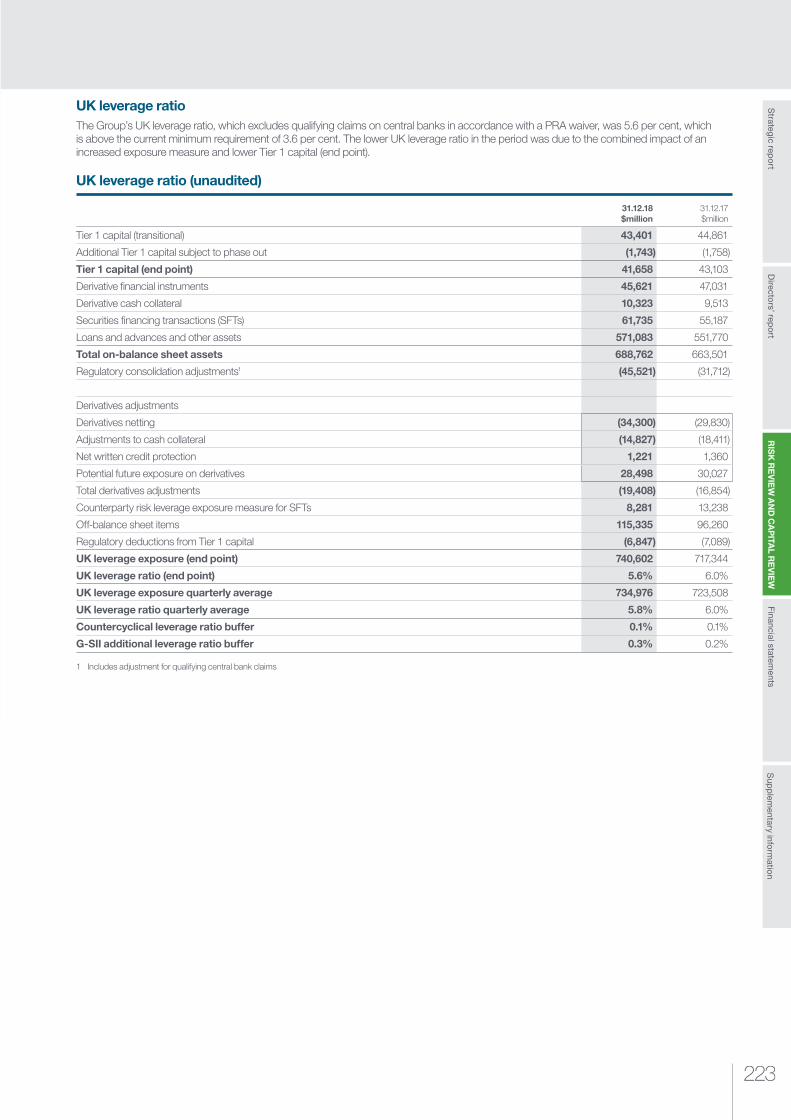
223223
RIS
K R
EV
IEW
AN
D C
AP
ITAL R
EV
IEW
Strategic rep
ort
Sup
plem
entary inform
ation
Financial statements
Directo
rs’ repo
rt
UK leverage ratio The Group’s UK leverage ratio, which excludes qualifying claims on central banks in accordance with a PRA waiver, was 5.6 per cent, which is above the current minimum requirement of 3.6 per cent. The lower UK leverage ratio in the period was due to the combined impact of an increased exposure measure and lower Tier 1 capital (end point).
UK leverage ratio (unaudited)
31.12.18 $million
31.12.17 $million
Tier 1 capital (transitional) 43,401 44,861
Additional Tier 1 capital subject to phase out (1,743) (1,758)
Tier 1 capital (end point) 41,658 43,103
Derivative financial instruments 45,621 47,031
Derivative cash collateral 10,323 9,513
Securities financing transactions (SFTs) 61,735 55,187
Loans and advances and other assets 571,083 551,770
Total on-balance sheet assets 688,762 663,501
Regulatory consolidation adjustments1 (45,521) (31,712)
Derivatives adjustments
Derivatives netting (34,300) (29,830)
Adjustments to cash collateral (14,827) (18,411)
Net written credit protection 1,221 1,360
Potential future exposure on derivatives 28,498 30,027
Total derivatives adjustments (19,408) (16,854)
Counterparty risk leverage exposure measure for SFTs 8,281 13,238
Off-balance sheet items 115,335 96,260
Regulatory deductions from Tier 1 capital (6,847) (7,089)
UK leverage exposure (end point) 740,602 717,344
UK leverage ratio (end point) 5.6% 6.0%
UK leverage exposure quarterly average 734,976 723,508
UK leverage ratio quarterly average 5.8% 6.0%
Countercyclical leverage ratio buffer 0.1% 0.1%
G-SII additional leverage ratio buffer 0.3% 0.2%
1 Includes adjustment for qualifying central bank claims

FINANCIAL STATEMENTS
Standard Chartered Annual Report 2018224
I spent years living and working in Tokyo, Japan, and that experience had a profound impact on my professional career. I have always admired the Japanese work ethic and dedication to their craft. A friend once said, “for the Japanese, perfection does exist”. I took that to heart and always put my all into everything I do to strive to achieve the Japanese standard of perfection. I #NeverSettle.
This photo is from an alleyway near my old apartment in Tamachi, Tokyo, an area that brought me great inspiration for my work and my passion in photography. It reminds me to #NeverSettle in everything I do.
Jonathan Jacob Siegel
Competition winnerJonathan Jacob Siegel
VALUED BEHAVIOURS
Never settleOur valued behaviours are the expression of Our Purpose, and will help us to truly be Here for good. Never Settle means we must always strive to do better; we can never settle for second best.
Never settle Better togetherDo the right thing

225
Risk review
and Cap
ital reviewS
trategic repo
rtS
upp
lementary info
rmatio
nF
INA
NC
IAL
STA
TE
ME
NT
SD
irectors’ rep
ort
We believe in always striving to make things
better. In the world of business, and the
world at large.
Blaise Akaye Guy Toba
Kok Seng Kang
FINANCIAL STATEMENTS
226 Independent auditor’s report
236 Consolidated income statement
237 Consolidated statement of comprehensive income
238 Consolidated balance sheet
239 Consolidated statement of changes in equity
240 Cash flow statement
241 Company balance sheet
242 Company statement of changes in equity
244 Notes to the financial statements
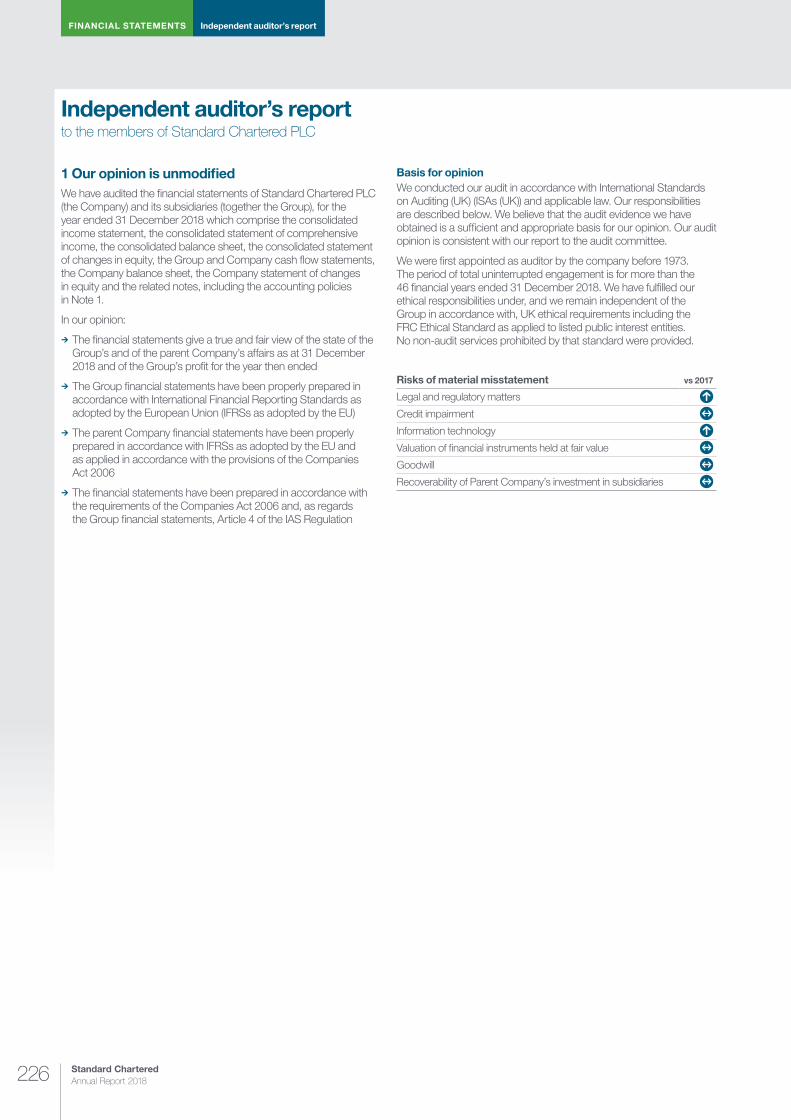
Standard Chartered Annual Report 2018226
FINANCIAL STATEMENTS Independent auditor’s report
Independent auditor’s reportto the members of Standard Chartered PLC
1 Our opinion is unmodified We have audited the financial statements of Standard Chartered PLC (the Company) and its subsidiaries (together the Group), for the year ended 31 December 2018 which comprise the consolidated income statement, the consolidated statement of comprehensive income, the consolidated balance sheet, the consolidated statement of changes in equity, the Group and Company cash flow statements, the Company balance sheet, the Company statement of changes in equity and the related notes, including the accounting policies in Note 1.
In our opinion:
¼ The financial statements give a true and fair view of the state of the Group’s and of the parent Company’s affairs as at 31 December 2018 and of the Group’s profit for the year then ended
¼ The Group financial statements have been properly prepared in accordance with International Financial Reporting Standards as adopted by the European Union (IFRSs as adopted by the EU)
¼ The parent Company financial statements have been properly prepared in accordance with IFRSs as adopted by the EU and as applied in accordance with the provisions of the Companies Act 2006
¼ The financial statements have been prepared in accordance with the requirements of the Companies Act 2006 and, as regards the Group financial statements, Article 4 of the IAS Regulation
Basis for opinion We conducted our audit in accordance with International Standards on Auditing (UK) (ISAs (UK)) and applicable law. Our responsibilities are described below. We believe that the audit evidence we have obtained is a sufficient and appropriate basis for our opinion. Our audit opinion is consistent with our report to the audit committee.
We were first appointed as auditor by the company before 1973. The period of total uninterrupted engagement is for more than the 46 financial years ended 31 December 2018. We have fulfilled our ethical responsibilities under, and we remain independent of the Group in accordance with, UK ethical requirements including the FRC Ethical Standard as applied to listed public interest entities. No non-audit services prohibited by that standard were provided.
Risks of material misstatement vs 2017
Legal and regulatory matters
Credit impairment
Information technology
Valuation of financial instruments held at fair value
Goodwill
Recoverability of Parent Company’s investment in subsidiaries

227
Risk review
and capital review
Strategic rep
ort
Sup
plem
entary inform
ation
FIN
AN
CIA
L S
TA
TE
ME
NT
SD
irectors’ rep
ort
2. Key audit matters: our assessment of risks of material misstatement Key audit matters are those matters that, in our professional judgement, were of most significance in the audit of the financial statements and include the most significant assessed risks of material misstatement (whether or not due to fraud) identified by us, including those which had the greatest effect on: the overall audit strategy; the allocation of resources in the audit; and directing the efforts of the engagement team. We summarise below the key audit matters, in decreasing order of audit significance, in arriving at our audit opinion above, together with our key audit procedures to address those matters and, as required for public interest entities, our results from those procedures. These matters were addressed, and our results are based on procedures undertaken, in the context of, and solely for the purpose of, our audit of the financial statements as a whole, and in forming our opinion thereon, and consequently are incidental to that opinion, and we do not provide a separate opinion on these matters.
Key audit matter The risk How our audit addressed the key audit matter
Legal and regulatory matters
Refer to page 73 (Audit Committee Report), page 304 (Note 24 Provisions for liabilities and charges), page 304 (Note 25 Contingent liabilities and commitments) and page 305 (Note 26 Legal and regulatory matters) including accounting policies
Estimation uncertaintyThere are a number of pending and ongoing legal disputes and regulatory investigations involving the Group. In certain litigation and regulatory matters significant judgement is required by the Group to determine whether a present obligation exists and whether a provision should be recognised. If there is a present obligation, there are significant judgements in determining the measurement of provisions, which are subject to the future outcome of legal or regulatory processes.
We focused on the risk of material misstatement arising from ongoing investigations by regulators, specifically in the US relating to the possible violation of US sanction laws and regulations. Refer to Note 26 (under ‘investigations into legacy financial crime control issues’) in relation to the Group’s ongoing discussions with the relevant US authorities regarding the resolution of these investigations.
The amounts involved could be potentially significant, and the application of accounting standards to estimate the expected outflow of any liability to be recognised is inherently subjective.
The value of provision liability recognised, for the legal and regulatory matters above, has a high degree of estimation uncertainty with a potential range of reasonable outcomes greater than our materiality for the financial statements as a whole.
Our procedures included:
Enquiry of lawyers: Meetings and correspondence with the Group’s external counsel in the US and UK and discussions with the PRA (who are in regular contact with US and other regulatory bodies) to understand the nature and status of legal disputes and regulatory investigations in order to determine whether or not a provision should be recognised.
Assessing provisions and contingent liabilities: We critically assessed and challenged the adequacy of provisions and disclosure of contingent liability disclosure including the Group’s ability to reliably estimate any monetary penalties. Our procedures included comparing assumptions to historical data, approved settlement agreements in similar cases and enquiry of, and inspection of correspondence with, external lawyers.
Assessing transparency: Assessed whether the disclosures related to significant litigation and regulatory matters adequately disclose the potential liabilities and the significant uncertainties that exist.
Our results: We considered the provisions for legal and regulatory matters recognised, including the related disclosures and the contingent liability disclosures made in Note 26, to be acceptable (2017: acceptable).

Standard Chartered Annual Report 2018228
FINANCIAL STATEMENTS Independent auditor’s report
Key audit matter The risk Our response
Credit impairment Charge: $653 million (2017: $1,362 million)
Provision: $5,185 million (1 January 2018: $6,597 million, 2017: $5,707 million)
Refer to page 73 (Audit Committee Report), page 254 (Note 8 Credit Impairment – financial disclosures and accounting policy), page 265 (Note 13 Financial instruments - accounting policy), page 294 (Note 15 Loans and advances to banks and customers – financial disclosures) and page 141 (Credit risk financial disclosures).
Subjective estimate IFRS 9 was implemented by the Group on 1 January 2018. This new standard requires the Group to recognise expected credit losses (ECL) on financial instruments which involves significant judgement and estimates to be made by the Group.
The carrying value of financial instruments within the scope of IFRS 9 ECL may be materially misstated if judgements or estimates made by the Group are inappropriate.
The most significant areas where we identified greater levels of management judgement are:
¼ Significant Increase in Credit Risk (SICR) – the criteria selected to identify a SICR are highly judgemental and can materially impact the ECL recognised for certain portfolios where the life of facilities is greater than 12 months
¼ Economic base case – IFRS 9 requires the Group to measure ECL on a forward-looking basis, incorporating future macro-economic variables reflecting a range of future conditions. The economic base case is the key driver of the range of future conditions
¼ Complex ECL models – inherently judgemental modelling techniques are used to estimate ECLs which involves determining Probabilities of Default (PD), Loss Given Default (LGD) and Exposure at Default (EAD). The PD model used in the CIB portfolio is the key driver of the Group’s overall ECL
¼ Qualitative adjustments – adjustments to model-driven ECL results are raised to address model limitations or emerging risks and trends in underlying portfolios which are inherently judgemental
¼ Individually assessed Stage 3 carrying value – the carrying value of loans and advances to banks and customers may be materially misstated if individual impairments are not appropriately identified and estimated. The identification of impaired assets and the estimation of impairment including a range of estimates of future cash flows and valuation of collateral
The effect of these matters is that, as part of our risk assessment, we determined that the value of ECL has a high degree of estimation uncertainty, with a potential range of reasonable outcomes greater than our materiality for the financial statements as a whole. The financial statements (page 177) disclose the sensitivity estimated by the Group.
Our procedures included:
Control design, observation and operation: We tested the design and operation of manual and automated controls over the ECL including over:
¼ The assessment and calculation of material SICR indicators and criteria
¼ The review and approval of the macroeconomic base case used in the ECL calculation
¼ The independent model validation function ¼ The accuracy of critical data elements input into the system used for credit grading and the approval of credit facilities;
¼ The completeness and accuracy of data flows from source systems into the ECL calculation
¼ The ongoing monitoring and identification of loans displaying indicators of impairment and whether they are migrating, on a timely basis, to a watchlist (early alert) or to grades 12 to 14 (managed by Group Special Asset Management)
Assessing SICR thresholds: We have tested the effectiveness of the SICR thresholds employed by the Group across material retail and wholesale portfolios.
Our economic scenario expertise: We involved KPMG economic specialists to assist us in assessing the appropriateness of the Group’s methodology for determining the base case economic scenario for material macroeconomic variables, and to challenge the base case forecast against market consensus information.
Our financial risk modelling expertise: We involved KPMG financial risk management modelling specialists to assist us in assessing the appropriateness of material models within the Group. For a sample of material models we assessed the credit risk modelling approach, reperformed certain aspects of the model build and independently evaluated model performance results during the year.
Assessing qualitative adjustments to model-driven ECL: We assessed the appropriateness of overlays to model-driven ECL for CIB, CB and Retail by taking into account the judgements and estimates the Group has made through the ECL calculation process (including macroeconomic forecasts). We also considered the performance of ECL models during the year, assessed the appropriateness of proxies and impact of assumptions used in the calculation.
Assessing individual exposures: We selected a sample (based on quantitative thresholds) of larger clients where impairment indicators had been identified by the Group. We obtained the Group’s assessment of the recoverability of these exposures and challenged whether individual impairment provisions, or lack of, were appropriate. This included the following procedures:
¼ Challenged the different recovery scenarios identified by the Group by comparing to external information including publically available financial performance and sale agreements
¼ Challenged the probability weighting assigned to each scenario by performing sensitivity analysis
¼ Assessed external collateral valuer’s credentials and compared external valuations to values used in the Group’s impairment assessments
Our results: We considered the credit impairment charge and provision recognised and the related disclosures to be acceptable (2017: acceptable).

229
Risk review
and capital review
Strategic rep
ort
Sup
plem
entary inform
ation
FIN
AN
CIA
L S
TA
TE
ME
NT
SD
irectors’ rep
ort
Key audit matter The risk Our response
Information technology
Refer to page 74 (Audit Committee Report)
Control performanceThe Group’s key financial accounting and reporting processes are highly dependent on the automated controls over the Group’s IT systems. There is a risk that gaps in the change management, segregation of duties or user access management controls (in relation to key financial accounting and reporting systems) may undermine our ability to place some reliance thereon in our audit.
Our procedures included:
General IT controls design, observation and operation: Tested a sample of key controls operating over the information (in relation to financial accounting and reporting systems), including change management, segregation of duties and user access management controls.
Change management control operation: Obtained and inspected the change management policies and, for a sample of system changes during the year (in relation to financial accounting and reporting systems), confirmed that changes had been performed in line with policy.
Segregation of duties control operation: Tested a sample of the automated controls (in relation to financial accounting and reporting systems) that are designed to enforce appropriate segregation of duties.
User access management controls operation: We obtained the Group’s evaluation of the access rights, including privileged access rights, granted to applications relevant to financial accounting and reporting systems and tested the resolution of a sample of exceptions. We also assessed the operating effectiveness of controls over granting, removal and appropriateness of access rights, including privileged access rights.
Our results: We considered the change management and segregation of duties controls in relation to financial accounting and reporting systems to be acceptable (2017: acceptable).
Our testing identified some weaknesses in the design and operation of user access management controls. As a result we expanded the extent of our testing by performing a combination of testing of mitigating controls and substantive testing to address control weaknesses identified. Such additional procedures included:
¼ Where relevant, evaluated alternative monitoring controls that were performed by the Group
¼ Obtained and inspected the last log in dates of users with privileged access, to identify whether they accessed any financial accounting and reporting system during 2018
¼ Obtained and evaluated reports which assessed the coding of the in scope applications to evaluate whether any unauthorised changes have taken place
¼ Assessed the nature of user IDs not subject to monitoring controls to ascertain the level of privilege and potential impact on financial and reporting systems
¼ Evaluated compensating controls, including reconciliation controls
When the above mitigating procedures were performed, we have reduced the audit risk relating to user access management controls to an acceptable level.
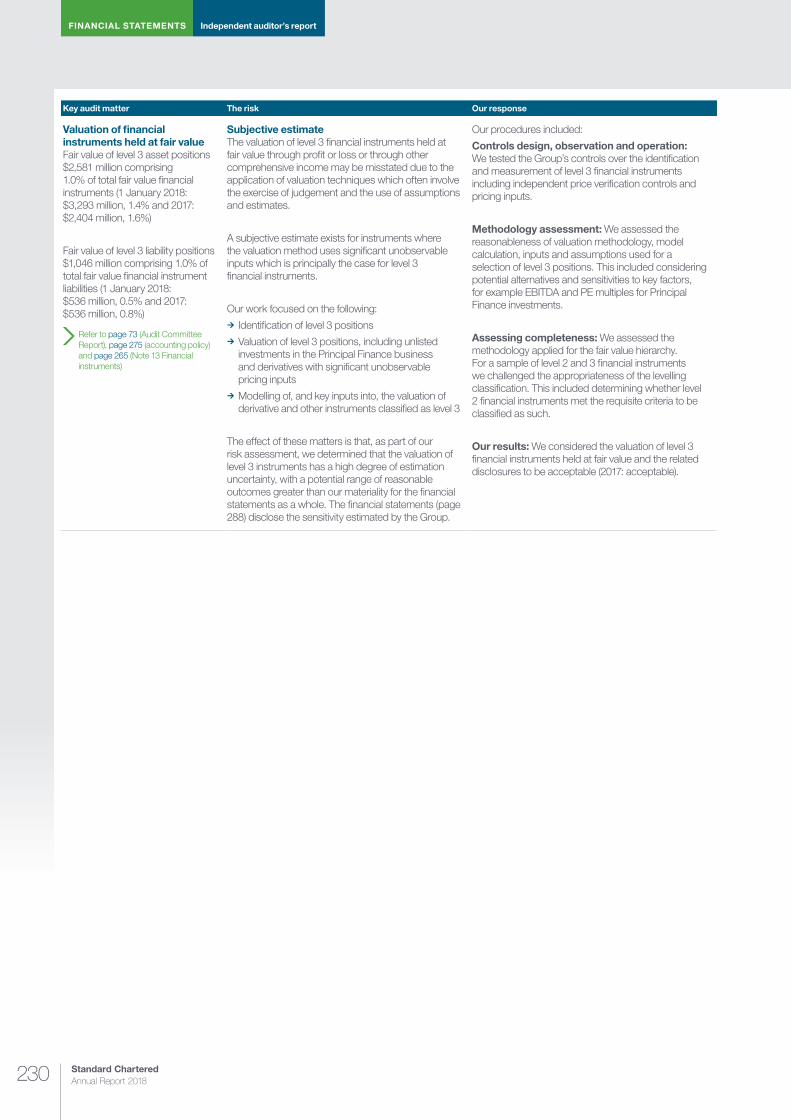
Standard Chartered Annual Report 2018230
FINANCIAL STATEMENTS Independent auditor’s report
Key audit matter The risk Our response
Valuation of financial instruments held at fair value Fair value of level 3 asset positions $2,581 million comprising 1.0% of total fair value financial instruments (1 January 2018: $3,293 million, 1.4% and 2017: $2,404 million, 1.6%)
Fair value of level 3 liability positions $1,046 million comprising 1.0% of total fair value financial instrument liabilities (1 January 2018: $536 million, 0.5% and 2017: $536 million, 0.8%)
Refer to page 73 (Audit Committee Report), page 275 (accounting policy) and page 265 (Note 13 Financial instruments)
Subjective estimate The valuation of level 3 financial instruments held at fair value through profit or loss or through other comprehensive income may be misstated due to the application of valuation techniques which often involve the exercise of judgement and the use of assumptions and estimates.
A subjective estimate exists for instruments where the valuation method uses significant unobservable inputs which is principally the case for level 3 financial instruments.
Our work focused on the following: ¼ Identification of level 3 positions ¼ Valuation of level 3 positions, including unlisted investments in the Principal Finance business and derivatives with significant unobservable pricing inputs
¼ Modelling of, and key inputs into, the valuation of derivative and other instruments classified as level 3
The effect of these matters is that, as part of our risk assessment, we determined that the valuation of level 3 instruments has a high degree of estimation uncertainty, with a potential range of reasonable outcomes greater than our materiality for the financial statements as a whole. The financial statements (page 288) disclose the sensitivity estimated by the Group.
Our procedures included:
Controls design, observation and operation: We tested the Group’s controls over the identification and measurement of level 3 financial instruments including independent price verification controls and pricing inputs.
Methodology assessment: We assessed the reasonableness of valuation methodology, model calculation, inputs and assumptions used for a selection of level 3 positions. This included considering potential alternatives and sensitivities to key factors, for example EBITDA and PE multiples for Principal Finance investments.
Assessing completeness: We assessed the methodology applied for the fair value hierarchy. For a sample of level 2 and 3 financial instruments we challenged the appropriateness of the levelling classification. This included determining whether level 2 financial instruments met the requisite criteria to be classified as such.
Our results: We considered the valuation of level 3 financial instruments held at fair value and the related disclosures to be acceptable (2017: acceptable).
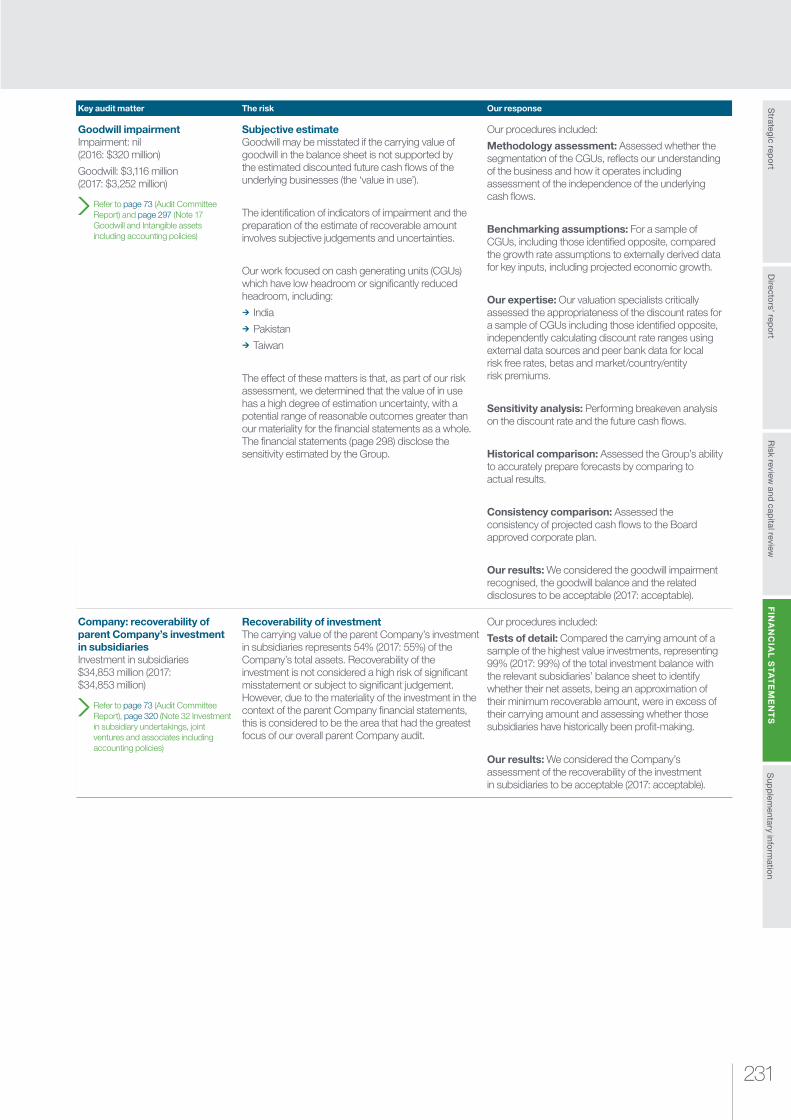
231
Risk review
and capital review
Strategic rep
ort
Sup
plem
entary inform
ation
FIN
AN
CIA
L S
TA
TE
ME
NT
SD
irectors’ rep
ort
Key audit matter The risk Our response
Goodwill impairmentImpairment: nil (2016: $320 million)
Goodwill: $3,116 million (2017: $3,252 million)
Refer to page 73 (Audit Committee Report) and page 297 (Note 17 Goodwill and Intangible assets including accounting policies)
Subjective estimate Goodwill may be misstated if the carrying value of goodwill in the balance sheet is not supported by the estimated discounted future cash flows of the underlying businesses (the ‘value in use’).
The identification of indicators of impairment and the preparation of the estimate of recoverable amount involves subjective judgements and uncertainties.
Our work focused on cash generating units (CGUs) which have low headroom or significantly reduced headroom, including:
¼ India ¼ Pakistan ¼ Taiwan
The effect of these matters is that, as part of our risk assessment, we determined that the value of in use has a high degree of estimation uncertainty, with a potential range of reasonable outcomes greater than our materiality for the financial statements as a whole. The financial statements (page 298) disclose the sensitivity estimated by the Group.
Our procedures included:
Methodology assessment: Assessed whether the segmentation of the CGUs, reflects our understanding of the business and how it operates including assessment of the independence of the underlying cash flows.
Benchmarking assumptions: For a sample of CGUs, including those identified opposite, compared the growth rate assumptions to externally derived data for key inputs, including projected economic growth.
Our expertise: Our valuation specialists critically assessed the appropriateness of the discount rates for a sample of CGUs including those identified opposite, independently calculating discount rate ranges using external data sources and peer bank data for local risk free rates, betas and market/country/entity risk premiums.
Sensitivity analysis: Performing breakeven analysis on the discount rate and the future cash flows.
Historical comparison: Assessed the Group’s ability to accurately prepare forecasts by comparing to actual results.
Consistency comparison: Assessed the consistency of projected cash flows to the Board approved corporate plan.
Our results: We considered the goodwill impairment recognised, the goodwill balance and the related disclosures to be acceptable (2017: acceptable).
Company: recoverability of parent Company’s investment in subsidiaries Investment in subsidiaries $34,853 million (2017: $34,853 million)
Refer to page 73 (Audit Committee Report), page 320 (Note 32 Investment in subsidiary undertakings, joint ventures and associates including accounting policies)
Recoverability of investment The carrying value of the parent Company’s investment in subsidiaries represents 54% (2017: 55%) of the Company’s total assets. Recoverability of the investment is not considered a high risk of significant misstatement or subject to significant judgement. However, due to the materiality of the investment in the context of the parent Company financial statements, this is considered to be the area that had the greatest focus of our overall parent Company audit.
Our procedures included:
Tests of detail: Compared the carrying amount of a sample of the highest value investments, representing 99% (2017: 99%) of the total investment balance with the relevant subsidiaries’ balance sheet to identify whether their net assets, being an approximation of their minimum recoverable amount, were in excess of their carrying amount and assessing whether those subsidiaries have historically been profit-making.
Our results: We considered the Company’s assessment of the recoverability of the investment in subsidiaries to be acceptable (2017: acceptable).
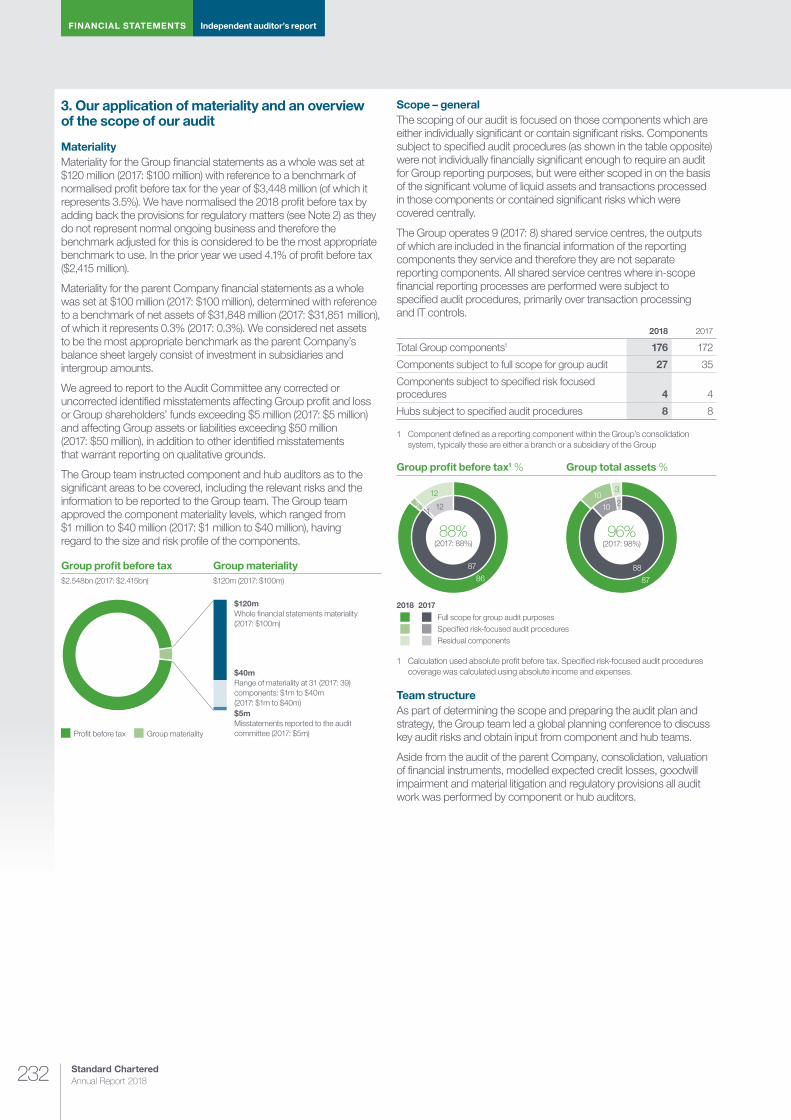
Standard Chartered Annual Report 2018232
FINANCIAL STATEMENTS Independent auditor’s report
3. Our application of materiality and an overview of the scope of our audit
Materiality Materiality for the Group financial statements as a whole was set at $120 million (2017: $100 million) with reference to a benchmark of normalised profit before tax for the year of $3,448 million (of which it represents 3.5%). We have normalised the 2018 profit before tax by adding back the provisions for regulatory matters (see Note 2) as they do not represent normal ongoing business and therefore the benchmark adjusted for this is considered to be the most appropriate benchmark to use. In the prior year we used 4.1% of profit before tax ($2,415 million).
Materiality for the parent Company financial statements as a whole was set at $100 million (2017: $100 million), determined with reference to a benchmark of net assets of $31,848 million (2017: $31,851 million), of which it represents 0.3% (2017: 0.3%). We considered net assets to be the most appropriate benchmark as the parent Company’s balance sheet largely consist of investment in subsidiaries and intergroup amounts.
We agreed to report to the Audit Committee any corrected or uncorrected identified misstatements affecting Group profit and loss or Group shareholders’ funds exceeding $5 million (2017: $5 million) and affecting Group assets or liabilities exceeding $50 million (2017: $50 million), in addition to other identified misstatements that warrant reporting on qualitative grounds.
The Group team instructed component and hub auditors as to the significant areas to be covered, including the relevant risks and the information to be reported to the Group team. The Group team approved the component materiality levels, which ranged from $1 million to $40 million (2017: $1 million to $40 million), having regard to the size and risk profile of the components.
Group profit before tax
$120mWhole financial statements materiality(2017: $100m)
$2.548bn (2017: $2.415bn)
Group materiality$120m (2017: $100m)
$40mRange of materiality at 31 (2017: 39) components: $1m to $40m (2017: $1m to $40m)$5mMisstatements reported to the audit committee (2017: $5m)Profit before tax Group materiality
Scope – general The scoping of our audit is focused on those components which are either individually significant or contain significant risks. Components subject to specified audit procedures (as shown in the table opposite) were not individually financially significant enough to require an audit for Group reporting purposes, but were either scoped in on the basis of the significant volume of liquid assets and transactions processed in those components or contained significant risks which were covered centrally.
The Group operates 9 (2017: 8) shared service centres, the outputs of which are included in the financial information of the reporting components they service and therefore they are not separate reporting components. All shared service centres where in-scope financial reporting processes are performed were subject to specified audit procedures, primarily over transaction processing and IT controls.
2018 2017
Total Group components1 176 172
Components subject to full scope for group audit 27 35
Components subject to specified risk focused procedures 4 4
Hubs subject to specified audit procedures 8 8
1 Component defined as a reporting component within the Group’s consolidation system, typically these are either a branch or a subsidiary of the Group
Group profit before tax1 %
88%(2017: 88%)
86
87
1122
12
2018 2017
Full scope for group audit purposesSpecified risk-focused audit proceduresResidual components
Group total assets %
96%(2017: 98%)
87
88
10 210
3
1 Calculation used absolute profit before tax. Specified risk-focused audit procedures coverage was calculated using absolute income and expenses.
Team structure As part of determining the scope and preparing the audit plan and strategy, the Group team led a global planning conference to discuss key audit risks and obtain input from component and hub teams.
Aside from the audit of the parent Company, consolidation, valuation of financial instruments, modelled expected credit losses, goodwill impairment and material litigation and regulatory provisions all audit work was performed by component or hub auditors.
233
Risk review
and capital review
Strategic rep
ort
Sup
plem
entary inform
ation
FIN
AN
CIA
L S
TA
TE
ME
NT
SD
irectors’ rep
ort
Further, the Group team visited 12 (2017: 9) component and hub locations; China, Ghana, Hong Kong, India, Kenya, Malaysia, Nigeria, Pakistan, Singapore, South Korea, United Arab Emirates and the UK (2017: Bangladesh, China, Hong Kong, India, Malaysia, Singapore, South Korea, the UK and the US). At these visits and meetings, the findings reported to the Group team and any further work required by the Group team were discussed in more detail.
Aside from the site visits, regular conference calls were also held with the component auditors. The Group team also inspected the component teams’ key work papers related to the significant risks and assessed the appropriateness of conclusions and the consistency between reported findings and work performed.
4. We have nothing to report on going concern The Directors have prepared the financial statements on the going concern basis as they do not intend to liquidate the Company or the Group or to cease their operations, and as they have concluded that the Company’s and the Group’s financial position means that this approach is realistic. They have also concluded that there are no material uncertainties that could have cast significant doubt over their ability to continue as a going concern for at least a year from the date of approval of the financial statements (‘the going concern period’).
Our responsibility is to conclude on the appropriateness of the Directors’ conclusions and, had there been a material uncertainty related to going concern, to make reference to that in this audit report. However, as we cannot predict all future events or conditions and as subsequent events may result in outcomes that are inconsistent with judgements that were reasonable at the time they were made, the absence of reference to a material uncertainty in this auditor’s report is not a guarantee that the Group and the Company will continue in operation.
In our evaluation of the Directors’ conclusions, we considered the inherent risks to the Group’s and Company’s business model and analysed how those risks might affect the Group’s and Company’s financial resources or ability to continue operations over the going concern period. The risks that we considered most likely to adversely affect the Group’s and Company’s available financial resources over this period were:
¼ Availability of funding and liquidity in the event of a market wide stress scenario
¼ Impact on regulatory capital requirements in the event of an economic slowdown or recession
As these were risks that could potentially cast significant doubt on the Group’s and the Company’s ability to continue as a going concern, we considered sensitivities over the level of available financial resources indicated by the Group’s financial forecasts taking account of reasonably possible (but not unrealistic) adverse effects that could arise from these risks individually and collectively and evaluated the achievability of the actions the Directors consider they would take to improve the position should the risks materialise. We also considered less predictable but realistic second order impacts, such as those included within the Bank’s recent stress tests, which could result in a rapid reduction of available financial resources.
Based on this work, we are required to report to you if:
¼ We have anything material to add or draw attention to in relation to the Directors’ statement in Note 1 to the financial statements on the use of the going concern basis of accounting with no material uncertainties that may cast significant doubt over the Group and Company’s use of that basis for a period of at least twelve months from the date of approval of the financial statements
¼ The related statement under the Listing Rules set out on page 126 is materially inconsistent with our audit knowledge
We have nothing to report in these respects, and we did not identify going concern as a key audit matter.
5. We have nothing to report on the other information in the Annual Report The Directors are responsible for the other information presented in the Annual Report together with the financial statements. Our opinion on the financial statements does not cover the other information and, accordingly, we do not express an audit opinion or, except as explicitly stated below, any form of assurance conclusion thereon.
Our responsibility is to read the other information and, in doing so, consider whether, based on our financial statements audit work, the information therein is materially misstated or inconsistent with the financial statements or our audit knowledge. Based solely on that work we have not identified material misstatements in the other information.
Strategic report and Directors’ report Based solely on our work on the other information:
¼ We have not identified material misstatements in the strategic report and the Directors’ report
¼ In our opinion the information given in those reports for the financial year is consistent with the financial statements
¼ In our opinion those reports have been prepared in accordance with the Companies Act 2006
Directors’ remuneration report In our opinion the part of the Directors’ Remuneration Report to be audited has been properly prepared in accordance with the Companies Act 2006.
Standard Chartered Annual Report 2018234
FINANCIAL STATEMENTS Independent auditor’s report
Disclosures of principal risks and longer-term viability Based on the knowledge we acquired during our financial statements audit, we have nothing material to add or draw attention to in relation to:
¼ The Directors’ confirmation within the Viability Statement on page 53 that they have carried out a robust assessment of the principal risks facing the Group, including those that would threaten its business model, future performance, solvency and liquidity
¼ The Principal Risks disclosures on page 198 to 212 describing these risks and explaining how they are being managed and mitigated
¼ The Directors’ explanation in the Viability Statement of how they have assessed the prospects of the Group, over what period they have done so and why they considered that period to be appropriate, and their statement as to whether they have a reasonable expectation that the Group will be able to continue in operation and meet its liabilities as they fall due over the period of their assessment, including any related disclosures drawing attention to any necessary qualifications or assumptions
Under the Listing Rules we are required to review the Viability Statement. We have nothing to report in this respect.
Our work is limited to assessing these matters in the context of only the knowledge acquired during our financial statements audit. As we cannot predict all future events or conditions and as subsequent events may result in outcomes that are inconsistent with judgements that were reasonable at the time they were made, the absence of anything to report on these statements is not a guarantee as to the Group’s and Company’s longer-term viability.
Corporate governance disclosures We are required to report to you if:
¼ We have identified material inconsistencies between the knowledge we acquired during our financial statements audit and the Directors’ statement that they consider that the annual report and financial statements taken as a whole is fair, balanced and understandable and provides the information necessary for shareholders to assess the Group’s position and performance, business model and strategy
¼ The section of the annual report describing the work of the Audit Committee does not appropriately address matters communicated by us to the Audit Committee
We are required to report to you if the Corporate Governance Statement does not properly disclose a departure from the eleven provisions of the UK Corporate Governance Code specified by the Listing Rules for our review.
We have nothing to report in these respects.
6. We have nothing to report on the other matters on which we are required to report by exception Under the Companies Act 2006, we are required to report to you if, in our opinion:
¼ Adequate accounting records have not been kept by the parent Company, or returns adequate for our audit have not been received from branches not visited by us; or
¼ The parent Company financial statements and the part of the Directors’ Remuneration Report to be audited are not in agreement with the accounting records and returns; or
¼ Certain disclosures of Directors’ remuneration specified by law are not made; or
¼ We have not received all the information and explanations we require for our audit.
We have nothing to report in these respects.
7. Respective responsibilities
Directors’ responsibilities As explained more fully in their statement set out on page 133, the Directors are responsible for: the preparation of the financial statements including being satisfied that they give a true and fair view; such internal control as they determine is necessary to enable the preparation of financial statements that are free from material misstatement, whether due to fraud or error; assessing the Group and parent Company’s ability to continue as a going concern, disclosing, as applicable, matters related to going concern; and using the going concern basis of accounting unless they either intend to liquidate the Group or the parent Company or to cease operations, or have no realistic alternative but to do so.
Auditor’s responsibilities Our objectives are to obtain reasonable assurance about whether the financial statements as a whole are free from material misstatement, whether due to fraud or other irregularities (see below), or error, and to issue our opinion in an auditor’s report. Reasonable assurance is a high level of assurance, but does not guarantee that an audit conducted in accordance with ISAs (UK) will always detect a material misstatement when it exists. Misstatements can arise from fraud, other irregularities or error and are considered material if, individually or in aggregate, they could reasonably be expected to influence the economic decisions of users taken on the basis of the financial statements.
A fuller description of our responsibilities is provided on the FRC’s website at www.frc.org.uk/auditorsresponsibilities.
Irregularities – ability to detect We identified areas of laws and regulations that could reasonably be expected to have a material effect on the financial statements from our general commercial and sector experience, through discussion with the Directors and other management (as required by auditing standards), and from inspection of the Group’s regulatory and legal correspondence and discussed with the Directors and other management the policies and procedures regarding compliance with laws and regulations. We communicated identified laws and regulations throughout our team and remained alert to any indications of non-compliance throughout the audit. This included communication from the group to component audit teams of relevant laws and regulations identified at group level.
The potential effect of these laws and regulations on the financial statements varies considerably.
235
Risk review
and capital review
Strategic rep
ort
Sup
plem
entary inform
ation
FIN
AN
CIA
L S
TA
TE
ME
NT
SD
irectors’ rep
ort
Firstly, the group is subject to laws and regulations that directly affect the financial statements including financial reporting legislation (including related companies legislation), distributable profits legislation and taxation legislation and we assessed the extent of compliance with these laws and regulations as part of our procedures on the related financial statement items.
Secondly, the group is subject to many other laws and regulations where the consequences of non-compliance could have a material effect on amounts or disclosures in the financial statements, for instance through the imposition of fines or litigation or the loss of the group’s licence to operate. We identified the following areas as those most likely to have such an effect: regulatory capital and liquidity, conduct, financial crime including money laundering, sanctions list and market abuse regulations recognising the financial and regulated nature of the group’s activities. Auditing standards limit the required audit procedures to identify non-compliance with these laws and regulations to enquiry of the Directors, and other management, and inspection of regulatory and legal correspondence, if any. Further detail in respect of legal and regulatory matters is set out in the key audit matter disclosures in section 2 of this report.
Owing to the inherent limitations of an audit, there is an unavoidable risk that we may not have detected some material misstatements in the financial statements, even though we have properly planned and performed our audit in accordance with auditing standards. For example, the further removed non-compliance with laws and regulations (irregularities) is from the events and transactions reflected in the financial statements, the less likely the inherently limited procedures required by auditing standards would identify it. In addition, as with any audit, there remained a higher risk of non-detection of irregularities, as these may involve collusion, forgery, intentional omissions, misrepresentations, or the override of internal controls. We are not responsible for preventing non-compliance and cannot be expected to detect non-compliance with all laws and regulations.
8. The purpose of our audit work and to whom we owe our responsibilities This report is made solely to the Company’s members, as a body, in accordance with Chapter 3 of Part 16 of the Companies Act 2006. Our audit work has been undertaken so that we might state to the Company’s members those matters we are required to state to them in an auditor’s report and for no other purpose. To the fullest extent permitted by law, we do not accept or assume responsibility to anyone other than the Company and the Company’s members, as a body, for our audit work, for this report, or for the opinions we have formed.
Paul Furneaux Senior Statutory Auditor for and on behalf of KPMG LLP, Statutory Auditor Chartered Accountants 15 Canada Square London E14 5GL
26 February 2019
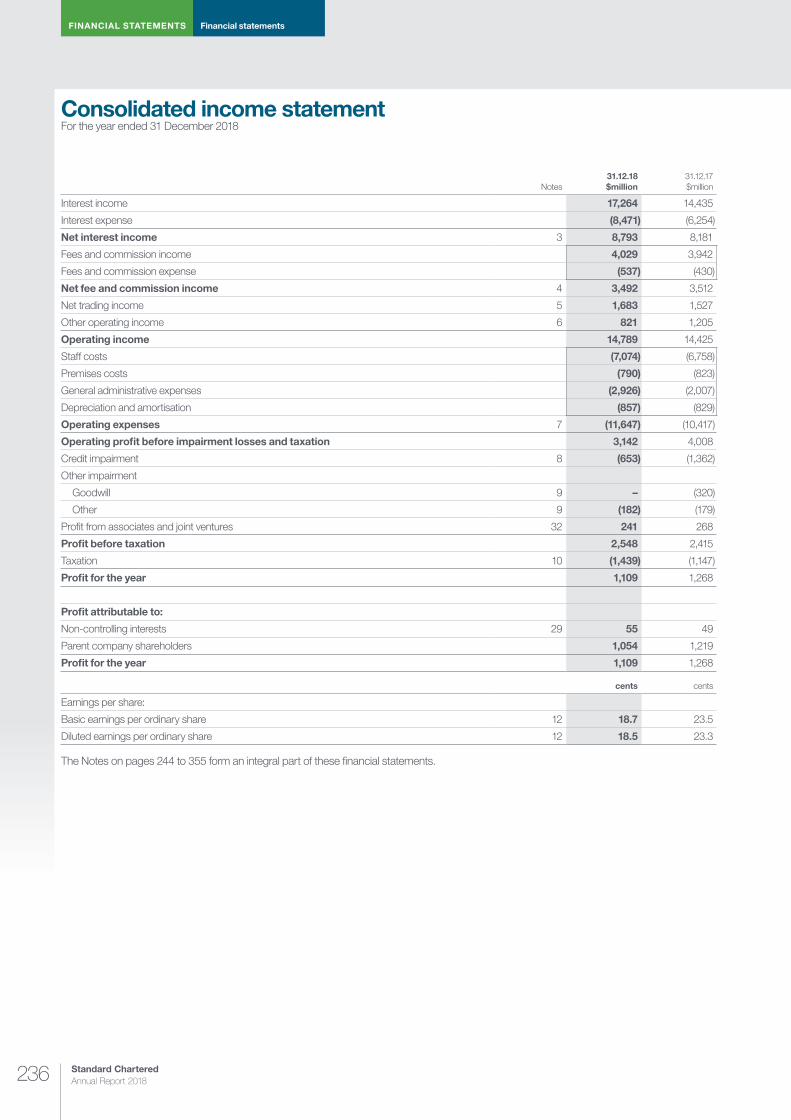
Standard Chartered Annual Report 2018236
FINANCIAL STATEMENTS Financial statements
Notes31.12.18
$million31.12.17 $million
Interest income 17,264 14,435
Interest expense (8,471) (6,254)
Net interest income 3 8,793 8,181
Fees and commission income 4,029 3,942
Fees and commission expense (537) (430)
Net fee and commission income 4 3,492 3,512
Net trading income 5 1,683 1,527
Other operating income 6 821 1,205
Operating income 14,789 14,425
Staff costs (7,074) (6,758)
Premises costs (790) (823)
General administrative expenses (2,926) (2,007)
Depreciation and amortisation (857) (829)
Operating expenses 7 (11,647) (10,417)
Operating profit before impairment losses and taxation 3,142 4,008
Credit impairment 8 (653) (1,362)
Other impairment
Goodwill 9 – (320)
Other 9 (182) (179)
Profit from associates and joint ventures 32 241 268
Profit before taxation 2,548 2,415
Taxation 10 (1,439) (1,147)
Profit for the year 1,109 1,268
Profit attributable to:
Non-controlling interests 29 55 49
Parent company shareholders 1,054 1,219
Profit for the year 1,109 1,268
cents cents
Earnings per share:
Basic earnings per ordinary share 12 18.7 23.5
Diluted earnings per ordinary share 12 18.5 23.3
The Notes on pages 244 to 355 form an integral part of these financial statements.
Consolidated income statementFor the year ended 31 December 2018

237
Risk review
and capital review
Strategic rep
ort
Sup
plem
entary inform
ation
FIN
AN
CIA
L S
TA
TE
ME
NT
SD
irectors’ rep
ort
Notes31.12.18 $million
31.12.17 $million
Profit for the year 1,109 1,268
Other comprehensive (loss)/income
Items that will not be reclassified to income statement: 382 (238)
Own credit gains/(losses) on financial liabilities designated at fair value through profit or loss 394 (249)
Equity instruments at fair value through other comprehensive income 36 –
Actuarial (losses)/gains on retirement benefit obligations 30 (19) 32
Taxation relating to components of other comprehensive income 10 (29) (21)
Items that may be reclassified subsequently to income statement: (1,189) 1,532
Exchange differences on translation of foreign operations:
Net (losses)/gains taken to equity (1,462) 1,637
Net gains/(losses) on net investment hedges 282 (288)
Share of other comprehensive income/(loss) from associates and joint ventures 33 (1)
Debt instruments at fair value through other comprehensive income/available-for-sale investments:
Net valuation (losses)/gains taken to equity (128) 369
Reclassified to income statement 31 (233)
Cash flow hedges:
Net gains taken to equity 34 35
Reclassified to income statement 14 7 11
Taxation relating to components of other comprehensive income 10 14 2
Other comprehensive (loss)/income for the year, net of taxation (807) 1,294
Total comprehensive income for the year 302 2,562
Total comprehensive income attributable to:
Non-controlling interests 29 34 50
Parent company shareholders 268 2,512
Total comprehensive income for the year 302 2,562
Consolidated statement of comprehensive incomeFor the year ended 31 December 2018

Standard Chartered Annual Report 2018238
FINANCIAL STATEMENTS Financial statements
Notes31.12.18 $million
31.12.17 $million
AssetsCash and balances at central banks 13,35 57,511 58,864Financial assets held at fair value through profit or loss 13 87,132 27,564Derivative financial instruments 13,14 45,621 47,031Loans and advances to banks1 13,15 61,414 78,188Loans and advances to customers2 13,15 256,557 282,288Investment securities 13 125,901 117,025Other assets 20 35,401 33,490Current tax assets 10 492 491Prepayments and accrued income 2,505 2,307Interests in associates and joint ventures 32 2,307 2,307Goodwill and intangible assets 17 5,056 5,013Property, plant and equipment 18 6,490 7,211Deferred tax assets 10 1,047 1,177Assets classified as held for sale 21 1,328 545Total assets 688,762 663,501
LiabilitiesDeposits by banks 13 29,715 30,945Customer accounts 13 391,013 370,509Repurchase agreements and other similar secured borrowing 13,16 1,401 39,783Financial liabilities held at fair value through profit or loss 13 60,700 16,633Derivative financial instruments 13,14 47,209 48,101Debt securities in issue 13,22 46,454 46,379Other liabilities 23 38,309 35,257Current tax liabilities 10 676 376Accruals and deferred income 5,393 5,493Subordinated liabilities and other borrowed funds 13,27 15,001 17,176Deferred tax liabilities 10 563 404Provisions for liabilities and charges 24 1,330 183Retirement benefit obligations 30 399 455Liabilities included in disposal groups held for sale 21 247 –Total liabilities 638,410 611,694
EquityShare capital and share premium account 28 7,111 7,097Other reserves 11,878 12,767Retained earnings 26,129 26,641Total parent company shareholders’ equity 45,118 46,505Other equity instruments 28 4,961 4,961Total equity excluding non-controlling interests 50,079 51,466Non-controlling interests 29 273 341Total equity 50,352 51,807Total equity and liabilities 688,762 663,501
1 Reverse repurchase agreements and other similar secured lending balances held at amortised cost of $3,815 million (31 December 2017: $20,694 million) have been included with loans and advances to banks
2 Reverse repurchase agreements and other similar secured lending balances held at amortised cost of $3,151 million (31 December 2017: $33,581 million) have been included with loans and advances to customers
The Notes on pages 244 to 355 form an integral part of these financial statements.
These financial statements were approved by the Board of directors and authorised for issue on 26 February 2019 and signed on its behalf by:
José Viñals Bill Winters Andy HalfordChairman Group Chief Executive Group Chief Financial Officer
Consolidated balance sheetAs at 31 December 2018
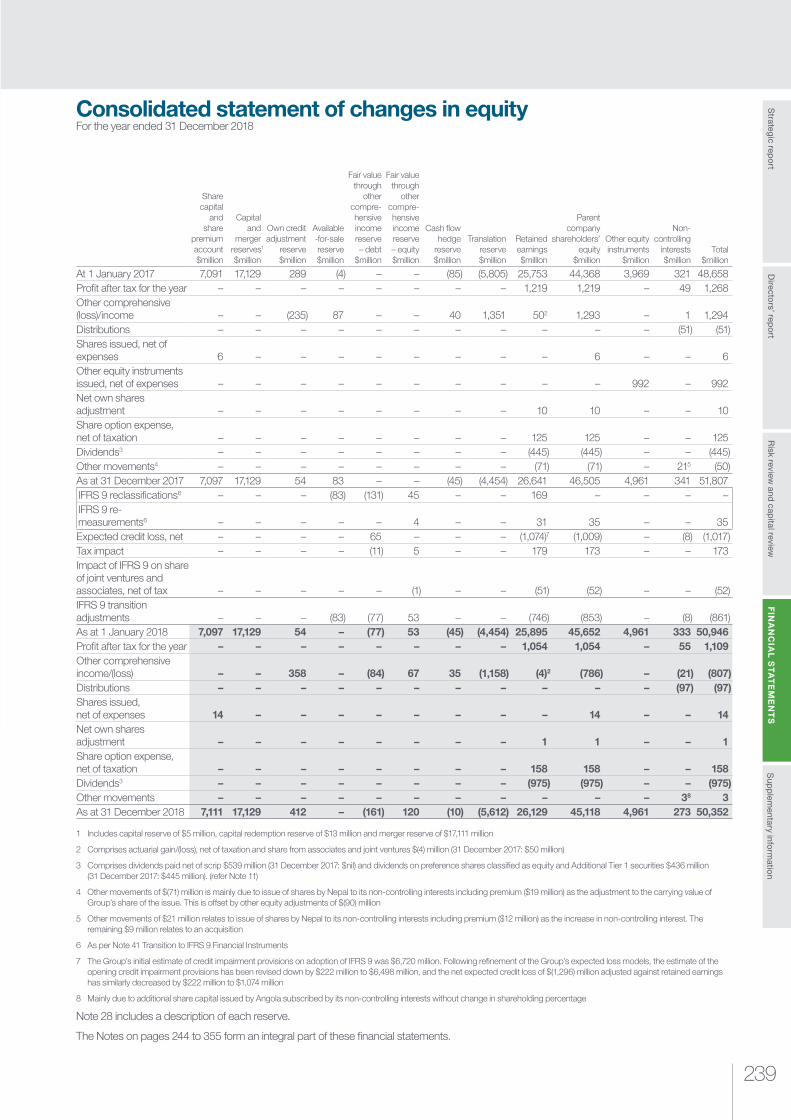
239
Risk review
and capital review
Strategic rep
ort
Sup
plem
entary inform
ation
FIN
AN
CIA
L S
TA
TE
ME
NT
SD
irectors’ rep
ort
Share capital
and share
premium account $million
Capital and
merger reserves1
$million
Own credit adjustment
reserve $million
Available -for-sale reserve $million
Fair value through
other compre-hensive income reserve – debt
$million
Fair value through
other compre-hensive income reserve – equity $million
Cash flow hedge
reserve $million
Translation reserve $million
Retained earnings $million
Parent company
shareholders’ equity
$million
Other equity instruments
$million
Non-controlling
interests $million
Total $million
At 1 January 2017 7,091 17,129 289 (4) – – (85) (5,805) 25,753 44,368 3,969 321 48,658Profit after tax for the year – – – – – – – – 1,219 1,219 – 49 1,268Other comprehensive (loss)/income – – (235) 87 – – 40 1,351 502 1,293 – 1 1,294Distributions – – – – – – – – – – – (51) (51)Shares issued, net of expenses 6 – – – – – – – – 6 – – 6Other equity instruments issued, net of expenses – – – – – – – – – – 992 – 992Net own shares adjustment – – – – – – – – 10 10 – – 10Share option expense, net of taxation – – – – – – – – 125 125 – – 125Dividends3 – – – – – – – – (445) (445) – – (445)Other movements4 – – – – – – – – (71) (71) – 215 (50)As at 31 December 2017 7,097 17,129 54 83 – – (45) (4,454) 26,641 46,505 4,961 341 51,807IFRS 9 reclassifications6 – – – (83) (131) 45 – – 169 – – – –IFRS 9 re-measurements6 – – – – – 4 – – 31 35 – – 35Expected credit loss, net – – – – 65 – – – (1,074)7 (1,009) – (8) (1,017)Tax impact – – – – (11) 5 – – 179 173 – – 173Impact of IFRS 9 on share of joint ventures and associates, net of tax – – – – – (1) – – (51) (52) – – (52)IFRS 9 transition adjustments – – – (83) (77) 53 – – (746) (853) – (8) (861)As at 1 January 2018 7,097 17,129 54 – (77) 53 (45) (4,454) 25,895 45,652 4,961 333 50,946Profit after tax for the year – – – – – – – – 1,054 1,054 – 55 1,109Other comprehensive income/(loss) – – 358 – (84) 67 35 (1,158) (4)2 (786) – (21) (807)Distributions – – – – – – – – – – – (97) (97)Shares issued, net of expenses 14 – – – – – – – – 14 – – 14Net own shares adjustment – – – – – – – – 1 1 – – 1Share option expense, net of taxation – – – – – – – – 158 158 – – 158Dividends3 – – – – – – – – (975) (975) – – (975)Other movements – – – – – – – – – – – 38 3As at 31 December 2018 7,111 17,129 412 – (161) 120 (10) (5,612) 26,129 45,118 4,961 273 50,352
1 Includes capital reserve of $5 million, capital redemption reserve of $13 million and merger reserve of $17,111 million
2 Comprises actuarial gain/(loss), net of taxation and share from associates and joint ventures $(4) million (31 December 2017: $50 million)
3 Comprises dividends paid net of scrip $539 million (31 December 2017: $nil) and dividends on preference shares classified as equity and Additional Tier 1 securities $436 million (31 December 2017: $445 million). (refer Note 11)
4 Other movements of $(71) million is mainly due to issue of shares by Nepal to its non-controlling interests including premium ($19 million) as the adjustment to the carrying value of Group’s share of the issue. This is offset by other equity adjustments of $(90) million
5 Other movements of $21 million relates to issue of shares by Nepal to its non-controlling interests including premium ($12 million) as the increase in non-controlling interest. The remaining $9 million relates to an acquisition
6 As per Note 41 Transition to IFRS 9 Financial Instruments
7 The Group’s initial estimate of credit impairment provisions on adoption of IFRS 9 was $6,720 million. Following refinement of the Group’s expected loss models, the estimate of the opening credit impairment provisions has been revised down by $222 million to $6,498 million, and the net expected credit loss of $(1,296) million adjusted against retained earnings has similarly decreased by $222 million to $1,074 million
8 Mainly due to additional share capital issued by Angola subscribed by its non-controlling interests without change in shareholding percentage
Note 28 includes a description of each reserve.
The Notes on pages 244 to 355 form an integral part of these financial statements.
Consolidated statement of changes in equityFor the year ended 31 December 2018

Standard Chartered Annual Report 2018240
FINANCIAL STATEMENTS Financial statements
Notes
Group Company
31.12.18 $million
31.12.17 $million
31.12.18 $million
31.12.17 $million
Cash flows from operating activities:
Profit before taxation 2,548 2,415 790 207
Adjustments for non-cash items and other adjustments included within income statement 34 2,635 3,241 232 615
Change in operating assets 34 (12,837) (13,625) 61 459
Change in operating liabilities 34 33,859 5,819 (462) 575
Contributions to defined benefit schemes 30 (143) (143) – –
UK and overseas taxes paid 10 (770) (915) – (14)
Net cash from/(used in) operating activities 25,292 (3,208) 621 1,842
Cash flows from investing activities:
Purchase of property, plant and equipment 18 (171) (165) – –
Disposal of property, plant and equipment 85 29 – –
Acquisition of investment in subsidiaries, associates, and joint ventures, net of cash acquired 32 – (44) – (1,000)
Dividends received from subsidiaries, associates and joint ventures 32 67 2 1,035 392
Disposal of subsidiaries 7 – – –
Purchase of investment securities (276,388) (265,186) – –
Disposal and maturity of investment securities 263,983 261,316 621 2,850
Net cash (used in)/from investing activities (12,417) (4,048) 1,656 2,242
Cash flows from financing activities:
Issue of ordinary and preference share capital, net of expenses 28 14 6 14 6
Exercise of share options 9 10 9 10
Purchase of own shares (8) – (8) –
Issue of Additional Tier 1 capital, net of expenses 28 – 992 – 992
Gross proceeds from issue of subordinated liabilities 34 500 – 500 –
Interest paid on subordinated liabilities 34 (602) (743) (507) (353)
Repayment of subordinated liabilities 34 (2,097) (2,984) (474) (1,249)
Proceeds from issue of senior debts 34 9,766 2,292 4,552 1,501
Repayment of senior debts 34 (7,030) (4,162) (3,141) (3,237)
Interest paid on senior debts 34 (507) (896) (355) (825)
Investment from non-controlling interests – 21 – –
Dividends paid to non-controlling interests and preference shareholders (533) (496) (436) (445)
Dividends paid to ordinary shareholders (539) – (539) –
Net cash used in financing activities (1,027) (5,960) (385) (3,600)
Net increase/(decrease) in cash and cash equivalents 11,848 (13,216) 1,892 484
Cash and cash equivalents at beginning of the year 87,231 96,977 15,714 15,230
Effect of exchange rate movements on cash and cash equivalents (1,579) 3,470 – –
Cash and cash equivalents at end of the year 35 97,500 87,231 17,606 15,714
Cash flow statementFor the year ended 31 December 2018
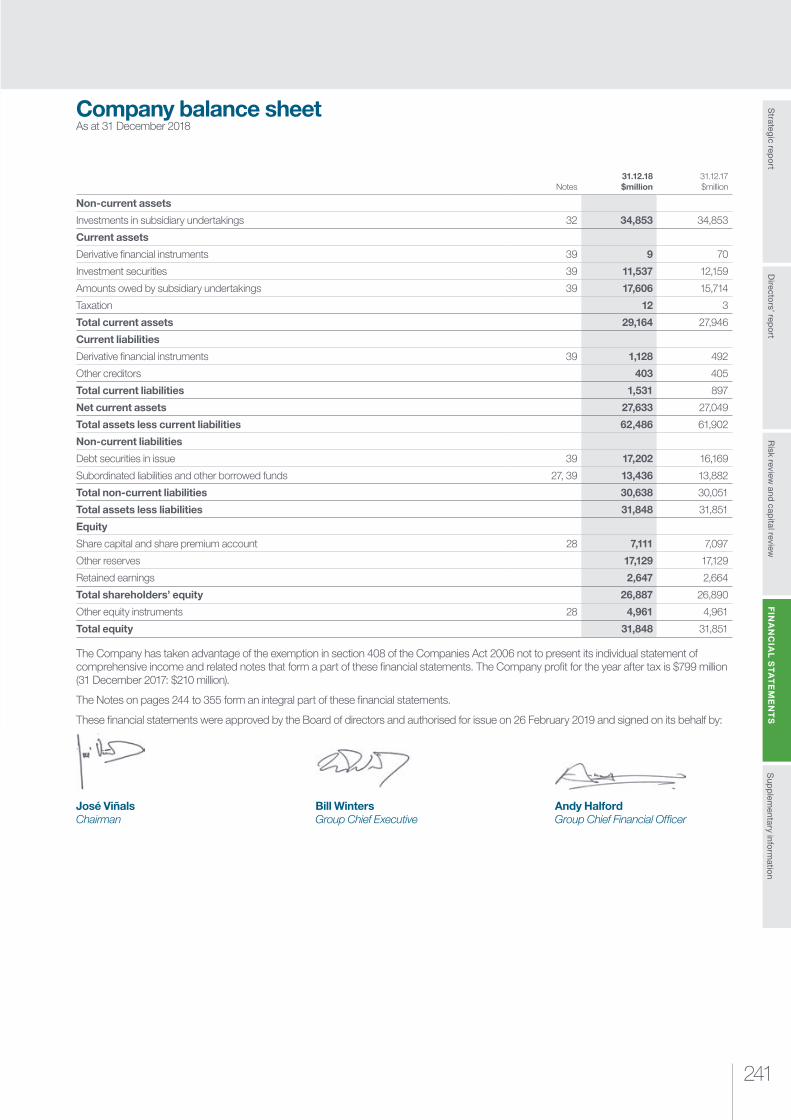
241
Risk review
and capital review
Strategic rep
ort
Sup
plem
entary inform
ation
FIN
AN
CIA
L S
TA
TE
ME
NT
SD
irectors’ rep
ort
Notes31.12.18 $million
31.12.17 $million
Non-current assets
Investments in subsidiary undertakings 32 34,853 34,853
Current assets
Derivative financial instruments 39 9 70
Investment securities 39 11,537 12,159
Amounts owed by subsidiary undertakings 39 17,606 15,714
Taxation 12 3
Total current assets 29,164 27,946
Current liabilities
Derivative financial instruments 39 1,128 492
Other creditors 403 405
Total current liabilities 1,531 897
Net current assets 27,633 27,049
Total assets less current liabilities 62,486 61,902
Non-current liabilities
Debt securities in issue 39 17,202 16,169
Subordinated liabilities and other borrowed funds 27, 39 13,436 13,882
Total non-current liabilities 30,638 30,051
Total assets less liabilities 31,848 31,851
Equity
Share capital and share premium account 28 7,111 7,097
Other reserves 17,129 17,129
Retained earnings 2,647 2,664
Total shareholders’ equity 26,887 26,890
Other equity instruments 28 4,961 4,961
Total equity 31,848 31,851
The Company has taken advantage of the exemption in section 408 of the Companies Act 2006 not to present its individual statement of comprehensive income and related notes that form a part of these financial statements. The Company profit for the year after tax is $799 million (31 December 2017: $210 million).
The Notes on pages 244 to 355 form an integral part of these financial statements.
These financial statements were approved by the Board of directors and authorised for issue on 26 February 2019 and signed on its behalf by:
José Viñals Bill Winters Andy HalfordChairman Group Chief Executive Group Chief Financial Officer
Company balance sheet As at 31 December 2018

Standard Chartered Annual Report 2018242
FINANCIAL STATEMENTS Financial statements
Share capital and share premium account $million
Capital and merger
reserve1
$million
Retained earnings $million
Other equity instruments
$millionTotal
$million
At 1 January 2017 7,091 17,129 2,764 3,969 30,953
Profit for the year – – 210 – 210
Shares issued, net of expenses 6 – – – 6
Other equity instruments issued, net of expenses – – – 992 992
Net own shares adjustment – – 10 – 10
Share option expense, net of taxation – – 125 – 125
Dividends2 – – (445) – (445)
At 31 December 2017 7,097 17,129 2,664 4,961 31,851
Profit after tax for the year – – 799 – 799
Shares issued, net of expenses 14 – – – 14
Net own shares adjustment – – 1 – 1
Share option expense, net of taxation – – 158 – 158
Dividends2 – – (975) – (975)
At 31 December 2018 7,111 17,129 2,647 4,961 31,848
1 Includes capital reserve of $5 million, capital redemption reserve of $13 million and merger reserve of $17,111 million
2 Comprises dividends paid net of scrip $539 million (31 December 2017: $nil) and dividends on preference shares classified as equity and Additional Tier 1 securities $436 million (31 December 2017: $445 million)
Note 28 includes a description of each reserve.
The Notes on pages 244 to 355 form an integral part of these financial statements.
Company statement of changes in equity For the year ended 31 December 2018
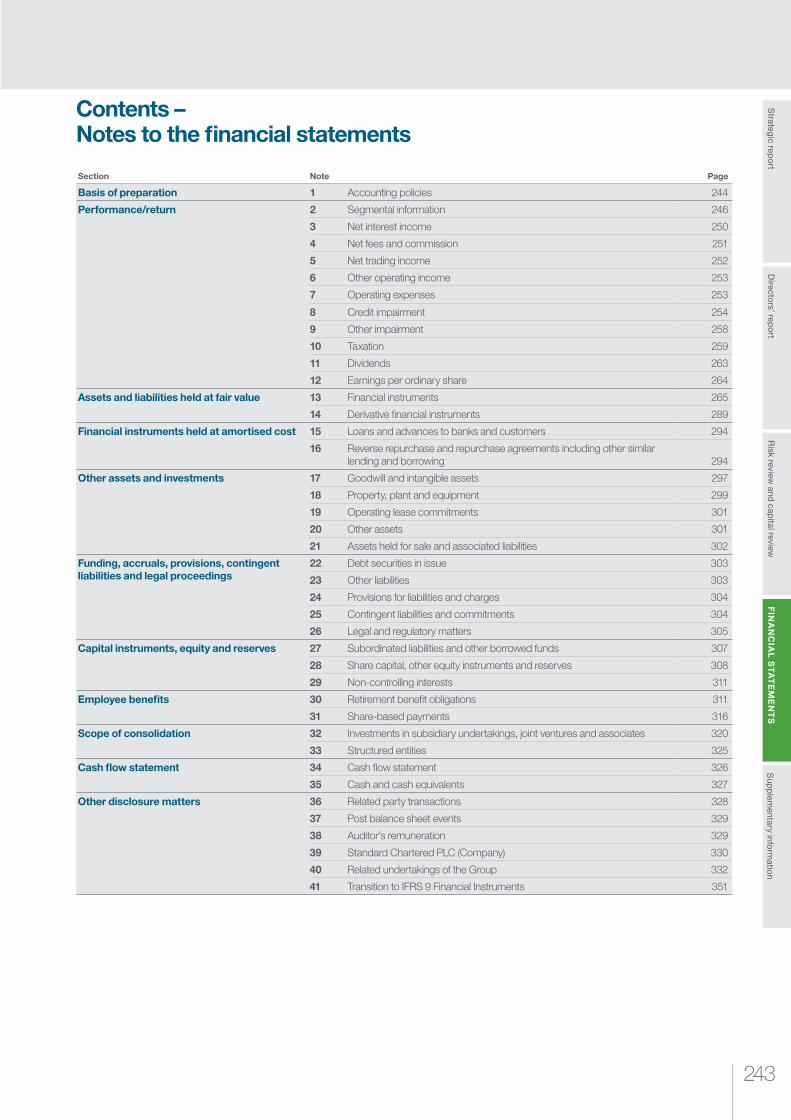
243
Risk review
and capital review
Strategic rep
ort
Sup
plem
entary inform
ation
FIN
AN
CIA
L S
TA
TE
ME
NT
SD
irectors’ rep
ort
Contents – Notes to the financial statements
Section Note Page
Basis of preparation 1 Accounting policies 244
Performance/return 2 Segmental information 246
3 Net interest income 250
4 Net fees and commission 251
5 Net trading income 252
6 Other operating income 253
7 Operating expenses 253
8 Credit impairment 254
9 Other impairment 258
10 Taxation 259
11 Dividends 263
12 Earnings per ordinary share 264
Assets and liabilities held at fair value 13 Financial instruments 265
14 Derivative financial instruments 289
Financial instruments held at amortised cost 15 Loans and advances to banks and customers 294
16 Reverse repurchase and repurchase agreements including other similar lending and borrowing 294
Other assets and investments 17 Goodwill and intangible assets 297
18 Property, plant and equipment 299
19 Operating lease commitments 301
20 Other assets 301
21 Assets held for sale and associated liabilities 302
Funding, accruals, provisions, contingent liabilities and legal proceedings
22 Debt securities in issue 303
23 Other liabilities 303
24 Provisions for liabilities and charges 304
25 Contingent liabilities and commitments 304
26 Legal and regulatory matters 305
Capital instruments, equity and reserves 27 Subordinated liabilities and other borrowed funds 307
28 Share capital, other equity instruments and reserves 308
29 Non-controlling interests 311
Employee benefits 30 Retirement benefit obligations 311
31 Share-based payments 316
Scope of consolidation 32 Investments in subsidiary undertakings, joint ventures and associates 320
33 Structured entities 325
Cash flow statement 34 Cash flow statement 326
35 Cash and cash equivalents 327
Other disclosure matters 36 Related party transactions 328
37 Post balance sheet events 329
38 Auditor’s remuneration 329
39 Standard Chartered PLC (Company) 330
40 Related undertakings of the Group 332
41 Transition to IFRS 9 Financial Instruments 351
Standard Chartered Annual Report 2018244
FINANCIAL STATEMENTSNotes to the financial statements
1. Accounting policies
Statement of complianceThe Group financial statements consolidate Standard Chartered PLC (the Company) and its subsidiaries (together referred to as the Group) and equity account the Group’s interest in associates and jointly controlled entities.
The parent company financial statements present information about the Company as a separate entity.
Both the parent company financial statements and the Group financial statements have been prepared and approved by the directors in accordance with International Financial Reporting Standards (IFRS) and IFRS Interpretations Committee interpretations as endorsed by the European Union (EU). EU-endorsed IFRS may differ from IFRS published by the International Accounting Standards Board (IASB) if a standard has not been endorsed by the EU.
The Company has taken advantage of the exemption in section 408 of the Companies Act 2006 not to present its individual statement of comprehensive income and related notes that form a part of these financial statements.
The following parts of the Risk review and Capital review form part of these financial statements:
a) From the start of Risk profile section (page 140) to the end of other principal risks in the same section (page 192) excluding:
¼ Credit quality by geographic region, (page 151)
¼ Credit quality by industry, (page 153)
¼ Forborne and other modified loans by region, (page 162)
¼ Credit-impaired (stage 3) loans by geographic region, (page 164)
¼ Industry and Retail products analysis by geographic region, (page 170)
¼ Asset-backed securities, (page 174)
¼ Country risk, (page 180)
¼ Risks not in VaR, (page 182)
¼ Backtesting, (page 182)
¼ Mapping of market risk items to the balance sheet, (page 183)
¼ Liquidity coverage ratio (LCR), (page 185)
¼ Stressed coverage, (page 185)
¼ Net stable funding ratio (NSFR), (page 186)
¼ Liquidity pool, (page 186)
¼ Encumbrance, (page 187)
¼ Interest rate risk in the banking book, (page 191)
¼ Operational risk, (page 192)
¼ Other principal risks, (page 192)
b) Capital review: from the start of ‘Capital Requirements Directive (CRD) IV capital base’ to the end of ‘Impact of IFRS 9 on CET1’, excluding capital ratios and risk-weighted assets (RWA)
Basis of preparation
The consolidated and Company financial statements have been prepared on a going concern basis and under the historical cost convention, as modified by the revaluation of cash-settled share-based payments, fair value through other comprehensive income, and financial assets and liabilities (including derivatives) at fair value through profit or loss.
Significant accounting estimates and judgements In determining the carrying amounts of certain assets and liabilities, the Group makes assumptions of the effects of uncertain future events on those assets and liabilities at the balance sheet date. The Group’s estimates and assumptions are based on historical experience and expectation of future events and are reviewed periodically. Further information about key assumptions concerning the future, and other key sources of estimation uncertainty and judgement, are set out in the relevant disclosure notes for the following areas:
¼ Credit impairment (Note 8)
¼ Taxation (Note 10)
¼ Valuation of financial instruments held at fair value (Note 13)
¼ Goodwill impairment (Note 17)
¼ Provisions for liabilities and charges (Note 24)
¼ Retirement benefit obligations (Note 30)
¼ Investments in associates and joint ventures (Note 32)
IFRS and Hong Kong accounting requirementsAs required by the Hong Kong Listing Rules, an explanation of the differences in accounting practices between EU-endorsed IFRS and Hong Kong Financial Reporting Standards is required to be disclosed. There would be no significant differences had these accounts been prepared in accordance with Hong Kong Financial Reporting Standards.
ComparativesPrior period comparatives are presented on an IAS 39 – Financial Instruments: Recognition and Measurement basis (Refer to the 31 December 2017 audited financial statements for the IAS 39 accounting policies). Certain comparatives have been changed to align with current year disclosures. The main changes are in respect of IFRS 9 (see below).
Amortised cost reverse repurchase agreements and other similar lending balances have been included with Loans and advances to customers and Loans and advances to banks as appropriate.
In addition, the comparatives for commitments disclosed in Note 25 Contingent liabilities and commitments have been restated, as a result of the availability of more reliable, centralised information following the implementation of IFRS 9. The ageing of commitments is now based on residual rather than original maturity. The Risk profile has similarly been updated. These changes have not resulted in any amendments to the reported income statement or balance sheet of the Group.
Notes to the financial statements
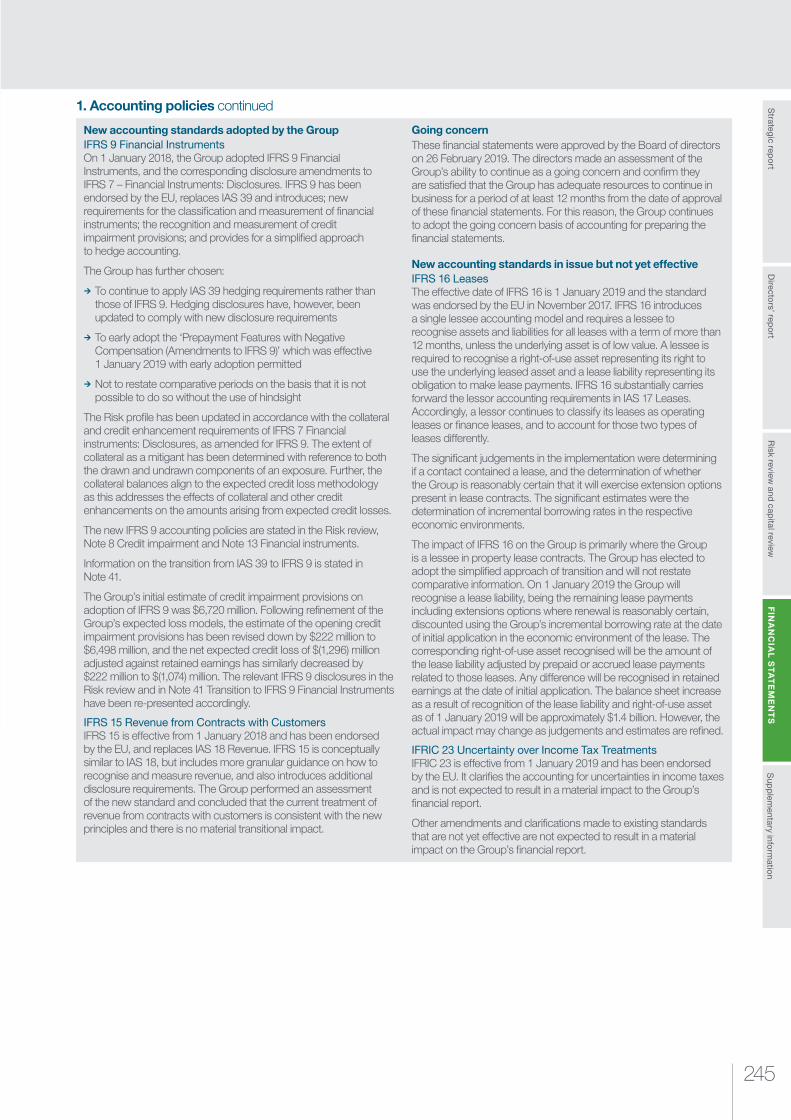
245
Risk review
and capital review
Strategic rep
ort
Sup
plem
entary inform
ation
FIN
AN
CIA
L S
TA
TE
ME
NT
SD
irectors’ rep
ort
1. Accounting policies continued
New accounting standards adopted by the Group IFRS 9 Financial InstrumentsOn 1 January 2018, the Group adopted IFRS 9 Financial Instruments, and the corresponding disclosure amendments to IFRS 7 – Financial Instruments: Disclosures. IFRS 9 has been endorsed by the EU, replaces IAS 39 and introduces; new requirements for the classification and measurement of financial instruments; the recognition and measurement of credit impairment provisions; and provides for a simplified approach to hedge accounting.
The Group has further chosen:
¼ To continue to apply IAS 39 hedging requirements rather than those of IFRS 9. Hedging disclosures have, however, been updated to comply with new disclosure requirements
¼ To early adopt the ‘Prepayment Features with Negative Compensation (Amendments to IFRS 9)’ which was effective 1 January 2019 with early adoption permitted
¼ Not to restate comparative periods on the basis that it is not possible to do so without the use of hindsight
The Risk profile has been updated in accordance with the collateral and credit enhancement requirements of IFRS 7 Financial instruments: Disclosures, as amended for IFRS 9. The extent of collateral as a mitigant has been determined with reference to both the drawn and undrawn components of an exposure. Further, the collateral balances align to the expected credit loss methodology as this addresses the effects of collateral and other credit enhancements on the amounts arising from expected credit losses.
The new IFRS 9 accounting policies are stated in the Risk review, Note 8 Credit impairment and Note 13 Financial instruments.
Information on the transition from IAS 39 to IFRS 9 is stated in Note 41.
The Group’s initial estimate of credit impairment provisions on adoption of IFRS 9 was $6,720 million. Following refinement of the Group’s expected loss models, the estimate of the opening credit impairment provisions has been revised down by $222 million to $6,498 million, and the net expected credit loss of $(1,296) million adjusted against retained earnings has similarly decreased by $222 million to $(1,074) million. The relevant IFRS 9 disclosures in the Risk review and in Note 41 Transition to IFRS 9 Financial Instruments have been re-presented accordingly.
IFRS 15 Revenue from Contracts with CustomersIFRS 15 is effective from 1 January 2018 and has been endorsed by the EU, and replaces IAS 18 Revenue. IFRS 15 is conceptually similar to IAS 18, but includes more granular guidance on how to recognise and measure revenue, and also introduces additional disclosure requirements. The Group performed an assessment of the new standard and concluded that the current treatment of revenue from contracts with customers is consistent with the new principles and there is no material transitional impact.
Going concernThese financial statements were approved by the Board of directors on 26 February 2019. The directors made an assessment of the Group’s ability to continue as a going concern and confirm they are satisfied that the Group has adequate resources to continue in business for a period of at least 12 months from the date of approval of these financial statements. For this reason, the Group continues to adopt the going concern basis of accounting for preparing the financial statements.
New accounting standards in issue but not yet effectiveIFRS 16 LeasesThe effective date of IFRS 16 is 1 January 2019 and the standard was endorsed by the EU in November 2017. IFRS 16 introduces a single lessee accounting model and requires a lessee to recognise assets and liabilities for all leases with a term of more than 12 months, unless the underlying asset is of low value. A lessee is required to recognise a right-of-use asset representing its right to use the underlying leased asset and a lease liability representing its obligation to make lease payments. IFRS 16 substantially carries forward the lessor accounting requirements in IAS 17 Leases. Accordingly, a lessor continues to classify its leases as operating leases or finance leases, and to account for those two types of leases differently.
The significant judgements in the implementation were determining if a contact contained a lease, and the determination of whether the Group is reasonably certain that it will exercise extension options present in lease contracts. The significant estimates were the determination of incremental borrowing rates in the respective economic environments.
The impact of IFRS 16 on the Group is primarily where the Group is a lessee in property lease contracts. The Group has elected to adopt the simplified approach of transition and will not restate comparative information. On 1 January 2019 the Group will recognise a lease liability, being the remaining lease payments including extensions options where renewal is reasonably certain, discounted using the Group’s incremental borrowing rate at the date of initial application in the economic environment of the lease. The corresponding right-of-use asset recognised will be the amount of the lease liability adjusted by prepaid or accrued lease payments related to those leases. Any difference will be recognised in retained earnings at the date of initial application. The balance sheet increase as a result of recognition of the lease liability and right-of-use asset as of 1 January 2019 will be approximately $1.4 billion. However, the actual impact may change as judgements and estimates are refined.
IFRIC 23 Uncertainty over Income Tax TreatmentsIFRIC 23 is effective from 1 January 2019 and has been endorsed by the EU. It clarifies the accounting for uncertainties in income taxes and is not expected to result in a material impact to the Group’s financial report.
Other amendments and clarifications made to existing standards that are not yet effective are not expected to result in a material impact on the Group’s financial report.

Standard Chartered Annual Report 2018246
FINANCIAL STATEMENTSNotes to the financial statements
2. Segmental informationThe Group’s segmental reporting is in accordance with IFRS 8 Operating Segments and is reported consistently with the internal performance framework and as presented to the Group’s Management Team. The four client segments are Corporate & Institutional Banking, Retail Banking, Commercial Banking and Private Banking. The four geographic regions are Greater China & North Asia, ASEAN & South Asia, Africa & Middle East, and Europe & Americas. Activities not directly related to a client segment and/or geographic region are included in Central & other items. These mainly include Corporate Centre costs, treasury markets, treasury activities, certain strategic investments and the UK bank levy.
The following should also be noted:
¼ Transactions and funding between the segments are carried out on an arm’s-length basis
¼ Corporate Centre costs represent stewardship and central management services roles and activities that are not directly attributable to business or country operations
¼ Treasury markets, joint ventures and associate investments are managed in the regions and are included within the applicable region. However, they are not managed directly by a client segment and are therefore included in the Central & other items segment
¼ In addition to treasury activities, Corporate Centre costs and other Group related functions, Central & other items for regions includes globally run businesses or activities that are managed by the client segments but not directly by geographic management. These include Principal Finance and Portfolio Management
¼ The Group allocated central costs (excluding Corporate Centre costs) relating to client segments and geographic regions using appropriate business drivers (such as in proportion to the direct cost base of each segment before allocation of indirect costs) and these are reported within operating expenses
Basis of preparationThe analysis reflects how the client segments and geographic regions are managed internally. This is described as the Management View and is principally the location from which a client relationship is managed, which may differ from where it is financially booked and may be shared between businesses and/or regions. In certain instances this approach is not appropriate and a Financial View is disclosed, that is, the location in which the transaction or balance was booked. Typically the Financial View is used in areas such as the Market and Liquidity risk reviews where actual booking location is more important for an assessment. Segmental information is therefore on a Management View unless otherwise stated.
Restructuring items excluded from underlying resultsThe Group has made a provision of $900 million for potential penalties related to previously disclosed matters, namely, the US investigation relating to historical violation of US sanctions laws and regulations, the decision notice from the FCA concerning the Group’s historical financial crime controls and investigations relating to foreign exchange trading issues. Further details of these and other legal and regulatory matters can be found in Note 26 (on page 305).
The Group incurred net restructuring charges of $478 million in 2018 of which $375 million related to Principal Finance and included a $160 million loss in the fourth quarter in respect of the announced spin-out of the business and the sale of the majority of the Group’s related investment portfolios to a third party. A further $155 million related to planned initiatives to reduce ongoing costs and $34 million related to the Group’s ship leasing business that the Group has decided to discontinue. These gross charges were partly offset by recoveries in relation to the liquidation portfolio.
A net gain of $69 million arose following the redemption of some GBP-denominated securities.
A reconciliation between underlying and statutory results is set out in the table below:
31.12.18
Underlying $million
Provision for regulatory
matters $million
Restructuring $million
Gains arising on repurchase
of senior and subordinated
liabilities $million
Net gain on businesses
disposed/held for sale
$million
Goodwill impairment
$millionStatutory
$million
Operating income 14,968 – (248) 69 – – 14,789
Operating expenses (10,464) (900) (283) – – – (11,647)
Operating profit/(loss) before impairment losses and taxation 4,504 (900) (531) 69 – – 3,142
Credit impairment (740) – 87 – – – (653)
Other impairment (148) – (34) – – – (182)
Profit from associates and joint ventures 241 – – – – – 241
Profit/(loss) before taxation 3,857 (900) (478) 69 – – 2,548
31.12.17
Underlying $million
Provision for regulatory
matters $million
Restructuring $million
Gains arising on repurchase
of senior and subordinated
liabilities $million
Net gain on businesses disposed/
held for sale $million
Goodwill impairment
$millionStatutory
$million
Operating income 14,289 – 58 – 78 – 14,425
Operating expenses (10,120) – (297) – – – (10,417)
Operating profit/(loss) before impairment losses and taxation 4,169 – (239) – 78 – 4,008
Credit impairment (1,200) – (162) – – – (1,362)
Other impairment (169) – (10) – – (320) (499)
Profit from associates and joint ventures 210 – 58 – – – 268
Profit/(loss) before taxation 3,010 – (353) – 78 (320) 2,415

247
Risk review
and capital review
Strategic rep
ort
Sup
plem
entary inform
ation
FIN
AN
CIA
L S
TA
TE
ME
NT
SD
irectors’ rep
ort
2. Segmental information continued
Underlying performance by client segment31.12.18
Corporate & Institutional
Banking $million
Retail Banking $million
Commercial Banking $million
Private Banking $million
Central & other items
$millionTotal
$million
Operating income 6,860 5,041 1,391 516 1,160 14,968
Operating expenses (4,396) (3,736) (923) (530) (879) (10,464)
Operating profit/(loss) before impairment losses and taxation 2,464 1,305 468 (14) 281 4,504
Credit impairment (242) (267) (244) – 13 (740)
Other impairment (150) (5) – – 7 (148)
Profit from associates and joint ventures – – – – 241 241
Underlying profit/(loss) before taxation 2,072 1,033 224 (14) 542 3,857
Provision for regulatory matters (50) – – – (850) (900)
Restructuring (350) (68) (12) (24) (24) (478)
Gains arising on repurchase of senior and subordinated liabilities 3 – – – 66 69
Statutory profit/(loss) before taxation 1,675 965 212 (38) (266) 2,548
Total assets 308,496 103,780 31,379 13,673 231,434 688,762
Of which: loans and advances to customers including FVTPL 146,575 101,635 27,271 13,616 10,274 299,371
loans and advances to customers 104,677 101,235 26,759 13,616 10,270 256,557
loans held at fair value through profit or loss 41,898 400 512 – 4 42,814
Total liabilities 369,316 140,328 37,260 19,733 71,773 638,410
Of which: customer accounts 243,019 136,691 34,860 19,622 2,989 437,181
31.12.17
Corporate & Institutional
Banking $million
Retail Banking $million
Commercial Banking $million
Private Banking $million
Central & other items
$millionTotal
$million
Operating income 6,496 4,834 1,333 500 1,126 14,289
Operating expenses (4,409) (3,585) (881) (500) (745) (10,120)
Operating profit before impairment losses and taxation 2,087 1,249 452 – 381 4,169
Credit impairment (658) (375) (167) (1) 1 (1,200)
Other impairment (168) (1) (3) – 3 (169)
Profit from associates and joint ventures – – – – 210 210
Underlying profit/(loss) before taxation 1,261 873 282 (1) 595 3,010
Restructuring (275) (19) (13) (15) (31) (353)
Net gains on businesses disposed/ held for sale – – – – 78 78
Goodwill impairment – – – – (320) (320)
Statutory profit/(loss) before taxation 986 854 269 (16) 322 2,415
Total assets 293,334 105,178 31,650 13,469 219,870 663,501
Of which: loans and advances to customers 131,738 103,013 28,108 13,351 9,343 285,553
Total liabilities 353,582 132,819 36,385 22,203 66,705 611,694
Of which: customer accounts 222,714 129,536 33,880 22,222 3,372 411,724
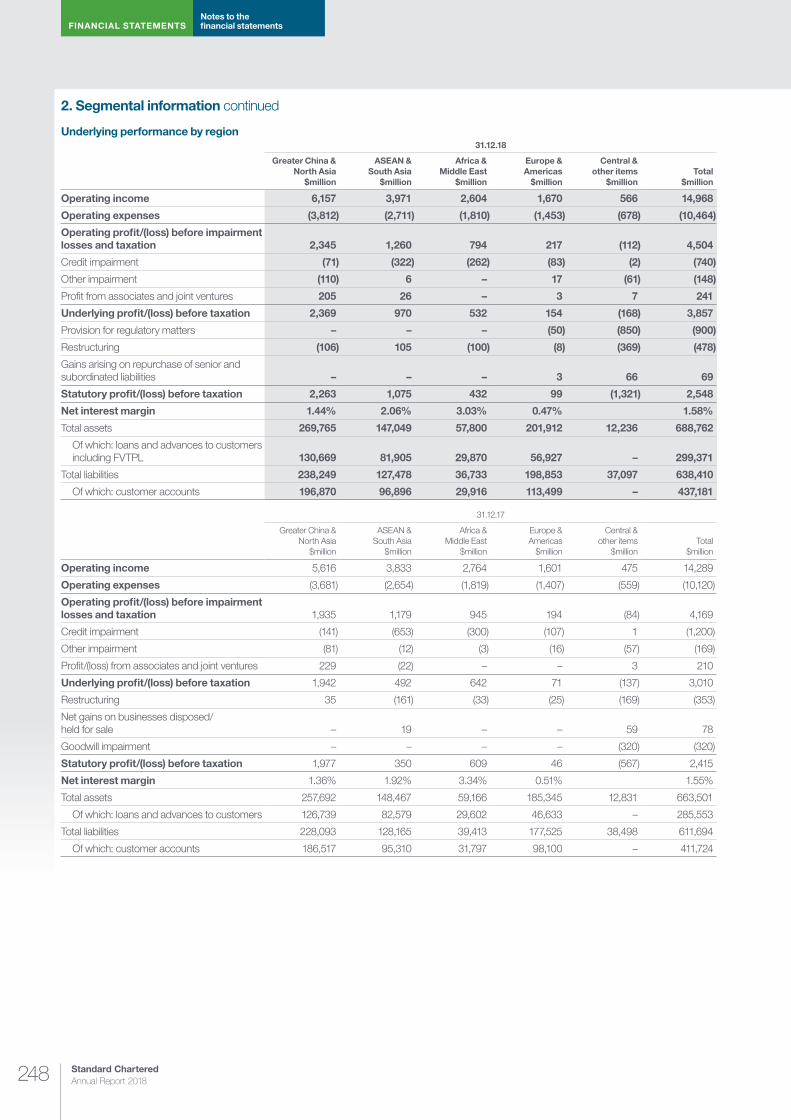
Standard Chartered Annual Report 2018248
FINANCIAL STATEMENTSNotes to the financial statements
2. Segmental information continued
Underlying performance by region31.12.18
Greater China & North Asia
$million
ASEAN & South Asia
$million
Africa & Middle East
$million
Europe & Americas
$million
Central & other items
$millionTotal
$million
Operating income 6,157 3,971 2,604 1,670 566 14,968
Operating expenses (3,812) (2,711) (1,810) (1,453) (678) (10,464)
Operating profit/(loss) before impairment losses and taxation 2,345 1,260 794 217 (112) 4,504
Credit impairment (71) (322) (262) (83) (2) (740)
Other impairment (110) 6 – 17 (61) (148)
Profit from associates and joint ventures 205 26 – 3 7 241
Underlying profit/(loss) before taxation 2,369 970 532 154 (168) 3,857
Provision for regulatory matters – – – (50) (850) (900)
Restructuring (106) 105 (100) (8) (369) (478)
Gains arising on repurchase of senior and subordinated liabilities – – – 3 66 69
Statutory profit/(loss) before taxation 2,263 1,075 432 99 (1,321) 2,548
Net interest margin 1.44% 2.06% 3.03% 0.47% 1.58%
Total assets 269,765 147,049 57,800 201,912 12,236 688,762
Of which: loans and advances to customers including FVTPL 130,669 81,905 29,870 56,927 – 299,371
Total liabilities 238,249 127,478 36,733 198,853 37,097 638,410
Of which: customer accounts 196,870 96,896 29,916 113,499 – 437,181
31.12.17
Greater China & North Asia
$million
ASEAN & South Asia
$million
Africa & Middle East
$million
Europe & Americas
$million
Central & other items
$millionTotal
$million
Operating income 5,616 3,833 2,764 1,601 475 14,289
Operating expenses (3,681) (2,654) (1,819) (1,407) (559) (10,120)
Operating profit/(loss) before impairment losses and taxation 1,935 1,179 945 194 (84) 4,169
Credit impairment (141) (653) (300) (107) 1 (1,200)
Other impairment (81) (12) (3) (16) (57) (169)
Profit/(loss) from associates and joint ventures 229 (22) – – 3 210
Underlying profit/(loss) before taxation 1,942 492 642 71 (137) 3,010
Restructuring 35 (161) (33) (25) (169) (353)
Net gains on businesses disposed/ held for sale – 19 – – 59 78
Goodwill impairment – – – – (320) (320)
Statutory profit/(loss) before taxation 1,977 350 609 46 (567) 2,415
Net interest margin 1.36% 1.92% 3.34% 0.51% 1.55%
Total assets 257,692 148,467 59,166 185,345 12,831 663,501
Of which: loans and advances to customers 126,739 82,579 29,602 46,633 – 285,553
Total liabilities 228,093 128,165 39,413 177,525 38,498 611,694
Of which: customer accounts 186,517 95,310 31,797 98,100 – 411,724
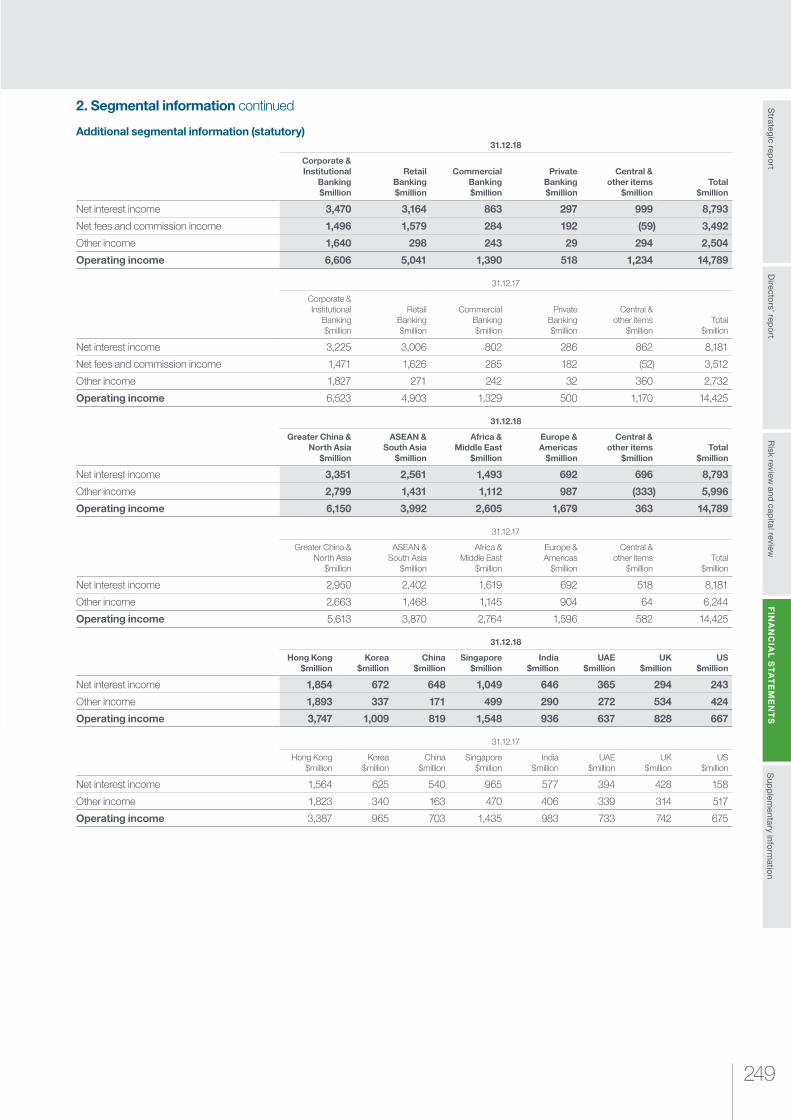
249
Risk review
and capital review
Strategic rep
ort
Sup
plem
entary inform
ation
FIN
AN
CIA
L S
TA
TE
ME
NT
SD
irectors’ rep
ort
2. Segmental information continued
Additional segmental information (statutory)31.12.18
Corporate & Institutional
Banking $million
Retail Banking $million
Commercial Banking $million
Private Banking $million
Central & other items
$millionTotal
$million
Net interest income 3,470 3,164 863 297 999 8,793
Net fees and commission income 1,496 1,579 284 192 (59) 3,492
Other income 1,640 298 243 29 294 2,504
Operating income 6,606 5,041 1,390 518 1,234 14,789
31.12.17
Corporate & Institutional
Banking $million
Retail Banking $million
Commercial Banking $million
Private Banking $million
Central & other items
$millionTotal
$million
Net interest income 3,225 3,006 802 286 862 8,181
Net fees and commission income 1,471 1,626 285 182 (52) 3,512
Other income 1,827 271 242 32 360 2,732
Operating income 6,523 4,903 1,329 500 1,170 14,425
31.12.18
Greater China & North Asia
$million
ASEAN & South Asia
$million
Africa & Middle East
$million
Europe & Americas
$million
Central & other items
$millionTotal
$million
Net interest income 3,351 2,561 1,493 692 696 8,793
Other income 2,799 1,431 1,112 987 (333) 5,996
Operating income 6,150 3,992 2,605 1,679 363 14,789
31.12.17
Greater China & North Asia
$million
ASEAN & South Asia
$million
Africa & Middle East
$million
Europe & Americas
$million
Central & other items
$millionTotal
$million
Net interest income 2,950 2,402 1,619 692 518 8,181
Other income 2,663 1,468 1,145 904 64 6,244
Operating income 5,613 3,870 2,764 1,596 582 14,425
31.12.18
Hong Kong $million
Korea $million
China $million
Singapore $million
India $million
UAE $million
UK $million
US $million
Net interest income 1,854 672 648 1,049 646 365 294 243
Other income 1,893 337 171 499 290 272 534 424
Operating income 3,747 1,009 819 1,548 936 637 828 667
31.12.17
Hong Kong $million
Korea $million
China $million
Singapore $million
India $million
UAE $million
UK $million
US $million
Net interest income 1,564 625 540 965 577 394 428 158
Other income 1,823 340 163 470 406 339 314 517
Operating income 3,387 965 703 1,435 983 733 742 675
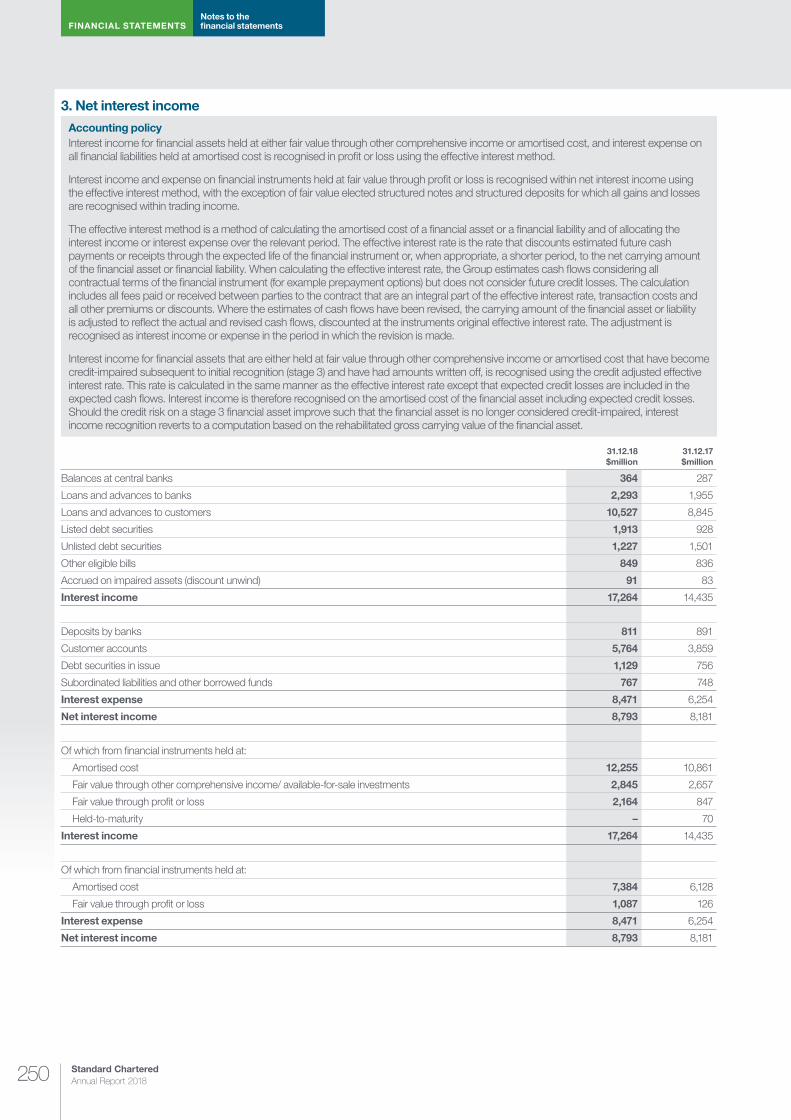
Standard Chartered Annual Report 2018250
FINANCIAL STATEMENTSNotes to the financial statements
3. Net interest income
Accounting policyInterest income for financial assets held at either fair value through other comprehensive income or amortised cost, and interest expense on all financial liabilities held at amortised cost is recognised in profit or loss using the effective interest method.
Interest income and expense on financial instruments held at fair value through profit or loss is recognised within net interest income using the effective interest method, with the exception of fair value elected structured notes and structured deposits for which all gains and losses are recognised within trading income.
The effective interest method is a method of calculating the amortised cost of a financial asset or a financial liability and of allocating the interest income or interest expense over the relevant period. The effective interest rate is the rate that discounts estimated future cash payments or receipts through the expected life of the financial instrument or, when appropriate, a shorter period, to the net carrying amount of the financial asset or financial liability. When calculating the effective interest rate, the Group estimates cash flows considering all contractual terms of the financial instrument (for example prepayment options) but does not consider future credit losses. The calculation includes all fees paid or received between parties to the contract that are an integral part of the effective interest rate, transaction costs and all other premiums or discounts. Where the estimates of cash flows have been revised, the carrying amount of the financial asset or liability is adjusted to reflect the actual and revised cash flows, discounted at the instruments original effective interest rate. The adjustment is recognised as interest income or expense in the period in which the revision is made.
Interest income for financial assets that are either held at fair value through other comprehensive income or amortised cost that have become credit-impaired subsequent to initial recognition (stage 3) and have had amounts written off, is recognised using the credit adjusted effective interest rate. This rate is calculated in the same manner as the effective interest rate except that expected credit losses are included in the expected cash flows. Interest income is therefore recognised on the amortised cost of the financial asset including expected credit losses. Should the credit risk on a stage 3 financial asset improve such that the financial asset is no longer considered credit-impaired, interest income recognition reverts to a computation based on the rehabilitated gross carrying value of the financial asset.
31.12.18 $million
31.12.17 $million
Balances at central banks 364 287
Loans and advances to banks 2,293 1,955
Loans and advances to customers 10,527 8,845
Listed debt securities 1,913 928
Unlisted debt securities 1,227 1,501
Other eligible bills 849 836
Accrued on impaired assets (discount unwind) 91 83
Interest income 17,264 14,435
Deposits by banks 811 891
Customer accounts 5,764 3,859
Debt securities in issue 1,129 756
Subordinated liabilities and other borrowed funds 767 748
Interest expense 8,471 6,254
Net interest income 8,793 8,181
Of which from financial instruments held at:
Amortised cost 12,255 10,861
Fair value through other comprehensive income/ available-for-sale investments 2,845 2,657
Fair value through profit or loss 2,164 847
Held-to-maturity – 70
Interest income 17,264 14,435
Of which from financial instruments held at:
Amortised cost 7,384 6,128
Fair value through profit or loss 1,087 126
Interest expense 8,471 6,254
Net interest income 8,793 8,181

251
Risk review
and capital review
Strategic rep
ort
Sup
plem
entary inform
ation
FIN
AN
CIA
L S
TA
TE
ME
NT
SD
irectors’ rep
ort
4. Net fees and commission
Accounting policyFees and commissions charged for services provided or received by the Group are recognised on an accrual basis when the service has been provided or significant act performed.
Loan syndication fees are recognised as revenue when the syndication has been completed and the Group retained no part of the loan package for itself, or retained a part at the same effective interest rate as for the other participants.
The Group can act as trustee or in other fiduciary capacities that result in the holding or placing of assets on behalf of individuals, trusts, retirement benefit plans and other institutions. The assets and income arising thereon are excluded from these financial statements, as they are not assets and income of the Group.
The determination of the services performed for the customer, the transaction price, and when the services are completed depends on the nature of the product with the customer. The main considerations on income recognition by product are as follows:
Transaction BankingThe Group recognises fee income associated with transactional Trade, Cash Management and Custody activities at the point in time the service is provided. The Group recognises income associated with Trade contingent risk exposures (such as letters of credit and guarantees) and periodic Custody activities over the period in which the service is provided.
Payment of fees is usually received at the same time the service is provided. In some cases, letters of credit and guarantees issued by the Group have annual upfront premiums, which are amortised on a straight-line basis to fee income over the year.
Financial Markets and Corporate FinanceThe Group recognises fee income at the point in time the service is provided. Fee income is recognised for a significant non-lending service when the transaction has been completed and the terms of the contract with the customer entitle the Group to the fee. Fees are usually received shortly after the service is provided.
Syndication fees are recognised when the syndication is complete. Fees are generally received before completion of the syndication, or within 12 months of the transaction date.
Wealth ManagementCommissions for bancassurance activities are recorded as they are earned. These commissions are received within a short time frame of the commission being earned.
Target-linked fees are accrued over the period in which the target is met, provided it is assessed as highly probable that the target will be met. Cash payment is received at a contractually specified date after achievement of a target has been confirmed.
Upfront and trailing commissions for managed investment placements are recorded as they are confirmed. Income from these activities is relatively even throughout the period, and cash is usually received within a short time frame after the commission is earned.
Retail ProductsThe Group recognises most income at the point in time the Group is entitled to the fee, since most services are provided at the time of the customer’s request.
Credit card annual fees are recognised at the time the fee is received since in most of our retail markets there are contractual circumstances under which fees are waived, so income recognition is constrained until the uncertainties associated with the annual fee are resolved. The Group defers the fair value of reward points on its credit card reward programmes, and recognises income and costs associated with fulfilling the reward at the time of redemption.
31.12.18 $million
31.12.17 $million
Fees and commissions income 4,029 3,942
Fees and commissions expense (537) (430)
Net fees and commission 3,492 3,512
Total fee income arising from financial instruments that are not fair valued through profit or loss is $1,478 million (31 December 2017: $1,067 million) and arising from trust and other fiduciary activities is $144 million (31 December 2017: $130 million).
Total fee expense arising from financial instruments that are not fair valued through profit or loss is $143 million (31 December 2017: $74 million) and arising from trust and other fiduciary activities is $27 million (31 December 2017: $22 million).
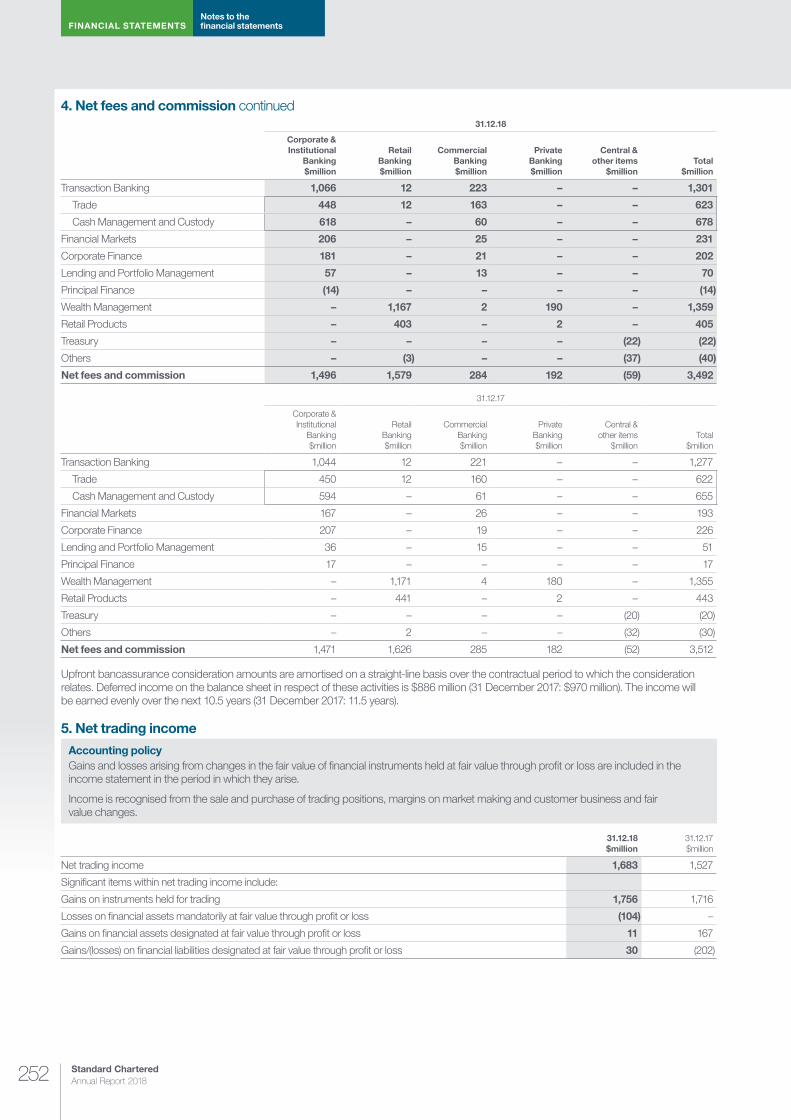
Standard Chartered Annual Report 2018252
FINANCIAL STATEMENTSNotes to the financial statements
4. Net fees and commission continued31.12.18
Corporate & Institutional
Banking $million
Retail Banking $million
Commercial Banking $million
Private Banking $million
Central & other items
$millionTotal
$million
Transaction Banking 1,066 12 223 – – 1,301
Trade 448 12 163 – – 623
Cash Management and Custody 618 – 60 – – 678
Financial Markets 206 – 25 – – 231
Corporate Finance 181 – 21 – – 202
Lending and Portfolio Management 57 – 13 – – 70
Principal Finance (14) – – – – (14)
Wealth Management – 1,167 2 190 – 1,359
Retail Products – 403 – 2 – 405
Treasury – – – – (22) (22)
Others – (3) – – (37) (40)
Net fees and commission 1,496 1,579 284 192 (59) 3,492
31.12.17
Corporate & Institutional
Banking $million
Retail Banking $million
Commercial Banking $million
Private Banking $million
Central & other items
$millionTotal
$million
Transaction Banking 1,044 12 221 – – 1,277
Trade 450 12 160 – – 622
Cash Management and Custody 594 – 61 – – 655
Financial Markets 167 – 26 – – 193
Corporate Finance 207 – 19 – – 226
Lending and Portfolio Management 36 – 15 – – 51
Principal Finance 17 – – – – 17
Wealth Management – 1,171 4 180 – 1,355
Retail Products – 441 – 2 – 443
Treasury – – – – (20) (20)
Others – 2 – – (32) (30)
Net fees and commission 1,471 1,626 285 182 (52) 3,512
Upfront bancassurance consideration amounts are amortised on a straight-line basis over the contractual period to which the consideration relates. Deferred income on the balance sheet in respect of these activities is $886 million (31 December 2017: $970 million). The income will be earned evenly over the next 10.5 years (31 December 2017: 11.5 years).
5. Net trading income
Accounting policyGains and losses arising from changes in the fair value of financial instruments held at fair value through profit or loss are included in the income statement in the period in which they arise.
Income is recognised from the sale and purchase of trading positions, margins on market making and customer business and fair value changes.
31.12.18 $million
31.12.17 $million
Net trading income 1,683 1,527
Significant items within net trading income include:
Gains on instruments held for trading 1,756 1,716
Losses on financial assets mandatorily at fair value through profit or loss (104) –
Gains on financial assets designated at fair value through profit or loss 11 167
Gains/(losses) on financial liabilities designated at fair value through profit or loss 30 (202)
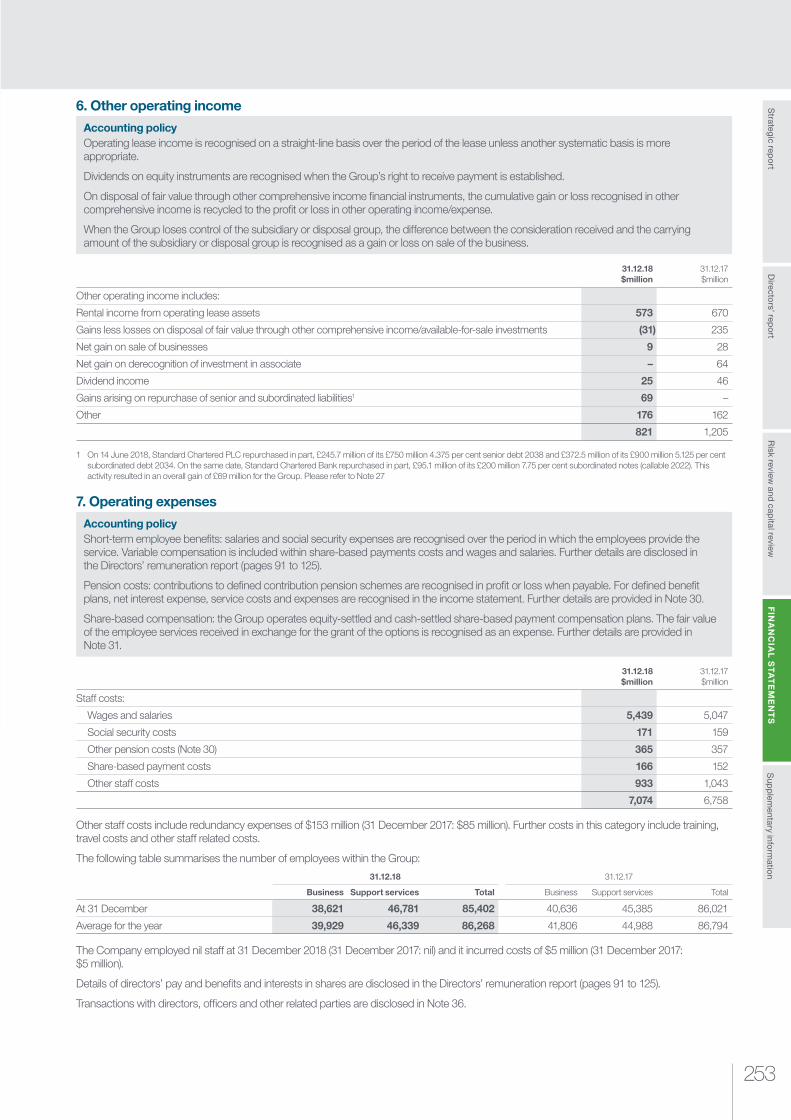
253
Risk review
and capital review
Strategic rep
ort
Sup
plem
entary inform
ation
FIN
AN
CIA
L S
TA
TE
ME
NT
SD
irectors’ rep
ort
6. Other operating income
Accounting policyOperating lease income is recognised on a straight-line basis over the period of the lease unless another systematic basis is more appropriate.
Dividends on equity instruments are recognised when the Group’s right to receive payment is established.
On disposal of fair value through other comprehensive income financial instruments, the cumulative gain or loss recognised in other comprehensive income is recycled to the profit or loss in other operating income/expense.
When the Group loses control of the subsidiary or disposal group, the difference between the consideration received and the carrying amount of the subsidiary or disposal group is recognised as a gain or loss on sale of the business.
31.12.18 $million
31.12.17 $million
Other operating income includes:
Rental income from operating lease assets 573 670
Gains less losses on disposal of fair value through other comprehensive income/available-for-sale investments (31) 235
Net gain on sale of businesses 9 28
Net gain on derecognition of investment in associate – 64
Dividend income 25 46
Gains arising on repurchase of senior and subordinated liabilities1 69 –
Other 176 162
821 1,205
1 On 14 June 2018, Standard Chartered PLC repurchased in part, £245.7 million of its £750 million 4.375 per cent senior debt 2038 and £372.5 million of its £900 million 5.125 per cent subordinated debt 2034. On the same date, Standard Chartered Bank repurchased in part, £95.1 million of its £200 million 7.75 per cent subordinated notes (callable 2022). This activity resulted in an overall gain of £69 million for the Group. Please refer to Note 27
7. Operating expenses
Accounting policyShort-term employee benefits: salaries and social security expenses are recognised over the period in which the employees provide the service. Variable compensation is included within share-based payments costs and wages and salaries. Further details are disclosed in the Directors’ remuneration report (pages 91 to 125).
Pension costs: contributions to defined contribution pension schemes are recognised in profit or loss when payable. For defined benefit plans, net interest expense, service costs and expenses are recognised in the income statement. Further details are provided in Note 30.
Share-based compensation: the Group operates equity-settled and cash-settled share-based payment compensation plans. The fair value of the employee services received in exchange for the grant of the options is recognised as an expense. Further details are provided in Note 31.
31.12.18 $million
31.12.17 $million
Staff costs:
Wages and salaries 5,439 5,047
Social security costs 171 159
Other pension costs (Note 30) 365 357
Share-based payment costs 166 152
Other staff costs 933 1,043
7,074 6,758
Other staff costs include redundancy expenses of $153 million (31 December 2017: $85 million). Further costs in this category include training, travel costs and other staff related costs.
The following table summarises the number of employees within the Group:
31.12.18 31.12.17
Business Support services Total Business Support services Total
At 31 December 38,621 46,781 85,402 40,636 45,385 86,021
Average for the year 39,929 46,339 86,268 41,806 44,988 86,794
The Company employed nil staff at 31 December 2018 (31 December 2017: nil) and it incurred costs of $5 million (31 December 2017: $5 million).
Details of directors’ pay and benefits and interests in shares are disclosed in the Directors’ remuneration report (pages 91 to 125).
Transactions with directors, officers and other related parties are disclosed in Note 36.
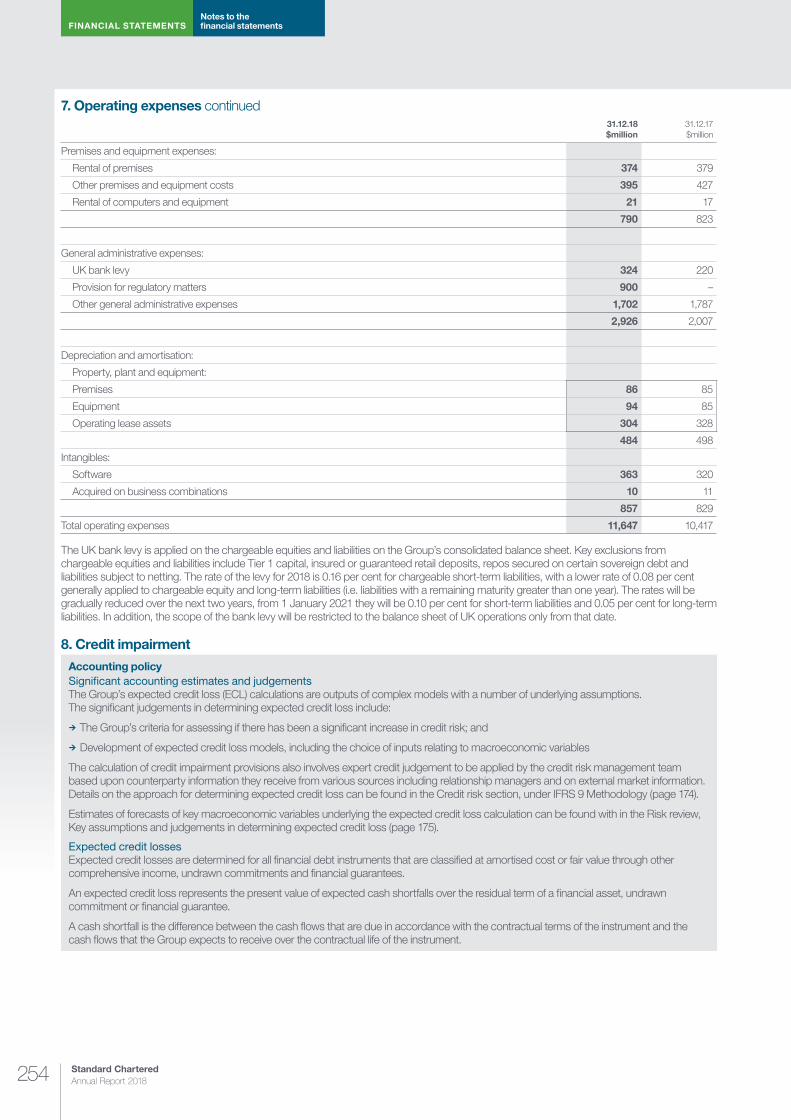
Standard Chartered Annual Report 2018254
FINANCIAL STATEMENTSNotes to the financial statements
7. Operating expenses continued31.12.18 $million
31.12.17 $million
Premises and equipment expenses:
Rental of premises 374 379
Other premises and equipment costs 395 427
Rental of computers and equipment 21 17
790 823
General administrative expenses:
UK bank levy 324 220
Provision for regulatory matters 900 –
Other general administrative expenses 1,702 1,787
2,926 2,007
Depreciation and amortisation:
Property, plant and equipment:
Premises 86 85
Equipment 94 85
Operating lease assets 304 328
484 498
Intangibles:
Software 363 320
Acquired on business combinations 10 11
857 829
Total operating expenses 11,647 10,417
The UK bank levy is applied on the chargeable equities and liabilities on the Group’s consolidated balance sheet. Key exclusions from chargeable equities and liabilities include Tier 1 capital, insured or guaranteed retail deposits, repos secured on certain sovereign debt and liabilities subject to netting. The rate of the levy for 2018 is 0.16 per cent for chargeable short-term liabilities, with a lower rate of 0.08 per cent generally applied to chargeable equity and long-term liabilities (i.e. liabilities with a remaining maturity greater than one year). The rates will be gradually reduced over the next two years, from 1 January 2021 they will be 0.10 per cent for short-term liabilities and 0.05 per cent for long-term liabilities. In addition, the scope of the bank levy will be restricted to the balance sheet of UK operations only from that date.
8. Credit impairment
Accounting policySigni�cant accounting estimates and judgements The Group’s expected credit loss (ECL) calculations are outputs of complex models with a number of underlying assumptions. The significant judgements in determining expected credit loss include:
¼ The Group’s criteria for assessing if there has been a significant increase in credit risk; and
¼ Development of expected credit loss models, including the choice of inputs relating to macroeconomic variables
The calculation of credit impairment provisions also involves expert credit judgement to be applied by the credit risk management team based upon counterparty information they receive from various sources including relationship managers and on external market information. Details on the approach for determining expected credit loss can be found in the Credit risk section, under IFRS 9 Methodology (page 174).
Estimates of forecasts of key macroeconomic variables underlying the expected credit loss calculation can be found with in the Risk review, Key assumptions and judgements in determining expected credit loss (page 175).
Expected credit lossesExpected credit losses are determined for all financial debt instruments that are classified at amortised cost or fair value through other comprehensive income, undrawn commitments and financial guarantees.
An expected credit loss represents the present value of expected cash shortfalls over the residual term of a financial asset, undrawn commitment or financial guarantee.
A cash shortfall is the difference between the cash flows that are due in accordance with the contractual terms of the instrument and the cash flows that the Group expects to receive over the contractual life of the instrument.
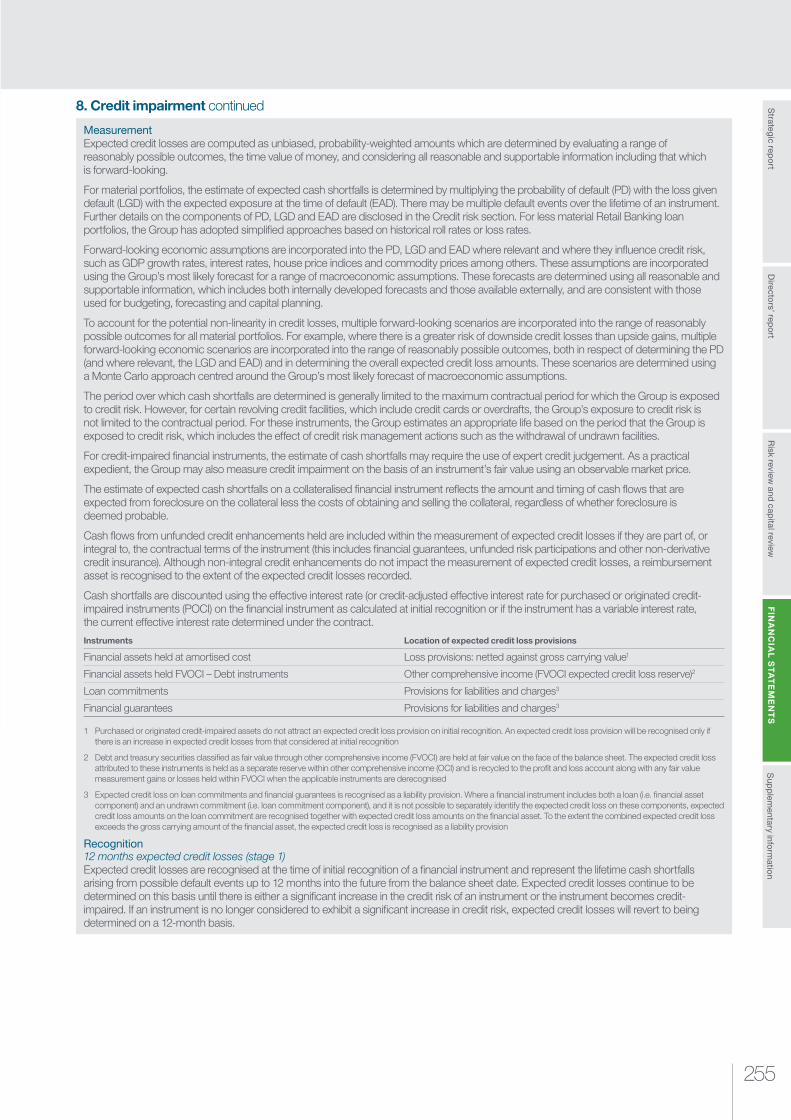
255
Risk review
and capital review
Strategic rep
ort
Sup
plem
entary inform
ation
FIN
AN
CIA
L S
TA
TE
ME
NT
SD
irectors’ rep
ort
8. Credit impairment continued
MeasurementExpected credit losses are computed as unbiased, probability-weighted amounts which are determined by evaluating a range of reasonably possible outcomes, the time value of money, and considering all reasonable and supportable information including that which is forward-looking.
For material portfolios, the estimate of expected cash shortfalls is determined by multiplying the probability of default (PD) with the loss given default (LGD) with the expected exposure at the time of default (EAD). There may be multiple default events over the lifetime of an instrument. Further details on the components of PD, LGD and EAD are disclosed in the Credit risk section. For less material Retail Banking loan portfolios, the Group has adopted simplified approaches based on historical roll rates or loss rates.
Forward-looking economic assumptions are incorporated into the PD, LGD and EAD where relevant and where they influence credit risk, such as GDP growth rates, interest rates, house price indices and commodity prices among others. These assumptions are incorporated using the Group’s most likely forecast for a range of macroeconomic assumptions. These forecasts are determined using all reasonable and supportable information, which includes both internally developed forecasts and those available externally, and are consistent with those used for budgeting, forecasting and capital planning.
To account for the potential non-linearity in credit losses, multiple forward-looking scenarios are incorporated into the range of reasonably possible outcomes for all material portfolios. For example, where there is a greater risk of downside credit losses than upside gains, multiple forward-looking economic scenarios are incorporated into the range of reasonably possible outcomes, both in respect of determining the PD (and where relevant, the LGD and EAD) and in determining the overall expected credit loss amounts. These scenarios are determined using a Monte Carlo approach centred around the Group’s most likely forecast of macroeconomic assumptions.
The period over which cash shortfalls are determined is generally limited to the maximum contractual period for which the Group is exposed to credit risk. However, for certain revolving credit facilities, which include credit cards or overdrafts, the Group’s exposure to credit risk is not limited to the contractual period. For these instruments, the Group estimates an appropriate life based on the period that the Group is exposed to credit risk, which includes the effect of credit risk management actions such as the withdrawal of undrawn facilities.
For credit-impaired financial instruments, the estimate of cash shortfalls may require the use of expert credit judgement. As a practical expedient, the Group may also measure credit impairment on the basis of an instrument’s fair value using an observable market price.
The estimate of expected cash shortfalls on a collateralised financial instrument reflects the amount and timing of cash flows that are expected from foreclosure on the collateral less the costs of obtaining and selling the collateral, regardless of whether foreclosure is deemed probable.
Cash flows from unfunded credit enhancements held are included within the measurement of expected credit losses if they are part of, or integral to, the contractual terms of the instrument (this includes financial guarantees, unfunded risk participations and other non-derivative credit insurance). Although non-integral credit enhancements do not impact the measurement of expected credit losses, a reimbursement asset is recognised to the extent of the expected credit losses recorded.
Cash shortfalls are discounted using the effective interest rate (or credit-adjusted effective interest rate for purchased or originated credit-impaired instruments (POCI) on the financial instrument as calculated at initial recognition or if the instrument has a variable interest rate, the current effective interest rate determined under the contract.
Instruments Location of expected credit loss provisions
Financial assets held at amortised cost Loss provisions: netted against gross carrying value1
Financial assets held FVOCI – Debt instruments Other comprehensive income (FVOCI expected credit loss reserve)2
Loan commitments Provisions for liabilities and charges3
Financial guarantees Provisions for liabilities and charges3
1 Purchased or originated credit-impaired assets do not attract an expected credit loss provision on initial recognition. An expected credit loss provision will be recognised only if there is an increase in expected credit losses from that considered at initial recognition
2 Debt and treasury securities classified as fair value through other comprehensive income (FVOCI) are held at fair value on the face of the balance sheet. The expected credit loss attributed to these instruments is held as a separate reserve within other comprehensive income (OCI) and is recycled to the profit and loss account along with any fair value measurement gains or losses held within FVOCI when the applicable instruments are derecognised
3 Expected credit loss on loan commitments and financial guarantees is recognised as a liability provision. Where a financial instrument includes both a loan (i.e. financial asset component) and an undrawn commitment (i.e. loan commitment component), and it is not possible to separately identify the expected credit loss on these components, expected credit loss amounts on the loan commitment are recognised together with expected credit loss amounts on the financial asset. To the extent the combined expected credit loss exceeds the gross carrying amount of the financial asset, the expected credit loss is recognised as a liability provision
Recognition12 months expected credit losses (stage 1)Expected credit losses are recognised at the time of initial recognition of a financial instrument and represent the lifetime cash shortfalls arising from possible default events up to 12 months into the future from the balance sheet date. Expected credit losses continue to be determined on this basis until there is either a significant increase in the credit risk of an instrument or the instrument becomes credit-impaired. If an instrument is no longer considered to exhibit a significant increase in credit risk, expected credit losses will revert to being determined on a 12-month basis.

Standard Chartered Annual Report 2018256
FINANCIAL STATEMENTSNotes to the financial statements
8. Credit impairment continued
Significant increase in credit risk (stage 2)If a financial asset experiences a significant increase in credit risk (SICR) since initial recognition, an expected credit loss provision is recognised for default events that may occur over the lifetime of the asset.
Significant increase in credit risk is assessed by comparing the risk of default of an exposure at the reporting date to the risk of default at origination (after taking into account the passage of time). Significant does not mean statistically significant nor is it assessed in the context of changes in expected credit loss. Whether a change in the risk of default is significant or not is assessed using a number of quantitative and qualitative factors, the weight of which depends on the type of product and counterparty. Financial assets that are 30 or more days past due and not credit-impaired will always be considered to have experienced a significant increase in credit risk. For less material portfolios where a loss rate or roll rate approach is applied to compute expected credit loss, significant increase in credit risk is primarily based on 30 days past due.
Quantitative factors include an assessment of whether there has been significant increase in the forward-looking probability of default (PD) since origination. A forward-looking PD is one that is adjusted for future economic conditions to the extent these are correlated to changes in credit risk. We compare the residual lifetime PD at the balance sheet date to the residual lifetime PD that was expected at the time of origination for the same point in the term structure and determine whether both the absolute and relative change between the two exceeds predetermined thresholds. To the extent that the differences between the measures of default outlined exceed the defined thresholds, the instrument is considered to have experienced a significant increase in credit risk.
Qualitative factors assessed include those linked to current credit risk management processes, such as lending placed on non-purely precautionary early alert (and subject to closer monitoring).
A non-purely precautionary early alert account is one which exhibits risk or potential weaknesses of a material nature requiring closer monitoring, supervision, or attention by management. Weaknesses in such a borrower’s account, if left uncorrected, could result in deterioration of repayment prospects and the likelihood of being downgraded. Indicators could include a rapid erosion of position within the industry, concerns over management’s ability to manage operations, weak/deteriorating operating results, liquidity strain and overdue balances among other factors.
Credit-impaired (or defaulted) exposures (stage 3)Financial assets that are credit-impaired (or in default) represent those that are at least 90 days past due in respect of principal and/or interest. Financial assets are also considered to be credit-impaired where the obligors are unlikely to pay on the occurrence of one or more observable events that have a detrimental impact on the estimated future cash flows of the financial asset. It may not be possible to identify a single discrete event but instead the combined effect of several events may cause financial assets to become credit-impaired.
Evidence that a financial asset is credit-impaired includes observable data about the following events:
¼ Significant financial difficulty of the issuer or borrower;
¼ Breach of contract such as default or a past due event;
¼ For economic or contractual reasons relating to the borrower’s financial difficulty, the lenders of the borrower have granted the borrower concession/s that lenders would not otherwise consider. This would include forbearance actions (pages 160 to 162);
¼ Pending or actual bankruptcy or other financial reorganisation to avoid or delay discharge of the borrower’s obligation/s;
¼ The disappearance of an active market for the applicable financial asset due to financial difficulties of the borrower;
¼ Purchase or origination of a financial asset at a deep discount that reflects incurred credit losses
Irrevocable lending commitments to a credit-impaired obligor that have not yet been drawn down are also included within the stage 3 credit impairment provision to the extent that the commitment cannot be withdrawn.
Loss provisions against credit-impaired financial assets are determined based on an assessment of the recoverable cash flows under a range of scenarios, including the realisation of any collateral held where appropriate. The loss provisions held represent the difference between the present value of the cash flows expected to be recovered, discounted at the instrument’s original effective interest rate, and the gross carrying value of the instrument prior to any credit impairment. The Group’s definition of default is aligned with the regulatory definition of default as set out in European Capital Requirements Regulation (CRR178) and related guidelines.
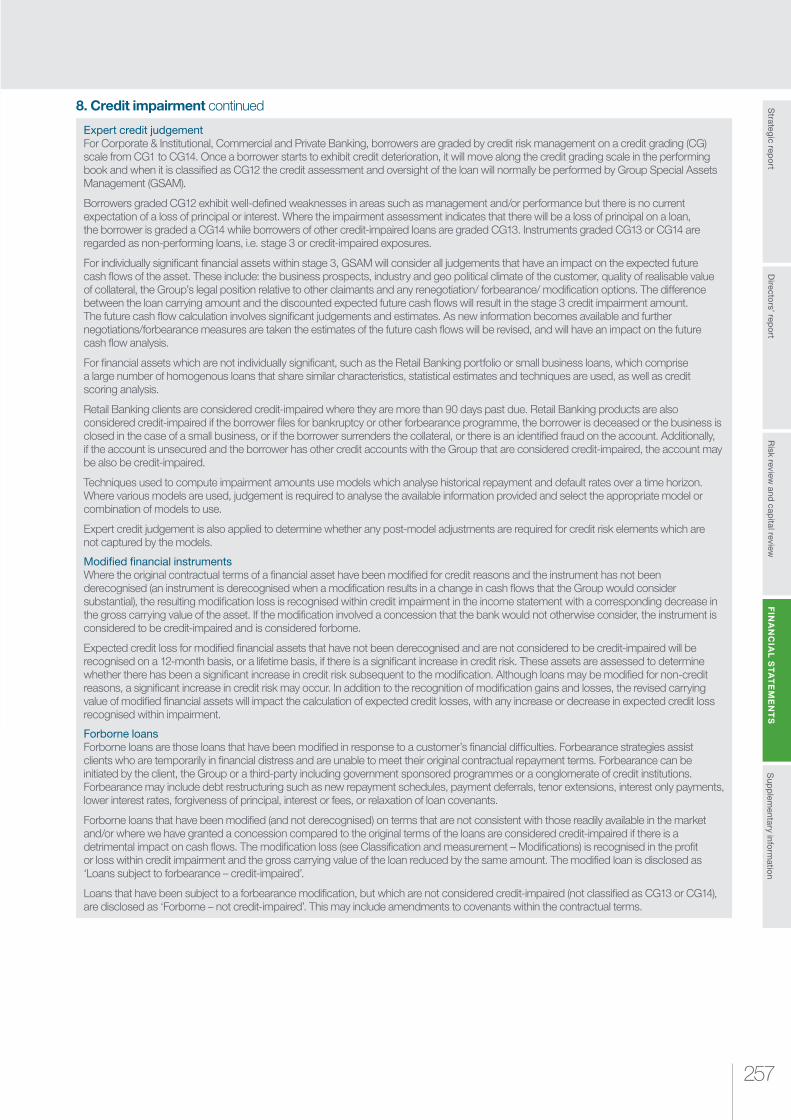
257
Risk review
and capital review
Strategic rep
ort
Sup
plem
entary inform
ation
FIN
AN
CIA
L S
TA
TE
ME
NT
SD
irectors’ rep
ort
8. Credit impairment continued
Expert credit judgementFor Corporate & Institutional, Commercial and Private Banking, borrowers are graded by credit risk management on a credit grading (CG) scale from CG1 to CG14. Once a borrower starts to exhibit credit deterioration, it will move along the credit grading scale in the performing book and when it is classified as CG12 the credit assessment and oversight of the loan will normally be performed by Group Special Assets Management (GSAM).
Borrowers graded CG12 exhibit well-defined weaknesses in areas such as management and/or performance but there is no current expectation of a loss of principal or interest. Where the impairment assessment indicates that there will be a loss of principal on a loan, the borrower is graded a CG14 while borrowers of other credit-impaired loans are graded CG13. Instruments graded CG13 or CG14 are regarded as non-performing loans, i.e. stage 3 or credit-impaired exposures.
For individually significant financial assets within stage 3, GSAM will consider all judgements that have an impact on the expected future cash flows of the asset. These include: the business prospects, industry and geo political climate of the customer, quality of realisable value of collateral, the Group’s legal position relative to other claimants and any renegotiation/ forbearance/ modification options. The difference between the loan carrying amount and the discounted expected future cash flows will result in the stage 3 credit impairment amount. The future cash flow calculation involves significant judgements and estimates. As new information becomes available and further negotiations/forbearance measures are taken the estimates of the future cash flows will be revised, and will have an impact on the future cash flow analysis.
For financial assets which are not individually significant, such as the Retail Banking portfolio or small business loans, which comprise a large number of homogenous loans that share similar characteristics, statistical estimates and techniques are used, as well as credit scoring analysis.
Retail Banking clients are considered credit-impaired where they are more than 90 days past due. Retail Banking products are also considered credit-impaired if the borrower files for bankruptcy or other forbearance programme, the borrower is deceased or the business is closed in the case of a small business, or if the borrower surrenders the collateral, or there is an identified fraud on the account. Additionally, if the account is unsecured and the borrower has other credit accounts with the Group that are considered credit-impaired, the account may be also be credit-impaired.
Techniques used to compute impairment amounts use models which analyse historical repayment and default rates over a time horizon. Where various models are used, judgement is required to analyse the available information provided and select the appropriate model or combination of models to use.
Expert credit judgement is also applied to determine whether any post-model adjustments are required for credit risk elements which are not captured by the models.
Modi�ed �nancial instrumentsWhere the original contractual terms of a financial asset have been modified for credit reasons and the instrument has not been derecognised (an instrument is derecognised when a modification results in a change in cash flows that the Group would consider substantial), the resulting modification loss is recognised within credit impairment in the income statement with a corresponding decrease in the gross carrying value of the asset. If the modification involved a concession that the bank would not otherwise consider, the instrument is considered to be credit-impaired and is considered forborne.
Expected credit loss for modified financial assets that have not been derecognised and are not considered to be credit-impaired will be recognised on a 12-month basis, or a lifetime basis, if there is a significant increase in credit risk. These assets are assessed to determine whether there has been a significant increase in credit risk subsequent to the modification. Although loans may be modified for non-credit reasons, a significant increase in credit risk may occur. In addition to the recognition of modification gains and losses, the revised carrying value of modified financial assets will impact the calculation of expected credit losses, with any increase or decrease in expected credit loss recognised within impairment.
Forborne loansForborne loans are those loans that have been modified in response to a customer’s financial difficulties. Forbearance strategies assist clients who are temporarily in financial distress and are unable to meet their original contractual repayment terms. Forbearance can be initiated by the client, the Group or a third-party including government sponsored programmes or a conglomerate of credit institutions. Forbearance may include debt restructuring such as new repayment schedules, payment deferrals, tenor extensions, interest only payments, lower interest rates, forgiveness of principal, interest or fees, or relaxation of loan covenants.
Forborne loans that have been modified (and not derecognised) on terms that are not consistent with those readily available in the market and/or where we have granted a concession compared to the original terms of the loans are considered credit-impaired if there is a detrimental impact on cash flows. The modification loss (see Classification and measurement – Modifications) is recognised in the profit or loss within credit impairment and the gross carrying value of the loan reduced by the same amount. The modified loan is disclosed as ‘Loans subject to forbearance – credit-impaired’.
Loans that have been subject to a forbearance modification, but which are not considered credit-impaired (not classified as CG13 or CG14), are disclosed as ‘Forborne – not credit-impaired’. This may include amendments to covenants within the contractual terms.
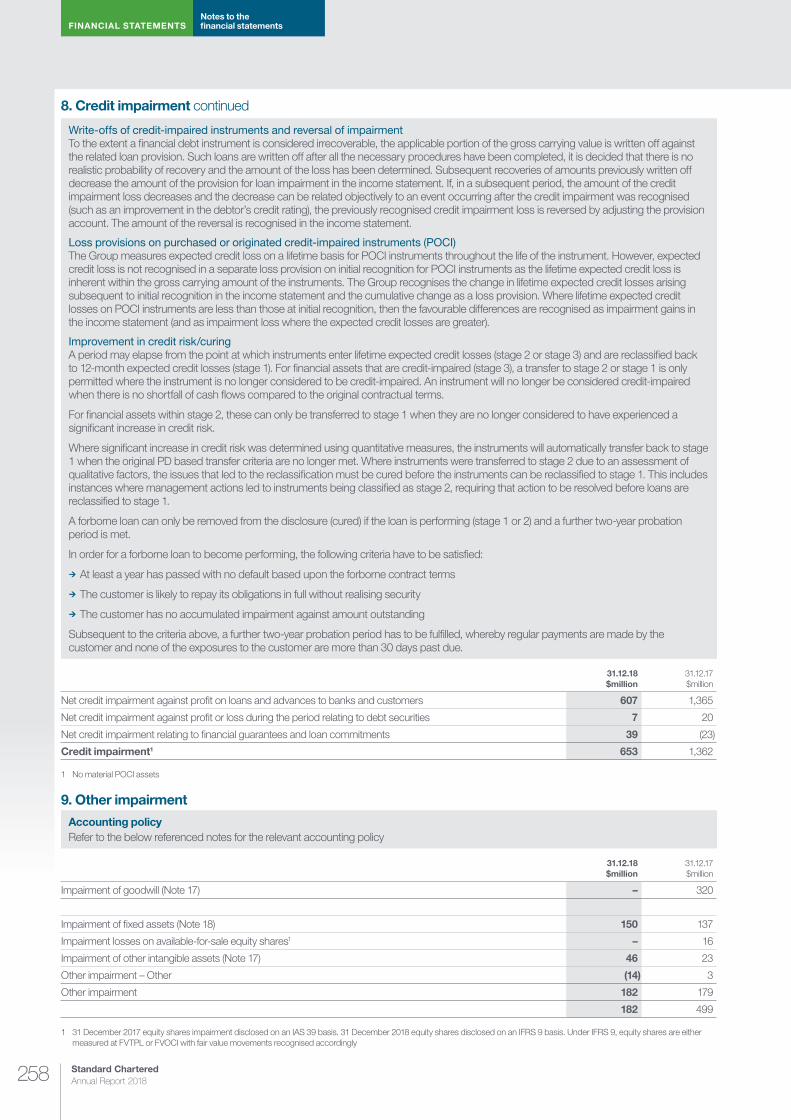
Standard Chartered Annual Report 2018258
FINANCIAL STATEMENTSNotes to the financial statements
8. Credit impairment continued
Write-offs of credit-impaired instruments and reversal of impairmentTo the extent a financial debt instrument is considered irrecoverable, the applicable portion of the gross carrying value is written off against the related loan provision. Such loans are written off after all the necessary procedures have been completed, it is decided that there is no realistic probability of recovery and the amount of the loss has been determined. Subsequent recoveries of amounts previously written off decrease the amount of the provision for loan impairment in the income statement. If, in a subsequent period, the amount of the credit impairment loss decreases and the decrease can be related objectively to an event occurring after the credit impairment was recognised (such as an improvement in the debtor’s credit rating), the previously recognised credit impairment loss is reversed by adjusting the provision account. The amount of the reversal is recognised in the income statement.
Loss provisions on purchased or originated credit-impaired instruments (POCI)The Group measures expected credit loss on a lifetime basis for POCI instruments throughout the life of the instrument. However, expected credit loss is not recognised in a separate loss provision on initial recognition for POCI instruments as the lifetime expected credit loss is inherent within the gross carrying amount of the instruments. The Group recognises the change in lifetime expected credit losses arising subsequent to initial recognition in the income statement and the cumulative change as a loss provision. Where lifetime expected credit losses on POCI instruments are less than those at initial recognition, then the favourable differences are recognised as impairment gains in the income statement (and as impairment loss where the expected credit losses are greater).
Improvement in credit risk/curingA period may elapse from the point at which instruments enter lifetime expected credit losses (stage 2 or stage 3) and are reclassified back to 12-month expected credit losses (stage 1). For financial assets that are credit-impaired (stage 3), a transfer to stage 2 or stage 1 is only permitted where the instrument is no longer considered to be credit-impaired. An instrument will no longer be considered credit-impaired when there is no shortfall of cash flows compared to the original contractual terms.
For financial assets within stage 2, these can only be transferred to stage 1 when they are no longer considered to have experienced a significant increase in credit risk.
Where significant increase in credit risk was determined using quantitative measures, the instruments will automatically transfer back to stage 1 when the original PD based transfer criteria are no longer met. Where instruments were transferred to stage 2 due to an assessment of qualitative factors, the issues that led to the reclassification must be cured before the instruments can be reclassified to stage 1. This includes instances where management actions led to instruments being classified as stage 2, requiring that action to be resolved before loans are reclassified to stage 1.
A forborne loan can only be removed from the disclosure (cured) if the loan is performing (stage 1 or 2) and a further two-year probation period is met.
In order for a forborne loan to become performing, the following criteria have to be satisfied:
¼ At least a year has passed with no default based upon the forborne contract terms
¼ The customer is likely to repay its obligations in full without realising security
¼ The customer has no accumulated impairment against amount outstanding
Subsequent to the criteria above, a further two-year probation period has to be fulfilled, whereby regular payments are made by the customer and none of the exposures to the customer are more than 30 days past due.
31.12.18 $million
31.12.17 $million
Net credit impairment against profit on loans and advances to banks and customers 607 1,365
Net credit impairment against profit or loss during the period relating to debt securities 7 20
Net credit impairment relating to financial guarantees and loan commitments 39 (23)
Credit impairment1 653 1,362
1 No material POCI assets
9. Other impairment
Accounting policy Refer to the below referenced notes for the relevant accounting policy
31.12.18 $million
31.12.17 $million
Impairment of goodwill (Note 17) – 320
Impairment of fixed assets (Note 18) 150 137
Impairment losses on available-for-sale equity shares1 – 16
Impairment of other intangible assets (Note 17) 46 23
Other impairment – Other (14) 3
Other impairment 182 179
182 499
1 31 December 2017 equity shares impairment disclosed on an IAS 39 basis. 31 December 2018 equity shares disclosed on an IFRS 9 basis. Under IFRS 9, equity shares are either measured at FVTPL or FVOCI with fair value movements recognised accordingly
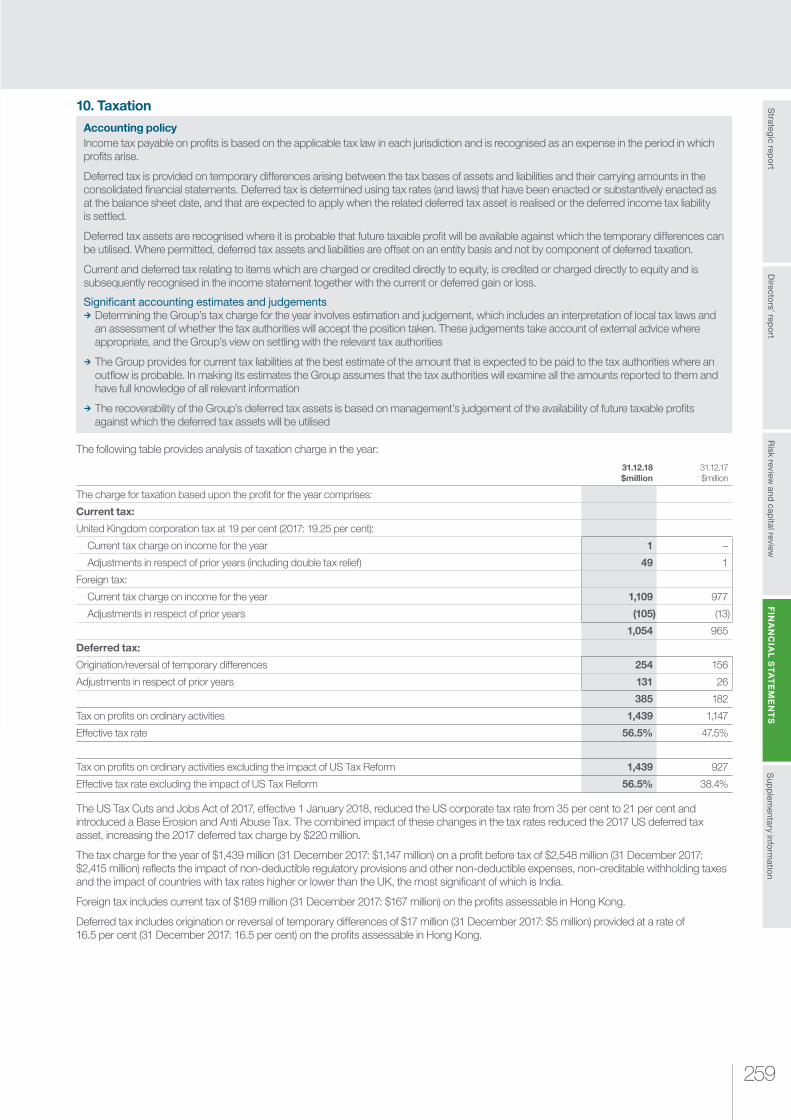
259
Risk review
and capital review
Strategic rep
ort
Sup
plem
entary inform
ation
FIN
AN
CIA
L S
TA
TE
ME
NT
SD
irectors’ rep
ort
10. Taxation
Accounting policyIncome tax payable on profits is based on the applicable tax law in each jurisdiction and is recognised as an expense in the period in which profits arise.
Deferred tax is provided on temporary differences arising between the tax bases of assets and liabilities and their carrying amounts in the consolidated financial statements. Deferred tax is determined using tax rates (and laws) that have been enacted or substantively enacted as at the balance sheet date, and that are expected to apply when the related deferred tax asset is realised or the deferred income tax liability is settled.
Deferred tax assets are recognised where it is probable that future taxable profit will be available against which the temporary differences can be utilised. Where permitted, deferred tax assets and liabilities are offset on an entity basis and not by component of deferred taxation.
Current and deferred tax relating to items which are charged or credited directly to equity, is credited or charged directly to equity and is subsequently recognised in the income statement together with the current or deferred gain or loss.
Signi�cant accounting estimates and judgements ¼ Determining the Group’s tax charge for the year involves estimation and judgement, which includes an interpretation of local tax laws and an assessment of whether the tax authorities will accept the position taken. These judgements take account of external advice where appropriate, and the Group’s view on settling with the relevant tax authorities
¼ The Group provides for current tax liabilities at the best estimate of the amount that is expected to be paid to the tax authorities where an outflow is probable. In making its estimates the Group assumes that the tax authorities will examine all the amounts reported to them and have full knowledge of all relevant information
¼ The recoverability of the Group’s deferred tax assets is based on management’s judgement of the availability of future taxable profits against which the deferred tax assets will be utilised
The following table provides analysis of taxation charge in the year:
31.12.18 $million
31.12.17 $million
The charge for taxation based upon the profit for the year comprises:
Current tax:
United Kingdom corporation tax at 19 per cent (2017: 19.25 per cent):
Current tax charge on income for the year 1 –
Adjustments in respect of prior years (including double tax relief) 49 1
Foreign tax:
Current tax charge on income for the year 1,109 977
Adjustments in respect of prior years (105) (13)
1,054 965
Deferred tax:
Origination/reversal of temporary differences 254 156
Adjustments in respect of prior years 131 26
385 182
Tax on profits on ordinary activities 1,439 1,147
Effective tax rate 56.5% 47.5%
Tax on profits on ordinary activities excluding the impact of US Tax Reform 1,439 927
Effective tax rate excluding the impact of US Tax Reform 56.5% 38.4%
The US Tax Cuts and Jobs Act of 2017, effective 1 January 2018, reduced the US corporate tax rate from 35 per cent to 21 per cent and introduced a Base Erosion and Anti Abuse Tax. The combined impact of these changes in the tax rates reduced the 2017 US deferred tax asset, increasing the 2017 deferred tax charge by $220 million.
The tax charge for the year of $1,439 million (31 December 2017: $1,147 million) on a profit before tax of $2,548 million (31 December 2017: $2,415 million) reflects the impact of non-deductible regulatory provisions and other non-deductible expenses, non-creditable withholding taxes and the impact of countries with tax rates higher or lower than the UK, the most significant of which is India.
Foreign tax includes current tax of $169 million (31 December 2017: $167 million) on the profits assessable in Hong Kong.
Deferred tax includes origination or reversal of temporary differences of $17 million (31 December 2017: $5 million) provided at a rate of 16.5 per cent (31 December 2017: 16.5 per cent) on the profits assessable in Hong Kong.
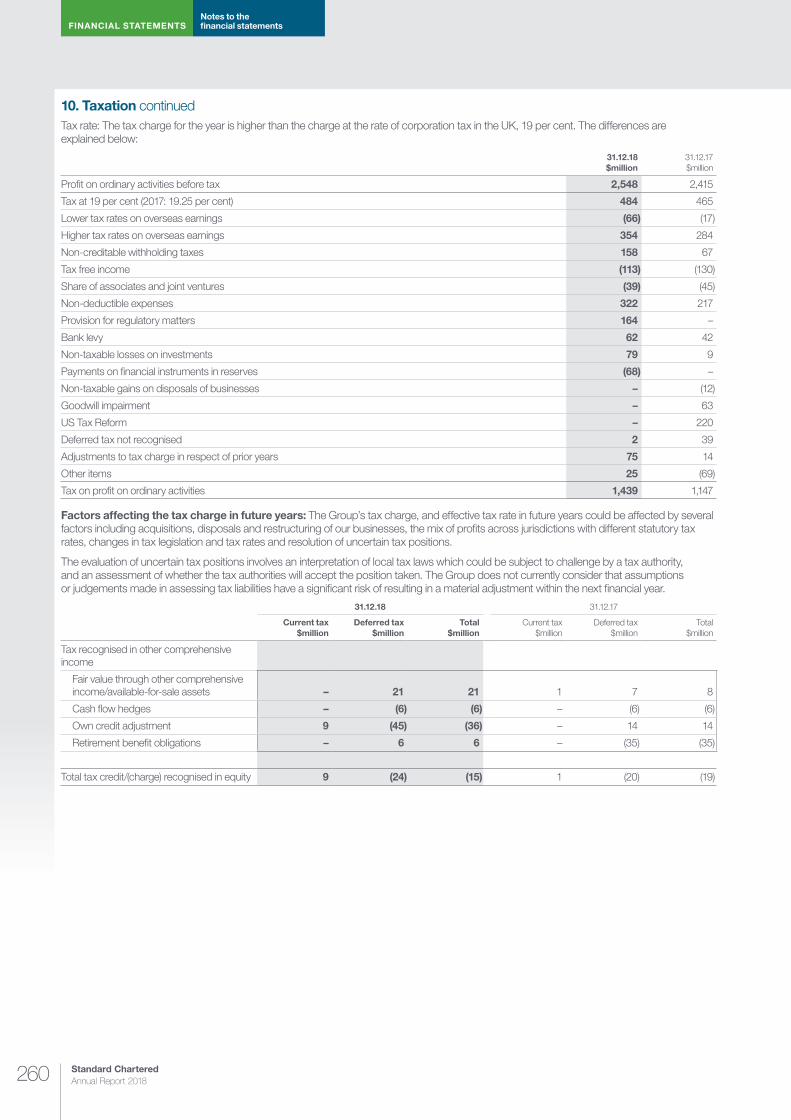
Standard Chartered Annual Report 2018260
FINANCIAL STATEMENTSNotes to the financial statements
10. Taxation continuedTax rate: The tax charge for the year is higher than the charge at the rate of corporation tax in the UK, 19 per cent. The differences are explained below:
31.12.18 $million
31.12.17 $million
Profit on ordinary activities before tax 2,548 2,415
Tax at 19 per cent (2017: 19.25 per cent) 484 465
Lower tax rates on overseas earnings (66) (17)
Higher tax rates on overseas earnings 354 284
Non-creditable withholding taxes 158 67
Tax free income (113) (130)
Share of associates and joint ventures (39) (45)
Non-deductible expenses 322 217
Provision for regulatory matters 164 –
Bank levy 62 42
Non-taxable losses on investments 79 9
Payments on financial instruments in reserves (68) –
Non-taxable gains on disposals of businesses – (12)
Goodwill impairment – 63
US Tax Reform – 220
Deferred tax not recognised 2 39
Adjustments to tax charge in respect of prior years 75 14
Other items 25 (69)
Tax on profit on ordinary activities 1,439 1,147
Factors affecting the tax charge in future years: The Group’s tax charge, and effective tax rate in future years could be affected by several factors including acquisitions, disposals and restructuring of our businesses, the mix of profits across jurisdictions with different statutory tax rates, changes in tax legislation and tax rates and resolution of uncertain tax positions.
The evaluation of uncertain tax positions involves an interpretation of local tax laws which could be subject to challenge by a tax authority, and an assessment of whether the tax authorities will accept the position taken. The Group does not currently consider that assumptions or judgements made in assessing tax liabilities have a significant risk of resulting in a material adjustment within the next financial year.
31.12.18 31.12.17
Current tax $million
Deferred tax $million
Total $million
Current tax $million
Deferred tax $million
Total $million
Tax recognised in other comprehensive income
Fair value through other comprehensive income/available-for-sale assets – 21 21 1 7 8
Cash flow hedges – (6) (6) – (6) (6)
Own credit adjustment 9 (45) (36) – 14 14
Retirement benefit obligations – 6 6 – (35) (35)
Total tax credit/(charge) recognised in equity 9 (24) (15) 1 (20) (19)
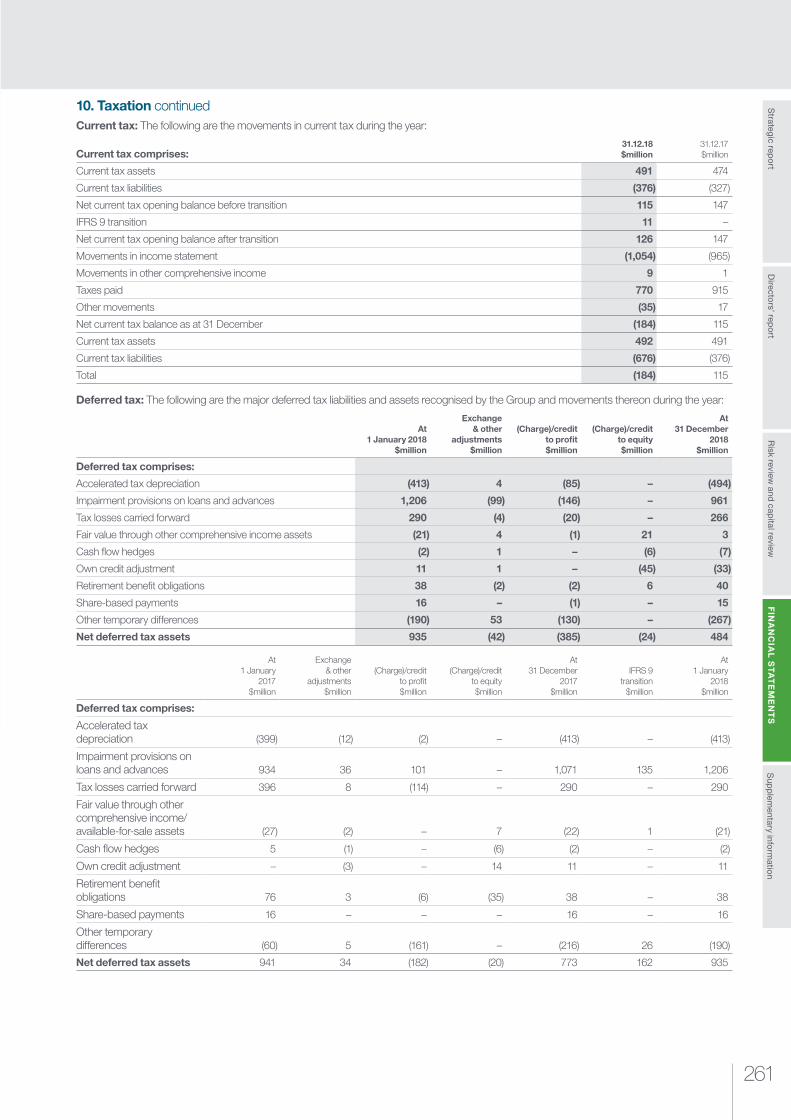
261
Risk review
and capital review
Strategic rep
ort
Sup
plem
entary inform
ation
FIN
AN
CIA
L S
TA
TE
ME
NT
SD
irectors’ rep
ort
10. Taxation continuedCurrent tax: The following are the movements in current tax during the year:
Current tax comprises:31.12.18 $million
31.12.17 $million
Current tax assets 491 474
Current tax liabilities (376) (327)
Net current tax opening balance before transition 115 147
IFRS 9 transition 11 –
Net current tax opening balance after transition 126 147
Movements in income statement (1,054) (965)
Movements in other comprehensive income 9 1
Taxes paid 770 915
Other movements (35) 17
Net current tax balance as at 31 December (184) 115
Current tax assets 492 491
Current tax liabilities (676) (376)
Total (184) 115
Deferred tax: The following are the major deferred tax liabilities and assets recognised by the Group and movements thereon during the year:
At 1 January 2018
$million
Exchange & other
adjustments $million
(Charge)/credit to profit $million
(Charge)/credit to equity $million
At 31 December
2018 $million
Deferred tax comprises:
Accelerated tax depreciation (413) 4 (85) – (494)
Impairment provisions on loans and advances 1,206 (99) (146) – 961
Tax losses carried forward 290 (4) (20) – 266
Fair value through other comprehensive income assets (21) 4 (1) 21 3
Cash flow hedges (2) 1 – (6) (7)
Own credit adjustment 11 1 – (45) (33)
Retirement benefit obligations 38 (2) (2) 6 40
Share-based payments 16 – (1) – 15
Other temporary differences (190) 53 (130) – (267)
Net deferred tax assets 935 (42) (385) (24) 484
At 1 January
2017 $million
Exchange & other
adjustments $million
(Charge)/credit to profit $million
(Charge)/credit to equity $million
At 31 December
2017 $million
IFRS 9 transition
$million
At 1 January
2018 $million
Deferred tax comprises:
Accelerated tax depreciation (399) (12) (2) – (413) – (413)
Impairment provisions on loans and advances 934 36 101 – 1,071 135 1,206
Tax losses carried forward 396 8 (114) – 290 – 290
Fair value through other comprehensive income/ available-for-sale assets (27) (2) – 7 (22) 1 (21)
Cash flow hedges 5 (1) – (6) (2) – (2)
Own credit adjustment – (3) – 14 11 – 11
Retirement benefit obligations 76 3 (6) (35) 38 – 38
Share-based payments 16 – – – 16 – 16
Other temporary differences (60) 5 (161) – (216) 26 (190)
Net deferred tax assets 941 34 (182) (20) 773 162 935

Standard Chartered Annual Report 2018262
FINANCIAL STATEMENTSNotes to the financial statements
10. Taxation continuedDeferred tax comprises assets and liabilities as follows:
31.12.18 01.01.18 31.12.17
Total $million
Asset $million
Liability $million
Total $million
Asset $million
Liability $million
Total $million
Asset $million
Liability $million
Deferred tax comprises:
Accelerated tax depreciation (494) 7 (501) (413) 17 (430) (413) 17 (430)
Impairment provisions on loans and advances 961 938 23 1,206 1,148 58 1,071 1,037 34
Tax losses carried forward 266 126 140 290 134 156 290 134 156
Fair value through other comprehensive income/ available-for-sale assets 3 (2) 5 (21) (7) (14) (22) (8) (14)
Cash flow hedges (7) (12) 5 (2) (7) 5 (2) (7) 5
Own credit adjustment (33) (18) (15) 11 (2) 13 11 (2) 13
Retirement benefit obligations 40 40 – 38 38 – 38 38 –
Share-based payments 15 15 – 16 16 – 16 16 –
Other temporary differences (267) (47) (220) (190) (29) (161) (216) (48) (168)
484 1,047 (563) 935 1,308 (373) 773 1,177 (404)
At 31 December 2018, the Group has net deferred tax assets of $484 million (31 December 2017: $773 million). The recoverability of the Group’s deferred tax assets is based on management’s judgement of the availability of future taxable profits against which the deferred tax assets will be utilised.
Of the Group’s total deferred tax assets, $266 million relates to tax losses carried forward. These tax losses have arisen in individual legal entities and will be offset as future taxable profits arise in those entities.
¼ $139 million of the deferred tax assets relating to losses has arisen in Ireland, where there is no expiry date for unused tax losses. These losses relate to aircraft leasing and are expected to be fully utilised over the useful economical life of the assets being up to 18 years
¼ $33 million of the deferred tax assets relating to losses has arisen in Korea. These losses have no expiry date, and there is a defined profit stream against which they are forecast to be utilised
¼ $27 million of the deferred tax assets relating to losses has arisen in the US. Management forecasts show that the losses are expected to be fully utilised over a period of nine years. The tax losses expire after 20 years
¼ $25 million of the deferred tax assets relating to losses has arisen in Taiwan. Management forecasts show that the losses are expected to be fully utilised over a period of one year. The tax losses expire after 10 years
The remaining deferred tax assets of $42 million relating to losses has arisen in other jurisdictions and is expected to be recovered in less than 10 years.
31.12.18 $million
31.12.17 $million
No account has been taken of the following potential deferred tax assets/(liabilities):
Withholding tax on unremitted earnings from overseas subsidiaries (281) (343)
Foreign exchange movements on investments in branches1 – –
Tax losses 1,283 1,311
Held over gains on incorporation of overseas branches (413) (399)
Other temporary differences 79 47
1 No potential deferred tax is included for foreign exchange movements on investments in branches as any branch disposals would be covered by the Branch Profits Exemptions and would not give rise to a tax liability or asset. The amount as at 31 December 2017, previously disclosed as $339 million, has been restated to nil

263
Risk review
and capital review
Strategic rep
ort
Sup
plem
entary inform
ation
FIN
AN
CIA
L S
TA
TE
ME
NT
SD
irectors’ rep
ort
11. Dividends
Accounting policyDividends on ordinary shares and preference shares classified as equity are recognised in equity in the year in which they are declared.
Dividends on ordinary equity shares are recorded in the year in which they are declared and, in respect of the final dividend, have been approved by the shareholders.
The Board considers a number of factors prior to dividend declaration which includes the rate of recovery in the Group’s financial performance, the macroeconomic environment, and opportunities to further invest in our business and grow profitably in our markets.
Ordinary equity shares31.12.18 31.12.17
Cents per share $million Cents per share $million
2017/2016 final dividend declared and paid during the year1 11.00 363 – –
2018/2017 interim dividend declared and paid during the year1 6.00 198 – –
1 The amounts are gross of scrip adjustments
Dividends on ordinary equity shares are recorded in the period in which they are declared and, in respect of the final dividend, have been approved by the shareholders. Accordingly, the final ordinary equity share dividends set out above relate to the respective prior years. The 2017 final dividend of 11 cents per ordinary share ($363 million) was paid to eligible shareholders on 17 May 2018 and the 2018 interim dividend of six cents per ordinary share ($198 million) was paid to eligible shareholders on 22 October 2018.
2018 recommended final ordinary equity share dividend The 2018 ordinary equity share dividend recommended by the Board is 15 cents per share. The financial statements for the year ended 31 December 2018 do not reflect this dividend as this will be accounted for in shareholders’ equity as an appropriation of retained profits in the year ending 31 December 2019.
The dividend will be paid in either pounds sterling, Hong Kong dollars or US dollars on 16 May 2019 to shareholders on the UK register of members at the close of business in the UK on 8 March 2019. The dividend will be paid in Indian rupees on 16 May 2019 to Indian Depository Receipt holders on the Indian register at the close of business in India on 8 March 2019.
Preference shares and Additional Tier 1 securitiesDividends on these preference shares and securities classified as equity are recorded in the period in which they are declared.
31.12.18 $million
31.12.17 $million
Non-cumulative redeemable preference shares: 7.014 per cent preference shares of $5 each 53 53
6.409 per cent preference shares of $5 each 26 39
79 92
Additional Tier 1 securities: $5 billion fixed rate resetting perpetual subordinated contingent convertible securities 357 353
436 445
Dividends on these preference shares are treated as interest expense and accrued accordingly
Non-cumulative irredeemable preference shares: 7 3/8 per cent preference shares of £1 each 9 10
8 1/4 per cent preference shares of £1 each 10 11
19 21

Standard Chartered Annual Report 2018264
FINANCIAL STATEMENTSNotes to the financial statements
12. Earnings per ordinary share
Accounting policyThe Group measures earnings per share on an underlying basis. This differs from earnings defined in IAS 33 Earnings per share. Underlying earnings is profit/(loss) attributable to ordinary shareholders adjusted for profits or losses of a capital nature; amounts consequent to investment transactions driven by strategic intent; and other infrequent and/or exceptional transactions that are significant or material in the context of the Group’s normal business earnings for the period.
The table below provides the basis of underlying earnings.
31.12.18 $million
31.12.17 $million
Profit for the period attributable to equity holders 1,109 1,268
Non-controlling interest (55) (49)
Dividend payable on preference shares and AT1 classified as equity (436) (445)
Profit for the period attributable to ordinary shareholders 618 774
Items normalised:
Provision for regulatory matters 900 –
Restructuring 478 353
Gains arising on repurchase of subordinated liabilities (69) –
Goodwill impairment (Note 9) – 320
Net gain on businesses disposed and available-for-sale financial instruments (included within Note 6) – (78)
Impact of US Tax Reform (Note 10) – 220
Tax on normalised items1 104 (36)
Underlying profit 2,031 1,553
Basic – Weighted average number of shares (millions) 3,306 3,293
Diluted – Weighted average number of shares (millions) 3,340 3,325
Basic earnings per ordinary share (cents) 18.7 23.5
Diluted earnings per ordinary share (cents) 18.5 23.3
Underlying basic earnings per ordinary share (cents) 61.4 47.2
Underlying diluted earnings per ordinary share (cents) 60.8 46.7
1 No tax is included in respect of the impairment of goodwill as no tax relief is available

265
Risk review
and capital review
Strategic rep
ort
Sup
plem
entary inform
ation
FIN
AN
CIA
L S
TA
TE
ME
NT
SD
irectors’ rep
ort
13. Financial instruments
Classification and measurement
Accounting policyThe Group classifies its financial assets into the following measurement categories: amortised cost; fair value through other comprehensive income; and fair value through profit or loss. Financial liabilities are classified as either amortised cost, or held at fair value through profit or loss. Management determines the classification of its financial assets and liabilities at initial recognition of the instrument or, where applicable, at the time of reclassification.
Financial assets held at amortised cost and fair value through other comprehensive incomeDebt instruments held at amortised cost or held at fair value through other comprehensive income (FVOCI) have contractual terms that give rise to cash flows that are solely payments of principal and interest (SPPI characteristics). Principal is the fair value of the financial asset at initial recognition but this may change over the life of the instrument as amounts are repaid. Interest consists of consideration for the time value of money, for the credit risk associated with the principal amount outstanding during a particular period and for other basic lending risks and costs, as well as a profit margin.
In assessing whether the contractual cash flows have SPPI characteristics, the Group considers the contractual terms of the instrument. This includes assessing whether the financial asset contains a contractual term that could change the timing or amount of contractual cash flows such that it would not meet this condition. In making the assessment, the Group considers:
¼ Contingent events that would change the amount and timing of cash flows
¼ Leverage features
¼ Prepayment and extension terms
¼ Terms that limit the Group’s claim to cash flows from specified assets (e.g. non-recourse asset arrangements); and
¼ Features that modify consideration of the time value of money – e.g. periodical reset of interest rates
Whether financial assets are held at amortised cost or at FVOCI depend on the objectives of the business models under which the assets are held. A business model refers to how the Group manages financial assets to generate cash flows.
The Group makes an assessment of the objective of a business model in which an asset is held at the individual product business line and, where applicable, within business lines depending on the way the business is managed and information is provided to management. Factors considered include:
¼ How the performance of the product business line is evaluated and reported to the Group’s management
¼ How managers of the business model are compensated, including whether management is compensated based on the fair value of assets or the contractual cash flows collected
¼ The risks that affect the performance of the business model and how those risks are managed
¼ The frequency, volume and timing of sales in prior periods, the reasons for such sales and expectations about future sales activity
The Group’s business model assessment is as follows:
Business model Business objective Characteristics Businesses Products
Hold to collect Intent is to originate financial assets and hold them to maturity, collecting the contractual cash flows over the term of the instrument
¼ Providing financing and originating assets to earn interest income as primary income stream
¼ Performing credit risk management activities
¼ Costs include funding costs, transaction costs and impairment losses
¼ Corporate Lending ¼ Corporate Finance ¼ Transaction Banking ¼ Retail Lending ¼ Treasury Markets (Loans and Borrowings)
¼ Financial Markets (selected)
¼ Loans and advances ¼ Debt securities
Hold to collect and sell
Business objective met through both hold to collect and by selling financial assets
¼ Portfolios held for liquidity needs; or where a certain interest yield profile is maintained; or that are normally rebalanced to achieve matching of duration of assets and liabilities
¼ Income streams come from interest income, fair value changes, and impairment losses
¼ Treasury Markets ¼ Derivatives ¼ Debt securities
Fair value through profit or loss
All other business objectives, including trading and managing financial assets on a fair value basis
¼ Assets held for trading ¼ Assets that are originated, purchased, and sold for profit taking or underwriting activity
¼ Performance of the portfolio is evaluated on a fair value basis
¼ Income streams are from fair value changes or trading gains or losses
¼ All other business lines ¼ Derivatives ¼ Trading portfolios ¼ Financial Markets reverse repos
Standard Chartered Annual Report 2018266
FINANCIAL STATEMENTSNotes to the financial statements
13. Financial instruments continued
Financial assets which have SPPI characteristics and that are held within a business model whose objective is to hold financial assets to collect contractual cash flows (‘hold to collect’) are recorded at amortised cost. Conversely, financial assets which have SPPI characteristics but are held within a business model whose objective is achieved by both collecting contractual cash flows and selling financial assets (‘hold to collect and sell’) are classified as held at FVOCI.
Both hold to collect business and a hold to collect and sell business model involve holding financial assets to collect the contractual cash flows. However, the business models are distinct by reference to the frequency and significance that asset sales play in meeting the objective under which a particular group of financial assets is managed. Hold to collect business models are characterised by asset sales that are incidental to meeting the objectives under which a group of assets is managed. Sales of assets under a hold to collect business model can be made to manage increases in the credit risk of financial assets but sales for other reasons should be infrequent or insignificant.
Cash flows from the sale of financial assets under a hold to collect and sell business model by contrast are integral to achieving the objectives under which a particular group of financial assets are managed. This may be the case where frequent sales of financial assets are required to manage the Group’s daily liquidity requirements or to meet regulatory requirements to demonstrate liquidity of financial instruments. Sales of assets under hold to collect and sell business models are therefore both more frequent and more significant in value than those under the hold to collect model.
Equity instruments designated as held at FVOCINon-trading equity instruments acquired for strategic purposes rather than capital gain may be irrevocably designated at initial recognition as held at FVOCI on an instrument by instrument basis. Dividends received are recognised in profit or loss. Gains and losses arising from changes in the fair value of these instruments, including foreign exchange gains and losses, are recognised directly in equity and are never reclassified to profit or loss even on derecognition.
Financial assets and liabilities held at fair value through profit or lossFinancial assets which are not held at amortised cost or that are not held at fair value through other comprehensive income are held at fair value through profit or loss. Financial assets and liabilities held at fair value through profit or loss are either mandatorily classified fair value through profit or loss or irrevocably designated at fair value through profit or loss at initial recognition.
Mandatorily classified at fair value through profit or lossFinancial assets and liabilities which are mandatorily held at fair value through profit or loss are split between two subcategories as follows:
Trading, including:
¼ Financial assets and liabilities held for trading, which are those acquired principally for the purpose of selling in the short-term; and
¼ Derivatives
Non-trading mandatorily at fair value through profit or loss, including;
¼ Instruments in a business which has a fair value business model (see the Group’s business model assessment) which are not trading or derivatives;
¼ Hybrid financial assets that contain one or more embedded derivatives;
¼ Financial assets that would otherwise be measured at amortised cost or FVOCI but which do not have SPPI characteristics;
¼ Equity instruments that have not been designated as held at FVOCI; and
¼ Financial liabilities that constitute contingent consideration in a business combination.
Designated at fair value through profit or lossFinancial assets and liabilities may be designated at fair value through profit or loss when the designation eliminates or significantly reduces a measurement or recognition inconsistency that would otherwise arise from measuring assets or liabilities on a different basis (‘accounting mismatch’).
Interest rate swaps have been acquired by the Group with the intention of significantly reducing interest rate risk on certain debt securities with fixed rates of interest. To significantly reduce the accounting mismatch between assets and liabilities and measurement bases, these debt securities have been designated at fair value through profit or loss.
Similarly, to reduce accounting mismatches, the Group has designated certain financial liabilities at fair value through profit or loss where the liabilities either:
¼ Have fixed rates of interest and interest rate swaps or other interest rate derivatives have been entered with the intention of significantly reducing interest rate risk; or
¼ Are exposed to foreign currency risk and derivatives have been acquired with the intention of significantly reducing exposure to market changes; or
¼ Have been acquired to fund trading asset portfolios or assets
Financial liabilities may also be designated at fair value through profit or loss where they are managed on a fair value basis or have a embedded derivative where the Group is not able to bifurcate and separately value the embedded derivative component.
267
Risk review
and capital review
Strategic rep
ort
Sup
plem
entary inform
ation
FIN
AN
CIA
L S
TA
TE
ME
NT
SD
irectors’ rep
ort
13. Financial instruments continued
Financial liabilities held at amortised costFinancial liabilities that are not financial guarantees or loan commitments and that are not classified as financial liabilities held at fair value through profit or loss are classified as financial liabilities held at amortised cost.
Preference shares which carry a mandatory coupon that represents a market rate of interest at the issue date, or which are redeemable on a specific date or at the option of the shareholder, are classified as financial liabilities and are presented in other borrowed funds. The dividends on these preference shares are recognised in the income statement as interest expense on an amortised cost basis using the effective interest method.
Financial guarantee contracts and loan commitmentsThe Group issues financial guarantee contracts and loan commitments in return for fees. Under a financial guarantee contract, the Group undertakes to meet a customer’s obligations under the terms of a debt instrument if the customer fails to do so. Loan commitments are firm commitments to provide credit under prespecified terms and conditions. Financial guarantee contracts and loan commitments issued at below market interest rates are initially recognised as liabilities at fair value, while financial guarantees and loan commitments issued at market rates are recorded off-balance sheet. Subsequently, these instruments are measured at the higher of the expected credit loss provision, and the amount initially recognised less the cumulative amount of income recognised in accordance with the principles of IFRS 15 Revenue from Contracts with Customers. Refer to Note 8 (page 255) for expected credit loss on loan commitments and financial guarantees.
Fair value of financial assets and liabilitiesFair value is the price that would be received to sell an asset or paid to transfer a liability in an orderly transaction between market participants at the measurement date in the principal market for the asset or liability, or in the absence of a principal market, the most advantageous market to which the Group has access at the date. The fair value of a liability includes the risk that the bank will not be able to honour its obligations.
The fair value of financial instruments is generally measured on the basis of the individual financial instrument. However, when a group of financial assets and financial liabilities is managed on the basis of its net exposure to either market risk or credit risk, the fair value of the group of financial instruments is measured on a net basis.
The fair values of quoted financial assets and liabilities in active markets are based on current prices. A market is regarded as active if transactions for the asset or liability take place with sufficient frequency and volume to provide pricing information on an ongoing basis. If the market for a financial instrument, and for unlisted securities, is not active, the Group establishes fair value by using valuation techniques.
Initial recognitionPurchases and sales of financial assets and liabilities held at fair value through profit or loss, and debt securities classified as financial assets held at fair value through other comprehensive income, are initially recognised on the trade-date (the date on which the Group commits to purchase or sell the asset). Loans and advances and other financial assets held at amortised cost are recognised on the settlement date (the date on which cash is advanced to the borrowers).
All financial instruments are initially recognised at fair value, which is normally the transaction price, plus directly attributable transaction costs for financial assets which are not subsequently measured at fair value through profit or loss.
In certain circumstances, the initial fair value may be based on a valuation technique which may lead to the recognition of profits or losses at the time of initial recognition. However, these profits or losses can only be recognised when the valuation technique used is based solely on observable market data. In those cases where the initially recognised fair value is based on a valuation model that uses unobservable inputs, the difference between the transaction price and the valuation model is not recognised immediately in the income statement but is amortised or released to the income statement as the inputs become observable, or the transaction matures or is terminated.
Subsequent measurementFinancial assets and �nancial liabilities held at amortised costFinancial assets and financial liabilities held at amortised cost are subsequently carried at amortised cost using the effective interest method (see Interest income and expense). Foreign exchange gains and losses are recognised in the income statement.
Where a financial instrument carried at amortised cost is the hedged item in a qualifying fair value hedge relationship, its carrying value is adjusted by the fair value gain or loss attributable to the hedged risk.
Financial assets held at FVOCIDebt instruments held at FVOCI are subsequently carried at fair value, with all unrealised gains and losses arising from changes in fair value (including any related foreign exchange gains or losses) recognised in other comprehensive income and accumulated in a separate component of equity. Foreign exchange gains and losses on the amortised cost are recognised in income. Changes in expected credit losses are recognised in the profit or loss and are accumulated in equity. On derecognition, the cumulative fair value gains or losses, net of the cumulative expected credit loss reserve, are transferred to the profit or loss.
Equity investments designated at FVOCI are subsequently carried at fair value with all unrealised gains and losses arising from changes in fair value (including any related foreign exchange gains or losses) recognised in other comprehensive income and accumulated in a separate component of equity. On derecognition, the cumulative reserve is transferred to retained earnings and is not recycled to profit or loss.
Financial assets and liabilities held at fair value through pro�t or lossFinancial assets and liabilities mandatorily held at fair value through profit or loss and financial assets designated at fair value through profit or loss are subsequently carried at fair value, with gains and losses arising from changes in fair value recorded in the net trading income line in the profit or loss unless the instrument is part of a cash flow hedging relationship. Contractual interest income on financial assets held at fair value through profit or loss is recognised as interest income in a separate line in the profit or loss.
Standard Chartered Annual Report 2018268
FINANCIAL STATEMENTSNotes to the financial statements
13. Financial instruments continued
Financial liabilities designated at fair value through pro�t or lossFinancial liabilities designated at fair value through profit or loss are held at fair value, with changes in fair value recognised in the net trading income line in the profit or loss, other than that attributable to changes in credit risk. Fair value changes attributable to credit risk are recognised in other comprehensive income and recorded in a separate category of reserves unless this is expected to create or enlarge an accounting mismatch, in which case the entire change in fair value of the financial liability designated at fair value through profit or loss is recognised in profit or loss.
Derecognition of financial instrumentsFinancial assets are derecognised when the rights to receive cash flows from the financial assets have expired or where the Group has transferred substantially all risks and rewards of ownership. If substantially all the risks and rewards have been neither retained nor transferred and the Group has retained control, the assets continue to be recognised to the extent of the Group’s continuing involvement.
Where financial assets have been modified, the modified terms are assessed on a qualitative and quantitative basis to determine whether a fundamental change in the nature of the instrument has occurred, such as whether the derecognition of the pre-existing instrument and the recognition of a new instrument is appropriate.
On derecognition of a financial asset, the difference between the carrying amount of the asset (or the carrying amount allocated to the portion of the asset derecognised) and the sum of the consideration received (including any new asset obtained less any new liability assumed) and any cumulative gain or loss that had been recognised in other comprehensive income is recognised in profit or loss except for equity instruments elected FVOCI (see above) and cumulative fair value adjustments attributable to the credit risk of a liability that are held in other comprehensive income.
Financial liabilities are derecognised when they are extinguished. A financial liability is extinguished when the obligation is discharged, cancelled or expires and this is evaluated both qualitatively and quantitatively. However, where a financial liability has been modified, it is derecognised if the difference between the modified cash flows and the original cash flows is more than 10 per cent.
If the Group purchases its own debt, it is derecognised and the difference between the carrying amount of the liability and the consideration paid is included in ‘Other income’ except for the cumulative fair value adjustments attributable to the credit risk of a liability that are held in other comprehensive income which are never recycled to the profit or loss.
Modified financial instrumentsFinancial assets and financial liabilities whose original contractual terms have been modified, including those loans subject to forbearance strategies, are considered to be modified instruments. Modifications may include changes to the tenor, cash flows and/or interest rates among other factors.
Where derecognition of financial assets is appropriate (see Derecognition), the newly recognised residual loans are assessed to determine whether the assets should be classified as purchased or originated credit-impaired assets (POCI).
Where derecognition is not appropriate, the gross carrying amount of the applicable instruments is recalculated as the present value of the renegotiated or modified contractual cash flows discounted at the original effective interest rate (or credit adjusted effective interest rate for POCI financial assets). The difference between the recalculated values and the pre-modified gross carrying values of the instruments are recorded as a modification gain or loss in the profit or loss.
Gains and losses arising from modifications for credit reasons are recorded as part of ‘Credit impairment’ (see credit Impairment policy). Modification gains and losses arising for non-credit reasons are recognised either as part of ‘Credit impairment’ or within income depending on whether there has been a change in the credit risk on the financial asset subsequent to the modification. Modification gains and losses arising on financial liabilities are recognised within income. The movements in the applicable expected credit loss loan positions are disclosed in further detail in Risk review.
ReclassificationsFinancial liabilities are not reclassified subsequent to initial recognition. Reclassifications of financial assets are made when, and only when, the business model for those assets changes. Such changes are expected to be infrequent and arise as a result of significant external or internal changes such as the termination of a line of business or the purchase of a subsidiary whose business model is to realise the value of pre-existing held for trading financial assets through a hold to collect model.
Financial assets are reclassified at their fair value on the date of reclassification and previously recognised gains and losses are not restated. Moreover, reclassifications of financial assets between financial assets held at amortised cost and financial assets held at fair value through other comprehensive income do not affect effective interest rate or expected credit loss computations.
Reclassified from amortised costWhere financial assets held at amortised cost are reclassified to financial assets held at fair value through profit or loss, the difference between the fair value of the assets at the date of reclassification and the previously recognised amortised cost is recognised in profit or loss.
For financial assets held at amortised cost that are reclassified to fair value through other comprehensive income, the difference between the fair value of the assets at the date of reclassification and the previously recognised gross carrying value is recognised in other comprehensive income. Additionally, the related cumulative expected credit loss amounts relating to the reclassified financial assets are reclassified from loan loss provisions to a separate reserve in other comprehensive income at the date of reclassification.
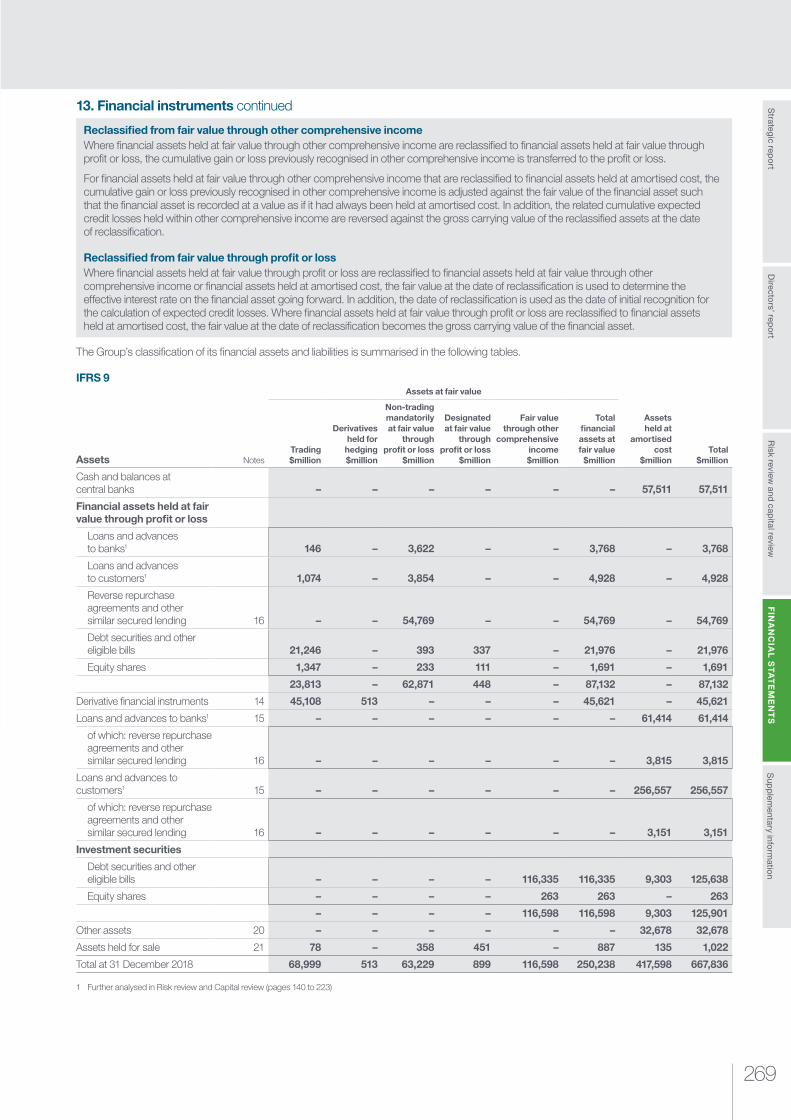
269
Risk review
and capital review
Strategic rep
ort
Sup
plem
entary inform
ation
FIN
AN
CIA
L S
TA
TE
ME
NT
SD
irectors’ rep
ort
13. Financial instruments continued
Reclassified from fair value through other comprehensive incomeWhere financial assets held at fair value through other comprehensive income are reclassified to financial assets held at fair value through profit or loss, the cumulative gain or loss previously recognised in other comprehensive income is transferred to the profit or loss.
For financial assets held at fair value through other comprehensive income that are reclassified to financial assets held at amortised cost, the cumulative gain or loss previously recognised in other comprehensive income is adjusted against the fair value of the financial asset such that the financial asset is recorded at a value as if it had always been held at amortised cost. In addition, the related cumulative expected credit losses held within other comprehensive income are reversed against the gross carrying value of the reclassified assets at the date of reclassification.
Reclassified from fair value through profit or lossWhere financial assets held at fair value through profit or loss are reclassified to financial assets held at fair value through other comprehensive income or financial assets held at amortised cost, the fair value at the date of reclassification is used to determine the effective interest rate on the financial asset going forward. In addition, the date of reclassification is used as the date of initial recognition for the calculation of expected credit losses. Where financial assets held at fair value through profit or loss are reclassified to financial assets held at amortised cost, the fair value at the date of reclassification becomes the gross carrying value of the financial asset.
The Group’s classification of its financial assets and liabilities is summarised in the following tables.
IFRS 9
Assets Notes
Assets at fair value
Assets held at
amortised cost
$millionTotal
$millionTrading $million
Derivatives held for hedging $million
Non-trading mandatorily at fair value
through profit or loss
$million
Designated at fair value
through profit or loss
$million
Fair value through other
comprehensive income $million
Total financial assets at fair value
$million
Cash and balances at central banks – – – – – – 57,511 57,511
Financial assets held at fair value through profit or loss
Loans and advances to banks1 146 – 3,622 – – 3,768 – 3,768
Loans and advances to customers1 1,074 – 3,854 – – 4,928 – 4,928
Reverse repurchase agreements and other similar secured lending 16 – – 54,769 – – 54,769 – 54,769
Debt securities and other eligible bills 21,246 – 393 337 – 21,976 – 21,976
Equity shares 1,347 – 233 111 – 1,691 – 1,691
23,813 – 62,871 448 – 87,132 – 87,132
Derivative financial instruments 14 45,108 513 – – – 45,621 – 45,621
Loans and advances to banks1 15 – – – – – – 61,414 61,414
of which: reverse repurchase agreements and other similar secured lending 16 – – – – – – 3,815 3,815
Loans and advances to customers1 15 – – – – – – 256,557 256,557
of which: reverse repurchase agreements and other similar secured lending 16 – – – – – – 3,151 3,151
Investment securities
Debt securities and other eligible bills – – – – 116,335 116,335 9,303 125,638
Equity shares – – – – 263 263 – 263
– – – – 116,598 116,598 9,303 125,901
Other assets 20 – – – – – – 32,678 32,678
Assets held for sale 21 78 – 358 451 – 887 135 1,022
Total at 31 December 2018 68,999 513 63,229 899 116,598 250,238 417,598 667,836
1 Further analysed in Risk review and Capital review (pages 140 to 223)

Standard Chartered Annual Report 2018270
FINANCIAL STATEMENTSNotes to the financial statements
13. Financial instruments continued
IFRS 9
Assets Notes
Assets at fair value
Assets held at
amortised cost
$millionTotal
$millionTrading $million
Derivatives held for
hedging $million
Non-trading mandatorily at fair value
through profit or loss
$million
Designated at fair value
through profit or loss
$million
Fair value through other
comprehensive income $million
Total financial
assets at fair value $million
Cash and balances at central banks – – – – – – 58,864 58,864
Financial assets held at fair value through profit or loss
Loans and advances to banks1 320 – 2,545 – – 2,865 – 2,865
Loans and advances to customers1 1,689 – 2,179 39 – 3,907 – 3,907
Reverse repurchase agreements and other similar secured lending 16 – – 45,518 – – 45,518 – 45,518
Debt securities and other eligible bills 19,318 – 504 393 – 20,215 – 20,215
Equity shares 718 – 684 733 – 2,135 – 2,135
22,045 – 51,430 1,165 – 74,640 – 74,640
Derivative financial instruments 46,333 698 – – – 47,031 – 47,031
Loans and advances to banks1 – – – – – – 62,295 62,295
of which: reverse repurchase agreements and other similar secured lending 16 – – – – – – 5,101 5,101
Loans and advances to customers1 – – – – – – 251,507 251,507
of which: reverse repurchase agreements and other similar secured lending 16 – – – – – – 4,566 4,566
Investment securities
Debt securities and other eligible bills – – – – 108,411 108,411 7,188 115,599
Equity shares – – – – 214 214 – 214
– – – – 108,625 108,625 7,188 115,813
Other assets – – – – – – 29,922 29,922
Assets held for sale – – – 466 – 466 62 528
Total at 1 January 2018 68,378 698 51,430 1,631 108,625 230,762 409,838 640,600
1 Further analysed in Risk review and Capital review (pages 140 to 223)
The table above is the representation as at 1 January 2018 of the balances after the implementation of IFRS 9.
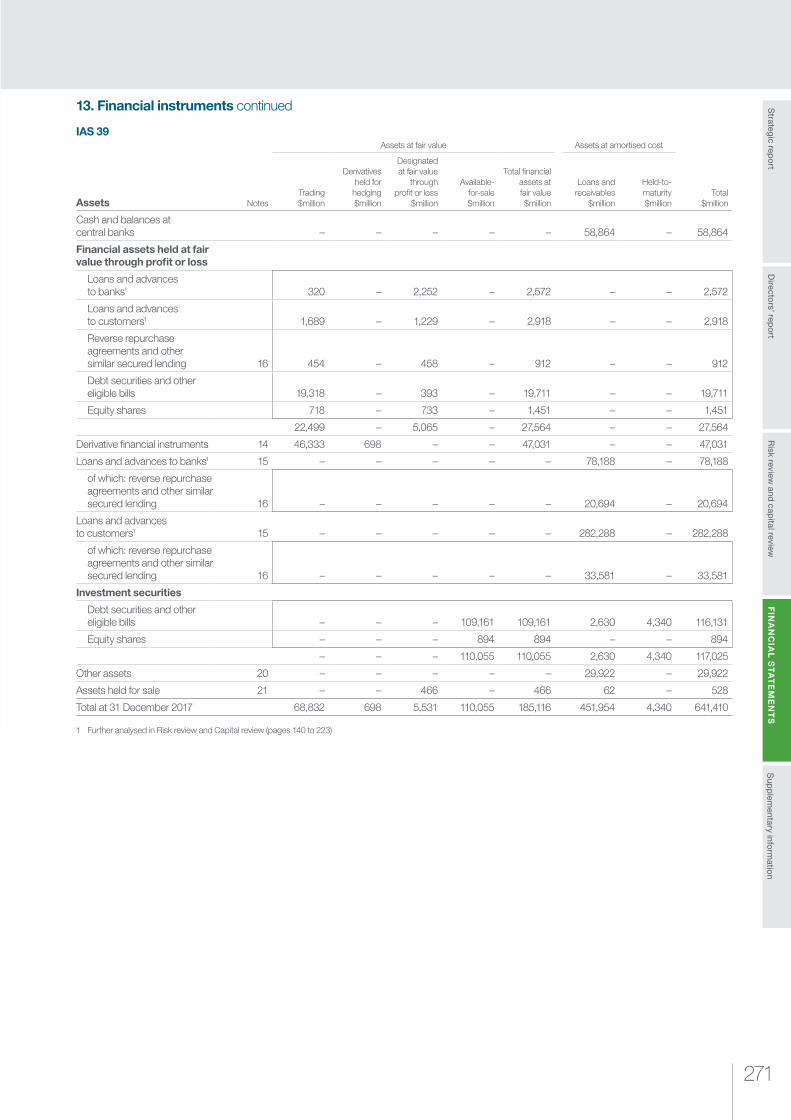
271
Risk review
and capital review
Strategic rep
ort
Sup
plem
entary inform
ation
FIN
AN
CIA
L S
TA
TE
ME
NT
SD
irectors’ rep
ort
13. Financial instruments continued
IAS 39
Assets Notes
Assets at fair value Assets at amortised cost
Total $million
Trading $million
Derivatives held for
hedging $million
Designated at fair value
through profit or loss
$million
Available- for-sale $million
Total financial assets at fair value $million
Loans and receivables
$million
Held-to- maturity $million
Cash and balances at central banks – – – – – 58,864 – 58,864
Financial assets held at fair value through profit or loss
Loans and advances to banks1 320 – 2,252 – 2,572 – – 2,572
Loans and advances to customers1 1,689 – 1,229 – 2,918 – – 2,918
Reverse repurchase agreements and other similar secured lending 16 454 – 458 – 912 – – 912
Debt securities and other eligible bills 19,318 – 393 – 19,711 – – 19,711
Equity shares 718 – 733 – 1,451 – – 1,451
22,499 – 5,065 – 27,564 – – 27,564
Derivative financial instruments 14 46,333 698 – – 47,031 – – 47,031
Loans and advances to banks1 15 – – – – – 78,188 – 78,188
of which: reverse repurchase agreements and other similar secured lending 16 – – – – – 20,694 – 20,694
Loans and advances to customers1 15 – – – – – 282,288 – 282,288
of which: reverse repurchase agreements and other similar secured lending 16 – – – – – 33,581 – 33,581
Investment securities
Debt securities and other eligible bills – – – 109,161 109,161 2,630 4,340 116,131
Equity shares – – – 894 894 – – 894
– – – 110,055 110,055 2,630 4,340 117,025
Other assets 20 – – – – – 29,922 – 29,922
Assets held for sale 21 – – 466 – 466 62 – 528
Total at 31 December 2017 68,832 698 5,531 110,055 185,116 451,954 4,340 641,410
1 Further analysed in Risk review and Capital review (pages 140 to 223)
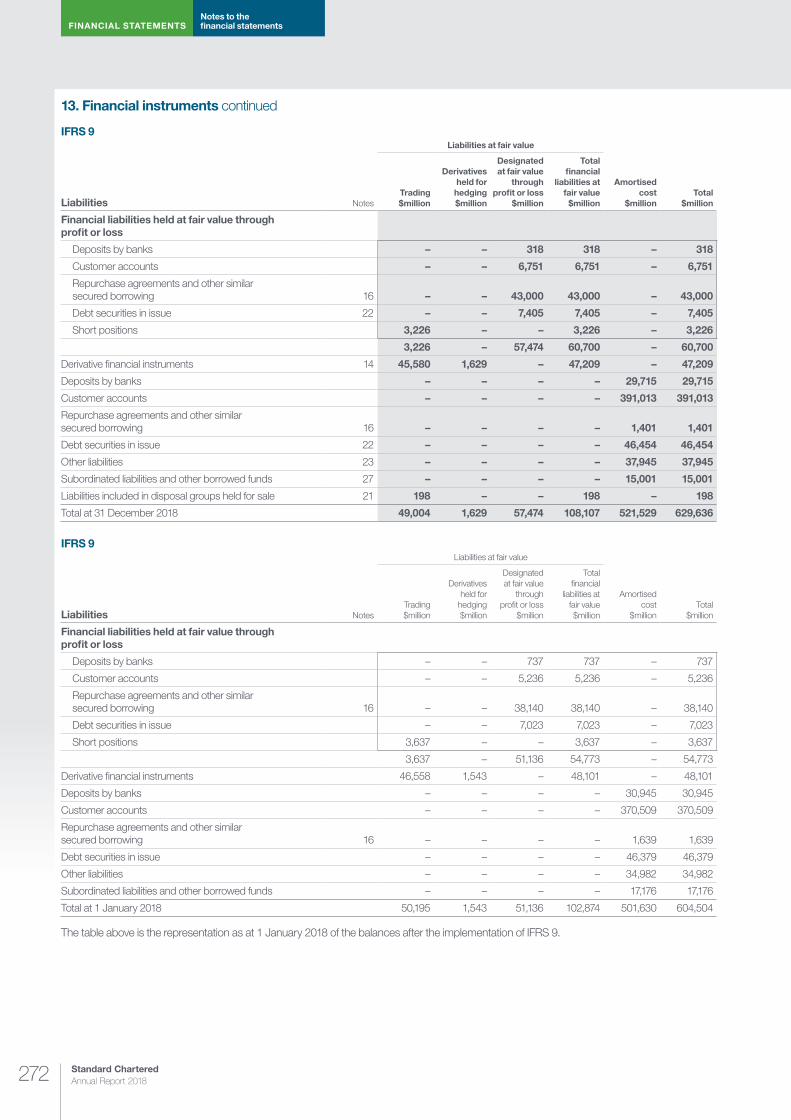
Standard Chartered Annual Report 2018272
FINANCIAL STATEMENTSNotes to the financial statements
13. Financial instruments continued
IFRS 9
Liabilities Notes
Liabilities at fair value
Amortised cost
$millionTotal
$millionTrading $million
Derivatives held for hedging $million
Designated at fair value
through profit or loss
$million
Total financial
liabilities at fair value
$million
Financial liabilities held at fair value through profit or loss
Deposits by banks – – 318 318 – 318
Customer accounts – – 6,751 6,751 – 6,751
Repurchase agreements and other similar secured borrowing 16 – – 43,000 43,000 – 43,000
Debt securities in issue 22 – – 7,405 7,405 – 7,405
Short positions 3,226 – – 3,226 – 3,226
3,226 – 57,474 60,700 – 60,700
Derivative financial instruments 14 45,580 1,629 – 47,209 – 47,209
Deposits by banks – – – – 29,715 29,715
Customer accounts – – – – 391,013 391,013
Repurchase agreements and other similar secured borrowing 16 – – – – 1,401 1,401
Debt securities in issue 22 – – – – 46,454 46,454
Other liabilities 23 – – – – 37,945 37,945
Subordinated liabilities and other borrowed funds 27 – – – – 15,001 15,001
Liabilities included in disposal groups held for sale 21 198 – – 198 – 198
Total at 31 December 2018 49,004 1,629 57,474 108,107 521,529 629,636
IFRS 9
Liabilities Notes
Liabilities at fair value
Amortised cost
$millionTotal
$millionTrading $million
Derivatives held for
hedging $million
Designated at fair value
through profit or loss
$million
Total financial
liabilities at fair value $million
Financial liabilities held at fair value through profit or loss
Deposits by banks – – 737 737 – 737
Customer accounts – – 5,236 5,236 – 5,236
Repurchase agreements and other similar secured borrowing 16 – – 38,140 38,140 – 38,140
Debt securities in issue – – 7,023 7,023 – 7,023
Short positions 3,637 – – 3,637 – 3,637
3,637 – 51,136 54,773 – 54,773
Derivative financial instruments 46,558 1,543 – 48,101 – 48,101
Deposits by banks – – – – 30,945 30,945
Customer accounts – – – – 370,509 370,509
Repurchase agreements and other similar secured borrowing 16 – – – – 1,639 1,639
Debt securities in issue – – – – 46,379 46,379
Other liabilities – – – – 34,982 34,982
Subordinated liabilities and other borrowed funds – – – – 17,176 17,176
Total at 1 January 2018 50,195 1,543 51,136 102,874 501,630 604,504
The table above is the representation as at 1 January 2018 of the balances after the implementation of IFRS 9.
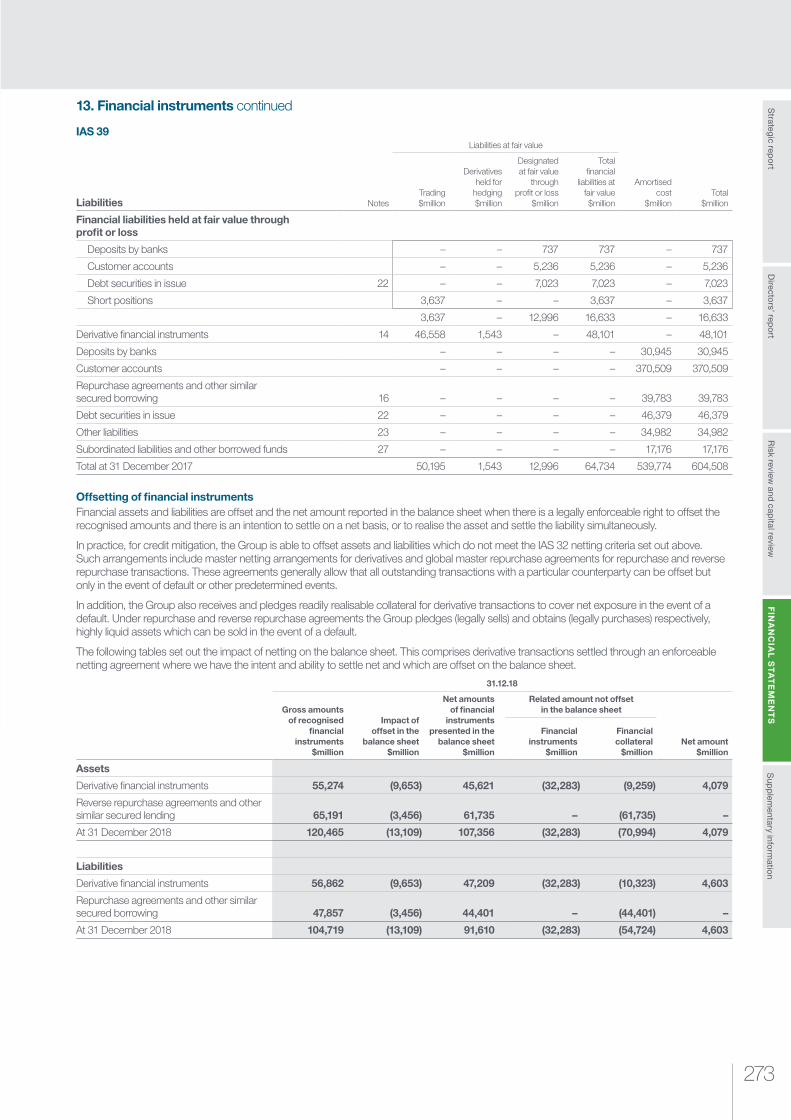
273
Risk review
and capital review
Strategic rep
ort
Sup
plem
entary inform
ation
FIN
AN
CIA
L S
TA
TE
ME
NT
SD
irectors’ rep
ort
13. Financial instruments continued
IAS 39
Liabilities Notes
Liabilities at fair value
Amortised cost
$millionTotal
$millionTrading $million
Derivatives held for
hedging $million
Designated at fair value
through profit or loss
$million
Total financial
liabilities at fair value $million
Financial liabilities held at fair value through profit or loss
Deposits by banks – – 737 737 – 737
Customer accounts – – 5,236 5,236 – 5,236
Debt securities in issue 22 – – 7,023 7,023 – 7,023
Short positions 3,637 – – 3,637 – 3,637
3,637 – 12,996 16,633 – 16,633
Derivative financial instruments 14 46,558 1,543 – 48,101 – 48,101
Deposits by banks – – – – 30,945 30,945
Customer accounts – – – – 370,509 370,509
Repurchase agreements and other similar secured borrowing 16 – – – – 39,783 39,783
Debt securities in issue 22 – – – – 46,379 46,379
Other liabilities 23 – – – – 34,982 34,982
Subordinated liabilities and other borrowed funds 27 – – – – 17,176 17,176
Total at 31 December 2017 50,195 1,543 12,996 64,734 539,774 604,508
Offsetting of financial instrumentsFinancial assets and liabilities are offset and the net amount reported in the balance sheet when there is a legally enforceable right to offset the recognised amounts and there is an intention to settle on a net basis, or to realise the asset and settle the liability simultaneously.
In practice, for credit mitigation, the Group is able to offset assets and liabilities which do not meet the IAS 32 netting criteria set out above. Such arrangements include master netting arrangements for derivatives and global master repurchase agreements for repurchase and reverse repurchase transactions. These agreements generally allow that all outstanding transactions with a particular counterparty can be offset but only in the event of default or other predetermined events.
In addition, the Group also receives and pledges readily realisable collateral for derivative transactions to cover net exposure in the event of a default. Under repurchase and reverse repurchase agreements the Group pledges (legally sells) and obtains (legally purchases) respectively, highly liquid assets which can be sold in the event of a default.
The following tables set out the impact of netting on the balance sheet. This comprises derivative transactions settled through an enforceable netting agreement where we have the intent and ability to settle net and which are offset on the balance sheet.
31.12.18
Gross amounts of recognised
financial instruments
$million
Impact of offset in the
balance sheet $million
Net amounts of financial
instruments presented in the
balance sheet $million
Related amount not offset in the balance sheet
Net amount $million
Financial instruments
$million
Financial collateral
$million
Assets
Derivative financial instruments 55,274 (9,653) 45,621 (32,283) (9,259) 4,079
Reverse repurchase agreements and other similar secured lending 65,191 (3,456) 61,735 – (61,735) –
At 31 December 2018 120,465 (13,109) 107,356 (32,283) (70,994) 4,079
Liabilities
Derivative financial instruments 56,862 (9,653) 47,209 (32,283) (10,323) 4,603
Repurchase agreements and other similar secured borrowing 47,857 (3,456) 44,401 – (44,401) –
At 31 December 2018 104,719 (13,109) 91,610 (32,283) (54,724) 4,603
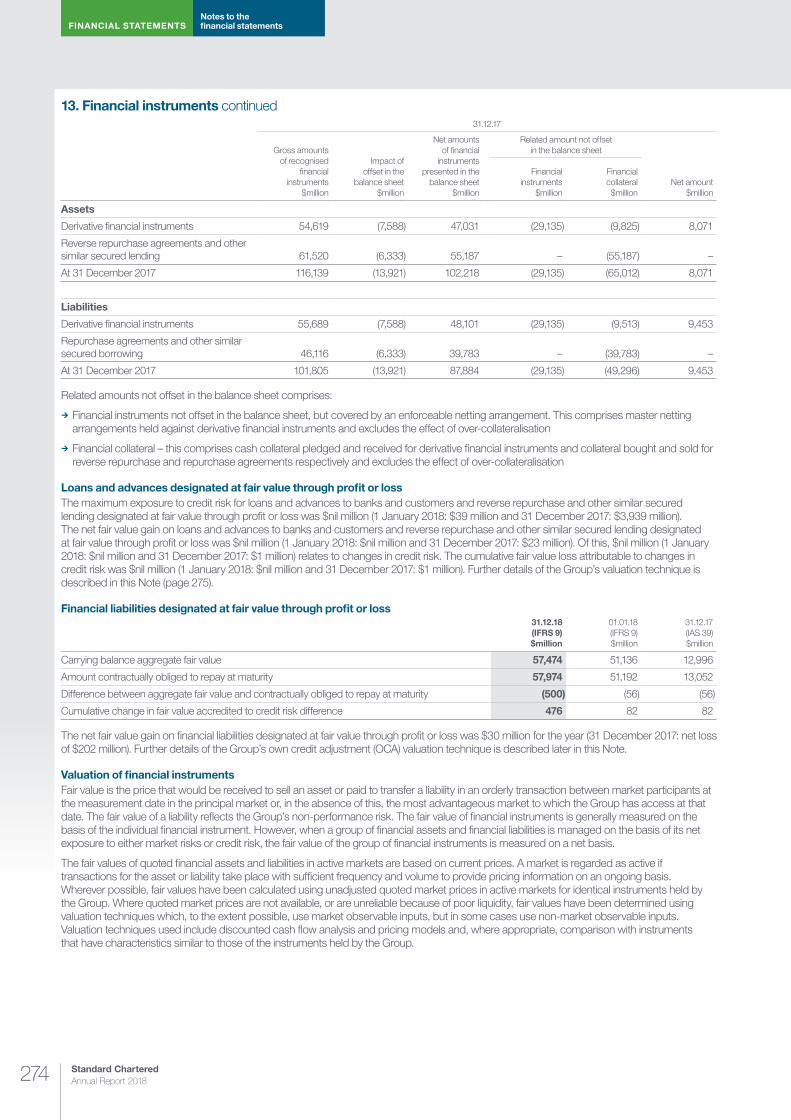
Standard Chartered Annual Report 2018274
FINANCIAL STATEMENTSNotes to the financial statements
13. Financial instruments continued31.12.17
Gross amounts of recognised
financial instruments
$million
Impact of offset in the
balance sheet $million
Net amounts of financial
instruments presented in the
balance sheet $million
Related amount not offset in the balance sheet
Net amount $million
Financial instruments
$million
Financial collateral $million
Assets
Derivative financial instruments 54,619 (7,588) 47,031 (29,135) (9,825) 8,071
Reverse repurchase agreements and other similar secured lending 61,520 (6,333) 55,187 – (55,187) –
At 31 December 2017 116,139 (13,921) 102,218 (29,135) (65,012) 8,071
Liabilities
Derivative financial instruments 55,689 (7,588) 48,101 (29,135) (9,513) 9,453
Repurchase agreements and other similar secured borrowing 46,116 (6,333) 39,783 – (39,783) –
At 31 December 2017 101,805 (13,921) 87,884 (29,135) (49,296) 9,453
Related amounts not offset in the balance sheet comprises:
¼ Financial instruments not offset in the balance sheet, but covered by an enforceable netting arrangement. This comprises master netting arrangements held against derivative financial instruments and excludes the effect of over-collateralisation
¼ Financial collateral – this comprises cash collateral pledged and received for derivative financial instruments and collateral bought and sold for reverse repurchase and repurchase agreements respectively and excludes the effect of over-collateralisation
Loans and advances designated at fair value through profit or lossThe maximum exposure to credit risk for loans and advances to banks and customers and reverse repurchase and other similar secured lending designated at fair value through profit or loss was $nil million (1 January 2018: $39 million and 31 December 2017: $3,939 million). The net fair value gain on loans and advances to banks and customers and reverse repurchase and other similar secured lending designated at fair value through profit or loss was $nil million (1 January 2018: $nil million and 31 December 2017: $23 million). Of this, $nil million (1 January 2018: $nil million and 31 December 2017: $1 million) relates to changes in credit risk. The cumulative fair value loss attributable to changes in credit risk was $nil million (1 January 2018: $nil million and 31 December 2017: $1 million). Further details of the Group’s valuation technique is described in this Note (page 275).
Financial liabilities designated at fair value through profit or loss31.12.18 (IFRS 9) $million
01.01.18 (IFRS 9) $million
31.12.17 (IAS 39) $million
Carrying balance aggregate fair value 57,474 51,136 12,996
Amount contractually obliged to repay at maturity 57,974 51,192 13,052
Difference between aggregate fair value and contractually obliged to repay at maturity (500) (56) (56)
Cumulative change in fair value accredited to credit risk difference 476 82 82
The net fair value gain on financial liabilities designated at fair value through profit or loss was $30 million for the year (31 December 2017: net loss of $202 million). Further details of the Group’s own credit adjustment (OCA) valuation technique is described later in this Note.
Valuation of financial instruments Fair value is the price that would be received to sell an asset or paid to transfer a liability in an orderly transaction between market participants at the measurement date in the principal market or, in the absence of this, the most advantageous market to which the Group has access at that date. The fair value of a liability reflects the Group’s non-performance risk. The fair value of financial instruments is generally measured on the basis of the individual financial instrument. However, when a group of financial assets and financial liabilities is managed on the basis of its net exposure to either market risks or credit risk, the fair value of the group of financial instruments is measured on a net basis.
The fair values of quoted financial assets and liabilities in active markets are based on current prices. A market is regarded as active if transactions for the asset or liability take place with sufficient frequency and volume to provide pricing information on an ongoing basis. Wherever possible, fair values have been calculated using unadjusted quoted market prices in active markets for identical instruments held by the Group. Where quoted market prices are not available, or are unreliable because of poor liquidity, fair values have been determined using valuation techniques which, to the extent possible, use market observable inputs, but in some cases use non-market observable inputs. Valuation techniques used include discounted cash flow analysis and pricing models and, where appropriate, comparison with instruments that have characteristics similar to those of the instruments held by the Group.
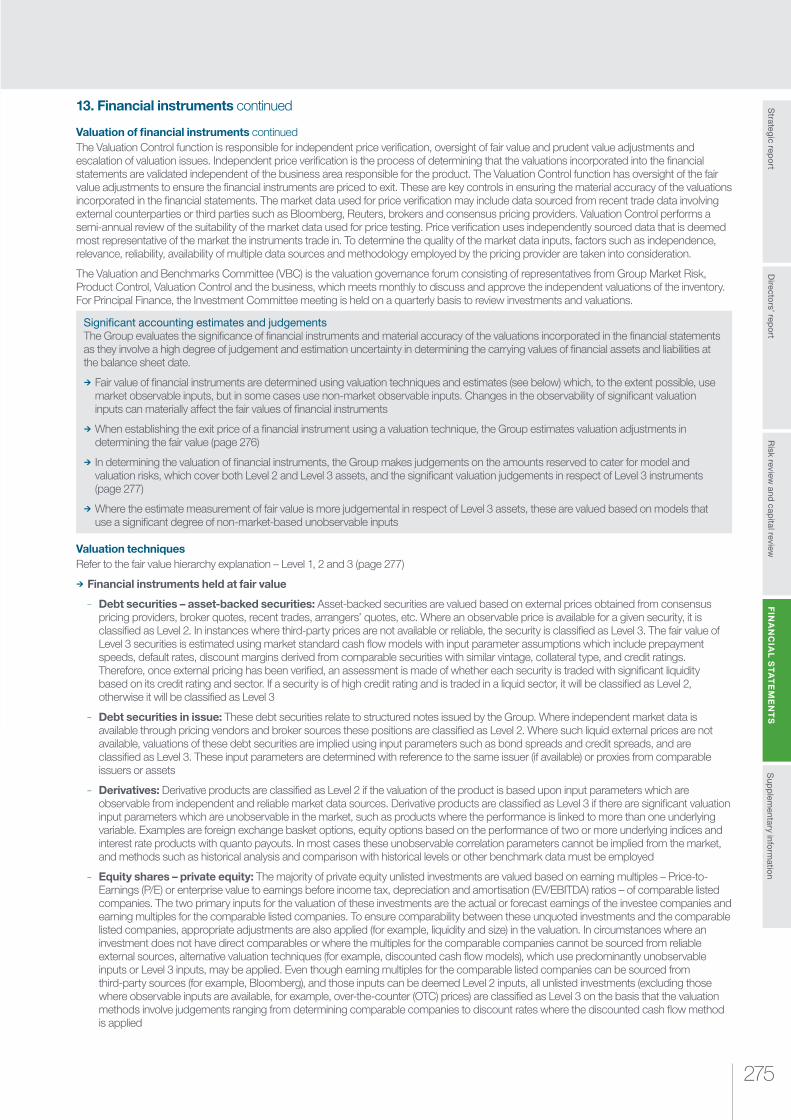
275
Risk review
and capital review
Strategic rep
ort
Sup
plem
entary inform
ation
FIN
AN
CIA
L S
TA
TE
ME
NT
SD
irectors’ rep
ort
13. Financial instruments continued
Valuation of financial instruments continuedThe Valuation Control function is responsible for independent price verification, oversight of fair value and prudent value adjustments and escalation of valuation issues. Independent price verification is the process of determining that the valuations incorporated into the financial statements are validated independent of the business area responsible for the product. The Valuation Control function has oversight of the fair value adjustments to ensure the financial instruments are priced to exit. These are key controls in ensuring the material accuracy of the valuations incorporated in the financial statements. The market data used for price verification may include data sourced from recent trade data involving external counterparties or third parties such as Bloomberg, Reuters, brokers and consensus pricing providers. Valuation Control performs a semi-annual review of the suitability of the market data used for price testing. Price verification uses independently sourced data that is deemed most representative of the market the instruments trade in. To determine the quality of the market data inputs, factors such as independence, relevance, reliability, availability of multiple data sources and methodology employed by the pricing provider are taken into consideration.
The Valuation and Benchmarks Committee (VBC) is the valuation governance forum consisting of representatives from Group Market Risk, Product Control, Valuation Control and the business, which meets monthly to discuss and approve the independent valuations of the inventory. For Principal Finance, the Investment Committee meeting is held on a quarterly basis to review investments and valuations.
Signi�cant accounting estimates and judgementsThe Group evaluates the significance of financial instruments and material accuracy of the valuations incorporated in the financial statements as they involve a high degree of judgement and estimation uncertainty in determining the carrying values of financial assets and liabilities at the balance sheet date.
¼ Fair value of financial instruments are determined using valuation techniques and estimates (see below) which, to the extent possible, use market observable inputs, but in some cases use non-market observable inputs. Changes in the observability of significant valuation inputs can materially affect the fair values of financial instruments
¼ When establishing the exit price of a financial instrument using a valuation technique, the Group estimates valuation adjustments in determining the fair value (page 276)
¼ In determining the valuation of financial instruments, the Group makes judgements on the amounts reserved to cater for model and valuation risks, which cover both Level 2 and Level 3 assets, and the significant valuation judgements in respect of Level 3 instruments (page 277)
¼ Where the estimate measurement of fair value is more judgemental in respect of Level 3 assets, these are valued based on models that use a significant degree of non-market-based unobservable inputs
Valuation techniques Refer to the fair value hierarchy explanation – Level 1, 2 and 3 (page 277)
¼ Financial instruments held at fair value
– Debt securities – asset-backed securities: Asset-backed securities are valued based on external prices obtained from consensus pricing providers, broker quotes, recent trades, arrangers’ quotes, etc. Where an observable price is available for a given security, it is classified as Level 2. In instances where third-party prices are not available or reliable, the security is classified as Level 3. The fair value of Level 3 securities is estimated using market standard cash flow models with input parameter assumptions which include prepayment speeds, default rates, discount margins derived from comparable securities with similar vintage, collateral type, and credit ratings. Therefore, once external pricing has been verified, an assessment is made of whether each security is traded with significant liquidity based on its credit rating and sector. If a security is of high credit rating and is traded in a liquid sector, it will be classified as Level 2, otherwise it will be classified as Level 3
– Debt securities in issue: These debt securities relate to structured notes issued by the Group. Where independent market data is available through pricing vendors and broker sources these positions are classified as Level 2. Where such liquid external prices are not available, valuations of these debt securities are implied using input parameters such as bond spreads and credit spreads, and are classified as Level 3. These input parameters are determined with reference to the same issuer (if available) or proxies from comparable issuers or assets
– Derivatives: Derivative products are classified as Level 2 if the valuation of the product is based upon input parameters which are observable from independent and reliable market data sources. Derivative products are classified as Level 3 if there are significant valuation input parameters which are unobservable in the market, such as products where the performance is linked to more than one underlying variable. Examples are foreign exchange basket options, equity options based on the performance of two or more underlying indices and interest rate products with quanto payouts. In most cases these unobservable correlation parameters cannot be implied from the market, and methods such as historical analysis and comparison with historical levels or other benchmark data must be employed
– Equity shares – private equity: The majority of private equity unlisted investments are valued based on earning multiples – Price-to-Earnings (P/E) or enterprise value to earnings before income tax, depreciation and amortisation (EV/EBITDA) ratios – of comparable listed companies. The two primary inputs for the valuation of these investments are the actual or forecast earnings of the investee companies and earning multiples for the comparable listed companies. To ensure comparability between these unquoted investments and the comparable listed companies, appropriate adjustments are also applied (for example, liquidity and size) in the valuation. In circumstances where an investment does not have direct comparables or where the multiples for the comparable companies cannot be sourced from reliable external sources, alternative valuation techniques (for example, discounted cash flow models), which use predominantly unobservable inputs or Level 3 inputs, may be applied. Even though earning multiples for the comparable listed companies can be sourced from third-party sources (for example, Bloomberg), and those inputs can be deemed Level 2 inputs, all unlisted investments (excluding those where observable inputs are available, for example, over-the-counter (OTC) prices) are classified as Level 3 on the basis that the valuation methods involve judgements ranging from determining comparable companies to discount rates where the discounted cash flow method is applied

Standard Chartered Annual Report 2018276
FINANCIAL STATEMENTSNotes to the financial statements
13. Financial instruments continued
Valuation techniques continued– Loans and advances: These primarily include loans in the global syndications business which were not syndicated as of the balance
sheet date and other financing transactions within Financial Markets and loans and advances including reverse repurchase agreements that do not have SPPI cash flows or are managed on a fair value basis. These loans are generally bilateral in nature and, where available, their valuation is based on market observable credit spreads. If observable credit spreads are not available, proxy spreads based on comparable loans with similar credit grade, sector and region, are used. Where observable credit spreads and market standard proxy methods are available, these loans are classified as Level 2. Where there are no recent transactions or comparable loans, these loans are classified as Level 3
– Other debt securities: These debt securities include convertible bonds, corporate bonds, credit and structured notes. Where quoted prices are available through pricing vendors, brokers or observable trading activities from liquid markets, these are classified as Level 2 and valued using such quotes. Where there are significant valuation inputs which are unobservable in the market, due to illiquid trading or the complexity of the product, these are classified as Level 3. The valuations of these debt securities are implied using input parameters such as bond spreads and credit spreads. These input parameters are determined with reference to the same issuer (if available) or proxied from comparable issuers or assets
¼ Financial instruments held at amortised cost
The following sets out the Group’s basis for establishing fair values of amortised cost financial instruments and their classification between Levels 1, 2 and 3. As certain categories of financial instruments are not actively traded, there is a significant level of management judgement involved in calculating the fair values:
– Cash and balances at central banks: The fair value of cash and balances at central banks is their carrying amounts
– Debt securities in issue, subordinated liabilities and other borrowed funds: The aggregate fair values are calculated based on quoted market prices. For those notes where quoted market prices are not available, a discounted cash flow model is used based on a current market related yield curve appropriate for the remaining term to maturity
– Deposits and borrowings: The estimated fair value of deposits with no stated maturity is the amount repayable on demand. The estimated fair value of fixed interest-bearing deposits and other borrowings without quoted market prices is based on discounted cash flows using the prevailing market rates for debts with a similar credit risk and remaining maturity
– Investment securities: For investment securities that do not have directly observable market values, the Group utilises a number of valuation techniques to determine fair value. Where available, securities are valued using input proxies from the same or closely related underlying (for example, bond spreads from the same or closely related issuer) or input proxies from a different underlying (for example, a similar bond but using spreads for a particular sector and rating). Certain instruments cannot be proxies as set out above, and in such cases the positions are valued using non-market observable inputs. This includes those instruments held at amortised cost and predominantly relates to asset-backed securities. The fair value for such instruments is usually proxies from internal assessments of the underlying cash flows
– Loans and advances to banks and customers: For loans and advances to banks, the fair value of floating rate placements and overnight deposits is their carrying amount. The estimated fair value of fixed interest-bearing deposits is based on discounted cash flows using the prevailing money market rates for debts with a similar credit risk and remaining maturity. The Group’s loans and advances to customers’ portfolio is well diversified by geography and industry. Approximately a quarter of the portfolio reprices within one month, and approximately half re-prices within 12 months. Loans and advances are presented net of provisions for impairment. The fair value of loans and advances to customers with a residual maturity of less than one year generally approximates the carrying value. The estimated fair value of loans and advances with a residual maturity of more than one year represents the discounted amount of future cash flows expected to be received, including assumptions relating to prepayment rates and credit risk. Expected cash flows are discounted at current market rates to determine fair value. The Group has a wide range of individual instruments within its loans and advances portfolio and as a result providing quantification of the key assumptions used to value such instruments is impractical
– Other assets: Other assets comprise primarily of cash collateral and trades pending settlement. The carrying amount of these financial instruments is considered to be a reasonable approximation of fair value as they are either short-term in nature or reprice to current market rates frequently
Fair value adjustmentsWhen establishing the exit price of a financial instrument using a valuation technique, the Group considers adjustments to the modelled price which market participants would make when pricing that instrument. The main valuation adjustments (described further below) in determining fair value for financial assets and financial liabilities are as follows:
31.12.18 $million
31.12.17 $million
Bid-offer valuation adjustment 67 82
CVA 196 229
DVA (143) (66)
Model valuation adjustment 6 6
FVA 60 79
Others (including day one) 159 148
Total 345 478
277
Risk review
and capital review
Strategic rep
ort
Sup
plem
entary inform
ation
FIN
AN
CIA
L S
TA
TE
ME
NT
SD
irectors’ rep
ort
13. Financial instruments continued
Fair value adjustments continued ¼ Bid-offer valuation adjustment: Where market parameters are marked on a mid-market basis in the revaluation systems, a bid-offer valuation adjustment is required to quantify the expected cost of neutralising the business’ positions through dealing away in the market, thereby bringing long positions to bid and short positions to offer. The methodology to calculate the bid-offer adjustment for a derivative portfolio involves netting between long and short positions and the grouping of risk by strike and tenor based on the hedging strategy where long positions are marked to bid and short positions marked to offer in the systems
¼ Credit valuation adjustment (CVA): The Group makes CVA adjustment against the fair value of derivative products. CVA is an adjustment to the fair value of the transactions to reflect the possibility that our counterparties may default and we may not receive the full market value of the outstanding transactions. It represents an estimate of the adjustment a market participant would include when deriving a purchase price to acquire our exposures. CVA is calculated for each subsidiary, and within each entity for each counterparty to which the entity has exposure and takes account of any collateral we may hold. The Group calculates the CVA by using estimates of future positive exposure, market-implied probability of default (PD) and recovery rates. Where market-implied data is not readily available, we use market-based proxies to estimate the PD. Wrong-way risk occurs when the exposure to a counterparty is adversely correlated with the credit quality of that counterparty, and the Group has implemented a model to capture this impact for certain key wrong-way exposures. The Group also captures the uncertainties associated with wrong-way risk in its Prudential Valuation Adjustments
¼ Day one profit and loss: In certain circumstances the initial fair value may be based on a valuation technique which may lead to the recognition of profits or losses at the time of initial recognition. However, these profits or losses can only be recognised when the valuation technique used is based primarily on observable market data. In those cases where the initially recognised fair value is based on a valuation model that uses inputs which are not observable in the market, the difference between the transaction price and the valuation model is not recognised immediately in the income statement. The difference is amortised to the income statement until the inputs become observable, or the transaction matures or is terminated
¼ Debit valuation adjustment (DVA): The Group calculates DVA adjustments on its derivative liabilities to reflect changes in its own credit standing. The Group’s DVA adjustments will increase if its credit standing worsens and conversely, decrease if its credit standing improves. For derivative liabilities, a DVA adjustment is determined by applying the Group’s probability of default to the Group’s negative expected exposure against the counterparty. The Group’s probability of default and loss expected in the event of default is derived based on bond spreads associated with the Group’s issuances and market standard recovery levels. The expected exposure is modelled based on the simulation of the underlying risk factors over the life of the deal booked against the particular counterparty. This simulation methodology incorporates the collateral posted by the Group and the effects of master netting agreements
¼ Funding valuation adjustment (FVA): The Group makes FVA adjustments against derivative products. FVA reflects an estimate of the adjustment to its fair value that a market participant would make to incorporate funding costs that could arise in relation to the exposure. FVA is calculated by determining the net expected exposure at a counterparty level and then applying a funding rate to those exposures that reflect the market cost of funding. The FVA for collateralised derivatives is based on discounting the expected future cash flows at the relevant overnight indexed swap (OIS) rate after taking into consideration the terms of the underlying collateral agreement with the counterparty. The FVA for uncollateralised (including partially collateralised) derivatives incorporates the estimated present value of the market funding cost or benefit associated with funding these transactions
¼ Model valuation adjustment: Valuation models may have pricing deficiencies or limitations that require a valuation adjustment. These pricing deficiencies or limitations arise due to the choice, implementation and calibration of the pricing model
In addition, the Group calculates own credit adjustment (OCA) on its issued debt designated at fair value, including structured notes, in order to reflect changes in its own credit standing. The Group’s OCA adjustments will increase if its credit standing worsens and conversely, decrease if its credit standing improves. The Group’s OCA adjustments will reverse over time as its liabilities mature. For issued debt and structured notes designated at fair value, an OCA adjustment is determined by discounting the contractual cash flows using a yield curve adjusted for market observed secondary senior unsecured credit spreads. The OCA at 31 December 2018 is $476 million, other comprehensive income gain $394 million (31 December 2017: $82 million, other comprehensive income loss $249 million).
Fair value hierarchy – financial instruments held at fair valueAssets and liabilities carried at fair value or for which fair values are disclosed have been classified into three levels according to the observability of the significant inputs used to determine the fair values. Changes in the observability of significant valuation inputs during the reporting period may result in a transfer of assets and liabilities within the fair value hierarchy. The Group recognises transfers between levels of the fair value hierarchy when there is a significant change in either its principal market or the level of observability of the inputs to the valuation techniques as at the end of the reporting period.
¼ Level 1: Fair value measurements are those derived from unadjusted quoted prices in active markets for identical assets or liabilities
¼ Level 2: Fair value measurements are those with quoted prices for similar instruments in active markets or quoted prices for identical or similar instruments in inactive markets and financial instruments valued using models where all significant inputs are observable
¼ Level 3: Fair value measurements are those where at least one input which could have a significant effect on the instrument’s valuation is not based on observable market data
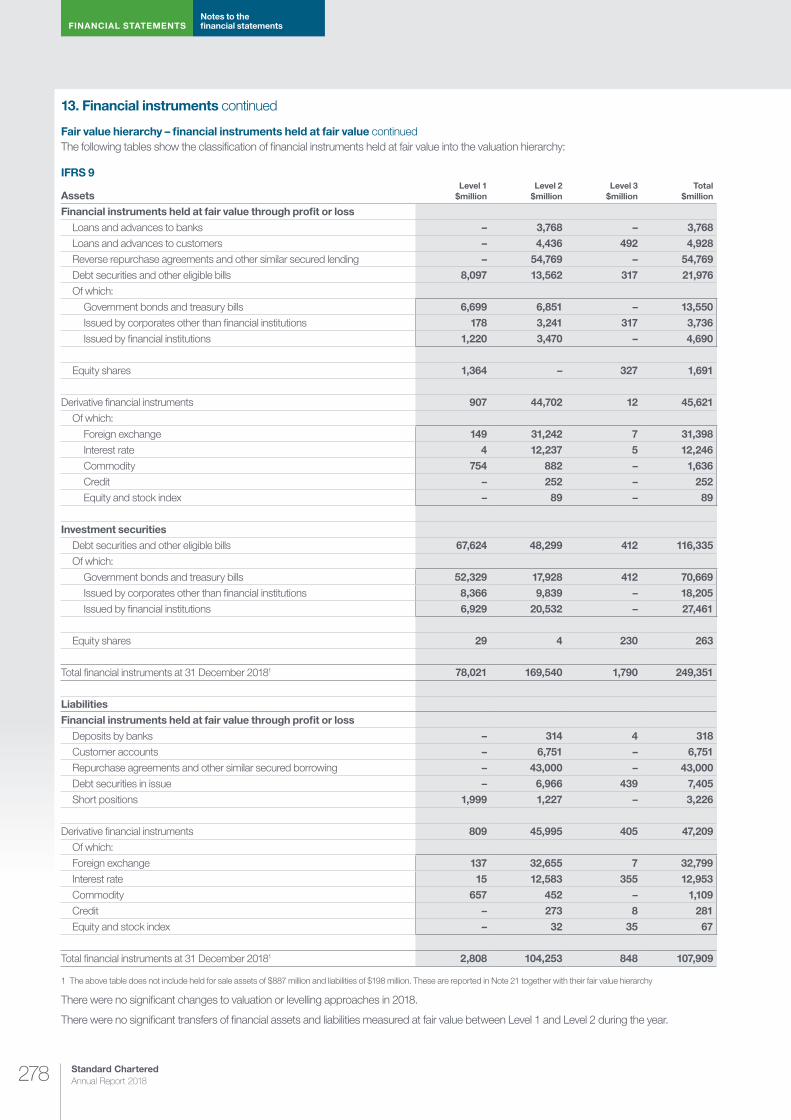
Standard Chartered Annual Report 2018278
FINANCIAL STATEMENTSNotes to the financial statements
13. Financial instruments continued
Fair value hierarchy – financial instruments held at fair value continuedThe following tables show the classification of financial instruments held at fair value into the valuation hierarchy:
IFRS 9
AssetsLevel 1
$millionLevel 2
$millionLevel 3
$millionTotal
$million
Financial instruments held at fair value through profit or loss
Loans and advances to banks – 3,768 – 3,768
Loans and advances to customers – 4,436 492 4,928
Reverse repurchase agreements and other similar secured lending – 54,769 – 54,769
Debt securities and other eligible bills 8,097 13,562 317 21,976
Of which:
Government bonds and treasury bills 6,699 6,851 – 13,550
Issued by corporates other than financial institutions 178 3,241 317 3,736
Issued by financial institutions 1,220 3,470 – 4,690
Equity shares 1,364 – 327 1,691
Derivative financial instruments 907 44,702 12 45,621
Of which:
Foreign exchange 149 31,242 7 31,398
Interest rate 4 12,237 5 12,246
Commodity 754 882 – 1,636
Credit – 252 – 252
Equity and stock index – 89 – 89
Investment securities
Debt securities and other eligible bills 67,624 48,299 412 116,335
Of which:
Government bonds and treasury bills 52,329 17,928 412 70,669
Issued by corporates other than financial institutions 8,366 9,839 – 18,205
Issued by financial institutions 6,929 20,532 – 27,461
Equity shares 29 4 230 263
Total financial instruments at 31 December 20181 78,021 169,540 1,790 249,351
Liabilities
Financial instruments held at fair value through profit or loss
Deposits by banks – 314 4 318
Customer accounts – 6,751 – 6,751
Repurchase agreements and other similar secured borrowing – 43,000 – 43,000
Debt securities in issue – 6,966 439 7,405
Short positions 1,999 1,227 – 3,226
Derivative financial instruments 809 45,995 405 47,209
Of which:
Foreign exchange 137 32,655 7 32,799
Interest rate 15 12,583 355 12,953
Commodity 657 452 – 1,109
Credit – 273 8 281
Equity and stock index – 32 35 67
Total financial instruments at 31 December 20181 2,808 104,253 848 107,909
1 The above table does not include held for sale assets of $887 million and liabilities of $198 million. These are reported in Note 21 together with their fair value hierarchy
There were no significant changes to valuation or levelling approaches in 2018.
There were no significant transfers of financial assets and liabilities measured at fair value between Level 1 and Level 2 during the year.
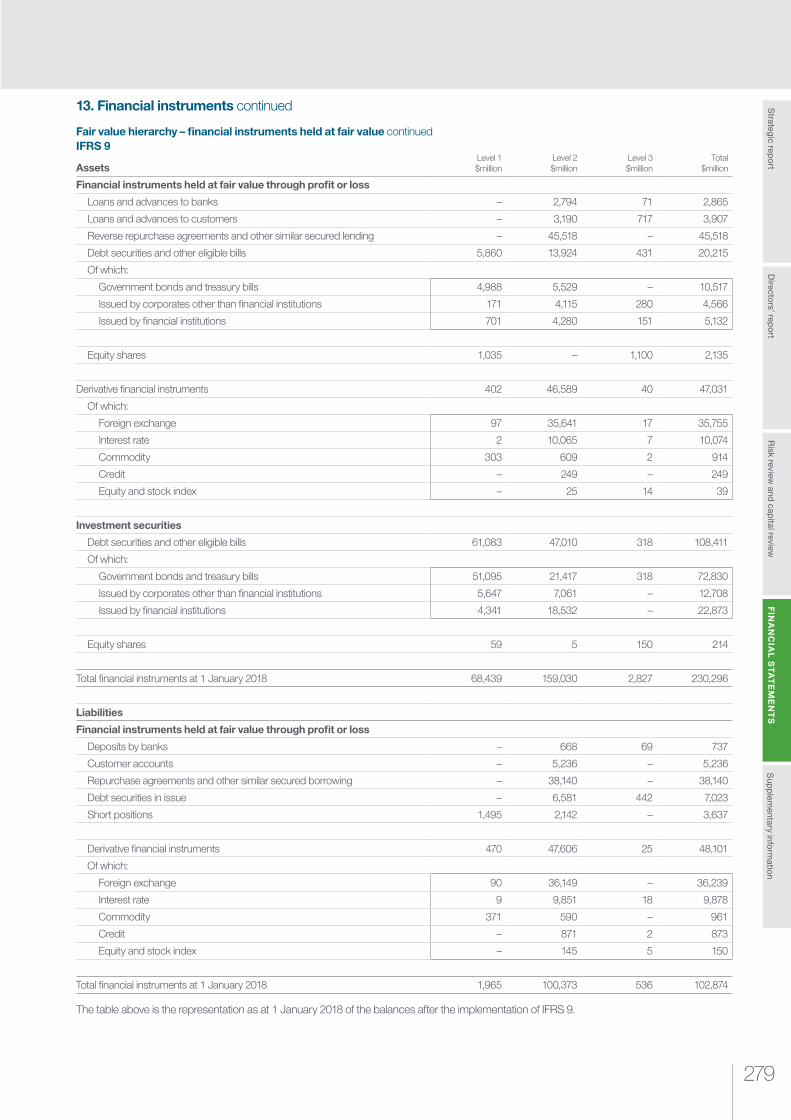
279
Risk review
and capital review
Strategic rep
ort
Sup
plem
entary inform
ation
FIN
AN
CIA
L S
TA
TE
ME
NT
SD
irectors’ rep
ort
13. Financial instruments continued
Fair value hierarchy – financial instruments held at fair value continuedIFRS 9
AssetsLevel 1 $million
Level 2 $million
Level 3 $million
Total $million
Financial instruments held at fair value through profit or loss
Loans and advances to banks – 2,794 71 2,865
Loans and advances to customers – 3,190 717 3,907
Reverse repurchase agreements and other similar secured lending – 45,518 – 45,518
Debt securities and other eligible bills 5,860 13,924 431 20,215
Of which:
Government bonds and treasury bills 4,988 5,529 – 10,517
Issued by corporates other than financial institutions 171 4,115 280 4,566
Issued by financial institutions 701 4,280 151 5,132
Equity shares 1,035 – 1,100 2,135
Derivative financial instruments 402 46,589 40 47,031
Of which:
Foreign exchange 97 35,641 17 35,755
Interest rate 2 10,065 7 10,074
Commodity 303 609 2 914
Credit – 249 – 249
Equity and stock index – 25 14 39
Investment securities
Debt securities and other eligible bills 61,083 47,010 318 108,411
Of which:
Government bonds and treasury bills 51,095 21,417 318 72,830
Issued by corporates other than financial institutions 5,647 7,061 – 12,708
Issued by financial institutions 4,341 18,532 – 22,873
Equity shares 59 5 150 214
Total financial instruments at 1 January 2018 68,439 159,030 2,827 230,296
Liabilities
Financial instruments held at fair value through profit or loss
Deposits by banks – 668 69 737
Customer accounts – 5,236 – 5,236
Repurchase agreements and other similar secured borrowing – 38,140 – 38,140
Debt securities in issue – 6,581 442 7,023
Short positions 1,495 2,142 – 3,637
Derivative financial instruments 470 47,606 25 48,101
Of which:
Foreign exchange 90 36,149 – 36,239
Interest rate 9 9,851 18 9,878
Commodity 371 590 – 961
Credit – 871 2 873
Equity and stock index – 145 5 150
Total financial instruments at 1 January 2018 1,965 100,373 536 102,874
The table above is the representation as at 1 January 2018 of the balances after the implementation of IFRS 9.

Standard Chartered Annual Report 2018280
FINANCIAL STATEMENTSNotes to the financial statements
13. Financial instruments continued
Fair value hierarchy – financial instruments held at fair value continuedIAS 39
AssetsLevel 1 $million
Level 2 $million
Level 3 $million
Total $million
Financial instruments held at fair value through profit or loss
Loans and advances to banks – 2,501 71 2,572
Loans and advances to customers – 2,792 126 2,918
Reverse repurchase agreements and other similar secured lending – 912 – 912
Debt securities and other eligible bills 5,860 13,800 51 19,711
Of which:
Government bonds and treasury bills 4,988 5,531 – 10,519
Issued by corporates other than financial institutions 171 4,017 48 4,236
Issued by financial institutions 701 4,252 3 4,956
Equity shares 725 – 726 1,451
Derivative financial instruments 402 46,589 40 47,031
Of which:
Foreign exchange 97 35,641 17 35,755
Interest rate 2 10,065 7 10,074
Commodity 303 609 2 914
Credit – 249 – 249
Equity and stock index – 25 14 39
Investment securities
Debt securities and other eligible bills 61,246 47,511 404 109,161
Of which:
Government bonds and treasury bills 51,257 21,364 318 72,939
Issued by corporates other than financial institutions 5,648 7,590 86 13,324
Issued by financial institutions 4,341 18,557 – 22,898
Equity shares 369 5 520 894
Total financial instruments at 31 December 20171 68,602 114,110 1,938 184,650
Liabilities
Financial instruments held at fair value through profit or loss
Deposits by banks – 668 69 737
Customer accounts – 5,236 – 5,236
Debt securities in issue – 6,581 442 7,023
Short positions 1,495 2,142 – 3,637
Derivative financial instruments 470 47,606 25 48,101
Of which:
Foreign exchange 90 36,149 – 36,239
Interest rate 9 9,851 18 9,878
Commodity 371 590 – 961
Credit – 871 2 873
Equity and stock index – 145 5 150
Total financial instruments at 31 December 2017 1,965 62,233 536 64,734
1 The above table does not include held for sale assets of $466 million. This is reported in Note 21 together with the fair value hierarchy
There were no significant changes to valuation or levelling approaches in 2017.
There were no significant transfers of financial assets and liabilities measured at fair value between Level 1 and Level 2 during 2017.

281
Risk review
and capital review
Strategic rep
ort
Sup
plem
entary inform
ation
FIN
AN
CIA
L S
TA
TE
ME
NT
SD
irectors’ rep
ort
13. Financial instruments continued
Fair value hierarchy – financial instruments measured at amortised costThe following table shows the carrying amounts and incorporates the Group’s estimate of fair values of those financial assets and liabilities not presented on the Group’s balance sheet at fair value. These fair values may be different from the actual amount that will be received or paid on the settlement or maturity of the financial instrument. For certain instruments, the fair value may be determined using assumptions for which no observable prices are available.
IFRS 9
Carrying value $million
Fair value
Level 1 $million
Level 2 $million
Level 3 $million
Total $million
Assets
Cash and balances at central banks1 57,511 – 57,511 – 57,511
Loans and advances to banks 61,414 – 61,357 – 61,357
of which: reverse repurchase agreements and other similar secured lending 3,815 – 3,842 – 3,842
Loans and advances to customers 256,557 – 18,514 238,797 257,311
of which: reverse repurchase agreements and other similar secured lending 3,151 – 2,409 744 3,153
Investment securities 9,303 – 8,953 8 8,961
Other assets1 32,678 – 32,673 – 32,673
Assets held for sale 135 – 135 – 135
At 31 December 2018 417,598 – 179,143 238,805 417,948
Liabilities
Deposits by banks 29,715 – 29,715 – 29,715
Customer accounts 391,013 – 391,018 – 391,018
Repurchase agreements and other similar secured borrowing 1,401 – 1,401 – 1,401
Debt securities in issue 46,454 17,009 29,195 – 46,204
Subordinated liabilities and other borrowed funds 15,001 14,505 23 – 14,528
Other liabilities1 37,945 – 37,945 – 37,945
At 31 December 2018 521,529 31,514 489,297 – 520,811
IFRS 9
Carrying value $million
Fair value
Level 1 $million
Level 2 $million
Level 3 $million
Total $million
Assets
Cash and balances at central banks1 58,864 – 58,864 – 58,864
Loans and advances to banks 62,295 – 62,273 4 62,277
of which: reverse repurchase agreements and other similar secured lending 5,101 – 5,107 – 5,107
Loans and advances to customers 251,507 – 17,684 234,568 252,252
of which: reverse repurchase agreements and other similar secured lending 4,566 – 2,399 2,174 4,573
Investment securities 7,188 – 7,133 86 7,219
Other assets1 29,922 – 29,911 – 29,911
Assets held for sale 62 – 62 – 62
At 1 January 2018 409,838 – 175,927 234,658 410,585
Liabilities
Deposits by banks 30,945 – 30,939 – 30,939
Customer accounts 370,509 – 370,489 – 370,489
Repurchase agreements and other similar secured borrowing 1,639 – 1,639 – 1,639
Debt securities in issue 46,379 15,264 30,158 – 45,422
Subordinated liabilities and other borrowed funds 17,176 17,456 161 – 17,617
Other liabilities1 34,982 – 34,982 – 34,982
At 1 January 2018 501,630 32,720 468,368 – 501,088
1 The carrying amount of these financial instruments is considered to be a reasonable approximation of fair value as they are short-term in nature or reprice to current market rates frequently
The table above is the representation as at 1 January 2018 of the balances after the implementation of IFRS 9.
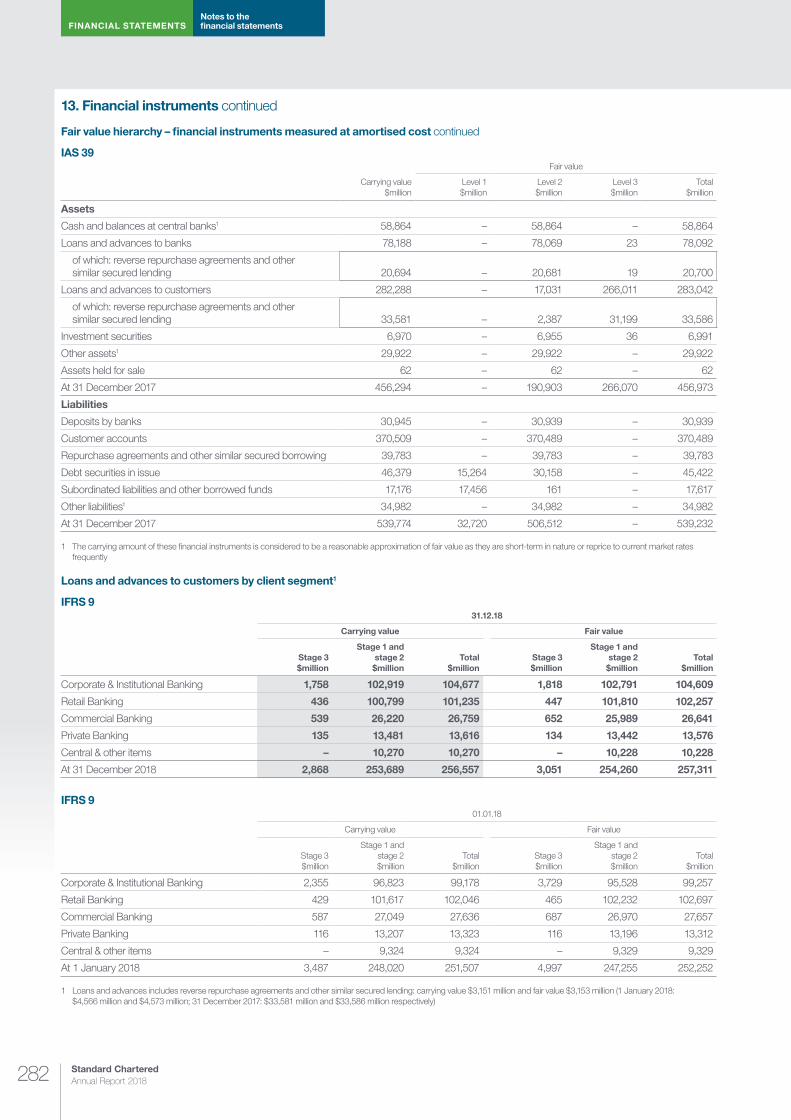
Standard Chartered Annual Report 2018282
FINANCIAL STATEMENTSNotes to the financial statements
13. Financial instruments continued
Fair value hierarchy – financial instruments measured at amortised cost continued
IAS 39
Carrying value $million
Fair value
Level 1 $million
Level 2 $million
Level 3 $million
Total $million
Assets
Cash and balances at central banks1 58,864 – 58,864 – 58,864
Loans and advances to banks 78,188 – 78,069 23 78,092
of which: reverse repurchase agreements and other similar secured lending 20,694 – 20,681 19 20,700
Loans and advances to customers 282,288 – 17,031 266,011 283,042
of which: reverse repurchase agreements and other similar secured lending 33,581 – 2,387 31,199 33,586
Investment securities 6,970 – 6,955 36 6,991
Other assets1 29,922 – 29,922 – 29,922
Assets held for sale 62 – 62 – 62
At 31 December 2017 456,294 – 190,903 266,070 456,973
Liabilities
Deposits by banks 30,945 – 30,939 – 30,939
Customer accounts 370,509 – 370,489 – 370,489
Repurchase agreements and other similar secured borrowing 39,783 – 39,783 – 39,783
Debt securities in issue 46,379 15,264 30,158 – 45,422
Subordinated liabilities and other borrowed funds 17,176 17,456 161 – 17,617
Other liabilities1 34,982 – 34,982 – 34,982
At 31 December 2017 539,774 32,720 506,512 – 539,232
1 The carrying amount of these financial instruments is considered to be a reasonable approximation of fair value as they are short-term in nature or reprice to current market rates frequently
Loans and advances to customers by client segment1
IFRS 931.12.18
Carrying value Fair value
Stage 3 $million
Stage 1 and stage 2 $million
Total $million
Stage 3 $million
Stage 1 and stage 2 $million
Total $million
Corporate & Institutional Banking 1,758 102,919 104,677 1,818 102,791 104,609
Retail Banking 436 100,799 101,235 447 101,810 102,257
Commercial Banking 539 26,220 26,759 652 25,989 26,641
Private Banking 135 13,481 13,616 134 13,442 13,576
Central & other items – 10,270 10,270 – 10,228 10,228
At 31 December 2018 2,868 253,689 256,557 3,051 254,260 257,311
IFRS 901.01.18
Carrying value Fair value
Stage 3 $million
Stage 1 and stage 2 $million
Total $million
Stage 3 $million
Stage 1 and stage 2 $million
Total $million
Corporate & Institutional Banking 2,355 96,823 99,178 3,729 95,528 99,257
Retail Banking 429 101,617 102,046 465 102,232 102,697
Commercial Banking 587 27,049 27,636 687 26,970 27,657
Private Banking 116 13,207 13,323 116 13,196 13,312
Central & other items – 9,324 9,324 – 9,329 9,329
At 1 January 2018 3,487 248,020 251,507 4,997 247,255 252,252
1 Loans and advances includes reverse repurchase agreements and other similar secured lending: carrying value $3,151 million and fair value $3,153 million (1 January 2018: $4,566 million and $4,573 million; 31 December 2017: $33,581 million and $33,586 million respectively)

283
Risk review
and capital review
Strategic rep
ort
Sup
plem
entary inform
ation
FIN
AN
CIA
L S
TA
TE
ME
NT
SD
irectors’ rep
ort
13. Financial instruments continued
Loans and advances to customers by client segment1 continued
IAS 3931.12.17
Carrying value Fair value
Impaired $million
Not impaired $million
Total $million
Impaired $million
Not impaired $million
Total $million
Corporate & Institutional Banking 2,465 126,224 128,689 2,491 126,695 129,186
Retail Banking 420 102,593 103,013 422 102,828 103,250
Commercial Banking 596 27,296 27,892 646 27,269 27,915
Private Banking 140 13,211 13,351 140 13,202 13,342
Central & other items – 9,343 9,343 – 9,349 9,349
At 31 December 2017 3,621 278,667 282,288 3,699 279,343 283,042
1 Loans and advances includes reverse repurchase agreements and other similar secured lending: carrying value $3,151 million and fair value $3,153 million (1 January 2018: $4,566 million and $4,573 million; 31 December 2017: $33,581 million and $33,586 million respectively)
Level 3 summary and significant unobservable inputsThe following table presents the Group’s primary Level 3 financial instruments which are held at fair value. The table also presents the valuation techniques used to measure the fair value of those financial instruments, the significant unobservable inputs, the range of values for those inputs and the weighted average of those inputs:
Instrument
Value at 31 December 2018
Principal valuation technique
Significant unobservable inputs Range1
Weighted average2
Assets $million
Liabilities $million
Loans and advances to customers 492 – Comparable pricing/yield Price/yield N/A N/A
Discounted cash flows Recovery rates 25.5% – 100% 94.7%
Debt securities 73 – Comparable pricing/yield Price/yield 5.4% – 6.3% 5.6%
Asset-backed securities 244 – Discounted cash flows Price/yield 1.0% – 11.0% 3.4%
Deposits by banks – 4 Discounted cash flows Credit spreads 1.0% – 1.0% 1.0%
Debt securities in issue – 439 Discounted cash flows Credit spreads 0.4% – 4.0% 1.4%
– – Internal pricing model Equity correlation 4.5% – 89.5% N/A
– – Equity-FX correlation -80.0% – 80.0% N/A
Government bonds and treasury bills 412 – Discounted cash flows Price/yield 2.9% – 38.1% 11.2%
Derivative financial instruments of which:
Foreign exchange 7 7 Option pricing model Foreign exchange option implied volatility 5.2% – 5.4% 5.4%
Discounted cash flows Foreign exchange curves -0.4% – 3.7% 0.4%
Interest rate 5 355 Discounted cash flows Interest rate curves 6.4% – 16.8% 8.3%
Credit – 8 Discounted cash flows Credit spreads 0.3% – 3.0% 0.9%
Equity – 35 Internal pricing model Equity correlation 4.5% – 89.5% N/A
Equity-FX correlation -80.0% – 80.0% N/A
Equity shares (includes private equity investments)3
557 – Comparable pricing/yield EV/EBITDA multiples 5.2x – 9.1x 8.5x
P/E multiples 14.5x 14.5x
P/B multiples 0.6x – 1.0x 1.0x
P/S multiples N/A N/A
Liquidity discount 10.0% – 20.0% 14.8%
Discounted cash flows Discount rates 7.3% – 13.2% 9.6%
Total 1,790 848
1 The ranges of values shown in the above table represent the highest and lowest levels used in the valuation of the Group’s Level 3 financial instruments as at 31 December 2018. The ranges of values used are reflective of the underlying characteristics of these Level 3 financial instruments based on the market conditions at the balance sheet date. However, these ranges of values may not represent the uncertainty in fair value measurements of the Group’s Level 3 financial instruments
2 Weighted average for non-derivative financial instruments has been calculated by weighting inputs by the relative fair value. Weighted average for derivatives has been provided by weighting inputs by the risk relevant to that variable. N/A has been entered for the cases where weighted average is not a meaningful indicator
3 The Group has an equity investment in the Series B preferred shares of Ripple Labs, Inc., which owns a digital currency (XRP) and is being carried at a fair value based on the shares’ initial offering price. The shares will continue to be valued at the initial offering price until such time as a reliable means of valuing the cash flows and underlying assets is possible or additional sales are observable
Standard Chartered Annual Report 2018284
FINANCIAL STATEMENTSNotes to the financial statements
13. Financial instruments continued
Level 3 summary and significant unobservable inputs continued The following section describes the significant unobservable inputs identified in the valuation technique table:
¼ Commodities correlation: This refers to the correlation between two commodity underlyings over a specified time
¼ Comparable price/yield is a valuation methodology in which the price of a comparable instrument is used to estimate the fair value where there are no direct observable prices. Yield is the interest rate that is used to discount the future cash flows in a discounted cash flow model. Valuation using comparable instruments can be done by calculating an implied yield (or spread over a liquid benchmark) from the price of a comparable instrument, then adjusting that yield (or spread) to derive a value for the instrument. The adjustment should account for relevant differences in the financial instruments such as maturity and/or credit quality. Alternatively, a price-to-price basis can be assumed between the comparable instrument and the instrument being valued in order to establish the value of the instrument (for example, deriving a fair value for a junior unsecured bond from the price of a senior secured bond). An increase in price, in isolation, would result in a favourable movement in the fair value of the asset. An increase in yield, in isolation, would result in an unfavourable movement in the fair value of the asset
¼ Correlation is the measure of how movement in one variable influences the movement in another variable. An equity correlation is the correlation between two equity instruments while an interest rate correlation refers to the correlation between two swap rates
¼ Credit spread represents the additional yield that a market participant would demand for taking exposure to the credit risk of an instrument
¼ Discount rate refers to the rate of return used to convert expected cash flows into present value
¼ EV/EBITDA ratio multiples: This is the ratio of Enterprise Value (EV) to Earnings Before Interest, Taxes, Depreciation and Amortisation (EBITDA). EV is the aggregate market capitalisation and debt minus the cash and cash equivalents. An increase in EV/EBITDA multiples in isolation, will result in a favourable movement in the fair value of the unlisted firm
¼ Interest rate curves is the term structure of interest rates and measure of future interest rates at a particular point in time
¼ Liquidity discounts in the valuation of unlisted investments: A liquidity discount is primarily applied to the valuation of unlisted firms’ investments to reflect the fact that these stocks are not actively traded. An increase in liquidity discount will result in unfavourable movement in the fair value of the unlisted firm
¼ Price-Book (P/B) multiple: This is the ratio of the market value of equity to the book value of equity. An increase in P/B multiple will result in a favourable movement in the fair value of the unlisted firm
¼ Price-Earnings (P/E) multiples: This is the ratio of the market capitalisation to the net income after tax. The multiples are determined from multiples of listed comparables, which are observable. An increase in P/E multiple will result in a favourable movement in the fair value of the unlisted firm
¼ Price-Sales (P/S) multiple: This is the ratio of the market value of equity to sales. An increase in P/S multiple will result in a favourable movement in the fair value of the unlisted firm
¼ Recovery rates are the expectation of the rate of return resulting from the liquidation of a particular loan. As the probability of default increases for a given instrument, the valuation of that instrument will increasingly reflect its expected recovery level assuming default. An increase in the recovery rate, in isolation, would result in a favourable movement in the fair value of the loan
¼ Volatility represents an estimate of how much a particular instrument, parameter or index will change in value over time. Generally, the higher the volatility, the more expensive the option will be

285
Risk review
and capital review
Strategic rep
ort
Sup
plem
entary inform
ation
FIN
AN
CIA
L S
TA
TE
ME
NT
SD
irectors’ rep
ort
13. Financial instruments continued
Level 3 movement tables – financial assetsThe table below analyses movements in Level 3 financial assets carried at fair value.
Assets
Held at fair value through profit or loss
Derivative financial
instruments $million
Investment securities
Total $million
Loans and advances to
banks $million
Loans and advances to
customers $million
Reverse repurchase agreements
and other similar
secured lending $million
Debt securities and other
eligible bills $million
Equity shares
$million
Debt securities and other
eligible bills $million
Equity shares
$million
At 31 December 2017 – IAS 39 71 126 – 51 726 40 404 520 1,938
Transfer due to IFRS 91 – 591 – 380 374 – (86) (370) 889
At 1 January 2018 – IFRS 9 71 717 – 431 1,100 40 318 150 2,827
Total gains/(losses) recognised in income statement 2 13 – (44) (10) (3) 22 – (20)
Net trading income 2 13 – (44) (10) (3) – – (42)
Other operating income – – – – – – 22 – 22
Total (losses)/gains recognised in other comprehensive income (OCI) – – – – – – (2) 40 38
Fair value through OCI reserve – – – – – – – 41 41
Exchange difference – – – – – – (2) (1) (3)
Purchases – 328 55 120 143 70 445 38 1,199
Sales – (254) – (215) (176) (40) – (5) (690)
Settlements (71) (261) – (6) – (14) (210) – (562)
Transfers out2 (101) (112) (55) (8) (743) (43) (161) (1) (1,224)
Transfers in3 99 61 – 39 13 2 – 8 222
At 31 December 2018 – 492 – 317 327 12 412 230 1,790
Total unrealised (losses)/gains recognised in the income statement, within net trading income, relating to change in fair value of assets held at 31 December 2018 – (2) – – 22 (3) – – 17
1 The increase in Level 3 instruments is a result of loans and debt securities that failed SPPI, with unobservable valuation inputs. Further, Level 3 equity shares which were classified as available-for-sale equity under IAS 39 are now classified as fair value through profit or loss under IFRS 9
2 Transfers out include loans and advances, reverse repurchase agreements, debt securities and other eligible bills, equity shares and derivative financial instruments where the valuation parameters became observable during the year, and were transferred to Level 1 and Level 2. Transfers out further relates to $743 million equity shares held for sale
3 Transfers in primarily relate to loans and advances, debt securities and other eligible bills, equity shares and derivative financial instruments where the valuation parameters become unobservable during the year
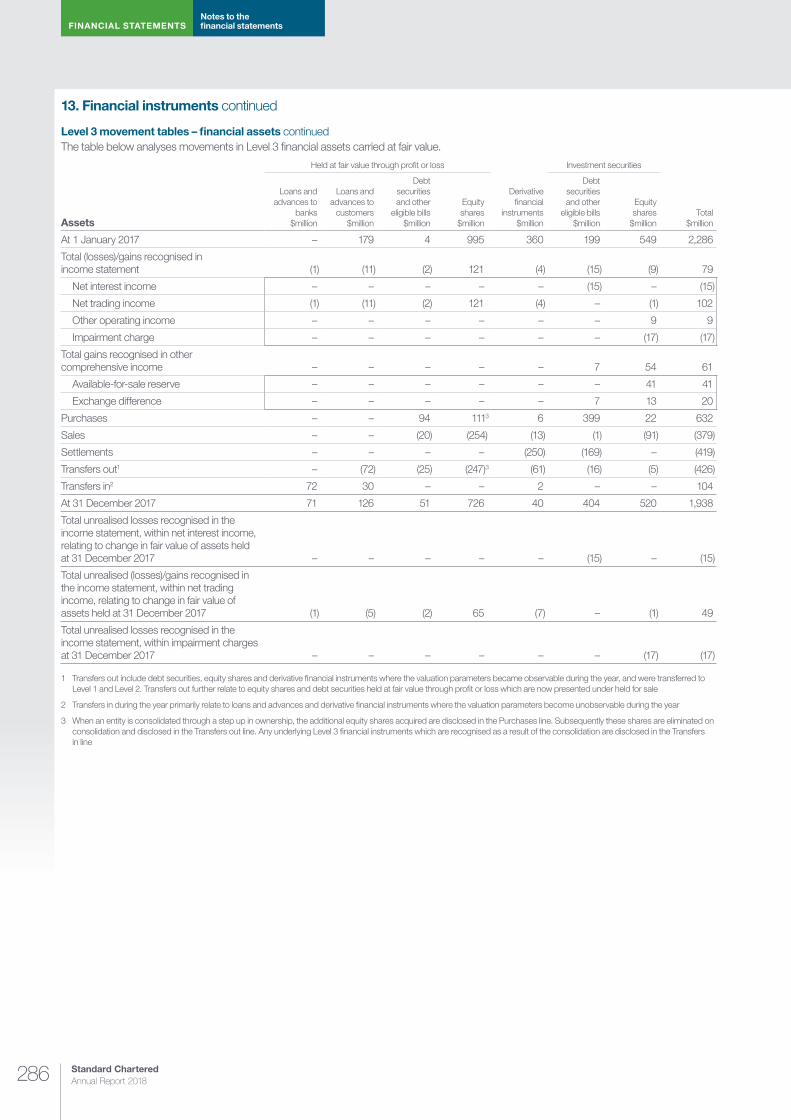
Standard Chartered Annual Report 2018286
FINANCIAL STATEMENTSNotes to the financial statements
13. Financial instruments continued
Level 3 movement tables – financial assets continuedThe table below analyses movements in Level 3 financial assets carried at fair value.
Assets
Held at fair value through profit or loss
Derivative financial
instruments $million
Investment securities
Total $million
Loans and advances to
banks $million
Loans and advances to
customers $million
Debt securities and other
eligible bills $million
Equity shares
$million
Debt securities and other
eligible bills $million
Equity shares
$million
At 1 January 2017 – 179 4 995 360 199 549 2,286
Total (losses)/gains recognised in income statement (1) (11) (2) 121 (4) (15) (9) 79
Net interest income – – – – – (15) – (15)
Net trading income (1) (11) (2) 121 (4) – (1) 102
Other operating income – – – – – – 9 9
Impairment charge – – – – – – (17) (17)
Total gains recognised in other comprehensive income – – – – – 7 54 61
Available-for-sale reserve – – – – – – 41 41
Exchange difference – – – – – 7 13 20
Purchases – – 94 1113 6 399 22 632
Sales – – (20) (254) (13) (1) (91) (379)
Settlements – – – – (250) (169) – (419)
Transfers out1 – (72) (25) (247)3 (61) (16) (5) (426)
Transfers in2 72 30 – – 2 – – 104
At 31 December 2017 71 126 51 726 40 404 520 1,938
Total unrealised losses recognised in the income statement, within net interest income, relating to change in fair value of assets held at 31 December 2017 – – – – – (15) – (15)
Total unrealised (losses)/gains recognised in the income statement, within net trading income, relating to change in fair value of assets held at 31 December 2017 (1) (5) (2) 65 (7) – (1) 49
Total unrealised losses recognised in the income statement, within impairment charges at 31 December 2017 – – – – – – (17) (17)
1 Transfers out include debt securities, equity shares and derivative financial instruments where the valuation parameters became observable during the year, and were transferred to Level 1 and Level 2. Transfers out further relate to equity shares and debt securities held at fair value through profit or loss which are now presented under held for sale
2 Transfers in during the year primarily relate to loans and advances and derivative financial instruments where the valuation parameters become unobservable during the year
3 When an entity is consolidated through a step up in ownership, the additional equity shares acquired are disclosed in the Purchases line. Subsequently these shares are eliminated on consolidation and disclosed in the Transfers out line. Any underlying Level 3 financial instruments which are recognised as a result of the consolidation are disclosed in the Transfers in line

287
Risk review
and capital review
Strategic rep
ort
Sup
plem
entary inform
ation
FIN
AN
CIA
L S
TA
TE
ME
NT
SD
irectors’ rep
ort
13. Financial instruments continued
Level 3 movement tables – financial liabilities31.12.18
Deposits by banks $million
Debt securities in issue $million
Derivative financial
instruments $million
Total $million
At 1 January 2018 69 442 25 536
Total losses/(gains) recognised in income statement – net trading income 1 (22) 30 9
Issues 4 167 439 610
Settlements (70) (148) (103) (321)
Transfers out1 – – (2) (2)
Transfers in2 – – 16 16
At 31 December 2018 4 439 405 848
Total unrealised (gains)/losses recognised in the income statement, within net trading income, relating to change in fair value of liabilities held at 31 December 2018 – (5) 8 3
31.12.17
Deposits by banks
$million
Debt securities in issue $million
Derivative financial
instruments $million
Total $million
At 1 January 2017 – 530 316 846
Total gains recognised in income statement – net trading income – (9) (24) (33)
Issues 79 274 1 354
Settlements (10) (353) (266) (629)
Transfers out1 – – (2) (2)
At 31 December 2017 69 442 25 536
Total unrealised gains recognised in the income statement, within net trading income, relating to change in fair value of liabilities held at 31 December 2017 – – (17) (17)
1 Transfers out during the year primarily relate to derivative financial instruments where the valuation parameters became observable during the year and were transferred to Level 2 financial liabilities
2 Transfers in during the year primarily relate to derivative financial instruments where the valuation parameters become unobservable during the year
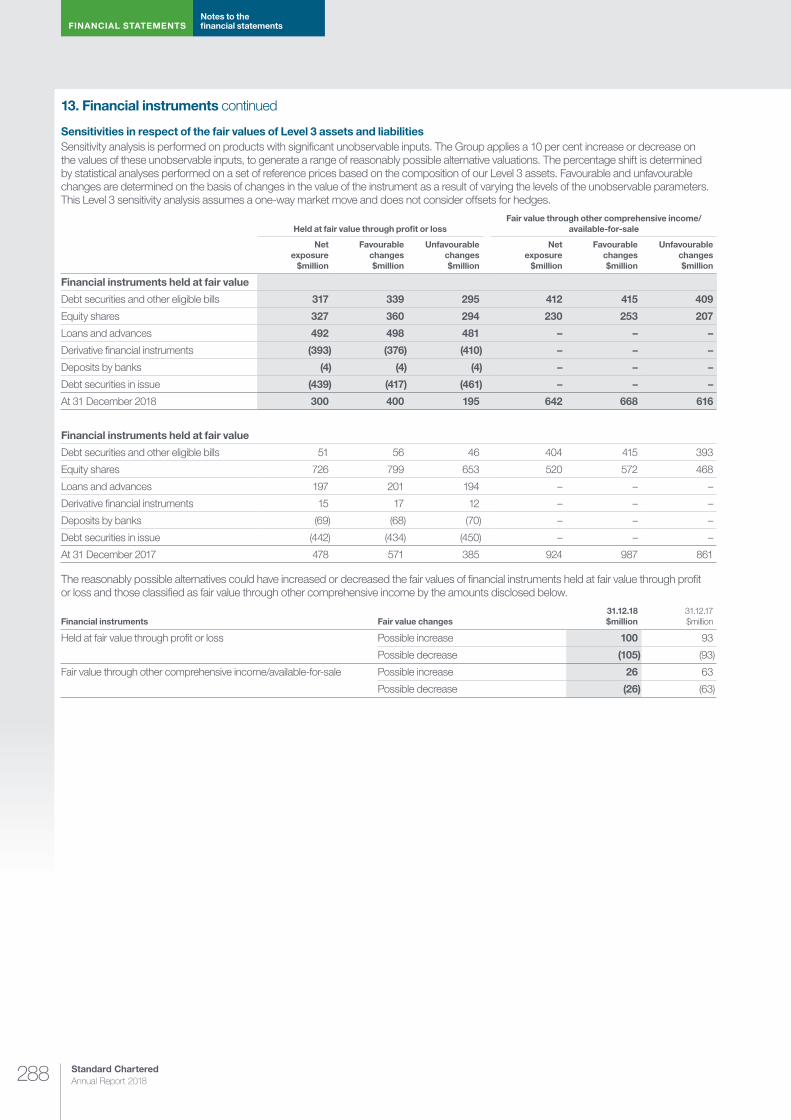
Standard Chartered Annual Report 2018288
FINANCIAL STATEMENTSNotes to the financial statements
13. Financial instruments continued
Sensitivities in respect of the fair values of Level 3 assets and liabilitiesSensitivity analysis is performed on products with significant unobservable inputs. The Group applies a 10 per cent increase or decrease on the values of these unobservable inputs, to generate a range of reasonably possible alternative valuations. The percentage shift is determined by statistical analyses performed on a set of reference prices based on the composition of our Level 3 assets. Favourable and unfavourable changes are determined on the basis of changes in the value of the instrument as a result of varying the levels of the unobservable parameters. This Level 3 sensitivity analysis assumes a one-way market move and does not consider offsets for hedges.
Held at fair value through profit or lossFair value through other comprehensive income/
available-for-sale
Net exposure
$million
Favourable changes $million
Unfavourable changes $million
Net exposure
$million
Favourable changes $million
Unfavourable changes $million
Financial instruments held at fair value
Debt securities and other eligible bills 317 339 295 412 415 409
Equity shares 327 360 294 230 253 207
Loans and advances 492 498 481 – – –
Derivative financial instruments (393) (376) (410) – – –
Deposits by banks (4) (4) (4) – – –
Debt securities in issue (439) (417) (461) – – –
At 31 December 2018 300 400 195 642 668 616
Financial instruments held at fair value
Debt securities and other eligible bills 51 56 46 404 415 393
Equity shares 726 799 653 520 572 468
Loans and advances 197 201 194 – – –
Derivative financial instruments 15 17 12 – – –
Deposits by banks (69) (68) (70) – – –
Debt securities in issue (442) (434) (450) – – –
At 31 December 2017 478 571 385 924 987 861
The reasonably possible alternatives could have increased or decreased the fair values of financial instruments held at fair value through profit or loss and those classified as fair value through other comprehensive income by the amounts disclosed below.
Financial instruments Fair value changes31.12.18 $million
31.12.17 $million
Held at fair value through profit or loss Possible increase 100 93
Possible decrease (105) (93)
Fair value through other comprehensive income/available-for-sale Possible increase 26 63
Possible decrease (26) (63)
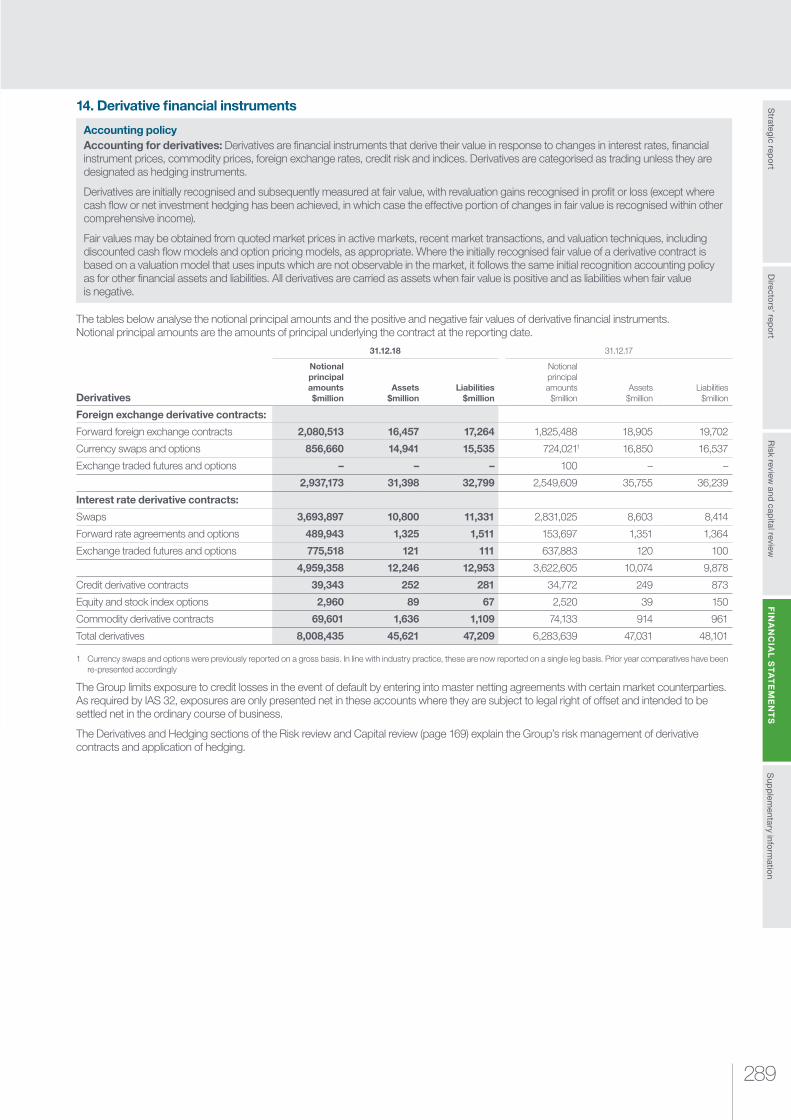
289
Risk review
and capital review
Strategic rep
ort
Sup
plem
entary inform
ation
FIN
AN
CIA
L S
TA
TE
ME
NT
SD
irectors’ rep
ort
14. Derivative financial instruments
Accounting policyAccounting for derivatives: Derivatives are financial instruments that derive their value in response to changes in interest rates, financial instrument prices, commodity prices, foreign exchange rates, credit risk and indices. Derivatives are categorised as trading unless they are designated as hedging instruments.
Derivatives are initially recognised and subsequently measured at fair value, with revaluation gains recognised in profit or loss (except where cash flow or net investment hedging has been achieved, in which case the effective portion of changes in fair value is recognised within other comprehensive income).
Fair values may be obtained from quoted market prices in active markets, recent market transactions, and valuation techniques, including discounted cash flow models and option pricing models, as appropriate. Where the initially recognised fair value of a derivative contract is based on a valuation model that uses inputs which are not observable in the market, it follows the same initial recognition accounting policy as for other financial assets and liabilities. All derivatives are carried as assets when fair value is positive and as liabilities when fair value is negative.
The tables below analyse the notional principal amounts and the positive and negative fair values of derivative financial instruments. Notional principal amounts are the amounts of principal underlying the contract at the reporting date.
Derivatives
31.12.18 31.12.17
Notional principal amounts $million
Assets $million
Liabilities $million
Notional principal amounts $million
Assets $million
Liabilities $million
Foreign exchange derivative contracts:
Forward foreign exchange contracts 2,080,513 16,457 17,264 1,825,488 18,905 19,702
Currency swaps and options 856,660 14,941 15,535 724,0211 16,850 16,537
Exchange traded futures and options – – – 100 – –
2,937,173 31,398 32,799 2,549,609 35,755 36,239
Interest rate derivative contracts:
Swaps 3,693,897 10,800 11,331 2,831,025 8,603 8,414
Forward rate agreements and options 489,943 1,325 1,511 153,697 1,351 1,364
Exchange traded futures and options 775,518 121 111 637,883 120 100
4,959,358 12,246 12,953 3,622,605 10,074 9,878
Credit derivative contracts 39,343 252 281 34,772 249 873
Equity and stock index options 2,960 89 67 2,520 39 150
Commodity derivative contracts 69,601 1,636 1,109 74,133 914 961
Total derivatives 8,008,435 45,621 47,209 6,283,639 47,031 48,101
1 Currency swaps and options were previously reported on a gross basis. In line with industry practice, these are now reported on a single leg basis. Prior year comparatives have been re-presented accordingly
The Group limits exposure to credit losses in the event of default by entering into master netting agreements with certain market counterparties. As required by IAS 32, exposures are only presented net in these accounts where they are subject to legal right of offset and intended to be settled net in the ordinary course of business.
The Derivatives and Hedging sections of the Risk review and Capital review (page 169) explain the Group’s risk management of derivative contracts and application of hedging.
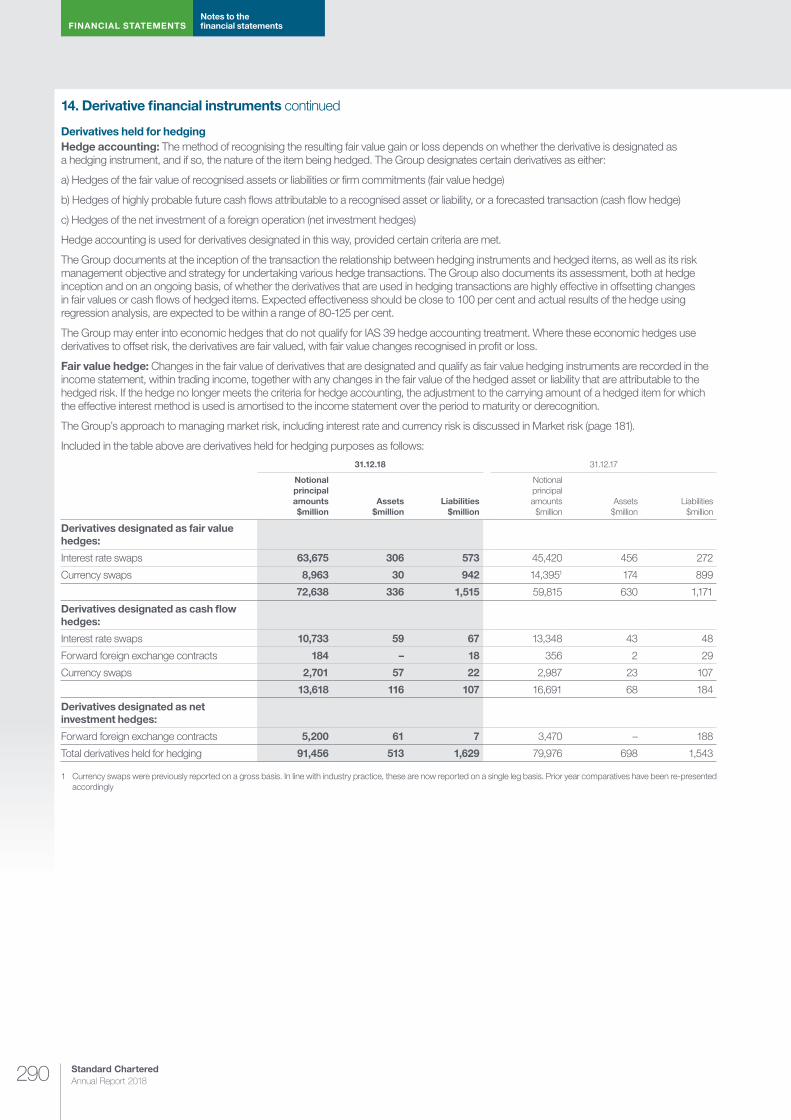
Standard Chartered Annual Report 2018290
FINANCIAL STATEMENTSNotes to the financial statements
14. Derivative financial instruments continued
Derivatives held for hedgingHedge accounting: The method of recognising the resulting fair value gain or loss depends on whether the derivative is designated as a hedging instrument, and if so, the nature of the item being hedged. The Group designates certain derivatives as either:
a) Hedges of the fair value of recognised assets or liabilities or firm commitments (fair value hedge)
b) Hedges of highly probable future cash flows attributable to a recognised asset or liability, or a forecasted transaction (cash flow hedge)
c) Hedges of the net investment of a foreign operation (net investment hedges)
Hedge accounting is used for derivatives designated in this way, provided certain criteria are met.
The Group documents at the inception of the transaction the relationship between hedging instruments and hedged items, as well as its risk management objective and strategy for undertaking various hedge transactions. The Group also documents its assessment, both at hedge inception and on an ongoing basis, of whether the derivatives that are used in hedging transactions are highly effective in offsetting changes in fair values or cash flows of hedged items. Expected effectiveness should be close to 100 per cent and actual results of the hedge using regression analysis, are expected to be within a range of 80-125 per cent.
The Group may enter into economic hedges that do not qualify for IAS 39 hedge accounting treatment. Where these economic hedges use derivatives to offset risk, the derivatives are fair valued, with fair value changes recognised in profit or loss.
Fair value hedge: Changes in the fair value of derivatives that are designated and qualify as fair value hedging instruments are recorded in the income statement, within trading income, together with any changes in the fair value of the hedged asset or liability that are attributable to the hedged risk. If the hedge no longer meets the criteria for hedge accounting, the adjustment to the carrying amount of a hedged item for which the effective interest method is used is amortised to the income statement over the period to maturity or derecognition.
The Group’s approach to managing market risk, including interest rate and currency risk is discussed in Market risk (page 181).
Included in the table above are derivatives held for hedging purposes as follows:
31.12.18 31.12.17
Notional principal amounts $million
Assets $million
Liabilities $million
Notional principal amounts $million
Assets $million
Liabilities $million
Derivatives designated as fair value hedges:
Interest rate swaps 63,675 306 573 45,420 456 272
Currency swaps 8,963 30 942 14,3951 174 899
72,638 336 1,515 59,815 630 1,171
Derivatives designated as cash flow hedges:
Interest rate swaps 10,733 59 67 13,348 43 48
Forward foreign exchange contracts 184 – 18 356 2 29
Currency swaps 2,701 57 22 2,987 23 107
13,618 116 107 16,691 68 184
Derivatives designated as net investment hedges:
Forward foreign exchange contracts 5,200 61 7 3,470 – 188
Total derivatives held for hedging 91,456 513 1,629 79,976 698 1,543
1 Currency swaps were previously reported on a gross basis. In line with industry practice, these are now reported on a single leg basis. Prior year comparatives have been re-presented accordingly
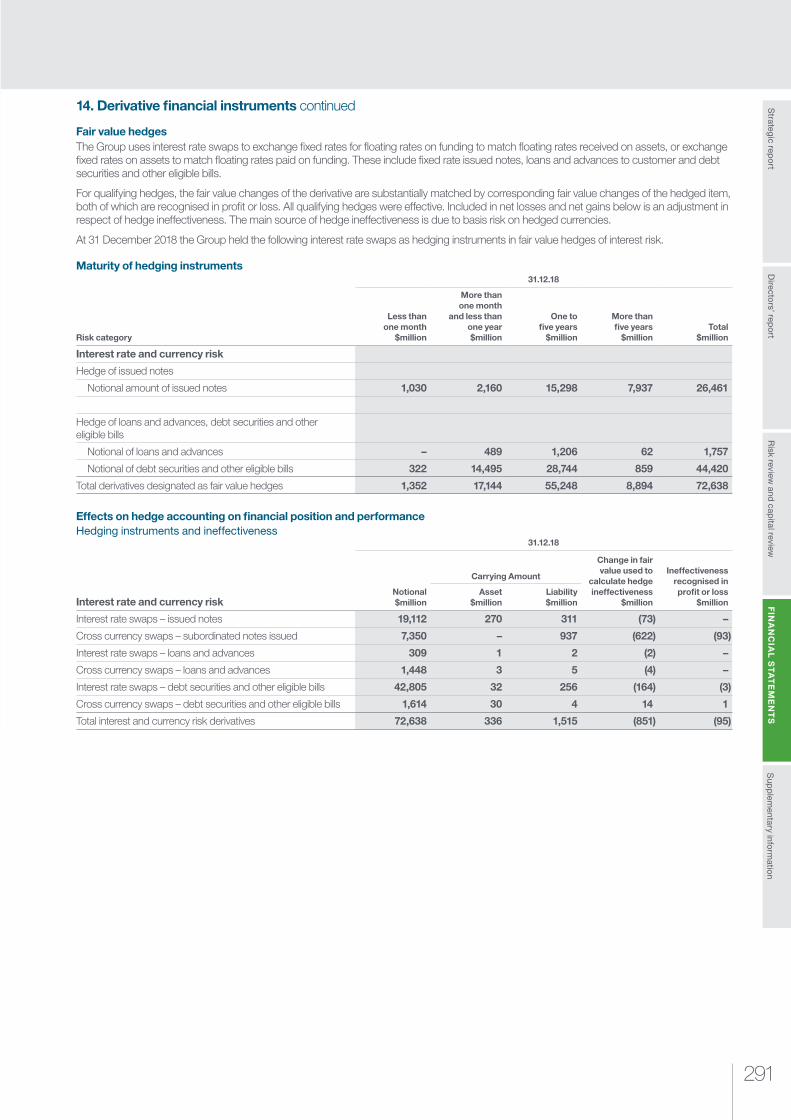
291
Risk review
and capital review
Strategic rep
ort
Sup
plem
entary inform
ation
FIN
AN
CIA
L S
TA
TE
ME
NT
SD
irectors’ rep
ort
14. Derivative financial instruments continued
Fair value hedges The Group uses interest rate swaps to exchange fixed rates for floating rates on funding to match floating rates received on assets, or exchange fixed rates on assets to match floating rates paid on funding. These include fixed rate issued notes, loans and advances to customer and debt securities and other eligible bills.
For qualifying hedges, the fair value changes of the derivative are substantially matched by corresponding fair value changes of the hedged item, both of which are recognised in profit or loss. All qualifying hedges were effective. Included in net losses and net gains below is an adjustment in respect of hedge ineffectiveness. The main source of hedge ineffectiveness is due to basis risk on hedged currencies.
At 31 December 2018 the Group held the following interest rate swaps as hedging instruments in fair value hedges of interest risk.
Maturity of hedging instruments
Risk category
31.12.18
Less than one month
$million
More than one month
and less than one year $million
One to five years
$million
More than five years
$millionTotal
$million
Interest rate and currency risk
Hedge of issued notes
Notional amount of issued notes 1,030 2,160 15,298 7,937 26,461
Hedge of loans and advances, debt securities and other eligible bills
Notional of loans and advances – 489 1,206 62 1,757
Notional of debt securities and other eligible bills 322 14,495 28,744 859 44,420
Total derivatives designated as fair value hedges 1,352 17,144 55,248 8,894 72,638
Effects on hedge accounting on financial position and performanceHedging instruments and ineffectiveness
Interest rate and currency risk
31.12.18
Notional $million
Carrying Amount
Change in fair value used to
calculate hedge ineffectiveness
$million
Ineffectiveness recognised in profit or loss
$millionAsset
$millionLiability $million
Interest rate swaps – issued notes 19,112 270 311 (73) –
Cross currency swaps – subordinated notes issued 7,350 – 937 (622) (93)
Interest rate swaps – loans and advances 309 1 2 (2) –
Cross currency swaps – loans and advances 1,448 3 5 (4) –
Interest rate swaps – debt securities and other eligible bills 42,805 32 256 (164) (3)
Cross currency swaps – debt securities and other eligible bills 1,614 30 4 14 1
Total interest and currency risk derivatives 72,638 336 1,515 (851) (95)
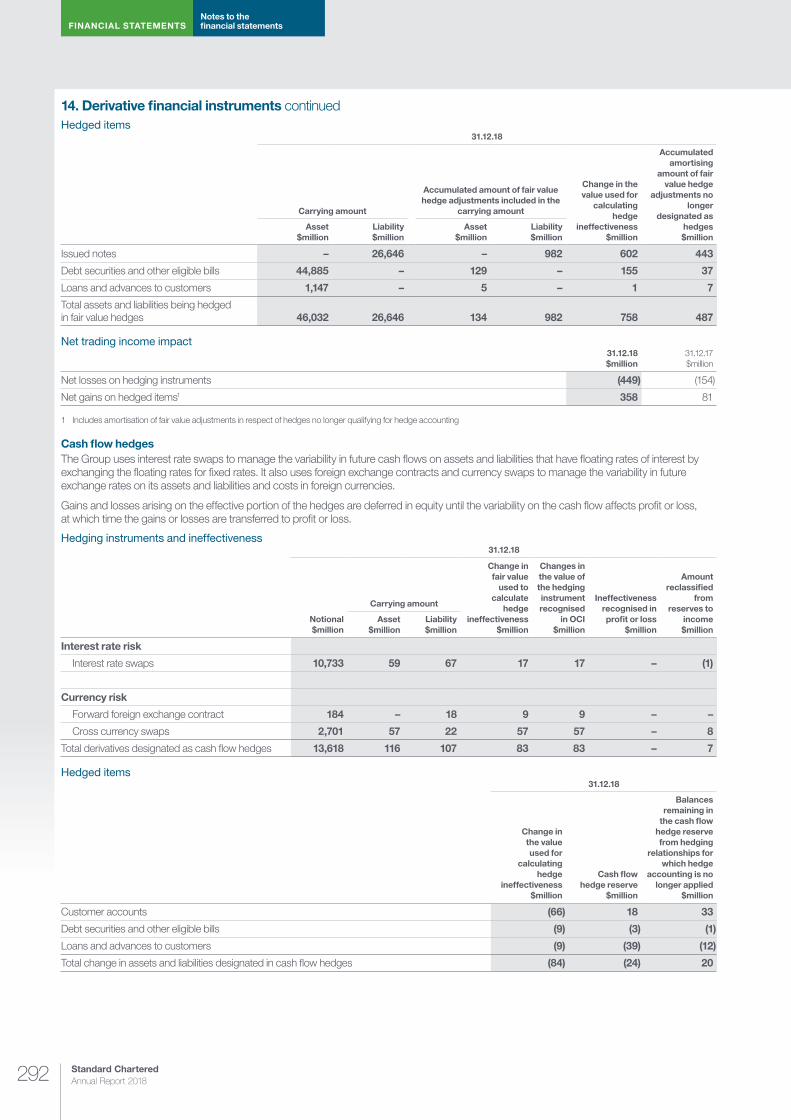
Standard Chartered Annual Report 2018292
FINANCIAL STATEMENTSNotes to the financial statements
14. Derivative financial instruments continuedHedged items
31.12.18
Carrying amount
Accumulated amount of fair value hedge adjustments included in the
carrying amount
Change in the value used for
calculating hedge
ineffectiveness $million
Accumulated amortising
amount of fair value hedge
adjustments no longer
designated as hedges $million
Asset $million
Liability $million
Asset $million
Liability $million
Issued notes – 26,646 – 982 602 443
Debt securities and other eligible bills 44,885 – 129 – 155 37
Loans and advances to customers 1,147 – 5 – 1 7
Total assets and liabilities being hedged in fair value hedges 46,032 26,646 134 982 758 487
Net trading income impact31.12.18 $million
31.12.17 $million
Net losses on hedging instruments (449) (154)
Net gains on hedged items1 358 81
1 Includes amortisation of fair value adjustments in respect of hedges no longer qualifying for hedge accounting
Cash flow hedgesThe Group uses interest rate swaps to manage the variability in future cash flows on assets and liabilities that have floating rates of interest by exchanging the floating rates for fixed rates. It also uses foreign exchange contracts and currency swaps to manage the variability in future exchange rates on its assets and liabilities and costs in foreign currencies.
Gains and losses arising on the effective portion of the hedges are deferred in equity until the variability on the cash flow affects profit or loss, at which time the gains or losses are transferred to profit or loss.
Hedging instruments and ineffectiveness31.12.18
Notional $million
Carrying amount
Change in fair value
used to calculate
hedge ineffectiveness
$million
Changes in the value of the hedging instrument recognised
in OCI $million
Ineffectiveness recognised in profit or loss
$million
Amount reclassified
from reserves to
income $million
Asset $million
Liability $million
Interest rate risk
Interest rate swaps 10,733 59 67 17 17 – (1)
Currency risk
Forward foreign exchange contract 184 – 18 9 9 – –
Cross currency swaps 2,701 57 22 57 57 – 8
Total derivatives designated as cash flow hedges 13,618 116 107 83 83 – 7
Hedged items31.12.18
Change in the value used for
calculating hedge
ineffectiveness $million
Cash flow hedge reserve
$million
Balances remaining in
the cash flow hedge reserve from hedging
relationships for which hedge
accounting is no longer applied
$million
Customer accounts (66) 18 33
Debt securities and other eligible bills (9) (3) (1)
Loans and advances to customers (9) (39) (12)
Total change in assets and liabilities designated in cash flow hedges (84) (24) 20
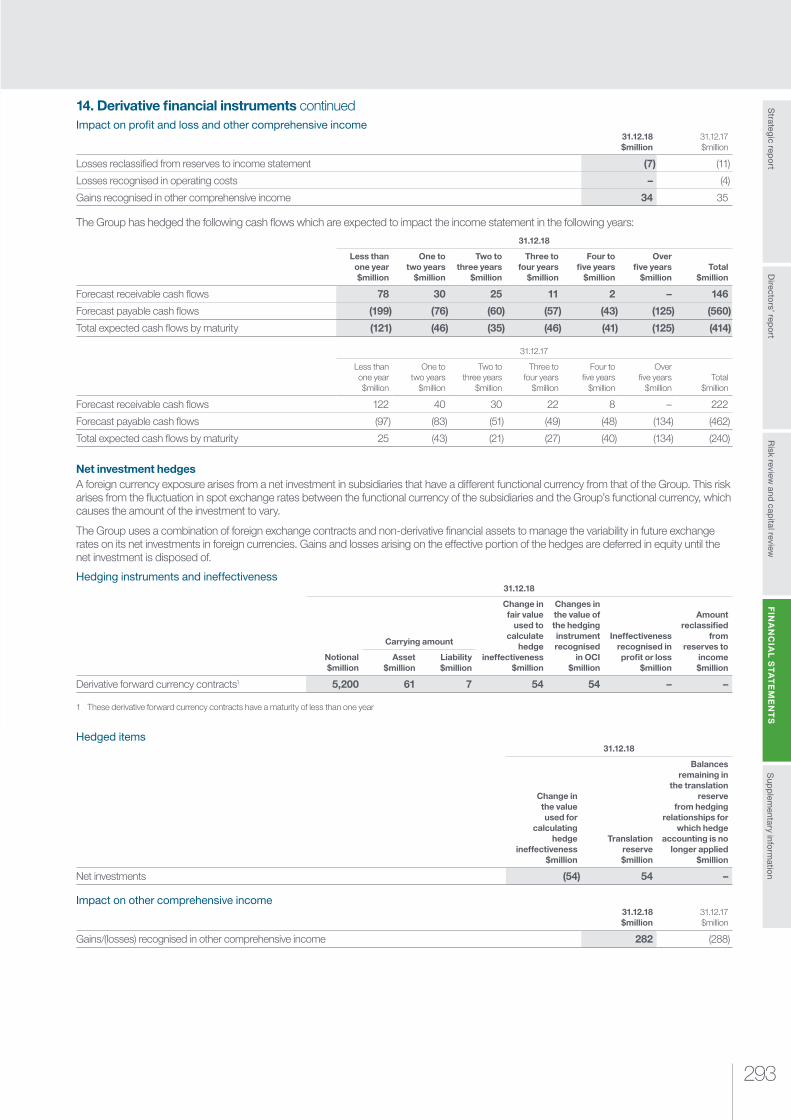
293
Risk review
and capital review
Strategic rep
ort
Sup
plem
entary inform
ation
FIN
AN
CIA
L S
TA
TE
ME
NT
SD
irectors’ rep
ort
14. Derivative financial instruments continuedImpact on pro�t and loss and other comprehensive income
31.12.18 $million
31.12.17 $million
Losses reclassified from reserves to income statement (7) (11)
Losses recognised in operating costs – (4)
Gains recognised in other comprehensive income 34 35
The Group has hedged the following cash flows which are expected to impact the income statement in the following years:
31.12.18
Less than one year $million
One to two years
$million
Two to three years
$million
Three to four years
$million
Four to five years
$million
Over five years
$millionTotal
$million
Forecast receivable cash flows 78 30 25 11 2 – 146
Forecast payable cash flows (199) (76) (60) (57) (43) (125) (560)
Total expected cash flows by maturity (121) (46) (35) (46) (41) (125) (414)
31.12.17
Less than one year $million
One to two years
$million
Two to three years
$million
Three to four years
$million
Four to five years
$million
Over five years
$millionTotal
$million
Forecast receivable cash flows 122 40 30 22 8 – 222
Forecast payable cash flows (97) (83) (51) (49) (48) (134) (462)
Total expected cash flows by maturity 25 (43) (21) (27) (40) (134) (240)
Net investment hedgesA foreign currency exposure arises from a net investment in subsidiaries that have a different functional currency from that of the Group. This risk arises from the fluctuation in spot exchange rates between the functional currency of the subsidiaries and the Group’s functional currency, which causes the amount of the investment to vary.
The Group uses a combination of foreign exchange contracts and non-derivative financial assets to manage the variability in future exchange rates on its net investments in foreign currencies. Gains and losses arising on the effective portion of the hedges are deferred in equity until the net investment is disposed of.
Hedging instruments and ineffectiveness31.12.18
Notional $million
Carrying amount
Change in fair value
used to calculate
hedge ineffectiveness
$million
Changes in the value of the hedging instrument recognised
in OCI $million
Ineffectiveness recognised in profit or loss
$million
Amount reclassified
from reserves to
income $million
Asset $million
Liability $million
Derivative forward currency contracts1 5,200 61 7 54 54 – –
1 These derivative forward currency contracts have a maturity of less than one year
Hedged items31.12.18
Change in the value used for
calculating hedge
ineffectiveness $million
Translation reserve $million
Balances remaining in
the translation reserve
from hedging relationships for
which hedge accounting is no
longer applied $million
Net investments (54) 54 –
Impact on other comprehensive income31.12.18 $million
31.12.17 $million
Gains/(losses) recognised in other comprehensive income 282 (288)

Standard Chartered Annual Report 2018294
FINANCIAL STATEMENTSNotes to the financial statements
15. Loans and advances to banks and customers
Accounting policyRefer to Note 13 Financial instruments for the relevant accounting policy.
31.12.18 $million
31.12.17 $million
Loans and advances to banks 61,420 78,193
Individual impairment provision – (4)
Portfolio impairment provision – (1)
Expected credit loss (6) –
61,414 78,188
Loans and advances to customers 261,455 287,990
Individual impairment provision – (5,237)
Portfolio impairment provision – (465)
Expected credit loss (4,898) –
256,557 282,288
Total loans and advances to banks and customers 317,971 360,476
The Group has outstanding residential mortgage loans to Korea residents of $16.9 billion (31 December 2017: $18.5 billion) and Hong Kong residents of $27.8 billion (31 December 2017: $28.3 billion).
Analysis of loans and advances to customers by geographic region and client segments and related impairment provisions as set out within the Risk review and Capital review (pages 151).
16. Reverse repurchase and repurchase agreements including other similar secured lending and borrowing
Accounting policyThe Group purchases securities (a reverse repurchase agreement – ‘reverse repo’) typically with financial institutions subject to a commitment to resell or return the securities at a predetermined price. These securities are not included in the balance sheet as the Group does not acquire the risks and rewards of ownership, however they are recorded off-balance sheet as collateral received. Consideration paid (or cash collateral provided) is accounted for as a loan asset at amortised cost, unless it is managed on a fair value basis or designated at fair value through profit or loss.
The Group also sells securities (a repurchase agreement – ‘repo’) subject to a commitment to repurchase or redeem the securities at a predetermined price. The securities are retained on the balance sheet as the Group retains substantially all the risks and rewards of ownership and these securities are disclosed as pledged collateral. Consideration received (or cash collateral received) is accounted for as a financial liability at amortised cost, unless it is either mandatorily classified as fair value through profit or loss or irrevocably designated at fair value through profit or loss at initial recognition.
Financial assets are pledged as collateral as part of sales and repurchases, securities borrowing and securitisation transactions under terms that are usual and customary for such activities. The Group is obliged to return equivalent securities.
Repo and reverse repo transactions typically entitle the Group and its counterparties to have recourse to assets similar to those provided as collateral in the event of a default. Securities sold subject to repos, either by way of a Global Master Repurchase Agreement (GMRA), or through a securities sale and Total Return Swap (TRS) continue to be recognised on the balance sheet as the Group retains substantially the associated risks and rewards of the securities (the TRS is not recognised). The counterparty liability is included in deposits by banks or customer accounts, as appropriate. Assets sold under repurchase agreements are considered encumbered as the Group cannot pledge these to obtain funding.
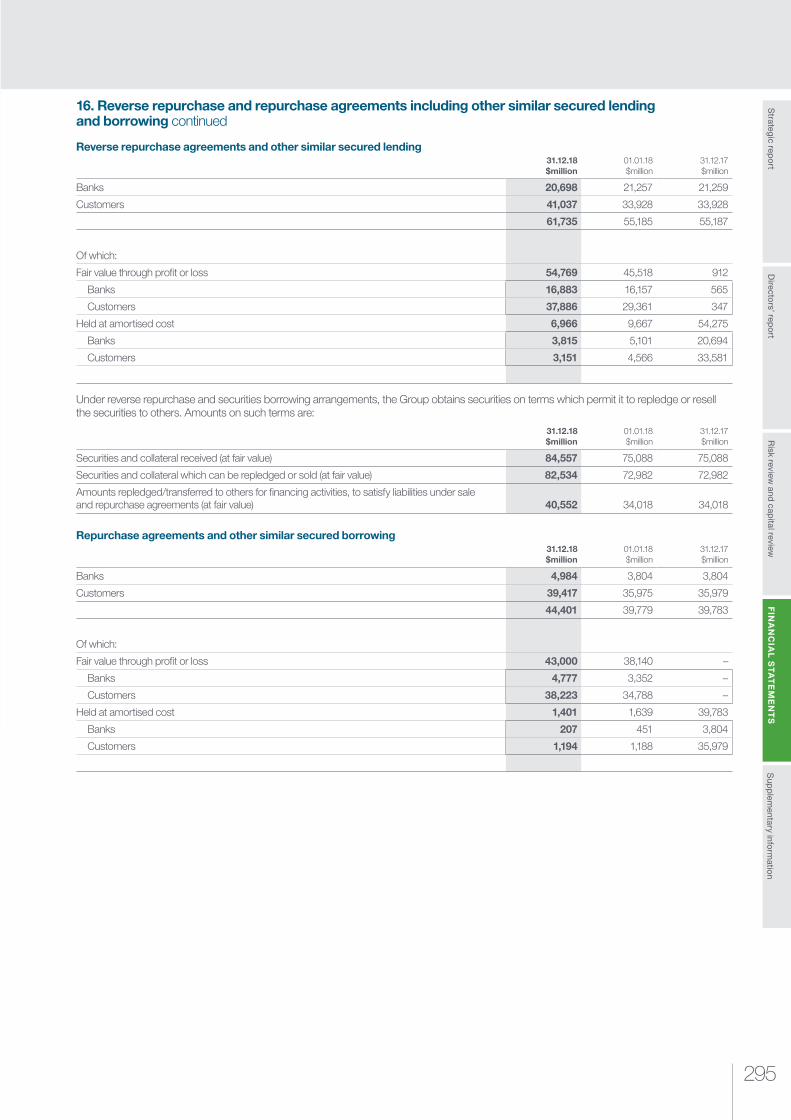
295
Risk review
and capital review
Strategic rep
ort
Sup
plem
entary inform
ation
FIN
AN
CIA
L S
TA
TE
ME
NT
SD
irectors’ rep
ort
16. Reverse repurchase and repurchase agreements including other similar secured lending and borrowing continued
Reverse repurchase agreements and other similar secured lending31.12.18 $million
01.01.18 $million
31.12.17 $million
Banks 20,698 21,257 21,259
Customers 41,037 33,928 33,928
61,735 55,185 55,187
Of which:
Fair value through profit or loss 54,769 45,518 912
Banks 16,883 16,157 565
Customers 37,886 29,361 347
Held at amortised cost 6,966 9,667 54,275
Banks 3,815 5,101 20,694
Customers 3,151 4,566 33,581
Under reverse repurchase and securities borrowing arrangements, the Group obtains securities on terms which permit it to repledge or resell the securities to others. Amounts on such terms are:
31.12.18 $million
01.01.18 $million
31.12.17 $million
Securities and collateral received (at fair value) 84,557 75,088 75,088
Securities and collateral which can be repledged or sold (at fair value) 82,534 72,982 72,982
Amounts repledged/transferred to others for financing activities, to satisfy liabilities under sale and repurchase agreements (at fair value) 40,552 34,018 34,018
Repurchase agreements and other similar secured borrowing31.12.18 $million
01.01.18 $million
31.12.17 $million
Banks 4,984 3,804 3,804
Customers 39,417 35,975 35,979
44,401 39,779 39,783
Of which:
Fair value through profit or loss 43,000 38,140 –
Banks 4,777 3,352 –
Customers 38,223 34,788 –
Held at amortised cost 1,401 1,639 39,783
Banks 207 451 3,804
Customers 1,194 1,188 35,979

Standard Chartered Annual Report 2018296
FINANCIAL STATEMENTSNotes to the financial statements
16. Reverse repurchase and repurchase agreements including other similar secured lending and borrowing continued
Repurchase agreements and other similar secured borrowing continuedThe tables below set out the financial assets provided as collateral for repurchase and other secured borrowing transactions:
Collateral pledged against repurchase agreements
31.12.18
Fair value through
profit or loss $million
Fair value through
other comprehensive
income $million
Amortised cost
$million
Off-balance sheet
$millionTotal
$million
On-balance sheet
Debt securities and other eligible bills 2,060 1,974 49 – 4,083
Off-balance sheet
Repledged collateral received – – – 40,552 40,552
At 31 December 2018 2,060 1,974 49 40,552 44,635
Collateral pledged against repurchase agreements
01.01.18
Fair value through
profit or loss $million
Fair value through
other comprehensive
income $million
Amortised cost
$million
Off-balance sheet
$millionTotal
$million
On-balance sheet
Debt securities and other eligible bills 2,178 3,618 – – 5,796
Off-balance sheet
Repledged collateral received – – – 34,018 34,018
At 1 January 2018 2,178 3,618 – 34,018 39,814
Collateral pledged against repurchase agreements
31.12.17
Fair value through
profit or loss $million
Available for sale $million
Loans and receivables
$million
Off-balance sheet
$millionTotal
$million
On-balance sheet
Debt securities and other eligible bills 2,178 3,618 – – 5,796
Off-balance sheet
Repledged collateral received – – – 34,018 34,018
At 31 December 2017 2,178 3,618 – 34,018 39,814

297
Risk review
and capital review
Strategic rep
ort
Sup
plem
entary inform
ation
FIN
AN
CIA
L S
TA
TE
ME
NT
SD
irectors’ rep
ort
17. Goodwill and intangible assets
Accounting policyGoodwillGoodwill represents the excess of the cost of an acquisition over the fair value of the Group’s share of the identifiable net assets and contingent liabilities of the acquired subsidiary, associate or joint venture at the date of acquisition. Goodwill on acquisitions of subsidiaries is included in Intangible assets. Goodwill on acquisitions of associates is included in Investments in associates. Goodwill included in intangible assets is assessed at each balance sheet date for impairment and carried at cost less any accumulated impairment losses. Gains and losses on the disposal of an entity include the carrying amount of goodwill relating to the entity sold. Detailed calculations are performed based on discounting expected cash flows of the relevant cash generating units (CGUs) and discounting these at an appropriate discount rate, the determination of which requires the exercise of judgement. Goodwill is allocated to CGUs for the purpose of impairment testing. CGUs represent the lowest level within the Group which generate separate cash inflows and at which the goodwill is monitored for internal management purposes. These are equal to or smaller than the Group’s reportable segments (as set out in Note 2) as the Group views its reportable segments on a global basis. The major CGUs to which goodwill has been allocated are set out in the CGU table (page 298).
Signi�cant accounting estimates and judgementsThe carrying amount of goodwill is based on the application of judgements including the basis of goodwill impairment calculation assumptions. Judgement is also applied in determination of cash generating units.
Estimates include forecasts used for determining cash flows for CGUs and discount rates which factor in country risk free rates and applicable risk premiums. The Group undertakes an annual assessment to evaluate whether the carrying value of goodwill on-balance sheet is impaired. The estimation of future cash flows and the level to which they are discounted is inherently uncertain and requires significant judgement and subject to potential change over time.
Acquired intangiblesAt the date of acquisition of a subsidiary or associate, intangible assets which are deemed separable and that arise from contractual or other legal rights are capitalised and included within the net identifiable assets acquired. These intangible assets are initially measured at fair value, which reflects market expectations of the probability that the future economic benefits embodied in the asset will flow to the entity, and are amortised on the basis of their expected useful lives (4 to 16 years). At each balance sheet date, these assets are assessed for indicators of impairment. In the event that an asset’s carrying amount is determined to be greater than its recoverable amount, the asset is written down immediately.
Computer softwareAcquired computer software licences are capitalised on the basis of the costs incurred to acquire and bring to use the specific software. Direct costs of the development of separately identifiable internally generated software are capitalised where it is probable that future economic benefits attributable to the asset will flow from its use (internally generated software). These costs include salaries and wages, materials, service providers and contractors, and directly attributable overheads. Costs incurred in the ongoing maintenance of software are expensed immediately when incurred. Internally generated software is amortised over a three to five year time period.
31.12.18 31.12.17
Goodwill $million
Acquired intangibles
$million
Computer software $million
Total $million
Goodwill $million
Acquired intangibles
$million
Computer software $million
Total $million
Cost
At 1 January 3,252 578 2,529 6,359 3,456 505 1,881 5,842
Exchange translation differences (105) (24) (67) (196) 85 38 152 275
Additions – 1 695 696 31 44 704 779
Disposals – – – – – – (2) (2)
Impairment – – – – (320) – – (320)
Amounts written off – (5) (322) (327) – (9) (206) (215)
Classified as held for sale (31) (40) – (71) – – – –
At 31 December 3,116 510 2,835 6,461 3,252 578 2,529 6,359
Provision for amortisation
At 1 January – 470 876 1,346 – 431 692 1,123
Exchange translation differences – (22) (21) (43) – 35 42 77
Amortisation – 10 363 373 – 11 320 331
Impairment charge – – 46 46 – 2 21 23
Disposals – – – – – – (2) (2)
Amounts written off – – (317) (317) – (9) (197) (206)
At 31 December – 458 947 1,405 – 470 876 1,346
Net book value 3,116 52 1,888 5,056 3,252 108 1,653 5,013
At 31 December 2018, accumulated goodwill impairment losses incurred from 1 January 2005 amounted to $2,801 million (31 December 2017: $2,801 million), of which $nil million was recognised in 2018 (31 December 2017: $320 million).
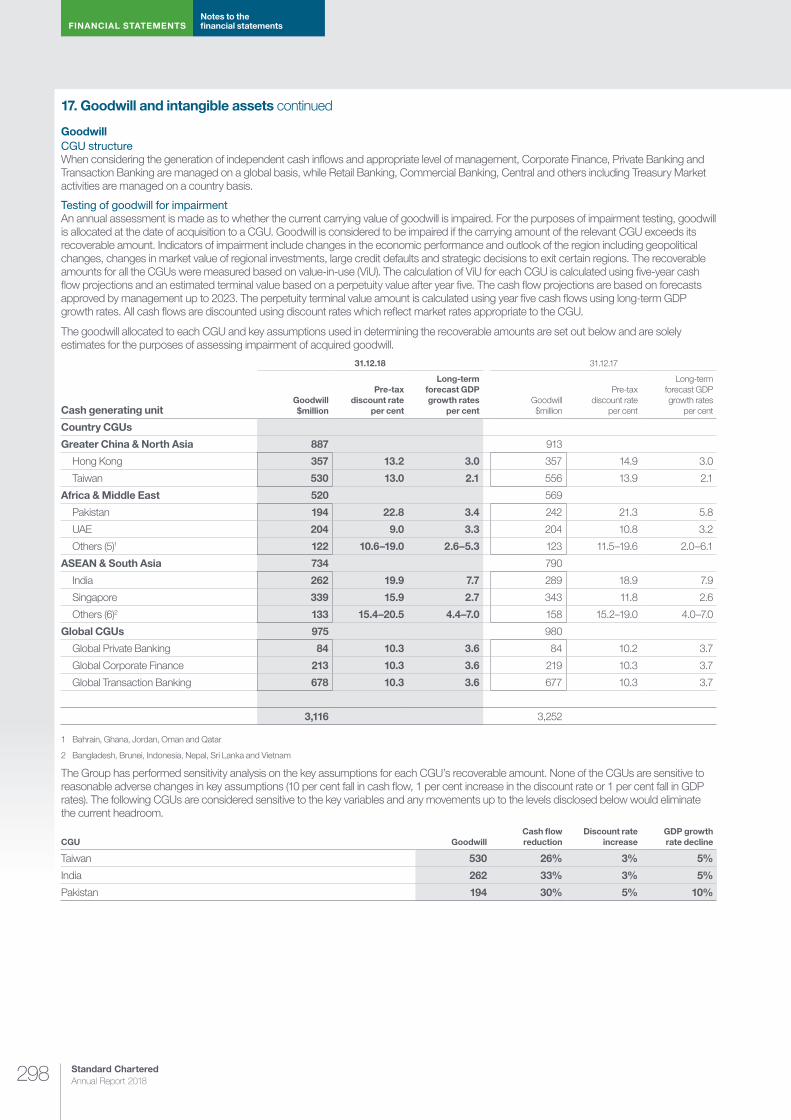
Standard Chartered Annual Report 2018298
FINANCIAL STATEMENTSNotes to the financial statements
17. Goodwill and intangible assets continued
GoodwillCGU structureWhen considering the generation of independent cash inflows and appropriate level of management, Corporate Finance, Private Banking and Transaction Banking are managed on a global basis, while Retail Banking, Commercial Banking, Central and others including Treasury Market activities are managed on a country basis.
Testing of goodwill for impairmentAn annual assessment is made as to whether the current carrying value of goodwill is impaired. For the purposes of impairment testing, goodwill is allocated at the date of acquisition to a CGU. Goodwill is considered to be impaired if the carrying amount of the relevant CGU exceeds its recoverable amount. Indicators of impairment include changes in the economic performance and outlook of the region including geopolitical changes, changes in market value of regional investments, large credit defaults and strategic decisions to exit certain regions. The recoverable amounts for all the CGUs were measured based on value-in-use (ViU). The calculation of ViU for each CGU is calculated using five-year cash flow projections and an estimated terminal value based on a perpetuity value after year five. The cash flow projections are based on forecasts approved by management up to 2023. The perpetuity terminal value amount is calculated using year five cash flows using long-term GDP growth rates. All cash flows are discounted using discount rates which reflect market rates appropriate to the CGU.
The goodwill allocated to each CGU and key assumptions used in determining the recoverable amounts are set out below and are solely estimates for the purposes of assessing impairment of acquired goodwill.
Cash generating unit
31.12.18 31.12.17
Goodwill $million
Pre-tax discount rate
per cent
Long-term forecast GDP growth rates
per centGoodwill $million
Pre-tax discount rate
per cent
Long-term forecast GDP growth rates
per cent
Country CGUs
Greater China & North Asia 887 913
Hong Kong 357 13.2 3.0 357 14.9 3.0
Taiwan 530 13.0 2.1 556 13.9 2.1
Africa & Middle East 520 569
Pakistan 194 22.8 3.4 242 21.3 5.8
UAE 204 9.0 3.3 204 10.8 3.2
Others (5)1 122 10.6–19.0 2.6–5.3 123 11.5–19.6 2.0–6.1
ASEAN & South Asia 734 790
India 262 19.9 7.7 289 18.9 7.9
Singapore 339 15.9 2.7 343 11.8 2.6
Others (6)2 133 15.4–20.5 4.4–7.0 158 15.2–19.0 4.0–7.0
Global CGUs 975 980
Global Private Banking 84 10.3 3.6 84 10.2 3.7
Global Corporate Finance 213 10.3 3.6 219 10.3 3.7
Global Transaction Banking 678 10.3 3.6 677 10.3 3.7
3,116 3,252
1 Bahrain, Ghana, Jordan, Oman and Qatar
2 Bangladesh, Brunei, Indonesia, Nepal, Sri Lanka and Vietnam
The Group has performed sensitivity analysis on the key assumptions for each CGU’s recoverable amount. None of the CGUs are sensitive to reasonable adverse changes in key assumptions (10 per cent fall in cash flow, 1 per cent increase in the discount rate or 1 per cent fall in GDP rates). The following CGUs are considered sensitive to the key variables and any movements up to the levels disclosed below would eliminate the current headroom.
CGU GoodwillCash flow reduction
Discount rate increase
GDP growth rate decline
Taiwan 530 26% 3% 5%
India 262 33% 3% 5%
Pakistan 194 30% 5% 10%
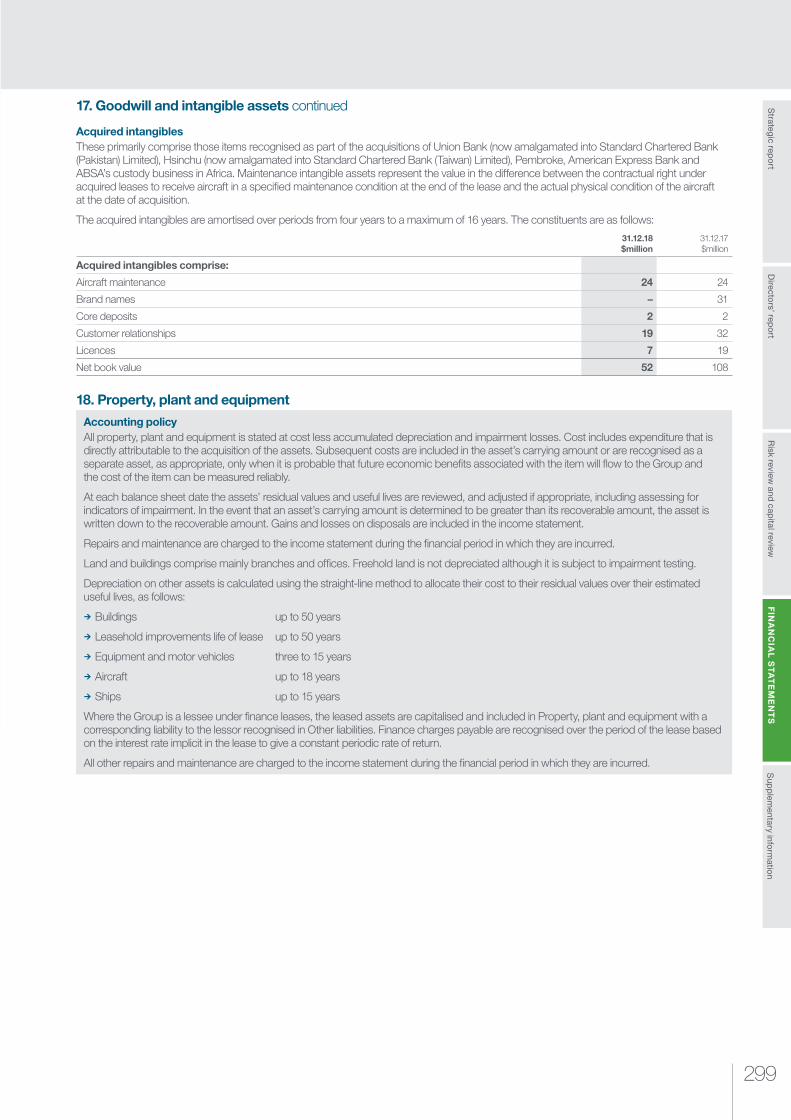
299
Risk review
and capital review
Strategic rep
ort
Sup
plem
entary inform
ation
FIN
AN
CIA
L S
TA
TE
ME
NT
SD
irectors’ rep
ort
17. Goodwill and intangible assets continued
Acquired intangiblesThese primarily comprise those items recognised as part of the acquisitions of Union Bank (now amalgamated into Standard Chartered Bank (Pakistan) Limited), Hsinchu (now amalgamated into Standard Chartered Bank (Taiwan) Limited), Pembroke, American Express Bank and ABSA’s custody business in Africa. Maintenance intangible assets represent the value in the difference between the contractual right under acquired leases to receive aircraft in a specified maintenance condition at the end of the lease and the actual physical condition of the aircraft at the date of acquisition.
The acquired intangibles are amortised over periods from four years to a maximum of 16 years. The constituents are as follows:
31.12.18 $million
31.12.17 $million
Acquired intangibles comprise:
Aircraft maintenance 24 24
Brand names – 31
Core deposits 2 2
Customer relationships 19 32
Licences 7 19
Net book value 52 108
18. Property, plant and equipment
Accounting policyAll property, plant and equipment is stated at cost less accumulated depreciation and impairment losses. Cost includes expenditure that is directly attributable to the acquisition of the assets. Subsequent costs are included in the asset’s carrying amount or are recognised as a separate asset, as appropriate, only when it is probable that future economic benefits associated with the item will flow to the Group and the cost of the item can be measured reliably.
At each balance sheet date the assets’ residual values and useful lives are reviewed, and adjusted if appropriate, including assessing for indicators of impairment. In the event that an asset’s carrying amount is determined to be greater than its recoverable amount, the asset is written down to the recoverable amount. Gains and losses on disposals are included in the income statement.
Repairs and maintenance are charged to the income statement during the financial period in which they are incurred.
Land and buildings comprise mainly branches and offices. Freehold land is not depreciated although it is subject to impairment testing.
Depreciation on other assets is calculated using the straight-line method to allocate their cost to their residual values over their estimated useful lives, as follows:
¼ Buildings up to 50 years
¼ Leasehold improvements life of lease up to 50 years
¼ Equipment and motor vehicles three to 15 years
¼ Aircraft up to 18 years
¼ Ships up to 15 years
Where the Group is a lessee under finance leases, the leased assets are capitalised and included in Property, plant and equipment with a corresponding liability to the lessor recognised in Other liabilities. Finance charges payable are recognised over the period of the lease based on the interest rate implicit in the lease to give a constant periodic rate of return.
All other repairs and maintenance are charged to the income statement during the financial period in which they are incurred.

Standard Chartered Annual Report 2018300
FINANCIAL STATEMENTSNotes to the financial statements
18. Property, plant and equipment continued31.12.18 31.12.17
Premises $million
Equipment $million
Operating lease assets
$millionTotal
$millionPremises
$millionEquipment
$million
Operating lease assets
$millionTotal
$million
Cost or valuation
At 1 January 2,216 767 7,000 9,983 2,117 699 6,982 9,798
Exchange translation differences (80) (38) (8) (126) 119 31 2 152
Additions 461 1251 866 1,037 61 104 1,603 1,768
Disposals and fully depreciated assets written off (92)2 (87)2 (1,244) (1,423) (75) (66) (1,587) (1,728)
Transfers to assets held for sale (20) (1) (291) (312) (6) (1) – (7)
As at 31 December 2,070 766 6,323 9,159 2,216 767 7,000 9,983
Depreciation
Accumulated at 1 January 753 513 1,506 2,772 713 474 1,359 2,546
Exchange translation differences (25) (26) (9) (60) 27 21 1 49
Charge for the year 86 94 304 484 85 85 328 498
Impairment (release)/charge (5) – 1553 150 (8) – 145 137
Attributable to assets sold, transferred or written off (91)2 (86)2 (358) (535) (58) (65) (327) (450)
Transfers to assets held for sale (12) (1) (129) (142) (6) (2) – (8)
Accumulated at 31 December 706 494 1,469 2,669 753 513 1,506 2,772
Net book amount at 31 December 1,364 272 4,854 6,490 1,463 254 5,494 7,211
1 Refer to the cash flow statement premises and equipment under the investing activities segment (page 240) $171 million (31 December 2017: $165 million) for purchase of property, plant and equipment
2 Disposals for property, plant and equipment during the period $85 million (31 December 2017: $29 million) in the cash flow statement would include the gains and losses incurred as part of other operating income (Note 6) on disposal of assets during the period and the net book value disposed
3 During the year, an impairment charge of $155 million (31 December 2017: $145 million) was recognised in respect of aircraft and ships held as operating lease assets, as the ViU or current market value (CMV) of the assets was lower than the net book value
Operating lease assetsAssets leased to customers under operating leases consist of commercial aircraft and ships which are included within property, plant and equipment. At 31 December 2018, these assets had a net book value of $4,854 million (31 December 2017: $5,494 million).
31.12.18 Minimum lease
receivables under operating
leases falling due:
$million
31.12.17 Minimum lease
receivables under operating
leases falling due:
$million
Within one year 527 564
Later than one year and not later than five years 1,712 1,881
After five years 997 1,228
3,236 3,673
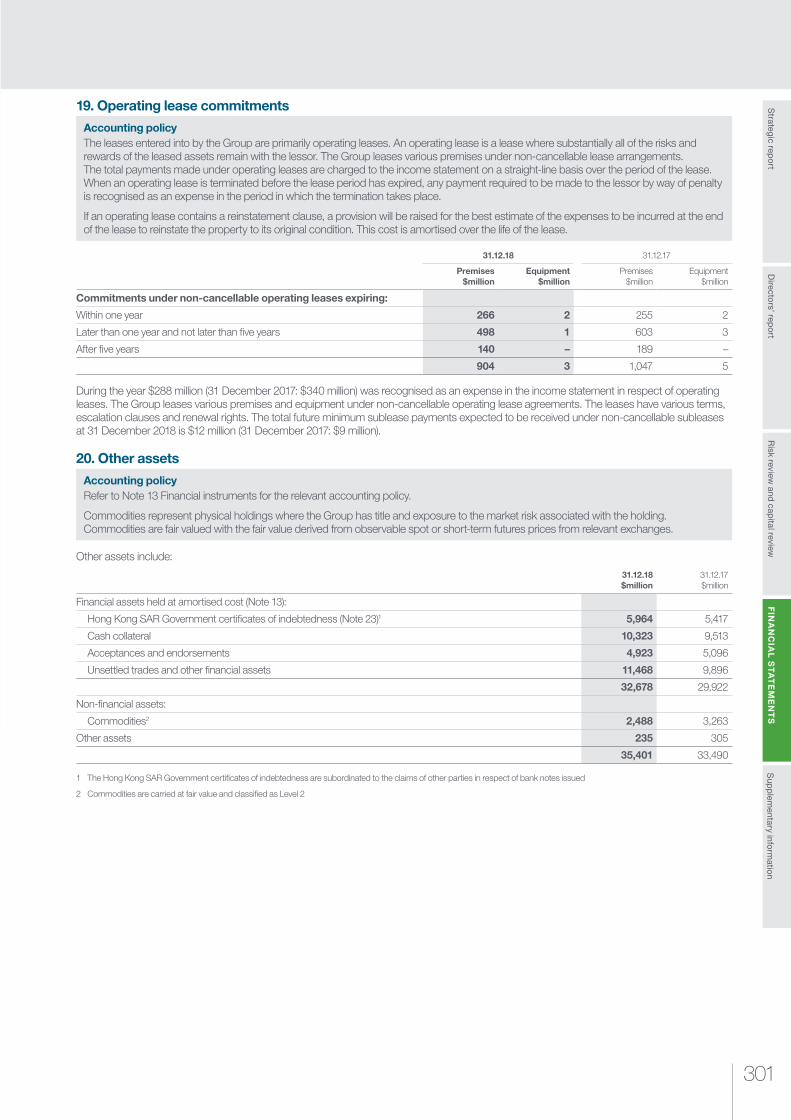
301
Risk review
and capital review
Strategic rep
ort
Sup
plem
entary inform
ation
FIN
AN
CIA
L S
TA
TE
ME
NT
SD
irectors’ rep
ort
19. Operating lease commitments
Accounting policyThe leases entered into by the Group are primarily operating leases. An operating lease is a lease where substantially all of the risks and rewards of the leased assets remain with the lessor. The Group leases various premises under non-cancellable lease arrangements. The total payments made under operating leases are charged to the income statement on a straight-line basis over the period of the lease. When an operating lease is terminated before the lease period has expired, any payment required to be made to the lessor by way of penalty is recognised as an expense in the period in which the termination takes place.
If an operating lease contains a reinstatement clause, a provision will be raised for the best estimate of the expenses to be incurred at the end of the lease to reinstate the property to its original condition. This cost is amortised over the life of the lease.
31.12.18 31.12.17
Premises $million
Equipment $million
Premises $million
Equipment $million
Commitments under non-cancellable operating leases expiring:
Within one year 266 2 255 2
Later than one year and not later than five years 498 1 603 3
After five years 140 – 189 –
904 3 1,047 5
During the year $288 million (31 December 2017: $340 million) was recognised as an expense in the income statement in respect of operating leases. The Group leases various premises and equipment under non-cancellable operating lease agreements. The leases have various terms, escalation clauses and renewal rights. The total future minimum sublease payments expected to be received under non-cancellable subleases at 31 December 2018 is $12 million (31 December 2017: $9 million).
20. Other assets
Accounting policyRefer to Note 13 Financial instruments for the relevant accounting policy.
Commodities represent physical holdings where the Group has title and exposure to the market risk associated with the holding. Commodities are fair valued with the fair value derived from observable spot or short-term futures prices from relevant exchanges.
Other assets include:
31.12.18 $million
31.12.17 $million
Financial assets held at amortised cost (Note 13):
Hong Kong SAR Government certificates of indebtedness (Note 23)1 5,964 5,417
Cash collateral 10,323 9,513
Acceptances and endorsements 4,923 5,096
Unsettled trades and other financial assets 11,468 9,896
32,678 29,922
Non-financial assets:
Commodities2 2,488 3,263
Other assets 235 305
35,401 33,490
1 The Hong Kong SAR Government certificates of indebtedness are subordinated to the claims of other parties in respect of bank notes issued
2 Commodities are carried at fair value and classified as Level 2

Standard Chartered Annual Report 2018302
FINANCIAL STATEMENTSNotes to the financial statements
21. Assets held for sale and associated liabilities
Accounting policyFinancial instruments can be reclassified as held for sale if they are non-current assets or if they are part of a disposal group; however, the measurement provisions for the financial instruments remain governed by the requirements of IFRS 9 Financial Instruments: Recognition and Measurement. Refer to Note 13 Financial instruments for the relevant accounting policy.
Non-current assets are classified as held for sale and measured at the lower of their carrying amount and fair value less cost to sell when:
a) Their carrying amounts will be recovered principally through sale
b) They are available for immediate sale in their present condition
c) Their sale is highly probable
Immediately before the initial classification as held for sale, the carrying amounts of the assets are measured in accordance with the applicable accounting policies related to the asset or liability before reclassification as held for sale.
The assets below have been presented as held for sale following the approval of Group management and the transactions are expected to complete in 2019.
The financial assets held at fair value through profit or loss reported below are classified under Level 1 $82 million, Level 2 $14 million and Level 3 $791 million (31 December 2017: $466 million).
Assets held for sale31.12.18 $million
31.12.17 $million
Debt securities 14 47
Equity shares 873 419
Financial assets held at fair value through profit or loss1 887 466
Loans and advances to banks 112 –
Loans and advances to customers 23 2
Debt securities held at amortised cost – 60
Financial assets held at amortised cost 135 62
Goodwill and intangible assets 71 –
Property, plant and equipment2 170 13
Others 65 4
1,328 545
1 Principal Finance assets of $887 million (31 December 2017: $216 million), classified as financial assets held at fair value through profit or loss comprising of debt securities ($14 million) and equity shares ($873 million), is expected to be disposed of by the end of 2019
2 Aircraft classified as held for sale by Pembroke Air Leasing Finance for $162 million (31 December 2017: nil) is included within property, plant and equipment
Reported below are the associated financial liabilities held for sale of the Principal Finance business amounting to $198 million (31 December 2017: nil), all of which are classified under Level 3. The transactions are expected to complete in 2019.
Liabilities held for sale31.12.18 $million
31.12.17 $million
Derivative financial instruments1 198
Financial liabilities held at fair value through profit or loss 198 –
Other liabilities 48 –
Provisions for liabilities and charges 1 –
247 –
1 The derivative liability is a fixed price forward sale contract to sell the Principal Finance assets
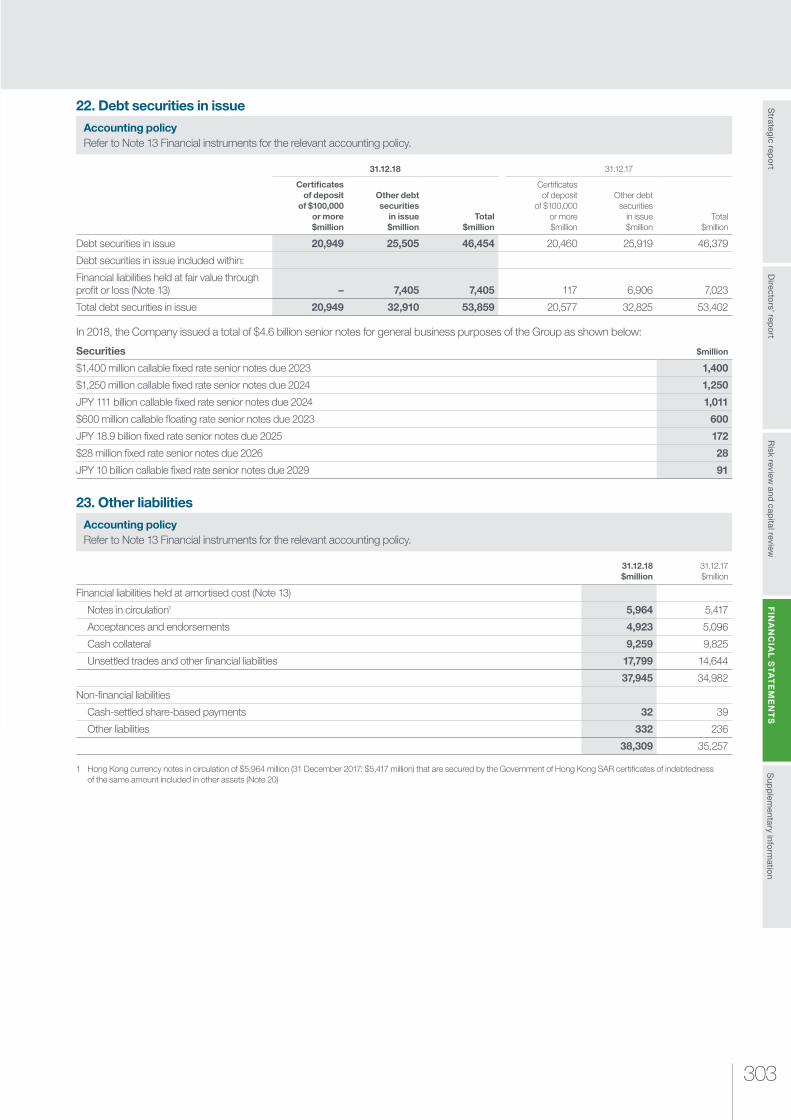
303
Risk review
and capital review
Strategic rep
ort
Sup
plem
entary inform
ation
FIN
AN
CIA
L S
TA
TE
ME
NT
SD
irectors’ rep
ort
22. Debt securities in issue
Accounting policyRefer to Note 13 Financial instruments for the relevant accounting policy.
31.12.18 31.12.17
Certificates of deposit
of $100,000 or more $million
Other debt securities
in issue $million
Total $million
Certificates of deposit
of $100,000 or more $million
Other debt securities
in issue $million
Total $million
Debt securities in issue 20,949 25,505 46,454 20,460 25,919 46,379
Debt securities in issue included within:
Financial liabilities held at fair value through profit or loss (Note 13) – 7,405 7,405 117 6,906 7,023
Total debt securities in issue 20,949 32,910 53,859 20,577 32,825 53,402
In 2018, the Company issued a total of $4.6 billion senior notes for general business purposes of the Group as shown below:
Securities $million
$1,400 million callable fixed rate senior notes due 2023 1,400
$1,250 million callable fixed rate senior notes due 2024 1,250
JPY 111 billion callable fixed rate senior notes due 2024 1,011
$600 million callable floating rate senior notes due 2023 600
JPY 18.9 billion fixed rate senior notes due 2025 172
$28 million fixed rate senior notes due 2026 28
JPY 10 billion callable fixed rate senior notes due 2029 91
23. Other liabilities
Accounting policyRefer to Note 13 Financial instruments for the relevant accounting policy.
31.12.18 $million
31.12.17 $million
Financial liabilities held at amortised cost (Note 13)
Notes in circulation1 5,964 5,417
Acceptances and endorsements 4,923 5,096
Cash collateral 9,259 9,825
Unsettled trades and other financial liabilities 17,799 14,644
37,945 34,982
Non-financial liabilities
Cash-settled share-based payments 32 39
Other liabilities 332 236
38,309 35,257
1 Hong Kong currency notes in circulation of $5,964 million (31 December 2017: $5,417 million) that are secured by the Government of Hong Kong SAR certificates of indebtedness of the same amount included in other assets (Note 20)
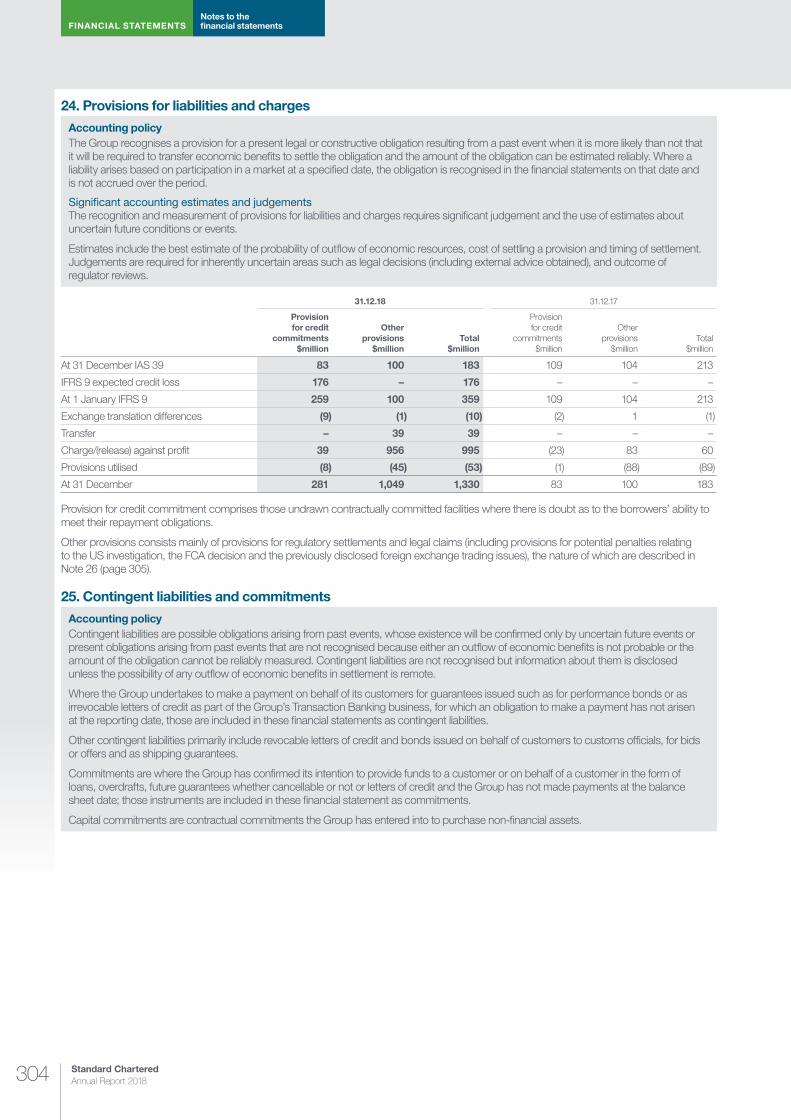
Standard Chartered Annual Report 2018304
FINANCIAL STATEMENTSNotes to the financial statements
24. Provisions for liabilities and charges
Accounting policyThe Group recognises a provision for a present legal or constructive obligation resulting from a past event when it is more likely than not that it will be required to transfer economic benefits to settle the obligation and the amount of the obligation can be estimated reliably. Where a liability arises based on participation in a market at a specified date, the obligation is recognised in the financial statements on that date and is not accrued over the period.
Signi�cant accounting estimates and judgementsThe recognition and measurement of provisions for liabilities and charges requires significant judgement and the use of estimates about uncertain future conditions or events.
Estimates include the best estimate of the probability of outflow of economic resources, cost of settling a provision and timing of settlement. Judgements are required for inherently uncertain areas such as legal decisions (including external advice obtained), and outcome of regulator reviews.
31.12.18 31.12.17
Provision for credit
commitments $million
Other provisions
$millionTotal
$million
Provision for credit
commitments $million
Other provisions
$millionTotal
$million
At 31 December IAS 39 83 100 183 109 104 213
IFRS 9 expected credit loss 176 – 176 – – –
At 1 January IFRS 9 259 100 359 109 104 213
Exchange translation differences (9) (1) (10) (2) 1 (1)
Transfer – 39 39 – – –
Charge/(release) against profit 39 956 995 (23) 83 60
Provisions utilised (8) (45) (53) (1) (88) (89)
At 31 December 281 1,049 1,330 83 100 183
Provision for credit commitment comprises those undrawn contractually committed facilities where there is doubt as to the borrowers’ ability to meet their repayment obligations.
Other provisions consists mainly of provisions for regulatory settlements and legal claims (including provisions for potential penalties relating to the US investigation, the FCA decision and the previously disclosed foreign exchange trading issues), the nature of which are described in Note 26 (page 305).
25. Contingent liabilities and commitments
Accounting policyContingent liabilities are possible obligations arising from past events, whose existence will be confirmed only by uncertain future events or present obligations arising from past events that are not recognised because either an outflow of economic benefits is not probable or the amount of the obligation cannot be reliably measured. Contingent liabilities are not recognised but information about them is disclosed unless the possibility of any outflow of economic benefits in settlement is remote.
Where the Group undertakes to make a payment on behalf of its customers for guarantees issued such as for performance bonds or as irrevocable letters of credit as part of the Group’s Transaction Banking business, for which an obligation to make a payment has not arisen at the reporting date, those are included in these financial statements as contingent liabilities.
Other contingent liabilities primarily include revocable letters of credit and bonds issued on behalf of customers to customs officials, for bids or offers and as shipping guarantees.
Commitments are where the Group has confirmed its intention to provide funds to a customer or on behalf of a customer in the form of loans, overdrafts, future guarantees whether cancellable or not or letters of credit and the Group has not made payments at the balance sheet date; those instruments are included in these financial statement as commitments.
Capital commitments are contractual commitments the Group has entered into to purchase non-financial assets.
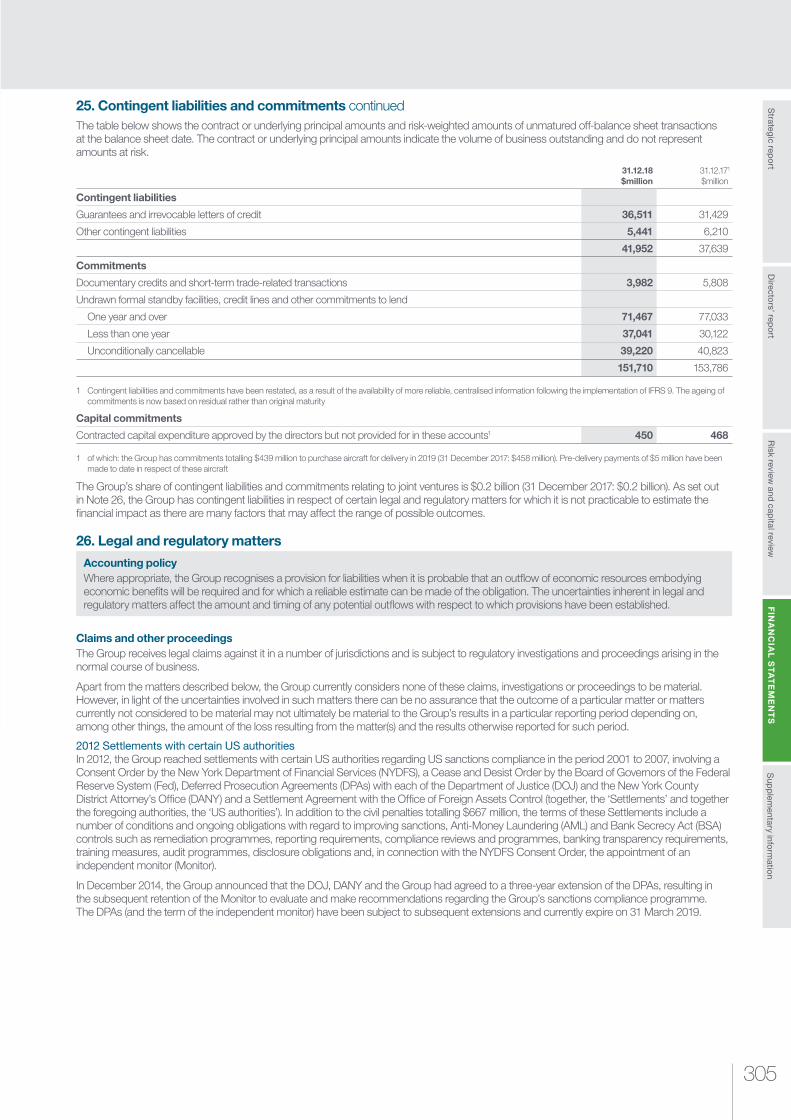
305
Risk review
and capital review
Strategic rep
ort
Sup
plem
entary inform
ation
FIN
AN
CIA
L S
TA
TE
ME
NT
SD
irectors’ rep
ort
25. Contingent liabilities and commitments continuedThe table below shows the contract or underlying principal amounts and risk-weighted amounts of unmatured off-balance sheet transactions at the balance sheet date. The contract or underlying principal amounts indicate the volume of business outstanding and do not represent amounts at risk.
31.12.18 $million
31.12.171
$million
Contingent liabilities
Guarantees and irrevocable letters of credit 36,511 31,429
Other contingent liabilities 5,441 6,210
41,952 37,639
Commitments
Documentary credits and short-term trade-related transactions 3,982 5,808
Undrawn formal standby facilities, credit lines and other commitments to lend
One year and over 71,467 77,033
Less than one year 37,041 30,122
Unconditionally cancellable 39,220 40,823
151,710 153,786
1 Contingent liabilities and commitments have been restated, as a result of the availability of more reliable, centralised information following the implementation of IFRS 9. The ageing of commitments is now based on residual rather than original maturity
Capital commitments
Contracted capital expenditure approved by the directors but not provided for in these accounts1 450 468
1 of which: the Group has commitments totalling $439 million to purchase aircraft for delivery in 2019 (31 December 2017: $458 million). Pre-delivery payments of $5 million have been made to date in respect of these aircraft
The Group’s share of contingent liabilities and commitments relating to joint ventures is $0.2 billion (31 December 2017: $0.2 billion). As set out in Note 26, the Group has contingent liabilities in respect of certain legal and regulatory matters for which it is not practicable to estimate the financial impact as there are many factors that may affect the range of possible outcomes.
26. Legal and regulatory matters
Accounting policyWhere appropriate, the Group recognises a provision for liabilities when it is probable that an outflow of economic resources embodying economic benefits will be required and for which a reliable estimate can be made of the obligation. The uncertainties inherent in legal and regulatory matters affect the amount and timing of any potential outflows with respect to which provisions have been established.
Claims and other proceedingsThe Group receives legal claims against it in a number of jurisdictions and is subject to regulatory investigations and proceedings arising in the normal course of business.
Apart from the matters described below, the Group currently considers none of these claims, investigations or proceedings to be material. However, in light of the uncertainties involved in such matters there can be no assurance that the outcome of a particular matter or matters currently not considered to be material may not ultimately be material to the Group’s results in a particular reporting period depending on, among other things, the amount of the loss resulting from the matter(s) and the results otherwise reported for such period.
2012 Settlements with certain US authoritiesIn 2012, the Group reached settlements with certain US authorities regarding US sanctions compliance in the period 2001 to 2007, involving a Consent Order by the New York Department of Financial Services (NYDFS), a Cease and Desist Order by the Board of Governors of the Federal Reserve System (Fed), Deferred Prosecution Agreements (DPAs) with each of the Department of Justice (DOJ) and the New York County District Attorney’s Office (DANY) and a Settlement Agreement with the Office of Foreign Assets Control (together, the ‘Settlements’ and together the foregoing authorities, the ‘US authorities’). In addition to the civil penalties totalling $667 million, the terms of these Settlements include a number of conditions and ongoing obligations with regard to improving sanctions, Anti-Money Laundering (AML) and Bank Secrecy Act (BSA) controls such as remediation programmes, reporting requirements, compliance reviews and programmes, banking transparency requirements, training measures, audit programmes, disclosure obligations and, in connection with the NYDFS Consent Order, the appointment of an independent monitor (Monitor).
In December 2014, the Group announced that the DOJ, DANY and the Group had agreed to a three-year extension of the DPAs, resulting in the subsequent retention of the Monitor to evaluate and make recommendations regarding the Group’s sanctions compliance programme. The DPAs (and the term of the independent monitor) have been subject to subsequent extensions and currently expire on 31 March 2019.

Standard Chartered Annual Report 2018306
FINANCIAL STATEMENTSNotes to the financial statements
26. Legal and regulatory matters continued
Claims and other proceedings continued2014 Settlement with NYDFSIn August 2014, the Group announced that it had reached a final settlement with the NYDFS regarding deficiencies in the AML transaction surveillance system in its New York branch (the ‘Branch’). The system, which is separate from the sanctions screening process, is one part of the Group’s overall financial crime controls and is designed to alert the Branch to unusual transaction patterns that require further investigation on a post-transaction basis.
The settlement provisions included a civil monetary penalty of $300 million; various remediation requirements and the appointment of the Monitor which eventually expired on 31 December 2018.
In November 2018, the Group announced it had agreed to engage an independent consultant selected by the NYDFS for up to one year with a possible extension for up to one additional year to provide guidance in connection with tasks necessary to complete the remediation contemplated by the 2012 and 2014 Consent Orders.
2019 Settlement relating to FX tradingIn January 2019, the Group reached a settlement with the NYDFS regarding past control failures and improper conduct related to the Group’s FX trading and sales business between 2007 and 2013. As part of this settlement the Group agreed to pay a civil monetary penalty of $40 million to the NYDFS. A provision has been made in these financial statements for the previously disclosed investigations relating to the FX trading issues including the January 2019 settlement with the NYDFS.
Investigations into legacy �nancial crime control issues The Group has received a decision notice from the Regulatory Decisions Committee of the Financial Conduct Authority (FCA) relating to the previously disclosed investigation by the FCA concerning the Group’s historical financial crime control issues, and is considering its options in relation to this decision notice, including the possibility of an appeal. The decision notice imposes a penalty of £102 million (net of early settlement discount) on the Group. This investigation had been focused on the effectiveness and governance of those historical financial crime controls from 2009 through 2014 within the correspondent banking business carried out by the Group’s London branch, particularly in relation to the business carried on with respondent banks from outside the European Economic Area, and the effectiveness and governance of those controls in one of the Group’s overseas branches and the oversight exercised at Group level over those controls.
The Group continues its discussions relating to the potential resolution of an investigation by the US authorities relating to historical violations of US sanctions laws and regulations. In contrast to the 2012 settlements, which focused on the period before the Group’s 2007 decision to stop doing new business with known Iranian parties, this investigation is focused on examining the extent to which conduct and control failures permitted clients with Iranian interests to conduct transactions through Standard Chartered Bank after 2007. The vast majority of the issues under investigation pre-date 2012 and none occurred after 2014.
The resolution of the US investigation may involve a range of civil and criminal penalties including substantial monetary penalties combined with other compliance measures such as remediation requirements and/or business restrictions.
A provision has been made in these financial statements for the penalty in the FCA decision notice and potential penalties relating to the investigation by the US authorities. This provision reflects management’s current view of the appropriate level of provision. Resolution of the US investigation and the FCA process might ultimately result in a different level of penalties.
Other proceedingsSince November 2014, seven lawsuits have been filed in the United States District Courts for the Southern and Eastern Districts of New York against a number of banks (including Standard Chartered Bank) on behalf of plaintiffs who are, or are relatives of, victims of various terrorist attacks in Iraq. Five of the lawsuits were filed in late December 2018. The plaintiffs allege that the defendant banks aided and abetted the unlawful conduct of US sanctioned parties in breach of the US Anti-Terrorism Act. The lawsuits are at an early procedural stage, with motions to dismiss pending in two of the seven lawsuits. Based on the facts currently known, it is not possible for the Group to predict the outcome of these lawsuits.
The Director of Public Prosecutions (DPP) and related agencies in Kenya are investigating Standard Chartered Kenya Limited (SCBK) and other banks in connection with the alleged theft of funds from Kenya’s State Department of Public Service, Youth and Gender Affairs. This investigation follows fines being imposed on those banks, including SCBK, by the Central Bank of Kenya regarding adequacy of controls related to the processing of the allegedly stolen funds. The DPP has announced that it has received recommendations from the Kenyan Directorate of Criminal Investigations that charges should be brought against a number of banks, including SCBK, bank officials and other individuals. The Group does not know whether any charges will be brought, but there may be penalties or other financial consequences for SCBK in connection with this investigation.
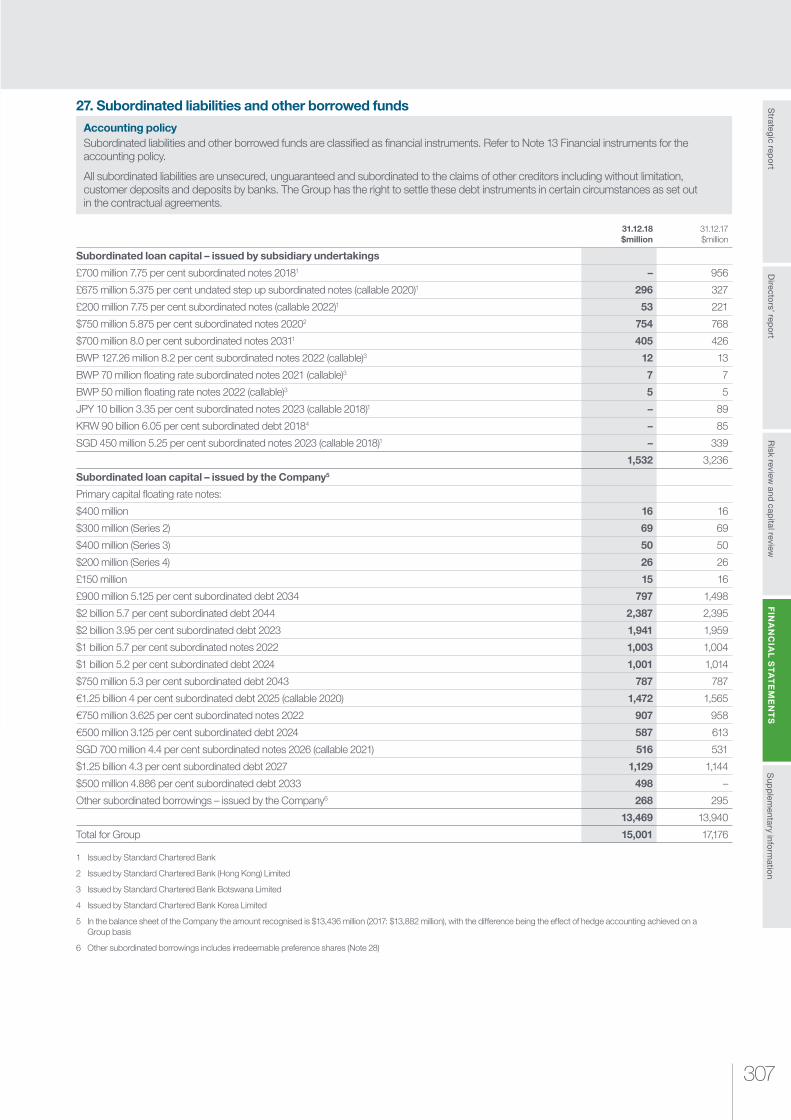
307
Risk review
and capital review
Strategic rep
ort
Sup
plem
entary inform
ation
FIN
AN
CIA
L S
TA
TE
ME
NT
SD
irectors’ rep
ort
27. Subordinated liabilities and other borrowed funds
Accounting policy Subordinated liabilities and other borrowed funds are classified as financial instruments. Refer to Note 13 Financial instruments for the accounting policy.
All subordinated liabilities are unsecured, unguaranteed and subordinated to the claims of other creditors including without limitation, customer deposits and deposits by banks. The Group has the right to settle these debt instruments in certain circumstances as set out in the contractual agreements.
31.12.18 $million
31.12.17 $million
Subordinated loan capital – issued by subsidiary undertakings
£700 million 7.75 per cent subordinated notes 20181 – 956
£675 million 5.375 per cent undated step up subordinated notes (callable 2020)1 296 327
£200 million 7.75 per cent subordinated notes (callable 2022)1 53 221
$750 million 5.875 per cent subordinated notes 20202 754 768
$700 million 8.0 per cent subordinated notes 20311 405 426
BWP 127.26 million 8.2 per cent subordinated notes 2022 (callable)3 12 13
BWP 70 million floating rate subordinated notes 2021 (callable)3 7 7
BWP 50 million floating rate notes 2022 (callable)3 5 5
JPY 10 billion 3.35 per cent subordinated notes 2023 (callable 2018)1 – 89
KRW 90 billion 6.05 per cent subordinated debt 20184 – 85
SGD 450 million 5.25 per cent subordinated notes 2023 (callable 2018)1 – 339
1,532 3,236
Subordinated loan capital – issued by the Company5
Primary capital floating rate notes:
$400 million 16 16
$300 million (Series 2) 69 69
$400 million (Series 3) 50 50
$200 million (Series 4) 26 26
£150 million 15 16
£900 million 5.125 per cent subordinated debt 2034 797 1,498
$2 billion 5.7 per cent subordinated debt 2044 2,387 2,395
$2 billion 3.95 per cent subordinated debt 2023 1,941 1,959
$1 billion 5.7 per cent subordinated notes 2022 1,003 1,004
$1 billion 5.2 per cent subordinated debt 2024 1,001 1,014
$750 million 5.3 per cent subordinated debt 2043 787 787
€1.25 billion 4 per cent subordinated debt 2025 (callable 2020) 1,472 1,565
€750 million 3.625 per cent subordinated notes 2022 907 958
€500 million 3.125 per cent subordinated debt 2024 587 613
SGD 700 million 4.4 per cent subordinated notes 2026 (callable 2021) 516 531
$1.25 billion 4.3 per cent subordinated debt 2027 1,129 1,144
$500 million 4.886 per cent subordinated debt 2033 498 –
Other subordinated borrowings – issued by the Company6 268 295
13,469 13,940
Total for Group 15,001 17,176
1 Issued by Standard Chartered Bank
2 Issued by Standard Chartered Bank (Hong Kong) Limited
3 Issued by Standard Chartered Bank Botswana Limited
4 Issued by Standard Chartered Bank Korea Limited
5 In the balance sheet of the Company the amount recognised is $13,436 million (2017: $13,882 million), with the difference being the effect of hedge accounting achieved on a Group basis
6 Other subordinated borrowings includes irredeemable preference shares (Note 28)

Standard Chartered Annual Report 2018308
FINANCIAL STATEMENTSNotes to the financial statements
27. Subordinated liabilities and other borrowed funds continued31.12.18
USD $million
GBP $million
EUR $million
Others $million
Total $million
Fixed rate subordinated debt 9,905 1,414 2,966 528 14,813
Floating rate subordinated debt 161 15 – 12 188
Total 10,066 1,429 2,966 540 15,001
31.12.17
USD $million
GBP $million
EUR $million
Others $million
Total $million
Fixed rate subordinated debt 9,497 3,297 3,136 1,057 16,987
Floating rate subordinated debt 161 16 – 12 189
Total 9,658 3,313 3,136 1,069 17,176
Redemptions and repurchases during the periodOn 19 March 2018, Standard Chartered Bank Korea Limited redeemed KRW90 billion 6.05 per cent subordinated debt 2018 on its maturity.
On 3 April 2018, Standard Chartered Bank redeemed £700m 7.75 per cent subordinated notes 2018 on its maturity.
On 10 April 2018, Standard Chartered Bank exercised its right to redeem SGD450 million 5.25 per cent subordinated notes 2023 (callable 2018).
On 18 April 2018, Standard Chartered Bank exercised its right to redeem JPY10 billion 3.35 per cent subordinated notes 2023 (callable 2018).
On 14 June 2018, Standard Chartered Bank repurchased in part, £95.1 million of its £200 million 7.75 per cent subordinated notes (callable 2022).
On 14 June 2018, Standard Chartered PLC repurchased in part, £372.5 million of its £900 million 5.125 per cent subordinated debt 2034.
Issuances during the periodOn 15 March 2018, Standard Chartered PLC issued $500 million 4.866 per cent subordinated debt 2033 (callable 2028).
28. Share capital, other equity instruments and reserves
Accounting policyFinancial instruments issued are classified as equity when there is no contractual obligation to transfer cash, other financial assets or issue available number of own equity instruments. Incremental costs directly attributable to the issue of new shares or options are shown in equity as a deduction, net of tax, from the proceeds.
Securities which carry a discretionary coupon and have no fixed maturity or redemption date are classified as other equity instruments. Interest payments on these securities are recognised, net of tax, as distributions from equity in the period in which they are paid.
Where the Company or other members of the consolidated Group purchase the Company’s equity share capital, the consideration paid is deducted from the total shareholders’ equity of the Group and/or of the Company as treasury shares until they are cancelled. Where such shares are subsequently sold or reissued, any consideration received is included in shareholders’ equity of the Group and/or the Company.
Number of ordinary shares
millions
Ordinary share capital1
millions
Share premium2
millions
Total share capital and share
premium millions
Other equity instruments
millions
At 1 January 2017 3,284 1,642 5,449 7,091 3,969
Shares issued 12 6 – 6 992
At 31 December 2017 3,296 1,648 5,449 7,097 4,961
Capitalised on scrip dividend 2 1 (1) – –
Shares issued 10 5 9 14 –
At 31 December 2018 3,308 1,654 5,457 7,111 4,961
1 Issued and fully paid ordinary shares of 50 cents each
2 Includes $1,494 million of share premium relating to preference capital

309
Risk review
and capital review
Strategic rep
ort
Sup
plem
entary inform
ation
FIN
AN
CIA
L S
TA
TE
ME
NT
SD
irectors’ rep
ort
28. Share capital, other equity instruments and reserves continued
Ordinary share capital In accordance with the Companies Act 2006 the Company does not have authorised share capital. The nominal value of each ordinary share is 50 cents.
On 17 May 2018, the Company issued 1,354,700 new ordinary shares instead of the 2017 final dividend. On 22 October 2018, the Company issued 876,126 new ordinary shares instead of the 2018 interim dividend.
During the period 10,008,515 shares were issued under employee share plans at prices between nil and 620 pence.
Preference share capitalAt 31 December 2018, the Company has 15,000 $5 non-cumulative redeemable preference shares in issue, with a premium of $99,995 making a paid up amount per preference share of $100,000. The preference shares are redeemable at the option of the Company and are classified in equity.
The available profits of the Company are distributed to the holders of the issued preference shares in priority to payments made to holders of the ordinary shares and in priority to, or pari passu with, any payments to the holders of any other class of shares in issue. On a winding up, the assets of the Company are applied to the holders of the preference shares in priority to any payment to the ordinary shareholders and in priority to, or pari passu with, the holders of any other shares in issue, for an amount equal to any dividends accrued and/or payable and the nominal value of the shares together with any premium as determined by the Board. The redeemable preference shares are redeemable at the paid up amount (which includes premium) at the option of the Company in accordance with the terms of the shares. The holders of the preference shares are not entitled to attend or vote at any general meeting except where any relevant dividend due is not paid in full or where a resolution is proposed varying the rights of the preference shares.
Other equity instrumentsOn 2 April 2015, Standard Chartered PLC issued $2,000 million Fixed Rate Resetting Perpetual Subordinated Contingent Convertible Securities as Additional Tier 1 (AT1) securities, raising $1,987 million after issue costs. On 18 August 2016, Standard Chartered PLC issued a further $2,000 million Fixed Rate Resetting Perpetual Subordinated Contingent Convertible Securities as AT1 securities, raising $1,982 million after issue costs. On 18 January 2017, Standard Chartered PLC issued a further $1,000 million Fixed Rate Resetting Perpetual Subordinated Contingent Convertible Securities as AT1 securities, raising $992 million after issue costs. All the issuances were made for general business purposes and to increase the regulatory capital base of the Group.
The principal terms of the AT1 securities are described below:
¼ The securities are perpetual and redeemable, at the option of Standard Chartered PLC in whole but not in part, on the first interest reset date and each date falling five years after the first reset date
¼ The securities are also redeemable for certain regulatory or tax reasons on any date at 100 per cent of their principal amount together with any accrued but unpaid interest up to (but excluding) the date fixed for redemption. Any redemption is subject to Standard Chartered PLC giving notice to the relevant regulator and the regulator granting permission to redeem
¼ The interest rate in respect of the securities issued on 2 April 2015 for the period from (and including) the issue date to (but excluding) 2 April 2020 is a fixed rate of 6.50 per cent per annum. The first reset date for the interest rate is 2 April 2020 and each date falling five, or an integral multiple of five years after the first reset date
¼ The interest rate in respect of the securities issued on 18 August 2016 for the period from (and including) the issue date to (but excluding) 2 April 2022 is a fixed rate of 7.50 per cent per annum. The first reset date for the interest rate is 2 April 2022 and each date falling five years, or an integral multiple of five years, after the first reset date
¼ The interest rate in respect of the securities issued on 18 January 2017 for the period from (and including) the issue date to (but excluding) 2 April 2023 is a fixed rate of 7.75 per cent per annum. The first reset date for the interest rate is 2 April 2023 and each date falling five years, or an integral multiple of five years, after the first reset date
¼ The interest on each of the securities will be payable semi-annually in arrears on 2 April and 2 October in each year, accounted for as a dividend
¼ Interest on the securities is due and payable only at the sole and absolute discretion of Standard Chartered PLC, subject to certain additional restrictions set out in the terms and conditions. Accordingly, Standard Chartered PLC may at any time elect to cancel any interest payment (or part thereof) which would otherwise be payable on any interest payment date
¼ The securities convert into ordinary shares of Standard Chartered PLC, at a pre-determined price, should the fully loaded Common Equity Tier 1 ratio of the Group fall below 7.0 per cent. Approximately 572 million ordinary shares would be required to satisfy the conversion of all the securities mentioned above
The securities rank behind the claims against Standard Chartered PLC of (a) unsubordinated creditors, (b) which are expressed to be subordinated to the claims of unsubordinated creditors of Standard Chartered PLC but not further or otherwise; or (c) which are, or are expressed to be, junior to the claims of other creditors of Standard Chartered PLC, whether subordinated or unsubordinated, other than claims which rank, or are expressed to rank, pari passu with, or junior to, the claims of holders of the AT1 securities in a winding–up occurring prior to the conversion trigger.
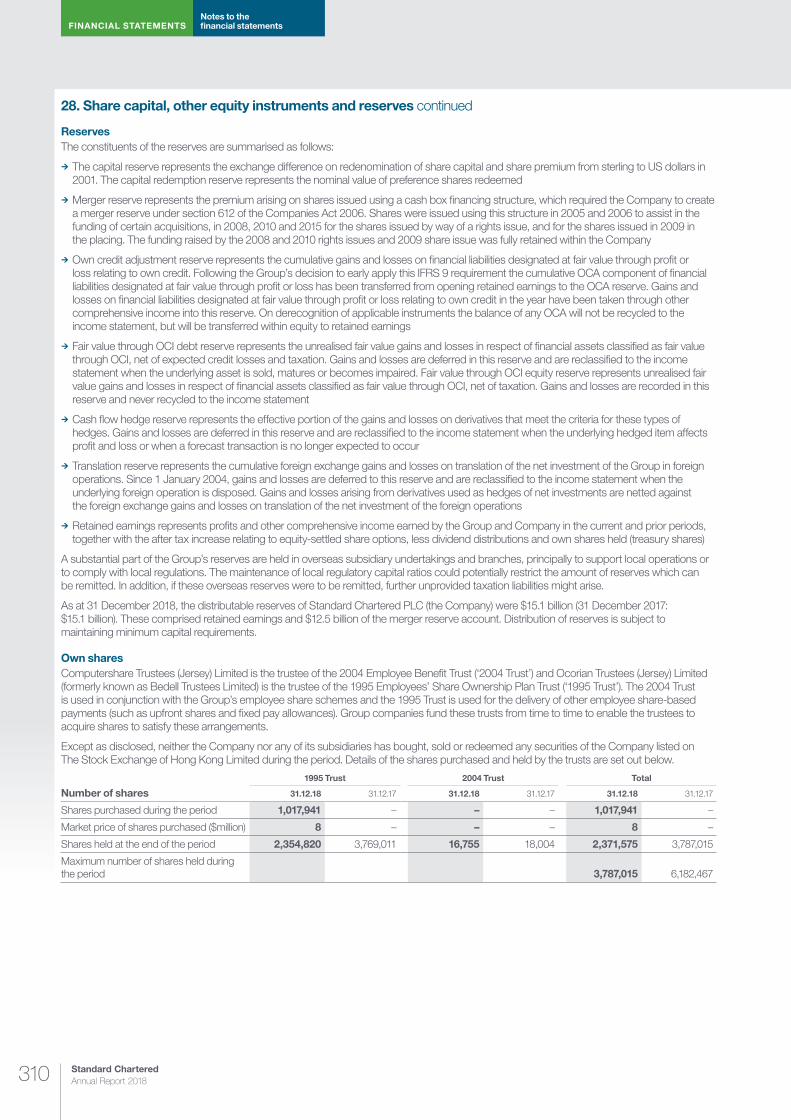
Standard Chartered Annual Report 2018310
FINANCIAL STATEMENTSNotes to the financial statements
28. Share capital, other equity instruments and reserves continued
ReservesThe constituents of the reserves are summarised as follows:
¼ The capital reserve represents the exchange difference on redenomination of share capital and share premium from sterling to US dollars in 2001. The capital redemption reserve represents the nominal value of preference shares redeemed
¼ Merger reserve represents the premium arising on shares issued using a cash box financing structure, which required the Company to create a merger reserve under section 612 of the Companies Act 2006. Shares were issued using this structure in 2005 and 2006 to assist in the funding of certain acquisitions, in 2008, 2010 and 2015 for the shares issued by way of a rights issue, and for the shares issued in 2009 in the placing. The funding raised by the 2008 and 2010 rights issues and 2009 share issue was fully retained within the Company
¼ Own credit adjustment reserve represents the cumulative gains and losses on financial liabilities designated at fair value through profit or loss relating to own credit. Following the Group’s decision to early apply this IFRS 9 requirement the cumulative OCA component of financial liabilities designated at fair value through profit or loss has been transferred from opening retained earnings to the OCA reserve. Gains and losses on financial liabilities designated at fair value through profit or loss relating to own credit in the year have been taken through other comprehensive income into this reserve. On derecognition of applicable instruments the balance of any OCA will not be recycled to the income statement, but will be transferred within equity to retained earnings
¼ Fair value through OCI debt reserve represents the unrealised fair value gains and losses in respect of financial assets classified as fair value through OCI, net of expected credit losses and taxation. Gains and losses are deferred in this reserve and are reclassified to the income statement when the underlying asset is sold, matures or becomes impaired. Fair value through OCI equity reserve represents unrealised fair value gains and losses in respect of financial assets classified as fair value through OCI, net of taxation. Gains and losses are recorded in this reserve and never recycled to the income statement
¼ Cash flow hedge reserve represents the effective portion of the gains and losses on derivatives that meet the criteria for these types of hedges. Gains and losses are deferred in this reserve and are reclassified to the income statement when the underlying hedged item affects profit and loss or when a forecast transaction is no longer expected to occur
¼ Translation reserve represents the cumulative foreign exchange gains and losses on translation of the net investment of the Group in foreign operations. Since 1 January 2004, gains and losses are deferred to this reserve and are reclassified to the income statement when the underlying foreign operation is disposed. Gains and losses arising from derivatives used as hedges of net investments are netted against the foreign exchange gains and losses on translation of the net investment of the foreign operations
¼ Retained earnings represents profits and other comprehensive income earned by the Group and Company in the current and prior periods, together with the after tax increase relating to equity-settled share options, less dividend distributions and own shares held (treasury shares)
A substantial part of the Group’s reserves are held in overseas subsidiary undertakings and branches, principally to support local operations or to comply with local regulations. The maintenance of local regulatory capital ratios could potentially restrict the amount of reserves which can be remitted. In addition, if these overseas reserves were to be remitted, further unprovided taxation liabilities might arise.
As at 31 December 2018, the distributable reserves of Standard Chartered PLC (the Company) were $15.1 billion (31 December 2017: $15.1 billion). These comprised retained earnings and $12.5 billion of the merger reserve account. Distribution of reserves is subject to maintaining minimum capital requirements.
Own sharesComputershare Trustees (Jersey) Limited is the trustee of the 2004 Employee Benefit Trust (‘2004 Trust’) and Ocorian Trustees (Jersey) Limited (formerly known as Bedell Trustees Limited) is the trustee of the 1995 Employees’ Share Ownership Plan Trust (‘1995 Trust’). The 2004 Trust is used in conjunction with the Group’s employee share schemes and the 1995 Trust is used for the delivery of other employee share-based payments (such as upfront shares and fixed pay allowances). Group companies fund these trusts from time to time to enable the trustees to acquire shares to satisfy these arrangements.
Except as disclosed, neither the Company nor any of its subsidiaries has bought, sold or redeemed any securities of the Company listed on The Stock Exchange of Hong Kong Limited during the period. Details of the shares purchased and held by the trusts are set out below.
Number of shares1995 Trust 2004 Trust Total
31.12.18 31.12.17 31.12.18 31.12.17 31.12.18 31.12.17
Shares purchased during the period 1,017,941 – – – 1,017,941 –
Market price of shares purchased ($million) 8 – – – 8 –
Shares held at the end of the period 2,354,820 3,769,011 16,755 18,004 2,371,575 3,787,015
Maximum number of shares held during the period 3,787,015 6,182,467
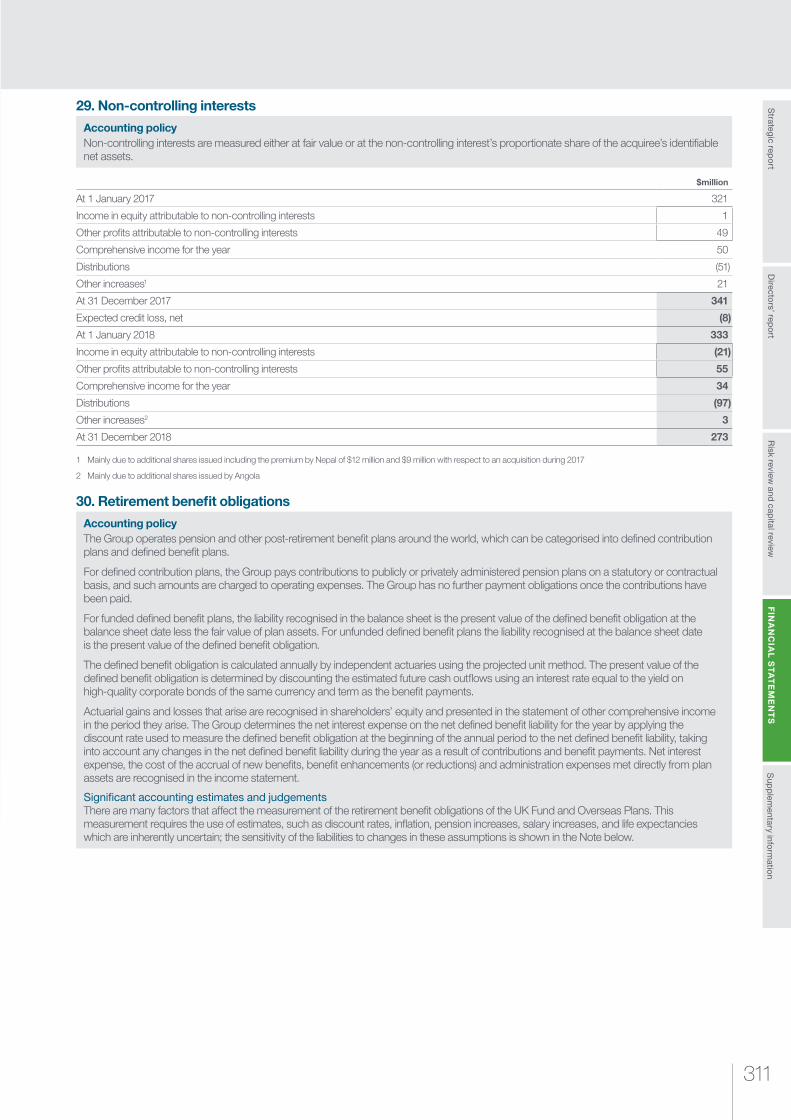
311
Risk review
and capital review
Strategic rep
ort
Sup
plem
entary inform
ation
FIN
AN
CIA
L S
TA
TE
ME
NT
SD
irectors’ rep
ort
29. Non-controlling interests
Accounting policyNon-controlling interests are measured either at fair value or at the non-controlling interest’s proportionate share of the acquiree’s identifiable net assets.
$million
At 1 January 2017 321
Income in equity attributable to non-controlling interests 1
Other profits attributable to non-controlling interests 49
Comprehensive income for the year 50
Distributions (51)
Other increases1 21
At 31 December 2017 341
Expected credit loss, net (8)
At 1 January 2018 333
Income in equity attributable to non-controlling interests (21)
Other profits attributable to non-controlling interests 55
Comprehensive income for the year 34
Distributions (97)
Other increases2 3
At 31 December 2018 273
1 Mainly due to additional shares issued including the premium by Nepal of $12 million and $9 million with respect to an acquisition during 2017
2 Mainly due to additional shares issued by Angola
30. Retirement benefit obligations
Accounting policyThe Group operates pension and other post-retirement benefit plans around the world, which can be categorised into defined contribution plans and defined benefit plans.
For defined contribution plans, the Group pays contributions to publicly or privately administered pension plans on a statutory or contractual basis, and such amounts are charged to operating expenses. The Group has no further payment obligations once the contributions have been paid.
For funded defined benefit plans, the liability recognised in the balance sheet is the present value of the defined benefit obligation at the balance sheet date less the fair value of plan assets. For unfunded defined benefit plans the liability recognised at the balance sheet date is the present value of the defined benefit obligation.
The defined benefit obligation is calculated annually by independent actuaries using the projected unit method. The present value of the defined benefit obligation is determined by discounting the estimated future cash outflows using an interest rate equal to the yield on high-quality corporate bonds of the same currency and term as the benefit payments.
Actuarial gains and losses that arise are recognised in shareholders’ equity and presented in the statement of other comprehensive income in the period they arise. The Group determines the net interest expense on the net defined benefit liability for the year by applying the discount rate used to measure the defined benefit obligation at the beginning of the annual period to the net defined benefit liability, taking into account any changes in the net defined benefit liability during the year as a result of contributions and benefit payments. Net interest expense, the cost of the accrual of new benefits, benefit enhancements (or reductions) and administration expenses met directly from plan assets are recognised in the income statement.
Signi�cant accounting estimates and judgementsThere are many factors that affect the measurement of the retirement benefit obligations of the UK Fund and Overseas Plans. This measurement requires the use of estimates, such as discount rates, inflation, pension increases, salary increases, and life expectancies which are inherently uncertain; the sensitivity of the liabilities to changes in these assumptions is shown in the Note below.
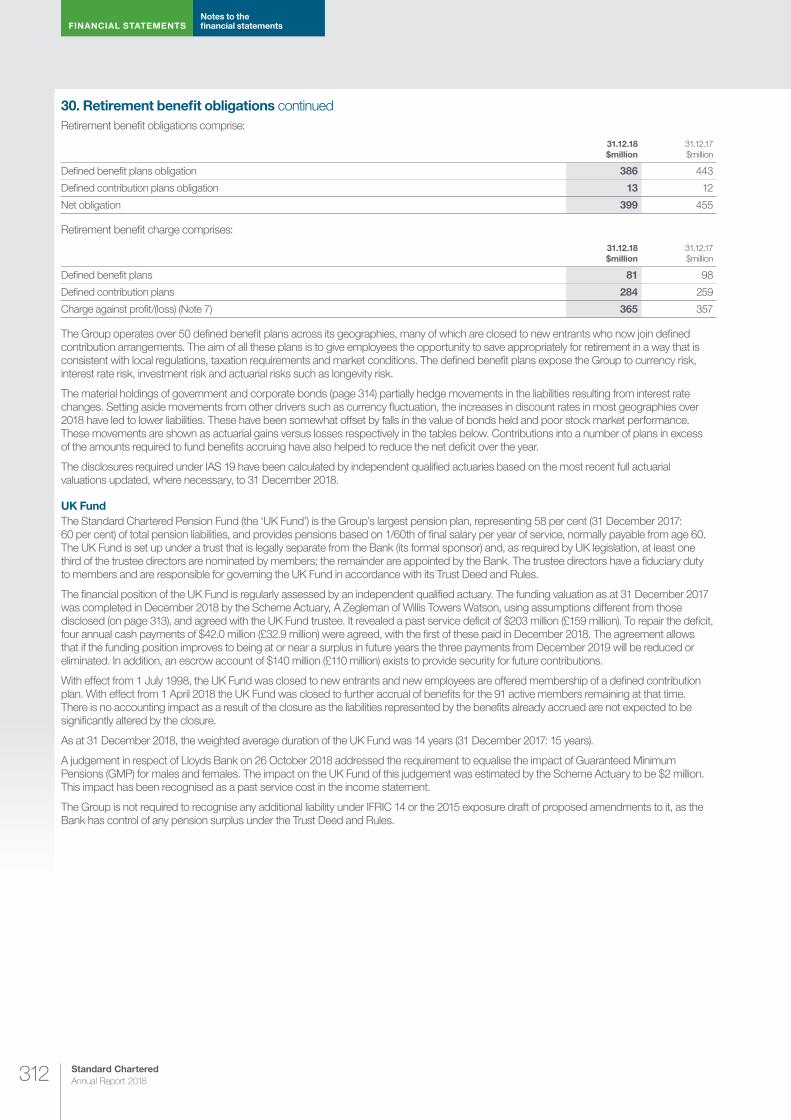
Standard Chartered Annual Report 2018312
FINANCIAL STATEMENTSNotes to the financial statements
30. Retirement benefit obligations continuedRetirement benefit obligations comprise:
31.12.18 $million
31.12.17 $million
Defined benefit plans obligation 386 443
Defined contribution plans obligation 13 12
Net obligation 399 455
Retirement benefit charge comprises:
31.12.18 $million
31.12.17 $million
Defined benefit plans 81 98
Defined contribution plans 284 259
Charge against profit/(loss) (Note 7) 365 357
The Group operates over 50 defined benefit plans across its geographies, many of which are closed to new entrants who now join defined contribution arrangements. The aim of all these plans is to give employees the opportunity to save appropriately for retirement in a way that is consistent with local regulations, taxation requirements and market conditions. The defined benefit plans expose the Group to currency risk, interest rate risk, investment risk and actuarial risks such as longevity risk.
The material holdings of government and corporate bonds (page 314) partially hedge movements in the liabilities resulting from interest rate changes. Setting aside movements from other drivers such as currency fluctuation, the increases in discount rates in most geographies over 2018 have led to lower liabilities. These have been somewhat offset by falls in the value of bonds held and poor stock market performance. These movements are shown as actuarial gains versus losses respectively in the tables below. Contributions into a number of plans in excess of the amounts required to fund benefits accruing have also helped to reduce the net deficit over the year.
The disclosures required under IAS 19 have been calculated by independent qualified actuaries based on the most recent full actuarial valuations updated, where necessary, to 31 December 2018.
UK FundThe Standard Chartered Pension Fund (the ‘UK Fund’) is the Group’s largest pension plan, representing 58 per cent (31 December 2017: 60 per cent) of total pension liabilities, and provides pensions based on 1/60th of final salary per year of service, normally payable from age 60. The UK Fund is set up under a trust that is legally separate from the Bank (its formal sponsor) and, as required by UK legislation, at least one third of the trustee directors are nominated by members; the remainder are appointed by the Bank. The trustee directors have a fiduciary duty to members and are responsible for governing the UK Fund in accordance with its Trust Deed and Rules.
The financial position of the UK Fund is regularly assessed by an independent qualified actuary. The funding valuation as at 31 December 2017 was completed in December 2018 by the Scheme Actuary, A Zegleman of Willis Towers Watson, using assumptions different from those disclosed (on page 313), and agreed with the UK Fund trustee. It revealed a past service deficit of $203 million (£159 million). To repair the deficit, four annual cash payments of $42.0 million (£32.9 million) were agreed, with the first of these paid in December 2018. The agreement allows that if the funding position improves to being at or near a surplus in future years the three payments from December 2019 will be reduced or eliminated. In addition, an escrow account of $140 million (£110 million) exists to provide security for future contributions.
With effect from 1 July 1998, the UK Fund was closed to new entrants and new employees are offered membership of a defined contribution plan. With effect from 1 April 2018 the UK Fund was closed to further accrual of benefits for the 91 active members remaining at that time. There is no accounting impact as a result of the closure as the liabilities represented by the benefits already accrued are not expected to be significantly altered by the closure.
As at 31 December 2018, the weighted average duration of the UK Fund was 14 years (31 December 2017: 15 years).
A judgement in respect of Lloyds Bank on 26 October 2018 addressed the requirement to equalise the impact of Guaranteed Minimum Pensions (GMP) for males and females. The impact on the UK Fund of this judgement was estimated by the Scheme Actuary to be $2 million. This impact has been recognised as a past service cost in the income statement.
The Group is not required to recognise any additional liability under IFRIC 14 or the 2015 exposure draft of proposed amendments to it, as the Bank has control of any pension surplus under the Trust Deed and Rules.
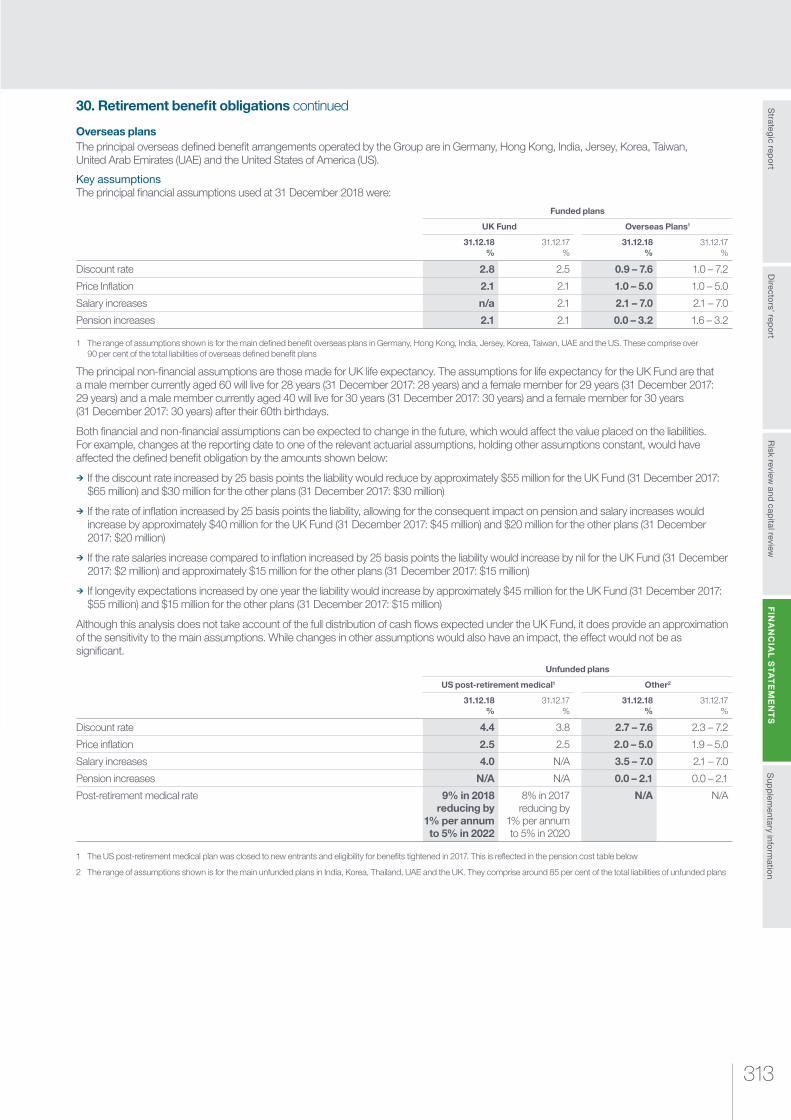
313
Risk review
and capital review
Strategic rep
ort
Sup
plem
entary inform
ation
FIN
AN
CIA
L S
TA
TE
ME
NT
SD
irectors’ rep
ort
30. Retirement benefit obligations continued
Overseas plansThe principal overseas defined benefit arrangements operated by the Group are in Germany, Hong Kong, India, Jersey, Korea, Taiwan, United Arab Emirates (UAE) and the United States of America (US).
Key assumptionsThe principal financial assumptions used at 31 December 2018 were:
Funded plans
UK Fund Overseas Plans1
31.12.18 %
31.12.17 %
31.12.18 %
31.12.17 %
Discount rate 2.8 2.5 0.9 – 7.6 1.0 – 7.2
Price Inflation 2.1 2.1 1.0 – 5.0 1.0 – 5.0
Salary increases n/a 2.1 2.1 – 7.0 2.1 – 7.0
Pension increases 2.1 2.1 0.0 – 3.2 1.6 – 3.2
1 The range of assumptions shown is for the main defined benefit overseas plans in Germany, Hong Kong, India, Jersey, Korea, Taiwan, UAE and the US. These comprise over 90 per cent of the total liabilities of overseas defined benefit plans
The principal non-financial assumptions are those made for UK life expectancy. The assumptions for life expectancy for the UK Fund are that a male member currently aged 60 will live for 28 years (31 December 2017: 28 years) and a female member for 29 years (31 December 2017: 29 years) and a male member currently aged 40 will live for 30 years (31 December 2017: 30 years) and a female member for 30 years (31 December 2017: 30 years) after their 60th birthdays.
Both financial and non-financial assumptions can be expected to change in the future, which would affect the value placed on the liabilities. For example, changes at the reporting date to one of the relevant actuarial assumptions, holding other assumptions constant, would have affected the defined benefit obligation by the amounts shown below:
¼ If the discount rate increased by 25 basis points the liability would reduce by approximately $55 million for the UK Fund (31 December 2017: $65 million) and $30 million for the other plans (31 December 2017: $30 million)
¼ If the rate of inflation increased by 25 basis points the liability, allowing for the consequent impact on pension and salary increases would increase by approximately $40 million for the UK Fund (31 December 2017: $45 million) and $20 million for the other plans (31 December 2017: $20 million)
¼ If the rate salaries increase compared to inflation increased by 25 basis points the liability would increase by nil for the UK Fund (31 December 2017: $2 million) and approximately $15 million for the other plans (31 December 2017: $15 million)
¼ If longevity expectations increased by one year the liability would increase by approximately $45 million for the UK Fund (31 December 2017: $55 million) and $15 million for the other plans (31 December 2017: $15 million)
Although this analysis does not take account of the full distribution of cash flows expected under the UK Fund, it does provide an approximation of the sensitivity to the main assumptions. While changes in other assumptions would also have an impact, the effect would not be as significant.
Unfunded plans
US post-retirement medical1 Other2
31.12.18 %
31.12.17 %
31.12.18 %
31.12.17 %
Discount rate 4.4 3.8 2.7 – 7.6 2.3 – 7.2
Price inflation 2.5 2.5 2.0 – 5.0 1.9 – 5.0
Salary increases 4.0 N/A 3.5 – 7.0 2.1 – 7.0
Pension increases N/A N/A 0.0 – 2.1 0.0 – 2.1
Post-retirement medical rate 9% in 2018 reducing by
1% per annum to 5% in 2022
8% in 2017 reducing by
1% per annum to 5% in 2020
N/A N/A
1 The US post-retirement medical plan was closed to new entrants and eligibility for benefits tightened in 2017. This is reflected in the pension cost table below
2 The range of assumptions shown is for the main unfunded plans in India, Korea, Thailand, UAE and the UK. They comprise around 85 per cent of the total liabilities of unfunded plans
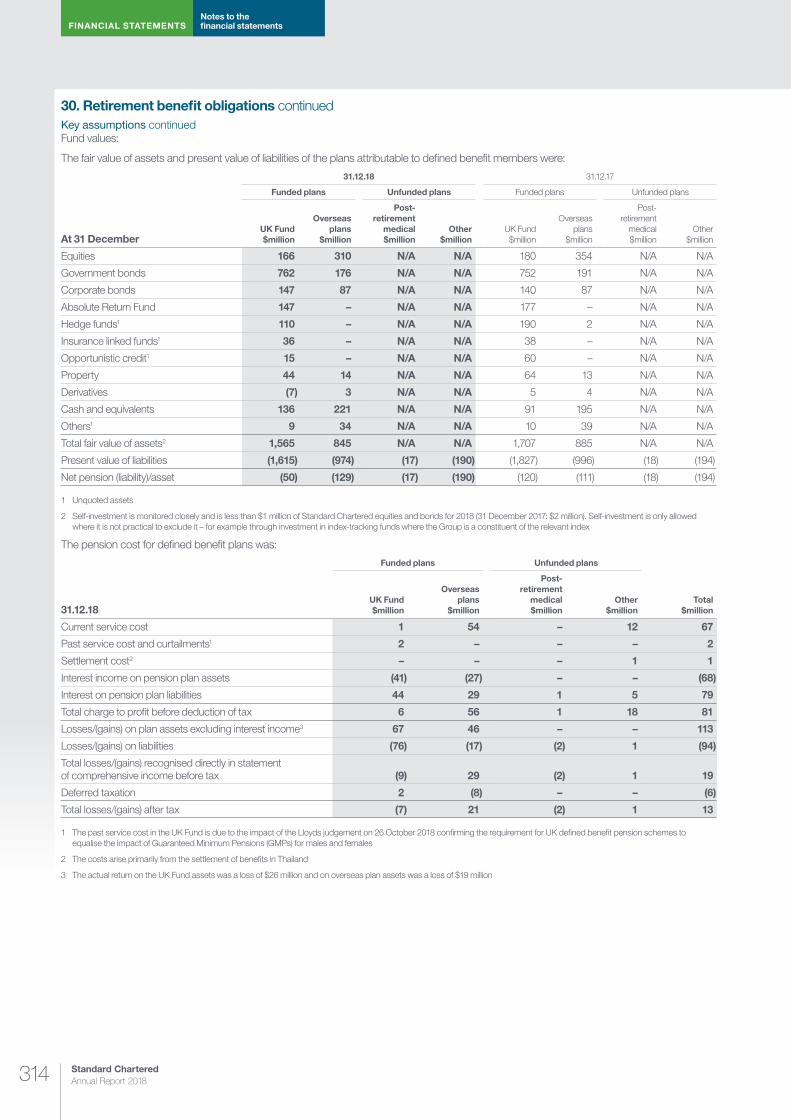
Standard Chartered Annual Report 2018314
FINANCIAL STATEMENTSNotes to the financial statements
30. Retirement benefit obligations continuedKey assumptions continuedFund values:
The fair value of assets and present value of liabilities of the plans attributable to defined benefit members were:
At 31 December
31.12.18 31.12.17
Funded plans Unfunded plans Funded plans Unfunded plans
UK Fund $million
Overseas plans
$million
Post-retirement
medical $million
Other $million
UK Fund $million
Overseas plans
$million
Post-retirement
medical $million
Other $million
Equities 166 310 N/A N/A 180 354 N/A N/A
Government bonds 762 176 N/A N/A 752 191 N/A N/A
Corporate bonds 147 87 N/A N/A 140 87 N/A N/A
Absolute Return Fund 147 – N/A N/A 177 – N/A N/A
Hedge funds1 110 – N/A N/A 190 2 N/A N/A
Insurance linked funds1 36 – N/A N/A 38 – N/A N/A
Opportunistic credit1 15 – N/A N/A 60 – N/A N/A
Property 44 14 N/A N/A 64 13 N/A N/A
Derivatives (7) 3 N/A N/A 5 4 N/A N/A
Cash and equivalents 136 221 N/A N/A 91 195 N/A N/A
Others1 9 34 N/A N/A 10 39 N/A N/A
Total fair value of assets2 1,565 845 N/A N/A 1,707 885 N/A N/A
Present value of liabilities (1,615) (974) (17) (190) (1,827) (996) (18) (194)
Net pension (liability)/asset (50) (129) (17) (190) (120) (111) (18) (194)
1 Unquoted assets
2 Self-investment is monitored closely and is less than $1 million of Standard Chartered equities and bonds for 2018 (31 December 2017: $2 million). Self-investment is only allowed where it is not practical to exclude it – for example through investment in index-tracking funds where the Group is a constituent of the relevant index
The pension cost for defined benefit plans was:
31.12.18
Funded plans Unfunded plans
Total $million
UK Fund $million
Overseas plans
$million
Post- retirement
medical $million
Other $million
Current service cost 1 54 – 12 67
Past service cost and curtailments1 2 – – – 2
Settlement cost2 – – – 1 1
Interest income on pension plan assets (41) (27) – – (68)
Interest on pension plan liabilities 44 29 1 5 79
Total charge to profit before deduction of tax 6 56 1 18 81
Losses/(gains) on plan assets excluding interest income3 67 46 – – 113
Losses/(gains) on liabilities (76) (17) (2) 1 (94)
Total losses/(gains) recognised directly in statement of comprehensive income before tax (9) 29 (2) 1 19
Deferred taxation 2 (8) – – (6)
Total losses/(gains) after tax (7) 21 (2) 1 13
1 The past service cost in the UK Fund is due to the impact of the Lloyds judgement on 26 October 2018 confirming the requirement for UK defined benefit pension schemes to equalise the impact of Guaranteed Minimum Pensions (GMPs) for males and females
2 The costs arise primarily from the settlement of benefits in Thailand
3 The actual return on the UK Fund assets was a loss of $26 million and on overseas plan assets was a loss of $19 million

315
Risk review
and capital review
Strategic rep
ort
Sup
plem
entary inform
ation
FIN
AN
CIA
L S
TA
TE
ME
NT
SD
irectors’ rep
ort
30. Retirement benefit obligations continuedKey assumptions continued
31.12.17
Funded plans Unfunded plans
Total $million
UK Fund $million
Overseas plans
$million
Post- retirement
medical $million
Other $million
Current service cost 4 53 – 16 73
Past service cost and curtailments1 (6) 7 (4) – (3)
Settlement cost2 – (1) – 8 7
Interest income on pension plan assets (43) (23) – – (66)
Interest on pension plan liabilities 46 28 1 12 87
Total charge/(credit) to profit before deduction of tax 1 64 (3) 36 98
Return on plan assets excluding interest income3 (30) (83) – – (113)
Losses/(gains) on liabilities 41 51 – (11) 81
Total losses/(gains) recognised directly in statement of comprehensive income before tax 11 (32) – (11) (32)
Deferred taxation 28 7 – – 35
Total losses/(gains) after tax 39 (25) – (11) 3
1 The gain In the UK Fund is due to the lower 2017 discretionary pension increase awarded. Costs arising in funded overseas schemes arise primarily in India from the expected statutory increase in the gratuity payment celling, an early retirement severance plan and a discretionary increase to minimum pensions. The gain in the post-retirement medical plan arises due to the reduction in eligibility criteria in the US plan
2 The costs arise primarily from the settlement of benefits in Thailand
3 The actual return on the UK Fund assets was a loss of $73 million and on overseas plan assets was a gain of $106 million
Movement in the defined benefit pension plans and post-retirement medical deficit during the year comprise:
Funded plans Unfunded plans
Total $million
UK Fund $million
Overseas plans
$million
Post- retirement
medical $million
Other $million
Deficit at 1 January 2018 (120) (111) (18) (194) (443)
Contributions 62 64 – 17 143
Current service cost (1) (54) – (12) (67)
Past service cost and curtailments (2) – – – (2)
Settlement costs and transfers impact – – – (1) (1)
Net interest on the net defined benefit asset/liability (3) (2) (1) (5) (11)
Actuarial (losses)/gains 9 (29) 2 (1) (19)
Exchange rate adjustment 5 3 – 6 14
Deficit at 31 December 20181 (50) (129) (17) (190) (386)
1 The deficit total of $386 million is made up of plans in deficit of $421 million (31 December 2017: $483 million) net of plans in surplus with assets totalling $35 million (31 December 2017: $40 million)
Funded plans Unfunded plans
Total $million
UK Fund $million
Overseas plans
$million
Post- retirement
medical $million
Other $million
Deficit at 1 January 2017 (116) (159) (22) (198) (495)
Contributions 19 92 1 31 143
Current service cost (4) (53) – (16) (73)
Past service cost and curtailments 6 (7) 4 – 3
Settlement costs and transfers impact – 1 – (8) (7)
Net interest on the net defined benefit asset/liability (3) (5) (1) (12) (21)
Actuarial (losses)/gains (11) 32 – 11 32
Adjustment for Indonesia scheme1 – (4) – 4 –
Exchange rate adjustment (11) (8) – (6) (25)
Deficit at 31 December 20172 (120) (111) (18) (194) (443)
1 During 2017 the Indonesian plan (with liabilities of $8 million) was partially funded with a Company contribution of $4 million. The scheme has moved from the unfunded to funded category in the tables
2 The deficit total of $443 million is made up of plans in deficit of $483 million (2016:$513 million) net of plans in surplus with assets totalling $40 million (2016: $18 million)
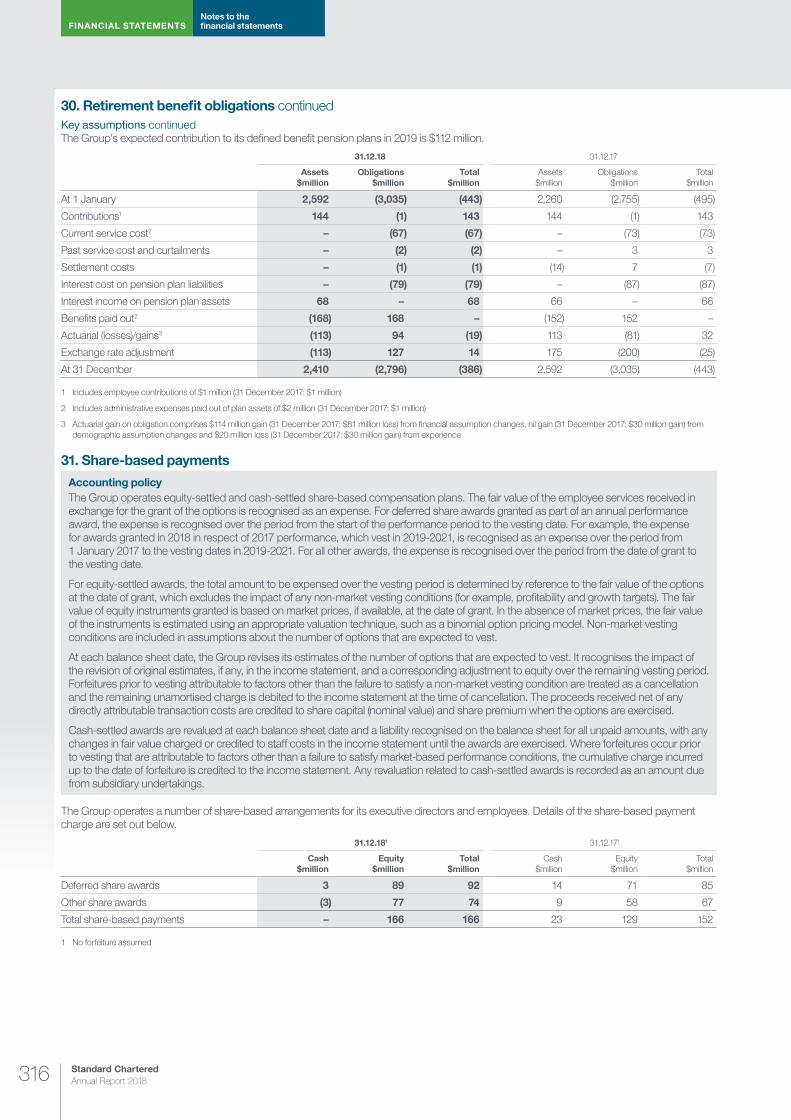
Standard Chartered Annual Report 2018316
FINANCIAL STATEMENTSNotes to the financial statements
30. Retirement benefit obligations continuedKey assumptions continuedThe Group’s expected contribution to its defined benefit pension plans in 2019 is $112 million.
31.12.18 31.12.17
Assets $million
Obligations $million
Total $million
Assets $million
Obligations $million
Total $million
At 1 January 2,592 (3,035) (443) 2,260 (2,755) (495)
Contributions1 144 (1) 143 144 (1) 143
Current service cost2 – (67) (67) – (73) (73)
Past service cost and curtailments – (2) (2) – 3 3
Settlement costs – (1) (1) (14) 7 (7)
Interest cost on pension plan liabilities – (79) (79) – (87) (87)
Interest income on pension plan assets 68 – 68 66 – 66
Benefits paid out2 (168) 168 – (152) 152 –
Actuarial (losses)/gains3 (113) 94 (19) 113 (81) 32
Exchange rate adjustment (113) 127 14 175 (200) (25)
At 31 December 2,410 (2,796) (386) 2,592 (3,035) (443)
1 Includes employee contributions of $1 million (31 December 2017: $1 million)
2 Includes administrative expenses paid out of plan assets of $2 million (31 December 2017: $1 million)
3 Actuarial gain on obligation comprises $114 million gain (31 December 2017: $81 million loss) from financial assumption changes, nil gain (31 December 2017: $30 million gain) from demographic assumption changes and $20 million loss (31 December 2017: $30 million gain) from experience
31. Share-based payments
Accounting policyThe Group operates equity-settled and cash-settled share-based compensation plans. The fair value of the employee services received in exchange for the grant of the options is recognised as an expense. For deferred share awards granted as part of an annual performance award, the expense is recognised over the period from the start of the performance period to the vesting date. For example, the expense for awards granted in 2018 in respect of 2017 performance, which vest in 2019-2021, is recognised as an expense over the period from 1 January 2017 to the vesting dates in 2019-2021. For all other awards, the expense is recognised over the period from the date of grant to the vesting date.
For equity-settled awards, the total amount to be expensed over the vesting period is determined by reference to the fair value of the options at the date of grant, which excludes the impact of any non-market vesting conditions (for example, profitability and growth targets). The fair value of equity instruments granted is based on market prices, if available, at the date of grant. In the absence of market prices, the fair value of the instruments is estimated using an appropriate valuation technique, such as a binomial option pricing model. Non-market vesting conditions are included in assumptions about the number of options that are expected to vest.
At each balance sheet date, the Group revises its estimates of the number of options that are expected to vest. It recognises the impact of the revision of original estimates, if any, in the income statement, and a corresponding adjustment to equity over the remaining vesting period. Forfeitures prior to vesting attributable to factors other than the failure to satisfy a non-market vesting condition are treated as a cancellation and the remaining unamortised charge is debited to the income statement at the time of cancellation. The proceeds received net of any directly attributable transaction costs are credited to share capital (nominal value) and share premium when the options are exercised.
Cash-settled awards are revalued at each balance sheet date and a liability recognised on the balance sheet for all unpaid amounts, with any changes in fair value charged or credited to staff costs in the income statement until the awards are exercised. Where forfeitures occur prior to vesting that are attributable to factors other than a failure to satisfy market-based performance conditions, the cumulative charge incurred up to the date of forfeiture is credited to the income statement. Any revaluation related to cash-settled awards is recorded as an amount due from subsidiary undertakings.
The Group operates a number of share-based arrangements for its executive directors and employees. Details of the share-based payment charge are set out below.
31.12.181 31.12.171
Cash $million
Equity $million
Total $million
Cash $million
Equity $million
Total $million
Deferred share awards 3 89 92 14 71 85
Other share awards (3) 77 74 9 58 67
Total share-based payments – 166 166 23 129 152
1 No forfeiture assumed
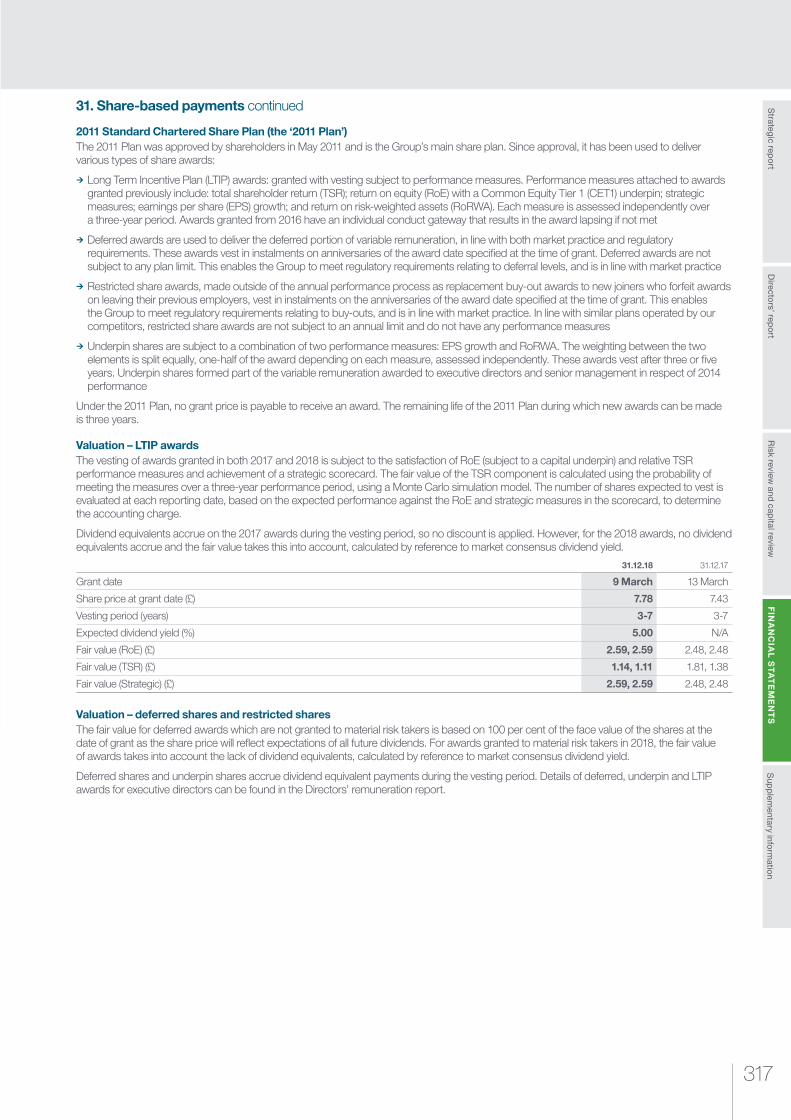
317
Risk review
and capital review
Strategic rep
ort
Sup
plem
entary inform
ation
FIN
AN
CIA
L S
TA
TE
ME
NT
SD
irectors’ rep
ort
31. Share-based payments continued
2011 Standard Chartered Share Plan (the ‘2011 Plan’)The 2011 Plan was approved by shareholders in May 2011 and is the Group’s main share plan. Since approval, it has been used to deliver various types of share awards:
¼ Long Term Incentive Plan (LTIP) awards: granted with vesting subject to performance measures. Performance measures attached to awards granted previously include: total shareholder return (TSR); return on equity (RoE) with a Common Equity Tier 1 (CET1) underpin; strategic measures; earnings per share (EPS) growth; and return on risk-weighted assets (RoRWA). Each measure is assessed independently over a three-year period. Awards granted from 2016 have an individual conduct gateway that results in the award lapsing if not met
¼ Deferred awards are used to deliver the deferred portion of variable remuneration, in line with both market practice and regulatory requirements. These awards vest in instalments on anniversaries of the award date specified at the time of grant. Deferred awards are not subject to any plan limit. This enables the Group to meet regulatory requirements relating to deferral levels, and is in line with market practice
¼ Restricted share awards, made outside of the annual performance process as replacement buy-out awards to new joiners who forfeit awards on leaving their previous employers, vest in instalments on the anniversaries of the award date specified at the time of grant. This enables the Group to meet regulatory requirements relating to buy-outs, and is in line with market practice. In line with similar plans operated by our competitors, restricted share awards are not subject to an annual limit and do not have any performance measures
¼ Underpin shares are subject to a combination of two performance measures: EPS growth and RoRWA. The weighting between the two elements is split equally, one-half of the award depending on each measure, assessed independently. These awards vest after three or five years. Underpin shares formed part of the variable remuneration awarded to executive directors and senior management in respect of 2014 performance
Under the 2011 Plan, no grant price is payable to receive an award. The remaining life of the 2011 Plan during which new awards can be made is three years.
Valuation – LTIP awardsThe vesting of awards granted in both 2017 and 2018 is subject to the satisfaction of RoE (subject to a capital underpin) and relative TSR performance measures and achievement of a strategic scorecard. The fair value of the TSR component is calculated using the probability of meeting the measures over a three-year performance period, using a Monte Carlo simulation model. The number of shares expected to vest is evaluated at each reporting date, based on the expected performance against the RoE and strategic measures in the scorecard, to determine the accounting charge.
Dividend equivalents accrue on the 2017 awards during the vesting period, so no discount is applied. However, for the 2018 awards, no dividend equivalents accrue and the fair value takes this into account, calculated by reference to market consensus dividend yield.
31.12.18 31.12.17
Grant date 9 March 13 March
Share price at grant date (£) 7.78 7.43
Vesting period (years) 3-7 3-7
Expected dividend yield (%) 5.00 N/A
Fair value (RoE) (£) 2.59, 2.59 2.48, 2.48
Fair value (TSR) (£) 1.14, 1.11 1.81, 1.38
Fair value (Strategic) (£) 2.59, 2.59 2.48, 2.48
Valuation – deferred shares and restricted sharesThe fair value for deferred awards which are not granted to material risk takers is based on 100 per cent of the face value of the shares at the date of grant as the share price will reflect expectations of all future dividends. For awards granted to material risk takers in 2018, the fair value of awards takes into account the lack of dividend equivalents, calculated by reference to market consensus dividend yield.
Deferred shares and underpin shares accrue dividend equivalent payments during the vesting period. Details of deferred, underpin and LTIP awards for executive directors can be found in the Directors’ remuneration report.
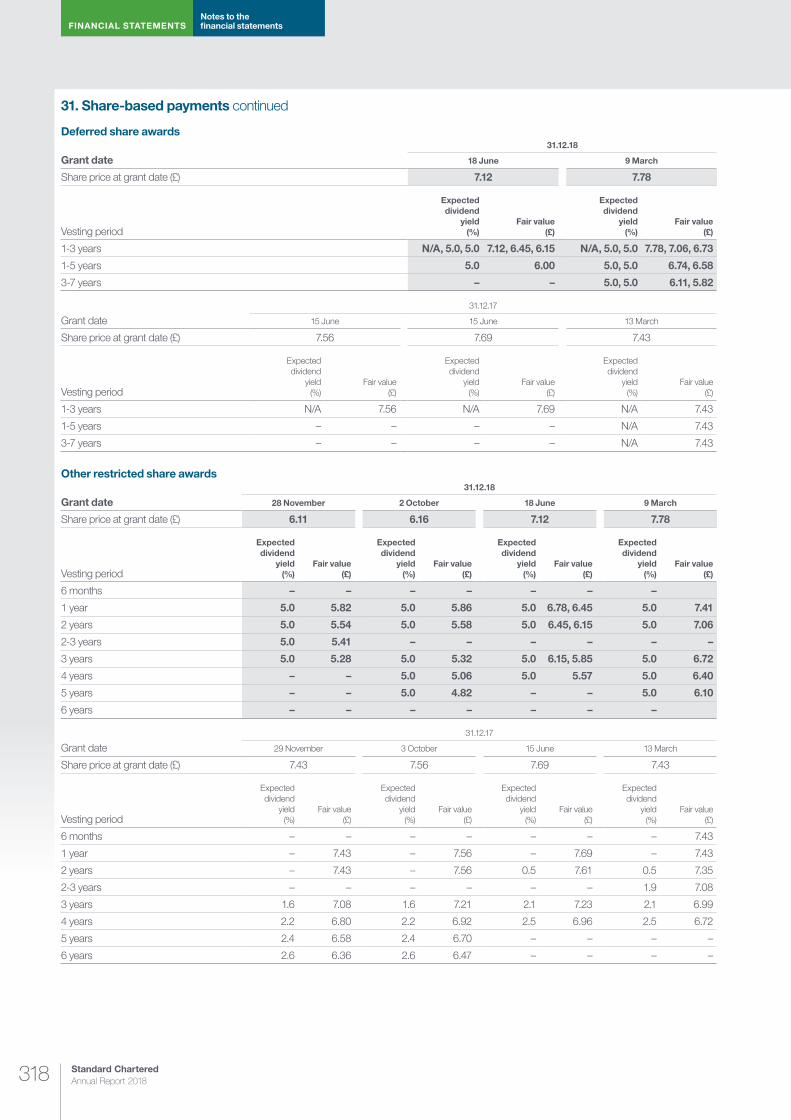
Standard Chartered Annual Report 2018318
FINANCIAL STATEMENTSNotes to the financial statements
31. Share-based payments continued
Deferred share awards
Grant date 31.12.18
18 June 9 March
Share price at grant date (£) 7.12 7.78
Vesting period
Expected dividend
yield (%)
Fair value (£)
Expected dividend
yield (%)
Fair value (£)
1-3 years N/A, 5.0, 5.0 7.12, 6.45, 6.15 N/A, 5.0, 5.0 7.78, 7.06, 6.73
1-5 years 5.0 6.00 5.0, 5.0 6.74, 6.58
3-7 years – – 5.0, 5.0 6.11, 5.82
Grant date 31.12.17
15 June 15 June 13 March
Share price at grant date (£) 7.56 7.69 7.43
Vesting period
Expected dividend
yield (%)
Fair value (£)
Expected dividend
yield (%)
Fair value (£)
Expected dividend
yield (%)
Fair value (£)
1-3 years N/A 7.56 N/A 7.69 N/A 7.43
1-5 years – – – – N/A 7.43
3-7 years – – – – N/A 7.43
Other restricted share awards
Grant date 31.12.18
28 November 2 October 18 June 9 March
Share price at grant date (£) 6.11 6.16 7.12 7.78
Vesting period
Expected dividend
yield (%)
Fair value (£)
Expected dividend
yield (%)
Fair value (£)
Expected dividend
yield (%)
Fair value (£)
Expected dividend
yield (%)
Fair value (£)
6 months – – – – – – –
1 year 5.0 5.82 5.0 5.86 5.0 6.78, 6.45 5.0 7.41
2 years 5.0 5.54 5.0 5.58 5.0 6.45, 6.15 5.0 7.06
2-3 years 5.0 5.41 – – – – – –
3 years 5.0 5.28 5.0 5.32 5.0 6.15, 5.85 5.0 6.72
4 years – – 5.0 5.06 5.0 5.57 5.0 6.40
5 years – – 5.0 4.82 – – 5.0 6.10
6 years – – – – – – –
Grant date 31.12.17
29 November 3 October 15 June 13 March
Share price at grant date (£) 7.43 7.56 7.69 7.43
Vesting period
Expected dividend
yield (%)
Fair value (£)
Expected dividend
yield (%)
Fair value (£)
Expected dividend
yield (%)
Fair value (£)
Expected dividend
yield (%)
Fair value (£)
6 months – – – – – – – 7.43
1 year – 7.43 – 7.56 – 7.69 – 7.43
2 years – 7.43 – 7.56 0.5 7.61 0.5 7.35
2-3 years – – – – – – 1.9 7.08
3 years 1.6 7.08 1.6 7.21 2.1 7.23 2.1 6.99
4 years 2.2 6.80 2.2 6.92 2.5 6.96 2.5 6.72
5 years 2.4 6.58 2.4 6.70 – – – –
6 years 2.6 6.36 2.6 6.47 – – – –

319
Risk review
and capital review
Strategic rep
ort
Sup
plem
entary inform
ation
FIN
AN
CIA
L S
TA
TE
ME
NT
SD
irectors’ rep
ort
31. Share-based payments continued2001 Performance Share Plan (2001 PSP) – now closed to new grants: The Group’s previous plan for delivering performance shares was the 2001 PSP and there remain outstanding vested awards. Under the 2001 PSP half the award was dependent upon TSR performance and the balance was subject to a target of defined EPS growth. Both measures used the same three-year period and were assessed independently.
2006 Restricted Share Scheme (2006 RSS)/2007 Supplementary Restricted Share Scheme (2007 SRSS):The Group’s previous plans for delivering restricted shares were the 2006 RSS and 2007 SRSS, both now replaced by the 2011 Plan. There remain outstanding vested awards under these plans. Awards were generally in the form of nil cost options and did not have any performance measures. Generally deferred restricted share awards vested equally over three years and for non-deferred awards half vested two years after the date of grant and the balance after three years. No further awards will be granted under the 2006 RSS and 2007 SRSS.
2013 Sharesave Plan: Under the 2013 Sharesave Plan, employees may open a savings contract. Within a period of six months after the third anniversary, employees may purchase ordinary shares in the Company at a discount of up to 20 per cent on the share price at the date of invitation (this is known as the option exercise price). There are no performance measures attached to options granted under the 2013 Sharesave Plan and no grant price is payable to receive an option. In some countries in which the Group operates, it is not possible to operate Sharesave plans, typically due to securities law and regulatory restrictions. In these countries, where possible, the Group offers an equivalent cash-based plan to its employees.
The 2013 Sharesave Plan was approved by Shareholders in May 2013 and all future Sharesave invitations are made under this plan. The remaining life of the 2013 Sharesave Plan is four years.
Valuation – Sharesave: Options under the Sharesave plans are valued using a binomial option-pricing model. The same fair value is applied to all employees including executive directors. The fair value per option granted and the assumptions used in the calculation are as follows:
All Employee Sharesave Plan (Sharesave)
Grant date 31.12.18 31.12.17
2 October 3 October
Share price at grant date (£) 6.16 7.71
Exercise price (£) 5.13 6.20
Vesting period (years) 3 3
Expected volatility (%) 33.8 34.9
Expected option life (years) 3.33 3.33
Risk-free rate (%) 0.87 0.47
Expected dividend yield (%) 5.00 1.87
Fair value (£) 1.39 2.32
The expected volatility is based on historical volatility over the last three years, or three years prior to grant. The expected life is the average expected period to exercise. The risk-free rate of return is the yield on zero-coupon UK Government bonds of a term consistent with the assumed option life. The expected dividend yield is based on historical dividend for three years prior to grant.
Reconciliation of option movements for the year to 31 December 2018
2011 Plan1
PSP1 RSS1 SRSS1 Sharesave
Weighted average exercise
price (£)
Performance shares
Deferred/restricted
shares
Outstanding as at 1 January 25,477,368 23,311,221 17,222 185,943 1,249 12,818,234 6.06
Granted2,3 2,481,485 13,649,191 4,769,917 5.13
Lapsed (935,037) (1,375,715) (553) (50,484) (2,995,333) 7.36
Exercised (20,483) (8,971,717) (12,399) (135,459) (1,249) (868,457) 5.57
Outstanding as at 31 December 27,003,333 26,612,980 4,270 – – 13,724,361 5.48
Exercisable as at 31 December 43,241 3,657,278 4,270 – – 3,483,196 5.57
Range of exercise prices (£)2 – 5.13 – 6.20
Intrinsic value of vested but not exercised options ($ million) 0.04 2.59 0.02 – – –
Weighted average contractual remaining life (years) 7.43 8.18 0.48 0 0 2.04
Weighted average share price for options exercised during the period (£) 7.18 7.17 6.76 7.84 7.85 6.20
1 Employees do not contribute towards the cost of these awards
2 12,508,120 (DRSA/RSA) granted on 9 March 2018, 39,945 (notional dividend) granted on 11 March 2018, 63,350 (notional dividend) granted on 13 March 2018, 37,774 (notional dividend) granted on 19 March 2018, 2,076,370 (LTIP) granted on 9 March 2018, 216,127 (notional dividend) granted on 11 March 2018, 22,317 (notional dividend) granted on 13 March 2018, 815 (notional dividend) granted on 19 March 2018, 246,367 (DRSA/RSA) granted on 18 June 2018, 165,856 (LTIP) and 75755 (DRSA/RSA) granted on 22 Aug 2018, and 423,038 (DRSA/RA) and 4,769,917 (Sharesave) granted on 2 October 2018, and 254,842 (DRSA/RSA) granted on 28 November 2018
3 For Sharesave granted in 2018 the exercise price is £5.13 per share, which was the average of the closing prices over the five days to the invitation date of 3 September. The closing share price on 31 August 2018 was £6.271
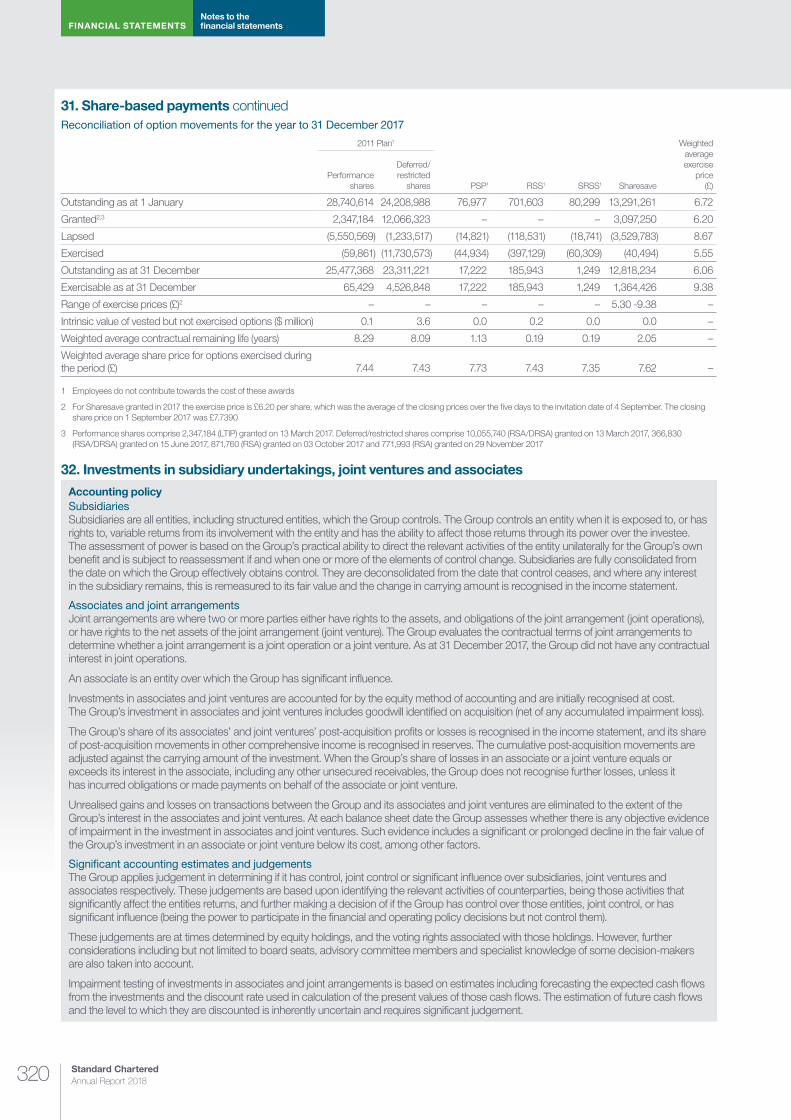
Standard Chartered Annual Report 2018320
FINANCIAL STATEMENTSNotes to the financial statements
31. Share-based payments continuedReconciliation of option movements for the year to 31 December 2017
2011 Plan1
PSP1 RSS1 SRSS1 Sharesave
Weighted average exercise
price (£)
Performance shares
Deferred/restricted
shares
Outstanding as at 1 January 28,740,614 24,208,988 76,977 701,603 80,299 13,291,261 6.72
Granted2,3 2,347,184 12,066,323 – – – 3,097,250 6.20
Lapsed (5,550,569) (1,233,517) (14,821) (118,531) (18,741) (3,529,783) 8.67
Exercised (59,861) (11,730,573) (44,934) (397,129) (60,309) (40,494) 5.55
Outstanding as at 31 December 25,477,368 23,311,221 17,222 185,943 1,249 12,818,234 6.06
Exercisable as at 31 December 65,429 4,526,848 17,222 185,943 1,249 1,364,426 9.38
Range of exercise prices (£)2 – – – – – 5.30 -9.38 –
Intrinsic value of vested but not exercised options ($ million) 0.1 3.6 0.0 0.2 0.0 0.0 –
Weighted average contractual remaining life (years) 8.29 8.09 1.13 0.19 0.19 2.05 –
Weighted average share price for options exercised during the period (£) 7.44 7.43 7.73 7.43 7.35 7.62 –
1 Employees do not contribute towards the cost of these awards
2 For Sharesave granted in 2017 the exercise price is £6.20 per share, which was the average of the closing prices over the five days to the invitation date of 4 September. The closing share price on 1 September 2017 was £7.7390
3 Performance shares comprise 2,347,184 (LTIP) granted on 13 March 2017. Deferred/restricted shares comprise 10,055,740 (RSA/DRSA) granted on 13 March 2017, 366,830 (RSA/DRSA) granted on 15 June 2017, 871,760 (RSA) granted on 03 October 2017 and 771,993 (RSA) granted on 29 November 2017
32. Investments in subsidiary undertakings, joint ventures and associates
Accounting policySubsidiariesSubsidiaries are all entities, including structured entities, which the Group controls. The Group controls an entity when it is exposed to, or has rights to, variable returns from its involvement with the entity and has the ability to affect those returns through its power over the investee. The assessment of power is based on the Group’s practical ability to direct the relevant activities of the entity unilaterally for the Group’s own benefit and is subject to reassessment if and when one or more of the elements of control change. Subsidiaries are fully consolidated from the date on which the Group effectively obtains control. They are deconsolidated from the date that control ceases, and where any interest in the subsidiary remains, this is remeasured to its fair value and the change in carrying amount is recognised in the income statement.
Associates and joint arrangementsJoint arrangements are where two or more parties either have rights to the assets, and obligations of the joint arrangement (joint operations), or have rights to the net assets of the joint arrangement (joint venture). The Group evaluates the contractual terms of joint arrangements to determine whether a joint arrangement is a joint operation or a joint venture. As at 31 December 2017, the Group did not have any contractual interest in joint operations.
An associate is an entity over which the Group has significant influence.
Investments in associates and joint ventures are accounted for by the equity method of accounting and are initially recognised at cost. The Group’s investment in associates and joint ventures includes goodwill identified on acquisition (net of any accumulated impairment loss).
The Group’s share of its associates’ and joint ventures’ post-acquisition profits or losses is recognised in the income statement, and its share of post-acquisition movements in other comprehensive income is recognised in reserves. The cumulative post-acquisition movements are adjusted against the carrying amount of the investment. When the Group’s share of losses in an associate or a joint venture equals or exceeds its interest in the associate, including any other unsecured receivables, the Group does not recognise further losses, unless it has incurred obligations or made payments on behalf of the associate or joint venture.
Unrealised gains and losses on transactions between the Group and its associates and joint ventures are eliminated to the extent of the Group’s interest in the associates and joint ventures. At each balance sheet date the Group assesses whether there is any objective evidence of impairment in the investment in associates and joint ventures. Such evidence includes a significant or prolonged decline in the fair value of the Group’s investment in an associate or joint venture below its cost, among other factors.
Signi�cant accounting estimates and judgementsThe Group applies judgement in determining if it has control, joint control or significant influence over subsidiaries, joint ventures and associates respectively. These judgements are based upon identifying the relevant activities of counterparties, being those activities that significantly affect the entities returns, and further making a decision of if the Group has control over those entities, joint control, or has significant influence (being the power to participate in the financial and operating policy decisions but not control them).
These judgements are at times determined by equity holdings, and the voting rights associated with those holdings. However, further considerations including but not limited to board seats, advisory committee members and specialist knowledge of some decision-makers are also taken into account.
Impairment testing of investments in associates and joint arrangements is based on estimates including forecasting the expected cash flows from the investments and the discount rate used in calculation of the present values of those cash flows. The estimation of future cash flows and the level to which they are discounted is inherently uncertain and requires significant judgement.
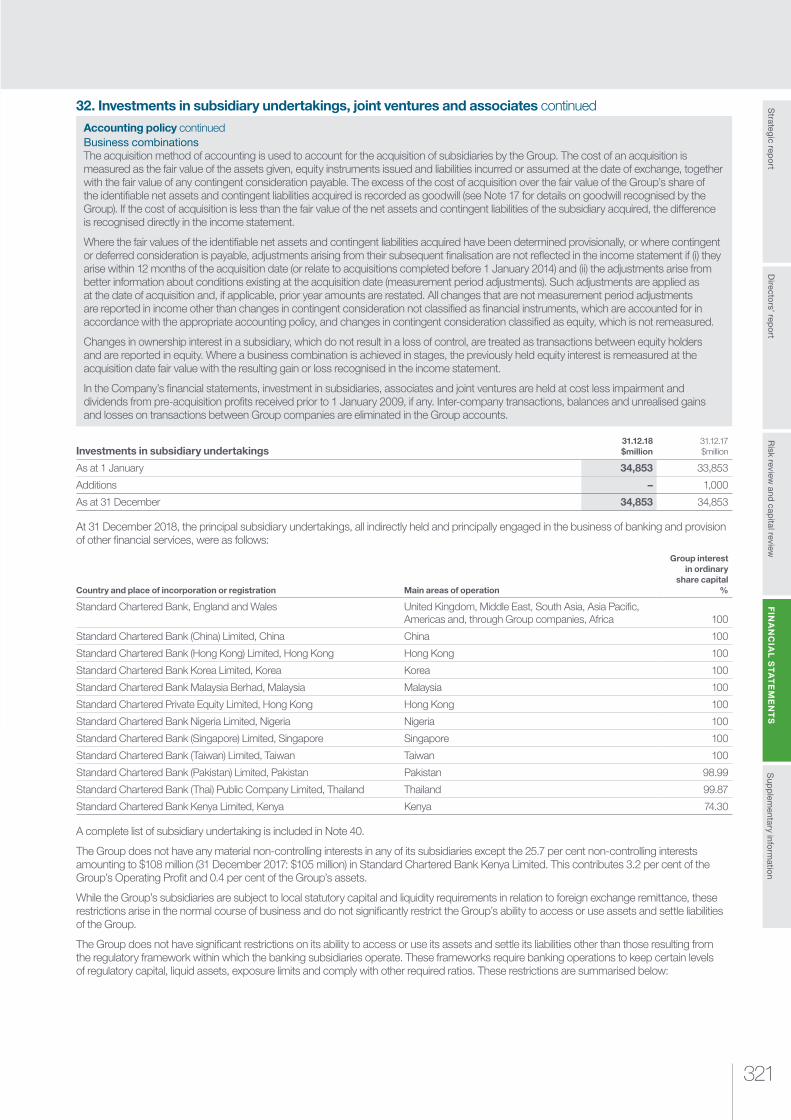
321
Risk review
and capital review
Strategic rep
ort
Sup
plem
entary inform
ation
FIN
AN
CIA
L S
TA
TE
ME
NT
SD
irectors’ rep
ort
32. Investments in subsidiary undertakings, joint ventures and associates continued
Accounting policy continuedBusiness combinationsThe acquisition method of accounting is used to account for the acquisition of subsidiaries by the Group. The cost of an acquisition is measured as the fair value of the assets given, equity instruments issued and liabilities incurred or assumed at the date of exchange, together with the fair value of any contingent consideration payable. The excess of the cost of acquisition over the fair value of the Group’s share of the identifiable net assets and contingent liabilities acquired is recorded as goodwill (see Note 17 for details on goodwill recognised by the Group). If the cost of acquisition is less than the fair value of the net assets and contingent liabilities of the subsidiary acquired, the difference is recognised directly in the income statement.
Where the fair values of the identifiable net assets and contingent liabilities acquired have been determined provisionally, or where contingent or deferred consideration is payable, adjustments arising from their subsequent finalisation are not reflected in the income statement if (i) they arise within 12 months of the acquisition date (or relate to acquisitions completed before 1 January 2014) and (ii) the adjustments arise from better information about conditions existing at the acquisition date (measurement period adjustments). Such adjustments are applied as at the date of acquisition and, if applicable, prior year amounts are restated. All changes that are not measurement period adjustments are reported in income other than changes in contingent consideration not classified as financial instruments, which are accounted for in accordance with the appropriate accounting policy, and changes in contingent consideration classified as equity, which is not remeasured.
Changes in ownership interest in a subsidiary, which do not result in a loss of control, are treated as transactions between equity holders and are reported in equity. Where a business combination is achieved in stages, the previously held equity interest is remeasured at the acquisition date fair value with the resulting gain or loss recognised in the income statement.
In the Company’s financial statements, investment in subsidiaries, associates and joint ventures are held at cost less impairment and dividends from pre-acquisition profits received prior to 1 January 2009, if any. Inter-company transactions, balances and unrealised gains and losses on transactions between Group companies are eliminated in the Group accounts.
Investments in subsidiary undertakings31.12.18 $million
31.12.17 $million
As at 1 January 34,853 33,853
Additions – 1,000
As at 31 December 34,853 34,853
At 31 December 2018, the principal subsidiary undertakings, all indirectly held and principally engaged in the business of banking and provision of other financial services, were as follows:
Country and place of incorporation or registration Main areas of operation
Group interest in ordinary
share capital %
Standard Chartered Bank, England and Wales United Kingdom, Middle East, South Asia, Asia Pacific, Americas and, through Group companies, Africa 100
Standard Chartered Bank (China) Limited, China China 100
Standard Chartered Bank (Hong Kong) Limited, Hong Kong Hong Kong 100
Standard Chartered Bank Korea Limited, Korea Korea 100
Standard Chartered Bank Malaysia Berhad, Malaysia Malaysia 100
Standard Chartered Private Equity Limited, Hong Kong Hong Kong 100
Standard Chartered Bank Nigeria Limited, Nigeria Nigeria 100
Standard Chartered Bank (Singapore) Limited, Singapore Singapore 100
Standard Chartered Bank (Taiwan) Limited, Taiwan Taiwan 100
Standard Chartered Bank (Pakistan) Limited, Pakistan Pakistan 98.99
Standard Chartered Bank (Thai) Public Company Limited, Thailand Thailand 99.87
Standard Chartered Bank Kenya Limited, Kenya Kenya 74.30
A complete list of subsidiary undertaking is included in Note 40.
The Group does not have any material non-controlling interests in any of its subsidiaries except the 25.7 per cent non-controlling interests amounting to $108 million (31 December 2017: $105 million) in Standard Chartered Bank Kenya Limited. This contributes 3.2 per cent of the Group’s Operating Profit and 0.4 per cent of the Group’s assets.
While the Group’s subsidiaries are subject to local statutory capital and liquidity requirements in relation to foreign exchange remittance, these restrictions arise in the normal course of business and do not significantly restrict the Group’s ability to access or use assets and settle liabilities of the Group.
The Group does not have significant restrictions on its ability to access or use its assets and settle its liabilities other than those resulting from the regulatory framework within which the banking subsidiaries operate. These frameworks require banking operations to keep certain levels of regulatory capital, liquid assets, exposure limits and comply with other required ratios. These restrictions are summarised below:
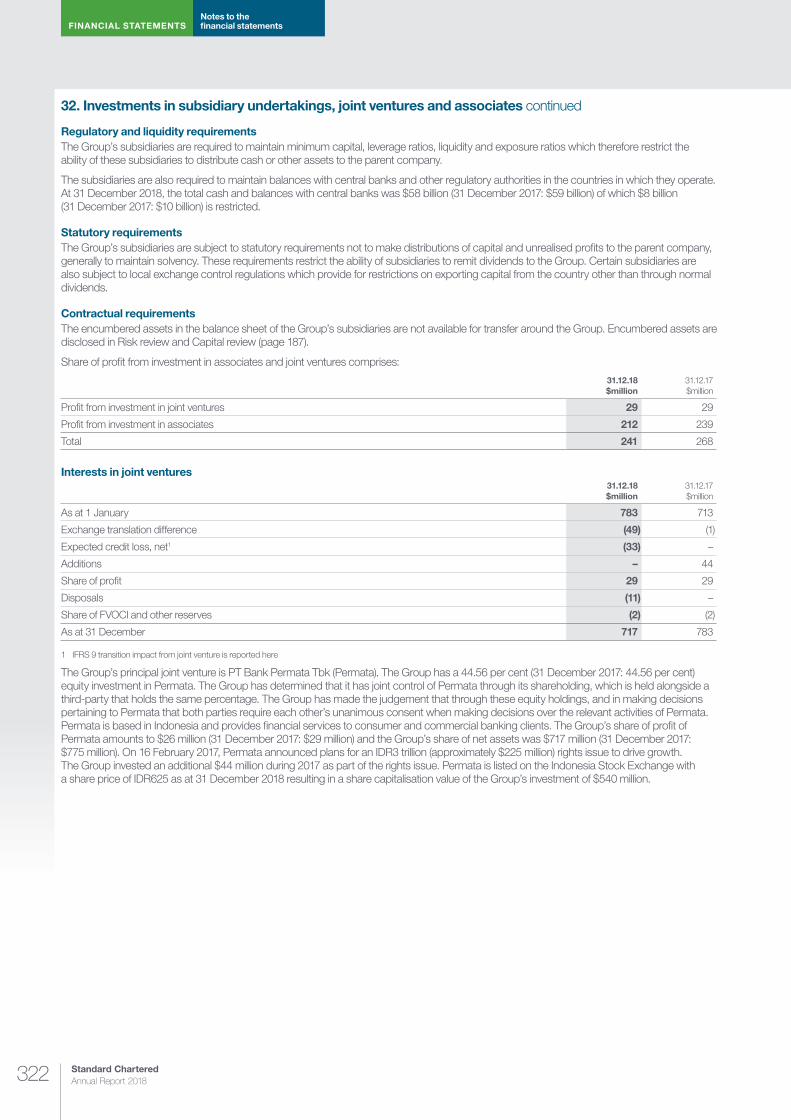
Standard Chartered Annual Report 2018322
FINANCIAL STATEMENTSNotes to the financial statements
32. Investments in subsidiary undertakings, joint ventures and associates continued
Regulatory and liquidity requirementsThe Group’s subsidiaries are required to maintain minimum capital, leverage ratios, liquidity and exposure ratios which therefore restrict the ability of these subsidiaries to distribute cash or other assets to the parent company.
The subsidiaries are also required to maintain balances with central banks and other regulatory authorities in the countries in which they operate. At 31 December 2018, the total cash and balances with central banks was $58 billion (31 December 2017: $59 billion) of which $8 billion (31 December 2017: $10 billion) is restricted.
Statutory requirements The Group’s subsidiaries are subject to statutory requirements not to make distributions of capital and unrealised profits to the parent company, generally to maintain solvency. These requirements restrict the ability of subsidiaries to remit dividends to the Group. Certain subsidiaries are also subject to local exchange control regulations which provide for restrictions on exporting capital from the country other than through normal dividends.
Contractual requirementsThe encumbered assets in the balance sheet of the Group’s subsidiaries are not available for transfer around the Group. Encumbered assets are disclosed in Risk review and Capital review (page 187).
Share of profit from investment in associates and joint ventures comprises:
31.12.18 $million
31.12.17 $million
Profit from investment in joint ventures 29 29
Profit from investment in associates 212 239
Total 241 268
Interests in joint ventures31.12.18 $million
31.12.17 $million
As at 1 January 783 713
Exchange translation difference (49) (1)
Expected credit loss, net1 (33) –
Additions – 44
Share of profit 29 29
Disposals (11) –
Share of FVOCI and other reserves (2) (2)
As at 31 December 717 783
1 IFRS 9 transition impact from joint venture is reported here
The Group’s principal joint venture is PT Bank Permata Tbk (Permata). The Group has a 44.56 per cent (31 December 2017: 44.56 per cent) equity investment in Permata. The Group has determined that it has joint control of Permata through its shareholding, which is held alongside a third-party that holds the same percentage. The Group has made the judgement that through these equity holdings, and in making decisions pertaining to Permata that both parties require each other’s unanimous consent when making decisions over the relevant activities of Permata. Permata is based in Indonesia and provides financial services to consumer and commercial banking clients. The Group’s share of profit of Permata amounts to $26 million (31 December 2017: $29 million) and the Group’s share of net assets was $717 million (31 December 2017: $775 million). On 16 February 2017, Permata announced plans for an IDR3 trillion (approximately $225 million) rights issue to drive growth. The Group invested an additional $44 million during 2017 as part of the rights issue. Permata is listed on the Indonesia Stock Exchange with a share price of IDR625 as at 31 December 2018 resulting in a share capitalisation value of the Group’s investment of $540 million.
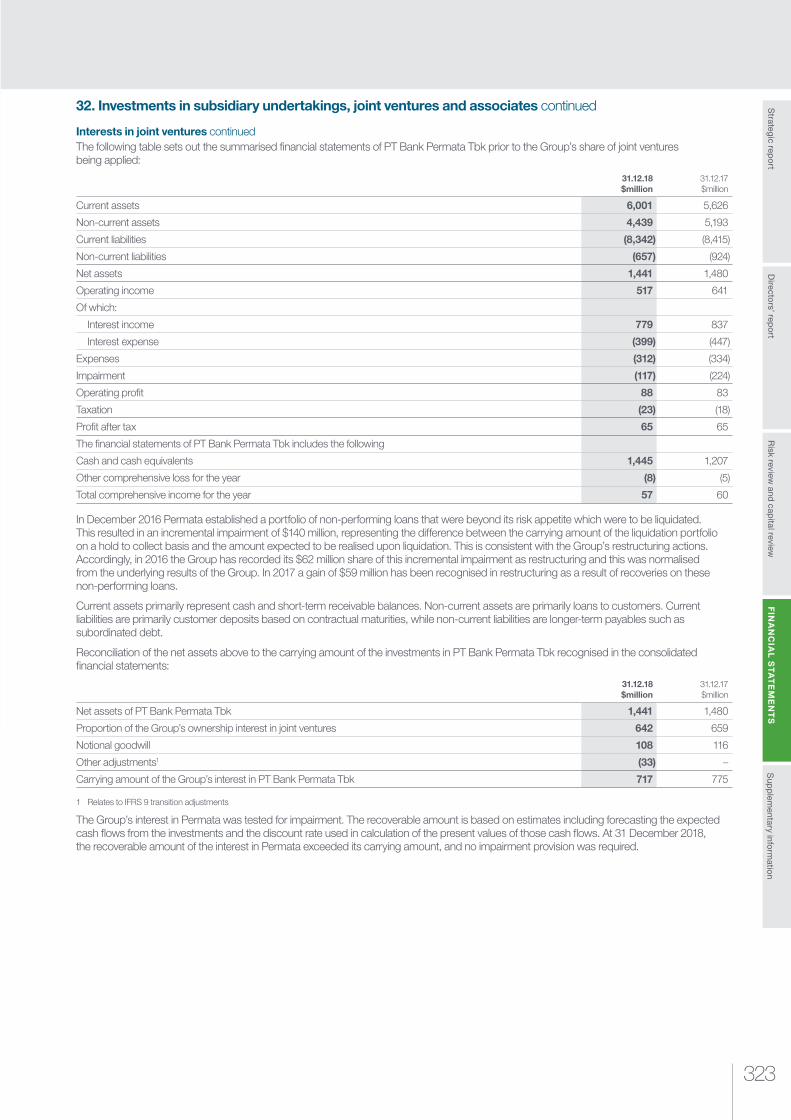
323
Risk review
and capital review
Strategic rep
ort
Sup
plem
entary inform
ation
FIN
AN
CIA
L S
TA
TE
ME
NT
SD
irectors’ rep
ort
32. Investments in subsidiary undertakings, joint ventures and associates continued
Interests in joint ventures continuedThe following table sets out the summarised financial statements of PT Bank Permata Tbk prior to the Group’s share of joint ventures being applied:
31.12.18 $million
31.12.17 $million
Current assets 6,001 5,626
Non-current assets 4,439 5,193
Current liabilities (8,342) (8,415)
Non-current liabilities (657) (924)
Net assets 1,441 1,480
Operating income 517 641
Of which:
Interest income 779 837
Interest expense (399) (447)
Expenses (312) (334)
Impairment (117) (224)
Operating profit 88 83
Taxation (23) (18)
Profit after tax 65 65
The financial statements of PT Bank Permata Tbk includes the following
Cash and cash equivalents 1,445 1,207
Other comprehensive loss for the year (8) (5)
Total comprehensive income for the year 57 60
In December 2016 Permata established a portfolio of non-performing loans that were beyond its risk appetite which were to be liquidated. This resulted in an incremental impairment of $140 million, representing the difference between the carrying amount of the liquidation portfolio on a hold to collect basis and the amount expected to be realised upon liquidation. This is consistent with the Group’s restructuring actions. Accordingly, in 2016 the Group has recorded its $62 million share of this incremental impairment as restructuring and this was normalised from the underlying results of the Group. In 2017 a gain of $59 million has been recognised in restructuring as a result of recoveries on these non-performing loans.
Current assets primarily represent cash and short-term receivable balances. Non-current assets are primarily loans to customers. Current liabilities are primarily customer deposits based on contractual maturities, while non-current liabilities are longer-term payables such as subordinated debt.
Reconciliation of the net assets above to the carrying amount of the investments in PT Bank Permata Tbk recognised in the consolidated financial statements:
31.12.18 $million
31.12.17 $million
Net assets of PT Bank Permata Tbk 1,441 1,480
Proportion of the Group’s ownership interest in joint ventures 642 659
Notional goodwill 108 116
Other adjustments1 (33) –
Carrying amount of the Group’s interest in PT Bank Permata Tbk 717 775
1 Relates to IFRS 9 transition adjustments
The Group’s interest in Permata was tested for impairment. The recoverable amount is based on estimates including forecasting the expected cash flows from the investments and the discount rate used in calculation of the present values of those cash flows. At 31 December 2018, the recoverable amount of the interest in Permata exceeded its carrying amount, and no impairment provision was required.
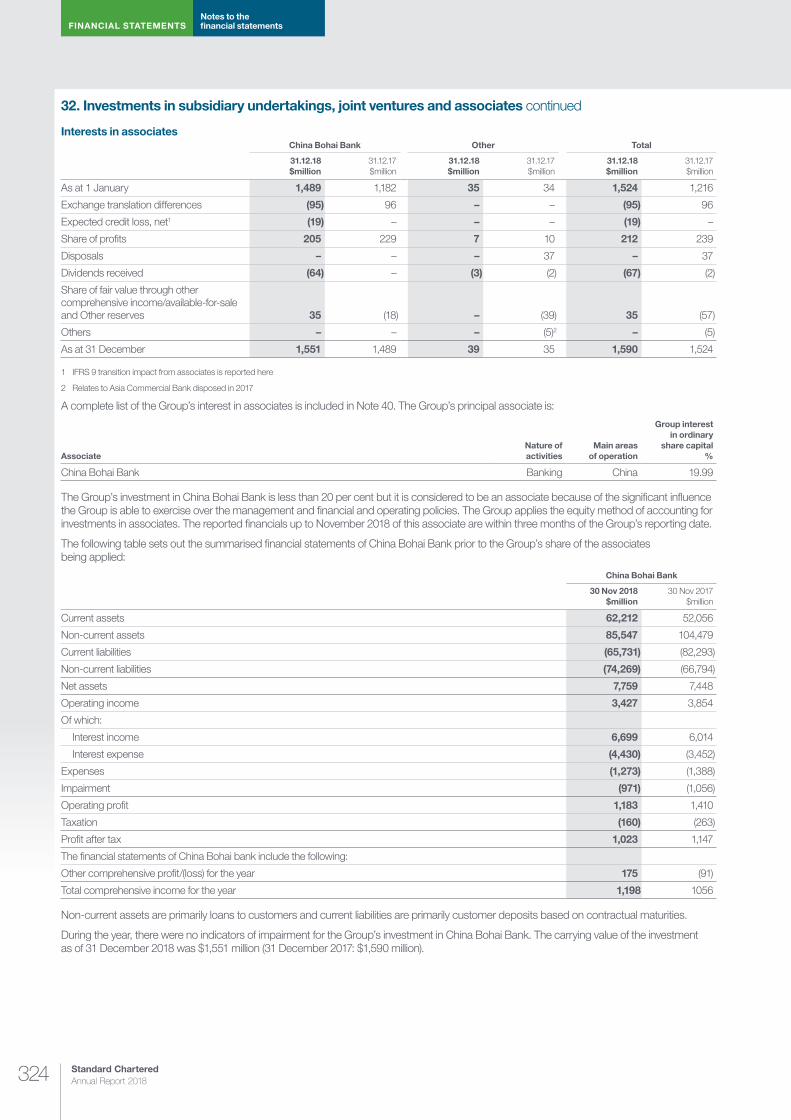
Standard Chartered Annual Report 2018324
FINANCIAL STATEMENTSNotes to the financial statements
32. Investments in subsidiary undertakings, joint ventures and associates continued
Interests in associates China Bohai Bank Other Total
31.12.18 $million
31.12.17 $million
31.12.18 $million
31.12.17 $million
31.12.18 $million
31.12.17 $million
As at 1 January 1,489 1,182 35 34 1,524 1,216
Exchange translation differences (95) 96 – – (95) 96
Expected credit loss, net1 (19) – – – (19) –
Share of profits 205 229 7 10 212 239
Disposals – – – 37 – 37
Dividends received (64) – (3) (2) (67) (2)
Share of fair value through other comprehensive income/available-for-sale and Other reserves 35 (18) – (39) 35 (57)
Others – – – (5)2 – (5)
As at 31 December 1,551 1,489 39 35 1,590 1,524
1 IFRS 9 transition impact from associates is reported here
2 Relates to Asia Commercial Bank disposed in 2017
A complete list of the Group’s interest in associates is included in Note 40. The Group’s principal associate is:
AssociateNature of activities
Main areas of operation
Group interest in ordinary
share capital %
China Bohai Bank Banking China 19.99
The Group’s investment in China Bohai Bank is less than 20 per cent but it is considered to be an associate because of the significant influence the Group is able to exercise over the management and financial and operating policies. The Group applies the equity method of accounting for investments in associates. The reported financials up to November 2018 of this associate are within three months of the Group’s reporting date.
The following table sets out the summarised financial statements of China Bohai Bank prior to the Group’s share of the associates being applied:
China Bohai Bank
30 Nov 2018 $million
30 Nov 2017 $million
Current assets 62,212 52,056
Non-current assets 85,547 104,479
Current liabilities (65,731) (82,293)
Non-current liabilities (74,269) (66,794)
Net assets 7,759 7,448
Operating income 3,427 3,854
Of which:
Interest income 6,699 6,014
Interest expense (4,430) (3,452)
Expenses (1,273) (1,388)
Impairment (971) (1,056)
Operating profit 1,183 1,410
Taxation (160) (263)
Profit after tax 1,023 1,147
The financial statements of China Bohai bank include the following:
Other comprehensive profit/(loss) for the year 175 (91)
Total comprehensive income for the year 1,198 1056
Non-current assets are primarily loans to customers and current liabilities are primarily customer deposits based on contractual maturities.
During the year, there were no indicators of impairment for the Group’s investment in China Bohai Bank. The carrying value of the investment as of 31 December 2018 was $1,551 million (31 December 2017: $1,590 million).

325
Risk review
and capital review
Strategic rep
ort
Sup
plem
entary inform
ation
FIN
AN
CIA
L S
TA
TE
ME
NT
SD
irectors’ rep
ort
33. Structured entities
Accounting policyA structured entity is an entity that has been designed so that voting or similar rights are not the dominant factor in deciding who controls the entity. Contractual arrangements determine the rights and therefore relevant activities of the structured entity. Structured entities are generally created to achieve a narrow and well-defined objective with restrictions around their activities. Structured entities are consolidated when the substance of the relationship between the Group and the structured entity indicates the Group has power over the contractual relevant activities of the structured entity, is exposed to variable returns, and can use that power to affect the variable return exposure.
In determining whether to consolidate a structured entity to which assets have been transferred, the Group takes into account its ability to direct the relevant activities of the structured entity. These relevant activities are generally evidenced through a unilateral right to liquidate the structured entity, investment in a substantial proportion of the securities issued by the structured entity or where the Group holds specific subordinate securities that embody certain controlling rights. The Group may further consider relevant activities embedded within contractual arrangements such as call options which give the practical ability to direct the entity, special relationships between the structured entity and investors, and if a single investor has a large exposure to variable returns of the structured entity.
Judgement is required in determining control over structured entities. The purpose and design of the entity is considered, along with a determination of what the relevant activities are of the entity and who directs these. Further judgements are made around which investor is exposed to, and absorbs the variable returns of the structured entity. The Group will have to weigh up all of these facts to consider whether the Group, or another involved party is acting as a principal in its own right or as an agent on behalf of others. Judgement is further required in the ongoing assessment of control over structured entities, specifically if market conditions have an effect on the variable return exposure of different investors.
The Group has involvement with both consolidated and unconsolidated structured entities, which may be established by the Group as a sponsor or by a third-party.
Interests in consolidated structured entities: A structured entity is consolidated into the Group’s financial statements where the Group controls the structured entity, as per the determination in the accounting policy above.
The following table presents the Group’s interests in consolidated structured entities.
31.12.18 $million
31.12.17 $million
Aircraft and ship leasing 4,854 5,494
Principal and other structured finance 1,452 2,534
Total 6,306 8,028
Interests in unconsolidated structured entities: Unconsolidated structured entities are all structured entities that are not controlled by the Group. The Group enters into transactions with unconsolidated structured entities in the normal course of business to facilitate customer transactions and for specific investment opportunities. An interest in a structured entity is contractual or non-contractual involvement which creates variability of the returns of the Group arising from the performance of the structured entity.
The table below presents the carrying amount of the assets recognised in the financial statements relating to variable interests held in unconsolidated structured entities, the maximum exposure to loss relating to those interests and the total assets of the structured entities. Maximum exposure to loss is primarily limited to the carrying amount of the Group’s on-balance sheet exposure to the structured entity. For derivatives, the maximum exposure to loss represents the on-balance sheet valuation and not the notional amount. For commitments and guarantees, the maximum exposure to loss is the notional amount of potential future losses.
31.12.18 31.12.17
Asset-backed
securities $million
Structured finance $million
Principal Finance
funds $million
Other activities $million
Total $million
Asset-backed
securities $million
Structured finance $million
Principal Finance
funds $million
Other activities $million
Total $million
Group’s interest – assets
Financial assets held at fair value through profit or loss 1,094 – 72 247 1,413 885 – 389 98 1,372
Loans and advances/investment securities at amortised cost 2,556 1,403 252 190 4,401 1,437 1,527 439 – 3,403
Investment securities (fair value through other comprehensive income/available-for-sale) 3,812 – – – 3,812 4,105 – 56 – 4,161
Other assets – – 336 – 336 – – 19 – 19
Total assets 7,462 1,403 660 437 9,962 6,427 1,527 903 98 8,955
Off-balance sheet 116 553 79 – 748 86 501 262 – 849
Group’s maximum exposure to loss 7,578 1,956 739 437 10,710 6,513 2,028 1,165 98 9,804
Total assets of structured entities 205,837 2,785 3,395 11,872 223,889 295,468 3,747 5,052 106 304,373
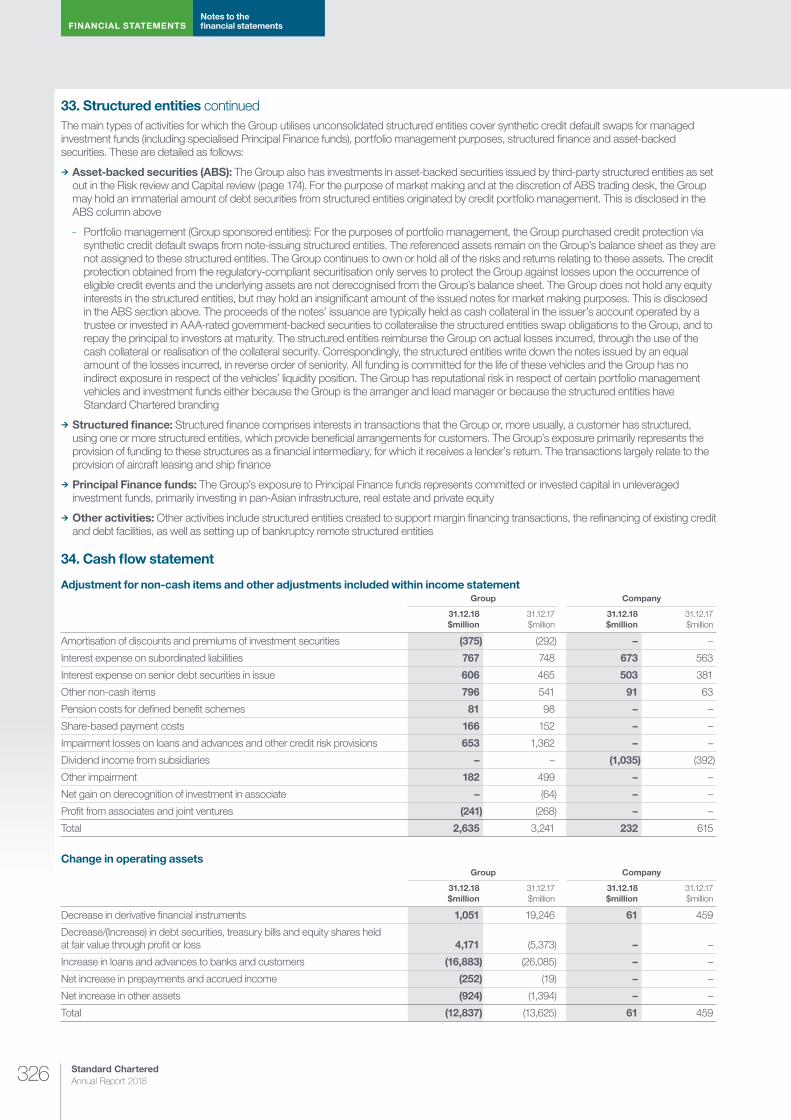
Standard Chartered Annual Report 2018326
FINANCIAL STATEMENTSNotes to the financial statements
33. Structured entities continuedThe main types of activities for which the Group utilises unconsolidated structured entities cover synthetic credit default swaps for managed investment funds (including specialised Principal Finance funds), portfolio management purposes, structured finance and asset-backed securities. These are detailed as follows:
¼ Asset-backed securities (ABS): The Group also has investments in asset-backed securities issued by third-party structured entities as set out in the Risk review and Capital review (page 174). For the purpose of market making and at the discretion of ABS trading desk, the Group may hold an immaterial amount of debt securities from structured entities originated by credit portfolio management. This is disclosed in the ABS column above
– Portfolio management (Group sponsored entities): For the purposes of portfolio management, the Group purchased credit protection via synthetic credit default swaps from note-issuing structured entities. The referenced assets remain on the Group’s balance sheet as they are not assigned to these structured entities. The Group continues to own or hold all of the risks and returns relating to these assets. The credit protection obtained from the regulatory-compliant securitisation only serves to protect the Group against losses upon the occurrence of eligible credit events and the underlying assets are not derecognised from the Group’s balance sheet. The Group does not hold any equity interests in the structured entities, but may hold an insignificant amount of the issued notes for market making purposes. This is disclosed in the ABS section above. The proceeds of the notes’ issuance are typically held as cash collateral in the issuer’s account operated by a trustee or invested in AAA-rated government-backed securities to collateralise the structured entities swap obligations to the Group, and to repay the principal to investors at maturity. The structured entities reimburse the Group on actual losses incurred, through the use of the cash collateral or realisation of the collateral security. Correspondingly, the structured entities write down the notes issued by an equal amount of the losses incurred, in reverse order of seniority. All funding is committed for the life of these vehicles and the Group has no indirect exposure in respect of the vehicles’ liquidity position. The Group has reputational risk in respect of certain portfolio management vehicles and investment funds either because the Group is the arranger and lead manager or because the structured entities have Standard Chartered branding
¼ Structured finance: Structured finance comprises interests in transactions that the Group or, more usually, a customer has structured, using one or more structured entities, which provide beneficial arrangements for customers. The Group’s exposure primarily represents the provision of funding to these structures as a financial intermediary, for which it receives a lender’s return. The transactions largely relate to the provision of aircraft leasing and ship finance
¼ Principal Finance funds: The Group’s exposure to Principal Finance funds represents committed or invested capital in unleveraged investment funds, primarily investing in pan-Asian infrastructure, real estate and private equity
¼ Other activities: Other activities include structured entities created to support margin financing transactions, the refinancing of existing credit and debt facilities, as well as setting up of bankruptcy remote structured entities
34. Cash flow statement
Adjustment for non-cash items and other adjustments included within income statementGroup Company
31.12.18 $million
31.12.17 $million
31.12.18 $million
31.12.17 $million
Amortisation of discounts and premiums of investment securities (375) (292) – –
Interest expense on subordinated liabilities 767 748 673 563
Interest expense on senior debt securities in issue 606 465 503 381
Other non-cash items 796 541 91 63
Pension costs for defined benefit schemes 81 98 – –
Share-based payment costs 166 152 – –
Impairment losses on loans and advances and other credit risk provisions 653 1,362 – –
Dividend income from subsidiaries – – (1,035) (392)
Other impairment 182 499 – –
Net gain on derecognition of investment in associate – (64) – –
Profit from associates and joint ventures (241) (268) – –
Total 2,635 3,241 232 615
Change in operating assetsGroup Company
31.12.18 $million
31.12.17 $million
31.12.18 $million
31.12.17 $million
Decrease in derivative financial instruments 1,051 19,246 61 459
Decrease/(Increase) in debt securities, treasury bills and equity shares held at fair value through profit or loss 4,171 (5,373) – –
Increase in loans and advances to banks and customers (16,883) (26,085) – –
Net increase in prepayments and accrued income (252) (19) – –
Net increase in other assets (924) (1,394) – –
Total (12,837) (13,625) 61 459
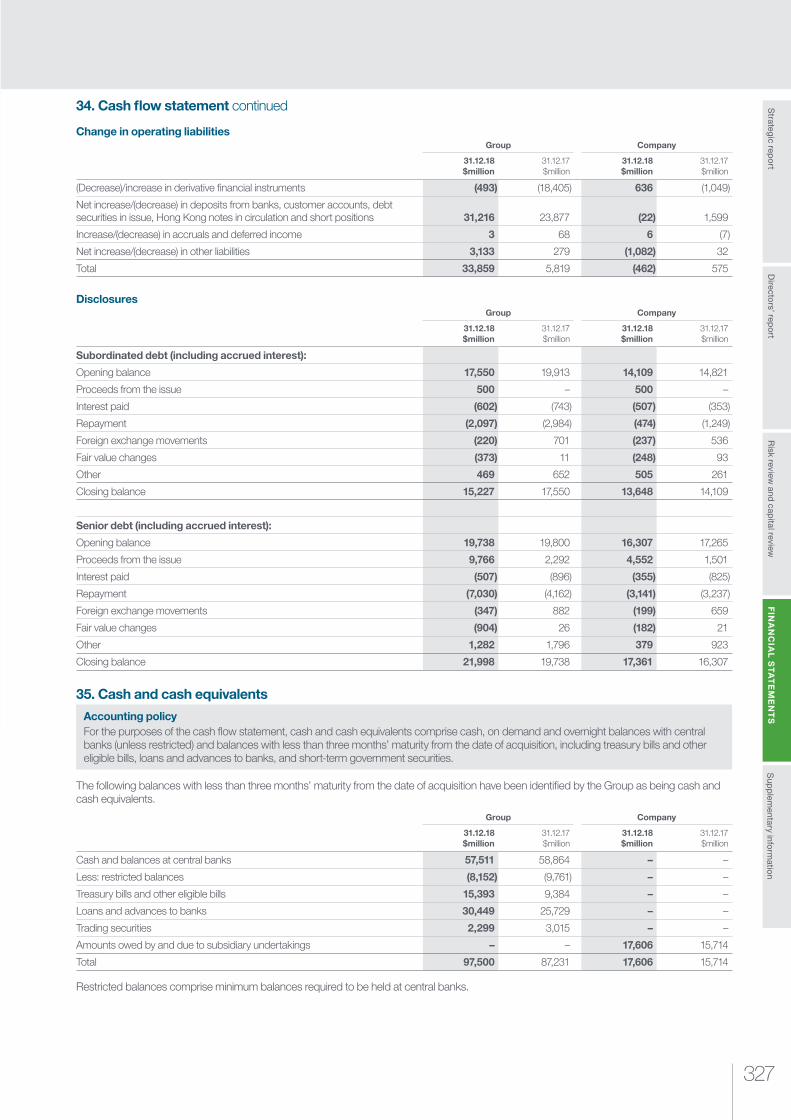
327
Risk review
and capital review
Strategic rep
ort
Sup
plem
entary inform
ation
FIN
AN
CIA
L S
TA
TE
ME
NT
SD
irectors’ rep
ort
34. Cash flow statement continued
Change in operating liabilitiesGroup Company
31.12.18 $million
31.12.17 $million
31.12.18 $million
31.12.17 $million
(Decrease)/increase in derivative financial instruments (493) (18,405) 636 (1,049)
Net increase/(decrease) in deposits from banks, customer accounts, debt securities in issue, Hong Kong notes in circulation and short positions 31,216 23,877 (22) 1,599
Increase/(decrease) in accruals and deferred income 3 68 6 (7)
Net increase/(decrease) in other liabilities 3,133 279 (1,082) 32
Total 33,859 5,819 (462) 575
DisclosuresGroup Company
31.12.18 $million
31.12.17 $million
31.12.18 $million
31.12.17 $million
Subordinated debt (including accrued interest):
Opening balance 17,550 19,913 14,109 14,821
Proceeds from the issue 500 – 500 –
Interest paid (602) (743) (507) (353)
Repayment (2,097) (2,984) (474) (1,249)
Foreign exchange movements (220) 701 (237) 536
Fair value changes (373) 11 (248) 93
Other 469 652 505 261
Closing balance 15,227 17,550 13,648 14,109
Senior debt (including accrued interest):
Opening balance 19,738 19,800 16,307 17,265
Proceeds from the issue 9,766 2,292 4,552 1,501
Interest paid (507) (896) (355) (825)
Repayment (7,030) (4,162) (3,141) (3,237)
Foreign exchange movements (347) 882 (199) 659
Fair value changes (904) 26 (182) 21
Other 1,282 1,796 379 923
Closing balance 21,998 19,738 17,361 16,307
35. Cash and cash equivalents
Accounting policyFor the purposes of the cash flow statement, cash and cash equivalents comprise cash, on demand and overnight balances with central banks (unless restricted) and balances with less than three months’ maturity from the date of acquisition, including treasury bills and other eligible bills, loans and advances to banks, and short-term government securities.
The following balances with less than three months’ maturity from the date of acquisition have been identified by the Group as being cash and cash equivalents.
Group Company
31.12.18 $million
31.12.17 $million
31.12.18 $million
31.12.17 $million
Cash and balances at central banks 57,511 58,864 – –
Less: restricted balances (8,152) (9,761) – –
Treasury bills and other eligible bills 15,393 9,384 – –
Loans and advances to banks 30,449 25,729 – –
Trading securities 2,299 3,015 – –
Amounts owed by and due to subsidiary undertakings – – 17,606 15,714
Total 97,500 87,231 17,606 15,714
Restricted balances comprise minimum balances required to be held at central banks.
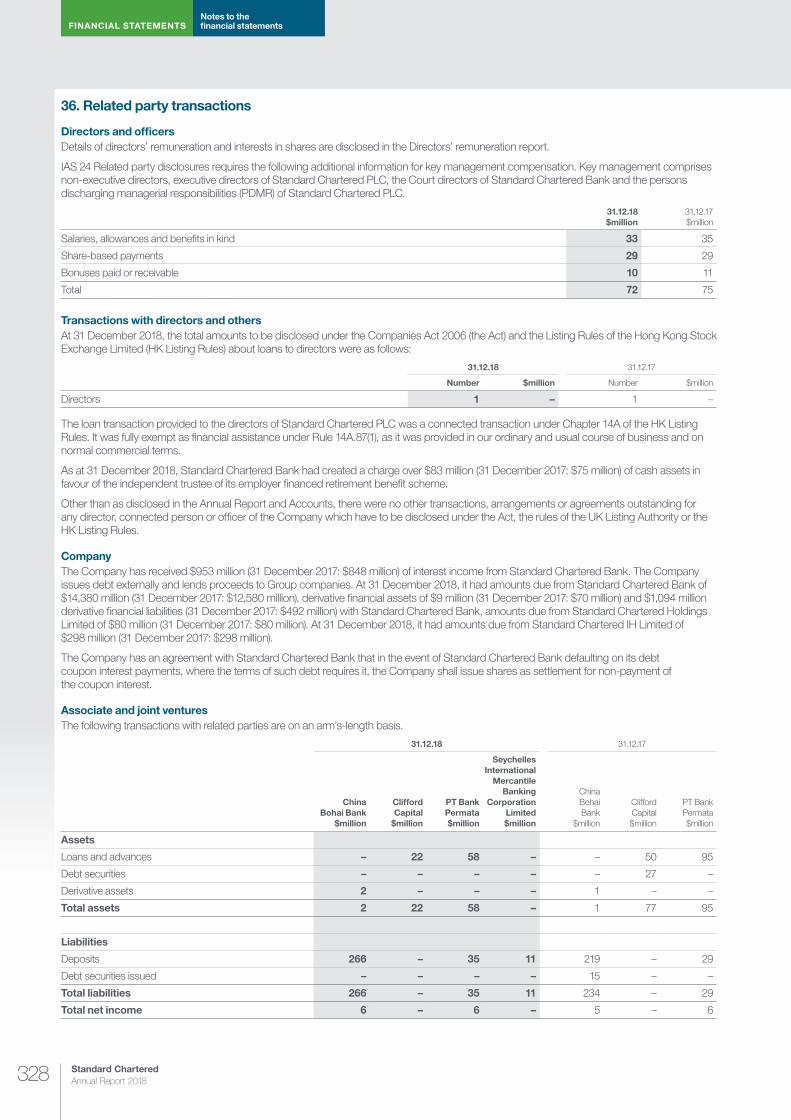
Standard Chartered Annual Report 2018328
FINANCIAL STATEMENTSNotes to the financial statements
36. Related party transactions
Directors and officersDetails of directors’ remuneration and interests in shares are disclosed in the Directors’ remuneration report.
IAS 24 Related party disclosures requires the following additional information for key management compensation. Key management comprises non-executive directors, executive directors of Standard Chartered PLC, the Court directors of Standard Chartered Bank and the persons discharging managerial responsibilities (PDMR) of Standard Chartered PLC.
31.12.18 $million
31.12.17 $million
Salaries, allowances and benefits in kind 33 35
Share-based payments 29 29
Bonuses paid or receivable 10 11
Total 72 75
Transactions with directors and othersAt 31 December 2018, the total amounts to be disclosed under the Companies Act 2006 (the Act) and the Listing Rules of the Hong Kong Stock Exchange Limited (HK Listing Rules) about loans to directors were as follows:
31.12.18 31.12.17
Number $million Number $million
Directors 1 – 1 –
The loan transaction provided to the directors of Standard Chartered PLC was a connected transaction under Chapter 14A of the HK Listing Rules. It was fully exempt as financial assistance under Rule 14A.87(1), as it was provided in our ordinary and usual course of business and on normal commercial terms.
As at 31 December 2018, Standard Chartered Bank had created a charge over $83 million (31 December 2017: $75 million) of cash assets in favour of the independent trustee of its employer financed retirement benefit scheme.
Other than as disclosed in the Annual Report and Accounts, there were no other transactions, arrangements or agreements outstanding for any director, connected person or officer of the Company which have to be disclosed under the Act, the rules of the UK Listing Authority or the HK Listing Rules.
CompanyThe Company has received $953 million (31 December 2017: $848 million) of interest income from Standard Chartered Bank. The Company issues debt externally and lends proceeds to Group companies. At 31 December 2018, it had amounts due from Standard Chartered Bank of $14,380 million (31 December 2017: $12,580 million), derivative financial assets of $9 million (31 December 2017: $70 million) and $1,094 million derivative financial liabilities (31 December 2017: $492 million) with Standard Chartered Bank, amounts due from Standard Chartered Holdings Limited of $80 million (31 December 2017: $80 million). At 31 December 2018, it had amounts due from Standard Chartered IH Limited of $298 million (31 December 2017: $298 million).
The Company has an agreement with Standard Chartered Bank that in the event of Standard Chartered Bank defaulting on its debt coupon interest payments, where the terms of such debt requires it, the Company shall issue shares as settlement for non-payment of the coupon interest.
Associate and joint venturesThe following transactions with related parties are on an arm’s-length basis.
31.12.18 31.12.17
China Bohai Bank
$million
Clifford Capital
$million
PT Bank Permata $million
Seychelles International
Mercantile Banking
Corporation Limited $million
China Bohai Bank
$million
Clifford Capital $million
PT Bank Permata $million
Assets
Loans and advances – 22 58 – – 50 95
Debt securities – – – – – 27 –
Derivative assets 2 – – – 1 – –
Total assets 2 22 58 – 1 77 95
Liabilities
Deposits 266 – 35 11 219 – 29
Debt securities issued – – – – 15 – –
Total liabilities 266 – 35 11 234 – 29
Total net income 6 – 6 – 5 – 6

329
Risk review
and capital review
Strategic rep
ort
Sup
plem
entary inform
ation
FIN
AN
CIA
L S
TA
TE
ME
NT
SD
irectors’ rep
ort
37. Post balance sheet eventsA final dividend for 2018 of 15 cents per ordinary share was declared by the directors after 31 December 2018.
On 21 February 2019 the Board of the Company approved an entity reorganisation in which it will acquire the direct ownership of Standard Chartered Bank (Hong Kong) Limited currently held by wholly owned subsidiary undertakings Standard Chartered Bank and Standard Chartered Holdings Limited. This common control transaction will have no financial impact on the consolidated accounts of the Group. In the Company only accounts, Investments in Subsidiaries will increase with a corresponding increase in equity being the dividend in specie utilised to achieve the reorganisation. The transaction is subject to Standard Chartered Bank and Standard Chartered Holdings Limited passing necessary resolutions for the dividends in specie and completing the necessary transfers, which are expected to be completed in March 2019.
38. Auditor’s remunerationAuditor’s remuneration is included within other general administration expenses. The amounts paid by the Group to their principal auditor, KPMG LLP and its associates (together KPMG), are set out below. All services are approved by the Group Audit Committee and are subject to controls to ensure the external auditor’s independence is unaffected by the provision of other services.
31.12.18 $million
31.12.171 $million
Audit fees for the Group statutory audit 9.2 9.4
Fees payable to KPMG for other services provided to the Group:
Audit of Standard Chartered PLC subsidiaries 8.3 7.7
Total audit fees 17.5 17.1
Audit-related services 7.0 5.9
Other assurance services 0.3 0.2
Tax compliance and advisory services 0.1 0.3
Corporate finance services 0.2 0.5
Total fees payable 25.1 24.0
1 Prior year balances have been re-presented to align to current year categories
The following is a description of the type of services included within the categories listed above:
¼ Audit fees for the Group statutory audit are in respect of fees payable to KPMG LLP for the statutory audit of the consolidated financial statements of the Group and the separate financial statements of Standard Chartered PLC
¼ Audit-related fees consist of fees such as those for services required by law or regulation to be provided by the auditor, reviews of interim financial information, reporting on regulatory returns, reporting to a regulator on client assets and extended work performed over financial information and controls authorised by those charged with governance
¼ Other assurance services include agreed-upon-procedures in relation to statutory and regulatory filings
¼ Tax services include services which are not prohibited by the European Directive on Statutory Audits of Annual and Consolidated Accounts and the Regulation on Statutory Audits of Public Interest Entities
¼ Corporate finance services are fees payable to KPMG for issuing comfort letters
Expenses incurred during the provision of services and which have been reimbursed by the Group are not included within auditor’s remuneration. Expenses incurred for 2018 were $0.6 million (2017: $0.9 million).

Standard Chartered Annual Report 2018330
FINANCIAL STATEMENTSNotes to the financial statements
39. Standard Chartered PLC (Company)
Classification and measurement of financial instruments
Financial assets
31.12.18 31.12.17
Derivatives held for hedging
$millionAmortised cost
$millionTotal
$million
Derivatives held for hedging
$millionAmortised cost
$millionTotal
$million
Derivatives 9 – 9 70 – 70
Investment securities – 11,537 11,537 – 12,159 12,159
Amounts owed by subsidiary undertakings – 17,606 17,606 – 15,714 15,714
Total 9 29,143 29,152 70 27,873 27,943
There was no change to the classification, measurement or credit impairment of financial assets upon the transition to IFRS 9. The instruments classified as amortised cost will be recorded in stage 1.
Derivatives held for hedging are held at fair value and are classified as Level 2 while the counterparty is Standard Chartered Bank.
Debt securities comprise corporate securities issued by Standard Chartered Bank and have a fair value equal to carrying value of $11,537 million (31 December 2017: $12,159 million).
In 2018 and 2017, amounts owed by subsidiary undertakings have a fair value equal to carrying value.
Financial liabilities
31.12.18 31.12.17
Derivatives held for hedging
$millionAmortised cost
$millionTotal
$million
Derivatives held for hedging
$millionAmortised cost
$millionTotal
$million
Derivatives 1,128 – 1,128 492 – 492
Debt securities in issue – 17,202 17,202 – 16,169 16,169
Subordinated liabilities and other borrowed funds – 13,436 13,436 – 13,882 13,882
Total 1,128 30,638 31,766 492 30,051 30,543
Derivatives held for hedging are held at fair value and are classified as Level 2 while the counterparty is Standard Chartered Bank.
The fair value of debt securities in issue is $17,202 million (31 December 2017: $16,169 million) and have fair value equal to carrying value.
The fair value of subordinated liabilities and other borrowed funds is $13,043 million (31 December 2017: $14,314 million).
Derivative financial instruments
Derivatives
31.12.18 31.12.17
Notional principal amounts $million
Assets $million
Liabilities $million
Notional principal amounts $million
Assets $million
Liabilities $million
Foreign exchange derivative contracts:
Currency swaps 6,864 – 818 8,038 59 300
Interest rate derivative contracts:
Swaps 10,939 9 310 11,980 11 192
Total 17,803 9 1,128 20,018 70 492
Credit riskMaximum exposure to credit risk
31.12.18 $million
31.12.17 $million
Derivative financial instruments 9 70
Debt securities 11,537 12,159
Amounts owed by subsidiary undertakings 17,606 15,714
Total 29,152 27,943
In 2018 and 2017, amounts owed by subsidiary undertakings were neither past due nor impaired; the Company had no individually impaired loans.
In 2018 and 2017, the Company had no impaired debt securities. The debt securities held by the Group are issued by Standard Chartered Bank, a wholly owned subsidiary undertaking with credit ratings of A+/A/A1.
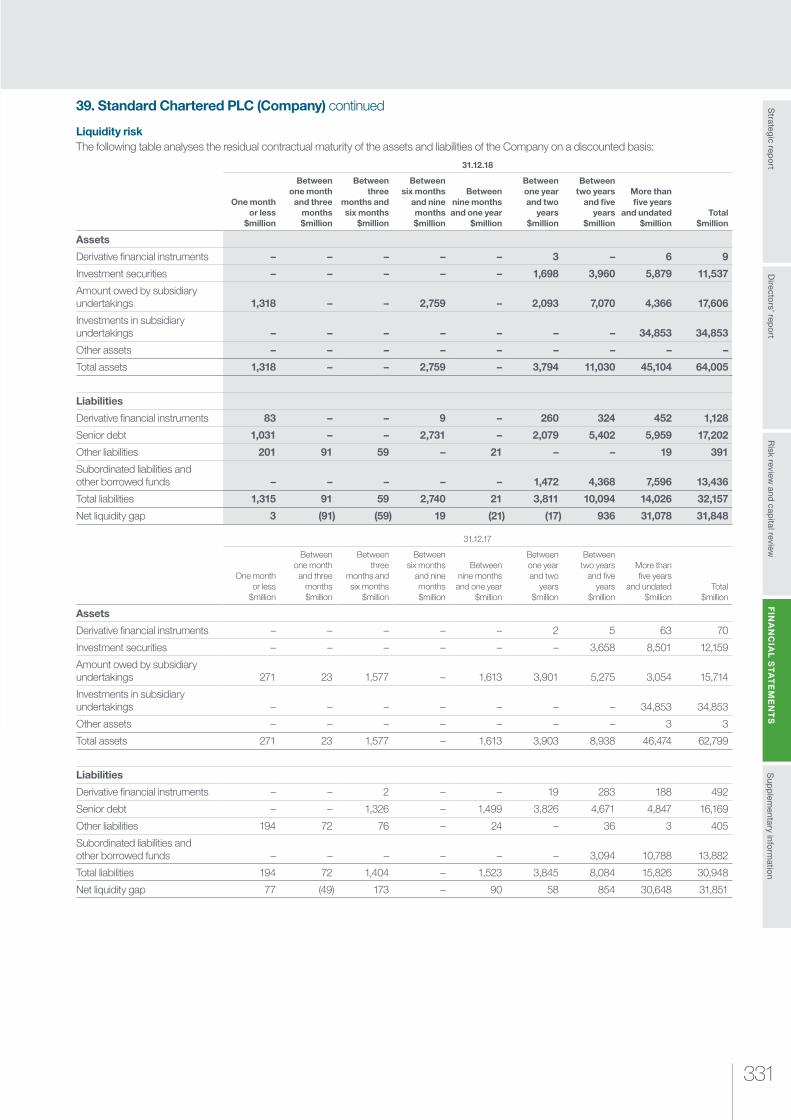
331
Risk review
and capital review
Strategic rep
ort
Sup
plem
entary inform
ation
FIN
AN
CIA
L S
TA
TE
ME
NT
SD
irectors’ rep
ort
39. Standard Chartered PLC (Company) continued
Liquidity risk The following table analyses the residual contractual maturity of the assets and liabilities of the Company on a discounted basis:
31.12.18
One month or less
$million
Between one month and three
months $million
Between three
months and six months
$million
Between six months
and nine months $million
Between nine months and one year
$million
Between one year and two
years $million
Between two years
and five years
$million
More than five years
and undated $million
Total $million
Assets
Derivative financial instruments – – – – – 3 – 6 9
Investment securities – – – – – 1,698 3,960 5,879 11,537
Amount owed by subsidiary undertakings 1,318 – – 2,759 – 2,093 7,070 4,366 17,606
Investments in subsidiary undertakings – – – – – – – 34,853 34,853
Other assets – – – – – – – – –
Total assets 1,318 – – 2,759 – 3,794 11,030 45,104 64,005
Liabilities
Derivative financial instruments 83 – – 9 – 260 324 452 1,128
Senior debt 1,031 – – 2,731 – 2,079 5,402 5,959 17,202
Other liabilities 201 91 59 – 21 – – 19 391
Subordinated liabilities and other borrowed funds – – – – – 1,472 4,368 7,596 13,436
Total liabilities 1,315 91 59 2,740 21 3,811 10,094 14,026 32,157
Net liquidity gap 3 (91) (59) 19 (21) (17) 936 31,078 31,848
31.12.17
One month or less
$million
Between one month and three
months $million
Between three
months and six months
$million
Between six months
and nine months $million
Between nine months
and one year $million
Between one year and two
years $million
Between two years
and five years
$million
More than five years
and undated $million
Total $million
Assets
Derivative financial instruments – – – – – 2 5 63 70
Investment securities – – – – – – 3,658 8,501 12,159
Amount owed by subsidiary undertakings 271 23 1,577 – 1,613 3,901 5,275 3,054 15,714
Investments in subsidiary undertakings – – – – – – – 34,853 34,853
Other assets – – – – – – – 3 3
Total assets 271 23 1,577 – 1,613 3,903 8,938 46,474 62,799
Liabilities
Derivative financial instruments – – 2 – – 19 283 188 492
Senior debt – – 1,326 – 1,499 3,826 4,671 4,847 16,169
Other liabilities 194 72 76 – 24 – 36 3 405
Subordinated liabilities and other borrowed funds – – – – – – 3,094 10,788 13,882
Total liabilities 194 72 1,404 – 1,523 3,845 8,084 15,826 30,948
Net liquidity gap 77 (49) 173 – 90 58 854 30,648 31,851
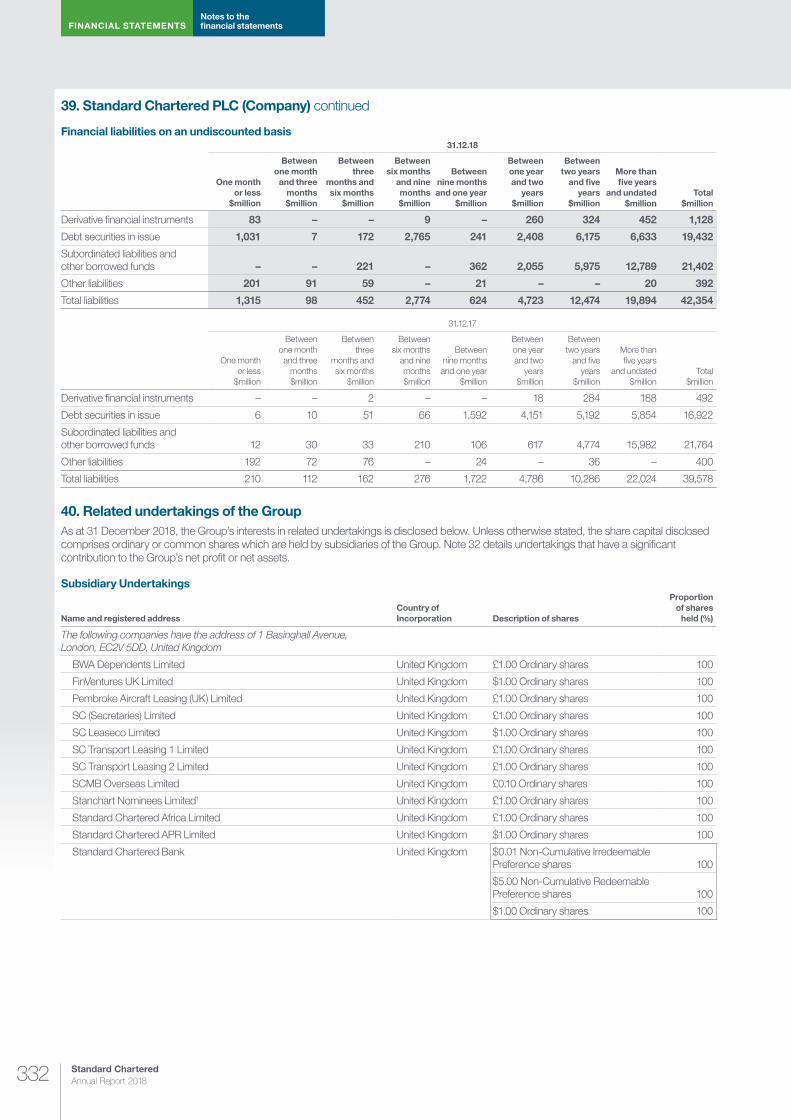
Standard Chartered Annual Report 2018332
FINANCIAL STATEMENTSNotes to the financial statements
39. Standard Chartered PLC (Company) continued
Financial liabilities on an undiscounted basis31.12.18
One month or less
$million
Between one month and three
months $million
Between three
months and six months
$million
Between six months
and nine months $million
Between nine months and one year
$million
Between one year and two
years $million
Between two years
and five years
$million
More than five years
and undated $million
Total $million
Derivative financial instruments 83 – – 9 – 260 324 452 1,128
Debt securities in issue 1,031 7 172 2,765 241 2,408 6,175 6,633 19,432
Subordinated liabilities and other borrowed funds – – 221 – 362 2,055 5,975 12,789 21,402
Other liabilities 201 91 59 – 21 – – 20 392
Total liabilities 1,315 98 452 2,774 624 4,723 12,474 19,894 42,354
31.12.17
One month or less
$million
Between one month and three
months $million
Between three
months and six months
$million
Between six months
and nine months $million
Between nine months
and one year $million
Between one year and two
years $million
Between two years
and five years
$million
More than five years
and undated $million
Total $million
Derivative financial instruments – – 2 – – 18 284 188 492
Debt securities in issue 6 10 51 66 1,592 4,151 5,192 5,854 16,922
Subordinated liabilities and other borrowed funds 12 30 33 210 106 617 4,774 15,982 21,764
Other liabilities 192 72 76 – 24 – 36 – 400
Total liabilities 210 112 162 276 1,722 4,786 10,286 22,024 39,578
40. Related undertakings of the GroupAs at 31 December 2018, the Group’s interests in related undertakings is disclosed below. Unless otherwise stated, the share capital disclosed comprises ordinary or common shares which are held by subsidiaries of the Group. Note 32 details undertakings that have a significant contribution to the Group’s net profit or net assets.
Subsidiary Undertakings
Name and registered address Country of Incorporation Description of shares
Proportion of shares
held (%)
The following companies have the address of 1 Basinghall Avenue, London, EC2V 5DD, United Kingdom
BWA Dependents Limited United Kingdom £1.00 Ordinary shares 100
FinVentures UK Limited United Kingdom $1.00 Ordinary shares 100
Pembroke Aircraft Leasing (UK) Limited United Kingdom £1.00 Ordinary shares 100
SC (Secretaries) Limited United Kingdom £1.00 Ordinary shares 100
SC Leaseco Limited United Kingdom $1.00 Ordinary shares 100
SC Transport Leasing 1 Limited United Kingdom £1.00 Ordinary shares 100
SC Transport Leasing 2 Limited United Kingdom £1.00 Ordinary shares 100
SCMB Overseas Limited United Kingdom £0.10 Ordinary shares 100
Stanchart Nominees Limited1 United Kingdom £1.00 Ordinary shares 100
Standard Chartered Africa Limited United Kingdom £1.00 Ordinary shares 100
Standard Chartered APR Limited United Kingdom $1.00 Ordinary shares 100
Standard Chartered Bank United Kingdom $0.01 Non-Cumulative Irredeemable Preference shares 100
$5.00 Non-Cumulative Redeemable Preference shares 100
$1.00 Ordinary shares 100
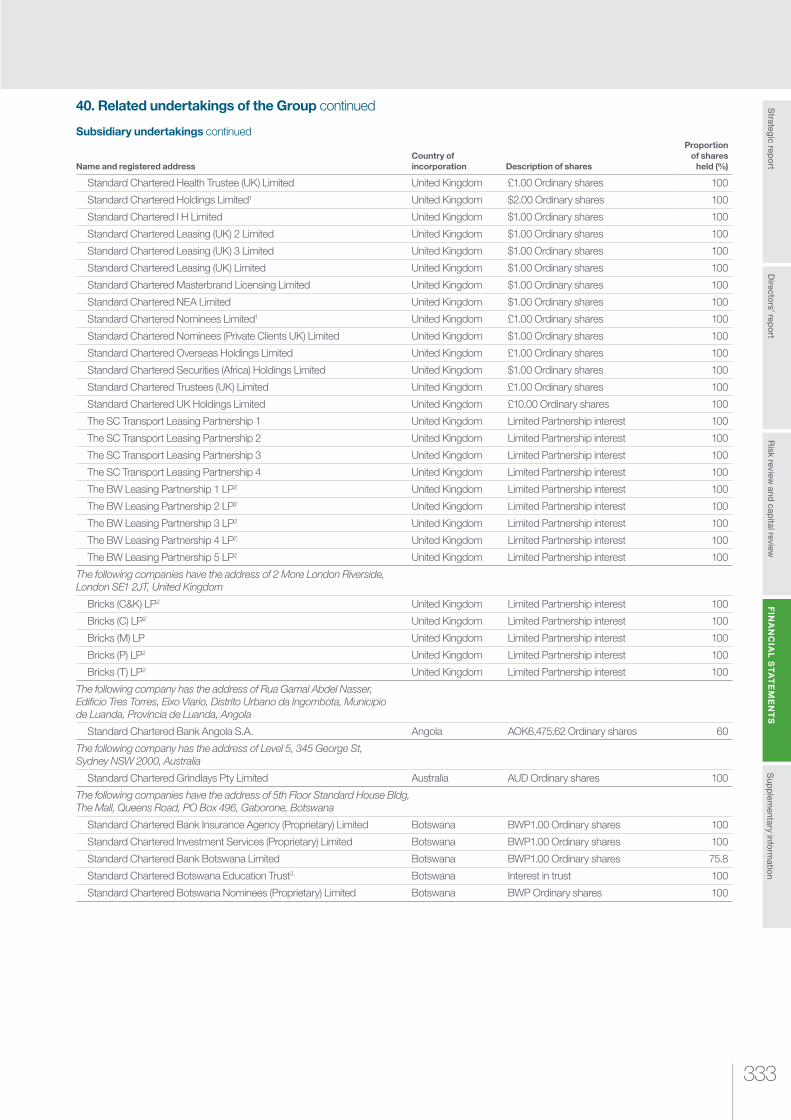
333
Risk review
and capital review
Strategic rep
ort
Sup
plem
entary inform
ation
FIN
AN
CIA
L S
TA
TE
ME
NT
SD
irectors’ rep
ort
40. Related undertakings of the Group continued
Subsidiary undertakings continued
Name and registered address Country of incorporation Description of shares
Proportion of shares
held (%)
Standard Chartered Health Trustee (UK) Limited United Kingdom £1.00 Ordinary shares 100
Standard Chartered Holdings Limited1 United Kingdom $2.00 Ordinary shares 100
Standard Chartered I H Limited United Kingdom $1.00 Ordinary shares 100
Standard Chartered Leasing (UK) 2 Limited United Kingdom $1.00 Ordinary shares 100
Standard Chartered Leasing (UK) 3 Limited United Kingdom $1.00 Ordinary shares 100
Standard Chartered Leasing (UK) Limited United Kingdom $1.00 Ordinary shares 100
Standard Chartered Masterbrand Licensing Limited United Kingdom $1.00 Ordinary shares 100
Standard Chartered NEA Limited United Kingdom $1.00 Ordinary shares 100
Standard Chartered Nominees Limited1 United Kingdom £1.00 Ordinary shares 100
Standard Chartered Nominees (Private Clients UK) Limited United Kingdom $1.00 Ordinary shares 100
Standard Chartered Overseas Holdings Limited United Kingdom £1.00 Ordinary shares 100
Standard Chartered Securities (Africa) Holdings Limited United Kingdom $1.00 Ordinary shares 100
Standard Chartered Trustees (UK) Limited United Kingdom £1.00 Ordinary shares 100
Standard Chartered UK Holdings Limited United Kingdom £10.00 Ordinary shares 100
The SC Transport Leasing Partnership 1 United Kingdom Limited Partnership interest 100
The SC Transport Leasing Partnership 2 United Kingdom Limited Partnership interest 100
The SC Transport Leasing Partnership 3 United Kingdom Limited Partnership interest 100
The SC Transport Leasing Partnership 4 United Kingdom Limited Partnership interest 100
The BW Leasing Partnership 1 LP2 United Kingdom Limited Partnership interest 100
The BW Leasing Partnership 2 LP2 United Kingdom Limited Partnership interest 100
The BW Leasing Partnership 3 LP2 United Kingdom Limited Partnership interest 100
The BW Leasing Partnership 4 LP2 United Kingdom Limited Partnership interest 100
The BW Leasing Partnership 5 LP2 United Kingdom Limited Partnership interest 100
The following companies have the address of 2 More London Riverside, London SE1 2JT, United Kingdom
Bricks (C&K) LP2 United Kingdom Limited Partnership interest 100
Bricks (C) LP2 United Kingdom Limited Partnership interest 100
Bricks (M) LP United Kingdom Limited Partnership interest 100
Bricks (P) LP2 United Kingdom Limited Partnership interest 100
Bricks (T) LP2 United Kingdom Limited Partnership interest 100
The following company has the address of Rua Gamal Abdel Nasser, Edificio Tres Torres, Eixo Viario, Distrito Urbano da Ingombota, Municipio de Luanda, Provincia de Luanda, Angola
Standard Chartered Bank Angola S.A. Angola AOK6,475.62 Ordinary shares 60
The following company has the address of Level 5, 345 George St, Sydney NSW 2000, Australia
Standard Chartered Grindlays Pty Limited Australia AUD Ordinary shares 100
The following companies have the address of 5th Floor Standard House Bldg, The Mall, Queens Road, PO Box 496, Gaborone, Botswana
Standard Chartered Bank Insurance Agency (Proprietary) Limited Botswana BWP1.00 Ordinary shares 100
Standard Chartered Investment Services (Proprietary) Limited Botswana BWP1.00 Ordinary shares 100
Standard Chartered Bank Botswana Limited Botswana BWP1.00 Ordinary shares 75.8
Standard Chartered Botswana Education Trust3 Botswana Interest in trust 100
Standard Chartered Botswana Nominees (Proprietary) Limited Botswana BWP Ordinary shares 100
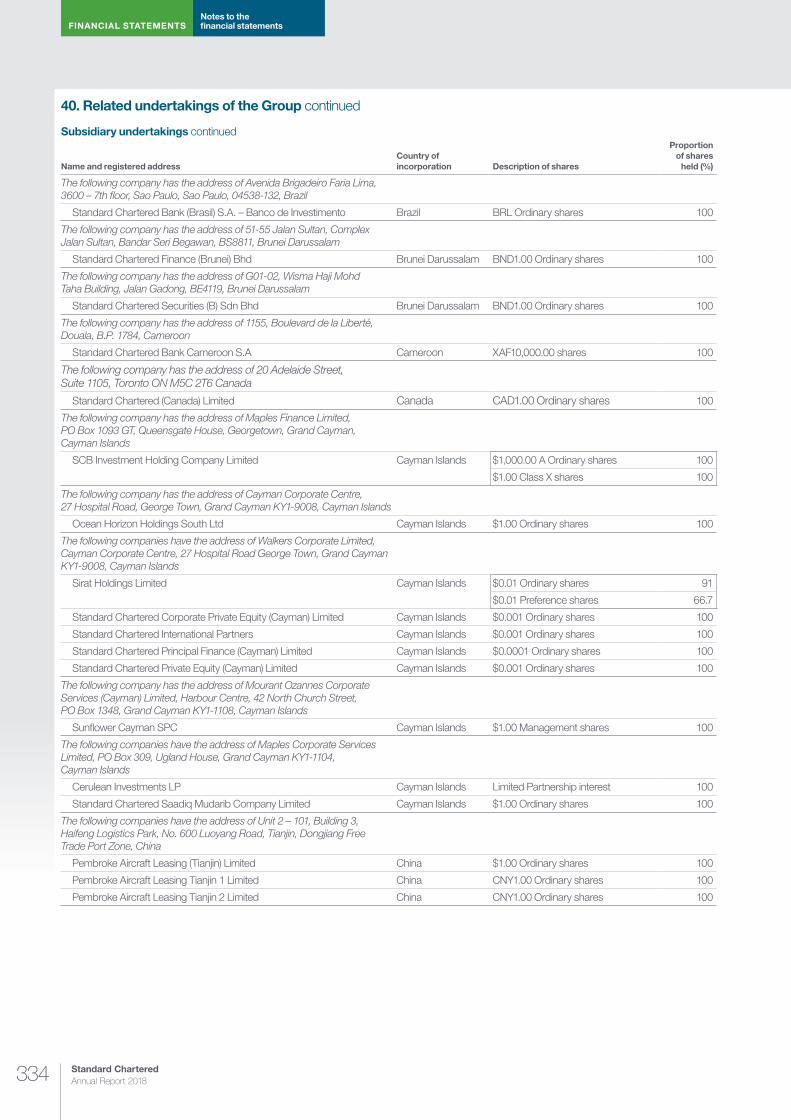
Standard Chartered Annual Report 2018334
FINANCIAL STATEMENTSNotes to the financial statements
40. Related undertakings of the Group continued
Subsidiary undertakings continued
Name and registered address Country of incorporation Description of shares
Proportion of shares
held (%)
The following company has the address of Avenida Brigadeiro Faria Lima, 3600 – 7th floor, Sao Paulo, Sao Paulo, 04538-132, Brazil
Standard Chartered Bank (Brasil) S.A. – Banco de Investimento Brazil BRL Ordinary shares 100
The following company has the address of 51-55 Jalan Sultan, Complex Jalan Sultan, Bandar Seri Begawan, BS8811, Brunei Darussalam
Standard Chartered Finance (Brunei) Bhd Brunei Darussalam BND1.00 Ordinary shares 100
The following company has the address of G01-02, Wisma Haji Mohd Taha Building, Jalan Gadong, BE4119, Brunei Darussalam
Standard Chartered Securities (B) Sdn Bhd Brunei Darussalam BND1.00 Ordinary shares 100
The following company has the address of 1155, Boulevard de la Liberté, Douala, B.P. 1784, Cameroon
Standard Chartered Bank Cameroon S.A Cameroon XAF10,000.00 shares 100
The following company has the address of 20 Adelaide Street, Suite 1105, Toronto ON M5C 2T6 Canada
Standard Chartered (Canada) Limited Canada CAD1.00 Ordinary shares 100
The following company has the address of Maples Finance Limited, PO Box 1093 GT, Queensgate House, Georgetown, Grand Cayman, Cayman Islands
SCB Investment Holding Company Limited Cayman Islands $1,000.00 A Ordinary shares 100
$1.00 Class X shares 100
The following company has the address of Cayman Corporate Centre, 27 Hospital Road, George Town, Grand Cayman KY1-9008, Cayman Islands
Ocean Horizon Holdings South Ltd Cayman Islands $1.00 Ordinary shares 100
The following companies have the address of Walkers Corporate Limited, Cayman Corporate Centre, 27 Hospital Road George Town, Grand Cayman KY1-9008, Cayman Islands
Sirat Holdings Limited Cayman Islands $0.01 Ordinary shares 91
$0.01 Preference shares 66.7
Standard Chartered Corporate Private Equity (Cayman) Limited Cayman Islands $0.001 Ordinary shares 100
Standard Chartered International Partners Cayman Islands $0.001 Ordinary shares 100
Standard Chartered Principal Finance (Cayman) Limited Cayman Islands $0.0001 Ordinary shares 100
Standard Chartered Private Equity (Cayman) Limited Cayman Islands $0.001 Ordinary shares 100
The following company has the address of Mourant Ozannes Corporate Services (Cayman) Limited, Harbour Centre, 42 North Church Street, PO Box 1348, Grand Cayman KY1-1108, Cayman Islands
Sunflower Cayman SPC Cayman Islands $1.00 Management shares 100
The following companies have the address of Maples Corporate Services Limited, PO Box 309, Ugland House, Grand Cayman KY1-1104, Cayman Islands
Cerulean Investments LP Cayman Islands Limited Partnership interest 100
Standard Chartered Saadiq Mudarib Company Limited Cayman Islands $1.00 Ordinary shares 100
The following companies have the address of Unit 2 – 101, Building 3, Haifeng Logistics Park, No. 600 Luoyang Road, Tianjin, Dongjiang Free Trade Port Zone, China
Pembroke Aircraft Leasing (Tianjin) Limited China $1.00 Ordinary shares 100
Pembroke Aircraft Leasing Tianjin 1 Limited China CNY1.00 Ordinary shares 100
Pembroke Aircraft Leasing Tianjin 2 Limited China CNY1.00 Ordinary shares 100
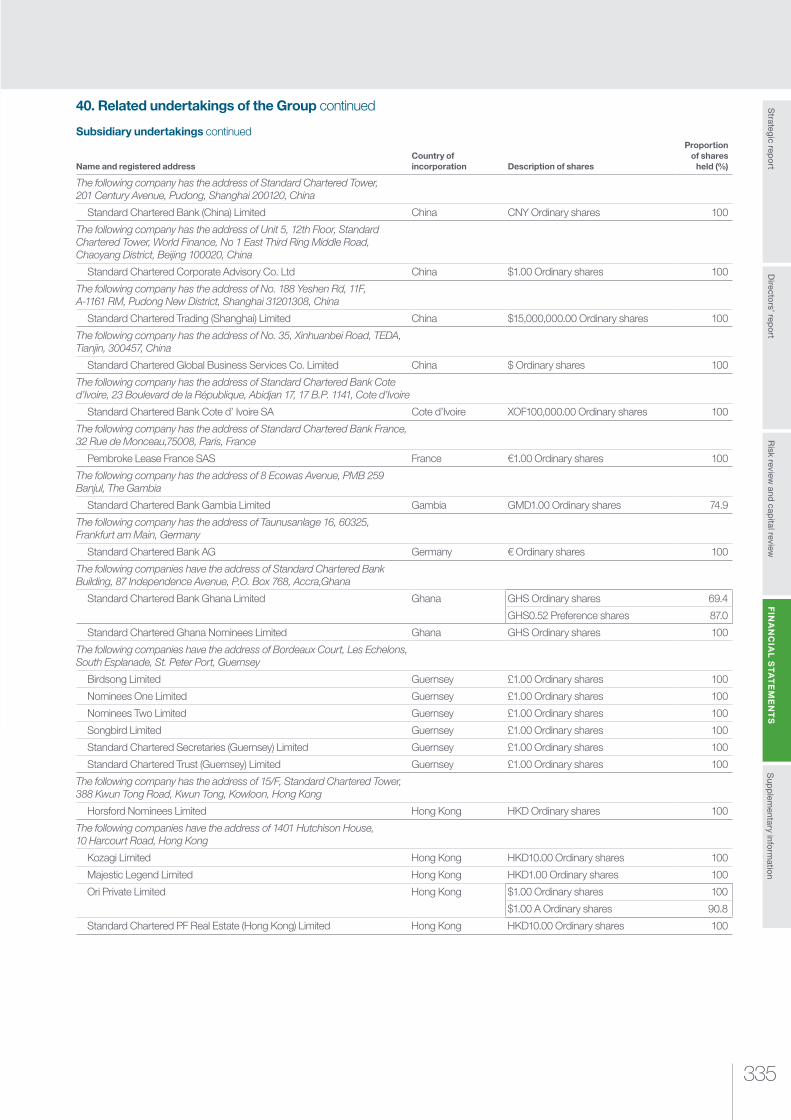
335
Risk review
and capital review
Strategic rep
ort
Sup
plem
entary inform
ation
FIN
AN
CIA
L S
TA
TE
ME
NT
SD
irectors’ rep
ort
40. Related undertakings of the Group continued
Subsidiary undertakings continued
Name and registered address Country of incorporation Description of shares
Proportion of shares
held (%)
The following company has the address of Standard Chartered Tower, 201 Century Avenue, Pudong, Shanghai 200120, China
Standard Chartered Bank (China) Limited China CNY Ordinary shares 100
The following company has the address of Unit 5, 12th Floor, Standard Chartered Tower, World Finance, No 1 East Third Ring Middle Road, Chaoyang District, Beijing 100020, China
Standard Chartered Corporate Advisory Co. Ltd China $1.00 Ordinary shares 100
The following company has the address of No. 188 Yeshen Rd, 11F, A-1161 RM, Pudong New District, Shanghai 31201308, China
Standard Chartered Trading (Shanghai) Limited China $15,000,000.00 Ordinary shares 100
The following company has the address of No. 35, Xinhuanbei Road, TEDA, Tianjin, 300457, China
Standard Chartered Global Business Services Co. Limited China $ Ordinary shares 100
The following company has the address of Standard Chartered Bank Cote d’Ivoire, 23 Boulevard de la République, Abidjan 17, 17 B.P. 1141, Cote d’Ivoire
Standard Chartered Bank Cote d’ Ivoire SA Cote d’Ivoire XOF100,000.00 Ordinary shares 100
The following company has the address of Standard Chartered Bank France, 32 Rue de Monceau,75008, Paris, France
Pembroke Lease France SAS France €1.00 Ordinary shares 100
The following company has the address of 8 Ecowas Avenue, PMB 259 Banjul, The Gambia
Standard Chartered Bank Gambia Limited Gambia GMD1.00 Ordinary shares 74.9
The following company has the address of Taunusanlage 16, 60325, Frankfurt am Main, Germany
Standard Chartered Bank AG Germany € Ordinary shares 100
The following companies have the address of Standard Chartered Bank Building, 87 Independence Avenue, P.O. Box 768, Accra,Ghana
Standard Chartered Bank Ghana Limited Ghana GHS Ordinary shares 69.4
GHS0.52 Preference shares 87.0
Standard Chartered Ghana Nominees Limited Ghana GHS Ordinary shares 100
The following companies have the address of Bordeaux Court, Les Echelons, South Esplanade, St. Peter Port, Guernsey
Birdsong Limited Guernsey £1.00 Ordinary shares 100
Nominees One Limited Guernsey £1.00 Ordinary shares 100
Nominees Two Limited Guernsey £1.00 Ordinary shares 100
Songbird Limited Guernsey £1.00 Ordinary shares 100
Standard Chartered Secretaries (Guernsey) Limited Guernsey £1.00 Ordinary shares 100
Standard Chartered Trust (Guernsey) Limited Guernsey £1.00 Ordinary shares 100
The following company has the address of 15/F, Standard Chartered Tower, 388 Kwun Tong Road, Kwun Tong, Kowloon, Hong Kong
Horsford Nominees Limited Hong Kong HKD Ordinary shares 100
The following companies have the address of 1401 Hutchison House, 10 Harcourt Road, Hong Kong
Kozagi Limited Hong Kong HKD10.00 Ordinary shares 100
Majestic Legend Limited Hong Kong HKD1.00 Ordinary shares 100
Ori Private Limited Hong Kong $1.00 Ordinary shares 100
$1.00 A Ordinary shares 90.8
Standard Chartered PF Real Estate (Hong Kong) Limited Hong Kong HKD10.00 Ordinary shares 100
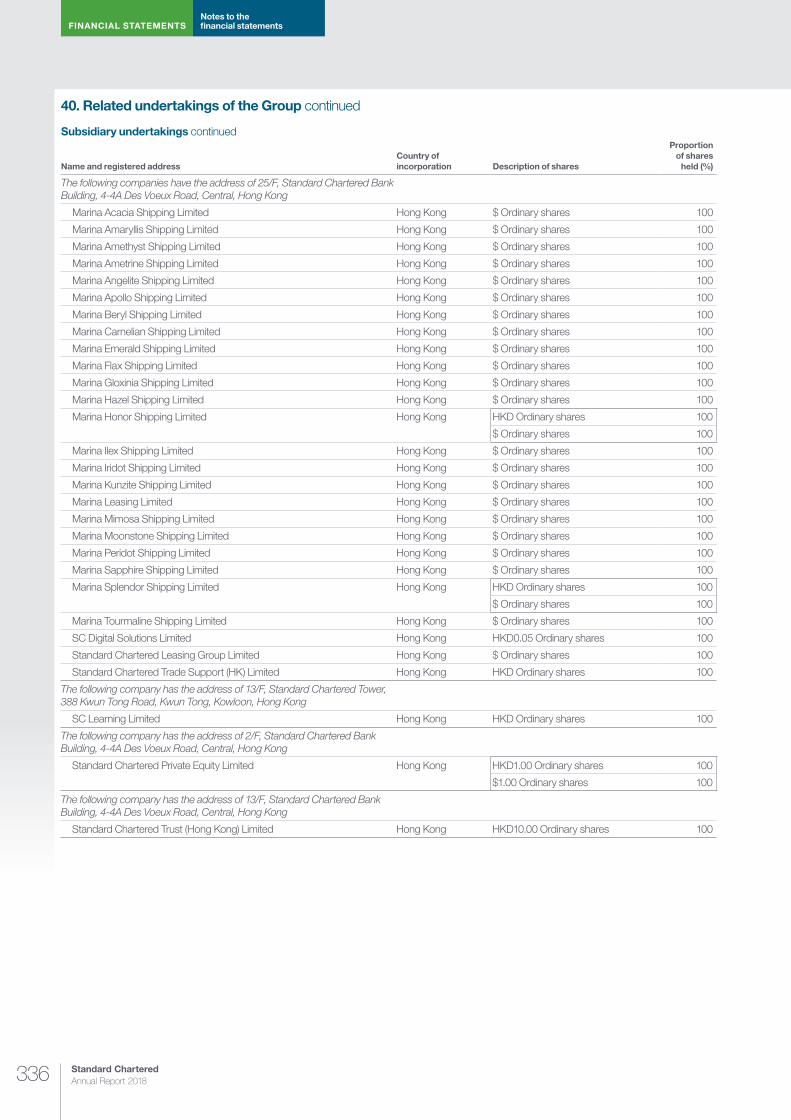
Standard Chartered Annual Report 2018336
FINANCIAL STATEMENTSNotes to the financial statements
40. Related undertakings of the Group continued
Subsidiary undertakings continued
Name and registered address Country of incorporation Description of shares
Proportion of shares
held (%)
The following companies have the address of 25/F, Standard Chartered Bank Building, 4-4A Des Voeux Road, Central, Hong Kong
Marina Acacia Shipping Limited Hong Kong $ Ordinary shares 100
Marina Amaryllis Shipping Limited Hong Kong $ Ordinary shares 100
Marina Amethyst Shipping Limited Hong Kong $ Ordinary shares 100
Marina Ametrine Shipping Limited Hong Kong $ Ordinary shares 100
Marina Angelite Shipping Limited Hong Kong $ Ordinary shares 100
Marina Apollo Shipping Limited Hong Kong $ Ordinary shares 100
Marina Beryl Shipping Limited Hong Kong $ Ordinary shares 100
Marina Carnelian Shipping Limited Hong Kong $ Ordinary shares 100
Marina Emerald Shipping Limited Hong Kong $ Ordinary shares 100
Marina Flax Shipping Limited Hong Kong $ Ordinary shares 100
Marina Gloxinia Shipping Limited Hong Kong $ Ordinary shares 100
Marina Hazel Shipping Limited Hong Kong $ Ordinary shares 100
Marina Honor Shipping Limited Hong Kong HKD Ordinary shares 100
$ Ordinary shares 100
Marina Ilex Shipping Limited Hong Kong $ Ordinary shares 100
Marina Iridot Shipping Limited Hong Kong $ Ordinary shares 100
Marina Kunzite Shipping Limited Hong Kong $ Ordinary shares 100
Marina Leasing Limited Hong Kong $ Ordinary shares 100
Marina Mimosa Shipping Limited Hong Kong $ Ordinary shares 100
Marina Moonstone Shipping Limited Hong Kong $ Ordinary shares 100
Marina Peridot Shipping Limited Hong Kong $ Ordinary shares 100
Marina Sapphire Shipping Limited Hong Kong $ Ordinary shares 100
Marina Splendor Shipping Limited Hong Kong HKD Ordinary shares 100
$ Ordinary shares 100
Marina Tourmaline Shipping Limited Hong Kong $ Ordinary shares 100
SC Digital Solutions Limited Hong Kong HKD0.05 Ordinary shares 100
Standard Chartered Leasing Group Limited Hong Kong $ Ordinary shares 100
Standard Chartered Trade Support (HK) Limited Hong Kong HKD Ordinary shares 100
The following company has the address of 13/F, Standard Chartered Tower, 388 Kwun Tong Road, Kwun Tong, Kowloon, Hong Kong
SC Learning Limited Hong Kong HKD Ordinary shares 100
The following company has the address of 2/F, Standard Chartered Bank Building, 4-4A Des Voeux Road, Central, Hong Kong
Standard Chartered Private Equity Limited Hong Kong HKD1.00 Ordinary shares 100
$1.00 Ordinary shares 100
The following company has the address of 13/F, Standard Chartered Bank Building, 4-4A Des Voeux Road, Central, Hong Kong
Standard Chartered Trust (Hong Kong) Limited Hong Kong HKD10.00 Ordinary shares 100
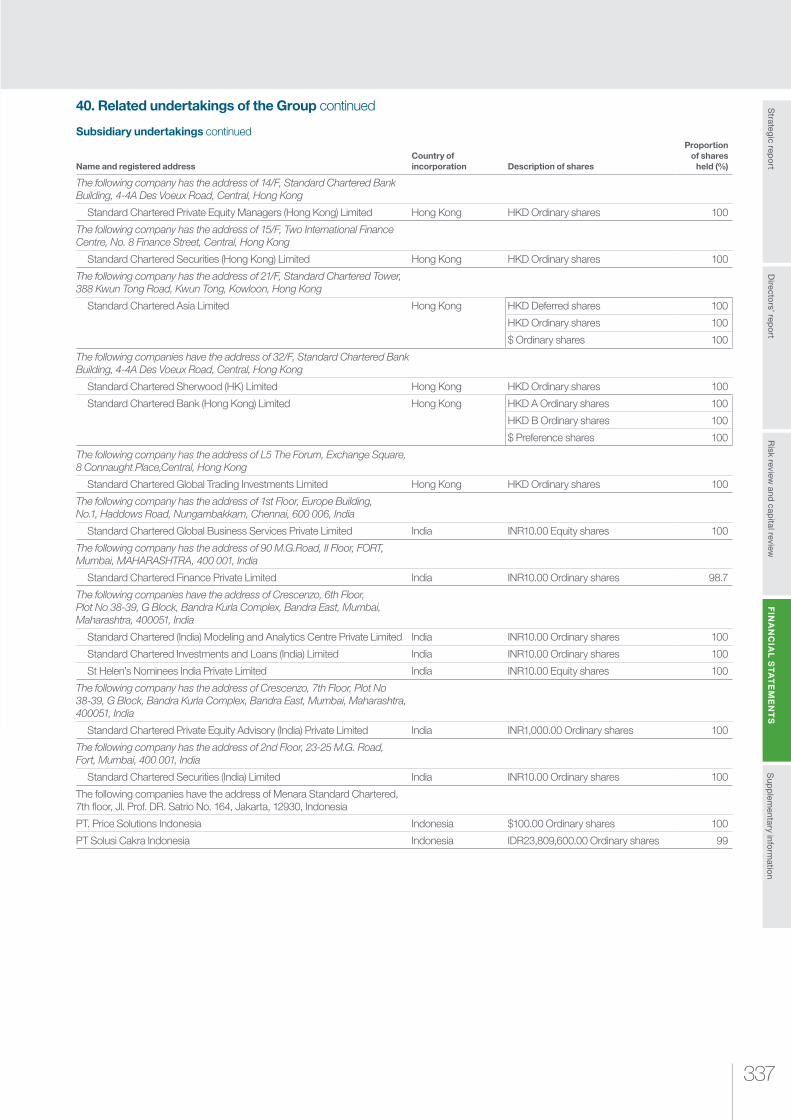
337
Risk review
and capital review
Strategic rep
ort
Sup
plem
entary inform
ation
FIN
AN
CIA
L S
TA
TE
ME
NT
SD
irectors’ rep
ort
40. Related undertakings of the Group continued
Subsidiary undertakings continued
Name and registered addressCountry of incorporation Description of shares
Proportion of shares
held (%)
The following company has the address of 14/F, Standard Chartered Bank Building, 4-4A Des Voeux Road, Central, Hong Kong
Standard Chartered Private Equity Managers (Hong Kong) Limited Hong Kong HKD Ordinary shares 100
The following company has the address of 15/F, Two International Finance Centre, No. 8 Finance Street, Central, Hong Kong
Standard Chartered Securities (Hong Kong) Limited Hong Kong HKD Ordinary shares 100
The following company has the address of 21/F, Standard Chartered Tower, 388 Kwun Tong Road, Kwun Tong, Kowloon, Hong Kong
Standard Chartered Asia Limited Hong Kong HKD Deferred shares 100
HKD Ordinary shares 100
$ Ordinary shares 100
The following companies have the address of 32/F, Standard Chartered Bank Building, 4-4A Des Voeux Road, Central, Hong Kong
Standard Chartered Sherwood (HK) Limited Hong Kong HKD Ordinary shares 100
Standard Chartered Bank (Hong Kong) Limited Hong Kong HKD A Ordinary shares 100
HKD B Ordinary shares 100
$ Preference shares 100
The following company has the address of L5 The Forum, Exchange Square, 8 Connaught Place,Central, Hong Kong
Standard Chartered Global Trading Investments Limited Hong Kong HKD Ordinary shares 100
The following company has the address of 1st Floor, Europe Building, No.1, Haddows Road, Nungambakkam, Chennai, 600 006, India
Standard Chartered Global Business Services Private Limited India INR10.00 Equity shares 100
The following company has the address of 90 M.G.Road, II Floor, FORT, Mumbai, MAHARASHTRA, 400 001, India
Standard Chartered Finance Private Limited India INR10.00 Ordinary shares 98.7
The following companies have the address of Crescenzo, 6th Floor, Plot No 38-39, G Block, Bandra Kurla Complex, Bandra East, Mumbai, Maharashtra, 400051, India
Standard Chartered (India) Modeling and Analytics Centre Private Limited India INR10.00 Ordinary shares 100
Standard Chartered Investments and Loans (India) Limited India INR10.00 Ordinary shares 100
St Helen’s Nominees India Private Limited India INR10.00 Equity shares 100
The following company has the address of Crescenzo, 7th Floor, Plot No 38-39, G Block, Bandra Kurla Complex, Bandra East, Mumbai, Maharashtra, 400051, India
Standard Chartered Private Equity Advisory (India) Private Limited India INR1,000.00 Ordinary shares 100
The following company has the address of 2nd Floor, 23-25 M.G. Road, Fort, Mumbai, 400 001, India
Standard Chartered Securities (India) Limited India INR10.00 Ordinary shares 100
The following companies have the address of Menara Standard Chartered, 7th floor, Jl. Prof. DR. Satrio No. 164, Jakarta, 12930, Indonesia
PT. Price Solutions Indonesia Indonesia $100.00 Ordinary shares 100
PT Solusi Cakra Indonesia Indonesia IDR23,809,600.00 Ordinary shares 99
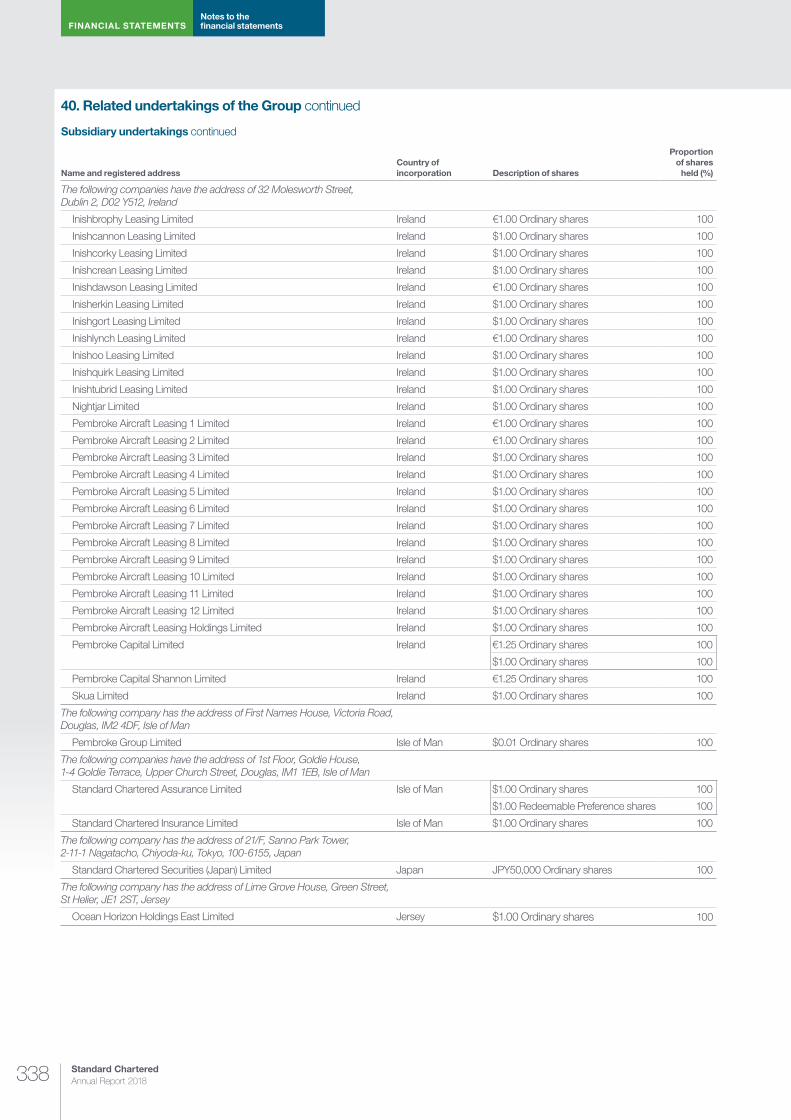
Standard Chartered Annual Report 2018338
FINANCIAL STATEMENTSNotes to the financial statements
40. Related undertakings of the Group continued
Subsidiary undertakings continued
Name and registered address Country of incorporation Description of shares
Proportion of shares
held (%)
The following companies have the address of 32 Molesworth Street, Dublin 2, D02 Y512, Ireland
Inishbrophy Leasing Limited Ireland €1.00 Ordinary shares 100
Inishcannon Leasing Limited Ireland $1.00 Ordinary shares 100
Inishcorky Leasing Limited Ireland $1.00 Ordinary shares 100
Inishcrean Leasing Limited Ireland $1.00 Ordinary shares 100
Inishdawson Leasing Limited Ireland €1.00 Ordinary shares 100
Inisherkin Leasing Limited Ireland $1.00 Ordinary shares 100
Inishgort Leasing Limited Ireland $1.00 Ordinary shares 100
Inishlynch Leasing Limited Ireland €1.00 Ordinary shares 100
Inishoo Leasing Limited Ireland $1.00 Ordinary shares 100
Inishquirk Leasing Limited Ireland $1.00 Ordinary shares 100
Inishtubrid Leasing Limited Ireland $1.00 Ordinary shares 100
Nightjar Limited Ireland $1.00 Ordinary shares 100
Pembroke Aircraft Leasing 1 Limited Ireland €1.00 Ordinary shares 100
Pembroke Aircraft Leasing 2 Limited Ireland €1.00 Ordinary shares 100
Pembroke Aircraft Leasing 3 Limited Ireland $1.00 Ordinary shares 100
Pembroke Aircraft Leasing 4 Limited Ireland $1.00 Ordinary shares 100
Pembroke Aircraft Leasing 5 Limited Ireland $1.00 Ordinary shares 100
Pembroke Aircraft Leasing 6 Limited Ireland $1.00 Ordinary shares 100
Pembroke Aircraft Leasing 7 Limited Ireland $1.00 Ordinary shares 100
Pembroke Aircraft Leasing 8 Limited Ireland $1.00 Ordinary shares 100
Pembroke Aircraft Leasing 9 Limited Ireland $1.00 Ordinary shares 100
Pembroke Aircraft Leasing 10 Limited Ireland $1.00 Ordinary shares 100
Pembroke Aircraft Leasing 11 Limited Ireland $1.00 Ordinary shares 100
Pembroke Aircraft Leasing 12 Limited Ireland $1.00 Ordinary shares 100
Pembroke Aircraft Leasing Holdings Limited Ireland $1.00 Ordinary shares 100
Pembroke Capital Limited Ireland €1.25 Ordinary shares 100
$1.00 Ordinary shares 100
Pembroke Capital Shannon Limited Ireland €1.25 Ordinary shares 100
Skua Limited Ireland $1.00 Ordinary shares 100
The following company has the address of First Names House, Victoria Road, Douglas, IM2 4DF, Isle of Man
Pembroke Group Limited Isle of Man $0.01 Ordinary shares 100
The following companies have the address of 1st Floor, Goldie House, 1-4 Goldie Terrace, Upper Church Street, Douglas, IM1 1EB, Isle of Man
Standard Chartered Assurance Limited Isle of Man $1.00 Ordinary shares 100
$1.00 Redeemable Preference shares 100
Standard Chartered Insurance Limited Isle of Man $1.00 Ordinary shares 100
The following company has the address of 21/F, Sanno Park Tower, 2-11-1 Nagatacho, Chiyoda-ku, Tokyo, 100-6155, Japan
Standard Chartered Securities (Japan) Limited Japan JPY50,000 Ordinary shares 100
The following company has the address of Lime Grove House, Green Street, St Helier, JE1 2ST, Jersey
Ocean Horizon Holdings East Limited Jersey $1.00 Ordinary shares 100

339
Risk review
and capital review
Strategic rep
ort
Sup
plem
entary inform
ation
FIN
AN
CIA
L S
TA
TE
ME
NT
SD
irectors’ rep
ort
40. Related undertakings of the Group continued
Subsidiary undertakings continued
Name and registered address Country of incorporation Description of shares
Proportion of shares
held (%)
The following company has the address of 4/F St Pauls Gate, 22-24 New Street, St Helier, JE1 4TR, Jersey
Ocean Horizon Holdings West Limited Jersey $1.00 Ordinary shares 100
The following company has the address of 15 Castle Street, St Helier, JE4 8PT, Jersey
SCB Nominees (CI) Limited Jersey $1.00 Ordinary shares 100
The following company has the address of IFC 5, St Helier, JE1 1ST, Jersey
Standard Chartered Funding (Jersey) Limited1 Jersey £1.00 Ordinary shares 100
The following companies have the address of Standard Chartered@ Chiromo, Number 48, Westlands Road, P. O. Box 30003 – 00100, Nairobi, Kenya
Standard Chartered Investment Services Limited Kenya KES20.00 Ordinary shares 100
Standard Chartered Bank Kenya Limited Kenya KES5.00 Ordinary shares 74.3
KES5.00 Preference shares 100
Standard Chartered Securities (Kenya) Limited Kenya KES10.00 Ordinary shares 100
Standard Chartered Financial Services Limited Kenya KES20.00 Ordinary shares 100
Standard Chartered Insurance Agency Limited Kenya KES100.00 Ordinary shares 100
Standard Chartered Kenya Nominees Limited Kenya KES20.00 Ordinary shares 100
The following companies have the address of M6-2701, West 27Fl, Suha-dong, 26, Eulji-ro 5-gil, Jung-gu, Seoul, Korea, Republic of
Resolution Alliance Korea Ltd Korea, Republic of KRW5,000.00 Ordinary shares 100
The following company has the address of 2/F, 47 Jongno, Jongno-gu, Seoul, 110-702, Korea, Republic of
Standard Chartered Bank Korea Limited Korea, Republic of KRW5,000.00 Ordinary shares 100
Standard Chartered Securities Korea Limited Korea, Republic of KRW5,000.00 Ordinary shares 100
The following companies have the address of 17/F, 100, Gongpyeong-dong, Jongno-gu, Seoul, Korea, Republic of
SCPEK IV Korea, Republic of Limited Partnership interest 41.4
Standard Chartered Private Equity Korea II Korea, Republic of KRW1,000,000.00 Partnership interest 100
Standard Chartered Private Equity Managers (Korea) Limited Korea, Republic of KRW5,000.00 Ordinary shares 100
SW Holdings Limited Korea, Republic of KRW1,000.00 Ordinary shares 100
TBO Korea Holdings Limited Korea, Republic of KRW1,000.00 Ordinary shares 100
The following company has the address of Atrium Building, Maarad Street, 3rd Floor, P.O.Box: 11-4081 Riad El Solh, Beirut, Beirut Central District, Lebanon
Standard Chartered Metropolitan Holdings SAL Lebanon $10.00 Ordinary A shares 100
The following companies have the address of Level 16, Menara Standard Chartered, 30, Jalan Sultan Ismail, 50250 Kuala Lumpur, Malaysia
Cartaban (Malaya) Nominees Sdn Berhad Malaysia RM10.00 Ordinary shares 100
Cartaban Nominees (Asing) Sdn Bhd Malaysia RM1.00 Ordinary shares 100
Cartaban Nominees (Tempatan) Sdn Bhd Malaysia RM1.00 Ordinary shares 100
Golden Maestro Sdn Bhd Malaysia RM1.00 Ordinary shares 100
Popular Ambience Sdn Bhd Malaysia RM1.00 Ordinary shares 100
Price Solutions Sdn Bhd Malaysia RM1.00 Ordinary shares 100
SCBMB Trustee Berhad Malaysia RM10.00 Ordinary shares 100
Standard Chartered Bank Malaysia Berhad Malaysia RM0.10 Irredeemable Cumulative Preference shares 100
RM1.00 Ordinary shares 100
Standard Chartered Saadiq Berhad Malaysia RM1.00 Ordinary shares 100
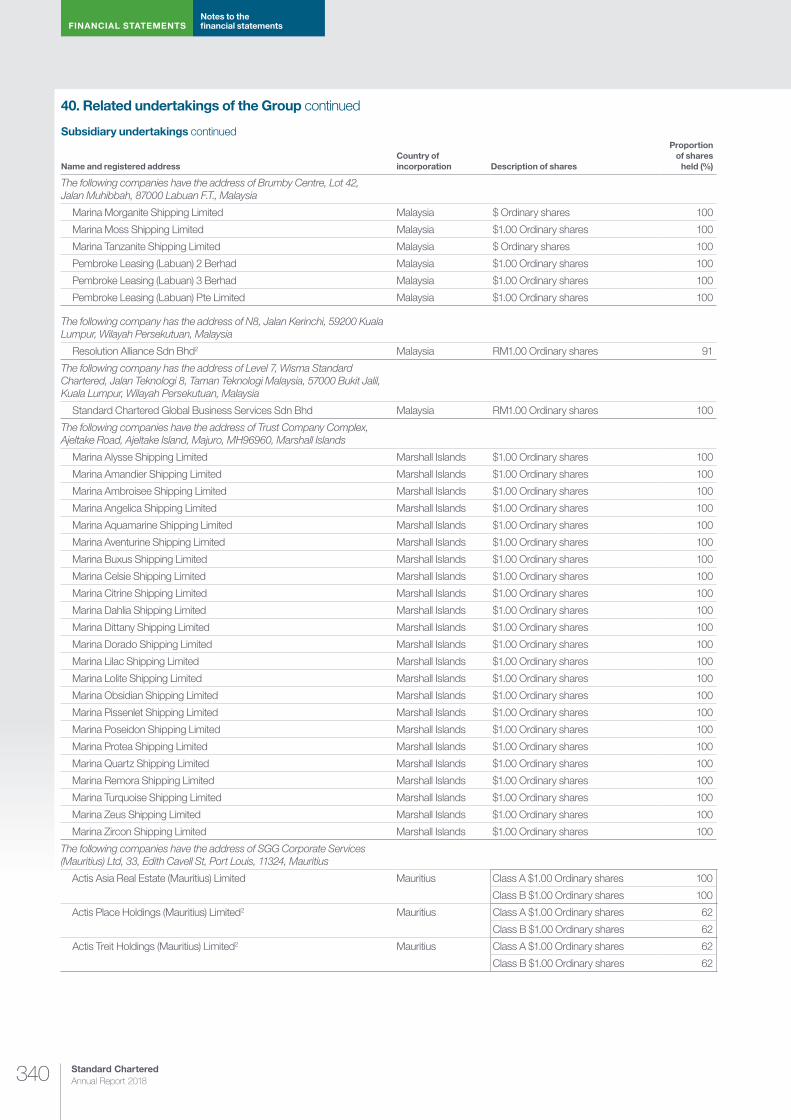
Standard Chartered Annual Report 2018340
FINANCIAL STATEMENTSNotes to the financial statements
40. Related undertakings of the Group continued
Subsidiary undertakings continued
Name and registered address Country of incorporation Description of shares
Proportion of shares
held (%)
The following companies have the address of Brumby Centre, Lot 42, Jalan Muhibbah, 87000 Labuan F.T., Malaysia
Marina Morganite Shipping Limited Malaysia $ Ordinary shares 100
Marina Moss Shipping Limited Malaysia $1.00 Ordinary shares 100
Marina Tanzanite Shipping Limited Malaysia $ Ordinary shares 100
Pembroke Leasing (Labuan) 2 Berhad Malaysia $1.00 Ordinary shares 100
Pembroke Leasing (Labuan) 3 Berhad Malaysia $1.00 Ordinary shares 100
Pembroke Leasing (Labuan) Pte Limited Malaysia $1.00 Ordinary shares 100
The following company has the address of N8, Jalan Kerinchi, 59200 Kuala Lumpur, Wilayah Persekutuan, Malaysia
Resolution Alliance Sdn Bhd2 Malaysia RM1.00 Ordinary shares 91
The following company has the address of Level 7, Wisma Standard Chartered, Jalan Teknologi 8, Taman Teknologi Malaysia, 57000 Bukit Jalil, Kuala Lumpur, Wilayah Persekutuan, Malaysia
Standard Chartered Global Business Services Sdn Bhd Malaysia RM1.00 Ordinary shares 100
The following companies have the address of Trust Company Complex, Ajeltake Road, Ajeltake Island, Majuro, MH96960, Marshall Islands
Marina Alysse Shipping Limited Marshall Islands $1.00 Ordinary shares 100
Marina Amandier Shipping Limited Marshall Islands $1.00 Ordinary shares 100
Marina Ambroisee Shipping Limited Marshall Islands $1.00 Ordinary shares 100
Marina Angelica Shipping Limited Marshall Islands $1.00 Ordinary shares 100
Marina Aquamarine Shipping Limited Marshall Islands $1.00 Ordinary shares 100
Marina Aventurine Shipping Limited Marshall Islands $1.00 Ordinary shares 100
Marina Buxus Shipping Limited Marshall Islands $1.00 Ordinary shares 100
Marina Celsie Shipping Limited Marshall Islands $1.00 Ordinary shares 100
Marina Citrine Shipping Limited Marshall Islands $1.00 Ordinary shares 100
Marina Dahlia Shipping Limited Marshall Islands $1.00 Ordinary shares 100
Marina Dittany Shipping Limited Marshall Islands $1.00 Ordinary shares 100
Marina Dorado Shipping Limited Marshall Islands $1.00 Ordinary shares 100
Marina Lilac Shipping Limited Marshall Islands $1.00 Ordinary shares 100
Marina Lolite Shipping Limited Marshall Islands $1.00 Ordinary shares 100
Marina Obsidian Shipping Limited Marshall Islands $1.00 Ordinary shares 100
Marina Pissenlet Shipping Limited Marshall Islands $1.00 Ordinary shares 100
Marina Poseidon Shipping Limited Marshall Islands $1.00 Ordinary shares 100
Marina Protea Shipping Limited Marshall Islands $1.00 Ordinary shares 100
Marina Quartz Shipping Limited Marshall Islands $1.00 Ordinary shares 100
Marina Remora Shipping Limited Marshall Islands $1.00 Ordinary shares 100
Marina Turquoise Shipping Limited Marshall Islands $1.00 Ordinary shares 100
Marina Zeus Shipping Limited Marshall Islands $1.00 Ordinary shares 100
Marina Zircon Shipping Limited Marshall Islands $1.00 Ordinary shares 100
The following companies have the address of SGG Corporate Services (Mauritius) Ltd, 33, Edith Cavell St, Port Louis, 11324, Mauritius
Actis Asia Real Estate (Mauritius) Limited Mauritius Class A $1.00 Ordinary shares 100
Class B $1.00 Ordinary shares 100
Actis Place Holdings (Mauritius) Limited2 Mauritius Class A $1.00 Ordinary shares 62
Class B $1.00 Ordinary shares 62
Actis Treit Holdings (Mauritius) Limited2 Mauritius Class A $1.00 Ordinary shares 62
Class B $1.00 Ordinary shares 62

341
Risk review
and capital review
Strategic rep
ort
Sup
plem
entary inform
ation
FIN
AN
CIA
L S
TA
TE
ME
NT
SD
irectors’ rep
ort
40. Related undertakings of the Group continued
Subsidiary undertakings continued
Name and registered address Country of incorporation Description of shares
Proportion of shares
held (%)
The following company has the address of 6/F, Standard Chartered Tower, 19, Bank Street, Cybercity, Ebene, 72201, Mauritius
Standard Chartered Bank (Mauritius) Limited Mauritius $10.00 Ordinary shares 100
The following companies have the address of c/o Abax Corporate Services Ltd, 6/F, Tower A, 1 CYBERCITY, Ebene, Mauritius
Standard Chartered Financial Holdings Mauritius $1.00 Ordinary shares 100
Standard Chartered Private Equity (Mauritius) II Limited Mauritius $1.00 Ordinary shares 100
Standard Chartered Private Equity (Mauritius) Limited Mauritius $1.00 Ordinary shares 100
$ Redeemable Preference shares 100
Standard Chartered Private Equity (Mauritius) lll Limited Mauritius $1.00 Ordinary shares 100
The following company has the address of 5/F, Ebene Esplanade, 24 Bank Street, Cybercity, Ebene, Mauritius
Subcontinental Equities Limited Mauritius $1.00 Ordinary shares 100
The following company has the address of Standard Chartered Bank Nepal Limited, Madan Bhandari Marg, Ward No.34, Kathmandu Metropolitan City, Kathmandu District, Bagmati Zone, Kathmandu, Nepal
Standard Chartered Bank Nepal Limited Nepal NPR100.00 Ordinary shares 70.2
The following companies have the address of Hoogoorddreef 15, 1101 BA, Amsterdam, Netherlands
Pembroke B717 Holdings B.V. Netherlands €1.00 Ordinary shares 100
Pembroke Holland B.V. Netherlands €450.00 Ordinary shares 100
The following companies have the address of 1 Basinghall Avenue, London, EC2V 5DD, United Kingdom
Smart Application Investment B.V. Netherlands €45.00 Ordinary shares 100
Standard Chartered Holdings (Africa) B.V. Netherlands €4.50 Ordinary shares 100
Standard Chartered Holdings (Asia Pacific) B.V. Netherlands €4.50 Ordinary shares 100
Standard Chartered Holdings (International) B.V. Netherlands €4.50 Ordinary shares 100
Standard Chartered MB Holdings B.V. Netherlands €4.50 Ordinary shares 100
The following companies have the address of 142 Ahmadu Bello Way, Victoria Island, Lagos, Nigeria
Cherroots Nigeria Limited Nigeria NGN1.00 Ordinary shares 100
Standard Chartered Bank Nigeria Limited Nigeria NGN1.00 Irredeemable Non Cumulative Preference shares 100
NGN1.00 Ordinary shares 100
NGN1.00 Redeemable Preference shares 100
Standard Chartered Capital & Advisory Nigeria Limited Nigeria NGN1.00 Ordinary shares 100
Standard Chartered Nominees (Nigeria) Limited Nigeria NGN1.00 Ordinary shares 100
The following company has the address of 3/F Main SCB Building, I.I Chundrigar Road, Karachi, Sindh, 74000, Pakistan
Price Solution Pakistan (Private) Limited1 Pakistan PKR10.00 Ordinary shares 100
The following company has the address of P.O. Box No. 5556I.I. Chundrigar Road, Karachi, 74000, Pakistan
Standard Chartered Bank (Pakistan) Limited Pakistan PKR10.00 Ordinary shares 100
The following company has the address of ul. Towarowa 25A, 00-869 Warszawa, Poland
Standard Chartered Global Business Services spólka z ograniczona odpowiedzialnoscia
PolandPLN50.00 Ordinary shares 100
The following company has the address of Offshore Chambers, PO Box 217, Apia, Western Samoa
Standard Chartered Nominees (Western Samoa) Limited Samoa $1.00 Ordinary shares 100

Standard Chartered Annual Report 2018342
FINANCIAL STATEMENTSNotes to the financial statements
40. Related undertakings of the Group continued
Subsidiary undertakings continued
Name and registered address Country of incorporation Description of shares
Proportion of shares
held (%)
The following company has the address of Al Faisaliah Office Tower, 7/F, King Fahad Highway, Olaya District, Riyadh P.O box 295522, Riyadh, 11351, Saudi Arabia
Standard Chartered Capital (Saudi Arabia) Saudi Arabia SAR10.00 Ordinary shares 100
The following company has the address of 9 & 11, Lightfoot Boston Street, Freetown, Sierra Leone
Standard Chartered Bank Sierra Leone Limited Sierra Leone SLL1.00 Ordinary shares 80.7
The following companies have the address of 8 Marina Boulevard, Level 23, Marina Bay Financial Centre, Tower 1, 018981, Singapore
Actis Mahi Holdings (Singapore) Private Limited Singapore SGD 1.00 Ordinary shares 100
Actis Place Holdings No.1 (Singapore) Private Limited2 Singapore SGD 1.00 Ordinary shares 100
Actis Place Holdings No.2 (Singapore) Private Limited2 Singapore SGD 1.00 Ordinary shares 100
Actis RE Investment 1 Private Limited2 Singapore SGD 1.00 Ordinary shares 100
Actis RE Investment 2 Private Limited2 Singapore SGD 1.00 Ordinary shares 100
Actis RE Investment 3 Private Limited2 Singapore SGD 1.00 Ordinary shares 100
Actis RE Investment 4 Private Limited2 Singapore SGD 1.00 Ordinary shares 100
Actis Treit Holdings No.1 (Singapore) Private Limited2 Singapore SGD 1.00 Ordinary shares 100
Actis Treit Holdings No.2 (Singapore) Private Limited2 Singapore SGD 1.00 Ordinary shares 100
Augusta Viet Pte. Ltd. Singapore $1.00 Ordinary shares 100
Greenman Pte. Ltd. Singapore SGD1.00 Class A Preferred shares 100
SGD1.00 Class B Preferred shares 100
SGD1.00 Ordinary shares 100
Standard Chartered PF Managers Pte. Limited Singapore $1.00 Ordinary shares 100
Standard Chartered Private Equity (Singapore) Pte. Ltd Singapore $ Ordinary shares 100
Standard Chartered Private Equity Managers (Singapore) Pte. Ltd Singapore $ Ordinary shares 100
Standard Chartered Real Estate Investment Holdings (Singapore) Private Limited Singapore SGD1.00 Ordinary shares 100
The following companies have the address of 8 Marina Boulevard, Level 26, Marina Bay Financial Centre, Tower 1, 018981, Singapore
Marina Aquata Shipping Pte. Ltd. Singapore $ Ordinary shares 100
Marina Aruana Shipping Pte. Ltd. Singapore SGD Ordinary shares 100
$ Ordinary shares 100
Marina Aster Shipping Pte. Ltd. Singapore SGD Ordinary shares 100
Marina Cobia Shipping Pte. Ltd. Singapore SGD Ordinary shares 100
$ Ordinary shares 100
Marina Daffodil Shipping Pte. Ltd. Singapore SGD Ordinary shares 100
Marina Fatmarini Shipping Pte. Ltd. Singapore $ Ordinary shares 100
Marina Frabandari Shipping Pte. Ltd. Singapore $ Ordinary shares 100
Marina Freesia Shipping Pte. Ltd. Singapore SGD Ordinary shares 100
Marina Gerbera Shipping Pte. Ltd. Singapore $ Ordinary shares 100
Marina Mars Shipping Pte. Ltd. Singapore SGD Ordinary shares 100
Marina Mercury Shipping Pte. Ltd. Singapore SGD Ordinary shares 100
Marina Opah Shipping Pte. Ltd. Singapore SGD Ordinary shares 100
$ Ordinary shares 100
Marina Partawati Shipping Pte. Ltd. Singapore $ Ordinary shares 100
Marina Poise Shipping Pte. Ltd. Singapore $ Ordinary shares 100
The following companies have the address of 231A Pandan Loop, 128419, Singapore
Phoon Huat Pte. Ltd. Singapore SGD1.00 Ordinary shares 70
Redman Pte. Ltd. Singapore SGD1.00 Ordinary shares 70
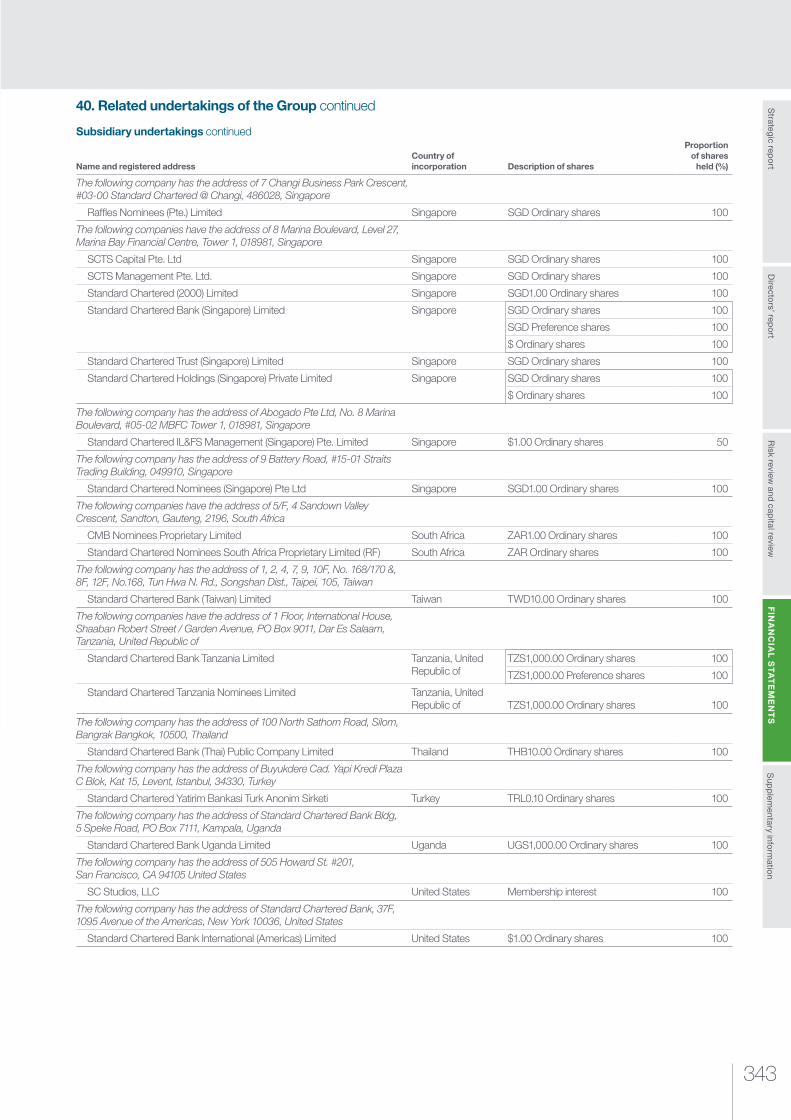
343
Risk review
and capital review
Strategic rep
ort
Sup
plem
entary inform
ation
FIN
AN
CIA
L S
TA
TE
ME
NT
SD
irectors’ rep
ort
40. Related undertakings of the Group continued
Subsidiary undertakings continued
Name and registered address Country of incorporation Description of shares
Proportion of shares
held (%)
The following company has the address of 7 Changi Business Park Crescent, #03-00 Standard Chartered @ Changi, 486028, Singapore
Raffles Nominees (Pte.) Limited Singapore SGD Ordinary shares 100
The following companies have the address of 8 Marina Boulevard, Level 27, Marina Bay Financial Centre, Tower 1, 018981, Singapore
SCTS Capital Pte. Ltd Singapore SGD Ordinary shares 100
SCTS Management Pte. Ltd. Singapore SGD Ordinary shares 100
Standard Chartered (2000) Limited Singapore SGD1.00 Ordinary shares 100
Standard Chartered Bank (Singapore) Limited Singapore SGD Ordinary shares 100
SGD Preference shares 100
$ Ordinary shares 100
Standard Chartered Trust (Singapore) Limited Singapore SGD Ordinary shares 100
Standard Chartered Holdings (Singapore) Private Limited Singapore SGD Ordinary shares 100
$ Ordinary shares 100
The following company has the address of Abogado Pte Ltd, No. 8 Marina Boulevard, #05-02 MBFC Tower 1, 018981, Singapore
Standard Chartered IL&FS Management (Singapore) Pte. Limited Singapore $1.00 Ordinary shares 50
The following company has the address of 9 Battery Road, #15-01 Straits Trading Building, 049910, Singapore
Standard Chartered Nominees (Singapore) Pte Ltd Singapore SGD1.00 Ordinary shares 100
The following companies have the address of 5/F, 4 Sandown Valley Crescent, Sandton, Gauteng, 2196, South Africa
CMB Nominees Proprietary Limited South Africa ZAR1.00 Ordinary shares 100
Standard Chartered Nominees South Africa Proprietary Limited (RF) South Africa ZAR Ordinary shares 100
The following company has the address of 1, 2, 4, 7, 9, 10F, No. 168/170 &, 8F, 12F, No.168, Tun Hwa N. Rd., Songshan Dist., Taipei, 105, Taiwan
Standard Chartered Bank (Taiwan) Limited Taiwan TWD10.00 Ordinary shares 100
The following companies have the address of 1 Floor, International House, Shaaban Robert Street / Garden Avenue, PO Box 9011, Dar Es Salaam, Tanzania, United Republic of
Standard Chartered Bank Tanzania Limited Tanzania, United Republic of
TZS1,000.00 Ordinary shares 100
TZS1,000.00 Preference shares 100
Standard Chartered Tanzania Nominees Limited Tanzania, United Republic of TZS1,000.00 Ordinary shares 100
The following company has the address of 100 North Sathorn Road, Silom, Bangrak Bangkok, 10500, Thailand
Standard Chartered Bank (Thai) Public Company Limited Thailand THB10.00 Ordinary shares 100
The following company has the address of Buyukdere Cad. Yapi Kredi Plaza C Blok, Kat 15, Levent, Istanbul, 34330, Turkey
Standard Chartered Yatirim Bankasi Turk Anonim Sirketi Turkey TRL0.10 Ordinary shares 100
The following company has the address of Standard Chartered Bank Bldg, 5 Speke Road, PO Box 7111, Kampala, Uganda
Standard Chartered Bank Uganda Limited Uganda UGS1,000.00 Ordinary shares 100
The following company has the address of 505 Howard St. #201, San Francisco, CA 94105 United States
SC Studios, LLC United States Membership interest 100
The following company has the address of Standard Chartered Bank, 37F, 1095 Avenue of the Americas, New York 10036, United States
Standard Chartered Bank International (Americas) Limited United States $1.00 Ordinary shares 100

Standard Chartered Annual Report 2018344
FINANCIAL STATEMENTSNotes to the financial statements
40. Related undertakings of the Group continued
Subsidiary undertakings continued
Name and registered address Country of incorporation Description of shares
Proportion of shares
held (%)
The following companies have the address of Corporation Trust Centre, 1209 Orange Street, Wilmington DE 19801, United States
Standard Chartered Holdings Inc. United States $100.00 Common shares 100
StanChart Securities International LLC United States Membership interest 100
Standard Chartered Capital Management (Jersey), LLC United States Membership interest 100
Standard Chartered Securities (North America) LLC United States Membership interest 100
Standard Chartered International (USA) LLC United States Membership interest 100
The following company has the address of 50 Fremont Street, San Francisco CA 94105, United States
Standard Chartered Overseas Investment, Inc. United States $10.00 Ordinary shares 100
The following company has the address of 251 Little Falls Drive, Wilmington, Delaware 19808, USA
Standard Chartered Trade Services Corporation United States $0.01 Common shares 100
The following company has the address of Room 1810-1815, Level 18, Building 72, Keangnam Hanoi Landmark Tower, Pham Hung Road, Cau Giay New Urban Area, Me Tri Ward, Nam Tu Liem District, Hanoi10000, Vietnam
Standard Chartered Bank (Vietnam) Limited Vietnam VND Charter Capital shares 100
The following companies have the address of Vistra Corporate Services Centre, Wickhams Cay II, Road Town, Tortola, VG1110, Virgin Islands, British
Sky Favour Investments Limited Virgin Islands, British $1.00 Ordinary shares 100
Sky Harmony Holdings Limited Virgin Islands, British $1.00 Ordinary shares 100
The following companies have the address of Standard Chartered House, Cairo Road, Lusaka, PO BOX 32238, Zambia
Standard Chartered Bank Zambia Plc Zambia ZMW0.25 Ordinary shares 90
Standard Chartered Zambia Securities Services Nominees Limited Zambia ZMK1.00 Ordinary shares 100
The following companies have the address of Africa Unity Square Building, 68 Nelson Mandela Avenue, Harare, Zimbabwe
Africa Enterprise Network Trust3 Zimbabwe Interest in Trust 100
Standard Chartered Asset Management Limited Zimbabwe $0.001 Ordinary shares 100
Standard Chartered Bank Zimbabwe Limited Zimbabwe $1.00 Ordinary shares 100
Standard Chartered Nominees Zimbabwe (Private) Limited Zimbabwe $2.00 Ordinary shares 100
1 Directly held by parent company of the Group
2 The Group has determined that these undertakings are excluded from being consolidated into the Group’s accounts, and do not meet the definition of a Subsidiary under IFRS. See Notes 32 and 33 for the consolidation policy and disclosure of the undertaking.
3 No share capital by virtue of being a trust
Joint ventures
NameCountry of incorporation Description of shares
Proportion of shares
held (%)
The following company has the address of WTC II Building, Jalan Jenderal Sudirman Kav29-31, Jakarta, 12920’ Indonesia
PT Bank Permata Tbk Indonesia IDR125.00 B shares 44.6
The following company has the address of 100/36 Sathorn Nakorn Tower, Fl 21 North Sathorn Road, Silom Sub-District, Bangrak District, Bangkok, 10500, Thailand
Resolution Alliance Limited Thailand THB10.00 Ordinary shares 49
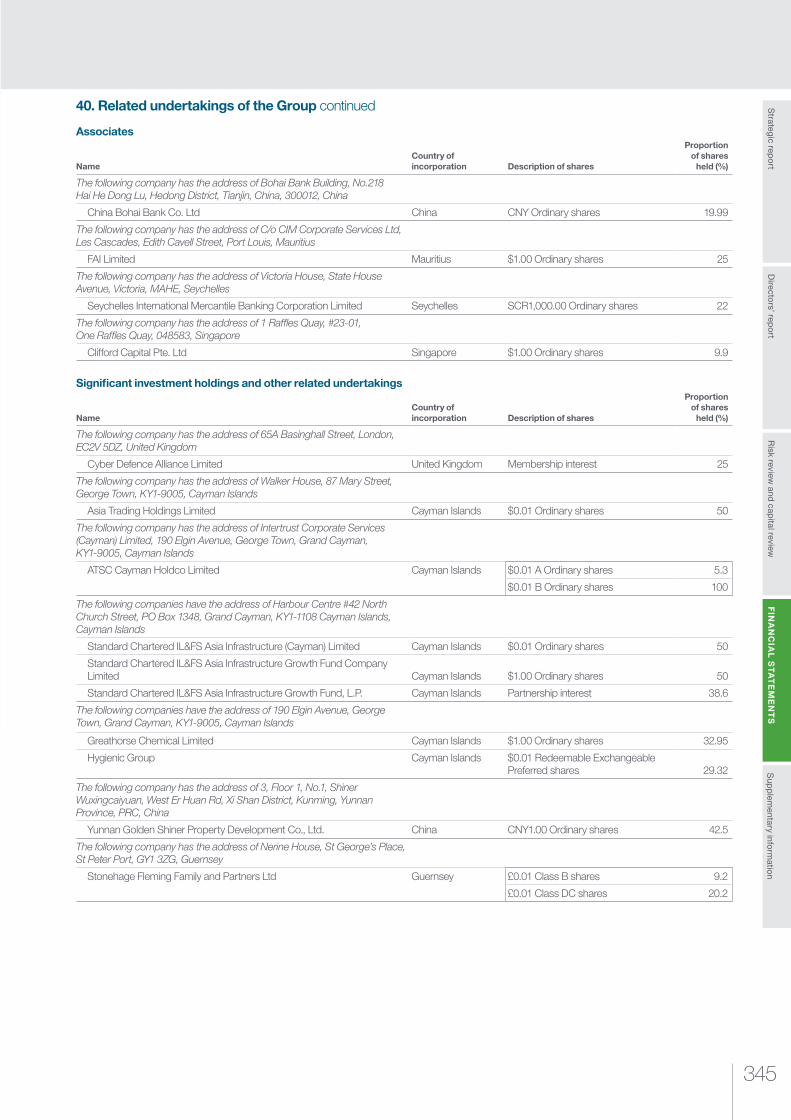
345
Risk review
and capital review
Strategic rep
ort
Sup
plem
entary inform
ation
FIN
AN
CIA
L S
TA
TE
ME
NT
SD
irectors’ rep
ort
40. Related undertakings of the Group continued
Associates
NameCountry of incorporation Description of shares
Proportion of shares
held (%)
The following company has the address of Bohai Bank Building, No.218 Hai He Dong Lu, Hedong District, Tianjin, China, 300012, China
China Bohai Bank Co. Ltd China CNY Ordinary shares 19.99
The following company has the address of C/o CIM Corporate Services Ltd, Les Cascades, Edith Cavell Street, Port Louis, Mauritius
FAI Limited Mauritius $1.00 Ordinary shares 25
The following company has the address of Victoria House, State House Avenue, Victoria, MAHE, Seychelles
Seychelles International Mercantile Banking Corporation Limited Seychelles SCR1,000.00 Ordinary shares 22
The following company has the address of 1 Raffles Quay, #23-01, One Raffles Quay, 048583, Singapore
Clifford Capital Pte. Ltd Singapore $1.00 Ordinary shares 9.9
Significant investment holdings and other related undertakings
NameCountry of incorporation Description of shares
Proportion of shares
held (%)
The following company has the address of 65A Basinghall Street, London, EC2V 5DZ, United Kingdom
Cyber Defence Alliance Limited United Kingdom Membership interest 25
The following company has the address of Walker House, 87 Mary Street, George Town, KY1-9005, Cayman Islands
Asia Trading Holdings Limited Cayman Islands $0.01 Ordinary shares 50
The following company has the address of Intertrust Corporate Services (Cayman) Limited, 190 Elgin Avenue, George Town, Grand Cayman, KY1-9005, Cayman Islands
ATSC Cayman Holdco Limited Cayman Islands $0.01 A Ordinary shares 5.3
$0.01 B Ordinary shares 100
The following companies have the address of Harbour Centre #42 North Church Street, PO Box 1348, Grand Cayman, KY1-1108 Cayman Islands, Cayman Islands
Standard Chartered IL&FS Asia Infrastructure (Cayman) Limited Cayman Islands $0.01 Ordinary shares 50
Standard Chartered IL&FS Asia Infrastructure Growth Fund Company Limited Cayman Islands $1.00 Ordinary shares 50
Standard Chartered IL&FS Asia Infrastructure Growth Fund, L.P. Cayman Islands Partnership interest 38.6
The following companies have the address of 190 Elgin Avenue, George Town, Grand Cayman, KY1-9005, Cayman Islands
Greathorse Chemical Limited Cayman Islands $1.00 Ordinary shares 32.95
Hygienic Group Cayman Islands $0.01 Redeemable Exchangeable Preferred shares 29.32
The following company has the address of 3, Floor 1, No.1, Shiner Wuxingcaiyuan, West Er Huan Rd, Xi Shan District, Kunming, Yunnan Province, PRC, China
Yunnan Golden Shiner Property Development Co., Ltd. China CNY1.00 Ordinary shares 42.5
The following company has the address of Nerine House, St George’s Place, St Peter Port, GY1 3ZG, Guernsey
Stonehage Fleming Family and Partners Ltd Guernsey £0.01 Class B shares 9.2
£0.01 Class DC shares 20.2
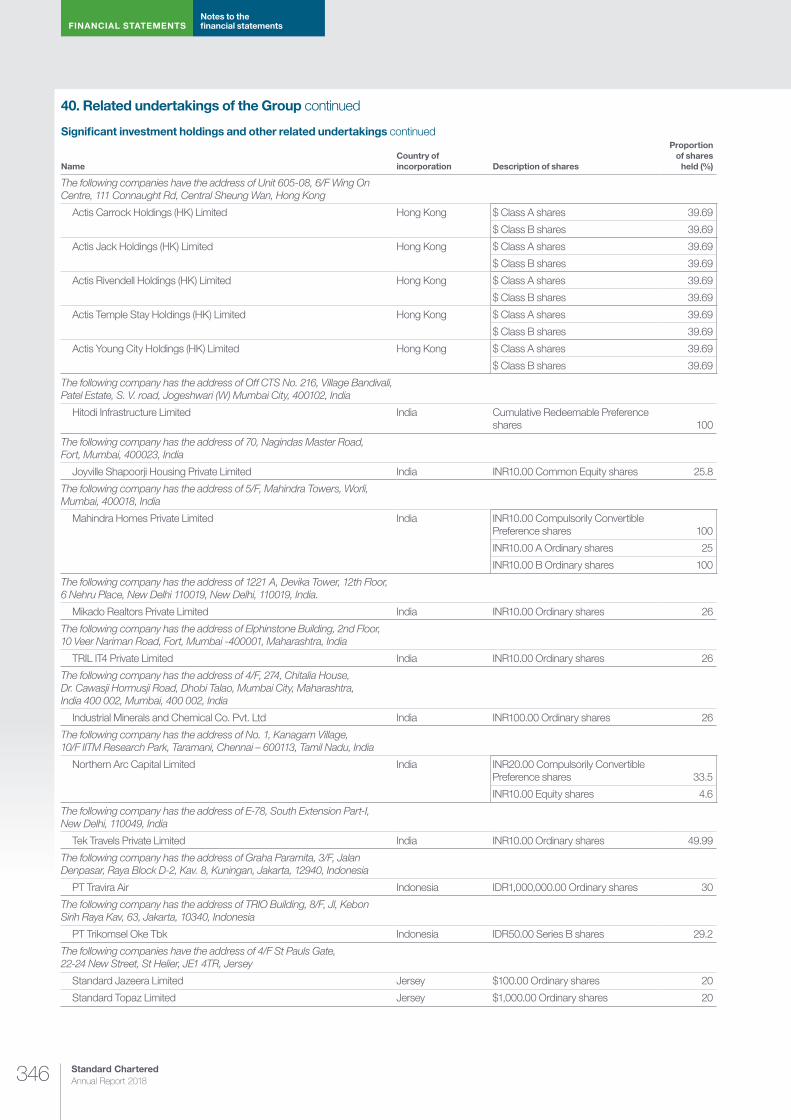
Standard Chartered Annual Report 2018346
FINANCIAL STATEMENTSNotes to the financial statements
40. Related undertakings of the Group continued
Significant investment holdings and other related undertakings continued
NameCountry of incorporation Description of shares
Proportion of shares
held (%)
The following companies have the address of Unit 605-08, 6/F Wing On Centre, 111 Connaught Rd, Central Sheung Wan, Hong Kong
Actis Carrock Holdings (HK) Limited Hong Kong $ Class A shares 39.69
$ Class B shares 39.69
Actis Jack Holdings (HK) Limited Hong Kong $ Class A shares 39.69
$ Class B shares 39.69
Actis Rivendell Holdings (HK) Limited Hong Kong $ Class A shares 39.69
$ Class B shares 39.69
Actis Temple Stay Holdings (HK) Limited Hong Kong $ Class A shares 39.69
$ Class B shares 39.69
Actis Young City Holdings (HK) Limited Hong Kong $ Class A shares 39.69
$ Class B shares 39.69
The following company has the address of Off CTS No. 216, Village Bandivali, Patel Estate, S. V. road, Jogeshwari (W) Mumbai City, 400102, India
Hitodi Infrastructure Limited India Cumulative Redeemable Preference shares 100
The following company has the address of 70, Nagindas Master Road, Fort, Mumbai, 400023, India
Joyville Shapoorji Housing Private Limited India INR10.00 Common Equity shares 25.8
The following company has the address of 5/F, Mahindra Towers, Worli, Mumbai, 400018, India
Mahindra Homes Private Limited India INR10.00 Compulsorily Convertible Preference shares 100
INR10.00 A Ordinary shares 25
INR10.00 B Ordinary shares 100
The following company has the address of 1221 A, Devika Tower, 12th Floor, 6 Nehru Place, New Delhi 110019, New Delhi, 110019, India.
Mikado Realtors Private Limited India INR10.00 Ordinary shares 26
The following company has the address of Elphinstone Building, 2nd Floor, 10 Veer Nariman Road, Fort, Mumbai -400001, Maharashtra, India
TRIL IT4 Private Limited India INR10.00 Ordinary shares 26
The following company has the address of 4/F, 274, Chitalia House, Dr. Cawasji Hormusji Road, Dhobi Talao, Mumbai City, Maharashtra, India 400 002, Mumbai, 400 002, India
Industrial Minerals and Chemical Co. Pvt. Ltd India INR100.00 Ordinary shares 26
The following company has the address of No. 1, Kanagam Village, 10/F IITM Research Park, Taramani, Chennai – 600113, Tamil Nadu, India
Northern Arc Capital Limited India INR20.00 Compulsorily Convertible Preference shares 33.5
INR10.00 Equity shares 4.6
The following company has the address of E-78, South Extension Part-I, New Delhi, 110049, India
Tek Travels Private Limited India INR10.00 Ordinary shares 49.99
The following company has the address of Graha Paramita, 3/F, Jalan Denpasar, Raya Block D-2, Kav. 8, Kuningan, Jakarta, 12940, Indonesia
PT Travira Air Indonesia IDR1,000,000.00 Ordinary shares 30
The following company has the address of TRIO Building, 8/F, Jl, Kebon Sirih Raya Kav, 63, Jakarta, 10340, Indonesia
PT Trikomsel Oke Tbk Indonesia IDR50.00 Series B shares 29.2
The following companies have the address of 4/F St Pauls Gate, 22-24 New Street, St Helier, JE1 4TR, Jersey
Standard Jazeera Limited Jersey $100.00 Ordinary shares 20
Standard Topaz Limited Jersey $1,000.00 Ordinary shares 20
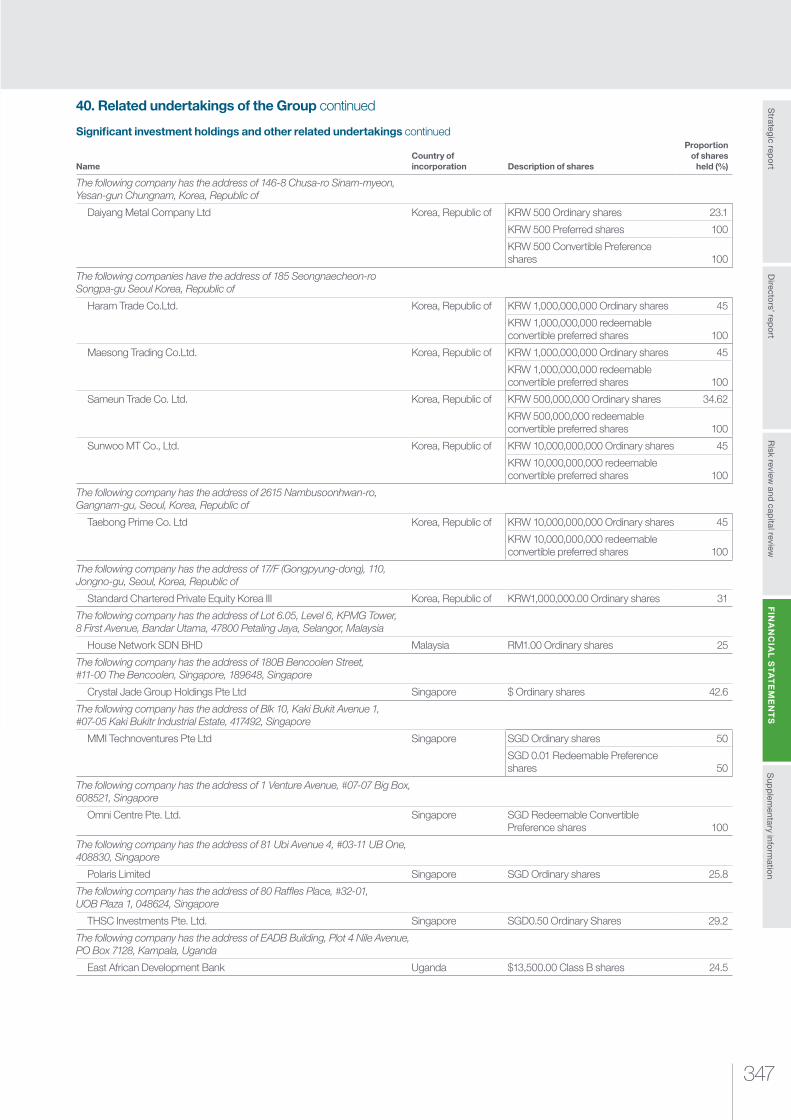
347
Risk review
and capital review
Strategic rep
ort
Sup
plem
entary inform
ation
FIN
AN
CIA
L S
TA
TE
ME
NT
SD
irectors’ rep
ort
40. Related undertakings of the Group continued
Significant investment holdings and other related undertakings continued
NameCountry of incorporation Description of shares
Proportion of shares
held (%)
The following company has the address of 146-8 Chusa-ro Sinam-myeon, Yesan-gun Chungnam, Korea, Republic of
Daiyang Metal Company Ltd Korea, Republic of KRW 500 Ordinary shares 23.1
KRW 500 Preferred shares 100
KRW 500 Convertible Preference shares 100
The following companies have the address of 185 Seongnaecheon-ro Songpa-gu Seoul Korea, Republic of
Haram Trade Co.Ltd. Korea, Republic of KRW 1,000,000,000 Ordinary shares 45
KRW 1,000,000,000 redeemable convertible preferred shares 100
Maesong Trading Co.Ltd. Korea, Republic of KRW 1,000,000,000 Ordinary shares 45
KRW 1,000,000,000 redeemable convertible preferred shares 100
Sameun Trade Co. Ltd. Korea, Republic of KRW 500,000,000 Ordinary shares 34.62
KRW 500,000,000 redeemable convertible preferred shares 100
Sunwoo MT Co., Ltd. Korea, Republic of KRW 10,000,000,000 Ordinary shares 45
KRW 10,000,000,000 redeemable convertible preferred shares 100
The following company has the address of 2615 Nambusoonhwan-ro, Gangnam-gu, Seoul, Korea, Republic of
Taebong Prime Co. Ltd Korea, Republic of KRW 10,000,000,000 Ordinary shares 45
KRW 10,000,000,000 redeemable convertible preferred shares 100
The following company has the address of 17/F (Gongpyung-dong), 110, Jongno-gu, Seoul, Korea, Republic of
Standard Chartered Private Equity Korea III Korea, Republic of KRW1,000,000.00 Ordinary shares 31
The following company has the address of Lot 6.05, Level 6, KPMG Tower, 8 First Avenue, Bandar Utama, 47800 Petaling Jaya, Selangor, Malaysia
House Network SDN BHD Malaysia RM1.00 Ordinary shares 25
The following company has the address of 180B Bencoolen Street, #11-00 The Bencoolen, Singapore, 189648, Singapore
Crystal Jade Group Holdings Pte Ltd Singapore $ Ordinary shares 42.6
The following company has the address of Blk 10, Kaki Bukit Avenue 1, #07-05 Kaki Bukitr Industrial Estate, 417492, Singapore
MMI Technoventures Pte Ltd Singapore SGD Ordinary shares 50
SGD 0.01 Redeemable Preference shares 50
The following company has the address of 1 Venture Avenue, #07-07 Big Box, 608521, Singapore
Omni Centre Pte. Ltd. Singapore SGD Redeemable Convertible Preference shares 100
The following company has the address of 81 Ubi Avenue 4, #03-11 UB One, 408830, Singapore
Polaris Limited Singapore SGD Ordinary shares 25.8
The following company has the address of 80 Raffles Place, #32-01, UOB Plaza 1, 048624, Singapore
THSC Investments Pte. Ltd. Singapore SGD0.50 Ordinary Shares 29.2
The following company has the address of EADB Building, Plot 4 Nile Avenue, PO Box 7128, Kampala, Uganda
East African Development Bank Uganda $13,500.00 Class B shares 24.5

Standard Chartered Annual Report 2018348
FINANCIAL STATEMENTSNotes to the financial statements
40. Related undertakings of the Group continued
Significant investment holdings and other related undertakings continued
NameCountry of incorporation Description of shares
Proportion of shares
held (%)
The following company has the address of 251 Little Falls Drive, Wilmington, New Castle DE 19808, United States
Paxata, Inc. United States $0.0001 Series C2 Preferred Stock 40.7
The following company has the address of Floor 7, Samco Building, No. 326 Vo Van Kiet, Co Giang Ward, District 1, Ho Chi Minh City, Vietnam
New Lifestyle Service Corporation Vietnam VND Dividend Preference shares 100
VND Redeemable Preference shares 100
The following company has the address of Floor M, Petroland Building, 12 Tan Trao, Tan Phu Ward, District 7, Ho Chi Minh City, Vietnam
Online Mobile Services Joint Stock Company Vietnam VND10,000 Class A1 Redeemable Preference shares 100
VND10,000 Class A1 Dividend Preference shares 100
VND10,000 Class C Dividend Preference shares 28.5
The following company has the address of PO Box 957, Offshore Incorporations Centre,, Road Town, Tortola, BVI, Virgin Islands, British
Ecoplast Technologies Inc Virgin Islands, British $0.0001 Class C Preferred shares 100
In liquidation
Subsidiary undertakings
NameCountry of incorporation Description of shares
Proportion of shares
held (%)
The following companies have the address of Deloitte LLP, Hill House, 1 Little New Street, London, EC4A 3TR, United Kingdom
SC Overseas Investments Limited United Kingdom AUD1.00 Ordinary shares 100
$1.00 Ordinary shares 100
Standard Chartered Capital Markets Limited United Kingdom £1.00 Ordinary shares 100
$1.00 Ordinary shares 100
Standard Chartered Debt Trading Limited United Kingdom £1.00 Ordinary shares 100
Standard Chartered (GCT) Limited United Kingdom £1.00 Ordinary shares 100
Compass Estates Limited United Kingdom £1.00 Ordinary shares 100
Chartered Financial Holdings Limited United Kingdom £5.00 Ordinary shares 100
£1.00 Preference shares 100
The following company has the address of Cra 7 Nro 71-52 TA if 702, Bogata, Colombia
Sociedad Fiduciaria Extebandes S.A. Colombia COP1.00 Ordinary shares 100
The following companies have the address of Schottegatweg Oost, 44, Curacao, Netherlands Antilles
American Express International Finance Corp.N.V. Curaçao $1,000.00 Ordinary shares 100
Ricanex Participations N.V. Curaçao $1,000.00 Ordinary shares 100
The following company has the address of 8/Floor, Gloucester Tower, The Landmark, 15 Queen’s Road Central, Hong Kong
Leopard Hong Kong Limited Hong Kong $ Ordinary shares 100
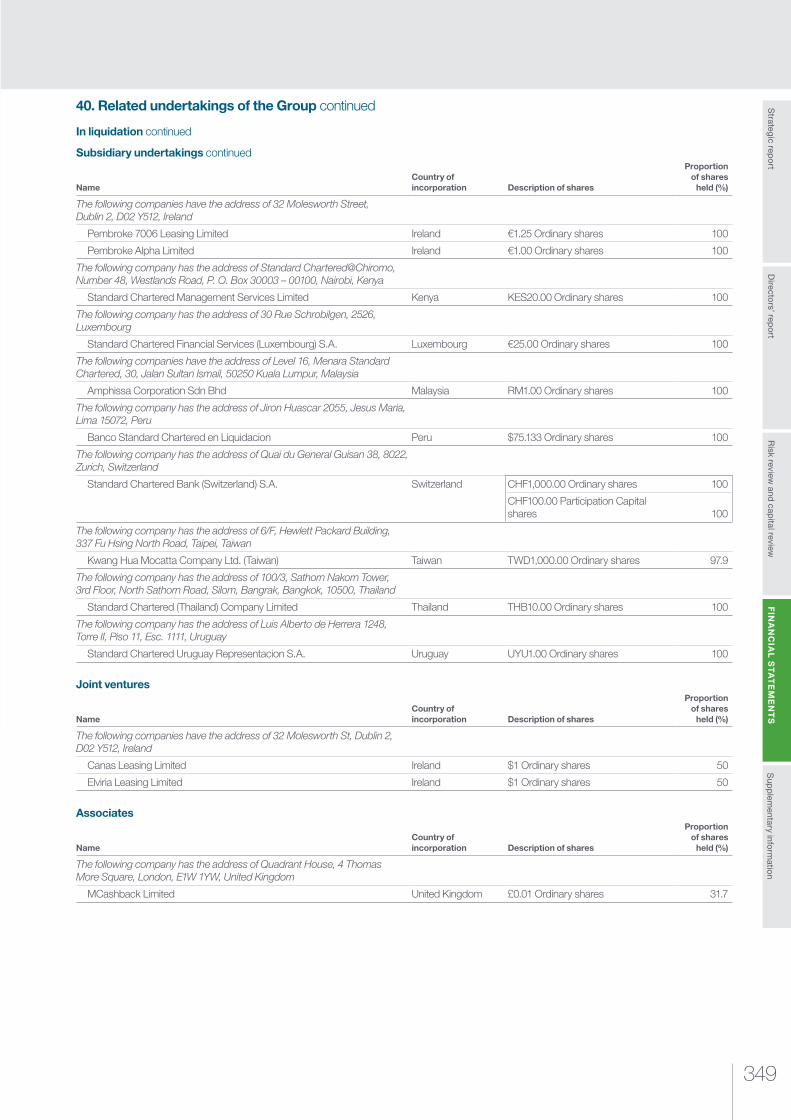
349
Risk review
and capital review
Strategic rep
ort
Sup
plem
entary inform
ation
FIN
AN
CIA
L S
TA
TE
ME
NT
SD
irectors’ rep
ort
40. Related undertakings of the Group continued
In liquidation continued
Subsidiary undertakings continued
NameCountry of incorporation Description of shares
Proportion of shares
held (%)
The following companies have the address of 32 Molesworth Street, Dublin 2, D02 Y512, Ireland
Pembroke 7006 Leasing Limited Ireland €1.25 Ordinary shares 100
Pembroke Alpha Limited Ireland €1.00 Ordinary shares 100
The following company has the address of Standard Chartered@Chiromo, Number 48, Westlands Road, P. O. Box 30003 – 00100, Nairobi, Kenya
Standard Chartered Management Services Limited Kenya KES20.00 Ordinary shares 100
The following company has the address of 30 Rue Schrobilgen, 2526, Luxembourg
Standard Chartered Financial Services (Luxembourg) S.A. Luxembourg €25.00 Ordinary shares 100
The following companies have the address of Level 16, Menara Standard Chartered, 30, Jalan Sultan Ismail, 50250 Kuala Lumpur, Malaysia
Amphissa Corporation Sdn Bhd Malaysia RM1.00 Ordinary shares 100
The following company has the address of Jiron Huascar 2055, Jesus Maria, Lima 15072, Peru
Banco Standard Chartered en Liquidacion Peru $75.133 Ordinary shares 100
The following company has the address of Quai du General Guisan 38, 8022, Zurich, Switzerland
Standard Chartered Bank (Switzerland) S.A. Switzerland CHF1,000.00 Ordinary shares 100
CHF100.00 Participation Capital shares 100
The following company has the address of 6/F, Hewlett Packard Building, 337 Fu Hsing North Road, Taipei, Taiwan
Kwang Hua Mocatta Company Ltd. (Taiwan) Taiwan TWD1,000.00 Ordinary shares 97.9
The following company has the address of 100/3, Sathorn Nakorn Tower, 3rd Floor, North Sathorn Road, Silom, Bangrak, Bangkok, 10500, Thailand
Standard Chartered (Thailand) Company Limited Thailand THB10.00 Ordinary shares 100
The following company has the address of Luis Alberto de Herrera 1248, Torre II, Piso 11, Esc. 1111, Uruguay
Standard Chartered Uruguay Representacion S.A. Uruguay UYU1.00 Ordinary shares 100
Joint ventures
NameCountry of incorporation Description of shares
Proportion of shares
held (%)
The following companies have the address of 32 Molesworth St, Dublin 2, D02 Y512, Ireland
Canas Leasing Limited Ireland $1 Ordinary shares 50
Elviria Leasing Limited Ireland $1 Ordinary shares 50
Associates
NameCountry of incorporation Description of shares
Proportion of shares
held (%)
The following company has the address of Quadrant House, 4 Thomas More Square, London, E1W 1YW, United Kingdom
MCashback Limited United Kingdom £0.01 Ordinary shares 31.7

Standard Chartered Annual Report 2018350
FINANCIAL STATEMENTSNotes to the financial statements
40. Related undertakings of the Group continued
Liquidated/dissolved/sold
Subsidiary undertakings
NameCountry of incorporation Description of shares
Proportion of shares
held (%)
St. Helens Nominees Limited United Kingdom £1.00 Ordinary shares 100
Standard Chartered Corporate Finance (Canada) Limited United Kingdom £1.00 Ordinary shares 100
Standard Chartered Corporate Finance (Eurasia) Limited United Kingdom £1.00 Ordinary shares 100
Standard Chartered (CT) Limited United Kingdom £1.00 Ordinary shares 100
Standard Chartered Equitor Limited United Kingdom £1.00 Ordinary shares 100
Standard Chartered Financial Investments Limited United Kingdom £1.00 Ordinary A Shares 100
Standard Chartered Portfolio Trading (UK) Limited United Kingdom £1.00 Ordinary shares 100
Standard Chartered Receivables (UK) Limited United Kingdom $1.00 Ordinary shares 100
Standard Chartered Participacoes E Assessoria Economica Ltda Brazil BRL0.51 Common shares 100
SCL Consulting (Shanghai) Co. Ltd China $ Ordinary shares 100
Double Wings Limited Hong Kong HKD1.00 Ordinary shares 100
GE Capital (Hong Kong) Limited Hong Kong HKD10.00 Ordinary shares 100
Rivendell Private Limited Hong Kong $1.00 A Ordinary shares 84.8
Union Town Limited Hong Kong HKD1.00 Ordinary shares 100
Standard Chartered Bank Mozambique, S.A. Mozambique $1.00 Ordinary shares 100
Standard Chartered Investments (Singapore) Private Limited Singapore $ Ordinary shares 100
Prime Financial Holdings Limited Singapore SGD Ordinary shares 100
$ Ordinary shares 100
Standard Chartered Securities (Singapore) Pte. Limited Singapore SGD Ordinary shares 100
Thai Exclusive Leasing Company Limited Thailand THB10.00 Ordinary shares 100
California Rose Limited Virgin Islands, British $1.00 Ordinary shares 90.5
Earnest Range Limited Virgin Islands, British $1.00 Ordinary shares 90.5
Significant investment holdings and other related undertakings
NameCountry of incorporation Description of shares
Proportion of shares
held (%)
Chayora Holdings Limited Cayman Islands $0.01 Series B Preferred Shares 100
Ningbo Xingxin Real Estate Development Co.,Ltd* China CNY1.00 Registered Capital 60
Fast Great Investment Limited Hong Kong HKD1.00 Ordinary shares 28
Standard Latitude Consultancy (HK) Limited Hong Kong $5,000 Ordinary shares 20
Fountain Valley PFV Limited Korea, Republic of KRW5,000.00 Ordinary shares 47.3
Lotus PFV Co. Ltd Korea, Republic of KRW5,000.00 Ordinary shares 50
Smoothie King Holdings, Inc. Korea, Republic of KRW5,000.00 Ordinary shares 20.3
Maxpower Group Pte Ltd Singapore Redeemable Preference shares 100
SGD Warrants 100

351
Risk review
and capital review
Strategic rep
ort
Sup
plem
entary inform
ation
FIN
AN
CIA
L S
TA
TE
ME
NT
SD
irectors’ rep
ort
41. Transition to IFRS 9 Financial Instruments
Accounting policies applied to financial instruments prior to 1 January 2018.
Impairment of financial instrumentsImpairment of financial instruments is performed on an incurred loss basis, when there is objective evidence of impairment.
The Group assesses at each balance sheet date whether there is objective evidence that a financial asset or group of financial assets is impaired. A financial asset or a group of financial assets is impaired and impairment losses are incurred if, and only if, there is objective evidence of impairment as a result of one or more events occurring after the initial recognition of the asset (a loss event), and that loss event (or events) has an impact on the estimated future cash flows of the financial asset or group of financial assets that can be reliably estimated.
Impairment of loans and receivables and held-to-maturity financial instruments.
Corporate & Institutional Banking and Commercial BankingThe assessment of the credit risk of corporate and commercial loans is done by the Credit Risk department, based upon counterparty information they receive from various sources including relationship managers and on external market information, or as soon as payment of interest or principal is 90 days overdue.
Once a loan starts to exhibit credit deterioration, it will move along the credit grading scale in the performing book and when it is classified as Credit Grade (CG) 12, the credit assessment and oversight of the loan will be performed by Group Special Asset Management (GSAM).
Where GSAM’s assessment indicates that a loan is impaired, GSAM will calculate an Individual Impairment Provision (IIP) based on estimated cash flows revised to reflect anticipated recoveries. GSAM’s assessment and calculation of impairment involves a significant level of judgement.
If there is objective evidence that an impairment loss on a loan and receivable or a held-to-maturity asset has occurred, the amount of the loss is measured as the difference between the asset’s carrying amount and the present value of estimated future cash flows (excluding future credit losses that have not been incurred), discounted at the asset’s original effective interest rate. The carrying amount of the asset is reduced through the use of an allowance account and the amount of the loss is recognised in the income statement. If a loan and receivable or held-to-maturity asset has a variable interest rate, the discount rate for measuring any impairment loss is the current effective interest rate determined under the contract. As a practical expedient, the Group may measure impairment on the basis of an instrument’s fair value using an observable market price.
The individual circumstances of each client are taken into account when GSAM estimates future cash flows. All available sources, such as cash flow arising from operations, selling assets or subsidiaries, realising collateral or payments under guarantees are considered. In any decision relating to the raising of provisions, the Group attempts to balance economic conditions, local knowledge and experience, and the results of independent asset reviews.
The calculation of the present value of the estimated future cash flows of a collateralised financial asset reflects the cash flows that may result from foreclosure, less costs for obtaining and selling the collateral, whether or not foreclosure is probable.
In cases where the impairment assessment indicates that there will be a loss of principal, the loan is graded CG14 while other impaired loans will be graded CG13. Loans graded CG13–CG14 are classified as non-performing loans.
The performing loan portfolio is subject to a Portfolio Impairment Provision (PIP) to cover latent losses i.e. those that are not specifically identified but are known, by experience, to be present in any performing portfolio. The PIP is based on models using risk sizing (including probability of default and loss given default), environmental parameters and exceptional adjustment overlays. The calculation of the PIP uses regulatory expected credit loss (ECL) models. ECL is subject to an emergence risk factor that is generally understood as the hypothetical amount of time between a loss event occurrence and the bank recognition of impairment. The emergence risk factor is the principal means of translating a risk position to an impairment estimate, and the main scaling factor to adjust the conservative regulatory expected loss to an effective PIP level, as the regulatory ECL models are more punitive than the incurred loss model under IAS 39. On a portfolio basis, the emergence risk factor ranges between two and three months based on structural economic drivers that might influence the accurate and timely discovery of credit issues in each country.
Retail BankingAn IIP is recognised for Retail Banking when an account meets a defined threshold condition in terms of overdue payments (‘contractual default’) or meets other objective conditions (such as bankruptcy, debt restructuring, fraud or death) as further described above in the assessment factors. The threshold conditions are set at the point where empirical evidence suggests that the client is unlikely to meet their contractual obligations or a loss of principal is expected.
A credit obligation in Retail Banking clients portfolio that is more than 150 Days Past Due (DPD) or, a credit obligation secured by Wealth Management products that is 90DPD, is recognised as ‘impaired’ and IIP is provided for accordingly. There are, however, exceptions to this rule for portfolios where empirical evidence suggests that they should be set more conservatively. In addition, the credit account is recognised as ‘impaired’ immediately if the borrower files for bankruptcy or other equivalent forbearance programme, or the borrower is deceased, or the business is closed in the case of small business clients, or the borrower’s other credit accounts with the Group are impaired. The core components of the IIP calculation are the value of gross charge-off and recoveries. Gross charge-off and/or provisions are recognised when it is established that the account is unlikely to pay. Recovery of unsecured debt post-impairment is recognised based on actual cash collected, either directly from clients or through the sale of defaulted loans to third-party institutions. Provision release of secured loans post-impairment is recognised if the loan outstanding is paid in full (release of full provision), or the provision is higher than the loan outstanding (release of the excess provision), or the loan is paid to current and remains in current for more than 180 days (release of full provision).
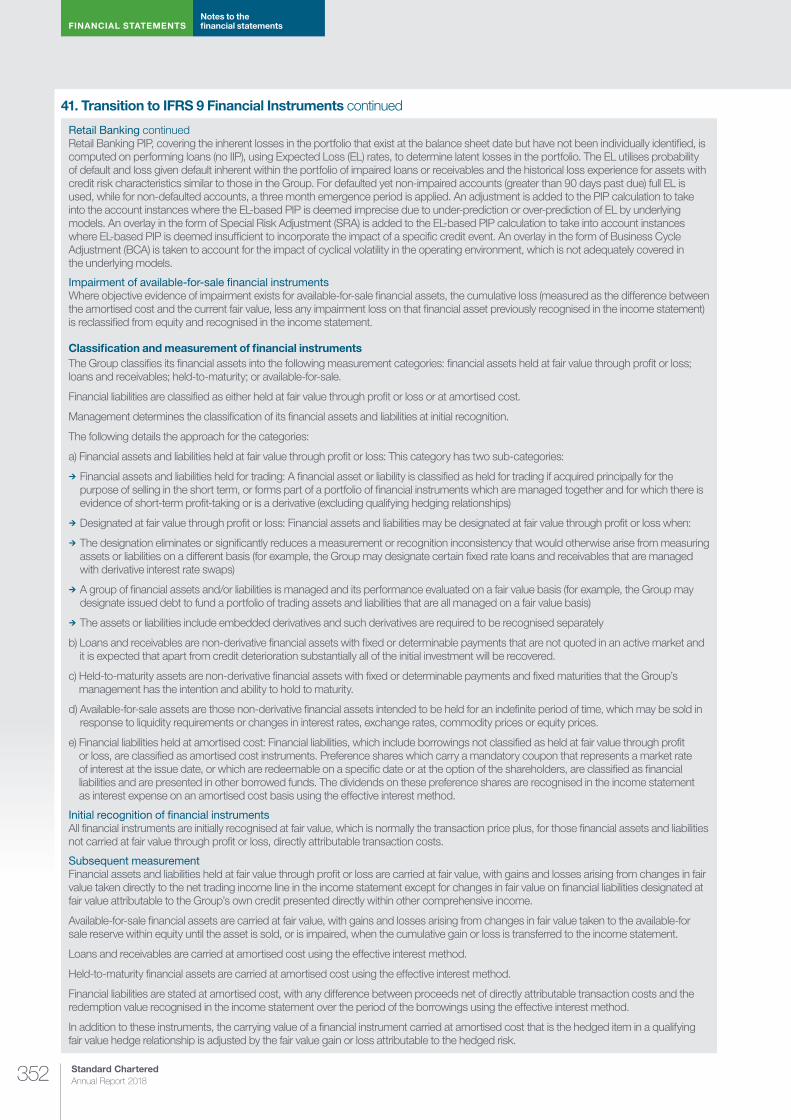
Standard Chartered Annual Report 2018352
FINANCIAL STATEMENTSNotes to the financial statements
41. Transition to IFRS 9 Financial Instruments continued
Retail Banking continuedRetail Banking PIP, covering the inherent losses in the portfolio that exist at the balance sheet date but have not been individually identified, is computed on performing loans (no IIP), using Expected Loss (EL) rates, to determine latent losses in the portfolio. The EL utilises probability of default and loss given default inherent within the portfolio of impaired loans or receivables and the historical loss experience for assets with credit risk characteristics similar to those in the Group. For defaulted yet non-impaired accounts (greater than 90 days past due) full EL is used, while for non-defaulted accounts, a three month emergence period is applied. An adjustment is added to the PIP calculation to take into the account instances where the EL-based PIP is deemed imprecise due to under-prediction or over-prediction of EL by underlying models. An overlay in the form of Special Risk Adjustment (SRA) is added to the EL-based PIP calculation to take into account instances where EL-based PIP is deemed insufficient to incorporate the impact of a specific credit event. An overlay in the form of Business Cycle Adjustment (BCA) is taken to account for the impact of cyclical volatility in the operating environment, which is not adequately covered in the underlying models.
Impairment of available-for-sale �nancial instruments Where objective evidence of impairment exists for available-for-sale financial assets, the cumulative loss (measured as the difference between the amortised cost and the current fair value, less any impairment loss on that financial asset previously recognised in the income statement) is reclassified from equity and recognised in the income statement.
Classification and measurement of financial instrumentsThe Group classifies its financial assets into the following measurement categories: financial assets held at fair value through profit or loss; loans and receivables; held-to-maturity; or available-for-sale.
Financial liabilities are classified as either held at fair value through profit or loss or at amortised cost.
Management determines the classification of its financial assets and liabilities at initial recognition.
The following details the approach for the categories:
a) Financial assets and liabilities held at fair value through profit or loss: This category has two sub-categories:
¼ Financial assets and liabilities held for trading: A financial asset or liability is classified as held for trading if acquired principally for the purpose of selling in the short term, or forms part of a portfolio of financial instruments which are managed together and for which there is evidence of short-term profit-taking or is a derivative (excluding qualifying hedging relationships)
¼ Designated at fair value through profit or loss: Financial assets and liabilities may be designated at fair value through profit or loss when:
¼ The designation eliminates or significantly reduces a measurement or recognition inconsistency that would otherwise arise from measuring assets or liabilities on a different basis (for example, the Group may designate certain fixed rate loans and receivables that are managed with derivative interest rate swaps)
¼ A group of financial assets and/or liabilities is managed and its performance evaluated on a fair value basis (for example, the Group may designate issued debt to fund a portfolio of trading assets and liabilities that are all managed on a fair value basis)
¼ The assets or liabilities include embedded derivatives and such derivatives are required to be recognised separately
b) Loans and receivables are non-derivative financial assets with fixed or determinable payments that are not quoted in an active market and it is expected that apart from credit deterioration substantially all of the initial investment will be recovered.
c) Held-to-maturity assets are non-derivative financial assets with fixed or determinable payments and fixed maturities that the Group’s management has the intention and ability to hold to maturity.
d) Available-for-sale assets are those non-derivative financial assets intended to be held for an indefinite period of time, which may be sold in response to liquidity requirements or changes in interest rates, exchange rates, commodity prices or equity prices.
e) Financial liabilities held at amortised cost: Financial liabilities, which include borrowings not classified as held at fair value through profit or loss, are classified as amortised cost instruments. Preference shares which carry a mandatory coupon that represents a market rate of interest at the issue date, or which are redeemable on a specific date or at the option of the shareholders, are classified as financial liabilities and are presented in other borrowed funds. The dividends on these preference shares are recognised in the income statement as interest expense on an amortised cost basis using the effective interest method.
Initial recognition of �nancial instrumentsAll financial instruments are initially recognised at fair value, which is normally the transaction price plus, for those financial assets and liabilities not carried at fair value through profit or loss, directly attributable transaction costs.
Subsequent measurementFinancial assets and liabilities held at fair value through profit or loss are carried at fair value, with gains and losses arising from changes in fair value taken directly to the net trading income line in the income statement except for changes in fair value on financial liabilities designated at fair value attributable to the Group’s own credit presented directly within other comprehensive income.
Available-for-sale financial assets are carried at fair value, with gains and losses arising from changes in fair value taken to the available-for sale reserve within equity until the asset is sold, or is impaired, when the cumulative gain or loss is transferred to the income statement.
Loans and receivables are carried at amortised cost using the effective interest method.
Held-to-maturity financial assets are carried at amortised cost using the effective interest method.
Financial liabilities are stated at amortised cost, with any difference between proceeds net of directly attributable transaction costs and the redemption value recognised in the income statement over the period of the borrowings using the effective interest method.
In addition to these instruments, the carrying value of a financial instrument carried at amortised cost that is the hedged item in a qualifying fair value hedge relationship is adjusted by the fair value gain or loss attributable to the hedged risk.
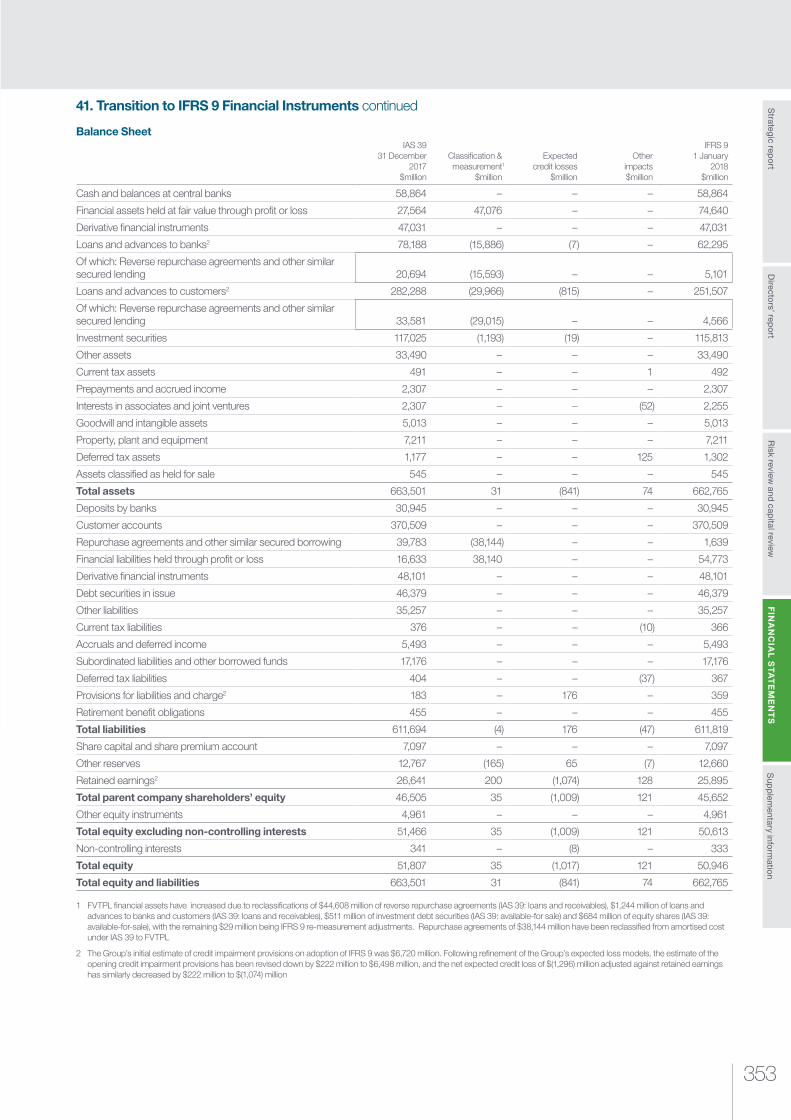
353
Risk review
and capital review
Strategic rep
ort
Sup
plem
entary inform
ation
FIN
AN
CIA
L S
TA
TE
ME
NT
SD
irectors’ rep
ort
41. Transition to IFRS 9 Financial Instruments continued
Balance SheetIAS 39
31 December 2017
$million
Classification & measurement1
$million
Expected credit losses
$million
Other impacts $million
IFRS 9 1 January
2018 $million
Cash and balances at central banks 58,864 – – – 58,864
Financial assets held at fair value through profit or loss 27,564 47,076 – – 74,640
Derivative financial instruments 47,031 – – – 47,031
Loans and advances to banks2 78,188 (15,886) (7) – 62,295
Of which: Reverse repurchase agreements and other similar secured lending 20,694 (15,593) – – 5,101
Loans and advances to customers2 282,288 (29,966) (815) – 251,507
Of which: Reverse repurchase agreements and other similar secured lending 33,581 (29,015) – – 4,566
Investment securities 117,025 (1,193) (19) – 115,813
Other assets 33,490 – – – 33,490
Current tax assets 491 – – 1 492
Prepayments and accrued income 2,307 – – – 2,307
Interests in associates and joint ventures 2,307 – – (52) 2,255
Goodwill and intangible assets 5,013 – – – 5,013
Property, plant and equipment 7,211 – – – 7,211
Deferred tax assets 1,177 – – 125 1,302
Assets classified as held for sale 545 – – – 545
Total assets 663,501 31 (841) 74 662,765
Deposits by banks 30,945 – – – 30,945
Customer accounts 370,509 – – – 370,509
Repurchase agreements and other similar secured borrowing 39,783 (38,144) – – 1,639
Financial liabilities held through profit or loss 16,633 38,140 – – 54,773
Derivative financial instruments 48,101 – – – 48,101
Debt securities in issue 46,379 – – – 46,379
Other liabilities 35,257 – – – 35,257
Current tax liabilities 376 – – (10) 366
Accruals and deferred income 5,493 – – – 5,493
Subordinated liabilities and other borrowed funds 17,176 – – – 17,176
Deferred tax liabilities 404 – – (37) 367
Provisions for liabilities and charge2 183 – 176 – 359
Retirement benefit obligations 455 – – – 455
Total liabilities 611,694 (4) 176 (47) 611,819
Share capital and share premium account 7,097 – – – 7,097
Other reserves 12,767 (165) 65 (7) 12,660
Retained earnings2 26,641 200 (1,074) 128 25,895
Total parent company shareholders’ equity 46,505 35 (1,009) 121 45,652
Other equity instruments 4,961 – – – 4,961
Total equity excluding non-controlling interests 51,466 35 (1,009) 121 50,613
Non-controlling interests 341 – (8) – 333
Total equity 51,807 35 (1,017) 121 50,946
Total equity and liabilities 663,501 31 (841) 74 662,765
1 FVTPL financial assets have increased due to reclassifications of $44,608 million of reverse repurchase agreements (IAS 39: loans and receivables), $1,244 million of loans and advances to banks and customers (IAS 39: loans and receivables), $511 million of investment debt securities (IAS 39: available-for sale) and $684 million of equity shares (IAS 39: available-for-sale), with the remaining $29 million being IFRS 9 re-measurement adjustments. Repurchase agreements of $38,144 million have been reclassified from amortised cost under IAS 39 to FVTPL
2 The Group’s initial estimate of credit impairment provisions on adoption of IFRS 9 was $6,720 million. Following refinement of the Group’s expected loss models, the estimate of the opening credit impairment provisions has been revised down by $222 million to $6,498 million, and the net expected credit loss of $(1,296) million adjusted against retained earnings has similarly decreased by $222 million to $(1,074) million

Standard Chartered Annual Report 2018354
FINANCIAL STATEMENTSNotes to the financial statements
41. Transition to IFRS 9 Financial Instruments continued
Statement of changes in equityShare capital
and share premium account $million
Capital and merger
reserves $million
Own credit adjustment
reserve $million
Available-for-sale reserve $million
Fair value through
OCI reserve $million
Cash flow hedge
reserve $million
Translation reserve $million
Retained earnings $million
Parent company
shareholders’ equity
$million
Other equity instruments
$million
Non-controlling
interests $million
Total $million
As at 31 December 2017 7,097 17,129 54 83 – (45) (4,454) 26,641 46,505 4,961 341 51,807
Net impact of: – – – (83) (82) – – 200 35 – – 35
IFRS 9 reclassifications1 – – – (83) (86) – – 169 – – – –
IFRS 9 re-measurements2 – – – – 4 – – 31 35 – – 35
Expected credit loss, net3 – – – – 65 – – (1,074) (1,009) – (8) (1,017)
Tax impact4 – – – – (6) – – 179 173 – – 173
Impact of IFRS 9 on share of joint ventures and associates, net of tax – – – – (1) – – (51) (52) – – (52)
Estimated IFRS 9 transition adjustments – – – (83) (24) – – (746) (853) – (8) (861)
As at 1 January 2018 7,097 17,129 54 – (24) (45) (4,454) 25,895 45,652 4,961 333 50,946
1 Available-for-sale category has been removed under IFRS 9. Unrealised gains and losses have been transferred to fair value through other comprehensive income (FVOCI) reserves, or retained earnings where the instruments are held as FVTPL. The FVOCI reserve includes a $187 million loss in respect of equity securities designated as FVOCI, partly offset by $18 million gain on debt securities designated as FVOCI
2 The remeasurement impact of financial assets that are now measured at fair value under IFRS 9 (page 353)
3 Impact from adopting expected credit losses. Gross impact is estimated at $1,082 million (comprising $1,074 million in retained earnings and $8 million in non-controlling interests). As FVOCI debt instruments are held at fair value on the balance sheet, the expected credit loss charged to retained earnings is recognised as a credit to the FVOCI reserve. The net FVOCI reserve relating to FVOCI debt instruments will be recycled to the income statement on disposal of the instruments
4 Tax of $173 million has been credited to reserves as a result of transition to IFRS 9. Of this, deferred tax of $142 million has been credited to retained earnings, and is provided on additional deductible temporary differences that have arisen from loss provisions due to initial adoption of the expected credit loss approach
Impact of moving from an incurred loss approach to an expected credit loss approach1 January 2018
Loss allowances per IAS 39 Expected credit loss per IFRS 9
Increase/(decrease)
$million
Portfolio impairment provisions
$million
Individual impairment provisions
$millionTotal
$millionStage 1 $million
Stage 2 $million
Stage 3 $million
Total $million
Corporate & Institutional Banking 156 3,466 3,622 105 394 3,433 3,932 310
Retail Banking 208 275 483 382 178 389 949 466
Commercial Banking 99 1,431 1,530 39 93 1,369 1,501 (29)
Private Banking 2 67 69 8 1 91 100 31
Central & other items – – – 4 – – 4 4
Total loans and advances to customers1 465 5,239 5,704 538 666 5,282 6,486 782
Loans and advances to banks 1 4 5 6 2 4 12 7
Financial guarantees – 77 77 6 16 77 99 22
Debt securities and other eligible bills – amortised cost – 114 114 3 16 213 232 118
Debt securities and other eligible bills – FVOCI – – – 23 42 – 65 65
Total 466 5,434 5,900 576 742 5,576 6,894 994
1 Includes both drawn and undrawn commitments
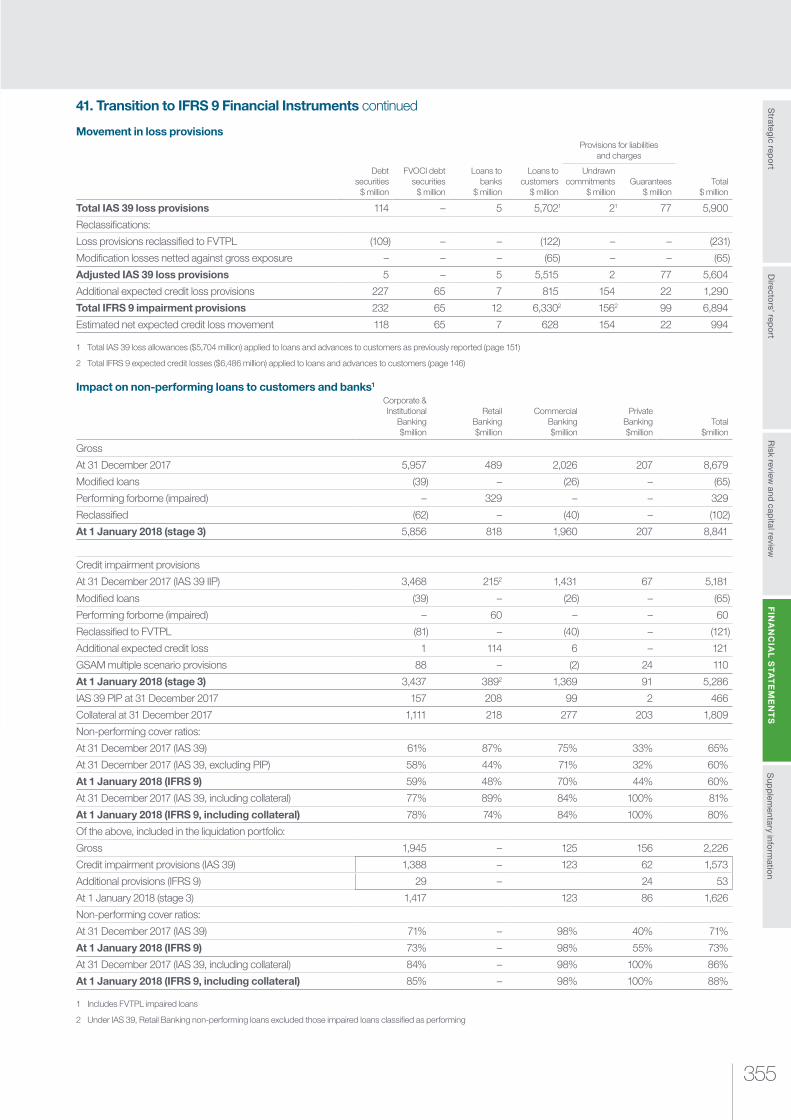
355
Risk review
and capital review
Strategic rep
ort
Sup
plem
entary inform
ation
FIN
AN
CIA
L S
TA
TE
ME
NT
SD
irectors’ rep
ort
41. Transition to IFRS 9 Financial Instruments continued
Movement in loss provisions
Debt securities
$ million
FVOCI debt securities
$ million
Loans to banks
$ million
Loans to customers
$ million
Provisions for liabilities and charges
Total $ million
Undrawn commitments
$ millionGuarantees
$ million
Total IAS 39 loss provisions 114 – 5 5,7021 21 77 5,900
Reclassifications:
Loss provisions reclassified to FVTPL (109) – – (122) – – (231)
Modification losses netted against gross exposure – – – (65) – – (65)
Adjusted IAS 39 loss provisions 5 – 5 5,515 2 77 5,604
Additional expected credit loss provisions 227 65 7 815 154 22 1,290
Total IFRS 9 impairment provisions 232 65 12 6,3302 1562 99 6,894
Estimated net expected credit loss movement 118 65 7 628 154 22 994
1 Total IAS 39 loss allowances ($5,704 million) applied to loans and advances to customers as previously reported (page 151)
2 Total IFRS 9 expected credit losses ($6,486 million) applied to loans and advances to customers (page 146)
Impact on non-performing loans to customers and banks1
Corporate & Institutional
Banking $million
Retail Banking $million
Commercial Banking $million
Private Banking $million
Total $million
Gross
At 31 December 2017 5,957 489 2,026 207 8,679
Modified loans (39) – (26) – (65)
Performing forborne (impaired) – 329 – – 329
Reclassified (62) – (40) – (102)
At 1 January 2018 (stage 3) 5,856 818 1,960 207 8,841
Credit impairment provisions
At 31 December 2017 (IAS 39 IIP) 3,468 2152 1,431 67 5,181
Modified loans (39) – (26) – (65)
Performing forborne (impaired) – 60 – – 60
Reclassified to FVTPL (81) – (40) – (121)
Additional expected credit loss 1 114 6 – 121
GSAM multiple scenario provisions 88 – (2) 24 110
At 1 January 2018 (stage 3) 3,437 3892 1,369 91 5,286
IAS 39 PIP at 31 December 2017 157 208 99 2 466
Collateral at 31 December 2017 1,111 218 277 203 1,809
Non-performing cover ratios:
At 31 December 2017 (IAS 39) 61% 87% 75% 33% 65%
At 31 December 2017 (IAS 39, excluding PIP) 58% 44% 71% 32% 60%
At 1 January 2018 (IFRS 9) 59% 48% 70% 44% 60%
At 31 December 2017 (IAS 39, including collateral) 77% 89% 84% 100% 81%
At 1 January 2018 (IFRS 9, including collateral) 78% 74% 84% 100% 80%
Of the above, included in the liquidation portfolio:
Gross 1,945 – 125 156 2,226
Credit impairment provisions (IAS 39) 1,388 – 123 62 1,573
Additional provisions (IFRS 9) 29 – 24 53
At 1 January 2018 (stage 3) 1,417 123 86 1,626
Non-performing cover ratios:
At 31 December 2017 (IAS 39) 71% – 98% 40% 71%
At 1 January 2018 (IFRS 9) 73% – 98% 55% 73%
At 31 December 2017 (IAS 39, including collateral) 84% – 98% 100% 86%
At 1 January 2018 (IFRS 9, including collateral) 85% – 98% 100% 88%
1 Includes FVTPL impaired loans
2 Under IAS 39, Retail Banking non-performing loans excluded those impaired loans classified as performing

SUPPLEMENTARY INFORMATION
Standard Chartered Annual Report 2018356
Muralimohan. K
What made this photograph so beautiful was that both the fishermen were so focused on fulfilling their dreams. They were aware of the odds, yet committed to their goals and living a life of purpose. They knew they were responsible to fulfil each other’s potential. They understood what it really meant to work together.
The photograph truly resonates because I live by the Helen Keller quote “Alone we can do so little; together we can do so much”. In my team, we believe we are #BetterTogether because we set strong objectives, we are open and transparent, we work together to make better decisions, we manage risks, we stay focused, we make ourselves more efficient and we serve our clients better.
Competition winnerMuralimohan. K
VALUED BEHAVIOURS
Better togetherOur valued behaviours are the expression of Our Purpose, and will help us to truly be Here for good. We bring people, cultures and clients together to form a truly powerful network. Better Together acknowledges that we can achieve with others what we cannot on our own.
Never settle Better togetherDo the right thing

357
Risk review
and Cap
ital reviewS
trategic repo
rtS
UP
PL
EM
EN
TAR
Y IN
FO
RM
AT
ION
Financial statements
Directo
rs’ repo
rt
SUPPLEMENTARY INFORMATION
358 Supplementary financial information
378 Supplementary people information
380 Supplementary sustainability information
383 Shareholder information
385 Major awards 2018
387 Glossary
Our unique diversity allows us to see
opportunities when others see challenges.
This makes us a better partner.
Gbire Boyo
Jonathan Jacob Siegel

Standard Chartered Annual Report 2018358
SUPPLEMENTARY INFORMATION
Supplementary financial information
Five-year summary1
2018 $million
2017 $million
2016 $million
2015 $million
2014 $million
Operating profit before impairment losses and taxation 3,142 4,008 3,849 4,116 7,289
Impairment losses on loans and advances and other credit risk provisions (653) (1,362) (2,791) (4,976) (2,141)
Other impairment (182) (179) (612) (855) (1,161)
Profit/(loss) before taxation 2,548 2,415 409 (1,523) 4,235
Profit/(loss) attributable to shareholders 1,054 1,219 (247) (2,194) 2,613
Loans and advances to banks2 61,414 78,188 72,609 64,494 83,890
Loans and advances to customers2 256,557 282,288 252,719 257,356 284,695
Total assets 688,762 663,501 646,692 640,483 725,914
Deposits by banks2 29,715 30,945 32,872 28,727 44,407
Customer accounts2 391,013 370,509 338,185 337,606 399,028
Shareholders’ equity 45,118 46,505 44,368 46,204 46,432
Total capital resources3 66,203 68,983 68,181 70,364 69,685
Information per ordinary share
Basic earnings/(loss) per share 18.7c 23.5c (14.5)c (91.9)c 97.3c
Underlying earnings/(loss) per share 61.4c 47.2c 3.4c (6.6)c 138.9c
Dividends per share4 17.0c – – 13.71c 81.85c
Net asset value per share 1,319.3c 1,366.9c 1,307.8c 1,366.0c 1,833.9c
Net tangible asset value per share 1,167.7c 1,214.7c 1,163.9c 1,244.1c 1,610.9c
Return on assets5 0.3% 0.2% 0.0% (0.3)% 0.4%
Ratios
Statutory return on ordinary shareholders’ equity6 1.4% 1.7% (1.1)% (5.3)% 5.5%
Statutory return on ordinary shareholders’ tangible equity7 1.6% 2.0% (1.2)% (5.9)% 6.3%
Underlying return on ordinary shareholders’ equity6 4.6% 3.5% 0.3% (0.4)% 7.8%
Underlying return on ordinary shareholders’ tangible equity7 5.1% 3.9% 0.3% (0.4)% 9.0%
Statutory cost to income ratio 78.8% 72.2% 72.6% 73.1% 60.2%
Underlying cost to income ratio 69.9% 70.8% 72.2% 67.8% 58.9%
Capital ratios:
(CET1)/Tier 1 capital8 14.2% 13.6% 13.6% 12.6% 10.5%
Total capital8 21.6% 21.0% 21.3% 19.5% 16.7%
1 The amounts for the four financial years ended 2014 to 2017 are presented in line with IAS 39 and, therefore, not on a comparable basis to the current financial year presented in accordance with IFRS 9
2 Excludes amounts held at fair value through profit or loss
3 Shareholders’ funds, non-controlling interests and subordinated loan capital
4 Dividend paid during the year per share
5 Represents profit attributable to shareholders divided by the total assets of the Group
6 Weighted average equity for 2018 is $44,636 million (2017: $44,420 million, 2016: $44,831 million, 2015: $44,363 million, 2014: $45,873 million)
7 Weighted average tangible equity for 2018 is $39,613 million (2017: $39,450, 2016: $40,166 million, 2015: $39,859 million, 2014: $39,952 million)
8 Unaudited
Supplementary financial information
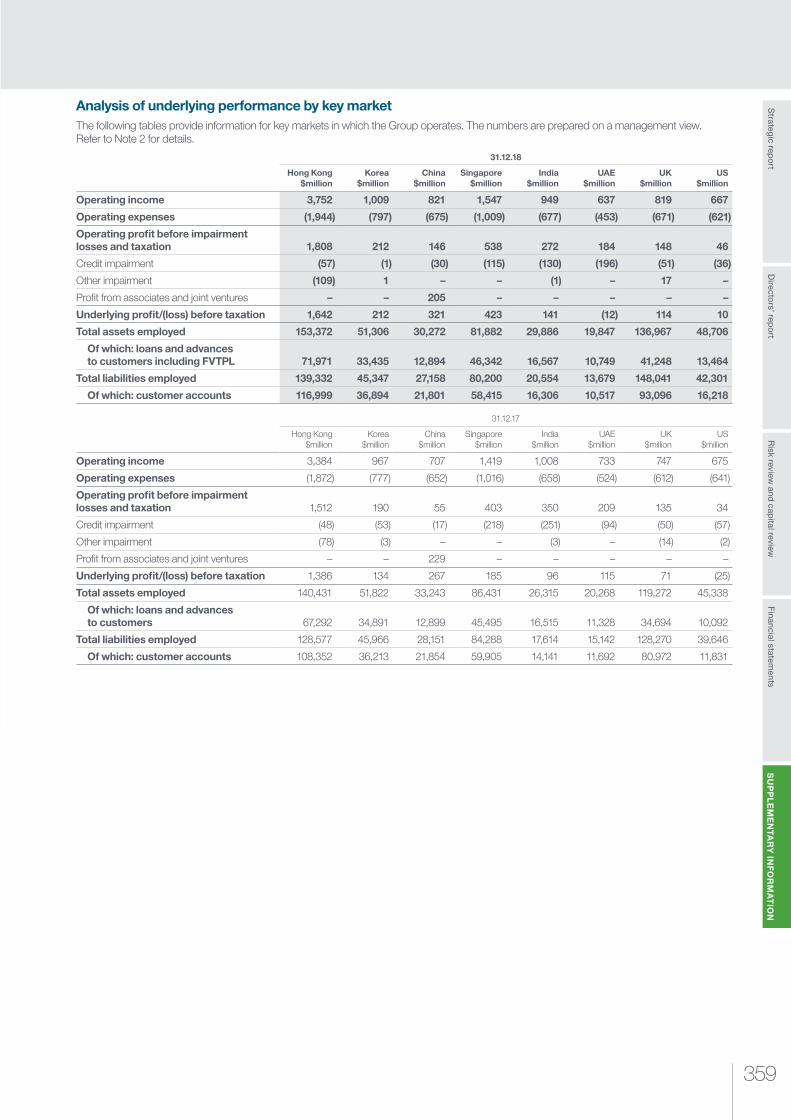
359
Risk review
and capital review
Strategic rep
ort
SU
PP
LE
ME
NTA
RY
INF
OR
MA
TIO
NFinancial statem
entsD
irectors’ rep
ort
Analysis of underlying performance by key marketThe following tables provide information for key markets in which the Group operates. The numbers are prepared on a management view. Refer to Note 2 for details.
31.12.18
Hong Kong $million
Korea $million
China $million
Singapore $million
India $million
UAE $million
UK $million
US $million
Operating income 3,752 1,009 821 1,547 949 637 819 667
Operating expenses (1,944) (797) (675) (1,009) (677) (453) (671) (621)
Operating profit before impairment losses and taxation 1,808 212 146 538 272 184 148 46
Credit impairment (57) (1) (30) (115) (130) (196) (51) (36)
Other impairment (109) 1 – – (1) – 17 –
Profit from associates and joint ventures – – 205 – – – – –
Underlying profit/(loss) before taxation 1,642 212 321 423 141 (12) 114 10
Total assets employed 153,372 51,306 30,272 81,882 29,886 19,847 136,967 48,706
Of which: loans and advances to customers including FVTPL 71,971 33,435 12,894 46,342 16,567 10,749 41,248 13,464
Total liabilities employed 139,332 45,347 27,158 80,200 20,554 13,679 148,041 42,301
Of which: customer accounts 116,999 36,894 21,801 58,415 16,306 10,517 93,096 16,218
31.12.17
Hong Kong $million
Korea $million
China $million
Singapore $million
India $million
UAE $million
UK $million
US $million
Operating income 3,384 967 707 1,419 1,008 733 747 675
Operating expenses (1,872) (777) (652) (1,016) (658) (524) (612) (641)
Operating profit before impairment losses and taxation 1,512 190 55 403 350 209 135 34
Credit impairment (48) (53) (17) (218) (251) (94) (50) (57)
Other impairment (78) (3) – – (3) – (14) (2)
Profit from associates and joint ventures – – 229 – – – – –
Underlying profit/(loss) before taxation 1,386 134 267 185 96 115 71 (25)
Total assets employed 140,431 51,822 33,243 86,431 26,315 20,268 119,272 45,338
Of which: loans and advances to customers 67,292 34,891 12,899 45,495 16,515 11,328 34,694 10,092
Total liabilities employed 128,577 45,966 28,151 84,288 17,614 15,142 128,270 39,646
Of which: customer accounts 108,352 36,213 21,854 59,905 14,141 11,692 80,972 11,831
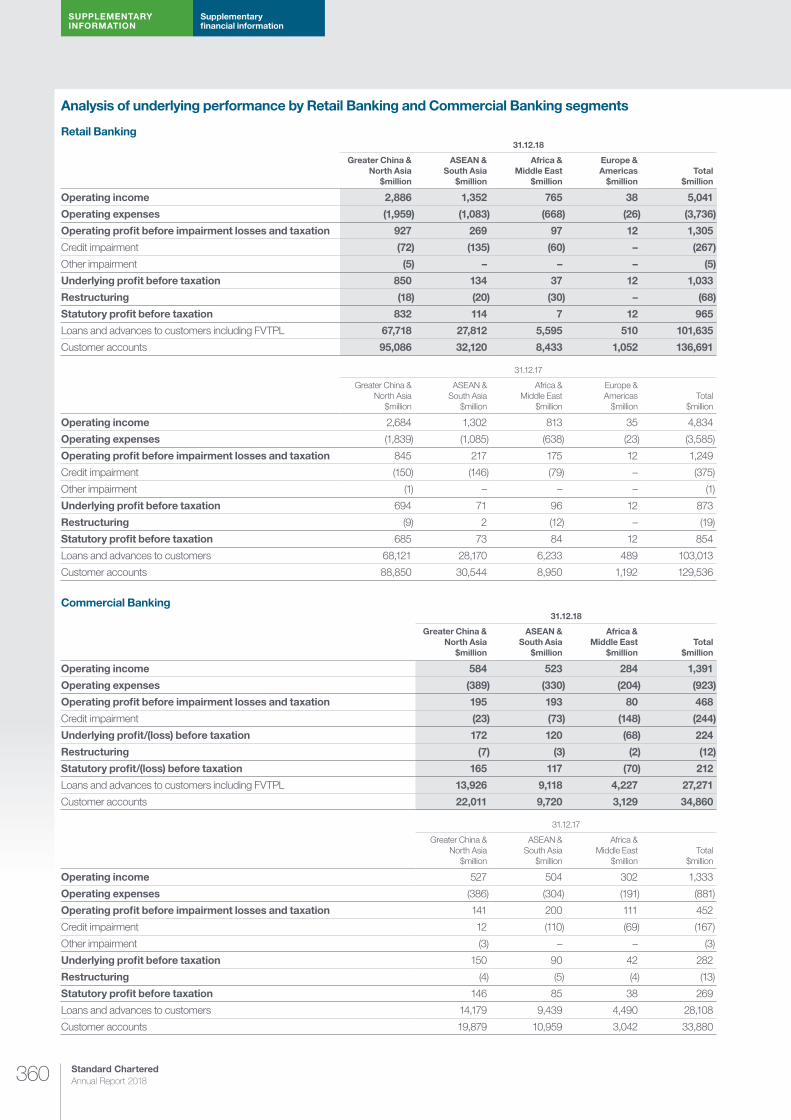
Standard Chartered Annual Report 2018360
SUPPLEMENTARY INFORMATION
Supplementary financial information
Analysis of underlying performance by Retail Banking and Commercial Banking segments
Retail Banking31.12.18
Greater China & North Asia
$million
ASEAN & South Asia
$million
Africa & Middle East
$million
Europe & Americas
$millionTotal
$million
Operating income 2,886 1,352 765 38 5,041
Operating expenses (1,959) (1,083) (668) (26) (3,736)
Operating profit before impairment losses and taxation 927 269 97 12 1,305
Credit impairment (72) (135) (60) – (267)
Other impairment (5) – – – (5)
Underlying profit before taxation 850 134 37 12 1,033
Restructuring (18) (20) (30) – (68)
Statutory profit before taxation 832 114 7 12 965
Loans and advances to customers including FVTPL 67,718 27,812 5,595 510 101,635
Customer accounts 95,086 32,120 8,433 1,052 136,691
31.12.17
Greater China & North Asia
$million
ASEAN & South Asia
$million
Africa & Middle East
$million
Europe & Americas
$millionTotal
$million
Operating income 2,684 1,302 813 35 4,834
Operating expenses (1,839) (1,085) (638) (23) (3,585)
Operating profit before impairment losses and taxation 845 217 175 12 1,249
Credit impairment (150) (146) (79) – (375)
Other impairment (1) – – – (1)
Underlying profit before taxation 694 71 96 12 873
Restructuring (9) 2 (12) – (19)
Statutory profit before taxation 685 73 84 12 854
Loans and advances to customers 68,121 28,170 6,233 489 103,013
Customer accounts 88,850 30,544 8,950 1,192 129,536
Commercial Banking31.12.18
Greater China & North Asia
$million
ASEAN & South Asia
$million
Africa & Middle East
$millionTotal
$million
Operating income 584 523 284 1,391
Operating expenses (389) (330) (204) (923)
Operating profit before impairment losses and taxation 195 193 80 468
Credit impairment (23) (73) (148) (244)
Underlying profit/(loss) before taxation 172 120 (68) 224
Restructuring (7) (3) (2) (12)
Statutory profit/(loss) before taxation 165 117 (70) 212
Loans and advances to customers including FVTPL 13,926 9,118 4,227 27,271
Customer accounts 22,011 9,720 3,129 34,860
31.12.17
Greater China & North Asia
$million
ASEAN & South Asia
$million
Africa & Middle East
$millionTotal
$million
Operating income 527 504 302 1,333
Operating expenses (386) (304) (191) (881)
Operating profit before impairment losses and taxation 141 200 111 452
Credit impairment 12 (110) (69) (167)
Other impairment (3) – – (3)
Underlying profit before taxation 150 90 42 282
Restructuring (4) (5) (4) (13)
Statutory profit before taxation 146 85 38 269
Loans and advances to customers 14,179 9,439 4,490 28,108
Customer accounts 19,879 10,959 3,042 33,880

361
Risk review
and capital review
Strategic rep
ort
SU
PP
LE
ME
NTA
RY
INF
OR
MA
TIO
NFinancial statem
entsD
irectors’ rep
ort
Analysis of operating income by product and segmentThe following tables provide a breakdown of the Group’s underlying operating income by product and client segment.
31.12.18
Corporate & Institutional
Banking $million
Retail Banking $million
Commercial Banking $million
Private Banking $million
Central & other items
$millionTotal
$million
Transaction Banking 2,887 20 811 – – 3,718
Trade 729 20 374 – – 1,123
Cash Management and Custody 2,158 – 437 – – 2,595
Financial Markets 2,328 – 284 – – 2,612
Foreign Exchange 829 – 172 – – 1,001
Rates1 527 – 28 – – 555
Commodities 168 – 24 – – 192
Credit and Capital Markets1 312 – 12 – – 324
Capital Structuring Distribution Group 285 – 24 – – 309
Other Financial Markets 207 – 24 – – 231
Corporate Finance 1,325 – 98 – – 1,423
Lending and Portfolio Management 315 – 203 – – 518
Wealth Management – 1,491 3 305 – 1,799
Retail Products – 3,535 4 211 – 3,750
CCPL and other unsecured lending – 1,310 – – – 1,310
Deposits – 1,603 4 175 – 1,782
Mortgage and Auto – 537 – 36 – 573
Other Retail Products – 85 – – – 85
Treasury – – – – 1,223 1,223
Other2 5 (5) (12) – (63) (75)
Total underlying operating income 6,860 5,041 1,391 516 1,160 14,968
1 Following a reorganisation of certain product teams within Financial Markets, $46 million of income that was in H1 2018 reported within Credit and Capital Markets has been transferred to Rates during Q3 2018. Prior periods have not been restated.
2 Others includes group special asset management from 2018 onwards. Prior periods have not been restated
31.12.17
Corporate & Institutional
Banking $million
Retail Banking $million
Commercial Banking $million
Private Banking $million
Central & other items
$millionTotal
$million
Transaction Banking 2,564 18 747 – – 3,329
Trade 793 18 386 – – 1,197
Cash Management and Custody 1,771 – 361 – – 2,132
Financial Markets 2,266 – 278 – – 2,544
Foreign Exchange 779 – 164 – – 943
Rates 503 – 32 – – 535
Commodities 136 – 21 – – 157
Credit and Capital Markets 365 – 11 – – 376
Capital Structuring Distribution Group 254 – 25 – – 279
Other Financial Markets 229 – 25 – – 254
Corporate Finance 1,390 – 86 – – 1,476
Lending and Portfolio Management 284 – 212 – – 496
Wealth Management – 1,438 4 299 – 1,741
Retail Products – 3,376 6 201 – 3,583
CCPL and other unsecured lending – 1,366 1 – – 1,367
Deposits – 1,245 6 168 – 1,419
Mortgage and Auto – 692 – 32 – 724
Other Retail Products – 73 (1) 1 – 73
Treasury – – – – 1,143 1,143
Other (8) 2 – – (17) (23)
Total underlying operating income 6,496 4,834 1,333 500 1,126 14,289
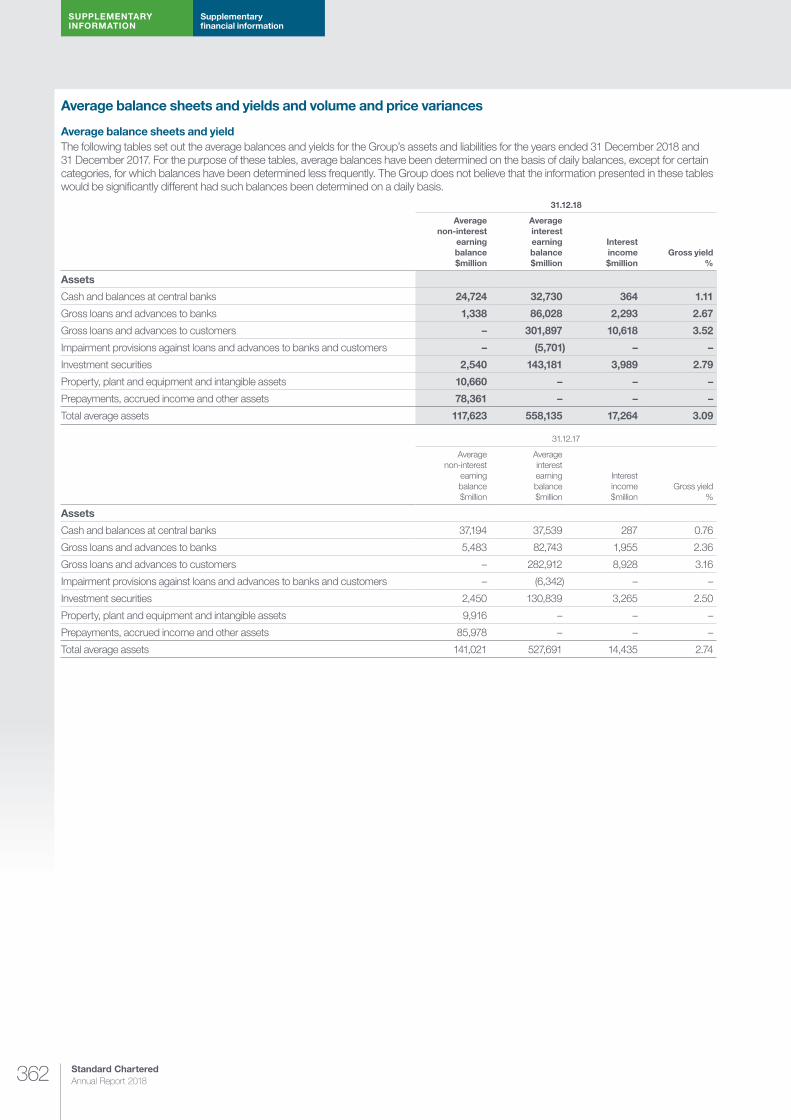
Standard Chartered Annual Report 2018362
SUPPLEMENTARY INFORMATION
Supplementary financial information
Average balance sheets and yields and volume and price variances
Average balance sheets and yieldThe following tables set out the average balances and yields for the Group’s assets and liabilities for the years ended 31 December 2018 and 31 December 2017. For the purpose of these tables, average balances have been determined on the basis of daily balances, except for certain categories, for which balances have been determined less frequently. The Group does not believe that the information presented in these tables would be significantly different had such balances been determined on a daily basis.
31.12.18
Average non-interest
earning balance $million
Average interest earning balance $million
Interest income $million
Gross yield %
Assets
Cash and balances at central banks 24,724 32,730 364 1.11
Gross loans and advances to banks 1,338 86,028 2,293 2.67
Gross loans and advances to customers – 301,897 10,618 3.52
Impairment provisions against loans and advances to banks and customers – (5,701) – –
Investment securities 2,540 143,181 3,989 2.79
Property, plant and equipment and intangible assets 10,660 – – –
Prepayments, accrued income and other assets 78,361 – – –
Total average assets 117,623 558,135 17,264 3.09
31.12.17
Average non-interest
earning balance $million
Average interest earning balance $million
Interest income $million
Gross yield %
Assets
Cash and balances at central banks 37,194 37,539 287 0.76
Gross loans and advances to banks 5,483 82,743 1,955 2.36
Gross loans and advances to customers – 282,912 8,928 3.16
Impairment provisions against loans and advances to banks and customers – (6,342) – –
Investment securities 2,450 130,839 3,265 2.50
Property, plant and equipment and intangible assets 9,916 – – –
Prepayments, accrued income and other assets 85,978 – – –
Total average assets 141,021 527,691 14,435 2.74

363
Risk review
and capital review
Strategic rep
ort
SU
PP
LE
ME
NTA
RY
INF
OR
MA
TIO
NFinancial statem
entsD
irectors’ rep
ort
Average balance sheets and yields and volume and price variances continued
Average balance sheets and yield continued31.12.18
Average non-interest
bearing balance $million
Average interest bearing balance $million
Interest expense $million
Rate paid %
Liabilities
Deposits by banks 6,320 34,497 811 2.35
Customer accounts:
Current accounts and savings deposits 38,909 178,454 1,667 0.93
Time and other deposits 8,660 201,349 4,097 2.03
Debt securities in issue 136 53,988 1,129 2.09
Accruals, deferred income and other liabilities 95,214 – – –
Subordinated liabilities and other borrowed funds – 15,780 767 4.86
Non-controlling interests 48 – – –
Shareholders’ funds 50,241 – – –
Total average liabilities and shareholders’ funds 199,528 484,068 8,471 1.75
Net yield 1.34
Net interest margin 1.58
31.12.17
Average non-interest
bearing balance $million
Average interest bearing balance $million
Interest expense $million
Rate paid %
Liabilities
Deposits by banks 6,696 41,565 891 2.14
Customer accounts:
Current accounts and savings deposits 36,070 165,300 1,063 0.64
Time and other deposits 8,096 199,426 2,796 1.40
Debt securities in issue 581 51,914 756 1.46
Accruals, deferred income and other liabilities 84,881 22 – –
Subordinated liabilities and other borrowed funds 841 17,205 748 4.35
Non-controlling interests 73 – – –
Shareholders’ funds 49,903 – – –
Total average liabilities and shareholders’ funds 187,141 475,432 6,254 1.32
Net yield 1.42
Net interest margin 1.55

Standard Chartered Annual Report 2018364
SUPPLEMENTARY INFORMATION
Supplementary financial information
Volume and price variancesThe following table analyses the estimated change in the Group’s net interest income attributable to changes in the average volume of interest-earning assets and interest-bearing liabilities, and changes in their respective interest rates for the years presented. Volume and rate variances have been determined based on movements in average balances and average exchange rates over the year and changes in interest rates on average interest-earning assets and average interest-bearing liabilities.
31.12.18 versus 31.12.17
(Decrease)/increase in interest due to:
Net increase/(decrease) in interest
$millionVolume $million
Rate $million
Interest earning assets
Cash and unrestricted balances at central banks (53) 130 77
Loans and advances to banks 88 250 338
Loans and advances to customers 660 1,030 1,690
Investment securities 346 378 724
Total interest earning assets 1,041 1,788 2,829
Interest bearing liabilities
Subordinated liabilities and other borrowed funds (69) 88 19
Deposits by banks (166) 86 (80)
Customer accounts:
Current accounts and savings deposits 124 482 606
Time and other deposits 39 1,260 1,299
Debt securities in issue 43 330 373
Total interest bearing liabilities (29) 2,246 2,217
31.12.17 versus 31.12.16
(Decrease)/increase in interest due to:
Net increase/(decrease) in interest
$millionVolume $million
Rate $million
Interest earning assets
Cash and unrestricted balances at central banks (52) 126 74
Loans and advances to banks 129 544 673
Loans and advances to customers 485 (306) 179
Investment securities 112 387 499
Total interest earning assets 674 751 1,425
Interest bearing liabilities
Subordinated liabilities and other borrowed funds (131) 44 (87)
Deposits by banks (13) 410 397
Customer accounts:
Current accounts and savings deposits 121 90 211
Time and other deposits 272 189 461
Debt securities in issue (142) 198 56
Total interest bearing liabilities 107 931 1,038

365
Risk review
and capital review
Strategic rep
ort
SU
PP
LE
ME
NTA
RY
INF
OR
MA
TIO
NFinancial statem
entsD
irectors’ rep
ort
Convenience translation of selected financial statements into Indian RupeesIn compliance with regulation 71(3) read with schedule IV part B of the Securities and Exchange Board of India (Listing Obligations and Disclosure Requirements) regulations, 2015, as amended, the Consolidated financial statements (pages 365 to 370) are presented in Indian rupees (INR) using a US dollar/Indian rupee exchange rate of 69.7923 as at 31 December 2018 as published by the Reserve Bank of India. Amounts have been translated using the said exchange rate including totals and sub-totals and any discrepancies in any table between totals and sums of the amounts listed are due to rounding.
Consolidated income statement (translated to INR)For the year ended 31 December 2018
31.12.18 Rs.million
31.12.17 Rs.million
Interest income 1,204,894 1,007,452
Interest expense (591,211) (436,481)
Net interest income 613,684 570,971
Fees and commission income 281,193 275,121
Fees and commission expense (37,478) (30,011)
Net fee and commission income 243,715 245,111
Net trading income 117,460 106,573
Other operating income 57,299 84,100
Operating income 1,032,158 1,006,754
Staff costs (493,711) (471,656)
Premises costs (55,136) (57,439)
General administrative expenses (204,212) (140,073)
Depreciation and amortisation (59,812) (57,858)
Operating expenses (812,871) (727,026)
Operating profit before impairment losses and taxation 219,287 279,728
Credit impairment (45,574) (95,057)
Other impairment
Goodwill – (22,334)
Other (12,702) (12,493)
Profit from associates and joint ventures 16,820 18,704
Profit before taxation 177,831 168,548
Taxation (100,432) (80,052)
Profit for the year 77,400 88,496
Profit attributable to:
Non-controlling interests 3,839 3,420
Parent company shareholders 73,561 85,077
Profit for the year 77,400 88,496
Rupees Rupees
Earnings per share:
Basic earnings per ordinary share 13.0 16.4
Diluted earnings per ordinary share 12.9 16.2
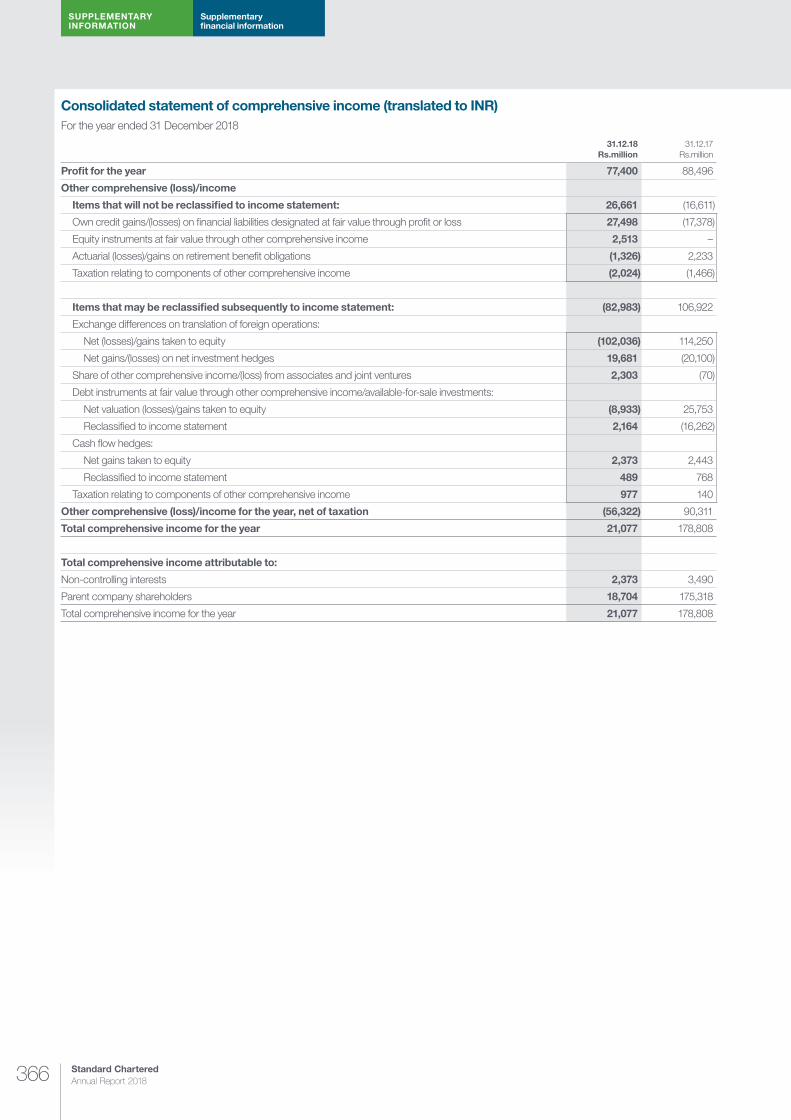
Standard Chartered Annual Report 2018366
SUPPLEMENTARY INFORMATION
Supplementary financial information
Consolidated statement of comprehensive income (translated to INR)For the year ended 31 December 2018
31.12.18 Rs.million
31.12.17 Rs.million
Profit for the year 77,400 88,496
Other comprehensive (loss)/income
Items that will not be reclassified to income statement: 26,661 (16,611)
Own credit gains/(losses) on financial liabilities designated at fair value through profit or loss 27,498 (17,378)
Equity instruments at fair value through other comprehensive income 2,513 –
Actuarial (losses)/gains on retirement benefit obligations (1,326) 2,233
Taxation relating to components of other comprehensive income (2,024) (1,466)
Items that may be reclassified subsequently to income statement: (82,983) 106,922
Exchange differences on translation of foreign operations:
Net (losses)/gains taken to equity (102,036) 114,250
Net gains/(losses) on net investment hedges 19,681 (20,100)
Share of other comprehensive income/(loss) from associates and joint ventures 2,303 (70)
Debt instruments at fair value through other comprehensive income/available-for-sale investments:
Net valuation (losses)/gains taken to equity (8,933) 25,753
Reclassified to income statement 2,164 (16,262)
Cash flow hedges:
Net gains taken to equity 2,373 2,443
Reclassified to income statement 489 768
Taxation relating to components of other comprehensive income 977 140
Other comprehensive (loss)/income for the year, net of taxation (56,322) 90,311
Total comprehensive income for the year 21,077 178,808
Total comprehensive income attributable to:
Non-controlling interests 2,373 3,490
Parent company shareholders 18,704 175,318
Total comprehensive income for the year 21,077 178,808
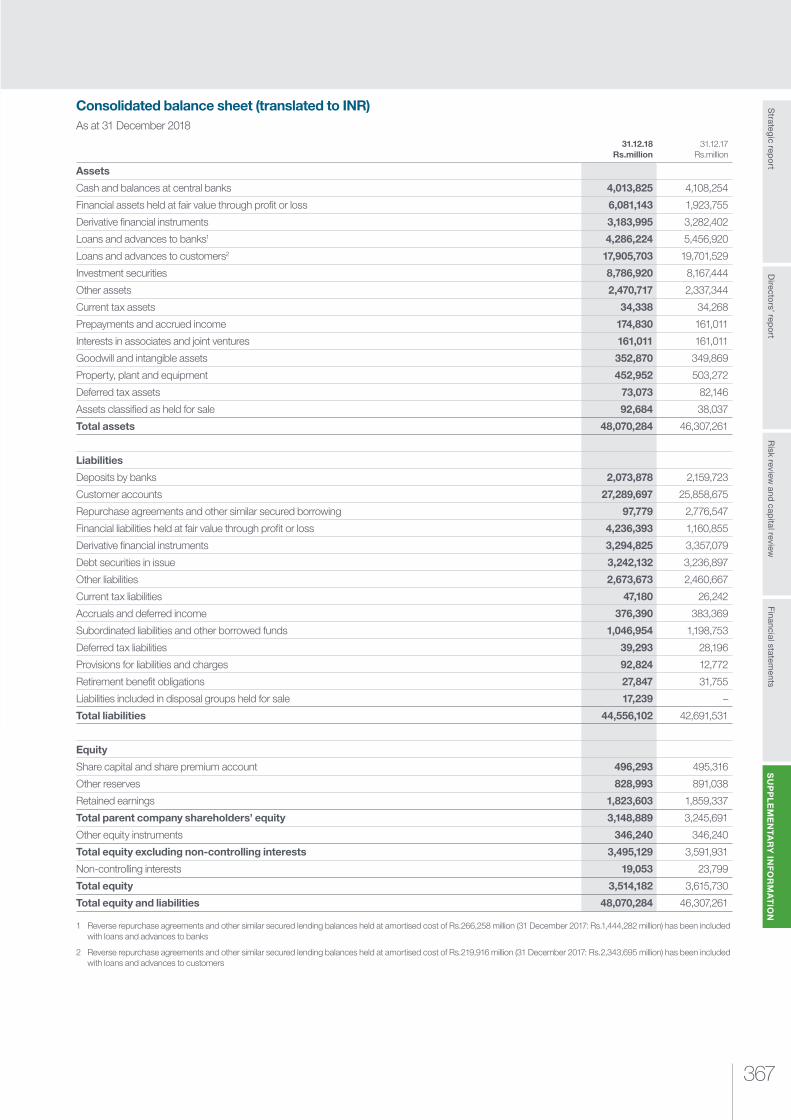
367
Risk review
and capital review
Strategic rep
ort
SU
PP
LE
ME
NTA
RY
INF
OR
MA
TIO
NFinancial statem
entsD
irectors’ rep
ort
Consolidated balance sheet (translated to INR)As at 31 December 2018
31.12.18 Rs.million
31.12.17 Rs.million
Assets
Cash and balances at central banks 4,013,825 4,108,254
Financial assets held at fair value through profit or loss 6,081,143 1,923,755
Derivative financial instruments 3,183,995 3,282,402
Loans and advances to banks1 4,286,224 5,456,920
Loans and advances to customers2 17,905,703 19,701,529
Investment securities 8,786,920 8,167,444
Other assets 2,470,717 2,337,344
Current tax assets 34,338 34,268
Prepayments and accrued income 174,830 161,011
Interests in associates and joint ventures 161,011 161,011
Goodwill and intangible assets 352,870 349,869
Property, plant and equipment 452,952 503,272
Deferred tax assets 73,073 82,146
Assets classified as held for sale 92,684 38,037
Total assets 48,070,284 46,307,261
Liabilities
Deposits by banks 2,073,878 2,159,723
Customer accounts 27,289,697 25,858,675
Repurchase agreements and other similar secured borrowing 97,779 2,776,547
Financial liabilities held at fair value through profit or loss 4,236,393 1,160,855
Derivative financial instruments 3,294,825 3,357,079
Debt securities in issue 3,242,132 3,236,897
Other liabilities 2,673,673 2,460,667
Current tax liabilities 47,180 26,242
Accruals and deferred income 376,390 383,369
Subordinated liabilities and other borrowed funds 1,046,954 1,198,753
Deferred tax liabilities 39,293 28,196
Provisions for liabilities and charges 92,824 12,772
Retirement benefit obligations 27,847 31,755
Liabilities included in disposal groups held for sale 17,239 –
Total liabilities 44,556,102 42,691,531
Equity
Share capital and share premium account 496,293 495,316
Other reserves 828,993 891,038
Retained earnings 1,823,603 1,859,337
Total parent company shareholders’ equity 3,148,889 3,245,691
Other equity instruments 346,240 346,240
Total equity excluding non-controlling interests 3,495,129 3,591,931
Non-controlling interests 19,053 23,799
Total equity 3,514,182 3,615,730
Total equity and liabilities 48,070,284 46,307,261
1 Reverse repurchase agreements and other similar secured lending balances held at amortised cost of Rs.266,258 million (31 December 2017: Rs.1,444,282 million) has been included with loans and advances to banks
2 Reverse repurchase agreements and other similar secured lending balances held at amortised cost of Rs.219,916 million (31 December 2017: Rs.2,343,695 million) has been included with loans and advances to customers

Standard Chartered Annual Report 2018368
SUPPLEMENTARY INFORMATION
Supplementary financial information
Condensed consolidated interim statement of changes in equity (translated to INR) For the year ended 31 December 2018
Share capital
and share premium account
Rs.million
Capital and merger
reserves1
Rs.million
Own credit adjustment
reserve Rs.million
Available -for-sale reserve
Rs.million
Fair value through
other compre-hensive income reserve
– debt Rs.million
Fair value through
other compre-hensive income reserve – equity
Rs.million
Cash flow hedge
reserve Rs.million
Translation reserve
Rs.million
Retained earnings
Rs.million
Parent company
share-holders’
equity Rs.million
Other equity
instruments Rs.million
Non-controlling
interests Rs.million
Total Rs.million
At 1 January 2017 494,897 1,195,472 20,170 (279) – – (5,932) (405,144) 1,797,361 3,096,545 277,006 22,403 3,395,954
Profit after tax for the year – – – – – – – – 85,077 85,077 – 3,420 88,497
Other comprehensive (loss)/income – – (16,401) 6,072 – – 2,792 94,289 3,4902 90,241 – 70 90,311
Distributions – – – – – – – – – – – (3,559) (3,559)
Shares issued, net of expenses 419 – – – – – – – – 419 – – 419
Other equity instruments issued, net of expenses – – – – – – – – – – 69,234 – 69,234
Net own shares adjustment – – – – – – – – 698 698 – – 698
Share option expense, net of taxation – – – – – – – – 8,724 8,724 – – 8,724
Dividends3 – – – – – – – – (31,058) (31,058) – – (31,058)
Other movements4 – – – – – – – – (4,955) (4,955) – 1,4665 (3,490)
As at 31 December 2017 495,316 1,195,472 3,769 5,793 – – (3,141) (310,855) 1,859,337 3,245,691 346,240 23,799 3,615,730
IFRS 9 reclassifications6 – – – (5,793) (9,143) 3,141 – – 11,795 – – – –
IFRS 9 re-measurements6 – – – – – 279 – – 2,164 2,443 – – 2,443
Expected credit loss, net – – – – 4,536 – – – (74,957)7 (70,420) – (558) (70,979)
Tax impact – – – – (768) 349 – – 12,493 12,074 – – 12,074
Impact of IFRS 9 on share of joint ventures and associates, net of tax – – – – – (70) – – (3,559) (3,629) – – (3,629)
IFRS 9 transition adjustments – – – (5,793) (5,374) 3,699 – – (52,065) (59,533) – (558) (60,091)
As at 1 January 2018 495,316 1,195,472 3,769 – (5,374) 3,699 (3,141) (310,855) 1,807,272 3,186,158 346,240 23,241 3,555,639
Profit after tax for the year – – – – – – – – 73,561 73,561 – 3,839 77,400
Other comprehensive income/(loss) – – 24,986 – (5,863) 4,676 2,443 (80,819) (279)2 (54,857) – (1,466) (56,322)
Distributions – – – – – – – – – – – (6,770) (6,770)
Shares issued, net of expenses 977 – – – – – – – – 977 – – 977
Net own shares adjustment – – – – – – – – 70 70 – – 70
Share option expense, net of taxation – – – – – – – – 11,027 11,027 – – 11,027
Dividends3 – – – – – – – – (68,047) (68,047) – – (68,047)
Other movements – – – – – – – – – – – 2098 209
As at 31 December 2018 496,293 1,195,472 28,754 – (11,237) 8,375 (698) (391,674) 1,823,603 3,148,889 346,240 19,053 3,514,182
1 Includes capital reserve of Rs.349 million, capital redemption reserve of Rs.907 million and merger reserve of Rs.1,194,216 million
2 Comprises actuarial gain/(loss), net of taxation and share from associates and joint ventures Rs.(279) million (31 December 2017: Rs.3,490 million)
3 Comprises dividends paid net of scrip Rs.37,618 million (31 December 2017: Rs.nil) and dividends on preference shares classified as equity and Additional Tier 1 securities Rs.30,429 million (31 December 2017: Rs.31,058 million) (refer Note 11)
4 Other movements of Rs.(4,955) million is mainly due to issue of shares by Nepal to its non-controlling interests including premium (Rs.1,326 million) as the adjustment to the carrying value of the Group’s share of the issue. This is offset by other equity adjustments of Rs.(6,281) million
5 Other movements of Rs.1,466 million relates to issue of shares by Nepal to its non-controlling interests including premium (Rs.838 million) as the increase in non-controlling interest. The remaining Rs.628 million relates to an acquisition
6 As per Note 41 Transition to IFRS 9 Financial Instruments
7 The Group’s initial estimate of credit impairment provisions on adoption of IFRS 9 was Rs.469,004 million. Following refinement of the Group’s expected loss models, the estimate of the opening credit impairment provisions has been revised down by Rs.15,494 million to Rs.453,510 million, and the net expected credit loss of Rs.(90,451) million adjusted against retained earnings has similarly decreased by Rs.15,494 million to Rs.74,957 million
8 Mainly due to additional share capital issued by Angola subscribed by its non-controlling interests without change in shareholding percentage
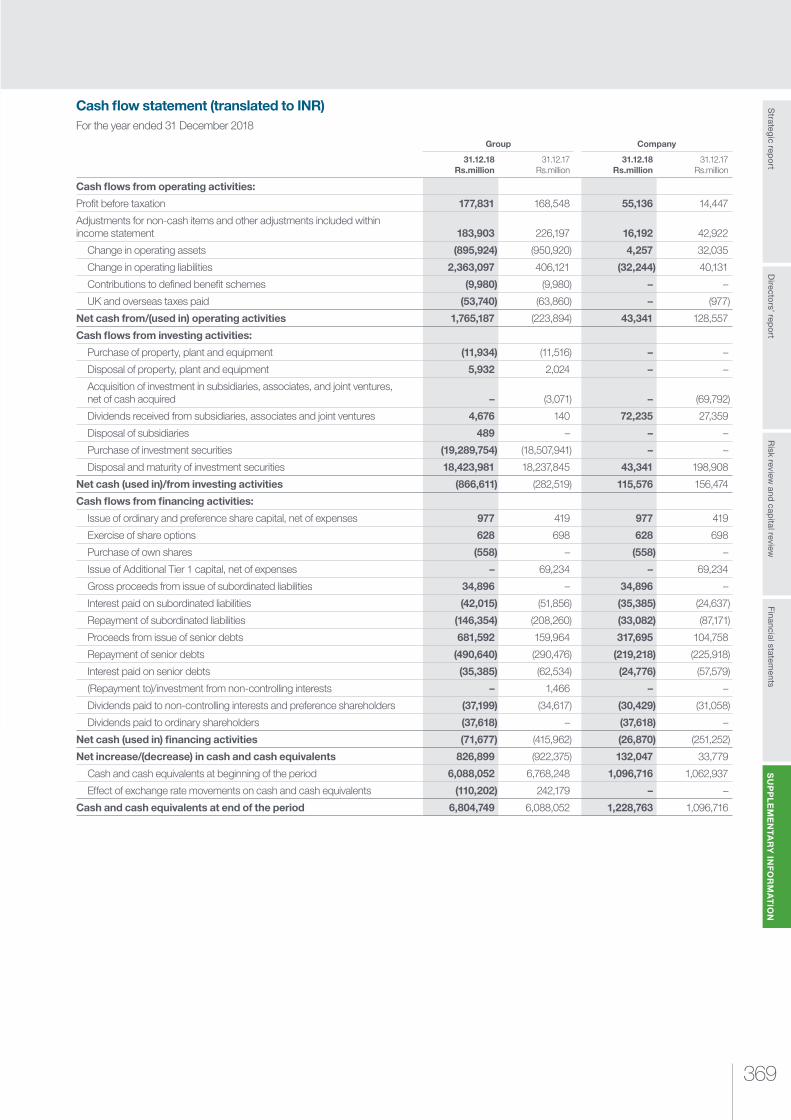
369
Risk review
and capital review
Strategic rep
ort
SU
PP
LE
ME
NTA
RY
INF
OR
MA
TIO
NFinancial statem
entsD
irectors’ rep
ort
Cash flow statement (translated to INR)For the year ended 31 December 2018
Group Company
31.12.18 Rs.million
31.12.17 Rs.million
31.12.18 Rs.million
31.12.17 Rs.million
Cash flows from operating activities:
Profit before taxation 177,831 168,548 55,136 14,447
Adjustments for non-cash items and other adjustments included within income statement 183,903 226,197 16,192 42,922
Change in operating assets (895,924) (950,920) 4,257 32,035
Change in operating liabilities 2,363,097 406,121 (32,244) 40,131
Contributions to defined benefit schemes (9,980) (9,980) – –
UK and overseas taxes paid (53,740) (63,860) – (977)
Net cash from/(used in) operating activities 1,765,187 (223,894) 43,341 128,557
Cash flows from investing activities:
Purchase of property, plant and equipment (11,934) (11,516) – –
Disposal of property, plant and equipment 5,932 2,024 – –
Acquisition of investment in subsidiaries, associates, and joint ventures, net of cash acquired – (3,071) – (69,792)
Dividends received from subsidiaries, associates and joint ventures 4,676 140 72,235 27,359
Disposal of subsidiaries 489 – – –
Purchase of investment securities (19,289,754) (18,507,941) – –
Disposal and maturity of investment securities 18,423,981 18,237,845 43,341 198,908
Net cash (used in)/from investing activities (866,611) (282,519) 115,576 156,474
Cash flows from financing activities:
Issue of ordinary and preference share capital, net of expenses 977 419 977 419
Exercise of share options 628 698 628 698
Purchase of own shares (558) – (558) –
Issue of Additional Tier 1 capital, net of expenses – 69,234 – 69,234
Gross proceeds from issue of subordinated liabilities 34,896 – 34,896 –
Interest paid on subordinated liabilities (42,015) (51,856) (35,385) (24,637)
Repayment of subordinated liabilities (146,354) (208,260) (33,082) (87,171)
Proceeds from issue of senior debts 681,592 159,964 317,695 104,758
Repayment of senior debts (490,640) (290,476) (219,218) (225,918)
Interest paid on senior debts (35,385) (62,534) (24,776) (57,579)
(Repayment to)/investment from non-controlling interests – 1,466 – –
Dividends paid to non-controlling interests and preference shareholders (37,199) (34,617) (30,429) (31,058)
Dividends paid to ordinary shareholders (37,618) – (37,618) –
Net cash (used in) financing activities (71,677) (415,962) (26,870) (251,252)
Net increase/(decrease) in cash and cash equivalents 826,899 (922,375) 132,047 33,779
Cash and cash equivalents at beginning of the period 6,088,052 6,768,248 1,096,716 1,062,937
Effect of exchange rate movements on cash and cash equivalents (110,202) 242,179 – –
Cash and cash equivalents at end of the period 6,804,749 6,088,052 1,228,763 1,096,716

Standard Chartered Annual Report 2018370
SUPPLEMENTARY INFORMATION
Supplementary financial information
Company balance sheet (translated to INR)As at 31 December 2018
31.12.18 Rs.million
31.12.17 Rs.million
Non-current assets
Investments in subsidiary undertakings 2,432,471 2,432,471
Current assets
Derivative financial instruments 628 4,885
Investment securities 805,194 848,605
Amounts owed by subsidiary undertakings 1,228,763 1,096,716
Taxation 838 209
Total current assets 2,035,423 1,950,415
Current liabilities
Derivative financial instruments 78,726 34,338
Other creditors 28,127 28,264
Taxation – –
Total current liabilities 106,853 62,602
Net current assets 1,928,570 1,887,813
Total assets less current liabilities 4,361,041 4,320,284
Non-current liabilities
Debt securities in issue 1,200,567 1,128,472
Subordinated liabilities and other borrowed funds 937,729 968,857
Total non-current liabilities 2,138,296 2,097,330
Total assets less liabilities 2,222,745 2,222,954
Equity
Share capital and share premium account 496,293 495,316
Other reserves 1,195,472 1,195,472
Retained earnings 184,740 185,927
Total shareholders’ equity 1,876,505 1,876,714
Other equity instruments 346,240 346,240
Total equity 2,222,745 2,222,954
Company statement of changes in equity (translated to INR)For the year ended 31 December 2018
Share capital and share premium account
Rs.million
Capital and merger
reserve1
Rs.million
Retained earnings
Rs.million
Other equity
instruments Rs.million
Total Rs.million
At 1 January 2017 494,897 1,195,472 192,906 277,006 2,160,281
Profit for the year – – 14,656 – 14,656
Shares issued, net of expenses 419 – – – 419
Other equity instruments issued, net of expenses – – 69,234 69,234
Net own shares adjustment – – 698 – 698
Share option expense – – 8,724 – 8,724
Dividends2 – – (31,058) – (31,058)
At 31 December 2017 495,316 1,195,472 185,926 346,240 2,222,954
Profit for the year – – 55,764 – 55,764
Shares issued, net of expenses 977 – – – 977
Net own shares adjustment – – 70 – 70
Share option expense – – 11,027 – 11,027
Dividends2 – – (68,047) – (68,047)
At 31 December 2018 496,293 1,195,472 184,740 346,240 2,222,745
1 Includes capital reserve of Rs.349 million, capital redemption reserve of Rs.907 million and merger reserve of Rs.1,194,216 million
2 Comprises dividends paid net of scrip Rs.37,618 million (31 December 2017: Rs.nil) and dividends on preferences shares classified as equity and Additional Tier 1 securities Rs.30,429 million (31 December 2017: Rs.31,058 million)
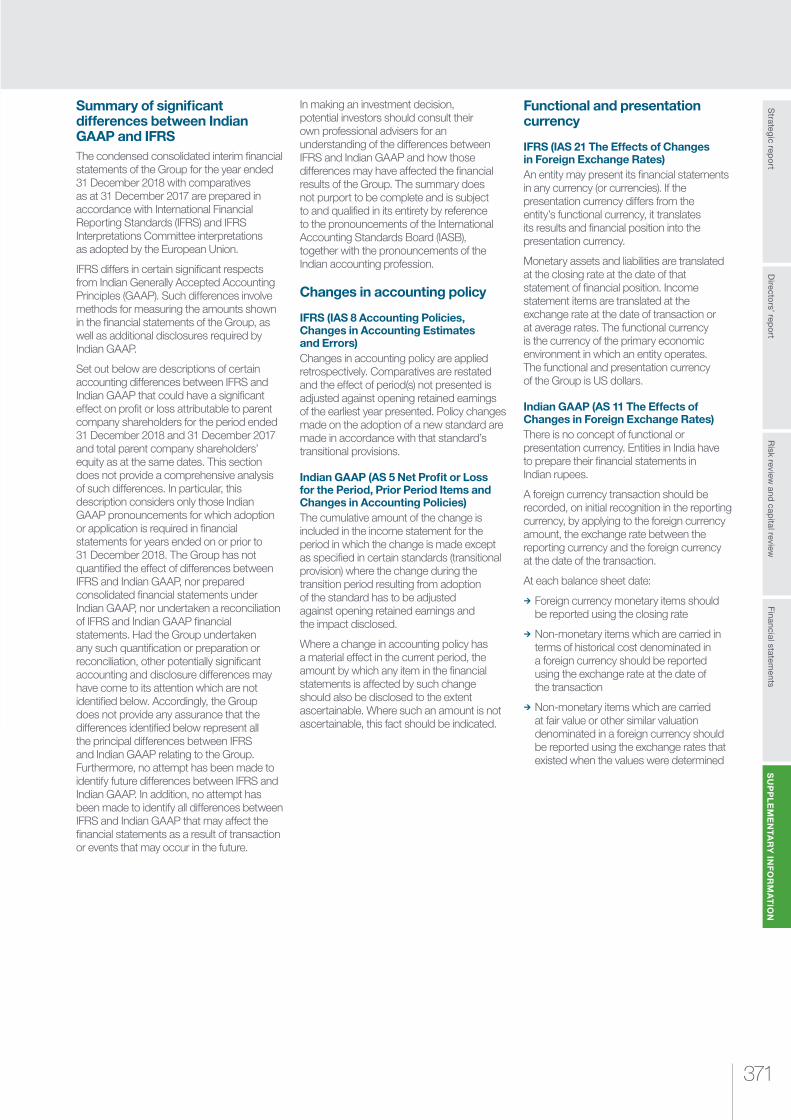
371
Risk review
and capital review
Strategic rep
ort
SU
PP
LE
ME
NTA
RY
INF
OR
MA
TIO
NFinancial statem
entsD
irectors’ rep
ort
Summary of significant differences between Indian GAAP and IFRSThe condensed consolidated interim financial statements of the Group for the year ended 31 December 2018 with comparatives as at 31 December 2017 are prepared in accordance with International Financial Reporting Standards (IFRS) and IFRS Interpretations Committee interpretations as adopted by the European Union.
IFRS differs in certain significant respects from Indian Generally Accepted Accounting Principles (GAAP). Such differences involve methods for measuring the amounts shown in the financial statements of the Group, as well as additional disclosures required by Indian GAAP.
Set out below are descriptions of certain accounting differences between IFRS and Indian GAAP that could have a significant effect on profit or loss attributable to parent company shareholders for the period ended 31 December 2018 and 31 December 2017 and total parent company shareholders’ equity as at the same dates. This section does not provide a comprehensive analysis of such differences. In particular, this description considers only those Indian GAAP pronouncements for which adoption or application is required in financial statements for years ended on or prior to 31 December 2018. The Group has not quantified the effect of differences between IFRS and Indian GAAP, nor prepared consolidated financial statements under Indian GAAP, nor undertaken a reconciliation of IFRS and Indian GAAP financial statements. Had the Group undertaken any such quantification or preparation or reconciliation, other potentially significant accounting and disclosure differences may have come to its attention which are not identified below. Accordingly, the Group does not provide any assurance that the differences identified below represent all the principal differences between IFRS and Indian GAAP relating to the Group. Furthermore, no attempt has been made to identify future differences between IFRS and Indian GAAP. In addition, no attempt has been made to identify all differences between IFRS and Indian GAAP that may affect the financial statements as a result of transaction or events that may occur in the future.
In making an investment decision, potential investors should consult their own professional advisers for an understanding of the differences between IFRS and Indian GAAP and how those differences may have affected the financial results of the Group. The summary does not purport to be complete and is subject to and qualified in its entirety by reference to the pronouncements of the International Accounting Standards Board (IASB), together with the pronouncements of the Indian accounting profession.
Changes in accounting policy
IFRS (IAS 8 Accounting Policies, Changes in Accounting Estimates and Errors)Changes in accounting policy are applied retrospectively. Comparatives are restated and the effect of period(s) not presented is adjusted against opening retained earnings of the earliest year presented. Policy changes made on the adoption of a new standard are made in accordance with that standard’s transitional provisions.
Indian GAAP (AS 5 Net Profit or Loss for the Period, Prior Period Items and Changes in Accounting Policies)The cumulative amount of the change is included in the income statement for the period in which the change is made except as specified in certain standards (transitional provision) where the change during the transition period resulting from adoption of the standard has to be adjusted against opening retained earnings and the impact disclosed.
Where a change in accounting policy has a material effect in the current period, the amount by which any item in the financial statements is affected by such change should also be disclosed to the extent ascertainable. Where such an amount is not ascertainable, this fact should be indicated.
Functional and presentation currency
IFRS (IAS 21 The Effects of Changes in Foreign Exchange Rates)An entity may present its financial statements in any currency (or currencies). If the presentation currency differs from the entity’s functional currency, it translates its results and financial position into the presentation currency.
Monetary assets and liabilities are translated at the closing rate at the date of that statement of financial position. Income statement items are translated at the exchange rate at the date of transaction or at average rates. The functional currency is the currency of the primary economic environment in which an entity operates. The functional and presentation currency of the Group is US dollars.
Indian GAAP (AS 11 The Effects of Changes in Foreign Exchange Rates)There is no concept of functional or presentation currency. Entities in India have to prepare their financial statements in Indian rupees.
A foreign currency transaction should be recorded, on initial recognition in the reporting currency, by applying to the foreign currency amount, the exchange rate between the reporting currency and the foreign currency at the date of the transaction.
At each balance sheet date:
¼ Foreign currency monetary items should be reported using the closing rate
¼ Non-monetary items which are carried in terms of historical cost denominated in a foreign currency should be reported using the exchange rate at the date of the transaction
¼ Non-monetary items which are carried at fair value or other similar valuation denominated in a foreign currency should be reported using the exchange rates that existed when the values were determined
Standard Chartered Annual Report 2018372
SUPPLEMENTARY INFORMATION
Supplementary financial information
Consolidation
IFRS (IFRS 10 Consolidated Financial Statements)Entities are consolidated when the Group controls an entity. The Group controls an entity when it is exposed to or has rights to direct relevant activities, or has the right to variable returns from its involvement with the entity and has the ability to affect those returns through its power over the investee. This also includes entities where control is not derived through voting rights such as structured entities.
Indian GAAP (AS 21 Consolidated Financial Statements)Guidance is based on the power through the ability to govern the financial and operating policies of an entity so as to obtain benefits while not taking into consideration potential voting rights.
No specific guidance is given by Indian GAAP on consolidation of structured entities.
Business combinations
IFRS (IFRS 3 Business Combinations)All business combinations are treated as acquisitions. Assets, liabilities and contingent liabilities acquired are measured at their fair values with the excess over this fair value when compared with the acquisition cost recognised as goodwill.
For acquisitions occurring on or after 1 January 2004, IFRS 3 requires that, when assessing the value of the assets of an acquired entity, certain identifiable intangible assets must be recognised and, if considered to have a finite life, amortised through the income statement over an appropriate period.
Adjustments to provisional fair values are permitted provided those adjustments are made within 12 months from the date of acquisition, with a corresponding adjustment to goodwill. After re-assessment of respective fair values of net assets acquired, any excess of acquirer’s interest in the net fair values of acquirer’s identifiable assets is recognised immediately in the income statement.
The Group’s policy for non-controlling interests is generally not to recognise non-controlling interests at their fair value, but to recognise them based on their proportionate share of the fair value of the identifiable net assets acquired.
Indian GAAP (AS 14 Accounting for Amalgamations)Treatment of a business combination depends on whether the acquired entity is held as a subsidiary, whether it is an amalgamation or whether it is an acquisition of a business. For an entity acquired and held as a subsidiary, the business combination is accounted for as an acquisition. The assets and liabilities acquired are incorporated at their existing carrying amounts.
For an amalgamation of an entity, either pooling of interests or acquisition accounting may be used. The assets and liabilities amalgamated are incorporated at their existing carrying amounts or, alternatively, if acquisition accounting is adopted, the consideration can be allocated to individual identifiable assets (which may include intangible assets) and liabilities on the basis of their fair values.
Adjustments to the value of acquired or amalgamated balances are not permitted after initial recognition. Any excess of acquirer’s interest in the net fair values of acquirer’s identifiable assets is recognised as capital reserve, which is neither amortised nor available for distribution to shareholders. However, in case of an amalgamation accounted under the purchase method, the fair value of intangible assets with no active market is reduced to the extent of capital reserve, if any, arising on the amalgamation. Minority interests arising on the acquisition of a subsidiary are recognised at their share of the historical book value.
Goodwill
IFRS (IFRS 3 Business Combinations and IAS 38 Intangible Assets)IFRS 3 requires that goodwill arising on all acquisitions by the Group and associated undertakings is capitalised but not amortised and is subject to an annual review for impairment. Goodwill is tested annually for impairment. Any impairment losses recognised may not be reversed in subsequent accounting periods.
Indian GAAP (AS 14 Accounting for Amalgamations and AS 26 Intangible Assets)Goodwill arising on amalgamations is capitalised and amortised over useful life not exceeding five years, unless a longer period can be justified. For goodwill arising on acquisition of a subsidiary or a business, there is no specific guidance. In practice, there is either no amortisation or amortisation not exceeding 10 years. Goodwill is reviewed for impairment whenever an indicator of impairment exists. Impairment losses recognised may be reversed under exceptional circumstances only in subsequent accounting periods through the income statement.
Acquired and internally generated intangible assets
IFRS (IAS 38 Intangible Assets)Intangible assets are recognised if they are deemed separable and arise from contractual or other legal rights. Assets with a finite useful life are amortised on a systematic basis over their useful life. An asset with an indefinite useful life should be tested for impairment annually.
Indian GAAP (AS 26 Intangible Assets)Intangible assets are capitalised if specific criteria are met and are amortised over their useful life, generally not exceeding 10 years. The recoverable amount of an intangible asset that is not available for use or is being amortised over a period exceeding 10 years should be reviewed at least at each financial year end even if there is no indication that the asset is impaired.
Property, plant and equipment
IFRS (IAS 16 Property, Plant and Equipment, IAS 23 Borrowing Costs)The Group’s policy is to hold all property, plant, aviation, shipping and equipment fixed assets at cost less depreciation and consequently tangible fixed assets are not subject to revaluation. Fixed assets are, however, subject to impairment testing.
Foreign exchange gains or losses relating to the procurement of property, plant and equipment can be capitalised as part of the asset. Depreciation is recorded over the asset’s estimated useful life. Borrowing costs that are directly attributable to the acquisition or construction of an asset must be capitalised as part of that asset.
373
Risk review
and capital review
Strategic rep
ort
SU
PP
LE
ME
NTA
RY
INF
OR
MA
TIO
NFinancial statem
entsD
irectors’ rep
ort
Property, plant and equipment continued
Indian GAAP (AS 10 Fixed Assets, AS 16 Borrowing Cost and AS 6 Depreciation Accounting)Fixed assets are recorded at historical costs or revalued amounts. Relevant borrowing costs are capitalised if certain criteria in AS 16 are met. Depreciation is recorded over the asset’s useful life. Schedule II (Part C) of the Companies Act 2013 and Banking Regulations prescribe minimum rates of depreciation and these are typically used as the basis for determining useful life.
Recognition and measurement of financial instruments
IFRS – IFRS 9 Financial InstrumentsClassi�cation and measurementAccounting policyThe Group classifies its financial assets into the following measurement categories: amortised cost; fair value through other comprehensive income; and fair value through profit or loss. Financial liabilities are classified as either amortised cost, or held at fair value through profit or loss. Management determines the classification of its financial assets and liabilities at initial recognition of the instrument or, where applicable, at the time of reclassification.
Financial assets held at amortised cost and fair value through other comprehensive incomeDebt instruments held at amortised cost or held at fair value through comprehensive income (FVOCI) have contractual terms that give rise to cash flows that are solely payments of principal and interest (SPPI characteristics). Principal is the fair value of the financial asset at initial recognition but this may change over the life of the instrument as amounts are repaid. Interest consists of consideration for the time value of money, for the credit risk associated with the principal amount outstanding during a particular period and for other basic lending risks and costs, as well as a profit margin.
Whether financial assets are held at amortised cost or at FVOCI depends on the objectives of the business models under which the assets are held. A business model refers to how the Group manages financial assets to generate cash flows.
The Group makes an assessment of the objective of a business model in which an asset is held at the individual product business line, and where applicable within business lines depending on the way the business is managed and information is provided to management.
Financial assets that have SPPI characteristics and which are held within a business model whose objective is to hold financial assets to collect contractual cash flows (‘hold to collect’) are recorded at amortised cost.
Conversely, financial assets that have SPPI characteristics but are held within a business model whose objective is achieved by both collecting contractual cash flows and selling financial assets (‘hold to collect and sell’) are classified as FVOCI.
Equity instruments designated as FVOCINon-trading equity instruments acquired for strategic purposes rather than capital gain may be irrevocably designated at initial recognition at FVOCI on an instrument-by-instrument basis. Gains and losses arising from changes in the fair value of these instruments, including foreign exchange gains and losses, are recognised directly in equity and are never reclassified to profit or loss, even on derecognition.
Financial assets and liabilities held at fair value through profit or lossFinancial assets that are not held at amortised cost or which are not held at fair value through other comprehensive income are held at fair value through profit or loss. Financial assets and liabilities held at fair value through profit or loss are either mandatorily classified fair value through profit or loss or irrevocably designated at fair value through profit or loss at initial recognition.
Mandatorily classified at fair value through profit or lossFinancial assets and liabilities that are mandatorily held at fair value through profit or loss include:
¼ Financial assets and liabilities held for trading, which are those acquired principally for the purpose of selling in the short term
¼ Hybrid financial assets that contain one or more embedded derivatives
¼ Financial assets that would otherwise be measured at amortised cost or FVOCI but which do not have SPPI characteristics
¼ Equity instruments that have not been designated as held at FVOCI
¼ Financial liabilities that constitute contingent consideration in a business combination
Designated at fair value through profit or lossFinancial assets and liabilities may be designated at fair value through profit or loss when the designation eliminates or significantly reduces a measurement or recognition inconsistency that would otherwise arise from measuring assets or liabilities on a different basis (‘accounting mismatch’).
Financial liabilities may also be designated at fair value through profit or loss where they are managed on a fair value basis or have a bifurcately embedded derivative where the Group is not able to separately value the embedded derivative component.
Financial liabilities held at amortised costFinancial liabilities that are not financial guarantees or loan commitments and that are not classified as financial liabilities held at fair value through profit or loss are classified as financial liabilities held at amortised cost.
Financial guarantee contracts and loan commitmentsFinancial guarantee contracts and loan commitments issued at below market interest rates are initially recognised as liabilities at fair value and subsequently at the higher of the expected credit loss provision, and the amount initially recognised less the cumulative amount of income recognised in accordance with the principles of IFRS 15 Revenue from Contracts with Customers.
Standard Chartered Annual Report 2018374
SUPPLEMENTARY INFORMATION
Supplementary financial information
Recognition and measurement of financial instruments continued
Fair value of financial assets and liabilitiesFair value is the price that would be received to sell an asset or paid to transfer a liability in an orderly transaction between market participants at the measurement date in the principal market for the asset or liability, or in the absence of a principal market, the most advantageous market to which the Group has access at that date. The fair value of a liability includes the risk that the Group will not be able to honour its obligations.
Initial recognitionPurchases and sales of financial assets and liabilities held at fair value through profit or loss, and debt securities classified as financial assets held at FVOCI are initially recognised on the trade-date (the date on which the Group commits to purchase or sell the asset). Loans and advances and other financial assets held at amortised cost are recognised on the settlement date (the date on which cash is advanced to the borrowers).
All financial instruments are initially recognised at fair value, which is normally the transaction price, plus directly attributable transaction costs for financial assets that are not subsequently measured at fair value through profit or loss.
Subsequent measurementFinancial assets and �nancial liabilities held at amortised costFinancial assets and financial liabilities held at amortised cost are subsequently carried at amortised cost using the effective interest method. Foreign exchange gains and losses are recognised in the income statement.
Financial assets held at FVOCIDebt instruments held at FVOCI are subsequently carried at fair value, with all unrealised gains and losses arising from changes in fair value (including any related foreign exchange gains or losses) recognised in other comprehensive income and accumulated in a separate component of equity. Foreign exchange gains and losses on the amortised cost are recognised in income. Changes in expected credit losses are recognised in the profit or loss and are accumulated in a separate component of equity.
Equity investments designated at FVOCI are subsequently carried at fair value with all unrealised gains and losses arising from changes in fair value (including any related foreign exchange gains or losses) recognised in other comprehensive income and accumulated in a separate component of equity.
Financial assets and liabilities mandatorily held at fair value through profit or loss and financial assets designated at fair value through profit or loss are subsequently carried at fair value, with gains and losses arising from changes in fair value recorded in the net trading income line in the income statement unless the instrument is part of a cash flow hedging relationship. Contractual interest income on financial assets held at fair value through profit or loss is recognised as interest income in a separate line in the income statement.
Financial liabilities designated at fair value through pro�t or lossFinancial liabilities designated at fair value through profit or loss are held at fair value, with changes in fair value recognised in the net trading income line in the profit or loss, other than that attributable to changes in credit risk. Fair value changes attributable to credit risk are recognised in other comprehensive income and recorded in a separate category of reserves unless this is expected to create or enlarge an accounting mismatch, in which case the entire change in fair value of the financial liability designated fair value through profit or loss is recognised in profit or loss.
Indian GAAP (AS 13 Investments)AS 13 requires investments to be categorised as follows:
¼ Current investments, which are those readily realisable and intended to be held for less than one year, are carried at the lower of cost and fair value, with changes in fair value taken directly to profit or loss
¼ Long-term investments, which are those investments not classified as current, are carried at cost unless there is a permanent diminution in value, in which case a provision for diminution is required to be made by the entity
For investments, the Reserve Bank of India (RBI) outlines similar classifications to IFRS, but the classification criteria and measurement requirements differ from those set out in IFRS. Financial liabilities are usually carried at cost. There is no ability to designate instruments at fair value.
Derivatives
IFRS (IFRS 9/IAS 39 Financial Instruments: Recognition and Measurement)IFRS 9 requires that all derivatives be recognised on-balance sheet at fair value. Changes in the fair value of derivatives that are not hedges are reported in the income statement. Changes in the fair value of derivatives that are designated as hedges are either offset against the change in fair value of the hedged asset or liability through earnings, or recognised directly in equity until the hedged item is recognised in earnings, depending on the nature of the hedge. The ineffective portion of the hedge’s change in fair value is immediately recognised in earnings. A derivative may only be classified as a hedge if an entity meets stringent qualifying criteria in respect of documentation and hedge effectiveness.
The Group continues to apply the hedge accounting requirements of IAS 39 rather than the requirements of IFRS 9.
Indian GAAPForeign exchange contracts held for trading or speculative purposes are carried at fair value, with gains and losses recognised in the income statement. In the absence of specific guidance, equity options are carried at the lower of cost or market value.
For banks, there are guidelines prescribed by RBI on measurement and accounting of interest rate swaps and forward rate agreements entered into for hedging purposes.
Impairment of financial assetsUnder IFRS 9 the impairment of financial assets is as follows:
MeasurementExpected credit losses are computed as unbiased, probability-weighted amounts which are determined by evaluating a range of reasonably possible outcomes, the time value of money, and considering all reasonable and supportable information including that which is forward-looking.
For material portfolios, the estimate of expected cash shortfalls is determined by multiplying the probability of default (PD) with the loss given default (LGD) with the expected exposure at the time of default (EAD). For less material Retail Banking loan portfolios, the Group has adopted simplified approaches based on historical roll rates or loss rates.
375
Risk review
and capital review
Strategic rep
ort
SU
PP
LE
ME
NTA
RY
INF
OR
MA
TIO
NFinancial statem
entsD
irectors’ rep
ort
Impairment of financial assets continuedFor credit-impaired financial instruments, the estimate of cash shortfalls may require the use of expert credit judgement. As a practical expedient, the Group may also measure credit impairment on the basis of an instrument’s fair value using an observable market price.
Cash shortfalls are discounted using the effective interest rate on the financial instrument as calculated at initial recognition, or if the instrument has a variable interest rate, the current effective interest rate determined under the contract.
InstrumentsLocation of expected credit loss provisions
Financial assets held at amortised cost
Loss provisions: netted against gross carrying value
Financial assets held at FVOCI – Debt instruments
Other comprehensive income (FVOCI expected credit loss reserve)
Loan commitments Provisions for liabilities and charges
Financial guarantees Provisions for liabilities and charges
Recognition
12 months expected credit losses (stage 1)Expected credit losses are recognised at the time of initial recognition of a financial instrument and represent the lifetime cash shortfalls arising from possible default events up to 12 months into the future from the balance sheet date. Expected credit losses continue to be determined on this basis until there is either a significant increase in the credit risk of an instrument or the instrument becomes credit-impaired. If an instrument is no longer considered to exhibit a significant increase in credit risk, expected credit losses will revert to being determined on a 12-month basis.
Significant increase in credit risk (stage 2)If a financial asset experiences a significant increase in credit risk (SICR) since initial recognition, an expected credit loss provision is recognised for default events that may occur over the lifetime of the asset.
Significant increase in credit risk is assessed by comparing the risk of default of an exposure at the reporting date to the risk of default at origination (after taking into account the passage of time). Significant does not mean statistically significant nor is it assessed in the context of changes in expected credit loss. Whether a change in the risk of default is significant or not is assessed using a number of quantitative and qualitative factors, the weight of which depends on the type of product and counterparty. Financial assets that are 30 or more days past due and not credit-impaired will always be considered to have experienced a significant increase in credit risk. For less material portfolios where a loss rate or roll rate approach is applied to compute expected credit loss, significant increase in credit risk is primarily based on 30 days past due.
Credit-impaired (or defaulted) exposures (stage 3)Financial assets that are credit-impaired (or in default) represent those that are at least 90 days past due in respect of principal and/or interest. Financial assets are also considered to be credit-impaired where the obligors are unlikely to pay on the occurrence of one or more observable events that have a detrimental impact on the estimated future cash flows of the financial asset. It may not be possible to identify a single discrete event but instead the combined effect of several events may cause financial assets to become credit-impaired.
Irrevocable lending commitments to a credit-impaired obligor that have not yet been drawn down are also included within the stage 3 credit impairment provision to the extent that the commitment cannot be withdrawn.
Loss provisions against credit-impaired financial assets are determined based on an assessment of the recoverable cash flows under a range of scenarios, including the realisation of any collateral held where appropriate. The loss provisions held represent the difference between the present value of the cash flows expected to be recovered, discounted at the instrument’s original effective interest rate, and the gross carrying value of the instrument prior to any credit impairment.
Indian GAAP (AS 13 Investments)Long-term investments are written down when there is a decline in fair value which is deemed to be other than temporary.
Impairments may be reversed through the income statement in subsequent periods if the investment rises in value or the reasons for the impairment no longer exist.
In accordance with RBI regulations, in respect of available-for- sale investments, impairments are required to be reversed through Investment Reserve Account (equity reserve) if the investment rises in value or the reasons for impairment no longer exist.
For loans and advances, the RBI regulations stipulate minimum provision based on days past due. Additionally, RBI regulations require banks to hold provisions in respect of standard assets and for specific country risk exposures.
Derecognition of financial instruments – IFRS 9Financial assets are derecognised when the rights to receive cash flows from the financial assets have expired or where the Group has transferred substantially all risks and rewards of ownership. If substantially all the risks and rewards have been neither retained nor transferred and the Group has retained control, the assets continue to be recognised to the extent of the Group’s continuing involvement.
Where financial assets have been modified, the modified terms are assessed on a qualitative and quantitative basis to determine whether a fundamental change in the nature of the instrument has occurred, such as whether the derecognition of the pre-existing instrument and the recognition of a new instrument is appropriate.
On derecognition of a financial asset, the difference between the carrying amount of the asset (or the carrying amount allocated to the portion of the asset derecognised) and the sum of the consideration received (including any new asset obtained less any new liability assumed) and any cumulative gain or loss that had been recognised in other comprehensive income is recognised in profit or loss except for equity instruments elected FVOCI (see above) and cumulative fair value adjustments attributable to the credit risk of a liability that are held in other comprehensive income.
Standard Chartered Annual Report 2018376
SUPPLEMENTARY INFORMATION
Supplementary financial information
Recognition continued
Derecognition of financial instruments – IFRS 9 continuedFinancial liabilities are derecognised when they are extinguished. A financial liability is extinguished when the obligation is discharged, cancelled or expires and this is evaluated both qualitatively and quantitatively. However, where a financial liability has been modified, it is derecognised if the difference between the modified cash flows and the original cash flows is more than 10 per cent.
If the Group purchases its own debt, it is derecognised and the difference between the carrying amount of the liability and the consideration paid is included in ‘Other income’ except for the cumulative fair value adjustments attributable to the credit risk of a liability that are held in other comprehensive income which are never recycled to the profit or loss.
IFRS – classification debt/equity The substance of a financial instrument, rather than its legal form, governs its classification. A financial instrument is classified as a liability where there is a contractual obligation to deliver either cash or another financial asset to the holder of that instrument, regardless of the manner in which the contractual obligation will be settled. Preference shares, which carry a mandatory coupon or are redeemable on a specific date or at the option of the shareholder are classified as financial liabilities and are presented in other borrowed funds. The dividends on these preference shares are recognised in the income statement as interest expense on an amortised cost basis using the effective interest method.
Indian GAAP Classification is based on the legal form rather than substance.
Provisions for liabilities and charges
IFRS (IAS 37 Provisions, Contingent Liabilities and Contingent Assets) The amount recognised as a provision is the best estimate at the balance sheet date of the expenditure required to settle the obligation, discounted using a pre-tax market discount rate if the effect is material.
Indian GAAP (AS 29 Provisions, Contingents Liabilities and Contingent Assets)Provisions are recognised and measured on a similar basis to IFRS, except that there is no requirement for discounting the provision or liability.
Pension obligations
IFRS (IAS 19 Employee Benefits)For defined contribution plans, contributions are charged to operating expenses. For funded defined benefit plans, the liability recognised in the balance sheet is the present value of the defined benefit obligation at the balance sheet date less the fair value of plan assets. For unfunded defined benefit plans the liability recognised at the balance sheet date is the present value of the defined benefit obligation. The defined benefit obligation is calculated annually by independent actuaries using the projected unit method. The present value of the defined benefit obligation is determined by discounting the estimated future cash outflows using an interest rate equal to the yield on high-quality corporate bonds. Actuarial gains and losses that arise are recognised in shareholders’ equity and presented in the statement of other comprehensive income in the period they arise. The net interest expense on the net defined liability for the year is determined by applying the discount rate used to measure the defined benefit obligation at the beginning of the annual period to the then net defined benefit liability, taking into account any changes in the net defined benefit liability during the year as a result of contributions and benefit payment. Net interest expense and other expense related to defined benefit plans are recognised in the income statement.
Indian GAAP (AS 15 Employee Benefits)The discount rate to be used for determining defined benefit obligations is established by reference to market yields at the balance sheet date on government bonds. The expected return on plan assets is based on market expectation for the returns over the entire life of the related obligation. Actuarial gains or losses are recognised immediately in the statement of income.
Share-based compensation
IFRS (IFRS 2 Share-based Payments)IFRS 2 requires that all share-based payments are accounted for using a fair value method. The fair value of the employee services received in exchange for the grant of the options is recognised as an expense. For equity-settled awards, the total amount to be expensed over the vesting period must be determined by reference to the fair value of the options granted (determined using an option pricing model), excluding the impact of any non-market vesting conditions (for example, profitability and growth targets). Non-market vesting conditions must be included in assumptions about the number of options that are expected to become exercisable. At each balance sheet date, the Group revises its estimates of the number of options that are expected to become exercisable. It recognises the impact of the revision of original estimates, if any, in the income statement, and a corresponding adjustment to equity over the remaining vesting period. The proceeds received net of any directly attributable transaction costs are credited to share capital (nominal value) and share premium when the options are exercised.
Cash-settled awards must be revalued at each balance sheet date on an intrinsic value basis (being the difference between the market price of the share at the measurement date and the exercise price) with any changes in fair value charged or credited to staff costs in the income statement.
Indian GAAPEntities may either follow the intrinsic value method or the fair value method for determining the costs of benefits arising from share-based compensation plans. Although the fair value approach is recommended, entities may use the intrinsic value method and provide fair value disclosures.
Deferred tax is not recognised as it is not considered to represent a timing difference.
Entities are also permitted the option of recognising the related compensation cost over the service period for the entire award (that is, over the service period of the last separately vesting portion of the award), provided that the amount of compensation cost recognised at any date at least equals the fair value of the vested portion of the award at that date.
377
Risk review
and capital review
Strategic rep
ort
SU
PP
LE
ME
NTA
RY
INF
OR
MA
TIO
NFinancial statem
entsD
irectors’ rep
ort
Deferred taxation
IFRS (IAS 12 Income Taxes)Deferred tax is determined based on temporary differences, being the difference between the carrying amount and tax base of assets and liabilities, subject to certain exceptions.
Deferred tax assets are recognised if it is probable (more likely than not) that sufficient future taxable profits will be available to utilise to deferred tax assets.
Indian GAAP (AS 22 Accounting for Taxes on Income)Deferred tax is determined based on timing differences, being the difference between accounting income and taxable income for a period that is capable of reversal in one or more subsequent periods.
Deferred tax assets are recognised where it is probable that future taxable profit will be available against which the temporary differences can be utilised.
Interest income and expense
IFRS (IFRS 9)Interest income and expense is recognised in the income statement using the effective interest method. The effective interest rate is the rate that discounts estimated future cash payments or receipts through the expected life of the financial instrument. When calculating the effective interest rate, the Group estimates cash flows considering all contractual terms of the financial instrument but does not consider future credit losses. The calculation includes all fees and points paid or received between parties to the contract that are an integral part of the effective interest rate, transaction costs and all other premiums or discounts.
Indian GAAP (IAS 9 Revenue Recognition)As per IAS 9, interest is recognised on a time proportion basis taking into account the amount outstanding and the rate applicable. In the absence of a specific effective interest rate requirement, premiums and discounts are usually amortised on a straight-line basis over the term of the instrument.
Dividends
IFRS (IAS 10 Events After the Reporting Date)Dividends to holders of equity instruments, when proposed or declared after the balance sheet date, should not be recognised as a liability on the balance sheet date. A company, however, is required to disclose the amount of dividends that were proposed or declared after the balance sheet date but before the financial statements were authorised for issue.
Indian GAAPAccounting and disclosure of dividends is similar to IFRS with effect from 1 April 2016.
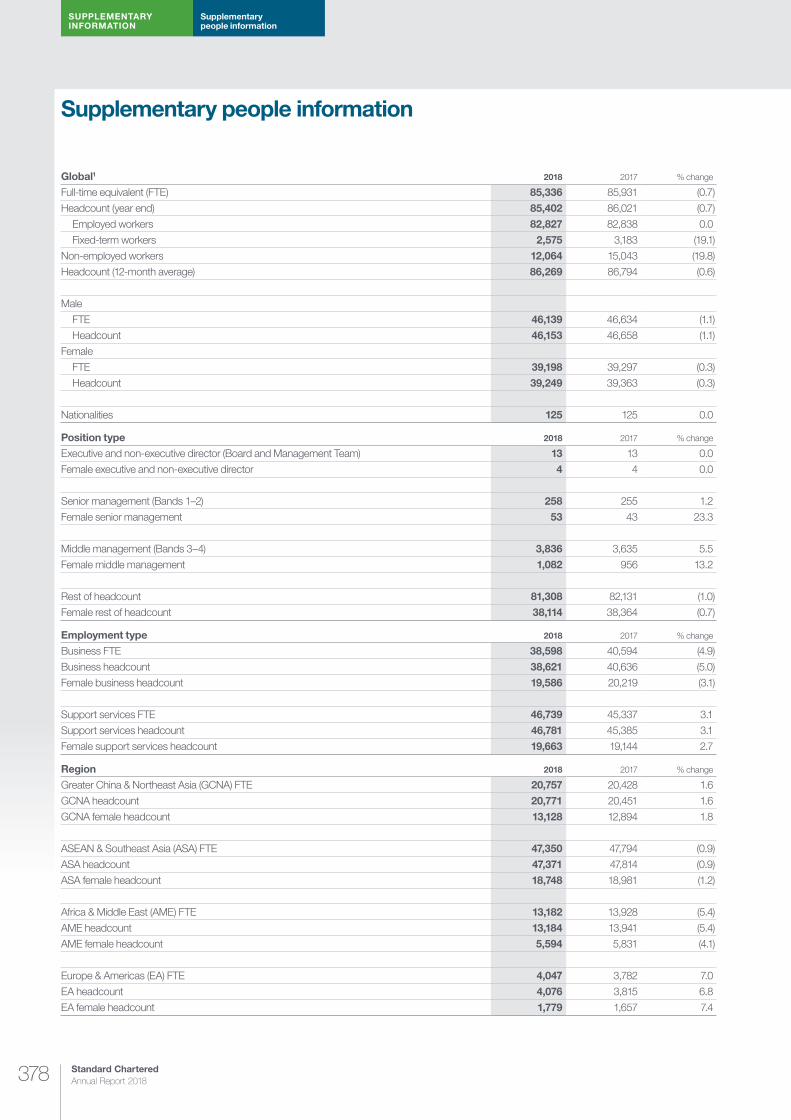
Standard Chartered Annual Report 2018378
SUPPLEMENTARY INFORMATION
Supplementary people information
Supplementary people information
Global1 2018 2017 % change
Full-time equivalent (FTE) 85,336 85,931 (0.7)
Headcount (year end) 85,402 86,021 (0.7)
Employed workers 82,827 82,838 0.0
Fixed-term workers 2,575 3,183 (19.1)
Non-employed workers 12,064 15,043 (19.8)
Headcount (12-month average) 86,269 86,794 (0.6)
Male
FTE 46,139 46,634 (1.1)
Headcount 46,153 46,658 (1.1)
Female
FTE 39,198 39,297 (0.3)
Headcount 39,249 39,363 (0.3)
Nationalities 125 125 0.0
Position type 2018 2017 % change
Executive and non-executive director (Board and Management Team) 13 13 0.0
Female executive and non-executive director 4 4 0.0
Senior management (Bands 1–2) 258 255 1.2
Female senior management 53 43 23.3
Middle management (Bands 3–4) 3,836 3,635 5.5
Female middle management 1,082 956 13.2
Rest of headcount 81,308 82,131 (1.0)
Female rest of headcount 38,114 38,364 (0.7)
Employment type 2018 2017 % change
Business FTE 38,598 40,594 (4.9)
Business headcount 38,621 40,636 (5.0)
Female business headcount 19,586 20,219 (3.1)
Support services FTE 46,739 45,337 3.1
Support services headcount 46,781 45,385 3.1
Female support services headcount 19,663 19,144 2.7
Region 2018 2017 % change
Greater China & Northeast Asia (GCNA) FTE 20,757 20,428 1.6
GCNA headcount 20,771 20,451 1.6
GCNA female headcount 13,128 12,894 1.8
ASEAN & Southeast Asia (ASA) FTE 47,350 47,794 (0.9)
ASA headcount 47,371 47,814 (0.9)
ASA female headcount 18,748 18,981 (1.2)
Africa & Middle East (AME) FTE 13,182 13,928 (5.4)
AME headcount 13,184 13,941 (5.4)
AME female headcount 5,594 5,831 (4.1)
Europe & Americas (EA) FTE 4,047 3,782 7.0
EA headcount 4,076 3,815 6.8
EA female headcount 1,779 1,657 7.4
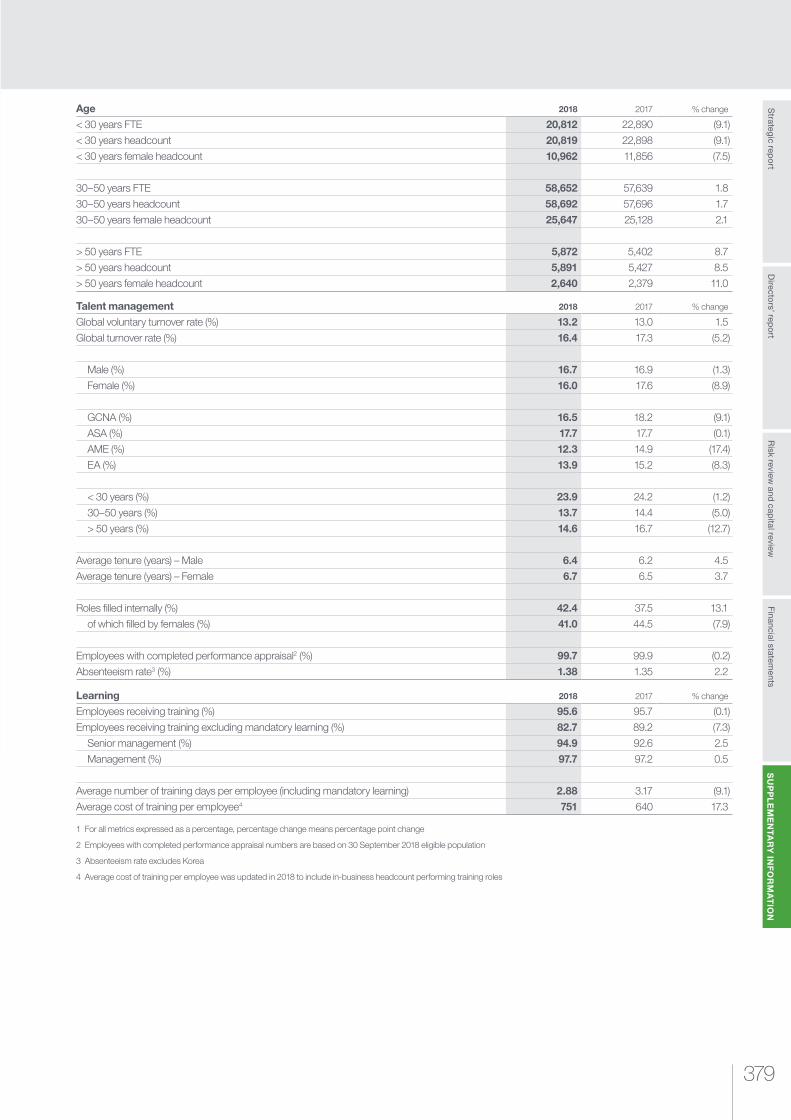
379
Risk review
and capital review
Strategic rep
ort
SU
PP
LE
ME
NTA
RY
INF
OR
MA
TIO
NFinancial statem
entsD
irectors’ rep
ort
Age 2018 2017 % change
< 30 years FTE 20,812 22,890 (9.1)
< 30 years headcount 20,819 22,898 (9.1)
< 30 years female headcount 10,962 11,856 (7.5)
30–50 years FTE 58,652 57,639 1.8
30–50 years headcount 58,692 57,696 1.7
30–50 years female headcount 25,647 25,128 2.1
> 50 years FTE 5,872 5,402 8.7
> 50 years headcount 5,891 5,427 8.5
> 50 years female headcount 2,640 2,379 11.0
Talent management 2018 2017 % change
Global voluntary turnover rate (%) 13.2 13.0 1.5
Global turnover rate (%) 16.4 17.3 (5.2)
Male (%) 16.7 16.9 (1.3)
Female (%) 16.0 17.6 (8.9)
GCNA (%) 16.5 18.2 (9.1)
ASA (%) 17.7 17.7 (0.1)
AME (%) 12.3 14.9 (17.4)
EA (%) 13.9 15.2 (8.3)
< 30 years (%) 23.9 24.2 (1.2)
30–50 years (%) 13.7 14.4 (5.0)
> 50 years (%) 14.6 16.7 (12.7)
Average tenure (years) – Male 6.4 6.2 4.5
Average tenure (years) – Female 6.7 6.5 3.7
Roles filled internally (%) 42.4 37.5 13.1
of which filled by females (%) 41.0 44.5 (7.9)
Employees with completed performance appraisal2 (%) 99.7 99.9 (0.2)
Absenteeism rate3 (%) 1.38 1.35 2.2
Learning 2018 2017 % change
Employees receiving training (%) 95.6 95.7 (0.1)
Employees receiving training excluding mandatory learning (%) 82.7 89.2 (7.3)
Senior management (%) 94.9 92.6 2.5
Management (%) 97.7 97.2 0.5
Average number of training days per employee (including mandatory learning) 2.88 3.17 (9.1)
Average cost of training per employee4 751 640 17.3
1 For all metrics expressed as a percentage, percentage change means percentage point change
2 Employees with completed performance appraisal numbers are based on 30 September 2018 eligible population
3 Absenteeism rate excludes Korea
4 Average cost of training per employee was updated in 2018 to include in-business headcount performing training roles
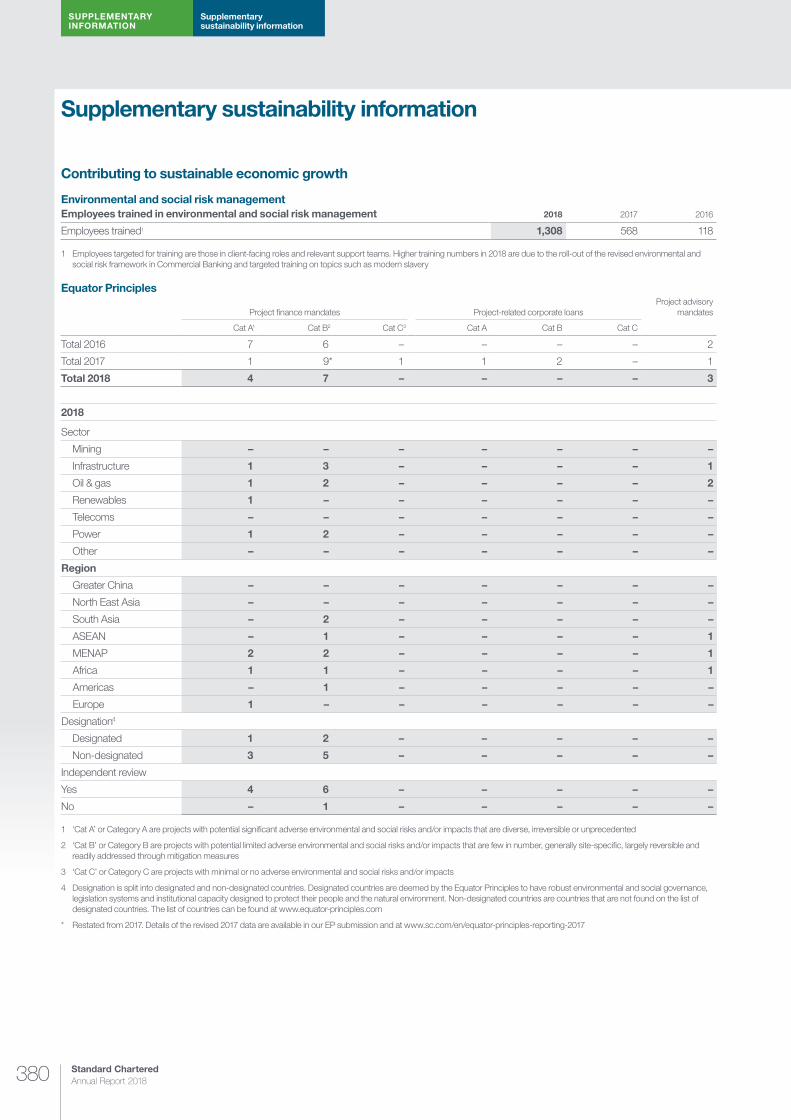
Standard Chartered Annual Report 2018380
SUPPLEMENTARY INFORMATION
Supplementary sustainability information
Supplementary sustainability information
Contributing to sustainable economic growth
Environmental and social risk managementEmployees trained in environmental and social risk management 2018 2017 2016
Employees trained1 1,308 568 118
1 Employees targeted for training are those in client-facing roles and relevant support teams. Higher training numbers in 2018 are due to the roll-out of the revised environmental and social risk framework in Commercial Banking and targeted training on topics such as modern slavery
Equator Principles
Project finance mandates Project-related corporate loans Project advisory
mandates
Cat A1 Cat B2 Cat C3 Cat A Cat B Cat C
Total 2016 7 6 – – – – 2
Total 2017 1 9* 1 1 2 – 1
Total 2018 4 7 – – – – 3
2018
Sector
Mining – – – – – – –
Infrastructure 1 3 – – – – 1
Oil & gas 1 2 – – – – 2
Renewables 1 – – – – – –
Telecoms – – – – – – –
Power 1 2 – – – – –
Other – – – – – – –
Region
Greater China – – – – – – –
North East Asia – – – – – – –
South Asia – 2 – – – – –
ASEAN – 1 – – – – 1
MENAP 2 2 – – – – 1
Africa 1 1 – – – – 1
Americas – 1 – – – – –
Europe 1 – – – – – –
Designation4
Designated 1 2 – – – – –
Non-designated 3 5 – – – – –
Independent review
Yes 4 6 – – – – –
No – 1 – – – – –
1 ‘Cat A’ or Category A are projects with potential significant adverse environmental and social risks and/or impacts that are diverse, irreversible or unprecedented
2 ‘Cat B’ or Category B are projects with potential limited adverse environmental and social risks and/or impacts that are few in number, generally site-specific, largely reversible and readily addressed through mitigation measures
3 ‘Cat C’ or Category C are projects with minimal or no adverse environmental and social risks and/or impacts
4 Designation is split into designated and non-designated countries. Designated countries are deemed by the Equator Principles to have robust environmental and social governance, legislation systems and institutional capacity designed to protect their people and the natural environment. Non-designated countries are countries that are not found on the list of designated countries. The list of countries can be found at www.equator-principles.com
* Restated from 2017. Details of the revised 2017 data are available in our EP submission and at www.sc.com/en/equator-principles-reporting-2017
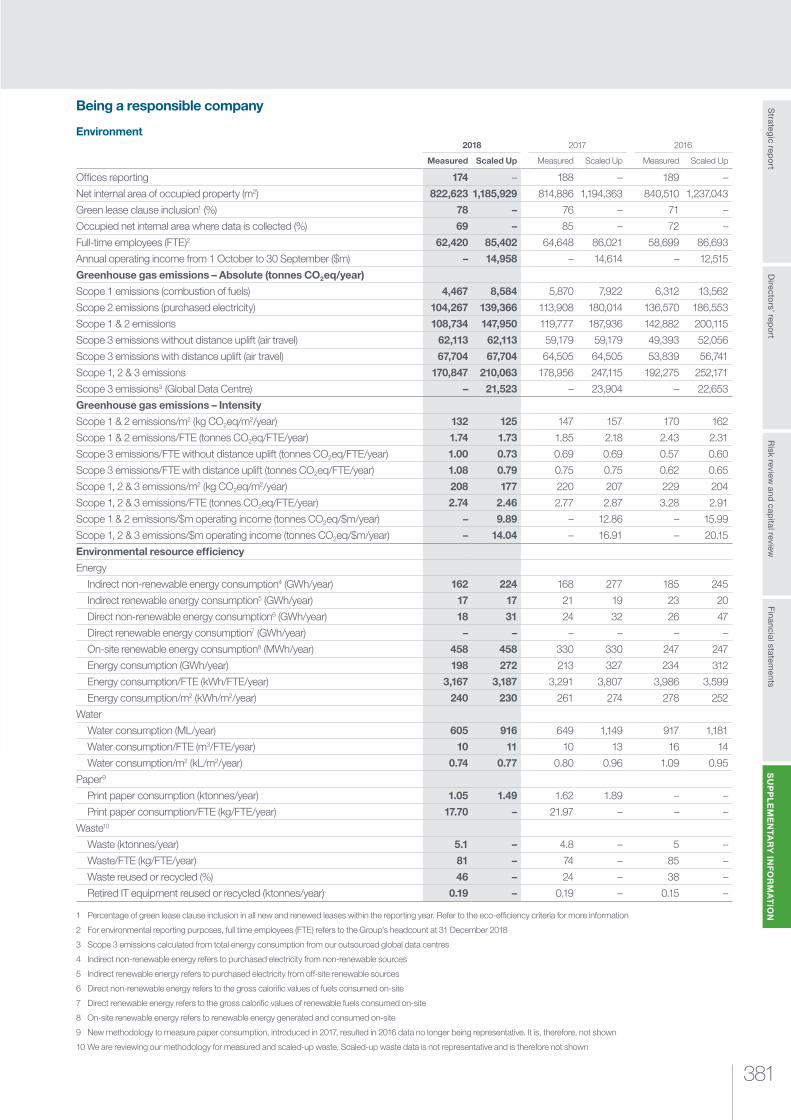
381
Risk review
and capital review
Strategic rep
ort
SU
PP
LE
ME
NTA
RY
INF
OR
MA
TIO
NFinancial statem
entsD
irectors’ rep
ort
Being a responsible company
Environment2018 2017 2016
Measured Scaled Up Measured Scaled Up Measured Scaled Up
Offices reporting 174 – 188 – 189 –
Net internal area of occupied property (m2) 822,623 1,185,929 814,886 1,194,363 840,510 1,237,043
Green lease clause inclusion1 (%) 78 – 76 – 71 –
Occupied net internal area where data is collected (%) 69 – 85 – 72 –
Full-time employees (FTE)2 62,420 85,402 64,648 86,021 58,699 86,693
Annual operating income from 1 October to 30 September ($m) – 14,958 – 14,614 – 12,515
Greenhouse gas emissions – Absolute (tonnes CO2eq/year)
Scope 1 emissions (combustion of fuels) 4,467 8,584 5,870 7,922 6,312 13,562
Scope 2 emissions (purchased electricity) 104,267 139,366 113,908 180,014 136,570 186,553
Scope 1 & 2 emissions 108,734 147,950 119,777 187,936 142,882 200,115
Scope 3 emissions without distance uplift (air travel) 62,113 62,113 59,179 59,179 49,393 52,056
Scope 3 emissions with distance uplift (air travel) 67,704 67,704 64,505 64,505 53,839 56,741
Scope 1, 2 & 3 emissions 170,847 210,063 178,956 247,115 192,275 252,171
Scope 3 emissions3 (Global Data Centre) – 21,523 – 23,904 – 22,653
Greenhouse gas emissions – Intensity
Scope 1 & 2 emissions/m2 (kg CO2eq/m2/year) 132 125 147 157 170 162
Scope 1 & 2 emissions/FTE (tonnes CO2eq/FTE/year) 1.74 1.73 1.85 2.18 2.43 2.31
Scope 3 emissions/FTE without distance uplift (tonnes CO2eq/FTE/year) 1.00 0.73 0.69 0.69 0.57 0.60
Scope 3 emissions/FTE with distance uplift (tonnes CO2eq/FTE/year) 1.08 0.79 0.75 0.75 0.62 0.65
Scope 1, 2 & 3 emissions/m2 (kg CO2eq/m2/year) 208 177 220 207 229 204
Scope 1, 2 & 3 emissions/FTE (tonnes CO2eq/FTE/year) 2.74 2.46 2.77 2.87 3.28 2.91
Scope 1 & 2 emissions/$m operating income (tonnes CO2eq/$m/year) – 9.89 – 12.86 – 15.99
Scope 1, 2 & 3 emissions/$m operating income (tonnes CO2eq/$m/year) – 14.04 – 16.91 – 20.15
Environmental resource efficiency
Energy
Indirect non-renewable energy consumption4 (GWh/year) 162 224 168 277 185 245
Indirect renewable energy consumption5 (GWh/year) 17 17 21 19 23 20
Direct non-renewable energy consumption6 (GWh/year) 18 31 24 32 26 47
Direct renewable energy consumption7 (GWh/year) – – – – – –
On-site renewable energy consumption8 (MWh/year) 458 458 330 330 247 247
Energy consumption (GWh/year) 198 272 213 327 234 312
Energy consumption/FTE (kWh/FTE/year) 3,167 3,187 3,291 3,807 3,986 3,599
Energy consumption/m2 (kWh/m2/year) 240 230 261 274 278 252
Water
Water consumption (ML/year) 605 916 649 1,149 917 1,181
Water consumption/FTE (m3/FTE/year) 10 11 10 13 16 14
Water consumption/m2 (kL/m2/year) 0.74 0.77 0.80 0.96 1.09 0.95
Paper9
Print paper consumption (ktonnes/year) 1.05 1.49 1.62 1.89 – –
Print paper consumption/FTE (kg/FTE/year) 17.70 – 21.97 – – –
Waste10
Waste (ktonnes/year) 5.1 – 4.8 – 5 –
Waste/FTE (kg/FTE/year) 81 – 74 – 85 –
Waste reused or recycled (%) 46 – 24 – 38 –
Retired IT equipment reused or recycled (ktonnes/year) 0.19 – 0.19 – 0.15 –
1 Percentage of green lease clause inclusion in all new and renewed leases within the reporting year. Refer to the eco-efficiency criteria for more information
2 For environmental reporting purposes, full time employees (FTE) refers to the Group’s headcount at 31 December 2018
3 Scope 3 emissions calculated from total energy consumption from our outsourced global data centres
4 Indirect non-renewable energy refers to purchased electricity from non-renewable sources
5 Indirect renewable energy refers to purchased electricity from off-site renewable sources
6 Direct non-renewable energy refers to the gross calorific values of fuels consumed on-site
7 Direct renewable energy refers to the gross calorific values of renewable fuels consumed on-site
8 On-site renewable energy refers to renewable energy generated and consumed on-site
9 New methodology to measure paper consumption, introduced in 2017, resulted in 2016 data no longer being representative. It is, therefore, not shown
10 We are reviewing our methodology for measured and scaled-up waste. Scaled-up waste data is not representative and is therefore not shown
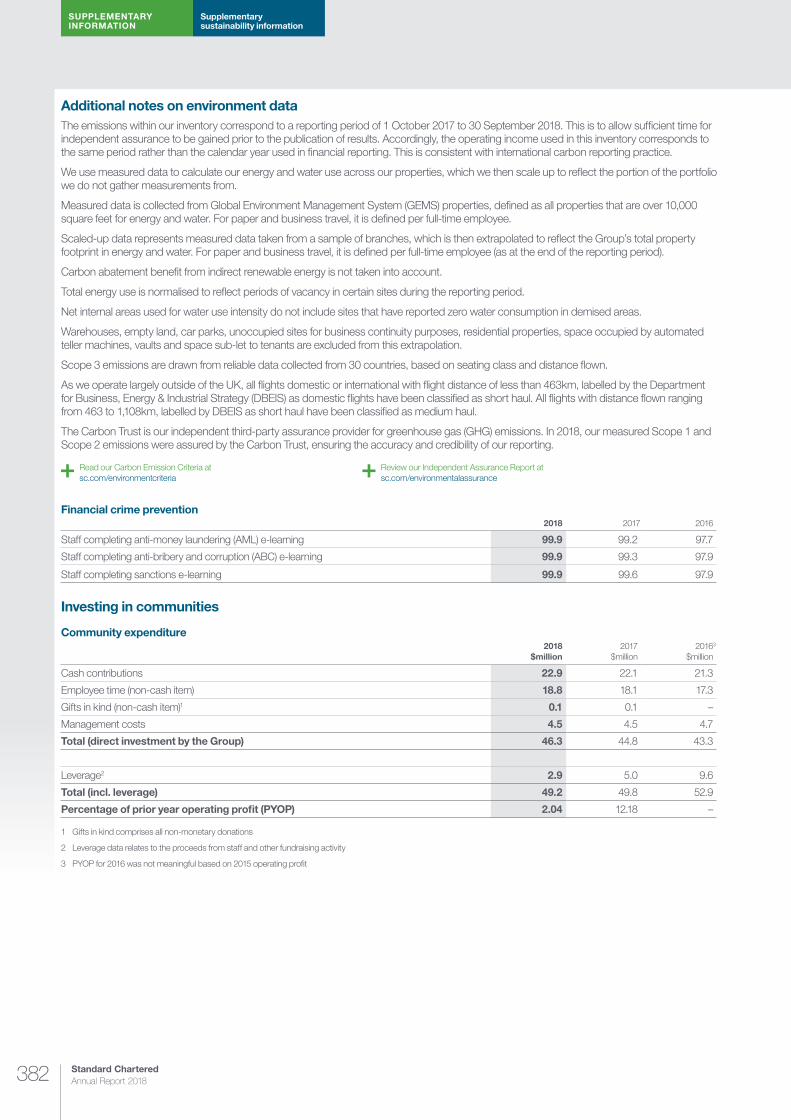
Standard Chartered Annual Report 2018382
SUPPLEMENTARY INFORMATION
Supplementary sustainability information
Additional notes on environment dataThe emissions within our inventory correspond to a reporting period of 1 October 2017 to 30 September 2018. This is to allow sufficient time for independent assurance to be gained prior to the publication of results. Accordingly, the operating income used in this inventory corresponds to the same period rather than the calendar year used in financial reporting. This is consistent with international carbon reporting practice.
We use measured data to calculate our energy and water use across our properties, which we then scale up to reflect the portion of the portfolio we do not gather measurements from.
Measured data is collected from Global Environment Management System (GEMS) properties, defined as all properties that are over 10,000 square feet for energy and water. For paper and business travel, it is defined per full-time employee.
Scaled-up data represents measured data taken from a sample of branches, which is then extrapolated to reflect the Group’s total property footprint in energy and water. For paper and business travel, it is defined per full-time employee (as at the end of the reporting period).
Carbon abatement benefit from indirect renewable energy is not taken into account.
Total energy use is normalised to reflect periods of vacancy in certain sites during the reporting period.
Net internal areas used for water use intensity do not include sites that have reported zero water consumption in demised areas.
Warehouses, empty land, car parks, unoccupied sites for business continuity purposes, residential properties, space occupied by automated teller machines, vaults and space sub-let to tenants are excluded from this extrapolation.
Scope 3 emissions are drawn from reliable data collected from 30 countries, based on seating class and distance flown.
As we operate largely outside of the UK, all flights domestic or international with flight distance of less than 463km, labelled by the Department for Business, Energy & Industrial Strategy (DBEIS) as domestic flights have been classified as short haul. All flights with distance flown ranging from 463 to 1,108km, labelled by DBEIS as short haul have been classified as medium haul.
The Carbon Trust is our independent third-party assurance provider for greenhouse gas (GHG) emissions. In 2018, our measured Scope 1 and Scope 2 emissions were assured by the Carbon Trust, ensuring the accuracy and credibility of our reporting.
Read our Carbon Emission Criteria at sc.com/environmentcriteria
Review our Independent Assurance Report at sc.com/environmentalassurance
Financial crime prevention2018 2017 2016
Staff completing anti-money laundering (AML) e-learning 99.9 99.2 97.7
Staff completing anti-bribery and corruption (ABC) e-learning 99.9 99.3 97.9
Staff completing sanctions e-learning 99.9 99.6 97.9
Investing in communities
Community expenditure2018
$million2017
$million20163
$million
Cash contributions 22.9 22.1 21.3
Employee time (non-cash item) 18.8 18.1 17.3
Gifts in kind (non-cash item)1 0.1 0.1 –
Management costs 4.5 4.5 4.7
Total (direct investment by the Group) 46.3 44.8 43.3
Leverage2 2.9 5.0 9.6
Total (incl. leverage) 49.2 49.8 52.9
Percentage of prior year operating profit (PYOP) 2.04 12.18 –
1 Gifts in kind comprises all non-monetary donations
2 Leverage data relates to the proceeds from staff and other fundraising activity
3 PYOP for 2016 was not meaningful based on 2015 operating profit
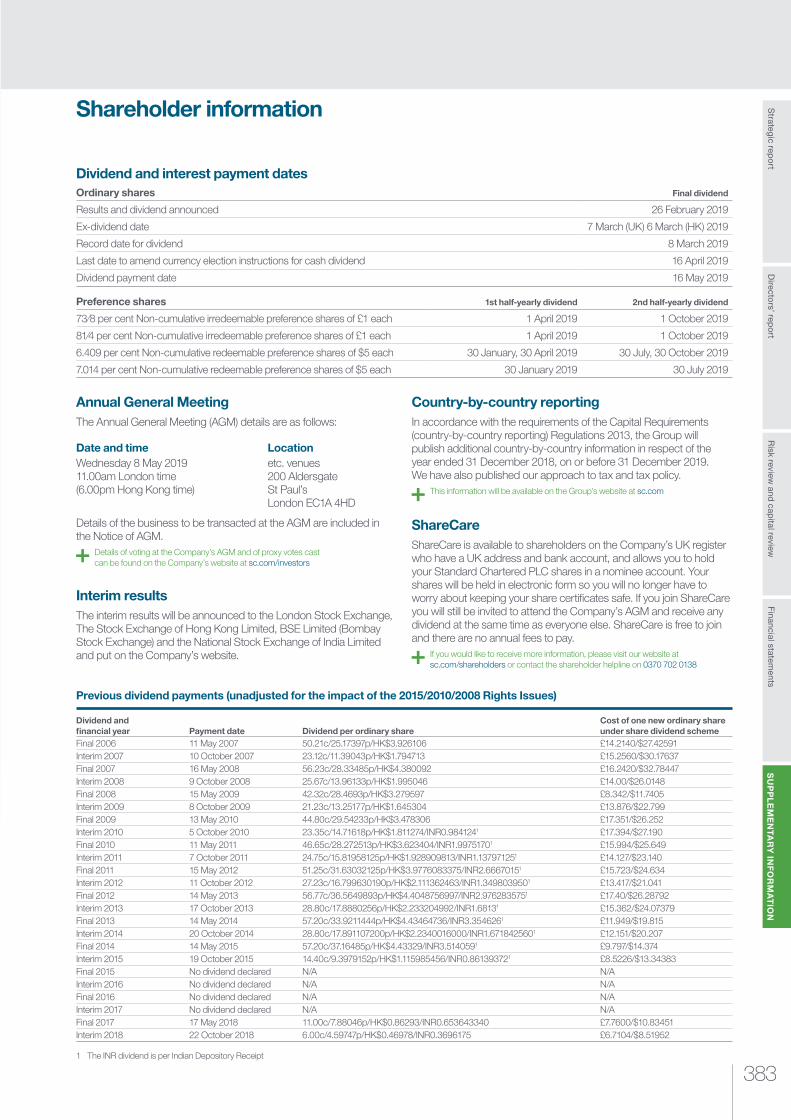
383
Risk review
and capital review
Strategic rep
ort
SU
PP
LE
ME
NTA
RY
INF
OR
MA
TIO
NFinancial statem
entsD
irectors’ rep
ort
Shareholder information
Dividend and interest payment datesOrdinary shares Final dividend
Results and dividend announced 26 February 2019
Ex-dividend date 7 March (UK) 6 March (HK) 2019
Record date for dividend 8 March 2019
Last date to amend currency election instructions for cash dividend 16 April 2019
Dividend payment date 16 May 2019
Preference shares 1st half-yearly dividend 2nd half-yearly dividend
73∕8 per cent Non-cumulative irredeemable preference shares of £1 each 1 April 2019 1 October 2019
81∕4 per cent Non-cumulative irredeemable preference shares of £1 each 1 April 2019 1 October 2019
6.409 per cent Non-cumulative redeemable preference shares of $5 each 30 January, 30 April 2019 30 July, 30 October 2019
7.014 per cent Non-cumulative redeemable preference shares of $5 each 30 January 2019 30 July 2019
Annual General MeetingThe Annual General Meeting (AGM) details are as follows:
Date and time LocationWednesday 8 May 2019 etc. venues 11.00am London time 200 Aldersgate (6.00pm Hong Kong time) St Paul’s
London EC1A 4HD
Details of the business to be transacted at the AGM are included in the Notice of AGM.
Details of voting at the Company’s AGM and of proxy votes cast can be found on the Company’s website at sc.com/investors
Interim resultsThe interim results will be announced to the London Stock Exchange, The Stock Exchange of Hong Kong Limited, BSE Limited (Bombay Stock Exchange) and the National Stock Exchange of India Limited and put on the Company’s website.
Country-by-country reportingIn accordance with the requirements of the Capital Requirements (country-by-country reporting) Regulations 2013, the Group will publish additional country-by-country information in respect of the year ended 31 December 2018, on or before 31 December 2019. We have also published our approach to tax and tax policy.
This information will be available on the Group’s website at sc.com
ShareCareShareCare is available to shareholders on the Company’s UK register who have a UK address and bank account, and allows you to hold your Standard Chartered PLC shares in a nominee account. Your shares will be held in electronic form so you will no longer have to worry about keeping your share certificates safe. If you join ShareCare you will still be invited to attend the Company’s AGM and receive any dividend at the same time as everyone else. ShareCare is free to join and there are no annual fees to pay.
If you would like to receive more information, please visit our website at sc.com/shareholders or contact the shareholder helpline on 0370 702 0138
Previous dividend payments (unadjusted for the impact of the 2015/2010/2008 Rights Issues)
Dividend and financial year Payment date Dividend per ordinary share
Cost of one new ordinary share under share dividend scheme
Final 2006 11 May 2007 50.21c/25.17397p/HK$3.926106 £14.2140/$27.42591Interim 2007 10 October 2007 23.12c/11.39043p/HK$1.794713 £15.2560/$30.17637Final 2007 16 May 2008 56.23c/28.33485p/HK$4.380092 £16.2420/$32.78447Interim 2008 9 October 2008 25.67c/13.96133p/HK$1.995046 £14.00/$26.0148Final 2008 15 May 2009 42.32c/28.4693p/HK$3.279597 £8.342/$11.7405Interim 2009 8 October 2009 21.23c/13.25177p/HK$1.645304 £13.876/$22.799Final 2009 13 May 2010 44.80c/29.54233p/HK$3.478306 £17.351/$26.252Interim 2010 5 October 2010 23.35c/14.71618p/HK$1.811274/INR0.9841241 £17.394/$27.190Final 2010 11 May 2011 46.65c/28.272513p/HK$3.623404/INR1.99751701 £15.994/$25.649Interim 2011 7 October 2011 24.75c/15.81958125p/HK$1.928909813/INR1.137971251 £14.127/$23.140Final 2011 15 May 2012 51.25c/31.63032125p/HK$3.9776083375/INR2.66670151 £15.723/$24.634Interim 2012 11 October 2012 27.23c/16.799630190p/HK$2.111362463/INR1.3498039501 £13.417/$21.041Final 2012 14 May 2013 56.77c/36.5649893p/HK$4.4048756997/INR2.9762835751 £17.40/$26.28792Interim 2013 17 October 2013 28.80c/17.8880256p/HK$2.233204992/INR1.68131 £15.362/$24.07379Final 2013 14 May 2014 57.20c/33.9211444p/HK$4.43464736/INR3.3546261 £11.949/$19.815Interim 2014 20 October 2014 28.80c/17.891107200p/HK$2.2340016000/INR1.6718425601 £12.151/$20.207Final 2014 14 May 2015 57.20c/37.16485p/HK$4.43329/INR3.5140591 £9.797/$14.374Interim 2015 19 October 2015 14.40c/9.3979152p/HK$1.115985456/INR0.861393721 £8.5226/$13.34383Final 2015 No dividend declared N/A N/AInterim 2016 No dividend declared N/A N/AFinal 2016 No dividend declared N/A N/AInterim 2017 No dividend declared N/A N/AFinal 2017 17 May 2018 11.00c/7.88046p/HK$0.86293/INR0.653643340 £7.7600/$10.83451Interim 2018 22 October 2018 6.00c/4.59747p/HK$0.46978/INR0.3696175 £6.7104/$8.51952
1 The INR dividend is per Indian Depository Receipt
Standard Chartered Annual Report 2018384
SUPPLEMENTARY INFORMATION Shareholder information
Donating shares to ShareGiftShareholders who have a small number of shares often find it uneconomical to sell them. An alternative is to consider donating them to the charity ShareGift (registered charity 1052686), which collects donations of unwanted shares until there are enough to sell, and uses the proceeds to support UK charities. There is no implication for capital gains tax (no gain or loss) when you donate shares to charity, and UK taxpayers may be able to claim income tax relief on the value of their donation.
Further information can be obtained from the Company’s registrars or from ShareGift on 020 7930 3737 or from sharegift.org
Bankers’ Automated Clearing System (BACS)Dividends can be paid straight into your bank or building society account.
Please register online at investorcentre.co.uk or contact our registrar for a mandate form
Registrars and shareholder enquiriesIf you have any enquiries relating to your shareholding and you hold your shares on the UK register, please contact our registrar Computershare Investor Services PLC, The Pavilions, Bridgwater Road, Bristol, BS99 6ZZ or call the shareholder helpline number on 0370 702 0138.
If you hold your shares on the Hong Kong branch register and you have enquiries, please contact Computershare Hong Kong Investor Services Limited, 17M Floor, Hopewell Centre, 183 Queen’s Road East, Wan Chai, Hong Kong.
You can check your shareholding at computershare.com/hk/investors
If you hold Indian Depository Receipts and you have enquiries, please contact Karvy Fintech Private Limited, Karvy Selenium Tower B, Plot 31-32, Financial District, Nanakramguda, Hyderabad 500032, India.
Chinese translationIf you would like a Chinese version of the 2018 Annual Report and Accounts, please contact Computershare Hong Kong Investor Services Limited, 17M Floor, Hopewell Centre, 183 Queen’s Road East, Wan Chai, Hong Kong.
本年報之中文譯本可向香港中央證券登記有限公司索取,地址為香 港灣仔皇后大道東183號合和中心17M樓。
Shareholders on the Hong Kong branch register who have asked to receive corporate communications in either Chinese or English can change this election by contacting Computershare.
If there is a dispute between any translation and the English version of this Annual Report and Accounts, the English text shall prevail.
Electronic communicationsIf you hold your shares on the UK register and in future you would like to receive the Annual Report and Accounts electronically rather than by post, please register online at: investorcentre.co.uk. Then click on Register and follow the instructions. You will need to have your Shareholder or ShareCare reference number when you log on. You can find this on your share certificate or ShareCare statement. Once registered you can also submit your proxy vote and dividend election electronically, and change your bank mandate or address information.
Forward-looking statementsThis document may contain ‘forward-looking statements’ that are based on current expectations or beliefs, as well as assumptions about future events. These forward-looking statements can be identified by the fact that they do not relate only to historical or current facts. Forward-looking statements often use words such as ‘may’, ‘could’, ‘will’, ‘expect’, ‘intend’, ‘estimate’, ‘anticipate’, ‘believe’, ‘plan’, ‘seek’, ‘continue’ or other words of similar meaning. By their very nature, such statements are subject to known and unknown risks and uncertainties and can be affected by other factors that could cause actual results, and the Group’s plans and objectives, to differ materially from those expressed or implied in the forward-looking statements.
Recipients should not place reliance on, and are cautioned about relying on, any forward-looking statements. There are several factors which could cause actual results to differ materially from those expressed or implied in forward-looking statements. The factors that could cause actual results to differ materially from those described in the forward-looking statements include (but are not limited to) changes in global, political, economic, business, competitive, market and regulatory forces or conditions, future exchange and interest rates, changes in tax rates, future business combinations or dispositions and other factors specific to the Group. Any forward- looking statement contained in this document is based on past or current trends and/or activities of the Group and should not be taken as a representation that such trends or activities will continue in the future.
No statement in this document is intended to be a profit forecast or to imply that the earnings of the Group for the current year or future years will necessarily match or exceed the historical or published earnings of the Group. Each forward-looking statement speaks only as of the date of the particular statement. Except as required by any applicable laws or regulations, the Group expressly disclaims any obligation to revise or update any forward looking statement contained within this document, regardless of whether those statements are affected as a result of new information, future events or otherwise.
Nothing in this document shall constitute, in any jurisdiction, an offer or solicitation to sell or purchase any securities or other financial instruments, nor shall it constitute a recommendation or advice in respect of any securities or other financial instruments or any other matter.
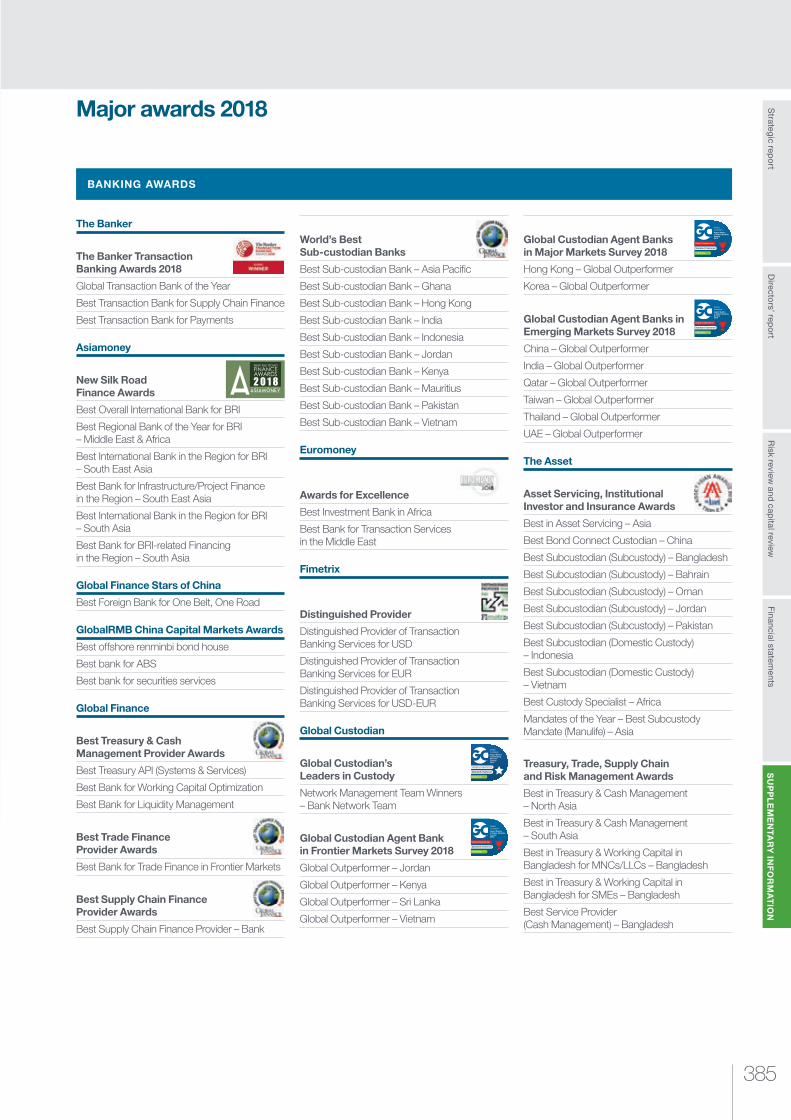
385
Risk review
and capital review
Strategic rep
ort
SU
PP
LE
ME
NTA
RY
INF
OR
MA
TIO
NFinancial statem
entsD
irectors’ rep
ort
Major awards 2018
BANKING AWARDS
The Banker
The Banker Transaction Banking Awards 2018
Global Transaction Bank of the Year
Best Transaction Bank for Supply Chain Finance
Best Transaction Bank for Payments
Asiamoney
New Silk Road Finance Awards
Best Overall International Bank for BRI
Best Regional Bank of the Year for BRI – Middle East & Africa
Best International Bank in the Region for BRI – South East Asia
Best Bank for Infrastructure/Project Finance in the Region – South East Asia
Best International Bank in the Region for BRI – South Asia
Best Bank for BRI-related Financing in the Region – South Asia
Global Finance Stars of China
Best Foreign Bank for One Belt, One Road
GlobalRMB China Capital Markets Awards
Best offshore renminbi bond house
Best bank for ABS
Best bank for securities services
Global Finance
Best Treasury & Cash Management Provider Awards
Best Treasury API (Systems & Services)
Best Bank for Working Capital Optimization
Best Bank for Liquidity Management
Best Trade Finance Provider Awards
Best Bank for Trade Finance in Frontier Markets
Best Supply Chain Finance Provider Awards
Best Supply Chain Finance Provider – Bank
Global Custodian Agent Banks in Major Markets Survey 2018
Hong Kong – Global Outperformer
Korea – Global Outperformer
Global Custodian Agent Banks in Emerging Markets Survey 2018
China – Global Outperformer
India – Global Outperformer
Qatar – Global Outperformer
Taiwan – Global Outperformer
Thailand – Global Outperformer
UAE – Global Outperformer
The Asset
Asset Servicing, Institutional Investor and Insurance Awards
Best in Asset Servicing – Asia
Best Bond Connect Custodian – China
Best Subcustodian (Subcustody) – Bangladesh
Best Subcustodian (Subcustody) – Bahrain
Best Subcustodian (Subcustody) – Oman
Best Subcustodian (Subcustody) – Jordan
Best Subcustodian (Subcustody) – Pakistan
Best Subcustodian (Domestic Custody) – Indonesia
Best Subcustodian (Domestic Custody) – Vietnam
Best Custody Specialist – Africa
Mandates of the Year – Best Subcustody Mandate (Manulife) – Asia
Treasury, Trade, Supply Chain and Risk Management Awards
Best in Treasury & Cash Management – North Asia
Best in Treasury & Cash Management – South Asia
Best in Treasury & Working Capital in Bangladesh for MNCs/LLCs – Bangladesh
Best in Treasury & Working Capital in Bangladesh for SMEs – Bangladesh
Best Service Provider (Cash Management) – Bangladesh
Global Custodian Agent Banks in Major Markets Survey 2018
Standard Chartered
Global Outperformer
2 Markets
Global Custodian Agent Banks in Major Markets Survey 2018
Standard Chartered
Global Outperformer
2 Markets
World’s Best Sub-custodian Banks
Best Sub-custodian Bank – Asia Pacific
Best Sub-custodian Bank – Ghana
Best Sub-custodian Bank – Hong Kong
Best Sub-custodian Bank – India
Best Sub-custodian Bank – Indonesia
Best Sub-custodian Bank – Jordan
Best Sub-custodian Bank – Kenya
Best Sub-custodian Bank – Mauritius
Best Sub-custodian Bank – Pakistan
Best Sub-custodian Bank – Vietnam
Euromoney
Awards for Excellence
Best Investment Bank in Africa
Best Bank for Transaction Services in the Middle East
Fimetrix
Distinguished Provider
Distinguished Provider of Transaction Banking Services for USD
Distinguished Provider of Transaction Banking Services for EUR
Distinguished Provider of Transaction Banking Services for USD-EUR
Global Custodian
Global Custodian’s Leaders in Custody
Network Management Team Winners – Bank Network Team
Global Custodian Agent Bank in Frontier Markets Survey 2018
Global Outperformer – Jordan
Global Outperformer – Kenya
Global Outperformer – Sri Lanka
Global Outperformer – Vietnam
Global Custodian Agent Banks in Major Markets Survey 2018
Standard Chartered
Global Outperformer
2 Markets

Standard Chartered Annual Report 2018386
SUPPLEMENTARY INFORMATION Major awards 2018
We were listed in the FTSE4Good Index. The FTSE4Good measures the performance of companies that meet globally recognised corporate responsibility standards.
We participate in the CDP Climate questionnaire.
Best Service Provider (Trade Finance) – Bangladesh
Best Service Provider (Risk Management) – Bangladesh
Best Service Provider (E-Solutions Partner) – Bangladesh
Best Service Provider (Cash Management) – India
Best Service Provider (Supply Chain Solutions) – India
Best in Treasury and Working Capital (MNCs) – China
Best Service Provider (Transaction Bank) – Hong Kong
Best Service Provider (Cash Management) – Hong Kong
Best Service Provider (Supply Chain) – Hong Kong
Best Service Provider (Liquidity Management) – Hong Kong
Best Renminbi Bank – Hong Kong
Best in Treasury and Working Capital (MNCs/LLCs) – South Korea
Best in Treasury and Working Capital (SMEs) – South Korea
Best Service Provider (Transaction Bank) – South Korea
Best Service Provider (Trade Finance) – South Korea
Best Service Provider (Liquidity Management) – South Korea
Best Service Provider (Cash Management) – South Korea
Best Service Provider (E-Solutions Partner) – Pakistan
Best Renminbi Bank – Taiwan
Best Service Provider (Supply Chain) – Taiwan
Best Renminbi Bank – Singapore
Best Service Provider (Structured Trade Finance) – Singapore
Best in Treasury & Cash Management – MENA
Best in Working Capital & Trade Finance – MENA
Best Renminbi Bank – Asia
Best in Treasury and Working Capital (MNCs/LLCs) – Asia
Best Specialist Bank (Liquidity Management) – Asia
BANKING AWARDS CONTINUED SUSTAINABILITY INDICES
Standard Chartered was recognised as one of 104 companies on the Bloomberg Gender Equality Index for the third consecutive year. The index is used by investors to compare reputation, value and performance of companies across the gender-equality space.
HR Asia Award 2018
Vietnam Chapter
Best company to work for in Asia
BENCHMARK Wealth Awards
Wealth Asia Media: Academy of the Year
Private Bank Academy – Gold Award
HR Metrics
Diversity Hub Diversity and Inclusion awards
Best Practices in D&I Vision
Best Practices in D&I Benefits
Best Practices in D&I Social Responsibility
Progressive Practices in D&I Communication
Progressive Practices in D&I Sustainability
CFA Charter Awards
Nigeria for outstanding achievements
Career progression for women (firms with more than 500 employees)
Work-life balance (firms with more than 500 employees)
HR AWARDS
Sustainable Business Awards
Special Recognition – Best Strategy and Sustainability Management
Community Chest Awards
Charity Platinum
People’s Association Community Spirit Awards
Community Partnership Merit Award
SUSTAINABILITY AWARDS

387
Risk review
and capital reviewS
trategic reportS
UP
PL
EM
EN
TAR
Y IN
FO
RM
AT
ION
Financial statements
Directors’ report
Glossary
AT1 or Additional Tier 1 capitalAdditional Tier 1 capital consists of instruments other than Common Equity Tier 1 that meet the Capital Requirements Regulation (CRR) criteria for inclusion in Tier 1 capital.
Additional value adjustmentSee Prudent valuation adjustment.
Advanced Internal Rating Based (AIRB) approachThe AIRB approach under the Basel framework is used to calculate credit risk capital based on the Group’s own estimates of prudential parameters.
Advances-to-deposits/customer advances-to-deposits (ADR) ratioThe ratio of total loans and advances to customers relative to total customer accounts. A low advances-to-deposits ratio demonstrates that customer accounts exceed customer loans resulting from emphasis placed on generating a high level of stable funding from customers.
Alternative performance measuresA financial measure of historical or future financial performance, financial position, or cash flows, other than a financial measure defined or specified in the applicable financial reporting framework.
ASEANAssociation of South East Asian Nations (ASEAN), which includes the Group’s operations in Brunei, Indonesia, Malaysia, Philippines, Singapore, Thailand and Vietnam.
AUM or Assets under managementTotal market value of assets such as deposits, securities and funds held by the Group on behalf of the clients.
Basel IIThe capital adequacy framework issued by the Basel Committee on Banking Supervision (BCBS) in June 2006 in the form of the International Convergence of Capital Measurement and Capital Standards.
Basel IIIThe global regulatory standards on bank capital adequacy and liquidity, originally issued in December 2010 and updated in June 2011. In December 2017, the BCBS published a document setting out the finalisation of the Basel III framework. The latest requirements issued in December 2017 will be implemented from 2022.
BCBS or Basel Committee on Banking SupervisionA forum on banking supervisory matters which develops global supervisory standards for the banking industry. Its members are officials from 45 central banks or prudential supervisors from 28 countries and territories.
Basic underlying earnings per share (EPS)Represents the underlying earnings divided by the basic weighted average number of shares.
Basis point (bps)One hundredth of a per cent (0.01 per cent); 100 basis points is 1 per cent.
CRD IV or Capital Requirements Directive IVA capital adequacy legislative package adopted by EU member states. CRD IV comprises the recast Capital Requirements Directive and the Capital Requirements Regulation (CRR). The package implements the Basel III framework together with transitional arrangements for some of its requirements. CRD IV came into force on 1 January 2014.
Capital-lite incomeComprises of income from products with low RWA consumption or products which are non-funding in nature.
Capital resourcesSum of Tier 1 and Tier 2 capital after regulatory adjustments.
CGU or Cash-generating unitThe smallest identifiable group of assets that generates cash inflows that are largely independent of the cash inflows from other assets or groups of assets.
Cash shortfallThe difference between the cash flows that are due in accordance with the contractual terms of the instrument and the cash flows that the Group expects to receive over the contractual life of the instrument.
ClawbackAn amount an individual is required to pay back to the Group, which has to be returned to the Group under certain circumstances.
CRE or Commercial real estateIncludes office buildings, industrial property, medical centres, hotels, malls, retail stores, shopping centres, farm land, multi-family housing buildings, warehouses, garages, and industrial properties. Commercial real estate loans are those backed by a package of commercial real estate assets.
CET1 or Common Equity Tier 1 capitalCommon Equity Tier 1 capital consists of the common shares issued by the Group and related share premium, retained earnings, accumulated other comprehensive income and other disclosed reserves, eligible non-controlling interests and regulatory adjustments required in the calculation of Common Equity Tier 1.
CET1 ratioA measure of the Group’s CET1 capital as a percentage of risk-weighted assets.
Constant currencyConstant currency change is derived by applying a simple translation of the previous period functional currency number in each entity using the current average and period end US dollar exchange rates to the income statement and balance sheet respectively.
Contractual maturityContractual maturity refers to the final payment date of a loan or other financial instrument, at which point all the remaining outstanding principal and interest is due to be paid.
CIR or Cost to income ratioRepresents the proportion of total operating expenses to total operating income. Underlying CIR represents the proportion of total underlying expenses to total underlying operating income.
Countercyclical capital bufferThe countercyclical capital buffer (CCyB) is part of a set of macroprudential instruments, designed to help counter procyclicality in the financial system. CCyB as defined in the Basel III standard provides for an additional capital requirement of up to 2.5 per cent of risk-weighted assets in a given jurisdiction. The Bank of England’s Financial Policy Committee has the power to set the CCyB rate for the United Kingdom. Each bank must calculate its ‘institution-specific’ CCyB rate, defined as the weighted average of the CCyB rates in effect across the jurisdictions in which it has credit exposures. The institution-specific CCyB rate is then applied to a bank’s total risk-weighted assets.
Counterparty credit riskThe risk that a counterparty defaults before satisfying its obligations under a derivative, a securities financing transaction (SFT) or a similar contract.
Standard Chartered Annual Report 2018388
SUPPLEMENTARY INFORMATION Glossary
Cover ratioThe ratio of impairment provisions for each stage to the gross loan exposure for each stage. For stage 3, the cover ratio is also presented as the ratio of impairment provisions plus the realisable value of collateral to the gross loan exposure.
Cover ratio (after collateral)Represents the extent to which non-performing loans are covered by both impairment provisions, and collateral held against the exposure.
CCF or Credit conversion factorAn estimate of the amount the Group expects a customer to have drawn further on a facility limit at the point of default. This is either prescribed by CRR or modelled by the bank.
CDS or Credit default swapsA credit derivative is an arrangement whereby the credit risk of an asset (the reference asset) is transferred from the buyer to the seller of protection. A credit default swap is a contract where the protection seller receives premium or interest-related payments in return for contracting to make payments to the protection buyer upon a defined credit event. Credit events normally include bankruptcy, payment default on a reference asset or assets, or downgrades by a rating agency.
Credit institutionsAn institution whose business is to receive deposits or other repayable funds from the public and to grant credits for its own account.
Credit risk mitigationCredit risk mitigation is a process to mitigate potential credit losses from any given account, customer or portfolio by using a range of tools such as collateral, netting agreements, credit insurance, credit derivatives and guarantees.
CVA or Credit valuation adjustmentsAn adjustment to the fair value of derivative contracts that reflects the possibility that the counterparty may default such that the Group would not receive the full market value of the contracts.
Customer accountsMoney deposited by all individuals and companies which are not credit institutions including securities sold under repurchase agreement (see repo/reverse repo). Such funds are recorded as liabilities in the Group’s balance sheet under customer accounts.
Days past dueOne or more days that interest and/or principal payments are overdue based on the contractual terms.
DVA or Debit valuation adjustmentAn adjustment to the fair value of derivative contracts that reflects the possibility that the Group may default and not pay the full market value of contracts.
Debt securitiesDebt securities are assets on the Group’s balance sheet and represent certificates of indebtedness of credit institutions, public bodies or other undertakings excluding those issued by central banks.
Debt securities in issueDebt securities in issue are transferrable certificates of indebtedness of the Group to the bearer of the certificate. These are liabilities of the Group and include certificates of deposits.
DTA or Deferred tax assetIncome taxes recoverable in future periods in respect of deductible temporary differences between the accounting and tax base of an asset or liability that will result in tax deductible amounts in future periods, the carry-forward of tax losses or the carry-forward of unused tax credits.
DTL or Deferred tax liabilityIncome taxes payable in future periods in respect of taxable temporary differences between the accounting and tax base of an asset or liability that will result in taxable amounts in future periods.
DefaultFinancial assets in default represent those that are at least 90 days past due in respect of principal or interest and/or where the assets are otherwise considered to be unlikely to pay, including those that are credit-impaired.
Defined benefit obligationThe present value of expected future payments required to settle the obligations of a defined benefit scheme resulting from employee service.
Defined benefit schemePension or other post-retirement benefit scheme other than a defined contribution scheme.
Defined contribution schemeA pension or other post-retirement benefit scheme where the employer’s obligation is limited to its contributions to the fund.
DelinquencyA debt or other financial obligation is considered to be in a state of delinquency when payments are overdue. Loans and advances are considered to be delinquent when consecutive payments are missed. Also known as arrears.
Deposits by banksDeposits by banks comprise amounts owed to other domestic or foreign credit institutions by the Group including securities sold under repo.
Diluted underlying earnings per share (EPS)Represents the underlying earnings divided by the diluted weighted average number of shares.
Dividend per shareRepresents the entitlement of each shareholder in the share of the profits of the Company. Calculated in the lowest unit of currency in which the shares are quoted.
Early alert, purely and non-purely precautionaryA borrower’s account which exhibits risks or potential weaknesses of a material nature requiring closer monitoring, supervision, or attention by management. Weaknesses in such a borrower’s account, if left uncorrected, could result in deterioration of repayment prospects and the likelihood of being downgraded to credit grade 12 or worse. When an account is on early alert, it is classified as either purely precautionary or non-purely precautionary. A purely precautionary account is one that exhibits early alert characteristics but these do not present any imminent credit concern. If the symptoms present an imminent credit concern, an account will be considered for classification as non-purely precautionary.
Effective tax rateThe tax on profit/ (losses) on ordinary activities as a percentage of profit/(loss) on ordinary activities before taxation.
Encumbered assetsOn-balance sheet assets pledged or used as collateral in respect of certain of the Group’s liabilities.
EU or European UnionThe European Union (EU) is a political and economic union of 28 member states that are located primarily in Europe.
EurozoneRepresents the 19 EU countries that have adopted the euro as their common currency.
ECL or Expected credit lossRepresents the present value of expected cash shortfalls over the residual term of a financial asset, undrawn commitment or financial guarantee.
389
Risk review
and capital reviewS
trategic reportS
UP
PL
EM
EN
TAR
Y IN
FO
RM
AT
ION
Financial statements
Directors’ report
Expected lossThe Group measure of anticipated loss for exposures captured under an internal ratings-based credit risk approach for capital adequacy calculations. It is measured as the Group-modelled view of anticipated loss based on probability of default, loss given default and exposure at default, with a one-year time horizon.
ExposuresCredit exposures represent the amount lent to a customer, together with any undrawn commitments.
EAD or Exposure at defaultThe estimation of the extent to which the Group may be exposed to a customer or counterparty in the event of, and at the time of, that counterparty’s default. At default, the customer may not have drawn the loan fully or may already have repaid some of the principal, so that exposure is typically less than the approved loan limit.
ECAI or External Credit Assessment InstitutionExternal credit ratings are used to assign risk-weights under the standardised approach for sovereigns, corporates and institutions. The external ratings are from credit rating agencies that are registered or certified in accordance with the credit rating agencies regulation or from a central bank issuing credit ratings which is exempt from the application of this regulation.
FCA or Financial Conduct AuthorityThe Financial Conduct Authority regulates the conduct of financial firms and, for certain firms, prudential standards in the UK. It has a strategic objective to ensure that the relevant markets function well.
ForbearanceForbearance takes place when a concession is made to the contractual terms of a loan in response to an obligor’s financial difficulties. The Group classifies such modified loans as either ‘Forborne – not impaired loans’ or ‘Loans subject to forbearance – impaired’. Once a loan is categorised as either of these, it will remain in one of these two categories until the loan matures or satisfies the ‘curing’ conditions described in Note 8 to the financial statements.
Forborne – not impaired loansLoans where the contractual terms have been modified due to financial difficulties of the borrower, but the loan is not considered to be impaired. See ‘Forbearance’.
Free deliveriesA transaction where a bank takes receipt of a debt or equity security, a commodity or foreign exchange without making immediate payment, or where a bank delivers a debt or equity security, a commodity or foreign exchange without receiving immediate payment.
Free fundsFree funds include equity capital, retained reserves, current year unremitted profits and capital injections net of proposed dividends. It does not include debt capital instruments, unrealised profits or losses or any non- cash items.
Funded/unfunded exposuresExposures where the notional amount of the transaction is funded or unfunded. Represents exposures where a commitment to provide future funding is made but funds have been released/ not released.
FVA or Funding valuation adjustmentsFVA reflects an adjustment to fair value in respect of derivative contracts that reflects the funding costs that the market participant would incorporate when determining an exit price.
G-SIBs or Global Systemically Important BanksGlobal banking financial institutions whose size, complexity and systemic interconnectedness mean that their distress or failure would cause significant disruption to the wider financial system and economic activity. The list of G-SIBs is assessed under a framework established by the FSB and the BCBS. In the EU, the G-SIB framework is implemented via CRD IV and G-SIBs are referred to as Global Systemically Important Institutions (G-SIIs).
G-SIB bufferA CET1 capital buffer which results from designation as a G-SIB. The G-SIB buffer is between 1 per cent and 3.5 per cent, depending on the allocation to one of five buckets based on the annual scoring. The G-SIB buffer has been phased in by 1 January 2019. In the EU, the G-SIB buffer is implemented via CRD IV as Global Systemically Important Institutions (G-SII) buffer requirement.
Interest rate riskThe risk of an adverse impact on the Group’s income statement due to changes in interest rates.
IRB approach or internal ratings-based approachRisk-weighting methodology in accordance with the Basel Capital Accord where capital requirements are based on a firm’s own estimates of prudential parameters.
IMA or internal model approachThe approach used to calculate market risk capital and RWA with an internal market risk model approved by the PRA under the terms of CRD IV/CRR.
IAS or International Accounting StandardA standard that forms part of the International Financial Reporting Standards framework.
IASB or International Accounting Standards BoardAn independent standard-setting body responsible for the development and publication of IFRS, and approving interpretations of IFRS standards that are recommended by the IFRS Interpretations Committee (IFRIC).
IFRS or International Financial Reporting StandardsA set of international accounting standards developed and issued by the International Accounting Standards Board, consisting of principles-based guidance contained within IFRSs and IASs. All companies that have issued publicly traded securities in the EU are required to prepare annual and interim reports under IFRS and IAS standards that have been endorsed by the EU.
IFRICThe IFRS Interpretations Committee supports the IASB in providing authoritative guidance on the accounting treatment of issues not specifically dealt with by existing IFRSs and IASs.
Investment gradeA debt security, treasury bill or similar instrument with a credit rating measured by external agencies of AAA to BBB.
Leverage ratioA ratio that compares Tier 1 capital to total exposures, including certain exposures held off-balance sheet as adjusted by stipulated credit conversion factors. Intended to be a simple, non-risk-based backstop measure.
Liquid asset ratioRatio of total liquid assets to total assets. Liquid assets comprise cash (less restricted balances), net interbank, treasury bills and debt securities less illiquid securities.

Standard Chartered Annual Report 2018390
SUPPLEMENTARY INFORMATION Glossary
Liquidation portfolioA portfolio of assets which is beyond our current risk appetite metrics and is held for liquidation.
LCR or Liquidity coverage ratioThe ratio of the stock of high-quality liquid assets to expected net cash outflows over the following 30 days. High-quality liquid assets should be unencumbered, liquid in markets during a time of stress and, ideally, be central bank eligible.
Loan exposureLoans and advances to customers reported on the balance sheet held at amortised cost or FVOCI, non-cancellable credit commitments and cancellable credit commitments for credit cards and overdraft facilities.
Loans and advancesThis represents lending made under bilateral agreements with customers entered into in the normal course of business and is based on the legal form of the instrument.
Loan loss rateLoan loss rate is total credit impairment for loans and advances to customers over average loans and advances to customers
Loans to banksAmounts loaned to credit institutions including securities bought under Reverse repo.
LTV or loan-to-value ratioA calculation which expresses the amount of a first mortgage lien as a percentage of the total appraised value of real property. The loan-to-value ratio is used in determining the appropriate level of risk for the loan and therefore the correct price of the loan to the borrower.
Loans past dueLoans on which payments have been due for up to a maximum of 90 days including those on which partial payments are being made.
Loans subject to forbearance – impairedLoans where the terms have been renegotiated on terms not consistent with current market levels due to financial difficulties of the borrower. Loans in this category are necessarily impaired. See ‘Forbearance’.
Loss rateUses an adjusted gross charge-off rate, developed using monthly write-off and recoveries over the preceding 12 months and total outstanding balances.
LGD or Loss given defaultThe percentage of an exposure that a lender expects to lose in the event of obligor default.
MalusAn arrangement that permits the Group to prevent vesting of all or part of the amount of an unvested variable remuneration award, due to a specific crystallised risk, behaviour, conduct or adverse performance outcome.
Master netting agreementAn agreement between two counterparties that have multiple derivative contracts with each other that provides for the net settlement of all contracts through a single payment, in a single currency, in the event of default on, or termination of, any one contract.
Mezzanine capitalFinancing that combines debt and equity characteristics. For example, a loan that also confers some profit participation to the lender.
MREL or minimum requirement for own funds and eligible liabilitiesA requirement under the Bank Recovery and Resolution Directive for EU resolution authorities to set a minimum requirement for own funds and eligible liabilities for banks, implementing the FSB’s Total Loss Absorbing Capacity (TLAC) standard. MREL is intended to ensure that there is sufficient equity and specific types of liabilities to facilitate an orderly resolution that minimises any impact on financial stability and ensures the continuity of critical functions and avoids exposing taxpayers to loss.
Net asset value (NAV) per shareRatio of net assets (total assets less total liabilities) to the number of ordinary shares outstanding at the end of a reporting period.
Net exposureThe aggregate of loans and advances to customers/loans and advances to banks after impairment provisions, restricted balances with central banks, derivatives (net of master netting agreements), investment debt and equity securities, and letters of credit and guarantees.
NII or Net interest incomeThe difference between interest received on assets and interest paid on liabilities.
NIM or Net interest marginNet interest income divided by average interest earning assets.
NSFR or Net stable funding ratioThe ratio of available stable funding to required stable funding over a one-year time horizon, assuming a stressed scenario. It is a longer-term liquidity measure designed to restrain the amount of wholesale borrowing and encourage stable funding over a one-year time horizon.
Net tangible asset value per shareRatio of net tangible assets (total tangible assets less total liabilities) to the number of ordinary shares outstanding at the end of a reporting period.
NPLs or non-performing loansAn NPL is any loan that is more than 90 days past due or is otherwise individually impaired. This excludes Retail loans renegotiated at or after 90 days past due, but on which there has been no default in interest or principal payments for more than 180 days since renegotiation, and against which no loss of principal is expected.
Non-linearityNon-linearity of expected credit loss occurs when the average of expected credit loss for a portfolio is higher than the base case (median) due to the fact that bad economic environment could have a larger impact on ECL calculation than good economic environment.
Normalised itemsSee ‘Underlying earnings’.
Operating expensesStaff and premises costs, general and administrative expenses, depreciation and amortisation. Underlying operating expenses exclude expenses as described in ‘Underlying earnings’. A reconciliation between underlying and statutory earnings is contained in Note 2 to the financial statements.
Operating income or operating profitNet interest, net fee and net trading income, as well as other operating income. Underlying operating income represents the income line items above, on an underlying basis. See ‘Underlying earnings’.
OTC or Over-the-counter derivativesA bilateral transaction (e.g. derivatives) that is not exchange traded and that is valued using valuation models.
OCA or Own credit adjustmentAn adjustment to the Group’s issued debt designated at fair value through profit or loss that reflects the possibility that the Group may default and not pay the full market value of the contracts.
391
Risk review
and capital reviewS
trategic reportS
UP
PL
EM
EN
TAR
Y IN
FO
RM
AT
ION
Financial statements
Directors’ report
Physical risksThe risk of increased extreme weather events including flood, drought and sea level rise.
Pillar 1The first pillar of the three pillars of the Basel framework which provides the approach to calculation of the minimum capital requirements for credit, market and operational risk. Minimum capital requirements are 8 per cent of the Group’s risk-weighted assets.
Pillar 2The second pillar of the three pillars of the Basel framework which requires banks to undertake a comprehensive assessment of their risks and to determine the appropriate amounts of capital to be held against these risks where other suitable mitigants are not available.
Pillar 3The third pillar of the three pillars of the Basel framework which aims to provide a consistent and comprehensive disclosure framework that enhances comparability between banks and further promotes improvements in risk practices.
Private equity investmentsEquity securities in operating companies generally not quoted on a public exchange. Investment in private equity often involves the investment of capital in private companies. Capital for private equity investment is raised by retail or institutional investors and used to fund investment strategies such as leveraged buyouts, venture capital, growth capital, distressed investments and mezzanine capital.
PD or Probability of defaultPD is an internal estimate for each borrower grade of the likelihood that an obligor will default on an obligation over a given time horizon.
Probability weightedObtained by considering the values the metric can assume, weighted by the probability of each value occurring.
Profit (loss) attributable to ordinary shareholdersProfit (loss) for the year after non-controlling interests and dividends declared in respect of preference shares classified as equity.
PVA or Prudent valuation adjustmentAn adjustment to CET1 capital to reflect the difference between fair value and prudent value positions, where the application of prudence results in a lower absolute carrying value than recognised in the financial statements.
PRA or Prudential Regulation AuthorityThe Prudential Regulation Authority is the statutory body responsible for the prudential supervision of banks, building societies, credit unions, insurers and a small number of significant investment firms in the UK. The PRA is a part of the Bank of England.
Repo/reverse repoA repurchase agreement or repo is a short-term funding agreement, which allows a borrower to sell a financial asset, such as asset backed securities or government bonds as collateral for cash. As part of the agreement the borrower agrees to repurchase the security at some later date, usually less than 30 days, repaying the proceeds of the loan. For the party on the other end of the transaction (buying the security and agreeing to sell in the future), it is a reverse repurchase agreement or reverse repo.
Residential mortgageA loan to purchase a residential property which is then used as collateral to guarantee repayment of the loan. The borrower gives the lender a lien against the property, and the lender can foreclose on the property if the borrower does not repay the loan per the agreed terms. Also known as a home loan.
RoE or Return on equityRepresents the ratio of the current year’s profit available for distribution to ordinary shareholders to the weighted average ordinary shareholders’ equity for the reporting period. Underlying return on equity represents the ratio above using underlying earnings. See ‘Underlying earnings’.
RoRWA or Return on risk-weighted assetsProfit before tax for year as a percentage of RWA. Profit may be statutory or underlying and is specified where used. See ‘RWA’ and ‘Underlying earnings’.
RoTE or Return on tangible equityRepresents the ratio of the current year’s profit available for distribution to ordinary shareholders, to the weighted average ordinary shareholders’ equity less the average goodwill and intangibles for the reporting period. Underlying return on tangible equity represents the ratio above using underlying earnings. See ‘Underlying earnings’.
RWA or Risk-weighted assetsA measure of a bank’s assets adjusted for their associated risks, expressed as a percentage of an exposure value in accordance with the applicable standardised or IRB approach provisions.
Risks-not-in-VaR (RNIV)A framework for identifying and quantifying marginal types of market risk that are not captured in the Value at Risk (VaR) measure for any reason, such as being a far-tail risk or the necessary historical market data not being available.
Roll rateUses a matrix that gives average loan migration rate from delinquency states from period to period. A matrix multiplication is then performed to generate the final PDs by delinquency bucket over different time horizons.
Secured (fully and partially)A secured loan is a loan in which the borrower pledges an asset as collateral for a loan which, in the event that the borrower defaults, the Group is able to take possession of. All secured loans are considered fully secured if the fair value of the collateral is equal to or greater than the loan at the time of origination. All other secured loans are considered to be partly secured.
SecuritisationSecuritisation is a process by which credit exposures are aggregated into a pool, which is used to back new securities. Under traditional securitisation transactions, assets are sold to a structured entity (SE) which then issues new securities to investors at different levels of seniority (credit tranching). This allows the credit quality of the assets to be separated from the credit rating of the originating institution and transfers risk to external investors in a way that meets their risk appetite. Under synthetic securitisation transactions, the transfer of risk is achieved by the use of credit derivatives or guarantees, and the exposures being securitised remain exposures of the originating institution.
Senior debtDebt that takes priority over other unsecured or otherwise more ‘junior’ debt owed by the issuer. Senior debt has greater seniority in the issuer’s capital structure after subordinated debt. In the event the issuer goes bankrupt, senior debt theoretically must be repaid before other creditors receive any payment.
SICR or Significant increase in credit riskAssessed by comparing the risk of default of an exposure at the reporting date to the risk of default at origination (after considering the passage of time).
Standard Chartered Annual Report 2018392
SUPPLEMENTARY INFORMATION Glossary
Sovereign exposuresExposures to central governments and central government departments, central banks and entities owned or guaranteed by the aforementioned.
Stage 1Assets have not experienced a significant increase in credit risk since origination and impairment recognised on the basis of 12 months expected credit losses.
Stage 2Assets have experienced a significant increase in credit risk since origination and impairment is recognised on the basis of lifetime expected credit losses.
Stage 3Assets that are in default and considered credit-impaired (non-performing loans).
Standardised approachIn relation to credit risk, a method for calculating credit risk capital requirements using External Credit Assessment Institutions (ECAI) ratings and supervisory risk weights. In relation to operational risk, a method of calculating the operational capital requirement by the application of a supervisory defined percentage charge to the gross income of eight specified business lines.
Structured noteAn investment tool which pays a return linked to the value or level of a specified asset or index and sometimes offers capital protection if the value declines. Structured notes can be linked to equities, interest rates, funds, commodities and foreign currency.
Subordinated liabilitiesLiabilities which, in the event of insolvency or liquidation of the issuer, are subordinated to the claims of depositors and other creditors of the issuer.
Tier 1 capitalThe sum of Common Equity Tier 1 capital and Additional Tier 1 capital.
Tier 1 capital ratioTier 1 capital as a percentage of risk-weighted assets.
Tier 2 capitalTier 2 capital comprises qualifying subordinated liabilities and related share premium accounts.
TLAC or Total loss absorbing capacityAn international standard for TLAC issued by the FSB, which requires G-SIBs to have sufficient loss-absorbing and recapitalisation capacity available in resolution, to minimise impacts on financial stability, maintain the continuity of critical functions and avoid exposing public funds to loss.
TSR or Total shareholder returnThe total return of the Group’s equity (share price growth and dividends) to investors.
Transition risksThe risk of changes to market dynamics or sectoral economics due to governments’ response to climate change.
UK bank levyA levy that applies to certain UK banks and the UK operations of foreign banks. The levy is payable each year based on a percentage of the chargeable equities and liabilities on the Group’s consolidated balance sheet date. Key exclusions from chargeable equities and liabilities include Tier 1 capital, insured or guaranteed retail deposits, repos secured on certain sovereign debt and liabilities subject to netting.
UnbiasedNot overly optimistic or pessimistic, represents information that is not slanted, weighted, emphasised, de-emphasised or otherwise manipulated to increase the probability that the financial information will be received favourably or unfavourably by users.
Underlying earningsThe Group’s statutory performance adjusted for restructuring and other items representing profits or losses of a capital nature; amounts consequent to investment transactions driven by strategic intent; and other infrequent and/or exceptional transactions that are significant or material in the context of the Group’s normal business earnings for the period, and items which management and investors would ordinarily identify separately when assessing performance period-by-period. A reconciliation between underlying and statutory performance is contained in Note 2 to the financial statements.
Unlikely to payIndications of unlikeliness to pay shall include placing the credit obligation on non-accrued status; the recognition of a specific credit adjustment resulting from a significant perceived decline in credit quality subsequent to the Group taking on the exposure; selling the credit obligation at a material credit related economic loss; the Group consenting to a distressed restructuring of the credit obligation where this is likely to result in a diminished financial obligation caused by the material forgiveness, or postponement, of principal, interest or, where relevant fees; filing for the obligor’s bankruptcy or a similar order in respect of an obligor’s credit obligation to the Group; the obligor has sought or has been placed in bankruptcy or similar protection where this would avoid or delay repayment of a credit obligation to the Group.
VaR or Value at RiskA quantitative measure of market risk estimating the potential loss that will not be exceeded in a set time period at a set statistical confidence level.
ViU or Value-in-UseThe present value of the future expected cash flows expected to be derived from an asset or CGU.
Write-downsAfter an advance has been identified as impaired and is subject to an impairment provision, the stage may be reached whereby it is concluded that there is no realistic prospect of further recovery. Write-downs will occur when, and to the extent that, the whole or part of a debt is considered irrecoverable.
XVAThe term used to incorporate credit, debit and funding valuation adjustments to the fair value of derivative financial instruments. See ‘CVA’, ‘DVA’ and ‘FVA’.

Designed and produced by Friend www.friendstudio.com
Printed by Park Communications on FSC® certified paper.
Park is an EMAS certified company and its Environmental Management System is certified to ISO 14001.
100% of the inks used are vegetable oil based, 95% of press chemicals are recycled for further use and, on average, 99% of any waste associated with this production will be recycled.
This document is printed on Revive 50 silk, a paper containing 50% recycled fibre (25% post-consumer and 25% pre-consumer) and 50% virgin fibre sourced from well-managed, responsible, FSC® certified forests. The pulp used in this product is bleached using an elemental chlorine free (ECF) process.
This document is fully recyclable.
© Standard Chartered PLC. All rights reserved.
The STANDARD CHARTERED word mark, its logo device and associated product brand names are owned by Standard Chartered PLC and centrally licensed to its operating entities.
Registered Office: 1 Basinghall Avenue, London EC2V 5DD. Telephone +44 (0) 20 7885 8888.
Principal place of business in Hong Kong: 32nd Floor, 4-4A Des Voeux Road, Central, Hong Kong.
Registered in England No. 966425.
Standard Chartered Annual Report 2018
About this report
Sustainability reporting is embedded across our Annual Report and Accounts and is also available in consolidated form in our Sustainability Summary at sc.com/sustainabilitysummary
The Group uses a number of alternative performance measures in the discussion of its performance. These measures exclude certain items which management believe are not representative of the underlying performance of the business and which distort period-on-period comparison. They provide the reader with insight into how management measures the performance of the business.
For more information please visit sc.com
Photo competition
In 2018 we ran our Annual Report staff photo competition again, this time showcasing our three valued behaviours. The top three entrants can be found on the front and back cover, and there is further information on pages 134, 224 and 356.
Unless another currency is specified, the word ‘dollar’ or symbol ‘$’ in this document means US dollar and the word ‘cent’ or symbol ‘c’ means one-hundredth of one US dollar.Those disclosures marked ‘unaudited’ are not within the scope of KPMG LLP’s audit.Unless the context requires, within this document, ‘China’ refers to the People’s Republic of China and, for the purposes of this document only, excludes Hong Kong Special Administrative Region (Hong Kong), Macau Special Administrative Region (Macau) and Taiwan. ‘Korea’ or ‘South Korea’ refers to the Republic of Korea. Greater China & North Asia (GCNA) includes China, Hong Kong, Japan, Korea, Macau and Taiwan; ASEAN & South Asia (ASA) includes Australia, Bangladesh, Brunei, Cambodia, India, Indonesia, Laos, Malaysia, Myanmar, Nepal, Philippines, Singapore, Sri Lanka, Thailand and Vietnam; and Africa & Middle East (AME) includes Bahrain, Egypt, Iraq, Jordan, Lebanon, Oman, Pakistan, Qatar, Saudi Arabia and the United Arab Emirates (UAE).Within the tables in this report, blank spaces indicate that the number is not disclosed, dashes indicate that the number is zero and nm stands for not meaningful.Standard Chartered PLC is headquartered in London. The Group’s head office provides guidance on governance and regulatory standards. Standard Chartered PLC stock codes are: HKSE 02888; LSE STAN.LN; and BSE/NSE STAN.IN.
@StanChart
linkedin.com/company/standard-chartered-bank
facebook.com/standardchartered
Further information is available where you see these icons:
More information is available online
Additional information can be found within the report
Standard Chartered is a leading international banking group.
Our heritage and values are expressed in our brand promise, Here for good. Our operations reflect Our Purpose, which is to drive commerce and prosperity through our unique diversity. We are present in 60 markets and serve clients in a further 85. Our businesses serve four client segments in four regions, supported by our global functions.
Greater China & North Asia
Read more on page 26
ASEAN & South Asia
Read more on page 27
Europe & Americas
Read more on page 29
Africa & Middle East
Read more on page 28

ANNUAL REPORT 2018
Here for goodDriving commerce and prosperity through our unique diversity
LSE Stock code: STAN.LN HKSE Stock code: 02888 BSE/NSE Stock code: STAN.IN
CONTACT INFORMATION
Global headquarters Standard Chartered Group 1 Basinghall Avenue London, EC2V 5DD United Kingdom
telephone: +44 (0)20 7885 8888 facsimile: +44 (0)20 7885 9999
Digital Annual Report and Accounts
sc.com/annualreport
Shareholder enquiriesShareCare informationwebsite: sc.com/shareholders helpline: 0370 702 0138
ShareGift information website: ShareGift.orghelpline: 020 7930 3737
Registrar informationUKComputershare Investor Services PLC The Pavilions Bridgwater Road Bristol, BS99 6ZZ Helpline: 0370 702 0138
Hong KongComputershare Hong Kong Investor Services Limited 17M Floor, Hopewell Centre 183 Queen’s Road East Wan Chai Hong Kongwebsite: computershare.com/hk/investors
Indian Depository ReceiptsKarvy Fintech Private Limited Karvy Selenium Tower B, Plot 31-32 Financial District Nanakramguda Hyderabad 500032, India
Chinese translationComputershare Hong Kong Investor Services Limited 17M Floor, Hopewell Centre 183 Queen’s Road East Wan Chai Hong Kong
Register for electronic communicationswebsite: investorcentre.co.uk
Sta
nd
ard
Ch
artered
PLC
Annual R
eport 2018